UNITED STATES
SECURITIES AND EXCHANGE COMMISSION
Washington, D.C. 20549
FORM 6-K
REPORT OF FOREIGN PRIVATE ISSUER
PURSUANT TO RULE 13a-16 OR 15d-16
UNDER THE SECURITIES EXCHANGE ACT OF 1934
For the month of March 2024
Commission File No. 001-39974
WEST FRASER TIMBER CO. LTD.
(Translation of registrant’s name into English)
885 West Georgia Street, Suite 1500
Vancouver, British Columbia
Canada V6C 3E8
(Address of principal executive office)
Indicate by check mark whether the registrant files or will file annual reports under cover of Form 20-F or Form 40-F
Form 20-F [ ] Form 40-F [X]
Indicate by check mark if the registrant is submitting the Form 6-K in paper as permitted by Regulation S-T Rule 101(b)(1) [ ]
Indicate by check mark if the registrant is submitting the Form 6-K in paper as permitted by Regulation S-T Rule 101(b)(7) [ ]
-2-
SUBMITTED HEREWITH
| Exhibits | ||||
| 99.1 | Notice of Annual General Meeting of Shareholders to be held on April 24, 2024 | |||
| 99.2 | Management Information Circular dated March 6, 2024 | |||
| 99.3 | Form of Proxy | |||
| 99.4 | Financial Statements Request Form (NI 51-102 Mailing List Card) | |||
| 99.5 | 2023 Annual Report | |||
SIGNATURE
Pursuant to the requirements of the Securities Exchange Act of 1934, the registrant has duly caused this report to be signed on its behalf by the undersigned, thereunto duly authorized.
Dated: March 19, 2024
WEST FRASER TIMBER CO. LTD.
| /s/ Christopher A. Virostek
|
| Christopher A. Virostek |
| Senior Vice-President, Finance and Chief Financial Officer |
Exhibit 99.1
NOTICE OF ANNUAL GENERAL MEETING OF SHAREHOLDERS
We will hold the Meeting in Quesnel, B.C. Additionally, a live-webcast option will be provided for Shareholders to listen in and view the Meeting and ask questions.
The annual general meeting (the “Meeting”) of shareholders (“Shareholders”) of West Fraser Timber Co. Ltd. (the “Company”) will be held on April 24, 2024 at 11:00 a.m. (Vancouver time). The Meeting will be held at 1250 Brownmiller Road, Quesnel, B.C. Additionally, through our online meeting platform Registered Shareholders (as defined in the accompanying Circular) and duly appointed proxyholders will have a live-webcast option at https://web.lumiagm.com/441482273, password “westfraser2024” (case sensitive), where they can listen in and view the Meeting and ask questions. The Meeting will be held, for the following purposes:
| 1. | to receive the consolidated financial statements of the Company for the financial years ended December 31, 2023 and 2022, together with the Auditor’s report on them; |
| 2. | to fix the number of Directors at twelve; |
| 3. | to elect the Directors to hold office until the close of the next annual meeting of Shareholders; |
| 4. | to appoint an auditor of the Company to serve until the close of the next annual meeting of Shareholders and to authorize the Directors to fix the auditor’s remuneration; and |
| 5. | to consider an advisory (non-binding) resolution on the Company’s approach to executive compensation, as more particularly set out in the section of the accompanying Circular entitled “Advisory Resolution on the Company’s Approach to Executive Compensation (Say on Pay)”. |
No other matters are contemplated for consideration at the Meeting, however any permitted amendment to or variation of any matter identified in this Notice of Annual General Meeting of Shareholders (the “Notice”) may properly be considered at the Meeting. The Meeting may also consider the transaction of such other business as may properly come before the Meeting or any adjournment thereof.
A copy of the annual report of the Company for the financial year ended December 31, 2023 (the “Annual Report”) will accompany this Notice for those Shareholders that had requested a copy of the Annual Report. The Annual Report may also be found on our website (www.westfraser.com) and under our profiles on SEDAR+ (the System for Electronic Document Analysis and Retrieval) at www.sedarplus.ca and on EDGAR (Electronic Data Gathering, Analysis, and Retrieval system) at www.sec.gov/edgar. The Annual Report includes our consolidated financial statements and the Auditor’s report thereon.
Shareholders registered at the close of business on February 29, 2024 will be entitled to receive this Notice and to vote at the Meeting.
2
INFORMATION ON NOTICE AND ACCESS
(You have not been sent a physical copy of the Circular.)
General Information
The Company has prepared this Notice of the Annual General Meeting (the “Notice”) of the Company, which includes Information on Notice and Access, the Circular and a form of proxy relating to the Meeting, and the Circular contains details of the matters to be considered at the Meeting. This Notice has been prepared and mailed to you under the notice and access rules that came into effect on February 11, 2013, pursuant to applicable Canadian securities laws. Notice and access enables issuers to reduce the volume of materials that must be physically mailed to shareholders by posting the information circular and related proxy materials on the Internet. Please call Computershare Investor Services Inc. (“Computershare”) toll-free at 1-800-564-6253 (North American toll free) or 1-514-982-7555 (International) if you have any questions about notice and access procedures.
How to Access the Circular and Obtain a Physical Copy
The Circular and related proxy materials are available under our profiles on SEDAR+ at www.sedarplus.ca and EDGAR at www.sec.gov/edgar, and on our website at www.westfraser.com. Shareholders are reminded to review these online materials in connection with the Meeting and before voting. Shareholders may obtain a physical copy of the Circular by: (a) calling the Company’s transfer agent, Computershare, toll free at 1-800-564-6253 (North American toll free) or 1-514-982-7555 (International); or (b) emailing a request to Computershare at service@computershare.com. A request for a physical copy of the Circular should be sent sufficiently in advance so that it is received by Computershare by April 4, 2024, in order to allow sufficient time for the Company to mail, and the Shareholder to receive, the physical copy of the Circular and return the completed form of proxy before the Proxy Deadline (defined below).
Forms of Proxy and Voting Instruction Forms (“VIFs”)
Registered Shareholders have received a form of proxy with this Notice. To have proxy votes counted in the voting at the Meeting, the deadline for submitting a completed form of proxy is 11:00 a.m. (Vancouver time) on April 22, 2024 (the “Proxy Deadline”). Please complete, date and sign the form of proxy and deliver it before the Proxy Deadline in accordance with the instructions set out in the form of proxy and in the Circular.
Non-registered Shareholders (as defined in the accompanying Circular) have received a voting instruction form with this Notice. The deadline for returning voting instruction forms is specified within the form itself. Voting instruction forms, whether provided by the Company or an intermediary, should be completed and returned in accordance with the specific instructions, and by the deadline specified, within the form. Please ensure you carefully follow the instructions set out in the voting instruction form, including those specifying to where and when the form is to be returned.
3
Please review the Circular before completing your form of proxy or voting instruction form, as the Circular contains additional information about each matter to be voted on at the Meeting. The following guide will assist you in locating the relevant disclosure for each matter.
|
For disclosure about: |
Refer to the following section(s) in the Circular |
|
|
• the fixing of the number of Directors at twelve |
“Fixing the Number and Election of Directors” | |
|
• the election of Directors
|
“Information Regarding Nominees for Election as Directors” | |
|
• the appointment of the Company’s auditor |
“Appointment of the Auditor” | |
|
• the approval of the Company’s approach to executive compensation |
“Advisory Resolution on the Company’s Approach to Executive Compensation (Say on Pay)” | |
A Shareholder who is unable to attend the Meeting in person and who wishes to ensure that such Shareholder’s shares are voted must complete, date and sign an acceptable form of proxy or voting instruction form and deliver it in accordance with the instructions set out in the enclosed form of proxy or voting instruction form and in the Circular.
DATED at Vancouver, B.C., March 6, 2024.
| BY ORDER OF THE BOARD
|
||
|
|
||
| Sean McLaren | ||
| President and Chief Executive Officer | ||
Exhibit 99.2

West Fraser Timber Co. Ltd.
Notice of Annual General
Meeting of Shareholders
To Be Held April 24, 2024
Management Information Circular
Your Participation is Important
Please Take the Time to Vote
WHAT’S INSIDE
| INVITATION TO SHAREHOLDERS |
1 | |||
| NOTICE OF ANNUAL GENERAL MEETING OF SHAREHOLDERS |
1 | |||
| MANAGEMENT INFORMATION CIRCULAR |
1 | |||
| DEFINITIONS |
1 | |||
| ADDITIONAL INFORMATION REGARDING THE MEETING |
5 | |||
| FREQUENTLY ASKED QUESTIONS |
7 | |||
| VOTING BY NON-REGISTERED SHAREHOLDERS |
11 | |||
| BUSINESS TO BE TRANSACTED AT THE MEETING |
12 | |||
| INFORMATION REGARDING NOMINEES FOR ELECTION AS DIRECTORS |
13 | |||
| BOARD RENEWAL |
26 | |||
| DIRECTOR COMPENSATION |
29 | |||
| VOTING SECURITIES AND PRINCIPAL SHAREHOLDERS |
33 | |||
| APPOINTMENT OF THE AUDITOR |
34 | |||
| ADVISORY RESOLUTION ON THE COMPANY’S APPROACH TO EXECUTIVE COMPENSATION (SAY ON PAY) |
35 | |||
| OUR CORPORATE GOVERNANCE POLICIES AND PROCEDURES |
36 | |||
| GOVERNANCE POLICY |
36 | |||
| CHAIR OF THE BOARD |
36 | |||
| GOVERNANCE & NOMINATING COMMITTEE |
37 | |||
| MAJORITY VOTING POLICY |
37 | |||
| ADVANCE NOTICE POLICY |
38 | |||
| CODE OF CONDUCT |
38 | |||
| ANTI-TRUST POLICY |
39 | |||
| SUPPLY CHAIN & HUMAN RIGHTS POLICY AND SUPPLIER CODE OF CONDUCT |
39 | |||
| ANTI-BRIBERY AND ANTI-CORRUPTION POLICY |
39 | |||
| CHARTERS |
40 | |||
| MINIMUM EQUITY HOLDING |
40 | |||
| MANDATE OF THE BOARD |
41 | |||
| ESG OVERSIGHT |
42 | |||
| CORPORATE DISCLOSURE POLICY |
44 | |||
| AUDIT COMMITTEE |
45 | |||
| DECISIONS REQUIRING PRIOR APPROVAL BY THE BOARD |
46 | |||
| SHAREHOLDER FEEDBACK AND CONCERNS |
47 | |||
| EXPECTATIONS OF MANAGEMENT |
47 | |||
| COMPOSITION OF THE BOARD |
48 | |||
| BOARD DIVERSITY POLICY |
50 | |||
| SERVING ON OTHER BOARDS |
51 | |||
| COMMITTEES OF THE BOARD |
51 | |||
| ORIENTATION PROGRAM AND CONTINUING EDUCATION |
54 | |||
| MEETING ATTENDANCE RECORD |
57 | |||
| EXECUTIVE COMPENSATION DISCUSSION & ANALYSIS |
58 | |||
| HUMAN RESOURCES & COMPENSATION COMMITTEE RESPONSIBILITY |
58 | |||
| COMPOSITION OF THE HR&C COMMITTEE |
58 | |||
| REPORT ON EXECUTIVE COMPENSATION |
59 | |||
| PERFORMANCE GRAPH |
69 | |||
| EXECUTIVE COMPENSATION |
70 | |||
| SUMMARY COMPENSATION TABLE |
71 | |||
| OPTION GRANTS |
72 | |||
| RS UNITS AND PS UNITS |
77 | |||
| PENSION PLANS |
79 | |||
| SEVERANCE AND CHANGE OF CONTROL AGREEMENTS |
82 | |||
| DIRECTORS’ COMPENSATION AND HOLDINGS |
83 | |||
| INTEREST OF INFORMED PERSONS IN MATERIAL TRANSACTIONS |
83 | |||
| INDEBTEDNESS OF DIRECTORS, OFFICERS AND EMPLOYEES |
83 | |||
| SECURITIES AUTHORIZED FOR ISSUANCE UNDER EQUITY COMPENSATION PLANS |
84 | |||
| ADDITIONAL INFORMATION |
84 |
INVITATION TO SHAREHOLDERS
We will hold the Meeting in Quesnel, B.C. with a live-webcast option for Shareholders to listen in and view the Meeting and ask questions.
March 6, 2024
Dear Shareholder:
You are invited to attend the annual general meeting (the “Meeting”) of shareholders (“Shareholders”) of West Fraser Timber Co. Ltd. (the “Company”), which will take place on April 24, 2024 at 11:00 a.m. (Vancouver time) at 1250 Brownmiller Road, Quesnel, B.C. Additionally, through the online meeting platform, Registered Shareholders and proxyholders (including non-registered Shareholders who have duly appointed themselves as proxyholder) will have a live-webcast option at https://web.lumiagm.com/441482273, password “westfraser2024” (case sensitive) to be able to listen in and view the Meeting and ask questions.
The items of business to be considered at the Meeting are described in the accompanying notice of annual general meeting (the “Notice”) and management information circular (the “Circular”).
Your participation and views are very important to us. You are encouraged to vote, which can be done by following the instructions enclosed with these materials. Whether or not you plan to attend the Meeting, please submit your vote as soon as possible to ensure your views are represented at the Meeting. You can vote online or by phone, fax, mail or in person at the Meeting.
At the Meeting, in addition to dealing with the matters described in the Notice, we will review the affairs of the Company. Also, you will have an opportunity to ask questions.
All of our public documents, including the annual report of the Company for the financial year ended December 31, 2023 and quarterly reports, are available on our website at www.westfraser.com. You are encouraged to access our website during the year for continuous disclosure items, including news releases and investor presentations.
We look forward to your participation at the Meeting.
| Yours sincerely, |
|
|
| Sean McLaren |
| President and Chief Executive Officer |
NOTICE OF ANNUAL GENERAL MEETING OF SHAREHOLDERS
We will hold the Meeting in Quesnel, B.C. Additionally, a live-webcast option will be provided for Shareholders to listen in and view the Meeting and ask questions.
The annual general meeting (the “Meeting”) of shareholders (“Shareholders”) of West Fraser Timber Co. Ltd. (the “Company”) will be held on April 24, 2024 at 11:00 a.m. (Vancouver time). The Meeting will be held at 1250 Brownmiller Road, Quesnel, B.C. Additionally, through our online meeting platform Registered Shareholders (as defined in the accompanying Circular) and duly appointed proxyholders will have a live-webcast option at https://web.lumiagm.com/441482273, password “westfraser2024” (case sensitive), where they can listen in and view the Meeting and ask questions. The Meeting will be held, for the following purposes:
| 1. | to receive the consolidated financial statements of the Company for the financial years ended December 31, 2023 and 2022, together with the Auditor’s report on them; |
| 2. | to fix the number of Directors at twelve; |
| 3. | to elect the Directors to hold office until the close of the next annual meeting of Shareholders; |
| 4. | to appoint an auditor of the Company to serve until the close of the next annual meeting of Shareholders and to authorize the Directors to fix the auditor’s remuneration; and |
| 5. | to consider an advisory (non-binding) resolution on the Company’s approach to executive compensation, as more particularly set out in the section of the accompanying Circular entitled “Advisory Resolution on the Company’s Approach to Executive Compensation (Say on Pay)”. |
No other matters are contemplated for consideration at the Meeting, however any permitted amendment to or variation of any matter identified in this Notice of Annual General Meeting of Shareholders (the “Notice”) may properly be considered at the Meeting. The Meeting may also consider the transaction of such other business as may properly come before the Meeting or any adjournment thereof.
A copy of the annual report of the Company for the financial year ended December 31, 2023 (the “Annual Report”) will accompany this Notice for those Shareholders that had requested a copy of the Annual Report. The Annual Report may also be found on our website (www.westfraser.com) and under our profiles on SEDAR+ (the System for Electronic Document Analysis and Retrieval) at www.sedarplus.ca and on EDGAR (Electronic Data Gathering, Analysis, and Retrieval system) at www.sec.gov/edgar. The Annual Report includes our consolidated financial statements and the Auditor’s report thereon.
Shareholders registered at the close of business on February 29, 2024 will be entitled to receive this Notice and to vote at the Meeting.
- 2 -
INFORMATION ON NOTICE AND ACCESS
(You have not been sent a physical copy of the Circular.)
General Information
The Company has prepared this Notice of the Annual General Meeting (the “Notice”) of the Company, which includes Information on Notice and Access, the Circular and a form of proxy relating to the Meeting, and the Circular contains details of the matters to be considered at the Meeting. This Notice has been prepared and mailed to you under the notice and access rules that came into effect on February 11, 2013, pursuant to applicable Canadian securities laws. Notice and access enables issuers to reduce the volume of materials that must be physically mailed to shareholders by posting the information circular and related proxy materials on the Internet. Please call Computershare Investor Services Inc. (“Computershare”) toll-free at 1-800-564-6253 (North American toll free) or 1-514-982-7555 (International) if you have any questions about notice and access procedures.
How to Access the Circular and Obtain a Physical Copy
The Circular and related proxy materials are available under our profiles on SEDAR+ at www.sedarplus.ca and EDGAR at www.sec.gov/edgar, and on our website at www.westfraser.com. Shareholders are reminded to review these online materials in connection with the Meeting and before voting. Shareholders may obtain a physical copy of the Circular by: (a) calling the Company’s transfer agent, Computershare, toll free at 1-800-564-6253 (North American toll free) or 1-514-982-7555 (International); or (b) emailing a request to Computershare at service@computershare.com. A request for a physical copy of the Circular should be sent sufficiently in advance so that it is received by Computershare by April 4, 2024, in order to allow sufficient time for the Company to mail, and the Shareholder to receive, the physical copy of the Circular and return the completed form of proxy before the Proxy Deadline (defined below).
Forms of Proxy and Voting Instruction Forms (“VIFs”)
Registered Shareholders have received a form of proxy with this Notice. To have proxy votes counted in the voting at the Meeting, the deadline for submitting a completed form of proxy is 11:00 a.m. (Vancouver time) on April 22, 2024 (the “Proxy Deadline”). Please complete, date and sign the form of proxy and deliver it before the Proxy Deadline in accordance with the instructions set out in the form of proxy and in the Circular.
Non-registered Shareholders (as defined in the accompanying Circular) have received a voting instruction form with this Notice. The deadline for returning voting instruction forms is specified within the form itself. Voting instruction forms, whether provided by the Company or an intermediary, should be completed and returned in accordance with the specific instructions, and by the deadline specified, within the form. Please ensure you carefully follow the instructions set out in the voting instruction form, including those specifying to where and when the form is to be returned.
- 3 -
Please review the Circular before completing your form of proxy or voting instruction form, as the Circular contains additional information about each matter to be voted on at the Meeting. The following guide will assist you in locating the relevant disclosure for each matter.
|
For disclosure about: |
Refer to the following section(s) in the Circular |
|
|
• the fixing of the number of Directors at twelve |
“Fixing the Number and Election of Directors” | |
|
• the election of Directors
|
“Information Regarding Nominees for Election as Directors” | |
|
• the appointment of the Company’s auditor |
“Appointment of the Auditor” | |
|
• the approval of the Company’s approach to executive compensation |
“Advisory Resolution on the Company’s Approach to Executive Compensation (Say on Pay)” | |
A Shareholder who is unable to attend the Meeting in person and who wishes to ensure that such Shareholder’s shares are voted must complete, date and sign an acceptable form of proxy or voting instruction form and deliver it in accordance with the instructions set out in the enclosed form of proxy or voting instruction form and in the Circular.
DATED at Vancouver, B.C., March 6, 2024.
| BY ORDER OF THE BOARD |
|
|
| Sean McLaren |
| President and Chief Executive Officer |
1
MANAGEMENT INFORMATION CIRCULAR
(As of the Record Date, except as otherwise provided)
This Circular is furnished in connection with the solicitation of proxies by the management of West Fraser for use at the Meeting to be held on April 24, 2024 at 11:00 a.m. (Vancouver time) in Quesnel, B.C. (and at any adjournment thereof) for the purposes set out in the attached Notice.
DEFINITIONS
Unless stated otherwise, in this Circular:
“2024 NCIB” has the meaning set out in “Voting Securities and Principal Shareholders – Share Repurchases”;
“2023 NCIB” has the meaning set out in “Voting Securities and Principal Shareholders – Share Repurchases”;
“$” means Canadian dollars;
“Annual Information Form” means the annual information form of the Company for the financial year ended December 31, 2023;
“Annual Report” means the annual report of the Company for the financial year ended December 31, 2023;
“Articles” means the latest Notice of Articles issued by the British Columbia Registrar of Companies and the corporate Articles of the Company;
“Auditor” means our external auditor, currently PricewaterhouseCoopers LLP;
“B.C.” means British Columbia;
“BCA” means the Business Corporations Act (British Columbia), R.S.B.C. 2002, c.57, as amended;
“Board” or “Board of Directors” means our board of Directors as presently constituted or proposed to be constituted;
“Bonus Plan” has the meaning set out in “Executive Compensation Discussion & Analysis – Report on Executive Compensation – Annual Incentive Bonus Plan”;
“Cash Value Alternative” has the meaning set out in “Executive Compensation Discussion & Analysis – Report on Executive Compensation – Long-Term Incentive Component – Stock Option Plan – Annual Burn Rate”;
“CEO” means our Chief Executive Officer;
“CFO” means our Chief Financial Officer;
“Chair” or “Chair of the Board” has the meaning set out in “Our Corporate Governance Policies and Procedures – Chair of the Board”; “Circular” means this management information circular;
2
“Class B Shares” means the Class B Common shares in the capital of West Fraser;
“Closing Price” has the meaning set out in “Information Regarding Nominees for Election as Directors – Director Compensation – Direct and Indirect Share and Other Holdings of Current and Proposed Directors (as at the Record Date)”;
“Code of Conduct” has the meaning set out in “Our Corporate Governance Policies and Procedures – Code of Conduct”;
“Committees” means the committees of the Board;
“Computershare” means Computershare Investor Services Inc., our transfer agent;
“Corporate Disclosure Policy” has the meaning set out in “Our Corporate Governance Policies and Procedures – Corporate Disclosure Policy”;
“Director” means a director of the Company;
“Disclosure Committee” has the meaning set out in “Our Corporate Governance Policies and Procedures – Corporate Disclosure Policy”;
“DSU Plan” means our Director Deferred Share Unit Plan;
“DS Unit” means a Deferred Share Unit granted under our DSU Plan;
“EDGAR” means the U.S. Securities and Exchange Commission’s Electronic Data Gathering, Analysis, and Retrieval system;
“Equity Holding Requirements Policy” has the meaning set out in “Executive Compensation Discussion & Analysis – Report on Executive Compensation – Executive Equity Holding Requirements”;
“Exchange Ratio” means the exchange ratio of 0.675 of a Common share for each Norbord Share acquired by the Company in connection with the Norbord Acquisition;
“Governance Committee” means the Governance & Nominating Committee of the Board;
“Governance Policy” has the meaning set out in “Our Corporate Governance Policies and Procedures – Governance Policy”;
“HR&C Committee” means the Human Resources & Compensation Committee of the Board;
“Meeting” means the annual general meeting of Shareholders to be held on April 24, 2024 and any adjournment of it;
“NI 52-110” has the meaning set out in “Our Corporate Governance Policies and Procedures – Composition of the Board – Independence”;
“NI 54-101” means National Instrument 54-101 – Communication with Beneficial Owners of Securities of a Reporting Issuer; “Non-registered Shareholder” means any Shareholder who is not a Registered Shareholder;
3
“Notice” means the notice of annual general meeting of Shareholders, which accompanies this Circular;
“Norbord” means Norbord Inc.;
“Norbord Acquisition” means the acquisition by the Company of all of the issued and outstanding Norbord Shares, which occurred on February 1, 2021;
“Norbord Continuing Executives” means the holders of Norbord Options, Norbord RSUs and Norbord DSUs who have continued as officers and employees of the Company following completion of the Norbord Acquisition;
“Norbord DSUs” means the outstanding deferred share units credited under certain Norbord deferred share unit plans, which have been adjusted by the Exchange Ratio and are to be paid out in reference to the Common shares following completion of the Norbord Acquisition;
“Norbord Options” means the outstanding options to purchase Norbord Shares granted under or otherwise subject to certain Norbord stock option plans, which have been exchanged for, or are otherwise characterized as, Replacement Options following completion of the Norbord Acquisition;
“Norbord RSUs” means the outstanding restricted share units credited under the Norbord restricted share unit plan, which have been adjusted by the Exchange Ratio and are to be paid out in reference to the Common shares following completion of the Norbord Acquisition;
“Norbord Shares” means the common shares in the capital of Norbord;
“NYSE” means the New York Stock Exchange;
“Options” means share purchase options granted under the Stock Option Plan;
“Phantom Share Unit Plan” means the plan described as set out in “Executive Compensation Discussion & Analysis – Report on Executive Compensation – Long-Term Incentive Component – Phantom Share Unit Plan”;
“PS Unit” or “PSU” means a performance share unit granted under our Phantom Share Unit Plan;
“Record Date” means February 29, 2024;
“Registered Shareholder” means a Shareholder who is in possession of a physical share certificate registered in their name or who appears as the Registered Shareholder in the records of Computershare;
“Replacement Option Plans” has the meaning set out in “Executive Compensation Discussion & Analysis – Option Grants – Description of Replacement Option Plans”;
“Replacement Options” means the options to purchase Common shares that are held by former holders of Norbord Options following completion of the Norbord Acquisition;
“ROSE” has the meaning set out in “Executive Compensation Discussion & Analysis – Report on Executive Compensation – Annual Incentive Bonus Plan”;
“RS Unit” means a restricted share unit granted under our Phantom Share Unit Plan; “SEC” means the U.S. Securities and Exchange Commission;
4
“SEDAR+” means the System for Electronic Document Analysis and Retrieval, a filing system developed for the Canadian securities regulatory authorities;
“Shares” or “Common shares” means the common shares in the capital of West Fraser, as currently constituted and that are currently listed and posted for trading on the TSX and the NYSE under the symbol “WFG”;
“Shareholder” means a holder of any Share or Class B Share, as the context requires;
“Stock Dividend” means the stock dividend of one Common share declared and issued in respect of each issued and outstanding Common share in the capital of the Company and each issued and outstanding Class B Share and paid to Shareholders on January 13, 2014;
“Stock Option Plan” means the West Fraser Timber Co. Ltd. Stock Option Plan, as amended;
“Towers Watson” has the meaning set out in “Executive Compensation Discussion & Analysis – Report on Executive Compensation”;
“TSR” has the meaning set out in “Executive Compensation Discussion & Analysis – Report on Executive Compensation – Long-Term Incentive Component – Phantom Share Unit Plan”;
“TSX” means the Toronto Stock Exchange;
“U.S.” means the United States of America, its territories, any State of the United States and the District of Columbia;
“U.S. ESPP” means the United States Employee Stock Purchase Plan;
“VWAP” means Volume Weighted Average Price; and
“West Fraser”, “Company”, “we”, “us” or “our” means West Fraser Timber Co. Ltd.
5
ADDITIONAL INFORMATION REGARDING THE MEETING
We will hold the Meeting in Quesnel, B.C. Additionally, a live-webcast option will be provided to Shareholders to listen in and view the Meeting and ask questions. Shareholders will be able to access the live-webcast at https://web.lumiagm.com/441482273, password “westfraser2024” (case sensitive), where they can listen in and view the Meeting and ask questions.
Registered Shareholders and duly appointed proxyholders (including Non-registered Shareholders who have duly appointed themselves as proxyholder) will have a live-webcast option where they can listen in and view the Meeting and ask questions, provided they are connected to the Internet and follow the instructions in this Circular. Non-registered Shareholders who have not duly appointed themselves as proxyholder will be able to use the live-webcast option as guests but will not be able to ask questions.
Shareholders who wish to appoint a person other than the management nominees identified in the form of proxy or voting instruction form (including a Non-registered Shareholder who wishes to appoint themselves as their own proxy to use the live webcast) must carefully follow the instructions set out in this Circular and on their form of proxy or voting instruction form. These instructions include the additional step of registering such proxyholder with Computershare, after submitting the form of proxy or voting instruction form. Failure to register the proxyholder with Computershare will result in the proxyholder not receiving a 15-digit control number required to ask questions in the Meeting, which would only allow the proxyholder to attend the Meeting as a guest. Guests will be able only to listen to the Meeting but will not be able to ask questions.
Your vote is important. Good corporate governance begins with Shareholder participation. If you cannot attend the Meeting or if you plan to attend but prefer the convenience of voting in advance, we encourage you to exercise your vote using either of the voting methods described below. Please read pages 7 through 11 for answers to commonly asked questions regarding voting and proxies.
How to Vote
You have two ways to vote:
| 1. | you may vote in person at the Meeting; or |
| 2. | by submitting your form of proxy or voting instruction form in accordance with the instructions set out therein. |
If a Registered Shareholder is a body corporate or association, the form of proxy must be signed by a person duly authorized by that body corporate or association. Completing, signing and returning a form of proxy will not prevent you from attending the Meeting in person. As the Company is relying on notice and access provisions of applicable Canadian securities laws, the Notice and form of proxy is being sent to Registered Shareholders.
How to Ask Questions at the Meeting
Shareholders will have an opportunity to ask questions in person and online (as applicable) by following the procedures set out below.
| 1. | Registered Shareholders and proxyholders (including Non-registered Shareholders who have duly appointed themselves as proxyholder) attending the Meeting in person will have an opportunity to ask questions at the Meeting during the Q&A session. |
6
| 2. | Registered Shareholders and proxyholders (including Non-registered Shareholders who have duly appointed themselves as proxyholder) and are following the Meeting online will have an opportunity to ask questions through the webcast platform. To do so, they will need to obtain a control number by following the instructions provided below. Once they have registered and obtained a control number and are logged into the online platform, they should select the messaging icon and type the question within the chat box at the bottom of the messaging screen. Once satisfied with the question, the Shareholder or proxyholder should click the arrow button to submit the question to the Chair of the Meeting. All submitted questions will be moderated before being sent to the Chair of the Meeting. Questions can be submitted at any time during the Q&A session up until the Chair of the Meeting closes the session. |
It is anticipated that Shareholders will have substantially the same opportunity to ask questions online on matters of business during the Meeting as if they attend the Meeting in person.
How Shareholders and appointees can obtain a control number to ask questions during the Meeting
| ● | Registered Shareholders: Registered Shareholders can find their control number on their proxy form. |
| ● | Non-registered Shareholders and Appointees: Non-registered Shareholders and duly appointed proxyholders must complete the additional step of registering as a proxyholder by calling Computershare at 1-800-564-6253 (North American toll free) or 1-514-982-7555 (International) by no later than 11:00 a.m. (Vancouver time) on April 22, 2024. Non-registered Shareholders and proxyholders who have not appointed themselves as proxyholder will not receive a control number, which is required to ask questions at the Meeting. |
Non-registered Shareholders who have not duly appointed themselves as proxyholder and registered with Computershare will not be able to ask questions at the Meeting but will be able to follow the proceedings as a guest.
Technical Assistance
Shareholders with questions regarding the live-webcast platform or requiring assistance accessing the Meeting website should visit the provider’s website at https://www.lumiglobal.com/faq. Furthermore, should a Shareholder wish to speak with a Computershare representative concerning the live-webcast, both a live chat service and a contact ticket system are available through the website above.
If you are accessing the Meeting using the live-webcast, you must remain connected to the Internet at all times during the Meeting in order to listen in, view the Meeting and ask questions. It is your responsibility to ensure Internet connectivity for the duration of the Meeting. Note that if you lose connectivity once the Meeting has commenced, there may be insufficient time to resolve your issue before the Meeting is completed.
7
FREQUENTLY ASKED QUESTIONS
| Q. | Am I entitled to vote? |
A. Holders of Shares at the close of business on the Record Date of February 29, 2024 and their duly appointed representatives are eligible to vote. Each Share is entitled to one vote.
| Q. | How do I vote? |
A. If you are a Registered Shareholder, you may vote your Shares by appointing a proxyholder to attend the Meeting and vote on your behalf. Voting by proxy is the easiest way to vote because you do not have to attend the Meeting. Instead, you appoint the persons named in the form of proxy or another person or entity of your choosing, who need not be a Shareholder, to represent you as a proxyholder and vote your Shares at the Meeting. A proxy will not be valid unless it is dated and signed by the Registered Shareholder or by the Registered Shareholder’s attorney with proof that they are authorized to sign and is completed according to the instructions therein.
There are different ways to submit your voting instructions depending on whether you are a Registered Shareholder or a Non-registered Shareholder. If your Shares are held in an account with a bank, trust company, securities broker, trustee or other intermediary, please refer to “Voting by Non-registered Shareholders”.
See “How to Vote” for further details on how to vote.
| Q. | What am I voting on? |
A. You will be asked to vote on the following matters:
| ● | fixing the number of Directors at 12; |
| ● | the election of Directors to hold office until the close of the next annual meeting of Shareholders; |
| ● | the appointment of PricewaterhouseCoopers LLP as our auditor until the close of the next annual meeting of Shareholders, at a remuneration to be fixed by the Directors; and |
| ● | the advisory (non-binding) resolution on the Company’s approach to executive compensation. |
| Q. | What if amendments are made to these matters or if other matters are brought before the Meeting? |
A. If you attend the Meeting and are eligible to vote, you may vote on such matters as you choose.
If you have completed and returned a proxy in the form enclosed, the persons named in it will have discretionary authority with respect to amendments or variations to matters identified in the Notice and to other matters which properly come before the Meeting. If any other matter properly comes before the Meeting, the persons so named will vote on it in accordance with their best judgment. As of the date of this Circular, our management does not know of any such amendment, variation or other matter expected to come before the Meeting.
8
| Q. | Who is soliciting my proxy? |
A. The management of West Fraser is soliciting your proxy. Solicitation of proxies is done primarily by mail, supplemented by telephone or other contact, by Company employees, and the Company bears all associated costs.
This Circular is prepared under the notice and access rules that came into effect on February 11, 2013 pursuant to applicable Canadian securities laws. Accordingly, this Circular is being posted on the Internet instead of being mailed to either Registered Shareholders or Non-registered Shareholders. This Circular and related proxy materials are available under our profiles on SEDAR+ at www.sedarplus.ca and on EDGAR at www.sec.gov/edgar, and on our website at www.westfraser.com. Shareholders are reminded to review these materials online in connection with the Meeting and before voting. Shareholders may obtain a physical copy of this Circular by: (a) calling Computershare, toll free at 1-800-564-6253 (North American toll free) or 1-514-982-7555 (International); or (b) emailing a request to Computershare at service@computershare.com. A request for a physical copy of this Circular should be sent sufficiently in advance so that it is received by Computershare by April 4, 2024 in order to allow sufficient time for the Shareholder to receive the physical copy of this Circular and return the proxy by its due date.
| Q. | How do I know if I am a “Registered” Shareholder or a “Non-registered” Shareholder? |
A. You may own Shares in one or both of the following ways:
1. If you are in possession of a physical share certificate in your name or you appear as the Registered Shareholder in the records of Computershare, you are a “Registered Shareholder” and your name and address are known to West Fraser through Computershare.
2. If you own Shares through a bank, trust company, securities broker, trustee or other intermediary, you are a “Non-registered Shareholder” and you will not have a physical share certificate. In this case, you will have an account statement from your bank or broker as evidence of your Share ownership.
Most Shareholders are Non-registered Shareholders. The Shares of Non-registered Shareholders are registered in the name of an intermediary, such as a bank, trust company, securities broker, trustee, custodian or other nominee who holds the Shares in a nominee account or in the name of such nominee, or in the name of a clearing agency in which the intermediary is a participant (such as CDS). Intermediaries have obligations to forward Meeting materials to such Non-registered Shareholders unless instructed otherwise by the holder (and as required by regulation in some cases, despite such instructions).
Non-registered Shareholders fall into two categories — those who object to their identity being known to the issuers of the securities which they own (“OBOs”) and those who do not object to their identity being made known to the issuers of the securities which they own (“NOBOs”). Subject to the provisions of NI 54-101, issuers may request and obtain a list of their NOBOs from intermediaries directly or via their transfer agent and may obtain and use the NOBO list for the distribution of proxy-related materials to such NOBOs. These securityholder materials are being sent to both registered and non-registered owners of securities of the Company. If you are a non-registered owner (a NOBO or an OBO) and the Company or its agent has sent the Meeting materials directly to you, your name, address and information about your holdings of Common shares have been obtained in accordance with applicable securities regulatory requirements from the intermediary holding the Common shares on your behalf. The Company’s OBOs can expect to be contacted by their intermediary. The Company does not intend to pay for intermediaries to deliver the Meeting materials to OBOs and it is the responsibility of such intermediaries to ensure delivery of the Meeting materials to their OBOs.
9
| Q. | Must I use the enclosed form of proxy? |
A. No. If you do not wish to use the enclosed proxy form, you may use any other form of proxy to appoint your proxyholder, although the Articles require that a form of proxy be substantially in the form enclosed.
| Q. | Can I appoint someone to vote my Shares other than persons named in the enclosed form of proxy? |
A. Yes. Shareholders who wish to appoint a person other than the management nominees identified in the form of proxy or voting instruction form (including a Non-registered Shareholder who wishes to appoint themselves as their own proxy to attend the Meeting) must carefully follow the instructions in this Circular and on their form of proxy or voting instruction form. These instructions include the additional step of registering such proxyholder with Computershare, after submitting the form of proxy or voting instruction form. Failure to register the proxyholder with Computershare, which will result in the proxyholder not receiving a 15-digit control number to ask questions in the Meeting and, consequently such proxyholder will only be able to follow the Meeting as a guest. Guests may only listen to the Meeting but will not be able to ask questions.
| Q. | What if my Shares are registered in more than one name or in the name of my company? |
A. If your Shares are registered in more than one name, all those registered must sign the form of proxy. If your Shares are registered in the name of your company or any name other than yours, we may require that you provide documentation that proves you are authorized to sign the form of proxy.
| Q. | What if I plan to attend the Meeting and vote at the Meeting? |
A. If you are a Registered Shareholder and plan to attend the Meeting and you wish to vote your Shares at the Meeting, do not complete or return a form of proxy. Your vote will be taken and counted at the Meeting.
If your Shares are not registered in your name, but you wish to attend the Meeting, please see “Voting by Non-registered Shareholders”.
| Q. | What happens when I sign and return a form of proxy? |
A. You will have given authority to whomever you have appointed as your proxyholder to vote your Shares at the Meeting in accordance with the voting instructions you provide.
| Q. | What do I do with my completed form of proxy? |
A. You must deposit your completed form of proxy (by mail, telephone, fax or online) with Computershare no later than 11:00 a.m. (Vancouver time) on April 22, 2024, or at least 48 hours (excluding Saturdays, Sundays and holidays) prior to the time of any adjournment or postponement of the Meeting. The Chair of the Meeting has the discretion to accept or reject any late proxies, and can waive or extend the deadline for receiving proxy voting instructions without notice. If you hold Shares through an intermediary you should refer to “Voting by Non-registered Shareholders”.
10
| Q. | How will my Shares be voted if my proxy is in the enclosed form with no other person named as proxyholder? |
A. The persons named in it will vote or withhold from voting your Shares in accordance with your instructions. In the absence of such instructions, however, your Shares will be voted FOR fixing the number of Directors at 12, FOR the election of the Directors nominated by management, FOR the appointment of the Auditor and FOR the advisory (non-binding) resolution on the Company’s approach to executive compensation.
| Q. | If I change my mind, can I revoke my proxy once I have given it? |
A. In addition to revocation in any other manner permitted by law, a Registered Shareholder who has completed a form of proxy may revoke it by:
| ● | executing a new form of proxy bearing a later date or by executing a valid notice of revocation, either of the foregoing to be executed by the Registered Shareholder or the Registered Shareholder’s authorized attorney in writing or, if the Registered Shareholder is a corporation, under its corporate seal by an officer or attorney duly authorized, and by delivering the form of proxy bearing a later date or notice of revocation to Computershare, or to the Company’s registered office at Royal Centre, Suite 1500, 1055 West Georgia Street, Vancouver, British Columbia, V6E 4N7, at any time up to and including the last business day that precedes the day of the Meeting or, if the Meeting is adjourned, the last business day that precedes any reconvening thereof, or to the Chair of the Meeting on the day of the Meeting or any reconvening thereof, or in any other manner provided by law; or |
| ● | personally attending the Meeting and voting at the Meeting. |
A revocation of a form of proxy will not affect a matter on which a vote is taken before the revocation.
Non-registered Shareholders who wish to change their vote must, within sufficient time in advance of the Meeting, arrange for their respective intermediaries to change their vote.
| Q. | What documents are sent to Shareholders? |
A. Registered Shareholders who have provided us with the required request will receive a package of the usual annual corporate documents (our Annual Report, our consolidated financial statements for the years ended December 31, 2023 and 2022 and Auditor’s report and management’s discussion and analysis thereon), along with the Notice and the form of proxy.
Our Circular may be accessed under our profiles on SEDAR+ at www.sedarplus.ca, on EDGAR at www.sec.gov/edgar, and on our website at www.westfraser.com.
Copies of our Annual Report, including our consolidated financial statements and Auditor’s report and management’s discussion and analysis thereon, are filed with Canadian securities regulators and are available under our profiles on SEDAR+ at www.sedarplus.ca and EDGAR at www.sec.gov/edgar, and may also be obtained, without charge, upon request by contacting Robert B. Winslow, CFA, Director, Investor Relations & Corporate Development at (416) 777-4426 or by email at shareholder@westfraser.com.
11
| Q. | Who are our Principal Shareholders? |
A. The Principal Shareholders (persons or companies that beneficially own or exercise control or direction over, directly or indirectly, more than 10% of a class of our outstanding Shares) are set out in this Circular under the heading “Voting Securities and Principal Shareholders”.
| Q. | What if I have other questions? |
A. If you have a question regarding the Meeting, please contact our transfer agent as set out below, the Vice-President, General Counsel of the Company at (604) 895-2700 or by email at shareholder@westfraser.com.
| Q. | How can I contact the transfer agent? |
A. You can contact the transfer agent at:
Computershare Investor Services Inc.
8th Floor, 100 University Avenue
Toronto, Ontario M5J 2Y1
Phone: 1-800-564-6253 (North American toll free) or
514-982-7555 (International).
Fax: 1-888-453-0330 (North America toll free or
416-263-9524 (International)
Online: www.computershare.com/service
VOTING BY NON-REGISTERED SHAREHOLDERS
| Q. | If my Shares are not registered in my name, how do I vote my Shares? |
A. Our share register does not list Non-registered Shareholders. The Shares of Non-registered Shareholders are usually held in the name of an intermediary or a “nominee”, such as a trust company, securities broker or other financial institution. If you are a Non-registered Shareholder, there are two ways that you can vote your Shares:
| 1. | By providing voting instructions to your nominee |
Applicable securities laws require institutional nominees to seek voting instructions from you in advance of the Meeting. Accordingly, you will receive, or have already received with these materials, from your nominee, either a voting instruction form or a form of proxy for the number of Shares you hold with that nominee. Every institutional nominee has its own mailing procedures and provides its own signing and return instructions, which you should follow carefully to ensure that your Shares are voted at the Meeting.
As the Company is relying on notice and access provisions of applicable Canadian securities law, the Notice and voting instruction form are being sent to both Non-registered Shareholders and Registered Shareholders.
| 2. | By being appointed as Proxy and attending the Meeting |
The Company generally does not have access to the names of its Non-registered Shareholders. Therefore, if you attend the Meeting, the Company will have no record of your shareholdings or of your entitlement to vote unless you have directed your nominee to appoint you as proxyholder.
12
If you wish to attend the Meeting and vote your Shares, insert your own name in the space provided on the voting instruction form or form of proxy provided by your nominee to appoint yourself as proxyholder. If you are a Non-registered Shareholder and instruct your nominee to appoint yourself as proxyholder, you must follow the additional steps set out above under the headings “Forms of Proxy and Voting Instruction Forms” and “How to Vote – How Shareholders and appointees can obtain a control number to ask questions during the Meeting”.
BUSINESS TO BE TRANSACTED AT THE MEETING
(See Notice of Annual Meeting of Shareholders)
1) Presentation of Financial Statements
The consolidated financial statements of the Company for the financial years ended December 31, 2023 and 2022 and the Auditor’s report thereon will be submitted to Shareholders at the Meeting, but no vote with respect to them is required or proposed to be taken. The consolidated financial statements are included in our Annual Report which is being mailed to those Shareholders who have provided us with the required request.
2) Fixing the Number and Election of Directors
Management is seeking approval to fix the number of Directors at 12 which is the current number of Directors of the Board.
The table of nominees on the following pages sets out the name, background and experience of each person proposed to be nominated for election as a Director, as well as other relevant information. Management of the Company recommends the election of the 12 nominees set out in the table of nominees to fill the 12 positions as Director. The term of office of each current Director will expire at the conclusion of the Meeting. Each Director elected at the Meeting will hold office until the conclusion of the next annual meeting of Shareholders at which a successor Director is elected, unless the Director’s office is earlier vacated in accordance with the Articles or the provisions of the BCA.
The Board of Directors has adopted a majority voting policy, which is described under the heading “Majority Voting Policy”, relating to the election of Directors.
On February 13, 2014, the Board adopted an advance notice policy setting out requirements for Director nominations and elections. On April 29, 2014, our Shareholders approved a special resolution to amend the Articles to include this advance notice requirement, which is described under the heading “Advance Notice Policy”.
The Board of Directors may fill vacancies on the Board resulting from the death, resignation or retirement of Directors. As well, the Board is authorized to appoint up to one-third additional Directors to hold office until not later than the next annual meeting of Shareholders.
3) Appointment of Auditor
The Auditor is to be appointed to serve until the close of the next annual meeting of Shareholders, and the Directors are to be authorized to fix the Auditor’s remuneration.
The Board of Directors and management of the Company, on the advice of the Audit Committee of the Board, recommend that PricewaterhouseCoopers LLP, Vancouver, Canada, be appointed as Auditor, at a remuneration to be fixed by the Board of Directors.
13
4) Advisory Resolution on our Approach to Executive Compensation (Say on Pay)
Our executive compensation philosophy, policies and programs are based on the fundamental principle of pay-for-performance to align the interests of our executives with those of our Shareholders. At the Meeting, Shareholders will be asked to consider and, if deemed advisable, to approve (on an advisory basis), by way of ordinary resolution, the Company’s approach to executive compensation.
INFORMATION REGARDING NOMINEES FOR ELECTION AS DIRECTORS
The following table sets out the name of each person nominated by management for election as a Director, as well as the date that person first became a Director, their age, residence, position in the Company, independence status, principal occupation, background, experience, committee memberships, attendance records and their voting results at the last annual meeting of Shareholders. Additional information concerning compensation and security holdings of such persons is provided elsewhere in the Circular, including in “Direct and Indirect Share and Other Holdings of Current and Proposed Directors.” All of our Directors elected at our last annual meeting of Shareholders are standing for re-election, with the exception of Ray Ferris, our former President and Chief Executive Officer, who retired from the Board on December 31, 2023. Eric Butler, who was appointed a Director effective May 15, 2023 and Sean McLaren, our current President and Chief Executive Officer who was appointed a Director effective January 1, 2024 have been nominated as Directors at the upcoming Meeting.
Unless otherwise indicated, each nominee has held the same or similar principal occupation with the organization set out below, or a predecessor of that organization, for the last five years. The information as to principal occupation and securities beneficially owned or controlled by each nominee has been furnished by the nominee and is not within the knowledge of our management.
14
|
HENRY H. (HANK) KETCHAM
Director since September 16, 1985
Age: 74
Place of Residence: Vancouver, B.C., Canada
Independent |
Hank Ketcham is the Chair of the Board. Mr. Ketcham was our President until April 2012 and retired from the position of CEO effective March 1, 2013 when his title as Chair of our Board was re-designated as Executive Chair. Effective April 19, 2016, he became our Chair of the Board. He is also a director and minority shareholder of Ketcham Investments, Inc., which owns 3,912,718 Common shares and 1,743,228 Class B Shares of the Company. See “Voting Securities and Principal Shareholders” for a description of such shareholdings. Mr. Ketcham has been actively involved with the Company since 1973. He was formerly a director of The Toronto-Dominion Bank.
Key Areas of Expertise and Experience:
|
|||||
| Strategic Leadership Senior Executive Industry Experience |
Geographic Expertise Government & Stakeholder Relations |
|||||
| Board and Committee memberships and attendance record in 2023:
|
||||||
| Attendance |
% Overall | |||||
|
Board |
6 of 6 |
100 |
||||
| Voting results of 2023 annual meeting of Shareholders: |
||||||
|
|
Votes for |
Votes withheld |
% Votes For |
|||||
| Number of votes |
65,972,655 | 1,907,222 | 97.19 | |||||
| Current Other Public Board Memberships
None
Past Public Board Memberships (2019 – 2023)
None
Securities held and total market value as at the Record Date:
|
||||||||
| Shares |
395,896 |
|||||||
| Options |
Nil |
|||||||
| DS Units |
3,128 |
|||||||
| Total market value of securities |
$43,581,401 |
|||||||
|
Meets share ownership target as of December 31, 2023 |
Yes |
|||||||
| 1. Includes Common shares and Class B Shares.
|
||||||||
15
|
DOYLE N. BENEBY
Director since April 18, 2023
Age: 64
Place of Residence: West Palm Beach, Florida, USA
Independent |
Doyle Beneby is a Corporate Director. From November 2018 to October 2022, he served as Chief Executive Officer of Midland Cogeneration Venture. Prior to that, he had been self-employed as a Corporate Director since May 2016. He was formerly the CEO of New Generation Power International, an international independent renewable energy company, from October 2015 to May 2016. Prior to joining New Generation Power International, he was the President and CEO of CPS Energy, the largest municipally-owned gas and electric utility in the U.S., a position he held since August 2010. Mr. Beneby has over 35 years’ experience in various aspects of the electrical power industry. Prior to joining CPS Energy, Mr. Beneby served at Exelon Corporation from 2003 to 2010 in various roles, most recently, as Senior Vice-President of Exelon Power and President of Exelon Corporation from 2009 to 2010. From 2008 to 2009, he served as Vice-President, Generation Operations for Exelon Corporation, and prior to that and from 2005 to 2008, he served as Vice-President, Electric Operations for PECO, a subsidiary of Exelon Corporation. Mr. Beneby holds a Master of Business Administration from the University of Miami, and a Bachelor of Science from Montana Technical College. In 2021, Mr. Beneby was recognized as one of the Most Influential Black Corporate Directors by Savoy Magazine. Mr. Beneby is a member of the Audit Committee and the Health, Safety and Environment Committee.
Key Areas of Expertise and Experience:
|
|||||
| Strategic Leadership Senior Executive Human Resources & Compensation |
Geographic Expertise Environment, Health & Safety Risk Management |
|||||
| Board and Committee memberships and attendance record in 2023: |
||||||
|
Attendance |
% Overall |
|||||
|
Board |
5 of 5 |
100 |
||||
|
Audit |
3 of 3 |
100 |
||||
|
Health, Safety & Environment |
1 of 1 |
100 |
||||
| Voting results of 2023 annual meeting of Shareholders: |
||||||
|
|
Votes for |
Votes withheld |
% Votes For |
|||||
| Number of votes |
67,677,147 | 202,731 | 99.70 | |||||
| Current Other Public Board Memberships
Capital Power Corporation Korn Ferry International Quanta Services
Past Public Board Memberships (2019 – 2023)
None
Securities held and total market value as at the Record Date:
|
||||||||
| Shares |
Nil |
|||||||||
| DS Units |
1,315 |
|||||||||
| Total market value of securities |
$143,624 |
|||||||||
| Meets share ownership target as of December 31, 20231 |
No |
|||||||||
|
1. Mr. Beneby was elected a Director at the April 18, 2023 annual and special meeting of Shareholders and is permitted to meet the minimum shareholding requirement within five years of his appointment.
|
||||||||||
16
|
ERIC L. BUTLER
Director since May 15, 2023
Age: 63
Place of Residence: Omaha, Nebraska, USA
Independent |
Eric Butler is a Corporate Director. Following his retirement from a 32-year career with Union Pacific, one of the largest freight rail providers in North America, he is the President and CEO of Aswani-Butler Investment Associates, a private equity firm. Currently, he is a member of the Board of Directors of NiSource Inc., and the Eastman Chemical Company and has served in the past in a number of appointments, including as the former Chair of the Board of the Federal Reserve Bank of Kansas City – Omaha Branch. Mr. Butler retired from Union Pacific in 2017 as Executive Vice President and Chief Administrative Officer, after a career which saw him lead a wide variety of company functions and initiatives, including marketing and sales, purchasing and supply chain, financial planning and analysis, strategic planning, human resources, industrial engineering and transportation. Having studied at the Carnegie Mellon University, Mr. Butler holds both a Bachelor of Science degree in Mechanical Engineering and a Master of Science degree in Industrial Administration from the university. Mr. Butler is a member of the Audit Committee and the Human Resources & Compensation Committee.
Key Areas of Expertise and Experience:
|
|||||
| Senior Executive Financial Literacy Geographic Expertise |
Strategic Leadership Human Resources & Compensation Risk Management |
|||||
| Board and Committee memberships and attendance record in 2023: |
||||||
|
Attendance |
% Overall |
|||||
|
Board |
4 of 4 |
100 |
||||
|
Audit |
1 of 1 |
100 |
||||
|
Human Resources & Compensation |
2 of 2 |
100 |
||||
| Voting results of 2023 annual meeting of Shareholders: |
||||||
|
|
Votes for |
Votes withheld |
% Votes For |
|||||
| Number of votes |
n/a | n/a | n/a | |||||
| Current Other Public Board Memberships
Eastman Chemical Company NiSource Inc.
Past Public Board Memberships (2019 – 2023)
None
Securities held and total market value as at the Record Date:
|
||||||||
| Shares |
5,000 |
|||||||
| DS Units |
650 |
|||||||
| Total market value of securities |
$617,093 |
|||||||
|
Meets share ownership target as of December 31, 2023 |
Yes |
|||||||
17
|
REID E. CARTER
Director since April 19, 2016
Age: 67
Place of Residence: West Vancouver, B.C., Canada
Independent |
Reid E. Carter is a Corporate Director. From 2003 to the end of 2018, Mr. Carter was a Managing Partner at Brookfield Asset Management, Inc., a global asset manager, and was President of Brookfield Timberlands Management LP. In this role, Mr. Carter led the acquisition of approximately 3.5 million acres of private timberlands throughout North America and Brazil as well as the teams responsible for all growth and operations aspects of these businesses. From 2010 to 2015, Mr. Carter also served as President and Chief Executive Officer, and until May 2021 as a director, of Acadian Timber Corp. and, from 2006 to 2010, as President and Chief Executive Officer of its predecessor, Acadian Timber Income Fund, which is listed on the TSX. He served as National Bank Financial’s Paper and Forest Products Analyst between 1996 and 2003. Between 1990 and 1996 he served as a resource analyst with TimberWest Forest Corp. Mr. Carter served as a director of Enercare Inc. until the end of 2019. Mr. Carter holds a combined undergraduate degree in Forestry and Biology and a master’s degree in Forest Soils, both from the University of British Columbia. Mr. Carter is the Chair of the Governance & Nominating Committee and a member of the Audit Committee.
Key Areas of Expertise and Experience:
|
|||||
| Senior Executive Financial Literacy Industry Experience |
Geographic Expertise Technology |
|||||
| Board and Committee memberships and attendance record in 2023:
|
||||||
| Attendance |
% Overall | |||||
|
Board |
6 of 6 |
100 |
||||
|
Audit |
4 of 4 |
100 |
||||
|
Governance & Nominating |
3 of 3 |
100 |
||||
| Voting results of 2023 annual meeting of Shareholders: |
||||||
|
|
Votes for |
Votes withheld |
% Votes For |
|||||
| Number of votes |
65,845,948 | 2,033,929 | 97.00 | |||||
| Current Other Public Board Memberships:
None
Past Public Board Memberships (2019 – 2023):
Enercare Inc. Acadian Timber Corp.
Securities held and total market value as at the Record Date:
|
||||||||
| Shares |
3,000 |
|||||||
| DS Units |
14,229 |
|||||||
| Total market value of securities |
$1,881,751 |
|||||||
|
Meets share ownership target as of December 31, 2023 |
Yes |
|||||||
18
|
JOHN N. FLOREN
Director since April 19, 2016
Age: 65
Place of Residence: Oakville, Ontario, Canada
Independent |
John N. Floren is the former President and Chief Executive Officer of Methanex Corporation and prior to that appointment he held the position Senior Vice-President, Global Marketing and Logistics of Methanex from June 2005 and, prior to that, Director, Marketing and Logistics, North America from May 2002. He was an employee of Methanex for approximately 23 years and has worked in the chemical industry for over 35 years. Mr. Floren holds a Bachelor of Arts in Economics from the University of Manitoba. He also attended the Harvard Business School’s Program for Management Development and has attended the International Executive Program at INSEAD. He also completed the Directors Education Program at the Institute of Corporate Directors. Mr. Floren is the Chair of the Health, Safety & Environment Committee and a member of the Human Resources & Compensation Committee and the Governance & Nominating Committee.
Key Areas of Expertise and Experience:
|
|||||
| Strategic Leadership Senior Executive Risk Management |
Environment, Health & Safety Sustainability, Climate Change & Social Responsibility |
|||||
| Board and Committee memberships and attendance record in 2023: |
||||||
|
Attendance |
% Overall |
|||||
|
Board |
6 of 6 |
100 |
||||
|
Human Resources & Compensation |
3 of 3 |
100 |
||||
|
Health, Safety & Environment |
3 of 3 |
100 |
||||
|
Governance & Nominating |
3 of 3 |
100 |
||||
| Voting results of 2023 annual meeting of Shareholders: |
||||||
|
|
Votes for |
Votes withheld |
% Votes For |
|||||
| Number of votes |
66,327,081 | 1,552,796 | 97.71 | |||||
| Current Other Public Board Memberships:
Imperial Oil Limited
Past Public Board Memberships (2019 – 2023):
Methanex Corporation
Securities held and total market value as at the Record Date:
|
||||||||
| Shares |
Nil |
|||||||
| DS Units |
8,206 |
|||||||
| Total market value of securities |
$896,259 |
|||||||
|
Meets share ownership target as of December 31, 2023 |
Yes |
|||||||
19
|
ELLIS KETCHAM JOHNSON
Director since April 20, 2021
Age: 60
Place of Residence: Greenwich, Connecticut, USA
Independent |
Ellis Ketcham Johnson is currently the President of a private philanthropic foundation and a member of the Parents Leadership Council of Georgetown University. She previously worked at Imax Corporation in Canada. Ms. Johnson completed her undergraduate degree at Lewis and Clark College and received a graduate degree from Yale University. She recently completed a Directorship Program with an emphasis on Board Governance. Ms. Johnson is a member of the Audit Committee and the Governance and Nominating Committee.
Key Areas of Expertise and Experience:
|
|||||
| Government & Stakeholder Relations Human Resources & Compensation Environment, Health & Safety |
Sustainability, Climate Change & Social Responsibility Financial Literacy |
|||||
| Board and Committee memberships and attendance record in 2023: |
||||||
|
Attendance |
% Overall |
|||||
|
Board |
6 of 6 |
100 |
||||
|
Audit |
4 of 4 |
100 |
||||
|
Governance and Nominating |
2 of 2 |
100 |
||||
|
Health, Safety & Environment |
2 of 2 |
100 |
||||
| Voting results of 2023 annual meeting of Shareholders: |
||||||
|
|
Votes for |
Votes withheld |
% Votes For |
|||||
| Number of votes |
67,553,290 | 326,587 | 99.52 | |||||
| Current Other Public Board Memberships:
None
Past Public Board Memberships (2019 – 2023):
None
Securities held and total market value as at the Record Date:
|
||||||||
| Shares |
1,004,990 |
|||||||
| DS Units |
Nil |
|||||||
| Total market value of securities |
$109,765,008 |
|||||||
|
Meets share ownership target as of December 31, 2023 |
Yes |
|||||||
20
|
BRIAN G. KENNING
Director since April 19, 2017
Age: 74
Place of Residence: Vancouver, B.C., Canada
Independent |
Brian G. Kenning is a Corporate Director. He was a Managing Partner of Brookfield Asset Management Inc., a company involved in the real estate, asset management and power generation sectors, from 1995 to 2005. From 1988 to 2005, Mr. Kenning was also Chairman and Managing Partner of B.C. Pacific Capital Corporation, an affiliate of Brookfield Asset Management Inc., active in merchant banking and investing. Over the past 10 years, Mr. Kenning has served as director of a number of public and private corporations. He served as a director of British Columbia Ferry Services Inc. until May 2019, and as a director of Maxar Technologies Ltd. From 2003 to 2019. In addition, Mr. Kenning is a past Governor of the B.C. Business Council and a past Director of the B.C. chapter of the Institute of Corporate Directors. Mr. Kenning graduated from Queen’s University with an MBA in 1973. Mr. Kenning is the Chair of the Human Resources & Compensation Committee and a member of the Governance & Nominating Committee.
Key Areas of Expertise and Experience:
|
|||||
| Financial Literacy Risk Management Capital Markets |
Human Resources & Compensation Board Experience |
|||||
| Board and Committee memberships and attendance record in 2023: |
||||||
|
Attendance |
% Overall |
|||||
|
Board |
6 of 6 |
100 |
||||
|
Human Resources & Compensation |
3 of 3 |
100 |
||||
|
Governance & Nominating |
3 of 3 |
100 |
||||
| Voting results of 2023 annual meeting of Shareholders: |
||||||
|
|
Votes for |
Votes withheld |
% Votes For |
|||||
| Number of votes |
65,771,883 | 2,107,995 | 96.89 | |||||
| Current Other Public Board Memberships
None
Past Public Board Memberships (2019 – 2023)
Maxar Technologies Ltd.
Securities held and total market value as at the Record Date:
|
||||||||
| Shares |
1,200 |
|||||||
| DS Units |
8,500 |
|||||||
| Total market value of securities |
$1,059,434 |
|||||||
|
Meets share ownership target as of December 31, 2023 |
Yes |
|||||||
21
|
MARIAN LAWSON
Director since February 1, 2021
Age: 68
Place of Residence: Toronto, Ontario, Canada
Independent |
Marian Lawson retired from Scotiabank in 2018, with over 30 years of experience in banking and capital markets. Ms. Lawson served as a director of Norbord from May 6, 2020 until her resignation and was appointed to the Board of West Fraser on February 1, 2021 in connection with the Norbord Acquisition. During her tenure, Ms. Lawson held numerous senior roles at Scotiabank including Executive Vice-President, Global Head, Financial Institutions and Transaction Banking, Deputy Head of Corporate Banking, Managing Director, Capital Markets, and Vice-President, Internal Audit. The majority of her roles involved assisting management teams in the execution of their strategies, which included acquisitions, expansions, divestitures, refinancings and restructurings. In addition, during the latter part of her career, Ms. Lawson successfully expanded and restructured several businesses. In 2016, Ms. Lawson received the Women in Capital Markets Award for Leadership and the Women’s Executive Network, Top 100 Corporate Executive Award. Ms. Lawson holds a BA in Economics from York University, an MBA (Finance) from McMaster University, and an ICD.D designation. Ms. Lawson is a director of Canadian Tire Bank (2018 to present) and was a board member of 1832 Asset Management LP, a wealth management subsidiary of Scotiabank, from 2016 to 2018. Ms. Lawson is a member of the Human Resources & Compensation Committee and the Health, Safety & Environment Committee.
Key Areas of Expertise and Experience:
|
|||||
| Strategic Leadership Financial Literacy Risk Management |
Capital Markets Board Experience Human Resources & Compensation |
|||||
| Board and Committee memberships and attendance record in 2023: |
||||||
|
Attendance |
% Overall |
|||||
|
Board |
5 of 6 |
83 |
||||
|
Human Resources & Compensation |
3 of 3 |
100 |
||||
|
Health, Safety & Environment |
3 of 3 |
100 |
||||
| Voting results of 2023 annual meeting of Shareholders: |
||||||
|
|
Votes for |
Votes withheld |
% Votes For |
|||||
| Number of votes |
67,680,778 | 199,099 | 99.71 | |||||
| Current Other Public Board Memberships
None
Past Public Board Memberships (2019 – 2023)
Norbord Inc.
Securities held and total market value as at the Record Date:
|
||||||||
| Shares |
Nil |
|||||||
| DS Units |
6,410 |
|||||||
| Total market value of securities |
$700,100 |
|||||||
|
Meets share ownership target as of December 31, 2023 |
Yes |
|||||||
22
|
SEAN P. MCLAREN
Director since: January 1, 2024
Age: 55
Place of Residence: Collierville, Tennessee, USA
Non-Independent |
Sean McLaren became our President and Chief Executive Officer on January 1, 2024, following the retirement of Ray Ferris. Mr. McLaren began his career with West Fraser in 2005, as General Manager of the Williams Lake Sawmill, when West Fraser acquired Weldwood. He was Chief Operating Officer from December 7, 2021 to December 31, 2023. Prior thereto, he was President, Solid Wood. Previous roles at West Fraser include Vice-President, U.S. Lumber in February 2016 and Vice-President, U.S. Lumber Operations in October 2010. Mr. McLaren holds a Master of Business Administration from the University of Calgary and is a Chartered Professional Accountant in British Columbia.
Key Areas of Expertise and Experience:
|
|||||
| Strategic Leadership Senior Executive Industry Experience |
Financial Literacy |
|||||
| Board and Committee memberships and attendance record in 2023: |
||||||
|
Attendance |
% Overall |
|||||
|
Board |
n/a |
n/a |
||||
| Voting results of 2023 annual meeting of Shareholders: |
||||||
|
|
Votes for |
Votes withheld |
% Votes For |
|||||
| Number of votes |
n/a | n/a | n/a | |||||
| Current Other Public Board Memberships
None
Past Public Board Memberships (2019 – 2023)
None
Securities held and total market value as at the Record Date:
|
||||||||
| Shares |
10,431 |
|||||||
| Options |
112,761 |
|||||||
| DS Units |
Nil |
|||||||
| PS Units |
24,158 |
|||||||
| Total market value of Shares |
$1,139,274 |
|||||||
|
Meets share ownership target as of December 31, 2023 |
Yes |
|||||||
|
1. Mr. McLaren also holds Options and Units as described in the Summary Compensation Table and under the heading Summary of Outstanding Options and the heading RS Units and PS Units.
|
||||||||
23
|
COLLEEN M. MCMORROW
Director since February 1, 2021
Age: 67
Place of Residence: Oakville, Ontario, Canada
Independent |
Colleen M. McMorrow earned a Bachelor of Commerce Degree and a Graduate Diploma in Accountancy, both from the John Molson School of Business, Concordia University. She is a Fellow Certified Public Accountant, Fellow Chartered Accountant and is currently a Corporate Director. Ms. McMorrow served as a director of Norbord from May 6, 2020 until her resignation and was appointed to the Board of West Fraser on February 1, 2021 in connection with the Norbord Acquisition. Ms. McMorrow was also a senior client assurance partner with Ernst & Young LLP (EY), a global professional services firm, until her retirement in June 2016. She has more than 35 years of experience in advising audit committees and senior management of public and private global companies. In addition to her client serving role, Ms. McMorrow held a number of leadership roles at EY and, from 2009 to 2016, she was the National Director in Canada of EY’s signature Entrepreneur of the Year awards program and the firm’s Growth Markets Leader (high-growth entrepreneurial companies). She is currently a director of Ether Capital Corporation, whose common shares are listed for trading on the Aequitas NEO Exchange, and Exco Technologies Limited, which is listed on the TSX (see “Our Corporate Governance Policies and Procedures – Serving on Other Boards”). She has also been a member of the board of the Investment Management Corporation of Ontario since 2016 and of Plan International Canada Inc. since 2015. Ms. McMorrow is a member of the Audit Committee and the Health, Safety & Environment Committee.
Key Areas of Expertise and Experience:
|
|||||
| Financial Literacy Risk Management Board Experience |
Human Resources & Compensation Technology |
|||||
| Board and Committee memberships and attendance record in 2023: |
||||||
|
Attendance |
% Overall |
|||||
|
Board |
6 of 6 |
100 |
||||
|
Audit |
4 of 4 |
100 |
||||
|
Health, Safety & Environment |
3 of 3 |
100 |
||||
| Voting results of 2023 annual meeting of Shareholders: |
||||||
|
|
Votes for |
Votes withheld |
% Votes For |
|||||
| Number of votes |
67,387,056 | 492,822 | 99.27 | |||||
| Current Other Public Board Memberships
Ether Capital Corporation Exco Technologies Limited.
Past Public Board Memberships (2019 – 2023)
Norbord Inc.
Securities held and total market value as at the Record Date:
|
||||||||
| Shares |
Nil |
|||||||
| DS Units |
6,627 |
|||||||
| Total market value of securities |
$723,801 |
|||||||
|
Meets share ownership target as of December 31, 20231 |
Yes |
|||||||
24
|
JANICE G. RENNIE
Director since April 28, 2004
Age: 66
Place of Residence: Edmonton, Alberta, Canada
Independent |
Janice G. Rennie who holds a Bachelor of Commerce, is a Chartered Professional Accountant, Chartered Accountant. She was elected as a Fellow of the Chartered Accountants in 1998. Ms. Rennie has chaired or been a member of several audit committees of public companies in the past and currently is chair of the audit committee of Major Drilling Group International Inc. From September 7, 2004 to September 9, 2005, she was the Senior Vice-President, Human Resources and Organizational Effectiveness of EPCOR Utilities Inc., a provider of energy, water and energy-related services and products that is solely owned by the City of Edmonton, on whose board she previously served for over 10 years and rejoined as a director in 2017 and currently serves as the Chair of its board. She currently serves as a director of Major Drilling Group International Inc., which is listed on the TSX (see “Our Corporate Governance Policies and Procedures – Serving on Other Boards”). Ms. Rennie was formerly a director of Methanex Corporation, Teck Resources Ltd. And WestJet Airlines Ltd. Ms. Rennie earned a Bachelor of Commerce Degree from the University of Alberta. Ms. Rennie is also the former Chair of the Provincial Audit Committee of Alberta. In recognition of her career achievements, in 2022, Ms. Rennie was also recognized by CPA Alberta with the Lifetime Achievement Award. Ms. Rennie is a member of the Human Resources & Compensation Committee and the Governance & Nominating Committee.
Key Areas of Expertise and Experience:
|
|||||
| Financial Literacy Capital Markets Human Resources & Compensation |
Board Experience Sustainability, Climate Change & Social Responsibility |
|||||
| Board and Committee memberships and attendance record in 2023: |
||||||
|
Attendance |
% Overall |
|||||
|
Board |
6 of 6 |
100 |
||||
|
Audit |
1 of 1 |
100 |
||||
|
Human Resources & Compensation |
3 of 3 |
100 |
||||
|
Governance & Nominating |
3 of 3 |
100 |
||||
| Voting results of 2023 annual meeting of Shareholders: |
||||||
|
|
Votes for |
Votes withheld |
% Votes For |
|||||
| Number of votes |
64,808,681 | 3,071,197 | 95.48 | |||||
| Current Other Public Board Memberships
Major Drilling Group International Inc. EPCOR Utilities Inc.
Past Public Board Memberships (2019 – 2023)
Methanex Corporation WestJet Airlines Ltd.
Securities held and total market value as at the Record Date:
|
||||||||
| Shares |
1,000 |
|||||||
| DS Units |
21,362 |
|||||||
| Total market value of securities |
$2,442,378 |
|||||||
|
Meets share ownership target as of December 31, 2023 |
Yes |
|||||||
25
|
GILLIAN D. WINCKLER
Director since April 19, 2017
Age: 61
Place of Residence: Vancouver, B.C., Canada
Independent |
Gillian D. Winckler is a former mining and business executive with over 25 years of diversified experience in the metals and mining industry and the financial sector. Ms. Winckler spent 16 years with BHP Billiton in London, England and Vancouver, Canada where she was involved with corporate and divisional strategy, mergers and acquisitions, divestments, exploration as well as project evaluation and development. Upon leaving the company she joined Coalspur Limited, a thermal coal development company listed in Canada and Australia, as its Chief Executive Officer and President. Ms. Winckler held this position, as well as Chief Financial Officer for a brief period of three years until the company was acquired in June 2015. Prior to the mining industry, Ms. Winckler spent five years as a corporate financier in South Africa and London and five years in the auditing profession. Ms. Winckler is a Chartered Accountant (South Africa), with a B.Sc. and B.Commerce (Honours) obtained in South Africa. Ms. Winckler also obtained an ESG Competent Boards Certificate and Global Competent Boards Designation (GCB.D). Ms. Winckler currently is the Chair of the Board of Directors of Pan American Silver Corp., which is listed on the TSX and the NYSE, and a director of FLSmidth & Co. A/S*, a Danish engineering company, which is listed on The NASDAQ OMX Exchange Copenhagen. Ms. Winckler is the Chair of the Audit Committee and a member of the Health, Safety & Environment Committee.
Key Areas of Expertise and Experience:
|
|||||
| Senior Executive Financial Literacy Geographic Expertise |
Environment, Health & Safety Sustainability, Climate Change & Social Responsibility |
|||||
| Board and Committee memberships and attendance record in 2023: |
||||||
|
Attendance |
% Overall |
|||||
|
Board |
6 of 6 |
100 |
||||
|
Audit |
4 of 4 |
100 |
||||
|
Health, Safety & Environment |
2 of 3 |
67 |
||||
| Voting results of 2023 annual meeting of Shareholders: |
||||||
|
|
Votes for |
Votes withheld |
% Votes For |
|||||
| Number of votes |
67,418,463 | 461,415 | 99.32 | |||||
| Current Other Public Board Memberships
Pan American Silver Corp. FLSmidth & Co.*
*Ms. Winckler will retire from the FLSmidth & Co. board of directors on April 10, 2024.
Past Public Board Memberships (2019 – 2023)
None
Securities held and total market value as at the Record Date:
|
||||||||
| Shares |
1,750 |
|||||||
| DS Units |
8,732 |
|||||||
| Total market value of securities |
$1,144,844 |
|||||||
|
Meets share ownership target as of December 31, 2023 |
Yes |
|||||||
26
Each nominee has consented to act as a Director if elected. We do not contemplate that any proposed nominee will be unable to serve as a Director, but if for any reason that occurs before the Meeting, the persons named in the enclosed form of proxy reserve the right to vote for another nominee at their discretion.
Board Renewal
The Board recognizes the need for, and benefits of, introducing new and diverse characteristics and perspectives at the Board level, and it also understands the importance of having continuity of institutional and industry knowledge and experience. Our Board renewal process is designed to achieve and maintain a balance between those considerations.
The Governance Committee is responsible for identifying new candidates to stand as nominees for election or appointment as Directors to our Board. In identifying potential Director candidates, the Governance Committee takes into account a broad variety of factors it considers appropriate, including skills, independence, financial acumen, Board dynamics and personal characteristics. In addition, the Governance Committee considers diversity in perspective arising from personal, professional or other attributes and experiences when identifying potential Director candidates. Desirable individual characteristics of nominees include integrity, credibility, the ability to generate public confidence and maintain the goodwill and confidence of our Shareholders, sound and independent business judgment, general good health and the capability and willingness to travel to, attend and contribute at Board functions on a regular basis. Background checks, as appropriate, are completed prior to nomination.
In 2015, the Governance Committee implemented the first phase of the Board renewal process by searching for and identifying two suitable candidates for nomination as Directors. As part of this process, the Governance Committee engaged an outside search firm and also sought input and advice from current Directors and our executive management. The major criteria adopted by the Governance Committee for candidates were: (a) chief executive officer experience; (b) experience in a cyclical, capital-intensive industry; (c) strong strategic thinker; and (d) representing diverse background and experience.
As a result of this process, in 2016, Reid Carter and John Floren were identified as nominees to the Board and they were elected as Directors at the 2016 annual meeting of Shareholders.
In 2016, the Governance Committee implemented the second phase of the Board renewal process through continuing efforts to search for and identify additional suitable candidates. As a result, the Governance Committee identified Brian Kenning and Gillian Winckler as important additions to the Board and they were elected as Directors at the 2017 annual meeting of Shareholders. Additionally, as part of the second phase of this process, Clark Binkley, Duncan Gibson and Harald Ludwig retired and did not stand for re-election as Directors.
The Governance Committee continues to focus on diversity and inclusion and to accelerate diverse representation on our Board, management and talent across the organization. In connection with the Norbord Acquisition, two independent directors of Norbord, being Marian Lawson and Colleen McMorrow, were added to the Board in 2021.
Further at the conclusion of the 2021 annual shareholders meeting, John Ketcham retired from our Board after serving for six years. Ellis Ketcham Johnson was nominated by management for election as a Director and was elected to the Board at the Company’s annual general meeting held April 20, 2021.
27
At the conclusion of the April 20, 2022 annual and special meeting, Gerry Miller retired from the Board and at the conclusion of the April 18, 2023 annual and special meeting, Robert Phillips retired from the Board.
To further enhance the Board renewal process, the Company has implemented a robust performance review process and employs a skills matrix to identify skills or experience gaps, which is updated and reviewed based on the advice and recommendation of the Governance Committee.
As a result of the Governance Committee review process and Robert Phillips retiring from the Board the Company engaged an outside search firm and also sought input and advice from current Directors and our executive management to identify a suitable candidate for nomination to the Board. The Company nominated Doyle Beneby to stand for election at the April 18, 2023 annual and special meeting, where he was elected a Director. Subsequent to the 2023 annual and special meeting, the Board appointed on May 15, 2023, Eric Butler to the Board. On December 31, 2023, Ray Ferris retired from the Board and effective January 1, 2024, Sean McLaren was appointed to the Board in Ray Ferris’ place.
Performance Reviews
The Governance Committee regularly, and not less frequently than annually, reviews the performance of the Board and its Committees. This review has been conducted by way of formal questionnaire and report and by informal interviews and discussions led by the Chair. The Board performance review also includes a “peer” or individual Director review process. To date, no significant problem with respect to performance of the Board, any Committee or any individual Director has been identified.
Skills Matrix
The Governance Committee uses a skills matrix to assist in the process of identifying suitable additions to the Board. The Governance Committee reviews a matrix that sets out the various skills and experience considered to be desirable for the Board to possess in the context of the Company’s strategic direction. The Governance Committee then assesses the skills and experience of each current Board member against this matrix. When completed, the matrix helps the Governance Committee identify any skills or experience gaps and provides the basis for a search to be conducted for new Directors to fill any gaps.
In February 2022, on the recommendation of the Governance Committee, the Board adopted changes to the skills matrix to align with the Company’s strategic direction and the skills and experience desirable for the Board. The Board believes the revised skills matrix is better aligned to meet the current skills and experience for the Board as a dual-listed TSX and NYSE company and the expectations of its Shareholders.
The following skills matrix sets out the skills or experience that the Governance Committee has targeted for Directors.
|
Target Number
|
||
|
STRATEGIC LEADERSHIP
|
||
|
Experience in strategic management, planning and development, or leading organic or acquisition growth.
|
5 | |
|
SENIOR EXECUTIVE
|
||
|
Experience as CEO or senior executive officer of a public company or a major private corporation.
|
4 | |
28
|
Target Number
|
||
|
FINANCIAL LITERACY
|
||
|
Executive or professional experience in public company financial accounting and reporting with knowledge of internal financial controls.
|
4 | |
|
INDUSTRY EXPERIENCE
|
||
|
Senior executive experience in the forest products industry or related industries including building products or home building, or with other significant manufacturing operations, including upstream and downstream supply chain and logistics.
|
3 | |
|
GEOGRAPHIC EXPERTISE
|
||
|
Executive, management or other significant experience in organizations with international operations including in those countries in which West Fraser operates.
|
4 | |
|
RISK MANAGEMENT
|
||
|
Experience identifying, assessing, managing and reporting on corporate risks, including experience with risk management systems.
|
4 | |
|
CAPITAL MARKETS
|
||
|
Experience in corporate finance with knowledge of debt and equity markets or experience in investment banking or mergers and acquisitions.
|
4 | |
|
GOVERNMENT AND STAKEHOLDER RELATIONS
|
||
|
Experience in, or strong understanding of, public policy related to the forest products industry including community, first nations and shareholder relations.
|
2 | |
|
HUMAN RESOURCES AND COMPENSATION
|
||
|
Experience managing or overseeing compensation, benefits and pension programs and executive compensation.
|
4 | |
|
Experience with developing or assessing succession planning, talent development and retention.
|
4 | |
|
BOARD EXPERIENCE
|
||
|
Prior or current experience as a board member of a major organization (public or private) other than West Fraser.
|
5 | |
|
ENVIRONMENT, HEALTH AND SAFETY
|
||
|
Experience in workplace health and safety practices and protection of the environment, including the requirement for a strong safety culture.
|
4 | |
|
SUSTAINABILITY, CLIMATE CHANGE AND SOCIAL RESPONSIBILITY
|
||
|
Experience in or with sustainability, climate change, diversity, equity and inclusion and social responsibility programs.
|
4 | |
|
TECHNOLOGY
|
||
|
Experience with technology programs and systems, including emerging technologies, information technology systems and/or cyber security.
|
2 | |
The key skills and experience of each Director are also set out in the table under the heading “Information Regarding Nominees for Election as Directors”. The Board is of the view that the minimum target levels have been achieved by the current Board and will be achieved assuming all nominees described above are elected at the Meeting.
29
Board Tenure
The Company does not have term limits for its Directors, as the Board is of the view that term limits are arbitrary and can result in the removal or exclusion of valuable and experienced Directors solely because of length of service. For similar reasons, in September 2016, the Board considered the continued use of an age limitation for Directors and determined that its continuation was no longer appropriate nor in the best interests of the Company. The Board believes that arbitrary age or term limits can be detrimental to the Company by excluding experienced and valuable candidates with the accompanying loss of continuity and institutional knowledge. Such belief is consistent with the positions of a number of governance and advisory groups.
The decision to not have term limits and to eliminate the age limitation was based upon the Board’s belief that Directors should be assessed on their ability to make meaningful contributions. The Company undertakes regular and rigorous reviews of Board, Committee and Director performance and skills as part of evaluating the overall performance of the Board, Committees and the contributions made by each Director. The Company’s annual performance review and skills assessment is a more meaningful way to evaluate and assess Director performance, and a more effective way to maintain an appropriate balance between the benefits of new and diverse characteristics and perspectives and ensuring there is continuity of institutional and industry knowledge and experience. The Board has demonstrated the effectiveness of its approach.
Over the past several years, the Company has identified and added a number of new Board members as long-term serving Board members have retired. The Board is composed of members with an appropriate mix of Directors who are new to the Company, and who bring fresh perspectives, including those with institutional knowledge and experience. See “Information Regarding Nominees for Election as Directors – Board Renewal” for more information.
The following table shows the tenure of the Directors standing for election at the Meeting (and assumes all proposed Director nominee candidates are elected):
| Board Tenure | ||||
| Tenure | Number of Directors | % of Directors | ||
| 0 to 1 years |
3 | 25 | ||
| 2 to 5 years |
3 | 25 | ||
| 6 to 10 years |
4 | 33 | ||
| 11 years and over |
2 | 17 | ||
Upon election, these Directors will have an average tenure of approximately 8.5 years.
Director Compensation
The HR&C Committee regularly reviews our Director compensation policy and, following a review in December 2018 and October 2021 of director compensation programs of our peers, approved a number of changes to Director compensation. The Board adopted a fixed fee Director compensation structure, which, effective October 1, 2021 through December 31, 2023, consists of the following:
30
| 2023 Director Compensation Structure | ||
| Retainer | Fee | |
| Annual base retainer |
$90,0001 | |
| Annual equity retainer |
$110,000 in DS Units | |
| Annual Committee Chair retainer2 |
$20,000 per Committee | |
| Chair annual retainer3 |
$200,000 | |
Notes:
| 1. | Each Director may elect once each year that up to 100% of the annual base retainer and other retainers be paid in DS Units. |
| 2. | For each Chair of the Audit Committee, Governance Committee, Health, Safety & Environment Committee and the HR&C Committee. |
| 3. | Exclusive of annual base and equity retainers. |
Following a review of the HR&C Committee completed in December, 2023, the Board adopted a fixed fee Director compensation structure, which, effective January 1, 2024, consists of the following:
| 2024 Director Compensation Structure | ||
| Retainer | Fee | |
| Annual base retainer |
$100,0001 | |
| Annual equity retainer |
$120,000 in DS Units | |
| Annual Committee Chair retainer2 |
$20,000 per Committee | |
| Chair annual retainer3 |
$200,000 | |
Notes:
| 1. | Each Director may elect once each year that up to 100% of the annual base retainer and other retainers be paid in DS Units. |
| 2. | For each Chair of the Audit Committee, Governance Committee, Health, Safety & Environment Committee and the HR&C Committee. |
| 3. | Exclusive of annual base and equity retainers. |
Directors are not paid separate meeting fees or fees for Committee membership and are not provided a travel allowance. The HR&C Committee believes that this compensation structure is consistent with current governance best practices and emphasizes that the role of a corporate Director is not confined to attendance and participation at meetings. Directors are reimbursed for out-of-pocket expenses incurred in attending meetings of the Board or Committee meetings or otherwise on Company business.
Under our Equity Holding Requirements Policy, the minimum shareholding requirement for each Director is a multiple of three times the aggregate of a Director’s annual base retainer and annual equity retainer, as described in further detail under the heading “Minimum Equity Holding”. If a Director’s equity ownership exceeds this threshold, that Director has the right to elect to receive cash in lieu of their annual equity retainer payable in DS Units.
The Company has DSU Plans which provides a structure for Directors to accumulate an equity-like holding in the Company. The DSU Plans allow Directors to participate in our growth by providing a deferred payment based on the value of a Common share at the time of redemption. DS Units qualify as equity for the purposes of the minimum equity holding requirement for Directors. Each Director may elect to receive up to 100% of their annual retainers in DS Units and must receive DS Units in payment of the annual equity retainer, unless the Director has achieved the minimum shareholding requirement and elected to receive cash in lieu of DS Units in payment of the annual equity retainer (see “Minimum Equity Holding”). The DS Units are issued based on the weighted average trading price of the Common shares on the TSX during the five trading days prior to their issue for DS Units issued prior to April 2022 and based on the volume weighted average trading price of the Common shares on the TSX on the trading day immediately prior to their issue for DS Units issued after April 2022. Additional DS Units are issued to take into account the value of dividends paid on Common shares from the date of issue to the date of redemption.
DS Units are redeemable only after a Director retires, resigns or otherwise leaves the Board and has ceased to fulfill any other role as an officer or employee of the Company. A holder of DS Units may on redemption elect to redeem DS Units in cash or in Common shares, or a combination of cash and Common shares.
31
Where a holder redeems DS Units issued after April 2022 for Common shares instead of cash, such Common shares will not be issued from treasury but will be purchased on the open market. The redemption value for each DS Unit a Director has elected to be redeemed in cash is the weighted average of the trading price on the TSX of a Common share over the last five trading days ending on the date of redemption for DS Units issued prior to April 2022 and is the weighted average trading price of the Common shares on the TSX on the trading day immediately before the date of redemption for DS Units issued after April 2022. DS Units qualify as equity for the purposes of the minimum equity holding requirement for Directors.
As at December 31, 2023, 78,895 DS Units were held by the Directors that could be redeemed for Common shares should a Director who retires, resigns or leaves the Board elect to redeem DS Units for Common shares instead of cash. No DS Units were redeemed for Common shares in 2023
In addition, Ms. Lawson and Ms. McMorrow continue to hold Norbord DSUs, the number of which have been adjusted by the Exchange Ratio and are to be paid out in reference to Common shares, in accordance with the terms of the Norbord Acquisition. The Norbord DSUs operate in a similar fashion to the DS Units. See “Norbord RSU Plan and DSU Plans”.
The Company also has a Directors’ Share Compensation Plan (the “Compensation Plan”), the purpose of which is to enable each Director to participate in our growth by receiving Common shares in lieu of cash for services performed as Directors. Under the Compensation Plan, Common shares are issued after each quarter at a price per share equal to the weighted average of the trading price for the Common shares on the TSX for the last five trading days in the quarter. The maximum number of Common shares that may be allotted for issuance under the Compensation Plan and the DSU Plan is 100,000.
Total Director Compensation
2023
| Name |
Fees ($) |
Share- based awards2 ($) |
Option- based |
Non-equity incentive plan compensation ($) |
Pension value |
All other compensation ($) |
Total ($) |
|||||||
| Hank Ketcham |
290,000 |
110,000 |
Nil | Nil | Nil | Nil | 400,000 | |||||||
| Doyle N. Beneby3 |
63,000 |
77,000 |
Nil | Nil | Nil | Nil | 140,000 | |||||||
| Eric L. Butler4 |
56,613 |
68,898 |
Nil | Nil | Nil | Nil | 125,511 | |||||||
| Reid E. Carter |
110,000 |
100,000 |
Nil | Nil | Nil | Nil | 220,000 | |||||||
| John N. Floren5 |
110,000 |
110,000 | Nil | Nil | Nil | Nil | 220,000 | |||||||
| Ellis Ketcham Johnson5 |
90,000 |
110,000 | Nil | Nil | Nil | Nil | 200,000 | |||||||
| Brian G. Kenning |
110,000 |
110,000 |
Nil | Nil | Nil | Nil | 220,000 | |||||||
| Marian Lawson |
90,000 |
110,000 |
Nil | Nil | Nil | Nil | 200,000 | |||||||
| Colleen M. McMorrow |
90,000 |
110,000 |
Nil | Nil | Nil | Nil | 200,000 | |||||||
| Janice G. Rennie5 |
90,000 |
110,000 |
Nil | Nil | Nil | Nil | 200,000 | |||||||
| Gillian D. Winckler5 |
110,000 |
110,000 |
Nil | Nil | Nil | Nil | 220,000 |
Notes:
| 1. | The amount represents the total fees earned during 2023, other than the annual equity retainer which is included in the Share-based awards column of this table. These amounts were paid either in cash or DS Units as described in the following chart. |
| 2. | DS Units granted at the end of each quarter in payment of the annual equity retainer are valued based on the volume weighted average trading price of the Common shares on the TSX on the trading day immediately before the end of the quarter. |
| 3. | Mr. Beneby joined the Board effective April 18, 2023. |
| 4. | Mr. Butler joined the Board effective May 15, 2023. |
| 5. | Share-based awards were paid in cash to Mr. Floren, Ms Johnson, Ms. Rennie and Ms. Winckler, rather than DS Units given that each Director achieved the minimum equity holding requirement (see “Minimum Equity Holding”) and elected to receive cash. |
32
Payment of 2023 Compensation
| Name |
Cash ($) |
DS Units1 ($) |
||
|
Hank Ketcham |
290,000 | 110,000 | ||
|
Doyle N. Beneby2 |
Nil3 | 140,000 | ||
|
Eric L. Butler4 |
56,613 | 68,898 | ||
|
Reid E. Carter |
110,000 | 110,000 | ||
|
John N. Floren |
220,000 | Nil5 | ||
|
Ellis Ketcham Johnson |
200,000 | Nil5 | ||
|
Brian G. Kenning |
110,000 | 110,000 | ||
|
Marian Lawson |
90,000 | 110,000 | ||
|
Colleen M. McMorrow |
Nil3 | 200,000 | ||
|
Janice G. Rennie |
200,000 | Nil5 | ||
|
Gillian D. Winckler |
220,000 | Nil5 |
Notes:
| 1. | DS Units are granted quarterly based on the volume weighted average trading price of the Common shares on the TSX on the trading day immediately before the end of the quarter. |
| 2. | Mr. Beneby joined the Board effective April 18, 2023. |
| 3. | Mr. Beneby and Ms. McMorrow elected to take all of their annual base retainer in DS Units. |
| 4. | Mr. Butler joined the Board effective May 15, 2023. |
| 5. | This amount was paid in cash rather than DS Units given that the individual Director achieved the minimum equity holding requirements (see “Minimum Equity Holding”) and elected to receive cash. |
Direct and Indirect Share and Other Holdings of Current and Proposed Directors
(as at the Record Date)
| Name | Shares1 | DS Units | ||||||
| Hank Ketcham2 |
395,896 | 3,128 | ||||||
| Doyle N. Beneby |
Nil | 1,315 | ||||||
| Eric L. Butler |
5,000 | 650 | ||||||
| Reid E. Carter |
3,000 | 14,229 | ||||||
| John N. Floren |
Nil | 8,206 | ||||||
| Ellis Ketcham Johnson |
1,004,990 | Nil | ||||||
| Brian G. Kenning |
1,200 | 8,500 | ||||||
| Marian Lawson3 |
Nil | 6,410 | ||||||
| Sean McLaren4 |
10,431 | Nil | ||||||
| Colleen M. McMorrow3 |
Nil | 6,627 | ||||||
| Janice G. Rennie |
1,000 | 21,362 | ||||||
| Gillian D. Winckler |
1,750 | 8,732 | ||||||
Notes:
| 1. | Includes Common shares and Class B Shares. |
| 2. | Does not include 3,912,718 Common shares and 1,743,228 Class B Shares held by Ketcham Investments, Inc. See “Voting Securities and Principal Shareholders” for a description of such shareholdings. |
| 3. | Ms. Lawson and Ms. McMorrow were appointed to the Board on February 1, 2021 on completion of the Norbord Acquisition. The units in the column for DS Units held by Ms. Lawson and Ms. McMorrow include Norbord DSUs, the number of which have been adjusted by the Exchange Ratio and will be paid out in reference to the value of Common shares in accordance with the terms of the Norbord Acquisition. See “Norbord RSU Plan and DSU Plans”. |
| 4. | Mr. McLaren also holds Options and PS Units as described in the Summary Compensation Table and under the heading Summary of Outstanding Options and the heading RS Units and PS Units. |
As at the Record Date, based on the closing price of the Common shares on the TSX (the “Closing Price”) of $109.22, the total value of all Shares, exercisable Options and DS Units held by each current Director is as follows:
33
Value of Shares and DS Units Held by Current and Proposed Directors
(as at the Record Date)
| Name | Shares ($) | DS Units ($) | Total Value ($) | |||||
| Hank Ketcham |
43,239,761 | 341,640 | 43,581,401 | |||||
| Doyle N. Beneby |
Nil | 143,624 | 143,624 | |||||
| Eric L. Butler |
546,100 | 70,993 | 617,093 | |||||
| Reid E. Carter |
327,660 | 1,554,091 | 1,881,751 | |||||
| John N. Floren |
Nil | 896,259 | 896,259 | |||||
|
Ellis Ketcham Johnson |
109,765,008 | Nil | 109,765,008 | |||||
| Brian G. Kenning |
131,064 | 928,370 | 1,059,434 | |||||
| Marian Lawson1 |
Nil | 700,100 | 700,100 | |||||
| Sean McLaren2 |
1,139,274 | Nil | 1,139,274 | |||||
| Colleen M. McMorrow1 |
Nil | 723,801 | 723,801 | |||||
| Janice G. Rennie |
109,220 | 2,333,158 | 2,442,378 | |||||
| Gillian D. Winckler |
191,135 | 953,709 | 1,144,844 | |||||
Notes:
| 1. | Ms. Lawson and Ms. McMorrow were appointed to the Board on February 1, 2021 on completion of the Norbord Acquisition. The units in the column for DS Units held by Ms. Lawson and Ms. McMorrow include Norbord DSUs, the number of which have been adjusted by the Exchange Ratio and will be paid out in reference to the value of Common shares in accordance with the terms of the Norbord Acquisition. See “Norbord RSU Plan and DSU Plans”. |
| 2. | Mr. McLaren also holds Options and Units as described in the Summary Compensation Table and under the heading Summary of Outstanding Options and the heading RS Units and PS Units. |
VOTING SECURITIES AND PRINCIPAL SHAREHOLDERS
As of the Record Date, a total of 79,366,809 Common shares and 2,281,478 Class B Shares were issued, each carrying the right to one vote. Our Class B Shares are equal in all respects to our Common shares and are exchangeable on a one-for-one basis for Common shares. Our Common shares are listed for trading on the TSX and the NYSE, while our Class B Shares are not listed for trading. Certain circumstances or corporate transactions may require the approval of the holders of our Common shares and Class B Shares on a separate class-by-class basis.
The Directors have fixed the close of business on the Record Date for the Meeting, being the date for the determination of the Registered Shareholders entitled to receive notice of, and to vote at, the Meeting and any adjournment thereof.
To the knowledge of the Directors and the Named Executive Officers (as defined in this Circular under the heading “Executive Equity Holding Requirements”), the only persons who, as at the Record Date, beneficially own or control or direct, directly or indirectly, Shares carrying 10% or more of the voting rights attached to any class of our voting securities are as follows:
34
| Name of Holder | Title of Class |
Amount Beneficially Owned, Controlled or Directed, Directly or Indirectly |
% of Class | % of Total Votes |
||||
|
Banasino Investments S.à r.l.1 |
Common shares |
8,356,494 |
10.53 | 10.23 | ||||
|
Great Pacific Capital Corporation2 |
Common shares |
8,926,000 |
11.25 | 10.93 | ||||
|
Ketcham Investments, Inc.3 |
Common shares Class B Shares |
3,912,718 1,743,228 |
4.93 76.41 |
4.79 2.14 6.93 |
||||
|
Tysa Investments, Inc.4 |
Common shares Class B Shares |
3,677,392 333,066 |
4.63 14.60 |
4.63 0.41 5.04 |
Ownership Notes:
| 1. | According to publicly available filings on EDGAR, any action by Banasino Investments S.à r.l. with respect to Shares held by Banasino Investments S.à r.l., including voting and dispositive decisions, are made by the directors of Banasino Investments S.à r.l., each of whom is appointed and may be removed by Banasino Investments Limited, the parent company of Banasino Investments S.à r.l. Banasino Investments Limited has been reported as a wholly-owned subsidiary of Luda Stiftung, who may be deemed to be a beneficial owner of Banasino Investments S.à r.l. |
| 2. | According to publicly available filings, James A. Pattison has beneficial ownership or control, directly or indirectly, of the 8,926,000 Common shares held by Great Pacific Capital Corporation. |
| 3. | Ketcham Investments, Inc. is controlled by three separate families related to Hank Ketcham, our Chair. Hank Ketcham’s immediate family owns an approximately 22% interest in Ketcham Investments, Inc. and Hank Ketcham is one of four directors on its board and has advised that he does not exercise independent control or direction over Ketcham Investments, Inc. or the Shares of the Company owned by Ketcham Investments, Inc. |
| 4. | Tysa Investments, Inc. is controlled by William P. Ketcham, one of our former Directors. |
Share Repurchases
On March 1, 2024, we commenced a normal course issuer bid (the “2024 NCIB”), allowing us to acquire up to 3,971,380 Common shares for cancellation until the 2024 NCIB’s expiry on February 28, 2025. The 2024 NCIB represents approximately 5% of the Common shares issued and outstanding as at February 16, 2024.
On February 22, 2023, we commenced a normal course issuer bid (the “2023 NCIB”), allowing us to acquire up to 4,063,696 Common shares for cancellation until the 2023 NCIB’s expiry on February 26, 2024. We purchased 1,907,510 Common shares under the 2023 NCIB.
Shareholders may obtain a copy of the notices filed with the TSX in relation to the 2024 NCIB and the 2023 NCIB, free of charge, by contacting Robert B. Winslow, CFA, Director, Investor Relations & Corporate Development at (416) 777-4426 or by email at shareholder@westfraser.com.
APPOINTMENT OF THE AUDITOR
Our current Auditor is PricewaterhouseCoopers LLP, Chartered Professional Accountants, of 700 – 250 Howe Street, Vancouver, B.C. PricewaterhouseCoopers LLP has been our Auditor for more than six years.
The Auditor is appointed by the Shareholders, performs its role as the Auditor of our annual financial statements on their behalf, and reports the results of the audit to them. In order to assure the Shareholders that the audit is effective, the Auditor is required to confirm to the Audit Committee its independence from our management in connection with the audit. PricewaterhouseCoopers LLP has confirmed its independence from our management in connection with the audit of our consolidated financial statements for the years ended December 31, 2023 and December 31, 2022.
35
All services provided by the Auditor are subject to the pre-approval of the Audit Committee through established procedures and a written policy. Management provides regular updates to the Audit Committee of the services that the Auditor undertakes on the Company’s behalf. As part of its mandate, the Audit Committee manages the Company’s relationship with the Auditor, through, among other things, a formal review of the performance of the Auditor. The lead Audit partner on the West Fraser audit engagement is required by the SEC to rotate every five years. The most recent rotation was completed in 2022.
During 2023, the Audit Committee met with the Auditor and members of management to review the overall scope and specific plans for the audit of our consolidated financial statements. In addition, the Auditor was engaged to review our unaudited quarterly consolidated financial statements and earnings releases and discussed these with management and the Audit Committee during the relevant quarters. Representatives of the Auditor meet with the Audit Committee in the absence of management representatives as part of each regularly scheduled meeting of the Audit Committee.
The Auditor, the Audit Committee and management maintain regular and open communications regarding the audit of our financial statements. No disagreement arose among the Auditor, the Audit Committee and our management on any matter affecting the audit of our financial statements.
For the years ended December 31, 2023 and 2022, the fees for audit, audit-related, tax and all other services provided to the Company by PricewaterhouseCoopers LLP were the following:
| Fees (in USD$ thousands) |
20231 | 20221 | ||
| Audit Fees2 |
2,776 | 2,531 | ||
| Audit-Related Fees3 |
255 | 84 | ||
| Tax Fees4 |
22 | 43 | ||
| All Other Fees5 |
34 | 74 | ||
| Total |
3,087 | 2,732 |
Notes:
| 1. | Amounts represent actual and estimated fees related to the respective fiscal years noted. Amounts are billed and paid in Canadian Dollars, British pounds sterling, and Euros and have been translated to United States Dollars (USD) using the average exchange rate for the respective years noted. Audit Fees and Audit-Related Fees represented 98% of all fees paid to the Auditor in 2023 and 96% of all fees paid to the Auditor in 2022. |
| 2. | Audit Fees relate to the integrated audit of our annual consolidated financial statements and the effectiveness of internal control over financial reporting as of December 31, 2023, reviews of our interim consolidated financial statements, and statutory audits of the financial statements of our subsidiaries. |
| 3. | Audit–Related Fees include employee benefit audits, services associated with registration statements, prospectuses, and other documents filed with securities regulators, and due diligence assistance. |
| 4. | Tax Fees relate to tax compliance, tax advice, and tax planning services. |
| 5. | All Other Fees relate to fees in connection with translation services and limited assurance engagements relating to climate matters. |
For additional information concerning the Audit Committee and its members see “Audit Committee” in the Annual Information Form, which is available at www.sedarplus.ca and www.sec.gov/edgar under our profiles.
ADVISORY RESOLUTION ON THE COMPANY’S APPROACH TO EXECUTIVE COMPENSATION (SAY ON PAY)
Our executive compensation philosophy, policies and programs are based on the fundamental principle of pay-for-performance to align the interests of our executives with those of our Shareholders. This compensation approach allows us to attract and retain high-performing executives who will be strongly incentivized to create value for our Shareholders on a sustainable basis. As a Shareholder you are asked to consider and approve the following advisory (non-binding) resolution:
36
Resolved, on an advisory basis and not to diminish the role and responsibilities of the Board of Directors, that the Shareholders accept the approach to executive compensation disclosed in the Company’s management information circular delivered in advance of the 2024 annual general meeting of the Shareholders of the Company.
Because your Say on Pay vote is advisory, it will not be binding upon the Board. However, the HR&C Committee will review and analyze the results of the vote and take into consideration such results when reviewing executive compensation philosophy, policies and programs. The Board confirms that the Company’s current practices achieve substantially the same results as the Canadian Coalition for Good Governance’s “Say on Pay” Policy for Boards of Directors released in September 2010.
We have held advisory votes on our approach to executive compensation at each annual meeting of Shareholders since 2014. In the most recent “Say on Pay” vote in April 2023, 94% of the votes were voted FOR the Company’s approach to executive compensation.
The management proxyholders intend to vote FOR the approval of the advisory (non-binding) resolution on executive compensation, except in relation to Shares held by a Shareholder who instructs otherwise.
OUR CORPORATE GOVERNANCE POLICIES AND PROCEDURES
Governance Policy
Our Board believes that sound governance practices are essential to the effective and efficient operation of the Company and to the enhancement of Shareholder value. We established a corporate governance policy (the “Governance Policy”) in 2002 which was updated and re-approved by our Board on September 7, 2022. The Governance Policy is reviewed annually by the Governance Committee which, from time to time, recommends updates and changes to such policy to the Board as may be required. The full text of the Governance Policy may be reviewed on our website at www.westfraser.com.
The following disclosure has been prepared under the direction of our Governance Committee and has been approved by the Board.
Chair of the Board
Hank Ketcham retired from his role as our Executive Chair effective April 19, 2016 and assumed the position of Chair of the Board. Hank Ketcham was appointed our President and CEO in 1985 and assumed the role of Chair of the Board in 1996. In 2012, he relinquished the title of President and, on March 1, 2013, Mr. Ketcham retired as our CEO and was designated as our Executive Chair of the Board.
For his duties as Chair of the Board, the Board has approved, on the advice of the HR&C Committee, Hank Ketcham’s annual Chair retainer in the aggregate amount of $200,000 per annum, exclusive of annual Director base and equity retainers. As of May 1, 2016, Mr. Ketcham was permitted to elect to receive all or a portion of his compensation in DS Units. Mr. Ketcham ceased to participate in our Bonus Plan after 2014 and ceased to participate in our long-term incentive plans as of January 1, 2016.
The Board has considered the issue of the Chair’s relationship with management in the context of the need to ensure the Board’s independence from management and has determined that the Chair is sufficiently aligned with Shareholder interests to ensure Board independence from management. The Chair is a director and minority shareholder, and is related to the other directors and shareholders, of Ketcham Investments, Inc., whose shareholdings are described under “Voting Securities and Principal Shareholders”. The Board considers that these relationships assure that the interests of the Chair are closely aligned with Shareholder interests and independent of management.
37
The Board has developed a formal position description for the position of Chair of the Board, which provides that the Chair of the Board leads the Board in its supervision of the business and affairs of the Company and its oversight of management. The responsibilities of the Chair include, among other things: (a) managing the affairs of the Board and monitoring its effectiveness; (b) ensuring that all matters of strategic importance are being dealt with at the Board level during the course of the year; (c) facilitating the Board’s and management’s efforts to promote engagement with, and feedback from, Shareholders and other stakeholders; (d) acting as an advisor to, and principal sounding board for, the CEO; (e) communicating to the CEO any matters arising from the Board’s meetings or meetings with Shareholders and other stakeholders that require management’s attention; and (f) supporting and assisting the Board, the HR&C Committee and the Governance Committee in the evaluation of, and succession planning for, the CEO.
Governance & Nominating Committee
The Board has established a Governance Committee comprised entirely of independent Directors. The mandate of the Governance Committee is summarized later in this Circular under “Committees of the Board”. The Board, through the Governance Committee, monitors changes to the regulatory, business and investment environments with respect to governance practices and regularly reviews governance issues with a view to ensuring that both our Governance Policy and our actual practices continue to serve the best interests of our Shareholders, employees and other stakeholders.
Majority Voting Policy
In February 2011, the Board reviewed and adopted a majority voting policy on the recommendation of the Governance Committee. The majority voting policy has been updated from time to time since adoption including the most recent amendment in February 2021 and reviewed and re-approved annually by the Board. Under this policy, a Director who is elected in an uncontested election with more votes withheld than cast in favour of their election will be required to tender their resignation to the Chair of the Board. If such a Director refuses to tender their resignation, such Director will not be nominated for election the following year. The resignation will be effective when accepted by the Board, and any Director who tenders their resignation may not participate in the deliberations of either the Committee or the Board which relate to such Director’s resignation. This policy does not apply to an election that involves a proxy contest.
The Governance Committee will convene a meeting and will consider the offer of resignation and make its recommendation to the Board on whether the resignation should be accepted. The Governance Committee will generally be expected to recommend to the Board that it accept the resignation, except in exceptional circumstances. The Board expects that resignations will be accepted unless there are exceptional circumstances that warrant a contrary decision. The Board will announce its decision (including the reasons for not accepting any resignation) by way of a news release within 90 days of the date of the Shareholders’ meeting at which the election occurred, and a copy of the news release will be provided to the TSX and the NYSE. Management will not re-nominate for re-election any Director who fails to comply with this policy.
In addition, subject to the requirements of the Articles and the BCA, in the event a majority of the members of the Governance Committee receive a greater number of votes withheld than votes for their election, the other Directors will appoint a Committee consisting only of those other Directors and solely for the purpose of considering the tendered resignations and such Committee will convene a meeting and recommend to the Board whether or not to accept these resignations.
38
Advance Notice Policy
Pursuant to the advance notice policy adopted by the Board on February 13, 2014, and subsequently incorporated as an amendment to our Articles following approval by Shareholders on April 29, 2014, any additional Director nominations for the Meeting must have been received by the Company no later than the close of business on March 25, 2024. No such nominations have been received as of the date of this Circular. If no such nominations are received by the Company prior to such date, management’s nominees for election as Directors set forth above will be the only nominees eligible to stand for election at the Meeting. The advance notice provisions provide Shareholders, Directors and management of the Company with a clear framework for nominating Directors. See our Articles on SEDAR+ at www.sedarplus.ca, EDGAR at www.sec.gov/edgar and our website at www.westfraser.com for the terms of our advance notice provisions.
Code of Conduct
In 2004, the Board approved a code of conduct for the Company and its Directors, officers and employees (the “Code of Conduct”). Since adoption, the Code of Conduct has been revised from time to time to update for current best practices and developments with the Code of Conduct being most recently amended on December 12, 2023. The Code of Conduct has been filed on SEDAR+ under the Company’s profile.
The Code of Conduct sets out expectations for compliance with laws, safety and health, environmental stewardship, discrimination and harassment, conflicts of interest, ethical conduct, fair dealing, human rights, anti-bribery, accounting, reporting and disclosure of information, protection over confidential personal information and other important areas. The Code of Conduct applies to all Directors, officers and employees of West Fraser and its subsidiaries and it applies to West Fraser’s contractors, consultants, agents and representatives when acting on behalf of West Fraser. Our Code of Conduct further emphasizes West Fraser’s commitment to environmental stewardship and supporting the communities in which West Fraser operates. The Code of Conduct includes provisions prohibiting certain insiders who are subject to minimum shareholding requirements from purchasing financial instruments designed to hedge or offset any decrease in the market value of our Shares, Options or units.
The Code of Conduct also establishes a “whistleblower” procedure for the reporting by any person of potential breaches of the Code of Conduct or other misconduct (whether illegal or unethical), including complaints regarding accounting, internal accounting controls or auditing matters and any other company policy violations.
A whistleblower report can be made by any of the following options:
| (i) | by leaving a voice report with the Company’s Director of Internal Audit at (604) 895-2700 or by mailing or couriering a report to the Company’s head office at 1500-885 West Georgia St., Vancouver, B.C., V6C 3E8, addressed to the Director of Internal Audit and marked “Personal and Confidential”; or |
| (ii) | through our reporting hotline that is managed by ClearView Connects, an independent third party service provider that will receive confidential and, if required, anonymous reports, by submitting an on-line report through the below website or by calling and making a report as follows: |
Website: www.clearviewconnects.com
Mail: ClearView Connects – PO Box 11017, Toronto, Ontario, M1E 1N0
North American Hotline: 1 (866) 608-7287 / European Hotline: 00 800 9643 9643
39
Any submission regarding an actual or potential misconduct will be treated on a confidential basis.
The Code of Conduct includes an acknowledgement with respect to compliance to be confirmed by each Director and each member of management. All Directors, members of management and substantially all salaried employees periodically confirm compliance with the Code of Conduct and any instances of non-compliance are reported to the Board. In 2023, no waivers of the application of the Code of Conduct were requested of, or granted by, the Board. The full text of the Code of Conduct may be viewed on our website at www.westfraser.com.
Anti-Trust Policy
On September 8, 2021, the Company adopted the Anti-Trust Policy outlining our commitment to comply with all applicable competition and antitrust laws, which are in place to prevent activities among competitors that could unfairly control the market and harm the consumer and not engage in activities that would reasonably appear to be an unfair trade practice, unreasonable restraint of trade or an attempt to use a dominant position to discourage competition. We conduct regular reviews and updates of our Anti-Trust Policy and training to support understanding and update on recent developments in this area. We expect all our employees, officers and Directors to comply with the Anti-Trust Policy, a full copy of which is available at: www.westfraser.com.
Supply Chain & Human Rights Policy and Supplier Code of Conduct
On December 12, 2023, the Supply Chain & Human Rights Policy and the Supplier Code of Conduct were approved by the Board. These Policies form part of our commitment to sustainability and reflect the Company’s evolving approach to ESG matters and our associated efforts to ensure regulatory compliance.
The Supply Chain and Human Rights Policy outlines our commitment to human rights throughout our supply chain. Along with the Supplier Code of Conduct, these documents set out our expectations for suppliers to abide by internationally recognized human rights standards. Both Policies are in place to prevent and reduce instances of human rights abuses, including forced and child labour, in our supply chain. The Supply Chain & Human Rights Policy integrates the Supplier Code of Conduct into our supplier contracts going forward.
We expect all our employees, officers and Directors to comply strictly with the Supply Chain & Human Rights Policy, and, similarly, for our suppliers to understand and comply with the Supplier Code of Conduct. Full copies of these Policies are available at: www.westfraser.com.
Anti-Bribery and Anti-Corruption Policy
On December 12, 2023, the Anti-Bribery and Anti-Corruption Policy was approved by the Board. The Anti-Bribery and Anti-Corruption Policy outlines our commitment to comply with all applicable anti-bribery and anti-corruption laws, and reflects our efforts to prevent any improper payments or benefits being given or offered to public officials or other third parties to secure an undue advantage in connection with any aspect of the Company’s business.
Bribery is illegal, harms our business and the communities we work within, and undermines fair trade. We expect all our employees, officers and Directors to comply with the Anti-Bribery and Anti-Corruption Policy, a full copy of which is available at: www.westfraser.com.
40
Charters
The Board has developed and approved formal charters for each of the Audit, HR&C, Governance, and Health, Safety & Environment Committees as well as formal position descriptions for each of the positions of Chair of the Board and CEO. The charters of these Committees and position descriptions are reviewed annually and revised, as required, by the Board.
On April 20, 2022, the Board approved amendments to the position descriptions of the Chair of the Board and CEO. The Chair of the Board’s general mandate is to ensure the effective and independent conduct of the Board. The CEO’s general mandate is to implement the Company’s strategic and operating plans and enhance Shareholder value.
The Governance Committee Charter was updated and re-approved by the Board on December 7, 2021 to include some housekeeping matters.
The Health, Safety & Environment Committee Charter was revised and re-approved by the Board on February 15, 2022.
The Audit Committee Charter is reviewed annually and was revised by the Board in 2017 and was again reviewed and updated in February 2020 to provide, among other things, that the Audit Committee would have oversight responsibility over the information technology, cyber security and information systems risks and on April 20, 2021, following the listing of Common shares on the NYSE, the Audit Committee Charter was further revised for compliance with NYSE rules and regulations and conformity with best corporate governance practices. These changes included certain administrative matters such as setting out the matters under the Audit Committee’s oversight responsibility, other disclosure-oriented process items such as specifying that the Audit Committee will review with management and the Auditor all news releases that contain first time disclosure of significant financial information and certain technical items such as setting out in detail the independence and financial literacy qualifications for Audit Committee members.
On December 10, 2019, the Board reviewed and re-approved the HR&C Committee Charter. The HR&C Committee Charter was further updated on February 11, 2021, to provide for conformity with best practices related to engagement of outside advisors or consultants and the NYSE rules for determination of independence of HR&C Committee members. The HR&C Committee Charter was further updated on December 7, 2021 to approve amendments that were part of the adoption of the Pension Oversight Committee of management into the governance structure.
The Company continues to review its Committees’ charters for updates and changes as may be required in connection with best practices and regulatory and stock exchanges requirements and will continue to monitor and update its Committees’ charters as necessary to comply with applicable law and current best governance practices.
These materials may be viewed on our website at www.westfraser.com.
Minimum Equity Holding
Under our Equity Holding Requirements Policy, the minimum equity holding requirement for Directors is a number of Shares or DS Units having a value of not less than three times a Director’s total annual base and equity retainers. Based on the current retainer amounts, this would total $600,000.
Shares, DS Units, Norbord DSUs (in the case of Ms. Lawson and Ms. McMorrow) and RS Units held by a Director are eligible to be included in determining whether the minimum equity holding requirement has been met (but Options and PS Units are not eligible).
41
For the purposes of such calculation, Shares, DS Units and Norbord DSUs (in the case of Ms. Lawson and Ms. McMorrow) held by a Director will be valued annually based on the greater of (1) their original cost or grant date value, and (2) the closing price on December 31 of the most recently completed financial year (or, if such date is not a trading date, on the last trading date of such year). This policy requires that all Directors meet the minimum equity holding requirement within five years of election or appointment and, if after any annual valuation of a Director’s equity holdings the value of the Director’s holdings fall below the requirement, the Director will have one year to regain compliance.
If a Director exceeds the minimum equity holding requirement, the Director may elect to receive, in lieu of DS Units, all or a designated portion of their annual equity retainer in cash.
For a description of the equity holdings of the Directors as of the Record Date, see the chart under the heading “Payment of 2023 Compensation”. The equity holding requirements for senior executives are described under “Executive Equity Holding Requirements”.
Director Equity Holdings
(as at December 31, 2023)
| Name | Shares | DS Units | Total | Value1 ($) |
Meets Requirement? |
|||||
|
Hank Ketcham |
395,896 |
3,118 |
399,014 |
45,232,227 |
Yes | |||||
| Doyle N. Beneby2 |
Nil |
1,312 |
1,312 |
148,728 |
No2 | |||||
| Eric L. Butler |
5,000 |
649 |
5,649 |
640,371 |
Yes | |||||
| Reid E. Carter |
3,000 |
14,180 |
17,180 |
1,947,525 |
Yes | |||||
| Ray Ferris3 |
39,452 |
Nil |
39,452 |
4,472,279 |
Yes | |||||
| John N. Floren |
Nil |
8,178 |
8,178 |
927,058 |
Yes | |||||
| Ellis Ketcham Johnson |
1,004,990 |
Nil |
1,004,990 |
113,925,666 |
Yes | |||||
| Brian G. Kenning |
1,200 |
8,471 |
9,671 |
1,096,305 |
Yes | |||||
| Marian Lawson4 |
Nil |
6,388 |
6,388 |
724,144 |
Yes | |||||
| Colleen M. McMorrow4 |
Nil |
6,606 |
6,606 |
748,856 |
Yes | |||||
| Janice G. Rennie |
1,000 |
21,288 |
22,288 |
2,526,568 |
Yes | |||||
| Gillian D. Winckler |
1,750 |
8,702 |
10,452 |
1,184,839 |
Yes | |||||
Notes:
| 1. | Based on the TSX closing price on December 29, 2023 of $113.36. Equity holdings and compliance under the Equity Holding Requirements Policy are valued and assessed annually. |
| 2. | Mr. Beneby was elected a Director on April 18, 2023. Each Director is permitted to meet the minimum shareholding requirement within five years of their appointment. |
| 3. | Mr. Ferris retired from the Board on December 31, 2023. |
| 4. | DS Units held by Ms. Lawson and Ms. McMorrow include both DS Units and Norbord DSUs, which have been adjusted by the Exchange Ratio and to be paid in Common shares in accordance with the terms of the Norbord Acquisition. See “Norbord RSU Plan and DSU Plans”. |
Mandate of the Board
Our Board has expressly assumed overall responsibility for the stewardship of the Company, including responsibility for: (i) adoption of a strategic planning process and approval of a strategic plan; (ii) identification of the principal risks to our business and implementation of appropriate systems to manage these risks; (iii) succession planning, including appointment, training and monitoring of our senior management; (iv) implementation of a communication policy regarding our disclosure of corporate information; and (v) ensuring the integrity of our internal controls and management information systems including accounting systems.
42
The Board met six times in 2023. Independent Directors also met without management at every Board meeting in 2023. During the regularly scheduled meetings, the Board received, reviewed and contributed to management’s strategic planning and operating and capital plans, taking into account identified business opportunities and business risks. In conjunction with the ongoing planning process, the Board regularly reviews, with management, the strategic environment, the emergence of new opportunities and risks, and the implications for our strategic direction.
The Board has, with the advice of management, identified the principal risks to our business and has overseen management’s establishment of systems and procedures to ensure that these risks are monitored. These systems and procedures provide for the effective management of our manufacturing assets, forest resources and financial resources, and compliance with all regulatory obligations. Management prepares and submits annually to the Board a matrix identifying key short-term and long-term enterprise risks together with an analysis of each risk and management’s mitigation strategy. In addition, management regularly reports to the Board on key evolving or new focus risks. The annual risk matrix and the focus risks are reviewed by the Board and consideration is given to any changes in circumstances that could either heighten or diminish the nature of a particular risk. The Board understands that our major risks are associated with safety, the environment, climate change and sustainability, access to raw materials, our product end markets, recruitment and retention, and cyber security.
The Board receives and reviews regular reports on our operations, including reports dealing with safety and environmental issues.
The Board is responsible for the supervision of our senior management to ensure that our operations are conducted in accordance with objectives set by the Board. All appointments of senior management are approved by the Board. As part of our planning process, succession planning for senior management positions is regularly reviewed and discussed.
ESG Oversight
Our commitment to sustainability starts at the top and at the Board level. Our Board of Directors is responsible for overseeing overall management and integration of sustainability, climate change and environmental, social, and governance (“ESG”) matters throughout the Company. This includes overseeing sustainability strategies and monitoring the practices of the Company relating to health and safety, workplace diversity, equity and inclusion. The Board’s goal is to ensure we operate as a sustainable business, optimizing financial returns while effectively managing risk. ESG governance, risk oversight and disclosure is a regular topic of discussion at Board and committee meetings.
The Company’s approach to ESG continues to grow and evolve in line with the needs, demands and expectations of its shareholders, regulators and stakeholders. In 2021, the Board and management conducted a comprehensive review of our sustainability and ESG-related approach and evaluated both the best practices and approaches of our peers.
As a result of the review, our Board has delegated oversight of certain ESG responsibilities to its Committees and management, which report their findings and provide recommendations to the Board. As ESG is a cross-functional discipline encompassing a wide range of issues, and thus is relevant to all Committees, different aspects of our ESG performance fall under each of our Committees and management. The Committees work together with management to identify ESG issues most pertinent to the Company’s business and its key stakeholders, and to help develop the policies and processes to integrate ESG into the Company’s long-term strategy and risk management responsibilities.
43
Oversight of governance-related ESG policies and programs is a responsibility that was specifically added in 2021 to the Charter of the Governance Committee, which also is responsible for monitoring diversity at the Board level, corporate governance practices and compliance with the Code of Conduct. In addition to oversight responsibility for the Company’s annual financial statements and audits, the Audit Committee ensures that financial risks, compliance matters and ethics complaints are properly managed and addressed. The HR&C Committee oversees the goals and risks associated with the Company’s compensation programs and oversight of the equity holding policy and the clawback policies. The Health, Safety and Environment Committee is responsible for, among other things, overseeing the Company’s key environmental and sustainability objectives established by management and the Board and reviewing the Company’s current sustainability report. Furthermore, management reports to the Board on issues related to stakeholder engagement, particularly with respect to relationships with local communities and Indigenous peoples and our actions to meaningfully advance reconciliation.
At the management level, West Fraser’s CEO and executive team are responsible for implementing the Company’s strategy and sustainability targets. The Vice-President, Canadian Woodlands oversees compliance with Canadian forestry regulations and certification. He is responsible for the practice and maintenance of sustainable forest management, strategic issues with regard to forest management-related environmental performance, climate risks and opportunities, and forest carbon. The Senior Vice-President, Western Canada oversees pulp, bioenergy development, projects, energy reduction initiatives and greenhouse gas emissions reporting. The Manager, Energy & Bioproduct Development leads corporate initiatives in energy reduction, bioproduct research and development and greenhouse gas emissions reporting. The Senior Vice-President, Corporate Services is responsible for the Company’s sustainability report and regularly engages with federal and provincial governments on climate policy, and the Company’s environmental performance. The Chief Environment and Sustainability Officer assists West Fraser’s operations to meet climate and carbon policy and regulations that may affect the Company or manufacturing facilities.
A snapshot of the Board’s delegated responsibilities to its Committees as related to ESG matters is as follows:
44
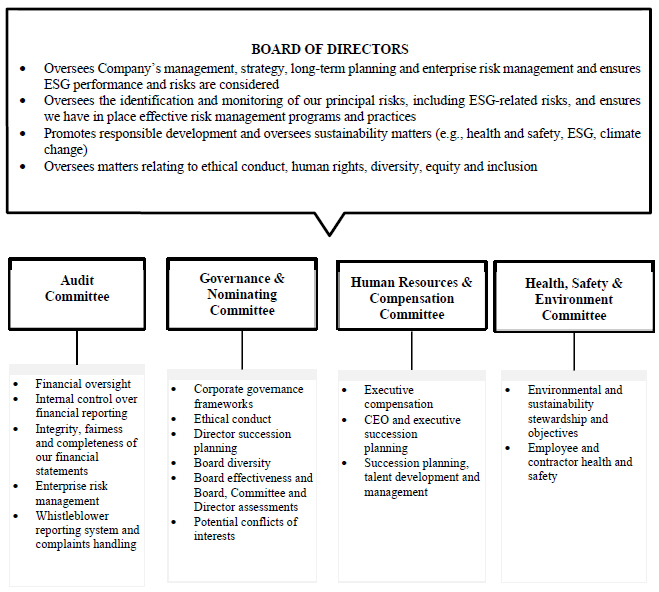
Corporate Disclosure Policy
The Board has, as part of our Governance Policy, approved a corporate disclosure policy (the “Corporate Disclosure Policy”), to be overseen by a disclosure committee (the “Disclosure Committee”) that is intended to ensure that all material information relating to the Company is communicated appropriately to our Shareholders and the public. The Corporate Disclosure Policy is reviewed annually and was most recently revised on December 12, 2023 to include certain clerical updates and requires materials posted to certain areas of the Company’s website have prior review under the policy. The Corporate Disclosure Committee is a minimum of five members and maximum of seven members, comprised of the CEO, the Senior Vice-President, Finance and CFO and senior leadership from operations, sales and legal as designated by the CEO and the Senior Vice-President, Finance and CFO from time to time. Under the Corporate Disclosure Policy, the Disclosure Committee is responsible for reviewing and approving all material continuous disclosure, including annual and interim financial statements, management discussion and analysis and financial results press releases, other press releases that contain material information or disclosure of first-time significant financial information, information circulars, annual information form, annual reports, prospectuses and other offering or tender documents.
45
The Disclosure Committee reviews these materials before they are provided to the Board or the applicable Board committee for review and approval. The Corporate Disclosure Policy may be viewed on our website at www.westfraser.com. In addition to annual meetings of Shareholders, meetings are held from time to time each year between management representatives and various investors, investment analysts, credit rating agencies and financial institutions, all of which are governed by the Corporate Disclosure Policy.
Audit Committee
The Board, through the Audit Committee, is responsible for overseeing our financial reporting and audit process and requiring that management has designed and implemented and maintains an effective system of internal controls and management information systems. The Audit Committee generally meets twice annually with the Auditor to discuss the annual audit. These meetings are in addition to regular meetings, in which the Auditor participates, during which the Audit Committee reviews and approves certain of our quarterly reports. The Audit Committee has been delegated the authority to approve our quarterly financial statements and quarterly earnings announcements before publication, other than those related to the fourth quarter and annual results. At regular meetings, the Audit Committee also meets separately and in-camera with the Auditor without management and separately and in-camera with management without the Auditor. The Audit Committee has complete and unrestricted access to the Auditor.
In 2023, the Audit Committee focused on these key areas:
| ● | reviewing significant accounting and financial reporting issues and assessing the appropriateness of our financial reports; |
| ● | overseeing and assessing the adequacy and effectiveness of our internal control procedures over annual and interim financial reporting; |
| ● | managing our relationship with the Auditor, through, among other things, a formal review of the performance of the Auditor; |
| ● | reviewing with management the adequacy and effectiveness of our systems for monitoring compliance with financial reporting and disclosure laws, including disclosure controls and procedures; |
| ● | overseeing compliance with our Code of Conduct and the process through which complaints (including regarding accounting, internal accounting controls or auditing matters or other misconduct) are received and dealt with, including confidential and anonymous submissions and those that are of a sensitive or “whistleblower” nature; and |
| ● | identifying and overseeing our principal information technology, cyber security, information security and information technology networks and information systems risks. |
In order to provide reasonable assurance that our financial reporting is complete, fairly presented and employs appropriate accounting principles, the Audit Committee reviews the following documents with management and the Auditor and recommends them to the Board for approval:
| ● | annual and interim financial statements and reports; and |
| ● | the related management’s discussion and analysis of financial performance. |
46
The Audit Committee reviews with management and the Auditor relevant and applicable legal and regulatory developments and the adoption and disclosure of new accounting standards. It also assesses the potential impacts of choosing between accounting alternatives.
As part of its mandate, the Audit Committee is responsible for reviewing any related party transaction in which a Director or a member of senior management has an interest, and making recommendations to the Board. The Audit Committee reviews such transactions in accordance with applicable legislation to ensure they reflect market terms and conditions, are at commercial arm’s length terms, and are in the best interests of the Company. The Audit Committee has the ability to retain independent advisors to provide advice on any proposed related party transactions. Any recommendations or advice pertaining to a specific matter is then communicated to the Board.
In connection with the Board’s overall enterprise risk management responsibility, the Audit Committee of the Board has been delegated the responsibility to, with the advice of management, identify the principal financial and audit risks of the Company and establish systems and procedures to ensure these principal financial and audit risks are monitored, and to make recommendations to the Board, which will include discussions with management relating to identification of key risks, including, without limitation significant financial risk exposures, significant audit risks, and the principal information technology risks, including cyber security, data protection, information security and information systems risks; the establishment of systems and procedures to ensure these risks are monitored; the steps management has taken to assess, monitor and control, manage or mitigate the Company’s exposures to these risks; the adoption of controls to prevent and detect fraud or improper or illegal transactions or payments and to ensure compliance with anti-fraud and anti-bribery laws; implementing guidelines and policies to govern the process by which risk assessment and management is undertaken and monitoring and reviewing, at least annually and more frequently as may be required, the processes and controls designed to identify, assess, monitor and manage the risks referred to above.
The Audit Committee receives regular briefing materials from management, at least semi-annually, on information technology, cyber security, information security and information technology networks and information systems risks, including details of top threats, risk management activities, vendor and supply chain monitoring, and internal training and awareness programs.
We rely on industry accepted security measures and technology to protect our information systems and confidential and proprietary information. Our information security management systems are based on ISO27001: 2022. See the “Risks and Uncertainties – Information Technology” and “Risks and Uncertainties – Cyber Security” sections of our Management’s Discussion and Analysis for the year ended December 31, 2023, for a discussion of the related risks and uncertainties associated with our business. The Company does not carry cyber security insurance.
Decisions Requiring Prior Approval by the Board
The Board has overall responsibility for the stewardship of the Company. Any responsibility that is not delegated to management or to a Committee remains with the full Board. We maintain policies with respect to matters requiring prior approval of the Board. These policies, and understandings between management and the Board through previous Board practice and accepted legal practice require that our annual operating and capital plans, significant capital expenditures and all transactions or other matters of a material nature involving the Company or any of its subsidiaries must be presented by management for approval by the Board.
47
Shareholder Feedback and Concerns
The Board and management welcome interaction with our Shareholders and believe that it is important to have direct regular and constructive engagement with our Shareholders to permit open dialogue and the exchange of ideas.
West Fraser communicates with its Shareholders and other stakeholders through various channels, including our annual report, management information circular, annual information form, quarterly reports, news releases, website, presentations at investor and industry conferences and other materials prepared in connection with the continuous disclosure requirements of the TSX, the NYSE and securities regulatory authorities. In addition, our quarterly earnings call is open to all Shareholders. Our website, at www.westfraser.com, also provides extensive information about the Company and all news releases issued by us are available on the website for viewing.
We maintain a policy of ongoing communication with investors and with representatives of the investment community. This process consists of periodic meetings with investment fund managers and investment analysts as well as individual investors and Shareholders, although always in circumstances that assure full compliance with disclosure requirements.
Inquiries by Shareholders are directed to, and dealt with by, members of senior management. Shareholders and potential investors are encouraged to communicate on any issues, including those relating to executive and Director compensation, directly with members of our senior management. All communications are subject to our Corporate Disclosure Policy. Shareholders may communicate their views to senior management by contacting our main investor contact as set out below:
West Fraser Timber Co. Ltd.
885 West Georgia Street, Suite 1500
Vancouver, British Columbia
V6C 3E8
Attention: Robert B. Winslow, CFA, Director, Investor Relations & Corporate Development
Email: shareholder@westfraser.com
Our Board values regular and constructive engagement with Shareholders and encourages Shareholders to express their views on governance matters directly to the Board. Questions regarding our governance practices can be sent to the Chair as set out below:
West Fraser Timber Co. Ltd.
885 West Georgia Street, Suite 1500
Vancouver, British Columbia
V6C 3E8
Attention: Chair of the Board
Expectations of Management
The Board has determined its expectations of management, which include provision of information and implementation of processes that enable the Board to identify risks and opportunities for the Company, the identification of appropriate comparisons and benchmarks against which our performance may be measured, and the provision of information and data that permits the Board to monitor ongoing operations, and management understands these expectations. As part of the ongoing process of monitoring the performance of management, the Board receives operational updates on each of our business units at each Board meeting.
48
These updates compare actual performance to our annual plan and historical results and include a discussion of all significant variances.
As part of the monitoring process, the CEO submits to the Board at the beginning of each year a written report setting out goals, expectations and priorities for the year. These are reviewed by the Board and may be varied based on the Board’s comments. At the end of the year, a report is submitted to the Board by the CEO that sets out achievements relative to the original goals and expectations. Both the Board and the CEO expect that the level of those achievements will be taken into account when establishing the CEO’s compensation for the following year.
Composition of the Board
Independence
We are required to assess and disclose which of our Directors are, or are not, “independent” of management as that term is used in National Instrument 52-110 – Audit Committees (“NI 52-110”). We also assess the independence of our Directors under the applicable rules of the NYSE. 11 of our 12 current Directors are independent, while Sean McLaren is considered not independent. Below is a summary of the basis of our determinations in respect of all current and proposed Directors:
| Name | Determination and Basis | |
| Hank Ketcham |
Independent (see commentary below) |
|
| Doyle N. Beneby | Independent | |
| Eric L. Butler |
Independent |
|
| Reid E. Carter |
Independent |
|
| John N. Floren |
Independent |
|
| Ellis Ketcham Johnson |
Independent (see commentary below) |
|
| Brian G. Kenning |
Independent |
|
| Marian Lawson |
Independent |
|
| Sean McLaren1 |
Non-independent (Basis for Determination: Currently our President and CEO) |
|
| Colleen M. McMorrow |
Independent |
|
| Janice G. Rennie |
Independent |
|
| Gillian D. Winckler |
Independent |
Notes:
| 1. | Mr. McLaren was appointed a Director on January 1, 2024. |
Where an individual is, or has been within the last three years, an employee or executive officer of an issuer, NI 52-110 provides that such individual is deemed to have a material relationship with the issuer and thus would be considered non-independent of the issuer.
Hank Ketcham was appointed our President and CEO in 1985 and assumed the role of Chair of the Board in 1996. In 2012, he relinquished the title of President and, on March 1, 2013, Mr. Ketcham retired as our CEO and was designated as our Executive Chair of the Board. Hank Ketcham retired from his role as our Executive Chair effective April 19, 2016 and assumed the position of Chair of the Board. As of the Record Date, more than seven years has elapsed since Hank Ketcham served in any executive capacity with the Company, and eight years will have elapsed as of the date of the Meeting. Mr. Ketcham does not engage in any related party transactions with the Company and does not have any consulting, advisory or other contractual arrangements with the Company outside of his role as the non-executive Chair and a member of the Board.
49
Having regard to Hank Ketcham’s past relationships with the Company and considering his current relationships with management and the Company and the passage of time and other factors, the Board determined that there are no “material relationships” (within the meaning of NI 52-110) which could, in the view of the Board, be reasonably expected to interfere with Hank Ketcham’s exercise of independent judgment. The Board also considered the issue of the Chair’s relationship with management in the context of the need to ensure the Board’s independence from management and determined that the Chair is sufficiently aligned with Shareholder interests to ensure Board independence from management. The Chair is a director and shareholder, and is related to the other directors and shareholders, of Ketcham Investments, Inc., whose shareholdings are described under “Voting Securities and Principal Shareholders”. The Board also considers that these relationships assure that the interests of the Chair are closely aligned with Shareholder interests.
Ellis Ketcham Johnson was appointed to the Board at the Company’s annual general meeting held April 20, 2021. Ellis Ketcham Johnson is a cousin of Hank Ketcham, the Company’s current Chair and former member of our management. The Board has considered this relationship and interest, including the shareholding interests of Ellis Ketcham Johnson and those of Hank Ketcham, and the fact that neither Ellis Ketcham Johnson nor Hank Ketcham are executives or employees of the Company and do not have any other material financial, familial or other relationship with the Company or its executives, and has determined that Ellis Ketcham Johnson is sufficiently independent of our management and has interests aligned with Shareholders to the extent that such independence qualifies her to be a member of the Board and make a valuable contribution in that role.
The Governance Committee is currently comprised of Reid Carter (Chair), John Floren, Brian Kenning, Ellis Ketcham Johnson and Janice Rennie, all of whom are independent Directors. The Governance Committee was reconstituted to its current membership effective April 18, 2023. The Governance Committee meets without any members of management present as part of each regularly scheduled meeting of the Board. There were three such meetings during 2023.
Diversity – Board and Executive Officers
The Company is committed to providing equal opportunities for individuals who have the necessary qualifications for employment and advancement within the Company. The Company’s objectives, as outlined in its Policy on Diversity Equity and Inclusion as well as its Human Rights, Discrimination & Harassment Policy that is part of our Code of Conduct and its employment practices, include providing an equal opportunity for employment and advancement and a work environment that is free of discrimination and harassment, including based on gender, race, ethnicity, disability or sexual orientation. The Company believes inclusive diverse teams build vibrant workforces, safer operations, and a stronger and more competitive company overall.
If all of the management nominees are elected to the Board, 5 of the 11 of the independent Directors (45%) on the Board and 5 of the 12 directors (42%) will be women and 2 of the 11 of the independent Directors (18%) on the Board and 2 of the 12 directors (16%) will identify as non-gender diverse or visible minorities.
The Company and its major subsidiaries have in the aggregate seventeen executive officers, including three executives who are gender or non-gender diverse/visible minorities. Although, the Company has not adopted any formal targets regarding gender or non-gender diverse candidates in Director and executive positions, we do consider diversity when considering Director candidates and making employee hiring or advancement decisions.
In 2019, we adopted the Board Diversity Policy (described below). The Company firmly believes that all of its stakeholders benefit from the broader exchange of perspectives and balance brought by diversity of background, thought and experience.
50
The Company’s commitment to inclusion and diversity is demonstrated through several facets, including initiatives in recruitment and retention, diversity and inclusion training, the consideration of diversity in employee development and advancement decisions, and workshops for identified diverse successors.
The Company does consider diversity to be important and believes that its current framework for evaluating Board and executive officer candidates takes into account diversity along with a broad variety of factors the Company considers appropriate. The Company also encourages female and minority candidates to apply for vacant positions, and the Company is an equal opportunity employer.
The Company strives to create workplaces and leadership teams that are reflective of the diverse communities where we live and work. Creating a culture of belonging for all employees aligns with our other core values of teamwork, respect, humility, and integrity. Our diversity, equity and inclusion approach applies to all levels of our organization and is foundational to achieving our strategic objectives to attract and retain engaged, talented, and high-performing people.
The Company’s objectives in advancing or recruiting new candidates is to attract, employ and retain engaged, talented and high-performing individuals who bring value to the Company and its Shareholders by possessing a suitable mix of qualifications, experience, skills and expertise. It is ultimately the skills, experience, characteristics and qualifications of the individual that are most important in assessing the value the individual could bring to the Company.
Board Diversity Policy
The Company recognizes the benefits of inclusion and diversity in its broadest sense and considers inclusion and diversity at the Board level to be an essential element of Board effectiveness. The Company views inclusion and diversity on the Board as leading to a better understanding of opportunities, issues and risks; enabling stronger decision-making; and ultimately improving our performance and ability to provide strategic oversight and maximize Shareholder value. To continue progress on this goal, in February 2019, the Board adopted a formal, written policy relating to Board diversity, including gender diversity (the “Board Diversity Policy”). The purpose of the Board Diversity Policy is to promote an environment within the Company that will attract and advance those Director candidates with the widest range of knowledge, skills and experience. While all Director appointments are made based on merit, the Board expects that when selecting and presenting candidates to the Board for appointment, the Governance Committee will consider not only the skills, experience and expertise of a candidate, but also other factors, including gender, race, ethnicity, age and geography to ensure that the Board has a diverse membership. Moreover, the Board recognizes that gender diversity is a significant aspect of diversity and acknowledges the important role that women with the relevant skills and experience can play in contributing to a diversity of perspectives on the Board.
While the Board does not support fixed percentages or quotas for achieving diversity, in recruiting candidates for nomination, the Board and the Governance Committee consider a variety of factors including decision-making ability, skill, geography, experience with businesses of a comparable size, diversity of backgrounds and perspectives, gender, race, ethnicity, age, the interplay of a candidate’s skills and experience with the skills and experience of other Board members and the extent to which a candidate would be a desirable addition to the Board.
The Governance Committee may from time to time consider adopting measurable objectives for achieving diversity on the Board, including gender and minority diversity, and recommend such objectives to the Board for adoption.
51
The Board Diversity Policy requires the Governance Committee to review and monitor the implementation of the policy on an annual basis to ensure its effectiveness and report the results of its review to the Board. The Board currently has five female Directors. A copy of the Board Diversity Policy is available on the Company’s website at www.westfraser.com.
In addition to the Board Diversity Policy, the charter of the Governance Committee provides that the Governance Committee will review and make recommendations to the Board on the composition of the Board in order to ensure that the Board has the requisite expertise and that its membership consists of persons with sufficiently diverse and independent backgrounds, with a view to facilitating effective decision-making. Similarly, in the process of identifying candidates for executive officer appointments, the Company considers whether our senior executive group consists of persons with sufficiently diverse and independent backgrounds.
Serving on Other Boards
Each of Doyle Beneby, Eric Butler, John Floren, Janice Rennie, Marian Lawson, Colleen McMorrow and Gillian Winckler is an active corporate director serving on several corporate boards. The Board and the Governance Committee have reviewed each of their board memberships and determined that they have devoted, and are expected to continue to devote or in the case of Mr. Butler expected to devote, the required time and attention to discharge their duties as members of our Board.
Ms. Rennie and Ms. Winckler have each demonstrated a strong understanding of West Fraser’s business, have been and are well prepared for all Board and Committee proceedings, and make consistent and valuable contributions to those proceedings. Similarly, since closing of the Norbord Acquisition in February 2021, when Ms. Lawson and Ms. McMorrow joined the Board of West Fraser, they have each been well prepared and ready for all Board and Committee proceedings. In 2023, Mr. Floren, Ms. Rennie and Ms. McMorrow each maintained a 100% attendance record at Board and Committee meetings. Ms. Lawson attended 100% of the Human Resources & Compensation Committee and Health, Safety & Environment Committee meetings and 83% of the Board meetings. Ms. Winckler attended 100% of the Board and Audit Committee meetings and 67% of the Health, Safety & Environment Committee meetings (2 of 3 meetings). They also made themselves available to meet with management and fellow Directors, and attend tours of the Company’s facilities on an ad hoc basis whenever required to do so.
The disclosure under “Information regarding Nominees for Election as Directors” lists the other public company directorships held by our Directors. West Fraser does not limit the number of outside directorships. The Governance Committee discusses our Director expectations with potential candidates to ensure the candidates understand the time commitments and expectations before agreeing to be nominated as a Director of the Company.
Committees of the Board
The Board has concluded that Committees should be kept to a minimum so that all members of the Board are able to participate in discussions on significant issues. Matters that are outside of management’s authority are reported to and approved by the Board.
Committees may engage outside advisors at the expense of the Company. Under the Governance Policy an individual Director may, with the approval of the Board, retain an outside advisor at the Company’s expense.
52
The Board has appointed the following four Committees, each of which is comprised entirely of Directors who are not members of our management: Audit Committee; HR&C Committee; Health, Safety & Environment Committee; and Governance Committee.
In order to facilitate open and candid discussion, in-camera sessions are held at every Committee meeting without management present. It is also the practice of each Committee to meet in-camera during each of its meetings. Topics discussed at these meetings include, but are not limited to, Board processes, succession planning, executive assessments, organizational changes, and strategy.
Each Committee chair helps ensure that their Committee governs itself independently of management and discharges its mandate in accordance with the Committee’s charter. Each chair also sets the agenda for their Committee meetings in consultation with other members of the Committee, the Board and senior management, as needed.
Audit Committee
| Chair: | Gillian D. Winckler | |
| Other Members: | Doyle N. Beneby | |
| Eric L. Butler | ||
| Reid E. Carter | ||
| Ellis K. Johnson | ||
| Colleen M. McMorrow |
||
The Audit Committee is responsible for reviewing our annual financial statements and making recommendations as to the approval of the annual financial statements by the Board. Material issues related to the audit of our internal control and management information systems are discussed by management representatives and the Audit Committee as they arise. The Audit Committee has been delegated the authority to approve our quarterly financial statements and quarterly earnings announcements before publication other than those related to our fourth quarter and annual results. The Audit Committee has direct access to the Auditor and is responsible for approving the nomination, and establishing the independence, of the Auditor. The role of the Audit Committee has been discussed at various times with our Auditor.
Under NI 52-110, the Audit Committee must be comprised of independent directors. An “independent director” is a director that has no direct or indirect material relationship with the Company, including not being affiliated with management or the Company in terms of specific familial or commercial relationships. Each member of our Audit Committee is considered “independent” and, in addition, “financially literate” as such terms are used in NI 52-110.
Additional disclosure concerning the Audit Committee is contained in our Annual Information Form. The full text of the Audit Committee Charter, which forms part of our Annual Information Form, is available for viewing on our website at www.westfraser.com. The Audit Committee Charter is reviewed at least annually and was last revised by the Board on April 20, 2021.
53
Human Resources & Compensation Committee
| Chair: | Brian G. Kenning | |
| Other Members: | Eric L. Butler | |
| John N. Floren | ||
| Marian Lawson | ||
| Janice G. Rennie | ||
The HR&C Committee consists of at least three members who must be independent directors. The independence of each Director on the HR&C Committee is determined in accordance with the applicable securities laws and in accordance with the applicable rules of the NYSE.
The HR&C Committee is responsible for reviewing and making recommendations to the Board with respect to the remuneration of our executive management and the remuneration of each Director, and has the authority to grant Options to officers and employees under our Stock Option Plan (described below), although in practice the Board gives final approval of all Option grants. The HR&C Committee reviews the remuneration of Directors and executive management each year. The HR&C Committee oversees succession planning of our executive management and reviews and makes recommendation to the Board on proposed executive management appointments. Under its mandate, the HR&C Committee is authorized to retain or obtain the advice of independent compensation consultants, legal counsel and other advisors.
In December 2019, the HR&C Committee reviewed the HR&C Committee Charter and made recommendations to update it in accordance with best practices and to, among other things, supplement the HR&C Committee’s responsibilities to oversee the Director remuneration every two years and CEO emergency succession planning. These recommendations were approved by the Board on December 10, 2019. In connection with the listing of the Common shares on the NYSE on February 1, 2021, the Company revised the HR&C Committee Charter on February 11, 2021 to address certain NYSE requirements. Further amendments related to the NYSE listing were also made on December 7, 2021. The HR&C Committee Charter may be viewed on our website at www.westfraser.com.
Health, Safety & Environment Committee
| Chair: | John N. Floren | |
| Other Members: | Doyle N. Beneby | |
| Marian Lawson | ||
| Colleen M. McMorrow | ||
| Gillian D. Winckler | ||
The Health, Safety & Environment Committee is responsible for monitoring our health, safety and environmental performance, including West Fraser’s short- and long-term environmental and sustainability objectives and assessing the Company’s performance with respect to such objectives. The Health, Safety & Environment Committee conducts an ongoing review of our health, safety and environment related policies and performance, including compliance with applicable laws and regulations. The Health, Safety & Environment Committee also reviews the suitability and effectiveness of safety and environment management systems and the environment sustainability certification programs to which we subscribe. The Committee is also responsible for periodically reviewing West Fraser’s disclosure of responsibility, sustainability, and health, safety and environmental reports. The Health, Safety & Environment Committee Charter is reviewed at least annually and was last revised by the Board on February 15, 2022. The Charter of the Health, Safety & Environment Committee may be viewed on our website at www.westfraser.com. Additional information about our environmental, social and governance policies and practices can be found on the “Responsibility” section of our website and in our Responsibility Report on our website, as well as in our Annual Information Form that can be found on our website and also under our profiles on SEDAR+ at www.sedarplus.ca and EDGAR at www.sec.gov/edgar.
54
Governance & Nominating Committee
| Chair: | Reid E. Carter | |
| Other Members: | John N. Floren | |
| Ellis K. Johnson | ||
| Brian G. Kenning | ||
| Janice G. Rennie | ||
The Governance Committee is comprised of Directors, each of whom is “independent” of management as that term is used in NI 52-110. The Governance Committee is responsible for providing support for the governance role of the Board and, as part of that support, reviews and makes recommendations on the composition of the Board, periodically assesses the function of the Board and its Committees, and monitors developments in corporate governance. The Governance Committee is also responsible for reviewing and monitoring the Company’s exposure to risks and opportunities related to governance practices, ethics, compliance, and independence of Directors. In addition, the Governance Committee is responsible for establishing criteria and procedures for identifying candidates for election to the Board, engaging search firms, where necessary, and recommending to the Board nominees to stand for election as Directors. The Governance Committee Charter was last reviewed and revised by the Board on December 7, 2021. The Governance Committee Charter may be viewed on our website at www.westfraser.com.
Orientation Program and Continuing Education
New Directors receive a broad range of materials that provide both historical and forward-looking information concerning West Fraser, its operations, senior management and the Board, and its strategic objectives. As part of our orientation program, new Directors have an opportunity to meet with senior management to discuss our business, receive historical and current operating and financial information and are encouraged to tour our facilities. Directors have access to an archive of Board materials, including management presentations from prior meetings. In addition to the formal orientation and continuing education programs, in connection with the appointment of Marian Lawson and Colleen McMorrow, the Governance Committee implemented a custom program for their orientation including an overview of the Company’s key policies, codes and mandates and briefings on the Company’s operations, business and key issues. A similar customized orientation program was also developed and implemented for Ellis Ketcham Johnson by the Governance Committee. In connection with the appointment of new Directors, the Governance Committee will develop and implement similar orientation programs customized for each candidate’s skills and experience.
We regularly provide and organize continuing education programs for all Directors. Our continuing education programs include regular presentations by senior executives about emerging issues, risks and topics relevant to our business and operations and the regulatory environment, as well as information packages developed to enhance the Director’s understanding of the subject matter. Furthermore, special subjects are also covered with a view to keeping the Directors informed and up to date in relation to industry developments, new legislation that affects operations and distribution, major files and projects, as well as economic, political, sustainability and ESG trends. External experts are also invited from time to time to speak on various topics. Committee chairs may also coordinate education sessions on specific topics for their Committee members.
55
The continuing education sessions and presentations by our senior executive and external experts to our Board during 2022 and 2023 included the following subject matter and topics:
| Subject | Topic | Presenter | ||
|
2023 |
||||
| Sustainability |
● Wildfire Risk and Implications for Forest Management |
External Expert |
||
|
● Canadian Wildfire Initial Impact Assessment |
Senior Management |
|||
|
● Sustainability Update |
Senior Management |
|||
| Regulatory & Government Affairs |
● Alberta Political Backdrop |
External Expert |
||
| Operations |
● Alberta Fibre Supply and Fibre Access |
Senior Management |
||
|
● Overview of Alberta Business |
Senior Management |
|||
|
● Overview of EWP manufacturing business |
Senior Management |
|||
|
● Long-term North American Supply/Demand Outlook |
External Expert |
|||
| 2022 | ||||
| Sustainability |
● Environment and Sustainability Update |
Senior Management |
||
|
● Environment and Climate Strategy |
Senior Management |
|||
| Regulatory & Government Affairs |
● Canadian Countervail and Antidumping |
Senior Management |
||
| Operations |
● U.S. Lumber and Orientated Strand Board |
Senior Management |
||
|
● U.S. South Timber Market and Cost Outlook |
External Expert |
|||
|
● Global Outlook in Wood Products Supply/Demand Trends |
External Expert |
|||
|
● Strategic Analysis of Plywood and Engineered Wood Products in North America |
External Expert |
|||
|
● U.S. Land Ownership |
Senior Management/
|
|||
|
Technology |
● Deploying Technology |
Senior Management |
||
Board proceedings also include regular review of risk factors including detailed reviews of focus risks and periodic presentations by management and outside industry experts on important and evolving issues. Directors also visit and tour certain of our facilities on a regular basis which contributes to a more complete understanding of our business. Site visits also give Directors an opportunity to meet directly with management and other employees in those areas or regions.
Each of our Directors has had, or currently has, executive or Board of Director responsibilities and there is a regular sharing of those experiences, which assists our Board in identifying and adopting, on a continuing basis, best corporate governance practices.
A key part of each regularly scheduled Board meeting is a business overview provided by the CEO. This overview includes an operational and financial review, but also provides perspectives on growth strategies, human resources, political, legal and regulatory issues and material changes in our risk environment. These discussions help our Directors to understand the full scope of our underlying business environment when making decisions that affect our future.
We also encourage individual Directors to participate in outside professional development programs. We pay for these expenses as long as the Chair of the Board and the Chair of the Governance Committee approve the program in advance. They are also provided with corporate subscriptions to certain relevant industry publications. All of our Directors are members of the Institute of Corporate Directors (“ICD”), which provides continuing education for directors through publications, seminars and conferences.
56
On an ongoing basis, the Company:
| ● | ensures that Directors have timely access to materials and information required to properly discharge their responsibilities; |
| ● | maintains a secure Directors’ portal for prompt dissemination of information and provides published information, industry publications, articles of interest and other relevant materials to Directors in between meetings; and |
| ● | canvasses Directors for suggestions as to topics and issues for which they would like to receive a presentation, briefing or report. |
Individual Directors attended and, in some cases, were participants or presenters at, third party conferences, seminars, webinars and presentations on a broad range of topics in 2021, 2022 and 2023, including the following:
|
Topic
|
Presented By
|
|
| 2021 National Corporate Governance Conference |
ICD |
|
| A New Executive Pay Landscape |
Willis Towers Watson |
|
| Anticorruption training |
Corporate issuers |
|
| Board Cybersecurity Governance during Geopolitical Conflict |
ICD |
|
| Board Governance and Effectiveness |
Hugessen |
|
| Board Oversight of AI: Opportunities and risks in a rapidly changing landscape |
E&Y |
|
| Board Oversight of Strategic Issues |
ICD |
|
| Board’s Role CEO Transitions |
ICD |
|
| Board’s Role Leveraging Human Capital |
ICD |
|
| Boardroom Financial Essentials |
ICD |
|
| Canada’s Proposed Cybersecurity Bill Key Insights |
ICD |
|
| Canadian Directors Network |
E&Y |
|
| CEO Performance Management |
Hugessen |
|
| CEO Transitions and ESG action, measurement, disclosure and oversight |
E&Y |
|
| Charting the Future of Canadian Governance |
Deloitte |
|
| Climate Action at the International Level |
Embassy of Canada |
|
| Continuing the Digital Transformation |
ICD |
|
| Corporate Reporting: How is the Landscape Changing? |
Toronto Climate Action Network |
|
| Corporate Reporting Update |
Globe & Mail |
|
| CPAB Audit Committee Forum |
CPAB |
|
| Cyber security Presentations and Workshops |
Various corporate issuers |
|
| Deloitte Audit Committee Webinar – The new global frontier (Climate Change and Global Warming) |
Deloitte |
|
| Dialogue with Indigenous Peoples |
ICD |
|
| Director Series for Audit Committees – Sustainability Reporting – Navigating evolving expectations and avoiding pitfalls |
Deloitte |
|
| ESG Conference and Sustainability Summit |
Scotiabank |
|
| Financial Reporting Developments |
E&Y |
57
|
Topic
|
Presented By
|
|
| Four Seasons of Reconciliation |
First Nations University of Canada |
|
| Geopolitics in the Year Ahead (Europe, U.S., Asia) |
Deloitte |
|
| Governance in Today’s World |
ICD |
|
| Governance of Artificial Intelligence |
ICD |
|
| Human Resources and Compensation Committee Effectiveness |
ICD |
|
| Hydrogen Economy |
CPA |
|
| ICD National Conference |
ICD |
|
| Impact of Canada’s Deteriorating Relationship with China |
E&Y |
|
| India Charting the Future of Canadian Governance |
E&Y |
|
| Indigenous Relations in Canada |
Major Drilling |
|
| Key Trends in Global Forestry |
- |
|
| National Association of Corporate Directors Annual Conference |
NACD |
|
| Proxy Season Preview: Regulatory and Disclosure Updates and the Evolution of ESG: The Agenda for Change |
Fasken Institute |
|
| Rethinking Risk Management |
ICD |
|
| Safety Summit |
EPCOR |
|
| Social Purpose |
ICD |
|
| Supply Chain Trends and Strategic Considerations (balancing efficiency and resiliency) |
E&Y |
|
| The 2022 Board Agenda |
KPMG |
|
| Transmission to Net Zero |
ICD |
|
| Ukraine/Russian Market Impacts |
FEA |
|
Meeting Attendance Record
In 2023, the attendance record for Board and Committee meetings was 98%. The following chart sets out meeting attendance records of each of the current Directors during 2023, including each Committee of which the Director is currently a member.
| Committees | ||||||||||
|
Director |
Board Meetings |
Audit | Human Resources & Compensation |
Health, Safety & Environment |
Governance & Nominating | |||||
| Hank Ketcham |
6 of 6 | Nil | Nil | Nil | Nil | |||||
| Doyle N. Beneby |
5 of 5 | 3 of 3 | Nil | 1 of 1 | Nil | |||||
| Eric L. Butler |
4 of 4 | 1 of 1 | 2 of 2 | Nil | Nil | |||||
| Reid E. Carter |
6 of 6 | 4 of 4 | Nil | Nil | 3 of 3 | |||||
| John N. Floren |
6 of 6 | Nil | 3 of 3 | 3 of 3 | 3 of 3 | |||||
| Ellis Ketcham Johnson |
6 of 6 | 4 of 4 | Nil | 2 of 2 | 2 of 2 | |||||
| Brian G. Kenning |
6 of 6 | Nil | 3 of 3 | Nil | 3 of 3 | |||||
| Marian Lawson |
5 of 6 | Nil | 3 of 3 | 3 of 3 | Nil | |||||
| Sean McLaren1 |
n/a | n/a | n/a | n/a | n/a | |||||
| Colleen M. McMorrow |
6 of 6 | 4 of 4 | Nil | 3 of 3 | Nil | |||||
| Janice G. Rennie |
6 of 6 | 1 of 1 | 3 of 3 | Nil | 3 of 3 | |||||
|
Gillian D. Winckler |
6 of 6 | 4 of 4 | Nil | 2 of 3 | Nil | |||||
Notes:
1. Mr. McLaren became a Director on January 1, 2024.
58
EXECUTIVE COMPENSATION DISCUSSION & ANALYSIS
Human Resources & Compensation Committee Responsibility
The HR&C Committee is responsible for recommending to the Board the level and nature of compensation for executive officers and Directors and may grant Options to officers and employees under the Stock Option Plan, although in practice the Board provides final approval of all compensation matters for Directors and executive officers, including Option grants. In making its determinations, the HR&C Committee has access to comparative data and, if considered appropriate, receives advice from selected independent consultants.
The HR&C Committee is also responsible for reviewing and recommending to the Board the approval of our compensation and benefits (including retirement and pension) philosophy and policies and any incentive compensation plans and equity-based plans and assessing on an ongoing basis whether such compensation and benefits policies are consistent with the sustainable achievement of our business objectives, the prudent management of our operations and risks, and the promotion of adherence to our Code of Conduct, its policies concerning safety and environmental stewardship and other material policies, procedures and controls. In reviewing such policies, the HR&C Committee may consider the recruitment, development, promotion, retention and compensation of executive management and other employees and any other factors that it deems appropriate.
The HR&C Committee also ensures that such compensation and benefit policies do not encourage unwarranted risk taking and undertakes annual risk assessments of these policies either through regular independent or internal reviews of material compensation-related risks. When it reviews and recommends compensation for the CEO and executive management, the HR&C Committee assesses the appropriateness of compensation relative to business risks undertaken by considering, among other things, adherence to our Code of Conduct and other material policies, procedures and controls, as well as any other factors it considers appropriate.
The HR&C Committee is also responsible for overseeing the financial position, governance, administration and compliance with statutory and regulatory requirements of the Company’s pension plans and reporting to the Board annually on these plans. The HR&C Committee also oversees talent development and succession planning for our executive management and annually reports to the Board on such planning.
Composition of the HR&C Committee
The HR&C Committee currently consists of five independent Directors, each of whom has held senior executive roles that have included involvement in executive compensation issues. The HR&C Committee met three times in 2023 to review matters relating to the compensation of executive officers. In addition to meetings, members of the HR&C Committee regularly receive reports and advice from independent consultants and members of executive management on executive compensation issues. None of the members of the HR&C Committee is indebted to the Company.
See also “Human Resources & Compensation Committee”.
59
Report on Executive Compensation
Compensation Philosophy, Core Values and Methodology
West Fraser’s executive compensation is designed to foster and support long-term, sustainable value creation of the Company and be closely aligned to the long-term returns to its shareholders. Our compensation structure is designed to support the following beliefs:
| • | average long-term valuation is best achieved by creating an environment that promotes teamwork through shared goals and values; |
| • | renumerating in a manner that is directly linked to the overall financial performance of the Company versus our Peers, and greater weighting be placed on long-term performance than short-term; and |
| • | attracting and retaining individuals that share and demonstrate the core value of diverse teams working closely together to collectively achieve high performance across the entire Company. |
The policy of the HR&C Committee and the Board with respect to executive compensation is to provide compensation to each executive officer in the form of a base salary, employment benefits, performance related bonus, equity-based long-term incentives and post-retirement pension benefits in order to attract and retain a highly motivated, cohesive and results oriented management team.
Total compensation for each executive officer (inclusive of long-term incentives and post-retirement pension benefits) is designed to be competitive with that provided by comparable companies to executive officers in similar positions as well as to align the interests of executive officers with those of our Shareholders and not encourage excessive risk taking. Each of the components of total compensation is established based on the following criteria:
|
|
Base Salary |
– |
to be at or below the median base salaries for comparable positions |
|
||||
| Annual Incentive Bonus |
– |
based on our financial performance above a minimum return on shareholders’ equity, and targeted to be at or below the median for comparable positions |
||||||
| Long-Term Incentive |
– |
to be above the median on long-term incentives for comparable positions |
Overall, the total compensation package is designed to compensate executive officers for above average, long-term, sustainable financial results, and is designed to be competitive at the 50th percentile for overall compensation for comparable positions.
In order to establish compensation for executive officers other than the CEO, the HR&C Committee receives recommendations with supporting documentation, including data on comparable compensation levels, from the CEO. The HR&C Committee considers the recommendations and comparative data and makes its recommendation to the Board. In respect of compensation for the CEO, the HR&C Committee bases its recommendation to the Board on its review of comparable compensation data for chief executive officer positions. In 2018, as part of its review the HR&C Committee considered a survey and report prepared by Willis Towers Watson (“Towers Watson”), a professional services firm, of our executive compensation program relative to those of different peer groups, which included a review of the compensation for the CEO and our other executive officers and comparable compensation data for chief executive officer and other executive officer positions of those peers. In 2021, the HR&C Committee updated its review and considered an updated survey and report prepared by Towers Watson of our executive compensation program relative to those of different peer groups.
60
In determining the comparability of similar positions in other companies, the HR&C Committee considers responsibility levels as well as industry similarity, annual revenues and cash flows, total assets, market capitalization and number of employees of the selected companies. For positions where compensation data is not comparable, internal guidelines and data are used.
The Company uses, and periodically participates in, broad-based compensation surveys prepared by independent consulting firms. As well, from time to time, the Company and the HR&C Committee may obtain specific benchmarking data prepared by independent consulting firms. This information, along with Company specific data, is considered when establishing compensation for executive officers.
In connection with the updated survey and report prepared in 2021 by Towers Watson of our executive compensation program relative to those of different peer groups, and on the recommendation of Towers Watson, the peer group for the compensation benchmarking study was updated in 2021 and is currently comprised of the publicly traded, Canadian and U.S. companies set out in the table below. Prior to the adoption of the updated peer group, the compensation peer group was based on the peer group in the 2018 survey and report and recommendation of Towers Watson.
| Paper and Forest Products |
Capital-Intensive |
|
| Resolute Forest Products Inc. |
Finning International Inc. |
|
| Canfor Corporation |
Gibson Energy Inc. |
|
| Cascades, Inc. |
Keyera Corp. |
|
| Louisiana-Pacific Corporation |
Methanex Corporation |
|
| Interfor Corporation |
Parkland Corporation |
|
| Boise Cascade Company |
WSP Global Inc. |
|
| Kinross Gold Corporation |
||
| Masco Corporation CCL Industries |
Base Salaries
The HR&C Committee reviews executive management base salaries periodically and considers annual adjustments to be effective in October of each year. The most recent review of base salaries was conducted in September 2023.
In determining its September 2023 recommendations for the base salary of each executive officer, the HR&C Committee considered the comparative data for the peer group.
Annual Incentive Bonus Plan
The annual incentive bonus plan (the “Bonus Plan”) covers our CEO and our Vice-Presidents. The Bonus Plan is the variable compensation component of total executive compensation designed to compensate these officers annually based on the achievement of our objective annual financial return targets.
The annual bonus is calculated as a percentage of current base salary, with the percentage earned based on the adjusted net income (adjusted to exclude equity-based compensation expense or recovery and any accrual for bonuses to our senior executives, both on an after-tax basis) divided by average Shareholders’ equity (“ROSE”). If the ROSE for the year is below 5% for the applicable year, no bonuses are payable under the Bonus Plan. At the 5% ROSE level, bonuses for the Vice-Presidents are earned at 17.5% of base salary.
61
The bonus percentage increases as the ROSE increases, and the bonus percentage earned will reach 100% of base salary at a 15% ROSE level, which is the maximum bonus percentage payable. The bonus percentage for the CEO is equal to 150% of the bonus percentage for other officers covered by the Bonus Plan for bonuses earned in 2022 and later years, and was 125% prior to 2022.
The Board may, in its discretion, also consider other issues, including safety and environmental performance, when determining the amount, if any, of bonuses earned under the Bonus Plan that will be paid.
In 2023, our earnings (loss) was (US$167) million, which resulted in an annual ROSE of (1.9%) for 2023. This resulted in not meeting the minimum threshold and no annual incentive bonuses were awarded to the qualifying senior executives for 2023.
In 2022, on an adjusted basis (adjusted by excluding equity-based compensation expense or recovery and any accrual for bonuses to our senior executives, both on an after-tax basis) our earnings were US$1,975 million, which resulted in an annual ROSE of 24.4% for 2022. This exceeded the bonus threshold and annual incentive bonuses of 100% of the base salary were awarded to the qualifying senior executives in accordance with the Bonus Plan (with the bonus percentage for the CEO equal to 150% of such bonus percentage) and were paid in 2023.
In 2021, the annual ROSE was 42.4% which exceeded the bonus threshold and annual incentive bonuses of a maximum of 100% of base salary were awarded to each of the qualifying senior executives in accordance with the Bonus Plan (with the bonus percentage for the CEO equal to 150% of such bonus percentage) and were paid in 2022.
See also “Clawback Policies” which applies to the Bonus Plan.
Long-Term Incentive Component
The long-term incentive component of compensation is comprised of Options and phantom share units (which are either RS Units or PS Units) that are intended to directly align the long-term interests of our senior management with those of our Shareholders. The proportion of Options and phantom share units included in a long-term incentive grant will vary from time to time at the discretion of the Board. In 2019, the Board, on the recommendation of the HR&C Committee, changed the mix of the long-term incentive components of executive compensation to eliminate grants of RS Units and grant additional PS Units in their place in order to increase the award of performance-conditioned equity incentive components of executive compensation. As a result, approximately 50% of the value of the long-term incentives granted in 2023, 2022 and 2021 to executive officers (which consisted of only Options and PS Units) are performance-conditioned.
Stock Option Plan
The Board first established the Stock Option Plan on February 24, 1994 as a means of recognizing contributions to the Company made by Directors, officers and employees and to provide a long-term incentive for their continuing relationship with the Company and its subsidiaries. Directors ceased to participate under the Stock Option Plan in 2004. The Stock Option Plan has been amended from time to time. In February of 2021, the Stock Option Plan was amended to increase the number of Common shares that may be issued in respect of Options granted under it, to impose certain limits on the number of Options that may be issued to our insiders, to establish certain restrictions on amendments to the Stock Option Plan without Shareholder approval, to provide for certain automatic extensions for Options expiring during or within five business days of a blackout period under the Company’s Securities Trading Policy, and to address certain incidental housekeeping changes.
62
In February of 2022, the Stock Option Plan was amended to provide that the cash value is determined using the VWAP as at the trading day prior to the date of exercise.
In addition, the Company has adopted Replacement Option Plans in connection with the Norbord Acquisition, pursuant to which the Company has issued Replacement Options. The Replacement Options carry substantially the same terms as the original Norbord Options, except that they are exercisable into Common shares and have been adjusted in accordance with the Exchange Ratio. The Replacement Option Plans exist solely to grant and administer the Replacement Options and did not require Shareholder approval under the policies of the TSX, as the aggregate number of Common shares issuable under them is less than 2% of the number of Common shares issued and outstanding prior to the Norbord Acquisition. Upon the exercise or expiry of all Replacement Options, the Replacement Option Plans will be terminated. See also “Option Grants”.
Outstanding and Authorized Options
| Year | Outstanding | Weighted Average Price |
Remaining Authorized6,7 |
Total | % of Outstanding Common Shares and Class B Shares (Dilution) |
|||||
| 20241 |
996,8542 |
$88.51 |
607,111 |
1,603,965 |
2.0 |
|||||
| 20231 |
849,6703 |
$83.59 |
777,255 |
1,626,925 |
2.0 |
|||||
| 20221 |
841,3054 |
$76.19 |
910,424 |
1,751,729 |
2.1 |
|||||
|
20211 |
1,077,8405 |
$66.64 |
1,025,337 |
2,103,177 |
2.0 |
|||||
Notes:
| 1. | As at the Record Date, December 31, 2023, December 31, 2022 and December 31, 2021, respectively. |
| 2. | Includes 949,742 under the Stock Option Plan and 47,112 under the Replacement Option Plans. |
| 3. | Includes 798,846 under the Stock Option Plan and 50,824 under the Replacement Option Plans. |
| 4. | Includes 728,381 under the Stock Option Plan and 112,934 under the Replacement Option Plans. |
| 5. | Includes 791,617 under the Stock Option Plan and 286,223 under the Replacement Option Plans. |
| 6. | No new Replacement Options may be granted under the Replacement Option Plans and they will be terminated when all Replacement Options are exercised or expire. |
| 7. | At the special meeting of Shareholders held on January 19, 2021, the Shareholders approved an increase of 1,000,000 Common shares to the maximum number of Common shares that may be issued on the exercise of Options under the Stock Option Plan. |
Annual Burn Rate
The following table summarizes the burn rate during the last three fiscal years. Burn rate is defined as the total number of Options granted during the applicable fiscal year divided by the weighted average number of Common shares and Class B Shares outstanding for the applicable fiscal year.
| Options Granted in Year | Net Burn Rate1 | Burn Rate2 | Weighted average number of securities outstanding |
|||||
| 2023 | 137,115 | 0.2% | 0.2% | 83,198,524 | ||||
| 2022 | 124,566 | 0.1% | 0.1% | 94,173,000 | ||||
|
2021 |
171,975 | 0.1% | 0.2% | 109,020,975 | ||||
Notes:
| 1. | Number of Options granted in a fiscal year, minus expired Options, divided by the weighted average number of Common shares and Class B Shares outstanding for the applicable fiscal year. |
63
| 2. | Number of Options granted divided by weighted average number of Common shares and Class B Shares outstanding for the applicable fiscal year. |
In 2003, our Stock Option Plan was revised to grant a holder the right to surrender an Option for a cash payment (the “Cash Value Alternative”) and only a very small number of Common shares have been issued under the Stock Option Plan. During the financial year ended December 31, 2023, 383 Options and Replacement Options collectively were exercised for Common shares under the Stock Option Plan and Replacement Option Plans, respectively. See “Option Grants”. Of the 996,854 outstanding Options and Replacement Options, 627,917 are exercisable and, of the outstanding Options and Replacement Options, 412,443 Options and Replacement Options were held by insiders, representing 0.51% of the total number of issued and outstanding Common shares and Class B Shares, in each case as of the Record Date.
A total of 137,115 Options were granted to officers or employees in 2023 representing 0.17% of the total number of issued and outstanding Common shares and Class B Shares as at the end of 2023, and a total of 170,144 Options were granted to officers or employees in February 2024, representing 0.21% of the total number of issued and outstanding Common shares and Class B Shares as of the Record Date.
Our Board has adopted a policy to manage the Stock Option Plan with a goal of limiting the potential dilution of outstanding and remaining authorized Options to 10% or less of the number of our outstanding Shares. The aggregate potential dilution of all issued and authorized Options under our Stock Option Plan was 1.96% at the Record Date and the aggregate potential dilution of all issued and authorized Options under our Stock Option Plan together with all outstanding Replacement Options under the Replacement Option Plans was, 2.0% at the Record Date.
Phantom Share Unit Plan
In 2010, the Board approved the Phantom Share Unit Plan, which is intended to supplement, in whole or in part, the granting of Options as long-term incentives for officers and employees. This plan provides contingent future compensation based on Common share price performance but is payable only in cash and represents no potential for Shareholder dilution. The HR&C Committee and the Board believe that this Phantom Share Unit Plan, combined with other components of compensation, provides a broader range of alternatives in developing retention and performance incentives for officers and employees that more directly align their interests with those of current and future Shareholders.
The Phantom Share Unit Plan permits the Board to grant, as it determines appropriate, two types of units, RS Units and PS Units, which vest on the third anniversary of the grant date. A vested RS Unit must be redeemed by us by payment to the holder of an amount equal to the VWAP of a Common share over the 20 trading days immediately preceding its vesting date (the “Vesting Date Value”). A vested PS Unit must be redeemed by us by payment to the holder of an amount, determined by the Board, that is equal to or between nil and twice its Vesting Date Value based on two performance criteria measuring our performance relative to the performance of a peer group of companies over the three-year performance period. At the end of such period, in order to determine the amount to be paid on vested PS Units, the Company’s performance is measured by reference to (i) the Company’s cumulative total Shareholder return (the “TSR”) relative to the TSR of the peer group, and (ii) the Company’s average annual return on capital employed (“ROCE”) relative to the ROCE of the peer group over the three-year performance period. The amount paid, if any, on such PS Units is based on an equal weighting of these two performance measurements, although if the ROCE is negative for the performance period, the weighting for that factor is capped at one half its potential maximum, regardless of relative performance. The peer group used for the purposes of the Phantom Share Unit Plan for PS Units granted prior to February 17, 2022 consists of Canfor Corporation, Interfor Corporation, Western Forest Products Inc. and Weyerhaeuser Company, all of which are North American publicly traded forest products companies. On the recommendation of the HR&C Committee, this peer group may be reviewed and changed by the Board, from time to time, as it deems appropriate.
64
The Board also has discretion to vary the payout calculation as it considers appropriate to take into account factors that may have a significant or extraordinary effect on relative performance.
Officers and employees granted phantom share units under the Phantom Share Unit Plan are also entitled to additional phantom share units to reflect cash dividends paid on Common shares from the applicable grant date until payout. The final amount to be paid, in cash, to each officer or employee on RS Units and PS Units is based on the type and number of vested phantom share units they hold, multiplied by the applicable payout value. Other than officers or employees who retire, become totally disabled or die, phantom share units will be automatically cancelled, without payout, on termination of employment or resignation. In the event of retirement, total disability or death of a holder of RS Units or PS Units granted after 2012, the number of phantom share units held will be reduced based on the proportion of the three year period that the holder was not an officer or employee.
In February 2022, the Board made a number of amendments to the Phantom Share Unit Plan including (a) updating the peer group to remove Western Forest Products Inc. and add Resolute Forest Products Inc. and Louisiana – Pacific Corporation, (b) providing that for U.S. residents units may be issued and cash settled in U.S. dollars with the fair market value on settlement referencing the VWAP on the NYSE, and (c) providing that cash value on settlement and value for dividend entitlements is to be determined using a single day VWAP as at the prior trading day. In February 2023, the Board further amended the peer group for grants after February 14, 2023 to remove Resolute Forest Products Inc. and add Potlach Deltic.
Beginning in 2020, the Board has granted only PS Units under the Phantom Share Unit Plan to executive officers and employees, and no RS Units have been granted. The change in 2020 in the mix of phantom share units granted was made to increase the award of performance-conditioned long-term incentives granted to executive officers and employees and reduce the award of time-conditioned incentives. As a result, since 2020, approximately 50% of the value of the long-term incentives granted to executive officers and employees (which in both cases consisted of only Options and PS Units) are performance-conditioned. See also “Clawback Policies”, which applies to the Phantom Share Unit Plan.
For PS Units which vested in February of 2024, the relative performance multiplier was 2.0. The calculation is set out below.
PS Unit Relative Performance Multiplier
First Comparison (out of a maximum of 1.00) – Return on Capital Employed (“ROCE”), annual average of calendar years, 2021, 2022 and 2023:
1.00 (exceeded four of four in peer group)]
Second Comparison (out of a maximum of 1.00) – Total Shareholder Return (“TSR”), cumulative from January 1, 2021 to December 31, 2023:
1.00 (exceeded four of four in peer group)]
Total 2.00
Previous PS Unit Relative Performance Multipliers were as follows:
| For PS Units Vesting in February of: | Multiplier | |||||
| 2019 | 1.92 | |||||
| 2020 | 1.83 | |||||
65
| 2021 | 1.83 | |||||
| 2022 | 1.25 | |||||
| 2023 | 2.00 |
Norbord RSU Plan and DSU Plans
In addition, in connection with the Norbord Acquisition, the Company assumed Norbord’s obligations under the Norbord RSU Plan and the Norbord DSU Plans with respect to the Norbord RSUs held by Norbord Continuing Executives who are continuing and with respect to all outstanding Norbord DSUs. As at February 4, 2023, all of the outstanding Norbord RSUs vested and, upon settlement the Norbord RSU Plan terminated.
All Norbord DSUs outstanding immediately prior to the closing of the Norbord Acquisition remained outstanding on their existing terms following the completion of the Norbord Acquisition, except that the number of such Norbord DSUs were adjusted by the Exchange Ratio and are to be paid out in reference to Common shares in accordance with the terms of the Norbord Acquisition. No new Norbord DSUs may be issued under the director Norbord DSU Plan following completion of the Norbord Acquisition. Both the management Norbord DSU Plan and the director Norbord DSU Plan will remain in place to administer Norbord DSUs outstanding thereunder until such time as all outstanding Norbord DSUs are settled, at which point the Norbord DSU Plans will be terminated. In February 2022, the Board amended Norbord DSU Plans to provide that cash value on settlement and value for dividend entitlements is to be determined using a single day VWAP as at the prior trading day.
Post-Retirement Pension Benefit
Most executive officers, including the CEO, are members of our non-contributory defined benefit pension plans for salaried employees. Certain executive officers are members of our defined contribution and 401K pension plans. The pension benefit provided under these pension plans is described under “Pension Plans” of this Circular. The Company does not provide any additional post-retirement benefits, such as medical or dental insurance, to the executive officers.
Clawback Policies
We have recognized a trend in recent years towards the adoption of recoupment and “clawback” policies, particularly among large public companies. As a prudent aspect of risk management and our commitment to operate consistently with good governance practices, the Board, in 2013, approved amendments to the Phantom Share Unit Plan and the Bonus Plan to incorporate payment adjustment provisions. These plans now both contain financial restatement triggers, permitting West Fraser to recoup the amount of the incentive awards that have been paid in excess of the amount that would have been payable under the restated financial statements, or deduct such excess amount from future payments to be made under such plans. These payment adjustment provisions also allow the Company to adjust incentive awards upwards to reflect restated financial statements that are more favourable than the original financial statements. The payment adjustment provisions have a three-year look-back period.
Further, effective December 1, 2023, we have adopted a Clawback Policy that complies with new SEC rules under the Dodd-Frank Wall Street Reform and Consumer Protection Act and related NYSE requirements. The Clawback Policy covers our executive officers and provides that in the event of a required accounting restatement, West Fraser will seek reimbursement of the portion of any incentive-based compensation that would not have been paid had our financial statements been correctly stated. A full copy of the Clawback Policy is available under the Company’s profile on EDGAR at www.sec.gov/edgar and on the Company’s website at www.westfraser.com.
66
CEO’s Compensation
In recommending compensation for the CEO, the HR&C Committee follows similar principles to those applied for all of our other executive officers. The HR&C Committee considers market competitive salary information for chief executive officer positions in similar sized companies in Canada and the U.S. This includes manufacturing companies in other sectors as well as in the forest products sector. The Company periodically participates in broad based compensation surveys and also periodically seeks the advice of independent compensation consultants engaged to review the executive compensation program. In 2021, Towers Watson conducted a survey and review of our executive compensation program relative to those of different peer groups. The survey and review results, along with Company specific data, are used to determine the competitiveness of the CEO’s compensation and its alignment with the interests of Shareholders. The CEO establishes, with guidance and direction from the Board, annual goals and reports to the Board at the end of each year on his performance against those goals. The HR&C Committee considers this performance when considering its recommendation of compensation of the CEO.
Details of our CEO’s compensation are described in the table titled “Summary Compensation Table”.
Executive Equity Holding Requirements
In February 2013, our Board approved the adoption of minimum equity holding requirements, which were subsequently amended in September 2013. The minimum equity holding requirements are reviewed from time to time to align with what the Board considers best governance practices. In February 2019, on the recommendation of the HR&C Committee, the Board adopted a new equity holding requirements policy (the “Equity Holding Requirements Policy”) to take into account changes to the Company’s equity compensation practices, which eliminated grants of RS Units and replaced them with grants of additional PS Units (which do not qualify as eligible equity under the Policy) to increase the award of performance-conditioned equity incentive components of executive compensation. As a result of these changes, beginning in 2020 approximately 50% of the value of the long-term incentives granted to executive officers (which consisted of only Options and PS Units) are performance-conditioned.
Under the Equity Holding Requirements Policy, each executive officer is required to hold Shares and RS Units having a value of not less than the executive’s base salary in the case of Executive Vice-Presidents, Senior Vice-Presidents and Vice-Presidents and not less than three times the executive’s base salary in the case of the CEO. Shares and RS Units held by an executive officer will be valued based on the greater of (1) their original cost or grant date value and (2) December 31 of the most recently completed financial year (or, if such date is not a trading date, on the last trading date of such year).
Initially, executive officers had until January 1, 2018, or if appointed after 2013, five years from the date of their appointment to meet the minimum equity holding requirements. In connection with changes to the long-term incentive components of executive compensation in February 2019, the Chief Executive Officer, Executive Vice-President and Senior Vice-Presidents have five years from the later of the date of adoption of the new Equity Holding Requirements Policy in February 2019 and the date of such officer’s appointment to meet the minimum equity holding requirements, provided that officers who did not meet the requirements on such date must acquire not less than a pro-rata amount of equity each year to achieve full compliance by the end of such five year period. In connection with amendments to the Company’s Equity Holding Requirements Policy in September 2022, Vice-Presidents that are not Executive Vice-Presidents or Senior Vice-Presidents, were permitted to have eight years from the later of the date of adoption of the new Equity Holding Requirements Policy in February 2019 and the date of such officer’s appointment to meet the minimum equity holding requirements, provided that Vice-Presidents who did not meet the requirements on such date must acquire not less than a pro-rata amount of equity each year to achieve full compliance by the end of such eight year period.
67
For the purposes of the following disclosure, the following officers are each a “Named Executive Officer” of the Company for the year ended December 31, 2023:
|
|
Ray Ferris, President and CEO*, |
|
| Chris Virostek, Senior Vice-President, Finance and CFO, |
||
| Sean McLaren, Chief Operating Officer,* |
||
| Kevin Burke, Senior Vice-President, Wood Products*, and |
||
| Robin Lampard, Senior Vice-President, Finance |
* On December 31, 2023, Ray Ferris retired as President and CEO and effective January 1, 2024, Sean McLaren was appointed as President and CEO and Kevin Burke was appointed as Executive Vice-President, North American Operations.
The following table shows the total holdings of Shares and RS Units held by each Named Executive Officer as at December 31, 2023, valued based on the TSX closing price on December 29, 2023 of $113.36:
Named Executive Officer Share and Unit Holdings
(December 31, 2023)
| Named Executive Officer | Shareholdings |
Value of total holdings1 ($) |
Total as multiple of 2023 base salary |
|||
| Ray Ferris2
|
39,452
|
4,472,279
|
3.82
|
|||
| Chris
Virostek2
|
7,013
|
794,994
|
1.38
|
|||
| Sean
McLaren2
|
10,431
|
1,182,458
|
1.84
|
|||
| Kevin Burke2
|
12,476
|
1,414,279
|
2.43
|
|||
| Robin Lampard2
|
9,727
|
1,102,653
|
2.19
|
|||
Notes:
| 1. | Based on the TSX closing price on December 29, 2023 of $113.36. Equity holdings and compliance under the Equity Holding Requirements Policy are valued and assessed annually. |
| 2. | Named Executive Officers also hold PS Units (exclusive of dividend entitlements) as follows: Mr. Ferris – 41,574; Mr. Virostek – 10,229; Mr. McLaren – 8,586; Mr. Burke – 10,645 (includes 4,307 Norbord DSUs under the management Norbord DSU Plan ); Ms. Lampard – 7,856 as of December 31, 2023. |
Independent Consultant
Compensation Advice
Towers Watson has provided consulting services to us for several years with respect to executive and non-executive compensation. In 2012, the HR&C Committee adopted a protocol under which all consulting services provided by Towers Watson related to executive compensation must be retained and authorized by the HR&C Committee.
68
Towers Watson reports to the HR&C Committee as its outside compensation consultant to advise on compensation policies, including providing information on comparative levels of compensation for our senior executives and Directors. In 2021, Towers Watson conducted a survey and review of our executive compensation program relative to those of different peer groups and to assess market competitiveness of our executive compensation programs and provided advice on executive compensation.
Compensation Risk Assessment Advice
Compensation risk assessments are conducted annually by the HR&C Committee. In 2022, the Company engaged Towers Watson to provide advice and to update its compensation risk assessment report to the HR&C Committee. The compensation risk assessment report concluded that there did not appear to be significant risks arising from the Company’s compensation policies and practices that were likely to have a material adverse effect on the Company. In its updated assessment and reports, Towers Watson also took into account and considered the limited compensation related risks within the Company, the involvement and authority of the Board in both compensation and risk management oversight, the presence of effective risk mitigating practices in the design of compensation programs and the changes to the long-term executive incentive compensation mix that place a greater emphasis on performance-conditioned long-term incentive grants. In 2023, the HR&C Committee conducted a compensation risk assessment and did not make changes to compensation methodology following the assessment.
Fees
The following table shows the fees paid to Towers Watson for services provided in the last two fiscal years:
|
Type of Work
|
2023
|
2022
|
||
|
Executive Compensation-Related Fees
|
$2,935
|
$13,279
|
||
|
All Other Fees1
|
$20,804
|
$102,974
|
||
Notes:
| 1. | All Other fees relate to fees paid for general industry compensation related services and surveys. |
|
|
Submitted by the HR&C Committee: |
|
| Brian G. Kenning (Chair) |
||
| Eric L. Butler |
||
| John N. Floren |
||
| Marian Lawson |
||
| Janice G. Rennie |
69
Performance Graph
The following graph and table compare the total cumulative return to a Shareholder who invested $100 in our Common shares on December 31, 2018 with the cumulative total return of the S&P/TSX Composite Index and the S&P/TSX Paper & Forest Products Index for the same period.
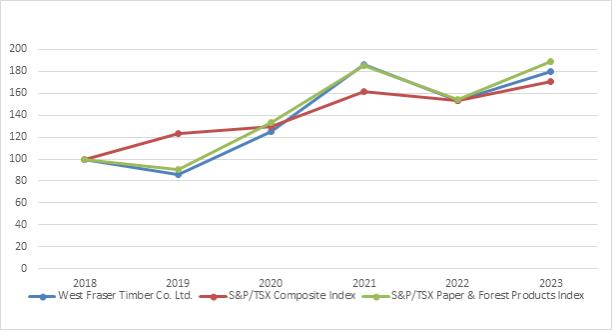
| 2018 | 2019 | 2020 | 2021 | 2022 | 2023 | |||||||
|
West Fraser Timber Co. Ltd.1, 2 |
100 | 86 | 125 | 186 | 153 | 180 | ||||||
|
S&P/TSX Composite Index1, 2 |
100 | 123 | 130 | 162 | 153 | 171 | ||||||
|
S&P/TSX Paper & Forest Products Index1, 2 |
100 | 90 | 133 | 185 | 154 | 189 | ||||||
Notes:
| 1. | All returns are expressed on a total return basis (all cash and stock dividends reinvested in the index or security). |
| 2. | All information per Bloomberg. |
We consider the S&P/TSX Paper & Forest Products Index to be an appropriate comparative measure. This is a capitalization weighted index of leading forest products companies and includes Canfor Corporation, Interfor Corporation, Norbord (prior to the Norbord Acquisition), Stella-Jones Inc., Western Forest Products Inc., and West Fraser.
The following graph and table illustrates the relationship between the indexed TSR of our Common shares on the TSX from December 31, 2018 to the period ending December 31, 2023 considering a $100 investment versus total indexed direct compensation for the Company’s Named Executive Officers (2018 equals $100).
70
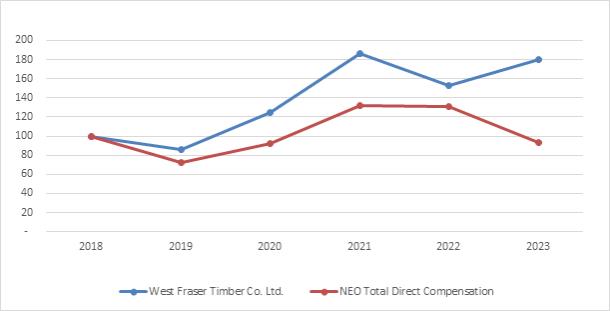
| 2018 | 2019 | 2020 | 2021 | 2022 | 2023 | |||||||
|
West Fraser Timber Co. Ltd.1 |
100 | 86 | 125 | 186 | 153 | 180 | ||||||
|
NEO total direct compensation2 |
100 | 72 | 92 | 132 | 131 | 93 | ||||||
Notes:
| 1. | All returns are expressed on a total return basis (all cash and stock dividends reinvested in the index or security). |
| 2. | Named Executive Officer direct compensation includes base salary, annual incentive (bonus) plan payments, share-based and Option based awards measured using the Binomial valuation method. |
Executive Compensation
Total compensation for Named Executive Officers, as described in the Summary Compensation Table set out below, reflects a gradual recovery from the significant downturn in the forest products industry that began in 2006. Annual incentive bonuses for Named Executive Officers will be earned in those years where the Company achieves a ROSE in excess of the minimum threshold, with payment occurring in the following year. The minimum ROSE threshold was not met in 2015 and no annual incentive bonuses were earned by the senior executives, including the Named Executive Officers. In 2016, 2017 and 2018 the minimum ROSE threshold was exceeded and annual incentive bonuses were earned, with payment occurring in each of the following years. The minimum ROSE threshold was not met in 2019 and no annual incentive bonuses were earned by the senior executives, including the Named Executive Officers. In 2020, 2021 and 2022 the annual minimum ROSE threshold was exceeded and the maximum annual incentive bonuses were earned by the senior executives, including the Named Executive Officers, which were paid out in 2021, 2022 and 2023 respectively. See also “Annual Incentive Bonus Plan”.
The compensation of each of our Named Executive Officers for our three most recently completed financial years is set out below:
71
Summary Compensation Table
| Name and principal position |
Year | Salary ($) | Share- based awards1 ($) |
Option- based awards2 ($) |
Non-equity incentive plan compensation ($) |
Pension value4 ($) |
All other compensation5 ($) |
Total compensation ($) |
||||||||||
| Annual incentive plans3 |
Long- term incentive plans |
|||||||||||||||||
|
Ray Ferris and CEO |
2023
2022
2021 |
1,169,438
1,113,750
984,375 |
1,386,017
1,319,985
1,151,505 |
1,385,957
1,320,009
1,152,452 |
Nil
1,732,500
1,650,000 |
Nil
Nil
Nil |
1,428,100
1,338,200
2,702,300 |
Nil
Nil
Nil |
5,369,512
6,824,444
7,640,632
|
|||||||||
|
Chris Virostek Senior Vice- President, Finance and CFO |
2023
2022
2021
|
576,250
540,000
491,460
|
341,964
317,902
287,677
|
342,003
318,098
288,280
|
Nil
570,000
530,000
|
Nil
Nil
Nil
|
156,700
258,800
428,000
|
Nil
Nil
Nil
|
1,416,917
2,004,800
2,025,417
|
|||||||||
|
Sean McLaren6 Operating Officer |
2023
2022
2021
|
641,107
592,093
508,713
|
281,927
270,057
243,388
|
282,041
269,884
242,516
|
Nil
611,611
563,400
|
Nil
Nil
Nil
|
256,200
402,500
1,340,700
|
Nil
Nil
Nil
|
1,461,275
2,146,145
2,898,717
|
|||||||||
|
Kevin Burke7 Vice- President, Wood Products |
2023
2022
2021
|
583,070
528,979
408,204
|
212,951
200,417
174,761
|
213,019
199,440
175,206
|
Nil
554,354
500,800
|
Nil
Nil
Nil
|
92,643
83,960
66,272
|
Nil
Nil
Nil
|
1,101,683
1,567,150
1,325,244
|
|||||||||
|
Robin Lampard7 Senior Vice- President, Finance |
2023
2022
2021
|
503,000
486,250
433,835
|
249,462
240,819
234,610
|
249,521
241,158
235,335
|
Nil
499,000
482,000
|
Nil
Nil
Nil
|
82,031
80,410
26,360
|
Nil
Nil
Nil
|
1,084,014
1,547,637
1,412,140
|
|||||||||
Notes:
| 1. | For a description of the units see “Phantom Share Unit Plan”. Units are valued at the date of grant using the Towers Watson Binomial method, which was the method used by the HR&C Committee when granting the units. This method was applied consistently in its competitive market analysis. |
| 2. | Options have a term of ten years and vest as to 20% on each of the first through fifth anniversary dates of the grant date. Each Option was valued using the Towers Watson Binomial method for the same reason as described in footnote 1. Whether the executive will receive value under these Options will depend on the future market price of Common shares. A description of the current value of all Options held by each Named Executive Officer is set out in the charts under “Summary of Outstanding Options”. |
| 3. | Annual incentive (bonus) plan payments are included in the year earned and are paid in the following year. |
| 4. | Pension values for Messrs. Ferris, Virostek, and McLaren represent the change in the defined benefit pension liability related to the annual service cost, actual and assumed future compensation changes, including the impact of plan changes, if any. The defined benefit pension value is calculated based on the Company’s best estimate of future events that affect pension liabilities, including assumptions about future salary adjustments and bonuses, and is reflected in the pension value for the Named Executive Officers. Defined benefit pension values will increase in those years where there has been a significant salary increase. Defined benefit pension values will also be affected by changes in future compensation assumptions and in particular in those years where such assumptions have been updated following periodic reviews of |
72
| the underlying pension plans and their associated liabilities. Pension value for Ms. Lampard and Mr. Burke represents the Company’s basic and matching contributions under the defined contribution pension plan. Mr. Burke’s value has been converted into Canadian dollars using the Bank of Canada’s average US/CAD exchange rate for the fiscal year (2023 = 1.3497; 2022 = 1.3013; 2021 = 1.2520). |
| 5. | Perquisites and other personal benefits that exceed the lesser of $50,000 and 10% of total compensation for any of our Named Executive Officers. |
| 6. | Mr. McLaren was appointed as the Chief Operating Officer on December 7, 2021 and previously served as President, Solid Wood. During the three-year period reported in the table above, Mr. McLaren’s salary and annual incentive compensation was awarded in U.S. dollars. The exchange rate used to convert this U.S. dollar compensation was the Bank of Canada’s average US/CAD exchange rate for the fiscal year (2023 = 1.3497; 2022 = 1.3013; 2021 = 1.2520). |
| 7. | Ms. Lampard and Mr. Burke joined West Fraser on February 1, 2021 and were previously Senior Vice-President and CFO and Senior Vice-President, North American Operations respectively, of Norbord until February 1, 2021. Ms. Lampard’s and Mr. Burke’s January 2021 compensation was earned at Norbord and not presented in the table. Mr. Burke is paid in U.S. dollars. The exchange rate used to convert this U.S. dollar compensation was the Bank of Canada’s average US/CAD exchange rate for the fiscal year (2023 = 1.3497; 2022 = 1.3013; 2021 = 1.2520). |
Option Grants
Description of West Fraser Stock Option Plan
Under the Stock Option Plan, the exercise price of an Option per Common share will not be less than the closing price on the last trading day before the Option is granted. The length of the term of Options will be fixed by the Board or the HR&C Committee at not more than ten years and, unless otherwise determined by the Board or the HR&C Committee, Options vest at the rate of 20% per year over the first five years of the term.
Under the Stock Option Plan, Options may not be exercised after a holder ceases to be an eligible participant, except that (a) an Option held on the death of an Option holder may be exercised by the personal representative of the holder during the period ending on the earlier of its expiry date and two years after the date of death, (b) an Option held on the retirement or total disability of an Option holder may be exercised during the period ending on the earlier of its expiry date and five years after the date of retirement or disability, and (c) a vested Option held in any other case may be exercised no later than the earlier of its expiry date and 30 days after the date the holder ceases to be an eligible participant. Options are not assignable, other than those that may be exercised by the personal representative of a deceased holder. We do not provide any financial assistance to holders of Options in connection with the exercise of Options.
The number of Common shares subject to an Option, the exercise price per Common share and the total number of Common shares that may be made subject to Options under the Stock Option Plan will be adjusted proportionately in the event of any subdivision or consolidation of Common shares or any dividend payable in Common shares and will be adjusted as determined by the Board in the event of certain other reorganizations or other events affecting the Common shares. Under the Stock Option Plan, Options granted that have not vested do not automatically vest on a change of control.
The Stock Option Plan permits outstanding vested Options to be surrendered by the holder to the Company in return for a cash payment under the Cash Value Alternative. The cash payment for a surrendered Option is equal to the amount by which the weighted average price per share at which the Common shares were traded on the TSX on the last trading day exceeds the exercise price per Common share applicable to the Option multiplied by the number of Common shares underlying the Option and the amount determined by the HR&C Committee as representative of the estimated costs avoided by the Option holder (such as trading commissions) by virtue of electing the Cash Value Alternative. In 2023, we issued 383 Common shares on the exercise of outstanding Options under the Stock Option Plan and Replacement Options under the Replacement Option Plans. Our management believes that the Stock Option Plan, with the Cash Value Alternative, operates in a manner similar to the types of long-term incentive plans currently recommended by major institutional shareholder groups for public companies in North America.
73
The Stock Option Plan restricts the Option holdings of insiders. It provides that: (a) annual grants of Options to insiders may not be for a number of Common shares that exceeds 1% of the total number of our outstanding voting securities (the “Issued Shares”); (b) no single insider may hold, at any time, Options to acquire a number of Common shares that, together with all other Common shares issuable to the insider under any other equity compensation arrangements then in place (“Other Arrangements”), would exceed 5% of the Issued Shares; (c) the total number of Options held, at any time, by insiders cannot allow them to acquire a number of Common shares that, together with all other Common shares issuable to insiders under any Other Arrangements, would exceed 10% of the Issued Shares; and (d) the number of Common shares that may be acquired by all insiders during any 12-month period by exercising Options, together with all other Common shares issuable to insiders under any Other Arrangements, may not exceed 10% of the Issued Shares.
The Board has the power, without Shareholder approval, to amend, suspend, terminate or discontinue the Stock Option Plan, provided that doing so will not adversely alter or impair any Option without the written consent of the holder. This power includes the right to make appropriate adjustments to outstanding Options in the event of certain corporate transactions, to add provisions requiring forfeiture of Options in certain circumstances, to specify practices with respect to applicable tax withholdings, and to enhance clarity or correct ambiguous provisions in the Stock Option Plan. Notwithstanding this power, the Stock Option Plan provides that the Board may not, without Shareholder approval, amend the Stock Option Plan or an Option to: (i) increase the number of Common shares that may be issued; (ii) reduce the subscription price of an outstanding Option; (iii) extend the term of any Option beyond its expiry date or allow for an expiry date to be greater than ten years; (iv) allow non-permitted assignments or exercises of Options; (v) expand the persons entitled to participate in the Stock Option Plan; or (vi) provide for other types of equity-based compensation.
In 2007, we obtained the approval of our Shareholders to make certain amendments to the Stock Option Plan which included, amending the amendment provision to specify the circumstances in which Shareholder approval is or is not required for an amendment to the Stock Option Plan. In 2008 and 2010, our Board made housekeeping amendments to the Stock Option Plan to (i) clarify provisions related to retirement, disability or death, and (ii) clarify provisions related to withholding taxes, respectively.
In 2016, we obtained approval of our Shareholders to amend the Stock Option Plan to increase by 750,000 the number of Common shares that may be issued under Options and to restrict other forms of amendment without Shareholder approval. At the special meeting of Shareholders held on January 19, 2021 to approve the Norbord Acquisition, the Shareholders approved a further increase of 1,000,000 Common shares to the maximum number of Common shares that may be issued on the exercise of Options under the Stock Option Plan.
On February 15, 2022, the Board amended the Stock Option Plan to provide that (a) cash value would be determined using the VWAP as at the trading day prior to the date of exercise; and (b) for Options granted to U.S. residents, Shares will be issued and cash settled in U.S. dollars with the fair market value on settlement referencing the VWAP on the NYSE.
A total of 137,115 Options were granted pursuant to the Stock Option Plan during the financial year ended December 31, 2023 and an additional 170,144 Options were granted pursuant to the Stock Option Plan in February of 2024.
In the financial year ended December 31, 2023, 46,575 outstanding Options and Replacement Options were surrendered for cash and no outstanding Options and Replacement Options were surrendered for Common shares, respectively, by the Named Executive Officers.
74
Description of Replacement Option Plans
In addition, the Company has adopted replacement option plans (the “Replacement Option Plans”) in connection with the Norbord Acquisition. These Replacement Option Plans exist solely to administer the Replacement Options, and no new Options may be granted thereunder following the completion of the Norbord Acquisition. The adoption of these plans did not require Shareholder approval under the policies of the TSX, as the aggregate number of Common shares issuable under them is less than 2% of the number of Common shares issued and outstanding prior to the Norbord Acquisition. Upon the exercise or expiry of all Replacement Options, the Replacement Option Plans will be terminated. As at December 31, 2023, 50,824 Common shares were issuable on the exercise of Replacement Options, the principal terms of which are set out below.
The exercise price of the Replacement Options was determined by multiplying the exercise price of the Norbord Options by the Exchange Ratio. The Replacement Options generally have a 10-year term and continue to vest under their original terms, being at an annual rate of 20% per year beginning on the first anniversary of the date of grant.
Unless otherwise determined by the Board, an option will expire immediately in the event of resignation or termination of employment with cause, within 90 days of termination of employment without cause, within six months of the death of an option holder, and in accordance with its terms on retirement. Notwithstanding the foregoing, the outstanding Norbord Options held by certain option holders will immediately vest in the event such option holders are terminated without cause or constructively dismissed within 24 months of the completion of the Norbord Acquisition.
Shareholder approval is required in respect of any amendment to the Replacement Option Plans that would: (a) increase the maximum number of Common shares issuable under such plans (other than on a corporate reorganization); (b) reduce the exercise price of Replacement Options to less than the market price of the Common shares on the date of the option grant; (c) reduce the exercise price of Replacement Options; (d) extend the expiry date for the benefit of an insider; (e) increase the maximum number of Common shares issuable to insiders under the Replacement Option Plans; or (f) amend any of the foregoing limitations.
Summary of Outstanding Options
The Options granted to each of the Named Executive Officers during the financial year ended December 31, 2023 pursuant to the Stock Option Plan were as follows:
75
Option Grants During 2023
| Name |
Securities Options Granted |
% of Total Options Granted to Employees in Financial Year |
Exercise or Base Price ($/Security)1 |
Market Value of Securities Underlying Options on the Date of
Grant |
Expiration Date |
|||||
|
Ray Ferris President and CEO |
31,666 | 23 | $109.42 | 3,464,894 | February 17, 2033 | |||||
|
Chris Virostek Senior Vice-President, Finance and CFO |
7,814 | 6 | $109.42 | 855,008 | February 17, 2033 | |||||
|
Sean McLaren Chief Operating Officer |
6,444 | 5 | US$81.42 | 707,623 | February 17, 2033 | |||||
|
Kevin Burke Senior Vice-President, Wood Products |
4,867 | 4 | US$81.42 | 534,451 | February 17, 2033 | |||||
|
Robin Lampard Senior Vice-President, Finance |
5,701 | 4 | $109.42 | 623,803 | February 17, 2033 |
Notes:
| 1. | The Exercise Price for Messrs. Ferris, Virostek and Ms. Lampard is based on the TSX closing price and for Messrs. McLaren and Burke is based on the NYSE closing price on February 16, 2023, being the FMV on the day prior to the grant date. |
| 2. | The February 17, 2023 Bank of Canada exchange rate used to convert the market value of securities to CAD dollars for Messrs. McLaren and Burke is US $1 = CAD $1.3487. |
The outstanding Options held by each Named Executive Officer that vested during the financial year ended December 31, 2023 were as follows:
Options and Replacement Options Vested During 2023
| Name | Number of Options | Value ($)1 | ||
|
Ray Ferris President and CEO |
126,5322 | 2,453,187 | ||
|
Chris Virostek Senior Vice-President, Finance and CFO |
9,362 | 259,461 | ||
|
Sean McLaren Chief Operating Officer |
7,055 | 184,660 | ||
|
Kevin Burke Senior Vice-President, Wood Products |
12,721 | 508,666 | ||
|
Robin Lampard Senior Vice-President, Finance |
18,664 | 762,228 |
Notes:
| 1. | Based on the closing price as at the date of vesting. No value is attributed to Options that have an exercise price greater than the closing price at date of vesting. |
| 2. | All unexercisable options vested December 31, 2023 upon Mr. Ferris’ retirement. |
The following tables provide particulars of Options and Replacement Options held by each of the Named Executive Officers as of the Record Date with current value based on the Closing Price on the Record Date on the TSX of $109.22 or in the case of Options with a U.S. dollar exercise price, the Closing Price on the Record Date of the NYSE of US$80.50:
76
Ray Ferris
|
Option Grant Date |
Exercisable1 | Non- Exercisable |
Exercise Price ($) |
Current Value of Exercisable Options ($) |
Current Value of Non- Exercisable Options ($) |
Expiry Date |
||||||
|
February 15, 2016 |
11,215 |
Nil |
40.97 |
765,424 |
Nil |
February 15, 2026 |
||||||
|
February 20, 2017 |
17,225 |
Nil |
52.95 |
969,251 |
Nil |
February 20, 2027 |
||||||
|
February 16, 2018 |
10,340 |
Nil |
85.40 |
246,299 |
Nil |
February 16, 2028 |
||||||
|
February 15, 2019 |
23,900 |
Nil |
72.11 |
886,929 |
Nil |
December 31, 2028 |
||||||
|
February 14, 2020 |
44,635 |
Nil |
64.50 |
1,996,077 |
Nil |
December 31, 2028 |
||||||
|
February 17, 2021 |
34,500 |
Nil |
92.79 |
566,835 |
Nil |
December 31, 2028 |
||||||
|
February 18, 2022 |
28,857 |
Nil |
123.63 |
Nil |
Nil |
December 31, 2028 |
||||||
|
February 17, 2023 |
31,666 |
Nil |
109.42 |
Nil |
Nil |
December 31, 2028 |
||||||
|
Totals |
202,338 |
Nil |
5,430,815 |
Nil |
Note:
| 1. | Ray Ferris retired as President and CEO effective December 31, 2023. All unexercisable options vested December 31, 2023 upon Mr. Ferris’ retirement. |
Chris Virostek
| Option Grant Date |
Exercisable | Non- Exercisable |
Exercise Price ($) |
Current Value of Exercisable Options ($) |
Current Value of Non- Exercisable Options ($) |
Expiry Date | ||||||
| February 16, 2018 |
7,565 |
Nil |
85.40 |
180,198 |
Nil |
February 16, 2028 |
||||||
| February 15, 2019 |
9,705 |
Nil |
72.11 |
360,153 |
Nil |
February 15, 2029 |
||||||
|
February 14, 2020 |
11,160 |
2,790 |
64.50 |
499,075 |
124,769 |
February 14, 2030 |
||||||
| February 17, 2021 |
5,178 |
3,452 |
92.79 |
85,075 |
56,716 |
February 17, 2031 |
||||||
| February 18, 2022 |
2,784 |
4,170 |
123.63 |
Nil |
Nil |
February 18, 2032 |
||||||
| February 17, 2023 |
1,564 |
6,250 |
109.42 |
Nil |
Nil |
February 17, 2033 |
||||||
| February 20, 2024 |
Nil |
10,376 |
107.53 |
Nil |
17,535 |
February 20, 2034 |
||||||
| Totals |
37,956 |
27,038 |
1,124,501 |
199,021 |
Sean McLaren
| Option Grant Date |
Exercisable | Non- Exercisable |
Exercise Price ($) |
Current Value of Exercisable Options ($)1 |
Current Value of Non- Exercisable |
Expiry Date | ||||||
| February 23, 2015 |
7,555 |
Nil |
73.99 |
266,163 |
Nil |
February 23, 2025 |
||||||
| February 15, 2016 |
12,240 |
Nil |
40.97 |
835,380 |
Nil |
February 15, 2026 |
||||||
| February 20, 2017 |
9,400 |
Nil |
52.95 |
528,938 |
Nil |
February 20, 2027 |
||||||
| February 16, 2018 |
5,700 |
Nil |
85.40 |
135,774 |
Nil |
February 16, 2028 |
||||||
| February 15, 2019 |
7,145 |
Nil |
72.11 |
265,151 |
Nil |
February 15, 2029 |
||||||
|
February 14, 2020 |
7,416 |
1,854 |
64.50 |
331,644 |
82,911 |
February 14, 2030 |
||||||
| February 17, 2021 |
4,356 |
2,904 |
92.79 |
71,569 |
47,713 |
February 17, 2031 |
||||||
| February 18, 2022 |
2,360 |
3,540 |
US$97.32 |
Nil |
Nil |
February 18, 2032 |
||||||
| February 17, 2023 |
1,289 |
5,155 |
US$81.42 |
Nil |
Nil |
February 17, 2033 |
||||||
| February 20, 2024 |
Nil |
41,847 |
US$79.69 |
Nil |
45,997 |
February 20, 2034 |
||||||
| Totals |
57,461 |
55,300 |
2,434,618 |
176,621 |
Note:
| 1. | The February 29, 2024 Bank of Canada exchange rate used to convert the market value of exercisable and non-exercisable options to CAD dollars for Messrs. McLaren and Burke is US $1 = CAD $1.3570. |
77
Kevin Burke
| Option Grant Date |
Exercisable | Non- Exercisable |
Exercise Price ($) |
Current Value of Exercisable Options ($)2 |
Current Value of Non- Exercisable Options ($)2 |
Expiry Date | ||||||
| November 11, 20191 |
Nil |
4,050 |
56.00 |
Nil |
215,541 |
November 11, 2029 |
||||||
| February 17, 2021 |
1,049 |
2,098 |
92.79 |
17,235 |
34,470 |
February 17, 2031 |
||||||
| February 18, 2022 |
1,744 |
2,616 |
US$97.32 |
Nil |
Nil |
February 18, 2032 |
||||||
| February 17, 2023 |
974 |
3,893 |
US$81.42 |
Nil |
Nil |
February 17, 2033 |
||||||
| February 20, 2024 |
Nil |
8,718 |
US$79.69 |
Nil |
9,583 |
February 20, 2034 |
||||||
| Totals |
3,767 |
21,375 |
17,235 |
259,594 |
Notes:
| 1. | Option Grant Date reflected represents the original grant date of the Norbord Options. The Replacement Options were issued under the Replacement Option Plans, which were adopted by the Company on closing of the Norbord Acquisition. |
| 2. | The February 29, 2024 Bank of Canada exchange rate used to convert the market value of exercisable and non-exercisable options to CAD dollars for Messrs. McLaren and Burke is US $1 = CAD $1.3570. |
Robin Lampard
| Option Grant Date |
Exercisable | Non- Exercisable |
Exercise Price ($) |
Current Value of Exercisable Options ($) |
Current Value of Non- Exercisable Options ($) |
Expiry Date | ||||||
| November 11, 20191 |
Nil |
5,400 |
56.00 |
Nil |
287,388 |
November 11, 2029 |
||||||
| February 17, 2021 |
2,818 |
2,818 |
92.79 |
46,300 |
46,300 |
February 17, 2031 |
||||||
| February 18, 2022 |
2,110 |
3,162 |
123.63 |
Nil |
Nil |
February 18, 2032 |
||||||
| February 17, 2023 |
1,141 |
4,560 |
109.42 |
Nil |
Nil |
February 17, 2033 |
||||||
| February 20, 2024 |
Nil |
7,482 |
107.53 |
Nil |
12,645 |
February 20, 2034 |
||||||
| Totals |
6,069 |
23,422 |
46,300 |
346,332 |
Notes:
| 1. | Option Grant Date reflected represents the original grant date of the Norbord Options. The Replacement Options were issued under the Replacement Option Plans, which were adopted by the Company on closing of the Norbord Acquisition. |
RS Units and PS Units
Beginning in 2010, our Board has approved annual grants of RS Units and/or PS Units (collectively, “Units”) to Named Executive Officers and other employees pursuant to the Phantom Share Unit Plan. The Phantom Share Unit Plan and Units are described in the Report on Executive Compensation under the heading “Phantom Share Unit Plan”.
The Units granted to each of the Named Executive Officers during the financial year ended December 31, 2023 were as follows:
78
Equity-Based Grants During 2023
| Name | Number of Units Granted1 PSUs2 |
% of Total Units Granted to Employees in the Current Year PSUs |
Aggregate Market Value of Units on Date of Grant ($) PSUs3 |
Aggregate Market Value of Units at December 31, 2023 ($) PSUs4 |
||||
| Ray Ferris President and CEO |
14,729 | 29.1 | 1,611,647 | 1,669,679 | ||||
| Chris Virostek Senior Vice-President, Finance and CFO |
3,634 | 7.2 | 397,632 | 411,950 | ||||
| Sean McLaren Chief Operating Officer |
2,996 | 5.9 | 327,822 | 339,627 | ||||
| Kevin Burke Senior Vice-President, Wood Products |
2,263 | 4.5 | 247,617 | 256,534 | ||||
| Robin Lampard Senior Vice-President, Finance |
2,651 | 5.2 | 290,072 | 300,517 | ||||
Notes:
| 1. | No RS Units were issued during 2023. |
| 2. | PS Units. |
| 3. | Based on the closing price of $109.42 on the date prior to February 17, 2023. |
| 4. | Based on the closing price of $113.36 on December 29, 2023. |
The following table provides particulars of Units held by each of the Named Executive Officers as of December 31, 2023:
| Vesting 20241 | Vesting 20251 | Vesting 20261 |
Value as at ($) |
|||||
| Name | PSUs | PSUs | PSUs | PSUs | ||||
| Ray Ferris President and CEO |
14,430 | 12,415 | 14,729 | 4,712,829 | ||||
| Chris Virostek Senior Vice-President, Finance and CFO |
3,605 | 2,990 | 3,634 | 1,159,559 | ||||
| Sean McLaren Chief Operating Officer |
3,050 | 2,540 | 2,996 | 973,309 | ||||
| Kevin Burke Senior Vice-President, Wood Products |
2,190 | 1,885 | 2,263 | 718,476 | ||||
| Robin Lampard Senior Vice-President, Finance |
2,940 | 2,265 | 2,651 | 890,556 |
Notes:
| 1. | Does not include PSUs to be credited under the Phantom Share Unit Plan as a result of dividends on the Common shares. |
| 2. | Based on the closing price of $113.36 on December 29, 2023. No RS Units of the Company were issued for these years. |
79
The Units held by each of the Named Executive Officers that vested during the financial year ended December 31, 2023 were as follows:
Equity-Based Awards Vested During 2023
| Number of units vested |
Value paid ($) |
|||||||
| Name | RSUs | PSUs1 | RSUs2 | PSUs3 | ||||
| Ray Ferris President and CEO |
Nil | 15,055 | Nil | 3,581,399 | ||||
| Chris Virostek Senior Vice-President, Finance and CFO |
Nil | 4,705 | Nil | 1,119,261 | ||||
| Sean McLaren Chief Operating Officer |
Nil | 3,125 | Nil | 743,399 | ||||
| Kevin Burke Senior Vice-President, Wood Products |
Nil | Nil | Nil | Nil | ||||
| Robin Lampard Senior Vice-President, Finance |
6,819 | Nil | 799,337 | Nil | ||||
Notes:
| 1. | PS Units granted during 2020 plus additional Units credited under the Phantom Share Unit Plan as a result of dividends on the Common shares and rounded for presentation to the nearest whole number of PS Units. |
| 2. | Represents Norbord RSUs which vested on February 4, 2023 at a price of $117.2136 per unit. |
| 3. | The value paid in 2023 was based on $114.164 per unit for PS Units and a performance multiplier of 2.00 for PS Units. Numbers may not add up due to rounding. |
Pension Plans
The majority of our fulltime salaried employees are covered by non-contributory defined benefit pension plans.
For those salaried employees whose employment began before 2016, the plans provide a pension equal to 2% of the highest average compensation (which includes base salary and bonuses) of the employee for any consecutive 60-month period in that employee’s final 10 years with us, multiplied by the number of years of credited service with us. Normal retirement is at age 65. In accordance with applicable tax legislation, these plans allow for additional years of credited service until a continuing employee reaches age 71. Each of these pension plans allows for early retirement at age 55 with a minimum service requirement of two years. Benefits provided for early retirement are reduced by 4% per year for retirement between the ages of 55 and 57 and by 3% per year for retirement between the ages of 58 and 59. No reduction is made for retirement between the ages of 60 and 64.
On January 1, 2016, we introduced a new non-contributory defined benefit pension plan for salaried employees whose employment begins on or after that date. Changes from the existing plans include a pension based on the employee’s average annual salary over the final 10 years with us, as well as the elimination of early retirement benefits so that full pension benefits are only achieved on retirement at age 65 or over. In accordance with applicable tax legislation, this new plan also allows for additional years of credited service until a continuing employee reaches age 71.
On January 1, 2022 the Canadian salaried defined benefit pension plans closed to new entrants. New salaried employees are enrolled in a defined contribution pension plan with an 8% employer contribution along with 100% matching contributions for the first 3% of employee contributions. At the same time in the U.S., the 401(k) plan for salaried lumber employees, OSB corporate employees and non-union hourly employees will provide a 3% non-elective retirement contribution, along with 100% matching employer contributions on the first 5% an employee contributes to the plan.
80
Defined Benefit Pension Plans
The estimated annual pension payable upon retirement under the defined benefit pension plans, assuming employment began before 2016, no reduction for early retirement and based on the standard form life annuity for a minimum of 60 months with no joint survivor pension, is as follows:
Estimated Annual Benefits Payable upon Retirement
| Annual Compensation |
Years of Service
|
|||||||
| 15 Years | 20 Years | 25 Years | 30 Years | |||||
|
$400,000 |
$120,000 | $160,000 | $200,000 | $240,000 | ||||
|
$500,000 |
$150,000 | $200,000 | $250,000 | $300,000 | ||||
|
$600,000 |
$180,000 | $240,000 | $300,000 | $360,000 | ||||
|
$700,000 |
$210,000 | $280,000 | $350,000 | $420,000 | ||||
|
$800,000 |
$240,000 | $320,000 | $400,000 | $480,000 | ||||
|
$900,000 |
$270,000 | $360,000 | $450,000 | $540,000 | ||||
|
$1,000,000 |
$300,000 | $400,000 | $500,000 | $600,000 | ||||
|
$1,100,000 |
$330,000 | $440,000 | $550,000 | $660,000 | ||||
|
$1,200,000 |
$360,000 | $480,000 | $600,000 | $720,000 | ||||
|
$1,300,000 |
$390,000 | $520,000 | $650,000 | $780,000 | ||||
|
$1,400,000 |
$420,000 | $560,000 | $700,000 | $840,000 | ||||
|
$1,500,000 |
$450,000 | $600,000 | $750,000 | $900,000 | ||||
Compensation for the purposes of the pension plans, based on employment beginning before 2016, is defined as the average annual compensation, including salary and bonus, of the highest consecutive 60-month period in the last 10 years’ service with the Company.
The benefits listed in the table are not subject to any deduction for Canada Pension Plan or other offset amounts.
81
The table below sets forth the accumulated defined benefit under our pension plans for the Named Executive Officers as at December 31, 2023.
|
Name
|
Number of years credited service (#)
|
Annual benefits payable1 |
Opening
|
Compensatory
|
Non- compensatory
|
Closing
|
||||||||
| At year end
|
At age 65
|
|||||||||||||
|
Ray Ferris President and CEO
|
22.3 | 885,900 | 1,021,900 | 10,411,800 | 1,428,100 | 1,843,900 | 13,683,800 | |||||||
|
Chris Virostek Senior Vice-President, Finance and CFO
|
6.7 | 108,900 | 337,500 | 833,800 | 156,700 | 172,100 | 1,162,600 | |||||||
|
Sean McLaren Chief Operating Officer
|
35.5 | 510,400 | 652,500 | 5,714,300 | 256,200 | 829,500 | 6,800,000 | |||||||
|
Kevin Burke
|
Nil | Nil | Nil | Nil | Nil | Nil | Nil | |||||||
|
Robin Lampard Senior Vice-President, Finance
|
9.75 | 43,709 | 43,729 | 441,860 | Nil | 49,158 | 491,018 | |||||||
Notes:
| 1. | Represents the estimated annual pension, excluding any employee paid ancillary benefits, where applicable, that would be received by the Named Executive Officer upon retirement at age 65 based on actual pensionable earnings at December 31, 2022. The annual pension payable at year end is based on actual credited service at December 31, 2023. The annual pension at age 65 is based on credited service projected to age 65. In accordance with applicable tax legislation, our pension plans allow for additional years of credited service until a continuing employee reaches age 71. |
| 2. | The present value is the estimated value of the pension obligation to the date indicated using the actuarial assumptions and methods that are consistent with those used in determining pension liabilities as disclosed in the consolidated financial statements. |
| 3. | Compensatory change represents the change in the pension liability related to the annual service cost, actual and assumed future compensation changes and the impact of plan changes, if any. The pension value is calculated based on the Company’s best estimate of future events that affect pension liabilities, including assumptions about future salary adjustments and bonuses, and is reflected in the pension value for the Named Executive Officers. Pension values will increase in those years where there has been a significant salary increase. Pension values will also be affected by changes in future compensation assumptions and in particular in those years where such assumptions have been updated following periodic reviews of the underlying pension plans and their associated liabilities. |
| 4. | Non-compensatory change includes items such as interest on the obligation and the impact of changes in the discount rate assumption. |
The estimated years of credited service under the defined benefit pension plans at the normal retirement age of 65 for each Named Executive Officer is set out below. We have not granted on a discretionary basis any additional years of credited service to our Named Executive Officers in excess of their actual years of service.
82
|
Name |
Estimated Years of Credited Service |
|
|
Ray Ferris President and CEO
|
27 | |
|
Chris Virostek Senior Vice-President, Finance and CFO
|
22 | |
|
Sean McLaren Chief Operating Officer
|
46 | |
|
Kevin Burke Senior Vice-President, Wood Products
|
Not applicable1 | |
|
Robin Lampard Senior Vice-President, Finance
|
102 |
Note:
| 1. | Mr. Burke is not a member of a defined benefit pension plan. |
| 2. | The years of credited service for Ms. Lampard reflect her accrued services in the defined benefit pension plan for Norbord. Ms. Lampard ceased participating in the Norbord defined benefit pension plan effective January 1, 2006 and her service in that plan is frozen at 10 years. |
Defined Contribution Pension Plans
The following table shows the value of investments held by the NEOs participating in the Company’s defined contribution pension plans:
| Name | Accumulated Value at December 31, 2022 ($) |
Total Compensatory Change ($)1 |
Accumulated Value at December. 31, 2023 ($) |
|||
|
Robin Lampard2 Senior Vice-President, Finance
|
1,231,471 | 82,031 | 1,528,307 | |||
|
Kevin Burke3 Products
|
1,607,341 | 92,643 | 2,152,198 |
Notes:
| 1. | These amounts represent employer contributions to the Company’s defined contribution pension plans. |
| 2. | Ms. Lampard, as a member accruing benefits under the defined contribution pension plan, is no longer eligible to contribute to the flex component of the defined benefit pension plan but has outstanding balances from her participation prior to 2006 that are included in the table. |
| 3. | Mr. Burke’s accumulated values and compensatory change have been converted to Canadian dollars. The exchange rate used to convert this U.S. dollar compensation was the Bank of Canada’s average US/CAD exchange rate for the fiscal year (2023 = 1.3497). The accumulated values shown include Mr. Burke’s personal salary and bonus allocation equivalent to CAD$1.3497 into a deferred compensation plan. |
Severance and Change of Control Agreements
On November 9, 2020, Norbord entered into a letter agreement with Ms. Lampard, providing for severance entitlements in the event that (i) Norbord (or its successor) or any of its affiliates terminated their employment on a without cause basis or such individual resigns in circumstances constituting constructive dismissal within 24 months following the Norbord Acquisition or other change of control transaction, or (ii) in connection with the consummation of the Norbord Acquisition or other change of control transaction, Norbord (or its successor) or any of its affiliates does not offer such individual a comparable position. Upon such event, the individual is entitled to receive an amount equal to the product of (a) one month per full year of employment with Norbord, and (b) the sum of (i) 1/12th of the individual’s base salary at the rate in effect on the termination date, and (ii) 1/12th of the average of the individual’s annual bonus earned in respect of the three most recently completed years prior to the termination date, less all applicable taxes, deductions and withholdings; provided that (a) is no less than 12 months or greater than 24 months. In addition, on November 9, 2020, Norbord entered into a letter agreement with Ms. Lampard, providing that in the event that Norbord (or its successor) or any of its affiliates terminated their employment on a without cause basis or such individual resigns in circumstances constituting constructive dismissal within 24 months following the Norbord Acquisition or other change of control transaction, all the Replacement Options held by them would immediately vest and would be exercisable for 12 months after the termination date and all the Norbord RSUs held by them would also immediately vest and be settled within 30 days following the termination date. The Norbord Acquisition constituted a change of control of Norbord for the purposes of these agreements. On January 18, 2023, the Company and Ms. Lampard agreed to a one-year extension of the foregoing agreements. In December 2023, West Fraser extended this arrangement for one additional year.
83
In connection with the retirement of Ray Ferris, the Board determined that it would be appropriate that, following his retirement on December 31, 2023, Mr. Ferris would be entitled to retain all his granted and unvested PS Units without any pro-rata reduction on account of his retirement.
Other than as described above and pension and retirement benefits described elsewhere in this Circular, the Company does not have any agreements with its Named Executive Officers that provide for payments following or in connection with any termination (whether voluntary, involuntary or constructive) or a change in control of the Company.
Directors’ Compensation and Holdings
For a description of retainers and fees payable to Directors, actual compensation paid during 2023 and securities held by Directors, see “Information regarding Nominees for Election as Directors - Director Compensation”.
Interest of Informed Persons in Material Transactions
No informed person of the Company (which includes our Directors and officers and persons who own or control securities carrying 10% or more of the voting rights attached to all of our voting securities) or any associate or affiliate of any informed person has had a material interest in any transaction since the commencement of the Company’s most recently completed financial year or has a material interest in any proposed transaction which has materially affected or would affect the Company or any of its subsidiaries.
Indebtedness of Directors, Officers and Employees
The following table sets out the aggregate indebtedness outstanding to us from our employees and former employees as at the Record Date. We do not make loans to our Directors or officers. During 2023, no loans were outstanding to persons who were Directors or officers during 2023 or to any of our former Directors or officers, or their associates.
| AGGREGATE INDEBTEDNESS | ||||
| Purpose | To the Company or its Subsidiaries |
To Another Entity | ||
|
Share purchases
|
Nil | Nil | ||
|
Employee loans
|
US$293,158 | Nil | ||
84
Securities Authorized for Issuance under Equity Compensation Plans
The following table provides information with respect to securities authorized for issuance under equity compensation plans that permit issuance from treasury as at December 31, 2023.
| Number of securities to be issued upon exercise of outstanding Options, warrants and rights |
Weighted average exercise price of outstanding Options, warrants and rights |
Number of securities equity compensation plans (excluding securities reflected in |
||||
|
Plan Category
|
(a) | (b) | (c) | |||
|
Equity compensation plans approved by Shareholders
|
798,846
|
84.63
|
777,255
|
|||
|
Equity compensation plans not approved by Shareholders1
|
50,824
|
55.96
|
Nil
|
|||
|
Total
|
849,670
|
83.59
|
777,255
|
|||
Notes:
| 1. | In connection with the Norbord Acquisition, the Company adopted the Replacement Option Plans, pursuant to which the Company has issued Replacement Options. Upon the exercise or expiry of all such Replacement Options, the Replacement Option Plans will be terminated. |
ADDITIONAL INFORMATION
Additional information (including financial information) relating to us can be found in our Annual Report, which includes our audited financial statements for the years ended December 31, 2023 and 2022 and the accompanying audit report and management’s discussion and analysis and in our Annual Information Form. The Annual Report and Annual Information Form are on our website at www.westfraser.com and can also be found under our profiles on SEDAR+ at www.sedarplus.ca and EDGAR at www.sec.gov/edgar. Copies of the Annual Report and the relevant portion of any documents incorporated by reference in the Annual Report, the Annual Information Form, as well as additional copies of this Circular, may be obtained upon request to Robert B. Winslow, CFA, Director, Investor Relations & Corporate Development, 885 West Georgia Street, Suite 1500, Vancouver, B.C., V6C 3E8 or by emailing to shareholder@westfraser.com.
DATED at Vancouver, B.C., March 6, 2024.
| BY ORDER OF THE BOARD | ||

|
|
|
| Sean McLaren | ||
| President and Chief Executive Officer | ||
Exhibit 99.3

|
8th Floor, 100 University Avenue |
|||||
| Toronto, Ontario M5J 2Y1 www.computershare.com |
| Security Class
Holder Account Number |
|
Fold |
|
Form of Proxy - Annual General Meeting to be held on April 24, 2024 |
| This Form of Proxy is solicited by and on behalf of Management.
Notes to proxy
1. Every holder has the right to appoint some other person or company of their choice, who need not be a holder, to attend and act on their behalf at the meeting or any adjournment or postponement thereof. If you wish to appoint a person or company other than the Management Nominees whose names are printed herein, please insert the name of your chosen proxyholder in the space provided (see reverse).
2. If the securities are registered in the name of more than one owner (for example, joint ownership, trustees, executors, etc.), then all those registered should sign this proxy. If you are voting on behalf of a corporation or another individual you may be required to provide documentation evidencing your power to sign this proxy with signing capacity stated.
3. This proxy should be signed in the exact manner as the name(s) appear(s) on the proxy.
4. If a date is not inserted in the space provided on the reverse of this proxy, it will be deemed to bear the date on which it was mailed to the holder by Management.
5. The securities represented by this proxy will be voted as directed by the holder, however, if such a direction is not made in respect of any matter, and the proxy appoints the Management Nominees listed on the reverse, this proxy will be voted as recommended by Management.
6. The securities represented by this proxy will be voted in favour, or withheld from voting, or voted against each of the matters described herein, as applicable, in accordance with the instructions of the holder, on any ballot that may be called for. If you have specified a choice with respect to any matter to be acted on, the securities will be voted accordingly.
7. This proxy confers discretionary authority in respect of amendments or variations to matters identified in the Notice of Meeting and Management Information Circular or other matters that may properly come before the meeting or any adjournment or postponement thereof, unless prohibited by law.
|
||||
| 8. This proxy should be read in conjunction with the accompanying documentation provided by Management. |
Fold
|
|||
|
Proxies submitted must be received by 11:00 am, Vancouver Time, on April 22, 2024.
VOTE USING THE TELEPHONE OR INTERNET 24 HOURS A DAY 7 DAYS A WEEK! |
||||
|
|

|

|
||||
| • Call the number listed BELOW from a touch tone telephone.
1-866-732-VOTE (8683) Toll Free |
• Go to the following web site: www.investorvote.com • Smartphone? Scan the QR code to vote now. |

|
• You can enroll to receive future securityholder communications electronically by visiting www.investorcentre.com. |
|||
|
If you vote by telephone or the Internet, DO NOT mail back this proxy.
Voting by mail may be the only method for securities held in the name of a corporation or securities being voted on behalf of another individual. Voting by mail or by Internet are the only methods by which a holder may appoint a person as proxyholder other than the Management Nominees named on the reverse of this proxy. Instead of mailing this proxy, you may choose one of the two voting methods outlined above to vote this proxy.
To vote by telephone or the Internet, you will need to provide your CONTROL NUMBER listed below.
CONTROL NUMBER
|
||||||

|
|
| Appointment of Proxyholder | ||||||||
| I/We being holder(s) of securities of West Fraser Timber Co. Ltd. (the “Company”) hereby appoint: Hank Ketcham, Chair of the Board, or failing this person, Sean McLaren, President and Chief Executive Officer of the Company (the “Management Nominees”) |
OR
|
Print the name of the person you are appointing if this person is someone other than the Management Nominees listed herein. |
|
|||||
as my/our proxyholder with full power of substitution and to attend, act and to vote for and on behalf of the holder in accordance with the following direction (or if no directions have been given, as the proxyholder sees fit) and on all other matters that may properly come before the Annual General Meeting of shareholders of the Company to be held at 1250 Brownmiller Road, Quesnel, BC on April 24, 2024 at 11:00 am (Vancouver Time), and at any adjournment or postponement thereof.
VOTING RECOMMENDATIONS ARE INDICATED BY HIGHLIGHTED TEXT OVER THE BOXES.
|
|
For | Against | ||||||||||||||||||
| 1. Number of Directors | ||||||||||||||||||||
|
To set the number of Directors at twelve (12).
|
☐
|
☐
|
||||||||||||||||||
|
Fold |
||||||||||||||||||||
| 2. Election of Directors | For | Withhold | For | Withhold | For | Withhold | ||||||||||||||
| 01. Henry H. (Hank) Ketcham | ☐ | ☐ | 02. Doyle N. Beneby | ☐ | ☐ | 03. Eric L. Butler | ☐ | ☐ | ||||||||||||
| 04. Reid E. Carter | ☐ | ☐ | 05. John N. Floren | ☐ | ☐ | 06. Ellis Ketcham Johnson | ☐ | ☐ | ||||||||||||
| 07. Brian G. Kenning | ☐ | ☐ | 08. Marian Lawson | ☐ | ☐ | 09. Sean P. McLaren | ☐ | ☐ | ||||||||||||
| 10. Colleen M. McMorrow | ☐ | ☐ | 11. Janice G. Rennie | ☐ | ☐ | 12. Gillian D. Winckler | ☐ | ☐ | ||||||||||||
|
|
For | Withhold | ||||||||||||||||||
| 3. Appointment of Auditor | ||||||||||||||||||||
| To appoint PricewaterhouseCoopers LLP, as the Auditor of the Company for the ensuing year and to authorize the Directors to fix the Auditor’s remuneration. |
☐ | ☐ | ||||||||||||||||||
|
|
For | Against | ||||||||||||||||||
| 4. Advisory “Say on Pay” Resolution |
||||||||||||||||||||
| To pass an advisory resolution to approve the Company’s approach to executive compensation, as more particularly described under “Advisory Resolution on the Company’s Approach to Executive Compensation (Say on Pay)” in the accompanying Information Circular.
|
☐ | ☐ | ||||||||||||||||||
|
Fold |
||||||||||||||||||||
|
|
||||||||||||||||||||
|
|
||||||||||||||||||||
| Signature of Proxyholder | Signature(s) | Date |
| I/We authorize you to act in accordance with my/our instructions set out above. I/We hereby revoke any proxy previously given with respect to the Meeting. If no voting instructions are indicated above, and the proxy appoints the Management Nominees, this Proxy will be voted as recommended by Management. |
DD / MM / YY |
|
Interim Financial Statements - Mark this box if you would like to receive Interim Financial Statements and accompanying Management’s Discussion and Analysis by mail. |
☐
|
Annual Financial Statements - Mark this box if you would like to receive the Annual Financial Statements and accompanying Management’s Discussion and Analysis by mail. |
☐
|
If you are not mailing back your proxy, you may register online to receive the above financial report(s) by mail at www.computershare.com/mailinglist.
| W X T Q | 3 6 1 4 4 5 | A R 1 | ||||||
|
|
|
|||||||
Exhibit 99.4
|
|
Please return completed form to: Computershare 8th Floor, 100 University Avenue Toronto, Ontario M5J 2Y1 |
|

|
|
|
|
|
| Interim Financial Statements | Annual Financial Statements | |||||||||

|
Mark this box if you would like to receive Interim Financial Statements by mail. |
|
Mark this box if you would like to receive the Annual Financial Statements by mail. |
|||||||
| Check below if you would like to receive future mailings by e-mail. | ||||||||||
|
|
I would like to receive future mailings by e-mail at: | |||||||||
Financial Statements Request Form
Under securities regulations, a reporting issuer must send annually a form to holders to request the Interim Financial Statements and MD&A and/or the Annual Financial Statements and MD&A. If you would like to receive the report(s) by mail, please make your selection and return to the address as noted or register online at www.computershare.com/mailinglist.
Alternatively, you may choose to access the report(s) online at www.sedar.com.
Computershare will use the information collected solely for the mailing of such financial statements. You may view Computershare’s Privacy Code at www.computershare.com/privacy or by requesting that we mail you a copy.
You can enroll to receive future securityholder communications electronically by visiting www.investorcentre.com.
Please place my name on your financial statements mailing list.
Name

Apt. Street Number Street Name

City Prov. Postal Code / Zip Code


|
W X T Q | 5 1 E T N N |

|
01VZ4B
Exhibit 99.5
West Fraser 2023 Annual Report
Contents
| Welcome to West Fraser |
2 | |||
| About West Fraser |
3 | |||
| Our Operations |
4 | |||
| Message From our President and CEO |
6 | |||
| Financial Highlights |
8 | |||
| Business Strategy |
9 | |||
| Our Products |
10 | |||
| Financial Performance |
12 | |||
| Management’s Discussion and Analysis |
14 | |||
| 2023 Audited Statements |
78 | |||
| Consolidated Financial Statements |
78 | |||
| Appendix |
122 | |||
| Directors and Officers |
123 | |||
| Glossary of Key Terms |
124 | |||
| Corporate Information |
125 | |||
| Memberships and Partner Organizations |
126 | |||
| Product Circularity |
127 | |||
Welcome to West Fraser
| About West Fraser | ||||
We make renewable, wood-based building products
for the world, contributing to a more sustainable future.
West Fraser was founded nearly 70 years ago in Quesnel, British Columbia, by three brothers — Sam, Bill and Pete Ketcham — who pooled their resources to buy a small planing mill with 12 employees.
Today, West Fraser is one of the world’s largest producers of sustainable wood-based building products, with more than 60 facilities in Canada, the United States, the United Kingdom and Europe.
From responsibly sourced and sustainably managed forest resources, West Fraser produces lumber, engineered wood products (oriented strand board, laminated veneer lumber, medium-density fibreboard, plywood, and particleboard), pulp, newsprint, wood chips, other residuals, and renewable energy.
West Fraser’s products are used in home construction, repair and remodelling, industrial applications, papers, tissue, and boxes.
We aim to develop and maintain:
| • | Excellence in performance and people |
| • | Leadership in our field |
| • | Challenge and satisfaction |
| • | Responsibility in communities in which we work |
| • | Profitability |
| • | Growth |

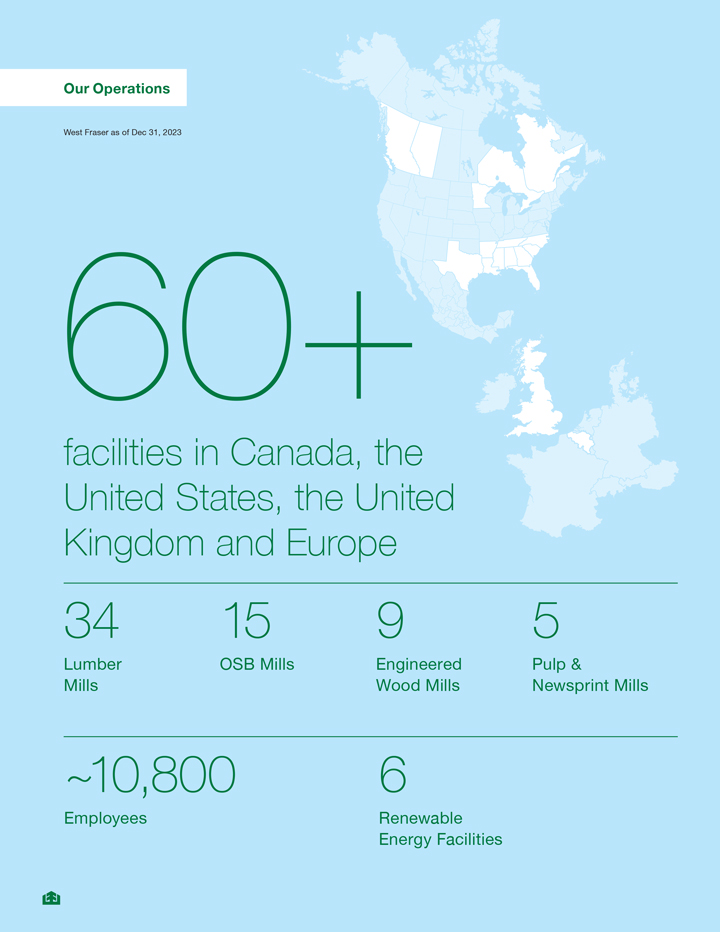
Our Operations West Fraser as of Dec 31, 2023 facilities in Canada, the United States, the United Kingdom and Europe 34 15 9 5 Lumber OSB Mills Engineered Pulp & Mills Wood Mills Newsprint Mills ~10,800 6 Employees Renewable Energy Facilities
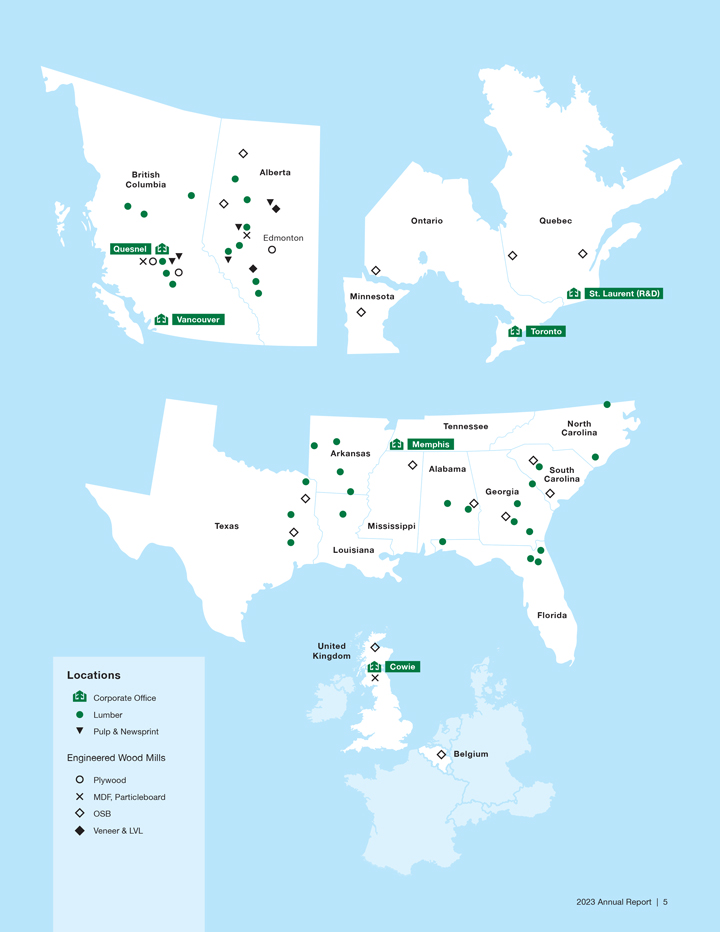
British Alberta Columbia Ontario Quebec Edmonton Quesnel Minnesota St. Laurent (R&D) Vancouver Toronto Tennessee North Carolina Arkansas Memphis Alabama Carolina South Georgia Texas Mississippi Louisiana Florida Kingdom United Cowie Locations Corporate Office Lumber Pulp & Newsprint Engineered Wood Mills Belgium Plywood MDF, Particleboard OSB Veneer & LVL 2023 Annual Report | 5
| Message From our President and CEO | ||||
Overall, slowing markets that began in the latter half of 2022 carried on into 2023 as higher inflation and mortgage rates dampened demand for new home construction as well as repair and remodelling spending. While lumber markets were particularly challenging, demand for our engineered wood products remained more robust.
In 2023, we achieved sales of nearly $6.5 billion and Adjusted EBITDA(1) of $561 million, representing 9% of sales. Our capital allocation strategy saw $477 million invested back into the business and we returned significant capital to shareholders, paying $100 million in dividends and $129 million in share repurchases. To date, we have repurchased 76% of the stock issued to acquire Norbord in 2021.
Although the outlook for our markets is somewhat uncertain as we head into 2024, our long-held business strategy is designed for precisely these circumstances. The strength of our people and our culture, combined with our modern, diversified manufacturing platform and a prudent balance sheet — with almost $2 billion in available liquidity — positions us to invest in our company and take advantage of opportunities that may come our way in all cycles. And over the past year, we did just that.
Beginning in January 2023, we began making a series of moves to optimize our asset portfolio. The decision to divest three pulp mills was announced this past summer, while a performance review of our North American lumber segment resulted in the indefinite curtailment of one sawmill, the permanent closure of three other sawmills and the acquisition of a sawmill and wood treater in Cochrane, Alberta. By year end, we had closed our furniture factory in southern England to focus on our core wood products business.
Putting Safety First
Safety remains our primary operating focus and in 2023 we achieved a reduction in recordable safety incidents compared to last year and our lowest rate ever for serious injuries. Our commitment to continuously improve safety remains our top priority as we work to further enhance all of our core safety systems while deepening involvement and ownership at all levels of the organization.
North America’s Leading Lumber Producer
Despite near-term challenges, we remain optimistic about the demand for lumber over the longer term given projected demand for U.S. housing and the shrinking lumber supply coming out of British Columbia (B.C.). West Fraser’s proximity to market centres and geographic diversification of our production position us well to meet future demand. In 2023, 52% of West Fraser lumber was produced in the U.S. south, 26% in Alberta and 23% in B.C.
In 2023, we have continued to execute on our strategy of modernizing our facilities to improve productivity and our environmental footprint. Construction is ongoing at our site in Henderson, Texas — a $255 million investment to redevelop the mill with start-up expected in the first half of 2025. We also completed the capital upgrades to our sawmill in Maplesville, Alabama. Our new Dudley sawmill achieved solid production and continued lowering costs, while progressing along its start-up curve. During 2023 we added a new solar energy installation at the site which will help us lower greenhouse gas emission while also lowering energy costs.
We believe these actions improve our company for the long-term and align with our strategy to be a premier, low-cost, sustainable and renewable wood building products manufacturer and key supplier to our customers.
| 1) | Adjusted EBITDA is a Non-GAAP financial measure. Refer to the “Non-GAAP and other specified financial measures” section of our 2023 MD&A included in this Annual Report. |


|
A North American and European Engineered Wood Leader
Our North American engineered wood products segment, which includes manufacturing of oriented strand board (OSB) and other wood-based panels such as plywood, had strong performance in 2023, generating $589 million Adjusted EBITDA. OSB demand was strong across North America. We added to our OSB capacity in June with the startup of our mill in Allendale, South Carolina, following an $83-million capital upgrade over the past two years. When operating at full capacity, this large-scale mill is expected to be one of the lowest cost producing mills across our OSB portfolio.
In our European engineered wood products segment, our business is well positioned with a leading market position in the U.K. With a modern, well-invested asset base, we will be able to capitalize on the longer-term demand tailwinds of continuing OSB substitution for plywood and an aging housing stock. We are investing in bringing rail service into our flagship Inverness, Scotland OSB mill to expand its market reach and reduce our carbon footprint and freight costs.
Producing Responsibly
We also took steps to further advance our sustainability goals in 2023. In April, the globally-recognized, Science Based Targets Initiative (SBTi) validated our targets to materially reduce our greenhouse gas emissions by 2030. By year’s end, each of our divisions had progressed on an energy reduction roadmap that identifies ways to reduce energy consumption and cut emissions.
We share a responsibility for the communities where we operate. This includes our commitment to build meaningful relationships with Indigenous Nations and seek to find opportunities to work together for economic prosperity and community well-being. Over the past year, we furthered our work to obtain Progressive Aboriginal Relations (PAR) certification. We also invest in people and their potential through our community investment program. Our strategy saw each of our mills invest in their local communities, prioritized to strategic areas, for a total of $4.8 million invested in more than 500 community partnerships in 2023.
Advancing People and Culture
What sets West Fraser apart from our competitors is the commitment, skills and performance of our people. In 2023, we continued to advance our internal learning programs for our employees and provided development opportunities that help support our culture of excellence and high performance. We also took steps this year to foster a more inclusive workplace, and launched a new Health and Wellness program, supported by tools and resources to help everyone bring their best self to work every day. For the eleventh consecutive year, West Fraser was named one of Canada’s Top 100 Employers.
Driving Value
We can be proud of what we achieved in 2023. As we look back, I would like to thank Ray Ferris, who retired as President and CEO at the end of 2023, following a 26-year career of progressive growth with West Fraser. I am grateful to the Board of Directors for their support of the entire management team. And I would like to acknowledge the enormous effort of our employees for delivering solid results and helping position a West Fraser that is ready to embrace the future.
As we move into 2024, although near-term uncertainties exist across the industry, we are confident in the company’s geographic and product diversity — which combined with the right strategy, people, assets and financial flexibility — will allow us to thrive as we embrace the many challenges and opportunities that lie ahead.

Sean McLaren
President and Chief Executive Officer
| 2023 Annual Report | 7 |
| Financial Highlights | ||||
| Achieved | Delivered | Invested | ||
| $6.5b | $561m | $477m | ||
| in sales | Adjusted EBITDA, representing 9% of sales |
capital to maintain and improve the business |
||
| Repurchased | Returned | Available | ||
| $129m | $100m | $1.95b | ||
| worth of shares | in dividends | liquidity at year-end, including $900 m of cash |
||
| Rated | ||||
| Investment Grade | ||||
| by three leading rating agencies | ||||

| Business Strategy | ||||
Our business strategy focuses on profitability and excellence in people, driven by three key elements.
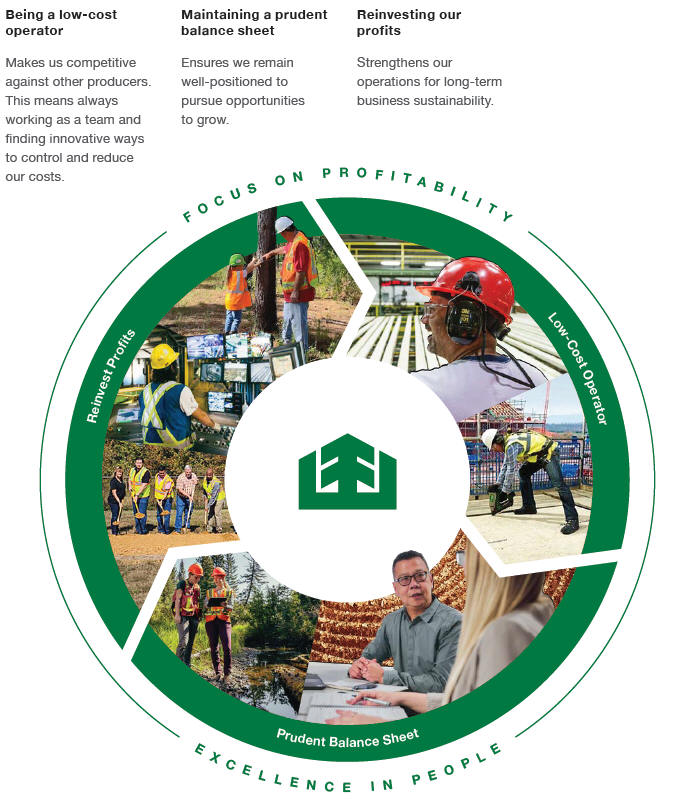
| 2023 Annual Report | 9 |
| Our Products | ||||
Why Wood
Wood is a sustainable, high-value building material that stores carbon. With the least embodied energy of all major building materials, it requires less energy from harvest to transport, manufacturing, installation, maintenance and disposal or recycling. Wood is known for its strength and durability in addition to its visual appeal when used in building structures and finishings.
2023 Sales by Business Segment to External Customers
in millions of U.S. dollars
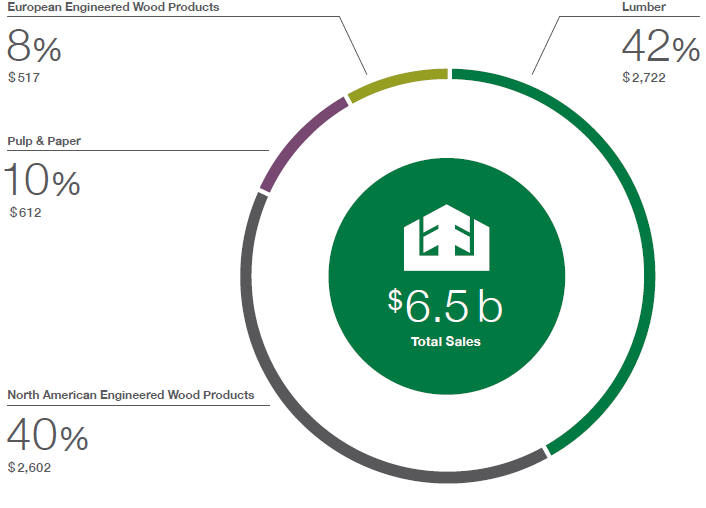
|
|
Our Products
|
|
|||
| SPF |
SYP |
|||
| Spruce Pine Fir (SPF) is a species that includes Engelmann spruce, white spruce, hybrid white spruce, lodgepole pine and subalpine fir. This lumber is lightweight, easily worked, takes paint well, holds nails well and exhibits small knots. |
Southern Yellow Pine (SYP), known for its strength and durability, grows in the southern United States from Virginia to Florida and west to Texas. SYP lumber is a versatile product used in a variety of applications. |
|||

|

|
|||
| OSB |
Plywood |
|||
| Oriented Strand Board (OSB) is a versatile structural wood panel. Used in roofs, walls and floor applications, OSB makes use of wood that may not otherwise have commercial value, which helps to maximize forest utilization. |
Plywood is made from multiple layers, or ply, of softwood veneer glued together with the grain of each layer perpendicular to adjacent layers. Plywood panels have superior dimensional stability, two-way strength and stiffness properties and an excellent strength-to-weight ratio. |
|||

|

|
|||
| LVL |
MDF |
|||
| Laminated Veneer Lumber (LVL) is manufactured primarily for structural framing in residential and commercial construction. LVL is made from rotary-peeled veneers bonded together under heat and pressure into large panels that are cut into a range of widths. |
Medium-Density Fibreboard (MDF) is an engineered non-structural wood panel made from 100% western white softwoods that have a consistent light sandy colour. The purity and long fibre allow the finishing to fit a variety of interior applications. |
|||

|

|
|||
| Particleboard |
Pulp |
|||
| Particleboard is a non-structural, engineered wood panel produced by pressing recycled wood fibre to create a product with a consistent, pristine surface that caters to many everyday applications, such as furniture or cabinets. |
Pulp is created through a chemical process, transforming chips into pulp fibres. The fibres, often referred to as reinforcing pulp, are very strong and are the basis for an extensive range of high-end paper products, from tissues and paper towels to cardboard and packaging materials. |
|||
| 2023 Annual Report | 11 |
| Financial Performance | ||||
Five-Year Financial Review
(in millions of U.S. dollars, except where indicated)
| 2023 | 2022 | 2021 | 2020 | 2019 | ||||||||||||||||
| Earnings |
||||||||||||||||||||
| Sales |
6,454 | 9,701 | 10,518 | 4,373 | 3,673 | |||||||||||||||
| Cost of product sold |
(4,685 | ) | (5,142 | ) | (4,645 | ) | (2,559 | ) | (2,750 | ) | ||||||||||
| Freight and other distribution costs |
(894 | ) | (963 | ) | (846 | ) | (529 | ) | (538 | ) | ||||||||||
| Export duties, net1 |
(8 | ) | (18 | ) | (146 | ) | (57 | ) | (122 | ) | ||||||||||
| Amortization |
(541 | ) | (589 | ) | (584 | ) | (203 | ) | (195 | ) | ||||||||||
| Selling, general and administration |
(307 | ) | (365 | ) | (312 | ) | (185 | ) | (159 | ) | ||||||||||
| Equity-based compensation |
(25 | ) | (5 | ) | (40 | ) | (9 | ) | (4 | ) | ||||||||||
| Restructuring and impairment charges |
(279 | ) | (60 | ) | — | — | (25 | ) | ||||||||||||
| Operating earnings |
(284 | ) | 2,559 | 3,945 | 831 | (120 | ) | |||||||||||||
| Finance income (expense), net |
51 | (3 | ) | (45 | ) | (27 | ) | (37 | ) | |||||||||||
| Other income (expense) |
5 | 37 | (2 | ) | (14 | ) | (8 | ) | ||||||||||||
| Tax recovery (provision) |
61 | (618 | ) | (951 | ) | (202 | ) | 52 | ||||||||||||
|
Earnings
|
|
(167 |
) |
|
1,975 |
|
|
2,947 |
|
|
588 |
|
|
(113 |
) |
|||||
| Adjusted EBITDA2 |
561 | 3,212 | 4,569 | 1,043 | 104 | |||||||||||||||
| Cash flows from operating activities |
525 | 2,207 | 3,552 | 968 | 87 | |||||||||||||||
| Capital expenditures |
477 | 477 | 635 | 180 | 309 | |||||||||||||||
| Financial position |
||||||||||||||||||||
| Current assets |
2,377 | 2,749 | 3,217 | 1,336 | 883 | |||||||||||||||
| PPE & timber licenses |
4,211 | 4,333 | 4,468 | 2,029 | 2,028 | |||||||||||||||
| Goodwill & other intangibles |
2,307 | 2,358 | 2,440 | 591 | 594 | |||||||||||||||
| Export duty deposits3 |
377 | 354 | 242 | 178 | 61 | |||||||||||||||
| Other assets |
137 | 175 | 58 | 35 | 20 | |||||||||||||||
| Deferred income tax assets |
6 | 4 | 8 | 9 | 8 | |||||||||||||||
| Total assets |
9,415 | 9,973 | 10,433 | 4,178 | 3,594 | |||||||||||||||
| Current liabilities |
750 | 792 | 1,206 | 528 | 644 | |||||||||||||||
| Long-term debt (including current portion) |
499 | 499 | 499 | 500 | 500 | |||||||||||||||
| Other liabilities |
260 | 268 | 360 | 408 | 350 | |||||||||||||||
| Deferred income tax liabilities |
683 | 795 | 712 | 264 | 195 | |||||||||||||||
| Shareholders’ equity |
7,223 | 7,619 | 7,656 | 2,478 | 1,905 | |||||||||||||||
| Total liabilities & equity |
9,415 | 9,973 | 10,433 | 4,178 | 3,594 | |||||||||||||||
| Sales | Adjusted EBITDA2 | Cash flows from operating activities | ||
| in millions of U.S. dollars | in millions of U.S. dollars | in millions of U.S. dollars | ||
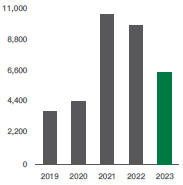
|
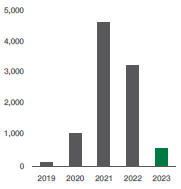
|
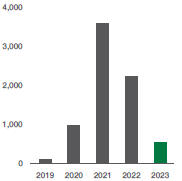
|
||
|
|
| 2023 | 2022 | 2021 | 2020 | 2019 | ||||||||||||||||
| Per common share (dollars) |
||||||||||||||||||||
| Basic EPS |
(2.01 | ) | 21.06 | 27.03 | 8.56 | (1.64 | ) | |||||||||||||
| TSX Price range (CAD): |
||||||||||||||||||||
| High |
121.66 | 132.91 | 124.74 | 86.50 | 80.13 | |||||||||||||||
| Low |
88.61 | 89.95 | 73.30 | 21.60 | 43.93 | |||||||||||||||
| Close |
113.36 | 97.77 | 120.68 | 81.78 | 57.28 | |||||||||||||||
| NYSE Price range: |
||||||||||||||||||||
| High |
91.44 | 102.96 | 97.59 | n/a | n/a | |||||||||||||||
| Low |
64.11 | 68.75 | 61.36 | n/a | n/a | |||||||||||||||
| Close |
85.58 | 72.29 | 95.36 | n/a | n/a | |||||||||||||||
| Dividends declared per share |
1.20 | 1.15 | 0.76 | 0.56 | 0.60 | |||||||||||||||
| Shares outstanding at year-end (‘000s) |
81,721 | 83,555 | 105,929 | 68,679 | 68,663 | |||||||||||||||
| Ratios |
||||||||||||||||||||
| Net debt to capitalization4 |
-5% | -9% | -16% | 2% | 29% | |||||||||||||||
| Number of employees at year-end |
10,771 | 11,056 | 10,928 | 8,115 | 8,200 | |||||||||||||||
| Shipments |
||||||||||||||||||||
| SPF Lumber (MMfbm) |
2,711 | 2,705 | 3,176 | 3,214 | 3,363 | |||||||||||||||
| SYP Lumber (MMfbm) |
2,882 | 3,036 | 2,649 | 2,861 | 2,692 | |||||||||||||||
| NA OSB (MMsf 3/8” basis) |
6,380 | 6,006 | 5,674 | — | — | |||||||||||||||
| EU OSB (MMsf 3/8” basis) |
1,023 | 977 | 1,010 | — | — | |||||||||||||||
| Pulp (Mtonnes) |
913 | 968 | 1,033 | 1,132 | 1,173 | |||||||||||||||
| 1. | Export duties for 2023 are net of a $62 million recovery related to the USDOC finalization of the duty rates for the AR4 POI dated January 1, 2021 to December 31, 2021. |
| Export duties for 2022 are net of a $81 million recovery related to the USDOC finalization of the duty rates for the AR3 POI dated January 1, 2020 to December 31, 2020. |
| Export duties for 2021 are net of a $55 million recovery related to the USDOC finalization of the duty rates for the AR2 POI dated January 1, 2019 to December 31, 2019. |
| Export duties for 2020 are net of a $95 million recovery related to the USDOC finalization of the duty rates for the AR1 POI dated April 28, 2017 to December 31, 2018. |
| 2. | Adjusted EBITDA is a non-GAAP financial measure. Refer to the “Non-GAAP and Other Specified Financial Measures” section of our 2023 MD&A included in this Annual Report for more information on this measure. Effective January 1, 2022, and for all comparative periods, export duties are no longer excluded from the definition of Adjusted EBITDA. |
| 3. | Export duty deposits for 2022 include export duty receivable of $81 million for the AR3 POI dated January 1, 2020 to December 31, 2020. |
| Export duty deposits for 2021 include export duty receivable of $55 million for the AR2 POI dated January 1, 2019 to December 31, 2019. |
| Export duty deposits for 2020 include export duty receivable of $95 million for the AR1 POI dated April 28, 2017 to December 31, 2018. |
| 4. | Net debt to capitalization is a non-GAAP financial measure. Refer to the “Non-GAAP and Other Specified Financial Measures” section of our 2023 MD&A included in this Annual Report for more information on this measure |
| SPF Lumber shipments | SYP Lumber shipments | NA OSB shipments | EU OSB shipments | |||
| in MMfbm | in MMfbm | in MMsf 3/8” basis | in MMsf 3/8” basis | |||
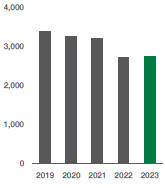
|
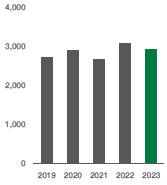
|
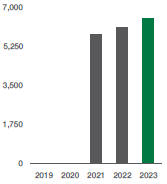
|
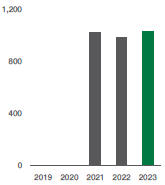
|
|||
| 2023 Annual Report | 13 |
| Management’s Discussion and Analysis | ||||
INTRODUCTION
This discussion and analysis by management (“MD&A”) of West Fraser Timber Co. Ltd.’s (“West Fraser”, the “Company”, “we”, “us”, or “our”) financial performance for the year and three months ended December 31, 2023 should be read in conjunction with our annual audited consolidated financial statements and accompanying notes for the year ended December 31, 2023 (the “Annual Financial Statements”).
The Company’s fiscal year is the calendar year ending December 31. Effective January 1, 2023, the Company’s fiscal quarters are the 13-week periods ending on the last Friday of March, June, and September with the fourth quarter ending on December 31. References to the three months ended December 31, 2023 and the fourth quarter of 2023 relate to the period between September 30, 2023 and December 31, 2023.
Unless otherwise indicated, the financial information contained in this MD&A is derived from our Annual Financial Statements, which have been prepared in accordance with International Financial Reporting Standards as issued by the International Accounting Standards Board (“IFRS Accounting Standards”). This MD&A uses various Non-GAAP and other specified financial measures, including “Adjusted EBITDA”, “Adjusted EBITDA by segment”, “available liquidity”, “total debt to capital ratio”, “net debt to capital ratio”, and “expected capital expenditures”. An explanation with respect to the use of these Non-GAAP and other specified financial measures is set out in the section titled “Non-GAAP and Other Specified Financial Measures”.
This MD&A includes statements and information that constitute “forward-looking information” within the meaning of Canadian securities laws and “forward-looking statements” within the meaning of United States securities laws (collectively, “forward-looking statements”). Please refer to the cautionary note entitled “Forward-Looking Statements” below for a discussion of these forward-looking statements and the risks that impact these forward-looking statements.
Dollar amounts are expressed in the United States (“U.S.”) currency unless otherwise indicated. This MD&A uses capitalized terms, abbreviations and acronyms that are defined under “Glossary of Key Terms”. Figures have been rounded to millions of dollars to reflect the accuracy of the underlying balances and as a result certain tables may not add due to rounding impacts. The information in this MD&A is as at February 14, 2024 unless otherwise indicated.
OUR BUSINESS AND STRATEGY
West Fraser is a diversified wood products company with facilities in Canada, the U.S., the U.K. and Europe, manufacturing, selling, marketing and distributing lumber, engineered wood products (OSB, LVL, MDF, plywood, particleboard), pulp, newsprint, wood chips and other residuals and renewable energy. As at December 31, 2023, our business is comprised of 34 lumber mills, 15 OSB facilities, 6 renewable energy facilities, 3 plywood facilities, 3 MDF facilities, 2 treated wood facilities, 1 particleboard facility, 1 LVL facility, 1 veneer facility, and 5 pulp and paper mills (as at December 31, 2023, three of our pulp mills are held for sale, one of which has since been sold).
Our goal at West Fraser is to generate strong financial results through the business cycle, supported by robust product and geographic diversity, and relying on our committed workforce, the quality of our assets and our well-established people and culture. This culture emphasizes cost control in all aspects of the business and operating in a responsible, sustainable, financially conservative and prudent manner.
The North American wood products industry is cyclical and periodically faces difficult market conditions. Our earnings are sensitive to changes in world economic conditions, primarily those in North America, Asia and Europe and particularly to the U.S. housing market for new construction and repair and renovation spending. Most of our revenues are from sales of commodity products for which prices are sensitive to variations in supply and demand. As many of our costs are denominated in Canadian dollars, British pounds sterling and Euros, exchange rate fluctuations of the Canadian dollar, British pound sterling and Euro against the United States dollar can and are anticipated to be a significant source of earnings volatility for us.
|
|
West Fraser strives to make sustainability a central principle upon which we and our people operate, and we believe the Company’s renewable building materials that sequester carbon are a truly natural solution in the fight against climate change. There are numerous government initiatives and proposals globally to address climate-related issues. Within the jurisdictions of West Fraser’s operations, some of these initiatives would regulate, and do regulate and/or tax the production of carbon dioxide and other greenhouse gases to facilitate the reduction of carbon emissions, providing incentives to produce and use cleaner energy. In April 2023, the Science Based Targets Initiative (“SBTi”) completed its validation of the science-based targets we set in the first quarter of 2022. This validation further supports West Fraser’s plan to achieve near-term greenhouse gas (“GHG”) reductions across all our operations located in the United States, Canada, U.K. and Europe.
We believe that maintaining a strong balance sheet and liquidity profile, along with our investment-grade debt rating, enables us to execute a balanced capital allocation strategy. Our goal is to reinvest in our operations across all market cycles to strategically enhance productivity, product mix, and capacity and to maintain a leading cost position. We believe that a strong balance sheet also provides the financial flexibility to capitalize on growth opportunities, including the pursuit of opportunistic acquisitions and larger-scale strategic growth initiatives, and is a key tool in managing our business over the long term including returning capital to shareholders.
RECENT DEVELOPMENTS
Markets
In North America, changes in new home construction activity in the U.S. are a significant driver of lumber and OSB demand. According to the U.S. Census Bureau, the seasonally adjusted annualized rate of U.S. housing starts averaged 1.46 million units in December 2023, with permits issued averaging 1.50 million units. U.S. housing starts were 1.41 million units for full year 2023, down 9% from 1.55 million units in 2022. The level of new housing construction began to rebound somewhat in the final months of the year as central bankers paused rate increases and inflation and mortgage rates moderated. Coupled with ongoing evidence of easing inflationary risks, the latest rate hiking cycle appears to be nearing its end. Low supply of existing homes for sale and a large cohort of the population entering the typical home buying age demographic are expected to support longer-term core demand for home construction activity. Notwithstanding these factors, should the economy and employment slow more broadly, interest rates begin to track meaningfully higher or housing prices not adjust sufficiently lower to offset a potential rise in mortgage rates, housing affordability may be adversely impacted, which could reduce near-term demand for new home construction and thus near-term demand for our wood-based building products.
In the fourth quarter, demand for our products used in repair and remodelling applications was relatively stable but remained below the elevated demand levels seen in recent years. There is a risk that historically low rates of existing home sales and a slowing economy will put further downward pressure on short-term repair and remodelling demand, consistent with near-term industry forecasts for repair and remodelling spending. However, over the medium and longer term, an aging housing stock and stabilization of inflation and interest rates are expected to stimulate renovation and repair spending that supports growth in lumber, plywood and OSB demand.
Regarding lumber supply fundamentals, significant new capacity announcements in the U.S. South have not translated into a meaningful increase in overall domestic supply. Capacity contraction within other key lumber producing regions of North America have contributed to this trend, as have meaningful reductions in production from less competitive mills in the U.S. South, a region that is generally lower-cost but is also heterogeneous in terms of mill costs associated with fibre supply, modernization levels and labour reliability. Lower demand from offshore markets for North American lumber is also a continuing factor, resulting in more domestically produced lumber remaining in the continent. Imports of lumber from Europe, which had been elevated earlier in 2023, have slowed in recent months. However, should this import trend reverse and head higher again, the rebalancing of supply and demand for lumber products in North America could experience an extended time to recovery, particularly for SPF products that compete more directly with European lumber imports. In the very near term, unusually warm weather in Western Canada has hampered logging activities so far this winter, which has limited the accumulation of log inventories at some of our mills and has the potential to constrain our ability to manufacture and ship SPF lumber.
| 2023 Annual Report | 15 |
A number of OSB mill greenfield and re-start projects have been announced in recent years, although actual new supply has been slow to come to market. We believe this is largely a function of extended vendor equipment backlogs and limited contractor availability, coupled with the 18-24 month start-up curves typical of OSB mills. While some of the announced mill projects are apt to be completed over the near-to-medium term, we continue to see meaningful constraints to significant new OSB supply in the near term. However, should new OSB supply come to market sooner, and production ramp more quickly than is typical for mill start-ups, OSB markets may experience a period of imbalance between supply and demand.
Completion of the Spray Lake Acquisition
On November 17, 2023, we completed the acquisition of the Spray Lake lumber mill located in Cochrane, Alberta and associated timber tenures for $102 million (CAD$140 million), net of cash acquired of $1 million. This acquisition has been accounted for as an acquisition of a business in accordance with IFRS 3, Business Combinations. Note 3 to our Annual Financial Statements provides details on the preliminary purchase price allocation as at December 31, 2023.
Facility Closures and Curtailments
On January 9, 2024, we announced the permanent closure of our lumber mill in Maxville, Florida and the indefinite curtailment of operations at our lumber mill in Huttig, Arkansas. High fibre costs at Maxville and the current low-price commodity environment have impaired the ability of both mills to profitably operate. In aggregate, this will reduce our U.S. lumber capacity by approximately 270 million board feet. The closure of Maxville and the indefinite curtailment of our Huttig lumber mill better aligns our U.S. lumber capacity with demand. We recorded restructuring and impairment charges of $47 million in the fourth quarter of 2023 associated with this announcement.
On January 22, 2024, we announced the permanent closure of our lumber mill in Fraser Lake, B.C., following an orderly wind-down. The decision is the result of our inability to access economically viable fibre in the region and will reduce our Canadian lumber capacity by approximately 160 million board feet. We recorded restructuring and impairment charges of $81 million in the fourth quarter of 2023 related to facility closures and curtailments due to availability of economic fibre sources in B.C.
Completion of sale of Hinton pulp mill
On July 10, 2023, we announced an agreement to sell our unbleached softwood kraft pulp mill in Hinton, Alberta to Mondi Group plc (“Mondi”). The transaction closed on February 3, 2024 following the completion of regulatory reviews and satisfaction of customary closing conditions.
CVD and ADD Duty Rates
On February 1, 2024, the USDOC released the preliminary results from AR5 POI covering the 2022 calendar year, which indicated a rate of 6.74% for CVD and 5.33% for ADD for West Fraser. The duty rates are subject to an appeal process, and we will record an adjustment once the rates are finalized. If the AR5 rates were to be confirmed, it would result in an expense of $35 million before the impact of interest for the POI covered by AR5. This adjustment would be in addition to the amounts already recorded on our balance sheet. If these rates were finalized, our combined cash deposit rate would be 12.07%.
Senior Leadership Transition
Effective January 1, 2024, Sean McLaren succeeded Ray Ferris as President and Chief Executive Officer and joined the Board of Directors.
|
|
ANNUAL RESULTS
| Summary Annual Results ($ millions, except as otherwise indicated) |
2023 | 2022 | 2021 | |||||||||
| Earnings |
||||||||||||
| Sales |
$ | 6,454 | $ | 9,701 | $ | 10,518 | ||||||
| Cost of products sold |
(4,685) | (5,142) | (4,645) | |||||||||
| Freight and other distribution costs |
(894) | (963) | (846) | |||||||||
| Export duties, net |
(8) | (18) | (146) | |||||||||
| Amortization |
(541) | (589) | (584) | |||||||||
| Selling, general and administration |
(307) | (365) | (312) | |||||||||
| Equity-based compensation |
(25) | (5) | (40) | |||||||||
| Restructuring and impairment charges |
(279) | (60) | — | |||||||||
| Operating earnings (loss) |
(284) | 2,559 | 3,945 | |||||||||
| Finance income (expense), net |
51 | (3) | (45) | |||||||||
| Other income (expense) |
5 | 37 | (2) | |||||||||
| Tax recovery (provision) |
61 | (618) | (951) | |||||||||
| Earnings (loss) |
$ | (167) | $ | 1,975 | $ | 2,947 | ||||||
| Adjusted EBITDA1 |
$ | 561 | $ | 3,212 | $ | 4,569 | ||||||
| Basic earnings (loss) per share ($) |
(2.01) | 21.06 | 27.03 | |||||||||
| Diluted earnings (loss) per share ($) |
(2.01) | 20.86 | 27.03 | |||||||||
| Cash dividends declared per share2 ($) |
1.20 | 1.15 | 0.76 | |||||||||
| Total assets |
9,415 | 9,973 | 10,433 | |||||||||
| Long-term debt, non-current |
199 | 499 | 499 | |||||||||
| Long-term debt, total |
499 | 499 | 499 | |||||||||
| 1. | This is a non-GAAP financial measure. Refer to the “Non-GAAP and Other Specified Financial Measures” section of this document for more information on this measure. |
| 2. | Cash dividends declared during the year ended December 31, 2021 were comprised of CAD$0.70 per share in aggregate for the first three quarters and USD$0.20 per share for the fourth quarter. The CAD amounts have been translated to USD for presentation purposes using the average exchange rate during the quarter that the dividends were declared. |
In 2023, our revenues were $6,454 million and we incurred a loss of $167 million, or $2.01 of diluted loss per share. This compares with revenues of $9,701 million and earnings of $1,975 million, or $20.86 of diluted earnings per share, in 2022, and revenues of $10,518 million and earnings of $2,947 million, or $27.03 of diluted earnings per share, in 2021. Our 2023 results were impacted primarily by decreases in lumber and OSB pricing, offset in part by lower input costs. We recorded higher restructuring and impairment charges in 2023 related to the sale of certain of our pulp mills as well as announced facility closures and curtailments in our lumber segment.
| 2023 Annual Report | 17 |
Discussion & Analysis of Annual Results by Product Segment
Lumber Segment
| Lumber Segment Earnings ($ millions unless otherwise indicated) |
2023 | 2022 | ||||||
| Sales |
||||||||
| Lumber |
$ | 2,436 | $ | 4,077 | ||||
| Wood chips and other residuals |
287 | 309 | ||||||
| Logs and other |
71 | 79 | ||||||
| 2,794 | 4,465 | |||||||
| Cost of products sold |
(2,215) | (2,489) | ||||||
| Freight and other distribution costs |
(405) | (435) | ||||||
| Export duties, net |
(8) | (18) | ||||||
| Amortization |
(185) | (186) | ||||||
| Selling, general and administration |
(164) | (194) | ||||||
| Restructuring and impairment charges |
(137) | (31) | ||||||
| Operating earnings (loss) |
(319) | 1,111 | ||||||
| Adjusted EBITDA1 |
$ | 2 | $ | 1,328 | ||||
| Capital expenditures |
$ | 253 | $ | 184 | ||||
| SPF (MMfbm) |
||||||||
| Production |
2,687 | 2,635 | ||||||
| Shipments |
2,711 | 2,705 | ||||||
| SYP (MMfbm) |
||||||||
| Production |
2,860 | 3,018 | ||||||
| Shipments |
2,882 | 3,036 | ||||||
| 1. | This is a non-GAAP financial measure. Refer to the “Non-GAAP and Other Specified Financial Measures” section of this document for more information on this measure. 2023 Adjusted EBITDA was impacted by a one-time charge of $2 million related to inventory purchase price accounting related to the Spray Lake lumber mill acquisition. |
Sales and Shipments
Lumber sales decreased compared to 2022 due primarily to lower product pricing and, to a lesser extent, lower shipments. The price variance resulted in a decrease in operating earnings and Adjusted EBITDA of $1,588 million compared to 2022.
SPF shipment volumes were comparable versus 2022. SPF shipment volumes in Q1-23 increased year-over-year as Q1-22 was impacted by disruptions to rail and truck services resulting from severe weather and flooding in B.C. carried over from Q4-21. This increase was substantially offset by lower shipment volumes resulting from weaker demand during the balance of the year.
SYP shipment volumes decreased compared to 2022 due primarily to reductions in production volumes, discussed further in the section below.
The volume variance resulted in an increase in operating earnings and Adjusted EBITDA of $4 million compared to 2022.
|
|
| 2023 | 2022 | |||||||
| SPF Sales by Destination | MMfbm | % | MMfbm | % | ||||
| U.S. |
1,760 | 65% | 1,755 | 65% | ||||
| Canada |
878 | 32% | 837 | 31% | ||||
| Other |
73 | 3% | 113 | 4% | ||||
| 2,711 | 2,705 | |||||||
We ship SPF to several export markets, while our SYP sales are almost entirely within the U.S. The relative proportion of shipments of SPF by destination was comparable versus prior year. Exports of SPF outside North America have declined in recent years due to reduced exports of low-grade lumber to China.
Wood chip and other residual sales decreased compared to 2022 due primarily to decreases in the pricing of chips and lower lumber production in the U.S. South. Logs and other sales were broadly comparable to prior year.
Costs and Production
SPF production volumes were comparable versus 2022 due primarily to fewer reductions in operating schedules taken in the current year, offset in part by the impact of the previously announced permanent curtailment of one shift at our Fraser Lake and Williams Lake lumber mills and reduced production at certain of our lumber mills in Alberta in the summer due to wildfire evacuation impacts.
SYP production volumes decreased compared to 2022 due primarily to the curtailment of operations at our lumber mill in Perry, Florida and incremental production curtailments to manage inventory.
Cost inflation across a number of our inputs including supplies and materials, energy, labour costs, and transportation has moderated.
Costs of products sold decreased compared to 2022 due primarily to lower log and manufacturing costs in our Canadian operations, lower SYP shipment volumes, and a favourable $77 million variance relating to inventory write-downs. We recorded significant inventory valuation reserves in Q4-22 due to low product pricing at period-end. Required inventory valuation reserves were lower in 2023 due to decreases in inventory costs, primarily from lower log costs, and lower overall inventory levels. Log harvesting in Western Canada in Q4-23 has been slowed by warm weather.
Most of our SPF log requirements are harvested from crown lands owned by the provinces of B.C. or Alberta. B.C.’s stumpage system is tied to reported lumber prices, with a time lag, and publicly auctioned timber harvesting rights. Alberta’s stumpage system is correlated to published lumber prices with a shorter time lag.
SPF log costs decreased compared to 2022 due primarily to lower stumpage rates in Alberta and B.C. and lower purchased log costs.
SPF unit manufacturing costs decreased compared to 2022 due primarily to lower energy, supplies and materials, and labour costs. The weakening of the CAD against the USD was also a contributing factor.
SYP log costs decreased compared to 2022 as availability of logs improved. SYP unit manufacturing costs increased compared to 2022 due to higher maintenance and labour costs, offset by lower energy costs.
Freight and other distribution costs decreased compared to 2022 due primarily to lower trucking rates, favourable changes in customer geography mix, and lower shipment volumes.
Export duty expense decreased compared to 2022. As disclosed in the table below, prior to consideration of the impact of duty recoveries attributable to finalization of POIs, export duties for 2023 decreased compared to 2022 due primarily to lower pricing, and a lower CVD cash deposit rate, offset in part by a higher estimated ADD rate. Export duties in 2023
| 2023 Annual Report | 19 |
included a recovery of $62 million related to the USDOC finalization of AR4 duty rates whereas export duties in 2022 included a recovery of $81 million related to the USDOC finalization of AR3 duty rates.
The following table reconciles our cash deposits paid during the year to the amount recorded in our statements of earnings:
| Duty impact on earnings ($ millions) | 2023 | 2022 | ||||||
| Cash deposits paid1 |
$ | (53 | ) | $ | (117 | ) | ||
| Adjust to West Fraser Estimated ADD rate2 |
(17 | ) | 18 | |||||
| Export duties, net |
(70 | ) | (99 | ) | ||||
| Duty recovery attributable to AR33 |
— | 81 | ||||||
| Duty recovery attributable to AR44 |
62 | — | ||||||
| Net duty recovery (expense) |
(8 | ) | (18 | ) | ||||
| Net interest income on duty deposits receivable |
$ | 27 | $ | 9 | ||||
| 1. | Represents combined CVD and ADD cash deposit rate of 11.12% for January 1 to January 9, 2022, 11.14% for January 10 to August 8, 2022, and 8.25% from August 9, 2022 to July 31, 2023, and 9.25% from August 1 to December 31, 2023. |
| 2. | Represents adjustment to West Fraser Estimated ADD rate of 8.84% for 2023 and 4.52% for 2022. |
| 3. | $81 million represents the duty recovery attributable to the finalization of AR3 duty rates for the 2020 POI. The final CVD rate was 3.62% and the final ADD rate was 4.63% for AR3. |
| 4. | $62 million represents the duty recovery attributable to the finalization of AR4 duty rates for the 2021 POI. The final CVD rate was 2.19% and the final ADD rate was 7.06% for AR4. |
Amortization expense was comparable versus 2022.
Selling, general and administration costs decreased compared to 2022 due primarily to lower variable compensation costs, offset in part by annual salary increases.
Restructuring and impairment charges of $137 million were recorded in 2023. Of this amount, $128 million related to facility closures and curtailments due to availability of economic fibre sources in the U.S. South and B.C. The remaining balance relates to impairment losses relating to an equity accounted investment that produces and distributes wood pellets and the closure of a regional corporate office.
Restructuring and impairment charges of $31 million were recorded in 2022 relating to the curtailment of operations at our lumber mill in Perry, Florida.
Operating earnings for the Lumber Segment decreased by $1,430 million compared to 2022 for the reasons explained above.
Adjusted EBITDA for the Lumber Segment decreased by $1,326 million compared to 2022. The following table shows the Adjusted EBITDA variance for the period. The impact of the contribution from our Spray Lake lumber mill from November 17, 2023, the date of acquisition, to December 31, 2023 is nominal and included under Other. This impact includes a one time charge of $2 million related to inventory purchase price accounting. The impact of changes in pricing, cost and volume for wood chip and other residuals is also included under Other. Energy revenues were also lower compared to the prior year.
| Adjusted EBITDA ($ millions) | 2022 to 2023 | |||
| Adjusted EBITDA - comparative period |
$ | 1,328 | ||
| Price |
(1,588 | ) | ||
| Volume |
4 | |||
| Changes in export duties |
11 | |||
| Changes in costs |
206 | |||
| Impact of inventory write-downs |
77 | |||
| Other |
(36 | ) | ||
| Adjusted EBITDA - current period |
$ | 2 | ||
|
|
Softwood Lumber Dispute
On November 25, 2016, a coalition of U.S. lumber producers petitioned the USDOC and the USITC to investigate alleged subsidies to Canadian softwood lumber producers and levy CVD and ADD duties against Canadian softwood lumber imports. The USDOC has and continues to choose us as a “mandatory respondent” to both the countervailing and antidumping investigations, and as a result, we have received unique company-specific rates.
Developments in CVD and ADD rates
We began paying CVD and ADD duties in 2017 based on the determination of duties payable by the USDOC. The CVD and ADD cash deposit rates are updated upon the finalization of the USDOC’s AR process for each POI, as summarized in the tables below.
On March 14, 2023, the USDOC initiated AR5 POI covering the 2022 calendar year. West Fraser was selected as a mandatory respondent, which will result in West Fraser continuing to be subject to a company-specific rate.
The respective Cash Deposit Rates, the AR POI Final Rate and the West Fraser Estimated ADD Rate for each period are as follows:
| Effective dates for CVD |
Cash Deposit Rate |
AR POI Final Rate |
||||
| AR1 POI1,2 |
||||||
| April 28, 2017 - August 24, 2017 |
24.12 % | 6.76 % | ||||
| August 25, 2017 - December 27, 2017 |
— % | — % | ||||
| December 28, 2017 - December 31, 2017 |
17.99 % | 6.76 % | ||||
| January 1, 2018 - December 31, 2018 |
17.99 % | 7.57 % | ||||
| AR2 POI3 |
||||||
| January 1, 2019 - December 31, 2019 |
17.99 % | 5.08 % | ||||
| AR3 POI4 |
||||||
| January 1, 2020 - November 30, 2020 |
17.99 % | 3.62 % | ||||
| December 1, 2020 - December 31, 2020 |
7.57 % | 3.62 % | ||||
| AR4 POI5 |
||||||
| January 1, 2021 - December 1, 2021 |
7.57 % | 2.19 % | ||||
| December 2, 2021 - December 31, 2021 |
5.06 % | 2.19 % | ||||
| AR5 POI6 |
||||||
| January 1, 2022 – January 9, 2022 |
5.06 % | n/a | ||||
| January 10, 2022 – August 8, 2022 |
5.08 % | n/a | ||||
| August 9, 2022 - December 31, 2022 |
3.62 % | n/a | ||||
| AR6 POI7 |
||||||
| January 1, 2023 - July 31, 2023 |
3.62 % | n/a | ||||
| August 1, 2023 - December 31, 2023 |
2.19 % | n/a | ||||
| 1. | On April 24, 2017, the USDOC issued its preliminary rate in the CVD investigation. The requirement that we make cash deposits for CVD was suspended on August 24, 2017, until the USDOC published the revised rate. |
| 2. | On November 24, 2020, the USDOC issued the final CVD rate for the AR1 POI. |
| 3. | On November 24, 2021, the USDOC issued the final CVD rate for the AR2 POI. On January 10, 2022, the USDOC amended the final CVD rate for the AR2 POI from 5.06% to 5.08% for ministerial errors. This table only reflects the final rate. |
| 4. | On August 4, 2022, the USDOC issued the final CVD rate for the AR3 POI. |
| 5. | On August 1, 2023, the USDOC issued the final CVD rate for the AR4 POI. |
| 6. | The CVD rate for the AR5 POI will be adjusted when AR5 is complete and the USDOC finalizes the rate, which is not expected until 2024. |
| 7. | The CVD rate for the AR6 POI will be adjusted when AR6 is complete and the USDOC finalizes the rate, which is not expected until 2025. |
| 2023 Annual Report | 21 |
| Effective dates for ADD | Cash Deposit Rate |
AR POI Final Rate |
West Fraser Rate |
|||||||
| AR1 POI1,2 |
||||||||||
| June 30, 2017 - December 3, 2017 |
6.76 % | 1.40 % | 1.46 % | |||||||
| December 4, 2017 - December 31, 2017 |
5.57 % | 1.40 % | 1.46 % | |||||||
| January 1, 2018 - December 31, 2018 |
5.57 % | 1.40 % | 1.46 % | |||||||
| AR2 POI3 |
||||||||||
| January 1, 2019 - December 31, 2019 |
5.57 % | 6.06 % | 4.65 % | |||||||
| AR3 POI4 |
||||||||||
| January 1, 2020 - November 29, 2020 |
5.57 % | 4.63 % | 3.40 % | |||||||
| November 30, 2020 - December 31, 2020 |
1.40 % | 4.63 % | 3.40 % | |||||||
| AR4 POI5 |
||||||||||
| January 1, 2021 - December 1, 2021 |
1.40 % | 7.06 % | 6.80 % | |||||||
| December 2, 2021 - December 31, 2021 |
6.06 % | 7.06 % | 6.80 % | |||||||
| AR5 POI6 |
||||||||||
| January 1, 2022 - August 8, 2022 |
6.06 % | n/a | 4.52 % | |||||||
| August 9, 2022 - December 31, 2022 |
4.63 % | n/a | 4.52 % | |||||||
| AR6 POI7 |
||||||||||
| January 1, 2023 - July 31, 2023 |
4.63 % | n/a | 8.84 % | |||||||
| August 1, 2023 - December 31, 2023 |
7.06 % | n/a | 8.84 % | |||||||
| 1. | On June 26, 2017, the USDOC issued its preliminary rate in the ADD investigation effective June 30, 2017. |
| 2. | On November 24, 2020, the USDOC issued the final ADD rate for the AR1 POI. |
| 3. | On November 24, 2021, the USDOC issued the final ADD rate for the AR2 POI. |
| 4. | On August 4, 2022, the USDOC issued the final ADD rate for the AR3 POI. |
| 5. | On July 31, 2023, the USDOC issued the final ADD rate for the AR4 POI. On September 7, 2023, the USDOC amended the final ADD rate for the AR4 POI from 6.96% to 7.06% for ministerial errors. This table only reflects the final rate. |
| 6. | The ADD rate for the AR5 POI will be adjusted when AR5 is complete and the USDOC finalizes the rate, which is not expected until 2024. |
| 7. | The ADD rate for the AR6 POI will be adjusted when AR6 is complete and the USDOC finalizes the rate, which is not expected until 2025. |
Accounting policies for duties
The CVD and ADD rates apply retroactively for each POI. We record CVD as export duty expense at the cash deposit rate until an AR finalizes a new applicable rate for each POI. We record ADD as export duty expense by estimating the rate to be applied for each POI by using our actual results and a similar calculation methodology as the USDOC and adjust when an AR finalizes a new applicable rate for each POI. The difference between the cumulative cash deposits paid and cumulative export duty expense recognized for each POI is recorded on our balance sheet as export duty deposits receivable or payable.
The difference between the cash deposit amount and the amount that would have been due based on the final AR rate will incur interest based on the U.S. federally published interest rate. We record interest income on our duty deposits receivable, net of any interest expense on our duty deposits payable, based on this rate.
Appeals
On May 22, 2020, the North American Free Trade Agreement (“NAFTA”) panel issued its final decision on “Injury”. The NAFTA panel rejected the Canadian parties’ arguments and upheld the USITC’s remand determination in its entirety.
On August 28, 2020, the World Trade Organization’s (“WTO”) dispute-resolution panel ruled unanimously that U.S. countervailing duties against Canadian softwood lumber are inconsistent with the WTO obligations of the United States. The decision confirmed that Canada does not subsidize its softwood lumber industry. On September 28, 2020, the U.S. announced that it would appeal the WTO panel’s decision.
Under U.S. trade law, the International Trade Commission (“ITC”) must review antidumping and countervailing orders every 5 years from the date of issuance. This process is referred to as a “Sunset Review”. On November 30, 2023, the ITC voted to maintain the ADD and CVD orders on softwood lumber from Canada on the grounds that the revocation would likely lead to the continuation or recurrence of material injury to the U.S. domestic industry within a reasonably foreseeable time.
|
|
The softwood lumber case will continue to be subject to NAFTA or the new Canada-United States-Mexico Agreement (“CUSMA”), WTO dispute resolution processes, and litigation in the U.S. In the past, long periods of litigation have led to negotiated settlements and duty deposit refunds. In the interim, duties remain subject to the USDOC AR process, which results in an annual adjustment of duty deposit rates.
Notwithstanding the deposit rates assigned under the investigations, our final liability for CVD and ADD will not be determined until each annual administrative review process is complete and related appeal processes are concluded.
North America Engineered Wood Products Segment
| NA EWP Segment Earnings ($ millions unless otherwise indicated) |
2023 | 2022 | ||||||
| Sales |
||||||||
| OSB |
$ | 1,998 | $ | 3,004 | ||||
| Plywood, LVL and MDF |
587 | 759 | ||||||
| Wood chips, logs and other |
23 | 26 | ||||||
| 2,608 | 3,789 | |||||||
| Cost of products sold |
(1,594 | ) | (1,677 | ) | ||||
| Freight and other distribution costs |
(329 | ) | (329 | ) | ||||
| Amortization |
(273 | ) | (306 | ) | ||||
| Selling, general and administration |
(96 | ) | (106 | ) | ||||
| Operating earnings |
316 | 1,371 | ||||||
| Adjusted EBITDA1 |
$ | 589 | $ | 1,677 | ||||
| Capital expenditures |
$ | 156 | $ | 235 | ||||
| OSB (MMsf 3/8” basis) |
||||||||
| Production |
6,389 | 6,109 | ||||||
| Shipments |
6,380 | 6,006 | ||||||
| Plywood (MMsf 3/8” basis) |
||||||||
| Production |
727 | 716 | ||||||
| Shipments |
731 | 707 | ||||||
| 1. | This is a non-GAAP financial measure. Refer to the “Non-GAAP and Other Specified Financial Measures” section of this document for more information on this measure. |
Our NA EWP segment includes our North American OSB, plywood, MDF, and LVL operations.
Sales and Shipments
Sales decreased compared to 2022 due primarily to lower product pricing, in particular OSB, offset in part by higher OSB shipment volumes.
The price variance resulted in a decrease in operating earnings and Adjusted EBITDA of $1,254 million compared to 2022.
OSB shipment volumes increased compared to 2022 as shipments in the first half of 2022 were constrained due to limited availability of railcars to service our Western Canada and Ontario manufacturing facilities. Higher production volumes, discussed further in the section below, was also a contributing factor. Plywood shipment volumes were slightly higher compared to 2022.
The volume variance resulted in an increase in operating earnings and Adjusted EBITDA of $22 million compared to 2022.
| 2023 Annual Report | 23 |
Costs and Production
OSB production volumes increased compared to 2022. OSB production volumes in 2022 were impacted by reduced operating schedules in the first half of the year to manage inventory levels as a result of transportation disruptions. Improved productivity at a number of our facilities and the ramp-up of our Allendale, South Carolina mill were also contributing factors to the increase year over year.
Plywood production volumes increased slightly compared to 2022 as improved recovery and reliability offset the impacts of the previously announced permanent curtailment of one shift at our plywood mill located in Quesnel, B.C. that was effective Q4-22.
Costs of products sold decreased compared to 2022 due to lower input prices, lower energy and fibre costs, lower labour costs, improved productivity, and the weakening of the CAD against the USD. These factors were offset in part by higher costs due to Allendale ramp-up.
Costs of products sold include the impact of incremental Allendale startup costs incurred in the current year. The 2023 NA EWP segment results include $13 million incurred through the second quarter in connection with the preparation of the Allendale, South Carolina mill for startup.
Freight and other distribution costs were comparable to 2022 as the impact of higher OSB shipment volumes was offset by lower trucking rates.
Amortization expense decreased compared to 2022 as certain assets reached the end of their estimated useful lives.
Selling, general and administration costs were lower than 2022 due primarily to lower variable compensation costs, offset in part by annual salary increases.
Operating earnings for the NA EWP Segment decreased $1,055 million compared to 2022 due to the reasons explained above.
Adjusted EBITDA for the NA EWP Segment decreased by $1,088 million from 2022. The following table shows the Adjusted EBITDA variance for the period.
| Adjusted EBITDA ($ millions) | 2022 to 2023 | |||
| Adjusted EBITDA - comparative period |
$ | 1,677 | ||
| Price |
(1,254 | ) | ||
| Volume |
22 | |||
| Changes in costs |
156 | |||
| Impact of inventory write-downs |
7 | |||
| Other |
(19 | ) | ||
| Adjusted EBITDA - current period |
$ | 589 | ||
|
|
Pulp & Paper Segment
| Pulp & Paper Segment Earnings ($ millions unless otherwise indicated) |
2023 | 2022 | ||||||
| Sales |
$ | 623 | $ | 807 | ||||
| Cost of products sold |
(555 | ) | (596 | ) | ||||
| Freight and other distribution costs |
(120 | ) | (153 | ) | ||||
| Amortization |
(24 | ) | (35 | ) | ||||
| Selling, general and administration |
(25 | ) | (32 | ) | ||||
| Restructuring and impairment charges |
(142 | ) | (13 | ) | ||||
| Operating loss |
(242 | ) | (22 | ) | ||||
| Adjusted EBITDA1 |
$ | (77 | ) | $ | 26 | |||
| Capital expenditures |
$ | 32 | $ | 29 | ||||
| Pulp (Mtonnes) |
||||||||
| Production |
913 | 940 | ||||||
| Shipments |
913 | 968 | ||||||
| 1. | This is a non-GAAP financial measure. Refer to the “Non-GAAP and Other Specified Financial Measures” section of this document for more information on this measure. |
Our Pulp & Paper segment results include the results of the Hinton pulp mill, Quesnel River Pulp mill, and Slave Lake Pulp mill held for sale as the transactions had not completed as at December 31, 2023.
Sales and Shipments
Sales decreased compared to 2022 due primarily to lower pulp pricing and the volume impact of the transition of our Hinton pulp mill to UKP. The price variance resulted in a decrease in operating earnings and Adjusted EBITDA of $144 million compared to 2022.
Pulp shipments decreased compared to 2022 due primarily to reduction in production volumes, discussed further in the section below. The volume variance resulted in an increase in operating earnings and Adjusted EBITDA of $6 million compared to 2022.
Costs and Production
Pulp production decreased compared to 2022 due primarily to the impact of transitioning our Hinton pulp mill, offset in part by a recovery of volumes lost in the prior year due to reductions in operating schedules taken as a result of transportation disruptions, in particular for our BCTMP mills, and lower production curtailments related to power prices in Alberta.
Costs of products sold decreased compared to 2022 due primarily to lower shipment volumes, lower fibre costs driven by lower pulp pricing, lower spend on chemicals and energy as a result of the Hinton pulp mill transition to UKP, and lower power prices. This was partially offset by a $12 million unfavourable impact relating to inventory write-downs and higher maintenance expenditures in the current year.
Freight and other distribution costs decreased compared to 2022 due to lower shipment volumes and lower ocean freight costs.
Amortization expense decreased compared to 2022. The decrease in amortization expense relates to the write-down and transfer of property, plant and equipment associated with the Hinton pulp mill, Quesnel River Pulp mill, and Slave Lake Pulp mill to a disposal group held for sale. No further amortization expense was taken on the assets upon transfer to the disposal group held for sale.
| 2023 Annual Report | 25 |
Selling, general, and administration costs decreased compared to 2022 due primarily to lower variable compensation costs, offset in part by annual salary increases.
In 2023, we recorded impairment losses of $142 million relating to the sale of the Hinton pulp mill, Quesnel River Pulp mill, and Slave Lake Pulp mill, including remeasurement of estimated working capital adjustments specified in the asset purchase agreements. In 2022, we recorded impairment losses of $13 million related to equipment that was decommissioned as part of the transition of the Hinton pulp mill to UKP.
Operating loss for the Pulp & Paper Segment increased by $220 million compared to 2022 due to the reasons explained above.
Adjusted EBITDA for the Pulp & Paper Segment decreased by $103 million compared to 2022. The following table shows the Adjusted EBITDA variance for the period.
| Adjusted EBITDA ($ millions) | 2022 to 2023 | |||||||
| Adjusted EBITDA - comparative period |
$ | 26 | ||||||
| Price |
(144 | ) | ||||||
| Volume |
6 | |||||||
| Changes in costs |
44 | |||||||
| Impact of inventory write-downs |
(12 | ) | ||||||
| Other |
3 | |||||||
| Adjusted EBITDA - current period |
$ | (77 | ) | |||||
The Hinton pulp mill, Quesnel River Pulp mill, and Slave Lake Pulp mill held for sale comprise a significant portion of the Pulp & Paper segment’s sales and operating earnings.
| ($ millions) | 2023 | 2022 | ||||||
| Sales relating to pulp mills held for sale |
433 | 585 | ||||||
| Operating earnings (losses) relating to pulp mills held for sale1 |
(250 | ) | (39 | ) | ||||
| 1. | Operating earnings (losses) include impairment losses of $141 million for 2023 and $13 million for 2022. |
|
|
Europe Engineered Wood Products Segment
| Europe EWP Segment Earnings ($ millions unless otherwise indicated) |
2023 | 2022 | ||||||
| Sales |
$ | 517 | $ | 738 | ||||
| Cost of products sold |
(409 | ) | (479 | ) | ||||
| Freight and other distribution costs |
(40 | ) | (46 | ) | ||||
| Amortization |
(49 | ) | (53 | ) | ||||
| Selling, general and administration |
(21 | ) | (28 | ) | ||||
| Restructuring and impairment charges |
— | (15 | ) | |||||
| Operating earnings (loss) |
(3 | ) | 117 | |||||
| Adjusted EBITDA1 |
$ | 46 | $ | 186 | ||||
| Capital expenditures |
$ | 30 | $ | 20 | ||||
| OSB (MMsf 3/8” basis) |
||||||||
| Production |
1,016 | 954 | ||||||
| Shipments |
1,023 | 977 | ||||||
| GBP - USD exchange rate |
||||||||
| Closing rate |
1.27 | 1.21 | ||||||
| Average rate |
1.24 | 1.24 | ||||||
| 1. | This is a non-GAAP financial measure. Refer to the “Non-GAAP and Other Specified Financial Measures” section of this document for more information on this measure. |
Our Europe EWP segment includes our U.K. and Belgium OSB, MDF, and particleboard operations. Revenues and expenses of our European operations, which have British pound sterling and Euro functional currencies, are translated at the average rate of exchange prevailing during the period.
Sales and Shipments
Sales decreased compared to 2022 due to lower product pricing in local currency terms and, to a lesser extent, lower shipment volumes.
The price variance resulted in a decrease in operating earnings and Adjusted EBITDA of $133 million compared to 2022. The price variance represents the impact of changes in product pricing in local currency terms, with any associated foreign exchange impact from the strengthening or weakening of the GBP against USD presented under Other in the Adjusted EBITDA variance table.
Overall shipment volumes decreased versus 2022 due to weaker demand. The impact of modestly higher OSB shipment volumes was more than offset by a significant decrease in MDF and particleboard shipment volumes. OSB shipment volumes increased as 2022 shipment volumes were adversely impacted by the impacts of customer destocking in the second half of the year. Shipment volumes of MDF and particleboard are highly correlated to home building activity and decreased significantly compared to 2022 due to weaker demand driven by higher interest rates over the past year. The volume variance resulted in a decrease of $25 million compared to 2022.
Costs and Production
Production volumes in both years were impacted by production curtailments taken to manage inventory levels for the reasons discussed above. OSB had higher production curtailments in 2022 and MDF and particleboard had higher production curtailments in 2023.
Costs of products sold decreased compared to 2022 due primarily to lower shipment volumes from MDF and particleboard as well as lower energy and resin costs, offset in part by higher OSB shipment volumes and fibre costs.
| 2023 Annual Report | 27 |
Freight and other distribution costs decreased compared to 2022 due primarily to lower shipment volumes.
Amortization decreased compared to 2022 as certain assets reached the end of their estimated useful lives. The impairment of our South Molton, England location in 2022 was also a contributing factor.
Selling, general and administration costs decreased compared to 2022 due primarily to lower variable compensation costs, offset in part by annual salary increases.
Restructuring and impairment charges of $15 million were recorded in 2022 relating to our South Molton, England location.
Operating earnings for the Europe EWP Segment decreased by $120 million compared to 2022 due to the reasons explained above.
Adjusted EBITDA for the Europe EWP Segment decreased by $140 million from 2022. The following table shows the Adjusted EBITDA variance for the period. The variances presented represent the impact of changes in price, volume and cost in local currency terms, with any associated foreign exchange impact from the strengthening or weakening of the GBP against USD presented under Other. The impact of the sale of carbon allowances is also included under Other.
| Adjusted EBITDA ($ millions) | 2022 to 2023 | |||
| Adjusted EBITDA - comparative period |
$ | 186 | ||
| Price |
(133 | ) | ||
| Volume |
(25 | ) | ||
| Changes in costs |
15 | |||
| Other |
3 | |||
| Adjusted EBITDA - current period |
$ | 46 | ||
|
|
Discussion & Analysis of Specific Items
Selling, general and administration
Selling, general and administration costs for 2023 were $307 million (2022 - $365 million).
Selling, general and administration costs decreased compared to 2022 due primarily to lower variable compensation costs, offset in part by annual salary increases.
Selling, general and administration expense related to our operating segments are also discussed under “Discussion & Analysis of Annual Results by Product Segment”.
Equity-based compensation
Our equity-based compensation includes our share purchase option, phantom share unit, and deferred share unit plans (collectively, the “Plans”). Our Plans are fair valued at each period-end, and the resulting expense or recovery is recorded in equity-based compensation over the vesting period.
Our valuation models consider various factors, with the most significant being the change in the market value of our shares from the beginning to the end of the relevant period. The expense or recovery does not necessarily represent the value that the holders of options and units will ultimately receive.
We recorded an expense of $25 million during 2023 (2022 - expense of $5 million). The expense for 2023 reflects an increase in the price of our common shares traded on the TSX, changes in the expected payout multiple on our performance share units, and additional vesting of units granted.
The expense for 2022 reflects changes in the expected payout on our performance share units and vesting of granted units, offset in part by a decrease in the price of our common shares.
Finance income (expense), net
Finance income (expense), net includes interest earned on short-term deposits and interest recognized on our duty deposits.
Finance income, net increased compared to 2022 due primarily to higher interest income earned on our cash equivalents, higher net interest income related to export duties, including the impact of AR4 finalization in Q3-23, and higher net interest income on our defined-benefit pension plans as our overall funded position has increased.
Other income
Other income of $5 million was recorded in 2023 (2022 - other income of $37 million). Other income in 2023 relates primarily to gains on our electricity swaps driven by increases in forward electricity prices over the remaining term of the contracts and settlement gains relating to pension annuity purchase agreements for certain retired and terminated vested employees. These factors were offset in part by foreign exchange losses recorded on our CAD-denominated monetary assets and liabilities as the CAD appreciated against the USD.
Other income in 2022 relates primarily to foreign exchange gains recorded on our CAD-denominated monetary assets and liabilities and mark-to-market gains on our interest rate swap contracts.
Tax recovery (provision)
We recorded an income tax recovery in 2023 of $61 million compared to an income tax expense of $618 million in 2022. The effective tax rate was 27% in 2023 compared to 24% in 2022. Note 20 to the Annual Financial Statements provides a reconciliation of income taxes calculated at the statutory rate to the income tax expense.
| 2023 Annual Report | 29 |
Other comprehensive earnings – translation of operations with different functional currencies
Our European operations have British pound sterling and Euro functional currencies. Our Spray Lake lumber mill and jointly-owned newsprint operation have Canadian dollar functional currency. Assets and liabilities of these entities are translated at the rate of exchange prevailing at the reporting date, and revenues and expenses at average rates during the period. Gains or losses on translation are included as a component of shareholders’ equity in Accumulated other comprehensive loss.
We recorded a translation gain of $34 million during 2023 (2022 - translation loss of $83 million).
In general, a strengthening (weakening) of the USD against the Canadian dollar, British pound sterling or Euro results in a translation loss (gain). The translation gain in the current year reflects a weakening of the USD against the aforementioned currencies.
Other comprehensive earnings – actuarial gains/losses on retirement benefits
The funded position of our defined benefit pension plans and other retirement benefit plans is estimated at the end of each period. The funded position, as shown in note 14 to the Annual Financial Statements, is determined by subtracting the value of the plan assets from the plan obligations.
We recorded an after-tax actuarial loss of $35 million during 2023 (2022 - after-tax actuarial gain of $164 million).
The actuarial loss in 2023 reflects a decrease in the discount rate used to calculate plan liabilities and adjustments to actuarial assumptions.
The actuarial gain in 2022 reflects an increase in the discount rate used to calculate plan liabilities offset in part by lower returns on plan assets.
|
|
FOURTH QUARTER RESULTS
| Summary Results ($ millions) |
Q4-23 | Q3-23 | Q4-22 | |||||||||
| Earnings |
||||||||||||
| Sales |
$ | 1,514 | $ | 1,705 | $ | 1,615 | ||||||
| Cost of products sold |
(1,117 | ) | (1,128 | ) | (1,209 | ) | ||||||
| Freight and other distribution costs |
(212 | ) | (217 | ) | (209 | ) | ||||||
| Export duties, net |
(8 | ) | 39 | (29 | ) | |||||||
| Amortization |
(136 | ) | (132 | ) | (148 | ) | ||||||
| Selling, general and administration |
(80 | ) | (73 | ) | (98 | ) | ||||||
| Equity-based compensation |
(15 | ) | 4 | (6 | ) | |||||||
| Restructuring and impairment charges |
(134 | ) | (13 | ) | (47 | ) | ||||||
| Operating earnings (loss) |
(187 | ) | 184 | (130 | ) | |||||||
| Finance income, net |
14 | 21 | 3 | |||||||||
| Other income (expense) |
(30 | ) | 11 | 2 | ||||||||
| Tax recovery (provision) |
50 | (56 | ) | 31 | ||||||||
| Earnings (loss) |
$ | (153 | ) | $ | 159 | $ | (94 | ) | ||||
| Adjusted EBITDA1 |
$ | 97 | $ | 325 | $ | 70 | ||||||
| 1. | This is a non-GAAP financial measure. Refer to the “Non-GAAP and Other Specified Financial Measures” section of this document for more information on this measure. |
| Selected Quarterly Amounts ($ millions, unless otherwise indicated) |
Q4-23 | Q3-23 | Q2-23 | Q1-23 | Q4-22 | Q3-22 | Q2-22 | Q1-22 | ||||||||||||||||||||||||
| Sales |
$ | 1,514 | $ | 1,705 | $ | 1,608 | $ | 1,627 | $ | 1,615 | $ | 2,088 | $ | 2,887 | $ | 3,110 | ||||||||||||||||
| Earnings (loss) |
$ | (153 | ) | $ | 159 | $ | (131 | ) | $ | (42 | ) | $ | (94 | ) | $ | 216 | $ | 762 | $ | 1,090 | ||||||||||||
| Basic EPS (dollars) |
(1.87 | ) | 1.91 | (1.57 | ) | (0.50 | ) | (1.12 | ) | 2.50 | 7.66 | 10.35 | ||||||||||||||||||||
| Diluted EPS (dollars) |
(1.87 | ) | 1.81 | (1.57 | ) | (0.52 | ) | (1.13 | ) | 2.50 | 7.59 | 10.25 | ||||||||||||||||||||
Pricing for our products improved through Q1-22, although these pricing gains were offset in part by lower shipments as a result of constraints on transportation availability. Subsequent decreases in sales and earnings through Q2-23 were driven primarily by decreases in lumber and OSB pricing, inventory write-downs, maintenance-related costs and downtime in our pulp segment, and impairment charges. Earnings improved in Q3-23, driven primarily by improvements in OSB pricing, lower impairment charges, the impacts of AR4 finalization, and lower maintenance-related expenditures in our pulp segment. Sales and earnings decreased in Q4-23 due primarily to decreases in lumber and OSB pricing, higher export duties, and impairment charges related to announced facility closures and curtailments in our lumber segment.
| 2023 Annual Report | 31 |
Discussion & Analysis of Quarterly Results by Product Segment
Lumber Segment
| Lumber Segment Earnings ($ millions unless otherwise indicated) |
Q4-23 | Q3-23 | Q4-22 | |||||||||
| Sales |
||||||||||||
| Lumber |
$ | 530 | $ | 613 | $ | 611 | ||||||
| Wood chips and other residuals |
66 | 68 | 73 | |||||||||
| Logs and other |
18 | 15 | 17 | |||||||||
| 614 | 697 | 701 | ||||||||||
| Cost of products sold |
(521 | ) | (551 | ) | (607 | ) | ||||||
| Freight and other distribution costs |
(93 | ) | (100 | ) | (92 | ) | ||||||
| Export duties, net |
(8 | ) | 39 | (29 | ) | |||||||
| Amortization |
(48 | ) | (46 | ) | (51 | ) | ||||||
| Selling, general and administration |
(43 | ) | (41 | ) | (51 | ) | ||||||
| Restructuring and impairment charges |
(128 | ) | — | (31 | ) | |||||||
| Operating loss |
(228 | ) | (2 | ) | (160 | ) | ||||||
| Adjusted EBITDA1 |
$ | (51 | ) | $ | 44 | $ | (77 | ) | ||||
| SPF (MMfbm) |
||||||||||||
| Production |
687 | 693 | 594 | |||||||||
| Shipments |
658 | 678 | 582 | |||||||||
| SYP (MMfbm) |
||||||||||||
| Production |
655 | 709 | 707 | |||||||||
| Shipments |
662 | 704 | 713 | |||||||||
| 1. | This is a non-GAAP financial measure. Refer to the “Non-GAAP and Other Specified Financial Measures” section of this document for more information on this measure. Q4-23 Adjusted EBITDA was impacted by a one-time charge of $2 million related to inventory purchase price accounting related to the Spray Lake lumber mill acquisition. |
Sales and Shipments
Lumber sales decreased compared to Q3-23 due to lower product pricing and lower shipment volumes. Lumber industry supply and demand balances continue to experience the effects of softened repair and remodelling market demand and relatively elevated imports of SPF products from Europe. Q4-23 lumber sales decreased compared to Q4-22 due primarily to lower product pricing offset in part by higher shipment volumes. Higher SPF shipment volumes more than offset lower SYP shipment volumes resulting in a positive volume variance compared to Q4-22.
The price variance resulted in a decrease in operating earnings and Adjusted EBITDA by $65 million compared to Q3-23, and a decrease by $99 million compared to Q4-22.
SPF shipment volumes were slightly lower than Q3-23. SPF shipment volumes increased compared to Q4-22 due to higher production volumes, discussed further in the section below.
SYP shipment volumes decreased compared to Q3-23 and Q4-22 due primarily to lower production volumes, discussed further in the section below.
The volume variance resulted in a decrease in operating earnings and Adjusted EBITDA of $5 million compared to Q3-23 and an increase of $5 million compared to Q4-22.
|
|
| Q4-23 | Q3-23 | Q4-22 | ||||||||||||||||
| SPF Sales by Destination | MMfbm | % | MMfbm | % | MMfbm | % | ||||||||||||
| U.S. |
388 | 59% | 454 | 67% | 347 | 60% | ||||||||||||
| Canada |
243 | 37% | 210 | 31% | 213 | 37% | ||||||||||||
| Other |
26 | 4% | 14 | 2% | 22 | 3% | ||||||||||||
| 657 | 678 | 582 | ||||||||||||||||
We ship SPF to certain export markets, while our SYP sales are almost entirely within the U.S. The relative proportion of shipments of SPF by destination remained broadly comparable versus comparative periods.
Wood chip and other residual sales were comparable to Q3-23 and decreased compared to Q4-22 due primarily to lower chip pricing. Sales relating to logs and other were consistent with comparative periods.
Costs and Production
SPF production volumes decreased slightly compared to Q3-23 due to the impact of incremental reductions in operating schedules to manage inventory levels at our B.C. mills, offset in part by incremental production volume from our newly acquired Spray Lake lumber mill. SPF production volumes increased compared to Q4-22 as the prior year period was impacted by higher reductions in operating schedules to manage inventory levels. Incremental production volume from our Spray Lake lumber mill was also a contributing factor in the comparison.
SYP production volumes decreased compared to Q3-23 and Q4-22 due to incremental reductions in operating schedules to manage inventory levels. The impacts of the previously announced curtailment of operations at our Perry, Florida lumber mill was also a contributing factor in the comparison to Q4-22.
Costs of products sold decreased compared to Q3-23 due primarily to lower shipment volumes and a favourable $11 million variance relating to inventory write-downs. Q3-23 was adversely impacted by an increase in inventory valuation reserves whereas inventory valuation reserves were largely unchanged in Q4-23. Despite lower product pricing compared to Q3-23, inventory valuation reserves remained largely unchanged in Q4-23 due primarily to lower log costs, offset in part by a seasonal increase in log inventory volumes over the fourth quarter.
Costs of products sold decreased compared to Q4-22 due primarily to lower log costs, lower unit manufacturing costs in our Western Canada operations, and a favourable $40 million variance relating to inventory write-downs. These factors were offset in part by higher shipment volumes. We recorded significant inventory valuation reserves in Q4-22 due to low product pricing at period-end whereas inventory valuation reserves were largely unchanged in Q4-23 as compared to Q3-23.
Most of our SPF log requirements are harvested from crown lands owned by the provinces of B.C. or Alberta. B.C.’s stumpage system is tied to reported lumber prices, with a time lag, and publicly auctioned timber harvesting rights. Alberta’s stumpage system is correlated to published lumber prices with a shorter time lag.
SPF log costs in Q4-23 decreased slightly compared to Q3-23 due primarily to lower B.C. stumpage rates. SPF log costs decreased compared to Q4-22 due primarily to lower B.C. stumpage rates and purchased log costs. Lower Alberta stumpage rates was also a contributing factor.
SPF unit manufacturing costs were broadly consistent versus Q3-23. SPF unit manufacturing costs decreased compared to Q4-22 due primarily to higher production and lower energy costs.
SYP log costs were comparable to Q3-23 and decreased compared to Q4-22 as availability of logs improved. SYP unit manufacturing costs decreased compared to Q3-23 due to lower maintenance, labour, and energy costs, offset in part by lower production in the current period. SYP unit manufacturing costs decreased compared to Q4-22 due primarily to lower labour and energy costs, offset in part by lower production in the current period.
Freight and other distribution costs decreased compared to Q3-23 due to lower shipment volumes and favourable changes in customer geography mix. Freight and other distribution costs were comparable to Q4-22 as the costs related to higher SPF shipment volumes were offset by lower SYP shipment volumes, lower trucking rates, and favourable changes in customer geography mix.
| 2023 Annual Report | 33 |
We recorded export duty expense in Q4-23 versus export duty recovery in Q3-23, which was attributable to the USDOC finalization of AR4 duty rates during Q3-23. The recovery primarily represents the difference between the final CVD rate of 2.19% and the CVD cash deposit rates paid on shipments of SPF lumber to the U.S. during AR4, which ranged from 5.06% to 7.57%.
Export duties, net decreased compared to Q3-23 due to lower estimated duty rates, as well as lower pricing and lower shipment volumes to the U.S. Export duties, net decreased compared to Q4-22 due primarily to lower pricing and a positive adjustment to West Fraser’s annualized estimated ADD rate in Q4-23, offset in part by higher shipment volumes to the U.S.
The following table reconciles our cash deposits paid during the period to the amount recorded in our statements of earnings:
| Duty impact on earnings ($ millions) | Q4-23 | Q3-23 | Q4-22 | |||||||||
| Cash deposits paid1 |
(12 | ) | (14 | ) | (12 | ) | ||||||
| Adjust to West Fraser Estimated ADD rate2 |
4 | (9 | ) | (17 | ) | |||||||
| Export duties, net |
(8 | ) | (23 | ) | (29 | ) | ||||||
| Duty recovery attributable to AR44 |
— | 62 | — | |||||||||
| Net duty recovery (expense) |
(8 | ) | 39 | (29 | ) | |||||||
| Net interest income on duty deposits receivable |
6 | 14 | 3 | |||||||||
| 1. | Represents combined CVD and ADD cash deposit rate of 9.25% for August 1 to December 31, 2023, 8.25% for for January 1 to July 31, 2023, and 8.25% for August 9 to December 31, 2022. |
| 2. | Represents adjustment to the annualized West Fraser estimated ADD rate of 8.84% for Q4-23, 10.40% for Q3-23, 4.52% for Q4-22. |
| 3. | $62 million represents the duty recovery attributable to the finalization of AR4 duty rates for the 2021 POI. The final CVD rate was 2.19% and the final ADD rate was 7.06% for AR4. |
Amortization expense was broadly consistent versus comparative periods.
Selling, general and administration costs were comparable to Q3-23. Selling, general and administration costs decreased compared to Q4-22 due primarily to lower variable compensation costs, offset in part by annual salary increases.
Restructuring and impairment charges of $128 million were recorded in Q4-23 related to facility closures and curtailments due to availability of economic fibre sources in the U.S. South and B.C. Restructuring and impairment charges of $31 million were recorded in Q4-22 relating to the curtailment of operations at our lumber mill in Perry, Florida.
Operating earnings for the Lumber Segment decreased by $225 million compared to Q3-23 and decreased by $68 million compared to Q4-22 for the reasons explained above.
Adjusted EBITDA for the Lumber Segment decreased by $95 million compared to Q3-23 and increased by $26 million compared to Q4-22. The following table shows the Adjusted EBITDA variance for the period. The impact of the contribution from our Spray Lake lumber mill from November 17, 2023, the date of acquisition, to December 31, 2023 is nominal and included under Other. This impact includes a one time charge of $2 million related to inventory purchase price accounting.
| Adjusted EBITDA ($ millions) | Q3-23 to Q4-23 | Q4-22 to Q4-23 | ||||||
| Adjusted EBITDA - comparative period |
$ | 44 | $ | (77 | ) | |||
| Price |
(65 | ) | (99 | ) | ||||
| Volume |
(5 | ) | 5 | |||||
| Changes in export duties |
(47 | ) | 21 | |||||
| Changes in costs |
17 | 67 | ||||||
| Impact of inventory write-downs |
11 | 40 | ||||||
| Other |
(6 | ) | (8 | ) | ||||
| Adjusted EBITDA - current period |
$ | (51 | ) | $ | (51 | ) | ||
|
|
North America Engineered Wood Products Segment
| NA EWP Segment Earnings ($ millions unless otherwise indicated) |
Q4-23 | Q3-23 | Q4-22 | |||||||||
| Sales |
||||||||||||
| OSB |
$ | 516 | $ | 627 | $ | 447 | ||||||
| Plywood, LVL and MDF |
137 | 145 | 157 | |||||||||
| Wood chips, logs and other |
7 | 5 | 6 | |||||||||
| 661 | 777 | 610 | ||||||||||
| Cost of products sold |
(410 | ) | (386 | ) | (397 | ) | ||||||
| Freight and other distribution costs |
(81 | ) | (80 | ) | (76 | ) | ||||||
| Amortization |
(69 | ) | (67 | ) | (73 | ) | ||||||
| Selling, general and administration |
(27 | ) | (22 | ) | (27 | ) | ||||||
| Operating earnings |
74 | 222 | 35 | |||||||||
| Adjusted EBITDA1 |
$ | 143 | $ | 289 | $ | 109 | ||||||
| OSB (MMsf 3/8” basis) |
||||||||||||
| Production |
1,549 | 1,606 | 1,442 | |||||||||
| Shipments |
1,590 | 1,589 | 1,409 | |||||||||
| Plywood (MMsf 3/8” basis) |
||||||||||||
| Production |
183 | 182 | 162 | |||||||||
| Shipments |
184 | 178 | 181 | |||||||||
| 1. | This is a non-GAAP financial measure. Refer to the “Non-GAAP and Other Specified Financial Measures” section of this document for more information on this measure. |
Our NA EWP segment includes our North American OSB, plywood, MDF, and LVL operations.
Sales and Shipments
Sales decreased compared to Q3-23 due primarily to lower OSB pricing. Sales increased compared to Q4-22 due primarily to higher OSB shipment volumes and, to a lesser extent, higher OSB pricing. These increases were offset in part by lower plywood, LVL, and MDF pricing.
The price variance resulted in a decrease in operating earnings and Adjusted EBITDA of $110 million compared to Q3-23, and a decrease of $7 million compared to Q4-22.
OSB shipment volumes were comparable to Q3-23. OSB shipment volumes increased compared to Q4-22 due to higher production volumes, discussed further in the section below. Plywood shipment volumes were consistent versus comparative periods.
The volume variance resulted in a decrease in operating earnings and Adjusted EBITDA of $1 million compared to Q3-23, and an increase of $14 million compared to Q4-22.
Costs and Production
OSB production volumes decreased compared to Q3-23 due to higher major maintenance shutdowns and production curtailments taken to manage inventory levels, offset in part by the continued ramp-up of our Allendale, South Carolina mill and improved productivity at certain facilities. OSB production volumes increased compared to Q4-22 due to the commencement of production from our Allendale mill, improved productivity, offset in part by higher major maintenance shutdowns and production curtailments taken to manage inventory levels.
Plywood production volumes were comparable to Q3-23. Plywood production volumes increased compared to Q4-22 due to more consistent operating schedules in the current quarter.
| 2023 Annual Report | 35 |
Costs of products sold increased compared to Q3-23 due primarily to higher maintenance spend, the strengthening of the CAD against the USD, and the impacts of Allendale ramp-up.
Costs of products sold increased compared to Q4-22 due primarily to higher OSB shipment volumes, the recognition of $14 million in insurance recoveries in Q4-22, and the impacts of Allendale ramp-up. These factors were offset in part by lower resin, energy, fibre, and labour costs, improved productivity, and a $5 million favourable impact relating to inventory valuation adjustments.
Freight and other distribution costs were comparable to Q3-23. Freight and other distribution costs increased compared to Q4-22 due to higher OSB shipment volumes, offset in part by lower trucking rates.
Amortization expense was comparable to Q3-23. Amortization expense decreased compared to Q4-22 as certain assets reached the end of their useful lives.
Selling, general and administration costs were broadly consistent versus Q3-23. Selling, general and administration costs were comparable to Q4-22 due primarily to lower variable compensation costs, offset in part by other factors including annual salary increases.
Operating earnings for the NA EWP Segment decreased by $148 million compared to Q3-23 and increased by $39 million compared to Q4-22 due to the reasons explained above.
Adjusted EBITDA for the NA EWP Segment decreased by $146 million compared to Q3-23 and increased by $34 million compared to Q4-22. The following table shows the Adjusted EBITDA variance for the period. The impact of the insurance recovery recorded in Q4-22 is included under Other.
| Adjusted EBITDA ($ millions) | Q3-23 to Q4-23 | Q4-22 to Q4-23 | ||||||
| Adjusted EBITDA - comparative period |
$ | 289 | $ | 109 | ||||
| Price |
(110 | ) | (7 | ) | ||||
| Volume |
(1 | ) | 14 | |||||
| Changes in costs |
(37 | ) | 38 | |||||
| Impact of inventory write-downs |
2 | 5 | ||||||
| Other |
— | (16 | ) | |||||
| Adjusted EBITDA - current period |
$ | 143 | $ | 143 | ||||
Pulp & Paper Segment
| Pulp & Paper Segment Earnings ($ millions unless otherwise indicated) |
Q4-23 | Q3-23 | Q4-22 | |||||||||
| Sales |
$ | 159 | $ | 128 | $ | 190 | ||||||
| Cost of products sold |
(120 | ) | (107 | ) | (136 | ) | ||||||
| Freight and other distribution costs |
(31 | ) | (27 | ) | (32 | ) | ||||||
| Amortization |
(3 | ) | (4 | ) | (9 | ) | ||||||
| Selling, general and administration |
(6 | ) | (6 | ) | (8 | ) | ||||||
| Restructuring and impairment charges |
(6 | ) | (13 | ) | — | |||||||
| Operating earnings (loss) |
(7 | ) | (29 | ) | 6 | |||||||
| Adjusted EBITDA1 |
$ | 2 | $ | (12 | ) | $ | 15 | |||||
| Pulp (Mtonnes) |
||||||||||||
| Production |
258 | 232 | 221 | |||||||||
| Shipments |
244 | 206 | 217 | |||||||||
| 1. | This is a non-GAAP financial measure. Refer to the “Non-GAAP and Other Specified Financial Measures” section of this document for more information on this measure. |
|
|
Our Pulp & Paper segment results include the results of the Hinton pulp mill, Quesnel River Pulp mill, and Slave Lake Pulp mill held for sale as the transactions had not completed as at December 31, 2023.
Sales and Shipments
Sales increased compared to Q3-23 due to higher shipment volumes and product pricing. Sales decreased compared to Q4-22 due to lower product pricing, offset in part by higher shipment volumes.
The price variance resulted in an increase in operating earnings and Adjusted EBITDA of $1 million compared to Q3-23 and a decrease of $47 million compared to Q4-22.
Pulp shipments increased versus comparative periods due to production volume changes as discussed further in the section below. In addition, Q3-23 shipment volumes were impacted by a labour dispute at B.C. ports, which impacted our ability to ship our products to overseas customers during July.
The volume variance resulted in a nominal change to operating earnings and Adjusted EBITDA compared to Q3-23, and a decrease of $5 million compared to Q4-22.
Costs and Production
Pulp production volumes increased compared to Q3-23 due primarily to our Slave Lake Pulp mill, which in Q4-23 benefited from fewer curtailments related to high power prices and management of inventory levels. Pulp production volumes increased compared to Q4-22. Q4-22 production volumes were impacted by the transition of our Hinton pulp mill to single-line production of UKP in October 2022, the curtailment at our Cariboo pulp mill to align operating capacity with the available supply of wood chips, and incremental production curtailments taken at Slave Lake Pulp mill to manage power prices in Alberta.
Costs of products sold increased compared to Q3-23 due to higher shipment volumes and fibre costs driven by higher pulp pricing, offset in part by lower power prices in Alberta. Costs of products sold decreased compared to Q4-22 due to lower fibre costs driven by lower pulp pricing and lower spend on chemicals and energy as a result of the Hinton pulp mill transition and lower power prices in Alberta, offset in part by higher shipment volumes.
Freight and other distribution costs generally trended with changes in shipment volumes. Lower ocean freight costs provided an offsetting factor in the comparison to Q4-22.
Amortization expense decreased versus comparative periods. The decrease in amortization expense relates to the write-down and transfer of property, plant and equipment associated with the Hinton pulp mill, Quesnel River Pulp mill, and Slave Lake Pulp mill to a disposal group held for sale. No further amortization expense was taken on the assets upon transfer to the disposal group held for sale.
Selling, general and administration costs were comparable to Q3-23 and decreased versus Q4-22 due primarily to lower variable compensation costs, offset in part by annual salary increases.
Restructuring and impairment charges of $6 million were recorded in Q4-23 upon remeasurement of estimated working capital adjustments specified in the asset purchase agreements for the Hinton pulp mill, Quesnel River Pulp mill, and Slave Lake Pulp mill.
In Q3-23, we recorded impairment losses of $17 million in relation to the sale of the Quesnel River Pulp mill and Slave Lake Pulp mill. In addition, we recorded an impairment reversal of $4 million in relation to the sale of the Hinton pulp mill upon remeasurement of estimated working capital adjustments specified in the asset purchase agreement.
Operating earnings for the Pulp & Paper Segment increased by $22 million compared to Q3-23 and decreased by $13 million compared to Q4-22 due to the reasons explained above.
Adjusted EBITDA for the Pulp & Paper Segment increased by $14 million compared to Q3-23 and decreased by $13 million compared to Q4-22. The following table shows the Adjusted EBITDA variance for the period.
| 2023 Annual Report | 37 |
| Adjusted EBITDA ($ millions) | Q3-23 to Q4-23 | Q4-22 to Q4-23 | ||||||
| Adjusted EBITDA - comparative period |
$ | (12 | ) | $ | 15 | |||
| Price |
1 | (47 | ) | |||||
| Volume |
— | (5 | ) | |||||
| Changes in costs |
14 | 38 | ||||||
| Impact of inventory write-downs |
(2 | ) | 7 | |||||
| Other |
1 | (6 | ) | |||||
| Adjusted EBITDA - current period |
$ | 2 | $ | 2 | ||||
Europe Engineered Wood Products Segment
| Europe EWP Segment Earnings ($ millions unless otherwise indicated) |
Q4-23 | Q3-23 | Q4-22 | |||||||||
| Sales |
$ | 100 | $ | 121 | $ | 142 | ||||||
| Cost of products sold |
(87 | ) | (101 | ) | (97 | ) | ||||||
| Freight and other distribution costs |
(7 | ) | (10 | ) | (9 | ) | ||||||
| Amortization |
(13 | ) | (12 | ) | (12 | ) | ||||||
| Selling, general and administration |
(3 | ) | (6 | ) | (7 | ) | ||||||
| Restructuring and impairment charges |
— | — | (15 | ) | ||||||||
| Operating earnings (loss) |
(10 | ) | (8 | ) | 3 | |||||||
| Adjusted EBITDA1 |
$ | 3 | $ | 4 | $ | 30 | ||||||
| OSB (MMsf 3/8” basis) |
||||||||||||
| Production |
213 | 235 | 184 | |||||||||
| Shipments |
227 | 245 | 201 | |||||||||
| GBP - USD exchange rate |
||||||||||||
| Closing rate |
1.27 | 1.22 | 1.21 | |||||||||
| Average rate |
1.24 | 1.27 | 1.17 | |||||||||
| 1. | This is a non-GAAP financial measure. Refer to the “Non-GAAP and Other Specified Financial Measures” section of this document for more information on this measure. |
Our Europe EWP segment includes our U.K. and Belgium OSB, MDF, and particleboard operations. Revenues and expenses of our European operations, which have British pound sterling and Euro functional currencies, are translated at the average rate of exchange prevailing during the period.
Sales and Shipments
Sales decreased compared to Q3-23 due to lower product pricing and lower shipment volumes. Sales decreased compared to Q4-22 due primarily to lower product pricing and lower MDF and particleboard shipment volumes, offset in part by the strengthening of the GBP against the USD.
The price variance resulted in a decrease in operating earnings and Adjusted EBITDA of $3 million compared to Q3-23 and a decrease of $31 million compared to Q4-22. The price variance represents the impact of changes in product pricing in local currency terms, with any associated foreign exchange impact from the strengthening or weakening of the GBP against USD presented under Other in the Adjusted EBITDA variance table.
Shipment volumes decreased compared to Q3-23 as demand weakened for all products. OSB shipment volumes increased compared to Q4-22 as Q4-22 shipment volumes were adversely impacted by the impacts of customer destocking. Shipment volumes of MDF and particleboard are highly correlated to home building activity and decreased significantly compared to Q4-22 due to weaker demand driven by higher interest rates over the past year.
|
|
The volume variance resulted in a decrease in operating earnings and Adjusted EBITDA of $3 million compared to Q3-23 and an increase of $1 million compared to Q4-22.
Costs and Production
Production volumes in all comparative periods were impacted by production curtailments taken to manage inventory levels. Production volumes decreased versus Q3-23 due to incremental production curtailments taken in the current period. OSB production volumes increased compared to Q4-22 as higher production curtailments were taken in the prior period in response to the impacts of customer destocking discussed above. MDF and particleboard production volumes decreased compared to Q4-22 due to incremental production curtailments in the current period.
Costs of products sold decreased versus Q3-23 due primarily to lower shipment volumes and lower fibre costs. These factors were offset in part by seasonally higher energy costs. Costs of products sold decreased compared to Q4-22 due to lower resin and labour costs, offset in part by a strengthening of the GBP against the USD and lower gains from the sale of carbon allowances. Costs of products sold in Q4-22 included a $7 million gain from the sale of carbon allowances whereas a gain of $2 million was recorded in Q4-23.
Freight and other distribution costs generally trended with changes in shipment volumes.
Amortization was consistent with comparable periods.
Selling, general and administration costs were broadly consistent versus Q3-23. Selling, general and administration costs decreased compared to Q4-22 due primarily to lower variable compensation, offset in part by annual salary increases.
Restructuring and impairment charges of $15 million were recorded in Q4-22 relating to our South Molton, England location.
Operating earnings for the Europe EWP Segment decreased by $2 million compared to Q3-23 and decreased by $12 million compared to Q4-22 due to the reasons explained above.
Adjusted EBITDA for the Europe EWP Segment decreased by $1 million compared to Q3-23, and decreased by $27 million compared to Q4-22. The following table shows the Adjusted EBITDA variance for the period. The variances presented represent the impact of changes in price, volume and cost in local currency terms, with any associated foreign exchange impact from the strengthening or weakening of the GBP against USD presented under Other. The impact of the sale of carbon allowances is also included under Other.
| Adjusted EBITDA ($ millions) | Q3-23 to Q4-23 | Q4-22 to Q4-23 | ||||||
| Adjusted EBITDA - comparative period |
$ | 4 | $ | 30 | ||||
| Price |
(3 | ) | (31 | ) | ||||
| Volume |
(3 | ) | 1 | |||||
| Changes in costs |
3 | 4 | ||||||
| Other |
2 | (1 | ) | |||||
| Adjusted EBITDA - current period |
$ | 3 | $ | 3 | ||||
| 2023 Annual Report | 39 |
Discussion & Analysis of Specific Items
Selling, general and administration
Selling, general and administration costs for Q4-23 was $80 million (Q3-23 - $73 million and Q4-22 - $98 million).
Selling, general and administration costs increased compared to Q3-23 due to increased levels of community investment, which are typically executed in the fourth quarter, and annual salary increases. Selling, general and administration costs decreased compared to Q4-22 due primarily to lower variable compensation costs, offset in part by annual salary increases and increased levels of community investment.
Selling, general and administration expense related to our operating segments are also discussed under “Discussion & Analysis of Quarterly Results by Product Segment”.
Equity-based compensation
We recorded an expense of $15 million during Q4-23 (Q3-23 - recovery of $4 million; Q4-22 - expense of $6 million). The expense in the current quarter reflects an increase in the price of our common shares traded on the TSX from September 30, 2023 to December 31, 2023.
Finance income, net
We recorded finance income, net of $14 million in Q4-23 compared to finance income, net of $21 million in Q3-23 and finance income, net of $3 million in Q4-22.
Finance income decreased compared to Q3-23 due primarily to the recognition of $11 million of interest income related to the finalization of our AR4 duty rates in Q3-23.
Finance income increased compared to Q4-22 due primarily to higher interest income earned on our cash equivalents, fluctuations in interest relating to export duties, and higher net interest income on our defined-benefit pension plans as our overall funded position has increased.
Other income (expense)
Other expense of $30 million was recorded in Q4-23 (Q3-23 - other income of $11 million; Q4-22 - other income of $2 million).
Other expense in Q4-23 relates primarily to foreign exchange losses recorded on our CAD-denominated monetary assets and liabilities as the CAD appreciated against the USD and losses on our electricity swaps driven by decreases in forward electricity prices over the remaining term of the contracts.
Tax recovery (provision)
Q4-23 results include an income tax recovery of $50 million, compared to income tax expense of $56 million in Q3-23 and income tax recovery of $31 million in Q4-22, resulting in an effective tax rate of 25% in the current quarter compared to 26% in Q3-23 and 25% in Q4-22.
Other comprehensive earnings – translation of operations with different functional currencies
We recorded a translation gain of $27 million during Q4-23 (Q3-23 - translation loss of $21 million; Q4-22 - translation gain of $50 million).
In general, a strengthening (weakening) of the USD against the Canadian dollar, British pound sterling or Euro results in a translation loss (gain). The translation gain in the current quarter reflects a weakening of the USD against the aforementioned currencies.
|
|
Other comprehensive earnings – actuarial gains/losses on retirement benefits
We recorded an after-tax actuarial loss of $57 million during Q4-23 (Q3-23 - after-tax actuarial gain of $30 million; Q4-22 - after-tax actuarial gain of $15 million). The actuarial loss in Q4-23 reflects a decrease in the discount rate used to calculate our plan liabilities and adjustments to actuarial assumptions, offset in part by higher returns on plan assets.
OUTLOOK AND OPERATIONS
Business Outlook
Markets
Several key trends that have served as positive drivers in recent years are expected to continue to support medium and longer-term demand for new home construction in North America.
The most significant uses for our North America lumber, OSB and engineered wood panel products are residential construction, repair and remodelling and industrial applications. Over the medium term, improved housing affordability from stabilization of inflation and interest rates, a large cohort of the population entering the typical home buying stage, and an aging U.S. housing stock are expected to drive new home construction and repair and renovation spending that supports lumber, plywood and OSB demand. Over the longer term, growing market penetration of mass timber in industrial and commercial applications is also expected to become a more significant source of demand growth for wood building products in North America.
The seasonally adjusted annualized rate of U.S. housing starts was 1.46 million units in December 2023, with permits issued of 1.50 million units, according to the U.S. Census Bureau. While there are near-term uncertainties for new home construction, owing in large part to interest rate expectations and the direction of changes to mortgage rates and the resulting impact on housing affordability, unemployment remains relatively low in the U.S. and central bankers across North America have indicated that the current rate hiking cycle appears to be nearing its end. However, demand for new home construction and our wood building products may decline in the near term should the broader economy and employment slow or interest rates remain elevated or increase further than currently expected, impacting consumer sentiment and housing affordability.
Although we continue to experience near-term softness, we expect demand for our European products will grow over the longer term as use of OSB as an alternative to plywood grows. Further, an aging housing stock supports long-term repair and renovation spending and additional demand for our wood building products. Near-term risks, including relatively high interest rates, ongoing geopolitical developments and the lagged impact of recent inflationary pressures, may cause further temporary slowing of demand for our panel products in the U.K. and Europe. Despite these risks, we are confident that we will be able to navigate through this period and capitalize on the long-term growth opportunities ahead.
Softwood lumber dispute
Canadian softwood lumber exports to the U.S. have been the subject of trade disputes and managed trade arrangements for several decades. Countervailing and antidumping duties have been in place since April 2017, and we are required to make deposits in respect of these duties. Whether and to what extent we can realize a selling price to recover the impact of duties payable will largely depend on the strength of demand for softwood lumber. The USDOC commenced Administrative Review 5 (“AR5”) in March 2023, with final rates expected in August 2024. Additional details can be found under the section “Discussion & Analysis of Annual Results by Product Segment - Lumber Segment - Softwood Lumber Dispute”.
Operations
Anticipated shipment levels assume no significant change from current market demand conditions, sufficient availability of logs within our economic return criteria, and no additional temporary, indefinite or permanent curtailments. Our operations and results could be negatively affected by increasing or elevated interest rates, softening demand, the availability of transportation, the availability of labour, disruption to the global economy resulting from the conflicts in Ukraine and the Middle East, inflationary pressures, including increases in energy prices, adverse weather conditions in our operating areas, intense competition for logs, elevated stumpage fees and production disruptions due to other uncontrollable factors.
| 2023 Annual Report | 41 |
We expect total lumber shipments in 2024 will be largely similar to 2023 levels as the acquisition of Spray Lake lumber mill and reliability and capital improvement gains across our lumber mill portfolio will be largely offset by capacity reductions from the recently announced permanent closures of our Maxville mill in Florida and Fraser Lake mill in British Columbia and the indefinite curtailment of the Huttig mill in Arkansas. In 2024, we expect SPF shipments to be 2.6 to 2.8 billion board feet and SYP shipments to be 2.7 to 2.9 billion board feet. On January 1, 2024, stumpage rates decreased slightly in B.C. due to the market-based adjustments related to lumber prices; that notwithstanding, inflationary pressures on development, logging and delivery costs continue to provide upward bias to fibre costs. Given the current commodity price environment, B.C. stumpage rates are expected to decrease modestly through much of Q1-24 before stabilizing as we head into Q2-24 given the stability in recent commodity prices. In Alberta, Q1-24 stumpage rates are expected to be largely similar to Q4-23 levels, remaining relatively low as they too are closely linked to the price of lumber but with a quicker response to changing lumber prices. We expect average 2024 log costs across the U.S. South to be largely similar to those of 2023, while region-specific log costs are likely to vary depending on the unique conditions in each procurement zone.
In our NA EWP segment, we expect 2024 OSB shipments to be consistent with 2023 levels and so are guiding to shipments of 6.3 to 6.6 billion square feet (3/8-inch basis) this year. Start-up of the Allendale mill is progressing and we continue to anticipate a ramp-up period for the mill of up to three years to meet targeted production levels. We expect our overall OSB platform to be better and lower cost with a modern Allendale facility operating, and as with all our wood products operations, demand is a key input in determining our operating schedules across our manufacturing footprint. While input costs for the NA EWP business moderated through much of 2023, we expect these costs to stabilize in 2024.
In the Pulp & Paper segment, the Hinton pulp sale transaction closed on February 3, 2024 following the completion of the customary regulatory reviews and closing conditions. Activities in respect of the closing conditions for the sale of Quesnel River Pulp mill and Slave Lake Pulp mill are proceeding and we continue to anticipate closing of the transaction in early 2024.
In our Europe EWP segment, we expect near-term demand weakness to persist for our panel products and therefore expect 2024 shipments of MDF, particleboard and OSB to be similar to 2023 levels. For OSB, we are guiding to shipments in the range of 0.9 to 1.1 billion square feet (3/8-inch basis). Input costs for the Europe EWP business, including energy and resin costs, are expected to stabilize in 2024 but remain elevated.
In Q4-23, we experienced continued moderation of costs and improved availability for inputs across our supply chain, including resins, chemicals, transportation and energy, although labour availability and some capital equipment lead times remained challenging. We expect these trends to largely continue over the near term.
We will continue to regularly evaluate the factors above as well as evolving market conditions in making production decisions across the business.
Cash Flows
We continue to anticipate levels of operating cash flows and available liquidity will support our capital spending estimate for 2024. Based on our current outlook, assuming no deterioration from current market demand conditions during the year and that there is no additional lengthening of lead times for projects underway or planned, we anticipate we will invest approximately $450 million to $550 million in 20241. Our total capital budget consists of various improvement projects and maintenance expenditures, projects focused on optimization and automation of the manufacturing process, and projects targeted to reduce greenhouse gas emissions. Expected capital expenditures1 in 2024 include approximately $80 million for the modernization of the Henderson, Texas lumber manufacturing facility, which we now expect will be ready for ramp-up starting in H1-25.
| 1. | This is a supplementary financial measure. Refer to the “Non-GAAP and Other Specified Financial Measures” section of this document for more information on this measure. |
We expect to maintain our investment grade debt rating and intend to preserve sufficient liquidity to be able to take advantage of strategic growth opportunities that may arise.
Under our 2022 NCIB that expired February 22, 2023, we purchased 10,194,000 Common shares of the Company, which was the full purchase authorization.
|
|
On February 22, 2023, we renewed our 2023 NCIB, allowing us to acquire up to 4,063,696 Common shares for cancellation from February 27, 2023 until the expiry of the bid on February 26, 2024. As of February 13, 2024, 1,878,648 Common shares have been repurchased for cancellation, leaving 2,185,048 available to purchase at our discretion until the expiry of the 2023 NCIB.
As of February 13, 2024, we have repurchased for cancellation 41,620,442 of the Company’s Common shares since the closing of the Norbord Acquisition on February 1, 2021 through the completion of the 2021 SIB, the 2022 SIB and normal course issuer bids, equalling 76% of the shares issued in respect of the Norbord Acquisition.
We have paid a dividend in every quarter since we became a public company in 1986 and expect to continue this practice. At the latest declared quarterly dividend rate of $0.30 per share, the total anticipated cash payment of dividends in 2024 is $98 million based on the number of Common and Class B Common shares outstanding on December 31, 2023.
We will continue to consider share repurchases with excess cash, subject to regulatory approvals, if we are satisfied that this will enhance shareholder value and not compromise our financial flexibility.
Estimated Earnings Sensitivity to Key Variables
| (based on 2023 shipment volumes - $ millions) | ||||||||||
| Factor | Variation |
Change in pre-tax earnings1 |
||||||||
| Lumber price |
$10 (per Mfbm) | $ | 56 | |||||||
| NA OSB price |
$10 (per Msf) | 55 | ||||||||
| Europe OSB price |
£10 (per Msf) | 9 | ||||||||
| Canadian - U.S. $ exchange rate2 |
$0.01 (per CAD) | 20 | ||||||||
| 1. | Each sensitivity has been calculated on the basis that all other variables remain constant and is based on changes in our realized sales prices. |
| 2. | Represents the USD impact of the initial $0.01 change on CAD revenues and expenses. Additional changes are substantially, but not exactly, linear. |
LIQUIDITY AND CAPITAL RESOURCES
Capital Management Framework
Our business is cyclical and is subject to significant changes in cash flow over the business cycle. In addition, financial performance can be materially influenced by changes in product prices and the relative values of the Canadian and U.S. dollars. Our objective in managing capital is to ensure adequate liquidity and financial flexibility at all times, particularly at the lower points in the business cycle.
Our main policy relating to capital management is to maintain a strong balance sheet and otherwise meet financial tests that rating agencies commonly apply for investment-grade issuers of public debt. Our debt is currently rated as investment grade by three major rating agencies.
We monitor and assess our financial performance to ensure that debt levels are prudent, taking into account the anticipated direction of the business cycle. When financing acquisitions, we combine cash on hand, debt, and equity financing in a proportion that is intended to maintain an investment-grade rating for debt throughout the cycle. Debt repayments are arranged, where possible, on a staggered basis that takes into account the uneven nature of anticipated cash flows. We have established committed revolving lines of credit that provide liquidity and flexibility when capital markets are restricted. In addition, as a normal part of our business, we have in the past and may from time to time seek to repurchase our outstanding securities through issuer bids or tender offers, open market purchases, privately negotiated transactions or otherwise. Such repurchases, if any, will depend on prevailing market conditions, our liquidity requirements, contractual and legal restrictions and other factors.
A strong balance sheet and liquidity profile, along with our investment-grade debt rating, are key elements of our goal to maintain a balanced capital allocation strategy. Priorities within this strategy include: reinvesting in our operations across all market cycles to strategically enhance productivity, product mix, and capacity; maintaining a leading cost position; maintaining financial flexibility to capitalize on growth opportunities, including the pursuit of acquisitions and larger-scale strategic growth initiatives; and returning capital to shareholders through dividends and share repurchases.
| 2023 Annual Report | 43 |
Liquidity and Capital Resource Measures
Our capital structure consists of Common share equity and long-term debt, and our liquidity includes our operating facilities.
| Summary of Liquidity and Debt Ratios ($ millions, except as otherwise indicated) |
December 31, 2023 |
December 31, 2022 |
||||
| Available liquidity |
||||||
| Cash and cash equivalents |
$ | 900 | $ 1,162 | |||
| Operating lines available (excluding newsprint operation)1 |
1,054 | 1,053 | ||||
| Available liquidity |
$ | 1,954 | $ 2,215 | |||
| Total debt to total capital2 |
7 | % | 7% | |||
| Net debt to total capital2 |
(5 | %) | (9%) | |||
| 1. | Excludes demand line of credit dedicated to our jointly-owned newsprint operation as West Fraser cannot draw on it. |
| 2. | This is a capital management measure. Refer to the “Non-GAAP and Other Specified Financial Measures” section of this document for more information on this measure. |
Available liquidity as at December 31, 2023 was $1,954 million (December 31, 2022 - $2,215 million). Available liquidity includes cash and cash equivalents, cheques issued in excess of funds on deposit, and amounts available on our operating loans, excluding the demand line of credit dedicated to our 50% jointly-owned newsprint operation.
Please refer to the “Cash Flow” section for analysis of the changes in cash and cash equivalents. Total debt to total capital was comparable to prior year and we remain well positioned with a strong balance sheet and liquidity profile.
Credit Facilities
As at December 31, 2023, our credit facilities consisted of a $1 billion committed revolving credit facility which matures July 2028, $35 million of uncommitted revolving credit facilities available to our U.S. subsidiaries, a $19 million (£15 million) credit facility dedicated to our European operations, and a $11 million (CAD$15 million) demand line of credit dedicated to our jointly-owned newsprint operation.
As at December 31, 2023, our revolving credit facilities were undrawn (December 31, 2022 - undrawn) and the associated deferred financing costs of $2 million (December 31, 2022 - $1 million) were recorded in other assets. Interest on the facilities is payable at floating rates based on Prime Rate Advances, Base Rate Advances, Bankers’ Acceptances, Secured Overnight Financing Rate (“SOFR”) Advances at our option. On July 25, 2023, we amended and restated the revolving credit facilities agreement to extend its maturity to July 2028 and replaced the previous London Inter-Bank Offered Rate (“LIBOR”) floating rate option with SOFR.
In addition, we have credit facilities totalling $133 million (December 31, 2022 - $131 million) dedicated to letters of credit. Letters of credit in the amount of $43 million (December 31, 2022 - $61 million) were supported by these facilities.
All debt is unsecured except the $11 million (CAD$15 million) jointly-owned newsprint operation demand line of credit, which is secured by that joint operation’s current assets.
As at December 31, 2023, we were in compliance with the requirements of our credit facilities.
Long-Term Debt
In October 2014, we issued $300 million of fixed-rate senior unsecured notes, bearing interest at 4.35% and due October 2024, pursuant to a private placement in the U.S. The notes are redeemable, in whole or in part, at our option at any time as provided in the indenture governing the notes.
We have a $200 million term loan maturing July 2025. Interest is payable at floating rates based on Base Rate Advances or SOFR Advances at our option. This loan is repayable at any time, in whole or in part, at our option and without penalty but cannot be redrawn after payment. On July 25, 2023, we amended and restated the term loan agreement to extend its maturity from August 2024 to July 2025 and replaced the LIBOR floating rate option with SOFR.
|
|
We have interest rate swap contracts to pay fixed interest rates and receive variable interest rates on $200 million notional principal amount of indebtedness. These swap agreements have the effect of fixing the interest rate on the $200 million 5-year term loan discussed above. In June 2023, these interest rate swaps were amended to reference 3-month SOFR (previously 3-month LIBOR) effective August 2023. The weighted average fixed interest rate payable under the contracts was 0.91% following the amendment (previously 1.14%).
In January 2024, these interest rate swaps were further amended to extend their maturity from August 2024 to July 2025.
Following this amendment, the weighted average fixed interest rate payable under the contract is 2.61%.
Debt Ratings
We are considered investment grade by three leading rating agencies. The ratings in the table below are as at February 13, 2024.
| Agency | Rating | Outlook | ||
| DBRS | BBB | Stable | ||
| Moody’s | Baa3 | Stable | ||
| Standard & Poor’s | BBB- | Stable | ||
These ratings are not a recommendation to buy, sell or hold securities and may be subject to revision or withdrawal at any time by the rating agencies.
Shareholder’s Equity
Our outstanding Common share equity consists of 79,427,614 Common shares and 2,281,478 Class B Common shares for a total of 81,709,092 Common shares issued and outstanding as at February 13, 2024. As of February 13, 2024, we held 31,943 Common shares as treasury shares for cancellation.
The Common shares and Class B Common shares are equal in all respects, including the right to dividends, rights upon dissolution or winding up and the right to vote, except that each Class B Common share may at any time be exchanged for one Common share. Our Common shares are listed for trading on the TSX and NYSE under the symbol WFG, while our Class B Common shares are not. Certain circumstances or corporate transactions may require the approval of the holders of our Common shares and Class B Common shares on a separate class by class basis.
Share Repurchases
Normal Course Issuer Bid
Under our 2022 NCIB that expired February 22, 2023, we repurchased for cancellation 10,194,000 Common shares of the Company, which was the full purchase authorization.
On February 22, 2023, we renewed our 2023 NCIB allowing us to acquire up to 4,063,696 Common shares for cancellation from February 27, 2023 until the expiry of the bid on February 26, 2024. For the year ended December 31, 2023, we repurchased for cancellation 1,834,801 Common shares under our 2023 NCIB program.
2022 Substantial Issuer Bid
On June 7, 2022, we completed a substantial issuer bid pursuant to which we repurchased for cancellation a total of 11,898,205 Common shares at a price of $95.00 per share for an aggregate purchase price of $1.13 billion.
| 2023 Annual Report | 45 |
The following table shows our purchases under our NCIB and SIB programs in 2022 and 2023:
| Share repurchases (number of common shares and price per share) |
Common Shares |
Average Price in USD |
||||||||
| NCIB: | January 1, 2022 to December 31, 2022 | 10,475,115 | $ | 82.01 | ||||||
| 2022 SIB: | June 7, 2022 | 11,898,205 | $ | 95.00 | ||||||
| NCIB: | January 1, 2023 to December 31, 2023 | 1,834,801 | $ | 70.24 | ||||||
Share Options
As at February 13, 2024, there were 828,453 share purchase options outstanding with exercise prices ranging from CAD$40.97 to CAD$123.63 per Common share.
|
|
Cash Flow
Our cash is deployed primarily for operating purposes, interest payments, repayment of debt, investments in property, plant, equipment, acquisitions, share repurchases, and dividends. In normal business cycles and in years without a major acquisition or debt repayment, cash on hand and cash provided by operations have typically been sufficient to meet these uses.
We are exposed to commodity price changes. To manage our liquidity risk, we maintain adequate cash and cash equivalents balances and appropriate lines of credit. In addition, we regularly monitor and review both actual and forecasted cash flows. Refinancing risks are managed by extending maturities through regular renewals and refinancing when market conditions are supportive.
| Years Ended | ||||||
|
|
|
|||||
| Cash Flow Statement ($ millions - cash provided by (used in)) |
December 31, 2023 |
December 31, 2022 |
||||
| Cash provided by operating activities |
||||||
| Earnings (loss) |
$ | (167 | ) | $ 1,975 | ||
| Adjustments |
||||||
| Amortization |
541 | 589 | ||||
| Restructuring and impairment charges |
279 | 60 | ||||
| Finance (income) expense, net |
(51 | ) | 3 | |||
| Foreign exchange loss (gain) |
7 | (28) | ||||
| Export duty |
(45 | ) | (99) | |||
| Retirement benefit expense |
77 | 103 | ||||
| Net contributions to retirement benefit plans |
(37 | ) | (76) | |||
| Tax (recovery) provision |
(61 | ) | 618 | |||
| Income taxes paid |
(24 | ) | (982) | |||
| Other |
(4 | ) | (11) | |||
| Changes in non-cash working capital |
||||||
| Receivables |
6 | 140 | ||||
| Inventories |
132 | 20 | ||||
| Prepaid expenses |
4 | (6) | ||||
| Payables and accrued liabilities |
(131 | ) | (99) | |||
| 525 | 2,207 | |||||
| Cash used for financing activities |
||||||
| Repayment of lease obligations |
(15 | ) | (14) | |||
| Finance expense paid |
(24 | ) | (23) | |||
| Repurchase of Common shares for cancellation |
(129 | ) | (1,990) | |||
| Dividends paid |
(100 | ) | (99) | |||
| (268 | ) | (2,126) | ||||
| Cash used for investing activities |
||||||
| Spray Lake Acquisition, net of cash acquired |
(100 | ) | — | |||
| Additions to capital assets |
(477 | ) | (477) | |||
| Interest received |
47 | 17 | ||||
| Other |
— | 1 | ||||
| $ | (530 | ) | $ (459) | |||
|
|
||||||
| Change in cash and cash equivalents |
$ | (273 | ) | $ (378) | ||
| 2023 Annual Report | 47 |
Operating Activities
The table above shows the main components of cash flows provided by operating activities for each year. The significant factor contributing to the decrease compared to 2022 was lower earnings, offset in part by lower income taxes paid. Changes in working capital was a contributing factor to the decrease year over year.
Earnings, after adjusting for non-cash items, were lower versus prior year due primarily to lower product pricing, offset in part by lower costs. Income taxes paid were lower in 2023 due to lower installment payments in the current year and receipt of refunds relating to prior year installment payments.
Working capital decreased modestly in 2023 due primarily to decreases in inventories offset by decreases in payables and accrued liabilities. Decreases in inventories is driven primarily by lower volumes of logs on hand. Accounts payable and accrued liabilities decreased due primarily to decreases in accrued compensation.
Financing Activities
Cash used in financing activities in 2023 decreased compared to 2022 due to lower share repurchases.
We returned $129 million and $1,990 million during 2023 and 2022 respectively to our shareholders through Common shares repurchased under our NCIB and SIB programs. During the year ended December 31, 2022, we repurchased for cancellation a total of 11,898,205 Common shares at a price of $95.00 per share for an aggregate purchase price of $1.13 billion under the 2022 SIB.
We also returned a total of $100 million during 2023 to our shareholders through dividend payments (2022 - $99 million).
Investing Activities
Cash payment of $100 million, representing the cash consideration transferred net of acquired cash, was made in relation to the Spray Lake Acquisition during 2023.
Interest received increased compared to 2022 due to higher interest income earned on our cash equivalents.
Capital expenditures of $477 million in 2023 (2022 - $477 million) reflect our philosophy of continued reinvestment in our mills.
| Capital Expenditures by Segment ($ millions) |
Profit Improvement |
Maintenance of Business1 |
Safety | Total | ||||||||||||
| Lumber |
157 | 73 | 23 | 253 | ||||||||||||
| North America EWP |
41 | 86 | 28 | 156 | ||||||||||||
| Pulp & Paper |
2 | 27 | 3 | 32 | ||||||||||||
| Europe EWP |
11 | 18 | 2 | 30 | ||||||||||||
| Corporate |
— | 7 | — | 7 | ||||||||||||
| Total |
210 | 211 | 56 | 477 | ||||||||||||
| 1. | Maintenance of business includes expenditures for roads, bridges, mobile equipment and major maintenance shutdowns. |
Contractual Obligations
The estimated cash payments due in respect of contractual and legal obligations as at December 31, 2023, including debt and interest payments and major capital improvements, are summarized as follows. Contractual obligations do not include energy purchases under various agreements, defined contribution pension plans, equity-based compensation, or contingent amounts payable.
|
|
| Contractual Obligations (at December 31, 2023, in $ millions) |
Total | 2024 | 2025 | 2026 | 2027 | Thereafter | ||||||||||||||||||
| Long-term debt |
$ | 500 | $ | 300 | $ | 200 | $ | — | $ | — | $ | — | ||||||||||||
| Interest on long-term debt1 |
25 | 18 | 7 | — | — | — | ||||||||||||||||||
| Lease obligations |
45 | 13 | 8 | 5 | 3 | 16 | ||||||||||||||||||
| Contributions to defined benefit pension plans2 |
68 | 19 | 16 | 33 | — | — | ||||||||||||||||||
| Payables and accrued liabilities |
620 | 620 | — | — | — | — | ||||||||||||||||||
| Purchase commitments |
265 | 265 | — | — | — | — | ||||||||||||||||||
| Reforestation and decommissioning obligations |
137 | 64 | 20 | 7 | 7 | 39 | ||||||||||||||||||
| Electricity swaps |
(14 | ) | (3 | ) | — | — | (1 | ) | (10 | ) | ||||||||||||||
| Total |
$ | 1,646 | $ | 1,296 | $ | 251 | $ | 45 | $ | 9 | $ | 45 | ||||||||||||
| 1. | Assumes debt remains at December 31, 2023 levels and includes the impact of interest rate swaps terminating August 2024. |
| 2. | Contributions to the defined benefit pension plans are based on the most recent actuarial valuation. Future contributions will be determined at the next actuarial valuation date. |
Financial Instruments
Our financial instruments, their accounting classification, and associated risks are described in note 23 to the Annual Financial Statements.
ACCOUNTING MATTERS
Critical Accounting Estimates and Judgments
The preparation of financial statements in conformity with IFRS Accounting Standards requires management to make estimates, assumptions, and judgments that affect the amounts reported. Our significant accounting policies are disclosed in our Annual Financial Statements.
In determining our critical accounting estimates, we consider trends, commitments, events or uncertainties that we reasonably expect to materially affect our methodology or assumptions. Our statements in this MD&A regarding such considerations are made subject to the “Forward-Looking Statements” section.
We have outlined below information about judgments, assumptions, and other sources of estimation uncertainty as at December 31, 2023 that have the most significant impact on the amounts recognized in our financial statements. The discussion of each critical accounting estimate does not differ between our reportable segments unless explicitly noted.
Recoverability of Goodwill
Goodwill is allocated to CGUs or groups of CGUs that are expected to benefit from the synergies of the business combination from which it arose. Goodwill exists in relation to our Lumber, North America EWP, and Europe EWP reportable segments.
Goodwill is tested annually for impairment, or more frequently if an indicator of impairment is identified.
Recoverability of goodwill is assessed by comparing the carrying value of the CGU or group of CGUs associated with the goodwill balance to its estimated recoverable amount, which is the higher of its estimated fair value less costs of disposal and its value in use.
We determined the value in use of CGU groups using discounted cash flow models. Key assumptions include production volume, product pricing, raw material input cost, production cost, terminal multiple, and discount rate. Key assumptions were determined using external sources and historical data from internal sources.
An impairment loss is recorded if the carrying value exceeds the estimated recoverable amount.
The estimated recoverable amounts of the CGU groups exceeded their respective carrying amounts and as such, no impairment losses were recognized for the year ended December 31, 2023 (2022 - nil).
| 2023 Annual Report | 49 |
The estimates and assumptions regarding expected cash flows and the appropriate discount rates require considerable judgment and are based upon historical experience, approved financial forecasts and industry trends and conditions.
There is a material degree of uncertainty with respect to the estimates of the recoverable amounts of the CGU groups, given the necessity of making key economic and operating assumptions about the future. If the future were to differ adversely from our best estimate and associated cash flows were to materially decrease, we could potentially experience future impairment charges in respect of our goodwill balances.
Recoverability of Capital Assets
We assess property, plant and equipment, timber licences, and other definite-lived intangible assets for indicators of impairment at each reporting date and whenever events or changes in circumstances indicate that the carrying amount may not be recoverable. We conduct a review of external and internal sources of information to assess for any impairment indicators. Examples of such triggering events related to our capital assets include, but are not limited to: a significant adverse change in the extent or manner in which the asset is being used or in its physical condition; a change in management’s intention or strategy for the asset, including a plan to dispose of the asset or idle the asset for a significant period of time; a significant adverse change in our long-term price assumption or in the price or availability of inputs required for manufacturing; a significant adverse change in legal factors or in the business climate that could affect the asset’s value; and a current period operating or cash flow loss combined with a history of operating or cash flow losses, or a projection or forecast that demonstrates continuing losses associated with the asset’s use.
When a triggering event is identified, recoverability of capital assets is assessed by comparing the carrying value of an asset or cash-generating unit to its estimated recoverable amount, which is the higher of its estimated fair value less costs of disposal and its value in use.
We determined the value in use of assets and cash-generating units using discounted cash flow models. Key assumptions included production volume, product pricing, raw material input cost, production cost, and discount rate. Key assumptions used in estimating recoverable amount were based on industry sources as well as management estimates.
An impairment loss is recorded if the carrying value exceeds the estimated recoverable amount.
In the year ended December 31, 2023, we recorded restructuring and impairment charges of $279 million.
In our Pulp & Paper segment, we recorded an impairment loss of $121 million in relation to the sale of the Hinton pulp mill. In addition, we recorded an impairment loss of $20 million in relation to the sale of the Quesnel River Pulp mill and Slave Lake Pulp mill.
In our Lumber segment, we recorded restructuring and impairment charges of $47 million associated with the announcement of the permanent closure of our lumber mill in Maxville, Florida and the indefinite curtailment of operations at our lumber mill in Huttig, Arkansas. We recorded restructuring and impairment charges of $81 million related to facility closures and curtailments due to availability of economic fibre sources in B.C. We estimated the recoverable amount of the impaired assets based on their value in use. The recoverable amount of the property, plant and equipment subject to impairment, other than the disposal group discussed above, was $36 million.
The assessment of impairment indicators requires the exercise of judgment given the necessity of making key economic and operating assumptions about the future. If the future were to differ adversely from our best estimate and associated cash flows were to materially decrease, we could potentially experience future impairment charges in respect of our capital assets.
Fair Value of PPE and Intangible Assets Acquired in Business Combinations
On November 17, 2023, we acquired the Spray Lake lumber mill located in Cochrane, Alberta and associated timber tenures (“Spray Lake Acquisition”) for preliminary cash consideration of $102 million (CAD$140 million), net of cash acquired of $1 million.
We recognize and measure the assets acquired and liabilities assumed in a business combination based on their estimated fair values at the acquisition date. Any excess of the purchase consideration compared to the fair value of the net assets acquired is recorded as goodwill.
|
|
A significant amount of judgment is involved in estimating the fair values of property, plant and equipment and intangible assets acquired in a business combination. The Spray Lake Acquisition resulted in the recognition of PPE and timber licenses in our Lumber segment.
We use all relevant information to make these fair value determinations and engage an independent valuation specialist to assist for material acquisitions.
We applied the market comparison approach and cost approach in determining the fair value of acquired property, plant, and equipment. We considered market prices for similar assets when they were available, and depreciated replacement cost in other circumstances. Depreciated replacement cost reflects adjustments for physical deterioration as well as functional and economic obsolescence. The key assumptions used in the estimation of depreciated replacement cost are the asset’s estimated replacement cost at the time of acquisition and estimated useful life.
The fair value of timber licenses acquired was determined by using a market comparison technique based on precedent transactions in Western Canada.
There is a material degree of uncertainty with respect to the estimates of fair value of PPE and intangible assets given the necessity of making economic assumptions about the future. If our estimates of the acquisition-date fair value of property, plant and equipment and intangible assets acquired in business combinations were incorrect, we could experience increased or decreased charges for depreciation or amortization in the future. If the future were to differ adversely from our best estimate of key economic assumptions and associated cash flows were to materially decrease, we could potentially experience future impairment charges in respect to our PPE or intangible assets.
Defined Benefit Pension Plan Assumptions
We maintain defined benefit pension plans for many of our employees. We use independent actuarial specialists to perform actuarial valuations of our defined benefit pension plans.
Key assumptions used in determining defined benefit pension expense and accrued benefit obligations included the assumed rates of increase for employee compensation and the discount rate. Note 14 to the Annual Financial Statements provides the sensitivity of our accrued benefit obligations to changes in these key assumptions.
If the future were to adversely differ from our best estimate of assumptions used in determining our accrued benefit obligations, we could experience increased defined benefit pension expense, financing costs and charges to other comprehensive earnings in the future.
CVD and ADD Duty Rates
On November 25, 2016, a coalition of U.S. lumber producers petitioned the USDOC and the USITC to investigate alleged subsidies to Canadian softwood lumber producers and levy CVD and ADD against Canadian softwood lumber imports. The USDOC chose us as a “mandatory respondent” to both the countervailing and antidumping investigations, and as a result, we have received unique company-specific rates. Details can be found under the section “Discussion & Analysis of Annual Results by Product Segment - Lumber - Softwood Lumber Dispute.”
The CVD and ADD rates are subject to adjustment by the USDOC through an AR of POI. The CVD and ADD rates apply retroactively for each POI. We record CVD as export duty expense at the cash deposit rate until an AR finalizes a new applicable rate for each POI. We record ADD as export duty expense by estimating the rate to be applied for each POI by using our actual results and a similar calculation methodology as the USDOC and adjust when an AR finalizes a new applicable rate for each POI. The difference between the cumulative cash deposits paid and cumulative export duty expense recognized for each POI is recorded on our balance sheet as export duty deposits receivable or payable.
The difference between the cash deposit amount and the amount that would have been due based on the final AR rate will incur interest based on the U.S. federally published interest rate. We record interest income on our duty deposits receivable, net of any interest expense on our duty deposits payable, based on this rate.
The softwood lumber case will continue to be subject to NAFTA or the new CUSMA and WTO dispute resolution processes and litigation in the U.S. In the past, long periods of litigation have led to negotiated settlements and duty deposit refunds.
| 2023 Annual Report | 51 |
In the interim, duties remain subject to the USDOC AR process, which results in an annual adjustment of duty deposit rates. Notwithstanding the deposit rates assigned under the investigations, our final liability for CVD and ADD will not be determined until each annual administrative review process is complete and related appeal processes are concluded.
If the future were to adversely differ from our best estimate of the duty deposit rate, we could experience material adjustments to duty expense and such adjustments could result in an increase of cash outflows.
Reforestation and Decommissioning Obligations
We recognize provisions for various statutory, contractual or legal obligations. In Canada, regulations in most provinces require timber quota holders to carry out reforestation to ensure re-establishment of the forest after harvesting. Reforested areas must be tended for a period sufficient to ensure that they are well established. The time needed to meet regulatory requirements depends on a variety of factors.
In our operating areas, the time to meet reforestation standards usually spans 12 to 15 years from the time of harvest. We record a liability for the estimated cost of the future reforestation activities when the harvesting takes place, discounted at an appropriate rate. The liability is accreted over time through charges to finance expense and reduced by silviculture expenditures. Changes to estimates are credited or charged to earnings.
We record the best estimate of the expenditure to be incurred to settle decommissioning obligations, such as landfill closures. This liability is determined using estimated closure and/or remediation costs discounted using an appropriate discount rate. On initial recognition, the carrying value of the liability is added to the carrying amount of the associated asset and amortized over its useful life, or expensed when there is no related asset. The liability is accreted over time through charges to finance expense and reduced by actual costs of settlement. Changes to estimates result in an adjustment to the carrying amount of the associated asset or, where there is no asset, they are credited or charged to earnings.
Key assumptions underlying the reforestation and decommissioning obligations included the timing and the amount of forecasted expenditures and the discount rate.
Material changes in financial position can arise as the actual costs incurred at the time of silviculture activities or decommissioning may differ from the estimates used in determining the liability. If the provisions for the reforestation and decommissioning obligations were to be inadequate, we could experience an increase to expenses in the future. A charge for an inadequate reforestation and decommissioning obligation provision would result in an increase of cash outflows at the time the obligation is satisfied.
Accounting Policy Developments
Note 2 to the Annual Financial Statements contains a description of current and future changes in accounting policies, including: (1) initial application of standards, interpretations and amendments to standards and interpretations in the reporting period and (2) standards, interpretations and amendments to standards and interpretations issued but not yet effective.
RISKS AND UNCERTAINTIES
Our business is subject to a number of risks and uncertainties that can significantly affect our operations, financial condition and future performance. We have a comprehensive process to identify, manage, and mitigate risk, wherever possible. The risks and uncertainties described below are not necessarily the only risks we face. Additional risks and uncertainties that are presently unknown to us or deemed immaterial by us may adversely affect our business.
Product Demand and Price Fluctuations
Our revenues and financial results are primarily dependent on the demand for, and selling prices of, our products, which are subject to significant fluctuations. The demand and prices for lumber, plywood, OSB, particleboard, MDF, LVL, pulp, newsprint, wood chips and other wood products are highly volatile and are affected by factors such as:
|
|
| · | global economic conditions including the strength of the U.S., Canadian, Chinese, Japanese, European and other international economies, particularly U.S. and Canadian housing markets and their mix of single and multifamily construction, repair, renovation and remodelling spending and industrial application; |
| · | elevated and continued rising of interest rates, and the consequential impacts of these interest rates on mortgage rates and housing affordability; |
| · | alternative products to lumber or panels; |
| · | construction and home building disruptor technologies that may reduce the use of lumber or panels; |
| · | changes in industry production capacity; |
| · | changes in global inventory levels; |
| · | increased competition from other consumers of logs and producers of lumber or panels; |
| · | regulatory regimes setting a price on carbon that would increase the price of energy or fuel affecting the manufacturing cost of our products; |
| · | ongoing geo-political developments, including disruptions to the global economy resulting from the conflict in Ukraine and the Middle East; |
| · | inflationary pressures, including increases in energy prices; and |
| · | other factors beyond our control. |
In addition, unemployment levels, interest rates, the availability of mortgage credit and the rate of mortgage foreclosures have a significant effect on housing affordability and residential construction and renovation activity, which in turn influences the demand for, and price of, building materials such as lumber and panel products. Declines in demand, and corresponding reductions in prices, for our products may adversely affect our financial condition and results of operations.
Our business is highly exposed to fluctuations in demand for and pricing of our wood products. Our sensitivity to commodity product pricing may result in a high degree of sales and earnings volatility. In the past, we have been negatively affected by declines in product pricing and have taken production downtime or indefinite curtailments to manage working capital and minimize cash losses. Severe and prolonged weakness in the markets for our wood products could seriously harm our financial position, operating results and cash flows.
We have developed a sales strategy that includes the development of sales plans to reduce our exposure to pricing and sales volatility that are based on pricing and demand forecasts and trends that we develop. These forecasts will be based on assumptions that we make as to the markets in which our products are sold. Our inability to accurately forecast the demand and pricing for our products or to effectively execute on our sales strategy could result in increased exposure of our business to pricing and demand volatility, with the result that our revenues and our financial condition could be adversely impacted.
We cannot predict with any reasonable accuracy future market conditions, demand or pricing for any of our products due to factors outside our control. Prolonged or severe weakness in the market for any of our principal products would adversely affect our financial condition. Future demand could also be impacted by the perceived sustainability of our wood products in contrast with competing alternatives.
Competition
We compete with global producers, some of which may have greater financial resources and lower production costs than we do. Currency devaluations can have the effect of reducing our competitors’ costs and making our products less competitive in certain markets. In addition, European lumber producers and South American panel producers may enter the North American market during periods of peak prices. Markets for our products are highly competitive. Our ability to maintain or improve the cost of producing and delivering products to those markets is crucial. Factors such as cost and availability of raw materials, energy and labour, the ability to maintain high operating rates and low per unit manufacturing costs, and the quality of our final products and our customer service all affect our earnings. Some of our products are also particularly sensitive to other factors including innovation, quality and service, with varying emphasis on these factors depending on the product. To the extent that one or more of our competitors become more successful with respect to any key competitive factor, our ability to attract and retain customers could be materially adversely affected. If we are unable to compete effectively, such failure could have a material adverse effect on our business, financial condition and results of operations.
Our products may compete with non-fibre based alternatives or with alternative products in certain market segments. For example, steel, engineered wood products, plastic, wood/plastic or composite materials may be used by builders as
| 2023 Annual Report | 53 |
alternatives to the products produced by our wood products businesses such as lumber, plywood, OSB, LVL, particleboard and MDF products. Changes in prices for oil, chemicals and wood-based fibre can change the competitive position of our products relative to available alternatives and could increase substitution of those products for our products. In addition, our customers or potential customers may factor in environmental and sustainability factors in assessing whether to purchase our wood products. As the use of these alternatives grows, demand for our products may further decline.
Because commodity products have few distinguishing properties from producer to producer, competition for these products is based primarily on price, which is determined by supply relative to demand and competition from substitute products. Prices for our products are affected by many factors outside of our control, and we have no influence over the timing and extent of price changes, which often are volatile. Accordingly, our revenues may be negatively affected by pricing decisions made by our competitors and by decisions of our customers to purchase products from our competitors.
In addition, continued consolidation in the retail and construction industries could expose us to increased concentration of customer dependence and increase customers’ ability to exert pricing pressure on us and our products. In addition, concentration of our business with fewer customers as a result of consolidation could expose us to risks associated with the loss of key customers. For example, the loss of a significant customer, any significant customer order cancellations or bad debts could negatively affect our sales and earnings.
Availability of Fibre
Canada
A significant majority of our Canadian log requirements are harvested from lands owned by a provincial government. Provincial governments control the volumes that can be harvested under provincially-granted tenures and otherwise regulate the availability of Crown timber for harvest. Determinations by provincial governments: (i) to reduce the volume of timber, to issue or not issue operating permits to harvest timber; (ii) to limit the areas that may be harvested under timber tenures; (iii) to restrict the transfer or acquisition of timber tenures; (iv) to regulate the processing of timber or use of harvesting contractors; (v) in response to jurisprudence or government policies respecting Indigenous rights and title or reconciliation efforts, land use management and planning processes, including those agreements between the B.C. provincial government and the Blueberry River First Nations or potential reallocation of harvesting rights to Indigenous Nations or communities; (vi) to restrict log processing to local or appurtenant sawmills or to mandate amounts of work to be provided or rates to be paid to harvesting contractors; or (vii) to change the methodology or rates for stumpage, may reduce our ability to secure log or residual fibre supply, may increase our log purchase and residual fibre costs, may adversely impact lumber grade and recovery and may impact our operations, including require us to reduce operating rates. These determinations may be made by the provincial government with the objective to protect the environment or endangered species, species at risk and critical habitat or to address the impact of forest fires, mountain pine beetle infestations, harvest and caribou conservation plans. Accordingly, forest fires, mountain pine beetle infestations, environmental protection measures and policies respecting indigenous rights and reconciliation efforts may result in government actions to reduce annual allowable cuts and timber supply that may adversely impact our access to fibre supply for our Canadian operations, and may significantly increase the cost of our Canadian operations. Our inability to access secure, economical and sustainable fibre supply has resulted in decisions to permanently curtail production at certain of our Canadian operations and may result in future curtailment of production.
In addition, our timber supply in B.C. may also be negatively impacted by rapid and on-going forest policy review by the B.C. Provincial Government. The continued evolution of B.C. forest policy is creating some uncertainty and constraining access to our timber harvesting land base. This development and implementation of updated forest policy is ongoing and the impacts to timber supply will not be fully understood for some time. These actions could have a material impact on both the amount of our AAC forest tenures and the amount of timber that we are able to harvest from these tenures. Without significant policy change in B.C., the B.C. forest sector may continue to experience further contraction.
We rely on third party independent contractors to harvest timber in areas over which we hold timber tenures. Increases in rates charged by these independent contractors or the limited availability of these independent contractors or new regulations on the work to be provided and rates to be paid to these contractors may increase our timber harvesting costs.
We also rely on the purchase of logs through open market purchases and private supply agreements and log exchange agreements and increased competition for logs, or shortages of logs may result in increases in our log purchase costs.
|
|
Unusually warm weather in Western Canada, including through the 2023/2024 winter, has hampered, and may hamper in the future, our ability to conduct logging activities which has the potential to limit our ability to accumulate the necessary log inventories, constrain our ability to manufacture and ship SPF lumber or necessitate reduced operating schedules.
United States
We rely on log supply agreements in the U.S. which are subject to log availability and based on market prices. The majority of the aggregate log requirements for our U.S. mills is purchased on the open market. Open market purchases come from timber real estate investment trusts, timberland investment management organizations and private land owners. Changes in the log markets in which we operate may reduce the supply of logs available to us and may increase the costs of log purchases, each of which could adversely affect our results. In addition, changes in the market for residuals may reduce the demand and selling price for the residuals produced by our operations and increase the disposal costs, which could adversely affect our results. We may experience higher competition for sustainable log supply sourcing as supply is limited by alternative demand for forests in carbon sequestration and through the increase in conversion to forest plantations or non-forest use where there is significant regional forest area decline.
While the U.S. South remains a critical area of lumber supply growth and a key region for West Fraser’s growth strategy, it is important to note that this region’s economic fibre supply, cost profile and access to end-use markets for sawmill residuals are not homogenous, and that all of these factors could limit our growth opportunities.
U.K. and Europe
Wood fibre for our U.K. and Belgium OSB, particleboard and MDF operations is purchased from government and private landowners. Changes in the log markets in which we operate may reduce the supply of logs available to us and may increase the costs of log purchases, each of which could adversely affect our results.
Residuals
We rely on fibre off-take agreements for certain of our Canadian solid wood operations under which we supply to third parties wood chips and other residuals generated from our lumber operations. While certain of these fibre supply agreements are long-term take-or-pay arrangements, we face counterparty risk in the event that the purchasers of our wood chips and other residuals default on their obligations. Default by our counterparties could force us to sell our wood chips and other residuals at then prevailing market prices which may be less than the prices under our fibre supply agreements.
We rely on third party consumers of wood chips, including pulp mills and paper mills, to purchase wood chips and other residuals generated at our U.S. solid wood mills. Recent pulp and paper mill closures in the U.S. South have reduced market demand for wood chips and other residuals in the areas where we operate. In addition, wood chip and residuals supply has increased as a result in regional increases in lumber production. These demand and supply factors can both decrease the price that we can obtain for our residuals in the U.S. market and require us to seek alternate means of sale or disposal of residuals, each of which could decrease the revenues and/or increase the overall costs of our U.S. operations.
Additional Risks to Availability of Fibre
When timber, wood chips, other residual fibre and wood recycled materials are purchased on the open market, we are in competition with other uses of such resources, where prices and the availability of supply are influenced by factors beyond our control. Fibre supply can also be influenced by natural events, such as forest fires, severe weather conditions, insect epidemics and other natural disasters, which may increase wood fibre costs, restrict access to wood fibre or force production curtailments.
Transportation Requirements
Our business depends on our ability to transport a high volume of products and raw materials to and from our production facilities and onto both domestic and international markets at cost effective rates. We rely primarily on third-party transportation providers for both the delivery of raw materials to our production facilities and the transportation of our products to market. These third-party transportation providers include truckers, bulk and container shippers and railways. Our ability to obtain transportation services from these transportation service providers is subject to risks which
| 2023 Annual Report | 55 |
include, without limitation, availability of equipment and operators, disruptions due to weather, natural disasters and labour disputes. To the extent that climate change results in more frequent severe weather occurrences, we may experience increased frequency of transportation disruptions in future years which may again result in a disruption of our ability to ship lumber and other products that we manufacture, including significant transportation disruptions from severe flooding, hurricanes, and other natural disasters. In addition, the potential of increased frequency of severe weather events may ultimately result in increased transportation costs as transportation providers, including railways, undertake capital expenditures to improve the ability of the transportation infrastructure to withstand severe weather events or to repair damage from severe weather events in order to maintain services.
Transportation services may also be impacted by seasonal factors, which could impact the timely delivery of raw materials and distribution of products to customers. As a result of rail and truck capacity constraints, access to adequate transportation capacity has at times been strained and could affect our ability to transport our products to markets and could result in increased product inventories. Any failure of third-party transportation providers to deliver finished goods or raw materials in a timely manner, including failure caused by adverse weather conditions or work stoppages, could harm our reputation, negatively affect customer relationships or disrupt production at our mills. Transportation costs are also subject to risks that include, without limitation, increased rates due to competition, increased fuel costs and increased capital expenditures related to repair, maintenance and upgrading of transportation infrastructure. Increases in transportation costs will increase our operating costs and adversely impact our profitability. If we are unable to obtain transportation services or if our transportation costs increase, our revenues may decrease due to our inability to deliver products to market and our operating expenses may increase, each of which would adversely affect our results of operations.
Costs and Availability of Materials and Energy
We rely heavily on certain raw materials, including logs, wood chips and other fibre sources, chemicals, and energy sources, including natural gas and electricity, in our manufacturing processes. Competition from our industry and other industries, as well as supply disruptions may result in increased demand and costs for these raw materials and energy sources. We have experienced significant cost inflation across a number of our inputs including supplies and materials and energy. Increases in the costs of these raw materials and energy sources will increase our operating costs and will reduce our operating margins. There is no assurance that we will be able to fully offset the effects of higher raw material or energy costs through hedging arrangements, price increases, productivity improvements or cost-reduction programs.
From time to time, we enter into arrangements with renewable power generators to purchase environmental attributes and receive settlements by reference to generation volumes and the spot price for electricity and pay settlements by reference to generation volumes and a fixed contractual price. These agreements act as a partial hedge against future electricity price increases. Fair values of our electricity swaps may be volatile and sensitive to fluctuations in forward electricity prices and counterparty credit risk.
Our operations depend on an uninterrupted supply of resins and chemicals, production inputs, and other supplies and resources such as skilled personnel. Supply may be interrupted due to a shortage or the scarce nature of inputs, especially with regard to chemicals. Supply might also be interrupted due to transportation and logistics associated with the remote location of some of our operations, and government restrictions or regulations which delay importation of necessary items. COVID-19 has had a significant impact on global supply chains, which has impacted our ability to source supplies required for our operations and has increased the costs of those supplies. Any interruptions to the procurement and supply of resins, chemicals, production inputs and other supplies, or the availability of skilled personnel, as well as continued increased rates of inflation, could have an adverse impact on our future cash flows, earnings, results of operations, and financial condition.
Operational Curtailments
From time to time, we suspend or curtail operations at one or more of our facilities in response to market conditions, environmental risks, or other operational issues, including, but not limited to scheduled and unscheduled maintenance, temporary periods of high electricity prices, power failures, equipment breakdowns, adverse weather conditions, labour disruptions, transportation disruptions, unavailability of staff, fire hazards, and the availability or cost of raw materials including logs, wood chips, resins and chemicals. In addition, the potential increased frequency of extreme weather events associated with climate change may result in operational curtailments becoming more frequent than we have experienced historically.
|
|
In addition, our ability to operate at full capacity may be affected by ongoing capital projects. As a result, our facilities may from time to time operate at less than full capacity. These operational suspensions could have a material adverse effect on our financial condition as a result of decreased revenues and lower operating margins.
In Canada, a substantial portion of the wood chip requirements of our Canadian pulp and paper operations are provided by our Canadian sawmills and plywood and LVL plants. If wood chip production is reduced because of production curtailments, improved manufacturing efficiencies or any other reason, our pulp and paper operations may incur additional costs to acquire or produce additional wood chips or be forced to reduce production. Conversely, pulp and paper mill production curtailments may require our sawmills and panel mills to find other ways to dispose of residual wood fibre and may result in curtailment or suspension of lumber, plywood or LVL production and increased costs.
In Canada, a substantial portion of the sawdust requirements of our Canadian MDF operations are provided by our Canadian sawmills and plywood and LVL plants. If sawdust is reduced because of production curtailments, improved manufacturing efficiencies or any other reason, our MDF operations may incur additional costs to acquire or produce additional sawdust or be forced to reduce production. Conversely, MDF mill production curtailments may require our sawmills and panel mills to find other ways to dispose of residual wood fibre and may result in curtailment or suspension of lumber, plywood or LVL production and increased costs.
Labour and Services
Our operations rely on experienced local and regional management and both skilled and unskilled workers as well as third party services such as logging and transportation and services for our capital projects. Because our operations are generally located away from major urban centers, we often face strong competition from our industry and others such as oil and gas production, mining and manufacturing for labour and services, particularly skilled trades. Shortages of key services or shortages of management leaders or skilled or unskilled workers, including those caused by a failure to attract and retain a sufficient number of qualified employees and other personnel or high employee turnover could impair our operations by reducing production or increasing costs or impacting the ability to execute on our capital projects including timing and costs. In addition, shortages of qualified employees may result in challenges to meet the objectives of our workforce diversity programs.
We employ a unionized workforce in a number of our operations. Walkouts or strikes by employees could result in lost production and sales, higher costs, supply constraints and litigation that could have a material adverse effect on our business. In addition, disputes with the unions that represent our employees may lead to litigation, the result of which may adversely impact cash flow and profitability of certain of our operations. Also, we depend on a variety of third parties that employ unionized workers to provide critical services to us. Labour disputes experienced by these third parties could lead to disruptions at our facilities.
Approximately 30% of our employees are covered by collective agreements. There were 6 expired collective agreements remaining as at December 31, 2023 representing approximately 29% of our unionized employees. All of our U.K. and Belgian union contracts are evergreen. Union agreements representing approximately 13% and 43% of our unionized employees expire in 2024 and 2025, respectively. In the event that we are unable to renew these collective agreements upon their expiry or the expired collective agreement in the near term, we could experience strikes or labour stoppages at the impacted facilities which could result in lost production and sales, higher costs and/or supply constraints.
Trade Restrictions
A substantial portion of our products that are manufactured in Canada are exported for sale. Our financial results are dependent on continued access to the export markets and tariffs, quotas and other trade barriers that restrict or prevent access represent a continuing risk to us. Canadian softwood lumber exports to the U.S. have been the subject of trade disputes and managed trade arrangements for the last several decades. During the period from October 2006 through October 2015 these exports were subject to a trade agreement between the U.S. and Canada and on the expiry of that agreement, a one-year moratorium on trade sanctions by the U.S. came into place. That moratorium has expired and in November 2016 a group of U.S. lumber producers petitioned the USDOC and the USITC to impose trade sanctions against Canadian softwood lumber exports to the U.S. In 2017 duties were imposed on Canadian softwood lumber exports to the U.S. The current duties are likely to remain in place until and unless some form of trade agreement can be reached between the U.S. and Canada (which trade agreement could include other tariffs or duties or quotas that restrict lumber exports) or a final, binding determination is made as a result of litigation. Unless the additional costs imposed by duties can be passed along to lumber consumers, the duties will increase costs for Canadian producers and, in certain cases,
| 2023 Annual Report | 57 |
could result in some Canadian production becoming unprofitable. Whether and to what extent duties can be passed along to consumers will largely depend on the strength of demand for softwood lumber, which is significantly influenced by the levels of new residential construction in the U.S. If duties can be passed through to consumers in whole or in part the price of Canadian softwood lumber will increase (although the increase will not necessarily be for the benefit of Canadian producers) which in turn could cause the price of SYP lumber, which would not be subject to the duty, to increase as well.
While the USDOC has issued its final duty rates for 2017 through 2021, the duty rates for the 2022 POI has not been finalized, and there is no assurance that the final rates for antidumping duty and countervailing duty will not differ materially from the cash deposit rates in place for those years.
The application of U.S. trade laws could, in certain circumstances, create significant burdens on us. We are a mandatory respondent in current investigations being conducted by the USDOC into alleged subsidies and dumping of Canadian softwood lumber. In addition, the current trade dispute between the U.S. and China could negatively impact either or both the U.S. and Chinese economies which could have an adverse effect on the demand for our products and could adversely affect our financial results. Further, the current diplomatic and trade issues between Canada and China could result in tariffs and other trade barriers that restrict access to the market in China for our products.
The future performance of our business is dependent upon international trade and, in particular, cross border trade between Canada and the U.S. and between the U.K. and European Union. Access to markets in the U.S., the European Union, China and other countries may be affected from time to time by various trade-related events. The financial condition and results of operations of our business could be materially adversely affected by trade rulings, the failure to reach or adopt trade agreements, the imposition of customs duties or other tariffs, or an increase in trade restrictions in the future.
Environment
We are subject to regulation by federal, provincial, state, municipal and local environmental authorities, including, among other matters, environmental regulations relating to air emissions and pollutants, wastewater (effluent) discharges, solid and hazardous waste, landfill operations, forestry practices, permitting obligations, site remediation and the protection of threatened or endangered species and critical habitat. Concerns over climate change, carbon emissions, water and land-use practices and the protection of threatened or endangered species and critical habitat could also lead governments to enact additional or more stringent environmental laws and regulations that may require us to incur significant capital expenditures, pay higher taxes or fees, including carbon related taxes or otherwise could adversely affect our operations or financial conditions.
We have incurred, and will continue to incur, capital expenditures and operating costs to comply with environmental laws and regulations, including the U.S. Environmental Protection Agency’s Boiler MACT (maximum achievable control technology) regulations and the National Ambient Air Quality Standards for Particulate Matter (PM) for PM2.5. These regulations include environmental laws and regulations relating to air emissions, wastewater discharges, solid and hazardous waste management, plant and wildlife protection and site remediation, as well as workplace safety. These laws, regulations and restrictions may be expanded to require us to take measures to protect or enhance the environment in which we operate, including measures to protect biodiversity, conserve habitats and reduce risk of invasive transportation of species to new ecosystems. In addition, changes in the regulatory environment respecting climate change have and may lead governments and regulatory bodies to enact additional or more stringent laws and regulations and impose operational restrictions or incremental levies and taxes applicable to our Company which could require us to incur increased capital expenditures, including further Best Available Control Technology or result in increased operating expenses or limit or constrain our ability to obtain permits and authorizations to advance our business and capital/modernization plans. In addition, we anticipate incurring additional capital expenditures in connection with capital projects that we plan to undertake in order to achieve our targeted greenhouse gas emission objectives. These capital expenditures may be greater than initially projected, and changes in environmental laws could impose more stringent requirements than our targeted objectives and result in increased capital expenditures or acceleration of the time for completion of the capital projects or delays in our ability to obtain permitting or execute on our new capital and modernization plans.
No assurance can be given that changes in these laws and regulations or their application will not have a material adverse effect on our business, operations, financial condition and operational results. Similarly, no assurance can be given that capital expenditures necessary for future compliance with existing and new environmental laws and regulations could be financed from our available cash flow.
|
|
Failure to comply with applicable laws and regulations could result in fines, penalties or other enforcement actions that could impact our production capacity or increase our production costs. In addition, laws and regulations could become more stringent or subject to different interpretation in the future.
We may discover currently unknown environmental problems, contamination, or conditions relating to our past or present operations. This or any failure to comply with environmental laws and regulations may require site or other remediation costs or result in governmental or private claims for damage to person, property, natural resources or the environmental or governmental sanctions, including fines or the curtailment or suspension of our operations, which could have a material adverse effect on our business, financial condition and operational results.
We are currently involved in investigation and remediation activities and maintain accruals for certain environmental matters or obligations, as set out in the notes to the Annual Financial Statements. Changing weather patterns and climatic conditions due to natural and man-made causes, including temperature shifts and changes to seasonal norms for winter and summer, can adversely impact our ability to meet our reforestation obligations and the expected cost to settle these liabilities. There can be no assurance that any costs associated with such obligations or other environmental matters will not exceed our accruals.
Our Canadian woodland operations, and the harvesting operations of our many key U.S. log and European wood fibre suppliers, in addition to being subject to various environmental protection laws, are subject to third-party certification as to compliance with internationally recognized, sustainable forest management standards. Demand for our products may be reduced if we are unable to achieve compliance or are perceived by the public as failing to comply, with these applicable environmental protection laws and sustainable forest management standards, or if our customers require compliance with alternate forest management standards for which our operations are not certified. In addition, changes in sustainable forest management standards or our determination to seek certification for compliance with alternate sustainable forest management standards may increase our costs of wood fibre and operations.
Climate Change, Environmental and Social Risks
We face direct risks associated with climate change and the environment, as well as indirect risks resulting from the growing international concern regarding climate change, environmental and social matters. Specifically, there has been a significant increase in focus on the timing and ability of organizations to transition to a lower-carbon economy and to demonstrate a commitment to environmental, social and governance issues. Governments, financial institutions, insurance companies, environmental and governance organizations, institutional investors, social and environmental activists, and individuals are increasingly seeking to implement, among other things, regulatory developments, policy changes and investment patterns, which, individually and collectively may have financial implications for both us and our stakeholders (i.e., customers, suppliers, shareholders).
Our business operations face risks associated with climate change and the environment. These risks include the following, as identified and discussed in this Risk and Uncertainties section of this MD&A:
| · | reduced access to fibre for our operations due to increased tree mortality or damage, including as a result of wildfire, extreme weather, drought and insect infestation; |
| · | transportation disruption due to extreme weather events, including flooding and forest fires; |
| · | risk to the availability of timber supply resulting from reduced timber supply, forest fires, and reduced forest access; |
| · | unplanned mill curtailments due to extreme weather or fire damage or power disruption. |
We also face transition risks attributable to climate change resulting from adaptation to climate change and government regulations in response to climate change, including:
| · | the potential of increasing energy costs; |
| · | changes in land-use and forest conservation practices; |
| · | increased capital expenditures associated with improving energy efficiency and meeting decarbonization objectives; |
| · | increased operating expenses associated with carbon pricing; |
| · | our inability to successfully transition to low-carbon technologies and operations. |
| 2023 Annual Report | 59 |
In addition, climate change and its associated impacts may increase our exposure to, and magnitude of, other risks identified in this Risk and Uncertainties section of this MD&A.
Overall, we continue to assess the degree to which climate change related regulatory, climatic conditions, and climate-related transition risks could impact our financial and operating results. Our business, financial condition, results of operations, cash flows, reputation, access to capital, access to insurance, cost of borrowing, access to liquidity, ability to fund dividend payments and/or business plans may, in particular, without limitation, be adversely impacted as a result of climate change and its associated impacts. We have initiated a formal climate change scenario analysis, informed by the Task Force on Climate-related Disclosures (TCFD) recommendations, to understand the potential impacts of climate-related risks and opportunities using different scenarios to help enhance our corporate strategy, supply planning and risk management and create awareness with our stakeholders, and build business resiliency.
We also face potential strategic, reputational, business, legal and regulatory risks relating to our actual or perceived actions, or inaction, in relation to climate change and other environmental and social risk issues, progress against our environmental or social commitments, or our disclosures on these matters. Investors and stakeholders increasingly compare companies based on climate-related performance and a perception among financial institutions and investors that our ESG initiatives, including the forestry industry’s sustainability initiatives, are insufficient, could adversely affect our reputation and ability to attract investors and capital.
In 2022, we joined the Science-Based Targets Initiative, which included setting specific science-based targets to achieve GHG emissions reduction across all our operations by 2030, as part of our overall sustainability and ESG initiatives. There is a risk that we will not meet our GHG emissions reduction targets, that some or all of the expected benefits and opportunities of achieving our various GHG and sustainability targets may fail to materialize, and that achieving the targets may cost more to achieve than projected or may not occur within anticipated time periods. Our failure to achieve our GHG or our sustainability targets, or a perception by key stakeholders, including our customers and our investors, that our GHG targets or other ESG initiatives are insufficient, could adversely affect our reputation and our ability to attract investors, capital and insurance coverage. Further, actions taken by us to meet our GHG targets and achieve our sustainability objectives may ultimately increase our projected capital expenditures and our costs of operations. In addition, our ability to access capital or the costs of available capital may be adversely affected in the event that financial institutions, investors, rating agencies and/or lenders adopt more restrictive sustainability policies than we have committed to.
Indigenous Groups
Issues relating to Indigenous groups, including Indigenous Nations, Métis and others, have the potential for an impact on resource companies operating in Canada including West Fraser. Risks include potential delays or effects of governmental decisions relating to Canadian Crown timber harvesting rights (including their grant, renewal or transfer or authorization to harvest) in light of the government’s duty to consult and accommodate Indigenous groups in respect of Aboriginal rights or treaty rights, agreements governments may choose to enter into with Indigenous groups or steps governments may take in favour of Indigenous groups even if not required by law, related terms and conditions of authorizations and potential findings of Aboriginal title over land. This includes potential Indigenous joint decision-making and consent agreements under the B.C. Declaration on the Rights of Indigenous Peoples Act related to forestry.
We participate, as requested by the government, in the consultation process in support of the government fulfilling its duty to consult. We also seek to develop and maintain good relationships and, where possible, agreements with Aboriginal groups that may be affected by our business activities. However, as the jurisprudence and government policies respecting Indigenous rights and title and the consultation process continue to evolve, as treaty and non-treaty negotiations continue, and as governments continue to announce and implement further policy and legislative changes to Indigenous interests (including, but not limited to the British Columbia Declaration of the Rights of Indigenous Peoples Act) and the federal United Nations Declaration on the Rights of Indigenous Peoples Act, we cannot assure that Indigenous claims will not in the future have a material adverse effect on our timber harvesting rights or our ability to exercise or renew them or secure other timber harvesting rights.
The Government of British Columbia’s evolving forest policy’s coupled with Indigenous Nations consultation and involvement in the land use planning process is expected to reduce the availability of and increase the timeline for, receipt of cutting permits and restrict volume available for harvest.
Recoverability of Capital Assets and Goodwill
|
|
Our capital assets and goodwill could become impaired, which could have a material non-cash adverse effect on our results of operations. We review our operations for events and circumstances that could indicate that the carrying value of our long-lived assets and goodwill may not be recoverable. If indicators of impairment are determined to exist, we review the recoverability of the carrying value of long-lived assets by estimating the recoverable amount of the asset, which is the higher of its estimated fair value less costs of disposal and its value in use. We also review our goodwill for impairment annually and when events or changes in circumstances indicate that the carrying value of the CGU or group of CGUs associated with the goodwill balance is not recoverable. We determine the value in use of assets and cash-generating units using discounted cash flow models. We make multiple assumptions in estimating future cash flows. Key assumptions include production volume, product pricing, raw material input cost, production cost, terminal multiple, and discount rate. Key assumptions were determined using external sources and historical data from internal sources. There are numerous uncertainties inherent in making these estimates, including many factors beyond our control, that could cause actual results to differ materially from expected financial and operating results. We may be required to recognize material non-cash charges relating to impairments of capital assets and/or goodwill in the future if actual results differ materially from management’s estimates. If a goodwill impairment charge is incurred, such charges are not reversible at a later date even when the events and circumstances that caused the impairment loss are favourably resolved. As a result of these uncertainties and the significant amount of goodwill ($1,949 million at December 31, 2023), our operating results may be significantly impacted from both the impairment and the underlying trends in the business that triggered the impairment, and actual results may be less favourable than estimated returns and initial financial outlook. As it relates to the North America EWP and Europe EWP CGU groups, a prolonged downturn in product pricing with an extended recovery could cause their carrying amounts to exceed their recoverable amounts. For additional information regarding goodwill, see note 9 to the Annual Financial Statements.
Regulatory
Our operations are subject to extensive general and industry-specific federal, provincial, state, municipal and other local laws and regulations and other requirements, including those governing forestry, exports, taxes (including, but not limited to, income, sales and carbon taxes), employees, labour standards, occupational health and safety, waste disposal, environmental protection and remediation, protection of endangered and protected species and land use and expropriation. We are required to obtain approvals, permits and licences for our operations, which may require advance consultation with potentially affected stakeholders including Indigenous groups and impose conditions that must be complied with. If we are unable to obtain, maintain, extend or renew, or are delayed in extending or renewing, a material approval, permit or license, our operations or financial condition could be adversely affected. There is no assurance that these laws, regulations or government requirements, or the administrative interpretation or enforcement of existing laws and regulations, will not change in the future in a manner that may require us to incur significant capital expenditures, pay higher taxes or otherwise could adversely affect our operations or financial condition. Failure to comply with applicable laws or regulations, including approvals, permits and licences, could result in fines, penalties or enforcement actions, including orders suspending or curtailing our operations or requiring corrective measures or remedial actions.
Natural and Man-Made Disasters and Climate Change Adaptation
Our operations are subject to adverse natural or man-made events such as forest fires, flooding, drought, hurricanes and other severe weather conditions, climate change, timber diseases and insect infestations including those that may be associated with warmer climate conditions, and earthquake activity. Over the past several years, changing weather patterns and climatic conditions due to natural and man-made causes, including temperature shifts and changes to seasonal norms for winter and summer, have added to the unpredictability and frequency of natural events such as severe weather, hurricanes, flooding, hailstorms, wildfires, mudslides, road washouts, snow, ice storms, and the spread of disease and insect infestations. These conditions have hampered, and may hamper in the future, our ability to conduct logging activities, constrain our ability to manufacture and ship our products or necessitate reduced operating schedules. Trends towards heavier precipitation patterns, changes to water quality and water storage on the land base can result in the overall degradation of water quality and reduced water supply levels. These events could damage or destroy or adversely affect the operations at our physical facilities or the cost, availability, and quality of our timber supply, and similar events could also affect the facilities of our suppliers or customers. Any such damage or destruction could adversely affect our financial results as a result of the reduced availability of timber, decreased production output, increased operating costs or the reduced availability of transportation. Although we believe we have reasonable insurance arrangements in place to cover certain of such incidents related to damage or destruction, there can be no assurance that these arrangements will be sufficient to fully protect us against such losses. As is common in the industry, we do not insure loss of standing timber for any cause.
| 2023 Annual Report | 61 |
In addition, government action to address climate change, carbon emissions, water and land use and the protection of threatened or endangered species and critical habitat may result in the enactment of additional or more stringent laws and regulations that may require us to incur significant capital expenditures, pay higher taxes or fees, including carbon related taxes, or otherwise could adversely affect our operations or financial conditions.
Information Technology
We are reliant on our information and operations technology systems to operate our manufacturing facilities, access fibre, communicate internally and with suppliers and customers, to sell our products and to process payments and payroll as well as for other corporate purposes and financial reporting. An interruption or failure or unsuccessful implementation and integration of our information and operations technology systems could result in a material adverse effect on our operations, business, financial condition and results of operations.
In order to optimize performance, we regularly implement business process improvement initiatives and invest capital to upgrade our information technology infrastructure. These initiatives may involve risks to the operations and we may experience difficulties during the transition to these new or upgraded systems and processes. Difficulties in implementing new or upgraded information systems or significant system failures could disrupt operations and have a material adverse effect on the business.
In addition, the history of our operations has resulted in multiple information technology platforms and applications across our business operations which complicates our business controls and processes, including our internal controls over financial reporting. Our strategy is to integrate and unify these information technology systems in order to avoid inefficiencies in our operations and to optimize our finance, sales, inventory management, maintenance and business intelligence functions. Our inability to integrate these systems, or delay in completing this integration, could result in impediments to our growth and profitability and increase our costs of operations and regulatory compliance.
In the ordinary course of our business, we collect and store sensitive data, including intellectual property, proprietary business and confidential financial information and identifiable personal information of our employees. We rely on industry accepted security measures and technology to protect our information systems and confidential and proprietary information. If our security measures and technology are not effective in ensuring unauthorized access to personally identifiable information, we may be subject to fines and/or penalties under privacy laws and regulations and our reputation with our customers, suppliers and employees may be adversely impacted.
Cyber Security
Our information and operations technology systems, including process control systems, are still subject to cyber security risks and are vulnerable to natural disasters, fires, power outages, vandalism, attacks by hackers or others or breaches due to employee error or other disruptions. We have had in the past, and may in the future, experience cyber security incidents. Any such incident, attack on or breach of our systems including through exposure to potential computer viruses or malware could compromise our systems and stored information may be accessed, publicly disclosed, lost or compromised, which could result in legal claims or proceedings, liability under laws that protect the privacy of personal information, regulatory penalties, disruptions to our operations, decreased performance and production, increased costs, and damage to our reputation, which could have a material adverse effect on our business, financial condition and results of operations. As cyber security threats continue to evolve, we may be required to expend additional resources to continue to modify or enhance protective measures or to investigate and remediate any security vulnerabilities. However, our exposure to these risks cannot be fully mitigated due to the nature of these threats. Our inability to adequately address risks from cyber security attacks could result in significant disruption to our information technology infrastructure and business applications, stoppage to our major operating, sales and financial processes and harm to our reputation and relationships with our customers and suppliers. Further, disruptions resulting from cyber security breaches could expose us to potential liability or other proceedings by affected individuals, business partners and/or regulators. As a result, we could face increased costs as a result of cyber security incidents for which we do not have insurance coverage.
In order to mitigate against the impact of potential cyber security breaches, we will be reliant on our disaster recovery and business continuity plans in order to continue our business operations with minimal disruption in the event of a cyber security breach. The success of these disaster recovery and business continuity plans will be contingent upon our ability to design and maintain effective plans that are resilient and will enable us to protect our information technology systems and data without disruption to our business.
|
|
Our inability to design and maintain effective recovery systems may adversely impact our ability to manage a cyber security breach without disruption to our operations with the result that our reputation may be harmed, we may be subject to regulatory reporting risk, our relationships with our customers and suppliers may be harmed and our result of operations may be adversely impacted.
In addition to risks we face from cyber security incidents directed at our systems, we also face risks from cyber security incidents impacting third parties, including but not limited to contractors, consultants and suppliers, directly or indirectly involved in our business and operations. We are vulnerable to damage and interruptions from incidents involving these third parties, and may be exposed to consequences that could have a material adverse effect on our financial condition, operations, production, sales and business.
Legal Proceedings
The Company is subject to various investigations, claims and legal, regulatory and tax proceedings covering a wide range of matters, including civil claims and lawsuits, regulatory examinations, investigations, audits and requests for information by various governmental regulatory agencies and law enforcement authorities in various jurisdictions. Each of these matters is subject to various uncertainties and it is possible that some of these matters may be resolved unfavourably. We establish provisions for matters that are probable and can be reasonably estimated in accordance with our accounting policies, however there is no assurance that our estimates will be accurate. We also carry liability insurance coverage, however such insurance does not cover all risks to which we might be exposed and in other cases, may only partially cover losses incurred by us. In addition, we may be involved in disputes with other parties in the future that may result in litigation, which may result in a material adverse effect on our financial position, cash flow and results of operations.
We produce a variety of wood-based panels that are used in new home construction, repair and remodelling of existing homes, furniture and fixtures, and industrial applications. In the normal course of business, the end users of our products have made, and could in the future make, claims with respect to the fitness for use of its products or claims related to product quality or performance issues.
In addition, we have been and may in the future be, involved in legal proceedings related to antitrust, negligence, personal injury, property damage, environmental matters, and labour and other claims against us or our predecessors.
Tax Exposures
In the normal course of business, we take various positions in the filing of our tax returns, and there can be no assurance that tax authorities will not challenge such filing positions. In addition, we are subject to further uncertainties concerning the interpretation and application of tax laws in various operating jurisdictions. We provide for known estimated tax exposures in all jurisdictions. These exposures are settled primarily through the closure of audits with the jurisdictional taxing authorities. However, future settlements could differ materially from our estimated liabilities.
Capital Intensity
Our business and the production of wood-based products is capital intensive. There can be no assurance that key manufacturing facilities and pieces of equipment will not need to be updated, modernized, repaired or replaced, or that operation of our manufacturing facilities could not otherwise be disrupted unexpectedly, for example by adverse weather, labour disputes, information technology disruptions, power outages, fire, explosion or other hazards including combustible wood dust. In certain circumstances, the costs of repairing or replacing equipment, and the associated downtime of the affected production line, may not be insurable.
We are required to review our long-lived assets for indicators that their carrying values are not recoverable. Indicators could include high raw material costs, high energy costs, changes in demand for our products, declines in product pricing, changes in technology, prolonged negative results or operational curtailments, and may result in non-cash impairment or accelerated depreciation charges in the future and therefore have a negative impact to earnings in the period when these charges are recorded.
Potential Future Changes in Tax Laws, including Tax Rates
Our corporate structure is based on prevailing taxation law, regulations and practice in the local jurisdictions in which we operate. We are aware that new taxation rules could be enacted or that existing rules could be applied in a manner that
| 2023 Annual Report | 63 |
subjects our profits to additional taxation or otherwise has a material adverse effect on our profitability, results of operations, deferred tax assets and liabilities, financial condition or the trading price of our securities, including without limitation the Pillar Two model rules and other tax reforms. Our management is continually monitoring changes in tax policy, tax legislation (including in relation to taxation rates), and the interpretation of tax policy or legislation or practice that could have such an effect. At any given time, we may face tax exposures arising out of changes in tax or transfer pricing laws, tax reassessments or otherwise. Governments around the world are increasingly seeking to regulate multinational companies and their use of differential tax rates between jurisdictions. This effort includes a greater emphasis by various nations to coordinate and share information regarding companies and the taxes they pay. Changes in governmental taxation policies and practices could adversely affect us or result in negative media coverage and, depending on the nature of such policies and practices, could have a greater impact on the Company than on other companies.
Foreign Currency Exchange Rates
Our Canadian operations sell the majority of their products at prices denominated in U.S. dollars or based on prevailing U.S. dollar prices while a significant portion of their operational costs and expenses are incurred in Canadian dollars. Upon closing of the Norbord Acquisition, we changed the functional currency and presentation currency of our Canadian operations, with the exception of our Spray Lake lumber mill and Canadian newsprint operation, from Canadian dollars to United States dollars. Our U.K. operations sell a portion of their products at prices denominated in Euros while the majority of their costs are incurred in British pounds sterling.
Accordingly, exchange rate fluctuations will result in exchange gains or losses recorded in earnings and other comprehensive earnings. This results in significant earnings sensitivity to changes in the relative value of the United States dollar in comparison to the value of the Canadian dollar, British pound sterling and Euro. These exchange rates are affected by a broad range of factors which makes future rates difficult to accurately predict. Significant fluctuations in relative currency values may also negatively affect the cost competitiveness of our facilities, the value of our foreign investments, the results of our operations and our financial position.
Financial
Capital Plans
Our capital plans will include, from time to time, expansion, productivity improvement, technology upgrades, operating efficiency optimization and maintenance, repair or replacement of our existing facilities and equipment. In addition, we will from time to time undertake the acquisition of facilities or the rebuilding or modernization of existing facilities, including the rebuilding and modernization of existing and newly acquired facilities and the incorporation of new technologies in our production facilities to improve operating efficiencies and reduce costs. We may also in the future be required to undertake capital projects to (i) address or mitigate the impacts of climate change and extreme weather events at our facilities, (ii) comply with new government regulation directed at reducing the impacts of climate change; (iii) reduce the carbon intensity or footprint of our existing operations by reducing or eliminating fossil fuel usage, or (iv) comply with new government regulation directed at improving environmental protection. If the capital expenditures associated with these capital projects are greater than we have projected or if construction timelines are longer than anticipated, or if we fail to achieve the intended efficiencies, our financial condition, results of operations and cash flows may be adversely affected. In addition, our ability to expand production and improve operational efficiencies will be contingent on our ability to execute on our capital plans. Our capital plans and our ability to execute on such plans may be adversely affected by availability of, and competition for, qualified workers and contractors, machinery and equipment lead times, changes in government regulations, unexpected delays and increases in costs of completing capital projects including due to increased materials, machinery and equipment costs resulting from trade disputes and increased tariffs and duties.
In addition, our ability to achieve our capital plans on budget and within the projected time frames will be contingent on our ability to build accurate business plans, budget and forecasts based on sound business assumptions. Our inability to develop accurate business plans, budgets and forecasts could result in increased costs of completion and our inability to realize the planned economic benefits of our capital plans. Our inability to modernize and incorporate new technologies into our existing production facilities could result in increased or high operating expenses or less than optimum operational capacities which may result in our facilities not being competitive with the production facilities of our competitors.
|
|
Capital Resources
We believe our capital resources will be adequate to meet our current projected operating needs, capital expenditures and other cash requirements. Factors that could adversely affect our capital resources include prolonged and sustained declines in the demand and prices for our products, unanticipated significant increases in our operating expenses and unanticipated capital expenditures. If for any reason we are unable to provide for our operating needs, capital expenditures and other cash requirements on commercially reasonable terms, we could experience a material adverse effect to our business, financial condition, results of operations and cash flows.
Availability of Credit
We rely on long-term borrowings and access to revolving credit in order to finance our ongoing operations. Our ability to refinance or renew such facilities will be dependent upon our financial condition, profitability and credit ratings and prevailing financial market conditions. Any change in availability of credit in the market, as could happen during an economic downturn, could affect our ability to access credit markets on commercially reasonable terms. In the future we may need to access public or private debt markets to issue new debt. Deteriorations or volatility in the credit markets could also adversely affect:
| · | our ability to secure financing to proceed with capital expenditures for the repair, replacement or expansion of our existing facilities and equipment; |
| · | our ability to comply with covenants under our existing credit or debt agreements; |
| · | the ability of our customers to purchase our products; and |
| · | our ability to take advantage of growth, expansion or acquisition opportunities. |
In addition, deteriorations or volatility in the credit market could result in increases in the interest rates that we pay on our outstanding non-fixed rate debt, which would increase our costs of borrowing and adversely affect our results.
We have notes maturing in 2024 and a term loan maturing in 2025. There is no assurance that financing will be available to us when required or available to us on commercially favourable or otherwise satisfactory terms in the future to re-finance these borrowings when they become due.
Credit Ratings
Credit rating agencies rate our debt securities based on factors that include our operating results, actions that we take, their view of the general outlook for our industry and their view of the general outlook for the economy. Actions taken by the rating agencies can include maintaining, upgrading or downgrading the current rating or placing us on a watch list for possible future downgrading. Downgrading the credit rating of our debt securities or placing us on a watch list for possible future downgrading could limit our access to the credit markets, increase our cost of financing and have an adverse effect on our financial condition.
Wood Dust
Our operations generate wood dust which has been recognized for many years as a potential health and safety hazard and operational issue. The potential risks associated with wood dust have been increased in those of our B.C. and Alberta facilities that have been processing mountain pine beetle-killed logs and fire damaged logs as the wood dust generated from these logs tends to be drier, lighter and finer than wood dust typically generated. We have adopted a variety of measures to reduce or eliminate the risks and operational challenges posed by the presence of wood dust in our facilities and we continue to work with industry and regulators to develop and adopt best mitigation practices. Any explosion or similar event at any of our facilities or any third-party facility could result in significant loss, increases in expenses and disruption of operations, increases in insurance costs, exposure to litigation, regulatory fines and/or penalties and damage to our reputation as an employer, each of which would have a material adverse effect on our business.
Pension Plan Funding
We are the sponsor of several defined benefit pension plans which exposes us to market risks related to plan assets and liabilities. Funding requirements for these plans are based on actuarial assumptions concerning expected return on plan assets, future salary increases, life expectancy and interest rates. If any of these assumptions differs from actual outcomes such that a funding deficiency occurs or increases, we would be required to increase cash funding contributions
| 2023 Annual Report | 65 |
which would in turn reduce the availability of capital for other purposes. We are also subject to regulatory changes regarding these plans which may increase the funding requirements which would in turn reduce the availability of capital for other purposes.
International Sales
A portion of our products are exported to customers in China, Japan and in developing markets. International sales present a number of risks and challenges, including but not limited to the effective marketing of our products in foreign countries, collectability of accounts receivable, tariffs and other barriers to trade and recessionary environments in foreign economies.
Strategic Initiatives
Our future success may in part be dependent on the performance of strategic initiatives, which could include growth in certain segments or markets and acquisitions. There can be no assurance that we will be able to successfully implement important strategic initiatives in accordance with our expectations, which may adversely affect our business, financial results and future growth prospects.
Acquisitions
We may evaluate and complete potential acquisitions from time to time and have in the past grown through acquisitions. However, there is no assurance that we in the future will be able to successfully identify potential acquisitions or efficiently and cost-effectively integrate any assets or business that we acquire without disrupting existing operations. Our inability to identify accretive acquisition targets and complete acquisitions may negatively impact our ability to grow our business operations and deploy our capital.
Acquisitions are subject to a range of inherent risks, including the assumption of incremental regulatory/compliance, pricing, labour relations, litigation, environmental, tax and other risks. There is no assurance that the due diligence that we undertake, including accounting, tax, regulatory and business due diligence, will be sufficient to identify all risks associated with any prospective acquisition that we undertake. Further, we may not be able to successfully integrate or achieve anticipated synergies from those acquisitions which we do complete and/or such acquisitions may be dilutive in the short to medium term. Specifically, there is no assurance that we will achieve the anticipated growth opportunities, synergies, efficiencies and costs savings from the combined business in respect of any acquisition that we undertake. Any of these adverse outcomes could result in us not achieving the financial benefits of prospective acquisitions and have a material adverse effect on our profitability.
Return of Capital to Shareholders
We have returned capital to our shareholders in 2023 through a combination of dividends and share repurchases, both through our normal course issuer bid and in 2022 through our substantial issuer bid. There is no assurance that we will continue to return capital to shareholders in future years, or as to the amount of capital that will be returned. Further, decisions to return capital to shareholders remain at the discretion of our board of directors and shareholders may not agree with the manner and the amounts of capital that are returned to shareholders. The declaration and payment of cash dividends remains within the discretion of our board of directors. Historically, cash dividends have been declared on a quarterly basis payable after the end of each quarter. There is no assurance that our board of directors will continue to maintain our dividend at the current rate. Our board of directors has the power to declare dividends at its discretion and in any manner and at any time as it may deem necessary or appropriate in the future. For these reasons, as well as others, there can be no assurance that dividends that we pay in the future will be equal or similar to the dividends historically paid by West Fraser or that our board of directors will not decide to suspend or discontinue the payment of cash dividends in the future.
Risks Associated with the NYSE Listing and Litigation
The West Fraser Common shares are listed on the NYSE. Our continued listing on the NYSE may expose us to additional regulatory proceedings, litigation (including class actions), mediation, and/or arbitration from time to time, which could adversely affect our business, financial condition and operations. Monitoring and defending against legal actions, with or without merit, can be time-consuming, may divert management’s attention and resources and can cause us to incur significant expenses. In addition, legal fees and costs incurred in connection with such activities may be significant and we may, in the future, be subject to judgments or enter into settlements of claims for significant monetary damages.
|
|
While we have insurance that may cover the costs and awards of certain types of litigation, the amount of insurance may not be sufficient to cover any costs or awards. Substantial litigation costs or an adverse result in any litigation may adversely impact our business, financial condition, or operations. Litigation, and any decision resulting therefrom, may also create a negative perception of West Fraser.
Risk Associated with Internal Controls
We are required to maintain and evaluate the effectiveness of our internal control over financial reporting under National Instrument 52-109 - Certification of Disclosure in Issuers’ Annual and Interim Filings in Canada and under the Securities Exchange Act of 1934 in the United States. Effective internal controls are required for us to provide reasonable assurance regarding the reliability of financial reporting and the preparation of our financial statements for external purposes in accordance with IFRS Accounting Standards. Management assesses the effectiveness of our internal control over financial reporting based on the criteria set forth in the Internal Control – Integrated Framework (2013) issued by the Committee of Sponsoring Organizations of the Treadway Commission. We also engage an independent registered public accounting firm to audit and provide an independent opinion on the effectiveness of our internal control over financial reporting.
There is no assurance that we will be able to achieve and maintain the adequacy of our internal control over financial reporting as such standards are modified, supplemented, or amended from time to time, and we may not be able to ensure that we can conclude on an ongoing basis that our internal control over financial reporting are effective. Also, projections of any evaluation of the effectiveness of internal control over financial reporting to future periods are subject to the risk that the controls may become inadequate because of changes in conditions, or that the degree of compliance with the policies or procedures may deteriorate. No evaluation can provide complete assurance that our internal control over financial reporting will prevent or detect misstatements on a timely basis, or detect or uncover all failures of persons employed by us to disclose material information otherwise required to be reported. The effectiveness of our controls and procedures could also be limited by simple errors or faulty judgments. In addition, as we continue to expand, the challenges involved in implementing appropriate internal control over financial reporting will increase and will require that we continue to improve our internal control over financial reporting.
Our failure to satisfy these requirements on a timely basis could result in the loss of investor confidence in the accuracy and reliability of our financial statements, which in turn could harm our business, expose us to legal or regulatory actions and negatively impact the trading price of our Common shares. In addition, any failure to implement required new or improved controls, or difficulties encountered in their implementation, could harm our operating results or cause us to fail to meet our reporting obligations. There can be no assurance that we will be able to remediate material weaknesses, if any, identified in future periods, or maintain all of the controls necessary for continued compliance, and there can be no assurance that we will be able to retain sufficient skilled finance and accounting personnel, especially in light of the increased demand for such personnel among publicly traded companies. Future acquisitions of companies may provide us with challenges in implementing the required processes, procedures and controls in our acquired operations. Acquired companies may not have disclosure controls and procedures or internal control over financial reporting that are as thorough or effective as those required by securities laws currently applicable to us.
Contagious Disease
Pandemics, epidemics and other outbreaks of contagious diseases, including COVID-19 and future COVID-19 variants, could cause interruptions to our business and operations and otherwise have an adverse effect on our business, financial condition and/or results of operations including as a result of the effects on: (i) global economic activity, (ii) the business, operations, financial condition, and solvency of our customers caused by operating shutdowns or disruptions or financial or liquidity issues, (iii) the demand for and price of our products, (iv) the health of our employees and the impact on their ability to work or travel, (v) our ability to operate our manufacturing facilities, (vi) our supply chain and the ability of third party suppliers, service providers and/or transportation carriers to supply goods or services on which we rely on to transport our products to market, and (vii) our revenues, cash flow, liquidity and ability to maintain compliance with the covenants in our credit agreements. In addition, our future business may be impacted by the local, regional, national or international outbreak or escalation of other contagious diseases, viruses or other illnesses, including the resurgence of COVID-19 and any future variants, Middle East Respiratory Syndrome, Severe Acute Respiratory Syndrome, H1N1 influenza virus, avian flu or any other similar illness, or fear of the foregoing,
Demand and prices for our products may be adversely affected by contagious diseases that affect levels of economic activity, and we are unable to predict or estimate the timing or extent of the impact of such pandemics, epidemics, and other outbreaks. Governmental measures or restrictions, including those requiring the closures of businesses, restrictions
| 2023 Annual Report | 67 |
on travel, country, provincial or state and city-wide isolation orders, and physical distancing requirements, may directly affect our operations and employees and those of our customers, suppliers and service providers, and the demand for and pricing of our products. The spread of such contagious diseases among our employees or those of our suppliers or service providers could result in lower production and sales, higher costs, and supply and transportation constraints. Accordingly, our production, costs, and sales may be negatively affected, which could have a material adverse effect on our business, financial condition and/or results of operation.
Given the ongoing nature of the COVID-19 outbreak, it is challenging to predict the impact on the Company’s business. The extent of such impact will depend on future developments, which are uncertain, including the resurgence of COVID-19 and any variants, new information that may emerge concerning the spread and severity, and actions taken to address its impact, among others. It is difficult to predict how this virus may affect our business in the future, including its effect (positive or negative; long or short term) on the demand and price for our products. It is possible that the resurgence of COVID-19, including any future variants, particularly if it has a prolonged duration, could have a material adverse effect on our supply chain, market pricing and customer demand, and distribution networks and may result in our inability to fully staff our manufacturing facilities, with the result that we may be forced to temporarily close facilities or reduce production rates during periods. These factors may further impact our operating plans, business, financial condition, liquidity, the valuation of long-lived assets, and operating results.
Our Common Shares May be Subject to Trading Volatility
Our Common shares will be subject to material fluctuations in trading prices and volumes which may increase or decrease in response to a number of events and factors, which will include:
| · | changes in the market price of the commodities that we sell and purchase; |
| · | current events affecting the economic situation in North America, Europe and the international markets in which our products are sold; |
| · | trends in the lumber and OSB industries and other industries in which we operate; |
| · | regulatory and/or government actions; |
| · | changes in financial estimates and recommendations by securities analysts; |
| · | future acquisitions and financings; |
| · | the economics of current and future projects undertaken by us; |
| · | variations in our operating results, financial condition or dividend policies; |
| · | the operating and share price performance of other companies, including those that investors may deem comparable to West Fraser; |
| · | the issuance of additional equity securities by us; and |
| · | the occurrence of any of the risks and uncertainties described above. |
In addition to factors directly affecting West Fraser, our Common shares may also experience volatility that is attributable to the overall state of the stock markets in which wide price swings may occur as a result of a variety of financial, economic and market perception factors. This overall market volatility may adversely affect the price of our Common shares, regardless of our own relative operating performance.
CONTROLS AND PROCEDURES
West Fraser is responsible for establishing and maintaining disclosure controls and procedures and internal control over financial reporting, each as defined in NI 52-109 in Canada and under the Securities Exchange Act of 1934, as amended, in the United States.
Limitations on Scope of Design of DC&P and ICFR
In accordance with the provisions of NI 52-109, our management has limited the scope of its design of the Company’s disclosure controls and procedures and internal control over financial reporting to exclude controls, policies and procedures of Spray Lake Sawmills (1980) Ltd., which was acquired on November 17, 2023.
Spray Lake’s contribution to our consolidated financial statements for the year ended December 31, 2023 was $5 million of sales, representing approximately 0.1% of consolidated sales, and $1 million of loss, representing 0.7% of consolidated loss. Additionally, assets attributed to Spray Lake’s assets were $134 million, representing approximately 1.4% of our total assets as at December 31, 2023.
|
|
Disclosure Controls and Procedures
We have designed our disclosure controls and procedures to provide reasonable assurance that information that is required to be disclosed by us in our annual filings, interim filings and other reports that we file or submit under securities legislation is recorded, processed, summarized and reported within the time periods specified in the securities legislation. These include controls and procedures designed to ensure that information that we are required to disclose under securities legislation is accumulated and communicated to our management, including our President and Chief Executive Officer (“CEO”) and the Senior Vice-President, Finance and Chief Financial Officer (“CFO”), as appropriate to allow timely decisions regarding required disclosure.
Our management, under the supervision and with the participation of our CEO and CFO, has conducted an evaluation of our disclosure controls and procedures as of December 31, 2023. Based on this evaluation, management, under the supervision of our CEO and CFO, have concluded that our disclosure controls and procedures are effective as of December 31, 2023.
Management’s Report on Internal Control Over Financial Reporting
Management, under the supervision of the CEO and CFO, is responsible for establishing and maintaining adequate internal control over financial reporting, as defined under NI 52-109 in Canada and the Securities Exchange Act of 1934, as amended, in the United States, to provide reasonable assurance regarding the reliability of financial reporting and the preparation of consolidated financial statements for external reporting purposes in accordance with IFRS Accounting Standards.
During the year ended December 31, 2023, we completed the migration of the enterprise resource planning (“ERP”) system used at our North American OSB operations to the ERP system used by our other North American operations. Although the implementation has allowed for improved standardization within the accounting function, it did not materially affect our internal control over financial reporting. There has been no change in our internal control over financial reporting during the year ended December 31, 2023, that has materially affected, or is reasonably likely to materially affect, our internal control over financial reporting.
Management, under the supervision of the CEO and CFO, has assessed the effectiveness of the Company’s internal control over financial reporting as of December 31, 2023 based on the criteria set forth in Internal Control - Integrated Framework (2013) issued by the Committee of Sponsoring Organizations of the Treadway Commission (“COSO”). Based on this assessment, management has concluded that the Company’s internal control over financial reporting was effective as of December 31, 2023.
The effectiveness of the Company’s internal control over financial reporting as of December 31, 2023 has been audited by PricewaterhouseCoopers LLP, the Company’s independent registered public accounting firm, as stated in their report included with our annual audited consolidated financial statements and accompanying notes for the year ended December 31, 2023.
Due to its inherent limitations, internal control over financial reporting may not prevent or detect misstatements on a timely basis. Additionally, projections of any evaluation of the effectiveness of internal control over financial reporting to future periods are subject to the risk that the controls may become inadequate because of changes in conditions, or that the degree of compliance with the policies or procedures may deteriorate.
| 2023 Annual Report | 69 |
DEFINITIONS, RECONCILIATIONS, AND OTHER INFORMATION
Transactions Between Related Parties
The Company has entered into executive compensation arrangements with key management personnel, consisting of our directors and officers. These individuals have the authority and responsibility for overseeing, planning, directing, and controlling our activities. Total compensation expense for key management personnel was $29 million in 2023, compared to $19 million in 2022. The increase in compensation expense was due primarily to higher equity-based compensation, influenced by changes in the price of our Common shares, vesting of granted units, and changes in the expected payout multiple on our performance share units, offset in part by lower salary and short-term employee benefits. See note 21 to the Annual Financial Statements for additional details.
Non-GAAP and Other Specified Financial Measures
Throughout this MD&A, we make reference to (i) certain non-GAAP financial measures, including Adjusted EBITDA and Adjusted EBITDA by segment (our “Non-GAAP Financial Measures”), (ii) certain capital management measures, including available liquidity, total debt to capital ratio, and net debt to capital ratio (our “Capital Management Measures”), and (iii) certain supplementary financial measures, including our expected capital expenditures (our “Supplementary Financial Measures”). We believe that these Non-GAAP Financial Measures, Capital Management Measures, and Supplementary Financial Measures (collectively, our “Non-GAAP and other specified financial measures”) are useful performance indicators for investors to understand our operating and financial performance and our financial condition. These Non-GAAP and other specified financial measures are not generally accepted financial measures under IFRS Accounting Standards and do not have standardized meanings prescribed by IFRS Accounting Standards. Investors are cautioned that none of our Non-GAAP Financial Measures should be considered as an alternative to earnings or cash flow, as determined in accordance with IFRS Accounting Standards. As there is no standardized method of calculating any of these Non-GAAP and other specified financial measures, our method of calculating each of them may differ from the methods used by other entities and, accordingly, our use of any of these Non-GAAP and other specified financial measures may not be directly comparable to similarly titled measures used by other entities. Accordingly, these Non-GAAP and other specified financial measures are intended to provide additional information and should not be considered in isolation or as a substitute for measures of performance prepared in accordance with IFRS Accounting Standards. The reconciliation of the Non-GAAP measures used and presented by the Company to the most directly comparable measures under IFRS Accounting Standards is provided in the tables set forth below.
Adjusted EBITDA and Adjusted EBITDA by Segment
Adjusted EBITDA is defined as earnings determined in accordance with IFRS Accounting Standards adding back the following line items from the consolidated statements of earnings and comprehensive earnings: finance income or expense, tax provision or recovery, amortization, equity-based compensation, restructuring and impairment charges, and other income or expense.
Adjusted EBITDA by segment is defined as operating earnings determined for each reportable segment in accordance with IFRS adding back the following line items from the consolidated statements of earnings and comprehensive earnings for that reportable segment: amortization, equity-based compensation, and restructuring and impairment charges.
EBITDA is commonly reported and widely used by investors and lending institutions as an indicator of a company’s operating performance, ability to incur and service debt, and as a valuation metric. We calculate Adjusted EBITDA and Adjusted EBITDA by segment to exclude items that do not reflect our ongoing operations and that should not, in our opinion, be considered in a long-term valuation metric or included in an assessment of our ability to service or incur debt.
We believe that disclosing these measures assists readers in measuring performance relative to other entities that operate in similar industries and understanding the ongoing cash generating potential of our business to provide liquidity to fund working capital needs, service outstanding debt, fund future capital expenditures and investment opportunities, and pay dividends. Adjusted EBITDA is used as an additional measure to evaluate the operating and financial performance of our reportable segments.
The following tables reconcile Adjusted EBITDA to the most directly comparable IFRS measure, earnings.
|
|
See note 19 to the Annual Financial Statements for a breakdown of the items making up Other. Other is comprised primarily of foreign exchange revaluations and gains/losses on our electricity swaps and interest rate swaps.
Annual Adjusted EBITDA
| ($ millions) | ||||||||||||
| 2023 | 2022 | 2021 | ||||||||||
| Earnings (loss) |
$ | (167 | ) | $ | 1,975 | $ | 2,947 | |||||
| Finance expense (income), net |
(51 | ) | 3 | 45 | ||||||||
| Tax provision (recovery) |
(61 | ) | 618 | 951 | ||||||||
| Amortization |
541 | 589 | 584 | |||||||||
| Equity-based compensation |
25 | 5 | 40 | |||||||||
| Restructuring and impairment charges |
279 | 60 | — | |||||||||
| Other expense (income) |
(5 | ) | (37 | ) | 2 | |||||||
| Adjusted EBITDA |
$ | 561 | $ | 3,212 | $ | 4,569 | ||||||
| Quarterly Adjusted EBITDA | ||||||||||||
| ($ millions) | ||||||||||||
| Q4-23 | Q3-23 | Q4-22 | ||||||||||
| Earnings (loss) |
$ | (153 | ) | $ | 159 | $ | (94 | ) | ||||
| Finance income, net |
(14 | ) | (21 | ) | (3 | ) | ||||||
| Tax provision (recovery) |
(50 | ) | 56 | (31 | ) | |||||||
| Amortization |
136 | 132 | 148 | |||||||||
| Equity-based compensation |
15 | (4 | ) | 6 | ||||||||
| Restructuring and impairment charges |
134 | 13 | 47 | |||||||||
| Other expense (income) |
30 | (11 | ) | (2 | ) | |||||||
| Adjusted EBITDA |
$ | 97 | $ | 325 | $ | 70 | ||||||
The following tables reconcile Adjusted EBITDA by segment to the most directly comparable IFRS measures for each of our reportable segments. We consider operating earnings to be the most directly comparable IFRS measure for Adjusted EBITDA by segment as operating earnings is the IFRS measure most used by the chief operating decision maker when evaluating segment operating performance.
Annual Adjusted EBITDA by Segment ($ millions)
| 2023 | Lumber | NA EWP | Pulp & Paper | Europe EWP | Corporate & Other |
Total | ||||||||||||||||||
| Operating earnings (loss) |
$ | (319 | ) | $ | 316 | $ | (242 | ) | $ | (3 | ) | $ | (35 | ) | $ | (284 | ) | |||||||
| Amortization |
185 | 273 | 24 | 49 | 10 | 541 | ||||||||||||||||||
| Equity-based compensation |
— | — | — | — | 25 | 25 | ||||||||||||||||||
| Restructuring and impairment charges |
137 | — | 142 | — | — | 279 | ||||||||||||||||||
| Adjusted EBITDA by segment |
$ | 2 | $ | 589 | $ | (77 | ) | $ | 46 | $ | — | $ | 561 | |||||||||||
| 2022 | Lumber | NA EWP | Pulp & Paper | Europe EWP | Corporate & Other |
Total | ||||||||||||||||||
| Operating earnings (loss) |
$ | 1,111 | $ | 1,371 | $ | (22 | ) | $ | 117 | $ | (18 | ) | $ | 2,559 | ||||||||||
| Amortization |
186 | 306 | 35 | 53 | 9 | 589 | ||||||||||||||||||
| Equity-based compensation |
— | — | — | — | 5 | 5 | ||||||||||||||||||
| Restructuring and impairment charges |
31 | — | 13 | 15 | — | 60 | ||||||||||||||||||
| Adjusted EBITDA by segment |
$ | 1,328 | $ | 1,677 | $ | 26 | $ | 186 | $ | (5 | ) | $ | 3,212 | |||||||||||
| 2023 Annual Report | 71 |
Quarterly Adjusted EBITDA by Segment ($ millions)
| Q4-23 | Lumber | NA EWP | Pulp & Paper | Europe EWP | Corporate & Other |
Total | ||||||||||||||||||
| Operating earnings (loss) |
$ | (228) | $ | 74 | $ | (7 | ) | $ | (10 | ) | $ | (17 | ) | $ | (187 | ) | ||||||||
| Amortization |
48 | 69 | 3 | 13 | 3 | 136 | ||||||||||||||||||
| Equity-based compensation |
— | — | — | — | 15 | 15 | ||||||||||||||||||
| Restructuring and impairment charges |
128 | — | 6 | — | — | 134 | ||||||||||||||||||
| Adjusted EBITDA by segment |
$ | (51 | ) | $ | 143 | $ | 2 | $ | 3 | $ | — | $ | 97 | |||||||||||
| Q3-23 | Lumber | NA EWP | Pulp & Paper | Europe EWP | Corporate & Other |
Total | ||||||||||||||||||
| Operating earnings (loss) |
$ | (2) | $ | 222 | $ | (29 | ) | $ | (8 | ) | $ | 2 | $ | 184 | ||||||||||
| Amortization |
46 | 67 | 4 | 12 | 3 | 132 | ||||||||||||||||||
| Equity-based compensation |
— | — | — | — | (4 | ) | (4 | ) | ||||||||||||||||
| Restructuring and impairment charges |
— | — | 13 | — | — | 13 | ||||||||||||||||||
| Adjusted EBITDA by segment |
$ | 44 | $ | 289 | $ | (12 | ) | $ | 4 | $ | 1 | $ | 325 | |||||||||||
| Q4-22 | Lumber | NA EWP | Pulp & Paper | Europe EWP | Corporate & Other |
Total | ||||||||||||||||||
| Operating earnings (loss) |
$ | (161) | $ | 35 | $ | 6 | $ | 3 | $ | (14 | ) | $ | (130 | ) | ||||||||||
| Amortization |
51 | 73 | 9 | 12 | 2 | 148 | ||||||||||||||||||
| Equity-based compensation |
— | — | — | — | 6 | 6 | ||||||||||||||||||
| Restructuring and impairment charges |
31 | — | — | 15 | — | 47 | ||||||||||||||||||
| Adjusted EBITDA by segment |
$ | (77 | ) | $ | 109 | $ | 15 | $ | 30 | $ | (6 | ) | $ | 70 | ||||||||||
Available liquidity
Available liquidity is the sum of our cash and cash equivalents and funds available under our committed and uncommitted bank credit facilities. We believe disclosing this measure assists readers in understanding our ability to meet uses of cash resulting from contractual obligations and other commitments at a point in time.
| Available Liquidity | December 31, | December 31, | ||||||
| ($ millions) | 2023 | 2022 | ||||||
| Cash and cash equivalents |
$ | 900 | $ | 1,162 | ||||
| Operating lines available (excluding newsprint operation)1 |
1,054 | 1,053 | ||||||
| 1,954 | 2,215 | |||||||
| Cheques issued in excess of funds on deposit |
— | — | ||||||
| Borrowings on operating lines |
— | — | ||||||
| Available liquidity |
$ | 1,954 | $ | 2,215 | ||||
| 1. | Excludes demand line of credit dedicated to our jointly-owned newsprint operation as West Fraser cannot draw on it. |
Total debt to total capital ratio
Total debt to total capital ratio is total debt divided by total capital, expressed as a percentage. Total capital is defined as the sum of total debt plus total equity. This calculation is defined in certain of our bank covenant agreements. We believe disclosing this measure assists readers in understanding our capital structure, financial solvency, and degree of leverage at a point in time.
|
|
The following table outlines the composition of the measure.
| Total Debt to Capital | December 31, | December 31, | ||||||
| ($ millions) | 2023 | 2022 | ||||||
| Debt |
||||||||
| Operating loans |
$ | — | $ | — | ||||
| Current and long-term lease obligation |
39 | 37 | ||||||
| Current and long-term debt |
500 | 500 | ||||||
| Derivative liabilities1 |
— | — | ||||||
| Open letters of credit1 |
43 | 61 | ||||||
| Total debt |
582 | 598 | ||||||
| Shareholders’ equity |
7,223 | 7,619 | ||||||
| Total capital |
$ | 7,805 | $ | 8,217 | ||||
| Total debt to capital |
7% | 7% | ||||||
| 1. | Letters of credit facilities and the fair value of derivative liabilities are part of our bank covenants’ total debt calculation. |
Net debt to capital ratio
Net debt to capital ratio is net debt divided by total capital, expressed as a percentage. Net debt is calculated as total debt less cash and cash equivalents, open letters of credit, and the fair value of any derivative liabilities. Total capital is defined as the sum of net debt plus total equity. We believe disclosing this measure assists readers in understanding our capital structure, financial solvency, and degree of leverage at a point in time. We believe that using net debt in the calculation is helpful because net debt represents the amount of debt obligations that are not covered by available cash and cash equivalents.
The following table outlines the composition of the measure.
| Net Debt to Capital | December 31, | December 31, | ||||||
| ($ millions) | 2023 | 2022 | ||||||
| Debt |
||||||||
| Operating loans |
$ | — | $ | — | ||||
| Current and long-term lease obligation |
39 | 37 | ||||||
| Current and long-term debt |
500 | 500 | ||||||
| Derivative liabilities1 |
— | — | ||||||
| Open letters of credit1 |
43 | 61 | ||||||
| Total debt |
582 | 598 | ||||||
| Cash and cash equivalents |
(900 | ) | (1,162 | ) | ||||
| Open letters of credit |
(43 | ) | (61 | ) | ||||
| Derivative liabilities |
— | — | ||||||
| Cheques issued in excess of funds on deposit |
— | — | ||||||
| Net debt |
(361 | ) | (625 | ) | ||||
| Shareholders’ equity |
7,223 | 7,619 | ||||||
| Total capital |
$ | 6,862 | $ | 6,994 | ||||
| Net debt to capital |
(5%) | (9%) | ||||||
| 1. | Letters of credit facilities and the fair value of derivative liabilities are part of our bank covenants’ total debt calculation. |
Expected capital expenditures
This measure represents our best estimate of the amount of cash outflows relating to additions to capital assets for the current year based on our current outlook. This amount is comprised primarily of various improvement projects and maintenance-of-business expenditures, projects focused on optimization and automation of the manufacturing process, and projects targeted to reduce greenhouse gas emissions. This measure assumes no deterioration in market conditions
| 2023 Annual Report | 73 |
during the year and that we are able to proceed with our plans on time and on budget. This estimate is subject to the risks and uncertainties identified in this MD&A.
Glossary of Key Terms
We use the following terms in this MD&A:
| Term | Description | |
| AAC |
Annual allowable cut | |
| ADD |
Antidumping duty | |
| AR |
Administrative Review by the USDOC | |
| B.C. |
British Columbia | |
| BCTMP |
Bleached chemithermomechanical pulp | |
| CAD or CAD$ |
Canadian dollars | |
| CEO |
President and Chief Executive Officer | |
| CFO |
Senior Vice-President, Finance and Chief Financial Officer | |
| CGU |
Cash generating unit | |
| COSO |
Committee of Sponsoring Organizations of the Treadway Commission | |
| Crown timber |
Timber harvested from lands owned by a provincial government | |
| CVD |
Countervailing duty | |
| EDGAR |
Electronic Data Gathering, Analysis and Retrieval System | |
| ESG |
Environmental, Social and Governance | |
| EWP |
Engineered wood products | |
| GBP |
British pound sterling | |
| GHG |
Greenhouse gas | |
| IFRS Accounting Standards |
International Financial Reporting Standards as issued by the International Accounting Standards Board | |
| LIBOR |
London Interbank Offered Rate | |
| LVL |
Laminated veneer lumber | |
| MDF |
Medium-density fibreboard | |
| NA |
North America | |
| NA EWP |
North America Engineered Wood Products | |
| NBSK |
Northern bleached softwood kraft pulp | |
| NCIB |
Normal course issuer bid | |
| 2022 NCIB |
Normal course issuer bid - February 23, 2022 to February 22, 2023 | |
| 2023 NCIB |
Normal course issuer bid - February 27, 2023 to February 26, 2024 | |
| NI 52-109 |
National Instrument 52-109 - Certification of Disclosure in Issuers’ Annual and Interim Filings | |
| Norbord |
Norbord Inc. | |
| Norbord Acquisition |
Acquisition of Norbord completed February 1, 2021 | |
| NYSE |
New York Stock Exchange | |
| OSB |
Oriented strand board | |
| POI |
Period of Investigation in respect of an USDOC administrative review | |
| PPE |
Property, plant, and equipment | |
| Q1-23 or Q1-22 |
three months ended March 31, 2023 or 2022 and for balance sheet amounts as at March 31, 2023 or 2022 | |
| Q2-23 or Q2-22 |
three months ended June 30, 2023 or 2022 and for balance sheet amounts as at June 30, 2023 or 2022 | |
| Q3-23 or Q3-22 |
three months ended September 29, 2023 or September 30, 2022 and for balance sheet amounts as at September 29, 2023 or September 30, 2022 | |
| Q4-23 or Q4-22 |
three months ended December 31, 2023 or 2022 and for balance sheet amounts as at December 31, 2023 or 2022 | |
| SEDAR+ |
System for Electronic Document Analysis and Retrieval + | |
|
|
| 2021 SIB |
Our substantial issuer bid completed in August 2021 | |
| 2022 SIB |
Our substantial issuer bid completed in June 2022 | |
| SOFR |
Secured Overnight Financing Rate | |
| SOX |
Section 404 of the Sarbanes-Oxley Act | |
| SPF |
Spruce/pine/balsam fir lumber | |
| Spray Lake lumber mill |
Spray Lake Sawmills (1980) Ltd. | |
| SYP |
Southern yellow pine lumber | |
| TSX |
Toronto Stock Exchange | |
| U.K. |
United Kingdom | |
| UKP |
Unbleached kraft pulp | |
| U.S. |
United States | |
| USD or $ or US$ |
United States Dollars | |
| USDOC |
United States Department of Commerce | |
| USITC |
United States International Trade Commission | |
Forward-Looking Statements
This MD&A includes statements and information that constitutes “forward-looking information” within the meaning of Canadian securities laws and “forward-looking statements” within the meaning of United States securities laws (collectively, “forward-looking statements”). Forward-looking statements include statements that are forward-looking or predictive in nature and are dependent upon or refer to future events or conditions. We use words such as “expects,” “anticipates,” “plans,” “believes,” “estimates,” “seeks,” “intends,” “targets,” “projects,” “forecasts,” or negative versions thereof and other similar expressions, or future or conditional verbs such as “may,” “will,” “should,” “would,” and “could,” to identify these forward-looking statements. These forward-looking statements generally include statements which reflect management’s expectations regarding the operations, business, financial condition, expected financial results, performance, prospects, opportunities, priorities, targets, goals, ongoing objectives, strategies and outlook of West Fraser and its subsidiaries, as well as the outlook for North American and international economies for the current fiscal year and subsequent periods.
Forward-looking statements included in this MD&A include references to:
| Discussion | Forward-Looking Statements | |
| Our Business and Strategy |
our corporate strategy and objectives to generate strong financial results through the business cycle, maintain a strong balance sheet and liquidity profile along with an investment-grade debt rating, to maintain a leading cost position and to return capital to shareholders, reinvest in operations, renewable building materials, and achieve science-based targets to achieve near-term greenhouse gas reductions across all our operations | |
| Recent Developments – Markets |
impact of interest rates and inflationary price pressures, mortgage rates, housing demand and affordability, housing prices, unemployment rates, repair and remodelling demand, inflationary pressures on demand for lumber and OSB, expectations regarding near, medium and longer-term core demand, import trends and inflation; impact of new lumber and OSB production capacity on market supply and pricing | |
| Recent Developments - Completion of Spray Lake Acquisition |
finalization of certain post-close working capital adjustments and purchase price allocation relating to the purchase of Spray Lake Sawmills (1980) Ltd. | |
| Recent Developments - CVD and ADD Duty Rates |
the finalization of the AR5 and AR6 duty rates and their impact on our financial position | |
| Discussion & Analysis of Annual Results by Product Segment - Lumber Segment - Softwood Lumber Dispute |
administrative review commencement, adjustment of export duty rates, proceedings related to duty rates, and timing of finalization of AR5 and AR6 duty rates | |
| Business Outlook – Markets |
market conditions, housing affordability, demand for our products over the near, medium and longer term, impacts of interest rates, ongoing geopolitical conflict, inflationary pressures, timing of finalization of AR5 and AR6 duty rates; ability to capitalize on long-term opportunities; and expectations as to stabilization and moderation of interest rates | |
| 2023 Annual Report | 75 |
| Business Outlook – Operations |
production levels, demand expectations, projected SPF and SYP lumber shipments, projected OSB shipments, operating costs, B.C. and Alberta stumpage rates and U.S. South log costs and trends, the moderation of impact of inflationary pressures and availability constraints for labour, transportation, raw materials such as resins and chemicals, and energy, expectations as to availability of transportation services, the timing, costs of restart, ramp up period to target production and contribution to shipments of Allendale OSB facility, and the overall OSB platform with modern Allendale OSB facility; expectations as to moderation of log and input costs and increasing or elevated interest rates; satisfaction of the conditions to closing of the sale of Quesnel River Pulp mill and Slave Lake Pulp mill and the timing of closing these transactions | |
| Business Outlook – Cash Flows |
projected cash flows from operations and available liquidity, projected capital expenditures and completion dates (including with respect to the modernization of the Henderson, Texas lumber manufacturing facility), expected results of capital expenditures, including improvements, maintenance, optimization and automation projects and projects targeted to reduce greenhouse gas emissions, maintenance of our investment grade debt rating, strategic growth opportunities, expected continuity of dividends and share repurchases | |
| Liquidity and Capital Resources |
Available liquidity | |
By their nature, these forward-looking statements involve numerous assumptions, inherent risks and uncertainties, both general and specific, which contribute to the possibility that the predictions, forecasts, and other forward-looking statements will not occur. Factors that could cause actual results to differ materially from those contemplated or implied by forward-looking statements include, but are not limited to:
| · | assumptions in connection with the economic and financial conditions in the U.S., Canada, U.K., Europe and globally and consequential demand for our products, including the impact of the conflicts in Ukraine and the Middle East; |
| · | continued increases in interest rates and inflation and sustained higher interest rates and rates of inflation could impact housing affordability and repair and remodelling demand, which could reduce demand for our products; |
| · | global supply chain issues may result in increases to our costs and may contribute to a reduction in near-term demand for our products; |
| · | continued governmental approvals and authorizations to access timber supply, and the impact of forest fires, infestations, environmental protection measures and actions taken by government respecting Indigenous rights, title and/or reconciliation efforts on these approvals and authorizations; |
| · | risks inherent in our product concentration and cyclicality; |
| · | effects of competition for logs, availability of fibre and fibre resources and product pricing pressures, including continued access to log supply and fibre resources at competitive prices and the impact of third-party certification standards; including reliance on fibre off-take agreements and third party consumers of wood chips; |
| · | effects of variations in the price and availability of manufacturing inputs, including energy, employee wages, resin and other input costs, and the impact of inflationary pressures on the costs of these manufacturing costs, including increases in stumpage fees and log costs; |
| · | availability and costs of transportation services, including truck and rail services, and port facilities, and impacts on transportation services of wildfires and severe weather events, and the impact of increased energy prices on the costs of transportation services; |
| · | transportation constraints may continue to negatively impact our ability to meet projected shipment volumes; |
| · | the timing of our planned capital investments may be delayed, the ultimate costs of these investments may be increased as a result of inflation, and the projected rates of return may not be achieved; |
| · | various events that could disrupt operations, including natural, man-made or catastrophic events including wildfires, cyber security incidents, any state of emergency and/or evacuation orders issued by governments, and ongoing relations with employees; |
| · | risks inherent to customer dependence; |
| · | impact of future cross border trade rulings or agreements; |
| · | implementation of important strategic initiatives and identification, completion and integration of acquisitions; |
| · | impact of changes to, or non-compliance with, environmental or other regulations; |
| · | the impact of the COVID-19 pandemic on our operations and on customer demand, supply and distribution and other factors; |
| · | government restrictions, standards or regulations intended to reduce greenhouse gas emissions and our inability to achieve our SBTi commitment for the reduction of greenhouse gases as planned; |
| · | the costs and timeline to achieve our greenhouse gas emissions objectives may be greater and take longer than anticipated; |
|
|
| · | changes in government policy and regulation, including actions taken by the Government of British Columbia pursuant to recent amendments to forestry legislation and initiatives to defer logging of forests deemed “old growth” and the impact of these actions on our timber supply; |
| · | impact of weather and climate change on our operations or the operations or demand of our suppliers and customers; |
| · | ability to implement new or upgraded information technology infrastructure; |
| · | impact of information technology service disruptions or failures; |
| · | impact of any product liability claims in excess of insurance coverage; |
| · | risks inherent to a capital intensive industry; |
| · | impact of future outcomes of tax exposures; |
| · | potential future changes in tax laws, including tax rates; |
| · | risks associated with investigations, claims and legal, regulatory and tax proceedings covering matters which if resolved unfavourably may result in a loss to the Company; |
| · | effects of currency exposures and exchange rate fluctuations; |
| · | fair values of our electricity swaps may be volatile and sensitive to fluctuations in forward electricity prices; |
| · | future operating costs; |
| · | availability of financing, bank lines, securitization programs and/or other means of liquidity; |
| · | continued access to timber supply in the traditional territories of Indigenous Nations; |
| · | our ability to continue to maintain effective internal control over financial reporting; |
| · | satisfaction of the conditions to closing of our sales of Quesnel River Pulp mill and Slave Lake Pulp mill and related timing of the closing of these transactions, including impacts to proceeds from the sale if the working capital at closing is below target; |
| · | continued access to timber supply in the traditional territories of Indigenous Nations; |
| · | our ability to continue to maintain effective internal control over financial reporting; |
| · | finalization of certain post-close working capital adjustments and purchase price allocation relating to the purchase of Spray Lake Sawmills (1980) Ltd.; |
| · | the risks and uncertainties described in the 2023 Annual MD&A; and |
| · | other risks detailed from time to time in our annual information forms, annual reports, MD&A, quarterly reports and material change reports filed with and furnished to securities regulators. |
In addition, actual outcomes and results of these statements will depend on a number of factors including those matters described under “Risks and Uncertainties” in this annual MD&A and may differ materially from those anticipated or projected. This list of important factors affecting forward-looking statements is not exhaustive and reference should be made to the other factors discussed in public filings with securities regulatory authorities. Accordingly, readers should exercise caution in relying upon forward-looking statements and we undertake no obligation to publicly update or revise any forward-looking statements, whether written or oral, to reflect subsequent events or circumstances except as required by applicable securities laws.
Additional Information
Additional information on West Fraser, including our Annual Information Form and other publicly filed documents, is available on the Company’s website at www.westfraser.com, on SEDAR+ at www.sedarplus.ca and on the EDGAR section of the SEC website at www.sec.gov/edgar.shtml.
Where this MD&A includes information from third parties, we believe that such information (including information from industry and general publications and surveys) is generally reliable. However, we have not independently verified any such third-party information and cannot assure you of its accuracy or completeness.
| 2023 Annual Report | 77 |
2023 Audited Statements Consolidated Financial Statements West Fraser Timber Co. Ltd. December 31, 2023 and 2022
RESPONSIBILITY OF MANAGEMENT
Management’s Report on the Consolidated Financial Statements
The accompanying consolidated financial statements and related notes are the responsibility of the management of West Fraser Timber Co. Ltd. (the “Company”). They have been prepared in accordance with International Financial Reporting Standards as issued by the International Accounting Standards Board (“IFRS Accounting Standards”) and include amounts based on estimates and judgments. Financial information included elsewhere in this report is consistent with the consolidated financial statements.
The consolidated financial statements are approved by the Board of Directors on the recommendation of the Audit Committee. The Audit Committee, appointed by the Board of Directors, is composed entirely of independent directors. The Audit Committee reviews the Company’s consolidated financial statements and reports its findings to the Board of Directors for consideration before the consolidated financial statements are approved for issuance to shareholders and submitted to securities commissions or other regulatory authorities.
The Audit Committee’s duties also include reviewing critical accounting policies and significant estimates and judgments underlying the consolidated financial statements as presented by management and approving the fees of the Company’s independent registered public accounting firm.
The Company’s independent registered public accounting firm, PricewaterhouseCoopers LLP, performed an audit of the consolidated financial statements, the results of which are reflected in their Report of Independent Registered Public Accounting Firm for 2023. PricewaterhouseCoopers LLP has full and independent access to the Audit Committee to discuss their audit and related matters.
Management’s Report on Internal Control over Financial Reporting
Under our supervision, management is responsible for establishing and maintaining adequate internal control over financial reporting, as defined under National Instrument 52-109 – Certification of Disclosure in Issuers’ Annual and Interim Filings in Canada and Rules 13a-15(f) and 15d-15(f) of the Securities Exchange Act of 1934, as amended, to provide reasonable assurance regarding the reliability of financial reporting and the preparation of consolidated financial statements for external reporting purposes in accordance with IFRS Accounting Standards.
In accordance with the provisions of NI 52-109, our management has limited the scope of its design of the Company’s disclosure controls and procedures and internal control over financial reporting to exclude controls, policies and procedures of Spray Lake Sawmills (1980) Ltd. (“Spray Lake”), which was acquired on November 17, 2023.
Spray Lake’s contribution to our consolidated financial statements for the year ended December 31, 2023 was $5 million of sales, representing approximately 0.1% of consolidated sales, and $1 million of loss, representing 0.7% of consolidated loss. Additionally, assets attributed to Spray Lake’s assets were $134 million, representing approximately 1.4% of our total assets as at December 31, 2023.
Under our supervision, management has assessed the effectiveness of the Company’s internal control over financial reporting as of December 31, 2023 based on the criteria set forth in Internal Control - Integrated Framework (2013) issued by the Committee of Sponsoring Organizations of the Treadway Commission (“COSO”). Based on this assessment, management has concluded that the Company’s internal control over financial reporting was effective as of December 31, 2023.
The effectiveness of the Company’s internal control over financial reporting as of December 31, 2023 has been audited by PricewaterhouseCoopers LLP, the Company’s independent registered public accounting firm, as stated in their report which appears herein.
Due to its inherent limitations, internal control over financial reporting may not prevent or detect misstatements on a timely basis. Additionally, projections of any evaluation of the effectiveness of internal control over financial reporting to future periods are subject to the risk that the controls may become inadequate because of changes in conditions, or that the degree of compliance with the policies or procedures may deteriorate.
| /s/ Sean McLaren | /s/ Chris Virostek | |
| Sean McLaren | Chris Virostek | |
| President and Chief Executive Officer | Senior Vice-President, Finance and Chief Financial Officer | |
| February 14, 2024 | ||
| 2023 Annual Report | 79 |

|
||
Report of Independent Registered Public Accounting Firm
To the Board of Directors and Shareholders of West Fraser Timber Co. Ltd.
Opinions on the Financial Statements and Internal Control over Financial Reporting
We have audited the accompanying consolidated balance sheets of West Fraser Timber Co. Ltd. and its subsidiaries (together, the Company) as of December 31, 2023 and 2022, and the related consolidated statements of earnings (loss) and comprehensive earnings (loss), of changes in shareholders’ equity and of cash flows for the years then ended, including the related notes (collectively referred to as the consolidated financial statements). We also have audited the Company’s internal control over financial reporting as of December 31, 2023, based on criteria established in Internal Control – Integrated Framework (2013) issued by the Committee of Sponsoring Organizations of the Treadway Commission (COSO).
In our opinion, the consolidated financial statements referred to above present fairly, in all material respects, the financial position of the Company as of December 31, 2023 and 2022, and its financial performance and its cash flows for the years then ended in conformity with International Financial Reporting Standards as issued by the International Accounting Standards Board (IFRS Accounting Standards). Also in our opinion, the Company maintained, in all material respects, effective internal control over financial reporting as of December 31, 2023, based on criteria established in Internal Control – Integrated Framework (2013) issued by the COSO.
Basis for Opinions
The Company’s management is responsible for these consolidated financial statements, for maintaining effective internal control over financial reporting, and for its assessment of the effectiveness of internal control over financial reporting, included in the accompanying Management’s Report on Internal Control over Financial Reporting. Our responsibility is to express opinions on the Company’s consolidated financial statements and on the Company’s internal control over financial reporting based on our audits. We are a public accounting firm registered with the Public Company Accounting Oversight Board (United States) (PCAOB) and are required to be independent with respect to the Company in accordance with the U.S. federal securities laws and the applicable rules and regulations of the Securities and Exchange Commission and the PCAOB.
We conducted our audits in accordance with the standards of the PCAOB. Those standards require that we plan and perform the audits to obtain reasonable assurance about whether the consolidated financial statements are free of material misstatement, whether due to error or fraud, and whether effective internal control over financial reporting was maintained in all material respects.
Our audits of the consolidated financial statements included performing procedures to assess the risks of material misstatement of the consolidated financial statements, whether due to error or fraud, and performing procedures that respond to those risks. Such procedures included examining, on a test basis, evidence regarding the amounts and disclosures in the consolidated financial statements. Our audits also included evaluating the accounting principles used and significant estimates made by management, as well as evaluating the overall presentation of the consolidated financial statements. Our audit of internal
PricewaterhouseCoopers LLP
PricewaterhouseCoopers Place, 250 Howe Street, Suite 1400, Vancouver, British Columbia, Canada V6C 3S7
T: +1 604 806 7000, F: +1 604 806 7806, ca_vancouver_main_fax@pwc.com
“PwC” refers to PricewaterhouseCoopers LLP, an Ontario limited liability partnership.
|
|
||
control over financial reporting included obtaining an understanding of internal control over financial reporting, assessing the risk that a material weakness exists, and testing and evaluating the design and operating effectiveness of internal control based on the assessed risk. Our audits also included performing such other procedures as we considered necessary in the circumstances. We believe that our audits provide a reasonable basis for our opinions.
As described in Management’s Report on Internal Control over Financial Reporting, management has excluded Spray Lake Sawmills (1980) Ltd. from its assessment of internal control over financial reporting as of December 31, 2023 because it was acquired by the Company in a purchase business combination during the year ended December 31, 2023. We have also excluded Spray Lake Sawmills (1980) Ltd. from our audit of internal control over financial reporting. Spray Lake Sawmills (1980) Ltd. is a wholly owned subsidiary whose total assets and total revenues excluded from management’s assessment and our audit of internal control over financial reporting represent $134 million and $5 million, respectively, of the related consolidated financial statement amounts as of and for the year ended December 31, 2023.
Definition and Limitations of Internal Control over Financial Reporting
A company’s internal control over financial reporting is a process designed to provide reasonable assurance regarding the reliability of financial reporting and the preparation of financial statements for external purposes in accordance with generally accepted accounting principles. A company’s internal control over financial reporting includes those policies and procedures that (i) pertain to the maintenance of records that, in reasonable detail, accurately and fairly reflect the transactions and dispositions of the assets of the company; (ii) provide reasonable assurance that transactions are recorded as necessary to permit preparation of financial statements in accordance with generally accepted accounting principles, and that receipts and expenditures of the company are being made only in accordance with authorizations of management and directors of the company; and (iii) provide reasonable assurance regarding prevention or timely detection of unauthorized acquisition, use, or disposition of the company’s assets that could have a material effect on the financial statements.
Because of its inherent limitations, internal control over financial reporting may not prevent or detect misstatements. Also, projections of any evaluation of effectiveness to future periods are subject to the risk that controls may become inadequate because of changes in conditions, or that the degree of compliance with the policies or procedures may deteriorate.
Critical Audit Matters
The critical audit matter communicated below is a matter arising from the current period audit of the consolidated financial statements that was communicated or required to be communicated to the audit committee and that (i) relates to accounts or disclosures that are material to the consolidated financial statements and (ii) involved our especially challenging, subjective, or complex judgments. The communication of critical audit matters does not alter in any way our opinion on the consolidated financial statements, taken as a whole, and we are not, by communicating the critical audit matter below, providing a separate opinion on the critical audit matter or on the accounts or disclosures to which it relates.
Goodwill Impairment Assessments
As described in Note 9 to the consolidated financial statements, the Company’s goodwill balance was $1,949 million as of December 31, 2023. Management conducts an impairment assessment as of December 31 of each year, or more frequently if an indicator of impairment is identified. Management
| 2023 Annual Report | 81 |
|
|
||
assesses the recoverability of goodwill by comparing the carrying value of each cash generating unit (CGU) or CGU group associated with the goodwill balance to its estimated recoverable amount, which is the higher of its estimated fair value less costs of disposal and its value in use. An impairment loss is recorded if the carrying value exceeds the estimated recoverable amount of a CGU or CGU group. Management has determined the recoverable amount of each applicable CGU group based on their fair value less cost of disposal through discounted cash flow models. The key assumptions used in the discounted cash flow models include production volume, product pricing, raw material input cost, production cost, terminal multiple and discount rate. The estimated recoverable amount of each applicable CGU group exceeded its respective carrying amount in management’s goodwill impairment assessments, and as such, no impairment losses were recorded by management.
The principal considerations for our determination that performing procedures relating to the goodwill impairment assessments is a critical audit matter are (i) the significant judgment by management when determining the recoverable amount of each applicable CGU group, including the development of key assumptions; (ii) a high degree of auditor judgment, subjectivity and effort in performing procedures and evaluating management’s key assumptions in the discounted cash flow models related to production volume, product pricing, raw material input cost, production cost, terminal multiple and discount rate; and (iii) the audit effort involved the use of professionals with specialized skills and knowledge.
Addressing the matter involved performing procedures and evaluating audit evidence in connection with forming our overall opinion on the consolidated financial statements. These procedures included testing the effectiveness of controls relating to management’s goodwill impairment assessments, including controls over the determination of the recoverable amount of each applicable CGU group. These procedures also included, among others, testing management’s process for determining the recoverable amount of each applicable CGU group, including evaluating the appropriateness of the discounted cash flow models, testing the completeness and accuracy of underlying data used in the models and evaluating the reasonableness of the key assumptions used by management. Evaluating the reasonableness of the production volume, product pricing, raw material input cost and production cost involved considering the current and past performance of each applicable CGU group, as well as economic and industry forecasts, as applicable. Professionals with specialized skill and knowledge were used to assist in the evaluation of the appropriateness of the discounted cash flow models, and the reasonableness of the terminal multiple and the discount rate.
/s/PricewaterhouseCoopers LLP
Chartered Professional Accountants
Vancouver, Canada
February 14, 2024
We have served as the Company’s auditor since 1973.
West Fraser Timber Co. Ltd.
Consolidated Balance Sheets
(in millions of United States dollars, except where indicated)
| As at December | As at December | |||||||||||
| Note | 31, 2023 | 31, 2022 | ||||||||||
| Assets |
||||||||||||
| Current assets |
||||||||||||
| Cash and cash equivalents |
4 | $ | 900 | $ | 1,162 | |||||||
| Receivables |
23 | 311 | 350 | |||||||||
| Income taxes receivable |
93 | 145 | ||||||||||
| Inventories |
5 | 851 | 1,032 | |||||||||
| Prepaid expenses |
40 | 60 | ||||||||||
| Assets held for sale |
6 | 182 | — | |||||||||
| 2,377 | 2,749 | |||||||||||
| Property, plant and equipment |
7 | 3,835 | 3,982 | |||||||||
| Timber licences |
8 | 376 | 351 | |||||||||
| Goodwill and other intangible assets |
9 | 2,307 | 2,358 | |||||||||
| Export duty deposits |
26 | 377 | 354 | |||||||||
| Other assets |
10 | 137 | 175 | |||||||||
| Deferred income tax assets |
20 | 6 | 4 | |||||||||
| $ | 9,415 | $ | 9,973 | |||||||||
| Liabilities |
||||||||||||
| Current liabilities |
||||||||||||
| Payables and accrued liabilities |
11 | $ | 620 | $ | 722 | |||||||
| Current portion of long-term debt |
13 | 300 | — | |||||||||
| Current portion of reforestation and decommissioning obligations |
12 | 60 | 58 | |||||||||
| Income taxes payable |
7 | 12 | ||||||||||
| Liabilities associated with assets held for sale |
6 | 63 | — | |||||||||
| 1,050 | 792 | |||||||||||
| Long-term debt |
13 | 199 | 499 | |||||||||
| Other liabilities |
12 | 260 | 268 | |||||||||
| Deferred income tax liabilities |
20 | 683 | 795 | |||||||||
| 2,193 | 2,354 | |||||||||||
| Shareholders’ Equity |
||||||||||||
| Share capital |
15 | 2,607 | 2,667 | |||||||||
| Retained earnings |
4,913 | 5,284 | ||||||||||
| Accumulated other comprehensive loss |
(297 | ) | (332 | ) | ||||||||
| 7,223 | 7,619 | |||||||||||
| $ | 9,415 | $ | 9,973 | |||||||||
The number of Common shares and Class B Common shares outstanding at February 13, 2024 was 81,709,092.
Approved by the Board of Directors
| /s/ Gillian D. Winckler | /s/ Reid Carter | |
| Gillian D. Winckler | Reid Carter | |
| Director | Director | |
-6-
| 2023 Annual Report | 83 |
West Fraser Timber Co. Ltd.
Consolidated Statements of Earnings (Loss) and Comprehensive Earnings (Loss)
(in millions of United States dollars, except where indicated)
| Years Ended | ||||||||||||
| December 31, | December 31, | |||||||||||
| 2023 | 2022 | |||||||||||
| Sales |
$ | 6,454 | $ | 9,701 | ||||||||
| Costs and expenses |
||||||||||||
| Cost of products sold |
4,685 | 5,142 | ||||||||||
| Freight and other distribution costs |
894 | 963 | ||||||||||
| Export duties, net |
26 | 8 | 18 | |||||||||
| Amortization |
541 | 589 | ||||||||||
| Selling, general and administration |
307 | 365 | ||||||||||
| Equity-based compensation |
16 | 25 | 5 | |||||||||
| Restructuring and impairment charges |
17 | 279 | 60 | |||||||||
| 6,738 | 7,142 | |||||||||||
| Operating earnings (loss) |
(284 | ) | 2,559 | |||||||||
| Finance income (expense), net |
18 | 51 | (3 | ) | ||||||||
| Other income |
19 | 5 | 37 | |||||||||
| Earnings (loss) before tax |
(228 | ) | 2,593 | |||||||||
| Tax recovery (provision) |
20 | 61 | (618 | ) | ||||||||
| Earnings (loss) |
$ | (167 | ) | $ | 1,975 | |||||||
| Earnings (loss) per share (dollars) |
||||||||||||
| Basic |
22 | $ | (2.01 | ) | $ | 21.06 | ||||||
| Diluted |
22 | $ | (2.01 | ) | $ | 20.86 | ||||||
| Comprehensive earnings (loss) |
||||||||||||
| Earnings (loss) |
$ | (167 | ) | $ | 1,975 | |||||||
| Other comprehensive earnings (loss) |
||||||||||||
| Items that may be reclassified to earnings |
||||||||||||
| Translation gain (loss) on operations with different functional currencies |
34 | (83 | ) | |||||||||
| Items that will not be reclassified to earnings |
||||||||||||
| Actuarial gain (loss) on retirement benefits, net of tax |
14 | (35 | ) | 164 | ||||||||
| — | 81 | |||||||||||
| Comprehensive earnings (loss) |
$ | (167 | ) | $ | 2,056 | |||||||
-7-
|
|
West Fraser Timber Co. Ltd.
Consolidated Statements of Changes in Shareholders’ Equity
(in millions of United States dollars, except where indicated)
| Share Capital | Retained | Accumulated Other Comprehensive |
||||||||||||||||||||||
| Note | Number of shares | Amount | Earnings | Loss | Total Equity | |||||||||||||||||||
| Balance at December 31, 2021 |
105,928,734 | $ | 3,402 | $ | 4,503 | $ | (249 | ) | $ | 7,656 | ||||||||||||||
| Earnings for the year |
— | — | 1,975 | — | 1,975 | |||||||||||||||||||
| Other comprehensive earnings (loss): |
||||||||||||||||||||||||
| Translation loss on operations with different functional currencies |
— | — | — | (83 | ) | (83 | ) | |||||||||||||||||
| Actuarial gain on retirement benefits, net of tax |
— | — | 164 | — | 164 | |||||||||||||||||||
| Repurchase of Common shares for cancellation |
15 | (22,373,320 | ) | (735 | ) | (1,255 | ) | — | (1,990 | ) | ||||||||||||||
| Dividends declared1 |
— | — | (103 | ) | — | (103 | ) | |||||||||||||||||
| Balance at December 31, 2022 |
83,555,414 | $ | 2,667 | $ | 5,284 | $ | (332 | ) | $ | 7,619 | ||||||||||||||
| Loss for the year |
— | — | (167 | ) | — | (167 | ) | |||||||||||||||||
| Other comprehensive earnings (loss): |
||||||||||||||||||||||||
| Translation gain on operations with different functional currencies |
— | — | — | 34 | 34 | |||||||||||||||||||
| Actuarial loss on retirement benefits, net of tax |
— | — | (35 | ) | — | (35 | ) | |||||||||||||||||
| Issuance of Common shares |
15 | 383 | — | — | — | — | ||||||||||||||||||
| Repurchase of Common shares for cancellation |
15 | (1,834,801 | ) | (60 | ) | (69 | ) | — | (129 | ) | ||||||||||||||
| Dividends declared1 |
— | — | (100 | ) | — | (100 | ) | |||||||||||||||||
| Balance at December 31, 2023 |
81,720,996 | $ | 2,607 | $ | 4,913 | $ | (297 | ) | $ | 7,223 | ||||||||||||||
| 1. | Cash dividends declared during the year ended December 31, 2022 were $1.15 per share. Cash dividends declared during the year ended December 31, 2023 were $1.20 per share. |
-8-
| 2023 Annual Report | 85 |
West Fraser Timber Co. Ltd.
Consolidated Statements of Cash Flows
(in millions of United States dollars, except where indicated)
| Years Ended | ||||||||||||
| December 31, | December 31, | |||||||||||
| Note | 2023 | 2022 | ||||||||||
| Cash provided by operating activities |
||||||||||||
| Earnings (loss) |
$ | (167 | ) | $ | 1,975 | |||||||
| Adjustments |
||||||||||||
| Amortization |
541 | 589 | ||||||||||
| Restructuring and impairment charges |
17 | 279 | 60 | |||||||||
| Finance (income) expense, net |
18 | (51 | ) | 3 | ||||||||
| Foreign exchange loss (gain) |
7 | (28 | ) | |||||||||
| Export duty |
26 | (45 | ) | (99 | ) | |||||||
| Retirement benefit expense |
14 | 77 | 103 | |||||||||
| Net contributions to retirement benefit plans |
14 | (37 | ) | (76 | ) | |||||||
| Tax (recovery) provision |
20 | (61 | ) | 618 | ||||||||
| Income taxes paid |
(24 | ) | (982 | ) | ||||||||
| Other |
(4 | ) | (11 | ) | ||||||||
| Changes in non-cash working capital |
||||||||||||
| Receivables |
6 | 140 | ||||||||||
| Inventories |
132 | 20 | ||||||||||
| Prepaid expenses |
4 | (6 | ) | |||||||||
| Payables and accrued liabilities |
(131 | ) | (99 | ) | ||||||||
| 525 | 2,207 | |||||||||||
| Cash used for financing activities |
||||||||||||
| Repayment of lease obligations |
(15 | ) | (14 | ) | ||||||||
| Finance expense paid |
(24 | ) | (23 | ) | ||||||||
| Repurchase of Common shares for cancellation |
15 | (129 | ) | (1,990 | ) | |||||||
| Dividends paid |
(100 | ) | (99 | ) | ||||||||
| (268 | ) | (2,126 | ) | |||||||||
| Cash used for investing activities |
||||||||||||
| Spray Lake Acquisition, net of cash acquired |
3 | (100 | ) | — | ||||||||
| Additions to capital assets |
(477 | ) | (477 | ) | ||||||||
| Interest received |
47 | 17 | ||||||||||
| Other |
— | 1 | ||||||||||
| (530 | ) | (459 | ) | |||||||||
| Change in cash and cash equivalents |
(273 | ) | (378 | ) | ||||||||
| Foreign exchange effect on cash and cash equivalents |
10 | (28 | ) | |||||||||
| Cash and cash equivalents - beginning of year |
1,162 | 1,568 | ||||||||||
| Cash and cash equivalents - end of year |
$ | 900 | $ | 1,162 | ||||||||
-9-
|
|
West Fraser Timber Co. Ltd.
Notes to Consolidated Financial Statements
For the years ended December 31, 2023 and December 31, 2022
(figures are in millions of United States dollars, except where indicated)
| 1. | Nature of operations |
West Fraser Timber Co. Ltd. (“West Fraser”, the “Company”, “we”, “us” or “our”) is a diversified wood products company with more than 60 facilities in Canada, the United States (“U.S.”), the United Kingdom (“U.K.”), and Europe. From responsibly sourced and sustainably managed forest resources, the Company produces lumber, engineered wood products (OSB, LVL, MDF, plywood, and particleboard), pulp, newsprint, wood chips, other residuals and renewable energy. West Fraser’s products are used in home construction, repair and remodelling, industrial applications, papers, tissue, and box materials. Our executive office is located at 885 West Georgia Street, Suite 1500, Vancouver, British Columbia. West Fraser was formed by articles of amalgamation under the Business Corporations Act (British Columbia) and is registered in British Columbia, Canada. Our Common shares are listed for trading on the Toronto Stock Exchange (“TSX”) and on the New York Stock Exchange (“NYSE”) under the symbol WFG.
| 2. | Basis of presentation |
These consolidated financial statements are prepared in accordance with International Financial Reporting Standards as issued by the International Accounting Standards Board (“IFRS Accounting Standards”) and were approved by our Board of Directors on February 14, 2024.
Figures have been rounded to millions of dollars to reflect the accuracy of the underlying balances and as a result certain tables may not add due to rounding impacts.
Assets and liabilities subject to transfer as a result of the pending sales of the Hinton pulp mill, Quesnel River Pulp mill, and Slave Lake Pulp mill have been presented as part of assets held for sale and liabilities held for sale respectively (see note 6) and are not included in the other December 31, 2023 balance sheet amounts presented throughout.
Material accounting policies
Material accounting policies that relate to the consolidated financial statements as a whole are incorporated in this note. Where a material accounting policy is applicable to a specific note disclosure, the policy is described within the respective note.
Basis of consolidation
These consolidated financial statements include the accounts of West Fraser and its wholly-owned subsidiaries after the elimination of intercompany transactions and balances.
Our material subsidiaries are West Fraser Mills Ltd. and Norbord Inc. Our 50%-owned joint operations, Alberta Newsprint Company and Cariboo Pulp & Paper Company, are accounted for by recognizing our share of the assets, liabilities, revenues, and expenses related to these joint operations.
Use of estimates and judgments
The preparation of these consolidated financial statements requires management to make estimates and assumptions that affect the amounts reported in the consolidated financial statements and accompanying notes. Actual amounts could differ materially from these and other estimates, the impact of which would be recorded in future periods. Management is also required to exercise judgment in the process of applying accounting policies. Information about the significant areas of estimation uncertainty and critical judgments in applying accounting policies that have the most significant effect on the amounts recognized in the consolidated financial statements is included in the following notes:
| • Note 2 – Determination of functional currency • Note 3 – Fair value of PPE and intangible assets acquired in business combinations • Note 5 – Valuation of inventories |
• Note 6 – Fair value less costs to sell of disposal group held for sale • Note 7-9, 17 – Recoverability of PPE, timber licences, and other intangible assets |
| 2023 Annual Report | 87 |
| • Note 7 – Estimated useful lives of PPE • Note 9 – Recoverability of goodwill • Note 12 – Reforestation and decommissioning obligations |
• Note 14 – Defined benefit pension plans • Note 20 – Income taxes • Note 26 – CVD and ADD duty dispute |
Revenue recognition
Revenue is derived primarily from product sales and is recognized when a customer obtains control over the goods. The timing of transfer of control to customers varies depending on the individual terms of the sales contract and typically occurs when the product is loaded on a common carrier at our mill, loaded on an ocean carrier, or delivered to the customer. The amount of revenue recognized is net of our estimate for early payment discounts and volume rebates.
Revenue includes charges for freight and handling. The costs related to these revenues are recorded in freight and other distribution costs.
Reporting currency and foreign currency translation
The consolidated financial statements are presented in USD, which is determined to be the functional currency of our U.S. operations and the majority of our Canadian operations.
For these entities, all transactions not denominated in our U.S. functional currency are considered to be foreign currency transactions. Foreign currency denominated monetary assets and liabilities are translated using the rate of exchange prevailing at the reporting date. Gains or losses on translation of these items are included in earnings and reported as Other income (expense). Foreign currency denominated non-monetary assets and liabilities, measured at historic cost, are translated at the rate of exchange at the transaction date.
Our European operations have British pound sterling and Euro functional currencies. Our Spray Lake lumber mill (note 3) and jointly-owned newsprint operation have Canadian dollar functional currency. Assets and liabilities of these entities are translated at the rate of exchange prevailing at the reporting date, and revenues and expenses at average rates during the period. Gains or losses on translation are included as a component of shareholders’ equity in Accumulated other comprehensive loss.
Impairment of capital assets
We assess property, plant and equipment, timber licences, and other definite-lived intangible assets for indicators of impairment at each reporting date and whenever events or changes in circumstances indicate that the carrying amount of the asset may not be recoverable.
Impairment testing is applied to individual assets or cash generating units (“CGUs”), the smallest group of assets that generates cash inflows that are largely independent of the cash inflows of other assets or groups of assets. We have identified each of our mills as a CGU for impairment testing unless there is economic interdependence of CGUs, in which case they are grouped for impairment testing.
When a triggering event is identified, the recoverability of an asset or CGU is assessed by comparing the carrying amount of the asset or CGU to the estimated recoverable amount, which is the higher of its estimated fair value less costs of disposal and its value in use.
Fair value less costs of disposal is determined by ascertaining the price that would be received to sell an asset in an orderly transaction between market participants under current market conditions, less incremental costs directly attributable to the disposal. Value in use is determined using a discounted cash flow model by measuring the pre-tax cash flows expected to be generated from the asset over its estimated useful life discounted by a pre-tax discount rate.
Where an impairment loss for an asset or CGU subsequently reverses, the carrying amount of the asset or CGU is increased to the lesser of the revised estimate of its recoverable amount and the carrying amount that would have been recorded had no impairment loss been previously recognized.
Fair value measurements
Fair value is the price that would be received to sell an asset or paid to transfer a liability in an orderly transaction between market participants at the measurement date, regardless of whether that price is directly observable or estimated using another valuation technique.
|
|
Fair value measurements are categorized into Level 1, 2 or 3 based on the degree to which the inputs to the fair value measurement are observable and the significance of the inputs.
The three levels of the fair value hierarchy are:
Level 1
Values based on unadjusted quoted prices in active markets that are accessible at the measurement date for identical assets or liabilities.
Level 2
Values based on inputs other than quoted prices that are observable for the asset or liability, directly or indirectly.
Level 3
Values based on valuation techniques that require inputs which are both unobservable and significant to the overall fair value measurement.
Application of new and revised accounting standards
We have adopted the amendments to IAS 1 Presentation of Financial Statements regarding the disclosure of material accounting policies, amendments to IAS 8 Changes in Accounting Estimates and Errors regarding the definition of accounting estimates, and amendments to IAS 12 Income Taxes regarding deferred tax related to assets and liabilities arising from a single transaction, which were effective for annual periods beginning on or after January 1, 2023. In addition, we have adopted the amendments to IAS 12 Income Taxes regarding relief from deferred tax accounting for top-up tax under Pillar Two, which was effective from May 23, 2023 onwards. These amendments did not have a material impact on our consolidated financial statements.
Accounting standards issued but not yet applied
Amendments to IAS 1, Presentation of Financial Statements
In January 2020, the IASB issued Classification of Liabilities as Current or Non-current (Amendments to IAS 1). The amendments clarify that the classification of liabilities as current or non-current should be based on rights that exist at the end of the reporting period. The amendments also clarify the definition of a settlement and provide situations that would be considered as a settlement of a liability. In October 2022, the IASB issued Non-current Liabilities with Covenants (Amendments to IAS 1). These further amendments clarify how to address the effects on classification and disclosure of covenants that an entity is required to comply with on or before the reporting date and covenants that an entity must comply with only after the reporting date. These amendments are effective for reporting periods beginning on or after January 1, 2024. These amendments are not expected to have a material impact on our consolidated financial statements.
There are no other standards or amendments or interpretations to existing standards issued but not yet effective that are expected to have a material impact on our consolidated financial statements.
| 3. | Business acquisition |
Accounting policies
Business combinations are accounted for using the acquisition method. We measure goodwill at the acquisition date as the fair value of the consideration transferred less the fair value of the identifiable assets acquired and liabilities assumed. The determination of the fair value of the assets acquired and liabilities assumed requires management to use estimates that contain uncertainty and critical judgments. Transaction costs in connection with business combinations are expensed as incurred.
Valuation techniques utilized
We engaged a valuations expert to assist with the determination of estimated fair value for acquired working capital, property, plant and equipment, and timber licenses.
We applied the market comparison approach and cost approach in determining the fair value of acquired property, plant, and equipment. We considered market prices for similar assets when they were available, and depreciated replacement cost in other circumstances. Depreciated replacement cost reflects adjustments for physical deterioration as well as
| 2023 Annual Report | 89 |
functional and economic obsolescence. The key assumptions used in the estimation of depreciated replacement cost are the asset’s estimated replacement cost at the time of acquisition and estimated useful life.
The fair value of timber licenses acquired was determined by using a market comparison technique based on precedent transactions in Western Canada.
Supporting information
On November 17, 2023, we acquired 100 percent of the shares in Spray Lake Sawmills (1980) Ltd., which operates a lumber mill located in Cochrane, Alberta, and the associated timber licenses (“Spray Lake Acquisition”) for preliminary cash consideration of $102 million (CAD$140 million). This acquisition has been accounted for as an acquisition of a business in accordance with IFRS 3 Business Combinations. We have allocated the purchase price based on our preliminary estimated fair value of the assets acquired and the liabilities assumed as follows:
| West Fraser purchase consideration: |
||||
| Cash consideration1 |
$ | 102 | ||
| Fair value of net assets acquired: |
||||
| Cash |
$ | 1 | ||
| Accounts receivable |
3 | |||
| Inventories |
24 | |||
| Prepaid expenses |
1 | |||
| Income taxes receivable |
1 | |||
| Property, plant and equipment |
58 | |||
| Timber licenses |
42 | |||
| Payables and accrued liabilities |
(8 | ) | ||
| Other liabilities |
(3 | ) | ||
| Deferred income tax liabilities |
(18 | ) | ||
| $ | 102 | |||
| 1. | A net outflow comprising the cash consideration of $102 million net of cash acquired of $1 million is presented in the consolidated statements of cash flows. |
Purchase consideration is preliminary as at December 31, 2023 and is subject to finalization of certain post-close working capital adjustments. Our valuation of property, plant and equipment and intangible assets remains preliminary as at December 31, 2023.
We have incorporated the mill into our Lumber segment. Acquisition costs were nominal and have been expensed in selling, general, and administration.
The following table represents the actual results of Spray Lake included in our consolidated statements of earnings (loss) from the date of acquisition to December 31, 2023.
| ($ millions) |
||||
| Sales |
$ | 5 | ||
| Operating loss1 |
$ | (2 | ) | |
| Loss1 |
$ | (1 | ) | |
| 1. | Operating loss and loss include a one-time charge of $2 million related to inventory purchase price accounting. |
The following table represents the proforma results of operations for the year ended December 31, 2023 assuming the Spray Lake Acquisition occurred on January 1, 2023 and that the fair value adjustments that arose on the date of acquisition would have been the same if the acquisition occurred on January 1, 2023.
|
|
| Proforma 2023 Results ($ millions) |
West Fraser Actual Results2 2023 |
Spray Lake Proforma Results1 Jan-23 to Nov-23 |
West Fraser Proforma Results1,2 2023 |
|||||||||
| Sales |
6,454 | 75 | $ | 6,529 | ||||||||
| Operating earnings (loss) |
(284 | ) | 8 | $ | (276 | ) | ||||||
| Earnings (loss) |
(167 | ) | 9 | $ | (158 | ) | ||||||
| 1. | These proforma results have been provided as required per IFRS 3 Business Combinations. West Fraser proforma 2023 results presents West Fraser’s results as if the Spray Lake Acquisition were completed on January 1, 2023. |
| 2. | Operating earnings (loss) and earnings (loss) include a one-time charge of $2 million related to inventory purchase price accounting. |
| 4. | Cash and cash equivalents |
Accounting policies
Cash and cash equivalents consist of cash on deposit and short-term interest-bearing securities maturing within three months of the date of purchase.
Supporting information
| As at |
December 31, 2023 |
December 31, 2022 |
||||||
| Cash |
$ | 513 | $ | 706 | ||||
| Cash equivalents |
387 | 456 | ||||||
| $ | 900 | $ | 1,162 | |||||
| 5. | Inventories |
Accounting policies
Inventories are valued at the lower of cost and net realizable value, with cost determined on an average cost basis. The cost of finished goods inventories includes direct material, direct labour, and an allocation of overhead.
Supporting information
| As at |
December 31, 2023 |
December 31, 2022 |
||||||
| Manufactured products |
$ | 363 | $ | 428 | ||||
| Logs and other raw materials |
257 | 376 | ||||||
| Materials and supplies |
231 | 228 | ||||||
| $ | 851 | $ | 1,032 | |||||
Inventories at December 31, 2023 were subject to a valuation reserve of $31 million (December 31, 2022 - $61 million) to reflect net realizable value being lower than cost.
The carrying amount of inventory recorded at net realizable value was $118 million at December 31, 2023 (December 31, 2022 - $232 million), with the remaining inventory recorded at cost.
| 6. | Disposal groups held for sale |
Accounting policies
Non-current assets, or disposal groups comprising assets and liabilities, are classified as held-for-sale if it is highly probable that they will be recovered primarily through sale rather than through continuing use. Such assets or disposal groups are generally measured at the lower of their carrying amount and fair value less costs to sell.
| 2023 Annual Report | 91 |
Any excess of carrying value over fair value less costs to sell is recognized as impairment loss. Impairment loss on a disposal group is allocated first to goodwill, if any, and then to the remaining non-current assets within the scope of the measurement requirements of IFRS 5 Non-current Assets Held for Sale and Discontinued Operations on a pro-rata basis. Impairment losses on initial classification as held-for-sale and subsequent gains and losses on remeasurement are recognized in earnings.
Once classified as held-for-sale, property, plant and equipment and timber licenses are no longer depreciated.
Supporting information
Sale of Hinton pulp mill
On July 10, 2023, we announced an agreement to sell our unbleached softwood kraft pulp mill in Hinton, Alberta to Mondi Group plc (“Mondi”). The transaction closed on February 3, 2024 following the completion of regulatory reviews and satisfaction of customary closing conditions. The facility is presented as a disposal group held for sale at December 31, 2023.
Under the terms of the agreement, Mondi purchased specified assets, including property, plant and equipment and working capital, and assumed certain liabilities related to the Hinton pulp mill in exchange for a base purchase price of $5 million prior to working capital and other adjustments specified in the asset purchase agreement. Pursuant to the transaction, we will continue to supply fibre to the Hinton pulp mill under long-term contract, via residuals from our Alberta lumber mills.
An impairment loss of $121 million in relation to the sale of the Hinton pulp mill has been included in Restructuring and impairment charges in the year ended December 31, 2023 (see note 17). The impairment loss includes remeasurements of estimated working capital adjustments specified in the asset purchase agreement.
Sale of Quesnel River Pulp mill and Slave Lake Pulp mill
On September 22, 2023, we announced an agreement to sell our two bleached chemithermomechanical pulp (“BCTMP”) mills, Quesnel River Pulp mill in Quesnel, B.C. and Slave Lake Pulp mill in Slave Lake, Alberta to an affiliate of Atlas Holdings (“Atlas”). The transaction is anticipated to close following successful completion of customary regulatory reviews and customary closing conditions. Activities in respect of the closing conditions are proceeding and we anticipate closing the transaction in early 2024. The facilities are presented as a disposal group held for sale at December 31, 2023.
Under the terms of the agreement, Atlas will purchase specified assets, including property, plant and equipment, working capital, certain timber licenses in Alberta, and assume certain liabilities related to the mills and timber licenses in exchange for a base purchase price of $120 million prior to working capital adjustments specified in the asset purchase agreement. Pursuant to the transaction, we will continue to supply fibre to the Quesnel River Pulp mill under long-term contract.
An impairment loss of $20 million in relation to the sale of the Quesnel River Pulp mill and Slave Lake Pulp mill has been included in Restructuring and impairment charges in the year ended December 31, 2023 (see note 17).
|
|
Carrying values of disposal groups
As at December 31, 2023, the disposal group comprised the following assets and liabilities:
| Receivables |
$ | 49 | ||
| Inventories |
72 | |||
| Prepaid expenses |
2 | |||
| Property, plant and equipment |
54 | |||
| Timber licenses |
3 | |||
| Retirement assets |
3 | |||
| Assets held for sale |
$ | 182 | ||
| Payables and accrued liabilities |
$ | 58 | ||
| Reforestation and decommissioning obligations |
2 | |||
| Retirement liabilities |
3 | |||
| Liabilities associated with assets held for sale |
$ | 63 | ||
| 7. | Property, plant and equipment |
Accounting policies
Property, plant and equipment are recorded at historical cost, less accumulated amortization and impairment losses. Expenditures for additions and improvements are capitalized. Borrowing costs are capitalized when the asset construction period exceeds 12 months and the borrowing costs are directly attributable to the asset. Expenditures for maintenance and repairs are charged to earnings. Upon retirement, disposal, or destruction of an asset, the cost and related amortization are derecognized and any resulting gain or loss is included in earnings.
Property, plant and equipment are amortized on a straight-line basis over their estimated useful lives as follows:
|
|
Buildings | 10 - 30 years | ||
| Manufacturing plant, equipment and machinery | 6 - 25 years | |||
| Fixtures, mobile and other equipment | 3 - 10 years | |||
| Roads and bridges | Not exceeding 40 years | |||
| Major maintenance shutdowns | 1 - 2 years | |||
Construction-in-progress includes the purchase price and any costs directly attributable to bringing the asset to the location and condition necessary for its intended use. Construction-in-progress is not depreciated. Once the asset is complete and available for use, the construction-in-progress balance is transferred to the appropriate category of property, plant and equipment and depreciation commences.
| 2023 Annual Report | 93 |
Supporting Information
| Manufacturing plant, equipment and machinery |
Construction- in-progress |
Roads and bridges |
Other | Total | ||||||||||||||||
| As at December 31, 2021 |
$ | 3,751 | $ | 252 | $ | 41 | $ | 56 | $ | 4,100 | ||||||||||
| Additions |
117 | 343 | 16 | 6 | 482 | |||||||||||||||
| Amortization1 |
(494 | ) | — | (13 | ) | — | (507 | ) | ||||||||||||
| Impairment (note 17) |
(43 | ) | (3 | ) | — | (2 | ) | (48 | ) | |||||||||||
| Foreign exchange |
(37 | ) | (2 | ) | — | (1 | ) | (40 | ) | |||||||||||
| Disposals |
(3 | ) | (2 | ) | — | — | (5 | ) | ||||||||||||
| Transfers |
229 | (229 | ) | — | — | — | ||||||||||||||
| As at December 31, 2022 |
$ | 3,520 | $ | 359 | $ | 44 | $ | 59 | $ | 3,982 | ||||||||||
| As at December 31, 2022 |
||||||||||||||||||||
| Cost |
$ | 6,702 | $ | 359 | $ | 157 | $ | 65 | $ | 7,283 | ||||||||||
| Accumulated amortization |
(3,182 | ) | — | (113 | ) | (6 | ) | (3,301 | ) | |||||||||||
| Net |
$ | 3,520 | $ | 359 | $ | 44 | $ | 59 | $ | 3,982 | ||||||||||
| As at December 31, 2022 |
$ | 3,520 | $ | 359 | $ | 44 | $ | 59 | $ | 3,982 | ||||||||||
| Acquisition (note 3) |
23 | — | — | 36 | 58 | |||||||||||||||
| Additions |
257 | 244 | 13 | 1 | 516 | |||||||||||||||
| Amortization1 |
(451 | ) | — | (11 | ) | (1 | ) | (462 | ) | |||||||||||
| Impairment (note 17) |
(202 | ) | (7 | ) | — | — | (209 | ) | ||||||||||||
| Transfer to disposal groups held for sale (note 6) |
(50 | ) | — | (3 | ) | (1 | ) | (54 | ) | |||||||||||
| Foreign exchange |
17 | 1 | — | 2 | 19 | |||||||||||||||
| Disposals |
(8 | ) | — | — | (1 | ) | (9 | ) | ||||||||||||
| Transfers |
217 | (222 | ) | 2 | (1 | ) | (4 | ) | ||||||||||||
| As at December 31, 2023 |
$ | 3,319 | $ | 376 | $ | 46 | $ | 94 | $ | 3,835 | ||||||||||
| As at December 31, 2023 |
||||||||||||||||||||
| Cost |
$ | 6,524 | $ | 376 | $ | 156 | $ | 95 | $ | 7,151 | ||||||||||
| Accumulated amortization |
(3,205 | ) | — | (110 | ) | (1 | ) | (3,316 | ) | |||||||||||
| Net |
$ | 3,319 | $ | 376 | $ | 46 | $ | 94 | $ | 3,835 | ||||||||||
| 1. | Amortization of $451 million relates to cost of products sold and $11 million relates to selling, general and administration expense (2022 - $499 million and $8 million, respectively). |
| 8. | Timber licenses |
Accounting policies
Timber licences, which are renewable or replaceable, are recorded at historical cost, less accumulated amortization and impairment losses. Timber licences are amortized on a straight-line basis over their estimated useful lives of 40 years.
|
|
Supporting information
| Timber licences | ||||
| As at December 31, 2021 |
$ | 368 | ||
| Amortization1 |
(17 | ) | ||
| As at December 31, 2022 |
$ | 351 | ||
| As at December 31, 2022 |
||||
| Cost |
$ | 641 | ||
| Accumulated amortization |
(290 | ) | ||
| Net |
$ | 351 | ||
| As at December 31, 2022 |
$ | 351 | ||
| Acquisition (note 3) |
42 | |||
| Additions |
— | |||
| Amortization1 |
(16 | ) | ||
| Transfer to disposal groups held for sale (note 6) |
(3 | ) | ||
| Foreign exchange |
2 | |||
| As at December 31, 2023 |
$ | 376 | ||
| As at December 31, 2023 |
||||
| Cost |
$ | 673 | ||
| Accumulated amortization |
(297 | ) | ||
| Net |
$ | 376 | ||
| 1. | Amortization relates to cost of products sold. |
| 9. | Goodwill and other intangibles |
Accounting policies
Goodwill represents the excess purchase price paid for a business acquisition over the fair value of the net assets acquired. Goodwill is tested annually for impairment at December 31, or more frequently if an indicator of impairment is identified.
The customer relationship intangible assets relate to the Norbord and Angelina Forest Products acquisitions and are amortized straight-line over 3 to 10 years.
Other intangibles are recorded at historical cost less accumulated amortization and impairment losses. Other intangibles include software which is amortized over periods of up to five years and non-replaceable finite term timber rights which are amortized as the related timber volumes are logged.
Goodwill is allocated to CGUs or groups of CGUs that are expected to benefit from the synergies of the business combination from which it arose. The allocation is based on the lowest level at which goodwill is monitored internally.
Recoverability of goodwill is assessed by comparing the carrying value of the CGU or group of CGUs associated with the goodwill balance to its estimated recoverable amount, which is the higher of its estimated fair value less costs of disposal and its value in use.
An impairment loss is recorded if the carrying value exceeds the estimated recoverable amount. Goodwill impairment losses cannot be reversed.
| 2023 Annual Report | 95 |
Supporting information
| Goodwill | Customer Relationship Intangible |
Other | Total | |||||||||||||
| As at December 31, 2021 |
$ | 1,975 | $ | 426 | $ | 39 | $ | 2,440 | ||||||||
| Amortization1 |
— | (54 | ) | (11 | ) | (65 | ) | |||||||||
| Foreign exchange |
(11 | ) | (3 | ) | (1 | ) | (15 | ) | ||||||||
| Finalization of purchase price allocation on Angelina acquisition |
(20 | ) | 21 | — | 1 | |||||||||||
| Other |
— | — | (3 | ) | (3 | ) | ||||||||||
| As at December 31, 2022 |
$ | 1,944 | $ | 390 | $ | 24 | $ | 2,358 | ||||||||
| As at December 31, 2022 |
||||||||||||||||
| Cost |
$ | 1,944 | $ | 486 | $ | 74 | $ | 2,504 | ||||||||
| Accumulated amortization |
— | (96 | ) | (50 | ) | (146 | ) | |||||||||
| Net |
$ | 1,944 | $ | 390 | $ | 24 | $ | 2,358 | ||||||||
| As at December 31, 2022 |
$ | 1,944 | $ | 390 | $ | 24 | $ | 2,358 | ||||||||
| Additions |
— | — | 3 | 3 | ||||||||||||
| Amortization1 |
— | (53 | ) | (9 | ) | (62 | ) | |||||||||
| Foreign exchange |
5 | 2 | — | 6 | ||||||||||||
| Transfers |
— | — | 4 | 4 | ||||||||||||
| Other |
— | — | (2 | ) | (2 | ) | ||||||||||
| As at December 31, 2023 |
$ | 1,949 | $ | 339 | $ | 20 | $ | 2,307 | ||||||||
| As at December 31, 2023 |
||||||||||||||||
| Cost |
$ | 1,949 | $ | 489 | $ | 80 | $ | 2,518 | ||||||||
| Accumulated amortization |
— | (150 | ) | (60 | ) | (211 | ) | |||||||||
| Net |
$ | 1,949 | $ | 339 | $ | 20 | $ | 2,307 | ||||||||
| 1. | Amortization of $62 million (2022 - $65 million) relates to selling, general and administration expense. |
Goodwill
For the purposes of impairment testing, goodwill has been allocated to the following CGU groups:
| As at | December 31, 2023 |
December 31, 2022 |
||||||
| Canadian lumber |
$ | 171 | $ | 171 | ||||
| US lumber |
409 | 409 | ||||||
| North America EWP |
1,280 | 1,280 | ||||||
| Europe EWP |
89 | 84 | ||||||
| Total |
$ | 1,949 | $ | 1,944 | ||||
The recoverable amounts of the above CGU groups as at December 31, 2023 were determined based on their fair value less costs of disposal using discounted cash flow models. Cash flow forecasts were based on internal estimates for 2024 and 2025 and estimated mid-cycle earnings for subsequent years. Key assumptions include production volume, product pricing, raw material input cost, production cost, terminal multiple, and discount rate. Key assumptions were determined using external sources and historical data from internal sources. Specifically, product pricing has been estimated by reference to average historical prices as well as third-party analyst projections of long-term product pricing. The post-tax discount rate used was 10.2%.
|
|
As it relates to the North America EWP and Europe EWP CGU groups, a prolonged downturn in product pricing with an extended recovery could cause their carrying amounts to exceed their recoverable amounts. For North America EWP, an OSB pricing assumption of $289 to $320 per Msf 7/16” was used in determining the recoverable amount and a decrease of 4% in the pricing assumption, assuming all other variables remain constant, could cause the carrying amount to exceed the recoverable amount. For Europe EWP, a decrease of 1% in the pricing assumptions used, assuming all other variables remain constant, could cause the carrying amount to exceed the recoverable amount.
The estimated recoverable amounts of all CGU groups exceeded their respective carrying amounts and as such, no impairment losses were recognized for the year ended December 31, 2023 (2022 - nil).
| 10. | Other assets |
| As at | Note | December 31, 2023 |
December 31, 2022 |
|||||||||
| Retirement assets |
14 | $ | 83 | $ | 132 | |||||||
| Interest rate swap contracts |
13 | — | 12 | |||||||||
| Electricity swaps |
23 | 18 | — | |||||||||
| Other |
36 | 31 | ||||||||||
| $ | 137 | $ | 175 | |||||||||
| 11. | Payables and accrued liabilities |
| As at | Note | December 31, 2023 |
December 31, 2022 |
|||||||||
| Trade accounts |
$ | 417 | $ | 430 | ||||||||
| Accrued equity-based compensation |
16 | 53 | 45 | |||||||||
| Compensation |
66 | 152 | ||||||||||
| Accrued export duties |
26 | 5 | 4 | |||||||||
| Accrued dividends |
25 | 25 | ||||||||||
| Accrued interest |
5 | 5 | ||||||||||
| Current portion of lease obligations |
13 | 11 | ||||||||||
| Restructuring provision |
3 | 10 | ||||||||||
| Other |
33 | 40 | ||||||||||
| $ | 620 | $ | 722 | |||||||||
| 2023 Annual Report | 97 |
| 12. | Other liabilities |
| As at | Note | December 31, 2023 |
December 31, 2022 |
|||||||||
| Retirement liabilities |
14 | $ | 106 | $ | 77 | |||||||
| Long-term portion of reforestation obligations |
53 | 55 | ||||||||||
| Long-term portion of decommissioning obligations |
16 | 15 | ||||||||||
| Long-term portion of lease obligations |
26 | 26 | ||||||||||
| Export duties |
26 | 24 | 73 | |||||||||
| Electricity swaps |
23 | 12 | 4 | |||||||||
| Other |
22 | 18 | ||||||||||
| $ | 260 | $ | 268 | |||||||||
Reforestation and decommissioning obligations
Reforestation and decommissioning obligations relate to our responsibility for reforestation under various timber licences and our obligations related to landfill closure and other site remediation costs.
Accounting policies
Reforestation obligations are measured at the present value of the expected expenditures required to settle the obligations and are accrued and charged to earnings when timber is harvested. The reforestation obligation is accreted over time through charges to finance expense and reduced by silviculture expenditures. Changes to estimates are credited or charged to earnings.
We record a liability for decommissioning obligations in the period a reasonable estimate can be made. The liability is determined using estimated closure and/or remediation costs and discounted using an appropriate discount rate. On initial recognition, the carrying value of the liability is added to the carrying amount of the associated asset and amortized over its useful life, or expensed when there is no related asset. The liability is accreted over time through charges to finance expense and reduced by actual costs of settlement. Changes to estimates result in an adjustment of the carrying amount of the associated asset or, where there is no asset, they are credited or charged to earnings.
Reforestation and decommissioning obligations are discounted at the risk-free rate at the balance sheet date.
Supporting information
| Reforestation | Decommissioning | |||||||||||||||||||
| Note | 2023 | 2022 | 2023 | 2022 | ||||||||||||||||
| Beginning of year |
$ | 93 | $ | 97 | $ | 35 | $ | 33 | ||||||||||||
| Acquisition |
3 | 3 | — | 1 | — | |||||||||||||||
| Transfer to disposal groups held for sale |
6 | — | — | (2 | ) | — | ||||||||||||||
| Liabilities recognized |
46 | 51 | 3 | 5 | ||||||||||||||||
| Liabilities settled |
(52 | ) | (49 | ) | (1 | ) | (1 | ) | ||||||||||||
| Foreign exchange |
2 | (6 | ) | 1 | (2 | ) | ||||||||||||||
| End of year |
92 | 93 | 37 | 35 | ||||||||||||||||
| Less: current portion |
(39 | ) | (38 | ) | (21 | ) | (20 | ) | ||||||||||||
| $ | 53 | $ | 55 | $ | 16 | $ | 15 | |||||||||||||
The total undiscounted amount of the estimated cash flows required to satisfy these obligations is $137 million (December 31, 2022 - $159 million). The cash flows have been discounted using risk-free rates ranging from 2.50% to 3.88% (2022 - 3.27% to 5.51%).
|
|
The timing of reforestation expenditures is based on the estimated period required to ensure the associated areas are well established and attain free to grow status, which is generally between 12 to 15 years. Payments relating to landfill closures and site remediation are expected to occur over periods ranging up to 50 years.
| 13. | Operating loans and long-term debt |
Accounting policies
Transaction costs related to debt financing or refinancing are deferred and amortized over the life of the associated debt. When our operating loan is undrawn, the related deferred financing costs are recorded in other assets.
Supporting information
Operating loans
As at December 31, 2023, our credit facilities consisted of a $1 billion committed revolving credit facility which matures July 2028, $35 million of uncommitted revolving credit facilities available to our U.S. subsidiaries, a $19 million (£15 million) credit facility dedicated to our European operations, and a $11 million (CAD$15 million) demand line of credit dedicated to our jointly-owned newsprint operation.
As at December 31, 2023, our revolving credit facilities were undrawn (December 31, 2022 - undrawn) and the associated deferred financing costs of $2 million (December 31, 2022 - $1 million) were recorded in other assets. Interest on the facilities is payable at floating rates based on Prime Rate Advances, Base Rate Advances, Bankers’ Acceptances, or Secured Overnight Financing Rate (“SOFR”) Advances at our option. On July 25, 2023, we amended and restated the revolving credit facilities agreement to extend its maturity to July 2028 and replaced the previous London Inter-Bank Offered Rate (“LIBOR”) floating rate option with SOFR.
In addition, we have credit facilities totalling $133 million (December 31, 2022 - $131 million) dedicated to letters of credit. Letters of credit in the amount of $43 million (December 31, 2022 - $61 million) were supported by these facilities.
All debt is unsecured except the $11 million (CAD$15 million) jointly-owned newsprint operation demand line of credit, which is secured by that joint operation’s current assets.
As at December 31, 2023, we were in compliance with the requirements of our credit facilities.
Long-term debt
| As at |
December 31, 2023 |
December 31, 2022 |
||||||
| Senior notes due October 2024; interest at 4.35% |
$ | 300 | $ | 300 | ||||
| Term loan due July 2025; floating interest rate |
200 | 200 | ||||||
| 500 | 500 | |||||||
| Less: deferred financing costs |
(1 | ) | (1 | ) | ||||
| Less: current portion |
(300 | ) | — | |||||
| $ | 199 | $ | 499 | |||||
On July 25, 2023, we amended and restated the term loan agreement to extend its maturity to July 2025 and replaced the LIBOR floating rate option with SOFR.
Required principal repayments are disclosed in note 23.
Interest rate swap contracts
We have interest rate swap contracts that have the effect of fixing the interest rate on the $200 million term loan disclosed in the long-term debt table above. In June 2023, these interest rate swaps were amended to reference 3-month
| 2023 Annual Report | 99 |
SOFR (previously 3-month LIBOR) effective August 2023. The weighted average fixed interest rate payable under the contracts was 0.91% following the amendment (previously 1.14%).
In January 2024, these interest rate swaps were further amended to extend their maturity from August 2024 to July 2025. Following this amendment, the weighted average fixed interest rate payable under the contract is 2.61%.
The interest rate swap contracts are accounted for as a derivative, with the related changes in the fair value included in Other income in our consolidated statements of earnings (loss). For the year ended December 31, 2023, a loss of $6 million (year ended December 31, 2022 - a gain of $13 million) was recognized in relation to the interest rate swap contracts. The fair value of the interest rate swap contracts at December 31, 2023 was an asset of $6 million (December 31, 2022 - asset of $12 million).
| 14. | Retirement benefits |
We maintain defined benefit and defined contribution pension plans covering most of our employees. The defined benefit plans generally do not require employee contributions and provide a guaranteed level of pension payable for life based either on length of service or on earnings and length of service, and in most cases do not increase after commencement of retirement. We also provide group life insurance, medical and extended health benefits to certain employee groups.
The defined benefit pension plans are operated in Canada, the U.S., and Europe under broadly similar regulatory frameworks. The majority are funded arrangements where benefit payments are made from plan assets that are held in trust. Responsibility for the governance of certain of the plans, including investment and contribution decisions, resides with our Retirement Committees, Human Resources & Compensation Committee of the Board of Directors, and Board of Directors. For the registered defined benefit pension plans, regulations set minimum requirements for contributions for benefit accruals and the funding of deficits.
Starting January 1, 2022, defined benefit pension plans for certain employee groups were closed to new entrants and were replaced by defined contribution plans.
Accounting policies
We record a retirement asset or liability for our employee defined benefit pension and other retirement benefit plans by netting our plan assets with our plan obligations, on a plan-by-plan basis.
The cost of defined benefit pensions and other retirement benefits earned by employees is actuarially determined using the projected unit credit method. The present value of the defined benefit obligation is determined by discounting the estimated future cash outflows using market yields from high quality corporate bonds with cash flows that approximate expected benefit payments at the balance sheet date. Plan assets are valued at fair value at each balance sheet date.
Actuarial gains and losses arising from experience adjustments and changes in actuarial assumptions are credited or charged to equity through other comprehensive earnings in the period in which they arise.
Past service costs arising from plan amendments are recognized immediately. The finance amount on net retirement balances is included in Finance income (expense), net in our consolidated statements of earnings (loss).
A gain or loss on settlement is recognized in earnings, calculated as the difference between the present value of the defined benefit obligation being settled, as determined on the date of settlement, and the settlement amount.
For defined contribution plans, pension expense is the amount of contributions we are required to make in respect of services rendered by employees.
Supporting information
The actual return on plan assets for 2023 was a gain of $78 million (2022 - loss of $138 million). The total pension expense for the defined benefit pension plans was $32 million (2022 - $71 million). In 2023, we made nominal net contributions to our defined benefit pension plans (2022 - $39 million). We expect to make cash contributions of approximately $19 million to our defined benefit pension plans during 2024 based on the most recent valuation report for each pension plan.
|
|
We also provide group life insurance, medical and extended health benefits to certain employee groups, for which we contributed $1 million in 2023 (2022 - $1 million).
In 2023, we entered into buy-out annuity purchase agreements to settle $120 million of our defined benefit obligations by purchasing annuities using our plan assets. The agreements transfer the pension obligations of retired employees under certain pension plans to financial institutions. The difference between the cost of the annuity purchases and the liabilities held for these pension plans was reflected as a settlement gain of $6 million in Other income (see note 19).
In 2022, we entered into buy-out annuity purchase agreements to settle $82 million of our defined benefit obligations by purchasing annuities using our plan assets. These agreements transferred the pension obligations of retired employees under certain pension plans to financial institutions. The difference between the cost of the annuity purchases and the liabilities held for these pension plans was reflected as a settlement cost of $5 million in Other income.
In 2022, as part of the process related to the annuitization of our U.K. defined benefit pension plan, we entered into a $15 million (£13 million) investment contract with an insurer. Future cash inflows from the investment contract will match the cash flows of the outgoing benefit payments made by the pension plan, substantially mitigating the exposure to future volatility in the related pension obligations. The completion of the buy-out of the defined benefit obligations is expected upon completion of certain normal-course administrative processes.
| 2023 Annual Report | 101 |
The status of the defined benefit pension plans and other retirement benefit plans, in aggregate, is as follows:
| Defined benefit | Other retirement | |||||||||||||||
| pension plans | benefit plans | |||||||||||||||
| 2023 | 2022 | 2023 | 2022 | |||||||||||||
| Accrued benefit obligations |
||||||||||||||||
| Benefit obligations - opening |
$ | 838 | $ | 1,355 | $ | 18 | $ | 23 | ||||||||
| Transfer to disposal groups held for sale (note 6) |
(77 | ) | — | (2 | ) | — | ||||||||||
| Service cost |
37 | 59 | — | — | ||||||||||||
| Finance cost on obligation |
42 | 41 | 1 | 1 | ||||||||||||
| Benefits paid |
(42 | ) | (56 | ) | (1 | ) | (1 | ) | ||||||||
| Actuarial (gain) loss due to change in financial assumptions |
63 | (408 | ) | 1 | (4 | ) | ||||||||||
| Actuarial loss due to demography/experience |
31 | 3 | — | — | ||||||||||||
| Settlement |
(120 | ) | (82 | ) | — | — | ||||||||||
| Foreign exchange1 |
17 | (74 | ) | — | (1 | ) | ||||||||||
| Benefit obligations - ending |
$ | 791 | $ | 838 | $ | 17 | $ | 18 | ||||||||
| Plan assets |
||||||||||||||||
| Plan assets - opening |
$ | 927 | $ | 1,239 | $ | — | $ | — | ||||||||
| Transfer to disposal groups held for sale (note 6) |
(79 | ) | — | — | — | |||||||||||
| Finance income on plan assets |
46 | 36 | — | — | ||||||||||||
| Actual return on plan assets, net of finance income |
32 | (174 | ) | — | — | |||||||||||
| Employer contributions |
14 | 39 | 1 | 1 | ||||||||||||
| Benefits paid |
(42 | ) | (56 | ) | (1 | ) | (1 | ) | ||||||||
| Settlement |
(115 | ) | (87 | ) | — | — | ||||||||||
| Other |
(2 | ) | (2 | ) | — | — | ||||||||||
| Refund of excess contributions |
(15 | ) | — | — | — | |||||||||||
| Foreign exchange1 |
20 | (68 | ) | — | — | |||||||||||
| Plan assets - ending |
$ | 786 | $ | 927 | $ | — | $ | — | ||||||||
| Funded status2 |
||||||||||||||||
| Retirement assets |
$ | 84 | $ | 148 | $ | — | $ | — | ||||||||
| Impact of minimum funding requirement3 |
(1 | ) | (16 | ) | — | — | ||||||||||
| Retirement assets (note 10) |
83 | 132 | — | — | ||||||||||||
| Retirement liabilities (note 12) |
(89 | ) | (59 | ) | (17 | ) | (18 | ) | ||||||||
| $ | (6 | ) | $ | 73 | $ | (17 | ) | $ | (18 | ) | ||||||
| 1. | Foreign currency translation relates to the foreign exchange impact of translating assets and liabilities of certain plans to U.S. dollars. |
| 2. | Plans in a surplus position are presented as assets and plans in a deficit position are presented as liabilities on our consolidated balance sheets. |
| 3. | Certain of our plans have a surplus that is not recognized on the basis that future economic benefits may not be available to us in the form of a reduction in future contributions or a cash refund. |
| Defined benefit pension plans |
Other retirement benefit plans |
|||||||||||||||
| 2023 | 2022 | 2023 | 2022 | |||||||||||||
| Expense |
||||||||||||||||
| Service cost |
$ | 37 | $ | 59 | $ | — | $ | — | ||||||||
| Administration fees |
4 | 3 | — | — | ||||||||||||
| Settlement loss (gain) |
(6 | ) | 5 | — | — | |||||||||||
| Finance expense (income), net |
(3 | ) | 4 | 1 | 1 | |||||||||||
| $ | 32 | $ | 71 | $ | 1 | $ | 1 | |||||||||
|
|
Assumptions and sensitivities
At December 31, 2023, the weighted average duration of the defined benefit pension obligations is 18 years (December 31, 2022 - 17 years). The projected future benefit payments for the defined benefit pension plans at December 31, 2023 are as follows:
| 2024 | 2025 | 2026 to 2028 | Thereafter | Total | ||||||
| Defined benefit pension plans |
$28 | $28 | $101 | $1,830 | $1,987 | |||||
Key assumptions used in determining defined benefit pension and other retirement pension benefit obligations include assumed rates of increase for future employee compensation and discount rates. These estimates are determined with the assistance of independent actuarial specialists.
The significant actuarial assumptions used to determine our balance sheet date retirement assets and liabilities and our retirement benefit plan expenses are as follows:
| Defined benefit pension plans |
Other retirement benefit plans |
|||||||||||||||
| 2023 | 2022 | 2023 | 2022 | |||||||||||||
| Benefit obligations: |
||||||||||||||||
| Discount rate |
4.69% | 5.17% | 4.69% | 5.10% | ||||||||||||
| Future compensation rate increase |
3.62% | 3.53% | n/a | n/a | ||||||||||||
| Benefit expense: |
||||||||||||||||
| Discount rate - beginning of year |
5.17% | 3.03% | 5.10% | 3.08% | ||||||||||||
| Future compensation rate increase |
3.53% | 3.60% | n/a | n/a | ||||||||||||
Health-care benefit costs, shown under other retirement benefit plans, are funded on a pay-as-you-go basis.
The impact of a change in these assumptions on our retirement obligations as at December 31, 2023 is as follows:
| Increase | Decrease | |||||||
| Discount rate - 0.50% change |
$ | (64) | $ | 75 | ||||
| Compensation rate - 0.50% change |
$ | 14 | $ | (13) | ||||
The sensitivities have been calculated on the basis that all other variables remain constant. When calculating the sensitivity of the defined benefit obligation, the same methodology is applied as was used to determine the retirement assets and liabilities.
Plan assets
The assets of the defined benefit pension plans are invested predominantly in a diversified range of equities, pooled funds and bonds. The weighted average asset allocations of the defined benefit plans at December 31, by asset category, are as follows:
| Target range | 2023 | 2022 | ||||||||
| Canadian equities |
2% - 30% | 28 | % | 26 | % | |||||
| Foreign equities |
15% - 57% | 17 | % | 30 | % | |||||
| Fixed income investments |
20% - 55% | 42 | % | 30 | % | |||||
| Other investments |
0% - 34% | 13 | % | 14 | % | |||||
| 100 | % |
|
100 |
% |
||||||
| 2023 Annual Report | 103 |
Risk management practices
We are exposed to various risks related to our defined benefit pension and other retirement benefit plans:
| · | Uncertainty in benefit payments: The value of the liability for retirement benefits will ultimately depend on the amount of benefits paid and this in turn will depend on the level of future compensation increase and life expectancy. |
| · | Volatility in asset value: We are exposed to changes in the market value of pension plan investments which are required to fund future benefit payments. |
| · | Uncertainty in cash funding: Movement in the value of the assets and obligations may result in increased levels of cash funding, although changes in the level of cash funding required can be spread over several years. We are also exposed to changes in pension regulation and legislation. |
Our Retirement Committees manage these risks in accordance with a Statement of Investment Policies and Procedures for each pension plan or group of plans administered under master trust agreements. The following are some specific risk management practices employed:
| · | Retaining and monitoring professional advisors including an outsourced chief investment officer (“OCIO”). |
| · | Monitoring our OCIO’s adherence to asset allocation guidelines and permitted categories of investments. |
| · | Monitoring investment decisions and performance of the OCIO and asset performance against benchmarks. |
Defined contribution plans
The total pension expense and funding contributions for the defined contribution pension plans for 2023 was $35 million (2022 - $36 million).
| 15. | Share capital |
Authorized
400,000,000 Common shares, without par value
20,000,000 Class B Common shares, without par value
10,000,000 Preferred shares, issuable in series, without par value
Issued
| December 31, 2023 | December 31, 2022 | |||||||||||||||||||
| As at | Number | Amount | Number | Amount | ||||||||||||||||
| Common |
79,439,518 | $ | 2,607 | 81,273,936 | $ | 2,667 | ||||||||||||||
| Class B Common |
2,281,478 | — | 2,281,478 | — | ||||||||||||||||
| Total Common |
81,720,996 | $ | 2,607 | 83,555,414 | $ | 2,667 | ||||||||||||||
For the year ended December 31, 2023, we issued 383 Common shares under our share option plans (2022 - no Common shares) and no Common shares under our employee share purchase plan (2022 - no Common shares).
Rights and restrictions of Common shares
The Common shares and Class B Common shares are equal in all respects, including the right to dividends, rights upon dissolution or winding up and the right to vote, except that each Class B Common share may at any time be exchanged for one Common share. Our Common shares are listed for trading on the TSX and NYSE under the symbol WFG, while our Class B Common shares are not. Certain circumstances or corporate transactions may require the approval of the holders of our Common shares and Class B Common shares on a separate class by class basis.
|
|
Share repurchases
Normal Course Issuer Bids
On February 22, 2023, we renewed our normal course issuer bid (“2023 NCIB”) allowing us to acquire up to 4,063,696 Common shares for cancellation until the expiry of the bid on February 26, 2024. For the year ended December 31, 2023, we repurchased for cancellation 1,834,801 Common shares at an average price of $70.24 per share under our normal course issuer bids.
For the year ended December 31, 2022, we repurchased for cancellation 10,475,115 Common shares at an average price of $82.01 per share under our normal course issuer bids.
2022 Substantial Issuer Bid
During the year ended December 31, 2022, we repurchased for cancellation a total of 11,898,205 Common shares at a price of $95.00 per share for an aggregate purchase price of $1.13 billion under the 2022 Substantial Issuer Bid (“2022 SIB”). The Common shares repurchased represented approximately 11.7% of the total number of our issued and outstanding Common shares and Class B Common shares at the time the 2022 SIB was announced in April 2022.
| 16. | Equity-based compensation |
We have share option, phantom share unit (“PSU”) and directors’ deferred share unit (“DSU”) plans. The equity-based compensation expense for the year ended December 31, 2023 was $25 million (2022 - expense of $5 million).
Accounting policies
We estimate the fair value of outstanding share options using the Black-Scholes option-pricing model and the fair value of our PSU plan and directors’ DSU plan using an intrinsic valuation model at each balance sheet date. We record the resulting charge or recovery to earnings over the related vesting period.
If a share option holder elects to acquire Common shares, both the exercise price and the accrued liability are credited to shareholders’ equity.
Supporting information
Share option plan
Under our share option plan, officers and employees may be granted options to purchase up to 8,295,940 Common shares, of which 777,255 remain available for issuance.
The exercise price of a share option is determined in accordance with the plan and is generally the closing price of a Common share on the trading day immediately preceding the grant date. Our share option plans give the share option holders the right to elect to receive a cash payment in lieu of exercising an option to purchase Common shares. Options vest at 20% per year from the grant date and expire after 10 years.
In 2023, we have recorded an expense of $11 million (2022 – recovery of $4 million) related to the share option plans. The liability associated with the share option plan is tracked in Canadian dollars and is based on prices published by the TSX. A summary of the activity in the share option plans based on Canadian dollar prices is presented below:
| 2023 Annual Report | 105 |
| 2023 | 2022 | |||||||||||||||
| Number | Weighted average price |
Number | Weighted average price |
|||||||||||||
| (CAD$) | (CAD$) | |||||||||||||||
| Outstanding - beginning of year |
841,305 | $ | 76.19 | 1,077,840 | $ | 66.64 | ||||||||||
| Granted |
137,115 | 109.42 | 124,566 | 123.63 | ||||||||||||
| Exercised |
(123,781 | ) | 59.81 | (351,448 | ) | 62.83 | ||||||||||
| Expired / Cancelled |
(4,969 | ) | 85.54 | (9,653 | ) | 108.40 | ||||||||||
| Outstanding - end of year |
849,670 | $ | 83.59 | 841,305 | $ | 76.19 | ||||||||||
| Exercisable - end of year |
568,481 | $ | 75.63 | 408,115 | $ | 62.71 | ||||||||||
The following table summarizes information about the share options outstanding and exercisable at December 31, 2023 in Canadian dollars:
| Exercise price range | Number of outstanding options |
Weighted average remaining contractual life |
Weighted average exercise price |
Number of exercisable options |
Weighted average exercise price |
|||||||||||||
| (CAD$) | (number) | (years) | (CAD$) | (number) | (CAD$) | |||||||||||||
| $40.97 - $56.00 |
167,737 | 4.4 | $ | 49.15 | 152,212 | $ | 48.45 | |||||||||||
| $64.50 - $73.99 |
241,690 | 6.0 | 67.87 | 198,029 | 68.20 | |||||||||||||
| $85.40 - $92.79 |
185,836 | 7.3 | 90.75 | 127,636 | 89.82 | |||||||||||||
| $109.42 - $123.63 |
254,407 | 9.1 | 116.02 | 90,604 | 117.56 | |||||||||||||
| 849,670 | 6.3 | $ | 83.59 | 568,481 | $ | 75.63 | ||||||||||||
The weighted average share price at the date of exercise for share options exercised during the year was CAD$107.45 per share (2022 - CAD$120.95 per share).
The accrued liability related to the share option plan was $30 million at December 31, 2023 (December 31, 2022 - $23 million). The weighted average fair value of the options used in the calculation was CAD$46.17 per option or USD$34.21 per option at December 31, 2023 (December 31, 2022 - CAD$35.59 per option or USD$27.34 per option).
The inputs to the Black-Scholes option-pricing model were as follows:
| As at | December 31, 2023 |
December 31, 2022 |
||||||
| Weighted-average share price on balance sheet date |
CAD$113.45 | CAD$98.20 | ||||||
| Weighted average exercise price |
CAD$83.59 | CAD$76.19 | ||||||
| Expected dividend |
CAD$1.59 | CAD$1.63 | ||||||
| Expected volatility |
42.22% | 45.15% | ||||||
| Weighted average interest rate |
3.57% | 3.77% | ||||||
| Weighted average expected remaining life in years |
4.07 | 4.14 | ||||||
The expected dividend on our shares was based on the annualized dividend rate at each period-end. Expected volatility was based on five years of historical data. The interest rate for the life of the options was based on the implied yield available on government bonds with an equivalent remaining term at each period-end. Historical data was used to estimate the expected life of the options and forfeiture rates.
The intrinsic value of options issued under the share option plans at December 31, 2023 was CAD$22 million or USD$16 million (December 31, 2022 - CAD$14 million or USD$11 million). The intrinsic value is determined based on the difference between the weighted-average share price on the last business day of the month and the exercise price, multiplied by the number of vested options.
|
|
Phantom share unit plan
Our PSU plan is intended to supplement, in whole or in part, or replace the granting of share options as long-term incentives for officers and employees. The plan provides for two types of units which vest on the third anniversary of the grant date. A restricted share unit pays out based on the volume weighted average price per Common share on the trading day immediately preceding its vesting date (the “vesting date value”). A performance share unit pays out at a value between 0% and 200% of its vesting date value contingent upon our performance relative to a peer group of companies over the three-year performance period. Officers and employees granted units under the plan are also entitled to additional units to reflect cash dividends paid on Common shares from the applicable grant date until payout.
We have recorded an expense of $12 million (2022 - expense of $10 million) related to the PSU plan. The number of units outstanding as at December 31, 2023 was 179,757 (December 31, 2022 – 184,207), including performance share units totalling 179,757 (December 31, 2022 – 167,156).
Directors’ deferred share unit plans
We have DSU plans which provide a structure for directors, who are not our employees, to accumulate an equity-like holding in West Fraser. The DSU plans allow directors to participate in our growth by providing a deferred payment based on market pricing of our Common shares at the time of redemption. Each director receives deferred share units in payment of an annual equity retainer until a minimum equity holding is reached and may elect to receive units in payment of up to 100% of other fees earned. After a minimum equity holding is reached, directors may elect to receive the equity retainer in units or cash. The units are issued based on the market price of our Common shares at the time of issue. Additional units are issued to take into account the value of dividends paid on Common shares from the date of issue to the date of redemption. Units are redeemable only after a director retires, resigns or otherwise leaves the board. The redemption value is equal to the market price of our Common shares at the date of redemption. A holder of units may elect to redeem units in cash or receive Common shares having an equivalent value.
We have recorded an expense of $2 million (2022 - recovery of $1 million) related to the DSU plan. The number of units outstanding as at December 31, 2023 was 78,895 (December 31, 2022 - 97,884).
| 17. | Restructuring and impairment charges |
| 2023 | 2022 | |||||||
| Impairment related to Hinton pulp mill |
$ | 121 | $ | 13 | ||||
| Impairment related to Quesnel River Pulp mill and Slave Lake Pulp mill |
20 | — | ||||||
| Restructuring and impairment related to Canadian lumber operations |
81 | — | ||||||
| Impairment related to US lumber operations |
47 | 29 | ||||||
| Impairment related to South Molton mill |
— | 9 | ||||||
| Impairment related to equity accounted investment |
7 | — | ||||||
| Other restructuring charges |
3 | 9 | ||||||
| $ | 279 | $ | 60 | |||||
| 2023 Annual Report | 107 |
In the year ended December 31, 2023, we recorded restructuring and impairment charges of $279 million.
We recorded an impairment loss of $121 million in relation to the sale of the Hinton pulp mill (see note 6). In addition, we recorded an impairment loss of $20 million in relation to the sale of the Quesnel River Pulp mill and Slave Lake Pulp mill (see note 6).
We recorded restructuring and impairment charges of $81 million related to facility closures and curtailments due to availability of economic fibre sources in B.C.
We recorded restructuring and impairment charges of $47 million associated with the announcement of the permanent closure of our lumber mill in Maxville, Florida and the indefinite curtailment of operations at our lumber mill in Huttig, Arkansas.
We estimated the recoverable amount of the impaired assets based on their value in use. The recoverable amount of the property, plant and equipment subject to impairment, other than the disposal group discussed above, was $36 million.
An impairment loss of $7 million was recorded in the year ended December 31, 2023 in relation to an equity accounted investment in our lumber segment that produces and distributes wood pellets. Restructuring charges of $3 million were recorded in the year ended December 31, 2023 relating to the closure of a regional corporate office in our lumber segment and the closure of a distribution centre in our pulp & paper segment.
| 18. | Finance income (expense), net |
| 2023 | 2022 | |||||||
| Interest expense |
$ | (24 | ) | $ | (24 | ) | ||
| Interest income on cash and cash equivalents |
47 | 18 | ||||||
| Net interest income on export duty deposits (note 26) |
27 | 9 | ||||||
| Finance income (expense) on employee future benefits |
1 | (6 | ) | |||||
| $ | 51 | $ | (3 | ) | ||||
| 19. | Other income |
| 2023 | 2022 | |||||||
| Foreign exchange gain (loss) |
$ | (7 | ) | $ | 28 | |||
| Settlement gain (loss) on defined benefit pension plan annuity purchases |
6 | (5 | ) | |||||
| Gain on electricity swaps |
17 | — | ||||||
| Gain (loss) on interest rate swap contracts |
(6 | ) | 13 | |||||
| Other |
(5 | ) | 1 | |||||
| $ | 5 | $ | 37 | |||||
|
|
| 20. | Tax recovery (provision) |
Accounting policies
Tax recovery (provision) for the year is comprised of current and deferred tax. Tax recovery (provision) is recognized in earnings, except to the extent that it relates to items recognized in other comprehensive earnings in which case it is recognized in other comprehensive earnings.
Deferred taxes are provided for using the liability method. Under this method, deferred taxes are recognized for temporary differences between the tax and financial statement basis of assets, liabilities and certain carry-forward items.
Deferred tax assets are recognized only to the extent that it is probable that they will be realized. Deferred income tax assets and liabilities are adjusted for the effects of changes in tax laws and rates on the date of substantive enactment.
International Tax Reform - Pillar Two Model Rules
The Organisation for Economic Co-operation and Development (OECD)/G20 Inclusive Framework on Base Erosion and Profit Shifting published the Pillar Two model rules designed to address the tax challenges arising from the digitalisation of the global economy. Pillar Two legislation has been enacted or substantively enacted in certain jurisdictions in which we operate, although some countries may have varying responses or adjustments to the initial model rules. We are in the process of evaluating the potential impact that these changes will have on our long-term financial position.
Supporting information
Certain 2022 figures within this note have been reclassified to conform with the current year’s presentation, including as it relates to amendments to IAS 12 Income Taxes regarding deferred tax related to assets and liabilities arising from a single transaction, which were effective for annual periods beginning on or after January 1, 2023.
The major components of income tax included in comprehensive earnings are as follows:
| 2023 | 2022 | |||||||
| Earnings: |
||||||||
| Current tax |
$ | (61) | $ | (581) | ||||
| Deferred tax recovery (provision) |
122 | (37) | ||||||
| Tax recovery (provision) on earnings |
$ | 61 | $ | (618) | ||||
| Other comprehensive earnings: |
||||||||
| Deferred tax recovery (provision) on retirement benefit actuarial loss (gain) |
$ | 12 | $ | (56) | ||||
| Tax recovery (provision) on comprehensive earnings |
$ | 73 | $ | (674) | ||||
The tax provision differs from the amount that would have resulted from applying the British Columbia statutory income tax rate to earnings before tax as follows:
| 2023 | 2022 | |||||||
| Income tax recovery (expense) at statutory rate of 27% |
$ | 62 | $ | (700) | ||||
| Non-taxable amounts |
— | 10 | ||||||
| Rate differentials between jurisdictions and on specified activities |
(3) | 81 | ||||||
| Other |
2 | (9) | ||||||
| Tax recovery (provision) |
$ | 61 | $ | (618) | ||||
| 2023 Annual Report | 109 |
Deferred income tax liabilities (assets) are made up of the following components:
| 2023 | 2022 | |||||||
| Property, plant, equipment and intangibles |
$ | 737 | $ | 796 | ||||
| Reforestation and decommissioning obligations |
(30 | ) | (30 | ) | ||||
| Employee benefits |
(22 | ) | (12 | ) | ||||
| Export duties |
90 | 72 | ||||||
| Tax loss carry-forwards1 |
(47 | ) | (11 | ) | ||||
| Inventory |
(12 | ) | (4 | ) | ||||
| Other |
(39 | ) | (20 | ) | ||||
| $ | 677 | $ | 791 | |||||
| Represented by: |
||||||||
| Deferred income tax assets |
$ | (6 | ) | $ | (4 | ) | ||
| Deferred income tax liabilities |
683 | 795 | ||||||
| $ | 677 | $ | 791 | |||||
| 1. | We have $241 million of net operating loss carry-forwards in various jurisdictions (December 31, 2022 - $61 million), $306 million of U.S. state net operating loss carry-forwards (December 31, 2022 - $345 million), and $83 million of capital loss carry-forwards (December 31, 2022 - $56 million). A portion of these losses expire over various periods starting in 2024. The net operating losses that have not been recognized as of December 31, 2023 are $32 million in various jurisdictions (December 31, 2022 - $35 million) and $270 million for U.S. states (December 31, 2022 - $272 million). Capital losses that have not been recognized as of December 31, 2023 are $83 million (December 31, 2022 - $56 million). |
| 21. | Employee compensation |
Our employee compensation expense includes salaries and wages, employee future benefits, bonuses and termination costs, but excludes restructuring charges. Total compensation expense for the year ended December 31, 2023 was $989 million (2022 - $1,133 million).
Key management includes directors and officers, and their compensation expense and balance sheet date payables are as follows:
| 2023 | 2022 | |||||||
| Expense |
||||||||
| Salary and short-term employee benefits |
$ | 8 | $ | 13 | ||||
| Retirement benefits |
2 | 2 | ||||||
| Equity-based compensation1 |
19 | 4 | ||||||
| $ | 29 | $ | 19 | |||||
| 1. Amounts do not necessarily represent the actual value which will ultimately be paid.
|
|
|||||||
| 2023 | 2022 | |||||||
| Payables and accrued liabilities |
||||||||
| Compensation |
$ | — | $ | 6 | ||||
| Equity-based compensation1 |
39 | 35 | ||||||
| $ | 39 | $ | 41 | |||||
| 1. | Amounts do not necessarily represent the actual value which will ultimately be paid. |
| 22. | Earnings (loss) per share |
Basic earnings (loss) per share is calculated based on earnings (loss) available to Common shareholders, as set out below, using the weighted average number of Common shares and Class B Common shares outstanding.
Certain of our equity-based compensation plans may be settled in cash or Common shares at the holder’s option and for the purposes of calculating diluted earnings (loss) per share, the more dilutive of the cash-settled and equity-settled method is used, regardless of how the plan is accounted for. Plans that are accounted for using the cash-settled method will require adjustments to the numerator and denominator if the equity-settled method is determined to have a dilutive effect as compared to the cash-settled method.
|
|
The numerator under the equity-settled method is calculated based on earnings (loss) available to Common shareholders adjusted to remove the cash-settled equity-based compensation expense or recovery that has been charged or credited to earnings (loss) and deducting a notional charge using the equity-settled method, as set out below. Adjustments to earnings (loss) are tax-effected as applicable. The denominator under the equity-settled method is calculated using the treasury stock method. Share options under the equity-settled method are considered dilutive when the average market price of our Common shares for the period exceeds the exercise price of the share option.
The cash-settled method was more dilutive for the year ended December 31, 2023. The equity-settled method was more dilutive for the year ended December 31, 2022 and an adjustment was required for both the numerator and denominator.
A reconciliation of the numerator and denominator used for the purposes of calculating diluted earnings (loss) per share is as follows:
| 2023 | 2022 | |||||||
| Earnings (loss) |
||||||||
| Numerator for basic EPS |
$ | (167 | ) | $ | 1,975 | |||
| Cash-settled (recovery) expense included in earnings |
— | (5) | ||||||
| Equity-settled expense adjustment |
— | (5) | ||||||
| Numerator for diluted EPS |
$ | (167 | ) | $ | 1,965 | |||
| Weighted average number of shares (thousands) |
||||||||
| Denominator for basic EPS |
83,199 | 93,760 | ||||||
| Effect of dilutive equity-based compensation |
— | 413 | ||||||
| Denominator for diluted EPS |
83,199 | 94,173 | ||||||
| Earnings (loss) per share (dollars) |
||||||||
| Basic |
$ | (2.01 | ) | $ | 21.06 | |||
| Diluted |
$ | (2.01 | ) | $ | 20.86 | |||
| 23. | Financial instruments |
Accounting policies
All financial assets and liabilities, except for derivatives, are initially measured at fair value and subsequently measured at amortized cost using the effective interest rate method. Derivatives are measured at fair value through profit or loss (“FVTPL”).
Supporting information
The following tables provide the carrying values and fair values of our financial instruments by category, as well as the associated fair value hierarchy levels as defined in note 2 under “Fair value measurements”. The carrying value is a reasonable approximation of fair value for cash and cash equivalents, receivables, and payables and accrued liabilities
| 2023 Annual Report | 111 |
due to their short-term nature. The carrying values of long-term debt include any current portions and exclude deferred financing costs.
| December 31, 2023 | Level | Financial assets at amortized cost |
Financial assets or financial liabilities at FVTPL |
Financial liabilities at amortized cost |
Carrying value | Fair value | ||||||||||||||||
| Financial assets |
||||||||||||||||||||||
| Cash and cash equivalents |
2 | $ | 900 | $ | — | $ | — | $ | 900 | $ | 900 | |||||||||||
| Receivables |
3 | 302 | — | — | 302 | 302 | ||||||||||||||||
| Interest rate swaps2 |
2 | — | 6 | — | 6 | 6 | ||||||||||||||||
| Electricity swaps2 |
3 | — | 22 | — | 22 | 22 | ||||||||||||||||
| $ | 1,202 | $ | 28 | $ | — | $ | 1,230 | $ | 1,230 | |||||||||||||
| Financial liabilities |
||||||||||||||||||||||
| Payables and accrued liabilities |
3 | $ | — | $ | — | $ | 620 | $ | 620 | $ | 620 | |||||||||||
| Long-term debt1 |
2 | — | — | 500 | 500 | 494 | ||||||||||||||||
| Electricity swaps |
3 | — | 12 | — | 12 | 12 | ||||||||||||||||
| $ | — | $ | 12 | $ | 1,120 | $ | 1,132 | $ | 1,126 | |||||||||||||
| 1. | The fair value of long-term debt is based on rates available to us at December 31, 2023 for long-term debt with similar terms and remaining maturities. |
| 2. | The value of our interest rate swap contracts and the current portion of our electricity swap contracts are included in receivables in our consolidated balance sheet at December 31, 2023. The value of the non-current portion of our electricity swap contracts are included in other assets in our consolidated balance sheet at December 31, 2023. |
| December 31, 2022 | Level | Financial assets at amortized cost |
Financial assets or financial liabilities at FVTPL |
Financial liabilities at amortized cost |
Carrying value | Fair value | ||||||||||||||||
| Financial assets |
||||||||||||||||||||||
| Cash and cash equivalents |
2 | $ | 1,162 | $ | — | $ | — | $ | 1,162 | $ | 1,162 | |||||||||||
| Receivables |
3 | 350 | — | — | 350 | 350 | ||||||||||||||||
| Interest rate swaps2 |
2 | — | 12 | — | 12 | 12 | ||||||||||||||||
| $ | 1,512 | $ | 12 | $ | — | $ | 1,524 | $ | 1,524 | |||||||||||||
| Financial liabilities |
||||||||||||||||||||||
| Payables and accrued liabilities |
3 | $ | — | $ | — | $ | 722 | $ | 722 | $ | 722 | |||||||||||
| Long-term debt1 |
2 | — | — | 500 | 500 | 491 | ||||||||||||||||
| Electricity swaps |
2 | — | 4 | — | 4 | 4 | ||||||||||||||||
| $ | — | $ | 4 | $ | 1,222 | $ | 1,226 | $ | 1,217 | |||||||||||||
| 1. | The fair value of long-term debt is based on rates available to us at December 31, 2022 for long-term debt with similar terms and remaining maturities. |
| 2. | The value of our interest rate swap contracts are included in other assets in our consolidated balance sheet at December 31, 2022. |
Financial risk management
Our activities result in exposure to a variety of financial risks, and the main objectives of our risk management process are to ensure risks are properly identified and analyzed and to establish appropriate risk limits and controls. Risk management policies and systems are reviewed regularly to reflect changes in market conditions and our activities. We are exposed to credit risk, liquidity risk, and market risk. A description of these risks and policies for managing these risks are summarized below.
|
|
The sensitivities provided in this section give the effect of possible changes in the relevant prices and rates on earnings. The sensitivities are hypothetical and should not be considered to be predictive of future performance or earnings. Changes in fair values or cash flows based on fluctuations in market variables cannot be extrapolated since the relationship between the change in the market variable and the change in fair value or cash flows may not be linear.
Credit risk
Credit risk is the risk of financial loss if a customer or counterparty to a financial instrument fails to meet its contractual obligations. We are exposed to credit risk with respect to cash and cash equivalents and receivables. The carrying amounts of these accounts represent the maximum credit exposure. We manage credit risk by holding cash and cash equivalents with major banks of high creditworthiness. Credit risk for trade and other receivables is managed through established credit monitoring activities such as:
| · | Establishing and monitoring customer credit limits; |
| · | Performing ongoing evaluations of the financial conditions of key customers; and |
| · | In certain market areas, undertaking additional measures to reduce credit risk including credit insurance, letters of credit and prepayments. At December 31, 2023, approximately 26% of trade accounts receivable was covered by at least some of these additional measures (December 31, 2022 - 45%). |
Given our credit monitoring activities, the low percentage of overdue accounts and our history of minimal customer defaults, we consider the credit quality of our trade accounts receivable at December 31, 2023 to be high and have recorded nominal expected credit losses on our trade accounts receivable. The aging analysis of trade accounts receivable is presented below:
| As at | December 31, 2023 |
December 31, 2022 |
||||||
| Trade accounts receivable |
||||||||
| Current |
$ | 215 | $ | 256 | ||||
| Past due 1 to 30 days |
28 | 19 | ||||||
| Past due 31 to 60 days |
4 | 9 | ||||||
| Past due over 60 days |
3 | 2 | ||||||
| Trade accounts receivable |
250 | 286 | ||||||
| Insurance receivable |
— | 3 | ||||||
| Sales taxes receivable |
26 | 22 | ||||||
| Other |
35 | 39 | ||||||
| Receivables |
$ | 311 | $ | 350 | ||||
Liquidity risk
Liquidity risk is the risk we will encounter difficulty in meeting obligations associated with financial liabilities. We manage liquidity risk by maintaining adequate cash and cash equivalents balances and having lines of credit available. In addition, we regularly monitor forecasted and actual cash flows. Refinancing risks are managed by extending maturities through regular renewals and refinancing when market conditions are supportive.
| 2023 Annual Report | 113 |
The following table summarizes the maturity profile of our financial liabilities based on contractual undiscounted payments:
| December 31, 2023 | Carrying value |
Total | 2024 | 2025 | 2026 | 2027 | Thereafter | |||||||||||||||||||||
| Long-term debt |
$ | 499 | $ | 500 | $ | 300 | $ | 200 | $ | — | $ | — | $ | — | ||||||||||||||
| Interest on long-term debt1 |
— | 25 | 18 | 7 | — | — | — | |||||||||||||||||||||
| Lease obligations |
39 | 45 | 13 | 8 | 5 | 3 | 16 | |||||||||||||||||||||
| Payables and accrued liabilities |
620 | 620 | 620 | — | — | — | — | |||||||||||||||||||||
| Total |
$ | 1,158 | $ | 1,190 | $ | 951 | $ | 215 | $ | 5 | $ | 3 | $ | 16 | ||||||||||||||
| 1. | Assumes debt remains at December 31, 2023 levels and includes the impact of interest rate swaps terminating August 2024. |
In addition, we have contractual commitments for the acquisition of property, plant and equipment in the amount of $265 million in 2024.
Market risk
Market risk is the risk of loss that might arise from changes in market factors such as interest rates, foreign exchange rates, commodity, and energy prices. We aim to manage market risk within acceptable parameters and may, from time to time, use derivatives to manage market risk.
Interest rates
Interest rate risk relates mainly to floating interest rate debt. By maintaining a mix of fixed and floating rate debt along with interest rate swap contracts, we mitigate the exposure to interest rate changes.
As at December 31, 2023, we had the following floating rate financial instruments:
| Financial instrument |
Carrying value |
|||
| Financial liability: Term loan |
$ | 200 | ||
| Financial asset: Interest rate swap contracts |
$ | 6 | ||
We maintain a $200 million term loan due July 2025 where the interest is payable at floating rates based on Prime, Base Rate Advances, Bankers’ Acceptances or SOFR Advances at our option.
We have interest rate swap agreements to pay fixed interest rates and receive variable interest rates equal to 3-month SOFR on $200 million notional principal amount of indebtedness. These agreements have the effect of fixing the interest rate on the $200 million term loan floating rate debt. In January 2024, these interest rate swaps were amended to extend their maturity from August 2024 to July 2025.
In addition, interest on certain of our credit facilities is payable at floating rates including Prime Rate Advances, Base Rate Advances, Bankers’ Acceptances, or SOFR Advances at our option.
At December 31, 2023, the impact of a 100-basis point change in interest rate affecting our floating rate debt would not result in a change in annual interest expense (December 31, 2022 - no change).
Energy
We are party to arrangements with renewable power generators to purchase environmental attributes and receive settlements by reference to generation volumes and the spot price for electricity and pay settlements by reference to generation volumes and a fixed contractual price. These agreements act as a partial hedge against future electricity price increases in Alberta and will provide us with access to renewable energy credits that we may surrender to achieve a reduction in our greenhouse gas emissions. While these arrangements economically hedge the risk of changes in cash flows due to fluctuations in Alberta electricity prices, hedge accounting has not been applied to these instruments.
|
|
A contract to receive renewable energy credits and the associated floating-for-fixed electricity swap are distinct units of account. We have selected this method as we believe the receipt of the renewable energy credits is an executory contract and the electricity swap meets the definition of an embedded derivative.
The electricity swaps are valued based on a discounted cash flow model, with the related changes in fair value included in Other income on our consolidated statements of earnings (loss). The valuation requires management to make certain assumptions about the model inputs, including future electricity prices, discount rates, and expected generation volumes associated with the contracts.
For the year ended December 31, 2023, a gain of $17 million was recognized in relation to the electricity swaps (2022 - nominal gain). The fair value of the electricity swaps at December 31, 2023 was an asset of $10 million (December 31, 2022 - a liability of $4 million). At December 31, 2023, the impact of a 10% increase (decrease) in future electricity prices would result in a gain (loss) of $20 million.
The following table summarizes the maturity profile of our net derivative asset based on contractual undiscounted payments:
| Carrying | ||||||||||||||||||||||||||||
| value - | ||||||||||||||||||||||||||||
| asset | ||||||||||||||||||||||||||||
| December 31, 2023 | (liability) | Total | 2024 | 2025 | 2026 | 2027 | Thereafter | |||||||||||||||||||||
| Electricity swaps |
$ | 10 | $ | 14 | $ | 3 | $ | — | $ | — | $ | 1 | $ | 10 | ||||||||||||||
| Total |
$ | 10 | $ | 14 | $ | 3 | $ | — | $ | — | $ | 1 | $ | 10 | ||||||||||||||
Currency risk
We are exposed to foreign currency risk because our Canadian operations incur a portion of their operating expenses in Canadian dollars. Therefore, an increase in the value of the CAD relative to the USD increases the value of expenses in USD terms incurred by our Canadian operations, which reduces operating margin and the cash flow available to fund operations.
In addition, foreign currency exposure arises from our net investment in our European operations, which have British pound sterling and Euro functional currencies, and from our Spray Lake lumber mill (note 3) and jointly-owned newsprint operation, which have Canadian dollar functional currency. The risk arises from the fluctuation in spot rates between these currencies and the U.S. dollar, which causes the amount of the net investment to vary with the resulting translation gains or losses being reported in other comprehensive earnings.
A $0.01 strengthening (weakening) of the USD against the CAD would increase (decrease) earnings by approximately $2 million. A $0.01 strengthening (weakening) of the USD against the CAD, British pound and Euro would result in an approximate $8 million translation loss (gain) on operations with different functional currencies included in other comprehensive earnings. These sensitivities assume that all other variables remain constant and ignores any impact of forecast sales and purchases.
| 24. | Capital disclosures |
Our business is cyclical and is subject to significant changes in cash flow over the business cycle. In addition, financial performance can be materially influenced by changes in product prices and the relative values of the Canadian and U.S. dollars. Our objective in managing capital is to ensure adequate liquidity and financial flexibility at all times, particularly at the lower points in the business cycle.
Our main policy relating to capital management is to maintain a strong balance sheet and otherwise meet financial tests that rating agencies commonly apply for investment-grade issuers of public debt. Our debt is currently rated as investment grade by three major rating agencies.
We monitor and assess our financial performance to ensure that debt levels are prudent, taking into account the anticipated direction of the business cycle. When financing acquisitions, we combine cash on hand, debt, and equity financing in a proportion that is intended to maintain an investment-grade rating for debt throughout the cycle. Debt repayments are arranged, where possible, on a staggered basis that takes into account the uneven nature of anticipated
| 2023 Annual Report | 115 |
cash flows. We have established committed revolving lines of credit that provide liquidity and flexibility when capital markets are restricted. In addition, as a normal part of our business, we have in the past and may from time to time seek to repurchase our outstanding securities through issuer bids or tender offers, open market purchases, privately negotiated transactions or otherwise. Such repurchases, if any, will depend on prevailing market conditions, our liquidity requirements, contractual and legal restrictions and other factors.
A strong balance sheet and liquidity profile, along with our investment-grade debt rating, are key elements of our goal to maintain a balanced capital allocation strategy. Priorities within this strategy include: reinvesting in our operations across all market cycles to strategically enhance productivity, product mix, and capacity; maintaining a leading cost position; maintaining financial flexibility to capitalize on growth opportunities, including the pursuit of acquisitions and larger-scale strategic growth initiatives; and returning capital to shareholders through dividends and share repurchases.
Two key measurements used to monitor our capital position are total debt to total capital and net debt to total capital, calculated as follows:
| December 31, | December 31, | |||||||
| As at | 2023 | 2022 | ||||||
| Debt |
||||||||
| Operating loans |
$ | — | $ | — | ||||
| Current and long-term lease obligation |
39 | 37 | ||||||
| Current and long-term debt |
500 | 500 | ||||||
| Derivative liabilities1 |
— | — | ||||||
| Open letters of credit1 |
43 | 61 | ||||||
| Total debt |
582 | 598 | ||||||
| Shareholders’ equity |
7,223 | 7,619 | ||||||
| Total capital |
$ | 7,805 | $ | 8,217 | ||||
| Total debt to capital |
7% | 7% | ||||||
| Total debt |
$ | 582 | $ | 598 | ||||
| Cash and cash equivalents |
(900) | (1,162) | ||||||
| Open letters of credit |
(43) | (61) | ||||||
| Derivative liabilities |
— | — | ||||||
| Cheques issued in excess of funds on deposit |
— | — | ||||||
| Net debt |
(361) | (625) | ||||||
| Shareholders’ equity |
7,223 | 7,619 | ||||||
| Total capital |
$ | 6,862 | $ | 6,994 | ||||
| Net debt to capital |
(5%) | (9%) | ||||||
| 1. | Letters of credit facilities and the fair value of derivative liabilities are part of our bank covenants’ total debt calculation. |
|
|
| 25. | Segment and geographical information |
The segmentation of manufacturing operations into lumber, NA EWP, pulp and paper and Europe EWP is based on a number of factors, including similarities in products, production processes and economic characteristics. The EWP segments have been separated due to differences in the operating region, customer base, profit margins and sales volumes. Transactions between segments are at market prices and on standard business terms. The segments follow the accounting policies described in these consolidated financial statement notes, where applicable.
During the first quarter of 2023, the Company changed its measure of profit or loss for each reportable segment from earnings before tax to operating earnings, as this is now the measure most used by the chief operating decision maker when evaluating segment operating performance. Prior year comparatives have been updated to conform to current year presentation.
| Pulp & | Europe | Corporate | ||||||||||||||||||||||
| Year ended December 31, 2023 | Lumber | NA EWP | Paper | EWP | & Other | Total | ||||||||||||||||||
| Sales |
||||||||||||||||||||||||
| To external customers |
$ | 2,722 | $ | 2,602 | $ | 612 | $ | 517 | $ | — | $ | 6,454 | ||||||||||||
| To other segments |
72 | 6 | 11 | — | (89 | ) | — | |||||||||||||||||
| $ | 2,794 | 2,608 | 623 | 517 | (89 | ) | 6,454 | |||||||||||||||||
| Cost of products sold |
(2,215 | ) | (1,594 | ) | (555 | ) | (409 | ) | 89 | (4,685 | ) | |||||||||||||
| Freight and other distribution costs |
(405 | ) | (329 | ) | (120 | ) | (40 | ) | — | (894 | ) | |||||||||||||
| Export duties, net |
(8 | ) | — | — | — | — | (8 | ) | ||||||||||||||||
| Amortization |
(185 | ) | (273 | ) | (24 | ) | (49 | ) | (10 | ) | (541 | ) | ||||||||||||
| Selling, general and administration |
(164 | ) | (96 | ) | (25 | ) | (21 | ) | — | (307 | ) | |||||||||||||
| Equity-based compensation |
— | — | — | — | (25 | ) | (25 | ) | ||||||||||||||||
| Restructuring and impairment charges |
(137 | ) | — | (142 | ) | — | — | (279 | ) | |||||||||||||||
| Operating earnings (loss) |
$ | (319 | ) | $ | 316 | $ | (242 | ) | $ | (3 | ) | $ | (35 | ) | $ | (284 | ) | |||||||
| Total assets |
3,606 | 4,338 | 333 | 691 | 446 | $ | 9,415 | |||||||||||||||||
| Total liabilities |
507 | 551 | 125 | 149 | 861 | $ | 2,193 | |||||||||||||||||
| Capital expenditures |
253 | 156 | 32 | 30 | 7 | $ | 477 | |||||||||||||||||
| Pulp & | Europe | Corporate | ||||||||||||||||||||||
| Year ended December 31, 2022 | Lumber | NA EWP | Paper | EWP | & Other | Total | ||||||||||||||||||
| Sales |
||||||||||||||||||||||||
| To external customers |
$ | 4,381 | $ | 3,780 | $ | 802 | $ | 738 | $ | — | $ | 9,701 | ||||||||||||
| To other segments |
84 | 9 | 5 | — | (98 | ) | — | |||||||||||||||||
| $ | 4,465 | $ | 3,789 | $ | 807 | $ | 738 | $ | (98 | ) | $ | 9,701 | ||||||||||||
| Cost of products sold |
(2,489 | ) | (1,677 | ) | (596 | ) | (479 | ) | 98 | (5,142 | ) | |||||||||||||
| Freight and other distribution costs |
(435 | ) | (329 | ) | (153 | ) | (46 | ) | — | (963 | ) | |||||||||||||
| Export duties, net |
(18 | ) | — | — | — | — | (18 | ) | ||||||||||||||||
| Amortization |
(186 | ) | (306 | ) | (35 | ) | (53 | ) | (9 | ) | (589 | ) | ||||||||||||
| Selling, general and administration |
(194 | ) | (106 | ) | (32 | ) | (28 | ) | (5 | ) | (365 | ) | ||||||||||||
| Equity-based compensation |
— | — | — | — | (5 | ) | (5 | ) | ||||||||||||||||
| Restructuring and impairment charges |
(31 | ) | — | (13 | ) | (15 | ) | — | (60 | ) | ||||||||||||||
| Operating earnings (loss) |
$ | 1,111 | $ | 1,371 | $ | (22 | ) | $ | 117 | $ | (18 | ) | $ | 2,559 | ||||||||||
| Total assets |
3,685 | 4,637 | 456 | 730 | 465 | $ | 9,973 | |||||||||||||||||
| Total liabilities |
553 | 622 | 90 | 170 | 919 | $ | 2,354 | |||||||||||||||||
| Capital expenditures |
184 | 235 | 29 | 20 | 9 | $ | 477 | |||||||||||||||||
| 2023 Annual Report | 117 |
The geographic distribution of non-current assets and external sales based on the location of product delivery is as follows:
| Non-current assets | Sales by geographic area | |||||||||||||||
| 2023 | 2022 | 2023 | 2022 | |||||||||||||
| United States |
$ | 2,689 | $ | 2,625 | $ | 4,251 | $ | 6,659 | ||||||||
| Canada |
3,883 | 4,139 | 1,118 | 1,531 | ||||||||||||
| U.K and Europe |
466 | 460 | 524 | 733 | ||||||||||||
| Asia |
— | — | 557 | 767 | ||||||||||||
| Other |
— | — | 4 | 11 | ||||||||||||
| $ | 7,038 | $ | 7,224 | $ | 6,454 | $ | 9,701 | |||||||||
| 26. | Countervailing (“CVD”) and antidumping (“ADD”) duty dispute |
On November 25, 2016, a coalition of U.S. lumber producers petitioned the U.S. Department of Commerce (“USDOC”) and the U.S. International Trade Commission (“USITC”) to investigate alleged subsidies to Canadian softwood lumber producers and levy CVD and ADD duties against Canadian softwood lumber imports. The USDOC chose us as a “mandatory respondent” to both the countervailing and antidumping investigations, and as a result, we have received unique company-specific rates.
Accounting policies
The CVD and ADD rates apply retroactively for each period of investigation (“POI”). We record CVD as export duty expense at the cash deposit rate until an Administrative Review (“AR”) finalizes a new applicable rate for each POI. We record ADD as export duty expense by estimating the rate to be applied for each POI by using our actual results and a similar calculation methodology as the USDOC and adjust when an AR finalizes a new applicable rate for each POI. The difference between the cumulative cash deposits paid and cumulative export duty expense recognized for each POI is recorded on our balance sheet as export duty deposits receivable or payable.
The difference between the cash deposit amount and the amount that would have been due based on the final AR rate will incur interest based on the U.S. federally published interest rate. We record interest income on our duty deposits receivable, net of any interest expense on our duty deposits payable, based on this rate.
Developments in CVD and ADD rates
We began paying CVD and ADD duties in 2017 based on the determination of duties payable by the USDOC. The CVD and ADD cash deposit rates are updated upon the finalization of the USDOC’s Administrative Review (“AR”) process for each Period of Inquiry (“POI”), as summarized in the tables below.
On March 14, 2023, the USDOC initiated AR5 POI covering the 2022 calendar year. West Fraser was selected as a mandatory respondent, which will result in West Fraser continuing to be subject to a company-specific rate.
On September 7, 2023, the USDOC finalized the duty rate for AR4, resulting in the recognition of an export duty recovery of $62 million plus interest income in earnings and a decrease in export duty deposits payable.
On February 1, 2024, the USDOC released the preliminary results from AR5 POI covering the 2022 calendar year, which indicated a rate of 6.74% for CVD and 5.33% for ADD for West Fraser. The duty rates are subject to an appeal process, and we will record an adjustment once the rates are finalized. If the AR5 rates were to be confirmed, it would result in an expense of $35 million before the impact of interest for the POI covered by AR5. This adjustment would be in addition to the amounts already recorded on our balance sheet. If these rates were finalized, our combined cash deposit rate would be 12.07%.
|
|
The respective Cash Deposit Rates, the AR POI Final Rate and the West Fraser Estimated ADD Rate for each period are as follows:
|
Cash Deposit |
AR POI Final |
|||||||
| Effective dates for CVD | Rate | Rate | ||||||
| AR1 POI1,2 |
||||||||
| April 28, 2017 - August 24, 2017 |
24.12 % | 6.76 % | ||||||
| August 25, 2017 - December 27, 2017 |
— % | — % | ||||||
| December 28, 2017 - December 31, 2017 |
17.99 % | 6.76 % | ||||||
| January 1, 2018 - December 31, 2018 |
17.99 % | 7.57 % | ||||||
| AR2 POI3 |
||||||||
| January 1, 2019 - December 31, 2019 |
17.99 % | 5.08 % | ||||||
| AR3 POI4 |
||||||||
| January 1, 2020 - November 30, 2020 |
17.99 % | 3.62 % | ||||||
| December 1, 2020 - December 31, 2020 |
7.57 % | 3.62 % | ||||||
| AR4 POI5 |
||||||||
| January 1, 2021 - December 1, 2021 |
7.57 % | 2.19 % | ||||||
| December 2, 2021 - December 31, 2021 |
5.06 % | 2.19 % | ||||||
| AR5 POI6 |
||||||||
| January 1, 2022 – January 9, 2022 |
5.06 % | n/a | ||||||
| January 10, 2022 – August 8, 2022 |
5.08 % | n/a | ||||||
| August 9, 2022 - December 31, 2022 |
3.62 % | n/a | ||||||
| AR6 POI7 |
||||||||
| January 1, 2023 - July 31, 2023 |
3.62 % | n/a | ||||||
| August 1, 2023 - December 31, 2023 |
2.19 % | n/a | ||||||
| 1. | On April 24, 2017, the USDOC issued its preliminary rate in the CVD investigation. The requirement that we make cash deposits for CVD was suspended on August 24, 2017, until the USDOC published the revised rate. |
| 2. | On November 24, 2020, the USDOC issued the final CVD rate for the AR1 POI. |
| 3. | On November 24, 2021, the USDOC issued the final CVD rate for the AR2 POI. On January 10, 2022, the USDOC amended the final CVD rate for the AR2 POI from 5.06% to 5.08% for ministerial errors. This table only reflects the final rate. |
| 4. | On August 4, 2022, the USDOC issued the final CVD rate for the AR3 POI. |
| 5. | On August 1, 2023, the USDOC issued the final CVD rate for the AR4 POI. |
| 6. | The CVD rate for the AR5 POI will be adjusted when AR5 is complete and the USDOC finalizes the rate, which is not expected until 2024. |
| 7. | The CVD rate for the AR6 POI will be adjusted when AR6 is complete and the USDOC finalizes the rate, which is not expected until 2025. |
| 2023 Annual Report | 119 |
| West Fraser | ||||||||||||
| Cash Deposit | AR POI Final | Estimated | ||||||||||
| Effective dates for ADD | Rate | Rate | Rate | |||||||||
| AR1 POI1,2 |
||||||||||||
| June 30, 2017 - December 3, 2017 |
6.76 % | 1.40 % | 1.46 % | |||||||||
| December 4, 2017 - December 31, 2017 |
5.57 % | 1.40 % | 1.46 % | |||||||||
| January 1, 2018 - December 31, 2018 |
5.57 % | 1.40 % | 1.46 % | |||||||||
| AR2 POI3 |
||||||||||||
| January 1, 2019 - December 31, 2019 |
5.57 % | 6.06 % | 4.65 % | |||||||||
| AR3 POI4 |
||||||||||||
| January 1, 2020 - November 29, 2020 |
5.57 % | 4.63 % | 3.40 % | |||||||||
| November 30, 2020 - December 31, 2020 |
1.40 % | 4.63 % | 3.40 % | |||||||||
| AR4 POI5 |
||||||||||||
| January 1, 2021 - December 1, 2021 |
1.40 % | 7.06 % | 6.80 % | |||||||||
| December 2, 2021 - December 31, 2021 |
6.06 % | 7.06 % | 6.80 % | |||||||||
| AR5 POI6 |
||||||||||||
| January 1, 2022 - August 8, 2022 |
6.06 % | n/a | 4.52 % | |||||||||
| August 9, 2022 - December 31, 2022 |
4.63 % | n/a | 4.52 % | |||||||||
| AR6 POI7 |
||||||||||||
| January 1, 2023 - July 31, 2023 |
4.63 % | n/a | 8.84 % | |||||||||
| August 1, 2023 - December 31, 2023 |
7.06 % | n/a | 8.84 % | |||||||||
| 1. | On June 26, 2017, the USDOC issued its preliminary rate in the ADD investigation effective June 30, 2017. |
| 2. | On November 24, 2020, the USDOC issued the final ADD rate for the AR1 POI. |
| 3. | On November 24, 2021, the USDOC issued the final ADD rate for the AR2 POI. |
| 4. | On August 4, 2022, the USDOC issued the final ADD rate for the AR3 POI. |
| 5. | On July 31, 2023, the USDOC issued the final ADD rate for the AR4 POI. On September 7, 2023, the USDOC amended the final ADD rate for the AR4 POI from 6.96% to 7.06% for ministerial errors. This table only reflects the final rate. |
| 6. | The ADD rate for the AR5 POI will be adjusted when AR5 is complete and the USDOC finalizes the rate, which is not expected until 2024. |
| 7. | The ADD rate for the AR6 POI will be adjusted when AR6 is complete and the USDOC finalizes the rate, which is not expected until 2025. |
Impact on results
The following table reconciles our cash deposits paid during the year to the amount recorded in our statements of earnings:
| ($ millions) | 2023 | 2022 | ||||||||||
| Cash deposits1 |
(53 | ) | (117 | ) | ||||||||
| Adjust to West Fraser Estimated ADD rate2 |
(17 | ) | 18 | |||||||||
| Export duties, net |
(70 | ) | (99 | ) | ||||||||
| Duty recovery attributable to AR33 |
— | 81 | ||||||||||
| Duty recovery attributable to AR44 |
62 | — | ||||||||||
| Export duty (expense) recovery |
(8 | ) | (18 | ) | ||||||||
| Net interest income on export duty deposits |
27 | 9 | ||||||||||
| 1. | Represents combined CVD and ADD cash deposit rate of 11.12% from January 1, 2022 to January 9, 2022, 11.14% from January 10, 2022 to August 8, 2022, 8.25% from August 9, 2022 to July 31, 2023 and 9.25% from August 1, 2023 to December 31, 2023. |
| 2. | Represents adjustment to West Fraser Estimated ADD rate of 8.84% for 2023 and 4.52% for 2022. |
| 3. | $81 million represents the duty recovery attributable to the finalization of the AR3 duty rates for the 2020 POI. The final CVD rate was 3.62% and the final ADD rate was 4.63% for AR3. |
| 4. | $62 million represents the duty recovery attributable to the finalization of AR4 duty rates for the 2021 POI. The final CVD rate was 2.19% and the final ADD rate was 7.06% for AR4. |
As of December 31, 2023, export duties paid and payable on deposit with the USDOC were $836 million (December 31, 2022 - $784 million).
|
|
Impact on balance sheet
Each POI is subject to independent administrative review by the USDOC, and the results of each POI may not be offset but the results within a POI in respect of ADD and CVD may be offset.
Export duty deposits receivable is represented by:
| Export duty deposits receivable | 2023 | 2022 | ||||||
| Beginning of year |
$ | 354 | $ | 242 | ||||
| Export duties recognized as duty deposits receivable |
— | 97 | ||||||
| Interest income recognized on duty deposits receivable |
23 | 15 | ||||||
| End of year |
$ | 377 | $ | 354 | ||||
Export duties payable is represented by:
| Export duties payable | 2023 | 2022 | ||||||
| Beginning of year |
$ | 73 | $ | 69 | ||||
| Export duties recognized as long-term payable |
(45 | ) | (2 | ) | ||||
| Interest expense (income) recognized on export duties payable |
(4 | ) | 6 | |||||
| End of year |
$ | 24 | $ | 73 | ||||
Appeals
On May 22, 2020, the North American Free Trade Agreement (“NAFTA”) panel issued its final decision on “Injury”. The NAFTA panel rejected the Canadian parties’ arguments and upheld the USITC remand determination in its entirety.
On August 28, 2020, the World Trade Organization’s (“WTO”) dispute-resolution panel ruled unanimously that U.S. countervailing duties against Canadian softwood lumber are inconsistent with the WTO obligations of the United States. The decision confirmed that Canada does not subsidize its softwood lumber industry. On September 28, 2020, the U.S. announced that it would appeal the WTO panel’s decision.
Under U.S. trade law, the International Trade Commission (“ITC”) must review antidumping and countervailing orders every 5 years from the date of issuance. This process is referred to as a “Sunset Review”. On November 30, 2023, the ITC voted to maintain the ADD and CVD orders on softwood lumber from Canada on the grounds that the revocation would likely lead to the continuation or recurrence of material injury to the U.S. domestic industry within a reasonably foreseeable time.
The softwood lumber case will continue to be subject to NAFTA or the new Canada-United States-Mexico Agreement (“CUSMA”), WTO dispute resolution processes, and litigation in the U.S. In the past, long periods of litigation have led to negotiated settlements and duty deposit refunds. In the interim, duties remain subject to the USDOC AR process, which results in an annual adjustment of duty deposit rates.
Notwithstanding the deposit rates assigned under the investigations, our final liability for CVD and ADD will not be determined until each annual administrative review process is complete and related appeal processes are concluded.
| 27. | Contingencies |
We are subject to various investigations, claims and legal, regulatory and tax proceedings covering matters that arise in the ordinary course of business activities, including civil claims and lawsuits, regulatory examinations, investigations, audits and requests for information by governmental regulatory agencies and law enforcement authorities in various jurisdictions. Each of these matters is subject to uncertainties and it is possible that some of these matters may be resolved unfavourably. Certain conditions may exist as of the date the financial statements are issued, which may result in an additional loss. In the opinion of management none of these matters are expected to have a material effect on our results of operations or financial condition.
| 28. | Subsequent events |
On February 3, 2024, the sale of our unbleached softwood kraft pulp mill in Hinton, Alberta to Mondi closed following the successful completion of regulatory reviews and satisfaction of customary closing conditions.
| 2023 Annual Report | 121 |

| Directors and Officers | ||||
Effective February 14, 2024
Directors and Principal Occupation
Henry H. (Hank) Ketcham
Chair of the Board
Sean P. McLaren
President and Chief Executive Officer
Doyle N. Beneby
Corporate Director
Eric L. Butler
Corporate Director
Reid E. Carter
Corporate Director
John N. Floren
Corporate Director
Ellis Ketcham Johnson
President, Private Philanthropic Foundation
Brian G. Kenning
Corporate Director
Marian Lawson
Corporate Director
Colleen M. McMorrow
Corporate Director
Janice G. Rennie
Corporate Director
Gillian D. Winckler
Corporate Director
Senior Executive Officers and Office Held
Sean P. McLaren
President and Chief Executive Officer
Kevin J. Burke
Executive Vice-President, North American Operations
Keith D. Carter
Senior Vice-President, Western Canada
James W. Gorman
Senior Vice-President, Corporate Services
Robin A. Lampard
Senior Vice-President, Finance
Alan G. McMeekin
Senior Vice-President, Europe
Matthew V. Tobin
Senior Vice-President, Sales and Marketing
Christopher A. Virostek
Senior Vice-President, Finance and
Chief Financial Officer
| 2023 Annual Report | 123 |
| Glossary of Key Terms | ||||
This Annual Report uses capitalized terms, abbreviations and acronyms that unless otherwise defined are defined under “Glossary of Key Terms” on page 74 of our Management’s Discussion and Analysis for the year ended December 31, 2023 incorporated into this Annual Report. The following key terms are included below for ease of reference:
AAC
Annual allowable cut.
The volume of timber that may be harvested annually from a specific timber tenure.
Adjusted EBITDA
Non-GAAP financial measure defined in the “Non-GAAP and Other Specified Financial Measures” section of the
2023 MD&A included in this Annual Report
B.C.
British Columbia
CAD or CAD$
Canadian dollars
Crown timber
Timber harvested from lands owned by a provincial government
EBITDA
Earnings before interest, taxes, depreciation and amortization
EDGAR
Electronic Data Gathering, Analysis and Retrieval system
EPS
Earnings per share
EU
Europe
EU OSB
Oriented strand board from the U.K. and Europe
EWP
Engineered wood products
GHG
Greenhouse gas
LIBOR
London interbank offered rate
M3
A solid cubic metre. A unit of measure for timber, equal to approximately 35 cubic feet.
Mcf
One thousand cubic feet. A unit of measure for laminated veneer lumber.
2023 MD&A
Management’s Discussion & Analysis for the year ended December 31, 2023
Mfbm
One thousand board feet equivalent to one thousand square feet of lumber, one inch thick
MMfbm
One thousand board feet (equivalent to one thousand square feet of lumber, one inch thick)
Msf
One thousand square feet. A unit of measure for Panel products (such as OSB, MDF and plywood) equal to one thousand square feet on a 3/4-inch basis for MDF, on a 3/8-inch basis for plywood and on either a 3/8-inch or 7/16-inch thick basis for OSB.
MMsf
One million square feet
Mtonne
One thousand tonnes
NA
North America
NA EWP
North America engineered wood products
NA OSB
Oriented strand board from Canada and the U.S.
NCIB
Normal course issuer bid
Norbord
Norbord Inc.
NYSE
New York Stock Exchange
OSB
Oriented strand board. An engineered structural wood panel produced by chemically bonding wood strands in a uniform direction under heat and pressure.
SEDAR+
System for Electronic Document Analysis and Retrieval+
SPF
Spruce/Pine/Fir lumber
SYP
Southern yellow pine lumber
Tonne
A unit of weight in the metric system equal to one thousand kilograms or approximately 2,204 pounds
TSX
Toronto Stock Exchange
U.K.
United Kingdom
U.S.
United States
USD or $ or US$
United States dollars
Forward-Looking Statements
This Annual Report contains forward-looking information or forward-looking statements (collectively, “forward-looking statements”) within the meaning of applicable securities laws, including those relating to our outlook for our markets, our business strategy and our ability to execute on such strategy, including positioning ourselves to invest in our company, improve productivity and our environmental footprint, and take advantage of opportunities, outlook for demand for our products and our ability to meet such demand, timing of Henderson start-up, expectations for Allendale’s performance, our SBTi commitments and our ability to maintain financial flexibility. Any such forward-looking statements are based on information currently available to us and are based on assumptions and analyses made by us considering our experience and our perception of historical trends and current conditions and are subject to inherent risks and uncertainties. Readers should also refer to the “Forward-Looking Statements” and “Risks and Uncertainties” section set forth in West Fraser’s 2023 MD&A included in this Annual Report. There can be no assurance that the plans, intentions, or expectations upon which forward-looking statements are based will be realized. Actual results may differ, and the difference may be material and adverse to West Fraser and its shareholders. Except as may be required by law, West Fraser undertakes no obligation to publicly update or revise any forward-looking statements.
|
|
| Corporate Information | ||||
Effective February 14, 2024
Annual General Meeting
The Annual General Meeting of the shareholders of the Company will be held on April 24, 2024, at 11:00 a.m. at 1250 Brownmiller Road, Quesnel, British Columbia Canada V2J 6P5.
Auditors
PricewaterhouseCoopers LLP Vancouver, British Columbia Canada
Legal Counsel
McMillan LLP Vancouver, British Columbia Canada
Transfer Agent
Computershare Investor Services Inc.
Tel: 1 (800) 564-6253 Canada/USA
Tel: (514) 982-7555 International
Filings
www.sedar.com
www.sec.gov/edgar
Shares are listed on the TSX and NYSE under the symbol: WFG
Investor Contact
Robert B. Winslow, CFA
Director, Investor Relations & Corporate Development
Tel: (416) 777-4426
E: shareholder@westfraser.com
Website
WestFraser.com
Corporate Offices
Corporate Headquarters
885 West Georgia Street, Suite 1500 Vancouver, British Columbia
Canada V6C 3E8
Tel: (604) 895-2700
US Operations Office
57 Germantown Ct., Suite 300
Cordova, Tennessee, USA, 38018
Tel: (901) 620-4200
Fax: (901) 620-4204
Canadian Operations Office
1250 Brownmiller Road, Quesnel
British Columbia Canada V2J 6P5
Tel: (250) 992-9244
Fax: (250) 992-9233
Cowie Regional Office
Station Road
Cowie, Stirlingshire
Scotland FK7 7BQ
Tel: +44 (0) 1786-812921
Fax: +44 (0) 1786-817143
Toronto Corporate Office
One Toronto Street, Suite 600
Toronto, Ontario Canada M5C 2W4
Tel: (416) 365-0705
West Fraser Technology Centre
4960 Levy Street
Ville St. Laurent, Quebec
Canada H4R 2P1
Tel: (514) 832-3360
Fax: (514) 832-3388
Sales Offices
SPF Lumber, MDF, LVL
1250 Brownmiller Road, Quesnel
British Columbia Canada V2J 6P5
Tel: (250) 992-9254
Fax: (250) 992-3034
SPF Export Lumber & Pulp
885 West Georgia Street, Suite 1500
Vancouver, British Columbia
Canada V6C 3E8
Tel: (604) 895-2700
Fax: (604) 895-2976
SYP Lumber
57 Germantown Ct., Suite 300
Cordova, Tennessee, USA, 38018
Tel: (901) 620-4200
Fax: (901) 620-4204
OSB & Plywood
One Toronto Street, Suite 600
Toronto, Ontario Canada M5C 2W4
Tel: (416) 365-0705
Operations
Canadian Operations
SPF Lumber, Pulp, Plywood, MDF & LVL
1250 Brownmiller Road, Quesnel
British Columbia Canada V2J 6P5
Tel: (250) 992-9244
Fax: (250) 992-9233
OSB
One Toronto Street, Suite 600
Toronto, Ontario Canada M5C 2W4
Tel: (416) 365-0705
Fax: (416) 365-3292
US Operations
SYP Lumber & OSB
57 Germantown Ct., Suite 300
Cordova, Tennessee, USA, 38018
Tel: (901) 620-4200
Fax: (901) 620-4204
European Operations
Station Road
Cowie, Stirlingshire
Scotland FK7 7BQ
Tel: +44 (0) 1786 812921
| 2023 Annual Report | 125 |
| Memberships and Partner Organizations | ||||
West Fraser believes in a layered approach to engagement. We actively participate in numerous forestry sector associations and external initiatives. We also belong to many local business organizations, such as the chambers of commerce, across our operating communities.
|
|
| Product Circularity | ||||
West Fraser supports the circular economy, which is designed to eliminate waste and pollution and keep products and materials in use. The trees we harvest and the products we make are balanced by conserving and regenerating the ecosystems where we work.
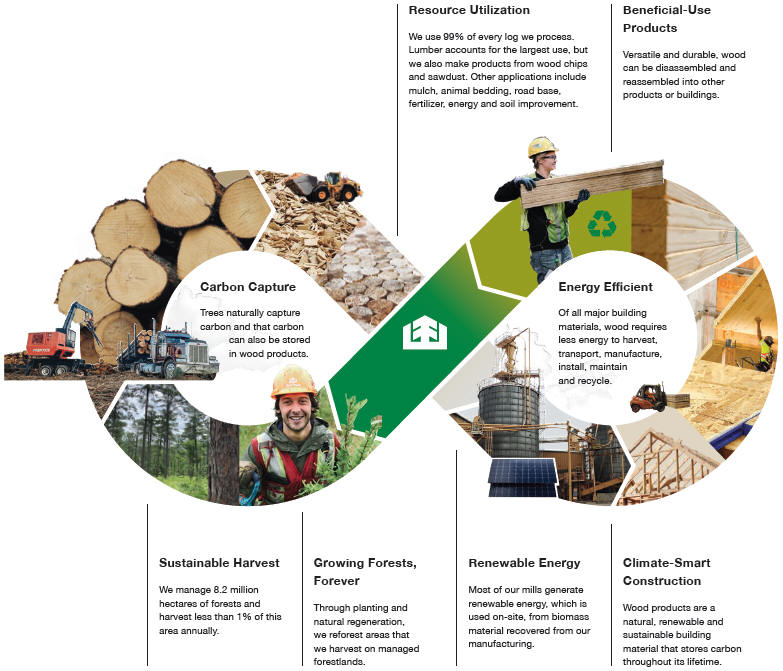
| 2023 Annual Report | 127 |

|
||||
|
|
||||
|
West Fraser Timber Co. Ltd.
604.895.2700
WestFraser.com |
||||