UNITED STATES
SECURITIES AND EXCHANGE COMMISSION
WASHINGTON, D.C. 20549
Form 6-K
REPORT OF FOREIGN PRIVATE ISSUER
PURSUANT TO RULE 13a-16 OR 15d-16
UNDER THE SECURITIES EXCHANGE ACT OF 1934
For the month of March 2024
Commission File Number: 1-9059
Barrick Gold Corporation
(Registrant’s name)
Brookfield Place, TD Canada Trust Tower, Suite 3700
161 Bay Street, P.O. Box 212
Toronto, Ontario M5J 2S1 Canada
(Address of principal executive offices)
Indicate by check mark whether the registrant files or will file annual reports under cover of Form 20-F or Form 40-F.
Form 20-F ☐ Form 40-F ☒
SIGNATURES
Pursuant to the requirements of the Securities Exchange Act of 1934, the registrant has duly caused this report to be signed on its behalf by the undersigned, thereunto duly authorized.
| Date: March 15, 2024 | BARRICK GOLD CORPORATION | |||||
| By: | /s/ Poupak Bahamin |
|||||
| Name: | Poupak Bahamin | |||||
| Title: | General Counsel | |||||
EXHIBIT INDEX
| Exhibit |
Description |
|
| 99.1 | Technical Report on the Turquoise Ridge Complex, Humboldt County, Nevada, USA | |
Exhibit 99.1

NI 43-101 Technical Report on the
Turquoise Ridge Complex
Humboldt County, Nevada, USA

March 15, 2024
Effective Date: December 31, 2023
Prepared for Barrick Gold Corporation
Prepared by:
Craig Fiddes, SME (RM)
John Langhans, MMSA (QP)
Paul Schmiesing, SME (RM)
Joseph Becker, SME (RM)
Timothy Webber, SME (RM)
Simon Bottoms, CGeol, MGeol, FGS, FAusIMM
|
|
Turquoise Ridge Complex NI 43-101 Technical Report |

|
Cautionary Statement on Forward-Looking Information
This Technical Report contains forward-looking statements. All statements, other than statements of historical fact regarding Nevada Gold Mines LLC, Barrick Gold Corporation, Newmont Corporation or the Turquoise Ridge Complex, are forward-looking statements. The words “believe”, “expect”, “anticipate”, “contemplate”, “target”, “plan”, “intend”, “project”, “continue”, “budget”, “estimate”, “potential”, “may”, “will”, “can”, “could” and similar expressions identify forward-looking statements. In particular, this Technical Report contains forward-looking statements with respect to cash flow forecasts, projected capital, operating and exploration expenditure, targeted cost reductions, mine life and production rates, potential mineralization and metal or mineral recoveries, and information pertaining to potential improvements to financial and operating performance and mine life at the Turquoise Ridge Complex. All forward-looking statements in this Technical Report are necessarily based on opinions and estimates made as of the date such statements are made and are subject to important risk factors and uncertainties, many of which cannot be controlled or predicted. Material assumptions regarding forward-looking statements are discussed in this Technical Report, where applicable. In addition to such assumptions, the forward-looking statements are inherently subject to significant business, economic and competitive uncertainties, and contingencies. Known and unknown factors could cause actual results to differ materially from those projected in the forward-looking statements. Such factors include, but are not limited to: fluctuations in the spot and forward price of commodities (including gold, diesel fuel, natural gas and electricity); the speculative nature of mineral exploration and development; changes in mineral production performance, exploitation and exploration successes; diminishing quantities or grades of reserves; increased costs, delays, suspensions, and technical challenges associated with the construction of capital projects; operating or technical difficulties in connection with mining or development activities, including disruptions in the maintenance or provision of required infrastructure and information technology systems; damage to Nevada Gold Mines LLC’s, Barrick Gold Corporation’s, or Newmont Corporation’s reputation due to the actual or perceived occurrence of any number of events, including negative publicity with respect to the handling of environmental matters or dealings with community groups, whether true or not; risk of loss due to acts of war, terrorism, sabotage and civil disturbances; uncertainty whether the Turquoise Ridge Complex will meet Nevada Gold Mines LLC’s or Barrick Gold Corporation’s capital allocation objectives; the impact of global liquidity and credit availability on the timing of cash flows and the values of assets and liabilities based on projected future cash flows; the impact of inflation; fluctuations in the currency markets; changes in interest rates; changes in national and local government legislation, taxation, controls or regulations and/or changes in the administration of laws, policies and practices, expropriation or nationalization of property and political or economic developments in the United States; failure to comply with environmental and health and safety laws and regulations; timing of receipt of, or failure to comply with, necessary permits and approvals; litigation; contests over title to properties or over access to water, power and other required infrastructure; increased costs and physical risks including extreme weather events and resource shortages, related to climate change; and availability and increased costs associated with mining inputs and labour. In addition, there are risks and hazards associated with the business of mineral exploration, development, and mining, including environmental hazards, industrial accidents, unusual or unexpected formations, ground conditions, pressures, cave-ins, flooding and gold ore losses (and the risk of inadequate insurance, or inability to obtain insurance, to cover these risks).
Many of these uncertainties and contingencies can affect Nevada Gold Mines LLC’s actual results and could cause actual results to differ materially from those expressed or implied in any forward-looking statements made by, or on behalf of, Nevada Gold Mines LLC. All of the forward-looking statements made in this Technical Report are qualified by these cautionary statements. None of Nevada Gold Mines LLC, Barrick Gold Corporation, Newmont Corporation, and the Qualified Persons who authored this Technical Report undertake no obligation to update publicly or otherwise revise any forward-looking statements whether as a result of new information or future events or otherwise, except as may be required by law.
| March 15, 2024 |
Page i |
|
|
Turquoise Ridge Complex NI 43-101 Technical Report |
|
Table of Contents
| 1 |
Summary | 18 | ||||
| 1.1 | Description, Location, and Ownership | 18 | ||||
| 1.2 | Geology and Mineralization | 18 | ||||
| 1.3 | Exploration Status | 19 | ||||
| 1.4 | Mineral Resource Estimate | 20 | ||||
| 1.5 | Mineral Reserve Estimate | 22 | ||||
| 1.6 | Mining Methods | 24 | ||||
| 1.7 | Mineral Processing | 24 | ||||
| 1.8 | Project Infrastructure | 25 | ||||
| 1.9 | Environmental, Permitting, and Social Considerations | 25 | ||||
| 1.10 | Capital and Operating Costs | 25 | ||||
| 1.11 | Interpretations and Conclusions | 26 | ||||
| 1.11.1 | Mineral Tenure, Rights, Royalties and Agreements | 26 | ||||
| 1.11.2 | Geology and Mineral Resources | 26 | ||||
| 1.11.3 | Mining and Mineral Reserves | 28 | ||||
| 1.11.4 | Mineral Processing | 29 | ||||
| 1.11.5 | Infrastructure | 30 | ||||
| 1.11.6 | Environmental, Permitting and Social Considerations | 30 | ||||
| 1.11.7 | Project Economics | 31 | ||||
| 1.12 | Recommendations | 32 | ||||
| 1.12.1 | Geology and Mineral Resources | 32 | ||||
| 1.12.2 | Mining and Mineral Reserves | 33 | ||||
| 1.12.3 | Mineral Processing | 33 | ||||
| 1.12.4 | Infrastructure | 34 | ||||
| 1.12.5 | Environment, Permitting, and Social and Community | 34 | ||||
| 2 |
Introduction | 35 | ||||
| 2.1 | Effective Date | 38 | ||||
| 2.2 | Qualified Persons | 38 | ||||
| 2.3 | Site Visits of Qualified Persons | 40 | ||||
| 2.4 | Information Sources | 41 | ||||
| March 15, 2024 |
Page ii |
|
|
Turquoise Ridge Complex NI 43-101 Technical Report |
|
| 2.5 | List of Abbreviations | 41 | ||||
| 3 |
Reliance on Other Experts | 43 | ||||
| 4 |
Property Description and Location | 44 | ||||
| 4.1 | Property and Title in Nevada | 44 | ||||
| 4.1.1 | Mineral Title | 44 | ||||
| 4.1.2 | Surface Rights | 46 | ||||
| 4.1.3 | Water Rights | 46 | ||||
| 4.2 | Project Ownership | 47 | ||||
| 4.3 | Mineral Tenure | 47 | ||||
| 4.3.1 | Unpatented Mining and Mill Site Claims | 49 | ||||
| 4.3.2 | Fee Property | 64 | ||||
| 4.4 | Surface Rights and Plans of Operations | 65 | ||||
| 4.5 | Agreements | 65 | ||||
| 4.6 | Royalties, Taxes, and Levies | 66 | ||||
| 4.6.1 | Government Mining Taxes, Levies, and Royalties | 66 | ||||
| 4.6.2 | NGM Royalty | 67 | ||||
| 4.6.3 | Claims Royalties | 67 | ||||
| 4.7 | Permit Considerations | 68 | ||||
| 4.8 | Environmental Liabilities | 68 | ||||
| 4.9 | Comment on Property Description and Location | 68 | ||||
| 5 |
Accessibility, Climate, Local Resources, Infrastructure and Physiography | 69 | ||||
| 5.1 | Accessibility | 69 | ||||
| 5.2 | Climate | 69 | ||||
| 5.3 | Local Resources and Infrastructure | 70 | ||||
| 5.4 | Physiography | 70 | ||||
| 5.5 | Seismicity | 70 | ||||
| 5.6 | Sufficiency of Surface Rights | 70 | ||||
| 6 |
History | 72 | ||||
| 6.1 | Development and Operations | 72 | ||||
| 6.2 | Production History | 74 | ||||
| 7 |
Geological Setting and Mineralization | 76 | ||||
| 7.1 | Regional Geology | 76 | ||||
| March 15, 2024 |
Page iii |
|
|
Turquoise Ridge Complex NI 43-101 Technical Report |
|
| 7.2 | Local Geology | 79 | ||||
| 7.2.1 | Lithologies | 79 | ||||
| 7.2.2 | Structure | 82 | ||||
| 7.2.3 | Alteration | 83 | ||||
| 7.2.4 | Mineralization | 85 | ||||
| 7.3 | Project Geology | 85 | ||||
| 7.3.1 | Turquoise Ridge Underground | 85 | ||||
| 7.3.2 | Turquoise Ridge Surface | 90 | ||||
| 7.3.3 | Vista Underground | 97 | ||||
| 7.4 | Comment on Geological Setting and Mineralization | 101 | ||||
| 8 |
Deposit Types | 102 | ||||
| 8.1 | Summary | 102 | ||||
| 8.2 | Deposit Type | 102 | ||||
| 8.3 | Comment on Deposit Types | 102 | ||||
| 9 |
Exploration | 103 | ||||
| 9.1 | Summary | 103 | ||||
| 9.2 | Grids and Surveys | 103 | ||||
| 9.2.1 | Turquoise Ridge Underground | 103 | ||||
| 9.2.2 | Turquoise Ridge Surface and Vista Underground | 103 | ||||
| 9.3 | Geological Mapping | 103 | ||||
| 9.3.1 | Turquoise Ridge Underground | 104 | ||||
| 9.3.2 | Turquoise Ridge Surface | 104 | ||||
| 9.3.3 | Vista Underground | 104 | ||||
| 9.4 | Geochemical Sampling | 104 | ||||
| 9.5 | Geophysics | 104 | ||||
| 9.6 | Petrology, Mineralogy, and Research Studies | 105 | ||||
| 9.7 | Exploration Potential | 105 | ||||
| 9.7.1 | Near Mine | 105 | ||||
| 9.7.2 | Regional Exploration | 106 | ||||
| 9.8 | Comment on Exploration | 106 | ||||
| 10 |
Drilling | 107 | ||||
| 10.1 | Summary | 107 | ||||
| March 15, 2024 |
Page iv |
|
|
Turquoise Ridge Complex NI 43-101 Technical Report |
|
| 10.2 | Drilling Used to Support Mineral Resource Estimation | 109 | ||||
| 10.3 | Drill Methods | 113 | ||||
| 10.3.1 | Drill Contractors | 113 | ||||
| 10.3.2 | Air and Mud Drilling Methods | 113 | ||||
| 10.3.3 | Reverse Circulation Drilling Methods | 113 | ||||
| 10.3.4 | Core Drilling | 113 | ||||
| 10.4 | Logging Procedures | 114 | ||||
| 10.4.1 | Reverse Circulation | 114 | ||||
| 10.4.2 | Core | 114 | ||||
| 10.5 | Collar Surveys | 115 | ||||
| 10.5.1 | Reverse Circulation | 115 | ||||
| 10.5.2 | Core | 116 | ||||
| 10.6 | Down Hole Surveys | 116 | ||||
| 10.6.1 | Reverse Circulation | 116 | ||||
| 10.6.2 | Core | 116 | ||||
| 10.7 | Recovery | 117 | ||||
| 10.8 | Surface Grade Control Drilling | 117 | ||||
| 10.9 | Underground Grade Control Drilling | 117 | ||||
| 10.10 | Sample Length/True Thickness | 118 | ||||
| 10.11 | Comments on Drilling | 118 | ||||
| 11 |
Sample Preparation, Analyses and Security | 120 | ||||
| 11.1 | Sampling Methods | 120 | ||||
| 11.1.1 | Historic Sampling Methods | 120 | ||||
| 11.1.2 | RC Drill Sampling | 120 | ||||
| 11.1.3 | Core Sampling | 120 | ||||
| 11.1.4 | Production Sampling | 121 | ||||
| 11.2 | Density Determinations | 121 | ||||
| 11.2.1 | Turquoise Ridge Underground | 121 | ||||
| 11.2.2 | Turquoise Ridge Surface | 122 | ||||
| 11.2.3 | Vista Underground | 122 | ||||
| 11.3 | Analytical and Test Laboratories | 122 | ||||
| 11.4 | Sample Preparation | 123 | ||||
| March 15, 2024 |
Page v |
|
|
Turquoise Ridge Complex NI 43-101 Technical Report |
|
| 11.5 | Analysis | 123 | ||||
| 11.6 | Quality Assurance and Quality Control | 125 | ||||
| 11.6.1 | Analytical Procedures | 125 | ||||
| 11.6.2 | Analytical Monitoring | 126 | ||||
| 11.7 | Databases | 128 | ||||
| 11.8 | Sample Security | 129 | ||||
| 11.9 | Sample Storage | 129 | ||||
| 11.10 | Comments on Sample Preparation, Analyses, and Security | 129 | ||||
| 12 |
Data Verification | 130 | ||||
| 12.1 | Summary | 130 | ||||
| 12.2 | External Reviews and Audits | 130 | ||||
| 12.3 | Internal Reviews and Audits | 130 | ||||
| 12.4 | Comments on Data Verification | 131 | ||||
| 13 |
Mineral Processing and Metallurgical Testing | 132 | ||||
| 13.1 | Summary | 132 | ||||
| 13.2 | Metallurgical Testwork | 133 | ||||
| 13.2.1 | Variability of Preg-robbing in Turquoise Ridge Ores | 133 | ||||
| 13.2.2 | Turquoise Ridge Underground | 134 | ||||
| 13.2.3 | Vista Underground | 139 | ||||
| 13.2.4 | Turquoise Ridge Mega Pit Cutback | 139 | ||||
| 13.2.5 | Stockpiles | 142 | ||||
| 13.3 | Metallurgical Variability | 143 | ||||
| 13.4 | Recovery Forecasts | 143 | ||||
| 13.4.1 | Juniper Mill | 144 | ||||
| 13.4.2 | Sage Mill | 144 | ||||
| 13.5 | Blending | 145 | ||||
| 13.6 | Deleterious Elements | 148 | ||||
| 14 |
Mineral Resource Estimates | 149 | ||||
| 14.1 | Summary | 149 | ||||
| 14.2 | Turquoise Ridge Underground | 152 | ||||
| 14.2.1 | Introduction | 152 | ||||
| 14.2.2 | Geological Modelling and Domaining | 152 | ||||
| March 15, 2024 |
Page vi |
|
|
Turquoise Ridge Complex NI 43-101 Technical Report |
|
| 14.2.3 | Exploratory Data Analysis | 154 | ||||
| 14.2.4 | Composites | 155 | ||||
| 14.2.5 | Grade Capping/Outlier Restriction | 157 | ||||
| 14.2.6 | Density Assignment | 160 | ||||
| 14.2.7 | Variography | 160 | ||||
| 14.2.8 | Estimation/Interpolation Methods | 163 | ||||
| 14.2.9 | Block Model Validation | 165 | ||||
| 14.2.10 | Confidence Classifications | 165 | ||||
| 14.2.11 | Reasonable Prospects of Eventual Economic Extraction | 166 | ||||
| 14.3 | Turquoise Ridge Surface | 167 | ||||
| 14.3.1 | Introduction | 167 | ||||
| 14.3.2 | Geological Modelling and Domaining | 168 | ||||
| 14.3.3 | Exploratory Data Analysis | 170 | ||||
| 14.3.4 | Composites | 176 | ||||
| 14.3.5 | Grade Capping/Outlier Restriction | 177 | ||||
| 14.3.6 | Density Assignment | 177 | ||||
| 14.3.7 | Variography | 178 | ||||
| 14.3.8 | Estimation/Interpolation Methods | 178 | ||||
| 14.3.9 | Block Model Validation | 178 | ||||
| 14.3.10 | Confidence Classifications | 179 | ||||
| 14.3.11 | Reasonable Prospects of Eventual Economic Extraction | 180 | ||||
| 14.4 | Vista Underground | 181 | ||||
| 14.4.1 | Introduction | 181 | ||||
| 14.4.2 | Geological Modelling and Domains | 182 | ||||
| 14.4.3 | Exploratory Data Analysis | 184 | ||||
| 14.4.4 | Composites | 184 | ||||
| 14.4.5 | Grade Capping/Outlier Restriction | 186 | ||||
| 14.4.6 | Density Assignment | 186 | ||||
| 14.4.7 | Variography | 186 | ||||
| 14.4.8 | Estimation/Interpolation Methods | 187 | ||||
| 14.4.9 | Block Model Validation | 188 | ||||
| 14.4.10 | Confidence Classifications | 189 | ||||
| 14.4.11 | Reasonable Prospects of Eventual Economic Extraction | 189 | ||||
| March 15, 2024 |
Page vii |
|
|
Turquoise Ridge Complex NI 43-101 Technical Report |
|
| 14.5 | Stockpiles | 190 | ||||
| 14.6 | Royalties | 190 | ||||
| 14.7 | Mineral Resource Statement | 191 | ||||
| 14.8 | Comments on Mineral Resource Estimates | 194 | ||||
| 14.8.1 | External Mineral Resource Audits | 194 | ||||
| 14.8.2 | Relative Accuracy/Confidence of the 2023 Mineral Resource Estimate | 194 | ||||
| 15 |
Mineral Reserve Estimates | 195 | ||||
| 15.1 | Summary | 195 | ||||
| 15.2 | Metal Price Assumptions | 198 | ||||
| 15.3 | Revenue Calculation | 198 | ||||
| 15.4 | Turquoise Ridge Underground | 198 | ||||
| 15.4.1 | Estimation Procedure | 198 | ||||
| 15.4.2 | Dilution and Mining Recovery | 200 | ||||
| 15.4.3 | Processing Recovery | 200 | ||||
| 15.4.4 | Net Value Calculation | 200 | ||||
| 15.4.5 | Sensitivities | 201 | ||||
| 15.5 | Turquoise Ridge Surface | 201 | ||||
| 15.5.1 | Estimation Procedure | 201 | ||||
| 15.5.2 | Dilution and Mining Recovery | 206 | ||||
| 15.5.3 | Net Value Calculation | 206 | ||||
| 15.5.4 | Processing Recovery | 206 | ||||
| 15.5.5 | Royalties | 207 | ||||
| 15.5.6 | Sensitivities | 207 | ||||
| 15.6 | Vista Underground | 207 | ||||
| 15.6.1 | Estimation Procedure | 207 | ||||
| 15.6.2 | Dilution and Mining Recovery | 208 | ||||
| 15.6.3 | Processing Recovery | 208 | ||||
| 15.6.4 | Net Value Calculation | 209 | ||||
| 15.6.5 | Sensitivities | 209 | ||||
| 15.7 | Stockpiles | 210 | ||||
| 15.7.1 | Estimation Procedure | 210 | ||||
| 15.7.2 | Net Value Calculation | 210 | ||||
| March 15, 2024 |
Page viii |
|
|
Turquoise Ridge Complex NI 43-101 Technical Report |
|
| 15.8 | Mineral Reserve Statement | 210 | ||||
| 15.9 | Comments on Mineral Reserve Estimates | 213 | ||||
| 16 |
Mining Methods | 214 | ||||
| 16.1 | Summary | 214 | ||||
| 16.2 | Turquoise Ridge Underground | 214 | ||||
| 16.2.1 | Mining Method and Mine Design | 214 | ||||
| 16.2.2 | Geotechnical Considerations | 216 | ||||
| 16.2.3 | Ground Support | 218 | ||||
| 16.2.4 | Hydrological Considerations | 219 | ||||
| 16.2.5 | Mine Dewatering | 220 | ||||
| 16.2.6 | Ventilation | 220 | ||||
| 16.2.7 | Electric Power | 221 | ||||
| 16.2.8 | Main Infrastructure Levels | 221 | ||||
| 16.2.9 | Material Handling | 222 | ||||
| 16.2.10 | Grade Control | 223 | ||||
| 16.2.11 | Backfill | 223 | ||||
| 16.2.12 | Blasting and Explosives | 224 | ||||
| 16.2.13 | Mining Equipment | 224 | ||||
| 16.2.14 | Production Rate | 225 | ||||
| 16.2.15 | Mine Schedule | 226 | ||||
| 16.3 | Turquoise Ridge Surface | 227 | ||||
| 16.3.1 | Mining Method | 227 | ||||
| 16.3.2 | Mine Design | 228 | ||||
| 16.3.3 | Geotechnical Considerations | 228 | ||||
| 16.3.4 | Hydrogeological Considerations | 230 | ||||
| 16.3.5 | Waste Rock Storage Facilities | 231 | ||||
| 16.3.6 | Stockpiles | 231 | ||||
| 16.3.7 | Grade Control | 231 | ||||
| 16.3.8 | Blasting and Explosives | 232 | ||||
| 16.3.9 | Mining Equipment | 232 | ||||
| 16.3.10 | Production Rate | 232 | ||||
| 16.3.11 | Mine Schedule | 233 | ||||
| 16.4 | Vista Underground | 234 | ||||
| March 15, 2024 |
Page ix |
|
|
Turquoise Ridge Complex NI 43-101 Technical Report |
|
| 16.4.1 | Mining Method and Mine Design | 234 | ||||
| 16.4.2 | Geotechnical Considerations | 238 | ||||
| 16.4.3 | Hydrological Considerations | 239 | ||||
| 16.4.4 | Ventilation | 239 | ||||
| 16.4.5 | Material Handling | 240 | ||||
| 16.4.6 | Backfill | 240 | ||||
| 16.4.7 | Blasting and Explosives | 240 | ||||
| 16.4.8 | Grade Control | 240 | ||||
| 16.4.9 | Mining Equipment | 240 | ||||
| 16.4.10 | Production Rate | 241 | ||||
| 16.4.11 | Mine Schedule | 241 | ||||
| 16.5 | Life of Mine Production Schedule | 242 | ||||
| 16.6 | Comments on Mining Methods | 245 | ||||
| 17 |
Recovery Methods | 246 | ||||
| 17.1 | Summary | 246 | ||||
| 17.2 | Design Basis | 246 | ||||
| 17.3 | Flowsheet | 246 | ||||
| 17.4 | Plant Design | 248 | ||||
| 17.4.1 | Juniper Mill | 248 | ||||
| 17.4.2 | Sage Autoclave | 248 | ||||
| 17.4.3 | Heap Leach | 250 | ||||
| 17.5 | Comments on Recovery Methods | 250 | ||||
| 17.6 | Energy, Water, and Consumables Requirements | 251 | ||||
| 17.6.1 | Energy | 251 | ||||
| 17.6.2 | Water | 251 | ||||
| 17.6.3 | Consumables | 251 | ||||
| 17.7 | Comments on Recovery Methods | 252 | ||||
| 18 |
Project Infrastructure | 253 | ||||
| 18.1 | Summary | 253 | ||||
| 18.1.1 | Turquoise Ridge Underground and Getchell Infrastructure | 254 | ||||
| 18.1.2 | Turquoise Ridge Surface, Vista Underground, and Process Infrastructure | 256 | ||||
| 18.1.3 | Common Purpose Infrastructure | 259 | ||||
| March 15, 2024 |
Page x |
|
|
Turquoise Ridge Complex NI 43-101 Technical Report |
|
| 18.1.4 | Planned Infrastructure and Facility Relocations | 259 | ||||
| 18.2 | Road and Logistics | 259 | ||||
| 18.3 | Stockpiles | 260 | ||||
| 18.4 | Heap Leach Pads | 260 | ||||
| 18.5 | Waste Rock Storage Facilities | 260 | ||||
| 18.6 | Tailings Storage Facilities | 261 | ||||
| 18.7 | Water Management | 262 | ||||
| 18.8 | Power and Electrical | 263 | ||||
| 19 |
Market Studies and Contracts | 264 | ||||
| 19.1 | Market Studies | 264 | ||||
| 19.2 | Commodity Price Assumptions | 264 | ||||
| 19.3 | Contracts | 265 | ||||
| 19.4 | Comment on Market Studies and Contracts | 265 | ||||
| 20 |
Environmental Studies, Permitting, and Social or Community Impact | 266 | ||||
| 20.1 | Environmental Studies | 266 | ||||
| 20.2 | Environmental Considerations | 266 | ||||
| 20.3 | Closure and Reclamation | 267 | ||||
| 20.4 | Permits | 267 | ||||
| 20.4.1 | Current Operations | 267 | ||||
| 20.4.2 | Mega Pit Layback | 268 | ||||
| 20.4.3 | Sage Tailings Facility | 269 | ||||
| 20.5 | Social Considerations | 269 | ||||
| 21 |
Capital and Operating Costs | 271 | ||||
| 21.1 | Summary | 271 | ||||
| 21.2 | Capital Cost Estimates | 271 | ||||
| 21.2.1 | Sustaining Capital | 271 | ||||
| 21.2.2 | Open Pit Stripping | 271 | ||||
| 21.2.3 | Underground Development | 271 | ||||
| 21.2.4 | Capital Drilling | 272 | ||||
| 21.2.5 | Expansion Capital | 272 | ||||
| 21.3 | Operating Cost Estimates | 272 | ||||
| 21.4 | Comments on Capital and Operating Costs | 273 | ||||
| March 15, 2024 |
Page xi |
|
|
Turquoise Ridge Complex NI 43-101 Technical Report |
|
| 22 |
Economic Analysis | 274 | ||||
| 23 |
Adjacent Properties | 275 | ||||
| 24 |
Other Relevant Data and Information | 276 | ||||
| 25 |
Interpretation and Conclusions | 277 | ||||
| 25.1 | Mineral Tenure, Rights, Royalties and Agreements | 277 | ||||
| 25.2 | Geology and Mineral Resources | 277 | ||||
| 25.2.1 | Exploration, Drilling and Analytical Data Collection in Support of Mineral Resource Estimation | 278 | ||||
| 25.2.2 | Mineral Resource Estimates | 278 | ||||
| 25.3 | Mining and Mineral Reserves | 279 | ||||
| 25.3.1 | Mineral Reserve Estimate | 279 | ||||
| 25.3.2 | Mine Plan | 279 | ||||
| 25.4 | Mineral Processing | 280 | ||||
| 25.4.1 | Metallurgical Testwork | 281 | ||||
| 25.5 | Infrastructure | 281 | ||||
| 25.6 | Environmental, Permitting and Social Considerations | 281 | ||||
| 25.7 | Project Economics | 282 | ||||
| 25.7.1 | Capital Cost Estimates | 283 | ||||
| 25.7.2 | Operating Cost Estimates | 283 | ||||
| 25.8 | Risks | 283 | ||||
| 25.8.1 | Risk Analysis Definitions | 283 | ||||
| 25.8.2 | Risk Analysis Table | 284 | ||||
| 26 |
Recommendations | 286 | ||||
| 26.1 | Geology and Mineral Resources | 286 | ||||
| 26.2 | Mining and Mineral Reserves | 286 | ||||
| 26.3 | Mineral Processing | 287 | ||||
| 26.4 | Infrastructure | 287 | ||||
| 26.5 | Environment, Permitting, and Social and Community | 287 | ||||
| 27 |
References | 289 | ||||
| 28 |
Date and Signature Page | 291 | ||||
| 29 |
Certificates of Qualified Persons | 293 | ||||
| 29.1 | Craig Fiddes | 293 | ||||
| March 15, 2024 |
Page xii |
|
|
Turquoise Ridge Complex NI 43-101 Technical Report |
|
| 29.2 | John Langhans | 295 | ||||
| 29.3 | Paul Schmiesing | 297 | ||||
| 29.4 | Joseph Becker | 299 | ||||
| 29.5 | Timothy Webber | 301 | ||||
| 29.6 | Simon P. Bottoms | 303 | ||||
| March 15, 2024 |
Page xiii |
|
|
Turquoise Ridge Complex NI 43-101 Technical Report |
|
List of Tables
| Table 1-1 |
Turquoise Ridge Mineral Resources Summary, 100% Basis, as of December 31, 2023 |
21 | ||||
| Table 1-2 |
Turquoise Ridge Mineral Reserves Summary, December 31, 2023 |
23 | ||||
| Table 2-1 |
QP Responsibilities |
39 | ||||
| Table 2-2 |
Table of Abbreviations |
42 | ||||
| Table 4-1 |
Plans of Operations Centroid Location Summary Table |
44 | ||||
| Table 4-2 |
Fee Properties |
64 | ||||
| Table 4-3 |
Agreements |
66 | ||||
| Table 6-1 |
Turquoise Ridge Complex Development History |
72 | ||||
| Table 6-2 |
Operations History |
74 | ||||
| Table 6-3 |
Summary of Gold Production |
75 | ||||
| Table 7-1 |
Local Structure |
83 | ||||
| Table 10-1 |
Turquoise Ridge Complex Drill Summary Table |
107 | ||||
| Table 10-2 |
Turquoise Ridge Underground Drilling Supporting Mineral Resource Estimates |
109 | ||||
| Table 10-3 |
Turquoise Ridge Surface Drilling Supporting Mineral Resource Estimates |
109 | ||||
| Table 10-4 |
Vista Underground Drilling Supporting Mineral Resource Estimates |
109 | ||||
| Table 10-5 |
Cutoff Dates for Drilling Data Supporting Mineral Resource Estimates by Deposit |
110 | ||||
| Table 11-1 |
QA/QC Samples and Insertion Rates |
126 | ||||
| Table 13-1 |
Drill Hole Test Program BTAC Results |
135 | ||||
| Table 13-2 |
TRUG Monthly Composite BTAC vs Plant Results |
136 | ||||
| Table 13-3 |
Turquoise Ridge Surface Ore Control Matrix |
140 | ||||
| Table 13-4 |
Number of Tests Conducted per Metallurgical Type |
141 | ||||
| Table 13-5 |
Turquoise Ridge Surface Refractory Ore Classification |
146 | ||||
| Table 13-6 |
Autoclave Feed Parameter Ranges |
146 | ||||
| Table 13-7 |
Typical Sage Mill Constraints |
147 | ||||
| Table 14-1 |
Turquoise Ridge Mineral Resources Summary, 100% Basis, as of December 31, 2023 |
151 | ||||
| Table 14-2 |
Grade Capping Analysis for Turquoise Ridge Underground |
158 | ||||
| Table 14-3 |
OK Estimation Parameters |
164 | ||||
| Table 14-4 |
Turquoise Ridge Underground Model Mineral Resource Classification Distances |
165 | ||||
| Table 14-5 |
Resources Cut-off Grade Inputs |
167 | ||||
| Table 14-6 |
Mega Leapfrog Grade Shell Cutoffs |
168 | ||||
| Table 14-7 |
Vista Leapfrog Grade Shell Cutoffs |
170 | ||||
| Table 14-8 |
Summary of Mega Modelled Densities |
177 | ||||
| Table 14-9 |
Summary of Vista Modelled Densities |
178 | ||||
| Table 14-10 |
Turquoise Ridge Surface Model Mineral Resource Classification Distances |
179 | ||||
| Table 14-11 |
Turquoise Ridge Surface Resource Cut-Off Grade Parameters |
181 | ||||
| Table 14-12 |
Grade Capping Analysis for Vista Underground |
186 | ||||
| Table 14-13 |
VUG Estimation Parameters |
188 | ||||
| Table 14-14 |
Input Considerations, Mineral Resources CoG, Vista Underground |
190 | ||||
| Table 14-15 |
Turquoise Ridge Mineral Resource Statement, 100% Basis, December 31, 2023 |
192 | ||||
| Table 14-16 |
Turquoise Ridge Mineral Resource Statement, Barrick Attributable Basis, December 31, 2023 |
193 |
| March 15, 2024 |
Page xiv |
|
|
Turquoise Ridge Complex NI 43-101 Technical Report |
|
| Table 15-1 |
Turquoise Ridge Mineral Reserves Summary, December 31, 2023 |
197 | ||||
| Table 15-2 |
TRUG Mining Dilution and Recovery Assumptions |
200 | ||||
| Table 15-3 |
Input Considerations, Mineral Reserve Net Value, Turquoise Ridge Underground |
201 | ||||
| Table 15-4 |
TRUG Reserves Sensitivity to Gold Price |
201 | ||||
| Table 15-5 |
Summary of Optimisation Input Parameters |
202 | ||||
| Table 15-6 |
Mega Pit Reserves Sensitivity to Gold Price |
207 | ||||
| Table 15-7 |
Input Considerations, Mineral Reserve Net Value, Vista Underground |
209 | ||||
| Table 15-8 |
VUG Reserves Sensitivity to Gold Price |
209 | ||||
| Table 15-9 |
Input Considerations, Mineral Reserve Net Value, Stockpiles |
210 | ||||
| Table 15-10 |
Turquoise Ridge Mineral Reserves Statement, December 31, 2023 |
211 | ||||
| Table 16-1 |
Typical Geotechnical Design Assumptions |
219 | ||||
| Table 16-2 |
Turquoise Ridge Underground Equipment List |
225 | ||||
| Table 16-3 |
Turquoise Ridge Underground LOM Production Schedule Summary |
226 | ||||
| Table 16-4 |
Historical Inter-ramp Slope Angles By Domain |
229 | ||||
| Table 16-5 |
Turquoise Ridge Surface LOM Equipment Requirements |
233 | ||||
| Table 16-6 |
Turquoise Ridge Surface LOM Production Schedule Summary |
234 | ||||
| Table 16-7 |
VUG Stope Design Parameters |
238 | ||||
| Table 16-8 |
Vista Underground Equipment List |
241 | ||||
| Table 16-9 |
Vista Underground LOM Production Schedule Summary |
241 | ||||
| Table 16-10 |
Consolidated LOM Mining Schedule |
243 | ||||
| Table 16-11 |
LOM Processing Schedule |
244 | ||||
| Table 17-1 |
Major Process Equipment, Juniper Mill |
248 | ||||
| Table 17-2 |
Major Process Equipment, Sage Autoclave |
249 | ||||
| Table 17-3 |
Major Process Equipment, Heap Leach Facilities |
250 | ||||
| Table 21-1 |
Capital Cost Summary |
271 | ||||
| Table 21-2 |
LOM Operating Costs Summary |
272 | ||||
| Table 25-1 |
Turquoise Ridge Risk Analysis |
285 |
| March 15, 2024 |
Page xv |
|
|
Turquoise Ridge Complex NI 43-101 Technical Report |
|
List of Figures
| Figure 2-1 |
Project Location Map |
37 | ||
| Figure 4-1 |
NGM Area of Interest |
48 | ||
| Figure 4-2 |
PoO Layout Plan (Operations), 2023 |
50 | ||
| Figure 4-3 |
PoO Layout Plan (Exploration), 2023 |
51 | ||
| Figure 4-4 |
Operations PoO Claims Locations, 2023; Sheet 1 of 4 |
52 | ||
| Figure 4-5 |
Operations PoO Claims Locations; 2023, Sheet 2 of 4 |
53 | ||
| Figure 4-6 |
Operations PoO Claims Locations, 2023; Sheet 3 of 4 |
54 | ||
| Figure 4-7 |
Operations PoO Claims Locations, 2023; Sheet 4 of 4 |
55 | ||
| Figure 4-8 |
Exploration PoO Claims Locations, Sheet 1 of 8 |
56 | ||
| Figure 4-9 |
Exploration PoO Claims Locations, Sheet 2 of 8 |
57 | ||
| Figure 4-10 |
Exploration PoO Claims Locations, Sheet 3 of 8 |
58 | ||
| Figure 4-11 |
Exploration PoO Claims Locations, Sheet 4 of 8 |
59 | ||
| Figure 4-12 |
Exploration PoO Claims Locations, Sheet 5 of 8 |
60 | ||
| Figure 4-13 |
Exploration PoO Claims Locations, Sheet 6 of 8 |
61 | ||
| Figure 4-14 |
Exploration PoO Claims Locations, Sheet 7 of 8 |
62 | ||
| Figure 4-15 |
Exploration PoO Claims Locations, Sheet 8 of 8 |
63 | ||
| Figure 7-1 |
Regional Geology Map |
78 | ||
| Figure 7-2 |
Getchell Trend Deposits |
79 | ||
| Figure 7-3 |
Simplified Geology Plan, Turquoise Ridge and Vista Areas |
80 | ||
| Figure 7-4: |
Stratigraphic Column |
81 | ||
| Figure 7-5 |
Turquoise Ridge Underground Geological Map |
87 | ||
| Figure 7-6 |
Example Cross-Section, Turquoise Ridge Underground, Showing Drill Intercepts |
88 | ||
| Figure 7-7 |
Example Cross-Section, Turquoise Ridge Underground, Showing Grade Shells |
89 | ||
| Figure 7-8 |
Geological Map, Turquoise Ridge Surface (Mega Pit) |
92 | ||
| Figure 7-9 |
Example Long Section, Turquoise Ridge Surface (Mega Pit), Showing Drill Intercepts |
93 | ||
| Figure 7-10 |
Example Long Section, Turquoise Ridge Surface (Mega Pit), Showing Grade Shells |
94 | ||
| Figure 7-11 |
Geological Map, Turquoise Ridge Surface (Vista 8 Pit) |
95 | ||
| Figure 7-12 |
Example Long Section, Turquoise Ridge Surface (Vista 8 Pit) |
96 | ||
| Figure 7-13 |
Geological Map, Vista Underground |
98 | ||
| Figure 7-14 |
Geological Map, Vista Underground Showing Location of Figure 7-15 |
99 | ||
| Figure 7-15 |
Example Cross Section, Vista Underground |
100 | ||
| Figure 10-1 |
Project Drill Collar Location Plan |
108 | ||
| Figure 10-2 |
Drill Collar Location Map Turquoise Ridge Underground Drilling Supporting Mineral Resource Estimates |
111 | ||
| Figure 10-3 |
Drill Collar Location Plan, Turquoise Ridge Surface and Vista Underground Drilling Supporting Mineral Resource Estimates |
112 | ||
| Figure 13-1 |
Relationship Between Total Organic Carbon (TOC) and the Preg-Rob Index |
134 | ||
| Figure 13-2 |
View of the TRUG Showing Mineral Reserves and BTAC Drill Holes |
136 | ||
| Figure 13-3 |
TRUG Recovery as a Function of Organic Carbon and Gold Head Grade |
139 | ||
| Figure 13-4 |
Sage Autoclave Recovery Data by shift for the years of 2022 and 2023 |
145 | ||
| Figure 13-5 |
Stockpile Locations at ROM |
147 | ||
| Figure 14-1 |
Geologic and Resource Domains Cross Section, Turquoise Ridge Underground |
153 | ||
| Figure 14-2 |
Box and Whisker Plots for Gold Domain Grades |
154 |
| March 15, 2024 |
Page xvi |
|
|
Turquoise Ridge Complex NI 43-101 Technical Report |
|
| Figure 14-3 |
Histogram Showing Raw Composite Sample Length and Comparing Raw and Composited Data 2500 Domain |
156 | ||
| Figure 14-4 |
Histogram Showing Raw Composite Sample Length and Comparing Raw and Composited Data 1000 Domain |
157 | ||
| Figure 14-5 |
Domain 2500 Datamine Supervisor Top Cut Analysis for 2500 Domain (140g/t topcut) |
159 | ||
| Figure 14-6 |
2500 Domain r-Grams Used to Help Determine the 2500 Domain |
160 | ||
| Figure 14-7 |
Variograms for Au Domain 2500 |
161 | ||
| Figure 14-8 |
Variograms for the TCM Estimation |
162 | ||
| Figure 14-9 |
Plan Section Example of TRUG Classification with Drilling (Section width 30.5m) |
166 | ||
| Figure 14-10 |
Mega Domains and Main Mafic Map |
168 | ||
| Figure 14-11 |
Vista Domains Plan View |
169 | ||
| Figure 14-12 |
Box and Whisker Plots for Mega aufa, by aufa Grade Shell |
170 | ||
| Figure 14-13 |
aufa Composite Statistics Less Than 0.3 g/t Gold Shell |
171 | ||
| Figure 14-14 |
aufa Composite Statistics Between 0.3 and 1.5 g/t Gold Shell |
172 | ||
| Figure 14-15 |
aufa Composite Statistics Greater Than 1.5 g/t Gold Shell |
173 | ||
| Figure 14-16 |
Vista 6.1m (20 ft) Composites by Domain |
174 | ||
| Figure 14-17 |
Vista 6.1m Composites Inside 111_hwcen Domain, 17.1 g/t (0.50 opt) Cap |
175 | ||
| Figure 14-18 |
Histogram and Probability Plot of the Gold Composites |
176 | ||
| Figure 14-19 |
Vista Open Pit Composite Length Statistics |
177 | ||
| Figure 14-20 |
Mega Section 51000 N, Looking North, Cut 40 Classification Model |
180 | ||
| Figure 14-21 |
Vista Database |
182 | ||
| Figure 14-22 |
VUG OZ domains |
183 | ||
| Figure 14-23 |
Vista Underground Gold Histograms by Domain and Composite Length Histograms by Domain |
185 | ||
| Figure 14-24 |
Vista Underground High Grade Variogram |
187 | ||
| Figure 14-25 |
Mega Pit Royal Gold Royalty Boundary |
191 | ||
| Figure 15-1 |
Turquoise Ridge Underground Cross-Section Showing Mineral Reserves |
199 | ||
| Figure 15-2 |
Mineral Reserves Remaining in Vista Pit |
203 | ||
| Figure 15-3 |
Mineral Reserves Remaining in Mega Pit – Cut 40 |
204 | ||
| Figure 15-4 |
Mineral Reserves Remaining in Turquoise Ridge Open Pit |
205 | ||
| Figure 15-5 |
Vista Underground Cross-Section Showing Mineral Reserves |
208 | ||
| Figure 16-1 |
Underhand Drift and Fill with Cemented Aggregate Backfill Mining Method Schematic |
215 | ||
| Figure 16-2 |
Long-hole Stoping Mining Method Schematic |
216 | ||
| Figure 16-3 |
Turquoise Ridge Underground VentSIM Model Long Section |
221 | ||
| Figure 16-4 |
Turquoise Ridge Underground Shaft Location Schematic |
223 | ||
| Figure 16-5 |
Turquoise Underground Schedule 2024 |
227 | ||
| Figure 16-6 |
VUG LHSR Layout and Mining Activities |
235 | ||
| Figure 16-7 |
VUG Surface Infrastructure Layout Plan |
236 | ||
| Figure 16-8 |
VUG Mine Layout Plan |
237 | ||
| Figure 16-9 |
Ventilation Design, VUG |
239 | ||
| Figure 17-1 |
Process Flow Sheet |
247 | ||
| Figure 18-1 |
Location Plan, Major Operations, Turquoise Ridge Complex |
253 | ||
| Figure 18-2 |
Location Plan, Key Infrastructure, Turquoise Ridge Underground and Getchell |
255 | ||
| Figure 18-3 |
Location Plan, Key Facilities, Turquoise Ridge Surface, Vista Underground, and Process Facilities |
258 |
| March 15, 2024 |
Page xvii |
|
|
Turquoise Ridge Complex NI 43-101 Technical Report |
|
| 1 | Summary |
| 1.1 | Description, Location, and Ownership |
The Turquoise Ridge Complex (the “Project”) is a gold mining operation utilizing both underground and open pit mining methods. It is located in Humboldt County, approximately 64 km northeast of Winnemucca, Nevada, and 40 km northeast of the settlement of Golconda, Nevada.
Since 1883, there has been sporadic mining of various minerals and metals at the property.
The Project is operated as a joint venture (JV) through Nevada Gold Mines (NGM) which was formed in 2019. Barrick is the JV operator and owns 61.5%, with Newmont owning the remaining 38.5% JV interest.
| 1.2 | Geology and Mineralization |
The Turquoise Ridge Complex deposits are considered examples of Carlin-type or carbonate-hosted disseminated gold–silver deposits. The Carlin deposit forms the type locality.
The Project is within the Basin and Range Province between the Osgood Mountains and the Dry Hills in Northern Nevada.
Preferred host lithologies for gold mineralization are the Comus Formation, followed by the Valmy and Etchart Formations.
Host rocks are most commonly thinly bedded silty or argillaceous carbonaceous limestone or dolomite, commonly with carbonaceous shale. Although less mineralized, non-carbonate siliciclastic and rare metavolcanic rocks can locally host gold that reaches economic grades. Felsic plutons and dikes may also be mineralized at some deposits. Deposits typically have a tabular shape, are strata-bound, localized at contacts between contrasting lithologies, but can also be discordant or breccia related.
Mineralization consists primarily of micrometer-sized gold in sulfide grains disseminated in zones of siliciclastic and decarbonated calcareous rocks and are commonly associated with jasperoids. Other associated minerals to mineralization include pyrite, arsenian pyrite, stibnite, realgar, orpiment, cinnabar, fluorite, barite, and rare thallium minerals. Gangue minerals typically comprise fine-grained quartz, barite, clay minerals, carbonaceous matter, and late-stage calcite veins.
| March 15, 2024 |
Page 18 |
|
|
Turquoise Ridge Complex NI 43-101 Technical Report |
|
Mineralization is often structurally focused, either related to lithologic contacts, anticlines, fault intersections and fracture sets or unconformities. Sub-microscopic gold mineralization is associated with arsenian pyrite, quartz, calcite, realgar, and orpiment. Gold mineralization is likely Eocene in age, and it is overprinted in some areas by a late stage of realgar, orpiment, and calcite. Gold-bearing zones can be located close to granodiorite and dacite dikes and beneath basaltic sills, evidencing the importance of rheologic contacts to mineralization.
| 1.3 | Exploration Status |
Given the mining history in the Project area, extensive exploration has occurred at various times by numerous operators.
Significant potential remains within the district plan of operations and exploration is actively being conducted at the Project and regionally.
Near mine exploration is focussed on prospectivity at depth, along strike, and down plunge from current operations. Current near mine exploration focus includes:
| ● | Interpreted corridors of high-angle faults and fractures that can act as conduits for mineralizing fluids; |
| ● | Intersections of faults and dikes; |
| ● | Favorable lithofacies that have been fractured and/or brecciated and represent good potential for gold mineralization; and |
| ● | Deformation above and below mafic units that could generate fluid pathways such that gold mineralization may occur between the mafic units or have ponded under the mafic units acting as impermeable barriers. |
Current regional exploration focus includes:
| ● | Geochemistry – using Carlin-type deposit model pathfinder elements as vectors to mineralization. |
| ● | Alteration – using alteration associated with Carlin-type deposit model as vectors to mineralization. |
| ● | Structure – targeting anticlines, fault intersections, dike and sill contacts, and other anomalous structural sites containing deep-seated fractures and rheologic changes that can act as conduits for mineralizing fluids. |
| ● | Facies interpretation – to identify the most favorable mineralization host rocks. |
| March 15, 2024 |
Page 19 |
|
|
Turquoise Ridge Complex NI 43-101 Technical Report |
|
| 1.4 | Mineral Resource Estimate |
The Mineral Resource estimates have been prepared according to the Canadian Institute of Mining, Metallurgy and Petroleum (CIM) 2014 Definition Standards for Mineral Resources and Mineral Reserves dated 10 May 2014 (CIM (2014) Standards) as incorporated with National Instrument 43-101 Standards of Disclosure for Mineral Projects (NI 43-101). Mineral Resource estimates were also prepared using the guidance outlined in CIM Estimation of Mineral Resources and Mineral Reserves (MRMR) Best Practice Guidelines 2019 (CIM (2019) MRMR Best Practice Guidelines).
Mineral Resources considered amenable to open pit mining methods were constrained within a Pseudoflow (Lerchs-Grossman algorithm alternative) pit shell that used $1,700/oz gold price. Value-based routing was used in generating the cost and cash value of each block to determine reasonable prospects for eventual economic extraction and are demonstrated as a result of this pit optimisation process.
Mineral Resources for the stockpiles was determined using a revenue-based approach with a gold price of US$1,700/oz and appropriate mining costs. Stockpiles that made a profit of at least $1.00 were then considered as Mineral Resources.
Underground Mineral Resources were reported using Deswik Stope Optimizer (Deswik SO) applying appropriate cut-off grades for the methods utilised, minimum mineable stope shape, reasonable mineability constraints (including a minimum mining width, a reasonable distance from current or planned development), and a positive profitability at a $1,700/oz gold price demonstrating a reasonable prospect for eventual economic extraction.
The estimate was reviewed internally as well as externally and approved by NGM prior to release.
A summary of the Mineral Resources for the Project is provided in Table 1-1.
| March 15, 2024 |
Page 20 |
|
|
Turquoise Ridge Complex NI 43-101 Technical Report |
|
Table 1-1 Turquoise Ridge Mineral Resources Summary, 100% Basis, as of December 31, 2023
| Location | Measured | Indicated | Measured + Indicated | Inferred | ||||||||||||||||||||
| Tonnes | Grade | Contained | Tonnes | Grade | Contained | Tonnes | Grade | Contained | Tonnes | Grade | Contained | |||||||||||||
| (Mt) | (g/t Au) | (Moz Au) | (Mt) | (g/t Au) | (Moz Au) | (Mt) | (g/t Au) | (Moz Au) | (Mt) | (g/t Au) | (Moz Au) | |||||||||||||
| Open Pits | - | - | - | 38 | 2.52 | 3.0 | 38 | 2.52 | 3.0 | 13 | 2.3 | 0.98 | ||||||||||||
| Twin Creeks Stockpile |
28 | 2.22 | 2.0 | - |
- | - | 28 | 2.22 | 2.0 | - | - | |||||||||||||
| Surface Total | 28 | 2.22 | 2.0 | 38 | 2.52 | 3.0 | 66 | 2.39 | 5.0 | 13 | 2.3 | 0.98 | ||||||||||||
| Underground Total |
17 | 10.72 | 5.8 | 31 | 8.96 | 9.0 | 48 | 9.57 | 15 | 2.4 | 7.7 | 0.61 | ||||||||||||
| Turquoise Ridge Total | 45 | 5.40 | 7.8 | 69 | 5.43 | 12 | 110 | 5.42 | 20 | 16 | 3.2 | 1.6 | ||||||||||||
Notes:
| • | Mineral Resources are reported on 100% basis. Barrick’s attributable share of the Mineral Resource is based on its 61.5% interest in NGM. |
| • | CIM (2014) Standards and CIM (2019) MRMR Best Practice Guidelines were followed for Mineral Resources |
| • | Underground Mineral Resources are estimated based on a positive net value stope economic analysis. |
| • | Surface Mineral Resources are estimated based on an economic pit shell using a pseudoflow algorithm. |
| • | Mineral Resources are estimated using a long-term gold price of US$1,700/oz. |
| • | Resource block model dimensions of 10 m x 10 m x 10 m were assumed to reflect mining selectivity. |
| • | Mineral Resources are inclusive of Mineral Reserves. |
| • | Numbers may not add due to rounding. |
| • | The QP responsible for this Mineral Resource Estimate is Craig Fiddes, SME Reg. |
| March 15, 2024 |
Page 21 |
|
|
Turquoise Ridge Complex NI 43-101 Technical Report |
|
| 1.5 | Mineral Reserve Estimate |
The Mineral Reserve estimates have been prepared according to the Canadian Institute of Mining, Metallurgy and Petroleum (CIM) 2014 Definition Standards for Mineral Resources and Mineral Reserves dated 10 May 2014 (CIM (2014) Standards) as incorporated with National Instrument 43-101 Standards of Disclosure for Mineral Projects (NI 43-101). Mineral Resource estimates were also prepared using the guidance outlined in CIM Estimation of Mineral Resource and Mineral Reserve Best Practice Guidelines 2019 (CIM (2019) MRMR Best Practice Guidelines).
The Mineral Reserves have been estimated from the Measured and Indicated Mineral Resources and do not include any Inferred Mineral Resources. Mineral Reserves include material that will be mined by open pit and underground mining methods, and stockpiles.
The estimate uses updated economic factors, the latest Mineral Resource and geological models, geotechnical and hydrological inputs, and metallurgical processing and recovery updates. The QPs responsible for estimating the Mineral Reserves have performed an independent verification of the block model tonnes and grade, and in their opinion the process has been carried out to industry standards.
For the open pit, economic pit shells were generated using the Pseudoflow algorithm within Deswik software and then used in the open pit mine design process and Mineral Reserve estimation. The final pit limit selection and design process is outlined in Section 16.
For the underground operations, the Deswik SO was used to evaluate the geological block model to create overall mining shapes. Preliminary stope wireframes were created and planned dilution was added to the mineable stope shape. Deswik Pseudo-flow software was used to estimate the cost, revenue, and resulting net value associated with each shape. Stopes with a positive net value were included in the Mineral Reserves estimate.
Mineral Reserves are summarised in Table 1-2 and stated:
| ● | As of December 31, 2023. |
| ● | Using a gold price of $1,300/oz. |
| ● | As ROM grades and tonnage delivered to the primary crushing facility. |
| ● | For Turquoise Ridge Underground, Vista Underground, Mega Pit, Vista Pit, and numerous historically mined surface ore stockpiles. |
A site specific financial model was populated and reviewed to demonstrate that the Mineral Reserves are economically viable.
| March 15, 2024 |
Page 22 |
|
|
Turquoise Ridge Complex NI 43-101 Technical Report |
|
Table 1-2 Turquoise Ridge Mineral Reserves Summary, December 31, 2023
| Location | Proven | Probable | Proven + Probable | |||||||||||||||||||||
| Tonnes | Grade | Contained | Attributable | Tonnes | Grade | Contained | Attributable | Tonnes | Grade | Contained | Attributable | |||||||||||||
| (Mt) | (g/t Au) | (Moz Au) | (Moz Au) | (Mt) | (g/t Au) | (Moz Au) | (Moz Au) | (Mt) | (g/t Au) | (Moz Au) | (Moz Au) | |||||||||||||
| Open Pits | - | - | - | - | 11 | 2.37 | 0.85 | 0.52 | 11 | 2.37 | 0.85 | 0.52 | ||||||||||||
| Twin Creeks Stockpile |
25 | 2.36 | 1.9 | 1.2 | - | - | - | - | 25 | 2.36 | 1.9 | 1.2 | ||||||||||||
| Surface Total | 25 | 2.36 | 1.9 | 1.2 | 11 | 2.37 | 0.85 | 0.52 | 36 | 2.36 | 2.8 | 1.7 | ||||||||||||
| Underground Total |
13 | 11.58 | 4.9 | 3.0 | 20 | 10.04 | 6.3 | 3.9 | 33 | 10.66 | 11 | 6.9 | ||||||||||||
| Turquoise Ridge Total |
38 | 5.53 | 6.8 | 4.2 | 31 | 7.24 | 7.2 | 4.4 | 69 | 6.29 | 14 | 8.6 | ||||||||||||
Notes
| • | Proven and Probable Mineral Reserves are reported on 100% basis. Barrick’s attributable share of the Mineral Reserve is 61.5% based on its interest in NGM. |
| • | The Mineral Reserve estimate has been prepared according to CIM (2014) Standards and using CIM (2019) MRMR Best Practice Guidelines. |
| • | Mineral Reserves are reported at a gold price of US$1,300/oz. |
| • | Underground Mineral Reserves are estimated based on a positive net value stope economic analysis applying appropriate cost and modifying factors. |
| • | Surface Mineral Reserves are estimated based on an economic pit design applying appropriate costs and modifying factors. |
| • | Mining recovery and dilution factors are applied based on calculated historic actual results. |
| • | All reported metal is contained before process recovery; metal recoveries are variable based on material type, gold grades, TCM grades, sulfide sulfur grades, and processing methodology. |
| • | Contained metal is reported in millions of troy ounces. |
| • | Numbers may not add due to rounding. |
| • | The QP responsible for the Surface Mineral Reserve Estimate is Timothy Webber, SME RM. |
| • | The QP responsible for the Underground Mineral Reserve Estimate is Paul Schmiesing, SME RM. |
| March 15, 2024 |
Page 23 |
|
|
Turquoise Ridge Complex NI 43-101 Technical Report |
|
| 1.6 | Mining Methods |
The Turquoise Ridge Complex consists of underground and open pit mining operations. The mining methods used are considered conventional and use conventional equipment.
Ore is mined from its source and transported to the ROM stockpiles where it is blended and fed to the various process facilities, or long-term stockpiles for future reclamation and processing.
Waste material is taken to several possible locations including; various dump locations underground, used as construction material, or placed onto long term waste rock storage facilities.
The mining rate is variable and dependent on the phase of the active operations, although when in full production it is expected to peak at approximately 3,200 tpd for the underground operations and more than 50 ktpd for the surface operations.
Life of Mine for the Reserves is expected to end in 2047 for Turquoise Ridge Underground (TRUG) operations, in 2034 for Turquoise Ridge Surface operations, and 2024 for Vista Underground (VUG).
| 1.7 | Mineral Processing |
Processing of oxide and refractory ores at Turquoise Ridge is completed through the Juniper oxide mill, the Sage refractory facility, and a number of heap leach pads:
| ● | Oxide ore from the open pits is processed through the existing Juniper oxide mill or heap leach facilities, depending on ore grade and characteristics such as the clay and silica percentages. Oxide ores are those in which the gold is available for direct leaching by cyanide via conventional leach or milling methods. Oxide ores have been processed through the Juniper Mill (originally the Chimney Creek mill) since 1988. |
| ● | Low-grade oxide ores have been leached on multiple run-of-mine heap leach pads since at least 1996. |
| ● | Refractory ore from underground and open pit sources is processed through the Sage Mill pressure oxidation autoclaves, where the sulfide sulfur (SS) holding the gold is oxidized to liberate the gold so it can be recovered through conventional cyanidation (CIL). Refractory ores have been processed through the Sage Mill (originally the Twin Creeks mill) since 1996. |
| ● | On an ad-hoc basis the Turquoise Ridge process facilities have periodically toll treated ores from other sources of non-owned regional operations when excess process capacity is available and if there is a benefit to NGM in doing so. |
| March 15, 2024 |
Page 24 |
|
|
Turquoise Ridge Complex NI 43-101 Technical Report |
|
Laboratory testing is completed on new deposits and mine extensions to confirm the amenability of ores in the new areas/zones to the current process methods. The majority of testwork has been completed in the on-site testing facility with some specialty work completed off site.
Recent metallurgical testwork primarily focused on core samples from the proposed expansion of the Mega open pit.
The Turquoise Ridge processing facilities are suitable for processing the ores envisaged in the LOM plan. Various plant modifications for improved performance are periodically undertaken, such as the CIL inter-tank screen upgrades that are currently underway with both throughput and recovery enhancements expected.
| 1.8 | Project Infrastructure |
The Turquoise Ridge operation is a mature project that has been operating intermittently since 1934 with modern open pit operations beginning in 1987 and modern underground mining in 1994. It has well developed infrastructure supporting the current operations and plans for additional infrastructure to support the Project growth.
| 1.9 | Environmental, Permitting, and Social Considerations |
NGM maintains a number of permits for the operation. These compliance permits cover areas such as air quality, water rights, wastewater treatment, tailings storage, hazardous materials storage, land reclamation, and community relations. NGM maintains a legal obligation register to track permitting and ensure on-going compliance. The Turquoise Ridge Complex is operating in compliance in all material respects with all applicable regulations and permit requirements as required by the BLM and the NDEP.
Closure and reclamation strategies and methods remain in accordance with the existing, approved Reclamation Plans.
There are no major challenges with respect to government relations, non-governmental organizations, social or legal issues, and community development.
| 1.10 | Capital and Operating Costs |
Capital and operating costs for Turquoise Ridge are based on extensive experience gained from many years of operating these mines and an extensive number of years operating other gold mines
| March 15, 2024 |
Page 25 |
|
|
Turquoise Ridge Complex NI 43-101 Technical Report |
|
in Nevada and within NGM. Capital costs reflect current price trends and supporting studies. Operating costs are in-line with historical averages and considering recent inflationary pressures.
| 1.11 | Interpretations and Conclusions |
| 1.11.1 | Mineral Tenure, Rights, Royalties and Agreements |
Information from NGM’s in-house experts supports that the tenure held is valid and sufficient to support a declaration of Mineral Resources and Mineral Reserves.
NGM holds sufficient surface rights to allow mining activities. The surface rights are sufficient to support mining operations,
Three minor royalties are payable on a portion of the production from Turquoise Ridge Surface to Royal Gold described in 4.6.3.
The State of Nevada imposes a 5% net proceeds tax on the value of all minerals severed in the State.
Environmental liabilities are typical of those that would be expected to be associated with a long-life mining operations. NGM complies with all required permit and regulatory obligations to manage these liabilities.
To the extent known to the QP, there are no other significant factors and risks that may affect access, title, or the right or ability to perform work on the Project that are not discussed in this Report.
| 1.11.2 | Geology and Mineral Resources |
The Turquoise Ridge Complex suite of deposits are considered to be examples of Carlin-type or carbonate-hosted disseminated gold–silver deposits.
The understanding of the deposit settings, lithologies, mineralisation, and the geological, structural, and alteration controls on mineralisation is sufficient to support estimation of Mineral Resources and Mineral Reserves.
Exploration potential remains within the Project area. Targets include depth extensions under the current pits, and structural targets associated with faults and intersecting structures.
| March 15, 2024 |
Page 26 |
|
|
Turquoise Ridge Complex NI 43-101 Technical Report |
|
Exploration, Drilling and Analytical Data Collection in Support of Mineral Resource Estimation
The exploration programs completed to date are appropriate for the style of the deposits in the Project area.
The geometry of the mineralized bodies can be variable, largely controlled by structural and stratigraphic complexities. Uncertainty about the morphology and vertical or lateral extent is mitigated by drilling at various orientations to the mineralized body.
Sampling methods are acceptable for Mineral Resource estimation.
Sample preparation, analysis and security are generally performed in accordance with industry-accepted practices.
The quantity and quality of the logged geological data, collar, and downhole survey data collected in the exploration and infill drill programs are sufficient to support Mineral Resource and Mineral Reserve estimation.
No material factors were identified with the data collection from the drill programs that could significantly affect Mineral Resource estimation.
The sample preparation, analysis, and security practices and are acceptable, meet industry-standard practice, and are sufficient to support Mineral Resource estimation. The collected sample data adequately reflect deposit dimensions, true widths of mineralisation, and the style of the deposits.
The QA/QC programs adequately address issues of precision, accuracy and contamination. Drilling programs typically included blanks, duplicates and CRM samples. QA/QC submission rates meet industry-accepted standards at the time of the campaign. The QA/QC programs did not detect any material sample biases in the data reviewed that supports Mineral Resource estimation.
The data verification programs concluded that the data collected from the Project adequately support the geological interpretations and constitute a database of sufficient quality to support the use of the data in Mineral Resource estimation.
Mineral Resource Estimates
The Mineral Resource and Mineral Reserve estimates have been prepared according to the Canadian Institute of Mining, Metallurgy and Petroleum CIM (2014) Standards as incorporated by reference in NI 43-101. Mineral Resource and Mineral Reserve estimates were also prepared using the guidance outlined in CIM Estimation of Mineral Resources and Mineral Reserves Best Practice Guidelines 2019 (CIM (2019) MRMR Best Practice Guidelines).
| March 15, 2024 |
Page 27 |
|
|
Turquoise Ridge Complex NI 43-101 Technical Report |
|
In the QP’s opinion, the Mineral Resources top capping, domaining and estimation approach are appropriate, using industry accepted methods. Furthermore, the constraint of underground Mineral Resource reporting to use optimised mineable stope shapes and the process for Mineral Resource pit shell generation reflects best practice. The QP considers the Turquoise Ridge Mineral Resources as appropriately estimated and classified.
The QP is not aware of any environmental, permitting, legal, title, taxation socioeconomic, marketing, political, metallurgical, fiscal, or other relevant factors, that could materially affect the Mineral Resource estimate.
In the QP’s opinion there is upside potential for the estimates if mineralisation that is currently classified as Inferred can be upgraded to higher-confidence Mineral Resource categories.
The strategic focus of Turquoise Ridge exploration is to prioritise the delineation of additional near mine resource definition targets, thereby increasing years of production with complimentary underground and open pit sources.
| 1.11.3 | Mining and Mineral Reserves |
Mineral Reserve Estimate
The Mineral Reserve estimation for the Project incorporates industry-accepted practices and meets the requirements of the Canadian Institute of Mining, Metallurgy and Petroleum (CIM) 2014 Definition Standards for Mineral Resources and Mineral Reserves dated 10 May 2014 (CIM (2014) Standards) as incorporated with National Instrument 43-101 Standards of Disclosure for Mineral Projects (NI 43-101). Mineral Resource estimates were also prepared using the guidance outlined in CIM Estimation of Mineral Resources and Mineral Reserves (MRMR) Best Practice Guidelines 2019 (CIM (2019) MRMR Best Practice Guidelines).
Mineral Resources were converted to Mineral Reserves using a detailed mine plan, an engineering analysis, and consideration of appropriate modifying factors. Modifying factors include the consideration of dilution and ore losses, underground and surface mining methods, geotechnical and hydrogelogical considerations, metallurgical recoveries, permitting, and infrastructure requirements.
Mine Plan
Mining operations are conducted year-round.
The mine plans are based on the current knowledge of geotechnical, hydrogeological, mining and processing information.
Underground mine designs incorporate underground infrastructure and ventilation requirements.
| March 15, 2024 |
Page 28 |
|
|
Turquoise Ridge Complex NI 43-101 Technical Report |
|
Turquoise Ridge Surface uses conventional open pit methods, and a conventional mining fleet.
Underground operations use conventional drift-and-fill and longhole stoping mining methods and conventional equipment fleets.
Barrick, as the operator of the Project, has significant experience in other mining operations within the region and North America. The production rates, modifying factors, and costs are benchmarked against other operations to ensure they are suitable.
The current Mineral Reserves for Turquoise Ridge support a total mine life of 23 years, 11 years of open pit operations, and 23 years of underground mining. Gold production averages approximately 590 koz Au per year for the first 10 years based only on Mineral Reserves.
The QP is not aware of any environmental, legal, title, socioeconomic, marketing, mining, metallurgical, infrastructure, permitting, fiscal, or other relevant factors that could materially affect the Mineral Reserve estimate.
| 1.11.4 | Mineral Processing |
The process plant flowsheet designs were based on testwork results, previous study designs and industry-standard practices.
The process methods are generally conventional to the industry.
The process plants will produce variations in recovery due to the day-to-day changes in ore type or combinations of ore type being processed. These variations are expected to trend to the forecast recovery value for monthly or longer reporting periods through manipulation of blends and blending materials, varying reagent additions, adjusting throughput, and planned maintenance of key operational equipment.
The QP considers the modelled recoveries for all ore sources and the process and plant engineering unit costs applied to the Mineral Resource and Mineral Reserve process to be acceptable.
Metallurgical Testwork
Metallurgical testwork and associated analytical procedures were appropriate to the mineralisation type, appropriate to establish the optimal processing routes, and were performed using samples that are typical of the mineralisation styles.
Samples selected for testing were representative of the various types and styles of mineralisation. Samples were selected from a range of depths within the deposits. Sufficient samples were taken so that tests were performed on sufficient sample mass.
| March 15, 2024 |
Page 29 |
|
|
Turquoise Ridge Complex NI 43-101 Technical Report |
|
Recovery factors estimated are based on appropriate metallurgical testwork and are appropriate to the mineralisation types and the selected process routes. Recovery forecasts are periodically adjusted based on plant performance, which is tracked on at least a monthly basis.
Depending upon the specific processing facility, several processing factors or deleterious elements could have an economic impact on extraction efficiency of a certain ore source, based either on the presence, absence, or concentration of the following constituents in the processing stream: organic carbon; sulfide sulfur; carbonate carbon; arsenic; mercury; antimony; and copper. However, under normal ore routing and blending practices at NGM where material from several sites may be processed at one facility, the above list of constituents is typically not a concern.
| 1.11.5 | Infrastructure |
The majority of the infrastructure required for operations is constructed and operational. Some additional facilities, such as construction of a new TSF will be required to support the operations as envisaged in the LOM plan.
The existing infrastructure, staff availability, existing power, water, and communications facilities, and the methods whereby goods are transported to the mines are all in place and well-established and support the estimation of Mineral Resources and Mineral Reserves.
| 1.11.6 | Environmental, Permitting and Social Considerations |
NGM maintains a number of permits for the operation. These compliance permits cover areas such as air quality, water rights, wastewater treatment, tailings storage, hazardous materials storage, land reclamation, and community relations. NGM maintains a legal obligation register to track permitting and ensure on-going compliance. As of the date of this report, all material permits were in compliance or were in the process of renewal.
The Turquoise Ridge Complex is operating in compliance in all material respects with all applicable regulations and permit requirements as required by the BLM and the NDEP.
The addition of Cut 40 will require modification of the permits, a revised reclamation cost estimate, and approval from the BLM and NDEP. Cut 40 does not require surface disturbance outside of the existing PoO Boundary. The area anticipated to be directly impacted by the Cut 40 pit shape is currently disturbed or approved for disturbance by the regulatory agencies. The NDEP, Bureau of Mining Regulation and Reclamation would evaluate the project under the existing WPCP. The changes associated with the Cut 40 project will likely be assessed as a Major Modification to the Turquoise Ridge Surface WPCP.
Closure and reclamation strategies and methods remain in accordance with the existing, approved Reclamation Plans. The Turquoise Ridge Complex closure costs are updated each year, with
| March 15, 2024 |
Page 30 |
|
|
Turquoise Ridge Complex NI 43-101 Technical Report |
|
increases or decreases in disturbed areas noted and costed; the current cost for rehabilitation and closure of the mine according to the calculation model is approximately $94 million for the entire complex.
There are no major challenges with respect to government relations, non-governmental organizations, social or legal issues, and community development. A community and social relations policy is in place at the Turquoise Ridge Complex.
The Turquoise Ridge Complex is a significant employer to members of the local communities. Stakeholder engagement activities, community development projects and local economic development initiatives contribute to the maintenance and strengthening of the social licence to operate.
The QP considers the extent of all environmental liabilities, to which the property is subject, to have been appropriately met.
| 1.11.7 | Project Economics |
Using the assumptions detailed in this Report, the Turquoise Ridge Complex mines have strongly positive economics in the Mineral Reserves mine plan, which confirms the economic viability of the Mineral Reserves at $1300/oz gold sales price.
The basis for the combined LOM plan is the Proven and Probable Mineral Reserves estimate described in Section 15 of this Technical Report. Cost inputs have been priced in real Q4 2023 US dollars, without any allowance for inflation or consideration for changes in foreign exchange rates.
In the QP’s opinion, the open pit and underground LOM and cost estimates have been completed in sufficient detail to be satisfied that economic extraction of the Proven and Probable Mineral Reserves is justified.
Capital Cost Estimates
Capital cost estimates contained in this report are based on quantities generated from the open pit and underground development requirements are based on operating experience gained in the many years of current operations and where appropriate equipment capital costs are based upon quotes received from manufacturers. Sustaining (replacement) capital costs reflect current price trends. Any potential exploration expenditure has not been included in the economic forecasts due to being a variable cost that is justified on the basis of individual motivations.
Capital expenditure over the remaining LOM is estimated to be $1083 million (from 2024) based on Mineral Reserves, consisting of the following allocation of costs (as defined in Table 21-1).
| March 15, 2024 |
Page 31 |
|
|
Turquoise Ridge Complex NI 43-101 Technical Report |
|
Operating Cost Estimates
Operating cost estimates were developed based on a combination of actual costs to the end of 2023 and forecast figures over the LOM plan.
Open pit mining costs range from $1.37–$2.65/t over the expected open pit LOM, with an average LOM cost of $2.24/t. Underground mining costs range from $135.01–$170.27/t over the expected underground LOM, with an average LOM cost of $137.48/t. Sage Autoclave processing cost range from $30.92-52.30, with an average LOM cost of $41.20/t. Juniper Oxide Mill processing costs range from $6.93-$14.00/t, with an average LOM cost of $9.71/t. Leach processing LOM average costs are $3.81/t. The QPs consider the operating cost estimates in the LOM plan to be reasonable and consistent with historical performance.
| 1.12 | Recommendations |
| 1.12.1 | Geology and Mineral Resources |
| ● | Continue to improve geology and estimation models with learnings acquired through continued mining development. |
| ● | Continue to investigate and improve, geochemical signature modeling, as a geological reconciliation of visual alteration logging, to test the 1.0g/t grade shell currently used to removal bimodal distributions. |
| ● | Review grade capping strategy and metal at risk, as current approach is potentially conservative (removing too much metal). |
| ● | Incorporate additional data density variability samples into sample workflow and update current density estimation procedures. |
| ● | Continue to collect additional Sulfide Sulfur, Total and Organic Carbon assay data to drive continuous improvement in models. |
| ● | Update the Vista geologic model using current software, modeling practices, and geologic understanding in alignment with the more recent Mega model update. While this is not expected to result in any material changes to the Resource estimate, it is good practice to maintain consistency between models at the site. |
| ● | Continue to review the drill hole database for anomalies, unusual downhole surveys, grade discrepancies, etc. and resolve them based on findings. |
| March 15, 2024 |
Page 32 |
|
|
Turquoise Ridge Complex NI 43-101 Technical Report |
|
| 1.12.2 | Mining and Mineral Reserves |
| ● | Continue monitoring of pit slope movements – particularly the current highwall on the northwest side of the Mega Pit (Cut 24). Current monitoring indicates a slope failure is possible in this area. Should the failure occur, appropriate remediation steps can be implemented as Cut 40 mining commences. |
| ● | Evaluate hydraulic shovels currently in-use at other NGM open pit operations for potential transfer to Turquoise Ridge Open Pit (perhaps with a rebuild) rather than purchasing two new 5500-class hydraulic shovels to decrease operating costs and/or mining capital costs. |
| ● | Continue investigations into the possibility of processing transitional sulfide ores (sulfide sulfur < 1-2%) at the Juniper oxide mill. Particularly if the carbonate values are high (making them less ideal for the autoclave due to the acid cost to neutralize the ore) for the potential down stream neutralization benefit to the Sage Autoclave discharge. |
| ● | Improve the relationship between waste factors used on mining shapes used later in TRUG mining life and expensed waste development and, if possible, eliminate these waste factors. |
| 1.12.3 | Mineral Processing |
| ● | Continue with laboratory assessment of blend behaviors with differing regimes of reagents to ensure validity of the recovery and operating cost predictions, as well as pre-empt potential anomalies. |
| ● | Pursue remedies for future increasing carbonate concentrations, such as sulfide concentrate additions. |
| ● | Continue validation of bench testing methods for calibration to actual plant performance. |
| ● | Continue reviewing sample density coverage of future TRUG ores and conduct bench-top testing to ensure recovery data is in line with predicted performance with representative sample selection. |
| ● | Continue reviewing the predictive recovery equations on at least an annual basis and adjust as necessary. Evaluate the need for an upper cap on the recovery predictions under certain grade and chemical constituents. Also refine the prediction at the outer extremes of the data set to optimize a fit. |
| ● | CIL Screen Replacement – Continue with the scheduled screen replacements and adjust the predicted recovery equations accordingly. |
| ● | Continue with planned Autoclave modeling efforts to identify opportunities for improvement along with identification of sub-optimal plant performance and their mitigation strategies. |
| March 15, 2024 |
Page 33 |
|
|
Turquoise Ridge Complex NI 43-101 Technical Report |
|
| 1.12.4 | Infrastructure |
| ● | Continue the design and approval process of the Sage TSF. |
| 1.12.5 | Environment, Permitting, and Social and Community |
| ● | Continued stakeholder engagement and public education of the Project. |
| ● | Continue identifying and implementing initiatives of renewable energies to support Barrick global commitment on Climate Change. |
| March 15, 2024 |
Page 34 |
|
|
Turquoise Ridge Complex NI 43-101 Technical Report |
|
| 2 | Introduction |
This Technical Report on the Turquoise Ridge Complex (the “Project”), located in Nevada, USA (see Figure 2-1), has been prepared by Nevada Gold Mines, LLC (NGM) on behalf of Barrick Gold Corporation (Barrick). The purpose of this Technical Report is to support public disclosure of updated Mineral Resource and Mineral Reserve estimates at the Project as of December 31, 2023.
The Project is operated as a joint venture (JV) through NGM. Barrick is the JV operator and owns 61.5%, with Newmont Corporation (Newmont) owning the remaining 38.5% JV interest.
Barrick is a Canadian publicly traded mining company with a portfolio of operating mines and projects. Newmont is a publicly traded gold producer with a portfolio of operations and exploration projects, based in Denver, Colorado, USA. On March 10, 2019, Barrick entered into an implementation agreement with Newmont to create a joint venture combining the companies’ respective mining operations, assets, Reserves and talent in Nevada, USA. This included Barrick’s Cortez, Goldstrike, Turquoise Ridge and Goldrush properties and Newmont’s Carlin, Twin Creeks, Phoenix, Long Canyon and Lone Tree properties. On July 1, 2019, the transaction closed, establishing NGM and Barrick began consolidating the operating results, cash flows and net assets of NGM from that date forward.
The Turquoise Ridge Complex consists of the following:
| ● | Turquoise Ridge Underground operations (TRUG); |
| ● | Vista Underground operations (VUG); and |
| ● | The Mega and Vista open pits and numerous historically mined surface ore stockpiles (collectively referred to as Turquoise Ridge Surface). |
It is noted that the Fiberline Resource (Fiberline) located to the east of the Mega open pit is currently excluded from the NGM JV and remains 100%-owned by Newmont.
Processing operations include the Sage autoclave, the Juniper oxide mill and a number of heap leach pads.
Mineral Resources and Mineral Reserves are estimated for the Turquoise Ridge, Vista and Mega deposit areas.
The Mineral Resource and Mineral Reserve estimates have been prepared according to the Canadian Institute of Mining, Metallurgy and Petroleum CIM (2014) Standards as incorporated by reference in National Instrument 43-101 (NI 43-101). Mineral Resource and Mineral Reserve
| March 15, 2024 |
Page 35 |
|
|
Turquoise Ridge Complex NI 43-101 Technical Report |
|
estimates were also prepared using the guidance outlined in CIM Estimation of Mineral Resources and Mineral Reserves Best Practice Guidelines 2019 (CIM (2019) MRMR Best Practice Guidelines).
All costs presented in this document are in USD (US$ or $) unless otherwise noted.
| March 15, 2024 |
Page 36 |
|
|
Turquoise Ridge Complex NI 43-101 Technical Report |
|
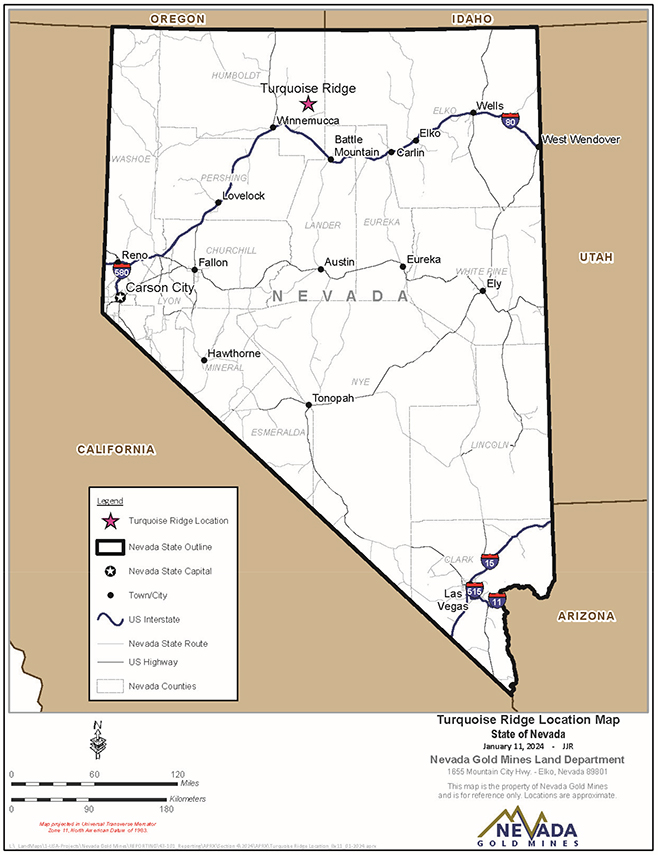
Figure 2-1 Project Location Map
| March 15, 2024 |
Page 37 |
|
|
Turquoise Ridge Complex NI 43-101 Technical Report |
|
| 2.1 | Effective Date |
The effective date of this Technical Report is December 31, 2023.
| 2.2 | Qualified Persons |
This Technical Report was prepared by NGM on behalf of Barrick.
The Qualified Persons (QP’s) and their responsibilities for this Technical Report are listed in Section 29 Certificates of Qualified Persons and summarized in Table 2-1.
| March 15, 2024 |
Page 38 |
|
|
Turquoise Ridge Complex NI 43-101 Technical Report |
|
Table 2-1 QP Responsibilities
| Qualified Person | Company | Title/Position | Sections | |||
| Craig Fiddes, SME (RM) | Nevada Gold Mines, LLC | Lead, Resource Modeling | 102, 112, 12, 14, 25.22, and 26.12 | |||
| John Langhans, MMSA (QP) | Nevada Gold Mines, LLC | Lead Technical Specialist, Metallurgy | 13, 17, 185, 25.4, 25.5, 26.3, and 26.45 | |||
| Paul Schmiesing, SME (RM) | Nevada Gold Mines, LLC | Lead, Underground Long Term Planning | 15.14 to 15.44, 15.6, 15.84, 15.96, 16.14, 16.2, 16.4, 16.54, 16.66, 184, 25.34, 25.54, 26.24, and 26.44 | |||
| Joseph Becker, SME (RM) | Nevada Gold Mines, LLC | Lead, Technology and People Strategy | 66, 7, 8, 9, 101, 111, 25.21 and 26.11 | |||
| Timothy Webber, SME (RM) | Nevada Gold Mines, LLC | Chief of Long-Term Planning | 66, 15.13 to 15.33, 15.5, 15.7, 15.83,15.96, 16.13, 16.3, 16.53, 16.66, 183, 25.33, 25.53, 26.23, and 26.43 | |||
| Simon Bottoms, (CGeol, MGeol, FGS, FAusIMM) | Barrick Gold Corporation | Mineral Resource Management and Evaluation Executive | 3, 4, 5, 19, to 24, 25.1, 25.6, 25.7 and 26.5 | |||
| All | - | - | 1, 2, 25.8, and 27 | |||
Notes:
| 1. | Geology |
| 2. | Mineral Resources |
| 3. | Mining and Mineral Reserves – Open Pit and Stockpiles |
| 4. | Mining and Mineral Reserves – Underground |
| 5. | Processing |
| 6. | Shared with other QP. |
| March 15, 2024 |
Page 39 |
|
|
Turquoise Ridge Complex NI 43-101 Technical Report |
|
| 2.3 | Site Visits of Qualified Persons |
Below are the most recent site visits of the QP’s:
| ● | Craig Fiddes is employed by NGM as Lead, Resource Modelling and has conducted regular visits to the Project in his current role since the inception of NGM. He oversaw the Resource estimation for this Technical Report. His most recent visit to site was November 6 through November 9 2023 to participate in an audit of Resource estimation (including review of data collection and QAQC, geologic and block models, grade estimation, and Resource optimization). |
| ● | John Langhans is employed by NGM as Lead Technical Specialist, Metallurgy and visits the Project several times a year. He reviews metallurgical improvements, including recovery predictions as well as provides guidance as required for improved plant performance. His most recent visit to site was October 19, 2023. |
| ● | Paul Schmiesing is employed by NGM as Lead, Underground Long Term Planning and visits the Project several times a year. He worked at the Project from 2019 to 2021 as general supervisor mine operations and engineering superintendent. His most recent visit to site was October 26, 2023. |
| ● | Joseph Becker is employed by NGM as Lead, Technology and People Strategy and visits the Project several times a year. He has worked at the Project from 2010 to 2013 as Fiberline Project Manager. His most recent visit to the Project was December 12, 2023. |
| ● | Tim Webber is employed by NGM as the Chief of Long-Term Planning and visits the Project several times a year. He reviews both open pit and underground mine engineering functions. His most recent visits to the Project were October 25, 2023, to participate in the Q3 2023 management review meeting, and on December 5, 2023, to participate in a portion of a third party audit of underground Resources and Reserves. |
| ● | Simon Bottoms is employed by Barrick as the Mineral Resource Management and Evaluation Executive. He visited the Turquoise Ridge Complex several times in 2023, and his most recent visit to the Project was October 24 to 27, 2023. where he reviewed the exploration programme results, Mineral Resource and grade control model updates, mine plans, mining performance results and associated financials, mine strategy, results of external audits, and board meeting reviews. |
| March 15, 2024 |
Page 40 |
|
|
Turquoise Ridge Complex NI 43-101 Technical Report |
|
| 2.4 | Information Sources |
NGM has utilised various internal presentations, memos, reports, and previous Technical Reports in the compilation of this Technical Report. The documentation reviewed, and other sources of information, are listed at the end of this report in Section 27 References.
Barrick has previously filed the following technical reports on the Project:
| ● | Bolin, C.L., Fiddes, C., Olcott, J., and Yopps, S.W., 2019: Technical Report on the Turquoise Ridge Complex, State of Nevada, USA: technical report prepared by Nevada Gold Mines LLC for Barrick Gold Corporation and Newmont Corporation, effective date December 31, 2019. |
Prior to the formation of the NGM JV, Barrick filed the following technical reports supporting Mineral Resource and Reserve estimates for Turquoise Ridge Underground:
| ● | Cox, J., Valliant, W.W., Altman, K.A., and Geusebroek, P.A., 2018: Technical Report on the Turquoise Ridge Mine, State of Nevada, U.S.A: technical report prepared by Roscoe Postle Associates Inc. (RPA) for Barrick Gold Corporation, effective date March 19, 2018; |
| ● | RPA Inc. 2014: Technical Report on the Turquoise Ridge Joint Venture, Nevada, USA: report prepared for Barrick Gold Corporation, March 14, 2014. |
| 2.5 | List of Abbreviations |
Units of measurement used in this Technical Report conform to the metric system unless otherwise noted. All currency in this Technical Report is in US dollars (US$ or $) unless otherwise noted.
Abbreviations used in this Technical Report are included in Table 2-2.
| March 15, 2024 |
Page 41 |
|
|
Turquoise Ridge Complex NI 43-101 Technical Report |
|
Table 2-2 Table of Abbreviations
| Unit | Measure | Unit | Measure | |||
| ° | degree | m3 | cubic metre | |||
| °C | degree Celsius | m3/d | cubic metre per day | |||
| A | ampere | m3/h | cubic metres per hour | |||
| ANFO | Ammonium Nitrate Fuel Oil | m3/s | cubic metres per second | |||
| Au | gold | Ma | million years | |||
| CFM | cubic feet per minute | masl | metres above sea level | |||
| CIL | carbon-in-Leach | min | minute | |||
| cm | centimetre | mm | millimetre | |||
| CoG | cut-off grade | Moz | million ounces | |||
| DDH | Diamond Drill Holes | Mpa | megapascal | |||
| EIA | Environmental Impact Assessment | Mt | million metric tonnes | |||
| ft | foot | Mtpa | million metric tonnes per annum | |||
| G | giga (billion) | MW | megawatt | |||
| g | gram | oz | Troy ounce (31.10348 g) | |||
| g/cm3 | grams per cubic centimetre | P80 | 80% passing | |||
| g/L | grams per litre | PoO | Plan of Operation | |||
| g/t | grams per tonne | ppm | parts per million | |||
| GSI | Geological strength index | QA/QC | quality assurance and quality control | |||
| ha | hectare | QP | Qualified Person | |||
| hrs | hours | RC | reverse circulation drilling | |||
| hr | hour | RQD | Rock Quality Designation | |||
| in | inch | Rwi | Bond Rod Mill Work Index | |||
| k | kilo (thousand) | s | second | |||
| kg | kilogram | SAG | Semi-Autogenous grinding | |||
| kL/min | thousand litres per minute | t | metric tonne | |||
| km | kilometre | tpd | metric tonnes per day | |||
| km2 | square kilometre | tph | metric tonnes per hour | |||
| koz | thousand ounces | t/m3 | metric tonne per cubic metre | |||
| kPa | kilopascal | tpa | metric tonnes per annum | |||
| kt | thousand metric tonnes | TR | Turquoise Ridge | |||
| ktpa | thousand tonne per annum | TSF | Tailings Storage Facility | |||
| kV | kilovolt | UCS | Unconfined Compressive Strength | |||
| kW | kilowatt | US$ | United States dollar | |||
| kWh | kilowatt-hour | µm | micrometre | |||
| L | litre | V | volt | |||
| L/s | litres per second | W | watt | |||
| LOM | life of mine | Wi | Work Index | |||
| M | mega (million) | wt% | content by weight | |||
| m | metre | yr | year | |||
| m2 | square metre |
| March 15, 2024 |
Page 42 |
|
|
Turquoise Ridge Complex NI 43-101 Technical Report |
|
| 3 | Reliance on Other Experts |
This report has been prepared by NGM. The information, conclusions, opinions, and estimates contained herein are based on:
| ● | Information available at the time of preparation of this Technical Report, |
| ● | Assumptions, conditions, and qualifications as set forth in this Technical Report. |
For the purpose of this report, the QP’s have relied upon information provided by NGM’s legal counsel regarding the validity of the permits and the fiscal regime applicable in accordance with United States of America Federal, and Nevada State laws as part of ongoing annual reviews. This opinion has been relied upon in Section 4 (Property Description and Location) and in the summary of this report.
Except for the purposes legislated under provincial securities laws, any use of this Technical Report by any third party is at that party’s sole risk.
| March 15, 2024 |
Page 43 |
|
|
Turquoise Ridge Complex NI 43-101 Technical Report |
|
| 4 | Property Description and Location |
The Turquoise Ridge Complex is in Humboldt County, approximately 64 km northeast of Winnemucca, Nevada, and 40 km northeast of the settlement of Golconda, Nevada.
The Turquoise Ridge Complex consists of the following:
| ● | Turquoise Ridge Underground operations (TRUG); |
| ● | Vista Underground operations (VUG); and |
| ● | The Mega and Vista open pits and numerous historically mined surface ore stockpiles (collectively referred to as Turquoise Ridge Surface). |
It is noted that the Fiberline Resource (Fiberline) located to the east of the Mega open pit is currently excluded from the Nevada Gold Mines Join Venture and remains 100%-owned by Newmont.
The latitude and longitude of the center of the Turquoise Ridge Underground is centered on 41° 12’ 58’’ N and longitude 117° 14’ 39’’ W. Turquoise Ridge Surface is centered on 41° 14’ 43” N and longitude 117° 10’ 20” W. The centroid of the Vista Underground is 41° 15’ 25” N and longitude 117° 10’ 21” W.
The centroid locations of the current Plans of Operations (PoOs) are summarized in Table 4-1 and covers a total area of approximately 37,953.43 ha.
Table 4-1 Plans of Operations Centroid Location Summary Table
| Plan Of Operations Name | Type | Easting | Northing | Projection Datum | ||||
| Twin Creeks |
Operations PoO | 487331.3948 | 4566477.3392 | UTM NAD83 Zone 11N | ||||
| Turquoise Ridge |
Operations PoO | 482164.3254 | 4560820.7831 | UTM NAD83 Zone 11N | ||||
| Turquoise Ridge Exploration |
Exploration PoO | 480678.4530 | 4563927.9600 | UTM NAD83 Zone 11N | ||||
| Chimney North |
Exploration PoO | 486989.4521 | 4576155.6723 | UTM NAD83 Zone 11N |
| 4.1 | Property and Title in Nevada |
| 4.1.1 | Mineral Title |
Federal (30 USC and 43 CFR) and Nevada (NRS 517) laws concerning mining claims on Federal land are based on an 1872 Federal law titled “An Act to Promote the Development of Mineral Resources of the United States.” Mining claim procedures still are based on this law, but the original scope of the law has been reduced by several legislative changes.
| March 15, 2024 |
Page 44 |
|
|
Turquoise Ridge Complex NI 43-101 Technical Report |
|
The Mineral Leasing Act of 1920 (30 USC Chapter 3A) provided for leasing of some non-metallic materials; and the Multiple Mineral Development Act of 1954 (30 USC Chapter 12) allowed simultaneous use of public land for mining under the mining laws and for lease operation under the mineral leasing laws. Additionally, the Multiple Surface Use Act of 1955 (30 USC 611-615) made “common variety” materials non- locatable; the Geothermal Steam Act of 1970 (30 USC Chapter 23) provided for leasing of geothermal resources; and the Federal Land Policy and Management Act of 1976 (the “BLM Organic Act,” 43 USC Chapter 35) granted the Secretary of the Interior broad authority to manage public lands. Most details regarding procedures for locating claims on Federal lands have been left to individual states, providing that state laws do not conflict with Federal laws (30 USC 28; 43 CFR 3831.1).
Mineral deposits are located either by lode or placer claims (43 CFR 3840). The locator must decide whether a lode or placer claim should be used for a given material; the decision is not always easy but is critical. A lode claim is void if used to acquire a placer deposit, and a placer claim is void if used for a lode deposit. The 1872 Federal law requires a lode claim for “veins or lodes of quartz or other rock in place” (30 USC 26; 43 CFR 3841.1), and a placer claim for all “forms of deposit, excepting veins of quartz or other rock in place” (30 USC 35). The maximum size of a lode claim is 1,500 ft (457 m) in length and 600 ft (183 m) in width, whereas an individual or company can locate a placer claim as much as 20 acres (8 ha) in area.
Claims may be patented or unpatented. A patented claim is a lode or placer claim or mill site for which a patent has been issued by the Federal Government, whereas an unpatented claim means a lode or placer claim, tunnel right or mill site located under the Federal (30 USC) act, for which a patent has not been issued. Lode claims cover classic veins or lodes having well-defined boundaries and also include other rock in-place bearing valuable mineral deposits. Federal statue limits a lode claim to a maximum of 1,500 feet in length along the vein or lode and a maximum width of 600 feet, 300 feet on either side of the centerline of the vein or lode. Placer claims cover all those deposits not subject to lode claims. Where possible, placer claims are to be located by legal subdivision. The maximum size a placer claim may be is 20 acres. An association of two locators may locate 40 acres, and three may locate 60 acres, etc. The maximum area of an association placer claim permitted by law is 160 acres for eight or more persons. A mill site must be located on “non-mineral lands” and must be non-contiguous to the lode or placer with which it is associated. Its purpose is to support a lode or placer mining operation. A mill site must include the erection of a mill or reduction works and/or may include other uses in support of a mining operation. Descriptions are by metes and bounds if on unsurveyed land and by legal subdivision if on surveyed lands. The maximum size is 5 acres. A patented mining claim is one for which the Federal Government has passed its title to the claimant, giving the claimant exclusive title to the locatable minerals and, in most cases, the surface and all resources.
| March 15, 2024 |
Page 45 |
|
|
Turquoise Ridge Complex NI 43-101 Technical Report |
|
| 4.1.2 | Surface Rights |
In Nevada, the Federal Government controls approximately 85% of the total land in the state. It is administered primarily by the US Bureau of Land Management (BLM), the US Forest Service (USFS), the US Department of Energy, or the US Department of Defense. Much of the land controlled by the BLM and the USFS is open to prospecting and claim location. The distribution of public lands in Nevada is shown on the BLM “Land Status Map of Nevada” (1990) at scales of 1:500,000 and 1:1,000,000.
BLM regulations regarding surface disturbance and reclamation require that a notice be submitted to the appropriate BLM Field Office for exploration activities in which five acres or fewer are proposed for disturbance (43 CFR 3809.1-1 through 3809.1-4). A PoO is needed for all mining and processing activities, plus all activities exceeding five acres of proposed disturbance. A PoO is also needed for any bulk sampling in which 1,000 or more tons of presumed mineralized material are proposed for removal (43 CFR 3802.1 through 3802.6, 3809.1-4, 3809.1-5). The BLM also requires the posting of bonds for reclamation for any surface disturbance caused by more than casual use (43 CFR 3809.500 through 3809.560). The USFS has regulations regarding land disturbance in forest lands (36 CFR Subpart A). Both agencies also have regulations pertaining to land disturbance in proposed wilderness areas.
The QP has been Informed by the NGM teams responsible for Land and Permits that all rights have been granted and there are no impediments to the current operations. Further rights for future operations will be acquired on an as need basis.
| 4.1.3 | Water Rights |
In the State of Nevada, “the water of all sources of water supply within the boundaries of the State whether above or beneath the surface of the ground, belongs to the public” (NRS 533.025). Furthermore, “except as otherwise provided in NRS 533.027 and 534.065, any person who wishes to appropriate any of the public waters, or to change the place of diversion, manner of use or place of use of water already appropriated, shall, before performing any work in connection with such appropriation, change in place of diversion or change in manner or place of use, apply to the State Engineer for a permit to do so” (NRS 533.325).
At the Turquoise Ridge Complex pumping occurs from both underground and open pit operations, per Water Rights Permits obtained from the Nevada Division of Water Resources. Groundwater withdrawals are monitored, and this information is reported to NDWR on a monthly basis. The site is in compliance with all permit requirements.
| March 15, 2024 |
Page 46 |
|
|
Turquoise Ridge Complex NI 43-101 Technical Report |
|
| 4.2 | Project Ownership |
NGM is a JV between Barrick and Newmont. Barrick is the JV operator and owns 61.5%, with Newmont owning the remaining 38.5%. The JV area of interest (AOI) covers a significant portion of northern Nevada (Figure 4-1). The AOI includes the Turquoise Ridge Complex area.
| 4.3 | Mineral Tenure |
The Turquoise Ridge Complex including the Turquoise Ridge and Twin Creeks Plans of Operations and Turquoise Ridge Exploration and Chimney North exploration boundaries covers a total area of approximately 37,953.43 ha, the surface rights for which are owned by the Federal Government and are administered by the BLM.
| March 15, 2024 |
Page 47 |
|
|
Turquoise Ridge Complex NI 43-101 Technical Report |
|
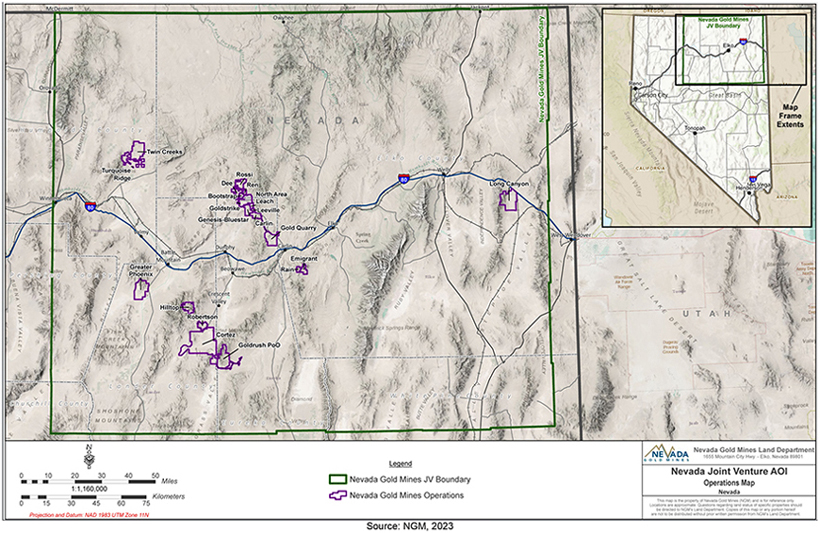
Figure 4-1 NGM Area of Interest
| March 15, 2024 |
Page 48 |
|
|
Turquoise Ridge Complex NI 43-101 Technical Report |
|
NGM’s rights are owned or controlled through ownership of a total of 3,129 unpatented lode mining claims and mill site claims held subject to the paramount title of the Federal Government and 316 owned patented claims:
| ● | Lode claims: 3,056; 24,881.96 ha; |
| ● | Mill site claims: 73 claims; 143.45 ha; |
| ● | Patented claims: 316 claims; 1,536.80 ha. |
Figure 4-2 shows the PoOs that cover the operations area and shows the Fiberline area excluded from the NGM JV. Figure 4-3 shows the locations of the exploration PoOs. The PoO areas include private land (surface and minerals) owned or controlled by NGM, and land owned by the Federal Government that is administered by the BLM.
| 4.3.1 | Unpatented Mining and Mill Site Claims |
Turquoise Ridge Underground covers a total area of 2,402 ha (24.02 km2), which consists of 1,145 ha (11.45 km2) of unpatented mining and mill site claims and 1,257 ha (12.57 km2) of patented/fee land. The Turquoise Ridge Underground area consists of 246 unpatented mining and mill-site claims.
Turquoise Ridge Surface/Vista Underground cover a total area of 7,925 ha (79.25 km2), of which 4,118 ha (41.18 km2) are unpatented mining claims and 3,808 ha (38.08 km2) are patented/fee lands. Turquoise Ridge Surface/Vista Underground consists of 613 unpatented mining and mill-site claims.
Each unpatented claim is marked on the ground and does not require a mineral survey. The unpatented and mill-site claims are maintained on an annual basis, and do not expire as long as the maintenance fee payments are timely filed with the BLM.
All mining leases and subleases are managed and reviewed monthly by the NGM Land Department and all payments and commitments are made as required by the specific agreements.
The claims locations, and underlying land surface ownership for the operations PoOs are provided in Figure 4-4 to Figure 4-7 and for the exploration PoOs in Figure 4-8 to Figure 4-15.
| March 15, 2024 |
Page 49 |
|
|
Turquoise Ridge Complex NI 43-101 Technical Report |
|
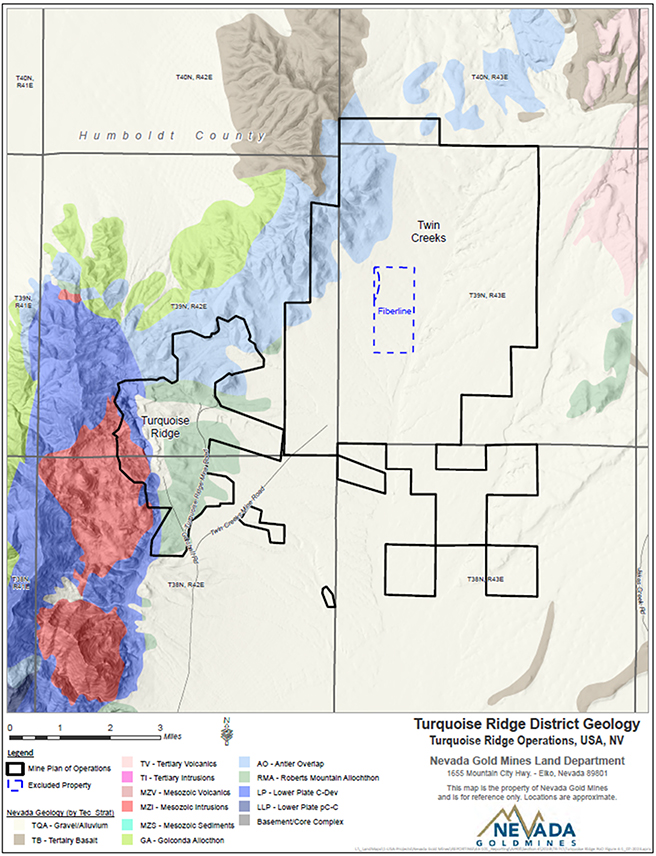
Figure 4-2 PoO Layout Plan (Operations), 2023
| March 15, 2024 |
Page 50 |
|
|
Turquoise Ridge Complex NI 43-101 Technical Report |
|
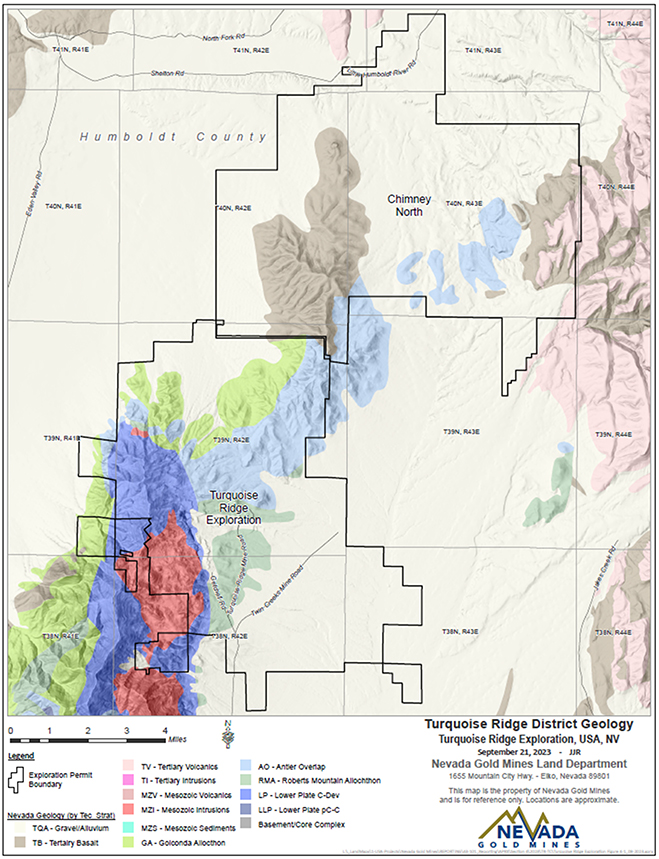
Figure 4-3 PoO Layout Plan (Exploration), 2023
| March 15, 2024 |
Page 51 |
|
|
Turquoise Ridge Complex NI 43-101 Technical Report |
|
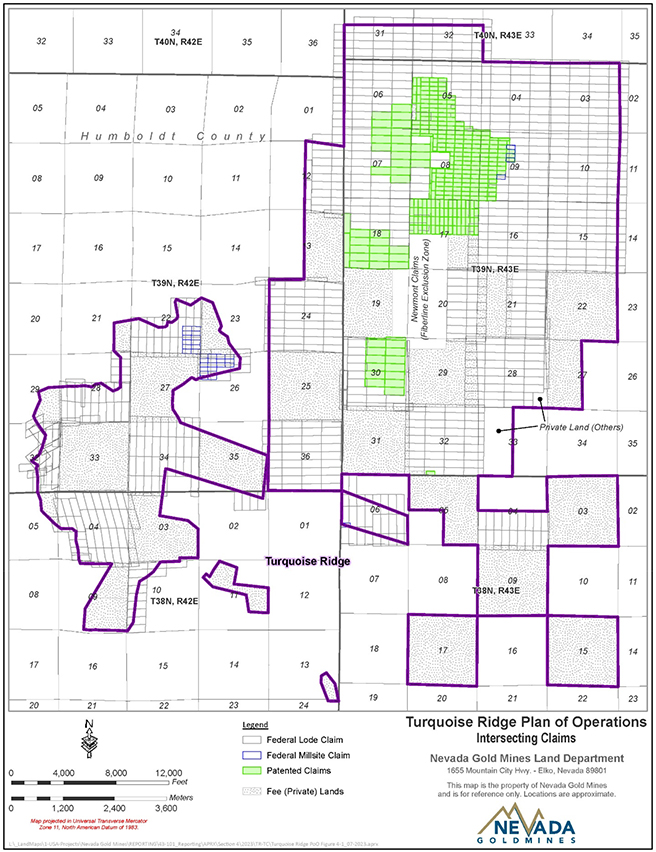
Figure 4-4 Operations PoO Claims Locations, 2023; Sheet 1 of 4
| March 15, 2024 |
Page 52 |
|
|
Turquoise Ridge Complex NI 43-101 Technical Report |
|
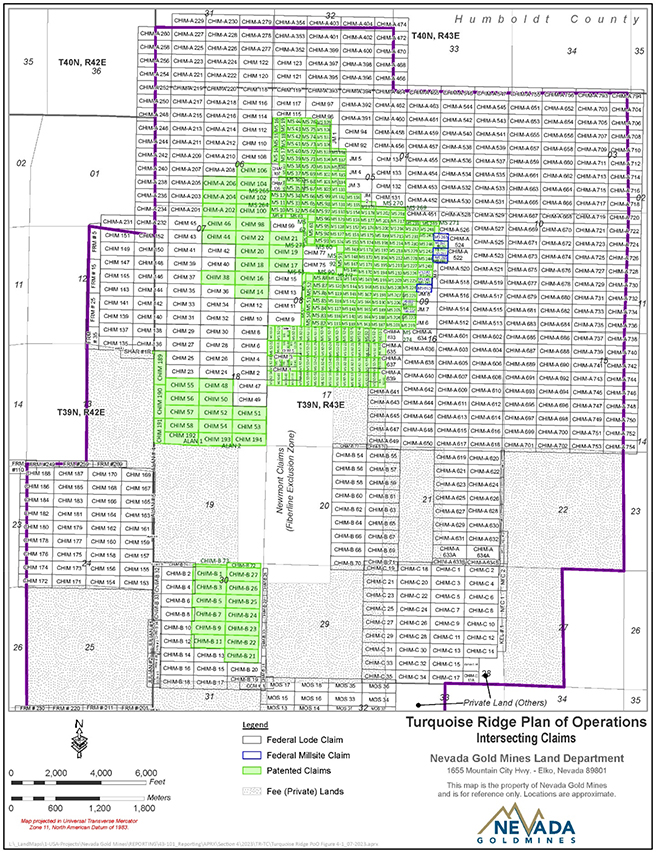
Figure 4-5 Operations PoO Claims Locations; 2023, Sheet 2 of 4
| March 15, 2024 |
Page 53 |
|
|
Turquoise Ridge Complex NI 43-101 Technical Report |
|
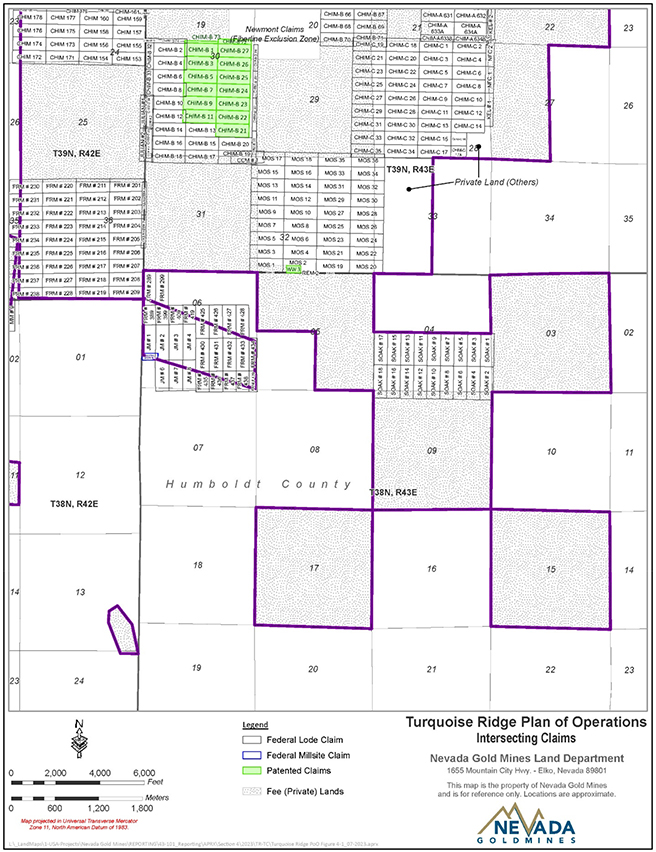
Figure 4-6 Operations PoO Claims Locations, 2023; Sheet 3 of 4
| March 15, 2024 |
Page 54 |
|
|
Turquoise Ridge Complex NI 43-101 Technical Report |
|
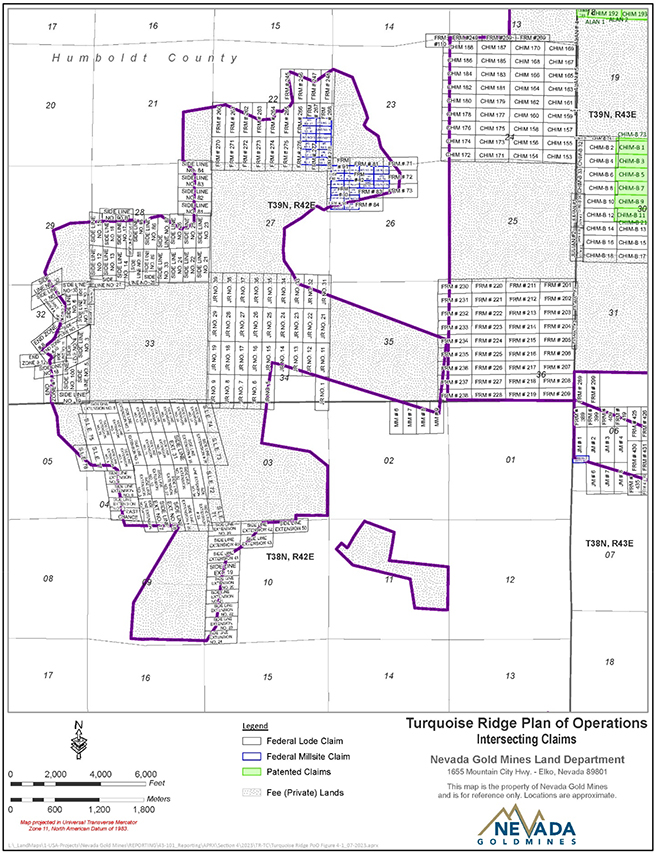
Figure 4-7 Operations PoO Claims Locations, 2023; Sheet 4 of 4
| March 15, 2024 |
Page 55 |
|
|
Turquoise Ridge Complex NI 43-101 Technical Report |
|
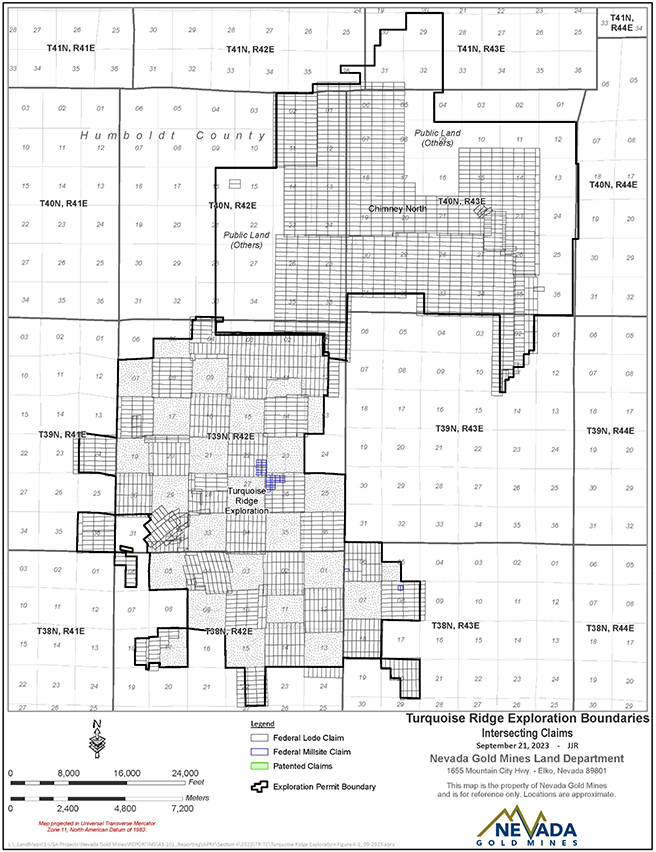
Figure 4-8 Exploration PoO Claims Locations, Sheet 1 of 8
|
|
||
| March 15, 2024 |
Page 56 | |
|
|
Turquoise Ridge Complex NI 43-101 Technical Report |
|
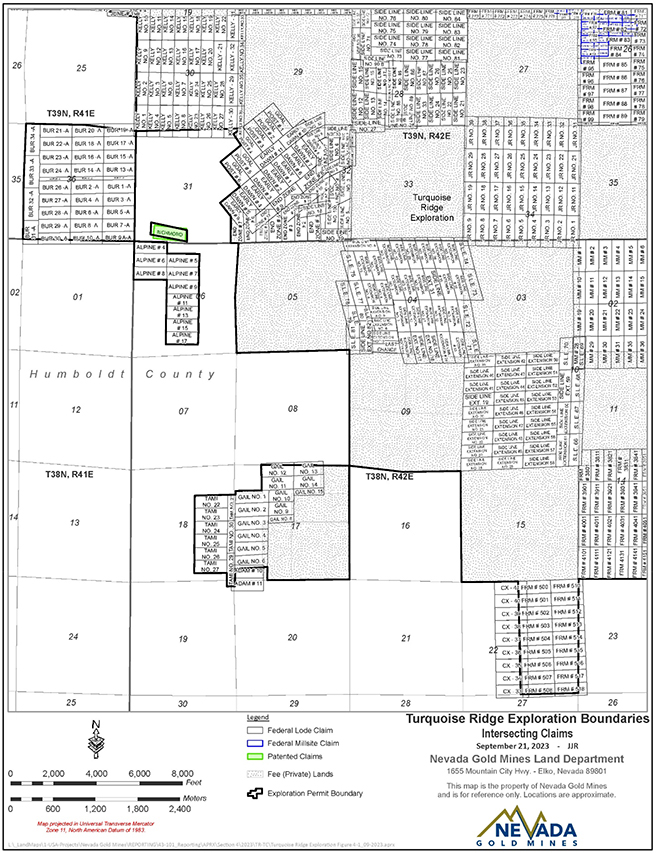
Figure 4-9 Exploration PoO Claims Locations, Sheet 2 of 8
| March 15, 2024 |
Page 57 |
|
|
Turquoise Ridge Complex NI 43-101 Technical Report |
|
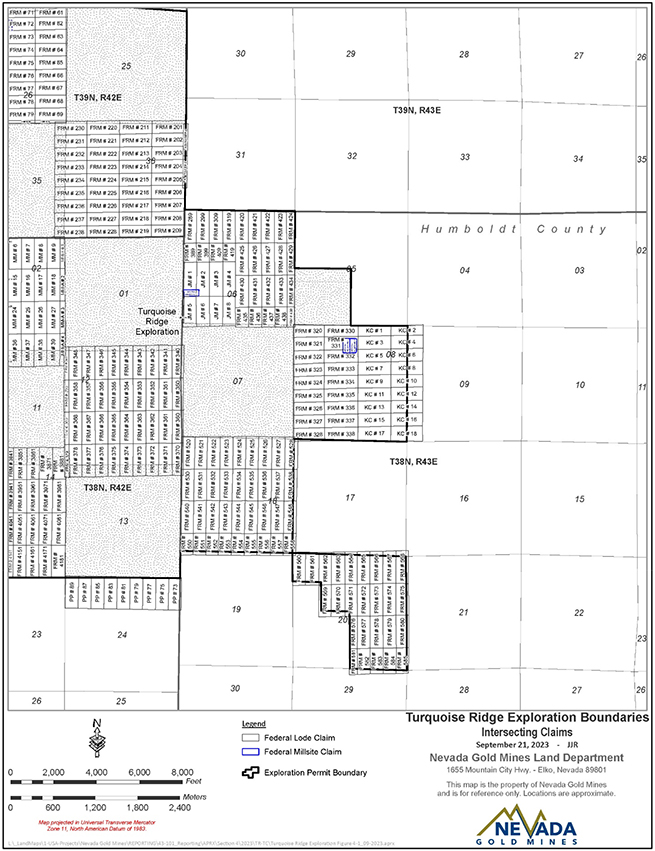
Figure 4-10 Exploration PoO Claims Locations, Sheet 3 of 8
| March 15, 2024 |
Page 58 |
|
|
Turquoise Ridge Complex NI 43-101 Technical Report |
|
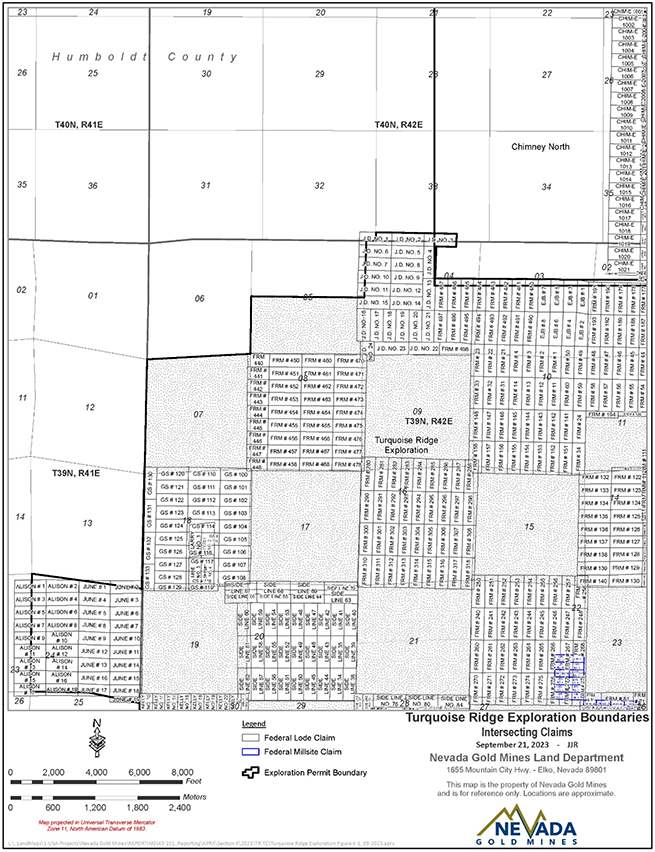
Figure 4-11 Exploration PoO Claims Locations, Sheet 4 of 8
| March 15, 2024 |
Page 59 |
|
|
Turquoise Ridge Complex NI 43-101 Technical Report |
|
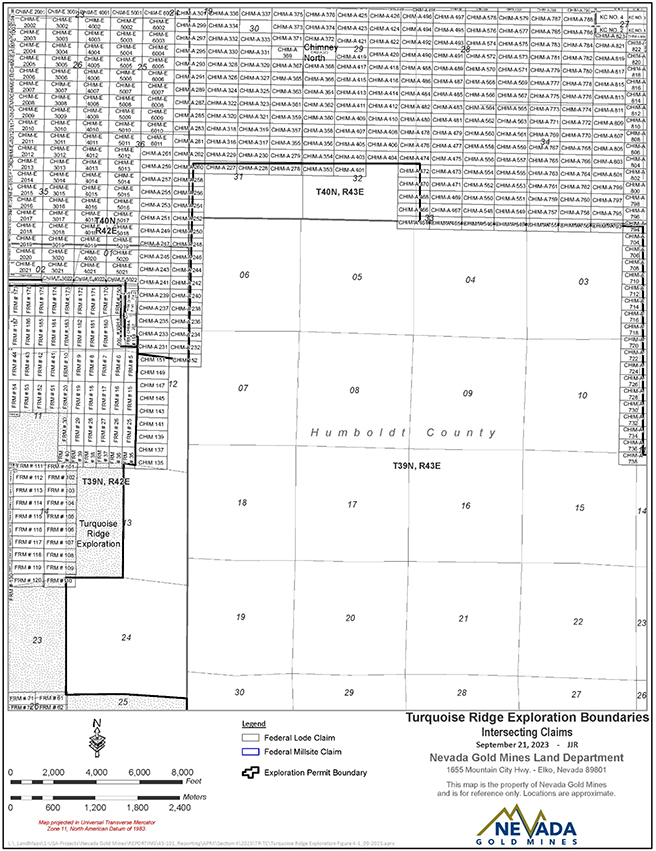
Figure 4-12 Exploration PoO Claims Locations, Sheet 5 of 8
| March 15, 2024 |
Page 60 |
|
|
Turquoise Ridge Complex NI 43-101 Technical Report |
|
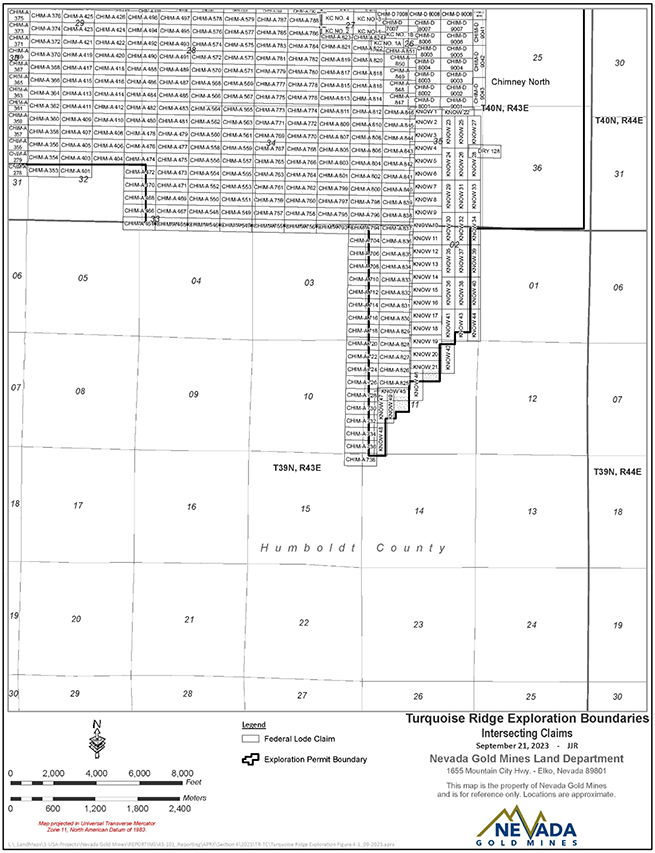
Figure 4-13 Exploration PoO Claims Locations, Sheet 6 of 8
| March 15, 2024 |
Page 61 |
|
|
Turquoise Ridge Complex NI 43-101 Technical Report |
|
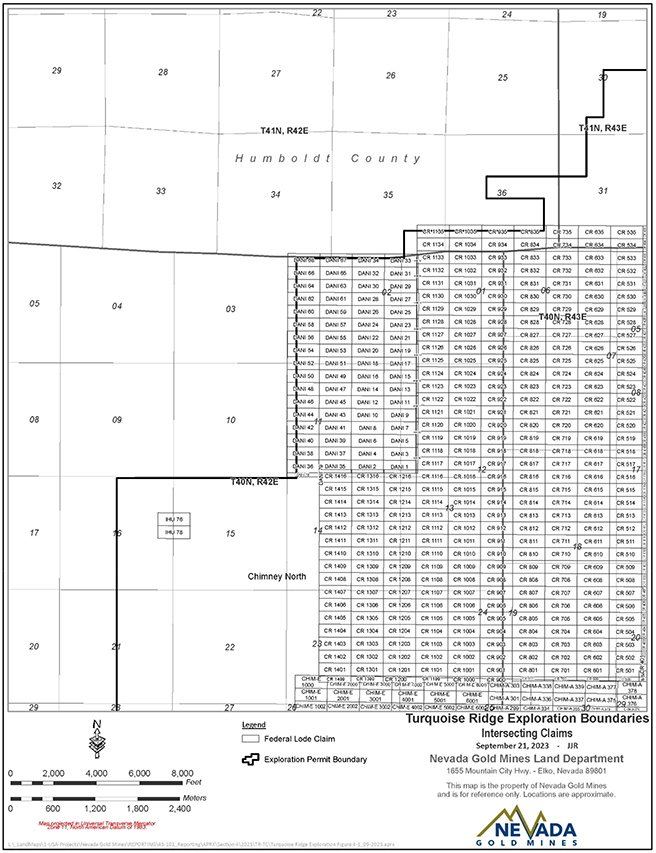
Figure 4-14 Exploration PoO Claims Locations, Sheet 7 of 8
| March 15, 2024 |
Page 62 |
|
|
Turquoise Ridge Complex NI 43-101 Technical Report |
|
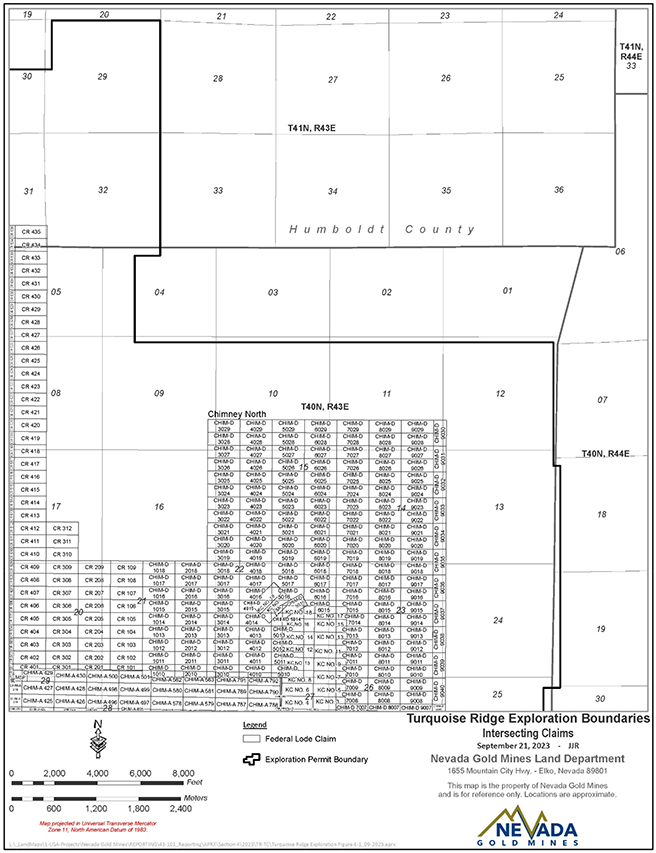
Figure 4-15 Exploration PoO Claims Locations, Sheet 8 of 8
| March 15, 2024 |
Page 63 |
|
|
Turquoise Ridge Complex NI 43-101 Technical Report |
|
| 4.3.2 | Fee Property |
NGM holds several fee properties in the Project area outlined in Table 4-2.
Patented ground or claims are surveyed by a certified mineral surveyor, and appropriate monuments are placed in the ground. Patented and fee lands require annual payment of tax assessments to the relevant Nevada county. Fee property locations were shown in Figure 4-4 to Figure 4-15.
Table 4-2 Fee Properties
| Township | Range | Section | Aliquot Parts | |||
| 38N | 42E | 3 | L4; SW4; Portions of S2NE4, SE4, S2NW4, & L3 | |||
| 38N | 42E | 5 | Portions of SE4NE4, L1, & L2 | |||
| 38N | 42E | 9 | Portions of E2SW4, NE4, NE4NW4, & SE4 | |||
| 38N | 42E | 11 | Portion of NW4; Portion of S2NE4; Portion of N2SE4 | |||
| 38N | 43E | 3 | ALL | |||
| 38N | 43E | 5 | N2; SE4 | |||
| 38N | 43E | 9 | ALL | |||
| 38N | 43E | 15 | ALL | |||
| 38N | 43E | 17 | ALL | |||
| 39N | 42E | 13 | E2 | |||
| 39N | 42E | 21 | Portion of E2SE4 | |||
| 39N | 42E | 23 | Portion of W2 | |||
| 39N | 42E | 25 | ALL | |||
| 39N | 42E | 27 | W2; Portions of W2SE4 & NE4 | |||
| 39N | 42E | 29 | Portions of SE4 & SE4NE4 | |||
| 39N | 42E | 31 | Portion of S2S2SW4 | |||
| 39N | 42E | 33 | ALL | |||
| 39N | 42E | 35 | Portions of S2, NW4, & S2NE4 | |||
| 39N | 43E | 5 | S2NW4; SW4; Portions of W2SE4 & SE4SE4 | |||
| 39N | 43E | 6 | S2SE4; S2NE4SE4; Portion of SE4SW4 | |||
| 39N | 43E | 7 | E2NE4; NW4NE4; Portions of NE4SW4, E2NW4, & SE4 | |||
| 39N | 43E | 8 | E2; Portions of E2SW4 and NW4 | |||
| 39N | 43E | 9 | Portion of W2 | |||
| 39N | 43E | 17 | Portions of E2 & NW4 | |||
| 39N | 43E | 18 | L4; W2SE4; Portions of L2, SW4, SW4NW4 | |||
| 39N | 43E | 19 | W2; W2E2; Portion of E2E2 | |||
| 39N | 43E | 21 | W2 | |||
| 39N | 43E | 22 | ALL | |||
| 39N | 43E | 27 | W2 | |||
| 39N | 43E | 29 | S2; S2N2; NE4NE4; Portions of NW4NE4 & N2NW4 | |||
| 39N | 43E | 30 | W2NE4; Portions of E2NE4, SE4, L5, L8, & L9 | |||
| 39N | 43E | 31 | ALL | |||
| 39N | 43E | 32 | Portion of S2SW4 | |||
| March 15, 2024 |
Page 64 |
|
|
Turquoise Ridge Complex NI 43-101 Technical Report |
|
| 4.4 | Surface Rights and Plans of Operations |
Turquoise Ridge Underground is located within the following Humboldt County Township/Range/Sections:
| ● | Township 38 North, Range 42 East, MDM, Sections 2–5, 9–11, 13; |
| ● | Township 39 North, Range 42 East, MDM, Sections 21–23, 26–29, 32–35; |
| ● | Township 38 North, Range 43 East, MDM, Section 6. |
Turquoise Ridge Surface and Vista Underground are located within the following Humboldt County Township/Range/Sections:
| ● | Township 38 North, Range 43 East, MDM., Sections 3–5, 9, 15, 17; |
| ● | Township 39 North, Range 43 East, MDM., Sections 3–10, 15–22, 27–33; |
| ● | Township 40 North, Range 43 East, MDM., Sections 31, 32; |
| ● | Township 39 North, Range 42 East, MDM., Sections 12, 13, 24, 25, 36. |
As described in this section, surface rights are either held by NGM outright or administered by the BLM. There are sufficient surface rights to support the life-of-mine (LOM) plan assumptions for the individual mines within the Turquoise Ridge Complex.
As noted in Section 4.2, a PoO must be completed as part of the permitting process for hard rock mining in Nevada providing both state and federal regulators with a description of the operations, facilities, and a plan of production for the life of the operation.
| 4.5 | Agreements |
A number of land related agreements exist with federal, state, and third-party entities and these are monitored by NGM using a land management database. The data managed includes contractual obligations, leases, associated payments, parties to agreements, and locations and details of the properties that the agreements cover. All mining leases and subleases are managed and reviewed on a monthly basis and all payments and commitments are paid as required by the specific agreements.
The database covers both monetary obligations such as lease payments and non-monetary obligations, such as third-party required reporting, work commitments, taxes, and contract expiry dates. The agreements that NGM has with third parties within the PoOs are monitored using this database.
| March 15, 2024 |
Page 65 |
|
|
Turquoise Ridge Complex NI 43-101 Technical Report |
|
Agreement types that cover the Turquoise Ridge Complex, including rights-of-way, patent claims and applications, mining leases, and property exchanges, are summarized in Table 4-3.
Agreement types include:
| ● | Water leases; |
| ● | Grazing leases; and |
| ● | Land Leases (surface and minerals). |
Easement and rights-of-way types include:
| ● | Roads; |
| ● | Utilities; |
| ● | Access; and |
| ● | Pipelines. |
Table 4-3 Agreements
| PoO Name | Agreement or Lease | Easements/Right-of-Ways | ||
| Turquoise Ridge |
1 | 1 | ||
| Twin Creeks |
4 | 10 | ||
| Turquoise Ridge Exploration |
2 | 2 | ||
| Chimney North |
0 | 2 |
| 4.6 | Royalties, Taxes, and Levies |
| 4.6.1 | Government Mining Taxes, Levies, and Royalties |
The state of Nevada imposes a 5% net proceeds tax on the value of all minerals severed in the State. This tax is calculated and paid based on a prescribed net income formula.
In July 2021, the Nevada State Legislature passed Assembly Bill 495 (AB 495). This new law established a new tax on mining to fund public education. The tax is levied on gross revenue from gold and silver mined in the State of Nevada and is calculated as follows:
| ● | First $20 M of gross revenue: exempt; |
| ● | >$20 M to $150 M of gross revenue: taxed at a flat rate of 0.75%; and |
| ● | >$150 M of gross revenue: taxed at a flat rate of 1.1%. |
For the Turquoise Ridge Complex, the effective life-of-mine AB 495 tax rate is 1.02% of gross revenue which accounts for the exemption, tiered tax rates, and royalty interests. From an NGM
| March 15, 2024 |
Page 66 |
|
|
Turquoise Ridge Complex NI 43-101 Technical Report |
|
perspective, royalty payments are exempt from this tax because royalty holders pay the AB 495 tax on their royalty revenues (i.e. the tax is not paid on the same revenue twice).
There are no government royalties applicable to the Turquoise Ridge Complex.
| 4.6.2 | NGM Royalty |
In connection with the formation of NGM, both Barrick and Newmont were granted a 1.5% net smelter returns royalty over the respective properties they contributed to the NGM JV. The 1.5% net smelter returns royalty is payable to Barrick or Newmont on all gold produced from the contributed properties after 47,301,000 ounces of gold have been produced from all NGM mines from and after July 1, 2019. Current NGM Reserves are not expected to trigger this royalty. However, as new discoveries and Resources are converted to Reserves and eventually mined and processed, this royalty could potentially be triggered. Currently, this royalty is not considered material to, nor used as an input into, the Reserve and Resource estimates.
| 4.6.3 | Claims Royalties |
There are no royalties payable on the Mineral Resources and Mineral Reserves within the Vista Underground or the Turquoise Ridge Underground (other than the NGM royalty discussed in Section 4.6.2 which is not considered material to, nor used as an input into, the Reserve and Resource estimates).
In addition to the NGM royalty, certain areas of Turquoise Ridge Surface are also subject to the following royalties:
| ● | T39N, R42E, Section 12: E2, No royalty except for a portion south of Chim 136 and within the Shar 1R claim, 2% gross proceeds to Royal Gold Inc (Royal Gold). Area is less than 1 acre within Section 12. |
| ● | T39N, R42E, Section 13: E2, 2% gross proceeds to Royal Gold after 50,000 ounces of gold has been sold from this area (which threshold has been met). |
| ● | T39N, R42E, Section 24: All, No royalty except that portion within the FRM 269 claim, 2% gross proceeds to Royal Gold. Sliver north of Chim 170, less than 1 acre. |
The Turquoise Ridge Exploration PoO area is subject to a 2% net smelter return (NSR) royalty payable to UMETCO Minerals Corp for T39N R42E Section 31: S2S2SW4 (Richmond, MS 37, Patent #11771) and Section 9: NE4NW4, N2SE4NW4.
| March 15, 2024 |
Page 67 |
|
|
Turquoise Ridge Complex NI 43-101 Technical Report |
|
| 4.7 | Permit Considerations |
The site has obtained and is in compliance with all required state and federal permits. Permitting for the Turquoise Ridge Complex is further discussed in Section 20, including permit modifications required for the Mega pit cutbacks.
| 4.8 | Environmental Liabilities |
Environmental liabilities at the Turquoise Ridge Complex consist of compliance obligations related to State and Federal permits and regulations. The site has obtained and is in compliance with all required state and federal permits. The site conducts quarterly and annual monitoring of surface, groundwater, and air quality, as well as ongoing review of closure and reclamation obligations to ensure best management of these liabilities.
Environmental considerations and monitoring programs for the Turquoise Ridge Complex are discussed in Section 20.
| 4.9 | Comment on Property Description and Location |
The processes to obtain and renew required permits, access, and rights are well understood by NGM and similar have been granted to the operations in the past. NGM expects to be granted all permits, access, and rights necessary and see no impediment to approval of these in the future.
To the extent known to the QPs, there are no other significant factors and risks that may affect access, title, or the right or ability to perform work on the Project that are not discussed in this Report.
| March 15, 2024 |
Page 68 |
|
|
Turquoise Ridge Complex NI 43-101 Technical Report |
|
| 5 | Accessibility, Climate, Local Resources, Infrastructure and Physiography |
| 5.1 | Accessibility |
The Turquoise Ridge Complex is in Humboldt County, Nevada, approximately 64 km northeast of Winnemucca, Nevada, and 40 km northeast of the settlement of Golconda, Nevada. The site is accessible from Interstate 80 (I-80), turning off the highway at Golconda approximately 24 km east of Winnemucca, then following a paved road for 24 km, and thereafter by an improved gravel road to the mine gates. It is 16 km to West Mine Gate, and 24 km to the East Mine Gate.
The Project area is accessible via a mixture of county and state highways and unpaved minor roads. The majority of the roads are suitable for most weather conditions; however, travel can be restricted during extreme weather events including heavy snow and rain.
The Union Pacific Rail line runs parallel to I-80. NGM operates the Dunphy Rail Terminal, which is located about 43 km west of Carlin, for the transportation of bulk commodities such as lubricants, fuel, and ball mill consumables. These bulk commodities are road-transported from the Dunphy Rail Terminal to the Project using commercial trucking services.
There are regional airports at Reno (330 km southwest of the operations) and Elko (220 km southeast of the operations). There is also a local airport at Winnemucca (83km southwest of the operations).
| 5.2 | Climate |
The climate is a semi-arid, steppe climate characterized by dry, hot summers and cold winters. Average monthly temperatures range from a low of -5ºC in December to a high of 29ºC in July.
The Turquoise Ridge Complex receives an annual average of 7.6 cm of precipitation, which falls primarily as snow in the winter months, though light seasonal rains commonly occur in April and September.
The Turquoise Ridge Complex operates on a year-round basis.
| March 15, 2024 |
Page 69 |
|
|
Turquoise Ridge Complex NI 43-101 Technical Report |
|
| 5.3 | Local Resources and Infrastructure |
The Turquoise Ridge Complex is located in a major mining region and local resources including labor, water, power, natural gas, and local infrastructure for transportation of supplies are well established. Mining has been an active industry in northern Nevada for more than 150 years. Elko (population of approximately 20,300) is a local hub for mining operations and services necessary for mining operations are readily available.
There are adequate schools, medical services and businesses to support the work force. A skilled and semi-skilled mining workforce has been established in the region as a result of on-going mining activities. Workers live in the surrounding communities.
Site infrastructure is discussed in Section 18.
| 5.4 | Physiography |
The Turquoise Ridge Complex is located in the basin between the Osgood Mountains and the Dry Hills, at approximately 1,615 metres above sea level (masl). The topography varies in height, from valley floors at approximately 1,340 masl to peaks at elevations between 1,798–2,590 masl.
Vegetation in the vicinity of the Turquoise Ridge Complex is dominated by low dense shrubs and sage brush mixed with sparse native grasses and low flowering plants.
| 5.5 | Seismicity |
The Turquoise Ridge Complex is located within a region classified by the United States Geological Survey (USGS) as having a moderate earthquake hazard.
The operations are not considered as seismically active mines and do not have a history of seismically induced failures.
| 5.6 | Sufficiency of Surface Rights |
The existing and planned infrastructure, availability of staff, existing power, water, and communications facilities, and methods whereby goods can be transported to the mining operations are well-established and well-understood by NGM given the decades of experience that Barrick and Newmont each have from their previous mining operations in the area.
| March 15, 2024 |
Page 70 |
|
|
Turquoise Ridge Complex NI 43-101 Technical Report |
|
The surface rights secured for the Turquoise Ridge Complex are sufficient to allow for the operation of all required Project infrastructure, and sufficient surface area remains if expansions to the existing infrastructure are required.
Surface rights to support current and planned mining operations are discussed in Section 4.4.
| March 15, 2024 |
Page 71 |
|
|
Turquoise Ridge Complex NI 43-101 Technical Report |
|
| 6 | History |
| 6.1 | Development and Operations |
Mining for copper, lead, and silver first began in the Turquoise Ridge area in 1883. Tungsten was discovered in 1916 and mined sporadically until 1957.
A summary of the deposit discovery and development programs conducted from 1934 to date is provided in Table 6-1. The deposits that have been developed and exploited are summarized in Table 6-2.
Table 6-1 Turquoise Ridge Complex Development History
| Operator | Year | Comment | ||
| Prospectors | 1933 | Discovery of Getchell gold deposit | ||
| Getchell Mine Inc. | 1938-1957 | Gold operations mining the Getchell deposit. Conversion of Getchell mill to treat tungsten ores. Mining of tungsten ores from Getchell and toll treatment of tungsten ores from other producers in the area. |
||
| Goldfields Consolidated Mines (Goldfields) | 1960–1967 | Purchased Getchell Mine Inc. Installs a sulfide roaster. Open pit mining from North Pit, Center Pit, South Pit, and Section 4 Pit (Hansen Creek). | ||
| Comanche Exploration (JV between Goldfields and Cyprus Mines | 1970–1971 | Soil sampling. Completed drilled several deep core holes east of the main gold production area | ||
| Continental Oil Company/Conoco Inc. (Conoco) | 1972–1974 | Mapped and sampled several large areas within the property and drilled over 300 exploration holes. Computerized all existing drill holes, underground assay data, and surface topography. | ||
| General Electric | 1975 | Acquired project interest from Conoco. Completed geological mapping, sampling, and core drilling on several tungsten occurrences | ||
| Conoco | 1981 | Purchased the Getchell mine. Leased the property to Utah International who explored it for tungsten. Property returned to Conoco in 1982. | ||
| E.I. du Pont de Nemours and Company | 1983 | Purchased Conoco and sells all mineral interests. | ||
| First Mississippi Corporation/FRM Minerals Inc./ FirstMiss Gold Inc | 1983–1995 | Purchased Getchell property. Demonstrated that the low-grade oxide ore dumps at the Getchell Mine could be treated by heap leaching. Completed metallurgical testwork and drill programs. Identified oxide ore bodies at Hansen Creek and Summer Camp in 1985–1986. Heap leaching of historic Getchell dumps started 1986. Completed drill programs to identify additional mineralization in historic workings. Completed feasibility study on Getchell deposit in 1996. Subsidiary of First Mississippi Corporation created to conduct mining operations at Getchell. Open pit mining began in 1989, completed Getchell Main pit in 1995. Getchell Footwall deposit discovered 1991. Getchell Main underground deposit identified in 1993, with production beginning in 1995. Turquoise Ridge underground deposit discovered in 1993. |
| March 15, 2024 |
Page 72 |
|
|
Turquoise Ridge Complex NI 43-101 Technical Report |
|
| Operator | Year | Comment | ||
| Santa Fe Pacific Gold Corporation (Santa Fe) | 1984 | Discovers Rabbit Creek gold deposit. | ||
| Gold Fields Mining Corporation (Gold Fields) | 1984-1986 |
Discovers Chimney Creek gold deposit. Completed drill programs to define initial reserve.
|
||
| Gold Fields | 1988 | Commences gold production from Chimney Creek. | ||
| Santa Fe | 1990 | Commences gold production from Rabbit Creek. | ||
| Hanson Natural Resources Company (Hanson) | 1991 | Acquires Gold Fields. | ||
| Santa Fe | 1993 | Acquires Chimney Creek operations following an asset exchange with Hanson. Consolidates Rabbit Creek and Chimney Creek into the Twin Creeks operations (now Turquoise Ridge Surface and Vista Underground). | ||
| Getchell Gold Corporation (Getchell Gold) | 1996–1998 |
First Miss changes name to Getchell Gold. Construction started on Turquoise Ridge underground mine.
|
||
| Newmont | 1997 | Acquires Santa Fe. Open pit portion of the Rabbit Creek deposit renamed to the Mega pit. Open pit portion of the Chimney Creek deposit renamed to the Vista pit. Piñon mill, associated with the Mega pit, treating oxide ore. Sage and Juniper Mills, associated with Vista pit, treating refractory and oxide ore, respectively. The N Zone mineralization, located 305 m north of Turquoise Ridge, discovered in 1997. | ||
| Placer Dome Inc. (Placer Dome) | 1998-2003 | Announces merger with Getchell Gold in 1998. Suspends Turquoise Ridge underground operations in 1999 and closes entire property in 2002. Operations restart at in 2003. | ||
| Placer Dome/Newmont | 2003 | Form the Turquoise Ridge Joint Venture, 75% Placer Dome interest, 25% Newmont interest. | ||
| Newmont | 2005–2018 | Evaluates various layback options for Mega pit. Conducts mine design studies, metallurgical and geotechnical drilling, environmental humidity cell testing, and metallurgical testwork. Evaluation drilling of Vista Underground area. North Portal developed in 2011. South Portal developed in 2013, after which Vista Underground put on care and maintenance. Mining recommenced at Vista Underground in 2018. | ||
| Barrick | 2005–2018 |
Acquires Placer Dome. Closes Getchell underground mine in 2009, continues to operate Turquoise Ridge Underground.
|
||
| NGM | 2019–Report effective date |
NGM JV established in 2019. Barrick’s Turquoise Ridge Mine and Newmont’s Twin Creeks Complex combined as a single operation, now know as the Turquoise Ridge Complex.
|
| March 15, 2024 |
Page 73 |
|
|
Turquoise Ridge Complex NI 43-101 Technical Report |
|
Table 6-2 Operations History
| Deposit | Duration | Note | ||
| Getchell open pit | 1938–1995 | North Pit, Center Pit, South Pit, and Section 4 Pit (Hansen Creek) | ||
| Riley Mine | 1942–1957 | Tungsten mine now part of property. | ||
| Chimney Creek open pit | 1987–1997 | Newmont consolidates into Twin Creeks operation. Renamed Vista pit | ||
| Hansen Creek open pit | 1988–1989 | Reclaimed. | ||
| Rabbit Creek open pit | 1989–1997 | Newmont consolidates into Twin Creeks operation. Renamed Mega pit | ||
| Summer Camp open pit | 1990–1991 | - | ||
| Turquoise Ridge Pit | 1991–1998 | - | ||
| Getchell Main underground | 1995–2009 | Placed on care and maintenance in 2008, closed 2009. | ||
| Valmy Pit | 1995–1998 | Current operation; site of Third Shaft. | ||
| Vista open pit | Mining continued from 1997 | Current operation | ||
| Mega open pit | Mining continued from 1997 | Current operation | ||
| Turquoise Ridge Underground | Mining started in 2003 | Current operation | ||
| Vista Underground | North and South Portals developed 2011–2013; mining started in 2018 | Current operation |
| 6.2 | Production History |
The history of Gold production from the Turquoise Ridge Complex is summarized in Table 6-3.
| March 15, 2024 |
Page 74 |
|
|
Turquoise Ridge Complex NI 43-101 Technical Report |
|
Table 6-3 Summary of Gold Production
| Years | Turquoise Ridge Underground Gold Produced (koz) |
Turquoise Ridge Surface and Vista Underground Gold Produced (koz) |
Turquoise Ridge Complex Gold Produced (koz) |
Average Annual Gold Recovery |
||||
| 1938–1945 | 330 | 0 | 329.9 | NR | ||||
| 1948–1950 | 42 | 0 | 42 | NR | ||||
| 1962–1967 | 391 | 0 | 391 | NR | ||||
| 1986–1999 | 2,029 | 5,930 | 7,960 | NR | ||||
| 2000–2009 | 1,451 | 9,238 | 10,689 | NR | ||||
| 2010 | 161 | 409 | 570 | NR | ||||
| 2011 | 170 | 408 | 578 | NR | ||||
| 2012 | 191 | 492 | 684 | NR | ||||
| 2013 | 186 | 464 | 650 | NR | ||||
| 2014 | 259 | 365 | 625 | NR | ||||
| 2015 | 289 | 415 | 704 | NR | ||||
| 2016 | 328 | 380 | 707 | NR | ||||
| 2017 | 340 | 332 | 672 | NR | ||||
| 2018 | 350 | 333 | 683 | NR | ||||
| 2019 | 370 | 283 | 653 | 89.2% | ||||
| 2020 | 302 | 250 | 551 | 82.0% | ||||
| 2021 | 282 | 262 | 543 | 82.0% | ||||
| 2022 | 279 | 180 | 459 | 82.2% | ||||
| 2023 | 389 | 114 | 503 | 86.5% | ||||
| Total | 8,139 | 19,854 | 27,993 | N/A |
Totals may not add due to rounding.
2023 Totals exclude 11,026oz of purchased ore produced.
NR = no record available.
| March 15, 2024 |
Page 75 |
|
|
Turquoise Ridge Complex NI 43-101 Technical Report |
|
| 7 | Geological Setting and Mineralization |
| 7.1 | Regional Geology |
The Project is within the Basin and Range province between the Osgood Mountains and the Dry Hills in Northern Nevada.
The western margin of the North American craton coincided with this area of Nevada during the early Paleozoic. An eastern depositional sequence of a shallow-water, platform and slope carbonate facies comprised of limestone, mudstone and mafic igneous sills; and a western assemblage of deep-water-siliceous chert, shale, quartzite, and mafic extrusive rocks interbedded with thin calcareous units occurred during the Cambrian–Ordovician. The eastern assemblage consists of the lower and middle Comus Formation. The western sequence, the Ordovician Valmy Formation, was thrust eastward tens of kilometers, stacking up upon itself over the upper Comus tuffaceous transitional facies that were deposited above the western assemblage. This thrust is a major structure in northern Nevada known as the Roberts Mountains thrust.
Sandy limestones and minor conglomerate of the Pennsylvanian-Permian Etchart and Battle Formations overlie the Cambrian–Ordovician sequence at an unconformable faulted contact. This is overlain by the Golconda thrust fault with siliciclastic rocks of the allochthonous Mississippian-Permian Havallah Formation and Miocene volcanic units. Recent alluvium and minor tuffs infill low-lying areas. (Hotz and Wilden, 1964)
There are two main Cretaceous intrusive events, a set of 114 Ma dacite dikes and sills, and the 92 Ma granodioritic Osgood Stock.
A general geology map for the regional area is provided in Figure 7-1.
Four compressional orogenic events affected this stratigraphy:
| ● | Late Devonian–Mississippian Antler orogeny: in which the western siliceous facies were emplaced over the eastern carbonate assemblage forming the regionally extensive Roberts Mountains thrust fault. |
| ● | Late Permian–Early Triassic Sonoma orogeny: caused post-Antler siliciclastic and carbonate rocks to be transported by the Golconda thrust fault eastward over the Roberts Mountains allochthon. |
| ● | Late Jurassic “Elko” orogeny: producing eastward-verging folds and thrusts. |
| ● | Late Cretaceous Sevier orogeny: deforming in-situ architecture with additional eastward-verging folds and thrust faults. |
| March 15, 2024 |
Page 76 |
|
|
Turquoise Ridge Complex NI 43-101 Technical Report |
|
Subsequent uplift, extension, and erosion created tectonic windows in the upper plate rocks of the Roberts Mountains thrust fault, locally exposing carbonate rocks of the lower plate. A 40 km long gold trend, termed the Getchell Trend, formed in altered, eastern facies, silty carbonate rocks in the lower plate of the Roberts Mountains thrust fault. Deposits of the Getchell Trend are shown in Figure 7-2 and include the Turquoise Ridge/Getchell (now Turquoise Ridge Underground), Twin Creeks (Chimney Creek and Rabbit Creek; now Turquoise Ridge Surface and Vista Underground), Riley and Kirby (not shown), Mag, Pinson (now Granite Creek) and Preble.
| March 15, 2024 |
Page 77 |
|
|
Turquoise Ridge Complex NI 43-101 Technical Report |
|
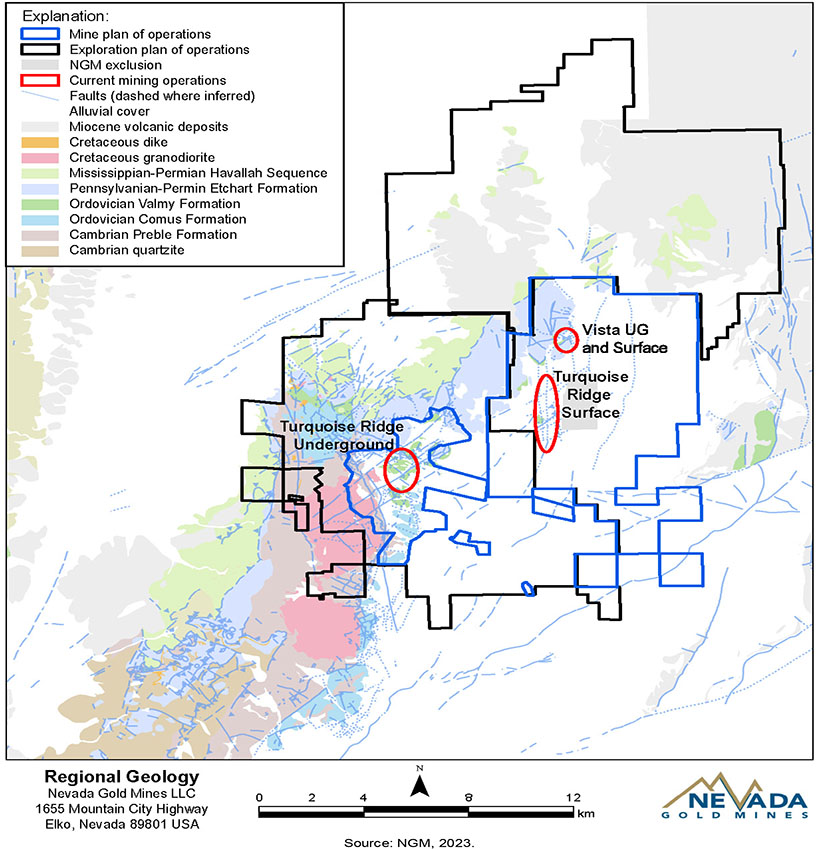
Figure 7-1 Regional Geology Map
| March 15, 2024 |
Page 78 |
|
|
Turquoise Ridge Complex NI 43-101 Technical Report |
|
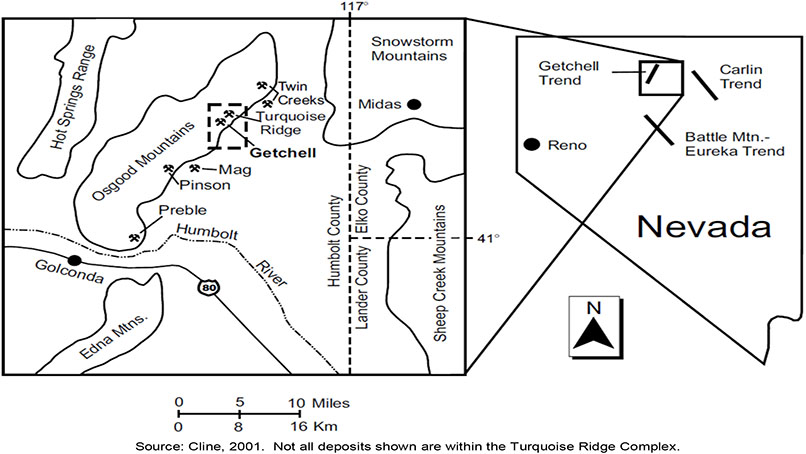
Figure 7-2 Getchell Trend Deposits
| 7.2 | Local Geology |
| 7.2.1 | Lithologies |
A simplified geology plan for the deposit areas is included as Figure 7-3. A district-wide stratigraphic column is provided in Figure 7-4.
| March 15, 2024 |
Page 79 |
|
|
Turquoise Ridge Complex NI 43-101 Technical Report |
|
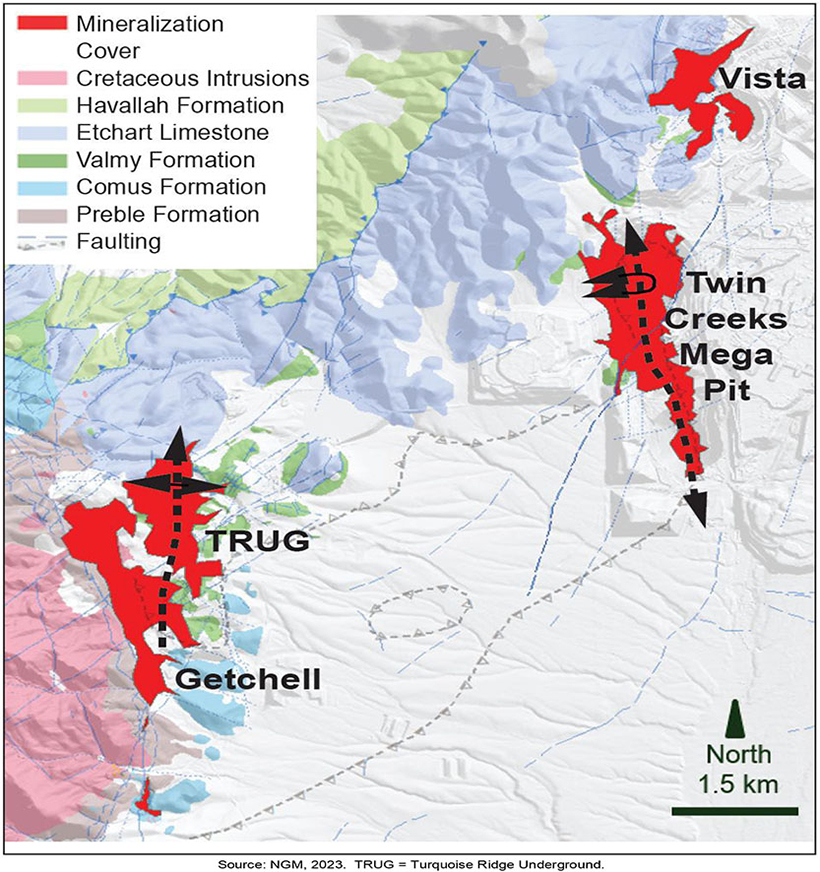
Figure 7-3 Simplified Geology Plan, Turquoise Ridge and Vista Areas
| March 15, 2024 |
Page 80 |
|
|
Turquoise Ridge Complex NI 43-101 Technical Report |
|
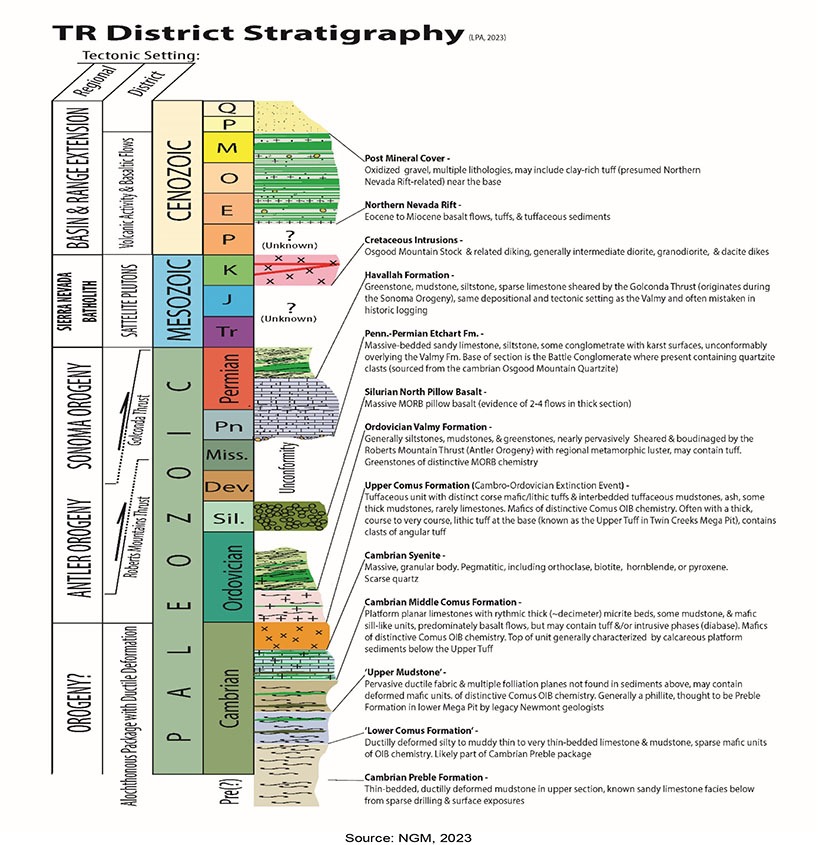
Figure 7-4: Stratigraphic Column
| March 15, 2024 |
Page 81 |
|
|
Turquoise Ridge Complex NI 43-101 Technical Report |
|
Facies changes, gradational contacts, discontinuity of units over short distances, lack of age control, and lack of marker units mean that the assignment of lithologies to any of the Valmy, Comus or Preble Formations is uncertain. It has been noted that units mapped as the Comus Formation along the eastern flank of the Osgood Mountains more closely resemble the lithology and structural deformation observed in the Preble Formation than the Comus Formation at its type locality; it has also been noted that units mapped as Comus Formation and Preble Formation along the Osgood Mountains are chemically indistinguishable.
Interpretations based on mapping and modeling within the Turquoise Ridge Complex infer that the Cambrian–Ordovician units may represent a series of one or more large-scale debris flows, or soft sediment slumps; much of the stratigraphic package is likely transported and allochthonous.
| 7.2.2 | Structure |
The structural setting of the Turquoise Ridge district is dominated by north–south and northeast-striking faults and contacts. Dips vary from low angle to moderate to steep. Multiple orogenies have shuffled the rock package and modern extensional large-displacement faulting is predominately down to the east on moderately east-dipping faults (i.e., Getchell, Central Pacific, 20K, and Kelly Creek faults). Thrust faults show general northeast-striking map patterns and dip moderately to the Northwest (i.e., Roberts Mountains and Golconda thrust faults),
Folding is generally north-trending with an eastern vergence and varies from megascopic to deposit-scale to parasitic.
Turquoise Ridge Underground, Turquoise Ridge Surface and Vista Underground areas have different local-scale structural settings. Mineralization is often structurally focused, either related to lithologic contacts, anticlines, fault intersections and fracture sets or unconformities.
The structural settings are summarized in Table 7-1.
| March 15, 2024 |
Page 82 |
|
|
Turquoise Ridge Complex NI 43-101 Technical Report |
|
Table 7-1 Local Structure
| Area | Major Folding | Major Faulting | ||
| Turquoise Ridge Underground | Valmy Formation rocks commonly have tight, locally recumbent, east to southeast-verging folds above the underground mine. A deposit-scale anticline has been defined by mapping within the Comus host rocks that trends and plunges North-northeast. Preble and Comus Formations commonly show west-verging more upright parasitic folds in the underground mine. Northwest-dipping monoclinal folding at the north end of Turquoise Ridge Underground may be related to deep-seated normal faulting associated with basin margin rifting. The monocline affects all the units except the uppermost basalt and the overlying Comus Formation lithologies. Mineralization is associated with fractures related to the axial plane of the deposit-scale fold. |
Thrust-faulted contact between the Valmy Formation and the Preble and Comus Formations is correlated with Roberts Mountains thrust; however, in the underground mine area the thrust contact is not always apparent, the contact locally appears gradational, and no older-over-younger relationships have been documented. The primary ore-controlling structure is the Getchell Fault Zone, currently a basin-and-range extensional fault, which runs along the northeastern flank of the Osgood stock and has been active since stock emplacement. It consists of anastomosing strands that coalesce at depth. The fault has a complex history with evidence for normal, reverse, and strike-slip motion. The fault is a master fault to a number of steeply-dipping, north-striking faults to the east of, and antithetic to it. High-angle normal faults strike northeast and dip steeply northwest, e.g., the Turquoise Ridge fault zone and associated splays. Associated with N30ºE fractures and folds. Mineralization is primarily associated with north–south, northeast- and northwest-trending high-angled faults and fracture zones, in particular where these features cross-cut favorable lithologies and low-angle fault and fracture zones. |
||
| Turquoise Ridge Surface | The principal mineralization-controlling structure is the Conelea anticline, a 5 km long doubly plunging, overturned fold in the Comus and underlying Preble formations. This anticline trends North-northwest and plunges in the same direction throughout most of the Twin Creeks deposits. At South Mega pit, the anticline plunges southward. Broad open folds that trend north–northwest characterize rocks of the overlying Valmy thrust package and Etchart Formation. |
Low-angle faults, predominately thrust faults, are common in all Paleozoic units, and some are interpreted to be regional in their extent such as the Golconda and Roberts Mountains thrusts. High-angle faults are mostly north–south- and northeast-striking, offsetting folds and low-angle faults, and, in many cases, cut Quaternary gravel deposits. All structures may be potential conduits for gold mineralization.
|
||
| Vista Underground | Sheared Valmy greenstone basalts generally dip moderately to the Northwest hosting the “Vista Vein”. | The primary mineralizing control is the Northeast-striking, steeply northwest dipping Trench Fault. |
| 7.2.3 | Alteration |
Thermal metamorphism associated with intrusion of the Cretaceous Osgood Stock at 92 Ma is present in the Turquoise Ridge Underground area and is characterized by ubiquitous development
| March 15, 2024 |
Page 83 |
|
|
Turquoise Ridge Complex NI 43-101 Technical Report |
|
of biotite hornfels within the tuffaceous mudstones throughout Turquoise Ridge Underground, and formation of calc–silicate alteration within carbonates only in the southern areas where they are close to the Osgood Stock.
Hydrothermal alteration at the Turquoise Ridge Underground consists of locally extensive, complete decalcification and argillic alteration of all rock types, spotty silicification, and the addition of gold-bearing fine-grained iron sulfides, the main mineralization of the deposit, and late arsenic sulfides. Hydrothermal alteration boundaries can be extremely sharp even where susceptible rocks are in direct, non-fault contact with altered rocks. To the east, mineralization is spatially related to north-south and northeast faults.
Calcareous rocks are the most important hosts for mineralization occurring as disseminated replacement ore bodies in the Comus and Etchart Formations. Valmy Formation basalts and related sedimentary rocks host structurally controlled mineralization, such as the Vista shear zone.
Hydrothermal alteration in sedimentary rocks at Turquoise Ridge Surface and Vista Underground includes decalcification, dolomitization, and lesser pervasive silicification. The dominant alteration type synchronous with gold mineralization is decalcification. Decalcified carbonate rocks are characterized by their permeability and weak reaction with hydrochloric acid, punky texture, and lower density. The transition from decalcified to fresh carbonate rocks can be abrupt outside mineralized zones. Sedimentary rocks adjacent to sills are commonly silicified.
Hydrothermally altered igneous rocks are variably clay-pyrite and propylitically altered, whether they host gold or not. Generally, there is a positive correlation between pyrite content and gold grade.
A minor amount of hornfels has been noted locally at sediment-mafic sill contacts. Intrusions, particularly the Ear peridotite, have a thicker rind of silicification. As gold mineralization is not always associated with silicification spatially related to sills and dikes, a portion of this alteration is thought to post-date sill emplacement and pre-date gold emplacement.
Milky quartz veins, some of which contain sphalerite, stibnite, pyrite and lesser amounts of galena have been interpreted as pre-gold and possibly related to the early silicification event. Pervasive silica replacement of carbonate rocks (jasperoid) is not widespread. Pervasively silicified carbonates are vuggy in appearance, and commonly have narrow voids or vugs which develop along bedding planes.
A late orpiment–realgar event is marked locally by massive pockets of these arsenic sulfides in voids and along fractures in decalcified carbonate rocks.
Hydrothermal alteration boundaries are locally extremely sharp even where preferential host rocks are in direct, non-faulted contact with altered rocks.
| March 15, 2024 |
Page 84 |
|
|
Turquoise Ridge Complex NI 43-101 Technical Report |
|
Overprinting clay alteration related to weathering processes is found in the Turquoise Ridge Surface area.
| 7.2.4 | Mineralization |
Preferred host lithologies for gold mineralization are the Comus Formation, followed by the Valmy and Etchart Formations.
Sub-microscopic gold mineralization is associated with arsenian pyrite, quartz, calcite, realgar, and orpiment. Gold mineralization is likely Eocene in age, and it is overprinted in some areas by a late stage of realgar, orpiment, and calcite. Gold-bearing zones can be located close to granodiorite and dacite dikes and beneath basaltic sills, evidencing the importance of rheologic contacts to mineralization.
Details of mineralization for each deposit are provided in Section 7.3.
| 7.3 | Project Geology |
The Project geology descriptions are provided by general geographic area, from south to north:
| ● | Turquoise Ridge Underground (TRUG); |
| ● | Turquoise Ridge Surface; |
| ● | Vista Underground (VUG). |
| 7.3.1 | Turquoise Ridge Underground |
The Getchell Fault, one of the most prominent structural features of the region, generally strikes north-south to north-northwest, and dips approximately 50° eastward in the vicinity of the mine site. The Turquoise Ridge north zone mineralization largely mimics the orientation of the Getchell Fault, with complications from northeast and north–south-striking structures.
The Turquoise Ridge deposit is a Carlin-type deposit and is structurally and stratigraphically controlled and sediment-hosted, containing disseminated micrometer-sized gold occurring on arsenic-rich pyrite rims, primarily within decalcified, carbonaceous rocks. All gold bearing zones at Turquoise Ridge are in proximity to granodiorite dikes that are associated with the Osgood stock.
Lithology and structure strongly influence the geometry of the mineralization. To the north, stratiform mineralized domains exhibit strike lengths exceeding 300 m with typical thicknesses in the 60–150 m range. Down dip lengths of over 300 m are common. In areas where mineralization is stratigraphically controlled, the mineralized domains and bedding have a general north–northwest-
| March 15, 2024 |
Page 85 |
|
|
Turquoise Ridge Complex NI 43-101 Technical Report |
|
trending strike, and dip to the east at 25–45°. Structural controls are dominantly related to high angle (75–85°) northeast-striking faults (Cricket Corridor, Turquoise Ridge (TR) Corridor, Ace Fault) and the intersections of those zones with throughgoing north–south-striking faults.
Host rocks are correlated with the Comus Formation and are locally sub-divided into a mid-slope facies (siliciclastic dominant mudstone and siltstone) and a basal slope facies (carbonaceous and calcareous silty limestone, and calcarenite). In addition, some ore grade intervals are present along mineralized faults that cut interbedded pillow basalt. Dacite and dacite porphyry dikes often control the distribution of high-grade gold, particularly where they are cut by high-angle mineralized faults.
A geological map for the Turquoise Ridge Underground area is provided in Figure 7-5. A long section through the deposit showing the mineralization is provided in Figure 7-6 and a section showing the grade shells is included as Figure 7-7.
| March 15, 2024 |
Page 86 |
|
|
Turquoise Ridge Complex NI 43-101 Technical Report |
|
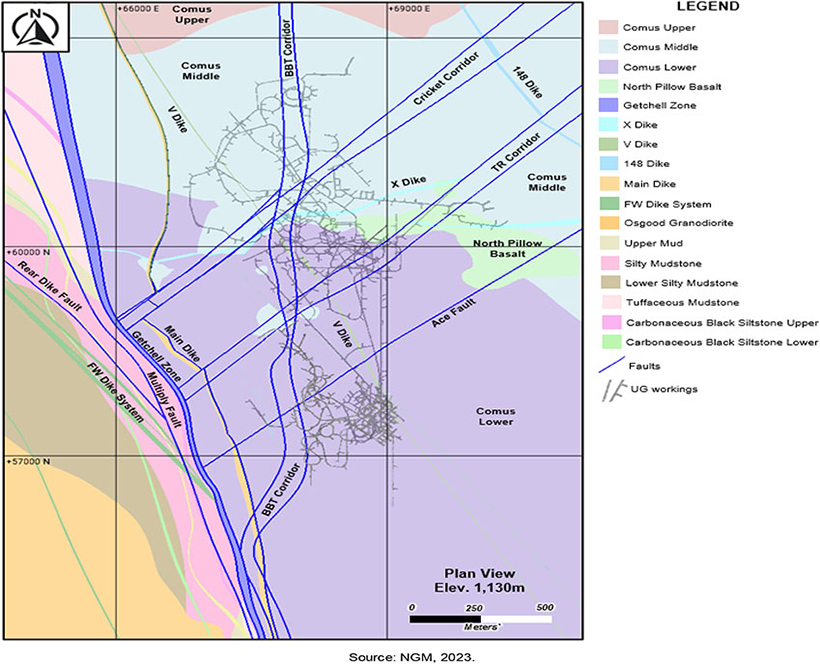
Figure 7-5 Turquoise Ridge Underground Geological Map
| March 15, 2024 |
Page 87 |
|
|
Turquoise Ridge Complex NI 43-101 Technical Report |
|
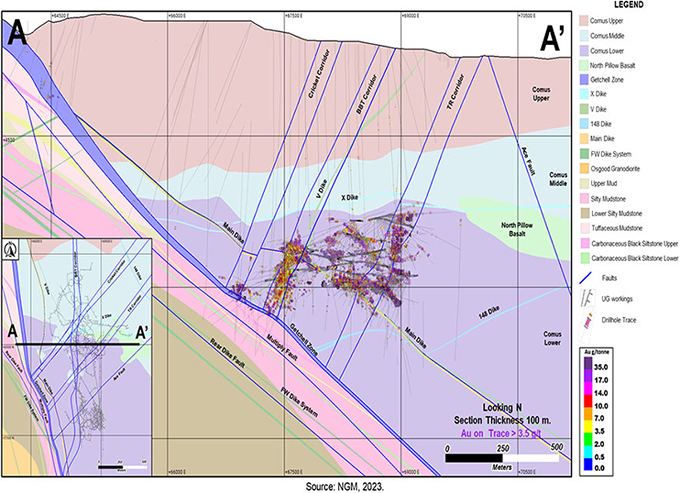
Figure 7-6 Example Cross-Section, Turquoise Ridge Underground, Showing Drill Intercepts
| March 15, 2024 |
Page 88 |
|
|
Turquoise Ridge Complex NI 43-101 Technical Report |
|
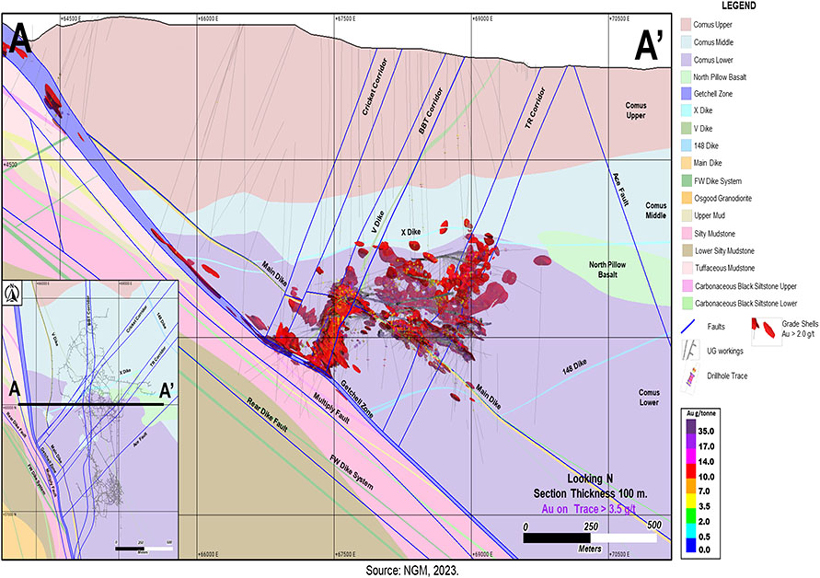
Figure 7-7 Example Cross-Section, Turquoise Ridge Underground, Showing Grade Shells
| March 15, 2024 |
Page 89 |
|
|
Turquoise Ridge Complex NI 43-101 Technical Report |
|
| 7.3.2 | Turquoise Ridge Surface |
Geologically, Turquoise Ridge Surface consists of two separate pits:
| ● | Mega Pit; and |
| ● | Vista Pit. |
Turquoise Ridge Surface Overview
The Turquoise Ridge Surface pits lie at the northwest edge of the Kelly Creek drainage and the southeast flank of the Dry Hills, an outlier of the Osgood Mountains. The Dry Hills and Osgood Mountains consist of a complexly folded and faulted sequence of early and late Paleozoic sedimentary and basaltic rocks that have been deformed through multiple orogenic events.
The Paleozoic rocks are subdivided into five groups based on age, lithology, and tectonic history:
| ● | Cambrian phyllite, argillite, and limestone of the Preble Formation; |
| ● | A Cambro-Ordovician sequence characterized by black shale, siltstone, dirty limestone, and basaltic rocks that comprise the Comus Formation; |
| ● | The Ordovician Valmy Formation, comprising highly-deformed basalt, chert and argillite in the upper plate of the Roberts Mountains allochthon; |
| ● | A relatively un-deformed and autochthonous group of Pennsylvanian and Permian age limestone and lesser conglomerate, sandstone, and siltstone of the Antler overlap sequence consisting of Etchart Formation limestone and Battle Formation conglomerate; and |
| ● | Highly deformed Permian sandstone, siltstone, basalt, and lesser chert of the Havallah Formation in the upper plate of the Golconda allochthon. |
Tilted Miocene basalts overlie the sequence.
Mega Pit
The mineralization remaining in the Mega Pit is approximately 2,740 m long and 1,690 m wide, covering an area of 4.1 km2, and extends at depth to about 1,103 masl. Mineralization thicknesses range from 6–30 m, with the thickness range a function of structural and stratigraphic controls.
A broad zone of low-angle, west dipping, and northerly striking faults characterize a major Paleozoic thrust in the northern part of the Mega Pit. This fault contact between the Valmy and Comus Formations is within the Roberts Mountains thrust zone. Intense shearing with compressional features adjacent to the fault contact affect at least 18 m of the Comus Formation in the north of the Mega Pit.
| March 15, 2024 |
Page 90 |
|
|
Turquoise Ridge Complex NI 43-101 Technical Report |
|
General stratigraphic location within the Mega Pit is tracked by modeling 13 different mafic units that are described as basaltic sills but cut bedding at a low-angle orientation. These mafic units control mineralization as they are less permeable and have acted as fluid traps within the folded Comus Formation. The principal structural element and the most important ore-controlling structure in the north Mega deposit is the Conelea anticline, which trends, and plunges to the north–northwest. The fold likely developed during the Antler Orogeny when the Valmy Formation was placed above the Comus Formation along the Roberts Mountains thrust.
Gold occurs in arsenic-rich rims or bands on pyrite grains associated with orpiment, realgar, stibnite, cinnabar, and quartz. Four discrete pulses of alteration and related mineralization are recognized at Turquoise Ridge Surface. Higher gold grades in the north Mega Pit occur in Comus Formation carbonate sediments above the Upper Sill. Carbonate-dominant stratigraphy transitions upward into a more tuffaceous and siliciclastic sequence. Mineralization is localized in decalcified carbonates but can occur less often in argillically altered and sulfidized basalt. Silicification is common in Comus Formation sediments immediately adjacent to basaltic contacts, with generally lower gold grades.
A geological map of the Vista and Mega Pits is provided in Figure 7-3 above. A level plan view showing the Turquoise Ridge surface is included in Figure 7-8. A cross section through the Mega Pit is provided in Figure 7-9 and a section showing the grade shells is included as Figure 7-10.
Vista Pit
The mineralization within the Vista Pit Resource shell (Vista 8) is approximately 250 m long, and 120 m wide, covering an approximate area of 0.03 km2, and extends at depth approximately 40 m below the current bottom of the open pit. Mineralization thicknesses range from 15–40 m as a function of structural and stratigraphic controls.
Strata-bound high-grade oxide mineralization occurs primarily within pervasively decalcified sandy carbonate rocks of the lower Etchart Formation limestone near the unconformity between the Etchart and the Valmy Formations. The Etchart Formation host is generally a calcareous sandstone to sandy limestone. The underlying Valmy Formation consists of pillow basalts, massive basalt flows, hyaloclastites, siliceous mudstones, and debris flow breccias. The unconformity is disrupted by northeast-striking faults, forming a horst block in the central part of the pit. These and other structures contain high-grade gold in narrow zones in the Valmy Formation and likely serve as feeders to the much larger strata-bound orebody in the basal Etchart Formation.
A geological map of the Vista 8 pit is included as Figure 7-11. A long section through the Vista 8 pit is provided in Figure 7-12.
| March 15, 2024 |
Page 91 |
|
|
Turquoise Ridge Complex NI 43-101 Technical Report |
|
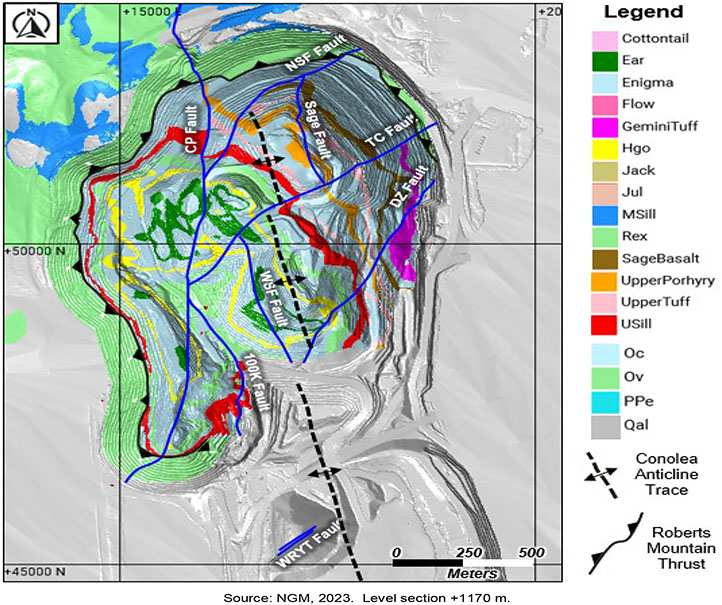
Figure 7-8 Geological Map, Turquoise Ridge Surface (Mega Pit)
| March 15, 2024 |
Page 92 |
|
|
Turquoise Ridge Complex NI 43-101 Technical Report |
|
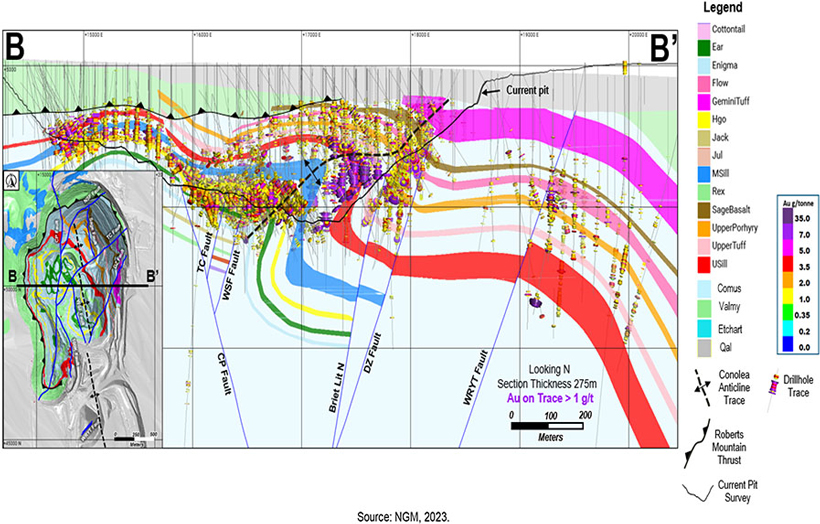
Figure 7-9 Example Long Section, Turquoise Ridge Surface (Mega Pit), Showing Drill Intercepts
| March 15, 2024 |
Page 93 |
|
|
Turquoise Ridge Complex NI 43-101 Technical Report |
|
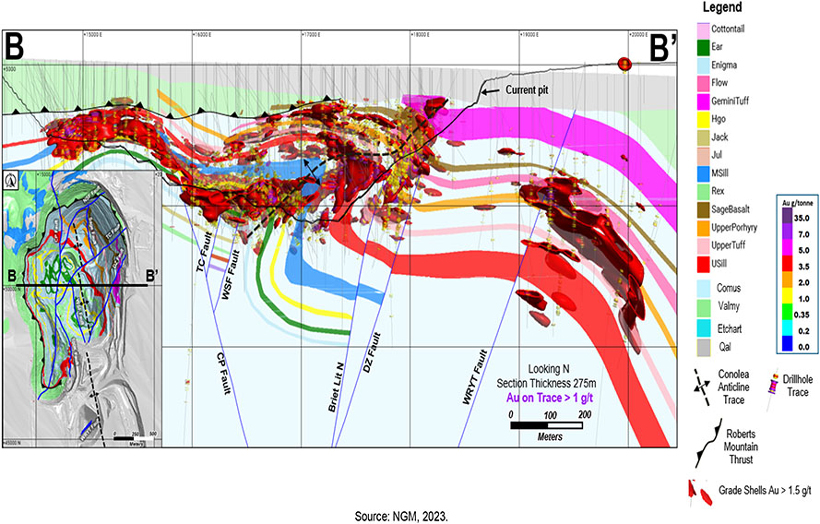
Figure 7-10 Example Long Section, Turquoise Ridge Surface (Mega Pit), Showing Grade Shells
| March 15, 2024 |
Page 94 |
|
|
Turquoise Ridge Complex NI 43-101 Technical Report |
|
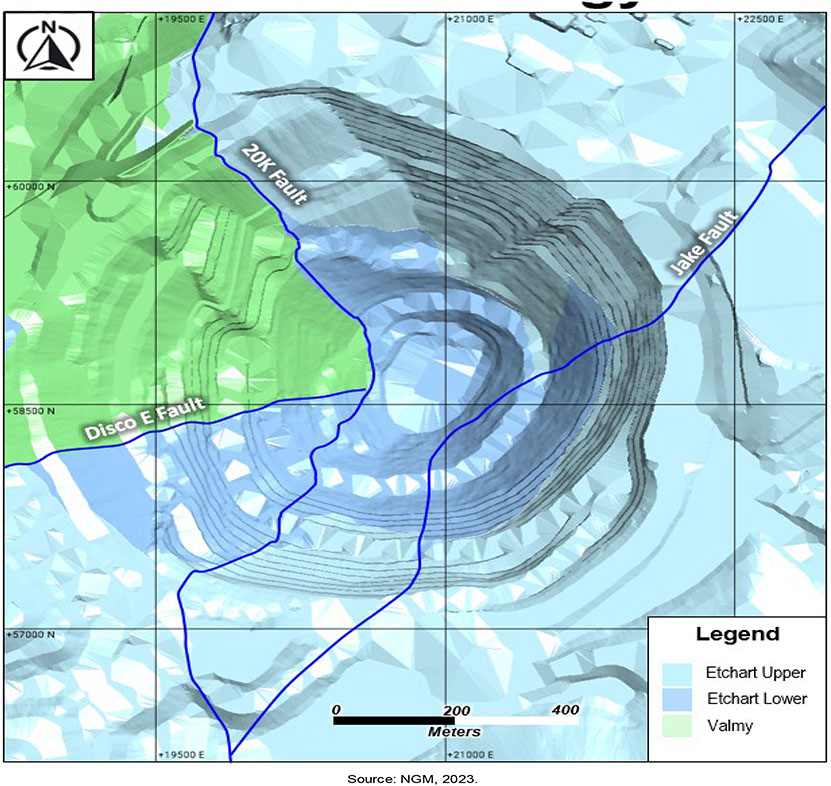
Figure 7-11 Geological Map, Turquoise Ridge Surface (Vista 8 Pit)
| March 15, 2024 |
Page 95 |
|
|
Turquoise Ridge Complex NI 43-101 Technical Report |
|
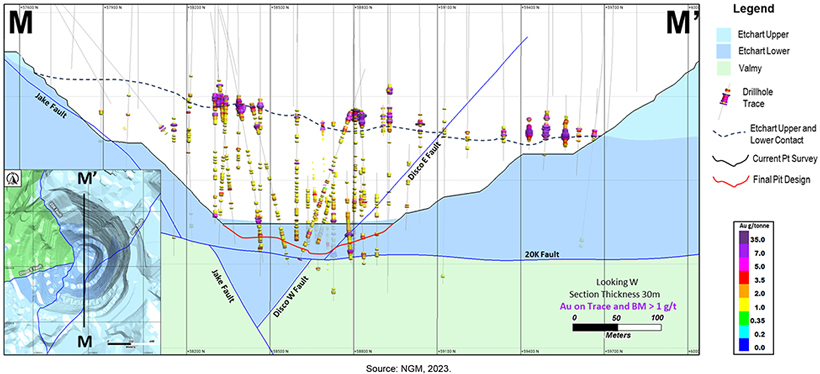
Figure 7-12 Example Long Section, Turquoise Ridge Surface (Vista 8 Pit)
| March 15, 2024 |
Page 96 |
|
|
Turquoise Ridge Complex NI 43-101 Technical Report |
|
| 7.3.3 | Vista Underground |
The Vista Underground mineralization has a strike length of approximately 1,400 m and a dip length of 300 m. Mineralization extends from about 1070–1460 masl. Thicknesses range from 0.1–12 m, with average thickness of 1 m.
In the Vista Underground, mineralization is largely confined to the Trench Fault shear zone within the basalts of the Valmy Formation. Mineralization consists of disseminated gold in arsenian pyrite and sooty sulfides. The Trench fault shear zone is defined by three anastomosing structural zones, or ore zones; OZ1, OZ2, and OZ3. Mineralization dominantly resides along the hanging wall and footwall of the defined ore zone (OZ) structures. Locally higher grades are encountered where the brecciated quartz-base “vein”, historically known as the Galena Vein, is crossed. There is no recognized “ore horizon” within the deposit. The only constraint on the extent of gold mineralization is the surface and the 20K fault that truncates the Trench fault to the northeast.
A geological map of the Vista Underground area is provided in Figure 7-13. Figure 7-14 is a location map showing the location of the cross section in Figure 7-15.
| March 15, 2024 |
Page 97 |
|
|
Turquoise Ridge Complex NI 43-101 Technical Report |
|
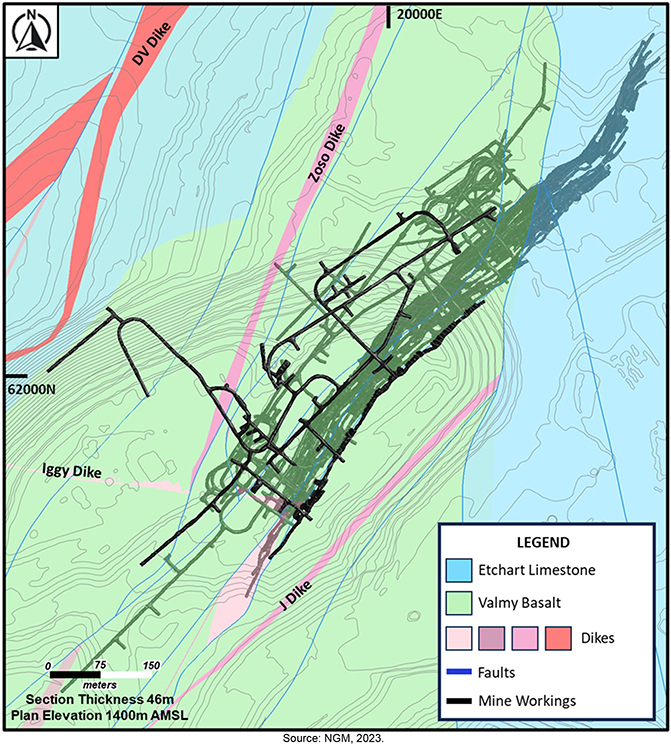
Figure 7-13 Geological Map, Vista Underground
| March 15, 2024 |
Page 98 |
|
|
Turquoise Ridge Complex NI 43-101 Technical Report |
|
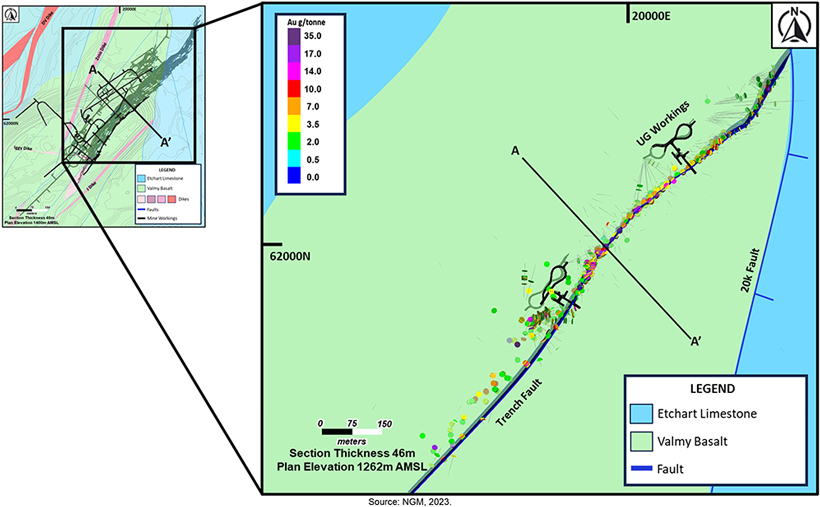
Figure 7-14 Geological Map, Vista Underground Showing Location of Figure 7-15
| March 15, 2024 |
Page 99 |
|
|
Turquoise Ridge Complex NI 43-101 Technical Report |
|
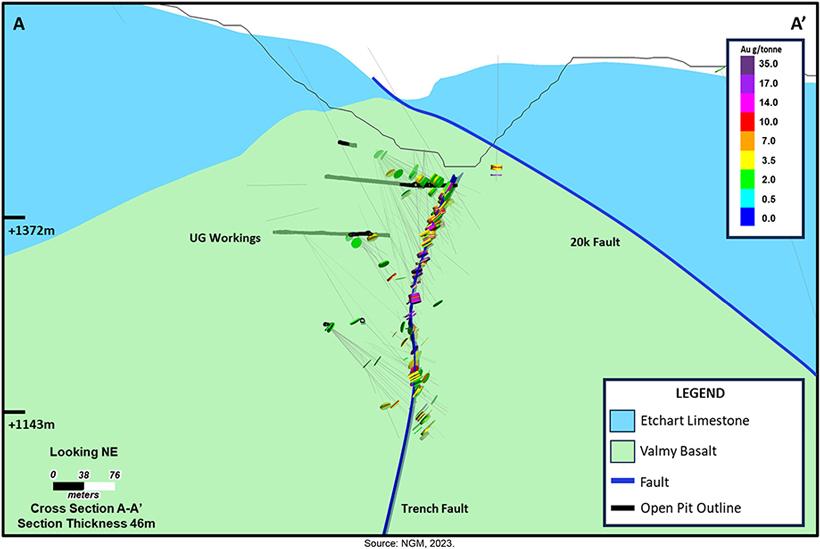
Figure 7-15 Example Cross Section, Vista Underground
| March 15, 2024 |
Page 100 |
|
|
Turquoise Ridge Complex NI 43-101 Technical Report |
|
| 7.4 | Comment on Geological Setting and Mineralization |
In the opinion of the QP:
| ● | The understanding of the deposit settings, lithologies, and geologic, structural, and alteration controls on mineralization is sufficient to support estimation of Mineral Resources and Mineral Reserves. |
| ● | The mineralization styles and settings are well understood and can support declaration of Mineral Resources and Mineral Reserves. |
| ● | The geological knowledge of the area is adequate to reliably inform mine planning. |
| March 15, 2024 |
Page 101 |
|
|
Turquoise Ridge Complex NI 43-101 Technical Report |
|
| 8 | Deposit Types |
| 8.1 | Summary |
The Turquoise Ridge Complex deposits are considered examples of Carlin-type or carbonate-hosted disseminated gold–silver deposits. The Carlin deposit forms the type locality.
| 8.2 | Deposit Type |
Host rocks are most commonly thinly bedded silty or argillaceous carbonaceous limestone or dolomite, commonly with carbonaceous shale. Although less mineralized, non-carbonate siliciclastic and rare metavolcanic rocks can locally host gold that reaches economic grades. Felsic plutons and dikes may also be mineralized at some deposits. Deposits typically have a tabular shape, are strata-bound, localized at contacts between contrasting lithologies, but can also be discordant or breccia related.
Mineralization consists primarily of micrometer-sized gold in sulfide grains disseminated in zones of siliciclastic and decarbonated calcareous rocks and are commonly associated with jasperoids. Other associated minerals to mineralization include pyrite, arsenian pyrite, stibnite, realgar, orpiment, cinnabar, fluorite, barite, and rare thallium minerals. Gangue minerals typically comprise fine-grained quartz, barite, clay minerals, carbonaceous matter, and late-stage calcite veins.
Current models attribute the genesis of the deposits to:
| ● | Epizonal plutons that contributed heat and possibly fluids and metals; |
| ● | Meteoric fluid circulation resulting from crustal extension and widespread magmatism; |
| ● | Metamorphic fluids, possibly with a magmatic contribution, from deep or mid-crustal levels; |
| ● | Upper crustal, extensional tectonic regime. |
| 8.3 | Comment on Deposit Types |
In the opinion of the QP the understanding of the deposit type was appropriate in guiding initial exploration activities and remains applicable for current exploration programs.
| March 15, 2024 |
Page 102 |
|
|
Turquoise Ridge Complex NI 43-101 Technical Report |
|
| 9 | Exploration |
| 9.1 | Summary |
The Turquoise Ridge Complex has a long history of exploration activities that has produced a vast quantity of information and led to several significant discoveries of gold deposits. While it may be considered a mature district, with respect to mining and exploration, there is still the possibility to discover more economic mineralization which justifies the continuation of exploration activities.
| 9.2 | Grids and Surveys |
| 9.2.1 | Turquoise Ridge Underground |
The underground was set up as a truncated form of the Nevada State Plane East NAD27 NGVD29 (Units XYZ feet (Truncation: X -800,000; Y- 2,000,000) coordinate system.
| 9.2.2 | Turquoise Ridge Surface and Vista Underground |
Prior to Newmont’s acquisition of the Twin Creeks Mine (now Turquoise Ridge Surface and Vista Underground), Santa Fe (Rabbit Creek Mine) acquired Gold Fields (Chimney Creek Mine). When Santa Fe acquired Gold Fields, Santa Fe’s Rabbit Creek Mine local coordinate grid was adopted as the grid for the combined mining area. It was renamed to the Twin Creeks Mine Grid.
Twin Creeks Mine Grid control is a local coordinate system based on the northeast corner of section 19 T39N, R43E and an assumed coordinate of 50000N, 20000E (US survey feet).
Conversions from published coordinate systems to local coordinates are handled in Trimble Geomatics Office (TGO), the survey software currently in use at Turquoise Ridge Surface and Vista Underground. Typically, the desired published coordinate systems xyz are loaded into the software and converted to WGS 84 LLH and then to Twin Creeks Mine Grid coordinates.
| 9.3 | Geological Mapping |
The mapping methods are described below by general geographic area.
| March 15, 2024 |
Page 103 |
|
|
Turquoise Ridge Complex NI 43-101 Technical Report |
|
| 9.3.1 | Turquoise Ridge Underground |
Faces and ribs are mapped in all active headings with occasional exception for conflict with mining sequence. Lithology, structure, alteration, and mineralization are recorded by intensity in Deswik Mapping using a Panasonic Toughpad.
| 9.3.2 | Turquoise Ridge Surface |
Historical mapping was scanned and integrated into ArcGIS. Mapping is now collected directly into mapping software in the field as the final highwall is exposed. Global Positing System (GPS) control has replaced traditional survey control. Using a tablet in the field with built in GPS, structural data, lithology, alterations, mineralization, and local rock type are entered into the digital map in NGM standard form.
| 9.3.3 | Vista Underground |
At Vista Underground, mapping data are collected for each round from every heading on paper and later entered into acQuire. Mapping of the face is done at 1:5, sills are typically 4.6 m wide. Data are collected for rock type, alteration, mineralization, and structure.
| 9.4 | Geochemical Sampling |
Due to the long mining history of the Turquoise Ridge Complex, geochemical sampling techniques used for grassroots exploration purposes, such as rock chip, stream sediment, and soil sampling, have been superseded by data from drilling, and information obtained from the exposures in the open pit and underground mines.
Current exploration activities use geochemical data collected from drill campaigns for exploration vectoring.
| 9.5 | Geophysics |
In the 1990s, previous operators began recognizing that geophysical methods could be used as to model geology and structure, aiding in vectoring for exploration. Completed geophysical surveys have employed gravity, airborne electromagnetic, magnetic, controlled source audio magnetotellurics (CSAMT), magnetotellurics (MT), and seismic methods. Hundreds of surveys have been completed by multiple operators across the entire Turquoise Ridge Complex over the last decades. The entire state of Nevada has been covered by geophysical surveys.
| March 15, 2024 |
Page 104 |
|
|
Turquoise Ridge Complex NI 43-101 Technical Report |
|
Gold mineralization is not directly detectable by geophysical methods; however, geophysical survey data is used to map subsurface properties that support lithology, alteration, and structural interpretations as guides to finding gold mineralization.
Key uses of the geophysical survey data are to delineate:
| ● | Intrusive rocks (porphyries) and contact metamorphic aureoles associated with such intrusions; |
| ● | Remnant-magnetized volcanic rocks; |
| ● | Fault mapping; |
| ● | Basin fill mapping; |
| ● | Pyrite zones, at depth; and |
| ● | Alteration, in particular zones of decalcification. |
| 9.6 | Petrology, Mineralogy, and Research Studies |
A significant number of structural, petrology, mineralogy, litho-geochemical, and research studies have been completed on the deposits of the Getchell Trend (including the area of the Turquoise Ridge Complex). NGM maintains a database of such studies as a reference tool for exploration.
| 9.7 | Exploration Potential |
| 9.7.1 | Near Mine |
NGM is actively exploring in the near mine areas, many of which retain prospectivity at depth, along strike from current operations, and down plunge. Current exploration focus includes:
| ● | Interpreted corridors of high-angle faults and fractures that can act as conduits for mineralizing fluids; |
| ● | Intersections of faults and dikes; |
| ● | Favorable lithofacies that have been fractured and/or brecciated and represent good potential for gold mineralization; and |
| ● | Deformation above and below mafic units that could generate fluid pathways such that gold mineralization may occur between the mafic units or have ponded under the mafic units acting as impermeable barriers. |
| March 15, 2024 |
Page 105 |
|
|
Turquoise Ridge Complex NI 43-101 Technical Report |
|
| 9.7.2 | Regional Exploration |
Significant potential remains within the Project PoO’s. Current regional exploration focus includes:
| ● | Geochemistry – using Carlin-type deposit model pathfinder elements as vectors to mineralization; |
| ● | Alteration – using alteration associated with Carlin-type deposit model as vectors to mineralization; |
| ● | Structure – targeting anticlines, fault intersections, dike and sill contacts, and other anomalous structural sites containing deep-seated fractures and rheologic changes that can act as conduits for mineralizing fluids; and |
| ● | Facies interpretation – to identify the most favorable mineralization host rocks. |
A major focus of NGM’s regional exploration programs remains in the area between Turquoise Ridge Underground and Mega Pit (refer to the locations shown on Figure 7-3).
| 9.8 | Comment on Exploration |
In the opinion of the QP:
| ● | The exploration programs completed to date are appropriate to the style of the deposits and prospects within the Turquoise Ridge Complex. |
| ● | In the opinion of the QP, all samples collected to date by the current and previous operators are representative and unbiased. The operation has and continues to show acceptable reconciliation results on a monthly and quarterly basis. |
| ● | The Turquoise Ridge Complex retains significant brownfields exploration potential, and additional work is planned by NGM to explore for mineralization at depth, along strike from current operations, and down plunge. |
| ● | Significant regional potential remains in the PoO areas, and a major focus of the regional exploration programs is the area between Turquoise Ridge Underground and Mega Pit. |
| March 15, 2024 |
Page 106 |
|
|
Turquoise Ridge Complex NI 43-101 Technical Report |
|
| 10 | Drilling |
| 10.1 | Summary |
A total of 31,053 drill holes totalling 4,383,771 m have been completed in the Turquoise Ridge Complex and recorded in the drillhole database as of December 31, 2023 and summarized in Table 10-1. Collar locations are shown in Figure 10-1. The drilling shown in this figure, as well as outside of it, encompasses drilling that has occurred during the majority of the exploration history of the Complex. Not all drilling shown is included in a Mineral Resource estimate, though it is relevant in the geologic and mineralization interpretations on a larger scale. This data has been validated and used in a regional scale exploration model for vectoring and targeting purposes supporting their accuracy and reliability for inclusion.
Over the history of the Turquoise Ridge Complex a number of different drilling techniques have been employed, including:
| ● | Reverse circulation (RC); |
| ● | Core; |
| ● | Air rotary; |
| ● | Mud rotary; and |
| ● | Cubex. |
Drilling fluids used during coring include water-based mud systems with bentonite (clay) and inorganic polymer added. Drilling muds are also employed in mud conventional and RC drilling.
Currently, core drilling is primarily used for Mineral Resource definition. RC drilling is used for grade control in both open pit and underground operations.
Table 10-1 Turquoise Ridge Complex Drill Summary Table
| Drill Type | Number of Drill Holes | Drilled Meters (m) | ||
| Core | 9,655 | 1,403,640 | ||
| RC | 11,314 | 1,609,361 | ||
| Rotary | 291 | 42,550 | ||
| Core;RC | 1,797 | 807,034 | ||
| Core;Rotary | 67 | 23,334 | ||
| RC;Rotary | 4 | 3,179 | ||
| Channel | 473 | 1,740 | ||
| Unknown | 7,452 | 492,933 | ||
| Total | 31,053 | 4,383,771 |
Totals may not add due to rounding.
| March 15, 2024 |
Page 107 |
|
|
Turquoise Ridge Complex NI 43-101 Technical Report |
|
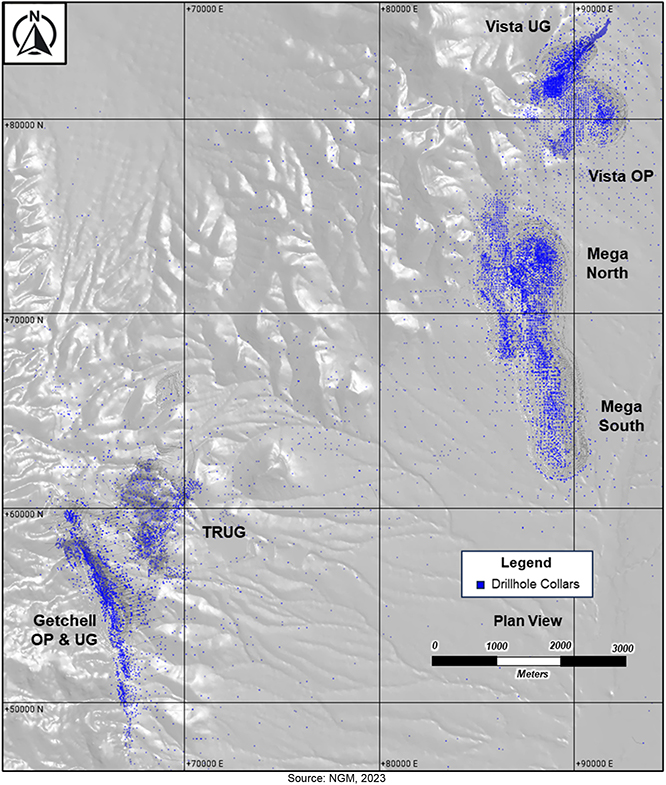
Figure 10-1 Project Drill Collar Location Plan
| March 15, 2024 |
Page 108 |
|
|
Turquoise Ridge Complex NI 43-101 Technical Report |
|
| 10.2 | Drilling Used to Support Mineral Resource Estimation |
Drilling that is used to support Mineral Resource estimation is summarized in Table 10-2 to Table 10-3 and the cutoff dates for this drilling data is shown in Table 10-5. It should be noted that the drilling used to support Mineral Resource estimation does not include all drilling contained in the database. Each estimation has a defined boundary that is a subset. There is drilling located outside of the defined Mineral Resource estimation boundaries but still within the overall Turquoise Ridge Complex. In some cases, drill holes may appear in two different estimations. An example of that would be the Vista Open Pit and Vista Underground, which overlap spatially. Additionally, as part of the QA/QC process some of the historical drilling was found to be unsuitable to be used to estimate Mineral Resources, but may be used for other purposes such as geologic modeling.
Drill collar location maps are provided for the deposits with current Mineral Resource estimates in Figure 10-2 and Figure 10-3.
Table 10-2 Turquoise Ridge Underground Drilling Supporting Mineral Resource Estimates
| Drill Type | Number of Drill Holes | Drilled Meters (m) | ||
| Core | 4,868 | 869,072 | ||
| RC | 3,028 | 275,883 | ||
| Core;RC | 430 | 269,392 | ||
| Core;Rotary | 2 | 2,073 | ||
| RC;Rotary | 1 | 549 | ||
| Unknown | 5,196 | 181,606 | ||
| Total | 13,525 | 1,598,573 |
Totals may not add due to rounding.
Table 10-3 Turquoise Ridge Surface Drilling Supporting Mineral Resource Estimates
| Drill Type | Number of Drill Holes | Drilled Meters (m) | ||
| Core | 1,772 | 273,665 | ||
| Reverse circulation | 5,053 | 850,287 | ||
| Core; RC | 1,282 | 357,354 | ||
| Core;Rotary | 64 | 20,363 | ||
| Unknown | 244 | 93,599 | ||
| Total | 8,415 | 1,595,270 |
Totals may not add due to rounding.
Table 10-4 Vista Underground Drilling Supporting Mineral Resource Estimates
| Drill Type | Number of Drill Holes | Drilled Meters (m) | ||
| Core | 3,009 | 246,886 | ||
| Core;RC | 356 | 98,462 | ||
| Channel | 473 | 1,740 | ||
| Unknown | 5 | 323 | ||
| Total | 3,843 | 347,412 |
Totals may not add due to rounding.
| March 15, 2024 |
Page 109 |
|
|
Turquoise Ridge Complex NI 43-101 Technical Report |
|
Table 10-5 Cutoff Dates for Drilling Data Supporting Mineral Resource Estimates by Deposit
| Deposit | Drilling Data Cutoff Date | |
| Turquoise Ridge Underground | May 16, 2023 | |
| Vista Underground | September 13, 2023 | |
| Mega Open Pit | April 12, 2023 | |
| Vista Open Pit | September 6, 2020 |
| March 15, 2024 |
Page 110 |
|
|
Turquoise Ridge Complex NI 43-101 Technical Report |
|
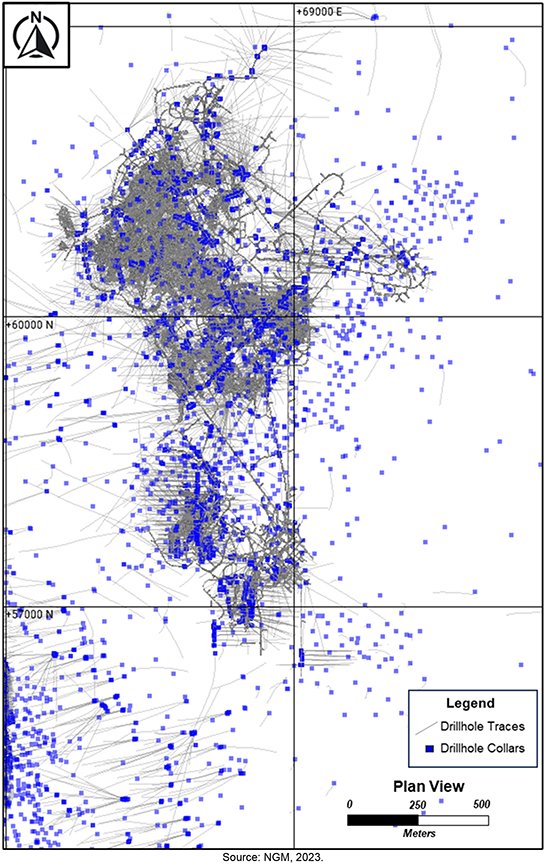
Figure 10-2 Drill Collar Location Map Turquoise Ridge Underground Drilling Supporting Mineral
Resource Estimates
| March 15, 2024 |
Page 111 |
|
|
Turquoise Ridge Complex NI 43-101 Technical Report |
|
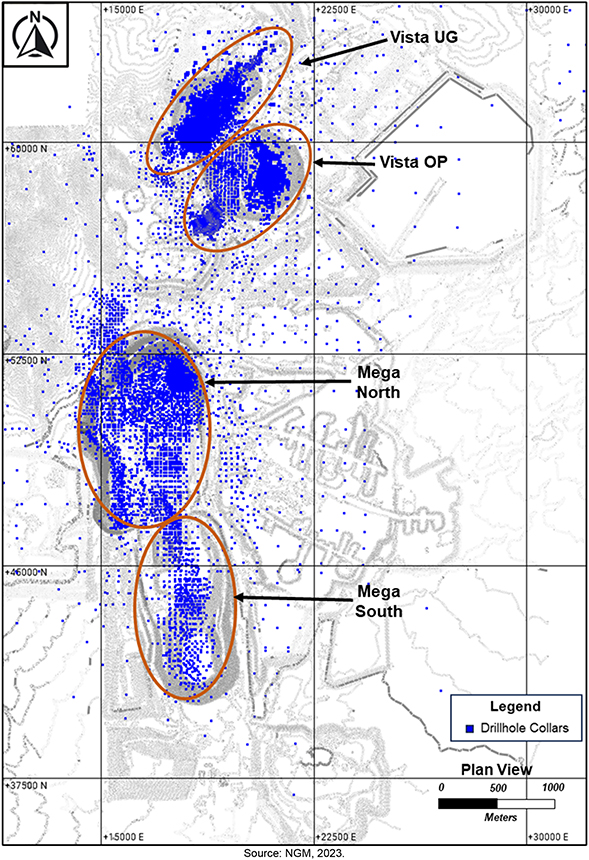
Figure 10-3 Drill Collar Location Plan, Turquoise Ridge Surface and Vista Underground Drilling
Supporting Mineral Resource Estimates
| March 15, 2024 |
Page 112 |
|
|
Turquoise Ridge Complex NI 43-101 Technical Report |
|
| 10.3 | Drill Methods |
| 10.3.1 | Drill Contractors |
Numerous drill contractors have been used over the Project history. Most recently, drill contractors have included Connor’s Drilling, Boart Longyear North America, Swick Drilling Inc., American Drilling Corporation, Timberline, Tonatec, Major Drilling, and National Drilling EWP.
| 10.3.2 | Air and Mud Drilling Methods |
The former Newmont operations (Turquoise Ridge Surface and Vista Underground) used conventional air drilling methods until about 1985. The drilling method used air to pull the sample from the bit to the hole collar up the outside of the drill stem. Typically, conventional air holes were short, <152 m (500 ft), and terminated at the water table. The drill diameter range was from 140–165 mm (5.5–6.5 in).
Conventional mud drilling by Newmont used a similar sampling technique; with drill muds employed facilitating drill sample return.
Both of these are no longer a standard industry drilling method as it does not provide a quality sample, as such NGM does not utilize these methods.
| 10.3.3 | Reverse Circulation Drilling Methods |
RC drill rigs are either truck-mounted or track-mounted. Drill bits are standard carbide-buttoned hammer bits (dry drilling conditions) and carbide-buttoned tri-cone (rock) bits (wet drilling conditions). Depths to which RC drilling is used depend on water table depths and the depth of mining activities in the region.
| 10.3.4 | Core Drilling |
Surface core drill rigs are either truck-mounted or track-mounted, underground core drills are self-powered (wheeled) or skid mount. Drilled core diameters include PQ (85 mm core diameter), HQ (63.5 mm), and NQ (47.6 mm). PQ rods are used for the upper portions of deep-target surface programs or in challenging ground conditions underground. HQ rods are the primary core size for both surface and underground. NQ rods are only used to complete a hole once HQ rods can no longer be advanced.
Drill bits are matrix supported with diamond for abrasive. Depths to which core is used depend on the capabilities of the drill, surface holes from truck mounted drills can extend to 1,500 m where underground drilling from a U-8 is limited to 450 m.
| March 15, 2024 |
Page 113 |
|
|
Turquoise Ridge Complex NI 43-101 Technical Report |
|
| 10.4 | Logging Procedures |
| 10.4.1 | Reverse Circulation |
The Turquoise Ridge Underground operations continue to use the Barrick logging procedures and codes, which were standardized in the 1990s and have undergone minor subsequent updates. Information collected includes hole number, project code, depth or total depth, logger, and date logged at the top of the page.
RC holes are logged directly into an acQuire database, and verified by the geology team before the drill hole is finalized and loaded into the database. Each chip tray is marked as logged with a red “L” on the end of the chip tray and then sent to the core shed where the trays are photographed.
The Turquoise Ridge Surface and Vista Underground mines have a comprehensive logging procedure for RC drill chips that was developed in the 1980s. Geological logging is conducted using a standardized set of pull-down fields in each column for structure, lithology (formation and rock type), metallurgical type, intensity codes for metallurgy and alteration. Comments can be added in the far-right column of the drill log at the geologist’s discretion.
With the formation of NGM, starting in October 2019, the drill hole data from the former Newmont-operated mines were copied to an NGM acQuire database with logging changed to the NGM logging data entry form using acQuire and web interface reports. This created a PDF document from the logged data, which is then stored on a network drive that is backed up regularly. The same data types are collected, and the procedures currently followed are those that were developed by Newmont.
| 10.4.2 | Core |
Comprehensive geological and geotechnical logging procedures have been developed for drill core. Geotechnical logging is completed on core using industry standards as directed by the project geologist or geotechnical engineer. NGM maintains a written protocol for drill core logging and sampling.
Samples from core drilling are taken from the core tube and placed into coated cardboard boxes. Intact core may be broken to make it fit into the box slots (mechanical breaks are marked). Core boxes are transported from the drill site to either the Twin Creeks or Turquoise Ridge core laboratories.
Core is measured and checked against run footage blocks and box labels for accuracy and sequence. Out of place core is reorganized and/or driller’s footage blocks relabeled as needed.
| March 15, 2024 |
Page 114 |
|
|
Turquoise Ridge Complex NI 43-101 Technical Report |
|
Core for all Turquoise Ridge operations is digitally logged in acQuire for lithology, stratigraphy, basic structural data, recovery, alteration, and mineralization. Detailed structural information such as faults and bedding angles as well as rock mass rating is recorded. Pre-2019 density samples were not regularly collected; however, post-NGM formation, density samples are collected every 15.2 m (50 ft). Stope test hole drill cuttings are logged as required.
Detailed digital geotechnical logging typically includes collection of information such as rock quality designation (RQD), joint roughness and shape, joint wall alteration, joint fills, joint condition rating, number of fractures, fracture frequency, and an estimate of the uniaxial compressive strength of intact rock.
At Turquoise Ridge Surface and Vista Underground, pre-2004 logging for geotechnical data, formation, lithology, alteration, structure, mineralization, and metallurgy was done on paper and hand-entered to the acQuire database. From 2004–2019, a propriety logging software (Visual Logger) was used to collect the same information. Since the formation of NGM, logging was adapted to acQuire.
Prior to the implementation of digital logging, the project geologist directly typed the hand-written logging information into the database. No validation or double data-entry techniques were employed at the time. Hardcopy logs that were used prior to the inception of electronic logging were archived and have since been digitised.
The core is photographed before sampling, either half or whole core (halved with a diamond saw). When half of the core is submitted for sampling, the other half is stored for future reference.
| 10.5 | Collar Surveys |
| 10.5.1 | Reverse Circulation |
Turquoise Ridge Underground drill holes are given sight lines by surveyors based on planned azimuths. High precision GPS instrumentation is used for collar surveys. Dips are set by the drillers based on the designed collar orientations. When drilling is complete, the collars of the exploration holes are surveyed to determine their final elevation, northing, easting, azimuth, and dip. If circumstances do not allow for survey of the collar, the planned location, azimuth, and dip are used.
Planned drill hole collar locations for the Turquoise Ridge Surface operations are set out by the open pit surveyors using a Trimble GPS instrument to determine the location of every drill hole and to establish foresights for all angled drill holes. After the holes are drilled, the surveyors pick up the final collar coordinates using GPS. Surveys are transferred electronically from the GPS to the computer of the appropriate project geologist who uploads the data, once validated, to the database.
| March 15, 2024 |
Page 115 |
|
|
Turquoise Ridge Complex NI 43-101 Technical Report |
|
Drill hole locations are field checked by either geologists or support staff, plotted on maps, and visually checked for reasonableness in the database.
| 10.5.2 | Core |
Planned drill hole collar locations for Turquoise Ridge Underground are marked up by drill services personnel using a Trimble total station instrument to determine the location of every hole and to establish front- and back-sites for all angle holes. Drillers use a TN-14 north-seeking azimuth aligner with a tolerance of ±0.5° to ensure proper setup. After collaring the hole, drill services pick up the collar coordinates using the Trimble instrument. Final collars are reviewed against plan to verify location.
Planned drill hole collar locations for the Turquoise Ridge Surface operations are set out by the open pit surveyors using a Trimble GPS instrument to determine the location of every drill hole and to establish foresights for all angled drill holes. After the holes are drilled, the surveyors pick up the final collar coordinates using GPS. Final collars are reviewed against plan to verify location.
Collars for Vista Underground are laid out using a Hilti Disto laser distance meter by measuring from established survey points by either geology or drill services. Final collars are picked up by underground surveyors using a Trimble total station. Final collars are reviewed against plan to verify locations.
| 10.6 | Down Hole Surveys |
| 10.6.1 | Reverse Circulation |
There is no current RC drilling taking place in Turquoise Ridge Underground. A similar method used for core was utilised for prior RC downhole surveys using reference gyro and azimuth aligner.
Determination of the hole trace was historically accomplished in the Turquoise Ridge Surface mines by projection of the initial collar orientation, using a downhole single-shot or multi-shot film camera (typical for most underground surveys), use of a downhole precession gyroscopic survey tool, or a gyroscopic tool requiring initial orientation with a compass. Current practice includes the use of gyroscopic surveys; with results being transmitted electronically and loaded into the acQuire database using pre-set software. Gyroscopic surveys are normally reported at 7.6 m or 15.2 m (25 or 50 ft) intervals. An external contracting company, IDS, completed the surveys.
| 10.6.2 | Core |
Downhole surveys are performed on all drill holes completed in the Turquoise Ridge Underground operations. Historically, surveys included magnetic and gyro instruments, but currently a
| March 15, 2024 |
Page 116 |
|
|
Turquoise Ridge Complex NI 43-101 Technical Report |
|
combination of north-seeking and conventional gyro instrumentation is used, including multi-shot Reflex Gyro, Reflex EZ-Trac, and Axis Gyro tools.
For underground drilling, surveys are conducted by the drillers during the drilling process either at final depth or when adverse ground conditions are encountered on approximately 3 m (10 ft) down-hole intervals. Currently, all holes greater than 15.2 m (50 ft) are downhole surveyed using SPT Gyrologic reference gyro with azimuth aligner.
Downhole surveys at Turquoise Ridge Surface are performed on all holes using a combination of north-seeking and conventional gyros. IDS conducts the surveys for holes collared from surface on 15.2 m (50 ft) downhole intervals.
| 10.7 | Recovery |
Recovery is not routinely recorded for RC drill holes. When recorded, core recovery is measured in the field during detailed logging and is generally good in all deposits, averaging greater than 94%. However, core recovery in the mineralized zones intersected during production drilling in the Turquoise Ridge Underground area can be poor (40–60%) and thus there is a risk of selective material loss that may impact on assay grade.
| 10.8 | Surface Grade Control Drilling |
As of the effective date of this report, there is no active open pit mining. In advance of scheduled mining, grade control drilling will be planned and executed, targeting areas scheduled to be mined in the next 18-month forecast. The grade control drilling will be completed using a combination of RC and diamond core drilling and will be used for final material routing.
When unable to complete grade control drill coverage, production blast hole samples may be used for final material routing.
| 10.9 | Underground Grade Control Drilling |
Grade control drilling programs are maintained for execution throughout the life of mine. The drilling utilizes diamond core drilling (HQ) targeting mineralization scheduled for mining within the next 18 months. The drilling is targeted to support local, high-resolution models used to support final mine designs and material routing.
| March 15, 2024 |
Page 117 |
|
|
Turquoise Ridge Complex NI 43-101 Technical Report |
|
Sampling and assaying gold and LECO utilize the same methods and standards as described previously for drilling informing long-term Resource models. Generally, multi-element data is not collected from grade control drilling.
When unable to complete grade control drill coverage ahead of mining, production samples (drill cuttings, channel samples, etc.) may be used to assist final material routing.
| 10.10 | Sample Length/True Thickness |
Mineralization at Turquoise Ridge Underground and Turquoise Ridge Surface is stratigraphically hosted and influenced by folding associated with regional tectonics that occurred prior to mineral deposition along with both pre and post mineral fault offsets. Drill holes are oriented to cross bedding and mineralized structure to define the true thickness of the mineralization.
Vista Underground is hosted in a northeasterly-trending sheer zone that dips approximately 70º to the west. Drilling for Vista Underground is oriented to cross this shear zone and define true widths of mineralization.
Sample lengths are determined more by geological changes in the core than the orientation of the drill hole relative to the mineralization.
Example sections showing the orientation of the drilling to the mineralization were provided previously in Figure 7-6 to Figure 7-10, Figure 7-12, and Figure 7-15.
| 10.11 | Comments on Drilling |
In the opinion of the QP, the quantity and quality of lithological, geotechnical, collar and downhole survey data collected in the drill programs are sufficient to support Mineral Resource and Mineral Reserve estimation.
The drilling, sampling methods, and collection process are representative of the material with no known factors that would introduce any biases of significant note. The QA/QC results show that there are no major issues and demonstrate the homogeneity of the ore bodies.
The recovery, while variable, is adequate to collect a sample that is representative over that interval. The zones of “no recovery” / “no sample” are indicated properly in areas of low to no recovery and aligned to a best practice in these deposits and is also aligned to the rest of the business.
| March 15, 2024 |
Page 118 |
|
|
Turquoise Ridge Complex NI 43-101 Technical Report |
|
No other material factors were identified with the data collection from the drill programs that would significantly affect the accuracy and reliability of drilling results nor the Mineral Resource and Mineral Reserve estimation.
| March 15, 2024 |
Page 119 |
|
|
Turquoise Ridge Complex NI 43-101 Technical Report |
|
| 11 | Sample Preparation, Analyses and Security |
| 11.1 | Sampling Methods |
| 11.1.1 | Historic Sampling Methods |
Air-Rotary and Mud-Rotary Sampling drill hole types were sampled on 1.5–30.5 m (5–100 ft) intervals. Early (mid 1980s) conventional rotary sampling may have been accomplished in dry conditions using non-porous plastic bags. Sample numbers were assigned using sample ticket books but since 1990, barcodes have been used.
These historic drill results are not used to support the Resource estimate.
| 11.1.2 | RC Drill Sampling |
RC drill holes are sampled on 1.5 m (5 ft) intervals, designated by measured intervals on the drill’s pull-down apparatus (e.g., cables, chains). Duplicate samples are typically collected at 1:20 intervals or every 30.5 m (100 ft). For RC holes <30.5 m in length, a duplicate is typically collected approximately half-way down the drill hole.
Drill samples (typically <1.2 cm (<0.5 inch) rock chips) are collected by the drillers in 1.5 m (5 ft) intervals in plastic chip trays for geologic logging. Each chip tray represents a maximum of 30 m (100 ft) of drilling. Samples from each interval are taken from the cyclone and placed into pre-labeled sample bags and closed with either draw string or zip tie. Bags are labeled with hole-ID and footage. Bar codes are affixed to each sample.
At Turquoise Ridge Underground, bags are loaded into metal bins and transported to the station and then to surface. Core technicians retrieve the samples from the collar and sort them at the core laboratory.
At Turquoise Ridge Surface, samples are placed in metal sample bins, which are taken to the core shed when the drill hole is complete. Core technicians complete the sample submittals and oversee the loading of the bins onto transport trucks provided by the commercial laboratory.
| 11.1.3 | Core Sampling |
Samples from core drilling are taken from the core tube and placed into coated cardboard boxes containing a nominal capacity of 3.05 m (10 ft). Intact core may be broken to make it fit into the box. Core is nominally sampled at 1.5 m (5 ft). Sample breaks respect lithological contacts with a minimum of 0.3 m (1 ft) at the discretion of the geologist.
| March 15, 2024 |
Page 120 |
|
|
Turquoise Ridge Complex NI 43-101 Technical Report |
|
At Turquoise Ridge Underground and Open Pit the entire core is sampled and split depending on the category of the drill program. For Framework and Inventory drill programs the core is fully split, and for Inferred drill programs approximately 25% of the drillholes are cut. At Vista Underground, the entire length of core is sampled and split as needed.
Core is cut with either a manual or automatic water-cooled diamond saw into 1⁄2 or 1⁄4 core segments depending on Mineral Resource category, geologic constraints, or metallurgical testing requirements. The samples are placed in bar-coded fabric bags, loaded in metal bins, and stored at the core shed until the core shed staff oversees loading of the bins onto a transport truck provided by the commercial laboratory.
| 11.1.4 | Production Sampling |
Production sampling for the underground operations consists of approximately 5 kg samples of drill cuttings collected by the drill operators after drilling of the round, at a rate of three to five samples per round, depending on heading width.
Grade Control and Reserve drilling use whole core sampling. Quarter or half core is only used when there is a requirement for further assays or other analysis types must be performed on the same sample interval. The drill core length for each assay is determined by the geology and alteration.
Production samples in the open pit operations are collected from blast holes using a through-the-deck rocket sampler.
Vista Underground geologists collect channel samples of every round at 3.5m from sill. These samples are taken from left to right, ensuring coverage of the hanging-wall, mineralized structural zone, and footwall. Sample breaks are determined by structure, lithology, alteration, and mineralization.
| 11.2 | Density Determinations |
| 11.2.1 | Turquoise Ridge Underground |
Density within the Mineral Resource models at Turquoise Ridge Underground is determined according to rock type or gold mineralization. Density studies in 2009, 2013, and 2019 were conducted to verify density according to rock type:
The 2019 study was completed in-house, used caliper measurements, instantaneous water immersion, and wax immersion to determine density. Samples were segregated into four lithologies: limestone, mudstone, dacite and basalt. Each group was further subdivided by alteration intensity. In all cases density decreased with increasing decalcification or argillic alteration.
| March 15, 2024 |
Page 121 |
|
|
Turquoise Ridge Complex NI 43-101 Technical Report |
|
The 2019 density study determined these density ranges using 1,296 samples.
| ● | Limestone: 2.33–2.69 g/cm3; |
| ● | Mudstone: 2.31–2.69 g/cm3; |
| ● | Basalt: 2.31–2.82 g/cm3; and |
| ● | Dacite: 2.34–2.66 g/cm3. |
The current model uses an average density of 2.63 g/cm3 for ore.
The collection of density data continues as does the effort to model density. Density samples are collected by the ore control geologists at a rate of 1 per 33 m for production core holes and 1 per 66 m for growth core holes. Once selected, the density measurements are conducted inhouse using a variation of the wax immersion technique. The database currently contains 5,122 measurements.
| 11.2.2 | Turquoise Ridge Surface |
The Turquoise Ridge surface operations assign density according to ore type (oxide or sulfide), or waste type (alluvium, mafic dikes or backfill). Density values range from 1.88 g/cm3 for alluvium to 2.63 g/cm3 for mafic dikes. The density of alluvium is highly variable and ranges from 1.65–1.99 g/cm3 with a weighted average of 1.88 g/cm3 applied for final tonnage factor.
Drill core samples 0.1–0.2 m in length are selected for density measurements based on rock type, alteration, oxide/sulfide and ore/waste characteristics. Geologists select the samples to be tested based on these observations.
| 11.2.3 | Vista Underground |
Density assignments at the Vista Underground are based on a current dataset of 2,793 measurements collected within the various ore zones. Generally, three density samples are collected per drill hole bracketing the mineralized zone. Current density measurements are conducted at the onsite labs.
| 11.3 | Analytical and Test Laboratories |
Over time different analytical laboratories have been used to support the Turquoise Ridge Complex. Laboratories have been picked to use best method and consistent methods over time for the areas being drilled and tested.
In the last 10 years, from 2013 to 2023, the Turquoise Ridge Complex has used 5 different external labs and two different internal labs. The external labs are ALS Global, American Assay Laboratories (AAL), BV Laboratories, Inspectorate America and SGS Minerals. The internal labs are on the
| March 15, 2024 |
Page 122 |
|
|
Turquoise Ridge Complex NI 43-101 Technical Report |
|
Turquoise Ridge site and one is known as the TR Lab, which was operated by Barrick, and one is known as the Twin Creeks Assay Laboratory (Twin Creeks Lab), which was operated by Newmont. Of the internal laboratories only the Twin Creeks Lab still operates under NGM. The Twin Creeks Lab is neither independent nor ISO-accredited.
Some de-risk drilling, which is drilling in areas to be mined in 18 months or less, is assayed at the internal Twin Creeks Laboratory to reduce cost and decrease turn around time. Those results are not used to support Mineral Resource estimates. For Resource drilling external labs that have ISO 17025 have been used as both primary and check assay labs. Those labs are ALS Global, AAL and SGS Minerals.
ALS (Reno & Elko, Nevada, United States of America; Twin Falls, Idaho, United States of America; Vancouver, British Columbia, Canada; Hermosillo, Sonora, Mexico) AAL (Reno, Nevada, United States of America), and SGS Minerals (Burnaby, British Columbia, Canada) are all independent, accredited testing laboratories and conform to the requirements set out by CAN-P-1579 and CAN-P-4E (ISO/IEC 17025:2005), the Requirements for the Accreditation of Mineral Analysis Testing Laboratories and General Requirements for the Competence of Testing and Calibration Laboratories, respectively. These commercial labs are independent of NGM and Barrick.
| 11.4 | Sample Preparation |
The procedures followed by the Twin Creeks Lab include drying, after which samples are crushed to 60% passing 10 mesh, split to 300 g, and pulverized to 80% passing 150 mesh.
The ALS sample preparation procedure consists of crushing to 70% passing -2 mm, split to 250 g, and pulverizing to better than 85% passing 75 µm.
At AAL, samples are crushed to 85% passing -2 mm, split to 300 g, and pulverized to 85% passing 75 µm.
Both commercial labs utilize rotary splitters to obtain the most representative sample in the sample reduction phase.
| 11.5 | Analysis |
The Turquoise Ridge Assay laboratory uses fire assay (FA) with an atomic absorption spectroscopy (AAS) finish for gold determinations. For quality assurance and quality control (QA/QC) purposes every batch of 24 samples contain two control samples of standard reference material (SRM). Every fourth board uses a control and a blank. If any control or blank QA/QC results are outside the accepted range, the entire batch is re-run.
| March 15, 2024 |
Page 123 |
|
|
Turquoise Ridge Complex NI 43-101 Technical Report |
|
AAS is performed for Cu, Fe, and Zn.
Many other elements are analysed by Vanta XRF ICP OES and MS including; Fe, As, Hg, Sb, Au, Ag, Mn, Zn, and Cu.
WAD and ICP MS cyanide analysis is also performed for environmental monitoring purposes.
Assay procedures requested of ALS Reno and ALS Vancouver include:
| ● | ALS Au-AA23 testing: fire assay (FA) gold with an atomic absorption spectroscopy (AAS) finish: |
| ○ | FA Fusion with AAS finish for Au |
| ○ | 30 g nominal sample weight |
| ○ | 0.005/10 g/t lower/upper limit |
| ○ | >100 g/t over limit testing by gravimetric by Au-GRA21 |
| ● | ALS Au-AA31b testing: cyanide leach and preg rob capacity: |
| ○ | Cyanide leach with Au spike; AAS finish for Au |
| ○ | 10 g nominal sample weight |
| ○ | 0.03/500 g/t lower/upper limit. |
| ● | Au-AA31bA testing: cyanide leach capacity: |
| ○ | Cyanide leach without Au spike; AAS finish for Au |
| ○ | 10 g nominal sample weight |
| ○ | 0.03/500 g/t lower/upper limit. |
| ● | ALS ME-MS41 testing: multi-element trace elements: |
| ○ | Aqua regia digestion with inductively coupled plasma (ICP) atomic emission spectroscopy (AES) or mass spectrometry (MS) |
| ○ | 0.50 g nominal sample weight |
| ○ | 51-element suite with automatic ore-grade testing on over limits |
| ○ | Over limits specific to each element. |
| ● | LECO testing: carbon and sulfur speciation for autoclave blending: |
| ○ | Total sulfur and carbon by LECO furnace analysis |
| ○ | HCI (25%) leach of carbonates (CO3) and sulfates with LECO furnace analysis for organic carbon (total carbonaceous material, TCM) and sulfide sulfur (SS). Sulfate and carbonate values reported as calculated values. |
| March 15, 2024 |
Page 124 |
|
|
Turquoise Ridge Complex NI 43-101 Technical Report |
|
| ○ | 0.1–0.2 g nominal sample weight |
| ○ | 0.01/50% lower/upper limit by weight. |
| ● | Assay procedures requested of AAL comprise: |
| ○ | Gold via FA with an ICP finish; detection limit of 0.003 g/t Au. |
| ○ | Overlimit analysis using gravimetric finish; detection limit 0.1 g/t Au. |
Both of the commercial labs are ISO 17025 accredited in all of the above analyses.
| 11.6 | Quality Assurance and Quality Control |
| 11.6.1 | Analytical Procedures |
Prior to the mid-1990s, few companies had rigorous QA/QC programs in place. At the time, QA/QC typically consisted of reanalysis of drill core or other samples when later sampling indicated a potential problem.
The QA/QC program for core and production samples processed at the Turquoise Ridge Assay laboratory consists of the insertion of SRM, blank, and pulp duplicates as internal laboratory checks in each batch of samples. Check assay samples are also sent to ALS Reno or ALS Vancouver, as applicable, for analysis. Insertion rates for the various QA/QC samples are provided in Table 11-1.
| March 15, 2024 |
Page 125 |
|
|
Turquoise Ridge Complex NI 43-101 Technical Report |
|
Table 11-1 QA/QC Samples and Insertion Rates
| QA/QC Type | Insertion Percentage |
Insertion Rate |
Note | |||
| Coarse Blanks | 5 | 1 in 20 | ||||
| Pulp blanks | Project specific as determined by site QP | N/A | Project specific as determined by site QP | |||
| Standards | 5 | 1 in 20 | ||||
| RC field duplicate | 5 | 1 in 20 | ||||
| Core field duplicate | Project specific as determined by site QP | N/A | Project specific as determined by site QP | |||
| Whole core field duplicate | N/A | N/A | Not inserted | |||
| Coarse duplicates | 2.5 | 1 in 40 | Geologist designates (wide spectrum must be selected: barren to mineralized), external laboratory creates rejects duplicate and analyzes in batch workflow | |||
| Pulp duplicates | 2.5 | 1 in 40 | Geologist designates (wide spectrum must be selected: barren to mineralized), external laboratory creates rejects duplicate and analyzes in batch workflow | |||
| Check assays (umpire assays) |
5 | 1 in 20 |
Geologist designates (wide spectrum must be selected: barren to mineralized), external laboratory creates pulp duplicates, returned to NGM and NGM resubmits to secondary laboratory with new SRMs inserted. Additional samples can be selected at the geologists’ discretion (QP driven) |
|||
NGM purchases SRM prepared by CDN Resources Labs (CDN) in Vancouver, British Columbia and OREAS in Victoria, Australia. The standards represent a grade range from approximately near detection limit to nearly 34 g/t Au and include both oxide and sulfide compositions.
Blank materials could be sourced from local hardware stores in the form of quartz pebble gravels, locally from Quaternary gravel pits, and from Ruby Mountain Sand and Gravel operations in Spring Creek, Nevada. The Twin Creeks Lab uses silica beads as an in-house blank.
| 11.6.2 | Analytical Monitoring |
NGM exploration QA/QC information from 2002 onward for the former Newmont operations was evaluated by the geology department using a variety of statistical procedures over different time periods resulting in multiple spreadsheets, reports, and memoranda. No critical issues were identified in these reviews, but a significant number of pre-NGM legacy issues concerning assay, collar and down hole survey were documented.
A specific QA/QC review was completed for the surface and underground deposit data, evaluating standard, blank and duplicate assays. No material issues were noted.
| March 15, 2024 |
Page 126 |
|
|
Turquoise Ridge Complex NI 43-101 Technical Report |
|
Current NGM practices are:
| ● | Blanks: a contamination failure is classified as either/or: 5x analytical detection limit and >1% carry over from three preceding samples. The re-run policy once contamination is confirmed is to create split from rejects, re-pulverized and re-analyze. If the contamination continues then quarter remaining drill core and re-submit with additional coarse blanks and silica washes. |
| ● | Standards: an accuracy failure is classified as any analysis that is outside ± 3 certified standard deviations from the certified mean. The re-run recommendations are: |
| ○ | For barren intervals (<0.5 g/t Au) – re-run at the geologist’s discretion (recommendation is not to re-run barren intervals). Inform the laboratory that there has been a standard failure and specify if the standard failed high or low; |
| ○ | For low grade intervals (>0.5–3 g/t Au) – re-run the failed standard ± 5 enveloping routine samples (max 11 samples). Inform the laboratory that there has been a standard failure and specify if the standard failed high or low; and |
| ○ | For mineralized intervals (>3 g/t Au) – re-run the failed standard ± 10 enveloping routine samples (max 21 samples). Inform the laboratory that there has been a standard failure and specify if the standard failed high or low. |
| ● | Standards: a bias failure is classified as any two consecutive standards that are both above or below ± 2 certified standard deviations from the certified mean. The re-run policy is to re-analyze pulps from last passing standard to the next passing standard. Inform the laboratory that there has been a standard failure and specify if the standard failed high or low. Barren intervals (<0.5 g/t Au) can be re-run at the geologist’s discretion. |
| ● | Duplicates: pulp duplicates are deemed failures if they fall outside of ±10% difference at concentrations ≥ 10 x the analytical detection limit. The re-run policy is to re-analyze pulps from last passing pulp duplicate to the next passing pulp duplicate. |
| ● | Check samples: considered failures if the two laboratories involved are outside of ± 5% bias difference. The re-run policy is to send the pulps to a third laboratory. |
Ongoing monitoring of QA/QC results is completed as assay data is received from ALS Reno and ALS Vancouver before uploading into the Turquoise Ridge Complex master database. Monthly and quarterly review and comprehensive analysis of the QA/QC results are conducted. The QA/QC program is monitored closely, and all issues identified with assay results are resolved prior to data approval and importation into the mine database. Automated reports are generated weekly, flagging any data that have not been reviewed to the relevant geologist; any data remaining uninvestigated for longer than a week at month-end is escalated in a report to site management.
The QA/QC reviews completed support that the data is acceptable for use in Mineral Resource estimation.
| March 15, 2024 |
Page 127 |
|
|
Turquoise Ridge Complex NI 43-101 Technical Report |
|
| 11.7 | Databases |
All project data is stored in an acQuire geoscience database on SQL Server. Assay data is imported directly from laboratory certificates or direct laboratory SQL server integration services (SSIS) packages.
For Turquoise Ridge Surface and Vista Underground, the former Newmont operations, geology logs were directly uploaded from Visual Logger to the Newmont Global Exploration Database (GED) database, eliminating the data entry step and possible errors associated with traditional paper logs. A hard copy was printed and archived in the geology office. All data within GED were transferred to acQuire after formation of NGM.
For Turquoise Ridge Underground, the former Barrick operation, geology logs were captured on paper and then a technician would enter that information into acQuire. The logs were then scanned and saved to a network drive for back up and archiving. This also served as a check to confirm logs had been uploaded to the database.
About 90–95% of the historical paper logging of the drill holes considered relevant to current exploration and operations, have been scanned.
Collar locations are verified by the geologist and the database analysts before the data are finalized. Downhole surveys are uploaded by the database administrator into acQuire. Survey accuracy and completeness are verified by the geologist and the database analysts before the data are finalized.
Density and geotechnical data are stored within the acQuire database.
Data that is logged on paper are subject to validation using built-in program triggers that automatically check manually entered data upon upload to the database.
Data is checked for QA/QC and validated by the importing database administrator. Integrated sub-programs called “triggers” and “constraints” automatically validate data whenever new information is added to, or changed within, the database. These sub-programs perform calculations, validation, verification, and range bound checks on the data to ensure that data errors are flagged and kept out of the data sets. Assays are ranked based on laboratory quality and method.
Data must be checked and approved by a geologist even if it has passed QA/QC and been verified by the database administrator. Only verified and approved assays are exported for Resource estimation purposes. Data extractions are accomplished using the acQuire export object and checked against previous exports to ensure data are not being altered and that exports are exporting the same historical data. The data extract may also be validated within Leapfrog or Vulcan using the validation tools in those software systems.
| March 15, 2024 |
Page 128 |
|
|
Turquoise Ridge Complex NI 43-101 Technical Report |
|
Database security and integrity is accomplished by restricting access and user level permissions that are set by the Database Manager. Once data entry and validation are completed for a drill hole, access is locked. There are procedures for version control on any updates that may happen over time, so that the database will retain all original information and prioritize use of any updates.
Data extractions are requested through the centralized share point system. Additionally, an onsite database administrator is available for direct consultation. The new data extraction is compared to previous extractions. It may also be validated within Leapfrog or Vulcan using the validation tools. Once the data are validated and database constructed, the data are visually validated within Vulcan, and new drill hole additions are checked within Vulcan for completeness.
| 11.8 | Sample Security |
Sample security from drill point to laboratory relies upon the fact that samples are either always attended to or stored in the on-site preparation facilities with a security presence or stored in a secure area prior to shipment to the external laboratories. Chain-of-custody procedures consist of sample submittal forms to be sent to the laboratory with sample shipments to ensure that all samples are received by the laboratory.
| 11.9 | Sample Storage |
Whole core, split core, and chip trays are stored on site in an enclosed warehouse, conex containers, or wrapped outside. Generally, entire holes are retained and are not skeletonized. Pulp envelopes are stored indefinitely. All core boxes, chip trays and pulps are coded to facilitate easy retrieval when required.
| 11.10 | Comments on Sample Preparation, Analyses, and Security |
The QPs consider that the sampling, sample preparation and analytical methods are acceptable, are in line with industry-standard practices, and are adequate for Mineral Resource and Mineral Reserve estimation and mine planning purposes.
| March 15, 2024 |
Page 129 |
|
|
Turquoise Ridge Complex NI 43-101 Technical Report |
|
| 12 | Data Verification |
| 12.1 | Summary |
Assay data verification performed during data upload is discussed in Section 11.7.
| 12.2 | External Reviews and Audits |
RPA checked previous Turquoise Ridge Underground estimates and external data reviews, and conducted independent reviews in 2011, 2014, and 2018 (RPA 2011, 2014, 2018). No material issues were identified at the time of each review.
In 2018, RPA completed a variety of validation queries and routines in Vulcan to identify any remaining data entry errors (RPA, 2018). Validity checks for data errors such as out of range values, missing intervals, and overlapping intervals were performed. The database was found to be acceptable, and no significant problems were noted. RPA did not collect independent samples as the historical production clearly demonstrates the presence of economic mineralization.
In 2023, as part of a comprehensive Resource Estimation audit, RSC reviewed sampling and assaying practices and performance (RSC, 2023). As part of this review check assays were undertaken for selected drill core and certified reference materials (CRM) pulps. The dataset is considered acceptable for Mineral Resource estimation, and results from the check assays passed bias and accuracy tests. In general data collection and verification procedures are in line with standard industry practices, although suggestions were provided for improvement. Notable recommendations included;
| ● | Review and expand documented procedures across data collection and verification activities. |
| ● | Consider reducing the use of RC, replacing with diamond core sampling. |
| ● | Reduce the available geologic logging codes and increase access to example core and geologic models for logging geologists to enhance the 3-D context of drillholes being logged. |
| 12.3 | Internal Reviews and Audits |
A project geologist must review and verify the collar survey, downhole survey, and geologic logging before the data are used in Resource modelling. Missing data, failure to survey, and use of planned data must be noted and such data inclusion in the Resource model is at the discretion of the geologist or Resource modeler. Database extractions are again reviewed by the modeling geologist. The
| March 15, 2024 |
Page 130 |
|
|
Turquoise Ridge Complex NI 43-101 Technical Report |
|
data are imported into Leapfrog. This step using Leapfrog readily identifies most problems within the extractions. Common problems include overlaps within a drill hole, missing or inconsistent total depths with final assay or survey data, or invalid data values. Any data errors are resolved in the AcQuire database, followed by extracting an updated dataset. A final data verification confirms all extracted data is suitable for Resource Estimation and compares with the previous data extraction to identify any unexpected data changes.
Internal reviews of the database were conducted annually from 2011–2023 in support of Mineral Resource estimates. New data is reviewed at completion of drilling when assays are returned. Data extractions are reviewed as an initial step for each model update. During 2023 an extensive and detailed internal review of the Turquoise Ridge Underground data was undertaken to confirm the quality of historic data.
| 12.4 | Comments on Data Verification |
The process of data verification for the Project has been performed by external consultancies and NGM personnel. The QPs performed data verification on the information in their areas of expertise.
The QPs consider that a reasonable level of verification has been completed, and that no material issues would have been left unidentified from the programs undertaken. The QP’s have reviewed and completed checks on the data and are of the opinion that the data verification and QA/QC programs undertaken on the database for the project adequately support the geological interpretations and Mineral Resource estimation process. The site and regional teams have a series of controls in place to generate a consistent set of best data for use in geologic and Resource estimations that are satisfactory. NGM has a plan in place to work through identified issues and resolve any uncertainties and is actively resolving issues as they arise.
| March 15, 2024 |
Page 131 |
|
|
Turquoise Ridge Complex NI 43-101 Technical Report |
|
| 13 | Mineral Processing and Metallurgical Testing |
| 13.1 | Summary |
This section reviews the metallurgical testing that has been completed to illustrate the amenability of both open pit and underground ore sources for processing at the oxidation/milling and leach facilities. Historical work on ores yet to be mined and processed, as well as bench testing of monthly composites from current processing have been reviewed. Both the past plant performance and more recent testing confirm the amenability of the ore to autoclave oxidation/carbon-in-leach (CIL) leaching as practiced at the Turquoise Ridge Processing facility. An adjustment of +3% to the recovery curve was made this year, based on plant CIL improvements.
Processing of oxide and refractory ores at the Turquoise Ridge Complex is completed through the Juniper oxide mill, the Sage refractory facility, and a number of heap leach pads:
| ● | Oxide ore from the open pits is processed through the existing Juniper oxide mill or heap leach facilities, depending on ore grade and characteristics such as the clay and silica percentages. Oxide ores are those in which the gold is available for direct leaching by cyanide via conventional leach or milling methods. Oxide ores have been processed through the Juniper Mill (originally the Chimney Creek mill) since 1988. |
| ● | Low-grade oxide ores have been leached on multiple run-of-mine heap leach pads since at least 1996. |
| ● | Refractory ore from underground and open pit sources is processed through the Sage Mill pressure oxidation autoclaves, where the sulfide sulfur (SS) holding the gold is oxidized to liberate the gold so it can be recovered through conventional cyanidation (CIL). Refractory ores have been processed through the Sage Mill (originally the Twin Creeks mill) since 1996. |
| ● | On an ad-hoc basis the Turquoise Ridge process facilities have periodically toll treated ores from other sources of non-owned regional operations when excess process capacity is available and if there is a benefit to NGM in doing so. |
All processing facilities are located at Turquoise Ridge Surface, on the former Twin Creeks property.
Over the Project history, testwork has been completed by a number of independent and non-independent metallurgical facilities, including: Amtel (London, ON, Canada) AuTec Innovative Extraction Solutions Inc (Vancouver, BC, Canada); Barrick Goldstrike Metallurgical Services (Eureka County, NV); Kappes Cassiday and Associates (Reno, NV); Newmont Metallurgical Services (Englewood, CO); Placer Dome Research Facility (Vancouver, BC, Canada); and Turquoise Ridge
| March 15, 2024 |
Page 132 |
|
|
Turquoise Ridge Complex NI 43-101 Technical Report |
|
Metallurgical Services (Golconda, NV). Metallurgical testwork facilities are typically not accredited for metallurgical testwork techniques.
Early testwork to establish heap leach, mill, and autoclave parameters included chemical analyses (head grade, screen); mineralogy; comminution (Bond work, Bond rod mill, abrasive index, grindability, multi-stage crushing, semi-autogenous grind circuit and ball milling parameters); agglomeration; flotation tests (bottle roll, column, bench); CIL (leach and shaker); autoclave tests (batch and continuous); circulating fluid bed roasting; calcine tests; carbon adsorption/activation tests; cyanide amenability testwork; chlorination testwork; bio-oxidation testwork; reagent selection tests; thickener tests; and deleterious element and impurity evaluations.
The testwork completed in these programs is considered acceptable to support recovery and deleterious element assumptions for LOM planning purposes.
Laboratory testing is completed on new deposits and mine extensions to confirm the amenability of ores in the new areas/zones to the current process methods. The majority of this testwork has been completed in the on-site testing facility with some specialty work completed off site.
Recent metallurgical testwork primarily focused on core samples from the proposed expansion of the Mega open pit (refer to discussion of the Mega Pit in Section 16.3).
| 13.2 | Metallurgical Testwork |
| 13.2.1 | Variability of Preg-robbing in Turquoise Ridge Ores |
The main variables that correlate to gold recovery in the Sage autoclave are gold grade and total organic carbon (total carbonaceous material, TCM). The carbon in different ore sources varies in its impact on recovery, observable both from plant data and preg-rob index testing (the comparison of cyanide solubility tests completed on an ore sample with and without additional gold added. The index is calculated by comparing how much of the gold “spike” addition remains relative to a leach without a spike). Figure 13-1 illustrates the relationship between total organic carbon and the preg-rob index for samples collected from various ore sources at the Turquoise Ridge Complex.
Ores with the same amount of organic carbon can vary in the preg-rob index from insignificant preg-rob (0–40%) to severe preg-rob (75–100%). This indicates a variability in the ability of these different carbons to adsorb gold from cyanide during leaching. The Mega Pit ores vary but contain the most aggressive preg-robbing material, while the Turquoise Ridge Underground and Vista Underground contain carbon with moderate to no preg-robbing characteristics. These differences are accounted for in the separate recovery curves for these ore sources.
| March 15, 2024 |
Page 133 |
|
|
Turquoise Ridge Complex NI 43-101 Technical Report |
|
In 2017, Hazen Research Inc. (Hazen, 2018) completed a series of six preg-robbing tests using a sample from Turquoise Ridge that had a head grade of 17.14 g/t Au and 0.6% organic carbon, and variable testing conditions. The results were consistent with historical results. Turquoise Ridge Underground organic carbon, though of similar concentrations, is less preg-robbing than the Mega Pit organic carbon.
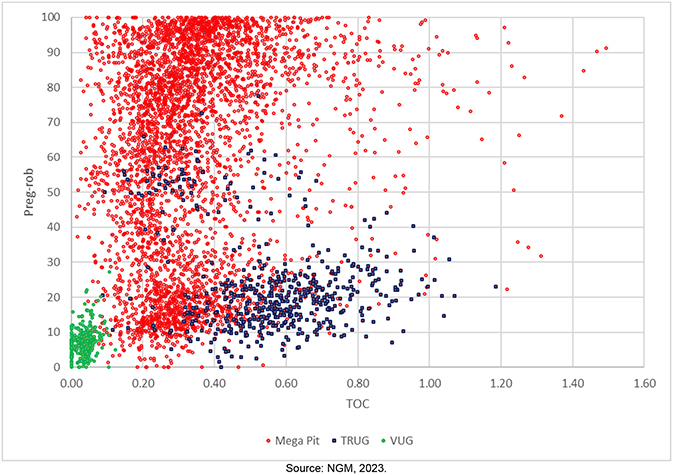
Figure 13-1 Relationship Between Total Organic Carbon (TOC) and the Preg-Rob Index
| 13.2.2 | Turquoise Ridge Underground |
Significant historical work has been completed on the TRUG refractory ores to date. Tests have been conducted on drill core samples, as well as monthly composites that were representative of plant feed. Results have shown that the ore is amenable to current autoclave oxidation processing methods, as practiced at the Sage Mill.
A test program was conducted between January 2012 and January 2015 with 17 drill holes being completed for bench-top autoclave (BTAC) testing which simulates the extraction process to predict recovery rates. Material for this testing comprised of drill hole composites with the results summarised in Table 13-1. The drill hole locations are shown in Figure 13-2.
| March 15, 2024 |
Page 134 |
|
|
Turquoise Ridge Complex NI 43-101 Technical Report |
|
Although a portion of the historical BTAC testing represents material that has already been processed, some future ores are still scheduled for processing and are also included in the historical results presented in Table 13-1.
Figure 13-2, shows the locations of drill holes from met testing in the underground workings and how they relate to the Mineral Reserves. It shows there is a significant overlap of the drill holes from the historical testing program with future ores to be mined and processed. After reviewing the proportion of mined out material represented by these drill holes and comparing it to the proportion associated with mining shapes included in the Mineral Reserves, more than two-thirds of the historical BTAC testing is representative of the future ores.
Table 13-1 Drill Hole Test Program BTAC Results
|
Sample ID |
Hole No. | Rock Type | Au g/t | CO3 % |
TCM % |
S2 % | As % |
Gold % |
||||||||
| VCS140 | TU01397 | Fragmental (100) | 5.86 | 3.25 | 0.72 | 4.78 | 3.46 | 94.9 | ||||||||
| VCS2 | TU01141 | Megaclastic (100) | 5.96 | 0.55 | 1.23 | 3.42 | 3.33 | 93.2 | ||||||||
| VCS68 | TU01146 | Megaclastic (100) | 5.99 | 7.10 | 0.99 | 3.46 | 0.32 | 88.9 | ||||||||
| VCS138 | TU01396 | Fragmental (100) | 6.05 | 5.08 | 0.19 | 5.06 | 4.48 | 89.7 | ||||||||
| VCS26 | TU01506 | North Pillow Basalt | 6.07 | 0.05 | 0.03 | 14.14 | 0.16 | 96.6 | ||||||||
| VCS40 | TU01172 | Fragmental (100) | 6.08 | 0.05 | 0.05 | 2.21 | 1.18 | 94.7 | ||||||||
| VCS141 | TU01397 | Megaclastic (100) | 6.63 | 0.10 | 1.31 | 2.90 | 1.61 | 92.0 | ||||||||
| VCS63 | TU01172 | Megaclastic (100) | 7.17 | 2.15 | 1.45 | 3.96 | 2.36 | 81.1 | ||||||||
| VCS13 | TU01138 | Megaclastic (100) | 8.33 | 2.60 | 1.82 | 3.47 | 0.37 | 75.6 | ||||||||
| VCS19 | TU01164A | Fragmental (100) | 8.86 | 6.45 | 0.38 | 3.38 | 0.46 | 87.0 | ||||||||
| VCS11 | TU01141 | Megaclastic (100) | 9.23 | 2.45 | 0.14 | 4.50 | 2.56 | 97.7 | ||||||||
| VCS97 | TU01385 | Fragmental (100) | 9.70 | 4.70 | 0.15 | 3.33 | 0.83 | 94.3 | ||||||||
| VCS37 | TU01184 | Limestone ( 100) | 10.39 | 0.35 | 0.68 | 3.47 | 0.32 | 75.1 | ||||||||
| VCS67 | TU01145 | Megaclastic (100) | 10.47 | 1.90 | 0.11 | 4.22 | 1.41 | 91.3 | ||||||||
| VCS10 | TU01137 | Megaclastic (100) | 11.40 | 0.65 | 1.64 | 4.00 | 0.53 | 65.4 | ||||||||
| VCS89 | TU01388 | Powderhill (100) | 13.28 | 0.40 | 1.28 | 4.54 | 4.01 | 93.6 | ||||||||
| VCS89 | TU01388 | Powderhill (100) | 13.28 | 0.40 | 1.28 | 4.54 | 4.01 | 93.0 | ||||||||
| VCS112 | TU01534 | North Pillow Basalt | 14.11 | 0.20 | 0.02 | 10.63 | 0.61 | 95.0 | ||||||||
| VCS90 | TU01388 | Powderhill (100) | 15.26 | 1.45 | 0.35 | 5.47 | 7.09 | 96.0 | ||||||||
| VCS70 | TU01165 | Megaclastic (100) | 16.78 | 8.55 | 0.98 | 3.25 | 1.90 | 70.4 | ||||||||
| VCS65 | TU01142A | Megaclastic (100) | 18.03 | 1.50 | 0.81 | 6.54 | 10.32 | 89.8 | ||||||||
| VCS65 | TU01142A | Megaclastic (100) | 18.03 | 1.50 | 0.81 | 6.54 | 10.32 | 86.1 | ||||||||
| VCS64 | TU01137 | Megaclastic (100) | 23.87 | 0.25 | 0.54 | 3.97 | 2.13 | 79.1 | ||||||||
| VCS64 | TU01137 | Megaclastic (100) | 23.87 | 0.25 | 0.54 | 3.97 | 2.13 | 83.8 | ||||||||
| VCS36 | TU01184 | Limestone (100) | 25.12 | 0.05 | 0.23 | 4.41 | 0.51 | 93.5 | ||||||||
| VCS113 | TU01535 | Fragmental (100) | 27.37 | 0.25 | 0.56 | 6.22 | 4.61 | 80.4 | ||||||||
| VCS16 | TU01138 | Fragmental (100) | 27.38 | 0.75 | 0.47 | 4.32 | 0.56 | 92.3 | ||||||||
| VCS18 | TU01164A | Fragmental (100) | 38.73 | 0.25 | 0.29 | 4.90 | 0.96 | 91.5 | ||||||||
| Average | 14.0 | 1.9 | 0.7 | 4.8 | 2.6 | 87.9 | ||||||||||
| March 15, 2024 |
Page 135 |
|
|
Turquoise Ridge Complex NI 43-101 Technical Report |
|
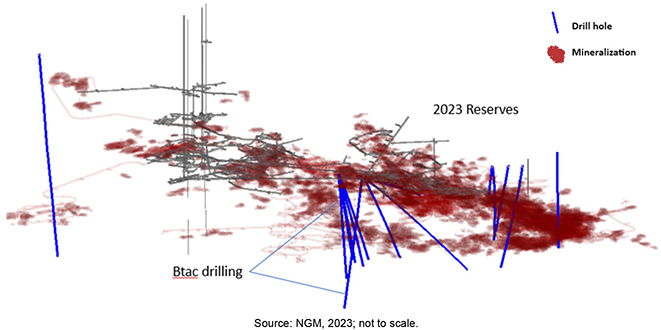
Figure 13-2 View of the TRUG Showing Mineral Reserves and BTAC Drill Holes
Monthly Composite Testing – Historical Data
Prior to the formation of NGM, the Turquoise Ridge Underground material was processed in distinct monthly lots. After completion of a monthly lot, but prior to processing, an RC drill rig would thoroughly drill the stockpile, generating approximately 1,000 to 3,000 samples from each stockpile. A composite sample from each month was then sent out to a third-party lab for BTAC testing. The results from these tests and the actual plant recovery results are shown below in Table 13-2.
Table 13-2 TRUG Monthly Composite BTAC vs Plant Results
|
Date Processed |
Lot Name | BTAC Results | Plant Results |
Difference (%) |
||||
| Feb 2008 | Turquoise Ridge Stockpile Lot #54 | 89.4 | 91.8 | 2.4 | ||||
| Mar 2008 | Turquoise Ridge Stockpile Lot #55 | 90.5 | 90.9 | 0.4 | ||||
| Apr 2008 | Turquoise Ridge Stockpile Lot #56 | 92.4 | 90.8 | -1.6 | ||||
| May 2008 | Turquoise Ridge Stockpile Lot #57 | 84.5 | 89.5 | 5.0 | ||||
| Jun 2008 | Turquoise Ridge Stockpile Lot #58 | 92.9 | 89.7 | -3.2 | ||||
| Jul 2008 | Turquoise Ridge Stockpile Lot #59 | 92.9 | 89.5 | -3.4 | ||||
| Aug 2008 | Turquoise Ridge Stockpile Lot #60 | 81.3 | 92.0 | 10.7 | ||||
| Sep 2008 | Turquoise Ridge Stockpile Lot #61 | 86.8 | 94.2 | 7.4 | ||||
| Oct 2008 | Turquoise Ridge Stockpile Lot #62 | 93.9 | 93.1 | -0.8 | ||||
| Nov 2008 | Turquoise Ridge Stockpile Lot #63 | 93.4 | 92.7 | -0.7 | ||||
| Dec 2008 | Turquoise Ridge Stockpile Lot #64 | 95.9 | 91.2 | -4.7 | ||||
| Jan 2009 | Turquoise Ridge Stockpile Lot #65 | 93.8 | 91.5 | -2.3 | ||||
| Feb 2009 | Turquoise Ridge Stockpile Lot #66 | 88.4 | 89.9 | 1.5 | ||||
| Mar 2009 | Turquoise Ridge Stockpile Lot #67 | 87.9 | 92.6 | 4.8 | ||||
| Apr 2009 | Turquoise Ridge Stockpile Lot #68 | 79.7 | 93.3 | 13.6 | ||||
| May 2009 | Turquoise Ridge Stockpile Lot #69 | 92.5 | 94.6 | 2.1 | ||||
| Jun 2009 | Turquoise Ridge Stockpile Lot #70 | 93.2 | 94.2 | 1.0 | ||||
| Jul 2009 | Turquoise Ridge Stockpile Lot #71 | 98.9 | 93.9 | -4.9 | ||||
| March 15, 2024 |
Page 136 |
|
|
Turquoise Ridge Complex NI 43-101 Technical Report |
|
| Aug 2009 | Turquoise Ridge Stockpile Lot #72 | 84.5 | 94.2 | 9.7 | ||||
| Sep 2009 | Turquoise Ridge Stockpile Lot #73 | 89.7 | 97.5 | 7.8 | ||||
| Oct 2009 | Turquoise Ridge Stockpile Lot #74 | 88.7 | 93.9 | 5.2 | ||||
| Nov 2009 | Turquoise Ridge Stockpile Lot #75 | 81.4 | 89.9 | 8.5 | ||||
| Dec 2009 | Turquoise Ridge Stockpile Lot #76 | 87.9 | 90.3 | 2.4 | ||||
| Jan 2010 | Turquoise Ridge Stockpile Lot #77 | 93.8 | 93.7 | -0.1 | ||||
| Feb 2010 | Turquoise Ridge Stockpile Lot #78 | 78.8 | 94.0 | 15.2 | ||||
| Mar 2010 | Turquoise Ridge Stockpile Lot #79 | 91.7 | 95.2 | 3.5 | ||||
| Apr 2010 | Turquoise Ridge Stockpile Lot #80 | 89.7 | 90.9 | 1.2 | ||||
| May 2010 | Turquoise Ridge Stockpile Lot #81 | 95.3 | 91.1 | -4.2 | ||||
| Jun 2010 | Turquoise Ridge Stockpile Lot #82 | 92.0 | 93.9 | 1.9 | ||||
| Jul 2010 | Turquoise Ridge Stockpile Lot #83 | 94.2 | 88.8 | -5.4 | ||||
| Aug 2010 | Turquoise Ridge Stockpile Lot #84 | 88.7 | 91.6 | 2.9 | ||||
| Sep 2010 | Turquoise Ridge Stockpile Lot #85 | 90.9 | 86.3 | -4.6 | ||||
| Oct 2010 | Turquoise Ridge Stockpile Lot #86 | 92.0 | 91.3 | -0.7 | ||||
| Nov 2010 | Turquoise Ridge Stockpile Lot #87 | 93.2 | 91.7 | -1.4 | ||||
| Dec 2010 | Turquoise Ridge Stockpile Lot #88 | 91.9 | 93.1 | 1.3 | ||||
| Jan 2011 | Turquoise Ridge Stockpile Lot #89 | 91.6 | 88.8 | -2.8 | ||||
| Feb 2011 | Turquoise Ridge Stockpile Lot #90 | No Results Available | 88.8 | N/A | ||||
| Mar 2011 | Turquoise Ridge Stockpile Lot #91 | 86.7 | N/A | |||||
| Apr 2011 | Turquoise Ridge Stockpile Lot #92 | 88.6 | N/A | |||||
| May 2011 | Turquoise Ridge Stockpile Lot #93 | 93.2 | N/A | |||||
| Jun 2011 | Turquoise Ridge Stockpile Lot #94 | 86.5 | N/A | |||||
| Jul 2011 | Turquoise Ridge Stockpile Lot #95 | 93.1 | N/A | |||||
| Aug 2011 | Turquoise Ridge Stockpile Lot #96 | 90.8 | N/A | |||||
| Sep 2011 | Turquoise Ridge Stockpile Lot #97 | 89.1 | N/A | |||||
| Oct 2011 | Turquoise Ridge Stockpile Lot #98 | 91.4 | N/A | |||||
| Nov 2011 | Turquoise Ridge Stockpile Lot #99 | 85.7 | N/A | |||||
| Dec 2011 | Turquoise Ridge Stockpile Lot #100 | 91.2 | N/A | |||||
| Jan 2012 | Turquoise Ridge Stockpile Lot #101 | 91.0 | 93.5 | 2.5 | ||||
| Feb 2012 | Turquoise Ridge Stockpile Lot #102 | 91.8 | 90.7 | -1.1 | ||||
| Mar 2012 | Turquoise Ridge Stockpile Lot #103 | 92.4 | 91.6 | -0.8 | ||||
| Apr 2012 | Turquoise Ridge Stockpile Lot #104 | 91.8 | 91.5 | -0.3 | ||||
| May 2012 | Turquoise Ridge Stockpile Lot #105 | 94.0 | 93.0 | -1.0 | ||||
| Jun 2012 | Turquoise Ridge Stockpile Lot #106 | 91.9 | 94.0 | 2.1 | ||||
| Jul 2012 | Turquoise Ridge Stockpile Lot #107 | 91.7 | 91.9 | 0.2 | ||||
| Aug 2012 | Turquoise Ridge Stockpile Lot #108 | 89.7 | 94.6 | 4.9 | ||||
| Sep 2012 | Turquoise Ridge Stockpile Lot #109 | 93.0 | 94.2 | 1.2 | ||||
| Oct 2012 | Turquoise Ridge Stockpile Lot #110 | 92.9 | 94.2 | 1.3 | ||||
| Nov 2012 | Turquoise Ridge Stockpile Lot #111 | 91.6 | 91.3 | -0.3 | ||||
| Dec 2012 | Turquoise Ridge Stockpile Lot #112 | 91.0 | 91.6 | 0.6 | ||||
| Jan 2013 | Turquoise Ridge Stockpile Lot #113 | 91.3 | 91.3 | 0.0 | ||||
| Feb 2013 | Turquoise Ridge Stockpile Lot #114 | 90.5 | 92.6 | 2.1 | ||||
| Mar 2013 | Turquoise Ridge Stockpile Lot #115 | 87.9 | 92.5 | 4.6 | ||||
| Apr 2013 | Turquoise Ridge Stockpile Lot #116 | 88.8 | 93.4 | 4.5 | ||||
| May 2013 | Turquoise Ridge Stockpile Lot #117 | 90.0 | 94.9 | 4.9 | ||||
| Jun 2013 | Turquoise Ridge Stockpile Lot #118 | 89.6 | 94.8 | 5.3 | ||||
| Jul 2013 | Turquoise Ridge Stockpile Lot #119 | 88.1 | 91.0 | 2.9 | ||||
| Aug 2013 | Turquoise Ridge Stockpile Lot #120 | 89.7 | 92.0 | 2.4 | ||||
| Sep 2013 | Turquoise Ridge Stockpile Lot #121 | 89.4 | 87.1 | -2.3 | ||||
| Oct 2013 | Turquoise Ridge Stockpile Lot #122 | 89.2 | 90.5 | 1.3 | ||||
| Nov 2013 | Turquoise Ridge Stockpile Lot #123 | 90.2 | 88.4 | -1.9 | ||||
| Dec 2013 | Turquoise Ridge Stockpile Lot #124 | 89.4 | 91.1 | 1.7 | ||||
| Jan 2014 | Turquoise Ridge Stockpile Lot #125 | 89.0 | 91.8 | 2.8 |
| March 15, 2024 |
Page 137 |
|
|
Turquoise Ridge Complex NI 43-101 Technical Report |
|
| Feb 2014 | Turquoise Ridge Stockpile Lot #126 | 92.6 | 93.0 | 0.5 | ||||
| Mar 2014 | Turquoise Ridge Stockpile Lot #127 | 85.9 | 94.1 | 8.2 | ||||
| Apr 2014 | Turquoise Ridge Stockpile Lot #128 | 87.5 | 93.1 | 5.6 | ||||
| May 2014 | Turquoise Ridge Stockpile Lot #129 | 86.4 | 92.2 | 5.8 | ||||
| Jun 2014 | Turquoise Ridge Stockpile Lot #130 | 86.8 | 92.3 | 5.5 | ||||
| Jul 2014 | Turquoise Ridge Stockpile Lot #131 | 92.2 | 92.7 | 0.5 | ||||
| Aug 2014 | Turquoise Ridge Stockpile Lot #132 | 88.1 | 93.4 | 5.4 | ||||
| Sep 2014 | Turquoise Ridge Stockpile Lot #133 | No Results Available | 94.5 | N/A | ||||
| Oct 2014 | Turquoise Ridge Stockpile Lot #134 | 86.0 | 92.0 | 6.0 | ||||
| Nov 2014 | Turquoise Ridge Stockpile Lot #135 | 83.6 | 93.5 | 9.9 | ||||
| Dec 2014 | Turquoise Ridge Stockpile Lot #136 | 77.7 | 92.3 | 14.6 |
The BTAC results were generally within a few percent of actual plant gold recoveries, indicating an acceptable accuracy of the BTAC testing method for recovery predictions. However, several lots had a notable deviation (typically lower) as compared to the plant. This can be caused by a malfunction in the BTAC test itself (blocked sparging tube, insufficient acidulation, etc), but is more typically due to the presence of active TCM in the sample and the presence of halogens, which dissolve and then deposit gold onto the TCM. This phenomenon is particular to BTAC testing, where oxidation conditions are very high, and is not typically observed in a commercial plant operating under normal conditions.
Monthly Composite Testing – Current
In addition to the historical BTAC testing results (shown in Table 13-2 above), composites from TRUG representing processed feed for the month have continued to be routinely evaluated. Figure 13-3 shows the average monthly TRUG recovery as a function of organic carbon/gold head grade from January 2014 to October 2023. Due to the varied blend of ore types and process changes over the last five years, budgeting and forecasting purposes uses the linear correlation which was updated to account for the most recent plant performance. It shows a correlation coefficient (R2) of 0.557, and represents an acceptable correlation, especially when considering the variable conditions inherent in plant operations. While this value does not indicate perfect predictability, it is significant in the context of the mining industry where numerous fluctuating factors such as ore composition, processing efficiency, and operational adjustments can introduce considerable variability. The achievement of an R2 of 0.557 suggests that despite these complexities and the inherent noise in plant data, there is a substantial and reliable degree of predictability between the ratio of organic carbon concentration to gold head grade and the gold recovery rate.
| March 15, 2024 |
Page 138 |
|
|
Turquoise Ridge Complex NI 43-101 Technical Report |
|
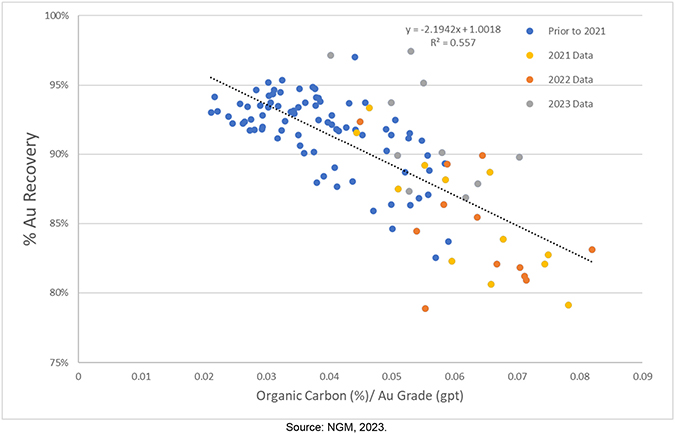
Figure 13-3 TRUG Recovery as a Function of Organic Carbon and Gold Head Grade
Based on the testwork performed to date, and with the knowledge that the underground ore domains planned in the LOM do not change appreciably with respect to metallurgical characteristics, the QP considers that historical testing in combination with current plant data will be representative of the recoveries that will be achieved going forward.
| 13.2.3 | Vista Underground |
The Vista Underground ore is planned to be exhausted in the LOM by the end of H1 2024. As such, no additional bench-scale amenability testing of VUG ore has been conducted.
Historic plant performance shown in Figure 13-1 above shows continued good amenability to autoclave/CIL processing as practiced at the Sage facility. Metallurgical testing of any future VUG extensions would be conducted as sufficient material is identified.
| 13.2.4 | Turquoise Ridge Mega Pit Cutback |
The Project has a 20-year history of processing ores very similar to the Mega Pit cut-back material through the Sage autoclave. This includes ore from Cut 22 and Cut 24, which were located adjacent to the proposed cut-back. The autoclave is configured appropriately to accept Mega Pit materials without significant changes to operating strategies, practices, or procedures. Process equipment
| March 15, 2024 |
Page 139 |
|
|
Turquoise Ridge Complex NI 43-101 Technical Report |
|
and experienced labor are already in place. Testwork suggests processing of Mega Pit mineralization is expected to provide similar results to those experienced when processing Cut 22 and Cut 24 mineralization.
Variability Sample Selection
Thirty-four variability composites, collected from core and pulp rejects from previously drilled holes, were subjected to autoclave studies. Samples were selected by grade range, sulfide sulfur (SS) range, carbonate (CO3) range, and TCM range. The SS, CO3, and TCM ranges were determined using the current Turquoise Ridge Surface ore control matrix and ore types, shown in Table 13-3.
Table 13-3 Turquoise Ridge Surface Ore Control Matrix
| Ore Type | SS (%) |
CO3 (%) |
TCM (%) |
Comments | ||||
| A | <4 | >4 and <8 | <0.6 | Med–low carbonate/low sulfide sulfur | ||||
| B | >4 | >4 and <12 | <0.6 | Medium carbonate/high sulfide sulfur | ||||
| C | >4 and <6 | <4 | <0.6 | Low carbonate/medium sulfide sulfur | ||||
| D | <4 | <4 | <0.6 | Low carbonate/low sulfide sulfur | ||||
| E | Any value | <8 | >0.6 and <1 | Low carbonate/med–high organic carbon | ||||
| F | Any value | >12 and <18 | <0.6 | High carbonate | ||||
| G | <4 | >8 and <12 | <0.6 | Med–high carbonate/low sulfide sulfur | ||||
| H | >6 | <4 | <0.6 | Low carbonate/high sulfide sulfur | ||||
| I | Any value | >18 | <0.6 | Very high carbonate | ||||
| K | Any value | >8 | >0.6 and <1 | High carbonate/med–high organic carbon | ||||
| O | Any value | Any value | >1 | Very high organic carbon | ||||
Prior to the formation of NGM, the number of samples to be tested were determined using an algorithm known as a bingo chart and based on the quantum tonnes and ounces in each domain for the whole orebody. This bingo chart was constructed to determine which major ore types in the Mega Pit needed to be tested.
The ore types were reclassified as:
| ● | High sulfur (B, C, and H ore types); |
| ● | Mid CO3 (A, D, and G); |
| ● | High CO3 (F and I); and |
| ● | High organic carbon (E, K, and O). |
The grade ranges for each ore type were:
| ● | High grade (>3.0 g/t Au); |
| ● | Mid-grade (2.5–3.0 g/t Au); and |
| ● | Low/cut-off grade (1.3–2.5 g/t Au). |
| March 15, 2024 |
Page 140 |
|
|
Turquoise Ridge Complex NI 43-101 Technical Report |
|
After adjustment for potential under-testing and limited sample selection availability, the sample selection is outlined in Table 13-4. To support the test work program, 13 core composites were selected from five drill locations. Eleven samples from old drilling in the Mega Pit were selected based on rock type, fragment size, and alteration, and composited for an additional comminution sample (for a total of 14 comminution samples).
Ore and waste characterization were based on the full, current Turquoise Ridge Surface ore control matrix. Material with organic carbon >1% would be considered waste because of the preg-robbing potential of the organic carbon and subsequent deleterious impact to gold recovery.
Table 13-4 Number of Tests Conducted per Metallurgical Type
| Ore Class | >g/t Au | Oxide | High Sulfide Sulfur |
Mid Carbonate |
High Carbonate |
High Organic |
Total Start |
|||||||
| High grade | 0.000 | - | - | - | - | - | 0 | |||||||
| ~2 x average grade | 0.000 | - | - | - | - | - | 0 | |||||||
| Average grade | 0.090 | - | 5 | 3 | 1 | 2 | 11 | |||||||
| Near CoG* | 0.075 | - | 4 | 1 | 1 | 2 | 8 | |||||||
| CoG | 0.040 | - | 9 | 2 | 1 | 3 | 15 | |||||||
| Sub CoG | 0.000 | - | - | - | - | - | 0 | |||||||
| Prior/existing tested total | 0 | 18 | 6 | 3 | 7 | 34 | ||||||||
* CoG = Cut-off grade
Autoclave and Leach Testwork
Standard autoclaving and leach tests were performed in 2018. Gold grade ranged from 1.30–13.51 g/t with an average of 3.23 g/t. SS grade ranged from 1.84–10.53% with an average of 5.23%. The composites were blended down with silica to a target of 4% SS for the laboratory autoclave feed. CO3 content was more varied, ranging from 0.02–19.12% with an average of 4.94%. Total organic carbon averaged 0.39% and ranged from 0.03–0.93%. Preg-robbing carbon averaged 35.2% and ranged from 3.6–95.2%.
The average gold recovery for the composites was 75.1% at a grinding P80 of approximately 37 µm. Recovery ranged between 34–96%, depending on the amount of preg-robbing carbon within the composite. The recovery at coarser grinds and higher throughput is projected to be approximately 4% less than the testwork.
Comminution Testwork
Fourteen samples were sent to Newmont Metallurgical Services (NMS) for comminution testing in 2018. One of the samples tested was a composite of samples taken from previous drilling in the Mega Pit. The other 13 samples were whole core samples from five drill holes. These samples were all subjected to semi-autogenous grinding (SAG) mill comminution (SMC)/drop weight (dWi) tests, Bond work index (bWi) tests, and abrasion index (Ai) tests.
| March 15, 2024 |
Page 141 |
|
|
Turquoise Ridge Complex NI 43-101 Technical Report |
|
The grinding properties of Mega Pit ore were found to be variable. SMC/ dWi tests showed that the ore varies from moderate soft to very hard. The bWi tests showed that the ore can be categorized as medium to very hard; a closing screen size of 38 µm was used. Eight of the samples were classified as hard. The Ai testwork showed that the ore varies greatly from non-abrasive to very abrasive; however, eight of the 14 samples were slightly abrasive.
Oxide Testwork
Cut 40 oxide ore represents less than 5% of the Mineral Reserve estimate for Mega Pit and metallurgical testing of this specific material has not been conducted. A combination of historical plant performance of oxide ores from adjacent cuts belonging to similar ore domains and unchanged ore routing criteria informs on the amenability of the Cut 40 oxide material for processing through the Juniper Mill. The QP considers that historical testing in combination with current plant data will be representative of the recoveries that will be achieved going forward.
Conclusions
Testwork showed that the Mega Pit ore is sulfidic refractory and responds well to autoclaving. The average recovery rate was 75.1% and was a function of the total organic carbon to gold grade ratio. This is similar to the current Sage autoclave feed blend.
Using the average organic carbon to gold ratio of the Mega Pit composites, the predicted recovery rate is 75.13%.
Mega Pit ore is harder than normal Turquoise Ridge Surface ore. There is additional grind capacity in the Sage autoclave but throughput is limited by the autoclaves, not the grind circuit. Mega Pit ore will also be blended with stockpile and other material for geochemistry control, which will mitigate the effects of any grindability-induced SAG mill throughput issues from Mega Pit ore. However, these results show that there is enough hard ore that there is potential for concern. Additional testwork needs to be completed to assess the extent of the effects of the Mega Pit ore hardness.
| 13.2.5 | Stockpiles |
Historical testing of the stockpiles at the Turquoise Ridge Complex have been conducted and have shown good gold recoveries that are in line with the predictive curve.
The remaining stockpiles are now lower grade and have higher TCM content as compared to the historical stockpiles that were tested in 2015 and 2016. These would be expected to generate a lower overall gold recovery when using the predictive equation and is reflected in the LOM Turquoise Ridge surface recovery shown below.
| March 15, 2024 |
Page 142 |
|
|
Turquoise Ridge Complex NI 43-101 Technical Report |
|
Select stockpiles currently being used for blending are sampled to determine any changes in chemistry and grade prior to utilizing in blends. High sulfide stockpiles are typically not drilled to avoid introducing air, accelerating oxidation, and adversely impacting SS content. Future periodic bench scale testing of the select stockpile samples will also be completed.
| 13.3 | Metallurgical Variability |
Samples selected for metallurgical testing during feasibility and development studies were representative of the various styles of mineralization within the different deposits. Samples were selected from a range of locations within the deposits. Sufficient samples were taken, and tests were performed using sufficient sample mass for the respective tests undertaken.
Variability assessments are supported by mill production and extensive open pit and underground exposures.
| 13.4 | Recovery Forecasts |
The organic carbon (TCM) content and gold feed grade are used to predict the LOM metallurgical recovery.
Gold is allocated between the different ore sources based on adjustments to this model that are made according to the different levels of impact that the organic carbon has on recovery. Stockpiles placed by the mill for processing are periodically sampled and tested to track certain ore characteristics important for processing such as gold grade and TCM.
The preg-rob factor test is a modified cyanide solubility assay. Higher levels of organic carbon do not yield significantly higher preg-robbing for Turquoise Ridge Underground ores; however, relatively low levels of carbon in the Mega Pit ores can be strongly preg-robbing. Vista Underground ores have comparatively very little organic carbon that is not significantly preg-robbing. Organic carbon found in open pit ores has more potential to absorb and retain gold during leaching than the organic carbon in Turquoise Ridge Underground ores. The difference is in the atomic structure of carbon between the ore sources, and this was confirmed using Raman spectroscopy.
LOM metallurgical recovery forecasts are based on the equations described in the next sub-sections, and average:
| ● | Turquoise Ridge Underground: 91.24%; |
| ● | Turquoise Ridge Surface: 68.20%; and |
| ● | Vista Underground: 92.15%. |
| March 15, 2024 |
Page 143 |
|
|
Turquoise Ridge Complex NI 43-101 Technical Report |
|
| 13.4.1 | Juniper Mill |
Turquoise Ridge Complex metallurgists developed formulas to predict gold recovery for the oxide mill based on gold grade (“Au” reported in g/t):
| ● | Mega Pit oxide mill recovery equation: |
| ○ | % Au Recovery = 0.0754 * ln (Au) + 0.72708. |
| ● | Vista Pit oxide mill recovery equation: |
| ○ | % Au Recovery = 0.919 – 0.06514 / (Au) |
| 13.4.2 | Sage Mill |
Turquoise Ridge Complex metallurgists developed formulas to predict gold recovery for the autoclave based on organic carbon (TCM as a percentage) content and gold grade (“Au” reported in g/t):
| ● | Turquoise Ridge Underground recovery equation: |
| ○ | % Au Recovery = -155.7 x (TCM/Au) + 100.79; |
| ● | Turquoise Ridge Surface recovery equation: |
| ○ | % Au Recovery = -224.6 x (TCM/Au) + 100.79; |
| ● | Vista Underground recovery equation: |
| ○ | % Au Recovery = -457.0 x (TCM/Au) + 97.68. |
Sage autoclave recoveries were calculated from gold grade and TCM percentages and are stored for each refractory block in the Resource block model. A block calculation script was created in Vulcan software for recovery calculation.
In 2023, site metallurgists noted improved gold recovery performance for the Sage autoclave compared to 2022 and attributed that to changing out both the lead (#1) and second to last (#6) CIL tank screens. This effectively keeps carbon advancing up the circuit, providing a benefit from counter-circuit carbon movement, rather than having carbon move down the train with the slurry as well as minimizing carbon losses to tails. This is known to improve gold recovery – especially in the presence of preg-robbing ores. Figure 13-4 demonstrates the year over year improvement in recovery.
| March 15, 2024 |
Page 144 |
|
|
Turquoise Ridge Complex NI 43-101 Technical Report |
|
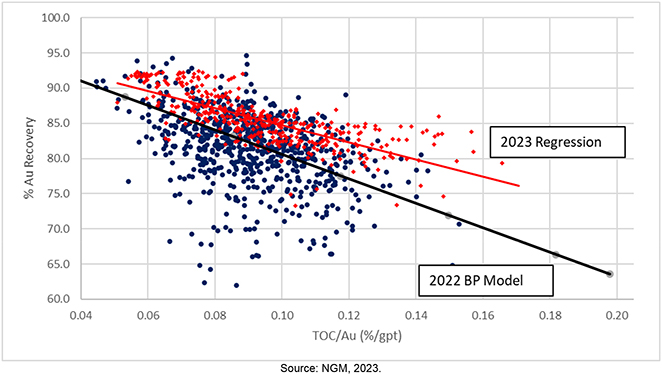
Figure 13-4 Sage Autoclave Recovery Data by shift for the years of 2022 and 2023
The rest of the inter-tank CIL screens (#2 through #5 and #7) are scheduled to be changed out in the next couple of years, and this is expected to add additional recovery benefits, estimated at approximately 1%. This is estimated to be achieved if the throughput is kept the same as 2023 levels. This additional 1% estimated future recovery improvement remains as upside potential, as it has not been applied to the ore sources other than for the Cut 40 Reserves (see Section 15), which is scheduled for processing after the screen upgrades have been completed.
| 13.5 | Blending |
Refractory ore is mined from the Turquoise Ridge Underground, Vista Underground, and Turquoise Ridge Surface mines and processed at the Sage autoclave.
An ore geochemistry-based classification system is used for ore mined and routed to either the mill ROM pad stockpiles or the outer stockpiles, as shown for Turquoise Ridge Surface in Table 13-5. Autoclave processing requires the feed geochemistry to be within the parameters shown in Table 13-6.
The standard chemistry components are percentages of TCM, CO3, and SS as analyzed in the mine laboratory, together with assaying for precious metals.
| March 15, 2024 |
Page 145 |
|
|
Turquoise Ridge Complex NI 43-101 Technical Report |
|
Table 13-5 Turquoise Ridge Surface Refractory Ore Classification
| Organic Carbon | Carbonate | Sulfide Sulfur | Met Type | Ore Type | ||||
| >1.0% | Any | Any | Met O | 12 | ||||
| 0.6–1.0% | >8% | Any | Met K | 11 | ||||
| <8% | Met E | 10 | ||||||
| <0.6% | >18% | Any | Met I | 9 | ||||
| 12–18% | Met F | 8 | ||||||
| 8–12% | >4% | Met B | 7 | |||||
| <4% | Met G | 6 | ||||||
| 4–8% | >4% | Met B | 5 | |||||
| <4% | Met A | 4 | ||||||
| 0–4% | >6% | Met H | 3 | |||||
| 4%-6% | Met C | 2 | ||||||
| 0%-4% | Met D | 1 |
Table 13-6 Autoclave Feed Parameter Ranges
| Variable | Target Range | Optimum | ||
| SS % | 2.6–2.9 | 2.7 | ||
| CO3 % | 3.5–4.3 | 3.7 | ||
| TCM % | <0.50 | <0.50 | ||
| SS:CO3 Ratio Before Acid | 0.7–0.9 | 0.75 | ||
| Au (g/t) | Max | Max | ||
| As (ppm) | <10,000 | <7,000 | ||
| Sb (ppm) | <500 | <400 | ||
| Fe/As | >3.5 | >5.0 | ||
| Ag (g/t) | <10.0 | <7.0 | ||
| Acid (gpm) | <25 | <15 | ||
| SS:CO3 Ratio After Acid | 0.9–1.0 | 0.9 |
The refractory ore classifications are further divided into gold grade ranges: high-grade, mid-grade, low-grade; and subgrade sulfide.. The routing code of ore is the combination of grade range prefix and geochemistry type letter. The refractory subgrade sulfide routings include materials that fall below economic gold cut-off grades (CoG), but because of their geochemistry, at times, they are fed to the Sage Mill for blending purposes. Only subgrade sulfide stockpiles that make a profit at $1,300/oz gold price are included in Mineral Reserves. For EOY2023, the subgrade sulfide stockpiles included in Mineral Reserves are SS-1, SS-3, SS-AB2, and SS-F2 (see Figure 13-5).
Blend constraints also include minimum and maximum annual tonnages of metallurgical types as shown in Table 13-7 for Turquoise Ridge Surface.
| March 15, 2024 |
Page 146 |
|
|
Turquoise Ridge Complex NI 43-101 Technical Report |
|
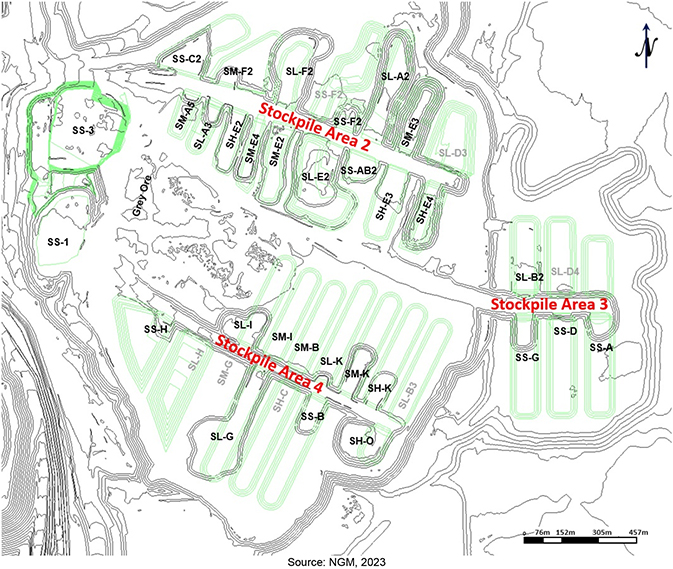
Figure 13-5 Stockpile Locations at ROM
Table 13-7 Typical Sage Mill Constraints
| Refractory Ore Type | Sage Mill Annual Tonnage Ranges | |
| A | < 1,200,000 per year | |
| B | < 480,000 per year | |
| C | 600,000 to 1,200,000 per year through 2023, then < 1,000,000 per year | |
| D | < 600,000 per year | |
| E | <420,000 per year | |
| F | <720,000 per year | |
| G | <1,200,000 per year | |
| H | <240,000 per year | |
| I | <360,000 per year | |
| K | <120,000 per year | |
| O | <120,000 per year |
| March 15, 2024 |
Page 147 |
|
|
Turquoise Ridge Complex NI 43-101 Technical Report |
|
| 13.6 | Deleterious Elements |
Depending upon the specific processing facility, several processing factors or deleterious elements could have an economic impact on extraction efficiency of a certain ore source, based either on the presence, absence, or concentration of the following constituents in the processing stream:
| ● | Organic carbon; |
| ● | Sulfide sulfur; |
| ● | Carbonate carbon; |
| ● | Arsenic; |
| ● | Mercury; |
| ● | Antimony; |
| ● | Copper. |
However, the above list of constituents is typically not a concern under normal ore routing and blending practices at NGM where either material from several mines and properties may be processed at one facility, and/or the large number of stockpiles held at the processing site and segregated by chemistry allow for flexibility in processing of the ore at the Turquoise Ridge Complex.
Mercury and arsenic pose hazards to the health of employees, and personal protective equipment requirements and engineering designs are in place to limit exposure. Employees with potential exposure are subject to routine health monitoring to ensure that levels remain below the regulatory limits.
| March 15, 2024 |
Page 148 |
|
|
Turquoise Ridge Complex NI 43-101 Technical Report |
|
| 14 | Mineral Resource Estimates |
| 14.1 | Summary |
This section describes the work undertaken by the NGM staff to prepare the Mineral Resource Estimate, including the key assumptions and parameters applied.
The Mineral Resource estimates have been prepared according to the Canadian Institute of Mining, Metallurgy and Petroleum (CIM) 2014 Definition Standards for Mineral Resources and Mineral Reserves dated 10 May 2014 (CIM (2014) Standards) as incorporated with National Instrument 43-101 Standards of Disclosure for Mineral Projects (NI 43-101). Mineral Resource estimates were also prepared using the guidance outlined in CIM Estimation of Mineral Resources and Mineral Reserves (MRMR) Best Practice Guidelines 2019 (CIM (2019) MRMR Best Practice Guidelines).
Since the previous technical report was filed for the Turquoise Ridge Complex (NGM, 2019) there have been a number of changes to Resource estimates. The main drivers of these changes were;
| ● | Depletion of the previously estimated Resources through mining activities at Turquoise Ridge and Vista UG operations, Mega and Vista Open Pits, and processing of stockpiled ore. |
| ● | Updates to the geologic framework as a result of additional drilling and field observations. |
| ● | Improvements to estimation domaining to better align with geologic controls while segregating grade populations. |
| ● | Ongoing development and optimization of estimation methodology and parameters to align with updated geologic and domain interpretations. |
| ● | Updates to Resource optimization methodology and parameters, influenced by inflationary pressure on input costs offset by improvements in process recovery and increased gold price assumptions. |
Mineral Resources considered amenable to open pit mining methods were constrained within a Pseudoflow (Lerchs-Grossman algorithm alternative) pit shell that used $1,700/oz gold price. Value-based routing was used in generating the cost and cash value of each block to determine reasonable prospects for eventual economic extraction and are demonstrated as a result of this pit optimisation process.
Mineral Resources for the stockpiles were determined using a revenue-based approach with a gold price of US$1,700/oz and appropriate mining costs. Stockpiles that made a profit of at least $1.00 were then considered as Mineral Resources.
| March 15, 2024 |
Page 149 |
|
|
Turquoise Ridge Complex NI 43-101 Technical Report |
|
Underground Mineral Resources were reported using Deswik Stope Optimizer (Deswik SO) applying appropriate cut-off grades for the methods utilised, minimum mineable stope shape, reasonable mineability constraints (including a minimum mining width, a reasonable distance from current or planned development), and a positive profitability at a $1,700/oz gold price demonstrating a reasonable prospect for eventual economic extraction.
The estimate was reviewed internally as well as externally and approved by NGM prior to release.
Table 14-1 summarises the Turquoise Ridge Mineral Resources, inclusive of Mineral Reserves as of December 31, 2023.
| March 15, 2024 |
Page 150 |
|
|
Turquoise Ridge Complex NI 43-101 Technical Report |
|
Table 14-1 Turquoise Ridge Mineral Resources Summary, 100% Basis, as of December 31, 2023
| Location | Measured | Indicated | Measured + Indicated | Inferred | ||||||||||||||||||||
|
Tonnes
|
Grade
|
Contained
|
Tonnes
|
Grade
|
Contained
|
Tonnes
|
Grade
|
Contained
|
Tonnes
|
Grade
|
Contained
|
|||||||||||||
| (Mt) | (g/t Au) | (Moz Au) | (Mt) | (g/t Au) | (Moz Au) | (Mt) | (g/t Au) | (Moz Au) | (Mt) | (g/t Au) | (Moz Au) | |||||||||||||
| Open Pits | - | - | - | 38 | 2.52 | 3.0 | 38 | 2.52 | 3.0 | 13 | 2.3 | 0.98 | ||||||||||||
| Twin Creeks Stockpile | 28 | 2.22 | 2.0 | - | - | - | 28 | 2.22 | 2.0 | - | - | |||||||||||||
| Surface Total | 28 | 2.22 | 2.0 | 38 | 2.52 | 3.0 | 66 | 2.39 | 5.0 | 13 | 2.3 | 0.98 | ||||||||||||
| Underground Total | 17 | 10.72 | 5.8 | 31 | 8.96 | 9.0 | 48 | 9.57 | 15 | 2.4 | 7.7 | 0.61 | ||||||||||||
| Turquoise Ridge Total | 45 | 5.40 | 7.8 | 69 | 5.43 | 12 | 110 | 5.42 | 20 | 16 | 3.2 | 1.6 | ||||||||||||
Notes:
| ● | Mineral Resources are reported on 100% basis. Barrick’s attributable share of the Mineral Resource is based on its 61.5% interest in NGM. |
| ● | CIM (2014) Standards and CIM (2019) MRMR Best Practice Guidelines were followed for Mineral Resources |
| ● | Underground Mineral Resources are estimated based on a positive net value stope economic analysis. |
| ● | Surface Mineral Resources are estimated based on an economic pit shell using a pseudoflow algorithm. |
| ● | Mineral Resources are estimated using a long-term gold price of US$1,700/oz. |
| ● | Resource block model dimensions of 10 m x 10 m x 10 m were assumed to reflect mining selectivity. |
| ● | Mineral Resources are inclusive of Mineral Reserves. |
| ● | Numbers may not add due to rounding. |
| ● | The QP responsible for this Mineral Resource Estimate is Craig Fiddes, SME Reg. |
| March 15, 2024 |
Page 151 |
|
|
Turquoise Ridge Complex NI 43-101 Technical Report |
|
| 14.2 | Turquoise Ridge Underground |
| 14.2.1 | Introduction |
The Mineral Resource estimate is based on 13,525 drill holes totalling 1,598,235 m. For this update the drillhole selection extents were restricted to include only data that was relevant to the Turquoise Ridge Underground deposit. The database closeout date was 16 May 2023. Block modelling was performed using the commercially available Maptek Vulcan.
The Resource model consists of 3.0 x 3.0 x 4.6 m (10 x 10 x 15 ft) parent blocks with 1.5 x 1.5 x 1.5 m (5 x 5 x 5 ft) subblocks. Domain boundaries, sterilized zones and excavated panels are bounded by the subblocks. The variables being estimated are Gold (Au), Carbonate (CO3), Total Carbon (Ctot), Sulfide/Sulfur (SS), total Sulfur (Stot), Organic Carbon (TCM), Arsenic (As), Iron (Fe), Mercury (Hg), and Antimony (Sb).
The coordinate system used for Resource modelling is a local mine grid called “TURQUOISERIDGE” and is a truncated version of Nevada State Plane East NAD27. The topography is derived from a 2012 LiDAR survey. The Mineral Resource model data did not use a topographic surface since it is entirely underground; however, a small proportion of the drill holes used in the Mineral Resource estimate were drilled from surface.
| 14.2.2 | Geological Modelling and Domaining |
Geological lithofacies and structural modelling is completed in Leapfrog based on a combination of type sections and underground mapping. The lithological contacts and ore controlling features are used to generate three geologically driven grade domains: 0.1-1.0 g/t; 1.0-2.5 g/t; and a greater than 2.5 g/t.
The resulting model is shown in Figure 14-1.
| March 15, 2024 |
Page 152 |
|
|
Turquoise Ridge Complex NI 43-101 Technical Report |
|
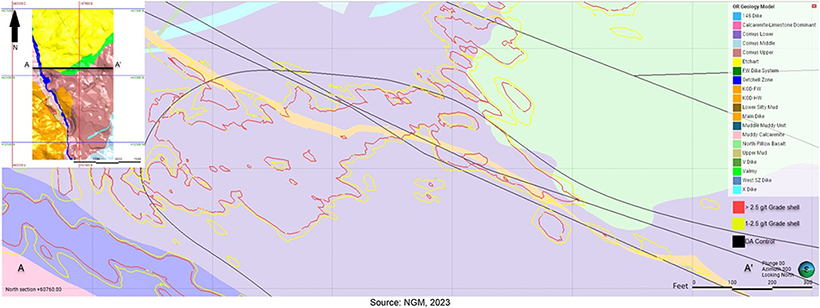
Figure 14-1 Geologic and Resource Domains Cross Section, Turquoise Ridge Underground
| March 15, 2024 |
Page 153 |
|
|
Turquoise Ridge Complex NI 43-101 Technical Report |
|
| 14.2.3 | Exploratory Data Analysis |
Within Datamine’s Supervisor software; log histograms, log probability plots, mean and variance plots and log box and whisker plots were constructed using the gold grade variable (“au_ppm”). The box and whisker plots (Figure 14-2) support the grade separation between the interpolant shapes. TRUG utilizes four primary grade domains: a 2500 grade domain that primarily encompasses material greater than 2.5 g/t; a 1000 grade domain that primarily encompasses material greater than 1.0 g/t up to 2.5 g/t; a 100-grade domain that primarily encompasses material greater than 0.1 g/t up to 1.0 g/t, and a 0 g/t waste domain. The majority of economic mineralization is contained within the 2500 domain. The uncapped coefficient of variation (CV) values for domains 2500 and 1000 are 1.34 and 1.83 respectively (discussed further in 14.2.5).
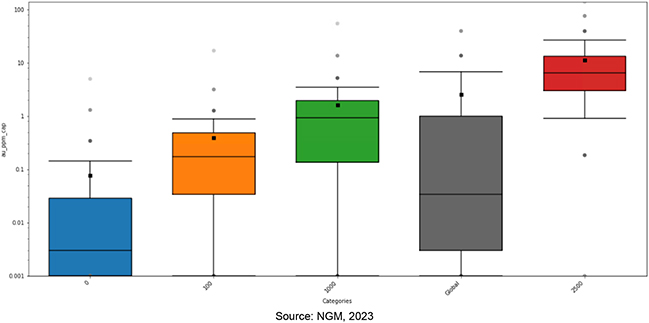
Figure 14-2 Box and Whisker Plots for Gold Domain Grades
Histograms in Figure 14-3 and Figure 14-4 depict lognormal distributions for the 2500 and 1000 domains without apparent bimodality. There are a number of zero-grade assays present in these domains, which have been identified as internal dilution after a thorough database review. Ongoing investigations aim to further understand the nature of these values and the internal dilution they represent. Figure 14-2 highlights significant differences in mean and data distributions between the 2500 and 1000 domains, suggesting the need for independent estimation for each domain. A final visual validation of the domains is considered to ensure the domains are geologically sound and representative of continuity consistent with the mineralization style. Internal to each domain we see varying gold mineralization orientation, so dynamic anisotropy controls are utilized to ensure the orientation of the variogram and sample search ellipse are aligned with local mineralization. The structures used to inform the dynamic anisotropy are discussed in section 14.2.8. Additional geology work is being undertaken to better understand the higher-grade core of the 2500 domain and
| March 15, 2024 |
Page 154 |
|
|
Turquoise Ridge Complex NI 43-101 Technical Report |
|
determine if it requires additional domain consideration. In the 100 and 0 domains the stationarity assumption is not well supported by the summary statistics as the mineralization becomes more distal and irregular; however almost no economic material exists within these domains.
| 14.2.4 | Composites |
The Resource model uses drill data composited to 1.5 m lengths in all domains. A ‘Run-Length de-surveyed (XYZ coordinate sample centroids derived from original FROM and TO values logged) assay composite file was constructed for comparative statistics.
Composites were split at domain boundaries and flagged with the domain character code in the ‘Au_Domain’ field that corresponds to the ‘Au_Domain’ field in the block model. For composite intervals where the last composite across the domain intersection was less than the nominal composite length, that length was distributed across the previous composites within the same domain intersection.
Figure 14-3 and Figure 14-4 illustrates a log histogram, log probability plot of the gold grades and the length distributions after compositing for the 1.5 m uncapped composites within the mineralised domains for Turquoise Ridge Underground.
| March 15, 2024 |
Page 155 |
|
|
Turquoise Ridge Complex NI 43-101 Technical Report |
|
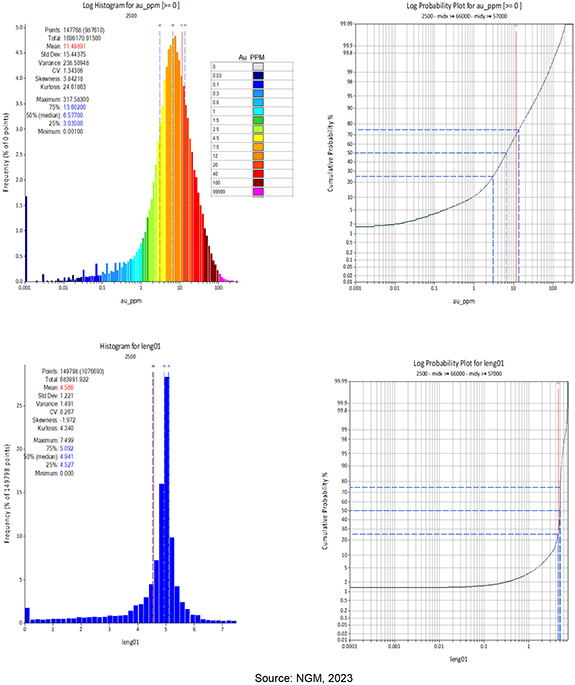
Figure 14-3 Histogram Showing Raw Composite Sample Length and Comparing Raw and
Composited Data 2500 Domain
| March 15, 2024 |
Page 156 |
|
|
Turquoise Ridge Complex NI 43-101 Technical Report |
|
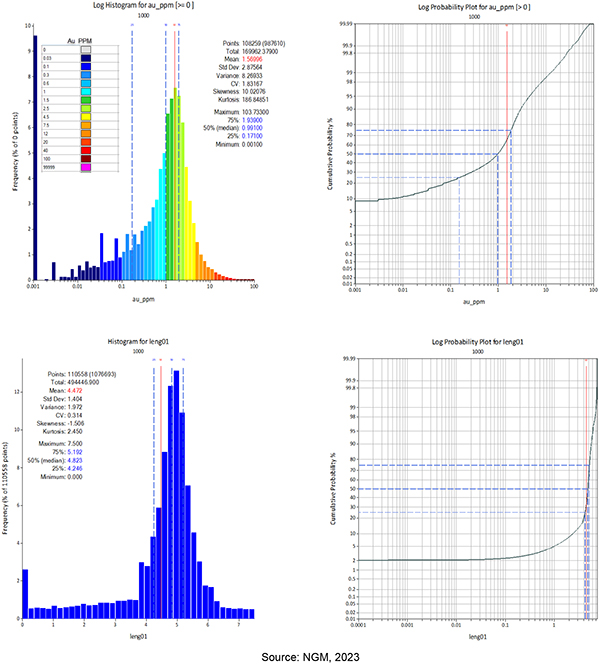
Figure 14-4 Histogram Showing Raw Composite Sample Length and Comparing Raw and
Composited Data 1000 Domain
| 14.2.5 | Grade Capping/Outlier Restriction |
In Datamine Supervisor’s global top-cut analysis tool, grade caps were implemented on composites using criteria such as log probability plot disintegration, extended tails on histograms, mean-variance plots indicating a substantial CV increase due to a small percentage of data, and cumulative metal analysis. The locations of capped data are scrutinized in a three-dimensional context to identify any potential clustering, which may indicate the necessity for additional domain delineation. The capping analysis was unique to each domain, with final cap grades ranging from 25–140 g/t Au. Figure 14-5
| March 15, 2024 |
Page 157 |
|
|
Turquoise Ridge Complex NI 43-101 Technical Report |
|
shows an example of the 2500 domain global top-cut analysis performed in Datamine Supervisor. High yield limits are utilized to restrict high grades from over-influencing the estimation. High yields are determined through the computation of the probability of encountering a grade above a designated high-yield threshold from a sample above that same threshold within a specified lag distance and orientation (p-gram). Figure 14-6, depicts the p-gram for 2500 domains, supporting a high yield limit of 80g/t, with a range of 18.3 m in the major direction and 12.2 m in the semi-major and minor directions. In the cumulative probability distribution of these 2500 domains minor discontinuities begin at the 80g/t threshold.
A detailed breakdown of the statistical analysis for top capping at Turquoise Ridge Underground is presented in Table 14-2.
Table 14-2 Grade Capping Analysis for Turquoise Ridge Underground
| Domain | No. of Samples |
Min (g/t Au) |
Max (g/t Au) |
Mean (g/t Au) |
CV Raw |
Capped (g/t Au) |
Mean (g/t Au) |
CV Capped |
No. of Samples Capped |
|||||||||
| 2500 | 147,768 | 0.001 | 317.5 | 11.5 | 1.34 | 140 | 11.5 | 1.32 | 151 | |||||||||
| 1000 | 109,259 | 0.001 | 103.7 | 1.57 | 1.83 | 55 | 1.56 | 1.76 | 34 | |||||||||
| 100 | 99,563 | 0.001 | 67.2 | 0.39 | 2.36 | 10 | 0.38 | 1.82 | 117 | |||||||||
| 0 | 526,163 | 0.001 | 175.5 | 0.08 | 6.87 | 25 | 0.08 | 5.56 | 23 | |||||||||
| March 15, 2024 |
Page 158 |
|
|
Turquoise Ridge Complex NI 43-101 Technical Report |
|
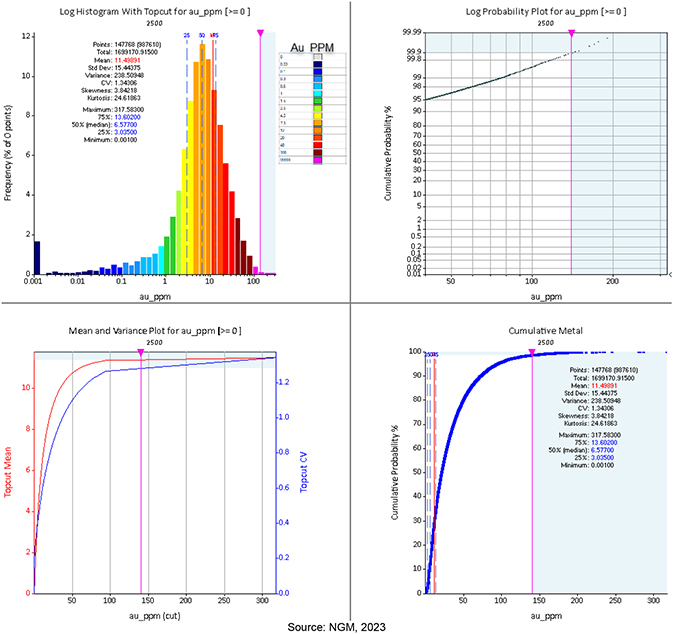
Figure 14-5 Domain 2500 Datamine Supervisor Top Cut Analysis for 2500 Domain (140g/t topcut)
| March 15, 2024 |
Page 159 |
|
|
Turquoise Ridge Complex NI 43-101 Technical Report |
|
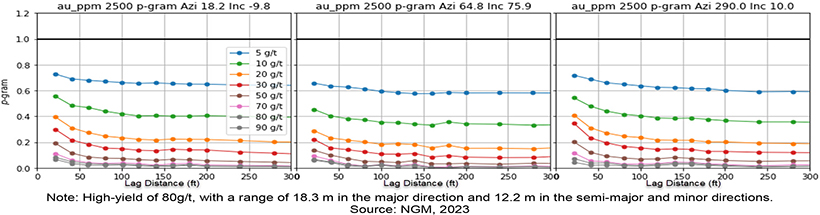
Figure 14-6 2500 Domain p-Grams Used to Help Determine the 2500 Domain
| 14.2.6 | Density Assignment |
A standard tonnage factor for all domains of 2.63 g/cm3 was used in estimation as described in Section 11.2.1.
| 14.2.7 | Variography |
Variographic analyses were completed by domain, using the 1.5 m composited data. Datamine Supervisor software was used to determine the major, semi- major, and minor directional axes of greatest continuity. Experimental gold and LECO variograms were modeled using two to three nested spherical or exponential (practical range) structures, see Figure 14-7 and Figure 14-8. Anisotropic variogram models were visually reviewed in Vulcan software as ellipsoids against the geologic model to verify alignment with interpreted mineralization controls.
| March 15, 2024 |
Page 160 |
|
|
Turquoise Ridge Complex NI 43-101 Technical Report |
|
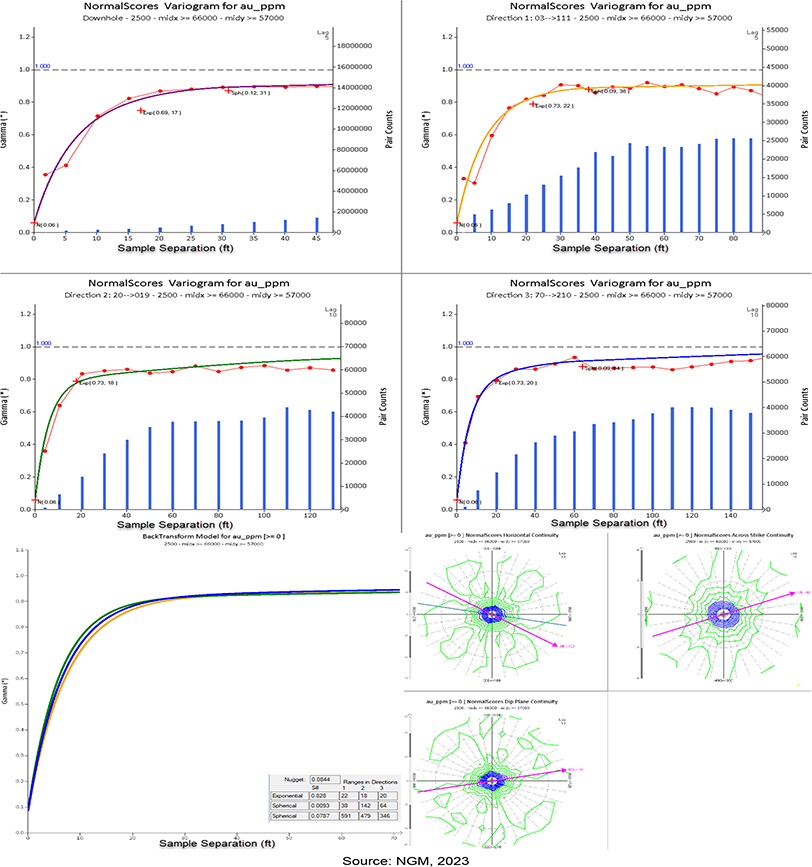
Figure 14-7 Variograms for Au Domain 2500
| March 15, 2024 |
Page 161 |
|
|
Turquoise Ridge Complex NI 43-101 Technical Report |
|
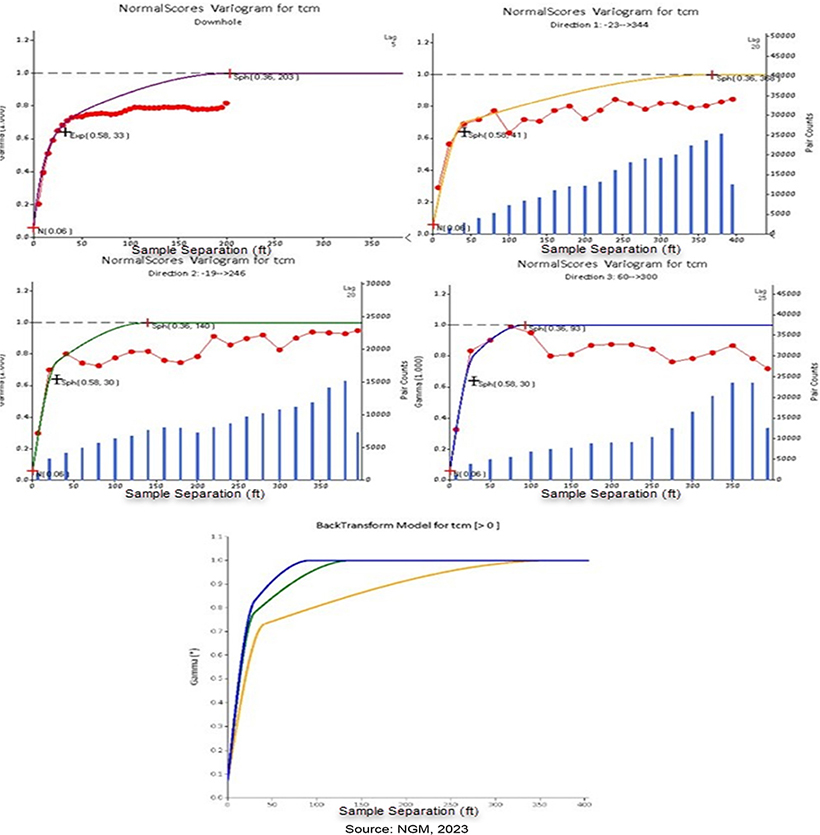
Figure 14-8 Variograms for the TCM Estimation
| March 15, 2024 |
Page 162 |
|
|
Turquoise Ridge Complex NI 43-101 Technical Report |
|
| 14.2.8 | Estimation/Interpolation Methods |
Interpolated gold grades were estimated into blocks using Ordinary Kriging (OK) in four separate estimation passes. The first pass utilizes a smaller search range and the largest sample selection to estimate all blocks where data is dense. The second pass allows for less data to be used and a larger search radius to populate areas of less dense drilling. The final two passes continue to increase the search radius while reducing the number of samples required to estimate. All search passes utilize the same high-yield restriction ensuring that high-grade are not over influencing the estimation. CO3, Ctot, SS, Stot, CC, and TCM are estimated using two OK passes. Arsenic (As) was estimated with similar parameters to gold. Estimation for Fe, Hg, and Sb each utilized a single pass Inverse Distance Squared (ID2) estimate with a large search.
All OK estimates utilize dynamic anisotropy that is based on the geological ore controlling features. The dynamic anisotropy model is given a general trend aligned with the Getchell fault. This trend is modified based on proximity to the following structural planes: 148 (TR FW BBT FW), 148 Fault (BBT FW Ace HW DB HW), 148 Fault (BBT FW DB FW), Bullion (Ace HW DB HW), Bullion (BBT HW Ace FW), Bullion (BBT HW Ace HW), Bullion (BBT HW Cricket FW), Bullion (BBT HW Cricket HW), Bullion (BBT HW in Ace), Bullion (Cricket HW), Bullion (DB FWI), Bullion (in BBT), Bullion (in Cricket), Bullion (in TR), Bullion (TR FW DB HWI, Bullion (TR HW in Cricket FW), Bullion Upper (in BBT) , Bullion Upper (in TR), Bullion Upper (TR FW), Bullion Upper (TR HW), Dean Fault (BBT FW), Fold Area inside Getchell, Low-angle between Cricket and TR, and Main Dike.
The estimation method, pass, and sample selections parameters are summarized in Table 14-3 for all estimated variables.
| March 15, 2024 |
Page 163 |
|
|
Turquoise Ridge Complex NI 43-101 Technical Report |
|
Table 14-3 OK Estimation Parameters
| Element | Method | Domain | Pass | Major (m) |
Semi (m) |
Minor (m) |
Min | Max |
Max sample per Drillhole |
|||||||||
| Au | OK | 2500 | 1 | 38.1 | 38.1 | 38.1 | 9 | 15 | 3 | |||||||||
| Au | OK | 2500 | 2 | 61.0 | 61.0 | 61.0 | 6 | 15 | 3 | |||||||||
| Au | OK | 2500 | 3 | 91.4 | 91.4 | 91.4 | 3 | 9 | 3 | |||||||||
| Au | OK | 2500 | 4 | 152.4 | 152.4 | 152.4 | 3 | 6 | 3 | |||||||||
| Au | OK | 1000 | 1 | 36.6 | 24.4 | 18.3 | 12 | 24 | 3 | |||||||||
| Au | OK | 1000 | 2 | 48.8 | 36.6 | 24.4 | 9 | 18 | 3 | |||||||||
| Au | OK | 1000 | 3 | 76.2 | 76.2 | 76.2 | 6 | 15 | 3 | |||||||||
| Au | OK | 1000 | 4 | 152.4 | 152.4 | 152.4 | 3 | 9 | 3 | |||||||||
| Au | OK | 100 | 1 | 36.6 | 24.4 | 18.3 | 12 | 24 | 3 | |||||||||
| Au | OK | 100 | 2 | 48.8 | 36.6 | 24.4 | 9 | 18 | 3 | |||||||||
| Au | OK | 100 | 3 | 76.2 | 76.2 | 76.2 | 6 | 15 | 3 | |||||||||
| Au | OK | 100 | 4 | 152.4 | 152.4 | 152.4 | 3 | 9 | 3 | |||||||||
| Au | OK | 0 | 1 | 48.8 | 36.6 | 24.4 | 9 | 18 | 3 | |||||||||
| Au | OK | 0 | 2 | 76.2 | 76.2 | 76.2 | 6 | 15 | 3 | |||||||||
| Au | OK | 0 | 3 | 152.4 | 152.4 | 152.4 | 3 | 9 | 3 | |||||||||
| As | OK | 2500 | 1 | 38.1 | 38.1 | 38.1 | 8 | 20 | 2 | |||||||||
| As | OK | 2500 | 2 | 61.0 | 61.0 | 61.0 | 6 | 16 | 2 | |||||||||
| As | OK | 2500 | 3 | 91.4 | 91.4 | 91.4 | 4 | 12 | 2 | |||||||||
| As | OK | 2500 | 4 | 152.4 | 152.4 | 152.4 | 2 | 8 | 2 | |||||||||
| As | OK | 1000 | 1 | 36.6 | 24.4 | 18.3 | 8 | 20 | 2 | |||||||||
| As | OK | 1000 | 2 | 48.8 | 36.6 | 24.4 | 6 | 16 | 2 | |||||||||
| As | OK | 1000 | 3 | 76.2 | 76.2 | 76.2 | 4 | 12 | 2 | |||||||||
| As | OK | 1000 | 4 | 152.4 | 152.4 | 152.4 | 2 | 8 | 2 | |||||||||
| As | OK | 100 | 1 | 36.6 | 24.4 | 18.3 | 8 | 20 | 2 | |||||||||
| As | OK | 100 | 2 | 48.8 | 36.6 | 24.4 | 6 | 16 | 2 | |||||||||
| As | OK | 100 | 3 | 76.2 | 76.2 | 76.2 | 4 | 12 | 2 | |||||||||
| As | OK | 100 | 4 | 152.4 | 152.4 | 152.4 | 2 | 8 | 2 | |||||||||
| As | OK | 0 | 1 | 48.8 | 36.6 | 24.4 | 6 | 16 | 2 | |||||||||
| As | OK | 0 | 2 | 76.2 | 76.2 | 76.2 | 4 | 12 | 2 | |||||||||
| As | OK | 0 | 3 | 152.4 | 152.4 | 152.4 | 2 | 8 | 2 | |||||||||
| TCM | OK | 0.5 | 1 | 134.6 | 51.2 | 34.0 | 4 | 12 | 3 | |||||||||
| TCM | OK | Global | 2 | 304.8 | 304.8 | 304.8 | 4 | 12 | 2 | |||||||||
| Ctot | OK | 1.5 | 1 | 78.6 | 95.1 | 65.1 | 4 | 12 | 3 | |||||||||
| Ctot | OK | Global | 2 | 304.8 | 304.8 | 304.8 | 4 | 12 | 2 | |||||||||
| CC | OK | 1.5 | 1 | 145.6 | 46.1 | 92.9 | 4 | 12 | 3 | |||||||||
| CC | OK | Global | 2 | 304.8 | 304.8 | 304.8 | 4 | 12 | 2 | |||||||||
| CO3 | OK | 0.5 | 1 | 109.0 | 72.8 | 86.3 | 4 | 12 | 3 | |||||||||
| CO3 | OK | Global | 2 | 304.8 | 304.8 | 304.8 | 4 | 12 | 2 | |||||||||
| Stot | OK | 1.5 | 1 | 216.9 | 88.5 | 93.6 | 4 | 12 | 3 | |||||||||
| Stot | OK | Global | 2 | 304.8 | 304.8 | 304.8 | 4 | 12 | 2 | |||||||||
| SS | OK | 1.5 | 1 | 202.6 | 134.2 | 132.0 | 4 | 12 | 3 | |||||||||
| SS | OK | Global | 2 | 304.8 | 304.8 | 304.8 | 4 | 12 | 2 | |||||||||
| Fe | ID2 | Global | 1 | 304.8 | 304.8 | 304.8 | 2 | 16 | 2 | |||||||||
| Sb | ID2 | Global | 1 | 304.8 | 304.8 | 304.8 | 2 | 16 | 2 | |||||||||
| Hg | ID2 | Global | 1 | 304.8 | 304.8 | 304.8 | 2 | 16 | 2 | |||||||||
| March 15, 2024 |
Page 164 |
|
|
Turquoise Ridge Complex NI 43-101 Technical Report |
|
| 14.2.9 | Block Model Validation |
The block model was validated using the following checks to confirm acceptability for Resource estimation:
| ● | Global bias check by domain: Review declustered mean for each domain to ensure they are within 5%. |
| ● | Visual inspection: Compare block model to drillhole data ensuring there is no visual artifacts. |
| ● | Swath plots: Ensure trends in the drillhole data match trends in the estimates. |
| ● | Comparisons between estimation types: Understand the sensitivity between estimation types and estimation parameters. |
| ● | Reconciliation to mine produced: Compare production vs estimation to ensure the estimate is reflective of what the mine is producing. |
| ● | QQ plots/histogram reproduction: Ensure that the statistical distribution of the estimation matches the expected support corrected drillholes distribution. |
| ● | De-cluster plots: Compare the support-adjusted data within a block to the block estimate to understand if the estimate aligns with the data. |
| ● | Grade tonnage curves: Compare the support-adjusted grade tonnage at different cut-off grades to the model grade tonnage to ensure the model is representative of the recoverable Resource. |
| 14.2.10 | Confidence Classifications |
The Turquoise Ridge Surface classification scheme primarily utilises drill spacing, defining local drill hole spacing based on the average distance to the nearest three drill holes (Table 14-4). The method uses a geometric method of assigning classification codes based on drill spacing, while also requiring an appropriate level of continuity. An example of the TRUG classification can be seen in Figure 14-9
Block estimates were compared with historic production and reconciliation to support classification applied in the model.
Table 14-4 Turquoise Ridge Underground Model Mineral Resource Classification Distances
| Measured | Indicated | Inferred | ||||
| TRUG | ≤7.6 m | >7.6 m and ≤61 m | >61 m |
Note: average distance to closest three drill holes.
| March 15, 2024 |
Page 165 |
|
|
Turquoise Ridge Complex NI 43-101 Technical Report |
|
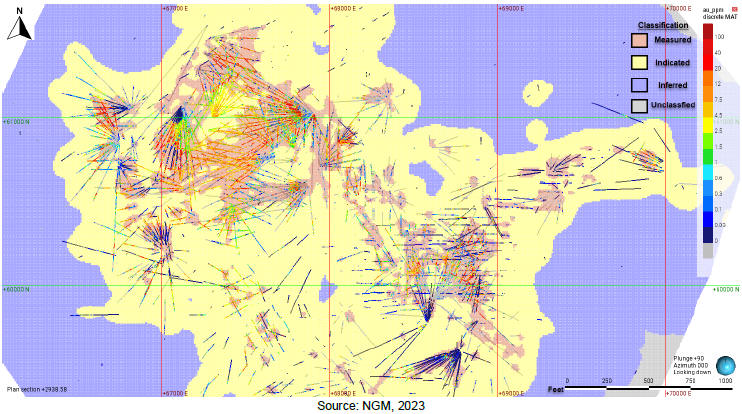
Figure 14-9 Plan Section Example of TRUG Classification with Drilling (Section width 30.5m)
| 14.2.11 | Reasonable Prospects of Eventual Economic Extraction |
Mining shapes for both underhand drift-and-fill and long hole stoping methods were created, based on the block model, and understanding of the geological domains, at appropriate cut-off grades using Deswik Stope Optimizer (Deswik SO). Mining costs were used to calculate a Resource cut-off grade at a $1,700/oz gold price. The Resource cut-off grade was determined to be 5.66 g/t. Mining Shapes were evaluated using only Measured, Indicated, and Inferred material. Mining Shapes with grades above the Resource cut-off grade were included in the Mineral Resource estimation.
The inputs for the TRUG Resources CoG is shown in Table 14-5.
| March 15, 2024 |
Page 166 |
|
|
Turquoise Ridge Complex NI 43-101 Technical Report |
|
Table 14-5 Resources Cut-off Grade Inputs
| COG Inputs | Units | COG Resource TRUG | ||
| Gold Price | $/rec. oz | 1,700 | ||
| Subtotal Mining Sustaining Capital | $/ore tonne | 12.04 | ||
| Subtotal Mining OPEX | $/ore tonne | 168.88 | ||
| Subtotal G&A Cost | $/ore tonne | 18.58 | ||
| Subtotal Processing Cost (including Surface Haul) | $/ore tonne | 44.39 | ||
| Total Cost | $/ore tonne | 243.89 | ||
| TR Autoclave (Sage) Recovery* | % | 79.6% | ||
| Royalties | % | 0.00% | ||
| AB495 Tax | % | 1.02% | ||
| External Refining & Selling | $/rec. oz | 0.38 | ||
| Cutoff Grade | g/t | 5.66 |
* TR Autoclave Recovery is calculated at the cutoff grade and assumes LOM plan average of 0.771% TCM
| 14.3 | Turquoise Ridge Surface |
| 14.3.1 | Introduction |
The Mineral Resource estimate is based on 8,415 drill holes totalling 1,595,270 m. The database closeout date is April 12, 2023. Modelling was performed using commercially available Maptek Vulcan and Leapfrog software with supporting work (exploratory data analysis, variography, validation) in Datamine Supervisor and X10-geo.
The Mega open pit block model uses a parent block size of 9.1 x 9.1 x 6.1 m (30 x 30 x 20 ft) in easting, northing, elevation. Sub-blocks of 3.0 x 3.0 x 3.0 m (10 x 10 x 10 ft) were used in the model building process and re-blocked to the 9.1 x 9.1 x 6.1 m when the modeling process was completed for engineering. The smaller sub-blocks were used to achieve better definition of the mafic sills/tuffs.
The Vista open pit block model uses a parent block size of 9.1 x 9.1 x 6.1 m in easting, northing, elevation. No sub-blocking was used in the Vista model. The block dimensions reflect the dimension of the selective mining unit (SMU) or smallest volume of material on which ore classification is decided, mineralized zones, and proposed mining methods for the Vista block model.
The coordinate system used for Resource modelling is a local grid that was developed in connection with the historic merger between Santa Fe and Gold Fields (see discussion in Section 9.2.2). The topographic surface was trimmed to the model extents to create a solid below the topography as well as an air solid above the topography.
The Turquoise Ridge Surface survey department regularly commissions site-wide aerial surveys as required by mining activities. Aerial data is reviewed for accuracy and correctness by UAV (drone) and Vulcan I-Sight scans on a regular basis to create the updated topography. Surface survey data is used in the construction of geological and Resource estimation models.
| March 15, 2024 |
Page 167 |
|
|
Turquoise Ridge Complex NI 43-101 Technical Report |
|
| 14.3.2 | Geological Modelling and Domaining |
The Mega open pit geology model re-interpreted the formations, faults, and mafic sills/tuffs with historical and new drilling/logging information with Leapfrog software. The Mega gold Resource model estimation domains are constructed by utilizing mineralization trends at 1.5 g/t and 0.3 g/t following the folding, using Leapfrog software. The resulting Mega composites, estimation domain grade shells, and mafic sills/tuffs are shown in Figure 14-10.
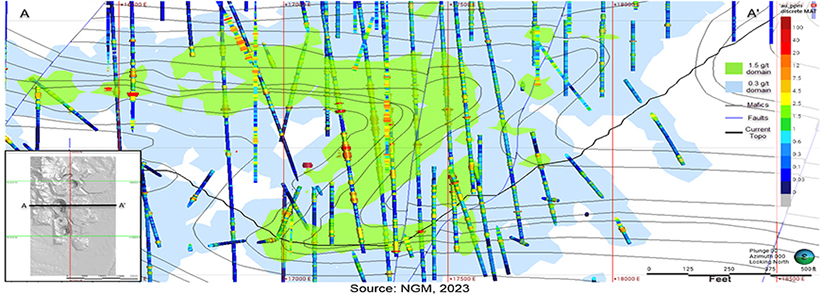
Figure 14-10 Mega Domains and Main Mafic Map
Estimation domains were created for the LECO and arsenic variables using leapfrog grade shells. The grade shells were constructed by utilizing mineralization trends which typically followed the structure of the mafic sills/tuffs from the geologic model. The grade shells have a low, medium, and high-grade cutoff for Au, CC, TCM, SS, and As and are shown in Table 14-6.
Table 14-6 Mega Leapfrog Grade Shell Cutoffs
| Au (g/t) | CC (%) | TCM (%) | SS (%) | |||
| 0 – 0.3 | 0 – 0.4 | 0 – 0.2 | 0 – 1 | |||
| 0.3 – 1.5 | 0.4 – 2 | 0.2 – 0.6 | 1 – 3 | |||
| >1.5 | >2 | >0.6 | >3 |
The Vista open pit geologic model was last updated in 2020 and used the most recent fault and formation interpretations available at that time. The formation shapes were broken into fault bounded groupings and projected to the new, larger model extents as required. A 0.137g/t gold grade shell aligned with interpreted mineralization controls was constructed using leapfrog software to separate mineralized from unmineralized material. The estimation domains are defined inside and outside the gold shell for each of 13 fault-bounded geologic domains. Leapfrog grade shells were also used
| March 15, 2024 |
Page 168 |
|
|
Turquoise Ridge Complex NI 43-101 Technical Report |
|
in a similar fashion to estimate the LECO variables and arsenic. The LECO variable grade shells for Vista were set at the process intervals for the various stockpiling codes shown in Table 13-3.
A plan view of the Vista open pit block model domains are provided in Figure 14-11.
The Vista geologic fields updated with Leapfrog in the geologic model are shown in Table 14-7
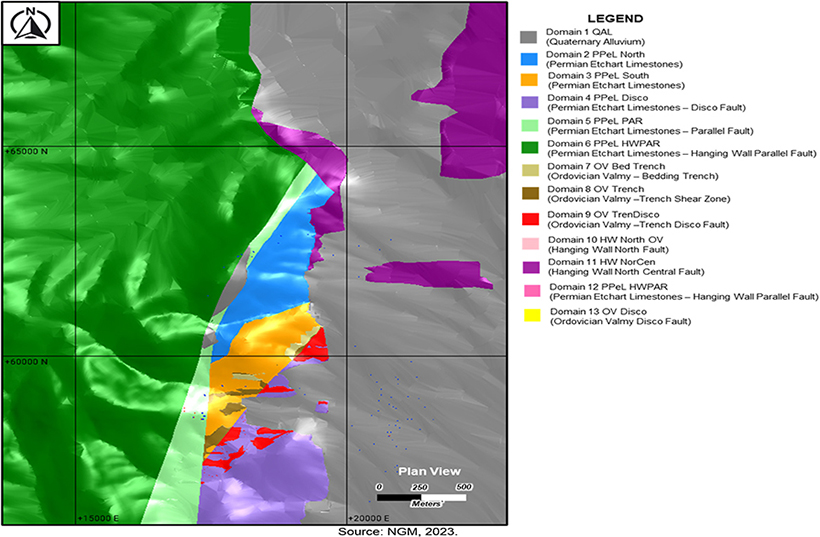
Figure 14-11 Vista Domains Plan View
| March 15, 2024 |
Page 169 |
|
|
Turquoise Ridge Complex NI 43-101 Technical Report |
|
Table 14-7 Vista Leapfrog Grade Shell Cutoffs
| Au (g/t) | CC (%) | TCM (%) | CO3 (%) | SS (%) | As (%) | |||||
| 0.137 | 0-0.8 | 0-0.3 | 0-4 | 0-4 | 0-0.3 | |||||
| >0.137 | 0.8-1.6 | 0.3-0.6 | 4-8 | 4-6 | 0.3-1.0 | |||||
| - | 1.6-2.4 | 0.6-1.0 | 8-12 | >6 | >1.0 | |||||
| - | 2.4-3.6 | >1.0 | 12-18 | - | - | |||||
| - | >3.6 | - | >18 | - | - | |||||
| 14.3.3 | Exploratory Data Analysis |
Within Datamine’s Supervisor software; log histograms, log probability plots, mean and variance plots and log box and whisker plots were constructed using gold grade (variable name “aufa”) and flagged with the Leapfrog grade shells (variable “au_gs” with 0: <=0.3 g/t; 1: >0.3 g/t and <=1.5 g/t; 2: >1.5 g/t). The box and whisker plots specifically confirmed the grade separation between the gold shells. The box and whisker plot shown in Figure 14-12 shows the Mega aufa grade separated into the au_gs flagging and the total aufa statistics.
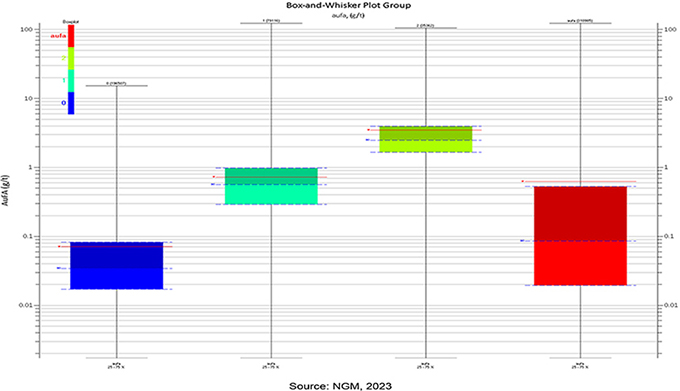
Figure 14-12 Box and Whisker Plots for Mega aufa, by aufa Grade Shell
The Datamine Supervisor program log histogram, log probability plot, mean and variance plot, cumulative metal plot, and the capping statistics of percent metal cut and number of samples capped
| March 15, 2024 |
Page 170 |
|
|
Turquoise Ridge Complex NI 43-101 Technical Report |
|
due to outliers in the data are shown in Figure 14-13 to Figure 14-15. The colors in the histogram represent decile percentages of the Au grade. The plots represent data below 0.3 g/t (gs_au=0), between 0.3 g/t and 1.5 g/t (gs_au=1), and greater than 1.5 g/t (gs_au=2).
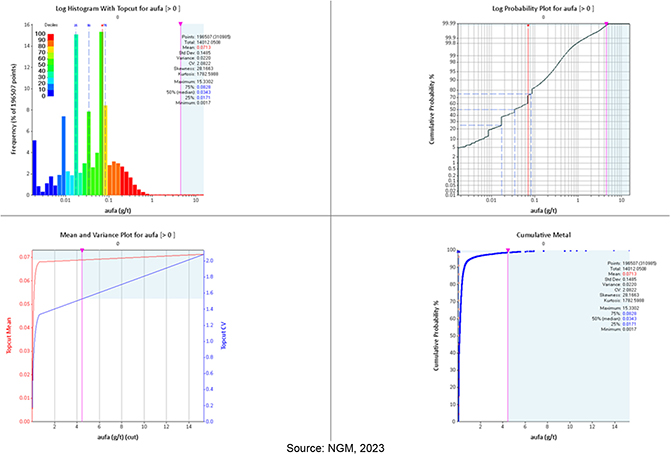
Figure 14-13 aufa Composite Statistics Less Than 0.3 g/t Gold Shell
| March 15, 2024 |
Page 171 |
|
|
Turquoise Ridge Complex NI 43-101 Technical Report |
|
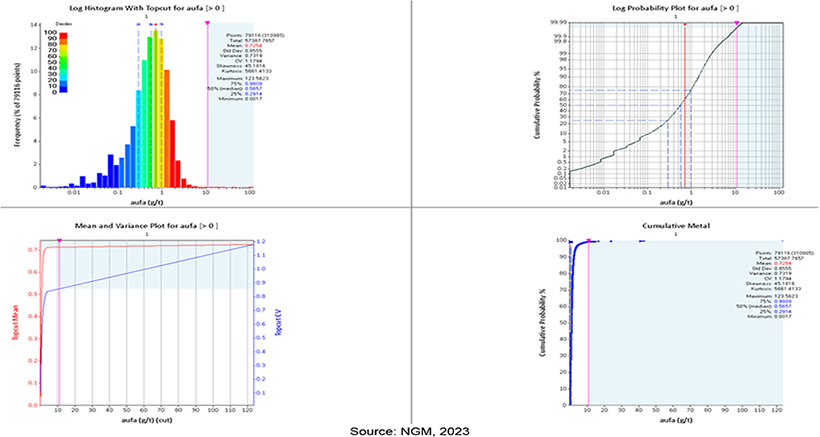
Figure 14-14 aufa Composite Statistics Between 0.3 and 1.5 g/t Gold Shell
| March 15, 2024 |
Page 172 |
|
|
Turquoise Ridge Complex NI 43-101 Technical Report |
|
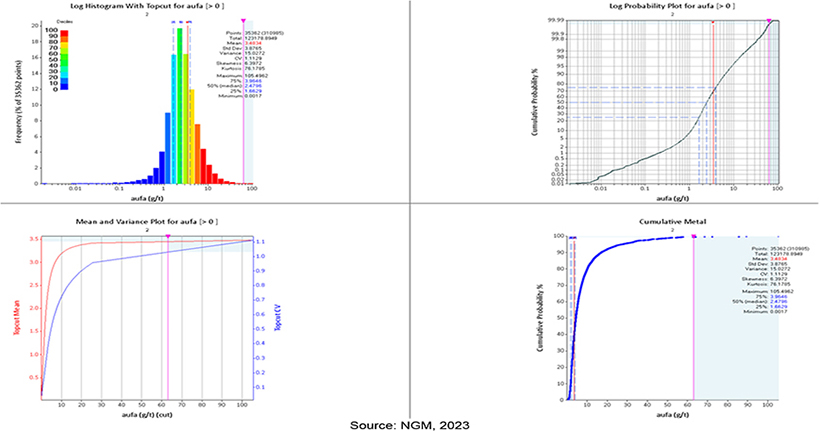
Figure 14-15 aufa Composite Statistics Greater Than 1.5 g/t Gold Shell
Exploratory data analysis for Vista Pit used GSLIB and internally developed programs. The Vista domains have 100 added to the numerical domain names to separate them from the Mega model when shown together. The boxplots in Figure 14-16 and Figure 14-17 represent the statistics of the Vista model 6.1 m (20 ft) composite model.
| March 15, 2024 |
Page 173 |
|
|
Turquoise Ridge Complex NI 43-101 Technical Report |
|
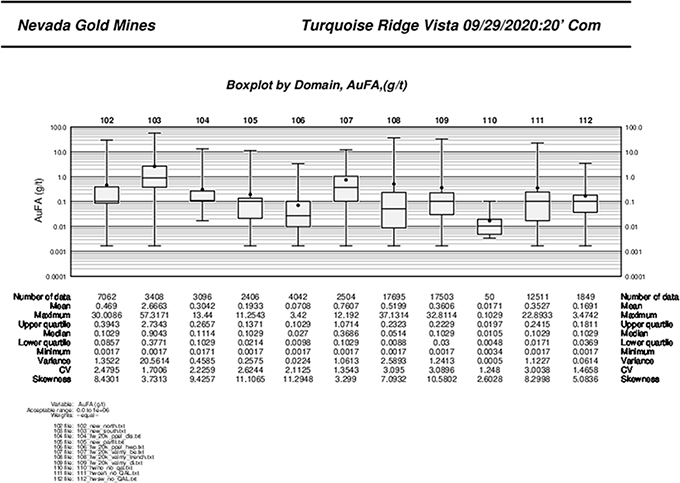
Figure 14-16 Vista 6.1m (20 ft) Composites by Domain
| March 15, 2024 |
Page 174 |
|
|
Turquoise Ridge Complex NI 43-101 Technical Report |
|
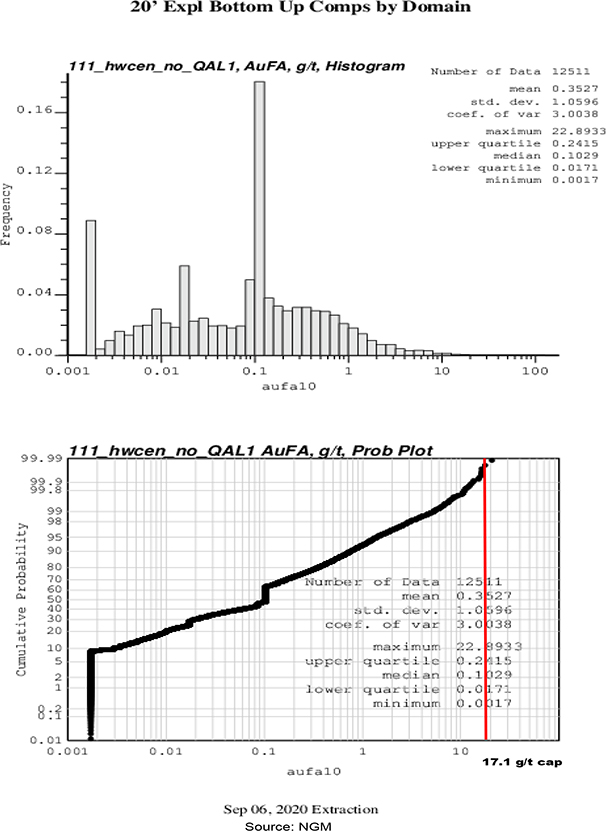
Figure 14-17 Vista 6.1m Composites Inside 111_hwcen Domain, 17.1 g/t (0.50 opt) Cap
| March 15, 2024 |
Page 175 |
|
|
Turquoise Ridge Complex NI 43-101 Technical Report |
|
| 14.3.4 | Composites |
A down-hole, run-length compositing method was used for the Mega Pit estimates in order to maintain a constant sample size when compositing the mixture of vertical and angled drill holes in the database.
The selected composite length was based on one-half the bench height of 3.0 m (10 ft) and began at the top of the hole. The shorter composite length was selected to get samples inside the mafic sill/tuff triangulations. Geology and the SMU, which is considered to be a 9.1 m x 9.1 m x 6.1 m block. The histogram and probability plots of the length of the Au assays is shown in Figure 14-18. Assays with a length less than one half of the composite length are not included in the estimation process.
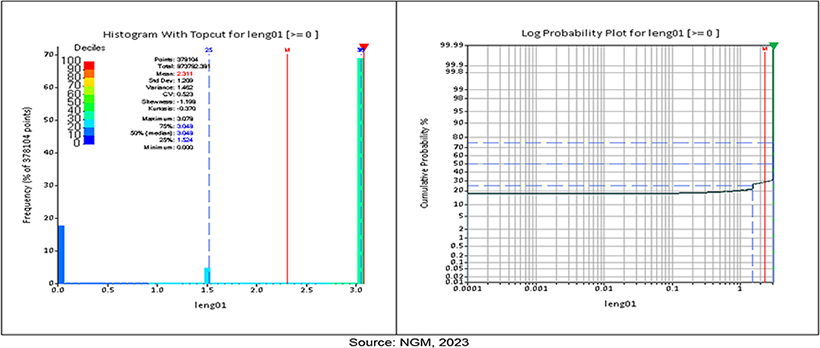
Figure 14-18 Histogram and Probability Plot of the Gold Composites
The Vista model compositing was completed using the Vulcan run length routine based on the 6.1 m (20 ft) composite interval. The fixed length compositing was used because the sample set contains numerous vertical holes as well as angle holes and gives consistent sample intervals for grade estimating. The fixed length started at the bottom of the hole and went up because we are nearing the bottom of the pit and wanted to use the assays at the bottom of the hole vs removing the assays that were less than 3.05 m at the bottom of the hole. At the end of compositing, residual lengths are discarded, samples are composited up the hole to primarily exclude excavated material not unexcavated material. The histogram and probability plot of the length of Au composite is shown in Figure 14-19.
| March 15, 2024 |
Page 176 |
|
|
Turquoise Ridge Complex NI 43-101 Technical Report |
|
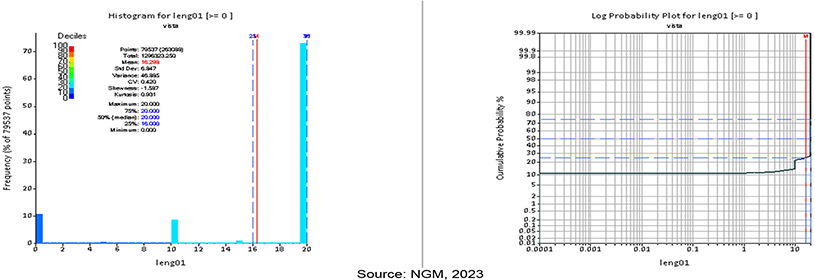
Figure 14-19 Vista Open Pit Composite Length Statistics
| 14.3.5 | Grade Capping/Outlier Restriction |
Capping was applied to the mid- and high-grade domains for the estimated elements Au, CC, TCM, and SS. The mid-grade domain was capped at 11.0 g/t Au (ten samples), and the high-grade domain at 63.1 g/t Au (seven samples). The Datamine Supervisor histogram, probability plots, cumulative metal and stats For Mega Pit were shown in Figure 14-14 and Figure 14-15. The Vista model was capped at 17.1 g/t as shown previously in the Vista Probability plot in Figure 14-17.
| 14.3.6 | Density Assignment |
The density database for Mega Pit contains 3,754 specific gravity (SG) samples. The mean value of the SG samples were assigned by formation and alteration. The density (g/cm3) samples ranged from 1.36 to 3.64 (g/cm3). No top or bottom capping was applied. Determination of Mega density is detailed in Section 11.2.2. Table 14-8 shows a summary of the densities used in the Mega model.
Table 14-8 Summary of Mega Modelled Densities
| Geologic Unit Description | Density (g/cm3) | |
| Oxide | 2.38 | |
| Sulfide between Mafic Sills/Tuffs | 2.36 – 2.64 | |
| Mafic Sills/Tuffs | 2.44 – 2.68 | |
| Alluvium (QAL) | 1.88 | |
| Backfill/Waste Dumps | 1.78 | |
The density database for Vista Pit contains 3,989 specific gravity (SG) samples. Determination of Vista density is detailed in Section 11.2.2 and summarized in Table 14-9.
| March 15, 2024 |
Page 177 |
|
|
Turquoise Ridge Complex NI 43-101 Technical Report |
|
Table 14-9 Summary of Vista Modelled Densities
| Geologic Unit Description | Density (g/cm3) | |
| Oxide, Silica 0,1 | 2.03 | |
| Oxide, Silica 2,3 | 2.30 | |
| Sulfide | 2.46 | |
| Alluvium (QAL) | 1.88 | |
| Backfill/Waste Dumps | 1.78 | |
| 14.3.7 | Variography |
Variographic analysis was completed by domain for the Mega open pit model, using the 3.05 m composited data. Supervisor software was used to determine the major, semi-major, and minor directional axes of greatest continuity. Experimental gold variograms were modeled using three nested spherical or exponential (practical range) structures. Anisotropic ellipsoids representing the variogram models were visually checked using Vulcan to ensure they were consistent with the underlying mineralization controls. An anisotropy model was created to vary the variogram directions based on the mafic sills/tuffs surfaces. The directions (bearing, plunge, and dip) were loaded into fields inside each of the model blocks. The variogram ranges were used in combination with the Anisotropy Model to complete the estimations.
Variography analysis was completed by domain for the Vista open pit model using 6.1 m composites using Newmont’s TSS Geologic modeling software TSS Sage.
| 14.3.8 | Estimation/Interpolation Methods |
The Mega Pit model was estimated using OK for gold and LECO assays carbon carbonate (CC), organic carbon (TCM), and sulfide sulfur (SS).
The Vista Pit model was estimated using both OK and inverse distance weighting to the fifth power (ID5).
CC, SS, and TCM were estimated using ID3 or ID5, and NN. Carbonate (CO3) was calculated from the carbon carbonate estimate using the relationship (CO3 = CC * 4.99618).
| 14.3.9 | Block Model Validation |
The block model was validated using the following checks:
| ● | Global bias check by domain: Review declustered mean of each domain to ensure they are within 5%. |
| ● | Visual inspection: Compare block model to drillhole data ensuring there are no visual artifacts. |
| March 15, 2024 |
Page 178 |
|
|
Turquoise Ridge Complex NI 43-101 Technical Report |
|
| ● | Swath plots: Ensure the drillhole data matches the estimate. |
| ● | Comparisons between estimation types: Understand the sensitivity between estimation types and estimation parameters. |
| ● | Reconciliation to mine produced: Compare production vs estimation to ensure the estimate is reflective of what the mine is producing. |
| ● | QQ plots/histogram reproduction: Ensure that the statistical distribution of the estimation matches the expected support corrected drillholes distribution. |
| ● | De-cluster plots: Compare the support-adjusted data within a block to the block estimate to understand if the estimate aligns with the data. |
| ● | Grade tonnage curves: Compare the support corrected grade tonnage at different cut-off grades to the model grade tonnage to ensure the model is representative of the recoverable Resource. |
| 14.3.10 | Confidence Classifications |
The Turquoise Ridge Surface models use a three-hole classification scheme, defining local drill hole spacing based on the average distance to the nearest three drill holes (Table 14-10). The method uses a geometric method of assigning classification codes based on drill spacing, while also requiring an appropriate level of continuity.
Block estimates were compared with historic production and reconciliation to support classification applied in the model.
Table 14-10 Turquoise Ridge Surface Model Mineral Resource Classification Distances
| Measured | Indicated | Inferred | ||||
| Mega | ≤13 m | >13 m and ≤26 m | >26 m and ≤52 m | |||
| Vista – FW Domains | - | ≤26 m | >26 m and ≤52 m | |||
| Vista – FW Valmy | - | ≤20 m | >20 m and ≤40 m | |||
| Vista – FW Etchart | - | ≤26 m | >26 m and ≤52 m | |||
Note: average distance to closest three drill holes, one composite/drill hole.
An example of the Mega pit classification is shown in Figure 14-20.
| March 15, 2024 |
Page 179 |
|
|
Turquoise Ridge Complex NI 43-101 Technical Report |
|
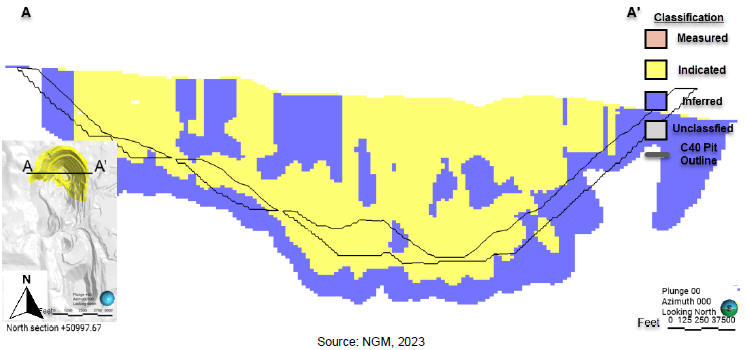
Figure 14-20 Mega Section 51000 N, Looking North, Cut 40 Classification Model
| 14.3.11 | Reasonable Prospects of Eventual Economic Extraction |
Mineral Resources considered amenable to open pit mining methods were constrained within a Pseudoflow (Lerchs-Grossman algorithm alternative) pit shell that used $1,700/oz Au price. The Pseudoflow process uses a cash-flow optimisation methodology for cut-off determination. This methodology results in a variable cut-off grade due to the dependence of numerous factors described below. Table 14-11 lists the parameters used to create the optimized pit shell.
Value-based routing was used in generating the cost and cash value of each block. For ore routed to the sulfide mill, considerations for an acid cost/credit depending on the carbonate and the sulfide sulfur values of each block applying an acid cost to those blocks with carbonates values >4.3% and a credit to those blocks with carbonate values <3.7%. Similarly, blocks with sulfide sulfur values >3.0% were given a credit and a cost if it was <2.6%.
Potential revenue was calculated using a $1,700/oz Au price, a carbon handling and refining cost per ounce of $0.38, and the 1.02% AB495 Nevada tax.
The following equations were used to calculate the recovery and nominal cutoff grades:
| ● | Vista Pit heap leach recovery = 70% |
| ● | Mega Pit heap leach recovery = 63% |
| ● | Vista Pit oxide mill recovery = 0.919 – 0.06514 / (Au) |
| ● | Mega Pit oxide mill recovery = 0.0754 * ln (Au) + 0.72708 |
| March 15, 2024 |
Page 180 |
|
|
Turquoise Ridge Complex NI 43-101 Technical Report |
|
| ● | Vista Pit sulfide mill recovery (note: same as Vista UG) = -457.0 x (TCM / Au) + 97.68 |
| ● | Mega Pit sulfide mill recovery= -224.6 x (TCM / Au) + 100.79 |
Table 14-11 Turquoise Ridge Surface Resource Cut-Off Grade Parameters
| Description | Sub-area | Units | Mega Cut 40 |
Mega Cut 55 |
Vista 9 | |||||
| Mining cost (average) | - | $/tonne | 2.2011 | 2.2051 | 2.50 | |||||
| Processing cost | Sage Mill | $/tonne | 35.86 | 35.86 | 35.86 | |||||
| Juniper Mill | $/tonne | 10.81 | 10.81 | 10.81 | ||||||
| Leach | $/tonne | 3.70 | 3.70 | 3.70 | ||||||
| General and administrative costs |
- | % of Mining cost | 11.0 | 11.0 | 11.0 | |||||
| Sustaining capital | Mining | $/tonne | 0.36 | 0.36 | 0.00 | |||||
|
Sulfide Mill & Tailings Dam Expansion |
$/tonne | 1.90 | 1.90 | 1.90 | ||||||
| Oxide Mill & Tailings Dam Expansion |
$/tonne | 3.23 | 3.23 | 3.23 | ||||||
| Leach | $/tonne | 0.00 | 0.00 | 0.00 | ||||||
| Gold metal recovery (average)2 |
Sulfide mill | % | 75.6* | 76.7* | 81.0* | |||||
| Oxide mill | % | 75.4* | 77.4* | N/A | ||||||
| Heap leach | % | 63 | 63 | 70 | ||||||
| Gold selling price | - | $/rec. oz | 1700 | 1700 | 1700 | |||||
| Refining & selling | - | $/rec. oz | 0.38 | 0.38 | 0.38 | |||||
| AB 495 tax | - | % gross revenue | 1.02 | 1.02 | 1.02 | |||||
| Mineral Resource cut-off grade |
- | g/tonne Au | varies | varies | varies | |||||
| 1. | Average mining cost including G&A and average recoveries – mining cost and G&A increase with pit depth. |
| 2. | Recovery varies based on recovery equations above. |
| 14.4 | Vista Underground |
| 14.4.1 | Introduction |
The Mineral Resource estimate is based on 15,768 drillholes (1,950,638 m) and 3,817 channel samples taken across the active mining faces. The database closeout date is September 13, 2023. Modelling was performed using the commercially available Maptek Vulcan software. The drill holes used in the Resource estimation are shown in Figure 14-21.
| March 15, 2024 |
Page 181 |
|
|
Turquoise Ridge Complex NI 43-101 Technical Report |
|
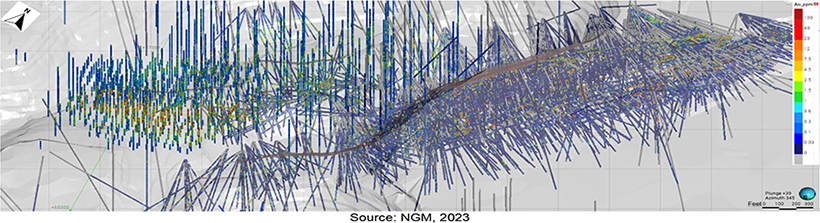
Figure 14-21 Vista Database
The block model uses a parent block size of 1.8 x 1.8 x 1.8 m (6 x 6 x 6 ft; easting, northing, elevation) outside of the mineralized domains and the halo domains. Within the mineralized domains and the halo domains the blocks are constrained to 0.6 x 0.6 x 0.6 m (2.0 x 2.0 x 2.0 ft). Domain boundaries, sterilized zones and excavated panels use the subblocks on the edges. Outside the mineralized domains, blocks were 9.1 x 9.1 x 9.1 m (30 x 30 x 30 ft). The block model is rotated 45 degrees to align with the trench fault mineralization.
The coordinate system used for Resource modelling is Nevada State Plane, Western zone, NAD 27.
| 14.4.2 | Geological Modelling and Domains |
Four domains were modelled, based on mineralization style, geology, and structural controls. Ore zones (OZ) 1-3 are modelled using face mapping point clouds and drill logs to model the mineralized vein system. A lower-grade dilution shape encompasses mineralization outside the ore zones. This dilution shape (OZ4) includes the traditional Trench Fault mineralization but excludes the indicator shapes. An example of these domains can be seen in Figure 14-22.
| March 15, 2024 |
Page 182 |
|
|
Turquoise Ridge Complex NI 43-101 Technical Report |
|
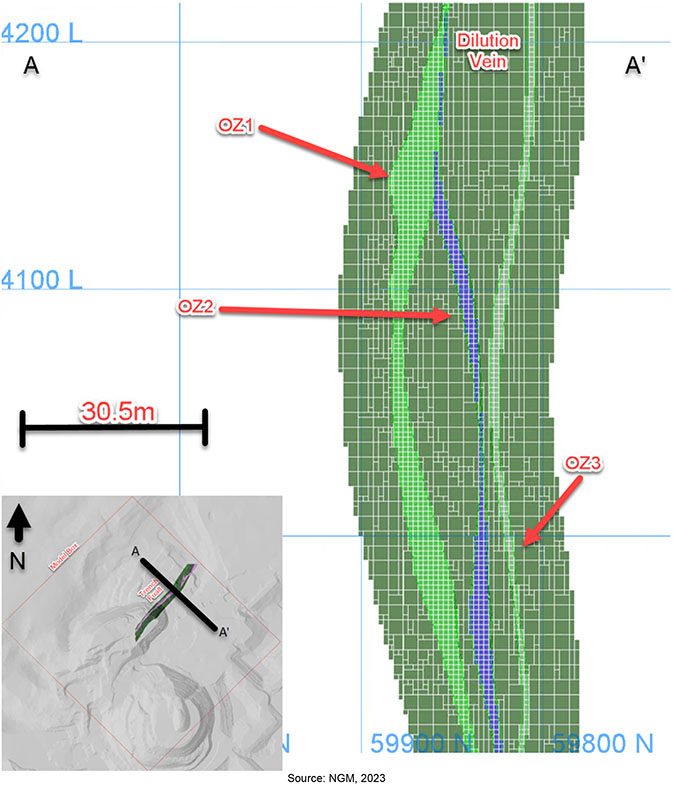
Figure 14-22 VUG OZ domains
| March 15, 2024 |
Page 183 |
|
|
Turquoise Ridge Complex NI 43-101 Technical Report |
|
| 14.4.3 | Exploratory Data Analysis |
Datamine’s Supervisor software was used to construct histograms, log probability plots, mean and variance plots using the declustered “au_opt” variable. Exploratory data analysis was completed on domains OZ1 (domain 1), OZ2 (domain 21), OZ2b (domain 22) and OZ3 (domain 23), Iggy (domain 5), OZ1_HW (domain 91), OZ1_FW (domain 96), OZ1_OZ Wedge (domain 92), OZ2_FW (domain 93), OZ2b_FW (domain 94) and OZ2b_HW (domain 25). An example of the log histogram and the log probability plot for domain OZ1 is presented in Figure 14-23.
| 14.4.4 | Composites |
The Resource model uses drill data composited to 0.76 m (2.5ft) lengths in mineralized domains and the surrounding lithologies. The 0.76 m composite length was chosen because of the very narrow vein width, which is frequently less than 0.76 m in true width. The enveloping dilution zones can be several meters thick on both the hanging and footwall sides but are usually much lower grade. Composites were split at domain boundaries.
| March 15, 2024 |
Page 184 |
|
|
Turquoise Ridge Complex NI 43-101 Technical Report |
|
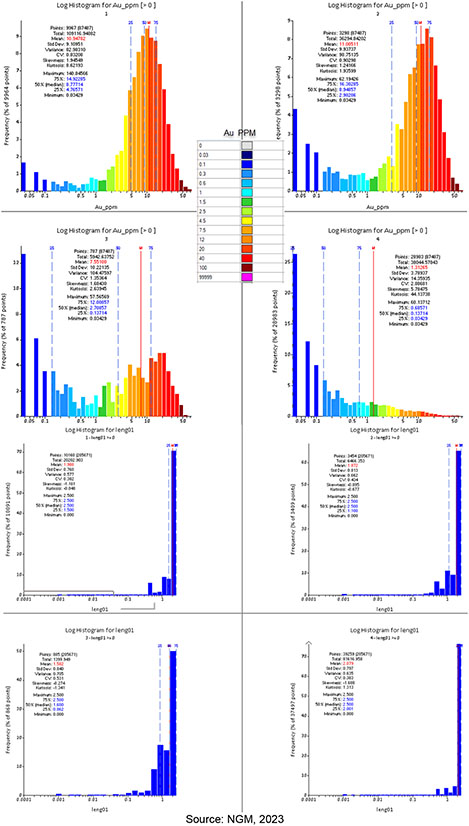
Figure 14-23 Vista Underground Gold Histograms by Domain and Composite Length Histograms by Domain
| March 15, 2024 |
Page 185 |
|
|
Turquoise Ridge Complex NI 43-101 Technical Report |
|
| 14.4.5 | Grade Capping/Outlier Restriction |
The caps were verified using Supervisor’s Global top-cut analysis tool, without any changes. Composite data are capped within the block estimation files. Caps range from 25 g/t Au to 50 g/t Au for the OZ domains. High yield limits are utilized to restrict high grades form over influencing the estimation. A summary of the capping results is shown in Table 14-12.
Table 14-12 Grade Capping Analysis for Vista Underground
| Domain | No. of Samples | Min (g/t Au) |
Max (g/t Au) |
Mean (g/t Au) |
CV Raw |
Capped (g/t Au) |
Mean (g/t Au) |
CV Capped |
No. of Samples Capped |
|||||||||
| OZ1 | 9,967 | 0.034 | 140.91 | 10.97 | 0.83 | 49.71 | 10.97 | 0.81 | 45 | |||||||||
| OZ2 | 3,298 | 0.034 | 62.06 | 10.97 | 0.90 | 49.71 | 10.97 | 0.90 | 14 | |||||||||
| OZ3 | 787 | 0.034 | 57.60 | 7.54 | 0.22 | 49.71 | 7.54 | 0.22 | 4 | |||||||||
| OZ4 | 28,983 | 0.034 | 60.00 | 1.37 | 2.89 | 25.02 | 1.37 | 2.68 | 162 | |||||||||
| 14.4.6 | Density Assignment |
Density was interpolated using OK, based on the gold variograms and a search radius of 1.2 times the second structure ranges. It required 3–10 samples and restricted samples to the block zone. The maximum number of allowed samples per drill hole was two. The default density value was equal to the estimated density value for each zone. The initial pass failed to estimate many blocks, hence the use of a default value.
Capping was not used, but the sample selection criterion restricted the density value to between 0 and 1.
| 14.4.7 | Variography |
Variographic analyses were completed by domain, using the 0.6 m composited data. Supervisor software was used to determine the major, semi-major, and minor directional axes of greatest continuity. Experimental gold variograms were modeled using three nested spherical or exponential (practical range) structures. Anisotropic search ellipsoids were visually checked using Vulcan to ensure they were consistent with the underlying mineralization controls.
Figure 14-24 shows the analysis for Vista Underground high-grade shell.
| March 15, 2024 |
Page 186 |
|
|
Turquoise Ridge Complex NI 43-101 Technical Report |
|
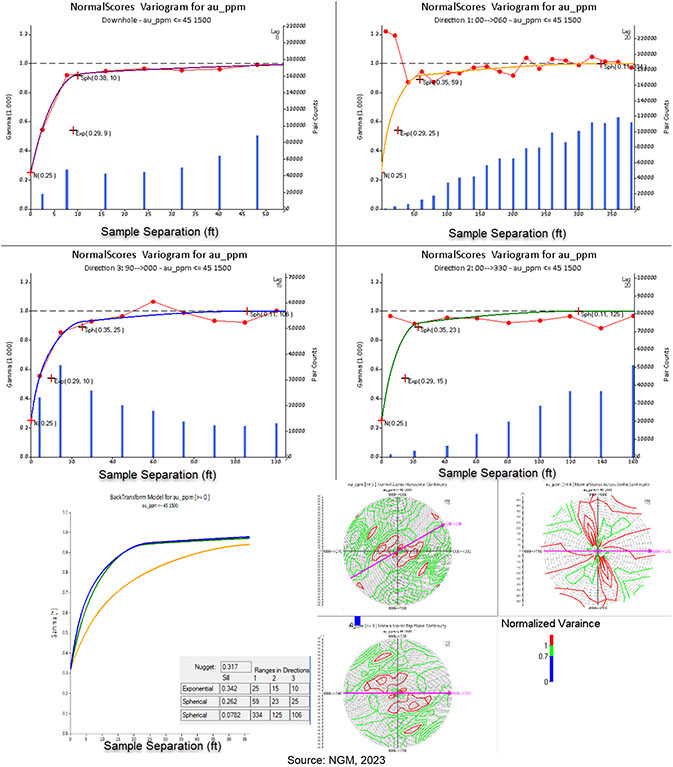
Figure 14-24 Vista Underground High Grade Variogram
| 14.4.8 | Estimation/Interpolation Methods |
The Vista underground gold model was estimated using OK.
| March 15, 2024 |
Page 187 |
|
|
Turquoise Ridge Complex NI 43-101 Technical Report |
|
The estimates used three passes. The first pass required the most amount of sample with the smallest search range estimating block where the data is dense, the flowing two pass required less data and increase the search range with each pass. An additional eight estimations were completed for the elements TCM, Ctot, CO3, Stot, SS, As, Sb, and CC utilizing inverse distance cubed. The estimation method, pass, and sample sections parameters are summarized in Table 14-13 for all estimated variables. All OK estimates utilize dynamic anisotropy following the vein system for variogram and search orientations.
Table 14-13 VUG Estimation Parameters
| Element | Method | Domain | Pass | Major (m) | Semi (m) | Minor (m) | Min | Max | Max DH | |||||||||
| Au | OK | OZ1 | 1 | 18.3 | 15.2 | 15.2 | 4 | 8 | 2 | |||||||||
| Au | OK | OZ1 | 2 | 36.6 | 30.5 | 30.5 | 3 | 6 | 2 | |||||||||
| Au | OK | OZ1 | 3 | 152.4 | 152.4 | 152.4 | 2 | 5 | 2 | |||||||||
| Au | OK | OZ2 | 1 | 18.3 | 15.2 | 15.2 | 4 | 8 | 2 | |||||||||
| Au | OK | OZ2 | 2 | 36.6 | 30.5 | 30.5 | 3 | 6 | 2 | |||||||||
| Au | OK | OZ2 | 3 | 152.4 | 152.4 | 152.4 | 2 | 5 | 2 | |||||||||
| Au | OK | OZ3 | 1 | 18.3 | 15.2 | 15.2 | 4 | 8 | 2 | |||||||||
| Au | OK | OZ3 | 2 | 36.6 | 30.5 | 30.5 | 3 | 6 | 2 | |||||||||
| Au | OK | OZ3 | 3 | 152.4 | 152.4 | 152.4 | 2 | 5 | 2 | |||||||||
| Au | OK | OZ4 | 1 | 48.8 | 36.6 | 24.4 | 4 | 8 | 2 | |||||||||
| Au | OK | OZ4 | 2 | 76.2 | 76.2 | 76.2 | 3 | 6 | 2 | |||||||||
| Au | OK | OZ4 | 3 | 152.4 | 152.4 | 152.4 | 2 | 5 | 2 | |||||||||
| TCM | ID3 | Global | 1 | 121.9 | 121.9 | 121.9 | 4 | 12 | 2 | |||||||||
| Ctot | ID3 | Global | 1 | 121.9 | 121.9 | 121.9 | 4 | 12 | 2 | |||||||||
| CO3 | ID3 | Global | 1 | 121.9 | 121.9 | 121.9 | 4 | 12 | 2 | |||||||||
| Stot | ID3 | Global | 1 | 121.9 | 121.9 | 121.9 | 4 | 12 | 2 | |||||||||
| SS | ID3 | Global | 1 | 121.9 | 121.9 | 121.9 | 4 | 12 | 2 | |||||||||
| As | ID3 | Global | 1 | 121.9 | 121.9 | 121.9 | 4 | 12 | 2 | |||||||||
| Sb | ID3 | Global | 1 | 121.9 | 121.9 | 121.9 | 4 | 12 | 2 | |||||||||
| CC | ID3 | Global | 1 | 121.9 | 121.9 | 121.9 | 4 | 12 | 2 | |||||||||
| 14.4.9 | Block Model Validation |
The block model was validated using the following checks:
| ● | Global bias check by domain: Review declustered mean of each domain to ensure they are within 5%. |
| ● | Visual inspection: Compare block model to drillhole data ensuring there are no visual artifacts. |
| ● | Swath plots: Ensure the drillhole data matches the estimate. |
| ● | Comparisons between estimation types: Understand the sensitivity between estimation types and estimation parameters. |
| ● | Reconciliation to mine produced: Compare production vs estimation to ensure the estimate is reflective of what the mine is producing. |
| March 15, 2024 |
Page 188 |
|
|
Turquoise Ridge Complex NI 43-101 Technical Report |
|
| ● | QQ plots/histogram reproduction: Ensure that the statistical distribution of the estimation matches the expected support corrected drillholes distribution. |
| ● | Decluster plots: Compare the support-adjusted data within a block to the block estimate to understand if the estimate aligns with the data. |
| ● | Grade tonnage curves: Compare the support corrected grade tonnage at different cut-off grades to the model grade tonnage to ensure the model is representative of the recoverable Resource. |
The validation checks showed that the model was acceptable.
| 14.4.10 | Confidence Classifications |
A block was classified as Measured if the block centroid lay within 6.4 m of three samples from three different drill holes, and the block was estimated in the first pass.
A block was classified as Indicated if the block centroid lay within 15.2 m of three samples from three drill holes, and the block was estimated in the first pass.
A block was classified as Inferred if the block centroid lay within 30.5 m of three samples from three different drill holes, and the block was estimated in the first pass.
| 14.4.11 | Reasonable Prospects of Eventual Economic Extraction |
Mining shapes for both drift-and-fill and stoping methods were created, based on the block model, and understanding of the geological domains, at appropriate cut-off grades using Deswik SO. Mining costs were used to calculate a Resource cut-off grade at a $1,700/oz gold price.
For Vista Underground, the Resource cut-off grade was determined to be 2.67 g/t for the uphole stoping mining method, and 4.02 g/t for the downhole stoping method. Cut-off grades were applied to mining shapes with the appropriate mining method determined by level. Mining shapes located outside existing development were not considered due to the lack of reasonable prospects for extraction. Mining Shapes within existing development above the appropriate Resource cut-off grade were included in the Mineral Resource estimate.
Table 14-14 summarises the inputs used for the Resources CoG determination.
| March 15, 2024 |
Page 189 |
|
|
Turquoise Ridge Complex NI 43-101 Technical Report |
|
Table 14-14 Input Considerations, Mineral Resources CoG, Vista Underground
| Description | Units | 2023 | ||
| Gold Price | $/rec. oz | 1,700 | ||
| Fixed Mining OPEX | $/ore tonne | 15.52 | ||
| Downhole Stope Cost | $/ore tonne | 94.15 | ||
| Uphole Stope Cost | $/ore tonne | 48.43 | ||
| Mining G&A | $/ore tonne | 9.75 | ||
| Surface Haul | $/ore tonne | 1.22 | ||
| Processing OPEX | $/ore tonne | 31.08 | ||
| Talings Dam CAPEX | $/ore tonne | 1.72 | ||
| Process G&A | $/ore tonne | 3.82 | ||
| TR Autoclave (Sage) Recovery | % | -457.0*(TCM/Au) + 97.68 | ||
| AB495 Tax | % of rec. oz | 1.02 % | ||
| External Refining & Selling | $/rec. oz | 0.38 | ||
| 14.5 | Stockpiles |
For the stockpiles, a net value-based approach was used to analyze each stockpile which took into consideration the tonnes, grade, ounces, organic carbon content (and the resulting metallurgical recovery), the processing costs including rehandle (at either Sage Autoclave or Juniper Oxide Mill), refining costs, and the AB 495 Nevada tax.
Using a gold price of $1,700/oz the potential revenue that could be generated from the stockpile was calculated. Stockpiles that made a profit of at least $1.00 were then considered as Mineral Resources.
The LOM plan does not process all the ore from the pit and the stockpiles by the end of processing life. The blending constraints exhaust the higher sulfide sulfur stockpile sources and leave low grade high carbonate and high organic carbon material.
| 14.6 | Royalties |
Turquoise Ridge Surface mining lands subject to royalty are in a portion of Section 4, T39N, R42E. The royalty is in favor of Royal Gold for 2% of the gold ounces when they are processed times the current gold price. The royalty applies to gold ounces sold in excess of 50,000 ounces, from this area which was exceeded in 2008. There are no remaining royalties in Vista 8. The portion of Cut 40 that is subject to this royalty is shown in Figure 14-25.
| March 15, 2024 |
Page 190 |
|
|
Turquoise Ridge Complex NI 43-101 Technical Report |
|
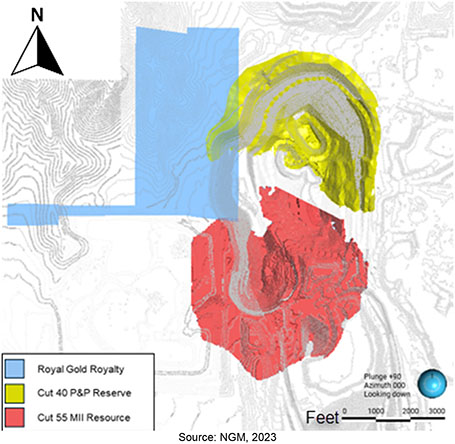
Figure 14-25 Mega Pit Royal Gold Royalty Boundary
| 14.7 | Mineral Resource Statement |
The Mineral Resource estimates have been prepared according to the Canadian Institute of Mining, Metallurgy and Petroleum (CIM) 2014 Definition Standards for Mineral Resources and Mineral Reserves dated 10 May 2014 (CIM (2014) Standards) as incorporated with National Instrument 43-101 Standards of Disclosure for Mineral Projects (NI 43-101). Mineral Resource estimates were also prepared using the guidance outlined in CIM Estimation of Mineral Resources and Mineral Reserves (MRMR) Best Practice Guidelines 2019 (CIM (2019) MRMR Best Practice Guidelines).
Total Mineral Resources for the Turquoise Ridge Complex on a 100% basis, shown in Table 14-15, are estimated to be the following:
| ● | Measured and Indicated categories: 110 Mt at an average grade of 5.42 g/t Au for 20 Moz; and |
| ● | Inferred category: 16 Mt at an average grade of 3.2 g/t Au for 1.6 Moz Au. |
Barrick’s attributable Mineral Resources are based on its 61.5% interest in NGM and is shown in Table 14-16.
| March 15, 2024 |
Page 191 |
|
|
Turquoise Ridge Complex NI 43-101 Technical Report |
|
Table 14-15 Turquoise Ridge Mineral Resource Statement, 100% Basis, December 31, 2023
| Location | Measured | Indicated | Measured + Indicated | Inferred | ||||||||||||||||||||
|
Tonnes |
Grade |
Contained |
Tonnes |
Grade |
Contained |
Tonnes |
Grade |
Contained |
Tonnes |
Grade |
Contained |
|||||||||||||
|
(Mt) |
(g/t Au) |
(Moz Au) |
(Mt) |
(g/t Au) |
(Moz Au) |
(Mt) |
(g/t Au) |
(Moz Au) |
(Mt) |
(g/t Au) |
(Moz Au) |
|||||||||||||
| Surface | ||||||||||||||||||||||||
| Mega Cut 40 | - | - | - | 16 | 2.21 | 1.1 | 16 | 2.21 | 1.1 | 3.5 | 1.9 | 0.22 | ||||||||||||
| Mega Cut 55 | - | - | - | 20 | 2.79 | 1.8 | 20 | 2.79 | 1.8 | 9.3 | 2.5 | 0.74 | ||||||||||||
| Vista 8 | - | - | - | 0.48 | 1.32 | 0.020 | 0.48 | 1.32 | 0.020 | - | - | - | ||||||||||||
| Vista 9 | - | - | - | 0.79 | 2.37 | 0.060 | 0.79 | 2.37 | 0.060 | 0.29 | 1.7 | 0.016 | ||||||||||||
| Open Pit Total | - | - | - | 38 | 2.52 | 3.0 | 38 | 2.52 | 3.0 | 13 | 2.3 | 0.98 | ||||||||||||
| Twin Creeks Stockpile | 28 | 2.22 | 2.0 | - | - | - | 28 | 2.22 | 2.0 | - | - | |||||||||||||
| Surface Total | 28 | 2.22 | 2.0 | 38 | 2.52 | 3.0 | 66 | 2.39 | 5.0 | 13 | 2.3 | 0.98 | ||||||||||||
| Underground | ||||||||||||||||||||||||
| TRUG | 17 | 10.72 | 5.8 | 31 | 8.96 | 9.0 | 48 | 9.57 | 15 | 2.4 | 7.7 | 0.61 | ||||||||||||
| Vista Underground | 0.0028 | 5.79 | 0.0053 | 0.0017 | 5.24 | 0.00028 | 0.030 | 5.76 | 0.0056 | - | - | |||||||||||||
| Underground Total | 17 | 10.72 | 5.8 | 31 | 8.96 | 9.0 | 48 | 9.57 | 15 | 2.4 | 7.7 | 0.61 | ||||||||||||
| Turquoise Ridge Total | 45 | 5.40 | 7.8 | 69 | 5.43 | 12 | 110 | 5.42 | 20 | 16 | 3.2 | 1.6 | ||||||||||||
Notes:
| ● | Mineral Resources are reported on 100% basis. Barrick’s attributable share of the Mineral Resource is 61.5% based on its interest in NGM. |
| ● | CIM (2014) Standards and CIM (2019) MRMR Best Practice Guidelines were followed for Mineral Resources |
| ● | Underground Mineral Resources are estimated based on a positive net value stope economic analysis. |
| ● | Surface Mineral Resources are estimated based on an economic pit shell using a pseudoflow algorithm. |
| ● | Mineral Resources are estimated using a long-term gold price of US$1,700/oz. |
| ● | Mineral Resources are inclusive of Mineral Reserves. |
| ● | Numbers may not add due to rounding. |
| ● | The QP responsible for this Mineral Resource Estimate is Craig Fiddes, SME Reg. |
| March 15, 2024 |
Page 192 |
|
|
Turquoise Ridge Complex NI 43-101 Technical Report |
|
Table 14-16 Turquoise Ridge Mineral Resource Statement, Barrick Attributable Basis, December 31, 2023
| Location | Measured | Indicated | Measured + Indicated | Inferred | ||||||||||||||||||||
|
Tonnes |
Grade |
Attrib. |
Tonnes |
Grade |
Attrib. |
Tonnes |
Grade |
Attrib. |
Tonnes |
Grade |
Attrib. |
|||||||||||||
|
(Mt) |
(g/t Au) |
(Moz Au) |
(Mt) |
(g/t Au) |
(Moz Au) |
(Mt) |
(g/t Au) |
(Moz Au) |
(Mt) |
(g/t Au) |
(Moz Au) |
|||||||||||||
| Surface | ||||||||||||||||||||||||
| Mega Cut 40 | - | - | - | 9.8 | 2.21 | 0.70 | 9.8 | 2.21 | 0.70 | 2.2 | 1.9 | 0.14 | ||||||||||||
| Mega Cut 55 | - | - | - | 1 | 2.79 | 1.1 | 12 | 2.79 | 1.1 | 5.7 | 2.5 | 0.45 | ||||||||||||
| Vista 8 | - | - | - | 0.30 | 1.32 | 0.013 | 0.30 | 1.32 | 0.013 | - | - | - | ||||||||||||
| Vista 9 | - | - | - | 0.49 | 2.37 | 0.037 | 0.49 | 2.37 | 0.037 | 0.18 | 1.7 | 0.0098 | ||||||||||||
| Open Pit Total | - | - | - | 23 | 2.52 | 1.9 | 23 | 2.52 | 1.9 | 8.1 | 2.3 | 0.60 | ||||||||||||
| Twin Creeks Stockpile | 17 | 2.22 | 1.2 | - | - | - | 17 | 2.22 | 1.2 | - | - | - | ||||||||||||
| Surface Total | 17 | 2.22 | 1.2 | 23 | 2.52 | 1.9 | 40 | 2.39 | 3.1 | 8.1 | 2.3 | 0.60 | ||||||||||||
| Underground | ||||||||||||||||||||||||
| TRUG | 10 | 10.72 | 3.6 | 19 | 8.96 | 5.5 | 29 | 9.57 | 9.1 | 1.5 | 7.7 | 0.37 | ||||||||||||
| Vista Underground |
0.018 | 5.79 | 0.0033 | 0.0010 | 5.24 | 0.00017 | 0.019 | 5.76 | 0.0034 | - | - | |||||||||||||
| Underground Total | 10 | 10.72 | 3.6 | 19 | 8.96 | 5.5 | 29 | 9.57 | 9.1 | 1.5 | 7.7 | 0.37 | ||||||||||||
| Turquoise Ridge Barrick Attributable Total |
28 | 5.40 | 4.8 | 42 | 5.43 | 7.4 | 70 | 5.42 | 12 | 9.6 | 3.2 | 0.97 | ||||||||||||
Notes:
| ● | Mineral Resources are reported on Barrick’s 61.5% attributable share of the Mineral Resource based on its interest in NGM. |
| ● | CIM (2014) Standards and CIM (2019) MRMR Best Practice Guidelines were followed for Mineral Resources |
| ● | Underground Mineral Resources are estimated based on a positive net value stope economic analysis. |
| ● | Surface Mineral Resources are estimated based on an economic pit shell using a pseudoflow algorithm. |
| ● | Mineral Resources are estimated using a long-term gold price of US$1,700/oz. |
| ● | Mineral Resources are inclusive of Mineral Reserves. |
| ● | Numbers may not add due to rounding. |
| ● | The QP responsible for this Mineral Resource Estimate is Criag Fiddes, SME Reg. |
| March 15, 2024 |
Page 193 |
|
|
Turquoise Ridge Complex NI 43-101 Technical Report |
|
| 14.8 | Comments on Mineral Resource Estimates |
| 14.8.1 | External Mineral Resource Audits |
In November 2023, RSC Consulting Ltd (RSC) completed an independent audit of the Mineral Resource estimation at Turquoise Ridge (RSC, 2023). Although the final audit report is pending the preliminary report indicated that the Mineral Resource estimates, and the data collected to inform them, do not present any fatal flaws. A number of recommendations were made by RSC that will provide direction for future improvements, summarized by the following points;
| ● | Expand standard approaches to geologic modeling, domaining, and grade estimation across all projects to ensure currency of models and reduce dependence on a few highly experienced personnel. |
| ● | Continue efforts to improve estimation quality for density and geochemical elements that impact mine planning, ore routing, and processing. |
| 14.8.2 | Relative Accuracy/Confidence of the 2023 Mineral Resource Estimate |
The QP considers the Mineral Resource estimation process including the data quality, geological modelling, treatment of outliers, estimation processes and Resource classification to be inline with industry best practices and free of any material forms of error.
The QP is not aware of any environmental, permitting, legal, title, taxation, socioeconomic, marketing, political, metallurgical, fiscal, or other relevant factors that are not discussed in this Report, that could materially affect the Mineral Resource estimate.
| March 15, 2024 |
Page 194 |
|
|
Turquoise Ridge Complex NI 43-101 Technical Report |
|
| 15 | Mineral Reserve Estimates |
| 15.1 | Summary |
The Mineral Reserve estimates have been prepared according to the Canadian Institute of Mining, Metallurgy and Petroleum (CIM) 2014 Definition Standards for Mineral Resources and Mineral Reserves dated 10 May 2014 (CIM (2014) Standards) as incorporated with National Instrument 43-101 Standards of Disclosure for Mineral Projects (NI 43-101). Mineral Resource estimates were also prepared using the guidance outlined in CIM Estimation of Mineral Resource and Mineral Reserve Best Practice Guidelines 2019 (CIM (2019) MRMR Best Practice Guidelines).
The Mineral Reserves have been estimated from the Measured and Indicated Mineral Resources and do not include any Inferred Mineral Resources. Mineral Reserves include material that will be mined by open pit and underground mining methods, and stockpiles.
The estimate uses updated economic factors, the latest Mineral Resource and geological models, geotechnical and hydrological inputs, and metallurgical processing and recovery updates. The QPs responsible for estimating the Mineral Reserves have performed an independent verification of the block model tonnes and grade, and in their opinion the process has been carried out to industry standards.
For the open pit, economic pit shells were generated using the Pseudoflow algorithm within Deswik software and then used in the open pit mine design process and Mineral Reserve estimation. The final pit limit selection and design process is outlined in Section 16.
For the underground operations, the Deswik SO was used to evaluate the geological block model to create overall mining shapes. Preliminary stope wireframes were created and planned dilution was added to the mineable stope shape. The Pseudoflow algorithm within Deswik software was used to evaluate the cost, revenue, and resulting net value associated with each shape. Stopes with a positive net value were included in the Mineral Reserves estimate.
A site specific financial model was populated and reviewed to demonstrate that the Mineral Reserves are economically viable.
A summary of the Mineral Reserves is shown in Table 15-1. Mineral Reserves are estimated:
| ● | As of December 31, 2023. |
| ● | Using a gold price of $1,300/oz. |
| ● | As ROM grades and tonnage delivered to the primary crushing facility. |
| March 15, 2024 |
Page 195 |
|
|
Turquoise Ridge Complex NI 43-101 Technical Report |
|
| ● | For Turquoise Ridge Underground, Vista Underground, Mega Pit, Vista Pit, and numerous historically mined surface ore stockpiles. |
| March 15, 2024 |
Page 196 |
|
|
Turquoise Ridge Complex NI 43-101 Technical Report |
|
Table 15-1 Turquoise Ridge Mineral Reserves Summary, December 31, 2023
| Location | Proven | Probable | Proven + Probable | |||||||||||||||||||||
|
Tonnes |
Grade |
Contained |
Attributable |
Tonnes |
Grade |
Contained |
Attributable |
Tonnes |
Grade |
Contained |
Attributable |
|||||||||||||
|
(Mt) |
(g/t Au) |
(Moz Au) |
(Moz Au) |
(Mt) |
(g/t Au) |
(Moz Au) |
(Moz Au) |
(Mt) |
(g/t Au) |
(Moz Au) |
(Moz Au) |
|||||||||||||
| Open Pits | - | - | - | - | 11 | 2.37 | 0.85 | 0.52 | 11 | 2.37 | 0.85 | 0.52 | ||||||||||||
| Twin Creeks Stockpile | 25 | 2.36 | 1.9 | 1.2 | - | - | - | - | 25 | 2.36 | 1.9 | 1.2 | ||||||||||||
| Surface Total | 25 | 2.36 | 1.9 | 1.2 | 11 | 2.37 | 0.85 | 0.52 | 36 | 2.36 | 2.8 | 1.7 | ||||||||||||
| Underground Total |
13 | 11.58 | 4.9 | 3.0 | 20 | 10.04 | 6.3 | 3.9 | 33 | 10.66 | 11 | 6.9 | ||||||||||||
| Turquoise Ridge Total | 38 | 5.53 | 6.8 | 4.2 | 31 | 7.24 | 7.2 | 4.4 | 69 | 6.29 | 14 | 8.6 | ||||||||||||
Notes
| ● | Proven and Probable Mineral Reserves are reported on 100% basis. Barrick’s attributable share of the Mineral Reserve is 61.5% based on its interest in NGM. |
| ● | The Mineral Reserve estimate has been prepared according to CIM (2014) Standards and using CIM (2019) MRMR Best Practice Guidelines. |
| ● | Mineral Reserves are reported at a gold price of US$1,300/oz. |
| ● | Underground Mineral Reserves are estimated based on a positive net value stope economic analysis applying appropriate cost and modifying factors. |
| ● | Surface Mineral Reserves are estimated based on an economic pit design applying appropriate costs and modifying factors. |
| ● | Mining recovery and dilution factors are applied based on calculated historic actual results. |
| ● | All reported metal is contained before process recovery; metal recoveries are variable based on material type, gold grades, TCM grades, sulfide sulfur grades, and processing methodology. |
| ● | Contained metal is reported in millions of troy ounces. |
| ● | Numbers may not add due to rounding. |
| ● | The QP responsible for the Surface Mineral Reserve Estimate is Timothy Webber, SME RM. |
| ● | The QP responsible for the Underground Mineral Reserve Estimate is Paul Schmiesing, SME RM. |
| March 15, 2024 |
Page 197 |
|
|
Turquoise Ridge Complex NI 43-101 Technical Report |
|
| 15.2 | Metal Price Assumptions |
Metal prices used for the Mineral Reserves estimate for the Turquoise Ridge Complex are the Barrick corporate guidance assumptions for the long-term metal price. These are in US dollars per troy ounce:
| ● | Gold – US$1,300/oz |
| 15.3 | Revenue Calculation |
Revenue for each deposit of the operations is calculated the same way which is according to the following:
Revenue = Au Price x Recovered ounces x (100% - AB495 Revenue Tax %)
The Recovered ounces is a function of the contained ounces of a mining shape or pit, factored with a mining recovery and the processing recovery. These factors are dependent on the deposit and mining method and are detailed in the following sections.
The AB 495 tax is described in Section 4.6.1. For Turquoise Ridge operations, the LOM effective tax rate due to AB 495 is 1.02%.
| 15.4 | Turquoise Ridge Underground |
| 15.4.1 | Estimation Procedure |
The Mineral Reserve estimate use the depleted Resource block model prepared by the QP responsible for Mineral Resource estimation. Only Measured and Indicated Mineral Resources were used in the Reserve estimation.
The estimation was undertaken using Deswik software following the general process below:
| ● | Review the historical and LOM planned costs to evaluate each mining method unit cost. |
| ● | Mining methods were defined by area, based on the geometry, geotechnical considerations, and the mine development requirement to access the orebody. |
| ● | Use Deswik SO to evaluate the geological block model mineralisation and determine the areas to be included and the overall mining shapes. Due to geotechnical, productivity and practical mining constraints potentially minable shapes are initially generated at a lower than |
| March 15, 2024 |
Page 198 |
|
|
Turquoise Ridge Complex NI 43-101 Technical Report |
|
| economic cut-off grade of 3.11 g/t using Deswik SO. Design parameters can be found in Section 16.2.1. |
| ● | Design the development required to access the mineable stopes. |
| ● | Use Deswik Scheduler to calculate the diluted mined tonnes, grades and contained metal. This included mining dilution added as a varying percentage depending on the mining method and stope sequence (Primary or Secondary) (see Table 15-2). |
| ● | Evaluate the stope shapes profitability using the Optimisation (Pseudo Flow) function in Deswik Scheduler. Each shape is linked to the development required to mine it and cost and revenue are calculated to determine the net value of each mining shape (see net value calculation in 15.4.4). Only shapes that have a positive net value are included in the Reserve’s estimation. |
A section through the deposit showing the Mineral Reserve layout is provided in Figure 15-1.
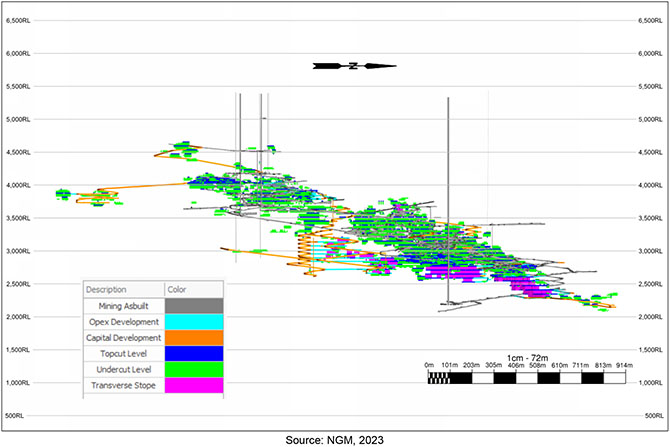
Figure 15-1 Turquoise Ridge Underground Cross-Section Showing Mineral Reserves
| March 15, 2024 |
Page 199 |
|
|
Turquoise Ridge Complex NI 43-101 Technical Report |
|
| 15.4.2 | Dilution and Mining Recovery |
Underground mining development and production stoping considers a waste tonnage dilution factor to the interrogated mined volume based on historical surveyed actuals. Dilution tonnes (0 g/t Au and insitu TCM% grade material) is calculated as a percentage of the interrogated planned design volume based on the mining method and activity as shown in Table 15-2. Long-hole stoping production subtracts a gold ounce recovery factor from the interrogated mined volume contained ounces has an average gold ounce recovery of 95% for both Primary and Secondary stopes. Drift and fill stoping recovery is 100% based on the selectivity of the mining method and historical reconciliations.
The QP considers these assumptions as appropriate based on historical results.
Table 15-2 TRUG Mining Dilution and Recovery Assumptions
| Mining Method | Dilution | Recovery | ||
| Undercut | 3.5% | 100% | ||
| Topcut | 4.7% | 100% | ||
| Long-hole Stoping – Primary | 3.0% | 95% | ||
| Long-hole Stoping – Secondary | 10.0% | 95% | ||
| Capital Development | 12.0% | 100% | ||
| Tertiary Development | 12.0% | 100% | ||
| 15.4.3 | Processing Recovery |
A discussion on the Sage Mill recovery for TRUG ore is detailed in Section 13. The recovery estimate utilises the diluted ore and TCM grades estimated for each Reserve shape using the following equation (Au in g/t, TCM in %):
TRUG Gold Recovery ( % ) = -155.7 x (TCM / Au) + 100.79
| 15.4.4 | Net Value Calculation |
The net value of each minable Reserve shape is calculated by subtracting the total costs of mining that shape from the revenue estimated from the shape.
Revenue is estimated as described in Section 15.3.
Costs are estimated using direct and indirect operating costs (including an allocation for required development). The inputs used for the net value calculation are provided in Table 15-3.
| March 15, 2024 |
Page 200 |
|
|
Turquoise Ridge Complex NI 43-101 Technical Report |
|
Table 15-3 Input Considerations, Mineral Reserve Net Value, Turquoise Ridge Underground
| Description | Units | Value | ||
| Gold Price | $/oz | 1,300 | ||
| Sustaining CAPEX | $/ore tonne | 9.91 | ||
| Topcut Mining | $/ore tonne | 127.01 | ||
| Undercut Mining | $/ore tonne | 90.72 | ||
| Stope Mining | $/ore tonne | 102.51 | ||
| Capital Development | $/waste tonne | 68.95 | ||
| Operational Development* | $/waste tonne | 134.26 | ||
| Mining G&A | $/ore tonne | 15.29 | ||
| Surface Haul | $/ore tonne | 2.00 | ||
| Processing OPEX | $/ore tonne | 29.51 | ||
| Processing CAPEX | $/ore tonne | 1.56 | ||
| Process G&A | $/ore tonne | 3.47 | ||
| TR Autoclave (Sage) Recovery | % | -155.7*(TCM/Au) + 100.79 | ||
| AB495 Tax | % of rec. oz | 1.02 % | ||
| External Refining & Selling | $/rec. oz | 0.38 | ||
* Operational Development costs include costs associated with fill activities.
| 15.4.5 | Sensitivities |
A series of sensitivities were performed on the Reserve shapes by adjusting gold metal price. The ore tonnes and contained gold ounces within the selected shapes is most sensitive to a lower long-term gold price with a lesser impact resulting from an increased gold price (Table 15-4). Gold price is considered a proxy for gold grade with changes in metal prices being representative of changes in grade.
Table 15-4 TRUG Reserves Sensitivity to Gold Price
| Gold Price ($/oz) | $1,000 | $1,100 | $1,200 | $1,300 | $1,400 | $1,500 | ||||||
| Reserve Ounces (Moz) | 7.89 | 9.08 | 10.26 | 11.20 | 12.04 | 12.57 | ||||||
| 15.5 | Turquoise Ridge Surface |
| 15.5.1 | Estimation Procedure |
The Mineral Reserves for the open pits are based on detailed pit designs informed by Pseudoflow (alternative to the Lerchs-Gorssman pit optimization algorithm) optimized pit shells created for each layback using Deswik software. In this process, each block of the pit is designated as being ore or waste based on a net value calculation. A summary of the input parameters for the optimisation is provided in Table 15-5.
Sulfide mill routing took into consideration the carbonate and the sulfide sulfur percentage by applying an acid cost to those blocks with carbonates values >4.3% and an acid credit to those blocks with carbonate values <3.7%. Similarly, blocks with sulfide sulfur values >3.0% were given an acid credit and an acid cost if sulfide sulfur <2.6%.
| March 15, 2024 |
Page 201 |
|
|
Turquoise Ridge Complex NI 43-101 Technical Report |
|
Table 15-5 Summary of Optimisation Input Parameters
| Open Pit Mining Costs | Units | Vista Pit | Mega Pit | |||
| Mining Cost | $/tonne mined | 2.49 | 1.91* | |||
| Site and Regional G&A | $/tonne mined | 0.27 | 0.21* | |||
| Mine Sustaining Capital | $/tonne mined | 0.00 | 0.36 | |||
| Mine Reclamation | $/tonne mined | 0.01 | 0.00 | |||
| Base Mining Cost | $/tonne mined | 2.77 | 2.48 |
*Average mining cost (mining and G&A costs increase with pit depth and in-pit waste dump material does not require drill & blast cost)
| Vista Pit V8 Ore Costs | Units | Sage Mill | Juniper Mill | Heap Leach | ||||
| Process Costs (no rehandle) | $/tonne processed | 35.86* | 10.81 | 3.70 | ||||
| Site and Regional G&A | $/tonne processed | 3.94 | 1.19 | 0.41 | ||||
| Process Sustaining Capital | $/tonne processed | 1.90 | 3.23 | 0.00 | ||||
| Process Reclamation | $/tonne processed | 0.11 | 0.00 | 0.01 | ||||
| Base Processing Cost | $/tonne processed | 41.81 | 15.23 | 4.12 |
*Base Sage autoclave cost – cost is modified with acid cost or credit depending on the carbonate and sulfide sulfur content of the ore
| Mega Pit Cut 40 Ore Costs | Units | Sage Mill | Juniper Mill | Heap Leach | ||||
| Process Costs (no rehandle) | $/tonne processed | 35.86* | 10.81 | 3.70 | ||||
| Site and Regional G&A | $/tonne processed | 3.94 | 1.19 | 0.41 | ||||
| Process Sustaining Capital | $/tonne processed | 1.90 | 3.23 | 0.00 | ||||
| Base Processing Cost | $/tonne processed | 41.70 | 15.23 | 4.11 |
*Base Sage autoclave cost – cost is modified with acid cost or credit depending on the carbonate and sulfide sulfur content of the ore
A figure showing the Mineral Reserves remaining in the Vista pit (Vista 8) is provided as Figure 15-2.
A figure showing the Mineral Reserves in the Mega pit (Cut 40) is provided as Figure 15-3.
A figure showing the Mineral Reserves in both the Vista and Mega pits is provided as Figure 15-4.
| March 15, 2024 |
Page 202 |
|
|
Turquoise Ridge Complex NI 43-101 Technical Report |
|
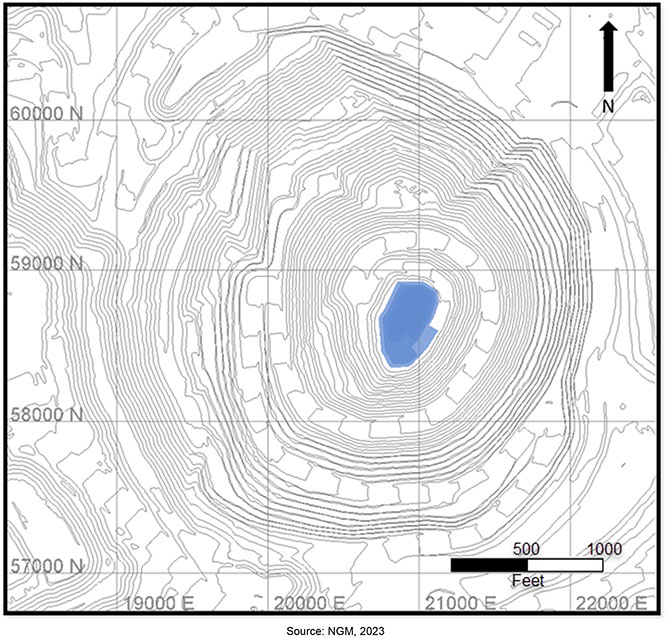
Figure 15-2 Mineral Reserves Remaining in Vista Pit
| March 15, 2024 |
Page 203 |
|
|
Turquoise Ridge Complex NI 43-101 Technical Report |
|
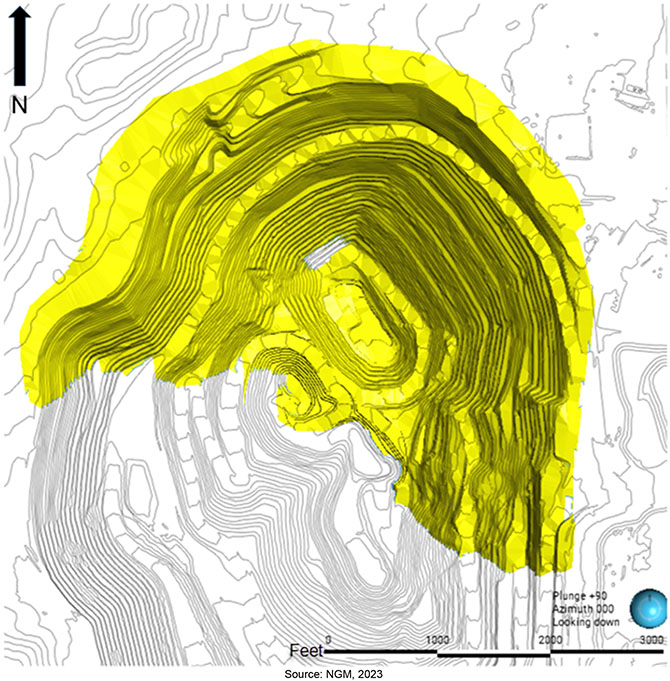
Figure 15-3 Mineral Reserves Remaining in Mega Pit – Cut 40
| March 15, 2024 |
Page 204 |
|
|
Turquoise Ridge Complex NI 43-101 Technical Report |
|
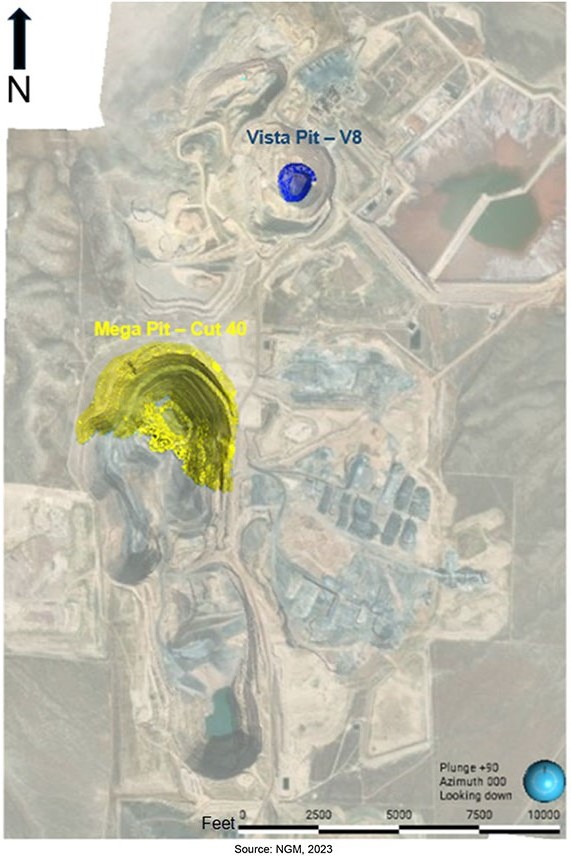
Figure 15-4 Mineral Reserves Remaining in Turquoise Ridge Open Pit
| March 15, 2024 |
Page 205 |
|
|
Turquoise Ridge Complex NI 43-101 Technical Report |
|
| 15.5.2 | Dilution and Mining Recovery |
Pit designs include appropriate minable geometry assumptions, so mining recovery is assumed to be 100%. With similar reasoning, no external dilution is included in pit designs.
The QP considers these assumptions as appropriate based on historical results.
| 15.5.3 | Net Value Calculation |
Each mining block is routed to ore or waste based on geochemical constituents (e.g., carbonate content and sulfide sulfur content) and a net value calculation. For blocks that can be processed at multiple process destinations (leach, oxide mill, refractory mill), the process destination that results in the highest margin is used. If a block is not profitable at any of the process destinations, then it is considered waste.
Revenue is estimated as described in Section 15.3.
Costs are estimated using the direct and indirect operating costs outlined in Table 15-5. Not listed in the table is an additional penalty for carbon handling and refining cost of $0.38 per recovered ounce.
| 15.5.4 | Processing Recovery |
A discussion on relevant processing recoveries for Turquoise Ridge Surface ores is detailed in Section 13.
Process recovery equations used are (Au in g/t, TCM in %):
| ● | Vista Ore Leach Gold Recovery (%) = 70% |
| ● | Mega Ore Leach Gold Recovery (%) = 63% |
| ● | Vista Ore Juniper Mill Gold Recovery (%) = 0.919 – 0.06514 / Au |
| ● | Mega Ore Juniper Mill Gold Recovery (%) = 0.0754*LN(Au) + 0.72708 |
| ● | Vista Pit V8 Reserves Sulfide Mill Gold Recovery (%): -224.6 x (TCM / Au) + 97.14 |
| ○ | Note: the Vista Pit V8 Reserves sulfide mill recovery formula varies from the open pit recovery formula described in Section 13. The detailed Vista 8 pit design was completed before the updated sulfide mill recovery formula described in Section 13 was available. The Vista 8 Reserves recovery formula returns lower recovery values, so the Vista 8 Reserve pit design is considered to be slightly conservative. |
| ● | Mega Pit Cut 40 Reserves Sulfide Mill Gold Recovery (%): -224.6 x (TCM / Au) +101.79 |
| March 15, 2024 |
Page 206 |
|
|
Turquoise Ridge Complex NI 43-101 Technical Report |
|
| ○ | Note: the Mega Pit Cut 40 Reserves sulfide mill recovery formula varies from the open pit recovery formula described in Section 13. Since the Cut 40 Reserves will be processed after the CIL screen replacements are completed, the Cut 40 Reserves recovery formula includes a nominal 1% increase in sulfide mill recovery. |
| 15.5.5 | Royalties |
Turquoise Ridge Surface mining lands subject to royalty are in a portion of Section 4, T39N, R42E. The royalty is in favor of Royal Gold for 2% of the gold ounces when they are processed times the current gold price. The royalty applies to gold ounces sold in excess of 50,000 ounces, from this area which was exceeded in 2008. There are no remaining royalties in Vista 8. The portion of Cut 40 that is subject to this royalty was shown previously in Figure 14-25. This royalty has been considered in the Reserves estimate.
| 15.5.6 | Sensitivities |
A series of sensitivities were performed on the Reserve pit shell by adjusting gold metal price (Table 15-6). Gold price is considered a proxy for gold grade with changes in metal prices being representative of changes in grade.
Table 15-6 Mega Pit Reserves Sensitivity to Gold Price
| Gold Price ($/oz) | $1,000 | $1,100 | $1,200 | $1,300 | $1,400 | $1,500 | ||||||
| Reserve Ounces (Moz) | 0.7 | 0.8 | 0.8 | 0.8 | 0.9 | 0.9 | ||||||
| 15.6 | Vista Underground |
| 15.6.1 | Estimation Procedure |
Mineable stope shapes were created from manually designed stope outlines in sections around the existing development drives, using actuals-based parameters summarized in Section 16.4.1. These were cross-referenced against shapes generated by Deswik SO with similar input parameters to validate mine-ability and recovery. The manually created shapes were used as the basis for Reserve estimation in place of SO shapes due to better approximating mineable stope profiles and improved handling of local geological complexities.
These shapes were evaluated for economic viability using a net value calculation with the parameters summarized in Table 15-7. Only shapes that have a positive net value are included in the Reserves estimation.
A section through the deposit showing the Mineral Reserve layout is provided in Figure 15-5.
| March 15, 2024 |
Page 207 |
|
|
Turquoise Ridge Complex NI 43-101 Technical Report |
|
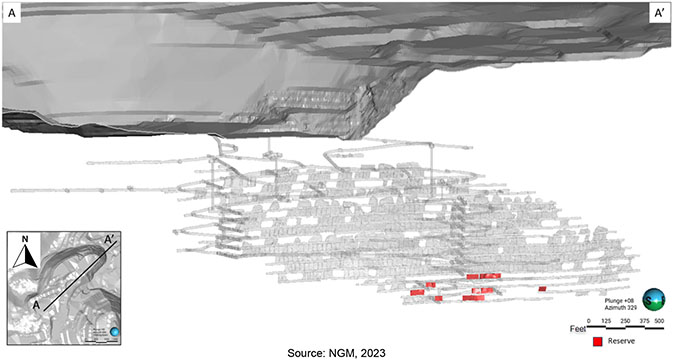
Figure 15-5 Vista Underground Cross-Section Showing Mineral Reserves
| 15.6.2 | Dilution and Mining Recovery |
Mining recovery is set to 95% for downhole stopes and 80% for up-hole stopes based on historic reconciled results. In up-hole stoping levels, 4.5m-length geotechnical support pillars are required for every 41m of open strike length to maintain stope stability. These support pillars consist of sterilized ore left in-situ and the Reserve estimate excludes this material.
Mining dilution is estimated at 10% for all stope types. This is based on historical stope overbreak results beyond the mineable stope outline. Stope economics are calculated with the average stope grade estimated to include all ore and waste material within the outline and 10% waste dilution due to overbreak.
The QP considers these assumptions as appropriate based on historical results.
| 15.6.3 | Processing Recovery |
A discussion on the Sage Mill recovery for VUG ore is detailed in Section 13. The recovery estimate utilises the diluted ore and TCM grades estimated for each Reserve shape using the following equation (Au in g/t, TCM in %):
VUG Gold Recovery (%) = -457.0 x (TCM / Au) + 97.68
| March 15, 2024 |
Page 208 |
|
|
Turquoise Ridge Complex NI 43-101 Technical Report |
|
| 15.6.4 | Net Value Calculation |
The net value of each minable Reserve shape is calculated by subtracting the total costs of mining that shape from the revenue estimated from the shape.
Revenue is estimated as described in Section 15.3.
Costs are estimated using direct and indirect operating costs. The inputs used for the net value calculation are provided in Table 15-7. No development or equipment replacement costs were included as all capital and operating development required for the LOM is complete and equipment is owned by the contractor.
Table 15-7 Input Considerations, Mineral Reserve Net Value, Vista Underground
| Description | Units | 2023 | ||
| Gold Price | $/rec. oz | 1,300 | ||
| Fixed Mining OPEX | $/ore tonne | 15.52 | ||
| Downhole Stope Cost | $/ore tonne | 94.15 | ||
| Uphole Stope Cost | $/ore tonne | 48.43 | ||
| Mining G&A | $/ore tonne | 9.75 | ||
| Surface Haul | $/ore tonne | 1.22 | ||
| Processing OPEX | $/ore tonne | 31.08 | ||
| Tailings Dam CAPEX | $/ore tonne | 1.72 | ||
| Process G&A | $/ore tonne | 3.82 | ||
| TR Autoclave (Sage) Recovery | % | -457.0*(TCM/Au) + 97.68 | ||
| AB495 Tax | % of rec. oz | 1.02 % | ||
| External Refining & Selling | $/rec. oz | 0.38 | ||
| 15.6.5 | Sensitivities |
A series of sensitivities were performed on the Reserve shapes by adjusting gold metal price. The ore tonnes and contained gold ounces within the selected shapes is most sensitive to a lower long-term gold price with a lesser impact resulting from an increased gold price (Table 15-8). Gold price is considered a proxy for gold grade with changes in metal prices being representative of changes in grade.
Table 15-8 VUG Reserves Sensitivity to Gold Price
| Gold Price ($/oz) | $1,000 | $1,100 | $1,200 | $1,300 | $1,400 | $1,500 | ||||||
| Reserve Ounces (Moz) | 0.002 | 0.003 | 0.004 | 0.004 | 0.005 | 0.005 | ||||||
| March 15, 2024 |
Page 209 |
|
|
Turquoise Ridge Complex NI 43-101 Technical Report |
|
| 15.7 | Stockpiles |
| 15.7.1 | Estimation Procedure |
Stockpiles Reserves are estimated by using a net value calculation. The net value of each stockpile is calculated by subtracting the total costs to process the stockpile from the revenue generated from the recovered ounces in the stockpile. Only stockpiles that have a positive net value at the Reserve gold price are included in the Reserves estimation. Additionally, stockpiles are required to be substantially included in the LOM processing plan to be considered Reserves. If a stockpile has a positive net value at the Reserve gold price, but it is not substantially included in the LOM processing plan, that stockpile is forced out of Reserves and included in Resources instead.
| 15.7.2 | Net Value Calculation |
Revenue is estimated as described in Section 15.3.
Costs are estimated using direct and indirect operating costs (including an allocation for required rehandle). The inputs used for the net value calculation are provided in Table 15-9.
Table 15-9 Input Considerations, Mineral Reserve Net Value, Stockpiles
| Description | Units | Value | ||
| Gold Price | $/rec. oz | $1300 | ||
| Sage Autoclave Recovery | % | (-224.6 * (TCM/Au) + 100.79) | ||
| AB495 Tax | % of Gross Revenue | 1.02 | ||
| Refining Cost | $/rec. oz | 0.38 | ||
| Sage Autoclave OPEX Including Rehandle | $/tonne | 35.86 | ||
| Sage Autoclave G&A | $/tonne | 3.94 | ||
| Sage Autoclave Sustaining CAPEX | $/tonne | 1.90 | ||
| Sage Autoclave Reclamation | $/tonne | 0.11 | ||
| Juniper Oxide Recovery | % | (0.919 – 0.06514 / (Au)*100 | ||
| Juniper Oxide OPEX Including Rehandle | $/tonne | 10.81 | ||
| Juniper Oxide G&A | $/tonne | 1.19 | ||
| Juniper Oxide CAPEX | $/tonne | 3.23 | ||
| Juniper Oxide Reclamation | $/tonne | 0 | ||
| 15.8 | Mineral Reserve Statement |
As of December 31, 2023, the total Proven and Probable Mineral Reserves in open pits, underground and stockpiles (100% basis) are estimated at 69. Mt with an average grade of 6.29 g/t Au, containing approximately 14. Moz of gold metal.
The project Mineral Reserves Statement as of December 31, 2023 is presented in Table 15-10.
| March 15, 2024 |
Page 210 |
|
|
Turquoise Ridge Complex NI 43-101 Technical Report |
|
Table 15-10 Turquoise Ridge Mineral Reserves Statement, December 31, 2023
| Location | Proven | Probable | Proven + Probable | |||||||||||||||||||||
|
Tonnes |
Grade |
Contained |
Attributable (61.5%) |
Tonnes |
Grade |
Contained | Attributable (61.5%) |
Tonnes |
Grade |
Contained |
Attributable (61.5%) |
|||||||||||||
| (Mt) | (g/t Au) | (Moz Au) | (Moz Au) | (Mt) | (g/t Au) | (Moz Au) | (Moz Au) | (Mt) | (g/t Au) | (Moz Au) | (Moz Au) | |||||||||||||
| Surface | ||||||||||||||||||||||||
| Mega Cut 40 |
- | - | - | - | 11 | 2.41 | 0.83 | 0.51 | 11 | 2.41 | 0.83 | 0.51 | ||||||||||||
| Vista 8 |
- | - | - | - | 0.48 | 1.32 | 0.020 | 0.013 | 0.48 | 1.32 | 0.020 | 0.013 | ||||||||||||
| Open Pit Total |
- | - | - | - | 11 | 2.37 | 0.85 | 0.52 | 11 | 2.37 | 0.85 | 0.52 | ||||||||||||
| Twin Creeks Stockpile |
25 | 2.36 | 1.9 | 1.2 | - | - | - | - | 25 | 2.36 | 1.9 | 1.2 | ||||||||||||
| Surface Total |
25 | 2.36 | 1.9 | 1.2 | 11 | 2.37 | 0.85 | 0.52 | 36 | 2.36 | 2.8 | 1.7 | ||||||||||||
| Underground |
||||||||||||||||||||||||
| TRUG |
13 | 11.59 | 4.9 | 3.0 | 20 | 10.04 | 6.3 | 3.9 | 33 | 10.66 | 11 | 6.9 | ||||||||||||
| Vista Underground |
0.023 | 5.85 | 0.0042 | 0.0026 | 0.0014 | 5.21 | 0.00024 | 0.00015 | 0.024 | 5.81 | 0.0045 | 0.0028 | ||||||||||||
| Underground Total |
13 | 11.58 | 4.9 | 3.0 | 20 | 10.04 | 6.3 | 3.9 | 33 | 10.66 | 11 | 6.9 | ||||||||||||
| Turquoise Ridge Total |
38 | 5.53 | 6.8 | 4.2 | 31 | 7.24 | 7.2 | 4.4 | 69 | 6.29 | 14 | 8.6 | ||||||||||||
Notes:
| ● | Proven and Probable Mineral Reserves are reported on 100% basis. Barrick’s attributable share of the Mineral Reserve is 61.5% based on its interest in NGM. |
| ● | The Mineral Reserve estimate has been prepared according to CIM (2014) Standards and using CIM (2019) MRMR Best Practice Guidelines. |
| ● | Mineral Reserves are reported at a gold price of US$1,300/oz. |
| ● | Underground Mineral Reserves are estimated based on a positive net value stope economic analysis applying appropriate cost and modifying factors. |
| ● | Surface Mineral Reserves are estimated based on an economic pit design applying appropriate costs and modifying factors. |
| ● | Mining recovery and dilution factors are applied based on calculated historic actual results. |
| ● | All reported metal is contained before process recovery; metal recoveries are variable based on material type, gold grades, TCM grades, sulfide sulfur grades, and processing methodology. |
| ● | Contained metal is reported in millions of troy ounces. |
| ● | Numbers may not add due to rounding. |
| ● | The QP responsible for the Surface Mineral Reserve Estimate is Timothy Webber, SME RM. |
| ● | The QP responsible for the Underground Mineral Reserve Estimate is Paul Schmiesing, SME RM. |
| March 15, 2024 |
Page 211 |
|
|
Turquoise Ridge Complex NI 43-101 Technical Report |
|
The Mineral Reserve estimates have been prepared according to the Canadian Institute of Mining, Metallurgy and Petroleum (CIM) 2014 Definition Standards for Mineral Resources and Mineral Reserves dated 10 May 2014 (CIM (2014) Standards) as incorporated with National Instrument 43-101 Standards of Disclosure for Mineral Projects (NI 43-101). Mineral Resource estimates were also prepared using the guidance outlined in CIM Estimation of Mineral Resource and Mineral Reserve Best Practice Guidelines 2019 (CIM (2019) MRMR Best Practice Guidelines).
The Mineral Reserves have been estimated from the Measured and Indicated Mineral Resources and do not include any Inferred Mineral Resources. Mineral Reserves include material that will be mined by open pit and underground mining methods and processed from stockpiles.
The estimate uses updated economic factors, the latest Mineral Resource and geological models, geotechnical and hydrogeological inputs, and metallurgical processing and recovery updates. The QPs responsible for estimating the Mineral Reserves have performed an independent verification of the block model tonnes and grade, and in their opinion the process has been carried out to industry standards.
For the open pit, economic pit shells were generated using the Pseudoflow algorithm within Deswik software and then used to guide the open pit mine design process and Mineral Reserve estimation. The final pit limit selection and design process is outlined in Section 16.
For the underground operations, the Deswik SO was used to evaluate the geological block model to create overall mining shapes. Preliminary stope wireframes were created and planned dilution was added to the mineable stope shape. The Pseudoflow algorithm was applied using Deswik software to evaluate the costs, revenue, and resulting net values associated with each shape. Stopes with a positive net value at the Reserve gold price were included in the Mineral Reserves estimate.
A site specific financial model was populated and reviewed to demonstrate that the Mineral Reserves are economically viable.
The year-end 2023 Mineral Reserves estimate shows a net increase of 0.6 Moz gold compared to the AIF declared estimate for year-end 2022 (on an attributable 61.5% basis). This is primarily due to due to the addition of Mega Pit Cut 40 to Reserves and increases in the surface stockpile Reserves from year-end 2022.
| March 15, 2024 |
Page 212 |
|
|
Turquoise Ridge Complex NI 43-101 Technical Report |
|
| 15.9 | Comments on Mineral Reserve Estimates |
The QPs responsible for the Mineral Reserves helped supervise the estimation process, and in their opinion, the process has been carried out to industry standards using appropriate modifying factors for the conversion of Mineral Resources to Mineral Reserves.
The QP is not aware of any environmental, legal, title, socioeconomic, marketing, mining, metallurgical, infrastructure, permitting, fiscal, or other relevant factors that are not discussed in this Report, that could materially affect the Mineral Reserve estimate.
| March 15, 2024 |
Page 213 |
|
|
Turquoise Ridge Complex NI 43-101 Technical Report |
|
| 16 | Mining Methods |
| 16.1 | Summary |
The Turquoise Ridge Complex consists of underground and open pit mining operations. The mining methods used are considered conventional and use conventional equipment.
Ore is mined from its source and transported to the ROM stockpiles where it is blended and fed to the various process facilities, or long-term stockpiles for future reclamation and processing.
Waste material is taken to several possible locations including; various dump locations underground, used as construction material, or placed onto long term waste rock storage facilities.
The mining rate is variable and dependent on the phase of the active operations, although when in full production it is expected to peak at approximately 3,200 tpd for the underground operations and more than 50 ktpd for the surface operations.
Life of Mine for the Reserves is expected to end in 2047 for Turquoise Ridge Underground (TRUG) operations, in 2034 for Turquoise Ridge Surface operations, and 2024 for Vista Underground (VUG).
| 16.2 | Turquoise Ridge Underground |
| 16.2.1 | Mining Method and Mine Design |
The Turquoise Ridge Underground is a multi-shaft access, mechanized mine, with an extensive system of ramps connecting the North and South zones to the shafts.
The most commonly used mining method is underhand drift and fill. Top-cut levels are excavated at 4.6 x 4.6 m (15 x 15 ft) and then backfilled with cemented aggregate backfill (CAF). Once filled, mining may take place in adjacent panels or below. Undercuts are driven at 4.6–5.5 m (15–18 ft) height x 4.6–9.1 m (15–30 ft) width beneath the backfill with conventional drill-and-blast methods. CAF cure delays are 24hrs for mining directly adjacent to a filled panel and 14 days for mining below a filled panel.
The underhand drift-and-fill mining method is conducted by successively undercutting levels above, and undercuts are driven at different angles to the panels above to avoid stacking parallel drifts directly on top of each other between two levels. It is a selective but expensive mining method with the advantage of allowing mining in weak ground conditions with a layer of backfill from the level above.
| March 15, 2024 |
Page 214 |
|
|
Turquoise Ridge Complex NI 43-101 Technical Report |
|
Sill-benching that can target small (2–6 m depth) benches of ore at the bottom of the ore pods is also employed where a full undercut is unnecessary. Sill-benching consists of first mining face rounds on either a top-cut (or an undercut drift) and then drilling and blasting vertical down holes to a depth up to 6.1 m. The bench and top-cut panel are backfilled concurrently after mining.
Long-hole stoping can be used in areas with vertically continuous ore geometries with Fair to Good ground conditions. Approximately 9% of the LOM plan for TRUG is mined using long-hole stoping. Planned stope level spacing is 10.6–18.3 m (35–60 ft) high with stope dimensions 4.6-4.9m (15-16ft) wide for Primaries and 4.6m-9.8m (15-32ft) wide for Secondaries. Primary stopes are sequenced to be mined first and have narrower width parameters while Secondary stopes are sequenced to be mined between Primary stopes having CAF fill on either side, allowing them to be mined at greater widths. Stopes are sequenced to be mined from the bottom up. Stope strike length varies from 9.1–21.3 m (30–70 ft). Primary stopes are currently filled with CAF (paste fill to be implemented by 2026), and Secondary stopes backfilled with paste or a combination of CAF and waste rock.
Figure 16-1 shows the mine method and progression for underhand drift and fill.
Figure 16-2 shows a schematic of the long-hole stoping and nomenclature used.
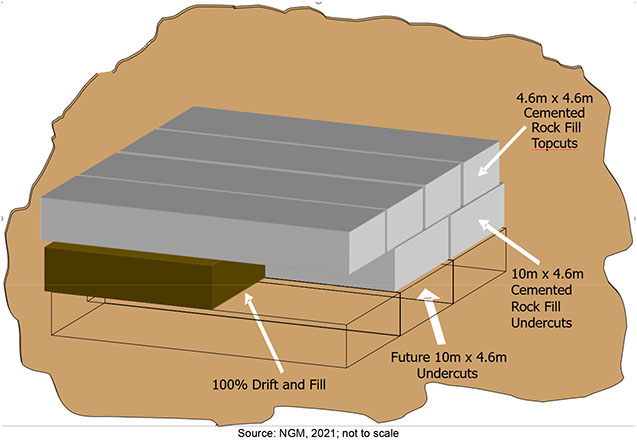
Figure 16-1 Underhand Drift and Fill with Cemented Aggregate Backfill Mining Method Schematic
| March 15, 2024 |
Page 215 |
|
|
Turquoise Ridge Complex NI 43-101 Technical Report |
|
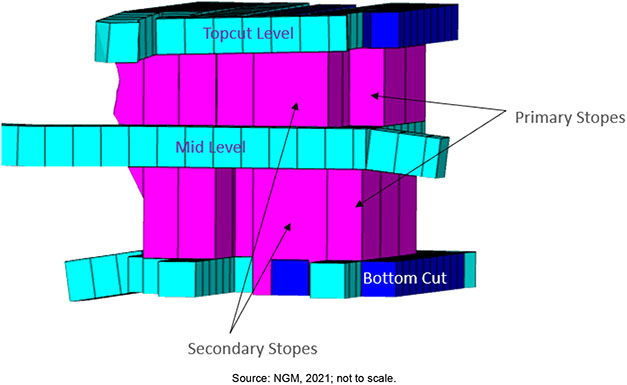
Figure 16-2 Long-hole Stoping Mining Method Schematic
| 16.2.2 | Geotechnical Considerations |
Turquoise Ridge Underground rock mass conditions are characterized by highly fractured and low strength ground which presents challenges in maintaining the long-term development and ore heading stability. Ground conditions are highly variable and require different techniques to successfully mine and maintain drifts with different rock mass ratings. The underground is in a relatively low stress environment, where the weight of overburden material dictates the prevailing stress conditions underground. This type of stress environment leads to the potential of unclamping in the back of the excavation and ground convergence on the side walls. Ground convergence rates at Turquoise Ridge Underground have ranged from 2.5 cm per year to over 2.5 cm per week, depending on ground conditions and mining history. Over time, converging ground causes damage to existing ground support necessitating rehabilitation for damaged areas.
Turquoise Ridge Underground is characterized by low strength rock mass with the following characteristics:
| ● | High alteration; |
| ● | Highly fractured and structured; |
| ● | Moderate levels of water inflow at distinct locations; |
| March 15, 2024 |
Page 216 |
|
|
Turquoise Ridge Complex NI 43-101 Technical Report |
|
| ● | 70% of gold bearing rock with assays greater than 1.5 g/t have a rock mass rating (RMR) < 20 (Very Poor Rock); |
| ● | 20-25% of gold bearing rock has RMR of 20-40 (Poor Rock); and |
| ● | Only 5% of gold bearing rock has RMR > 40 (Fair Rock to Good). |
All underground excavation designs are geotechnically assessed for stability by evaluating against specific design criteria locally developed for TRUG. Where practical, geotechnical hazards identified during the design phase are either eliminated, deferred, or mitigated using engineered ground support strategies (refer 16.2.3).
Underground excavations are evaluated for performance against plan using both visual techniques and quantitative techniques such as Light Detection and Ranging (LiDAR) based scans and instrumentation. The type of monitoring system employed is dependent on the determined geotechnical risk of the excavation. This reconciliation process is an iterative system that allows for adjustments in both the design process and response to hazards created by excavations that do not meet the mining plan.
Ground behavior and anticipated response to mining is numerically modeled using geotechnical software. These models are constructed for localized geotechnical issues and scenarios. Modeling results are used to provide recommendations on excavation and ground support strategies.
The systems and processes used to manage ground control at TRUG are outlined in the site Ground Control Management Plan (GCMP). The purpose of the GCMP is to provide:
| ● | A systematic, consistent approach for the management and communication of geotechnical hazards with regard for the safety and protection of personnel and equipment from rock related hazards, the environment and economic impact. |
| ● | A process for prediction, identification, monitoring, assessment and responding to ground control hazards. |
| ● | Define responsibilities and actions. |
| ● | A central reference for information relating to ground control at the operation. |
| ● | Effective measurement and monitoring of ground control measures and determination of compliance. |
Compliance to the GCMP, ground support standards and any other associated geotechnical system employed at TRUG is evaluated during Geotechnical Audits. The audit process involves a comprehensive assessment of compliance against the NGM Ground Control Standard. The audit process is conducted every two years by a senior member of the NGM Geotechnical Department,
| March 15, 2024 |
Page 217 |
|
|
Turquoise Ridge Complex NI 43-101 Technical Report |
|
external to TRUG. Non and partial compliances are used to inform the site on necessary improvements and adjustments to current practices.
| 16.2.3 | Ground Support |
The ground support systems used at TRUG are typically made up of reinforcing elements that act directly upon the rock mass to increase its inherent strength. Resin or grout encapsulated solid steel or hollow steel bar is used for long term corrosion-resistant support, and inflatable or split sets bolts are used short term support. In addition to this, fabric (mesh) or coatings (shotcrete) and arches are used to contain any potentially unstable rock mass between the reinforcing units.
The fundamental philosophy of the ground support system at TRUG is to maintain the integrity of the rock mass under static load conditions for the expected service life of the underground operation. The ground support regime used at TRUG considers several factors including:
| ● | Expected service life of excavations; |
| ● | Geology; |
| ● | Hydrogeological conditions; |
| ● | Rockmass classification data (based on Barton’s Q classification); and |
| ● | Structural analysis. |
Typical geotechnical design assumptions used in operations are summarized in Table 16-1.
Long-term, fully encapsulated rock bolts are currently being installed throughout the mine to ensure critical infrastructure is appropriately supported with consideration to corrosion, lithological domain, and opening size. Ground monitoring and rock bolt testing is regularly performed to help identify areas in need of rehabilitation or additional ground support.
In situations where very poor ground or deteriorating conditions are encountered, shotcrete can be utilized to provide additional confinement to the ground support system. When these areas are encountered, it is important that shotcrete be utilized as soon as possible to ensure that minimal unravelling and bagging occurs. Pre-mixed shotcrete is delivered by boreholes to underground 1550 shotcrete and 2280 shotcrete plants.
Geotechnical inspections of active development faces, drifts and stopes are routinely conducted. Heading inspections are performed and recorded daily on workplace inspection cards by all individuals working in the area. The entirety of the underground workings are inspected on at least an annual basis to ensure that any changing conditions are identified and recorded. Locations that have identified geotechnical hazards are prioritized.
| March 15, 2024 |
Page 218 |
|
|
Turquoise Ridge Complex NI 43-101 Technical Report |
|
Table 16-1 Typical Geotechnical Design Assumptions
| Parameter | Assumption | |
| Level offsets from main ramps | 5:1 pillar between main ramp and excavation width. | |
| Distance between parallel drifts in levels | 2x panel widths of the larger panel. If pillar is jammed backfill, minimum pillar with is minimum 1.5x panel widths of the larger panel. | |
| Mining under open or gob filled drifts | 10.7 m of rock between levels. | |
| Mining under end dump fill | Must have 6.1 m of rock between. No mining directly under end dump fill. | |
| Distance between open drift and backfill cap | Minimum of 4.6 m of rock | |
| Cure time |
To mine next to backfill: 24 h To mine under backfill: 14 days |
|
| Undercuts |
Designed to have a minimum of 3 m of backfill overhead. ≤6.1 m wide must have at least 3 m of backfill in the back. >6.1 m wide undercuts must have 4.6 m of backfill. |
|
| Intersections under fill | Span < 12.2 m. | |
| Maximum panel width | Branching off a 9.1 m wide panel is 6.1 m wide. | |
Engineered cemented backfill is used to facilitate full extraction of the orebody, minimize excavation damage, and provide localized support where a ground control issue is identified. Cemented Aggregate Fill (CAF) at TRUG comprises a mixture of crushed and sized aggregate, cementitious binders, water, and admixtures to create a homogenous, engineered product. The backfill product is designed to be self-supporting and therefore capable of being exposed when underhand without the requirement for reinforcing elements or creating single vertical exposure backfill walls when Stoping. Aggregate used in the production of CAF is mined and crushed on surface and delivered via a surface borehole. Underground batch plants are used in the production of CAF with routine sampling and testing to confirm backfill quality.
The extended mining history at Turquoise Ridge Underground presents a risk of current mining encountering a heading that was not properly backfilled or was recorded as having been backfilled but left open. The underhand drift and fill mining method exposes nearly all production undercuts to the risk of encountering a void. Several systems including design review, heading inspection, and risk assessed safe work plans are utilized to control the void hazard interacting with the mine excavations. Additional to that, Turquoise Ridge using different ground monitoring instrumentations to monitor ground movement such as cross drift extensometers, multi-point borehole extensometers, and single point extensometers. The readings are done in monthly basis and more frequently when the rate of damage exceed 2.5cm displacement.
| 16.2.4 | Hydrological Considerations |
Water occurrence underground is related to fault and fault intersections with point water occurrences in both drill holes and mine workings. Mapping correlates spatially well with contact areas between igneous rocks (flows, dikes, or sills) and adjacent rocks, within and along the length of prominent fault zones/shears, and at intersections of the above features. It is expected that these contacts areas and fault/shear zones host the principal aquifers in the mine area.
| March 15, 2024 |
Page 219 |
|
|
Turquoise Ridge Complex NI 43-101 Technical Report |
|
Active dewatering of the Comus formation with wells was performed between 1992 and 2000, coincident with the development of the Getchell underground mine and sinking of the #1 Shaft and #2 Shaft at TRUG. From 1997 to date, the mine dewatering is managed through passive systems only. Mine ground water occurrences are generally localized and manageable as small inflows at the face.
| 16.2.5 | Mine Dewatering |
Encountered ground water and service water is diverted or pumped from the face to sumps and then to main pumping stations for settling and pumping to surface. At the main pump station, there is a clarifier, three clear water pumps, and a piston pump for pumping slimes. All material is pumped to surface in a single stage via a 76mm sludge line and 300mm clear water line in the #2 Shaft. The clear water pumping capacity is about 13,250 L/min with current average utilization of 2,300 L/min.
Clear water is recycled for reuse in the mine. Excess water is treated at the Turquoise Ridge Water Treatment Plant before discharge to rapid infiltration basins. When water is non-compliant with discharge criteria, it is currently diverted to the Getchell Tailing Storage Facility and eliminated by evaporation in the summer months. Slimes are pumped on a daily basis, recovered, dried, and added to the mill feed stockpiles.
Ground water inflow rates remain relatively constant at 1,000-2,000 L/min with no significant increase predicted over the LOM.
The QP considers the current dewatering infrastructure as sufficient for the operations with adequate excess capacity to allow for future operations.
| 16.2.6 | Ventilation |
Fresh air is drawn into the mine at the collar of #2 Shaft and #3 Shaft . Fresh air that intakes in #2 Shaft is distributed on the 1250 level, 1715 level, and shaft bottom. Fresh air that intakes in the #3 Shaft is distributed on the 2280 level, 3150 level, and shaft bottom. Air is exhausted from the mine via #1 Shaft by three surface main exhaust fans. Air is permitted into the #1 Shaft through the Hanging Wall Drift (Old Main Fan Drift), Vent Drift, the 1550 level (exhaust from the shotcrete plant), and the 1250 level. Bulkheads at the 1715, 1550, 1250 and 900 levels limit ventilation loss from the #1 Shaft. There is a regulator at the 1250 level that controls the amount of air that is exhausted at that level.
Based on surveyed ventilation airflows, there is approximately 600 m3/s (1,290k cubic feet per minute (CFM)) of net intake air passing through the main fans. 275 m3/s (580k CFM) from the #2 Shaft, 300 m3/s (650k CFM) from the #3 Shaft, and 28 m3/s (60k CFM) from #1 Shaft leakage on surface. The natural airflow range is approximately 33-95 m3/s (70k-200k CFM) without Main Fan assistance. This is dependent on the season and ambient surface temperatures.
| March 15, 2024 |
Page 220 |
|
|
Turquoise Ridge Complex NI 43-101 Technical Report |
|
Typical ventilation setups for active mining areas utilize auxiliary fans ranging from 37 kW-186 kW installed in areas of primary airflow. These fans can be used to ventilate a number of working headings based on local conditions.
The ventilation design is shown in Figure 16-3.
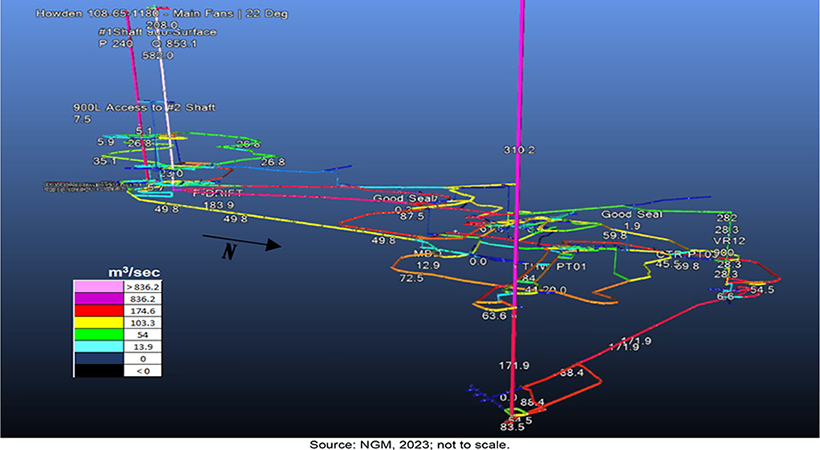
Figure 16-3 Turquoise Ridge Underground VentSIM Model Long Section
| 16.2.7 | Electric Power |
120 kV from the NV Energy #147 line is step-down to 13.8 kV for underground distribution down the #2 Shaft and #3 Shaft by the TR Main and NZ substations, respectively. Three switchgears on the TR Main substation and four switchgear on the NZ substation distribute 13.8 kV electrical power to approximately 50 Mine Load Centers (MLC’s) which step-down power to 480 V for useful production and development mining.
| 16.2.8 | Main Infrastructure Levels |
Main infrastructure is primarily located on the 1250, 1550, and 1715 levels of #2 shaft and the 2280 and 3150 levels of #3 Shaft as summarized below:
| March 15, 2024 |
Page 221 |
|
|
Turquoise Ridge Complex NI 43-101 Technical Report |
|
| ● | 1250 Level: 1250 CAF Batch Plant and Tractor/Light Vehicle Shop. |
| ● | 1550 Level: Shotcrete Batch Plant and Pump Repair shop. |
| ● | 1715 Level: #2 Shaft material handling system including Material Handling Drifts, Grizzly, Apron Feeder and Shaft Loading Pocket; mining equipment maintenance shop; MAD fuel station; and main pump station. |
| ● | 2280 Level: #3 Shaft material handling system including Material Handling Drifts, Grizzly, Apron Feeder, and Shaft Loading Pocket; receiving station for the surface shotcrete plant slickline; face drill and bolter maintenance shop; NZ CAF Batch Plant; NZ fuel station. |
| ● | 3150 Level: Detailed design and engineering is in process for an ore bin material handling system with greater surge and storage capacity than the 2280 and 1715 levels by 2027. |
Additional maintenance shop facilities, powder magazines, pumping stations, laydowns, refuge stations, and other support facilities are dispersed throughout the underground workings.
| 16.2.9 | Material Handling |
The mine is accessed via three shafts and a system of internal ramps as shown in Figure 16-4.
The #1 Shaft has a diameter of 6.1 m and is used for both exhaust ventilation and as a secondary egress. This shaft reaches to the 1550 level of the mine (543 m below surface).
The #2 Shaft has a diameter of 7.3 m and is used as a ventilation intake and primary access to the mine. The shaft extends to 554 m below surface. It is used to bring equipment into or out of the mine (nominal hoist capacity of 9.1 t), as well as skipping ore and waste. Skips are loaded at the bottom loading pocket. There is an 80-person capacity cage with a removable deck. Both the service and production hoists are double drum hoists.
The #3 Shaft has a diameter of 7.3 m diameter and extends to 954 m total depth. It serves as the primary ventilation intake and secondary access to the underground mine. Shaft furnishings include two skip compartments, each containing one 11.8 t skip, a service compartment housing an 80-person cage with a capacity of 9.1 t and a small “Mary Ann” compartment for low-volume personnel movements.
| March 15, 2024 |
Page 222 |
|
|
Turquoise Ridge Complex NI 43-101 Technical Report |
|
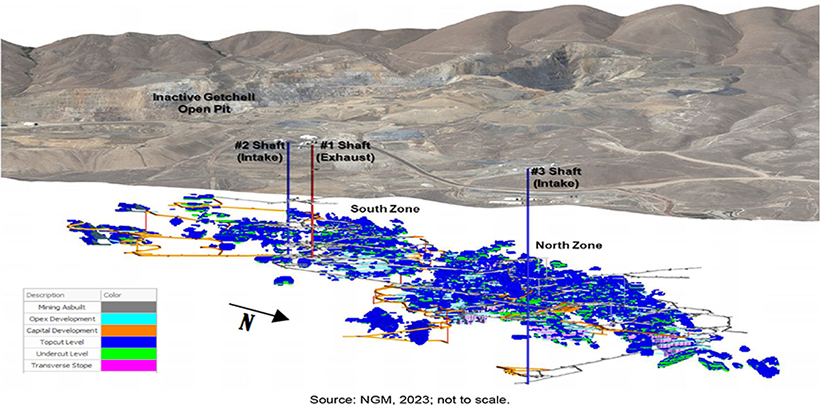
Figure 16-4 Turquoise Ridge Underground Shaft Location Schematic
Ore and waste may be re-handled multiple times between the face and surface; material is mucked from the face to a re-muck bay to keep the mining cycle efficiency. From the re-muck the rock is hauled by truck to the material handling drift where it is re-handled by load-haul-dump (LHD) units to the skip loading dump. The material handling drift consists of several short drifts where ore and waste are dumped by truck before being re-handled by loader. The loader further dumps material to the grizzly, apron feeder, then short transfer conveyance to skip loading. The material handling drift is necessary as the ore is so soft that it will pack and plug if stored in a vertical pass. There is no practical storage between the material handling drift re-muck bays and the shaft. The shaft capacities do not constrain the mine production.
| 16.2.10 | Grade Control |
Grade control for Turquoise Ridge Underground is managed through the Mineral Resources Management department and detailed in Section 10.9.
| 16.2.11 | Backfill |
The main backfilling method used at Turquoise Ridge is cemented-aggregate-fill (CAF) which is prepared in two underground batch plants; one located near the #2 Shaft on the 1250 level and one
| March 15, 2024 |
Page 223 |
|
|
Turquoise Ridge Complex NI 43-101 Technical Report |
|
near the North Zone. Rock is quarried on surface and crushed before being delivered by borehole to the batch plant. Cement is delivered from surface silos to the batch plant by borehole. At the batch plant, an operator oversees the preparation of backfill, which is done in approximately 10 t batches that are loaded into a truck. From the batch plant the backfill is trucked to stopes throughout the mine. Placement of CAF is dependent on the mining method. CAF placement in drift and fill mining involves the movement of CAF material to the designated heading and using mechanical jamming techniques to place the material tight to the back and walls. CAF placement in stopes involves placing CAF material over a protected vertical edge and advancing the backfill until level with the floor of the upper development. The remaining top-level development is filled using mechanical jamming techniques.
Quality control of the CAF is maintained by testing 15 cm diameter concrete test cylinders which are filled at the batch plant to test the uniaxial compressive strength (UCS). Minimum CAF strength criteria are engineered based on the type and geometry of the backfill exposure. Backfill at Turquoise Ridge typically has a UCS of 8.3 Mpa.
Development waste can be used as an additional source of backfill in combination with a cemented backfill in the Secondary stopes, when appropriate based on a cost benefit assessment with consideration to the mining cycle.
The current backfill system is capable of supporting production until 2028 at which time a small expansion is required. Studies are underway to determine if an expansion of the current CAF system or the installation of a paste plant is best suited to the Project. An allowance for the expected capital has been made in the economic modelling.
| 16.2.12 | Blasting and Explosives |
Turquoise Ridge Underground uses standard loading practices for face advance via blasting. Emulsion is the bulk explosive, and trim powder is typically used in areas of soft ground. Turquoise Ridge Underground employs a centralized blasting system that allows for multiple firings from a remote location during shift change to protect personnel from gasses and other hazards from working during underground blasting.
| 16.2.13 | Mining Equipment |
The LOM plan average and maximum equipment requirements are summarized in Table 16-2.
| March 15, 2024 |
Page 224 |
|
|
Turquoise Ridge Complex NI 43-101 Technical Report |
|
Table 16-2 Turquoise Ridge Underground Equipment List
| Primary Production Fleet | Class | Average # | Max # | |||
| Loaders | 4.6 m3 (6 yard) | 1 | 3 | |||
| 5.8 m3 (9 yard) | 13 | 15 | ||||
| Haul Trucks | 30 t | 3 | 6 | |||
| 45 t | 13 | 16 | ||||
| Bolter | - | 11 | 12 | |||
| Jumbo Drills | - | 5 | 6 | |||
| Production Drills | - | 4 | 4 | |||
The operations are supported by a fleet of ancillary/support equipment which includes:
| ● | Shotcrete: Normet Transmixers, Normet Sprayers. |
| ● | Scissor Lifts: Getman, Normet Utilifts. |
| ● | Powder Trucks: Normet Charmec’s. |
| ● | Lube Truck/Material Handlers: Normet Multimec’s. |
| ● | Light Vehicles: John Deere Tractors and Gators, Ford pickups, Mahindra’s Roxor. |
| ● | Telehandlers: CAT Telehandlers. |
| ● | Construction: CAT Excavators, CAT Skidsteers. |
| ● | Road Maintenance: CAT Graders, CAT Dozer, CAT AD30’s retro fitted to water trucks, Atlas Copco 20 t truck retrofitted to a water truck. |
| 16.2.14 | Production Rate |
The mine is currently producing 2,700 tpd ore and is expecting to increase production to approximately 4,100 tpd by 2028. This increase in production requires expansion of the existing equipment fleet, development of new drift and fill mining zones, increased longhole mining, and increased backfilling capacity (discussed in Section 16.2.11). The increase in production will be aided by the recent addition of #3 Shaft (commissioned in Q4 2022) which provides more airflow and hoisting capacity to the mine, and quicker access to new mining areas.
The project to increase the production rate has been an ongoing process starting with improved mining cycle and equipment efficiency, and identification of the other production bottlenecks. The mine production rate has increased from approximately 1,700 tpd ore in 2016 to 2,950 tpd ore in 2023.
The expansion of the mine will begin in in 2024 (Figure 16-5) with the addition of upper South Zone mining along with development of the FED & MBD longhole stoping areas. It is expected that longhole mining will add an average 250 to 300 tpd over the LOM. The remaining production rate increase will come from mine expansion into drift and fill areas, supported by the additional equipment, airflow, and backfilling capacity.
| March 15, 2024 |
Page 225 |
|
|
Turquoise Ridge Complex NI 43-101 Technical Report |
|
| 16.2.15 | Mine Schedule |
Mining operations are currently planned to continue to 2047. A summary of the LOM production plan is shown in Table 16-3. The planned mining and development for 2024 is show in Figure 16-5.
The basis for the consolidated LOM plan is the Proven and Probable Mineral Reserves estimate as described in Section 15.
Table 16-3 Turquoise Ridge Underground LOM Production Schedule Summary
| Year | Total TRUG Ore (Mt) | TRUG Mined Gold Grade (g/t) |
Total TRUG Mined Ounces (Moz Au) |
|||
| 2024 | 1.18 | 12.51 | 0.48 | |||
| 2025 | 1.23 | 12.52 | 0.50 | |||
| 2026 | 1.30 | 12.48 | 0.52 | |||
| 2027 | 1.39 | 11.94 | 0.53 | |||
| 2028 | 1.49 | 11.59 | 0.56 | |||
| 2029 | 1.49 | 11.98 | 0.58 | |||
| 2030 | 1.49 | 11.46 | 0.55 | |||
| 2031 | 1.48 | 10.15 | 0.48 | |||
| 2032 | 1.49 | 9.92 | 0.47 | |||
| 2033 | 1.49 | 10.14 | 0.49 | |||
| 2034 | 1.49 | 9.94 | 0.48 | |||
| 2035 | 1.49 | 9.93 | 0.48 | |||
| 2036 | 1.49 | 9.81 | 0.47 | |||
| 2037 | 1.49 | 9.90 | 0.47 | |||
| 2038 | 1.49 | 9.96 | 0.48 | |||
| 2039 | 1.49 | 9.90 | 0.47 | |||
| 2040 | 1.49 | 9.91 | 0.47 | |||
| 2041 | 1.49 | 9.93 | 0.48 | |||
| 2042 | 1.32 | 10.10 | 0.43 | |||
| 2043 | 1.33 | 10.63 | 0.45 | |||
| 2044 | 1.25 | 10.19 | 0.41 | |||
| 2045 | 1.19 | 10.40 | 0.40 | |||
| 2046 | 1.01 | 10.35 | 0.34 | |||
| 2047 | 0.69 | 11.35 | 0.25 | |||
| Total | 32.73 | 10.66 | 11.22 | |||
| March 15, 2024 |
Page 226 |
|
|
Turquoise Ridge Complex NI 43-101 Technical Report |
|
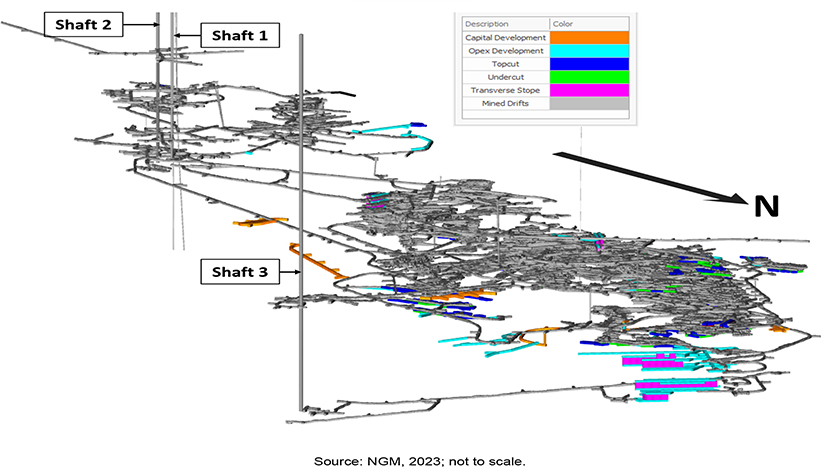
Figure 16-5 Turquoise Underground Schedule 2024
| 16.3 | Turquoise Ridge Surface |
| 16.3.1 | Mining Method |
Turquoise Ridge Surface operates the open pits, ore rehandle, and surface project work at the mine. Surface mining uses conventional open pit mining methods including drilling, blasting, loading, and hauling. Mining operations also currently include the TRUG Limestone Quarry, rehandling from the long-term ore stockpiles, and the underground ore haul.
Haul roads are designed width a width of 36 m. For single lane haul roads, a minimum road width of 24 m is used for the bottom benches of the pit. The Vista 8 design was modified due to a pit wall failure in May 2020. As a result, the last nine benches’ ramps are single lane access to reach ore at the pit bottom.
Ramp grades are designed at 10%.
| March 15, 2024 |
Page 227 |
|
|
Turquoise Ridge Complex NI 43-101 Technical Report |
|
| 16.3.2 | Mine Design |
Surface mining operations occur in two developed open pit areas; Vista Pit to the north and Mega Pit to the south, as shown previously in Figure 15-4.
Surface mining is also conducted in the TRUG Limestone Quarry to provide aggregate for the backfill material used in the Turquoise Ridge Underground operations.
The Vista Pit measures approximately 1.1 km north to south, 1.0 km east to west, and the current pit depth is over 213 m. A layout plan showing the final pit configuration is provided in Figure 15-2.
The Mega Pit measures 4.0 km overall north to south, and approximately 1.6 km east to west. The current pit depth is over 365 m and will deepen by approximately 48 m in the ultimate design. A layout plan showing the final pit configuration is provided in Figure 15-3.
The Reserves include two laybacks; Vista 8 in the Vista Pit and Cut 40 in the Mega Pit. Cut 40 will require relocation of the infrastructure that falls within the mining footprint (powerline, dewatering line, truck scales, radio shop, environmental storage yard, powder magazine, and drill and blasting department storage areas and tanks) and construction of a new, approximately 2 km long, haul road around the perimeter of the Cut 40 pit.
| 16.3.3 | Geotechnical Considerations |
All geotechnical data collected from the adjacent Cuts 22, 23, 24, and 25 pits from 2006–2019 were compiled in the Mega North Pit geotechnical model and this historical information was then used for geotechnical slope designs. Designs were verified with additional drilling, sampling, and testing to help define the final parameters of the ultimate pit slopes.
There are over 60 geotechnical domains modelled in Leapfrog. A geotechnical review of Cut 40 is required to streamline these domains. A geotechnical assessment of a potential additional layback, Cut 55, is underway to update the geotechnical domains and slope design recommendations. The geotechnical drilling for this assessment was completed in December 2023. The geotechnical laboratory testing and analysis will be completed in 2024. The historic recommended inter-ramp slope angles vary by domain and range from 27–50º as shown in Table 16-4.
| March 15, 2024 |
Page 228 |
|
|
Turquoise Ridge Complex NI 43-101 Technical Report |
|
Table 16-4 Historical Inter-ramp Slope Angles By Domain
| Domain Name | Geotech Region |
Inter-ramp Slope Angle (°) |
||
| 14_2023_Domain_CP_WRYT_601_LOPT_dzsMSn | 1 | 42 | ||
| 17_2023_Domain_CP_601_LOPT_604_Dzsl | 1 | 42 | ||
| 19_2023_Domain_LOPT_604FW | 2 | 45 | ||
| 20_2023_Domain_LOPT_604HW | 3 | 42 | ||
| 09_2023_Domain_CP_DZ_LOPT_WRYT | 4 | 45 | ||
| 13_2023_Domain_CP_WRYT_601_LOPT | 4 | 45 | ||
| 16_2023_Domain_CP_601_LOPT_604 | 4 | 45 | ||
| 10_2023_Domain_CP_WRYT_LOPT_DZ_BriteLiteS | 5 | 42 | ||
| 2023_backfill_dump.tri | 6 | 36 | ||
| 2023_backfill_dump.tri | 6 | 36 | ||
| 2021_geology.tri\2021_geotech.tri\07_CP_220-220_Final_38s.00t | 7 | 38 | ||
| 07_2023_Domain_CP_WSF_BriteLiteN_TC_DZ | 8 | 42 | ||
| 08_2023_Domain_DZ_TC_BriteLiteN | 8 | 42 | ||
| 04_2023_Domain_CP_Sage_TC_NSF_DZ | 9 | 45 | ||
| 03_2023_Domain_CP_Sage_TC_NSF | 10 | 42 | ||
| 01_2023_Domain_CP_DZ | 11 | 45 | ||
| 01_2023_Domain_CP_DZ | 11 | 45 | ||
| 02_2023_Domain_CP_TC_NSF | 11 | 45 | ||
| 02_2023_Domain_CP_TC_NSF | 11 | 45 | ||
| 03_2023_Domain_CP_Sage_TC_NSF | 11 | 45 | ||
| 04_2023_Domain_CP_Sage_TC_NSF_DZ | 11 | 45 | ||
| 04_2023_Domain_CP_Sage_TC_NSF_DZ | 11 | 45 | ||
| 05_2023_Domain_CP_100K_TC_DZ | 11 | 45 | ||
| 06_2023_Domain_CP_100K_TC_DZ_WSIF | 11 | 45 | ||
| 07_2023_Domain_CP_WSF_BriteLiteN_TC_DZ | 11 | 45 | ||
| 08_2023_Domain_DZ_TC_BriteLiteN | 11 | 45 | ||
| 01_2023_Domain_CP_DZ | 12 | 45 | ||
| 11_2023_Domain_DZ_WRYT_BriteLiteS | 13 | 42 | ||
| 15_2023_Domain_DZ_WRYT_601_DzsMsn | 13 | 42 | ||
| 18_2023_Domain_601_604_Dzsl | 13 | 42 | ||
| 02_2023_Domain_CP_TC_NSF | 14 | 42 | ||
| 09_2023_Domain_CP_DZ_LOPT_WRYT | 15 | 42 | ||
| 11_2023_Domain_DZ_WRYT_BriteLiteS | 15 | 42 | ||
| 11_2023_Domain_DZ_WRYT_BriteLiteS | 15 | 42 | ||
| 12_2023_Domain_CP_DZ_604 | 15 | 42 | ||
| 13_2023_Domain_CP_WRYT_601_LOPT | 15 | 42 | ||
| 15_2023_Domain_DZ_WRYT_601_DzsMsn | 15 | 42 | ||
| 15_2023_Domain_DZ_WRYT_601_DzsMsn | 15 | 42 | ||
| 18_2023_Domain_601_604_Dzsl | 15 | 42 | ||
| 19_2023_Domain_LOPT_604FW | 15 | 42 | ||
| 20_2023_Domain_LOPT_604HW | 15 | 42 | ||
| 01_2023_Domain_CP_DZ | 16 | 50 | ||
| 02_2023_Domain_CP_TC_NSF | 16 | 50 | ||
| 03_2023_Domain_CP_Sage_TC_NSF | 16 | 50 | ||
| 04_2023_Domain_CP_Sage_TC_NSF_DZ | 16 | 50 | ||
| 05_2023_Domain_CP_100K_TC_DZ | 16 | 50 | ||
| 06_2023_Domain_CP_100K_TC_DZ_WSIF | 16 | 50 | ||
| 07_2023_Domain_CP_WSF_BriteLiteN_TC_DZ | 16 | 50 | ||
| 08_2023_Domain_DZ_TC_BriteLiteN | 16 | 50 | ||
| 09_2023_Domain_CP_DZ_LOPT_WRYT | 16 | 50 | ||
| 10_2023_Domain_CP_WRYT_LOPT_DZ_BriteLiteS | 16 | 50 | ||
| March 15, 2024 |
Page 229 |
|
|
Turquoise Ridge Complex NI 43-101 Technical Report |
|
| 11_2023_Domain_DZ_WRYT_BriteLiteS | 16 | 50 | ||
| 12_2023_Domain_CP_DZ_604 | 16 | 50 | ||
| 13_2023_Domain_CP_WRYT_601_LOPT | 16 | 50 | ||
| 14_2023_Domain_CP_WRYT_601_LOPT_dzsMSn | 16 | 50 | ||
| 15_2023_Domain_DZ_WRYT_601_DzsMsn | 16 | 50 | ||
| 16_2023_Domain_CP_601_LOPT_604 | 16 | 50 | ||
| 17_2023_Domain_CP_601_LOPT_604_Dzsl | 16 | 50 | ||
| 18_2023_Domain_601_604_Dzsl | 16 | 50 | ||
| 19_2023_Domain_LOPT_604FW | 16 | 50 | ||
| 20_2023_Domain_LOPT_604HW | 16 | 50 | ||
| 12_2023_Domain_CP_DZ_604 | 17 | 45 | ||
| 2023_Final_Faults.tri\RMT_50_50.00t | 18 | 38 | ||
| fltblk.tri\19_LOPT_604FW.00t | 19 | 36 | ||
| fltblk.tri\20_LOPT_604HW.00t | 20 | 27 | ||
| 05_2023_Domain_CP_100K_TC_DZ | 20 | 27 | ||
| 06_2023_Domain_CP_100K_TC_DZ_WSIF | 20 | 27 | ||
| cpfaultarea70_tri_flag_general | 70 | 42 |
The Vista 8 design consists of five benches. There have been no significant geotechnical concerns during operations, and the Vista pit slopes have performed very well based on real-time monitoring and visual inspection. Existing controls reflect current conditions on the buttressed fall of the ground on the west wall of Vista 8. No material has breached the existing buttressed zone, which is monitored in near real-time with a combination of a robotic total station/prisms and slope stability radar. There is an inherent risk of exposing the 20K Fault in the west highwall as mining progresses, and wall control blast shots are recommended to minimize blast damage. The historic recommended inter-ramp slope angles range from 25–40º.
| 16.3.4 | Hydrogeological Considerations |
Prior to the formation of NGM, separate conceptualization and groundwater flow models were developed and used for the Twin Creeks and Turquoise Ridge/Getchell operations. The two groundwater-flow models are summarized as follows.
| ● | The original Twin Creeks groundwater flow model was developed in the mid-1990s and has been updated several times since then. The most recent version of the model was used to support the Cut 40 Expansion of the North Mega pit (Itasca 2020) and to fulfil the NDEP, Bureau of Mining Regulation and Reclamation requirements for Water Pollution Control Permits NEV0089035 and NEV0086018. The last version of the separate Twin Creeks numerical groundwater flow model was based on the finite-element groundwater flow modelling software, MINEDW (Azrag et al., 1998). |
| ● | The original Turquoise Ridge/Getchell groundwater flow model was developed in the early 2000s and has been updated several times since. The most recent version of the model (Geomega, 2017) was used to assess mine dewatering impacts and to support regulatory requirements for Water Pollution Control Permits NEV0086014 and NEV0095113. The |
| March 15, 2024 |
Page 230 |
|
|
Turquoise Ridge Complex NI 43-101 Technical Report |
|
| current version of the Turquoise Ridge/Getchell numerical groundwater-flow model uses the finite-difference code MODFLOW-USG (Panday et al., 2013). |
In 2022 these numerical models were combined into a single model (Turquoise Ridge/Getchell/Twin Creeks model) to support permitting for the Quarry pit and dewatering predictions for the various deposits and zones (Itasca, 2022).
Groundwater modelling shows Cut 40 mining will require dewatering rates averaging between 75–14 kL/min to achieve the LOM plan. This will require two additional dewatering wells which are already permitted.
Piezometers are being installed in Cut 55 to update the groundwater model and further determine dewatering requirements.
A total of seven dewatering wells are actively used for around Vista 8, with a pumping rate of about 21,577 L/min. Vista open pit is being dewatered at a much slower rate than the originally anticipated rate of 26,500 L/min. Dewatering rates have delayed delivery of ore to the bottom of the planned pit. The mining plan has been adjusted to match the realized dewatering rate.
| 16.3.5 | Waste Rock Storage Facilities |
The currently active waste rock storage facilities (WRSFs) have adequate capacity for the LOM.
The waste rock from Mega Pit that is not utilized in the construction of Juniper and Sage tailings facilities will be sent to backfill south Mega Pit and Vista Pit. These backfill areas have a capacity for 475 Mt with a LOM storage requirement of 278Mt.
| 16.3.6 | Stockpiles |
There is a well-established area to the east of the Mega Pit with room to store ore in stockpiles. The stockpiles are typically segregated based on sulfide sulfur content (high, SH; medium, SM; and low, SL), organic carbon content, and/or gold grade. These stockpiles aid in managing the sulfide sulfur and carbonate values of the blended ore feed of the Sage autoclave.
| 16.3.7 | Grade Control |
Production samples in the open pit operations are collected from blast holes using a rocket sampler. Samples are tested in the onsite laboratory and detailed in Section 10.8.
| March 15, 2024 |
Page 231 |
|
|
Turquoise Ridge Complex NI 43-101 Technical Report |
|
| 16.3.8 | Blasting and Explosives |
Blasting patterns are designed to accommodate the sites Pit Viper and DML blast hole drills with consideration to factors such as geomechanics, material type and/or hardness, and ore location. Blast holes are drilled using a variety of drill hole diameters and hole depths based on the objective and expected results.
Explosives are supplied and loaded into blast holes by Southwest Energy. Emulsion, Heavy ANFO or ANFO are used, depending on the blasting conditions and material type, together with boosters, electronic detonators and a Nonel Backups. Appropriate powder factors are used to match ore, and waste types based on required fragmentation and other outcomes.
| 16.3.9 | Mining Equipment |
The current mine equipment fleet will be used throughout the mine operations as well as for stockpile rehandle and reclamation after surface mining has ended. The loading fleet includes two Hitachi hydraulic excavators and a Caterpillar 994 front end loader. The haul truck fleet currently consists of five CAT 793 and five CAT 785 haul trucks. Additional trucks will be needed for Cut 40 waste stripping, which are expected to be transferred from another NGM site. Blast hole drills include one Atlas Copco DML and two Atlas Copco PV271s. Ancillary equipment includes track and wheeled dozers, graders, water trucks and mill feed loaders. Equipment requirements are summarized in Table 16-5.
| 16.3.10 | Production Rate |
Open pit mining rates in 2024-2026 will be low (<500 ktpd) while the Vista 8 Reserves are slowly mined as the water table is drawn-down. The mining rate increases to an average of approximately 52 ktpd in 2027-2032, peaking at 87.5 ktpd in 2033, with depletion of current reserves occurring in 2034. Note: the 87.5 ktpd peak in 2033 is associated with the completion of the non-reserve Cut 55 layback (leaving only Cut 40 reserves remaining to be mined beginning in 2033), so all open pit equipment is applied to mining solely Cut 40 rather than splitting equipment between Cut 55 and Cut 40.
| March 15, 2024 |
Page 232 |
|
|
Turquoise Ridge Complex NI 43-101 Technical Report |
|
Table 16-5 Turquoise Ridge Surface LOM Equipment Requirements
| Class | Description | Current # of Units | Future # of Units (5 year window) |
|||
|
Prime Loading Fleet |
||||||
| Excavator | Hitachi EX3600 | 1 | 1 | |||
| Excavator | Hitachi EX5500 | 0 | 2 | |||
| Loader | CAT 994 | 2 | 2 | |||
|
Hauling Fleet |
||||||
| Haul Truck | CAT 793 | 5 | 15 | |||
| Haul Truck | CAT 785 | 3 | 3 | |||
|
Drilling Fleet |
||||||
| Drill | IR DML | 1 | 1 | |||
| Drill | PV-271 | 1 | 2 | |||
|
Support Fleet |
||||||
| Support Loader | CAT 992 | 4 | 4 | |||
| Support Loader | CAT 988 | 1 | 1 | |||
| Dozer | CAT D10 | 3 | 3 | |||
| Grader | CAT 16 | 2 | 3 | |||
| Grader | CAT 24 | 1 | 1 | |||
| RTD | CAT 834 | 2 | 2 | |||
| RTD | CAT 854 | 2 | 2 | |||
| Scraper | CAT 633 | 1 | 1 | |||
| Scraper | CAT 637 | 1 | 1 | |||
| Water Truck | CAT 623 H20 | 1 | 1 | |||
| Water Truck | CAT 785 H2O | 3 | 3 | |||
| Track Hoe | CAT 330C | 1 | 1 | |||
| Track Hoe | CAT 245 | 1 | 1 | |||
| 16.3.11 | Mine Schedule |
Mining operations are currently planned to deplete the open pit Reserves in 2034. A summary of the LOM production plan is shown in Table 16-6.
The basis for the consolidated LOM plan is the Proven and Probable Mineral Reserves estimate as described in Section 15.
| March 15, 2024 |
Page 233 |
|
|
Turquoise Ridge Complex NI 43-101 Technical Report |
|
Table 16-6 Turquoise Ridge Surface LOM Production Schedule Summary
| Year | Ore Tonnes Mined (Mt) |
Average Grade (g/t) |
Ore Ounces Mined (koz) |
Waste Tonnes Mined (Mt) |
Total Tonnes Mined (Mt) |
|||||
| 2024 | 0.2 | 1.32 | 7.5 | 0.0 | 0.2 | |||||
| 2025 | 0.1 | 1.32 | 5.5 | 0.0 | 0.1 | |||||
| 2026 | 0.2 | 1.32 | 7.5 | 0.0 | 0.2 | |||||
| 2027 | 0.5 | 0.38 | 5.9 | 18.2 | 18.6 | |||||
| 2028 | 1.1 | 0.59 | 21.7 | 17.5 | 18.7 | |||||
| 2029 | 1.4 | 0.42 | 18.6 | 17.2 | 18.6 | |||||
| 2030 | 1.7 | 1.59 | 89.0 | 20.4 | 22.1 | |||||
| 2031 | 0.9 | 3.94 | 112.8 | 18.3 | 19.2 | |||||
| 2032 | 0.8 | 4.21 | 112.2 | 16.9 | 17.7 | |||||
| 2033 | 3.0 | 3.37 | 320.7 | 29.0 | 31.9 | |||||
| 2034 | 1.3 | 3.64 | 151.2 | 23.4 | 24.7 | |||||
| Total | 11.2 | 2.37 | 852.7 | 160.8 | 172.0 |
Totals may not add due to rounding.
| 16.4 | Vista Underground |
Mining at Vista Underground is scheduled to be completed in June 2024. All remaining planned mining consists of long-hole stoping in the “BWT” region. All capital and operating development for the remaining stopes is complete.
| 16.4.1 | Mining Method and Mine Design |
The mining method is long-hole stoping retreat (LHSR). This method is conducted by mining multiple sill drives along the strike of the mineralized structure at 9-14 m vertical intervals. Once the sill cuts reach the furthest mineralized extents, narrow stopes are mined on retreat.
The deposit is accessed by two portals and a series of spiral ramps/raises with footwall drives used to access the ore. The Vista Underground portals are located towards the bottom of the Vista Pit. Material is extracted using mechanized/rubber-tired equipment to develop sill drives for drilling/mucking horizons and then stopes are mined on retreat.
Mining activities at Vista Underground are performed by a mining contractor. The contractor supplies all underground production/development equipment and skilled labor to execute all mining activities. The site is supported with technical expertise from TRUG and a small satellite support staff of engineers, surveyors, and geologists.
Figure 16-6 shows a cross section of the typical activities and their interaction for the LHSR mining method.
A surface mine layout plan is shown in Figure 16-7 and the underground plan is shown in Figure 16-8.
| March 15, 2024 |
Page 234 |
|
|
Turquoise Ridge Complex NI 43-101 Technical Report |
|
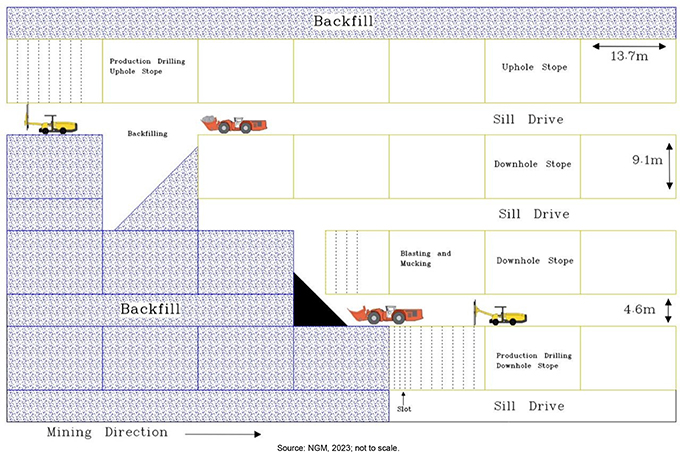
Figure 16-6 VUG LHSR Layout and Mining Activities
| March 15, 2024 |
Page 235 |
|
|
Turquoise Ridge Complex NI 43-101 Technical Report |
|
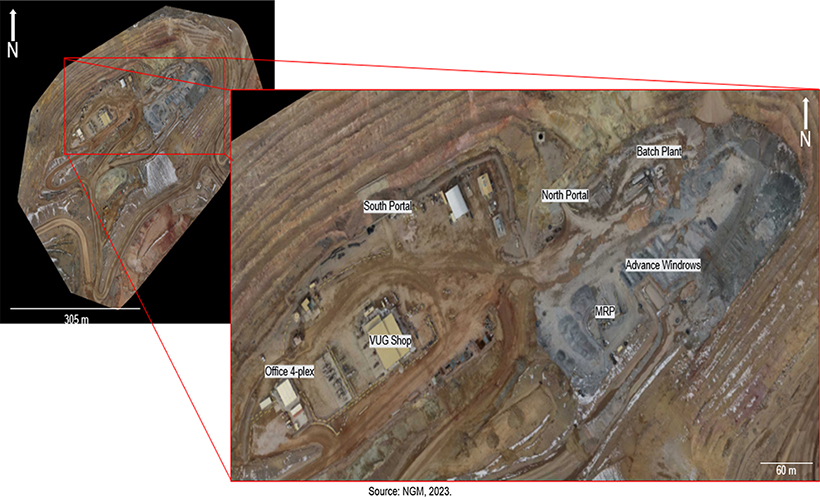
Figure 16-7 VUG Surface Infrastructure Layout Plan
| March 15, 2024 |
Page 236 |
|
|
Turquoise Ridge Complex NI 43-101 Technical Report |
|
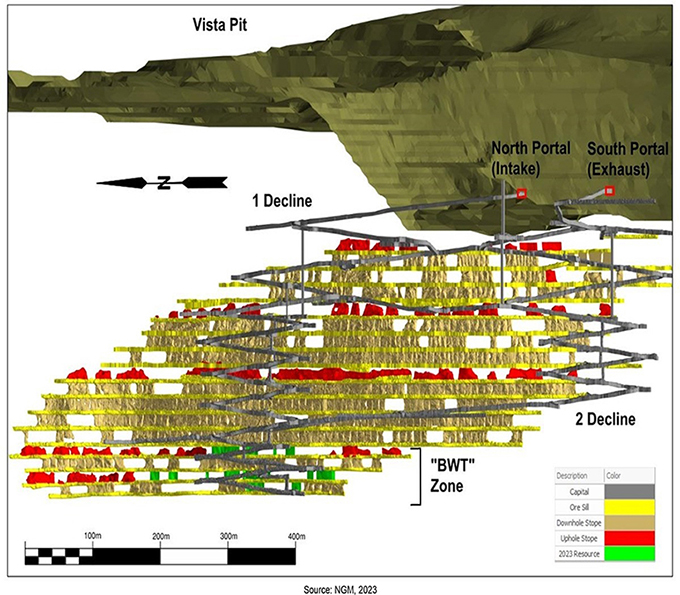
Figure 16-8 VUG Mine Layout Plan
| March 15, 2024 |
Page 237 |
|
|
Turquoise Ridge Complex NI 43-101 Technical Report |
|
The actuals-based parameters used for stope design is summarised in Table 16-7.
Table 16-7 VUG Stope Design Parameters
| Vista Underground | Unit | Min | Max | |||
| Stope Width | m | 2.1 | 9.1 | |||
| Dip Angle | degrees | 60 | 90 | |||
| Hanging Wall Dilution | m | 0 | 1.2 | |||
| Footwall Dilution | m | 0 | 0.9 | |||
| Uphole Stope Crown:Toe Width Ratio | - | 0.75:1 | 2:1 | |||
| 16.4.2 | Geotechnical Considerations |
Vista Underground rock mass typically ranges from poor to fair quality with a geological strength index (GSI) ranging from low 20s to mid-60s or an equivalent RMR range of approximately 20 to 65 per cent.
Vista Underground is typically able to be split into two primary domains:
| ● | Waste: Fair rock (RMR rating system) and is favorable for mine development requiring average extraction processes and support. |
| ● | Vein: Poor ground spanning a range of the ground classes (Very Poor to Fair boundaries). The dominant issue is alteration within and surrounding the Vista Vein (VV). Core drilling has identified significant occurrences of clay alteration. Sill mapping supports that the alteration is quite pervasive to the vein and quite continuous along strike. The effects of this clay alteration and Poor rock mass ratings are higher support requirements and potential constrictive limits with stope sizing for stability or high dilution potential. |
Overall ground conditions are sufficient to support the utilised long-hole open stoping mining method with cemented rock backfill. Stope strike length is informed by the Mathews/Potvin Stability Graph method. Historically, stope strike length has been limited to 9 m at 14 m height; however, a trial is underway to evaluate extending strike length of stopes below the water table at 9 m height. Results of the trial are not yet available.
Standard ground support consists of inflatable rock bolts, welded wire mesh, and shotcrete. Inflatable bolts vary in size (2.4 m, 3.6 m, or 4.9 m) depending on ground conditions and development configuration. Additional rock bolts are installed along the hanging wall of stopes before they are shot with sizing and spacing determined by local rock conditions and stope dimensions. In up-hole stopes, bolts are installed at the brow to mitigate backbreak.
| March 15, 2024 |
Page 238 |
|
|
Turquoise Ridge Complex NI 43-101 Technical Report |
|
| 16.4.3 | Hydrological Considerations |
Water inflows have historically been minimal at Vista Underground with mining taking place above the static water table elevation at 1,189 masl. A 2022 expansion added four new mining levels at depth, bringing the lowest mining elevation to 1,134 masl and 55 m below the static water table. The four new levels are referred to as the Below the Water Table (BWT) Zone. Significant water inflows were encountered in BWT capital development and ore sill drives that slowed advance rates while passive dewatering lowered the water table. As of 2023, mine dewatering has brought the static water table elevation down to 1,134 masl with passive water inflows reducing to a steady-state 400 L/min rate. Current steady-state water inflow does not affect long-hole stoping production.
| 16.4.4 | Ventilation |
Fresh air intakes mechanically by two 224 kW main exhaust fans. Air intakes through the North Portal and exhausts out the South Portal with total airflow of approximately 132 m3/s (280k CFM). Fresh air from the intake travels down the 1-Decline to the 3720 level where it exhausts to the 2-Decline through the lower internal raise network and the 4080 Connection Drift. Return air travels up the 2-Decline to the South Portal. Air doors and bulkheads are used to segregate fresh and return air streams at crossover drifts and raise accesses.
Auxiliary ventilation for active mining areas is pulled from fans ranging from 37 kW – 112 kW on the main ramps to feed working headings through ducting. The ventilation configuration is shown in Figure 16-9.
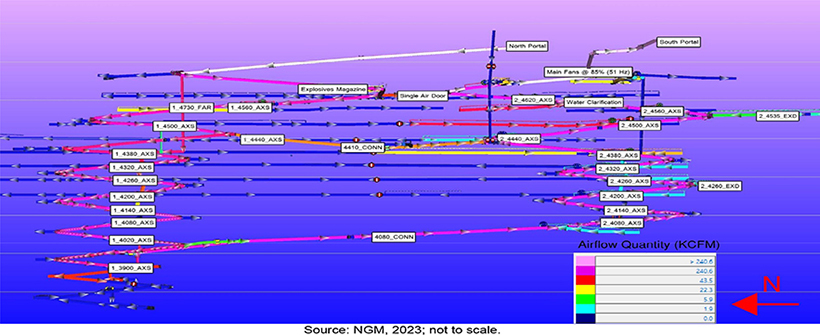
Figure 16-9 Ventilation Design, VUG
| March 15, 2024 |
Page 239 |
|
|
Turquoise Ridge Complex NI 43-101 Technical Report |
|
| 16.4.5 | Material Handling |
Stope ore tonnes are mucked out using a remote LHD loader to a muck-bay. A fleet of five 30 t underground haul trucks haul ore to the surface, dumping the loads into windrows. These piles are sampled, and grades assigned on the basis of gold and LECO analyses.
| 16.4.6 | Backfill |
Backfill is completed using CAF and ROM waste material where applicable. CAF consists of waste material from Turquoise Ridge Surface and a cement slurry and is mixed using pit-mix processes. The mining contractor trucks the mixed CAF into the mine where it is end-dump filled and jammed into stope voids.
| 16.4.7 | Blasting and Explosives |
Vista Underground uses standard loading practices for face advance and stope production via blasting. ANFO is the current primary explosive product to load and blast stopes. Blasts can take place in the middle of shift after the mine is cleared and guarded or initiated with centralized blasting system during the shift change.
| 16.4.8 | Grade Control |
Grade control for Vista Underground is managed through the Mineral Resources Management department and detailed in Section 10.9.
| 16.4.9 | Mining Equipment |
An equipment list of the average number of equipment required, by type, for the LOM is provided in Table 16-8.
| March 15, 2024 |
Page 240 |
|
|
Turquoise Ridge Complex NI 43-101 Technical Report |
|
Table 16-8 Vista Underground Equipment List
| Equipment Type | LOM Plan Average Requirement | |
| CAT R1600G LHD | 3 | |
| CAT AD30 U/G trucks | 5 | |
| Atlas Copco T1D long-hole drills | 1 | |
| Atlas Copco Jumbo drills | 1 | |
| Tamrock bolters | 1 | |
| CAT Dozers D6XL,D4K2 | 2 | |
| Water trucks | 1 | |
| Norman grader | 1 | |
| Getman explosives truck | 1 | |
| Getman shotcrete truck | 1 | |
| Komatsu transmixer | 1 | |
| Skid steer | 1 | |
| Getman service truck | 1 | |
| Fletcher fan hanger | 1 | |
| Forklifts | 4 | |
| Buggy/Roxor/personnel carriers | 15 | |
| Scissorlift truck | 1 | |
| Flat bed truck | 1 | |
| Telehandler | 1 | |
| 16.4.10 | Production Rate |
Vista Underground is currently producing 225 tpd ore. The current LOM is scheduled to be complete by April 2024.
| 16.4.11 | Mine Schedule |
Mining operations are currently planned to continue to 2024. A summary of the LOM production plan is shown in Table 16-9.
The basis for the consolidated LOM plan is the Proven and Probable Mineral Reserves estimate as described in Section 15.
Table 16-9 Vista Underground LOM Production Schedule Summary
| Year | Total VUG Ore (Mt) | VUG Mined Gold Grade (g/t) |
Total VUG Mined Ounces (Moz) |
|||
| 2024 | 0.02 | 5.81 | 0.0045 | |||
| Total | 0.02 | 5.81 | 0.0045 | |||
| March 15, 2024 |
Page 241 |
|
|
Turquoise Ridge Complex NI 43-101 Technical Report |
|
| 16.5 | Life of Mine Production Schedule |
The consolidated Open Pit and underground Mine Production Schedule is shown in Table 16-10.
The LOM processing schedule is shown in Table 16-11.
The basis for the consolidated LOM plan is the Proven and Probable Mineral Reserves estimate as described in Section 15.
| March 15, 2024 |
Page 242 |
|
|
Turquoise Ridge Complex NI 43-101 Technical Report |
|
Table 16-10 Consolidated LOM Mining Schedule
| LOM Mine Plan | Units | 2024 | 2025 | 2026 | 2027 | 2028 | 2029 | 2030 | 2031 | 2032 | 2033 | 2034 | 2035 | |||||||||||||
| Open Pit Waste Mined | kt | 4 | 3 | 4 | 18,170 | 17,517 | 17,183 | 20,364 | 18,293 | 16,853 | 28,978 | 23,392 | - | |||||||||||||
| Open Pit Ore Mined | kt | 176 | 130 | 177 | 480 | 1,147 | 1,387 | 1,745 | 890 | 830 | 2,959 | 1,291 | - | |||||||||||||
| Open Pit Grade Mined | g/t | 1.32 | 1.32 | 1.32 | 0.38 | 0.59 | 0.42 | 1.59 | 3.94 | 4.21 | 3.37 | 3.64 | - | |||||||||||||
| Open Pit Ounces Mined | koz | 7 | 5 | 7 | 6 | 22 | 19 | 89 | 113 | 112 | 321 | 151 | - | |||||||||||||
| Underground Waste Mined | kt | 327 | 397 | 425 | 382 | 652 | 603 | 635 | 635 | 635 | 635 | 636 | 639 | |||||||||||||
| Underground Ore Mined | kt | 1,157 | 1,242 | 1,305 | 1,391 | 1,496 | 1,495 | 1,493 | 1,487 | 1,490 | 1,491 | 1,494 | 1,492 | |||||||||||||
| Underground Grade Mined | g/t | 12.89 | 12.51 | 12.48 | 11.94 | 11.58 | 11.99 | 11.45 | 10.15 | 9.92 | 10.14 | 9.93 | 9.93 | |||||||||||||
| Underground Ounces Mined | koz | 480 | 500 | 524 | 534 | 557 | 576 | 550 | 485 | 475 | 486 | 477 | 476 | |||||||||||||
| Total Waste Mined | kt | 331 | 400 | 429 | 18,552 | 18,169 | 17,786 | 20,999 | 18,928 | 17,488 | 29,613 | 24,027 | 639 | |||||||||||||
| Total Ore Mined | kt | 1,334 | 1,372 | 1,482 | 1,871 | 2,643 | 2,883 | 3,239 | 2,377 | 2,320 | 4,450 | 2,784 | 1,492 | |||||||||||||
| Total Grade Mined | g/t | 11.36 | 11.45 | 11.14 | 8.98 | 6.81 | 6.42 | 6.14 | 7.82 | 7.87 | 5.64 | 7.02 | 9.93 | |||||||||||||
| Total Ounces Mined | koz | 487 | 505 | 531 | 540 | 579 | 595 | 639 | 598 | 587 | 807 | 628 | 476 | |||||||||||||
| LOM Mine Plan | Units | 2036 | 2037 | 2038 | 2039 | 2040 | 2041 | 2042 | 2043 | 2044 | 2045 | 2046 | 2047 |
LOM Total |
||||||||||||||
| Open Pit Waste Mined | kt | - | - | - | - | - | - | - | - | - | - | - | - | 160,761 | ||||||||||||||
| Open Pit Ore Mined | kt | - | - | - | - | - | - | - | - | - | - | - | - | 11,213 | ||||||||||||||
| Open Pit Grade Mined | g/t | - | - | - | - | - | - | - | - | - | - | - | - | 2.37 | ||||||||||||||
| Open Pit Ounces Mined | koz | - | - | - | - | - | - | - | - | - | - | - | - | 853 | ||||||||||||||
| Underground Waste Mined | kt | 630 | 546 | 490 | 512 | 554 | 505 | 519 | 469 | 369 | 352 | 248 | 80 | 11,873 | ||||||||||||||
| Underground Ore Mined | kt | 1,489 | 1,492 | 1,492 | 1,494 | 1,492 | 1,494 | 1,494 | 1,366 | 1,175 | 1,087 | 997 | 649 | 32,757 | ||||||||||||||
| Underground Grade Mined | g/t | 9.80 | 9.89 | 9.95 | 9.91 | 9.90 | 9.92 | 10.04 | 10.19 | 9.95 | 9.98 | 10.36 | 12.94 | 10.66 | ||||||||||||||
| Underground Ounces Mined | koz | 469 | 474 | 477 | 476 | 475 | 476 | 483 | 447 | 376 | 349 | 332 | 270 | 11,225 | ||||||||||||||
| Total Waste Mined | kt | 630 | 546 | 490 | 512 | 554 | 505 | 519 | 469 | 369 | 352 | 248 | 80 | 172,634 | ||||||||||||||
| Total Ore Mined | kt | 1,489 | 1,492 | 1,492 | 1,494 | 1,492 | 1,494 | 1,494 | 1,366 | 1,175 | 1,087 | 997 | 649 | 43,969 | ||||||||||||||
| Total Grade Mined | g/t | 9.80 | 9.89 | 9.95 | 9.91 | 9.90 | 9.92 | 10.04 | 10.19 | 9.95 | 9.98 | 10.36 | 12.94 | 8.54 | ||||||||||||||
| Total Ounces Mined | koz | 469 | 474 | 477 | 476 | 475 | 476 | 483 | 447 | 376 | 349 | 332 | 270 | 12,078 | ||||||||||||||
| March 15, 2024 |
Page 243 |
|
|
Turquoise Ridge Complex NI 43-101 Technical Report |
|
Table 16-11 LOM Processing Schedule
| Reserves Process Plan |
Units | 2024 | 2025 | 2026 | 2027 | 2028 | 2029 | 2030 | 2031 | 2032 | 2033 | 2034 | 2035 | |||||||||||||||
| Open Pit Processed | kt | 74 | 115 | 186 | 568 | 2,045 | 4,483 | 3,740 | - | - | - | - | - | |||||||||||||||
| Open Pit Stockpiles Processed | kt | 2,730 | 3,068 | 2,660 | 3,000 | 1,376 | 751 | 300 | 466 | 505 | 73 | - | 56 | |||||||||||||||
| TR Underground Processed | kt | 1,133 | 1,242 | 1,305 | 1,391 | 1,496 | 1,495 | 1,493 | 1,487 | 1,490 | 1,491 | 1,494 | 1,492 | |||||||||||||||
| Vista UG Processed | kt | 24 | - | - | - | - | - | - | - | - | - | - | - | |||||||||||||||
| Total Ore Processed | kt | 3,961 | 4,425 | 4,152 | 4,960 | 4,917 | 6,730 | 5,533 | 1,953 | 1,995 | 1,564 | 1,494 | 1,548 | |||||||||||||||
| Ore Au Grade Processed | g/t | 5.18 | 4.86 | 5.23 | 4.74 | 4.42 | 3.39 | 4.33 | 11.43 | 10.69 | 13.32 | 9.93 | 9.65 | |||||||||||||||
| Contained Au oz Processed | koz | 660 | 691 | 698 | 756 | 699 | 733 | 770 | 718 | 686 | 670 | 477 | 480 | |||||||||||||||
| Recovery % | % | 83.1% | 82.0% | 83.2% | 79.5% | 82.0% | 80.5% | 83.9% | 82.0% | 82.3% | 87.7% | 91.6% | 88.2% | |||||||||||||||
| Recovered Au oz Produced | koz | 549 | 567 | 580 | 601 | 573 | 590 | 646 | 589 | 564 | 588 | 437 | 424 | |||||||||||||||
| Reserves Process Plan |
Units | 2036 | 2037 | 2038 | 2039 | 2040 | 2041 | 2042 | 2043 | 2044 | 2045 | 2046 | 2047 | Total | ||||||||||||||
| Open Pit Processed | kt | - | - | - | - | - | - | - | - | - | - | - | - | 11,213 | ||||||||||||||
| Open Pit Stockpiles Processed | kt | 836 | 664 | 1,792 | 1,561 | 2,305 | 2,037 | 595 | 409 | 68 | 1 | - | - | 25,253 | ||||||||||||||
| TR Underground Processed | kt | 1,489 | 1,492 | 1,492 | 1,494 | 1,492 | 1,494 | 1,494 | 1,366 | 1,175 | 1,087 | 997 | 649 | 32,733 | ||||||||||||||
| Vista UG Processed | kt | - | - | - | - | - | - | - | - | - | - | - | - | 24 | ||||||||||||||
| Total Ore Processed | kt | 2,326 | 2,155 | 3,284 | 3,055 | 3,797 | 3,531 | 2,090 | 1,775 | 1,242 | 1,088 | 997 | 649 | 69,222 | ||||||||||||||
| Ore Au Grade Processed | g/t | 7.48 | 8.02 | 6.15 | 6.06 | 5.30 | 5.53 | 7.74 | 8.29 | 9.51 | 9.98 | 10.36 | 12.94 | 6.29 | ||||||||||||||
| Contained Au oz Processed | koz | 559 | 556 | 649 | 595 | 647 | 628 | 520 | 473 | 380 | 349 | 332 | 270 | 13,997 | ||||||||||||||
| Recovery % | % | 83.5% | 81.4% | 77.8% | 80.5% | 78.1% | 78.1% | 77.1% | 89.0% | 96.1% | 93.0% | 89.4% | 92.7% | 83.4% | ||||||||||||||
| Recovered Au oz Produced | koz | 467 | 452 | 505 | 479 | 505 | 490 | 401 | 421 | 365 | 325 | 297 | 250 | 11,667 | ||||||||||||||
| March 15, 2024 |
Page 244 |
|
|
Turquoise Ridge Complex NI 43-101 Technical Report |
|
Barrick, as the owner operator of the Project, has significant experience in other mining operations within North America and these production rates, modifying factors, and costs are benchmarked against other operations to ensure they are suitable.
The current Mineral Reserves for Turquoise Ridge support a total mine life of 23 years, 11 years of open pit operations, and 23 years of underground mining. Gold production averages approximately 590koz Au per year for the first 10 years based only on Mineral Reserves.
| 16.6 | Comments on Mining Methods |
NGM has regularly undertaken, and will continue to undertake, as part of its normal course of business operations, reviews of the mine plan and consideration of alternatives to and variations within the plan. Alternative scenarios and reviews are based on ongoing or future mining considerations, evaluation of different potential input factors and assumptions, and requests made of project staff by NGM. Such iterations can include where appropriate, but are not limited to:
| ● | Changes to Mineral Resource/Mineral Reserve estimation methodologies. |
| ● | Changes to dilution and reconciliation strategies. |
| ● | Changes to metal price assumptions. |
It is the opinion of the QP’s responsible for this section that the mining methods, the mining equipment and productivities, the mine designs and input parameters are suitable for the NGM operations and estimation of Mineral Reserves.
| March 15, 2024 |
Page 245 |
|
|
Turquoise Ridge Complex NI 43-101 Technical Report |
|
| 17 | Recovery Methods |
| 17.1 | Summary |
Oxide ore and refractory ore are both processed on-site at the Turquoise Ridge Complex. The Turquoise Ridge processing facilities remain fundamentally unchanged from the original design and are suitable for processing the ores envisaged in the LOM plan. Various plant modifications for improved performance are periodically undertaken, such as the CIL inter-tank screen upgrades that are currently underway with both throughput and recovery enhancements expected. In fact, a 3% gold recovery adjustment has been included this year to the predictive curves (see Section 13), based on partial completion of the project to date.
| 17.2 | Design Basis |
The current process routes include two active mills, the Juniper oxide mill and the Sage autoclave facility, and a number of heap leach pads. The combined Sage/Juniper capacity is 12,000 tpd; however, actual throughput can vary depending on ore type and constituents.
| 17.3 | Flowsheet |
An overall process flow sheet is shown in Figure 17-1. The flowsheet includes the Juniper Mill and the Sage autoclave.
| March 15, 2024 |
Page 246 |
|
|
Turquoise Ridge Complex NI 43-101 Technical Report |
|
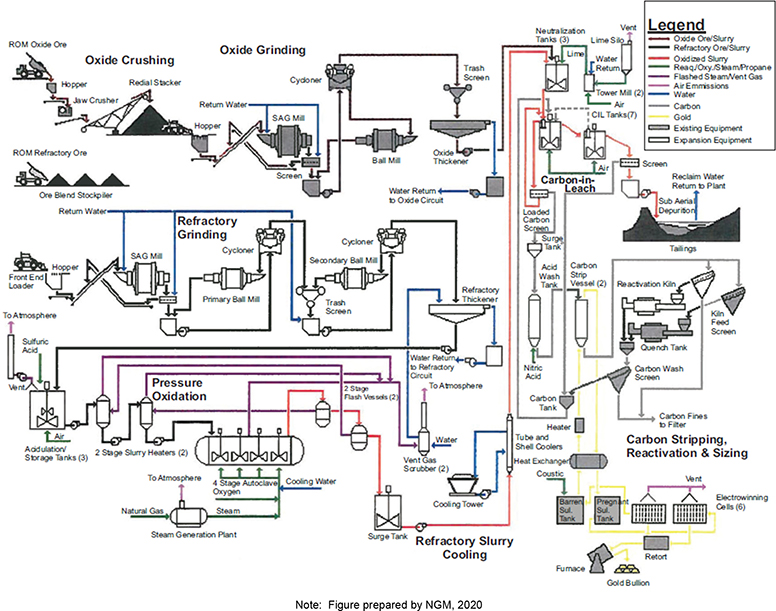
Figure 17-1 Process Flow Sheet
| March 15, 2024 |
Page 247 |
|
|
Turquoise Ridge Complex NI 43-101 Technical Report |
|
| 17.4 | Plant Design |
| 17.4.1 | Juniper Mill |
Overview
Run-of-mine (ROM) higher-grade oxide ore from the Turquoise Ridge Surface sources are blended for gold grade, hardness, and carbonate content and fed to the Juniper oxide mill.
The mill consists of a variable speed 671kW semi-autogenous grind (SAG) mill operating in closed circuit with a discharge screen. The SAG mill product is fed to a 846 kW mill operating in closed circuit with cyclones. The final product grind size is 85% passing -200 mesh.
Cyclone overflow product is fed to the neutralization circuit, where the carbonate in the oxide ore is used to neutralize the acidic autoclave discharge slurry. The combined oxide slurry and autoclave discharge slurry are further neutralized with lime before treatment in the CIL circuit. The CIL circuit is used to concurrently leach gold from the ore and adsorb it onto activated carbon. The final tailings slurry is pumped to the tailings storage facility (TSF).
The gold loaded carbon is stripped, acid washed, kiln reactivated, and recycled back to the CIL circuit. The gold stripped from the carbon is electrowon and refined into doré for shipment to an offsite refinery.
Plant throughput can reach 108 tph (120 short tons/hr) depending on the hardness of the ore being processed. This is augmented when limestone is added. The plant is permitted for running 226 tph (250 short tons/hr) or 5,443 tpd (6,000 short tons/day).
Equipment Sizing
The major equipment at the Juniper Mill is summarized in Table 17-1.
Table 17-1 Major Process Equipment, Juniper Mill
| Item | Description | Capacity | ||
| SAG mill | Marcy 5.5 m x 2.0 m (18 ft x 6.5 ft) | 662 kW (900 hp) | ||
| Primary ball mill | Marcy 3.5 m x 5.0 m (11.5 ft x 16.4 ft) | 846 kW (1,150 hp) | ||
| 17.4.2 | Sage Autoclave |
Overview
The Sage Mill consists of SAG milling followed by two-stage ball milling. The final grinding product is 80% passing -200 mesh. The cyclone overflow reports to a thickener. Thickener underflow reports
| March 15, 2024 |
Page 248 |
|
|
Turquoise Ridge Complex NI 43-101 Technical Report |
|
to an acidification circuit where sulfuric acid is added as necessary to ensure adequate autoclave free acid solution levels. The free acid concentration for Turquoise Ridge Complex ore needs to be maintained at >18 g/L. Thickener overflow solution is returned to the milling circuit. After acidification, ore slurry is added to two identical autoclaves that are operated in parallel. Two stages of flash heat recovery are used. Autoclave discharge is cooled before reporting to the lime neutralization circuit. Autoclave waste gas is cooled and scrubbed before discharging to the atmosphere.
Oxide ore and acidic oxidized sulfide ore slurry are combined in the neutralization circuit. After neutralization with the carbonate oxide ore and supplemental lime, the ore slurry reports to a CIL circuit where the ore is leached in cyanide solution to extract the gold. Final tailings slurry is pumped to the tailings area. Tailings settle and decant solution is reclaimed and reused in the grinding circuit.
Loaded carbon from the CIL circuit is transferred to the recovery plant. After acid washing to remove inorganic contaminants, the carbon is transferred to the pressure Zadra stripping circuit. Gold is stripped from the carbon using caustic and cyanide solution at elevated temperature and pressure. Pregnant solution from the stripping circuit is pumped to an electrowinning circuit where precious metal is removed from the solution as sludge. The sludge is filtered, dried in a mercury retort, mixed with fluxes, and refined into doré bars.
After carbon stripping, the barren carbon reports to the kiln regeneration circuit and returns to the CIL circuit.
A number of efficiency-related plant improvements have been recently completed. In addition to the recovery improvements described in Section 13 related to the CIL screens, the site has also worked on debottlenecking the mill by upgrading trash screens in the grind circuit, which has reduced downtime associated with plugged strainers in the autoclaves.
Equipment Sizing
The major equipment at the Sage autoclave is summarized in Table 17-2.
Table 17-2 Major Process Equipment, Sage Autoclave
| Item | Description | Capacity | ||
| SAG mill | Koppers 8.5 m x 3.0 m (28 ft x 10 ft) | 2,942 kW (4,000 hp) | ||
| Primary ball mill | Svedala 6.1 m x 9.2 m (20 ft x 30 ft) | 5,516 kW (7,500 hp) | ||
| Secondary ball mills | 2 x Dominion 5.0 m x 8.8 m (16.5 ft x 29 ft) | 2,942 kW (4,000 hp) | ||
| Thickener | 61.0 m x 7.6 m (200 ft x 25 ft) | 4x 3.7 kW Motors(5hp) | ||
| Autoclaves | 2x 5.0 m x 22.3 m (16.5 ft x 73.3 ft) | 338.8 m^3 (89,500 gal) | ||
| Oxygen plant | Air products ASU 95% O2 | 1233 tpd (1,360 tons/d) | ||
| March 15, 2024 |
Page 249 |
|
|
Turquoise Ridge Complex NI 43-101 Technical Report |
|
| 17.4.3 | Heap Leach |
Overview
ROM lower-grade oxide ore from the Turquoise Ridge Surface sources is delivered to the Izzenhood heap leach pad (L8) located south-east of the Vista Pit. This ore is normally stacked in 6 m lifts. Both the Snowstorm and Sonoma leach pads are classified as inactive. The Osgood leach pad is in closure.
When a cell is full and ripped, drip irrigation lines are installed to apply barren cyanide solution to the top surface. The cyanide solution is used to leach gold from the ore as the solution percolates through the stacked ore and collects on an impermeable liner at the bottom of the heap. This pregnant solution is fed to a carbon-in-column (CIC) circuit to adsorb the gold onto carbon. The CIC barren solution is then recycled back to the top of the leach pad. The gold loaded carbon is sent to the stripping circuit (the same used for the loaded carbon coming from the CIL circuit). Where it is stripped, acid washed, kiln reactivated, and recycled back to the CIC circuit.
The gold stripped from the carbon is electrowon and refined into doré for shipment to an off-site refinery.
Equipment Sizing
Major equipment for the heap leach facility is listed in Table 17-3.
Table 17-3 Major Process Equipment, Heap Leach Facilities
| Goul vertical turbine pump | 372 kW (500 hp) | |
| Carbon Columns (Train of 5 tanks) 2 set | 2.6 m x 2.7 m (8.5 ft x 9.5 ft) | |
| 17.5 | Comments on Recovery Methods |
All process facilities are constructed and operational. Facilities are suitable for processing the ores included in the LOM plan, including the Mega Pit Cut 40 expansion. NGM has and will continue to review the plant performance as part of its normal business operations to identify opportunities for improved performance.
| March 15, 2024 |
Page 250 |
|
|
Turquoise Ridge Complex NI 43-101 Technical Report |
|
| 17.6 | Energy, Water, and Consumables Requirements |
| 17.6.1 | Energy |
The process facilities will require 363.1 gigawatt-hrs per annum. Power sources are discussed in Section 18.9. The expansion of Mega Pit does not require additional power or processing capacity but increases the LOM duration.
| 17.6.2 | Water |
The process facilities require both process and potable water. The expansion of Mega Pit does not require additional Process or potable water capacity on a per annum basis but increases the LOM duration.
Process water is sourced from Twin Creeks dewatering wells DW-76, DW-77, and DW-80 and requirements will average approximately 11.4M m3 per annum.
Potable water is sourced from potable water well GFW-1 and 6.3k m3 is consumed per annum.
| 17.6.3 | Consumables |
The Juniper Mill uses grinding media for the SAG and ball mills, lime, and cyanide with the following average annual LOM consumptions of:
| ● | Grinding media 225 tpa; and |
| ● | Lime and cyanide usage are accounted for in the Sage autoclave usage below. |
The Sage autoclave uses grinding media for the SAG and ball mills, sulfuric acid, oxygen, lime, cyanide, and activated carbon. The average annual consumption for the LOM is summarized below:
| ● | Carbon 140 tpa.; |
| ● | Cyanide 1.6 ktpa.; |
| ● | Lime 94 ktpa.; |
| ● | Sulphuric acid 36 ktpa.; and |
| ● | Grinding media 4 ktpa. |
The major consumables in the gold heap leach facilities are cyanide and antiscalant. The average annual consumption for the LOM is:
| ● | Cyanide 900 tpa.; and |
| March 15, 2024 |
Page 251 |
|
|
Turquoise Ridge Complex NI 43-101 Technical Report |
|
| ● | Antiscalent 120 tpa. |
| 17.7 | Comments on Recovery Methods |
The majority of the infrastructure required for operations is constructed and operational. Facilities are suitable for processing the ores envisaged in the LOM plan. No major modifications to the existing flow sheets would be necessary to process Cut 40 ores. Some additional facilities, such as construction of a new TSF, and expansion of the Izzenhood heap leach pad will be required to support the operations as envisaged in the LOM plan, including the Cut 40 expansion.
| March 15, 2024 |
Page 252 |
|
|
Turquoise Ridge Complex NI 43-101 Technical Report |
|
| 18 | Project Infrastructure |
| 18.1 | Summary |
The Turquoise Ridge Complex is a mature project that has been operating intermittently since 1934 with modern open pit operations beginning in 1987 and modern underground mining beginning in 1994. It has well developed infrastructure supporting the current operations and plans for additional infrastructure to support future Project growth.
The locations of the key infrastructure are shown in Figure 18-1
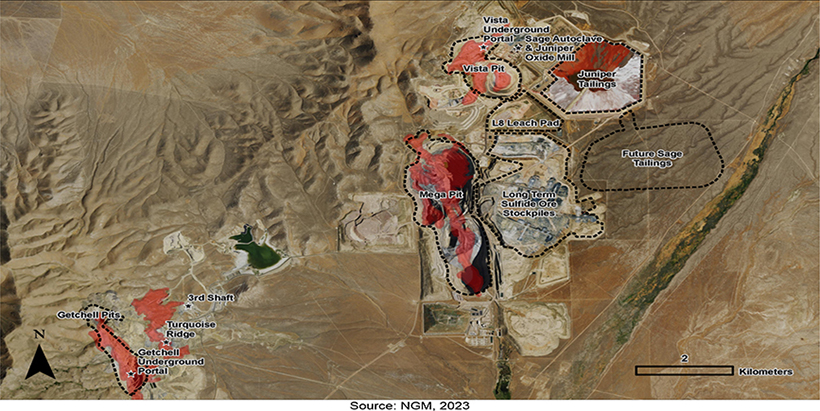
Figure 18-1 Location Plan, Major Operations, Turquoise Ridge Complex
| March 15, 2024 |
Page 253 |
|
|
Turquoise Ridge Complex NI 43-101 Technical Report |
|
| 18.1.1 | Turquoise Ridge Underground and Getchell Infrastructure |
Major existing infrastructure includes:
| ● | Turquoise Ridge Underground: |
| ○ | Two ventilation intake shafts (7.3 m diameter) with production skips, service hoists, and supplemental three person hoists; |
| ○ | One ventilation exhaust shaft (6.1 m diameter) with double deck personnel hoist; |
| ○ | Three 1119 kW primary exhaust fans; |
| ○ | Underground airdoors, bulkheads, and other ventilation controls; |
| ○ | Two underground cemented aggregate backfill plants (fed from surface silos); |
| ○ | One underground shotcrete plant (fed from surface silos); |
| ○ | Multiple underground powder magazines; |
| ○ | Underground dewatering/pumping infrastructure; |
| ○ | Surface compressor house; |
| ○ | 120 kV Switches (TR Main substation and NZ substation); |
| ○ | Two 2.0 MW and one 2.5 MW 13.8 kV surface generators; |
| ○ | 13.8 kV and below underground electrical distribution lines; |
| ○ | Underground leaky feeder radio; |
| ○ | Underground fiber optic network; |
| ○ | Multiple refuge chambers and stench release notification system; and |
| ○ | Mobile equipment mining fleet; |
| ● | Getchell |
| ○ | Getchell Open Pit (inactive); |
| ○ | Two portals (barricaded) and inactive underground workings; and |
| ○ | Portal dewatering/pumping infrastructure |
| ● | Surface Facilities |
| ○ | Limestone quarry and surface crushing facility; |
| ○ | One surface shotcrete/concrete plant with slickline to the 2280 level; |
| ○ | TRUG WRSF; |
| ○ | Getchell TSF; |
| March 15, 2024 |
Page 254 |
|
|
Turquoise Ridge Complex NI 43-101 Technical Report |
|
| ○ | Potable and fire water tanks and distribution infrastructure; |
| ○ | Turquoise Ridge Water Treatment Plant with three sets of Rapid infiltration basins (RIBS); and |
| ○ | Turquoise Ridge Landfill. |
A detailed overview of Turquoise Ridge Underground and Getchell, including key facility locations, is shown in Figure 18-2.
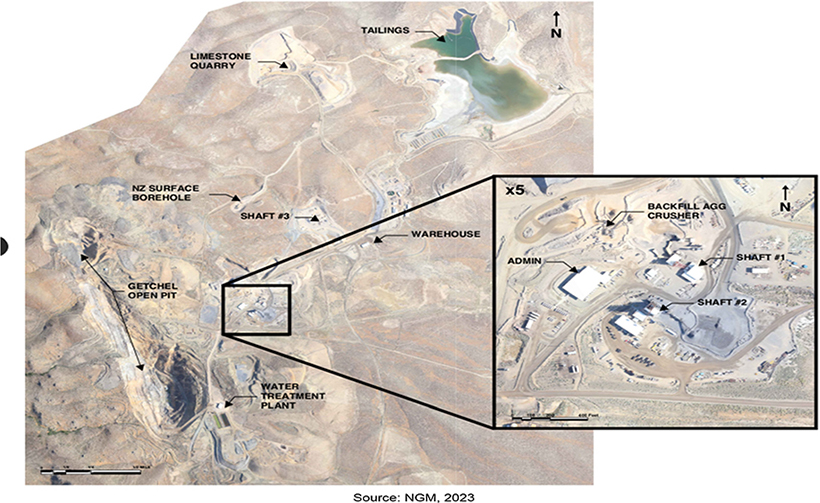
Figure 18-2 Location Plan, Key Infrastructure, Turquoise Ridge Underground and Getchell
| March 15, 2024 |
Page 255 |
|
|
Turquoise Ridge Complex NI 43-101 Technical Report |
|
| 18.1.2 | Turquoise Ridge Surface, Vista Underground, and Process Infrastructure |
Existing major infrastructure includes:
| ● | Turquoise Ridge Surface: |
| ○ | Mega Pit; |
| ○ | Vista Pit; |
| ○ | Vista and South Mega in-pit backfill waste storage; |
| ○ | One active WRSF (W22); |
| ○ | Several inactive WRSFs; |
| ○ | Numerous stockpiles of oxide and refractory ore, separated by chemistry and grade; |
| ○ | Landfill; |
| ○ | Powder magazine area; and |
| ○ | Mobile equipment mining fleet; |
| ● | Vista Underground |
| ○ | North Portal (intake) and South Portal (exhaust) |
| ○ | Two 224 kW primary exhaust fans; |
| ○ | Underground airdoors, bulkheads, and other ventilation controls; |
| ○ | One surface cemented rock backfill plant; |
| ○ | One metal removal plant and ore stacker; |
| ○ | Underground powder magazine; |
| ○ | Underground dewatering/pumping infrastructure; |
| ○ | Surface compressor house; |
| ○ | 120 kV Switches (TR substation and NZ substation); |
| ○ | 13.8 kV and below underground electrical distribution lines; |
| ○ | Underground leaky feeder radio; |
| ○ | Multiple refuge chambers and stench release notification system; and |
| ○ | Mobile equipment mining fleet; |
| ● | Process Facilities |
| ○ | Sage refractory mill with two autoclaves; |
| March 15, 2024 |
Page 256 |
|
|
Turquoise Ridge Complex NI 43-101 Technical Report |
|
| ○ | Acidulation and neutralization circuits; |
| ○ | Off gas and slurry cooling; |
| ○ | Oxygen plant; |
| ○ | Lime, cyanide, sulfuric acid, other reagent storage; |
| ○ | Juniper oxide mill; |
| ○ | Inactive Juniper crusher structure (CP1); |
| ○ | One active leach pad (Izzenhood L8); |
| ○ | Inactive leach pads (Osgood, Snowstorm, Sonoma); |
| ○ | Active Juniper TSF; |
| ○ | Inactive mill and TSF (Piñon); |
| ○ | CIL circuit; |
| ○ | Cyanide destruction circuits (caros acid and INCO); |
| ○ | Juniper strip circuit and gold refinery; |
| ○ | Assay laboratory; and |
| ○ | Twin Creeks water treatment plant |
An overview of Turquoise Ridge Surface and Vista Underground infrastructure, including key facility locations is shown in Figure 18-3.
| March 15, 2024 |
Page 257 |
|
|
Turquoise Ridge Complex NI 43-101 Technical Report |
|
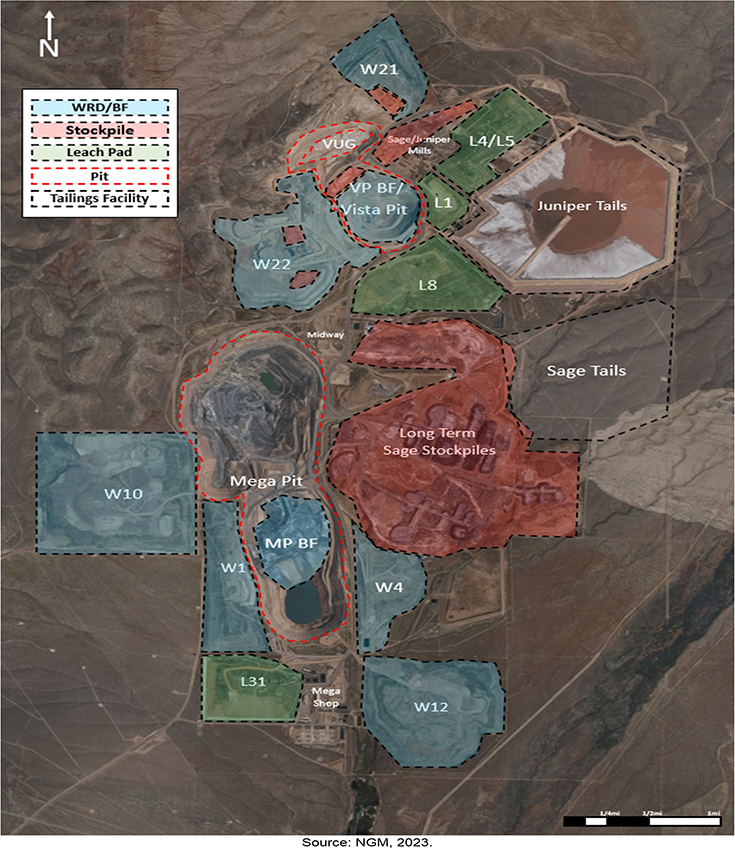
Figure 18-3 Location Plan, Key Facilities, Turquoise Ridge Surface, Vista Underground, and
Process Facilities
| March 15, 2024 |
Page 258 |
|
|
Turquoise Ridge Complex NI 43-101 Technical Report |
|
| 18.1.3 | Common Purpose Infrastructure |
Infrastructure common to all aspects of the project include:
| ● | Multiple surface workshop facilities; |
| ● | Multiple administration buildings; |
| ● | Multiple mine rescue buildings, ambulance bays, and helipads; |
| ● | Multiple warehousing and laydown facilities; |
| ● | Haul and access roads for heavy and light equipment; |
| ● | Multiple guard stations and perimeter control fencing; |
| ● | Multiple fuel islands (service heavy and light equipment separately); |
| ● | Multiple hydrocarbon and 90-day hazardous material storage facilities; |
| ● | Multiple septic facilities; |
| ● | Dewatering, piezometer, and potable water wells; |
| ● | Extensive dewatering and potable water pipelines; |
| ● | Electrical power throughout mine site; |
| ● | Fiber optic lines and network communication; and |
| ● | Mine radio network; |
There are no accommodation facilities or camps on site.
| 18.1.4 | Planned Infrastructure and Facility Relocations |
Development of Mega Pit cut-back will require relocation of a section of powerline, dewatering pipelines, haul road, a WRSF, and a small (<4.5 million tonne) expansion of the L8 heap leach pad. Additional alternatives to increase the capacity available on the L8 heap leach pad include rehandling the spent leach material on the pad and using it as tailings dam construction material (on liner), and/or feeding the material to the Juniper oxide mill as a carbonate source for downstream neutralization of the Sage autoclave discharge. Tailings expansions are scheduled through LOM and is discussed in Section 18.6.
| 18.2 | Road and Logistics |
Road and rail access and the proximity to airfields of the Turquoise Ridge Complex are discussed in Section 5.
| March 15, 2024 |
Page 259 |
|
|
Turquoise Ridge Complex NI 43-101 Technical Report |
|
The Project has a network of internal unsealed roads interconnecting the various parts of the operation. There is a connector road between Turquoise Ridge Underground and Turquoise Ridge Surface that is utilized by CAT 785 haul trucks to convey ore from Turquoise Ridge Underground to the Sage autoclave.
Material supply to site is achieved via the connection to I-80 and the nearby Dunphy Rail Terminal, which provides year-round access.
| 18.3 | Stockpiles |
There are 13 stockpiles within the Project area as shown Figure 18-3.
Except for heap leach ore, most ore types will pass through either short- or long-term stockpiles prior to processing through either the Sage or Juniper Mills. Stockpiled ore is classified, managed, blended, and processed based on grade and chemistry (oxidized/reduced, sulfide content, carbonate content, organic carbon content) as discussed in Section 13.
| 18.4 | Heap Leach Pads |
There are five leach pads at the Turquoise Ridge Complex, four adjacent to the Sage and Juniper processing facilities, and one located to the south of the Mega Pit (identified with the prefix L in Figure 18-3).
Pad L31 (Osgood) is closed and currently undergoing reclamation. Pads L1 (Snowstorm), L4, and L5 (collectively known as Sonoma) are closed with no capacity remaining. These could be used as a future source of TSF construction material, if needed.
The L8 pad (Izzenhood) is the only remaining active leach pad. There is an initial design for a small (<4.5 million tonne) expansion of the L8 leach pad. Additional alternatives to increase the capacity available on the L8 heap leach pad include rehandling the spent leach material on the pad and using it as tailings dam construction material (on liner), and/or feeding the material to the Juniper oxide mill as a carbonate source for downstream neutralization of the Sage autoclave discharge.
| 18.5 | Waste Rock Storage Facilities |
WRSFs are constructed and managed according to operating permit conditions and material handling plans that are approved by the BLM and the NDEP. Material handling, or waste rock management, uses a “blend and cover” approach whereas facility design and construction
| March 15, 2024 |
Page 260 |
|
|
Turquoise Ridge Complex NI 43-101 Technical Report |
|
encapsulates a blend of acid-generating and acid-neutralizing material within basal and cover layers of acid-neutralizing material. This has been determined through test work and regulatory review as the optimum approach due in part to the high ratio of acid-neutralizing to acid-generating material and the arid conditions of the site.
There are numerous WRSF at the Project that are both active and inactive. Partial reclamation is being performed on several inactive dumps that are not scheduled to be utilized in the LOM. The history of open pit mining at the project has provided the opportunity to use depleted pits as WRSF. The main WRSF’s planned to be used are the Mega Pit Cut38 Backfill and Vista Pit Backfill in-pit locations. The total capacity of these facilities is 475 Mt, which exceeds the 278 Mt requirement of the mine plan.
Much of the non-mineralized material (alluvium and oxide) to be mined from the Mega Pit is planned to be used for TSF construction and TSF lifts.
| 18.6 | Tailings Storage Facilities |
There are three TSFs that have been constructed in the Project area, of which one, Piñon, is inactive and undergoing reclamation, and two, the Getchell and Juniper TSFs, are active. A fourth, the Sage facility, is planned and will be design and constructed to be in conformance with the Global Industry Standard on Tailings Management (GISTM). The Sage and Juniper facility locations are seen in Figure 18-3.
TSF’s are designed, permitted and operated following best engineering practices to meet regulatory requirements. The Juniper TSF is currently in conformance with the GISTM) and the Getchell TSF is planned to achieve GISTM conformance by August of 2025. The TSFs consist of geotechnically-stable embankments enclosing basins lined with low-permeability soil or high-density polyethylene synthetic liners.
The Piñon TSF has been remediated and runoff water is managed by the site water management plan.
The Getchell TSF is a 52 m high downstream-constructed facility. Active tailings deposition ceased in 1999; however, the facility is currently being used for water management from the Turquoise Ridge Water Treatment Plant (WTP). Upgrades to the water treatment plant are being evaluated to minimize water inflows, and to reduce and eliminate the water pool in the facility.
The Juniper TSF stores tailings from the Juniper and Sage process facilities. It is constructed using an upstream centerline method, with a 2.5H:1V upstream design slope and a 2.25H:1V downstream design slope. There is one remaining permitted lift to 72 m, which will allow for storage of an additional 25 Mt of tailings, bringing the TSF to the maximum permitted capacity of 159 Mt. The
| March 15, 2024 |
Page 261 |
|
|
Turquoise Ridge Complex NI 43-101 Technical Report |
|
future Sage TSF has undergone NEPA analysis and been approved by the Bureau of Land Management (BLM) and is currently in the final design stage in support of State level permitting actions. Currently, construction is scheduled to begin in 2025, after final permits from the NDEP, Bureau of Mine Regulation and Reclamation (BMRR) and Division of Water Resources (DWR) have been received. The design assumes a centerline construction method with a 3.0H:1V downstream design slope, and an upstream slope of 2.5H:1V where tailings spigot pipes are located, and 1.5H:1V in all other areas. The Sage TSF, when completed, will have a total capacity of 73 Mt. The LOM plan assumes that 62 Mt will be deposited in the Sage TSF once the Juniper TSF has reached capacity.
| 18.7 | Water Management |
Water management operations include systems of dewatering wells, water gathering and conveyance facilities, water storage, water use, and various management options for discharge of excess water. Water not used for mining or milling can be pumped to storage reservoirs. Rapid infiltration basins are used to capture storm run-off water to avoid that water coming into contact with mining operations.
Contact and non-contact water is managed in accordance with NDEP-issued Stormwater Pollution Prevention Plan General Permits, zero discharge Water Pollution Control Permits, and National Pollutant Discharge Elimination Systems (NPDES) permits.
The water from the Turquoise Ridge Underground operations and the Getchell Pit is treated through the Turquoise Ridge WTP. The combined flow of about 6.4 kL/min is initially sent to a thickener for solids settling and removal, it is then pumped to a reaction tank for chemical treatment, and then through the microfiltration and nanofiltration process to meet permit limitations before being discharged to a series of three rapid infiltration basins. Waste water from the water treatment plant is sent to the Getchell TSF. A project is underway to upgrade the water treatment plant to a zero-waste discharge facility rather than discharging waste to the Getchell TSF.
The Juniper process plant uses the water pumped from the Vista underground operations as make-up water for the mills.
Water from wells and in-pit sumps from the Turquoise Ridge open pit operations, where not used for onsite operations (e.g., dust suppression, mill make-up water), is sent to a distribution pond, before flowing to the Twin Creeks water treatment plant for chemical treatment to meet discharge criteria. The plant capacity is 85.2 kL/min. Treated water is discharged to the Rabbit Creek drainage.
The infrastructure and WTP’s for both Turquoise Ridge and Twin Creeks are of sufficient size and capacity to manage and treat anticipated dewatering flow rates for the LOM plan.
| March 15, 2024 |
Page 262 |
|
|
Turquoise Ridge Complex NI 43-101 Technical Report |
|
Operations potable water requirements are supplied by dedicated potable water wells.
| 18.8 | Power and Electrical |
Power used by the Turquoise Ridge Complex is generated by NV Energy at its North Valmy generating station power plant, located 22 miles (35 km) south of the Project. This plant has a 522 MW capacity, generated using two coal-fueled, steam-electric turbine/generator units. Power is purchased outside the local provider system through the Nevada Wholesale Energy Market at day ahead prices or credited from NGM-owned power plants (TS Power Plant (205 MW) and Western 102 (115 MW)). Additionally, NGM will complete commissioning of the 200 MW TS Solar Project (adjacent to the TS Power Plant) in 2024, which will further supplement the available power capacity for Turquoise Ridge. Power is distributed to the Turquoise Ridge Complex via the NV Energy #147 line from the North Valmy substation and a series of on-site electrical distribution lines.
The combined total peak load forecast for the LOM is 97.1 MW broken down as follows:
| ● | Turquoise Ridge Underground: 23.2 MW; and |
| ● | Turquoise Ridge Surface, Vista Underground, and the process facilities: 73.9 MW. |
Barrick and NV Energy are in the process of increasing the utility limit for Turquoise Ridge Underground from 15 MW to 28 MW, supported by a capacitor bank substation project that will regulate the voltage on the NV Energy #147 line.
The installed power infrastructure is sufficient to meet the requirements of the mine and support the LOM Mineral Reserves.
| March 15, 2024 |
Page 263 |
|
|
Turquoise Ridge Complex NI 43-101 Technical Report |
|
| 19 | Market Studies and Contracts |
| 19.1 | Market Studies |
No market studies are currently relevant as the Turquoise Ridge Complex consists of active mining operations producing a readily-saleable commodity in the form of doré. Gold is freely traded at prices that are reported daily by reputable trading facilities such as the London Metals Exchange.
NGM has established contracts and buyers for the gold bullion products from the Turquoise Ridge Complex, and has an internal marketing group that monitors markets for its key products. Together with public documents and analyst forecasts, these data support that there is a reasonable basis to assume that for the LOM plan, that the bullion will be saleable at the assumed commodity pricing.
There are no agency relationships relevant to the marketing strategies used.
| 19.2 | Commodity Price Assumptions |
Barrick sets metal price forecasts by reviewing the LOM for the operations, which is 10+ years, and setting the commodity price for that duration. The guidance is based on a combination of historical and current contract pricing, contract negotiations, knowledge of its key markets from a long operations production record, short-term versus long-term price forecasts prepared by the Barrick’s internal marketing group, public documents, and analyst forecasts when considering the long-term commodity price forecasts.
Higher metal prices are used for the Mineral Resource estimates to ensure the Mineral Reserves are a sub-set of, and not constrained by, the Mineral Resources, in accordance with industry-accepted practice.
The long-term commodity price forecasts are:
| ● | Mineral Resources: US$1,700/oz Au. |
| ● | Mineral Reserves: US$1,300/oz Au; |
| March 15, 2024 |
Page 264 |
|
|
Turquoise Ridge Complex NI 43-101 Technical Report |
|
| 19.3 | Contracts |
NGM’s bullion is sold on the spot market, by marketing experts retained in-house by NGM/Barrick. The terms contained within the sales contracts are typical and consistent with standard industry practice and are similar to contracts for the supply of bullion elsewhere in the world.
NGM provides Newmont with the date and number of ounces that will be credited to Newmont’s account, and invoices Newmont for how much NGM is owed, such that Newmont receives credits for the ounces (based on the JV interest) and Newmont pays NGM for the ounces.
The Turquoise Ridge Complex is a large modern operation and NGM is owned by major international firms with policies and procedures for the letting of contracts. NGM has many supply contracts in place for goods and services required to operate the open pit, underground mines and integrated processing facilities. The largest in-place contracts other than for product sales cover items such as bulk commodities, operational and technical services, mining and process equipment, and administrative support services. Contracts are negotiated and renewed as needed. While there are numerous contracts in place at the Turquoise Ridge Complex, there are no contracts considered to be material to Barrick or NGM.
| 19.4 | Comment on Market Studies and Contracts |
The QP notes:
| ● | The terms contained within the sales contracts are typical and consistent with standard industry practice, and are similar to contracts for the supply of doré elsewhere in the world; |
| ● | Metal prices used in this study have been set by Barrick and are appropriate to the commodity and mine life projections. |
The QP has reviewed commodity pricing assumptions, marketing assumptions and the current major contract areas, and considers the information acceptable for use in estimating Mineral Reserves and in the economic analysis that supports the Mineral Reserves.
| March 15, 2024 |
Page 265 |
|
|
Turquoise Ridge Complex NI 43-101 Technical Report |
|
| 20 | Environmental Studies, Permitting, and Social or Community Impact |
| 20.1 | Environmental Studies |
Baseline and environmental studies were completed to support operations permitting. The total permitted surface disturbance for the Turquoise Ridge Complex is approximately 6,234 ha (62.34 km2), of which Turquoise Ridge Underground covers a total area of 855 ha (8.55 km2) and Turquoise Ridge Surface covers a total area of 5,379 ha (53.79 km2).
| 20.2 | Environmental Considerations |
NGM has an ISO 14001 certified environmental management system (EMS) that controls environmental risks. The EMS is reviewed, and updated as needed, on an annual basis and audited every year. Environmental incidents are noted in a register that forms part of the EMS. Causes and responses are identified, and once completed, the incident is closed out.
Routine environmental monitoring takes place across the Turquoise Ridge Complex, including dust deposition, noise, arsenic concentrations, drinking water, ground water, and surface water.
Air emissions are monitored in accordance with requirements imposed by NDEP Air Quality Operating Permits.
Surface water quality has been characterized based on samples collected from stream and spring locations. Springs and streams in the monitoring program are periodically sampled for flow and constituents of concern. Groundwater has been characterized (Profile I, NDEP) by samples from monitoring wells, dewatering wells, horizontal drains, and seeps. Sampling frequency varies from quarterly (groundwater) to annually (dewatering) to once every five years (regional).
The site operates with a Solid and Hazardous Waste Management Plan that was revised in November of 2023; a Tailings Storage Facility Operation, Maintenance and Surveillance Manual (July 2014 and updated yearly by the Engineer of Record); and a Sampling and Analysis Plan for Water Pollution Control Permit (updated 2023).
The Turquoise Ridge Complex is operating in compliance in all material respects with all applicable State and Federal regulations and permit requirements. Environmental Management Plans will continue to be complied during operations and closure.
| March 15, 2024 |
Page 266 |
|
|
Turquoise Ridge Complex NI 43-101 Technical Report |
|
Environmental liabilities at the Turquoise Ridge Complex are discussed in Section 4.8.
| 20.3 | Closure and Reclamation |
Closure and reclamation strategies and methods for the project remain in accordance with the approved Turquoise Ridge Complex Closure and Reclamation Plans.
Components used in the active operations will be reclaimed and closed at the end of the mine life. Reclamation of the historic Getchell processing facilities and legacy areas has essentially been completed with the final reclamation work scheduled to be completed in 2024.
Environmental bonds are required by both the NDEP and the BLM to guarantee completion of reclamation and closure activities. Bonds must be updated any time there is a triggering modification or every three years. The unit costs for the bond calculations are based on a cost data file provided by the NDEP and BLM. NGM maintains environmental bonds, which cover all permitted disturbances, in accordance with these requirements, with the current bond amounts for the Project area totalling approximately $217 million. The bond amount is subject to review and approval by the NDEP and BLM.
The Turquoise Ridge Complex Provisions for Environmental Rehabilitation closure costs are updated each year, with increases or decreases in disturbed areas noted and cost estimated. The current cost for rehabilitation and closure, based on the closure model, is approximately $98 million for the entire site. This forecast is used in the cashflow model that supports the Mineral Reserves.
| 20.4 | Permits |
| 20.4.1 | Current Operations |
NGM maintains a number of permits for the operation. These compliance permits cover areas such as air quality, water rights, wastewater treatment, tailings storage, hazardous materials storage, and land reclamation. NGM also maintains a legal obligation register to track permitting and ensure on-going compliance. Permit applications and renewals are undertaken as required. As of December 31, 2023, all material permits were in compliance or were in the renewal process.
Turquoise Ridge Underground operates under the following key permits:
| ● | Plan of Operation (NVN-064093); |
| ● | Water Pollution Control Permits (WPCP) (NEV0086014 and NEV0095113); and |
| ● | Reclamation Permit 0105 and 0148. |
| March 15, 2024 |
Page 267 |
|
|
Turquoise Ridge Complex NI 43-101 Technical Report |
|
Turquoise Ridge Surface and Vista Underground operate under the following key permits:
| ● | Plan of Operation (NVN-064094); |
| ● | WPCP (NEV0089035 and NEV0086018); and |
| ● | Reclamation Permit 0058. |
There are numerous minor permits in addition to these key permits required to support operations.
| 20.4.2 | Mega Pit Layback |
Any changes to the Mega Pit final wall location and exposed geologic formations will require that the pit lake water quality model be revised to reflect those changes. Geochemical studies are underway and include humidity cell testing. Pit lake modelling may be required for both the Mega and Vista Pits since water will migrate from the Vista Pit to the Mega Pit.
It is not expected that any laybacks would require an amendment of the current air quality permit, as the mining is not expected to add any emission sources to the existing processing facilities. The Mega Pit expansion will address energy requirements and climate change considerations as this would primarily extend the mining and processing life of Turquoise Ridge Surface.
The Mega Pit will not require additional equipment, generators, or power supply. There will not be a change in carbon footprint of greater than 2,700 tpa. No cost of carbon assessment is required.
The stormwater plan will be updated and submitted for review to cover the Mega Pit changes. Existing facilities, permits and plans are available for waste rock storage, ore processing (mill, heap leach and tailings), waste management (hazardous and non-hazardous), and water management.
The addition of any Mega Pit laybacks may require modification of some permits, a revised reclamation cost estimate, and approval from the BLM and NDEP. They will need to be evaluated by the BLM under the National Environmental Policy Act (NEPA). No permit modifications have been submitted at the Report effective date.
Mega Pit Cut 40 does not require surface disturbance outside of the existing PoO boundary. The area anticipated to be directly impacted by the pit shape is currently disturbed or approved for disturbance by the regulatory agencies.
The NDEP, Bureau of mining Regulation and Reclamation is evaluating the project under the existing WPCP as a minor modification.
There are no requirements for consultation; however, anytime NGM permits projects, key stakeholders are identified, engaged, and informed of the project. These engagements are done
| March 15, 2024 |
Page 268 |
|
|
Turquoise Ridge Complex NI 43-101 Technical Report |
|
either one-on-one or through the quarterly community meetings where NGM publicly provide an update on the operations and permitting projects.
| 20.4.3 | Sage Tailings Facility |
The future Sage TSF has undergone NEPA analysis, has been approved by the Bureau of Land Management (BLM), and is currently in the final design stage in support of State level permitting actions. Currently, construction is scheduled to begin in 2025, after final permits from the NDEP, Bureau of Mine Regulation and Reclamation (BMRR) and Division of Water Resources (DWR) have been received. The design assumes a centerline construction method with a 3.0H:1V downstream design slope, and an upstream slope of 2.5H:1V where tailings spigot pipes are located, and 1.5H:1V in all other areas. The Sage TSF, when completed, will have a total capacity of 73 Mt. The LOM plan assumes that 62 Mt will be deposited in the Sage TSF once the Juniper TSF has reached capacity.
| 20.5 | Social Considerations |
The rural communities located in northeastern Nevada rely heavily upon the mining industry for employment and economic stability. This dynamic has subsequently created a supportive, pro-mining culture, whereby NGM has established and maintained positive and collaborative working relationships with local, state, and federal regulatory agencies as well as the surrounding communities where NGM operates.
NGM has successfully partnered with multiple groups throughout Nevada to share and promote the industries many benefits to both rural communities as well as the broader State economy. These partnerships include Native American communities, local government and government agencies, Chambers of Commerce, and educational institutions.
The Turquoise Ridge Complex operates on lands traditionally inhabited by the Western Shoshone and Fort McDermitt Paiute, and as such, NGM puts forth an immense amount of effort to demonstrate respect for Indigenous cultural resources, including placing emphasis on environmental stewardship. NGM convenes quarterly via dialogue meetings with Tribal Leaders and other interested members. These dialogues provide a forum for NGM stakeholders to listen and learn about Native American culture, interests, concerns, and priorities with regard to mining. The dialogues also enables Native American stakeholders to learn more about NGM’s operations, environmental management, employment opportunities, long-term plans, and the social investment and engagement programming NGM conducts with the ten Native American partner communities.
NGM complies with all mandatory processes regarding permitting and operations, including requirements for public opinion periods, open houses, and public meetings. As necessary, NGM
| March 15, 2024 |
Page 269 |
|
|
Turquoise Ridge Complex NI 43-101 Technical Report |
|
holds and advertises public meetings according to procedure so that citizens in the surrounding areas and communities may come to learn more about NGM’s various projects and express support or concerns. Formal consultation occurs through the permitting process, where comments on permit documents are actively solicited from stakeholders by the BLM and NDEP as part of their legal obligations under NEPA and the Nevada Administrative Code. Informal consultation occurs via community outreach, including presentations to the communities in which NGM operates, regarding the project status and future plans for NGM operations. All landowners directly impacted by the project will be individually contacted by the project team.
NGM’s Corporate Social Responsibility (CSR) team prioritizes its engagement through the Community Development and Engagement Strategy, stakeholder matrices and maps social risk analysis, register, and mitigation plans, and stakeholder engagement plans. There are numerous avenues for providing funding to local government agencies and non-profit organizations to support economic development, education, environment, cultural heritage, and health. A prominent social risk associated with mining schedules is the need for childcare in rural Nevada. In an effort to address this, in 2023, NGM partnered with the Boys and Girls Club of Winnemucca, investing $1.4M to establish a quality, dependable childcare service for the Turquoise Ridge Complex and host community.
| March 15, 2024 |
Page 270 |
|
|
Turquoise Ridge Complex NI 43-101 Technical Report |
|
| 21 | Capital and Operating Costs |
| 21.1 | Summary |
Capital and operating costs for Turquoise Ridge are based on extensive experience gained from many years of operating these mines and an extensive number of years operating other gold mines in Nevada and within NGM. Capital costs reflect current price trends and supporting studies. Operating costs are in-line with historical averages.
All costs presented are in real USD as of Q4 2023, without any allowance for inflation.
| 21.2 | Capital Cost Estimates |
The capital costs for the Project are summarised in Table 21-1.
Table 21-1 Capital Cost Summary
| Cost Category | LOM Value (US$M) | |
| Sustaining Capital | 586 | |
| Open Pit Stripping | 102 | |
| Underground Development | 241 | |
| Capital Drilling | 153 | |
| Expansion Capital | 1 | |
| Total | 1,083 | |
| 21.2.1 | Sustaining Capital |
Sustaining capital is capital required for the continuation of the mining operations and includes items such as replacement and additional mobile equipment, tailing storage facilities, capitalized mobile maintenance components, new and upgraded mining infrastructure, geotechnical risk management equipment and light vehicles.
| 21.2.2 | Open Pit Stripping |
Capitalized open pit stripping covers open pit waste stripping and fleet requirements.
| 21.2.3 | Underground Development |
Underground development is the capitalized cost of on-going LOM waste development. Underground development costs are based on a calculated average cost per tonne for development
| March 15, 2024 |
Page 271 |
|
|
Turquoise Ridge Complex NI 43-101 Technical Report |
|
such as development of declines, inclines, ventilation drives, ventilation raises, shops, and powder magazines.
| 21.2.4 | Capital Drilling |
Capitalized drilling is drilling required for ore definition, development, and geotechnical purposes.
| 21.2.5 | Expansion Capital |
This category includes remaining cost associated with the completion of the #3 Shaft at Turquoise Ridge Underground, which was commissioned and substantially completed in the fourth quarter of 2022.
| 21.3 | Operating Cost Estimates |
The operating costs for the LOM were developed considering the planned mine physicals, equipment hours, labor projections, consumables forecasts, other expected incurred costs and historical costs.
Open pit mining costs range from $1.37–$2.65/t over the expected open pit LOM, with an average LOM cost of $2.24/t. Underground mining costs range from $135.01–$170.27/t over the expected underground LOM, with an average LOM cost of $137.48/t. Sage Autoclave processing cost range from $30.92-52.30, with an average LOM cost of $41.20/t. Juniper Oxide Mill processing costs range from $6.93-$14.00/t, with an average LOM cost of $9.71/t. Leach processing LOM average costs are $3.81/t.
A summary of the LOM operating costs for the Mineral Reserves is shown in Table 21-2.
Table 21-2 LOM Operating Costs Summary
| Operating Cost Category | LOM Total (US$M) | |
| Mining – UG | 6,036 | |
| Mining – OP | 328 | |
| Processing | 2,555 | |
| General & Administration | 981 | |
| Production Taxes | 146 | |
| Freight & Refining Costs | 95 | |
| Total Operating Costs | 10,149 | |
| March 15, 2024 |
Page 272 |
|
|
Turquoise Ridge Complex NI 43-101 Technical Report |
|
| 21.4 | Comments on Capital and Operating Costs |
It is noted that in the opinion of the QP the capital and operating estimates for the project are based on historical values (adjusted as necessary) and/or are well supported by technical studies.
The QP has validated that the recent historical and actual costs reconcile well against the projected forecast costs and believe the costs assumptions used for the Mineral Resource and Mineral Reserves are appropriate. The QP believes appropriate provision has been made in the estimates for the expected mine operating usages including labour, fuel and power and for closure and environmental considerations.
| March 15, 2024 |
Page 273 |
|
|
Turquoise Ridge Complex NI 43-101 Technical Report |
|
| 22 | Economic Analysis |
This section is not required as Barrick, the operator of the Turquoise Ridge Complex, is a producing issuer, the operations are currently in production, and there is no material expansion of current production planned.
NGM performed an economic analysis of the Turquoise Ridge Complex using the Mineral Reserve estimates presented in this Report and that the QP has verified that the outcome is a strongly positive cash flow at $1,300/oz assumed gold sales price which confirms the economic viability of the Mineral Reserves.
| March 15, 2024 |
Page 274 |
|
|
Turquoise Ridge Complex NI 43-101 Technical Report |
|
| 23 | Adjacent Properties |
This section is not applicable for this Technical Report.
| March 15, 2024 |
Page 275 |
|
|
Turquoise Ridge Complex NI 43-101 Technical Report |
|
| 24 | Other Relevant Data and Information |
This section is not applicable for this Technical Report.
| March 15, 2024 |
Page 276 |
|
|
Turquoise Ridge Complex NI 43-101 Technical Report |
|
| 25 | Interpretation and Conclusions |
The QPs note the following interpretations and conclusions in their respective areas of expertise, based on the review of data available for this Report.
| 25.1 | Mineral Tenure, Rights, Royalties and Agreements |
Information from NGM’s in-house experts supports that the tenure held is valid and sufficient to support a declaration of Mineral Resources and Mineral Reserves.
NGM holds sufficient surface rights to allow mining activities. The surface rights are sufficient to support mining operations,
Three minor royalties are payable on a portion of the production from Turquoise Ridge Surface to Royal Gold described in 4.6.3.
The State of Nevada imposes a 5% net proceeds tax on the value of all minerals severed in the State.
Environmental liabilities are typical of those that would be expected to be associated with a long-life mining operations. NGM complies with all required permit and regulatory obligations to manage these liabilities.
To the extent known to the QP, there are no other significant factors and risks that may affect access, title, or the right or ability to perform work on the Project that are not discussed in this Report.
| 25.2 | Geology and Mineral Resources |
The Turquoise Ridge Complex suite of deposits are considered to be examples of Carlin-type or carbonate-hosted disseminated gold–silver deposits.
The understanding of the deposit settings, lithologies, mineralisation, and the geological, structural, and alteration controls on mineralisation is sufficient to support estimation of Mineral Resources and Mineral Reserves.
Exploration potential remains within the Project area. Targets include depth extensions under the current pits, and structural targets associated with faults and intersecting structures.
| March 15, 2024 |
Page 277 |
|
|
Turquoise Ridge Complex NI 43-101 Technical Report |
|
| 25.2.1 | Exploration, Drilling and Analytical Data Collection in Support of Mineral Resource Estimation |
The exploration programs completed to date are appropriate for the style of the deposits in the Project area.
The geometry of the mineralized bodies can be variable, largely controlled by structural and stratigraphic complexities. Uncertainty about the morphology and vertical or lateral extent is mitigated by drilling at various orientations to the mineralized body.
Sampling methods are acceptable for Mineral Resource estimation.
Sample preparation, analysis and security are generally performed in accordance with industry-accepted practices.
The quantity and quality of the logged geological data, collar, and downhole survey data collected in the exploration and infill drill programs are sufficient to support Mineral Resource and Mineral Reserve estimation.
No material factors were identified with the data collection from the drill programs that could significantly affect Mineral Resource estimation.
The sample preparation, analysis, and security practices and are acceptable, meet industry-standard practice, and are sufficient to support Mineral Resource estimation. The collected sample data adequately reflect deposit dimensions, true widths of mineralisation, and the style of the deposits.
The QA/QC programs adequately address issues of precision, accuracy and contamination. Drilling programs typically included blanks, duplicates and CRM samples. QA/QC submission rates meet industry-accepted standards at the time of the campaign. The QA/QC programs did not detect any material sample biases in the data reviewed that supports Mineral Resource estimation.
The data verification programs concluded that the data collected from the Project adequately support the geological interpretations and constitute a database of sufficient quality to support the use of the data in Mineral Resource estimation.
| 25.2.2 | Mineral Resource Estimates |
The Mineral Resource and Mineral Reserve estimates have been prepared according to the Canadian Institute of Mining, Metallurgy and Petroleum CIM (2014) Standards as incorporated by reference in NI 43-101. Mineral Resource and Mineral Reserve estimates were also prepared using the guidance outlined in CIM Estimation of Mineral Resources and Mineral Reserves Best Practice Guidelines 2019 (CIM (2019) MRMR Best Practice Guidelines).
| March 15, 2024 |
Page 278 |
|
|
Turquoise Ridge Complex NI 43-101 Technical Report |
|
In the QP’s opinion, the Mineral Resources top capping, domaining and estimation approach are appropriate, using industry accepted methods. Furthermore, the constraint of underground Mineral Resource reporting to use optimised mineable stope shapes and the process for Mineral Resource pit shell generation reflects best practice. The QP considers the Turquoise Ridge Mineral Resources as appropriately estimated and classified.
The QP is not aware of any environmental, permitting, legal, title, taxation, socioeconomic, marketing, political, metallurgical, fiscal, or other relevant factors that are not discussed in this Report, that could materially affect the Mineral Resource estimate.
In the QP’s opinion there is upside potential for the estimates if mineralisation that is currently classified as Inferred can be upgraded to higher-confidence Mineral Resource categories.
The strategic focus of Turquoise Ridge exploration is to prioritise the delineation of additional near mine resource definition targets, thereby increasing years of production with complimentary underground and open pit sources.
| 25.3 | Mining and Mineral Reserves |
| 25.3.1 | Mineral Reserve Estimate |
The Mineral Reserve estimation for the Project incorporates industry-accepted practices and meets the requirements of the Canadian Institute of Mining, Metallurgy and Petroleum (CIM) 2014 Definition Standards for Mineral Resources and Mineral Reserves dated 10 May 2014 (CIM (2014) Standards) as incorporated with National Instrument 43-101 Standards of Disclosure for Mineral Projects (NI 43-101). Mineral Resource estimates were also prepared using the guidance outlined in CIM Estimation of Mineral Resources and Mineral Reserves (MRMR) Best Practice Guidelines 2019 (CIM (2019) MRMR Best Practice Guidelines).
Mineral Resources were converted to Mineral Reserves using a detailed mine plan, an engineering analysis, and consideration of appropriate modifying factors. Modifying factors include the consideration of dilution and ore losses, underground and surface mining methods, geotechnical andhydrogeological considerations, metallurgical recoveries, permitting, and infrastructure requirements.
| 25.3.2 | Mine Plan |
Mining operations are conducted year-round.
The mine plans are based on the current knowledge of geotechnical, hydrogeological, mining and processing information.
| March 15, 2024 |
Page 279 |
|
|
Turquoise Ridge Complex NI 43-101 Technical Report |
|
Underground mine designs incorporate underground infrastructure and ventilation requirements.
Turquoise Ridge Surface uses conventional open pit methods, and a conventional mining fleet.
Underground operations use conventional drift-and-fill and longhole stoping mining methods and conventional equipment fleets.
Barrick, as the operator of the Project, has significant experience in other mining operations within the region and North America. The production rates, modifying factors, and costs are benchmarked against other operations to ensure they are suitable.
The current Mineral Reserves for Turquoise Ridge support a total mine life of 23 years, 11 years of open pit operations, and 23 years of underground mining. Gold production averages approximately 590 koz Au per year for the first 10 years based only on Mineral Reserves.
The QP is not aware of any environmental, legal, title, socioeconomic, marketing, mining, metallurgical, infrastructure, permitting, fiscal, or other relevant factors that are not discussed in this Report, that could materially affect the Mineral Reserve estimate.
| 25.4 | Mineral Processing |
The process plant flowsheet designs were based on testwork results, previous study designs and industry-standard practices.
The process methods are generally conventional to the industry.
The process plants will produce variations in recovery due to the day-to-day changes in ore type or combinations of ore type being processed. These variations are expected to trend to the forecast recovery value for monthly or longer reporting periods through manipulation of blends and blending materials, varying reagent additions, adjusting throughput, and planned maintenance of key operational equipment.
The QP considers the modelled recoveries for all ore sources and the process and plant engineering unit costs applied to the Mineral Resource and Mineral Reserve process to be acceptable.
| March 15, 2024 |
Page 280 |
|
|
Turquoise Ridge Complex NI 43-101 Technical Report |
|
| 25.4.1 | Metallurgical Testwork |
Metallurgical testwork and associated analytical procedures were appropriate to the mineralisation type, appropriate to establish the optimal processing routes, and were performed using samples that are typical of the mineralisation styles.
Samples selected for testing were representative of the various types and styles of mineralisation. Samples were selected from a range of depths within the deposits. Sufficient samples were taken so that tests were performed on sufficient sample mass.
Recovery factors estimated are based on appropriate metallurgical testwork and are appropriate to the mineralisation types and the selected process routes. Recovery forecasts are periodically adjusted based on plant performance, which is tracked on at least a monthly basis.
Depending upon the specific processing facility, several processing factors or deleterious elements could have an economic impact on extraction efficiency of a certain ore source, based either on the presence, absence, or concentration of the following constituents in the processing stream: organic carbon; sulfide sulfur; carbonate carbon; arsenic; mercury; antimony; and copper. However, under normal ore routing and blending practices at NGM where material from several sites may be processed at one facility, the above list of constituents is typically not a concern.
| 25.5 | Infrastructure |
The majority of the infrastructure required for operations is constructed and operational. Some additional facilities, such as construction of a new TSF will be required to support the operations as envisaged in the LOM plan.
The existing infrastructure, staff availability, existing power, water, and communications facilities, and the methods whereby goods are transported to the mines are all in place and well-established and support the estimation of Mineral Resources and Mineral Reserves.
| 25.6 | Environmental, Permitting and Social Considerations |
NGM maintains a number of permits for the operation. These compliance permits cover areas such as air quality, water rights, wastewater treatment, tailings storage, hazardous materials storage, land reclamation, and community relations. NGM maintains a legal obligation register to track permitting and ensure on-going compliance. As of the date of this report, all material permits were in compliance or were in the process of renewal.
| March 15, 2024 |
Page 281 |
|
|
Turquoise Ridge Complex NI 43-101 Technical Report |
|
The Turquoise Ridge Complex is operating in compliance in all material respects with all applicable regulations and permit requirements as required by the BLM and the NDEP.
The addition of Cut 40 will require modification of the permits, a revised reclamation cost estimate, and approval from the BLM and NDEP. Cut 40 does not require surface disturbance outside of the existing PoO Boundary. The area anticipated to be directly impacted by the Cut 40 pit shape is currently disturbed or approved for disturbance by the regulatory agencies. The NDEP, Bureau of Mining Regulation and Reclamation would evaluate the project under the existing WPCP. The changes associated with the Cut 40 project will likely be assessed as a Major Modification to the Turquoise Ridge Surface WPCP.
Closure and reclamation strategies and methods remain in accordance with the existing, approved Reclamation Plans. The Turquoise Ridge Complex closure costs are updated each year, with increases or decreases in disturbed areas noted and costed; the current cost for rehabilitation and closure of the mine according to the calculation model is approximately $94 million for the entire complex.
There are no major challenges with respect to government relations, non-governmental organizations, social or legal issues, and community development. A community and social relations policy is in place at the Turquoise Ridge Complex.
The Turquoise Ridge Complex is a significant employer to members of the local communities. Stakeholder engagement activities, community development projects and local economic development initiatives contribute to the maintenance and strengthening of the social licence to operate.
The QP considers the extent of all environmental liabilities, to which the property is subject, to have been appropriately met.
| 25.7 | Project Economics |
Using the assumptions detailed in this Report, the Turquoise Ridge Complex mines have strongly positive economics in the LOM plan, which confirms the economic viability of the Mineral Reserves at $1300/oz gold sales price.
| March 15, 2024 |
Page 282 |
|
|
Turquoise Ridge Complex NI 43-101 Technical Report |
|
The basis for the combined LOM plan is the Proven and Probable Mineral Reserves estimate described in Section 15 of this Technical Report. Cost inputs have been priced in real Q4 2023 US dollars, without any allowance for inflation or consideration for changes in foreign exchange rates.
In the QP’s opinion, the open pit and underground LOM and cost estimates have been completed in sufficient detail to be satisfied that economic extraction of the Proven and Probable Mineral Reserves is justified.
| 25.7.1 | Capital Cost Estimates |
Capital cost estimates contained in this report are based on quantities generated from the open pit and underground development requirements are based on operating experience gained in the many years of current operations and where appropriate equipment capital costs are based upon quotes received from manufacturers. Sustaining (replacement) capital costs reflect current price trends. Any potential exploration expenditure has not been included in the economic forecasts due to being a variable cost that is justified on the basis of individual motivations.
Capital expenditure over the remaining LOM is estimated to be $1083 million (from 2024) based on Mineral Reserves, consisting of the following allocation of costs (as defined in Table 21-1).
| 25.7.2 | Operating Cost Estimates |
Operating cost estimates were developed based on a combination of actual costs to the end of 2023 and forecast figures over the LOM plan.
Open pit mining costs range from $1.37–$2.65/t over the expected open pit LOM, with an average LOM cost of $2.24/t. Underground mining costs range from $135.01–$170.27/t over the expected underground LOM, with an average LOM cost of $137.48/t. Sage Autoclave processing cost range from $30.92-52.30, with an average LOM cost of $41.20/t. Juniper Oxide Mill processing costs range from $6.93-$14.00/t, with an average LOM cost of $9.71/t. Leach processing LOM average costs are $3.81/t. The QPs consider the operating cost estimates in the LOM plan to be reasonable and consistent with historical performance.
| 25.8 | Risks |
| 25.8.1 | Risk Analysis Definitions |
The following definitions have been employed by the QP’s in assigning risk factors to the various aspects and components of the Project:
| March 15, 2024 |
Page 283 |
|
|
Turquoise Ridge Complex NI 43-101 Technical Report |
|
| ● | Low – Risks that are considered to be average or typical for a deposit of this nature and could have a relatively insignificant impact on the economics. These generally can be mitigated by normal management processes combined with minor cost adjustments or schedule allowances. |
| ● | Minor – Risks that have a measurable impact on the quality of the estimate but not sufficient to have a significant impact on the economics. These generally can be mitigated by normal management processes combined with minor cost adjustments or schedule allowances. |
| ● | Moderate – Risks that are considered to be average or typical for a deposit of this nature but could have a more significant impact on the economics. These risks are generally recognisable and, through good planning and technical practices, can be minimised so that the impact on the deposit or its economics is manageable. |
| ● | Major – Risks that have a definite, significant, and measurable impact on the economics. This may include basic errors or substandard quality in the basis of estimate studies or project definition. These risks can be mitigated through further study and expenditure that may be significant. Included in this category may be environmental/social non-compliance, particularly regarding Equator Principles and IFC Performance Standards. |
| ● | High – Risks that are largely uncontrollable, unpredictable, unusual, or are considered not to be typical for a deposit of a particular type. Good technical practices and quality planning are no guarantee of successful exploitation. These risks can have a major impact on the economics of the deposit including significant disruption of schedule, significant cost increases, and degradation of physical performance. These risks cannot likely be mitigated through further study or expenditure. |
In addition to assigning risk factors, the QP’s provided opinion on the probability of the risk occurring during the LOM. The following definitions have been employed by the QP’s in assigning probability of the risk occurring:
| ● | Rare – The risk is very unlikely to occur during the Project life. |
| ● | Unlikely – The risk is more likely not to occur than occur during the Project life. |
| ● | Possible – There is an increased probability that the risk will occur during the Project life. |
| ● | Likely – The risk is likely to occur during the Project life. |
| ● | Almost Certain – The risk is expected to occur during the Project life. |
| 25.8.2 | Risk Analysis Table |
Table 25-1 details the Turquoise Ridge Risk Analysis as determined by the QP’s.
| March 15, 2024 |
Page 284 |
|
|
Turquoise Ridge Complex NI 43-101 Technical Report |
|
Table 25-1 Turquoise Ridge Risk Analysis
| Issue | Likelihood | Consequence Rating |
Risk Rating | Mitigation | ||||
| Geology and Mineral Resources - Confidence in Mineral Resource Models |
Unlikely | Minor | Low |
Additional scheduled GC drilling maintaining 18 months of partial grade control coverage ahead of mining. Resource model updated on a regular basis using new drilling and updated geologic interpretation |
||||
| Mining and Mineral Reserves - Open Pit Slope Stability |
Unlikely | Moderate | Minor | Continued 24hr in-pit monitoring with radar, instrumentation, and continued updating of geotechnical and hydrogeology models. | ||||
| Processing - Increased carbonate content of future ore sources leading to poor oxidation performance, higher OPEX costs, and resulting lower gold recoveries |
Possible | Moderate | Medium | Pursue concentrate additions, other ore sources for blending, selective removal of the carbonate rock to improve the SS:CO3 ratio, or capital improvements in the acidulation circuit. | ||||
| Processing - Decreased sample coverage in some future ore processing areas. |
Possible | Moderate | Minor | Identify gaps and conduct additional metallurgical testing to confirm continued amenability. | ||||
| Environmental -Tailings failure |
Unlikely | High | Low | Engineering design and construction of TSF to international standards, proper water management at the TSF; emergency spillway; buttressing if required. | ||||
| Environmental - Hydrocarbon or ARD spillage |
Unlikely | Moderate | Low | Water and hydrocarbon monitoring and management processes employed on site. | ||||
| Environmental - Commercial and Reputational Issues due to GHG Emissions |
Possible | Moderate | Moderate | Continue transition to renewable energy sources and identifying future opportunities through the climate committee | ||||
| Permitting delays | Unlikely | Moderate | Low | TR reserve is not impacted currently by any permitting limitations | ||||
| Mining & Infrastructure - long term availability of rebuilt surface haul truck fleet |
Unlikely | Minor | Minor | Turquoise Ridge Open Pit will initially rebuild 15-each 793-class haul trucks to execute the open pit mining plan. If low mechanical availability of the rebuilt fleet becomes an issue in the longer-term, NGM is purchasing a new fleet of Komatsu 930E haul trucks (for delivery in 2024) that could be redeployed to Turquoise Ridge if necessary. | ||||
| Capital and Operating Costs | Possible | Moderate | Low | Continue to track actual costs and LOM forecast costs, including considerations for inflation. | ||||
| March 15, 2024 |
Page 285 |
|
|
Turquoise Ridge Complex NI 43-101 Technical Report |
|
| 26 | Recommendations |
The QP’s have made the following recommendations.
| 26.1 | Geology and Mineral Resources |
| ● | Continue to improve geology and estimation models with learnings acquired through continued mining development. |
| ● | Continue to investigate and improve, geochemical signature modeling, as a geological reconciliation of visual alteration logging, to test the 1.0g/t grade shell currently used to removal bimodal distributions. |
| ● | Review grade capping strategy and metal at risk, as current approach is potentially conservative (removing too much metal). |
| ● | Incorporate additional data density variability samples into sample workflow and update current density estimation procedures. |
| ● | Continue to collect additional Sulfide Sulfur, Total and Organic Carbon assay data to drive continuous improvement in models. |
| ● | Update the Vista geologic model using current software, modeling practices, and geologic understanding in alignment with the more recent Mega model update. While this is not expected to result in any material changes to the Resource estimate, it is good practice to maintain consistency between models at the site. |
| ● | Continue to review the drill hole database for anomalies, unusual downhole surveys, grade discrepancies, etc. and resolve them based on findings. |
| 26.2 | Mining and Mineral Reserves |
| ● | Continue monitoring of pit slope movements – particularly the current highwall on the northwest side of the Mega Pit (Cut 24). Current monitoring indicates a slope failure is possible in this area. Should the failure occur, appropriate remediation steps can be implemented as Cut 40 mining commences. |
| ● | Evaluate hydraulic shovels currently in-use at other NGM open pit operations for potential transfer to Turquoise Ridge Open Pit (perhaps with a rebuild) rather than purchasing two new 5500-class hydraulic shovels to decrease operating costs and/or mining capital costs. |
| March 15, 2024 |
Page 286 |
|
|
Turquoise Ridge Complex NI 43-101 Technical Report |
|
| ● | Continue investigations into the possibility of processing transitional sulfide ores (sulfide sulfur < 1-2%) at the Juniper oxide mill. Particularly if the carbonate values are high (making them less ideal for the autoclave due to the acid cost to neutralize the ore) for the potential down stream neutralization benefit to the Sage Autoclave discharge. |
| ● | Improve the relationship between waste factors used on mining shapes used later in TRUG mining life and expensed waste development and, if possible, eliminate these waste factors. |
| 26.3 | Mineral Processing |
| ● | Continue with laboratory assessment of blend behaviors with differing regimes of reagents to ensure validity of the recovery and operating cost predictions, as well as pre-empt potential anomalies. |
| ● | Pursue remedies for future increasing carbonate concentrations, such as concentrate additions. |
| ● | Continue validation of bench testing methods for calibration to actual plant performance. |
| ● | Continue reviewing sample density coverage of future TRUG ores and conduct bench-top testing to ensure recovery data is in line with predicted performance with representative sample selection. |
| ● | Expand the database on Mega Pit ore hardness to assess the impact to throughput. |
| ● | Continue reviewing the predictive recovery equations on at least an annual basis and adjust as necessary. Evaluate the need for an upper cap on the recovery predictions under certain grade and chemical constituents. Also refine the prediction at the outer extremes of the data set to optimize a fit. |
| ● | CIL Screen Replacement – Continue with the scheduled screen replacements and adjust the predicted recovery equations accordingly. |
| ● | Continue with planned Autoclave modeling efforts to identify opportunities for improvement along with identification of sub-optimal plant performance and their mitigation strategies. |
| 26.4 | Infrastructure |
| ● | Continue the design and approval process of the Sage TSF. |
| 26.5 | Environment, Permitting, and Social and Community |
| ● | Continued stakeholder engagement and public education of the Project. |
| March 15, 2024 |
Page 287 |
|
|
Turquoise Ridge Complex NI 43-101 Technical Report |
|
| ● | Continue identifying and implementing initiatives of renewable energies to support Barrick global commitment on Climate Change. |
| March 15, 2024 |
Page 288 |
|
|
Turquoise Ridge Complex NI 43-101 Technical Report |
|
| 27 | References |
Azrag et al. 1998; Azrag, Ugorets and Atkinson, 1998; Use of a Finite Element Code to Model Complex Mine Water Problems; IMWA Symposium Johannesburg 1998, p 31-41.
CIM, 2014; Canadian Institute of Mining, Metallurgy and Petroleum (CIM), 2014, CIM Definition Standards for Mineral Resources and Mineral Reserves, adopted by the CIM Council on May 10, 2014.
CIM, 2019; Canadian Institute of Mining, Metallurgy and Petroleum (CIM), (2019). CIM Definition Standards for Mineral Resources and Mineral Reserves (MRMR) Best Practice Guidelines 2019.
RPA, 2018; Technical Report on the Turquoise Ridge Mine, State of Nevada, USA, Prepared for Barrick Gold Corporation; Roscoe Postle Associates Inc., 2018.
Cline, 2001; Jean S. Cline; Timing of Gold and Arsenic Sulfide Mineral Deposition at the Getchell Carlin-Type Gold Deposit, North-Central Nevada; Economic Geology, Vol. 96, 2001, pp. 75–89
Entech, 2023: Turquoise Ridge Mineral Reserves Audit December 2023 – Draft; Entech Mining Ltd., Toronto, Canada, 2023.
Geomega, 2017; The Turquoise Ridge Groundwater Model, Prepared for: Barrick Turquoise Ridge Inc.; Geomega Inc., Boulder, USA, 2017.
Itasca, 2022; Conceptual Hydrogeologic Model and Numerical Groundwater-Flow Model for the Turquoise Ridge/Getchell and Twin Creeks Mines; Itasca Denver Inc, Lakewood, USA, 2022.
Hazen, 2018; Hazen Research, Inc., 2017: Metallurgical Test Program for Turquoise Ridge and Goldstrike Ores: internal Barrick report, September 21, 2018.
Hotz and Wilden, 1964; Hotz, P.E., and Willden, Ronald, 1964; Geology and mineral deposits of the Osgood Mountains quadrangle, Humboldt County, Nevada: U.S. Geological Survey Professional Paper, 431.
NGM, 2019; Fiddes, C., Olcott, J., Bolin, C.L., and Yopps, S.W., 2019: Technical Report on the Turquoise Ridge Complex, State of Nevada, USA: Technical Report prepared by Nevada Gold Mines LLC for Barrick Gold Corporation and Newmont Corporation, effective date 31 December, 2019.
Panday et al. 2013; Panday, Sorab, Langevin, C.D., Niswonger, R.G., Ibaraki, Motomu, and Hughes, J.D., 2013; MODFLOW-USG version 1: An unstructured grid version of MODFLOW for
| March 15, 2024 |
Page 289 |
|
|
Turquoise Ridge Complex NI 43-101 Technical Report |
|
simulating groundwater flow and tightly coupled processes using a control volume finite-difference formulation; U.S. Geological Survey Techniques and Methods, book 6, chap. A45, 66 p.
RPA, 2011; Technical Report on the Turquoise Ridge Joint Venture, Nevada, USA, Prepared for Barrick Gold Corporation, September 2011; Roscoe Postle Associates Inc., 2011.
RPA, 2014; Technical Report on the Turquoise Ridge Joint Venture, Nevada, USA, Prepared for Barrick Gold Corporation, March 14, 2014; Roscoe Postle Associates Inc., 2014.
RPA, 2018; Technical Report on the Turquoise Ridge Joint Venture, Nevada, USA, Prepared for Barrick Gold Corporation, March 19, 2018; Roscoe Postle Associates Inc., 2018.
RSC, 2023; Mineral Resource Audit Turquoise Ridge Complex, Nevada, USA – DRAFT Technical Report on a Mineral Resource Audit for the Turquoise Ridge Mine in Nevada, USA; RSC Consulting Ltd., 2023.
| March 15, 2024 |
Page 290 |
|
|
Turquoise Ridge Complex NI 43-101 Technical Report |
|
| 28 | Date and Signature Page |
This report titled “NI 43-101 Technical Report on the Turquoise Ridge Complex, Humboldt County, Nevada, USA” with an effective date of December 31, 2023 and dated March 15, 2024 was prepared and signed by the following authors:
| (Signed) Craig Fiddes |
||
| Dated at Elko Nevada, USA
March 15, 2024 |
Craig Fiddes, SME (RM) Lead, Resource Modeling Nevada Gold Mines, LLC |
|
| (Signed) John Langhans |
||
| Dated at Elko Nevada, USA
March 15, 2024 |
John Langhans, MMSA (QP) Lead Technical Specialist, Metallurgy Nevada Gold Mines, LLC |
|
| (Signed) Paul Schmiesing |
||
| Dated at Elko Nevada, USA
March 15, 2024 |
Paul Schmiesing, SME (RM) Lead, Long Term Planning Nevada Gold Mines, LLC |
|
| (Signed) Joseph Becker |
||
| Dated at Elko Nevada, USA
March 15, 2024 |
Joseph Becker, SME (RM) Lead, Technology and People Strategy Nevada Gold Mines, LLC |
|
| (Signed) Timothy Webber |
||
| Dated at Elko Nevada, USA
March 15, 2024 |
Timothy Webber, SME (RM) Chief of Long-Term Planning Nevada Gold Mines, LLC |
|
| March 15, 2024 |
Page 291 |
|
|
Turquoise Ridge Complex NI 43-101 Technical Report |
|
| (Signed) Simon Bottoms |
||
| Dated at London, UK
March 15, 2024 |
Simon Bottoms, CGeol, MGeol, FGS, FAusIMM Mineral Resource Management and Evaluation Executive Barrick Gold Corporation |
|
| March 15, 2024 |
Page 292 |
|
|
Turquoise Ridge Complex NI 43-101 Technical Report |
|
| 29 | Certificates of Qualified Persons |
| 29.1 | Craig Fiddes |
I, Craig Fiddes, SME (RM), as an author of this report entitled “NI 43-101 Technical Report on the Turquoise Ridge Complex, Humboldt County, Nevada, USA” prepared for Barrick Gold Corporation by Nevada Gold Mines LLC and dated March 15, 2024 with an effective date of December 31, 2023 do hereby certify that:
| 1. | I am the Lead, Resource Modelling with Nevada Gold Mines, of 1655 Mountain City Highway, Elko, Nevada, 89801. |
| 2. | I am a graduate of the University of Otago, New Zealand, graduating in 1998 with a BSc (Hons) degree in Geology. |
| 3. | I am a SME Registered Member, #04197758. |
| 4. | I have worked as a geologist and resource modeler for over 20 years since my graduation. My relevant experience for the purpose of the Technical Report is: |
| ● | Over 20 years of mining industry experience, including direct involvement in exploration, geologic interpretation and resource estimation, mine geology and reconciliation (both open pit and underground), compilation and reporting of Mineral Resource and Mineral Reserve estimates, and pre-feasibility and feasibility studies for gold deposits. |
| 5. | I have read the definition of “qualified person” set out in National Instrument 43-101 (NI 43-101) and certify that by reason of my education, affiliation with a professional association (as defined in NI 43-101) and past relevant work experience, I fulfil the requirements to be a “qualified person” for the purposes of NI 43-101. |
| 6. | I visited the Turquoise Ridge Complex most recently on November 6 through November 9, 2023 |
| 7. | I am responsible for the following Sections of the Technical Report (see notes); 102, 112, 12, 14, 25.22, and 26.12, and contributions to Sections 1, 2, 25.8, and 27. |
| 8. | I am not independent of the Issuer applying the test set out in Section 1.5 of NI 43-101, as I have been a full-time employee of Nevada Gold Mines since 2019. |
| 9. | I have had prior involvement with the Turquoise Ridge Complex since July 2019 in my current role. |
| 10. | I have read NI 43-101, and the parts of the Technical Report that I am responsible for have been prepared in compliance with NI 43-101. |
| March 15, 2024 |
Page 293 |
|
|
Turquoise Ridge Complex NI 43-101 Technical Report |
|
| 11. | At the effective date of the Technical Report, to the best of my knowledge, information, and belief the Technical Report contains all scientific and technical information that is required to be disclosed to make the Technical Report not misleading. |
Dated March 15, 2024
(Signed) Craig Fiddes
Craig Fiddes, SME(RM)
Notes:
| 1. | Geology |
| 2. | Mineral Resources |
| 3. | Mining and Mineral Reserves – Open Pit and Stockpiles |
| 4. | Mining and Mineral Reserves – Underground |
| 5. | Processing |
| 6. | Shared with other QP. |
| March 15, 2024 |
Page 294 |
|
|
Turquoise Ridge Complex NI 43-101 Technical Report |
|
| 29.2 | John Langhans |
I, John Langhans (BSc Chem Eng) as an author of this report titled “NI 43-101 Technical Report on the Turquoise Ridge Complex, Humboldt County, Nevada, USA” (the Technical Report) with an effective date of December 31, 2023 and dated March 15, 2024 prepared for Barrick Gold Corporation, do herby certify that:
| 1. | I am Lead Technical Specialist, Metallurgy, with Nevada Gold Mines, of 1655 Mountain City Highway, Elko, Nevada, 89801. |
| 2. | I graduated with a BSc chemical engineering degree from the University of Nevada, Reno in 1984. |
| 3. | I am a member of the MMSA (1563QP), and the SME (04062897). |
| 4. | I have worked in the mining industry for the past 39 years with roles in gold-related research, metallurgical testing/consulting, operational, growth, and project studies/management. My relevant experience for the purposes of the Technical Report includes: |
| ● | Metallurgical and Operational roles within Autoclave processing |
| ● | Lab, pilot, and plant scale testing |
| ● | Ore characterization and routing |
| ● | Project studies (scoping, prefeasibility, and feasibility), design review/oversight, and commissioning |
| 5. | I have read the definition of “qualified person” set out in National Instrument 43-101 (NI 43-101) and certify that by reason of my education, affiliation with a professional association (as defined in NI 43-101) and past relevant work experience, I fulfil the requirements to be a “qualified person” for the purposes of NI 43-101. |
| 6. | I visited the Turquoise Ridge Complex most recently on October 19, 2023 and at various other times throughout the year (2023). |
| 7. | I am responsible for the following Sections of the Technical Report (see notes); 13, 17, 185, 25.4, 25.5, 26.3, and 26.45 and contributions to Sections 1, 2, 25.8, and 27. |
| 8. | I am not independent of the Issuer applying the test set out in Section 1.5 of NI 43-101, as I have been a full-time employee of Nevada Gold Mines since July 2019, and Barrick since April 1999. |
| 9. | I have had prior involvement with the property that is the subject of the Technical Report, as Technical Specialist, Metallurgy for Nevada Gold Mines through involvement with site personnel on a variety of improvement topics for the Turquoise Ridge Complex. |
| 10. | I have read NI 43-101, and the sections of the Technical Report for which I am responsible have been prepared in compliance with NI 43-101 and Form 43-101F1. |
| 11. | At the effective date of the Technical Report, to the best of my knowledge, information, and belief the Technical Report contains all scientific and technical information that is required to be disclosed to make the Technical Report not misleading. |
| March 15, 2024 |
Page 295 |
|
|
Turquoise Ridge Complex NI 43-101 Technical Report |
|
Dated March 15, 2024
(Signed) John Langhans
John W. Langhans, Jr., BSc Chem Eng
Notes:
| 1. | Geology |
| 2. | Mineral Resources |
| 3. | Mining and Mineral Reserves – Open Pit and Stockpiles |
| 4. | Mining and Mineral Reserves – Underground |
| 5. | Processing |
| 6. | Shared with other QP |
| March 15, 2024 |
Page 296 |
|
|
Turquoise Ridge Complex NI 43-101 Technical Report |
|
| 29.3 | Paul Schmiesing |
I, Paul Schmiesing SME RM as an author of this report titled “NI 43-101 Technical Report on the Turquoise Ridge Complex, Humboldt County, Nevada, USA” (the Technical Report) with an effective date of December 31, 2023 and dated March 15, 2024 prepared for Barrick Gold Corporation, do herby certify that:
| 1. | I am Lead Long Term Planning Mine Engineer, with Nevada Gold Mines, of 1655 Mountain City Hwy, Elko, NV 89801. |
| 2. | I graduated with a Bachelor of Science Mining Engineering degree from Virgina Tech in 1994 |
| 3. | I am a Registered Member of the Society for Mining, Metallurgy, and Exploration, Inc. SME (Member number 4314033) |
| 4. | I have worked in the mining industry for 25 years in operations and engineering roles. My relevant experience for the purposes of the Technical Report includes: |
| ● | Working as a mining engineer in Nevada for the last 12 years at Leeville Mine, Midas Mine, Hollister Mine, Vista Mine, Turquoise Ridge Mine, and Nevada Gold Mines regional office. I have been involved with mine planning and design, mine ventilation, geotechnics, paste fill, projects, drill and blast, and operations and engineering management roles. |
| 5. | I have read the definition of “qualified person” set out in National Instrument 43-101 (NI 43-101) and certify that by reason of my education, affiliation with a professional association (as defined in NI 43-101) and past relevant work experience, I fulfil the requirements to be a “qualified person” for the purposes of NI 43-101. |
| 6. | I visited the Turquoise Ridge Complex most recently on 25 October 2023. |
| 7. | I am responsible for the following Sections of the Technical Report (see notes); 15.14 to 15.44, 15.6, 15.84, 15.96, 16.14, 16.2, 16.4, 16.54, 16.66, 184, 25.34, 25.54, 26.24, and 26.44, and contributions to Sections 1, 2, 25.8, and 27. |
| 8. | I am not independent of the Issuer applying the test set out in Section 1.5 of NI 43-101, as I have been a full-time employee of Nevada Gold Mines since December 2019 |
| 9. | I have had prior involvement with the property that is the subject of the Technical Report, as General Supervisor of Mine Operations and Engineering Superintendent |
| 10. | I have read NI 43-101, and the sections of the Technical Report for which I am responsible have been prepared in compliance with NI 43-101 and Form 43-101F1. |
| 11. | At the effective date of the Technical Report, to the best of my knowledge, information, and belief the Technical Report contains all scientific and technical information that is required to be disclosed to make the Technical Report not misleading. |
| March 15, 2024 |
Page 297 |
|
|
Turquoise Ridge Complex NI 43-101 Technical Report |
|
Dated March 15, 2024
(Signed) Paul Schmiesing
Paul Schmiesing, BSc Mining Engineering SME RM
Notes:
| 1. | Geology |
| 2. | Mineral Resources |
| 3. | Mining and Mineral Reserves – Open Pit and Stockpiles |
| 4. | Mining and Mineral Reserves – Underground |
| 5. | Processing |
| 6. | Shared with other QP |
| March 15, 2024 |
Page 298 |
|
|
Turquoise Ridge Complex NI 43-101 Technical Report |
|
| 29.4 | Joseph Becker |
I, Joseph P. Becker, SMERM, as an author of this report titled “NI 43-101 Technical Report on the Turquoise Ridge Complex, Humboldt County, Nevada, USA” (the Technical Report) with an effective date of December 31, 2023 and dated March 15, 2024 prepared for Barrick Gold Corporation, do herby certify that:
| 1. | I am Lead, Technology and People Strategy, with Nevada Gold Mines, of 1655 Mountain City Highway, Elko, Nevada, USA, 89801. |
| 2. | I graduated with a Bachelor of Science in Geology from Oregon State University in 2004. |
| 3. | I am a Registered Member of the Society for Mining, Metallurgy & Exploration (#04275986). |
| 4. | I have worked in the mining industry for 18 years. My relevant experience for the purposes of the Technical Report includes: |
| ● | Eighteen years of hard rock mining and exploration experience spanning diverse roles with exposure to numerous mines, projects, and business development opportunities. Assimilated broad knowledge and expertise of operations, functions, and business processes - from greenfields to brownfields and business development to mining and processing. |
| 5. | I have read the definition of “qualified person” set out in National Instrument 43-101 (NI 43-101) and certify that by reason of my education, affiliation with a professional association (as defined in NI 43-101) and past relevant work experience, I fulfil the requirements to be a “qualified person” for the purposes of NI 43-101. |
| 6. | I visited the Turquoise Ridge Complex most recently on December 4th, 2023. |
| 7. | I am responsible for the following Sections of the Technical Report (see notes); 66, 7, 8, 9, 101, 111, 25.21 and 26.11, and share responsibility for Section 1 to 3, and contributions to Sections 1, 2, 25.8, and 27. |
| 8. | I am not independent of the Issuer applying the test set out in Section 1.5 of NI 43-101, as I have been a full-time employee of Nevada Gold Mines since 2019. |
| 9. | I have had prior involvement with the property that is the subject of the Technical Report, as having worked in the district from 2010 to 2013 as the Fiberline Project Manager and Twin Creeks District Brownfields Exploration Lead and have been involved with the district in my current role since 2021. |
| 10. | I have read NI 43-101, and the sections of the Technical Report for which I am responsible have been prepared in compliance with NI 43-101 and Form 43-101F1. |
| 11. | At the effective date of the Technical Report, to the best of my knowledge, information, and belief the Technical Report contains all scientific and technical information that is required to be disclosed to make the Technical Report not misleading. |
| March 15, 2024 |
Page 299 |
|
|
Turquoise Ridge Complex NI 43-101 Technical Report |
|
Dated March 15, 2024
(Signed) Joseph P. Becker
Joseph P. Becker, SME RM
Notes:
| 1. | Geology |
| 2. | Mineral Resources |
| 3. | Mining and Mineral Reserves – Open Pit and Stockpiles |
| 4. | Mining and Mineral Reserves – Underground |
| 5. | Processing |
| 6. | Shared with other QP |
| March 15, 2024 |
Page 300 |
|
|
Turquoise Ridge Complex NI 43-101 Technical Report |
|
| 29.5 | Timothy Webber |
I, Timothy Webber SME (RM), as an author of this report titled “NI 43-101 Technical Report on the Turquoise Ridge Complex, Humboldt County, Nevada, USA” (the Technical Report) with an effective date of December 31, 2023 and dated March 15, 2024 prepared for Barrick Gold Corporation, do herby certify that:
| 1. | I am the Chief of Long-Term Planning with the Mineral Resource Management department of Nevada Gold Mines, of 1655 Mountain City Highway, Elko, NV 89801. |
| 2. | I graduated with a Bachelor of Science in Mining Engineering from the Colorado School of Mines in 2003 and a Master of Science in Engineering and Technology Management from the Colorado School of Mines in 2004. |
| 3. | I am a Registered Member of the Society for Mining, Metallurgy, and Exploration (SME) #4131311. |
| 4. | I have worked in the mining industry for over 19 years. My relevant experience for the purposes of the Technical Report includes: |
| ● | Working as a mining engineer in both technical and operational leadership roles across Nevada Gold Mines operations at Carlin, Cortez, and Turquoise Ridge. |
| 5. | I have read the definition of “qualified person” set out in National Instrument 43-101 (NI 43-101) and certify that by reason of my education, affiliation with a professional association (as defined in NI 43-101) and past relevant work experience, I fulfil the requirements to be a “qualified person” for the purposes of NI 43-101. |
| 6. | I visited the Turquoise Ridge Complex most recently on December 6, 2023, to participate in a third-party audit of the Turquoise Ridge Underground Reserves. |
| 7. | I am responsible for the following Sections of the Technical Report (see notes); 66, 15.13 to 15.33, 15.5, 15.7, 15.83,15.96, 16.13, 16.3, 16.53, 16.66, 183, 25.33, 25.53, 26.23, and 26.43, and contributions to Sections 1, 2, 25.8, and 27. |
| 8. | I am not independent of the Issuer applying the test set out in Section 1.5 of NI 43-101, as I have been a full-time employee of Nevada Gold Mines since December 23, 2019. |
| 9. | I have had prior involvement with the property that is the subject of the Technical Report, as a member of the Management Committee for the Turquoise Ridge Joint Venture that owned the Turquoise Ridge property prior to the formation of the Nevada Gold Mines Joint Venture, a mine engineer for Newmont that owned the Twin Creeks property prior to the formation of the Nevada Gold Mines Joint Venture, a member of the Steering Committee for the 3rd Shaft Prefeasibility and Feasibility studies, and, most-recently, Turquoise Ridge is a key component of Nevada Gold Mines’ long-term business plans. |
| 10. | I have read NI 43-101, and the sections of the Technical Report for which I am responsible have been prepared in compliance with NI 43-101 and Form 43-101F1. |
| March 15, 2024 |
Page 301 |
|
|
Turquoise Ridge Complex NI 43-101 Technical Report |
|
| 11. | At the effective date of the Technical Report, to the best of my knowledge, information, and belief the Technical Report contains all scientific and technical information that is required to be disclosed to make the Technical Report not misleading. |
Dated March 15, 2024
(Signed) Timothy Webber
Timothy Webber, SME (RM)
Notes:
| 1. | Geology |
| 2. | Mineral Resources |
| 3. | Mining and Mineral Reserves – Open Pit and Stockpiles |
| 4. | Mining and Mineral Reserves – Underground |
| 5. | Processing |
| 6. | Shared with other QP |
| March 15, 2024 |
Page 302 |
|
|
Turquoise Ridge Complex NI 43-101 Technical Report |
|
| 29.6 | Simon P. Bottoms |
I, Simon P. Bottoms, CGeol, MGeol, FGS, FAusIMM, as an author of this report titled “NI 43-101 Technical Report on the Turquoise Ridge Complex, Humboldt County, Nevada, USA” (the Technical Report) with an effective date of December 31, 2023 and dated March 15, 2024 prepared for Barrick Gold Corporation, do herby certify that:
| 1. | I am Mineral Resource Manager and Evaluation Executive with Barrick Gold Corporation, of the 3rd floor, Unity Chambers, 28 Halkett Street, St. Helier, Jersey, Channel Islands, UK, OJE2. |
| 2. | I am a graduate of the University of Southampton, UK in 2009 with a Masters of Geology degree. |
| 3. | I am registered as a Chartered Geologist registered (1023769) with the Geological Society of London. I am a current Fellow of the Australasian Institute of Mining and Metallurgy (313276). |
| 4. | I have worked as a geologist continuously for 13 years since my graduation from University My relevant experience for the purpose of the Technical Report is: |
| ● | I am the global lead technical executive for the Barrick group, and have direct responsibility for managing all mineral resources, mineral reserves, mine planning, mine geology, evaluations, including associated technical studies spanning from preliminary economic assessments through to feasibility studies. I am also responsible for reviewing and approving all related public project disclosures by Barrick as the lead Qualified Person in accordance with National Instrument 43-101. Throughout my career, I have experience evaluating, developing and mining, geologically and metallurgically complex ore bodies. Previously, I held positions in exploration and mine geology across Africa, Central Asia, Russia and Australia. |
| 5. | I have read the definition of “qualified person” set out in National Instrument 43-101 (NI 43-101) and certify that by reason of my education, affiliation with a professional association (as defined in NI 43-101) and past relevant work experience, I fulfil the requirements to be a “qualified person” for the purposes of NI 43-101. |
| 6. | I visited the Turquoise Ridge Complex most recently on 24 to 27 October 2023. |
| 7. | I am responsible for the following Sections of the Technical Report; 3, 4, 5, 19 to 24, 25.1, 25.6, 25.7 and 26.5, and contributions to Sections 1, 2, 25.8, and 27. |
| 8. | I am not independent of the Issuer applying the test set out in Section 1.5 of NI 43-101, as I have been a full-time employee of Barrick Gold Corporation (previously Randgold Resources) since 2013. |
| 9. | I have had prior involvement with the property that is the subject of the Technical Report, with exploration programme results, Mineral Resource and grade control model updates, mine plans, mining performance results and associated financials, mine strategy, results of external audits, and board meeting reviews. |
| March 15, 2024 |
Page 303 |
|
|
Turquoise Ridge Complex NI 43-101 Technical Report |
|
| 10. | I have read NI 43-101, and the sections of the Technical Report for which I am responsible have been prepared in compliance with NI 43-101 and Form 43-101F1. |
| 11. | At the effective date of the Technical Report, to the best of my knowledge, information, and belief, the Technical Report contains all scientific and technical information that is required to be disclosed to make the Technical Report not misleading. |
Dated March 15, 2024
(Signed) Simon P. Bottoms
Simon P. Bottoms, CGeol, MGeol, FGS, FAusIMM
| March 15, 2024 |
Page 304 |