SECURITIES AND EXCHANGE COMMISSION
Washington, D.C. 20549
Form 6-K
REPORT OF FOREIGN PRIVATE ISSUER
PURSUANT TO RULE 13a-16 OR 15d-16 UNDER
THE SECURITIES EXCHANGE ACT OF 1934
For the month of March 2024
Commission File Number: 001-31811
Woori Financial Group Inc.
(Translation of registrant’s name into English)
51, Sogong-ro, Jung-gu, Seoul, 04632, Korea
(Address of principal executive office)
Indicate by check mark whether the registrant files or will file annual reports under cover of Form 20-F or Form 40-F.
Form 20-F ☒ Form 40-F ☐
Index
| 1. |
| - | For the Audit Reports of Woori Financial Group for Fiscal Year 2023, please refer to the exhibits to the Form 6-K furnished to the U.S. Securities and Exchange Commission on March 6, 2024. |
2
Summary of 2023 Business Report
3
Except where indicated otherwise, financial information contained in this document (including the attached financial statements) has been prepared in accordance with the Korean equivalent of International Financial Reporting Standards (“Korean IFRS”), which differ in certain important respects from generally accepted accounting principles in the United States.
All references to “Woori Financial Group,” “we,” “us” or the “Company” are to Woori Financial Group Inc. and, unless the context requires otherwise, its subsidiaries. In addition, all references to “Won” or “KRW” in this document are to the currency of the Republic of Korea.
4
| I. | Introduction of the Company |
| 1. | Overview of the Company |
| a. | History |
| January 11, 2019 | Establishment of the Company pursuant to a comprehensive stock transfer, by which Woori Bank, Woori FIS, Woori Finance Research Institute, Woori Credit Information, Woori Fund Services and Woori Private Equity Asset Management became wholly-owned subsidiaries of the Company. | |
| February 13, 2019 | Listed on the Korea Exchange (KRX). | |
| April 5, 2019 | Entered into share purchase agreements to acquire Tongyang Asset Management Corp. and ABL Global Asset Management Co., Ltd. | |
| June 21, 2019 | Entered into a purchase agreement with Woori Bank to acquire the common shares of Woori Investment Bank Co., Ltd. (“Woori Investment Bank”) and integrate Woori Investment Bank as a first-tier subsidiary of the Company (Buyer: Woori Financial Group, Seller: Woori Bank) | |
| July 3, 2019 | Entered into a stock exchange agreement between the Company and Woori Card Co., Ltd (“Woori Card”) to integrate Woori Card as a first-tier subsidiary of the Company | |
| July 25, 2019 | Entered into a share purchase agreement to acquire Kukje Asset Trust, Ltd. | |
| August 1, 2019 | Integrated Woori Asset Management Corp. (formerly known as Tongyang Asset Management Co., Ltd.) as a first-tier subsidiary of the Company. | |
| September 10, 2019 | Integrated Woori Card and Woori Investment Bank as first-tier subsidiaries of the Company. | |
| September 26, 2019 | Disposed 4% of common shares of the Company held by Woori Bank to a Taiwanese company, Fubon Life Insurance Co., Ltd. | |
| December 6, 2019 | Integrated Woori Global Asset Management Corp. as a first-tier subsidiary of the Company | |
| December 30, 2019 | Integrated Woori Asset Trust Ltd. as a first-tier subsidiary of the Company | |
| March 25, 2020 | Held the first annual general meeting of shareholders of Woori Financial Group; reappointed the Chief Executive Officer | |
5
| October 26, 2020 | Entered into a share purchase agreement to acquire Aju Capital Co., Ltd. | |
| December 10, 2020 | Integrated Woori Financial Capital Co., Ltd., (formerly known as Aju Capital Co., Ltd.) as a first-tier subsidiary of the Company
Integrated Woori Savings Bank (formerly known as Aju Savings Bank) as a second-tier subsidiary of the Company |
|
| January 15, 2021 | Joined the Carbon Disclosure Project (CDP), announced support for the Task force on Climate related Financial Disclosure (TCFD) and established the ESG management principles of Woori Financial Group | |
| March 5, 2021 | Established the Board ESG Management Committee | |
| March 12, 2021 | Integrated Woori Savings Bank as a first-tier subsidiary of the Company | |
| April 9, 2021 | After-hours trading of a 2% stake in Woori Financial Group held by the Korea Deposit Insurance Corporation | |
| April 15, 2021 | Purchased additional equity shares of Woori Financial Capital Co., Ltd., increasing the Company’s equity ownership by 12.9% | |
| May 13, 2021 | Participated in the capital increase of Woori Savings Bank (KRW 100 billion) | |
| May 24, 2021 | Purchased 3.6% of Woori Financial Capital Co., Ltd. in treasury shares | |
| June 4, 2021 | Entered into a stock exchange agreement to acquire the remaining shares of Woori Financial Capital Co., Ltd. | |
| August 10, 2021 | Integrated Woori Financial Capital Co., Ltd., as a wholly-owned subsidiary of the Company (Completion of stock exchange) | |
| September 9, 2021 | Announcement of contemplated sales of the remaining stake in Woori Financial Group held by the Korea Deposit Insurance Corporation | |
| October 8, 2021 | Joined the SBTi (Science Based Targets initiative) as part of the roadmap for achieving carbon neutrality | |
| November 2, 2021 | Obtained regulatory approval for using the IRB (Internal Rating Based) approach | |
| November 9, 2021 | Obtained ‘AA’ rating from MSCI ESG assessment (2 grades higher than the previous year), ‘A’ rating from KCGS(Korea Corporate Governance Service)(1 grade higher than the previous year) | |
6
| November 17, 2021 | Included newly in Asia Pacific Index of DJSI (Dow Jones Sustainability Indices) | |
| December 9, 2021 | Achieved practically full privatization through the decrease of the KDIC’S stake in us from 15.1% to 5.8%, changing the largest shareholder from the KDIC to the Employee Stock Ownership Association of Woori Financial Group | |
| December 26, 2021 | Launched the Group integrated car finance platform “Woori WON Car” | |
| January 7, 2022 | Officially launched the NPL investment company Woori Financial F&I Inc. | |
| January 13, 2022 | Joined the global environment initiative Taskforce on Nature-related Financial Disclosures (TNFD) | |
| February 4, 2022 | Recognized as an ‘Industry Mover’ in a sustainability assessment by S&P Global for 2022 | |
| February 10, 2022 | Disposal by the Korea Deposit Insurance Corporation of a 2.2% stake in Woori Financial Group (reducing the KDIC’s stake in Woori Financial Group from 5.8% to 3.6%) | |
| May 11, 2022 | Became the first company in the world to join the launch of the ‘Business for Land (B4L) Initiative’ for the protection of sustainable forests and the recovery of land degradation | |
| May 18, 2022 | Disposal by the Korea Deposit Insurance Corporation of a 2.3% stake in Woori Financial Group (reducing the KDIC’s stake in Woori Financial Group from 3.6% to 1.3%) | |
| June 19, 2022 | Held the inaugural meeting of Woori Financial Future Foundation | |
| August 22, 2022 | Joined the ‘Partnership for Biodiversity Accounting Financials(PBAF)’ as the first Asian company | |
| November 7, 2022 | Held the global conference ‘Sustainable Finance for a Better World’ | |
| December 14, 2022 | Signatory of Statement from the Financial Sector at the Conference of the Parties to the ‘UN Convention on Biological Diversity(UN CBD)’ | |
7
| December 29, 2022 | Received ‘AA’ rating from MSCI ESG Research for 2 consecutive years | |
| January 16, 2023 | Completed the establishment of the ‘WON Synergy’ system to create effective synergy within group companies | |
| January 26, 2023 | Became the first financial company in Korea to join the ‘Finance Leadership Group on Plastics’ hosted by ‘UN Environment Programme Finance Initiative (UNEP FI)’ | |
| February 27, 2023 | Entered into a stock purchase agreement to acquire Daol Investment (52% ownership) | |
| March 23, 2023 | Daol Investment, re-named Woori Venture Partners, incorporated as a subsidiary into Woori Financial Holdings | |
| March 24, 2023 | Jong-Yong Yim appointed as the 9th chairman of Woori Financial Group (4th annual general meeting of shareholders of Woori Financial Group) | |
| April 21, 2023 | Resolved to repurchase and cancel treasury shares, a first-time since the transition to a holding company | |
| June 01, 2023 | Entered into a comprehensive stock exchange agreement with Woori Investment Bank and Woori Venture Partners | |
| August 08, 2023 | Woori Investment Bank and Woori Venture Partners to each become a wholly-owned subsidiary of Woori Financial Group | |
| August 24, 2023 | Group Carbon Emission Reduction Target validated by SBTi (Science Based Targets initiative) | |
| October 05, 2023 | Entered into a memorandum of understanding with the Korea Deposit Insurance Corporation to purchase its remaining stake in Woori Financial Group (1.2%) | |
| December 22, 2023 | A capital increase of KRW 500 billion conducted by Woori Investment Bank (to enhance competitiveness) | |
| December 26, 2023 | Obtained an ‘AAA’ rating from MSCI ESG assessment | |
| March 13, 2024 | Resolved to acquire and cancel the remaining shares owned by the Korea Deposit Insurance Corporation | |
8
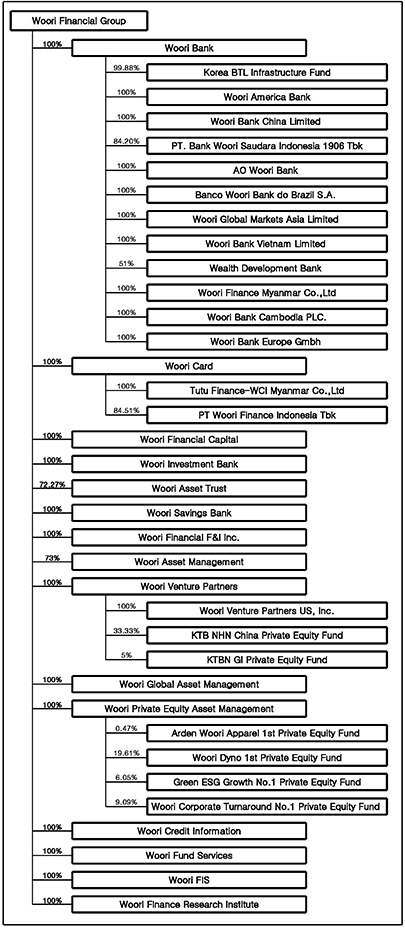
| b. | Affiliated Companies |
| (1) | Overview of Business Group |
| 1. | Name of business group: Woori Financial Group Inc. |
| (2) | Affiliated companies within the business group |
As of December 31, 2023
| Type |
Name of Company |
|
| Listed company (3 companies) |
Woori Financial Group |
|
| PT Bank Woori Saudara Indonesia 1906 Tbk |
||
| PT Woori Finance Indonesia Tbk |
||
| Unlisted company (34 companies) |
Woori Bank |
|
| Woori Card |
||
| Woori Financial Capital |
||
| Woori Investment Bank |
||
| Woori Asset Trust |
||
| Woori Savings Bank |
||
| Woori Asset Management |
||
| Woori Venture Partners |
||
| Woori Financial F&I Inc. |
||
| Woori Credit Information |
||
| Woori Fund Services |
||
| Woori Private Equity Asset Management |
||
| Woori Global Asset Management |
||
| Woori FIS |
||
| Woori Finance Research Institute |
||
| Korea BTL Infrastructure Fund |
||
| Woori America Bank |
||
| Woori Bank China Limited |
||
| AO Woori Bank |
||
| Banco Woori Bank do Brazil S.A. |
||
| Woori Global Markets Asia Limited |
||
| Woori Bank Vietnam Limited |
||
| Wealth Development Bank |
||
| Woori Finance Myanmar Co., Ltd. |
||
| Woori Bank (Cambodia) PLC. |
||
| Woori Bank Europe Gmbh |
||
| Tutu Finance-WCI Myanmar Co., Ltd. |
||
| Woori Venture Partners US, Inc. |
||
| KTB-NHN China Private Equity Fund |
||
| KTBN GI Private Equity Fund |
||
| Arden Woori Apparel 1st Private Equity Fund |
||
| Woori Dyno 1st Private Equity Fund |
||
| Green ESG Growth No.1 Private Equity Fund |
||
| Woori Corporate Turnaround No.1 Private Equity Fund |
| Note 1) | Includes first-tier and second-tier subsidiaries under the Financial Holding Company Act as of December 31, 2023 |
9
10
| 2. | Capital Structure (Changes in Capital) |
(units: Won, shares)
| Date |
Item |
Type | ||||||||||||
| Common Shares | Preferred Shares | Others | ||||||||||||
| December 31, 2023 |
Number of issued shares | 751,949,461 | — | — | ||||||||||
| Par Value | 5,000 | — | — | |||||||||||
| Capital Stock | 3,802,676,300,000 | — | — | |||||||||||
| December 31, 2022 |
Number of issued shares | 728,060,549 | — | — | ||||||||||
| Par Value | 5,000 | — | — | |||||||||||
| Capital Stock | 3,640,302,745,000 | — | — | |||||||||||
| December 31, 2021 |
Number of issued shares | 728,060,549 | — | — | ||||||||||
| Par Value | 5,000 | — | — | |||||||||||
| Capital Stock | 3,640,302,745,000 | — | — | |||||||||||
| December 31, 2020 |
Number of issued shares | 722,267,683 | — | — | ||||||||||
| Par Value | 5,000 | — | — | |||||||||||
| Capital Stock | 3,611,338,415,000 | — | — | |||||||||||
| December 31, 2019 |
Number of issued shares | 722,267,683 | — | — | ||||||||||
| Par Value | 5,000 | — | — | |||||||||||
| Capital Stock | 3,611,338,415,000 | — | — | |||||||||||
| Note 1) | Our common shares of 680,164,306 were issued in January 2019 upon our establishment and the number of our common shares increased by 42,103,377 as a result of a comprehensive stock exchange that took place between Woori Financial Group and Woori Card in September 2019. | |
| Note 2) | The number of our common shares increased by 5,792,866 on August 10, 2021 due to a comprehensive stock exchange to integrate Woori Financial Capital as a wholly-owned subsidiary. | |
| Note 3) | The number of our common shares increased by 32,474,711 as a result of a comprehensive stock exchange that took place on August 8, 2023 to convert Woori Investment Bank and Woori Venture Partners as our wholly-owned subsidiaries. | |
| Note 4) | On October 30, 2023, of the number of our common shares was reduced by 8,585,799 due to the cancellation of our treasury shares acquired through a trust agreement. |
- Our paid-in capital does not match the par value of our total issued shares at year-end because our cancellation of treasury shares constitutes the cancellation of treasury shares acquired within the limits of profits available for dividends, which means that there would be no reduction in the paid-in capital of Woori Financial Group.
11
| As of December 31, 2023 | (units: Won, shares) |
| Date |
Category | Stock Decrease/Increase | ||||||||||||||||||||
| Type | Quantity | Par Value |
Issue price |
Note |
||||||||||||||||||
| January 11, 2019 |
— | Common | 680,164,306 | 5,000 | 26,415 | Establishment (comprehensive stock transfer) |
||||||||||||||||
| September 10, 2019 |
— | Common | 42,103,377 | 5,000 | 12,350 | Comprehensive stock exchange Stock increase ratio: 6.19018% |
||||||||||||||||
| August 10, 2021 |
— | Common | 5,792,866 | 5,000 | 11,100 | Comprehensive stock exchange Stock increase ratio: 0.80204% |
||||||||||||||||
| August 8, 2023 |
— | Common | 32,474,711 | 5,000 | 11,520 | Comprehensive stock exchange Stock increase ratio: 4.46044% |
||||||||||||||||
| October 30, 2023 |
— | Common | (8,585,799 | ) | 5,000 | — | Cancellation of treasury shares | |||||||||||||||
| Note 1) | Due to Woori Financial Group’s establishment through a comprehensive stock transfer, the issue price was calculated by dividing the total equity from its financial statements at the time of establishment (KRW 17,966,458,911,689) by the total number of issued shares (680,164,306). | |
| Note 2) | Our capital changed in September 2019 and August 2021 due to a comprehensive stock exchanges. The issue prices were based on the closing stock price on the comprehensive stock exchange date. | |
| Note 3) | On October 30, 2023, we canceled our treasury shares (8,585,799 common shares) acquired through a trust agreement. This share cancellation falls under the provision of Article 343, Paragraph 1 of the Commercial Code, and as it involves the cancellation of treasury shares acquired within the limits of distributable profits, the paid-in capital remains unchanged despite the decrease in the number of the total issued shares (common shares). |
| 3. | Total Number of Authorized Shares |
| As of December 31, 2023 | (unit: shares) |
| Items |
Type | Notes | ||||||||||
| Common Shares | Total | |||||||||||
| Number of authorized shares |
4,000,000,000 | 4,000,000,000 | — | |||||||||
| Number of issued shares |
760,535,260 | 760,535,260 | — | |||||||||
| Number of decreased shares |
8,585,799 | 8,585,799 | |
Cancellation of Treasury Shares |
|
|||||||
| Number of treasury shares |
53,945 | 53,945 | Note 1 | ) | ||||||||
| Number of outstanding shares |
751,895,516 | 751,895,516 | — | |||||||||
| Note 1) | Acquired from the issuance of fractional shares (2,322 new fractional shares were added in August 2021 due to the comprehensive stock exchange between Woori Financial Group and Woori Financial Capital. 51,621 shares from comprehensive stock exchange between Woori Financial Group-Woori Investment Bank and Woori Financial Group-Woori Venture Partners, etc.) |
12
| II. | Business Overview |
| 1. | Results of Operations |
(unit: billions of Won)
| Type |
2023 | 2022 | 2021 | |||||||||
| Operating income |
3,499 | 4,431 | 3,660 | |||||||||
| Non-operating income |
18 | 55 | 89 | |||||||||
| Income from continuing operations before income tax |
3,517 | 4,485 | 3,749 | |||||||||
| Income tax expense from continuing operations |
891 | 1,161 | 942 | |||||||||
| Income from discontinued operations |
— | — | — | |||||||||
| Net income |
2,627 | 3,324 | 2,807 | |||||||||
| Controlling Interest |
2,506 | 3,142 | 2,588 | |||||||||
| Non-controlling Interest |
121 | 182 | 219 | |||||||||
| Note 1) | Based on K-IFRS consolidated financial statements |
| 2. | Funding Sources and Uses of Funds |
| a. | Sources of Funds |
| For the periods indicated other than as noted below | (units: millions of Won, %) |
| Classification |
Funding Source | 2023 | 2022 | 2021 | ||||||||||||||||||||||||||||||||||
| Average Balance |
Interest Rate |
Proportion | Average Balance |
Interest Rate |
Proportion | Average Balance |
Interest Rate |
Proportion | ||||||||||||||||||||||||||||||
| Source |
Deposits | 324,824,465 | 2.83 | 68.98 | 313,019,768 | 1.45 | 68.21 | 291,653,291 | 0.79 | 70.88 | ||||||||||||||||||||||||||||
| Borrowings | 28,052,983 | 4.02 | 5.96 | 27,296,742 | 1.99 | 5.95 | 21,628,379 | 0.98 | 5.26 | |||||||||||||||||||||||||||||
| Debentures | 42,458,653 | 3.55 | 9.02 | 45,945,392 | 2.26 | 10.01 | 40,901,547 | 1.78 | 9.94 | |||||||||||||||||||||||||||||
| Others | 42,829,998 | — | 9.09 | 42,537,152 | — | 9.27 | 29,470,312 | — | 7.15 | |||||||||||||||||||||||||||||
| Total Liabilities |
438,166,099 | — | 93.05 | 428,799,054 | — | 93.44 | 383,653,529 | — | 93.23 | |||||||||||||||||||||||||||||
|
|
|
|
|
|
|
|
|
|
|
|
|
|
|
|
|
|
|
|||||||||||||||||||||
| Total Equity |
32,708,219 | — | 6.95 | 30,082,662 | — | 6.56 | 27,845,863 | — | 6.77 | |||||||||||||||||||||||||||||
|
|
|
|
|
|
|
|
|
|
|
|
|
|
|
|
|
|
|
|||||||||||||||||||||
| Total Liabilities & Equity |
470,874,318 | — | 100.00 | 458,881,716 | — | 100.00 | 411,499,392 | — | 100.00 | |||||||||||||||||||||||||||||
|
|
|
|
|
|
|
|
|
|
|
|
|
|
|
|
|
|
|
|||||||||||||||||||||
| Note 1) | Average Balance : simple average of the starting balance for the fiscal year and the balance at the end of each quarter | |
| Note 2) | Based on K-IFRS consolidated financial statements |
13
| b. | Use of Funds |
| For the periods indicated other than as noted below | (units: millions of Won, %) |
|
Type |
Managed Item |
2023 | 2022 | 2021 | ||||||||||||||||||||||||||||||||||
| Average Balance |
Interest Rate |
Proportion | Average Balance |
Interest Rate |
Proportion | Average Balance |
Interest Rate |
Proportion | ||||||||||||||||||||||||||||||
| Cash & Due from Banks | 16,692,268 | 3.26 | 3.54 | 16,097,533 | 1.52 | 3.51 | 13,809,362 | 0.34 | 3.36 | |||||||||||||||||||||||||||||
| Marketable securities | 75,522,522 | 3.61 | 16.04 | 68,661,882 | 1.50 | 14.96 | 58,416,310 | 1.67 | 14.20 | |||||||||||||||||||||||||||||
| Loans | 334,205,508 | 5.08 | 70.98 | 326,710,683 | 3.73 | 71.20 | 301,849,585 | 2.79 | 73.35 | |||||||||||||||||||||||||||||
| Loans in local currency |
287,312,990 | 4.84 | 61.02 | 280,414,033 | 3.53 | 61.12 | 262,010,967 | 2.59 | 63.67 | |||||||||||||||||||||||||||||
| Loans in foreign Currency |
31,215,114 | 6.64 | 6.63 | 30,916,107 | 4.54 | 6.74 | 25,104,084 | 3.58 | 6.10 | |||||||||||||||||||||||||||||
| Guarantee payments |
14,567 | 2.28 | 0.00 | 21,260 | 2.67 | 0.00 | 28,000 | 2.46 | 0.01 | |||||||||||||||||||||||||||||
| Credit card receivables |
11,215,186 | 6.85 | 2.38 | 10,026,037 | 7.24 | 2.18 | 9,196,190 | 7.42 | 2.23 | |||||||||||||||||||||||||||||
| Foreign bills bought |
4,447,651 | 5.33 | 0.95 | 5,333,246 | 2.58 | 1.16 | 5,510,344 | 0.85 | 1.34 | |||||||||||||||||||||||||||||
| Bad debt expense in local currency (-) | 2,609,403 | (0.55 | ) | 2,128,867 | — | (0.46 | ) | 1,878,781 | — | (0.46 | ) | |||||||||||||||||||||||||||
| Others | 47,063,423 | 9.99 | 49,540,485 | — | 10.79 | 39,302,916 | — | 9.55 | ||||||||||||||||||||||||||||||
|
|
|
|
|
|
|
|
|
|
|
|
|
|
|
|
|
|||||||||||||||||||||||
| Total Assets |
470,874,318 | — | 100.00 | 458,881,716 | — | 100.00 | 411,499,392 | — | 100.00 | |||||||||||||||||||||||||||||
|
|
|
|
|
|
|
|
|
|
|
|
|
|
|
|
|
|||||||||||||||||||||||
| Note 1) | Average Balance : simple average of the starting balance for the fiscal year and the balance at the end of each quarter | |
| Note 2) | Based on K-IFRS consolidated financial statements |
| 3. | Other Information Necessary for Making Investment Decisions |
| a. | Capital Adequacy Ratios |
Group BIS Capital Adequacy Ratios
| As of the end of the period indicated | (units: billions of Won, % ) |
| Type |
2023 |
2022 |
2021 |
|||
| Equity capital (A) |
34,756 | 31,404 | 28,980 | |||
| Risk weighted assets (B) |
219,792 | 205,307 | 192,503 | |||
| BIS(Capital adequacy) ratio (A/B) |
15.81 | 15.30 | 15.05 |
| Note 1) | BIS (Bank for International Settlements) Capital Adequacy Ratios = Equity capital / Risk weighted assets * 100 | |
| Note 2) | Based on K-IFRS consolidated financial statements and Basel III standards (2021 figures partially based on IRB Approach) | |
| Note 3) | 2023 figures are estimates only and are subject to change |
14
Capital Adequacy Ratios for Significant Subsidiaries and Consolidated Companies
| As of the end of the periods indicated | (units: millions of Won, % ) |
| Name of Company |
Type |
2023 | 2022 | 2021 | ||||||||||||
| Woori Bank Note2) |
BIS ratio Note1) |
Equity capital (A) | 28,237,929 | 26,119,135 | 25,473,034 | |||||||||||
| Risk weighted assets (B) | 176,073,743 | 167,432,214 | 157,275,764 | |||||||||||||
| Capital adequacy ratio (A/B) | 16.04 | 15.60 | 16.20 | |||||||||||||
| Woori Card Note3) |
Adjusted capital ratio | 16.03 | 16.54 | 17.73 | ||||||||||||
| Tangible common equity ratio | 10.97 | 11.28 | 11.84 | |||||||||||||
| Woori Financial Capital Note3) |
Adjusted capital ratio | 14.35 | 13.78 | 13.38 | ||||||||||||
| Tangible common equity ratio | 11.48 | 10.66 | 11.70 | |||||||||||||
| Woori Investment Bank Note4) |
BIS ratio Note1) |
Equity capital (A) | 1,127,425 | 674,082 | 576,693 | |||||||||||
| Risk weighted assets (B) | 4,664,162 | 4,448,524 | 4,037,822 | |||||||||||||
| Capital adequacy ratio (A/B) | 24.17 | 15.15 | 14.28 | |||||||||||||
| Woori Asset Trust Note5) |
Operating capital ratio | 1,284.26 | 1,189.77 | 1,078.93 | ||||||||||||
| Woori Asset Management Note3) |
Minimum operating capital ratio | 650.26 | 681.18 | 721.87 | ||||||||||||
| Woori Venture Partners Note6) |
Tangible common equity ratio | 90.82 | 90.92 | 88.57 | ||||||||||||
| Woori Savings Bank Note7) |
BIS Capital adequacy ratio Note1) | 13.21 | 18.06 | 21.47 | ||||||||||||
| Woori Private Equity Asset Management Note3) |
Minimum operating capital ratio | 8,618.79 | 8,937.76 | 3,967.99 | ||||||||||||
| Note 1) | BIS (Bank for International Settlements) Capital Adequacy Ratio : Equity capital / Risk weighted assets * 100 | |
| Note 2) | Figures for Woori Bank are based on K-IFRS consolidated financial statements and Basel III standards. 2023 figures are estimates only and are subject to change | |
| Note 3) | Figures for Woori Card, Woori Financial Capital, Woori Asset Management, Woori Private Equity Asset Management are based on the applicable standards for business reports submitted to the Financial Supervisory Service and our K-IFRS separate financial statements | |
| Note 4) | Figures for Woori Investment Bank are based on the applicable standards for business reports submitted to the Financial Supervisory Service and our K-IFRS consolidated financial statements | |
| Note 5) | Figures for Woori Asset Trust are based on K-IFRS separate financial statements |
|
| Note 6) | Figures for Woori Venture Partners are based on K-IFRS consolidated financial statements | |
| Note 7) | Figures for Woori Savings Bank are based on K-GAAP |
15
| b. | Liquidity Ratios |
Won Liquidity Ratios
| As of the end of the periods indicated | (units: millions of Won, % ) |
| Type |
2023 | 2022 | 2021 | |||||||||||||||||||||||||||||||||
| Won Liquidity Assets |
Won Liquidity Liabilities |
Won Liquidity Ratio |
Won Liquidity Assets |
Won Liquidity Liabilities |
Won Liquidity Ratio |
Won Liquidity Assets |
Won Liquidity Liabilities |
Won Liquidity Ratio |
||||||||||||||||||||||||||||
| Woori Financial Group Note 1) |
111,895 | 8,155 | 1,372.1 | 316,876 | 7,656 | 4,138.9 | 560,744 | 5,734 | 9,779.3 | |||||||||||||||||||||||||||
| Woori Card Note 2) |
9,119,265 | 2,454,480 | 371.54 | 8,282,745 | 1,832,484 | 452.0 | 7,455,390 | 1,419,809 | 525.1 | |||||||||||||||||||||||||||
| Woori Financial Capital Note 2) |
1,919,083 | 1,245,067 | 154.1 | 2,468,298 | 1,205,067 | 204.8 | 1,531,101 | 856,736 | 178.7 | |||||||||||||||||||||||||||
| Woori Investment Bank Note 2) |
4,032,290 | 1,926,080 | 209.4 | 3,128,499 | 1,802,149 | 173.6 | 2,728,159 | 2,031,260 | 134.3 | |||||||||||||||||||||||||||
| Woori Asset Trust Note 2) |
171,860 | 18,555 | 926.2 | 232,036 | 32,755 | 708.4 | 176,660 | 25,558 | 691.2 | |||||||||||||||||||||||||||
| Woori Savings Bank Note 2), Note3) |
434,495 | 231,003 | 188.09 | 534,678 | 384,493 | 139.1 | 292,913 | 228,445 | 128.2 | |||||||||||||||||||||||||||
| Woori Venture Partners Note 2) |
103,367 | 7,210 | 1,433.6 | 109,432 | 10,707 | 1,022.1 | 122,396 | 21,978 | 556.9 | |||||||||||||||||||||||||||
| Woori Private Equity Asset Management Note 2) |
27,506 | 2,396 | 1,147.8 | 23,226 | 1,897 | 1,224.4 | 8,068 | 1,539 | 540.0 | |||||||||||||||||||||||||||
| Note 1) | Based on current assets and liabilities within one month of maturity | |
| Note 2) | Based on current assets and liabilities within 90 days of maturity | |
| Note 3) | Based on K-GAAP |
Foreign Currency (FC) Liquidity Ratios
| As of the end of the periods indicated | (units: millions of Won, % ) |
| Type |
2023 | 2022 | 2021 | |||||||||||||||||||||||||||||||||
| FC Liquidity Assets |
FC Liquidity Liabilities |
FC Liquidity Ratio |
FC Liquidity Assets |
FC Liquidity Liabilities |
FC Liquidity Ratio |
FC Liquidity Assets |
FC Liquidity Liabilities |
FC Liquidity Ratio |
||||||||||||||||||||||||||||
| Woori Investment Bank Note 1) |
9,450 | 7,362 | 128.36 | 65,102 | 63,365 | 102.74 | 13,583 | — | — | |||||||||||||||||||||||||||
| Note 1) | Based on current assets and liabilities within three months of maturity |
Liquidity Coverage Ratios
(unit: % )
| Name of Company |
Type |
2023 | 2022 | 2021 | ||||||||||
| Woori Bank |
Liquidity coverage ratio Note 1) | 101.26 | 102.40 | 89.95 | ||||||||||
| Foreign currency liquidity coverage ratio Note 2) | 162.75 | 143.11 | 107.40 | |||||||||||
| Ratio of business purpose premises and equipment | 10.20 | 11.04 | 11.46 | |||||||||||
| Note 1) | LCR: Average of daily ratios during a quarter (same as the calculation method used for business disclosure) |
| - | 2023 year-end regulatory ratio: 95.0%, 2022 year-end regulatory ratio: 92.5%, 2021 year-end regulatory ratio: 85.0% |
| Note 2) | Foreign currency LCR: ratio calculated based on averages of the amount of each category (same as the calculation method used for business disclosure) |
| - | Regulatory ratio after 2022: 80.0%, 2021 year-end regulatory ratio: 70.0% |
| Note 3) | The applicable periods for LCR and Foreign currency LCR are: 4Q2023, 4Q2022 and 4Q2021 |
16
| c. | Profitability Ratios Note1), Note2) |
(unit: %)
| Type |
2023 | 2022 | 2021 | |||||||||||||||||||||
|
|
|
|
|
|
|
|||||||||||||||||||
| ROA | ROE | ROA | ROE | ROA | ROE | |||||||||||||||||||
| Woori Financial Group |
||||||||||||||||||||||||
| Including non-controlling interests |
0.54 | 8.65 | 0.70 | 12.21 | 0.66 | 11.48 | ||||||||||||||||||
| Excluding non-controlling interests |
0.52 | 8.25 | 0.66 | 11.54 | 0.61 | 10.58 | ||||||||||||||||||
| Woori Bank |
0.56 | 9.68 | 0.66 | 11.71 | 0.60 | 9.92 | ||||||||||||||||||
| Woori Card |
1.02 | 6.64 | 1.14 | 7.28 | 1.10 | 6.36 | ||||||||||||||||||
| Woori Financial Capital |
0.83 | 6.39 | 1.51 | 12.53 | 1.69 | 15.74 | ||||||||||||||||||
| Woori Investment Bank |
(0.93 | ) | (6.95 | ) | 1.74 | 14.47 | 1.59 | 12.89 | ||||||||||||||||
| Woori Asset Trust |
9.73 | 12.68 | 20.86 | 29.74 | 18.64 | 27.05 | ||||||||||||||||||
| Woori Savings Bank Note3) |
(2.42 | ) | (18.47 | ) | 0.41 | 3.05 | 1.06 | 7.95 | ||||||||||||||||
| Woori Asset Management |
4.97 | 5.30 | 0.75 | 0.80 | 6.82 | 7.11 | ||||||||||||||||||
| Woori Venture Partners |
2.63 | 2.90 | 4.06 | 4.51 | 27.83 | 32.93 | ||||||||||||||||||
| Woori Private Equity Asset Management |
2.07 | 2.16 | 2.60 | 2.75 | 5.46 | 5.96 | ||||||||||||||||||
| Note 1) | Based on the applicable standards for business reports submitted to the Financial Supervisory Service. The figures for Woori Financial Group and Woori Bank are on a consolidated basis while the figures for the other subsidiaries are on a non-consolidated basis | |
| Note 2) | Total assets and total equity : simple average of the starting balance for the fiscal year and the ending balance of each quarter | |
| Note 3) | Figures for Woori Savings Bank are based on K-GAAP |
| d. | Asset Quality |
Group Asset Quality
(units: billions of Won, % )
| Type |
2023 | 2022 | 2021 | |||||||||
| Total loans |
365,780 | 343,821 | 332,797 | |||||||||
| Substandard and below loans |
1,357 | 1,082 | 990 | |||||||||
| Substandard and below ratio |
0.37 | 0.31 | 0.30 | |||||||||
| Non-performing loans (“NPL”) |
1,299 | 997 | 902 | |||||||||
| NPL ratio |
0.36 | 0.29 | 0.27 | |||||||||
| Substandard and below coverage ratio (A/B) |
220.1 | 217.6 | 192.2 | |||||||||
| Loan loss reserve (A) |
2,986 | 2,354 | 1,903 | |||||||||
| Substandard and below loans (B) |
1,357 | 1,082 | 990 | |||||||||
| Note 1) | Based on the applicable standards for financial holding company business reports submitted to the Financial Supervisory Service |
17
Asset Quality for Significant Subsidiaries and Consolidated Companies
(units: % )
| Type |
2023 | 2022 | 2021 | |||||||||||||||||||||||||||||||||
|
|
|
|
|
|
|
|||||||||||||||||||||||||||||||
| Substandard and below ratio |
NPL ratio |
Substandard and below coverage ratio |
Substandard and below ratio |
NPL ratio |
Substandard and below coverage ratio |
Substandard and below ratio |
NPL ratio |
Substandard and below coverage ratio |
||||||||||||||||||||||||||||
| Woori Bank |
0.18 | 0.17 | 320.84 | 0.19 | 0.16 | 263.43 | 0.20 | 0.18 | 205.50 | |||||||||||||||||||||||||||
| Woori Card |
0.97 | — | 104.92 | 0.80 | — | 104.92 | 0.41 | — | 103.21 | |||||||||||||||||||||||||||
| Woori Financial Capital |
2.37 | — | 113.21 | 1.22 | — | 198.56 | 1.20 | — | 196.70 | |||||||||||||||||||||||||||
| Woori Investment Bank |
0.55 | 0.55 | 578.29 | 0.63 | 0.58 | 151.81 | 0.57 | 0.55 | 120.05 | |||||||||||||||||||||||||||
| Woori Asset Trust |
32.11 | — | — | 32.23 | — | — | 56.61 | — | — | |||||||||||||||||||||||||||
| Woori Savings Bank Note 2) |
3.53 | — | 101.66 | 3.22 | — | 97.54 | 2.32 | — | 117.37 | |||||||||||||||||||||||||||
| Note 1) | Based on the applicable standards for business reports submitted to the Financial Supervisory Service | |
| Note 2) | Based on K-GAAP |
18
| III. | Financial Information |
| 1. | Condensed Financial Statements (Consolidated) |
Summary Consolidated Statement of Financial Position
| (The Company and its Consolidated Subsidiaries, as of the end of the periods indicated) |
(unit: millions of Won) | |||
| Classification |
2023 | 2022 | 2021 | |||||||||
| ASSETS | ||||||||||||
| Cash and cash equivalents |
30,556,618 | 34,219,148 | 20,613,073 | |||||||||
| Financial assets at fair value through profit or loss (“FVTPL”) |
21,544,756 | 19,860,573 | 13,497,234 | |||||||||
| Financial assets at fair value through other comprehensive income |
37,891,495 | 33,085,080 | 39,119,789 | |||||||||
| Securities at amortized cost |
23,996,172 | 28,268,516 | 17,086,274 | |||||||||
| Loans and other financial assets at amortized cost |
373,148,148 | 355,760,729 | 348,885,617 | |||||||||
| Investments in joint ventures and associates |
1,795,370 | 1,305,636 | 1,335,167 | |||||||||
| Investment properties |
472,768 | 387,707 | 389,495 | |||||||||
| Premises and equipment |
3,176,759 | 3,142,930 | 3,174,720 | |||||||||
| Intangible assets and goodwill |
996,842 | 849,114 | 785,386 | |||||||||
| Assets held for sale |
20,345 | 13,772 | 26,327 | |||||||||
| Net defined benefit asset |
240,260 | 319,280 | 21,346 | |||||||||
| Current tax assets |
203,542 | 53,274 | 22,598 | |||||||||
| Deferred tax assets |
93,366 | 109,299 | 31,131 | |||||||||
| Derivative assets (designated for hedging) |
26,708 | 37,786 | 106,764 | |||||||||
| Other assets |
3,841,787 | 3,061,552 | 2,088,950 | |||||||||
|
|
|
|
|
|
|
|||||||
| Total assets |
498,004,936 | 480,474,396 | 447,183,871 | |||||||||
|
|
|
|
|
|
|
|||||||
| LIABILITIES |
||||||||||||
| Financial liabilities at FVTPL |
6,138,313 | 8,952,399 | 4,873,458 | |||||||||
| Deposits due to customers |
357,784,297 | 342,105,209 | 317,899,871 | |||||||||
| Borrowings |
30,986,746 | 28,429,603 | 24,755,459 | |||||||||
| Debentures |
41,239,245 | 44,198,486 | 44,653,864 | |||||||||
| Provisions |
806,031 | 545,865 | 576,134 | |||||||||
| Net defined benefit liability |
6,939 | 35,202 | 47,986 | |||||||||
| Current tax liabilities |
103,655 | 843,555 | 584,491 | |||||||||
| Deferred tax liabilities |
470,311 | 31,799 | 186,946 | |||||||||
| Derivative liabilities (designated for hedging) |
153,007 | 202,911 | 27,584 | |||||||||
| Other financial liabilities |
26,115,005 | 22,811,868 | 24,171,030 | |||||||||
| Other liabilities |
803,897 | 690,157 | 556,853 | |||||||||
|
|
|
|
|
|
|
|||||||
| Total liabilities |
464,607,446 | 448,847,054 | 418,333,676 | |||||||||
|
|
|
|
|
|
|
|||||||
| EQUITY |
||||||||||||
| Owners’ equity: |
31,666,881 | 28,761,897 | 25,842,019 | |||||||||
| Capital stock |
3,802,676 | 3,640,303 | 3,640,303 | |||||||||
| Hybrid securities |
3,611,129 | 3,112,449 | 2,294,381 | |||||||||
| Capital surplus |
935,563 | 682,385 | 682,385 | |||||||||
| Other equity |
(1,668,957 | ) | (2,423,392 | ) | (2,167,614 | ) | ||||||
| Retained earnings |
24,986,470 | 23,750,152 | 21,392,564 | |||||||||
| Non-controlling interests |
1,730,609 | 2,865,445 | 3,008,176 | |||||||||
|
|
|
|
|
|
|
|||||||
| Total equity |
33,397,490 | 31,627,342 | 28,850,195 | |||||||||
|
|
|
|
|
|
|
|||||||
| Total liabilities and equity |
498,004,936 | 480,474,396 | 447,183,871 | |||||||||
|
|
|
|
|
|
|
|||||||
| Number of Consolidated Subsidiaries (excluding holding company) |
179 | 167 | 152 | |||||||||
19
Summary Consolidated Statement of Comprehensive Income
| (The Company and its Consolidated Subsidiaries, for the periods indicated) |
(unit: millions of Won, except per share amounts) | |||
| Classification |
2023 | 2022 | 2021 | |||||||||
| Operating income |
3,499,029 | 4,430,524 | 3,659,749 | |||||||||
| Net interest income |
8,742,540 | 8,696,579 | 6,985,721 | |||||||||
| Net fees and commissions income |
1,720,481 | 1,710,170 | 1,470,775 | |||||||||
| Dividend income |
240,293 | 159,982 | 309,211 | |||||||||
| Net gain or loss on financial instruments at FVTPL |
488,486 | 238,502 | 325,751 | |||||||||
| Net gain or loss on financial assets at FVTOCI |
(37,641 | ) | (21,498 | ) | 32,624 | |||||||
| Net gain or loss arising on financial assets at amortized cost |
203,942 | 74,204 | 107,317 | |||||||||
| Impairment losses due to credit loss |
(1,894,916 | ) | (885,272 | ) | (536,838 | ) | ||||||
| General and administrative expenses |
(4,443,433 | ) | (4,529,890 | ) | (4,147,411 | ) | ||||||
| Other net operating income (expenses) |
(1,520,723 | ) | (1,012,253 | ) | (887,401 | ) | ||||||
| Non-operating income |
18,424 | 54,850 | 89,492 | |||||||||
| Net income before income tax expense |
3,517,453 | 4,485,374 | 3,749,241 | |||||||||
| Income tax expense |
(890,559 | ) | (1,161,392 | ) | (941,870 | ) | ||||||
| Net income |
2,626,894 | 3,323,982 | 2,807,371 | |||||||||
| Net income attributable to owners |
2,506,296 | 3,141,680 | 2,587,936 | |||||||||
| Net income attributable to the non-controlling interests |
120,598 | 182,302 | 219,435 | |||||||||
| Other comprehensive income (loss), net of tax |
663,537 | (239,819 | ) | 170,181 | ||||||||
| Items that will not be reclassified to profit or loss |
122,334 | 216,767 | 96,529 | |||||||||
| Items that may be reclassified to profit or loss |
541,203 | (456,586 | ) | 73,652 | ||||||||
| Total comprehensive income |
3,290,431 | 3,084,163 | 2,977,552 | |||||||||
| Comprehensive income attributable to the owners |
3,164,464 | 2,909,053 | 2,745,764 | |||||||||
| Comprehensive income attributable to non-controlling interests |
125,967 | 175,110 | 231,788 | |||||||||
| Net income per share: |
||||||||||||
| Basic and diluted loss per share (in Korean Won) |
3,230 | 4,191 | 3,481 | |||||||||
20
| 2. | Condensed Financial Statements (Separate) |
Summary Statement of Financial Position
| (The Company, as of the end of the period indicated) | (unit: millions of Won) |
| Classification |
2023 | 2022 | 2021 | |||||||||
| ASSETS |
||||||||||||
| Cash and cash equivalents |
289,507 | 313,361 | 578,725 | |||||||||
| Financial assets at fair value through profit or loss |
— | 689 | — | |||||||||
| Financial assets at fair value through other comprehensive income |
539,709 | 312,771 | 146,294 | |||||||||
| Loans and other financial assets at amortized cost |
1,104,815 | 2,041,877 | 633,110 | |||||||||
| Investments in subsidiaries |
23,670,476 | 22,394,915 | 22,144,915 | |||||||||
| Premises and equipment |
6,609 | 11,052 | 7,790 | |||||||||
| Intangible assets |
4,052 | 4,859 | 5,171 | |||||||||
| Net defined benefit asset |
3,941 | 5,947 | 1,516 | |||||||||
| Current tax assets |
158,951 | 14,350 | 856 | |||||||||
| Deferred tax assets |
7,478 | 13,433 | 6,454 | |||||||||
| Other assets |
484 | 322 | 151 | |||||||||
|
|
|
|
|
|
|
|||||||
| Total assets |
25,786,022 | 25,113,576 | 23,524,982 | |||||||||
|
|
|
|
|
|
|
|||||||
| LIABILITIES |
||||||||||||
| Financial liabilities at fair value through profit or loss |
— | — | 329 | |||||||||
| Debentures |
1,587,659 | 1,447,762 | 1,367,429 | |||||||||
| Provisions |
1,227 | 487 | 394 | |||||||||
| Current tax liabilities |
32,125 | 721,795 | 468,305 | |||||||||
| Other financial liabilities |
163,621 | 46,039 | 22,988 | |||||||||
| Other liabilities |
392 | 591 | 548 | |||||||||
|
|
|
|
|
|
|
|||||||
| Total liabilities |
1,785,024 | 2,216,674 | 1,859,993 | |||||||||
|
|
|
|
|
|
|
|||||||
| EQUITY |
||||||||||||
| Capital stock |
3,802,676 | 3,640,303 | 3,640,303 | |||||||||
| Hybrid securities |
3,610,953 | 3,112,273 | 2,294,288 | |||||||||
| Capital surplus |
11,120,236 | 10,909,281 | 10,909,281 | |||||||||
| Other equity |
(7,871 | ) | (26,186 | ) | (3,874 | ) | ||||||
| Retained Earnings | 5,475,004 | 5,261,231 | 4,824,991 | |||||||||
|
|
|
|
|
|
|
|||||||
| Total equity |
24,000,998 | 22,896,902 | 21,664,989 | |||||||||
|
|
|
|
|
|
|
|||||||
| Total liabilities and equity |
25,786,022 | 25,113,576 | 23,524,982 | |||||||||
|
|
|
|
|
|
|
|||||||
21
Summary Statement of Comprehensive Income
| (The Company, for the period indicated) | (unit: millions of Won, except per share amounts) |
| Classification |
2023 | 2022 | 2021 | |||||||||
| Operating income |
1,424,670 | 1,185,627 | 590,550 | |||||||||
| Net interest income (expense) |
27,495 | (5,030 | ) | (22,245 | ) | |||||||
| Interest income |
64,592 | 25,614 | 4,236 | |||||||||
| Interest expense |
(37,097 | ) | (30,644 | ) | (26,481 | ) | ||||||
| Net fees and commissions loss |
(20,097 | ) | (15,059 | ) | (12,585 | ) | ||||||
| Fees and commissions income |
1,625 | 1,596 | 1,306 | |||||||||
| Fees and commissions expense |
(21,722 | ) | (16,655 | ) | (13,891 | ) | ||||||
| Dividend income |
1,482,956 | 1,272,393 | 692,605 | |||||||||
| Net gain (loss) on financial instruments at FVTPL |
2,023 | 1,018 | (7,576 | ) | ||||||||
| Reversal (Provision) of impairment losses due to credit loss |
(348 | ) | (244 | ) | 76 | |||||||
| General and administrative expenses |
(67,359 | ) | (67,451 | ) | (59,725 | ) | ||||||
| Non-operating income (expense) |
(1,043 | ) | (1,363 | ) | (305 | ) | ||||||
| Net income before income tax expense |
1,423,627 | 1,184,264 | 590,245 | |||||||||
| Income tax income (expense) |
881 | (1,015 | ) | 4,607 | ||||||||
| Net income |
1,424,508 | 1,183,249 | 594,852 | |||||||||
| Other comprehensive income (loss), net of tax |
18,916 | (22,312 | ) | (2,330 | ) | |||||||
| Items that will not be reclassified to profit or loss |
18,916 | (22,312 | ) | (2,330 | ) | |||||||
| Net gain (loss) on valuation of equity securities at FVTOCI |
19,789 | (24,676 | ) | (2,408 | ) | |||||||
| Remeasurement of the net defined benefit liability |
(873 | ) | 2,364 | 78 | ||||||||
| Total comprehensive Income |
1,443,424 | 1,160,937 | 592,522 | |||||||||
| Net Income per share: |
||||||||||||
| Basic and diluted income per share (in Korean Won) |
1,754 | 1,499 | 730 | |||||||||
22
| 3. | Dividend Information |
As a financial holding company, we depend on receiving dividends from our subsidiaries to pay dividends, and our subsidiaries pay us dividends within the limits of their distributable profits after deducting the necessary internal reserves required to maintain the adequate regulatory capital imposed by the financial authorities by sector. Therefore, the levels of our dividend payouts take into holistic consideration the current and future asset growth of Woori Financial Group and its subsidiaries and surplus funds after maintaining the appropriate capital adequacy ratios, among other factors.
In 2023, we established and disclosed, through our IR activities, our “Shareholder Return Policy and Capital Management Plan based on the Total Shareholder Return (“TSR”) Ratio (considering both dividends and treasury share buyback/cancellation”. Accordingly, for the first time since our establishment, we paid interim dividends (KRW 180 per share for each of the second and third quarters), repurchased and canceled treasury shares worth KRW 100 billion, and achieved a TSR of approximately 33.8% through a resolution to pay a year-end dividend of KRW 640 per share.
Furthermore, to advance the dividend process (dividend decision g record date), we resolved to amend our articles of incorporation at the FY2022 shareholders’ meeting (held on March 24, 2023) and subsequently set the record date for the FY2023 annual dividend to come after the announcement of the dividend decision, effectively enhancing the predictability of dividends.
Considering the recent strengthening of capital regulations, enhanced loss-absorption capacity, and the competitive landscape, we have reviewed and made some modifications to the existing shareholder return policy, including changing the CET1 ratio criterion from 12% to 13%. The main points are as follows:
| ① | Maintain the current policy of “concurrently paying cash dividends and repurchasing and canceling treasury shares” and gradually increase the level of such activities. |
| ② | Modify the shareholder return policy for each CET1 ratio range as follows: |
| Classification |
Tier 1 |
Tier 2 |
Tier 3 |
|||
| CET1 Ratio |
~ 11.5% | 11.5% ~ 13.0% | 13.0% ~ | |||
| Total Shareholder Return (TSR) |
below 30% | 30% ~ 35% Level | 35% or above | |||
| (Target TSR 50%) |
| Note 1) | The TSR ratio is determined annually based on the macro environments (both domestic and international) and group net profit, etc. | |
| Note 2) | The shareholder return policy may change depending on regulatory supervision, economic conditions and management objectives, among others. |
| ③ | Promote selective growth considering Return on Risk Weighted Asset (RoRWA) for a proactive risk-weighted asset management and additional capital ratio improvement through asset portfolio enhancement, such as increasing high-quality assets with low risk and high returns. |
We will continue our efforts to review the criteria and scale of future shareholder return policies, aiming to enhance market predictability and shareholder value. If there are any changes to the shareholder return policy, such as the implementation of the “Enterprise Value-Up Program” in the future, we will actively communicate such updates with stakeholders through guidance and disclosure.
23
| Items |
2023 | 2022 | 2021 | |||||||||||||
| Par value per share (Won) |
|
5,000 | 5,000 | 5,000 | ||||||||||||
| Net profit (Millions of Won) |
|
2,506,296 | 3,141,680 | 2,587,936 | ||||||||||||
| Earnings per share (Won) |
|
3,230 | 4,191 | 3,481 | ||||||||||||
| Total cash dividends (Millions of Won) |
|
747,302 | 822,705 | 654,384 | ||||||||||||
| Total stock dividends (Millions of Won) |
|
— | — | — | ||||||||||||
| Cash dividend payout ratio (%) |
|
29.82 | 26.19 | 25.29 | ||||||||||||
| Cash dividend yield (%) |
Common Shares | 6.7 | 8.8 | 6.8 | ||||||||||||
| Preferred Shares | — | — | — | |||||||||||||
| Stock dividend yield (%) |
Common Shares | — | — | — | ||||||||||||
| Preferred Shares | — | — | — | |||||||||||||
| Cash dividend per share (Won) |
Common Shares | 1,000 | 1,130 | 900 | ||||||||||||
| Preferred Shares | — | — | — | |||||||||||||
| Stock dividend per share (Share) |
Common Shares | — | — | — | ||||||||||||
| Preferred Shares | — | — | — | |||||||||||||
| Note 1) | The dividends for FY2023 include interim dividends of KRW 130,748 million (KRW 180 cash dividend per share) for the second quarter, and KRW 135,341 million (KRW 180 cash dividend per share) for the third quarter | |
| Note 2) | The dividends for FY2022 include the interim dividends of KRW 109,209 million (KRW 150 cash dividend per share) | |
| Note 3) | The dividends for FY2021 include the interim dividends of KRW 108,340 million (KRW 150 cash dividend per share) | |
| Note 4) | Of the total cash dividends for FY2023, the annual dividends of KRW 481,213 million represents the amount prior to its approval at the annual general meeting of shareholders for FY2023. If the amount is rejected or amended at the annual general meeting, the Company will disclose such changes, including details and reasons. | |
| Note 5) | The above cash dividend yield is calculated as the percentage of dividend per share to the arithmetic average price formed in the stock market during the past week, starting from two trading days before the record date. The percentage is rounded to the first decimal place. |
24
| IV. | Independent Auditor’s Opinion |
| 1. | Independent Auditor’s Opinion |
| 2023 | 2022 | 2021 | ||||
| Auditor |
KPMG Samjong Accounting Corp. | Samil PricewaterhouseCoopers | Samil PricewaterhouseCoopers | |||
| Auditor’s Opinion |
Note 1) | Note 2) | Note 3) |
| Note 1) | In its audit report, KPMG Samjong Accounting Corp. has stated that the financial statements are presented fairly, in all material respects, in accordance with Korean IFRS. |
| Note 2) | In its audit report, Samil PricewaterhouseCoopers has stated that the financial statements are presented fairly, in all material respects, in accordance with Korean IFRS. |
| Note 3) | In its audit report, Samil PricewaterhouseCoopers has stated that the financial statements are presented fairly, in all material respects, in accordance with Korean IFRS. |
| 2. | Compensation to the Independent Auditor |
| a. | Audit Services |
| Term |
Auditor |
Description |
Contractual | Actual | ||||||||
| Fee | Time | Fee | Time | |||||||||
| 2023 |
KPMG Samjong Accounting Corp. | 1Q/1H/3Q Review Closing audit (including internal accounting management system) |
KRW 964 million |
9,380 hours |
KRW 964 million |
9,613 hours |
||||||
| 2022 |
Samil PricewaterhouseCoopers |
1Q/1H/3Q Review Closing audit (including internal accounting management system) |
KRW 1,068 million |
9,380 hours |
KRW 1,068 million |
8,714 hours |
||||||
| 2021 |
Samil PricewaterhouseCoopers |
1Q/1H/3Q Review Closing audit (including internal accounting management system) |
KRW 1,172 million |
10,450 hours |
KRW 1,172 million |
9,962 hours |
||||||
| Note 1) |
Fee excludes VAT | |
| Note 2) |
Time includes planning time up until the commencement of the applicable services | |
| b. | Other Audit Services |
Not Applicable
25
| c. | Current Status of Audit Service Agreements with the Independent Auditor Relating to U.S. Listing |
| Term | Auditor |
Description |
Fee |
|||
| 2023 | KPMG Samjong Accounting Corp. | U.S. PCAOB standard audit of consolidated financial statements and internal control over financial reporting (for FY2023) | KRW 1,891 million | |||
| 2022 | Samil PricewaterhouseCoopers | U.S. PCAOB standard audit of consolidated financial statements and internal control over financial reporting (for FY2022) | KRW 2,240 million | |||
| 2021 | Samil PricewaterhouseCoopers | U.S. PCAOB standard audit of consolidated financial statements and internal control over financial reporting (for FY2021) | KRW 2,370 million |
| Note 1) | Fee excludes VAT |
| d. | Non-Audit Services |
| Term | Date of Execution of Agreement |
Description of Service | Service Term | Fees | ||||
|
|
|
|
|
|||||
| 2023 | March 31, 2023 | Tax adjustment (including review relating to application of consolidated tax) | April 1, 2023 ~ May 31, 2024 | KRW 64 million | ||||
| 2022 | March 30, 2022 | Tax adjustment (including review relating to application of consolidated tax) | April 1, 2022 ~ May 31, 2023 | KRW 64 million | ||||
| 2021 | March 29, 2021 | Tax adjustment (including review relating to application of consolidated tax) | June 1, 2021 ~ May 31, 2022 | KRW 61 million |
| Note 1) | Fee excludes VAT |
26
| V. | Corporate Governance |
| 1. | About the Board of Directors |
| a. | Composition of the Board of Directors |
As of December 31, 2023, our board of directors consists of seven directors in total, consisting of six independent directors and one standing director.
On March 24, 2023, at the annual general meeting of shareholders, three independent directors and one standing director were appointed.
- New independent directors (2): Su-Young Yun, Sung-Bae Ji / Reappointed independent director (1): Chan-Hyoung Chung / New standing director (1): Jong-Yong Yim
On March 24, 2023, three independent directors and one standing director completed their terms and resigned.
- Resignation of independent directors (3): Sung-Tae Ro, Sang-Yong Park, Dong-Woo Chang / Resignation of standing director (1): Tae-Seung Son
On July 3, 2023, Won-Duk Lee, a non-standing director, resigned due to personal reasons.
The board of directors operates a total of six standing committees: Audit Committee, Risk Management Committee, Compensation Committee, Committee for Recommending Executive Officer Candidates, Committee for Recommending Subsidiary Representative Director Candidates, ESG Management Committee.
On March 24, 2023, Chan-Hyoung Chung, an independent director, was appointed as the chair of the board of directors. Chan-Hyoung Chung, a former CEO of a finance company, has outstanding insight and experience in the financial and accounting sectors. He has demonstrated leadership and responsibility as an independent director of Woori Financial Group (from January 11, 2019 to present) and as the chair of the Audit Committee (from January 11, 2019 to March 24, 2023), which led to his appointment as the chair of our board of directors based on unanimous consent from all of the directors.
The chair of the board of directors does not concurrently hold the position of representative director.
27
| b. | Committees under the Board of Directors |
We currently have the following committees serving under the board of directors:
| (a) | Audit Committee |
| (b) | Risk Management Committee |
| (c) | Compensation Committee |
| (d) | Committee for Recommending Executive Officer Candidates |
| (e) | Committee for Recommending Subsidiary Representative Director Candidates |
| (f) | ESG Management Committee |
(As of December 31, 2023)
| Name of Committee |
Composition |
Names of Members |
||
| Audit Committee | Four independent directors | (Chair) Su-Young Yun (independent director) Chan-Hyoung Chung (independent director) Yo-Hwan Shin (independent director) Sung-Bae Ji (independent director) |
||
| Risk Management Committee | Three independent directors | (Chair) In-Sub Yoon (independent director) Su-Young Yun (independent director) Soo-Young Song (independent director) |
||
| Compensation Committee | Four independent directors | (Chair) Yo-Hwan Shin (independent director) In-Sub Yoon (independent director) Chan-Hyoung Chung (independent director) Su-Young Yun (independent director) |
||
| Committee for Recommending Executive Officer Candidates | Six independent directors | (Chair) Sung-Bae Ji (independent director) In-Sub Yoon (independent director) Chan-Hyoung Chung (independent director) Su-Young Yun (independent director) Yo-Hwan Shin (independent director) Soo-Young Song (independent director) |
||
| Committee for Recommending Subsidiary Representative Director Candidates | Six independent directors One standing director |
(Chair) Jong-Yong Yim (standing director) In-Sub Yoon (independent director) Chan-Hyoung Chung (independent director) Su-Young Yun (independent director) Yo-Hwan Shin (independent director) Sung-Bae Ji (independent director) Soo-Young Song (independent director) |
||
| ESG Management Committee | Six independent directors One standing director |
(Chair) Soo-Young Song (independent director) In-Sub Yoon (independent director) Chan-Hyoung Chung (independent director) Su-Young Yun (independent director) Yo-Hwan Shin (independent director) Sung-Bae Ji (independent director) Jong-Yong Yim (standing director) |
||
28
| 2. | Shareholders’ Meetings |
| a. | Voting Rights Note 1) |
(unit: shares, as of Dec. 31, 2023)
| Items |
Number of shares |
Notes | ||||||||
| Number of issued shares |
Common Shares | 751,949,461 | — | |||||||
| Preferred Shares | — | — | ||||||||
| Number of shares without voting rights |
Common Shares | 3,427,497 | Note 2 | ) | ||||||
| Preferred Shares | — | — | ||||||||
| Number of shares for which voting rights are excluded pursuant to the articles of incorporation | Common Shares | — | — | |||||||
| Preferred Shares | — | — | ||||||||
| Number of shares for which voting rights are limited by law |
Common Shares | 10,482,022 | Note 3 | ) | ||||||
| Preferred Shares | — | — | ||||||||
| Number of shares for which voting rights have been restored |
Common Shares | — | — | |||||||
| Preferred Shares | — | — | ||||||||
| Number of shares for which voting rights may be exercised |
Common Shares | 738,039,942 | — | |||||||
| Preferred Shares | — | — | ||||||||
| Note 1) | As of the annual general meeting of shareholders for FY2023 in March 2024 | |
| Note 2) | Treasury shares acquired from the issuance of fractional shares and shares in mutual ownership (pursuant to Article 369 of the Commercial Code) | |
| Note 3) | A non-financial business operator is restricted from exercising voting rights in excess of 4% of the total number of outstanding voting shares of a financial holding company (pursuant to Article 8-2 of the Financial Holding Company Act) |
29
| b. | Summary of the Minutes of Shareholders’ Meetings |
| Agenda | Result | |||
|
Annual General Meeting of Shareholders for FY2020 (March 26, 2021) |
1. Approval of financial statements for the fiscal year 2020 | Approved as submitted | ||
| 2. Approval of amendments to the Articles of Incorporation | Approved as submitted | |||
| 3. Approval of reduction of Capital Reserve | Approved as submitted | |||
| 4. Appointment of directors (1 standing director, 4 independent directors) - 4-1 Candidate for standing director : Won-Duk Lee - 4-2 Candidate for independent director : Sung-Tae Ro - 4-3 Candidate for independent director : Sang-Yong Park - 4-4 Candidate for independent director : Zhiping Tian - 4-5 Candidate for independent director : Dong-Woo Chang |
Approved as submitted | |||
| 5. Appointment of independent director who will serve as an Audit Committee Member - Candidate for independent director who will serve as an Audit Committee Member : Chan-Hyoung Chung |
Approved as submitted | |||
| 6. Appointment of Audit Committee Members who are independent directors - 6-1 Candidate for Audit Committee Member who is an independent director : Sung-Tae Ro - 6-2 Candidate for Audit Committee Member who is an independent director : Dong-Woo Chang |
Approved as submitted | |||
| 7. Approval of the maximum limit on directors’ compensation | Approved as submitted | |||
|
Extraordinary General Meeting of Shareholder in 2022 (January 27, 2022) |
1. Appointment of directors (2 independent directors) - 1-1 Candidate for independent director : In-Sub Yoon - 1-2 Candidate for independent director : Yo-Hwan Shin |
Approved as submitted | ||
| Annual General Meeting of Shareholders for FY2021 (March 25, 2022) |
1. Approval of financial statements for the fiscal year 2021 | Approved as submitted | ||
| 2. Approval of amendments to the Articles of Incorporation | Approved as submitted |
30
| 3. Appointment of directors (4 independent directors, 1 non-standing director) - 3-1 Candidate for independent director : Soo-Young Song - 3-2 Candidate for independent director : Sung-Tae Ro |
Approved as submitted | |||
| - 3-3 Candidate for independent director : Sang-Yong Park - 3-4 Candidate for independent director : Dong-Woo Chang - 3-5 Candidate for non-standing director : Won-Duk Lee |
||||
| 4. Appointment of independent director who will serve as an Audit Committee Member - Candidate for independent director who will serve as an Audit Committee Member : Chan-Hyoung Chung |
Approved as submitted | |||
| 5. Appointment of Audit Committee Members who are independent directors - 5-1 Candidate for Audit Committee Member who is an independent director : Sung-Tae Ro - 5-2 Candidate for Audit Committee Member who is an independent director : Dong-Woo Chang |
Approved as submitted | |||
| 6. Approval of the maximum limit on directors’ compensation | Approved as submitted | |||
| Annual General Meeting of Shareholders for FY2022 (March 24, 2023) |
1. Approval of financial statements for the fiscal year 2022 (Jan. 1, 2022 – Dec.31, 2022) | Approved as submitted | ||
| 2. Approval of amendments to the Articles of Incorporation | Approved as submitted | |||
| 3. Election of directors (2 independent directors, 1 standing director) - 3-1 Candidate for independent director : Chan-Hyoung Chung - 3-2 Candidate for independent director : Su-Young Yun - 3-3 Candidate for standing director : Jong-Yong Yim |
Approved as submitted | |||
| 4. Election of independent director who will serve as an Audit Committee Member - Candidate for independent director who will serve as an Audit Committee Member : Sung-Bae Ji |
Approved as submitted | |||
| 5. Election of Audit Committee Members who are independent directors - 5-1 Candidate for Audit Committee Member who is an Independent director : Chan-Hyoung Chung - 5-2 Candidate for Audit Committee Member who is an Independent director : Su-Young Yun - 5-3 Candidate for Audit Committee Member who is an Independent director : Yo-Hwan Shin |
Approved as submitted | |||
| 6. Approval of maximum limit on directors’ compensation | Approved as submitted |
31
| VI. | Shareholder Information |
| 1. | Share Distribution |
| a. | Share Information of the Largest Shareholder and Specially Related Parties |
| As of December 31, 2023 | (units: shares, %) |
| Name |
Relation | Type | Shares Held | Notes | ||||||||||||||||||||||||
| Beginning balance | Ending balance | |||||||||||||||||||||||||||
| Number | Share | Number | Share | |||||||||||||||||||||||||
| Employee Stock Ownership Association of Woori Financial Group |
The largest shareholder | Common | 41,165,138 | 5.65 | 43,990,091 | 5.85 | — | |||||||||||||||||||||
| Employee Stock Ownership Association of Woori Bank |
|
The related party of the largest shareholder |
|
Common | 28,136,218 | 3.87 | 25,040,007 | 3.33 | — | |||||||||||||||||||
| Total |
Common | 69,301,356 | 9.52 | 69,030,098 | 9.18 | — | ||||||||||||||||||||||
| Others | — | — | — | — | — | |||||||||||||||||||||||
| Note 1) | Shares in beginning balance is as of December 31, 2022 |
| b. | Changes in the largest shareholder |
| As of December 31, 2023 | (units: shares, %) |
| Change of Date |
Largest Shareholder |
Number Held | Share | Notes |
||||||||
| April 9, 2021 |
Korea Deposit Insurance Corporation | 110,159,443 | 15.25 | Sales of KDIC’S 14,445,354 shares through after-hours trading Note 1) | ||||||||
| August 10, 2021 |
Korea Deposit Insurance Corporation | 110,159,443 | 15.13 | Issuance of new common shares (5,792,866 shares) Note 2) |
||||||||
| December 9, 2021 |
Employee Stock Ownership Association of Woori Financial Group and others 1 | 71,346,178 | 9.80 | Bought 1.00% of the KDIC’s remaining shares of Woori Financial Group (8.80% share already held) Note 3) | ||||||||
| Note 1) | Refer to the prior disclosures on Form 6-K on April 13, 2021, Change in the Number of Shares Owned by the Largest Shareholder of Woori Financial Group |
| Note 2) | Comprehensive stock exchange between Woori Financial Group and Woori Financial Capital |
| Note 3) | Refer to the prior disclosure on the Form 6-K on December 10, 2021, Changes in the Largest Shareholder |
32
| c. | Share Ownership of More Than 5% |
| As of December 31, 2023 | (units: shares, %) |
| Name |
Shares | Notes | ||||||||||
| No. of shares | Percentage of shareholding |
|||||||||||
| Share ownership of more than 5% |
National Pension Service | 47,428,392 | 6.31 | — | ||||||||
| Nobis1, Inc. (IMM PE) | 40,560,000 | 5.39 | — | |||||||||
| Employee Stock Ownership Association |
69,030,098 | 9.18 | The largest shareholder Note 1) |
|||||||||
| Note 1) | Total shares of the employee stock ownership association of Woori Financial Group and Woori Bank |
| Note 2) | Blackrock Fund Advisors’ ownership exceeded the 5% threshold in their filing made on February 6, 2023, but they have been excluded from this table due to a decrease in ownership percentage resulting from an increase in the number of issued shares through our comprehensive stock swap in August 2023 (4.91% as of the end of 2023). |
| 2. | Stock Price and Stock Market Performance |
| a. | Domestic Stock Market |
(units: Won, shares)
| Period |
July 2023 |
August 2023 |
September 2023 |
October 2023 |
November 2023 |
December 2023 |
||||||||||||||||||||
| Common Shares |
High | 12,140 | 11,910 | 12,590 | 12,730 | 13,020 | 13,050 | |||||||||||||||||||
| Low | 11,360 | 11,320 | 11,870 | 11,880 | 12,030 | 12,800 | ||||||||||||||||||||
| Average | 11,657 | 11,541 | 12,231 | 12,323 | 12,525 | 12,922 | ||||||||||||||||||||
| Monthly Trade Volume |
High | 9,251,858 | 7,958,807 | 4,631,152 | 3,138,026 | 3,483,732 | 21,327,324 | |||||||||||||||||||
| Low | 1,257,253 | 983,882 | 1,013,134 | 992,609 | 717,389 | 719,284 | ||||||||||||||||||||
| Monthly Total | 52,450,175 | 50,077,077 | 37,554,074 | 37,368,743 | 33,250,556 | 47,190,723 | ||||||||||||||||||||
| Note 1) | Source: KRX KOSPI Market |
| Note 2) | Share prices are based on closing prices. |
33
| b. | Foreign Stock Market (NYSE) |
(units: US Dollars, Won, ADSs)
| Period |
July 2023 |
August 2023 |
September 2023 |
October 2023 |
November 2023 |
December 2023 |
||||||||||||||||||||
| ADS |
High | 28.30 | 27.27 | 28.57 | 28.28 | 30.31 | 30.63 | |||||||||||||||||||
| Low | 26.23 | 25.04 | 26.58 | 26.21 | 27.05 | 29.19 | ||||||||||||||||||||
| Average | 27.49 | 26.07 | 27.52 | 27.39 | 29.04 | 29.98 | ||||||||||||||||||||
| Won Conversion |
High | 36,244 | 34,737 | 37,930 | 38,161 | 39,070 | 39,647 | |||||||||||||||||||
| Low | 34,120 | 33,336 | 35,200 | 35,570 | 36,507 | 38,309 | ||||||||||||||||||||
| Average | 35,357 | 34,366 | 36,583 | 36,991 | 38,049 | 39,094 | ||||||||||||||||||||
| Monthly Trade Volume |
High | 174,364 | 100,862 | 49,475 | 71,564 | 60,254 | 52,667 | |||||||||||||||||||
| Low | 18,350 | 16,952 | 24,010 | 19,787 | 15,079 | 14,900 | ||||||||||||||||||||
| Monthly Total | 1,067,103 | 1,097,243 | 708,596 | 867,528 | 676,055 | 588,147 | ||||||||||||||||||||
| Note 1) | Source: standard trading rate (daily and monthly average) (Seoul Money Brokerage, www.smbs.biz) |
| Note 2) | One ADS represents three common shares. |
| Note 3) | Share prices are based on closing prices. |
34
| VII. | Directors and Employee Information |
| 1. | Directors and Executives |
As of December 31, 2023
| Position |
Name |
Common Shares Owned |
Term Commencement Date |
Expiration of Term |
||||||||
| Chief Executive Officer |
Registered | Jong-Yong Yim | 10,000 | March 24, 2023 ~ | Note 1) | |||||||
| Independent Director |
Registered | In-Sub Yoon | — | January 27, 2022 ~ | Note 2) | |||||||
| Independent Director |
Registered | Chan-Hyoung Chung | 10,532 | January 11, 2019 ~ | Note 2) | |||||||
| Independent Director |
Registered | Su-Young Yun | — | March 24, 2023~ | Note 3) | |||||||
| Independent Director |
Registered | Yo-Hwan Shin | — | January 27, 2022 ~ | Note 2) | |||||||
| Independent Director |
Registered | Sung-Bae Ji | — | March 24, 2023~ | Note 3) | |||||||
| Independent Director |
Registered | Soo-Young Song | — | March 25, 2022 ~ | Note 2) | |||||||
| Deputy President |
Non-Registered | Sung-Wook Lee | 16,000 | February 25, 2022~ | ~February 10,2024 Note 4) | |||||||
| Deputy President |
Non-Registered | Gwang-Ik Jang | — | April 3, 2023~ | ~April 2, 2025 | |||||||
| Deputy President |
Non-Registered | Il-Jin Ouk | 3,000 | December 8, 2023 ~ | ~ November 30, 2024 | |||||||
| Deputy President |
Non-Registered | Jang-Keun Park | — | December 8, 2023 ~ | ~ March 6, 2025 | |||||||
| Deputy President |
Non-Registered | Jung-Soo Lee | 6,890 | December 8, 2023 ~ | ~ March 6, 2025 | |||||||
| Deputy President |
Non-Registered | Chan-Ho Jeong | 5,492 | December 8, 2023 ~ | ~ November 30, 2025 | |||||||
| Deputy President |
Non-Registered | Yoon-Hong Song | — | December 8, 2023 ~ | ~ November 30, 2025 | |||||||
| Deputy President |
Non-Registered | Jae-Hwa Jeon | 7,872 | March 7, 2023~ | ~ March 6, 2025 | |||||||
| Deputy President |
Non-Registered | Kyu-Hwang Jeong | 11,741 | December 8, 2023 ~ | ~ November 30, 2025 | |||||||
| Managing Director |
Non-Registered | Hae-Kwang Lee | — | December 8, 2023 ~ | ~ December 22, 2024 | |||||||
| Note 1) | The term of Standing Director (Jong-Yong Yim): Until the end of the annual general meeting of shareholders for FY2025. |
| Note 2) | The terms of Independent Directors (Chan-Hyoung Chung, In-Sub Yoon, Yo-Hwan Shin, Soo-Young Song): Until the end of the annual general meeting of shareholders for FY2023. |
| Note 3) | The terms of Independent Directors (Su-Young Yun, Sung-Bae Ji): Until the end of the annual general meeting of shareholders for FY2024. |
| Note 4) | Deputy President Sung-Wook Lee’s term has been extended to February 10, 2025 (change in term took place subsequent to December 31, 2023). |
| Note 5) | Term commencement date: date of inauguration for registered officers or directors / date of appointment for non-registered officers or directors |
| Note 6) | Common shares owned are as of the date of submission of this report, and those owned by executives exclude shares owned through the Employee Stock Ownership Association. |
35
| 2. | Employee Status |
| As of December 31, 2023 | (units: persons, millions of Won) |
| Number of Employees | Average Tenure |
Total Compensation |
Average Compensation Per Person |
Note | ||||||||||||||||||||||||||||||||
| Regular | Contract | Total | ||||||||||||||||||||||||||||||||||
| Total | (Short time worker) |
Total | (Short time worker) |
|||||||||||||||||||||||||||||||||
| Total |
78 | — | 37 | — | 115 | |
2 years 11 months (13 years 6 months |
) |
22,402 | 167 | — | |||||||||||||||||||||||||
| Note 1) | Average tenure: term in ( ) includes tenure at affiliated companies |
| Note 2) | Contract employees include non-registered executives |
| 3. | Directors’ Compensation |
| As of December 31, 2023 | (units: persons, millions of Won) |
| Items |
Number of Persons |
Total Compensation |
Average Compensation Per Director |
Note | ||||||||||||
| Registered Directors (excludes independent directors and audit committee members) |
1 | 1,998 | 1,326 | — | ||||||||||||
| Independent Directors (excludes audit committee members) |
2 | 194 | 87 | — | ||||||||||||
| Audit Committee Members |
4 | 261 | 65 | — | ||||||||||||
| Auditor |
— | — | — | — | ||||||||||||
| Note 1) | Number of Persons is as of December 31, 2023 |
| Note 2) | Total Compensation is the amount paid from January to December 2023 |
| Note 3) | Average compensation per director was calculated by dividing the total compensation by the average number of persons |
| Note 4) | Registered directors and audit committee members include uncompensated directors |
| Note 5) | Only the compensation amount paid by Woori Financial Group is included for the executives concurrently employed by Woori Bank |
36
SIGNATURES
Pursuant to the requirements of the Securities Exchange Act of 1934, the registrant has duly caused this report to be signed on its behalf by the undersigned, thereunto duly authorized.
| Woori Financial Group Inc. |
||||||
| (Registrant) | ||||||
| Date: March 14, 2024 | By: | /s/ Sung-Wook Lee |
||||
| (Signature) | ||||||
| Name: Sung-Wook Lee | ||||||
| Title:Deputy President | ||||||
37