☐
|
REGISTRATION STATEMENT PURSUANT TO SECTION 12(b) OR (g) OF THE SECURITIES EXCHANGE ACT OF 1934 |
☒
|
ANNUAL REPORT PURSUANT TO SECTION 13 OR 15(d) OF THE SECURITIES EXCHANGE ACT OF 1934 |
☐
|
TRANSITION REPORT PURSUANT TO SECTION 13 OR 15(d) OF THE SECURITIES EXCHANGE ACT OF 1934 |
☐
|
SHELL COMPANY REPORT PURSUANT TO SECTION 13 OR 15(d) OF THE SECURITIES EXCHANGE ACT OF 1934 |
Title of each class |
Trading symbol(s) |
Name of each exchange on which registered |
||
American Depositary Shares (each representing one B share) B Share s * |
ERIC |
The NASDAQ Stock Market LLC |
* |
Not for trading, but only in connection with the registration of the American Depositary Shares representing such B Shares pursuant to the requirements of the Securities and Exchange Commission. |
B shares (SEK 5.00 nominal value) |
3,082,395,752 |
|||
A shares (SEK 5.00 nominal value) |
261,755,983 |
|||
C shares (SEK 5.00 nominal value) |
0 |
Large accelerated filer |
☒ |
Accelerated filer |
☐ |
|||
Non-accelerated filer |
☐ |
Emerging growth company |
☐ |
|||
☐ |
U.S. GAAP |
☒ |
International Financial Reporting Standards as issued by the International Accounting Standards Board |
☐ |
Other |
TABLE OF CONTENTS
i
ii
PART I
INTRODUCTION
Unless otherwise indicated, all references herein to “Ericsson,” the “Company,” the “Group,” “we,” “us,” “our” or “our company” are references to Telefonaktiebolaget LM Ericsson and its consolidated subsidiaries.
This document is our Annual Report on Form 20-F for the year ended December 31, 2023 (the “2023 Form 20-F”). Reference is made to the English version of our Swedish Annual Report for 2023, with certain adjustments made to comply with U.S. requirements, which is attached hereto as Exhibit 15.1 (the “2023 Swedish Annual Report (adjusted version)”). Only (i) the information included in this 2023 Form 20-F, (ii) the information in the 2023 Swedish Annual Report (adjusted version) that is incorporated by reference in this 2023 Form 20-F, and (iii) the exhibits to the 2023 Form 20-F that are required to be filed pursuant to the Form 20-F shall be deemed to be filed with the Securities and Exchange Commission (the “SEC”) for any purpose, including incorporation by reference into any document filed by us pursuant to the Securities Act of 1933, as amended, which incorporates by reference the 2023 Form 20-F. Any information in the 2023 Swedish Annual Report (adjusted version) that is not referenced in this 2023 Form 20-F or filed as an exhibit thereto shall not be deemed to be so incorporated by reference. Certain industry, technical and financial terms used in this 2023 Form 20-F are defined in the subsections entitled “Glossary” and “Financial terminology” of the 2023 Swedish Annual Report (adjusted version), which are incorporated herein by reference.
Market data and certain industry forecasts used herein were obtained from internal surveys, market research, publicly available information and industry publications. While we believe that the market research, publicly available information and industry publications we use are reliable, we have not independently verified market and industry data from third-party sources. Moreover, while we believe our internal surveys are reliable, they have not been verified by any independent source.
The information included on http://www.ericsson.com/ and other websites that appear in this 2023 Form 20-F is not incorporated by reference herein. From time to time, we may use our website as a channel of distribution of material Company information. Financial and other material information regarding our company is routinely posted on and accessible at http://www.ericsson.com/.
Forward-Looking Statements
This 2023 Form 20-F includes forward-looking statements, including statements reflecting the Company’s current views relating to the growth of the market, future market conditions, future events, financial condition, and expected operational and financial performance, including, in particular the following:
| • | Potential material additional costs and liability resulting from our ongoing future compliance with the terms of the Deferred Prosecution Agreement (“Plea Agreement”) with the US Department of Justice (“DOJ”) and extended monitorship |
| • | Potential to become a target for public scrutiny as a result of entering into the Plea Agreement with the DOJ, which could damage our reputation and materially and adversely affect our business and prospects |
| • | Risks resulting from entering into the Plea Agreement, including potential debarment from government contracting in the United States and elsewhere, reputational risk, as well as potential counter-party reluctance to continue business relationships |
| • | Potential material additional liability resulting from past conduct, including allegations of past conduct that remains unresolved or unknown in multiple jurisdictions including Iraq, which remains the subject of ongoing investigations by Ericsson and US governmental authorities |
| • | Risks related to internal controls and governance, including the potential to incur material liability in connection with internal controls surrounding payments made to third parties in connection with past conduct in multiple jurisdictions, including Iraq which remains the subject of ongoing investigations by Ericsson and US governmental authorities |
| • | The risk that the ongoing investigations by Ericsson and US governmental authorities result in a conclusion by Ericsson or US governmental authorities that the Company’s past conduct included making or having responsibility for making payments to a terrorist organization or other improper payments, which could lead to material additional liability |
| • | Risks related to our ongoing compliance with obligations under the National Security Agreement entered into in connection with Ericsson’s acquisition of Vonage Holdings Corp. (“Vonage”), which may adversely affect the Vonage business and subject the Company to additional liabilities |
| • | Our goals, strategies, planning assumptions and operational or financial performance expectations |
| • | Macroeconomic conditions, including inflationary pressures and effects on customer investments, market recovery and growth |
| • | Ongoing geopolitical and trade uncertainty, including challenging global economic conditions, market trends and pandemics such as COVID-19 |
| • | Risks related to cybersecurity and privacy |
| • | Industry trends, future characteristics and development of the markets in which we operate |
| • | Our ability to comply with legal and regulatory requirements internationally |
| • | Our future liquidity, capital resources, capital expenditures, cost savings and profitability |
| • | The expected demand for our existing and new products and services as well as plans to launch new products and services, including research and development expenditures |
| • | Our ability to deliver on future plans and achieve future growth |
| • | The expected operational or financial performance of strategic cooperation activities and joint ventures |
| • | Risks related to acquisitions and divestments, including our ability to successfully consummate such transactions, protect the value of acquisitions during integration, or achieve the value anticipated with an acquisition |
| • | Trends related to our industry, including our regulatory environment, competition and customer structure |
| • | Other factors included in our filings with the SEC, including the factors described throughout this report, included in the section Risk Factors, as updated by subsequent reports filed with the SEC. |
The words “believe,” “expect,” “foresee,” “anticipate,” “assume,” “intend,” “likely,” “projects,” “may,” “could,” “plan,” “estimate,” “forecast,” “will,” “should,” “would,” “predict,” “aim,” “ambition,” “seek,” “potential,” “target,” “might,” “continue,” or, in each case, their negative or variations, and similar words or expressions are used to identify forward-looking statements. Any statement that refers to the Company’s strategy, future financial performance, expectations, projections or other characterizations of future events or circumstances, including any underlying assumptions, are forward-looking statements. Such statements are based on management’s expectations as of the date of this report, unless an earlier date is specified, including expectations based on third-party information and projections that management believes to be reputable.
1
We caution investors that these statements are subject to risks and uncertainties many of which are difficult to predict and generally beyond our control that could cause actual results to differ materially and adversely from those expressed in, or implied or projected by, the forward-looking information and statements. Important factors that could affect whether and to what extent any of our forward-looking statements materialize include but are not limited to the factors described throughout this 2023 Form 20-F, including in the section Risk factors. These forward-looking statements also represent our estimates, assumptions and expectations only as of the date that they were made, and to the extent they represent third-party data, we have not undertaken to independently verify such third-party data and do not intend to do so.
Given these risks and uncertainties, readers are cautioned not to place undue reliance on such forward-looking statements. Readers are urged to carefully review and consider the various disclosures made in this 2023 Form 20-F and in other documents we file from time to time with our regulators that disclose risks and uncertainties that may affect our business. Unless specifically indicated otherwise, the forward-looking statements in this 2023 Form 20-F do not reflect the potential impact of any divestitures, mergers, acquisitions, or other business combinations that have not been completed as of the date of this report. We expressly disclaim a duty to provide updates to these forward-looking statements, and the estimates and assumptions associated with them, after the date of this 2023 Form 20-F, to reflect events or changes in circumstances or changes in expectations or the occurrence of anticipated events, whether as a result of new information, future events or otherwise, except as required by applicable law or stock exchange regulation. This 2023 Form 20-F includes websites or references to additional Company reports. These are intended to provide inactive, textual references only. The information on websites and contained in those reports is not part of this report and not incorporated by reference in this report. This 2023 Form 20-F contains statements based on hypothetical scenarios and assumptions as well as estimates that are subject to a high level of uncertainty, and these statements should not necessarily be viewed as being representative of current or actual risk or performance, or forecasts of expected risk or performance. In addition, historical, current, and forward-looking environmental and social-related statements may be based on standards for measuring progress that are still developing and on internal controls and processes that continue to evolve. While certain matters discussed in this 2023 Form 20-F may be significant, any significance should not be taken, or otherwise assumed, as necessarily rising to the level of materiality used for purposes of complying with Ericsson’s public company reporting obligations pursuant to the U.S. federal securities laws and regulations, even if the report uses the words “material” or “materiality.”
ITEM 1. IDENTITY OF DIRECTORS, SENIOR MANAGEMENT AND ADVISERS
Not applicable.
ITEM 2. OFFER STATISTICS AND EXPECTED TIMETABLE
Not applicable.
ITEM 3. KEY INFORMATION
B. Capitalization and Indebtedness
Not applicable.
C. Reasons for the Offer and Use of Proceeds
Not applicable.
D. Risk Factors
The information set forth under the heading “Financial report – Risk factors” of the 2023 Swedish Annual Report (adjusted version) is incorporated herein by reference.
ITEM 4. INFORMATION ON THE COMPANY
A. History and Development of the Company
General facts on the company
Legal and commercial name of the Parent Company: Telefonaktiebolaget LM Ericsson (publ).
Organization number: 556016-0680
Legal form of the Parent Company: A Swedish limited liability company, organized under the Swedish Companies Act.
Country of incorporation: Sweden.
Date of incorporation: The Parent Company was incorporated on August 18, 1918, as a result of a merger between AB LM Ericsson & Co. and Stockholms Allmänna Telefon AB.
Domicile: Our registered office is Telefonaktiebolaget LM Ericsson, SE–164 83 Stockholm, Sweden. Our headquarters are located at Torshamnsgatan 21, Kista, Sweden.
Telephone number: +46 10 719 0000
Website: www.ericsson.com. The information included on our website is not incorporated herein by reference.
In addition, the SEC maintains a website that contains reports, proxy and information statements, and other information regarding issuers that file electronically with the SEC: http://www.sec.gov.
Agent in the US: Ericsson Inc., 6300 Legacy Drive, Plano, Texas 75024. Telephone number: +1 972 583 0000.
Shares: Ericsson’s Class A and Class B shares are traded on Nasdaq Stockholm. In the US, our American Depository Shares (“ADS”), each representing one underlying Class B share, are traded on NASDAQ New York.
Parent Company operations: The business of the Parent Company, Telefonaktiebolaget LM Ericsson, consists mainly of corporate management, holding company functions and internal banking activities. Our Parent Company operations also include customer credit management activities performed by Ericsson Credit AB on a commission basis.
Subsidiaries and associated companies: For a list of our significant subsidiaries, please see Item 4.C. “Shares owned directly by the Parent Company.” We are engaged in a number of minor joint ventures and cooperative arrangements. For more information regarding risks associated with joint ventures, strategic alliances and third-party agreements, please see “Item 3.D. Risk Factors.”
2
Company history and development
Innovating to empower people, business and society
Our origins date back to 1876 when Alexander Graham Bell filed a patent application in the United States for the telephone. The same year, Lars Magnus Ericsson opened a small workshop in Stockholm to repair telegraph instruments and sell his own telephone equipment.
Today, Ericsson enables communications service providers and enterprises to capture the full value of connectivity. The Company’s portfolio spans the following segments: Networks, Cloud Software and Services and Enterprise (which includes Enterprise Wireless Solutions, Global Communications Platform, and Technologies and New Businesses). In addition, segment Other includes media businesses as well as other non-allocated business. Our portfolio is designed to help our customers go digital, increase efficiency and find new revenue streams. Ericsson’s innovation investments have delivered the benefits of mobility and mobile broadband to billions of people globally.
The information set forth under the following headings of the 2023 Swedish Annual Report (adjusted version) is incorporated herein by reference:
| • | Financial report |
| • | This is Ericsson |
| • | Business strategy – Creating long-term value |
| • | Board of Directors’ report |
| • | Business in 2023 |
| • | Financial highlights - Capital expenditures |
For capital expenditures we typically use available cash from operations.
| • | Notes to the consolidated financial statements |
| • | Note E2 – Business combinations |
| • | Note H6 – Events after the reporting period |
B. Business Overview
The information set forth under the following headings of the 2023 Swedish Annual Report (adjusted version) is incorporated herein by reference:
| • | Financial report |
| • | This is Ericsson |
| • | Business strategy – Creating long-term value |
| • | Board of Directors’ report |
| • | Business in 2023 |
| • | Financial highlights – Research and development, patents and licensing |
| • | Financial highlights – Seasonality |
| • | Business results – Segments |
| • | Business results – Market areas |
| • | Sourcing and supply |
| • | Sustainability and Corporate Responsibility |
| • | Notes to the consolidated financial statements |
| • | Note B1 – Segment information |
| • | Risk factors |
| • | Risks related to business activities and industry |
| • | Risks related to Ericsson’s financial condition |
| • | Legal and regulatory risks |
| • | Cybersecurity risks |
| • | Environmental, social and business conduct risks |
| • | Corporate Governance report |
| • | Regulation |
Disclosure pursuant to Section 219 of the Iran Threat Reduction and Syria Human Rights Act of 2012 (“ITRA”)
During 2023, Ericsson recorded revenues relating to the sale of communications infrastructure related support services in Iran to the following telecommunications company operating in the country: MTN Irancell. During 2023, Ericsson’s gross revenue (reported as net sales) related to sales to MTN Irancell was SEK 91 million. Ericsson does not normally allocate net profit (reported as net income)on a country-by-country or activity-by-activity basis, other than as set forth in Ericsson’s consolidated financial statements prepared in accordance with IFRS as issued by the IASB. However, Ericsson has estimated that its operating loss (income/loss before taxes and financial net) from such sales was, after internal cost allocation, SEK -98 million during 2023.
In some instances, Ericsson has previously had to arrange performance bonds or similar financial guarantees to secure Ericsson’s performance of obligations under the commercial agreements Ericsson had entered into relating to the business in Iran. In such instances, Ericsson usually engaged its banks outside Iran, who in turn engaged local banks in the country. These local banks include Tejarat Bank, Melli Bank, Parsian Bank and Saderat Bank. Although some bonds and guarantees are still in place, no new performance bonds or similar guarantees involving these banks with respect to Ericsson’s business activities in Iran were issued during 2023. During 2023, existing bank guarantees issued by Maskan Bank, Parsian Bank, Post Bank of Iran, Bank Mellat and Tejarat Bank (local banks in Iran) to secure Iranian customer payment obligations to Ericsson were renewed. Further, Ericsson has made two payments (535,153,658 IRR on January 24, 2023 and 1,498,643,323 IRR on February 14, 2023) to the Islamic Republic of Iran Customs Administration for customs fees related to repaired products, which the Central Bank of Iran processed.
In 2018, Ericsson began reducing its business engagement as well as its presence in Iran significantly but continued to provide certain critical services and support to telecommunications networks and systems. As of December 2023, Ericsson has wound down its active business activities in Iran and anticipates that future activities will be limited to fulfilling its obligations, such as deliveries of repairs and software licenses already purchased by the customer as well as administrative activities to close down the legal entity.
3
C. Organizational Structure
The following list shows certain shareholdings owned directly and indirectly by our Parent Company as of December 31, 2023. A complete list of shareholdings, prepared in accordance with the Swedish Annual Accounts Act and filed with the Swedish Companies Registration Office (Bolagsverket), may be obtained upon request to: Telefonaktiebolaget LM Ericsson, External Reporting, SE-164 83 Stockholm, Sweden.
Shares owned directly by the Parent Company
| Company |
Reg. No. | Domicile | Percentage of ownership |
Par value in local currency, million |
Carrying value, SEK million |
|||||||||||||||
| Subsidiary companies |
||||||||||||||||||||
| Ericsson AB |
556056-6258 | Sweden | 100 | 50 | 20,731 | |||||||||||||||
| Ericsson Shared Services AB |
556251-3266 | Sweden | 100 | 361 | 2,216 | |||||||||||||||
| Datacenter i Rosersberg AB |
556895-3748 | Sweden | 100 | — | 74 | |||||||||||||||
| Datacenter i Mjärdevi Aktiebolag |
556366-2302 | Sweden | 100 | 10 | 69 | |||||||||||||||
| Aktiebolaget Aulis |
556030-9899 | Sweden | 100 | 14 | 6 | |||||||||||||||
| Other (Sweden) |
— | — | 706 | |||||||||||||||||
| Ericsson Austria GmbH |
Austria | 100 | 4 | 94 | ||||||||||||||||
| Ericsson Danmark A/S |
Denmark | 100 | 90 | 216 | ||||||||||||||||
| Oy LM Ericsson Ab |
Finland | 100 | 13 | 196 | ||||||||||||||||
| Ericsson France SAS |
France | 100 | 21 | 524 | ||||||||||||||||
| Ericsson Antenna Technology Germany GmbH |
Germany | 100 | 2 | 21 | ||||||||||||||||
| Ericsson Germany GmbH |
Germany | 100 | 1 | 1,816 | ||||||||||||||||
| Ericsson Hungary Ltd. |
Hungary | 100 | 1,301 | 120 | ||||||||||||||||
| L M Ericsson Limited |
Ireland | 100 | 4 | 34 | ||||||||||||||||
| Ericsson Telecomunicazioni S.p.A. |
Italy | 100 | 44 | 2,429 | ||||||||||||||||
| Ericsson Holding International B.V. |
The Netherlands | 100 | 222 | 2,983 | ||||||||||||||||
| Ericsson A/S |
Norway | 100 | 75 | 114 | ||||||||||||||||
| Ericsson Sp. z o.o. |
Poland | 100 | 4 | 412 | ||||||||||||||||
| Ericsson España S.A.U |
Spain | 100 | 28 | 14 | ||||||||||||||||
| Ericsson Ltd. |
United Kingdom | 100 | 53 | 1,957 | ||||||||||||||||
| Other (Europe, excluding Sweden) |
— | — | 709 | |||||||||||||||||
| Ericsson Holding II Inc. |
United States | 100 | — | 34,295 | ||||||||||||||||
| Ericsson Smart Factory Inc. |
United States | 100 | — | 424 | ||||||||||||||||
| Ericsson Global Network Platform Holding Inc. |
United States | 100 | — | 30,674 | ||||||||||||||||
| Companía Ericsson S.A.C.I. |
Argentina | 95 | (1) | 193 | 10 | |||||||||||||||
| Ericsson Canada Inc. |
Canada | 100 | — | 221 | ||||||||||||||||
| Ericsson de Colombia S.A.S |
Colombia | 97 | (1) | 701 | 176 | |||||||||||||||
| Ericsson Telecom S.A. de C.V. |
Mexico | 100 | 1,439 | 576 | ||||||||||||||||
| Other (United States, Latin America) |
— | — | 435 | |||||||||||||||||
| Teleric Pty Ltd. |
Australia | 100 | 20 | 100 | ||||||||||||||||
| Ericsson (China) Company Ltd. |
China | 100 | 65 | 475 | ||||||||||||||||
| P.T. Ericsson Indonesia |
Indonesia | 95 | 9,531 | 614 | ||||||||||||||||
| Ericsson India Private Limited |
India | 100 | 291 | 51 | ||||||||||||||||
| Ericsson Kenya Limited |
Kenya | 100 | — | 10 | ||||||||||||||||
| Ericsson-LG CO Ltd. |
Korea | 75 | 285 | 2,279 | ||||||||||||||||
| Ericsson (Malaysia) Sdn. Bhd. |
Malaysia | 100 | 3 | 131 | ||||||||||||||||
| Ericsson South Africa PTY. Ltd |
South Africa | 70 | — | 94 | ||||||||||||||||
| Ericsson Taiwan Ltd. |
Taiwan | 90 | 270 | 36 | ||||||||||||||||
| Ericsson (Thailand) Ltd. |
Thailand | 49 | (2) | 90 | 17 | |||||||||||||||
| Ericsson Telekomünikasyon A.Ş. |
Turkey | 100 | 5 | 150 | ||||||||||||||||
| Other countries (the rest of the world) |
— | — | 325 | |||||||||||||||||
| Total |
106,534 | |||||||||||||||||||
| Joint ventures and associated companies |
||||||||||||||||||||
| Concealfab Co |
United States | 36 | — | 298 | ||||||||||||||||
| Leone Media Inc. |
United States | 46 | 134 | — | ||||||||||||||||
| Ericsson Nikola Tesla d.d. |
Croatia | 49 | 65 | 330 | ||||||||||||||||
| Total |
628 | |||||||||||||||||||
| 1) | Through subsidiary holdings, total holdings amount to 100% of Compañía Ericsson S.A.C.I. and Ericsson de Colombia S.A.S. |
| 2) | Through subsidiary holdings, total holdings amount to 74% of Ericsson (Thailand) Ltd. |
4
Shares owned by subsidiary companies
| Company |
Reg. No. | Domicile | Percentage of ownership |
|||||||
| Subsidiary companies |
||||||||||
| Emodo Inc. |
United States | 100 | ||||||||
| Ericsson Telekommunikation GmbH |
Germany | 100 | ||||||||
| Ericsson GmbH |
Germany | 100 | ||||||||
| Ericsson Telecommunicatie B.V. |
The Netherlands | 100 | ||||||||
| Ericsson Inc. |
United States | 100 | ||||||||
| Vonage Holdings Corp. |
United States | 100 | ||||||||
| Ericsson Wireless Office Inc. |
United States | 100 | ||||||||
| Cradlepoint Inc. |
United States | 100 | ||||||||
| Iconectiv, LLC. |
United States | 83 | ||||||||
| Ericsson Telecomunicações LTDA. |
Brazil | 100 | ||||||||
| Ericsson Australia Pty. Ltd. |
Australia | 100 | ||||||||
| Ericsson (China) Communications Co. Ltd. |
China | 100 | ||||||||
| Nanjing Ericsson Panda Communication Co. Ltd. |
China | 51 | ||||||||
| Ericsson Japan K.K. |
Japan | 100 | ||||||||
D. Property, Plants and Equipment
Primary manufacturing and assembly facilities
We continuously adjust our production capacity to meet expected customer demand. During 2023, our overall capacity utilization* was 42%.
The table below summarizes where we have major sites and the total floor space at year-end. All facilities are leased, other than Nanjing (China). The majority of the floor space within our production facilities is used for assembly and test.
| 2023 | 2022 | 2021 | ||||||||||||||||||||||
| Sites | Thousands of sq meters** |
Sites | Thousands of sq meters** |
Sites | Thousands of sq meters** |
|||||||||||||||||||
| Sweden |
1 | 5 | 1 | 5 | 1 | 5 | ||||||||||||||||||
| China |
1 | 13.9 | 1 | 13.9 | 1 | 13.9 | ||||||||||||||||||
| Estonia |
1 | 9 | 1 | 9 | 1 | 9 | ||||||||||||||||||
| Brazil |
1 | 7 | 1 | 6.5 | 1 | 6.5 | ||||||||||||||||||
| United States |
1 | 9 | 1 | 6 | 1 | 6 | ||||||||||||||||||
|
|
|
|
|
|
|
|
|
|
|
|
|
|||||||||||||
| Total |
5 | 43.9 | 5 | 40.4 | 5 | 40.4 | ||||||||||||||||||
|
|
|
|
|
|
|
|
|
|
|
|
|
|||||||||||||
| * | Test capacity utilization. |
| ** | Floor space in square meters does not include any warehouses or transportation areas. |
In July 2023, the Company announced plans to build a next-generation smart manufacturing and technology hub in Tallinn, Estonia.
The proposed 50,000-square-meter facility is a green field investment valued at approximately EUR 155 million and expected to be operational in early 2026. This project will be executed through the Company’s Estonian affiliate and will be financed through the Company’s Treasury organization. The Company currently does not expect any increase of production capacity after the completion of this project.
The Company plans to consolidate all of its operations in Estonia into this proposed new facility, which will be a single, state-of-the art, smart hub that comprises test labs, warehouses, production lines, and offices. This smart hub will be used for co-developing cellular ecosystems and production techniques, mainly with customers and partners in Europe but with global impact on industrialization for volume production.
As a first step towards this goal, the Company, through its Estonian affiliate, has signed a definitive agreement dated June 29, 2023, to acquire property to build this proposed facility, with the transaction expected to close in the fourth quarter of 2024, subject to agreed conditions. The Company has already paid EUR 5.5 million in connection with acquiring the property up to date.
The information set forth under the following headings of the 2023 Swedish Annual Report (adjusted version) is incorporated herein by reference:
| • | Financial report |
| • | Board of Directors’ report |
| • | Financial highlights – Capital expenditures |
| • | Notes to the consolidated financial statements |
| • | Note C2 – Property, plant and equipment |
| • | Note C3 – Leases |
| • | Risk factors |
| • | Legal and regulatory risks |
| • | Environmental, social and business conduct risks |
ITEM 4A. Unresolved Staff Comments
None.
ITEM 5. OPERATING AND FINANCIAL REVIEW AND PROSPECTS
Year-to-year comparisons between 2022 and 2021 have been omitted from this 2023 Form 20-F but may be found in “Item 5. Operating and Financial Review and Prospects” in our annual report on Form 20-F for the fiscal year ended December 31, 2022.
A. Operating Results
The information set forth under the following headings of the 2023 Swedish Annual Report (adjusted version) is incorporated herein by reference:
| • | Financial report |
| • | This is Ericsson |
| • | Business strategy |
| • | Board of Directors’ report |
5
| • | Business in 2023 |
| • | Financial highlights |
| • | Business results – Segments |
| • | Business results – Market areas |
| • | Risk management |
| • | Notes to the consolidated financial statements |
| • | Note A1 – Material accounting policies |
| • | Note F1 – Financial risk management |
| • | Risk Factors |
| • | Alternative performance measures |
| • | Corporate Governance report |
| • | Regulation |
B. Liquidity and Capital Resources
The information set forth under the following headings of the 2023 Swedish Annual Report (adjusted version) is incorporated herein by reference:
| • | Financial report |
| • | Board of Directors’ report |
| • | Financial highlights – Cash flow |
| • | Financial highlights – Financial position |
| • | Financial highlights – Seasonality |
| • | Financial highlights – Off-balance sheet arrangements |
| • | Financial highlights – Capital expenditures |
| • | Notes to the consolidated financial statements |
| • | Note B9 – Other current liabilities |
| • | Note D1 – Provisions |
| • | Note D2 – Contingent liabilities |
| • | Note D4 – Contractual obligations |
| • | Note F1 – Financial risk management |
| • | Note F4 – Interest-bearing liabilities |
| • | Note H3 – Statement of cash flows |
C. Research and Development, Patents and Licenses, etc.
The information set forth under the following headings of the 2023 Swedish Annual Report (adjusted version) is incorporated herein by reference:
| • | Financial report |
| • | Business strategy |
| • | Risk factors – Risks related to business activities and industry |
| • | Board of Directors’ report |
| • | Financial highlights – Research and development, patents and licensing |
Ericsson has a policy of strong commitment to research and development (“R&D”) with substantial contributions to cutting-edge open standards and technologies, leading the development of cellular technology – from 2G to 5G and beyond. Our strong R&D investments position us to further extend our technology leadership for cost performance and sustainability. It is Ericsson’s policy to protect and capitalize on our R&D investments by creating, securing, protecting, and licensing a portfolio of patents in support of our overall business goals. Our patent portfolio comprises more than 60,000 granted patents, which are licensed globally on FRAND terms to the users of our technology.
Ericsson is one of the largest contributors to O-RAN, driving the alignment between 3GPP and Open RAN and investing heavily in Cloud RAN to ensure long-term competitiveness. Within Enterprise, Ericsson is increasing investments in developing the network APIs. Other areas of focus in R&D include the capability of networks to handle gigabytes per second more efficiently, using more automation, using Artificial Intelligence to improve network performance and reducing energy consumption, while securing sustainability leadership to support customers to lower the total cost of ownership and meet net zero requirements.
Research and Development and Patent Information
| 2023 | 2022 | 2021 | ||||||||||
| R&D employees |
28,219 | 29,304 | 27,379 | |||||||||
| R&D expenses SEK bn |
50.7 | 47.3 | 42.1 | |||||||||
| Patents |
over 60,000 | over 60,000 | over 60,000 | |||||||||
D. Trend Information
The information set forth under the following headings of the 2023 Swedish Annual Report (adjusted version) is incorporated herein by reference:
| • | Financial report |
| • | CEO Comment |
| • | Our industry vision |
| • | Enterprise expansion |
| • | Leading with integrity |
| • | Looking ahead |
| • | Board of Directors’ report |
| • | Business in 2023 |
| • | Financial highlights – Seasonality |
6
| • | Business results – Segments |
| • | Business results – Market areas |
E. Critical accounting estimates
| • | Financial report |
| • | Notes to the consolidated financial statements |
| • | Note A2 – Critical accounting estimates and judgments |
ITEM 6. DIRECTORS, SENIOR MANAGEMENT AND EMPLOYEES
A. Directors and Senior Management
The information set forth under the following headings of the 2023 Swedish Annual Report (adjusted version) is incorporated herein by reference:
| • | Corporate Governance report |
| • | Members of the Board of Directors |
| • | Members of the Executive Team |
Board Diversity
The table below provides certain information regarding the diversity of our board of directors. Each of the categories listed in the table has the meaning ascribed to it in NASDAQ Listing Rule 5605(f).
| Board Diversity Matrix (as of March 12, 2024) | ||||||||
| Country of Principal Executive Offices: | Sweden | |||||||
| Foreign Private Issuer | Yes | |||||||
| Disclosure Prohibited under Home Country Law | Yes | |||||||
| Total Number of Directors | 13 | |||||||
| Female | Male | Non-Binary | Did Not Disclose Gender |
|||||
| Part I: Gender Identity | ||||||||
| Directors | 5 | 8 | 0 | 0 | ||||
| Part II: Demographic Background | ||||||||
| Underrepresented Individual in Home Country Jurisdiction | — | |||||||
| LGBTQ+ | — | |||||||
| Did Not Disclose Demographic Background | — | |||||||
The information set forth under the following headings of the 2023 Swedish Annual Report (adjusted version) is incorporated herein by reference:
| • | Financial report |
| • | Notes to the consolidated financial statements |
| • | Note G3 – Share-based compensation |
See Item 8.B. “Financial Information – Significant Changes” herein.
B. Compensation
The information set forth under the following headings of the 2023 Swedish Annual Report (adjusted version) is incorporated herein by reference:
| • | Financial report |
| • | Board of Directors’ report |
| • | Corporate governance – Remuneration |
| • | Guidelines for Remuneration to Group management |
| • | Notes to the consolidated financial statements |
| • | Note G1 – Post-employment benefits |
| • | Note G2 – Information regarding members of the Board of Directors and Group management |
| • | Note G3 – Share-based compensation |
| • | Corporate Governance report |
| • | Remuneration to Board members |
| • | Remuneration report |
| • | Remuneration report 2023 |
See Item 8.B. “Financial Information – Significant Changes” herein.
C. Board Practices
The information set forth under the following headings of the 2023 Swedish Annual Report (adjusted version) is incorporated herein by reference:
| • | Financial report |
| • | Notes to the consolidated financial statements |
| • | Note G2 – Information regarding members of the Board of Directors and Group management – Comments to the table |
| • | Corporate Governance report |
| • | Board of Directors – Composition of the Board of Directors and diversity |
| • | Committees of the Board of Directors – Audit and Compliance Committee |
| • | Committees of the Board of Directors – Remuneration Committee |
7
D. Employees
The information set forth under the following headings of the 2023 Swedish Annual Report (adjusted version) is incorporated herein by reference:
| • | Financial report |
| • | Board of Directors’ report |
| • | Financial Highlights – Employees |
| • | Notes to the Consolidated financial statements |
| • | Note G4 – Employee Information |
We believe that we have a good relationship with the labor unions that represent our employees.
Number of employees by market area at year-end
| 2023 | 2022 | 2021 | ||||||||||
| South East Asia, Oceania and India |
27,016 | 27,761 | 26,369 | |||||||||
| North East Asia |
12,331 | 13,207 | 13,091 | |||||||||
| North America |
10,744 | 11,993 | 10,344 | |||||||||
| Europe and Latin America 1) |
45,380 | 48,023 | 47,064 | |||||||||
| Middle East and Africa |
4,481 | 4,545 | 4,454 | |||||||||
|
|
|
|
|
|
|
|||||||
| Total |
99,952 | 105,529 | 101,322 | |||||||||
|
|
|
|
|
|
|
|||||||
| 1) Number of employees in Sweden |
13,977 | 14,481 | 14,183 | |||||||||
E. Share Ownership
The information set forth under the following headings of the 2023 Swedish Annual Report (adjusted version) is incorporated herein by reference:
| • | Financial report |
| • | The Ericsson share - Shareholders |
| • | Notes to the consolidated financial statements |
| • | Note G2 – Information regarding members of the Board of Directors and Group management |
| • | Corporate Governance report |
| • | Members of the Board of Directors |
| • | Members of the Executive Team |
| • | Remuneration report |
| • | Remuneration report 2023 |
F. Disclosure of a Registrant’s Action to Recover Erroneously Awarded Compensation
Not applicable.
ITEM 7. MAJOR SHAREHOLDERS AND RELATED PARTY TRANSACTIONS
A. Major Shareholders
The information set forth under the following headings of the 2023 Swedish Annual Report (adjusted version) is incorporated herein by reference:
| • | Financial report |
| • | The Ericsson Share - Shareholders |
| • | Corporate Governance report |
| • | Governance Structure and Core Values - Ownership structure |
B. Related Party Transactions
The information set forth under the following heading of the 2023 Swedish Annual Report (adjusted version) is incorporated herein by reference.
| • | Financial report |
| • | Notes to the consolidated financial statements |
| • | Note H4 – Related party transactions |
| • | Note G2 – Information regarding members of the Board of Directors and Group management |
C. Interests of Experts and Counsel.
Not applicable.
ITEM 8. FINANCIAL INFORMATION
A. Consolidated Statements and Other Financial Information.
The information set forth under the following headings of the 2023 Swedish Annual Report (adjusted version) is incorporated herein by reference:
| • | Financial report |
| • | Board of Directors’ report |
| • | Legal proceedings |
| • | Proposed disposition of earnings |
| • | Consolidated financial statements |
| • | Notes to the consolidated financial statements |
| • | Reports of independent registered public accounting firm |
See Item 10.B. “Additional Information – Memorandum and Articles of Association” and Item 17. “Financial Statements” herein.
8
B. Significant Changes
Ericsson appoints Lars Sandström as Chief Financial Officer
On January 23, 2024, Ericsson announced the appointment of Lars Sandström as its new Chief Financial Officer, Senior Vice President, and Head of Group Function Finance. Mr. Sandström will replace Carl Mellander, whose departure Ericsson announced in April 2023. Mr. Sandström will join Ericsson on April 1, 2024, and will be based in Sweden. Lars Sandström is currently Chief Financial Officer and member of the executive team at Getinge - a listed global leader within Medtech. Mr. Sandström has been with Getinge since 2017 and holds a Master of Science in Business Administration. Mr. Sandström has previously held several senior positions at AB Volvo, Scania and Swedish Orphan Biovitrum AB.
Ericsson announces changes to the Executive Team
On January 24, 2024, Ericsson announced that Senior Vice President Niklas Heuveldop been appointed as new Head of Business Area Global Communications Platform and CEO of Vonage as of February 1, 2024. Mr. Heuveldop who has been a member of the Executive Team and headed Market Area North America since 2017, succeeds Rory Read who will leave Ericsson at the end of the first quarter 2024. Yossi Cohen replaces Mr. Heuveldop as Head of Market Area North America as of February 1, 2024. Effective the same date he will become member of the Executive Team, reporting to the President and CEO. Mr. Cohen is previously Head of Strategy, Technology, Marketing and Business Development within Market Area North America.
Ericsson appoints Chafic Nassif Head of Market Area North East Asia
On January 29, 2024, Ericsson announced that Chafic Nassif has been appointed as Head of Market Area North East Asia and Senior Vice President, as of February 26, 2024. Effective the same date he will become member of the Executive Team, reporting to the President and CEO. Chafic Nassif succeeds Chris Houghton who was appointed Chief Operating Officer of Ericsson in November 2023. Chafic Nassif has held several executive and management positions within Ericsson across various business segments and geographies worldwide. Most recently he was the Head of Ericsson’s Customer Unit Latin America North within Market Area Europe & Latin America. Before joining Ericsson, Mr. Nassif was active in tech start-ups, as well as IT and business consulting leadership roles in Europe.
Ericsson to utilize mandate to transfer shares
Ericsson’s annual general meeting on March 29, 2023 authorized the company’s board of directors to resolve on the transfer of the company’s own shares. Under the authorization the company may, in conjunction with the delivery of vested shares under the long-term variable compensation programs 2019 and 2020 (“LTV 2019” and “LTV 2020”), prior to the annual general meeting in 2024, decide to retain and sell no more than 60% of the vested shares of series B in the company in order to cover for the costs for withholding and paying tax and social security liabilities on behalf of the participants in relation to the performance share awards for remittance to revenue authorities. Ericsson decided on February 16, 2024 to utilize the authorization to transfer shares for these purposes.
The transfer of own shares may take place on Nasdaq Stockholm during the period from and including February 16, 2024 up to the annual general meeting 2024 at a price within the price interval registered from time to time.
Ericsson currently holds 12,932,223 shares of series B in the company and the maximum number of shares that may be transferred on Nasdaq Stockholm pursuant to the decision to utilize the authorization amounts to 774,889 shares of series B in the company.
ITEM 9. THE OFFER AND LISTING
A. Offer and Listing Details
The information set forth in Exhibit 2.3, “Description of Securities Registered Pursuant to Section 12 of the Securities Exchange Act of 1934” is incorporated herein by reference.
B. Plan of Distribution
Not applicable.
C. Markets
The information set forth in Exhibit 2.3, “Description of Securities Registered Pursuant to Section 12 of the Securities Exchange Act of 1934” is incorporated herein by reference.
D. Selling Shareholders
Not applicable.
E. Dilution
Not applicable.
F. Expenses of the Issue
Not applicable.
ITEM 10. ADDITIONAL INFORMATION
A. Share Capital
Not applicable.
B. Memorandum and Articles of Association
The information set forth in Exhibit 2.3, “Description of Securities Registered Pursuant to Section 12 of the Securities Exchange Act of 1934.” is incorporated herein by reference.
C. Material Contracts
The information set forth under the following headings of the 2023 Swedish Annual Report (adjusted version) is incorporated herein by reference:
| • | Financial report |
| • | Board of Directors’ report |
| • | Material contracts |
| • | Notes to the consolidated financial statements |
| • | Note E2 – Business combinations |
Vonage Merger Agreement
On November 22, 2021, Ericsson, Vonage and Ericsson Muon Holding Inc. (“Ericsson Muon”) entered into an Agreement and Plan of Merger (the “Vonage Merger Agreement”) providing for the acquisition of Vonage by Ericsson.
9
The Vonage Merger Agreement provides that, among other things, upon the terms and subject to the conditions set forth in the Vonage Merger Agreement, Ericsson Muon will merge with and into Vonage, with Vonage continuing as the surviving corporation and an indirect wholly owned subsidiary of Ericsson. Pursuant to the Vonage Merger Agreement, each share of common stock, par value $0.001 USD per share, of Vonage prior to the effective time of the merger (other than specific exceptions noted in the Vonage Merger Agreement) was converted into the right to receive $21.00 USD per share in cash, without interest. The Vonage Merger Agreement was subject to customary representations and warranties, and customary covenants and agreements. On July 21, 2022, Ericsson completed the acquisition of Vonage through an all cash transaction for approximately $6.2 billion USD.
D. Exchange Controls
There is no Swedish legislation affecting the import or export of capital or the remittance of dividends, interest or other payments to non-resident holders of our securities, except that, subject to the provisions in any tax treaty, dividends are subject to withholding tax.
E. Taxation
General
The taxation discussion set forth below does not purport to be a complete analysis or listing of all potential tax effects relevant to the acquisition, ownership or disposition of Class B shares or ADSs. The statements of United States and Swedish tax laws set forth below are based on the laws in force as of the date of this report and may be subject to any changes in United States or Swedish law, and in any double taxation convention or treaty between the United States and Sweden, occurring after that date, which changes may then have a retroactive effect.
Specific tax provisions may apply for certain categories of taxpayers. Your tax treatment if you are a holder of Class B shares or ADSs depends in part on your particular situation. If you are a holder of Class B shares or ADSs, you should, therefore, consult a tax advisor as to the tax consequences relating to your particular circumstances resulting from the ownership of Class B shares or ADSs.
The tax consequences to holders of ADSs, as discussed below, apply equally to holders of Class B shares.
Certain Swedish Tax Considerations
This section describes the material Swedish income and net wealth tax consequences for a holder of ADSs or Class B shares who is not considered to be a Swedish resident for Swedish tax purposes. This section applies to you only if you are a holder of portfolio investments representing less than 10% of capital and votes and is not applicable if the ADSs or Class B shares pertain to a permanent establishment or fixed place of business in Sweden.
Taxation on Capital Gains
Generally, non-residents of Sweden are not liable for Swedish capital gains taxation with respect to the sale of ADSs or Class B shares. However, under Swedish tax law, capital gains from the sale of shares in Swedish companies and certain other securities by an individual may be taxed in Sweden at a rate of 30% if the seller has been a resident of Sweden or has lived permanently in Sweden at any time during the year of the sale or the 10 calendar years preceding the year of the sale (absent treaty provisions to the contrary). The provision is applicable to ADSs or Class B shares. From January 1, 2008, the rule has been extended so that it also applies to shares in foreign companies, provided that the shares were acquired during the time that the person was liable to tax in Sweden.
This provision may, however, be limited by tax treaties that Sweden has concluded with other countries. Under the tax treaty between Sweden and the United States (the “U.S. Tax Treaty”), this provision applies for ten years from the date the individual became a non-resident of Sweden.
Taxation on Dividends
A Swedish dividend withholding tax at a rate of 30% is imposed on dividends paid by a Swedish corporation, such as us, to non-residents of Sweden. The same withholding tax applies to certain other payments made by a Swedish corporation, including payments as a result of redemption of shares and repurchase of stock through an offer directed to its shareholders. Exemption from the withholding tax or a lower tax rate may apply by virtue of a tax treaty. Under the U.S. Tax Treaty, the withholding tax on dividends paid on portfolio investments to eligible U.S. holders is reduced to 15%.
Under all Swedish tax treaties, except the tax treaty with Switzerland, withholding tax at the applicable treaty rate should be withheld by the payer of the dividends. With regard to dividends paid from shares in corporations registered with the Euroclear Sweden (such as our shares), a reduced rate of dividend withholding tax under a tax treaty is generally applied at the source by the Euroclear Sweden or, if the shares are registered with a nominee, the nominee, as long as the person entitled to the dividend is registered as a non-resident and sufficient information regarding the tax residency of the beneficial owner is available to the Euroclear Sweden or the nominee.
In those cases where Swedish withholding tax is withheld at the rate of 30% and the person who received the dividends is entitled to a reduced rate of withholding tax under a tax treaty, a refund may be claimed from the Swedish tax authorities before the end of the fifth calendar year following the year that the distribution was made.
Certain United States Federal Income Tax Consequences
The following discussion is a summary of the material United States federal income tax consequences relevant to the ownership and disposition of ADSs or Class B shares. This discussion is based on the tax laws of the United States (including the Internal Revenue Code of 1986, as amended (the “Code”), its legislative history, existing and proposed U.S. Treasury regulations thereunder, published rulings and court decisions) as in effect on the date hereof, all of which are subject to change, possibly with retroactive effect. The discussion is not a full discussion of all tax considerations that may be relevant to the ownership and disposition of ADSs or Class B shares and does not address the Medicare tax on net investment income or the effects of any state, local or non-U.S. tax laws. The discussion applies only if you hold the ADSs and/or the Class B shares as capital assets and you use the USD as your functional currency. It does not deal with the tax treatment of investors subject to special rules, such as grantor trusts, real estate investment trusts, regulated investment companies, banks, brokers or dealers in securities or currencies, traders in securities that elect to use a mark-to-market method of recording for their securities holdings, financial institutions, insurance companies, persons required to accelerate the recognition of any item of gross income with respect to our ADSs or Class B shares as a result of such income being recognized on an applicable financial statement, tax-exempt entities, investors liable for alternative minimum tax, holders (either actually or constructively) of 10% or more of the voting power or the value of our shares, persons holding ADSs and/or Class B shares as part of a hedging, straddle, conversion or constructive sale transaction and persons who are resident or ordinarily resident in Sweden. In addition, investors holding ADSs and/or Class B shares indirectly through partnerships are subject to special rules not discussed below. You should consult your tax advisors about the United States federal, state, local and non-U.S. tax consequences to you of the ownership and disposition of the ADSs or Class B shares.
The discussion below is not binding on the U.S. Internal Revenue Service (the “IRS”) or any court. Therefore, we can provide no assurance that the United States federal income tax consequences discussed below will not be challenged by the IRS or will be sustained by a court if challenged by the IRS.
10
The discussion below applies to you only if you are a beneficial owner of ADSs and/or Class B shares not resident in Sweden for purposes of the U.S. Tax Treaty and you are, for United States federal income tax purposes, (1) a citizen or resident of the United States, (2) a corporation or any other entity treated as a corporation that is organized in or under the laws of the United States or its political subdivisions, including the District of Columbia, (3) a trust if all of the trust’s substantial decisions are subject to the control of one or more United States persons and the primary supervision of the trust is subject to a United States court, or if a valid election is in effect with respect to the trust to be taxed as a United States person, or (4) an estate the income of which is subject to United States federal income taxation regardless of its source.
The discussion below assumes that the representations contained in the deposit agreement governing the ADSs are true and that the obligations in the deposit agreement and any related agreement will be complied with in accordance with the terms. If you hold ADSs, you are expected to be treated as the holder of the underlying Class B shares represented by those ADSs for United States federal income tax purposes. The remainder of this discussion assumes that a holder of ADSs will be treated in this manner.
Dividends
Subject to the passive foreign investment company rules discussed below, the gross amount of distributions paid (before reduction for any Swedish withholding taxes) with respect to the ADSs or Class B shares generally will be included in your gross income as ordinary income from foreign sources to the extent paid out of our current or accumulated earnings and profits (as determined for United States federal income tax purposes). Distributions in excess of earnings and profits will be treated as a non-taxable return of capital to the extent of your adjusted tax basis in the ADSs or Class B shares and thereafter as capital gain. Because we do not maintain calculations of our earning and profits under United States federal income tax principles, you should expect all distributions will be reported as dividends for United States federal income tax purposes. The dividends will not be eligible for the dividends received deduction available to corporations in respect of dividends received from other U.S. corporations. The amount of any distribution paid in SEK will be the USD value of the distribution payment based on the spot rate of exchange in effect on the date of receipt (or constructive receipt) by you, in the case of Class B shares, or by the depositary, in the case of ADSs, whether or not the payment is converted into USD at that time. Your tax basis in the SEK received will equal such USD amount. Gain or loss, if any, recognized on a subsequent sale or conversion of the SEK will be U.S. source ordinary income or loss.
If you are a non-corporate holder of ADSs or Class B shares, dividends you receive on the ADSs or Class B shares may be taxed at the lower applicable long-term capital gains rate provided that (1) we are not a passive foreign investment company (as discussed below) for either our taxable year in which the dividend was paid or the preceding taxable year, (2) certain holding period requirements are met, (3) you are not under any obligation to make related payments with respect to substantially similar or related property and (4) either (a) in the case of ADSs our ADSs continue to be listed on the NASDAQ Stock Market (or a national securities exchange that is registered under section 6 of the Securities Exchange Act of 1934, as amended (the “Exchange Act”)) or (b) we are eligible for the benefits of the U.S. Tax Treaty. You should consult your tax advisors regarding the availability of the lower rate for dividends paid with respect to ADSs or Class B shares.
Subject to certain limitations, you will generally be entitled to receive credit against your United States federal income tax liability (or a deduction against your United States federal taxable income) with respect to any Swedish tax withheld in accordance with the U.S. Tax Treaty and paid over to Sweden. If a refund of the tax withheld is available to you under the laws of Sweden or under the U.S. Tax Treaty, the amount of tax withheld that is refundable will not be eligible for such credit against your United States federal income tax liability (and will not be eligible for the deduction in computing your United States federal taxable income). For foreign tax credit limitation purposes, dividends will be income from sources without the United States, and will generally be treated as “passive category income” (or, in the case of certain holders, “general category income”). There are significant and complex limits on your ability to claim foreign tax credits. Under certain circumstances, applicable U.S. Treasury regulations may restrict the availability of any such credit based on the nature of the withholding tax imposed by the non-U.S. jurisdiction, such as Sweden. You should consult your tax advisors regarding the creditability or deductibility of any withholding taxes.
Sale or Exchange of ADSs or Class B shares
Subject to the passive foreign investment company rules discussed below, you will generally recognize capital gain or loss on the sale or other disposition of the ADSs or Class B shares equal to the difference between the USD value of the amount realized and your adjusted tax basis (determined in USD) in the ADSs or Class B shares. Such gain or loss will generally be long-term capital gain or loss if you have held the ADSs or Class B shares for more than one year, and will generally be treated as arising from U.S. sources for foreign tax credit limitation purposes. If you are a non-corporate holder of ADSs or Class B Shares, long-term capital gains are eligible for reduced rates of taxation. The deductibility of capital losses is subject to limitations.
The amount realized on a disposition of ADSs or Class B shares for cash will generally be the amount of cash you receive for the ADSs or Class B shares (which, in the case of payment in a non-U.S. currency, will equal the USD value of the payment received generally determined on the date of disposition). If the ADSs or Class B shares are treated as traded on an “established securities market” for United States federal income tax purposes and you are a cash basis taxpayer or an accrual basis taxpayer making a special election (which must be applied consistently from year to year and cannot be changed without the consent of the IRS), you will determine the USD value of the amount realized by translating the amount received at the spot rate of exchange on the settlement date of the sale.
If you are an accrual basis taxpayer and do not make the special election, you will recognize exchange gain or loss to the extent attributable to the difference between the exchange rates on the trade date and the settlement date, and such exchange gain or loss will be U.S. source ordinary income or loss.
Your initial tax basis in ADSs or Class B shares generally will equal the cost of such ADSs or Class B shares. If you used non-U.S. currency to purchase ADSs or Class B shares, the cost of such ADSs or Class B shares generally will be the USD value of the non-U.S. currency purchase price on the date of purchase, translated at the spot rate of exchange on that date. If ADSs or Class B shares are treated as traded on an “established securities market” for United States federal income tax purposes and you are a cash basis taxpayer or an accrual basis taxpayer making a special election (which must be applied consistently from year to year and cannot be changed without the consent of the IRS), you will determine the USD value of the cost of such ADSs or Class B shares by translating the amount paid at the spot rate of exchange on the settlement date of purchase.
Passive Foreign Investment Company Status
A non-U.S. corporation is a passive foreign investment company (a “PFIC”) in any taxable year in which, after taking into account the income and assets of certain subsidiaries, either (a) at least 75% of its gross income is passive income or (b) at least 50% of the quarterly average value of its assets is attributable to assets that produce or are held to produce passive income. For this purpose, passive income includes interest, dividends, gains from transactions in commodities (other than certain active business gains from the sale of commodities) and other investment income, with certain exceptions. The PFIC rules also contain a look-through rule whereby we will be treated as owning our proportionate share of the gross assets and earning our proportionate share of the gross income of any other corporation in which we own, directly or indirectly, 25% or more (by value) of the stock. Based on the market value of our shares, the composition of our assets and income and our operations, we believe we were not a PFIC during the year 2023. However, whether or not we will be considered a PFIC will depend on the nature and source of our income and the composition and value of our assets, as determined from time to time. There can be no assurance that we will not be a PFIC for current or future taxable years. If we are treated as a PFIC, we will not provide information necessary for the “qualified electing fund” election as the term is defined in the relevant provisions of the Code. You should consult your tax advisors about the consequences of our potential classification as a PFIC.
If we were classified as a PFIC with respect to your ADSs or Class B shares for any taxable year, we would generally continue to be a PFIC (unless certain conditions are met), and you would be subject to special rules with respect to:
| • | any gain realized on the sale or other disposition of ADSs or Class B shares; or |
| • | any other “excess distribution” made to you (generally, any distributions to you in respect of ADSs or Class B shares during a single taxable year that are, in the aggregate, greater than 125% of the average annual distributions received by you in respect of ADSs or Class B shares during the three preceding taxable years or, if shorter, your holding period for ADSs or Class B shares). |
11
Under these rules:
| • | the gain or any other excess distribution would be allocated ratably over your holding period for ADSs or Class B shares; |
| • | the amount allocated to the taxable year in which the gain or excess distribution was realized and any year before we became a PFIC would be taxable as ordinary income; |
| • | the amount allocated to each prior year, other than the current year and any taxable year prior to the first taxable year in which we were a PFIC, would be subject to tax at the highest applicable marginal tax rate in effect for each such year; and |
| • | an interest charge would be imposed. |
If we are a PFIC for any taxable year, you will also be deemed to own shares in any of our subsidiaries that are also PFICs in such a year. As an alternative to the special rules described above, holders of “marketable stock” in a PFIC may elect mark-to-market treatment with respect to their ADSs or Class B shares. ADSs or Class B shares will not be considered marketable stock unless they are regularly traded on a qualified exchange or other market. If the mark-to-market election is available and you elect mark-to-market treatment you will, in general, include as ordinary income each year an amount equal to the increase in value of your ADSs or Class B shares for that year (measured at the close of your taxable year) and will generally be allowed a deduction for any decrease in the value of your ADSs or Class B shares for the year but only to the extent of previously included mark-to-market income. In addition, any gain you recognize upon the sale or other disposition of the ADSs or Class B shares will be treated as ordinary income and any loss will be treated as ordinary loss but only to the extent of previously included mark-to-market income. Any loss in excess of previously included mark-to-market income will be treated as a capital loss. However, a mark-to-market election would likely be unavailable with respect to your proportionate share in any of our subsidiaries that are PFICs.
If you own ADSs or Class B shares during any year in which we are a PFIC, you will generally be required to make an annual return on IRS Form 8621.
Information Reporting and Backup Withholding
In general, information reporting requirements will apply to dividends paid in respect of ADSs or Class B shares and the proceeds received on the sale or exchange of the ADSs or Class B shares within the United States or by a broker with certain United States connections. Backup withholding may apply to payments to you of dividends paid in respect of ADSs or Class B shares or the proceeds of a sale or other disposition of ADSs or Class B shares if you fail to provide an accurate taxpayer identification number (certified on IRS Form W–9) or, upon request, to certify that you are not subject to backup withholding or otherwise to comply with the applicable requirements of the backup withholding rules. Backup withholding is not an additional tax. The amount of any backup withholding from a payment to you will be allowed as a credit against your United States federal income tax liability, and a refund of any excess amount withheld under the backup withholding rules may be obtained by filing the appropriate claim for refund with the Internal Revenue Service and furnishing any required information.
Additional Reporting Requirements
Certain holders who are individuals (and certain entities) that hold an interest in “specified foreign financial assets” (which may include ADSs and/or Class B shares) are required to report information relating to such assets, subject to certain exceptions (including an exception for ADSs or Class B shares held in accounts maintained by certain financial institutions). Substantial penalties can apply if you are such a holder and fail to satisfy such reporting requirements. You should consult your tax advisors regarding the effects, if any, of these requirements on your ownership and disposition of ADSs or Class B shares.
F. Dividends and Paying Agents
Not applicable.
G. Statement by Experts
Not applicable.
H. Documents on Display
Annual reports and other information are filed with, or furnished to, the SEC in the United States, pursuant to the rules and regulations that apply to foreign private issuers. Electronic access to these documents may be obtained from the SEC’s website, www.sec.gov where they are stored in the EDGAR database.
I. Subsidiary Information
See Item 4.C. “Information on the Company – Organizational Structure.”
J. Annual Report to Security Holders
Not applicable.
ITEM 11. QUANTITATIVE AND QUALITATIVE DISCLOSURES ABOUT MARKET RISK
A. Quantitative Information about Market Risk
The information set forth under the following heading of the 2023 Swedish Annual Report (adjusted version) is incorporated herein by reference:
| • | Financial report |
| • | Board of Directors’ report |
| • | Risk management |
| • | Notes to the consolidated financial statements |
| • | Note F1 – Financial risk management |
B. Qualitative Information about Market Risk
The information set forth under the following headings of the 2023 Swedish Annual Report (adjusted version) is incorporated herein by reference:
| • | Financial report |
| • | Board of Directors’ report |
| • | Risk management |
| • | Notes to the consolidated financial statements |
| • | Note F1 – Financial risk management |
| • | Corporate Governance report |
| • | Risk Management |
12
C. Interim Periods
Not applicable.
D. Safe Harbor
Not applicable.
E. Smaller Reporting Companies
Not applicable.
ITEM 12. DESCRIPTION OF SECURITIES OTHER THAN EQUITY SECURITIES
A. Debt Securities
Not applicable.
B. Warrants and Rights
Not applicable.
C. Other Securities
Not applicable.
D. American Depositary Shares
Depositary fees, charges and payments
During 2023, an annual service fee of $0.02 was charged per ADS, for the operation and maintenance costs in administering the ADS program. The Depositary, Deutsche Bank Trust Company Americas (“Deutsche Bank”), established October 20, 2023 as the record date for payment of annual servicing fees. During 2023, an annual dividend fee of $0.01 was charged per ADS. The Depositary, Deutsche Bank, established March 31, 2023 and September 29, 2023 as the record dates for payments of the dividend fee.
Fees and charges payable by ADS holders
| Service |
Rate |
By whom paid |
||||
| 1) | Deposit of shares and issuance of receipts | Up to USD 5 per 100 American Depositary Shares or fraction thereof | Party to whom receipts are issued | |||
| 2) | Delivery of deposited shares against surrender of receipts | Up to USD 5 per 100 American Depositary Shares or fraction thereof | Party surrendering receipts | |||
| 3) | Processing of distribution of cash dividends and cash proceeds | Up to USD 3 per 100 American Depositary Shares | All ADS holders | |||
| 4) | Administration of the ADSs | Up to USD 3 per 100 American Depositary Shares per annum | All ADS holders | |||
In addition to the fees of the Depositary enumerated above, ADS holders are required under the terms of the deposit agreement to bear the following: (i) taxes and other governmental charges, (ii) share transfer registration fees on deposits, (iii) certain cable and facsimile transmission and delivery charges, and (iv) such expenses as are incurred by Deutsche Bank in the conversion of foreign currency into dollars.
Fees payable by the Depositary to the Company
Effective January 2019, Deutsche Bank agreed to pay Ericsson an amount equal to a fixed percentage of the net revenues, if any, collected by it as a result of charging ADS holders issuance and cancellation fees, and dividend processing and annual servicing fees. In 2023, such amount totaled approximately USD 10.1 million.
Effective January 2019, Deutsche Bank waived the cost of providing the ADS program administrative and reporting services to the extent provided by Deutsche Bank, and has agreed to bear the cost of certain third-party out-of-pocket costs related to the ADS program up to USD 50,000 per year. These costs include costs for the local custodian’s administration of matters relating to meetings of shareholders and costs of certain transfer agent administration services, such as the registration and transfer of depositary receipts. In 2023, such amount totaled approximately USD 61,000.
13
PART II
ITEM 13. DEFAULTS, DIVIDEND ARREARAGES AND DELINQUENCIES
None.
ITEM 14. MATERIAL MODIFICATIONS TO THE RIGHTS OF SECURITY HOLDERS AND USE OF PROCEEDS
None.
ITEM 15. CONTROLS AND PROCEDURES
A. Disclosure Controls and Procedures
The information set forth under the following heading of the 2023 Swedish Annual Report (adjusted version) is incorporated herein by reference:
| • | Corporate Governance report |
| • | Internal control over financial reporting – Disclosure controls and procedures |
B. Management’s Annual Report on Internal Control Over Financial Reporting
The information set forth under the section “Financial report – Management’s report on internal control over financial reporting” of the 2023 Swedish Annual Report (adjusted version) is incorporated herein by reference.
C. Attestation Report of the Registered Public Accounting Firm
The information set forth under the section “Financial report – Report of independent registered public accounting firm” of the 2023 Swedish Annual Report (adjusted version) is incorporated herein by reference.
D. Changes in Internal Control Over Financial Reporting
The information set forth under the section “Financial report – Management’s report on internal control over financial reporting – Changes in internal control over financial reporting” of the 2023 Swedish Annual Report (adjusted version) is incorporated herein by reference.
ITEM 16A. AUDIT COMMITTEE FINANCIAL EXPERT
The information set forth under the following heading of the 2023 Swedish Annual Report (adjusted version) is incorporated herein by reference:
| • | Corporate Governance report |
| • | Committees of the Board of Directors |
| • | Audit and Compliance Committee – Members of the Audit and Compliance Committee |
ITEM 16B. CODE OF ETHICS
We have adopted a Code of Business Ethics applicable to executive officers, directors and all other employees. Our Code of Business Ethics is available on our website at https://www.ericsson.com/en/about-us/corporate-governance/code-of-ethics. The Company will promptly disclose to our shareholders, if required by applicable laws or stock exchange requirements, any amendments to or waivers from the Code of Business Ethics applicable to our directors or officers by posting such information on our website at https://www.ericsson.com/en/about-us/corporate-governance/code-of-ethics. No waivers were requested or given during 2023. During 2023, we made technical and administrative changes to the Code of Business Ethics intended to enhance its readability and ease of use. The information set forth under the following headings of the 2023 Swedish Annual Report (adjusted version) is incorporated herein by reference:
| • | Corporate Governance report |
| • | Regulation |
| • | Ethics and Compliance |
ITEM 16C. PRINCIPAL ACCOUNTANT FEES AND SERVICES
The information set forth under the Section “Financial report - Notes to the consolidated financial statements - Note H5 – Fees to auditors” of the 2023 Swedish Annual Report (adjusted version) is incorporated herein by reference.
Audit and Compliance Committee Pre-Approval Policies and Procedures
The Audit and Compliance Committee reviews the scope and execution of audits to be performed by external and internal auditors and analyzes the results and costs of the audits performed. The Audit and Compliance Committee keeps the Board of Directors informed regarding the external and internal audit results, the reliability of the Company’s financial reporting and the auditors’ performance. It also makes recommendations to the Nomination Committee regarding the appointment of the external auditor by the Annual General Meeting and auditor remuneration. In order to ensure the external auditor’s independence, the Audit and Compliance Committee has established pre-approval policies and procedures for audit and non-audit related services to be performed by the external auditor. Pre-approval authority may not be delegated to management. The policies and procedures include a list of prohibited services, and audit and non-audit services that require pre-approval by the Audit and Compliance Committee. Such services fall into two broad categories:
| • | General pre-approval – certain services regarding taxes, transactions, risk management, business improvement, corporate finance, attestation and accounting services and the so-called general services (other than prohibited services) have received general pre-approval by the Audit and Compliance Committee, provided that the estimated fee for each project does not exceed SEK 1 million. In addition, non-audit services provided to the Group shall not exceed 70% of the average of the fees paid in the last three consecutive financial years for the statutory audits of the Group. The external auditor must advise the Audit and Compliance Committee with a quarterly summary of ongoing projects related to audit and non-audit services and an annual report of fees and expenses for all audit and non-audit services. |
| • | Specific pre-approval – all other non-audit services and services subject to general pre-approval exceeding SEK 1 million must receive specific pre-approval. The external auditor submits an application in writing to the Parent Company for final approval by the Audit and Compliance Committee, including a statement as to whether, in the view of the external auditor, the contemplated services are consistent with applicable rules on its independence. The Audit and Compliance Committee Chairman has the delegated authority for specific pre-approval in between Committee meetings, provided that the estimated fee in each case does not exceed SEK 2.5 million. The Audit and Compliance Committee Chairman or other member designated by the Audit and Compliance Committee reports any pre-approval to the Audit and Compliance Committee at its next meeting. |
All services provided in 2023 by the independent auditors were pre-approved in accordance with the pre-approval policies and procedures described above.
14
ITEM 16D. EXEMPTIONS FROM THE LISTING STANDARDS FOR AUDIT COMMITTEES
All members of the Audit Committee of a NASDAQ New York-listed company must be independent in accordance with NASDAQ New York and SEC rules. SEC Rule 10A-3(b)(1)(iv)(C) under the Exchange Act includes a specific exemption from these independence requirements for Audit Committee members of foreign private issuers who are non-executive employee representatives appointed to the Audit Committee pursuant to local law. The Company relies on this exemption, and does not consider that such reliance materially adversely affects the ability of the Audit and Compliance Committee to act independently or to satisfy other SEC requirements applicable to Audit Committees.
ITEM 16E. PURCHASES OF EQUITY SECURITIES BY THE ISSUER AND AFFILIATED PURCHASERS
None.
ITEM 16F. CHANGE IN REGISTRANT’S CERTIFYING ACCOUNTANT
None.
ITEM 16G. CORPORATE GOVERNANCE
Ericsson, as a company whose shares are listed on NASDAQ New York, is subject to the listing requirements and certain of the corporate governance requirements of NASDAQ New York and to certain rules of the SEC.
Under NASDAQ New York rules, all members of the audit committee of a NASDAQ New York-listed company must be independent in accordance with SEC rules. SEC rules include a specific exemption from these independence requirements for an employee of a foreign private issuer who is not an executive officer if the employee is elected or named to the board of directors or audit committee pursuant to the issuer’s governing law or documents, or other home country legal or listing requirements. The Company relies on this exemption and does not consider that such reliance materially adversely affects the ability of the Audit and Compliance Committee to act independently or to satisfy other SEC requirements applicable to audit committees.
Under NASDAQ New York rules, Ericsson is permitted to follow home country practices in lieu of certain NASDAQ corporate governance requirements that would apply to US companies listed on NASDAQ New York. The rules require disclosures regarding the ways in which Ericsson’s corporate governance practices differ from those required of US companies under the rules of NASDAQ New York.
These differences include the following:
| • | Employee representatives are appointed to Ericsson’s Board of Directors and serve on Committees (including the Audit and Compliance Committee and the Remuneration Committee) in accordance with Swedish law. |
| • | Employee representatives on the Ericsson Board and committees may attend all meetings of the Board and committees on which they serve (including those of the Audit and Compliance Committee and the Remuneration Committee) in accordance with Swedish law. |
| • | In accordance with Swedish market practices, the Nomination Committee is not fully comprised of Board members. In addition to the Chair of the Board, representatives of the four largest shareholders are members of the current Nomination Committee of Ericsson. |
| • | The determination regarding independence of Board members is made by the Nomination Committee (instead of the Board) prior to the Annual General Meeting of Shareholders (“AGM”). Before the AGM 2023, the Nomination Committee determined that the following Board members were independent under all applicable independence requirements, including the NASDAQ New York rules: Jon Fredrik Baksaas, Jan Carlson, Carolina Dybeck Happe, Eric A. Elzvik, Kristin S. Rinne, Jonas Synnergren and Christy Wyatt. When appointing members to the committees of the Board, the Board makes determinations regarding committee member independence. |
| • | The Board holds non-executive directors’ sessions but does not have regularly scheduled meetings with only independent directors present. |
| • | Under applicable Swedish rules, Ericsson is not required to publicly disclose the material terms of all agreements and arrangements between its directors or nominees for director and any person or entity (other than Ericsson) relating to compensation or other payment in connection with such person’s candidacy or service as a director of the company. |
| • | The external auditor is elected by the shareholders and is proposed by the Nomination Committee upon recommendation from the Audit and Compliance Committee. |
| • | NASDAQ New York rules applicable to US companies require the consideration of six factors relating to the independence of compensation consultants, legal counsel or other advisers retained by compensation or remuneration committees. Consistent with Swedish practices, the Remuneration Committee’s procedures addressing independence of advisers do not expressly require the consideration of those six factors. |
| • | Ericsson does not solicit proxies for shareholder meetings, which is in accordance with Swedish practices and rules. However, the Board may collect proxies in accordance with the Articles of Association. |
| • | There are no minimum quorum requirements for shareholder meetings under Swedish law, except under certain limited circumstances. Certain resolutions requiring special quorums and majorities are described under Exhibit 2.3. |
| • | Some of the requirements addressed by NASDAQ New York rules are included in the Swedish Corporate Governance Code or the work procedure for the Board instead of committee charters. The work procedure establishes the attribution of various responsibilities among the Board, its committees and the President and CEO. The work procedure for the Board is reviewed, evaluated and amended as required or appropriate, and adopted by the Board at least once a year. |
ITEM 16H. MINE SAFETY DISCLOSURE
Not applicable.
ITEM 16I. DISCLOSURE REGARDING FOREIGN JURISDICTIONS THAT PREVENT INSPECTIONS
Not applicable.
ITEM 16K. CYBERSECURITY
The information set forth under the following heading of the 2023 Swedish Annual Report (adjusted version) is incorporated herein by reference:
| • | Financial report |
| • | Risk factors |
| • | Cybersecurity risks |
| • | Corporate Governance report |
| • | Cybersecurity |
15
| • | Consolidated income statement and Consolidated statement of comprehensive income (loss) |
| • | Consolidated balance sheet |
| • | Consolidated statement of cash flows |
| • | Consolidated statement of changes in equity |
| • | Notes to the consolidated financial statements |
| • | Reports of independent registered public accounting firm (Deloitte PCAOB ID: 1126) |
EXHIBIT INDEX
The agreements and other documents filed as exhibits to this 2023 Form 20-F are not intended to provide factual information or other disclosure other than with respect to the terms of the agreements or other documents themselves, and you should not rely on them for that purpose. In particular, any representations and warranties made by the registrant in these agreements or other documents were made solely within the specific context of the relevant agreement or document and may not describe the actual state of affairs as of the date they were made or at any other time.
Securities Exhibit
17
| Exhibit Number |
Description |
|
| 101.INS*** | Inline XBRL Instance Document -The instance document does not appear in the Interactive Data File because its XBRL tags are embedded within the Inline XBRL document. | |
| 101.SCH*** | Inline XBRL Taxonomy Extension Schema Document. | |
| 101.CAL*** | Inline XBRL Taxonomy Extension Calculation Linkbase Document. | |
| 101.DEF*** | Inline XBRL Taxonomy Definition Linkbase Document. | |
| 101.LAB*** | Inline XBRL Taxonomy Extension Label Linkbase Document. | |
| 101.PRE*** | Inline XBRL Taxonomy Extension Presentation Linkbase Document. | |
| 104 | Cover Page Interactive Data File (embedded within the inline XBRL document). | |
| * | This certification will not be deemed “filed” for purposes of Section 18 of the Exchange Act (15 U.S.C. §78r), or otherwise subject to the liability of that section. Such certification will not be deemed to be incorporated by reference into any filing under the Securities Act of 1933, as amended, or the Exchange Act, except to the extent that the Registrant specifically incorporates it by reference. |
| ** | Certain of the information included in Exhibit 15.1 is incorporated by reference into this 2023 Form 20-F, as specified elsewhere in this report, in accordance with Rule 12b-23(a)(3) of the Exchange Act. With the exception of the items so specified, the 2023 Swedish Annual Report is not deemed to be filed as part of this 2023 Form 20-F. |
| *** | In accordance with Rule 406T(b)(2) of Regulation S-T, such XBRL information will be furnished and not filed or part of a registration statement or prospectus for purposes of Sections 11 or 12 of the Securities Act of 1933, as amended, will be deemed not filed for purposes of Section 18 of the Exchange Act, and otherwise will not be subject to liability under those sections. |
| (P) | Paper exhibits |
18
SIGNATURES
The registrant hereby certifies that it meets all of the requirements for filing on Form 20-F and that it has duly caused and authorized the undersigned to sign this Annual Report on Form 20-F on its behalf.
| TELEFONAKTIEBOLAGET LM ERICSSON | ||
| By: | /s/ STEFAN SALENTIN |
|
| Name: | Stefan Salentin | |
| Title: | Head of Group Controlling and External Reporting | |
| By: | /s/ CARL MELLANDER |
|
| Name: | Carl Mellander | |
| Title: | Senior Vice President and Chief Financial Officer | |
Date March 12, 2024
19
Exhibit 2.3
Description of Securities
Registered Pursuant to Section 12 of the
Securities Exchange Act of 1934
All references below to “Ericsson,” the “Company,” “we,” “our” or “us” refer to Telefonaktiebolaget LM Ericsson, and not to its subsidiaries.
As of December 31, 2023, Ericsson had one class of securities registered under Section 12 of the Securities Exchange Act of 1934, as amended: American Depositary Shares (or “ADSs”), each representing one Class B share. Ericsson’s Class A and Class B shares are listed on Nasdaq Stockholm. In the United States, the American Depositary Shares representing Class B shares are listed on NASDAQ New York under the symbol “ERIC.”
The following description of our share capital and American Depositary Shares is a summary and does not purport to be complete. It is subject to and qualified in its entirety by reference to our Articles of Association, as amended (our “Articles”), the Second Amended and Restated Deposit Agreement, dated as of January 7, 2014, among Ericsson, Deutsche Bank Trust Company Americas and holders of American Depositary Receipts (as amended, the deposit agreement”), and the form of American Depositary Receipt (as amended), which are incorporated by reference as exhibits to the Annual Report on Form 20-F of which this Exhibit is a part. We encourage you to read our Articles, and the applicable provisions of the Swedish Companies Act (as defined below) for additional information.
DESCRIPTION OF SHARE CAPITAL
REGISTER AND COMPANY PURPOSE
Telefonaktiebolaget LM Ericsson is registered under no. 556016–0680 in the Company Register kept by the Swedish Companies Registration Office.
Our Company’s objective and purposes are described in article 2 of the Articles, as follows: The objects of the Company are to, directly or indirectly, develop, construct, produce, sell and deliver and in other forms carry on trade and other commercial business related to goods, products and other equipment as well as maintenance and other services based on telecommunication and radio technology and other technologies for transference, transmission and other communications of speech, data, images, text, other kinds of information and means of payment and to carry on other activities consistent therewith.
SUMMARY OF PROVISIONS RELATING TO CERTAIN
POWERS AND INTERESTS OF DIRECTORS
Our Articles do not stipulate anything regarding:
| • | a director’s power to vote on a proposal, arrangement, or contract in which the director is materially interested; |
| • | our directors’ power to vote for compensation to themselves; |
| • | our directors’ borrowing powers; |
| • | retirement rules for our directors; or |
| • | the number of shares required for a director’s qualification. |
Applicable provisions are found in the Swedish Companies Act (2005:551) (the “Swedish Companies Act”).
Other than being of legal age, there are no age limit restrictions for directors and they are not required to own any shares in the Company.
SHARE CAPITAL
As of December 31, 2023, our Articles provide that our share capital may not be less than SEK 6,000,000,000 nor more than SEK 24,000,000,000, and that the number of shares in Ericsson shall amount to no less than 3,000,000,000 and no more than 12,000,000,000. All of our outstanding shares are validly issued, fully paid and non-assessable, are not redeemable and do not have any preemptive rights other than under the Swedish Companies Act and our Articles, as described below. In accordance with our Articles, Ericsson’s shares are divided into three classes of shares, denoted as Class A shares, Class B shares and Class C shares; however, as of December 31, 2023, no Class C shares were outstanding.
ADDITIONAL SHARE ISSUANCES; PREEMPTIVE RIGHTS
Under the Swedish Companies Act, shareholders must approve each issue of additional shares either by deciding on the share issue at a shareholders’ meeting, or by a shareholders’ approval of a decision on a share issue by our Board of Directors (the “Board”), or by giving an authorization to the Board to decide about a share issue. If we decide to issue new Class A, Class B or Class C shares by means of a cash issue, or an issue against payment through set-off of claims, Class A, Class B and Class C shareholders (except for Ericsson and its subsidiaries, in the event they hold shares in Ericsson) have a preemptive right to subscribe for new shares of the same type in relation to the number of shares previously held by them. Shares not subscribed for through a preferential right shall be offered to all shareholders for subscription on a pro rata basis. If we decide to issue new shares of only one series by means of a cash issue or an issue against payment through set-off of claims, all shareholders, regardless of whether their shares are Class A, Class B or Class C, are entitled to a preferential right to subscribe for new shares in proportion to the number of shares previously held by them. Shareholders may vote to waive shareholders’ preferential rights at a general meeting of shareholders.
If we decide to issue warrants or convertibles through a cash issue or an issue against payment through set-off of claims, the shareholders have preferential rights to subscribe to warrants as if the issue were of the shares that may be subscribed to pursuant to the warrant and, respectively, preferential rights to subscribe to convertibles as if the issue were of the shares that the convertibles may be converted to.
The above does not constitute any restriction to waive the shareholders’ preferential rights when deciding on either an issue of shares, warrants or convertibles by means of a cash issue or an issue against payment through set-off of claims.
DIVIDENDS AND OTHER DISTRIBUTIONS
Our Class A and Class B shareholders have the same right to dividends. Class C shareholders do not have any right to dividends, as described in article 6 of our Articles. No Class C shares are currently outstanding.
Under Swedish law, only a general meeting of shareholders may decide on payment of dividends, which may not exceed the amount proposed by the Board (except in certain limited circumstances), and may only be paid from funds legally available for that purpose. Under Swedish law, no interim dividends may be paid in respect of any fiscal period for which audited financial statements of the company have not yet been adopted by the annual general meeting of shareholders. The market practice in Sweden is most often for dividends to be paid annually. Under the Swedish Companies Act, dividends to shareholders and other transfers of value from a company—such as purchases of its own shares (see below)—may only be made when the company’s restricted equity remains fully covered after the transfer of value has been made. The calculation shall be based upon the most recently adopted balance sheet, and any changes in the restricted equity that has occurred after the balance sheet date shall be taken into account. In addition, dividends to shareholders and other transfers of value from the company may only be made if this is justifiable taking into account the type of business activities of the company, the scope and risks related thereto and the company’s need for financial resources, its liquidity and financial position. In respect of parent companies, also the business activities of the group, their scope and risks related thereto and the group’s need for financial resources, its liquidity and financial position shall be taken into account.
The Company’s shares are registered in the computerized book-entry share registration system administered by Euroclear Sweden AB (“Euroclear”). The rights attached to shares eligible for dividends accrue to those persons whose names are recorded in the register of shareholders on the record day. The dividends are then sent to a specified account as directed by the person registered with Euroclear. The relevant record day must, in most circumstances, be specified in the resolution declaring a dividend or resolving upon a capital increase or any similar matter in which shareholders have preferential rights, or the Board must be authorized to determine the relevant record day.
Where the registered holder is a nominee, the nominee receives, for the account of the beneficial owner, dividends and, on issues of shares with preferential rights for the shareholders, shares, as well as rights. Dividends are remitted in a single payment to the nominee who is responsible for the distribution of such dividends to the beneficial owner.
A similar procedure is adopted for share issues. Specific authority to act as a nominee must be obtained from Euroclear. At the request of Euroclear, the nominee must provide information about all beneficial holders of shares to Euroclear. Euroclear is required to keep a register with regard to any holding on behalf of a single beneficial owner in excess of 500 shares in any one company. This list is prepared every third month and must reveal the names of the beneficial owner and be open to public inspection.
RIGHTS IN A LIQUIDATION
On a return of capital on winding up or liquidation, any assets available for distribution amongst our shareholders at the commencement of the winding up (i.e. any surplus after paying off all the creditors of the company), will be equally distributed amongst our shareholders in proportion to the par value of the shares held by them.
ANNUAL GENERAL MEETINGS: VOTING RIGHTS
In a general meeting of shareholders of Ericsson, each Class A share shall carry one vote, each Class B share one tenth of one vote and each Class C share one-thousandth of one vote.
We are required to publish notices to attend annual general meetings no earlier than six weeks and no later than four weeks prior to the annual general meeting and the same notice period requirements apply regarding extraordinary general meetings concerning changes in our Articles. Notices to attend other types of extraordinary general meetings at Ericsson must be published no earlier than six weeks and no later than three weeks prior to the general meeting. Pursuant to the procedure stated in Swedish Companies Act, the Board may decide before a general meeting that the shareholders shall be able to exercise their voting rights by post before the meeting. In addition, the Board may collect proxies in accordance with the Swedish Companies Act. If the Company chooses to apply proxy solicitation or postal voting, the proxy form or the postal voting form must be made available on the Company’s website together with information on how to participate in the general meeting prior to the meeting.
Directors are elected during the annual general meeting for a period of one year at a time and do not stand for reelection at staggered intervals.
A shareholder may attend and vote at the meeting in person or by proxy. For companies whose shares are registered in a central securities depositary register, proxies are valid for up to five years from the date of issuance. Any shareholder wishing to attend a general meeting must notify us no later than on the day specified in the notice. We are required to accept all notifications of attendance received at least five business days (Saturdays normally included) prior to the meeting. A person designated in the register as a nominee (including the depositary of the ADSs) is not entitled to vote at a general meeting, nor is a beneficial owner whose share is registered in the name of a nominee (including the depositary of the ADSs) unless the beneficial owner first arranges to have such owner’s own name entered in the register of shareholders maintained by Euroclear no later than the designated record day, which is six banking days prior to the general meeting (however, a voting right registration requested by an owner (as per the record date) in such time that the voting right registration has been made by the relevant nominee no later than four banking days prior to the general meeting, will be taken into account in Euroclear’s compilation of the register of shareholders for the general meeting). Under the Swedish Companies Act, elections are determined by a plurality vote. Resolutions, other than elections, are passed by a simple majority of votes cast at the meeting with the chairman of the meeting having a decisive vote, unless otherwise required by law or a company’s Articles. Under the Swedish Companies Act, certain resolutions require special quorums and majorities, including, but not limited to, the following:
| a) | a resolution to amend our Articles requires a majority of two-thirds of the votes cast as well as two-thirds of the shares represented at the meeting, except in those circumstances described in b)—d) below; |
| b) | a resolution to amend our Articles that reduces any shareholder’s rights to profits or assets, restricts the transferability of shares or alters the legal relationship between shares, normally requires the unanimous approval of the shareholders present at the meeting and who hold nine-tenths of all outstanding shares; |
| c) | a resolution to amend our Articles for the purpose of limiting the number of shares with which a shareholder may vote at a general meeting or allocating part of the net profit for the fiscal year to a restricted fund or limiting the use of the company’s profits or assets in a liquidation or dissolution, normally requires the approval of shareholders representing two-thirds of the votes cast and nine-tenths of the shares represented at the meeting; |
| d) | a resolution of the kind referred to under b) or c) above may, however, be taken with a lower supermajority requirement if the amendments referred to therein will only adversely affect specific shares or classes of shares. In such cases, the requirement under a) above will apply together with the following separate supermajority: (i) where only a class of shares is adversely affected, approval of the owners of one-half of all shares of such class and nine-tenths of the shares of such |
| class represented at the meeting, or (ii) where the shares adversely affected do not constitute a class of shares, the unanimous approval of all such affected outstanding shares present at the meeting and who hold nine-tenths of all outstanding shares adversely affected; |
| e) | a resolution to issue, approve or authorize the issuance for cash of new shares, warrants or convertibles with a deviation from the preferential right for existing shareholders requires a two-thirds majority of votes cast at the meeting as well as two-thirds of the shares represented at the meeting; |
| f) | a resolution to reduce the outstanding share capital requires a two-thirds majority of votes cast at the meeting as well as two-thirds of the shares represented at the meeting. In the event there are several classes of shares in a company, the above described majority requirement shall apply also within each share class represented at the meeting and for which the rights of the shares are adversely affected; and |
| g) | a resolution to approve a merger requires a two-thirds majority of the votes cast at the meeting and two-thirds of the shares represented at the meeting (however, under certain circumstances a higher majority is required). |
At a general meeting of shareholders, a shareholder or proxy for one or more shareholders may cast the full number of votes represented by the holder’s shares.
AMENDMENTS TO THE ARTICLES
Under the Swedish Companies Act, an amendment of our Articles requires a resolution passed at a shareholders’ meeting. The number of votes required for a valid resolution depends on the type of amendment, however, any amendment must be approved by not less than two-thirds of the votes cast and represented at the meeting. The Board is not allowed to make amendments to the Articles absent shareholder approval.
PROVISIONS RESTRICTING CHANGE IN CONTROL OF OUR COMPANY
Neither our Articles nor the Swedish Companies Act contains any restrictions on change of control. However, mandatory bid requirements under the Swedish Stock Market (Takeover Bids) Act (2006:451) may apply under certain circumstances.
REDEMPTION, REPURCHASE AND SURRENDER OF SHARES
A Swedish public limited liability company whose shares are traded on a regulated market place within the European Economic Area (“EEA”) or a market place comparable to a regulated market place outside the EEA is entitled to purchase its own shares under certain conditions. A purchase by us of our own shares may take place only if (a) the purchase has been decided upon by a general meeting of shareholders or the Board has been authorized by a general meeting of shareholders, in both cases by a two-thirds majority of votes cast at the meeting as well as two-thirds of the shares represented at the meeting, (b) the purchase is effected on a regulated market place within the EEA or a market place comparable to a regulated market place outside the EEA (in the latter case with the approval of the Swedish Financial Supervisory Authority, the “SFSA”) or pursuant to an offer to all shareholders or holders of a specific class of shares, (c) the Company’s restricted equity will still be fully covered and the purchase is justifiable taken into account the type of business activities of the Company and the group, their scope and risks related thereto and the Company’s and the group’s need for financial resources, their liquidity and financial position and (d) we and our subsidiaries do not hold or, as a result of purchase, will not hold in excess of 10% of all our outstanding shares.
LIMITATION ON OWNING SECURITIES
There are no limitations imposed by Swedish law or by our Articles in respect of the rights of non-residents or foreign persons to purchase, own or sell securities issued by us.
There are, however, certain flagging and ownership examination rules that apply, irrespective of nationality.
Pursuant to the Swedish Financial Instruments Trading Act, any change in a holding of shares, depository receipts with voting rights or financial instruments that entitle the holder to acquire shares in issue in a Swedish limited liability company whose shares are admitted for trading on a regulated market place within the EEA shall be reported by the holder to the company and the SFSA, where the change entails that the holder’s portion of all shares or votes in the company reaches, exceeds or falls below any of the limits of 5, 10, 15, 20, 25, 30, 50, 66 2/3 or 90 percent. Such a change should, as a main rule, be reported not later than three trading days following the day on which the party with a duty to report has entered into an agreement for the acquisition or transfer of shares or any other change to the shareholding has occurred.
In addition, the EU Market Abuse Regulation requires, among other things, that the Company holds a register of all persons discharging managerial responsibilities and of persons closely associated with them. The Company and the SFSA must be notified of certain transactions conducted by the aforementioned persons. Such notifications shall be made no later than three business days after the date of the transaction.
DESCRIPTION OF AMERICAN DEPOSITARY SHARES
Deutsche Bank Trust Company Americas, as depositary, has registered and delivered the ADSs. Each ADS represent ownership of one B share (or a right to receive one Class B share), deposited with Skandinaviska Enskilda Banken AB (publ), having its principal office at Kungsträdgårdsgatan 8, SE 106 40, Stockholm, Sweden, as custodian for the depositary. Each ADS will also represent ownership of any other securities, cash or other property which may be held by the depositary. The depositary’s principal office at which the ADSs are administered is located at 60 Wall Street, New York, NY 10005, USA. The principal executive office of the depositary is located at 60 Wall Street, New York, NY 10005, USA.
The Direct Registration System, or DRS, is a system administered by The Depository Trust Company, or DTC, pursuant to which the depositary may register the ownership of uncertificated ADSs, which ownership shall be evidenced by periodic statements issued by the depositary to the ADS holders entitled thereto.
We do not treat ADS holders as our shareholders and accordingly, you, as an ADS holder, will not have shareholder rights. Swedish law governs shareholder rights. The depositary is the holder of the Class B shares underlying your ADSs. As a holder of ADSs, you have ADS holder rights. A deposit agreement among us, the depositary and you, as an ADS holder, and the beneficial owners of ADSs sets out ADS holder rights as well as the rights and obligations of the depositary. The laws of the State of New York govern the deposit agreement and the ADSs.
HOLDING THE ADSs
How may you hold your ADSs?
You may hold ADSs either (a) directly (i) by having an American Depositary Receipt, or ADR, which is a certificate evidencing a specific number of ADSs, registered in your name, or (ii) by holding ADSs in uncertificated form in DRS, or (b) indirectly through your broker or other financial institution. If you hold ADSs directly, you are an ADS holder. This description assumes you hold your ADSs directly. ADSs will be issued through DRS, unless you specifically request certificated ADRs. If you hold the ADSs indirectly, you must rely on the procedures of your broker or other financial institution to assert the rights of ADS holders described in this summary. You should consult with your broker or financial institution to find out what those procedures are.
DIVIDENDS AND OTHER DISTRIBUTIONS
How may you receive dividends and other distributions on the shares?
The depositary has agreed to pay to you the cash dividends or other distributions it or the custodian receives on shares or other deposited securities, after deducting its fees and expenses. You will receive these distributions in proportion to the number of shares your ADSs represent as of the record date (which will be as close as practicable to the record date for our shares) set by the depositary with respect to the ADSs.
| • | Cash. The depositary will convert or cause to be converted any cash dividend or other cash distribution we pay on the shares or any net proceeds from the sale of any shares, rights, securities or other entitlements under the terms of the deposit agreement into U.S. dollars if it can do so on a practicable basis, and can transfer the U.S. dollars to the United States and will distribute promptly the amount thus received. If the depositary determines in its judgment that such conversions or transfers are not practical or lawful or if any government approval or license is needed and cannot be obtained at a reasonable cost within a reasonable period or otherwise sought, the deposit agreement allows the depositary to distribute the foreign currency only to those ADS holders to whom it is possible to do so. It will hold or |
| cause the custodian to hold the foreign currency it cannot convert for the account of the ADS holders who have not been paid and such funds will be held for the respective accounts of the ADS holders. It will not invest the foreign currency and it will not be liable for any interest for the respective accounts of the ADS holders. |
Before making a distribution, any taxes or other governmental charges, together with fees and expenses of the depositary, that must be paid, will be deducted. The depositary will distribute only whole U.S. dollars and cents and will round fractional cents to the nearest whole cent. If the exchange rates fluctuate during a time when the depositary cannot convert the foreign currency, you may lose some or all of the value of the distribution.
| • | Shares. For any shares we distribute as a dividend or free distribution, either (a) the depositary will, with our approval or at our request, distribute additional ADSs representing such shares or (b) existing ADSs as of the applicable record date will represent rights and interests in the additional shares distributed, in either case, net of applicable fees, charges and expenses incurred by the depositary and taxes and/or other governmental charges. The depositary will only distribute whole ADSs. It will sell shares which would require it to deliver a fractional ADS and distribute the net proceeds in the same way as it does with cash. |
| • | Elective Distributions in Cash or Shares. If we offer our shareholders the option to receive dividends in either cash or shares, we will notify the depositary at least 30 days prior to the proposed distribution stating whether or not we want such distribution to be made available to ADR holders. Following such notice, the depositary will consult with us to determine, with our assistance, whether it is lawful and reasonably practicable to make such elective distribution available to ADR holders. The depositary will make such elective distribution available to ADR holders only if (a) we have timely requested that the elective distribution is available to ADR holders, (b) the depositary has determined that such distribution is reasonably practicable and (c) the depositary has received satisfactory legal opinions of counsel as provided in the deposit agreement. If these conditions are not satisfied, the depositary will, on the basis of the same determination as is made in respect of the shares for which no election is made, distribute either cash in the same way as it does in a cash distribution, or additional ADSs representing shares in the same way as it does in a share distribution. The depositary is not obligated to make available to you a method to receive the elective distribution in shares rather than in ADSs. There can be no assurance that you will be given the opportunity to receive elective distributions on the same terms and conditions as our shareholders. |
| • | Rights to Purchase Additional Shares. If we offer our shareholders any rights to subscribe for additional shares or any rights of any other nature, the depositary will establish procedures to either (a) distribute such rights and enable you to exercise the rights or (b) dispose of such rights on your behalf and making the net proceeds available in dollars, each upon your payment of applicable fees, charges and expenses incurred by the depositary and taxes and/or other governmental charges. At our request, however: |
| • | if the depositary determines that it is lawful and feasible to make such rights available to you by means of warrants or otherwise, it will distribute warrants or other instruments to you, or employ such other method as it may deem feasible in order to facilitate the exercise, sale or transfer of rights by you; or |
| • | if the depositary determines that it is not lawful or not feasible to make such rights available to you by means of warrants or otherwise, or if the rights represented by such warrants or such other instruments are not exercised and appear to be about to lapse, the depositary may sell the rights or the warrants or other instruments, at such place and upon such terms (including public or private sale) as it may deem proper and distribute the net proceeds in the same way as it does with cash. The depositary will allow rights that are not distributed or sold to lapse. In that case, you will receive no value for them. |
If the depositary makes rights available to you, U.S. securities laws may restrict transfers and cancellation of the ADSs represented by shares purchased upon exercise of rights. For example, you may not be able to trade these ADSs freely in the United States. In this case, the depositary may deliver restricted depositary shares that have the same terms as the ADSs described in this summary except for changes needed to put the necessary restrictions in place.
There can be no assurance that you will be given the opportunity to exercise rights on the same terms and conditions as our shareholders or be able to exercise such rights.
| • | Other Distributions. The depositary will distribute to you anything else we distribute on deposited securities by any means it may deem equitable and practicable, upon your payment of applicable fees, charges and expenses incurred by the depositary and taxes and/or other governmental charges. If the depositary determines that such distribution cannot be made proportionately, or if for any other reason the depositary deems such distribution not to be feasible, the depositary may adopt such method as it may deem equitable and practicable for the purpose of effecting such distribution, including the sale of the property we distributed, and the net proceeds of any such sale will be distributed. |
The depositary is not responsible if it decides that it is unlawful or impractical to make a distribution available to any ADS holders. We have no obligation to register ADSs, shares, rights or other securities under the US Securities Act of 1933, as amended (the “Securities Act”). We also have no obligation to take any other action to permit the distribution of ADSs, shares, rights or any other property to ADS holders. This means that you may not receive the distributions we make on our shares or any value for them if we and/or the depositary determines that it is illegal or not practicable for us or the depositary to make them available to you.
DEPOSIT, WITHDRAWAL AND CANCELLATION
How are ADSs issued?
The depositary will deliver ADSs if you or your broker deposit shares or evidence of rights to receive shares with the custodian. Upon payment of its applicable fees and expenses and of any taxes or charges, such as stamp taxes or stock transfer taxes or fees, the depositary will register the appropriate number of ADSs in the names you request and will deliver the ADSs to, or upon the order of, the person or persons entitled thereto.
How do ADS holders cancel an ADS?
You may turn in your ADSs at the depositary’s principal office or by providing appropriate instructions to your broker. Upon payment of its applicable fees and expenses and of any taxes or charges, such as stamp taxes or stock transfer taxes or fees, the depositary will deliver the shares and any other deposited securities underlying the ADSs to you or a person you designate at the office of the custodian. Or, at your request, risk and expense, the depositary will deliver the deposited securities at its principal office, to the extent permitted by law and the deposit agreement. See “Requirements for Depositary Actions” below.
How do ADS holders interchange between Certificated ADSs and Uncertificated ADSs?
You may surrender your ADR to the depositary for the purpose of exchanging your ADR for uncertificated ADSs. The depositary will cancel that ADR and will send you a statement confirming that you are the owner of uncertificated ADSs. Alternatively, upon receipt by the depositary of a proper instruction from a holder of uncertificated ADSs requesting the exchange of uncertificated ADSs for certificated ADSs, the depositary will execute and deliver to you an ADR evidencing those ADSs.
How do ADS holders vote?
You may instruct the depositary to vote the shares or other deposited securities underlying your ADSs at any meeting at which you are entitled to vote pursuant to Swedish law, the provisions of our Articles, and the deposit agreement. Otherwise, you could exercise your right to vote directly if you withdraw the shares. However, you may not know about the meeting sufficiently enough in advance to withdraw the shares.
The depositary will notify you of any meeting at which you are entitled to vote, and arrange to deliver our voting materials to you. The materials will contain (a) such information as is contained in our notice of meeting, solicitation of consent or proxy, and (b) a statement that the ADS holders at the close of business in New York on the specified record date will be entitled, subject to Swedish law, our Articles and the deposit agreement, to instruct the depositary as to the exercise of the voting rights, if any, pertaining to the shares or other deposited securities represented by such holder’s ADSs. Blocking and voting instructions may be given only in respect of a number of ADSs representing an integral number of shares or other deposited securities. For instructions to be valid, the depositary must receive them in writing on or before the date specified. The depositary will try, in so far as practicable and as permitted under Swedish law, our Articles, and the deposit agreement, to vote or to have its agents block or vote the shares or other deposited securities (in person or by proxy) as you instruct. If the depositary timely receives blocking and voting instructions from you that fail to specify the manner in which the depositary is to vote the ADSs on one or more matters presented at the relevant meeting, the depositary will abstain on those items for which you failed to specify the manner in which the depositary is to vote.
We cannot assure you that you will receive the voting materials in time to ensure that you can instruct the depositary to vote the shares underlying your ADSs. In addition, there can be no assurance that ADS holders and beneficial owners generally, or any holder or beneficial owner in particular, will be given the opportunity to vote or cause the depositary or the custodian, as applicable, to vote on the same terms and conditions as our shareholders.
COMPLIANCE WITH REGULATIONS
Disclosure of Interests
Each ADR holder is required to comply with our Articles, as they may be amended from time to time, and the laws of Sweden with respect to disclosure requirements, if any, regarding ownership of ADSs and shares in, and other securities and debt obligations, of the Company, all as if such ADRs were to the extent practicable the Class B shares represented thereby. This may include providing information as to whether any ADSs represented by any of the ADRs held by or registered in the name of such holder are being held, directly or indirectly, for some person other than such holder and, if so, the name, address and citizenship of such other person or persons.
How may the deposit agreement be amended?
We may agree with the depositary to amend the deposit agreement and the form of ADR without your consent for any reason. If an amendment adds or increases fees or charges, except for taxes and other governmental charges or expenses of the depositary for registration fees, facsimile costs, delivery charges or similar items, including expenses incurred in connection with foreign exchange control regulations and other charges specifically payable by ADS holders under the deposit agreement, or prejudice any substantial existing right of ADS holders, it will not become effective for outstanding ADSs until one month after the depositary notifies ADS holders of the amendment. At the time an amendment becomes effective, you are considered, by continuing to hold your ADSs, to agree to the amendment and to be bound by the ADRs and the deposit agreement as amended. If any new laws are adopted that would require the deposit agreement to be amended in order to comply therewith, we and the depositary may amend the deposit agreement in accordance with such laws and such amendment may become effective before notice thereof is given to ADS holders.
How may the deposit agreement be terminated?
The depositary will terminate the deposit agreement if we ask it to do so, in which case the depositary will give notice to you at least 30 days prior to termination. The depositary may also terminate the deposit agreement if the depositary has delivered to us a written notice that it would like to resign, and we have not appointed a new depositary within 90 days.
After termination, the depositary and its agents will do the following under the deposit agreement but nothing else: continue to collect dividends and other distributions pertaining to ADSs, sell rights as provided in the deposit agreement, and continue to deliver ADSs, together with any dividends or other distributions received and the net proceeds of the sale of any rights or other property, in exchange for ADRs surrendered to the depositary. Six months or more after the date of termination, the depositary may sell any remaining deposited securities by public or private sale.
After that, the depositary will hold the money it received on the sale, as well as any other cash it is holding under the deposit agreement, for the pro rata benefit of the ADS holders that have not surrendered their ADSs. It will not invest the money and has no liability for interest. After such sale, the depositary’s only obligations will be to account for the money and other cash. After termination, we shall be discharged from all obligations under the deposit agreement except for our obligations to the depositary thereunder.
BOOKS OF DEPOSITARY; REPORTS
The depositary will maintain ADS holder records at its depositary office. You may inspect such records at such office at all reasonable times, provided that such inspection is not for the purpose of communicating with ADR holders in the interest of a business or object other than the business of the Company or a matter related to the deposit agreement or the ADRs.
The depositary will maintain facilities in the Borough of Manhattan, The City of New York for the execution and delivery, registration, registration of transfers and surrender of ADRs.
These facilities may be closed at any time or from time to time when such action is deemed necessary or advisable by the depositary in connection with the performance of its duties under the deposit agreement or at our reasonable request.
The depositary will make available for inspection by you at its principal office any reports and communications received from the Company, including any proxy soliciting material. The depositary will also send to you copies of such reports when furnished by the Company pursuant to the deposit agreement
LIMITATIONS ON OBLIGATIONS AND LIABILITY OF DEPOSITARY
The deposit agreement expressly limits our obligations and the obligations of the depositary and the custodian. It also limits our liability and the liability of the depositary. The depositary:
| • | is only obligated to take the actions specifically set forth in the deposit agreement without gross negligence or willful misconduct; |
| • | is not obligated to appear in, prosecute or defend any action, suit or other proceeding in respect of any ADSs or ADRs, which in its opinion may involve it in expense or liability, unless indemnity satisfactory to it against all expense and liability is furnished as often as may be required; |
| • | is not liable for (a) any action or non-action by it in reliance on the advice of or information from legal counsel, accountants, any person presenting Class B shares for deposit, any ADR holder, or any other person believed by it in good faith to be competent to give such advice or information, (b) the inability by an ADS holder to benefit from any distribution, offering, right or other benefit which is made available to shareholders but is not, under the terms of the deposit agreement, made available to ADS holders or (c) any special, consequential, indirect or punitive damages for any breach of the terms of the deposit agreement or otherwise; and |
| • | is not responsible for any failure to carry out any instructions to vote any of the ADSs, or for the manner in which any such vote is cast or effect of any such vote, provided that any such action or non-action is in good faith. |
The custodian is not under any obligation whatsoever with respect to any action, suit or other proceeding in respect of any ADSs or ADRs, the responsibility of the custodian being solely to the depositary.
In the deposit agreement, we agree to indemnify the depositary under certain circumstances.
Requirements for Depositary Actions
Before the depositary issues, delivers or registers a transfer of an ADS, splits-up, subdivides or combines ADSs, makes a distribution on an ADS, or permits withdrawal of shares, the depositary may require:
| • | reimbursement for any applicable tax or other governmental charge and any applicable stock transfer or registration fee (including any such tax or charge and fee with respect to deposits or withdrawals) and payment of any applicable fees, expenses and charges of the depositary; |
| • | satisfactory proof of the identity and genuineness of any signature or any other matters contemplated in the deposit agreement; and |
| • | compliance with any regulations, if any, that the depositary may establish consistent with the provisions of the deposit agreement. |
The depositary may refuse to issue and deliver ADSs or register transfers of ADSs during any period when the transfer books of the depositary are closed, or if we or the depositary deem such refusal to be necessary or advisable because of compliance with any requirement of applicable law or regulation. The depositary is not permitted to knowingly accept for deposit under the deposit agreement any shares or other deposited securities required to be registered under the provisions of the Securities Act, unless a registration statement is in effect as to such shares.
Exhibit 12.1
Certification of Chief Executive Officer
Pursuant to Section 302 of the Sarbanes-Oxley Act of 2002
I, Börje Ekholm, certify that:
| 1. | I have reviewed this annual report on Form 20-F of Telefonaktiebolaget LM Ericsson (publ) (the “Company”); |
| 2. | Based on my knowledge, this report does not contain any untrue statement of a material fact or omit to state a material fact necessary to make the statements made, in light of the circumstances under which such statements were made, not misleading with respect to the period covered by this report; |
| 3. | Based on my knowledge, the financial statements, and other financial information included in this report, fairly present in all material respects the financial condition, results of operations and cash flows of the Company as of, and for, the periods presented in this report; |
| 4. | The Company’s other certifying officer(s) and I are responsible for establishing and maintaining disclosure controls and procedures (as defined in Exchange Act Rules 13a-15(e) and 15d-15(e)) and internal control over financial reporting (as defined in Exchange Act Rules 13a-15(f) and 15d-15(f)) for the Company and have: |
| (a) | designed such disclosure controls and procedures, or caused such disclosure controls and procedures to be designed under our supervision, to ensure that material information relating to the Company, including its consolidated subsidiaries, is made known to us by others within those entities, particularly during the period in which this report is being prepared; |
| (b) | designed such internal control over financial reporting, or caused such internal control over financial reporting to be designed under our supervision, to provide reasonable assurance regarding the reliability of financial reporting and the preparation of financial statements for external purposes in accordance with generally accepted accounting principles; |
| (c) | evaluated the effectiveness of the Company’s disclosure controls and procedures and presented in this report our conclusions about the effectiveness of the disclosure controls and procedures, as of the end of the period covered by this report based on such evaluation; and |
| (d) | disclosed in this report any change in the Company’s internal control over financial reporting that occurred during the period covered by the annual report that has materially affected, or is reasonably likely to materially affect, the Company’s internal control over financial reporting; and |
| 5. | The Company’s other certifying officer(s) and I have disclosed, based on our most recent evaluation of internal control over financial reporting, to the Company’s auditors and the audit committee of the Company’s board of directors (or persons performing the equivalent functions): |
| (a) | all significant deficiencies and material weaknesses in the design or operation of internal control over financial reporting which are reasonably likely to adversely affect the Company’s ability to record, process, summarize and report financial information; and |
| (b) | any fraud, whether or not material, that involves management or other employees who have a significant role in the Company’s internal control over financial reporting. |
Dated March 12, 2024
| /s/ Börje Ekholm |
| Börje Ekholm President and Chief Executive Officer |
Exhibit 12.2
Certification of Chief Financial Officer
Pursuant to Section 302 of the Sarbanes-Oxley Act of 2002
I, Carl Mellander, certify that:
| 1. | I have reviewed this annual report on Form 20-F of Telefonaktiebolaget LM Ericsson (publ) (the “Company”); |
| 2. | Based on my knowledge, this report does not contain any untrue statement of a material fact or omit to state a material fact necessary to make the statements made, in light of the circumstances under which such statements were made, not misleading with respect to the period covered by this report; |
| 3. | Based on my knowledge, the financial statements, and other financial information included in this report, fairly present in all material respects the financial condition, results of operations and cash flows of the Company as of, and for, the periods presented in this report; |
| 4. | The Company’s other certifying officer(s) and I are responsible for establishing and maintaining disclosure controls and procedures (as defined in Exchange Act Rules 13a-15(e) and 15d-15(e)) and internal control over financial reporting (as defined in Exchange Act Rules 13a-15(f) and 15d-15(f)) for the Company and have: |
| (a) | designed such disclosure controls and procedures, or caused such disclosure controls and procedures to be designed under our supervision, to ensure that material information relating to the Company, including its consolidated subsidiaries, is made known to us by others within those entities, particularly during the period in which this report is being prepared; |
| (b) | designed such internal control over financial reporting, or caused such internal control over financial reporting to be designed under our supervision, to provide reasonable assurance regarding the reliability of financial reporting and the preparation of financial statements for external purposes in accordance with generally accepted accounting principles; |
| (c) | evaluated the effectiveness of the Company’s disclosure controls and procedures and presented in this report our conclusions about the effectiveness of the disclosure controls and procedures, as of the end of the period covered by this report based on such evaluation; and |
| (d) | disclosed in this report any change in the Company’s internal control over financial reporting that occurred during the period covered by the annual report that has materially affected, or is reasonably likely to materially affect, the Company’s internal control over financial reporting; and |
| 5. | The Company’s other certifying officer(s) and I have disclosed, based on our most recent evaluation of internal control over financial reporting, to the Company’s auditors and the audit committee of the Company’s board of directors (or persons performing the equivalent functions): |
| (a) | all significant deficiencies and material weaknesses in the design or operation of internal control over financial reporting which are reasonably likely to adversely affect the Company’s ability to record, process, summarize and report financial information; and |
| (b) | any fraud, whether or not material, that involves management or other employees who have a significant role in the Company’s internal control over financial reporting. |
Dated March 12, 2024
| /s/ Carl Mellander |
| Carl Mellander Senior Vice President and Chief Financial Officer |
Exhibit 13.1
Certification of Chief Executive Officer
Pursuant to 18 U.S.C. §1350, as adopted pursuant to Section 906 of the Sarbanes-Oxley Act of 2002, the undersigned officer of Telefonaktiebolaget LM Ericsson (publ) (the “Company”) hereby certifies, to such officer’s knowledge, that:
| (i) | the Annual Report on Form 20-F of the Company for the period ended December 31, 2023 (the “Report”) fully complies with the requirements of Section 13(a) or Section 15(d), as applicable, of the Securities Exchange Act of 1934, as amended; and |
| (ii) | the information contained in the Report fairly presents, in all material respects, the financial condition and results of operations of the Company. |
Dated March 12, 2024
| /s/ Börje Ekholm |
| Börje Ekholm President and Chief Executive Officer |
The foregoing certification is being furnished solely to accompany the Report pursuant to 18 U.S.C. § 1350, and is not being filed for purposes of Section 18 of the Securities Exchange Act of 1934, as amended, and is not to be incorporated by reference into any filing of the Company, whether made before or after the date hereof, regardless of any general incorporation language in such filing.
Exhibit 13.2
Certification of Chief Financial Officer
Pursuant to 18 U.S.C. §1350, as adopted pursuant to Section 906 of the Sarbanes-Oxley Act of 2002, the undersigned officer of Telefonaktiebolaget LM Ericsson (publ) (the “Company”) hereby certifies, to such officer’s knowledge, that:
| (i) | the Annual Report on Form 20-F of the Company for the period ended December 31, 2023 (the “Report”) fully complies with the requirements of Section 13(a) or Section 15(d), as applicable, of the Securities Exchange Act of 1934, as amended; and |
| (ii) | the information contained in the Report fairly presents, in all material respects, the financial condition and results of operations of the Company. |
Dated March 12, 2024
| /s/ Carl Mellander |
| Carl Mellander Chief Financial Officer |
The foregoing certification is being furnished solely to accompany the Report pursuant to 18 U.S.C. § 1350, and is not being filed for purposes of Section 18 of the Securities Exchange Act of 1934, as amended, and is not to be incorporated by reference into any filing of the Company, whether made before or after the date hereof, regardless of any general incorporation language in such filing.
Financial report |
||||||
This is Ericsson |
1 |
|||||
CEO comment |
2 |
|||||
Business strategy |
5 |
|||||
Letter from the Chair of the Board |
14 |
|||||
Board of Directors’ report |
16 |
|||||
Report of independent registered public accounting firm |
32 |
|||||
Report of independent registered public accounting firm |
33 |
|||||
Consolidated financial statements with notes |
35 |
|||||
Management’s report on internal control over financial reporting |
89 |
|||||
Risk factors |
90 |
|||||
Alternative performance measures |
107 |
|||||
The Ericsson share |
112 |
|||||
Corporate Governance report |
||||||
Introduction and Key 2023 Governance Updates |
2 |
|||||
Regulation |
3 |
|||||
Governance Structure and Core Values |
3 |
|||||
Ethics & Compliance |
5 |
|||||
Risk Management |
6 |
|||||
General Meetings of shareholders |
8 |
|||||
Nomination Committee |
8 |
|||||
Board of Directors |
9 |
|||||
Committees of the Board of Directors |
11 |
|||||
Remuneration to Board members |
13 |
|||||
Members of the Board of Directors |
14 |
|||||
Management |
18 |
|||||
Cybersecurity |
19 |
|||||
Members of the Executive Team |
20 |
|||||
Auditor |
25 |
|||||
Internal control over financial reporting |
25 |
|||||
Remuneration report |
||||||
Statement from the Chair of the Remuneration Committee |
1 |
|||||
Introduction |
2 |
|||||
Remuneration 2023 at a glance |
3 |
|||||
Total remuneration to the President and CEO and Executive Vice President |
5 |
|||||
Variable remuneration |
6 |
|||||
Comparative information on changes in remuneration and the Company’s performance |
11 |
|||||
● |
The Financial report, including Board of Directors’ report and the financial statements and notes |
● |
The Corporate Governance report |
● |
The Remuneration report |

Contents |
||||||||
|
Financial report 2023 |
||||||||
This is Ericsson |
1 |
|||||||
CEO comment |
2 |
|||||||
Business strategy – Creating long-term value |
5 |
|||||||
Letter from the Chair of the Board |
14 |
|||||||
Board of Directors’ report |
16 |
|||||||
Board Assurance |
31 |
|||||||
Report of independent registered public accounting firm |
32 |
|||||||
Report of independent registered public accounting firm |
33 |
|||||||
Consolidated financial statements |
35 |
|||||||
Notes to the consolidated financial statements |
42 |
|||||||
|
Management’s report on internal control over financial reporting |
89 |
|||||||
Risk factors |
90 |
|||||||
Forward-looking statements |
105 |
|||||||
Alternative performance measures |
107 |
|||||||
The Ericsson share |
112 |
|||||||
Shareholder information |
116 |
|||||||
Financial terminology |
117 |
|||||||
Glossary |
118 |
|||||||
 |
 |
|||
| 1 | Financial Report 2023 | | Ericsson Annual Report on Form 20-F 2023 | ||
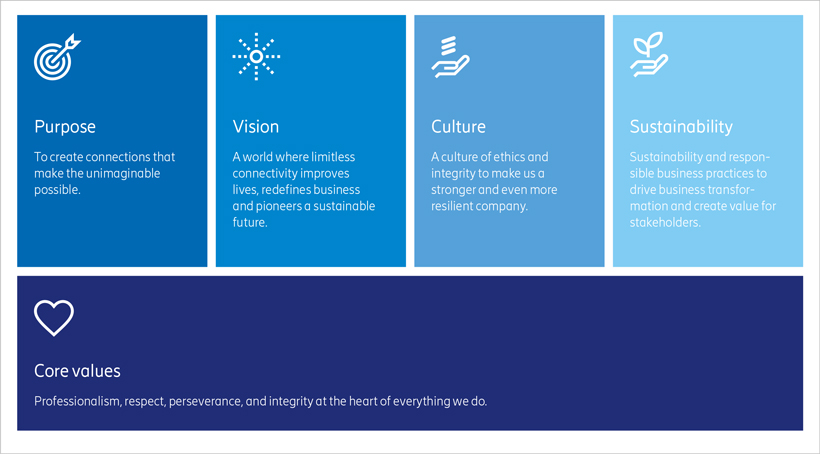
|
|
||||
| 2 | Financial Report 2023 | CEO comment | Ericsson Annual Report on Form 20-F 2023 | ||

|
|
||||
| 3 | Financial Report 2023 | CEO comment | Ericsson Annual Report on Form 20-F 2023 | ||
|
1) |
Excluding restructuring charges. |
|
|
||||
| 4 | Financial Report 2023 | CEO comment | Ericsson Annual Report on Form 20-F 2023 | ||
|
1) |
Net sales adjusted for comparable units and currency. |
|
2) |
Excluding restructuring charges. |

|
|
||||
| 5 | Financial Report 2023 | Business strategy | Ericsson Annual Report on Form 20-F 2023 | ||
|
Digitalization and society Over the past three decades, mobile connectivity has fundamentally transformed our world – driving advanced digitalization in industries and society. Today, we have near-ubiquitous connectivity globally, with 8.5 billion mobile phone subscriptions. And over the last 30 years, data speeds have increased at a rate faster than Moore’s Law. During this time, 4G networks gave rise to the app economy and digitalized consumer life. Today digitalization is a key tool for solving some of society’s biggest challenges, including the climate crisis and social inclusion. But to take the next step in digitalization, “best effort” connectivity for consumers will not be enough. What is needed are faster speeds, reduced latency and improved quality of service to achieve complete digitalization in both enterprises and the public sector. Satisfying those demands will require higher-performance networks that are significantly more powerful than previous generations. |
 |
| • | Quality of Service and time-bound latency |
| • | Improved outdoor and indoor coverage |
| • | Advanced location and positioning 3D-mapping |
| • | Improved security authentication |
|
|
||||
| 6 | Financial Report 2023 | Business strategy | Ericsson Annual Report on Form 20-F 2023 | ||

|
|
||||
| 7 | Financial Report 2023 | Business strategy | Ericsson Annual Report on Form 20-F 2023 | ||
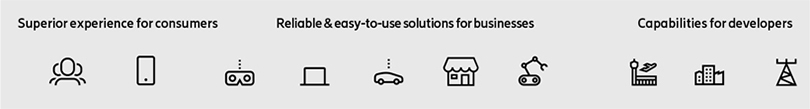
Best performance for differentiated networks, relentless efficiency and growth in an open world |
Leadership in mobile networks |
Focused expansion into enterprise |
|||||
|
• Technology leadership for performance, security, and sustainability at lowest TCO across RAN, Core & OSS/BSS • Lead industry shift to programmable, automated cloud-native networks and operations, and advanced network services |
Wireless networks • Pre-packaged solutions• Leading reliability, security, and operations |
Communication platform • Accelerate the world’s ability to connect • Global network platform |
||||
Be first in critical innovations, and capture strategic business opportunities |
||||||
Technology leadership |
Cost efficiency |
Data-driven operations |
Global skill & scale |
|||
|
Delivering on
end-user requirementsCreating value through our strategy is closely linked with our commitment to fulfill the diverse needs of consumers, enterprises and developers. For consumers, this means delivering on their demand for an unparalleled experience with seamless connectivity and high-quality communications services. Enterprises require reliable and
easy-to-use |
Customer success Through our products and solutions, we drive relentless efficiency in order to minimize our customer’s total cost of ownership (TCO) while accelerating their revenue growth in an increasingly open world. This includes addressing the need for spectrum, greater energy efficiency and superior performance. We are also ensuring that our customers are well prepared for future opportunities by embracing open and programmable networks. |
|
|
||||
| 8 | Financial Report 2023 | Business strategy | Ericsson Annual Report on Form 20-F 2023 | ||
|
Focused expansion into enterprise With 5G, we are in the early stages of widespread enterprise digitalization – creating significant additional value for industrial applications such as mining, airports, and manufacturing. We continue to build an enterprise business with a strategy that is organized around two pillars. The first, Enterprise Wireless Solutions, is where we are driving business transformation through seamless and secure network solutions. The second, Global Communications Platform, is where we will help customers monetize 5G in new ways by transforming how network capabilities – such as high speed and low latency – are globally exposed, consumed and paid for. |
Enterprise Wireless Solutions We are developing wireless solutions for businesses with leading reliability, security and
easy-to-manage Through business area
Enterprise Wireless Solutions Wireless-WAN (WWAN) and Cloud Security (Security Services Edge – or SSE) solutions. These solutions are primarily delivered via a unified management, policy, and security framework to enterprises, Managed Service Providers (MSPs) and CSPs.The business area continues to expand its portfolio. In April 2023, Cradlepoint acquired Ericom Software including their advanced enterprise cloud security platform to solidify its Secure Access Service Edge (SASE) and
zero-trust offerings for hybrid 5G and wireline environments. |
Global Communications Platform The second pillar of our enterprise strategy is powered by our acquisition of Vonage and the formation of business area
Global Communications Platform Our ambition is to accelerate the world’s ability to connect and we do this by maintaining a strong position in the market for Communications Platform as a Service (CPaaS) with deep enterprise and developer engagements. In addition, 5G offers programmable and differentiated network performance and capabilities which in turn enables CSPs to provide new revenue-driving uses cases on top of their current subscription offerings. The key to this lies in making network capabilities broadly available – through network APIs – to developers and enterprises. By combining the Vonage platform and developer ecosystem with open and programmable networks, we now have the building blocks to launch a Global Network Platform – making it easy to expose, consume and pay for network APIs. In September 2023, we reached an important milestone together with Deutsche Telecom, announcing a world-first in the commercialization of network APIs. |
||||||||||
1) Excluding restructuring charges. |
|
|
||||
| 9 | Financial Report 2023 | Business strategy | Ericsson Annual Report on Form 20-F 2023 | ||

|
|
||||
| 10 | Financial Report 2023 | Business strategy | Ericsson Annual Report on Form 20-F 2023 | ||

|
|
||||
| 11 | Financial Report 2023 | Business strategy | Ericsson Annual Report on Form 20-F 2023 | ||
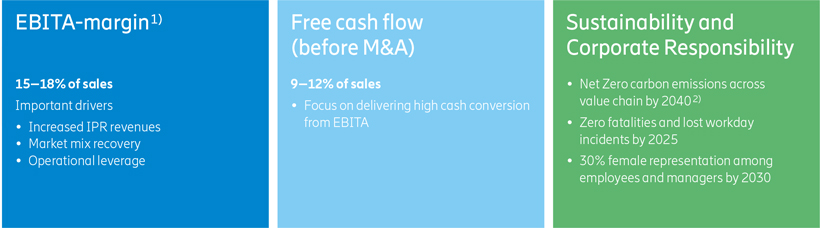
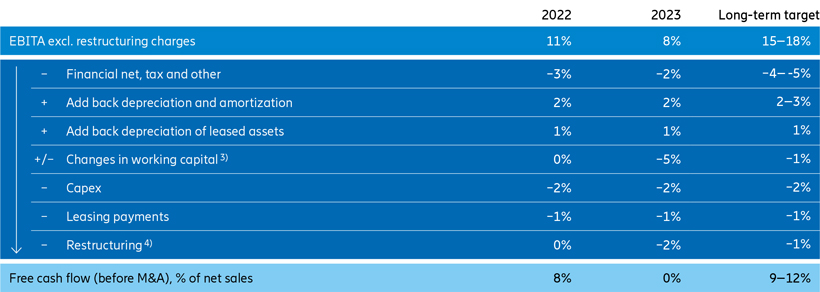
|
1) |
Excluding restructuring charges. |
|
2) |
Validated by the Science Based Targets initiative (SBTi). |
|
3) |
Defined as changes in operating net assets. |
|
4) |
Restructuring charges as reported in the income statement for each year. |
|
|
||||
| 12 | Financial Report 2023 | Business strategy | Ericsson Annual Report on Form 20-F 2023 | ||
|
Mobile Networks – Networks |
Offering |
Business model |
||||||
|
Networks offers multi-technology-capable Radio Access Network (RAN) solutions for all network spectrum bands, including purpose-built and Open RAN-prepared high-performance hardware and software. The offerings also include a Cloud RAN portfolio, a transport portfolio, passive and active antenna solutions and a complete service portfolio, covering network deployment and support. |
Networks is primarily based on a business model where Ericsson develops, sells, licenses and delivers hardware, software and services. Networks business also includes recurring revenue streams such as customer support and software revenues. |
|||||||
|
Mobile Networks – Cloud Software and Services |
Offering |
Business model |
||||||
|
Cloud Software and Services provides solutions for core networks, business and operational support systems, network design and optimization, and managed network services. Focus is to enable communications service providers (CSPs) to succeed in their transition to cloud operations, intelligent and automated networks. |
Cloud Software and Services develops, sells, and delivers solutions, and operate customer networks. The software solutions typically include services for deployment projects as well as recurring revenues from software, support and lifecycle management. The Managed Network Services contracts are typically multi-year outsourcing agreements. |
|||||||
Enterprise |
Offering |
Business model |
||||||
|
The segment comprises three business areas offering solutions primarily to enterprises: • Enterprise Wireless Solutions, including private wireless networks and wireless WAN (Cradlepoint) pre-packaged solutions.• Global Communications Platform (Vonage), including cloud-based Unified Communications as a Service (UCaaS), Contact Center as a Service (CCaaS) and Communications Platform as a Service (CPaaS).• Technologies and New Businesses, including mobile financial services, security solutions and advertising services. |
The
Enterprise Wireless Solutions portfolio (including Cradlepoint) is sold through a term-based subscription contract, typically a three-year contract with subsequent yearly renewal periods. These subscriptions have
up-front payments at the beginning of the contract and at each renewal period.The business model for API services in the
Global Communications Platform is transaction based. In this model, Application Service Providers (ASPs) pay a transaction fee to Ericsson each time an API is used, while the CSPs get paid from Ericsson for providing network capability/capacity. CSPs also benefit from increased revenues from additional traffic going over their network. As the market for Network APIs is still being developed, multiple commercial models may emerge.
Other contracts in segment Enterprise such as UCaaS, CCaaS, Private Network etc. are typically as a Service (aaS) or license based, with recurring revenue from software licenses, services, subscriptions and support. |
|||||||
Other |
Offering |
Business model |
||||||
|
Segment Other comprises media businesses as well as other non-allocated business, including Redbee Media, which prepares and distributes live and on-demand video services for broadcasters, sports leagues and CSPs. The segment also includes other non-allocated business. |
Outsourced broadcast service contracts are generally multi-year agreements while other media contracts are typically aaS or license based with recurring revenue from services, subscriptions and support. |
|||||||
|
|
||||
| 13 | Financial Report 2023 | Business strategy | Ericsson Annual Report on Form 20-F 2023 | ||
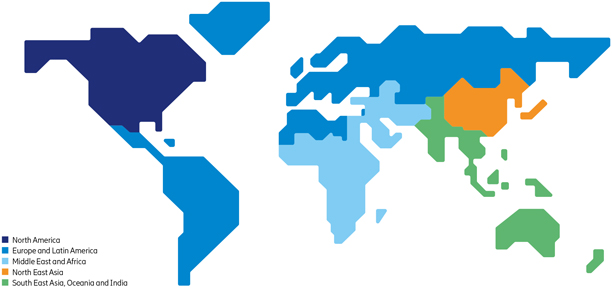
Geographical market areas |
||||
|
• North America • Europe and Latin America • Middle East and Africa • North East Asia • South East Asia, Oceania and India |
Sales in segments Networks and Cloud Software and Services are divided into five geographical market areas. Market areas are responsible for selling and delivering products and solutions that are developed in these business segments, mainly to CSP customers. In line with our strategy, the market areas have the responsibility to ensure that we stay close to our customers while maintaining Group guidelines and governance structures. |
|||
Market area Other |
||||
|
The majority of sales in segment Enterprise is reported in market area Other. To reach the enterprise market with businesses of all sizes, Ericsson has a multi-channel approach, which builds on the enterprise channel from Cradlepoint. This is a global program with access to tens of thousands of reseller partners in Enterprise Wireless Solutions. In order to provide communication APIs and build a Global Network Platform, the
go-to-market go-to-market |
IPR licensing revenues from Ericsson’s patents are also reported in Market Area Other. Patents are licensed globally on fair, reasonable, and nondiscriminatory terms (FRAND) to companies that use our technology. The key cellular market segments for our patents are smartphones, Internet of Things (IoT) devices, consumer electronics and automotive. Beyond cellular, other licensed technologies include media technologies and other connectivity standards. Ericsson licenses its patents bilaterally as well as by participating in patent pools covering certain market segments. |
|||
|
|
||||
| 14 | Financial Report 2023 | Letter from the Chair of the Board | Ericsson Annual Report on Form 20-F 2023 | ||

|
|
||||
| 15 | Financial Report 2023 | Letter from the Chair of the Board | Ericsson Annual Report on Form 20-F 2023 | ||
|
|
||||
| 16 | Financial Report 2023 | Board of Directors’ report | Ericsson Annual Report on Form 20-F 2023 | ||
| 16 | Business in 2023 | |
| 17 | Financial highlights | |
| 20 | Business results – Segments | |
| 22 | Business results – Market areas | |
| 23 | Corporate governance | |
| 24 | Material contracts | |
| 24 | Risk management | |
| 24 | Sourcing and supply | |
| 25 | Sustainability and Corporate Responsibility | |
| 25 | Legal proceedings | |
| 26 | Group structure | |
| 26 | Parent Company | |
| 26 | Share information | |
| 26 | Proposed disposition of earnings | |
| 27 | Guidelines for Remuneration to Group Management |
|
| 30 | Events after the reporting period | |
| 31 | Board assurance | |
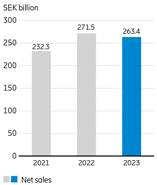
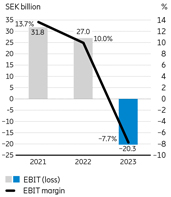
| – | Net sales decreased by -3% to SEK 263.4 (271.5) billion. Sales adjusted for comparable units and currency declined by -10%. |
| – | Gross income decreased to SEK 101.6 (113.3) billion due to sales and margin decline in Networks. |
| – | EBIT (loss) amounted to SEK -20.3 (27.0) billion, impacted by a non-cash goodwill impairment charge of SEK -31.9 billion attributed to Vonage. EBIT margin was -7.7% (10.0%). EBIT margin excluding restructuring charges was -5.2% (10.1%). |
| – | Net income (loss) was SEK -26.1 (19.1) billion. Earnings per share (EPS) diluted was SEK -7.94 (5.62). |
| – | EBITA amounted to SEK 14.9 (29.1) billion with an EBITA margin of 5.7% (10.7%). EBITA margin excluding restructuring charges was 8.1% (10.9%). |
| – | Cash flow from operating activities was SEK 7.2 (30.9) billion. Free cash flow before M&A amounted to SEK -1.1 (22.2) billion. Cash and cash equivalents was SEK 35.2 (38.3) billion on December 31, 2023. Net cash was SEK 7.8 (23.3) billion on December 31, 2023. |
| – | The Board of Directors proposes a dividend for 2023 of SEK 2.70 (2.70) per share to the AGM. |
|
|
||||
| 17 | Financial Report 2023 | Board of Directors’ report | Ericsson Annual Report on Form 20-F 2023 | ||
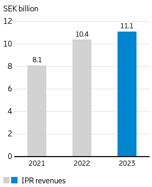
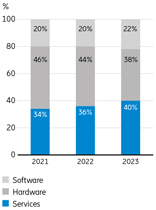
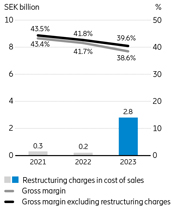
|
|
||||
| 18 | Financial Report 2023 | Board of Directors’ report | Ericsson Annual Report on Form 20-F 2023 | ||
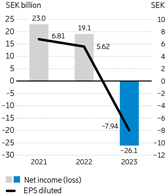
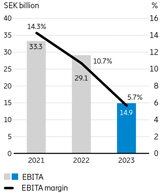
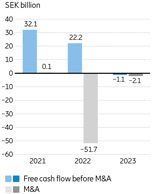
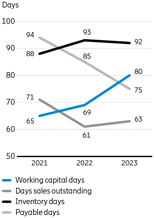
|
|
||||
| 19 | Financial Report 2023 | Board of Directors’ report | Ericsson Annual Report on Form 20-F 2023 | ||
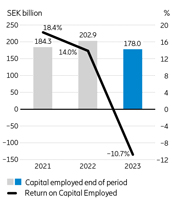
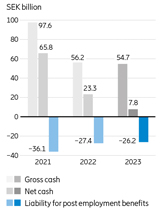
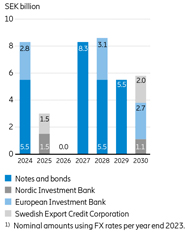
| Most recent three-year average seasonality | ||||||||||||||||
| First quarter |
Second quarter |
Third quarter |
Fourth quarter |
|||||||||||||
| Share of annual Group sales | 22% | 24% | 25% | 30% | ||||||||||||
| Sequential change, Networks sales | -25% | 8% | 1% | 19% | ||||||||||||
| Sequential change, Cloud Software and Service sales | -34% | 13% | 3% | 33% | ||||||||||||
| Capital expenditures 2021–2023 | ||||||||||||
| SEK billion | 2023 | 2022 | 2021 | |||||||||
| Capital expenditures | 3.3 | 4.5 | 3.7 | |||||||||
Of which in Sweden |
1.2 |
1.7 |
1.5 |
|||||||||
| Share of annual sales | 1.3% | 1.6% | 1.6% | |||||||||
|
|
||||
| 20 | Financial Report 2023 | Board of Directors’ report | Ericsson Annual Report on Form 20-F 2023 | ||
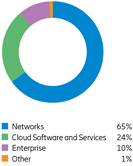
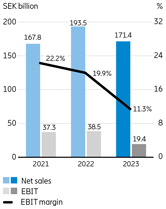
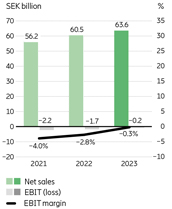
|
|
||||
| 21 | Financial Report 2023 | Board of Directors’ report | Ericsson Annual Report on Form 20-F 2023 | ||
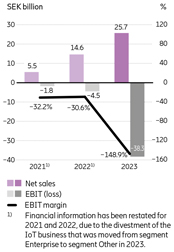
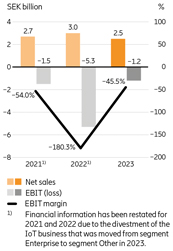
|
|
||||
| 22 | Financial Report 2023 | Board of Directors’ report | Ericsson Annual Report on Form 20-F 2023 | ||
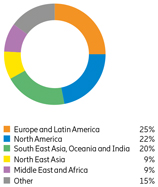
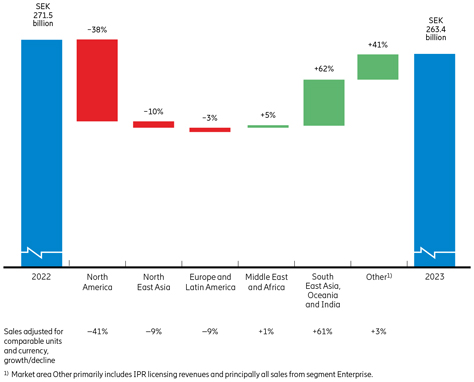
|
|
||||
| 23 | Financial Report 2023 | Board of Directors’ report | Ericsson Annual Report on Form 20-F 2023 | ||
| – | Empowers the business, enabling strategic execution and operational excellence; |
| – | Promotes and facilitates effective oversight across the organization by the Board of Directors (Board), the President and CEO, the Executive Team and at all levels of the organization; |
| – | Ensures high-quality decision-making with clear accountabilities at all levels; and |
| – | Instills a robust approach to risk management to effectively identify, manage and mitigate risks and capture opportunities. |
| – | Fully embedded the Material Group Risk Protocol and Business Risk Committee (BRC) into the Group’s governance and risk management frameworks, as described further below. |
| – | Introduced clarified Group governance and operating principles, to be rolled out in early 2024. |
| – | Refreshed and clarified the Company’s Code of Business Ethics (CoBE), which is being re-launched in early 2024. |
| – | Updated, streamlined and clarified the Group’s key policies and other guidance documents, including those on contracting, compliance, allegation assessment, investigations and remediation, and human rights. This work will continue into 2024. |
| – | Continued to embed various aspects of its compliance program into business operations, through a close partnership with the compliance function and stakeholders across the entire organization (as described further below in the Ethics & Compliance section). |
| – | Continued to strengthen performance-management at all levels of the organization while also implementing strong remediation measures where misconduct has occurred. |
|
|
||||
| 24 | Financial Report 2023 | Board of Directors’ report | Ericsson Annual Report on Form 20-F 2023 | ||
| – | significant improvements made to Ericsson’s governance framework which has included enhanced Board and management oversight and strong, proactive risk management; |
| – | the effective integration of enhanced controls into Ericsson’s operations and decision-making; |
| – | emphasis on driving continuous cultural change with a focus on embedding integrity into Ericsson’s ways of working, fostering a culture of transparency, collaboration and open dialogue, sound and ethical business decisions, strong risk management; |
| – | implementation of employee training programs and providing Speak-Up resources to drive an integrity-led culture; and |
| – | significant testing of the E&C program’s effectiveness, simplification of policies, procedures and tools, an improved understanding of managing risks in business interactions, and digitalization. |
|
|
||||
| 25 | Financial Report 2023 | Board of Directors’ report | Ericsson Annual Report on Form 20-F 2023 | ||
|
|
||||
| 26 | Financial Report 2023 | Board of Directors’ report | Ericsson Annual Report on Form 20-F 2023 | ||
| – | Current and non-current liabilities to subsidiaries decreased by SEK 46.8 billion to SEK 47.6 billion. |
| – | Current and non-current receivables from subsidiaries decreased by SEK 6.3 billion to SEK 17.8 billion. |
| – | Shareholder contributions to subsidiaries of SEK 11.9 billion. |
| – | Impairment of investments in subsidiaries and associates of SEK 32.8 billion. |
| – | Dividends from subsidiaries and associated companies of SEK 32.5 billion. |
| – | Gross cash decreased by SEK 6.5 billion to SEK 34.9 billion. |
| Amount to be paid to the shareholders | SEK 9,029,209,684 | |
| Amount to be retained by the Parent Company | SEK 18,555,216,849 | |
| Total non-restricted equity of the Parent Company |
SEK 27,584,426,533 |
|
|
||||
| 27 | Financial Report 2023 | Board of Directors’ report | Ericsson Annual Report on Form 20-F 2023 | ||
| – | attract and retain highly competent, performing, and motivated people that have the ability, experience, and skill to deliver on the Ericsson strategy; |
| – | encourage behavior consistent with Ericsson’s culture and core values; |
| – | ensure fairness in reward by delivering total remuneration that is appropriate but not excessive, and clearly explained; |
| – | have a total compensation mix of fixed pay, variable pay and benefits that is competitive where Ericsson competes for talent; and |
| – | encourage variable remuneration which aligns employees with clear and relevant targets, reinforces their performance and enables flexible remuneration costs for Ericsson. |
|
|
||||
| 28 | Financial Report 2023 | Board of Directors’ report | Ericsson Annual Report on Form 20-F 2023 | ||
| Element and purpose | Description | |
|
Fixed salary Fixed compensation paid at set times. Purpose: – attract and retain the executive talent required to implement Ericsson’s strategy – deliver part of the annual compensation in a predictable format |
Salaries shall be set taking into account: – Ericsson’s overall business performance – business performance of the Unit that the individual leads – year-on-year – external economic environment – size and complexity of the position – external market data – pay and conditions for other employees based in locations considered to be relevant to the role. When setting fixed salaries, the impact on total remuneration, including pensions and associated costs, shall be taken into consideration. |
|
|
Short-term variable compensation (STV) STV is a variable compensation plan that shall be measured against targets derived from the business plan and paid over a single year. Purpose: – align members of Group Management with clear and relevant targets to Ericsson’s strategy and sustainable long-term interests, – provide individuals an earning opportunity for performance at flexible cost to the Company. |
The STV shall be paid in cash every year after the Committee and, as applicable, the Board have reviewed and approved performance against targets which are normally determined at the start of each year for each member of Group Management. Target
pay-out opportunity for any financial year may be up to 150% of annual fixed salary of the individual. This shall normally be determined in line with the external market practices of the country of employment. Maximum pay-out shall be up to two times the target pay-out opportunity (i.e., no more than 300% of annual fixed salary). Any existing long-term variable pay-opportunity should be taken into account when determining target opportunity for STV (and vice versa).The STV shall be based on measures linked to the annual business plan and to Ericsson’s long-term strategy and sustainability. Measures will include financial targets at Group, Business Area and/or Market Area level (for relevant members of Group Management). Other potential measures may include strategic targets, operational targets, employee engagement targets, customer satisfaction targets, sustainability and corporate responsibility targets or other lead indicator targets. At the end of the performance period for each STV cycle, the Board and the Committee shall assess performance versus the measures and determine the formula-based outcome using the financial information made public by the Company for the financial targets when applicable. The Board and the Committee reserve the right to: – revise any or all of the STV targets at any time, – adjust the STV targets retroactively under extraordinary circumstances, – reduce or cancel STV if Ericsson faces severe economic difficulties, for instance in circumstances as serious as no dividend being paid, – adjust STV in the event that the results of the STV targets are not a true reflection of business performance, – reduce or cancel STV for individuals either whose performance evaluation or whose documented performance feedback is below an acceptable level or who are on performance counselling. The Board and the Committee shall have the right in their discretion to: – deny, in whole or in part, the entitlement of an individual to the STV payout in case an individual has acted in breach of Ericsson’s Code of Business Ethics, – claim repayment in whole or in part the STV paid in case an individual has acted in breach of Ericsson’s Code of Business Ethics, – reclaim STV paid to an individual on incorrect grounds such as restatement of financial results due to incorrect financial reporting,
non-compliance with a financial reporting requirement etc. |
|
|
Pension Contributions paid towards retirement fund. Purpose: – attract and retain the executive talent required to implement Ericsson’s strategy, – facilitate planning for retirement by way of providing competitive retirement arrangements in line with local market practices. |
The operation of the pension plan shall follow competitive practice in the individual’s home country and may contain various supplementary plans in addition to any national system for social security. Pension plans should be defined contribution plans unless the individual concerned is subject to defined benefit pension plan under mandatory collective bargaining agreement provisions or mandatory local regulations. For Group Management members in Sweden: – pension benefits shall be granted based on a defined contribution plan except where law or collective bargaining agreement require a defined benefit pension. The pensionable salary shall include fixed salary and, where required by law or collective bargaining agreement, any variable salary. – a supplementary pension contribution can be paid amounting to a maximum of 35% of the fixed annual salary that exceeds any cap in collective pension plans, unless a higher percentage is obliged by law or collective bargaining agreement. – the supplementary pension contribution can, as an alternative to a pension contribution, be exchanged for a cash payment provided that it is done in a way that is cost-neutral for the Company. Members of Group Management employed outside of Sweden may participate in the local market competitive pension arrangements that apply in their home countries in line with what is offered to other employees in the same country. In some special circumstances where individuals cannot participate in the local pension plans of their home countries of employment: – cash equivalent to pension may be provided as a taxable benefit, or – contributions may be made to an international pension fund on behalf of the individual on a costneutral basis In all cases the annual pension contributions shall be capped at 70% of annual fixed salary. |
|
|
Other benefits Additional tangible or intangible compensation paid annually which do not fall under fixed salary, short-term and long-term variable compensation, or pension. Purpose: – attract and retain the executive talent required to implement Ericsson’s strategy, – deliver part of the annual compensation in a predictable format. |
Benefits offered shall consider the competitive practices in the individual’s country of employment and should be in line with what is offered to other senior employees in the same country and may evolve year on year. Benefits may for example include Company phones, Company cars, wellbeing assistance, medical and other insurance benefits, tax support, travel, Company gifts and any international relocation and/or commuting benefits if the individual is required to relocate and/or commute internationally to execute the requirements of the role. Benefit opportunities shall be set in line with competitive market practices and shall reflect what is offered to other senior employees in the individual’s country of employment. The levels of benefits provided may vary year on year depending on the cost of the provision of benefits to the Company. Other benefits shall be capped at 10% of annual fixed salary for members of Group Management located in Sweden. Additional benefits and allowances for members of Group Management who are commuters into Sweden or who are on long-term assignment (“
LTA |
|
|
|
||||
| 29 | Financial Report 2023 | Board of Directors’ report | Ericsson Annual Report on Form 20-F 2023 | ||
| – | the role being taken on, |
| – | the skills, experience and caliber of the candidate, |
| – | the level and type of remuneration opportunity received at a previous employer, |
| – | the geography in which the candidate is being recruited from and whether any relocation allowance is required, |
| – | the circumstances of the candidate, |
| – | the current external market and salary practice, |
| – | internal relativities. |
| – | upon change of the President and CEO, |
| – | upon material changes in the Company structure, organization, ownership, and business (for example takeover, acquisition, merger, demerger etc.) which may require adjustments in STV and LTV or other elements to ensure continuity of Group Management, and |
| – | in any other circumstances, provided that the deviation is required to serve the long-term interests and sustainability of the Company or to assure its financial viability. |
|
|
||||
| 30 | Financial Report 2023 | Board of Directors’ report | Ericsson Annual Report on Form 20-F 2023 | ||
|
|
||||
| 31 | Financial Report 2023 | Board of Directors’ report | Ericsson Annual Report on Form 20-F 2023 | ||
|
|
||||
| 32 | Financial Report 2023 | Report of independent registered public accounting firm | Ericsson Annual Report on Form 20-F 2023 | ||
|
|
||||
| 33 | Financial Report 2023 | Report of independent registered public accounting firm | Ericsson Annual Report on Form 20-F 2023 | ||
| – | We tested the effectiveness of the Company’s controls over revenue recognition with particular focus on the controls related to the identification of performance obligations within large contracts with customers and determination of the timing of revenue recognition for each performance obligation. |
|
|
||||
| 34 | Financial Report 2023 | Report of independent registered public accounting firm | Ericsson Annual Report on Form 20-F 2023 | ||
| – | We tested a sample of large contracts with customers to assess management’s judgments and estimates related to the identification of performance obligations and determination of the timing of recognition for each revenue obligation based on the contract. |
| – | We tested a sample of revenue transactions related to large contracts with customers recorded during the year by tracing them to supporting evidence of delivery and acceptance and assessed the judgments and estimates for revenue recorded in the period by comparing it to contract terms such as, delivery terms, transaction prices including variable considerations, discounts and incentive agreements. |
| – | We tested a sample of ongoing negotiations with existing customers and analysed reversals of revenue subsequent to year end for indicators of unrecorded discounts and concessions during the period. |
| – | We tested the effectiveness of the Company’s controls over goodwill impairment evaluation and determination of the recoverable amount with particular focus on the controls over management’s preparation and review of assumptions for future sales growth, operating income, working capital, capital expenditure requirements and method for determining the discount and terminal growth rate used. |
| – | We evaluated management’s ability to accurately forecast future sales growth, operating income, working capital and capital expenditure requirements by comparing actual results to management’s historical forecasts, the Company’s historical results, external analyst reports and internal communications to management and the Board of Directors. |
| – | With the assistance of our valuation specialists, we evaluated the discount and terminal growth rates, including testing the underlying source information and the mathematical accuracy of the calculations, and developing a range of independent estimates and comparing those to the discount rates selected by management. |
| – | With the assistance of our valuation specialists, we further evaluated the company’s sensitivity analysis by comparing to our own sensitivity analysis to corroborate the disclosures around assumptions that are most sensitive to a reasonably possible change that could cause the carrying amount to exceed its recoverable amount for a cash generating unit. |
|
|
||||
| 35 Consolidated financial statements with notes | Financial report 2023 | |||
Consolidated financial statements |
||||
36 |
Consolidated income statement | |||
36 |
Consolidated statement of comprehensive income (loss) | |||
37 |
Consolidated balance sheet | |||
38 |
Consolidated statement of cash flows | |||
39 |
Consolidated statement of changes in equity | |||
Notes to the consolidated financial statements |
||||
42 |
A |
Basis of presentation |
||
42 |
A1 | Material accounting policies | ||
48 |
A2 | Critical accounting estimates and judgments | ||
50 |
B |
Business and operations |
||
50 |
B1 | Segment information | ||
53 |
B2 | Net sales | ||
53 |
B3 | Expenses by nature | ||
53 |
B4 | Other operating income and expenses | ||
53 |
B5 | Inventories | ||
54 |
B6 | Customer contract related balances | ||
54 |
B7 | Other current receivables | ||
54 |
B8 | Trade payables | ||
54 |
B9 | Other current liabilities | ||
55 |
C |
Long-term assets |
||
55 |
C1 | Intangible assets | ||
57 |
C2 | Property, plant and equipment | ||
58 |
C3 | Leases | ||
59 |
D |
Obligations |
||
59 |
D1 | Provisions | ||
61 |
D2 | Contingent liabilities | ||
61 |
D3 | Assets pledged as collateral | ||
61 |
D4 | Contractual obligations | ||
62 |
E |
Group structure |
||
62 |
E1 | Equity | ||
63 |
E2 | Business combinations | ||
64 |
E3 | Associated companies | ||
65 |
F |
Financial instruments |
||
65 |
F1 | Financial risk management | ||
70 |
F2 | Financial income and expenses | ||
70 |
F3 | Financial assets, non-current
|
||
71 |
F4 | Interest-bearing liabilities | ||
72 |
G |
Employee related |
||
72 |
G1 | Post-employment benefits | ||
76 |
G2 | Information regarding members of the Board of Directors and Group management | ||
78 |
G3 | Share-based compensation | ||
84 |
G4 | Employee information | ||
85 |
H |
Other |
||
85 |
H1 | Taxes | ||
86 |
H2 | Earnings per share | ||
87 |
H3 | Statement of cash flows | ||
87 |
H4 | Related party transactions | ||
88 |
H5 | Fees to auditors | ||
88 |
H6 | Events after the reporting period | ||
|
|
||||
Financial report 2023 |
Consolidated financial statements 36 |
|||
| January–December, SEK million | Notes | 2023 | 2022 | 2021 | ||||||||||||||||||||||||
Net sales |
B1, B2 |
263,351 | 271,546 | 232,314 | ||||||||||||||||||||||||
Cost of sales |
–161,749 | –158,251 | –131,565 | |||||||||||||||||||||||||
Gross income |
101,602 |
113,295 |
100,749 |
|||||||||||||||||||||||||
Research and development expenses |
–50,664 | –47,298 | –42,074 | |||||||||||||||||||||||||
Selling and administrative expenses |
–39,255 | –35,692 | –26,957 | |||||||||||||||||||||||||
Impairment losses on trade receivables |
F1 |
–268 | –40 | –40 | ||||||||||||||||||||||||
Operating expenses |
–90,187 |
–83,030 |
–69,071 |
|||||||||||||||||||||||||
Other operating income |
B4 |
994 | 1,231 | 1,526 | ||||||||||||||||||||||||
Other operating expenses |
B4 |
–32,859 | –4,493 | –1,164 | ||||||||||||||||||||||||
Share in earnings of joint ventures and associated companies |
B1, E3 |
124 | 17 | –260 | ||||||||||||||||||||||||
Earnings (loss) before financial items and income tax (EBIT) |
B1 |
–20,326 |
27,020 |
31,780 |
||||||||||||||||||||||||
Financial income |
F2 |
2,145 | 778 | 691 | ||||||||||||||||||||||||
Financial expenses |
F2 |
–4,118 | –1,930 | –1,674 | ||||||||||||||||||||||||
Net foreign exchange gains/losses |
F2 |
–1,020 | –1,259 | –1,547 | ||||||||||||||||||||||||
Income (loss) after financial items |
–23,319 |
24,609 |
29,250 |
|||||||||||||||||||||||||
Income tax |
H1 |
–2,785 | –5,497 | –6,270 | ||||||||||||||||||||||||
Net income (loss) |
–26,104 |
19,112 |
22,980 |
|||||||||||||||||||||||||
Net income (loss) attributable to: |
||||||||||||||||||||||||||||
Owners of the Parent Company |
–26,446 | 18,724 | 22,694 | |||||||||||||||||||||||||
Non-controlling interests |
342 | 388 | 286 | |||||||||||||||||||||||||
Other information |
||||||||||||||||||||||||||||
Average number of shares, basic (million) |
H2 |
3,330 | 3,330 | 3,329 | ||||||||||||||||||||||||
Earnings (loss) per share attributable to owners of the Parent Company, basic (SEK) |
H2 |
–7.94 | 5.62 | 6.82 | ||||||||||||||||||||||||
Earnings (loss) per share attributable to owners of the Parent Company, diluted (SEK) |
H2 |
–7.94 | 5.62 | 6.81 | ||||||||||||||||||||||||
| January–December, SEK million | 2023 | 2022 | 2021 | |||||||||||||||||||||||||||||
Net income (loss) |
–26,104 |
19,112 |
22,980 |
|||||||||||||||||||||||||||||
Other comprehensive income (loss) |
||||||||||||||||||||||||||||||||
Items that will not be reclassified to profit or loss |
||||||||||||||||||||||||||||||||
Remeasurements of defined benefit pension plans including asset ceiling |
905 | 10,669 | 3,537 | |||||||||||||||||||||||||||||
Revaluation of borrowings due to change in credit risk |
–667 | 1,030 | 31 | |||||||||||||||||||||||||||||
Cash flow hedge reserve |
||||||||||||||||||||||||||||||||
Gains/losses arising during the period |
– | 3,703 | – | |||||||||||||||||||||||||||||
Transfer to goodwill |
– | –3,677 | – | |||||||||||||||||||||||||||||
Tax on items that will not be reclassified to profit or loss |
–114 | –3,067 | –682 | |||||||||||||||||||||||||||||
Items that have been or may be reclassified to profit or loss |
||||||||||||||||||||||||||||||||
Cash flow hedge reserve |
||||||||||||||||||||||||||||||||
Gains/losses arising during the period |
754 | –701 | –542 | |||||||||||||||||||||||||||||
Reclassification adjustments on gains/losses included in profit or loss |
1,090 | 280 | –96 | |||||||||||||||||||||||||||||
Translation reserves |
||||||||||||||||||||||||||||||||
Changes in translation reserves |
–2,375 | 7,130 | 3,342 | |||||||||||||||||||||||||||||
Reclassification to profit and loss |
59 | –85 | 46 | |||||||||||||||||||||||||||||
Share of other comprehensive income of JV and associated companies |
–10 | 49 | 28 | |||||||||||||||||||||||||||||
Tax on items that have been or may be reclassified to profit or loss |
–380 | 87 | 126 | |||||||||||||||||||||||||||||
Other comprehensive income (loss), net of tax |
–738 |
15,418 |
5,790 |
|||||||||||||||||||||||||||||
Total comprehensive income (loss) |
–26,842 |
34,530 |
28,770 |
|||||||||||||||||||||||||||||
Total comprehensive income (loss) attributable to: |
||||||||||||||||||||||||||||||||
Owners of the Parent Company |
–27,233 | 34,274 | 28,694 | |||||||||||||||||||||||||||||
Non-controlling interests |
391 | 256 | 76 | |||||||||||||||||||||||||||||
|
|
||||
| 3 7 Consolidated financial statements |
Financial report 2023 | |||
| SEK million | Notes | Dec 31 2023 |
Dec 31 2022 |
|||||||||||||||||||||
Assets |
||||||||||||||||||||||||
Non-current assets |
||||||||||||||||||||||||
Intangible assets |
C1 |
|||||||||||||||||||||||
Capitalized development expenses |
4,678 | 3,705 | ||||||||||||||||||||||
Goodwill |
52,944 | 84,570 | ||||||||||||||||||||||
Customer relationships, IPRs and other intangible assets |
22,667 | 26,340 | ||||||||||||||||||||||
Property, plant and equipment |
C2 |
12,195 | 14,236 | |||||||||||||||||||||
Right-of-use |
C3 |
6,320 | 7,870 | |||||||||||||||||||||
Financial assets |
||||||||||||||||||||||||
Equity in joint ventures and associated companies |
E3 |
1,150 | 1,127 | |||||||||||||||||||||
Other investments in shares and participations |
F3 |
2,091 | 2,074 | |||||||||||||||||||||
Customer finance, non-current
|
B6, F1 |
1,347 | 415 | |||||||||||||||||||||
Interest-bearing securities, non-current
|
F1, F3 |
9,931 | 9,164 | |||||||||||||||||||||
Other financial assets, non-current
|
F3 |
6,350 | 6,839 | |||||||||||||||||||||
Deferred tax assets |
H1 |
22,375 | 19,394 | |||||||||||||||||||||
142,048 |
175,734 |
|||||||||||||||||||||||
Current assets |
||||||||||||||||||||||||
Inventories |
B5 |
36,073 | 45,846 | |||||||||||||||||||||
Contract assets |
B6, F1 |
7,999 | 9,843 | |||||||||||||||||||||
Trade receivables |
B6, F1 |
42,215 | 48,413 | |||||||||||||||||||||
Customer finance, current |
B6, F1 |
5,570 | 4,955 | |||||||||||||||||||||
Current tax assets |
6,395 | 7,973 | ||||||||||||||||||||||
Other current receivables |
B7 |
11,962 | 9,688 | |||||||||||||||||||||
Interest-bearing securities, current |
F1 |
9,584 | 8,736 | |||||||||||||||||||||
Cash and cash equivalents |
H3 |
35,190 | 38,349 | |||||||||||||||||||||
154,988 |
173,803 |
|||||||||||||||||||||||
Total assets |
297,036 |
349,537 |
||||||||||||||||||||||
Equity and liabilities |
||||||||||||||||||||||||
Equity |
||||||||||||||||||||||||
Capital stock |
E1 |
16,722 | 16,672 | |||||||||||||||||||||
Additional paid in capital |
E1 |
24,731 | 24,731 | |||||||||||||||||||||
Other reserves |
E1 |
6,759 | 8,201 | |||||||||||||||||||||
Retained earnings |
E1 |
50,461 | 85,210 | |||||||||||||||||||||
Equity attributable to owners of the Parent Company |
E1 |
98,673 | 134,814 | |||||||||||||||||||||
Non-controlling interests |
E1 |
–1,265 | –1,510 | |||||||||||||||||||||
97,408 |
133,304 |
|||||||||||||||||||||||
Non-current liabilities |
||||||||||||||||||||||||
Post-employment benefits |
G1 |
26,229 | 27,361 | |||||||||||||||||||||
Provisions, non-current
|
D1 |
4,927 | 3,959 | |||||||||||||||||||||
Deferred tax liabilities |
H1 |
3,880 | 4,784 | |||||||||||||||||||||
Borrowings, non-current
|
F4 |
29,218 | 26,946 | |||||||||||||||||||||
Lease liabilities, non-current
|
C3 |
5,220 | 6,818 | |||||||||||||||||||||
Other non-current liabilities |
755 | 745 | ||||||||||||||||||||||
70,229 |
70,613 |
|||||||||||||||||||||||
Current liabilities |
||||||||||||||||||||||||
Provisions, current |
D1 |
6,779 | 7,629 | |||||||||||||||||||||
Borrowings, current |
F4 |
17,655 | 5,984 | |||||||||||||||||||||
Lease liabilities, current |
C3 |
2,235 | 2,486 | |||||||||||||||||||||
Contract liabilities |
B6 |
34,416 | 42,251 | |||||||||||||||||||||
Trade payables |
B8 |
27,768 | 38,437 | |||||||||||||||||||||
Current tax liabilities |
3,561 | 2,640 | ||||||||||||||||||||||
Other current liabilities |
B9 |
36,985 | 46,193 | |||||||||||||||||||||
129,399 |
145,620 |
|||||||||||||||||||||||
Total equity and liabilities |
297,036 |
349,537 |
||||||||||||||||||||||
|
|
||||
| Financial report 2023 | Consolidated financial statements 3 8
|
|||
| January–December, SEK million | Notes | 2023 | 2022 | 2021 | ||||||||||||||||||||||||||||
Operating activities |
||||||||||||||||||||||||||||||||
Net income (loss) |
–26,104 | 19,112 | 22,980 | |||||||||||||||||||||||||||||
Adjustments to reconcile net income to cash |
H3 |
51,710 | 17,638 | 17,143 | ||||||||||||||||||||||||||||
25,606 |
36,750 |
40,123 |
||||||||||||||||||||||||||||||
Changes in operating net assets |
||||||||||||||||||||||||||||||||
Inventories |
9,304 | –7,740 | –5,565 | |||||||||||||||||||||||||||||
Customer finance, current and non-current
|
–1,708 | –1,732 | 34 | |||||||||||||||||||||||||||||
Trade receivables and contract assets |
6,333 | 4,766 | 1,551 | |||||||||||||||||||||||||||||
Trade payables |
–10,037 | –1,995 | 1,385 | |||||||||||||||||||||||||||||
Provisions and post-employment benefits |
1,308 | 2,339 | –118 | |||||||||||||||||||||||||||||
Contract liabilities |
–7,088 | 5,794 | 4,014 | |||||||||||||||||||||||||||||
Other operating assets and liabilities, net |
–10,111 | –813 | 2,701 | |||||||||||||||||||||||||||||
–11,999 |
619 |
4,002 |
||||||||||||||||||||||||||||||
Interest received |
1,218 | 344 | 8 | |||||||||||||||||||||||||||||
Interest paid |
–2,280 | –1,250 | –974 | |||||||||||||||||||||||||||||
Taxes paid |
–5,368 | –5,600 | –4,094 | |||||||||||||||||||||||||||||
Cash flow from operating activities |
7,177 |
30,863 |
39,065 |
|||||||||||||||||||||||||||||
Investing activities |
||||||||||||||||||||||||||||||||
Investments in property, plant and equipment |
C2 |
–3,297 | –4,477 | –3,663 | ||||||||||||||||||||||||||||
Sales of property, plant and equipment |
163 | 249 | 115 | |||||||||||||||||||||||||||||
Acquisitions of subsidiaries and other operations |
H3, E2 |
–1,515 | –51,995 | –389 | ||||||||||||||||||||||||||||
Divestments of subsidiaries and other operations |
H3, E2 |
–625 | 307 | 448 | ||||||||||||||||||||||||||||
Product development |
C1 |
–2,173 | –1,720 | –962 | ||||||||||||||||||||||||||||
Purchase of interest-bearing securities |
–15,304 | –13,582 | –35,415 | |||||||||||||||||||||||||||||
Sale of interest-bearing securities |
11,739 | 40,541 | 20,114 | |||||||||||||||||||||||||||||
Other investing activities |
2,299 | –3,720 | –131 | |||||||||||||||||||||||||||||
Cash flow from investing activities |
–8,713 |
–34,397 |
–19,883 |
|||||||||||||||||||||||||||||
Financing activities |
||||||||||||||||||||||||||||||||
Proceeds from issuance of borrowings |
F4 |
19,728 | 10,755 | 7,882 | ||||||||||||||||||||||||||||
Repayment of borrowings |
F4 |
–7,884 | –16,029 | –5,791 | ||||||||||||||||||||||||||||
Sale of own shares |
– | – | 42 | |||||||||||||||||||||||||||||
Dividends paid |
–9,104 | –8,415 | –6,889 | |||||||||||||||||||||||||||||
Repayment of lease liabilities |
F4 |
–2,857 | –2,593 | –2,368 | ||||||||||||||||||||||||||||
Other financing activities |
1,124 | 352 | –2,183 | |||||||||||||||||||||||||||||
Cash flow from financing activities |
1,007 |
–15,930 |
–9,307 |
|||||||||||||||||||||||||||||
Effect of exchange rate changes on cash |
–2,630 | 3,763 | 563 | |||||||||||||||||||||||||||||
Net change in cash and cash equivalents |
–3,159 |
–15,701 |
10,438 |
|||||||||||||||||||||||||||||
Cash and cash equivalents, beginning of period |
38,349 |
54,050 |
43,612 |
|||||||||||||||||||||||||||||
Cash and cash equivalents, end of period |
H3 |
35,190 |
38,349 |
54,050 |
||||||||||||||||||||||||||||
|
| ||||
| 3 9 Consolidated financial statements |
Financial report 2023 | |||
| SEK million | Capital stock |
Additional paid in capital |
Other reserves |
Retained earnings |
Stockholders’ equity |
Non-controlling
interests |
Total equity | |||||||||||||||||||||
| January 1, 2023 |
16,672 |
24,731 |
8,201 |
85,210 |
134,814 |
–1,510 |
133,304 |
|||||||||||||||||||||
| Net income (loss) |
– |
– |
– |
–26,446 |
–26,446 |
342 |
–26,104 |
|||||||||||||||||||||
| Other comprehensive income (loss) |
||||||||||||||||||||||||||||
| Items that will not be reclassified to profit or loss |
||||||||||||||||||||||||||||
| Remeasurements of defined benefit pension plans including asset ceiling | – | – | – | 906 | 906 | –1 | 905 | |||||||||||||||||||||
| Revaluation of borrowings due to change in credit risk | – | – | –667 | – | –667 | – | –667 | |||||||||||||||||||||
| Tax on items that will not be reclassified to profit or loss | – | – | 137 | –251 | –114 | – | –114 | |||||||||||||||||||||
Items that have been or may be reclassified to profit or loss |
||||||||||||||||||||||||||||
| Cash flow hedge reserve |
||||||||||||||||||||||||||||
| Gains/losses arising during the period |
– | – | 754 | – | 754 | – | 754 | |||||||||||||||||||||
| Reclassification to profit and loss |
– | – | 1,090 | – | 1,090 | – | 1,090 | |||||||||||||||||||||
| Translation reserves 1)
|
||||||||||||||||||||||||||||
| Changes in translation reserves |
– | – | –2,425 | – | –2,425 | 50 | –2,375 | |||||||||||||||||||||
| Reclassification to profit and loss |
– | – | 59 | – | 59 | – | 59 | |||||||||||||||||||||
| Share of other comprehensive income of JV and associated companies | – | – | –10 | – | –10 | – | –10 | |||||||||||||||||||||
| Tax on items that have been or may be reclassified to profit or loss | – | – | –380 | – | –380 | – | –380 | |||||||||||||||||||||
| Other comprehensive income (loss), net of tax |
– |
– |
–1,442 |
655 |
–787 |
49 |
–738 |
|||||||||||||||||||||
| Total comprehensive income (loss) |
– |
– |
–1,442 |
–25,791 |
–27,233 |
391 |
–26,842 |
|||||||||||||||||||||
| Transactions with owners |
||||||||||||||||||||||||||||
| Share issue, net |
50 | – | – | – | 50 | – | 50 | |||||||||||||||||||||
| Repurchase of own shares |
– | – | – | –50 | –50 | – | –50 | |||||||||||||||||||||
| Long-term variable compensation plans |
– | – | – | 82 | 82 | – | 82 | |||||||||||||||||||||
| Dividends paid 2)
|
– | – | – | –8,991 | –8,991 | –113 | –9,104 | |||||||||||||||||||||
| Transactions with non-controlling interest |
– | – | – | 1 | 1 | –33 | –32 | |||||||||||||||||||||
| December 31, 2023 |
16,722 |
24,731 |
6,759 |
50,461 |
98,673 |
–1,265 |
97,408 |
|||||||||||||||||||||
|
1) |
Changes in translation reserves include changes regarding translation of goodwill in local currency of SEK –77 million (SEK 5,070 million in 2022 and SEK 2,646 million in 2021), and realized gains/losses net from divested/liquidated companies, SEK 59 million (SEK –85 million in 2022 and SEK 46 million in 2021). |
|
2) |
Dividends paid per share amounted to SEK 2.70 (SEK 2.50 in 2022 and SEK 2.00 in 2021). |
|
|
||||
| Financial report 2023 | Consolidated financial statements 40
| |||
| SEK million | Capital stock |
Additional paid in capital |
Other reserves |
Retained earnings |
Stockholders’ equity |
Non-controlling
interests |
Total equity | |||||||||||||||||||||
| January 1, 2022 |
16,672 |
24,731 |
454 |
66,918 |
108,775 |
–1,676 |
107,099 |
|||||||||||||||||||||
| Net income |
– |
– |
– |
18,724 |
18,724 |
388 |
19,112 |
|||||||||||||||||||||
| Other comprehensive income (loss) |
||||||||||||||||||||||||||||
| Items that will not be reclassified to profit or loss |
||||||||||||||||||||||||||||
| Remeasurements of defined benefit pension plans including asset ceiling | – | – | – | 10,654 | 10,654 | 15 | 10,669 | |||||||||||||||||||||
| Revaluation of borrowings due to change in credit risk | – | – | 1,030 | – | 1,030 | – | 1,030 | |||||||||||||||||||||
| Cash flow hedge reserve | ||||||||||||||||||||||||||||
| Gains/losses arising during the period |
– | – | 3,703 | – | 3,703 | – | 3,703 | |||||||||||||||||||||
| Transfer to goodwill |
– | – | –3,677 | – | –3,677 | – | –3,677 | |||||||||||||||||||||
| Tax on items that will not be reclassified to profit or loss |
– | – | –970 | –2,093 | –3,063 | –4 | –3,067 | |||||||||||||||||||||
| Items that have been or may be reclassified to profit or loss |
||||||||||||||||||||||||||||
| Cash flow hedge reserve | ||||||||||||||||||||||||||||
| Gains/losses arising during the period |
– | – | –701 | – | –701 | – | –701 | |||||||||||||||||||||
| Reclassification to profit and loss |
– | – | 280 | – | 280 | – | 280 | |||||||||||||||||||||
| Translation reserves | ||||||||||||||||||||||||||||
| Changes in translation reserves |
– | – | 7,273 | – | 7,273 | –143 | 7,130 | |||||||||||||||||||||
| Reclassification to profit and loss |
– | – | –85 | – | –85 | – | –85 | |||||||||||||||||||||
| Share of other comprehensive income of JV and associated companies | – | – | 49 | – | 49 | – | 49 | |||||||||||||||||||||
| Tax on items that have been or may be reclassified to profit or loss | – | – | 87 | – | 87 | – | 87 | |||||||||||||||||||||
| Other comprehensive income (loss), net of tax |
– |
– |
6,989 |
8,561 |
15,550 |
–132 |
15,418 |
|||||||||||||||||||||
| Total comprehensive income |
– |
– |
6,989 |
27,285 |
34,274 |
256 |
34,530 |
|||||||||||||||||||||
| Transfer to retained earnings |
– | – | 758 | –758 | – | – | – | |||||||||||||||||||||
| Transactions with owners |
||||||||||||||||||||||||||||
| Long-term variable compensation plans |
– | – | – | 89 | 89 | – | 89 | |||||||||||||||||||||
| Dividends paid |
– | – | – | –8,325 | –8,325 | –90 | –8,415 | |||||||||||||||||||||
| Transactions with non-controlling interest |
– | – | – | 1 | 1 | – | 1 | |||||||||||||||||||||
| December 31, 2022 |
16,672 |
24,731 |
8,201 |
85,210 |
134,814 |
–1,510 |
133,304 |
|||||||||||||||||||||
|
|
||||
|
41 Consolidated financial statements |
Financial report 2023 | |||
| SEK million | Capital stock |
Additional paid in capital |
Other reserves |
Retained earnings |
Stockholders’ equity |
Non-controlling
interests |
Total equity | |||||||||||||||||||||
January 1, 2021 |
16,672 |
24,731 |
–2,689 |
47,960 |
86,674 |
–1,497 |
85,177 |
|||||||||||||||||||||
Net income |
– |
– |
– |
22,694 |
22,694 |
286 |
22,980 |
|||||||||||||||||||||
Other comprehensive income (loss) |
||||||||||||||||||||||||||||
Items that will not be reclassified to profit or loss |
||||||||||||||||||||||||||||
| Remeasurements of defined benefit pension plans including asset ceiling | – | – | – | 3,532 | 3,532 | 5 | 3,537 | |||||||||||||||||||||
| Revaluation of borrowings due to change in credit risk | – | – | 31 | – | 31 | – | 31 | |||||||||||||||||||||
| Tax on items that will not be reclassified to profit or loss | – | – | –6 | –675 | –681 | –1 | –682 | |||||||||||||||||||||
Items that have been or may be reclassified to profit or loss |
||||||||||||||||||||||||||||
| Cash flow hedge reserve | ||||||||||||||||||||||||||||
Gains/losses arising during the period |
– | – | –542 | – | –542 | – | –542 | |||||||||||||||||||||
Reclassification to profit and loss |
– | – | –96 | – | –96 | – | –96 | |||||||||||||||||||||
| Translation reserves | ||||||||||||||||||||||||||||
Changes in translation reserves |
– | – | 3,556 | – | 3,556 | –214 | 3,342 | |||||||||||||||||||||
Reclassification to profit and loss |
– | – | 46 | – | 46 | – | 46 | |||||||||||||||||||||
| Share of other comprehensive income of JV and associated companies | – | – | 28 | – | 28 | – | 28 | |||||||||||||||||||||
| Tax on items that have been or may be reclassified to profit or loss | – | – | 126 | – | 126 | – | 126 | |||||||||||||||||||||
Other comprehensive income (loss), net of tax |
– |
– |
3,143 |
2,857 |
6,000 |
–210 |
5,790 |
|||||||||||||||||||||
Total comprehensive income |
– |
– |
3,143 |
25,551 |
28,694 |
76 |
28,770 |
|||||||||||||||||||||
Transactions with owners |
||||||||||||||||||||||||||||
| Sale of own shares | – | – | – | 42 | 42 | – | 42 | |||||||||||||||||||||
| Long-term variable compensation plans | – | – | – | 93 | 93 | – | 93 | |||||||||||||||||||||
Dividends paid |
– | – | – | –6,658 | –6,658 | –231 | –6,889 | |||||||||||||||||||||
Transactions with non-controlling interest |
– | – | – | –70 | –70 | –24 | –94 | |||||||||||||||||||||
December 31, 2021 |
16,672 |
24,731 |
454 |
66,918 |
108,775 |
–1,676 |
107,099 |
|||||||||||||||||||||
|
|
||||
| Financial report 2023 | Notes to the consolidated financial statements 42
|
|||
 |
Material accounting policies |
|
| ||||
|
43 Notes to the consolidated financial statements |
Financial report 2023 | |||
|
|
||||
| Financial report 2023 | Notes to the consolidated financial statements 44
| |||
|
| ||||
| 4 5 Notes to the consolidated financial statements |
Financial report 2023 | |||
|
|
||||
| Financial report 2023 | Notes to the consolidated financial statements 4 6
| |||
| a) | Certain customer contracts where a fluctuation in the USD/SEK foreign exchange (FX) rate would significantly impact net sales. These contracts are multi-year contracts denominated in USD with highly probable payments at fixed points in time. |
| b) | Highly probable forecasted sales denominated in USD in Ericsson AB ( EAB) for the next 7 to 18 months are hedged on a monthly rolling basis. |
|
| ||||
| 4 7 Notes to the consolidated financial statements |
Financial report 2023 | |||
| – | IFRS 17 Insurance contracts (including the June 2020 and December 2021 amendments to IFRS 17, which establishes principles for the recognition, measurements, presentation and disclosure of insurance contracts ) |
| – | Amendments to IAS 1 Presentation of Financial Statements and IFRS Practice Statement 2 – Disclosure of Accounting policies |
| – | Amendments to IAS 8 Accounting policies, Changes in Accounting Estimates and Errors – Definition of Accounting Estimates |
| – | Amendments to IAS 12 Income Taxes – Deferred Tax related to Assets and Liabilities arising from a Single Transaction. |
| – | Amendments to IAS 12 Income taxes: International Tax Reform – Pillar Two Model Rules |
| – | Amendments to IAS 1 Presentation of financial statements – Classification of liabilities as current or non-current |
| – | Amendments to IAS 1 Presentation of financial statements – Non-current liabilities with covenants |
| – | Amendments to IFRS 16 Leases – Lease liability in a sale and leaseback |
| – | Amendments to IAS 7 Statement of Cash Flows and IFRS 7 Financial Instruments – Disclosures: Supplier Finance Arrangements |
| – These amendments will increase the disclosures for Supplier Finance Arrangements. |
| – | Amendments to IAS 21 The Effects of Changes in Foreign Exchange Rates: Lack of Exchangeability (issued on 15 August 2023) |
|
|
||||
| Financial report 2023 | Notes to the consolidated financial statements 4 8
| |||
 |
Critical accounting estimates and judgments |
| – | Key sources of estimation uncertainty |
| – | Judgments management has made in the process of applying the Company’s accounting policies. |
|
| ||||
| 4 9 Notes to the consolidated financial statements |
Financial report 2023 | |||
|
|
||||
| Financial report 2023 | Notes to the consolidated financial statements 50
| |||
 |
Segment information |
| – | Networks |
| – | Cloud Software and Services |
| – | Enterprise |
| – | Europe and Latin America |
| – | Middle East and Africa |
| – | North America |
| – | North East Asia |
| – | South East Asia, Oceania and India. |
Segment information 2023 |
| |||||||||||||||||||||||
Networks |
Cloud Software and Services |
Enterprise |
Other |
Total Segments |
Group |
|||||||||||||||||||
| Segment sales |
171,442 | 63,630 | 25,745 | 2,534 | 263,351 | 263,351 | ||||||||||||||||||
| Net sales |
171,442 |
63,630 |
25,745 |
2,534 |
263,351 |
263,351 |
||||||||||||||||||
| Gross income |
67,959 |
22,088 |
12,016 |
–461 |
101,602 |
101,602 |
||||||||||||||||||
| Gross margin (%) |
39.6% | 34.7% | 46.7% | –18.2% | 38.6% | 38.6% | ||||||||||||||||||
| Earnings (loss) before financial items and income tax (EBIT) 1)
|
19,382 |
–220 |
–38,336 |
–1,152 |
–20,326 |
–20,326 |
||||||||||||||||||
| EBIT margin (%) |
11.3% | –0.3% | –148.9% | –45.5% | –7.7% | –7.7% | ||||||||||||||||||
| Financial income and expenses, net |
–2,993 | |||||||||||||||||||||||
| Income (loss) after financial items |
–23,319 |
|||||||||||||||||||||||
| Income tax |
–2,785 | |||||||||||||||||||||||
| Net income (loss) |
–26,104 |
|||||||||||||||||||||||
| Other segment items |
||||||||||||||||||||||||
| Share in earnings of JV and associated companies |
83 | 41 | – | – | 124 | 124 | ||||||||||||||||||
| Amortizations |
–1,013 | –43 | –3,401 | –1 | –4,458 | –4,458 | ||||||||||||||||||
| Depreciations |
–4,460 | –1,470 | –274 | –495 | –6,699 | –6,699 | ||||||||||||||||||
| Impairment losses 1
)
|
–527 | –176 | –31,952 | –77 | –32,732 | –32,732 | ||||||||||||||||||
| Restructuring charges |
–4,437 | –1,924 | –173 | 13 | –6,521 | –6,521 | ||||||||||||||||||
| Gains/losses on investments and sale of operations |
–24 | –39 | –16 | –206 | –285 | –285 | ||||||||||||||||||
|
| ||||
|
51 Notes to the consolidated financial statements
|
Financial report 2023 | |||
Segment information 2022 |
||||||||||||||||||||||||||||
Networks |
Cloud Software and Services |
Enterprise 2)
|
Other 2)
|
Total Segments |
Group |
|||||||||||||||||||||||
| Segment sales |
193,468 |
60,524 |
14,597 |
2,957 |
271,546 |
271,546 |
||||||||||||||||||||||
| Net sales |
193,468 |
60,524 |
14,597 |
2,957 |
271,546 |
271,546 |
||||||||||||||||||||||
| Gross income |
86,368 |
20,106 |
7,096 |
–275 |
113,295 |
113,295 |
||||||||||||||||||||||
| Gross margin (%) |
44.6% |
33.2% |
48.6% |
–9.3% |
41.7% |
41.7% |
||||||||||||||||||||||
| Earnings (loss) before financial items and income tax (EBIT) 1)
|
38,512 |
–1,689 |
–4,473 |
–5,330 |
27,020 |
27,020 |
||||||||||||||||||||||
| EBIT margin (%) |
19.9% |
–2.8% |
–30.6% |
–180.3% |
10.0% |
10.0% |
||||||||||||||||||||||
| Financial income and expenses, net |
–2,411 |
|||||||||||||||||||||||||||
| Income after financial items |
24,609 |
|||||||||||||||||||||||||||
| Income tax |
–5,497 |
|||||||||||||||||||||||||||
| Net income |
19,112 |
|||||||||||||||||||||||||||
| Other segment items |
||||||||||||||||||||||||||||
| Share in earnings of JV and associated companies |
30 |
27 |
– |
–40 |
17 |
17 |
||||||||||||||||||||||
| Amortizations |
–1,424 |
–122 |
–2,019 |
–12 |
–3,577 |
–3,577 |
||||||||||||||||||||||
| Depreciations |
–4,073 |
–1,792 |
–515 |
–185 |
–6,565 |
–6,565 |
||||||||||||||||||||||
| Impairment losses |
–211 |
–91 |
–87 |
–12 |
–401 |
–401 |
||||||||||||||||||||||
| Restructuring charges |
–146 |
–96 |
–65 |
–92 |
–399 |
–399 |
||||||||||||||||||||||
| Gains/losses on investments and sale of operations |
253 |
– |
111 |
–108 |
256 |
256 |
||||||||||||||||||||||
| 1) Segment Other includes a provision of SEK –2.3 billion related to the DPA breach resolution with the U.S. Department of Justice, including expenses for the extended monitorship, and by SEK –1.0 billion due to charges related to the divestment of IoT and other portfolio adjustments.2) The segments have been restated to reflect the change where the divested IoT business in the first quarter 2023 was transferred from segment Enterprise to segment Other. |
| |||||||||||||||||||||||||||
Segment information 2021 |
||||||||||||||||||||||||||||
Networks |
Cloud Software and Services |
Enterprise 1)
|
Other 1)
|
Total Segments |
Group |
|||||||||||||||||||||||
| Segment sales |
167,838 |
56,224 |
5,513 |
2,739 |
232,314 |
232,314 |
||||||||||||||||||||||
| Net sales |
167,838 |
56,224 |
5,513 |
2,739 |
232,314 |
232,314 |
||||||||||||||||||||||
| Gross income |
78,869 |
18,829 |
3,026 |
25 |
100,749 |
100,749 |
||||||||||||||||||||||
| Gross margin (%) |
47.0% |
33.5% |
54.9% |
0.9% |
43.4% |
43.4% |
||||||||||||||||||||||
| Earnings (loss) before financial items and income tax (EBIT) |
37,266 |
–2,234 |
–1,774 |
–1,478 |
31,780 |
31,780 |
||||||||||||||||||||||
| EBIT margin (%) |
22.2% |
–4.0% |
–32.2% |
–54.0% |
13.7% |
13.7% |
||||||||||||||||||||||
| Financial income and expenses, net |
–2,530 |
|||||||||||||||||||||||||||
| Income after financial items |
29,250 |
|||||||||||||||||||||||||||
| Income tax |
–6,270 |
|||||||||||||||||||||||||||
| Net income |
22,980 |
|||||||||||||||||||||||||||
| Other segment items |
||||||||||||||||||||||||||||
| Share in earnings of JV and associated companies |
40 |
72 |
– |
–372 |
–260 |
–260 |
||||||||||||||||||||||
| Amortizations |
–1,169 |
–508 |
–830 |
– |
–2,507 |
–2,507 |
||||||||||||||||||||||
| Depreciations |
–3,764 |
–1,568 |
–430 |
–189 |
–5,951 |
–5,951 |
||||||||||||||||||||||
| Impairment losses |
–127 |
–185 |
–188 |
–11 |
–511 |
–511 |
||||||||||||||||||||||
| Restructuring charges |
–262 |
–254 |
9 |
–42 |
–549 |
–549 |
||||||||||||||||||||||
| Gains/losses on investments and sale of operations |
14 |
–51 |
998 |
– |
961 |
961 |
||||||||||||||||||||||
| 1) The segments have been restated to reflect the change where the divested IoT business in the first quarter 2023 was transferred from segment Enterprise to segment Other. |
| |||||||||||||||||||||||||||
Products and Services by Segments |
||||||||||||||||||||
Networks |
Cloud Software and Services |
Enterprise 1)
|
Other 1)
|
Total Segments |
||||||||||||||||
| 2023 |
||||||||||||||||||||
| Products |
131,393 |
21,672 |
5,704 |
–4 |
158,765 |
|||||||||||||||
| Services |
40,049 |
41,958 |
20,041 |
2,538 |
104,586 |
|||||||||||||||
| Total |
171,442 |
63,630 |
25,745 |
2,534 |
263,351 |
|||||||||||||||
| 2022 |
||||||||||||||||||||
| Products |
147,997 |
21,105 |
4,923 |
–1 |
174,024 |
|||||||||||||||
| Services |
45,471 |
39,419 |
9,674 |
2,958 |
97,522 |
|||||||||||||||
| Total |
193,468 |
60,524 |
14,597 |
2,957 |
271,546 |
|||||||||||||||
| 2021 |
||||||||||||||||||||
| Products |
128,951 |
19,267 |
3,955 |
24 |
152,197 |
|||||||||||||||
| Services |
38,887 |
36,957 |
1,558 |
2,715 |
80,117 |
|||||||||||||||
| Total |
167,838 |
56,224 |
5,513 |
2,739 |
232,314 |
|||||||||||||||
1) |
The segments have been restated to reflect the change where the divested IoT business in the first quarter 2023 was transferred from segment Enterprise to segment Other. |
|
|
||||
| Financial report 2023 | Notes to the consolidated financial statements 52
| |||
| Market area 2023 | ||||||||||||||||||||||||
| Net sales |
Non-current
assets 5)
|
|||||||||||||||||||||||
| Networks | Cloud Software and Services |
Enterprise | Other | Total | Total | |||||||||||||||||||
| South East Asia, Oceania and India 3)
|
43,235 | 10,038 | 36 | 9 | 53,318 | 886 | ||||||||||||||||||
| North East Asia 4)
|
18,986 | 4,720 | 37 | 189 | 23,932 | 1,775 | ||||||||||||||||||
| North America 2)
|
44,640 | 14,199 | 266 | 125 | 59,230 | 33,214 | ||||||||||||||||||
| Europe and Latin America 1)
|
42,298 | 22,270 | 245 | 71 | 64,884 | 64,497 | ||||||||||||||||||
| Middle East and Africa |
12,902 | 10,457 | 378 | 2 | 23,739 | 174 | ||||||||||||||||||
| Other 1)
2) 3) 4) 6)
|
9,381 | 1,946 | 24,783 | 2,138 | 38,248 | – | ||||||||||||||||||
| Total |
171,442 |
63,630 |
25,745 |
2,534 |
263,351 |
100,546 |
||||||||||||||||||
| 1) Of which in EU 6)
|
34,257 |
59,456 |
||||||||||||||||||||||
| Of which in Sweden 6)
|
1,774 |
58,728 |
||||||||||||||||||||||
| 2) Of which in the United States 6)
|
85,313 |
32,133 |
||||||||||||||||||||||
| 3) Of which in India 6)
|
31,205 |
535 |
||||||||||||||||||||||
| 4) Of which in Japan 6)
|
10,139 |
132 |
||||||||||||||||||||||
| 4) Of which in China 6)
|
10,716 |
1,449 |
||||||||||||||||||||||
| 5) Total non-current assets excluding financial instruments, deferred tax assets, and post-employment benefit assets.6) Including IPR licensing revenue reported under Market area Other which is allocated based on the country location of the customer. Other sales are attributed to countries based on the destination of products or services delivered. |
| |||||||||||||||||||||||
| Market area 2022 | ||||||||||||||||||||||||
| Net sales |
Non-current
assets 5)
|
|||||||||||||||||||||||
| Networks | Cloud Software and Services |
Enterprise 7)
|
Other 7)
|
Total | Total | |||||||||||||||||||
| South East Asia, Oceania and India 3)
|
23,695 | 9,179 | 17 | 60 | 32,951 | 999 | ||||||||||||||||||
| North East Asia 4)
|
22,488 | 4,015 | 8 | 222 | 26,733 | 3,385 | ||||||||||||||||||
| North America 2)
|
81,917 | 13,362 | 47 | 68 | 95,394 | 41,065 | ||||||||||||||||||
| Europe and Latin America 1)
|
44,644 | 21,638 | 99 | 409 | 66,790 | 93,612 | ||||||||||||||||||
| Middle East and Africa |
11,707 | 10,472 | 368 | 24 | 22,571 | –804 | ||||||||||||||||||
| Other 1)
2) 3) 4) 6)
|
9,017 | 1,858 | 14,058 | 2,174 | 27,107 | – | ||||||||||||||||||
| Total |
193,468 |
60,524 |
14,597 |
2,957 |
271,546 |
138,257 |
||||||||||||||||||
| 1) Of which in EU 6)
|
35,859 |
92,167 |
||||||||||||||||||||||
| Of which in Sweden 6)
|
3,239 |
88,057 |
||||||||||||||||||||||
| 2) Of which in the United States 6)
|
109,709 |
39,906 |
||||||||||||||||||||||
| 3) Of which in India 6)
|
10,957 |
519 |
||||||||||||||||||||||
| 4) Of which in Japan 6)
|
9,965 |
187 |
||||||||||||||||||||||
| 4) Of which in China 6)
|
10,523 |
2,068 |
||||||||||||||||||||||
| 5) Total non-current assets excluding financial instruments, deferred tax assets, and post-employment benefit assets.6) Including IPR licensing revenue reported under Market area Other which is allocated based on the country location of the customer. Other sales are attributed to countries based on the destination of products or services delivered.7) The segments have been restated to reflect the change where the divested IoT business in the first quarter 2023 was transferred from segment Enterprise to segment Other. |
| |||||||||||||||||||||||
Market area 2021 |
||||||||||||||||||||||||
| Net sales |
Non-current
assets 5)
|
|||||||||||||||||||||||
| Networks | Cloud Software and Services |
Enterprise 7)
|
Other 7)
|
Total | Total | |||||||||||||||||||
| South East Asia, Oceania and India 3)
|
20,299 | 8,493 | 10 | 27 | 28,829 | 1,010 | ||||||||||||||||||
| North East Asia 4)
|
24,464 | 4,405 | 1 | 251 | 29,121 | 2,700 | ||||||||||||||||||
| North America 2)
|
66,464 | 10,913 | 20 | 59 | 77,456 | 11,971 | ||||||||||||||||||
| Europe and Latin America 1)
|
38,671 | 21,181 | 41 | 379 | 60,272 | 52,141 | ||||||||||||||||||
| Middle East and Africa |
10,743 | 9,726 | 309 | 7 | 20,785 | 209 | ||||||||||||||||||
| Other 1)
2) 3) 4) 6)
|
7,197 | 1,506 | 5,132 | 2,016 | 15,851 | – | ||||||||||||||||||
| Total |
167,838 |
56,224 |
5,513 |
2,739 |
232,314 |
68,031 |
||||||||||||||||||
| 1) Of which in EU 6)
|
31,307 |
50,428 |
||||||||||||||||||||||
| Of which in Sweden 6)
|
2,349 |
45,997 |
||||||||||||||||||||||
| 2) Of which in the United States 6)
|
79,896 |
10,749 |
||||||||||||||||||||||
| 3) Of which in India 6)
|
7,482 |
484 |
||||||||||||||||||||||
| 4) Of which in Japan 6)
|
13,678 |
261 |
||||||||||||||||||||||
| 4) Of which in China 6)
|
10,078 |
2,202 |
||||||||||||||||||||||
|
5) |
Total non-current assets excluding financial instruments, deferred tax assets, and post-employment benefit assets. |
|
6) |
Including IPR licensing revenue reported under Market area Other which is allocated based on the country location of the customer. Other sales are attributed to countries based on the destination of products or services delivered. |
|
7) |
The segments have been restated to reflect the change where the divested IoT business in the first quarter 2023 was transferred from segment Enterprise to segment Other. |
|
| ||||
|
53 Notes to the consolidated financial statements |
Financial report 2023 | |||
 |
Net sales |
Net sales |
||||||||||||
| 2023 | 2022 | 2021 | ||||||||||
| Hardware |
99,642 | 119,215 | 106,399 | |||||||||
| Software |
59,123 | 54,809 | 45,798 | |||||||||
| Services |
104,586 | 97,522 | 80,117 | |||||||||
| Net sales |
263,351 |
271,546 |
232,314 |
|||||||||
| Of which IPR licensing revenues |
11,101 | 10,399 | 8,134 | |||||||||
| Of which export sales from Sweden |
125,242 | 153,833 | 140,898 | |||||||||
 |
Expenses by nature |
Expenses by nature |
||||||||||||
| 2023 | 2022 | 2021 | ||||||||||
| Goods and services |
127,214 | 147,023 | 119,787 | |||||||||
| Employee remuneration |
101,438 | 89,191 | 77,462 | |||||||||
| Amortizations and depreciations |
11,157 | 10,142 | 8,458 | |||||||||
| Impairments, obsolescence allowances and revaluation | 4,996 | 4,383 | 1,456 | |||||||||
| Inventory increase, net |
9,304 | –7,738 | –5,565 | |||||||||
| Additions to capitalized development |
–2,173 | –1,720 | –962 | |||||||||
Expenses charged to cost of sales and operating expenses |
251,936 |
241,281 |
200,636 |
|||||||||
Restructuring charges by function |
||||||||||||
| 2023 | 2022 | 2021 | ||||||||||
| Cost of sales |
2,802 | 195 | 273 | |||||||||
| R&D expenses |
2,431 | 54 | 137 | |||||||||
| Selling and administrative expenses |
1,288 | 150 | 139 | |||||||||
| Total restructuring charges |
6,521 |
399 |
549 |
|||||||||
 |
Other operating income and expenses |
Other operating income and expenses |
||||||||||||
| 2023 | 2022 | 2021 | ||||||||||
| Other operating income |
||||||||||||
| Gains on sales of intangible assets and PP&E |
17 | 85 | 13 | |||||||||
| Gains on investments and sale of operations 1)
|
136 | 701 | 1,199 | |||||||||
| Other operating income |
841 | 445 | 314 | |||||||||
| Total other operating income |
994 |
1,231 |
1,526 |
|||||||||
| Other operating expenses |
||||||||||||
| Losses on sales of intangible assets and PP&E |
– | –54 | –3 | |||||||||
| Losses on investments and sale of operations 1)
|
–421 | –445 | –238 | |||||||||
| Impairment of goodwill 2)
|
–31,897 | – | –112 | |||||||||
| Other operating expenses 3)
|
–541 | –3,994 | –811 | |||||||||
| Total other operating expenses |
–32,859 |
–4,493 |
– 1,164 |
|||||||||
|
1) |
Information about divestments is presented in note E2 “Business combinations.” The loss of the divestment of the IoT business is reduced by the release of the provision reported in 2022 as Other operating expenses. |
|
2) |
2023 includes an impairment of SEK –31.9 billion related to the acquisition of Vonage. For more information about the impairment of goodwill, see note C1 “Intangible assets.” |
|
3) |
2022 includes a provision of SEK –2.3 billion related to the DPA breach resolution with the U.S. Department of Justice, including expenses for the extended monitorship, and by SEK –1.0 billion due to charges related to the divestment of IoT and other portfolio adjustments. |
 |
Inventories |
Inventories |
||||||||
| 2023 | 2022 | |||||||
| Finished products and components | 24,222 | 31,249 | ||||||
| Contract work in progress |
11,851 | 14,597 | ||||||
| Inventories, net |
36,073 |
45,846 |
||||||
|
|
||||
| Financial report 2023 | Notes to the consolidated financial statements 54
| |||
 |
Customer contract related balances |
Trade receivables, customer finance, contract assets, contract liabilities and deferred sales commissions |
||||||||
| 2023 | 2022 | |||||||
| Customer finance credits 1)
|
6,917 | 5,370 | ||||||
| Trade receivables 2)
|
42,215 | 48,413 | ||||||
| Contract assets |
7,999 | 9,843 | ||||||
| Contract liabilities 3)
|
34,416 | 42,251 | ||||||
| Deferred sales commissions 4)
|
1,006 | 754 | ||||||
|
1) |
Of the total Customer finance credits balance, SEK 5,570 (4,955) million is current . |
|
2) |
Total trade receivables include SEK 166 (70) million relating to associated companies. |
|
3) |
The decrease in contract liabilities is mainly due to decreased incentive earnings based on lower sales as well as utilization of incentives in the period . |
|
4) |
Of the total Deferred sales commissions balance SEK 414 (345) million is current. The non-current balance is presented within Other financial assets, non-current (see note F3 “Financial assets, non-current”) and the current balance is presented within Other current receivables (see note B7 “Other current receivables”). |
Revenue recognized in the period |
||||||||
| 2023 | 2022 | |||||||
| Revenue recognized relating to the opening contract liability balance | 32,874 | 25,601 | ||||||
| Revenue recognized relating to performance obligations satisfied, or partially satisfied, in prior reporting periods | 134 | –7 | ||||||
| Transaction price allocated to the remaining performance obligations |
| |||||||
| 2023 | 2022 | |||||||
| Aggregate amount of transaction price allocated to unsatisfied, or partially unsatisfied, performance obligations | 133,247 | 169,609 | ||||||
 |
Other current receivables |
| Other current receivables |
||||||||
| 2023 | 2022 | |||||||
| Prepaid expenses |
2,552 | 2,506 | ||||||
| Advance payments to suppliers |
128 | 473 | ||||||
| Derivative assets 1)
|
1,851 | 1,121 | ||||||
| Other taxes 2)
|
4,176 | 3,349 | ||||||
| Other 3)
|
3,255 | 2,239 | ||||||
| Total |
11,962 |
9,688 |
||||||
|
1) |
See also note F1 “Financial risk management.” |
|
2) |
Other taxes mainly includes VAT receivables. |
|
3) |
Includes items such as loans to associates deferred sales commissions and deposits paid to third parties. |
 |
Trade payables |
| Trade payables |
||||||||
| 2023 | 2022 | |||||||
| Trade payables to associated companies and joint ventures | 434 | 179 | ||||||
| Trade payables, excluding associated companies and joint ventures 1)
|
27,334 | 38,258 | ||||||
| Total |
27,768 |
38,437 |
||||||
|
1) |
Of the trade payables amount SEK 8.2 (9.7) billion relates to supplier invoices under Ericsson’s supplier payments program. |
 |
Other current liabilities |
| Other current liabilities |
||||||||
| 2023 | 2022 | |||||||
| Accrued interest |
439 | 335 | ||||||
| Accrued expenses |
26,294 | 35,896 | ||||||
| Of which employee-related |
13,440 |
19,630 |
||||||
| Of which supplier-related |
8,009 |
9,849 |
||||||
| Of which other 1)
|
4,845 |
6,417 |
||||||
| Derivative liabilities 2)
|
1,794 | 2,621 | ||||||
| Other 3)
|
8,458 | 7,341 | ||||||
| Total |
36,985 |
46,193 |
||||||
|
1) |
Major balance relates to accrued expenses for customer projects. |
|
2) |
See also note F1 “Financial risk management.” |
|
3) |
Includes items such as VAT and other payroll deductions. |
|
|
||||
|
55 Notes to the consolidated financial statements |
Financial report 2023 | |||
 |
Intangible assets |
Intangible assets |
||||||||||||||||||||||||||
2023 |
2022 |
|||||||||||||||||||||||||
| Capitalized development expenses |
Goodwill |
Customer relationships,
IPR 1) ,and other intangible
assets |
Capitalized development expenses |
Goodwill |
Customer relationships,
IPR 1) ,and other intangible
assets |
|||||||||||||||||||||
Cost |
||||||||||||||||||||||||||
Opening balance |
21,096 | 90,914 | 82,854 | 19,158 | 44,963 | 55,936 | ||||||||||||||||||||
Additions |
2,173 | – | 97 | 1,720 | – | 126 | ||||||||||||||||||||
Balances regarding acquired/divested business 2)
|
– | 348 | 306 | – | 40,881 | 23,451 | ||||||||||||||||||||
Disposals |
–153 | – | – 563 | – | – | –452 | ||||||||||||||||||||
Reclassifications |
–16 | – | – | – | – | – | ||||||||||||||||||||
Translation differences |
–117 | –77 | –1,884 | 218 | 5,070 | 3,793 | ||||||||||||||||||||
Closing balance |
22,983 |
91,185 |
80,810 |
21,096 |
90,914 |
82,854 |
||||||||||||||||||||
Accumulated amortizations |
||||||||||||||||||||||||||
Opening balance |
–13,646 | – | –48,770 | –11,885 | – | –44,456 | ||||||||||||||||||||
Amortizations |
–1,137 | – | –3,321 | –1,586 | – | –1,991 | ||||||||||||||||||||
Balances regarding divested business 2)
|
– | – | – | – | – | 22 | ||||||||||||||||||||
Disposals |
153 | – | 563 | – | – | 452 | ||||||||||||||||||||
Translation differences |
70 | – | 1,123 | –175 | – | –2,797 | ||||||||||||||||||||
Closing balance |
–14,560 |
– |
–50,405 |
–13,646 |
– |
–48,770 |
||||||||||||||||||||
Accumulated impairment losses |
||||||||||||||||||||||||||
Opening balance |
–3,745 | –6,344 | –7,744 | –3,745 | –6,759 | –7,650 | ||||||||||||||||||||
Balances regarding divested business 2)
|
– | – | – | – | 415 | 81 | ||||||||||||||||||||
Impairment losses |
– | –31,897 | –19 | – | – | –61 | ||||||||||||||||||||
Translation differences |
– | – | 25 | – | – | –114 | ||||||||||||||||||||
Closing balance |
–3,745 |
–38,241 |
–7,738 |
–3,745 |
–6,344 |
–7,744 |
||||||||||||||||||||
Net carrying value |
4,678 |
52,944 |
22,667 |
3,705 |
84,570 |
26,340 |
||||||||||||||||||||
| 1) | Intellectual property rights. |
| 2) | For more information on acquired/divested businesses, see note E2 “Business combinations.” |
| – | Sales growth |
| – | Development of EBIT (based on EBIT margin or cost of goods sold and operating expenses relative to sales) |
|
|
||||
| Financial report 2023 | Notes to the consolidated financial statements 5 6
|
|||
| – | Related development of working capital and capital expenditure requirements. |
| – | By 2028, about 37 years after the introduction of digital mobile technology, it is predicted that there will be 9.1 billion mobile subscriptions (excl. Cellular IoT) compared to 8.5 billion in 2023. Out of all mobile subscriptions, 8.2 billion will be associated with a smartphone. |
| – | The number of 5G subscriptions is forecasted to reach 4.7 billion (excluding Cellular IoT) by the end of 2028 compared to 1.6 billion in 2023. |
| – | By 2028, about 46 billion connected devices are forecasted compared to 26 billion in 2023, of the 46 billion around 30 billion will be related to Internet of Things, IoT. Connected IoT devices includes connected cars, machines, meters, sensors, point-of-sale |
| – | Cellular IoT is predicted to grow from 3.5 billion devices in end of 2024 to 5.5 billion devices in end of 2028. |
| – | Mobile data traffic volume is estimated to increase by more than two times in the period 2024–2028. The mobile traffic is driven by smartphone users and video traffic, with mobile video traffic forecasted to grow by almost 25% annually through 2028 to account for more than 70% of all mobile data traffic. Fixed Wireless Access is another contributor to mobile traffic, growing with more than 30% annually in the period to account for more than 25% of all mobile data traffic in 2028. |
Rates per CGU |
||||||||||||||||||||
Post-tax discount rates (%) |
Terminal growth rates (%) | |||||||||||||||||||
| CGU | 2023 | 2022 | 2023 | 2022 | ||||||||||||||||
Networks |
10.0 | 9.0 | 2.0 | 2.0 | ||||||||||||||||
Cloud Software and Services |
10.5 | 10.0 | 1.5 | 2.0 | ||||||||||||||||
Vonage |
11.0 | 9.5 | 3.5 | 3.5 | ||||||||||||||||
Cradlepoint |
11.0 | 9.5 | 3.5 | 2.0 | ||||||||||||||||
iconectiv |
10.5 | 10.0 | 3.5 | 2.0 | ||||||||||||||||
Emodo |
14.5 | 14.5 | 2.0 | 2.0 | ||||||||||||||||
Red Bee Media |
12.5 | 11.0 | 2.0 | 2.0 | ||||||||||||||||
|
| ||||
| 5 7 Notes to the consolidated financial statements |
Financial report 2023 | |||
 |
Property, plant and equipment |
| Real estate | Machinery and other technical assets |
Other equipment, tools and installations |
Construction in progress and advance payments |
Total | ||||||||||||||||
| Cost |
||||||||||||||||||||
| Opening balance |
7,523 | 3,825 | 38,220 | 973 | 50,541 | |||||||||||||||
| Additions |
87 | 134 | 1,713 | 1,363 | 3,297 | |||||||||||||||
| Balances regarding acquired/divested business |
– | – | –347 | – | –347 | |||||||||||||||
| Disposals |
–443 | –221 | –2,318 | –232 | –3,214 | |||||||||||||||
| Reclassifications |
327 | 75 | 627 | –1,029 | – | |||||||||||||||
| Translation differences |
–158 | –61 | –498 | –17 | –734 | |||||||||||||||
| Closing balance |
7,336 |
3,752 |
37,397 |
1,058 |
49,543 |
|||||||||||||||
| Accumulated depreciations |
||||||||||||||||||||
| Opening balance |
–4,282 | –2,797 | –27,606 | – | –34,685 | |||||||||||||||
| Depreciations |
–480 | –382 | –3,410 | – | –4,272 | |||||||||||||||
| Balances regarding divested business |
– | – | 227 | – | 227 | |||||||||||||||
| Disposals |
395 | 220 | 2,321 | – | 2,936 | |||||||||||||||
| Reclassifications |
– | 1 | –1 | – | – | |||||||||||||||
| Translation differences |
102 | 60 | 378 | – | 540 | |||||||||||||||
| Closing balance |
–4,265 |
–2,898 |
–28,091 |
– |
–35,254 |
|||||||||||||||
| Accumulated impairment losses |
||||||||||||||||||||
| Opening balance |
–385 | –114 | –1,121 | – | –1,620 | |||||||||||||||
| Impairment losses |
–101 | –114 | –428 | –19 | –662 | |||||||||||||||
| Disposals |
40 | 7 | 65 | 19 | 131 | |||||||||||||||
| Translation differences |
9 | 10 | 38 | – | 57 | |||||||||||||||
| Closing balance |
–437 |
–211 |
–1,446 |
– |
–2,094 |
|||||||||||||||
| Net carrying value |
2,634 |
643 |
7,860 |
1,058 |
12,195 |
|||||||||||||||
| Property, plant and equipment 2022 | | |||||||||||||||||||
| Real estate | Machinery and other technical assets |
Other equipment, tools and installations |
Construction in progress and advance payments |
Total | ||||||||||||||||
| Cost |
||||||||||||||||||||
| Opening balance |
6,946 | 3,549 | 35,009 | 705 | 46,209 | |||||||||||||||
| Additions |
47 | 200 | 2,705 | 1,525 | 4,477 | |||||||||||||||
| Balances regarding acquired/divested business |
37 | – | 138 | 11 | 186 | |||||||||||||||
| Disposals |
–275 | –421 | –1,638 | –253 | –2,587 | |||||||||||||||
| Reclassifications |
287 | 213 | 593 | –1,093 | – | |||||||||||||||
| Translation differences |
481 | 284 | 1,413 | 78 | 2,256 | |||||||||||||||
| Closing balance |
7,523 |
3,825 |
38,220 |
973 |
50,541 |
|||||||||||||||
| Accumulated depreciations |
||||||||||||||||||||
| Opening balance |
–3,741 | –2,678 | –24,769 | – | –31,188 | |||||||||||||||
| Depreciations |
–502 | –373 | –3,239 | – | –4,114 | |||||||||||||||
| Disposals |
226 | 434 | 1,509 | – | 2,169 | |||||||||||||||
| Translation differences |
–265 | –180 | –1,107 | – | –1,552 | |||||||||||||||
| Closing balance |
–4,282 |
–2,797 |
–27,606 |
– |
–34,685 |
|||||||||||||||
| Accumulated impairment losses |
||||||||||||||||||||
| Opening balance |
–283 | –104 | –1,054 | – | –1,441 | |||||||||||||||
| Impairment losses |
–115 | –4 | –146 | –9 | –274 | |||||||||||||||
| Disposals |
44 | 3 | 145 | 9 | 201 | |||||||||||||||
| Translation differences |
–31 | –9 | –66 | – | –106 | |||||||||||||||
| Closing balance |
–385 |
–114 |
–1,121 |
– |
–1,620 |
|||||||||||||||
| Net carrying value |
2,856 |
914 |
9,493 |
973 |
14,236 |
|||||||||||||||
|
|
||||
| Financial report 2023 | Notes to the consolidated financial statements 5 8
| |||
 |
Leases |
| 2023 | 2022 | |||||||||||||||||||||||||||||||||||
| Real estate | Vehicles | Other | Total | Real estate | Vehicles | Other | Total | |||||||||||||||||||||||||||||
| Cost |
||||||||||||||||||||||||||||||||||||
| Opening balance |
15,895 | 998 | 303 | 17,196 | 13,756 | 930 | 171 | 14,857 | ||||||||||||||||||||||||||||
| Additions |
1,307 | 257 | 1 | 1,565 | 1,650 | 168 | 136 | 1,954 | ||||||||||||||||||||||||||||
| Balances regarding acquired/divested business |
2 | – | – | 2 | 334 | – | – | 334 | ||||||||||||||||||||||||||||
| Terminations |
–870 | –489 | – | –1,359 | –719 | –178 | – | –897 | ||||||||||||||||||||||||||||
| Translation differences |
–331 | 3 | –4 | –332 | 874 | 78 | –4 | 948 | ||||||||||||||||||||||||||||
| Closing balance |
16,003 |
769 |
300 |
17,072 |
15,895 |
998 |
303 |
17,196 |
||||||||||||||||||||||||||||
| Accumulated depreciations |
||||||||||||||||||||||||||||||||||||
| Opening balance |
–7,789 | –629 | –138 | –8,556 | –5,687 | –495 | –79 | –6,261 | ||||||||||||||||||||||||||||
| Depreciations |
–2,146 | –232 | –49 | –2,427 | –2,141 | –250 | –60 | –2,451 | ||||||||||||||||||||||||||||
| Terminations |
546 | 373 | – | 919 | 393 | 159 | – | 552 | ||||||||||||||||||||||||||||
| Translation differences |
209 | –1 | 3 | 211 | –354 | –43 | 1 | –396 | ||||||||||||||||||||||||||||
| Closing balance |
–9,180 |
–489 |
–184 |
–9,853 |
–7,789 |
–629 |
–138 |
–8,556 |
||||||||||||||||||||||||||||
| Accumulated impairment losses |
||||||||||||||||||||||||||||||||||||
| Opening balance |
–374 | – | – | –374 | –303 | – | – | –303 | ||||||||||||||||||||||||||||
| Impairment losses |
–93 | – | –61 | –154 | –66 | – | – | –66 | ||||||||||||||||||||||||||||
| Terminations |
3 | – | – | 3 | 27 | – | – | 27 | ||||||||||||||||||||||||||||
| Translation differences |
11 | – | – | 11 | –32 | – | – | –32 | ||||||||||||||||||||||||||||
| Closing balance |
–453 |
– |
–61 |
–514 |
–374 |
– |
– |
–374 |
||||||||||||||||||||||||||||
| Financial sublease |
||||||||||||||||||||||||||||||||||||
| Opening balance |
–396 | – | – | –396 | –345 | – | – | –345 | ||||||||||||||||||||||||||||
| Derecognition for sublease |
–2 | – | – | –2 | – | – | – | – | ||||||||||||||||||||||||||||
| Translation differences |
13 | – | – | 13 | –51 | – | – | –51 | ||||||||||||||||||||||||||||
| Closing balance |
–385 |
– |
– |
–385 |
–396 |
– |
– |
–396 |
||||||||||||||||||||||||||||
| Net carrying value |
5,985 |
280 |
55 |
6,320 |
7,336 |
369 |
165 |
7,870 |
||||||||||||||||||||||||||||
| Cash payments | ||||||||
| 2023 | 2022 | |||||||
| Repayments of the lease liabilities 1)
|
–2,857 | –2,593 | ||||||
| Interest expense of the lease liabilities | –464 | –464 | ||||||
|
Low-value asset not included in the measurement of the liabilities |
–459 | –516 | ||||||
| Variable lease payments not included in the measurement of the lease liabilities | -284 | –278 | ||||||
Total cash outflow |
–4,064 |
–3,851 |
||||||
1) |
Including advance payments. |
| Future minimum payment receivables | ||||||||
| Financial leases | Operating leases | |||||||
| 2024 |
78 | 48 | ||||||
| 2025 |
13 | 22 | ||||||
| 2026 |
– | 19 | ||||||
| 2027 |
– | 11 | ||||||
| 2028 and later |
– | 4 | ||||||
| Total |
91 |
104 |
||||||
|
|
||||
| 5 9 Notes to the consolidated financial statements |
Financial report 2023 | |||
 |
Provisions
|
Restructuring |
Customer related |
Supplier related |
Warranty |
Share-based
payments |
Other |
Total |
||||||||||||||||||||||
2023 |
||||||||||||||||||||||||||||
Opening balance |
669 | 3,093 | 722 | 678 | 985 | 5,441 | 11,588 | |||||||||||||||||||||
Additions |
6,082 | 481 | 849 | 831 | 1,410 | 824 | 10,477 | |||||||||||||||||||||
Balances regarding acquired business |
– | |||||||||||||||||||||||||||
Reversal of excess amounts |
–112 | –131 | –416 | – | –60 | –821 | –1,540 | |||||||||||||||||||||
Charged to income statement |
8,937 | |||||||||||||||||||||||||||
Utilization |
–2,866 | –541 | –138 | –547 | –682 | –3,792 | –8,566 | |||||||||||||||||||||
Reclassifications |
–14 | – | –57 | – | – | 7 | –64 | |||||||||||||||||||||
Translation differences |
–39 | –45 | –6 | –6 | –69 | –24 | –189 | |||||||||||||||||||||
Closing balance |
3,720 |
2,857 |
954 |
956 |
1,584 |
1,635 |
11,706 |
|||||||||||||||||||||
Of which current provisions |
984 |
346 |
705 |
902 |
977 |
6,779 |
||||||||||||||||||||||
Of which non-current provisions |
855 |
1,873 |
608 |
251 |
682 |
658 |
4,927 |
|||||||||||||||||||||
2022 |
||||||||||||||||||||||||||||
Opening balance |
639 | 3,440 | 1,231 | 1,074 | 1,591 | 1,529 | 9,504 | |||||||||||||||||||||
Additions |
400 | 1,024 | 561 | 368 | 303 | 4,129 | 6,785 | |||||||||||||||||||||
Balances regarding acquired business |
– | – | – | – | – | 1,050 | 1,050 | |||||||||||||||||||||
Reversal of excess amounts |
–54 | –585 | –960 | –120 | –99 | –220 | –2,038 | |||||||||||||||||||||
Charged to income statement |
4,747 |
|||||||||||||||||||||||||||
Utilization |
–338 | –824 | –144 | –646 | –897 | –1,724 | –4,573 | |||||||||||||||||||||
Reclassifications |
–21 | –31 | 32 | – | – | 595 | 575 | |||||||||||||||||||||
Translation differences |
43 | 69 | 2 | 2 | 87 | 82 | 285 | |||||||||||||||||||||
Closing balance |
669 |
3,093 |
722 |
678 |
985 |
5,441 |
11,588 |
|||||||||||||||||||||
Of which current provisions |
448 |
1,215 |
198 |
572 |
642 |
4,554 |
7,629 |
|||||||||||||||||||||
Of which non-current provisions |
221 |
1,878 |
524 |
106 |
343 |
887 |
3,959 |
|||||||||||||||||||||
|
|
||||
| Financial report 2023 | Notes to the consolidated financial statements 60
|
|||
|
| ||||
| 6 1 Notes to the consolidated financial statements |
Financial report 2023 | |||
 |
Contingent liabilities |
| Contingent liabilities | ||||||||||||
| 2023 | 2022 | |||||||||||
| Contingent liabilities |
3,037 | 3,322 | ||||||||||
| Total |
3,037 |
3,322 |
||||||||||
 |
Assets pledged as collateral |
| Assets pledged as collateral |
||||||||||||
| 2023 | 2022 | |||||||||||
| Chattel mortgages 1)
|
7,678 | 6,333 | ||||||||||
| Bank deposits 2)
|
547 | 604 | ||||||||||
| Marketable securities 2)
|
276 | 289 | ||||||||||
| Total |
8,501 |
7,226 |
||||||||||
| 1) | See also note G1 “Post-employment benefits.” |
| 2) | As of 2023, “Marketable securities” which was previously disclosed under “Bank deposits” is now presented as a separate line and the comparative year has been adjusted accordingly. |
 |
Contractual obligations |
| Contractual obligations, SEK billion |
| |||||||||||||||||||
| Payment due by period | ||||||||||||||||||||
| 2023 | <1 year |
1–3 years |
3–5 years |
>5 years |
Total | |||||||||||||||
| Current and non-current debt 1)
|
18.3 | 4.9 | 18.4 | 12.0 | 53.6 | |||||||||||||||
| Lease obligations 2)
|
2.6 | 3.6 | 1.3 | 1.1 | 8.6 | |||||||||||||||
| Other non-current liabilities |
– | 0.1 | 0.6 | – | 0.7 | |||||||||||||||
| Purchase obligations 3)
|
18.4 | 0.7 | 0.2 | – | 19.3 | |||||||||||||||
| Trade payables |
27.8 | – | – | – | 27.8 | |||||||||||||||
| Commitments for customer finance 4)
|
27.3 | 5.7 | 4.0 | – | 37.0 | |||||||||||||||
| Derivatives liabilities 4)
|
1.3 | 0.2 | 0.3 | – | 1.8 | |||||||||||||||
| Total |
95.7 |
15.2 |
24.8 |
13.1 |
148.8 |
|||||||||||||||
| 2022 | ||||||||||||||||||||
| Current and non-current debt 1)
|
6.3 | 12.9 | 9.1 | 11.2 | 39.5 | |||||||||||||||
| Lease obligations 2)
|
3.0 | 4.4 | 2.1 | 1.1 | 10.6 | |||||||||||||||
| Other non-current liabilities |
– | 0.6 | – | 0.1 | 0.7 | |||||||||||||||
| Purchase obligations 3)
|
17.8 | 3.1 | 0.2 | – | 21.1 | |||||||||||||||
| Trade payables |
38.4 | – | – | – | 38.4 | |||||||||||||||
| Commitments for customer finance 4)
|
44.3 | 8.6 | 1.2 | – | 54.1 | |||||||||||||||
| Derivatives liabilities 4)
|
0.9 | 1.1 | 0.6 | – | 2.6 | |||||||||||||||
| Total |
110.7 |
30.7 |
13.2 |
12.4 |
167.0 |
|||||||||||||||
|
1) |
Current and non-current debt, including interest commitments. |
|
2) |
Future lease obligations, nominal lease liability, see also note C3 “Leases.” |
|
3) |
The amounts of purchase obligations are gross, before deduction of any related provisions. |
|
4) |
See also note F1 “Financial risk management.” |
|
|
||||
| Financial report 2023 | Notes to the consolidated financial statements 62
| |||
 |
Equity |
| Capital stock | ||||||||||
| Parent Company | Class A shares | Class B shares | Total | |||||||
| December 31, 2023 |
1,309 | 15,413 | 16,722 | |||||||
| December 31, 2022 |
1,309 | 15,363 | 16,672 | |||||||
| Number of shares | ||||||||||||
| 2023 | Class A shares | Class B shares | Total | |||||||||
| As of January 1 | 261,755,983 | 3,072,395,752 | 3,334,151,735 | |||||||||
| As of December 31 | 261,755,983 | 3,082,395,752 | 3,344,151,735 | |||||||||
| 2022 |
Class A shares | Class B shares | Total | |||||||||
| As of January 1 | 261,755,983 | 3,072,395,752 | 3,334,151,735 | |||||||||
| As of December 31 |
261,755,983 | 3,072,395,752 | 3,334,151,735 | |||||||||
| Other reserves | ||||||||||||||||||||||||||||||||
| 2023 | 2022 | |||||||||||||||||||||||||||||||
| SEK million | Translation reserves |
Cash flow hedge reserve |
Revaluation of borrowings |
Total other reserves |
Translation reserves |
Cash flow hedge reserve |
Revaluation of borrowings |
Total other reserves |
||||||||||||||||||||||||
| Opening balance | 8,443 | –719 | 477 | 8,201 | 1,206 | –411 | –341 | 454 | ||||||||||||||||||||||||
Other comprehensive income |
||||||||||||||||||||||||||||||||
Items that will not be reclassified to profit or loss |
||||||||||||||||||||||||||||||||
| Revaluation of borrowings due to change in credit risk | – | – | –667 | –667 | – | – | 1,030 | 1,030 | ||||||||||||||||||||||||
| Cash flow hedge reserve | ||||||||||||||||||||||||||||||||
| Gains/losses arising during the period |
– | – | – | – | – | 3,703 | – | 3,703 | ||||||||||||||||||||||||
| Transfer to goodwill |
– | – | – | – | – | –3,677 | – | –3,677 | ||||||||||||||||||||||||
| Tax on items that will not be reclassified to profit or loss | – | – | 137 | 137 | – | –758 | –212 | –970 | ||||||||||||||||||||||||
Items that have been or may be reclassified to profit or loss |
||||||||||||||||||||||||||||||||
| Cash flow hedge reserve | ||||||||||||||||||||||||||||||||
| Gains/losses arising during the period |
– | 754 | – | 754 | – | –701 | – | –701 | ||||||||||||||||||||||||
| Reclassification to profit and loss |
– | 1,090 | – | 1,090 | – | 280 | – | 280 | ||||||||||||||||||||||||
| Translation reserves | ||||||||||||||||||||||||||||||||
| Changes in translation reserves |
–2,425 | – | – | –2,425 | 7,273 | – | – | 7,273 | ||||||||||||||||||||||||
| Reclassification to profit and loss |
59 | – | – | 59 | –85 | – | – | –85 | ||||||||||||||||||||||||
| Share of other comprehensive income of JV and associated companies | –10 | – | – | –10 | 49 | – | – | 49 | ||||||||||||||||||||||||
| Tax on items that have been or may be reclassified to profit or loss |
– | –380 | – | –380 | – | 87 | – | 87 | ||||||||||||||||||||||||
Other comprehensive income, net of tax |
–2,376 |
1,464 |
–530 |
–1,442 |
7,237 |
–1,066 |
818 |
6,989 |
||||||||||||||||||||||||
Total comprehensive income |
–2,376 |
1,464 |
–530 |
–1,442 |
7,237 |
–1,066 |
818 |
6,989 |
||||||||||||||||||||||||
Transfer to retained earnings |
– |
– |
– |
– |
– |
758 |
– |
758 |
||||||||||||||||||||||||
Closing balance |
6,067 |
745 |
–53 |
6,759 |
8,443 |
–719 |
477 |
8,201 |
||||||||||||||||||||||||
|
| ||||
|
63 Notes to the consolidated financial statements |
Financial report 2023 | |||
 |
Business combinations |
| Acquisitions 2021–2023 | ||||||||||||
| 2023 | 2022 | 2021 | ||||||||||
| Consideration |
||||||||||||
| Purchase price paid on acquisition |
579 | 51,297 | 256 | |||||||||
| Deferred consideration/Others 1)
|
– | 1,972 | – | |||||||||
| Total consideration, all cash and cash equivalents |
579 |
53,269 |
256 |
|||||||||
| Net assets (liabilities) acquired |
||||||||||||
| Intangible assets |
306 | 23,554 | –95 | |||||||||
| Property, plant and equipment |
1 | 186 | 1 | |||||||||
| Right-of-use |
2 | 334 | – | |||||||||
| Cash and cash equivalents |
7 | 521 | – | |||||||||
| Other assets |
83 | 5,344 | 21 | |||||||||
| Provisions, incl. post-employment benefits |
– | –1,050 | – | |||||||||
| Other liabilities |
–168 | –16,916 | –348 | |||||||||
| Total identifiable net assets (liabilities) |
231 |
11,973 |
–421 |
|||||||||
| Goodwill |
348 |
41,296 |
677 |
|||||||||
| Total |
579 |
53,269 |
256 |
|||||||||
| Acquisition-related costs 2)
|
36 | 436 | 11 | |||||||||
|
1) |
Deferred consideration relates to the pre-combination portion of employee stock awards that were previously granted to Vonage employees, which will be paid out post acquisition according to the original award vesting schedule. |
|
2) |
Acquisition-related costs are included in Selling and administrative expenses in the consolidated income statement. |
| Acquisitions 2021–2023 | ||||
| Business | Description | Transaction date | ||
| Ericom | An Israel based enterprise cloud security platform provider. | |||
| Vonage | A US based global provider of cloud-based communications. | |||
| Quortus | A UK based mobile core software business with expertise in enterprise 4G/5G technology. | |||
| Axonix | A UK based mobile-first programmatic advertising exchange business. |
|
|
||||
| Financial report 2023 | Notes to the consolidated financial statements 64
| |||
| Divestments 2021–2023 | ||||||||||||
| 2023 | 2022 | 2021 | ||||||||||
| Proceeds |
||||||||||||
| Cash and cash equivalents |
–633 | 20 | 273 | |||||||||
| Shares in associated companies |
– | 298 | – | |||||||||
| Total proceeds |
–633 |
318 |
273 |
|||||||||
| Net assets disposed of |
||||||||||||
| Property, plant and equipment |
121 | – | 26 | |||||||||
| Right-of-use |
– | – | 7 | |||||||||
| Investments in associates |
– | 82 | – | |||||||||
| Goodwill |
– | – | –48 | |||||||||
| Other assets |
– | 23 | 51 | |||||||||
| Provisions, incl. post-employment benefits |
– | –42 | –30 | |||||||||
| Other liabilities |
35 | –101 | 36 | |||||||||
| Total net assets |
156 |
–38 |
42 |
|||||||||
| Net gains/losses from divestments |
–789 | 356 | 231 | |||||||||
| Shares in associated companies |
– | –298 | – | |||||||||
| Cash flow effect |
–633 |
20 |
273 |
|||||||||
Divestments 2021–2023 |
||||
| Business | Description | Transaction date | ||
| IoT | IoT accelerator and connected vehicle cloud businesses and related assets. | |||
| Aerialink | A US based company providing premier messaging solutions for business to business communications. | |||
| Data center | A data center business located in the Netherlands. |
 |
Associated companies |
| Equity in associated companies |
||||||||
| 2023 | 2022 | |||||||
| Opening balance |
1,127 | 941 | ||||||
| Investments |
– | 298 | ||||||
| Share in earnings |
124 | 17 | ||||||
| Distribution of capital stock |
–25 | –24 | ||||||
| Taxes |
–20 | –14 | ||||||
| Dividends |
–46 | –58 | ||||||
| Divested business |
– | –82 | ||||||
| Translation differences |
–10 | 49 | ||||||
| Closing balance |
1,150 |
1,127 |
||||||
|
| ||||
| 6 5 Notes to the consolidated financial statements |
Financial report 2023 | |||
 |
Financial risk management |
| – | Free cash flow before M&A of 9–12% of net sales |
| – | Positive net cash position |
| – | Investment grade rating by Moody’s (Baa3), S&P Global (BBB –) and Fitch Ratings (BBB–). |
| Capital objectives-related information | | |||||||
| 2023 | 2022 | |||||||
| Free cash flow before M&A as % of net sales 1)
|
–0.4% | 8.2% | ||||||
| Positive net cash (SEK billion) 1)
|
7.8 | 23.3 | ||||||
| Credit rating and outlook |
||||||||
| Fitch Ratings |
BBB–, stable | BBB–, stable | ||||||
| S&P Global |
|
BBB–, developing |
|
|
BBB–, developing |
| ||
| Moody’s |
Ba1, stable | Ba1, stable | ||||||
1) |
For more information about the measures, see Alternative performance measures and Financial terminology. |
| – | Foreign exchange risk |
| – | Interest rate risk |
| – | Credit risk |
| – | Liquidity risk |
| – | Refinancing risk |
| – | Market price risk in own and other equity instruments. |
Currency exposure, SEK billion |
| |||||||||||||||||||||||
| Exposure currency |
Sales trans- lation exposure |
Sales trans- action exposure |
Sales net exposure |
Cost trans- lation exposure |
Cost trans- action exposure 1)
|
Cost net exposure |
||||||||||||||||||
| USD 2)
|
81.7 | 55.6 | 137.3 | –62.2 | –42.4 | –104.6 | ||||||||||||||||||
| EUR |
40.9 | –0.5 | 40.4 | –37.3 | –2.6 | –39.9 | ||||||||||||||||||
| INR |
31.2 | –0.7 | 30.5 | –19.9 | 0.2 | –19.7 | ||||||||||||||||||
| JPY |
10.1 | – | 10.1 | –4.1 | – | –4.1 | ||||||||||||||||||
| GBP |
9.1 | –1.0 | 8.1 | –3.6 | – | –3.6 | ||||||||||||||||||
| CNY |
7.8 | – | 7.8 | –5.7 | 1.1 | –4.6 | ||||||||||||||||||
| SAR |
5.6 | 0.4 | 6.0 | –3.5 | 0.1 | –3.4 | ||||||||||||||||||
| BRL |
5.0 | – | 5.0 | –4.1 | 1.2 | –2.9 | ||||||||||||||||||
|
1) |
External purchases in foreign currency translated to functional currency. |
|
2) |
Sales transaction exposure in 2023 includes volume in the cash flow hedge of USD 2,462 million. Based on the outstanding cash flow hedge volume at year end, the hedged sales volume that will occur in 2024 is USD 2,467 million. |
|
|
||||
| Financial report 2023 | Notes to the consolidated financial statements 6 6
| |||
| Sensitivity to interest rate increase of 1 basis point, SEK million |
| |||||||||||||||||||||||
| < 3M | 3–12M | 1–3Y | 3–5Y | >5Y | Total | |||||||||||||||||||
| Interest-bearing assets |
– | –1 | –1 | –1 | – | –3 | ||||||||||||||||||
| Interest-bearing liabilities 1)
|
– | – | – | 5 | 4 | 9 | ||||||||||||||||||
| Derivatives |
– | –1 | –2 | –3 | –4 | |||||||||||||||||||
| Total |
– |
–1 |
– |
2 |
1 |
2 |
||||||||||||||||||
|
1) |
Borrowings are included as they are designated FVTPL. |
| Outstanding derivatives |
| |||||||||||||||||||
| 2023 | Gross amount recognized |
Offset | Net amount presented |
Related amounts not offset – collaterals |
Net | |||||||||||||||
| Currency derivatives 1)
|
||||||||||||||||||||
| Assets |
1,916 | –43 | 1,873 | –1,486 | 387 | |||||||||||||||
| Liabilities |
–1,837 | 43 | –1,794 | 873 | –921 | |||||||||||||||
| Interest rate derivatives |
||||||||||||||||||||
| Assets |
– | – | – | – | – | |||||||||||||||
| Liabilities |
–22 | – | –22 | – | –22 | |||||||||||||||
| 2022 | Gross amount recognized |
Offset | Net amount presented |
Related amounts not offset – collaterals |
Net | |||||||||||||||
| Currency derivatives 1)
|
||||||||||||||||||||
| Assets |
1,275 | –165 | 1,110 | –277 | 833 | |||||||||||||||
| Liabilities |
–2,778 | 165 | –2,613 | 2,382 | –231 | |||||||||||||||
| Interest rate derivatives |
||||||||||||||||||||
| Assets |
11 | – | 11 | – | 11 | |||||||||||||||
| Liabilities |
–8 | – | –8 | – | –8 | |||||||||||||||
|
1) |
Currency derivatives designated as cash flow hedge of SEK 1,617 (566) million are included in Other current receivables and SEK 679 (1,472) million in Other current liabilities. |
| Foreign exchange forward contracts | ||||||||||||||
| 2023 | < 3 months |
3 – 12 months |
> 1 year | Total | ||||||||||
| Notional Amount (USD millions) |
1,091 | 1,376 | 1,888 | 4,355 | ||||||||||
| Average forward rate (SEK/USD) |
9.81 | 10.46 | 10.03 | |||||||||||
|
| ||||
| 6 7 Notes to the consolidated financial statements |
Financial report 2023 | |||
| – | Avoid credit losses through establishing internal standard credit approval routines in all the Company’s legal entities |
| – | Ensure monitoring and risk mitigation of defaulting accounts, i.e. events of non-payment |
| – | Ensure efficient credit management within the Company and thereby improve days sales outstanding and cash flow |
| – | Define escalation path and approval process for customer credit limits. |
| Movements in allowances for impairment of trade receivables and contract assets | | |||||||
| 2023 | 2022 | |||||||
| Opening balance |
2,492 | 2,398 | ||||||
| Balances regarding acquired business |
–16 | 90 | ||||||
| Increase in allowance |
268 | 40 | ||||||
| Write-offs |
–35 | –70 | ||||||
| Translation difference |
–124 | 34 | ||||||
| Closing balance |
2,585 |
2,492 |
||||||
| Aging analysis of gross values of trade receivables and contracts assets by risk category |
||||||||||||||||||||||||
| Days past dues | ||||||||||||||||||||||||
| 2023 | Not due | 1–90 | 91–180 | 181–360 | >360 | Total | ||||||||||||||||||
| Country risk :Low |
27,431 | 2,434 | 445 | 137 | 320 | 30,767 | ||||||||||||||||||
| Country risk: Medium |
14,369 | 826 | 227 | 224 | 605 | 16,251 | ||||||||||||||||||
| Country risk: High |
3,364 | 512 | 186 | 197 | 1,522 | 5,781 | ||||||||||||||||||
| Total |
45,164 |
3,772 |
858 |
558 |
2,447 |
52,799 |
||||||||||||||||||
| Days past dues | ||||||||||||||||||||||||
| 2022 | Not due | 1–90 | 91–180 | 181–360 | >360 | Total | ||||||||||||||||||
| Country risk :Low |
32,015 | 2,090 | 165 | 103 | 328 | 34,701 | ||||||||||||||||||
| Country risk: Medium |
17,731 | 1,614 | 150 | 134 | 585 | 20,214 | ||||||||||||||||||
| Country risk: High |
3,304 | 610 | 384 | 295 | 1,240 | 5,833 | ||||||||||||||||||
| Total |
53,050 |
4,314 |
699 |
532 |
2,153 |
60,748 |
||||||||||||||||||
|
|
||||
| Financial report 2023 | Notes to the consolidated financial statements 6 8
|
| Outstanding customer finance credit risk exposure 1)
|
|
|||||||
| 2023 | 2022 | |||||||
| Fair value of customer finance credits |
6,917 | 5,370 | ||||||
| Financial guarantees for third-parties |
4 | 6 | ||||||
| Accrued interest |
7 | 8 | ||||||
| Maximum exposure to credit risk |
6,928 |
5,384 |
||||||
| Less third-party risk coverage |
–79 | –298 | ||||||
| The Company’s risk exposure, less third-party risk coverage |
6,849 |
5,086 |
||||||
1) |
This table shows the maximum exposure to credit risk. |
Customer finance fair value reconciliation |
||||||||
| 2023 | 2022 | |||||||
| Opening balance |
5,370 | 3,287 | ||||||
| Additions |
49,583 | 37,295 | ||||||
| Disposals/repayments |
–47,409 | –35,412 | ||||||
| Revaluation/amortization of interest |
–467 | –151 | ||||||
| Translation difference |
–160 | 351 | ||||||
| Closing balance |
6,917 |
5,370 |
||||||
| Of which non-current |
1,347 |
415 |
||||||
| Cash, cash equivalents, interest bearing securities and derivative assets | ||||||||||||||||||||||||
| 2023 | Rating or equi- valent |
< 3 M | 3–12 M | 1–5 Y | >5 Y | Total | ||||||||||||||||||
| Bank deposits |
33,298 | 181 | — | — | 33,479 | |||||||||||||||||||
| Other financial institutions |
548 | — | — | — | 548 | |||||||||||||||||||
| Type of issuer: |
||||||||||||||||||||||||
| Governments |
AA/AAA | 789 | 490 | 1,254 | — | 2,533 | ||||||||||||||||||
| Corporates |
A2/P2 | 1,510 | 296 | — | — | 1,806 | ||||||||||||||||||
| Mortgage institutes |
AAA | 1,995 | 5,668 | 8,676 | — | 16,339 | ||||||||||||||||||
| Derivative assets |
445 | 749 | 622 | 35 | 1,851 | |||||||||||||||||||
38,585 |
7,384 |
10,552 |
35 |
56,556 |
||||||||||||||||||||
| 2022 | Rating or equi- valent |
< 3 M | 3–12 M | 1–5 Y | >5 Y | Total | ||||||||||||||||||
| Bank deposits |
38,485 | 166 | 7 | — | 38,658 | |||||||||||||||||||
| Other financial institutions |
604 | — | — | — | 604 | |||||||||||||||||||
| Type of issuer: |
||||||||||||||||||||||||
| Governments |
AA/AAA | 915 | 3,950 | 277 | — | 5,142 | ||||||||||||||||||
| Corporates |
A2/P2 | 1,283 | — | — | — | 1,283 | ||||||||||||||||||
| Mortgage institutes |
AAA | — | 1,682 | 8,880 | — | 10,562 | ||||||||||||||||||
| Derivative assets |
323 | 385 | 277 | 136 | 1,121 | |||||||||||||||||||
41,610 |
6,183 |
9,441 |
136 |
57,370 |
||||||||||||||||||||
Funding programs 1)
|
||||||||||||
| Amount | Utilized | Unutilized | ||||||||||
| Euro Medium Term Note program (USD million) |
5,000 | 2,842 | 2,158 | |||||||||
| SEC Registered program (USD million) 2)
|
— | — | — | |||||||||
| Commercial Paper Program (SEK million) |
10,000 | 2,014 | 7,986 | |||||||||
|
1) |
There are no financial covenants related to these programs. |
|
2) |
Program amount indeterminate. |
|
| ||||
| 6 9 Notes to the consolidated financial statements |
Financial report 2023 | |||
Committed credit facilities |
||||||||||||
| Amount | Utilized | Unutilized | ||||||||||
| Multi-currency revolving credit facility (USD million) |
2,000 | — | 2,000 | |||||||||
| Liquidity revolving credit facility (USD million) |
1,000 | 400 | 600 | |||||||||
| Reconciliation of Level 3 fair value of other financial asset | ||||
| Investment in shares and participations |
||||
| Opening balance |
1,986 | |||
| Additions |
206 | |||
| Disposals |
–2 | |||
| Gains or losses 1)
|
–186 | |||
| Translation differences |
–2 | |||
| Closing balance |
2,002 |
|||
|
1) |
Table shows net gains or losses recognized in Other operating income or expenses, of which SEK 186 million unrealized loss relate to Level 3 assets held at the end of the year. |
Financial instruments |
||||||||||||||||||||||||||||||||||||||||||||
| 2023 | 2022 | |||||||||||||||||||||||||||||||||||||||||||
| Amortized | Fair | Fair value hierarchy level | Amortized | Fair | Fair value hierarchy level | |||||||||||||||||||||||||||||||||||||||
| SEK billion | cost | value | Level 1 | Level 2 | Level 3 | cost | value | Level 1 | Level 2 | Level 3 | ||||||||||||||||||||||||||||||||||
| Assets at fair value through profit or loss |
||||||||||||||||||||||||||||||||||||||||||||
| Customer finance |
– | 6.9 | – | – | 6.9 | – | 5.4 | – | – | 5.4 | ||||||||||||||||||||||||||||||||||
| Interest-bearing securities |
– | 19.1 | 18.6 | 0.5 | – | – | 17.5 | 17.5 | – | – | ||||||||||||||||||||||||||||||||||
| Cash equivalents 1)
|
– | 17.5 | 0.8 | 16.7 | – | – | 15.7 | – | 15.7 | – | ||||||||||||||||||||||||||||||||||
| Other financial assets |
– | 2.1 | 0.1 | – | 2.0 | – | 2.1 | 0.1 | – | 2.0 | ||||||||||||||||||||||||||||||||||
| Other current assets |
– | 1.9 | – | 1.9 | – | – | 1.1 | – | 1.1 | – | ||||||||||||||||||||||||||||||||||
| Assets at fair value through OCI |
||||||||||||||||||||||||||||||||||||||||||||
| Trade receivable |
– | 42.2 | – | – | 42.2 | – | 48.4 | – | – | 48.4 | ||||||||||||||||||||||||||||||||||
| Assets at amortized cost |
||||||||||||||||||||||||||||||||||||||||||||
| Interest-bearing securities |
0.4 | – | – | – | – | 0.4 | – | – | – | – | ||||||||||||||||||||||||||||||||||
| Cash equivalents 1)
|
– | – | – | – | – | 2.9 | – | – | – | – | ||||||||||||||||||||||||||||||||||
| Other financial assets |
0.6 | – | – | – | – | 0.6 | – | – | – | – | ||||||||||||||||||||||||||||||||||
| Financial assets |
1.0 |
89.7 |
3.9 |
90.2 |
||||||||||||||||||||||||||||||||||||||||
| Financial liabilities at designated |
||||||||||||||||||||||||||||||||||||||||||||
| FVTPL |
||||||||||||||||||||||||||||||||||||||||||||
| Parent Company borrowings |
– | –38.0 | –23.7 | –14.3 | – | – | –29.6 | –16.7 | –12.9 | – | ||||||||||||||||||||||||||||||||||
| Financial liabilities at FVTPL |
||||||||||||||||||||||||||||||||||||||||||||
| Other current liabilities |
– | –1.8 | – | –1.8 | – | – | –2.6 | – | –2.6 | – | ||||||||||||||||||||||||||||||||||
| Liabilities at amortized cost |
||||||||||||||||||||||||||||||||||||||||||||
| Trade payables |
–27.8 | – | – | – | – | –38.4 | – | – | – | – | ||||||||||||||||||||||||||||||||||
| Borrowings |
–8.9 | – | – | – | – | –3.3 | – | – | – | – | ||||||||||||||||||||||||||||||||||
| Financial liabilities |
–36.7 |
–39.8 |
–41.7 |
–32.2 |
||||||||||||||||||||||||||||||||||||||||
1) |
Total Cash and cash equivalent is SEK 35.2 (38.3) billion, of which SEK 17.5 (18.6) billion relating to Cash equivalents are presented in the table above. |
|
|
||||
| Financial report 2023 | Notes to the consolidated financial statements 70
|
 |
Financial income and expenses |
2023 |
2022 |
2021 |
||||||||||
| Contractual interest on financial assets |
1,897 | 717 | 360 | |||||||||
| of which on financial assets at amortized cost |
403 |
251 |
148 |
|||||||||
| Net revaluation gains and losses on financial assets |
64 | –146 | 10 | |||||||||
| Other financial income |
184 | 207 | 321 | |||||||||
| Financial income |
2,145 |
778 |
691 |
|||||||||
| Contractual interest on financial liabilities |
–2,282 | –972 | –525 | |||||||||
| of which on financial liabilities at amortized cost |
–501 |
–128 |
–41 |
|||||||||
| Net revaluation gains and losses on financial liabilities |
–134 | 379 | 67 | |||||||||
| Lease interest expense |
–464 | –464 | –426 | |||||||||
| Net interest on pension liabilities |
–517 | –361 | –262 | |||||||||
| Other financial expenses |
–721 | –512 | –528 | |||||||||
| Financial expenses |
–4,118 |
–1,930 |
–1,674 |
|||||||||
| Net foreign exchange gains/losses |
–1,020 | –1,259 | –1,547 | |||||||||
| Financial income and expenses, net |
–2,993 |
–2,411 |
–2,530 |
|||||||||
| Net gains and losses on financial instruments exclude effect of foreign exchange translations: |
||||||||||||
| Financial instruments at fair value through profit or loss 1)
|
885 | –2,552 | –534 | |||||||||
| Financial liabilities designated at fair value through profit or loss |
–1,100 | 2,847 | 404 | |||||||||
|
1) |
Excludes net loss from revaluation of customer finance receivables of SEK 209 million (net loss of SEK 15 million in 2022 and net gain of SEK 350 million in 2021), reported as Selling and administrative expenses, and net loss on revaluation of investments in shares and participations of SEK 186 million (net loss of SEK 205 million in 2022 and net gain of SEK 784 million in 2021) reported as Other operating income or expenses. |
 |
Financial assets, non-current
|
Financial assets, non-current
|
||||||||||||||||||||||||||||
2023 |
2022 |
|||||||||||||||||||||||||||
Other investments in shares and participations |
Interest- bearing securities, non-current
|
Other financial assets, non-current
1)
|
Other investments in shares and participations |
Interest- bearing securities, non-current
|
Other financial assets, non-current
1)
|
|||||||||||||||||||||||
| Opening balance |
2,074 | 9,164 | 6,839 | 2,258 | 30,626 | 6,217 | ||||||||||||||||||||||
| Additions |
206 | 12,887 | 1,899 | 218 | 13,583 | 1,249 | ||||||||||||||||||||||
| Disposals/repayments/deductions |
–2 | –4,127 | –816 | –205 | –29,523 | –481 | ||||||||||||||||||||||
| Amortization |
– | – | –457 | – | – | –288 | ||||||||||||||||||||||
| Change in value in funded pension plans 2)
|
– | – | –1,033 | – | – | 244 | ||||||||||||||||||||||
| Revaluation |
–185 | 269 | – | –205 | 262 | 85 | ||||||||||||||||||||||
| Reclassification |
– | –8,262 | –65 | – | –5,784 | –542 | ||||||||||||||||||||||
| Translation differences |
–2 | – | –17 | 8 | – | 355 | ||||||||||||||||||||||
| Closing balance |
2,091 |
9,931 |
6,350 |
2,074 |
9,164 |
6,839 |
||||||||||||||||||||||
|
1) |
Includes items such as pension surplus assets, tax credit receivables, deferred sales commissions and loans to associates. |
|
2) |
This amount includes asset ceiling. For further information, see note G1 “Post-employment benefits.” |
|
| ||||
|
71 Notes to the consolidated financial statements |
Financial report 2023 | |||
 |
Interest-bearing liabilities |
| 2023 | 2022 | |||||||
| Borrowings, current |
||||||||
| Current part of non-current borrowings |
8,995 | 2,865 | ||||||
| Other borrowings, current |
8,660 | 3,119 | ||||||
| Total borrowings, current |
17,655 |
5,984 |
||||||
| Borrowings, non-current |
||||||||
| Notes and bond loans |
29,071 | 26,752 | ||||||
| Other borrowings, non-current |
147 | 194 | ||||||
| Total borrowings, non-current |
29,218 |
26,946 |
||||||
| Total interest-bearing liabilities |
46,873 |
32,930 |
||||||
| 2023 | 2022 | |||||||
| Opening balance |
42,234 | 41,134 | ||||||
| Cash flows |
||||||||
| Proceeds from issuance of borrowings |
19,728 | 10,755 | ||||||
| Repayment of borrowings |
–7,884 | –16,029 | ||||||
| Other financing activities |
1,101 | 315 | ||||||
| Lease payments |
–2,857 | –2,593 | ||||||
| Non-cash changes |
||||||||
| Effect of foreign exchange movement |
–930 | 4,762 | ||||||
| Revaluation due to changes in credit risk |
667 | –1,030 | ||||||
| Other changes in fair value |
1,131 | –2,888 | ||||||
| New lease contracts |
1,547 | 1,986 | ||||||
| Balances regarding acquired business |
2 | 6,876 | ||||||
| Other non-cash movements |
–411 | –1,054 | ||||||
| Closing balance |
54,328 |
42,234 |
||||||
| Issued-maturing | Nominal amount |
Coupon | Currency | Maturity date | Carrying value 2023 |
Changes in fair value due to changes in credit risk 2023 |
Cumulative changes in fair value due to changes in credit risk 2023 |
Carrying value 2022 |
||||||||||||||||||||||||
| Notes and bond loans |
||||||||||||||||||||||||||||||||
| 2017–2024 |
500 | 1.875% | EUR | Mar 1, 2024 | 5,523 | –33 | 13 | 5,392 | ||||||||||||||||||||||||
| 2017–2025 1)
|
150 | 2.741% | USD | Dec 22, 2025 | 1,416 | –3 | 27 | 1,422 | ||||||||||||||||||||||||
| 2020–2030 1)
|
200 | 3.020% | USD | Dec 30, 2030 | 1,736 | 69 | 87 | 1,682 | ||||||||||||||||||||||||
| 2021–2029 |
500 | 1.000% | EUR | May 26, 2029 | 4,701 | 160 | –152 | 4,196 | ||||||||||||||||||||||||
| 2022–2027 |
750 | 1.125% | EUR | Feb 8, 2027 | 7,714 | 205 | –2 | 7,119 | ||||||||||||||||||||||||
| 2023–2028 |
500 | 5.375% | EUR | May 29, 2028 | 5,798 | 141 | 141 | – | ||||||||||||||||||||||||
| Total notes and bond loans |
26,888 |
539 |
114 |
19,811 |
||||||||||||||||||||||||||||
| Bilateral loans and syndicated loans |
||||||||||||||||||||||||||||||||
| 2017–2023 2)
|
220 | USD | Jun 15, 2023 | – | –6 | – | 2,292 | |||||||||||||||||||||||||
| 2019–2024 3)
|
281 | USD | July 31, 2024 | 2,829 | 7 | 11 | 2,925 | |||||||||||||||||||||||||
| 2019–2025 2)
|
150 | USD | Dec 18, 2025 | 1,509 | 9 | 8 | 1,555 | |||||||||||||||||||||||||
| 2021–2028 3)
|
305 | USD | Jun 21, 2028 | 2,976 | 107 | –76 | 2,981 | |||||||||||||||||||||||||
| 2023–2030 2)
|
107 | USD | Dec 16, 2030 | 1,097 | 29 | 29 | – | |||||||||||||||||||||||||
| 2023–2030 3)
|
273 | USD | Dec 18, 2030 | 2,718 | –18 | –18 | – | |||||||||||||||||||||||||
| 2023–2024 4)
|
200 | USD | Aug 30, 2024 | 2,002 | – | – | – | |||||||||||||||||||||||||
| 2023–2024 4)
|
200 | USD | Feb 29, 2024 | 2,002 | – | – | – | |||||||||||||||||||||||||
| Total bilateral and syndicated loans |
|
15,133 |
128 |
–46 |
9,753 |
|||||||||||||||||||||||||||
| Commercial papers |
||||||||||||||||||||||||||||||||
| 2023–2024 4) 5)
|
2,030 | SEK | Feb-Mar 2024 | 2,014 | – | – | – | |||||||||||||||||||||||||
| Total commercial papers |
2,014 |
– |
– |
– |
||||||||||||||||||||||||||||
|
1) |
Private Placement, Swedish Export Credit Corporation (SEK). |
|
2) |
Nordic Investment Bank (NIB), R&D project financing. |
|
3) |
European Investment Bank (EIB), R&D project financing. |
|
4) |
Short-term borrowings are classified as amortized cost liabilities. |
|
5) |
Commercial papers with weighted average yield of 4.633%. |
|
|
||||
| Financial report 2023 | Notes to the consolidated financial statements 72
|
 |
Post-employment benefits |
| – | A defined benefit plan, known as ITP 2 (occupational pension for salaried employees in manufacturing industries and trade), complemented by a defined contribution plan, known as ITPK (supplementary retirement benefits). This is a final salary-based plan. |
| – | A defined contribution plan, known as ITP 1, for employees born in 1979 or later. |
| – | A defined contribution plan ITP 1 or alternative ITP, for employees earning more than 10 income base amount and who have opted out of the defined benefit plan ITP 2, where rules are set by the Company and approved by each employee selected to participate. |
|
| ||||
|
73 Notes to the consolidated financial statements |
Financial report 2023 | |||
| Amount recognized in the Consolidated balance sheet | ||||||||||||||||||||
| Sweden | US | UK | Other | Total | ||||||||||||||||
| 2023 |
||||||||||||||||||||
| Defined benefit obligation (DBO) |
50,043 | 5,073 | 10,595 | 19,824 | 85,535 | |||||||||||||||
| Fair value of plan assets |
29,627 | 4,815 | 12,410 | 15,741 | 62,593 | |||||||||||||||
| Deficit/surplus (+/–) |
20,416 |
258 |
–1,815 |
4,083 |
22,942 |
|||||||||||||||
| Plans with net surplus, excluding asset ceiling 1)
|
– | 255 | 1,889 | 1,143 | 3,287 | |||||||||||||||
| Provision for post-employment benefits 2)
|
20,416 |
513 |
74 |
5,226 |
26,229 |
|||||||||||||||
| 2022 |
||||||||||||||||||||
| Defined benefit obligation (DBO) |
50,441 | 5,365 | 9,866 | 18,019 | 83,691 | |||||||||||||||
| Fair value of plan assets |
28,521 | 5,111 | 11,999 | 14,849 | 60,480 | |||||||||||||||
| Deficit/surplus (+/–) |
21,920 |
254 |
–2,133 |
3,170 |
23,211 |
|||||||||||||||
| Plans with net surplus, excluding asset ceiling 1)
|
– | 298 | 2,137 | 1,715 | 4,150 | |||||||||||||||
| Provision for post-employment benefits 2)
|
21,920 |
552 |
4 |
4,885 |
27,361 |
|||||||||||||||
|
1) |
Plans with a net surplus, i.e., where plan assets exceed DBO, are reported as Other financial assets, non-current, see note F3 “Financial assets, non-current.” |
| The asset ceiling increased during the year to SEK 755 (584) million. |
|
2) |
Plans with net liabilities are reported in the balance sheet as Post-employment benefits, non-current. |
| Pension costs for defined contribution plans and defined benefit plans | ||||||||||||||||||||
| Sweden | US | UK | Other | Total | ||||||||||||||||
| 2023 |
||||||||||||||||||||
| Pension cost for defined contribution plans |
1,223 | 522 | 148 | 1,571 | 3,464 | |||||||||||||||
| Pension cost for defined benefit plans 1)
|
2,013 | 67 | –67 | 1,166 | 3,179 | |||||||||||||||
| Total |
3,236 |
589 |
81 |
2,737 |
6,643 |
|||||||||||||||
| Total pension cost expressed as a percentage of wages and salaries |
7.8% | |||||||||||||||||||
| 2022 |
||||||||||||||||||||
| Pension cost for defined contribution plans |
1,192 | 542 | 128 | 1,209 | 3,071 | |||||||||||||||
| Pension cost for defined benefit plans |
2,144 | 160 | –22 | 1,204 | 3,486 | |||||||||||||||
| Total |
3,336 |
702 |
106 |
2,413 |
6,557 |
|||||||||||||||
| Total pension cost expressed as a percentage of wages and salaries |
8.9% | |||||||||||||||||||
| 2021 |
||||||||||||||||||||
| Pension cost for defined contribution plans |
1,199 | 460 | 138 | 1,084 | 2,881 | |||||||||||||||
| Pension cost for defined benefit plans |
1,920 | 97 | –6 | 931 | 2,942 | |||||||||||||||
| Total |
3,119 |
557 |
132 |
2,015 |
5,823 |
|||||||||||||||
| Total pension cost expressed as a percentage of wages and salaries |
9.3% | |||||||||||||||||||
1) |
For the UK plans, negative cost was due to interest income of SEK 626 million exceeding interest cost of SEK 514 million during the year. |
|
|
||||
| Financial report 2023 | Notes to the consolidated financial statements 74
|
Change in the net defined benefit obligation |
||||||||||||||||||||||||
|
|
Present value of obligation 2023 |
1) |
|
Fair value of plan assets 2023 |
|
|
Total 2023 |
|
|
Present value of obligation 2022 |
1) |
|
Fair value of plan assets 2022 |
|
|
Total 2022 |
| |||||||
| Opening balance |
83,691 |
–60,480 |
23,211 |
113,543 |
–81,355 |
32,188 |
||||||||||||||||||
| Included in the income statement 2)
|
||||||||||||||||||||||||
| Current service cost |
2,291 |
– |
2,291 |
2,772 |
– |
2,772 |
||||||||||||||||||
| Past service cost and gains and losses on settlements |
179 |
– |
179 |
311 |
– |
311 |
||||||||||||||||||
| Interest cost/income (+/–) |
2,839 |
–2,371 |
468 |
1,716 |
–1,475 |
241 |
||||||||||||||||||
| Taxes and administrative expenses |
– |
78 |
78 |
– |
62 |
62 |
||||||||||||||||||
| Other |
108 |
–7 |
101 |
43 |
1 |
44 |
||||||||||||||||||
5,417 |
–2,300 |
3,117 |
4,842 |
–1,412 |
3,430 |
|||||||||||||||||||
| Remeasurements |
||||||||||||||||||||||||
| Return on plan assets excluding amounts in interest expense/income |
– |
–663 |
–663 |
– |
14,135 |
14,135 |
||||||||||||||||||
| Actuarial gains/losses (–/+) arising from changes in demographic assumptions |
267 |
– |
267 |
1,118 |
– |
1,118 |
||||||||||||||||||
| Actuarial gains/losses (–/+) arising from changes in financial assumptions |
–943 |
– |
–943 |
–29,031 |
– |
–29,031 |
||||||||||||||||||
| Experience-based gains/losses (–/+) |
347 |
– |
347 |
3,236 |
– |
3,236 |
||||||||||||||||||
–329 |
–663 |
–992 |
–24,677 |
14,135 |
–10,542 |
|||||||||||||||||||
| Other changes |
||||||||||||||||||||||||
| Translation difference |
–179 |
110 |
–69 |
3,381 |
–3,297 |
84 |
||||||||||||||||||
| Contributions and payments from: |
||||||||||||||||||||||||
| Employers 3)
|
–1,737 |
–594 |
–2,331 |
–1,302 |
–652 |
–1,954 |
||||||||||||||||||
| Plan participants |
350 |
–342 |
8 |
334 |
–325 |
9 |
||||||||||||||||||
| Payments from plans: |
||||||||||||||||||||||||
| Benefit payments |
–1,294 |
1,292 |
–2 |
–1,806 |
1,806 |
– |
||||||||||||||||||
| Settlements |
–488 |
488 |
– |
–10,759 |
10,755 |
–4 |
||||||||||||||||||
| Other |
104 |
–104 |
– |
135 |
–135 |
– |
||||||||||||||||||
| Closing balance |
85,535 |
–62,593 |
22,942 |
83,691 |
–60,480 |
23,211 |
||||||||||||||||||
1) |
The weighted average duration of DBO is 16.8 (18.3) years. |
2) |
Excludes the impact of the asset ceiling of SEK 62 (55) million in 2023. |
3) |
The expected contribution to the plans during 2024 is SEK 2.3 billion. |
Present value of the defined benefit obligation |
||||||||||||||||||||
Sweden |
US |
UK |
Other |
Total |
||||||||||||||||
| 2023 |
||||||||||||||||||||
| DBO, closing balance |
50,043 |
5,073 |
10,595 |
19,824 |
85,535 |
|||||||||||||||
| Of which partially or fully funded |
50,043 |
4,560 |
10,595 |
16,702 |
81,900 |
|||||||||||||||
| Of which unfunded |
– |
513 |
– |
3,122 |
3,635 |
|||||||||||||||
| 2022 |
||||||||||||||||||||
| DBO, closing balance |
50,441 |
5,365 |
9,866 |
18,019 |
83,691 |
|||||||||||||||
| Of which partially or fully funded |
50,441 |
4,812 |
9,866 |
14,417 |
79,536 |
|||||||||||||||
| Of which unfunded |
– |
553 |
– |
3,602 |
4,155 |
|||||||||||||||
|
|
||||
| 7 5 Notes to the consolidated financial statements |
Financial report 2023 | |||
| Asset allocation by asset type and geography 1)
|
||||||||||||||||||||||||||
| Sweden | US | UK | Other | Total | |
Of which unquoted |
2) |
|||||||||||||||||||
2023 |
||||||||||||||||||||||||||
Cash and cash equivalents |
271 | 181 | 681 | 133 | 1,266 | 22% |
||||||||||||||||||||
Equity securities |
7,311 | 361 | 769 | 1,873 | 10,314 | 27% |
||||||||||||||||||||
Debt securities |
14,335 | 3,591 | 5,681 | 9,285 | 32,892 | 21% |
||||||||||||||||||||
Real estate |
5,461 | – | – | 544 | 6,005 | 100% |
||||||||||||||||||||
Investment funds |
2,016 | 834 | 2,346 | 1,829 | 7,025 | 69% |
||||||||||||||||||||
Assets held by insurance company |
– | – | 2,437 | 1,679 | 4,116 | 100% |
||||||||||||||||||||
Other |
233 | –152 | 496 | 398 | 975 | 38% |
||||||||||||||||||||
Total |
29,627 |
4,815 |
12,410 |
15,741 |
62,593 |
|||||||||||||||||||||
Of which real estate occupied by the Company |
– |
– |
– |
– |
– |
|||||||||||||||||||||
Of which securities issued by the Company |
– |
– |
– |
– |
– |
|||||||||||||||||||||
2022 |
||||||||||||||||||||||||||
Cash and cash equivalents |
1,151 | 184 | 449 | 88 | 1,872 | 6% |
||||||||||||||||||||
Equity securities |
6,803 | 419 | 1,113 | 2,791 | 11,126 | 50% |
||||||||||||||||||||
Debt securities |
14,114 | 3,646 | 5,818 | 8,539 | 32,117 | 28% |
||||||||||||||||||||
Real estate |
5,577 | – | 199 | 603 | 6,379 | 100% |
||||||||||||||||||||
Investment funds |
917 | 789 | 2,417 | 578 | 4,701 | 74% |
||||||||||||||||||||
Assets held by insurance company |
– | – | 1,872 | 1,717 | 3,589 | 100% |
||||||||||||||||||||
Other |
–41 | 73 | 131 | 533 | 696 | 15% |
||||||||||||||||||||
Total |
28,521 |
5,111 |
11,999 |
14,849 |
60,480 |
|||||||||||||||||||||
Of which real estate occupied by the Company |
– |
– |
– |
– |
– |
|||||||||||||||||||||
Of which securities issued by the Company |
– |
– |
– |
– |
– |
|||||||||||||||||||||
1) |
Asset class is presented based on the underlying exposure of the investment. This includes direct investment in securities or investment through pooled funds that invest in an asset class. |
2) |
Unquoted refers to assets classified as fair value level 2 and 3. Unquoted assets comprise mainly investments in pooled investment vehicles. |
| Financial and demographic actuarial assumptions | ||||||||||||||||||||||||||
| 2023 | 2022 | |||||||||||||||||||||||||
| Sweden | US | UK | Sweden | US | UK | |||||||||||||||||||||
Financial assumptions |
||||||||||||||||||||||||||
Discount rate |
2.1% | 5.0% | 4.8% | 2.0% | 5.4% | 4.9% | ||||||||||||||||||||
Inflation rate |
2.0% | 2.5% | 3.0% | 2.3% | 2.5% | 3.1% | ||||||||||||||||||||
Salary increase rate |
2.5% | 4.0% | – | 2.8% | 3.0% | – | ||||||||||||||||||||
Demographic assumptions |
||||||||||||||||||||||||||
Life expectancy after age 65 in years |
23 | 23 | 23 | 23 | 22 | 23 | ||||||||||||||||||||
|
Total remeasurements in Other comprehensive income related to
post-employment benefits
|
|
|||||||
| 2023 | 2022 | |||||||
Actuarial gains and losses (+/–) |
538 | 8,943 | ||||||
The effect of asset ceiling |
–87 | 127 | ||||||
Swedish special payroll taxes |
454 | 1,599 | ||||||
Total |
905 |
10,669 |
||||||
| Sensitivity analysis of significant actuarial assumptions, SEK billion | ||||||||||||
| 2023 | ||||||||||||
| Impact on the DBO of a change in assumptions |
Sweden | US | UK | |||||||||
Financial assumptions |
||||||||||||
Discount rate –0.5% |
5.2 | 0.3 | 0.8 | |||||||||
Discount rate +0.5% |
–4.6 | –0.2 | –0.7 | |||||||||
Inflation rate –0.5% |
–4.4 | – | –0.1 | |||||||||
Inflation rate +0.5% |
4.9 | – | 0.6 | |||||||||
Salary increase rate –0.5% |
–1.4 | – | – | |||||||||
Salary increase rate +0.5% |
1.5 | – | – | |||||||||
Demographic assumptions |
||||||||||||
Longevity – 1 year |
–2.1 | –0.1 | –0.3 | |||||||||
Longevity + 1 year |
2.1 | 0.1 | 0.3 | |||||||||
|
|
||||
| Financial report 2023 | Notes to the consolidated financial statements 7 6
|
 |
Information regarding members of the Board of Directors and Group management
|
| SEK | Board fees | Number of synthetic shares/portion of Board fee 4)
|
|
Value at grant date of synthetic shares allocated in 2023 4)
|
|
Number of previously allocated synthetic shares outstanding |
|
Net change in value of synthetic shares |
1) |
Committee fees |
|
Total fees paid in cash |
2) |
Total remunera- tion 2023 |
|
Total remunera- tion 2022 |
|
|||||||||||||||||||
| A | B | C | (A+B+C) | |||||||||||||||||||||||||||||||||
Board member |
||||||||||||||||||||||||||||||||||||
Jan Carlson |
4,500,000 | – | – | 34,041 | –837,475 | 420,000 | 4,920,000 | 4,082,525 | –218,839 | |||||||||||||||||||||||||||
Jacob Wallenberg |
1,140,000 | – | – | 34,041 | –837,475 | 185,000 | 1,325,000 | 487,525 | –493,839 | |||||||||||||||||||||||||||
Börje Ekholm |
– | – | – | – | – | – | – | – | – | |||||||||||||||||||||||||||
Carolina Dybeck Happe |
1,140,000 | – | – | 10,003 | –166,650 | – | – | –166,650 | 609,182 | |||||||||||||||||||||||||||
Christy Wyatt |
1,140,000 | – | – | – | – | 185,000 | 1,325,000 | 1,325,000 | – | |||||||||||||||||||||||||||
Eric A. Elzvik |
1,140,000 | – | – | 11,345 | –279,111 | 495,000 | 1,635,000 | 1,355,889 | 983,791 | |||||||||||||||||||||||||||
Helena Stjernholm |
1,140,000 | – | – | 22,693 | –558,274 | 185,000 | 1,325,000 | 766,726 | 97,535 | |||||||||||||||||||||||||||
Jon Fredrik Baksaas |
1,140,000 | – | – | 25,391 | –619,545 | 495,000 | 1,635,000 | 1,015,455 | –214,424 | |||||||||||||||||||||||||||
Jonas Synnergren |
1,140,000 | – | – | – | – | 470,000 | 1,610,000 | 1,610,000 | – | |||||||||||||||||||||||||||
Kristin S. Rinne |
1,140,000 | – | – | 16,913 | –458,693 | 370,000 | 1,510,000 | 1,051,307 | 305,308 | |||||||||||||||||||||||||||
Kurt Jofs 5)
|
– | – | – | 11,427 | –239,336 | – | – | –239,336 | 1,275,090 | |||||||||||||||||||||||||||
Nora Denzel 5)
|
– | – | – | 11,345 | –279,111 | – | – | –279,111 | 688,791 | |||||||||||||||||||||||||||
Ronnie Leten 5)
|
– | – | – | 63,985 | –1,784,460 | – | – | –1,784,460 | 2,258,226 | |||||||||||||||||||||||||||
Employee Representatives |
||||||||||||||||||||||||||||||||||||
Kjell-Åke Soting |
54,750 | – | – | – | – | 22,200 | 76,950 | 76,950 | 58,500 | |||||||||||||||||||||||||||
Annika Salomonsson 6)
|
54,750 | – | – | – | – | 14,400 | 69,150 | 69,150 | 28,500 | |||||||||||||||||||||||||||
Ulf Rosberg 7)
|
54,750 | – | – | – | – | 9,000 | 63,750 | 63,750 | 43,500 | |||||||||||||||||||||||||||
Loredana Roslund (deputy) |
54,750 | – | – | – | – | – | 54,750 | 54,750 | 43,500 | |||||||||||||||||||||||||||
Frans Frejdestedt (deputy) 8)
|
29,250 | – | – | – | – | – | 29,250 | 29,250 | – | |||||||||||||||||||||||||||
Stefan Wänstedt (deputy) 8)
|
29,250 | – | – | – | – | – | 29,250 | 29,250 | – | |||||||||||||||||||||||||||
Torbjörn Nyman 9)
|
25,500 | – | – | – | – | 11,700 | 37,200 | 37,200 | 66,000 | |||||||||||||||||||||||||||
Anders Ripa 10)
|
23,250 | – | – | – | – | 6,900 | 30,150 | 30,150 | 55,500 | |||||||||||||||||||||||||||
Total |
13,946,250 |
– |
– |
241,184 |
–6,060,130 |
2,869,200 |
15,675,450 |
9,615,320 |
3) |
5,586,321 |
||||||||||||||||||||||||||
|
1) |
The difference in value as of the time for payment, compared to December 31, 2022, for synthetic shares allocated in 2018 (for which payment was made in 2023). The difference in value as of December 31, 2023 compared to December 31, 2022, for synthetic shares allocated in 2019, 2020, 2021 and 2022. Calculated on a share price of SEK 63.11. The value of synthetic shares allocated in 2019, 2020, 2021 and 2022 includes respectively SEK 1.50, SEK 2.00, SEK 2.50 and SEK 2.70 per share in compensation for dividends resolved by the Annual General Meetings 2020, 2021, 2022 and 2023, and the value of the synthetic shares allocated in 2018 includes dividend compensation for dividends resolved in 2019, 2020, 2021 and 2022. |
|
2) |
Committee fee and cash portion of the Board fee. |
|
3) |
Excluding social security charges in the amount of SEK 2,077,206. |
|
4) |
None of the Board members participated in the synthetic share program during 2023. |
|
5) |
Resigned from the Board of Directors in connection with the AGM held on March 29, 2023. |
|
6) |
Appointed employee representative Board member as of July 31, 2023, previously deputy employee representative Board member. |
|
7) |
Appointed employee representative Board member as of July 4, 2023, previously deputy employee representative Board member. |
|
8) |
Appointed deputy employee representative Board members as of September 1, 2023. |
|
9) |
Resigned as employee representative Board member as of July 31, 2023. |
|
10) |
Resigned as employee representative Board member as of July 4, 2023. |
| – | The Chair of the Board was entitled to a Board fee of SEK 4,500,000. |
| – | The other Directors elected by the Annual General Meeting were entitled to a fee of SEK 1,140,000 each. |
| – | The Chair of the Audit and Compliance Committee was entitled to a fee of SEK 495,000 and the other non-employee members of the Audit and Compliance Committee were entitled to a fee of SEK 285,000 each. The Chairs of the Finance, Remuneration and Enterprise Business and Technology Committees were entitled to a fee of SEK 210,000 each and the other non-employee members of these Committees were entitled to a fee of SEK 185,000 each. |
| – | Members of the Board, who are not employees of the Company, have not received any remuneration other than the fees and synthetic shares as above. None of the Directors have entered into a service contract with the Parent Company or any of its subsidiaries, providing for termination benefits. |
| – | Members and deputy members of the Board who are Ericsson employees received no remuneration or benefits other than their entitlements as employees and a fee to the employee representatives and their deputies of SEK 2,250 per attended Board meeting and SEK 1,800 per attended Committee meeting. |
| – | The Annual General Meeting 2023 resolved that non-employee Directors may choose to receive the Board fee (i.e., exclusive of Committee fee) as follows: i) 25% of the Board fee in cash and 75% in the form of synthetic shares, ii) 50% in cash and 50% in the form of synthetic shares, or iii) 75% in cash and 25% in the form of synthetic shares. Directors may also choose not to participate in the synthetic share program and receive 100% of the Board fee in cash. Committee fees are always paid in cash. |
|
|
||||
| 7 7 Notes to the consolidated financial statements |
Financial report 2023 | |||
| Remuneration costs for the President and CEO and other members of the Executive Team (ET) | ||||||||||||||||||
| SEK | President and CEO 2023 |
President and CEO 2022 |
President and CEO 2021 |
Other members of ET 2023 3)
|
Other members of ET 2022 3)
|
Other members of ET 2021 |
Total 2023 | Total 2022 | Total 2021 | |||||||||||||||||||||||||||
Salary 1)
|
19,520,568 | 19,154,852 | 18,208,859 | 135,208,734 | 132,945,295 | 110,043,431 | 154,729,302 | 152,100,147 | 128,252,290 | |||||||||||||||||||||||||||
Termination benefits |
– | – | – | – | 25,503,967 | – | – | 25,503,967 | – | |||||||||||||||||||||||||||
| Annual variable remuneration provision earned for the year | – | – | – | 48,399,226 | 90,908,181 | 52,507,185 | 48,399,226 | 90,908,181 | 52,507,185 | |||||||||||||||||||||||||||
Long-term variable compensation provision |
31,708,587 | 41,125,015 | 43,701,650 | 30,547,582 | 43,688,149 | 48,260,833 | 62,256,169 | 84,813,164 | 91,962,483 | |||||||||||||||||||||||||||
Pension costs 2)
|
10,151,804 | 9,856,121 | 9,569,049 | 24,607,643 | 42,248,588 | 40,886,802 | 34,759,447 | 52,104,709 | 50,455,851 | |||||||||||||||||||||||||||
Other benefits |
828,287 | 135,743 | 555,688 | 19,575,733 | 20,167,043 | 11,199,631 | 20,404,020 | 20,302,786 | 11,755,319 | |||||||||||||||||||||||||||
Social charges and taxes |
19,546,145 | 22,079,378 | 22,633,474 | 45,222,286 | 60,745,133 | 57,469,705 | 64,768,431 | 82,824,511 | 80,103,179 | |||||||||||||||||||||||||||
Total |
81,755,391 |
92,351,109 |
94,668,720 |
303,561,204 |
416,206,356 |
320,367,587 |
385,316,595 |
508,557,465 |
415,036,307 |
|||||||||||||||||||||||||||
|
1) |
Includes compensation for unused vacation days. |
|
2) |
Includes cash payments to the President and CEO in lieu of defined contribution payment in a cost neutral way to Ericsson. |
|
3) |
Does not include cash compensation paid to Rory Read of MUSD 32.76 in 2022 and 10,64 MSUD in 2023. The total amount was reported separately as ‘Deviations from adopted Guidelines for remuneration to Group Management’ in Remuneration Report 2022 as compensation for acceleration of pre-existing long-term share based variable incentive program of restricted and performance stock units (RSU and PSU) in Vonage. |
| – | Fredrik Jejdling was appointed Executive Vice President by the Board of Directors effective November 7, 2017. He did not substitute the President and CEO as the deputy to the President and CEO in 2023. Information regarding Fredrik Jejdling is included in the group “Other members of ET.” The details of Fredrik Jejdling’s remuneration in 2023 can be found in the Remuneration report 2023. |
| – | The group “Other members of ET 2023” comprises the following persons: MajBritt Arfert, Scott Dresser, Erik Ekudden, Moti Gyamlani, Niklas Heuveldop, Chris Houghton, Fredrik Jejdling, Stella Medlicott, Carl Mellander, Nunzio Mirtillo, Per Narvingar, Fadi Pharaon, Rory Read and Åsa Tamsons. In addition, Jenny Lindqvist joined ET on February 1, 2023, and George Mulhern left ET effective November 1, 2023. |
| – | The group “Other members of ET 2022” comprises the following persons: MajBritt Arfert, Scott Dresser, Erik Ekudden, Niklas Heuveldop, Chris Houghton, Fredrik Jejdling, George Mulhern, Moti Gyamlani, Per Narvingar, Stella Medlicott, Carl Mellander, Nunzio Mirtillo, Fadi Pharaon, Rory Read and Åsa Tamsons. In addition, Xavier Dedullen left ET effective March 21, 2022 and Arun Bansal, Jan Karlsson and Peter Laurin left ET effective June 1, 2022. |
| – | The group “Other members of ET 2021” comprises the following persons: MajBritt Arfert, Arun Bansal, Xavier Dedullen, Erik Ekudden, Niklas Heuveldop, Chris Houghton, Fredrik Jejdling, Jan Karlsson, Peter Laurin, |
| Stella Medlicott, Carl Mellander, Nunzio Mirtillo, Fadi Pharaon and Åsa Tamsons. |
| – | The salary stated in the table for the President and CEO and other members of the ET includes vacation pay paid during 2023, as well as other contracted compensation expenses in 2023. |
| – | “Long-term variable compensation provision” refers to the compensation costs for full year 2023 for all outstanding share-based plans. |
| – | Ericsson’s commitments for defined benefit based pensions as of December 31, 2023, for other members of ET under IAS 19 amounted to 2023: SEK 35.4 million, 2022: SEK 37.6 million of which 2023: SEK 28.3 million, 2022: SEK 30.0 million refers to the ITP and early retirement, and the remaining 2023 SEK 7.1 million, 2022 SEK 7.7 million to disability and survivors’ pensions. The President and CEO does not have a Swedish defined benefit based pension plan, hence, Ericsson bears no commitment. |
| – | For previous Presidents and CEOs, the Company has made provisions for defined benefit pension plans in connection with their active service periods within the Company. |
|
|
||||
| Financial report 2023 | Notes to the consolidated financial statements 7 8
|
 |
Share-based compensation |
| – | Share-settled programs, the total compensation expense is calculated based on the fair value (FV) at grant date and recognized over the service period of three years. |
| – | Cash-settled plans, the accounting principles are the same as for any other accruals or provisions. Prior to payout an accrual or provision is recognized every period based on the present period’s best estimate of the total amount. Any difference between total payout and the sum of accruals or provisions is recognized in the income statement in the period of final payout. |
| LTV and EPP performance criteria | ||||||||||||||||||||
|
Program
Year
|
Target | Criteria | Weight | Performance Period |
Vesting Opportunity
(linear pro-rata)
|
Achievement |
Achieved
Vesting Level
|
|||||||||||||
2023 |
2023 Group operating income (EBITA) | Range (SEK billion): 26.4 - 40.4 | 45% | Jan 1, 2023–Dec 31, 2023 | 0%–200% | SEK 21.4 billion |
2) |
0% | ||||||||||||
2023 |
Absolute TSR | Range: 6%-14% | 25% | Jan 1, 2023–Dec 31, 2025 | 0%–200% | |||||||||||||||
2023 |
Relative TSR | Ranking of Ericsson: 6–2 | 20% | Jan 1, 2023–Dec 31, 2025 | 0%–200% | 1) |
||||||||||||||
2023 |
Group Environmental, Social and Governance (“ESG”) | CO2e emissions (ktonnes): 142–121 | 1.66% | Jan 1, 2023–Dec 31, 2023 | 0%–200% | |
121.9 ktonne CO 2
|
|
193.72% | |||||||||||
| CO2e emissions (ktonnes): 132–113 | 1.66% | Jan 1, 2024–Dec 31, 2024 | 0%–200% | |||||||||||||||||
| CO2e emissions (ktonnes): 122–104 | 1.68% | Jan 1, 2025–Dec 31, 2025 | 0%–200% | |||||||||||||||||
| Increasing the representation of women leaders in the Ericsson Group: Range 23%–25% | 5% | Jan 1, 2023–Dec 31, 2025 | 0%–200% | |||||||||||||||||
2023 Total |
100
%
|
0
%–
200
%
|
||||||||||||||||||
2022 |
2022 Group operating income (EBIT) | Range (SEK billion): 24.1–34.1 | 45% | Jan 1, 2022–Dec 31, 2022 | 0%–200% | SEK 32.2 billion |
2) |
162.76% | ||||||||||||
2022 |
Absolute TSR | Range: 6%-14% | 25% | Jan 1, 2022–Dec 31, 2024 | 0%–200% | |||||||||||||||
2022 |
Relative TSR | Ranking of Ericsson: 6–2 | 20% | Jan 1, 2022–Dec 31, 2024 | 0%–200% | 1) |
||||||||||||||
2022 |
Group Environmental, Social and Governance (“ESG”) | CO2e emissions (ktonnes): 265–200 | 5% | Jan 1, 2022–Dec 31, 2024 | 0%–200% | |||||||||||||||
| Increasing the representation of women leaders in the Ericsson Group: Range 22%–24% | 5% | Jan 1, 2022–Dec 31, 2024 | 0%–200% | |||||||||||||||||
2022 Total |
100% |
0%–200% |
||||||||||||||||||
2021 |
2021 Group operating income (EBIT) | Range (SEK billion): 15.0–24.0 | 50% | Jan 1, 2021–Dec 31, 2021 | 0%–200% | SEK 27.4 billion |
2) |
200% | ||||||||||||
2021 |
Absolute TSR | Range: 6%–14% | 30% | Jan 1, 2021–Dec 31, 2023 | 0%–200% | -16.17% | 0.00% | |||||||||||||
2021 |
Relative TSR | Ranking of Ericsson: 6–2 | 20% | Jan 1, 2021–Dec 31, 2023 | 0%–200% | 1) |
12 out of 11 | 0.00% | ||||||||||||
2021 Total |
100% |
0%–200% |
100.00% |
|||||||||||||||||
2020 |
2020 Group operating income (EBIT) | Range (SEK billion): 19.1–27.9 | 50% | Jan 1, 2020–Dec 31, 2020 | 0%–200% | SEK 29.1 billion |
3) |
200% | ||||||||||||
2020 |
Absolute TSR | Range: 6%–14% | 30% | Jan 1, 2020–Dec 31, 2022 | 0%–200% | –6.65% | 0.00% | |||||||||||||
2020 |
Relative TSR | Ranking of Ericsson: 6–2 | 20% | Jan 1, 2020–Dec 31, 2022 | 0%–200% | 1) |
12 out of 11 | 0.00% | ||||||||||||
2020 Total |
100% |
0%–200% |
100.00% |
|||||||||||||||||
|
1) |
The portion of the Performance Share Awards granted to a participant based on the relative TSR performance condition is subject to fulfilment of the related performance criteria over the performance period compared to Peer Groups consisting of 11 companies for the program year 2023, 2022, 2021 and 2020. The vesting of the Performance Share Awards under this performance condition will vary depending on the Company’s TSR performance ranking versus the other companies in the peer group at the end of the performance period. |
|
2) |
Excludes restructuring charges and items not included in target performance criterion. |
|
3) |
Excludes restructuring charges. |
|
4) |
Excludes fines and similar related to the United States Department of Justice (DOJ) / U.S. Securities and Exchange Commission (SEC) resolution, including payments required pursuant to the DOJ Plea Agreement announced by the Company on March 2, 2023. |
|
|
||||
| 7 9 Notes to the consolidated financial statements |
Financial report 2023 | |||
|
|
||||
| Financial report 2023 | Notes to the consolidated financial statements 80
|
|
|
||||
|
81 Notes to the consolidated financial statements |
Financial report 2023 | |||
|
|
||||
| Financial report 2023 | Notes to the consolidated financial statements 82
|
| Number of shares and synthetic shares | ||||||||||||||||||||||||||||||||||||||||||||||||||||
| (million) | Executive programs 1)
2)
|
Of which the President and CEO | ||||||||||||||||||||||||||||||||||||||||||||||||||
| Share-settled programs | LTV 2023 | LTV 2022 | LTV 2021 | LTV 2020 | LTV 2019 | Total | LTV 2023 | LTV 2022 | LTV 2021 | LTV 2020 | LTV 2019 | Total | ||||||||||||||||||||||||||||||||||||||||
Maximum shares required |
4.1 | 2.0 | 2.1 | 2.5 | 3.0 | 13.7 | – | – | – | – | – | – | ||||||||||||||||||||||||||||||||||||||||
Granted shares |
3.7 | 0.7 | 0.6 | 0.9 | 0.6 | 6.5 | 0.6 | 0.3 | 0.3 | 0.4 | 0.3 | 1.9 | ||||||||||||||||||||||||||||||||||||||||
Outstanding number of shares beginning of 2023 |
– | 0.9 | 0.9 | 0.9 | 0.8 |
3.5 | – | 0.4 | 0.5 | 0.4 | 0.3 | 1.6 |
||||||||||||||||||||||||||||||||||||||||
Exercised during 2023 |
– | – | – | – | – | – | – | – | – | – | – | — | ||||||||||||||||||||||||||||||||||||||||
Forfeited during 2023 |
– | – | –0.1 | – | – | –0.1 | – | – | – | – | – | — | ||||||||||||||||||||||||||||||||||||||||
Increase/decrease due to performance condition 2023 |
–1.7 | – | –0.3 | – | – | –2.0 | –0.3 | – | –0.2 | – | – | –0.5 | ||||||||||||||||||||||||||||||||||||||||
Outstanding number of shares end of 2023 |
2.0 | 0.9 | 0.5 | 0.9 | 0.8 |
5.1 | 0.3 | 0.4 | 0.3 | 0.4 | 0.3 | 1.7 | ||||||||||||||||||||||||||||||||||||||||
1) |
LTV 2023 includes Executive Team and Executives |
2) |
LTV 2019 and 2020 actual share delivery in 2024 can deviate due to reduced or cancelled vesting and withholding of shares . |
| Executive performance program | Key contributors plans | |||||||||||||||||||||||||||||||||||||||||
| Cash-settled plan | EPP 2022 | EPP 2021 | EPP 2020 | Total | KC 2023 | KC 2022 | KC 2021 | KC 2020 | Total | |||||||||||||||||||||||||||||||||
Synthetic shares |
1.1 | 0.7 | – | 1.8 | 30.2 | 7.5 | 3.4 | – | 41.1 | |||||||||||||||||||||||||||||||||
Compensation expense for LTV 2020–2023 |
||||||||||||||||||||
Share-settled programs |
2023 | 2022 | 2021 | 2020 | Total | |||||||||||||||
LTV 2023 1)
|
25 | – | – | – | 25 | |||||||||||||||
LTV 2022 |
20 | 12 | – | – | 32 | |||||||||||||||
LTV 2021 |
31 | 36 | 24 | – | 91 | |||||||||||||||
LTV 2020 |
6 | 31 | 31 | 23 | 91 | |||||||||||||||
LTV 2019 |
– | 10 | 28 | 28 | 66 | |||||||||||||||
Total share-settled programs |
82 |
89 |
83 |
51 |
305 |
|||||||||||||||
Of which the President and CEO |
32 |
41 |
38 |
24 |
135 |
|||||||||||||||
Cash-settled plans |
||||||||||||||||||||
EPP 2022 |
20 | 12 | – | – | 32 | |||||||||||||||
EPP 2021 |
16 | 15 | 17 | – | 48 | |||||||||||||||
EPP 2020 |
3 | –19 | 56 | 34 | 74 | |||||||||||||||
Total executive performance plans |
39 |
8 |
73 |
34 |
154 |
|||||||||||||||
KC 2023 |
811 | – | – | – | 811 | |||||||||||||||
KC 2022 |
330 | 280 | – | – | 610 | |||||||||||||||
KC 2021 |
91 | 89 | 355 | – | 535 | |||||||||||||||
KC 2020 |
18 | 5 | 376 | 523 | 922 | |||||||||||||||
Total key contributor plans |
1,250 |
374 |
731 |
523 |
2,878 |
|||||||||||||||
Total cash-settled plans |
1,289 |
382 |
804 |
557 |
3,032 |
|||||||||||||||
Total compensation expense |
1,371 |
471 |
887 |
608 |
3,337 |
|||||||||||||||
1) |
LTV 2023 includes Executive Team and Executives . |
|
| ||||
|
83 Notes to the consolidated financial statements |
Financial report 2023 | |||
| Fair values (SEK) |
||||||||||||||||||||
| Executive team/ Executives programs |
LTV 2023 |
LTV 2022 |
LTV 2021 |
LTV 2020 |
LTV 2019 |
|||||||||||||||
| Share price at grant |
55.59 | 78.88 | 116.66 | 78.88 | 90.70 | |||||||||||||||
| Fair value Absolute TSR |
32.75 | 41.18 | 113.47 | 54.69 | 87.92 | |||||||||||||||
| Fair value ESG – Environmental (1,2,3) |
47.80 | 71.45 | – | – | – | |||||||||||||||
| Fair value ESG – Social |
47.80 | 71.45 | – | – | – | |||||||||||||||
| Fair value Relative TSR |
39.40 | 54.48 | 108.61 | 98.06 | 94.63 | |||||||||||||||
| Fair value Group operating income (EBITA and EBIT) |
47.80 | 71.45 | 110.70 | 74.22 | 86.94 | |||||||||||||||
| Executive performance plans |
EPP 2023 |
EPP 2022 |
EPP 2021 |
EPP 2020 |
||||||||||||||||
| Fair value Absolute TSR |
– | 2.30 | – | – | ||||||||||||||||
| Fair value ESG – Environmental |
– | 58.42 | – | – | ||||||||||||||||
| Fair value ESG – Social |
– | 58.42 | – | – | ||||||||||||||||
| Fair value Relative TSR |
– | 2.40 | – | – | ||||||||||||||||
| Fair value Group operating income (EBIT) |
– | 58.42 | 61.13 | 60.31 | ||||||||||||||||
| Key contributor plans |
KC 2023 |
KC 2022 |
KC 2021 |
KC 2020 |
||||||||||||||||
| Fair value – Tranche 1 |
61.12 | 60.31 | 94.13 | 109.80 | ||||||||||||||||
| Fair value – Tranche 2 |
58.40 | 61.13 | 60.31 | 94.13 | ||||||||||||||||
| Fair value – Tranche 3 |
55.81 | 58.42 | 61.13 | 60.31 | ||||||||||||||||
| Ericsson share purchase plan |
| |||||||||
| Eligible employees | Number of countries with ESPP |
Number of participants |
Take-up rate – percent of eligible employees |
|||||||
| 77,748 |
77 | 14,030 | 18.0% | |||||||
|
|
||||
| Financial report 2023 | Notes to the consolidated financial statements 84
| |||
 |
Employee information | |||||||||||||
| Average number of employees by gender and market area |
||||||||||||||||||||||||||||
| 2023 | 2022 | |||||||||||||||||||||||||||
| Women | Men | Total | Women | Men | Total | |||||||||||||||||||||||
| South East Asia, Oceania and India |
6,035 | 21,625 | 27,660 | 5,700 | 20,902 | 26,602 | ||||||||||||||||||||||
| North East Asia |
4,293 | 8,403 | 12,696 | 4,376 | 8,711 | 13,087 | ||||||||||||||||||||||
| North America |
2,720 | 8,546 | 11,266 | 2,471 | 8,415 | 10,886 | ||||||||||||||||||||||
| Europe and Latin America 1)
|
11,772 | 33,740 | 45,512 | 12,017 | 34,637 | 46,654 | ||||||||||||||||||||||
| Middle East and Africa |
886 | 3,624 | 4,510 | 883 | 3,629 | 4,512 | ||||||||||||||||||||||
| Total |
25,706 |
75,938 |
101,644 |
25,447 |
76,294 |
101,741 |
||||||||||||||||||||||
| 1) Of which in EU |
8,900 |
25,564 |
34,464 |
9,006 |
26,259 |
35,265 |
||||||||||||||||||||||
| Of which in Sweden |
3,393 |
10,224 |
13,617 |
3,408 |
10,635 |
14,043 |
||||||||||||||||||||||
| Number of employees by market area at year-end |
| |||||||||||
| 2023 | 2022 | |||||||||||
| South East Asia, Oceania and India |
27,016 | 27,761 | ||||||||||
| North East Asia |
12,331 | 13,207 | ||||||||||
| North America |
10,744 | 11,993 | ||||||||||
| Europe and Latin America 1)
|
45,380 | 48,023 | ||||||||||
| Middle East and Africa |
4,481 | 4,545 | ||||||||||
| Total |
99,952 |
105,529 |
||||||||||
| 1) Of which in EU |
34,763 |
36,594 |
||||||||||
| Of which in Sweden |
13,977 |
14,481 |
||||||||||
| Number of employees by gender and age at year-end 2023 |
| |||||||||||
| Women | Men | Percent of total |
||||||||||
| Under 25 years old |
1,378 | 2,063 | 3% | |||||||||
| 25–35 years old |
9,222 | 19,196 | 29% | |||||||||
| 36–45 years old |
8,093 | 26,681 | 35% | |||||||||
| 46–55 years old |
5,019 | 17,809 | 23% | |||||||||
| Over 55 years old |
2,265 | 8,226 | 10% | |||||||||
| Percent of total |
26% |
74% |
100% |
|||||||||
| Employee movements |
||||||||||||
| 2023 | 2022 | |||||||||||
| Headcount at year-end |
99,952 | 105,529 | ||||||||||
| Employees who have left the Company |
13,362 | 13,028 | ||||||||||
| Employees who have joined the Company |
7,785 | 17,235 | ||||||||||
| Temporary employees |
433 | 627 | ||||||||||
| Wages and salaries and social security expenses |
| |||||||
| (SEK million) | 2023 | 2022 | ||||||
| Wages and salaries |
84,996 | 73,526 | ||||||
| Social security expenses |
16,442 | 15,665 | ||||||
| Of which pension costs |
6,175 |
6,316 |
||||||
| Remuneration to Board members and Presidents in subsidiaries |
| |||||||
| (SEK million) | 2023 | 2022 | ||||||
| Salary and other remuneration |
459 | 477 | ||||||
| Of which annual variable remuneration |
109 |
90 |
||||||
| Pension costs 1)
|
36 | 34 | ||||||
1) |
Pension costs are over and above any social security charges and taxes. |
| Board members, Presidents and Group management by gender at year end | | |||||||||||||||
| 2023 | 2022 | |||||||||||||||
| Women | Men | Women | Men | |||||||||||||
| Parent Company |
||||||||||||||||
| Board members and President | 38% | 62% | 36% | 64% | ||||||||||||
| Group Management |
25% | 75% | 19% | 81% | ||||||||||||
| Subsidiaries |
||||||||||||||||
| Board members and Presidents | 21% | 79% | 20% | 80% | ||||||||||||
|
| ||||
| 8 5 Notes to the consolidated financial statements |
Financial report 2023 | |||
 |
Taxes |
| Income taxes recognized in the income statement |
| |||||||||||
| 2023 | 2022 | 2021 | ||||||||||
| Current income taxes for the year |
–4,289 | –7,353 | –6,110 | |||||||||
| Current income taxes related to prior years |
118 | 253 | –337 | |||||||||
| Deferred tax income/expense (+/–) |
1,406 | 1,617 | 188 | |||||||||
| Share of taxes in joint ventures and associated companies | –20 | –14 | –11 | |||||||||
| Income tax expense |
–2,785 |
–5,497 |
–6,270 |
|||||||||
| Reconciliation of Swedish income tax rate with effective tax rate |
| |||||||||||
| 2023 | 2022 | 2021 | ||||||||||
| Calculated tax expense at Swedish tax rate of 20.6% |
4,804 | –5,070 | –6,025 | |||||||||
| Effect of foreign tax rates | –884 | –605 | –324 | |||||||||
| Current income taxes related to prior years | 118 | 253 | –337 | |||||||||
| Remeasurement of tax loss carry-forwards | –28 | –49 | –175 | |||||||||
| Remeasurement of deductible temporary differences | 394 | 15 | 220 | |||||||||
| Withholding tax expense | –217 | – | – | |||||||||
| Recognition of previously expensed withholding tax | – | 411 | 969 | |||||||||
| Tax effect of non-deductible expenses | –7,311 | –760 | –975 | |||||||||
| Tax effect of non-taxable income | 335 | 327 | 392 | |||||||||
| Tax effect of changes in tax rates | 4 | –19 | –15 | |||||||||
| Income tax expense |
–2,785 |
–5,497 |
–6,270 |
|||||||||
| Effective tax rate |
–11.9% |
22.3% |
21.4% |
|||||||||
| Tax effects of temporary differences and tax loss carry-forwards |
| |||||||||||
| Deferred tax assets |
Deferred tax liabilities |
Net balance |
||||||||||
| 2023 |
||||||||||||
| Intangible assets and property, plant and equipment | 1,195 | 7,193 | ||||||||||
| RoU lease assets and similar assets |
– | 1,272 | ||||||||||
| Current assets |
3,413 | 1,313 | ||||||||||
| Post-employment benefits |
5,297 | 477 | ||||||||||
| Provisions |
3,980 | – | ||||||||||
| RoU lease liabilities and similar liabilities |
1,337 | – | ||||||||||
| Deferred tax credits |
5,453 | – | ||||||||||
| Other |
2,095 | 178 | ||||||||||
| Loss carry-forwards |
6,158 | – | ||||||||||
| Deferred tax assets/liabilities |
28,928 |
10,433 |
18,495 |
|||||||||
| Netting of assets/liabilities |
–6,553 | –6,553 | ||||||||||
| Deferred tax balances, net |
22,375 |
3,880 |
18,495 |
|||||||||
| 2022 |
||||||||||||
| Intangible assets and property, plant and equipment | 1,098 | 8,136 | ||||||||||
| RoU lease assets and similar assets | – | 1,311 | ||||||||||
| Current assets | 3,605 | 1,055 | ||||||||||
| Post-employment benefits | 5,558 | 571 | ||||||||||
| Provisions | 5,215 | – | ||||||||||
| RoU lease liabilities and similar liabilities | 1,394 | – | ||||||||||
| Deferred tax credits | 2,081 | – | ||||||||||
| Other | 1,837 | 295 | ||||||||||
| Loss carry-forwards | 5,190 | – | ||||||||||
| Deferred tax assets/liabilities |
25,978 |
11,368 |
14,610 |
|||||||||
| Netting of assets/liabilities |
–6,584 | –6,584 | ||||||||||
| Deferred tax balances, net |
19,394 |
14,610 |
||||||||||
| Changes in deferred taxes, net |
||||||||
| 2023 | 2022 | |||||||
| Opening balance, net |
14,610 | 22,225 | ||||||
| Recognized in net income |
1,406 | 1,617 | ||||||
| Recognized in other comprehensive income |
–631 | –2,099 | ||||||
| Balances regarding acquired/divested businesses |
–57 | –3,911 | ||||||
| Deferred tax credits increase (+) / utilization (–) |
3,249 | –3,586 | ||||||
| Translation difference |
–82 | 364 | ||||||
| Closing balance, net |
18,495 |
14,610 |
||||||
|
|
||||
| Financial report 2023 | Notes to the consolidated financial statements 8 6
|
| Tax loss carry-forwards | ||||||||||||||||||||
| Recognized tax loss | Unrecognized tax loss | |||||||||||||||||||
| Year of expiration | Tax loss carry-forwards
|
Tax value | Tax loss carry-forwards
|
Tax value | ||||||||||||||||
| 2024 |
15 | 3 | 159 | 20 | ||||||||||||||||
| 2025 |
16 | 3 | 153 | 20 | ||||||||||||||||
| 2026 |
124 | 31 | 151 | 25 | ||||||||||||||||
| 2027 |
1,101 | 281 | 92 | 10 | ||||||||||||||||
| 2028 |
1,688 | 373 | 100 | 13 | ||||||||||||||||
| 2029 or later (also includes unlimited carry-forwards) |
24,722 | 5,467 | 8,263 | 1,731 | ||||||||||||||||
| Total |
27,666 |
6,158 |
8,918 |
1,819 |
||||||||||||||||
| Deferred tax credits | ||||||||
| Recognized deferred tax credits |
Unrecognized deferred tax credits |
|||||||
| Year of expiration | Tax Value | Tax Value | ||||||
| 2024 |
99 | 135 | ||||||
| 2025 |
938 | 108 | ||||||
| 2026 |
46 | 125 | ||||||
| 2027 |
1,778 | 133 | ||||||
| 2028 |
1,521 | 8 | ||||||
| 2029 or later |
1,071 | 639 | ||||||
| Total |
5,453 |
1,148 |
||||||
 |
Earnings per share |
| Earnings per share | ||||||||||||
| 2023 | 2022 | 2021 | ||||||||||
| Basic |
||||||||||||
| Net income (loss) attributable to owners of the Parent Company (SEK million) | –26,446 | 18,724 | 22,694 | |||||||||
| Average number of shares outstanding, basic (millions) | 3,330 | 3,330 | 3,329 | |||||||||
| Earnings (loss) per share, basic (SEK) |
–7.94 |
5.62 |
6.82 |
|||||||||
| Diluted |
||||||||||||
| Net income (loss) attributable to owners of the Parent Company (SEK million) | –26,446 | 18,724 | 22,694 | |||||||||
| Average number of shares outstanding, basic (millions) | 3,330 | 3,330 | 3,329 | |||||||||
| Dilutive effect for stock purchase (millions) | – | 4 | 3 | |||||||||
| Average number of shares outstanding, diluted (millions) | 3,330 | 3,334 | 3,332 | |||||||||
Earnings (loss) per share, diluted (SEK) |
–7.94 |
5.62 |
6.81 |
|||||||||
|
| ||||
| 8 7 Notes to the consolidated financial statements |
Financial report 2023 | |||
 |
Statement of cash flows |
| Adjustments to reconcile net income to cash | ||||||||||||
| 2023 | 2022 | 2021 | ||||||||||
| Property, plant and equipment |
||||||||||||
| Depreciations |
4,272 | 4,114 | 3,674 | |||||||||
| Impairment losses |
662 | 274 | 198 | |||||||||
| Total |
4,934 |
4,388 |
3,872 |
|||||||||
| Right-of-use assets |
||||||||||||
| Depreciations |
2,427 | 2,451 | 2,277 | |||||||||
| Impairment losses |
154 | 66 | – | |||||||||
| Total |
2,581 |
2,517 |
2,277 |
|||||||||
| Intangible assets |
||||||||||||
| Amortizations |
||||||||||||
| Capitalized development expenses |
1,137 | 1,586 | 1,343 | |||||||||
| Customer relationships, IPRs and other intangible assets |
3,321 | 1,991 | 1,164 | |||||||||
| Total amortizations |
4,458 |
3,577 |
2,507 |
|||||||||
| Impairments |
||||||||||||
| Customer relationships, IPRs and other intangible assets |
19 | 61 | 201 | |||||||||
| Goodwill |
31,897 | – | 112 | |||||||||
| Total impairments |
31,916 |
61 |
313 |
|||||||||
| Total |
36,374 |
3,638 |
2,820 |
|||||||||
Total depreciation, amortization and impairment losses on property, plant and equipment and intangible assets |
43,889 |
10,543 |
8,969 |
|||||||||
| Taxes |
3,189 | 5,383 | 6,576 | |||||||||
| Dividends from joint ventures/associated companies 1)
|
46 | 58 | 90 | |||||||||
| Undistributed earnings in joint ventures/associated companies 1)
|
–104 | –3 | 270 | |||||||||
| Gains/losses on investments and sale of operations, intangible assets and PP&E, net 2)
|
268 | –287 | –971 | |||||||||
| Other non-cash items 3)
|
4,422 | 1,944 | 2,209 | |||||||||
Total adjustments to reconcile net income to cash |
51,710 |
17,638 |
17,143 |
|||||||||
|
1) |
See note E3 “Associated companies.” |
|
2) |
Includes revaluation gains and losses on investments, see note B4 “Other operating income and expenses. |
|
3) |
Relates mainly to unrealized foreign exchange, gains/losses on financial instruments. |
| Acquisitions/divestments of subsidiaries and other operations | ||||||||
| Acquisitions | Divestments | |||||||
| 2023 |
||||||||
| Cash flow from business combinations 1)
|
–1,309 | –633 | ||||||
| Acquisitions/divestments of other investments |
–206 | 8 | ||||||
| Total |
–1,515 |
–625 |
||||||
| 2022 |
||||||||
| Cash flow from business combinations 1)
|
–51,734 | 20 | ||||||
| Acquisitions/divestments of other investments |
–261 | 287 | ||||||
| Total |
–51,995 |
307 |
||||||
| 2021 |
||||||||
| Cash flow from business combinations 1)
|
–256 | 273 | ||||||
| Acquisitions/divestments of other investments |
–133 | 175 | ||||||
| Total |
–389 |
448 |
||||||
|
1) |
See also note E2 “Business combinations.” |
 |
Related party transactions |
| Related party transactions, SEK billion | ||||||||||||
| 2023 | 2022 | 2021 | ||||||||||
| Sales to Ericsson Nikola Tesla |
0.4 | 0.3 | 0.4 | |||||||||
| Purchases from Ericsson Nikola Tesla |
1.6 | 1.5 | 1.2 | |||||||||
| Loans to MediaKind (Leone Media Inc.) |
0.6 | 0.6 | 0.5 | |||||||||
|
|
||||
| Financial report 2023 | Notes to the consolidated financial statements 8 8
|
 |
Fees to auditors | |||||
| Fees to auditors | ||||||||||||
2023 |
Deloitte | Others | Total | |||||||||
| Audit fees |
164 | 8 | 172 | |||||||||
| Audit-related fees |
6 | — | 6 | |||||||||
| Tax fees |
12 | 13 | 25 | |||||||||
| All other fees |
– | 37 | 37 | |||||||||
| Total |
182 |
58 |
240 |
|||||||||
| 2022 |
||||||||||||
| Audit fees |
163 | 7 | 170 | |||||||||
| Audit-related fees |
7 | 2 | 9 | |||||||||
| Tax fees |
2 | 11 | 13 | |||||||||
| All other fees |
1 | 22 | 23 | |||||||||
| Total |
173 |
42 |
215 |
|||||||||
| 2021 |
||||||||||||
| Audit fees |
132 | 8 | 140 | |||||||||
| Audit-related fees |
9 | 1 | 10 | |||||||||
| Tax fees |
2 | 6 | 8 | |||||||||
| All other fees |
1 | 2 | 3 | |||||||||
| Total |
144 |
17 |
161 |
|||||||||
 |
Events after the reporting period |
|
|
||||
| 89 | Management’s report on internal control over financial reporting | Ericsson Annual Report on Form 20-F 2023 | ||
| – | pertain to the maintenance of records that, in reasonable detail, accurately and fairly reflect the transactions and dispositions of the assets of the Company; |
| – | provide reasonable assurance that transactions are recorded as necessary to permit preparation of financial statements in accordance with IFRS, and that receipts and expenditures of the Company are being made only in accordance with authorizations of management and directors of the Company; and |
| – | provide reasonable assurance regarding prevention or timely detection of unauthorized acquisition, use or disposition of the Company’s assets that could have a material effect on the financial statements. |
|
|
||||
| 90 | Financial Report 2023 | Risk factors | Ericsson Annual Report on Form 20-F 2023 | ||
| 90 | Risks related to business activities and industry | |
| 97 | Risks related to Ericsson’s financial condition | |
| 98 | Legal and regulatory risks | |
| 101 | Cybersecurity risks | |
| 103 | Environmental, social and business conduct risks | |
|
|
||||
| 91 | Financial Report 2023 | Risk factors | Ericsson Annual Report on Form 20-F 2023 | ||
|
|
||||
| 92 | Financial Report 2023 | Risk factors | Ericsson Annual Report on Form 20-F 2023 | ||
| – | Inability to consummate acquisitions that it considers important to the future of its business. |
| – | Underperformance of the acquired company, failure to realize expected benefits and synergies and/or inability to deliver on anticipated business plans to the extent or in the timeframe anticipated. |
| – | Insufficiencies of technologies and products acquired, including unexpected quality problems. |
| – | Difficulties in the full or partial integration of the operations, technologies, products and personnel of the acquired company to materialize expected synergies or to maintain independent operations in these companies at a risk appropriate level. |
| – | Risks of entering markets in which the Company has no or limited prior experience, or in creating such market or eco-system as envisioned in e.g., the Vonage and Cradlepoint examples. |
|
|
||||
| 93 | Financial Report 2023 | Risk factors | Ericsson Annual Report on Form 20-F 2023 | ||
| – | Potential loss of key employees. |
| – | Diversion of management’s attention away from other business concerns. |
| – | Risks and expenses of any disclosed, undisclosed or potential legal liabilities of or other adverse financial impacts on the acquired company, including failure to comply with laws or regulations or other requirements or conditions, e.g., from foreign direct investment reviews and decisions such as the Committee on Foreign Investment in the United States (CFIUS) review process. See Risk Factor 3.3 for further information related to the CFIUS review process. |
| – | Difficulties in the separation of the operations, technologies, products and personnel of the business divested. |
| – | Potential loss of key employees. |
| – | Impairment losses or write-downs of the carrying value of the relevant assets. |
| – | Expenses of any undisclosed or potential legal liabilities of the business divested. |
|
|
||||
| 94 | Financial Report 2023 | Risk factors | Ericsson Annual Report on Form 20-F 2023 | ||
|
|
||||
| 95 | Financial Report 2023 | Risk factors | Ericsson Annual Report on Form 20-F 2023 | ||
|
|
||||
| 96 | Financial Report 2023 | Risk factors | Ericsson Annual Report on Form 20-F 2023 | ||
|
|
||||
| 97 | Financial Report 2023 | Risk factors | Ericsson Annual Report on Form 20-F 2023 | ||
| – | Increasing Ericsson’s vulnerability to general economic and industry conditions. |
| – | Requiring a substantial portion of cash flow from operations to be dedicated to the payment of principal and interest on the Company’s indebtedness, thereby reducing Ericsson’s ability to use its cash flow to fund the Company’s operations, capital expenditures and future business opportunities. |
| – | Restricting Ericsson from making strategic acquisitions or causing Ericsson to make non-strategic divestitures. |
| – | Limiting Ericsson’s ability to obtain additional financing for adjusted working capital, capital expenditures, debt service requirements, acquisitions and general corporate or other purposes. |
| – | Limiting the Company’s ability to adjust to changing market conditions and placing Ericsson at a competitive disadvantage compared to Ericsson’s competitors. |
|
|
||||
| 98 | Financial Report 2023 | Risk factors | Ericsson Annual Report on Form 20-F 2023 | ||
|
|
||||
| 99 | Financial Report 2023 | Risk factors | Ericsson Annual Report on Form 20-F 2023 | ||
|
|
||||
| 100 | Financial Report 2023 | Risk factors | Ericsson Annual Report on Form 20-F 2023 | ||
|
|
||||
| 101 | Financial Report 2023 | Risk factors | Ericsson Annual Report on Form 20-F 2023 | ||
|
|
||||
| 102 | Financial Report 2023 | Risk factors | Ericsson Annual Report on Form 20-F 2023 | ||
|
|
||||
| 103 | Financial Report 2023 | Risk factors | Ericsson Annual Report on Form 20-F 2023 | ||
|
|
||||
| 104 | Financial Report 2023 | Risk factors | Ericsson Annual Report on Form 20-F 2023 | ||
|
|
||||
| 105 | Financial Report 2023 | Risk factors | Ericsson Annual Report on Form 20-F 2023 | ||
| – | Potential material additional costs and liability resulting from our ongoing future compliance with the terms of the Plea Agreement with the DOJ and extended monitorship |
| – | Potential to become a target for public scrutiny as a result of entering into the Plea Agreement with the DOJ, which could damage our reputation and materially and adversely affect our business and prospects |
| – | Risks resulting from entering into the Plea Agreement, including potential debarment from government contracting in the United States and elsewhere, reputational risk, as well as potential counterparty reluctance to continue business relationships |
| – | Potential material additional liability resulting from past conduct, including allegations of past conduct that remains unresolved or unknown in multiple jurisdictions including Iraq, which remains the subject of ongoing investigations by Ericsson and US governmental authorities |
| – | Risks related to internal controls and governance, including the potential to incur material liability in connection with internal controls surrounding payments made to third parties in connection with past conduct in multiple jurisdictions, including Iraq which remains the subject of ongoing investigations by Ericsson and US governmental authorities |
| – | The risk that the ongoing investigations by Ericsson and US governmental authorities result in a conclusion by Ericsson or US governmental authorities that the Company’s past conduct included making or having responsibility for making payments to a terrorist organization or other improper payments, which could lead to material additional liability |
| – | Risks related to our ongoing compliance with obligations under the National Security Agreement entered into in connection with Ericsson’s acquisition of Vonage, which may adversely affect the Vonage business and subject the Company to additional liabilities |
| – | Our goals, strategies, planning assumptions and operational or financial performance expectations |
| – | Macroeconomic conditions, including inflationary pressures and effects on customer investments, market recovery and growth |
| – | Ongoing geopolitical and trade uncertainty, including challenging global economic conditions, market trends and pandemics such as COVID-19 |
| – | Risks related to cybersecurity and privacy |
| – | Industry trends, future characteristics and development of the markets in which we operate |
| – | Our ability to comply with legal and regulatory requirements internationally |
| – | Our future liquidity, capital resources, capital expenditures, cost savings and profitability |
| – | The expected demand for our existing and new products and services as well as plans to launch new products and services, including research and development expenditures |
| – | Our ability to deliver on future plans and achieve future growth |
| – | The expected operational or financial performance of strategic cooperation activities and joint ventures |
| – | Risks related to acquisitions and divestments, including our ability to successfully consummate such transactions, protect the value of acquisitions during integration, or achieve the value anticipated with an acquisition |
| – | Trends related to our industry, including our regulatory environment, competition and customer structure |
| – | Other factors included in our filings with the U.S. Securities and Exchange Commission (the “SEC”), including the factors described throughout this report, included in the section Risk |
|
|
||||
| 106 | Financial Report 2023 | Forward-looking statements | Ericsson Annual Report on Form 20-F 2023 | ||
|
|
||||
| 107 | Financial Report 2023 | Alternative performance measures | Ericsson Annual Report on Form 20-F 2023 | ||
Adjusted working capital |
||||||||||||||||||||
SEK million |
2023 |
2022 |
2021 |
2020 |
2019 |
|||||||||||||||
Current assets |
154,988 |
173,803 |
174,805 |
149,795 |
153,914 |
|||||||||||||||
Current non-interest-bearing provisions and liabilities |
||||||||||||||||||||
Provisions, current |
–6,779 |
–7,629 |
–5,782 |
–7,580 |
–8,244 |
|||||||||||||||
Contract liabilities |
–34,416 |
–42,251 |
–32,834 |
–26,440 |
–29,041 |
|||||||||||||||
Trade payables |
–27,768 |
–38,437 |
–35,684 |
–31,988 |
–30,403 |
|||||||||||||||
Current tax liabilities 1)
|
–3,561 |
–2,640 |
–2,917 |
–4,486 |
– |
|||||||||||||||
Other current liabilities 1)
|
–36,985 |
–46,193 |
–37,921 |
–33,688 |
–37,405 |
|||||||||||||||
Adjusted working capital |
45,479 |
36,653 |
59,667 |
45,613 |
48,821 |
|||||||||||||||
|
1) |
As from 2021 current tax liabilities is presented as a separate line item in the balance sheet and the comparison year 2020 has been updated accordingly. For 2019 the current tax liabilities is included in other current liabilities. |
Definition |
Reason to use |
|
| Current assets less current non-interest-bearing provisions and liabilities (which include: current provisions, contract liabilities, trade payables, current tax liabilities and other current liabilities). |
Due to the need to optimize cash generation to create value for Ericsson’s shareholders, management focuses on working capital and reducing lead times between orders booked and cash received. |
Capital employed |
||||||||||||||||||||
SEK million |
2023 |
2022 |
2021 |
2020 |
2019 |
|||||||||||||||
Total assets |
297,036 |
349,537 |
305,614 |
271,530 |
276,383 |
|||||||||||||||
Non-interest-bearing provisions and liabilities |
||||||||||||||||||||
Provisions, non-current
|
4,927 |
3,959 |
3,722 |
2,886 |
2,679 |
|||||||||||||||
Deferred tax liabilities |
3,880 |
4,784 |
884 |
1,089 |
1,224 |
|||||||||||||||
Other non-current liabilities |
755 |
745 |
1,587 |
1,383 |
2,114 |
|||||||||||||||
Provisions, current |
6,779 |
7,629 |
5,782 |
7,580 |
8,244 |
|||||||||||||||
Contract liabilities |
34,416 |
42,251 |
32,834 |
26,440 |
29,041 |
|||||||||||||||
Trade payables |
27,768 |
38,437 |
35,684 |
31,988 |
30,403 |
|||||||||||||||
Current tax liabilities 1)
|
3,561 |
2,640 |
2,917 |
4,486 |
– |
|||||||||||||||
Other current liabilities 1)
|
36,985 |
46,193 |
37,921 |
33,688 |
37,405 |
|||||||||||||||
Capital employed |
177,965 |
202,899 |
184,283 |
161,990 |
165,273 |
|||||||||||||||
|
1) |
As from 2021 current tax liabilities is presented as a separate line item in the balance sheet and the comparison year 2020 has been updated accordingly. For 2019 the current tax liabilities is included in other current liabilities. |
Definition |
Reason to use |
|
| Total assets less non-interest-bearing provisions and liabilities (which includes non-current provisions, deferred tax liabilities, contract liabilities, other non-current liabilities, current provisions, trade payables, current tax liabilities and other current liabilities). |
Capital employed represents the value of the balance sheet assets that contributes to revenue and profit generation. It is also used in the calculation of return on capital employed. |
|
|
||||
| 108 | Financial Report 2023 | Alternative performance measures | Ericsson Annual Report on Form 20-F 2023 | ||
Capital turnover |
||||||||||||||||||||
SEK million |
2023 |
2022 |
2021 |
2020 |
2019 |
|||||||||||||||
Net sales |
263,351 |
271,546 |
232,314 |
232,390 |
227,216 |
|||||||||||||||
Average capital employed |
||||||||||||||||||||
Capital employed at beginning of period |
202,899 |
184,283 |
161,990 |
165,273 |
149,615 |
|||||||||||||||
Capital employed at end of period |
177,965 |
202,899 |
184,283 |
161,990 |
165,273 |
|||||||||||||||
Average capital employed |
190,432 |
193,591 |
173,137 |
163,632 |
157,444 |
|||||||||||||||
Capital turnover (times) |
1.4 |
1.4 |
1.3 |
1.4 |
1.4 |
|||||||||||||||
Definition |
Reason to use |
|
| Net sales divided by average capital employed (based on the amounts at January 1 and December 31). |
Capital turnover indicates how effectively investment capital is used to generate revenues. |
SEK million |
2023 |
2022 |
2021 |
2020 |
2019 |
|||||||||||||||
EBIT (loss) |
–20,326 |
27,020 |
31,780 |
27,808 |
10,564 |
|||||||||||||||
Net sales |
263,351 |
271,546 |
232,314 |
232,390 |
227,216 |
|||||||||||||||
EBIT margin (%) |
–7.7% |
10.0% |
13.7% |
12.0% |
4.6% |
|||||||||||||||
Restructuring charges |
6,521 |
399 |
549 |
1,306 |
798 |
|||||||||||||||
EBIT (loss) excluding restructuring charges |
–13,805 |
27,419 |
32,329 |
29,114 |
11,362 |
|||||||||||||||
EBIT margin excluding restructuring charges (%) |
–5.2% |
10.1% |
13.9% |
12.5% |
5.0% |
|||||||||||||||
Impairment of goodwill |
31,897 |
– |
112 |
– |
– |
|||||||||||||||
EBIT excluding restructuring charges and goodwill impairment |
18,092 |
27,419 |
32,441 |
29,114 |
11,362 |
|||||||||||||||
EBIT margin excl. restructuring charges and goodwill impairment (%) |
6.9% |
10.1% |
14.0% |
12.5% |
5.0% |
|||||||||||||||
Definition |
Reason to use |
|
|
Earnings (loss) before financial items and income tax. EBIT as a percentage of net sales. Earnings (loss) before financial items and income tax excluding restructuring charges. EBIT excluding restructuring charges as a percentage of net sales. Earnings before financial items and income tax excluding restructuring charges and goodwill impairment. EBIT excluding restructuring charges and goodwill impairment as a percentage of net sales. |
EBIT margin shows the EBIT in percentage of net sales. EBIT margin is a key internal measure as the Company believes that it provides users of the financial statements with a better understanding of the Group’s financial performance both short and long term. The Company’s view is that EBIT margin excluding restructuring charges and goodwill impairment gives a fair view of the profitability of the ongoing business. |
SEK million |
2023 |
2022 |
2021 |
2020 |
2019 |
|||||||||||||||
Net income (loss) |
–26,104 |
19,112 |
22,980 |
17,623 |
1,840 |
|||||||||||||||
Income tax |
2,785 |
5,497 |
6,270 |
9,589 |
6,922 |
|||||||||||||||
Financial income and expenses, net |
2,993 |
2,411 |
2,530 |
596 |
1,802 |
|||||||||||||||
Amortizations and write-downs of acquired intangible assets |
35,238 |
2,051 |
1,477 |
1,220 |
1,038 |
|||||||||||||||
EBITA |
14,912 |
29,071 |
33,257 |
29,028 |
11,602 |
|||||||||||||||
Net sales |
263,351 |
271,546 |
232,314 |
232,390 |
227,216 |
|||||||||||||||
EBITA margin (%) |
5.7% |
10.7% |
14.3% |
12.5% |
5.1% |
|||||||||||||||
Restructuring charges |
6,521 |
399 |
549 |
1,306 |
798 |
|||||||||||||||
EBITA excluding restructuring charges |
21,433 |
29,470 |
33,806 |
30,334 |
12,400 |
|||||||||||||||
EBITA margin excluding restructuring charges (%) |
8.1% |
10.9% |
14.6% |
13.1% |
5.5% |
|||||||||||||||
Definition |
Reason to use |
|
|
Earnings (loss) before interest, income tax, amortizations and write-downs of acquired intangible assets. EBITA as a percentage of net sales. EBITA excluding restructuring charges. EBITA excluding restructuring charges as a percentage of net sales. |
Amortizations and write-downs of intangible assets are normally non-cash items in the annual income statement, EBITA margin % gives an indication of the financial performance without the impact from acquired companies. The Company’s view is that EBITA margin excluding restructuring charges gives a fair view of the profitability of the ongoing business. |
|
|
||||
| 109 | Financial Report 2023 | Alternative performance measures | Ericsson Annual Report on Form 20-F 2023 | ||
Equity ratio |
||||||||||||||||||||
SEK million |
2023 |
2022 |
2021 |
2020 |
2019 |
|||||||||||||||
Total equity |
97,408 |
133,304 |
107,099 |
85,177 |
81,878 |
|||||||||||||||
Total assets |
297,036 |
349,537 |
305,614 |
271,530 |
276,383 |
|||||||||||||||
Equity ratio (%) |
32.8% |
38.1% |
35.0% |
31.4% |
29.6% |
|||||||||||||||
Definition |
Reason to use |
|
| Equity expressed as a percentage of total assets. | This supports financial flexibility and independence to operate and manage variations in working capital needs as well as to capitalize on business opportunities. |
Free cash flow before M&A / Free cash flow after M&A |
||||||||||||||||||||
SEK million |
2023 |
2022 |
2021 |
2020 |
2019 |
|||||||||||||||
Cash flow from operating activities |
7,177 |
30,863 |
39,065 |
28,933 |
16,873 |
|||||||||||||||
Net capital expenditures and other investments (excluding M&A) |
||||||||||||||||||||
Investments in property, plant and equipment |
–3,297 |
–4,477 |
–3,663 |
–4,493 |
–5,118 |
|||||||||||||||
Sales of property, plant and equipment |
163 |
249 |
115 |
254 |
744 |
|||||||||||||||
Product development |
–2,173 |
–1,720 |
–962 |
–817 |
–1,545 |
|||||||||||||||
Other investments 1)
|
–97 |
–126 |
–131 |
801 |
–331 |
|||||||||||||||
Repayment of lease liabilities |
–2,857 |
–2,593 |
–2,368 |
–2,417 |
–2,990 |
|||||||||||||||
Free cash flow before M&A |
–1,084 |
22,196 |
32,056 |
22,261 |
7,633 |
|||||||||||||||
Acquisitions of subsidiaries and other operations |
–1,515 |
–51,995 |
–389 |
–9,657 |
–1,753 |
|||||||||||||||
Divestments of subsidiaries and other operations |
–625 |
307 |
448 |
59 |
248 |
|||||||||||||||
Free cash flow after M&A |
–3,224 |
–29,492 |
32,115 |
12,663 |
6,128 |
|||||||||||||||
Net sales |
263,351 |
271,546 |
232,314 |
232,390 |
227,216 |
|||||||||||||||
Free cash flow before M&A as percentage of net sales (%) |
–0.4% |
8.2% |
13.8% |
9.6% |
3.4% |
|||||||||||||||
|
1) |
Other investments is part of the line item Other investing activities in the Consolidated cash flow statement. The difference is movements in other interest-bearing assets which is not part of the definition of Free cash flow. |
Definition |
Reason to use |
|
|
Free cash flow before M&A: Cash flow from operating activities less net capital expenditures, other investments and repayment of lease liabilities (excluding M&A). Free cash flow after M&A: Cash flow from operating activities less net capital expenditures, other investments and repayment of lease liabilities. Free cash flow before M&A as a percentage of net sales. |
Free cash flow before M&A represents the cash that the Company generates after capital expenditures, other investments and repayment of lease liabilities. The Company believes that free cash flow before M&A is a good way of reflecting the cash flows generated by the Company that can be used to expand the business, invest in subsidiaries, pay dividends and reduce debt. Free cash flow after M&A represents the cash that the Company generates after capital expenditures, other investments, repayment of lease liabilities and acquisitions/divestments of subsidiaries. The Company believes that free cash flow after M&A is a good way of reflecting the cash flows generated by the Company that can be used to expand the business, pay dividends and reduce debt. Free cash flow before M&A as a percentage of net sales is used by the Company as one of the long-term targets. |
Gross cash |
||||||||||||||||||||
SEK million |
2023 |
2022 |
2021 |
2020 |
2019 |
|||||||||||||||
Cash and cash equivalents |
35,190 |
38,349 |
54,050 |
43,612 |
45,079 |
|||||||||||||||
Interest-bearing securities, current |
9,584 |
8,736 |
12,932 |
6,820 |
6,759 |
|||||||||||||||
Interest-bearing securities, non-current
|
9,931 |
9,164 |
30,626 |
21,613 |
20,354 |
|||||||||||||||
Gross cash |
54,705 |
56,249 |
97,608 |
72,045 |
72,192 |
|||||||||||||||
Definition |
Reason to use |
|
| Cash and cash equivalents plus interest-bearing securities (current and non-current).
|
Gross cash is showing total available cash and interest-bearing securities and is a parameter for calculating the net cash position. |
|
|
||||
| 110 | Financial Report 2023 | Alternative performance measures | Ericsson Annual Report on Form 20-F 2023 | ||
Gross margin and Gross margin excluding restructuring charges |
||||||||||||||||||||
SEK million |
2023 |
2022 |
2021 |
2020 |
2019 |
|||||||||||||||
Gross income |
101,602 |
113,295 |
100,749 |
93,724 |
84,824 |
|||||||||||||||
Net sales |
263,351 |
271,546 |
232,314 |
232,390 |
227,216 |
|||||||||||||||
Gross margin (%) |
38.6% |
41.7% |
43.4% |
40.3% |
37.3% |
|||||||||||||||
Restructuring charges included in cost of sales |
2,802 |
195 |
273 |
725 |
337 |
|||||||||||||||
Gross income excluding restructuring charges |
104,404 |
113,490 |
101,022 |
94,449 |
85,161 |
|||||||||||||||
Gross margin excluding restructuring charges (%) |
39.6% |
41.8% |
43.5% |
40.6% |
37.5% |
|||||||||||||||
Definition |
Reason to use |
|
|
Gross income as a percentage of net sales. Gross income excluding restructuring charges as a percentage of net sales. |
Gross margin shows the difference between net sales and cost of sales, in percentage of net sales. Gross margin is impacted by several factors such as business mix, service share, price development and cost reductions. Gross margin is an important internal measure and this number is also provided in the income statement as the Company believes that it provides users of the financial statements with a better understanding of the Group’s business development. The Company’s view is that gross margin excluding restructuring charges gives a fair view of the profitability of the ongoing business. |
Net cash |
||||||||||||||||||||
SEK million |
2023 |
2022 |
2021 |
2020 |
2019 |
|||||||||||||||
Cash and cash equivalents |
35,190 |
38,349 |
54,050 |
43,612 |
45,079 |
|||||||||||||||
+ Interest-bearing securities, current |
9,584 |
8,736 |
12,932 |
6,820 |
6,759 |
|||||||||||||||
+ Interest-bearing securities, non-current
|
9,931 |
9,164 |
30,626 |
21,613 |
20,354 |
|||||||||||||||
– Borrowings, current |
17,655 |
5,984 |
9,590 |
7,942 |
9,439 |
|||||||||||||||
– Borrowings, non-current
|
29,218 |
26,946 |
22,241 |
22,218 |
28,257 |
|||||||||||||||
Net cash |
7,832 |
23,319 |
65,777 |
41,885 |
34,496 |
|||||||||||||||
Definition |
Reason to use |
|
| Cash and cash equivalents plus interest-bearing securities (current and non-current) less borrowings (current and non-current).
|
A positive net cash position is one of the company’s capital targets. This creates financial flexibility and independence to operate and manage variations in working capital needs. |
Operating expenses excluding restructuring charges |
||||||||||||||||||||
SEK million |
2023 |
2022 |
2021 |
2020 |
2019 |
|||||||||||||||
Operating expenses |
–90,187 |
–83,030 |
–69,071 |
–66,280 |
–64,215 |
|||||||||||||||
Restructuring charges included in R&D expenses |
2,431 |
54 |
137 |
411 |
344 |
|||||||||||||||
Restructuring charges included in selling and administrative expenses |
1,288 |
150 |
139 |
170 |
117 |
|||||||||||||||
Operating expenses excluding restructuring charges |
–86,468 |
–82,826 |
–68,795 |
–65,699 |
–63,754 |
|||||||||||||||
Definition |
Reason to use |
|
| Operating expenses excluding restructuring charges. | Restructuring charges vary between years and in order to analyse trends in reported expenses over time, restructuring charges are excluded. |
Return on capital employed |
||||||||||||||||||||
SEK million |
2023 |
2022 |
2021 |
2020 |
2019 |
|||||||||||||||
EBIT (loss) |
–20,326 |
27,020 |
31,780 |
27,808 |
10,564 |
|||||||||||||||
Average capital employed |
||||||||||||||||||||
Capital employed at beginning of period |
202,899 |
184,283 |
161,990 |
165,273 |
149,615 |
|||||||||||||||
Capital employed at end of period |
177,965 |
202,899 |
184,283 |
161,990 |
165,273 |
|||||||||||||||
Average capital employed |
190,432 |
193,591 |
173,137 |
163,632 |
157,444 |
|||||||||||||||
Return on capital employed (%) |
–10.7% |
14.0% |
18.4% |
17.0% |
6.7% |
|||||||||||||||
Definition |
Reason to use |
|
| EBIT (loss) as a percentage of average capital employed (based on the amounts at January 1 and December 31). |
Return on capital employed is a measure of the profitability after taking into account the amount of capital used. A higher return on capital employed indicates a more efficient use of capital. |
|
|
||||
| 111 | Financial Report 2023 | Alternative performance measures | Ericsson Annual Report on Form 20-F 2023 | ||
Return on equity |
||||||||||||||||||||
SEK million |
2023 |
2022 |
2021 |
2020 |
2019 |
|||||||||||||||
Net income (loss) attributable to owners of the Parent Company |
–26,446 |
18,724 |
22,694 |
17,483 |
2,223 |
|||||||||||||||
Average stockholders’ equity |
||||||||||||||||||||
Stockholders’ equity, beginning of period 1)
|
134,814 |
108,775 |
86,674 |
82,559 |
86,729 |
|||||||||||||||
Stockholders’ equity, end of period |
98,673 |
134,814 |
108,775 |
86,674 |
82,559 |
|||||||||||||||
Average stockholders’ equity |
116,744 |
121,795 |
97,725 |
84,617 |
84,644 |
|||||||||||||||
Return on equity (%) |
–22.7% |
15.4% |
23.2% |
20.7% |
2.6% |
|||||||||||||||
|
1) |
For 2019, adjusted opening balance due to implementation of IFRS 16 “Leases.” |
Definition |
Reason to use |
|
| Net income (loss) attributable to owners of the Parent Company as a percentage of average stockholders’ equity (based on the amounts at January 1 and December 31). | Return on equity is a measure of the profitability in relation to the book value of shareholder equity. Return on equity is a measure of how investments are used to generate earnings growth. |
Sales growth adjusted for comparable units and currency |
||||||||||||||||||||
SEK million |
2023 |
2022 |
2021 |
2020 |
2019 |
|||||||||||||||
Net sales |
263,351 |
271,546 |
232,314 |
232,390 |
227,216 |
|||||||||||||||
Acquired/divested business |
–9,048 |
–7,015 |
–1,201 |
–1,362 |
–96 |
|||||||||||||||
Net FX impact |
–9,421 |
–25,968 |
11,607 |
7,796 |
–10,675 |
|||||||||||||||
Comparable net sales, excluding FX impact |
244,882 |
238,563 |
242,720 |
238,824 |
216,445 |
|||||||||||||||
Comparable net sales adjusted for acquired/divested business |
271,373 |
232,314 |
232,390 |
227,132 |
208,130 |
|||||||||||||||
Sales growth adjusted for comparable units and currency (%) |
–10% |
3% |
4% |
5% |
4% |
|||||||||||||||
Definition |
Reason to use |
|
| Sales growth adjusted for the impact of acquisitions and divestments as well as the effects of foreign currency fluctuations. Also named organic sales. | Ericsson’s presentation currency is SEK while the total revenues are mainly in other currencies. Reported sales growth is dependent on fluctuations in SEK versus other currencies and in addition acquired or divested business can have an impact on reported net sales. Sales growth adjusted for comparable units and currency shows the underlying sales development without these parameters. |
|
|
||||
| 112 | Financial Report 2023 | The Ericsson share | Ericsson Annual Report on Form 20-F 2023 | ||
|
Share trading on different market places (B shares and ADS) 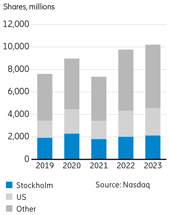 |
With the implementation of the Mifid directive in the EU, share trading became heavily fragmented across a large number of venues and trading categories. Trading on MTFs (multilateral trading facilities) and other venues gained market shares from stock exchanges such as Nasdaq Stockholm. In the last few years, following a series of merger and acquisitions among trading venues, trading has become more concentrated. According to Nasdaq, total trading in Ericsson B shares on all venues combined has increased over the past five years from 7.6 billion shares in 2019 to 10.2 billion shares in 2023. Over the same period, trading of Ericsson ADS in the US has increased from 1.5 billion shares in 2019 to 2.5 billion shares in 2023. |
The Ericsson share |
||||
Share/ADS listings |
||||
Nasdaq Stockholm |
||||
Nasdaq New York |
||||
| Share data | ||||
| Total number of shares in issue | 3,344,151,735 | |||
of which Class A shares, each carrying one vote 1)
|
261,755,983 |
|||
of which Class B shares, each carrying one tenth of one vote 1)
|
3,082,395,752 |
|||
| Ericsson treasury shares, Class B | 14,009,306 | |||
| Quotient value | SEK 5.00 | |||
| Market capitalization, December 31, 2023 | SEK 211 billion | |||
| ICB (Industry Classification Benchmark) | 9,500 | |||
1) |
Both classes of shares have the same rights of participation in the net assets and earnings. |
| Ticker codes | ||||
| Nasdaq Stockholm | ERIC A/ERIC B | |||
| Nasdaq New York | ERIC | |||
| Bloomberg Nasdaq Stockholm | ERICA SS/ERICB SS | |||
| Bloomberg Nasdaq | ERIC US | |||
| Reuters Nasdaq Stockholm | ERICa.ST/ERICb.ST | |||
| Reuters Nasdaq | ERIC.O | |||
| Changes in number of shares and capital stock 2019–2023 | ||||||||||
| Number of shares | Share capital (SEK) | |||||||||
| 2019 | December 31 | 3,334,151,735 | 16,670,758,678 | |||||||
| 2020 | December 31 | 3,334,151,735 | 16,670,758,678 | |||||||
| 2021 | December 31 | 3,334,151,735 | 16,670,758,678 | |||||||
| 2022 | December 31 | 3,334,151,735 | 16,670,758,678 | |||||||
| 2023 | May 2, new issue (Class C shares, later converted to Class B shares) 1)
|
10,000,000 | 50,000,000 | |||||||
| 2023 | December 31 | 3,344,151,735 | 16,720,758,678 | |||||||
|
1) |
The Annual General Meeting 2023 resolved to issue 10,000,000 Class C shares for the Long-Term Variable Compensation Programs LTV II 2023, LTV 2022 and LTV 2021 for Ericsson’s Executive Team and other executives. In accordance with an authorization from the AGM, the Board of Directors resolved to repurchase the new issued shares, which were subsequently converted into Class B shares. The quotient value of the repurchased shares was SEK 5, totaling SEK 50 million, representing less than 0.3% of capital stock. The acquisition cost was approximately SEK 50.2 million. |
Share performance indicators |
||||||||||||||||||||
2023 |
2022 |
2021 |
2020 |
2019 |
||||||||||||||||
Earnings (loss) per share, diluted (SEK) 1)
|
–7.94 |
5.62 |
6.81 |
5.26 |
0.67 |
|||||||||||||||
Dividend per share (SEK) 2)
|
2.70 |
2.70 |
2.50 |
2.00 |
1.50 |
|||||||||||||||
Total shareholder return (%) |
8 |
–36 |
4 |
22 |
6 |
|||||||||||||||
P/E ratio |
–8 |
11 |
15 |
19 |
122 |
|||||||||||||||
|
1) |
Calculated on average number of shares outstanding, diluted. |
|
2) |
For 2023 as proposed by the Board of Directors. |
|
|
||||
| 113 | Financial Report 2023 | The Ericsson share | Ericsson Annual Report on Form 20-F 2023 | ||
Share prices on Nasdaq Stockholm |
||||||||||||||||||||
(SEK) |
2023 |
2022 |
2021 |
2020 |
2019 |
|||||||||||||||
Class A at last day of trading |
63.80 |
66.00 |
100.20 |
105.40 |
85.40 |
|||||||||||||||
|
Class A high (Jan 12, 2023) |
73.00 |
118.40 |
128.80 |
119.00 |
96.80 |
|||||||||||||||
|
Class A low (Oct 17, 2023) |
50.00 |
63.50 |
91.90 |
64.10 |
74.70 |
|||||||||||||||
Class B at last day of trading |
63.11 |
60.90 |
99.79 |
99.98 |
81.56 |
|||||||||||||||
|
Class B high (Jan 12, 2023) |
68.50 |
117.32 |
121.80 |
110.15 |
96.74 |
|||||||||||||||
|
Class B low (Oct 30, 2023) |
48.53 |
58.81 |
91.00 |
59.54 |
74.02 |
|||||||||||||||
Share prices on Nasdaq New York |
||||||||||||||||||||
(USD) |
2023 |
2022 |
2021 |
2020 |
2019 |
|||||||||||||||
ADS at last day of trading |
6.30 |
5.84 |
10.87 |
11.95 |
8.78 |
|||||||||||||||
ADS high (Jan 12, 2023) |
6.43 |
12.78 |
15.32 |
12.20 |
10.46 |
|||||||||||||||
ADS low (Oct 27, 2023) |
4.33 |
5.16 |
9.93 |
6.15 |
7.58 |
|||||||||||||||
| Share prices on Nasdaq Stockholm and Nasdaq New York | ||||||||||||||||||||||||||||
| Nasdaq Stockholm | Nasdaq New York | |||||||||||||||||||||||||||
| SEK per Class A share | SEK per Class B share | USD per ADS 1)
|
||||||||||||||||||||||||||
| Period | High | Low | High | Low | High | Low | ||||||||||||||||||||||
Annual high and low |
||||||||||||||||||||||||||||
| 2019 | 96.80 | 74.70 | 96.74 | 74.02 | 10.45 | 7.58 | ||||||||||||||||||||||
| 2020 | 119.00 | 64.10 | 110.15 | 59.54 | 12.61 | 6.15 | ||||||||||||||||||||||
| 2021 | 128.80 | 91.90 | 121.80 | 91.00 | 15.32 | 9.93 | ||||||||||||||||||||||
| 2022 | 118.40 | 63.50 | 117.32 | 58.81 | 12.78 | 5.16 | ||||||||||||||||||||||
| 2023 | 73.00 | 50.00 | 68.50 | 48.53 | 6.43 | 4.33 | ||||||||||||||||||||||
Quarterly high and low |
||||||||||||||||||||||||||||
| 2022 First Quarter | 118.40 | 78.50 | 117.32 | 72.56 | 12.78 | 5.16 | ||||||||||||||||||||||
| 2022 Second Quarter | 97.00 | 76.00 | 94.77 | 72.60 | 9.80 | 7.26 | ||||||||||||||||||||||
| 2022 Third Quarter | 88.30 | 66.30 | 81.32 | 64.12 | 7.81 | 5.65 | ||||||||||||||||||||||
| 2022 Fourth Quarter | 77.00 | 63.50 | 73.56 | 58.81 | 6.82 | 5.16 | ||||||||||||||||||||||
| 2023 First Quarter | 73.00 | 60.40 | 68.50 | 54.96 | 6.43 | 5.22 | ||||||||||||||||||||||
| 2023 Second Quarter | 70.00 | 56.40 | 62.66 | 53.36 | 6.04 | 5.01 | ||||||||||||||||||||||
| 2023 Third Quarter | 63.00 | 53.10 | 59.62 | 49.79 | 5.75 | 4.74 | ||||||||||||||||||||||
| 2023 Fourth Quarter | 64.70 | 50.00 | 64.28 | 48.53 | 6.36 | 4.33 | ||||||||||||||||||||||
Monthly high and low |
||||||||||||||||||||||||||||
| August 2023 | 58.70 | 55.10 | 57.29 | 52.39 | 5.24 | 4.83 | ||||||||||||||||||||||
| September 2023 | 60.40 | 53.10 | 58.62 | 51.76 | 5.29 | 4.74 | ||||||||||||||||||||||
| October 2023 | 56.20 | 50.00 | 55.51 | 48.53 | 4.96 | 4.33 | ||||||||||||||||||||||
| November 2023 | 55.90 | 52.00 | 53.92 | 49.86 | 5.07 | 4.39 | ||||||||||||||||||||||
| December 2023 | 64.70 | 53.00 | 64.28 | 51.41 | 6.36 | 4.86 | ||||||||||||||||||||||
| January 2024 | 67.00 | 59.70 | 65.33 | 58.72 | 6.28 | 5.62 | ||||||||||||||||||||||
1) One ADS = 1 Class B share. |
Source: Nasdaq Stockholm and Nasdaq New York. | |||||||||||||||||||||||||||
|
|
||||
| 114 | Financial Report 2023 | The Ericsson share | Ericsson Annual Report on Form 20-F 2023 | ||
The Executive Team and Board members, ownership |
||||||||||||
|
Number of Class A shares |
Number of Class B shares |
Voting rights, percent |
||||||||||
The Executive Team and Board members (31 persons) |
0 |
2,464,565 |
0.4% |
|||||||||
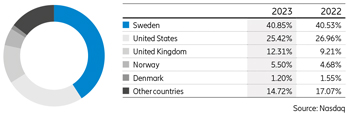
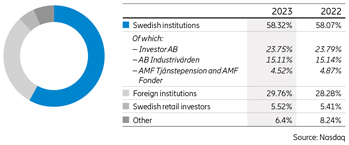
Number of shares 1)
|
||||||||||||||||||||||||
Holding |
No. of shareholders |
No. of A shares |
No. of B shares |
Percentage of share capital |
Percentage of voting rights |
Market value (MSEK) |
||||||||||||||||||
1–500 |
326,620 |
1,424,814 |
41,017,663 |
1.27% |
0.97% |
2,682 |
||||||||||||||||||
501–1,000 |
38,509 |
968,303 |
28,288,228 |
0.87% |
0.67% |
1,849 |
||||||||||||||||||
1,001–5,000 |
39,367 |
2,800,106 |
83,213,686 |
2.57% |
1.95% |
5,436 |
||||||||||||||||||
5,001–10,000 |
5,301 |
1,151,118 |
37,095,706 |
1.14% |
0.85% |
2,417 |
||||||||||||||||||
10,001–15,000 |
1,398 |
378,550 |
16,863,538 |
0.52% |
0.36% |
1,089 |
||||||||||||||||||
15,001–20,000 |
733 |
344,628 |
12,793,236 |
0.39% |
0.28% |
830 |
||||||||||||||||||
20,001– |
1,857 |
254,688,464 |
2,862,378,791 |
93.21% |
94.90% |
197,091 |
||||||||||||||||||
Total, December 31, 2023 2)
|
413,786 |
261,755,983 |
3,082,395,752 |
100% |
100% |
211,441 |
||||||||||||||||||
|
1) |
Source: Euroclear. |
|
2) |
Includes a nominee reporting discrepancy of 744,904 shares. |
| Largest shareholders December 31, 2023 and percentage of voting rights December 31, 2023, 2022 and 2021 | ||||||||||||||||||||||||||||||||
| Identity of person or group 1)
|
Number of Class A shares |
Of total Class A shares percent |
Number of Class B shares |
Of total Class B shares percent |
Of total Class A+B shares percent |
2023 Voting rights percent |
2022 Voting rights percent |
2021 Voting rights percent |
||||||||||||||||||||||||
| Investor AB | 120,762,803 | 46.14 | 145,982,932 | 4.74 | 7.98 | 23.75 | 23.79 | 23.79 | ||||||||||||||||||||||||
| AB Industrivärden | 86,052,615 | 32.88 | 1,000,000 | 0.03 | 2.60 | 15.11 | 15.14 | 15.14 | ||||||||||||||||||||||||
| AMF Tjänstepension and AMF Fonder | 20,650,000 | 7.89 | 50,892,267 | 1.65 | 2.14 | 4.52 | 4.87 | 4.36 | ||||||||||||||||||||||||
| Cevian Capital | 339,228 | 0.13 | 152,218,174 | 4,94 | 4.56 | 2.73 | 2.72 | 2.72 | ||||||||||||||||||||||||
| BlackRock Institutional Trust Company, N.A. | 0 | 0.00 | 137,894,228 | 4.47 | 4.12 | 2.42 | 2.41 | 2.41 | ||||||||||||||||||||||||
| Fidelity International | 0 | 0.00 | 202,719,471 | 6.58 | 6.06 | 3.56 | 2.16 | 1.05 | ||||||||||||||||||||||||
| AFA Försäkring AB | 11,555,100 | 4.41 | 3,805,747 | 0.12 | 0.46 | 2.09 | 2.14 | 2.05 | ||||||||||||||||||||||||
| Swedbank Robur Fonder AB (EX Folksam) | 7,695 | 0.00 | 107,105,167 | 3.47 | 3.20 | 1.88 | 1.97 | 2.24 | ||||||||||||||||||||||||
| The Vanguard Group, Inc. | 1,161,057 | 0.44 | 96,697,401 | 3.14 | 2.93 | 1.90 | 1.87 | 1.56 | ||||||||||||||||||||||||
| PRIMECAP Management Company | 0 | 0.00 | 54,905,971 | 1.78 | 1.64 | 0.96 | 1.45 | 1.86 | ||||||||||||||||||||||||
| Norges Bank Investment Management (NBIM) | 123,410 | 0.05 | 39,008,009 | 1.27 | 1.17 | 0.71 | 1.25 | 0.89 | ||||||||||||||||||||||||
| Livförsäkringsbolaget Skandia, ömsesidigt | 4,143,458 | 1.58 | 26,301,905 | 0.85 | 0.91 | 1.19 | 1.19 | 1.20 | ||||||||||||||||||||||||
| Tredje AP Fonden | 4,250,736 | 1.62 | 16,580,931 | 0.54 | 0.62 | 1.04 | 1.08 | 1.02 | ||||||||||||||||||||||||
| Handelsbanken Asset Management | 18,246 | 0.01 | 63,430,978 | 2.06 | 1.90 | 1.12 | 1.06 | 0.93 | ||||||||||||||||||||||||
| State Street Global Advisors (US) | 1,143 | 0.00 | 53,442,698 | 1.73 | 1.60 | 0.94 | 0.95 | 0.95 | ||||||||||||||||||||||||
| Others | 12,690,492 | 4.85 | 1,930,409,873 | 62.63 | 58.10 | 36.09 | 35.95 | 37.83 | ||||||||||||||||||||||||
Total |
261,755,983 |
100 |
3,082,395,752 |
100 |
100 |
100 |
100 |
100 |
||||||||||||||||||||||||
1) |
Source: Nasdaq |
|
|
||||
| 115 | Financial Report 2023 | The Ericsson share | Ericsson Annual Report on Form 20-F 2023 | ||
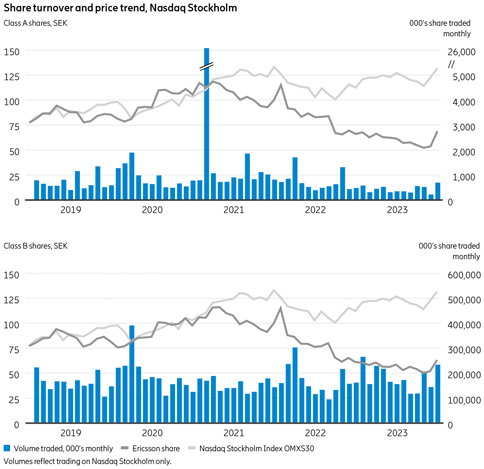
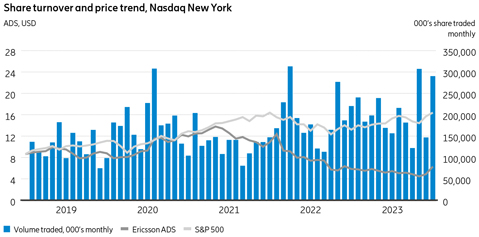
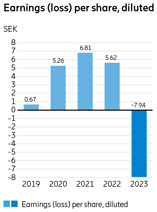
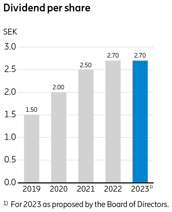
|
|
||||
| 116 | Financial Report 2023 | Shareholder information | Ericsson Annual Report on Form 20-F 2023 | ||
| – | March 12, 2024 |
| – | Q1, April 16, 2024 |
| – | Q2, July 12, 2024 |
| – | Q3, October 15, 2024 |
| – | Q4, January 25, 2025 |
| – | March, 2025 |
|
|
||||
| 117 | Financial Report 2023 | Financial terminology | Ericsson Annual Report on Form 20-F 2023 | ||
| Exchange rates in consolidation | ||||||||
| January–December | ||||||||
| 2023 | 2022 | |||||||
SEK/EUR |
||||||||
Average rate 1)
|
11.47 | 10.61 | ||||||
Closing rate |
11.09 | 11.08 | ||||||
SEK/USD |
||||||||
Average rate 1)
|
10.62 | 10.04 | ||||||
Closing rate |
10.01 | 10.38 | ||||||
1) For additional information of certain financial terms, see Alternative performance measures on pages 107–111 |
1) Average for the year for disclosure purpose only. Period income and expenses for each income statement are translated at period average exchange rates. |
|||
|
|
||||
| 118 | Financial Report 2023 | Glossary | Ericsson Annual Report on Form 20-F 2023 | ||

Corporate Governance report 2023 |
||||||
|
Introduction and Key 2023 Governance Updates |
2 |
|||||
Regulation |
3 |
|||||
Governance Structure and Core Values |
3 |
|||||
Ethics & Compliance |
5 |
|||||
Risk Management |
6 |
|||||
General Meetings of shareholders |
8 |
|||||
Nomination Committee |
8 |
|||||
Board of Directors |
9 |
|||||
Committees of the Board of Directors |
11 |
|||||
Remuneration to Board members |
13 |
|||||
Members of the Board of Directors |
14 |
|||||
Management |
18 |
|||||
Cybersecurity |
19 |
|||||
Members of the Executive Team |
20 |
|||||
Auditor |
25 |
|||||
Internal control over financial reporting |
25 |
|||||
|
This Corporate Governance report is rendered as a separate report added to the Financial Report in accordance with the Annual Accounts Act ((SFS 1995:1554) Chapter 6, Sections 6 and 8) and the Swedish Corporate Governance Code. The report has been reviewed by Ericsson’s auditor in accordance with the Annual Accounts Act. A report from the auditor is appended hereto. |
||||||
 |
||||
| 1 | Corporate Governance report 2023 | Ericsson Annual Report on Form 20-F 2023 | ||
|
|
||||
| 2 | Corporate Governance report 2023 | Ericsson Annual Report on Form 20-F 2023 |
| – | Empowers the business, enabling strategic execution and operational excellence; |
| – | Promotes and facilitates effective oversight across the organization by the Board of Directors (Board), the President and CEO, the Executive Team and at all levels of the organization; |
| – | Ensures high-quality decision-making with clear accountabilities at all levels; and |
| – | Instills a robust approach to risk management to effectively identify, manage and mitigate risks and capture opportunities. |
| – | Fully embedded the Material Group Risk Protocol and Business Risk Committee (BRC) into the Group’s governance and risk management frameworks, as described further below. |
| – | Introduced clarified Group governance and operating principles, to be rolled out in early 2024. |
| – | Refreshed and clarified the Company’s Code of Business Ethics (CoBE), which is being re-launched in early 2024. |
| – | Updated, streamlined and clarified the Group’s key policies and other guidance documents, including those on contracting, compliance, allegation assessment, investigations and remediation, and human rights. This work will continue into 2024. |
| – | Continued to embed various aspects of its compliance program into business operations, through a close partnership with the |
compliance function and stakeholders across the entire organization (as described further below in the Ethics & Compliance section). |
| – | Continued to strengthen performance-management at all levels of the organization while also implementing strong remediation measures where misconduct has occurred. |
| – | significant improvements made to Ericsson’s governance framework which has included enhanced Board and management oversight and strong, proactive risk management; |
| – | the effective integration of enhanced controls into Ericsson’s operations and decision-making; |
| – | emphasis on driving continuous cultural change with a focus on embedding integrity into Ericsson’s ways of working, fostering a culture of transparency, collaboration and open dialogue, sound and ethical business decisions, strong risk management; |
| – | implementation of employee training programs and providing Speak-Up resources to drive an integrity-led culture; and |
| – | significant testing of the E&C program’s effectiveness, simplification of policies, procedures and tools, an improved understanding of managing risks in business interactions, and digitalization. |
|
|
||||
| 3 | Corporate Governance report 2023 | Ericsson Annual Report on Form 20-F 2023 |
| – | The Swedish Companies Act. |
| – | Applicable EU regulations. |
| – | The Swedish Corporate Governance Code (the Code). |
| – | The Nasdaq Stock Market Rules, including the Nasdaq Nordic Main Market Rules for Issuers of Shares and applicable Nasdaq New York corporate governance requirements (subject to certain exemptions principally reflecting mandatory Swedish legal requirements). |
| – | Applicable requirements of the US Securities and Exchange Commission (SEC). |
| – | The Code of Business Ethics. |
| – | The Code of Conduct for Business Partners. |
| – | Material Group Risk Protocol. |
| – | A set of core Group policies necessary to operate the Group’s business and satisfy its internal and relevant external standards. Each policy establishes the requirements and expectations for Ericsson and its employees. |
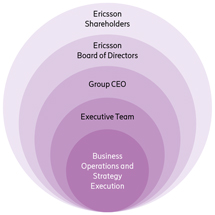
|
|
||||
| 4 | Corporate Governance report 2023 | Ericsson Annual Report on Form 20-F 2023 |
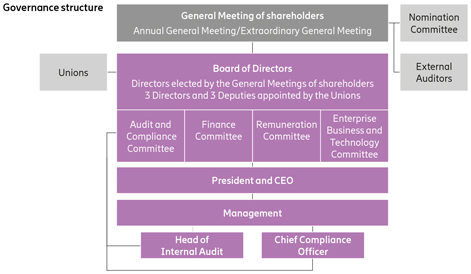
|
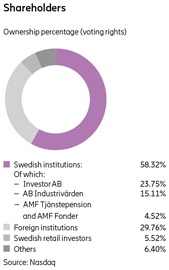
|
Contact the Board of Directors |
Annual General Meeting 2024 |
|
Telefonaktiebolaget LM Ericsson |
Ericsson’s AGM 2024 is expected to be held on April 3, 2024. Further | |
The Board of Directors Secretariat |
information is available on Ericsson’s website. | |
SE-164 83 Stockholm, Sweden |
||
boardsecretariat@ericsson.com |
||
|
|
||||
| 5 | Corporate Governance report 2023 | Ericsson Annual Report on Form 20-F 2023 |
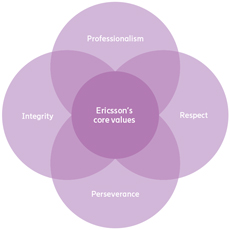 |
Ericsson’s core values The Company’s core values are the touchstones of its culture. They guide employees’ daily work, in how they relate to each other and the world around them and in the way the Company does business. As Ericsson executes its strategy, people are the foundation–embracing and carrying forward the core values of professionalism, perseverance, respect and integrity. At Ericsson, the satisfaction and well-being of employees is both consistent with its core values and a key element of its ability to compete and succeed in future. |
|
|
||||
| 6 | Corporate Governance report 2023 | Ericsson Annual Report on Form 20-F 2023 |
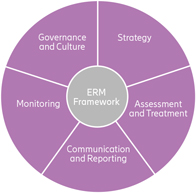
|
|
||||
| 7 | Corporate Governance report 2023 | Ericsson Annual Report on Form 20-F 2023 |
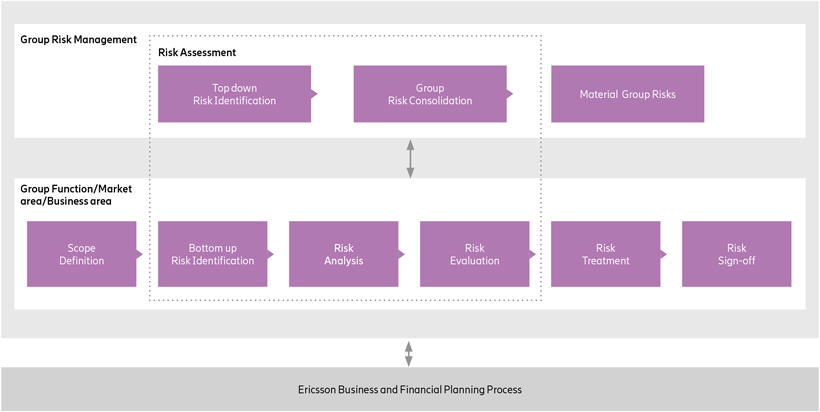
|
|
||||
| 8 | Corporate Governance report 2023 | Ericsson Annual Report on Form 20-F 2023 |
| – | Discharge of Carolina Dybeck Happe and Annika Salomonsson from liability for the financial year 2022. Shareholders representing more than 85% of the Company’s share capital also voted for discharging from liability for each of the other members of the Board and the Company’s President and CEO for the financial year 2022. More than 10% voted against such discharging. |
| – | Payment of a dividend of SEK 2.70 per share to be paid in two installments. |
| – | Election of Jan Carlson as new Chair of the Board of Directors. |
| – | Re-election of the following members of the Board of Directors: Jon Fredrik Baksaas, Jan Carlson, Carolina Dybeck Happe, Eric A. Elzvik, Börje Ekholm, Kristin S. Rinne, Helena Stjernholm and Jacob Wallenberg. |
| – | New election of the following members of the Board of Directors: Jonas Synnergren and Christy Wyatt. |
| – | Approval of Board of Directors’ fees, in accordance with the Nomination Committee’s proposal: |
| – | Chair: SEK 4,500,000 (previously SEK 4,375,000) |
| – | Other non-employee Board members: SEK 1,140,000 each (previously SEK 1,100,000) |
| – | Chair of the Audit and Compliance Committee: SEK 495,000 (previously SEK 475,000) |
| – | Other non-employee members of the Audit and Compliance Committee: SEK 285,000 each (previously SEK 275,000) |
| – | Chairs of the Finance Committee, the Remuneration Committee and the Enterprise and Technology Committee: SEK 210,000 each (previously SEK 205,000) |
| – | Other non-employee members of the Finance Committee, the Remuneration Committee and the Enterprise and Technology Committee: SEK 185,000 each (previously SEK 180,000) |
| – | Approval for part of the Board members’ fees to be paid in the form of synthetic shares. |
| – | Re-appointment of Deloitte AB as auditor for the period up until the end of the AGM 2024 and approval of the auditor fee. |
| – | Implementation of the Long-Term Variable Compensation Programs (LTV) I and II 2023, including a share issue of and authorization to the Board to buy back 5,900,000 shares for the LTV II 2023. |
| – | Approval of a share issue of and authorization to the Board to buy back 4,100,000 shares for the LTV 2021 and LTV 2022. |
| – | Johan Forssell (appointed by Investor AB), Chair of the Nomination Committee. |
| – | Bengt Kjell (replaced Karl Åberg on November 30, 2023) (appointed by AB Industrivärden). |
| – | Anders Oscarsson (appointed by AMF Tjänstepension and AMF Fonder). |
| – | Christer Gardell (appointed by Cevian Capital Partners Limited). |
| – | Jan Carlson (the Chair of the Board of Directors). |
|
Contact the Nomination Committee Telefonaktiebolaget LM Ericsson The Nomination Committee c/o The Board of Directors Secretariat SE-164 83 StockholmSweden nomination.committee@ericsson.com |
Proposals to the Nomination Committee Shareholders may submit proposals to the Nomination Committee at any time, but should do so in due time before the AGM to ensure that the proposals can be considered by the Nomination Committee. Further information is available on Ericsson’s website. |
|||||||
|
|
||||
| 9 | Corporate Governance report 2023 | Ericsson Annual Report on Form 20-F 2023 |
| – | Remuneration to non-employee Board members elected by the AGM and remuneration of the auditor. |
| – | Appointment of auditor, whereby candidates are selected in cooperation with the Audit and Compliance Committee of the Board. |
| – | Election of Chair at the AGM. |
| – | Changes to the Instruction for the Nomination Committee (if any). |
|
The Board’s annual work cycle 2023 The annual cycle applied to the Board’s work allows the Board to appropriately address its duties during the year. It also facilitates the organization in aligning its global processes to allow appropriate Board involvement. |
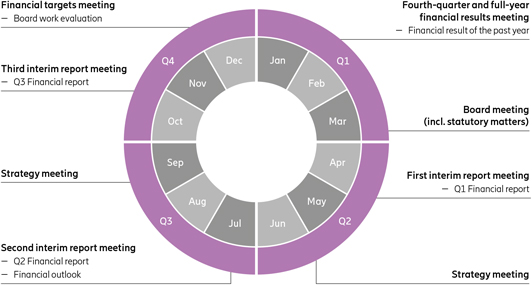 |
|
|
||||
| 10 | Corporate Governance report 2023 | Ericsson Annual Report on Form 20-F 2023 |
– |
Fourth-quarter and full-year financial results meeting |
Following the end of the calendar year, the Board held a meeting that focused on the financial results of the entire year 2022 and handled the fourth-quarter financial report. |
– |
Board meeting (including statutory matters) |
A Board meeting was held in connection with the AGM 2023. Members of each of the Board Committees were appointed and the Board resolved on signatory powers. |
– |
First interim report meeting |
At the first interim report meeting, the Board addressed the interim financial report for the first quarter of the year. |
– |
Strategy meeting |
A Board meeting was held to address particular strategic matters in further detail. |
– |
Second interim report meeting |
At the second interim report meeting, the Board addressed the interim financial report for the second quarter of the year and the financial outlook. |
– |
Strategy meeting |
A Board meeting was held, in essence dedicated to short-term and long-term strategies of the Group, with particular focus on merger and acquisitions. |
– |
Third interim report meeting |
At the third interim report meeting, the Board addressed the interim financial report for the third quarter of the year. |
– |
Financial targets meeting |
A Board meeting was held for the Board to address the financial targets. At this meeting, the results of the Board evaluation were presented to and discussed by the Board. |
Board of Directors |
||||||
|
13 Board members |
||||||
|
Audit and Compliance Committee (4 Board members) Oversight of financial reporting Oversight of internal control Oversight of auditing Oversight of the Group’s Ethics and Compliance program Oversight of risk management |
Finance Committee (4 Board members) Finance strategy |
Remuneration Committee (4 Board members) Guidelines for remuneration to Group management Long-Term Variable Remuneration Executive remuneration |
Enterprise Business and Technology Committee (4 Board members) Enterprise business and technology strategy and planning Technology ecosystem and partnerships Science direction |
|||
|
|
||||
| 11 | Corporate Governance report 2023 | Ericsson Annual Report on Form 20-F 2023 |
| – | The scope and correctness of the financial statements |
| – | Compliance with legal and regulatory requirements |
| – | Internal control over financial reporting |
| – | Risk management |
| – | The effectiveness, appropriateness and implementation of the Group’s compliance programs, including the E&C Program. |
|
Members of the Committees of the Board of Directors |
||||||
|
Audit and Compliance Committee Eric A. Elzvik (Chair) Jon Fredrik Baksaas Annika Salomonsson Jonas Synnergren |
Finance Committee Jan Carlson (Chair) Ulf Rosberg Helena Stjernholm Jacob Wallenberg |
Remuneration Committee Jan Carlson (Chair) Kristin S. Rinne Kjell-Åke Soting Jonas Synnergren |
Enterprise Business and Technology Committee Jon Fredrik Baksaas (Chair) Ulf Rosberg Kristin S. Rinne Christy Wyatt |
|||
|
|
||||
| 12 | Corporate Governance report 2023 | Ericsson Annual Report on Form 20-F 2023 |
| – | Reviewing and preparing, for resolution by the Board, proposals on salary and other remuneration, including retirement compensation, for the President and CEO. |
| – | Reviewing and preparing, for resolution by the Board, proposals to the AGM on Guidelines for remuneration to the Executive Team. |
| – | Reviewing and preparing, for resolution by the Board, proposals to the AGM on the Long-Term Variable Compensation Program (LTV) and similar equity arrangements. |
| – | Approving proposals on salary and other remuneration, including retirement compensation, for the members of the Executive Team (other than the President and CEO). |
| – | Approving proposals on target levels for the short-term variable compensation (STV) for the members of the Executive Team (other than the President and CEO). |
| – | Approving pay-out of the STV for the members of the Executive Team members (other than the President and CEO), based on achievements and performance. |
|
|
||||
| 13 | Corporate Governance report 2023 | Ericsson Annual Report on Form 20-F 2023 |
| – | Reviewing and preparing for consideration and/or resolution by the Board proposals on the enterprise business and technology matters of key importance to the Board of Directors. |
| – | Reviewing and preparing for consideration and/or resolution by the Board proposals for overall direction of the technology and industry strategy for the Group to ensure technology leadership and world class R&D. |
| – | Reviewing and preparing for consideration and/or resolution by the Board, matters related to science direction and influence on a geopolitical level. |
| – | Radio and core network evolution |
| – | Enterprise networking and security solutions |
| – | Application programming interfaces (API) for telecom networks |
| – | Artificial Intelligence |
| – | Ericsson Research and Development status and direction |
| Board members’ attendance and fees 2023 | ||||||||||||||||||||||||||||
| Fees resolved by the AGM 2023 | Number of Board/Committee meetings attended in 2023 11)
|
|||||||||||||||||||||||||||
| Board member | |
Board fees, SEK |
1) |
|
Committee fees, SEK |
|
Board | |
Audit and Compliance Committee |
|
|
Finance Committee |
|
|
Remuner- ation Com- mittee |
|
|
Enterprise Business and Technology Committee |
|
|||||||||
| Jan Carlson | 4,500,000 | 420,000 | 27 | 3 | 4 | 9 | 1 | |||||||||||||||||||||
| Jacob Wallenberg | 1,140,000 | 185,000 | 25 | 5 | ||||||||||||||||||||||||
| Jon Fredrik Baksaas | 1,140,000 | 495,000 | 27 | 9 | 4 | 3 | ||||||||||||||||||||||
Nora Denzel 4)
|
– | – | 6 | |||||||||||||||||||||||||
| Carolina Dybeck Happe | 1,140,000 | – | 27 | |||||||||||||||||||||||||
| Börje Ekholm | – |
2) |
– | 25 | ||||||||||||||||||||||||
| Eric A. Elzvik | 1,140,000 | 495,000 | 27 | 13 | ||||||||||||||||||||||||
|
Kurt Jofs 4)
|
– | – | 9 | 3 | 4 | 1 | ||||||||||||||||||||||
|
Ronnie Leten 4)
|
– | – | 9 | 1 | 4 | |||||||||||||||||||||||
| Kristin S. Rinne | 1,140,000 | 370,000 | 25 | 9 | 4 | |||||||||||||||||||||||
| Helena Stjernholm | 1,140,000 | 185,000 | 27 | 5 | ||||||||||||||||||||||||
| Jonas Synnergren 5)
|
1,140,000 | 470,000 | 19 | 10 | 9 | |||||||||||||||||||||||
| Christy Wyatt 5)
|
1,140,000 | 185,000 | 19 | 3 | ||||||||||||||||||||||||
|
Torbjörn Nyman 6)
|
25,500 |
3) |
11,700 |
3) |
14 | 7 | ||||||||||||||||||||||
|
Anders Ripa 7)
|
23,250 |
3) |
6,900 |
3) |
13 | 2 | 2 | |||||||||||||||||||||
| Ulf Rosberg 8)
|
54,750 |
3) |
9,000 | 27 | 3 | 2 | ||||||||||||||||||||||
| Kjell-Åke Soting | 54,750 |
3) |
20,400 |
3) |
27 | 11 | ||||||||||||||||||||||
| Annika Salomonsson 9)
|
54,750 |
3) |
14,400 | 27 | 8 | |||||||||||||||||||||||
| Loredana Roslund | 54,750 |
3) |
– | 27 | ||||||||||||||||||||||||
| Frans Frejdestedt 10)
|
29,250 | – | 13 | |||||||||||||||||||||||||
| Stefan Wänstedt 10)
|
29,250 | – | 13 | |||||||||||||||||||||||||
Total number of meetings |
27 |
13 |
5 |
13 |
4 |
|||||||||||||||||||||||
|
1) |
Non-employee Directors can choose to receive part of their Board fee (exclusive of Committee fees) in the form of synthetic shares. |
|
2) |
Board member remuneration resolved by the AGM is only for non-employee Directors elected by the shareholders. |
|
3) |
Employee representative Board members and their deputies are not entitled to a Board fee, but instead get paid compensation in the amount of SEK 2,250 per attended Board meeting and SEK 1,800 per attended Committee meeting. Until March 2023, the compensation was SEK 1,500 per attended Board meeting and SEK 1,500 per attended Committee meeting. |
|
4) |
Resigned from the Board of Directors in connection with the AGM held on March 29, 2023. |
|
5) |
Elected member of the Board of Directors at the AGM held on March 29, 2023. |
|
6) |
Resigned as employee representative Board member as of July 31, 2023. |
|
7) |
Resigned as employee representative Board member as of July 4, 2023. |
|
8) |
Appointed employee representative Board member as of July 4, 2023, previously deputy employee representative Board member. |
|
9) |
Appointed employee representative Board member as of July 31, 2023, previously deputy employee representative Board member. |
|
10) |
Appointed deputy employee representative Board members as of September 1, 2023. |
|
11) |
This table reflects the attendance of Board members who are formal members of the Committee at the relevant Committee meetings. |
|
|
||||
| 14 | Corporate Governance report 2023 | Ericsson Annual Report on Form 20-F 2023 | ||
 |
 |
 |
 |
|||||||||
|
Jan Carlson Chair of the Board of Directors since 2023, Chair of the Finance Committee and of the Remuneration Committee |
Jacob Wallenberg Deputy Chair of the Board of Directors, Member of the Finance Committee |
Jon Fredrik Baksaas Chair of the Enterprise Business and Technology Committee, Member of the Audit and Compliance Committee |
Carolina Dybeck Happe Member of the Board |
|||||||||
First elected |
First elected |
First elected |
First elected |
|||||||||
| 2017 | 2011 | 2017 | 2022 | |||||||||
Born |
Born |
Born |
Born |
|||||||||
| 1960 | 1956 | 1954 | 1972 | |||||||||
Education |
Education |
Education |
Education |
|||||||||
| Master of Science degree in Engineering Physics and Electrical Engineering, Linköping University, Sweden. | Bachelor of Science in Economics and Master of Business Administration, Wharton School, University of Pennsylvania, USA. Officer of the Reserve, Swedish Navy. | Master of Science in Economics (Siviløkonom), NHH Norwegian School of Economics and Business Administration, Norway. | Master of Science in Business and Economics, Uppsala University, Sweden. | |||||||||
Nationality |
Nationality |
Nationality |
Nationality |
|||||||||
| Sweden | Sweden | Norway | Sweden | |||||||||
Board Chair |
Board Chair |
Board Chair |
Board Chair |
|||||||||
| Autoliv Inc. |
Investor AB and the Confederation of Swedish Enterprise |
DNV GL Group AS | – | |||||||||
Deputy Board Chair |
||||||||||||
| ABB Ltd., FAM, Patricia Industries and Wallenberg Investments AB | ||||||||||||
Board Member |
Board Member |
Board Member |
Board Member |
|||||||||
| AB Volvo | The Knut and Alice Wallenberg Foundation | Svenska Handelsbanken AB | – | |||||||||
Holdings in Ericsson |
Holdings in Ericsson |
Holdings in Ericsson |
Holdings in Ericsson |
|||||||||
| 7,900 Class B shares 1) and 34,041 synthetic shares 2)
|
427,703 Class B shares 1) and 34,041 synthetic shares 2)
|
25,391 synthetic shares 2)
|
36,100 Class B shares 1) and 10,003 synthetic shares 2)
|
|||||||||
Principal work experience and other information |
Principal work experience and other information |
Principal work experience and other information |
Principal work experience and other information |
|||||||||
| Chair and President and CEO of Veoneer Inc. (2018-2022). President and CEO of Autoliv Inc. (2007–2018) and Chair of Autoliv Inc. since 2014. Previous positions within the Autoliv Group since 1999, including President Autoliv Europe, Vice President Engineering of Autoliv and President Autoliv Electronics. Previous positions include President of Saab Combitech and of Swedish Gate Array. Honorary Doctor at the Technical faculty of Linköping University. | Chair of the Board of Investor AB since 2005. President and CEO of SEB in 1997 and Chair of SEB’s Board of Directors (1998–2005). Executive Vice President and CFO of Investor AB (1990–1993). Honorary Chair of IBLAC (Mayor of Shanghai’s International Business Leaders Advisory Council) and member of the steering committee of the European Round Table of Industrialists, Deputy Chair of the Swedish-American Chamber of Commerce US, member of the International Advisory Board of the Atlantic Council, Washington DC, member of the International Business Council of the World Economic Forum, Trilateral Commission and the Advisory Board of Tsinghua Management School. | President and CEO of Telenor Group (2002–2015). Previous positions within the Telenor Group since 1989, including Deputy CEO, CFO and CEO of TBK AS. Positions before Telenor include CFO of Aker AS, finance director of Stolt Nielsen Seaway AS and controller at Det Norske Veritas, Norway and Japan. Member of the GSMA Board (2008–2016) and Chair of the GSMA Board (2014–2016). | SVP of GE since 2020, CFO of GE (2020 – 2023). Group CFO of A.P. Moller - Maersk A/S (2019–2020). Group CFO of ASSA ABLOY (2012–2018) as well as CFO for Europe, the Middle East and Africa (2007–2011) and CFO for Central Europe (2002–2006). Group CFO of Trelleborg Group (2011–2012). CFO of Establish (2000–2002). Various positions at EF Education First (1996–1999). | |||||||||
|
1) |
The number of shares and ADS includes holdings by related persons, if applicable. |
|
2) |
Since 2008, the AGM has each year resolved that part of the Board fee may be received in the form of synthetic shares. A synthetic share is a right to receive in the future a payment corresponding to the value of the Class B share in Ericsson at the time of payment. Please see page 13 for further information. |
|
|
||||
| 15 | Corporate Governance report 2023 | Ericsson Annual Report on Form 20-F 2023 | ||
 |
 |
 |
 |
|||||||||
Börje Ekholm |
Eric A. Elzvik |
Kristin S. Rinne |
Helena Stjernholm |
|||||||||
| President, CEO and Member of the Board | Chair of the Audit and Compliance Committee | Member of the Remuneration Committee and of the Enterprise Business and Technology Committee | Member of the Finance Committee | |||||||||
First elected |
First elected |
First elected |
First elected |
|||||||||
| 2006 | 2017 | 2016 | 2016 | |||||||||
Born |
Born |
Born |
Born |
|||||||||
| 1963 | 1960 | 1954 | 1970 | |||||||||
Education |
Education |
Education |
Education |
|||||||||
| Master of Science in Electrical Engineering, KTH Royal Institute of Technology, Stockholm, Sweden. Master of Business Administration, INSEAD, France. | Master of Business Administration, Stockholm School of Economics, Sweden. | Bachelor of Arts, Washburn University, USA. | Master of Business Administration, Stockholm School of Economics, Sweden. | |||||||||
Nationality |
Nationality |
Nationality |
Nationality |
|||||||||
| Sweden and USA | Sweden and Switzerland | USA | Sweden | |||||||||
Board Chair |
Board Chair |
Board Chair |
Board Chair |
|||||||||
| Trimble Inc. | Global Connect Group and Deutsche Glasfaser Group | – | – | |||||||||
Board Member |
Board Member |
Board Member |
Board Member |
|||||||||
| – | Landis+Gyr Group AG and AB Volvo | Synchronoss | AB Industrivärden, AB Volvo and Sandvik AB | |||||||||
Holdings in Ericsson |
Holdings in Ericsson |
Holdings in Ericsson |
Holdings in Ericsson |
|||||||||
| 260,351 Class B shares, 1,009,000 ADS 1) and 2,000,000 call options 3)
|
10,000 Class B shares 1) and 11,345 synthetic shares 2)
|
16,913 synthetic shares 2)
|
20,000 Class B shares 1) and 22,693 synthetic shares 2)
|
|||||||||
Principal work experience and other information |
Principal work experience and other information |
Principal work experience and other information |
Principal work experience and other information |
|||||||||
| President and CEO of Telefonaktiebolaget LM Ericsson since 2017. CEO of Patricia Industries, a division within Investor AB (2015–2017). President and CEO of Investor AB (2005–2015). Former Head of Investor Growth Capital Inc. and New Investments. Previous positions at Novare Kapital AB and McKinsey & Co Inc. Holds honorary Doctorate at KTH Royal Institute of Technology, Sweden. Since 2017, member of the Steering Committee of the World Economic Forum Digital Communication Governors. Member of the Board of the Swedish-American Chamber of Commerce New York. |
CFO and member of the Group Executive Committee of ABB Ltd (2013–2017). Division CFO ABB Discrete Automation & Motion (2010–2012) and division CFO Automation Products Division (2006–2010). Previous positions within the ABB Group since 1984, including senior management positions within finance, M&A and new ventures. Currently, senior industrial advisor to EQT. |
Previously Senior Vice President, Network Technology, Network Architecture and Planning, at AT&T (2007–2014). CTO of Cingular Wireless (2005–2007) and VP Technology and New Product Development of Cingular Wireless (2000–2005). Previous positions within Southwestern Bell and SBC (1976–2000). Trustee of Washburn University Foundation. Member of the Advisory Board of Link Labs. Honorary Doctorate of Science, Washburn University, USA. | President and CEO of AB Industrivärden since 2015. Partner in the private equity firm IK Investment Partners (2008–2015). Investment Manager at IK Investment Partners (1998–2008). Previous experience as consultant for Bain & Company (1997–1998). | |||||||||
|
1) |
The number of shares and ADS includes holdings by related persons, if applicable. |
|
2) |
Since 2008, the AGM has each year resolved that part of the Board fee may be received in the form of synthetic shares. A synthetic share is a right to receive in the future a payment corresponding to the value of the Class B share in Ericsson at the time of payment. Please see page 13 for further information. |
|
3) |
Call options issued by AB Industrivärden (1,000,000 call options) and Investor AB (1,000,000 call options), each entitling the purchase of one Ericsson B share from AB Industrivärden/Investor AB respectively (further information is available in the Notes to the consolidated financial statements – note G2 “Information regarding members of the Board of Directors and Group management” in the Financial Report). |
|
|
||||
| 16 | Corporate Governance report 2023 | Ericsson Annual Report on Form 20-F 2023 | ||
 |
 |
|||||||||||
Jonas Synnergren |
Christy Wyatt |
|||||||||||
| Member of the Audit and Compliance Committee and of the Remuneration Committee | Member of the Enterprise Business and Technology Committee | |||||||||||
First elected |
First elected |
|||||||||||
| 2023 | 2023 | |||||||||||
Born |
Born |
|||||||||||
| 1977 | 1972 | |||||||||||
Education |
Education |
|||||||||||
| Master of Science in Business and Economics, Stockholm School of Economics, Sweden | Diploma, Scientific Computer Programming Technology, College of Geographic Sciences, Canada | |||||||||||
Nationality |
Nationality |
|||||||||||
| Sweden | Canada and USA | |||||||||||
Board Chair |
Board Chair |
|||||||||||
| – | – | |||||||||||
Board Member |
Board Member |
|||||||||||
| Nordea Oyj | Silicon Laboratories Inc. and Absolute Software Corporation | |||||||||||
Holdings in Ericsson |
Holdings in Ericsson |
|||||||||||
| – | – | |||||||||||
Principal work experience and other information |
Principal work experience and other information |
|||||||||||
| Senior Partner at Cevian Capital AB since 2020. Various positions within Cevian Capital AB since 2007, including Head of Cevian’s Swedish office since 2012. Various positions at The Boston Consulting Group AB (2000–2006). | President and CEO Absolute Software since 2018, which was recently taken private 4) . President and CEO of DTEX Systems (2016–2018). President and CEO (2013–2015) as well as Chair (2014–2015) of Good Technology (now BB). Global Head, Consumer eBusiness and Mobile Technology at Citigroup (2012). Various positions at Motorola (2005–2011), including SVP, Ecosystem and GM, Enterprise Business. Director, Developer Relations at Apple (2003–2005). Various positions at Palm (1999–2003), at Sun Microsystems JavaSoft (1995–1999) and at Esri (1994–1995). Member of the Board in Quotient (2018–2022). |
Ronnie Leten, Nora Denzel and Kurt Jofs resigned from the Board of Directors in connection with the AGM 2023 on March 29, 2023. Börje Ekholm was the only Director who held an operational management position at Ericsson in 2023. |
||||||||||
|
4) |
Completion of the take-private acquisition of Absolute Software by an affiliate of Crosspoint Capital Partners was announced on July 27, 2023. |
|
|
||||
| 17 | Corporate Governance report 2023 | Ericsson Annual Report on Form 20-F 2023 | ||
 |
 |
 |
||||||||||
Ulf Rosberg |
Kjell-Åke Soting |
Annika Salomonsson |
||||||||||
| Employee representative since July 4, 2023 (former Deputy), Member of the Finance Committee and of the Enterprise Business and Technology Committee | Employee representative, Member of the Remuneration Committee | Employee representative since July 31, 2023 (former Deputy), Member of the Audit and Compliance Committee | ||||||||||
First appointed |
First appointed |
First appointed |
||||||||||
| 2021 | 2016 | 2022 | ||||||||||
Born |
Born |
Born |
||||||||||
| 1964 | 1963 | 1972 | ||||||||||
Appointed by |
Appointed by |
Appointed by |
||||||||||
| PTK | PTK | LO | ||||||||||
Nationality |
Nationality |
Nationality |
||||||||||
| Sweden | Sweden | Sweden | ||||||||||
Holdings in Ericsson |
Holdings in Ericsson |
Holdings in Ericsson |
||||||||||
| 110 Class B shares 1)
|
10,065 Class B shares 1)
|
1,998 Class B shares 1)
|
||||||||||
Employed since |
Employed since |
Employed since |
||||||||||
| 1985 Working as System Developer within R&D, Business Area Networks |
1996 Working as Global SQA Manager within Business Area Networks |
1997–2003 and since 2005. Working as Verification Engineer | ||||||||||
 |
 |
 |
||||||||||
Loredana Roslund |
Frans Frejdestedt |
Stefan Wänstedt |
||||||||||
| Employee representative – Deputy | Employee representative – Deputy since September 1, 2023 | Employee representative – Deputy since September 1, 2023 | ||||||||||
First appointed |
First appointed |
First appointed |
||||||||||
| 2017 | 2023 | 2023 | ||||||||||
Born |
Born |
Born |
||||||||||
| 1967 | 1979 | 1964 | ||||||||||
Appointed by |
Appointed by |
Appointed by |
||||||||||
| PTK | PTK | LO | ||||||||||
Nationality |
Nationality |
Nationality |
||||||||||
| Sweden | Sweden | Sweden | ||||||||||
Holdings in Ericsson |
Holdings in Ericsson |
Holdings in Ericsson |
||||||||||
| 2,422 Class B shares 1)
|
– | 3,235 Class B shares 1)
|
||||||||||
Employed since |
Employed since |
Employed since |
||||||||||
| 1994 Working as Project Manager within R&D, Business Area Networks |
2008 Working as R&D manager within Business Area Cloud Software and Services |
1999 Working as a Senior Researcher |
Anders Ripa was employee representative until July 4, 2023. Torbjörn Nyman was employee representative until July 31, 2023. | |||||||||
|
1) |
The number of shares reflects ownership as of December 31, 2023 and includes holdings by related persons, if applicable. |
|
|
||||
| 18 | Corporate Governance report 2023 | Ericsson Annual Report on Form 20-F 2023 | ||
| – | Defining Group strategies and policies, driving the corporate strategy and establishing and maintaining the corporate culture. |
| – | Group-wide oversight and ensuring an effective framework for risk management and decision-making (including through the implementation of effective governance, a strong compliance program and related internal controls). |
| – | Managing and executing on “central” corporate matters (ranging from managing Ericsson’s capital structure, financing and other corporate transactions, listing compliance and disclosure obligations). |
| – | Group financial management and reporting (including determining targets for operational units, allocating resources and monitoring market area and business area performance). |
| – | Leading on operational excellence, performance management and realizing global synergies through efficient organization of the Group. |
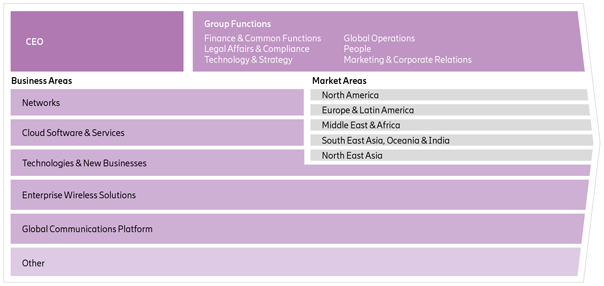
|
|
||||
| 19 | Corporate Governance report 2023 | Ericsson Annual Report on Form 20-F 2023 | ||
|
|
||||
| 20 | Corporate Governance report 2023 | Ericsson Annual Report on Form 20-F 2023 | ||
 |
 |
 |
 |
|||||||||
Börje Ekholm |
Fredrik Jejdling |
MajBritt Arfert |
Yossi Cohen |
|||||||||
| President and Chief Executive Officer (CEO) (since 2017) |
Executive Vice President, Business Area Networks (since 2017) |
Senior Vice President, Chief People Officer (CPO) (since 2017) | Senior Vice President Market Area North America (since February 2024) | |||||||||
Functions |
Functions |
Functions |
Functions |
|||||||||
| President and CEO and Head of Segment Enterprise | Head of Business Area Networks and Head of Segment Networks | Head of Group Function People | Head of Market Area North America | |||||||||
Born |
Born |
Born |
Born |
|||||||||
| 1963 | 1969 | 1963 | 1971 | |||||||||
Education |
Education |
Education |
Education |
|||||||||
| Master of Science in Electrical Engineering, KTH Royal Institute of Technology, Sweden. Master of Business Administration, INSEAD, France. | Master of Science in Economics and Business Administration, Stockholm School of Economics, Sweden. | Bachelor of Human Resources, University of Gothenburg, Sweden. | Bachelor of Business Administration, University of West London. Diploma in Electronic Technical Engineering from Mosenson Elite academy, Israel. | |||||||||
Nationality |
Nationality |
Nationality |
Nationality |
|||||||||
| Sweden and USA | Sweden | Sweden | Israel and USA | |||||||||
Board Member: |
Board Member |
Board Member |
Board Member |
|||||||||
| Telefonaktiebolaget LM Ericsson and Trimble Inc. (Chair) |
Teknikföretagen and the Confederation of Swedish Enterprise |
– | MediaKind | |||||||||
Holdings in Ericsson 1)
|
Holdings in Ericsson 1)
|
Holdings in Ericsson 1)
|
Holdings in Ericsson 1)
|
|||||||||
|
260,351 Class B shares, 1,009,000 ADS and 2,000,000 call options 2) . |
74,126 Class B shares. | 53,218 Class B shares. | - | |||||||||
Background |
Background |
Background |
Background |
|||||||||
| CEO of Patricia Industries, a division within Investor AB (2015–2017). President and CEO of Investor AB (2005–2015). Formerly Head of Investor Growth Capital Inc. and New Investments. Previous positions at Novare Kapital AB and McKinsey & Co Inc. Since 2017, member of the Steering Committee of the World Economic Forum Digital Communication Governors. Member of the Board of the Swedish- American Chamber of Commerce New York. | Senior Vice President and Head of Business Unit Network Services (2016–2017). Has held a variety of positions in commercial operations and financials, including Head of Region Sub-Saharan Africa, Head of Region India, and Head of Sales and Finance for Business Unit Global Services. Previous positions include senior positions with LUX Asia Pacific and Tele2 Group. |
Acting Head of Group Function Human Resources (November 2016–March 2017). Previously Head of Human Resources Ericsson Sweden (2015– 2016) and Vice President and Head of Human Resources Business Unit Support Solutions (2007–2015). Has held various senior global positions in Ericsson including Head of Human Resources Business Unit Broadband Networks, Head of Human Resources Microwave Systems as well as a position as Head of Human Resources and Internal Communications at Sony Ericsson Germany. | Until January 31, 2024, Head of Strategy, Technology, Marketing and Business Development of Ericsson North America. Previous management positions within Ericsson Business Area and Market Area organizations include Head of Customer Unit Verizon in USA, Global Head of Radio Sales and Business Management in Sweden, Head of Global Customer Unit Softbank based in Japan, Key Account Manager Bezeq Group and CTO for Ericsson Israel. Previous positions outside Ericsson include roles in telecommunication technology-centric startup as well as mobile operator. | |||||||||
|
1) |
The number of shares and ADS includes holdings by related persons, if applicable. |
|
2) |
Call options issued by AB Industrivärden (1,000,000 call options) and Investor AB (1,000,000 call options), each entitling the purchase of one Ericsson B share from AB Industrivärden/Investor AB respectively (further information is available in the Notes to the consolidated financial statements – note G2 “Information regarding members of the Board of Directors and the Group management” in the Financial Report). |
|
|
||||
| 21 | Corporate Governance report 2023 | Ericsson Annual Report on Form 20-F 2023 | ||
 |
 |
 |
 |
|||||||||
Scott Dresser |
Erik Ekudden |
Moti Gyamlani |
Niklas Heuveldop |
|||||||||
| Senior Vice President, Chief Legal Officer, and secretary of the Board of Directors of Telefonaktiebolaget LM Ericsson (since 2022) |
Senior Vice President, Chief Technology Officer (CTO) (since 2018) |
Senior Vice President, Group Function Global Operations (since 2022) |
Senior Vice President, Business Area Global Communications Platform and CEO of Vonage (since February 2024), Head of Market Area North America (2017–January 2024) | |||||||||
Functions |
Functions |
Functions |
Functions |
|||||||||
| Head of Group Function Legal Affairs and Compliance | Head of Group Function Technology | Head of Group Function Global Operations | Head of Business Area Global Communications Platform and CEO of Vonage | |||||||||
Born |
Born |
Born |
Born |
|||||||||
| 1967 | 1968 | 1973 | 1968 | |||||||||
Education |
Education |
Education |
Education |
|||||||||
| Juris Doctorate, Vanderbilt University Law School, Bachelor of Science Business Administration and Finance, University of New Hampshire, USA. | Master of Science in Electrical Engineering, KTH Royal Institute of Technology, Sweden. | Master of Business Administration, Arizona State University, USA, and Bachelor of Mechanical engineering, MIT, India. | Master of Science in Industrial Engineering and Management, Linköping Institute of Technology, Sweden. | |||||||||
Nationality |
Nationality |
Nationality |
Nationality |
|||||||||
| USA | Sweden | USA | Sweden | |||||||||
Board Member |
Board Member |
Board Member |
Board Member |
|||||||||
| BirdLife International, Cambridge UK; member of Advisory Board | ASSA ABLOY AB | – | The Swedish-American Chamber of Commerce New York and CTIA – US wireless industry trade association | |||||||||
Holdings in Ericsson 1)
|
Holdings in Ericsson 1)
|
Holdings in Ericsson 1)
|
Holdings in Ericsson 1)
|
|||||||||
| – | 32,594 Class B shares and 9,857 ADS. |
4,877 Class B Shares |
82,729 Class B shares and 14,744 ADS. |
|||||||||
Background |
Background |
Background |
Background |
|||||||||
| Previously Group General Counsel at VEON and General Counsel of Virgin Media. Has held senior leadership positions with BirdLife International, White Mountains Re and Conservation International. Started professional career in New York in private practice with law firms Lord Day & Lord and Morgan Lewis, and specialized in corporate law, governance, and M&A. | Group Chief Technology Officer and Head of Technology and Architecture within Group Function Technology and Emerging Business (July 2017–March 2018). Joined Ericsson in 1993 and has held various management positions in the Company, including Head of Technology Strategy, Chief Technology Officer Americas in Santa Clara US, and Head of Standardization and Industry. Member of the Royal Swedish Academy of Engineering Sciences (IVA). Since 2020, member of the Broadband Commission for Sustainable Development and vice chairman of IVA’s Näringslivsråd. | Head of Group Sourcing (2019–2022). Previous position as Chief Procurement and Supply Chain Officer and Chief Cost Transformation Officer of Airtel (2012–2019). Leadership positions include Group Vice President Global Supply Chain and Sourcing at General Electric Power Conversion, Vice President Global Sourcing at Honeywell, and Executive Director at General Motors. Lived and worked in multiple countries and markets, including USA, France, Mexico, and India. Board advisor to eSmartMobility. | Head of Market Area North America (2017 until January 31, 2024), Chief Strategy Officer and Head of Group Function Technology and Emerging Business (April 2017–March 2018). Previous positions include Chief Customer Officer and Head of Group Function Sales (2016–2017) and senior leadership positions across Europe and the Americas, including Head of Global Customer Unit AT&T and Head of Market Unit Central America and Caribbean. Previous positions outside Ericsson include CEO of ServiceFactory and COO of WaterCove Networks. | |||||||||
|
1) |
The number of shares and ADS includes holdings by related persons, if applicable. |
|
|
||||
| 22 | Corporate Governance report 2023 | Ericsson Annual Report on Form 20-F 2023 | ||
 |
 |
 |
 |
|||||||||
Chris Houghton |
Jenny Lindqvist |
Stella Medlicott |
Carl Mellander |
|||||||||
| Senior Vice President, Chief Operating Officer (COO), Business Area Technology & New Businesses (since November 2023), Market Area North East Asia (2017–February 2024) | Senior Vice President, Market Area Europe and Latin America (since February 2023) | Senior Vice President, Chief Marketing and Communications Officer (CMO and CCO) (since 2019) | Senior Vice President, Chief Financial Officer (CFO) (since 2017) | |||||||||
Functions |
Functions |
Functions |
Functions |
|||||||||
| Head of Business Area Technology & New Businesses and Chief Operating Officer | Head of Market Area Europe and Latin America | Head of Group Function Marketing and Corporate Relations | Head of Group Function Finance and Common Functions | |||||||||
Born |
Born |
Born |
Born |
|||||||||
| 1966 | 1982 | 1969 | 1964 | |||||||||
Education |
Education |
Education |
Education |
|||||||||
| Bachelor of Law, Huddersfield Polytechnic, United Kingdom. | Master of Science in Business and Economics, Stockholm School of Economics, Sweden. | Bachelor of Arts (Hons) degree in Social Science, University of Lincoln (known at that time as University of Humberside), United Kingdom and Postgraduate Diploma in Marketing, Chartered Institute of Marketing, United Kingdom. | Bachelor of Arts in Business Administration and Economics, Stockholm University, Sweden; and East- and South East Asia Program, Lund University, Sweden. | |||||||||
Nationality |
Nationality |
Nationality |
Nationality |
|||||||||
| United Kingdom and Sweden | Sweden | United Kingdom | Sweden | |||||||||
Board Member |
Board Member |
Board Member |
Board Member |
|||||||||
| – | TechSverige | – | International Chamber of Commerce (ICC) Sweden and Grönskär Gruppen AB | |||||||||
Holdings in Ericsson 1)
|
Holdings in Ericsson 1)
|
Holdings in Ericsson 1)
|
Holdings in Ericsson 1)
|
|||||||||
| 96,963 Class B shares. | 824 Class B shares. | 8,126 Class B shares. | 94,856 Class B shares. | |||||||||
Background |
Background |
Background |
Background |
|||||||||
| Head of Market Area North East Asia (2017 until February 25, 2024). Head of Region North East Asia (2015–2017). Has also previously held management positions within Ericsson, including Head of Region India, Head of Customer Unit UK and Ireland and various management positions within Ericsson in China, Hungary, India, Ireland, Japan, Sweden and the UK. | Head of Northern and Central Europe within Market Area Europe and Latin America. Previous management positions within Ericsson Business Area and Market Area organizations include Head of Global Customer Unit Telia Company, Head of Solution Line Intelligent Transport Systems, Key Account Manager Telenor, Managed Services Engagement Lead and Business Manager Multimedia. Previous positions outside Ericsson include roles in management consulting in France and Sweden, as well as in Pharmaceuticals in the Philippines. | Vice President of Marketing, Communications and Government Relations for Ericsson Market Area Europe and Latin America (July 2017–June 2019). Prior to joining Ericsson, Chief Marketing Officer at Red Bee Media, which was acquired by Ericsson in May 2014. Has over 25 years of marketing experience in major IT, telecoms and media companies including two years at Technicolor as VP Marketing and 10 years at Siemens Communications as Global VP Marketing. | Acting Chief Financial Officer and Head of Group Function Finance and Common Functions (July 2016–March 2017). Previous positions within Ericsson include Vice President and Group Treasurer, and Head of Finance in Region Western and Central Europe. Also held Head of Finance/CFO positions within the telecom operator space and defense industry. | |||||||||
|
1) |
The number of shares and ADS includes holdings by related persons, if applicable. |
|
|
||||
| 23 | Corporate Governance report 2023 | Ericsson Annual Report on Form 20-F 2023 | ||
 |
 |
 |
 |
|||||||||
Nunzio Mirtillo |
George Mulhern |
Per Narvinger |
Chafic Nassif |
|||||||||
| Senior Vice President, Market Area South East Asia, Oceania and India (since 2017) | Former Senior Vice President, Business Area Enterprise Wireless Solutions and CEO of Cradlepoint (2022–October 2023) | Senior Vice President, Business Area Cloud Software and Services (since 2022) | Senior Vice President, Market Area North East Asia (since February 2024) | |||||||||
Functions |
Functions |
Functions |
Functions |
|||||||||
| Head of Market Area South East Asia, Oceania and India | Former Head of Business Area Enterprise Wireless Solutions and CEO of Cradlepoint | Head of Business Area Cloud Software and Services and Head of Segment Cloud Software and Services | Head of Market Area North East Asia | |||||||||
Born |
Born |
Born |
Born |
|||||||||
| 1961 | 1956 | 1974 | 1981 | |||||||||
Education |
Education |
Education |
Education |
|||||||||
| Master in Electronic Engineering, Sapienza University, Italy. | Bachelor of Science and Master of Business Administration, San Jose State University (USA). | Master of Science in Electrical Engineering, KTH Royal Institute of Technology, Sweden. | Master of Science in ICT Entrepreneurship and Master of Science Wireless Systems, KTH Royal Institute of Technology, Sweden. | |||||||||
Nationality |
Nationality |
Nationality |
Nationality |
|||||||||
| Italy | USA | Sweden | Sweden | |||||||||
Board Member |
Board Member |
Board Member |
Board Member |
|||||||||
| – | Regence Blue Shield of Idaho, Cambia Health Solutions and Focus IP, Inc. dba Tracer. | – | – | |||||||||
Holdings in Ericsson 1)
|
Holdings in Ericsson 1)
|
Holdings in Ericsson 1)
|
Holdings in Ericsson 1)
|
|||||||||
| 83,276 Class B shares. | – | 9,070 Class B shares. | 5,944 Class B shares | |||||||||
Background |
Background |
Background |
Background |
|||||||||
| Previously Head of Region Mediterranean. Previous management positions within Ericsson include Head of Sales Networks for Western Europe within Business Unit Networks, Head of Business Operations in Market Unit South East Europe and Key Account Manager for Wind Italy, Vodafone Italy and other customers. | CEO of Cradlepoint when it was acquired by Ericsson in 2020. Previously general partner at Highway 12 Ventures, a venture capital firm making investments in early-stage technology companies. Held various leading positions during a long tenure at Hewlett Packard Company, including senior vice president, leading the LaserJet Global Business Unit. | Head of Product Area Networks, Business Unit Networks (2018–2022). Head of Customer Unit Northern and Central Europe, Market Area Europe and Latin America (2017–2018). Has held a variety of senior management positions in Ericsson since 1997, spanning R&D line management, Head of Customer Solutions (Australia and Spain) and Product Management. | Previously Head of Customer Unit North Latin America & Caribbean within Market Area Europe & Latin America with responsibility across 41 countries. Has held various senior positions in Ericsson spanning over four continents, including President and Board Member of Ericsson Taiwan, Key Account Manager in Germany, VP Business Development and Head of TV & Enterprise Segments for Global Customer Unit Vodafone based out of the UK, and Head of TV & Media Sales for EMEA. Prior to Ericsson, he held roles in consulting and business development in the technology industry in Sweden and the Nordics. | |||||||||
|
1) |
The number of shares and ADS includes holdings by related persons, if applicable. |
|
|
||||
| 24 | Corporate Governance report 2023 | Ericsson Annual Report on Form 20-F 2023 | ||
 |
 |
 |
||||||||||
Fadi Pharaon |
Rory Read |
Åsa Tamsons |
||||||||||
| Senior Vice President, Market Area Middle East and Africa (since 2019) | Former Senior Vice President, Business Area Global Communications Platform and CEO of Vonage (2022–February 2024) | Senior Vice President, Business Area Enterprise Wireless Solutions and CEO of Cradlepoint (since November 2023). | ||||||||||
Functions |
Functions |
Functions |
||||||||||
| Head of Market Area Middle East and Africa | Former Head of Business Area Global Communications Platform and CEO of Vonage | Head of Business Area Enterprise Wireless Solutions and CEO of Cradlepoint | ||||||||||
Born |
Born |
Born |
||||||||||
| 1972 | 1961 | 1981 | ||||||||||
Education |
Education |
Education |
||||||||||
| Master of Science in Computer Science, KTH Royal Institute of Technology, Sweden and a Master of Business Administration, Heriot Watt University, Edinburgh Business School, Scotland. | Bachelor of Information Sciences, Hartwick College, New York, USA. | Master of Business Administration, Stockholm School of Economics, Sweden. | ||||||||||
Nationality |
Nationality |
Nationality |
Changes in the Executive Team during 2023 and 2024 Effective February 1, 2023,
Jenny Lindqvist Åsa Tamsons Effective November 1, 2023,
Chris Houghton Effective February 1, 2024,
Niklas Heuveldop Effective February 1, 2024,
Yossi Cohen Effective February 26, 2024,
Chafic Nassif |
|||||||||
|
Sweden and Lebanon |
USA |
Sweden |
||||||||||
Board Member |
Board Member |
Board Member |
||||||||||
|
– |
– |
CNH Industrial |
||||||||||
Holdings in Ericsson 1)
|
Holdings in Ericsson 1)
|
Holdings in Ericsson 1)
|
||||||||||
|
355 Class B shares and 1,206 ADS. |
56,614 Class B shares. |
35,756 Class B shares. |
||||||||||
Background |
Background |
Background |
||||||||||
| Vice President of Networks and Managed Services (presales and commercial management) within Market Area Europe and Latin America. Previous management positions within Ericsson include Head of Presales and Strategy for Ericsson Region South East Asia and Oceania, and Country Manager for Ericsson Singapore and Brunei. |
Has more than three decades of global technology industry experience and became CEO of Vonage in July 2020. Vonage was acquired by Ericsson in July 2022. Previously, was Chief Operating Executive of Dell Technologies, CEO and President of Dell’s Virtustream, and EVP of Dell Boomi. Also served as Chief Integration Officer of the USD 67 billion merger of Dell and EMC. Earlier, was CEO, President and Board member of Advanced Micro Devices and Chief Operating Officer and President at Lenovo following 23 years at IBM. |
Head of Business Area Technology and New Businesses (2018 until November 2023). IPR & Licensing (November 2018–November 2023), Group Strategy & M&A (April 2018-March 2020). Previously Partner at McKinsey & Company, serving high-tech and telecommunications companies worldwide on growth strategies, digital and commercial transformations. Before joining Ericsson lived and work in the USA, Brazil, France, Sweden and Singapore. |
||||||||||
|
1) |
The number of shares and ADS includes holdings by related persons, if applicable. |
|
|
||||
| 25 | Corporate Governance report 2023 | Ericsson Annual Report on Form 20-F 2023 | ||
| – | Updating the Board of Directors regarding the planning, scope and content of the annual audit work |
| – | Reviewing the interim reports to assess that the financial statements are presented fairly in all material respects and providing review opinions over the interim reports for the third and fourth quarters and the year-end financial statements |
| – | Providing an audit opinion over the Annual Report |
| – | Advising the Board of Directors of non-audit services performed, the consideration paid and other issues that determine the auditor’s independence. |
| – | Steering documents, such as policies and directives, and the Code of Business Ethics. |
| – | A strong corporate culture. |
| – | The Company’s organization and mode of operations, with well-defined roles and responsibilities and delegations of authority. |
| – | Several well-defined Group-wide processes for planning, operations and support. |
|
|
||||
| 26 | Corporate Governance report 2023 | Ericsson Annual Report on Form 20-F 2023 | ||
| – | Transparent |
| – | Consistent |
| – | Simple |
| – | Relevant |
| – | Timely ad-hoc information, such as press releases on important events, performed in a timely manner. |
| – | Fair and equal |
| – | Complete |
|
|
||||
| 27 | Corporate Governance report 2023 | Ericsson Annual Report on Form 20-F 2023 | ||
Remuneration report 2023 |
||||||
|
Introduction from the Chair of the Remuneration Committee |
1 |
|||||
Introduction |
2 |
|||||
Remuneration 2023 at a glance |
3 |
|||||
|
Total remuneration to the President and CEO and Executive Vice President |
5 |
|||||
Variable remuneration |
6 |
|||||
Short-term variable compensation (STV) |
6 |
|||||
Long-term variable compensation (LTV) |
6 |
|||||
|
Information on guidelines for shareholdings by Executive Team |
10 |
|||||
Deviations from adopted Guidelines for remuneration to Group Management |
10 |
|||||
Comparative information on changes in remuneration and the Company’s performance |
11 |
|||||
|
The report has been prepared in accordance with Chapter 8, Sections 53a and 53b of the Swedish Companies Act (2005:551) and the Rules on Executive Remuneration and Incentive Schemes (January 1, 2021) administered by the Swedish Stock Market Self-Regulation Committee. Information required by Chapter 5, Sections 40–44 of the Annual Accounts Act (1995:1554) is included in note G1–G4 in the Financial report. Information on the work of the Remuneration Committee in 2023 can be found on page 12 in the Corporate Governance report. |
||||||
 |
||||
| 1 | Financial Report 2023 | Remuneration report 2023 | Ericsson Annual Report on Form 20-F 2023 |
|
|
||||
| 2 | Financial Report 2023 | Remuneration report 2023 | Ericsson Annual Report on Form 20-F 2023 |
| – | attract and retain highly competent, performing, and motivated people who have the ability, experience, and skill to deliver on the Ericsson strategy; |
| – | encourage behavior consistent with Ericsson’s culture and core values; |
| – | ensure fairness in reward by delivering total remuneration that is appropriate but not excessive, and clearly explained; |
| – | have a total compensation mix of fixed pay, variable pay and benefits that is competitive where Ericsson competes for talent; and |
| – | encourage variable remuneration which aligns employees with clear and relevant targets, reinforces their performance and enables flexible remuneration costs for Ericsson. |
| – | The achievement for LTV 2021 was set at 100% of target, based on pre-determined performance conditions: group operating income and relative and absolute total shareholder return (TSR). |
| – | The level of achievement of the performance condition for the Group’s operating income for LTV 2023 was set at 0%. |
| – | To include STV in the remuneration package for the President and CEO from January 1, 2024 in alignment with the Remuneration Guidelines and in direct response to investor feedback. Börje Ekholm was appointed as CEO of Ericsson on January 16, 2017, and since then, his compensation structure has been base salary, pension allowance and long-term variable compensation. The current business strategy is focused on a combination of short-, mid- and long-term achievements on leadership in mobile networks, focused expansion into enterprise and to establish lasting cultural transformation. The external market typically offers CEOs a combination of long-term and short-term variable pay. From January 1, 2024, the variable compensation for the President and CEO, will be 50% target opportunity for short-term variable pay and 150% target opportunity for long-term variable pay i.e., total 200% of annual base pay. This is an increase in the total variable pay at target opportunity from 190% to 200% of annual base salary compared with 2023. |
| – | To further drive accountability throughout the organization, all employees who are eligible for an STV pay-out may be denied all or part the entitlement if they act in breach of Ericsson’s Code of Business Ethics (CoBE). In addition, top executives are subject to evaluation according to a set of pre-defined integrity criteria, which relate to compliance training, third party management, allegation management and other items tied to the Company’s Ethics and Compliance Program (E&C). Underperformance against these pre-defined criteria can reduce STV pay-out by up to 100%, while exceptional performance may justify an additional incentive of up to a maximum of 10% of the executive’s annual base salary. |
| – | After evaluating the ongoing LTV programs for the Executive Team, the Remuneration Committee and the Board of Directors concluded that the ongoing LTV programs for 2021 and 2022, as well as the completed programs for 2018, 2019 and 2020, enabled the Company to attract, retain and motivate Executives and offer them globally competitive remuneration. Although the performance condition for the Group’s operating income (EBITA) has a one-year performance period, it has a three-year vesting period which is the same as the vesting period of the performance conditions relating to absolute and relative Total Shareholder Return (TSR), which is in line with the objectives of the LTV programs. This means that participants cannot redeem any of the Performance Share rights granted before the end of the three-year vesting period and that participants are fully exposed to share price movements during the three-year period. |
| – | LTV programs for 2018, 2019, 2020, 2021 and 2022 have supported the long-term targets, and the Remuneration Committee and the Board of Directors proposed at the Annual General Meeting 2023 to approve an LTV program to the Executive Team with the same structure as previous LTV programs with targets to further strengthen Ericsson’s and the Executive Team’s commitment to long-term sustainability and responsible business practices. |
| – | Also, for 2024 the Remuneration Committee and the Board of Directors propose to include other Executives in LTV 2024 in order to be covered by a plan that delivers in shares. This is to further reinforce the alignment between shareholders and Group Management. |
|
|
||||
| 3 | Financial Report 2023 | Remuneration report 2023 | Ericsson Annual Report on Form 20-F 2023 |
Purpose and link to strategy |
Arrangement in brief |
Implementation during the financial year ending December 31, 2023 |
||||
Fixed salary |
Attract and retain the executive talent required to implement Ericsson’s strategy. Deliver part of the annual compensation in a predictable format. |
Pay a portion of the annual remuneration in a predictable manner. Salaries are normally reviewed to be effective in January, taking into account: – Ericsson’s overall business performance – The business performance of the unit that the employee manages – Employee performance over time – External economic conditions – The scope and complexity of the position – External market data – Pay and conditions of other employees in countries considered relevant to the role. When determining fixed salaries, the impact on total remuneration must also be taken into account. |
President and CEO: fixed annual salary of SEK 18,799,636 corresponding to an increase of 3% since 2022. EVP and Head of Business Area Networks: fixed annual salary of SEK 9,280,189, corresponding to an increase of 7% since 2022. |
|||
Other benefits |
Attract and retain the executive talent required to implement Ericsson’s strategy. Deliver part of the annual compensation in a predictable format. |
Benefits are aligned with competitive market practices in the individual’s country of employment. The benefits amount to a maximum of 10% of the annual fixed salary for members the Executive Team in Sweden. Benefits for members of the Executive Team on international long-term assignment (“LTA”) in a country other than the country of original employment, are determined in line with the Company’s global policy on international mobility. Such benefits may include, but are not limited to, commuting or moving expenses, increased cost of living, housing costs, travel home, educational allowances, and tax and social security benefits. |
President and CEO: other benefits to the value of SEK 828,287. EVP and Head of Business Area Networks: other benefits to the value of SEK 28,600. |
|||
Pension |
Provide long-term financial security and planning for retirement by offering competitive pension solutions that are in line with local market practice. |
The pension plans follow competitive practices in the individual’s home country. The pension plans for the President and CEO and the EVP are defined contribution plans. |
Company pension contributions: – President and CEO: SEK 10,151,804. – EVP and Head of the Networks Business Area: SEK 2,728,761. |
|||
|
Short-term variable remuneration (STV) |
Setting clear and relevant objectives for the Executive Team that are in line with Ericsson’s strategy and sustainable long-term interest. Offer an individual earning opportunity linked to performance at a flexible cost to the Company. |
The President and CEO’s compensation in 2023 did not include an STV component. For the Executive Vice President the target level is 50% of the fixed salary, and the maximum is 100% of the fixed salary. Performance conditions, weightings and target levels are set annually. Subject to malus and clawback. |
Outcome for STV 2023: – EVP and Head of the Networks Business Area: 0% of the maximum level. |
|||
|
Long-term variable remuneration (LTV) |
Creating a common ownership interest between Executive Team and shareholders. Remuneration based on long-term performance in line with Ericsson’s business strategy. Provide individuals with long-term remuneration for long-term commitment and value creation in accordance with the interests of shareholders. |
Remuneration is awarded after approval by the Annual General Meeting. Remuneration levels are determined as a percentage of the fixed salary. – For the President and CEO, 190% of the fixed salary. – For the Executive Vice President, 50% of the fixed salary. Performance conditions, weightings and target levels are taken to the AGM for approval. Three- year vesting period. Subject to malus and clawback. |
LTV 2021 target achievement level of 100%. | |||
|
|
||||
| 4 | Financial Report 2023 | Remuneration report 2023 | Ericsson Annual Report on Form 20-F 2023 |
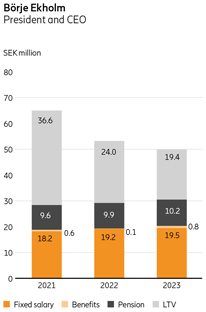 |
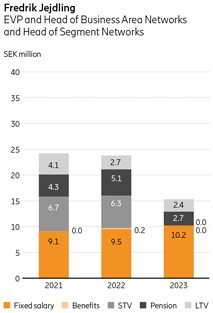 |
|
STV The information presented for 2023 covers the financial year 2023 and the information for 2022 and 2021 covers the financial years 2022 and 2021, respectively. |
LTV The information presented for 2023 includes information on the LTV 2021, which expired in 2023. Information presented for 2022 and 2021 includes information on LTV 2020 and LTV 2019 that expired in 2022 and 2021, respectively. |
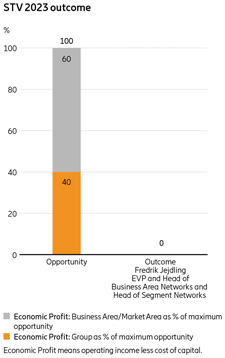 |
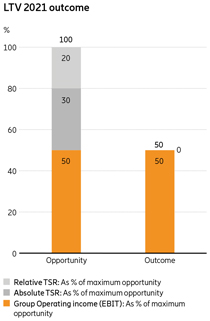 |
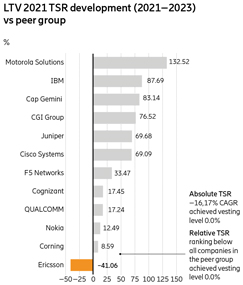 |
|
|
||||
| 5 | Financial Report 2023 | Remuneration report 2023 | Ericsson Annual Report on Form 20-F 2023 |
| Fixed remuneration | Variable remuneration | |||||||||||||||||||||||||||||||||||||||||
| Name and position |
Financial year |
Fixed salary (including holiday pay) |
Other benefits 1)
|
One-year
variable remune- ration 2)
|
Multiannual variable remune- ration 3)
|
Additional agree- ments 4)
|
Pension 5)
|
Total remuneration 6)
|
Share of fixed remuneration 7)
|
Share of variable remuneration 8)
|
||||||||||||||||||||||||||||||||
|
Börje Ekholm President and CEO |
2023 | 19,520,568 | 828,287 | – | 19,371,871 | – | 10,151,804 | 49,872,530 | 61% | 39% | ||||||||||||||||||||||||||||||||
| 2022 | 19,154,852 | 135,743 | – | 24,034,229 | – | 9,856,121 | 53,180,945 | 55% | 45% | |||||||||||||||||||||||||||||||||
| 2021 | 18,208,859 | 555,688 | – | 36,630,457 | – | 9,569,049 | 64,964,053 | 44% | 56% | |||||||||||||||||||||||||||||||||
|
Fredrik Jejdling Executive Vice President and Head of Business Area Networks |
2023 | 10,154,237 | 28,600 | – | 2,399,101 | – | 2,728,761 | 15,310,698 | 84% | 16% | ||||||||||||||||||||||||||||||||
| 2022 | 9,515,305 | 151,452 | 6,251,115 | 2,746,240 | – | 5,061,846 | 23,725,958 | 62% | 38% | |||||||||||||||||||||||||||||||||
| 2021 | 9,129,087 | 14,980 | 6,671,595 | 4,092,344 | – | 4,314,186 | 24,222,193 | 56% | 44% | |||||||||||||||||||||||||||||||||
|
1) |
For further information about other benefits, see table regarding the implementation of fixed remuneration and pension for the President and CEO and the Executive Vice President. |
|
2) |
The amounts represent STV earned during the financial year and paid in the following year, i.e., for 2023 the amounts represent STV 2023, for 2022, the amounts represent STV 2022 and for 2021, the amounts represent STV 2021. |
|
3) |
Amounts represent LTVs for which all performance periods expired during the fiscal year. For 2023, the amounts represent LTV 2021, for 2022, the amounts represent LTV 2020 and for 2021, the amounts represent LTV 2019. For LTV 2019, LTV 2020 and LTV 2021, the amounts are calculated based on the number of Performance Shares that will vest during 2024 multiplied by the volume weighted average of the last five trading days of each financial year. |
|
4) |
Amounts represent additional discretionary arrangements approved by the Remuneration Committee or the Board of Directors and entered into during the financial year. |
|
5) |
Amounts represent cash payment in lieu of pension (for the President and CEO) or pension premium (for the Executive Vice President) paid during the financial year. |
|
6) |
The amounts represent the sum of fixed remuneration, variable remuneration, additional agreements and pension. |
|
7) |
Amounts represent the sum of fixed remuneration and pension divided by total remuneration. |
|
8) |
Amounts represent the sum of variable remuneration and additional agreements divided by total remuneration. |
Fixed salary |
Other benefits |
Pension |
||||
|
Börje Ekholm President and CEO |
During the annual review of the total remuneration, the Board of Directors decided on a salary increase of 3% of the fixed salary as of January 1, 2023 for the President and CEO. The increase reflects the performance of the President and CEO until the end of 2022. The fixed salary level for 2023 is considered appropriate in relation to the responsibility of being the President and CEO of a leading global provider of ICT solutions, compared to the remuneration packages for the position of President and CEO of comparable international companies. |
According to the Company’s Swedish benefits policy, Börje Ekholm is entitled to a company car or equivalent cash remuneration and other benefits as other employees in Sweden. Since Börje Ekholm is a resident of the US, he is also eligible for health insurance in the US and tax advice regarding his tax return. | Börje Ekholm receives a cash payment instead of a defined contribution pension, as it is not possible to enroll him in the Swedish defined contribution pension plan (ITP1) as he is a resident in the US. The cash payment is treated as salary for tax and social security purposes and is made in a way that is cost neutral for Ericsson. According to his employment contract, the pension supplement shall include an additional premium on top of the fixed annual salary to take into account an assumed achieved target level of STV. | |||
|
Fredrik Jejdling Executive Vice President and Head of Business Area Networks |
The salary level reflects Fredrik Jejdling’s responsibility as head of Ericsson’s largest business area, Networks. The salary level is considered competitive in the external market for both other VPs on leading ICT solution providers and for the position of President and CEO of smaller companies. | According to the Company’s Swedish benefits policy, Fredrik Jejdling is entitled to a company car or equivalent cash remuneration and other benefits as other employees in Sweden. | In accordance with Ericsson’s pension guidelines, Fredrik Jejdling participates in the ITP1 defined contribution plan. He is also entitled to supplementary pension contribution at 30% of base salary parts exceeding the cap in ITP1 (30 income base amounts). | |||
|
|
||||
| 6 | Financial Report 2023 | Remuneration report 2023 | Ericsson Annual Report on Form 20-F 2023 |
| – | At group level for heads of group functions |
| – | As a combination of group level and business area level for business area managers |
| – | As a combination of group level and market area level for market area managers. |
Executive Vice President and Head of Business Area Networks – Fredrik Jejdling (STV 2023) |
||||||||||||||||||||||||
|
Threshold level (in % of target) |
Target level |
Maximum level (in % of target) |
Outcome (% of target) |
|||||||||||||||||||||
Performance measures |
Weighing |
SEK outcome at threshold performance |
SEK outcome at target performance |
SEK outcome at maximum performance |
SEK actual performance outcome |
|||||||||||||||||||
Group Economic Profit 1)
|
40% |
47% |
100% |
140% |
0% |
|||||||||||||||||||
0 |
1,856,038 |
3,712,076 |
0 |
|||||||||||||||||||||
Economic Profit Business Area Networks 1)
|
60% |
77% |
100% |
115% |
0% |
|||||||||||||||||||
0 |
2,784,057 |
5,568,113 |
0 |
|||||||||||||||||||||
Total |
0 |
4,640,095 |
9,280,189 |
0 |
||||||||||||||||||||
|
1) |
Economic profit means operating income minus cost of capital. |
| – | the Company’s financial performance and position; |
| – | stock market conditions; and/or |
| – | such other circumstances and reasons as the Board of Directors considers relevant. |
|
|
||||
| 7 | Financial Report 2023 | Remuneration report 2023 | Ericsson Annual Report on Form 20-F 2023 |
Award information, Long-Term Variable Remuneration 2023 (LTV 2023) program |
||||||||||||||||||||
Participants |
Allocation value 1)
|
Allocation value as a percentage of annual basic salary 2)
|
Number of Performance Shares granted 3)
|
Percentage of the award to which performance conditions apply 4)
|
Maximum number of Performance Shares that can be earned 5)
|
|||||||||||||||
Börje Ekholm |
35,719,309 |
190% |
596,216 |
100% |
1,192,432 |
|||||||||||||||
Fredrik Jejdling |
4,640,094 |
50% |
77,451 |
100% |
154,902 |
|||||||||||||||
|
1) |
The amount represents the basic amount in SEK. |
|
2) |
The figures represent basic amounts as a percentage of annual basic salary at the date of award. |
|
3) |
Calculated as the respective grant value divided by the volume weighted average price of Ericsson’s B-shares on Nasdaq Stockholm during the five trading days immediately following the publication of the Company’s fourth quarter report for 2022. |
|
4) |
All Performance Shares are subject to challenging performance conditions. These are measured over pre-defined performance periods spanning one to three years. Performance conditions for LTV 2023 are: (1) Group operating income target (weighted at 45%) measured over the period January 1, 2023 to December 31, 2023, (2) absolute TSR performance (weighted 25%) in the range 6%-14% annual growth rate, (3) relative TSR performance (weighted 20%) of Ericsson’s B-share, ranked 6-2 against 11 peers, measured over the period January 1, 2023 to December 31, 2026, (4) reduction of CO2 emissions (weighted 5%) in the Company’s own facilities and (5) increased proportion of female leaders (weighted 5%) within the Company. Performance conditions for LTV 2023 and details of how performance conditions will be calculated and measured are set out in the minutes of the 2023 AGM under item 16. |
|
5) |
The maximum number of shares that can be allotted will result in a dilution of approximately 0.1% of the total number of outstanding shares. The effect on key ratios is marginal. |
Performance conditions for LTV 2023 |
||||||||||||||||||||||||||||
Program |
Target |
Conditions |
Weight |
Performance period |
Possible outcome (Linear distribution) |
Outcome |
Target achievement level 1)
|
|||||||||||||||||||||
LTV 2023 |
Group Operating income (EBITA) 2023 |
Range (billion SEK) 26.4–40.4 |
45% |
Jan 1, 2023– Dec 31, 2023 |
0%–200% |
21,4 billion SEK 2)
|
0% |
|||||||||||||||||||||
LTV 2023 |
Absolute TSR |
Range 6%–14% |
25% |
Jan 1, 2023– Dec 31, 2025 |
0%–200% |
– |
– |
|||||||||||||||||||||
LTV 2023 |
Relative TSR |
|
Ericsson’s
ranking 6–2
|
|
20% |
Jan 1, 2023– Dec 31, 2025 |
0%–200% |
– |
– |
|||||||||||||||||||
|
|
Reduction of CO
2 e2023
|
|
|
ktonne CO
2 e142–121
|
|
1,66% |
Jan 1, 2023– Dec 31, 2023 |
0%–200% |
121,9 ktonne CO2 |
193,72% |
||||||||||||||||||
LTV 2023 |
|
Reduction of CO
2 e2024
|
|
|
ktonne CO
2 e132–113
|
|
1,66% |
Jan 1, 2024– Dec 31, 2024 |
0%–200% |
– |
– |
|||||||||||||||||
|
|
Reduction of CO
2 e2025
|
|
|
ktonne CO
2 e122–104
|
|
1,68% |
Jan 1, 2025– Dec 31, 2025 |
0%–200% |
– |
– |
||||||||||||||||||
LTV 2023 |
Female managers |
Percentage of female managers Range 23%–25% |
5% |
Jan 1, 2023– Dec 31, 2025 |
0%–200% |
– |
– |
|||||||||||||||||||||
Total |
100% |
0%–200% |
||||||||||||||||||||||||||
|
1) |
The Board decided that the target achievement level for the performance condition for the Group’s operating income 2023 was 0% for the part of the Performance Share Rights that are granted based on the outcome of the Group’s operating result in 2023. Furthermore, the target achievement level for the performance condition for the CO2 2023 was approved to be 193,72%. Further information regarding the number of Performance Share Units earned by each of the President and CEO and the Executive Vice President is provided in the table Long-Term Variable Compensation (LTV) to the President and CEO and to the Executive Vice President. The performance share rights vest at the end of the vesting period in 2026. |
|
2) |
Excluding restructuring charges and other items not included in the performance condition. |
Performance conditions for LTV 2021 |
||||||||||||||||||||||||||
Program |
Target 1)
|
Conditions |
Weight |
Performance period |
Possible outcome (Linear distribution) |
Outcome |
Target achievement level 2)
|
|||||||||||||||||||
LTV 2021 |
Group Operating income (EBIT) 2021 |
Range (billion SEK) 15.0–24.0 |
50% |
Jan 1, 2021– Dec 31, 2021 |
0%–200% |
SEK 27.4 billion |
200.00% 1)
|
|||||||||||||||||||
LTV 2021 |
Absolute TSR |
Range 6%–14% |
30% |
Jan 1, 2021– Dec 31, 2023 |
0%–200% |
-16,17% |
0% 2)
|
|||||||||||||||||||
LTV 2021 |
Relative TSR |
Ericsson’s ranking 6–2 |
20% |
Jan 1, 2021– Dec 31, 2023 |
0%–200% |
Ranking below all companies in the peer group |
0% 2)
|
|||||||||||||||||||
Total |
100% |
0%–200% |
100% |
|||||||||||||||||||||||
|
1) |
As announced in the 2021 Annual Report, the Board decided that the target achievement level for the performance condition for the Group’s 2021 operating income was 200% for the part of the Performance Share Rights based on an outcome of the Group’s 2021 operating income. |
|
2) |
The Board of Directors decided that the target achievement level for the performance conditions development of absolute TSR and relative TSR amounted to 0% and 0% respectively, based on the achievements of -16,17% absolute TSR and ranking 12 (lower than all companies in the peer group) for relative TSR, resulting in an overall achieved target achievement level of 100% for LTV 2021. Performance shares vest at the end of the vesting period in 2024. For further information on the number of Performance Share Units earned by each of the President and CEO and the Executive Vice President, please refer to the table Long-Term Variable Remuneration (LTV) of the President and CEO and the Executive Vice President. |
|
|
||||
| 8 | Financial Report 2023 | Remuneration report 2023 | Ericsson Annual Report on Form 20-F 2023 |
| Long-term variable remuneration (LTV) to the President and CEO and to the Executive Vice President | ||||||||||||||||||||||||||||||||||||||||||||||||
| Main conditions for share-based plans | Information concerning the reported financial year | |||||||||||||||||||||||||||||||||||||||||||||||
|
Name and position |
Program | Target (weight) 1)
|
Date of award 2)
|
Perfor- mance period 3)
|
End date of the perfor- mance period 4)
|
End date of vesting period 5)
|
Performance share rights granted (value in SEK) 6)
|
Maximum number of Performance Shares that can be Awarded (value in SEK) 7)
|
Balance beginning of at the year (value in SEK) 8)
|
Performance share rights earned during the year (value in SEK) 9)
|
Performance share rights still subject to performance conditions (value in SEK) 10)
|
Performance share rights forfeited and paid out in shares during the year (value in SEK) 11)
|
Balance at year-end,
Performance shares earned but not forfeited (value in SEK) 12)
|
|||||||||||||||||||||||||||||||||||
|
Börje Ekholm
CEO and President
|
LTV 2023 |
Group Operating income (EBITA) (45%) |
|
18/5/ 2023 |
|
1 year | |
31/12/ 2023 |
|
|
18/5/ 2026 |
|
|
268,297 (16,073,673) |
|
|
536,594 (32,147,346) |
|
|
0 (0) |
|
|
0 (0) |
|
||||||||||||||||||||||||
| TSR performance conditions (45%) | |
18/5/ 2023 |
|
3 years | |
31/12/ 2025 |
|
|
18/5/ 2026 |
|
|
268,297 (16,073,673) |
|
|
536,594 (32,147,346) |
|
|
536,594 (33,714,201) |
|
|||||||||||||||||||||||||||||
| ESG targets (10%) | |
18/5/ 2023 |
|
3 years | |
31/12/ 2025 |
|
|
18/5/ 2026 |
|
|
59,622 (3,571,954) |
|
|
119,244 (7,143,908) |
|
|
19,172 (1,204,577) |
|
|
99,450 (6,248,444) |
|
|
19,172 (1,204,577) |
|
|||||||||||||||||||||||
| LTV 2022 | Group Operating income (EBIT) (45%) | |
18/5/ 2022 |
|
1 year | |
31/12/ 2022 |
|
|
18/5/ 2025 |
|
|
137,994 (15,605,741) |
|
|
275,988 (31,211,483) |
|
|
224,599 (13,853,266) |
|
|
224,599 (14,111,555) |
|
|||||||||||||||||||||||||
| TSR performance conditions (45%) | |
18/5/ 2022 |
|
3 years | |
31/12/ 2024 |
|
|
18/5/ 2025 |
|
|
137,991 (15,605,402) |
|
|
275,982 (31,210,804) |
|
|
275,982 (17,339,949) |
|
|||||||||||||||||||||||||||||
| ESG targets (10%) | |
18/5/ 2022 |
|
3 years | |
31/12/ 2024 |
|
|
18/5/ 2025 |
|
|
30,664 (3,467,792) |
|
|
61,328 (6,935,584) |
|
|
61,328 (3,853,238) |
|
|||||||||||||||||||||||||||||
| LTV 2021 | Group Operating income (EBIT) (50%) | |
3/5/ 2021 |
|
1 year | |
31/12/ 2021 |
|
|
3/5/ 2024 |
|
|
154,161 (16,834,381) |
|
|
308,322 (33,668,762) |
|
|
308,322 (19,017,301) |
|
|
308,322 (19,371,871) |
|
|||||||||||||||||||||||||
| TSR performance conditions (50%) | |
3/5/ 2021 |
|
3 years | |
31/12/ 2023 |
|
|
3/5/ 2024 |
|
|
154,162 (16 834 490) |
|
|
308,324 (33,668,981) |
|
||||||||||||||||||||||||||||||||
| LTV 2020 13)
|
Group Operating income (EBIT) (50%) | |
1/4/ 2020 |
|
1 year | |
31/12/ 2020 |
|
|
1/4/ 2023 |
|
|
194,830 (15,188,947) |
|
|
389,660 (30,377,894) |
|
|
389,660 (24,034,229) |
|
|
389,660 (24,482,338) |
|
|||||||||||||||||||||||||
| TSR performance conditions (50%) | |
1/4/ 2020 |
|
3 years | |
31/12/ 2022 |
|
|
1/4/ 2023 |
|
|
194,830 (15,188,947) |
|
|
389,660 (30,377,894) |
|
||||||||||||||||||||||||||||||||
| LTV 2019 13)
|
Group Operating income (EBIT) (50%) | |
18/5/ 2019 |
|
1 year | |
31/12/ 2019 |
|
|
18/5/ 2022 |
|
|
146,087 (13,808,143) |
|
|
292,174 (27,616,286) |
|
|
292,174 (18,021,292) |
|
|
292,174 (18,357,292) |
|
|||||||||||||||||||||||||
| TSR performance conditions (50%) | |
18/5/ 2019 |
|
3 years | |
31/12/ 2021 |
|
|
18/5/ 2022 |
|
|
146,087 (13,808,143) |
|
|
292,174 (27,616,286) |
|
|
76,974 (4,747,756) |
|
|
76,974 (4,836,276) |
|
||||||||||||||||||||||||||
Total |
1,291,729 (79,673,845) |
19,172 (1,204,577) |
973,354 (61,155,832) |
1,310,901 (82,363,910) |
||||||||||||||||||||||||||||||||||||||||||||
|
1) |
TSR performance conditions include both absolute and relative performance conditions for each program. |
|
2) |
The date of allocation represents the date on which the original allocation was made. |
|
3) |
Performance period represents the period over which the performance conditions are measured. |
|
4) |
The end date of the performance period represents the date on which the performance period ends. |
|
5) |
The Vesting Period End Date represents the date on which any Performance Shares will vest and entitle participants to receive shares. |
|
6) |
The figures represent the original number of Performance Share Rights granted on the grant date. Values in SEK represent the corresponding value on the date of award. |
|
7) |
The figures represent the maximum number of Performance Share Units that can be earned for each performance condition. Values in SEK represent the corresponding value on the date of award. |
|
8) |
Figures represent the balance at the beginning of the year, which includes Performance Share Units earned for prior years that have not yet been awarded. Values in SEK are calculated as the number of vested Performance Share rights multiplied by the volume weighted average share price for the last five trading days of the previous financial year. |
|
9) |
The figures represent the number of Performance Share Units earned that had a performance period that expired during the financial year. Values in SEK are calculated as the number of Performance Share Units earned multiplied by the volume weighted average share price for the last five trading days of the financial year. |
|
10) |
The figures represent the maximum number of outstanding Performance Shares that are still subject to an ongoing performance period. Values in SEK are calculated as the number of outstanding Performance Shares still subject to a performance period multiplied by the volume weighted average share price for the last five trading days of the financial year. |
|
11) |
The figures represent the number of Performance Share Units that had a vesting period expiring during the financial year and that entitled the participant to receive shares free of charge. Values in SEK represent the fair value of shares granted to the participant at the end of the vesting period. |
|
12) |
The figures represent the balance at the end of the year, which includes Performance Share Units earned during the financial year as well as previous Performance Share Units earned but not forfeited. Values in SEK are calculated as the number of Performance Share Units earned multiplied by the volume weighted average share price for the last five trading days of the financial year. |
|
13) |
The Board of Directors have approved vesting for LTV 2019 and 2020 (which expired in 2022 and 2023, respectively). Planned vesting date will be during Q1 2024. |
|
|
||||
| 9 | Financial Report 2023 | Remuneration report 2023 | Ericsson Annual Report on Form 20-F 2023 |
| Main conditions for share-based plans | Information concerning the reported financial year | |||||||||||||||||||||||||||||||||||||||||||||||
|
Name and position |
Program | Target (weight) 1)
|
Date of award 2)
|
Perfor- mance period 3)
|
End date of the perfor- mance period 4)
|
End date of vesting period 5)
|
Performance share rights granted (value in SEK) 6)
|
Maximum number of Performance Shares that can be Awarded (value in SEK) 7)
|
Balance beginning of at the year (value in SEK) 8)
|
Performance share rights earned during the year (value in SEK) 9)
|
Performance share rights still subject to performance conditions (value in SEK) 10)
|
Performance share rights forfeited and paid out in shares during the year (value in SEK) 11)
|
Balance at year-end,
Performance shares earned but not forfeited (value in SEK) 12)
|
|||||||||||||||||||||||||||||||||||
|
Fredrik Jejdling
Executive Vice President
and Head of Business Area Networks
|
LTV 2023 | Group Operating income (EBITA) (45%) |
|
18/5/ 2023 |
|
1 year | |
31/12/ 2023 |
|
|
18/5/ 2026 |
|
|
34,852 (2,087,983) |
|
|
69,704 (4,175,966) |
|
|
0 (0) |
|
|
0 (0) |
|
||||||||||||||||||||||||
| TSR performance conditions (45%) |
|
18/5/ 2023 |
|
3 years | |
31/12/ 2025 |
|
|
18/5/ 2026 |
|
|
34,853 (2,088,043) |
|
|
69,706 (4,176,086) |
|
|
69,706 (4,379,628) |
|
|||||||||||||||||||||||||||||
| ESG targets (10%) |
|
18/5/ 2023 |
|
3 years | |
31/12/ 2025 |
|
|
18/5/ 2026 |
|
|
7,746 (464,062) |
|
|
15,492 (928,125) |
|
|
2,491 (156,510) |
|
|
12,920 (811,764) |
|
|
2,491 (156,510) |
|
|||||||||||||||||||||||
| LTV 2022 | Group Operating income (EBIT) (45%) |
|
18/5/ 2022 |
|
1 year | |
31/12/ 2022 |
|
|
18/5/ 2025 |
|
|
17,257 (1,951,594) |
|
|
34,514 (3,903,188) |
|
|
28,087 (1,732,406) |
|
|
28,087 (1,764,706) |
|
|||||||||||||||||||||||||
| TSR performance conditions (45%) |
|
18/5/ 2022 |
|
3 years | |
31/12/ 2024 |
|
|
18/5/ 2025 |
|
|
17,255 (1,951,368) |
|
|
34,510 (3,902,736) |
|
|
34,510 (2,168,263) |
|
|||||||||||||||||||||||||||||
| ESG targets (10%) |
|
18/5/ 2022 |
|
3 years | |
31/12/ 2024 |
|
|
18/5/ 2025 |
|
|
3,834 (433,587) |
|
|
7,668 (867,174) |
|
|
7,668 (481,780) |
|
|||||||||||||||||||||||||||||
| LTV 2021 | Group Operating income (EBIT) (50%) |
|
3/5/ 2021 |
|
1 year | |
31/12/ 2023 |
|
|
3/5/ 2024 |
|
|
19,092 (2,084,846) |
|
|
38,184 (4,169,693) |
|
|
38,184 (2,355,189) |
|
|
38,184 (2,399,101) |
|
|||||||||||||||||||||||||
| TSR performance criteria (50%) |
|
3/5/ 2021 |
|
3 years | |
12/31/ 2023 |
|
|
3/5/ 2024 |
|
|
19,092 (2,084,846) |
|
|
38,184 (4,169,693) |
|
||||||||||||||||||||||||||||||||
| LTV 2020 13)
|
Group Operating income (EBIT) (50%) |
|
1/4/ 2020 |
|
1 year | |
12/31/ 2020 |
|
|
1/4/ 2023 |
|
|
22,262 (1,735,546) |
|
|
44,524 (3,471,091) |
|
|
44,524 (2,746,240) |
|
|
44,524 (2,797,443) |
|
|||||||||||||||||||||||||
| TSR performance criteria (50%) |
|
1/4/ 2020 |
|
3 years | |
12/31/ 2022 |
|
|
1/4/ 2023 |
|
|
22,263 (1,735,623) |
|
|
44,526 (3,471,247) |
|
||||||||||||||||||||||||||||||||
| LTV 2019 13)
|
Group Operating income (EBIT) (50%) |
|
18/5/ 2019 |
|
1 year | |
31/12/ 2019 |
|
|
18/5/ 2022 |
|
|
16,321 (1,542,661) |
|
|
32,642 (3,085,322) |
|
|
32,642 (2,013,359) |
|
|
32,642 (2,050,897) |
|
|||||||||||||||||||||||||
| TSR performance criteria (50%) |
|
18/5/ 2019 |
|
3 years | |
31/12/ 2021 |
|
|
18/5/ 2022 |
|
|
16,322 (1,542,755) |
|
|
32,644 (3,085,511) |
|
|
8,600 (530,448) |
|
|
8,600 (540,338) |
|
||||||||||||||||||||||||||
Total |
152,037 (9,377,642) |
2,491 (156,510) |
124,804 (7,841,435) |
154,528 (9,708,994) |
||||||||||||||||||||||||||||||||||||||||||||
|
1) |
TSR performance conditions include both absolute and relative performance conditions for each program. |
|
2) |
The date of allocation represents the date on which the original allocation was made. |
|
3) |
Performance period represents the period over which the performance conditions are measured. |
|
4) |
The end date of the performance period represents the date on which the performance period ends. |
|
5) |
The Vesting Period End Date represents the date on which any Performance Shares will vest and entitle participants to receive shares. |
|
6) |
The figures represent the original number of Performance Share Rights granted on the grant date. Values in SEK represent the corresponding value on the date of award. |
|
7) |
The figures represent the maximum number of Performance Share Units that can be earned for each performance condition. Values in SEK represent the corresponding value on the date of award. |
|
8) |
Figures represent the balance at the beginning of the year, which includes Performance Share Units earned for prior years that have not yet been awarded. Values in SEK are calculated as the number of vested Performance Share rights multiplied by the volume weighted average share price for the last five trading days of the previous financial year. |
|
9) |
The figures represent the number of Performance Share Units earned that had a performance period that expired during the financial year. Values in SEK are calculated as the number of Performance Share Units earned multiplied by the volume weighted average share price for the last five trading days of the financial year. |
|
10) |
The figures represent the maximum number of outstanding Performance Shares that are still subject to an ongoing performance period. Values in SEK are calculated as the number of outstanding Performance Shares still subject to a performance period multiplied by the volume weighted average share price for the last five trading days of the financial year. |
|
11) |
The figures represent the number of Performance Share Units that had a vesting period expiring during the financial year and that entitled the participant to receive shares free of charge. Values in SEK represent the fair value of shares granted to the participant at the end of the vesting period. |
|
12) |
The figures represent the balance at the end of the year, which includes Performance Share Units earned during the financial year as well as previous Performance Share Units earned but not forfeited. Values in SEK are calculated as the number of Performance Share Units earned multiplied by the volume weighted average share price for the last five trading days of the financial year. |
|
13) |
The Board of Directors have approved vesting for LTV 2019 and 2020 (which expired in 2022 and 2023, respectively). Planned vesting date will be during Q1 2024. |
|
|
||||
| 10 | Financial Report 2023 | Remuneration report 2023 | Ericsson Annual Report on Form 20-F 2023 |
| – | The President and CEO must build-up and maintain a shareholding equivalent to at least 200% of the annual fixed salary. |
| – | Other members of the Executive Team must build up and maintain a shareholding equivalent to at least 75% of their respective annual fixed salary. |
| – | Holdings of Ericsson Class B-shares held or acquired by the Executive Team member |
| – | Vested but unexercised options (value calculated after tax and after utilization costs) |
| – | Share rights held by the member of the Executive Team, for which performance and/or employment conditions have been met, but which must be held for a certain period of time (value calculated after tax). |
|
|
||||
| 11 | Financial Report 2023 | Remuneration report 2023 | Ericsson Annual Report on Form 20-F 2023 |
Comparison table of the change in remuneration and the Company’s performance over the last three financial years reported |
||||||||||||||
Ericsson’s performance |
||||||||||||||
|
Remuneration to the President and CEO and to the Executive Vice President |
Börje Ekholm President and CEO |
Fredrik Jejdling Executive Vice President and Head of Business Area Networks |
Average remuneration of employees converted to full-time equivalents
3)
|
Group operating income (EBIT) SEK million |
Group Net Sales SEK million |
Share price at December 31 for the financial year |
||||||||
–20,326 |
263,351 |
63,11 |
||||||||||||
2023 |
Fixed remuneration 1)
|
20,348,855 (5%) |
10,182,837 (5%) |
1,016,295 (5%) |
(–175,23%) |
(–3,02%) |
(3,63%) |
|||||||
(% change) |
||||||||||||||
Variable remuneration 2)
|
– |
6,251,115 (–6%) |
176,279 (–24%) |
|||||||||||
|
2022 (% change) |
Fixed remuneration 1)
|
19,290,595 (3%) |
9,666,757 (6%) |
966,031 (8,5%) |
27,020 |
271,546 |
60.9 |
|||||||
(10%) |
(17%) |
(–38,97%) |
||||||||||||
Variable remuneration 2)
|
– |
6,671,595 (–54%) |
230,928 (–22%) |
|||||||||||
|
2021 (% change) |
Fixed remuneration 1)
|
18,764,547 (1%) |
9,144,067 (15%) |
889,538 (13%) |
31,780 |
232,314 |
99.79 |
|||||||
(14%) |
(–0.03%) |
(2.20%) |
||||||||||||
Variable remuneration 2)
|
88,782,271 (22%) |
14,626,469 (122%) |
295,193 (–1%) |
|||||||||||
Comments |
LTV 2018 expired and shares were transferred in May 2021. LTV 2019 and 2020 expired in 2022 and 2023 respectively but vesting postponed. |
LTV 2018 expired and shares were transferred in May 2021. LTV 2019 and 2020 expired in 2022 and 2023 respectively but vesting postponed. |
In 2021, the delayed salary revision for 2020 took place with a company-sponsored retroactive effect, which increased the remuneration of other employees. A majority of employees do not have variable remuneration. |
|||||||||||
|
1) |
Fixed remuneration includes fixed salary and other benefits. |
|
2) |
Variable remuneration for the CEO and President and to the Executive Vice President includes applicable STV and LTV. For the Company’s employees, variable remuneration includes short-term and long-term variable remuneration. For the sake of comparison, variable remuneration represents figures accrued and paid during the financial year. This is because performance reviews and long-term variable remuneration programs for other employees with performance periods expiring in fiscal year 2023 have not yet been completed. |
|
3) |
Employees of Telefonaktiebolaget LM Ericsson, excluding the CEO and President and other members of the Executive Team employed by the Company. |
| Financial Report 2023 | | Ericsson Annual Report on Form 20-F 2023 | |||
| By: | /s/ Stefan Salentin | |||||
| Stefan Salentin | ||||||
| Head of Group Controlling and External Reporting | ||||||
| By: | /s/ Carl Mellander | |||||
| Carl Mellander | ||||||
| Senior Vice President and Chief Financial Officer | ||||||
Exhibit 15.2
We consent to the incorporation by reference in the Registration Statements on Form F-3 (No. 333-254736) and Form S-8 (Nos. 333-81524, 333-100472, 333-107160, 333-122785, 333-125978, 333-135116, 333-151490, 333-161683, 333-161684, 333-167643, 333-196453 and 333-262071) of our reports dated March 12, 2024, relating to the financial statements of Telefonaktiebolaget LM Ericsson (publ) and subsidiaries (the “Company”), and the effectiveness of the Company’s internal control over financial reporting appearing in this Annual Report on Form 20-F for the year ended December 31, 2023.
/s/ Deloitte AB
Stockholm, Sweden
March 12, 2024
Exhibit 97.1
TELEFONAKTIEBOLAGET LM ERICSSON
POLICY FOR RECOVERY OF ERRONEOUSLY AWARDED COMPENSATION
Telefonaktiebolaget LM Ericsson (the “Company”) has adopted this Policy for Recovery of Erroneously Awarded Compensation (this “Policy”), effective as of October 2, 2023 (the “Effective Date”). Capitalized terms used in this Policy but not otherwise defined herein are defined in Section 11.
| 1. | Persons Subject to Policy |
This Policy shall apply to current and former Officers of the Company. Each Officer shall be required to sign an acknowledgment pursuant to which such Officer will agree to be bound by the terms of, and comply with, this Policy; however, any Officer’s failure to sign any such acknowledgment shall not negate the application of this Policy to the Officer.
| 2. | Compensation Subject to Policy |
This Policy shall apply to Variable Pay received on or after the Effective Date. For purposes of this Policy, the date on which Variable Pay is “received” shall be determined under the Applicable Rules, which generally provide that Variable Pay is “received” in the fiscal period during which the relevant Financial Reporting Measure is attained or satisfied, without regard to whether the grant, vesting or payment of the Variable Pay occurs after the end of that period.
| 3. | Recovery of Compensation |
In the event that the Company is required to prepare a Restatement, the Company shall recover, reasonably promptly, the portion of any Variable Pay that is Erroneously Awarded Compensation, unless the Committee has determined that recovery would be Impracticable. Recovery shall be required in accordance with the preceding sentence regardless of whether the applicable Officer engaged in misconduct or otherwise caused or contributed to the requirement for the Restatement and regardless of whether or when restated financial statements are filed by the Company. Erroneously Awarded Compensation means the amount of Variable Pay received by a current or former Officer that exceeds the amount of Variable Pay that would have been received by such current or former Officer based on a restated Financial Reporting Measure, as determined on a pre-tax basis in accordance with the Applicable Rules.
For clarity, the recovery of Erroneously Awarded Compensation under this Policy will not give rise to any person’s right to voluntarily terminate employment for “good reason,” or due to a “constructive termination” (or any similar term of like effect) under any plan, program or policy of or agreement with the Company or any of its affiliates.
| 4. | Manner of Recovery; Limitation on Duplicative Recovery |
The Committee shall, in its sole discretion, determine the manner of recovery of any Erroneously Awarded Compensation, which may include, without limitation, reduction or cancellation by the Company or an affiliate of the Company of Variable Pay or Erroneously Awarded Compensation, reimbursement or repayment by any person subject to this Policy of the Erroneously Awarded Compensation, and, to the extent permitted by applicable employment or other law, an offset of the Erroneously Awarded Compensation against other compensation payable by the Company or an affiliate of the Company to such person. Notwithstanding the foregoing, unless otherwise prohibited by the Applicable Rules, to the extent this Policy provides for recovery of Erroneously Awarded Compensation already recovered by the Company pursuant to Section 304 of the Sarbanes-Oxley Act of 2002 or Other Recovery Arrangements, the amount of Erroneously Awarded Compensation already recovered by the Company from the recipient of such Erroneously Awarded Compensation may be credited to the amount of Erroneously Awarded Compensation required to be recovered pursuant to this Policy from such person.
| 5. | Administration |
This Policy shall be administered, interpreted and construed by the Committee, which is authorized to make all determinations necessary, appropriate or advisable for such purpose. The Board of Directors of the Company (the “Board”) may re-vest in itself the authority to administer, interpret and construe this Policy in accordance with applicable law, and in such event references herein to the “Committee” shall be deemed to be references to the Board. Subject to any permitted review by the applicable U.S. securities exchange or association pursuant to the Applicable Rules, all determinations and decisions made by the Committee pursuant to the provisions of this Policy shall be final, conclusive and binding on all persons, including the Company and its affiliates, stockholders and employees. The Committee may delegate administrative duties with respect to this Policy to one or more directors or employees of the Company, as permitted under applicable law, including any Applicable Rules.
| 6. | Interpretation |
This Policy will be interpreted and applied in a manner that is consistent with the requirements of the Applicable Rules, and to the extent this Policy is inconsistent with such Applicable Rules, it shall be deemed amended to the minimum extent necessary to ensure compliance therewith.
| 7. | No Indemnification; No Liability |
The Company shall not indemnify or insure any person against the loss of any Erroneously Awarded Compensation pursuant to this Policy, nor shall the Company directly or indirectly pay or reimburse any person for any premiums for third-party insurance policies that such person may elect to purchase to fund such person’s potential obligations under this Policy. None of the Company, an affiliate of the Company or any member of the Committee or the Board shall have any liability to any person as a result of actions taken under this Policy.
| 8. | Application; Enforceability |
Except as otherwise determined by the Committee or the Board, the adoption of this Policy does not limit, and is intended to apply in addition to, any other clawback, recoupment, forfeiture or similar policies or provisions of the Company or its affiliates, including any such policies or provisions of such effect contained in any employment agreement, bonus plan, incentive plan, equity-based plan or award agreement thereunder or similar plan, program or agreement of the Company or an affiliate or required under applicable law (the “Other Recovery Arrangements”). The remedy specified in this Policy shall not be exclusive and shall be in addition to every other right or remedy at law or in equity that may be available to the Company or an affiliate of the Company.
| 9. | Severability |
The provisions in this Policy are intended to be applied to the fullest extent of the law; provided, however, to the extent that any provision of this Policy is found to be unenforceable or invalid under any applicable law, such provision will be applied to the maximum extent permitted, and shall automatically be deemed amended in a manner consistent with its objectives to the extent necessary to conform to any limitations required under applicable law.
| 10. | Amendment and Termination |
The Board or the Committee may amend, modify or terminate this Policy in whole or in part at any time and from time to time in its sole discretion. This Policy will terminate automatically when the Company does not have a class of securities listed on a U.S. securities exchange or association.
| 11. | Definitions |
2
“Applicable Rules” means Section 10D of the Exchange Act, Rule 10D-1 promulgated thereunder, the listing rules of the Nasdaq New York exchange on which the Company’s securities are listed, and any applicable rules, standards or other guidance adopted by the Securities and Exchange Commission or any U.S. securities exchange or association on which the Company’s securities are listed.
“Committee” means the remuneration committee of the Board responsible for executive compensation decisions comprised solely of independent directors (as determined under the Applicable Rules), or in the absence of such a remuneration committee, a majority of the independent directors serving on the Board.
“Exchange Act” means the Securities Exchange Act of 1934, as amended.
“Financial Reporting Measure” means any measure determined and presented in accordance with the accounting principles used in preparing the Company’s financial statements, and any measures derived wholly or in part from such measures, including GAAP, IFRS and non-GAAP/IFRS financial measures, as well as stock price and total stockholder return.
“GAAP” means United States generally accepted accounting principles.
“IFRS” means international financial reporting standards as adopted by the International Accounting Standards Board.
“Impracticable” means (a) the direct costs paid to third parties to assist in enforcing recovery would exceed the Erroneously Awarded Compensation; provided that the Company (i) has made reasonable attempts to recover the Erroneously Awarded Compensation, (ii) documented such attempt(s), and (iii) provided such documentation to the relevant listing exchange or association, (b) to the extent permitted by the Applicable Rules, the recovery would violate the Company’s home country laws pursuant to an opinion of home country counsel; provided that the Company has (i) obtained an opinion of home country counsel, acceptable to the relevant listing exchange or association, that recovery would result in such violation, and (ii) provided such opinion to the relevant listing exchange or association, or (c) recovery would likely cause an otherwise tax-qualified retirement plan, under which benefits are broadly available to employees of the Company, to fail to meet the requirements of 26 U.S.C. 401(a)(13) or 26 U.S.C. 411(a) and the regulations thereunder.
“Officer” means each person who serves as an executive officer of the Company, as defined in Rule 10D-1(d) under the Exchange Act.
“Restatement” means an accounting restatement to correct the Company’s material noncompliance with any financial reporting requirement under securities laws, including restatements that correct an error in previously issued financial statements (a) that is material to the previously issued financial statements or (b) that would result in a material misstatement if the error were corrected in the current period or left uncorrected in the current period.
“Three-Year Period” means, with respect to a Restatement, the three completed fiscal years immediately preceding the date that the Board, a committee of the Board, or the officer or officers of the Company authorized to take such action if Board action is not required, concludes, or reasonably should have concluded, that the Company is required to prepare such Restatement, or, if earlier, the date on which a court, regulator or other legally authorized body directs the Company to prepare such Restatement. The “Three-Year Period” also includes any transition period (that results from a change in the Company’s fiscal year) within or immediately following the three completed fiscal years identified in the preceding sentence. However, a transition period between the last day of the Company’s previous fiscal year end and the first day of its new fiscal year that comprises a period of nine to 12 months shall be deemed a completed fiscal year.
“Variable Pay” means, with respect to a Restatement, any compensation that is granted, earned, or vested based wholly or in part upon the attainment of one or more Financial Reporting Measures and received by a person (a) after beginning service as an Officer, (b) who served as an Officer at any time during the performance period for that compensation, (c) while the issuer has a class of its securities listed on a U.S. securities exchange or association, and (d) during the applicable Three-Year Period.
3
4
ACKNOWLEDGMENT AND CONSENT TO
POLICY FOR RECOVERY OF ERRONEOUSLY AWARDED COMPENSATION
The undersigned has received a copy of the Policy for Recovery of Erroneously Awarded Compensation (the “Policy”) adopted by Telefonaktiebolaget LM Ericsson (the “Company”).
For good and valuable consideration, the receipt of which is acknowledged, the undersigned agrees to the terms of the Policy and agrees that compensation received by the undersigned may be subject to reduction, cancellation, forfeiture and/or recoupment to the extent necessary to comply with the Policy, notwithstanding any other agreement to the contrary. The undersigned further acknowledges and agrees that the undersigned is not entitled to indemnification in connection with any enforcement of the Policy and expressly waives any rights to such indemnification under the Company’s organizational documents or otherwise.
|
|
|
|||||
| Date | Signature | |||||
|
|
||||||
| Name | ||||||
|
|
||||||
| Title | ||||||