UNITED STATES
SECURITIES AND EXCHANGE COMMISSION
WASHINGTON, D.C. 20549
FORM 8-K
CURRENT REPORT
Pursuant to Section 13 or 15(d)
of The Securities Exchange Act of 1934
Date of Report (Date of earliest event reported): March 12, 2024
THE GEO GROUP, INC.
(Exact Name of Registrant as Specified in its Charter)
| Florida | 1-14260 | 65-0043078 | ||
| (State or Other Jurisdiction of Incorporation) |
(Commission File Number) |
(IRS Employer Identification No.) |
| 4955 Technology Way, Boca Raton, Florida | 33431 | |
| (Address of Principal Executive Offices) | (Zip Code) |
Registrant’s telephone number, including area code (561) 893-0101
N/A
(Former Name or Former Address, if Changed Since Last Report)
Check the appropriate box below if the Form 8-K filing is intended to simultaneously satisfy the filing obligation of the registrant under any of the following provisions (see General Instruction A.2. below):
| ☐ | Written communications pursuant to Rule 425 under the Securities Act (17 CFR 230.425) |
| ☐ | Soliciting material pursuant to Rule 14a-12 under the Exchange Act (17 CFR 240.14a-12) |
| ☐ | Pre-commencement communications pursuant to Rule 14d-2(b) under the Exchange Act (17 CFR 240.14d-2(b)) |
| ☐ | Pre-commencement communications pursuant to Rule 13e-4(c) under the Exchange Act (17 CFR 240.13e-4(c)) |
Securities registered pursuant to Section 12(b) of the Act:
| Title of each class |
Trading Symbol |
Name of each exchange on which registered |
||
| Common Stock, $0.01 Par Value | GEO | New York Stock Exchange |
Indicate by check mark whether the registrant is an emerging growth company as defined in Rule 405 of the Securities Act of 1933 (§230.405 of this chapter) or Rule 12b-2 of the Securities Exchange Act of 1934 (§240.12b-2 of this chapter).
Emerging growth company ☐
If an emerging growth company, indicate by check mark if the registrant has elected not to use the extended transition period for complying with any new or revised financial accounting standards provided pursuant to Section 13(a) of the Exchange Act. ☐
| Section 7 | Regulation FD |
| Item 7.01 | Regulation FD Disclosure. |
The slide presentation furnished hereto as Exhibit 99.1, and incorporated herein by reference, will be presented to certain existing investors of The GEO Group, Inc. (the “Company”) beginning on March 12, 2024, and may be used by the Company in various other presentations to existing and prospective investors and analysts on or after March 12, 2024.
The presentation furnished with this Form 8-K contains forward-looking statements regarding future events and future performance of GEO that involve risks and uncertainties that could materially and adversely affect actual results, including statements regarding GEO’s financial guidance for the full-year of 2024, GEO’s focus on reducing net debt, future financial position, business strategy, budgets, projected costs and plans and objectives of management for future operations, and GEO’s assumptions regarding segment trends and government budgetary pressures. Forward-looking statements generally can be identified by the use of forward-looking terminology such as “may,” “will,” “expect,” “anticipate,” “intend,” “plan,” “believe,” “seek,” “estimate,” or “continue” or the negative of such words and similar expressions. Risks and uncertainties that could cause actual results to vary from current expectations and forward-looking statements contained in this presentation include, but are not limited to those described in GEO’s Securities and Exchange Commission periodic filings, including its Form 10-K for the year ended December 31, 2023, and subsequent Form 10-Q and 8-K reports, many of which are difficult to predict and outside of GEO’s control. Except as required under applicable law, GEO does not assume any obligation to update these forward-looking statements.
The information furnished in this Item 7.01, including Exhibit 99.1 hereto, shall not be deemed “filed” for purposes of Section 18 of the Securities Exchange Act of 1934, as amended (the “Exchange Act”) or otherwise subject to the liabilities of that section, nor shall such information be deemed incorporated by reference in any filings under the Securities Act of 1933, as amended, or the Exchange Act, except as shall be expressly set forth by specific reference in such filing. The filing of this Item 7.01 of this Current Report on Form 8-K shall not be deemed an admission as to the materiality of any information herein that is required to be disclosed solely by reason of Regulation FD.
| Section 9 | Financial Statements and Exhibits |
| Item 9.01. | Financial Statements and Exhibits. |
| (d) | Exhibits |
| Exhibit No. | Description |
|
| 99.1 | Investor Presentation to be used beginning on March 12, 2024. | |
| 104 | Cover Page Interactive Data File (embedded within the Inline XBRL document). | |
2
SIGNATURES
Pursuant to the requirements of the Securities Exchange Act of 1934, the registrant has duly caused this report to be signed on its behalf by the undersigned hereunto duly authorized.
| THE GEO GROUP, INC. | ||||||
| March 12, 2024 | By: | /s/ Shayn P. March |
||||
| Date | Shayn P. March | |||||
| Acting Chief Financial Officer, Executive Vice President, Finance and Treasurer |
||||||
| (Principal Financial Officer) | ||||||
3
Exhibit 99.1 Investor Presentation 4Q23
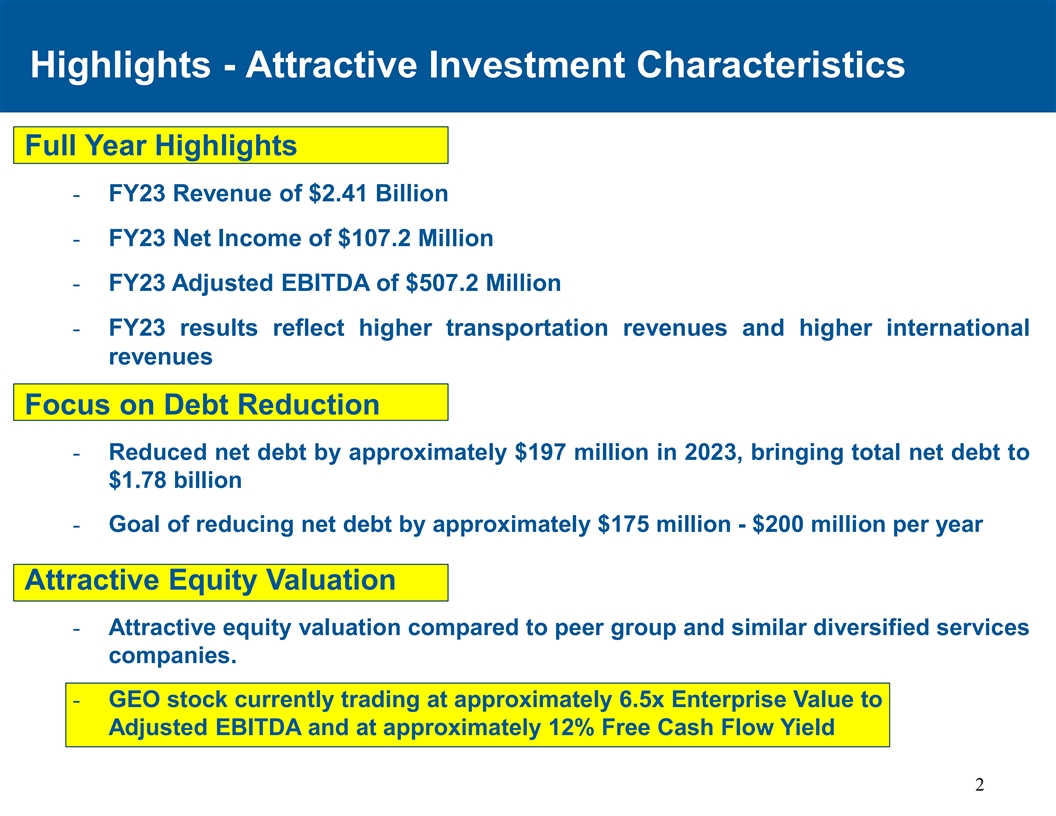
Highlights - Attractive Investment Characteristics Full Year Highlights - FY23 Revenue of $2.41 Billion - FY23 Net Income of $107.2 Million - FY23 Adjusted EBITDA of $507.2 Million - FY23 results reflect higher transportation revenues and higher international revenues Focus on Debt Reduction - Reduced net debt by approximately $197 million in 2023, bringing total net debt to $1.78 billion - Goal of reducing net debt by approximately $175 million - $200 million per year Attractive Equity Valuation - Attractive equity valuation compared to peer group and similar diversified services companies. - GEO stock currently trading at approximately 6.5x Enterprise Value to Adjusted EBITDA and at approximately 12% Free Cash Flow Yield 2
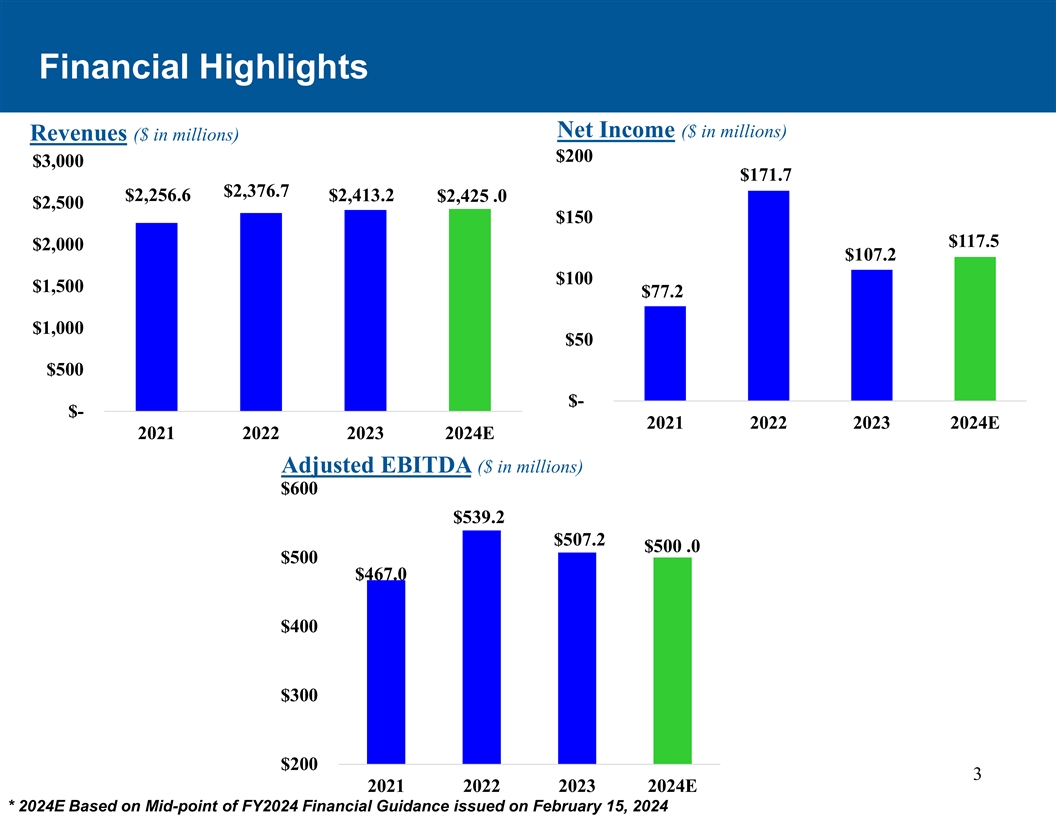
Financial Highlights Net Income ($ in millions) Revenues ($ in millions) $200 $3,000 $171.7 $2,376.7 $2,256.6 $2,413.2 $2,425 .0 $2,500 $150 $117.5 $2,000 $107.2 $100 $1,500 $77.2 $1,000 $50 $500 $- $- 2021 2022 2023 2024E 2021 2022 2023 2024E Adjusted EBITDA ($ in millions) $600 $539.2 $507.2 $500 .0 $500 $467.0 $400 $300 $200 3 2021 2022 2023 2024E * 2024E Based on Mid-point of FY2024 Financial Guidance issued on February 15, 2024
Company Overview 4
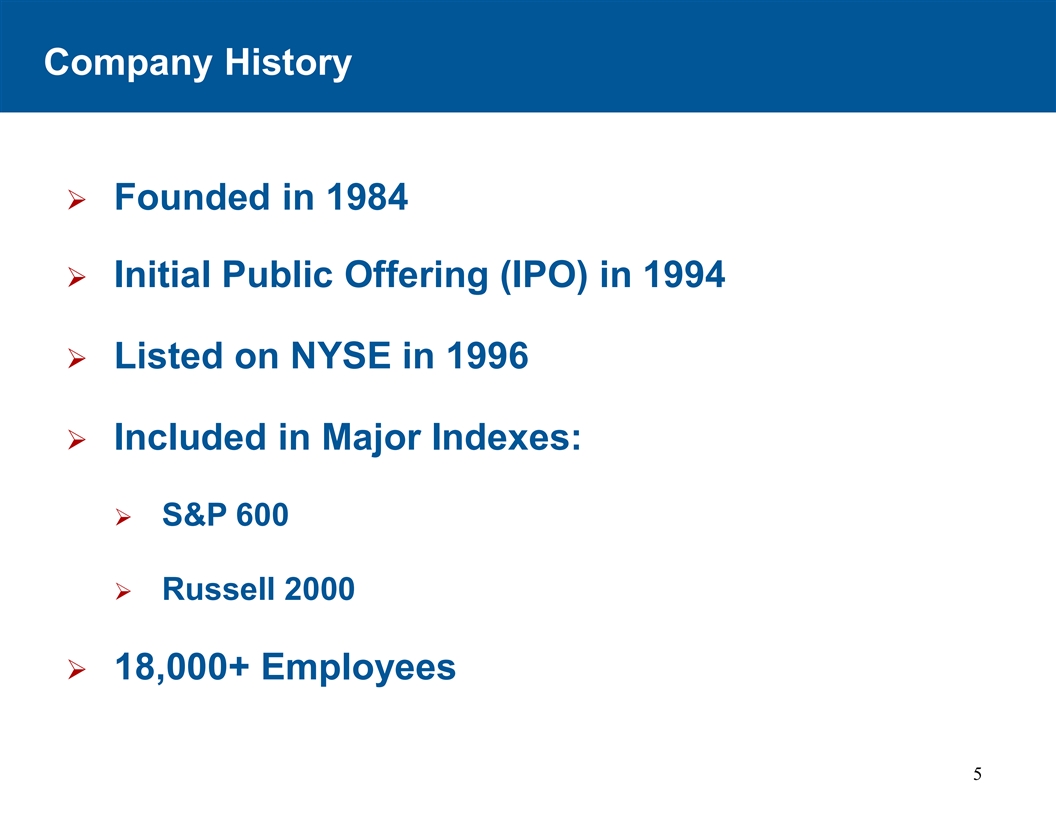
Company History Ø Founded in 1984 Ø Initial Public Offering (IPO) in 1994 Listed on NYSE in 1996 Ø Ø Included in Major Indexes: Ø S&P 600 Ø Russell 2000 Ø 18,000+ Employees 5
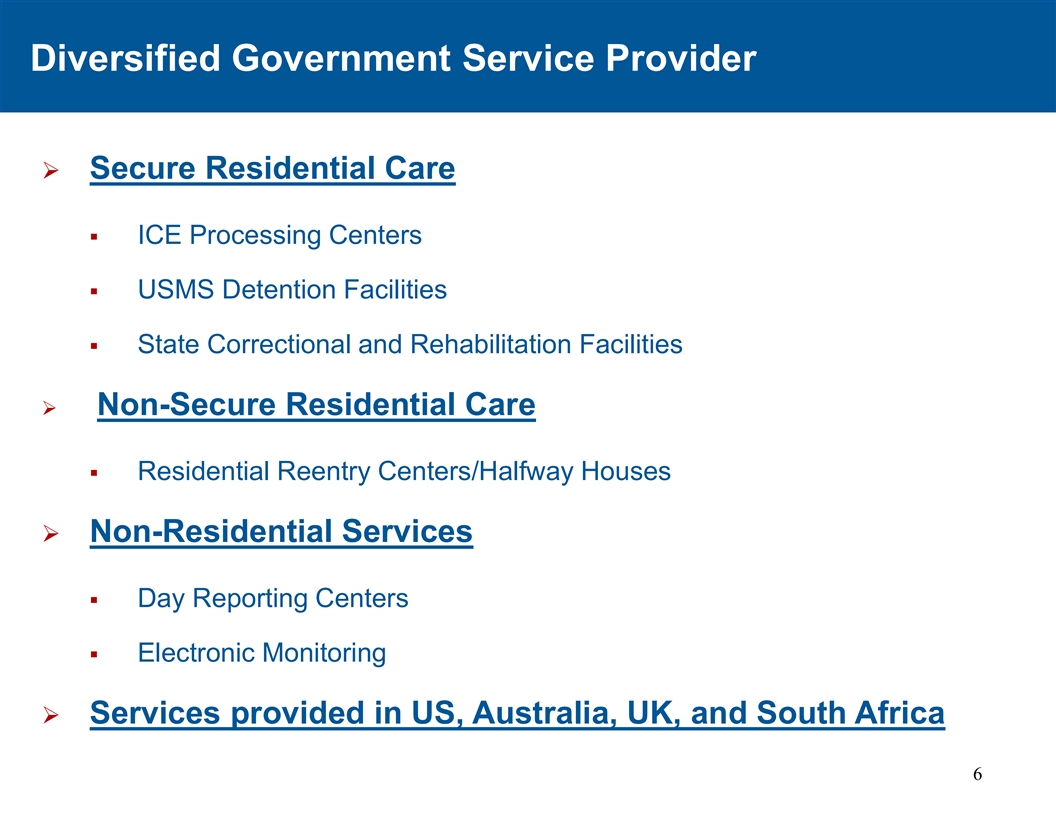
Diversified Government Service Provider Ø Secure Residential Care § ICE Processing Centers § USMS Detention Facilities § State Correctional and Rehabilitation Facilities Ø Non-Secure Residential Care § Residential Reentry Centers/Halfway Houses Ø Non-Residential Services § Day Reporting Centers § Electronic Monitoring Ø Services provided in US, Australia, UK, and South Africa 6
7
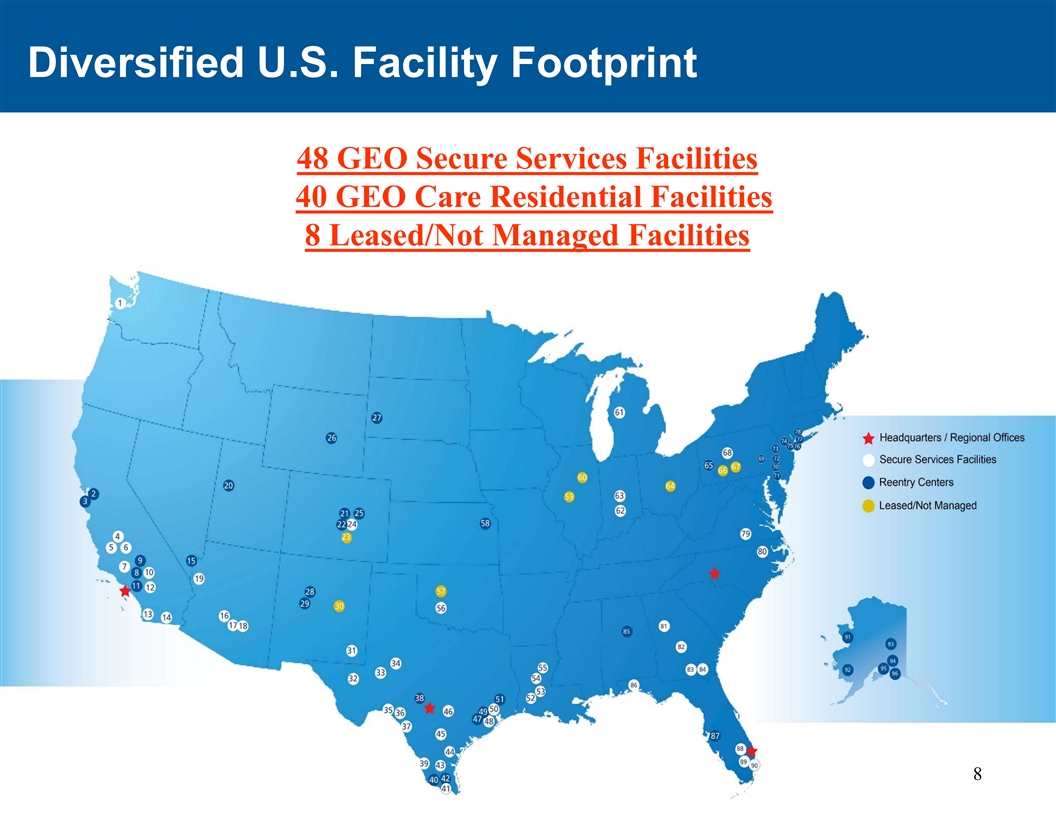
Diversified U.S. Facility Footprint 48 GEO Secure Services Facilities 40 GEO Care Residential Facilities 8 Leased/Not Managed Facilities 8
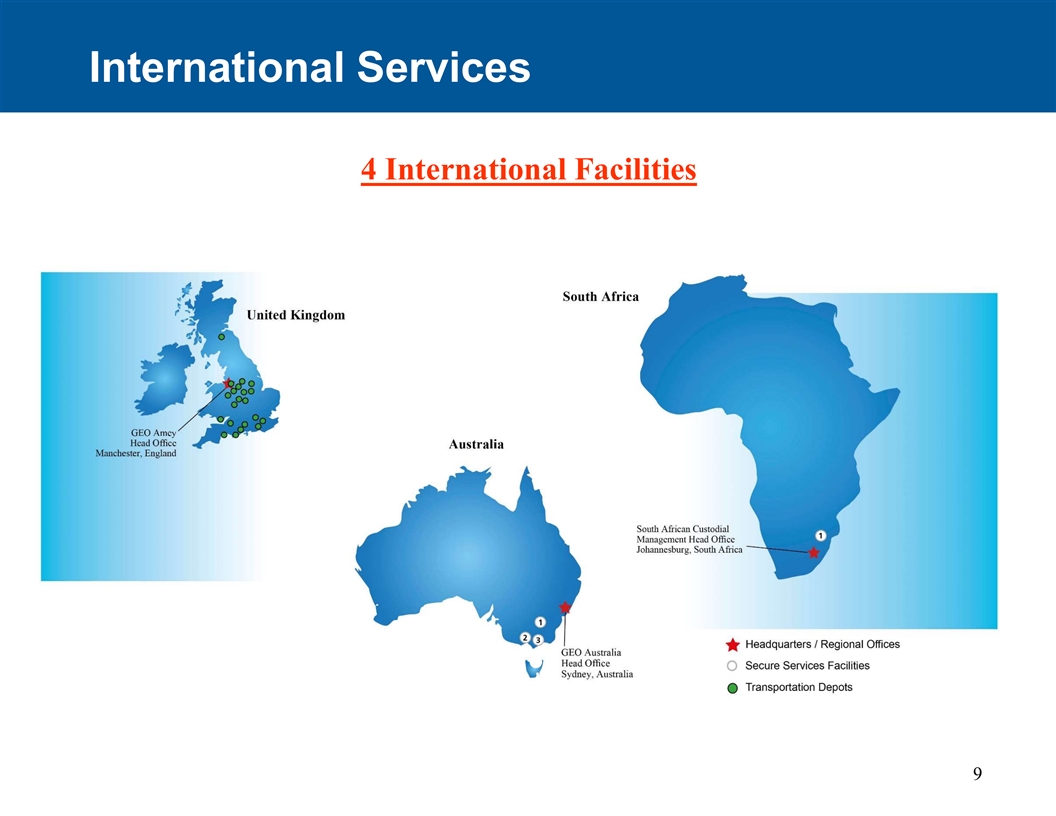
International Services 4 International Facilities 9
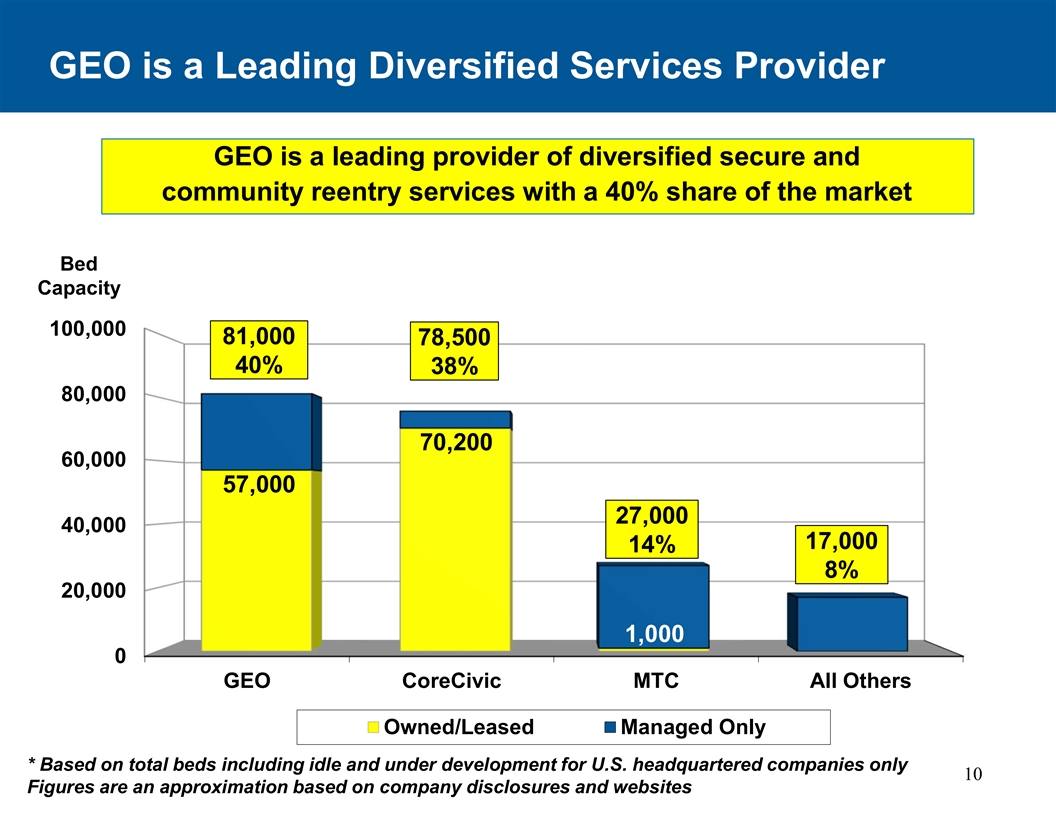
GEO is a Leading Diversified Services Provider GEO is a leading provider of diversified secure and community reentry services with a 40% share of the market Bed Capacity 100,000 81,000 78,500 40% 38% 80,000 70,200 60,000 57,000 27,000 40,000 17,000 14% 8% 20,000 1,000 0 GEO CoreCivic MTC All Others Owned/Leased Managed Only * Based on total beds including idle and under development for U.S. headquartered companies only 10 Figures are an approximation based on company disclosures and websites
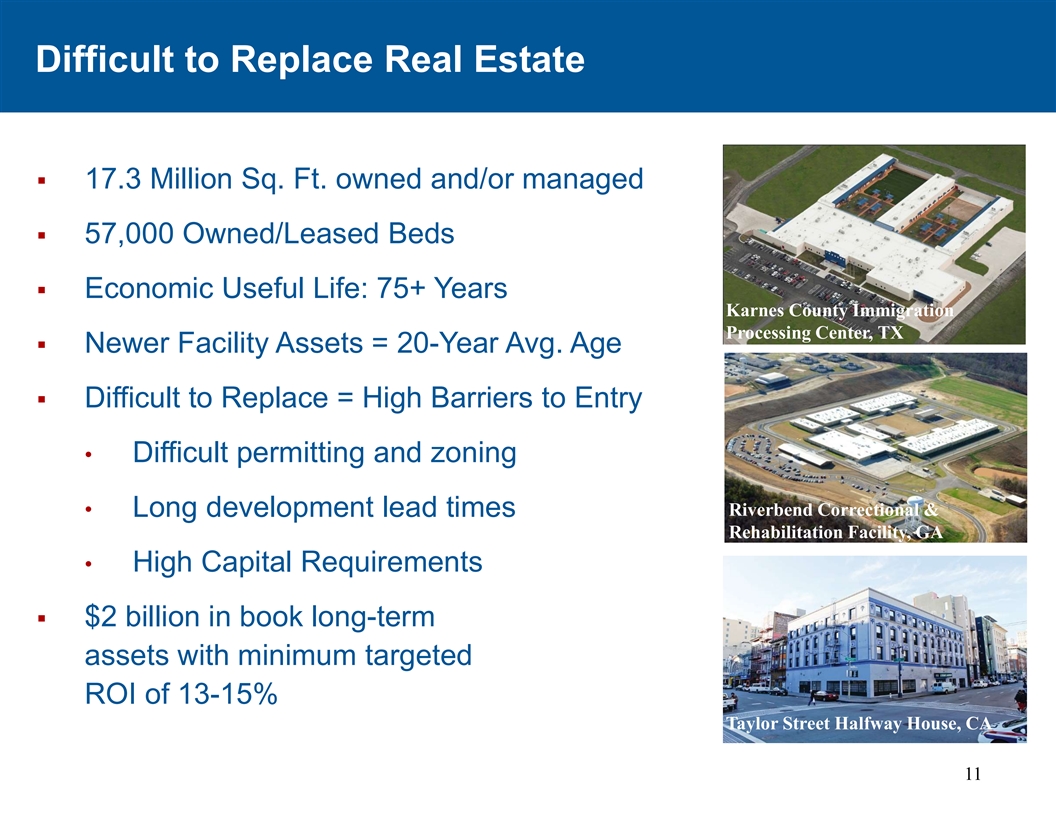
Difficult to Replace Real Estate § 17.3 Million Sq. Ft. owned and/or managed § 57,000 Owned/Leased Beds § Economic Useful Life: 75+ Years Karnes County Immigration Processing Center, TX § Newer Facility Assets = 20-Year Avg. Age § Difficult to Replace = High Barriers to Entry • Difficult permitting and zoning Riverbend Correctional & • Long development lead times Rehabilitation Facility, GA • High Capital Requirements § $2 billion in book long-term assets with minimum targeted ROI of 13-15% Taylor Street Halfway House, CA 11
Segment Trends 12
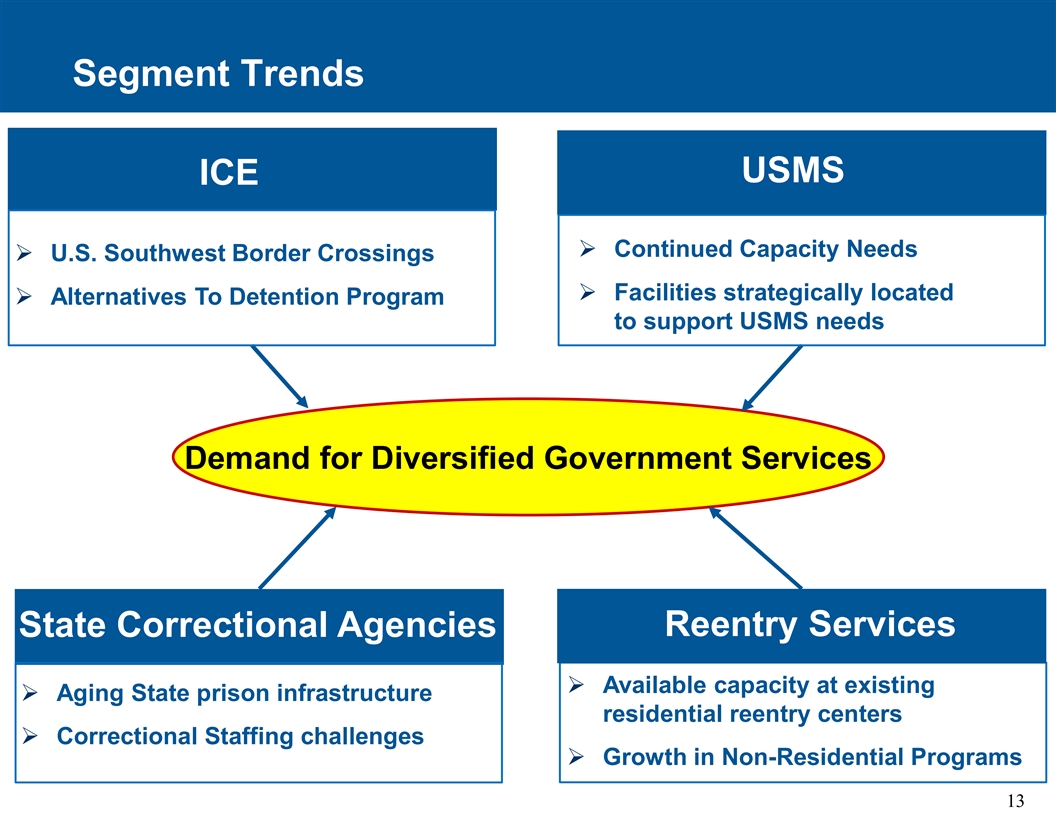
Segment Trends USMS ICE Ø Continued Capacity Needs Ø U.S. Southwest Border Crossings Ø Facilities strategically located Ø Alternatives To Detention Program to support USMS needs Demand for Diversified Government Services Reentry Services State Correctional Agencies Ø Available capacity at existing Ø Aging State prison infrastructure residential reentry centers Ø Correctional Staffing challenges Ø Growth in Non-Residential Programs 13
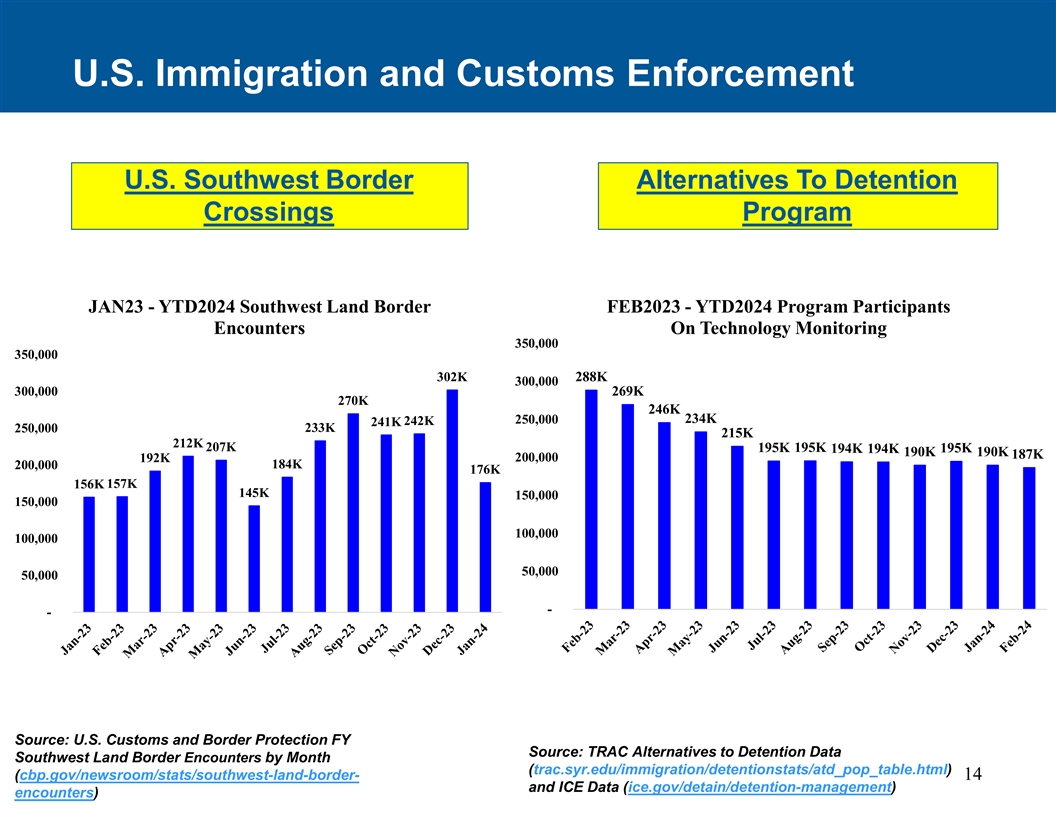
U.S. Immigration and Customs Enforcement FEDERAL SEGMENT U.S. Southwest Border Alternatives To Detention Reentry Crossings Program Services JAN23 - YTD2024 Southwest Land Border FEB2023 - YTD2024 Program Participants Encounters On Technology Monitoring 350,000 350,000 302K 288K 300,000 300,000 269K 270K 246K 234K 250,000 242K 241K 250,000 233K 215K 212K 207K 195K 195K 195K 194K 194K 190K 190K 187K 200,000 192K 184K 200,000 176K 156K 157K 145K 150,000 150,000 100,000 100,000 50,000 50,000 - - Source: U.S. Customs and Border Protection FY Source: TRAC Alternatives to Detention Data Southwest Land Border Encounters by Month (trac.syr.edu/immigration/detentionstats/atd_pop_table.html) (cbp.gov/newsroom/stats/southwest-land-border- 14 and ICE Data (ice.gov/detain/detention-management) encounters)
Federal Appropriations Update • We believe that ICE continues to face budgetary pressures, and the outcome and timing of ongoing federal budget discussions in Congress remain uncertain. • Since October 1, 2023, the U.S. Department of Homeland Security and ICE have been funded under a short-term Continuing Resolution, which has been extended three times and is currently set to expire on March 22, 2024. • In February 2024, a group U.S. Senators released a proposed Supplemental Appropriations Bill that would have provided funding for 50,000 ICE detention beds and increased the annual funding for Alternatives to Detention programs to approximately $1.3 billion, from the current funding level of $440 million. • The proposed Supplemental Appropriations Bill did not pass in the full U.S. Senate. Subsequently, a bipartisan group of U.S. House of Representatives lawmakers have introduced a $66 billion foreign aid and border package. • If Congress is unable to reach agreement on an appropriations package prior nd to March 22 , the federal government could continue to be funded under a continuing resolution or face the prospect of a government shutdown. 15
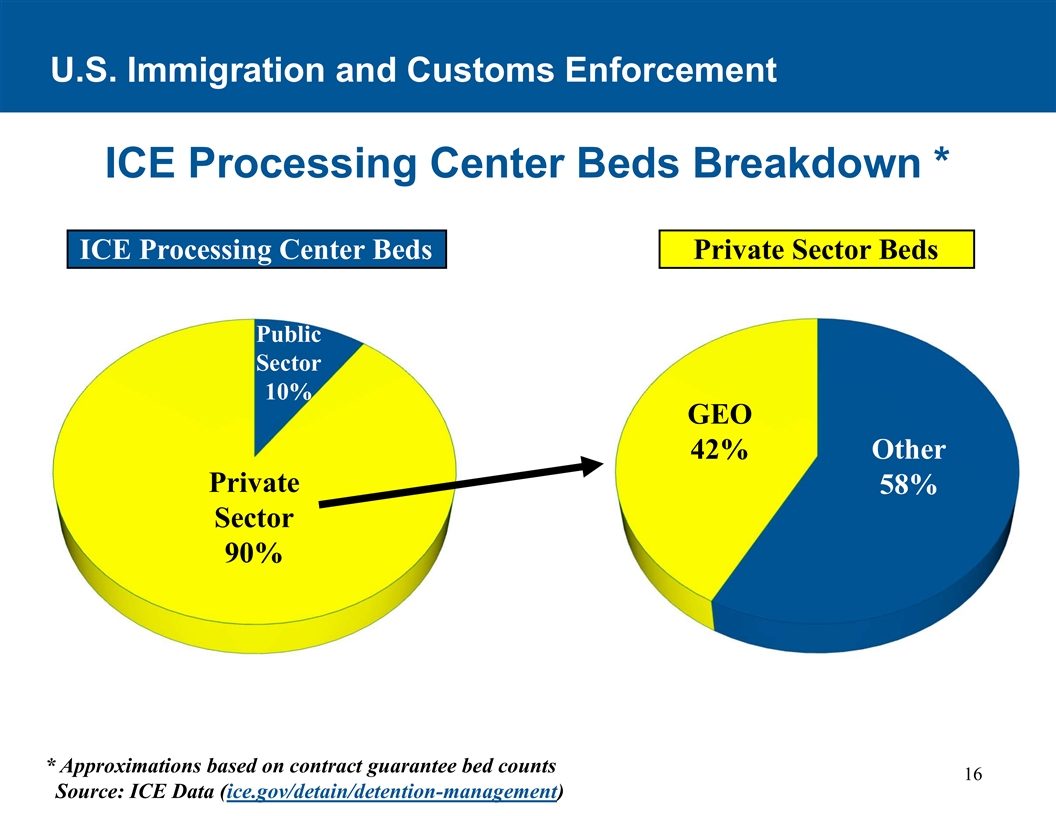
U.S. Immigration and Customs Enforcement ICE Processing Center Beds Breakdown * ICE Processing Center Beds Private Sector Beds Public Sector 10% GEO 42% Other Private 58% Sector 90% * Approximations based on contract guarantee bed counts 16 Source: ICE Data (ice.gov/detain/detention-management)
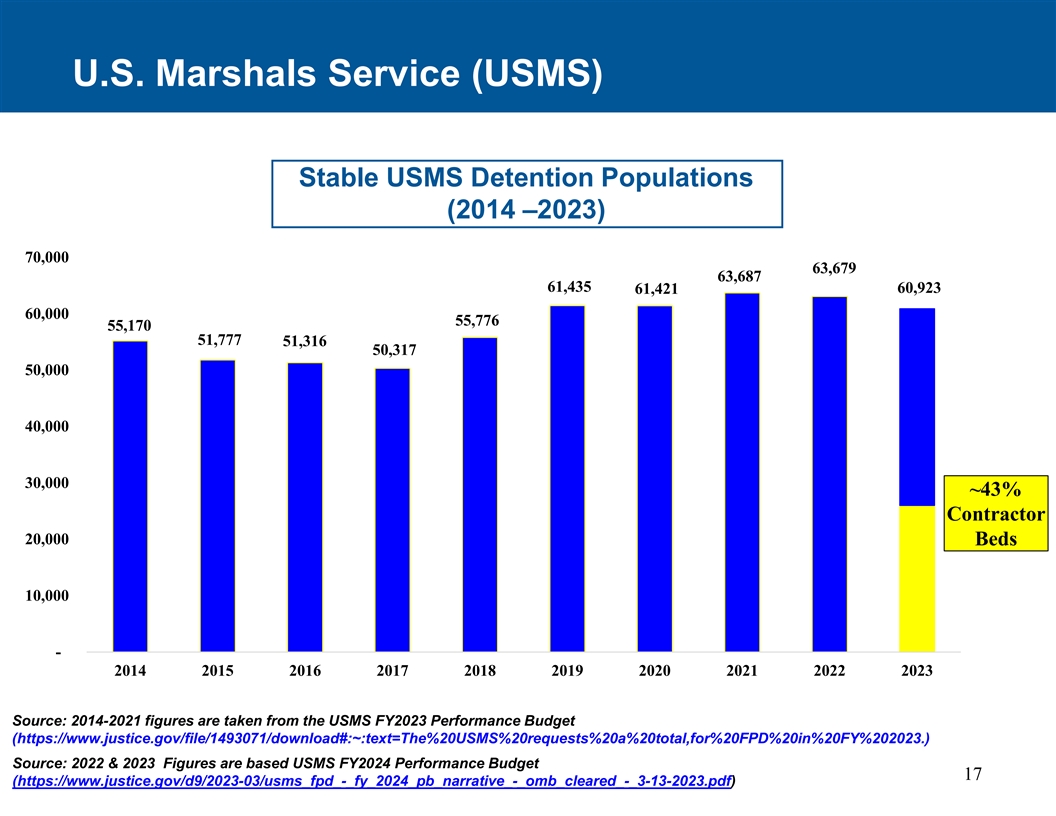
U.S. Marshals Service (USMS) Stable USMS Detention Populations (2014 –2023) 70,000 63,679 63,687 61,435 60,923 61,421 60,000 55,776 55,170 51,777 51,316 50,317 50,000 40,000 30,000 ~43% Contractor 20,000 Beds 10,000 - 2014 2015 2016 2017 2018 2019 2020 2021 2022 2023 Source: 2014-2021 figures are taken from the USMS FY2023 Performance Budget (https://www.justice.gov/file/1493071/download#:~:text=The%20USMS%20requests%20a%20total,for%20FPD%20in%20FY%202023.) Source: 2022 & 2023 Figures are based USMS FY2024 Performance Budget 17 (https://www.justice.gov/d9/2023-03/usms_fpd_-_fy_2024_pb_narrative_-_omb_cleared_-_3-13-2023.pdf)
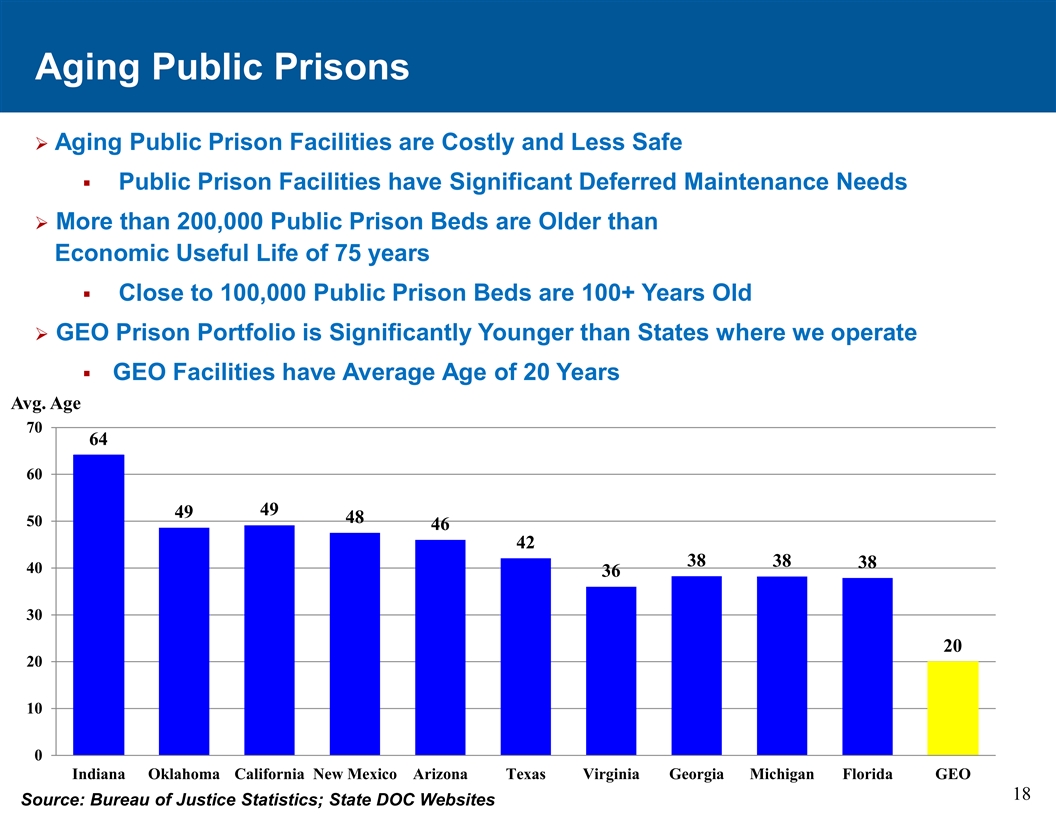
Aging Public Prisons Ø Aging Public Prison Facilities are Costly and Less Safe § Public Prison Facilities have Significant Deferred Maintenance Needs Ø More than 200,000 Public Prison Beds are Older than Economic Useful Life of 75 years § Close to 100,000 Public Prison Beds are 100+ Years Old Ø GEO Prison Portfolio is Significantly Younger than States where we operate § GEO Facilities have Average Age of 20 Years Avg. Age 70 64 60 49 49 48 50 46 42 38 38 38 40 36 30 20 20 10 0 Indiana Oklahoma California New Mexico Arizona Texas Virginia Georgia Michigan Florida GEO 18 Source: Bureau of Justice Statistics; State DOC Websites
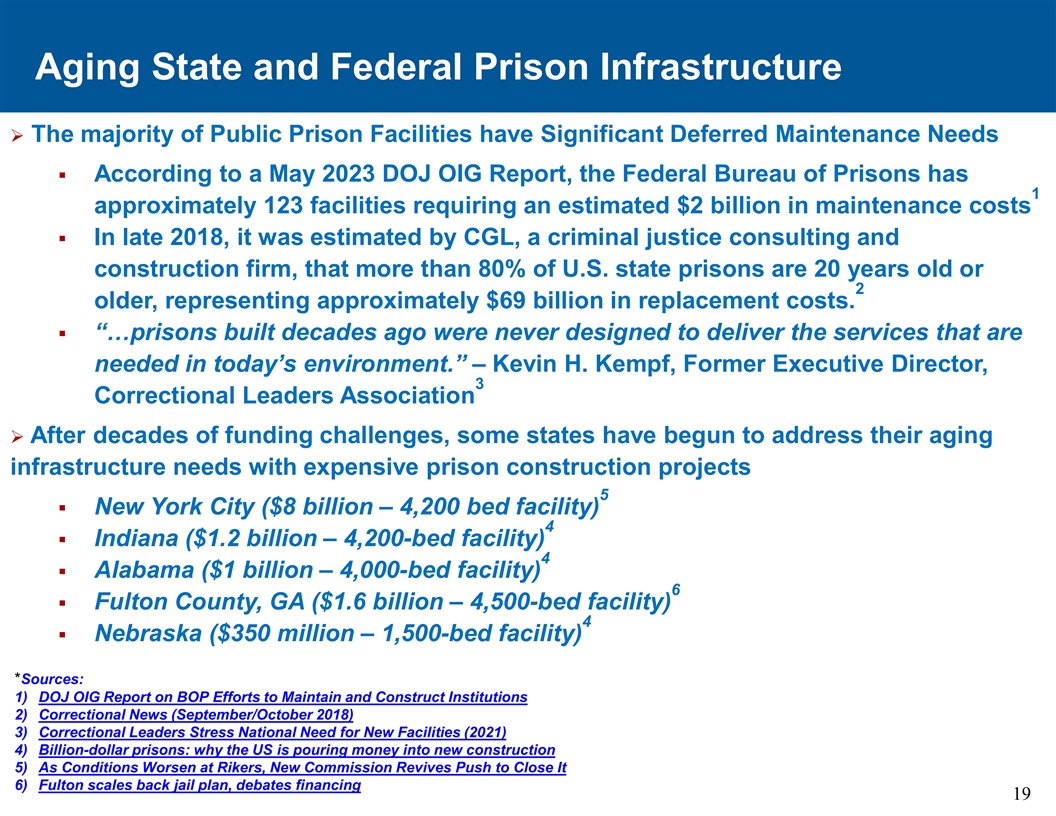
Aging State and Federal Prison Infrastructure Ø The majority of Public Prison Facilities have Significant Deferred Maintenance Needs § According to a May 2023 DOJ OIG Report, the Federal Bureau of Prisons has 1 approximately 123 facilities requiring an estimated $2 billion in maintenance costs § In late 2018, it was estimated by CGL, a criminal justice consulting and construction firm, that more than 80% of U.S. state prisons are 20 years old or 2 older, representing approximately $69 billion in replacement costs. § “…prisons built decades ago were never designed to deliver the services that are needed in today’s environment.” – Kevin H. Kempf, Former Executive Director, 3 Correctional Leaders Association Ø After decades of funding challenges, some states have begun to address their aging infrastructure needs with expensive prison construction projects 5 § New York City ($8 billion – 4,200 bed facility) 4 § Indiana ($1.2 billion – 4,200-bed facility) 4 § Alabama ($1 billion – 4,000-bed facility) 6 § Fulton County, GA ($1.6 billion – 4,500-bed facility) 4 § Nebraska ($350 million – 1,500-bed facility) *Sources: 1) DOJ OIG Report on BOP Efforts to Maintain and Construct Institutions 2) Correctional News (September/October 2018) 3) Correctional Leaders Stress National Need for New Facilities (2021) 4) Billion-dollar prisons: why the US is pouring money into new construction 5) As Conditions Worsen at Rikers, New Commission Revives Push to Close It 6) Fulton scales back jail plan, debates financing 19
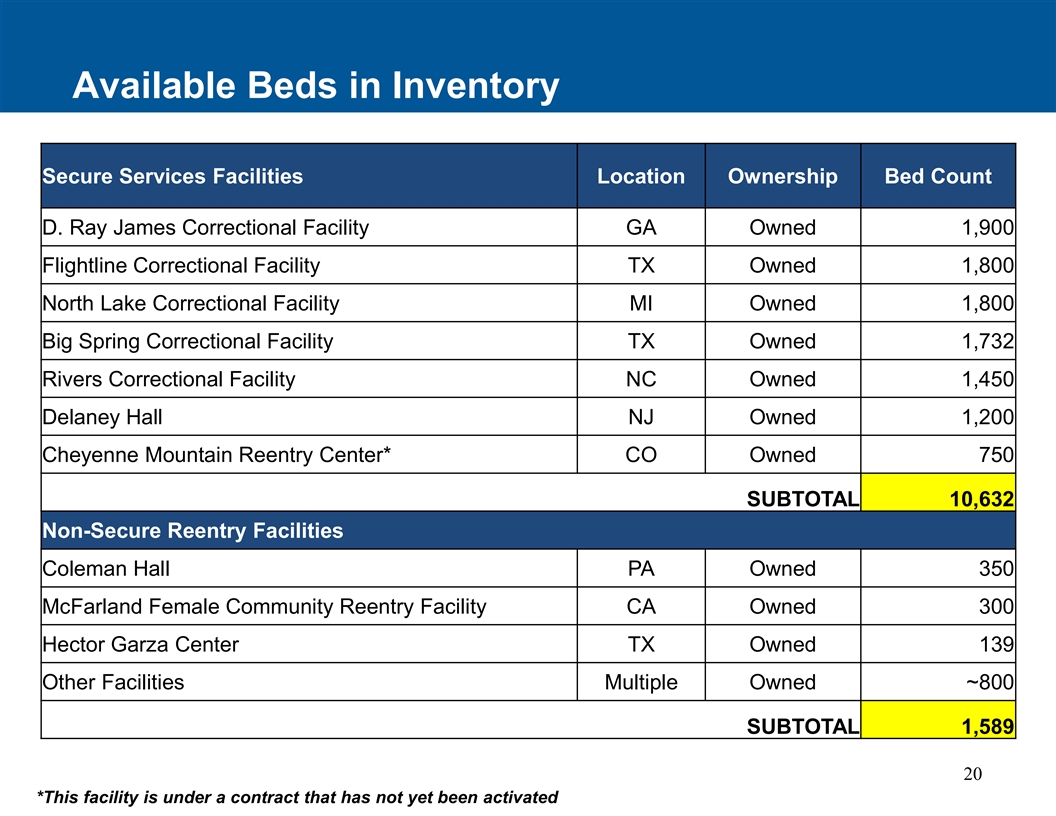
Available Beds in Inventory Secure Services Facilities Location Ownership Bed Count D. Ray James Correctional Facility GA Owned 1,900 Flightline Correctional Facility TX Owned 1,800 North Lake Correctional Facility MI Owned 1,800 Big Spring Correctional Facility TX Owned 1,732 Rivers Correctional Facility NC Owned 1,450 Delaney Hall NJ Owned 1,200 Cheyenne Mountain Reentry Center* CO Owned 750 SUBTOTAL 10,632 Non-Secure Reentry Facilities Coleman Hall PA Owned 350 McFarland Female Community Reentry Facility CA Owned 300 Hector Garza Center TX Owned 139 Other Facilities Multiple Owned ~800 SUBTOTAL 1,589 20 *This facility is under a contract that has not yet been activated
Financial Overview 21
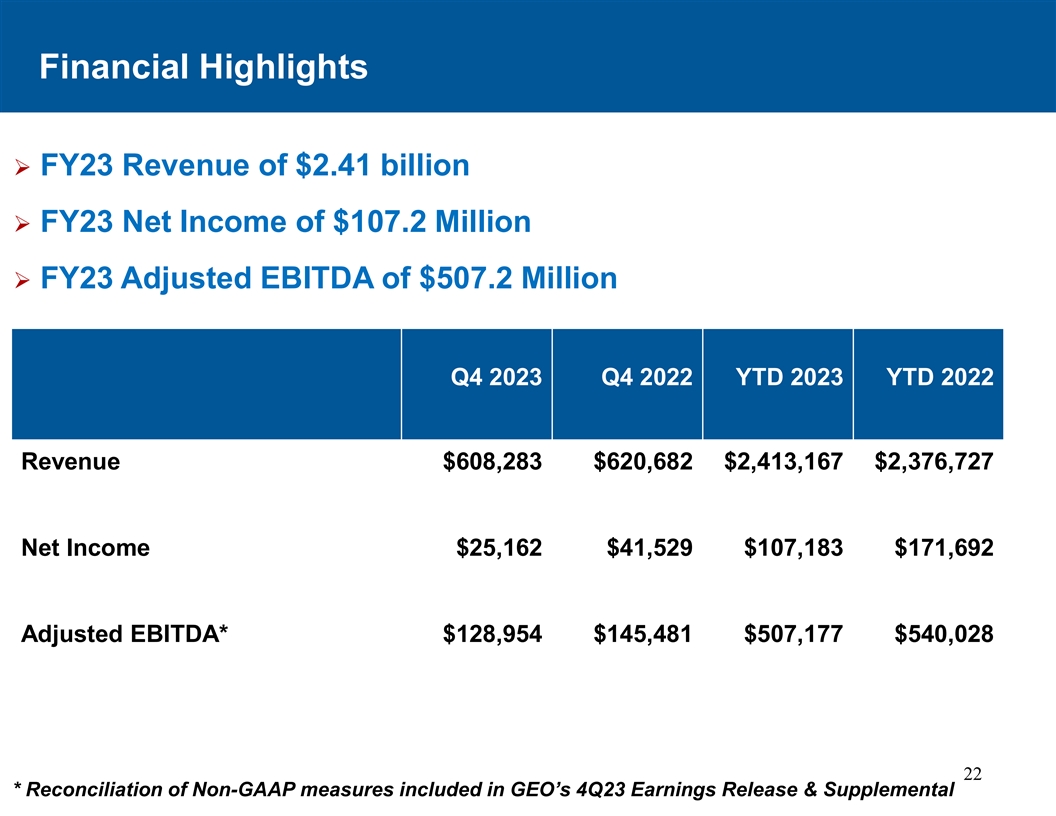
Financial Highlights Ø FY23 Revenue of $2.41 billion Ø FY23 Net Income of $107.2 Million FY23 Adjusted EBITDA of $507.2 Million Ø Q4 2023 Q4 2022 YTD 2023 YTD 2022 Revenue $608,283 $620,682 $2,413,167 $2,376,727 Net Income $25,162 $41,529 $107,183 $171,692 Adjusted EBITDA* $128,954 $145,481 $507,177 $540,028 22 * Reconciliation of Non-GAAP measures included in GEO’s 4Q23 Earnings Release & Supplemental
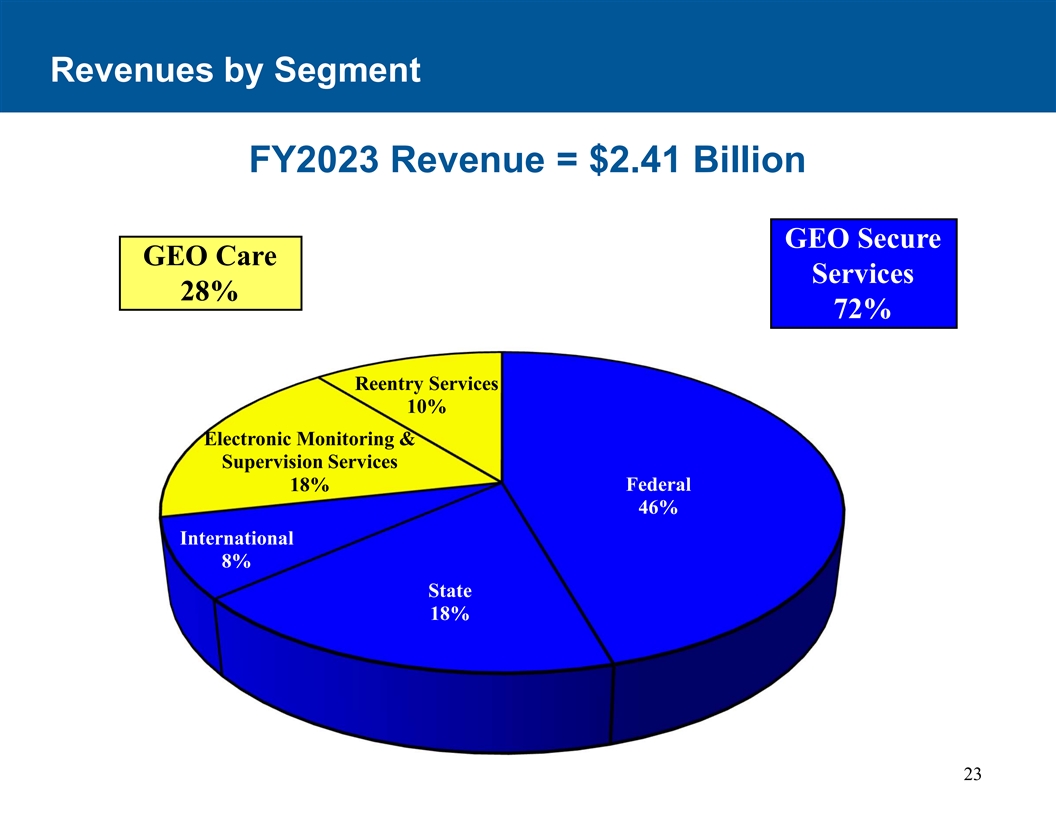
Revenues by Segment FY2023 Revenue = $2.41 Billion GEO Secure GEO Care Services 28% 72% Reentry Services 10% Electronic Monitoring & Supervision Services Federal 18% 46% International 8% State 18% 23
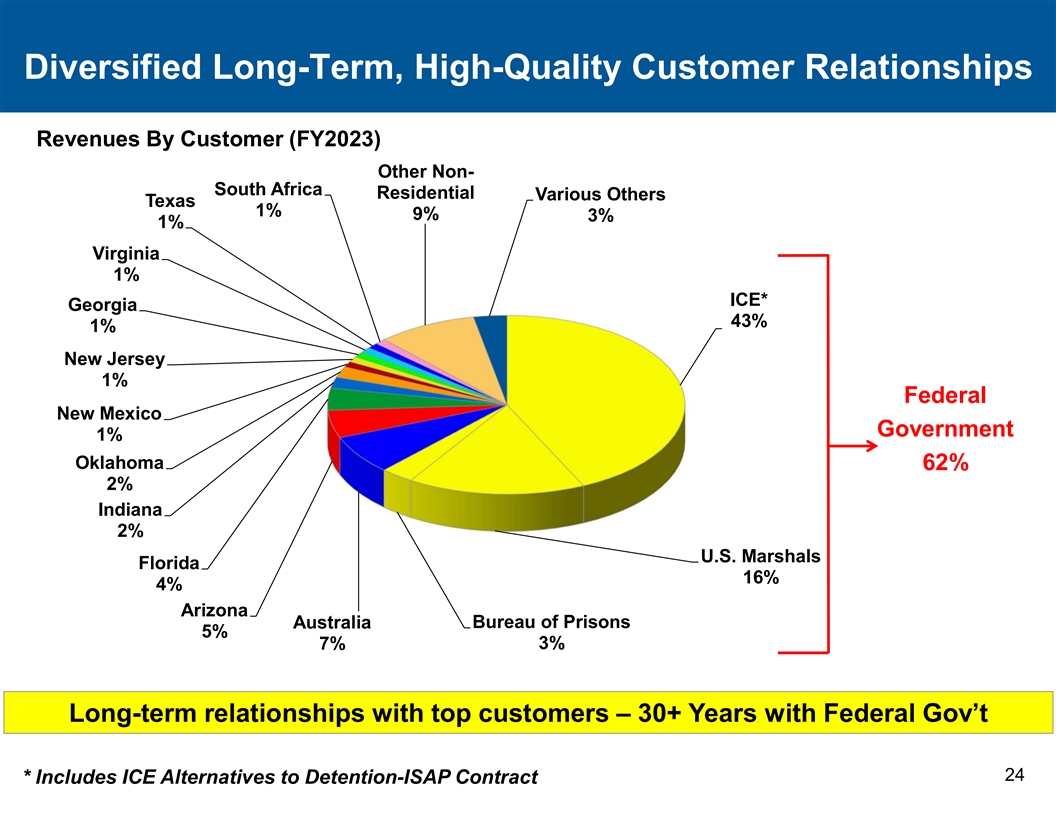
Diversified Long-Term, High-Quality Customer Relationships Revenues By Customer (FY2023) Other Non- South Africa Residential Various Others Texas 1% 9% 3% 1% Virginia 1% ICE* Georgia 43% 1% New Jersey 1% Federal New Mexico Government 1% Oklahoma 62% 2% Indiana 2% U.S. Marshals Florida 16% 4% Arizona Bureau of Prisons Australia 5% 7% 3% Long-term relationships with top customers – 30+ Years with Federal Gov’t 24 * Includes ICE Alternatives to Detention-ISAP Contract
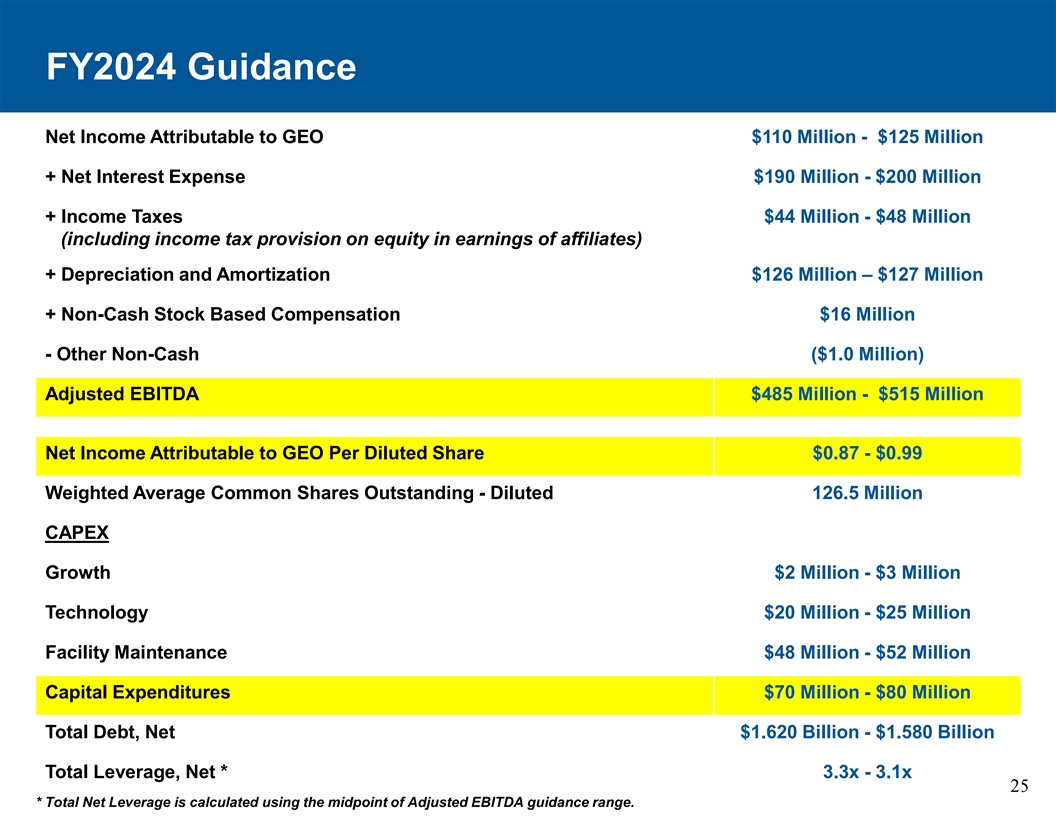
FY2024 Guidance Net Income Attributable to GEO $110 Million - $125 Million + Net Interest Expense $190 Million - $200 Million + Income Taxes $44 Million - $48 Million (including income tax provision on equity in earnings of affiliates) + Depreciation and Amortization $126 Million – $127 Million + Non-Cash Stock Based Compensation $16 Million - Other Non-Cash ($1.0 Million) Adjusted EBITDA $485 Million - $515 Million Net Income Attributable to GEO Per Diluted Share $0.87 - $0.99 Weighted Average Common Shares Outstanding - Diluted 126.5 Million CAPEX Growth $2 Million - $3 Million Technology $20 Million - $25 Million Facility Maintenance $48 Million - $52 Million Capital Expenditures $70 Million - $80 Million Total Debt, Net $1.620 Billion - $1.580 Billion Total Leverage, Net * 3.3x - 3.1x 25 * Total Net Leverage is calculated using the midpoint of Adjusted EBITDA guidance range.
Environmental, Social & Governance (ESG) Overview 26
High Quality Government Contracts Ø All Investment Grade Customers Ø Required by Law to Pay on Time: 45-60 days Ø No Receivables Problems Ø Payment Schedule: Monthly Billing Ø Majority of Contracts Include Fixed Monthly Payments Ø Contract Terms: Average Length of 7-10 Years Ø Customer Retention: In Excess of 90% 27
Highly Regulated / Professional Services Ø Lengthy Contracts Specifying all Service Requirements Ø On-Site, Full-Time Customer Contract Monitors at Facilities in the U.S. Ø Full-time GEO Compliance Monitors at Facilities in the U.S. Ø Independent Contract Compliance Division Reporting Directly to the CEO, which Conducts Ongoing Comprehensive Facility Audits Ø American Correctional Association Accreditation with Scores in Excess of 99% Ø National Commission on Correctional Health Care Accreditation 28
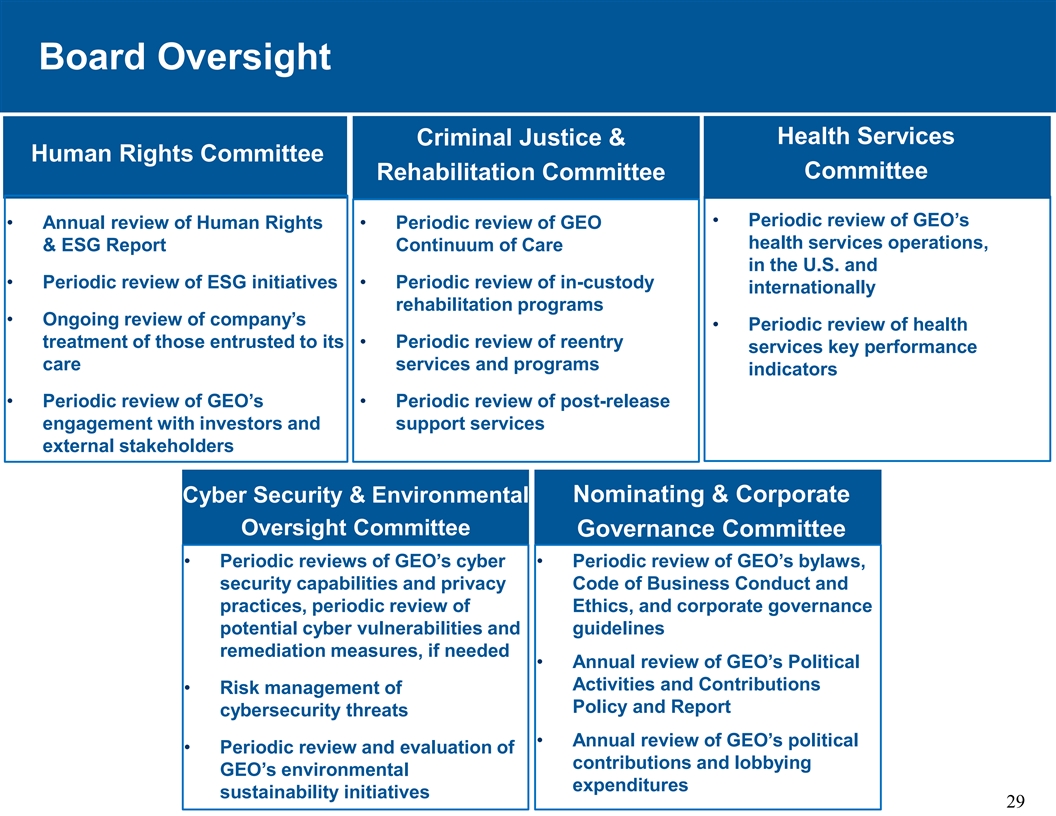
Board Oversight Health Services Criminal Justice & Human Rights Committee Committee Rehabilitation Committee • Periodic review of GEO’s • Annual review of Human Rights • Periodic review of GEO health services operations, & ESG Report Continuum of Care in the U.S. and • Periodic review of ESG initiatives • Periodic review of in-custody internationally rehabilitation programs • Ongoing review of company’s • Periodic review of health treatment of those entrusted to its • Periodic review of reentry services key performance care services and programs indicators • Periodic review of GEO’s • Periodic review of post-release engagement with investors and support services external stakeholders Cyber Security & Environmental Nominating & Corporate Oversight Committee Governance Committee • Periodic reviews of GEO’s cyber • Periodic review of GEO’s bylaws, security capabilities and privacy Code of Business Conduct and practices, periodic review of Ethics, and corporate governance potential cyber vulnerabilities and guidelines remediation measures, if needed • Annual review of GEO’s Political Activities and Contributions • Risk management of Policy and Report cybersecurity threats • Annual review of GEO’s political • Periodic review and evaluation of contributions and lobbying GEO’s environmental expenditures sustainability initiatives 29
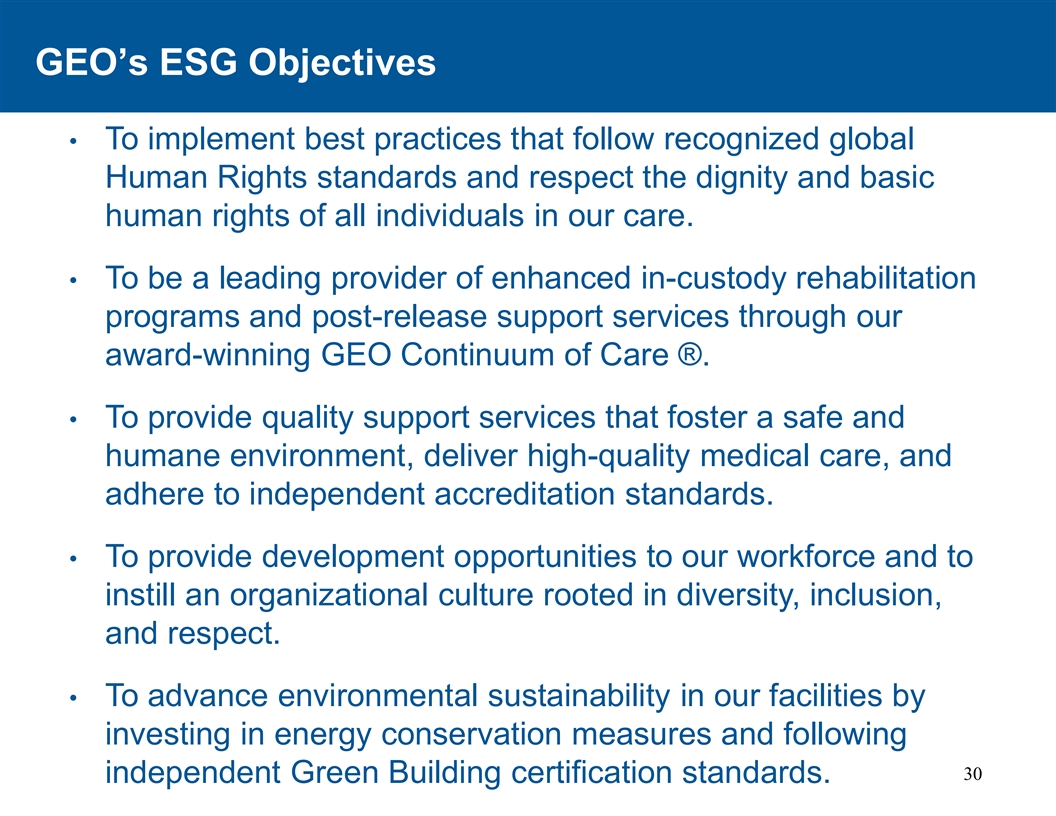
GEO’s ESG Objectives • To implement best practices that follow recognized global Human Rights standards and respect the dignity and basic human rights of all individuals in our care. • To be a leading provider of enhanced in-custody rehabilitation programs and post-release support services through our award-winning GEO Continuum of Care ®. • To provide quality support services that foster a safe and humane environment, deliver high-quality medical care, and adhere to independent accreditation standards. • To provide development opportunities to our workforce and to instill an organizational culture rooted in diversity, inclusion, and respect. • To advance environmental sustainability in our facilities by investing in energy conservation measures and following 30 independent Green Building certification standards.
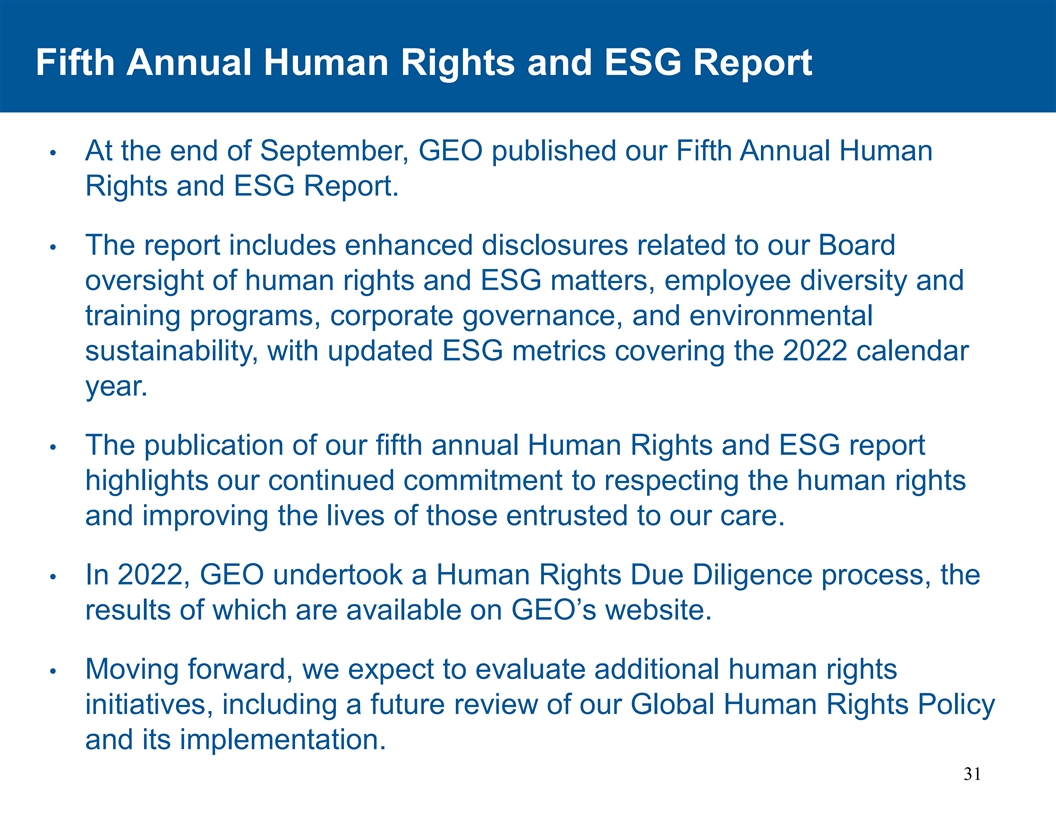
Fifth Annual Human Rights and ESG Report At the end of September, GEO published our Fifth Annual Human • Rights and ESG Report. • The report includes enhanced disclosures related to our Board oversight of human rights and ESG matters, employee diversity and training programs, corporate governance, and environmental sustainability, with updated ESG metrics covering the 2022 calendar year. • The publication of our fifth annual Human Rights and ESG report highlights our continued commitment to respecting the human rights and improving the lives of those entrusted to our care. In 2022, GEO undertook a Human Rights Due Diligence process, the • results of which are available on GEO’s website. • Moving forward, we expect to evaluate additional human rights initiatives, including a future review of our Global Human Rights Policy and its implementation. 31
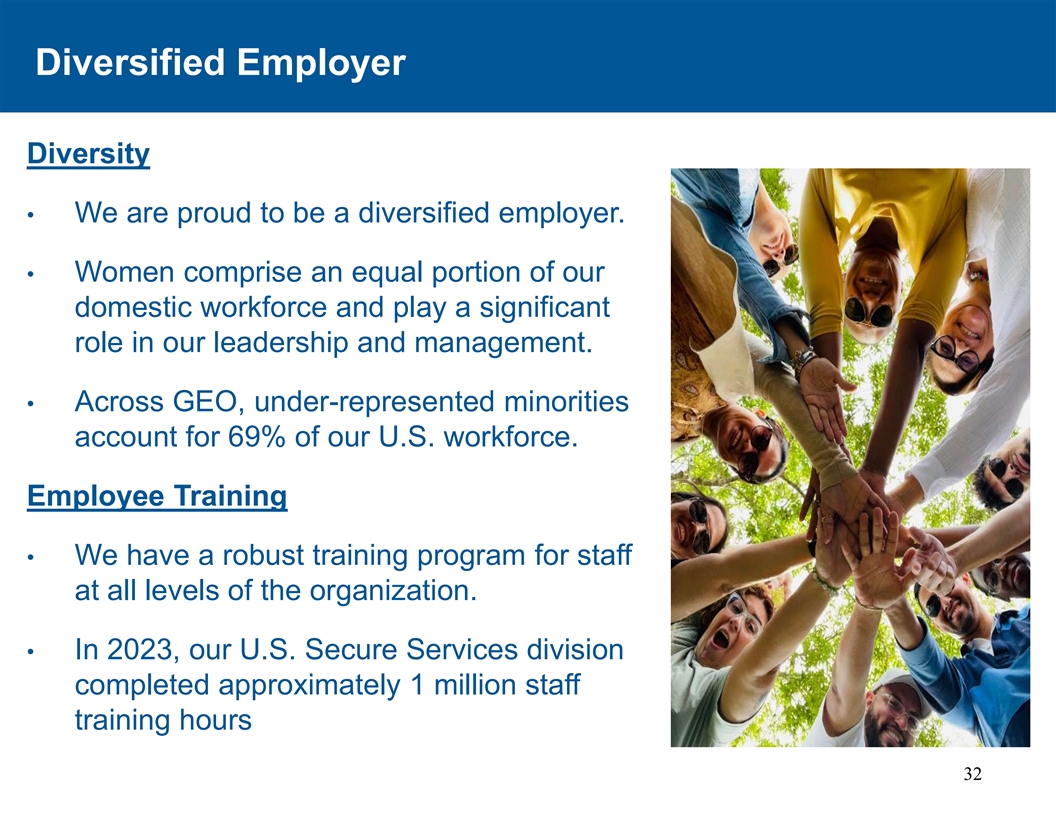
Diversified Employer Diversity • We are proud to be a diversified employer. • Women comprise an equal portion of our domestic workforce and play a significant role in our leadership and management. • Across GEO, under-represented minorities account for 69% of our U.S. workforce. Employee Training • We have a robust training program for staff at all levels of the organization. • In 2023, our U.S. Secure Services division completed approximately 1 million staff training hours 32
Environmentally Responsible • GEO’s Environmental Sustainability Policy Statement is disclosed in Annual ESG Report. • GEO also provides disclosures on energy consumption statistics, water usage metrics, and Greenhouse Gas (GHG) Scope 1 and Scope 2 Emissions and Intensity Ratios. • New disclosures related to Sustainability Audits and Energy Improvements at select GEO facilities. • As a result of these audits, GEO will invest approximately $25 million to retrofit, modify, and upgrade lighting, water, laundry, and HVAC systems at select Secure Services facilities. As of 2022, $13 million in energy improvement projects have been completed. 33
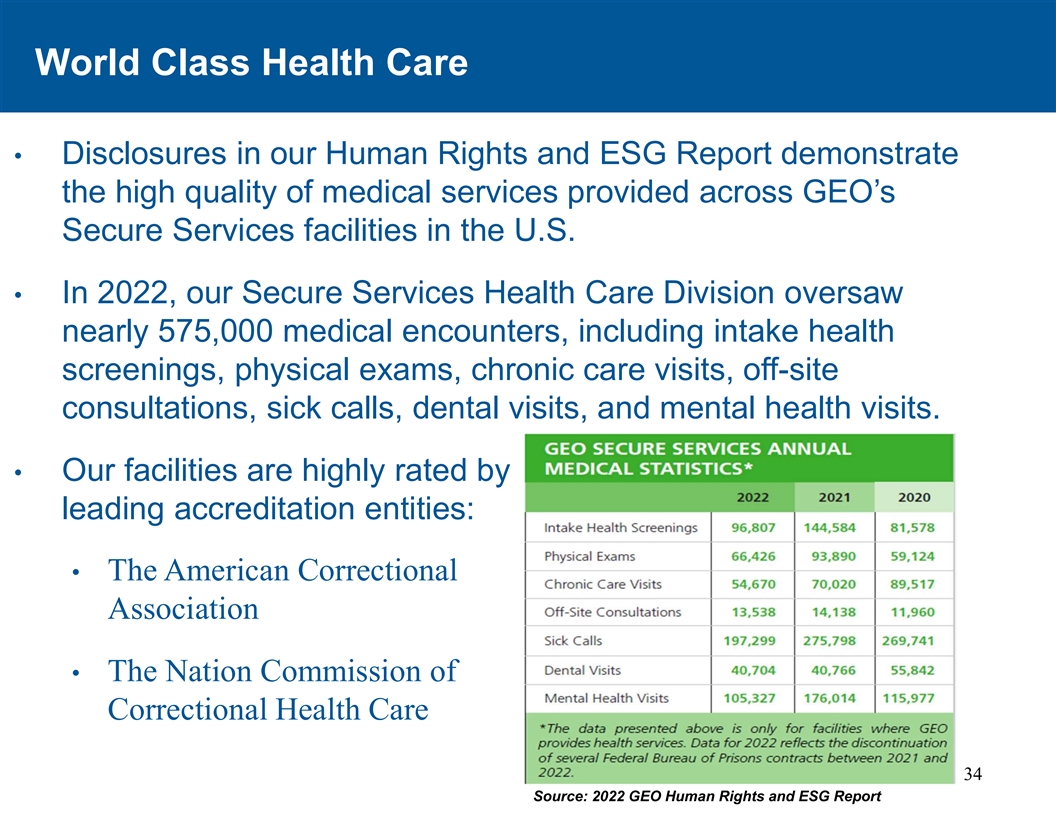
World Class Health Care • Disclosures in our Human Rights and ESG Report demonstrate the high quality of medical services provided across GEO’s Secure Services facilities in the U.S. • In 2022, our Secure Services Health Care Division oversaw nearly 575,000 medical encounters, including intake health screenings, physical exams, chronic care visits, off-site consultations, sick calls, dental visits, and mental health visits. • Our facilities are highly rated by leading accreditation entities: • The American Correctional Association • The Nation Commission of Correctional Health Care 34 Source: 2022 GEO Human Rights and ESG Report
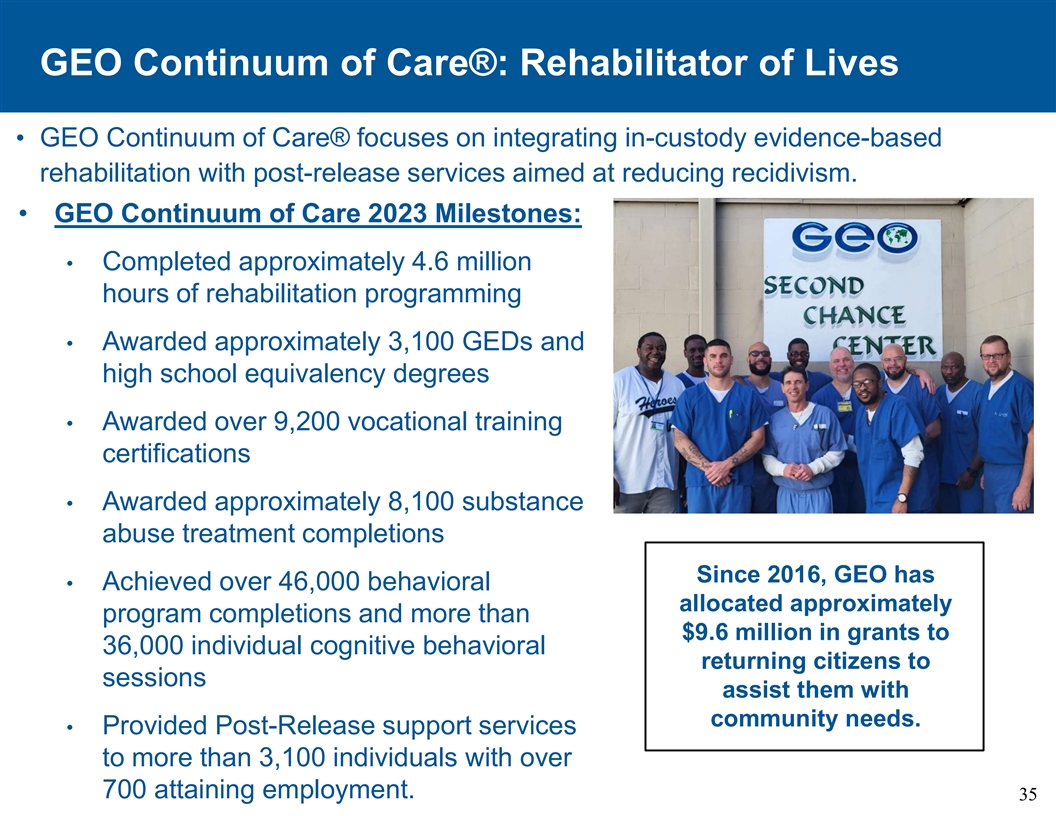
GEO Continuum of Care®: Rehabilitator of Lives • GEO Continuum of Care® focuses on integrating in-custody evidence-based rehabilitation with post-release services aimed at reducing recidivism. • GEO Continuum of Care 2023 Milestones: • Completed approximately 4.6 million hours of rehabilitation programming • Awarded approximately 3,100 GEDs and high school equivalency degrees • Awarded over 9,200 vocational training certifications • Awarded approximately 8,100 substance abuse treatment completions Since 2016, GEO has • Achieved over 46,000 behavioral allocated approximately program completions and more than $9.6 million in grants to 36,000 individual cognitive behavioral returning citizens to sessions assist them with community needs. • Provided Post-Release support services to more than 3,100 individuals with over 700 attaining employment. 35
Appendix 36
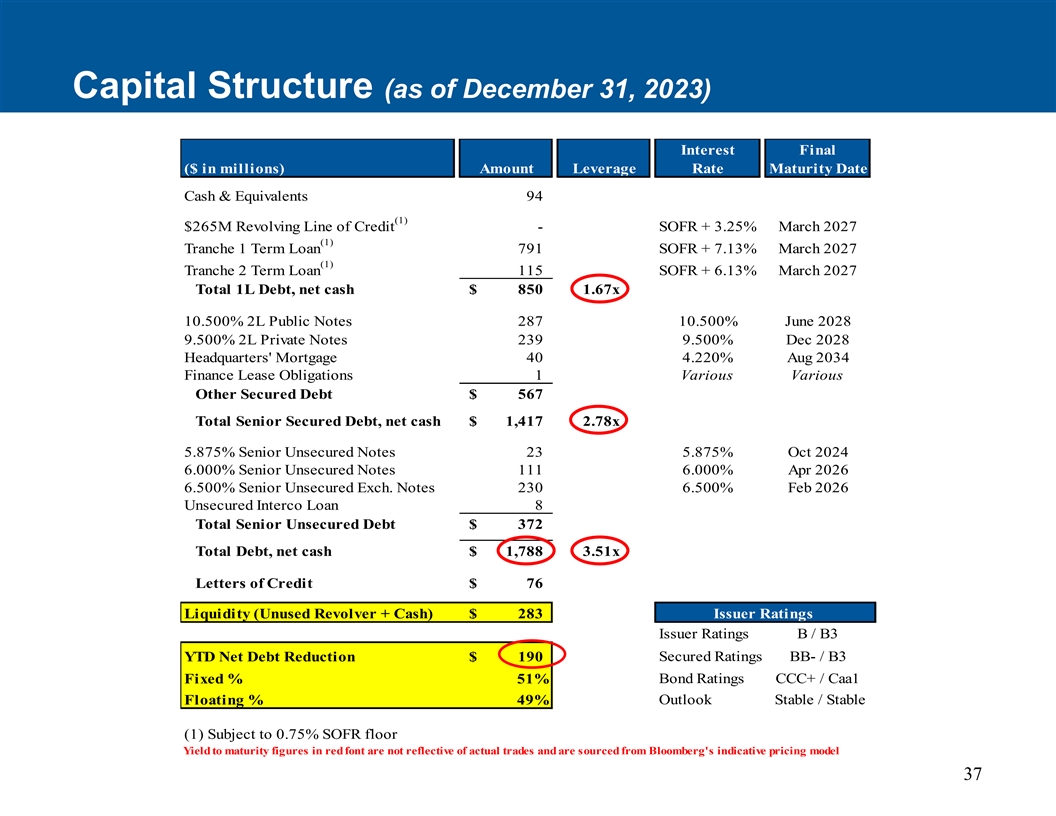
Capital Structure (as of December 31, 2023) Interest Final ($ in millions) Amount Leverage Rate Maturity Date Cash & Equivalents 94 (1) $265M Revolving Line of Credit - SOFR + 3.25% March 2027 (1) Tranche 1 Term Loan 7 91 SOFR + 7.13% March 2027 (1) Tranche 2 Term Loan 1 15 SOFR + 6.13% March 2027 Total 1L Debt, net cash $ 850 1.67x 10.500% 2L Public Notes 287 10.500% June 2028 9.500% 2L Private Notes 239 9.500% Dec 2028 Headquarters' Mortgage 40 4.220% Aug 2034 Finance Lease Obligations 1 Various Various Other Secured Debt $ 567 Total Senior Secured Debt, net cash $ 1,417 2.78x 5.875% Senior Unsecured Notes 23 5.875% Oct 2024 6.000% Senior Unsecured Notes 111 6.000% Apr 2026 6.500% Senior Unsecured Exch. Notes 230 6.500% Feb 2026 Unsecured Interco Loan 8 Total Senior Unsecured Debt $ 372 Total Debt, net cash $ 1,788 3.51x Letters of Credit $ 76 Liquidity (Unused Revolver + Cash) $ 283 Issuer Ratings Issuer Ratings B / B3 YTD Net Debt Reduction $ 190 Secured Ratings BB- / B3 Fixed % 51% Bond Ratings CCC+ / Caa1 Outlook Stable / Stable Floating % 49% (1) Subject to 0.75% SOFR floor Yield to maturity figures in red font are not reflective of actual trades and are sourced from Bloomberg's indicative pricing model 37
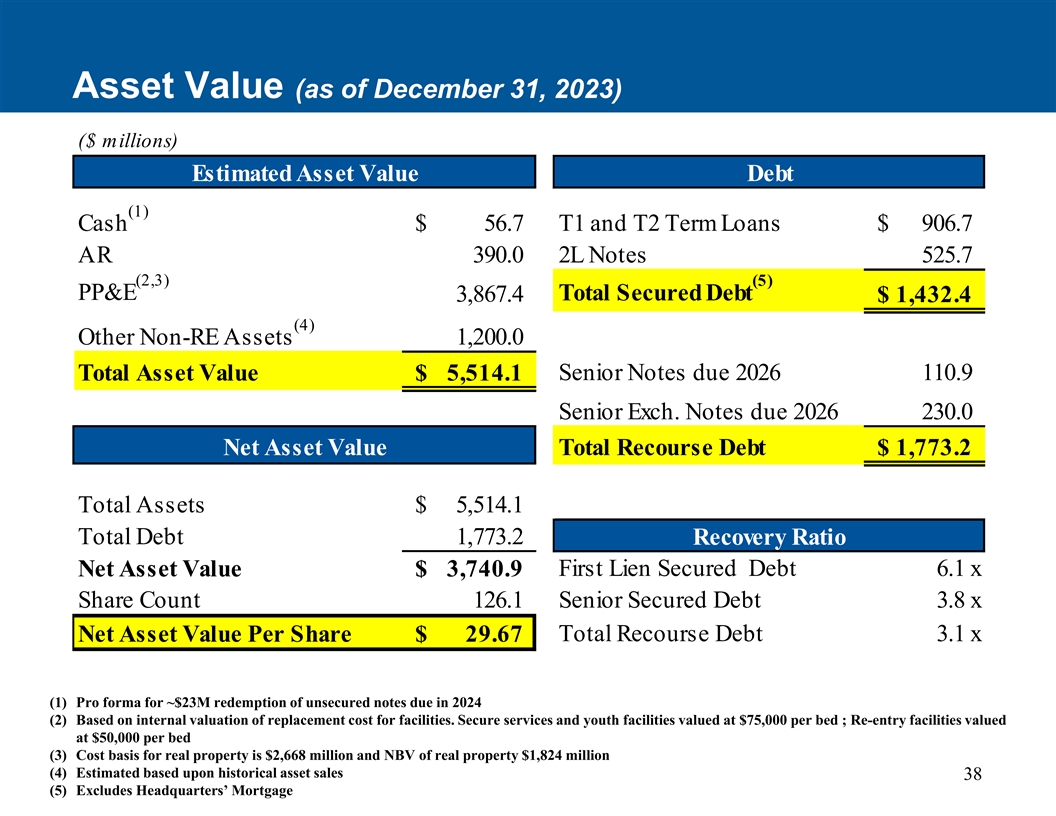
Asset Value (as of December 31, 2023) ($ millions) Estimated Asset Value Debt (1) Cash $ 56.7 T1 and T2 Term Loans $ 9 06.7 AR 390.0 2L Notes 5 25.7 (2,3) (5) PP&E Total Secured Debt 3,867.4 $ 1 ,432.4 (4) Other Non-RE Assets 1,200.0 Senior Notes due 2026 110.9 Total Asset Value $ 5,514.1 Senior Exch. Notes due 2026 230.0 Net Asset Value Total Recourse Debt $ 1 ,773.2 Total Assets $ 5,514.1 Total Debt 1,773.2 Recovery Ratio First Lien Secured Debt 6.1 x Net Asset Value $ 3,740.9 Share Count 126.1 Senior Secured Debt 3.8 x Net Asset Value Per Share $ 29.67 Total Recourse Debt 3.1 x (1) Pro forma for ~$23M redemption of unsecured notes due in 2024 (2) Based on internal valuation of replacement cost for facilities. Secure services and youth facilities valued at $75,000 per bed ; Re-entry facilities valued at $50,000 per bed (3) Cost basis for real property is $2,668 million and NBV of real property $1,824 million (4) Estimated based upon historical asset sales 38 (5) Excludes Headquarters’ Mortgage
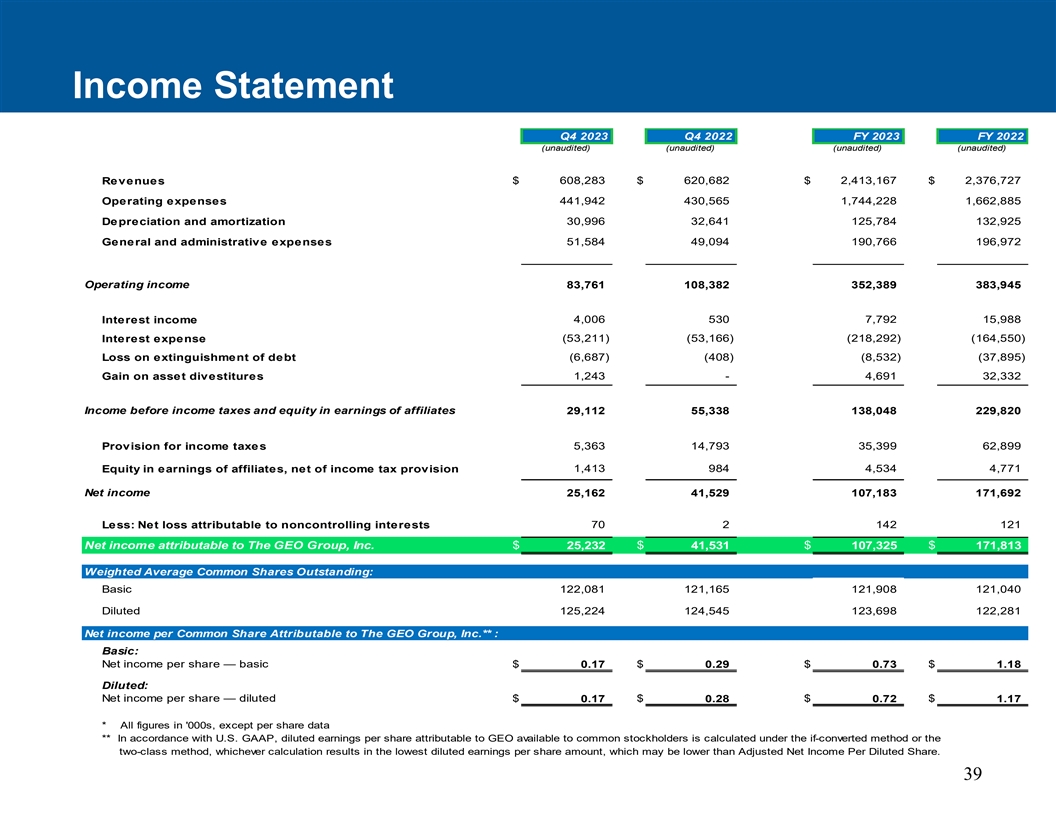
Income Statement Q4 2023 Q4 2022 FY 2023 FY 2022 (unaudited)(unaudited)(unaudited)(unaudited) Revenues $ 6 08,283 $ 620,682 $ 2,413,167 $ 2,376,727 441,942 430,565 1,744,228 1,662,885 Operating expenses Depreciation and amortization 30,996 32,641 125,784 132,925 General and administrative expenses 51,584 49,094 1 90,766 196,972 Operating income 83,761 108,382 352,389 383,945 4 ,006 530 7,792 15,988 Interest income Interest expense (53,211) ( 53,166) (218,292) (164,550) Loss on extinguishment of debt ( 6,687) (408) ( 8,532) ( 37,895) Gain on asset divestitures 1 ,243 - 4 ,691 3 2,332 Income before income taxes and equity in earnings of affiliates 29,112 55,338 138,048 229,820 5 ,363 1 4,793 35,399 62,899 Provision for income taxes Equity in earnings of affiliates, net of income tax provision 1 ,413 984 4,534 4,771 Net income 25,162 41,529 107,183 171,692 Less: Net loss attributable to noncontrolling interests 70 2 1 42 1 21 Net income attributable to The GEO Group, Inc. $ 25,232 $ 41,531 $ 107,325 $ 171,813 Weighted Average Common Shares Outstanding: Basic 122,081 121,165 121,908 121,040 Diluted 125,224 124,545 123,698 122,281 Net income per Common Share Attributable to The GEO Group, Inc.** : Basic: Net income per share — basic $ 0.17 $ 0.29 $ 0.73 $ 1.18 Diluted: Net income per share — diluted $ 0.17 $ 0.28 $ 0.72 $ 1.17 * All figures in '000s, except per share data ** In accordance with U.S. GAAP, diluted earnings per share attributable to GEO available to common stockholders is calculated under the if-converted method or the two-class method, whichever calculation results in the lowest diluted earnings per share amount, which may be lower than Adjusted Net Income Per Diluted Share. 39
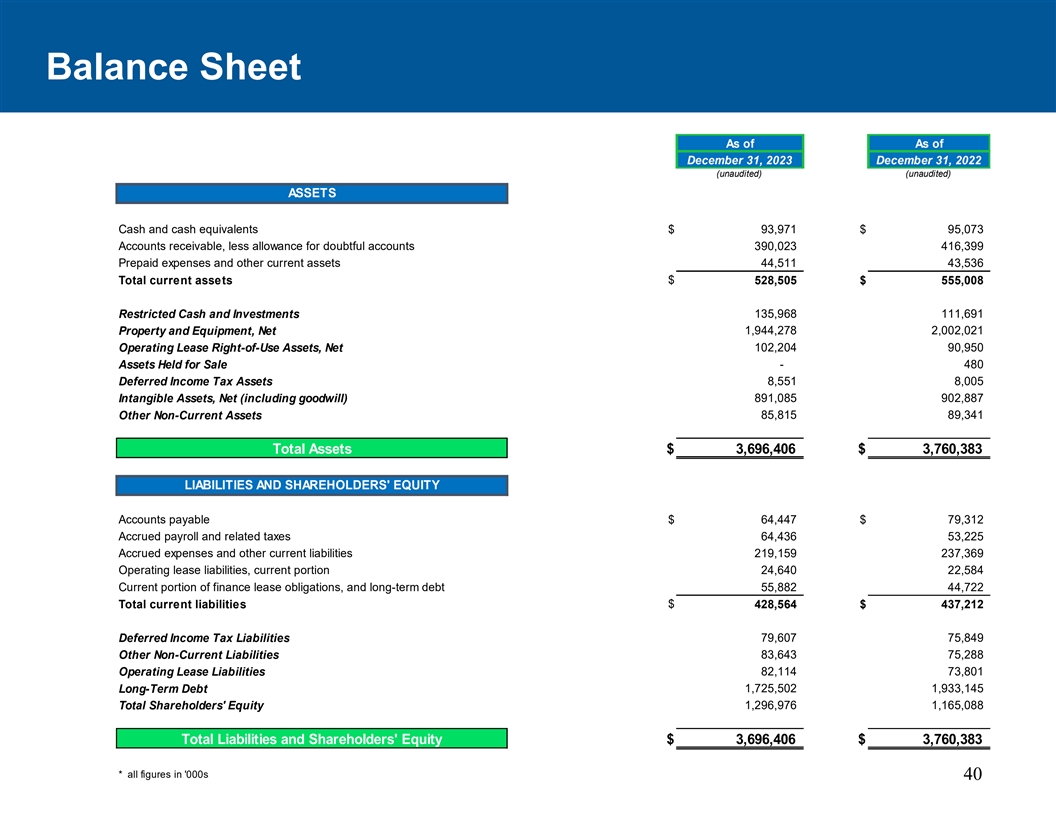
Balance Sheet As of As of December 31, 2023 December 31, 2022 (unaudited)(unaudited) ASSETS Cash and cash equivalents $ 93,971 $ 95,073 Accounts receivable, less allowance for doubtful accounts 3 90,023 416,399 Prepaid expenses and other current assets 44,511 43,536 Total current assets $ 5 28,505 $ 555,008 1 35,968 111,691 Restricted Cash and Investments Property and Equipment, Net 1,944,278 2,002,021 Operating Lease Right-of-Use Assets, Net 1 02,204 90,950 - 480 Assets Held for Sale Deferred Income Tax Assets 8 ,551 8,005 Intangible Assets, Net (including goodwill) 8 91,085 902,887 85,815 89,341 Other Non-Current Assets Total Assets $ 3,696,406 $ 3,760,383 LIABILITIES AND SHAREHOLDERS' EQUITY Accounts payable $ 64,447 $ 79,312 Accrued payroll and related taxes 64,436 53,225 Accrued expenses and other current liabilities 2 19,159 237,369 Operating lease liabilities, current portion 24,640 22,584 Current portion of finance lease obligations, and long-term debt 55,882 44,722 Total current liabilities $ 4 28,564 $ 437,212 79,607 75,849 Deferred Income Tax Liabilities Other Non-Current Liabilities 83,643 75,288 Operating Lease Liabilities 82,114 73,801 1,725,502 1,933,145 Long-Term Debt Total Shareholders' Equity 1,296,976 1,165,088 Total Liabilities and Shareholders' Equity $ 3,696,406 $ 3,760,383 * all figures in '000s 40
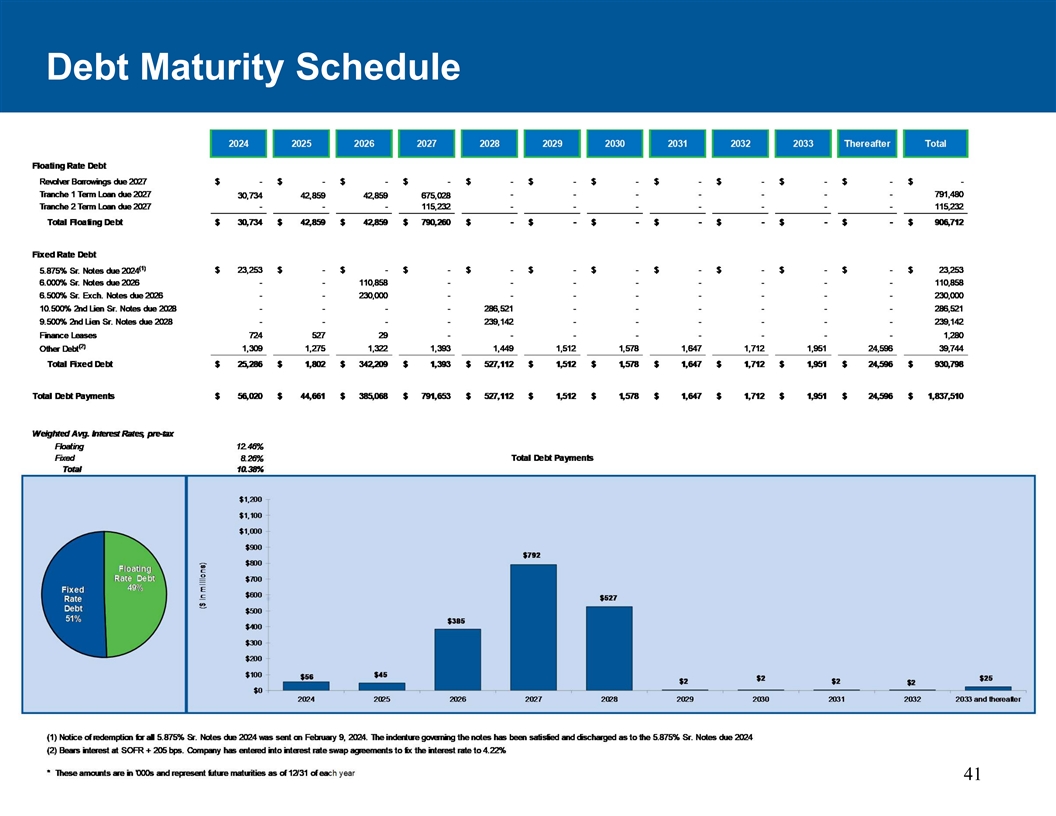
Debt Maturity Schedule 41