| For the fiscal year ended: | December 31, 2023 | Commission File Number: | 1-8481 | ||||||||
| Martin Cossette Senior Vice-President, Corporate Strategy (M&A) and Corporate Secretary BCE Inc. 1, carrefour Alexander-Graham-Bell Building A, 7th Floor Verdun, Québec H3E 3B3 Canada Tel: (514) 786-8424 |
Donald R. Crawshaw Sullivan & Cromwell LLP 125 Broad Street New York, New York 10004-2498 Tel: (212) 558-4000 |
||||
| Title of each class | Trading symbol | Name of each exchange on which registered | ||||||
|
Common shares
|
BCE
|
New York Stock Exchange
|
||||||
| Common Shares | 912,274,545 | ||||
| First Preferred Shares | |||||
| Series R | 7,764,800 | ||||
| Series S | 2,054,167 | ||||
| Series T | 5,301,633 | ||||
| Series Y | 6,451,752 | ||||
| Series Z | 2,708,031 | ||||
| Series AA | 11,482,631 | ||||
| Series AB | 6,918,839 | ||||
| Series AC | 6,482,274 | ||||
| Series AD | 12,513,726 | ||||
| Series AE | 6,022,513 | ||||
| Series AF | 9,076,087 | ||||
| Series AG | 8,442,830 | ||||
| Series AH | 4,784,070 | ||||
| Series AI | 9,246,640 | ||||
| Series AJ | 4,118,260 | ||||
| Series AK | 22,303,812 | ||||
| Series AL | 1,755,688 | ||||
| Series AM | 10,183,378 | ||||
| Series AN | 1,035,822 | ||||
| Series AQ | 8,303,614 | ||||
| Total First Preferred Shares | 146,950,567 | ||||
| – | update the Message from our President and Chief Executive Officer; |
||||
| – | update the section entitled Human Rights to reference Bell Canada's support of the objective of eliminating global forced and child labour; |
||||
| – | update the section entitled Insider Trading to clarify certain obligations resulting from BCE and Bell Canada's Insider Trading and Reporting Guidelines; |
||||
| – | update the section entitled Proper Use of Bell-Provided Internet Access and Other IT Resources to clarify the permitted uses of Internet access and Bell computers, devices and email addresses; and |
||||
| — | update the section entitled Environmental Leadership to add a category of employees to whom mandatory environmental training applies. |
||||
|
BCE Inc.
|
|||||
| By: | (signed) Curtis Millen | ||||
| Curtis Millen Executive Vice-President and Chief Financial Officer |
|||||
| Date: | March 8, 2024 | ||||
| LIST OF EXHIBITS TO FORM 40-F | |||||
| BCE Inc. Policy for the recovery of erroneously awarded incentive-based compensation from executive officers | Exhibit 97 | ||||
| Annual Information Form of BCE Inc. for the year ended December 31, 2023 | Exhibit 99.1 | ||||
| Management's Discussion and Analysis of BCE Inc. for the year ended December 31, 2023 | Exhibit 99.2 | ||||
| Annual audited consolidated financial statements of BCE Inc. for the year ended December 31, 2023 | Exhibit 99.3 | ||||
| Management’s report on internal control over financial reporting and the Report of Independent Registered Public Accounting Firm thereon | Exhibit 99.4 | ||||
| Consent of Independent Registered Public Accounting Firm | Exhibit 99.5 | ||||
| Bell Canada Unaudited Selected Summary Financial Information | Exhibit 99.6 | ||||
| Exhibit to 2023 Annual Financial Statements – Earnings Coverage | Exhibit 99.7 | ||||
| Certifications of the Chief Executive Officer and the Chief Financial Officer pursuant to Section 302 of the Sarbanes-Oxley Act of 2002 | Exhibit 99.31 | ||||
| Certification of the Chief Executive Officer and the Chief Financial Officer pursuant to 18 U.S.C. Section 1350, as adopted pursuant to Section 906 of the Sarbanes-Oxley Act of 2002 | Exhibit 99.32 | ||||
| Interactive Data File | Exhibit 101 | ||||
| Cover Page Interactive Data File (formatted as Inline XBRL and contained in Exhibit 101) | Exhibit 104 | ||||
Exhibit 97
BCE INC. POLICY FOR THE
RECOVERY OF ERRONEOUSLY AWARDED INCENTIVE-BASED COMPENSATION
FROM EXECUTIVE OFFICERS
I. BACKGROUND
BCE Inc. (the “Company”) has adopted this policy (this “Policy”) to provide for the recovery or “clawback” of certain incentive compensation in the event of a Restatement (as defined below). This Policy is intended to comply with, and will be interpreted to be consistent with, the requirements of Section 303A.14 of the New York Stock Exchange (“NYSE”) Listed Company Manual (the “Listing Standard”).
II. STATEMENT OF POLICY
The Company shall recover reasonably promptly the amount of erroneously awarded Incentive-Based Compensation in the event that the Company is required to prepare an accounting restatement due to the material noncompliance of the Company with any financial reporting requirement under applicable securities laws, including any required accounting restatement to correct an error in previously issued financial statements that is material to the previously issued financial statements, or that would result in a material misstatement if the error were corrected in the current period or left uncorrected in the current period (a “Restatement”).
The Company shall recover erroneously awarded Incentive-Based Compensation in compliance with this Policy except to the extent provided under the section entitled “V. Exceptions” herein.
III. SCOPE OF POLICY
A. Covered Persons and Recovery Period. This Policy applies to all Incentive-Based Compensation received by a person:
| ● | after beginning service as an Executive Officer, |
| ● | who served as an Executive Officer at any time during the performance period for that Incentive-Based Compensation, |
| ● | while the Company has a class of securities listed on NYSE, and |
| ● | during the three completed fiscal years immediately preceding the date that the Company is required to prepare a Restatement (the “Recovery Period”). |
Notwithstanding this look-back requirement, the Company is only required to apply this Policy to Incentive-Based Compensation received on or after October 2, 2023.
For purposes of this Policy, Incentive-Based Compensation shall be deemed “received” in the Company’s fiscal period during which the Financial Reporting Measure (as defined herein) specified in the Incentive-Based Compensation award is attained, even if the payment or grant of the Incentive-Based Compensation occurs after the end of that period.
B. Transition Period. In addition to the Recovery Period, this Policy applies to any transition period (that results from a change in the Company’s fiscal year) within or immediately following the Recovery Period (a “Transition Period”), provided that a Transition Period between the last day of the Company’s previous fiscal year end and the first day of the Company’s new fiscal year that comprises a period of nine to 12 months will be deemed a completed fiscal year. For clarity, the Company’s obligation to recover erroneously awarded Incentive-Based Compensation under this Policy is not dependent on if or when a Restatement is filed.
-1-
C. Determining Recovery Period. For purposes of determining the relevant Recovery Period, the date that the Company is required to prepare the Restatement is the earlier to occur of:
| ● | the date the board of directors of the Company (the “Board”), a committee of the Board, or the officer or officers of the Company authorized to take such action if Board action is not required, concludes, or reasonably should have concluded, that the Company is required to prepare a Restatement, and |
| ● | the date a court, regulator, or other legally authorized body directs the Company to prepare a Restatement. |
IV. AMOUNT SUBJECT TO RECOVERY
A. Recoverable Amount. The amount of Incentive-Based Compensation subject to recovery under this Policy is the amount of Incentive-Based Compensation received that exceeds the amount of Incentive-Based Compensation that otherwise would have been received had it been determined based on the restated amounts, computed without regard to any taxes paid.
B. Covered Compensation Based on the Company’s Common Share Price or TSR. For Incentive-Based Compensation based on the price of the Company’s common shares or total shareholder return (“TSR”), where the amount of erroneously awarded Incentive-Based Compensation is not subject to mathematical recalculation directly from the information in a Restatement, the recoverable amount shall be based on a reasonable estimate of the effect of the Restatement on the share price or TSR upon which the Incentive-Based Compensation was received. In such event, the Company shall maintain documentation of the determination of that reasonable estimate and provide such documentation to the NYSE.
V. EXCEPTIONS
The Company shall recover erroneously awarded Incentive-Based Compensation in compliance with this Policy except to the extent that the conditions set out below are met and the Management Resources and Compensation Committee (the “Committee”) has made a determination that recovery would be impracticable:
A. Direct Expense Exceeds Recoverable Amount. The direct expense paid to a third party to assist in enforcing this Policy would exceed the amount to be recovered; provided, however, that before concluding it would be impracticable to recover any amount of erroneously awarded Incentive-Based Compensation based on the anticipated expense of enforcement, the Company shall make a reasonable attempt to recover such erroneously awarded Incentive-Based Compensation, document such reasonable attempt(s) to recover, and provide that documentation to the NYSE.
B. Violation of Home Country Law. Recovery would violate applicable Canadian federal or provincial law (“Canadian law”) where that law was adopted prior to November 28, 2022; provided, however, that before concluding it would be impracticable to recover any amount of erroneously awarded Incentive-Based Compensation based on violation of Canadian law, the Company shall obtain an opinion of Canadian counsel, acceptable to the NYSE, that recovery would result in such a violation, and shall provide such opinion to NYSE.
-2-
C. Recovery from Certain Tax-Qualified Retirement Plans. Recovery would likely cause an otherwise tax-qualified retirement plan, under which benefits are broadly available to employees of the Company, to fail to meet the requirements of 26 U.S.C. 401(a)(13) or 26 U.S.C. 411(a) and regulations thereunder.
VI. PROHIBITION AGAINST INDEMNIFICATION
The Company shall not indemnify any Executive Officer or former Executive Officer against the loss of erroneously awarded Incentive-Based Compensation.
VII. DISCLOSURE
The Company shall file all disclosures with respect to recoveries under this Policy in accordance with the requirements of all applicable Canadian and U.S. Federal securities laws, including the disclosure required to be included in applicable Securities and Exchange Commission (“SEC”) filings.
VIII. DEFINITIONS
Unless the context otherwise requires, the following definitions apply for purposes of this Policy:
“Executive Officer” means the Company’s president, principal financial officer, principal accounting officer (or if there is no such accounting officer, the controller), any vice-president of the Company in charge of a principal business unit, division, or function (such as sales, administration, or finance), any other officer who performs a policy-making function, or any other person who performs similar policymaking functions for the Company. Executive officers of the Company’s subsidiaries are deemed Executive Officers of the Company if they perform such policy making functions for the Company. Policy-making function is not intended to include policymaking functions that are not significant. Identification of an Executive Officer for purposes of this Policy will include at a minimum executive officers identified pursuant to 17 CFR 229.401(b).
“Financial Reporting Measures” means any of the following: (i) measures that are determined and presented in accordance with the accounting principles used in preparing the Company’s financial statements, and any measures that are derived wholly or in part from such measures, (ii) stock price and (iii) TSR. A Financial Reporting Measure need not be presented within the Company’s financial statements or included in a filing with the SEC.
“Incentive-Based Compensation” means any compensation that is granted, earned, or vested based wholly or in part upon the attainment of a Financial Reporting Measure.
-3-
IX. ADMINISTRATION; AMENDMENT; TERMINATION.
All determinations under this Policy will be made by the Committee, including determinations regarding how any recovery under this Policy is effected. Any determinations of the Committee will be final, binding and conclusive and need not be uniform with respect to each individual covered by this Policy.
The Committee may amend this Policy from time to time and may terminate this Policy at any time, in each case in its sole discretion.
X. EFFECTIVENESS; OTHER RECOUPMENT RIGHTS
This Policy shall be effective as of December 1, 2023. Any right of recoupment under this Policy is in addition to, and not in lieu of, any other remedies or rights of recoupment that may be available to the Company and its subsidiaries and affiliates under applicable law or pursuant to the terms of any similar policy or similar provision in any employment agreement, equity award agreement or similar agreement.
-4-
Exhibit 99.1

Telco to Techco ANNUAL INFORMATION FORM FOR THE YEAR ENDED DECEMBER 31, 2023 MARCH 7, 2024
In this Annual Information Form, we, us, our, BCE and the company mean, as the context may require, either BCE Inc. or, collectively, BCE Inc., Bell Canada, their subsidiaries, joint arrangements and associates. Bell means, as the context may require, either Bell Canada or, collectively, Bell Canada, its subsidiaries, joint arrangements and associates.
Each section of BCE’s 2021, 2022 and 2023 management’s discussion and analysis (BCE 2021 MD&A, BCE 2022 MD&A and BCE 2023 MD&A, respectively) and each section of BCE’s 2023 consolidated financial statements referred to in this Annual Information Form is incorporated by reference herein. No other document shall be considered to be incorporated by reference in this Annual Information Form. The BCE 2021 MD&A, BCE 2022 MD&A, BCE 2023 MD&A and BCE 2023 consolidated financial statements have been filed with the Canadian provincial securities regulatory authorities (available at sedarplus.ca) and with the United States (U.S.) Securities and Exchange Commission (SEC) as exhibits to BCE’s annual reports on Form 40-F (available at sec.gov). They are also available on BCE’s website at BCE.ca.
Unless otherwise indicated herein, documents and other information contained in BCE’s website or in any other site referred to in BCE’s website or in this Annual Information Form are not part of this Annual Information Form and are not incorporated by reference herein. In particular, but without limitation, BCE’s integrated annual report for the year ended December 31, 2023 (BCE 2023 Integrated Annual Report) and BCE’s Climate Action Report are not part of this Annual Information Form and are not incorporated by reference herein.
All dollar figures are in Canadian dollars, unless stated otherwise. The information in this Annual Information Form is as of March 7, 2024, unless stated otherwise, and except for information in documents incorporated by reference that have a different date.
Trademarks in this Annual Information Form which are owned or used under licence by BCE Inc., Bell Canada or their subsidiaries include, without limitation, BCE, BELL Design, BELL MOBILITY and BELL MEDIA. This Annual Information Form also includes trademarks of other parties. The trademarks referred to in this Annual Information Form may be listed without the ® and TM symbols.
© BCE Inc., 2024. All rights reserved.
| Annual information form |
Parts of MD&A and financial statements incorporated by reference (references are to pages of the BCE 2023 Annual Financial Report, except where otherwise indicated) |
|||||||||
| 1 | Caution regarding forward-looking statements | 2 | 33; 40; 61; 66; 88-98 | |||||||
| 2 | Corporate structure | 4 | ||||||||
| 2.1 | 4 | |||||||||
| 2.2 | 4 | |||||||||
| 3 | Description of our business | 5 | ||||||||
| 3.1 | 5 | 15-18; 47; 55; 60-61; 65-66; 82 | ||||||||
| 3.2 | 6 | 35-38 | ||||||||
| 3.3 | 6 | |||||||||
| 3.4 | 6 | 36 | ||||||||
| 3.5 | 11 | |||||||||
| 3.6 | 13 | |||||||||
| 3.7 | 15 | |||||||||
| 3.8 | 16 | 23-34 | ||||||||
| 3.9 | 17 | 42-43; 58-60; 62; 64-65; 67 | ||||||||
| 3.10 | 17 | 83-87 | ||||||||
| 3.11 | 17 | |||||||||
| 4 | General development of our business – three-year history | 19 | ||||||||
| 4.1 | 19 | |||||||||
| 4.2 | 20 | 18-23; 35-38; 18-21 (1); 33-36 (1); 38-42 (2); 51-54 (2) | ||||||||
| 4.3 | 20 | 83-87; 86-90 (1); 103-106 (2) | ||||||||
| 5 | Our capital structure | 21 | ||||||||
| 5.1 | 21 | 154-155 | ||||||||
| 5.2 | 22 | 144-145 | ||||||||
| 5.3 | 23 | |||||||||
| 5.4 | 26 | |||||||||
| 6 | Dividends and dividend payout policy | 28 | 20-23; 103-108 | |||||||
| 7 | Our directors and executive officers | 30 | ||||||||
| 7.1 | 30 | |||||||||
| 7.2 | 31 | |||||||||
| 7.3 | 31 | |||||||||
| 8 | Legal proceedings | 32 | ||||||||
| 9 | Interest of management and others in material transactions | 34 | ||||||||
| 10 | Interest of experts | 34 | ||||||||
| 11 | Transfer agent and registrar | 34 | ||||||||
| 12 | For more information | 34 | ||||||||
| 13 | Schedule 1 – Audit Committee information | 35 | ||||||||
| 14 | Schedule 2 – Audit Committee charter | 37 | ||||||||
| (1) | References to parts of the BCE 2022 MD&A contained in BCE’s annual financial report for the year ended December 31, 2022 (BCE 2022 Annual Financial Report). |
| (2) | References to parts of the BCE 2021 MD&A contained in BCE’s annual report for the year ended December 31, 2021 (BCE 2021 Annual Report). |
| BCE INC. 2023 ANNUAL INFORMATION FORM | 1 |
1 Caution regarding forward-looking statements
| 1 | Caution regarding forward-looking statements |
Certain statements made in this Annual Information Form are forward-looking statements. These statements include, without limitation, statements relating to BCE’s dividend growth objective, 2024 annualized common share dividend and dividend payout ratio level, and dividend payout policy target, BCE’s anticipated capital expenditures and network deployment plans, our transformation initiatives and the benefits expected to result therefrom, the cost savings and other benefits expected to result from workforce reductions as well as estimated related severance payments, the expected timing and completion of the proposed acquisition of the Canadian out-of-home (OOH) media business of OUTFRONT Media Inc. (OUTFRONT) and the benefits expected to result therefrom, our business outlook, objectives, plans and strategic priorities, and other statements that do not refer to historical facts. A statement we make is forward-looking when it uses what we know and expect today to make a statement about the future. Forward-looking statements are typically identified by the words assumption, goal, guidance, objective, outlook, project, strategy, target, commitment and other similar expressions or future or conditional verbs such as aim, anticipate, believe, could, expect, intend, may, plan, seek, should, strive and will. All such forward-looking statements are made pursuant to the safe harbour provisions of applicable Canadian securities laws and of the U.S. Private Securities Litigation Reform Act of 1995.
Unless otherwise indicated by us, forward-looking statements in this Annual Information Form describe our expectations as at March 7, 2024 and, accordingly, are subject to change after that date. Except as may be required by applicable securities laws, we do not undertake any obligation to update or revise any forward-looking statements, whether as a result of new information, future events or otherwise.
Forward-looking statements, by their very nature, are subject to inherent risks and uncertainties and are based on several assumptions, both general and specific, which give rise to the possibility that actual results or events could differ materially from our expectations expressed in, or implied by, such forward-looking statements and that our business outlook, objectives, plans and strategic priorities may not be achieved. These statements are not guarantees of future performance or events, and we caution you against relying on any of these forward-looking statements. Forward-looking statements are presented in this Annual Information Form for the purpose of assisting investors and others in understanding our objectives, strategic priorities and business outlook, as well as our anticipated operating environment. Readers are cautioned, however, that such information may not be appropriate for other purposes.
Subject to various factors, we believe that the assumptions on which the forward-looking statements made in this Annual Information Form are based were reasonable at March 7, 2024. Refer in particular to the sub-sections of the BCE 2023 MD&A entitled Assumptions on pages 33, 40, 61 and 66 of BCE’s annual financial report for the year ended December 31, 2023 (BCE 2023 Annual Financial Report) for a discussion of certain key economic, market, operational and other assumptions we have made in preparing forward-looking statements. If our assumptions turn out to be inaccurate, actual results or events could be materially different from what we expect.
Important risk factors that could cause actual results or events to differ materially from those expressed in, or implied by, the previously mentioned forward-looking statements and other forward-looking statements contained in this Annual Information Form include, but are not limited to: the negative effect of adverse economic conditions, including a potential recession, elevated inflation, high interest rates and financial and capital market volatility, and the resulting negative impact on business and customer spending and the demand for our products and services; the negative effect of adverse conditions associated with geopolitical events; regulatory initiatives, proceedings and decisions, government consultations and government positions that negatively affect us and influence our business including, without limitation, concerning mandatory access to networks, spectrum auctions, the imposition of consumer-related codes of conduct, approval of acquisitions, broadcast and spectrum licensing, foreign ownership requirements, privacy and cybersecurity obligations and control of copyright piracy; the inability to implement enhanced compliance frameworks and to comply with legal and regulatory obligations; unfavourable resolution of legal proceedings; the intensity of competitive activity and the failure to effectively respond to evolving competitive dynamics; the level of technological substitution and the presence of alternative service providers contributing to disruptions and disintermediation in each of our business segments; changing customer behaviour and the expansion of cloud-based, over-the-top (OTT) and other alternative solutions; advertising market pressures from economic conditions, fragmentation and non-traditional/global digital services; rising content costs and challenges in our ability to acquire or develop key content; high Canadian Internet and smartphone penetration; the failure to evolve and transform our networks, systems and operations using next-generation technologies while lowering our cost structure, including the failure to transition from a traditional telecommunications company to a tech services and digital media company and meet customer expectations of product and service
| 2 | BCE INC. 2023 ANNUAL INFORMATION FORM |
1 Caution regarding forward-looking statements
experience; the inability to drive a positive customer experience; the inability to protect our physical and non-physical assets from events such as information security attacks, unauthorized access or entry, fire and natural disasters; the failure to implement an effective data governance framework; the failure to attract, develop and retain a diverse and talented team capable of furthering our strategic imperatives and high-tech transformation; the potential deterioration in employee morale and engagement resulting from staff reductions, cost reductions or reorganizations and the de-prioritization of transformation initiatives due to staff reductions, cost reductions or reorganizations; the failure to adequately manage health and safety concerns; labour disruptions and shortages; the risk that we may need to incur significant capital expenditures to provide additional capacity and reduce network congestion; service interruptions or outages due to network failures or slowdowns; events affecting the functionality of, and our ability to protect, test, maintain, replace and upgrade, our networks, information technology (IT) systems, equipment and other facilities; the failure by other telecommunications carriers on which we rely to provide services to complete planned and sufficient testing, maintenance, replacement or upgrade of their networks, equipment and other facilities, which could disrupt our operations including through network or other infrastructure failures; the complexity of our operations and IT systems and the failure to implement or maintain highly effective processes and IT systems; in-orbit and other operational risks to which the satellites used to provide our satellite TV services are subject; the inability to access adequate sources of capital and generate sufficient cash flows from operating activities to meet our cash requirements, fund capital expenditures and provide for planned growth; uncertainty as to whether dividends will be declared or the dividend on common shares will be increased by BCE’s board of directors; the failure to reduce costs and adequately assess investment priorities, as well as unexpected increases in costs; the inability to manage various credit, liquidity and market risks; the failure to evolve practices to effectively monitor and control fraudulent activities; new or higher taxes due to new tax laws or changes thereto or in the interpretation thereof, and the inability to predict the outcome of government audits; the impact on our financial statements and estimates from a number of factors; pension obligation volatility and increased contributions to post-employment benefit plans; our dependence on third-party suppliers, outsourcers and consultants to provide an uninterrupted supply of the products and services we need; the failure of our vendor selection, governance and oversight processes, including our management of supplier risk in the areas of security, data governance and responsible procurement; the quality of our products and services and the extent to which they may be subject to defects or fail to comply with applicable government regulations and standards; reputational risks and the inability to meaningfully integrate environmental, social and governance (ESG) considerations into our business strategy and operations; the failure to take appropriate actions to adapt to current and emerging environmental impacts, including
climate change; pandemics, epidemics and other health risks, including health concerns about radio frequency emissions from wireless communications devices and equipment; the inability to adequately manage social issues; the failure to develop and implement sufficient corporate governance practices; the adverse impact of various internal and external factors on our ability to achieve our ESG targets including, without limitation, those related to greenhouse gas (GHG) emissions reduction and diversity, equity, inclusion and belonging.
These and other risk factors that could cause actual results or events to differ materially from our expectations expressed in, or implied by, our forward-looking statements are discussed in this Annual Information Form and the BCE 2023 MD&A and, in particular, in section 9, Business risks of the BCE 2023 MD&A, on pages 88 to 98 of the BCE 2023 Annual Financial Report.
Forward-looking statements contained in this Annual Information Form for periods beyond 2024 involve longer-term assumptions and estimates than forward-looking statements for 2024 and are consequently subject to greater uncertainty. Forward-looking statements for periods beyond 2024 further assume, unless otherwise indicated, that the risks described above and in section 9, Business risks of the BCE 2023 MD&A will remain substantially unchanged during such periods.
We caution readers that the risks described above are not the only ones that could affect us. Additional risks and uncertainties not currently known to us or that we currently deem to be immaterial may also have a material adverse effect on our business, financial condition, liquidity, financial results or reputation. We regularly consider potential acquisitions, dispositions, mergers, business combinations, investments, monetizations, joint ventures and other transactions, some of which may be significant. Except as otherwise indicated by us, forward-looking statements do not reflect the potential impact of any such transactions or of special items that may be announced or that may occur after March 7, 2024. The financial impact of these transactions and special items can be complex and depends on facts particular to each of them. We therefore cannot describe the expected impact in a meaningful way or in the same way we present known risks affecting our business.
| BCE INC. 2023 ANNUAL INFORMATION FORM | 3 |
2 Corporate structure
| 2 | Corporate structure |
| 2.1 | Incorporation and registered office |
BCE Inc. was incorporated in 1970 and was continued under the Canada Business Corporations Act in 1979. It is governed by a certificate and articles of amalgamation dated August 1, 2004, as amended by: (a) a certificate and articles of arrangement dated July 10, 2006 to implement a plan of arrangement providing for the distribution by BCE Inc. to its shareholders of units in the Bell Aliant Regional Communications Income Fund and to consolidate outstanding BCE Inc. common shares; (b) a certificate and articles of amendment dated January 25, 2007 to implement a plan of arrangement providing for the exchange of
Bell Canada preferred shares for BCE Inc. preferred shares; (c) a certificate and articles of amendment dated June 29, 2011 to create two additional series of BCE Inc. Cumulative Redeemable First Preferred Shares (first preferred shares); and (d) certificates and articles of amendment dated September 22, 2014 and November 11, 2014 to create six additional series of BCE Inc. first preferred shares. BCE Inc.’s head and registered offices are located at 1, Carrefour Alexander-Graham-Bell, Building A, Verdun, Québec H3E 3B3.
| 2.2 | Subsidiaries |
The table below shows BCE Inc.’s main subsidiaries at December 31, 2023, which are all incorporated in Canada, and the percentage of voting securities that BCE Inc. directly or indirectly held in such subsidiaries on that date. BCE Inc. has other subsidiaries that have not been included in the table since each represented 10% or less of our total consolidated
assets and 10% or less of our total consolidated operating revenues at December 31, 2023. These other subsidiaries together represented 20% or less of our total consolidated assets and 20% or less of our total consolidated operating revenues at December 31, 2023.
| Subsidiary | |
Percentage of voting securities held by BCE Inc. at December 31, 2023 |
(1) |
|
| Bell Canada |
100% | |||
| Bell Mobility Inc. |
100% | |||
| Bell Media Inc. |
100% | |||
| (1) | At December 31, 2023, BCE Inc. directly held 94.1% of the voting securities of Bell Canada and indirectly held the remaining 5.9% through its wholly-owned subsidiary, Bell MTS Inc. (Bell MTS). BCE Inc. indirectly held all the voting securities of: (i) Bell Mobility Inc. (Bell Mobility) through Bell Canada, which in turn indirectly held all the voting securities of Bell Mobility through its wholly-owned subsidiary, Bell Mobility Holdings Inc.; and (ii) Bell Media Inc. (Bell Media) through Bell Canada. |
| 4 | BCE INC. 2023 ANNUAL INFORMATION FORM |
3 Description of our business
| 3 | Description of our business |
This section contains forward-looking statements, including relating to our anticipated capital expenditures and network deployment plans, our transformation initiatives and the benefits expected to result therefrom, the cost savings and other benefits expected to result from workforce reductions as well as estimated related severance payments, and our business outlook, objectives, plans and strategic priorities. Refer to section 1, Caution regarding forward-looking statements in this Annual Information Form.
| 3.1 | General summary |
BCE is Canada’s largest communications company (1), providing residential, business and wholesale customers with a wide range of solutions for all their communications needs.
In 2022, we began modifying our internal and external reporting processes to align with organizational changes that were made to reflect an increasing strategic focus on multiproduct sales, the continually increasing technological convergence of our wireless and wireline telecommunications infrastructure and operations driven by the deployment of our Fifth Generation (5G) and fibre networks, and our digital transformation. These factors have made it increasingly difficult to distinguish between our wireless and wireline operations and resulted in changes in the first quarter of 2023 to the financial information that is regularly provided to our chief operating decision maker to measure performance and allocate resources.
Effective with our Q1 2023 results, our previous Bell Wireless and Bell Wireline operating segments were combined to form a single reporting segment called Bell Communication and Technology Services (Bell CTS). Bell Media remains a distinct reportable segment and is unaffected. Our results are therefore reported in two segments: Bell CTS and Bell Media. As a result of our reporting changes, prior periods have been restated for comparative purposes.
Our Bell CTS segment provides a wide range of communication products and services to consumers, businesses and government customers across Canada. Wireless products and services include mobile data and voice plans and devices and are available nationally. Wireline products and services comprise data (including Internet access, Internet protocol television (IPTV), cloud-based services and business solutions), voice, and other communication services and products, which are available to our residential, small and medium-sized business and large enterprise customers primarily in Ontario, Québec, the Atlantic provinces and Manitoba, while satellite TV service and connectivity to business customers are available nationally across Canada. In addition, this segment includes our wholesale business, which buys and sells local telephone, long distance, data and other services from or to resellers and other carriers, as well as the results of operations of our national consumer electronics retailer, The Source (Bell) Electronics Inc. (The Source). Subsequent to year end, Bell Canada announced a strategic partnership with Best Buy Canada to operate 165 The Source consumer electronics retail stores in Canada, which will be rebranded as Best Buy Express and offer the latest in consumer electronics from Best Buy along with exclusive telecommunications services from Bell. In addition, Bell will wind down The Source head office and back office operations, as well as close 107 The Source stores.
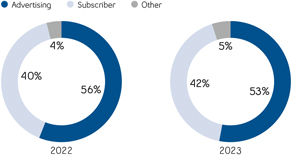
Our Bell Media segment provides conventional TV, specialty TV, pay TV, streaming services, digital media services, radio broadcasting services and OOH and advanced advertising services to customers nationally
across Canada. Revenues are derived primarily from advertising and subscriber fees.
Additional information regarding our business operations and the products and services we provide can be found in section 1.2, About BCE of the BCE 2023 MD&A, on pages 15 to 18 of the BCE 2023 Annual Financial Report. Additional information regarding the business outlook of our Bell CTS and Bell Media segments can be found in the sections entitled Business outlook and assumptions of the BCE 2023 MD&A, on pages 60 and 61, and 65 and 66 of the BCE 2023 Annual Financial Report.
In addition to our operating segments, we also hold investments in a number of other assets, including:
| • | a 37.5% indirect equity interest in Maple Leaf Sports & Entertainment Ltd. (MLSE) (2), a sports and entertainment company that owns several sports teams, including the Toronto Maple Leafs, the Toronto Raptors, Toronto FC and the Toronto Argonauts, as well as real estate and entertainment assets in Toronto; |
| • | a 50% indirect equity interest in Glentel Inc. (Glentel), a Canadian-based connected services retailer; |
| • | a 20.2% indirect equity interest in entities that operate the Montréal Canadiens Hockey Club, evenko (a promoter and producer of cultural and sports events) and the Bell Centre in Montréal, Québec, as well as Place Bell in Laval, Québec. |
A discussion of the key transactions completed by BCE since 2021 can be found in section 4.1, Transactions of this Annual Information Form.
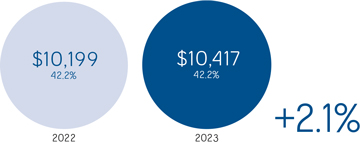
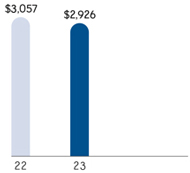
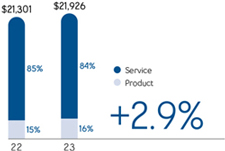
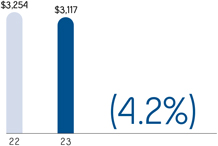
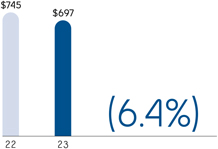
For the years ended December 31, 2023 and 2022, we generated consolidated operating revenues of $24,673 million and $24,174 million, respectively, and consolidated net earnings of $2,327 million and $2,926 million, respectively. For the year ended December 31, 2023, Bell CTS’ operating revenues totaled $21,926 million ($21,897 million external revenues) and Bell Media’s operating revenues totaled $3,117 million ($2,776 million external revenues). For the year ended December 31, 2022, Bell CTS’ operating revenues totaled $21,301 million ($21,270 million external revenues) and Bell Media’s operating revenues totaled $3,254 million ($2,904 million external revenues). A table showing the operating revenues that each segment contributed to total operating revenues for the years ended December 31, 2023 and 2022 can be found in section 4.3, Operating revenues of the BCE 2023 MD&A, on page 47 of the BCE 2023 Annual Financial Report. A table showing the operating revenues of our Bell CTS segment by category of products and services can be found in section 5.1, Bell CTS of the BCE 2023 MD&A, on page 55 of the BCE 2023 Annual Financial Report.
Some of our segments’ revenues vary slightly by season. For more information, refer to section 7.2, Quarterly financial information – Seasonality considerations of the BCE 2023 MD&A, on page 82 of the BCE 2023 Annual Financial Report.
| (1) | Based on total revenue and total combined customer connections. |
| (2) | In January 2023, we repurchased the BCE Master Trust Fund’s interest in MLSE for a cash consideration of $149 million, thereby increasing our indirect equity interest in MLSE from 28% to 37.5%. |
| BCE INC. 2023 ANNUAL INFORMATION FORM | 5 |
3 Description of our business
| 3.2 | Strategic imperatives |
BCE’s purpose is to advance how Canadians connect with each other and the world. Our strategy builds on our longstanding strengths in networks, service innovation and content creation, and positions the company for continued growth and innovation leadership. Our primary business objectives are to grow our subscriber base profitably and to maximize revenues, operating profit, free cash flow and return on invested capital by further enhancing our position as the foremost provider in Canada of comprehensive communications services to residential, business and wholesale customers, and as Canada’s leading content creation company. We seek to take advantage of opportunities to leverage our networks, infrastructure, sales channels, and brand and marketing resources across our various lines of business to create value for our customers and other stakeholders.
Our strategy is centred on our disciplined focus and execution of six strategic imperatives that position us to deliver continued success in a fast-changing communications marketplace. The six strategic imperatives that underlie BCE’s business plan are:

Additional information regarding our strategic imperatives can be found in section 2, Strategic imperatives of the BCE 2023 MD&A, on pages 35 to 38 of the BCE 2023 Annual Financial Report.
| 3.3 | Our transformation from Telco to Techco |
We have begun our journey to modernize from a traditional telecommunications company (telco) to a technology services and digital media company (collectively referred to as techco).
Innovation is driving customer expectations for enhanced user experiences, improved customer service, and faster market responses, all of which are improved by our transformation to a techco.
Our evolution to a techco takes a customer-first approach and specifically sets out to deliver incremental value to our customers:
| • | Ability for customers to enjoy our products, services, and content on any device in any location |
| • | Enable customers to be served on their timeline through simple sales and support interactions across the channel of their choosing (e.g., online, call centre, store) |
| • | Access to new and better products, services and solutions on an accelerated basis tailored to meet customers’ evolving needs and expectations |
To support and accelerate this evolution, we launched a multi-year operational transformation project to modernize our operations, increase productivity, build tech talent and materially right-size our cost base.
| 3.4 | Competitive strengths |
Canada’s largest communications company
We are Canada’s largest communications company (1), providing residential, business and wholesale customers with a wide range of solutions for all their communications needs, as described below:
| • | We are the largest local exchange carrier in Canada. BCE operates an extensive local access network in Ontario, Québec, the Atlantic provinces and Manitoba, as well as in Canada’s Northern Territories. We provide a complete suite of wireless communications, wireline voice and data, including Internet access and TV, product and service offerings to residential, business and wholesale customers. We also own Bell Media, Canada’s leading content creation company with premier assets in TV, radio and OOH, monetized through traditional and digital platforms. |
| • | We also offer competitive local exchange carrier services in Alberta and British Columbia. |
| • | At December 31, 2023, BCE was one of the largest wireless operators in Canada based on number of subscribers, providing 10,287,046 mobile phone subscribers with nationwide mobile voice and data |
| services. We also had 2,732,548 mobile connected device subscribers at December 31, 2023. |
| • | BCE is the largest Internet service provider (ISP) in Canada based on number of subscribers, providing 4,473,429 retail customers at December 31, 2023 with high-speed Internet access through fibre-optic, wireless-to-the-premise (WTTP) and digital subscriber line (DSL) technology. |
| • | BCE is one of the largest TV providers in Canada based on number of subscribers, nationally broadcasting a wide range of domestic and international programming to 2,725,292 retail subscribers at December 31, 2023 through its IPTV services, namely Fibe TV, the Fibe TV app and Virgin Plus TV, as well as its satellite TV service. |
| • | BCE operated 2,021,617 retail residential network access service voice lines at December 31, 2023. |
| • | Our business markets team maintains a leadership position, having established relationships with a majority of Canada’s largest 100 corporations. |
| (1) | Based on total revenue and total combined customer connections. |
| 6 | BCE INC. 2023 ANNUAL INFORMATION FORM |
3 Description of our business
Our large customer base, our wireline and wireless network reach, and our ability to sell through a variety of distribution channels, as discussed in more detail in section 3.5, Marketing and distribution channels in this Annual Information Form, give us scale that supports the execution of our six strategic imperatives. With a wireless network service footprint that encompasses more than 99% of Canada’s population, a coast-to-coast national fibre transport network and a local exchange carrier footprint from Manitoba to the Atlantic provinces, BCE is well positioned to take advantage of integrated wireless and wireline solutions in the future.
Technologically advanced wireless networks and services
Through our Bell CTS segment, we provide wireless services over technologically advanced wireless networks that are available to virtually all Canadians. We offer a broad range of wireless voice and data communication products and services to residential and business customers through our Bell brand, as well as our Virgin Plus and Lucky Mobile brands, which enhance our competitive market position by allowing us to compete more effectively with the Canadian industry’s other discount brands as well as regional facilities-based wireless service providers.
We are focused on growing our market share of national operators’ postpaid mobile phone net customer activations, growing our prepaid mobile phone subscriber base, improving sales execution and customer retention, and introducing new devices and data services. We also believe our priorities for improved customer experience at all touch points, enhanced network quality and performance driven by effective spectrum deployment and carrier aggregation that support bandwidth and speeds, as well as a broad device offering, should continue to improve our ability to attract and retain wireless customers. With our 5G and 5G+ wireless networks, fourth-generation (4G) long-term evolution (LTE) wireless network, LTE Advanced (LTE-A) network and our high-speed packet access plus (HSPA+) network, we are able to offer one of the broadest ranges of choice in wireless smartphones in Canada, along with extensive North American and international coverage. Bell also offers a LTE, Category M1 (LTE-M) network, which is a subset of our LTE network supporting low-power Internet of Things (IoT) applications with enhanced coverage, longer device battery life and enabling lower costs for IoT devices connecting to Bell’s national network.
Through its 5G and 5G+ wireless service, Bell offers enhanced mobile data speeds and the latest 5G and 5G+-capable smartphones. Bell is working with multiple equipment suppliers for its 5G rollout, including Nokia Corporation (Nokia) and Telefonaktiebolaget LM Ericsson (Ericsson). In 2021, Bell acquired significant additional mid-band, flexible-use 3500 megahertz (MHz) wireless spectrum in the auction by Innovation, Science and Economic Development Canada (ISED) and on May 19, 2023, Bell obtained the right to use, through subordination, certain of Xplore Inc.’s 3500 MHz spectrum licences in Québec after receiving approval from ISED. On November 30, 2023, Bell announced having secured the right to acquire 939 wireless spectrum licences in the recently completed 3800 MHz spectrum auction, covering 1.77 billion MHz per population (MHz-Pop) for $518 million. Essential to Canada’s ongoing transition to 5G communications, these high-capacity airwaves support Bell’s delivery of enhanced 5G digital experiences to Canadian consumers and businesses in urban, rural and remote communities. Refer to section 4.1, Transactions in this Annual Information Form for more details.
Bell’s 5G network covered 86% of Canada’s population at December 31, 2023, a significant increase from the 26% of Canada’s population covered at the end of 2020, attributable in part to our capital expenditure acceleration program, which provided for $1.7 billion in additional network funding in 2021 and 2022, in addition to the approximately $4 billion that Bell typically spent each year in network expansion and enhancement prior to 2020. This $1.7 billion in accelerated capital expenditures advanced the rollout of our broadband fibre, 5G wireless and rural networks and helped drive Canada’s recovery from the COVID-19 pandemic. In 2022, Bell launched its 5G+ network, a faster and more responsive service allowing for a superior mobile experience, and which covered 51% of Canada’s population at December 31, 2023. Refer to section 3.6, Networks – Wireless in this Annual Information Form for more details concerning our wireless networks.
For the third consecutive year, Bell 5G was ranked Canada’s fastest and best 5G network by Global Wireless Solutions (GWS) in its 2023 nationwide assessment of 5G networks (1). New this year, GWS’s testing included 3500 MHz network wireless spectrum and determined Bell’s network (5G+) performance to be the fastest and best in the country.
Advancing 5G and IoT solutions
Bell is working with a range of global and domestic 5G partners, including Ericsson and Nokia, to accelerate Canada’s 5G innovation ecosystem. This includes continued investment in research and development (R&D) at Canadian institutions, such as a partnership between Western University and Bell creating an advanced centre for research into 5G applications across health (including mental health), transportation, education and other sectors. In 2022, Bell also launched a private mobile network at the Centre for Port Innovation, Engagement and Research (The PIER), an innovation hub in Halifax focused on developing innovative solutions for supply chain and logistics in the transportation industry, enabling IoT solutions that help support business-critical functions with real-time data monitoring and reporting, as well as supporting partners as they work to develop commercial opportunities seeking to benefit Canadian and global companies and their customers. On the international stage, Bell is involved in the setting of global 5G standards with our participation in the Next Generation Mobile Networks consortium and Third Generation Partnership Program.
The high capacity and near instant connections offered by 5G will support new consumer and business applications in the coming years, including augmented and virtual reality (AR/VR), artificial intelligence (AI) and machine learning, immersive entertainment services, connected vehicles, smart cities and enhanced rural access, and IoT opportunities for business and government enterprises. In 2021, our 5G network enabled the launch of TSN 5G View/Vision 5G RDS, an exclusive in-app feature that leverages Bell’s 5G network to offer fans interactive new ways to watch sports. It was initially introduced with Montréal Canadiens and Toronto Maple Leafs regional home game broadcasts, enabling fans to control the viewing angle of the game on their smartphones, getting up close to every goal, pass, hit and penalty with zoom, pause, rewind and slow motion capabilities. The feature was later expanded to Toronto Raptors home games and was expanded again in 2022 to Winnipeg Jets home games. In January 2023, we announced a partnership with Snap Inc. which introduced the first-ever 5G multi-user augmented
| (1) | Based on a third-party score (Global Wireless Solutions OneScore) calculated using Bell wireless 5G network testing in Canada against other national wireless networks from April 12, 2023 to October 27, 2023. |
| BCE INC. 2023 ANNUAL INFORMATION FORM | 7 |
3 Description of our business
reality (AR) basketball experience on Snapchat. Fans with a 5G device in attendance at four Toronto Raptors Welcome Toronto home games in early 2023 could join a shared AR experience where thousands could participate by teaming up and competing against each other, leveraging Snapchat’s AR technology and the speed, latency and bandwidth capabilities of 5G. In time for the start of the 2023-2024 hockey season, the 5G multi-user AR experience was also introduced in Winnipeg at the Canada Life Centre with the Bell 5G Slapshot Challenge AR lens. Jets fans were able to test their slapshot skills against other fans in the stadium to see who could score the most goals.
On September 25, 2023, we announced that Bell, Verizon, Vodafone and independent software vendor Matsuko successfully conducted the first live transatlantic collaborative meeting connecting multiple holographic people in Canada, the U.S. and the United Kingdom using 5G and multi-access edge computing (MEC) technology and Matsuko’s real-time software. Interacting with holograms of humans rather than avatars can provide a more personal experience for many applications such as remote healthcare, collaborative working and education. The call was enabled by the speed of 5G combined with the quick response times of MEC, which moves the necessary computing closer to the edge of the network. Through its active participation in the 5G Future Forum industry body, Bell continues to support the developer community to access 5G MEC technologies and for their solutions to take advantage of Bell’s 5G network in Canada, and to interoperate globally.
Bell also provides a number of solutions in the IoT sector, which enables the interconnection of a range of devices and applications that send and receive data. Bell further offers global connectivity solutions for our IoT platforms and applications, which offer customers worldwide network access and the ability to manage all of their international devices remotely from a single web platform. Bell’s lineup of innovative IoT applications includes connected telematics services, including security, safety, diagnostics and infotainment, for vehicles; fuel tank monitoring and water management solutions; fleet management solutions connecting commercial vehicles to the Internet to provide web-based analytics to manage the fleet; connected laptop solutions, enabling LTE connectivity directly from select LTE-enabled laptops; managed IoT security services that offer businesses, smart cities and other organizations employing IoT solutions a fully managed solution to detect and protect organizations from evolving cyber threats; and new solutions made available in the context of the COVID-19 pandemic, such as real-time occupancy monitoring, digital signage and sanitizer kiosks.
Next-generation high-speed Internet and
TV services
Our strategic imperative to build the best networks is focused on the expansion of our fibre network to more homes and business locations. At December 31, 2023, our fibre-to-the-premise (FTTP) footprint covered more than 7 million homes and businesses in Ontario, Québec, the Atlantic provinces and Manitoba. Our fibre network enables the delivery of Bell’s next-generation fibre-optic high-speed Internet service marketed as Fibe Internet, offering symmetrical download and upload speeds of up to 3 gigabits per second (Gbps) with FTTP through our Gigabit Fibe 3.0 service, as well as download speeds of up
to 100 megabits per second (Mbps) with fibre-to-the node (FTTN). Our network also enables the delivery of our Internet service marketed as Virgin Plus Internet, offering download speeds of up to 300 Mbps. Refer to section 3.6, Networks – Wireline – High-speed fibre deployment in this Annual Information Form for more details concerning the deployment of our fibre-optic high-speed Internet services.
Bell pure fibre Internet was awarded fastest in Canada in Ookla’s Q3-Q4 2023 Speedtest Awards report (1), with the report also ranking Bell pure fibre Wi-Fi as fastest in the country – both for the second time in a row. Bell was named the Best Major & All Around ISP in PCMag’s Best ISPs 2023 Canada report (2) and Bell recognitions also include BrandSpark’s Most Trusted ISP 2023 and 2024 (3).
As Bell extends its direct fibre links in urban and suburban centres, we are also delivering broadband speeds to smaller towns and rural locations with our Wireless Home Internet fixed wireless service, which is based on 5G-capable WTTP technology. With the expansion of wireless cell site coverage, deep fibre backhaul and advancements in technology, the cost to provide a fixed wireless solution has become viable in rural areas where it is uneconomical to deploy FTTP. In 2021, we completed the buildout of our Wireless Home Internet service in smaller towns and rural communities across Ontario, Québec, the Atlantic provinces and Manitoba, reaching our target of 1 million locations one year ahead of schedule. Bell delivers Wireless Home Internet service with download speeds of up to 50 Mbps and upload speeds of 10 Mbps (50/10) to a majority of customers. In August 2021, an agreement with Casa Systems, Inc. was announced for the upgrade of a portion of Bell’s WTTP network to 5G to further boost speed and capacity for Wireless Home Internet customers in rural regions, which was completed in June 2023.
Our fibre network also enables the delivery of Bell’s IPTV services, namely Fibe TV, the Fibe TV app and Virgin Plus TV.
Bell’s Fibe TV service, built on an IPTV platform, offers a wide range of flexible programming options and innovative features to customers in Ontario, Québec, the Atlantic provinces and Manitoba, such as: the Fibe TV wireless receiver, which enables customers to enjoy the Fibe experience on up to 10 additional TVs anywhere in the home (five in Manitoba) without the hassle of running cable through the house; the Restart and Look Back features, enabling customers to rewind and watch TV shows already in progress from the beginning and up to 30 hours after they started; and the Trending feature, which lists the five most-watched shows in both English and French among Fibe TV customers at any given time and allows customers to switch to watch live or Restart from the beginning. Fibe TV further allows access to Crave, Netflix, Prime Video and YouTube directly from customer TV receivers, providing a seamless experience.
In 2022, Bell introduced the new evolution of Fibe TV in Ontario and Québec with thousands of apps and powerful search options to make our customers’ experience even better. With the latest Google Android TV technology, Fibe TV provides access to over 10,000 apps from Google Play. Viewers can easily find the content they want to watch, and explore new and exciting entertainment with a voice remote powered by Google Assistant and intuitive universal search capabilities that will find content across Fibe TV and supported subscribed streaming services. With added Cloud personal video recorder (PVR) capabilities, viewers
| (1) | Based on analysis by Ookla of Speedtest Intelligence data Fixed and Wi-Fi nationally aggregated Speed Score results for Q3–Q4 2023. Ookla trademarks used under license and reprinted with permission. |
| (2) | PCMag Best ISPs 2023: Canada, based on speed, price, coverage and customer satisfaction comparing major and overall Canadian ISPs from June 1, 2022 to June 27, 2023. |
| (3) | BrandSpark is a research and consulting firm. Winners were determined by a national survey of 15,878 Canadian shoppers who gave their top-of-mind, unaided answers as to which brands they trust most and why in categories they have recently shopped. |
| 8 | BCE INC. 2023 ANNUAL INFORMATION FORM |
3 Description of our business
can record an unlimited number of shows simultaneously to watch at their convenience. In January 2024, the next generation of Fibe TV was launched in the Atlantic region, leveraging the same Google Android TV technology with enhanced search capabilities and voice remote. This service offers customers a consistent viewing experience on all screens with the Fibe TV app including access to more than 500 live TV channels, on-demand content and over 10,000 apps from the Google Play Store, including Crave, Netflix, Prime Video, Apple TV and YouTube.
The Fibe TV app is available to customers in Ontario, Québec, the Atlantic provinces and Manitoba, and brings the rich Fibe TV viewing experience to tablets, smartphones, laptops, Bell Streamer, Apple TV, Amazon Fire TV, Google Chromecast and a variety of Android TV devices, with access to more than 500 live and on-demand channels at home or on the go, which allows customers to seamlessly transfer a channel being viewed from a mobile device to a TV, or resume what is being watched on TV on a mobile device. In addition, Fibe customers can download their personal video recordings with the Fibe TV app to watch on iOS and Android mobile devices without Wi-Fi network access, and customers can pause and rewind live TV on any device with the Fibe TV app.
In addition, we offer the Fibe TV app service in Ontario and Québec as a standalone (SA) app-based live TV streaming service that offers live and on-demand programming. With no traditional TV set-top box required, the Fibe TV app offers up to 500 live and on-demand channels on tablets, smartphones, laptops, Bell Streamer, Apple TV, Amazon Fire TV, Google Chromecast and a variety of Android TV devices. The SA Fibe TV app offers access to two TV streams at a time and customers can add individual channels to build their own packages. Like Bell’s Fibe TV service, the SA Fibe TV app operates as a licensed broadcast service on the privately managed Bell Fibe broadband network for in-home viewing, and on mobile or Wi-Fi networks outside the home.
Virgin Plus TV is an app-based service that does not require a traditional TV set-top box or installation and that lets members in Ontario and Québec watch live and on-demand TV shows and live sports on any screen they want as it works on virtually all devices – iOS and Android smartphones and tablets, laptops, Amazon Fire TV, Android TV, Apple TV and Google Chromecast. The Virgin Plus TV app lets members watch two streams at once, pause and rewind live TV, resume on-demand programs where they left off, and track all the top trending shows.
In addition, through Bell Streamer, an all-in-one 4K High Dynamic Range streaming device powered by Android TV, we offer customers in Ontario and Québec all-in-one access to the Fibe TV app, support for all major streaming services and access to thousands of apps on Google Play.
Our strong position in broadband Internet and TV and our broad suite of product offerings serve as a foundation for the other products and services we offer. This provides us with a significant number of established customer connections to drive uptake of new products and services, either through bundled offerings or on a SA basis, and allows us to improve customer retention. In addition, our team continues to deliver network-centric business service solutions to large business and public sector clients, including cloud, security and workflow automation solutions, which are key to business communications today and increase the value of connectivity services.
Innovation in communications technology
Technological advancement plays a significant role in the success of our business. We invest in Canadian innovation and have spent $684 million in R&D capital expenditures in 2023. Our investments in R&D enable us to continue providing our customers with innovative products and services and to adopt new technologies that better support our own operations and our strategic imperatives to champion the customer experience and drive growth with innovative services. Our deployment of new and innovative networks and services is a direct result of our investment in R&D.
Over the past decades, Bell has invested in developing data analytics capabilities and AI applications in multiple areas of its operations. Providing advanced technological solutions allows us to differentiate our product and service offerings and to seek to provide greater value to our customers. As part of Bell’s objective to remain at the forefront of technology and innovation in communications services, and encourage the development of, and expertise in, new emerging technologies in Canada, we partner with a range of global and domestic organizations.
In 2022, we announced a five-year strategic engagement with the Vector Institute, an independent, not-for-profit corporation dedicated to research in the field of AI, and announced a three-year strategic partnership with Montréal innovation centre Centech to provide tech entrepreneurs with access to the latest in Bell 5G, IoT and MEC technologies.
Bell also introduced Bell Ventures in 2022, its corporate venture capital initiative to encourage development of early-stage and growth companies that harness the power of Bell’s networks to drive growth and adoption of advanced technological solutions. Building on Bell’s history of innovation and investments, Bell Ventures is a natural extension of Bell’s purpose to advance how Canadians connect with each other and the world. Bell Ventures invests in early-stage and growth companies that provide advanced technology solutions seeking to further differentiate Bell’s 5G and fibre networks and deliver solutions for its customers, including in the areas of network, security, IoT, robotics, telematics, clean technology, data monetization and AI.
We announced in 2022 and 2023 a number of significant milestones in our strategic cloud and technology partnerships. In February 2022, Bell announced its deployment of Google Distributed Cloud Edge in its network, enabling more efficiency, reliability and scale while also driving new business opportunities. This is the world’s first implementation of core network functions on Google Distributed Cloud Edge, a fully managed product that brings Google Cloud’s infrastructure and services closer to where data is being generated and consumed. This advancement builds on Bell and Google Cloud’s strategic partnership, announced in 2021, to combine Bell’s 5G network leadership with Google Cloud’s expertise in multi-cloud, data analytics and AI, and to enable Bell to drive operational efficiencies and deliver richer customer experiences. In addition, Bell announced the launch of the first public MEC with AWS Wavelength in Canada. Building on Bell’s agreement with Amazon Web Services (AWS), announced in 2021, together the two companies are deploying AWS Wavelength Zones throughout the country at the edge of Bell’s 5G network, starting in Toronto. Bell Public MEC with AWS Wavelength embeds AWS compute and storage services
| BCE INC. 2023 ANNUAL INFORMATION FORM | 9 |
3 Description of our business
at the edge of the Bell 5G network, closer to mobile and connected devices where data is generated and consumed. This enables software developers and businesses to take full advantage of the high speed and low latency of Bell’s 5G network and the cloud with AWS to build innovative, low-latency solutions that leverage real-time visual data processing, AR/VR, AI and machine learning, advanced robotics and much more.
On March 29, 2023, Bell announced a partnership with Palo Alto Networks to better support Canadian businesses managing their cloud security with the launch of two new cloud-native application protection platform (CNAPP) solutions, Cloud Security Posture Assessment and Cloud Security Posture Protection. These cybersecurity solutions identify threats to enterprise data in the cloud and provide managed services to protect data across complex hybrid, multicloud environments.
In addition, on June 1, 2023, Bell acquired FX Innovation, a Montréal-based provider of cloud-focused managed and professional services and workflow automation solutions for business clients. This acquisition combines FX Innovation’s agility, start-up culture, and cloud services expertise with Bell’s next-generation fibre and 5G networks, resources, and scale to deliver leading-edge technology solutions for Canadian businesses. The acquisition aims to position Bell as a technology services leader for our enterprise customers. On November 29, 2023, Bell and ServiceNow, a digital workflow company, announced a collaboration to launch Service Bridge capabilities on the ServiceNow platform, leveraging FX Innovation’s deep industry expertise to elevate the end-to-end experience for Bell customers with customized solutions and automation capabilities.
On February 1, 2024, Bell announced a partnership with SentinelOne, Inc. (SentinelOne), a global leader in AI-powered security, to provide extensive data protection services for Bell’s enterprise customers.
On February 2, 2024, Bell announced an 18-month collaborative project with Mila, a research institute in AI, to apply deep learning neural network algorithms to Bell’s systems and data. Mila researchers will work alongside Bell’s Machine Learning and AI teams to build on Bell’s previous investments by using deep learning neural network techniques to identify opportunities to improve business performance and customer experience. By advancing its understanding of deep learning AI techniques, Bell seeks to continue to enhance its customer experience and accelerate its transition from a telco to a techco.
In addition, on February 6, 2024, Bell announced a collaboration with Microsoft to expand its hybrid work solutions to help Canadian enterprises modernize their communications platforms with the launch of Bell Operator Connect, pairing Bell’s high-quality voice network and Microsoft Teams. Bell is also advancing its company-wide digital transformation and workforce modernization in selecting Microsoft 365 as its cloud collaboration solution.
Our significant media assets
Bell Media’s range of video and radio content enhances the execution of our strategic imperatives by leveraging our significant network investments, delivering compelling content across all screens and platforms, and enabling us to maximize strategic and operating synergies, including the efficiency of our content and advertising spend.
Bell Media’s assets in TV, radio, OOH and digital platforms are a key competitive advantage, as described below:
| • | We own and operate 35 conventional TV stations, including CTV, Canada’s #1 network for 22 consecutive years, #1 Canadian advertising-based video-on-demand (AVOD) platform CTV.ca and leading digital news destination CTVNews.ca, and the French-language Noovo network in Québec, including its AVOD platform and digital news destination Noovo.info. |
| • | We own and operate 26 specialty channels, including TSN, Canada’s sports leader, and RDS, the top French-language sports network. |
| • | We own and operate four pay TV services, as well as five streaming services, including Crave, the exclusive home of HBO and Max Originals in Canada, TSN and RDS. |
| • | We own Crave, a bilingual premium video streaming service that features a broad catalogue of sought-after content including box-office hits, Emmy Award-winning programming, and original Canadian productions, as well as thousands of hours of exclusive French-language content. Crave is available directly to all Canadians with access to the Internet, and through participating service providers. STARZ remains available through participating service providers and directly to consumers as a separate add-on. In Q2 2023, Crave extended a long-term licensing agreement with Warner Bros. Discovery that sees the service continuing to be the home of HBO and Max Originals, as well as new cable series, library television series, and new theatrically released Warner Bros. films. Crave is the most distributed Canadian-owned premium video streaming service. |
| • | We own 103 licensed radio stations in 58 markets across Canada, all available through iHeartRadio.ca and the iHeartRadio Canada app alongside an extensive catalogue of podcasts. In June 2023, we announced our intent to divest three of our 103 radio stations and in February 2024, we announced our intent to divest an additional 45 radio stations, all subject to the Canadian Radio-television and Telecommunications Commission (CRTC) review and other closing conditions. |
| • | We own Astral, a leader among Canada’s OOH advertising companies with strategically located advertising faces spanning across the country in 20 of Canada’s largest cities. Astral offers six product lines: outdoor advertising, lifestyle networks, street furniture, airport, large digital format and transit. |
| • | We lead Canadian TV media competitors in the digital landscape in the number of unique visitors, page views and total page minutes. |
| • | Part of Noovo’s multi-platform news division, our noovo.info website offers exclusive original features dedicated entirely to news. |
| • | Through CTV’s all-in-one digital video platform and streaming from CTV.ca and the CTV app on smartphones, Smart TVs and other connected devices, audiences can get even more value from their TV subscriptions all in one place, with livestreams and on-demand viewing of programming from CTV Comedy Channel, CTV Drama Channel, CTV Sci-Fi Channel, CTV Life Channel, CTV2, Discovery, E! and MTV, as well as Canada’s #1 lineup from CTV. The platform provides access for subscribers of CTV-branded entertainment channels to |
| 10 | BCE INC. 2023 ANNUAL INFORMATION FORM |
3 Description of our business
| stream premium content from those channels all at no additional cost and with one simple login, as well as digital channels CTV Throwback and CTV Movies available with no subscription or sign-in required. |
| • | We continue to provide live and on-demand access to content from our specialty networks, BNN Bloomberg, TSN, RDS and other brands in news, sports and entertainment. As discussed under Advancing 5G and IoT solutions above, TSN and RDS operate TSN 5G View/Vision 5G RDS, an exclusive in-app feature that leverages Bell’s 5G network to offer fans interactive new ways to watch sports, and which was expanded in 2022 for TSN’s regional coverage of Winnipeg Jets home games. |
| • | Through TSN+, a new direct-to-consumer (DTC) streaming product available on TSN.ca and the TSN app, Canadians have access to marquee live games and events that are incremental to the sports |
| content delivered across TSN’s platforms, as well as live streaming-only coverage from a multitude of marquee sports properties. |
Our competitive strengths also include our broad reach across Canada, our ability to deliver top programming for conventional, specialty and pay TV and streaming services, our constant drive to provide the most engaging and interactive experience for viewers, and our ability to serve the needs of advertisers across multiple platforms.
Refer to section 2.3, Deliver the most compelling content of the BCE 2023 MD&A, on page 36 of the BCE 2023 Annual Financial Report, for a description of certain agreements entered into and initiatives launched in 2023 by Bell Media.
| 3.5 | Marketing and distribution channels |
Bell CTS
The guiding principle driving our marketing strategy is to offer our clients the ultimate in reliable, simple and accessible communications services. In doing so, our objective is to increase customer acquisition, retention and loyalty through multiple service offerings.
Through the bundling of services, which combines wireline local voice and long distance, high-speed Internet, TV and smart home, as well as wireless services, our goal is to use a multi-product offering to achieve competitive differentiation by offering a premium, integrated set of services that provides customers with more freedom, flexibility and choice. We also make use of limited-time promotional offers featuring discounted rate plans, special rates on wireless handsets and TV receivers, as well as other incentives, to stimulate new customer acquisition and retain existing customers or to respond to competitive actions in our markets.
We focus our marketing efforts on a coordinated program of TV, print, radio, Internet, outdoor signage, direct mail and point-of-sale media promotions. We engage in mass market advertising in order to maintain our brand and support direct and indirect distribution channels. Coordinated marketing efforts throughout our service area ensure that our marketing message is presented consistently across all our markets. Promoting the Bell brand is complemented by our other brand marketing efforts, reinforcing awareness of all our services and capitalizing on the size and breadth of our customer base across all product lines.
The Bell brands play a key role in product positioning. Our branding is straightforward and directly supports our strategy of delivering a better customer experience at every level. In July 2021, Virgin Mobile Canada officially rebranded to Virgin Plus, a new name and a new identity that reflect the company’s evolving service offerings beyond mobility. In addition, on July 25, 2023, Virgin Plus unveiled a fresh new look with more affordable service offerings, along with a new brand campaign and updated member benefits. The service offerings include the introduction of unlimited nationwide rate plans and access to 5G at an affordable price with no zones for members across Canada. These new offerings join the lineup of Virgin Plus service offerings including high-speed Internet and app-based TV service for members in Ontario and Québec.
Acquiring and retaining wireless subscribers is a key marketing objective that we seek to achieve through our networks and suite of leading-edge devices and services to drive higher usage and increased adoption of data services. We offer unlimited plans featuring unlimited data access with no overage charges. We also offer SmartPay device financing plans that let Bell Mobility customers buy their new smartphones with 24 interest-free installments separate from their service plan, and we similarly offer Sweet Pay device financing plans for Virgin Plus customers. In addition, we offer Connect Everything plans that provide a way to link all of a customer’s Bell devices with a pool of data to share across smartphones, tablets, smartwatches and other devices, such as wireless trackers, security cameras and vehicles with Bell Connected Car. In January 2022, we introduced new mobile unlimited Ultimate plans to make the most of 5G with more data at maximum speeds, international messaging, high-definition video quality and hotspot capability. We also continue to offer discounts on the price of wireless handsets in exchange for a contractual commitment from a subscriber, a practice also used by other Canadian wireless operators. As the Canadian wireless market further matures and competition intensifies, customer retention is increasingly important. Accordingly, we employ customer retention initiatives aimed at increasing our customers’ level of satisfaction and loyalty.
We also offer eligible customers the convenience of One Bill for Internet, TV, home phone, wireless and smart home services.
We deliver our products and services to residential wireless and wireline customers through:
| • | approximately 1,000 Bell, Virgin Plus, Lucky Mobile and The Source retail locations; |
| • | national retailers such as Best Buy, Walmart, Loblaws and Glentel’s WIRELESSWAVE, Tbooth wireless and WIRELESS etc., as well as a network of regional and independent retailers in all regions; |
| • | call centre representatives; |
| • | our websites, including bell.ca, virginplus.ca, luckymobile.ca and thesource.ca; |
| • | door-to-door sales representatives. |
| BCE INC. 2023 ANNUAL INFORMATION FORM | 11 |
3 Description of our business
On January 31, 2023, Bell and Staples Canada ULC (Staples) announced a multi-year exclusive agreement to sell Bell, Virgin Plus and Lucky Mobile wireless and wireline services through Staples stores across Canada for consumers and small businesses. In addition, Bell and Staples partner to sell Bell wireless and wireline services direct to medium-sized businesses through the Staples Professional sales team, backed by Bell’s advanced communications expertise.
On May 3, 2023, Bell announced a multi-year strategic agreement with Air Canada, which includes premier sponsorship of its free in-flight messaging for Aeroplan members and the distribution of complimentary subscriber identity module (SIM) cards on board to enable newcomers and visitors arriving in Canada to activate a wireless SIM while still in the air.
On January 18, 2024, Bell announced a strategic partnership with Best Buy Canada to operate 165 The Source consumer electronics retail stores in Canada, which will be rebranded as Best Buy Express and offer the latest in consumer electronics from Best Buy along with exclusive telecommunications services from Bell. Best Buy Express is expected to open locations across Canada starting in the second half of 2024. On February 8, 2024, Bell announced that it will wind down The Source head office and back office operations, as well as close 107 The Source stores.
For small and medium-sized business customers, our small and medium business team offers a wide range of wireline and wireless services, including Business Fibe Internet, Bell Total Connect, Business Phone and TV, and IoT solutions, along with many other communications solutions, all designed for companies. All solutions are sold through dedicated call centre representatives and our bell.ca website, as well as our retail network and door-to-door sales representatives.
Communications solutions for large enterprise customers, including our wireless services, are delivered by our business markets team, and our products and services are sold through dedicated sales representatives, certified resellers and competitive bids. By combining products and services, including professional services, into fully managed, end-to-end information and technology solutions, we have been successful in providing large enterprise customers with complex communications products and services. We continue to differentiate ourselves in the marketplace by enhancing our customer service levels and offering solutions designed to provide superior service, performance, availability and security. We deliver expertise in key solution areas, including Internet, private networks, voice and unified communications, cloud solutions, security solutions, cloud-based contact centre, IoT and MEC.
Our wholesale business communications products and services are delivered by our wholesale team. They are sold through our dedicated sales representatives, web portals and call centres.
Bell Media
Bell Media’s TV, OOH and digital advertising customer base is comprised of large advertising agencies, which place advertisements with Bell Media on behalf of their customers, and advertisers who buy directly. Bell Media also has contracts with a variety of broadcasting distribution undertakings (BDUs), under which monthly subscription fees for specialty TV and pay TV are earned. Bell Media’s radio broadcast customer base is comprised of both advertising agencies and businesses in local markets.
Bell Media’s conventional TV networks are delivered to Canadians through over-the-air broadcast transmission and through distribution by BDUs. Bell Media’s specialty TV, pay TV channels and streaming services are delivered through distribution arrangements with BDUs, and its radio programming is distributed through over-the-air transmission. In addition to these primary distribution channels, Bell Media also distributes its video and radio programming through a variety of non-traditional means, such as mobile and Internet streaming (iHeartRadio).
Crave is available through participating TV providers across Canada, which provide the added opportunity to access the Crave linear channels on traditional set-top boxes, as well as via on-demand channels, through the Crave app and online at Crave.ca. Crave, TSN and RDS are also available directly via the Internet through each brand’s official website and app. Crave can be streamed on the web and through partner platforms such as iOS and Android mobile devices, Apple TV, Android TV, Amazon Fire TV, Bell Streamer, Chromecast, Roku, Samsung, LG, Hisense, Sony PlayStation and Xbox One. Finally, Bell Media’s OOH business delivers its services through an inventory of OOH faces and street furniture equipment in key urban cities across the country. On July 25, 2023, Crave expanded its DTC subscription offering with new ad-supported plan options. The new plans give customers a range of options to access Crave’s lineup of award-winning premium content.
On June 8, 2023, Bell Media unveiled new and expanded ad solutions accessible through the Bell Marketing Platform, combining the innovation, content and technology of Bell and Bell Media to build an integrated and automated future for Canadian marketers, including:
| • | Bell Media’s new Addressable TV (ATV) and Addressable Audio offerings; |
| • | new upgrades to its Strategic Audience Management (SAM) tool, including faster optimization, better proposals, expanded user capabilities, and automation; |
| • | expanded inventory on Bell demand-side platform (DSP), Bell Media’s programmatic advertising marketplace. |
On September 12, 2023, Bell Media launched ATV, an innovation that delivers tailored ads to TV audiences, across its platinum linear and video on demand (VOD) content on CTV, CTV2 and Noovo, as well as a selection of English and French specialty channels. ATV reaches viewers through the Bell Fibe TV app across Connected TV, mobile and web platforms, and launched on next-generation set top boxes on January 17, 2024. ATV provides a personalized ad experience to specific households or devices, based on demographic and behavioural data across VOD, livestreams and linear content, and makes Bell Media the first Canadian broadcaster to offer the technology on linear channels through a Canadian broadcast distributor. Bell Media’s ATV solution leverages Bell’s premium first party data, for precise targeting to an advertiser’s core audience.
On October 12, 2023, Bell Media launched Addressable Audio, an innovative new format that dynamically inserts digital audio ads into live linear programming, and on-demand content on iHeartRadio.ca and the iHeartRadio Canada app. Addressable Audio, available through Bell DSP and directly through a Bell Media sales representative, allows brands to target listeners through AM/FM streaming, on-demand tracks, and podcasts. Advanced by Bell’s premium first party data, Addressable Audio gives brands the opportunity to customize the listener experience and yield higher conversion rates.
| 12 | BCE INC. 2023 ANNUAL INFORMATION FORM |
3 Description of our business
| 3.6 | Networks |
The telecommunications industry is evolving rapidly as it continues to move from multiple service-specific networks to Internet protocol (IP)-based integrated communications networks that can carry voice, data and video traffic. We continue to work with key vendor partners to expand our national multi-service IP-enabled networks.
Our communications networks provide wireless and wireline voice, data and video services to customers across Canada. Our infrastructure includes:
| • | national transport networks for voice, data and video traffic, including Internet traffic; |
| • | urban and rural access networks and infrastructure for delivering services to customers; |
| • | national wireless networks that provide voice, data and video services. |
Wireless
To provide wireless connectivity, we have deployed and operate a number of nationwide wireless broadband networks compatible with global standards that deliver high-quality and reliable voice and high-speed data services. With our high-speed data network, we are able to offer Canadian consumers a broad range of choice in wireless smartphones, as well as touch screen tablets, IoT devices and other devices designed for data services such as video and audio streaming, IoT communications, e-mail, messaging, Internet access and social networking. We also support international roaming in over 230 destinations, with LTE roaming in 211 destinations and 5G roaming in 87 destinations.
HSPA+ network
Our wireless HSPA+ network offered high-speed mobile access to 99% of Canada’s population at December 31, 2023, covering thousands of cities and towns in both urban and rural locations. The HSPA+ network supports global roaming, as well as a wide range of smartphones, data cards, universal serial bus (USB) sticks, tablets and other leading-edge mobile devices. The vast majority of the site connectivity for the HSPA+ network was built with high-speed fibre and an all-IP architecture for enhanced reliability.
4G LTE network
With Bell’s 4G LTE wireless network coverage, customers have data access speeds similar to those of broadband connections and significantly faster than our HSPA+ network, making it easier for users to download applications, stream high-definition videos and music, play online games, or videoconference and chat with virtually no delays or buffering. The HSPA+ and LTE networks work together such that most Bell LTE devices support both networks.
Our LTE wireless network reached more than 99% of Canada’s population at December 31, 2023 with theoretical peak download speeds of up to 150 Mbps, with expected average download speeds of 18 to 40 Mbps. LTE currently accounts for 81% of our total wireless data traffic.
LTE-A network
With Dual-band LTE-A technology, Bell generally delivers theoretical peak download speeds of up to 260 Mbps (expected average download speeds of 18 to 74 Mbps). By assigning three radio channels or carriers to one user, we generally deliver, with Tri-band LTE-A technology, theoretical mobile data peak download speeds of up to 335 Mbps (expected average download speeds of 25 to 100 Mbps). With the addition of multiple-input and multiple-output (MIMO) technologies and quadrature amplitude modulation (QAM), we can deliver in certain areas theoretical peak download speeds of up to 800 Mbps with Dual-band LTE-A technology and 1.2 Gbps with Tri-band LTE-A technology.
Bell’s LTE network is also capable of delivering Quad-band LTE-A service. Quad-band technology leverages four bands of wireless spectrum to boost LTE-A speeds to the gigabit level. In addition to employing a combination of carrier aggregation, Bell also uses 256 QAM and 4X4 MIMO technologies to increase spectrum efficiency and multiply capacity. Bell’s enhanced Gigabit LTE-A network is available in select cities across Canada. Quad-band LTE-A now offers theoretical mobile data peak download speeds of up to 1.5 Gbps in markets across Canada (expected average download speeds of 25 to 325 Mbps).
At December 31, 2023, we provided LTE-A network service to 95% of the population in Canada, and provided Quad-band LTE-A service to over 60% of Canadians.
LTE-M network
Our LTE-M network is a subset of our LTE network supporting low-power IoT applications with enhanced coverage, longer device battery life and enabling lower costs for IoT devices connecting to Bell’s national network. An expanded reciprocal roaming partnership with AT&T Inc. (AT&T) provides Bell Canadian business customers with access to AT&T’s LTE-M network across the U.S. and also enables AT&T’s customers to roam on Bell’s national LTE-M network in Canada. Our LTE-M network is available in most Canadian provinces.
5G network
Our 5G wireless network enables us to offer enhanced mobile data speeds and the latest 5G-capable smartphones. The high capacity and near instant connections offered by mobile 5G will support new consumer and business applications in coming years, including AR/VR, AI and machine learning, immersive entertainment services, connected vehicles, smart cities and enhanced rural access, and IoT opportunities for business and government enterprises. In 2021, Bell acquired significant additional mid-band, flexible-use 3500 MHz wireless spectrum in the auction conducted by ISED and on May 19, 2023, Bell obtained the right to use, through subordination, certain of Xplore Inc.’s 3500 MHz spectrum licences in Québec after approval from ISED. On November 30, 2023, Bell announced having secured the right to acquire 939 wireless spectrum licences in the recently completed 3800 MHz spectrum auction. Essential to Canada’s ongoing transition to 5G communications, these high-capacity airwaves support Bell’s delivery of enhanced 5G digital experiences to Canadian consumers and businesses in urban, rural and remote communities.
| BCE INC. 2023 ANNUAL INFORMATION FORM | 13 |
3 Description of our business
In 2023, Bell continued to expand its 5G network to new markets across Québec, Ontario, the Atlantic provinces and Manitoba. Bell’s 5G network covered 86% of Canada’s population at December 31, 2023, a significant increase from the 26% of Canada’s population covered at the end of 2020, attributable in part to our capital expenditure acceleration program, which provided for additional network funding in 2021 and 2022.
In July 2022, Bell began deploying 3500 MHz wireless spectrum, unleashing the next phase of 5G advancement and allowing Bell to launch its 5G+ network. Bell 5G+ is expected to be faster and more responsive, allowing for a superior mobile experience. Initially launched in southern Ontario, the 5G+ network was expanded to Manitoba and many centres cross Atlantic Canada, as well as in other communities, and reached 51% of Canada’s population at December 31, 2023, with the availability of peak theoretical download speeds of 3 Gbps in select markets.
In 2022, Bell also announced plans to roll out a 5G SA core network, starting in Toronto. The addition of 3500 MHz wireless spectrum allows Bell to deliver a new 5G core network to Canadian businesses, supported by world-class SA architecture, and which is expected, over time, to unlock even faster speeds and ultra-low latency. Over time, a 5G SA core network will provide additional benefits such as network slicing and is expected to enable a full range of 5G features and functionality for both enterprise and consumer use cases, and support the growth of IoT.
Wireline
Voice and data network
Our national voice and data network consists of an optical fibre network with the latest technologies to provide redundancy and fault protection. It reaches all major Canadian metropolitan centres, as well as New York, Chicago, Boston, Buffalo, Detroit, Minneapolis, Ashburn (Virginia) and Seattle in the U.S.
Our network in major Canadian cities provides state-of-the-art high-speed access at multi-gigabit speeds based on IP technology. We operate a national IP multi-protocol label switching network with international gateways to the rest of the world. This network delivers next-generation, business-grade IP virtual private network (IP VPN) services that connect our customers’ offices throughout Canada and around the world. The IP VPN service is the foundation platform required for the delivery of business service solutions that add value and efficiencies to customers’ businesses. These technology solutions include voice over IP/IP telephony, IP videoconferencing, IP call centre applications and other future IP-based applications. In addition, we maintain extensive copper and voice-switching networks that provide traditional local and interexchange voice and data services to all business and residential customers in Ontario, Québec, the Atlantic provinces and Manitoba.
In April 2021, Bell announced commercial 400 gigabit wavelength service deployed across major spans of Bell’s fibre infrastructure to deliver significantly increased connectivity speed and capacity while optimizing network performance and energy efficiency. On November 14, 2023, Bell announced, in partnership with FirstLight Fiber, new wavelength data routes with speeds of 400 gigabits that will enable triversity, otherwise known as triple redundancy, between Secaucus, New Jersey, Toronto and Montréal, expected to be available in the first half of 2024. 400 gigabit technology increases fibre capacity using less network hardware and more automation to deliver four times the data speed and 50% more capacity per wavelength than compared to 100 gigabit core infrastructure or previous technology.
Key traffic routes span more than 25,000 kilometres across Canada and into the United States.
On November 16, 2021, Bell and Nokia announced the first successful test of 25G PON fibre broadband technology in North America, which validates that current GPON and XGS-PON broadband technology and future 25G PON can work seamlessly together on the same fibre hardware, which is being deployed throughout the network. 25G PON delivers significant symmetrical bandwidth capacity that will support new use cases such as premium service and 5G transport.
High-speed fibre deployment
Our strategic imperative to build the best networks is focused on the expansion of our fibre network to more homes and business locations. Over the past few years, Bell has pivoted to exclusively deploying FTTP connections by overlaying legacy copper infrastructure with fibre directly to homes and businesses. In addition, Bell continues to deploy FTTP to all new urban and suburban housing developments in Ontario, Québec, the Atlantic provinces and Manitoba, in addition to Bell’s ongoing deployment of FTTP to multi-dwelling units and business locations. In our view, FTTP, in which optical fibre cables are used to connect each and every location, is the best available network architecture to support future bandwidth-demanding IP services and applications. Our residential fibre-optic Internet service, marketed as Fibe Internet and Virgin Plus Internet, is enabled by our fibre network, offering symmetrical download and upload speeds of up to 3 Gbps with FTTP through our Gigabit Fibe 3.0 service, as well as download speeds of up to 100 Mbps with FTTN. On February 8, 2024, we announced that we would cap fibre speeds at 3 Gbps as a result of federal government policies and the CRTC’s decision of November 6, 2023 that imposed an interim aggregated access to FTTP facilities obligation and discourages network investment. As a result, we removed our Gigabit Fibe 8.0 service, initially introduced in September 2022, from the market.
Introduced in April 2022, the Bell Gigabit Fibe 3.0 service was initially offered in eligible areas of Toronto and has since been rolled out in several communities across Ontario, Québec, Manitoba and the Atlantic provinces.
Bell Gigabit Fibe service includes the new Giga Hub with Wi-Fi 6E, the next evolution of Wi-Fi, enabling faster speeds and lower latency when used with a compatible device, and allowing customers to work, learn, video chat, stream and game online on any or all of their household devices simultaneously.
In addition to the significant deployments of FTTP direct fibre connections announced in prior years, which continued throughout the Greater Toronto Area/905 region surrounding Toronto, on the island of Montréal, in Hamilton and Winnipeg, we announced in August 2022 an investment of over $650 million in partnership with a Government of Ontario investment of $484 million to deploy Bell’s all-fibre network to over 80,000 homes and businesses in underserved regions across Ontario by 2025, as part of the Ontario Accelerated High Speed Internet Program (AHSIP).
Also, in addition to several direct fibre deployment projects announced in a number of smaller communities over the past few years, on March 22, 2021, Bell announced that it would roll out high-speed Internet service to several underserved areas of Québec in partnership with the governments of Canada and Québec as part of their Operation High Speed initiative to connect all Québecers by September 2022. The Bell project provides 100% fibre Internet connections to approximately 31,000 homes and businesses in nearly 100 Québec communities. In 2021, Bell subsidiary Northwestel Inc. (Northwestel) also began offering all-fibre service to customers in Dawson City, Watson Lake
| 14 | BCE INC. 2023 ANNUAL INFORMATION FORM |
3 Description of our business
and Upper Liard in Yukon as part of its Every Community Project, a three-year initiative to provide high-speed Internet to 10,000 homes and businesses across Yukon and the Northwest Territories. In 2023, Northwestel completed the final year of construction in its Every Community Project, launching fibre-to-the-home service in 24 locations in Yukon and 18 in the Northwest Territories. This project brought high speed Internet to over 10,000 homes, and as a result, over 90% of terrestrially served households have access to Internet speeds of up to 500 Mbps, exceeding the national broadband objective. Among the communities launched in 2023 was the ultra-remote, 100-person Indigenous community of Tuktoyaktuk, which became the northern-most community with FTTH in Canada.
In 2023, Bell announced the expansion of pure fibre Internet service to additional homes and businesses, including in the Ontario communities of Leamington, Lincoln, Essex Centre and Harrow, and in six more communities across rural Manitoba. In addition, as part of the Grand Council Treaty #3 Dibaajimowin Project, Bell will provide broadband fibre-optic Internet access to 23 Indigenous and 13 non-Indigenous communities in Northwestern Ontario.
Further to the CRTC decision of November 6, 2023 that imposed an interim aggregated access to FTTP facilities obligation, we intend to reduce capital expenditures by over $1 billion over 2024 and 2025 combined, including a minimum of $500 million in 2024, that we had planned to invest in bringing high-speed fibre Internet to hundreds of thousands of additional homes and businesses in rural, suburban and urban communities. This reduction is in addition to Bell investing $105 million less than planned in Q4 2023 as a result of the CRTC’s decision. Prior to the decision, our near-term plan was to build high-speed fibre to 9 million locations by the end of 2025. As a direct result of federal government policies and the CRTC’s decision that discourages network investment, we are slowing the pace of our fibre footprint expansion to a near-term target of 8.3 million locations by the end of 2025 and capping fibre speeds at 3 Gbps.
At December 31, 2023, our FTTP footprint covered more than 7 million homes and businesses in Ontario, Québec, the Atlantic provinces and Manitoba.
In addition to our Fibe Internet service, we offer Internet under the Virgin Plus brand for customers in Ontario and Québec. This high-speed Internet service offers existing Virgin Plus customers download speeds of up to 300 Mbps and upload speeds of up to 100 Mbps.
Additionally, we continue to deploy our IPTV services in areas in Ontario, Québec, the Atlantic provinces and Manitoba where cable providers had long been dominant. As of December 31, 2023, our IPTV services had the capacity to service approximately 9.5 million homes in major cities and municipalities across Ontario, Québec, the Atlantic provinces and Manitoba.
WTTP
WTTP is 5G-capable fixed wireless technology delivered over Bell’s wireless network using 3500 MHz spectrum to deliver high-speed Internet service to residents in smaller and underserved communities. WTTP enables Bell’s Wireless Home Internet broadband service and complements its FTTP network.
In 2021, Bell completed the buildout of its Wireless Home Internet service in small towns and rural communities across Ontario, Québec, the Atlantic provinces and Manitoba, reaching its target of 1 million locations one year ahead of schedule. The accelerated rollout of its Wireless Home Internet service formed part of Bell’s capital expenditure acceleration program which provided for additional network funding in 2021 and 2022.
Bell delivers Wireless Home Internet service with download speeds of up to 50 Mbps and upload speeds of 10 Mbps (50/10) to a majority of customers. Innovation in WTTP complements Bell’s extensive broadband fibre buildout in urban markets, and our deployment of WTTP in rural locations underscores our focus on the full utilization of Bell’s assigned wireless spectrum resources.
DSL
We also offer DSL-based Internet service in areas where Fibe Internet and Wireless Home Internet are not available, with download speeds of up to 5 Mbps.
Satellite TV service
We provide satellite TV service nationwide under the Bell TV brand using satellites operated by Telesat Canada.
| 3.7 | Employees |
The table below shows the number of BCE employees at December 31, 2023 and 2022.
| Number of employees at December 31 | 2023 | 2022 | ||||||||||
| Bell CTS |
39,914 | 38,965 | ||||||||||
| Bell Media |
5,218 | 5,645 | ||||||||||
| Total (1) |
45,132 | 44,610 | ||||||||||
| (1) | The total number of BCE employees at the end of 2023 was up 522 from 44,610 at December 31, 2022 due to the acquisition of FX Innovation in June 2023, and other small acquisitions made during the year, along with greater hiring at our customer service centres, partly offset by natural attrition, retirements and workforce reduction. |
Approximately 42% of BCE employees were represented by unions and were covered by collective agreements at December 31, 2023.
The following collective agreement covering 250 or more employees was ratified in 2023:
| • | the collective agreement between Unifor and Bell Canada (Bell MTS) covering approximately 450 employees expired on December 19, 2022. A new collective agreement was ratified on June 30, 2023. |
| BCE INC. 2023 ANNUAL INFORMATION FORM | 15 |
3 Description of our business
The following collective agreement covering 250 or more employees will expire in 2024:
| • | the collective agreement between Unifor and Bell Canada (Craft and Services) covering approximately 2,865 employees will expire on November 30, 2024. Negotiations are anticipated to begin in Q4 2024. |
The following describes the status of collective agreements covering 250 or more employees that have already expired:
| • | the collective agreement between Unifor and Expertech (Craft and Services) covering approximately 680 employees expired on November 30, 2023. Negotiations began in Q3 2023 and are ongoing. |
| • | the collective agreement between Unifor and Bell Media (CTV Agincourt) covering approximately 430 employees expired on December 31, 2023. Negotiations began in Q4 2023 and are ongoing. |
| • | the collective agreement between International Brotherhood of Electrical Workers (IBEW) and Bell Canada (Bell MTS) covering |
| approximately 415 employees expired on January 31, 2024. Negotiations began in Q1 2024 and are ongoing. |
In light of an operating environment that is being reshaped by increasingly unsupportive federal government policies and regulatory decisions, an economy with high interest rates and continued inflation, increasing competition, and evolving consumer preferences, Bell is taking action to lower its cost structure and align costs to the revenue potential of each business segment. This includes Bell’s largest workforce restructuring initiative in nearly 30 years, that will result in the reduction of our workforce by approximately 4,800 positions, or 9% of all BCE employees in 2024. These workforce reductions are expected to yield in-year cost savings of $150 million to $200 million for 2024, or $250 million on an annualized basis. Severance payments related to the restructuring initiative could amount to up to approximately $400 million.
| 3.8 | Corporate responsibility |
General
ESG practices form an integral part of BCE’s corporate responsibility approach, which is to manage the company in ways that nurture the social and economic prosperity of our communities while safeguarding the environment.
BCE has adopted a range of ESG policies that are supported by various programs and initiatives. These policies address issues of importance to our many stakeholders, including: preventing conflicts of interest; protecting company assets; safeguarding privacy and confidentiality; treating clients, business partners, team members and competitors with respect and honesty; fostering a diverse and safe workplace; protecting the environment; and responsible use of AI.
These BCE policies include, among others, the following:
| • | Code of Business Conduct |
| • | Data Governance Policy |
| • | Information Security Policy |
| • | Privacy Policy |
| • | Environmental Policy |
| • | Supplier Code of Conduct |
| • | Procurement Policy |
| • | Political Contributions Policy |
| • | Journalistic Independence Policy |
| • | Mandatory Reporting of Internet Child Pornography |
| • | Health & Safety Policy |
| • | Employee Privacy Policy |
| • | Mental Health Policy Statement |
| • | Workplace Violence and Harassment Prevention Policy |
| • | Community Investment Policy |
| • | Human Rights and Accommodation Policy |
| • | Responsible Artificial Intelligence Policy |
We report annually on our corporate responsibility performance and our ESG practices. Since 2022, we no longer publish a Corporate Responsibility Report. Instead, we are presenting both our financial and
non-financial performance in an integrated annual report, with the BCE 2023 Integrated Annual Report being available at BCE.ca. For greater certainty, the BCE 2023 Integrated Annual Report is not part of this Annual Information Form and is not incorporated by reference herein.
Additional information regarding our corporate governance and risk management practices, as well as our corporate responsibility strategy and related activities and outcomes, can be found in section 1.5, Corporate governance and risk management and section 1.6, Capitals and our corporate responsibility of the BCE 2023 MD&A, on pages 23 to 34 of the BCE 2023 Annual Financial Report.
Environment
Environmental protection and efficient energy performance are core to our corporate responsibility approach. Our Environmental Policy, which is reviewed annually, contains principles that support our goals, ranging from exercising due diligence to meet or exceed requirements of the environmental legislation that applies to us, to preventing pollution and promoting cost-effective resource and waste minimization initiatives. We have instructed subsidiaries subject to this policy to support these principles, and have established an executive-level committee to oversee the implementation of the policy.
We monitor our operations to seek to ensure that we comply with our Environmental Policy, environmental requirements and standards, and take action seeking to prevent and correct problems when needed. We have an environmental management system in place that:
| • | enables systematic environmental risks and opportunities management, including cost savings; |
| • | establishes a course of corporate environmental action; |
| • | seeks to provide early warning of potential problems; |
| • | identifies environmental management accountability from top management to employees; |
| • | seeks to ensure ongoing improvement through regular monitoring and reporting. |
Since 2009, Bell Canada maintains an environmental management system certified to the ISO 14001 standard, making us the first North American communications company to be so designated (1). This
| (1) | Bell’s review in 2020 of publicly available information for North American communications and telecommunications companies indicated Bell was the first of its North American communications and telecommunications competitors to receive ISO 14001 certification. |
| 16 | BCE INC. 2023 ANNUAL INFORMATION FORM |
3 Description of our business
certification covers Bell Canada’s administrative oversight of the environmental management system associated with the development of policies and procedures for the delivery of services by Bell Canada for business sectors including landline, wireless, TV, Internet services, connectivity, broadband services, data hosting and cloud computing. In addition, in 2020, our energy management system was certified to be ISO 50001-compliant, making us the first North American communications company to be so designated (1). This certification covers the corporate and operational level management activities related to Bell Canada’s energy management program at its national business locations associated with the activities of real estate management services, fleet services, radio broadcasting and digital media services, landline, wireless, TV, Internet services, connectivity, broadband services, data hosting and cloud computing, in addition to related general administrative functions.
One of our key tools is our Corporate Environmental Action Plan, which outlines the environmental activities of our various business units. The plan identifies funding requirements, accountabilities and deliverables, and monitors our progress in meeting our objectives.
For the year ended December 31, 2023, we spent $13.9 million as expenses and $140.2 million as capital expenditures for environmental activities. For 2024, we have budgeted $14.1 million of expenses and $94.6 million of capital expenditures to seek to ensure that our Environmental Policy is applied properly, that our environmental risks are minimized and that we progress towards our GHG emissions reduction targets.
Additional information regarding our environmental protection activities can be found in section 1.6, Capitals and our corporate responsibility of the BCE 2023 MD&A, on pages 26 to 34 of the BCE 2023 Annual Financial Report.
BCE welcomes the increased demand for transparency from our stakeholders regarding our climate actions. We also believe it is important to detail how climate-related risks and opportunities impact our business. We report on climate-related information in accordance with the recommendations of the Task Force on Climate-related Financial Disclosures (TCFD) in our Climate Action Report, available at BCE.ca. For greater certainty, our Climate Action Report is not part of this Annual Information Form and is not incorporated by reference herein.
| 3.9 | Competitive environment |
A discussion of our competitive environment can be found in section 3.3, Principal business risks and the various subsections entitled Competitive landscape and industry trends and Principal business risks of the BCE 2023 MD&A, on pages 42 and 43, 58 to 60, 62, 64 and 65, and 67 of the BCE 2023 Annual Financial Report.
See also section 3.4, Competitive strengths in this Annual Information Form for more information concerning our competitive position.
| 3.10 | Regulatory environment |
A discussion of certain legislation that governs our businesses, as well as government consultations and recent regulatory initiatives and proceedings affecting us, can be found in section 8, Regulatory environment of the BCE 2023 MD&A, on pages 83 to 87 of the BCE 2023 Annual Financial Report.
More information about the Canadian ownership restrictions on BCE’s common shares can be found in section 5.1, BCE securities in this Annual Information Form.
| 3.11 | Intangible properties |
Intellectual property
We use various works protected by intellectual property rights (IP Assets), which we own or for which we have been granted rights of use. These IP Assets include, without limitation: brand names; trademarks such as names, designs and logos; copyrights of content, programs and musical works; broadcast signals, software and applications; domain names; patents or patent applications for inventions owned or produced by us and our employees; and various other copyright materials, trademarks, patents and other intellectual property owned or licensed by us. We derive value through the use of these IP Assets in various business activities, and they are important to our operations and our success. To protect these IP Assets, we rely on a combination of legal protections afforded under copyright, trademark, patent and other intellectual property laws, as well as contractual provisions under licensing arrangements.
In particular, the Bell brand plays a key role in product positioning. Our branding is straightforward and directly supports our strategy of delivering a better customer experience at every level. Our trademark rights are perpetual, provided that their registrations are renewed on a timely basis when applicable and that the trademarks are used in commerce by us or our licensees. Other types of intangible proprietary information are also important to our operations, such as customer lists.
We believe that we take reasonable and appropriate measures to protect, renew and defend our IP Assets, including prosecuting infringers, and we take great care not to infringe on the intellectual property rights of others. However, we cannot provide any assurance that the laws protecting intellectual property in various jurisdictions are, or will continue to be, adequate to protect our IP Assets or that we will be successful in preventing or defending claims by others asserting rights in or to our IP Assets, or enforcing their intellectual property rights.
| (1) | Bell’s review in 2020 of publicly available information for North American communications and telecommunications companies indicated Bell was the first of its North American communications and telecommunications competitors to receive ISO 50001 certification. |
| BCE INC. 2023 ANNUAL INFORMATION FORM | 17 |
3 Description of our business
Spectrum and broadcasting licences
Our intangible assets also include spectrum licences from ISED, which provide us with the right to utilize designated wireless spectrum to provide our wireless services, and broadcasting licences from the CRTC, which enable us to deliver Bell Media’s content to Canadians.
Our wireless spectrum licence holdings extend across various spectrum bands and regions across Canada, totalling more than 6.4 billion MHz-Pop, corresponding to an average of approximately 182 MHz of spectrum per Canadian. In previous years, we have deployed 600 MHz, 700 MHz, 2300 MHz, 2500 MHz, 1900 MHz, AWS and 850 MHz as part of our wireless networks, and in 2022 we began deploying our 3500 MHz spectrum acquired in the 2021 auction. We intend to renew existing licences to meet network capacity requirements.
Rights to use, through subordination, certain of Xplore Inc.’s 3500 MHz spectrum licences in Québec were acquired by Bell on May 19, 2023, after approval from ISED. Also, on November 30, 2023, Bell announced having secured the right to acquire 939 wireless spectrum licences in the recently completed 3800 MHz spectrum auction.
Broadcasting licences issued by the CRTC are important to the success of our Bell Media segment, as they allow us to deliver radio and TV services in the communities in which we operate. We seek to maintain and renew, as applicable, all such broadcasting licences required for our operations. Many of our licences are set for a five-year term and reviewed by the CRTC under a group licence approach. While we expect to continually renew our licences, the terms under which they are provided may change from one licence term to another.
| 18 | BCE INC. 2023 ANNUAL INFORMATION FORM |
4 General development of our business – three-year history
| 4 | General development of our business – |
| three-year history |
This section contains forward-looking statements, including relating to the expected timing and completion of the proposed acquisition of the Canadian OOH media business of OUTFRONT and the benefits expected to result therefrom, and our objectives, plans and strategic priorities. Refer to section 1, Caution regarding forward-looking statements in this Annual Information Form.
In line with our strategic imperatives, since 2021, we have entered into or announced transactions and implemented various business strategies and corporate initiatives that have influenced the general development of our business. During this period, our regulatory environment has also influenced the general development of our business. The principal transactions, regulatory developments, business strategies and corporate initiatives that have influenced the general development of our business during the last three completed financial years are discussed below.
| 4.1 | Transactions |
Proposed acquisition of Canadian OOH media business of OUTFRONT
On October 23, 2023, Bell Media announced that it had entered into an agreement to acquire the Canadian OOH media business of OUTFRONT. The transaction is valued at $410 million, subject to certain adjustments, and is expected to close in the first half of 2024, subject to regulatory approval and other closing conditions. The acquisition of the Canadian OOH media business of OUTFRONT is expected to support Bell Media’s digital media strategy and to deliver impactful, multi-channel marketing solutions coast-to-coast. The results of the Canadian OOH media business of OUTFRONT will be included in our Bell Media segment.
Key completed transactions
We have concluded a number of transactions, including acquisitions, dispositions, partnerships and investments, since 2021 to support our strategic imperatives and our purpose to advance how Canadians connect with each other and the world. More information with respect to the most significant of these transactions is provided in the table below.
| Transaction | Key characteristics | |
| Strategic partnership with Best Buy Canada (2024) | • On January 18, 2024, Bell announced a strategic partnership with Best Buy Canada to operate 165 The Source consumer electronics retail stores in Canada, which will be rebranded as Best Buy Express and offer the latest in consumer electronics from Best Buy along with exclusive telecommunications services from Bell. Best Buy Express is expected to open locations across Canada starting in the second half of 2024. |
|
| Acquisition of FX Innovation (2023) | • On June 1, 2023, Bell acquired FX Innovation, a Montréal-based provider of cloud-focused managed and professional services and workflow automation solutions for business clients, for cash consideration of $157 million, of which $12 million is payable within two years and an estimated $6 million of additional cash consideration contingent on the achievement of certain performance objectives. This contingent consideration is expected to be settled by 2027 and the maximum amount payable is $7 million. The results of FX Innovation are included in our Bell CTS segment. |
|
| Disposition of production studios (2023) | • On May 3, 2023, Bell Media completed the previously announced sale of its 63% ownership in certain production studios, which were included in our Bell Media segment, for net cash proceeds of $211 million. |
|
| Acquisition of Distributel Communications Limited (Distributel) (2022) | • On December 1, 2022, Bell acquired Distributel, a national independent communications provider offering a wide range of consumer, business and wholesale communications services for cash consideration of $303 million ($282 million net of cash acquired) and $39 million of estimated additional cash consideration contingent on the achievement of certain performance objectives. The acquisition of Distributel is expected to support growth in Bell’s residential and business customers. Distributel’s results are included in our Bell CTS segment. |
|
| Acquisition of EBOX (2022) | • In February 2022, Bell acquired EBOX and other related companies, which provide Internet, telephone and TV services to consumers and businesses in Québec and parts of Ontario, for cash consideration of $153 million ($139 million net of cash acquired). Bell maintains the EBOX brand and operations, and EBOX continues providing telecommunications options for consumers and businesses in these areas. |
|
| • The acquisition is expected to accelerate growth in Bell’s residential and small business customers. The results of the acquired business are included in our Bell CTS segment. |
||
| BCE INC. 2023 ANNUAL INFORMATION FORM | 19 |
4 General development of our business – three-year history
Acquisition of wireless spectrum
In 2021, Bell acquired significant additional mid-band, flexible-use 3500 MHz wireless spectrum in the auction by ISED. Essential to Canada’s ongoing transition to 5G communications, these high-capacity airwaves extend Bell’s leadership in delivering enhanced 5G digital experiences to Canadian consumers and businesses in urban, rural and remote communities. Bell acquired 271 licences for 678 million MHz-Pop of 3500 MHz spectrum – critical to enabling the full potential of 5G – for $2.07 billion.
On May 19, 2023, after approval from ISED, Bell obtained the right to use, through subordination, certain of Xplore Inc.’s 3500 MHz spectrum licences in Québec for $145 million.
On November 30, 2023, Bell announced having secured the right to acquire 939 licences of 3800 MHz spectrum for 1.77 billion MHz-Pop for $518 million in the recently completed spectrum auction. This acquisition will increase Bell’s total 3500 MHz and 3800 MHz spectrum holdings to 3.5 billion MHz-Pop, acquired at an average cost of $0.79 per MHz-Pop.
Normal course issuer bid for BCE Preferred Shares
On November 5, 2020, BCE announced a normal course issuer bid (2020 NCIB) to purchase for cancellation up to 10% of the public float of each series of BCE’s outstanding first preferred shares that are listed on the Toronto Stock Exchange (TSX). The 2020 NCIB extended from November 9, 2020 to November 8, 2021, and BCE repurchased and cancelled an aggregate of 41,400 first preferred shares under the
2020 NCIB. On November 4, 2021, BCE announced the renewal of its normal course issuer bid (2021 NCIB), which extended from November 9, 2021 to November 8, 2022. BCE did not repurchase any first preferred shares under the 2021 NCIB. On November 3, 2022, BCE announced the renewal of its normal course issuer bid (2022 NCIB), which extended from November 9, 2022 to November 8, 2023, and BCE repurchased and cancelled an aggregate of 7,411,036 first preferred shares under the 2022 NCIB.
On November 2, 2023, BCE announced the renewal of its normal course issuer bid (2023 NCIB), which will extend from November 9, 2023 to November 8, 2024, or an earlier date should BCE complete its purchases under the 2023 NCIB. BCE initiated the 2023 NCIB because it believed that, from time to time, the first preferred shares may trade in price ranges that do not fully reflect their value. BCE believes that, in such circumstances, the repurchase of its first preferred shares represents an appropriate use of its available funds.
The actual number of first preferred shares to be repurchased under the 2023 NCIB and the timing of such repurchases will be at BCE’s discretion and shall be subject to the limitations set out by the TSX. The 2023 NCIB may be conducted through the facilities of the TSX as well as alternative trading systems in Canada, if eligible, or by such other means as may be permitted by securities regulatory authorities. At December 31, 2023, BCE had repurchased and canceled 1,297,797 first preferred shares under the 2023 NCIB.
| 4.2 | Corporate developments |
Refer to the sections of the BCE 2021 MD&A and BCE 2022 MD&A, contained in the BCE 2021 Annual Report and BCE 2022 Annual Financial Report, respectively, indicated in the adjacent table for a discussion of various business strategies and corporate initiatives implemented, and other actions taken, in the financial years ended December 31, 2021 and December 31, 2022 that have influenced the general development of our business in 2021 and 2022. Refer to the sections of the BCE 2023 MD&A, contained in the BCE 2023 Annual Financial Report, indicated in the adjacent table for a discussion of various business strategies and corporate initiatives implemented, and other actions taken, in the financial year ended December 31, 2023 that have influenced the general development of our business in 2023, and the priorities we intend to focus on in 2024.
| MD&A | Section references | |||
| BCE 2021 MD&A | Section 1.3,
Section 1.4,
Section 2, |
Key corporate developments
Capital markets strategy
Strategic imperatives – 2021 progress for each strategic imperative |
||
| BCE 2022 MD&A | Section 1.3,
Section 1.4,
Section 2, |
Key corporate developments
Capital markets strategy
Strategic imperatives – 2022 progress for each strategic imperative |
||
| BCE 2023 MD&A | Section 1.3,
Section 1.4,
Section 2,
Section 2, |
Key corporate developments
Capital markets strategy
Strategic imperatives – 2023 progress for each strategic imperative
Strategic imperatives – 2024 focus for each strategic imperative |
||
| 4.3 | Regulatory environment |
During the past three financial years, the general development of our business has been affected, and will continue to be affected, by decisions made by the Government of Canada and its relevant departments and agencies, including the CRTC, ISED, Canadian Heritage and the Competition Bureau. Although most of our retail services are not price-regulated, government agencies and departments such as those mentioned above continue to play a significant role in regulatory matters such as establishing and modifying regulations for mandatory access to networks, spectrum auctions, the imposition of consumer-related codes of conduct, approval of acquisitions, broadcast and spectrum
licensing, foreign ownership requirements, privacy and cybersecurity obligations and control of copyright piracy. Refer to section 8, Regulatory environment of the BCE 2021 MD&A, BCE 2022 MD&A and BCE 2023 MD&A contained in the BCE 2021 Annual Report, BCE 2022 Annual Financial Report and BCE 2023 Annual Financial Report, respectively, for a discussion of the regulatory initiatives and proceedings that influenced, in the financial years ended December 31, 2021, 2022 and 2023, and may in the future influence, the general development of our business.
| 20 | BCE INC. 2023 ANNUAL INFORMATION FORM |
5 Our capital structure
| 5 | Our capital structure |
This section describes BCE’s and Bell Canada’s securities, the trading of certain of such securities on the TSX and the ratings that certain rating agencies have attributed to BCE’s first preferred shares and Bell Canada’s debt securities that are issued and outstanding.
| 5.1 | BCE securities |
BCE’s articles of amalgamation, as amended, provide for an unlimited number of common shares, an unlimited number of first preferred shares issuable in series, an unlimited number of second preferred shares also issuable in series and an unlimited number of Class B shares. As at March 7, 2024, BCE had no Class B shares or second preferred shares outstanding.
Each common share entitles its holder to one vote at any meeting of shareholders. Additional information about the terms and conditions of the BCE preferred shares, common shares and Class B shares can be found in Note 30, Share capital of the BCE 2023 consolidated financial statements, on pages 154 and 155 of the BCE 2023 Annual Financial Report.
Since 1993, the Telecommunications Act and associated regulations (Telecom Regulations) have governed Canadian ownership and control of Canadian telecommunications carriers. Bell Canada and other affiliates of BCE that are Canadian carriers are subject to this Act. In 2012, amendments to the Telecommunications Act largely eliminated the foreign ownership restrictions for any carrier that, with its affiliates, has annual revenues from the provision of telecommunications services in Canada that represent less than 10% of the total annual revenues from the provision of these services in Canada, as determined by the CRTC. However, given that Bell Canada and its affiliates exceed this 10% threshold, they remain subject to the pre-existing Canadian ownership and control restrictions, which are detailed below.
Under the Telecommunications Act, in order for a corporation that exceeds the 10% threshold mentioned above to operate as a Canadian common carrier, the following conditions have to be met:
| • | Canadians own at least 80% of its voting shares; |
| • | at least 80% of the members of the carrier company’s board of directors are Canadian; and |
| • | the carrier company is not controlled by non-Canadians. |
In addition, where a parent company (Carrier holding company) owns at least 66 2⁄3% of the voting shares of the carrier company (subject to ownership rules), the Carrier holding company must have at least 66 2⁄3% of its voting shares owned by Canadians and must not be controlled by non-Canadians. BCE is a Carrier holding company. The Telecom Regulations give certain powers to the CRTC and to Canadian carriers and Carrier holding companies to monitor and control the level of non-Canadian ownership of voting shares to ensure compliance with the Telecommunications Act. Accordingly, BCE, which controls Bell Canada and other Canadian carriers, must satisfy the following conditions:
| • | Canadians own at least 66 2⁄3% of its voting shares; and |
| • | it is not controlled by non-Canadians. |
The powers under the Telecom Regulations include the right to:
| • | suspend the voting rights attached to shares considered to be owned or controlled by non-Canadians; |
| • | refuse to register a transfer of voting shares to a non-Canadian; and |
| • | force a non-Canadian to sell the non-Canadian’s voting shares. |
However, in our case, there is an additional control restriction under the Bell Canada Act. Prior approval by the CRTC is necessary for any sale or other disposal of Bell Canada’s voting shares unless BCE retains at least 80% of all Bell Canada voting shares.
Similarly, the Canadian ownership rules under the Broadcasting Act for broadcasting licensees, such as Bell Media and Bell Canada, generally mirror the rules for Canadian-owned and -controlled common carriers under the Telecommunications Act by restricting allowable foreign investments in voting shares at the licensee operating company level to a maximum of 20% and at the holding company level to a maximum of 33 1⁄3%. An additional requirement under these Canadian broadcasting ownership rules is that the chief executive officer of a company that is a licensed broadcasting undertaking must be a Canadian citizen or permanent resident of Canada. The CRTC is precluded under a direction issued under the Broadcasting Act from issuing, amending or renewing a broadcasting licence of an applicant that does not satisfy these Canadian ownership and control criteria.
Cultural concerns over increased foreign control of broadcasting activities also require broadcasting licensees to establish programming committees when foreign investment in their holding company, while within permissible limits, exceeds 20%. In line with CRTC practice, programming committees have been established within the relevant subsidiary licensees, thereby allowing foreign investment in voting shares of BCE to reach the maximum of 33 1⁄3%.
We monitor the level of non-Canadian ownership of BCE’s common shares by obtaining data on: (i) registered shareholders from our transfer agent and registrar, TSX Trust Company, and (ii) beneficial shareholders from the Canadian Depository for Securities (CDS) and the Depository Trust Company (DTC) in the U.S. We also provide periodic reports to the CRTC.
As of March 7, 2024, BCE had no debt securities outstanding.
| BCE INC. 2023 ANNUAL INFORMATION FORM | 21 |
5 Our capital structure
| 5.2 | Bell Canada debt securities |
Bell Canada long-term debt securities
As at December 31, 2023, Bell Canada had issued or assumed long-term debt securities as summarized in the table below.
| Debt securities | Weighted average interest rate |
Maturity | At December 31, 2023 (in $ millions) |
|||||||||||||
| 1997 trust indenture |
4.02% | 2024 – 2053 | 19,768 | |||||||||||||
| 1976 trust indenture |
9.38% | 2027 – 2054 | 975 | |||||||||||||
| 1996 trust indenture (subordinated) |
8.21% | 2026 – 2031 | 275 | |||||||||||||
| 2016 U.S. trust indenture (1) |
3.58% | 2024 – 2052 | 7,529 | |||||||||||||
| 2011 trust indenture (2) |
4.00% | 2024 | 225 | |||||||||||||
| Total |
28,772 | |||||||||||||||
| (1) | As at December 31, 2023, Bell Canada had issued notes under the 2016 U.S. trust indenture for an aggregate amount of $5.7 billion in U.S. dollars, which have been hedged for foreign currency fluctuations with cross currency interest rate swaps. |
| (2) | As part of the acquisition of Manitoba Telecom Services Inc. (MTS), on March 17, 2017, Bell Canada assumed all of MTS’ debt issued under its 2011 trust indenture. |
The Bell Canada long-term debt securities are unsecured and have been guaranteed by BCE. Additional information about the terms and conditions of the Bell Canada long-term debt securities can be found in Note 25, Long-term debt of the BCE 2023 consolidated financial statements on pages 144 and 145 of the BCE 2023 Annual Financial Report.
Under its shelf prospectus dated March 7, 2022 (2022 Shelf Prospectus), Bell Canada may issue unsecured debt securities from time to time over a 25-month period. In addition, under its prospectus supplement dated May 19, 2022 (2022 Prospectus Supplement), Bell Canada may issue unsecured Medium Term Notes (MTN) debentures under the 2022 Shelf Prospectus.
On February 9, 2023, Bell Canada issued, under the 2022 Shelf Prospectus and 2022 Prospectus Supplement, $1.5 billion principal amount of MTN debentures in two series. The $1.05 billion 4.55% MTN debentures, Series M-58, were issued at a price of $99.787 per $100 principal amount, to mature on February 9, 2030. The $450 million 5.15% MTN debentures, Series M-59, were issued at a price of $99.500 per $100 principal amount, to mature on February 9, 2053. The net proceeds of the offerings were used to repay short-term debt and for general corporate purposes.
On May 11, 2023, Bell Canada issued, under the 2022 Shelf Prospectus and a prospectus supplement dated May 8, 2023, US$850 million (C$1,138 million) principal amount of 5.100% Series US-8 Notes, at a price of US$99.930 per US$100 principal amount, to mature on May 11, 2033. The net proceeds of the offering were used to repay short-term debt and for general corporate purposes.
On August 11, 2023, Bell Canada issued, under the 2022 Shelf Prospectus and 2022 Prospectus Supplement, $1.0 billion principal amount of MTN debentures in two series. The $600 million 5.15% MTN debentures, Series M-60, were issued at a price of $99.917 per $100 principal amount, to mature on November 14, 2028. The $400 million 5.60% MTN debentures, Series M-61, were issued at a price of $99.726 per $100 principal amount, to mature on August 11, 2053. The net proceeds of the offerings were used to repay short-term debt and for general corporate purposes.
On November 14, 2023, Bell Canada issued, under the 2022 Shelf Prospectus and 2022 Prospectus Supplement, $1.0 billion principal amount of MTN debentures in two series. The $300 million 5.85% MTN debentures, Series M-57, which were issued pursuant to a re-opening of an existing series of MTN debentures, were issued at a price of $101.232
per $100 principal amount plus accrued and unpaid interest from and including November 10, 2023 to but excluding November 14, 2023, to mature on November 10, 2032. The $700 million 5.25% MTN debentures, Series M-62, were issued at a price of $99.897 per $100 principal amount, to mature on March 15, 2029. The net proceeds of the offering were used to fund the repayment at maturity of Bell Canada’s $1.0 billion principal amount of 2.70% MTN Debentures, Series M-44, due February 2024.
On February 15, 2024, Bell Canada issued, under the 2022 Shelf Prospectus and a prospectus supplement dated February 12, 2024, US$1.45 billion (C$1.95 billion) aggregate principal amount of notes in two series. The US$700 million (C$942 million) 5.200% Series US-9 Notes were issued at a price of US$99.823 per US$100 principal amount, to mature on February 15, 2034. The US$750 million (C$1,009 million) 5.550% Series US-10 Notes were issued at a price of US$99.869 per US$100 principal amount, to mature on February 15, 2054. The net proceeds of the offering are intended to be used for the repayment at maturity of Bell Canada’s US$600 million Series US-3 Notes due March 17, 2024, to fund the remaining payment for the 3800 MHz spectrum licences and for other general corporate purposes, which may include the repayment of short-term debt.
As at March 7, 2024, Bell Canada had issued $7.589 billion principal amount of debt securities under its 2022 Shelf Prospectus.
Bell Canada is required, under certain conditions, to make an offer to repurchase all or, at the option of the holder thereof, any part of certain series of its debt securities upon the occurrence of both a “Change of Control” of BCE or Bell Canada and a “Rating Event” relating to the relevant series of debt securities, as defined in the terms and conditions of the relevant series of debt securities or in the relevant trust indenture, as applicable (the Repurchase upon Change of Control Triggering Event). In addition, MTS’ 2011 trust indenture assumed by Bell Canada imposes covenants that place limitations on the issuance of additional debt with a maturity date exceeding one year based on certain tests related to interest and asset coverage. Bell Canada is in compliance with all conditions and restrictions of its debt securities.
Bell Canada commercial paper
Bell Canada may issue short-term notes (CP Notes) under its Canadian and U.S. commercial paper programs up to the maximum aggregate principal amount of $3.0 billion in either Canadian or U.S. currency provided that at no time shall such aggregate principal amount of CP Notes exceed $3.5 billion in Canadian currency, which equals the
| 22 | BCE INC. 2023 ANNUAL INFORMATION FORM |
5 Our capital structure
aggregate amount available under Bell Canada’s committed supporting revolving and expansion credit facilities as of March 7, 2024. The sale of CP Notes pursuant to Bell Canada’s separate Canadian or U.S. program decreases the Canadian or U.S. $3.0 billion maximum principal amount of CP Notes authorized to be outstanding at any time under both programs, with one Canadian dollar being treated as equal to one U.S.
dollar for purposes of this limitation. At March 7, 2024, Bell Canada had CP Notes outstanding under its U.S. program in the principal amount of US$1,084 million (C$1,444 million when taking into account hedges with forward currency contracts against foreign currency fluctuations). As at the same date, no CP Notes were outstanding under Bell Canada’s Canadian program.
| 5.3 | Credit ratings |
Ratings generally address the ability of a company to repay principal and pay interest or dividends on issued and outstanding securities.
Our ability to raise financing depends on our ability to access the public equity and debt capital markets, the money market, as well as the bank credit market. Our ability to access such markets and the cost and amount of funding available partly depend on our assigned credit ratings at the time capital is raised. Investment grade credit ratings usually mean that when we borrow money, we can obtain lower interest rates than companies that have ratings lower than investment grade. Credit ratings are subject to change based on a number of factors including, but not limited to, our financial strength, competitive position, liquidity and other factors that are not completely within our control. There is no assurance that we will maintain our current credit ratings and a ratings downgrade could result in adverse consequences for our funding cost and capacity, and our ability to access the capital markets, the money market and/or bank credit market.
As of March 7, 2024, BCE’s preferred shares are rated by DBRS Limited (DBRS) and S&P Global Ratings Canada, a business unit of S&P Global Canada Corp. (S&P), and Bell Canada’s debt securities are rated by DBRS, Moody’s Investors Service, Inc. (Moody’s) and S&P.
This section describes the credit ratings, as of March 7, 2024, for certain of the issued and outstanding securities of BCE and Bell Canada. These ratings provide investors with an independent measure of the credit quality of an issue of securities. However, they are not recommendations to buy, sell or hold any of the securities referred to below, and they may be revised or withdrawn at any time by the assigning rating agency. Ratings are determined by the rating agencies based on criteria established from time to time by them, and they do not comment on market price or suitability for a particular investor. Each credit rating should be evaluated independently of any other credit rating.
In the past two years, we have paid rating agencies to assign ratings to BCE’s preferred shares, as well as to Bell Canada’s short-term and long-term debt securities. The fees paid to DBRS, Moody’s and S&P include access to some or all of their websites. In addition, we paid DBRS for services provided in connection with Bell Canada’s securitization program.
Ratings for BCE and Bell Canada securities
Ratings for Bell Canada short-term debt securities
| Short-term debt securities | Rating agency | Rating | Rank | |||||
| Bell Canada commercial paper | DBRS | R-2 (high) | 4 out of 10 | |||||
| Moody’s | P-2 | 2 out of 4 | ||||||
| S&P | A-1 (Low) (Canadian scale) | 3 out of 8 | ||||||
| A-2 (Global scale) | 3 out of 7 | |||||||
|
Ratings for Bell Canada long-term debt securities
|
||||||||
| Long-term debt securities | Rating agency | Rating | Rank | |||||
| Bell Canada unsubordinated long-term debt securities | DBRS | BBB (high) | 8 out of 26 | |||||
| Moody’s | Baa1 | 8 out of 21 | ||||||
| S&P | BBB+ | 8 out of 22 | ||||||
| Bell Canada subordinated long-term debt securities | DBRS | BBB (low) | 10 out of 26 | |||||
| Moody’s | Baa2 | 9 out of 21 | ||||||
| S&P | BBB | 9 out of 22 | ||||||
|
Ratings for BCE preferred shares
|
||||||||
| Preferred shares | Rating agency | Rating | Rank | |||||
| BCE preferred shares | DBRS | Pfd-3 | 8 out of 16 | |||||
| S&P | P-2 (Low) (Canadian scale) | 6 out of 18 | ||||||
| BBB- (Global scale) | 8 out of 20 | |||||||
As of March 7, 2024, BCE and Bell Canada’s credit ratings have stable outlooks from DBRS, Moody’s and S&P.
| BCE INC. 2023 ANNUAL INFORMATION FORM | 23 |
5 Our capital structure
General explanation
Short-term debt securities
The table below shows the range of credit ratings that each rating agency assigns to short-term debt instruments, and is based upon public statements from the respective rating agencies as of March 7, 2024.
| Highest quality of securities rated |
Lowest quality of securities rated |
|||||||||||
| DBRS |
R-1 (high) | D | ||||||||||
| Moody’s |
P-1 | NP | ||||||||||
| S&P (Canadian scale) |
A-1 (High) | D | ||||||||||
| S&P (Global scale) |
A-1+ | D | ||||||||||
The DBRS short-term debt rating scale provides an opinion on the risk that a borrower will not meet its short-term financial obligations in a timely manner. Ratings are based on quantitative and qualitative considerations relevant to the issuer and the relative ranking of claims.
Moody’s short-term ratings are assigned to obligations with an original maturity of 13 months or less and reflect both on the likelihood of a default or impairment on contractual financial obligations and the expected financial loss suffered in the event of default or impairment.
An S&P Canadian commercial paper rating is a forward-looking opinion about the capacity of an obligor to meet financial commitments associated with a specific commercial paper program or other short-term financial instrument, relative to the debt servicing and repayment capacity of other obligors active in the Canadian domestic financial markets with respect to their own financial obligations.
An S&P Global rating is a forward-looking opinion about the credit-worthiness of an obligor with respect to a specific financial obligation, a specific class of financial obligations or a specific financial program, and about the obligor’s capacity and willingness to meet its financial commitments.
Long-term debt securities
The table below shows the range of credit ratings that each rating agency assigns to long-term debt instruments, and is based upon public statements from the respective rating agencies as of March 7, 2024.
| Highest quality of securities rated |
Lowest quality of securities rated |
|||||||||||
| DBRS |
AAA | D | ||||||||||
| Moody’s |
Aaa | C | ||||||||||
| S&P |
AAA | D | ||||||||||
The DBRS long-term debt rating scale provides an opinion on the risk of default; that is, the risk that an issuer will fail to satisfy its financial obligations in accordance with the terms under which an obligation has been issued. Ratings are based on quantitative and qualitative considerations relevant to the issuer and the relative ranking of claims.
Moody’s long-term debt ratings are assigned to issuers or obligations with an original maturity of eleven months or more and reflect both on the likelihood of a default or impairment on contractual financial obligations and the expected financial loss suffered in the event of default or impairment.
S&P’s long-term debt credit rating scale provides a forward-looking opinion of the creditworthiness of a company in meeting a specific financial obligation, a specific class of financial obligations or a specific financial program. It takes into consideration the likelihood of payment; that is, the capacity and willingness of the company to meet its financial commitment on an obligation according to the terms of the obligation, among other factors.
Preferred shares
The table below describes the range of credit ratings that each rating agency assigns to preferred shares and is based upon public statements from the respective rating agencies as of March 7, 2024.
| Highest quality of securities rated |
Lowest quality of securities rated |
|||||||||||
| DBRS |
Pfd-1 (high) | D | ||||||||||
| S&P (Canadian scale) |
P-1 (High) | D | ||||||||||
| S&P (Global scale) |
AA | D | ||||||||||
The DBRS preferred share rating scale reflects an opinion of the risk that an issuer will not fulfill its obligations with respect to both dividends and principal commitments. Every DBRS rating is based on quantitative and qualitative considerations relevant to the issuing entity.
S&P’s Canadian preferred share rating is a forward-looking opinion about the creditworthiness of an obligor in meeting a specific preferred share obligation issued in the Canadian market, compared to preferred shares issued by other issuers in the Canadian market.
An S&P Global rating is a forward-looking opinion about the credit-worthiness of an obligor with respect to a specific financial obligation, a specific class of financial obligations or a specific financial program, and about the obligor’s capacity and willingness to meet its financial commitments.
| 24 | BCE INC. 2023 ANNUAL INFORMATION FORM |
5 Our capital structure
Explanation of rating categories received for our securities
The following explanations of the rating categories received for our securities have been published by the applicable rating agencies. The explanations and corresponding rating categories provided below are subject to change by the applicable rating agencies.
| Rating agency |
Description of securities |
Rating category |
Explanation of rating category received |
|||
| DBRS | Short-term debt | R-2 (high) | upper end of adequate credit quality | |||
|
|
||||||
| capacity for the payment of short-term financial obligations as they fall due is acceptable | ||||||
|
|
||||||
| may be vulnerable to future events | ||||||
|
|
||||||
| Long-term debt | BBB (high) | adequate credit quality | ||||
|
|
||||||
| capacity for the payment of financial obligations is considered acceptable | ||||||
|
|
||||||
| may be vulnerable to future events | ||||||
|
|
||||||
| Long-term subordinated debt |
BBB (low) | adequate credit quality
|
||||
|
|
||||||
|
capacity for the payment of financial obligations is considered acceptable |
||||||
|
|
||||||
| may be vulnerable to future events | ||||||
|
|
||||||
| Preferred shares | Pfd-3 | adequate credit quality | ||||
|
|
||||||
| protection of dividends and principal is still considered acceptable, but the company is more susceptible to adverse changes in financial and economic conditions, and there may be other adverse conditions present which detract from debt protection. Generally, companies with Pfd-3 ratings correspond with companies with a BBB category or higher reference point | ||||||
| Moody’s | Short-term debt | P-2 | a strong ability to repay short-term debt obligations | |||
|
|
||||||
| Long-term debt | Baa | subject to moderate credit risk | ||||
|
|
||||||
| considered medium-grade and may have certain speculative characteristics | ||||||
| S&P | Short-term debt | A-1 (Low) (Canadian scale)
A-2 (Global scale) |
satisfactory capacity of the company to fulfill its financial commitment on the obligation | |||
|
|
||||||
|
somewhat more susceptible to adverse effects of changes in circumstances and economic conditions than obligations rated higher |
||||||
|
|
||||||
| Long-term debt | BBB | adequate protection parameters | ||||
|
|
||||||
| adverse economic conditions or changing circumstances are more likely to weaken the obligor’s ability to meet its financial commitments | ||||||
|
|
||||||
| Preferred shares | P-2 (Low) (Canadian scale)
BBB- (Global scale) |
adequate protection parameters | ||||
|
|
||||||
|
adverse economic conditions or changing circumstances are more likely to weaken the obligor’s ability to meet its financial commitments |
||||||
| BCE INC. 2023 ANNUAL INFORMATION FORM | 25 |
5 Our capital structure
| 5.4 | Trading of our securities |
The common and first preferred shares of BCE are listed on the TSX under the respective symbols set out in the tables below. BCE’s common shares are also listed on the New York Stock Exchange (NYSE) under the symbol BCE.
The tables below and on the next page show the range in share price per month and volume traded on the TSX in 2023 for BCE’s common shares and each series of BCE’s first preferred shares.
| First preferred shares | ||||||||||||||||||||||||||||||||||||||||||||
| Common shares (BCE) |
Series R (BCE.PR.R) |
Series S (BCE.PR.S) |
Series T (BCE.PR.T) |
Series Y (BCE.PR.Y) |
Series Z (BCE.PR.Z) |
Series AA (BCE.PR.A) |
Series AB (BCE.PR.B) |
Series AC (BCE.PR.C) |
Series AD (BCE.PR.D) |
Series AE (BCE.PR.E) |
||||||||||||||||||||||||||||||||||
| January 2023 |
||||||||||||||||||||||||||||||||||||||||||||
| High |
$63.35 | $16.10 | $18.78 | $18.85 | $18.91 | $20.21 | $18.78 | $18.96 | $19.00 | $18.89 | $18.99 | |||||||||||||||||||||||||||||||||
| Low |
$59.33 | $14.63 | $18.19 | $17.16 | $18.15 | $18.40 | $17.08 | $18.15 | $18.12 | $18.12 | $18.02 | |||||||||||||||||||||||||||||||||
| Volume |
41,421,895 | 209,262 | 11,025 | 86,769 | 215,954 | 101,800 | 150,474 | 195,612 | 173,880 | 251,779 | 126,126 | |||||||||||||||||||||||||||||||||
| February 2023 |
||||||||||||||||||||||||||||||||||||||||||||
| High |
$63.37 | $16.00 | $18.99 | $18.75 | $19.05 | $19.70 | $18.49 | $19.07 | $18.96 | $19.19 | $19.11 | |||||||||||||||||||||||||||||||||
| Low |
$60.01 | $14.71 | $18.40 | $18.17 | $18.51 | $19.25 | $17.75 | $18.51 | $18.12 | $18.52 | $18.43 | |||||||||||||||||||||||||||||||||
| Volume |
51,165,209 | 169,435 | 9,620 | 55,797 | 59,460 | 62,100 | 90,827 | 118,393 | 350,130 | 211,996 | 113,184 | |||||||||||||||||||||||||||||||||
| March 2023 |
||||||||||||||||||||||||||||||||||||||||||||
| High |
$61.23 | $15.99 | $18.70 | $18.62 | $19.40 | $19.64 | $18.37 | $18.82 | $18.44 | $18.98 | $18.76 | |||||||||||||||||||||||||||||||||
| Low |
$58.41 | $14.50 | $17.82 | $17.57 | $17.94 | $18.00 | $17.10 | $17.84 | $17.55 | $17.83 | $17.88 | |||||||||||||||||||||||||||||||||
| Volume |
69,790,651 | 72,672 | 51,432 | 72,735 | 79,933 | 72,238 | 112,115 | 212,166 | 83,852 | 334,591 | 204,449 | |||||||||||||||||||||||||||||||||
| April 2023 |
||||||||||||||||||||||||||||||||||||||||||||
| High |
$65.41 | $15.83 | $18.41 | $18.81 | $18.45 | $19.92 | $18.78 | $18.47 | $19.19 | $18.51 | $18.50 | |||||||||||||||||||||||||||||||||
| Low |
$60.23 | $15.00 | $17.86 | $17.84 | $17.82 | $18.85 | $17.55 | $17.72 | $18.07 | $17.78 | $17.84 | |||||||||||||||||||||||||||||||||
| Volume |
36,131,303 | 54,354 | 57,800 | 96,372 | 81,241 | 56,770 | 210,148 | 157,133 | 137,724 | 254,324 | 84,752 | |||||||||||||||||||||||||||||||||
| May 2023 |
||||||||||||||||||||||||||||||||||||||||||||
| High |
$65.66 | $15.50 | $18.19 | $18.84 | $18.15 | $19.10 | $18.25 | $18.14 | $18.96 | $18.16 | $18.16 | |||||||||||||||||||||||||||||||||
| Low |
$61.08 | $14.16 | $17.70 | $17.31 | $17.40 | $17.60 | $17.09 | $17.52 | $17.40 | $17.42 | $17.38 | |||||||||||||||||||||||||||||||||
| Volume |
36,137,538 | 42,374 | 50,880 | 56,593 | 97,846 | 34,633 | 84,130 | 136,564 | 49,835 | 238,358 | 83,920 | |||||||||||||||||||||||||||||||||
| June 2023 |
||||||||||||||||||||||||||||||||||||||||||||
| High |
$61.99 | $15.27 | $18.20 | $18.20 | $18.09 | $18.39 | $17.87 | $18.43 | $18.04 | $18.17 | $18.10 | |||||||||||||||||||||||||||||||||
| Low |
$58.49 | $14.29 | $17.70 | $17.46 | $17.43 | $17.80 | $17.10 | $17.53 | $17.46 | $17.54 | $17.40 | |||||||||||||||||||||||||||||||||
| Volume |
47,361,189 | 183,727 | 30,436 | 106,585 | 134,334 | 85,045 | 214,678 | 98,784 | 69,306 | 318,563 | 120,310 | |||||||||||||||||||||||||||||||||
| July 2023 |
||||||||||||||||||||||||||||||||||||||||||||
| High |
$60.60 | $15.46 | $18.20 | $17.96 | $18.50 | $18.39 | $17.78 | $18.42 | $17.93 | $18.30 | $18.23 | |||||||||||||||||||||||||||||||||
| Low |
$56.86 | $14.50 | $17.94 | $17.40 | $17.94 | $17.80 | $16.70 | $18.00 | $17.37 | $17.97 | $17.88 | |||||||||||||||||||||||||||||||||
| Volume |
35,580,374 | 42,203 | 11,665 | 125,368 | 127,134 | 30,009 | 210,919 | 117,841 | 75,099 | 259,216 | 115,385 | |||||||||||||||||||||||||||||||||
| August 2023 |
||||||||||||||||||||||||||||||||||||||||||||
| High |
$58.10 | $15.05 | $18.10 | $18.05 | $18.30 | $18.16 | $17.08 | $18.19 | $17.57 | $18.07 | $18.05 | |||||||||||||||||||||||||||||||||
| Low |
$54.62 | $14.38 | $17.93 | $16.97 | $17.77 | $16.78 | $15.42 | $17.73 | $16.20 | $17.75 | $17.65 | |||||||||||||||||||||||||||||||||
| Volume |
48,097,886 | 177,422 | 41,881 | 127,724 | 122,750 | 39,506 | 262,204 | 188,297 | 95,177 | 245,425 | 198,922 | |||||||||||||||||||||||||||||||||
| September 2023 |
||||||||||||||||||||||||||||||||||||||||||||
| High |
$56.90 | $14.55 | $17.89 | $17.18 | $17.80 | $17.34 | $15.93 | $17.90 | $16.45 | $18.09 | $17.76 | |||||||||||||||||||||||||||||||||
| Low |
$51.01 | $14.00 | $17.30 | $16.08 | $17.25 | $16.02 | $15.03 | $17.32 | $15.35 | $17.30 | $17.17 | |||||||||||||||||||||||||||||||||
| Volume |
51,385,041 | 80,451 | 34,512 | 78,227 | 86,894 | 21,695 | 198,617 | 114,626 | 84,368 | 161,829 | 101,043 | |||||||||||||||||||||||||||||||||
| October 2023 |
||||||||||||||||||||||||||||||||||||||||||||
| High |
$52.81 | $14.10 | $17.56 | $16.16 | $17.50 | $16.49 | $15.28 | $17.78 | $15.65 | $17.82 | $17.40 | |||||||||||||||||||||||||||||||||
| Low |
$49.57 | $12.91 | $16.70 | $14.00 | $16.60 | $14.57 | $13.66 | $16.77 | $14.02 | $16.73 | $16.18 | |||||||||||||||||||||||||||||||||
| Volume |
42,352,718 | 179,600 | 30,914 | 150,411 | 124,562 | 21,660 | 316,732 | 117,802 | 294,284 | 324,675 | 138,836 | |||||||||||||||||||||||||||||||||
| November 2023 |
||||||||||||||||||||||||||||||||||||||||||||
| High |
$54.72 | $15.60 | $18.10 | $17.90 | $18.45 | $17.20 | $16.20 | $18.50 | $16.95 | $18.26 | $18.24 | |||||||||||||||||||||||||||||||||
| Low |
$51.54 | $13.32 | $17.05 | $14.59 | $16.65 | $14.85 | $14.30 | $16.93 | $14.25 | $16.87 | $16.65 | |||||||||||||||||||||||||||||||||
| Volume |
35,691,340 | 43,844 | 36,786 | 87,226 | 224,025 | 53,723 | 306,273 | 117,137 | 81,269 | 174,837 | 133,264 | |||||||||||||||||||||||||||||||||
| December 2023 |
||||||||||||||||||||||||||||||||||||||||||||
| High |
$56.04 | $15.60 | $18.18 | $17.27 | $18.19 | $17.47 | $16.35 | $18.43 | $17.00 | $18.28 | $18.18 | |||||||||||||||||||||||||||||||||
| Low |
$50.88 | $14.73 | $17.20 | $15.84 | $17.15 | $16.15 | $15.34 | $17.36 | $15.77 | $17.30 | $17.24 | |||||||||||||||||||||||||||||||||
| Volume |
56,852,911 | 83,408 | 25,543 | 154,816 | 116,903 | 98,241 | 344,474 | 205,704 | 118,240 | 143,662 | 90,333 | |||||||||||||||||||||||||||||||||
| 26 | BCE INC. 2023 ANNUAL INFORMATION FORM |
5 Our capital structure
| First preferred shares | ||||||||||||||||||||||||||||||||||||||||
| Series AF (BCE.PR.F) |
Series AG (BCE.PR.G) |
Series AH (BCE.PR.H) |
Series AI (BCE.PR.I) |
Series AJ (BCE.PR.J) |
Series AK (BCE.PR.K) |
Series AL (BCE.PR.L) |
Series AM (BCE.PR.M) |
Series AN (BCE.PR.N) |
Series AQ (BCE.PR.Q) |
|||||||||||||||||||||||||||||||
| January 2023 |
||||||||||||||||||||||||||||||||||||||||
| High |
$17.10 | $16.34 |
|
$18.85 |
|
$16.53 | $18.84 | $15.26 | $16.70 | $15.81 | $18.29 | $21.41 | ||||||||||||||||||||||||||||
| Low |
$16.00 | $15.40 | $18.05 | $15.21 | $18.05 | $13.89 | $16.29 | $14.41 | $17.49 | $19.01 | ||||||||||||||||||||||||||||||
| Volume |
57,816 | 48,360 | 108,033 | 238,723 | 209,326 | 613,497 | 11,820 | 138,665 | 17,300 | 148,332 | ||||||||||||||||||||||||||||||
| February 2023 |
||||||||||||||||||||||||||||||||||||||||
| High |
$17.24 | $16.39 | $19.22 | $16.25 | $19.16 | $15.51 | $17.40 | $15.95 | $18.30 | $21.68 | ||||||||||||||||||||||||||||||
| Low |
$16.46 | $15.73 | $18.49 | $15.78 | $18.54 | $14.57 | $16.05 | $15.21 | $17.05 | $20.70 | ||||||||||||||||||||||||||||||
| Volume |
77,070 | 20,451 | 64,098 | 24,748 | 134,884 | 160,596 | 18,464 | 143,996 | 6,588 | 115,386 | ||||||||||||||||||||||||||||||
| March 2023 |
||||||||||||||||||||||||||||||||||||||||
| High |
$17.00 | $15.95 | $18.74 | $16.00 | $18.83 | $14.82 | $16.74 | $15.39 | $17.85 | $20.94 | ||||||||||||||||||||||||||||||
| Low |
$15.51 | $14.61 | $17.86 | $14.60 | $17.92 | $13.78 | $16.10 | $14.28 | $16.45 | $19.40 | ||||||||||||||||||||||||||||||
| Volume |
98,965 | 257,287 | 72,061 | 38,387 | 193,655 | 322,029 | 7,890 | 109,775 | 6,292 | 138,027 | ||||||||||||||||||||||||||||||
| April 2023 |
||||||||||||||||||||||||||||||||||||||||
| High |
$16.85 | $15.65 | $18.47 | $15.77 | $18.65 | $14.65 | $16.45 | $15.37 | $17.60 | $21.20 | ||||||||||||||||||||||||||||||
| Low |
$16.03 | $14.93 | $17.85 | $14.88 | $17.95 | $13.85 | $16.07 | $14.40 | $16.45 | $19.54 | ||||||||||||||||||||||||||||||
| Volume |
71,348 | 85,609 | 104,385 | 51,249 | 116,557 | 411,241 | 4,600 | 94,386 | 13,957 | 365,395 | ||||||||||||||||||||||||||||||
| May 2023 |
||||||||||||||||||||||||||||||||||||||||
| High |
$16.55 | $15.55 | $18.20 | $15.39 | $18.35 | $14.29 | $16.43 | $14.68 | $17.49 | $21.00 | ||||||||||||||||||||||||||||||
| Low |
$15.49 | $14.42 | $17.43 | $14.25 | $17.47 | $13.35 | $15.26 | $13.65 | $16.60 | $19.12 | ||||||||||||||||||||||||||||||
| Volume |
40,466 | 35,496 | 57,713 | 38,791 | 42,014 | 226,856 | 10,690 | 40,762 | 8,729 | 107,030 | ||||||||||||||||||||||||||||||
| June 2023 |
||||||||||||||||||||||||||||||||||||||||
| High |
$16.31 | $15.09 | $18.18 | $15.09 | $18.32 | $14.41 | $16.25 | $14.62 | $17.20 | $20.97 | ||||||||||||||||||||||||||||||
| Low |
$15.70 | $14.56 | $17.57 | $14.45 | $17.75 | $13.68 | $15.21 | $13.90 | $16.51 | $19.39 | ||||||||||||||||||||||||||||||
| Volume |
92,222 | 52,319 | 83,115 | 26,821 | 34,573 | 209,186 | 12,917 | 54,874 | 3,100 | 86,133 | ||||||||||||||||||||||||||||||
| July 2023 |
||||||||||||||||||||||||||||||||||||||||
| High |
$16.25 | $15.07 | $18.29 | $15.08 | $18.29 | $14.78 | $16.55 | $15.23 | $17.50 | $21.60 | ||||||||||||||||||||||||||||||
| Low |
$15.02 | $14.59 | $17.97 | $14.54 | $18.02 | $14.25 | $15.84 | $14.30 | $17.00 | $20.64 | ||||||||||||||||||||||||||||||
| Volume |
173,317 | 43,149 | 95,188 | 66,620 | 41,299 | 304,670 | 37,461 | 269,923 | 8,700 | 76,957 | ||||||||||||||||||||||||||||||
| August 2023 |
||||||||||||||||||||||||||||||||||||||||
| High |
$16.25 | $15.10 | $18.19 | $15.26 | $18.08 | $14.58 | $16.92 | $15.15 | $17.65 | $22.00 | ||||||||||||||||||||||||||||||
| Low |
$15.59 | $14.50 | $17.76 | $14.31 | $17.79 | $13.65 | $15.60 | $14.15 | $16.75 | $20.95 | ||||||||||||||||||||||||||||||
| Volume |
186,712 | 61,722 | 50,612 | 134,516 | 19,777 | 499,399 | 19,550 | 237,414 | 45,490 | 496,868 | ||||||||||||||||||||||||||||||
| September 2023 |
||||||||||||||||||||||||||||||||||||||||
| High |
$16.11 | $14.74 | $17.75 | $14.50 | $17.88 | $13.90 | $15.89 | $14.25 | $17.00 | $21.45 | ||||||||||||||||||||||||||||||
| Low |
$14.88 | $13.51 | $17.20 | $13.87 | $17.33 | $13.21 | $15.41 | $13.85 | $16.40 | $19.80 | ||||||||||||||||||||||||||||||
| Volume |
65,975 | 64,799 | 42,726 | 74,019 | 16,229 | 333,476 | 5,076 | 121,776 | 10,600 | 171,081 | ||||||||||||||||||||||||||||||
| October 2023 |
||||||||||||||||||||||||||||||||||||||||
| High |
$15.20 | $13.85 | $17.40 | $13.80 | $17.50 | $13.85 | $16.00 | $14.26 | $16.50 | $19.97 | ||||||||||||||||||||||||||||||
| Low |
$14.06 | $12.72 | $16.53 | $12.85 | $16.70 | $13.32 | $15.05 | $13.65 | $16.08 | $19.01 | ||||||||||||||||||||||||||||||
| Volume |
176,476 | 402,489 | 74,730 | 283,296 | 52,970 | 460,386 | 19,268 | 164,464 | 21,800 | 177,051 | ||||||||||||||||||||||||||||||
| November 2023 |
||||||||||||||||||||||||||||||||||||||||
| High |
$16.57 | $15.59 | $18.05 | $15.63 | $18.20 | $15.02 | $16.67 | $15.25 | $16.70 | $22.18 | ||||||||||||||||||||||||||||||
| Low |
$14.70 | $13.25 | $16.70 | $13.32 | $16.57 | $13.55 | $14.99 | $13.99 | $15.99 | $19.80 | ||||||||||||||||||||||||||||||
| Volume |
92,459 | 294,705 | 92,273 | 363,707 | 124,416 | 296,108 | 19,545 | 200,952 | 40,069 | 61,460 | ||||||||||||||||||||||||||||||
| December 2023 |
||||||||||||||||||||||||||||||||||||||||
| High |
$16.25 | $15.20 | $18.54 | $15.16 | $18.22 | $14.68 | $16.10 | $14.87 | $16.85 | $22.52 | ||||||||||||||||||||||||||||||
| Low |
$15.50 | $14.31 | $16.91 | $14.29 | $17.27 | $13.66 | $15.20 | $14.02 | $16.10 | $21.03 | ||||||||||||||||||||||||||||||
| Volume |
76,916 | 156,413 | 244,735 | 233,565 | 13,884 | 470,289 | 26,714 | 163,585 | 26,018 | 134,917 | ||||||||||||||||||||||||||||||
| BCE INC. 2023 ANNUAL INFORMATION FORM | 27 |
6 Dividends and dividend payout policy
| 6 | Dividends and dividend payout policy |
This section contains forward-looking statements, including relating to BCE’s dividend growth objective, 2024 annualized common share dividend and dividend payout ratio level, and dividend payout policy target, anticipated capital expenditures and business outlook. Refer to section 1, Caution regarding forward-looking statements in this Annual Information Form.
The BCE Board reviews from time to time the adequacy of BCE’s common share dividend payout policy. BCE’s common share dividend payout policy is currently set to a target dividend payout ratio (1) of 65% to 75% of free cash flow (1). Our objective seeks to achieve dividend growth while maintaining our dividend payout ratio within the target range and balancing our strategic business priorities. As at December 31, 2023, our dividend payout ratio was 111%, compared to 108% at December 31, 2022, which is higher than our policy range due to elevated capital expenditures compared to pre-2020 annual levels as we continued to make generational investments in our networks to support the buildout of our fibre, 5G and 5G+ network infrastructure. Although a significant reduction in capital expenditures is planned in 2024, due largely to government policy, they are expected to remain higher
than pre-2020 annual levels. In addition, free cash flow in 2024 will be adversely impacted by significantly higher severance payments related to workforce restructuring initiatives, higher interest paid and lower cash from working capital. As a result, BCE’s dividend payout ratio will remain above our target policy range in 2024.
For additional information, refer to section 1.4, Capital markets strategy of the BCE 2023 MD&A, on pages 20 to 23 of the BCE 2023 Annual Financial Report.
BCE’s dividend payout policy, increases in the common share dividend and the declaration of dividends are subject to the discretion of the BCE Board and, consequently, there can be no guarantee that BCE’s dividend payout policy will be maintained or achieved, that the dividend on common shares will be increased, or that dividends will be declared. Dividend increases and the declaration of dividends by the BCE Board are ultimately dependent on BCE’s operations and financial results, which are in turn subject to various assumptions and risks, including those outlined in section 1, Caution regarding forward-looking statements of this Annual Information Form.
The table below describes the increases in BCE’s annualized common share dividend starting with the quarterly dividend payable on April 15, 2021.
| Date of announcement | Amount of increase | Effective date | ||
| February 4, 2021 | 5.1% (from $3.33 per share to $3.50 per share) | Quarterly dividend payable on April 15, 2021 | ||
| February 3, 2022 | 5.1% (from $3.50 per share to $3.68 per share) | Quarterly dividend payable on April 15, 2022 | ||
| February 2, 2023 | 5.2% (from $3.68 per share to $3.87 per share) | Quarterly dividend payable on April 17, 2023 | ||
| February 8, 2024 | 3.1% (from $3.87 per share to $3.99 per share) | Quarterly dividend payable on April 15, 2024 | ||
Dividends on BCE’s first preferred shares are, if declared, payable quarterly, except for dividends on Series S, Series Y, Series AB, Series AD, Series AE, Series AH and Series AJ first preferred shares, which, if declared, are payable monthly.
| (1) | Free cash flow is a non-GAAP financial measure and dividend payout ratio is a non-GAAP ratio. These financial measures do not have any standardized meaning under International Financial Reporting Standards (IFRS). Therefore, they are unlikely to be comparable to similar measures presented by other issuers. Dividend payout ratio is calculated by dividing dividends paid on common shares by free cash flow. Refer to section 11, Non-GAAP financial measures, other financial measures and key performance indicators (KPIs) of the BCE 2023 MD&A, on pages 103 to 108 of the BCE 2023 Annual Financial Report for more information on these measures including, in the case of free cash flow, a reconciliation to cash flows from operating activities, being the most directly comparable IFRS financial measure. |
| 28 | BCE INC. 2023 ANNUAL INFORMATION FORM |
6 Dividends and dividend payout policy
The table below shows the amount of cash dividends declared per BCE common share and per Series R, Series S, Series T, Series Y, Series Z, Series AA, Series AB, Series AC, Series AD, Series AE, Series AF, Series AG, Series AH, Series AI, Series AJ, Series AK, Series AL, Series AM, Series AN, Series AO and Series AQ first preferred share for 2023, 2022 and 2021.
| 2023 | 2022 | 2021 | ||||||||||
| Common shares |
$3.87 | $3.68 | $3.50 | |||||||||
| First preferred shares |
||||||||||||
| Series R |
$0.75450 | $0.75450 | $0.75450 | |||||||||
| Series S |
$1.74988 | $1.11611 | $0.67884 | |||||||||
| Series T |
$1.24750 | $1.24750 | $0.87794 | |||||||||
| Series Y |
$1.74988 | $1.11611 | $0.58530 | |||||||||
| Series Z |
$1.33650 | $1.06613 | $0.97600 | |||||||||
| Series AA |
$1.23500 | $1.06876 | $0.90252 | |||||||||
| Series AB |
$1.74988 | $1.11611 | $0.61248 | |||||||||
| Series AC |
$1.27000 | $1.09500 | $1.09500 | |||||||||
| Series AD |
$1.74988 | $1.11611 | $0.61248 | |||||||||
| Series AE |
$1.74988 | $1.11611 | $0.61248 | |||||||||
| Series AF |
$0.96625 | $0.96625 | $0.96625 | |||||||||
| Series AG |
$0.84250 | $0.84250 | $0.80688 | |||||||||
| Series AH |
$1.74988 | $1.11611 | $0.61248 | |||||||||
| Series AI |
$0.84750 | $0.84750 | $0.76751 | |||||||||
| Series AJ |
$1.74988 | $1.11611 | $0.61248 | |||||||||
| Series AK |
$0.82650 | $0.82650 | $0.73850 | |||||||||
| Series AL |
$1.62174 | $0.81844 | $0.49935 | |||||||||
| Series AM |
$0.73475 | $0.73475 | $0.72382 | |||||||||
| Series AN |
$1.67424 | $0.87094 | $0.55186 | |||||||||
| Series AO (1) |
$ — | $0.26625 | $1.06500 | |||||||||
| Series AQ |
$1.31088 | $1.20300 | $1.20300 | |||||||||
| (1) | On March 31, 2022, BCE redeemed all of its outstanding Cumulative Redeemable First Preferred Shares, Series AO. |
| BCE INC. 2023 ANNUAL INFORMATION FORM | 29 |
7 Our directors and executive officers
| 7 | Our directors and executive officers |
| 7.1 | Directors |
The table below lists BCE’s directors, where they lived, the date they were elected or appointed and their principal occupation on March 7, 2024.
Under BCE’s by-laws, each director holds office until the earlier of the next annual shareholder meeting or his or her resignation. David F. Denison and Robert C. Simmonds will be retiring at the end of our 2024 annual shareholder meeting to be held on May 2, 2024.
| Name, province/state and country of residence |
Date elected or appointed to the BCE board |
Principal occupation on March 7, 2024 | ||
| Mirko Bibic, Ontario, Canada |
January 2020 | President and Chief Executive Officer, BCE and Bell Canada, since January 2020 | ||
| David F. Denison, FCPA, FCA, Ontario, Canada |
October 2012 | Corporate director, since June 2012, and Chartered Professional Accountant | ||
| Robert P. Dexter, Nova Scotia, Canada |
November 2014 | Chair and Chief Executive Officer of Maritime Travel Inc. (an integrated travel company), since July 1979 | ||
| Katherine Lee, Ontario, Canada |
August 2015 | Corporate director, since March 2018, and Chartered Professional Accountant | ||
| Monique F. Leroux, C.M., O.Q., FCPA, FCA, Québec, Canada |
April 2016 | Corporate director, since April 2016, and Chartered Professional Accountant | ||
| Sheila A. Murray, Ontario, Canada |
May 2020 | Corporate director, since April 2019 | ||
| Gordon M. Nixon, C.M., O. Ont., Ontario, Canada |
November 2014 | Chair of the board of directors, BCE and Bell Canada, since April 2016, and corporate director, since September 2014 | ||
| Louis P. Pagnutti, FCPA, FCA, Ontario, Canada |
November 2020 | Corporate director, since September 2020, and Chartered Professional Accountant | ||
| Calin Rovinescu, C.M., Ontario, Canada |
April 2016 | Corporate director, since February 2021 | ||
| Karen Sheriff, Ontario, Canada |
April 2017 | Corporate director, since October 2016 | ||
| Robert C. Simmonds, Ontario, Canada |
May 2011 | Chair, Lenbrook Corporation (a national distributor of electronics components and radio products), since April 2002 | ||
| Jennifer Tory, C.M., Ontario, Canada |
April 2021 | Corporate director, since December 2019 | ||
| Louis Vachon, C.M., O.Q., Québec, Canada |
October 2022 | Operating Partner, J.C. Flowers & Co. (a private investment firm), since January 2022 | ||
| Johan Wibergh, Barbados |
November 2023 | Corporate director, since February 2023 | ||
| Cornell Wright, Ontario, Canada |
April 2021 | President, Wittington Investments, Limited (the principal holding company of the Weston group of companies, which includes George Weston, Loblaw and Choice Properties), since January 2022 | ||
Past occupation
All of BCE’s directors have held the positions listed above or other senior management positions with the same or associated firms or organizations during the past five years or longer, except for the directors listed below.
| Name | Past occupation | |
| Sheila A. Murray | President of CI Financial Corp. (an investment fund company), from 2016 to March 2019 | |
| Louis P. Pagnutti, FCPA, FCA | Global Managing Partner of Ernst & Young (EY) (a professional services firm), from 2013 to September 2020 | |
| Calin Rovinescu, C.M. | President and Chief Executive Officer of Air Canada (an airline company), from 2009 to February 2021 | |
| Jennifer Tory, C.M. | Chief Administrative Officer of Royal Bank of Canada (a chartered bank), from 2017 to December 2019 | |
| Louis Vachon, C.M., O.Q. | Chief Executive Officer of National Bank of Canada (a chartered bank), from 2007 to November 2021 | |
| Johan Wibergh | Chief Technology Officer of Vodafone Group plc (a global telecommunications provider), from 2015 to December 2022 | |
| Cornell Wright | Partner of Torys LLP (a law firm), from 2009 to April 2021 | |
| 30 | BCE INC. 2023 ANNUAL INFORMATION FORM |
7 Our directors and executive officers
Committees of the BCE Board
The table below lists the committees of the BCE Board and their members on March 7, 2024.
| Committee | Members | |
| Audit | Louis P. Pagnutti (Chair) Katherine Lee, Monique F. Leroux, Jennifer Tory, Cornell Wright |
|
| Corporate Governance | Monique F. Leroux (Chair) David F. Denison, Katherine Lee, Karen Sheriff, Robert C. Simmonds, Cornell Wright |
|
| Management Resources and Compensation |
David F. Denison (Chair) Robert P. Dexter, Sheila A. Murray, Calin Rovinescu, Jennifer Tory, Louis Vachon |
|
| Risk and Pension Fund | Calin Rovinescu (Chair) Robert P. Dexter, Sheila A. Murray, Louis P. Pagnutti, Karen Sheriff, Robert C. Simmonds, Louis Vachon |
|
| 7.2 | Executive officers |
On September 1, 2023, Curtis Millen became Executive Vice President and Chief Financial Officer of BCE and Bell Canada following the retirement of Glen LeBlanc from such position. Curtis Millen was previously Senior Vice President, Corporate Strategy and Treasurer. Mr. LeBlanc remains as Special Advisor and Vice-Chair, Bell Atlantic.
On November 1, 2023, Sean Cohan became President of Bell Media, following the retirement of Wade Oosterman from such position. Mr. Oosterman remained in his role as Vice-Chair, BCE and Bell Canada until January 2, 2024.
The table below lists BCE’s and Bell Canada’s executive officers, where they lived and the office they held at BCE and/or Bell Canada on March 7, 2024.
| Name | Province and country of residence | Office held at BCE/Bell Canada | ||
| Mirko Bibic | Ontario, Canada | President and Chief Executive Officer (BCE and Bell Canada) | ||
| Sean Cohan | Ontario, Canada (1) | President, Bell Media (Bell Canada) | ||
| Stephen Howe | Ontario, Canada | Chief Technology and Information Officer (Bell Canada) | ||
| Blaik Kirby | Ontario, Canada | Group President, Consumer and Small & Medium Business (SMB) (Bell Canada) | ||
| Devorah Lithwick | Ontario, Canada | Senior Vice President and Chief Brand Officer (Bell Canada) | ||
| Robert Malcolmson | Ontario, Canada | Executive Vice President and Chief Legal & Regulatory Officer (BCE and Bell Canada) | ||
| Curtis Millen (2) | Québec, Canada | Executive Vice President and Chief Financial Officer (BCE and Bell Canada) | ||
| Nikki Moffat | Ontario, Canada | Executive Vice President, Corporate Services and Chief Human Resources Officer (BCE and Bell Canada) | ||
| Karine Moses (2) | Québec, Canada | Senior Vice President, Content Development & News and Vice Chair, Québec (Bell Canada) | ||
| John Watson | Ontario, Canada | Group President, Business Markets, Customer Experience & AI (Bell Canada) | ||
| (1) | While Sean Cohan maintains a residence and works in Canada, he is also considered to be a resident of New York, United States. |
| (2) | Karine Moses is a director of Gestion Juste Pour Rire Inc. and related entities, which filed on March 5, 2024 a notice of intention to make a proposal under section 50.4 of the Bankruptcy and Insolvency Act. In addition, Curtis Millen was a director of these entities for part of the 12 months preceding March 5, 2024. |
All of our executive officers have held their present positions or other senior management positions with BCE or Bell Canada during the past five years or longer, except for Sean Cohan, who was Chief Growth Officer & President at Nielsen Holdings PLC (a global measurement and data analytics company) from March 2020 to January 2023 and President at Pick Six LLC (a media consulting and investing company) from 2019 to 2020.
| 7.3 | Directors’ and executive officers’ share ownership |
As at December 31, 2023, BCE’s directors and executive officers elected or appointed at such date as a group beneficially owned, or exercised control or direction over, directly or indirectly, 583,186 common shares (or less than 0.1%) of BCE.
| BCE INC. 2023 ANNUAL INFORMATION FORM | 31 |
8 Legal proceedings
| 8 | Legal proceedings |
In the ordinary course of our business, we become involved in various claims and legal proceedings seeking monetary damages and other relief. In particular, because of the nature of our consumer-facing business, we are exposed to class actions pursuant to which substantial monetary damages may be claimed. This section describes important legal proceedings in which we were involved as at March 7, 2024. This list is not comprehensive and we are involved in a number of other legal proceedings. Due to the inherent risks and uncertainties of the litigation process, we cannot predict the final outcome or timing of claims and legal proceedings. Subject to the foregoing, and based on information currently available and management’s assessment of the merits of the claims and legal proceedings pending at March 7, 2024, management believes that the ultimate resolution of these claims and legal proceedings is unlikely to have a material and negative effect on our financial statements or operations. We believe that we have strong defences and we intend to vigorously defend our positions.
Class action and lawsuits concerning
neighbourhood marketing practices
On November 24, 2021, an application for authorization to institute a class action was filed against Bell Canada on behalf of all consumers in Québec who subscribed to or renewed a services contract with Bell Canada at their homes through a neighbourhood marketing agent or outside a permanent Bell Canada retail location from June 23, 2018 to the date of final judgment. The plaintiff alleges that Bell Canada’s neighbourhood marketing process violates the Québec Consumer Protection Act (QCPA) and the Civil Code of Québec. The plaintiff further alleges that Bell Canada conducts these practices in bad faith. The action seeks punitive damages of $1,000 per class member. On July 4, 2023, the Québec Superior Court delivered its decision authorizing the class action.
On September 21, 2018, a claim was filed in the Québec Superior Court against Bell Canada for damages and for injunctive relief by Vidéotron Ltée (Vidéotron). The claim alleges that Bell Canada pursues itinerant merchant activities in Québec without complying with the requirements of the QCPA. The claim estimates damages at $78.5 million. Vidéotron is also seeking an injunction ordering Bell Canada to obtain a permit and comply with the provisions of the QCPA governing itinerant merchants. On January 8, 2019, Cogeco Connexion Inc. filed a claim in damages and for injunctive relief against Bell Canada in the Québec Superior Court, which is similar to the Vidéotron claim referred to above. The claim estimates damages at $9.2 million.
Claim under the Copyright Act
On July 5, 2021, a statement of claim was filed in the Federal Court against Bell Canada (and the former Bell Aliant) by certain copyright owners including Millennium Funding Inc. The claim alleges breach of the Copyright Act for failing to forward certain copyright infringement notices to Bell customers. The claim seeks $10,000 for each alleged failure, for a total of $397,910,000.
Intellectual property infringement
lawsuits concerning IPTV, satellite TV and/or
Crave systems
On January 19, 2018, a patent infringement claim was filed in the Federal Court against BCE Inc., Bell Canada, Bell Aliant Regional Communications Inc., Bell MTS and NorthernTel, Limited Partnership by Rovi Guides, Inc. (Rovi) and Tivo Solutions Inc. (Tivo). The claim alleges that the defendants, through their manufacture, distribution, sale and use of certain features of their IPTV systems, have infringed, and induced users to infringe, on six patents variously owned by the plaintiffs (the two Tivo patents were subsequently withdrawn). In addition to declaratory and injunctive relief, the plaintiffs seek damages in the form of unpaid royalties in relation to the defendants’ revenues from their IPTV services or an accounting of the defendants’ profits. Following a trial on the merits of the liability phase, on October 7, 2022, the trial judge delivered a judgment completely in the defendants’ favour, dismissing all of the plaintiffs’ claims and invalidating all four of the remaining patents. The plaintiffs’ appeal from that judgment was heard on November 29, 2023. The Federal Court of Appeal reserved its decision.
On July 27, 2021, a further claim was filed in the Federal Court by Rovi against BCE Inc., Bell Canada, Bell Media, Bell ExpressVu, NorthernTel, Limited Partnership and certain third-party suppliers alleging infringement of a different set of four patents from the action noted above. The claim alleges that the defendants, through their manufacture, distribution, sale and use of certain features of their IPTV, satellite TV and OTT Crave systems, have infringed, and induced users to infringe, on four patents owned by the plaintiffs. The plaintiffs seek similar damages as in the 2018 action. On February 15, 2023, the Court granted the defendants’ motion to bifurcate the action into separate liability and damages phases. The plaintiffs were amended to include TiVo LLC and then subsequently to replace Rovi and TiVo with corporate successors Adeia Guides Inc. and Adeia Media Holdings LLC.
Class actions concerning service fee modifications
On November 27, 2015, an application for authorization to institute a class action was filed in the Québec Superior Court against Bell Canada, Bell ExpressVu and Bell Mobility on behalf of all consumers whose monthly fees for wireline telephone services, Internet services, Fibe TV services, satellite TV services or wireless postpaid services were unilaterally modified at any time since November 2012. The plaintiff alleges that the notices provided by the defendants of the price increases were not compliant with the QCPA. The action seeks the reimbursement, since November 2012, of the monthly price increases, and payment of punitive damages in the amount of $100 per class member. On July 10, 2017, the court authorized the action to proceed as a class action.
| 32 | BCE INC. 2023 ANNUAL INFORMATION FORM |
8 Legal proceedings
On December 12, 2018, another application for authorization to institute a class action was filed in the Québec Superior Court against regional subsidiaries Télébec, Limited Partnership and Cablevision du Nord de Québec Inc. on behalf of all consumers and business entities whose monthly fees for wireline telephone services, Internet services, TV services or wireless postpaid services were unilaterally modified at any time since December 2015. The plaintiff alleges that the notices provided by the defendants of the price increases were not compliant under the QCPA and the Civil Code of Québec. The action seeks the reimbursement, since December 2015, of the monthly price increases, and payment of punitive damages in the amount of $100 per class member. In a decision dated February 3, 2022, the court authorized the action to proceed as a class action for the price increases that occurred between December 12, 2015 and November 2022.
Class action and purported class action
concerning relevant advertisements initiative
On April 14 and 16, 2015, respectively, an application for authorization to institute a class action was filed against Bell Canada and Bell Mobility in the Québec Superior Court and a statement of claim was filed against Bell Canada and Bell Mobility pursuant to the Class Proceedings Act (Ontario) in the Ontario Superior Court. The plaintiffs seek damages for breach of contract, breach of applicable consumer protection legislation, breach of the Civil Code of Québec, intrusion upon seclusion, negligence, breach of confidence, unjust enrichment and waiver of tort resulting from Bell Canada’s and Bell Mobility’s alleged unauthorized use and disclosure of personal information pursuant to the Relevant Advertisements Initiative. Unspecified punitive damages are also sought in both actions. On November 16, 2017, the court stayed the Québec action. On May 13, 2019, the Ontario Superior Court certified the Ontario action as a national class action against Bell Mobility for the period between November 16, 2013 and April 14, 2015.
Class actions concerning increase to late
payment charges
On October 28, 2010, an application for authorization to institute a class action was filed in the Québec Superior Court against Bell Canada and Bell Mobility on behalf of all physical persons and companies of 50 employees or less in Canada who were billed late payment charges since June 2010. The plaintiffs allege that the increase by Bell Canada and Bell Mobility of the late payment charge imposed on customers who fail to pay their invoices by the due date from 2% to 3% per month is invalid. The action seeks an order requiring Bell Canada and Bell Mobility to repay all late payment charges in excess of 2% per month to the members of the class, in addition to general and punitive damages. On December 16, 2011, the court authorized the action but limited the class members to residents of the province of Québec with respect to home phone, wireless and Internet services.
On January 10, 2012, another application for the authorization to institute an identical class action was filed in the Québec Superior Court against Bell ExpressVu with respect to TV services, later amended to add Bell Canada as defendant. On December 19, 2014, the court authorized this action to proceed as a class action.
Class action concerning rounding-up of minutes
On August 18, 2008, a statement of claim was filed pursuant to the Class Proceedings Act (Ontario) in the Ontario Superior Court against Bell Mobility on behalf of all Canadian Bell Mobility customers who, since July 2002, have had their wireless airtime rounded up to the next full minute. The action alleges misrepresentation and breach of contract and seeks reimbursement of all amounts received by Bell Mobility as a result of the rounded-up portion of per minute charges for wireless airtime, alleged to be general damages of $500 million and punitive damages of $20 million. The action was certified as a class action on November 25, 2014, for the period between August 18, 2006 and October 1, 2009.
Purported class action concerning “911 fees”
On June 26, 2008, a statement of claim was filed under The Class Actions Act (Saskatchewan) in the now Saskatchewan Court of King’s Bench against a number of communications service providers, including Bell Mobility and its predecessors Bell MTS and Bell Aliant Regional Communications, Limited Partnership (Bell Aliant LP), on behalf of certain alleged customers (the action also named BCE Inc. and Bell Canada as defendants but they were removed). The statement of claim alleges, among other things, breach of contract and duty to inform, deceit, misrepresentation, unjust enrichment, breaches of provincial consumer protection legislation and the Competition Act, and collusion in connection with certain “911 fees” invoiced by communications service providers to their customers. The plaintiffs seek unspecified damages, punitive damages and an accounting and constructive trust of the “911 fees” collected. The action seeks certification of a national class encompassing all customers of communications service providers, wherever resident in Canada. The action has not yet been certified as a class action.
Class action concerning wireless system
access fees
On August 9, 2004, a statement of claim was filed under The Class Actions Act (Saskatchewan) in the now Saskatchewan Court of King’s Bench against a number of wireless communications service providers, including Bell Mobility and its predecessors Bell MTS and Bell Aliant LP, on behalf of certain alleged customers. This statement of claim alleges, among other things, breach of contract and duty to inform, deceit, misrepresentation, unjust enrichment and collusion in connection with certain system access fees and system licensing charges invoiced by wireless communications service providers to their customers. The plaintiffs are seeking unspecified general and punitive damages. On September 17, 2007, the court granted certification, on the grounds of unjust enrichment only, of a national class encompassing all customers of the defendant wireless communications service providers, wherever resident in Canada, on the basis of an opt-out class in Saskatchewan and an opt-in class elsewhere in Canada.
Other
We are subject to other claims and legal proceedings in the ordinary course of our current and past operations, including class actions, employment-related disputes, contract disputes, competitor disputes and customer disputes. In some claims and legal proceedings, the claimant seeks damages as well as other relief which, if granted, could require substantial expenditures on our part or could result in changes to our business practices.
| BCE INC. 2023 ANNUAL INFORMATION FORM | 33 |
9 Interest of management and others in material transactions
10 Interest of experts
11 Transfer agent and registrar
12 For more information
| 9 | Interest of management and others |
| in material transactions |
To the best of our knowledge, there have been no current or nominated directors or executive officers or any associate or affiliate of a current or nominated director or executive officer with a material interest in
any transaction within the three most recently completed financial years or during the current financial year that has materially affected us or is reasonably expected to materially affect us.
| 10 | Interest of experts |
Deloitte LLP prepared the Report of independent registered public accounting firm in respect of our audited consolidated financial statements as at and for the years ended December 31, 2023 and 2022, and the Report of independent registered public accounting firm in respect of our internal control over financial reporting as of
December 31, 2023. Deloitte LLP is independent of BCE within the meaning of the Code of Ethics of the Ordre des comptables professionnels agréés du Québec and within the meaning of the U.S. Securities Act of 1933, as amended, and the applicable rules and regulations thereunder adopted by the SEC and the Public Company Accounting Oversight Board (U.S.).
| 11 | Transfer agent and registrar |
The transfer agent and registrar for the common shares and preferred shares of BCE in Canada is TSX Trust Company at its principal offices in Montréal, Québec; Toronto, Ontario; Calgary, Alberta; and Vancouver, British Columbia; and in the U.S. is Equiniti Trust Company, LLC (successor to American Stock Transfer & Trust Company, LLC) at its principal office in New York, New York.
The register for Bell Canada’s Canadian unsubordinated debentures is kept at the principal office of BNY Trust Company of Canada (BNY) in Montréal, and facilities for registration, exchange and transfer of the Canadian unsubordinated debentures are maintained at the principal offices of BNY in Montréal and Toronto.
The register for Bell Canada’s Canadian subordinated debentures is kept at the principal office of BNY in Montréal, and facilities for registration, exchange and transfer of the Canadian subordinated debentures are maintained at the principal offices of BNY in Montréal and Toronto.
The register for Bell MTS’s notes assumed by Bell Canada is kept at the principal office of Computershare Trust Company of Canada (Computershare) in Montréal, and facilities for registration, exchange and transfer of the notes are maintained at Computershare’s offices in Montréal, Toronto and Calgary.
The register for Bell Canada’s U.S. notes, issued pursuant to its 2016 U.S. trust indenture, is kept at the principal office of The Bank of New York Mellon in New York, and facilities for registration, exchange and transfer of such U.S. notes are also maintained at the principal office of The Bank of New York Mellon in New York.
| 12 | For more information |
This Annual Information Form as well as BCE’s annual and quarterly shareholder reports and news releases are available on BCE’s website at BCE.ca.
Additional information, including information about directors’ and officers’ remuneration and securities authorized for issuance under equity compensation plans, is contained in BCE’s management proxy circular for its most recent annual meeting of security holders that involved the election of directors.
Additional information relating to BCE is available on SEDAR+ at sedarplus.ca and on EDGAR at sec.gov. Additional financial information is provided in BCE’s audited consolidated financial statements and the related management’s discussion and analysis for BCE’s most recently completed financial year, contained in the BCE 2023 Annual Financial Report. You may ask for a copy of the annual and quarterly management’s discussion and analysis of BCE by contacting the Investor Relations group of BCE at Building A, 8th Floor, 1, Carrefour Alexander-Graham-Bell, Verdun, Québec H3E 3B3 or by sending an e-mail to investor.relations@bce.ca.
| Shareholder inquiries |
1-800-561-0934 |
|
| Investor relations |
1-800-339-6353 |
|
| 34 | BCE INC. 2023 ANNUAL INFORMATION FORM |
13 Schedule 1 – Audit Committee information
| 13 | Schedule 1 – Audit Committee information |
The purpose of BCE’s Audit Committee (Audit Committee) is to assist the BCE Board in its oversight of:
| • | the integrity of BCE’s financial statements and related information; |
| • | BCE’s compliance with applicable legal and regulatory requirements; |
| • | the independence, qualifications and appointment of the external auditors; |
| • | the performance of both the external and internal auditors; |
| • | management’s responsibility for assessing and reporting on the effectiveness of internal controls; |
| • | BCE’s risk processes as they relate to financial reporting. |
Members’ financial literacy, expertise
and simultaneous service
Under the Sarbanes-Oxley Act of 2002 and related SEC rules, BCE is required to disclose whether its Audit Committee members include at least one “audit committee financial expert” as defined by these rules. In addition, National Instrument 52-110 – Audit Committees and the NYSE governance rules followed by BCE require that all audit committee members be “financially literate” and “independent”.
The BCE Board has determined that all the members of the Audit Committee during 2023 were, and all current members of the Audit Committee are, financially literate and independent, and that the current Chair of the Audit Committee, Mr. L.P. Pagnutti, as well as Ms. K. Lee and Ms. M.F. Leroux are qualified as “audit committee financial experts”. The table below outlines the relevant education and experience of all members of the Audit Committee, whether during 2023 or currently.
Relevant education and experience
| L.P. Pagnutti, FCPA, FCA (Chair) |
Mr. Pagnutti has been a director of BCE since November 2020 and is Chair of the Audit Committee since January 2021. Mr. Pagnutti is a corporate director and was Global Managing Partner Business Enablement of EY (a professional services firm) and a member of EY’s Global Executive Board until his retirement in September 2020. As Global Managing Partner, he was responsible for EY’s business functions across the globe. He oversaw EY’s strategy and its execution for all functions, including technology, finance, risk management, legal, shared services and procurement. Mr. Pagnutti joined EY Assurance in 1981, before moving to EY Tax in 1986. From 2004 until 2010, he was Chairman and Chief Executive Officer of EY Canada and a member of the EY Americas Executive Board. He was EY Asia-Pacific Area Managing Partner from 2010 to 2013. Mr. Pagnutti holds an Honours Bachelor of Commerce degree from Laurentian University. He earned his Chartered Accountant designation in 1983 and was honoured with a Fellow Chartered Accountant designation in 2006. He has served on the Sunnybrook Hospital Foundation and Pathways to Education boards. Mr. Pagnutti initiated EY Canada’s role as National Volunteer Partner of Pathways to Education, a program dedicated to helping high school students from low-income and under-represented groups complete high school and pursue post-secondary education. | |
| K. Lee | Ms. Lee has been a director of BCE since August 2015. She is a corporate director and, from 2010 to February 2015, served as President and Chief Executive Officer of GE Capital Canada (a leading global provider of financial and fleet management solutions to mid-market companies operating in a broad range of economic sectors). Prior to this role, Ms. Lee served as Chief Executive Officer of GE Capital Real Estate in Canada from 2002 to 2010, building it to a full debt and equity operating company. Ms. Lee joined GE in 1994, where she held a number of positions, including Director, Mergers & Acquisitions, for GE Capital’s Pension Fund Advisory Services based in San Francisco, and Managing Director of GE Capital Real Estate Korea based in Seoul and Tokyo. Ms. Lee earned a Bachelor of Commerce degree from the University of Toronto. She is a Chartered Professional Accountant and Chartered Accountant. She is active in the community, championing women’s networks and Asia- Pacific forums. Ms. Lee is a director of Colliers International Group and Public Sector Pension Investments. | |
| M.F. Leroux, C.M., O.Q., FCPA, FCA |
Ms. Leroux has been a director of BCE since April 2016. Companion of the Canadian Business Hall of Fame and inductee into the Canadian Accounting Hall of Fame and the Investment Industry Hall of Fame, Ms. Leroux is a corporate director, who serves as an independent board member of Michelin Group (Michelin) and Alimentation Couche-Tard Inc. As such, she brings to these boards her diverse experience, among others as Audit Partner at Ernst and Young from 1988 to 1995 and Chair of the Board and Chief Executive Officer of Desjardins Group from 2008 to 2016. Ms. Leroux is Chair of Michelin’s Corporate Social Responsibility Committee, which oversees ESG (including climate change) matters for such company. In 2020, Ms. Leroux acted as Chair of the Industry Strategy Council appointed by the Minister of Innovation, Science and Industry Canada. From 2016 to 2020, she was Chair of the Board of Investissement Québec. She is Vice-Chair of the Orchestre symphonique de Montréal and she is also Chair of the Boards of the University of Sherbrooke and Conservatoire de musique et d’art dramatique du Québec. Ms. Leroux is a Member of the Order of Canada, an Officer of the Ordre national du Québec, a Chevalier of the Légion d’honneur (France) and a recipient of the Woodrow Wilson Award (United States). She has been awarded Fellowships by the Ordre des comptables professionnels agréés du Québec and the Institute of Corporate Directors and holds honourary doctorates from ten Canadian universities in recognition of her contributions to the business sector and to the community. | |
| BCE INC. 2023 ANNUAL INFORMATION FORM | 35 |
13 Schedule 1 – Audit Committee information
| J. Tory, C.M. | Ms. Tory has been a director of BCE since April 2021. She is a corporate director who was, until her retirement in December 2019, the Chief Administrative Officer of RBC (a chartered bank), where she held responsibility for Brand, Marketing, Citizenship (ESG) & Communications, Procurement and Real Estate functions globally. Prior to this role, she was Group Head, Personal & Commercial Banking, leading RBC’s retail and commercial customer businesses and operations in Canada and the Caribbean from 2014 to 2017. Throughout her 42-year career, Ms. Tory held a number of key senior operating positions across retail distribution and operations, including overseeing digital and cost transformation of the business. An acknowledged community leader and fundraiser, she currently sits on the Sunnybrook Hospital Foundation and is past Chair of the board of the Toronto International Film Festival. A champion of diversity, Ms. Tory is the recipient of numerous awards recognizing her work related to the advancement of women and advocacy for BIPOC and LGBTQ+ communities. She has completed her Global Competent Board Sustainability & ESG Designation and Certificate (GCB.D), which included a session on climate change and biodiversity. | |
| C. Wright | Mr. Wright has been a director of BCE since April 2021. Mr. Wright is President of Wittington Investments, Limited (Wittington) (the principal holding company of the Weston group of companies, which includes George Weston, Loblaw and Choice Properties). As President of Wittington, Mr. Wright serves as a director of the Weston group of companies. Mr. Wright joined Wittington in 2021 following a 20-year career at Torys LLP (a law firm), where he was a leading corporate lawyer. He served as Chair of the firm’s Corporate Department and was co-head of the firm’s M&A Practice. As a lawyer, his practice focused on M&A transactions, both public and private, and other critical situations. He played a lead role acting for some of Canada’s largest public and private companies in their most significant strategic matters. Mr. Wright has a broad range of experience in complex transactional, securities, family-controlled business, private equity, regulatory, governance, activism and compliance matters. He has counselled boards of directors and board committees on corporate governance matters, crisis management and shareholder engagement issues. He is a Fellow of The American College of Governance Counsel. Mr. Wright is a Trustee of University Health Network and a member of the Dean’s Advisory Board at the Rotman School of Management, and is past Chair of the board of the National Ballet of Canada. He holds a Bachelor of Arts degree from McGill University and JD and MBA degrees from the University of Toronto. | |
The NYSE rules followed by BCE require that if an audit committee member serves simultaneously on the audit committee of more than three public companies, the board of directors must determine and disclose that this simultaneous service does not impair the ability of the member to effectively serve on the Audit Committee. No Audit Committee member currently serves simultaneously on the audit committee of more than three public companies.
Pre-approval policies and procedures
BCE’s Auditor Independence Policy is a comprehensive policy governing all aspects of our relationship with the external auditors, including:
| • | establishing a process for determining whether various audit and other services provided by the external auditors affect their independence; |
| • | identifying the services that the external auditors may and may not provide to BCE and its subsidiaries; |
| • | pre-approving all services to be provided by the external auditors of BCE and its subsidiaries; |
| • | establishing a process outlining procedures when hiring current or former personnel of the external auditors in a financial oversight role to ensure auditor independence is maintained. |
In particular, the policy specifies that:
| • | the external auditors cannot be hired to provide any services falling within the prohibited services category, such as bookkeeping, financial information system design and implementation, or legal services; |
| • | for all audit and non-audit services falling within the permitted services category (such as prospectus, due diligence and non-statutory audits), a request for approval must be submitted to the Audit Committee prior to engaging the external auditors; |
| • | specific permitted services, however, are pre-approved annually and quarterly by the Audit Committee and consequently only require approval by the Executive Vice-President and Chief Financial Officer prior to engaging the external auditors; |
| • | at each regularly scheduled Audit Committee meeting, a summary of all fees billed by the external auditors by type of service is presented. This summary includes the details of fees incurred within the pre-approval amounts. |
The Auditor Independence Policy is available in the governance section of BCE’s website at BCE.ca.
External auditors’ fees
The table below shows the fees that BCE’s external auditors, Deloitte LLP, billed to BCE and its subsidiaries for various services in each of the past two fiscal years.
| 2023 (in $ millions) |
2022 (in $ millions) |
|||||||||||
| Audit fees (1) |
10.1 | 9.8 | ||||||||||
| Audit-related fees (2) |
3.5 | 3.3 | ||||||||||
| Tax fees (3) |
0.3 | 0.3 | ||||||||||
| All other fees (4) |
0.1 | 0.1 | ||||||||||
| Total (5) |
14.0 | 13.5 | ||||||||||
| (1) | These fees include professional services provided by the external auditors for statutory audits of the annual financial statements, the audit of the effectiveness of internal control over financial reporting, the review of interim financial reports, the review of financial accounting and reporting matters, the review of securities offering documents and translation services. |
| (2) | These fees relate to non-statutory audits and due diligence procedures, and other regulatory audits and filings. |
| (3) | These fees include professional services for tax compliance, tax advice and assistance with tax audits. |
| (4) | These fees include any other fees for permitted services not included in any of the above-stated categories. |
| (5) | The amounts of $14.0 million for 2023 and $13.5 million for 2022 reflect fees billed in those fiscal years without taking into account the year to which those services relate. Total fees for services provided for each fiscal year amounted to $10.8 million in 2023 and $10.5 million in 2022. |
| 36 | BCE INC. 2023 ANNUAL INFORMATION FORM |
14 Schedule 2 – Audit Committee charter
| 14 | Schedule 2 – Audit Committee charter |
| I. | Purpose |
The purpose of the Audit Committee is to assist the Board of Directors in its oversight of:
| A. | the integrity of the Corporation’s financial statements and related information; |
| B. | the Corporation’s compliance with applicable legal and regulatory requirements; |
| C. | the independence, qualifications and appointment of the shareholders’ auditor; |
| D. | the performance of the Corporation’s shareholders’ auditor and internal audit; |
| E. | management responsibility for assessing and reporting on the effectiveness of internal controls; and |
| F. | the Corporation’s risks as it relates to financial reporting. |
| II. | Duties and responsibilities |
The Audit Committee shall perform the functions customarily performed by audit committees and any other functions assigned by the Board of Directors. In particular, the Audit Committee shall have the following duties and responsibilities:
| A. | Financial reporting and control |
| 1. | On a quarterly and annual basis, review and discuss with management and the shareholders’ auditor the following: |
| a. | major issues regarding accounting principles and financial statement presentation, including any significant changes in the Corporation’s selection or application of accounting principles or material related party transactions, and issues as to the adequacy of the Corporation’s internal controls and any special audit steps adopted in light of material control deficiencies; |
| b. | analyses prepared by management and/or the shareholders’ auditor setting forth significant financial reporting issues and judgements made in connection with the preparation of the financial statements, including the impact of selecting one of several International Financial Reporting Standards (IFRS) and/ or non IFRS measures on the financial statements when such a selection has been made in the current reporting period; |
| c. | the effect of regulatory and accounting developments, as well as off-balance sheet arrangements, on the financial statements of the Corporation; and |
| d. | the type and presentation of information to be included in earnings press releases (including any use of pro-forma or non-IFRS information). |
| 2. | Meet to review and discuss with management and the shareholders’ auditor, report and, where appropriate, provide recommendations to the Board of Directors on the following prior to its public disclosure: |
| a. | the Corporation’s annual and interim consolidated financial statements and the related “Management’s Discussion and Analysis”, safe harbour notice concerning forward-looking statements, annual integrated report, Annual Information Forms, earnings press releases and earnings guidance provided to analysts and rating agencies and the integrity of the financial reporting of the Corporation; |
| – | In addition to the role of the Audit Committee to make recommendations to the Board of Directors, where the members of the Audit Committee consider that it is appropriate and in the best interest of the Corporation, the Corporation’s interim consolidated financial statements and the related “Management’s Discussion and Analysis”, the interim earnings press releases and the earnings guidance, may also be approved on behalf of the Board of Directors by the Audit Committee, provided that such approval is subsequently reported to the Board of Directors at its next meeting; |
| b. | any audit issues raised by the shareholders’ auditor and management’s response thereto, including any restrictions on the scope of the activities of the shareholders’ auditor or access to requested information and any significant disagreements with management. |
| 3. | Review and discuss reports from the shareholders’ auditor on: |
| a. | all critical accounting policies and practices used by the Corporation; |
| b. | all material selections of accounting policies when there is a choice of policies available under IFRS that have been discussed with management, including the ramifications of the use of such alternative treatment and the alternative preferred by the shareholders’ auditor; and |
| c. | other material written communications between the shareholders’ auditor and management, and discuss such communication with the shareholders’ auditor. |
| B. | Oversight of the shareholders’ auditor |
| 1. | Be directly responsible for the appointment, compensation, retention and oversight of the work of the shareholders’ auditor, who shall report directly to the Audit Committee, and any other auditor preparing or issuing an audit report or performing other audit services or attest services for the Corporation or any consolidated subsidiary of the Corporation, where required, and review, report and, where appropriate, provide recommendations to the Board of Directors on the appointment, terms and review of engagement, removal, independence and proposed fees of the shareholders’ auditor. |
| BCE INC. 2023 ANNUAL INFORMATION FORM | 37 |
14 Schedule 2 – Audit Committee charter
| 2. | Approve in advance all audit, review or attest engagement fees and terms for all audit, review or attest services to be provided by the shareholders’ auditor to the Corporation and any consolidated subsidiary and any other auditor preparing or issuing an audit report or performing other audit services or attest services for the Corporation or any consolidated subsidiary of the Corporation, where required. |
| 3. | Pre-approve all engagements for permitted audit and non-audit services to be provided by the shareholders’ auditor to the Corporation and any consolidated subsidiary and to this effect may establish policies and procedures for the engagement of the shareholders’ auditor to provide to the Corporation and any consolidated subsidiary permitted non-audit services, which shall include approval in advance by the Audit Committee of all audit/review and permitted non-audit services to be provided by the shareholders’ auditor to the Corporation and any consolidated subsidiary. |
| 4. | Delegate, if deemed appropriate, authority to the Chief Financial Officer to grant pre-approvals of audit, review and permitted non-audit services, provided that any such approvals shall be presented to the Audit Committee at its next scheduled meeting. |
| 5. | Establish policies for the hiring of partners, employees and former partners and employees of the shareholders’ auditor. |
| 6. | At least annually, consider, assess, and report to the Board of Directors on: |
| a. | the independence, objectivity and professional skepticism of the shareholders’ auditor, including that the shareholders’ auditor’s performance of permitted non-audit services does not impair the shareholders’ auditor’s independence; |
| b. | obtaining from the shareholders’ auditor a written statement (i) delineating all relationships between the shareholders’ auditor and the Corporation; (ii) assuring that lead audit partner rotation is carried out, as required by law; and (iii) delineating any other relationships that may adversely affect the independence of the shareholders’ auditor; |
| c. | the quality of the engagement team including the evaluation of the lead audit partner, taking into account the opinions of management and internal audit; and |
| d. | the quality of the communications and interactions with the external auditor. |
| 7. | At least annually, obtain and review a report by the shareholders’ auditor describing: |
| a. | the shareholders’ auditor’s internal quality-control procedures; |
| b. | any material issues raised by the most recent internal quality-control review, or peer review of the shareholders’ auditor firm, or by any inquiry or investigation by governmental or professional authorities, issued in the reporting year, respecting one or more independent audits carried out by the shareholders’ auditor firm in Canada and the United States, limited to the Public Company Accounting Oversight Board, and any steps taken to deal with any such issues. |
| 8. | At least every 5 years, unless the annual assessment indicates otherwise, conduct a comprehensive review of the shareholders’ auditor focussing on the firm and report to the Board of Directors on: |
| a. | the independence, objectivity and professional skepticism of the shareholders’ auditor; |
| b. | the quality of the engagement team; and |
| c. | the quality of communications and interactions with the shareholders’ auditor. |
| 9. | Resolve any disagreement between management and the shareholders’ auditor regarding financial reporting. |
| 10. | Review the annual audit plan with the shareholders’ auditor. |
| 11. | Meet periodically with the shareholders’ auditor in the absence of management and internal audit. |
| C. | Oversight of internal audit |
| 1. | Review and discuss with the head of internal audit, report and, where appropriate, provide recommendations to the Board of Directors on the following: |
| a. | the appointment and mandate of internal audit, including the responsibilities, budget and staffing of internal audit; |
| b. | discuss with the head of internal audit the scope and performance of internal audit, including a review of the annual internal audit plan, and whether there are any restrictions or limitations on internal audit; and |
| c. | obtain periodic reports from the head of internal audit regarding internal audit findings, including those related to the Corporation’s internal controls, and the Corporation’s progress in remedying any audit findings. |
| 2. | Meet periodically with the head of internal audit in the absence of management and the shareholders’ auditor. |
| D. | Oversight of the Corporation’s internal control system |
| 1. | Review and discuss with management, the shareholders’ auditor and internal audit, monitor, report and, where appropriate, provide recommendations to the Board of Directors on the following: |
| a. | the Corporation’s systems of internal controls over financial reporting; |
| b. | the existence of any fraud, whether or not material, that involves management or other employees who have a significant role in the Corporation’s internal controls over financial reporting; |
| c. | compliance with the policies and practices of the Corporation relating to business ethics and code of conduct; |
| d. | compliance by Directors, Officers and other management personnel with the Corporation’s Disclosure Policy; and |
| e. | the relationship of the Audit Committee with other committees of the Board of Directors, management and the Corporation’s consolidated subsidiaries’ audit committees. |
| 38 | BCE INC. 2023 ANNUAL INFORMATION FORM |
14 Schedule 2 – Audit Committee charter
| 2. | Review and discuss with the Chief Executive Officer and Chief Financial Officer of the Corporation the process for the certifications to be provided in the Corporation’s public disclosure documents. |
| 3. | Review, monitor, report, and, where appropriate, provide recommendations to the Board of Directors on the Corporation’s disclosure controls and procedures. |
| 4. | Establish procedures for the receipt, retention, and treatment of complaints received by the Corporation regarding accounting, internal accounting controls or auditing matters, including procedures for confidential, anonymous submissions by employees regarding questionable accounting or auditing matters. |
| 5. | Meet periodically with management in the absence of the shareholders’ auditor and internal audit. |
| E. | Oversight of the Corporation’s financial |
| reporting risks |
| 1. | Review, monitor, report and, where appropriate, provide recommendations to the Board of Directors on the Corporation’s processes for identifying, assessing, mitigating, remedying and, where required, reporting major risk exposures as it relates to financial reporting. |
| F. | Journalistic independence |
| 1. | Consider and approve, on recommendation from the Chief Executive Officer, the appointment and termination of the Vice President responsible for CTV News and the Vice President responsible for Noovo News. |
| 2. | At least annually, obtain and review reports regarding compliance with the Corporation’s Journalistic Independence Policy by each of the Vice President responsible for CTV News and the Vice President responsible for Noovo News. |
| G. | Compliance with legal requirements |
| 1. | Review and discuss with management, the shareholders’ auditor and internal audit, monitor, report and, when appropriate, provide recommendation to the Board of Directors on the adequacy of the Corporation’s process for complying with laws and regulations. |
| 2. | Receive, on a periodic basis, reports from the Corporation’s Chief Legal Officer, with respect to the Corporation’s pending or threatened material litigation. |
| III. | Evaluation of the Audit Committee and report to |
| Board of Directors |
| A. | The Audit Committee shall evaluate and review with the Corporate Governance Committee of the Board of Directors, on an annual basis, the performance of the Audit Committee. |
| B. | The Audit Committee shall review and discuss with the Corporate Governance Committee of the Board of Directors, on an annual basis, the adequacy of the Audit Committee charter. |
| C. | The Audit Committee shall report to the Board of Directors periodically on the Audit Committee’s activities. |
| IV. | Outside advisors |
The Audit Committee shall have the authority to engage outside counsel and other outside advisors as it deems appropriate to assist the Audit Committee in the performance of its functions. The Corporation shall provide appropriate funding for such advisors as determined by the Audit Committee.
| V. | Membership |
The Audit Committee shall consist of such number of directors, in no event to be less than three, as the Board of Directors may from time to time by resolution determine. The members of the Audit Committee shall meet the independence, experience and other membership requirements under applicable laws, rules and regulations as determined by the Board of Directors.
| VI. | Audit Committee Chair |
The Chair of the Audit Committee shall be appointed by the Board of Directors. The Chair of the Audit Committee leads the Audit Committee in all aspects of its work and is responsible to effectively manage the affairs of the Audit Committee and ensure that it is properly organized and functions efficiently. More specifically, the Chair of the Audit Committee shall:
| A. | Provide leadership to enable the Audit Committee to act effectively in carrying out its duties and responsibilities as described elsewhere in this charter and as otherwise may be appropriate; |
| B. | In consultation with the Board Chair and the Chief Executive Officer, ensure that there is an effective relationship between management and the members of the Audit Committee; |
| C. | Chair meetings of the Audit Committee; |
| D. | In consultation with the Chief Executive Officer, the Corporate Secretary’s Office and the Board Chair, determine the frequency, dates and locations of meetings of the Audit Committee; |
| E. | In consultation with the Chief Executive Officer, the Chief Financial Officer, the Corporate Secretary’s Office and, as required, other Officers, review the annual work plan and the meeting agendas to ensure all required business is brought before the Audit Committee to enable it to efficiently carry out its duties and responsibilities; |
| F. | Ensure, in consultation with the Board Chair, that all items requiring the Audit Committee’s approval are appropriately tabled; |
| G. | Ensure the proper flow of information to the Audit Committee and review, with the Chief Executive Officer, the Chief Financial Officer, the Corporate Secretary’s Office and, as required, other Officers, the adequacy and timing of materials in support of management’s proposals; |
| H. | Report to the Board of Directors on the matters reviewed by, and on any decisions or recommendations of, the Audit Committee at the next meeting of the Board of Directors following any meeting of the Audit Committee; and |
| I. | Carry out any special assignments or any functions as requested by the Board of Directors. |
| BCE INC. 2023 ANNUAL INFORMATION FORM | 39 |
14 Schedule 2 – Audit Committee charter
| VII. | Term |
The members of the Audit Committee shall be appointed or changed by resolution of the Board of Directors to hold office from the time of their appointment until the next annual general meeting of the shareholders or until their successors are so appointed.
| VIII. | Procedures for meetings |
The Audit Committee shall fix its own procedure at meetings and for the calling of meetings. The Audit Committee shall meet separately in executive session in the absence of management, internal audit and the shareholders’ auditor, at each regularly scheduled meeting.
| IX. | Quorum and voting |
Unless otherwise determined from time to time by resolution of the Board of Directors, two members of the Audit Committee shall constitute a quorum for the transaction of business at a meeting. For any meeting(s) at which the Audit Committee Chair is absent, the Chair of the meeting shall be the person present who shall be decided upon by all members present. At a meeting, any question shall be decided by a majority of the votes cast by members of the Audit Committee, except where only two members are present, in which case any question shall be decided unanimously.
| X. | Secretary |
Unless otherwise determined by resolution of the Board of Directors, the Corporate Secretary of the Corporation or the Corporate Secretary’s delegate shall be the Secretary of the Audit Committee.
| XI. | Vacancies |
Vacancies at any time occurring shall be filled by resolution of the Board of Directors.
| XII. | Records |
The Audit Committee shall keep such records as it may deem necessary of its proceedings and shall report regularly its activities and recommendations to the Board of Directors as appropriate.
| 40 | BCE INC. 2023 ANNUAL INFORMATION FORM |
BCE.CA
Exhibit 99.2
MD&A
Management’s
discussion and analysis
Table of contents
| 5 | Business segment analysis | 54 | ||||||
| 5.1 | Bell CTS | 54 | ||||||
| 5.2 | Bell Media | 63 | ||||||
| 6 | Financial and capital management | 68 | ||||||
| 6.1 | Net debt | 68 | ||||||
| 6.2 | Outstanding share data | 69 | ||||||
| 6.3 | Cash flows | 69 | ||||||
| 6.4 | Post-employment benefit plans | 71 | ||||||
| 6.5 | Financial risk management | 72 | ||||||
| 6.6 | Credit ratings | 75 | ||||||
| 6.7 | Liquidity | 75 | ||||||
| 6.8 | Litigation | 77 | ||||||
| 7 | Selected annual and quarterly information | 78 | ||||||
| 7.1 | Annual financial information | 78 | ||||||
| 7.2 | Quarterly financial information | 80 | ||||||
| 8 | Regulatory environment | 83 | ||||||
| 8.1 | Introduction | 83 | ||||||
| 8.2 | Telecommunications Act | 83 | ||||||
| 8.3 | Broadcasting Act | 85 | ||||||
| 8.4 | Radiocommunication Act | 86 | ||||||
| 8.5 | Bell Canada Act | 87 | ||||||
| 8.6 | Other | 87 | ||||||
| 9 | Business risks | 88 | ||||||
| 10 | Accounting policies | 99 | ||||||
| 11 | Non-GAAP financial measures, other financial measures and key performance indicators (KPIs) | 103 | ||||||
| 11.1 | Non-GAAP financial measures | 103 | ||||||
| 11.2 | Non-GAAP ratios | 106 | ||||||
| 11.3 | Total of segments measures | 106 | ||||||
| 11.4 | Capital management measures | 107 | ||||||
| 11.5 | Supplementary financial measures | 108 | ||||||
| 11.6 | KPIs | 108 | ||||||
| 12 | Effectiveness of internal controls | 109 | ||||||
| 8 | BCE INC. 2023 ANNUAL FINANCIAL REPORT |
MD&A
In this management’s discussion and analysis (MD&A), we, us, our, BCE and the company mean, as the context may require, either BCE Inc. or, collectively, BCE Inc., Bell Canada, their subsidiaries, joint arrangements and associates. Bell means, as the context may require, either Bell Canada or, collectively, Bell Canada, its subsidiaries, joint arrangements and associates.
All amounts in this MD&A are in millions of Canadian dollars, except where noted. Please refer to section 11, Non-GAAP financial measures, other financial measures and key performance indicators (KPIs) for a list of defined non-GAAP financial measures, other financial measures and KPIs.
Please refer to BCE’s audited consolidated financial statements for the year ended December 31, 2023 when reading this MD&A.
In preparing this MD&A, we have taken into account information available to us up to March 7, 2024, the date of this MD&A, unless otherwise stated.
You will find additional information relating to BCE, including BCE’s audited consolidated financial statements for the year ended December 31, 2023, BCE’s annual information form for the year ended December 31, 2023, dated March 7, 2024 (BCE 2023 AIF) and recent financial reports, on BCE’s website at BCE.ca, on SEDAR+ at sedarplus.ca and on EDGAR at sec.gov.
Documents and other information contained in BCE’s website or in any other site referred to in BCE’s website or in this MD&A are not part of this MD&A and are not incorporated by reference herein.
This MD&A comments on our business operations, performance, financial position and other matters for the two years ended December 31, 2023 and 2022.
| 9 |
MD&A
Caution regarding forward-looking statements
This MD&A and, in particular, but without limitation, section 1.3, Key corporate developments, section 1.4, Capital markets strategy, section 1.6, Capitals and our corporate responsibility, section 2, Strategic imperatives, section 3.2, Business outlook and assumptions, section 5, Business segment analysis and section 6.7, Liquidity, contain forward-looking statements. These forward-looking statements include, without limitation, statements relating to our projected financial performance for 2024, BCE’s dividend growth objective, 2024 annualized common share dividend and dividend payout ratio level, and dividend payout policy target, BCE’s anticipated capital expenditures and network deployment plans, BCE’s financial policy target, the cost savings and other benefits expected to result from workforce reductions as well as estimated related severance payments, the sources of liquidity we expect to use to meet our 2024 cash requirements, our expected post-employment benefit plans funding, the expected timing and completion of the proposed acquisition of the Canadian out-of-home media business of OUTFRONT Media Inc. and the benefits expected to result therefrom, our environmental, social and governance (ESG) objectives, which include, without limitation, our objectives concerning diversity, equity, inclusion and belonging (DEIB), our targeted reductions in the level of our greenhouse gas (GHG) emissions including, without limitation, our carbon neutrality (scope 1 and 2 only) target and our science-based targets, our objectives concerning reductions in waste to landfill, community investment, privacy and information security, corporate governance and ethical business conduct, BCE’s business outlook, objectives, plans and strategic priorities, and other statements that do not refer to historical facts. A statement we make is forward-looking when it uses what we know and expect today to make a statement about the future. Forward-looking statements are typically identified by the words assumption, goal, guidance, objective, outlook, project, strategy, target, commitment and other similar expressions or future or conditional verbs such as aim, anticipate, believe, could, expect, intend, may, plan, seek, should, strive and will. All such forward-looking statements are made pursuant to the safe harbour provisions of applicable Canadian securities laws and of the United States (U.S.) Private Securities Litigation Reform Act of 1995.
Unless otherwise indicated by us, forward-looking statements in this MD&A describe our expectations as at March 7, 2024 and, accordingly, are subject to change after that date. Except as may be required by applicable securities laws, we do not undertake any obligation to update or revise any forward-looking statements, whether as a result of new information, future events or otherwise.
Forward-looking statements, by their very nature, are subject to inherent risks and uncertainties and are based on several assumptions, both general and specific, which give rise to the possibility that actual results or events could differ materially from our expectations expressed in,
or implied by, such forward-looking statements and that our business outlook, objectives, plans and strategic priorities may not be achieved. These statements are not guarantees of future performance or events, and we caution you against relying on any of these forward-looking statements. Forward-looking statements are presented in this MD&A for the purpose of assisting investors and others in understanding our objectives, strategic priorities and business outlook as well as our anticipated operating environment. Readers are cautioned, however, that such information may not be appropriate for other purposes.
We have made certain economic, market, operational and other assumptions in preparing the forward-looking statements contained in this MD&A, and, in particular, but without limitation, the forward-looking statements contained in the previously mentioned sections of this MD&A. These assumptions include, without limitation, the assumptions described in the various sub-sections of this MD&A entitled Assumptions, which sub-sections are incorporated by reference in this cautionary statement. Subject to various factors, we believe that our assumptions were reasonable at March 7, 2024. If our assumptions turn out to be inaccurate, actual results or events could be materially different from what we expect.
Important risk factors that could cause actual results or events to differ materially from those expressed in, or implied by, the previously-mentioned forward-looking statements and other forward-looking statements contained in this MD&A, include, but are not limited to: the negative effect of adverse economic conditions, including a potential recession, elevated inflation, high interest rates and financial and capital market volatility, and the resulting negative impact on business and customer spending and the demand for our products and services; the negative effect of adverse conditions associated with geopolitical events; regulatory initiatives, proceedings and decisions, government consultations and government positions that negatively affect us and influence our business including, without limitation, concerning mandatory access to networks, spectrum auctions, the imposition of consumer-related codes of conduct, approval of acquisitions, broadcast and spectrum licensing, foreign ownership requirements, privacy and cybersecurity obligations and control of copyright piracy; the inability to implement enhanced compliance frameworks and to comply with legal and regulatory obligations; unfavourable resolution of legal proceedings; the intensity of competitive activity and the failure to effectively respond to evolving competitive dynamics; the level of technological substitution and the presence of alternative service providers contributing to disruptions and disintermediation in each of our business segments; changing customer behaviour and the expansion of cloud-based, over-the-top (OTT) and other alternative solutions; advertising market pressures from economic conditions,
| 10 | BCE INC. 2023 ANNUAL FINANCIAL REPORT |
MD&A
fragmentation and non-traditional/global digital services; rising content costs and challenges in our ability to acquire or develop key content; high Canadian Internet and smartphone penetration; the failure to evolve and transform our networks, systems and operations using next-generation technologies while lowering our cost structure, including the failure to transition from a traditional telecommunications company to a tech services and digital media company and meet customer expectations of product and service experience; the inability to drive a positive customer experience; the inability to protect our physical and non-physical assets from events such as information security attacks, unauthorized access or entry, fire and natural disasters; the failure to implement an effective data governance framework; the failure to attract, develop and retain a diverse and talented team capable of furthering our strategic imperatives and high-tech transformation; the potential deterioration in employee morale and engagement resulting from staff reductions, cost reductions or reorganizations and the de-prioritization of transformation initiatives due to staff reductions, cost reductions or reorganizations; the failure to adequately manage health and safety concerns; labour disruptions and shortages; the risk that we may need to incur significant capital expenditures to provide additional capacity and reduce network congestion; service interruptions or outages due to network failures or slowdowns; events affecting the functionality of, and our ability to protect, test, maintain, replace and upgrade, our networks, information technology (IT) systems, equipment and other facilities; the failure by other telecommunications carriers on which we rely to provide services to complete planned and sufficient testing, maintenance, replacement or upgrade of their networks, equipment and other facilities, which could disrupt our operations including through network or other infrastructure failures; the complexity of our operations and IT systems and the failure to implement or maintain highly effective processes and IT systems; in-orbit and other operational risks to which the satellites used to provide our satellite television (TV) services are subject; the inability to access adequate sources of capital and generate sufficient cash flows from operating activities to meet our cash requirements, fund capital expenditures and provide for planned growth; uncertainty as to whether dividends will be declared or the dividend on common shares will be increased by BCE’s board of directors; the failure to reduce costs and adequately assess investment priorities, as well as unexpected increases in costs; the inability to manage various credit, liquidity and market risks; the failure to evolve practices to effectively monitor and control fraudulent activities; new or higher taxes due to new tax laws or changes thereto or in the interpretation thereof, and the inability to predict the outcome of government audits; the impact on our financial statements and estimates from a number of factors; pension obligation volatility and increased contributions to post-employment benefit plans; our dependence on third-party suppliers, outsourcers and consultants to provide an uninterrupted supply of the products
and services we need; the failure of our vendor selection, governance and oversight processes, including our management of supplier risk in the areas of security, data governance and responsible procurement; the quality of our products and services and the extent to which they may be subject to defects or fail to comply with applicable government regulations and standards; reputational risks and the inability to meaningfully integrate ESG considerations into our business strategy and operations; the failure to take appropriate actions to adapt to current and emerging environmental impacts, including climate change; pandemics, epidemics and other health risks, including health concerns about radio frequency emissions from wireless communications devices and equipment; the inability to adequately manage social issues; the failure to develop and implement sufficient corporate governance practices; the adverse impact of various internal and external factors on our ability to achieve our ESG targets including, without limitation, those related to GHG emissions reduction and DEIB.
These and other risk factors that could cause actual results or events to differ materially from our expectations expressed in, or implied by, our forward-looking statements are discussed in this MD&A and, in particular, in section 9, Business risks of this MD&A.
Forward-looking statements contained in this MD&A for periods beyond 2024 involve longer-term assumptions and estimates than forward-looking statements for 2024 and are consequently subject to greater uncertainty. Forward-looking statements for periods beyond 2024 further assume, unless otherwise indicated, that the risks described above and in section 9, Business risks of this MD&A will remain substantially unchanged during such periods.
We caution readers that the risk factors described above and in the previously-mentioned section and in other sections of this MD&A are not the only ones that could affect us. Additional risks and uncertainties not currently known to us or that we currently deem to be immaterial may also have a material adverse effect on our business, financial condition, liquidity, financial results or reputation. We regularly consider potential acquisitions, dispositions, mergers, business combinations, investments, monetizations, joint ventures and other transactions, some of which may be significant. Except as otherwise indicated by us, forward-looking statements do not reflect the potential impact of any such transactions or of special items that may be announced or that may occur after March 7, 2024. The financial impact of these transactions and special items can be complex and depends on facts particular to each of them. We therefore cannot describe the expected impact in a meaningful way, or in the same way we present known risks affecting our business.
| 11 |
1 MD&A Overview
| 1 | Overview |
In 2022, we began modifying our internal and external reporting processes to align with organizational changes that were made to reflect an increasing strategic focus on multiproduct sales, the continually increasing technological convergence of our wireless and wireline telecommunications infrastructure and operations driven by the deployment of our Fifth Generation (5G) and fibre networks, and our digital transformation. These factors have made it increasingly difficult to distinguish between our wireless and wireline operations and resulted in changes in Q1 2023 to the financial information that is regularly provided to our chief operating decision maker to measure performance and allocate resources.
Effective with our Q1 2023 results, our previous Bell Wireless and Bell Wireline operating segments were combined to form a single reporting segment called Bell Communication and Technology Services (Bell CTS). Bell Media remains a distinct reportable segment and is unaffected. As a result of our reporting changes, prior periods have been restated for comparative purposes.
| 1.1 | Introduction |
At a glance
BCE is Canada’s largest communications company (1), providing residential, business and wholesale customers with a wide range of solutions for all their communications needs. BCE’s shares are publicly traded on the Toronto Stock Exchange and on the New York Stock Exchange (TSX, NYSE: BCE).
Our results are reported in two segments: Bell CTS and Bell Media.
Bell CTS provides a wide range of communication products and services to consumers, businesses and government customers across Canada. Wireless products and services include mobile data and voice plans and devices and are available nationally. Wireline products and services comprise data (including Internet access, Internet protocol television (IPTV), cloud-based services and business solutions), voice, and other communication services and products, which are available to our residential, small and medium-sized business and large enterprise customers primarily in Ontario, Québec, the Atlantic provinces and Manitoba, while satellite TV service and connectivity to business customers are available nationally across Canada. In addition, this segment includes our wholesale business, which buys and sells local telephone, long distance, data and other services from or to resellers and other carriers, as well as the results of operations of our national consumer electronics retailer, The Source (Bell) Electronics Inc. (The Source). Subsequent to year end, Bell Canada announced a strategic partnership with Best Buy Canada to operate 165 The Source consumer electronics retail stores in Canada, which will be rebranded as Best Buy Express and offer the latest in consumer electronics from Best Buy along with exclusive telecommunications services from Bell. In addition, Bell will wind down The Source head office and back office operations, as well as close 107 The Source stores.
Bell Media provides conventional TV, specialty TV, pay TV, streaming services, digital media services, radio broadcasting services and out-of-home (OOH) and advanced advertising services to customers nationally across Canada. Revenues are derived primarily from advertising and subscriber fees.
We also hold investments in a number of other assets, including:
| • | a 37.5% indirect equity interest in Maple Leaf Sports & Entertainment Ltd. (MLSE) |
| • | a 50% indirect equity interest in Glentel Inc. (Glentel) |
| • | a 20.2% indirect equity interest in entities that operate the Montréal Canadiens Hockey Club, evenko and the Bell Centre in Montréal, Québec, as well as Place Bell in Laval, Québec |
BCE is Canada’s largest communications company
BCE’s business segments
At December 31, 2023
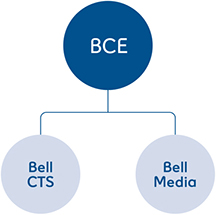
| (1) | Based on total revenue and total combined customer connections. |
| 12 | BCE INC. 2023 ANNUAL FINANCIAL REPORT |
1 MD&A Overview
Our purpose
BCE’s purpose is to advance how Canadians connect with each other and the world. Our strategy builds on our longstanding strengths in networks, service innovation and content creation, and positions the company for continued growth and innovation leadership. Our primary business objectives are to grow our subscriber base profitably and to maximize revenues, operating profit, free cash flow and return on invested capital by further enhancing our position as the foremost provider in Canada of comprehensive communications services to residential, business and wholesale customers, and as Canada’s leading content creation company. We seek to take advantage of opportunities to leverage our networks, infrastructure, sales channels, and brand and marketing resources across our various lines of business to create value for our customers and other stakeholders.
Our strategy is centred on our disciplined focus and execution of six strategic imperatives that position us to deliver continued success in a fast-changing communications marketplace. The six strategic imperatives that underlie BCE’s business plan are:
| Bell’s six strategic imperatives |
|
We have begun our journey to modernize from a traditional telecommunications company (telco) to a technology services and digital media company (collectively referred to as techco). Innovation is driving customer expectations for enhanced user experiences, improved customer service, and faster market responses, all of which are improved by our transformation to a techco. Our evolution to a techco takes a customer-first approach and specifically sets out to deliver incremental value to our customers:
| • | Ability for customers to enjoy our products, services, and content on any device in any location |
| • | Enable customers to be served on their timeline through simple sales and support interactions across the channel of their choosing (e.g., online, call centre, store) |
| • | Access to new and better products, services and solutions on an accelerated basis tailored to meet customers’ evolving needs and expectations |
To support and accelerate this evolution, we launched a multi-year operational transformation project to modernize our operations, increase productivity, build tech talent and materially right-size our cost base.
Our alignment to the International Integrated Reporting Framework
Following the principles of the International Integrated Reporting Framework (<IR> Framework), now part of the International Financial Reporting Standards Foundation, Bell released, concurrently with this MD&A, an Integrated Annual Report which contains a strategic overview outlining our sustainable value creation process. This strategic overview discloses how we seek to generate sustainable value for our stakeholders as the result of our business operations, guided by our strategic imperatives and use of capitals. Our capitals are outlined below and serve as inputs that are transformed through our business strategy and strategic imperatives resulting in outcomes that seek to create value for our stakeholders over time.
|
|
|
|
|
|
|
|||||
| Our networks |
Our customers and relationships |
Our products and services |
Our environment |
Our people |
Our financial resources |
|||||
| Reliable, accessible and affordable world-class broadband fibre and wireless networks. |
Strong relationships with customers, communities and suppliers. |
Innovative and compelling products, services and media content addressing societal demands. |
Responsible environmental management throughout our operations. |
Skilled, engaged and diverse team members. |
Capital from our investors, returns on our investments and free cash flow generated from our operations. |
|||||
To increase the connectivity of information, we have incorporated the icons representing our six capitals described above throughout this MD&A to highlight the respective linkage between our capitals and the topics discussed.
| 13 |
1 MD&A Overview
BCE 2023 consolidated results
| Operating revenues | Net earnings | Adjusted EBITDA (1) | ||
| $24,673 | $2,327 | $10,417 | ||
| million | million | million | ||
| 2.1% vs. 2022 | (20.5%) vs. 2022 | 2.1% vs. 2022 | ||
| Net earnings attributable | Adjusted net earnings (1) | Cash flows from | Free cash flow (1) | |||
| to common shareholders | operating activities | |||||
| $2,076 | $2,926 | $7,946 | $3,144 | |||
| million | million | million | million | |||
| (23.6%) vs. 2022 | (4.3%) vs. 2022 | (5.0%) vs. 2022 | 2.5% vs. 2022 | |||
|
BCE customer connections
|
||||||
| Total mobile phones (3) | Retail high-speed | Retail TV (2) (5) | Retail residential network | |||
| Internet (2) (4) (5) | access services (NAS) lines (2) (5) | |||||
| +3.4% | +5.0% | (1.0%) | (7.7%) | |||
| 10.3 million subscribers | 4.5 million subscribers | 2.7 million subscribers | 2.0 million subscribers | |||
| at the end of 2023 | at the end of 2023 | at the end of 2023 | at the end of 2023 | |||
| (1) | Adjusted EBITDA is a total of segments measure, and adjusted net earnings and free cash flow are non-GAAP financial measures. See section 11.3, Total of segments measures and section 11.1, Non-GAAP financial measures in this MD&A for more information on these measures. |
| (2) | In Q2 2023, our retail high-speed Internet, retail IPTV and retail residential NAS lines subscriber bases increased by 35,080, 243 and 7,458 subscribers, respectively, as a result of small acquisitions. |
| (3) | In Q1 2023, we adjusted our mobile phone postpaid subscriber base to remove older non-revenue generating business subscribers of 73,229. |
| (4) | In Q1 2023, subsequent to a review of customer account records, our retail high-speed Internet subscriber base was reduced by 7,347 subscribers. |
| (5) | In Q4 2022, as a result of the acquisition of Distributel Communications Limited (Distributel), our retail high-speed Internet, retail IPTV and retail residential NAS lines subscriber bases increased by 128,065, 2,315 and 64,498 subscribers, respectively. |
| 14 | BCE INC. 2023 ANNUAL FINANCIAL REPORT |
1 MD&A Overview
| 1.2 | About BCE |
Our 2023 results are reported in two segments: Bell CTS and Bell Media. We describe our products and services by segment in this section, to provide further insight into our operations.
Our products and services

Bell CTS
| Segment description
• Provides a wide range of communication products and services to consumers, businesses and government customers across Canada.
• Wireless products and services include mobile data and voice plans and devices and are available nationally.
• Wireline products and services comprise data (including Internet access, IPTV, cloud-based services and business solutions), voice, and other communication services and products, which are available to our residential, small and medium-sized business and large enterprise customers primarily in Ontario, Québec, the Atlantic provinces and Manitoba, while satellite TV service and connectivity to business customers are available nationally across Canada.
• Includes our wholesale business, which buys and sells local telephone, long distance, data and other services from or to resellers and other carriers, and the wireline operations of Northwestel Inc. (Northwestel), which provides telecommunications services in Canada’s Northern Territories.
• Includes the results of operations of our national consumer electronics retailer, The Source. Subsequent to year end, Bell Canada announced a strategic partnership with Best Buy Canada to operate 165 The Source consumer electronics retail stores in Canada, which will be rebranded as Best Buy Express and offer the latest in consumer electronics from Best Buy along with exclusive telecommunications services from Bell. In addition, Bell will wind down The Source head office and back office operations, as well as close 107 The Source stores. |
|
Our brands include
|
Our networks and reach
We hold wireless spectrum licences, with holdings across various spectrum bands and regions across Canada, totalling more than 6.4 billion megahertz per population (MHz-Pop), corresponding to an average of approximately 182 megahertz (MHz) of spectrum per Canadian (1).
The vast majority of our cell towers are connected with fibre, the latest network infrastructure technology, for a faster and more reliable connection.
Our Fourth Generation (4G) Long-term Evolution (LTE) nationwide wireless broadband network is compatible with global standards and delivers high-quality and reliable voice and high-speed data services coast to coast to virtually all of the Canadian population. 5G and 5G+ are the next generation of wireless technology, offering faster speeds and lower latency. Our LTE network will be the backbone for our 5G network as it expands across Canada.
| • | LTE coverage of over 99% of Canada’s population, with LTE Advanced (LTE-A) covering 95% of Canada’s population, and 5G coverage of 86% of Canada’s population, with 5G+ covering 51% of Canada’s population at December 31, 2023 |
| • | Peak theoretical mobile data access download speeds: 5G+, up to 3 gigabit(s) per second (Gbps) in select markets; 5G, up to 1.7 Gbps (average expected speeds of 89 to 705 megabits per second (Mbps) in markets across Canada); LTE-A, up to 1.5 Gbps (average expected speeds of 25 to 325 Mbps) in markets across Canada; LTE, up to 150 Mbps (expected average speeds of 18 to 40 Mbps); high-speed packet access plus (HSPA+), up to 42 Mbps (expected average speeds of 7 to 14 Mbps) (2) |
| • | Reverts to LTE/LTE-A technology and speeds when customers are outside 5G and 5G+ coverage areas |
| • | Bell also operates a LTE-category M1 (LTE-M) network, which is a subset of our LTE network, supporting low-power Internet of Things (IoT) applications with enhanced coverage, longer device battery life and enabling lower costs for IoT devices connecting to Bell’s national network. Our LTE-M network is available in most Canadian provinces. |
| • | Extensive local access network in Ontario, Québec, the Atlantic provinces and Manitoba, as well as in Canada’s Northern Territories |
| • |
Fibre-to-the-premise (FTTP) footprint covering over 7 million homes and businesses in Ontario, Québec, the Atlantic provinces and Manitoba |
| (1) | Bell secured the right to acquire 3800 MHz spectrum licences in the auction completed in November 2023, which will increase our overall wireless spectrum holdings to more than 8.2 billion MHz-Pop, corresponding to an average of approximately 234 MHz of spectrum per Canadian. |
| (2) | Network speeds vary with location, signal and customer device. Compatible device required. |
| 15 |
1 MD&A Overview
| • |
Wireless-to-the-premise (WTTP) footprint covering approximately 1 million locations primarily in rural areas. WTTP is 5G-capable fixed wireless technology delivered over Bell’s LTE wireless network that provides broadband residential Internet access to smaller and underserved communities. |
| • | Largest Internet protocol (IP) multi-protocol label switching footprint of any Canadian provider, enabling us to offer business customers a virtual private network (VPN) service for IP traffic and to optimize bandwidth for real-time voice and TV |
We have approximately 9,000 retail points of distribution across Canada, including approximately 1,000 Bell, Virgin Plus, Lucky Mobile (Lucky) and The Source locations, as well as Glentel-operated locations (WIRELESSWAVE, Tbooth wireless and WIRELESS etc.) and other third-party dealer and retail locations. Subsequent to year end, we announced a strategic partnership with Best Buy Canada to operate 165 The Source consumer electronics retail stores in Canada, which will be rebranded as Best Buy Express and offer the latest in consumer electronics from Best Buy along with exclusive telecommunications services from Bell. In addition, Bell will wind down The Source head office and back office operations, as well as close 107 The Source stores.
Our wireless products and services
| • | Data and voice plans: From plans focused on affordability to premium services, we have plans that cater to all customer segments, available on either postpaid or prepaid options, including unlimited data, shareable, device financing plans and Connect Everything plans. Our services provide fast Internet access for video, social networking, messaging and mobile applications, as well as a host of call features. |
| • | Specialized plans: for tablets, smartwatches, Connected Car, mobile Internet, trackers, laptops and security cameras |
| • | Extensive selection of devices: the latest 5G and 5G+ smartphones, tablets, smartwatches, mobile Internet devices and connected things (Bell Connected Car, trackers, connected home, lifestyle and virtual reality) |
| • | Travel: international roaming in over 230 destinations, with LTE roaming in 211 destinations and 5G roaming in 87 destinations |
| • | Mobile business solutions: push-to-talk, field service management, worker safety and mobility management |
| • | IoT solutions: fleet management, asset management, smart supply chain, building and site management, municipal operations, integrated smart city ecosystem with Esri |
Our wireline products and services
Residential
| • | Internet: high-speed Internet access through fibre-optic broadband technology, 5G-capable WTTP technology or digital subscriber line (DSL) with a wide range of options, including reliable Wi-Fi, unlimited usage, security services and mobile Internet. Our Internet service, marketed as Fibe Internet, offers symmetrical download and upload speeds of up to 3 Gbps with FTTP, or download speeds of up to 100 Mbps with Fibre-to-the-node (FTTN), while our Wireless Home Internet (WHI) fixed wireless service delivers broadband download speeds of up to 50 Mbps. We also offer Internet service under the Virgin Plus brand offering download speeds of up to 300 Mbps. |
| • | TV: IPTV services (Fibe TV, Fibe TV app and Virgin Plus TV) and satellite TV service. Bell’s new Fibe TV service powered by Google Android TV technology provides extensive live and on-demand content options with 4K resolution (4K) picture quality and capabilities and features including access to thousands of apps, voice remote powered by Google Assistant, universal search, cloud personal video recorder (PVR), compact 4K high dynamic range (HDR) receiver and access to the Fibe TV app. The Fibe TV app live TV streaming service offers live and on-demand programming on Bell Streamer, Apple TV, Amazon Fire TV, Google Chromecast, Android TV devices, smartphones, tablets and computers. Bell Streamer is a 4K HDR streaming device powered by Android TV offering all-in-one access to the Fibe TV app, support for all major streaming services and access to over 10,000 apps from Google Play. We also offer an app-based live TV streaming service branded as Virgin Plus TV. |
| • | Home Phone: local telephone service, long distance and advanced calling features |
| • | Smart Home: home security, monitoring and automation services from Bell Smart Home |
| • | Bundles: multi-product bundles of Internet, TV, home phone, mobility and smart home services with monthly discounts |
Business
| • | Internet and network solutions: through our advanced technologies and end-to-end network, cloud and security expertise, Bell is a network transformation partner of choice for Canadian businesses. Our solutions include business Internet, software-defined solutions, private networks, global networks, managed and professional services. |
| • | Voice and Collaboration: we offer a variety of voice and collaboration solutions, including unified communications as a service (UCaaS), traditional local and long distance phone services, cloud-based voice over IP (VoIP) services and advanced solutions with custom calling features |
| • | Cloud: Bell supports every stage of businesses’ cloud journey with cloud, network and security expertise, an advanced partner ecosystem and advanced hybrid multi-cloud solutions. Our cloud solutions include professional and managed services, public multi-access edge computing (MEC) with Amazon Web Services (AWS) Wavelength, cloud connect, and backup and disaster recovery. |
| • | Security: we offer a full suite of solutions to address businesses’ security concerns, including network security, cloud security and managed and professional services |
| • | Contact centre: we offer scalable, cloud-based contact centre solutions that include artificial intelligence (AI)-enhanced features, enabling omnichannel experiences and flexible, hybrid work styles |
| 16 | BCE INC. 2023 ANNUAL FINANCIAL REPORT |
1 MD&A Overview
Bell Media
| Segment description
|
Our brands include
|
|||
| • Canada’s leading content creation company with premier assets in TV, radio and OOH, monetized through traditional and digital platforms
• Revenues are derived primarily from advertising and subscriber fees
• Conventional TV, radio and OOH revenues are derived from advertising
• Specialty TV revenue is generated from subscription fees and advertising
• Pay TV revenue is derived from subscription fees
• Direct-to-consumer (DTC) streaming services revenue is derived from subscription fees and advertising |
|
|
Our assets and reach
TV
| • | 35 conventional TV stations including CTV, Canada’s #1 network for 22 consecutive years, #1 Canadian advertising-based video on demand (AVOD) platform CTV.ca and leading digital news destination CTVNews.ca, and the French-language Noovo network in Québec, including its popular AVOD platform and digital news destination Noovo.info |
| • | 26 specialty TV channels, including TSN, Canada’s sports leader and RDS, the top French-language sports network |
| • | 4 pay TV services and 5 streaming services, including Crave, the exclusive home of HBO and Max Originals in Canada, TSN and RDS |
Radio
| • | 103 licensed radio stations in 58 markets across Canada, all available through iHeartRadio.ca and the iHeartRadio Canada app alongside an extensive catalogue of podcasts. In June 2023, Bell Media announced its intent to divest 3 of the 103 radio stations and on February 8, 2024, Bell Media announced its intent to divest an additional 45 of its radio stations to seven buyers, subject to Canadian Radio-television and Telecommunications Commission (CRTC) review and other closing conditions. |
OOH advertising
| • | Network of strategically located advertising faces spanning across the country in 20 of Canada’s largest cities |
Broadcast rights
| • | Sports: long-term media rights to key sports properties and official Canadian broadcaster of the Super Bowl, Grey Cup and International Ice Hockey Federation (IIHF) World Junior Championship. Live sports coverage includes the Toronto Maple Leafs, Montréal Canadiens, Winnipeg Jets and Ottawa Senators, Canadian Football League (CFL), National Football League (NFL), National Basketball Association (NBA), Professional Women’s Hockey League (PWHL), Major League Soccer (MLS), Fédération Internationale de Football Association (FIFA) World Cup events, Curling’s Season of Champions, Major League Baseball (MLB), Golf’s Majors, NASCAR, Formula 1 (F1), Grand Slam Tennis, National Collegiate Athletic Association (NCAA) March Madness, and more. |
| • | Warner Bros. Discovery: Crave extended a long-term licensing agreement with Warner Bros. Discovery that sees Crave continuing to be the home of HBO and Max Originals, as well as new cable series, library television series, and pay and post-pay window rights for Warner Bros. films. The agreement also feeds CTV, CTV.ca, the CTV app, and Bell Media’s suite of Specialty channels with Warner Bros. Discovery’s iconic content. |
| • | STARZ: long-term agreement with Lionsgate for premium STARZ programming in Canada |
| • | iHeartRadio: exclusive partnership for digital and streaming music services in Canada |
Other assets
| • | Equity interest in Dome Productions Partnership, one of North America’s leading providers of sports and other event production and broadcast facilities |
| • | Montréal’s Octane Racing Group Inc., promoter of the F1 Canadian Grand Prix, the largest annual sports and tourism event in the country |
| • | Minority interest in Montréal’s Grandé Studios, a Montréal-based multipurpose TV, film and equipment company which provides production facilities, equipment rentals, and technical services |
Our products and services
| • | Varied and extensive array of video content to broadcast distributors across Canada |
| • | Advertising on our TV, radio, digital and OOH properties to both local and national advertisers across a wide range of industry sectors |
| • | Crave bilingual subscription-based on-demand premium video streaming service offering a large collection of premium content in one place, including HBO, Max, STARZ, and original French-language programming, on set-top boxes (STBs), mobile devices, streaming devices and online. Crave is offered through a number of Canadian TV providers, and is available directly to all Canadian Internet subscribers as an OTT service. |
| • | TSN, TSN+, and RDS streaming services offering live and on-demand TSN and RDS content directly to consumers through an annual or monthly subscription on computers, tablets, mobile devices, Apple TV and other streaming devices |
| 17 |
1 MD&A Overview
Other BCE investments
| BCE also holds investments in a number of other assets, including:
• a 37.5% indirect equity interest in MLSE, a sports and entertainment company that owns several sports teams, including the Toronto Maple Leafs, the Toronto Raptors, Toronto FC and the Toronto Argonauts, as well as real estate and entertainment assets in Toronto
• a 50% indirect equity interest in Glentel, a Canadian-based connected services retailer
• a 20.2% indirect equity interest in entities that operate the Montréal Canadiens Hockey Club, evenko (a promoter and producer of cultural and sports events) and the Bell Centre in Montréal, Québec, as well as Place Bell in Laval, Québec |
|
|
|
Our people

| Employees
At the end of 2023, our team consisted of 45,132 employees, an increase of 522 employees, compared to the 44,610 employees at the end of 2022, driven by the acquisition of FX Innovation in June 2023, and other small acquisitions made during the year, along with greater hiring at our customer service centres, partly offset by natural attrition, retirements and workforce reductions.
Approximately 42% of total BCE employees were represented by labour unions at December 31, 2023. |
|
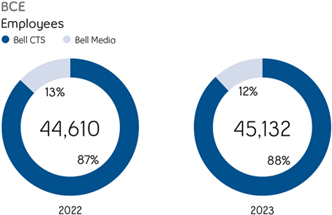
|
Bell code of business conduct
The ethical business conduct of our people is core to the integrity with which we operate our business. The Bell Code of Business Conduct sets out specific expectations and accountabilities, providing employees with practical guidelines to conduct business in an ethical manner. Our commitment to the Code of Business Conduct is renewed by employees each year in an ongoing effort to ensure that all employees are aware of, and adhere to, Bell’s standards of conduct.
| 1.3 | Key corporate developments |

This section contains forward-looking statements, including relating to BCE’s capital expenditures and network deployment plans, the cost savings and other benefits expected to result from workforce reductions as well as estimated related severance payments, the expected timing and completion of the proposed acquisition of the Canadian OOH media business of OUTFRONT Media Inc. and the benefits expected to result therefrom, and our objectives and plans. Refer to the section Caution regarding forward-looking statements at the beginning of this MD&A.
Reduction in capital expenditures and fibre expansion
Further to the CRTC decision of November 6, 2023 that imposed an interim aggregated access to FTTP facilities obligation, Bell announced its intention to reduce capital expenditures by over $1 billion over 2024 and 2025 combined, including a minimum of $500 million in 2024, that the company had planned to invest in bringing high-speed fibre Internet to hundreds of thousands of additional homes and businesses in rural, suburban and urban communities. This reduction is in addition to Bell investing $105 million less than planned in Q4 2023 as a result of the CRTC’s decision. Prior to the decision, Bell’s near-term plan was to build high-speed fibre to 9 million locations by the end of 2025. As a direct result of federal government policies and the CRTC’s decision that discourages network investment, Bell is slowing the pace of fibre footprint expansion to a near-term target of 8.3 million locations by the end of 2025 and capping fibre speeds at 3 Gbps.
| 18 | BCE INC. 2023 ANNUAL FINANCIAL REPORT |
1 MD&A Overview
Workforce restructuring
In light of an operating environment that is being reshaped by increasingly unsupportive federal government policies and regulatory decisions, an economy with high interest rates and continued inflation, increasing competition, and evolving consumer preferences, Bell is taking action to lower its cost structure and align costs to the revenue potential of each business segment. This includes Bell’s largest workforce restructuring initiative in nearly 30 years, that will result in the reduction of our workforce by approximately 4,800 positions, or 9% of all BCE employees in 2024. These workforce reductions are expected to yield in-year cost savings of $150 million to $200 million for 2024, or $250 million on an annualized basis. Severance payments related to the restructuring initiative could amount to up to approximately $400 million.
Acquisition of 3800 MHz wireless spectrum
Bell secured additional mid-band spectrum licences through Innovation, Science and Economic Development Canada (ISED)’s 3800 MHz spectrum auction completed in November 2023, to continue bringing fast and reliable 5G+ wireless service to more people and businesses across Canada. Bell secured 939 licences covering 1.77 billion MHz-Pop of 3800 MHz spectrum for $518 million. This acquisition complements Bell’s existing 3500 MHz spectrum holdings, providing the company with 100 MHz of 3500 MHz and 3800 MHz cross-band spectrum across approximately 99% of Canada’s population. Bell will have access to an industry-leading 3.5 billion MHz-Pop of 5G+ spectrum (combining the 3500 MHz and 3800 MHz spectrum bands), acquired at a total cost of $2.78 billion, the lowest among national wireless carriers.
Strategic partnership with Best Buy Canada
On January 18, 2024, Bell announced a strategic partnership with Best Buy Canada to operate 165 The Source consumer electronics retail stores in Canada, which will be rebranded as Best Buy Express. Bell will be the exclusive telecommunications provider, selling wireless and wireline (in footprint) services from its Bell, Virgin Plus and Lucky Mobile brands, as well as remain responsible for store operations and labour. Best Buy will assume responsibility for the consumer electronics assortment and procurement, as well as branding, marketing and e-commerce. Best Buy Express is expected to open locations across Canada starting in the second half of 2024. On February 8, 2024, Bell announced that with the strengths of Best Buy’s buying power and supply chain, Bell will wind down The Source head office and back office operations, as well as close 107 The Source stores.
Proposed acquisition of Canadian out-of-home media business of OUTFRONT
Media Inc.
On October 23, 2023, Bell Media announced it plans to acquire the Canadian out-of-home media business of OUTFRONT Media Inc. The transaction is valued at $410 million, subject to certain adjustments, and is expected to close in the first half of 2024, subject to regulatory approval and other closing conditions. The acquisition of the Canadian out-of-home media business of OUTFRONT Media Inc. is expected to support Bell Media’s digital media strategy and to deliver impactful, multi-channel marketing solutions coast-to-coast. The results of the Canadian out-of-home media business of OUTFRONT Media Inc. will be included in our Bell Media segment.
Curtis Millen appointed as Chief Financial Officer
On September 1, 2023, Curtis Millen became Executive Vice President and Chief Financial Officer (CFO) of BCE and Bell Canada following the retirement of Glen LeBlanc from such position. A Bell leader since 2008, Mr. Millen was most recently Senior Vice President, Corporate Strategy and Treasurer, head of Bell Ventures and President of Bimcor Inc., a wholly-owned subsidiary of Bell that is one of the largest private sector pension fund management companies in Canada. Glen LeBlanc remains as Special Advisor and Vice-Chair, Bell Atlantic, and maintains his position as Chair of Northwestel and as Board member and Chair of the Audit Committee for MLSE.
Bell Media leadership change
On November 1, 2023, Sean Cohan assumed leadership of Bell Media and joined the BCE leadership team, following the retirement of Wade Oosterman as President of Bell Media. Mr. Cohan joined Bell Media after having progressed through increasingly senior executive responsibilities in his time in media and consumer businesses, including a 15-year tenure at A+E Networks ultimately in the role of President, International and Digital Media. He and his A+E teams are credited with driving global content, digital, and commercial transformation and notable growth across the business.
| 19 |
1 MD&A Overview
| 1.4 | Capital markets strategy |

This section contains forward-looking statements, including relating to BCE’s dividend growth objective, 2024 annualized common share dividend and dividend payout ratio level, and dividend payout policy target, BCE’s financial policy target, anticipated capital expenditures and network deployment plans, and our business outlook, objectives and plans. Refer to the section Caution regarding forward-looking statements at the beginning of this MD&A.
We seek to deliver shareholder returns through dividend growth. This objective is underpinned by substantial free cash flow generation and a strong balance sheet, supporting ongoing capital investment on advanced broadband networks and services that are essential to driving the long-term growth of our business.
Dividend growth and payout policy
| Dividend yield (1) | 2024 dividend increase | Dividend payout (2) policy | ||
| 7.4% | +3.1% | 65%–75% | ||
| in 2023 | to $3.99 per common share | of free cash flow |
On February 8, 2024, we announced a 3.1%, or 12 cents, increase in the annualized dividend payable on BCE’s common shares for 2024 to $3.99 per share from $3.87 per share in 2023, starting with the quarterly dividend payable on April 15, 2024.
Our objective seeks to achieve dividend growth while maintaining our dividend payout ratio within the target policy range of 65% to 75% of free cash flow and balancing our strategic business priorities. BCE’s dividend payout policy, increases in the common share dividend and the declaration of dividends are subject to the discretion of the BCE Board of Directors (BCE Board) and, consequently, there can be no guarantee that BCE’s dividend policy will be maintained or achieved, that the dividend on common shares will be increased or that dividends will be declared.
As at December 31, 2023, our dividend payout ratio was 111%, compared to 108% at December 31, 2022, which is higher than our policy range due to elevated capital expenditures compared to pre-2020 annual levels as we continued to make generational investments in our networks to support the buildout of our fibre, 5G and 5G+ network infrastructure. Although a significant reduction in capital expenditures is planned in 2024, due largely to government policy, they are expected to remain higher than pre-2020 annual levels. In addition, free cash flow in 2024 will be adversely impacted by significantly higher severance payments related to workforce restructuring initiatives, higher interest paid and lower cash from working capital. As a result, BCE’s dividend payout ratio will remain above our target policy range in 2024.
Executive compensation alignment
BCE is focused on a pay-for-performance approach for all team members, including our executives. In order to attract, motivate and retain top talent, the company offers a competitive total compensation package.
| • | Base salary: rewards the scope and responsibilities of a position, with target positioning at the median of our comparator group. |
| • | Annual incentive: encourages strong performance against yearly corporate and individual objectives. |
| • | Long-term incentive: aligns with long-term interests of shareholders. |
The mix of vehicles awarded under BCE’s long-term incentive plan favours the execution of multiple objectives. They are structured to create sustainable value for shareholders by attracting, motivating and retaining the executive officers needed to drive the business strategy, and rewarding them for delivering on our goal of advancing how Canadians connect with each other and the world, through the successful execution of our six strategic imperatives. We have strong alignment of interest between shareholders and management through our equity-based incentive plans.
| Best practices adopted by BCE for executive compensation |
• Stringent share ownership requirements
|
|
| • Emphasis on pay at risk for executive compensation
|
||
| • Double trigger change-in-control policy
|
||
| • Anti-hedging policy on share ownership and incentive compensation
|
||
| • Clawbacks for the President and Chief Executive Officer (CEO) and all Executive Vice-Presidents as well as all option holders
|
||
| • Caps on BCE supplemental executive retirement plans and annual bonus payouts, in addition to long-term incentive grants
|
||
| • Vesting criteria aligned to shareholder interests |
| (1) | Annualized dividend per BCE common share divided by BCE’s share price at the end of the year. |
| (2) | Dividend payout ratio is a non-GAAP ratio. Refer to section 11.2, Non-GAAP ratios in this MD&A for more information on this measure. |
| 20 | BCE INC. 2023 ANNUAL FINANCIAL REPORT |
1 MD&A Overview
Capital markets priorities
Consistent with our capital markets objective to deliver shareholder returns through dividend growth, while maintaining appropriate levels of capital investment, investment-grade credit ratings and considerable overall financial flexibility, we deploy excess free cash flow and divestiture proceeds, when available, in a balanced manner and on uses that include, but are not limited to:
| • | Funding of strategic acquisitions and investments (including wireless spectrum purchases) that support the growth of our business |
| • | Debt reduction |
| • | Share buybacks through normal course issuer bid programs |
In 2023, excess free cash flow (1) was negative $342 million, down from negative $245 million in 2022. The year-over-year decrease was primarily attributable to lower cash flows from operating activities of $7,946 million, which decreased by $419 million year over year, mainly due to lower cash from working capital, in part from timing of supplier payments, and higher interest paid. These factors were partly offset by higher adjusted EBITDA and lower contributions to post-employment benefit plans.
Total shareholder return performance
| Five-year total | One-year total |
|||
| shareholder return (2) | shareholder return (2) |
|||
| +29.5% | (6.2%) |
|||
| 2019–2023 | 2023 |
|||
Five-year cumulative total value of a $100 investment (3)
December 31, 2018 – December 31, 2023
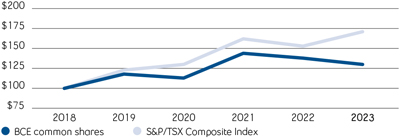
This graph compares the yearly change in the cumulative annual total shareholder return of BCE common shares against the cumulative annual total return of the S&P Global Ratings Canada (S&P)/TSX Composite Index (4), for the five-year period ending December 31, 2023, assuming an initial investment of $100 on December 31, 2018 and the quarterly reinvestment of all dividends.
| (1) | Excess free cash flow is a non-GAAP financial measure. Refer to section 11.1, Non-GAAP financial measures in this MD&A for more information on this measure. |
| (2) | Shareholder return is defined as the change in BCE’s common share price for a specified period plus BCE common share dividends reinvested, divided by BCE’s common share price at the beginning of the period. |
| (3) | Based on BCE’s common share price on the TSX and assuming the reinvestment of dividends. |
| (4) | As the headline index for the Canadian equity market, the S&P/TSX Composite Index is the primary gauge against which to measure total shareholder return for Canadian-based, TSX-listed companies. |
| 21 |
1 MD&A Overview
Strong capital structure
BCE’s balance sheet is underpinned by a healthy available liquidity (1) position of $5.8 billion at the end of 2023, comprised of $547 million in cash, $225 million in cash equivalents, $1,000 million in short-term investments, $700 million available under our securitized receivables program and $3.3 billion available under our $3.5 billion committed revolving and expansion credit facilities, and an investment-grade credit profile, providing the company with a solid financial foundation and a high level of overall financial flexibility. BCE has an attractive long-term debt maturity profile with all 2024 maturities already pre-funded. We continue to monitor the capital markets for opportunities to lower our cost of debt and optimize our cost of capital. We seek to proactively manage financial risk in terms of currency exposure of our U.S. dollar-denominated purchases, as well as equity risk exposure under BCE’s long-term equity-based incentive plans and interest rate and foreign currency exposure under our various debt instruments. We also seek to maintain investment-grade credit ratings with stable outlooks.
Attractive long-term public
debt maturity profile
| • | Average term of Bell Canada’s publicly issued debt securities: approximately 12 years (2) |
| • | Average after-tax cost of publicly issued debt securities: 3.0% (2) |
| • | All publicly issued debt securities maturing in 2024 already pre-funded |
Strong liquidity position (2)
| • | $3.3 billion available under our $3.5 billion multi-year committed credit facilities |
| • | $700 million receivables securitization available capacity |
| • | $547 million cash |
| • | $225 million cash equivalents |
| • | $1,000 million short-term investments |
Investment-grade
credit profile (2) (3)
| • | Long-term debt credit rating of BBB (high) by DBRS Limited (DBRS), Baa 1 by Moody’s Investors Service, Inc. (Moody’s) and BBB+ by S&P, all with stable outlooks |
We monitor our capital structure by utilizing a number of measures, principally net debt leverage ratio and dividend payout ratio.
At December 31, 2023, our net debt leverage ratio (1) was 3.48 times adjusted EBITDA, an increase from 3.30 times adjusted EBITDA at December 31, 2022, due mostly to ongoing elevated capital expenditures. These leverage levels exceeded our internal target range of 2.0 to 2.5 times adjusted EBITDA as we have been in a cycle of strategically accelerating our pace of capital expenditures to advance our network and transformation investments, acquiring wireless spectrum, financing a number of strategic acquisitions and making voluntary pension plan funding contributions. As well, our net debt leverage ratio was adversely affected by COVID-19 impacts on our business and the adoption of IFRS 16 that added $2.3 billion of lease liabilities to net debt (1) on our balance sheet on January 1, 2019. Our objective is to see our net debt leverage ratio decline over time to be in the range of 3.0 times adjusted EBITDA. While currently in excess of this level, our net debt leverage ratio is still consistent with a strong balance sheet, ample financial flexibility and investment grade credit ratings.
This new objective is higher than the previous target for our net debt leverage ratio, which was established several years ago. Since that time, our leverage level has largely exceeded that target and yet we have maintained adequate financial flexibility through various market conditions. Moreover, at the time of setting our previous targets, we had sizeable pension funding deficits. We currently have sizeable surpluses. While pension funding deficits and surpluses are not factored into the net debt leverage ratio, the deficits represented a potential future cash funding requirement while the current surpluses allow us to take contribution holidays, enhancing our financial flexibility. We believe the new objective of 3.0 times adjusted EBITDA is reflective of our operational size and strength, an optimized cost of capital, and is aligned with the expectations of our investors, lenders and other stakeholders.
BCE’s adjusted EBITDA to adjusted net interest expense ratio (1) at the end of 2023 was 6.94 times adjusted EBITDA, which was below our internal target of greater than 7.5 times adjusted EBITDA due to an increase in interest expense in 2023 attributable to higher average debt balances and higher interest rates. Given the correlation between this ratio and the net debt leverage ratio, we are simplifying our internal targets to reflect the net debt leverage ratio only and will not report against the adjusted EBITDA to adjusted net interest expense ratio target in the future. We believe that this ratio is of less relative importance to our investors, lenders and other stakeholders as a measure of the strength of our capital structure.
| BCE credit ratios |
Internal target |
December 31, 2023 |
December 31, 2022 |
|||||||||
| Net debt leverage ratio |
3.0 | 3.48 | 3.30 | |||||||||
| Adjusted EBITDA to adjusted net interest expense ratio |
n/a | 6.94 | 8.50 | |||||||||
Bell Canada successfully accessed the debt capital markets in February 2023, May 2023, August 2023 and November 2023, raising a total of $3.5 billion in gross proceeds from the issuance in Canada of medium-term note (MTN) debentures, and $850 million in U.S. dollars ($1,138 million in Canadian dollars) in gross proceeds from the issuance of notes in the U.S. Both the Canadian-dollar and U.S.-dollar issuances contributed to maintaining our after-tax cost of outstanding publicly issued debt securities relatively stable at approximately 3.0% (4.1% on a pre-tax basis) and the average term to maturity at approximately 12 years. The net proceeds of the 2023 offerings were used to fund the repayment of Bell Canada’s $1 billion 2.70% Series M-44 MTN debentures, to repay short-term debt and for general corporate purposes.
| (1) | Available liquidity and net debt are non-GAAP financial measures and net debt leverage ratio and adjusted EBITDA to adjusted net interest expense ratio are capital management measures. See section 11.1, Non-GAAP financial measures and section 11.4, Capital management measures in this MD&A for more information on these measures. |
| (2) | As at December 31, 2023 |
| (3) | These credit ratings are not recommendations to buy, sell or hold any of the securities referred to, and they may be revised or withdrawn at any time by the assigning rating agency. Ratings are determined by the rating agencies based on criteria established from time to time by them, and they do not comment on market price or suitability for a particular investor. Each credit rating should be evaluated independently of any other credit rating. |
| 22 | BCE INC. 2023 ANNUAL FINANCIAL REPORT |
1 MD&A Overview
Subsequent to year end, on February 15, 2024, Bell Canada issued 5.200% Series US-9 Notes with a principal amount of $700 million in U.S. dollars ($942 million in Canadian dollars), which mature on February 15, 2034. Additionally, on the same date, Bell Canada issued 5.550% Series US-10 Notes with a principal amount of $750 million in U.S. dollars ($1,009 million in Canadian dollars), which mature on February 15, 2054. The net proceeds of the offering are intended to be used for the
repayment at maturity of Bell Canada’s US $600 million US-3 Notes due on March 17, 2024, to fund the remaining payment for the 3800 MHz spectrum licences secured by Bell Mobility Inc. (Bell Mobility) through the Canadian government’s 3800 MHz spectrum auction, and other general corporate purposes, which may include the repayment of short-term debt.
| 1.5 | Corporate governance and risk management |
Corporate governance philosophy
The Board and management of BCE believe that strong corporate governance practices contribute to superior results in creating and maintaining shareholder value. That is why we continually seek to strengthen our corporate governance practices and ethical business conduct by aiming to adopt best practices, and providing full transparency and accountability to our shareholders. The Board is responsible for the supervision of the business and affairs of the company.
Below are our key Board information and governance best practices:
|
✓ |
Directors are ALL Independent (except CEO) |
|
| 99.6% |
2023 Board and Committee Director Attendance Record |
|
| ✓ | Board Committee Members are All Independent |
|
| ✓ | Board Diversity Policy and Target for Gender Representation |
|
| ✓ | Annual Election of All Directors |
|
| ✓ | Directors Elected Individually |
|
| ✓ | Majority Voting for Directors |
|
| ✓ | Separate Chair and CEO |
|
| ✓ | Board Interlocks Guidelines |
|
|
✓ |
Directors’ Tenure Guidelines |
|
| ✓ | Board Renewal: 7 Non-Executive Director Nominees < 7 Years Tenure |
|
| ✓ | Share Ownership Guideline for Directors and Executives |
|
| ✓ | Code of Business Conduct and Ethics Program |
|
| ✓ | Annual Advisory Vote on Executive Compensation |
|
| ✓ | Formal Board Evaluation Process |
|
| ✓ | Board Risk Oversight Practices |
|
| ✓ | ESG Strategy Reviewed by Board |
|
| ✓ | Robust Succession Planning |
|
For more information, please refer to BCE’s most recent notice of annual general shareholder meeting and management proxy circular (the Proxy Circular) filed with the Canadian provincial securities regulatory authorities (available at sedarplus.ca) and furnished to the U.S. Securities and Exchange Commission (available at sec.gov), and available on BCE’s website at BCE.ca.
Risk governance framework
| Board oversight
BCE’s full Board is entrusted with the responsibility for identifying and overseeing the principal risks to which our business is exposed and seeking to ensure there are processes in place to effectively identify, monitor and manage them. These processes seek to mitigate rather than eliminate risk. A risk is the possibility that an event might happen in the future that could have a negative effect on our business, financial condition, liquidity, financial results or reputation. While the Board has overall responsibility for risk, the responsibility for certain elements of the risk oversight program is delegated to Board committees in order to ensure that they are treated with appropriate expertise, attention and diligence, with reporting to the Board on a regular basis. |
|
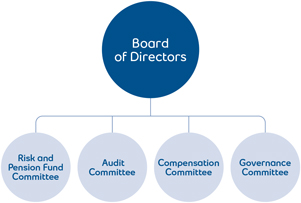
|
| 23 |
1 MD&A Overview
Risk information is reviewed by the Board or the relevant committee throughout the year, and business leaders present regular updates on the execution of business strategies, risks and mitigation.
| • | The Risk and Pension Fund Committee has oversight responsibility for the organization’s risk governance framework, which exists to identify, assess, mitigate and report key risks to which BCE is exposed. As part of its Charter, the Risk and Pension Fund Committee is tasked with oversight of risks relating to business continuity plans, work stoppage and disaster recovery plans, regulatory and public policy, information management and privacy, information security (including cyber security), physical security, fraud, vendor and supply chain management, ESG (including climate change), the pension fund, network resiliency and other risks as required. The Risk and Pension Fund Committee receives reports on security matters, including information security (including cyber security), and on environmental matters, each quarter. |
| • | The Audit Committee is responsible for overseeing the integrity of our financial statements and related information, management’s assessment and reporting on the effectiveness of internal controls, and risk processes as they relate to financial reporting. |
| • | The Management Resources and Compensation Committee (Compensation Committee) oversees risks relating to compensation, succession planning and workplace policies and practices. |
| • | The Corporate Governance Committee (Governance Committee) assists the Board in developing and implementing BCE’s corporate governance principles and guidelines, identifying individuals qualified to become members of the Board, and determining the composition of the Board and its committees. The Governance Committee is responsible for oversight of our ESG strategy (including climate change strategy and climate-related matters, and supply chain labour issues), and its integration within our overall business strategy, and disclosure. The Governance Committee is also responsible for oversight of the company’s policies concerning business conduct, ethics, public disclosure of material information and AI governance. |
Risk management culture
There is a strong culture of risk management at BCE that is actively promoted by the Board, the Risk and Pension Fund Committee and the President and CEO, at all levels within the organization. It is a part of how the company operates on a day-to-day basis and is woven into its structure and operating principles, guiding the implementation of the organization’s strategic imperatives.
The President and CEO, selected by the Board, has set his strategic focus through the establishment of six strategic imperatives and focuses risk management around the factors that could impact the achievement of those strategic imperatives. While the constant state of change in the economic environment and the industry creates challenges that need to be managed, clarity around strategic objectives, performance expectations, risk management and integrity in execution ensures discipline and balance in all aspects of our business.
Risk management framework
While the Board is responsible for BCE’s risk oversight program, operational business units are central to the proactive identification and management of risk. They are supported by a range of corporate support functions that provide independent expertise to reinforce implementation of risk management approaches in collaboration with the operational business units. The Internal Audit function provides a further element of expertise and assurance, working to provide insight and support to the operational business units and corporate support
functions, while also providing the Audit Committee, and other Board committees as required, with an independent perspective on the state of risk and control within the organization. Collectively, these elements can be thought of as a “three lines” approach to risk management. Although the risk management framework described in this section 1.5 is aligned with industry practices, there can be no assurance that it will be sufficient to prevent the occurrence of events that could have a material adverse effect on our business, financial condition, liquidity, financial results or reputation.
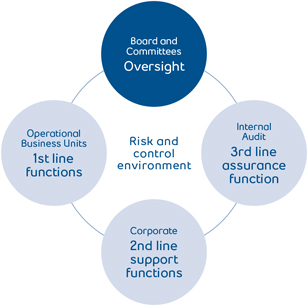
First line – operational business units
The first line refers to management within our operational business units, who are expected to understand their operations in great detail and the financial results that underpin them. There are regular reviews of operating performance involving the organization’s executive and senior management. The discipline and precision associated with this process, coupled with the alignment and focus around performance goals, creates a high degree of accountability and transparency in support of our risk management practices.
As risks emerge in the business environment, they are discussed in a number of regular forums to share details and explore their relevance across the organization. Executive and senior management are integral to these activities in driving the identification, assessment, mitigation and reporting of risks at all levels. Formal risk reporting occurs through strategic planning sessions, management presentations to the Board and formal enterprise risk reporting, which is shared with the Board and the Risk and Pension Fund Committee during the year.
Management is also responsible for maintaining effective internal controls and for executing risk and control procedures on a day-to-day basis. Each operational business unit develops its own operating controls and procedures that fit the needs of its unique environment.
Second line – corporate support functions
BCE is a very large enterprise, with 45,132 employees as at December 31, 2023, multiple business units and a diverse portfolio of risks that is constantly evolving based on internal and external factors. In a large organization, it is common to manage certain functions centrally for
| 24 | BCE INC. 2023 ANNUAL FINANCIAL REPORT |
1 MD&A Overview
efficiency, scale and consistency. While the first line is often central to identification and management of business risks, in many instances operational management works collaboratively with, and also relies on, the corporate functions that make up the second line of support in these areas. These corporate functions include Regulatory, Finance, Corporate Security, Corporate Risk Management, Legal, Corporate Responsibility, Human Resources, Real Estate and Procurement.
Regulatory function: This function is responsible for the regulatory portfolio, including an expanding range of obligations set out in new privacy and data protection laws being enacted in Canada and around the world. BCE has developed, and maintains, an enhanced Data Governance Policy that encompasses the protection and appropriate use of data across its life cycle. A significant element of the data governance program relies on the Corporate Security activities outlined below and these two functions work jointly with data owners, data custodians and other relevant employees to seek to ensure this policy is appropriately implemented. We recognize that a strong and consistently applied approach to data governance is essential to maintaining the social licence necessary to achieve our business objectives. For more information on our approach to privacy and data security, refer to section 1.6, Capitals and our corporate responsibility, in this MD&A.
Finance function: BCE’s Finance function plays a pivotal role in seeking to identify, assess and manage risks through a number of activities, which include financial performance management, external reporting, pension management, capital management, and oversight and execution practices related to the U.S. Sarbanes-Oxley Act of 2002 and equivalent Canadian securities legislation, including the establishment and maintenance of appropriate internal control over financial reporting. BCE has also established and maintains disclosure controls and procedures to seek to ensure that the information it publicly discloses, including its business risks, is accurately recorded, processed, summarized and reported on a timely basis. For more details concerning BCE’s internal control over financial reporting and disclosure controls and procedures, refer to the Proxy Circular and section 12, Effectiveness of internal controls, in this MD&A.
Corporate Security function: This function is responsible for all aspects of security, which requires a deep understanding of the business, the risk environment and the external stakeholder environment. Based on this understanding, Corporate Security sets the standards of performance required across the organization through security policies and directives that define requirements to protect team members, company assets and information. In high and emerging risk areas such as information security, Corporate Security leverages its experience and competence to develop strategies intended to mitigate the organization’s risks. For instance, we have implemented security awareness training, policies and directives that seek to mitigate information security threats. We further rely on security assessments to identify risks and review projects with the objective of ensuring that systems are deployed with the appropriate level of control, including access management, vulnerability management, security monitoring and testing. We evaluate and seek to adapt our security policies and directives designed to protect our information and assets in light of the continuously evolving nature and sophistication of information security threats. However, given the complexity and scale of our business, network infrastructure, technology and IT support systems, there can be no assurance that the security policies and directives that we implement will prevent the occurrence of all potential information security breaches. In addition, although BCE has contracted an insurance policy covering information security risk, there can be no assurance that any insurance we may have will cover the costs, damages, liabilities or losses that could result from the occurrence of any information security breach.
Corporate Risk Management function: This function works across the company to gather information and report on the organization’s assessment of its principal risks and the related exposures. Annually, senior management participate in a risk survey that provides an important reference point in the overall risk assessment process.
In addition to the activities described above, the second line is also critical in building and operating the oversight mechanisms that bring focus to relevant areas of risk and reinforce the bridges between the first and second lines, thereby seeking to ensure that there is a clear understanding of emerging risks, their relevance to the organization and the proposed mitigation plans.
To further coordinate efforts between the first and second lines, BCE has established a Health and Safety, Security, Environment and Compliance Oversight Committee (HSSEC Committee). A significant number of BCE’s most senior leaders are members of the HSSEC Committee, the purpose of which is to oversee BCE’s strategic security (including information security), compliance, environmental, and health and safety risks and opportunities. This cross-functional committee seeks to ensure that relevant risks are adequately recognized and mitigation activities are well integrated and aligned across the organization and are supported with sufficient resources. The HSSEC Committee also mandates the company’s Energy Board, a working group composed of business unit employees, including vice-presidents and directors, to ensure oversight of our overall energy consumption and costs with the objective of minimizing financial and reputational risks while maximizing business opportunities. The Energy Board also oversees the progress made towards meeting our GHG emissions reduction and supplier engagement targets. In addition, the company’s Climate Resiliency Task Force, composed of senior vice-presidents, vice-presidents, directors and managers, reports to the HSSEC Committee and assists in building a climate resiliency governance to seek to address the potential impacts of climate change in the short and medium terms.
The company’s Corporate Responsibility (CR) Board, composed of a significant number of employees at the senior vice-president, vice-president and director levels, supports the evolution of our corporate responsibility strategy. The CR Board has the responsibilities, among others, to embed corporate responsibility considerations into corporate and business unit strategies, assist in identifying corporate responsibility areas for further improvement, establish relevant ESG metrics, respond to stakeholders’ concerns, review ESG public disclosures, approve procedures seeking to verify the accuracy of publicly disclosed ESG information and support various corporate responsibility initiatives. The CR Board reports on progress to the HSSEC Committee, the co-chairs of which report to the Risk and Pension Fund Committee, Governance Committee and Compensation Committee of the Board of Directors. The CR Board also reports to the BCE Disclosure and Compliance Committee with regards to the public disclosure of ESG information.
Third line – internal audit function
Internal Audit is a part of the overall management information and control system and has the responsibility to act as an independent appraisal function. Its purpose is to provide the Audit Committee, other Board committees, as required, and management with objective evaluations of the company’s risk and control environment, to support management in fulfilling BCE’s strategic imperatives and to maintain an audit presence throughout BCE and its subsidiaries.
| 25 |
1 MD&A Overview
| 1.6 | Capitals and our corporate responsibility |
This section contains forward-looking statements, including relating to our ESG objectives. Refer to the section Caution regarding forward-looking statements at the beginning of this MD&A and to the sub-section Assumptions at the end of this section 1.6. For explanations of certain climate-related terms, metrics and targets used in this section 1.6 including, without limitation, carbon neutral, science-based targets and net zero, please refer to Explanation of certain climate-related terms, metrics and targets at the end of this section 1.6.
Since our founding in 1880, Bell has been enabling Canadians to connect with each other and the world. Our approach to corporate responsibility is to manage the company in ways that nurture the social and economic prosperity of our communities while safeguarding the environment.
Corporate responsibility underpins our six strategic imperatives
Corporate responsibility is a fundamental element of each of the six strategic imperatives that inform BCE’s policies, decisions and actions. As one of Canada’s largest companies, we are driven to continually improve our impact and our contribution to society with our network deployments, investments in mental health initiatives, environmental sustainability and an engaged workplace. This approach also supports our purpose to advance how Canadians connect with each other and the world.
Our corporate responsibility approach is informed by a set of guiding principles that support our corporate strategy and policies throughout the organization. Through our own internal processes along with stakeholder feedback, we have prioritized, and set clear objectives to address ESG issues and opportunities, seeking to enhance sustainability across BCE. We constantly measure and report on our progress. Through these actions, we strive to drive environmental leadership, achieve a diverse and inclusive workplace, lead data governance, and protect and build stronger, healthier communities.
The Board has established clear oversight of our corporate responsibility programs and our approach to ESG practices with primary accountability at the committee level. The Governance Committee is responsible for oversight of our corporate purpose and our ESG strategy and disclosure. This includes the integration of ESG within our company strategy and monitoring the implementation of ESG programs, goals and key initiatives. Moreover, it is responsible for oversight and related disclosure of climate-related risks, and for our governance practices and policies, including those concerning business conduct and ethics.
In addition, the Risk and Pension Fund Committee oversees risks that could impact our business, such as safety and security, business continuity and ESG risks, while the Audit Committee monitors significant ESG issues and approves our risks and assumptions disclosures. The Compensation Committee has oversight of human resource issues and tracks corporate performance against our ESG targets. Since 2020, the Compensation Committee has formally added ESG targets to the corporate performance metrics within the measures of the company’s annual short-term incentive compensation program, the Annual Incentive Plan (AIP). In 2022, to reflect how ESG is embedded into the overall strategy of the business, ESG-related metrics were embedded throughout our strategic imperatives score and represent, in aggregate, at least 30% of the total strategic imperatives score. The strategic imperative score represents 40% weighting of the Corporate Performance Index within the AIP.
Since 1993, BCE had been publishing a Corporate Responsibility Report detailing our performance in managing ESG issues. In 2022, for the first time, we presented both our financial and non-financial performance in an Integrated annual report following the principles of the <IR> Framework now part of the International Financial Reporting Standards. We believe this approach provides a useful basis for disclosing how we seek to create sustained value for our stakeholders over time. An integral element of the <IR> Framework are the six pillars, called “capitals” (our networks, our customers and relationships, our products and services, our environment, our people and our financial resources). We call them capitals because they are inputs to value creation.
| 26 | BCE INC. 2023 ANNUAL FINANCIAL REPORT |
1 MD&A Overview
Our networks

Our networks and services are fundamental to the communities we serve, the nation’s economy and Canadian society as a whole. Our networks are integral to delivering our wireless, wireline, and broadcasting services. We work closely with governments, regulators and our customers to maximize these societal benefits.
Additionally, privacy and information security present both potentially significant risks and opportunities for any business operating in the digital economy. They are the subject of an expanding range of obligations, including under new privacy and data protection laws being enacted in Canada and around the world. Our customers, team members and investors increasingly expect us to demonstrate that we collect data appropriately, use it for purposes that advance their interests, and keep it secure.
How digital access helps create value
Advanced communications networks provide access to a broad spectrum of everyday activities for all Canadians. Today, Bell’s network technologies are a key part of Canada’s 21st century infrastructure. Our networks provide an ever-increasing number of consumers and businesses of all sizes with greater capabilities and new opportunities to connect, build, and grow, while bridging the digital divide.
Our activities and outcomes
Bell investments are delivering benefits directly to our customers, from providing more consumers with better access to family and friends, remote learning and entertainment to enabling businesses and communities to operate more efficiently and grow in the digital economy. At the same time, by continuing to close the digital divide that separate communities, we are also supporting growth among suppliers and partners and helping build and drive innovation across the Canadian digital ecosystem.
In 2023, Bell’s capital expenditures were $4.6 billion as we continued to accelerate fibre deployments directly to homes and businesses and 5G wireless connectivity throughout our footprint. As a direct result of these investments, Bell’s pure fibre Internet was made available to an additional 633,000 homes and businesses by the end of 2023.
Bell wireless and network technologies are a key part of Canada’s 21st century infrastructure. Bell’s LTE wireless network reached 99% of Canadians by 2020. Since then we have launched and expanded our 5G network in urban and rural markets, reaching 86% of all Canadians by the end of 2023.
Investing in network security, capacity and resiliency has helped Bell achieve 99.9952% network reliability in 2023. Our investments provide core network architecture, diversity and redundancy – including multiple transport routes – which minimize the risk of major service disruptions. We also proactively provide notifications to keep customers informed if services are disrupted.
Key metrics
| 5G network coverage at December 31 |
Number of additional pure fibre locations built |
|
|
|
|
|
Bell’s network reliability (1)
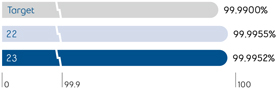
How data governance helps create value
We recognize that to achieve our purpose of advancing how Canadians connect with each other and the world, we must maintain the social licence from our customers and all Canadians to collect and use data in our operations. A strong and consistently applied approach to data governance is critical to maintaining that social licence by focusing on respecting the privacy of our customers’ data and protecting such data against information security threats. Conversely, failure to meet customer expectations regarding the appropriate use and protection of their data can have negative reputational, business and financial consequences for our company.
Our activities and outcomes
Our approach to data governance encompasses the protection and appropriate use of data across their life cycle, and we are incorporating data governance proactively as a core consideration in all our business initiatives and technology decisions. We have a data governance policy which covers privacy, information security, data access management and records management. All employees are trained on data governance, as part of our mandatory biannual code of business conduct training. In 2023, Bell continued to make significant investments in people, processes and technology in order to seek to protect confidential information from evolving cybersecurity threats.
Key metric
| 2021 | 2022 | 2023 | ||||||||||
| Number of unresolved well-founded privacy complaints (2) from the Office of the Privacy Commissioner of Canada | – | – | – | |||||||||
| (1) | Bell’s network reliability refers to our high-speed Fibre-to-the home (FTTH) Internet connection. 2022 data have been restated to reflect a change in methodology. In 2022, the metric was based on the entire Internet network (FTTH and N-FTTH). |
| (2) | A complaint is considered well-founded if the Information Commissioner concluded that one or more of the allegations in the complaint has merit. |
| 27 |
1 MD&A Overview
How information security governance
helps create value
Cybersecurity threats give rise to new and emerging standards and regulations. We need to be able to identify and address information security risks in a timely manner in order to be in a better position to protect our market share and reputation, and these efforts align with our strategic imperative to champion customer experience, while at the same time reducing exposure to cyberattacks. Avoiding data breaches can also limit the increase in expenses associated with remediation efforts and legal exposures, aligning with our strategic imperative to operate with agility and cost efficiency.
Our activities and outcomes
We are focused on maintaining the trust that our customers have in us to protect their data. To do this, we are implementing prevention, detection, and response programs related to security threats. In addition, we are helping define industry security and risk management practices, and we are training our team members on data protection.
In 2023, we have aligned our Information Security program at 100% of the ISO/IEC 27001 standard. Starting in 2021, we launched our Be Cyber Savvy information security training program. This training program
includes onboarding to our specialized Cyber Awareness platform, the conducting of monthly phishing simulations and the completion of four baseline courses. Team members must complete these four courses within 12 months of being onboarded to the program. This year, 95% of onboarded team members completed baseline training by the end of 2023. As we move forward, we believe a combination of training, clear messaging, and positive reinforcement when reporting a phishing attempt, should lead to year-over-year phishing report rate improvement. This year, we observed a 142% increase in reported phishing simulations by trained employees.
Key metric
Reported phish simulation between our fully trained
employees and non-trained employees on our Be Cyber
Savvy information security training

Our customers and relationships

Since 2010, the Bell Let’s Talk mental health initiative has raised awareness and action for Canadian mental health, with a focus on helping reduce the stigma around mental illness, improving access to care, supporting world-class research and leading by example in workplace mental health. Over the last 14 years, Canadians have taken action to create real change by engaging in the world’s largest mental health conversation, to help create a Canada where everyone can get the culturally-appropriate mental health support they need. By 2025, Bell expects to reach its total current commitment of $155 million for Canadian mental health supports and services.
How taking action on mental health
helps create value
Our products and services help communities thrive, and we believe the way we invest – our time, our money and our passion – has a positive impact on the communities we serve. Communities also benefit from the engagement of our team members as they support the causes they value deeply. Bell is taking a leading role in helping address the mental health crisis in Canada with the Bell Let’s Talk mental health initiative. The program encourages Canadians to take action and achieve real change in their mental health.
Our activities and outcomes
Bell Let’s Talk is active year round providing funding through the Bell Let’s Talk Community Fund, Diversity Fund, Post-Secondary Fund and Bell True Patriot Love Fund. Bell Let’s Talk has partnered with more than 1,500 organizations including hospitals, universities, local community service providers and other care and research organizations. This collaboration has enabled these organizations to improve access to mental health supports and services in communities nationwide.
| • | In January 2024, the Bell Let’s Talk Post-Secondary Fund awarded $1 million to 11 Canadian colleges, universities, and cégeps to support initiatives that align with the National Standard of Canada for Mental |
| Health and Well-Being for Post-Secondary Students or the Québec Action Plan on Student Mental Health for Higher Education. |
| • | Since the launch in 2020, the Bell Let’s Talk Diversity Fund provided 49 grants totalling $5.45 million, including 10 new grants announced in January 2024. |
| • | The Bell Let’s Talk Community Fund has provided over 1,100 grants and invested over $20.5 million, including 115 new grants announced in October 2023. |
| • | In 2023, The Bell True Patriot Love Fund awarded a total of $350,000 to 10 organizations making a meaningful difference in the military veteran community. |
| • | Also in 2023, Bell Let’s Talk announced a $1 million gift to the IWK Health Foundation in Halifax, the Maritime’s leading children’s health care and research centre. |
On Bell Let’s Talk Day 2024, communities and organizations across Canada showed their support for mental health by raising the Bell Let’s Talk flag at city and town halls, military bases, schools and other locations. Students at Canadian elementary and high schools, universities, colleges and cégeps across the country also engaged in a variety of initiatives in their learning environments to promote student mental health.
Key metric
In 2023, Bell made a fundamental shift in the Bell Let’s Talk Day campaign by highlighting the mental health crisis Canadians are facing in very real and personal ways, and issued a collective call to action and change. Bell Let’s Talk Day 2024 continued to put a spotlight on mental health organizations across the country that are providing support and services for Canadians experiencing mental health issues – organizations that Bell Let’s Talk is proud to support. Bell expects to reach its current commitment of $155 million for Canadian mental health programs by 2025.
| 28 | BCE INC. 2023 ANNUAL FINANCIAL REPORT |
1 MD&A Overview
Our products and services

Our products and services provide value to Canadians by helping them both mitigate climate change and adapt to its impacts. Our solutions enable customers to reduce environmental impacts, improve health and safety and better safeguard protected data from growing risks.
How our products and services contributing
to climate change mitigation and adaptation
helps create value
Bell technologies and services can help our customers reduce energy needs, minimize carbon footprints and enhance productivity. Our solutions help businesses embrace new ways to communicate, collaborate, ensure business continuity and be able to maintain services in the event of emergencies and extreme incidents.
Our activities and outcomes
Our solutions include:
| • | virtualization and cloud computing which encourage optimal use of space, power and cooling resources by consolidating servers and storage and improve business continuity through redundancies in our network |
| • | IoT services which can help optimize asset and fleet management and are effective for smart buildings, smart cities, smart operations and smart fieldwork applications. Electronic controls coupled with our communications networks can help communities adapt to rising mean temperatures and/or events such as extended heat waves. |
| • | hybrid workforce solutions and teleworking which help ensure business continuity, as evidenced during the COVID-19 pandemic |
| • | dematerialization, the reduction of the quantities of materials needed to serve an economic function, which substitutes technology (e.g., online banking apps) for travel (e.g., commuting to the bank) |
At Bell, we believe it is important to understand the net carbon abatement impact of our solutions. To achieve this, we have worked with Groupe AGECO, a third-party consultant with expertise in GHG emissions quantification, to develop a methodology that uses a carbon abatement ratio which estimates the carbon reduction capacity of our products and services used by our customers. The carbon abatement ratio represents the GHG emissions estimated to have been avoided by our customers through the use of our technological solutions in comparison to our own operational (scope 1 and 2) GHG emissions. To do so, GHG emissions are estimated in a business-as-usual case where technology is not used compared to the case where Bell’s products are used. The avoided GHG emissions correspond to the difference between the emissions estimated to have been generated in a business-as-usual case compared to the case where Bell’s technological solutions are used. The emissions generated by Bell in providing the solutions to
the customers are not deducted from the total carbon abatement of solutions, but are included in our operational emissions. Only the benefits resulting from technologies deployed to Bell’s clients are considered, i.e., environmental benefits associated with solutions implemented within Bell’s own operations are not included. An example of how the calculations were made is provided below:
| Business- as-usual scenario |
Physical meeting in one room between 2 or more participants, including the transportation to the meeting location | |
| Bell’s solution |
Virtual meeting through a cloud-hosted platform with integrated video and audio conferencing, online presentations, shared applications and group document editing. Users can share their entire or part of their desktop, or a specific application with a small group of people. | |
| Carbon abatement |
GHG emissions avoided from business travel for a meeting due to the use of Bell’s web conferencing solution | |
The calculation method of the carbon abatement ratio is based on existing methodologies developed in the Information and Communications Technology (ICT) sector. The calculation, as shown below, is based on assumptions that are dependent on customers’ behaviour over which Bell has no control.

Key metric
GHG emissions estimated to have been avoided by our
customers through the use of Bell’s products and services
Number of times by which GHG emissions estimated to have been abated
by our customers through the use of Bell’s technologies exceeded scope 1
and 2 GHG emitted by Bell’s operations (1)

| (1) | GHG emitted by Bell’s operations refers to scope 1 emissions (direct GHG emissions from sources that are owned or controlled by Bell) and scope 2 emissions (indirect GHG emissions associated with the consumption of purchased electricity, heating/cooling and steam required by Bell’s activities). The analyses were performed based on 2015, 2017 and 2020 data, respectively. |
| 29 |
1 MD&A Overview
Our environment

We strive to minimize the negative environmental impacts of our operations and to create positive impacts where possible. We also know that our team members, our customers, and our investors expect this. Taking care of the environment makes good business sense. If we fail to take action to reduce our negative impacts on the environment, we risk losing our valuable team members and customers to competitors, we risk increased costs due to fines or remediation requirements, and we risk losing investors, all of which could adversely impact our business.
We have been implementing and maintaining programs to reduce the environmental impact of our operations for more than 30 years. Our Environmental Policy, first issued in 1993, reflects our team members’ values, as well as the expectations of customers, investors and society that we regard environmental protection as an integral part of doing business that needs to be managed systematically under a continuous improvement process. We implemented an environmental management system (EMS) to help with this continuous improvement, which has been certified ISO 14001 (1) since 2009, making us the first North American communications company to be so designated. We have continuously maintained this certification since then. In addition, Bell’s energy management system was certified ISO 50001 (2) in 2020, also making us the first North American communications company to be so designated (3).
How addressing climate change
helps create value
Climate change poses risks to our operating environment and our ability to create value. To help mitigate these risks, we aim to reduce our energy consumption and GHG emissions while continuing to adapt to the impacts of climate change.
Our activities and outcomes
We are taking action both to help fight climate change and adapt to its consequences. We are adapting by taking action to seek to maintain our resiliency in the face of climate change, and are helping our customers do the same. To fight climate change, we are focused on reducing our energy consumption and GHG emissions, while also helping customers reduce theirs. Fostering innovation that helps reduce our carbon footprint is part of our culture. On an annual basis, we calculate, monitor and
publicly report on our energy performance and GHG emissions as part of our environmental and energy management systems. Since 2003, we report on our climate change mitigation and adaptation efforts through the CDP (formerly the Carbon Disclosure Project), a not-for-profit organization that gathers information on climate-related risks and opportunities from organizations worldwide. In 2023, we obtained an A- score from the CDP, ranking us in the “Leadership Band” for the eighth consecutive year, recognizing our leadership on climate action, our alignment with current best practices and the transparency of our climate-related disclosures. Furthermore, we disclose annually on our risks and opportunities related to climate change following the 11 recommendations of the Task Force on Climate-related Financial Disclosures (TCFD). We are also engaged in reducing our GHG footprint to contribute to the global effort in fighting climate change. We have set the target to be carbon neutral for our operational GHG emissions (scope 1 and 2 only) starting in 2025. For 2026 and 2030, we have set science-based GHG emissions reduction and supplier engagement targets that are consistent with the goals of the Paris Agreement. The Science Based Targets initiative (SBTi) (4) has approved the three specific targets set by BCE Inc. that cover all scopes.
Key metrics
| Energy intensity (Energy consumption (Megawatt hours (MWh) equivalent) divided by network usage (petabytes)) |
Operational (scope 1 and 2) GHG emissions (tonnes of CO2e) |
|
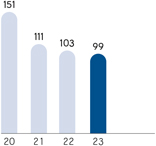
|
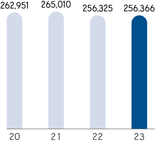
|
|
| (1) | Our ISO 14001 certification covers Bell Canada’s administrative oversight of the EMS associated with the development of policies and procedures for the delivery of services for business sectors including landline, wireless, television, Internet services, connectivity, broadband services, data hosting and cloud computing. |
| (2) | Our ISO 50001 certification covers Bell Canada’s energy management program at its national business locations associated with the activities of real estate management services, fleet services, radio broadcasting and digital media services, landline, wireless, television, Internet services, connectivity, broadband services, data hosting and cloud computing, in addition to related general administrative functions. |
| (3) | Bell’s review in 2020 of publicly available information for North American communications and telecommunications companies indicated Bell was the first of its North American communications and telecommunications competitors to receive ISO 14001 and 50001 certifications. |
| (4) | The SBTi is a partnership between CDP, the United Nations Global Compact, World Resources Institute and the World Wide Fund for Nature driving ambitious climate action in the private sector by enabling organizations to set science-based emissions reduction targets. The SBTi approved our targets in 2022, prior to the recalculation of our 2020 GHG emission base year. The impact of this recalculation is an increase of our target to reduce absolute scope 1 and 2 GHG emissions by 58% instead of 57% by 2030, from a 2020 base year. The recalculated target has been submitted to the SBTi for approval on October 20, 2023. |
| 30 | BCE INC. 2023 ANNUAL FINANCIAL REPORT |
1 MD&A Overview
How circular economy helps create value
We are improving our circular economy model to focus on solutions that detach growth from accelerating raw material consumption in order to reduce the environmental impact of our operations. Waste reduction is essential to our objective of improving our operational efficiency and also aligns with the values and expectations of our team members and customers.
Our activities and outcomes
Bell has managed waste reduction, reuse and recycling programs for more than 30 years. We have waste reduction goals and strong monitoring processes in place that enable us to track and report on our activities that generate waste. To manage the waste created from the electronic devices we distribute to customers, we have implemented effective and accessible e-waste collection programs for the recovery, reuse, refurbishment and recycling of customer-facing devices, including national take-back programs, drop boxes and mail-in instructions. To measure the success of these programs, we had set a goal to collect 7 million used TV receivers, modems, mobile phones and Wi-Fi pods between October 1, 2020 and September 30, 2023, which we’ve exceeded in 2023 with the collection of 7,760,323 devices. At Bell, we believe in leading by example, and so to continue to manage and reduce the waste generated from our own operations, we have the target to reach and maintain a 15% reduction of total waste sent to landfill by
2025, from a 2019 baseline year. We’ve exceeded this target in 2023 by diverting a total of 16% waste from landfill. Through setting waste reduction targets, such as the ones listed above, we are striving to build a resilient path to circularity. In 2024, we will work to set a new target, while efforts will continue to further divert waste from landfill and keep the numbers of electronic devices we recover as a key metric to monitor our performance. We are also investing in research and development for solutions where current technology does not provide responsible waste diversion methods.
Key metric
Cumulative recovery of used TV receivers, modems,
Wi-Fi pods (1) and mobile phones
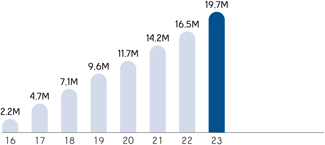
Our people

To execute on our strategic imperatives, we rely on the engagement and expertise of our team members. We focus on attracting, developing and retaining the best talent, as well as creating a positive team member experience to drive effectiveness, high performance and agility in our evolving business environment. Through workplace wellness initiatives and by celebrating diversity in the workplace, we reinforce our goal of creating a safe and inclusive atmosphere for all team members.
How well-being helps create value
Bell team members bring our corporate purpose and strategic imperatives to life every day. To support the Bell team, we strive for a dynamic culture where all team members feel valued and respected in a safe, supported environment. We offer inclusive benefits, ongoing education and awareness programs and a range of progressive initiatives to foster well-being and success. At Bell, we believe that taking care of the well-being of our team members is essential to their personal success and to our organization’s ongoing progress.
Our activities and outcomes
To foster the well-being of our team members, we believe that engaging our team members as well as nurturing an inclusive environment are both essential. We are proud to be again ranked as one of Canada’s Top Employers (2). Bell has also been recognized by Mediacorp as one of Canada’s Top Employers for Young People, Top Family-Friendly Employers, one of Canada’s Greenest Employers and one of Montréal’s Top Employers (3) (4) (5) (6). We are focused on developing and retaining the best talent in the country by providing a workplace that is positive, professional and rewarding, all of which enable creativity and innovation. We also continue to develop, implement and share mental health practices in the workplace, and to broaden our approach to emphasize total-health support. We educate team members through our training programs and campaigns, support them through an extensive range of mental health services, and support and adapt workplace policies and practices to foster a psychologically safe workplace. Since 2010, over 90 metrics have been measured quarterly and assessed for trends
| (1) | Wi-Fi pods have been included in the scope starting in 2021. |
| (2) | Bell was recognized as one of “Canada’s Top 100 Employers” in years 2016 to 2024 by Canada’s Top Employers, an editorial competition organized by Mediacorp Canada Inc., a publisher of employment periodicals. Winners are evaluated and selected based on their industry leadership in offering exceptional workplaces for their employees. Employers are compared to others in their field to determine which offers the most progressive and forward-thinking programs. |
| (3) | Bell was recognized as one of “Canada’s Top Employers for Young People” in years 2018 to 2024 by Canada’s Top 100 Employers. Winners are evaluated and selected based on the programs offered to attract and retain young employees, when compared to other employers in the same field. |
| (4) | Bell was recognized as one of “Canada’s Top Family-Friendly Employers” in years 2020 to 2024 by Canada’s Top 100 Employers. Winners are evaluated and selected based on the programs and initiatives offered to help employees balance work and family commitments, when compared to other employers in the same field. |
| (5) | Bell was recognized as one of “Canada’s Greenest Employers” in years 2017 to 2023 by Canada’s Top 100 Employers. Winners are evaluated and selected based on the development of sustainability initiatives and environmental leadership, when compared to other employers in the same field. |
| (6) | Bell was recognized as one of “Montréal’s Top Employers” in years 2013 to 2024 by Canada’s Top Employers. Winners are evaluated and selected based on progressive and forward-thinking programs offered in a variety of areas, when compared to other organizations in the same field. |
| 31 |
1 MD&A Overview
and program insights to closely monitor the psychological health of our workplace. Collecting qualitative and quantitative data is crucial to ensuring that we are heading in the right direction and making any required adjustments to our mental health programs.
| Key metrics | ||
| People leaders who completed mandatory base training on mental health |
Overall team member engagement score (1) |
|
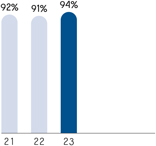
|
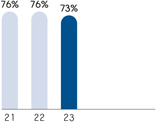
|
|
How fostering diversity, equity, inclusion
and belonging helps create value
At Bell, we are proud of our focus on fostering a diverse, inclusive, equitable and accessible workplace where all team members feel valued, respected and supported. We are dedicated to building a workforce that reflects the diversity of the communities we serve, where every team member has the opportunity to reach their full potential. The integration of DEIB programs within Bell fosters the innovation and creativity of our team members.
Our activities and outcomes
Our DEIB strategy is supported by a governance framework that includes the Diversity Leadership Council with senior leaders from every business unit, business unit committees and employee-led networks, including Black Professionals at Bell, Pride at Bell, Diversability at Bell and Women at Bell.
In line with our objective of improving gender diversity, our current gender diversity target for the Board is a minimum of 35% gender diverse directors, defined as directors who identify as women and directors who identify with a gender other than a man or a woman. This target was met from its adoption, in 2021, until the appointment of Johan Wibergh to the Board on November 1, 2023, following which (and as of December 31, 2023) 33% of all directors identified as women. With the increase in the number of directors upon his appointment, the Board is temporarily below the target to allow for an orderly transition ahead of the retirements of David F. Denison and Robert C. Simmonds at the end of the 2024 Annual General Shareholder Meeting (the Meeting) in May. The target will be met again if all director nominees are elected at the Meeting, after which directors identifying as women will represent 38% of all directors. In step with our overarching corporate objective to improve gender diversity across levels, including in our senior leadership, Bell was a signatory to the Catalyst Accord 2022 (2) and is currently a member of the 30% Club, (3) which aim to increase the proportion of
women within executive leadership positions and serving on Canadian corporate boards to at least 30%. In 2022 and 2023, Bell exceeded that target with 32% women in executive positions but did not achieve Bell’s goal of at least 35% gender diverse executives (vice president level and above) by the end of 2023 and in July 2023, we extended our target date to achieve this goal to the end of 2025.
Bell continues to take meaningful actions to address the impacts of systemic racism experienced by Black, Indigenous and Persons of Colour (BIPOC). Our goal is to reach at least 25% BIPOC representation in our senior management team by 2025. As of the end of 2023, we were at 23%. We exceeded our target of 40% BIPOC representation in our new graduate and intern hires, achieving 66% representation in 2023. Ongoing partnerships with the Onyx Initiative and the Black Professionals in Tech Network are helping drive the recruitment of Black college and university students and promote Black talent in technology. Bell Media continues to promote greater diversity in Canadian media with the HireBIPOC website and the Bell Media Content Diversity Task Force in partnership with BIPOC TV & Film.
Looking ahead, we plan to continue building momentum for our DEIB strategy based on concrete objective-setting and the integration of inclusive leadership practices.
| Key metrics | ||
| Gender diverse (4) representation in executive positions (vice-president level and above) |
Gender diverse (4) representation among directors on the BCE Board |
|
|
|
|
|
| BIPOC | BIPOC | |
| representation in Bell senior management |
representation among new graduates and interns |
|
|
|
|
|
| (1) | This metric is calculated as the average score obtained in the annual Bell team member satisfaction survey. The Team Member Engagement score is based on five specific questions and the percentage of employees who responded favourably (Strongly agree or Agree) to these questions out of the total number of employees who responded to the survey. |
| (2) | The Catalyst Accord 2022 calls on Canadian boards and CEOs to pledge to accelerate the advancement of women in business through these actions: Increase the average percentage of women on boards and women in executive positions in corporate Canada to 30% or greater by 2022. |
| (3) | Recognizing Canada’s distinct corporate governance framework, the aim of the 30% Club Canada is to include both board Chairs and CEOs to achieve better gender balance at board level, as well as at senior management levels. |
| (4) | Gender diverse is defined as a person who identifies as a woman or with a gender other than a man or a woman. |
| 32 | BCE INC. 2023 ANNUAL FINANCIAL REPORT |
1 MD&A Overview
Our financial resources

The financial resources of the company are addressed throughout this MD&A. In addition, in 2022 and 2023, we added sustainability-linked pricing to our $3.5 billion committed credit facilities, to our securitization program and to certain derivatives, introducing price adjustments based on our performance of certain sustainability performance targets.
Assumptions
GHG emissions reduction and supplier
engagement targets

Our GHG emissions reduction and supplier engagement targets are based on a number of assumptions including, without limitation, the following principal assumptions:
| • | Our ability to purchase a significant amount of high-quality credible carbon credits and/or renewable energy certificates (RECs) to offset or reduce, as applicable, our GHG emissions |
| • | The carbon offset resulting from the purchase of carbon credits will be permanent and will not be reversed, in whole or in part, prior to the date of our targets |
| • | The successful and timely implementation of various corporate and business initiatives to reduce our electricity and fuel consumption, as well as reduce other direct and indirect GHG emissions enablers |
| • | No new corporate initiatives, business acquisitions, business divestitures or technologies that would materially change our anticipated levels of GHG emissions |
| • | No negative impact on the calculation of our GHG emissions from refinements in or modifications to international standards or the methodology we use for the calculation of such GHG emissions |
| • | No required changes to our science-based targets pursuant to the SBTi methodology that would make the achievement of our science-based targets, as updated from time to time, more onerous or unachievable in light of business requirements |
| • | Sufficient supplier engagement and collaboration in setting their own science-based targets, no significant change in the allocation of our spend by supplier and sufficient engagement and collaboration from the other participants across our whole value chain in reducing their own GHG emissions |
DEIB targets

Our DEIB targets are based on a number of assumptions including, without limitation, the following principal assumptions:
| • | Ability to leverage DEIB partnerships and recruitment agencies to help identify qualified diverse talent for vacant positions |
| • | Sufficient diverse labour market availability |
| • | Implementation of corporate and business initiatives to increase awareness, education and engagement in support of our DEIB targets |
| • | Propensity of existing employees and job-seekers to self-identify to enable a diverse workforce representation |
| 33 |
1 MD&A Overview
Explanation of certain climate-related terms, metrics and targets
Scope 1, 2 and 3 GHG emissions
Scope 1 emissions are direct GHG emissions from sources that are controlled by Bell. Scope 2 emissions are indirect GHG emissions associated with the consumption of purchased electricity, heating/cooling and steam required by Bell’s activities. Scope 1 and 2 emissions are sometimes collectively referred to in this MD&A as “operational emissions”. Scope 3 emissions are all indirect emissions (not included in scope 2) that occur in our value chain, including both upstream and downstream emissions.
By definition, GHG emissions from scope 3 (upstream and downstream indirect emissions) occur from sources owned or controlled by other entities in Bell’s value chain (such as our suppliers, employees and customers). As a result, measuring scope 3 emissions is more complex than measuring scope 1 and scope 2 emissions, for which we are able to obtain primary data (such as litres of fuel consumed within our vehicle fleet and kilowatt-hours of electricity consumed within our buildings). For scope 3 categories for which primary data is not available, we have to rely on secondary data (such as financial data and industry-average data from published databases). These data collection challenges contribute to uncertainty in scope 3 emissions measurement.
Carbon neutrality
We will measure our carbon neutrality performance based on our operational GHG emissions (scope 1 and scope 2 emissions in tonnes of CO2e) minus GHG emissions offset by carbon credits purchased (in tonnes of CO2e). To be carbon neutral, the total must be equal to zero or lower. In order to achieve our target of carbon neutral operations
starting in 2025, we expect that we will need to purchase a significant amount of carbon credits to offset our scope 1 and 2 GHG emissions that will not have been avoided by internal initiatives, in addition to RECs to reduce our scope 2 emissions. In 2023, our scope 1 and 2 emissions represented 12% of our total carbon footprint. Our target for carbon neutral operations excludes our scope 3 emissions that represented 88% of our carbon footprint in 2023.
Science-based targets
Science-based targets provide a clearly-defined pathway for companies to reduce GHG emissions, aiming to prevent the worst impacts of climate change. Targets are considered ‘science-based’ if they are in line with what the latest climate science deems necessary to meet the goals of the Paris Agreement – limiting global warming to 1.5°C above pre-industrial levels. The SBTi brings together a team of experts to provide companies with independent assessment and validation of targets.
Net zero target
BCE’s carbon neutrality and science-based targets are different than, and independent of, the SBTi’s net zero target. Net zero refers to the state in which an organization reduces GHG emissions in its entire value chain (i.e., scopes 1, 2 and 3 GHG emissions) to as close to zero as possible (with a minimum reduction of at least 90%) and neutralizes (1) any remaining emissions such that its net global GHG emissions balance to zero. At the moment, BCE does not have a net zero target.
| (1) | According to SBTi, neutralize means that carbon is removed from the atmosphere and permanently stored in geological, terrestrial, or ocean reservoirs, or in products. |
| 34 | BCE INC. 2023 ANNUAL FINANCIAL REPORT |
2 MD&A Strategic imperatives
| 2 | Strategic imperatives |
Our success is built on the BCE team’s dedicated execution of the six strategic imperatives that support our purpose to advance how Canadians connect with each other and the world.
This section contains forward-looking statements, including relating to our network deployment plans, the cost savings expected to result from workforce reductions, our ESG objectives, and our 2024 objectives, plans and strategic priorities. Refer to the section Caution regarding forward-looking statements at the beginning of this MD&A.
| 2.1 | Build the best networks |
|
|
Continuing to enhance our key competitive advantage with a focus on delivering leading broadband fibre and wireless networks in locations large and small. |
2023 progress
| • | Expanded our FTTP direct fibre footprint to an additional 633,000 homes and businesses. FTTP enables multi-gigabit symmetrical download and upload Internet speeds, offering a performance and quality advantage over cable networks. At the end of 2023, approximately 6.5 million locations in Bell’s footprint had access to multi-gigabit symmetrical speeds of 3 Gbps. |
| • | Secured the acquisition of 939 licences for 1.77 billion MHz-Pop of 3800 MHz spectrum for $518 million following ISED’s wireless spectrum auction, enabling Bell to continue bringing fast and reliable 5G+ wireless service to more people and businesses across Canada. Combined with our existing 3500 MHz holdings, Bell will have access to an industry-leading 3.5 billion MHz-Pop of 5G+ spectrum nationwide, acquired at a total cost of $2.78 billion, the lowest among national wireless carriers. |
| • | Expanded our 5G wireless network to reach 86% of Canada’s population |
| • | Expanded 5G+ service coverage, leveraging 3500 MHz spectrum, to reach 51% of Canada’s population |
| • | Bell 5G was ranked Canada’s fastest and best 5G network by Global Wireless Solutions (GWS) for the third consecutive year in its 2023 nationwide assessment of 5G networks (1). New this year, GWS’s testing included 3500 MHz network wireless spectrum and determined Bell’s network (5G+) performance to be the fastest and best in the country. |
| • | Launched mobile service in Toronto’s TTC subway tunnels and stations for Bell, Virgin Plus and Lucky Mobile customers |
| • | Continued to work closely with governments on projects to bring broadband access to remote and other hard to serve areas, including in rural Ontario, and in Newfoundland and Labrador with the Universal Broadband Fund |
| • | Announced new wavelength data routes with speeds up to 400 gigabits that will enable triple redundancy between Secaucus, NJ, Toronto and Montréal, expected to be available in the first half of 2024, in partnership with FirstLight Fiber, an Albany, New York-based provider of fibre-optic data, Internet, data centre, cloud, unified communications, and managed services to enterprise and carrier customers throughout the Northeast and mid-Atlantic |
2024 focus
| • | Further deployment of direct fibre to more homes and businesses within our wireline footprint, but at a slower pace than during any of 2020 to 2023. Bell’s near-term fibre build target is to reach 8.3 million locations with fibre by the end of 2025. |
| • | Ongoing expansion and deployment of 5G and 5G+ wireless networks, offering competitive coverage and quality |
| 2.2 | Drive growth with innovative services |
|
|
Leveraging our leading network technologies to provide truly differentiated communications services to Canadians and drive revenue growth. |
2023 progress
| • | Added 411,189 total net postpaid and prepaid mobile phone subscribers, bringing Bell’s mobile phone customer base to 10,287,046 at December 31, 2023, up 3.4% over 2022 |
| • | Entered into a multi-year exclusive agreement with Staples Canada to sell Bell, Virgin Plus and Lucky Mobile wireless and wireline services through Staples stores across Canada for consumers and small businesses. In addition, Bell and Staples are partnering to sell Bell wireless and wireline services direct to medium-sized businesses through the Staples Professional sales team, backed by Bell’s communications expertise. |
| • | Entered into a multi-year strategic agreement with Air Canada, which includes premier sponsorship of its in-flight Wi-Fi, free in-flight messaging for Aeroplan members and the distribution of complimentary SIM cards on board to enable newcomers and visitors arriving in Canada to activate a wireless SIM while still in the air |
| • | Virgin Plus unveiled a fresh new look with more affordable service offerings for everyone, including those new to Canada, including unlimited nationwide rate plans and access to 5G, plus updated Member benefits |
| • | Built on our position as the leading Internet service provider (ISP) in Canada with a retail high-speed Internet subscriber base of 4,473,429 at December 31, 2023, up 5.0% over 2022 |
| (1) | Based on a third party score (Global Wireless Solutions OneScore) calculated using Bell wireless 5G network testing in Canada against other national wireless networks from April 12, 2023 to October 27, 2023. |
| 35 |
2 MD&A Strategic imperatives
| • | Bell pure fibre was ranked Canada’s fastest Internet and Wi-Fi in Ookla’s Q1-Q2 2023 and Q3-Q4 2023 Speedtest Awards reports (1) |
| • | Named the Best Major & All Around ISP in Canada in PCMag’s Best ISPs 2023 Canada report, based on Internet speed as well as price, coverage and customer satisfaction (2) |
| • | Recognized as BrandSpark’s Most Trusted ISP 2024 (3) |
| • | Launched Gigabit Fibe 3.0 service in Manitoba with symmetrical download and upload speeds of 3 Gbps |
| • | Acquired FX Innovation, a Montréal-based provider of cloud-focused managed and professional services and workflow automation solutions for business clients. The acquisition enables the delivery of leading-edge technology solutions for Canadian businesses and supports Bell’s position as a technology services leader. |
| • | Entered into a collaboration with ServiceNow, a digital workflow company, to launch Service Bridge capabilities on the ServiceNow platform, leveraging FX Innovation’s deep industry expertise to elevate the end-to-end experience for Bell customers with customized solutions and automation capabilities |
| • | Partnered with Palo Alto Networks to better support Canadian businesses managing their cloud security with the launch of two new cloud-native application protection platform (CNAPP) solutions, Cloud Security Posture Assessment and Cloud Security Posture Protection |
2024 focus
| • | Leverage innovative new partnerships and collaborations to deliver for our customers |
| • | In January 2024, Bell entered into a strategic partnership with Best Buy Canada to operate 165 The Source consumer electronics retail stores in Canada, which will be rebranded as Best Buy Express and offer the latest in consumer electronics from Best Buy along with exclusive telecommunications services from Bell. In February 2024, Bell announced that with the strengths of Best Buy’s buying power |
| and supply chain, Bell will wind down The Source head office and back office operations, as well as close 107 The Source stores. |
| • | In February 2024, Bell announced a partnership with SentinelOne, a global leader in AI-powered security, to provide extensive data protection services for Bell’s enterprise customers |
| • | In February 2024, Bell announced a collaboration with Microsoft to bring new hybrid work solutions to Canadian enterprises with the launch of Bell Operator Connect, pairing Bell’s high-quality voice network and Microsoft Teams. Bell is also rolling out Microsoft 365 within its own enterprise IT environment. |
| • | In February 2024, Bell announced a collaboration with Mila, a research institute in AI, to apply deep learning neural network algorithms to Bell’s systems and data to improve business performance and customer experience and accelerate AI innovations using cloud computing |
| • | Increase our market share of national operators’ wireless mobile phone net additions |
| • | Introduction of more 5G and 5G+ devices and services |
| • | Increased adoption of unlimited data plans and device financing plans |
| • | Accelerated business customer adoption of advanced 5G and IoT solutions |
| • | Continued growth in retail Internet subscribers |
| • | Enhance Internet product superiority through new service offerings and hardware to provide an enhanced customer experience in the home |
| • | Cross sell to customers who do not have all their telecommunication services with Bell |
| • | Continued diversification of Bell’s distribution strategy with a focus on expanding DTC and online transactions |
| • | Continue to deliver network-centric managed and professional services solutions to large and medium-sized businesses that increase the value of connectivity services |
| 2.3 | Deliver the most compelling content |
|
|
Taking a unified approach across our media and distribution assets to deliver the content Canadians want the most. |
2023 progress
| • | Increased our IPTV subscriber base by 4.1% to 2,070,342 at December 31, 2023 |
| • | Crave expanded its DTC subscription offering with the launch of ad-supported plans, giving customers a range of options to access Crave’s ever-growing lineup of award-winning premium content |
| • | 2023 was the most watched year in Crave’s streaming history |
| • | Maintained CTV’s #1 ranking as the most-watched TV network in Canada for the 22nd year in a row |
| • | Extended a long-term and exclusive licensing agreement with Warner Bros. Discovery that includes HBO and Max Originals, new cable and library television series, and pay and post-pay window rights for Warner Bros. films and library films |
| • | Forged a licensing and distribution pact with FOX Entertainment Global to support Canadian original productions for all Bell Media platforms, including CTV and Crave, and in the U.S. for FOX |
| • | TSN acquired exclusive media rights to PGA Tour Live, featuring more than 4,300 hours of live coverage from PGA Tour events throughout the season |
| • | Launched TSN+, a DTC streaming product available on TSN.ca and the TSN app that provides access to marquee live games and events that are incremental to the sports content delivered across TSN’s platforms |
| • | Launched Addressable TV, an innovation that delivers tailored ads to TV audiences, across Bell Media’s premium linear and video on demand (VOD) content on CTV, CTV2, and Noovo, as well as a selection of English and French specialty channels |
| • | Launched Addressable Audio, an innovative new format that dynamically inserts digital audio ads into live linear programming, and on-demand content on iHeartRadio.ca and the iHeartRadio Canada app |
| • | Implemented upgrades to Bell Media’s proprietary Strategic Audience Management (SAM) tool, including faster optimization, better proposals, expanded user capabilities, and automation |
| (1) | Based on analysis by Ookla of Speedtest Intelligence data Fixed and Wi-Fi nationally aggregated Speed Score results for Q1–Q2 and Q3–Q4 2023. Ookla trademarks used under license and reprinted with permission. |
| (2) | PCMag Best ISPs 2023: Canada, based on speed, price, coverage and customer satisfaction comparing major and overall Canadian ISPs from June 1, 2022 to June 27, 2023. |
| (3) | BrandSpark is a research and consulting firm. Winners were determined by a national survey of 15, 878 Canadian shoppers who gave their top-of-mind, unaided answers as to which brands they trust most and why in categories they have recently shopped. |
| 36 | BCE INC. 2023 ANNUAL FINANCIAL REPORT |
2 MD&A Strategic imperatives
2024 focus
| • | Continued growth in IPTV subscribers |
| • | Enhance TV product superiority through new service offerings and innovation to provide an enhanced customer experience in the home |
| • | In January 2024, Bell launched the next generation Fibe TV service in Atlantic Canada, with capabilities and features including live TV, on-demand shows and movies, access to the Google Play app catalogue, voice remote powered by Google Assistant, universal search, Cloud PVR and unlimited simultaneous streams with the Fibe TV app |
| • | Reinforce industry leadership in conventional TV, specialty TV, pay TV, streaming and sports services |
| • | Continued scaling of Crave through optimized content offering, user experience improvements and expanded distribution |
| • | In February 2024, Bell Media reached an agreement with Amazon to make Crave available on Prime Video Channels in Canada |
| • | Continued support of original French programming with a focus on digital platforms such as Crave, Noovo.ca and iHeartRadio, to better serve our French-language customers through a personalized digital experience |
| • | Grow advertising revenue and maximize market share |
| • | Continued scaling of our SAM TV and demand-side platform (DSP) buying platforms, Bell Media’s advertising buying optimization platforms which give customers the ability to plan, activate and measure marketing campaigns using Bell’s premium first-party data and expand personalization of ad content to TV and digital radio |
| • | Advance our digital-first media strategy including growing digital revenues (1) and DTC subscribers |
| • | Optimize unique partnerships and strategic content investments to monetize content rights and Bell Media properties across all platforms |
| 2.4 | Champion customer experience |
|
|
Making it easier for customers to do business with Bell at every step, from sales to installation, to ongoing support. |
2023 progress
| • | Led national telecom service providers in reducing our share of consumer complaints, according to the 2022–2023 Annual Report from the Commission for Complaints for Telecom-television Services (CCTS). Bell reduced its share of total industry complaints for an eighth consecutive year, decreasing its share of complaints by 6% over the previous year. |
| • | Won a Webby award for the MyBell app (2), recognized by both a panel of expert judges and the voting public. The app was judged among 14,000 applicants across criteria including user experience, design, innovation and overall usability. |
| • | Reached one million digital repair sessions on our self-serve Virtual Repair tool, and enhanced the tool with new features such as Wi-Fi check-up to help customers simplify the repair process |
| • | Leveraged our online and social media platforms to do a better job keeping customers informed through social media and outage notifications accessible online through the MyBell app |
| • | Increased our share of digital online service transactions through self-serve tools to nearly 70% of all digital transactions |
| • | Leveraged AI to automate the service experience either through our agents or our digital platforms |
2024 focus
| • | Improve customer experience with continued scaling of digital sales capabilities and functionality |
| • | Further improve and expand self-installation capabilities |
| • | Further improve customer satisfaction scores |
| • | Further reduce the total number of customer calls to our call centres as well as the number of truck rolls |
| • | Continue to invest in AI and machine learning to resolve customer issues faster |
| 2.5 | Operate with agility and cost efficiency |
|
|
Underscoring our focus on operational excellence and cost discipline throughout every part of our business. |
2023 progress
| • | Launched a multi-year operational transformation project to modernize our operations, increase productivity, build tech talent and materially right-size our cost base, to support Bell’s evolution from a telco to a techco |
| • | Undertook restructuring initiatives as a result of the unfavourable economic and regulatory environments |
| • | Delivered productivity improvements and cost efficiencies resulting from the expansion of Bell’s all-fibre network footprint and service innovations enabled by new broadband technologies |
| • | Maintained stable BCE consolidated adjusted EBITDA margin (3) |
| • | Maintained low average after-tax cost of Bell Canada’s publicly issued debt securities of 3.0% |
2024 focus
| • | Accelerate Bell’s transformation from a telco to a techco |
| • | Continued focus on our cost structure |
| • | Realize cost savings from: |
| • | workforce restructuring initiative announced in February 2024, our largest in nearly 30 years, that will result in the reduction of our workforce by approximately 4,800 positions, or 9% of all BCE employees in 2024, and is expected to yield in-year cost savings of $150 million to $200 million, or $250 million on an annualized basis |
| • | operating efficiencies enabled by our direct fibre footprint |
| (1) | Digital revenues are comprised of advertising revenue from digital platforms including web sites, mobile apps, connected TV apps and OOH digital assets/platforms, as well as advertising procured through Bell digital buying platforms and subscription revenue from direct-to-consumer services and VOD services. |
| (2) | The Webby awards are presented annually by the International Academy of Digital Arts & Sciences that honour outstanding digital achievements. |
| (3) | Adjusted EBITDA margin is defined as adjusted EBITDA divided by operating revenues. |
| 37 |
2 MD&A Strategic imperatives
| • | changes in consumer behaviour and product innovation |
| • | digital adoption |
| • | product and service enhancements |
| • | expanding self-serve capabilities |
| • | new call centre and digital investments |
| • | other improvements to the customer service experience |
| • | lower contracted rates from our suppliers |
| • | rationalization of real estate footprint |
| 2.6 | Engage and invest in our people and create a sustainable future |
|
|
Strengthening our inclusive workplace culture, recognizing that Bell’s success requires a dynamic and engaged team that is committed to the highest ESG standards. |
2023 progress
| • | Named one of Canada’s Top Employers for Young People for the sixth consecutive year by Mediacorp (1) |
| • | Named one of Canada’s Top Family-Friendly Employers for the fourth consecutive year by Mediacorp (2) |
| • | Named a Montréal Top Employer for the 11th consecutive year by Mediacorp (3) |
| • | Recognized with a special mention by the Workforce Disclosure Initiative’s (WDI) 2023 Workforce Transparency Awards |
| • | Introduced a new virtual health care program to team members called Dialogue, making it easier to bring high-quality health care to our team and their families when they need it, 24 hours a day, 7 days a week |
| • | Launched a new Human Rights and Accommodation policy as part of our ongoing objective to take action to promote our team’s human rights and continue fostering an accessible, inclusive and equitable workplace |
| • | Released a new Accessibility Plan on BCE.ca, improving our ongoing focus and support for all Canadians |
| • | Continued to support our DEIB strategy through various initiatives, policies, training and multiple employee resource groups, including the launch of a new Diversability at Bell employee group to help advance inclusion and promote accessibility at Bell |
| • | Ranked 1st most sustainable telecom globally and 51st overall in the Corporate Knights Global 100 2024 ranking of the most sustainable corporations in the world (4) |
| • | Named to the Canada’s Best 50 Corporate Citizens list compiled by Corporate Knights, ranking 20th overall (5) |
| • | Named one of Canada’s Greenest Employers for the seventh straight year (6) |
| • | Recognized with a Clean50 Top Project Award for our halocarbon free, energy-efficient computer room cooling project (7) |
| • | Amended our securitization program to add sustainability-linked pricing that introduces a financing cost that varies based on Bell’s performance of certain sustainability performance targets |
| • | Entered into our first Sustainability-Linked Derivatives, with a pricing adjustment that increases the derivatives’ cost based on Bell’s performance towards its science-based target to reduce its operational GHG emissions |
2024 focus
| • | Continue to support employees with enhanced pension, savings and benefits options that focus on flexibility, inclusion and wellness |
| • | Deliver new Bell U tech training for leaders to advance and build the company’s transformation culture |
| • | Play an active role in engaging our team and the broader community in diversity issues and deliver on DEIB objectives |
| • | Continue to enhance our workplace programs for the mental health and well-being of all Bell team members, by evolving existing programs and focusing on prevention and protective psychological workplace factors to proactively improve mental health |
| • | Continue to implement our action plan to address climate change and achieve carbon neutral operations starting in 2025 |
| • | In January 2024, we were ranked the most sustainable communications company in the world in the Corporate Knights Global 100 2024 ranking (8) |
| • | Enhance our Cyber Savvy program for employees, further advancing their cyber security knowledge and awareness |
| • | Continue to advance ESG initiatives and Bell for Better commitments |
| (1) | Canada’s Top 100 Employers report is issued annually by Medicorp. Winners were evaluated and selected based on programs offered to attract and retain young employees, when compared to other employers in the same field. |
| (2) | Canada’s Top 100 Employers report is issued annually by Medicorp. Winners were evaluated and selected based on programs and initiatives offered to help employees balance work and family commitments, when compared to other employers in the same field. |
| (3) | Canada’s Top 100 Employers report is issued annually by Medicorp. Winners were evaluated and selected based on progressive and forward-thinking programs offered in a variety of areas, when compared to other organizations in the same field. |
| (4) | In January 2024, Corporate Knights, a sustainable-economy media and research company, ranked Bell #1 among telecom providers and #51 overall in its global 2024 ranking of the World’s 100 Most Sustainable Corporations. The ranking is based on an assessment of more than 6,000 public companies with revenue over US $1 billion. All companies are scored on applicable metrics relative to their peers, with 50% of the weight assigned to sustainable revenue and sustainable investment. |
| (5) | According to Corporate Knights Inc. The annual ranking was released on June 28, 2023 and is based on a set of 25 ESG indicators that compares Canadian companies with a gross revenue of at least $1 billion. |
| (6) | Canada’s Top 100 Employers report is issued annually by Medicorp. Winners were announced in April 2023 and were selected and evaluated in terms of: the unique environmental initiatives and programs they have developed; the extent to which they have been successful in reducing the organization’s own environmental footprint; the degree to which their employees are involved in these programs and whether they contribute any unique skills; and the extent to which these initiatives have become linked to the employer’s public identity, attracting new employees and clients to the organization. |
| (7) | The Clean50 Awards were founded by Delta Management Group, a sustainability, ESG and clean tech focused search firm in Canada, in June 2011 and have been awarded annually since. Selection is primarily by Delta Management, with significant assistance by third- party advisors and based on detailed submissions by nominees. Clean50 Top Projects annually recognize projects completed in the prior two years based on their innovation, ability to inform and inspire other Canadians. |
| (8) | According to Corporate Knights Inc.’s global rankings released on January 17, 2024. BCE was ranked #51 overall and #1 in our sector and industry, in its 2024 ranking of the world’s 100 most sustainable corporations. The ranking is based on an assessment of more than 6,000 public companies with revenue over US $1 billion. All companies are scored on applicable metrics relative to their peers, with 50% of the weight assigned to sustainable revenue and sustainable investment. |
| 38 | BCE INC. 2023 ANNUAL FINANCIAL REPORT |
3 MD&A Performance targets, outlook, assumptions and risks
| 3 | Performance targets, outlook, assumptions and risks |
This section provides information pertaining to our performance against 2023 targets, our consolidated business outlook and operating assumptions for 2024 and our principal business risks.
| 3.1 | BCE 2023 performance vs. guidance targets |
| Financial measure |
2023 target |
2023 performance and results |
||||
| Revenue growth | 1% to 5% | 2.1% | BCE revenues grew by 2.1% in 2023, compared to 2022, driven by higher product revenue of 9.4%, and higher service revenue of 0.9%, attributable to growth from our Bell CTS segment, moderated by a decline in our Bell Media segment. |
|||
| Adjusted EBITDA growth | 2% to 5% | 2.1% | BCE adjusted EBITDA grew by 2.1% in 2023, compared to 2022, reflecting a greater contribution from our Bell CTS segment, partly offset by a decline in our Bell Media segment. The growth was driven by higher revenues, moderated by increased operating costs. |
|||
| Net earnings growth |
Not applicable | (20.5%) | In 2023, net earnings decreased by 20.5%, compared to 2022, due to higher other expense mainly due to losses on our equity investments in associates and joint ventures which included a loss on BCE’s share of an obligation to repurchase at fair value the minority interest in one of BCE’s joint ventures, higher interest expense, higher depreciation and amortization and higher severance, acquisition and other costs, partly offset by higher adjusted EBITDA and lower impairment of assets. |
|||
| Capital intensity (1) | 19% to 20% | 18.6% | 2023 capital expenditures of $4,581 million declined by 10.8% year over year, which corresponded to a capital intensity ratio of 18.6%, down 2.6 pts over last year, driven by lower planned capital spending in 2023 subsequent to accelerated network investments in 2022, as well as an unplanned additional $105 million decrease in Q4 2023 as a result of the CRTC’s decision in November 2023 to mandate wholesale access to Bell’s FTTP network. |
|||
| Net earnings per share (EPS) growth | Not applicable | (23.5%) | Net earnings attributable to common shareholders in 2023 decreased by $640 million, or $0.70 per common share, compared to 2022, due to higher other expense mainly due to losses on our equity investments in associates and joint ventures which included a loss on BCE’s share of an obligation to repurchase at fair value the minority interest in one of BCE’s joint ventures, higher interest expense, higher depreciation and amortization and higher severance, acquisition and other costs, partly offset by higher adjusted EBITDA and lower impairment of assets. |
|||
| Adjusted net earnings per share (adjusted EPS) (2) growth | (7%) to (3%) | (4.2%) | Excluding the impact of severance, acquisition and other costs, net mark-to-market gains (losses) on derivatives used to economically hedge equity settled share-based compensation plans, net equity gains (losses) on investments in associates and joint ventures, net gains (losses) on investments, early debt redemption costs and impairment of assets, net of tax and non-controlling interest (NCI), adjusted net earnings in 2023 was $2,926 million, or $3.21 per common share, compared to $3,057 million, or $3.35 per common share, in 2022. |
|||
| Cash flows from operating activities growth | Not applicable | (5.0%) | In 2023, BCE’s cash flows from operating activities of $7,946 million decreased by $419 million, compared to 2022, mainly due to lower cash from working capital, in part from timing of supplier payments, and higher interest paid, partly offset by higher adjusted EBITDA and lower contributions to post-employment benefit plans. |
|||
| Free cash flow growth | 2% to 10% | 2.5% | Free cash flow of $3,144 million in 2023 increased by $77 million compared to 2022, mainly due to lower capital expenditures, partly offset by lower cash flows from operating activities, excluding cash from acquisition and other costs paid. |
|||
| Annualized dividend per common share | $3.87 per share | $3.87 per share |
Annualized dividend per BCE common share for 2023 increased by $0.19 cents, or 5.2%, to $3.87 compared to $3.68 per share in 2022. |
|||
| (1) | Capital intensity is defined as capital expenditures divided by operating revenues. |
| (2) | Adjusted EPS is a non-GAAP ratio. Refer to section 11.2, Non-GAAP ratios in this MD&A for more information on this measure. |
| 39 |
3 MD&A Performance targets, outlook, assumptions and risks
| 3.2 | Business outlook and assumptions |
This section contains forward-looking statements, including relating to our projected financial performance, our anticipated capital expenditures and network deployment plans, and our business outlook, objectives, plans and strategic priorities. Refer to the section Caution regarding forward-looking statements at the beginning of this MD&A.
2024 outlook
2024 will be an important transformation year for BCE. We look to maintain operational momentum, while balancing growth with financial performance, as we continue our transition to a tech services and digital media company. Our outlook for 2024 takes into consideration potential recessionary and competitive pricing pressures, as well as the financial impact of our strategic distribution partnership with Best Buy Canada that will result in a decrease in largely consumer electronics related revenue from our consolidated results. The impact of this partnership on BCE’s adjusted EBITDA will not be material given relatively low margins for consumer electronics. Our 2024 outlook also reflects the impacts of our workforce restructuring and other transformation initiatives that aim to better position the company for future growth and success.
Our strategic priorities in 2024 centre on:
| • | Accelerating growth investments, including in cloud and security services, advanced advertising and digital transformation, while de-emphasizing and reducing spending on highly-regulated and declining businesses |
| • | Maintaining focus on premium mobile phone subscriber acquisition with increased emphasis on market growth |
| • | Leveraging our existing fibre footprint, network speed leadership and product strength to drive greater cross-sell penetration of Internet households with wireless |
| • | Accelerating our business markets growth in cloud, security and workflow automation solutions |
| • | Maintaining our strength in digital media driven by our advanced advertising capabilities, premium inventory and new distribution initiatives |
| • | Realizing cost savings from our transformation initiatives, including workforce reductions |
Underpinning our outlook for 2024 is a stable financial profile that reflects our sound operating fundamentals and consistent execution in a competitive marketplace. Wireless, retail Internet and IPTV subscriber base growth, together with promotional offer discipline and the flow-through of operating cost savings from transformation initiatives, including a reduced workforce, are projected to drive year-over-year growth in revenue and adjusted EBITDA. Directly as a result of federal government policies and the CRTC’s decision in November 2023 to mandate wholesale access to Bell’s FTTP network, we plan a significant reduction in capital expenditures that will lead to a slowdown in our pure fibre build and lower spending in highly-regulated businesses. Despite expected growth in adjusted EBITDA and lower planned capital expenditures, a combination of higher severance payments related to workforce restructuring initiatives, higher interest paid and lower projected cash from working capital is expected to drive lower free cash flow.
Assumptions
Assumptions about the Canadian economy
| • | Slowing economic growth, given the Bank of Canada’s most recent estimated growth in Canadian gross domestic product of 0.8% in 2024, down from 1.0% in 2023 |
| • | Easing, but still elevated, consumer price index (CPI) inflation as the effects of past interest rate increases work through the economy |
| • | Easing labour market conditions |
| • | Muted growth in household spending due to slow labour income growth, high debt-servicing costs and weak consumer confidence |
| • | Soft business investment growth due to slow demand and still-elevated borrowing costs |
| • | Prevailing high interest rates expected to remain at or near current levels |
| • | Population growth resulting from strong immigration |
| • | Canadian dollar expected to remain near current levels. Further movements may be impacted by the degree of strength of the U.S. dollar, interest rates and changes in commodity prices. |
Market assumptions
| • | A higher level of wireline and wireless competition in consumer, business and wholesale markets |
| • | Higher, but slowing, wireless industry penetration |
| • | A shrinking data and voice connectivity market as business customers migrate to lower-priced telecommunications solutions or alternative OTT competitors |
| • | The Canadian advertising market is experiencing a slowdown consistent with trends in the global advertising market, with improvement expected in the medium term, although visibility to the specific timing and pace of recovery remains limited |
| • | Declines in broadcasting distribution undertaking (BDU) subscribers driven by increasing competition from the continued rollout of subscription video on demand (SVOD) streaming services together with further scaling of OTT aggregators |
Assumptions underlying expected continuing
contribution holiday in 2024 in the majority
of our pension plans
| • | At the relevant time, our defined benefit (DB) pension plans will remain in funded positions with going concern surpluses and maintain solvency ratios that exceed the minimum legal requirements for a contribution holiday to be taken for applicable DB and defined contribution (DC) components |
| • | No significant declines in our DB pension plans’ financial position due to declines in investment returns or interest rates |
| • | No material experience losses from other events such as through litigation or changes in laws, regulations or actuarial standards |
| 40 | BCE INC. 2023 ANNUAL FINANCIAL REPORT |
3 MD&A Performance targets, outlook, assumptions and risks
| 3.3 | Principal business risks |
Provided below is a summary description of certain of our principal business risks that could have a material adverse effect on all of our segments. Certain additional business segment-specific risks are reported in section 5, Business segment analysis. For a detailed description of the principal risks relating to our regulatory environment and of the other principal business risks that could have a material adverse effect on our business, financial condition, liquidity, financial results or reputation, refer to section 8, Regulatory environment and section 9, Business risks, respectively.
General economic conditions
and geopolitical events
Our business and financial results could be negatively affected by adverse economic conditions, including a potential recession. The current global economic environment could further exacerbate pre-existing risk factors, including those described in this MD&A, in light of slowing Canadian economic growth, elevated CPI inflation, high interest rates,
high housing support costs relative to income, and financial and capital market volatility. All of these could negatively affect our business and financial results, including by adversely affecting business and customer spending and the resulting demand for our products and services, our customers’ financial condition, the availability of our offerings in light of supply chain disruptions, and the cost and amount of funding available in the financial markets.
Furthermore, risk factors including, without limitation, those described in this MD&A, could be exacerbated, or become more likely to materialize, as a result of geopolitical events, which could have an adverse impact on our business or future financial results and related assumptions, the extent of which is difficult to predict. Geopolitical events could adversely impact the global economy and cause financial and capital market volatility, broader geopolitical instability and armed conflicts, higher energy prices, increased inflationary pressures limiting consumer and business spending and increasing our operating costs, disruptions in our supply chain and increased information security threats.
Regulatory environment and compliance

Our regulatory environment influences our strategies, and adverse governmental or regulatory decisions could have negative financial, operational, reputational or competitive consequences for our business
Although most of our retail services are not price-regulated, government agencies and departments such as the CRTC, ISED, Canadian Heritage and the Competition Bureau continue to play a significant role in regulatory matters such as establishing and modifying regulations for mandatory access to networks, spectrum auctions, the imposition of consumer-related codes of conduct, approval of acquisitions, broadcast and spectrum licensing, foreign ownership requirements, privacy and cybersecurity obligations, and control of copyright piracy. As with all regulated organizations, strategies are contingent upon regulatory decisions. Adverse decisions by governments or regulatory agencies, increased regulation or lack of effective anti-piracy remedies could have negative financial, operational, reputational or competitive consequences for our business.
For a discussion of our regulatory environment and the principal risks related thereto, refer to section 8, Regulatory environment as well as the segment discussion under Principal business risks in section 5.1, Bell CTS.

Failure to proactively address our legal and regulatory obligations, and our involvement in various claims and legal proceedings, could have an adverse effect on our business, financial performance and reputation
Changes in laws or regulations, or in how they are interpreted, and the adoption of new laws or regulations, as well as pending or future litigation, could have an adverse effect on our business, financial performance and reputation. The increase in laws and regulations around customer interactions and the technological evolution of our business further create an environment of complex compliance requirements that must be adequately managed. The failure to monitor and comply with legal or regulatory obligations applicable to us could expose us to litigation, significant fines and penalties, and operational restrictions, as well as result in reputational harm. Heightened focus on consumer protection through provincial legislation and regulatory consumer codes, as well as increased legal and regulatory pressure in the areas of privacy, accessibility, data governance and other ESG topics, require that we build and operationalize enhanced compliance frameworks and could further increase the company’s exposure to investigations, litigation, sanctions, fines and reputational harm.
We become involved in various claims and legal proceedings as part of our business. For a description of important legal proceedings involving us, please see the section entitled Legal proceedings contained in the BCE 2023 AIF.
| 41 |
3 MD&A Performance targets, outlook, assumptions and risks
Competitive environment

Competitive activity in our industry is intense and competitive dynamics are evolving, contributing to disruptions in each of our business segments
Our market landscape is being reshaped by changing macroeconomic and regulatory environments, increasing global and national competition, and evolving customer preferences. As our business evolves and technological advances drive new services, delivery models and strategic partnerships, our competitive landscape continues to intensify and expand to include new and emerging competitors, certain of which were historically our partners or suppliers, as well as global-scale competitors, including, in particular, cloud and OTT service providers, IoT hardware and software providers, VoIP providers and other web-based players that are penetrating the communications space with significant resources and a large customer base over which to amortize costs. Certain of these competitors are changing the competitive landscape by establishing a material market presence, which has accelerated in recent years. Established competitors further seek to consolidate or expand their product offerings through acquisitions in order to increase scale and market opportunities in light of these changes in market dynamics. In particular, the combination of Rogers Communications Inc. (Rogers) with Shaw Communications Inc. (Shaw) in April 2023 created a Canadian competitor with larger scale, and the acquisition of Freedom Mobile by Vidéotron Ltd. (Vidéotron) also increases its scale with a change in competitive dynamics in several provinces, which could have adverse implications in particular for our Bell CTS segment. Failure to effectively respond to such evolving competitive dynamics could adversely affect our business and financial results.
Technology substitution, IP networks and recent regulatory decisions, in particular, continue to facilitate entry in our industry. In addition, the effects of government policies that result in the acquisition of spectrum at favourable pricing by regional facilities-based wireless service providers distort market dynamics. These factors have changed industry economics and allowed competitors to launch new products and services and gain market share with far less investment in financial, marketing, human, technological and network resources than has historically been required. In particular, with regulatory decisions mandating wholesale rates for wireline Internet and mobile virtual network operator (MVNO) access, competitors can deliver their services over our networks, leveraging regulatory obligations applicable to us, therefore limiting their need to invest in building their own networks and impacting the network-based differentiation of our services. Such lower required investment challenges the monetization of our networks and our operating model. Moreover, foreign OTT players are currently not subject to the same Canadian content investment obligations as those imposed on Canadian domestic digital suppliers, which provides them with a competitive advantage over us.
New technologies create a potential for diversifying our product and service offerings and create growth opportunities. However, if we are unable to develop and deploy new solutions in advance of or concurrently with our competitors, if the market does not adopt these new technologies in pace with our deployment of new solutions, or if we fail to adequately assess and manage the risks associated with these new solutions, our business and financial results could be adversely affected.
We expect these trends to continue in the future, and the increased competition we face as a result could negatively impact our business including, without limitation, in the following ways:
| • | The acceleration of disruptions and disintermediation in each of our business segments could adversely affect our business and financial results |
| • | Adverse economic conditions, such as economic downturns or recessions, high interest rates and elevated inflation, adverse conditions in the financial markets or a declining level of retail and commercial activity, could have a negative impact on the demand for, and prices of, our wireline, wireless and media products and services, and improve the competitive position of lower-cost providers |
| • | Competitors’ aggressive market offers, combined with heightened customer sensitivity around pricing, could result in pricing pressures, lower margins and increased costs of customer acquisition and retention, and our market share and sales volumes could decrease if we do not match competitors’ pricing levels or increase customer acquisition and retention spending |
| • | Should our value proposition on pricing, network, speed, service or features not be considered sufficient for customers in light of available alternatives, or should our products and services not be provided over customers’ preferred delivery channels, this could lead to increased churn |
| • | The shift to online transactions could cause a reduction in in-store traffic, which could adversely impact our ability to leverage our extensive retail network to increase the number of subscribers and sell our products and services |
| • | Evolving customer behaviour could result in ongoing customer suppression of mobile phone data and offloading onto Wi-Fi networks, as well as influence customer adoption of new services including, without limitation, 5G and IoT |
| • | The convergence of wireline and wireless services is impacting product purchase choice by customers and could increase product substitution in favour of lower-margin products as well as increase churn. These trends are expected to increase with the continued adoption of 5G and 5G+. |
| • | Increased embedded SIM (eSIM) adoption makes it easier for customers to change service providers and has the potential to upend existing distribution models, including negatively impacting roaming revenue |
| • | Regulatory decisions regarding wholesale access to our wireless and fibre networks could facilitate entry of new competitors, including OTT players, or strengthen the market position of current competitors, or encourage existing competitors to expand beyond their traditional footprint, which may negatively impact our retail subscriber base in favour of lower-margin wholesale subscribers and thus could negatively impact our capacity to optimize scale and invest in our networks |
| • | The extent and timely rollout of fibre networks and 5G and 5G+ mobile services may be adversely impacted by government and regulatory decisions, constraints on access to and price of network equipment, labour shortages and potential operational challenges in delivering new technology |
| 42 | BCE INC. 2023 ANNUAL FINANCIAL REPORT |
3 MD&A Performance targets, outlook, assumptions and risks
| • | Cloud-based and OTT-based substitution and the market expansion of lower-cost VoIP, collaboration and software-defined networking in a wide area network (SD WAN) solutions offered by local and global competitors, such as traditional software players, are changing our approach to service offerings and pricing and could have an adverse effect on our business |
| • | Increased insolvency, spending rationalization and consolidation by business customers could lead to further disruptions in our Bell CTS segment, driven by technology substitution, economic factors and customers’ operational efficiencies |
| • | The pressure from simpler, lower-cost, agile service models is driving in-sourcing trends, which could have an adverse impact on our managed services business |
| • | Greater customer adoption of services like 5G, as well as IoT services and applications in the areas of retail (e.g., home automation), business (e.g., remote monitoring), transportation (e.g., connected car and asset tracking) and urban city optimization (smart cities), combined with the increased use of AI, is expected to accelerate competition in these areas |
| • | Subscriber and viewer growth is challenged by changing viewer habits, the expansion and continued market penetration of global scale low-cost OTT content providers, OTT aggregators and other alternative service providers, some of which may offer content and platforms as loss leaders to support their core business, as well as account stacking, CRTC arbitration and a fragmentation of audiences due to an abundance of choices |
| • | Competition, with both global competitors and traditional Canadian TV competitors, for programming content could drive significant |
| increases in content acquisition and development costs as well as reduced access to key content as some competitors withhold content to enhance their OTT service offering |
| • | The proliferation of content piracy could negatively impact our ability to monetize products and services beyond our current expectations, while creating bandwidth pressure without corresponding revenue growth in the context of regulated wholesale high-speed Internet access rates |
| • | Our ability to grow digital and other alternative advertising revenue, in the context of a changing and fragmented advertising market, is being challenged by global-scale players |
| • | Traditional radio faces accelerated substitution from new music players and alternative streaming services such as those offered by global audio streaming players and those made available by new technologies, including smart car services |
| • | The launch by Canadian and international competitors of low earth orbit (LEO) satellites to provide connectivity, primarily in rural areas and the North, intensifies competition, which could adversely affect our network deployment strategy in such areas and negatively impact demand for our connectivity services. The ability of our subsidiary Northwestel, operating in Canada’s North, to respond to the competitive threat from these providers is further hampered by CRTC retail Internet regulations. |
For a further discussion of our competitive environment and related risks, as well as a list of our main competitors, on a segmented basis, refer to Competitive landscape and industry trends and Principal business risks in section 5, Business segment analysis.
Technology/infrastructure transformation
The evolution and transformation of our networks, systems and operations using next-generation technologies, while lowering our cost structure, are essential to effective competition and customer experience
Globalization, increased competition and ongoing technological advances are driving customer expectations for faster market responses, improved customer service, enhanced user experiences and cost-effective delivery. Meeting these expectations requires the deployment of new service and product technologies along with customer service tools that are network-neutral and based on a more collaborative and integrated development environment. The availability of improved networks and software technologies further provides the foundation for better and faster connections, which have in turn led to a significant growth in IoT applications. Change can be difficult and may present unforeseen obstacles that might impact successful execution, and this transition is made more challenging by the complexity of our multi-product environment, combined with the complexity of our network and IT infrastructure.
We are pursuing a transformation from a telco to a techco, which entails fundamentally improving the experience and value we deliver to customers enabled by modernized infrastructure, simplified business processes, and a right sized cost model. Failure to successfully pursue this transformation and accurately assess the potential of new technologies,

or to invest and evolve in the appropriate direction in an environment of changing business models, could limit our ability to deliver value to our customers through easy and simple buy and support interactions and through enabling them to get what they want much faster through any channel, as well as limit our customers’ ability to receive products, services and content to any device or location regardless of network access type. As a result, this could have an adverse impact on our business and financial results.
Our network and IT evolution activities seek to use new as well as evolving and developing technologies, including network functions virtualization, software-defined networks, cloud technologies, MEC, open source software, AI and machine learning. They further seek to transform our networks and systems through consolidation, virtualization and automation to achieve our objectives of becoming more agile in our service delivery and operations, as well as providing omni-channel capabilities for our customers and driving lower costs. Our evolution activities also focus on building next-generation converged wireline and wireless networks leveraging smart-core technologies, to enable competitive quality and customer experience at a competitive cost structure amid rapidly growing capacity requirements. Alignment across technology platforms, product and service development and operations is increasingly critical to ensure appropriate trade-offs and optimization of capital allocation. Failure to adopt best-in-class
| 43 |
3 MD&A Performance targets, outlook, assumptions and risks
technology practices in transforming our operations in order to enable a truly customer-centric service experience may hinder our ability to build customers’ trust in our innovation and technological capabilities and our ability to compete on footprint, service experience and cost structure. Any one or more of the above could have an adverse impact on our business, financial results and reputation.
Customer retention and new customer acquisitions may be hindered during our transformation activities if such transformation causes poor service performance, which in turn may adversely affect our ability to achieve operational and financial objectives. Failure to quickly maximize adaptable infrastructures, processes and technologies to efficiently respond to evolving customer patterns and behaviours and to leverage IP and automation across many facets of our network, product and service portfolio could inhibit a fully customer-centric approach. This could reduce our ability to provide comprehensive self-serve convenience, real-time provisioning, cost savings and flexibility in delivery and consumption, leading to negative business and financial outcomes.
We further seek to expand our network footprint to enhance our value proposition and meet customer needs while deploying technologies to support growth. However, adverse government, regulatory or court decisions may impact the specific nature, magnitude, location and timing of investment decisions. In particular, the requirement to provide aggregated access to our FTTP facilities on a wholesale basis, lowering of rates by the CRTC of mandated wholesale services over FTTP and/or FTTN, the imposition of unfavourable terms or the adoption of unfavourable rates in arbitration processes associated with the facilities-based MVNO access service the CRTC has implemented, the potential for additional mandated access to our networks, or the imposition of broader wholesale obligations on wireless networks would undermine the incentives for facilities-based digital infrastructure providers to invest in next-generation wireline and wireless networks. Failure to continue investment in next-generation capabilities in a disciplined, timely and strategic manner could limit our ability to compete effectively and to achieve desired business and financial results.
Other examples of risks that could affect the achievement of our desired technology/infrastructure transformation include the following:
| • | The current global economic environment as well as geopolitical events may bring about further incremental costs, delays or unavailability of equipment, materials and resources, which may impact our ability to continue building next-generation converged networks and drive other transformation initiatives |
| • | Challenges in hiring, retaining, insourcing, and developing technical and skilled resources could adversely impact transformation activities. Potential deterioration in employee morale and de-prioritization of transformation initiatives due to staff reductions, cost reductions or reorganizations could adversely affect our transformation and financial results. |
| • | Suboptimal capital deployment in network build, infrastructure and process upgrades, and customer service improvements, could hinder our ability to compete effectively |
| • | Execution risk and lower or slower than expected savings achieved through targeted savings initiatives (e.g., vendor management, real estate optimization) could impact our ability to invest in the transformation |
| • | We, and other telecommunications carriers upon which we rely to provide services, must be able to purchase high-quality, reputable network equipment and services from third-party suppliers on a timely basis and at a reasonable cost |
| • | Network construction and deployment on municipal or private property requires the issuance of municipal or property owner consents, respectively, for the installation of network equipment, which could increase the cost of, and cause delays in, fibre and wireless rollouts |
| • | The successful deployment of 5G mobile services could be impacted by various factors affecting coverage and costs |
| • | Higher demand for faster Internet speed and capacity, coupled with governmental policies and initiatives, creates tensions around FTTP deployment in terms of geographic preference and pace of rollout |
| • | The increasing dependence on applications for content delivery, sales, customer engagement and service experience drives the need for new and scarce capabilities (sourced internally or externally), that may not be available, as well as the need for associated operating processes integrated into ongoing operations |
| • | New products, services or applications could reduce demand for our existing, more profitable service offerings or cause prices for those services to decline, and could result in a shorter life cycle for existing or developing technologies, which could increase depreciation and amortization expense |
| • | The decommissioning of legacy equipment could be challenged by customer requirements to continue using older technologies as well as inherent risks involved with transitioning to new systems |
| • | As content providers’ business models change, content consumption habits evolve and viewing options increase, our ability to aggregate and distribute relevant content and our ability to develop alternative delivery vehicles to compete in new markets and increase customer engagement and revenue streams may be hindered by the significant software development and network investment required |
| • | Successfully managing the development and deployment of relevant product solutions on a timely basis to match the speed of adoption of IoT in the areas of retail, business and government could be challenging |
| • | Customers continue to expect improvements in customer service, new functions and features, and reductions in the price charged to provide those services. Our ability to provide such improvements increasingly relies upon using a number of rapidly evolving technologies, including AI, machine learning and “big data”. However, the use of such technologies is being increasingly scrutinized by legislators and regulators. If we cannot build market-leading competencies in the use of these emerging technologies in a way that respects societal values, we may not be able to continue to meet changing customer expectations and to continue to grow our business. |
| 44 | BCE INC. 2023 ANNUAL FINANCIAL REPORT |
4 MD&A Consolidated financial analysis
| 4 | Consolidated financial analysis |
This section provides detailed information and analysis about BCE’s performance in 2023 compared with 2022. It focuses on BCE’s consolidated operating results and provides financial information for our Bell CTS and Bell Media business segments. For further discussion and analysis of our business segments, refer to section 5, Business segment analysis.
| 4.1 | Introduction |
BCE consolidated income statements
| 2023 | 2022 | $ change | % change | |||||||||||||
| Operating revenues |
||||||||||||||||
| Service |
21,154 | 20,956 | 198 | 0.9% | ||||||||||||
| Product |
3,519 | 3,218 | 301 | 9.4% | ||||||||||||
| Total operating revenues |
24,673 | 24,174 | 499 | 2.1% | ||||||||||||
| Operating costs |
(14,256 | ) | (13,975 | ) | (281 | ) | (2.0% | ) | ||||||||
| Adjusted EBITDA |
10,417 | 10,199 | 218 | 2.1% | ||||||||||||
| Adjusted EBITDA margin |
42.2% | 42.2% | – | |||||||||||||
| Severance, acquisition and other costs |
(200 | ) | (94 | ) | (106 | ) | n.m. | |||||||||
| Depreciation |
(3,745 | ) | (3,660 | ) | (85 | ) | (2.3% | ) | ||||||||
| Amortization |
(1,173 | ) | (1,063 | ) | (110 | ) | (10.3% | ) | ||||||||
| Finance costs |
||||||||||||||||
| Interest expense |
(1,475 | ) | (1,146 | ) | (329 | ) | (28.7% | ) | ||||||||
| Net return on post-employment benefit plans |
108 | 51 | 57 | n.m. | ||||||||||||
| Impairment of assets |
(143 | ) | (279 | ) | 136 | 48.7% | ||||||||||
| Other expense |
(466 | ) | (115 | ) | (351 | ) | n.m. | |||||||||
| Income taxes |
(996 | ) | (967 | ) | (29 | ) | (3.0% | ) | ||||||||
| Net earnings |
2,327 | 2,926 | (599 | ) | (20.5% | ) | ||||||||||
| Net earnings attributable to: |
||||||||||||||||
| Common shareholders |
2,076 | 2,716 | (640 | ) | (23.6% | ) | ||||||||||
| Preferred shareholders |
187 | 152 | 35 | 23.0% | ||||||||||||
|
Non-controlling interest |
64 | 58 | 6 | 10.3% | ||||||||||||
| Net earnings |
2,327 | 2,926 | (599 | ) | (20.5% | ) | ||||||||||
| Adjusted net earnings |
2,926 | 3,057 | (131 | ) | (4.3% | ) | ||||||||||
| Net earnings per common share (EPS) |
2.28 | 2.98 | (0.70 | ) | (23.5% | ) | ||||||||||
| Adjusted EPS |
3.21 | 3.35 | (0.14 | ) | (4.2% | ) | ||||||||||
n.m.: not meaningful
| 45 |
4 MD&A Consolidated financial analysis
BCE statements of cash flows – selected information
| 2023 | 2022 | $ change | % change | |||||||||||||
| Cash flows from operating activities |
7,946 | 8,365 | (419 | ) | (5.0% | ) | ||||||||||
| Capital expenditures |
(4,581 | ) | (5,133 | ) | 552 | 10.8% | ||||||||||
| Free cash flow |
3,144 | 3,067 | 77 | 2.5% | ||||||||||||
BCE operating revenues grew by 2.1% in 2023, compared to last year, attributable to higher product revenues of 9.4%, primarily due to greater wireless device sales, coupled with higher wireline equipment sales to large enterprise customers due to the alleviating year-over-year impact from global supply chain disruptions experienced in 2022. Service revenues also contributed to the growth in BCE operating revenues, increasing by 0.9% year over year, mainly from higher wireless and Internet revenues combined with the contribution from various acquisitions made during the year. This was moderated by continued erosion in legacy voice, data and satellite TV revenues, as well as lower media advertising revenues, primarily driven by ongoing unfavourable economic conditions.
In 2023, net earnings decreased by 20.5%, compared to 2022, due to higher other expense mainly due to losses on our equity investments in associates and joint ventures which included a loss on BCE’s share of an obligation to repurchase at fair value the minority interest in one of BCE’s joint ventures, higher interest expense, higher depreciation and amortization and higher severance, acquisition and other costs, partly offset by higher adjusted EBITDA and lower impairment of assets.
BCE’s adjusted EBITDA grew by 2.1% in 2023, compared to last year, driven by growth from our Bell CTS segment, partly offset by a decline in our Bell Media segment. The year-over-year increase in adjusted EBITDA reflected higher operating revenues, partly offset by increased operating expenses, primarily attributable to greater cost of revenue, associated with the revenue growth, moderated by various cost reduction initiatives and operating efficiencies. This drove a corresponding adjusted EBITDA margin of 42.2% in 2023, which remained unchanged from last year.
In 2023, BCE’s cash flows from operating activities decreased by $419 million, compared to 2022, mainly due to lower cash from working capital, in part from timing of supplier payments, and higher interest paid, partly offset by higher adjusted EBITDA and lower contributions to post-employment benefit plans.
Free cash flow increased by $77 million in 2023, compared to 2022, mainly due to lower capital expenditures, partly offset by lower cash flows from operating activities, excluding cash from acquisition and other costs paid.
| 4.2 | Customer connections |

BCE net activations (losses)
| 2023 | 2022 | % change | ||||||||||
| Mobile phone net subscriber activations (losses) |
411,189 | 489,901 | (16.1% | ) | ||||||||
| Postpaid |
426,172 | 439,842 | (3.1% | ) | ||||||||
| Prepaid |
(14,983 | ) | 50,059 | n.m. | ||||||||
| Mobile connected device net subscriber activations |
293,307 | 202,024 | 45.2% | |||||||||
| Retail high-speed Internet net subscriber activations |
187,126 | 201,762 | (7.3% | ) | ||||||||
| Retail TV net subscriber (losses) activations |
(26,449 | ) | 5,148 | n.m. | ||||||||
| IPTV |
81,918 | 94,400 | (13.2% | ) | ||||||||
| Satellite |
(108,367 | ) | (89,252 | ) | (21.4% | ) | ||||||
| Retail residential NAS lines net losses |
(176,612 | ) | (175,788 | ) | (0.5% | ) | ||||||
| Total services net activations |
688,561 | 723,047 | (4.8% | ) | ||||||||
n.m.: not meaningful
| 46 | BCE INC. 2023 ANNUAL FINANCIAL REPORT |
4 MD&A Consolidated financial analysis
Total BCE customer connections
| 2023 | 2022 | % change | ||||||||||
| Mobile phone subscribers (2) |
10,287,046 | 9,949,086 | 3.4% | |||||||||
| Postpaid (2) |
9,422,830 | 9,069,887 | 3.9% | |||||||||
| Prepaid |
864,216 | 879,199 | (1.7% | ) | ||||||||
| Mobile connected devices subscribers (2) |
2,732,548 | 2,451,818 | 11.4% | |||||||||
| Retail high-speed Internet subscribers (1) (3) (4) |
4,473,429 | 4,258,570 | 5.0% | |||||||||
| Retail TV subscribers (1) (4) |
2,725,292 | 2,751,498 | (1.0% | ) | ||||||||
| IPTV (1) (4) |
2,070,342 | 1,988,181 | 4.1% | |||||||||
| Satellite |
654,950 | 763,317 | (14.2% | ) | ||||||||
| Retail residential NAS lines (1) (4) |
2,021,617 | 2,190,771 | (7.7% | ) | ||||||||
| Total services subscribers |
22,239,932 | 21,601,743 | 3.0% | |||||||||
| (1) | In Q2 2023, our retail high-speed Internet, retail IPTV and retail residential NAS lines subscriber bases increased by 35,080, 243 and 7,458 subscribers, respectively, as a result of small acquisitions. |
| (2) | In Q1 2023, we adjusted our mobile phone postpaid and mobile connected device subscriber bases to remove older non-revenue generating business subscribers of 73,229 and 12,577, respectively. |
| (3) | In Q1 2023, subsequent to a review of customer account records, our retail high-speed Internet subscriber base was reduced by 7,347 subscribers. |
| (4) | In Q4 2022, as a result of the acquisition of Distributel, our retail high-speed Internet, retail IPTV and retail residential NAS lines subscriber bases increased by 128,065, 2,315 and 64,498 subscribers, respectively. |
BCE added 688,561 net retail subscriber activations in 2023, down 4.8% compared to last year. The net retail subscriber activations in 2023 consisted of:
| • | 411,189 mobile phone net subscriber activations, along with 293,307 mobile connected device net subscriber activations |
| • | 187,126 retail high-speed Internet net subscriber activations |
| • | 26,449 retail TV net subscriber losses comprised of 108,367 retail satellite TV net subscriber losses, partly offset by 81,918 retail IPTV net subscriber activations |
| • | 176,612 retail residential NAS lines net losses |
At December 31, 2023, BCE’s retail subscriber connections totaled 22,239,932, up 3.0% year over year, and consisted of:
| • | 10,287,046 mobile phone subscribers, up 3.4% year over year, and 2,732,548 mobile connected device subscribers, up 11.4% year over year |
| • | 4,473,429 retail high-speed Internet subscribers, 5.0% higher year over year |
| • | 2,725,292 total retail TV subscribers, comprised of 2,070,342 retail IPTV subscribers, up 4.1% year over year, and 654,950 retail satellite TV subscribers, down 14.2% year over year |
| • | 2,021,617 retail residential NAS lines, down 7.7% year over year |
| 4.3 | Operating revenues |
BCE
Revenues
(in $ millions)
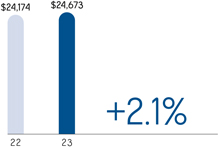
| 2023 | 2022 | $ change | % change | |||||||||||||
| Bell CTS |
21,926 | 21,301 | 625 | 2.9% | ||||||||||||
| Bell Media |
3,117 | 3,254 | (137 | ) | (4.2% | ) | ||||||||||
| Inter-segment eliminations |
(370 | ) | (381 | ) | 11 | 2.9% | ||||||||||
| Total BCE operating revenues |
24,673 | 24,174 | 499 | 2.1% | ||||||||||||
BCE
BCE operating revenues increased by 2.1% in 2023, compared to last year, driven by 9.4% higher product revenues of $3,519 million and 0.9% higher service revenues of $21,154 million. The year-over-year growth in operating revenues reflected higher revenues from our Bell CTS segment, partly offset by a decline in our Bell Media segment. Bell CTS operating revenues grew by 2.9%, year over year, due to higher product
and service revenues of 9.4% and 1.8%, respectively. The higher service revenues were driven by ongoing growth in wireless and wireline data revenues, moderated by continued erosion in wireline voice revenues. Bell Media operating revenues declined by 4.2% in 2023, compared to last year, from lower advertising revenues, partly offset by higher subscriber revenues.
| 47 |
4 MD&A Consolidated financial analysis
| 4.4 | Operating costs |
| BCE | BCE | |
| Operating costs | Operating cost profile
|
|
| (in $ millions)
|
|
|
| 2023 | 2022 | $ change | % change | |||||||||||||
| Bell CTS |
(12,206 | ) | (11,847 | ) | (359 | ) | (3.0% | ) | ||||||||
| Bell Media |
(2,420 | ) | (2,509 | ) | 89 | 3.5% | ||||||||||
| Inter-segment eliminations |
370 | 381 | (11 | ) | (2.9% | ) | ||||||||||
| Total BCE operating costs |
(14,256 | ) | (13,975 | ) | (281 | ) | (2.0% | ) | ||||||||
| (1) | Cost of revenues includes costs of wireless devices and other equipment sold, network and content costs, and payments to other carriers. |
| (2) | Labour costs (net of capitalized costs) include wages, salaries and related taxes and benefits, post-employment benefit plans service cost, and other labour costs, including contractor and outsourcing costs. |
| (3) | Other operating costs include marketing, advertising and sales commission costs, bad debt expense, taxes other than income taxes, IT costs, professional service fees and rent. |
BCE
BCE operating costs increased by 2.0% in 2023, compared to last year, due to higher expenses at Bell CTS of 3.0%, primarily reflecting increased cost of revenues associated with the revenue growth, partly offset by lower expenses at Bell Media of 3.5%, due to lower programming and content costs.
| 4.5 | Net earnings |
BCE
Net earnings
(in $ millions)
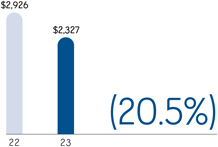
In 2023, net earnings decreased by 20.5%, compared to 2022, due to higher other expense mainly due to losses on our equity investments in associates and joint ventures which included a loss on BCE’s share of an obligation to repurchase at fair value the minority interest in one of BCE’s joint ventures, higher interest expense, higher depreciation and amortization and higher severance, acquisition and other costs, partly offset by higher adjusted EBITDA and lower impairment of assets.
| 48 | BCE INC. 2023 ANNUAL FINANCIAL REPORT |
4 MD&A Consolidated financial analysis
| 4.6 | Adjusted EBITDA |
| BCE | BCE | |
| Adjusted EBITDA | Adjusted EBITDA | |
| (in $ millions) | (in $ millions) | |
| (% adjusted EBITDA margin) | ||
|
|
|
|
| 2023 | 2022 | $ change | % change | |||||||||||||
| Bell CTS |
9,720 | 9,454 | 266 | 2.8% | ||||||||||||
| Adjusted EBITDA margin |
44.3% | 44.4% | (0.1) pts | |||||||||||||
| Bell Media |
697 | 745 | (48 | ) | (6.4% | ) | ||||||||||
| Adjusted EBITDA margin |
22.4% | 22.9% | (0.5) pts | |||||||||||||
| Total BCE adjusted EBITDA |
10,417 | 10,199 | 218 | 2.1% | ||||||||||||
| Adjusted EBITDA margin |
42.2% | 42.2% | – | |||||||||||||
BCE
BCE’s adjusted EBITDA grew by 2.1% in 2023, compared to last year, driven by a higher year-over-year contribution from Bell CTS of 2.8%, moderated by a decline in Bell Media of 6.4%. The increase in adjusted EBITDA was driven by higher operating revenues, partly offset by increased operating expenses. Adjusted EBITDA margin of 42.2% in 2023 remained unchanged from 2022.
| 4.7 | Severance, acquisition and other costs |
This category includes various income and expenses that are not related directly to the operating revenues generated during the year. This includes severance costs consisting of charges related to involuntary and voluntary employee terminations, as well as transaction costs, such as legal and financial advisory fees, related to completed or potential acquisitions, employee severance costs related to the purchase of a business, the costs to integrate acquired companies into our operations, costs relating to litigation and regulatory decisions, when they are significant, and other costs.
BCE
Severance, acquisition
and other costs
(in $ millions)
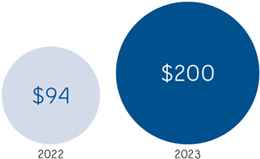
2023
Severance, acquisition and other costs included:
| • | Severance costs of $134 million related to involuntary and voluntary employee terminations |
| • | Acquisition and other costs of $66 million |
2022
Severance, acquisition and other costs included:
| • | Severance costs of $83 million related to involuntary and voluntary employee terminations |
| • | Acquisition and other costs of $11 million |
| 49 |
4 MD&A Consolidated financial analysis
| 4.8 | Depreciation and amortization |
| The amount of our depreciation and amortization in any year is affected by:
• How much we invested in new property, plant and equipment and intangible assets in previous years
• How many assets we retired during the year
• Estimates of the useful lives of assets |
BCE
Depreciation
(in $ millions)
|
BCE
Amortization
(in $ millions)
|
Depreciation
Depreciation in 2023 increased by $85 million, compared to 2022, mainly due to a higher asset base as we continued to invest in our broadband and wireless networks.
Amortization
Amortization in 2023 increased by $110 million, compared to 2022, mainly due to a higher asset base.
| 4.9 | Finance costs |
| BCE
Interest expense
(in $ millions)
|
BCE
Net return on
post-employment
benefit plans
(in $ millions)
|
Interest expense
Interest expense in 2023 increased by $329 million, compared to 2022, mainly due to higher average debt balances and higher interest rates.
Net return on post-employment benefit plans
Net return on our post-employment benefit plans is based on market conditions that existed at the beginning of the year as well as the net post-employment benefit plan asset (liability). On January 1, 2023, the discount rate was 5.3% compared to 3.2% on January 1, 2022.
In 2023, net return on post-employment benefit plans increased by $57 million, compared to last year, as a result of a higher discount rate in 2023 and a higher net asset position.
The impacts of changes in market conditions during the year are recognized in Other comprehensive (loss) income (OCI).
| 50 | BCE INC. 2023 ANNUAL FINANCIAL REPORT |
4 MD&A Consolidated financial analysis
| 4.10 | Impairment of assets |
| 2023
During the fourth quarter of 2023, we recognized $86 million of impairment charges for French TV channels within our Bell Media segment. The impairment charges were the result of a reduction in advertising demand in the industry resulting from economic uncertainties and unfavourable impacts to market-based valuation assumptions. These charges included $41 million allocated to indefinite-life intangible assets for broadcast licences and brands, and $45 million to finite-life intangible assets for program and feature film rights.
There was no impairment of Bell Media goodwill.
Additionally in 2023, we recorded impairment charges of $57 million related mainly to right-of-use assets for certain office spaces we ceased using as part of our real estate optimization strategy as a result of our hybrid work policy.
2022
During the fourth quarter of 2022, we recognized $147 million of impairment charges for French TV channels within our Bell Media segment. The impairment charges were the result of a reduction in advertising demand in the industry resulting from economic uncertainties and unfavourable impacts to assumptions for discount rates. These charges included $94 million allocated to indefinite-life intangible assets for broadcast licences, and $53 million to finite-life intangible assets for program and feature film rights.
There was no impairment of Bell Media goodwill.
Additionally in 2022, we recorded impairment charges of $132 million related mainly to right-of-use assets for certain office spaces we ceased using as part of our real estate optimization strategy as a result of our hybrid work policy. |
BCE
Impairment of assets
(in $ millions)
|
| 4.11 | Other expense |
| Other (expense) income includes income and expense items, such as:
• Net mark-to-market gains or losses on derivatives used to economically hedge equity settled share-based compensation plans
• Equity income or losses from investments in associates and joint ventures
• Gains or losses on retirements and disposals of property, plant and equipment and intangible assets
• Gains or losses on investments, including gains or losses when we dispose of, write down or reduce our ownership in investments
• Early debt redemption costs
• Interest income |
BCE
Other expense
(in $ millions)
|
| For the year ended December 31 | 2023 | 2022 | ||||||
| Equity (losses) income from investments in associates and joint ventures |
||||||||
| Loss on investment |
(581 | ) | (42 | ) | ||||
| Operations |
28 | (19 | ) | |||||
| Net mark-to-market losses on derivatives used to economically hedge equity settled share-based compensation plans |
(103 | ) | (53 | ) | ||||
| Early debt redemption costs |
(1 | ) | (18 | ) | ||||
| Gains on investments |
80 | 24 | ||||||
| Interest income |
67 | 22 | ||||||
| Gains (losses) on retirements and disposals of property, plant and equipment and intangible assets |
11 | (27 | ) | |||||
| Other |
33 | (2 | ) | |||||
| Total other expense |
(466 | ) | (115 | ) | ||||
| 51 |
4 MD&A Consolidated financial analysis
2023
Other expense of $466 million included losses on our equity investments in associates and joint ventures which included a loss on BCE’s share of an obligation to repurchase at fair value the minority interest in one of BCE’s joint ventures and net mark-to-market losses on derivatives used to economically hedge equity settled share-based compensation plans, partly offset by gains on our investments as a result of the sale of our 63% ownership in certain production studios and higher interest income.
2022
Other expense of $115 million included net mark-to-market losses on derivatives used to economically hedge equity settled share-based compensation plans, losses on our equity investments which included a loss on BCE’s share of an obligation to repurchase at fair value the minority interest in one of BCE’s joint ventures and losses on operations from our equity investments, losses on retirements and disposals of property, plant and equipment and intangible assets and early debt redemption costs, partly offset by gains on investments which included a gain related to the sale of our wholly-owned subsidiary, 6362222 Canada Inc. (Createch).
| 4.12 | Income taxes |
BCE
Income taxes
(in $ millions)
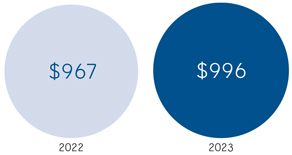
The following table reconciles the amount of reported income taxes in the income statements with income taxes calculated at a statutory income tax rate of 26.8% for both 2023 and 2022.
| For the year ended December 31 | 2023 | 2022 | ||||||
| Net earnings |
2,327 | 2,926 | ||||||
| Add back income taxes |
996 | 967 | ||||||
| Earnings before income taxes |
3,323 | 3,893 | ||||||
| Applicable statutory tax rate |
26.8% | 26.8% | ||||||
| Income taxes computed at applicable statutory rates |
(891 | ) | (1,043 | ) | ||||
| Non-taxable portion of gains on investments |
5 | 4 | ||||||
| Uncertain tax positions |
16 | 91 | ||||||
| Change in estimate relating to prior periods |
10 | – | ||||||
| Non-taxable portion of equity losses |
(149 | ) | (18 | ) | ||||
| Other |
13 | (1 | ) | |||||
| Total income taxes |
(996 | ) | (967 | ) | ||||
| Average effective tax rate |
30.0% | 24.8% | ||||||
Income taxes in 2023 increased by $29 million, compared to 2022, mainly due to a lower value of uncertain tax positions favourably resolved in 2023 compared to 2022, partly offset by lower taxable income.
| 4.13 | Net earnings attributable to common shareholders and EPS |
| BCE
Net earnings attributable
(in $ millions) |
BCE
EPS
(in $)
|
BCE
Adjusted net earnings
(in $ millions)
|
BCE
Adjusted EPS
(in $)
|
|||
|
|
|
|
|
|||
| 52 | BCE INC. 2023 ANNUAL FINANCIAL REPORT |
4 MD&A Consolidated financial analysis
Net earnings attributable to common shareholders in 2023 decreased by $640 million, or $0.70 per common share, compared to 2022, due to higher other expense mainly due to losses on our equity investments in associates and joint ventures which included a loss on BCE’s share of an obligation to repurchase at fair value the minority interest in one of BCE’s joint ventures, higher interest expense, higher depreciation and amortization and higher severance, acquisition and other costs, partly offset by higher adjusted EBITDA and lower impairment of assets.
Excluding the impact of severance, acquisition and other costs, net mark-to-market gains (losses) on derivatives used to economically hedge equity settled share-based compensation plans, net equity gains (losses) on investments in associates and joint ventures, net gains (losses) on investments, early debt redemption costs and impairment of assets, net of tax and NCI, adjusted net earnings in 2023 was $2,926 million, or $3.21 per common share, compared to $3,057 million, or $3.35 per common share, in 2022.
| 4.14 | Capital expenditures |

BCE
Capital expenditures
(in $ millions)
Capital intensity
(%)
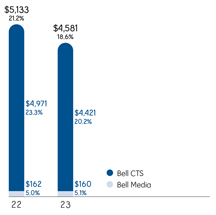
BCE capital expenditures of $4,581 million in 2023, declined by 10.8% year over year, which corresponded to a capital intensity ratio of 18.6%, down 2.6 pts over last year. The decline was driven by lower planned capital spending in 2023 subsequent to accelerated network investments in 2022, as well as an unplanned additional $105 million decrease in Q4 2023 as a result of the CRTC’s decision in November 2023 to mandate wholesale access to Bell’s FTTP network. We continued to focus our investments in 2023 on the further expansion of our FTTP and mobile 5G networks.
| 4.15 | Cash flows |
In 2023, BCE’s cash flows from operating activities decreased by $419 million, compared to 2022, mainly due to lower cash from working capital, in part from timing of supplier payments, and higher interest paid, partly offset by higher adjusted EBITDA and lower contributions to post-employment benefit plans.
Free cash flow increased by $77 million in 2023, compared to 2022, mainly due to lower capital expenditures, partly offset by lower cash flows from operating activities, excluding cash from acquisition and other costs paid.
BCE
Cash flows from operating activities
(in $ millions)
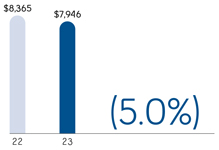
BCE
Free cash flow
(in $ millions)
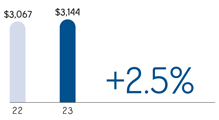
| 53 |
5 MD&A Business segment analysis Bell CTS
| 5 | Business segment analysis |

| 5.1 | Bell CTS |
Financial performance analysis
2023 performance highlights
| Bell CTS
Revenues
(in $ millions) |
Bell CTS
Adjusted EBITDA
(in $ millions)
(% adjusted EBITDA margin) |
|
|
|
|
|
| Total mobile phone subscriber growth (1) |
Mobile phone postpaid net subscriber activations in 2023 |
Mobile phone prepaid net subscriber losses in 2023
|
Mobile phone postpaid churn in 2023 |
Mobile phone blended average revenue per user (ARPU) (2) per month |
||||
| +3.4%
in 2023 |
426,172
Decreased 3.1% vs. 2022 |
(14,983)
vs. net activations of 50,059 in 2022 |
1.15%
Increased 0.23 pts vs. 2022 |
+0.3%
2023: $59.08 2022: $58.92 |
| Retail high-speed Internet subscriber growth (3) (4) (5) |
Retail high-speed Internet net subscriber activations in 2023 |
Retail TV subscriber decline (3) (5) |
||
| +5.0%
in 2023 |
187,126
Decreased 7.3% vs. 2022 |
(1.0%)
in 2023 |
| Retail IPTV net subscriber activations in 2023 |
Retail residential NAS lines subscriber decline (3) (5) |
|
| 81,918
Decreased 13.2% vs. 2022 |
(7.7%)
in 2023 |
| (1) | In Q1 2023, we adjusted our mobile phone postpaid subscriber base to remove older non-revenue generating business subscribers of 73,229. |
| (2) | Effective Q1 2023, as a result of the segment reporting changes impacting intersegment eliminations, ARPU has been updated and is defined as Bell CTS wireless external services revenues (previously wireless operating service revenues) divided by the average mobile phone subscriber base for the specified period, expressed as a dollar unit per month. |
| (3) | In Q2 2023, our retail high-speed Internet, retail IPTV and retail residential NAS lines subscriber bases increased by 35,080, 243 and 7,458 subscribers, respectively, as a result of small acquisitions. |
| (4) | In Q1 2023, subsequent to a review of customer account records, our retail high-speed Internet subscriber base was reduced by 7,347 subscribers. |
| (5) | In Q4 2022, as a result of the acquisition of Distributel, our retail high-speed Internet, retail IPTV and retail residential NAS lines subscriber bases increased by 128,065, 2,315 and 64,498 subscribers, respectively. |
| 54 | BCE INC. 2023 ANNUAL FINANCIAL REPORT |
5 MD&A Business segment analysis Bell CTS
Bell CTS results
Revenues
| 2023 | 2022 | $ change | % change | |||||||||||||
| Wireless |
7,120 | 6,821 | 299 | 4.4% | ||||||||||||
| Wireline data |
8,084 | 7,920 | 164 | 2.1% | ||||||||||||
| Wireline voice |
2,862 | 3,002 | (140 | ) | (4.7% | ) | ||||||||||
| Other wireline services |
312 | 309 | 3 | 1.0% | ||||||||||||
| External service revenues |
18,378 | 18,052 | 326 | 1.8% | ||||||||||||
| Inter-segment service revenues |
29 | 31 | (2 | ) | (6.5% | ) | ||||||||||
| Operating service revenues |
18,407 | 18,083 | 324 | 1.8% | ||||||||||||
| Wireless |
2,885 | 2,714 | 171 | 6.3% | ||||||||||||
| Wireline |
634 | 504 | 130 | 25.8% | ||||||||||||
| External/Operating product revenues |
3,519 | 3,218 | 301 | 9.4% | ||||||||||||
| Total external revenues |
21,897 | 21,270 | 627 | 2.9% | ||||||||||||
| Total operating revenues |
21,926 | 21,301 | 625 | 2.9% | ||||||||||||
Bell CTS operating revenues grew by 2.9% in 2023, compared to last year, driven by both higher service and product revenues. The year-over-year increase in service revenues reflected higher wireless and wireline data revenues, partly offset by continued erosion in wireline voice revenues.
Bell CTS operating service revenues increased by 1.8% in 2023, compared to 2022.
| • | Wireless revenues increased by 4.4% in 2023, compared to last year, driven by: |
| • | Continued growth in our mobile phone and connected device subscriber bases coupled with the flow-through of rate increases |
| • | Higher roaming revenues due to increased international travel |
These factors were partly offset by:
| • | Unfavourable impact of competitive pricing pressures |
| • | Lower data overages driven by greater customer adoption of monthly plans with higher data thresholds, including unlimited plans |
| • | Wireline data revenues increased by 2.1% in 2023, compared to last year, driven by: |
| • | Greater retail Internet and IPTV subscriber bases, coupled with the flow-through of residential rate increases |
| • | The acquisitions of Distributel in December 2022, FX Innovation in June 2023, and other small acquisitions made during the year |
| • | Increased sales of maintenance contracts and software subscriptions to business customers |
These factors were partly offset by:
| • | Greater acquisition, retention and bundle discounts on residential services |
| • | Ongoing erosion in our satellite TV subscriber base, along with IP connectivity and legacy data declines |
| • | Wireline voice revenues decreased by 4.7% in 2023, compared to last year, driven by: |
| • | Ongoing retail residential NAS lines erosion, combined with business voice declines, driven by technological substitution to wireless and Internet-based services |
| • | Reduced sales of international wholesale long distance minutes |
These factors were partly offset by:
| • | Flow-through of residential rate increases |
| • | The acquisition of Distributel in December 2022 and other small acquisitions made during the year |
Bell CTS operating product revenues increased by 9.4% in 2023, over last year.
| • | Wireless operating product revenues increased by 6.3% in 2023, compared to last year, due to greater sales mix of premium mobile phones and disciplined handset pricing, partly offset by lower contracted sales volumes and reduced consumer electronic sales at The Source |
| • | Wireline operating product revenues grew by 25.8% year over year, from strong sales to large business customers mainly due to the alleviating year-over-year impact from global supply chain challenges experienced in 2022 |
Operating costs and adjusted EBITDA
| 2023 | 2022 | $ change | % change | |||||||||||||
| Operating costs |
(12,206 | ) | (11,847 | ) | (359 | ) | (3.0% | ) | ||||||||
| Adjusted EBITDA |
9,720 | 9,454 | 266 | 2.8% | ||||||||||||
| Adjusted EBITDA margin |
44.3% | 44.4% | (0.1) pts | |||||||||||||
Bell CTS operating costs increased by 3.0% in 2023, compared to 2022, due to:
| • | Greater costs from the acquisitions of Distributel in December 2022, FX Innovation in June 2023, and other small acquisitions made during the year |
| • | Higher cost of goods sold corresponding to higher product revenues |
| • | Increased costs related to the revenue growth from maintenance and software subscriptions |
| 55 |
5 MD&A Business segment analysis Bell CTS
These factors were partly offset by:
| • | Lower labour costs reflecting workforce reductions, along with various other cost reduction initiatives and operating efficiencies |
| • | Pension savings, driven by lower DB expense due to a higher year-over-year discount rate |
| • | Lower year-over-year storm-related repairs expense |
Bell CTS adjusted EBITDA increased by 2.8% in 2023, compared to last year, due to higher operating revenues, partly offset by greater operating costs. Adjusted EBITDA margin of 44.3% in 2023, was essentially stable year over year, decreasing by only 0.1 pts over last year, reflecting an increased proportion of low-margin product sales in our total revenue base, partly offset by service revenue flow-through.
Bell CTS operating metrics
Wireless
| 2023 | 2022 | Change | % change | |||||||||||||
| Mobile phones |
||||||||||||||||
| Blended ARPU ($/month) |
59.08 | 58.92 | 0.16 | 0.3% | ||||||||||||
| Gross subscriber activations |
2,224,555 | 1,953,912 | 270,643 | 13.9% | ||||||||||||
| Postpaid |
1,608,503 | 1,355,772 | 252,731 | 18.6% | ||||||||||||
| Prepaid |
616,052 | 598,140 | 17,912 | 3.0% | ||||||||||||
| Net subscriber activations (losses) |
411,189 | 489,901 | (78,712 | ) | (16.1% | ) | ||||||||||
| Postpaid |
426,172 | 439,842 | (13,670 | ) | (3.1% | ) | ||||||||||
| Prepaid |
(14,983 | ) | 50,059 | (65,042 | ) | n.m. | ||||||||||
| Blended churn % (average per month) |
1.51% | 1.27% | (0.24) pts | |||||||||||||
| Postpaid |
1.15% | 0.92% | (0.23) pts | |||||||||||||
| Prepaid |
5.31% | 4.85% | (0.46) pts | |||||||||||||
| Subscribers (1) |
10,287,046 | 9,949,086 | 337,960 | 3.4% | ||||||||||||
| Postpaid (1) |
9,422,830 | 9,069,887 | 352,943 | 3.9% | ||||||||||||
| Prepaid |
864,216 | 879,199 | (14,983 | ) | (1.7% | ) | ||||||||||
| Mobile connected devices |
||||||||||||||||
| Net subscriber activations |
293,307 | 202,024 | 91,283 | 45.2% | ||||||||||||
| Subscribers (1) |
2,732,548 | 2,451,818 | 280,730 | 11.4% | ||||||||||||
n.m.: not meaningful
| (1) | In Q1 2023, we adjusted our mobile phone postpaid and mobile connected device subscriber bases to remove older non-revenue generating business subscribers of 73,229 and 12,577, respectively. |
Mobile phone blended ARPU of $59.08 increased by 0.3% in 2023, compared to last year, driven by:
| • | Higher roaming revenues due to increased international travel |
| • | Flow-through of rate increases |
These factors were partly offset by:
| • | Unfavourable impact of competitive pricing pressures |
| • | Lower data overages due to greater customer adoption of monthly plans with higher data thresholds, including unlimited plans |
Mobile phone gross subscriber activations grew by 13.9% in 2023, compared to 2022, due to both higher postpaid and prepaid gross subscriber activations.
| • | Mobile phone postpaid gross subscriber activations increased by 18.6% in 2023, compared to last year, driven by increased immigration, continued 5G momentum, successful bundled service offerings and effective promotions |
| • | Mobile phone prepaid gross subscriber activations increased by 3.0% in 2023, compared to last year, driven by higher immigration and travel to Canada, partly offset by more attractive promotional offers in the market on postpaid discount brands |
Mobile phone net subscriber activations decreased by 16.1% in 2023, compared to 2022, due to lower postpaid net subscriber activations, as well as prepaid net subscriber losses.
| • | Mobile phone postpaid net subscriber activations decreased by 3.1% in 2023, compared to last year, due to higher subscriber deactivations, partly offset by higher gross activations and greater migrations from prepaid |
| • | Mobile phone prepaid net subscriber losses were 65,042 unfavourable in 2023, compared to last year, due to higher subscriber deactivations and greater migrations to postpaid, partly offset by higher gross activations |
Mobile phone blended churn of 1.51% increased by 0.24 pts in 2023, compared to 2022.
| • | Mobile phone postpaid churn of 1.15% increased by 0.23 pts in 2023, compared to last year, due to higher subscriber deactivations driven by greater overall competitive market activity and promotional offer intensity compared to last year |
| • | Mobile phone prepaid churn of 5.31% increased by 0.46 pts in 2023, compared to last year, due to higher subscriber deactivations driven by greater overall competitive market activity and more attractive promotional offers in the market on postpaid discount brands |
Mobile phone subscribers at December 31, 2023 totaled 10,287,046, an increase of 3.4%, from 9,949,086 subscribers reported at the end of last year. This consisted of 9,422,830 postpaid subscribers, an increase of 3.9% from 9,069,887 subscribers at the end of 2022, and 864,216 prepaid subscribers, a decrease of 1.7% from 879,199 subscribers at the end of 2022.
Mobile connected device net subscriber activations increased by 45.2% in 2023, compared to last year, due to lower net losses from data devices, primarily fewer tablet deactivations, higher connected car subscriptions and greater business IoT net activations.
Mobile connected device subscribers at December 31, 2023 totaled 2,732,548, an increase of 11.4% from 2,451,818 subscribers reported at the end of 2022.
| 56 | BCE INC. 2023 ANNUAL FINANCIAL REPORT |
5 MD&A Business segment analysis Bell CTS
Wireline data
Retail high-speed Internet
| 2023 | 2022 | Change | % change | |||||||||||||
| Retail net subscriber activations |
187,126 | 201,762 | (14,636 | ) | (7.3% | ) | ||||||||||
| Retail subscribers (1) (2) (3) |
4,473,429 | 4,258,570 | 214,859 | 5.0% | ||||||||||||
| (1) | In Q2 2023, our retail high-speed Internet subscriber base increased by 35,080 as a result of small acquisitions. |
| (2) | In Q1 2023, subsequent to a review of customer account records, our retail high-speed Internet subscriber base was reduced by 7,347 subscribers. |
| (3) | In Q4 2022, as a result of the acquisition of Distributel, our retail high-speed Internet subscriber base increased by 128,065. |
Retail high-speed Internet net subscriber activations decreased by 7.3% in 2023, compared to 2022, due to greater deactivations in our non-FTTP service footprint reflecting aggressive promotional offers by competitors. This was partly offset by higher customer gross activations driven by the ongoing expansion of our FTTP footprint, the success of our bundled service offerings and multi-brand strategy, as well as the contribution from Distributel and other small acquisitions made during the year.
Retail high-speed Internet subscribers totaled 4,473,429 at December 31, 2023, up 5.0% from 4,258,570 subscribers reported at the end of 2022. In Q1 2023, our retail high-speed Internet subscriber base was decreased by 7,347 subscribers, subsequent to a review of customer account records. Additionally, in Q2 2023, our retail high-speed Internet subscriber base increased by 35,080 as a result of small acquisitions.
Retail TV
| 2023 | 2022 | Change | % change | |||||||||||||
| Retail net subscriber (losses) activations |
(26,449 | ) | 5,148 | (31,597 | ) | n.m. | ||||||||||
| IPTV |
81,918 | 94,400 | (12,482 | ) | (13.2% | ) | ||||||||||
| Satellite |
(108,367 | ) | (89,252 | ) | (19,115 | ) | (21.4% | ) | ||||||||
| Total retail subscribers (1) (2) |
2,725,292 | 2,751,498 | (26,206 | ) | (1.0% | ) | ||||||||||
| IPTV (1) (2) |
2,070,342 | 1,988,181 | 82,161 | 4.1% | ||||||||||||
| Satellite |
654,950 | 763,317 | (108,367 | ) | (14.2% | ) | ||||||||||
n.m.: not meaningful
| (1) | In Q2 2023, our retail IPTV subscriber base increased by 243 as a result of small acquisitions. |
| (2) | In Q4 2022, as a result of the acquisition of Distributel, our retail IPTV base increased by 2,315 subscribers. |
Retail IPTV net subscriber activations decreased by 13.2% in 2023, compared to 2022, driven by higher deactivations, primarily from our app streaming service, mainly attributable to a greater number of customers with expired promotional offers, as well as reflecting greater competitive intensity and higher substitution with OTT services. This was partly mitigated by increased activations from greater Internet pull-through.
Retail satellite TV net subscriber losses increased by 21.4% in 2023, compared to last year, attributable to aggressive offers from cable competitors, particularly in rural areas, along with increased substitution with OTT services.
Total retail TV net subscriber losses (IPTV and satellite TV combined) were unfavourable by 31,597 year over year, due to higher satellite TV net losses, and lower IPTV net activations.
Retail IPTV subscribers at December 31, 2023 totaled 2,070,342, up 4.1% from 1,988,181 subscribers reported at the end of 2022. In Q2 2023, our retail IPTV subscriber base increased by 243 as a result of small acquisitions.
Retail satellite TV subscribers at December 31, 2023 totaled 654,950, down 14.2% from 763,317 subscribers reported at the end of 2022.
Total retail TV subscribers (IPTV and satellite TV combined) at December 31, 2023 were 2,725,292 decreasing by 1.0% over the 2,751,498 subscribers at the end of 2022. In Q2 2023, our retail IPTV subscriber base increased by 243 as a result of small acquisitions.
Wireline voice
| 2023 | 2022 | Change | % change | |||||||||||||
| Retail residential NAS lines net losses |
(176,612 | ) | (175,788 | ) | (824 | ) | (0.5% | ) | ||||||||
| Retail residential NAS lines (1) (2) |
2,021,617 | 2,190,771 | (169,154 | ) | (7.7% | ) | ||||||||||
| (1) | In Q2 2023, our retail residential NAS lines subscriber base increased by 7,458 subscribers as a result of small acquisitions. |
| (2) | In Q4 2022, as a result of the acquisition of Distributel, our retail residential NAS lines subscriber base increased by 64,498 subscribers. |
Retail residential NAS lines net losses increased by 0.5%, compared to 2022, as the growth in gross activations was more than offset by higher year-over-year deactivations, mainly due to lower deactivations in Q1 2022 as a result of the COVID-19 pandemic and the unfavourable impact of continued substitution to wireless and Internet-based technologies.
Retail residential NAS lines at December 31, 2023 of 2,021,617 declined by 7.7% from 2,190,771 lines reported at the end of 2022. In Q2 2023, our retail residential NAS lines subscriber base increased by 7,458 subscribers as a result of small acquisitions. The erosion in retail residential NAS lines of 7.7% deteriorated over the 4.7% rate of erosion experienced in 2022, mainly due to the impact of the acquisition of Distributel and EBOX in 2022.
| 57 |
5 MD&A Business segment analysis Bell CTS
Competitive landscape and industry trends
This section contains forward-looking statements, including relating to our business outlook. Refer to the section Caution regarding forward-looking statements at the beginning of this MD&A.
Competitive landscape
Wireless products and services
The Canadian wireless industry has experienced strong subscriber growth in recent years, supported by immigration and population growth, a continued increase in the rate of penetration in line with the trend toward multiple devices, and the ongoing adoption of mobile devices and services. With penetration rates in other developed nations well above 100% (United States, Europe and Asia), the Canadian mobile phone penetration rate is expected to continue to increase, above and beyond the approximate rate of 91% for 2023.
In 2023, the Canadian wireless industry continued to experience heightened levels of competition nationally, particularly within the flanker brand environment. This competitive intensity has led to continued declines in chargeable data usage and rising levels of data allocation in monthly plans, including unlimited data plans, in addition to other ongoing factors, such as the popularity of data sharing plans and an evolving shift in the customer mix toward non-traditional mobile devices and tools such as video chats. The roll-out of 5G network infrastructure continued in 2023, with 5G coverage by the national carriers reaching approximately 86% of the Canadian population at the end of 2023, compared to approximately 80% at the end of 2022. For Bell, our long-standing focus on network excellence is reflected in the recognition we received from independent third-party sources in 2023, including being recognized as Canada’s fastest and best 5G network by GWS for the third consecutive year in its 2023 nationwide assessment of 5G networks. New this year, GWS’s testing included 3500 MHz network wireless spectrum and determined Bell’s network (5G+) performance to be the fastest and best in the country.
The Canadian wireless industry remains highly competitive and capital-intensive among facilities-based providers, as carriers continue to expand and enhance their broadband wireless networks, including the ongoing build-out of 5G, as well as making significant investments in spectrum.
Competitors for wireless products and services
| • | Facilities-based national wireless service providers Rogers, the Telus Corporation group of companies (Telus) and Québecor Inc. (Québecor) |
| • | Regional facilities-based wireless service providers Saskatchewan Telecommunications Holding Corporation, which provides service in Saskatchewan; Bragg Communications Inc. (Eastlink), which provides service in the three Maritime provinces |
Wireline products and services
The cable market changed in 2023 as Rogers completed its acquisition of Shaw, creating a Canadian competitor with larger scale. An estimated 7.5 million Internet subscribers received their service over the networks of the three largest cable companies at the end of 2023, relatively unchanged from 2022. Meanwhile, an estimated 7.6 million Internet subscribers received their service over the networks of incumbent local exchange carriers (ILECs) like Bell at the end of 2023, compared to approximately 7.2 million at the end of 2022. Bell continues to make gains in market share as a result of the ongoing expansion of our FTTP direct fibre network and increased customer penetration of bundled service offerings. Our ongoing focus on FTTP and its superior characteristics as compared to cable, such as higher and symmetrical download and upload speeds, has allowed us to connect more than 7 million homes and businesses in Ontario, Québec, the Atlantic provinces and Manitoba to our pure fibre technology. Notably, Bell pure fibre Internet was awarded fastest in Canada in Ookla’s Q1-Q2 and Q3-Q4 2023 Speedtest Awards reports, with the reports also ranking Bell pure fibre Wi-Fi as fastest in the country – both for the second time in a row. In addition, Bell was named the Best Major & All Around ISP in PCMag’s Best ISPs 2023 Canada report. Bell recognitions also include BrandSpark’s Most Trusted ISP 2023 and 2024.
While Canadians still watch conventional TV, digital streaming platforms are playing an increasingly important role in the broadcasting industry and in the distribution of content. Popular online video services are providing Canadians with more choice about where, when and how to access video content. In 2023, ILECs offering IPTV service expanded their subscriber base by an estimated 4% to reach 3.5 million customers, or a 38% market share, up compared to approximately 34% at the end of 2022, through wider network coverage, enhanced differentiated services and bundled offerings, and marketing and promotions focused on IPTV. Canada’s three largest cable companies had an estimated 4.7 million TV subscribers, or a 50% market share at the end of 2023, up compared to 48% at the end of 2022. The balance of industry subscribers were served by satellite TV and regional providers.
In recent years, two of the largest Canadian cable companies have launched new TV services based on the Comcast X1 video platform – Rogers (and previously Shaw prior to its acquisition by Rogers) and Québecor’s Vidéotron brand. Our IPTV platform (Fibe TV, Fibe TV app and Virgin Plus TV) continues to offer numerous service advantages compared to this cable platform, including: flexible pricing plans and packages available to all customers; picture clarity and quality; content depth and breadth; the number of ways customers can access content, including wireless set-top boxes, Restart TV, higher-capacity PVR and the Fibe TV app. We continue to offer more on-demand content and more OTT content with Crave, Netflix, Prime Video and YouTube all in one place.
| 58 | BCE INC. 2023 ANNUAL FINANCIAL REPORT |
5 MD&A Business segment analysis Bell CTS
The financial performance of the overall Canadian wireline telecommunications market continues to be impacted by the ongoing declines in legacy voice service revenues resulting from technological substitution to wireless and OTT services, as well as by the ongoing conversion to IP-based data services and networks by large business customers. Canada’s three largest cable companies had an estimated combined base of approximately 2.7 million telephony subscribers at the end of 2023, representing a national residential market share of approximately 41%, relatively flat compared to 2022. Telecommunications companies had an estimated combined total of 3.3 million telephony subscribers at the end of 2023, representing a market share of approximately 50%, up compared to approximately 49% at the end of 2022. Other non-facilities-based competitors also offer local and long distance VoIP services and resell high-speed Internet services.
Competitors for wireline products and services
| • | Cable TV providers offering cable TV, Internet and cable telephony services, including: |
| • | Rogers in Ontario, New Brunswick, Newfoundland and Labrador, and upon its acquisition of Shaw, in British Columbia, Alberta, Saskatchewan and Manitoba |
| • | Vidéotron in Québec |
| • | Cogeco Cable Inc. (a subsidiary of Cogeco Inc.) (Cogeco) in Ontario and Québec |
| • | Shaw Direct, providing satellite TV service nationwide |
| • | Eastlink in every province except Saskatchewan, where it does not provide cable TV and Internet service |
| • | Telus provides residential voice, Internet and IPTV services in British Columbia, Alberta and Eastern Québec |
| • | Telus and Allstream Inc. (Allstream) provide wholesale products and business services across Canada |
| • | Various others such as TekSavvy Solutions and Vonage Canada (a division of Vonage Holdings Corp.) offer resale or VoIP-based local, long distance and Internet services |
| • | LEO satellite providers offering Internet services |
| • | OTT voice and/or video services, such as Zoom, Skype, Netflix, Prime Video, Disney+ and YouTube |
| • | Digital media streaming devices such as Apple TV, Roku and Google Chromecast |
| • | Other Canadian ILECs and cable TV operators |
| • | Substitution to wireless services, including those offered by Bell |
| • | Customized managed outsourcing solutions competitors, such as systems integrators CGI and IBM |
| • | Wholesale competitors include cable operators, domestic competitive local exchange carrier (CLEC)s, U.S. or other international carriers for certain services, and electrical utility-based telecommunications providers |
| • | Competitors for home security range from local to national companies, such as Telus, Rogers, Chubb Fire & Security and Stanley Security. Competitors also include do-it-yourself security providers such as Lorex and home automation service providers such as Ring, Nest and Wyze. |
Industry trends
Wireless products and services
Wireless growth continues to be driven by the ongoing increase in data usage and adoption, including: higher- value smartphones, unlimited data offerings, shared family data plans, and IoT devices. In addition, consumers continue to replace wireline access services with wireless access and related data services. These trends are expected to drive the growing demand for wireless data services for the foreseeable future, particularly as the industry continues to shift to 5G. Industry ARPU is expected to continue moderating, compared to periods prior to the COVID-19 pandemic, particularly now that the industry has lapped the meaningful recovery in roaming revenues, which had fallen during the peak of the COVID-19 pandemic. Furthermore, as a result of increased competitive intensity, the industry continues to see greater adoption of bring-your-own-device (BYOD) additions, resulting in increased switching activity.
While LTE and LTE-A technologies increase download speeds, encourage data usage and enhance the customer experience, growth in data traffic poses challenges to mobile access technology. To better manage this data traffic, Canadian providers continue to evolve their networks and deploy spectrum to support the shift to 5G. ISED held its auction of spectrum in the 3800 MHz band in the fourth quarter of 2023 and announced an auction for millimetre wave (mmWave) spectrum; these bands are important for the expansion of 5G networks.
IoT technologies connect communications-enabled devices via wireless technologies, allowing them to exchange key information and share processes. Advanced platforms and networks are already in place in industries such as transportation and logistics, utilities and fleet management, with deployment ongoing in other sectors, including smart cities, manufacturing, retail, food services, consumer utilities, and connected cars. These industries are adopting IoT solutions, combined with other applications, to digitally transform their operations and generate value from their connections. IoT presents a meaningful opportunity for growth in wireless connectivity, which can deliver services to customers more efficiently. IoT connectivity generally has a lower ARPU when sold as a stand-alone service, but supports both revenue and margin growth, since it often leads to the sale of IoT applications or our other service offerings, enhancing customer penetration. In 2023, we added 293,307 mobile connected devices, bringing our mobile connected device subscriber base to more than 2.7 million, up 11% from 2022.
Wireline products and services
The wireline telecommunications market is expected to remain very competitive in 2024. Although the residential high-speed internet market is maturing, with a penetration rate of approximately 92% across Canada at the end of 2023, subscriber growth is expected to continue over the coming years. Technology substitution, including the growth of wireless and VoIP services, is expected to continue to replace higher-margin legacy voice revenues, while digital streaming services and other online content providers are expected to impact current linear TV services. Bell is an important provider of these substitution services and the decline in this legacy business is continuing as expected.
| 59 |
5 MD&A Business segment analysis Bell CTS
The popularity of viewing TV and on-demand content anywhere, particularly on handheld devices, is expected to continue to grow as customers adopt services that enable them to view content on multiple screens. Streaming media providers continue to enhance OTT and DTC streaming services in order to compete for a share of viewership in response to evolving viewing habits and consumer demand. TV providers are monitoring OTT developments and seeking to adapt their content and market strategies to compete with these non-traditional offerings. We view OTT as an opportunity to add further capabilities to our linear and on-demand assets, providing customers with flexible options to choose the content they want and encouraging greater customer usage of Bell’s high-speed Internet and wireless networks. In 2023, our Crave streaming service expanded its DTC subscription offering with the launch of ad-supported plans, giving customers a range of options to access Crave’s lineup of premium content. And we are expanding the reach of Crave in 2024 through our agreement with Amazon to make Crave available on Prime Video Channels in Canada.
The Canadian ILECs continue to make significant capital investments in broadband networks, with a focus on FTTP to maintain and enhance their ability to support advanced IP-based services and higher broadband speeds. Cable companies continue to evolve their cable networks with DOCSIS-related bandwidth enhancements and node splitting. Although
the platform increases speed in the near term and is cost-efficient, it does not offer the advanced capabilities of FTTP over the longer term, such as fast symmetrical upload and download speeds. At the end of 2023, approximately 6.5 million locations in Bell’s footprint had access to multi-gigabit symmetrical speeds of 3 Gbps.
In the business market, the convergence of IT and telecommunications, facilitated by the ubiquity of IP, continues to shape the competitive environment, with non-traditional providers increasingly blurring the lines of competition and business models. Cable companies continue to make investments to better compete in the highly contested small and medium-sized business space. Telecommunications companies like Bell are providing network-centric managed applications that leverage their significant FTTP investments, while IT service providers are bundling network connectivity with their proprietary software-as-a-service (SaaS) offerings. The development of IP-based platforms, which provide combined IP voice, data and video solutions, creates potential cost efficiencies that compensate, in part, for reduced margins resulting from the continuing shift from legacy to IP-based services. The evolution of IT has created significant opportunities for our business markets services, such as cloud, security and workflow automation solutions, that can have a greater business impact than traditional telecommunications services.
Business outlook and assumptions
This section contains forward-looking statements, including relating to our projected financial performance for 2024 and our business outlook, objectives, plans and strategic priorities. Refer to the section Caution regarding forward-looking statements at the beginning of this MD&A.
2024 outlook
Our outlook for 2024 takes into consideration the financial impact of our strategic distribution partnership with Best Buy Canada that will result in a decrease in largely consumer electronics related revenue from Bell CTS results. The impact of this partnership on adjusted EBITDA will not be material given relatively low margins for consumer electronics.
We are targeting revenue growth driven by continued subscriber base expansion.
Wireless subscriber growth is expected to be supported by an ongoing 5G upgrade cycle, strong immigration levels and our continued focus on multi-product cross sales. We are focused on increasing our market share of national operators’ postpaid mobile phone net additions in a disciplined and cost-conscious manner. We expect higher, but more moderate, growth in ARPU driven by increased 5G subscriptions and higher roaming revenue, partly offset by reduced data overage revenue resulting from the continued adoption of unlimited plans. We will also seek to achieve higher revenues from the flow-through of pricing changes, as well as IoT services and applications.
Continued expansion of our retail Internet and IPTV subscriber bases is expected to be supported by a broader FTTP service footprint together with higher household penetration, further penetration of WHI access technology in rural communities, further scaling of Bell’s app-based live TV streaming services and the introduction of new products and features. We will continue to focus on winning the home by leveraging our symmetrical Internet speed advantage over cable, delivering the best customer experience with our products, and driving greater cross-sell penetration of higher value mobility and Internet households.
In our business markets, we expect an improving financial performance trajectory predicated on higher product sales and project spending by large enterprise customers combined with wireless subscriber growth. However, as large enterprise customers continue to look for opportunities to leverage low-cost technologies to grow and transform the workforce of the future and face increased uncertainty about future economic conditions, spending on telecommunications services and products is expected to be variable. In addition, ongoing customer migrations from traditional technologies to IP-based systems and demand for cheaper bandwidth alternatives will continue to impact business markets’ results in 2024. We intend to seek to offset the revenue decline from traditional legacy telecommunications services by continuing to develop unique services and value enhancements to improve the client experience through services such as cloud, security and workforce automation solutions. Further, we intend to use marketing initiatives and other customer-specific strategies with the objective of slowing the pace of NAS erosion, while also investing in direct fibre expansion, 5G and new solutions in key portfolios such as Internet, private networks, voice and unified communications, cloud solutions, security solutions, cloud-based contact centre, IoT and MEC. We will also continue to focus on delivering network-centric managed and professional services solutions to large and medium-sized businesses that increase the value of connectivity services.
| 60 | BCE INC. 2023 ANNUAL FINANCIAL REPORT |
5 MD&A Business segment analysis Bell CTS
We expect the overall level of competitive intensity in our small and medium-sized business markets to remain high, as cable operators and other telecom competitors look to these customer segments as potential growth opportunities. We also intend to expand key sales channels and introduce service offerings that help drive innovative solutions and value for our small and medium-sized customers by leveraging Bell’s network assets, broadband fibre footprint and service capabilities to expand our relationships with them.
We are maintaining a sharp focus on our operating cost structure to help offset pressures related to customer growth and retention, the ongoing erosion of high-margin wireline voice and other legacy revenues, and competitive repricing pressures in our residential, business and wholesale markets. This, combined with further operating efficiencies enabled by our direct fibre footprint, changes in consumer behaviour and product innovation, digital adoption, product and service enhancements, expanding self-serve capabilities, new call centre and digital investments, other improvements to the customer service experience, management workforce reductions including attrition and retirements, and lower contracted rates from our suppliers, is expected to deliver meaningful cost savings and productivity gains across the organization.
Assumptions
| • | Increase our market share of national operators’ wireless mobile phone net additions |
| • | Increased competitive intensity and promotional activity across all regions and market segments |
| • | Ongoing expansion and deployment of 5G and 5G+ wireless networks, offering competitive coverage and quality |
| • | Continued diversification of our distribution strategy with a focus on expanding DTC and online transactions |
| • | Moderating growth in mobile phone blended ARPU, driven by growth in 5G subscriptions, and increased roaming revenue from the easing of travel restrictions implemented as a result of the COVID-19 pandemic, partly offset by reduced data overage revenue due, among others, to the continued adoption of unlimited plans |
| • | Accelerating business customer adoption of advanced 5G, 5G+ and IoT solutions |
| • | Improving wireless handset device availability in addition to stable device pricing and margins |
| • | Further deployment of direct fibre to more homes and businesses within our wireline footprint, but at a slower pace than during any of 2020 to 2023 |
| • | Continued growth in retail Internet and IPTV subscribers |
| • | Increasing wireless and Internet-based technological substitution |
| • | Continued focus on the consumer household and bundled service offers for mobility and Internet customers |
| • | Continued large business customer migration to IP-based systems |
| • | Ongoing competitive repricing pressures in our business and wholesale markets |
| • | Continued competitive intensity in our small and medium-sized business markets as cable operators and other telecommunications competitors continue to intensify their focus on business customers |
| • | Traditional high-margin product categories challenged by large global cloud and OTT providers of business voice and data solutions expanding into Canada with on-demand services |
| • | Increasing customer adoption of OTT services resulting in downsizing of TV packages |
| • | Growing consumption of OTT TV services and on-demand video streaming, as well as the proliferation of devices, such as tablets, that consume large quantities of bandwidth, will require ongoing capital investment |
| • | Realization of cost savings related to operating efficiencies enabled by our direct fibre footprint, changes in consumer behaviour and product innovation, digital adoption, product and service enhancements, expanding self-serve capabilities, new call centre and digital investments, other improvements to the customer service experience, management workforce reductions including attrition and retirements, and lower contracted rates from our suppliers |
| • | No adverse material financial, operational or competitive consequences of changes in or implementation of regulations affecting our communication and technology services business |
Key growth drivers
| • | Strong immigration levels |
| • | A greater number of customers on our 5G and 5G+ networks |
| • | Cross-sell to customers who do not have all their telecommunication services with Bell |
| • | Further expansion of FTTP footprint, but at a slower pace than during any of 2020 to 2023 |
| • | Increasing FTTP and WTTP customer penetration |
| • | Continued growth in retail Internet and IPTV subscribers |
| • | Expansion of our business customer relationships to drive higher revenue per customer |
| • | Ongoing service innovation and product value enhancements |
| 61 |
5 MD&A Business segment analysis Bell CTS
Principal business risks
This section discusses certain principal business risks specifically related to the Bell CTS segment. For a detailed description of the other principal risks that could have a material adverse effect on our business, refer to section 9, Business risks.
Regulatory environment
Risk
| • | Increased regulation of wireless services, pricing and infrastructure, such as additional mandated access to wireless networks, establishing rates for mandated wireless services that are materially different from the rates we propose, and limitations placed on future spectrum bidding |
| • | The CRTC has mandated the establishment of an aggregated wholesale high-speed access service available on FTTP facilities in Ontario and Québec on an interim basis, and at rates that are materially lower from the rates we proposed, and which do not sufficiently account for the investment required in these facilities. The CRTC may maintain, reverse or otherwise modify this new obligation when it concludes its ongoing wholesale high-speed access review. This new service materially improves the business position of our competitors. On February 9, 2024, the Federal Court of Appeal granted Bell Canada leave to appeal the CRTC decision but declined to grant the requested stay of the decision pending resolution of its appeal. Bell Canada has also filed an appeal to the Governor-in-Council. |
| • | The courts could overturn the new wholesale rates the CRTC set for aggregated high-speed access service in 2021, which were much higher than the rates it had proposed in 2019 |
Potential impact
| • | Increased regulation could influence network investment and the market structure, limit our flexibility, improve the business position of our competitors, limit network-based differentiation of our services, and negatively impact the financial performance of our Bell CTS segment |
| • | In respect of the potential for new aggregated wholesale high-speed access service available on FTTP facilities: (i) the mandating of final rates that are materially different from the rates we proposed; (ii) the risk that the wholesale FTTP obligation will only be imposed on Bell Canada and not other providers or only in Ontario and Québec while not available to Bell Canada in Western Canada, putting Bell Canada at a competitive disadvantage where it could not access wholesale FTTP out of its traditional territory, but its major competitors could access Bell Canada’s FTTP facilities; and (iii) in the case of our existing wholesale high-speed access service, the implementation of the rates for aggregated or disaggregated wholesale high-speed access services, could change our investment strategy, especially in relation to investment in next-generation wireline networks in smaller communities and rural areas, improve the business position of our competitors, further accelerate penetration and disintermediation by OTT players, and negatively impact the financial performance of our business. |
Aggressive competition
Risk
| • | The intensity of competitive activity from national wireless operators, smaller or regional facilities-based wireless service providers, non-traditional players and resellers |
| • | The intensity of competitive activity coupled with the proliferation of installment and/or buy and pay later plans, and new wireline product launches for residential customers (e.g., IoT, smart home systems and devices, innovative TV platforms, etc.) and business customers (e.g., OTT VoIP, collaboration and SD WAN solutions) from national operators, non-traditional players and wholesalers, including the expanded offering of retail services based on wholesale access by large facilities-based competitors |
Potential impact
| • | Pressure on our revenue, adjusted EBITDA, ARPU, cash flows and churn would likely result if wireless competitors continue to aggressively pursue new types of price plans, increase discounts, offer shared plans based on sophisticated pricing requirements (e.g., installments) or offer other incentives, such as cash-back for upgrade with old smartphone and multi-product bundles, in order to attract new customers |
| • | An increase in the intensity level of competitive activity for wireline services could result in lost revenue, higher churn and increased acquisition and retention expenses, all of which would put pressure on Bell CTS’s adjusted EBITDA |
Market environment, technological advancement
and changing customer behaviour
Risk
| • | Slower subscriber growth due to high Canadian Internet and smartphone penetration, combined with potential pressures from the economic environment and reduced discretionary spending, and potential varying levels of immigration |
| • | With technological advancement, the traditional TV viewing model (i.e., a subscription for bundled channels) is challenged by an increasing number of legal and illegal viewing options available in the market offered by traditional, non-traditional and global players, as well as increasing cord-cutting and cord-shaving trends |
| • | The proliferation of network technologies impacts business customers’ decision to migrate to OTT, VoIP and/or leverage SD WAN architecture |
| • | Changing customer habits further contribute to the erosion of NAS lines |
Potential impact
| • | A maturing wireline and wireless market could challenge subscriber growth and the cost of subscriber acquisition and retention, putting pressure on the financial performance of our business |
| • | Our market penetration and number of TV subscribers could decline as a result of innovative offerings by BDUs and an increasing number of domestic and non-domestic unregulated OTT providers, as well as a significant volume of content piracy |
| • | The proliferation of IP-based products, including OTT content and OTT software offerings directly to consumers, may accelerate the disconnection of TV services or the reduction of TV spending, as well as the reduction in business IT investments by customers |
| • | The ongoing loss of NAS lines challenges our traditional voice revenues and compels us to develop other service offerings |
| 62 | BCE INC. 2023 ANNUAL FINANCIAL REPORT |
5 MD&A Business segment analysis Bell Media
| 5.2 | Bell Media |
Financial performance analysis
2023 performance highlights
| Bell Media | Bell Media | |
| Revenues | Adjusted EBITDA | |
| (in $ millions) | (in $ millions) | |
|
|
|
|
| Bell Media | Bell Media | |
| Revenue mix | Revenue mix | |
| (product) | (line of business) | |
|
|
|
|
Bell Media results
Revenues
| 2023 | 2022 | $ change | % change | |||||||||||||
| External revenues |
2,776 | 2,904 | (128 | ) | (4.4% | ) | ||||||||||
| Inter-segment revenues |
341 | 350 | (9 | ) | (2.6% | ) | ||||||||||
| Bell Media operating revenues |
3,117 | 3,254 | (137 | ) | (4.2% | ) | ||||||||||
Bell Media operating revenues decreased by 4.2% in 2023, compared to last year, due to lower advertising revenues, partly offset by higher subscriber revenues. Operating revenues reflected continued growth from digital revenues (1) of 19% in 2023, which moderated the overall year-over-year pressure in operating revenues.
• Advertising revenues declined by 8.6% in 2023, compared to last year, due to lower demand from advertisers as a result of the ongoing unfavourable economic conditions, which negatively impacted revenues across our TV and radio platforms. TV advertising revenues, in particular conventional TV revenues, were also unfavourably impacted by the Writers Guild of America (WGA) and the Screen Actors Guild
and American Federation of Television and Radio Artists (SAG-AFTRA) strikes, along with the unfavourable year-over-year impact on specialty TV due to the benefit last year from the broadcast of the FIFA World Cup Qatar 2022. The decline in advertising revenues was moderated by growth in digital advertising revenues, mainly driven by increased bookings from Bell Media’s SAM TV media sales tool.
• Subscriber revenues grew by 0.7% in 2023, compared to last year, due to the continued growth in Crave and sports streaming DTC subscribers, partly offset by the benefit last year from a retroactive adjustment related to a contract with a Canadian TV distributor.
| (1) | Digital revenues are comprised of advertising revenue from digital platforms including web sites, mobile apps, connected TV apps and OOH digital assets/platforms, as well as advertising procured through Bell digital buying platforms and subscription revenue from DTC services and VOD services. |
| 63 |
5 MD&A Business segment analysis Bell Media
Operating costs and adjusted EBITDA
| 2023 | 2022 | $ change | % change | |||||||||||||
| Operating costs |
(2,420 | ) | (2,509 | ) | 89 | 3.5% | ||||||||||
| Adjusted EBITDA |
697 | 745 | (48 | ) | (6.4% | ) | ||||||||||
| Adjusted EBITDA margin |
22.4% | 22.9% | (0.5) pts | |||||||||||||
Bell Media operating costs decreased by 3.5% in 2023, compared to last year, due to:
| • | Lower content and programming costs driven by content delays due to the WGA and SAG-AFTRA strikes, and higher 2022 costs related to the broadcast of the FIFA World Cup Qatar 2022, partly offset by continued contractual increases in content costs |
| • | Cessation of the CRTC Part II broadcasting licence fee |
| • | Reduced labour costs driven by restructuring initiatives undertaken as a result of the unfavourable economic and broadcasting regulatory environments |
Bell Media adjusted EBITDA decreased by 6.4% in 2023, compared to last year, due to lower operating revenues, partly offset by reduced operating costs.
Bell Media operating metrics
| • | CTV maintained its #1 ranking as the most-watched network in Canada for the 22nd year in a row among total viewers in primetime, with 10 of the top 20 programs nationally among total viewers |
| • | Bell Media maintained its leadership position in the specialty and pay TV market with its English specialty and pay TV properties reaching 76% of all Canadian English specialty and pay TV viewers in the average week among key viewers aged 25 to 54 and with its French specialty and pay TV properties reaching 53% of Québec French specialty and pay TV viewers in an average week |
| • | Noovo had 3 out of the top 10 most watched regular shows on French conventional TV among viewers aged 25 to 54 |
| • | Crave the most distributed Canadian-owned premium video streaming service |
| • | Bell Media continued to rank first in unique visitors, total page views and total page minutes in digital media in 2023 among Canadian broadcast and video network competitors. Bell Media also ranked sixth among online properties in the country in terms of unique visitors and reach, with an average of 23.5 million unique visitors per month, reaching 72% of the digital audience in 2023. |
| • | Bell Media remained Canada’s top radio broadcaster in 2023, and it had the #1 and #2 musical radio station in the Montréal French-language market for Fall 2023 among listeners aged 25 to 54 |
| • | Astral continues to be a leading OOH solution provider across Canada, offering a range of six product lines: outdoor advertising, street furniture, airport, digital large format, transit and indoor place-based. Our products have the potential to reach over 13 million Canadians weekly in 40 markets, and we offer exclusive advertising presence including 6 of the top 15 airports and 2 of the top transit commissions in Canada. |
Competitive landscape and industry trends
This section contains forward-looking statements, including related to our business outlook. Refer to the section Caution regarding forward-looking statements at the beginning of this MD&A.
Competitive landscape
Competition for content in the Canadian media industry continues to be increasingly controlled by a small number of global competitors with significant scale and financial resources. Technology has allowed new entrants to become media players in their own right. Some players have become more vertically integrated across both traditional and emerging platforms to better enable the acquisition and monetization of premium content. Global aggregators have also emerged and are competing for both content and viewers.
Bell Media competes in the TV, radio, OOH advertising and digital media markets:
| • | TV: The TV market has become increasingly fragmented and this trend is expected to continue as new services and technologies increase the diversity of information and entertainment outlets available to consumers |
| • | Radio: Competition within the radio broadcasting industry occurs primarily in discrete local market areas among individual stations |
| • | OOH: The Canadian OOH advertising industry is fragmented, consisting of a few large companies as well as numerous smaller and local companies operating in a few local markets |
| • | Digital media: Consumer demand for digital media, content on mobile devices, and on-demand content is increasing and media products have experienced significant digital uptake, requiring industry players to increase their efforts in digital content and capabilities in order to compete. In response to this trend, advertisers are shifting their spending to premium video and audio products on global digital platforms and social media that enable marketers to narrowly target specific audiences instead of the previous mass marketing approach. This results in lower use of traditional advertising methods and requires a shift in focus. Bell Media and other media companies have initiated programs to sell their advertising inventory on a more targeted basis through updated buying platforms with enhanced access to data and are now selling their inventory on programmatic buying platforms. |
In 2023, the Canadian advertising market continued to experience a slowdown consistent with trends in the global advertising market. Improvement is expected in the medium term, although visibility as to the specific timing and pace of recovery remains limited.
| 64 | BCE INC. 2023 ANNUAL FINANCIAL REPORT |
5 MD&A Business segment analysis Bell Media
Competitors
TV
| • | Conventional Canadian TV stations (local and distant signals) and specialty and pay channels, such as those owned by Corus Entertainment Inc. (Corus), Rogers, Québecor and Canadian Broadcasting Corporation (CBC)/Société Radio-Canada |
| • | U.S. conventional TV stations and specialty channels |
| • | OTT streaming providers such as Netflix, Prime Video, Disney+, Apple TV+, Paramount +, discovery+ and DAZN |
| • | Video-sharing websites such as YouTube, TikTok and Instagram |
Radio
| • | Large radio operators, such as Rogers, Corus, Cogeco and Stingray Group Inc. that also own and operate radio station clusters in various local markets |
| • | Radio stations in specific local markets |
| • | Satellite radio provider SiriusXM |
| • | Music streaming services such as Spotify and Apple Music |
| • | Music downloading services such as Apple’s iTunes Store |
| • | Other media such as newspapers, local weeklies, TV, magazines, outdoor advertising and the Internet |
OOH advertising
| • | Large outdoor and indoor advertisers, such as Pattison Outdoor Advertising, Allvision, Vendo, OUTFRONT Media (1), Québecor, Branded City, REC Media, UB Media and Rouge Media (a division of Rogers Sports & Media) |
| • | Numerous smaller and local companies operating a limited number of faces in a few local markets |
| • | Other media such as TV, radio, print media and the Internet |
Industry trends
Consumers continue to have access to an array of online entertainment and information alternatives, with new options being added yearly. The increase in alternative entertainment options has led to a fragmentation in consumption habits. Traditional linear TV still delivers higher viewership compared to other forms of video consumption, although the gap is closing with more people consuming content from an assortment of services and in a variety of formats. In particular, today’s viewers are
consuming more content online, watching less scheduled programming live, time-shifting original broadcasts through PVRs, viewing more video on mobile devices, and catching up on an expanded library of past programming on-demand. While households use pure OTT services, such as Crave, Netflix, Prime Video, Disney+ and Apple TV+, to complement linear TV consumption, an increasing number are using these services as alternatives to a traditional linear package. With the increase of options in the alternative market, content is more widespread than ever before across providers, resulting in a more competitive landscape. This has resulted in price increases and consumers’ need to subscribe to more than one service. The industry has responded with bundling options, lower price ad tiers, and an increase in free, ad-supported streaming television (FAST) channels, such as The Roku Channel, Tubi and Pluto TV.
Premium video content remains vitally important to media companies in attracting and retaining viewers and advertisers. This content, including live sports and special events, should continue to draw audiences and advertisers moving forward. Heightened competition for these rights from global competitors, including Netflix, Prime Video, Disney+, DAZN and Apple TV+, has already resulted in higher program rights costs and may also make it more difficult to secure content.
Consumer behaviour is continually changing and media companies are adjusting by evolving and personalizing their content and product offerings. Media companies have launched their own solutions with the objective of better competing with non-traditional offerings through DTC products such as Bell Media’s bilingual Crave service, TSN and RDS, all of which offer streaming on a variety of platforms. While the SVOD model continues to dominate the streaming landscape, AVOD and FAST services are seeing tremendous growth due to the appeal to price-conscious consumers.
In addition, there has been a shift in how advertisers want to buy advertising across all media platforms. The growth of digital consumption has also given advertisers the opportunity to buy more targeted inventory and to buy inventory via self-serve and programmatically. As a result, Bell Media and other media companies have initiated programs to sell their advertising inventory on a more targeted basis through updated buying platforms with enhanced access to data and are now selling their inventory on programmatic buying platforms.
Business outlook and assumptions
This section contains forward-looking statements, including relating to our projected financial performance for 2024 and our business outlook, objectives, plans and strategic priorities. Refer to the section Caution regarding forward-looking statements at the beginning of this MD&A.
2024 outlook
We are targeting positive media revenue growth in 2024. While the advertising market continues to be adversely affected by economic uncertainty, we expect a recovery in 2024, although visibility as to the specific timing and pace of recovery remains limited. Subscriber revenue is expected to reflect the non-recurrence of revenue adjustments in 2023, but moderated by BDU rate increases and continued scaling of DTC products, such as Crave, including expanded distribution and price increases. The effects of shifting media consumption towards
competing OTT and digital platforms, as well as further TV cord-shaving and cord-cutting, are also expected to continue to negatively impact subscriber volumes.
We remain focused on advancing our digital-first media strategy, including growing digital revenues and DTC subscribers, and increasing usage of our ad buying optimization platforms. We also intend to continue controlling costs by achieving productivity gains and pursuing operational efficiencies across all of our media properties, while continuing to invest in premium content across all screens and platforms.
| (1) | On October 23, 2023, Bell Media announced it plans to acquire the Canadian out-of-home media business of OUTFRONT Media Inc. The transaction is valued at $410 million, subject to certain adjustments, and is expected to close in the first half of 2024, subject to regulatory approval and other closing conditions. |
| 65 |
5 MD&A Business segment analysis Bell Media
Across our media properties, particularly in TV, we intend to leverage our market position combined with enhanced audience targeting to offer advertisers, both nationally and locally, premium opportunities to reach their target audiences. Success in this area requires that we focus on successfully acquiring highly rated programming and differentiated content; building and maintaining strategic supply arrangements for content across all screens and platforms; and producing and commissioning high-quality Canadian content, including market-leading news. We will also continue scaling our SAM TV and Bell DSP ad buying optimization platforms, which give customers the ability to plan, activate and measure marketing campaigns using Bell’s premium first-party data and expanding personalization of ad content to TV and digital radio.
Our sports offerings are expected to continue to deliver popular content and viewing experiences to our TV and DTC audiences. These offerings, combined with the integration of our digital platforms, are integral parts of our strategy to enhance viewership and engagement. We will also continue to focus on creating innovative high-quality productions in the areas of sports news and editorial coverage.
In non-sports specialty TV, audiences and advertising revenues are expected to be driven by investment in quality programming and production.
Through Crave, our bilingual premium video streaming service, we will continue to leverage our investments in premium content (including HBO, Max, STARZ and original French-language programming) in order to attract pay TV and DTC subscribers. We intend to continue expanding platform distribution and delivering user experience improvements.
We will continue to support original French programming with a focus on digital platforms such as Crave, Noovo.ca and iHeartRadio, to better serve our French-language customers through a personalized digital experience.
In radio, we intend to offer advertisers, both nationally and locally, attractive opportunities to reach their target audiences. Additionally, in conjunction with our TV properties, we will continue to pursue opportunities that leverage our promotional capabilities, provide an expanded platform for content sharing, and offer other synergistic efficiencies.
In our OOH operations, we plan to provide advertisers with attractive opportunities in key Canadian markets. We will also continue to seek new opportunities to support the growing demand in digital, including converting certain outdoor structures to digital and adding new boards. Our proposed acquisition of the Canadian out-of-home media business of OUTFRONT Media Inc., which is expected to close in the first half of 2024, subject to regulatory approval and other closing conditions, is expected to support our digital media strategy and to deliver impactful, multi-channel marketing solutions coast-to-coast.
Assumptions
| • | Overall digital revenue expected to reflect continued scaling of our SAM TV and DSP buying platforms, expansion of Addressable TV (ATV), as well as DTC subscriber growth, contributing towards the advancement of our digital-first media strategy |
| • | Leveraging of first-party data to improve targeting, advertisement delivery including personalized viewing experience and attribution |
| • | Continued escalation of media content costs to secure quality programming |
| • | Continued scaling of Crave through optimized content offering, user experience improvements and expanded distribution |
| • | Continued support in original French programming with a focus on digital platforms such as Crave, Noovo.ca and iHeartRadio, to better serve our French-language customers through a personalized digital experience |
| • | Ability to successfully acquire and produce highly-rated programming and differentiated content |
| • | Building and maintaining strategic supply arrangements for content across all screens and platforms |
| • | No adverse material financial, operational or competitive consequences of changes in or implementation of regulations affecting our media business |
| 66 | BCE INC. 2023 ANNUAL FINANCIAL REPORT |
5 MD&A Business segment analysis Bell Media
Key growth drivers
| • | Building out digital experiences and expanding distribution in order to support audience growth and increase advertising inventory |
| • | Monetization of Bell data through continued scaling of SAM TV and Bell DSP buying platforms as well as expansion of Addressable TV and Addressable Audio |
| • | Ongoing growth in BDU rates |
| • | Delivery of compelling content to maintain strength in audience performance |
Principal business risks
This section discusses certain principal business risks specifically related to the Bell Media segment. For a detailed description of the other principal risks that could have a material adverse effect on our business, refer to section 9, Business risks.
Advertising and subscription revenue uncertainty
Risk
| • | Advertising is heavily dependent on economic conditions and viewership, and traditional media is under increasing pressure for advertising spend against dominant non-traditional/global digital services |
| • | The advertising market could be further impacted by cancelled or delayed advertising campaigns from many sectors due to the economic environment |
| • | Bell Media has contracts with a variety of BDUs, under which monthly subscription fees for specialty and pay TV services are earned, that expire on a specific date |
Potential impact
| • | Economic uncertainty could continue to impact advertisers’ spending. Our failure to increase or maintain viewership or capture our share of the changing and fragmented advertising market, including digital revenues, could result in the loss of advertising revenue. |
| • | If we are not successful in obtaining favourable agreements with BDUs, it could result in the loss of subscription revenue |
Aggressive competition
Risk
| • | The intensity of competitive activity from new technologies and alternative distribution platforms such as unregulated OTT content offerings, VOD, personal video platforms, DTC distribution and pirated content, in addition to traditional TV services, in combination with the development of more aggressive product and sales strategies by non-traditional global players with a much larger scale |
Potential impact
| • | Increased competitive activity in combination with the development of more aggressive product and sales strategies could have an adverse impact on the level of subscriptions and/or viewership for Bell Media’s TV services and on Bell Media’s revenue streams |
Rising content costs and ability to secure key content
Risk
| • | Rising content costs, as an increasing number of domestic and global competitors seek to acquire the same content or to restrict content within their own ecosystems, and the ability to acquire or develop key differentiated content to drive revenues and subscriber growth |
Potential impact
| • | Rising programming costs could require us to incur unplanned expenses, which could result in negative pressure on adjusted EBITDA |
| • | Our inability to acquire or develop popular programming content could adversely affect Bell Media’s viewership and subscription levels and, consequently, advertising and subscription revenues |
| 67 |
6 MD&A Financial and capital management
| 6 | Financial and capital management |

This section tells you how we manage our cash and capital resources to carry out our strategy and deliver financial results. It provides an analysis of our financial condition, cash flows and liquidity on a consolidated basis.
| 6.1 | Net debt |
| 2023 | 2022 | $ change | % change | |||||||||||||
| Long-term debt |
31,135 | 27,783 | 3,352 | 12.1% | ||||||||||||
| Debt due within one year |
5,042 | 4,137 | 905 | 21.9% | ||||||||||||
| 50% of preferred shares (1) |
1,834 | 1,935 | (101 | ) | (5.2% | ) | ||||||||||
| Cash |
(547 | ) | (99 | ) | (448 | ) | n.m. | |||||||||
| Cash equivalents |
(225 | ) | (50 | ) | (175 | ) | n.m. | |||||||||
| Short-term investments |
(1,000 | ) | – | (1,000 | ) | n.m. | ||||||||||
| Net debt |
36,239 | 33,706 | 2,533 | 7.5% | ||||||||||||
n.m.: not meaningful
| (1) | 50% of outstanding preferred shares of $3,667 million and $3,870 million at December 31, 2023 and December 31, 2022, respectively, are classified as debt consistent with the treatment by some credit rating agencies. |
The increase of $905 million in debt due within one year and $3,352 million in long-term debt were due to:
| • | the issuance by Bell Canada of Series M-57, Series M-58, Series M-59, Series M-60, Series M-61 and Series M-62 MTN debentures, with total principal amounts of $300 million, $1,050 million, $450 million, $600 million, $400 million and $700 million in Canadian dollars, respectively |
| • | the issuance by Bell Canada of Series US-8 Notes, with a total principal amount of $850 million in U.S. dollars ($1,138 million in Canadian dollars) |
| • | outstanding loans of $491 million under the Bell Mobility uncommitted trade loan agreement |
| • | a net increase of $374 million due to higher lease liabilities and other debt |
Partly offset by:
| • | a decrease in notes payable (net of issuances) of $646 million |
| • | the repayment at maturity of Series M-29 MTN debentures, with a total principal amount of $600 million |
The increase in cash of $448 million, the increase in cash equivalents of $175 million and the increase in short-term investments of $1,000 million were mainly due to:
| • | $7,946 million of cash flows from operating activities |
| • | $5,195 million of issuance of long-term debt |
| • | $209 million from business dispositions |
Partly offset by:
| • | $4,581 million of capital expenditures |
| • | $3,486 million of dividends paid on BCE common shares |
| • | $1,858 million of repayment of long-term debt |
| • | $646 million decrease in notes payable (net of issuances) |
| • | $223 million paid for the purchase on the open market of BCE common shares for the settlement of share-based payments |
| • | $222 million for business acquisitions |
| • | $183 million for the purchase of spectrum licences |
| • | $182 million of dividends paid on BCE preferred shares |
| • | $149 million repurchase of a financial liability |
| • | $140 million paid for the repurchase of BCE preferred shares |
| 68 | BCE INC. 2023 ANNUAL FINANCIAL REPORT |
6 MD&A Financial and capital management
| 6.2 | Outstanding share data |
| Common shares outstanding |
Number of shares |
|||
| Outstanding, January 1, 2023 |
911,982,866 | |||
| Shares issued under deferred share plan |
843 | |||
| Shares issued under employee stock option plan |
306,139 | |||
| Unclaimed shares (1) |
(15,303 | ) | ||
| Outstanding, December 31, 2023 |
912,274,545 | |||
| (1) | Represents unclaimed shares following the expiry of former Manitoba Telecom Services Inc. (MTS) shareholders’ right to receive BCE common shares in connection with the acquisition of MTS. |
| Stock options outstanding | Number of options |
Weighted average exercise price ($) |
||||||
| Outstanding, January 1, 2023 |
7,802,108 | 61 | ||||||
| Exercised (1) |
(306,139 | ) | 60 | |||||
| Forfeited or expired |
(11,408 | ) | 63 | |||||
| Outstanding, December 31, 2023 |
7,484,561 | 61 | ||||||
| Exercisable, December 31, 2023 |
7,484,561 | 61 | ||||||
| (1) | The weighted average market share price for options exercised in 2023 was $63. |
At March 7, 2024, 912,275,388 common shares and 6,599,815 stock options were outstanding.
| 6.3 | Cash flows |
| 2023 | 2022 | $ change | % change | |||||||||||||
| Cash flows from operating activities |
7,946 | 8,365 | (419 | ) | (5.0% | ) | ||||||||||
| Capital expenditures |
(4,581 | ) | (5,133 | ) | 552 | 10.8% | ||||||||||
| Cash dividends paid on preferred shares |
(182 | ) | (136 | ) | (46 | ) | (33.8% | ) | ||||||||
| Cash dividends paid by subsidiaries to non-controlling interest |
(47 | ) | (39 | ) | (8 | ) | (20.5% | ) | ||||||||
| Acquisition and other costs paid |
8 | 10 | (2 | ) | (20.0% | ) | ||||||||||
| Free cash flow |
3,144 | 3,067 | 77 | 2.5% | ||||||||||||
| Business acquisitions |
(222 | ) | (429 | ) | 207 | 48.3% | ||||||||||
| Business dispositions |
209 | 52 | 157 | n.m. | ||||||||||||
| Acquisition and other costs paid |
(8 | ) | (10 | ) | 2 | 20.0% | ||||||||||
| Short-term investments |
(1,000 | ) | – | (1,000 | ) | n.m. | ||||||||||
| Spectrum licences |
(183 | ) | (3 | ) | (180 | ) | n.m. | |||||||||
| Other investing activities |
(4 | ) | (4 | ) | – | – | ||||||||||
| (Decrease) increase in notes payable |
(646 | ) | 111 | (757 | ) | n.m. | ||||||||||
| Increase in securitized receivables |
– | 700 | (700 | ) | (100.0% | ) | ||||||||||
| Issue of long-term debt |
5,195 | 1,951 | 3,244 | n.m. | ||||||||||||
| Repayment of long-term debt |
(1,858 | ) | (2,023 | ) | 165 | 8.2% | ||||||||||
| Repurchase of a financial liability |
(149 | ) | – | (149 | ) | n.m. | ||||||||||
| Issue of common shares |
18 | 171 | (153 | ) | (89.5% | ) | ||||||||||
| Purchase of shares for settlement of share-based payments |
(223 | ) | (255 | ) | 32 | 12.5% | ||||||||||
| Repurchase of preferred shares |
(140 | ) | (125 | ) | (15 | ) | (12.0% | ) | ||||||||
| Cash dividends paid on common shares |
(3,486 | ) | (3,312 | ) | (174 | ) | (5.3% | ) | ||||||||
| Other financing activities |
(24 | ) | (31 | ) | 7 | 22.6% | ||||||||||
| Net increase (decrease) in cash |
448 | (190 | ) | 638 | n.m. | |||||||||||
| Net increase in cash equivalents |
175 | 50 | 125 | n.m. | ||||||||||||
n.m.: not meaningful
| 69 |
6 MD&A Financial and capital management
Cash flows from operating activities and free cash flow
In 2023, BCE’s cash flows from operating activities decreased by $419 million, compared to 2022, mainly due to lower cash from working capital, in part from timing of supplier payments, and higher interest paid, partly offset by higher adjusted EBITDA and lower contributions to post-employment benefit plans.
Free cash flow increased by $77 million in 2023, compared to 2022, mainly due to lower capital expenditures, partly offset by lower cash flows from operating activities, excluding cash from acquisition and other costs paid.
Capital expenditures
| 2023 | 2022 | $ change | % change | |||||||||||||
| Bell CTS |
4,421 | 4,971 | 550 | 11.1% | ||||||||||||
| Capital intensity |
20.2% | 23.3% | 3.1 pts | |||||||||||||
| Bell Media |
160 | 162 | 2 | 1.2% | ||||||||||||
| Capital intensity |
5.1% | 5.0% | (0.1) pts | |||||||||||||
| BCE |
4,581 | 5,133 | 552 | 10.8% | ||||||||||||
| Capital intensity |
18.6% | 21.2% | 2.6 pts | |||||||||||||
BCE capital expenditures of $4,581 million in 2023, declined 10.8% or $552 million, compared to 2022, with a corresponding capital intensity ratio of 18.6%, down 2.6 pts over last year. The decline was driven by lower capital expenditures in our Bell CTS segment of $550 million as a result of lower planned capital spending in 2023 subsequent to
accelerated network investments in 2022, as well as an unplanned additional $105 million decrease in Q4 2023 as a result of the CRTC’s decision in November 2023 to mandate wholesale access to Bell’s FTTP network. We continued to focus our investments in 2023 on the further expansion of our FTTP and mobile 5G networks.
Business acquisitions
On June 1, 2023, Bell acquired FX Innovation, a Montréal-based provider of cloud-focused managed and professional services and workflow automation solutions for business clients, for cash consideration of $157 million ($156 million net of cash acquired), of which $12 million is payable within two years, and an estimated $6 million of additional cash consideration contingent on the achievement of certain performance objectives. This contingent consideration is expected to be settled by 2027 and the maximum amount payable is $7 million. Contingent consideration is estimated to be nil at December 31, 2023.
On December 1, 2022, Bell acquired Distributel, a national independent communications provider offering a wide range of consumer, business and wholesale communications services, for cash consideration of
$303 million ($282 million net of cash acquired) and $39 million of estimated additional cash consideration contingent on the achievement of certain performance objectives. This contingent consideration was expected to be settled by 2026 and the maximum contingent consideration payable was $65 million. Contingent consideration is estimated to be $49 million at December 31, 2023 of which $19 million was paid in 2023. The remaining $30 million is expected to be paid in 2024.
In February 2022, Bell acquired EBOX and other related companies, which provide Internet, telephone and TV services to consumers and businesses in Québec and parts of Ontario, for cash consideration of $153 million ($139 million net of cash acquired).
Business dispositions
On May 3, 2023, we completed the sale of our 63% ownership in certain production studios, which were included in our Bell Media segment for net cash proceeds of $211 million.
On March 1, 2022, we completed the sale of our wholly-owned subsidiary, Createch for cash proceeds of $54 million.
Spectrum licences
On May 19, 2023, after approval from ISED, Bell Mobility obtained the right to use, through subordination, certain of Xplore Inc.’s 3500 megahertz spectrum licences in Québec, for $145 million.
| 70 | BCE INC. 2023 ANNUAL FINANCIAL REPORT |
6 MD&A Financial and capital management
Debt instruments
We use a combination of short-term and long-term debt to finance our operations. Our short-term debt consists mostly of notes payable under commercial paper programs, loans securitized by receivables and wireless device financing plan receivables, and bank facilities. We usually pay fixed rates of interest on our long-term debt and floating rates on our short-term debt. As at December 31, 2023, all of our debt was denominated in Canadian dollars with the exception of our commercial paper, Bell Mobility trade loans and Series US-1, US-2, US-3, US-4, US-5, US-6, US-7 and US-8 Notes, which are denominated in U.S. dollars and have been hedged for foreign currency fluctuations with cross currency interest rate swaps.
2023
During 2023, we issued debt, net of repayments. This included:
| • | $5,195 million issuance of long-term debt comprised of the issuance of Series M-57, Series M-58, Series M-59, Series M-60, Series M-61 and Series M-62 MTN debentures, with total principal amounts of $300 million, $1,050 million, $450 million, $600 million, $400 million and $700 million in Canadian dollars, respectively, the issuance of Series US-8 Notes, with a total principal amount of $850 million in U.S. dollars ($1,138 million in Canadian dollars), the increase of $491 million in outstanding loans under the Bell Mobility uncommitted trade loan agreement and the issuance of other debt of $75 million, partly offset by $8 million of discounts on our debt issuances |
Partly offset by:
| • | $1,258 million repayment of long-term debt comprised of net payments of leases and other debt |
| • | $646 million repayment (net of issuances) of notes payable |
| • | $600 million repayment of Series M-29 MTN debentures |
2022
During 2022, we issued debt, net of repayments. This included:
| • | $1,951 million issuance of long-term debt comprised of the issuance of Series M-57 MTN debentures with a total principal amount of $1 billion in Canadian dollars and the issuance of Series US-7 Notes, with a total principal amount of $750 million in U.S. dollars ($954 million in Canadian dollars), partly offset by $3 million mainly related to discounts on our debt issuances |
| • | $700 million increase in securitized receivables |
| • | $111 million issuance (net of repayments) of notes payable |
Partly offset by:
| • | $2,023 million repayment of long-term debt comprised of the early redemption of Series M-26 MTN debentures with a total principal amount of $1 billion in Canadian dollars, and net payments of leases and other debt of $1,023 million |
Consolidation of MLSE ownership under BCE (repurchase of a financial liability)
In January 2023, BCE repurchased the 9% interest held by the BCE Master Trust Fund (Master Trust Fund), a trust fund that holds pension fund investments serving the pension obligations of the BCE group pension plan participants, in MLSE for a cash consideration of $149 million, as a result of BCE’s obligation to repurchase the Master Trust Fund’s interest in MLSE at that price.
Issuance of common shares
The issuance of common shares in 2023 decreased by $153 million, compared to 2022, mainly due to a lower number of exercised stock options.
Repurchase of preferred shares
In 2023, BCE repurchased and canceled 8,124,533 First Preferred Shares under its normal course issuer bid (NCIB) for a total cost of $140 million.
Subsequent to year end, BCE repurchased and canceled 1,412,388 First Preferred Shares for a total cost of $25 million.
In 2022, BCE repurchased and canceled 584,300 First Preferred Shares for a total cost of $10 million.
In Q1 2022, BCE redeemed its 4,600,000 issued and outstanding Cumulative Redeemable First Preferred Shares, Series AO for a total cost of $115 million.
Cash dividends paid on common shares
In 2023, cash dividends paid on common shares of $3,486 million increased by $174 million, compared to 2022, due to a higher dividend paid in 2023 of $3.8225 per common share, compared to $3.6350 per common share in 2022.
| 6.4 | Post-employment benefit plans |
For the year ended December 31, 2023, we recorded a decrease in our post-employment benefit plans and a loss, before taxes, in OCI of $553 million. This was due to a lower actual discount rate of 4.6% at December 31, 2023, compared to 5.3% at December 31, 2022, partly offset by a gain on plan assets, experience gains and a decrease in the effect of the asset limit.
For the year ended December 31, 2022, we recorded an increase in our post-employment benefit plans and a gain, before taxes, in OCI of $566 million. This was due to a higher actual discount rate of 5.3% at December 31, 2022, compared to 3.2% at December 31, 2021, partly offset by a loss on plan assets, experience losses and an increase in the effect of the asset limit.
| 71 |
6 MD&A Financial and capital management
| 6.5 | Financial risk management |
Management’s objectives are to protect BCE and its subsidiaries on a consolidated basis against material economic exposures and variability of results from various financial risks, including credit risk, liquidity risk, foreign currency risk, interest rate risk , equity price risk and longevity risk. These risks are further described in Note 2, Material accounting policies, Note 9, Other expense, Note 27, Post-employment benefit plans and Note 29, Financial and capital management in BCE’s 2023 consolidated financial statements.
The following table outlines our financial risks, how we manage these risks and their financial statement classification.
| Financial risk | Description of risk | Management of risk and financial statement classification | ||
| Credit risk | We are exposed to credit risk from operating activities and certain financing activities, the maximum exposure of which is represented by the carrying amounts reported in the statements of financial position. We are exposed to credit risk if counterparties to our receivables, including wireless device financing plan receivables, and derivative instruments are unable to meet their obligations. |
• Large and diverse customer base
• Deal with institutions with investment-grade credit ratings
• Regularly monitor our credit risk and credit exposure, and consider, among other factors, the effects of changes in interest rates and inflation
• Our trade receivables and allowance for doubtful accounts balances at December 31, 2023, which both include the current portion of wireless device financing plan receivables, were $3,959 million and $118 million, respectively
• Our non-current wireless device financing plan receivables and allowance for doubtful accounts balances at December 31, 2023 were $401 million and $15 million, respectively
• Our contract assets balance at December 31, 2023 was $735 million, net of an allowance for doubtful accounts balance of $18 million |
||
| Liquidity risk | We are exposed to liquidity risk for financial liabilities. |
• Our cash, cash equivalents, short-term investments, amounts available under our securitized receivables program, cash flows from operations and possible capital markets financing are expected to be sufficient to fund our operations and fulfill our obligations as they become due. Should our cash requirements exceed the above sources of cash, we would expect to cover such a shortfall by drawing on existing committed bank facilities and new ones, to the extent available
• Refer to section 6.7, Liquidity – Contractual obligations, for a maturity analysis of our recognized financial liabilities |
||
| Foreign currency risk |
We are exposed to foreign currency risk related to anticipated purchases and certain foreign currency debt.
A 10% depreciation (appreciation) in the value of the Canadian dollar relative to the U.S. dollar would result in a gain of $28 million (loss of $100 million) recognized in net earnings at December 31, 2023 and a gain of $124 million (loss of $123 million) recognized in Other comprehensive (loss) income at December 31, 2023, with all other variables held constant.
A 10% depreciation (appreciation) in the value of the Canadian dollar relative to the Philippine peso would result in a gain (loss) of $5 million recognized in Other comprehensive (loss) income at December 31, 2023, with all other variables held constant.
Refer to the following Fair value section for details on our derivative financial instruments. |
• At December 31, 2023, we had outstanding foreign currency forward contracts and options maturing from 2024 to 2025 of $4.6 billion in U.S. dollars ($5.9 billion in Canadian dollars) and ₱2.9 billion in Philippine pesos ($69 million in Canadian dollars), to manage foreign currency risk related to anticipated purchases and certain foreign currency debt
• For cash flow hedges relating to anticipated purchases denominated in foreign currencies, changes in the fair value are recognized in our statements of comprehensive income, except for any ineffective portion of the hedging relationship, which is recognized in Other expense in the income statements. Realized gains and losses in Accumulated OCI are reclassified to the income statements or to the initial cost of the related non-financial asset in the same periods as the corresponding hedged transactions are recognized.
• For cash flow hedges relating to our U.S. dollar debt under our commercial paper program, securitization of receivables program and committed credit facilities, changes in the fair value are recognized in Other expense in the income statements and offset the foreign currency translation adjustment on the related debt, except for any portion of the hedging relationship which is ineffective
• For economic hedges, changes in the fair value are recognized in Other expense in the income statements
• At December 31, 2023, we had outstanding cross currency interest rate swaps with notional amounts of $5,100 million in U.S. dollars ($6,603 million in Canadian dollars) to hedge the U.S. currency exposure of our U.S. Notes maturing from 2032 to 2052
• For these cross currency interest rate swaps, changes in the fair value of these derivatives are recognized in our statements of comprehensive income, except for amounts recorded in Other expense in the income statements to offset the foreign currency translation adjustment on the related debt and any portion of the hedging relationship which is ineffective
• At December 31, 2023, we had outstanding cross currency interest rate swaps with a notional amount of $360 million in U.S. dollars ($491 million in Canadian dollars) to hedge the U.S. currency exposure of outstanding loans maturing in 2025 under our Bell Mobility trade loan agreement
• For these cross currency interest rate swaps, changes in the fair value of these derivatives are recognized in our statements of comprehensive income, except for amounts recorded in Other expense in the income statements to offset the foreign currency translation adjustment on the related debt and any portion of the hedging relationship which is ineffective |
||
| 72 | BCE INC. 2023 ANNUAL FINANCIAL REPORT |
6 MD&A Financial and capital management
| Financial risk | Description of risk | Management of risk and financial statement classification | ||
| Interest rate risk | We are exposed to risk on the interest rates of our debt, our post-employment benefit plans and on dividend rate resets on our preferred shares.
A 1% increase (decrease) in interest rates would result in a loss (gain) of $26 million recognized in net earnings at December 31, 2023, with all other variables held constant.
A 0.1% increase (decrease) in cross currency basis swap rates would result in a gain (loss) of $11 million recognized in net earnings at December 31, 2023, with all other variables held constant.
Refer to the following Fair value section for details on our derivative financial instruments. |
• We use interest rate swaps, cross currency basis rate swaps, cross currency interest rate swaps, forward starting interest rate swaps, and amortizing interest rate swaps to hedge interest rate exposure on existing and/or future debt issuances. We also use leveraged interest rate options to hedge economically the dividend rate resets on preferred shares.
• At December 31, 2023, we had outstanding cross currency interest rate swaps with a notional amount of $600 million in U.S. dollars ($748 million in Canadian dollars) to hedge the interest exposure of our U.S. Notes maturing in 2024
• For these cross currency interest rate swaps, changes in the fair value of these derivatives and the related debt are recognized in Other expense in the income statements and offset each other, except for any ineffective portion of the hedging relationship
• At December 31, 2023, we had outstanding interest rate swaps with a notional amount of $625 million which will mature in 2027 and have been designated to hedge the fair value of our Series M-53 MTN debentures
• For interest rate swaps, changes in the fair value of these derivatives and the related debt are recognized in Other expense in the income statements and offset each other, except for any ineffective portion of the hedging relationship
|
||
| • At December 31, 2023, we had outstanding forward starting interest rate swaps, effective 2024, with a notional amount of $700 million which will mature in 2029 and have been designated to hedge the fair value of our Series M-62 MTN debentures |
||||
| • For forward starting interest rate swaps, changes in the fair value of these derivatives and the related debt are recognized in Other expense in the income statements and offset each other, except for any ineffective portion of the hedging relationship |
||||
| • At December 31, 2023, we had outstanding interest rate swaps with a notional amount of $500 million to hedge the fair value of our series M-52 MTN debentures maturing in 2030 |
||||
| • For interest rate swaps, changes in the fair value of these derivatives and the related debt are recognized in Other expense in the income statements and offset each other, except for any ineffective portion of the hedging relationship |
||||
| • At December 31, 2023, we had outstanding interest rate swaps with a notional amount of $500 million to hedge the fair value of our series M-57 MTN debentures maturing in 2032 |
||||
| • For interest rate swaps, changes in the fair value of these derivatives and the related debt are recognized in Other expense in the income statements and offset each other, except for any ineffective portion of the hedging relationship |
||||
| • At December 31, 2023, we had outstanding forward starting interest rate swaps, effective from 2028 with a notional amount of $125 million to hedge the fair value of our series M-59 MTN debentures maturing in 2053 |
||||
| • For forward starting interest rate swaps, changes in the fair value of these derivatives and the related debt are recognized in Other expense in the income statements and offset each other, except for any ineffective portion of the hedging relationship |
||||
| • At December 31, 2023, we had outstanding forward starting interest rate swaps, effective from 2028 with a notional amount of $400 million to hedge the fair value of our series M-61 MTN debentures maturing in 2053 |
||||
| • For forward starting interest rate swaps, changes in the fair value of these derivatives and the related debt are recognized in Other expense in the income statements and offset each other, except for any ineffective portion of the hedging relationship |
||||
| • At December 31, 2023, we had an outstanding amortizing interest rate swap with a notional amount of $197 million to hedge the interest rate exposure on other debt maturing in 2028 |
||||
| • For amortizing interest rate swaps, changes in the fair value of these derivatives are recognized in our statements of comprehensive income |
||||
| • At December 31, 2023, we had outstanding cross currency basis rate swaps maturing in 2024 with a notional amount of $644 million to hedge economically the basis rate exposure on future debt issuances |
||||
| • For these cross currency basis rate swaps, changes in the fair value of these derivatives are recognized in the income statements in Other expense |
||||
| • At December 31, 2023, we had outstanding leveraged interest rate options with a fair value of nil to hedge economically the dividend rate resets on $582 million of our preferred shares which had varying reset dates in 2021 for the periods ending in 2026 |
||||
| • For leveraged interest rate options, changes in the fair value of these derivatives are recognized in the income statements in Other expense |
||||
|
• For our post-employment benefit plans, the interest rate risk is managed using a liability matching approach, which reduces the exposure of the DB plans to a mismatch between investment growth and obligation growth |
||||
| 73 |
6 MD&A Financial and capital management
| Financial risk | Description of risk | Management of risk and financial statement classification | ||
| Equity price risk | We are exposed to risk on our cash flow related to the settlement of equity settled share-based payment plans.
A 5% increase (decrease) in the market price of BCE’s common shares would result in a gain (loss) of $29 million recognized in net earnings at December 31, 2023, with all other variables held constant.
Refer to the following Fair value section for details on our derivative financial instruments. |
• At December 31, 2023, we had outstanding equity forward contracts with a fair value net liability of $162 million on BCE’s common shares to economically hedge the cash flow exposure related to the settlement of equity settled share-based compensation plans
• Changes in the fair value of these derivatives are recorded in the income statements in Other expense |
||
| Longevity risk | We are exposed to life expectancy risk on our post-employment benefit plans. |
• The Bell Canada Pension Plan has an investment arrangement which hedges part of its exposure to potential increases in longevity, which covers approximately $3 billion of post-employment benefit obligations |
||
Fair value
Fair value is the price that would be received to sell an asset or paid to transfer a liability in an orderly transaction between market participants at the measurement date.
Certain fair value estimates are affected by assumptions we make about the amount and timing of future cash flows and discount rates, all of which reflect varying degrees of risk. Income taxes and other expenses that may be incurred on disposition of financial instruments are not reflected in the fair values. As a result, the fair values may not be the net amounts that would be realized if these instruments were settled.
The carrying values of our cash, cash equivalents, short-term investments, trade and other receivables, trade payables and other liabilities, interest payable, dividends payable, notes payable and loans secured by receivables approximate fair value as they are short-term. The carrying value of wireless device financing plan receivables approximates fair value given that their average remaining duration is short and the carrying value is reduced by an allowance for doubtful accounts and an allowance for revenue adjustments. The carrying value of the Bell Mobility trade loans approximates fair value given their average remaining duration is short and they bear interest at a variable rate.
The following table provides the fair value details of other financial instruments measured at amortized cost in the statements of financial position.
| December 31, 2023 | December 31, 2022 | |||||||||||||||||||
| Classification | Fair value methodology |
Carrying value |
Fair value |
Carrying value |
Fair value |
|||||||||||||||
| Debt securities and other debt |
Debt due within one year and long-term debt |
Quoted market price of debt | 29,049 | 28,225 | 25,061 | 23,026 | ||||||||||||||
The following table provides the fair value details of financial instruments measured at fair value in the statements of financial position.
| Fair value | ||||||||||||||||||
| Classification | |
Carrying value of asset (liability) |
|
|
Quoted prices in active markets for identical assets (level 1) |
|
|
Observable market data (level 2) |
(1) |
|
Non-observable market inputs (level 3) |
(2) |
||||||
| December 31, 2023 |
||||||||||||||||||
| Publicly-traded and privately-held investments (3) | Other non-current assets | 587 | 10 | – | 577 | |||||||||||||
| Derivative financial instruments | Other current assets, trade payables and other liabilities, other non-current assets and liabilities | (488 | ) | – | (488 | ) | – | |||||||||||
| Other | Other non-current assets and liabilities | 147 | – | 216 | (69 | ) | ||||||||||||
| December 31, 2022 | ||||||||||||||||||
| Publicly-traded and privately-held investments (3) | Other non-current assets | 215 | 9 | – | 206 | |||||||||||||
| Derivative financial instruments | Other current assets, trade payables and other liabilities, other non-current assets and liabilities | 72 | – | 72 | – | |||||||||||||
| MLSE financial liability (4) | Trade payables and other liabilities | (149 | ) | – | – | (149 | ) | |||||||||||
| Other |
Other non-current assets and liabilities | 108 | – | 184 | (76 | ) | ||||||||||||
| (1) | Observable market data such as equity prices, interest rates, swap rate curves and foreign currency exchange rates. |
| (2) | Non-observable market inputs such as discounted cash flows and revenue and earnings multiples. For certain privately-held investments, changes in our valuation assumption relating to revenue and earnings multiples may result in a significant increase (decrease) in the fair value of our level 3 financial instruments. |
| (3) | Unrealized gains and losses are recorded in OCI in the statements of comprehensive income and are reclassified from Accumulated OCI to the deficit in the statements of financial position when realized. |
| (4) | Represented BCE’s obligation to repurchase the Master Trust Fund’s 9% interest in MLSE at a price not less than an agreed minimum price. In January 2023, BCE repurchased the interest in MLSE held by the Master Trust Fund for a cash consideration of $149 million. |
| 74 | BCE INC. 2023 ANNUAL FINANCIAL REPORT |
6 MD&A Financial and capital management
| 6.6 | Credit ratings |
Credit ratings generally address the ability of a company to repay principal and pay interest on debt or dividends on issued and outstanding preferred shares.
Our ability to raise financing depends on our ability to access the public equity and debt capital markets, the money market, as well as the bank credit market. Our ability to access such markets and the cost and amount of funding available partly depend on our assigned
credit ratings at the time capital is raised. Investment grade credit ratings usually mean that when we borrow money, we can obtain lower interest rates than companies that have ratings lower than investment grade. A ratings downgrade could result in adverse consequences for our funding cost and capacity, and our ability to access the capital markets, the money market and/or bank credit market.
The following table provides BCE’s and Bell Canada’s credit ratings, which are considered investment grade, as at March 7, 2024 from DBRS, Moody’s and S&P.
Key credit ratings
| Bell Canada (1) | ||||||
| March 7, 2024 | DBRS | Moody’s | S&P | |||
| Commercial paper |
R-2 (high) | P-2 | A-1 (Low) (Canadian scale) | |||
| A-2 (Global scale) | ||||||
| Long-term debt |
BBB (high) | Baa1 | BBB+ | |||
| Subordinated long-term debt |
BBB (low) | Baa2 | BBB | |||
| BCE (1) | ||||||
| DBRS | Moody’s | S&P | ||||
| Preferred shares |
Pfd-3 | – | P-2 (Low) (Canadian scale) | |||
| BBB- (Global scale) | ||||||
| (1) | These credit ratings are not recommendations to buy, sell or hold any of the securities referred to, and they may be revised or withdrawn at any time by the assigning rating agency. Ratings are determined by the rating agencies based on criteria established from time to time by them, and they do not comment on market price or suitability for a particular investor. Each credit rating should be evaluated independently of any other credit rating. |
As of March 7, 2024, BCE’s and Bell Canada’s credit ratings have stable outlooks from DBRS, Moody’s and S&P.
| 6.7 | Liquidity |
This section contains forward-looking statements, including relating to our anticipated capital expenditures, our expected post-employment benefit plans funding, and the sources of liquidity we expect to use to meet our 2024 cash requirements. Refer to the section Caution regarding forward-looking statements at the beginning of this MD&A.
Available liquidity
Total available liquidity at December 31, 2023 was $5.8 billion, comprised of $547 million in cash, $225 million in cash equivalents, $1,000 million in short-term investments, $700 million available under our securitized receivables program and $3.3 billion available under our $3.5 billion committed revolving and expansion credit facilities (given $197 million of commercial paper outstanding).
We expect that our cash, cash equivalents, short-term investments, amounts available under our securitized receivables program, cash flows from operations and possible capital markets financing will permit us to meet our cash requirements in 2024 for capital expenditures, post-employment benefit plans funding, dividend payments, the payment of contractual obligations, maturing debt, ongoing operations and other cash requirements.
Should our 2024 cash requirements exceed our cash, cash equivalents, short-term investments, cash generated from our operations, and funds raised under capital markets financings and our securitized receivables program, we would expect to cover such a shortfall by drawing under committed credit facilities that are currently in place or through new facilities to the extent available.
In 2024, our cash flows from operations, cash, cash equivalents, short-term investments, capital markets financings, securitized receivables program and credit facilities should give us flexibility in carrying out our plans for business growth, including business acquisitions, as well as for the payment of contingencies.
We continuously monitor our operations, capital markets and the Canadian economy with the objective of maintaining adequate liquidity.
Securitization program
In 2022, we entered into a new securitization program which replaced our previous securitized trade receivables program and now includes wireless device financing plan receivables. As a result, the maximum amount available under our securitization program increased from $1.3 billion at December 31, 2021 to $2.3 billion at December 31, 2022.
In 2023, we amended our securitization program to add sustainability-linked pricing. The amendment introduces a financing cost that varies based on our performance of certain sustainability performance targets.
| 75 |
6 MD&A Financial and capital management
The securitization program is recorded as a floating rate revolving loan secured by certain receivables. We continue to service trade receivables and wireless device financing plan receivables under the securitization program, which matures in July 2025 unless previously terminated. The lenders’ interest in the collection of these receivables ranks ahead of our interests, which means that we are exposed to certain risks of default on the amounts securitized.
We have provided various credit enhancements in the form of overcollateralization and subordination of our retained interests.
The lenders have no further claim on our other assets if customers do not pay the amounts owed.
As of December 31, 2023, the balance of loans secured by receivables was $1.2 billion in U.S. dollars ($1.6 billion in Canadian dollars) and the total receivable balance collateralized under the program was $3.3 billion. The foreign currency risk on these loans is managed using foreign currency forward contracts. See section 6.5, Financial risk management in this MD&A for additional details.
Credit facilities
The table below is a summary of our total bank credit facilities at December 31, 2023.
| December 31, 2023 | Total available |
Drawn | Letters of credit |
Commercial paper outstanding |
Net available |
|||||||||||||||
| Committed credit facilities |
||||||||||||||||||||
| Unsecured revolving and expansion credit facilities (1) (2) |
3,500 | – | – | 197 | 3,303 | |||||||||||||||
| Unsecured non-revolving credit facilities (3) |
641 | – | – | – | 641 | |||||||||||||||
| Other |
106 | – | 81 | – | 25 | |||||||||||||||
| Total committed credit facilities |
4,247 | – | 81 | 197 | 3,969 | |||||||||||||||
| Non-committed credit facilities |
||||||||||||||||||||
| Bell Canada |
2,159 | – | 862 | – | 1,297 | |||||||||||||||
| Bell Mobility |
794 | 476 | – | – | 318 | |||||||||||||||
| Total non-committed credit facilities |
2,953 | 476 | 862 | – | 1,615 | |||||||||||||||
| Total committed and non-committed credit facilities |
7,200 | 476 | 943 | 197 | 5,584 | |||||||||||||||
| (1) | Bell Canada’s $2.5 billion committed revolving credit facility expires in May 2028 and its $1 billion committed expansion credit facility expires in May 2026. In 2022, Bell Canada converted its committed credit facilities into a sustainability-linked loan. The amendment introduces a borrowing cost that varies based on our performance of certain sustainability performance targets. |
| (2) | As of December 31, 2023, Bell Canada’s outstanding commercial paper included $149 million in U.S. dollars ($197 million in Canadian dollars). All of Bell Canada’s commercial paper outstanding is included in Debt due within one year. |
| (3) | In 2022, Bell Canada entered into two 30-year senior unsecured non-revolving credit facilities in the aggregate principal amount of up to $647 million to partly fund the expansion of its broadband networks as part of government subsidy programs. In 2023, the maximum aggregate principal amount of such credit facilities was decreased to $641 million. |
Bell Canada may issue notes under its Canadian and U.S. commercial paper programs up to the maximum aggregate principal amount of $3 billion in either Canadian or U.S. currency provided that at no time shall such maximum amount of notes exceed $3.5 billion in Canadian currency, which equals the aggregate amount available under Bell Canada’s committed supporting revolving and expansion credit facilities as at December 31, 2023. The total amount of the net available committed revolving and expansion credit facilities may be drawn at any time.
In 2023, Bell Mobility entered into a $600 million U.S. dollar uncommitted trade loan agreement to finance certain purchase obligations. Loan
requests may be made until April 30, 2024, with each loan having a term of up to 24 months. The loan agreement has been hedged for foreign currency fluctuations.
Some of our credit agreements require us to meet specific financial ratios and to offer to repay and cancel the credit agreement upon a change of control of BCE or Bell Canada. In addition, some of our debt agreements require us to make an offer to repurchase certain series of debt securities upon the occurrence of a change of control event as defined in the relevant debt agreements. We are in compliance with all conditions and restrictions under such agreements.
Cash requirements
Capital expenditures
In 2024, our planned capital spending will be focused on our strategic imperatives, reflecting an appropriate level of investment in our networks and services with a rollback of our fibre network expansion as a result of federal government policies and the CRTC’s decision in November 2023 to mandate wholesale access to Bell’s FTTP network.
Post-employment benefit plans funding
Our post-employment benefit plans include DB pension and DC pension plans, as well as other post-employment benefits (OPEBs) plans. The funding requirements of our post-employment benefit plans, resulting
from valuations of our plan assets and liabilities, depend on a number of factors, including actual returns on post-employment benefit plan assets, long-term interest rates, plan demographics, and applicable regulations and actuarial standards. Actuarial valuations were last performed for our significant post-employment benefit plans as at December 31, 2022.
We expect to contribute approximately $45 million to our DB pension plans in 2024, subject to actuarial valuations being completed. We expect to contribute approximately $10 million to the DC pension plans and to pay approximately $60 million to beneficiaries under OPEB plans in 2024.
| 76 | BCE INC. 2023 ANNUAL FINANCIAL REPORT |
6 MD&A Financial and capital management
Dividend payments
In 2024, the cash dividends to be paid on BCE’s common shares are expected to be higher than in 2023 as BCE’s annual common share dividend increased by 3.1% to $3.99 per common share from $3.87 per common share effective with the dividend payable on April 15, 2024. The declaration of dividends is subject to the discretion of the BCE Board.
Contractual obligations
The following table is a summary of our contractual obligations at December 31, 2023 that are due in each of the next five years and thereafter.
| At December 31, 2023 | 2024 | 2025 | 2026 | 2027 | 2028 | Thereafter | Total | |||||||||||||||||||||
| Recognized financial liabilities |
||||||||||||||||||||||||||||
| Total debt, excluding lease liabilities |
2,172 | 2,690 | 1,609 | 1,742 | 2,120 | 19,337 | 29,670 | |||||||||||||||||||||
| Notes payable |
207 | – | – | – | – | – | 207 | |||||||||||||||||||||
| Lease liabilities (1) |
1,245 | 1,034 | 673 | 403 | 334 | 2,041 | 5,730 | |||||||||||||||||||||
| Loan secured by receivables |
1,588 | – | – | – | – | – | 1,588 | |||||||||||||||||||||
| Interest payable on long-term debt, notes payable and loan secured by receivables |
1,301 | 1,133 | 1,060 | 1,019 | 962 | 10,548 | 16,023 | |||||||||||||||||||||
| Net (receipts) payments on cross currency interest rate swaps |
(6 | ) | 18 | (5 | ) | (11 | ) | (9 | ) | (70 | ) | (83 | ) | |||||||||||||||
| Commitments |
||||||||||||||||||||||||||||
| Commitments for property, plant and equipment and intangible assets |
2,043 | 1,513 | 599 | 316 | 246 | 1,041 | 5,758 | |||||||||||||||||||||
| Purchase obligations |
619 | 513 | 537 | 314 | 219 | 820 | 3,022 | |||||||||||||||||||||
| Planned acquisition of OUTFRONT Media Inc. |
410 | – | – | – | – | – | 410 | |||||||||||||||||||||
| Leases committed not yet commenced |
2 | 6 | – | – | – | – | 8 | |||||||||||||||||||||
| Total |
9,581 | 6,907 | 4,473 | 3,783 | 3,872 | 33,717 | 62,333 | |||||||||||||||||||||
| (1) | Includes imputed interest of $873 million. |
We are also exposed to liquidity risk for financial liabilities due within one year as shown in the statements of financial position in BCE’s 2023 consolidated financial statements.
Our commitments for property, plant and equipment and intangible assets include program and feature film rights and investments to expand and update our networks to meet customer demand.
Purchase obligations consist of contractual obligations under service and product contracts for operating expenditures and other purchase obligations.
Our commitments for leases not yet commenced include real estate, OOH advertising spaces and fibre use. These leases are non-cancellable.
On October 23, 2023, Bell Media announced it plans to acquire the Canadian OOH media business of OUTFRONT Media Inc. The transaction is valued at $410 million, subject to certain adjustments, and is expected to close in the first half of 2024, subject to regulatory approval and other closing conditions. The acquisition of the Canadian OOH media business of OUTFRONT Media Inc. is expected to support Bell Media’s
digital media strategy and to deliver impactful, multi-channel marketing solutions coast-to-coast. The results of the Canadian OOH business of OUTFRONT Media Inc. will be included in our Bell Media segment.
Indemnifications and guarantees
As a regular part of our business, we enter into agreements that provide for indemnifications and guarantees to counterparties in transactions involving business dispositions, sales of assets, sales of services, purchases and development of assets, securitization agreements and leases. While some of the agreements specify a maximum potential exposure, many do not specify a maximum amount or termination date.
We cannot reasonably estimate the maximum potential amount we could be required to pay counterparties because of the nature of almost all of these indemnifications and guarantees. As a result, we cannot determine how they could affect our future liquidity, capital resources or credit risk profile. We have not made any significant payments under indemnifications or guarantees in the past.
| 6.8 | Litigation |
In the ordinary course of business, we become involved in various claims and legal proceedings seeking monetary damages and other relief. In particular, because of the nature of our consumer-facing business, we are exposed to class actions pursuant to which substantial monetary damages may be claimed. Due to the inherent risks and uncertainties of the litigation process, we cannot predict the final outcome or timing of claims and legal proceedings. Subject to the foregoing, and based on information currently available and management’s assessment of the
merits of the claims and legal proceedings pending at March 7, 2024, management believes that the ultimate resolution of these claims and legal proceedings is unlikely to have a material and negative effect on our financial statements or operations. We believe that we have strong defences and we intend to vigorously defend our positions.
For a description of important legal proceedings pending at March 7, 2024, please see the section entitled Legal proceedings contained in the BCE 2023 AIF.
| 77 |
7 MD&A Selected annual and quarterly information
| 7 | Selected annual and |
| quarterly information |
| 7.1 | Annual financial information |
The following table shows selected consolidated financial data of BCE for 2023, 2022 and 2021 based on the annual consolidated financial statements, which are prepared in accordance with International Financial Reporting Standards (IFRS) as issued by the International Accounting Standards Board (IASB). We discuss the factors that caused our results to vary over the past two years throughout this MD&A.
| 2023 | 2022 | 2021 | ||||||||||
| Consolidated income statements |
||||||||||||
| Operating revenues |
||||||||||||
| Service |
21,154 | 20,956 | 20,350 | |||||||||
| Product |
3,519 | 3,218 | 3,099 | |||||||||
| Total operating revenues |
24,673 | 24,174 | 23,449 | |||||||||
| Operating costs |
(14,256 | ) | (13,975 | ) | (13,556 | ) | ||||||
| Adjusted EBITDA |
10,417 | 10,199 | 9,893 | |||||||||
| Severance, acquisition and other costs |
(200 | ) | (94 | ) | (209 | ) | ||||||
| Depreciation |
(3,745 | ) | (3,660 | ) | (3,627 | ) | ||||||
| Amortization |
(1,173 | ) | (1,063 | ) | (982 | ) | ||||||
| Finance costs |
||||||||||||
| Interest expense |
(1,475 | ) | (1,146 | ) | (1,082 | ) | ||||||
| Net return (interest) on post-employment benefit obligations |
108 | 51 | (20 | ) | ||||||||
| Impairment of assets |
(143 | ) | (279 | ) | (197 | ) | ||||||
| Other (expense) income |
(466 | ) | (115 | ) | 160 | |||||||
| Income taxes |
(996 | ) | (967 | ) | (1,044 | ) | ||||||
| Net earnings |
2,327 | 2,926 | 2,892 | |||||||||
| Net earnings attributable to: |
||||||||||||
| Common shareholders |
2,076 | 2,716 | 2,709 | |||||||||
| Preferred shareholders |
187 | 152 | 131 | |||||||||
|
Non-controlling interest |
64 | 58 | 52 | |||||||||
| Net earnings |
2,327 | 2,926 | 2,892 | |||||||||
| Net earnings per common share – basic and diluted |
2.28 | 2.98 | 2.99 | |||||||||
|
Ratios |
||||||||||||
| Adjusted EBITDA margin (%) |
42.2% | 42.2% | 42.2% | |||||||||
| 78 | BCE INC. 2023 ANNUAL FINANCIAL REPORT |
7 MD&A Selected annual and quarterly information
| 2023 | 2022 | 2021 | ||||||||||
| Consolidated statements of financial position |
||||||||||||
| Property, plant and equipment |
30,352 | 29,256 | 28,235 | |||||||||
| Total assets |
71,940 | 69,329 | 66,764 | |||||||||
| Debt due within one year (including notes payable and loans secured by receivables) |
5,042 | 4,137 | 2,625 | |||||||||
| Long-term debt |
31,135 | 27,783 | 27,048 | |||||||||
| Total non-current liabilities |
39,276 | 35,345 | 34,710 | |||||||||
| Equity attributable to BCE shareholders |
20,229 | 22,178 | 22,635 | |||||||||
| Total equity |
20,557 | 22,515 | 22,941 | |||||||||
| Consolidated statements of cash flows |
||||||||||||
| Cash flows from operating activities |
7,946 | 8,365 | 8,008 | |||||||||
| Cash flows used in investing activities |
(5,781 | ) | (5,517 | ) | (7,018 | ) | ||||||
| Capital expenditures |
(4,581 | ) | (5,133 | ) | (4,852 | ) | ||||||
| Short-term investments |
(1,000 | ) | – | – | ||||||||
| Business acquisitions |
(222 | ) | (429 | ) | (12 | ) | ||||||
| Business dispositions |
209 | 52 | – | |||||||||
| Spectrum licences |
(183 | ) | (3 | ) | (2,082 | ) | ||||||
| Cash flows used in financing activities |
(1,542 | ) | (2,988 | ) | (925 | ) | ||||||
| Issue of common shares |
18 | 171 | 261 | |||||||||
| (Decrease) increase in notes payable |
(646 | ) | 111 | 351 | ||||||||
| Increase (decrease) in securitized receivables |
– | 700 | (150 | ) | ||||||||
| Issue of long-term debt |
5,195 | 1,951 | 4,985 | |||||||||
| Repayment of long-term debt |
(1,858 | ) | (2,023 | ) | (2,751 | ) | ||||||
| Repurchase of a financial liability |
(149 | ) | – | – | ||||||||
| Cash dividends paid on common shares |
(3,486 | ) | (3,312 | ) | (3,132 | ) | ||||||
| Cash dividends paid on preferred shares |
(182 | ) | (136 | ) | (125 | ) | ||||||
| Cash dividends paid by subsidiaries to non-controlling interest |
(47 | ) | (39 | ) | (86 | ) | ||||||
| Free cash flow |
3,144 | 3,067 | 2,980 | |||||||||
| Share information |
||||||||||||
| Weighted average number of common shares (millions) |
912.2 | 911.5 | 906.3 | |||||||||
| Common shares outstanding at end of year (millions) |
912.3 | 912.0 | 909.0 | |||||||||
| Market capitalization (1) |
47,595 | 54,255 | 59,821 | |||||||||
| Dividends declared per common share (dollars) |
3.87 | 3.68 | 3.50 | |||||||||
| Dividends declared on common shares |
(3,530 | ) | (3,356 | ) | (3,175 | ) | ||||||
| Dividends declared on preferred shares |
(187 | ) | (152 | ) | (131 | ) | ||||||
| Closing market price per common share (dollars) |
52.17 | 59.49 | 65.81 | |||||||||
| Total shareholder return |
(6.2% | ) | (4.2% | ) | 27.9% | |||||||
|
Ratios |
||||||||||||
| Capital intensity (%) |
18.6% | 21.2% | 20.7% | |||||||||
| Price to earnings ratio (times) (2) |
22.88 | 19.96 | 22.01 | |||||||||
| Other data |
||||||||||||
| Number of employees (thousands) |
45 | 45 | 50 | |||||||||
| (1) | BCE’s common share price at the end of the year multiplied by the number of common shares outstanding at the end of the year. |
| (2) | Price to earnings ratio is defined as BCE’s common share price at the end of the year divided by EPS. |
| 79 |
7 MD&A Selected annual and quarterly information
| 7.2 | Quarterly financial information |
The following table shows selected BCE consolidated financial data by quarter for 2023 and 2022. This quarterly information is unaudited but has been prepared on the same basis as the annual consolidated financial statements. We discuss the factors that caused our results to vary over the past eight quarters throughout this MD&A.
| 2023 | 2022 | |||||||||||||||||||||||||||||||
| Q4 | Q3 | Q2 | Q1 | Q4 | Q3 | Q2 | Q1 | |||||||||||||||||||||||||
| Operating revenues |
||||||||||||||||||||||||||||||||
| Service |
5,348 | 5,281 | 5,303 | 5,222 | 5,353 | 5,193 | 5,233 | 5,177 | ||||||||||||||||||||||||
| Product |
1,125 | 799 | 763 | 832 | 1,086 | 831 | 628 | 673 | ||||||||||||||||||||||||
| Total operating revenues |
6,473 | 6,080 | 6,066 | 6,054 | 6,439 | 6,024 | 5,861 | 5,850 | ||||||||||||||||||||||||
| Adjusted EBITDA |
2,567 | 2,667 | 2,645 | 2,538 | 2,437 | 2,588 | 2,590 | 2,584 | ||||||||||||||||||||||||
| Severance, acquisition and other costs |
(41 | ) | (10 | ) | (100 | ) | (49 | ) | (19 | ) | (22 | ) | (40 | ) | (13 | ) | ||||||||||||||||
| Depreciation |
(954 | ) | (937 | ) | (936 | ) | (918 | ) | (922 | ) | (914 | ) | (933 | ) | (891 | ) | ||||||||||||||||
| Amortization |
(299 | ) | (295 | ) | (296 | ) | (283 | ) | (270 | ) | (267 | ) | (266 | ) | (260 | ) | ||||||||||||||||
| Finance costs |
||||||||||||||||||||||||||||||||
| Interest expense |
(399 | ) | (373 | ) | (359 | ) | (344 | ) | (319 | ) | (298 | ) | (269 | ) | (260 | ) | ||||||||||||||||
| Net return on post-employment benefit plans |
27 | 27 | 27 | 27 | 13 | 13 | 7 | 18 | ||||||||||||||||||||||||
| Impairment of assets |
(109 | ) | – | – | (34 | ) | (150 | ) | (21 | ) | (106 | ) | (2 | ) | ||||||||||||||||||
| Other (expense) income |
(147 | ) | (129 | ) | (311 | ) | 121 | 19 | (130 | ) | (97 | ) | 93 | |||||||||||||||||||
| Income taxes |
(210 | ) | (243 | ) | (273 | ) | (270 | ) | (222 | ) | (178 | ) | (232 | ) | (335 | ) | ||||||||||||||||
| Net earnings |
435 | 707 | 397 | 788 | 567 | 771 | 654 | 934 | ||||||||||||||||||||||||
| Net earnings attributable to common shareholders |
382 | 640 | 329 | 725 | 528 | 715 | 596 | 877 | ||||||||||||||||||||||||
| Net earnings per common share – basic and diluted |
0.42 | 0.70 | 0.37 | 0.79 | 0.58 | 0.78 | 0.66 | 0.96 | ||||||||||||||||||||||||
| Weighted average number of common shares outstanding – basic (millions) |
912.3 | 912.3 | 912.2 | 912.1 | 912.0 | 911.9 | 911.9 | 910.1 | ||||||||||||||||||||||||
| Other information |
||||||||||||||||||||||||||||||||
| Cash flows from operating activities |
2,373 | 1,961 | 2,365 | 1,247 | 2,056 | 1,996 | 2,597 | 1,716 | ||||||||||||||||||||||||
| Free cash flow |
1,289 | 754 | 1,016 | 85 | 376 | 642 | 1,333 | 716 | ||||||||||||||||||||||||
| Capital expenditures |
(1,029 | ) | (1,159 | ) | (1,307 | ) | (1,086 | ) | (1,638 | ) | (1,317 | ) | (1,219 | ) | (959 | ) | ||||||||||||||||
Fourth quarter highlights
| Operating revenues | Q4 2023 | Q4 2022 | $ change | % change | ||||||||||||
| Bell CTS |
5,744 | 5,649 | 95 | 1.7% | ||||||||||||
| Bell Media |
822 | 889 | (67 | ) | (7.5% | ) | ||||||||||
| Inter-segment eliminations |
(93 | ) | (99 | ) | 6 | 6.1% | ||||||||||
| Total BCE operating revenues |
6,473 | 6,439 | 34 | 0.5% | ||||||||||||
| Adjusted EBITDA | Q4 2023 | Q4 2022 | $ change | % change | ||||||||||||
| Bell CTS |
2,419 | 2,308 | 111 | 4.8% | ||||||||||||
| Bell Media |
148 | 129 | 19 | 14.7% | ||||||||||||
| Total BCE adjusted EBITDA |
2,567 | 2,437 | 130 | 5.3% | ||||||||||||
| 80 | BCE INC. 2023 ANNUAL FINANCIAL REPORT |
7 MD&A Selected annual and quarterly information
Total operating revenues at BCE increased by 0.5% in Q4 2023, compared to Q4 2022, driven by higher product revenues of 3.6%, moderated by a modest decline in service revenues of 0.1%, as the decline in Bell Media revenues was mostly offset by the growth in Bell CTS service revenues. Bell CTS operating revenues increased by 1.7% year over year, attributable to both higher service revenues of 1.2% and greater product revenues of 3.6%. The year-over-year growth in service revenues reflected greater wireless and wireline data revenues, moderated by ongoing declines in voice revenues. Bell Media operating revenues declined by 7.5% year over year, driven by ongoing pressures in advertising revenues.
BCE net earnings decreased by 23.3% in Q4 2023, compared to Q4 2022, mainly due to higher other expense, higher interest expense, higher depreciation and amortization and higher severance, acquisition and other costs, partly offset by higher adjusted EBITDA and lower impairment of assets.
BCE’s adjusted EBITDA increased by 5.3% in Q4 2023, compared to the same period last year, due to growth from both our Bell CTS and Bell Media segments of 4.8% and 14.7%, respectively. The year-over-year increase in adjusted EBITDA reflected the flow-through of revenues, along with lower operating costs of 2.4%, mainly driven by Bell Media programming and content savings and the impact of various cost reduction initiatives and operating efficiencies across the company. This resulted in a year-over-year increase in adjusted EBITDA margin of 1.9 pts, to 39.7% in Q4 2023.
Bell CTS operating revenues grew by 1.7% in Q4 2023, compared to the same period last year, driven by higher service revenues of 1.2% from ongoing growth in our mobile phone, connected device, Internet and IPTV subscriber bases coupled with the flow-through of consumer rate increases, the contribution from acquisitions, mainly Distributel and FX Innovation, greater wireless roaming revenues and higher sales of business solutions services to large enterprise customers. This was moderated by increased acquisition, retention and bundle discounts on residential services, ongoing erosion in legacy voice, data and satellite TV services and lower wireless data overages driven by greater customer adoption of monthly plans with higher data thresholds. Additionally, product revenues increased by 3.6% year over year, mainly driven by higher wireless product revenues due to greater sales mix of premium mobile phones and lower year-over-year device discounting during the Black Friday and December holiday periods, moderated by lower contracted sales volumes and reduced consumer electronic sales at The Source.
Bell CTS adjusted EBITDA increased by 4.8% in Q4 2023, compared to Q4 2022, from greater year-over-year operating revenues, along with lower operating costs. The decline in operating costs of 0.5% reflected various cost reduction initiatives and operating efficiencies, including workforce reductions. Adjusted EBITDA margin of 42.1% in Q4 2023, increased by 1.2 points over Q4 2022, mainly due to the impact of better promotional offer discipline during the Black Friday and December holiday sales periods this year compared to 2022, as well as higher year-over-year revenue flow-through and greater operating cost savings.
Bell Media operating revenues decreased by 7.5% in Q4 2023, compared to the same period last year, driven by lower advertising revenues, partly offset by higher subscriber revenues. The continued growth in digital revenues of 27% moderated the overall decline in operating revenues. Advertising revenues decreased by 13.7% in Q4 2023, compared to Q4 2022, due to lower demand from advertisers as a result of ongoing unfavourable economic conditions, which negatively impacted revenues across our TV and radio platforms. TV advertising revenues were also unfavourably impacted by the WGA and SAG-AFTRA strikes and the benefit last year from the broadcast of the FIFA World Cup Qatar 2022. The decline in advertising revenues was partly offset by continued growth in digital advertising revenues, mainly driven by increased bookings from Bell Media’s SAM TV media sales tool. Subscriber revenues increased by 1.0% in Q4 2023, compared to the same period last year, due to a one-time retroactive adjustment related to a contract with a Canadian TV distributor.
Bell Media adjusted EBITDA increased by 14.7% in Q4 2023, compared to the same period last year, as lower operating costs more than offset the decline in operating revenues. The decrease in operating costs was mainly attributable to lower content and programming costs due to higher costs in Q4 2022 related to the broadcast of the FIFA World Cup Qatar 2022, and content delays in Q4 2023 due to the WGA and SAG-AFTRA strikes, partly offset by ongoing contractual increases in content costs. Additionally, the year-over-year decline in operating costs reflected lower labour costs due to restructuring initiatives undertaken as a result of the unfavourable economic and broadcasting regulatory environments and the cessation of the CRTC Part II broadcasting licence fee.
BCE capital expenditures of $1,029 million in Q4 2023, declined by $609 million or 37.2%, compared to the same period last year. This corresponded to a capital intensity ratio of 15.9%, down 9.5 pts over Q4 2022. The decrease in capital expenditures was driven by lower capital spending in Bell CTS of $584 million, due to lower planned spending in 2023 subsequent to accelerated network investments in 2022, along with an unplanned additional $105 million decrease in Q4 2023 as a result of the CRTC’s decision in November 2023 to mandate wholesale access to Bell’s FTTP network. Bell Media capital expenditures in Q4 2023 also declined year-over-year by $25 million, due to greater spending in Q4 2022 on studio expansions and timing of investments to support digital growth.
BCE severance, acquisition and other costs of $41 million in Q4 2023 increased by $22 million, compared to Q4 2022, mainly due to higher acquisition and other costs, partly offset by lower severance costs related to involuntary and voluntary employee terminations.
BCE depreciation of $954 million in Q4 2023 increased by $32 million, year over year, mainly due to a higher asset base as we continued to invest in our broadband and wireless networks.
BCE amortization of $299 million in Q4 2023 increased by $29 million, year over year, mainly due to a higher asset base.
BCE interest expense of $399 million in Q4 2023 increased by $80 million, compared to Q4 2022, mainly due to higher average debt balances and higher average interest rates.
BCE impairment of assets of $109 million in Q4 2023 decreased by $41 million, compared to Q4 2022, mainly due to lower impairment charges for French TV channels within our Bell Media segment.
| 81 |
7 MD&A Selected annual and quarterly information
BCE other expense of $147 million in Q4 2023 increased by $166 million, year over year, mainly due to losses on our equity investments in associates and joint ventures which included a loss on BCE’s share of an obligation to repurchase at fair value the minority interest in one of BCE’s joint ventures, partly offset by higher interest income.
BCE income taxes of $210 million in Q4 2023 decreased by $12 million, compared to Q4 2022, mainly due to a higher value of uncertain tax positions favourably resolved in 2023 compared to 2022, partly offset by higher taxable income.
BCE net earnings attributable to common shareholders of $382 million in Q4 2023, or $0.42 per share, were lower than the $528 million, or $0.58 per share, reported in Q4 2022. The year-over-year decrease was mainly due to higher other expense, higher interest expense, higher depreciation and amortization and higher severance, acquisition
and other costs, partly offset by higher adjusted EBITDA and lower impairment of assets. Adjusted net earnings increased to $691 million in Q4 2023, compared to $654 million in Q4 2022, and adjusted EPS increased to $0.76 from $0.71 in Q4 2022.
BCE cash flows from operating activities was $2,373 million in Q4 2023 compared to $2,056 million in Q4 2022. The increase was mainly attributed to lower income taxes paid, higher cash from working capital and higher adjusted EBITDA, partly offset by higher interest paid.
BCE free cash flow generated in Q4 2023 was $1,289 million, compared to $376 million in Q4 2022. The increase was mainly attributable to lower capital expenditures and higher cash flows from operating activities, excluding acquisition and other costs paid.
Seasonality considerations
Some of our revenues and expenses vary slightly by season, which may impact quarter-to-quarter financial results.
Wireless service and product revenues are influenced by the timing of new mobile device launches and seasonal promotional periods, such as back-to-school, Black Friday and the Christmas holiday period, as well as the level of overall competitive intensity. Because of these seasonal effects, subscriber additions and retention costs due to device upgrades related to contract renewals are typically higher in the third and fourth quarters. For ARPU, historically we have experienced seasonal sequential increases in the second and third quarters, due to higher levels of usage and roaming in the spring and summer months, followed by historical seasonal sequential declines in the fourth and first quarters. However, this seasonal effect on ARPU has moderated, as unlimited voice and data options have become more prevalent, resulting in less variability in chargeable data usage.
Wireline service and product revenues tend to be higher in the fourth quarter because of historically higher data and equipment product sales to business customers. However, this may vary from year to year depending on the strength of the economy and the presence of targeted sales initiatives, which can influence customer spending. Home Phone, TV and Internet subscriber activity is subject to modest seasonal fluctuations, attributable largely to residential moves during the summer months and the back-to-school period in the third quarter. Targeted marketing efforts conducted during various times of the year to coincide with special events or broad-based marketing campaigns also may have an impact on overall wireline service and product revenues.
Bell Media revenue and related expenses from TV and radio broadcasting are largely derived from the sale of advertising, the demand for which is affected by prevailing economic conditions as well as cyclical and seasonal variations. Seasonal variations in TV are driven by the strength of TV ratings, particularly during the fall programming season, major sports league seasons and other special sporting events such as the Olympic Games, National Hockey League (NHL) and NBA playoffs and FIFA World Cup soccer, as well as fluctuations in consumer retail activity during the year.
| 82 | BCE INC. 2023 ANNUAL FINANCIAL REPORT |
8 MD&A Regulatory environment
| 8 | Regulatory environment |
| 8.1 | Introduction |
This section describes certain legislation that governs our business and provides highlights of recent regulatory initiatives and proceedings, government consultations and government positions that affect us, influence our business and may continue to affect our ability to compete in the marketplace. Bell Canada and several of its direct and indirect subsidiaries, including Bell Mobility, Bell ExpressVu Limited Partnership (ExpressVu), Bell Media, NorthernTel, Limited Partnership (NorthernTel), Télébec, Limited Partnership (Télébec), Group Maskatel Québec LP (Maskatel) and Northwestel, are governed by the Telecommunications Act, the Broadcasting Act, the Radiocommunication Act and/or the Bell Canada Act. Our business is affected by regulations, policies and decisions made by various regulatory agencies, including the CRTC, a quasi-judicial agency of the Government of Canada responsible for regulating Canada’s telecommunications and broadcasting industries, and other federal government departments, in particular ISED and the Competition Bureau.
In particular, the CRTC regulates the prices we can charge for retail telecommunications services when it determines there is not enough competition to protect the interests of consumers. The CRTC has determined that competition is sufficient to grant forbearance from retail price regulation under the Telecommunications Act for the vast majority of our retail wireline and wireless telecommunications services. The CRTC can also mandate the provision of access by
competitors to our wireline and wireless networks and the rates we can charge them. Notably, it currently mandates wholesale high-speed access for wireline broadband as well as domestic wireless roaming services and a wholesale facilities-based MVNO access service. Lower mandated wholesale rates or the imposition of unfavourable terms for mandated services would undermine our incentives to invest in network improvements and extensions, limit our flexibility, influence the market structure, improve the business position of our competitors, limit network-based differentiation of our services and negatively impact the financial performance of our businesses. Our TV distribution and our TV and radio broadcasting businesses are subject to the Broadcasting Act and are, for the most part, not subject to retail price regulation.
Although most of our retail services are not price-regulated, government agencies and departments such as the CRTC, ISED, Canadian Heritage and the Competition Bureau continue to play a significant role in regulatory matters such as establishing and modifying regulations for mandatory access to networks, spectrum auctions, the imposition of consumer-related codes of conduct, approval of acquisitions, broadcast and spectrum licensing, foreign ownership requirements, privacy and cybersecurity obligations, and control of copyright piracy. Adverse decisions by governments or regulatory agencies, increasing regulation or a lack of effective anti-piracy remedies could have negative financial, operational, reputational or competitive consequences for our business.
| 8.2 | Telecommunications Act |
The Telecommunications Act governs telecommunications in Canada. It defines the broad objectives of Canada’s telecommunications policy and provides the Government of Canada with the power to give general direction to the CRTC on any of its policy objectives. It applies to several of the BCE group of companies and partnerships, including Bell Canada, Bell Mobility, NorthernTel, Télébec, Maskatel and Northwestel.
Under the Telecommunications Act, all facilities-based telecommunications service providers in Canada, known as telecommunications common carriers (TCCs), must seek regulatory approval for all telecommunications services, unless the services are exempt or forborne from regulation. Most retail services offered by the BCE group of companies are forborne from retail regulation. The CRTC may exempt an entire class of carriers from regulation under the Telecommunications Act if the exemption meets the objectives of Canada’s telecommunications policy. In addition, a few large TCCs, including those in the BCE group, must also meet certain Canadian ownership requirements. BCE monitors and periodically reports on the level of non-Canadian ownership of its common shares.
Review of mobile wireless services
On April 15, 2021, the CRTC released a decision requiring Bell Mobility, Rogers Communications Canada Inc., Telus Communications Inc. and Saskatchewan Telecommunications (SaskTel) to provide MVNO access to their networks to regional wireless carriers to allow them to operate
as MVNOs in ISED Tier 4 spectrum licence areas where they own spectrum. While the terms and conditions for MVNO access would be established in tariffs to be approved by the CRTC, the rate for MVNO access would not be subject to the CRTC tariff regime but instead be commercially negotiated between the parties with final offer arbitration (FOA) by the CRTC as a recourse if negotiations fail. The CRTC indicated that the mandated access service is intended to be a temporary measure and will, in the absence of certain implementation delays, be phased out seven years from the date tariffed terms and conditions are finalized. In the decision, the CRTC has also required Bell Mobility, Rogers Communications Canada Inc. and Telus Communications Inc. to provide seamless handoffs as part of the CRTC’s existing mandated domestic roaming service and has confirmed that its mandatory roaming obligations apply to 5G. On July 14, 2021, Bell Mobility, Rogers Communications Canada Inc., Telus Communications Inc. and SaskTel filed proposed tariff terms and conditions for the mandated MVNO access service and Bell Mobility, Rogers Communications Canada Inc. and Telus Communications Inc. filed proposed amendments to their mandated roaming tariffs to reflect the CRTC’s determinations. On April 6, 2022, the CRTC issued a decision on the mandated roaming tariffs in which it directed Bell Mobility, Rogers Communications Canada Inc. and Telus Communications Inc. to make specified changes to their tariffs by April 21, 2022, for CRTC approval.
| 83 |
8 MD&A Regulatory environment
On October 19, 2022, the CRTC issued a decision in which it made certain determinations regarding the terms and conditions of the proposed MVNO tariffs previously filed by Bell Mobility, Rogers Communications Canada Inc., Telus Communications Inc. and SaskTel, and directed them to file revised tariffs reflecting these determinations within 30 days. In the decision, the CRTC directed Bell Mobility, Rogers Communications Canada Inc., Telus Communications Inc. and SaskTel to offer MVNO access service to regional carriers with a home radio access network (RAN) and core network actively offering mobile wireless services commercially to retail customers in Canada, and confirmed that similar terms and conditions related to seamless handoffs and 5G in the domestic roaming tariffs should apply to the mandated MVNO tariffs. The CRTC required Bell Mobility, Rogers Communications Canada Inc., Telus Communications Inc. and SaskTel to begin accepting requests for MVNO access from regional wireless carriers from the date of the decision. Bell Mobility is required to provide access to the mandated MVNO service in all provinces (excluding Saskatchewan) and in the three territories. It is unclear at this time what impact, if any, the measures set out in this decision could have on our business and financial results, and our ability to make investments at the same levels as we have in the past. In Q3 2023, we began providing MVNO access service on Bell Mobility’s network in certain regions and expect that use of the service on our network by our wholesale customers will continue to expand in the future.
On July 13, 2023, the CRTC accepted a request from Québecor Media Inc. to initiate FOA in respect of rates for MVNO access service from Bell Mobility. Following the parties’ submissions in August 2023, the CRTC issued a decision on October 10, 2023, selecting the rate proposed by Bell Mobility. On December 15, 2023, Québecor Media Inc. subsequently filed a Part 1 application seeking the CRTC’s intervention in determining the start date for the MVNO access service from Bell Mobility. Bell Mobility filed its responding submission on January 19, 2024.
The CRTC previously accepted a joint request for FOA from Rogers Communications Canada Inc. and Québecor Media Inc. On July 24, 2023, the CRTC issued its decision in that arbitration, selecting the rate proposed by Québecor Media Inc. In the decision, the CRTC made a number of findings or determinations that indicate a continued trend toward downplaying the importance of incentives for investment in telecommunications networks in Canada. While the CRTC’s determination in Bell Mobility’s FOA with Québecor Media Inc appears to have moderated this approach by highlighting the importance of providing a return on investment to facilities-based carriers, adverse regulatory decisions such as the Rogers Communications Canada Inc. and Québecor Media Inc FOA decision are expected to impact the specific nature, magnitude, location and timing of our future wireless and wireline investment decisions. On August 23, 2023, Rogers Communications Canada Inc. sought leave to appeal the CRTC’s arbitration decision with the Federal Court of Appeal.
Review of wholesale FTTN high-speed access service rates
As part of its ongoing review of wholesale Internet rates, on October 6, 2016, the CRTC significantly reduced, on an interim basis, some of the wholesale rates that Bell Canada and other major providers charge for access by third-party Internet resellers to FTTN or cable networks, as applicable. On August 15, 2019, the CRTC further reduced the wholesale rates that Internet resellers pay to access network infrastructure built by facilities-based providers like Bell Canada, with retroactive effect to March 2016.
The August 2019 decision was stayed, first by the Federal Court of Appeal and then by the CRTC, with the result that it never came into effect. In response to review and vary applications filed by each of Bell Canada, five major cable carriers (Cogeco Communications Inc., Eastlink, Rogers Communications Canada Inc., Shaw and Vidéotron) and Telus Communications Inc., the CRTC issued Decision 2021-182 on May 27, 2021, which mostly reinstated the rates prevailing prior to August 2019 with some reductions to the Bell Canada rates with retroactive effect to March 2016. As a result, in the second quarter of 2021, we recorded a reduction in revenue of $44 million in our consolidated income statements.
While there remains a requirement to refund monies to third-party Internet resellers, the establishment of final wholesale rates that are similar to those prevailing since 2019 reduces the impact of the CRTC’s long-running review of wholesale Internet rates. The largest reseller, TekSavvy Solutions Inc. (TekSavvy), obtained leave to appeal the CRTC’s decision of May 27, 2021 before the Federal Court of Appeal. Oral hearings are now complete and we are awaiting a decision of the court. The decision was also challenged in three petitions brought by TekSavvy, Canadian Network Operators Consortium Inc. and National Capital Freenet before Cabinet but, on May 26, 2022, Cabinet announced it would not alter the decision.
Review of the wholesale high-speed access service framework
On March 8, 2023, the CRTC launched a consultation, TNC 2023-56, to review the wholesale high-speed access framework. The CRTC expressed the preliminary views that (i) the provision of aggregated wholesale high-speed access services should be mandated, including over FTTP facilities, and (ii) aggregated access to FTTP facilities should be mandated on a temporary and expedited basis, until the CRTC reaches a decision as to whether such access is to be provided indefinitely.
The review is also notably seeking comments on (i) the future of disaggregated high-speed access services, (ii) the state of competition in the retail Internet service market, (iii) whether other changes are required to support wholesale-based competition across all regions of the country, (iv) whether wholesale regulation should continue to be relied upon to address concerns regarding market concentration and the potential exercise of market power, and (v) whether the CRTC should consider any type of retail regulation.
On November 6, 2023, in Telecom Decision CRTC 2023-358 (the Decision), the CRTC determined that aggregated access to Bell Canada’s FTTP facilities in Ontario and Québec should be mandated on a temporary and expedited basis, and the CRTC set interim access rates. The CRTC may maintain, reverse or otherwise modify this new obligation when it concludes its ongoing wholesale high-speed access review.
The imposition of an interim aggregated access to FTTP facilities obligation has undermined Bell Canada’s incentives to invest in next-generation wireline networks and is expected to adversely impact our financial results. Bell Canada announced its intention to reduce capital expenditures by over $1 billion over 2024 and 2025 combined, including a minimum of $500 million in 2024, and roll back fibre network expansion to a near-term target of 8.3 million locations by the end of 2025 as a result of federal government policies and the Decision. Bell Canada is also capping fibre speeds at 3 Gbps. In Q4 2023, Bell Canada reduced its capital investment by $105 million more than originally planned as a result of the Decision.
| 84 | BCE INC. 2023 ANNUAL FINANCIAL REPORT |
8 MD&A Regulatory environment
On November 15, 2023, Bell Canada sought leave to appeal the Decision to the Federal Court of Appeal, along with a stay of the Decision pending resolution of its appeal. On February 9, 2024, the Federal Court of Appeal granted Bell Canada leave to appeal but declined to grant the requested stay. On February 2, 2024, Bell Canada filed an appeal to the Governor-in-Council.
Additionally, on February 1, 2024, CIK Telecom filed an application with the CRTC asking that the CRTC clarify or vary the intended scope of the Decision to: (1) prevent Bell Canada, Rogers Communications Inc., Québecor Media Inc. and Telus Communications Inc. from accessing aggregated FTTP facilities pursuant to the Decision, and (2) lower the interim rates set in the Decision. In a letter dated March 5, 2024, the CRTC stated that the changes CIK Telecom sought will be considered in the final decision and thus closed the application.
Review of the CRTC’s regulatory framework for Northwestel
On June 8, 2022, the CRTC launched the second phase of a proceeding to review the regulatory framework for Northwestel and the state of telecommunications services in Canada’s North. This proceeding may result in modifications to the current regulatory framework for Northwestel, including with respect to issues such as rates, wholesale access and subsidies. Modifications to the current regulatory framework may result in additional subsidies and rate flexibility for Northwestel, which would encourage investment, or they may result in rate reductions/ restrictions or additional wholesale obligations, which would undermine incentives for investment in the North. At this time, it is unclear what impact, if any, the results of the proceeding could have on our business and financial results.
CRTC review of access to poles
On February 15, 2023, the CRTC issued a decision which included a number of determinations to facilitate access by third parties to poles owned by Canadian carriers or poles to which Canadian carriers control access. Among other directions, the CRTC’s decision: establishes new timelines for each step in the pole access permitting process; reduces the obligations of access seekers to pay costs for any pole repairs, upgrades or replacements required to accommodate the addition of the access seeker’s equipment; provides access seekers with greater flexibility to carry out pole repairs and upgrades themselves; maintains
the circumstances under which pole owners may obtain priority access to poles or reserve capacity for their future use on poles; and imposes new notification and reporting obligations on pole owners. On April 3, 2023, large ILECs, including Bell Canada, updated their applicable tariffs to incorporate the new determinations and are awaiting the CRTC’s approval.
On October 16, 2023, Bell Canada filed Tariff Notice 981 to revise the tariff pages for its National Services Tariff (NST) CRTC 7400 Item 901 – Support Structure Service to reflect an updated monthly pole rental rate per unit applicable in its Ontario and Québec serving area, and is awaiting the CRTC’s decision on this application.
Bill C-26, An Act Respecting Cyber Security
On June 14, 2022, the Government of Canada introduced Bill C-26, An Act Respecting Cyber Security (ARCS). ARCS would enact the Critical Cyber Systems Protection Act, which would establish a regulatory framework requiring designated operators in the finance, telecommunications, energy and transportation sectors to protect their critical cyber systems. Also included in Bill C-26 are proposed changes to the Telecommunications Act that would establish new authorities that would enable the Government to take action to promote the security of the Canadian telecommunications system, which could include measures with respect to certain suppliers, such as Huawei and ZTE. If enacted, Bill C-26 would give the Minister responsible for ISED additional order-making powers and establish an enforcement regime under which the Minister responsible for ISED could impose administrative monetary penalties, among other actions. It is unclear at this time what impact the legislative changes could have on our business and financial results.
Canada’s telecommunications foreign
ownership rules
Under the Telecommunications Act, there are no foreign investment restrictions applicable to TCCs that have less than a 10% share of the total Canadian telecommunications market as measured by annual revenues. However, foreign investment in telecommunications companies can still be refused by the government under the Investment Canada Act. The absence of foreign ownership restrictions on such small or new entrant TCCs could result in more foreign companies entering the Canadian market, including by acquiring spectrum licences or Canadian TCCs.
| 8.3 | Broadcasting Act |
The Broadcasting Act outlines the broad objectives of Canada’s broadcasting policy and assigns the regulation and supervision of the broadcasting system to the CRTC. Key policy objectives of the Broadcasting Act are to protect and strengthen the cultural, political, social and economic fabric of Canada and to encourage the development of Canadian expression.
Most broadcasting activities require a programming or distribution licence from the CRTC. The CRTC may exempt broadcasting undertakings from complying with certain licensing and regulatory requirements if it is satisfied that non-compliance will not materially affect the implementation of Canadian broadcasting policy. A corporation must
also meet certain Canadian ownership and control requirements to obtain a programming or distribution licence, and corporations must have the CRTC’s approval before they can transfer effective control of a broadcasting licensee.
Our TV distribution operations and our TV and radio broadcasting operations are subject to the requirements of the Broadcasting Act, the policies and decisions of the CRTC and their respective broadcasting licences. Any changes in the Broadcasting Act, amendments to regulations or the adoption of new ones, or amendments to licences, could negatively affect our competitive position or the cost of providing services.
| 85 |
8 MD&A Regulatory environment
Bill C-11, An Act to amend the Broadcasting Act
On April 27, 2023, Bill C-11, An Act to amend the Broadcasting Act and to make related and consequential amendments to other Acts, received royal assent. Key among the amendments in Bill C-11 is the immediate elimination of CRTC Part II Licence Fees whereby the broadcasting industry paid an annual tax of approximately $125 million per year. In addition, foreign online broadcasting undertakings doing business in Canada will be required to contribute to the Canadian broadcasting system in a manner that the CRTC deems appropriate. The specifics of such contributions will be determined through the CRTC’s public consultation processes and enforced by way of conditions imposed by the CRTC. The timing and the outcome of the CRTC’s consultation processes, the first stage of which was launched on May 12, 2023 (as discussed under Broadcast Notice of Consultation 2023-138 below) are unknown; therefore the impact that these regulatory changes could have on our business and financial results is unclear at this time.
Broadcast Notice of Consultation CRTC 2023-138
On May 12, 2023, the CRTC issued Broadcasting Notice of Consultation CRTC 2023-138, The Path Forward – Working towards a modernized regulatory framework regarding the contributions to support Canadian and Indigenous content. This Notice represents the first of three steps to develop an updated regulatory framework for broadcasting undertakings, including online undertakings. A key part of this new framework is to establish the conditions under which online services would be required to make financial contributions, including initial base contributions, to support the creation and discoverability of Canadian
and Indigenous content. It will also determine who the recipients of the initial base contributions will be. The CRTC held a three-week hearing beginning on November 20, 2023 to focus on these issues. While the CRTC has not yet initiated its public consultations for Steps 2 and 3, these subsequent proceedings will focus on the overall framework for both traditional and online undertakings, with a focus on how to support the creation of Canadian and Indigenous content beyond financial contribution requirements, as well as diversity, inclusion and discoverability issues. In Step 3, the CRTC intends to finalize each undertaking’s or ownership group’s contribution requirements, presumably as part of our group licence renewal. The timing and outcome of all of these proceedings, including the CRTC’s Step 1 decision, is unknown. Therefore, the impact that these regulatory changes could have on our business and financial results is unclear at this time.
Broadcast Policy Direction
On November 14, 2023, the Government of Canada released its Policy Direction, which directs the CRTC on how to implement the amendments to the Broadcasting Act (Bill C-11). The Direction requires the CRTC to focus on ensuring strong support for Canadian and Indigenous programming, as well as to consider the importance of sustainable support for local and regional news by the Canadian broadcasting system. In addition, the Direction requires the CRTC to minimize the regulatory burden on the Canadian broadcasting system, and to consider how to foster collaboration between Canadian and foreign undertakings. At this time, it is unclear what impact, if any, the Direction could have on our business and financial results.
| 8.4 | Radiocommunication Act |
ISED regulates the use of radio spectrum under the Radiocommunication Act and Radiocommunication Regulations to ensure that radiocommunication in Canada is developed and operated efficiently. All companies wishing to operate radio apparatus in Canada must hold a radio licence or spectrum licence to do so. The Radiocommunication Regulations specify those persons (including corporations such as Bell Canada and Bell Mobility) who are eligible to be issued radio licences or spectrum licences.
3800 MHz spectrum auction
The auction for licensing 3800 MHz spectrum began on October 24, 2023 and the provisional spectrum licence winners were announced by ISED on November 30, 2023. Bell Mobility secured the right to acquire 939 licences of 3800 MHz spectrum across Canada covering 1.77 billion MHz-Pop for $518 million. As part of this auction, ISED implemented a cross-band spectrum cap (with the 3500 MHz band) of 100 MHz. The auctioned licences will have a 20-year term and licences will not be transferable for the first five years of the licence term if the transfer results in exceeding the cross-band spectrum cap. In addition, licensees will be required to provide network coverage to a certain percentage of the population at 5, 7, 10 and 20 years following licence issuance depending on the licence area. Licensees with existing LTE networks will be subject to additional deployment requirements based on their existing LTE coverage. Bell Mobility’s initial auction payment representing 20% of the total payment was made on January 17, 2024. The remaining 80% representing the final auction payment is due on May 29, 2024, at which time ISED will issue the 3800 MHz spectrum licences.
Consultation on 26, 28 and 38 GHz (Millimeter
Wave) spectrum licensing framework
On June 6, 2022, ISED initiated a consultation seeking input regarding a policy and licensing framework to govern the auction and use of spectrum licences in the 26, 28 and 38 Gigahertz (GHz) (Millimeter Wave) spectrum bands. The consultation paper seeks comments on the use of a spectrum set-aside for certain auction bidders, or a spectrum cap across the 26, 28 and 38 GHz spectrum bands. ISED proposes that the auctioned licences will have a 10-year term and that there will be limits on the extent of transferability of licences for the first five years of the licence term. In addition, ISED proposes that licensees will be required to deploy a certain number of sites in each licence area at five and nine and a half years following licence issuance. ISED has not yet indicated a specific date when the auction will take place. The consultation paper also seeks comments on the transition process for existing 38 GHz licensees from fixed to flexible use (i.e., mobile or fixed use), as well as the limitations on the use of 38 GHz spectrum by satellite earth stations. It is unclear what impact the results of this consultation and future related processes could have on our business and financial results.
| 86 | BCE INC. 2023 ANNUAL FINANCIAL REPORT |
8 MD&A Regulatory environment
| 8.5 | Bell Canada Act |
Among other things, the Bell Canada Act limits how Bell Canada voting shares and Bell Canada facilities may be sold or transferred. Specifically, under the Bell Canada Act, the CRTC must approve any sale or other disposal of Bell Canada voting shares that are held by BCE, unless the sale or disposal would result in BCE retaining at least
80% of all of the issued and outstanding voting shares of Bell Canada. Except in the ordinary course of business, the sale or other disposal of facilities integral to Bell Canada’s telecommunications activities must also receive CRTC approval.
| 8.6 | Other |
Bill C-18, the Online News Act
On June 22, 2023, Bill C-18, An Act respecting online communications platforms that make news content available to persons in Canada (the Online News Act) received royal assent. The Online News Act requires digital news intermediaries, such as Google and Meta, that share news content produced by other news outlets to negotiate commercial arrangements with those outlets, compensating them for the news content shared on digital platforms. The legislation entitles Bell Media’s general news services, such as CTV and Noovo, to compensation. Further details regarding the compensation framework have been set out in Regulations that were released on December 15, 2023. These Regulations clarify that the Online News Act applies to search engines and social media sites that provide access to news content in Canada provided these platforms earn at least Cdn $1 billion in annual global
revenue and reach at least 20 million Canadians on a monthly basis. In addition, the total amount of compensation to be provided by the largest platform (i.e., Google) is limited to $100 million annually, and compensation provided by other platforms will be determined by the CRTC based on the platform’s Canadian advertising revenues. Of these amounts, private broadcasters cannot receive more than 30% of the overall compensation available. The amount of compensation that Bell Media may receive from Google is unclear, as is the timing of such compensation. It is also unknown whether Meta will stop blocking news links and subject themselves to the jurisdiction of the Online News Act. While Meta’s actions are having some negative impact on our news sites, the full impact that the legislative changes could have on our business and financial results is unknown at this time. Finally, the CRTC must still establish its processes to administer the Online News Act.
| 87 |
9 MD&A Business risks
| 9 | Business risks |
A risk is the possibility that an event might happen in the future that could have a negative effect on our business, financial condition, liquidity, financial results or reputation. The actual effect of any event could be materially different from what we currently anticipate. The risks described in this MD&A are not the only ones that could affect us. Additional risks and uncertainties not currently known to us or that we currently deem to be immaterial may also materially and adversely affect our business, financial condition, liquidity, financial results or reputation.
This section describes the principal business risks that could have a material adverse effect on our business, financial condition, liquidity, financial results or reputation, and cause actual results or events to differ materially from our expectations expressed in, or implied by, our forward-looking statements. Certain of these principal business risks have already been discussed in other sections of this MD&A, and we refer the reader to those sections for a discussion of such risks. All of the risk discussions set out in the sections referred to in the table below, as well as the risk discussion relating to general economic conditions and geopolitical events set out in Section 3.3, Principal business risks, are incorporated by reference in this section 9.
| Risks discussed in other sections of this MD&A |
Section references | |
|
Regulatory environment |
Section 3.3, Principal business risks
Section 8, Regulatory environment |
|
|
Competitive environment |
Section 3.3, Principal business risks
Section 5, Business segment analysis (Competitive landscape and industry trends section for each segment) |
|
|
Technology/infrastructure transformation |
Section 3.3, Principal business risks | |
|
Risks specifically relating to our Bell CTS |
Section 5, Business segment analysis (Principal business risks section for each segment) | |
The other principal business risks that could also have a material adverse effect on our business, financial condition, liquidity, financial results or reputation are discussed below.
Customer experience

Driving a positive customer experience in all aspects of our engagement with customers is important to avoid brand degradation and other adverse impacts on our business and financial performance
As the bar continues to be raised by customers’ evolving expectations of service and value, failure to get ahead of such expectations and build a more robust and consistent service experience at a fair value proposition could hinder product and service differentiation and customer loyalty. The foundation of effective customer service is the ability to deliver high-quality, consistent and simple solutions to customers in an expeditious manner and on mutually agreeable terms. Although we seek to reduce complexity in our operations through our transformation initiatives, we operate with multiple technology platforms, ordering and billing systems, sales channels, marketing databases and a myriad of rate plans, promotions, brands and product offerings, in the context of a large customer base and a workforce that continuously requires to be trained, monitored and replaced, which may limit our ability to respond quickly to market changes and reduce costs, and may lead to customer confusion or billing, service or other errors, which could adversely affect customer satisfaction, acquisition and retention. Media attention to customer complaints could also erode our brand and reputation and adversely affect customer acquisition and retention. In addition, the current global economic environment may bring about further workforce reduction initiatives or limit investments, which could negatively impact the rapidity of our response to customer demands and the overall customer experience.
With the proliferation of connectivity services, apps and devices, customers are accustomed to doing things when, how and where they want through websites, self-serve options, web chat, call centres and social media forums. These customer demands have intensified since the beginning of the COVID-19 pandemic and the resulting shift to online transactions, and we seek to provide the necessary platforms for customers to research, interact, purchase and receive service. Customers’ journey is increasingly completed on mobile devices, requiring alignment of websites, customer support platforms and marketing. Understanding the customer relationship as a whole in a multi-product environment and delivering a simple, seamless experience at a fair price is increasingly central to an evolving competitive dynamic. While we have introduced new services and tools, including self-managed solutions, designed to accelerate our customer experience evolution, we are unable to predict whether such services and tools will be sufficient to meet customer expectations. Failure to develop true omni-channel capabilities and improve our customer experience by digitizing and developing a consistent, fast and on-demand end-to-end experience before, during and after sales using new technologies such as AI and machine learning, in parallel with our network evolution, could also adversely affect our business, financial results, reputation and brand value. Such development activities could further be challenged by scarcity of skilled resources in a competitive labour market. In addition, while AI could provide for better, cost-effective and convenient customer experiences, we must carefully assess the challenges associated with the use of such technology by us as well as by our competitors.
| 88 | BCE INC. 2023 ANNUAL FINANCIAL REPORT |
9 MD&A Business risks
Customers’ perception of our products, services, brand and corporate image is also important. Embracing topics that matter to the stakeholder value proposition, such as ESG practices and the reporting of same, adds an important layer to the customer perception of our company and thus to the overall customer experience. Failure to positively
influence customer perceptions through effective communication, including through our use of social media and other communication media or otherwise, could adversely affect our business, financial results, reputation and brand value.
Security management and data governance

Our operations, service performance, reputation and business continuity depend on how well we protect our physical and non-physical assets, including from information security threats
Our operations, service performance, reputation and business continuity depend on how well we protect our physical and non-physical assets, including networks, IT systems, offices, corporate stores and sensitive information, from events such as information security attacks, unauthorized access or entry, fire, natural disasters, power loss, building cooling loss, acts of war or terrorism, sabotage, vandalism, actions of neighbours and other events. The protection and effective organization of our systems, applications and information repositories are central to the secure and continuous operation of our networks and business, as electronic and physical records of proprietary business and personal data, such as confidential customer and employee information, are all sensitive from a market and privacy perspective.
Information security breaches can result from deliberate or unintended actions by a growing number of sophisticated actors, including hackers, organized criminals, state-sponsored organizations and other parties. Information security attacks have grown in complexity, magnitude and frequency in recent years and the potential for damage is increasing. Information security attacks may be perpetrated using a complex array of ever evolving and changing means including, without limitation, the use of stolen credentials, social engineering, computer viruses and malicious software, phishing and other attacks on network and information systems. Information security attacks aim to achieve various malicious objectives including unauthorized access to, ransom/encryption of, and theft of, confidential, proprietary, sensitive or personal information, as well as extortion and business disruptions.
We are also exposed to information security threats as a result of actions that may be taken by our customers, suppliers, outsourcers, business partners, employees or independent third parties, whether malicious or not, including as a result of the use of social media, cloud-based solutions and IT consumerization. Our use of third-party suppliers and outsourcers and reliance on business partners, which may similarly be subject to information security threats, also expose us to risks as we have less immediate oversight over their IT domains. Furthermore, the introduction of 5G, cloud computing and the proliferation of data services, including mobile TV, mobile commerce, mobile banking and IoT applications, as well as increased digitization and the use or misuse of emerging technologies such as AI, robotics and smart contracts leveraging blockchain for digital certification, have significantly increased the threat surface of our networks and systems, resulting in higher complexity that needs to be carefully monitored and managed to minimize security threats. Failure to implement an information security program that efficiently considers relationships and interactions with business partners, suppliers, customers, employees and other third parties across all methods of communication, including social media and cloud-based solutions, could adversely affect our ability to successfully defend against information security attacks.
Changes in behaviour further to the COVID-19 pandemic as well as recent geopolitical events have further increased our exposure to information security threats. Remote work arrangements of our employees and those of our suppliers have increased remote connectivity to our systems and the potential use of unauthorized communications technologies. In addition, we have seen an increase in global criminal activity, which further pressures our security environment.
If information security threats were to become successful attacks resulting in information security breaches, they could harm our brand, reputation and competitiveness, decrease customer and investor confidence and adversely affect our business, financial results, stock price and long-term shareholder value, given that they could lead to:
| • | Network operating failures and business disruptions, which could negatively impact our ability to sell products and services to our customers and adversely affect their ability to maintain normal business operations and deliver critical services, and/or the ability of third-party suppliers to deliver critical services to us |
| • | Unauthorized access to, and use of, proprietary or sensitive information, which could result in lost revenue, diminished competitive advantages, challenges in retaining or attracting customers after an incident and loss of future business opportunities |
| • | Theft, loss, unauthorized disclosure, destruction, encryption or corruption of data and confidential information, including personal information about our customers or employees, that could result in financial loss, exposure to claims for damages by customers, employees and others, extortion threats due to ransomware and difficulty in accessing materials to defend legal actions |
| • | Physical damage to network assets impacting service continuity |
| • | Fines and sanctions for failure to meet legislative requirements or from credit card providers for failing to comply with payment card industry data security standards for protection of cardholder data |
| • | Increased fraud as criminals leverage stolen information against our customers, our employees or our company |
| • | Remediation costs such as liability for stolen information, equipment repair and service recovery, and incentives to customers or business partners in an effort to maintain relationships after an incident |
| • | Increased information security protection costs, including the costs of deploying additional personnel and protection technologies, training and monitoring employees, and engaging third-party security experts and auditors |
| • | Changes in the terms, conditions and pricing of customer, supplier and financial contracts and agreements that we may have |
| 89 |
9 MD&A Business risks
In light of the evolving nature and sophistication of information security threats, our information security policies, procedures and controls must continuously adapt and evolve in order to seek to mitigate risk and, consequently, require constant monitoring to ensure effectiveness. However, given the complexity and scale of our business, network infrastructure, technology and IT supporting systems, there can be no assurance that the security policies, procedures and controls that we implement will be effective against all information security attacks. In addition, there can be no assurance that any insurance we may have will cover all or part of the costs, damages, liabilities or losses that could result from the occurrence of any information security breach.
Failure to implement an effective data governance framework could harm our brand and reputation, expose us to regulatory pressure and penalties, constrain our competitive opportunities, and adversely affect our business and financial results
To achieve our purpose of advancing how Canadians connect with each other and the world, we must preserve the social licence from our customers and all Canadians to collect and use data in our operations. A strong and consistently applied approach to data governance is critical to maintaining that social licence, requiring us to focus on respecting the privacy of our customers’ data and protecting such data against information security threats. As our operations involve receiving, processing and storing such proprietary business and personal data, effective policies, procedures and controls must be implemented to protect information systems and underlying data in accordance with applicable privacy legislation. Failure to meet customer and employee expectations regarding the appropriate use and protection of their data could have negative reputational, business and financial consequences for the company.
There has also been increased regulatory scrutiny over the use, collection, and disclosure of personal information in Canada. We are subject to various privacy legislation, such as Canada’s anti-spam legislation (CASL) and the Personal Information Protection and Electronic Documents Act, as well as foreign privacy legislation via the mandatory flow-through of privacy-related obligations by our customers, including those of the General Data Protection Regulation (EU). Global and domestic regulation around privacy and data practices are evolving rapidly and new or amended privacy legislation has been proposed or adopted federally and in a number of Canadian provincial jurisdictions with significant obligations, limitations on the use of personal information, penalties and short implementation horizons. Our data governance framework must not only meet applicable privacy requirements, but also be able to evolve for continuous improvement. Effective data governance is also a component of good ESG practices, which are considered an increasingly important measure of corporate performance and value creation.
Failure to implement an effective data governance framework encompassing the protection and appropriate use of data across its life cycle, and incorporating data governance as a core consideration in our business initiatives and technology decisions, could harm our brand, reputation and competitiveness, decrease customer and investor confidence and adversely affect our business and financial results. It could give rise to litigation, investigations, fines and liability for failure to comply with increasingly stringent privacy legislation, as well as increased audit and regulatory scrutiny that could divert resources from business operations.
People

Attracting, developing and retaining a diverse and talented team capable of furthering our strategic imperatives and high-tech transformation is essential to our success
Our business depends on the efforts, engagement and expertise of our management and non-management employees and contractors, who must be able to operate efficiently and safely based on their responsibilities and the environment in which they are functioning. Demand for highly skilled team members has intensified, as retiring workers, varying levels of immigration, and an increase in remote-work arrangements allowing more global competition have created an even more competitive marketplace. This emphasizes the importance of developing and maintaining a comprehensive and inclusive human resources strategy and employee value proposition to adequately compete for talent and to identify and secure high-performing candidates for a broad range of job functions, roles and responsibilities. In addition, an appropriately skilled and diversified pool of talent (as a result of hiring, insourcing and reskilling) is essential to support evolving business priorities in the context of an ongoing business transformation impacting job nature and skill sets. Our objective to transform from a telco to a techco requires a cultural change and a capacity to evolve, and impacts our recruitment strategy and deployment of resources. Failure to attract and appropriately train, motivate, remunerate or
deploy employees on initiatives that further our strategic imperatives and high-tech transformation, or to efficiently replace departing employees, could have an adverse impact on our ability to attract and retain talent and drive performance across the organization. Shortages of skilled labour could negatively affect our ability to implement our strategic priorities, as well as sell our products and services and more generally serve our customers.
Establishing a culture that drives inclusivity, employee engagement, development and progression is essential to attract and retain talent. In addition, employees are typically more engaged at work when their value system aligns with their employer’s corporate values. We seek to foster an inclusive, equitable and accessible workplace where team members are valued, respected and supported, reflecting the diversity of the communities we serve and our desire to provide team members with the opportunity to reach their full potential. We further endeavour to establish programs and provide resources to support team members on a wide range of topics, including mental health services and support. However, failure to establish robust programs to further these aspirations could adversely affect our ability to attract and retain team members. Failure to sufficiently address evolving employee expectations related to our culture and value proposition could also adversely affect our ability to attract and retain team members.
| 90 | BCE INC. 2023 ANNUAL FINANCIAL REPORT |
9 MD&A Business risks
As we emerged from the COVID-19 pandemic, we introduced our Bell Workways program to help team members and leaders manage work, family and other commitments by offering a new approach for our workplace that allows flexibility for team members on how and where they work, depending on their new designated role-based work profiles (remote, mobile or full-time office). However, flexible work models require a cultural shift that may impact business activities. Failure to establish an optimal post-pandemic work arrangement conducive to corporate performance and employee preference, and develop new leadership skills necessary in the context of a new hybrid model, could impair our ability to engage, motivate and retain employees, impact productivity, increase the number of employees on disability leave for mental health reasons, and introduce additional operational risks or exacerbate our exposure to existing ones, which could impair our ability to manage our business.
Other examples of people-related risks include the following:
| • | The increasing technical and operational complexity of our businesses and the high demand in the market for skilled resources in strategic areas create a challenging environment for hiring, retaining and developing such skilled resources |
| • | Failure to establish a complete and effective succession plan, including preparation of internal talent and identification of potential external candidates, where relevant, for senior executive and other key roles, could impair our business until qualified replacements are found |
| • | Ensuring the health and safety of our workforce operating in different environments, including manholes, telephone poles, cell towers, vehicles, foreign news bureaus and war zones, and/or in times of pandemic, requires focus, effective processes and flexibility to avoid injury, illness, service interruption, fines and reputational impact |
| • | Potential deterioration in employee morale and engagement resulting from staff reductions, cost reductions or reorganizations could adversely affect our business and financial results |
Challenges related to collective agreements could adversely affect our business
Approximately 42% of BCE employees were represented by unions and were covered by collective agreements at December 31, 2023. The positive engagement of members of our team represented by unions is contingent on negotiating collective agreements that deliver competitive labour conditions and uninterrupted service, both of which are critical to achieving our business objectives.
We cannot predict the outcome of collective agreement negotiations. Renewal of collective agreements could result in higher labour costs and be challenging in the context of a declining workload due to transformation, a maturing footprint, improved efficiencies and adverse government or regulatory decisions. If during the bargaining process there were to be project delays and work disruptions, including work stoppages or work slowdowns, this could adversely affect service to our customers and, in turn, our customer relationships and financial performance.
Operational performance

Our networks and IT systems are the foundation of high-quality consistent services, which are critical to meeting service expectations
Our ability to provide high-quality and consistent wireless, wireline and media services to customers in a complex and changing operating environment is crucial for sustained success. It is therefore essential that we continuously refine our operating model in order to accelerate our transition from a telco to a techco, and meet customer expectations of product and service experience at a desired cost structure.
Network capacity demands for content offerings and other bandwidth-intensive applications on our wireline and wireless networks have been growing at unprecedented rates. Unexpected capacity pressures on our networks may negatively affect our network performance and our ability to provide services. Evolving customer behaviour and their use of our networks, products and services have created increased capacity pressure on certain areas of our wireless, wireline and broadcast media networks, and there can be no certainty that our networks will continue to sustain such increased usage. In addition, we may need to incur significant capital expenditures in order to provide additional capacity and reduce network congestion. Network performance and/or reliability may vary depending on the location and the recent trend for families to move from urban centres to less urbanized areas increases the need to develop and/or enhance our networks in areas that were not previously served or that were underserved.
Customers and other stakeholders expect that we deliver reliable service performance, enabled by our networks and other infrastructure, as well as the networks and other infrastructure of third-party providers on which we rely. Issues relating to network availability, speed, consistency
and traffic management on our more current as well as our legacy networks could adversely affect our customers, including by preventing the provisioning of critical services, and could have an adverse impact on our business, reputation and financial performance. Furthermore, we may need to manage the possibility of instability in the context of our transformation initiatives, including as we transition towards converged wireline and wireless networks and newer technologies, including software-defined networks leveraging open source software and cloud services. Network failures and slowdowns, whether caused by internal or external forces, human-caused error or threat, or external events, could adversely affect our brand and reputation, subscriber acquisition and retention as well as our financial results. While we invest in the resiliency of our networks and other infrastructure and establish response strategies and business continuity protocols to seek to maintain service consistency, there is no assurance that such investments and protocols will be sufficient to prevent network failure or the failure of other infrastructure, or a disruption in the delivery of our services.
In addition, we currently use a very large number of interconnected internal and third-party operational and business support systems for provisioning, networking, distribution, broadcast management, ordering, billing and accounting, which may hinder our operational efficiency. If we fail to implement, maintain or manage highly effective IT systems supported by an effective governance and operating framework, and implement transformation initiatives to streamline and integrate our processes and systems, this may lead to inconsistent performance and dissatisfied customers, which over time could result in higher churn. It may also limit our cross-sell capabilities across our portfolio of products and services.
| 91 |
9 MD&A Business risks
Further examples of risks to operational performance that could impact our reputation, business operations and financial performance include the following:
| • | The current global economic environment as well as geopolitical events may bring about further incremental costs, delays or unavailability of equipment, materials and resources, which may impact our ability to maintain or upgrade our networks in order to accommodate increased network usage and to provide the desired levels of customer service |
| • | Failure to maintain required service delivery amid operational challenges (including those related to targeted cost savings initiatives, flexible work models and the availability of employees with the required skill set) and a transformation of our infrastructure and technology could adversely affect our brand, reputation and financial results |
| • | We may lose sales should we fail to maximize channel efficiencies, which could adversely affect our financial results |
| • | Corporate restructurings, system replacements and upgrades, process redesigns, staff reductions and the integration of business acquisitions may not deliver the benefits contemplated, or be completed when expected, and could adversely impact our ongoing operations |
| • | Failure to streamline our significant IT legacy system portfolio and proactively improve operating performance could adversely affect our business and financial results |
| • | We may experience more service interruptions or outages due to legacy infrastructure. In some cases, vendor support is no longer available or legacy vendor operations have ceased. |
| • | There may be a lack of replacement parts and competent and cost-effective resources to perform the life cycle management and upgrades necessary to maintain the operational status of legacy networks and IT systems |
| • | Climate change increases the probability, frequency, intensity and length of severe weather-related events such as ice, snow and wind storms, wildfires, flooding, extended heat waves, hurricanes, tornadoes and tsunamis, all of which could impact network availability and performance and drive more repairs of network equipment |
Our operations and business continuity depend on how well we protect, test, maintain, replace and upgrade our networks, IT systems, equipment and other facilities
Our operations, service performance, reputation, business continuity and strategy depend on how well we and our contracted product and service providers, as well as other telecommunications carriers on which we rely to provide services, protect our or their networks and IT systems, as well as other infrastructure and facilities, from events such as information security attacks, unauthorized access or entry,
fire, natural disasters, power loss, building cooling loss, acts of war or terrorism, sabotage, vandalism, actions of neighbours and other events. Climate change, especially in areas of greater environmental sensitivity, could heighten the occurrence of certain of the above-mentioned risks. We must also manage business continuity issues caused by internal sources, including human error, human-caused threats and inefficiencies. Establishing response strategies and business continuity protocols to maintain service consistency if any disruptive event materializes is critical to the achievement of effective customer service. Any of the above-mentioned events, as well as the failure by us, or by other telecommunications carriers on which we rely to provide services, to adequately complete planned and sufficient testing, maintenance, replacement or upgrade of our or their networks, equipment and other facilities, which is, among other factors, dependent on our or their ability to purchase equipment and services from third-party suppliers, could disrupt our operations (including through disruptions such as network and other infrastructure failures, billing errors or delays in customer service), require significant resources and result in significant remediation costs, which in turn could have an adverse effect on our business and financial performance, or impair our ability to keep existing subscribers or attract new ones.
In addition, the current global economic environment as well as geopolitical events may bring about further incremental costs, delays or unavailability of equipment, materials and resources, which could impact our operations and business continuity strategies.
Satellites used to provide our satellite TV services are subject to significant operational risks that could have an adverse effect on our business and financial performance
Pursuant to a set of commercial arrangements between ExpressVu and Telesat Canada (Telesat), we currently have satellites under contract with Telesat. Telesat operates or directs the operation of these satellites, which utilize highly complex technology and operate in the harsh environment of space and are therefore subject to significant operational risks while in orbit. These risks include in-orbit equipment failures, malfunctions and other problems, commonly referred to as anomalies, that could reduce the commercial usefulness of a satellite used to provide our satellite TV services. Acts of war or terrorism, magnetic, electrostatic or solar storms, or space debris or meteoroids could also damage such satellites. Any loss, failure, manufacturing defect, damage or destruction of these satellites, of our terrestrial broadcasting infrastructure or of Telesat’s tracking, telemetry and control facilities to operate the satellites could have an adverse effect on our business and financial performance and could result in customers terminating their subscriptions to our satellite TV service.
Financial management

If we are unable to raise the capital we need or generate sufficient cash flows from operating activities, we may need to limit our capital expenditures or our investments in new businesses, or try to raise capital by disposing of assets
Our ability to meet our cash requirements, fund capital expenditures and provide for planned growth depends on having access to adequate sources of capital and on our ability to generate cash flows from operating activities, which is subject to various risks, including those described in this MD&A.
Our ability to raise financing depends on our ability to access the public equity and debt capital markets, the money market, as well as the bank credit market. Our ability to access such markets and the cost and amount of funding available depend largely on prevailing market conditions and the outlook for our business and credit ratings at the time capital is raised.
Risk factors such as capital market disruptions, political, economic and financial market instability in Canada or abroad, government policies, central bank monetary policies, increasing interest rates, changes to bank capitalization or other regulations, reduced bank lending in
| 92 | BCE INC. 2023 ANNUAL FINANCIAL REPORT |
9 MD&A Business risks
general or fewer banks as a result of reduced activity or consolidation, could reduce capital available or increase the cost of such capital. In addition, an increased level of debt borrowings could result in lower credit ratings, increased borrowing costs and a reduction in the amount of funding available to us, including through equity offerings. Business acquisitions and our acquisition of wireless spectrum licences could also adversely affect our outlook and credit ratings and have similar adverse consequences. There is no assurance that we will maintain our credit ratings and a ratings downgrade could result in adverse consequences for our funding cost and capacity, and our ability to access the capital markets, money market and/or the bank credit market. In addition, participants in the public capital and bank credit markets have internal policies limiting their ability to invest in, or extend credit to, any single entity or entity group or a particular industry. Finally, with increasing emphasis by the capital markets on ESG performance and reporting, there is a potential for the cost and availability of funding to be increasingly tied to the quality of our ESG practices and related disclosed metrics.
Our bank credit facilities, including credit facilities supporting our commercial paper program, are provided by various financial institutions. While it is our intention to renew certain of such credit facilities from time to time, there are no assurances that these facilities will be renewed on favourable terms or in similar amounts.
Global financial markets have experienced, and could again experience, significant volatility and weakness as a result of market disruptions, including relating to the economy and geopolitical events. The current global economic environment could continue to negatively impact equity and debt capital markets, cause interest rate and currency volatility and movements, and adversely affect our ability to raise financing in the public capital, bank credit and/or commercial paper markets as well as the cost thereof. Additionally, the negative impact of the global economic environment and potential recession, elevated inflation and high interest rates on our customers’ financial condition could adversely affect our ability to recover payment of receivables from customers and lead to further increases in bad debts, thereby negatively affecting our revenues and cash flows, as well as our position under our securitized receivables program.
Differences between BCE’s actual or anticipated financial results and the published expectations of financial analysts, as well as events affecting our business or operating environment, may contribute to volatility in the market price of BCE’s securities. A major decline in the capital markets in general, or an adjustment in the market price or trading volumes of BCE’s securities, may negatively affect our ability to raise debt or equity capital, retain senior executives and other key employees, make strategic acquisitions or enter into joint ventures.
If we cannot access the capital we need or generate cash flows to implement our business plan or meet our financial obligations on acceptable terms, we may have to limit our ongoing capital expenditures and our investment in new businesses or try to raise additional capital by selling or otherwise disposing of assets. Any of these could have an adverse effect on our cash flows from operating activities and on our growth prospects.
We cannot guarantee that dividends will be increased or declared
Increases in the BCE common share dividend and the declaration of dividends on any of BCE’s outstanding shares are subject to the discretion of the BCE Board and, consequently, there can be no guarantee that the dividend on common shares will be increased or that dividends will be declared. Dividend increases and the declaration of dividends by the BCE Board are ultimately dependent on BCE’s operations and financial results which are, in turn, subject to various assumptions and risks, including those set out in this MD&A.
The failure to reduce costs, unexpected increases in costs and the failure to optimize capital spending, could adversely affect our ability to achieve our strategic imperatives and financial guidance
Our objective to lower our cost structure continues to be aggressive with a company-wide focus on cost transformation and reduction, but there is no assurance that we will be successful in reducing costs. Examples of risks to our ability to reduce costs or limit potential cost increases include the following:
| • | Inflation could continue to result in higher input costs for equipment, products and services, and create increased pressure for wage increases |
| • | Increased costs related to geopolitical events, in particular as they impact our supply chain, could continue for an undetermined period of time |
| • | Increasing or prevailing high interest rates could continue to negatively impact our cost of financing |
| • | Our cost reduction objectives require aggressive negotiations with our suppliers and there can be no assurance that such negotiations will be successful or that replacement products or services provided will not lead to operational issues |
| • | As suppliers continue to shorten software life cycles, the cost of seeking to maintain adequate information security increases |
| • | Achieving timely cost reductions while moving to an IP-based network is dependent on disciplined network decommissioning, which can be delayed by customer contractual commitments, regulatory considerations and other unforeseen obstacles |
| • | Failure to contain growing operational costs related to network sites, network performance and resiliency, footprint expansion, spectrum licences, insurance and content and equipment acquisition could have a negative effect on our financial performance |
| • | In addition to the potential impact from the global economic environment and geopolitical events, fluctuations in energy prices are further partly influenced by government policies to address climate change such as carbon pricing which, combined with growing data demand that increases our energy requirements, could increase our energy costs beyond our current expectations |
| • | Failure to successfully deliver on our contractual commitments, whether due to security events, operational challenges or other reasons, may result in financial penalties and loss of revenues |
In addition, as part of our business operations and transformation initiatives, it is essential that we optimize capital spending and ensure appropriate trade-offs in our capital allocation. However, should we fail to adequately assess investment priorities and optimal trade-offs, our business and financial results could be negatively affected.
| 93 |
9 MD&A Business risks
We are exposed to various credit, liquidity and market risks
Our exposure to credit, liquidity and market risks, including equity price, interest rate and currency fluctuations, is discussed in section 6.5, Financial risk management of this MD&A and in Note 29 to BCE’s 2023 consolidated financial statements.
Our failure to identify and manage our exposure to changes in interest rates, foreign exchange rates, BCE’s share price and other market conditions could lead to missed opportunities, increased costs, reduced profit margins, cash flow shortages, inability to complete planned capital expenditures, reputational damage, equity and debt securities devaluations, and challenges in raising capital on market-competitive terms.
The failure to evolve practices to effectively monitor and control fraudulent activities could result in financial loss and brand degradation
As a public company with a range of desirable and valuable products and services and a large number of employees, BCE requires a disciplined program covering governance, exposure identification and assessment, prevention, detection and reporting that considers corruption, misappropriation of assets and intentional manipulation of financial statements by employees and/or external parties. The current global economic environment could further lead to increased fraud activities, which could result in financial loss and brand degradation.
Specific examples relevant to us include:
| • | Copyright theft and other forms of unauthorized use that undermine the exclusivity of Bell Media’s content offerings, which could divert users to unlicensed or otherwise illegitimate platforms, thus impacting our ability to derive distribution and advertising revenues |
| • | Unauthorized individuals taking over someone else’s online account without the account owner‘s permission to gain access to wireless products and goods via various means (social engineering, phishing, smishing, etc.) |
| • | Subscription fraud where fraudsters use their own, a stolen or a synthetic identity to obtain mobile devices and services with no intention to pay |
| • | Network usage fraud such as call/sell operations using our wireline or wireless networks or incidents related to network components such as copper theft |
| • | Ongoing efforts to steal the services of TV distributors, including Bell Canada and ExpressVu, through compromise or circumvention of signal security systems, causing revenue loss |
Income and commodity tax amounts may materially differ from the expected amounts
Our complex business operations are subject to various tax laws. The adoption of new tax laws, or regulations or rules thereunder, or changes thereto or in the interpretation thereof, could result in higher tax rates, new taxes or other adverse tax implications. In addition, while we believe that we have adequately provided for all income and commodity taxes based on all of the information that is currently available, the calculation of income taxes and the applicability of commodity taxes in many cases require significant judgment in interpreting tax rules and regulations. Our tax filings are subject to government audits that could result in material changes to the amount of current and deferred income tax assets and liabilities and other liabilities and could, in certain circumstances, result in an assessment of interest and penalties.
A number of factors could impact our financial statements and estimates
We base our estimates on a number of factors, including but not limited to historical experience, current events, and actions that the company may undertake in the future, as well as other assumptions that we believe are reasonable under the circumstances. A change in these assumptions may have an impact on our financial statements including but not limited to impairment testing, fair value determination, expected credit losses and discount rates used for the present value of cash flows. By their nature, these estimates and judgments are subject to measurement uncertainty and actual results could differ.
The economic environment, pension rules or ineffective governance could have an adverse effect on our pension obligations, and we may be required to increase contributions to our post-employment benefit plans
With a large pension plan membership and DB pension plans that are subject to the pressures of the global economic environment and changing regulatory and reporting requirements, our pension obligations are exposed to potential volatility. Failure to recognize and manage economic exposure and pension rule changes, or to ensure that effective governance is in place for the management and funding of pension plan assets and obligations, could have an adverse impact on our liquidity and financial performance.
The funding requirements of our post-employment benefit plans, based on valuations of plan assets and obligations, depend on a number of factors, including actual returns on post-employment benefit plan assets, long-term interest rates, inflation, plan demographics including longevity, and applicable regulations and actuarial standards. Changes in these factors, including changes caused by the current global economic environment and recent geopolitical events, could cause future contributions to significantly differ from our current estimates, require us to increase contributions to our post-employment benefit plans in the future and, therefore, have a negative effect on our liquidity and financial performance.
There is no assurance that the assets of our post-employment benefit plans will earn their assumed rate of return. A substantial portion of our post-employment benefit plans’ assets is invested in public and private equity and debt securities. As a result, the ability of our post-employment benefit plans’ assets to earn the rate of return that we have assumed depends significantly on the performance of capital markets. Market conditions also impact the discount rate used to calculate our pension plan solvency obligations and could therefore also significantly affect our cash funding requirements.
| 94 | BCE INC. 2023 ANNUAL FINANCIAL REPORT |
9 MD&A Business risks
Vendor management/supply chain

We depend on third-party suppliers, outsourcers and consultants, some of which are critical, to provide an uninterrupted supply of the products and services we need, as well as comply with various obligations
We depend on key third-party suppliers and outsourcers, over which we have no operational or financial control, for products and services, some of which are critical to our operations. If there are gaps in our vendor selection, governance or oversight processes established to seek to ensure full risk transparency at point of purchase and throughout the relationship, including any contract renegotiations, there is the potential for a breakdown in supply, which could impact our ability to make sales, service customers and achieve our business and financial objectives. In addition, any such gaps could result in suboptimal management of our vendor base, increased costs and missed opportunities. Ongoing relationships must further be adequately managed in order to address existing and new operational and compliance requirements. Some of our third-party suppliers and outsourcers are located in foreign countries, which increases the potential for a breakdown in supply due to the risks of operating in foreign jurisdictions with different laws, geopolitical environments and cultures, as well as the potential for localized natural disasters. Concerns related to geopolitical events could put pressure on our supply chain and require increased focus on supply chain diversification to support continuity.
We may have to select different third-party suppliers for equipment or other products and services, or different outsourcers, in order to meet evolving internal company policies and guidelines as well as regulatory requirements. Should we decide, or be required by a governmental authority or otherwise, to terminate our relationship with an existing supplier or outsourcer, this would decrease the number of available suppliers or outsourcers and could result in significant increased costs, as well as transitional, support, service, quality or continuity issues; delay our ability to deploy new network and other technologies and offer new products and services; and adversely affect our business and financial results.
The use of third-party suppliers and the outsourcing of services generally involve transfer of risks, and we must take appropriate steps to ensure that our suppliers’ and outsourcers’ approach to risk management is aligned with our own standards in order to maintain continuity of supply and brand strength. Increased focus on supplier risks in areas of security, data governance, responsible procurement and broader ESG factors requires increased attention given that supplier actions or omissions could have significant impacts on our business, financial results, brand and reputation. Furthermore, cloud-based supplier models have continued to evolve and grow and, while they offer many potential benefits, cloud-based services can also change the level or types of risks. Accordingly, our procurement and vendor management practices must also continue to evolve to fully take into account the potential risks of cloud-based services.
In addition, certain company initiatives rely heavily on professional consulting services provided by third parties, and a failure of such third-party services may not be reasonably evident until their work is delivered or delayed. Difficulties in implementing remedial strategies in respect of professional consulting services provided by third parties that are not performed in a proper or timely fashion could result in an adverse effect on our ability to comply with various obligations, including applicable legal and accounting requirements.
Other examples of risks associated with third-party suppliers and outsourcers include the following:
| • | We rely upon the successful implementation and execution of business continuity plans by our product and service suppliers. To the extent that such plans do not successfully mitigate the impacts of the current global economic environment, geopolitical events or other events, and our suppliers or vendors experience operational failures or inventory constraints, such failures or constraints could result in, or amplify existing, supply chain disruptions that could adversely affect our business. Incremental costs, delays or unavailability of equipment, materials, products or services, as well as unavailability of our suppliers’ or contractors’ employees due to strikes, workforce reduction initiatives or other factors, could impact sales and execution of our strategic imperatives and adversely affect our business and financial results. |
| • | The current global economic environment and recent geopolitical events have given rise to inflationary pressures and sharp increases in prices, which could put increased pressure on purchasing costs |
| • | The insolvency of one or more of our suppliers could cause a breakdown in supply and have an adverse effect on our operations, including our ability to make sales or service customers, as well as on our financial results |
| • | Demand for products and services available from only a limited number of suppliers, some of which dominate their global market, may lead to decreased availability, increased costs or delays in the delivery of such products and services, since suppliers may choose to favour global competitors that are larger than we are and, accordingly, purchase a larger volume of products and services. In addition, production issues or geopolitical events affecting any such suppliers, or other suppliers, could result in decreased quantities or a total lack of supply of products or services. Any of these events could adversely impact our ability to meet customer commitments and demand. |
| • | A suboptimal outsourcing model could result in the loss of key corporate knowledge, reduced efficiency and effectiveness, and impede agile delivery of new products or technology |
| • | Cloud-based solutions may increase the risk of security and data leakage exposure if security control protocols and configurations implemented by our cloud-based partners or suppliers, or by us where we retain responsibility for such protocols, are inadequate |
| • | If existing suppliers do not have appropriate alternative cloud-based products or services, our ability to complete desired migrations to the cloud could be limited or delayed |
| • | Failure to maintain strong discipline around vendor administration (especially around initial account setup) may mask potential financial or operational risks and complicate future problem resolutions |
| 95 |
9 MD&A Business risks
| • | If products and services important to our operations have manufacturing defects or do not comply with applicable government regulations and standards (including product safety practices), our ability to sell products and provide services on a timely basis may be negatively impacted. We work with our suppliers to seek to identify serious product defects (including safety incidents) and develop appropriate remedial strategies, which may include a recall of products. To the extent that a supplier does not actively participate in, and/or bear primary financial responsibility for, a recall of its products, our ability to perform such recall programs at a reasonable cost and/or in a timely fashion may be negatively impacted. Any of the events referred to above could have an adverse effect on our business, reputation and financial results. |
| • | Products (including software) and services supplied to us may contain security issues including, but not limited to, latent security issues that would not be apparent upon an inspection. Should we or a supplier fail to correct a security issue in a timely fashion, there could be an adverse effect on our business, reputation and financial results. |
| • | We rely on other telecommunications carriers from time to time to deliver services. Should these carriers fail to roll out new networks or fail to upgrade existing networks, or should their networks be affected by operational failures or service interruptions, such issues could adversely affect our ability to provide services using such carriers’ networks and could, consequently, have an adverse effect on our business, reputation and financial results. |
| • | BCE depends on call centre and technical support services provided by a number of external suppliers and outsourcers, some of which are located in foreign countries. These vendors have access to customer and internal BCE information necessary for the support services that they provide. Information access and service delivery issues that are not managed appropriately may have an adverse impact on our business, reputation, the quality and speed of services provided to customers, or our ability to address technical issues. |
Reputation and ESG practices

Our ability to maintain positive customer relationships is significantly influenced by our reputation
Many customers’ choice to purchase our products and services is directly related to their perception of our company. Accordingly, our ability to maintain positive customer relationships and acquire or retain customers is significantly influenced by our reputation. The company faces many sources of reputational risks, as discussed in this MD&A. Should our perceived or actual outlook, plans, priorities or actions, or those of our employees or suppliers, fail to align with stakeholders’ expectations, our reputation could be impacted, which could have an adverse effect on our brand, our ability to retain or attract customers, and more generally on our business, financial condition, liquidity and financial results.
There is no assurance that we will succeed in meaningfully integrating ESG considerations into our business strategy and operations to generate a positive outcome for stakeholders
While we seek to understand the evolving ESG environment and identify topics and activities that may expose us to ESG risks, there is no assurance that we will succeed in meaningfully integrating ESG considerations into our business strategy and operations to generate positive outcomes for stakeholders. Good ESG practices are an important measure of corporate performance and value creation. As such, we are increasingly under scrutiny to address ESG matters of importance to our stakeholders. A wide range of ESG topics have progressively become important elements of corporate culture and seeking to embrace them reinforces our value proposition to drive employee attraction and retention. Customers now factor broader considerations into purchase decisions and look for alignment of personal values with corporate behaviour. Investors increasingly link investment decisions to the quality of ESG practices and related disclosed metrics. Moreover, we have directly linked some pricing elements in certain financing agreements to our performance on key ESG targets. Legal and regulatory pressures have further intensified in the ESG sphere, including, without limitation,
in the areas of privacy, accessibility, data governance, climate change and diversity. Accordingly, failure to integrate ESG considerations into our governance activities and effectively manage ESG risks and opportunities could harm our brand and reputation, and could lead to negative business, financial, legal and regulatory consequences for the company. Perceived misalignment of our actions with stakeholder expectations could also harm our brand and reputation and lead to further financial and other consequences. Finally, enhanced ESG-related disclosures could increase the company’s exposure to claims for misrepresentation in the primary or secondary market.
Failure to take appropriate actions to adapt to current and emerging environmental impacts, including climate change, could have an adverse effect on our business
We face risks related to environmental events, including climate-related events, which could impact our operations, service performance, reputation and business continuity, cost of insurance, and more generally have an adverse effect on our business, financial performance and reputation. In particular, climate change poses potential risks to our business, our employees, our customers, our suppliers and outsourcers, and the communities we operate in. Inadequate management of environmental issues associated with our company and our business, as well as our suppliers and other stakeholders, could also adversely affect our business, financial condition, liquidity, financial results and reputation given the implications for the company as well as various stakeholders.
| 96 | BCE INC. 2023 ANNUAL FINANCIAL REPORT |
9 MD&A Business risks
In alignment with the recommendations of the TCFD, we categorize climate-related risks into physical and transition risks:
| • | Physical risks are associated with the physical impacts from a changing climate and can either be event-driven (acute) or longer-term (chronic) shifts in climate patterns. Global scientific evidence suggests that climate change will increase both the frequency and severity of extreme weather events. This will include such events as flooding, ice storms and wildfires, among others. These could have a destructive impact on our communications network infrastructure and in turn affect our ability to deliver services that are critical to our customers and society. A service disruption due to extreme weather events could lead to financial impacts including an increase in operating costs from maintenance and repairs, labour, heating and cooling, and equipment damage. Our insurance premiums could increase, or we could face reduced insurability in high risk areas. Furthermore, this could jeopardize customer satisfaction and may result in a decrease in revenues. In addition, if average temperatures where we are operating are warmer or cooler year-over-year for longer periods of time, there will be an increasing need for cooling or heating capacity in our facilities. This will increase our energy consumption and associated operational costs. Furthermore, in order to remain resilient to these increasing or decreasing temperatures, we would need to increase our investments in our infrastructure, again leading to increased operational costs. |
| • | Transition risks are associated with a transition to a lower-carbon economy, which may include extensive regulatory, technology and market changes to address mitigation and adaptation requirements related to climate change. These risks may include increased operational costs driven by the rising price of energy due to carbon pricing regulations and the shifting supply and demand for energy, increased operational costs related to e-waste treatment programs and management systems, reputational risks related to our management of climate-related issues as well as to our level of disclosure related to such matters. There is also a reputational risk of not demonstrating our proactive behaviour towards climate change, which could affect customer perception and the cost and availability of funding that has the potential to be increasingly tied to the quality of our ESG practices and related disclosed metrics, all of which could have negative financial outcomes. |
Furthermore, climate-related events could also impact our suppliers and outsourcers, which in turn could impact our business. Given that some of our third-party suppliers and outsourcers are located in foreign countries that are more at risk of experiencing weather-related events, localized natural disasters in such countries could further negatively impact our business.
In addition, several areas of our operations raise other environmental considerations, such as fuel storage, GHG emissions and energy consumption reduction, waste management, disposal of hazardous residual materials, recovery and recycling of end-of-life electronic products we sell or lease, and other network associated impacts (e.g., treated wood poles, manhole effluents, lead cables, etc.).
Our team members, customers, investors and governments expect that we regard environmental protection as an integral part of doing business and that we seek to minimize the negative environmental impacts of our operations and create positive impacts where possible. Failure to recognize and adequately respond to their evolving expectations, to take
action to reduce our negative impacts on the environment, to achieve our environmental objectives and to effectively report on environmental matters, could result in fines, and could harm our brand, reputation and competitiveness, as well as lead to other negative business, financial, legal and regulatory consequences for the company.
Pandemics, epidemics and other health risks, including health concerns about radiofrequency emissions from wireless communications devices and equipment, could have an adverse effect on our business
Health concerns related to COVID-19 still give rise to uncertainties, and resurgences in new COVID-19 cases and/or the emergence and progression of new variants could cause governments to reintroduce restrictive measures. Other pandemics, epidemics and health risks could also occur, any of which could adversely affect our ability to maintain operational networks and provide products and services to our customers, as well as the ability of our suppliers to provide us with products and services we need to operate our business. Any such pandemics, epidemics and other health risks could have an adverse effect on the economy and financial markets resulting in a declining level of retail and commercial activity, which could have a negative impact on the demand for, and prices of, our products and services.
Many studies have been performed or are ongoing to assess whether mobile communications devices, such as smartphones, as well as wireless networks and towers pose a potential health risk. While some studies suggest links to certain conditions, others conclude there is no established causation between mobile phone usage and adverse health effects. The International Agency for Research on Cancer (IARC) of the World Health Organization classified radiofrequency electromagnetic fields from wireless phones as possibly carcinogenic to humans, but also indicated that chance, bias or confounding could not be ruled out with reasonable confidence. The IARC also called for additional research into long-term heavy use of mobile phones.
ISED is responsible for approving radiofrequency equipment and performing compliance assessments and has chosen Health Canada’s Safety Code 6, which sets the limits for safe exposure to radiofrequency emissions at home or at work, as its exposure standard. This code also outlines safety requirements for the installation and operation of devices that emit radiofrequency fields such as mobile communications devices, Wi-Fi technologies and base station antennas. ISED has made compliance to Safety Code 6 mandatory for all proponents and operators of radio installations.
The following challenges, among others, could result from our business being heavily dependent on radiofrequency technologies:
| • | We may face lawsuits relating to alleged adverse health effects on customers, as well as relating to our marketing and disclosure practices in connection therewith, and the likely outcome of such potential lawsuits is unpredictable and could change over time |
| • | Changes in scientific evidence and/or public perceptions could lead to additional government regulations and costs for retrofitting infrastructure and handsets to achieve compliance |
| • | Public concerns could result in a slower deployment of, or in our inability to deploy, infrastructure necessary to maintain and/or expand our wireless network as required by market evolution |
Any of these events could have an adverse effect on our business and financial performance.
| 97 |
9 MD&A Business risks
Various social issues, if not adequately managed, could have an adverse effect on our business
Effective management of social risk is a component of good ESG practices. Inadequate management of social issues associated with our company and our business, as well as our suppliers and other stakeholders, could adversely affect our business, financial condition, liquidity, financial results and reputation. This may include social issues discussed elsewhere in this MD&A such as DEIB, employees’ well-being, health and safety, responsible procurement, as well as other social issues such as human rights, including Indigenous peoples’ rights, consultation and accommodation, and community acceptance and engagement. Failure to sufficiently address and report on our management of social issues and to achieve our social objectives could harm our brand and reputation, and could lead to negative business, financial, legal and regulatory consequences for the company.
There can be no assurance that our corporate governance practices will be sufficient to prevent violations of legal and ethical standards
Our employees, officers, Board members, suppliers and other business partners are expected to comply with applicable legal and ethical standards including, without limitation, anti-bribery laws, as well as with our governance policies and contractual obligations. Failure to comply with such laws, policies, standards and contractual obligations could expose us to investigations or litigation and significant fines and penalties, and result in reputational harm or being disqualified from bidding on contracts. While we have developed and implemented corporate governance practices, including through our Code of Business Conduct which is updated regularly and subject to an annual review by our team members, there can be no assurance that such practices and measures will be sufficient to prevent violations of legal and ethical standards. Any such failure or violation could have an adverse effect on our business, financial performance and reputation.
Various factors could negatively impact our ability to achieve our ESG targets
We have set a number of ambitious ESG targets to monitor our ESG performance and align to our strategic imperatives. However, our ability to achieve these targets depends on many factors and is subject to many risks that could cause our assumptions or estimates to be inaccurate and cause actual results or events to differ materially from those expressed in, or implied by, these targets. Failure to sufficiently address evolving employee, customer, investor and other stakeholder expectations through achievement of our ESG targets could harm our brand, reputation and competitiveness, as well as lead to other negative business, financial, legal and regulatory consequences for the company.
Important risk factors that could affect certain of our key ESG targets are set out below.
GHG emissions reduction and supplier engagement targets
The achievement of our carbon neutrality target (which includes only our operational GHG emissions (scope 1 and 2) and excludes scope 3 GHG emissions) will require that we purchase a significant quantity of carbon credits and/or RECs. Should a sufficient quantity of high-quality credible carbon credits and/or RECs be unavailable, should their cost of acquisition be considered too onerous, should laws, regulations, applicable standards, public perception or other factors limit the number of carbon credits or RECs that we can purchase, should any purchased carbon credits be subject to reversal, in whole or in part, or should the carbon offsets not materialize, the achievement of carbon neutrality target could be negatively impacted.
The achievement of our science-based target related to our scope 1 and 2 GHG emissions will require that we purchase a significant quantity of RECs. To achieve this science-based target, only RECs will be considered given that the SBTi standards do not enable carbon credits to be used for this target. Should a sufficient quantity of acceptable (according to the SBTi guidelines) RECs be unavailable, should their cost of acquisition be considered too onerous, or should laws, regulations, applicable standards, public perception or other factors limit the number of RECs that we can purchase, in whole or in part, the achievement of our science-based target related to our scope 1 and 2 GHG emissions could be negatively impacted.
A portion of our GHG emissions reduction targets also depend on our ability to implement sufficient corporate and business initiatives in order to reduce GHG emissions to the desired levels. Failure to implement such initiatives according to planned schedules due to changes in business plans, our inability to implement requisite operational or technological changes, unavailability of capital, technologies, equipment or employees, cost allocations, actual costs exceeding anticipated costs, or other factors, or the failure of such initiatives, including of new technologies, to generate anticipated GHG emissions reductions, could negatively affect our ability to achieve our GHG emissions reduction targets. In addition, future corporate initiatives, such as business acquisitions and organic growth, could negatively affect our ability to achieve our targets, as would the adoption of new technologies that are carbon enablers or do not generate the anticipated energy savings.
A refinement in or modifications to international standards or to the methodology we use for the calculation of GHG emissions that would result in an increase in our GHG emissions could further impact our ability to achieve our targets. In addition, as it relates to our science-based targets specifically, the SBTi requires the recalculation of our targets upon the occurrence of certain events, such as business acquisitions or divestitures, or to conform to evolving SBTi methodology or standards. A recalculation resulting in the introduction of more ambitious targets could challenge our ability to achieve such updated targets.
The achievement of our science-based target relating to the level of our suppliers by spend covering purchased goods and services that have adopted science-based targets could be negatively impacted should we fail to achieve the required level of engagement and collaboration from our suppliers over which we have no control, despite the engagement measures that we may implement, or should we change significantly the allocation of our spend by supplier.
In addition, we have much less influence over the reduction of our scope 3 GHG emissions than over our scope 1 and scope 2 GHG emissions given that we must rely on the engagement and collaboration of our suppliers and other participants in our value chain in reducing their own GHG emissions. Accordingly, failure to obtain our suppliers’ and other participants’ engagement and collaboration could adversely affect our ability to meet our scope 3 GHG emissions reduction target.
DEIB targets
Failure to attract and retain a certain level of diverse talent across the organization could negatively affect our ability to meet our DEIB targets and objectives. In addition, our ability to achieve such targets and objectives could also be challenged by reduced labour market availability or restricted access to a diverse talent pool.
| 98 | BCE INC. 2023 ANNUAL FINANCIAL REPORT |
10 MD&A Accounting policies
| 10 | Accounting policies |
This section discusses key estimates and assumptions that management has made and how they affect the amounts reported in the financial statements and notes. It also describes key changes in accounting standards and our accounting policies, and how they affect our financial statements.
We have prepared our consolidated financial statements using IFRS. Other significant accounting policies, not involving the same level of measurement uncertainty as those discussed in this section, are nevertheless important to an understanding of our financial statements. See Note 2, Material accounting policies, in BCE’s 2023 consolidated financial statements for more information about the accounting principles we used to prepare our consolidated financial statements.
Critical accounting estimates and key judgments
When preparing the financial statements, management makes estimates and judgments relating to:
| • | reported amounts of revenues and expenses |
| • | reported amounts of assets and liabilities |
| • | disclosure of contingent assets and liabilities |
We base our estimates on a number of factors, including but not limited to historical experience, current events, economic and financial market conditions such as interest rates, inflation and the risk of recession, geopolitical events and supply chain disruptions, and actions that the company may undertake in the future, as well as other assumptions that we believe are reasonable under the circumstances. A change in these assumptions may have an impact on our financial statements including but not limited to impairment testing, fair value determination, expected credit losses and discount rates used for the present value of cash flows. By their nature, these estimates and judgments are subject to measurement uncertainty and actual results could differ. Our more significant estimates and judgments are described below.
We consider the estimates and judgments described in this section to be an important part of understanding our financial statements because they require management to make assumptions about matters that were highly uncertain at the time the estimates and judgments were made, and changes to these estimates and judgments could have a material impact on our financial statements and our segments.
Our senior management has reviewed the development and selection of the critical accounting estimates and judgments described in this section with the Audit Committee of the BCE Board.
Any sensitivity analysis included in this section should be used with caution as the changes are hypothetical and the impact of changes in each key assumption may not be linear.
Our more significant estimates and judgments are described below.
Estimates
Useful lives of property, plant and equipment
and finite-life intangible assets
We review our estimates of the useful lives of property, plant and equipment and finite-life intangible assets on an annual basis and adjust depreciation or amortization on a prospective basis, as required.
Property, plant and equipment represent a significant proportion of our total assets. Changes in technology or our intended use of these assets, climate change and our environmental, social and corporate governance initiatives as well as changes in business prospects or economic and industry factors, may cause the estimated useful lives of these assets to change.
The estimated useful lives of property, plant and equipment and finite-life intangible assets are determined by internal asset life studies, which take into account actual and expected future usage, physical wear and tear, replacement history and assumptions about technology evolution. When factors indicate that assets’ useful lives are different from the prior assessment, we depreciate or amortize the remaining carrying value prospectively over the adjusted estimated useful lives.
Post-employment benefit plans
The amounts reported in the financial statements relating to DB pension plans and OPEBs are determined using actuarial calculations that are based on several assumptions.
Our actuaries perform a valuation at least every three years to determine the actuarial present value of the accrued DB pension plan and OPEB obligations. The actuarial valuation uses management’s assumptions for, among other things, the discount rate, life expectancy, the rate of compensation increase, cost of living indexation rate, trends in healthcare costs and expected average remaining years of service of employees.
While we believe that these assumptions are reasonable, differences in actual results or changes in assumptions could materially affect post-employment benefit obligations and future net post-employment benefit plans cost.
We account for differences between actual and expected results in benefit obligations and plan performance in OCI, which are then recognized immediately in the deficit.
The most significant assumptions used to calculate the net post-employment benefit plans cost are the discount rate and life expectancy.
A discount rate is used to determine the present value of the future cash flows that we expect will be needed to settle post-employment benefit obligations.
The discount rate is based on the yield on long-term, high-quality corporate fixed income investments, with maturities matching the estimated cash flows of the post-employment benefit plans. Life expectancy is based on publicly available Canadian mortality tables and is adjusted for the company’s specific experience.
A lower discount rate and a higher life expectancy result in a higher net post-employment benefit obligation and a higher current service cost.
| 99 |
10 MD&A Accounting policies
Sensitivity analysis
The following table shows a sensitivity analysis of key assumptions used to measure the net post-employment benefit obligations and the net post-employment benefit plans cost for our DB pension plans and OPEB plans.
| Impact on net post-employment benefit plans cost for 2023 – increase/(decrease) |
Impact on post-employment
benefit obligations at December 31, 2023 – increase/(decrease) |
|||||||||||||||||||
| Change in assumption |
Increase in assumption |
Decrease in assumption |
Increase in assumption |
Decrease in assumption |
||||||||||||||||
| Discount rate |
0.5% | (83 | ) | 78 | (1,146 | ) | 1,255 | |||||||||||||
| Cost of living indexation rate |
0.5% | 55 | (46 | ) | 1,007 | (822 | ) | |||||||||||||
| Life expectancy at age 65 |
1 year | 38 | (39 | ) | 714 | (735 | ) | |||||||||||||
Revenue from contracts with customers
We are required to make estimates that affect the amount of revenue from contracts with customers, including estimating the stand-alone selling prices of products and services.
For bundled arrangements, we account for individual products and services when they are separately identifiable and the customer can benefit from the product or service on its own or with other readily available resources. The total arrangement consideration is allocated to each product or service included in the contract with the customer based on its stand-alone selling price. We generally determine stand-alone selling prices based on the observable prices at which we sell products separately without a service contract and prices for non-bundled service offers with the same range of services, adjusted for market conditions and other factors, as appropriate. When similar products and services are not sold separately, we use the expected cost plus margin approach to determine stand-alone selling prices. Products and services purchased by a customer in excess of those included in the bundled arrangement are accounted for separately.
Impairment of non-financial assets
Goodwill and indefinite-life intangible assets are tested for impairment annually or when there is an indication that the asset may be impaired. Property, plant and equipment and finite-life intangible assets are tested for impairment if events or changes in circumstances, assessed at each reporting period, indicate that their carrying amount may not be recoverable. For the purpose of impairment testing, assets other than goodwill are grouped at the lowest level for which there are separately identifiable cash inflows.
Impairment losses are recognized and measured as the excess of the carrying value of the assets over their recoverable amount. An asset’s recoverable amount is the higher of its fair value less costs of disposal and its value in use. Previously recognized impairment losses, other than those attributable to goodwill, are reviewed for possible reversal at each reporting date and, if the asset’s recoverable amount has increased, all or a portion of the impairment is reversed.
We make a number of estimates when calculating recoverable amounts using discounted future cash flows or other valuation methods to test for impairment. These estimates include the assumed growth rates for future cash flows, the number of years used in the cash flow model and the discount rate. When impairment charges occur they are recorded in Impairment of assets.
During the fourth quarter of 2023, we recognized $86 million of impairment charges for French TV channels within our Bell Media segment. The impairment charges were the result of a reduction in advertising demand in the industry resulting from economic uncertainties and unfavourable impacts to market-based valuation assumptions. These charges included $41 million allocated to indefinite-life intangible assets for broadcast licences and brands, and $45 million to finite-life intangible assets for program and feature film rights. The impairment was determined by comparing the carrying value of the cash generating units (CGUs) to their fair value less cost of disposal. We estimated the fair value of the CGUs using both discounted cash flows and market-based valuation models, which include five-year cash flow projections derived from business plans reviewed by senior management for the period of October 1, 2023 to December 31, 2028, using a discount rate of 9.5% and a perpetuity growth rate of 0.0%. After impairments, the carrying value of our impacted CGU was $62 million.
Additionally in 2023, we recorded impairment charges of $57 million related mainly to right-of-use assets for certain office spaces we ceased using as part of our real estate optimization strategy as a result of our hybrid work policy.
There was no impairment of Bell Media goodwill.
During the fourth quarter of 2022, we recognized $147 million of impairment charges for French TV channels within our Bell Media segment. The impairment charges were the result of a reduction in advertising demand in the industry resulting from economic uncertainties and unfavourable impacts to assumptions for discount rates. These charges included $94 million allocated to indefinite-life intangible assets for broadcast licences, and $53 million to finite-life intangible assets for program and feature film rights. The impairment was determined by comparing the carrying value of the CGUs to their fair value less cost of disposal. We estimated the fair value of the CGUs using the discounted cash flow valuation models, which include five-year cash flow projections derived from business plans reviewed by senior management for the period of October 1, 2022 to December 31, 2027, using a discount rate of 10.3% and a perpetuity growth rate of 0.5%. After impairments, the carrying value of our impacted CGUs was $109 million.
Additionally in 2022, we recorded impairment charges of $132 million related mainly to right-of-use assets for certain office spaces we ceased using as part of our real estate optimization strategy as a result of our hybrid work policy.
| 100 | BCE INC. 2023 ANNUAL FINANCIAL REPORT |
10 MD&A Accounting policies
Goodwill impairment testing
We perform an annual test for goodwill impairment in the fourth quarter for each of our CGUs or groups of CGUs to which goodwill is allocated, and whenever there is an indication that goodwill might be impaired.
A CGU is the smallest identifiable group of assets that generates cash inflows that are independent of the cash inflows from other assets or groups of assets.
We identify any potential impairment by comparing the carrying value of a CGU or group of CGUs to its recoverable amount. The recoverable amount of a CGU or group of CGUs is the higher of its fair value less costs of disposal and its value in use. Both fair value less costs of disposal and value in use are based on estimates of discounted future cash flows or other valuation methods. Cash flows are projected based on past experience, actual operating results and business plans, including any impact from changes in interest rates and inflation. When the recoverable amount of a CGU or group of CGUs is less than its carrying value, the recoverable amount is determined for its identifiable assets and liabilities. The excess of the recoverable amount of the CGU or group of CGUs over the total of the amounts assigned to its assets and liabilities is the recoverable amount of goodwill.
An impairment charge is recognized in Impairment of assets in the income statements for any excess of the carrying value of goodwill over its recoverable amount. For purposes of impairment testing of goodwill, our CGUs or groups of CGUs correspond to our reporting segments as disclosed in Note 3, Segmented information, in BCE’s 2023 consolidated financial statements.
Any significant change in each of the estimates used could have a material impact on the calculation of the recoverable amount and resulting impairment charge. As a result, we are unable to reasonably quantify the changes in our overall financial performance if we had used different assumptions.
We cannot predict whether an event that triggers impairment will occur, when it will occur or how it will affect the asset values we have reported.
We believe that any reasonable possible change in the key assumptions on which the estimate of recoverable amount of the Bell CTS group of CGUs is based would not cause its carrying amount to exceed its recoverable amount.
For the Bell Media group of CGUs, a decrease of (0.3%) in the perpetuity growth rate or an increase of 0.2% in the discount rate would have resulted in its recoverable amount being equal to its carrying value.
There were no goodwill impairment charges in 2023 or 2022.
Deferred taxes
Deferred tax assets and liabilities are calculated at the tax rates that are expected to apply when the asset or liability is recovered or settled. Both our current and deferred tax assets and liabilities are calculated using tax rates that have been enacted or substantively enacted at the reporting date.
Deferred taxes are provided on temporary differences arising from investments in subsidiaries, joint arrangements and associates, except where we control the timing of the reversal of the temporary difference and it is probable that the temporary difference will not reverse in the foreseeable future.
The amounts of deferred tax assets and liabilities are estimated with consideration given to the timing, sources and amounts of future taxable income.
Leases
The application of IFRS 16 requires us to make estimates that affect the measurement of right-of-use assets and liabilities, including determining the appropriate discount rate used to measure lease liabilities. Lease liabilities are initially measured at the present value of the lease payments that are not paid at the commencement date, discounted using our incremental borrowing rate, unless the rate implicit in the lease is readily determinable. Our incremental borrowing rate is derived from publicly available risk-free interest rates, adjusted for applicable credit spreads and lease terms. We apply a single incremental borrowing rate to a portfolio of leases with similar characteristics.
Fair value of financial instruments
Certain financial instruments, such as investments in equity securities, derivative financial instruments and certain elements of borrowings, are carried in the statements of financial position at fair value, with changes in fair value reflected in the income statements and the statements of comprehensive income. Fair values are estimated by reference to published price quotations or by using other valuation techniques that may include inputs that are not based on observable market data, such as discounted cash flows and earnings multiples.
Contingencies
In the ordinary course of business, we become involved in various claims and legal proceedings seeking monetary damages and other relief. Pending claims and legal proceedings represent a potential cost to our business. We estimate the amount of a loss by analyzing potential outcomes and assuming various litigation and settlement strategies, based on information that is available at the time.
If the final resolution of a legal or regulatory matter results in a judgment against us or requires us to pay a large settlement, it could have a material adverse effect on our consolidated financial statements in the period in which the judgment or settlement occurs.
Onerous contracts
A provision for onerous contracts is recognized when the unavoidable costs of meeting our obligations under a contract exceed the expected benefits to be received under the contract. The provision is measured at the present value of the lower of the expected cost of terminating the contract and the expected net cost of completing the contract.
Judgments
Post-employment benefit plans
The determination of the discount rate used to value our post-employment benefit obligations requires judgment. The rate is set by reference to market yields of long-term, high-quality corporate fixed income investments at the beginning of each fiscal year. Significant judgment is required when setting the criteria for fixed income investments to be included in the population from which the yield curve is derived. The most significant criteria considered for the selection of investments include the size of the issue and credit quality, along with the identification of outliers, which are excluded.
| 101 |
10 MD&A Accounting policies
Income taxes
The calculation of income taxes requires judgment in interpreting tax rules and regulations. There are transactions and calculations for which the ultimate tax determination is uncertain. Our tax filings are also subject to audits, the outcome of which could change the amount of current and deferred tax assets and liabilities. Management believes that it has sufficient amounts accrued for outstanding tax matters based on information that currently is available.
Management judgment is used to determine the amounts of deferred tax assets and liabilities to be recognized. In particular, judgment is required when assessing the timing of the reversal of temporary differences to which future income tax rates are applied.
Leases
The application of IFRS 16 requires us to make judgments that affect the measurement of right-of-use assets and liabilities. A lease contract conveys the right to control the use of an identified asset for a period of time in exchange for consideration. At inception of the contract, we assess whether the contract contains an identified asset, whether we have the right to obtain substantially all of the economic benefits from use of the asset and whether we have the right to direct how and for what purpose the asset is used. In determining the lease term, we include periods covered by renewal options when we are reasonably certain to exercise those options. Similarly, we include periods covered by termination options when we are reasonably certain not to exercise those options. To assess if we are reasonably certain to exercise an option, we consider all facts and circumstances that create an economic incentive to exercise renewal options (or not exercise termination options). Economic incentives include the costs related to the termination of the lease, the significance of any leasehold improvements and the importance of the underlying assets to our operations.
Revenue from contracts with customers
The identification of performance obligations within a contract and the timing of satisfaction of performance obligations under long-term contracts requires judgment. For bundled arrangements, we account for individual products and services when they are separately identifiable and the customer can benefit from the product or service on its own or
with other readily available resources. When our right to consideration from a customer corresponds directly with the value to the customer of the products and services transferred to date, we recognize revenue in the amount to which we have a right to invoice. We recognize product revenues from the sale of wireless handsets and devices and wireline equipment when a customer takes possession of the product. We recognize service revenues over time, as the services are provided. Revenues on certain long-term contracts are recognized using output methods based on products delivered, performance completed to date, time elapsed or milestones met.
Additionally, the determination of costs to obtain a contract, including the identification of incremental costs, also requires judgment. Incremental costs of obtaining a contract with a customer, principally comprised of sales commissions, and prepaid contract fulfillment costs are included in Contract costs in the statements of financial position, except where the amortization period is one year or less, in which case costs of obtaining a contract are immediately expensed. Capitalized costs are amortized on a systematic basis that is consistent with the period and pattern of transfer to the customer of the related products or services.
CGUs
The determination of CGUs or groups of CGUs for the purpose of impairment testing requires judgment.
Contingencies
The determination of whether a loss is probable from claims and legal proceedings and whether an outflow of resources is likely requires judgment.
We accrue a potential loss if we believe a loss is probable and an outflow of resources is likely and can be reasonably estimated, based on information that is available at the time. Any accrual would be charged to earnings and included in Trade payables and other liabilities or Other non-current liabilities. Any payment as a result of a judgment or cash settlement would be deducted from cash from operating activities. We estimate the amount of a loss by analyzing potential outcomes and assuming various litigation and settlement strategies.
Adoption of amended accounting standards
As required, we adopted the following amendments to accounting standards issued by the IASB.
| Standard | Description | Impact | ||
| Disclosure of Accounting Policies – Amendments to IAS 1 – Presentation of Financial Statements |
These amendments require that entities disclose material accounting policies, as defined, instead of significant accounting policies. | These amendments were adopted effective with our annual financial statements for the year ended December 31, 2023 and did not result in any significant changes to our financial statements. | ||
| International Tax Reform – Pillar Two Model Rules – Amendments to IAS 12 – Income Taxes |
These amendments require that entities apply IAS 12 to income taxes arising from tax law enacted or substantively enacted to implement the Pillar Two model rules published by the Organisation for Economic Co-operation and Development, including tax law that implements qualified domestic minimum top-up taxes described in those rules (Pillar Two). As an exception to the requirements in IAS 12, entities do not recognize or disclose information about deferred tax assets and liabilities related to Pillar Two. | In May 2023, we adopted the amendments to IAS 12 retrospectively. As required, we applied the exception and do not recognize or disclose information about deferred tax assets and liabilities related to Pillar Two.
The adoption of these amendments did not have a significant impact on our financial statements. |
||
| 102 | BCE INC. 2023 ANNUAL FINANCIAL REPORT |
11 MD&A Non-GAAP financial measures, other financial measures and key performance indicators (KPIs)
| 11 | Non-GAAP financial measures, other financial measures and key performance indicators (KPIs) |
BCE uses various financial measures to assess its business performance. Certain of these measures are calculated in accordance with IFRS or GAAP while certain other measures do not have a standardized meaning under GAAP. We believe that our GAAP financial measures, read together with adjusted non-GAAP and other financial measures, provide readers with a better understanding of how management assesses BCE’s performance.
National Instrument 52-112, Non-GAAP and Other Financial Measures Disclosure (NI 52-112), prescribes disclosure requirements that apply to the following specified financial measures:
| • | Non-GAAP financial measures; |
| • | Non-GAAP ratios; |
| • | Total of segments measures; |
| • | Capital management measures; and |
| • | Supplementary financial measures. |
This section provides a description and classification of the specified financial measures contemplated by NI 52-112 that we use to explain our financial results except that, for supplementary financial measures, an explanation of such measures is provided where they are first referred to in this MD&A if the supplementary financial measures’ labelling is not sufficiently descriptive.
| 11.1 | Non-GAAP financial measures |
A non-GAAP financial measure is a financial measure used to depict our historical or expected future financial performance, financial position or cash flow and, with respect to its composition, either excludes an amount that is included in, or includes an amount that is excluded from, the composition of the most directly comparable financial measure disclosed in BCE’s consolidated primary financial statements. We believe that
non-GAAP financial measures are reflective of our ongoing operating results and provide readers with an understanding of management’s perspective on and analysis of our performance.
Below are descriptions of the non-GAAP financial measures that we use to explain our results as well as reconciliations to the most directly comparable IFRS financial measures.
Adjusted net earnings
The term adjusted net earnings does not have any standardized meaning under IFRS. Therefore, it is unlikely to be comparable to similar measures presented by other issuers.
We define adjusted net earnings as net earnings attributable to common shareholders before severance, acquisition and other costs, net mark-to-market losses (gains) on derivatives used to economically hedge equity settled share-based compensation plans, net equity losses (gains) on investments in associates and joint ventures, net losses (gains) on investments, early debt redemption costs, impairment of assets and discontinued operations, net of tax and NCI.
We use adjusted net earnings and we believe that certain investors and analysts use this measure, among other ones, to assess the performance of our businesses without the effects of severance, acquisition and other costs, net mark-to-market losses (gains) on derivatives used to economically hedge equity settled share-based compensation plans, net equity losses (gains) on investments in associates and joint ventures, net losses (gains) on investments, early debt redemption costs, impairment of assets and discontinued operations, net of tax and NCI. We exclude these items because they affect the comparability of our financial results and could potentially distort the analysis of trends in business performance. Excluding these items does not imply they are non-recurring.
The most directly comparable IFRS financial measure is net earnings attributable to common shareholders.
| 103 |
11 MD&A Non-GAAP financial measures, other financial measures and key performance indicators (KPIs)
The following table is a reconciliation of net earnings attributable to common shareholders to adjusted net earnings on a consolidated basis.
| Q4 2023 | Q4 2022 | 2023 | 2022 | |||||||||||||
| Net earnings attributable to common shareholders |
382 | 528 | 2,076 | 2,716 | ||||||||||||
| Reconciling items: |
||||||||||||||||
| Severance, acquisition and other costs |
41 | 19 | 200 | 94 | ||||||||||||
| Net mark-to-market (gains) losses on derivatives used to economically hedge equity settled share-based compensation plans |
(6 | ) | (27 | ) | 103 | 53 | ||||||||||
| Net equity losses on investments in associates and joint ventures |
204 | – | 581 | 42 | ||||||||||||
| Net (gains) losses on investments |
(2 | ) | 29 | (80 | ) | (24 | ) | |||||||||
| Early debt redemption costs |
– | – | 1 | 18 | ||||||||||||
| Impairment of assets |
109 | 150 | 143 | 279 | ||||||||||||
| Income taxes for the above reconciling items |
(39 | ) | (37 | ) | (100 | ) | (117 | ) | ||||||||
| NCI for the above reconciling items |
2 | (8 | ) | 2 | (4 | ) | ||||||||||
| Adjusted net earnings |
691 | 654 | 2,926 | 3,057 | ||||||||||||
Adjusted net interest expense
The term adjusted net interest expense does not have any standardized meaning under IFRS. Therefore, it is unlikely to be comparable to similar measures presented by other issuers.
We define adjusted net interest expense as twelve-month trailing net interest expense as shown in our consolidated statements of cash flows, plus 50% of twelve-month trailing net earnings attributable to preferred shareholders as shown in our consolidated income statements.
Adjusted net interest expense is a component in the calculation of the adjusted EBITDA to adjusted net interest expense ratio, which is a capital management measure. For further details on the adjusted EBITDA to adjusted net interest expense ratio, see section 11.4, Capital management measures. In 2022 and 2023, we used, and believe that certain investors and analysts used, the adjusted EBITDA to adjusted net interest expense ratio, among other measures, to evaluate the financial health of the company. However, given the correlation between this
ratio and the net debt leverage ratio, we are simplifying our internal targets to reflect the net debt leverage ratio only and will not report against adjusted EBITDA to adjusted net interest expense in the future. We believe that this ratio is of less relative importance to our investors, lenders and other stakeholders as a measure of the strength of our capital structure.
The most directly comparable IFRS financial measure is net interest expense. The following table is a reconciliation of net interest expense to adjusted net interest expense on a consolidated basis.
| 2023 | 2022 | |||||||
| Net interest expense |
1,408 | 1,124 | ||||||
| 50% of net earnings attributable to preferred shareholders |
94 | 76 | ||||||
| Adjusted net interest expense |
1,502 | 1,200 | ||||||
Available liquidity
The term available liquidity does not have any standardized meaning under IFRS. Therefore, it is unlikely to be comparable to similar measures presented by other issuers.
We define available liquidity as cash, cash equivalents, short-term investments and amounts available under our securitized receivables program and our committed bank credit facilities, excluding credit facilities that are available exclusively for a pre-determined purpose. In Q4 2023, we updated our definition of available liquidity to account for short-term investments as these funds are liquid and can be used to meet our cash requirements. This change does not impact the available liquidity amounts previously presented.
We consider available liquidity to be an important indicator of the financial strength and performance of our businesses because it shows the funds available to meet our cash requirements, including for, but not limited to, capital expenditures, post-employment benefit plans funding, dividend payments, the payment of contractual obligations, maturing debt, ongoing operations, the acquisition of spectrum, and other cash requirements. We believe that certain investors and analysts use available liquidity to evaluate the financial strength and performance of our businesses. The most directly comparable IFRS financial measure is cash.
The following table is a reconciliation of cash to available liquidity on a consolidated basis.
| December 31, 2023 | December 31, 2022 | |||||||
| Cash |
547 | 99 | ||||||
| Cash equivalents |
225 | 50 | ||||||
| Short-term investments |
1,000 | – | ||||||
| Amounts available under our securitized receivables program (1) |
700 | 700 | ||||||
| Amounts available under our committed bank credit facilities (2) |
3,303 | 2,651 | ||||||
| Available liquidity |
5,775 | 3,500 | ||||||
| (1) | At December 31, 2023 and December 31, 2022, $700 million was available under our securitized receivables program, under which we borrowed $1,200 million in U.S. dollars ($1,588 million in Canadian dollars) and $1,173 million in U.S. dollars ($1,588 million in Canadian dollars) as at December 31, 2023 and December 31, 2022, respectively. Loans secured by receivables are included in Debt due within one year in our consolidated financial statements. |
| (2) | At December 31, 2023 and December 31, 2022, respectively, $3,303 million and $2,651 million were available under our committed bank credit facilities, given outstanding commercial paper of $149 million in U.S. dollars ($197 million in Canadian dollars) and $627 million in U.S. dollars ($849 million in Canadian dollars) as at December 31, 2023 and December 31, 2022, respectively. Commercial paper outstanding is included in Debt due within one year in our consolidated financial statements. |
| 104 | BCE INC. 2023 ANNUAL FINANCIAL REPORT |
11 MD&A Non-GAAP financial measures, other financial measures and key performance indicators (KPIs)
Free cash flow and excess free cash flow
The terms free cash flow and excess free cash flow do not have any standardized meaning under IFRS. Therefore, they are unlikely to be comparable to similar measures presented by other issuers.
We define free cash flow as cash flows from operating activities, excluding cash from discontinued operations, acquisition and other costs paid (which include significant litigation costs) and voluntary pension funding, less capital expenditures, preferred share dividends and dividends paid by subsidiaries to NCI. We exclude cash from discontinued operations, acquisition and other costs paid and voluntary pension funding because they affect the comparability of our financial results and could potentially distort the analysis of trends in business performance. Excluding these items does not imply they are non-recurring.
We define excess free cash flow as free cash flow less dividends paid on common shares.
We consider free cash flow and excess free cash flow to be important indicators of the financial strength and performance of our businesses. Free cash flow shows how much cash is available to pay dividends on common shares, repay debt and reinvest in our company. Excess free cash flow shows how much cash is available to repay debt and reinvest in our company, after the payment of dividends on common shares. We believe that certain investors and analysts use free cash flow and excess free cash flow to value a business and its underlying assets and to evaluate the financial strength and performance of our businesses. The most directly comparable IFRS financial measure is cash flows from operating activities.
The following tables provide reconciliations of cash flows from operating activities to free cash flow and excess free cash flow on a consolidated basis.
| 2023 | Q4 2023 | Q3 2023 | Q2 2023 | Q1 2023 | ||||||||||||||||
| Cash flows from operating activities |
7,946 | 2,373 | 1,961 | 2,365 | 1,247 | |||||||||||||||
| Capital expenditures |
(4,581 | ) | (1,029 | ) | (1,159 | ) | (1,307 | ) | (1,086 | ) | ||||||||||
| Cash dividends paid on preferred shares |
(182 | ) | (46 | ) | (35 | ) | (46 | ) | (55 | ) | ||||||||||
| Cash dividends paid by subsidiaries to NCI |
(47 | ) | (12 | ) | (13 | ) | (1 | ) | (21 | ) | ||||||||||
| Acquisition and other costs paid |
8 | 3 | – | 5 | – | |||||||||||||||
| Free cash flow |
3,144 | 1,289 | 754 | 1,016 | 85 | |||||||||||||||
| Dividends paid on common shares |
(3,486 | ) | (882 | ) | (883 | ) | (882 | ) | (839 | ) | ||||||||||
| Excess free cash flow |
(342 | ) | 407 | (129 | ) | 134 | (754 | ) | ||||||||||||
| 2022 | Q4 2022 | Q3 2022 | Q2 2022 | Q1 2022 | 2021 | |||||||||||||||||||
| Cash flows from operating activities |
8,365 | 2,056 | 1,996 | 2,597 | 1,716 | 8,008 | ||||||||||||||||||
| Capital expenditures |
(5,133 | ) | (1,638 | ) | (1,317 | ) | (1,219 | ) | (959 | ) | (4,852 | ) | ||||||||||||
| Cash dividends paid on preferred shares |
(136 | ) | (42 | ) | (27 | ) | (34 | ) | (33 | ) | (125 | ) | ||||||||||||
| Cash dividends paid by subsidiaries to NCI |
(39 | ) | (3 | ) | (11 | ) | (14 | ) | (11 | ) | (86 | ) | ||||||||||||
| Acquisition and other costs paid |
10 | 3 | 1 | 3 | 3 | 35 | ||||||||||||||||||
| Free cash flow |
3,067 | 376 | 642 | 1,333 | 716 | 2,980 | ||||||||||||||||||
| Dividends paid on common shares |
(3,312 | ) | (839 | ) | (839 | ) | (839 | ) | (795 | ) | (3,132 | ) | ||||||||||||
| Excess free cash flow |
(245 | ) | (463 | ) | (197 | ) | 494 | (79 | ) | (152 | ) | |||||||||||||
Net debt
The term net debt does not have any standardized meaning under IFRS. Therefore, it is unlikely to be comparable to similar measures presented by other issuers.
We define net debt as debt due within one year plus long-term debt and 50% of preferred shares, less cash, cash equivalents and short-term investments, as shown in BCE’s consolidated statements of financial position. We include 50% of outstanding preferred shares in our net debt as it is consistent with the treatment by certain credit rating agencies. In Q4 2023, we updated our definition of net debt to account for short-term investments as these funds are liquid and may be used to repay the debt due within one year. This change does not impact the net debt amounts previously presented.
We consider net debt to be an important indicator of the company’s financial leverage because it represents the amount of debt that is not covered by available cash, cash equivalents and short-term investments. We believe that certain investors and analysts use net debt to determine a company’s financial leverage.
Net debt is calculated using several asset and liability categories from the statements of financial position. The most directly comparable IFRS financial measure is long-term debt. The following table is a reconciliation of long-term debt to net debt on a consolidated basis.
| December 31, 2023 | December 31, 2022 | |||||||
| Long-term debt |
31,135 | 27,783 | ||||||
| Debt due within one year |
5,042 | 4,137 | ||||||
| 50% of preferred shares |
1,834 | 1,935 | ||||||
| Cash |
(547 | ) | (99 | ) | ||||
| Cash equivalents |
(225 | ) | (50 | ) | ||||
| Short-term investments |
(1,000 | ) | – | |||||
| Net debt |
36,239 | 33,706 | ||||||
| 105 |
11 MD&A Non-GAAP financial measures, other financial measures and key performance indicators (KPIs)
| 11.2 | Non-GAAP ratios |
A non-GAAP ratio is a financial measure disclosed in the form of a ratio, fraction, percentage or similar representation and that has a non-GAAP financial measure as one or more of its components.
Adjusted EPS
The term adjusted EPS does not have any standardized meaning under IFRS. Therefore, it is unlikely to be comparable to similar measures presented by other issuers.
We define adjusted EPS as adjusted net earnings per BCE common share. Adjusted net earnings is a non-GAAP financial measure. For further details on adjusted net earnings, see section 11.1, Non-GAAP financial measures.
We use adjusted EPS, and we believe that certain investors and analysts use this measure, among other ones, to assess the performance of our
businesses without the effects of severance, acquisition and other costs, net mark-to-market losses (gains) on derivatives used to economically hedge equity settled share-based compensation plans, net equity losses (gains) on investments in associates and joint ventures, net losses (gains) on investments, early debt redemption costs, impairment of assets and discontinued operations, net of tax and NCI. We exclude these items because they affect the comparability of our financial results and could potentially distort the analysis of trends in business performance. Excluding these items does not imply they are non-recurring.
Dividend payout ratio
The term dividend payout ratio does not have any standardized meaning under IFRS. Therefore, it is unlikely to be comparable to similar measures presented by other issuers.
We define dividend payout ratio as dividends paid on common shares divided by free cash flow. Free cash flow is a non-GAAP financial
measure. For further details on free cash flow, see section 11.1, Non-GAAP financial measures.
We consider dividend payout ratio to be an important indicator of the financial strength and performance of our businesses because it shows the sustainability of the company’s dividend payments.
| 11.3 | Total of segments measures |
A total of segments measure is a financial measure that is a subtotal or total of 2 or more reportable segments and is disclosed within the Notes to BCE’s consolidated primary financial statements.
Adjusted EBITDA
We define adjusted EBITDA as operating revenues less operating costs as shown in BCE’s consolidated income statements.
The most directly comparable IFRS financial measure is net earnings. The following tables provide reconciliations of net earnings to adjusted EBITDA on a consolidated basis.
| 2023 | Q4 2023 | Q3 2023 | Q2 2023 | Q1 2023 | ||||||||||||||||
| Net earnings |
2,327 | 435 | 707 | 397 | 788 | |||||||||||||||
| Severance, acquisition and other costs |
200 | 41 | 10 | 100 | 49 | |||||||||||||||
| Depreciation |
3,745 | 954 | 937 | 936 | 918 | |||||||||||||||
| Amortization |
1,173 | 299 | 295 | 296 | 283 | |||||||||||||||
| Finance costs |
||||||||||||||||||||
| Interest expense |
1,475 | 399 | 373 | 359 | 344 | |||||||||||||||
| Net return on post-employment benefit plans |
(108 | ) | (27 | ) | (27 | ) | (27 | ) | (27 | ) | ||||||||||
| Impairment of assets |
143 | 109 | – | – | 34 | |||||||||||||||
| Other expense (income) |
466 | 147 | 129 | 311 | (121 | ) | ||||||||||||||
| Income taxes |
996 | 210 | 243 | 273 | 270 | |||||||||||||||
| Adjusted EBITDA |
10,417 | 2,567 | 2,667 | 2,645 | 2,538 | |||||||||||||||
| 106 | BCE INC. 2023 ANNUAL FINANCIAL REPORT |
11 MD&A Non-GAAP financial measures, other financial measures and key performance indicators (KPIs)
| 2022 | Q4 2022 | Q3 2022 | Q2 2022 | Q1 2022 | 2021 | |||||||||||||||||||
| Net earnings |
2,926 | 567 | 771 | 654 | 934 | 2,892 | ||||||||||||||||||
| Severance, acquisition and other costs |
94 | 19 | 22 | 40 | 13 | 209 | ||||||||||||||||||
| Depreciation |
3,660 | 922 | 914 | 933 | 891 | 3,627 | ||||||||||||||||||
| Amortization |
1,063 | 270 | 267 | 266 | 260 | 982 | ||||||||||||||||||
| Finance costs |
||||||||||||||||||||||||
| Interest expense |
1,146 | 319 | 298 | 269 | 260 | 1,082 | ||||||||||||||||||
| Net (return) expense on post-employment benefit plans |
(51 | ) | (13 | ) | (13 | ) | (7 | ) | (18 | ) | 20 | |||||||||||||
| Impairment of assets |
279 | 150 | 21 | 106 | 2 | 197 | ||||||||||||||||||
| Other expense (income) |
115 | (19 | ) | 130 | 97 | (93 | ) | (160 | ) | |||||||||||||||
| Income taxes |
967 | 222 | 178 | 232 | 335 | 1,044 | ||||||||||||||||||
| Adjusted EBITDA |
10,199 | 2,437 | 2,588 | 2,590 | 2,584 | 9,893 | ||||||||||||||||||
| 11.4 | Capital management measures |
A capital management measure is a financial measure that is intended to enable a reader to evaluate our objectives, policies and processes for managing our capital and is disclosed within the Notes to BCE’s consolidated financial statements.
The financial reporting framework used to prepare the financial statements requires disclosure that helps readers assess the company’s capital management objectives, policies, and processes, as set out in IFRS in IAS 1 – Presentation of Financial Statements. BCE has its own methods for managing capital and liquidity, and IFRS does not prescribe any particular calculation method.
Adjusted EBITDA to adjusted net interest expense ratio
The adjusted EBITDA to adjusted net interest expense ratio represents adjusted EBITDA divided by adjusted net interest expense. For the purposes of calculating our adjusted EBITDA to adjusted net interest expense ratio, adjusted EBITDA is twelve-month trailing adjusted EBITDA. Adjusted net interest expense used in the calculation of the adjusted EBITDA to adjusted net interest expense ratio is a non-GAAP financial measure defined as twelve-month trailing net interest expense as shown in our consolidated statements of cash flows, plus 50% of twelve-month trailing net earnings attributable to preferred shareholders as shown in our consolidated income statements. For further details on adjusted net interest expense, see section 11.1, Non-GAAP financial measures.
In 2022 and 2023, we used, and believe that certain investors and analysts used, the adjusted EBITDA to adjusted net interest expense ratio, among other measures, to evaluate the financial health of the company. However, given the correlation between this ratio and the net debt leverage ratio, we are simplifying our internal targets to reflect the net debt leverage ratio only and will not report against adjusted EBITDA to adjusted net interest expense in the future. We believe that this ratio is of less relative importance to our investors, lenders and other stakeholders as a measure of the strength of our capital structure.
Net debt leverage ratio
The net debt leverage ratio represents net debt divided by adjusted EBITDA. Net debt used in the calculation of the net debt leverage ratio is a non-GAAP financial measure. For further details on net debt, see section 11.1, Non-GAAP financial measures. For the purposes of calculating our net debt leverage ratio, adjusted EBITDA is twelve-month trailing adjusted EBITDA.
We use, and believe that certain investors and analysts use, the net debt leverage ratio as a measure of financial leverage.
| 107 |
11 MD&A Non-GAAP financial measures, other financial measures and key performance indicators (KPIs)
| 11.5 | Supplementary financial measures |
A supplementary financial measure is a financial measure that is not reported in BCE’s consolidated financial statements, and is, or is intended to be, reported periodically to represent historical or expected future financial performance, financial position, or cash flows.
An explanation of such measures is provided where they are first referred to in this MD&A if the supplementary financial measures’ labelling is not sufficiently descriptive.
| 11.6 | KPIs |
In addition to the non-GAAP financial measures and other financial measures described previously, we use the following KPIs to measure the success of our strategic imperatives. These KPIs are not accounting measures and may not be comparable to similar measures presented by other issuers.
| KPI | Definition | |
| Adjusted EBITDA margin | Adjusted EBITDA margin is defined as adjusted EBITDA divided by operating revenues. | |
| ARPU | Effective Q1 2023, as a result of the segment reporting changes impacting intersegment eliminations, ARPU has been updated and is defined as Bell CTS wireless external services revenues (previously wireless operating service revenues) divided by the average mobile phone subscriber base for the specified period, expressed as a dollar unit per month. | |
| Capital intensity | Capital intensity is defined as capital expenditures divided by operating revenues. | |
| Churn | Mobile phone churn is the rate at which existing mobile phone subscribers cancel their services. It is a measure of our ability to retain our customers. Mobile phone churn is calculated by dividing the number of mobile phone deactivations during a given period by the average number of mobile phone subscribers in the base for the specified period and is expressed as a percentage per month. | |
| Subscriber unit | Mobile phone subscriber unit is comprised of a recurring revenue-generating portable unit (e.g. smartphones and feature phones) on an active service plan, that has access to our wireless networks and includes voice, text and/or data connectivity. We report mobile phone subscriber units in two categories: postpaid and prepaid. Prepaid mobile phone subscriber units are considered active for a period of 90 days following the expiry of the subscriber’s prepaid balance.
Mobile connected device subscriber unit is comprised of a recurring revenue-generating portable unit (e.g. tablets, wearables, mobile Internet devices and IoT) on an active service plan, that has access to our wireless networks and is intended for limited or no cellular voice capability.
Wireline subscriber unit consists of an active revenue-generating unit with access to our services, including retail Internet, satellite TV, IPTV, and/or residential NAS. A subscriber is included in our subscriber base when the service has been installed and is operational at the customer premise and a billing relationship has been established.
• Retail Internet, IPTV and satellite TV subscribers have access to stand-alone services, and are primarily represented by a dwelling unit
• Retail residential NAS subscribers are based on a line count and are represented by a unique telephone number |
|
| 108 | BCE INC. 2023 ANNUAL FINANCIAL REPORT |
12 MD&A Effectiveness of internal controls
| 12 | Effectiveness of internal controls |
Disclosure controls and procedures
Our disclosure controls and procedures are designed to provide reasonable assurance that information required to be disclosed by us in reports filed or submitted under Canadian and U.S. securities laws is recorded, processed, summarized and reported within the time periods specified under those laws, and include controls and procedures that are designed to ensure that the information is accumulated and communicated to management, including BCE’s President and CEO and Executive Vice-President and CFO, to allow timely decisions regarding required disclosure.
As at December 31, 2023, management evaluated, under the supervision of and with the participation of the CEO and the CFO, the effectiveness of our disclosure controls and procedures, as defined in Rule 13a-15(e) under the U.S. Securities Exchange Act of 1934, as amended, and under National Instrument 52-109 – Certification of Disclosure in Issuers’ Annual and Interim Filings.
Based on that evaluation, the CEO and CFO concluded that our disclosure controls and procedures were effective as at December 31, 2023.
Internal control over financial reporting
Management is responsible for establishing and maintaining adequate internal control over financial reporting, as defined in Rule 13a-15(f) under the U.S. Securities Exchange Act of 1934, as amended, and under National Instrument 52-109. Our internal control over financial reporting is a process designed under the supervision of the CEO and CFO, and effected by the Board, management and other personnel of BCE, to provide reasonable assurance regarding the reliability of financial reporting and the preparation of financial statements for external purposes in accordance with IFRS as issued by the IASB. However, because of its inherent limitations, internal control over financial reporting may not prevent or detect misstatements on a timely basis.
Management evaluated, under the supervision of and with the participation of the CEO and the CFO, the effectiveness of our internal control over financial reporting as at December 31, 2023, based on the criteria established in Internal Control – Integrated Framework (2013) issued by the Committee of Sponsoring Organizations of the Treadway Commission (COSO).
Based on that evaluation, the CEO and CFO concluded that our internal control over financial reporting was effective as at December 31, 2023.
Changes in internal control over financial reporting
No changes were made in our internal control over financial reporting during the year ended December 31, 2023 that have materially affected, or are reasonably likely to materially affect, our internal control over financial reporting.
| 109 |
| Consolidated financial statements | ||
| Management's responsibility for financial reporting | ||
| Report of independent registered public accounting firm | ||
| FOR THE YEAR ENDED DECEMBER 31 (IN MILLIONS OF CANADIAN DOLLARS, EXCEPT SHARE AMOUNTS) |
NOTE | 2023 | 2022 | ||||||||||||||
| Operating revenues | 3 | 24,673 | 24,174 | ||||||||||||||
| Operating costs | 3, | 5 | (14,256) | (13,975) | |||||||||||||
| Severance, acquisition and other costs | 6 | (200) | (94) | ||||||||||||||
| Depreciation | 17 | (3,745) | (3,660) | ||||||||||||||
| Amortization | 19 | (1,173) | (1,063) | ||||||||||||||
| Finance costs | |||||||||||||||||
| Interest expense | 7 | (1,475) | (1,146) | ||||||||||||||
| Net return on post-employment benefit plans | 27 | 108 | 51 | ||||||||||||||
| Impairment of assets | 8, | 17, | 19 | (143) | (279) | ||||||||||||
| Other expense | 9 | (466) | (115) | ||||||||||||||
| Income taxes | 10 | (996) | (967) | ||||||||||||||
| Net Earnings | 2,327 | 2,926 | |||||||||||||||
| Net earnings attributable to: | |||||||||||||||||
| Common shareholders | 2,076 | 2,716 | |||||||||||||||
| Preferred shareholders | 187 | 152 | |||||||||||||||
| Non-controlling interest | 36 | 64 | 58 | ||||||||||||||
| Net earnings | 2,327 | 2,926 | |||||||||||||||
| Net earnings per common share - basic and diluted | 11 | 2.28 | 2.98 | ||||||||||||||
| Weighted average number of common shares outstanding - basic (millions) | 912.2 | 911.5 | |||||||||||||||
| FOR THE YEAR ENDED DECEMBER 31 (IN MILLIONS OF CANADIAN DOLLARS) |
NOTE | 2023 | 2022 | ||||||||
| Net earnings | 2,327 | 2,926 | |||||||||
| Other comprehensive (loss) income, net of income taxes | |||||||||||
| Items that will be subsequently reclassified to net earnings | |||||||||||
Net change in value of derivatives designated as cash flow hedges, net of income taxes of $93 million and $118 million for 2023 and 2022, respectively |
(257) | (321) | |||||||||
| Items that will not be reclassified to net earnings | |||||||||||
Actuarial (losses) gains on post-employment benefit plans, net of income taxes of $149 million and ($151) million for 2023 and 2022, respectively |
27 | (404) | 415 | ||||||||
Net change in value of publicly-traded and privately-held investments, net of income taxes of ($50) million and ($19) million for 2023 and 2022, respectively |
325 | 30 | |||||||||
Net change in value of derivatives designated as cash flow hedges, net of income taxes of $5 million and ($21) million for 2023 and 2022, respectively |
(12) | 58 | |||||||||
| Other comprehensive (loss) income | (348) | 182 | |||||||||
| Total comprehensive income | 1,979 | 3,108 | |||||||||
| Total comprehensive income attributable to: | |||||||||||
| Common shareholders | 1,731 | 2,891 | |||||||||
| Preferred shareholders | 187 | 152 | |||||||||
| Non-controlling interest | 36 | 61 | 65 | ||||||||
| Total comprehensive income | 1,979 | 3,108 | |||||||||
| (IN MILLIONS OF CANADIAN DOLLARS) | NOTE | December 31, 2023 |
December 31, 2022 |
|||||||||||
| ASSETS | ||||||||||||||
| Current assets | ||||||||||||||
| Cash | 547 | 99 | ||||||||||||
| Cash equivalents | 225 | 50 | ||||||||||||
| Short-term investments | 1,000 | — | ||||||||||||
| Trade and other receivables | 12 | 4,031 | 4,138 | |||||||||||
| Inventory | 13 | 465 | 656 | |||||||||||
| Contract assets | 14 | 443 | 436 | |||||||||||
| Contract costs | 15 | 633 | 540 | |||||||||||
| Prepaid expenses | 230 | 244 | ||||||||||||
| Other current assets | 264 | 324 | ||||||||||||
| Assets held for sale | 16 | 60 | — | |||||||||||
| Total current assets | 7,898 | 6,487 | ||||||||||||
| Non-current assets | ||||||||||||||
| Contract assets | 14 | 292 | 288 | |||||||||||
| Contract costs | 15 | 779 | 603 | |||||||||||
| Property, plant and equipment | 17 | 30,352 | 29,256 | |||||||||||
| Intangible assets | 19 | 16,609 | 16,183 | |||||||||||
| Deferred tax assets | 10 | 96 | 84 | |||||||||||
| Investments in associates and joint ventures | 20 | 323 | 608 | |||||||||||
| Post-employment benefit assets | 27 | 2,935 | 3,559 | |||||||||||
| Other non-current assets | 21 | 1,714 | 1,355 | |||||||||||
| Goodwill | 22 | 10,942 | 10,906 | |||||||||||
| Total non-current assets | 64,042 | 62,842 | ||||||||||||
| Total assets | 71,940 | 69,329 | ||||||||||||
| LIABILITIES | ||||||||||||||
| Current liabilities | ||||||||||||||
| Trade payables and other liabilities | 23 | 4,729 | 5,221 | |||||||||||
| Contract liabilities | 14 | 811 | 857 | |||||||||||
| Interest payable | 332 | 281 | ||||||||||||
| Dividends payable | 910 | 867 | ||||||||||||
| Current tax liabilities | 268 | 106 | ||||||||||||
| Debt due within one year | 24 | 5,042 | 4,137 | |||||||||||
| Liabilities held for sale | 16 | 15 | — | |||||||||||
| Total current liabilities | 12,107 | 11,469 | ||||||||||||
| Non-current liabilities | ||||||||||||||
| Contract liabilities | 14 | 277 | 228 | |||||||||||
| Long-term debt | 25 | 31,135 | 27,783 | |||||||||||
| Deferred tax liabilities | 10 | 4,869 | 4,953 | |||||||||||
| Post-employment benefit obligations | 27 | 1,278 | 1,311 | |||||||||||
| Other non-current liabilities | 28 | 1,717 | 1,070 | |||||||||||
| Total non-current liabilities | 39,276 | 35,345 | ||||||||||||
| Total liabilities | 51,383 | 46,814 | ||||||||||||
| Commitments and contingencies | 34 | |||||||||||||
| EQUITY | ||||||||||||||
| Equity attributable to BCE shareholders | ||||||||||||||
| Preferred shares | 30 | 3,667 | 3,870 | |||||||||||
| Common shares | 30 | 20,859 | 20,840 | |||||||||||
| Contributed surplus | 30 | 1,258 | 1,172 | |||||||||||
| Accumulated other comprehensive loss | (42) | (55) | ||||||||||||
| Deficit | (5,513) | (3,649) | ||||||||||||
| Total equity attributable to BCE shareholders | 20,229 | 22,178 | ||||||||||||
| Non-controlling interest | 36 | 328 | 337 | |||||||||||
| Total equity | 20,557 | 22,515 | ||||||||||||
| Total liabilities and equity | 71,940 | 69,329 | ||||||||||||
| ATTRIBUTABLE TO BCE SHAREHOLDERS | ||||||||||||||||||||||||||||||||
|
FOR THE YEAR ENDED DECEMBER 31, 2023 (IN MILLIONS OF CANADIAN DOLLARS) |
NOTE | PREFERRED SHARES | COMMON SHARES | CONTRI-BUTED SURPLUS | ACCUM-ULATED OTHER COMPRE-HENSIVE (LOSS) INCOME | DEFICIT | TOTAL | NON-CONTR-OLLING INTEREST | TOTAL EQUITY | |||||||||||||||||||||||
| Balance at December 31, 2022 | 3,870 | 20,840 | 1,172 | (55) | (3,649) | 22,178 | 337 | 22,515 | ||||||||||||||||||||||||
| Net earnings | — | — | — | — | 2,263 | 2,263 | 64 | 2,327 | ||||||||||||||||||||||||
| Other comprehensive income (loss) | — | — | — | 59 | (404) | (345) | (3) | (348) | ||||||||||||||||||||||||
| Total comprehensive income | — | — | — | 59 | 1,859 | 1,918 | 61 | 1,979 | ||||||||||||||||||||||||
| Common shares issued under employee stock option plan |
30 | — | 19 | (1) | — | — | 18 | — | 18 | |||||||||||||||||||||||
| Other share-based compensation | 30 | — | — | 24 | — | (23) | 1 | — | 1 | |||||||||||||||||||||||
| Repurchase of preferred shares | 30 | (203) | — | 63 | — | — | (140) | — | (140) | |||||||||||||||||||||||
| Dividends declared on BCE common and preferred shares |
— | — | — | — | (3,717) | (3,717) | — | (3,717) | ||||||||||||||||||||||||
| Dividends declared by subsidiaries to non-controlling interest |
— | — | — | — | — | — | (47) | (47) | ||||||||||||||||||||||||
| Settlement of cash flow hedges transferred to the cost basis of hedged items |
— | — | — | (29) | — | (29) | — | (29) | ||||||||||||||||||||||||
| Disposition of production studios | 4 | — | — | — | — | — | — | (23) | (23) | |||||||||||||||||||||||
| Other | — | — | (17) | 17 | — | — | — | |||||||||||||||||||||||||
| Balance at December 31, 2023 | 3,667 | 20,859 | 1,258 | (42) | (5,513) | 20,229 | 328 | 20,557 | ||||||||||||||||||||||||
| ATTRIBUTABLE TO BCE SHAREHOLDERS | ||||||||||||||||||||||||||||||||
|
FOR THE YEAR ENDED DECEMBER 31, 2022 (IN MILLIONS OF CANADIAN DOLLARS) |
NOTE | PREFERRED SHARES | COMMON SHARES | CONTRI-BUTED SURPLUS | ACCUMU-LATED OTHER COMPRE-HENSIVE INCOME (LOSS) | DEFICIT | TOTAL | NON-CONTR-OLLING INTEREST | TOTAL EQUITY | |||||||||||||||||||||||
| Balance at December 31, 2021 | 4,003 | 20,662 | 1,157 | 213 | (3,400) | 22,635 | 306 | 22,941 | ||||||||||||||||||||||||
| Net earnings | — | — | — | — | 2,868 | 2,868 | 58 | 2,926 | ||||||||||||||||||||||||
| Other comprehensive (loss) income | — | — | — | (238) | 413 | 175 | 7 | 182 | ||||||||||||||||||||||||
| Total comprehensive (loss) income | — | — | — | (238) | 3,281 | 3,043 | 65 | 3,108 | ||||||||||||||||||||||||
| Common shares issued under employee stock option plan |
30 | — | 177 | (6) | — | — | 171 | — | 171 | |||||||||||||||||||||||
| Other share-based compensation | 30 | — | 1 | 13 | — | (41) | (27) | — | (27) | |||||||||||||||||||||||
| Repurchase of preferred shares | 30 | (133) | — | 8 | — | — | (125) | — | (125) | |||||||||||||||||||||||
| Dividends declared on BCE common and preferred shares |
— | — | — | — | (3,508) | (3,508) | — | (3,508) | ||||||||||||||||||||||||
| Dividends declared by subsidiaries to non-controlling interest |
— | — | — | — | — | — | (39) | (39) | ||||||||||||||||||||||||
| Settlement of cash flow hedges transferred to the cost basis of hedged items |
— | — | — | (11) | — | (11) | — | (11) | ||||||||||||||||||||||||
| Other | — | — | — | (19) | 19 | — | 5 | 5 | ||||||||||||||||||||||||
| Balance at December 31, 2022 | 3,870 | 20,840 | 1,172 | (55) | (3,649) | 22,178 | 337 | 22,515 | ||||||||||||||||||||||||
| FOR THE YEAR ENDED DECEMBER 31 | ||||||||||||||
| (IN MILLIONS OF CANADIAN DOLLARS) | NOTE | 2023 | 2022 | |||||||||||
| Cash flows from operating activities | ||||||||||||||
| Net earnings | 2,327 | 2,926 | ||||||||||||
| Adjustments to reconcile net earnings to cash flows from operating activities | ||||||||||||||
| Severance, acquisition and other costs | 6 | 200 | 94 | |||||||||||
| Depreciation and amortization | 17 | , | 19 | 4,918 | 4,723 | |||||||||
| Post-employment benefit plans cost | 27 | 98 | 198 | |||||||||||
| Net interest expense | 1,408 | 1,124 | ||||||||||||
| Impairment of assets | 8 | 143 | 279 | |||||||||||
| Gains on investments | 9 | (80) | (24) | |||||||||||
| Net equity losses from investments in associates and joint ventures | 9 | 581 | 42 | |||||||||||
| Income taxes | 10 | 996 | 967 | |||||||||||
| Contributions to post-employment benefit plans | 27 | (52) | (140) | |||||||||||
| Payments under other post-employment benefit plans | 27 | (64) | (64) | |||||||||||
| Severance and other costs paid | (178) | (129) | ||||||||||||
| Interest paid | (1,486) | (1,197) | ||||||||||||
| Income taxes paid (net of refunds) | (700) | (749) | ||||||||||||
| Acquisition and other costs paid | (8) | (10) | ||||||||||||
| Change in contract assets | 14 | (11) | (59) | |||||||||||
| Change in wireless device financing plan receivables | 12 | (46) | 22 | |||||||||||
| Net change in operating assets and liabilities | (100) | 362 | ||||||||||||
| Cash flows from operating activities | 7,946 | 8,365 | ||||||||||||
| Cash flows used in investing activities | ||||||||||||||
| Capital expenditures | 3 | (4,581) | (5,133) | |||||||||||
| Short-term investments | (1,000) | — | ||||||||||||
| Business acquisitions | 4 | (222) | (429) | |||||||||||
| Business disposition | 4 | , | 9 | 209 | 52 | |||||||||
| Spectrum licences | 19 | (183) | (3) | |||||||||||
| Other investing activities | (4) | (4) | ||||||||||||
| Cash flows used in investing activities | (5,781) | (5,517) | ||||||||||||
| Cash flow used in financing activities | ||||||||||||||
| (Decrease) increase in notes payable | (646) | 111 | ||||||||||||
| Increase in securitized receivables | 24 | — | 700 | |||||||||||
| Issue of long-term debt | 25 | 5,195 | 1,951 | |||||||||||
| Repayment of long-term debt | 25 | (1,858) | (2,023) | |||||||||||
| Repurchase of financial liability | 29 | (149) | — | |||||||||||
| Issue of common shares | 30 | 18 | 171 | |||||||||||
| Purchase of shares for settlement of share-based payments | 31 | (223) | (255) | |||||||||||
| Repurchase of preferred shares | 30 | (140) | (125) | |||||||||||
| Cash dividends paid on common shares | (3,486) | (3,312) | ||||||||||||
| Cash dividends paid on preferred shares | (182) | (136) | ||||||||||||
| Cash dividends paid by subsidiaries to non-controlling interest | (47) | (39) | ||||||||||||
| Other financing activities | (24) | (31) | ||||||||||||
| Cash flow used in financing activities | (1,542) | (2,988) | ||||||||||||
| Net increase (decrease) in cash | 448 | (190) | ||||||||||||
| Cash at beginning of year | 99 | 289 | ||||||||||||
| Cash at end of year | 547 | 99 | ||||||||||||
| Net increase in cash equivalents | 175 | 50 | ||||||||||||
| Cash equivalents at beginning of year | 50 | — | ||||||||||||
| Cash equivalents at end of year | 225 | 50 | ||||||||||||
| Note 1 | Corporate information | ||||
| Note 2 | Material accounting policies | ||||
| B) Basis of consolidation | ||
C) Revenue from contracts with customers |
||
| D) Share-based payments | ||
| E) Income and other taxes | ||
| F) Cash equivalents and other short-term deposits | ||
| G) Securitization of receivables | ||
H) Inventory |
||
| I) Property, plant and equipment | ||
| J) Intangible assets | ||
| K) Depreciation and amortization | ||
| ESTIMATED USEFUL LIFE | |||||
Property, plant and equipment |
|||||
Network infrastructure and equipment |
2 to 50 years |
||||
Buildings |
5 to 50 years |
||||
Finite-life intangible assets |
|||||
Software |
2 to 12 years |
||||
Customer relationships |
2 to 26 years |
||||
Program and feature film rights |
Up to 5 years |
||||
| L) Investments in associates and joint arrangements | ||
M) Business acquisitions and goodwill |
||
| N) Impairment of non-financial assets | ||
| O) Financial instruments and contract assets | ||
| P) Derivative financial instruments | ||
| Q) Post-employment benefit plans | ||
| R) Provisions | ||
| S) Estimates and key judgments | ||
| T) Adoption of amended accounting standards | ||
| STANDARD | DESCRIPTION | IMPACT | ||||||
| Disclosure of Accounting Policies - Amendments to IAS 1 - Presentation of Financial Statements | These amendments require that entities disclose material accounting policies, as defined, instead of significant accounting policies. | These amendments were adopted effective with our annual financial statements for the year ended December 31, 2023 and did not result in any significant changes to our financial statements. | ||||||
| International Tax Reform - Pillar Two Model Rules - Amendments to IAS 12 - Income Taxes | These amendments require that entities apply IAS 12 to income taxes arising from tax law enacted or substantively enacted to implement the Pillar Two model rules published by the Organisation for Economic Co-operation and Development, including tax law that implements qualified domestic minimum top-up taxes described in those rules (Pillar Two). As an exception to the requirements in IAS 12, entities do not recognize or disclose information about deferred tax assets and liabilities related to Pillar Two. | In May 2023, we adopted the amendments to IAS 12 retrospectively. As required, we applied the exception and do not recognize or disclose information about deferred tax assets and liabilities related to Pillar Two. The adoption of these amendments did not have a significant impact on our financial statements. |
||||||
| Note 3 | Segmented information | ||||
| Segmented information | ||
| FOR THE YEAR ENDED DECEMBER 31, 2023 | NOTE | BELL CTS | BELL MEDIA |
INTER- SEGMENT ELIMINA- TIONS |
BCE | |||||||||||||||
| Operating revenues | ||||||||||||||||||||
| External service revenues | 18,378 | 2,776 | — | 21,154 | ||||||||||||||||
| Inter-segment service revenues | 29 | 341 | (370) | — | ||||||||||||||||
| Operating service revenues | 18,407 | 3,117 | (370) | 21,154 | ||||||||||||||||
| External/Operating product revenues | 3,519 | — | — | 3,519 | ||||||||||||||||
| Total external revenues | 21,897 | 2,776 | — | 24,673 | ||||||||||||||||
| Total inter-segment revenues | 29 | 341 | (370) | — | ||||||||||||||||
| Total operating revenues | 21,926 | 3,117 | (370) | 24,673 | ||||||||||||||||
| Operating costs | 5 | (12,206) | (2,420) | 370 | (14,256) | |||||||||||||||
Adjusted EBITDA (1) |
9,720 | 697 | — | 10,417 | ||||||||||||||||
| Severance, acquisition and other costs | 6 | (200) | ||||||||||||||||||
| Depreciation and amortization | 17, | 19 | (4,918) | |||||||||||||||||
| Finance costs | ||||||||||||||||||||
| Interest expense | 7 | (1,475) | ||||||||||||||||||
| Net return on post-employment benefit plans | 27 | 108 | ||||||||||||||||||
| Impairment of assets | 8 | (143) | ||||||||||||||||||
| Other expense | 9 | (466) | ||||||||||||||||||
| Income taxes | 10 | (996) | ||||||||||||||||||
| Net earnings | 2,327 | |||||||||||||||||||
| Goodwill | 22 | 8,099 | 2,843 | — | 10,942 | |||||||||||||||
| Indefinite-life intangible assets | 19 | 8,052 | 1,763 | — | 9,815 | |||||||||||||||
| Capital expenditures | 4,421 | 160 | — | 4,581 | ||||||||||||||||
| FOR THE YEAR ENDED DECEMBER 31, 2022 | NOTE | BELL CTS | BELL MEDIA |
INTER- SEGMENT ELIMINA- TIONS |
BCE | ||||||||||||||||||
| Operating revenues | |||||||||||||||||||||||
| External service revenues | 18,052 | 2,904 | — | 20,956 | |||||||||||||||||||
| Inter-segment service revenues | 31 | 350 | (381) | — | |||||||||||||||||||
| Operating service revenues | 18,083 | 3,254 | (381) | 20,956 | |||||||||||||||||||
| External/Operating product revenues | 3,218 | — | — | 3,218 | |||||||||||||||||||
| Total external revenues | 21,270 | 2,904 | — | 24,174 | |||||||||||||||||||
| Total inter-segment revenues | 31 | 350 | (381) | — | |||||||||||||||||||
| Total operating revenues | 21,301 | 3,254 | (381) | 24,174 | |||||||||||||||||||
| Operating costs | 5 | (11,847) | (2,509) | 381 | (13,975) | ||||||||||||||||||
Adjusted EBITDA (1) |
9,454 | 745 | — | 10,199 | |||||||||||||||||||
| Severance, acquisition and other costs | 6 | (94) | |||||||||||||||||||||
| Depreciation and amortization | 17, | 19 | (4,723) | ||||||||||||||||||||
| Finance costs | |||||||||||||||||||||||
| Interest expense | 7 | (1,146) | |||||||||||||||||||||
| Net return on post-employment benefit plans | 27 | 51 | |||||||||||||||||||||
| Impairment of assets | 8 | (279) | |||||||||||||||||||||
| Other expense | 9 | (115) | |||||||||||||||||||||
| Income taxes | 10 | (967) | |||||||||||||||||||||
| Net earnings | 2,926 | ||||||||||||||||||||||
| Goodwill | 22 | 7,960 | 2,946 | — | 10,906 | ||||||||||||||||||
| Indefinite-life intangible assets | 19 | 7,980 | 1,846 | — | 9,826 | ||||||||||||||||||
| Capital expenditures | 4,971 | 162 | — | 5,133 | |||||||||||||||||||
| FOR THE YEAR ENDED DECEMBER 31 | 2023 | 2022 | ||||||
Services(1) |
||||||||
| Wireless | 7,120 | 6,821 | ||||||
| Wireline data | 8,084 | 7,920 | ||||||
| Wireline voice | 2,862 | 3,002 | ||||||
| Media | 2,776 | 2,904 | ||||||
| Other wireline services | 312 | 309 | ||||||
| Total services | 21,154 | 20,956 | ||||||
Products(2) |
||||||||
| Wireless | 2,885 | 2,714 | ||||||
| Wireline | 634 | 504 | ||||||
| Total products | 3,519 | 3,218 | ||||||
| Total operating revenues | 24,673 | 24,174 | ||||||
| Note 4 | Business acquisitions and disposition | ||||
| Acquisition of FX Innovation | ||
| 2023 | ||||||||
| Cash consideration paid | 145 | |||||||
| Cash consideration payable | 12 | |||||||
| Contingent consideration | 6 | |||||||
| Total cost to be allocated | 163 | |||||||
| Trade and other receivables | 23 | |||||||
| Other non-cash working capital | 4 | |||||||
Indefinite-life intangible assets (1) |
29 | |||||||
Finite-life intangible assets (2) |
23 | |||||||
| Other non-current assets | 4 | |||||||
| Trade payables and other liabilities | (15) | |||||||
| Contract liabilities | (3) | |||||||
| Debt due within one year | (5) | |||||||
| Deferred tax liabilities | (13) | |||||||
| 47 | ||||||||
| Cash and cash equivalents | 1 | |||||||
| Fair value of net assets acquired | 48 | |||||||
Goodwill (3) |
115 | |||||||
| Disposition of production studios | ||
| 2023 | |||||
| Trade and other receivables | 1 | ||||
| Prepaid expenses | 1 | ||||
| Property, plant and equipment | 179 | ||||
| Intangible assets | 4 | ||||
| Goodwill | 76 | ||||
| Total assets | 261 | ||||
| Trade payables and other liabilities | 10 | ||||
| Contract liabilities | 3 | ||||
| Debt due within one year | 11 | ||||
| Long-term debt | 82 | ||||
| Deferred tax liabilities | 3 | ||||
| Total liabilities | 109 | ||||
| Non-controlling interest | 23 | ||||
| Net assets sold | 129 | ||||
| Acquisition of Distributel Communications Limited (Distributel) | ||
| 2022 | ||||||||
| Cash consideration | 303 | |||||||
| Contingent consideration | 39 | |||||||
| Total cost to be allocated | 342 | |||||||
| Trade and other receivables | 7 | |||||||
| Other non-cash working capital | 7 | |||||||
| Property, plant and equipment | 29 | |||||||
Indefinite-life intangible assets (1) |
70 | |||||||
Finite-life intangible assets (2) |
68 | |||||||
| Deferred tax assets | 7 | |||||||
| Other long-term assets | 2 | |||||||
| Trade payables and other liabilities | (29) | |||||||
| Contract liabilities | (3) | |||||||
| Deferred tax liabilities | (39) | |||||||
| Other long-term liabilities | (6) | |||||||
| 113 | ||||||||
| Cash and cash equivalents | 21 | |||||||
| Fair value of net assets acquired | 134 | |||||||
Goodwill (3) |
208 | |||||||
| Acquisition of EBOX and other related companies | ||
| 2022 | ||||||||
| Cash consideration | 153 | |||||||
| Total cost to be allocated | 153 | |||||||
| Other non-cash working capital | 5 | |||||||
| Property, plant and equipment | 5 | |||||||
Indefinite-life intangible assets (1) |
17 | |||||||
Finite-life intangible and other assets (2) |
15 | |||||||
| Trade payables and other liabilities | (17) | |||||||
| Contract liabilities | (5) | |||||||
| Deferred tax liabilities | (9) | |||||||
| 11 | ||||||||
| Cash and cash equivalents | 14 | |||||||
| Fair value of net assets acquired | 25 | |||||||
Goodwill (3) |
128 | |||||||
| Note 5 | Operating costs | ||||
| FOR THE YEAR ENDED DECEMBER 31 | NOTE | 2023 | 2022 | |||||||||||
| Labour costs | ||||||||||||||
| Wages, salaries and related taxes and benefits | (4,354) | (4,250) | ||||||||||||
| Post-employment benefit plans service cost (net of capitalized amounts) | 27 | (206) | (249) | |||||||||||
Other labour costs(1) |
(1,063) | (1,054) | ||||||||||||
| Less: | ||||||||||||||
| Capitalized labour | 1,217 | 1,136 | ||||||||||||
| Total labour costs | (4,406) | (4,417) | ||||||||||||
Cost of revenues(2) |
(7,926) | (7,641) | ||||||||||||
Other operating costs (3) |
(1,924) | (1,917) | ||||||||||||
| Total operating costs | (14,256) | (13,975) | ||||||||||||
| Note 6 | Severance, acquisition and other costs | ||||
| FOR THE YEAR ENDED DECEMBER 31 | 2023 | 2022 | ||||||
| Severance | (134) | (83) | ||||||
| Acquisition and other | (66) | (11) | ||||||
| Total severance, acquisition and other costs | (200) | (94) | ||||||
| Note 7 | Interest expense | ||||
| FOR THE YEAR ENDED DECEMBER 31 | 2023 | 2022 | ||||||
| Interest expense on long-term debt | (1,391) | (1,148) | ||||||
| Interest expense on other debt | (219) | (126) | ||||||
| Capitalized interest | 135 | 128 | ||||||
| Total interest expense | (1,475) | (1,146) | ||||||
| Note 8 | Impairment of assets | ||||
| Note 9 | Other expense | ||||
| FOR THE YEAR ENDED DECEMBER 31 | NOTE | 2023 | 2022 | ||||||||||||||
| Equity (losses) income from investments in associates and joint ventures | 20 | ||||||||||||||||
| Loss on investment | (581) | (42) | |||||||||||||||
| Operations | 28 | (19) | |||||||||||||||
| Net mark-to-market losses on derivatives used to economically hedge equity settled share-based compensation plans | 29 | (103) | (53) | ||||||||||||||
| Early debt redemption costs | 25 | (1) | (18) | ||||||||||||||
| Gains on investments | 80 | 24 | |||||||||||||||
| Interest income | 67 | 22 | |||||||||||||||
| Gains (losses) on retirements and disposals of property, plant and equipment and intangible assets | 11 | (27) | |||||||||||||||
| Other | 33 | (2) | |||||||||||||||
| Total other expense | (466) | (115) | |||||||||||||||
| Equity (losses) income from investments in associates and joint ventures | ||
| Gains on investments | |||||
| Gains (losses) on disposals of property, plant and equipment | |||||
| Note 10 | Income taxes | |||||||
| FOR THE YEAR ENDED DECEMBER 31 | 2023 | 2022 | |||||||||
| Current taxes | |||||||||||
| Current taxes | (923) | (878) | |||||||||
| Uncertain tax positions | 8 | 91 | |||||||||
| Change in estimate relating to prior periods | 9 | 8 | |||||||||
| Deferred taxes | |||||||||||
| Deferred taxes relating to the origination and reversal of temporary differences | (75) | (176) | |||||||||
| Change in estimate relating to prior periods | 1 | (8) | |||||||||
| Recognition and utilization of loss carryforwards | (24) | (4) | |||||||||
| Uncertain tax positions | 8 | — | |||||||||
| Total income taxes | (996) | (967) | |||||||||
| FOR THE YEAR ENDED DECEMBER 31 | 2023 | 2022 | ||||||
| Net earnings | 2,327 | 2,926 | ||||||
| Add back income taxes | 996 | 967 | ||||||
| Earnings before income taxes | 3,323 | 3,893 | ||||||
| Applicable statutory tax rate | 26.8 | % | 26.8 | % | ||||
| Income taxes computed at applicable statutory rates | (891) | (1,043) | ||||||
| Non-taxable portion of gains on investments | 5 | 4 | ||||||
| Uncertain tax positions | 16 | 91 | ||||||
| Change in estimate relating to prior periods | 10 | — | ||||||
| Non-taxable portion of equity losses | (149) | (18) | ||||||
| Other | 13 | (1) | ||||||
| Total income taxes | (996) | (967) | ||||||
| Average effective tax rate | 30.0 | % | 24.8 | % | ||||
| FOR THE YEAR ENDED DECEMBER 31 | 2023 | 2022 | ||||||||||||
| OTHER COMPREHENSIVE (LOSS)/INCOME |
DEFICIT | OTHER COMPREHENSIVE LOSS |
DEFICIT | |||||||||||
| Current taxes | (2) | 1 | — | 3 | ||||||||||
| Deferred taxes | 199 | (8) | (73) | (7) | ||||||||||
| Total income taxes recovery (expense) | 197 | (7) | (73) | (4) | ||||||||||
| NET DEFERRED TAX LIABILITY | NON- CAPITAL LOSS CARRY- FORWARDS |
POST- EMPLOYMENT BENEFIT PLANS |
INDEFINITE- LIFE INTANGIBLE ASSETS |
PROPERTY, PLANT AND EQUIPMENT AND FINITE- LIFE INTANGIBLE ASSETS |
OTHER | TOTAL | ||||||||||||||
| January 1, 2022 | 63 | (466) | (1,701) | (2,417) | (53) | (4,574) | ||||||||||||||
| Income statements | (4) | 15 | (40) | (307) | 148 | (188) | ||||||||||||||
| Business acquisitions | 1 | — | (26) | (21) | 3 | (43) | ||||||||||||||
| Other comprehensive (loss)/income | — | (151) | — | — | 78 | (73) | ||||||||||||||
| Deficit | — | — | — | — | (7) | (7) | ||||||||||||||
| Other | — | — | — | — | 16 | 16 | ||||||||||||||
| December 31, 2022 | 60 | (602) | (1,767) | (2,745) | 185 | (4,869) | ||||||||||||||
| Income statements | (23) | 10 | (35) | (36) | (6) | (90) | ||||||||||||||
| Business acquisitions/business disposition | (1) | — | (10) | (4) | (3) | (18) | ||||||||||||||
| Other comprehensive income | — | 149 | — | — | 50 | 199 | ||||||||||||||
| Deficit | — | — | — | — | (8) | (8) | ||||||||||||||
| Reclassified to liabilities held for sale | — | — | 7 | (1) | — | 6 | ||||||||||||||
| Other | — | — | — | 5 | 2 | 7 | ||||||||||||||
| December 31, 2023 | 36 | (443) | (1,805) | (2,781) | 220 | (4,773) | ||||||||||||||
| Note 11 | Earnings per share | ||||
| FOR THE YEAR ENDED DECEMBER 31 | 2023 | 2022 | |||||||||
| Net earnings attributable to common shareholders - basic | 2,076 | 2,716 | |||||||||
| Dividends declared per common share (in dollars) | 3.87 | 3.68 | |||||||||
| Weighted average number of common shares outstanding (in millions) | |||||||||||
| Weighted average number of common shares outstanding - basic | 912.2 | 911.5 | |||||||||
Assumed exercise of stock options(1) |
— | 0.5 | |||||||||
| Weighted average number of common shares outstanding - diluted (in millions) | 912.2 | 912.0 | |||||||||
| Note 12 | Trade and other receivables | ||||
| FOR THE YEAR ENDED DECEMBER 31 | NOTE | 2023 | 2022 | ||||||||
Trade receivables (1) |
3,959 | 4,102 | |||||||||
| Allowance for revenue adjustments | (145) | (160) | |||||||||
| Allowance for doubtful accounts | 29 | (118) | (129) | ||||||||
| Current tax receivable | 12 | 48 | |||||||||
| Commodity taxes receivable | 12 | 11 | |||||||||
| Other accounts receivable | 311 | 266 | |||||||||
| Total trade and other receivables | 4,031 | 4,138 | |||||||||
| FOR THE YEAR ENDED DECEMBER 31 | NOTE | 2023 | 2022 | |||||||||||
| Current | 1,052 | 1,021 | ||||||||||||
| Non-current | 21 | 401 | 386 | |||||||||||
Total wireless device financing plan receivables (1) |
1,453 | 1,407 | ||||||||||||
| Note 13 | Inventory | ||||
| FOR THE YEAR ENDED DECEMBER 31 | 2023 | 2022 | ||||||
| Wireless devices and accessories | 190 | 238 | ||||||
| Merchandise and other | 275 | 418 | ||||||
| Total inventory | 465 | 656 | ||||||
| Note 14 | Contract assets and liabilities | ||||
Contract assets (1) |
Contract liabilities | ||||||||||||||||
| FOR THE YEAR ENDED DECEMBER 31 | NOTE | 2023 | 2022 | 2023 | 2022 | ||||||||||||
| Opening balance, January 1 | 724 | 665 | 1,085 | 1,045 | |||||||||||||
| Revenue recognized included in contract liabilities at the beginning of the year | — | — | (734) | (736) | |||||||||||||
| Revenue recognized from contract liabilities included in contract assets at the beginning of the year | 84 | 89 | — | — | |||||||||||||
| Increase in contract liabilities during the year | — | — | 785 | 794 | |||||||||||||
| Increase in contract liabilities included in contract assets during the year | (88) | (83) | — | — | |||||||||||||
| Increase in contract assets from revenue recognized during the year | 713 | 728 | — | — | |||||||||||||
| Contract assets transferred to trade receivables | (613) | (586) | 8 | 14 | |||||||||||||
| Acquisitions / (Disposition) | 4 | — | — | — | 8 | ||||||||||||
| Contract terminations transferred to trade receivables | (60) | (50) | (1) | (1) | |||||||||||||
| Other | (25) | (39) | (55) | (39) | |||||||||||||
| Ending balance, December 31 | 735 | 724 | 1,088 | 1,085 | |||||||||||||
| Note 15 | Contract costs | ||||
| FOR THE YEAR ENDED DECEMBER 31 | 2023 | 2022 | ||||||
| Opening balance, January 1 | 1,143 | 894 | ||||||
| Incremental costs of obtaining a contract and contract fulfillment costs | 892 | 807 | ||||||
| Amortization included in operating costs | (623) | (558) | ||||||
| Ending balance, December 31 | 1,412 | 1,143 | ||||||
| Note 16 | Assets held for sale |
||||
| NOTE | 2023 | |||||||
| Property, plant and equipment | 17 | 12 | ||||||
| Intangible assets | 19 | 26 | ||||||
| Goodwill | 22 | 22 | ||||||
| Total assets held for sale | 60 | |||||||
| Long-term debt | 7 | |||||||
| Deferred tax liabilities | 6 | |||||||
| Other non-current liabilities | 2 | |||||||
| Total liabilities held for sale | 15 | |||||||
| Net assets held for sale | 45 | |||||||
| Note 17 | Property, plant and equipment |
||||
| FOR THE YEAR ENDED DECEMBER 31, 2023 | NOTE |
NETWORK
INFRASTRUCTURE
AND EQUIPMENT (1)
|
LAND AND
BUILDINGS (1)
|
ASSETS UNDER CONSTRUCTION |
TOTAL | ||||||||||||
| COST | |||||||||||||||||
| January 1, 2023 | 71,875 | 9,139 | 2,598 | 83,612 | |||||||||||||
| Additions | 2,990 | 795 | 2,176 | 5,961 | |||||||||||||
| Business acquisitions/(business disposition) | 8 | (103) | (100) | (195) | |||||||||||||
| Transfers | 1,368 | 79 | (2,317) | (870) | |||||||||||||
| Retirements and disposals | (1,557) | (53) | (2) | (1,612) | |||||||||||||
| Impairment losses recognized in earnings | 8 | — | (42) | — | (42) | ||||||||||||
| Reclassified to assets held for sale | 16 | (8) | (10) | — | (18) | ||||||||||||
| December 31, 2023 | 74,676 | 9,805 | 2,355 | 86,836 | |||||||||||||
| ACCUMULATED DEPRECIATION | |||||||||||||||||
| January 1, 2023 | 49,236 | 5,120 | — | 54,356 | |||||||||||||
| Depreciation | 3,254 | 491 | — | 3,745 | |||||||||||||
| Business disposition | (1) | (17) | — | (18) | |||||||||||||
| Retirements and disposals | (1,508) | (37) | — | (1,545) | |||||||||||||
| Transfers | 23 | 2 | — | 25 | |||||||||||||
| Reclassified to assets held for sale | 16 | (6) | — | — | (6) | ||||||||||||
| Other | (72) | (1) | — | (73) | |||||||||||||
| December 31, 2023 | 50,926 | 5,558 | — | 56,484 | |||||||||||||
| NET CARRYING AMOUNT | |||||||||||||||||
| January 1, 2023 | 22,639 | 4,019 | 2,598 | 29,256 | |||||||||||||
| December 31, 2023 | 23,750 | 4,247 | 2,355 | 30,352 | |||||||||||||
| FOR THE YEAR ENDED DECEMBER 31, 2022 | NOTE |
NETWORK
INFRASTRUCTURE
AND EQUIPMENT (1)
|
LAND AND
BUILDINGS (1)
|
ASSETS UNDER CONSTRUCTION |
TOTAL | ||||||||||||
| COST | |||||||||||||||||
| January 1, 2022 | 70,923 | 8,889 | 2,241 | 82,053 | |||||||||||||
| Additions | 2,824 | 394 | 2,675 | 5,893 | |||||||||||||
| Business acquisitions/(business disposition) | 11 | (28) | 3 | (14) | |||||||||||||
| Transfers | 1,180 | 51 | (2,318) | (1,087) | |||||||||||||
| Retirements and disposals | (3,063) | (35) | (3) | (3,101) | |||||||||||||
| Impairment losses recognized in earnings | 8 | — | (132) | — | (132) | ||||||||||||
| December 31, 2022 | 71,875 | 9,139 | 2,598 | 83,612 | |||||||||||||
| ACCUMULATED DEPRECIATION | |||||||||||||||||
| January 1, 2022 | 49,122 | 4,696 | — | 53,818 | |||||||||||||
| Depreciation | 3,195 | 465 | — | 3,660 | |||||||||||||
| Business disposition | (14) | (7) | — | (21) | |||||||||||||
| Retirements and disposals | (3,025) | (28) | — | (3,053) | |||||||||||||
| Transfers | 2 | (2) | — | — | |||||||||||||
| Other | (44) | (4) | — | (48) | |||||||||||||
| December 31, 2022 | 49,236 | 5,120 | — | 54,356 | |||||||||||||
| NET CARRYING AMOUNT | |||||||||||||||||
| January 1, 2022 | 21,801 | 4,193 | 2,241 | 28,235 | |||||||||||||
| December 31, 2022 | 22,639 | 4,019 | 2,598 | 29,256 | |||||||||||||
| Note 18 | Leases | ||||
| FOR THE YEAR ENDED DECEMBER 31, 2023 | NOTE | NETWORK INFRASTRUCTURE AND EQUIPMENT |
LAND AND BUILDINGS |
TOTAL | ||||||||||
| COST | ||||||||||||||
| January 1, 2023 | 3,693 | 4,119 | 7,812 | |||||||||||
| Additions | 832 | 729 | 1,561 | |||||||||||
| Transfers | (215) | (4) | (219) | |||||||||||
| Business disposition | — | (20) | (20) | |||||||||||
| Lease terminations | (37) | (15) | (52) | |||||||||||
| Impairment losses recognized in earnings | 8 | — | (30) | (30) | ||||||||||
| Reclassified to assets held for sale | (2) | (5) | (7) | |||||||||||
| December 31, 2023 | 4,271 | 4,774 | 9,045 | |||||||||||
| ACCUMULATED DEPRECIATION | ||||||||||||||
| January 1, 2023 | 1,804 | 1,858 | 3,662 | |||||||||||
| Depreciation | 425 | 364 | 789 | |||||||||||
| Transfers | (113) | (1) | (114) | |||||||||||
| Business disposition | — | (3) | (3) | |||||||||||
| Lease terminations | (13) | (2) | (15) | |||||||||||
| December 31, 2023 | 2,103 | 2,216 | 4,319 | |||||||||||
| NET CARRYING AMOUNT | ||||||||||||||
| January 1, 2023 | 1,889 | 2,261 | 4,150 | |||||||||||
| December 31, 2023 | 2,168 | 2,558 | 4,726 | |||||||||||
| FOR THE YEAR ENDED DECEMBER 31, 2022 | NOTE | NETWORK INFRASTRUCTURE AND EQUIPMENT |
LAND AND BUILDINGS |
TOTAL | ||||||||||
| COST | ||||||||||||||
| January 1, 2022 | 3,240 | 3,931 | 7,171 | |||||||||||
| Additions | 681 | 336 | 1,017 | |||||||||||
| Transfers | (195) | (6) | (201) | |||||||||||
| Business acquisitions/(business disposition) | 2 | (11) | (9) | |||||||||||
| Lease terminations | (35) | (7) | (42) | |||||||||||
| Impairment losses recognized in earnings | 8 | — | (124) | (124) | ||||||||||
| December 31, 2022 | 3,693 | 4,119 | 7,812 | |||||||||||
| ACCUMULATED DEPRECIATION | ||||||||||||||
| January 1, 2022 | 1,554 | 1,538 | 3,092 | |||||||||||
| Depreciation | 374 | 335 | 709 | |||||||||||
| Transfers | (112) | (5) | (117) | |||||||||||
| Business disposition | — | (7) | (7) | |||||||||||
| Lease terminations | (12) | (3) | (15) | |||||||||||
| December 31, 2022 | 1,804 | 1,858 | 3,662 | |||||||||||
| NET CARRYING AMOUNT | ||||||||||||||
| January 1, 2022 | 1,686 | 2,393 | 4,079 | |||||||||||
| December 31, 2022 | 1,889 | 2,261 | 4,150 | |||||||||||
| FOR THE YEAR ENDED DECEMBER 31 | 2023 | 2022 | ||||||
| Interest expense on lease liabilities | 193 | 165 | ||||||
| Variable lease payment expenses not included in the measurement of lease liabilities | 126 | 133 | ||||||
| Expenses for leases of low value assets | 63 | 60 | ||||||
| Expenses for short-term leases | 29 | 27 | ||||||
| Note 19 | Intangible assets | ||||
| FINITE-LIFE | INDEFINITE-LIFE | ||||||||||||||||||||||||||||||||||
| FOR THE YEAR ENDED DECEMBER 31, 2023 | NOTE | SOFTWARE | CUSTOMER RELATION- SHIPS |
PROGRAM AND FEATURE FILM RIGHTS |
OTHER | TOTAL | BRANDS | SPECTRUM AND OTHER LICENCES |
BROADCAST LICENCES |
TOTAL | TOTAL INTANGIBLE ASSETS | ||||||||||||||||||||||||
| COST | |||||||||||||||||||||||||||||||||||
| January 1, 2023 | 10,543 | 1,802 | 603 | 407 | 13,355 | 2,435 | 5,905 | 1,486 | 9,826 | 23,181 | |||||||||||||||||||||||||
| Additions | 471 | — | 1,260 | 149 | 1,880 | — | 53 | — | 53 | 1,933 | |||||||||||||||||||||||||
| Business acquisitions/(business disposition) | 10 | 45 | — | (4) | 51 | 31 | (7) | — | 24 | 75 | |||||||||||||||||||||||||
| Transfers | 897 | — | — | (27) | 870 | — | — | — | — | 870 | |||||||||||||||||||||||||
| Retirements and disposals | (576) | (69) | (2) | (4) | (651) | — | (2) | (9) | (11) | (662) | |||||||||||||||||||||||||
| Impairment losses recognized in earnings | 8 | — | — | (45) | — | (45) | (34) | — | (17) | (51) | (96) | ||||||||||||||||||||||||
| Amortization included in operating costs | — | — | (1,165) | — | (1,165) | — | — | — | — | (1,165) | |||||||||||||||||||||||||
| Reclassified to assets held for sale | 16 | — | — | — | — | — | — | — | (26) | (26) | (26) | ||||||||||||||||||||||||
| December 31, 2023 | 11,345 | 1,778 | 651 | 521 | 14,295 | 2,432 | 5,949 | 1,434 | 9,815 | 24,110 | |||||||||||||||||||||||||
| ACCUMULATED AMORTIZATION | |||||||||||||||||||||||||||||||||||
| January 1, 2023 | 5,734 | 1,060 | — | 204 | 6,998 | — | — | — | — | 6,998 | |||||||||||||||||||||||||
| Amortization | 1,033 | 98 | — | 42 | 1,173 | — | — | — | — | 1,173 | |||||||||||||||||||||||||
| Retirements and disposals | (574) | (69) | — | (2) | (645) | — | — | — | — | (645) | |||||||||||||||||||||||||
| Transfers | — | — | — | (25) | (25) | — | — | — | — | (25) | |||||||||||||||||||||||||
| December 31, 2023 | 6,193 | 1,089 | — | 219 | 7,501 | — | — | — | — | 7,501 | |||||||||||||||||||||||||
| NET CARRYING AMOUNT | |||||||||||||||||||||||||||||||||||
| January 1, 2023 | 4,809 | 742 | 603 | 203 | 6,357 | 2,435 | 5,905 | 1,486 | 9,826 | 16,183 | |||||||||||||||||||||||||
| December 31, 2023 | 5,152 | 689 | 651 | 302 | 6,794 | 2,432 | 5,949 | 1,434 | 9,815 | 16,609 | |||||||||||||||||||||||||
| FINITE-LIFE | INDEFINITE-LIFE | ||||||||||||||||||||||||||||||||||
| FOR THE YEAR ENDED DECEMBER 31, 2022 | NOTE | SOFTWARE | CUSTOMER RELATION- SHIPS |
PROGRAM AND FEATURE FILM RIGHTS |
OTHER | TOTAL | BRANDS | SPECTRUM AND OTHER LICENCES |
BROADCAST LICENCES |
TOTAL | TOTAL INTANGIBLE ASSETS | ||||||||||||||||||||||||
| COST | |||||||||||||||||||||||||||||||||||
| January 1, 2022 | 9,565 | 1,736 | 631 | 404 | 12,336 | 2,409 | 5,786 | 1,580 | 9,775 | 22,111 | |||||||||||||||||||||||||
| Additions | 484 | 1 | 1,208 | 7 | 1,700 | — | 44 | — | 44 | 1,744 | |||||||||||||||||||||||||
| Business acquisitions | 6 | 65 | — | 3 | 74 | 26 | 75 | — | 101 | 175 | |||||||||||||||||||||||||
| Transfers | 1,087 | — | — | — | 1,087 | — | — | — | — | 1,087 | |||||||||||||||||||||||||
| Retirements and disposals | (599) | — | — | (7) | (606) | — | — | — | — | (606) | |||||||||||||||||||||||||
| Impairment losses recognized in earnings | 8 | — | — | (53) | — | (53) | — | — | (94) | (94) | (147) | ||||||||||||||||||||||||
| Amortization included in operating costs | — | — | (1,183) | — | (1,183) | — | — | — | — | (1,183) | |||||||||||||||||||||||||
| December 31, 2022 | 10,543 | 1,802 | 603 | 407 | 13,355 | 2,435 | 5,905 | 1,486 | 9,826 | 23,181 | |||||||||||||||||||||||||
| ACCUMULATED AMORTIZATION | |||||||||||||||||||||||||||||||||||
| January 1, 2022 | 5,407 | 969 | — | 165 | 6,541 | — | — | — | — | 6,541 | |||||||||||||||||||||||||
| Amortization | 926 | 91 | — | 46 | 1,063 | — | — | — | — | 1,063 | |||||||||||||||||||||||||
| Retirements and disposals | (599) | — | — | (7) | (606) | — | — | — | — | (606) | |||||||||||||||||||||||||
| December 31, 2022 | 5,734 | 1,060 | — | 204 | 6,998 | — | — | — | — | 6,998 | |||||||||||||||||||||||||
| NET CARRYING AMOUNT | |||||||||||||||||||||||||||||||||||
| January 1, 2022 | 4,158 | 767 | 631 | 239 | 5,795 | 2,409 | 5,786 | 1,580 | 9,775 | 15,570 | |||||||||||||||||||||||||
| December 31, 2022 | 4,809 | 742 | 603 | 203 | 6,357 | 2,435 | 5,905 | 1,486 | 9,826 | 16,183 | |||||||||||||||||||||||||
| Note 20 | Investments in associates and joint ventures | |||||||
| Statements of financial position | ||
| FOR THE YEAR ENDED DECEMBER 31 | NOTE | 2023 | 2022 | ||||||||
| Assets | 4,050 | 3,857 | |||||||||
| Liabilities | (3,875) | (2,641) | |||||||||
| Total net assets | 175 | 1,216 | |||||||||
| BCE's share of net assets | 323 | 608 | |||||||||
| BCE’s share of net liabilities | 28 | (252) | — | ||||||||
| Income statements | ||
| FOR THE YEAR ENDED DECEMBER 31 | NOTE | 2023 | 2022 | ||||||||
| Revenues | 2,722 | 2,335 | |||||||||
| Expenses | (3,832) | (2,456) | |||||||||
| Total net losses | (1,110) | (121) | |||||||||
| BCE’s share of net losses | 9 | (553) | (61) | ||||||||
| Note 21 | Other non-current assets | ||||
| FOR THE YEAR ENDED DECEMBER 31 | NOTE | 2023 | 2022 | ||||||||
| Long-term wireless device financing plan receivables | 12 | 401 | 386 | ||||||||
| Long-term receivables | 331 | 255 | |||||||||
| Derivative assets | 29 | 116 | 233 | ||||||||
| Publicly-traded and privately-held investments | 29 | 587 | 215 | ||||||||
Investments(1) |
29 | 216 | 184 | ||||||||
| Other | 63 | 82 | |||||||||
| Total other non-current assets | 1,714 | 1,355 | |||||||||
| Note 22 | Goodwill | ||||
| NOTE | BELL CTS | BELL MEDIA |
BCE | |||||||||||
| Balance at January 1, 2022 | 7,626 | 2,946 | 10,572 | |||||||||||
| Acquisitions | 4 | 334 | — | 334 | ||||||||||
| Balance at December 31, 2022 | 7,960 | 2,946 | 10,906 | |||||||||||
| Acquisitions, disposition and other | 4 | 139 | (81) | 58 | ||||||||||
| Reclassified to assets held for sale | 16 | — | (22) | (22) | ||||||||||
| Balance at December 31, 2023 | 8,099 | 2,843 | 10,942 | |||||||||||
| Impairment testing | ||
| ASSUMPTIONS USED | ||||||||
| PERPETUITY | DISCOUNT | |||||||
| GROUPS OF CGUs | GROWTH RATE | RATE | ||||||
| Bell CTS | 1.5 | % | 7.0 | % | ||||
| Bell Media | 0.7 | % | 10.2 | % | ||||
| Note 23 | Trade payables and other liabilities | ||||
| FOR THE YEAR ENDED DECEMBER 31 | NOTE | 2023 | 2022 | ||||||||||||||
| Trade payables and accruals | 3,308 | 3,602 | |||||||||||||||
| Compensation payable | 599 | 607 | |||||||||||||||
Maple Leaf Sports and Entertainment Ltd. (MLSE) financial liability (1) |
29 | — | 149 | ||||||||||||||
| Commodity taxes payable | 143 | 108 | |||||||||||||||
| Derivative liabilities | 29 | 107 | 106 | ||||||||||||||
| Provisions | 26 | 65 | 74 | ||||||||||||||
| Other current liabilities | 507 | 575 | |||||||||||||||
| Total trade payables and other liabilities | 4,729 | 5,221 | |||||||||||||||
| Note 24 | Debt due within one year | ||||
| FOR THE YEAR ENDED DECEMBER 31 | NOTE | WEIGHTED AVERAGE INTEREST RATE AT DECEMBER 31, 2023 |
2023 | 2022 | |||||||||||||
Notes payable(1) |
29 | 5.21 | % | 207 | 869 | ||||||||||||
Loans secured by receivables(2) |
29 | 6.16 | % | 1,588 | 1,588 | ||||||||||||
Long-term debt due within one year(3) |
25 | 3.60 | % | 3,247 | 1,680 | ||||||||||||
| Total debt due within one year | 5,042 | 4,137 | |||||||||||||||
| Securitized receivables | ||
| FOR THE YEAR ENDED DECEMBER 31 | 2023 | 2022 | ||||||
| Average interest rate throughout the year | 5.72 | % | 3.15 | % | ||||
| Securitized receivables | 3,320 | 3,353 | ||||||
| Credit facilities | ||
| TOTAL AVAILABLE |
DRAWN | LETTERS OF CREDIT | COMMERCIAL PAPER OUTSTANDING |
NET AVAILABLE | |||||||||||||
| Committed credit facilities | |||||||||||||||||
Unsecured revolving and expansion credit facilities (1)(2) |
3,500 | — | — | 197 | 3,303 | ||||||||||||
Unsecured non-revolving credit facilities (3) |
641 | — | — | — | 641 | ||||||||||||
| Other | 106 | — | 81 | — | 25 | ||||||||||||
| Total committed credit facilities | 4,247 | — | 81 | 197 | 3,969 | ||||||||||||
| Non-committed credit facilities | |||||||||||||||||
| Bell Canada | 2,159 | — | 862 | — | 1,297 | ||||||||||||
| Bell Mobility | 794 | 476 | — | — | 318 | ||||||||||||
| Total non-committed credit facilities | 2,953 | 476 | 862 | — | 1,615 | ||||||||||||
| Total committed and non-committed credit facilities | 7,200 | 476 | 943 | 197 | 5,584 | ||||||||||||
| Restrictions | ||
| Note 25 | Long-term debt | ||||
| FOR THE YEAR ENDED DECEMBER 31 | NOTE | WEIGHTED AVERAGE INTEREST RATE AT DECEMBER 31, 2023 |
MATURITY | 2023 | 2022 | |||||||||||||||||||||
| Debt securities | ||||||||||||||||||||||||||
1997 trust indenture (1) |
4.02 | % | 2024-2053 | 19,768 | 16,747 | |||||||||||||||||||||
| 1976 trust indenture | 9.38 | % | 2027-2054 | 975 | 975 | |||||||||||||||||||||
| 2011 trust indenture | 4.00 | % | 2024 | 225 | 225 | |||||||||||||||||||||
2016 U.S. trust indenture (2) |
3.58 | % | 2024-2052 | 7,529 | 6,525 | |||||||||||||||||||||
| 1996 trust indenture (subordinated) | 8.21 | % | 2026-2031 | 275 | 275 | |||||||||||||||||||||
| Lease liabilities | 5.82 | % | 2024-2068 | 4,857 | 4,402 | |||||||||||||||||||||
Bell Mobility trade loan (3) |
6.98 | % | 2025 | 476 | — | |||||||||||||||||||||
| Other | 422 | 449 | ||||||||||||||||||||||||
| Total debt | 34,527 | 29,598 | ||||||||||||||||||||||||
| Net unamortized discount | (33) | (34) | ||||||||||||||||||||||||
| Unamortized debt issuance costs | (112) | (101) | ||||||||||||||||||||||||
| Less: | ||||||||||||||||||||||||||
| Amount due within one year | 24 | (3,247) | (1,680) | |||||||||||||||||||||||
| Total long-term debt | 31,135 | 27,783 | ||||||||||||||||||||||||
| Restrictions | ||
| Note 26 | Provisions | ||||
| FOR THE YEAR ENDED DECEMBER 31 | NOTE | AROs | Other (1) |
Total | ||||||||||
| January 1, 2023 | 165 | 197 | 362 | |||||||||||
| Additions | 6 | 39 | 45 | |||||||||||
| Usage | (5) | (26) | (31) | |||||||||||
| Reversals | (3) | (22) | (25) | |||||||||||
| December 31, 2023 | 163 | 188 | 351 | |||||||||||
| Current | 23 | 30 | 35 | 65 | ||||||||||
| Non-current | 28 | 133 | 153 | 286 | ||||||||||
| December 31, 2023 | 163 | 188 | 351 | |||||||||||
| Note 27 | Post-employment benefit plans | ||||
| FOR THE YEAR ENDED DECEMBER 31 | 2023 | 2022 | |||||||||
| DB pension | (128) | (193) | |||||||||
| DC pension | (133) | (118) | |||||||||
| OPEBs | (1) | (2) | |||||||||
| Less: | |||||||||||
| Capitalized benefit plans cost | 56 | 64 | |||||||||
| Total post-employment benefit plans service cost | (206) | (249) | |||||||||
| FOR THE YEAR ENDED DECEMBER 31 | 2023 | 2022 | |||||||||
| DB pension | 149 | 84 | |||||||||
| OPEBs | (41) | (33) | |||||||||
| Total net return on post-employment benefit plans | 108 | 51 | |||||||||
| 2023 | 2022 | ||||||||||
| Cumulative gains recognized directly in equity, January 1 | 985 | 419 | |||||||||
Actuarial (losses) gains in other comprehensive (loss) income(1) |
(835) | 894 | |||||||||
Decrease (increase) in the effect of the asset limit in other comprehensive (loss) income(2) |
282 | (328) | |||||||||
| Cumulative gains recognized directly in equity, December 31 | 432 | 985 | |||||||||
| DB PENSION PLANS | OPEB PLANS | TOTAL | |||||||||||||||||||||||||||
| 2023 | 2022 | 2023 | 2022 | 2023 | 2022 | ||||||||||||||||||||||||
| Post-employment benefit obligations, January 1 | (19,295) | (24,544) | (1,138) | (1,457) | (20,433) | (26,001) | |||||||||||||||||||||||
| Current service cost | (128) | (193) | (1) | (2) | (129) | (195) | |||||||||||||||||||||||
| Interest on obligations | (993) | (770) | (58) | (44) | (1,051) | (814) | |||||||||||||||||||||||
Actuarial (losses) gains(1) |
(1,572) | 4,856 | 51 | 294 | (1,521) | 5,150 | |||||||||||||||||||||||
| Benefit payments | 1,401 | 1,366 | 72 | 70 | 1,473 | 1,436 | |||||||||||||||||||||||
| Employee contributions | (8) | (9) | — | — | (8) | (9) | |||||||||||||||||||||||
| Other | — | (1) | — | 1 | — | — | |||||||||||||||||||||||
| Post-employment benefit obligations, December 31 | (20,595) | (19,295) | (1,074) | (1,138) | (21,669) | (20,433) | |||||||||||||||||||||||
| Fair value of plan assets, January 1 | 23,355 | 28,040 | 327 | 351 | 23,682 | 28,391 | |||||||||||||||||||||||
Expected return on plan assets(2) |
1,195 | 875 | 17 | 11 | 1,212 | 886 | |||||||||||||||||||||||
Actuarial gains (losses) (1) |
692 | (4,227) | (6) | (29) | 686 | (4,256) | |||||||||||||||||||||||
| Benefit payments | (1,401) | (1,366) | (72) | (70) | (1,473) | (1,436) | |||||||||||||||||||||||
| Employer contributions | 41 | 81 | 64 | 64 | 105 | 145 | |||||||||||||||||||||||
| Employee contributions | 8 | 9 | — | — | 8 | 9 | |||||||||||||||||||||||
| Transfers to DC plans | (124) | (57) | — | — | (124) | (57) | |||||||||||||||||||||||
| Other | 2 | — | — | — | 2 | — | |||||||||||||||||||||||
| Fair value of plan assets, December 31 | 23,768 | 23,355 | 330 | 327 | 24,098 | 23,682 | |||||||||||||||||||||||
| Plan asset (deficit) | 3,173 | 4,060 | (744) | (811) | 2,429 | 3,249 | |||||||||||||||||||||||
| Effect of asset limit | (719) | (980) | — | — | (719) | (980) | |||||||||||||||||||||||
| Interest on effect of asset limit | (53) | (21) | — | — | (53) | (21) | |||||||||||||||||||||||
| Post-employment benefit asset (liability), December 31 | 2,401 | 3,059 | (744) | (811) | 1,657 | 2,248 | |||||||||||||||||||||||
| Post-employment benefit assets | 2,935 | 3,559 | — | — | 2,935 | 3,559 | |||||||||||||||||||||||
| Post-employment benefit obligations | (534) | (500) | (744) | (811) | (1,278) | (1,311) | |||||||||||||||||||||||
| FUNDED | PARTIALLY FUNDED(1) |
UNFUNDED(2) |
TOTAL | ||||||||||||||||||||||||||
| FOR THE YEAR ENDED DECEMBER 31 | 2023 | 2022 | 2023 | 2022 | 2023 | 2022 | 2023 | 2022 | |||||||||||||||||||||
| Present value of post-employment benefit obligations | (20,004) | (18,741) | (1,453) | (1,461) | (212) | (231) | (21,669) | (20,433) | |||||||||||||||||||||
| Fair value of plan assets | 23,703 | 23,291 | 395 | 391 | — | — | 24,098 | 23,682 | |||||||||||||||||||||
| Plan surplus (deficit) | 3,699 | 4,550 | (1,058) | (1,070) | (212) | (231) | 2,429 | 3,249 | |||||||||||||||||||||
| Effect of asset limit | (772) | (1,001) | — | — | — | — | (772) | (1,001) | |||||||||||||||||||||
| Post-employment benefit asset (liability) | 2,927 | 3,549 | (1,058) | (1,070) | (212) | (231) | 1,657 | 2,248 | |||||||||||||||||||||
| DB PENSION PLANS AND OPEB PLANS | ||||||||||||||
| FOR THE YEAR ENDED DECEMBER 31 | 2023 | 2022 | ||||||||||||
| Post-employment benefit obligations | ||||||||||||||
| Discount rate | 4.6 | % | 5.3 | % | ||||||||||
| Rate of compensation increase | 2.25 | % | 2.25 | % | ||||||||||
Cost of living indexation rate(1) |
1.6 | % | 1.6 | % | ||||||||||
| Life expectancy at age 65 (years) | 23.4 | 23.3 | ||||||||||||
| DB PENSION PLANS AND OPEB PLANS | ||||||||||||||
| FOR THE YEAR ENDED DECEMBER 31 | 2023 | 2022 | ||||||||||||
| Net post-employment benefit plans cost | ||||||||||||||
| Discount rate | 5.3 | % | 3.4 | % | ||||||||||
| Rate of compensation increase | 2.25 | % | 2.25 | % | ||||||||||
Cost of living indexation rate(1) |
1.6 | % | 1.6 | % | ||||||||||
| Life expectancy at age 65 (years) | 23.3 | 23.3 | ||||||||||||
| EFFECT ON POST-EMPLOYMENT BENEFITS – INCREASE/(DECREASE) | 1% INCREASE | 1% DECREASE | ||||||||||||
| Total service and interest cost | 3 | (3) | ||||||||||||
| Post-employment benefit obligations | 64 | (47) | ||||||||||||
| IMPACT ON NET POST-EMPLOYMENT BENEFIT PLANS COST FOR 2023 – INCREASE/(DECREASE) |
IMPACT ON POST-EMPLOYMENT BENEFIT OBLIGATIONS AT DECEMBER 31, 2023 – INCREASE/(DECREASE) |
||||||||||||||||||||||
| CHANGE IN ASSUMPTION |
INCREASE IN ASSUMPTION |
DECREASE IN ASSUMPTION |
INCREASE IN ASSUMPTION |
DECREASE IN ASSUMPTION |
|||||||||||||||||||
| Discount rate | 0.5 | % | (83) | 78 | (1,146) | 1,255 | |||||||||||||||||
| Cost of living indexation rate | 0.5 | % | 55 | (46) | 1,007 | (822) | |||||||||||||||||
| Life expectancy at age 65 | 1 year |
38 | (39) | 714 | (735) | ||||||||||||||||||
| WEIGHTED AVERAGE TARGET ALLOCATION |
TOTAL PLAN ASSETS FAIR VALUE |
||||||||||||||||
| ASSET CATEGORY | 2023 | December 31, 2023 | December 31, 2022 | ||||||||||||||
| Equity securities | 0%-40% |
13 | % | 15 | % | ||||||||||||
| Debt securities | 50%-100% |
55 | % | 52 | % | ||||||||||||
| Alternative investments | 0%-50% |
32 | % | 33 | % | ||||||||||||
| Total | 100 | % | 100 | % | |||||||||||||
| FOR THE YEAR ENDED DECEMBER 31 | 2023 | 2022 | ||||||||||||
| Observable markets data | ||||||||||||||
| Equity securities | ||||||||||||||
| Canadian | 858 | 824 | ||||||||||||
| Foreign | 2,265 | 2,555 | ||||||||||||
| Debt securities | ||||||||||||||
| Canadian | 10,284 | 9,904 | ||||||||||||
| Foreign | 1,550 | 1,537 | ||||||||||||
| Money market | 1,222 | 739 | ||||||||||||
| Non-observable markets inputs | ||||||||||||||
| Alternative investments | ||||||||||||||
| Private equities | 831 | 1,017 | ||||||||||||
| Hedge funds | 1,268 | 1,374 | ||||||||||||
| Real estate and infrastructure | 4,221 | 4,297 | ||||||||||||
| Private debt | 1,237 | 1,048 | ||||||||||||
| Other | 32 | 60 | ||||||||||||
| Total | 23,768 | 23,355 | ||||||||||||
| DB PLANS | DC PLANS | OPEB PLANS | ||||||||||||||||||||||||
| FOR THE YEAR ENDED DECEMBER 31 | 2023 | 2022 | 2023 | 2022 | 2023 | 2022 | ||||||||||||||||||||
| Contributions/payments | (41) | (81) | (11) | (59) | (64) | (64) | ||||||||||||||||||||
| Note 28 | Other non-current liabilities | ||||
| FOR THE YEAR ENDED DECEMBER 31 | NOTE | 2023 | 2022 | ||||||||||||||
| Provisions | 26 | 286 | 288 | ||||||||||||||
| Long-term disability benefits obligation | 269 | 260 | |||||||||||||||
| Derivative liabilities | 29 | 607 | 191 | ||||||||||||||
| Joint venture obligation | 9, | 20 | 252 | — | |||||||||||||
| Other | 303 | 331 | |||||||||||||||
| Total other non-current liabilities | 1,717 | 1,070 | |||||||||||||||
| Note 29 | Financial and capital management | ||||
| December 31, 2023 | December 31, 2022 | |||||||||||||||||||||||||
| CLASSIFICATION | FAIR VALUE METHODOLOGY | NOTE | CARRYING VALUE | FAIR VALUE | CARRYING VALUE | FAIR VALUE | ||||||||||||||||||||
| Debt securities and other debt | Debt due within one year and long-term debt | Quoted market price of debt | 24, | 25 | 29,049 | 28,225 | 25,061 | 23,026 | ||||||||||||||||||
| FAIR VALUE | ||||||||||||||||||||
| CLASSIFICATION | NOTE | CARRYING VALUE OF ASSET (LIABILITY) | QUOTED PRICES IN ACTIVE MARKETS FOR IDENTICAL ASSETS (LEVEL 1) | OBSERVABLE MARKET DATA (LEVEL 2)(1) |
NON-OBSERVABLE MARKET INPUTS (LEVEL 3)(2) |
|||||||||||||||
| December 31, 2023 | ||||||||||||||||||||
Publicly-traded and privately-held investments(3) |
Other non-current assets | 21 | 587 | 10 | — | 577 | ||||||||||||||
| Derivative financial instruments | Other current assets, trade payables and other liabilities, other non-current assets and liabilities | (488) | — | (488) | — | |||||||||||||||
| Other | Other non-current assets and liabilities | 147 | — | 216 | (69) | |||||||||||||||
| December 31, 2022 | ||||||||||||||||||||
Publicly-traded and privately-held investments(3) |
Other non-current assets | 21 | 215 | 9 | — | 206 | ||||||||||||||
| Derivative financial instruments | Other current assets, trade payables and other liabilities, other non-current assets and liabilities | 72 | — | 72 | — | |||||||||||||||
MLSE financial liability(4) |
Trade payables and other liabilities | 23 | (149) | — | — | (149) | ||||||||||||||
| Other | Other non-current assets and liabilities | 108 | — | 184 | (76) | |||||||||||||||
| NOTE | 2023 | 2022 | |||||||||
| Balance, January 1 | (129) | (136) | |||||||||
| Additions | (126) | (109) | |||||||||
| Usage and reversals | 137 | 116 | |||||||||
| Balance, December 31 | 12 | (118) | (129) | ||||||||
| AT DECEMBER 31 | 2023 | 2022 | |||||||||
| Trade receivables not past due | 3,158 | 3,215 | |||||||||
| Trade receivables past due | |||||||||||
| Under 60 days | 421 | 434 | |||||||||
| 60 to 120 days | 209 | 253 | |||||||||
| Over 120 days | 53 | 71 | |||||||||
| Trade receivables, net of allowance for doubtful accounts | 3,841 | 3,973 | |||||||||
| NOTE | 2023 | 2022 | ||||||||||||
| Balance, January 1 | (19) | (20) | ||||||||||||
| Additions | (40) | (20) | ||||||||||||
| Usage and reversals | 41 | 21 | ||||||||||||
| Balance, December 31 | (18) | (19) | ||||||||||||
| Current | (6) | (7) | ||||||||||||
| Non-current | (12) | (12) | ||||||||||||
| Balance, December 31 | 14 | (18) | (19) | |||||||||||
| AT DECEMBER 31, 2023 | NOTE | 2024 | 2025 | 2026 | 2027 | 2028 | THERE- AFTER |
TOTAL | |||||||||||||||||||||
| Total debt, excluding lease liabilities | 25 | 2,172 | 2,690 | 1,609 | 1,742 | 2,120 | 19,337 | 29,670 | |||||||||||||||||||||
Lease liabilities (1) |
25 | 1,245 | 1,034 | 673 | 403 | 334 | 2,041 | 5,730 | |||||||||||||||||||||
| Notes payable | 24 | 207 | — | — | — | — | — | 207 | |||||||||||||||||||||
| Loan secured by receivables | 24 | 1,588 | — | — | — | — | — | 1,588 | |||||||||||||||||||||
| Interest payable on long-term debt, notes payable and loan secured by receivables |
1,301 | 1,133 | 1,060 | 1,019 | 962 | 10,548 | 16,023 | ||||||||||||||||||||||
| Net (receipts) payments on cross currency interest rate swaps and interest rate swaps | (6) | 18 | (5) | (11) | (9) | (70) | (83) | ||||||||||||||||||||||
| Total | 6,507 | 4,875 | 3,337 | 3,153 | 3,407 | 31,856 | 53,135 | ||||||||||||||||||||||
| TYPE OF HEDGE | BUY CURRENCY | AMOUNT TO RECEIVE | SELL CURRENCY | AMOUNT TO PAY | MATURITY | HEDGED ITEM | ||||||||||||||
Cash flow(1) |
USD | 1,207 | CAD | 1,609 | 2024 | Loans | ||||||||||||||
| Cash flow | USD | 150 | CAD | 201 | 2024 | Commercial paper | ||||||||||||||
| Cash flow | USD | 624 | CAD | 790 | 2024 | Anticipated purchases | ||||||||||||||
| Cash flow | PHP | 2,885 | CAD | 69 | 2024 | Anticipated purchases | ||||||||||||||
| Cash flow | USD | 495 | CAD | 645 | 2025 | Anticipated purchases | ||||||||||||||
| Economic | USD | 210 | CAD | 277 | 2024 | Anticipated purchases | ||||||||||||||
Economic - options(2) |
USD | 175 | CAD | 225 | 2024 | Anticipated purchases | ||||||||||||||
| Economic - call options | USD | 244 | CAD | 327 | 2024 | Anticipated purchases | ||||||||||||||
| Economic - call options | CAD | 225 | USD | 156 | 2024 | Anticipated purchases | ||||||||||||||
| Economic - put options | USD | 519 | CAD | 675 | 2024 | Anticipated purchases | ||||||||||||||
| Economic | USD | 120 | CAD | 158 | 2025 | Anticipated purchases | ||||||||||||||
Economic - options(2) |
USD | 65 | CAD | 85 | 2025 | Anticipated purchases | ||||||||||||||
| Economic - call options | USD | 540 | CAD | 694 | 2025 | Anticipated purchases | ||||||||||||||
| Economic - put options | USD | 360 | CAD | 461 | 2025 | Anticipated purchases | ||||||||||||||
| Capital management | ||
| AT DECEMBER 31 | 2023 | 2022 | |||||||||
| Net debt leverage ratio | 3.48 | 3.30 | |||||||||
| Adjusted EBITDA to adjusted net interest expense ratio | 6.94 | 8.50 | |||||||||
| Note 30 | Share capital | ||||
| ANNUAL DIVIDEND RATE |
STATED CAPITAL | ||||||||||||||||||||||||||||
| SERIES | CONVERTIBLE INTO |
CONVERSION DATE | REDEMPTION DATE | REDEMPTION PRICE |
NUMBER OF SHARES ISSUED AND OUTSTANDING |
DECEMBER 31, 2023 | DECEMBER 31, 2022 | ||||||||||||||||||||||
| Q | floating | Series R | December 1, 2030 | At any time | $25.50 | — | — | — | |||||||||||||||||||||
R(1) |
3.018 | % | Series Q | December 1, 2025 | December 1, 2025 | $25.00 | 7,764,800 | 194 | 200 | ||||||||||||||||||||
| S | floating | Series T | November 1, 2026 | At any time | $25.50 | 2,054,167 | 51 | 53 | |||||||||||||||||||||
T(1) |
4.99 | % | Series S | November 1, 2026 | November 1, 2026 | $25.00 | 5,301,633 | 132 | 146 | ||||||||||||||||||||
| Y | floating | Series Z | December 1, 2027 | At any time | $25.50 | 6,451,752 | 161 | 175 | |||||||||||||||||||||
Z(1) |
5.346 | % | Series Y | December 1, 2027 | December 1, 2027 | $25.00 | 2,708,031 | 68 | 74 | ||||||||||||||||||||
AA(1) |
4.94 | % | Series AB | September 1, 2027 | September 1, 2027 | $25.00 | 11,482,631 | 293 | 312 | ||||||||||||||||||||
| AB | floating | Series AA | September 1, 2027 | At any time | $25.50 | 6,918,839 | 176 | 195 | |||||||||||||||||||||
AC(1) |
5.08 | % | Series AD | March 1, 2028 | March 1, 2028 | $25.00 | 6,482,274 | 165 | 255 | ||||||||||||||||||||
| AD | floating | Series AC | March 1, 2028 | At any time | $25.50 | 12,513,726 | 319 | 254 | |||||||||||||||||||||
| AE | floating | Series AF | February 1, 2025 | At any time | $25.50 | 6,022,513 | 151 | 162 | |||||||||||||||||||||
AF(1) |
3.865 | % | Series AE | February 1, 2025 | February 1, 2025 | $25.00 | 9,076,087 | 227 | 237 | ||||||||||||||||||||
AG(1) |
3.37 | % | Series AH | May 1, 2026 | May 1, 2026 | $25.00 | 8,442,830 | 211 | 223 | ||||||||||||||||||||
| AH | floating | Series AG | May 1, 2026 | At any time | $25.50 | 4,784,070 | 120 | 125 | |||||||||||||||||||||
AI(1) |
3.39 | % | Series AJ | August 1, 2026 | August 1, 2026 | $25.00 | 9,246,640 | 231 | 237 | ||||||||||||||||||||
| AJ | floating | Series AI | August 1, 2026 | At any time | $25.50 | 4,118,260 | 103 | 111 | |||||||||||||||||||||
AK(1) |
3.306 | % | Series AL | December 31, 2026 | December 31, 2026 | $25.00 | 22,303,812 | 558 | 578 | ||||||||||||||||||||
AL(2) |
floating | Series AK | December 31, 2026 | At any time | 1,755,688 | 44 | 45 | ||||||||||||||||||||||
AM(1) |
2.939 | % | Series AN | March 31, 2026 | March 31, 2026 | $25.00 | 10,183,378 | 233 | 239 | ||||||||||||||||||||
AN(2) |
floating | Series AM | March 31, 2026 | At any time | 1,035,822 | 24 | 24 | ||||||||||||||||||||||
AO(3) |
fixed | Series AP | — | — | — | ||||||||||||||||||||||||
AP(3) |
floating | Series AO | — | — | — | ||||||||||||||||||||||||
AQ(1) |
6.538 | % | Series AR | September 30, 2028 | September 30, 2028 | $25.00 | 8,303,614 | 206 | 225 | ||||||||||||||||||||
AR(4) |
floating | Series AQ | September 30, 2033 | At any time | — | — | — | ||||||||||||||||||||||
| 3,667 | 3,870 | ||||||||||||||||||||||||||||
| Common shares and Class B shares | ||
| 2023 | 2022 | ||||||||||||||||
| NOTE | NUMBER OF SHARES |
STATED CAPITAL |
NUMBER OF SHARES |
STATED CAPITAL |
|||||||||||||
| Outstanding, January 1 | 911,982,866 | 20,840 | 909,018,871 | 20,662 | |||||||||||||
| Shares issued under deferred share plan | 843 | — | 11,003 | 1 | |||||||||||||
| Shares issued under employee stock option plan | 31 | 306,139 | 19 | 2,952,992 | 177 | ||||||||||||
Unclaimed shares(1) |
(15,303) | — | — | — | |||||||||||||
| Outstanding, December 31 | 912,274,545 | 20,859 | 911,982,866 | 20,840 | |||||||||||||
| Contributed surplus | ||
| Note 31 | Share-based payments | ||||
| FOR THE YEAR ENDED DECEMBER 31 | 2023 | 2022 | ||||||
| ESP | (29) | (28) | ||||||
| RSUs/PSUs | (62) | (69) | ||||||
| DSUs and stock options | (4) | (4) | ||||||
| Total share-based payments | (95) | (101) | ||||||
| Description of the plans | ||
| NUMBER OF RSUs/PSUs | 2023 | 2022 | ||||||
| Outstanding, January 1 | 3,124,187 | 3,085,667 | ||||||
Granted(1) |
1,125,502 | 1,016,211 | ||||||
| Dividends credited | 213,427 | 173,100 | ||||||
| Settled | (957,402) | (1,061,392) | ||||||
| Forfeited | (92,902) | (89,399) | ||||||
| Outstanding, December 31 | 3,412,812 | 3,124,187 | ||||||
Vested, December 31(2) |
1,225,815 | 887,158 | ||||||
| 2023 | 2022 | ||||||||||||||||
| NOTE | NUMBER OF OPTIONS | WEIGHTED AVERAGE EXERCISE PRICE ($) | NUMBER OF OPTIONS | WEIGHTED AVERAGE EXERCISE PRICE ($) | |||||||||||||
| Outstanding, January 1 | 7,802,108 | 61 | 10,778,724 | 60 | |||||||||||||
Exercised(1) |
30 | (306,139) | 60 | (2,952,992) | 58 | ||||||||||||
| Forfeited or expired | (11,408) | 63 | (23,624) | 65 | |||||||||||||
| Outstanding, December 31 | 7,484,561 | 61 | 7,802,108 | 61 | |||||||||||||
| Exercisable, December 31 | 7,484,561 | 61 | 4,539,188 | 58 | |||||||||||||
| STOCK OPTIONS OUTSTANDING | ||||||||||||||||||||
| 2023 | 2022 | |||||||||||||||||||
| RANGE OF EXERCISE PRICES | NUMBER | WEIGHTED AVERAGE REMAINING LIFE (YEARS) | WEIGHTED AVERAGE EXERCISE PRICE ($) | NUMBER | WEIGHTED AVERAGE REMAINING LIFE (YEARS) | WEIGHTED AVERAGE EXERCISE PRICE ($) | ||||||||||||||
$50-$59 |
4,291,180 | 3 | 58 | 4,510,298 | 4 | 58 | ||||||||||||||
$60 & above |
3,193,381 | 6 | 65 | 3,291,810 | 7 | 65 | ||||||||||||||
| 7,484,561 | 4 | 61 | 7,802,108 | 5 | 61 | |||||||||||||||
| Note 32 | Additional cash flow information | ||||
| NOTE | DEBT DUE WITHIN ONE YEAR AND LONG-TERM DEBT | DERIVATIVE TO HEDGE FOREIGN CURRENCY ON DEBT (1) |
DIVIDENDS PAYABLE | OTHER LIABILITIES (2) |
TOTAL | |||||||||||||||
| January 1, 2023 | 31,920 | (307) | 867 | 253 | 32,733 | |||||||||||||||
| Cash flows from (used in) financing activities | ||||||||||||||||||||
| Decrease in notes payable | (646) | — | — | — | (646) | |||||||||||||||
| Issue of long-term debt | 5,195 | — | — | — | 5,195 | |||||||||||||||
| Repayment of long-term debt | (1,858) | — | — | — | (1,858) | |||||||||||||||
| Repurchase of financial liability | — | — | — | (149) | (149) | |||||||||||||||
| Cash dividends paid on common and preferred shares | — | — | (3,668) | — | (3,668) | |||||||||||||||
| Cash dividends paid by subsidiaries to non-controlling interests |
36 | — | — | (47) | — | (47) | ||||||||||||||
| Other financing activities | (24) | — | — | — | (24) | |||||||||||||||
| Total cash flows from (used in) financing activities excluding equity |
2,667 | — | (3,715) | (149) | (1,197) | |||||||||||||||
| Non-cash changes arising from | ||||||||||||||||||||
| Increase in lease liabilities | 1,562 | — | — | — | 1,562 | |||||||||||||||
| Dividends declared on common and preferred shares | — | — | 3,717 | — | 3,717 | |||||||||||||||
| Dividends declared by subsidiaries to non-controlling interests | — | — | 47 | — | 47 | |||||||||||||||
| Effect of changes in foreign exchange rates | (169) | 169 | — | — | — | |||||||||||||||
| Business acquisitions | 4 | 5 | — | — | — | 5 | ||||||||||||||
| Business disposition | 4 | (93) | — | — | — | (93) | ||||||||||||||
| Reclassification to liabilities held for sale | (7) | — | — | — | (7) | |||||||||||||||
| Other | 292 | (15) | (6) | (26) | 245 | |||||||||||||||
| Total non-cash changes | 1,590 | 154 | 3,758 | (26) | 5,476 | |||||||||||||||
| December 31, 2023 | 36,177 | (153) | 910 | 78 | 37,012 | |||||||||||||||
| NOTE | DEBT DUE WITHIN ONE YEAR AND LONG-TERM DEBT | DERIVATIVE TO HEDGE FOREIGN CURRENCY ON DEBT (1) |
DIVIDENDS PAYABLE | OTHER LIABILITIES (2) |
TOTAL | |||||||||||||||
| January 1, 2022 | 29,673 | 79 | 811 | 294 | 30,857 | |||||||||||||||
| Cash flows from (used in) financing activities | ||||||||||||||||||||
| Increase in notes payable | 42 | 69 | — | — | 111 | |||||||||||||||
| Issue of long-term debt | 1,951 | — | — | — | 1,951 | |||||||||||||||
| Repayment of long-term debt | (2,023) | — | — | — | (2,023) | |||||||||||||||
| Cash dividends paid on common and preferred shares | — | — | (3,448) | — | (3,448) | |||||||||||||||
| Cash dividends paid by subsidiaries to non-controlling interests |
36 | — | — | (39) | — | (39) | ||||||||||||||
| Increase in securitized trade receivables | 700 | — | — | — | 700 | |||||||||||||||
| Other financing activities | (13) | — | — | (18) | (31) | |||||||||||||||
| Total cash flows from (used in) financing activities excluding equity |
657 | 69 | (3,487) | (18) | (2,779) | |||||||||||||||
| Non-cash changes arising from | ||||||||||||||||||||
| Increase in lease liabilities | 1,008 | — | — | — | 1,008 | |||||||||||||||
| Dividends declared on common and preferred shares | — | — | 3,508 | — | 3,508 | |||||||||||||||
| Dividends declared by subsidiaries to non-controlling interests | — | — | 39 | — | 39 | |||||||||||||||
| Effect of changes in foreign exchange rates | 437 | (437) | — | — | — | |||||||||||||||
| Business acquisitions | 8 | — | — | — | 8 | |||||||||||||||
| Business disposition | (14) | — | — | — | (14) | |||||||||||||||
| Other | 151 | (18) | (4) | (23) | 106 | |||||||||||||||
| Total non-cash changes | 1,590 | (455) | 3,543 | (23) | 4,655 | |||||||||||||||
| December 31, 2022 | 31,920 | (307) | 867 | 253 | 32,733 | |||||||||||||||
| Note 33 | Remaining performance obligations | ||||
| 2024 | 2025 | 2026 | 2027 | 2028 | THEREAFTER | TOTAL | |||||||||||||||||
| Bell CTS | 3,019 | 1,713 | 765 | 375 | 171 | 482 | 6,525 | ||||||||||||||||
| Bell Media | 35 | — | — | — | — | — | 35 | ||||||||||||||||
| Total | 3,054 | 1,713 | 765 | 375 | 171 | 482 | 6,560 | ||||||||||||||||
| Note 34 | Commitments and contingencies | |||||||
| 2024 | 2025 | 2026 | 2027 | 2028 | THERE- AFTER |
TOTAL | |||||||||||||||||
| Commitments for property, plant and equipment and intangible assets |
2,043 | 1,513 | 599 | 316 | 246 | 1,041 | 5,758 | ||||||||||||||||
| Purchase obligations | 619 | 513 | 537 | 314 | 219 | 820 | 3,022 | ||||||||||||||||
| Planned acquisition of OUTFRONT Media Inc. | 410 | — | — | — | — | — | 410 | ||||||||||||||||
| Leases committed not yet commenced | 2 | 6 | — | — | — | — | 8 | ||||||||||||||||
| Total | 3,074 | 2,032 | 1,136 | 630 | 465 | 1,861 | 9,198 | ||||||||||||||||
| Contingencies | ||
| Note 35 | Related party transactions | ||||
| OWNERSHIP PERCENTAGE | ||||||||
| SUBSIDIARY | 2023 | 2022 | ||||||
| Bell Canada | 100 | % | 100 | % | ||||
| Bell Mobility Inc. | 100 | % | 100 | % | ||||
| Bell Media Inc. | 100 | % | 100 | % | ||||
| Transactions with joint arrangements and associates | ||
| BCE Master Trust Fund | ||
|
Compensation of key management personnel
|
||
| FOR THE YEAR ENDED DECEMBER 31 | 2023 | 2022 | ||||||
| Wages, salaries, fees and related taxes and benefits | (28) | (28) | ||||||
| Post-employment benefit plans and OPEBs cost | (3) | (4) | ||||||
| Share-based compensation | (30) | (38) | ||||||
| Key management personnel compensation expense | (61) | (70) | ||||||
| Note 36 | Significant partly-owned subsidiary | ||||
CTV SPECIALTY(1) (2) |
||||||||
| FOR THE YEAR ENDED DECEMBER 31 | 2023 | 2022 | ||||||
| Current assets | 466 | 400 | ||||||
| Non-current assets | 941 | 958 | ||||||
| Total assets | 1,407 | 1,358 | ||||||
| Current liabilities | 153 | 140 | ||||||
| Non-current liabilities | 239 | 246 | ||||||
| Total liabilities | 392 | 386 | ||||||
| Total equity attributable to BCE shareholders | 707 | 678 | ||||||
| NCI | 308 | 294 | ||||||
| Selected income and cash flow information | ||
CTV SPECIALTY(1) |
||||||||
| FOR THE YEAR ENDED DECEMBER 31 | 2023 | 2022 | ||||||
| Operating revenues | 969 | 986 | ||||||
| Net earnings | 209 | 180 | ||||||
| Net earnings attributable to NCI | 65 | 57 | ||||||
| Total comprehensive income | 196 | 198 | ||||||
| Total comprehensive income attributable to NCI | 61 | 63 | ||||||
| Cash dividends paid to NCI | 47 | 39 | ||||||
Exhibit 99.4
Reports on internal controls
Reports on internal controls
Management’s report on internal control over financial reporting
The management of BCE Inc. (BCE) is responsible for establishing and maintaining adequate internal control over financial reporting. Our internal control over financial reporting is a process designed under the supervision of the President and Chief Executive Officer and the Executive Vice-President and Chief Financial Officer and effected by the board of directors, management and other personnel of BCE, to provide reasonable assurance regarding the reliability of financial reporting and the preparation of financial statements for external purposes in accordance with International Financial Reporting Standards (IFRS) as issued by the International Accounting Standards Board (IASB).
Due to its inherent limitations, internal control over financial reporting may not prevent or detect misstatements on a timely basis. Also, projections of any evaluation of the effectiveness of internal control over financial reporting to future periods are subject to the risk that the controls may become inadequate because of changes in conditions, or that the degree of compliance with the policies or procedures may deteriorate.
Management evaluated, under the supervision of and with the participation of the President and Chief Executive Officer and the Executive Vice-President and Chief Financial Officer, the effectiveness of our internal control over financial reporting as at December 31, 2023, based on the criteria established in Internal Control – Integrated Framework (2013) issued by the Committee of Sponsoring Organizations of the Treadway Commission (COSO).
Based on that evaluation, the President and Chief Executive Officer and the Executive Vice-President and Chief Financial Officer concluded that our internal control over financial reporting was effective as at December 31, 2023. There were no material weaknesses that have been identified by BCE’s management in internal control over financial reporting as at December 31, 2023.
Our internal control over financial reporting as at December 31, 2023 has been audited by Deloitte LLP, independent registered public accounting firm, who also audited our consolidated financial statements for the year ended December 31, 2023. Deloitte LLP issued an unqualified opinion on the effectiveness of our internal control over financial reporting as at December 31, 2023.
(signed) Mirko Bibic
President and Chief Executive Officer
(signed) Curtis Millen
Executive Vice-President and Chief Financial Officer
(signed) Thierry Chaumont
Senior Vice-President, Controller and Tax
March 7, 2024
| 110 | BCE INC. 2023 ANNUAL FINANCIAL REPORT |
Reports on internal controls
Report of independent registered public accounting firm
To the shareholders and the Board of Directors of BCE Inc.
Opinion on internal control over
financial reporting
We have audited the internal control over financial reporting of BCE Inc. and subsidiaries (the “Company”) as of December 31, 2023, based on criteria established in Internal Control – Integrated Framework (2013) issued by the Committee of Sponsoring Organizations of the Treadway Commission (COSO). In our opinion, the Company maintained, in all material respects, effective internal control over financial reporting as of December 31, 2023 based on criteria established in Internal Control – Integrated Framework (2013) issued by COSO.
We have also audited, in accordance with the standards of the Public Company Accounting Oversight Board (United States) (PCAOB) the consolidated financial statements as at and for the year ended December 31, 2023, of the Company and our report dated March 7, 2024, expressed an unqualified opinion on those financial statements.
Basis for opinion
The Company’s management is responsible for maintaining effective internal control over financial reporting and for its assessment of the effectiveness of internal control over financial reporting, included in the accompanying Management’s Report on Internal Control over Financial Reporting. Our responsibility is to express an opinion on the Company’s internal control over financial reporting based on our audit. We are a public accounting firm registered with the PCAOB and are required to be independent with respect to the Company in accordance with the U.S. federal securities laws and the applicable rules and regulations of the Securities and Exchange Commission and the PCAOB.
We conducted our audit in accordance with the standards of the PCAOB. Those standards require that we plan and perform the audit to obtain reasonable assurance about whether effective internal control over financial reporting was maintained in all material respects. Our audit included obtaining an understanding of internal control over financial reporting, assessing the risk that a material weakness exists, testing and evaluating the design and operating effectiveness of internal control based on the assessed risk, and performing such other procedures as we considered necessary in the circumstances. We believe that our audit provides a reasonable basis for our opinion.
Definition and limitations of internal control
over financial reporting
A company’s internal control over financial reporting is a process designed to provide reasonable assurance regarding the reliability of financial reporting and the preparation of financial statements for external purposes in accordance with generally accepted accounting principles. A company’s internal control over financial reporting includes those policies and procedures that (1) pertain to the maintenance of records that, in reasonable detail, accurately and fairly reflect the transactions and dispositions of the assets of the company; (2) provide reasonable assurance that transactions are recorded as necessary to permit preparation of financial statements in accordance with generally accepted accounting principles, and that receipts and expenditures of the company are being made only in accordance with authorizations of management and directors of the company; and (3) provide reasonable assurance regarding prevention or timely detection of unauthorized acquisition, use, or disposition of the company’s assets that could have a material effect on the financial statements.
Because of its inherent limitations, internal control over financial reporting may not prevent or detect misstatements. Also, projections of any evaluation of effectiveness to future periods are subject to the risk that controls may become inadequate because of changes in conditions, or that the degree of compliance with the policies or procedures may deteriorate.
/s/ Deloitte LLP
Chartered Professional Accountants
Montréal, Canada
March 7, 2024
| 111 |
Exhibit 99.6
NOTICE OF RELIANCE
SECTION 13.4 OF NATIONAL INSTRUMENT 51-102
CONTINUOUS DISCLOSURE OBLIGATIONS
| To: | Alberta Securities Commission |
British Columbia Securities Commission
Manitoba Securities Commission
Financial and Consumer Services Commission, New Brunswick
Office of the Superintendent of Securities, Newfoundland and Labrador
Nova Scotia Securities Commission
Ontario Securities Commission
Department of Justice and Public Safety, Financial and Consumer Services Division, Prince Edward Island
Autorité des marchés financiers
Financial and Consumer Affairs Authority of Saskatchewan
Toronto Stock Exchange
Notice is hereby given that Bell Canada relies on the continuous disclosure documents filed by BCE Inc. pursuant to the exemption from the requirements of National Instrument 51-102 – Continuous Disclosure Obligations (“NI 51-102”) provided in Section 13.4 of NI 51-102.
The continuous disclosure documents of BCE Inc. can be found for viewing in electronic format at www.sedarplus.ca.
Attached to this notice and forming part thereof is the consolidating summary financial information for BCE Inc. as required by Section 13.4 of NI 51-102.
Dated: March 8, 2024
| BELL CANADA | ||||
| By: | (signed) Thierry Chaumont |
|||
| Name: | Thierry Chaumont | |||
| Title: | Senior Vice-President, Controller and Tax | |||

|
BELL CANADA
|
UNAUDITED SELECTED SUMMARY FINANCIAL INFORMATION (1)
For the periods ended December 31, 2023 and 2022
(in millions of Canadian dollars)
BCE Inc. fully and unconditionally guarantees the payment obligations of its 100% owned subsidiary Bell Canada under the public debt issued by Bell Canada. Accordingly, the following summary financial information is provided by Bell Canada in compliance with the requirements of section 13.4 of National Instrument 51-102 (Continuous Disclosure Obligations) providing for an exemption for certain credit support issuers. The tables below contain selected summary financial information for (i) BCE Inc. (as credit supporter), (ii) Bell Canada (as credit support issuer) on a consolidated basis, (iii) BCE Inc.’s subsidiaries, other than Bell Canada, on a combined basis, (iv) consolidating adjustments, and (v) BCE Inc. and all of its subsidiaries on a consolidated basis, in each case for the periods indicated. Such summary financial information for BCE Inc. and Bell Canada and all other subsidiaries is intended to provide investors with meaningful and comparable financial information about BCE Inc. and its subsidiaries. This summary financial information should be read in conjunction with BCE Inc.’s audited consolidated financial statements for the year ended December 31, 2023.
For the periods ended December 31:
| BCE INC. | BELL CANADA CONSOLIDATED | SUBSIDIARIES OF BCE INC. | CONSOLIDATING | BCE INC. | ||||||||||||||||||||||||||||||||||||||||||||||||||||||||||||||||||||
| (“CREDIT SUPPORTER”)(2)
|
(“CREDIT SUPPORT ISSUER”)
|
OTHER THAN BELL CANADA(3)
|
ADJUSTMENTS(4)
|
CONSOLIDATED
|
||||||||||||||||||||||||||||||||||||||||||||||||||||||||||||||||||||
|
2023
|
2022
|
2023
|
2022
|
2023
|
2022
|
2023
|
2022
|
2023
|
2022
|
|||||||||||||||||||||||||||||||||||||||||||||||||||||||||||||||
| Operating revenues |
— | — | 24,673 | 24,175 | — | — | — | (1 | ) | 24,673 | 24,174 | |||||||||||||||||||||||||||||||||||||||||||||||||||||||||||||
| Net earnings from continuing operations attributable to owners |
2,263 | 2,868 | 2,858 | 2,951 | 157 | 181 | (3,015 | ) | (3,132 | ) | 2,263 | 2,868 | ||||||||||||||||||||||||||||||||||||||||||||||||||||||||||||
| Net earnings attributable to owners |
2,263 | 2,868 | 2,858 | 2,951 | 157 | 181 | (3,015 | ) | (3,132 | ) | 2,263 | 2,868 | ||||||||||||||||||||||||||||||||||||||||||||||||||||||||||||
|
As at December 31, 2023 and December 31, 2022, respectively:
|
|
|||||||||||||||||||||||||||||||||||||||||||||||||||||||||||||||||||||||
| BCE INC. | BELL CANADA CONSOLIDATED | SUBSIDIARIES OF BCE INC. | CONSOLIDATING | BCE INC. | ||||||||||||||||||||||||||||||||||||||||||||||||||||||||||||||||||||
| (“CREDIT SUPPORTER”)(2)
|
(“CREDIT SUPPORT ISSUER”)
|
OTHER THAN BELL CANADA(3)
|
ADJUSTMENTS(4)
|
CONSOLIDATED
|
||||||||||||||||||||||||||||||||||||||||||||||||||||||||||||||||||||
|
Dec. 31, |
Dec. 31, |
Dec. 31, |
Dec. 31, |
Dec. 31, |
Dec. 31, |
Dec. 31, |
Dec. 31, |
Dec. 31, |
Dec. 31, |
|||||||||||||||||||||||||||||||||||||||||||||||||||||||||||||||
| 2023
|
2022
|
2023
|
2022
|
2023
|
2022
|
2023
|
2022
|
2023
|
2022
|
|||||||||||||||||||||||||||||||||||||||||||||||||||||||||||||||
| Total Current Assets |
772 | 744 | 10,472 | 7,865 | 646 | 473 | (3,992 | ) | (2,595 | ) | 7,898 | 6,487 | ||||||||||||||||||||||||||||||||||||||||||||||||||||||||||||
| Total Non-current Assets |
23,307 | 23,856 | 57,655 | 56,461 | 21 | 38 | (16,941 | ) | (17,513 | ) | 64,042 | 62,842 | ||||||||||||||||||||||||||||||||||||||||||||||||||||||||||||
| Total Current Liabilities |
3,521 | 2,401 | 12,496 | 11,583 | 81 | 81 | (3,991 | ) | (2,596 | ) | 12,107 | 11,469 | ||||||||||||||||||||||||||||||||||||||||||||||||||||||||||||
| Total Non-current Liabilities |
329 | 21 | 38,378 | 34,746 | — | — | 569 | 578 | 39,276 | 35,345 | ||||||||||||||||||||||||||||||||||||||||||||||||||||||||||||||
| (1) | The summary financial information is prepared in accordance with International Financial Reporting Standards (IFRS) and is in accordance with generally accepted accounting principles issued by the Canadian Accounting Standards Board for publicly-accountable enterprises. |
| (2) | This column accounts for investments in all subsidiaries of BCE Inc. under the equity method. |
| (3) | This column accounts for investments in all subsidiaries of BCE Inc. (other than Bell Canada) on a consolidated basis. |
| (4) | This column includes the necessary amounts to eliminate the intercompany balances between BCE Inc., Bell Canada and other subsidiaries and other adjustments to arrive at the information for BCE Inc. on a consolidated basis. |
Exhibit 99.7
BCE Inc.
EXHIBIT TO 2023 ANNUAL FINANCIAL STATEMENTS
EARNINGS COVERAGE
The following consolidated financial ratios are calculated for the twelve months ended December 31, 2023, give effect to the issuance and redemption of all long-term debt since January 1, 2023 as if these transactions occurred on January 1, 2023, and are based on unaudited financial information of BCE Inc.
| December 31, 2023 |
||
| Earnings coverage of interest on debt requirements based on net earnings attributable to owners of BCE Inc. before interest expense and income tax: | 2.6 times | |
| Earnings coverage of interest on debt requirements based on net earnings attributable to owners of BCE Inc. before interest expense, income tax and non-controlling interest: | 2.6 times | |
| Date: March 8, 2024 | (signed) Mirko Bibic | |||||||
| Mirko Bibic President and Chief Executive Officer BCE Inc. |
||||||||
| Date: March 8, 2024 | (signed) Curtis Millen | |||||||
| Curtis
Millen Executive Vice-President and Chief Financial Officer BCE Inc. |
||||||||