UNITED STATES
SECURITIES AND EXCHANGE COMMISSION
Washington, D.C. 20549
Form 6-K
Report of Foreign Private Issuer
Pursuant to Rule 13a-16 or 15d-16 Under the
Securities Exchange Act of 1934
For the month of March, 2024
Commission File Number: 001-38336
NUTRIEN LTD.
(Name of registrant)
Suite 1700, 211 19th Street East
Saskatoon, Saskatchewan, Canada
S7K 5R6
(Address of principal executive office)
Indicate by check mark whether the registrant files or will file annual reports under cover of Form 20-F or Form 40-F.
Form 20-F ☐ Form 40-F ☒ Pursuant to the requirements of the Securities Exchange Act of 1934, the registrant has duly caused this report to be signed on its behalf by the undersigned, thereunto duly authorized.
SIGNATURES
| NUTRIEN LTD.
|
||||||
| Date: March 1, 2024 | By: | /s/ Robert A. Kirkpatrick | ||||
| Name: | Robert A. Kirkpatrick | |||||
| Title: | Senior Vice President, General Counsel Securities & Corporate Secretary |
|||||
Exhibit 99.1
2023 Annual Report
| Overview |
MD&A | Five-year highlights | Financial statements and notes | |||||
You can find this report and information on Nutrien on our website at nutrien.com. More detailed information on our sustainability strategy and performance is provided on our website at nutrien.com/sustainability.
The Overview contains certain non-GAAP financial measures, which do not have a standard meaning under IFRS, and other financial measures including
| • | Adjusted net earnings per share |
| • | Adjusted EBITDA |
| • | Return on invested capital (“ROIC”) |
| • | Adjusted net debt |
For definitions, further information and reconciliation of these measures, to the most directly comparable measures under IFRS, see the “Non-GAAP financial measures” section. See the “Other financial measures” and “Terms and definitions” sections for definitions, abbreviations and terms used in this annual report.
| MD&A | Five-year highlights | Financial statements and notes | ||||||
Why Nutrien
Nutrien is a leading provider of crop inputs and services, helping to safely and sustainably feed a growing world. We operate a world-class integrated network of production, distribution and ag retail facilities that positions us to efficiently serve the needs of growers. Our Nutrien Ag Solutions (“Retail”) business enhances the stability of earnings and our low-cost fertilizer production assets have historically generated significant cash flow through the cycle. We take a balanced and disciplined approach to capital allocation, prioritizing investments that strengthen the advantages of our integrated business and returning meaningful capital to our shareholders.
|
|
||||||||
| 1 | | | Advantaged | ||||||
| position across | ||||||||
| the ag value | ||||||||
| chain | ||||||||
|
|
||||||||
| 2 | | | Proven | ||||||
| financial strength | ||||||||
| and stability | ||||||||

|
||||||||
| 3 | | | Provider of | ||||||
| sustainable | ||||||||
| agriculture | ||||||||
| solutions | ||||||||
| Nutrien Annual Report 2023 | 1 |
| Overview |
MD&A | Five-year highlights | Financial statements and notes | |||||
President and CEO
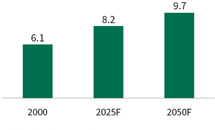
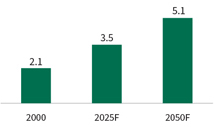
By 2050, the world’s population is expected to reach nearly 10 billion people and global grain and oilseed demand is projected to exceed 5 billion tonnes on an annual basis. The amount of arable land per person is estimated to decline by 15 percent over this period, highlighting the challenge that lies ahead to produce enough nutritious food to sustain this population while preserving the world’s resources for generations to come.
Feeding the future
Nutrien’s purpose of Feeding the Future reflects the vital role we play in helping growers safely and sustainably feed a growing world. We provide products and services that increase crop productivity while improving environmental performance, important outcomes that we believe must be achieved in tandem. Through the collective expertise of our nearly 26,000 employees and the unique advantages of our world-class integrated network, we strive to provide a more profitable, sustainable and secure future for our stakeholders.
Navigated through period of unprecedented market volatility
We operate with a long-term mindset but need to be flexible and responsive to our near-term operating environment. The agriculture industry has come through a period of unprecedented market volatility since early 2022 driven by a series of global geopolitical conflicts, supply chain disruptions and shifting buying patterns. These unique events have impacted our performance and resulted in adjustments to our strategic priorities.
In 2022, Nutrien generated record earnings and operating cash flows as prices for agriculture and crop input products rose in response to supply-side shocks. We allocated free cash flow to advance strategic growth initiatives and increased share repurchases, deploying capital in areas that we believed would create the greatest long-term value for our shareholders.
Crop input market fundamentals shifted in 2023 as supply chains adapted and higher cost inventory worked its way through the channel, resulting in lower fertilizer selling prices and Retail gross margins compared to the record prior year. As the year progressed, we saw increased market stability and stronger fertilizer demand in North America, supported by improved grower affordability and lower channel inventories. Fertilizer demand in key offshore markets also increased in the second half of 2023, however the level of market stabilization varied by product and geography.
|
|
| Ken Seitz
President and Chief Executive Officer
Global population growth 1
(billions of people)
Source: United Nations
1 Forecast as of January 30, 2024.
Global grain and oilseed demand 1
(billions of tonnes)
Source: USDA
1 Forecast as of January 30, 2024. Based on trend production of barley, corn, millet, mixed grains, oats, oil palm, canola/rapeseed, soybean, sunflower, rice, rye, sorghum and wheat. |
| 2 | Nutrien Annual Report 2023 |
| Overview |
MD&A | Five-year highlights | Financial statements and notes | |||||

|
$5.1B
|
|
| cash provided by operating activities in 2023
|
||
|
$2.1B
|
||
| returned to shareholders through share repurchases and dividends in 2023
|
Nutrien delivered adjusted EBITDA1 of $6.1 billion (net earnings of $1.3 billion) in 2023, below our initial expectations for the year. In response to the change in market conditions, we took a number of actions to reduce controllable costs and enhance free cash flow. This included a pause of our potash ramp-up and suspension of work on our Geismar clean ammonia project. These decisions, along with other operational efficiency initiatives, lowered our 2023 planned capital expenditures by $300 million and operating expenses by $100 million.
Operating cash flow of $5.1 billion was supported by a reduction in non-cash working capital in Retail, one of the counter-cyclical advantages of our integrated business. We maintained a balanced and disciplined approach to capital allocation, investing $2.7 billion to sustain and enhance our assets and returned $2.1 billion to shareholders through dividends and share repurchases. Since the beginning of 2018, we have increased our dividend per share by 35 percent and repurchased 23 percent of our outstanding shares.
Strengthened advantages of our integrated business
As we reflect on the past year, I am proud of the progress we made on a number of strategic initiatives that strengthened our core business, positioned the Company for growth and advanced our key sustainability priorities.
In Retail, we continue to develop new and innovative ways to serve the needs of our grower customers. A great
example of this is our proprietary products business. These high-value products enhance yield and environmental performance for the grower, while supporting higher margins for Nutrien.
Our global proprietary products portfolio contributed $1.0 billion in gross margin in 2023 and we increased sales and margins from our plant nutritional and biostimulant product lines. Gross margin for these nutritional products has grown at a compound annual growth rate of 15 percent over the last five years. We plan to continue to invest in our proprietary product business through differentiated offerings and expanded manufacturing capacity.
In late 2022, we established a global commercial organization with a single point of accountability for delivering best-in-class customer service, driving supply chain efficiencies, and leading margin optimization opportunities across our integrated network. The commercial team executed on a number of opportunities that supported netbacks in a volatile market environment and record sales volumes to North American fertilizer customers in the second half of 2023. This included capturing incremental value by delivering record potash volumes through Nutrien Ag Solutions in North America, as well as more than doubling sales of MAP+MST, our specialty phosphate fertilizer offering.
| 1 | This is a non-GAAP financial measure. See the “Non-GAAP Financial Measures” section. |
| Nutrien Annual Report 2023 | 3 |
| Overview |
MD&A | Five-year highlights | Financial statements and notes | |||||
|
$1.0B
|
|
|
| gross margin from Retail proprietary products in 2023
|
||
| 40%
|
||
| increase in annual potash ore mining technology
|
We have a low-cost, flexible, six-mine potash network with access to the best geology in the world. In 2023, we increased our annual potash ore tonnes cut using autonomous mining technology by 40 percent, improving the safety and efficiency of our operations. We announced the pause of our ramp-up to 18 million tonnes while continuing to retain operational flexibility and our low-cost position, preserving the ability to respond to opportunities when there are disruptions to global potash supply or surges in demand.
Nutrien is an industry leader in developing low-carbon nitrogen production for integration into our value chain. In 2023, we completed our GHG Phase 1 abatement projects, which was a multi-year capital program that will be a key contributor to reducing our greenhouse gas emissions. We also completed brownfield expansion projects at our Geismar nitrogen facility and major maintenance turnarounds at our Geismar and Borger sites that will support increased operating rates going forward.
Nothing is more important than the safety, health and wellness of our employees, our contractors and the communities we serve. While we achieved our lowest recordable injury rate ever across our global operations, regretfully our safety performance in 2023 fell short of our expectations. This past year we experienced a loss that deeply impacted our organization – the tragic passing of one of our US Retail co-workers. This devastating loss reminds us of the importance of our relentless pursuit of safety. We are committed to doing better and continue to take steps to prevent similar incidents from happening
again. It is critical that we continue to prioritize the training, processes and systems that keep our people and communities safe.
Positioned for growth in the future
Looking at the year ahead, agriculture fundamentals remain supportive with global grain stocks-to-use ratios at historically low levels. Crop prices have declined from historically high levels in 2022 but lower crop input prices have resulted in improved affordability and demand.
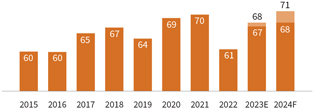
We expect gross margins for our Retail business to improve across all product lines as input prices stabilize and grower purchasing behavior normalizes. Global potash shipments are projected to increase to 68 to 71 million tonnes in 2024 as demand continues to recover towards trend levels. Constraints on global energy and nitrogen supply continue to provide a positive backdrop for our low-cost nitrogen assets. We expect to deliver higher fertilizer sales volumes supported by increased global fertilizer demand and improved operating rates at our nitrogen and phosphate facilities.
Over the longer-term, we believe structural market shifts will be supportive of higher fertilizer benchmark prices compared to historical 10-year average levels. This view is driven by the expectation for continued tightness in global crop markets, higher energy prices and other inflationary impacts on the global cost curve.
Beyond these market factors, we are prioritizing initiatives within our control that enhance the quality of earnings,
| 4 | Nutrien Annual Report 2023 |
| Overview |
MD&A | Five-year highlights | Financial statements and notes | |||||
free cash flow and return on capital. We intend to maintain a balanced and disciplined approach to capital allocation and have reduced planned capital expenditures by approximately $400 million in 2024 compared to the prior year.
We are projecting investment capital of $500 million in 2024, with approximately half of this total associated with initiatives that support organic growth in our core Retail geographies. This includes investments that expand our proprietary products portfolio, drive network optimization and enhance our digital capabilities.
The prospects for agriculture in Brazil remain positive and it remains an important crop input market for Nutrien. In the near term, we will continue to focus on integration of our recent acquisitions and optimization of our cost structure in this market.
The focus in our fertilizer operations is to maintain a low-cost position and drive further efficiencies through potash mine automation and reliability improvements at our nitrogen facilities. We expect to achieve more than 1 million tonnes of annual nitrogen volume growth through the completion of high-return brownfield expansion projects and reliability initiatives over the next few years. Additionally, we have capability to deliver an additional 1 to 2 million tonnes of potash per year compared to 2023 levels as demand for potash grows.
Across our business, we continue to build strong relationships with our customers, partners, suppliers, and the communities we serve, and will utilize the advantages of our integrated business and position the Company to deliver long-term value for our shareholders.
On behalf of the Board and our management team, I want to thank everyone who played a part in our successes in 2023 and especially our employees for your tireless effort as we work together to safely and sustainably Feed the Future.

Ken Seitz
President and Chief Executive Officer
February 22, 2024
Retail adjusted EBITDA 1,2
(US$ billions)
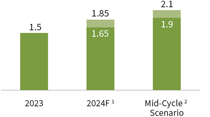
| 1 |
Guidance provided in our news release dated February 21, 2024. |
| 2 | See the “Forward-looking statements” section. |
Potash manufactured sales volumes 1,2
(millions of tonnes KCl)
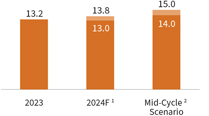
| 1 |
Guidance provided in our news release dated February 21, 2024. |
| 2 | See the “Forward-looking statements” section. |
Nitrogen manufactured sales volumes 1,2
(millions of tonnes)
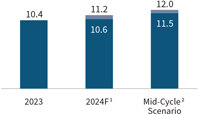
| 1 |
Guidance provided in our news release dated February 21, 2024. |
| 2 | See the “Forward-looking statements” section. |
| Nutrien Annual Report 2023 | 5 |
| Overview |
MD&A | Five-year highlights | Financial statements and notes | |||||
Nutrien’s results were impacted by unprecedented volatility in global crop input markets over the past two years. Net earnings and adjusted EBITDA decreased in 2023 compared to the record results in 2022 due to lower selling prices across all segments and lower Retail earnings. We generated $5.1 billion in cash from operating activities, invested $2.7 billion to sustain and enhance our assets, and returned $2.1 billion of cash to our shareholders through dividends and share repurchases in 2023. We continued to invest in key initiatives to reduce our total Scope 1 and 2 greenhouse gas (“GHG”) emissions.
Years ended December 31
| (in millions of US dollars, except as otherwise noted) | 2023 | 2022 | 2021 | |||||||||
| Financial performance |
||||||||||||
| Sales |
29,056 | 37,884 | 27,712 | |||||||||
| Gross margin |
8,474 | 15,424 | 9,409 | |||||||||
| Net earnings |
1,282 | 7, 687 | 3,179 | |||||||||
| Diluted net earnings per share (US dollars) |
2.53 | 14.18 | 5.52 | |||||||||
| Adjusted net earnings per share 1 (US dollars) |
4.44 | 13.19 | 6.23 | |||||||||
| Adjusted EBITDA 1 |
6,058 | 12,170 | 7,126 | |||||||||
| Retail adjusted EBITDA |
1,459 | 2,293 | 1,939 | |||||||||
| Potash adjusted EBITDA |
2,404 | 5,769 | 2,736 | |||||||||
| Nitrogen adjusted EBITDA |
1,930 | 3,931 | 2,308 | |||||||||
| Phosphate adjusted EBITDA |
470 | 594 | 540 | |||||||||
| Cash provided by operating activities |
5,066 | 8,110 | 3,886 | |||||||||
| Cash used in investing activities |
2,958 | 2,901 | 1,807 | |||||||||
| Capital expenditures |
2,671 | 2,475 | 1,884 | |||||||||
| Cash used for dividends and share repurchases 2 |
2,079 | 5,551 | 2,080 | |||||||||
| Return on invested capital 1 |
10% | 26% | 15% | |||||||||
| Adjusted net debt/Adjusted EBITDA 3 |
1.9x | 0.9x | 1.4x | |||||||||
| Non-financial performance 4 |
||||||||||||
| Scope 1 and 2 GHG emissions (Mmt CO2e) |
12.2 | 12.8 | 13.8 | |||||||||
| CO2 captured and sold (Mmt) |
1.0 | 1.1 | 1.1 | |||||||||
| Sustainably engaged acres (millions) |
2 | 1 | n/m | |||||||||
| Lost-time injury frequency 5 |
0.24 | 0.24 | 0.27 | |||||||||
| Proportion of women in senior leadership 5 |
23% | 21% | 21% | |||||||||
| Community investment |
23 | 33 | 19 | |||||||||
| 1 | This is a non-GAAP financial measure. See the “Non-GAAP Financial Measures” section. Additional information relating to 2021 is contained in the “Appendix - Non-IFRS Financial Measures” sections of Nutrien’s MD&A dated February 17, 2022 for the year ended December 31, 2021, which information is incorporated by reference herein. Such MD&A are available on SEDAR+ at sedarplus.ca. |
| 2 | This is a supplementary financial measure. See the “Other Financial Measures” section. |
| 3 | This is a capital management financial measure that includes non-GAAP components. See the “Non-GAAP Financial Measures” and “Other Financial Measures” sections. |
| 4 | These are non-financial measures. See the “Terms & Definitions” section. |
| 5 | Frequency based on every 200,000 hours worked. |
| 6 | Nutrien Annual Report 2023 |
| Overview |
MD&A | Five-year highlights | Financial statements and notes | |||||
Nutrien is committed to delivering results for our stakeholders and pursuing our purpose of Feeding the Future with strategic targets and goals that address our key sustainability risks and opportunities. As our operating environment evolves, we continue to refine our approach through collaboration, innovation and continuous improvement.
| 2 million sustainably engaged acres |
In 2023, we measured, documented and calculated outcomes on 2 million sustainably engaged acres in North America, South America and Australia. We continue to provide growers with whole-acre solutions that support sustainable and productive agriculture and aim to deliver improved environmental outcomes. |
|||||
|
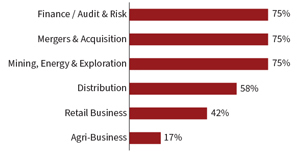
Supporting our 2030 Commitment to enable growers to adopt sustainable and productive agricultural products and practices on 75 million acres globally
|
||||||
| GHG phase 1 completed |
In 2023, we completed our GHG Phase 1 abatement program, which included a number of nitrous oxide (“N2O”) abatement projects, energy and emission efficiency upgrades, and tied in our second ammonia plant at our Redwater site to the Alberta Carbon Trunk Line to allow additional carbon dioxide (“CO2”) to be permanently sequestered.
|
|||||
| Supporting our 2030 Commitment to achieve at least a 30 percent intensity reduction in GHG emissions (Scope 1 and 2) per tonne of our products produced, from a baseline year of 2018
|
||||||
| Verified carbon offsets and insets |
In 2023, we enabled emissions reductions on 900 thousand sustainably engaged acres in North America, working with growers and collaborating with 15 suppliers and downstream partners. We established a validated pathway and verified our first GHG insets in Canada and verified GHG offsets and insets in the US, based on grower data.
|
|||||
| Supporting our 2030 Commitment to launch and scale a comprehensive Carbon Program, empowering growers and our industry to accelerate climate-smart agriculture and soil carbon sequestration while rewarding growers for their efforts
|
||||||
| 1.2 Mmt low-carbon ammonia |
Our near-term focus is on using carbon capture, utilization and storage (“CCUS”) infrastructure, and growing our low-carbon ammonia production. As of the end of 2023, Nutrien has annual production capability of 1.2 million tonnes of low-carbon ammonia at our Geismar, Redwater and Joffre nitrogen facilities.
|
|||||
| Supporting our 2030 Commitment to invest in new technologies and pursue the transition to low-carbon fertilizers, including low-carbon and clean ammonia
|

Global Sustainability Report
For more information on our 2030 sustainability commitments and targets,
please refer to our Global Sustainability Report expected to be published in
March 2024, available on our website at nutrien.com.
|
Nutrien Annual Report 2023 |
7 |
| Overview | MD&A | Five-year highlights | Financial statements and notes | |||||
& analysis
The following management’s discussion and analysis (“MD&A”) is the responsibility of management and is dated as of February 22, 2024.
The Board of Directors (“Board”) of Nutrien carries out its responsibility for review of this disclosure principally through its Audit Committee, comprised exclusively of independent directors. The Audit Committee reviews and, prior to its publication, recommends to the Board approval of this disclosure. The Board has approved this disclosure. The term “Nutrien” refers to Nutrien Ltd. and the terms “we”, “us”, “our”, “Nutrien” and “the Company” refer to Nutrien and, as applicable, Nutrien and its direct and indirect subsidiaries on a consolidated basis. This MD&A is based on the Company’s audited consolidated financial statements for the year ended December 31, 2023 (“consolidated financial statements”) based on International Financial Reporting Standards (“IFRS”) as issued by the International Accounting Standards Board, unless otherwise stated.
This MD&A contains certain non-GAAP financial measures and ratios, which do not have a standard meaning under IFRS and, therefore, may not be comparable to similar measures presented by other issuers. Such non-GAAP financial measures and ratios include
| • | Adjusted EBITDA |
| • | Adjusted net earnings and adjusted net earnings per share |
| • | Gross margin excluding depreciation and amortization per tonne – manufactured |
| • | Potash controllable cash cost of product manufactured per tonne |
| • | Ammonia controllable cash cost of product manufactured per tonne |
| • | Retail adjusted average working capital to sales and Retail adjusted average working capital to sales excluding Nutrien Financial |
| • | Nutrien Financial adjusted net interest margin |
| • | Retail cash operating coverage ratio |
| • | Return on invested capital (“ROIC”) |
| • | Adjusted net debt |
For definitions, further information and reconciliation of these measures to the most directly comparable measures under IFRS, see the “Non-GAAP financial measures” and “Other financial measures” sections.
Also see the cautionary statement in the “Forward-looking statements” section.
All references to per share amounts pertain to diluted net earnings (loss) per share. Financial data in this annual report is stated in millions of US dollars, which is the functional currency of Nutrien and the majority of its subsidiaries, unless otherwise noted.
Information that is not meaningful is indicated by n/m. Information that is not applicable is indicated by n/a. See the “Other financial measures” and “Terms and definitions” sections for definitions, abbreviations and terms used in this annual report including the MD&A.
Additional information relating to Nutrien (which, except as otherwise noted, is not incorporated by reference herein), including our Annual Information Form for the year ended December 31, 2023, can be found on SEDAR+ at sedarplus.ca and on EDGAR at sec.gov. The Company is a foreign private issuer under the rules and regulations of the US Securities and Exchange Commission (the “SEC”).
The information contained on or accessible from our website or any other website is not incorporated by reference into this MD&A or any other report or document we file with or furnish to applicable Canadian or US securities regulatory authorities.
| 8 | Nutrien Annual Report 2023 |
| Overview | MD&A |
Five-year highlights | Financial statements and notes | |||||
Our approach to annual reporting
Our goal is to communicate how we evaluate the opportunities and challenges in our operating environment, which shape our approach to setting strategy, managing risk and governing our actions. The priorities of our key stakeholders impact the way we approach long-term value creation, including addressing key sustainability priorities. We continue to integrate sustainability-related information into our corporate reporting framework, including reporting our Scope 1 and 2 GHG emissions, in this annual report.
| 01 Our company Outlines who we are as a company, where we operate, how we create value and describes each of our operating segments
12 | How we create value 14 | Global profile 16 | Operating segments
|
03 Strategy Describes our corporate strategy and how each of our operating segments is supporting that strategy
30 | Nutrien’s strategy 31 | Operating segment focus 35 | Capital allocation |
05 Key enterprise risks Outlines the key risks that could affect our performance and our future operations
44 | Key enterprise risks
06 Results Highlights our financial results for the year 2023 and guidance for 2024
52 | Operating segment performance 64 | Performance against 2023 targets 65 | 2024 Guidance and sensitivities 66 | Annual financial information |
||||||||||
|
|
04 Governance Describes our key corporate governance principles and risk management process
40 | Corporate governance 41 | Board and executive leadership 42 | Risk governance 43 | Risk management process |
|||||||||||
|
02 Operating environment Defines factors and trends that influence the environment we operate in and outlook for 2024
20 | Megatrends 23 | Market fundamentals and outlook |

|
| Nutrien Annual Report 2023 | 9 |

| Overview | MD&A
|
Five-year highlights | Financial statements and notes | |||||||||
| Our company | ||||||||||||
| Operating environment | ||||||||||||
| Strategy | ||||||||||||
| Governance | ||||||||||||
| Key enterprise risks | ||||||||||||
| Results | ||||||||||||
|
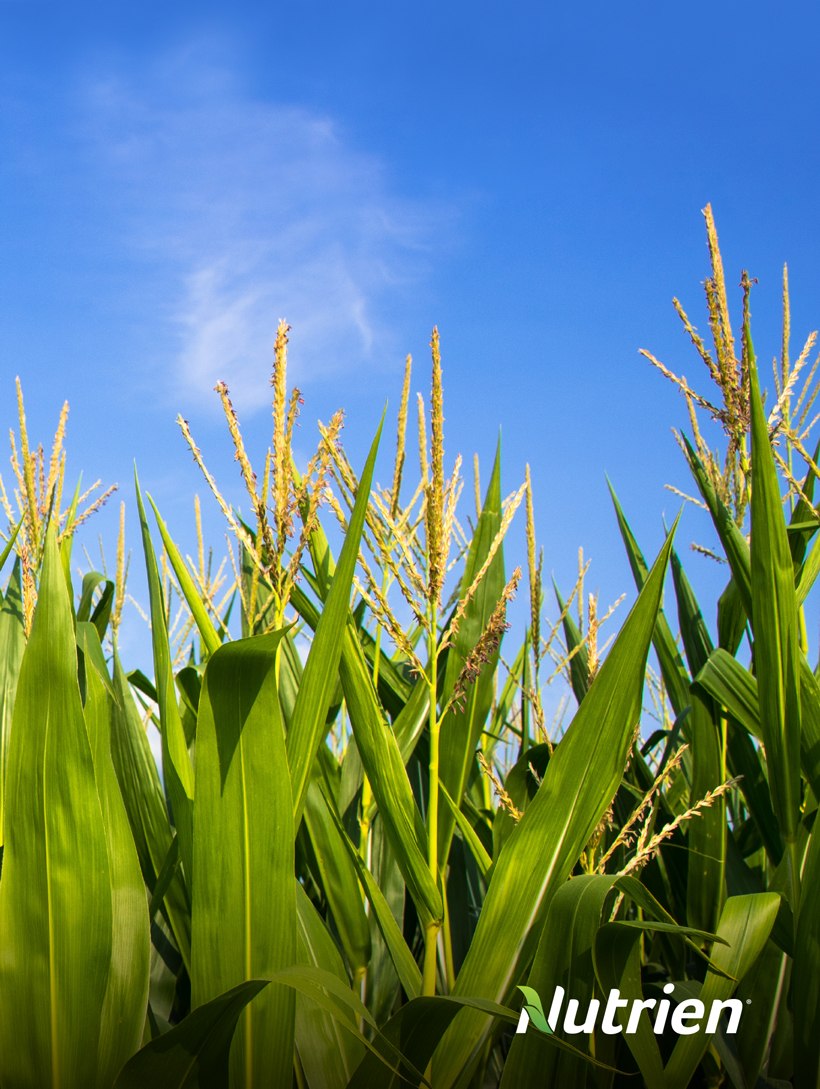
Alberta, Canada
Wheat is a staple food for 35 percent of the world’s population. Canada is a top exporter of wheat to approximately 60 countries worldwide. Nutrien operates 10 fertilizer production facilities in Western Canada and serves growers from our 275 Retail selling locations on the Canadian prairies. |
| Nutrien Annual Report 2023
|
11 |
| Overview | MD&A |
Five-year highlights | Financial statements and notes | |||||
| Our company | ||||||||
Our integrated business provides a number of advantages compared to our competitors, including operational, financial and sustainability opportunities. We continue to explore ways to further enhance the capabilities of our business to capture additional benefits across the agriculture value chain.
|
1 | Advantaged position across the ag value chain
Our integrated business provides competitive advantages to optimize operations, transportation and logistics, increase supply chain efficiencies, support volume growth, and be the key connection with the grower. |
|
|||
| World-class production assets | Global supply chain | Leading ag retail network | ||||||
| 26Mmt
|
~460
|
>2,000
|
||||||
| NPK manufactured sales volumes in 2023 | wholesale fertilizer distribution points |
Retail selling locations across North America, South America and Australia |
||||||
| ~2,000
|
>1,000
|
>4,000
|
||||||
| proprietary products | crop input suppliers | crop consultants | ||||||
| 12 | Nutrien Annual Report 2023 |
| Overview | MD&A |
Five-year highlights | Financial statements and notes | |||||
| Our company | ||||||||
|
2 | Proven financial strength and stability
Our diversified Retail business enhances the stability of our earnings base and our low-cost fertilizer production assets have historically generated significant cash flow, providing the ability to invest in our business and return meaningful capital to our shareholders. |
|
| Substantial cash generation | Balanced approach to capital allocation (2019-2023) | |||
|
$4.8B
annual average cash provided
by |
(percent)
|
|
3 | Provider of sustainable agriculture solutions
Positioned to drive long-term value creation
through integration of |

|
| Carbon sequestration
|
Sustainability program
|
Collaborative partnerships
|
||||||
| 400K | 900K | Value chain collaborator |
||||||
| tonnes CO2 permanently sequestered | sustainable agriproduct | |||||||
| from our operations in 2023 | program acres | to advance sustainable agriculture
|
| Nutrien Annual Report 2023 | 13 |
| Overview | MD&A |
Five-year highlights | Financial statements and notes | |||||
| Our company | ||||||||
|
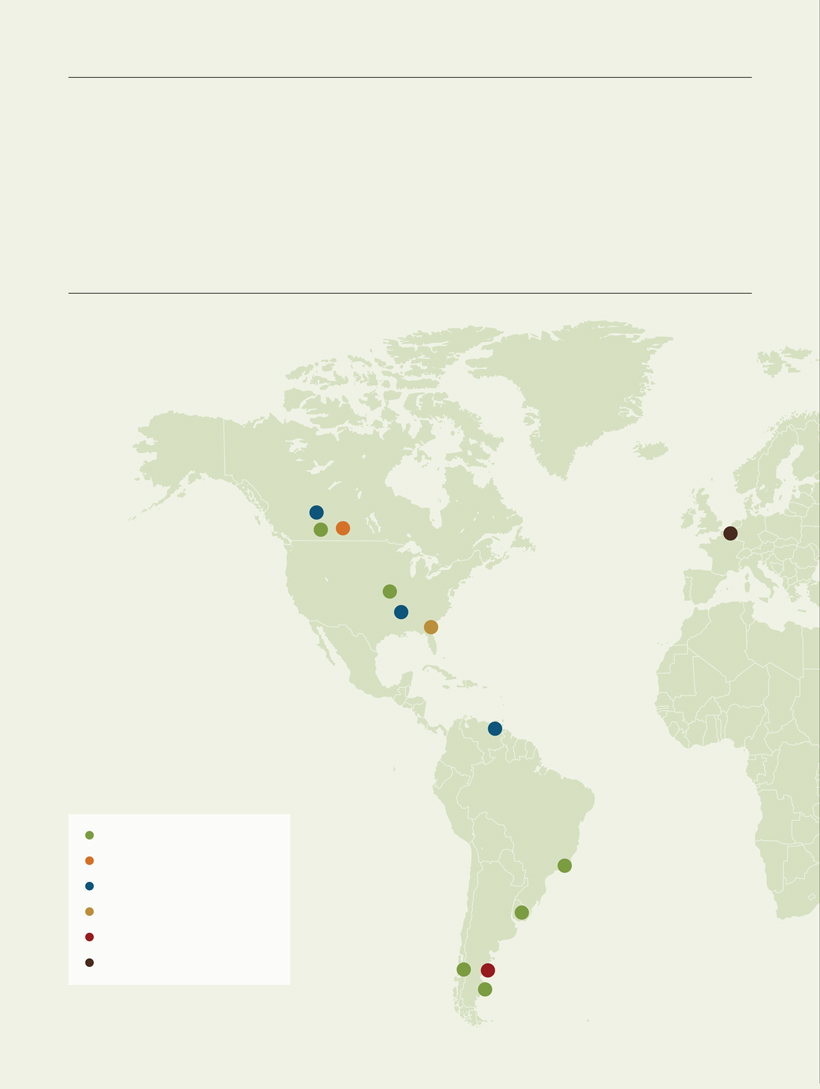
Our world-class fertilizer manufacturing assets are primarily located in North America, with access to high-quality resources, lower cost inputs and an extensive distribution network to efficiently supply our customers. Our Retail business serves growers in key agricultural markets in North America, South America and Australia. |
| 6 | 13 | |||||||
| Potash mines in Saskatchewan |
Nitrogen production and upgrade facilities in North America and Trinidad |
| 1,475 | 6 | |||||||
| Retail selling locations in North America | Phosphate production and upgrade facilities in the US |
| Retail
|
250 Retail selling locations in South America |
|
| Potash
|
||
|
Nitrogen
|
||
|
Phosphate
|
||
|
Joint venture and investments
|
||
|
European distribution
|
||
| 14 | Nutrien Annual Report 2023
|
| Overview | MD&A |
Five-year highlights | Financial statements and notes | |||||
| Our company | ||||||||
| $19.5B | $3.8B | $3.8B | $1.7B | |||
| Net sales 1 | Net sales 1,2 | Net sales 1,2 | Net sales 1,2 | |||
| $1.5B | $2.4B | $1.9B | $0.5B | |||
| Adjusted | Adjusted | Adjusted | Adjusted | |||
| EBITDA 1 | EBITDA 1 | EBITDA 1 | EBITDA 1 | |||
| 17,000 | 3,200 | 1,700 | 1,500 | |||
| Number of | Number of | Number of | Number of | |||
| employees 3 | employees 3 | employees 3 | employees 3 | |||
| 1 | For the fiscal year ended December 31, 2023. |
| 2 | Related to manufactured products for Potash, Nitrogen and Phosphate. |
| 3 | As at December 31, 2023. |
| 385 | ||
| Retail selling locations in Australia |
||
| Nutrien has four reportable operating segments: Retail, Potash, Nitrogen and Phosphate. The Retail segment distributes crop nutrients, crop protection products, seed and merchandise, and provides services, including financing, directly to growers through a network of Retail selling locations in North America, South America and Australia. The Potash, Nitrogen and Phosphate segments are differentiated by the chemical nutrient contained in the products that each produces.
|
||
| Nutrien Annual Report 2023
|
15 |
| Overview | MD&A |
Five-year highlights | Financial statements and notes | |||||
| Our company | ||||||||
Nutrien has four reportable operating segments: Retail, Potash, Nitrogen and Phosphate. We are the world’s premier retailer of crop inputs and services and operate the largest global network of fertilizer production and distribution assets.

|
| | Retail | #1 Global ag retailer | ||
Our global Retail network of over 2,000 selling locations in seven countries provides growers with a comprehensive portfolio of value-added agronomic products and services that includes crop nutrients, crop protection products, seed and application services. The size and scale of our network provides reach and flexibility to reliably serve our customers throughout the growing season. We are focused on building leading digital capabilities that support data-driven insights to more efficiently serve our grower customers and offer competitive credit products that meet their crop input financing needs.
We produce an innovative portfolio of approximately 2,000 proprietary crop nutrient, crop protection and seed products. These proprietary products generate a
higher margin for Nutrien and enhance crop production efficiency and profitability for the grower. We are a leading provider of plant nutritional products, including biostimulants, which aim to increase crop yields through enhanced nutrient efficiency and improved plant and soil health outcomes.
Over 4,000 crop consultants support our grower customers in crop planning, seed selection, soil sampling, variable rate fertilizer application and crop monitoring. Our agronomic tools and expertise combined with our broad portfolio of value-added products supports on-farm sustainability, enabling grower adoption of products and practices that maximize productivity and minimize environmental impacts.

|
| | Potash | #1 Global potash producer | ||
We operate six low-cost potash mines in Saskatchewan, which have access to the best potash geology in the world and are located in a stable geopolitical environment, minimizing supply risk for our customers. We produce multiple grades of potash and our flexible network provides the ability to efficiently adjust operating capability in response to changing market conditions.
Our extensive North American transportation and distribution network includes approximately 5,900 owned or leased railcars serviced by multiple railway providers.
Through Canpotex – our joint venture potash export, sales and marketing company – we have access to four North American marine terminals and other facilities as needed to export potash to customers in approximately 40 countries around the world.
Our engagement practices help in building relationships and supporting our communities, including the procurement of materials and supplies from over 35 Indigenous owned and operated businesses.
| 16 | Nutrien Annual Report 2023 |
| Overview | MD&A |
Five-year highlights | Financial statements and notes | |||||
| Our company | ||||||||

|
| | Nitrogen | #3 Global nitrogen producer | ||
We produce nitrogen at nine strategically located production facilities throughout Canada, the US and Trinidad and operate four regional product upgrade sites in North America. Our North American operations, which account for approximately 85 percent of our Nitrogen sales volumes, have access to some of the lowest cost natural gas in the world and are well positioned to serve agriculture and industrial markets. Our Trinidad operations support sales to approximately 30 countries and have natural gas supply contracts indexed to ammonia prices.
We produce a diverse portfolio of nitrogen products and have flexibility to optimize product mix in changing
market conditions. Our transportation and distribution network leverages truck, rail, pipeline, barge and marine vessel modes, including direct access to tidewater in both the US and Trinidad.
We leverage CCUS at two of our facilities and have captured and sold at least 1 million tonnes of CO2 annually for the last five years. We continue to support our grower customers to reduce their environmental impact by expanding our portfolio of manufactured products, including enhanced efficiency fertilizers such as ESN®.

|
| | Phosphate | #2 North American phosphate producer | ||
Nutrien has two large integrated phosphate production facilities and four regional product upgrade sites in the US. Our high-quality phosphate rock enables production of a diverse mix of phosphate products, including solid and liquid fertilizers, feed and industrial acids. We are the largest producer of purified phosphoric acid in North America and sell the majority of our product in this market, benefiting from our extensive distribution network and customer relationships.
We have a strong focus on environmental stewardship, reclaiming thousands of acres of mined land every year to useful purposes, remediating soil and groundwater including the planting of over half a million trees in 2023, and reducing environmental risks through our commitment to sustaining our assets at the highest level.
| Nutrien Annual Report 2023 | 17 |

| Overview | MD&A
|
Five-year highlights | Financial statements and notes | |||||
| Our company | ||||||||
| Operating environment | ||||||||
| Strategy | ||||||||
| Governance | ||||||||
| Key enterprise risks | ||||||||
| Results | ||||||||
|
Paraná, Brazil
Brazil is one of the largest and fastest growing agriculture markets in the world. The country produces over 150 million tonnes of soybeans annually, which requires a significant amount of potash. Brazil was the largest market for Canpotex potash sales in 2023.
|
||||||||
| Nutrien Annual Report 2023
|
19 |
| Overview | MD&A |
Five-year highlights | Financial statements and notes | |||||
| Operating environment | ||||||||
We define megatrends as emerging macro-level trends and global dynamics that we believe will have ongoing impacts on business, government and society that are expected to shape our operating environment over the next decade. Tracking and analyzing megatrends informs Nutrien’s strategy. See page 28 for more information on our related strategy and page 44 for our related key enterprise risks.
| Food security
Despite advances in modern agriculture, food security remains a global challenge. Producing enough nutritious food for the world’s eight billion people, and transporting it to where it is needed, is straining existing global resources. It is estimated that over 10 percent of the world’s population is food insecure. A rising population, expected to grow by close to two billion people by 2050, is further increasing the scale of this challenge.
The agricultural landscape continues to evolve and be influenced by sustainability practices, climate change and social trends that could impact the ability to address global food security challenges. Nutrien is well positioned to develop innovative products and solutions to help our customers feed a growing population while addressing the environmental and social challenges the agriculture industry is facing.
Related enterprise risks:
– Agricultural changes and trends
– Climate change
– Stakeholder support |
|
| 20 | Nutrien Annual Report 2023 |
| Overview | MD&A |
Five-year highlights | Financial statements and notes | |||||
| Operating environment | ||||||||
|
Climate change
Our business, industry, customers and other stakeholders in the agriculture value chain face long-term challenges related to climate change, including increasing expectations for climate actions and reductions of GHG emissions.
Physical risks from a changing climate can impact our operations, our customers and our supply chain. These include more intense weather events, longer droughts, rising sea levels, and changes in average temperature and precipitation patterns. Global decarbonization ambitions and the resulting energy transition are driving carbon regulations and informing capital allocation priorities of investors.
Nutrien faces evolving challenges related to potential regulatory changes, including carbon pricing. At the same time, a transition to a low-carbon economy could create significant opportunities for Nutrien to help growers manage these impacts and improve their resilience by facilitating the adoption of climate-smart agriculture practices and developing products that can improve yields in more challenging conditions. The energy transition is accelerating the development of technologies that can support our GHG emission reduction efforts.
Related enterprise risks:
– Climate change
|
Technology and digitalization
Digital technologies and access to vast amounts of data are supporting the transformation of our industry and Nutrien. In mining operations, advances in automation and autonomous mining are improving safety by removing workers from the more hazardous areas and enabling productivity increases. Agriculture and food systems are undergoing technological changes driven by big data, digital connectivity, artificial intelligence and innovations in biotechnology.
The regulatory environment around artificial intelligence continues to evolve across multiple jurisdictions. This evolution can cause uncertainty as to how these tools could be deployed and leveraged, how privacy and security safeguards will be incorporated, and levels of investment in innovation.
We also have an opportunity to help turn data into insights for our grower customers, and for our grower customers to turn those insights into actions, which presents further opportunities through the agriculture value chain.
The proliferation of technology and data also creates increased risks to our information systems and customer data. Our dependence on technology may contribute to cyber-related events becoming more disruptive and costly. As we gather increasingly more data from our customers, we are continually evolving our practices to align with data security and privacy regulations.
Related enterprise risks:
– Cybersecurity threats
– Agricultural changes and trends |
| Nutrien Annual Report 2023 | 21 |
| Overview | MD&A |
Five-year highlights | Financial statements and notes | |||||
| Operating environment | ||||||||
|
Geopolitical volatility
Geopolitical turmoil around the world is being driven by nationalism, polarization and economic instability. Due to globalization, regional events are having global impacts. In particular, the continued war in Eastern Europe and the more recent escalation of tensions in the Middle East have resulted in, and may continue to result in, supply chain disruptions and price volatility for energy and several commodities.
Global geopolitical instability and resulting disruptions could impair our ability to distribute our products in a cost-effective and timely manner to our customers or disrupt our supply chains. If significant geopolitical events occur in one of the countries where we have significant operations, the impact could be more direct and affect our operations, production or revenues. Conversely, disruptions in markets could result in improvements to our financial performance through increased market share or higher sales.
Related enterprise risks:
– Political, economic and
social instability |
Societal expectations
Stakeholders are increasingly focused on corporate sustainability performance and disclosure. Investors are considering environmental and social principles alongside traditional financial metrics in capital allocation decisions and, along with regulators, are considering those principles in evaluating disclosure enhancements. In addition to climate-related matters, societal concerns include impacts on ecosystems and biodiversity, as well as challenges faced by underrepresented groups inside and outside of the workplace.
In response to these expectations, governments may impose new regulations or increase the stringency of existing ones. If we are not able to meet stakeholder expectations for environmental and social performance and disclosure, it could be more difficult to access cost-efficient capital, retain talent or maintain our freedom to operate.
Nutrien believes that our response to these trends will not only help to address some of the world’s most pressing challenges but also create opportunities to differentiate ourselves from our competitors. Delivering on our sustainability commitments can attract new investors, support internal engagement, and help attract and retain talent.
Related enterprise risks:
– Changing regulations
– Stakeholder support
– Talent and organization culture |
| 22 | Nutrien Annual Report 2023 |
| Overview | MD&A |
Five-year highlights | Financial statements and notes | |||||
| Operating environment | ||||||||
Market fundamentals and outlook
We carefully monitor market fundamentals and our competitive landscape in order to anticipate and adapt to the environment in which we operate. Understanding our operating environment and expectations for the future positions us to better identify and manage risks that could jeopardize our ability to deliver on our strategy and capitalize on emerging opportunities.
|
|
|
|
||||

|
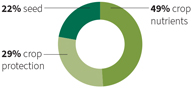
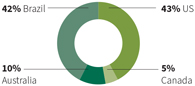
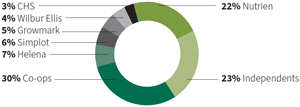
Retail | Crop input sales by product (2023) 1 | Crop input sales by region (2023) 1 | |||
| (percent) | (percent) | |||||
|
$130B
2023 total market crop |
|
|
||||
| Source: USDA, StatsCan, ABARES, Conab, IMEA, AgbioInvestor, Nutrien | Source: USDA, StatsCan, ABARES, Conab, IMEA, AgbioInvestor, Nutrien | |||||
|
|
|
|
||||

|
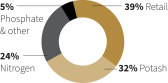
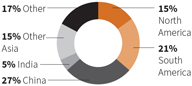
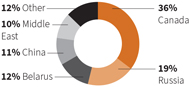
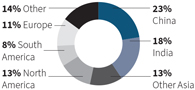
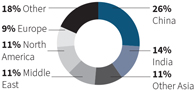
Potash | Global potash demand (2023) | Global potash production (2023) | |||
| (percent) | (percent) | |||||
| 67-68Mmt
2023 global potash (KCI) demand |
|
|
||||
| Source: CRU | Source: CRU | |||||
|
|
|
|
||||

|
Nitrogen | Global nitrogen demand (2023) | Global nitrogen production (2023) | |||
| (percent) | (percent) | |||||
|
~155Mmt
2023 global nitrogen (N) demand |
|
|
||||
| Source: SPGCI | Source: SPGCI | |||||
|
|
|
|
||||

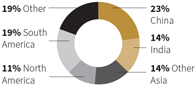
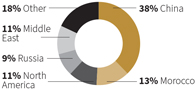
|
Phosphate | Global phosphate demand (2023) | Global phosphate production (2023) | |||
| (percent) | (percent) | |||||
|
~51Mmt
2023 global phosphate |
|
|
||||
| Source: CRU | Source: CRU | |||||
| 1 | Represents total market sales of seed, fertilizer and crop protection products in the US, Canada, Australia and Brazil. |
| Nutrien Annual Report 2023 | 23 |
| Overview | MD&A |
Five-year highlights | Financial statements and notes | |||||
| Operating environment | ||||||||

|
Retail |
Market fundamentals
Total crop protection, seed and fertilizer sales in our major Retail operating regions equated to approximately $130 billion in 2023. As the need to feed the world’s population increases, growers are challenged to sustainably increase yields from a finite arable land base. This drives growth in demand for crop inputs and agronomic services.
The agriculture retail industry is highly fragmented in most of the major markets in which we operate, primarily composed of small and medium-sized competitors. Scale, reliability of supply and the ability to provide innovative products and solutions, including digital offerings that support sustainable agriculture, are increasingly important to growers.
In North America, the largest crops grown include canola, corn, cotton, soybean and wheat. It is a more mature market with growers leveraging advanced agriculture tools and who are willing and able to invest in high-value products and services.
In Australia, growers require a full suite of crop production inputs but also solutions for livestock, water and irrigation services.
Brazil is one of the world’s largest and fastest growing agriculture markets. It is currently the largest soybean producer and the third largest producer of corn globally. Its retail industry is highly fragmented, and there remains opportunity for investment and adoption of more advanced products and services at the grower level.
Market outlook
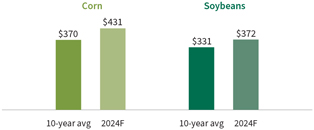
Global grain stocks-to-use ratios remain historically low going into the 2024 growing season as tightening supplies of wheat and rice have offset increased corn supplies in the US and Brazil. We expect weather and geopolitical issues will continue to impact grain and oilseed production, exports and inventory levels.
Crop prices have declined from historically high levels in 2022, but lower crop input prices have resulted in improved demand, evidenced
by the strong North American fall application season in 2023. We expect US corn plantings to range from 91 to 92 million acres in 2024 and soybean plantings to range from 87 to 88 million acres.
In Brazil, dry weather during the summer crop growing season and lower corn prices could result in lower corn area in 2024. Brazilian growers are expected to continue to expand soybean acreage, which we anticipate will support the need for strong fertilizer imports in the second and third quarters of 2024.
In Australia, growers have benefited from multiple years of above-average yields and fundamentals remain supportive entering 2024. Timely precipitation led to higher-than-expected winter crop production, however if the El Niño weather pattern continues, it could pose a risk for the 2024 growing season.
|
US ag retail industry profile (2023)
(percent) |
US grower cash production margins 1
(US$ margin per acre) |
|||
|
|
|||
| Source: Croplife | Source: CRU, Fertecon, USDA, Bloomberg, Nutrien
1 Forecasts use the December 2024 corn and November 2024 soybean futures contracts as of January 30, 2024. |
|||
| 24 | Nutrien Annual Report 2023 |
| Overview | MD&A |
Five-year highlights | Financial statements and notes | |||||
| Operating environment | ||||||||

|
Potash |
Market fundamentals
Potash strengthens root systems including water uptake, drought and disease tolerance and increases the uptake of other nutrients – all important in volatile growing conditions. Potash demand growth is driven by increasing nutrient requirements of higher-yielding crops and improving soil fertility practices, particularly in emerging markets where potash has been historically under-applied and crop yields lag.
High-quality potash reserves in significant quantities are limited to a small number of countries. Canada has the largest known global potash reserves, accounting for approximately 40 percent of the total. More than 75 percent of the world’s potash capacity is held by the six largest producers.
Building new production capacity requires significant capital and time to bring online. Brownfield projects have a significant per- tonne capital cost advantage over greenfield projects.
Most major potash-consuming countries in Asia and Latin America have limited or no production capability and rely on imports to meet their needs. Trade typically accounts for approximately three-quarters of demand for potash, resulting in a globally diversified marketplace.
Market outlook
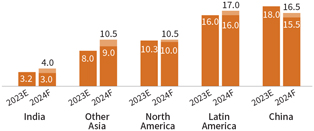
Global potash demand was strong through the second half of 2023, and we estimate full-year shipments were between 67 to 68 million tonnes. The increase was supported by strong consumption and increased imports in key markets such as North America, China and Brazil.
We expect global potash demand will continue to recover towards trend levels in 2024 with full-year shipments projected between
68-71 million tonnes. We anticipate a relatively balanced global market with incremental supply
from producers in Canada, Russia, Belarus and Laos.
We are seeing strong potash demand ahead of the North American spring application season as channel inventories were tight to start the year. Potash demand in Southeast Asia is expected to increase significantly in 2024 due to much lower inventory levels compared to the prior year and favorable economics for key crops such as oil palm and rice. We expect lower potash imports from China compared to the record levels in 2023 but for demand to remain at historically high levels driven by increased consumption.
|
Global potash demand
(millions of tonnes KCl) |
Potash demand in key regions
(millions of tonnes KCl) |
|||
|
|
|
|||
| Source: IFA, Argus, CRU, Nutrien | Source: Industry Consultants, Nutrien | |||
| Nutrien Annual Report 2023 | 25 |
| Overview | MD&A |
Five-year highlights | Financial statements and notes | |||||
| Operating environment | ||||||||

|
Nitrogen |
Market fundamentals
Nitrogen is an essential crop nutrient and is a fundamental building block of plant proteins that improve both crop yield and quality. The necessity of nitrogen for crop yield supports a strong and growing demand source for nitrogen fertilizers. Additionally, nitrogen is used as an input in many industrial processes and has the potential to provide further value as markets for low-carbon ammonia emerge.
Production of nitrogen products is the most geographically diverse of the three primary crop nutrients due to the widespread availability of hydrogen sources. Access to reliable and competitively priced energy feedstock supply is an important driver of profitability, as recent geopolitical events have created additional volatility in certain global energy markets. North American nitrogen producers currently have an advantaged cost position due to
the relatively low price of natural gas compared to competitors in Europe and Asia.
The US remains one of the largest importers of nitrogen products and a key driver of global trade despite a significant increase in domestic capacity and production over the past decade. China and India are the largest-consuming countries of nitrogen products, accounting for approximately 40 percent of the world’s consumption.
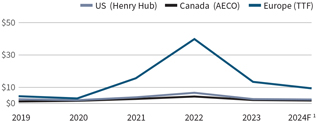
Market outlook
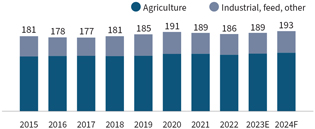
We expect nitrogen supply constraints to persist in 2024, including limited Russian ammonia exports, reduced European operating rates and Chinese urea export restrictions. North American natural gas prices remain highly competitive compared to Europe and Asia, and we expect Henry Hub natural gas prices to average approximately $2.50 per MMBtu for the year.
The US nitrogen supply and demand balance is projected to be tight ahead of the spring application season, as nitrogen fertilizer net imports in the first half of the 2023/2024 fertilizer year were down an estimated 55 percent compared to the three-year average. Global industrial nitrogen demand remains a risk in 2024 as industrial production, most notably in Europe and Asia, has yet to rebound to historical levels.
|
Global ammonia demand
(millions of tonnes) |
Natural gas prices in key regions
(US$ per MMBtu) |
|||
|
|
|||
| Source: SPGCI | Source: ICE, CME, Nutrien
1 Futures prices as of February 7, 2024. AECO based on US Henry Hub forecast less $1.00/MMBtu of basis. |
|||
| 26 | Nutrien Annual Report 2023 |
| Overview | MD&A |
Five-year highlights | Financial statements and notes | |||||
| Operating environment | ||||||||

|
Phosphate |
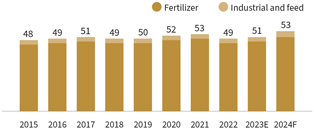
Market fundamentals
Phosphorus is essential to all living things and is key to energy reactions in the plant, particularly photosynthesis, and vital to plant growth. Demand for phosphate fertilizers has steadily increased over the last 20 years. Additionally, phosphate is used as an input in many feed and industrial processes.
Phosphate rock is found in significant quantity and quality in only a handful of geographic locations. Given the concentration of deposits in North Africa and the Middle East, government involvement is a major consideration when evaluating potential phosphate project developments.
The majority of new phosphate fertilizer supply over the past
decade was from producers in China, Morocco, Russia and Saudi Arabia. As a result, total US phosphate production declined by approximately 30 percent over this period.
China’s trade policy has a major impact on the global phosphate market. In 2023, Chinese DAP/MAP exports were down approximately 30 percent from 2021 levels as a result of export restrictions.
India and Brazil are the largest importers of phosphate fertilizers, with limited domestic production. In more mature markets like North America, we have seen continued demand growth for phosphate fertilizers that incorporate secondary nutrients and micronutrients like Nutrien’s MAP+MST product.
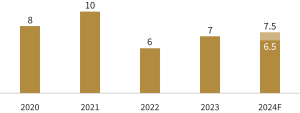
Market outlook
Phosphate fertilizer markets have remained relatively strong in the first quarter of 2024, particularly in North America where channel inventories were low entering the year. We expect Chinese phosphate export restrictions to be similar to 2023 levels and tight stocks in India to support demand ahead of their key planting season.
|
Global P2O5 demand
(millions of tonnes) |
China DAP/MAP exports
(millions of tonnes) |
|||
|
|
|||
| Source: CRU | Source: CRU, Argus, Nutrien | |||
| Nutrien Annual Report 2023 | 27 |

| Overview | MD&A | Five-year highlights | Financial statements and notes | |||||||
| Our company | ||||||||||
| Operating environment | ||||||||||
| Strategy | ||||||||||
| Governance | ||||||||||
| Key enterprise risks | ||||||||||
| Results | ||||||||||
|
Victoria, Australia
|
||||||||||
|
Canola is Australia’s major oilseed crop. Grown in Australia’s Grain Belt, canola production has increased significantly to an average of 3 million tonnes per year. Nutrien has 385 Retail selling locations in Australia to support growers of many different crops, including canola. |
||||||||||
| Nutrien Annual Report 2023
|
29 |
| Overview | MD&A |
Five-year highlights | Financial statements and notes | |||||
| Strategy | ||||||||
Our vision is to be the leading global integrated agriculture solutions provider, delivering superior shareholder value through sustainable operations. In pursuit of our vision, we utilize our integrated business to optimize enterprise value by enhancing our core business, allocating capital to high-value strategic investments and progressing initiatives that fortify our business for the future.

|

|

|
||||||||||
| Enhance | Advance | Fortify our | ||||||||||
| our core | high-value | business | ||||||||||
| business | strategic | for the | ||||||||||
| initiatives | future | |||||||||||
|
Increase operational efficiency and asset utilization, maximize cost savings, and focus on integration and investments that enhance margins and free cash flow. |
|
Allocate capital to high-value and high-conviction investments that generate significant long-term returns for our shareholders. |
Focus on initiatives that reduce GHG emissions, enhance on-farm environmental performance, invest in our people and procurement programs, and position our Company to sustainably deliver on our current and future business needs. |
|||||||||
| 30 | Nutrien Annual Report 2023 |
| Overview | MD&A |
Five-year highlights | Financial statements and notes | |||||
| Strategy | ||||||||
|
|
Achieve best-in-class commercial execution, rationalize costs and maximize network efficiencies and integration synergies |
|||||||
| Business optimization |
Key 2023 activities |
|||||||
| • Centralized and modernized five locations in our core markets, allowing us to serve the customer more safely and efficiently |
||||||||
| • Paused our expansions and acquisitions in Brazil, focusing on integrating recently acquired businesses |
||||||||
|
|
Enhance our core business |
• Optimized our North American footprint through the closure and consolidation of 10 locations |
||||||
|
|
Prioritize digital capability development that supports our core business offering, improves decision-making, drives efficiency and enhances our grower value proposition |
|||||||
| Digital innovation |
Key 2023 activities |
|||||||
| • Launched a digitally enabled financing platform in Australia, enhancing our grower value proposition |
||||||||
|
|
Enhance our core business |
• Empowered our grower customer financial operations with new digital decision-making tools through advancements to our digital innovation in North America
|
||||||
|
|
Grow earnings and share in core geographies through targeted network expansion and investment in high growth categories, such as biological product technologies |
|||||||
| Targeted expansion and proprietary products |
Key 2023 activities |
|||||||
| • Contributed $1.0 billion in gross margin from our global proprietary products portfolio, with growth of 6 percent per year over the last five years |
||||||||
| • Continued to extract value from our innovation pipeline, realizing over $750 million in global proprietary plant nutrition and biostimulant sales in 2023 |
||||||||
|
|
Advance high-value strategic initiatives |
• Completed 23 acquisitions in our core Retail markets |
||||||
|
|
Development of scalable sustainability programming, featuring solutions that improve grower productivity and efficiency and generate value for Nutrien and our diverse group of partners |
|||||||
| Sustainability |
Key 2023 activities |
|||||||
| • Doubled our sustainably engaged acres to two million, continuing integration of our high-value products and services into our outcome-based sustainability programming |
||||||||
|
|
Fortify our business for the future |
• Generated first verified GHG offsets and insets from our sustainability programming, creating opportunities for deeper value-chain collaboration and partner connectivity
|
||||||
|
|
|
|||||||
| Nutrien Annual Report 2023 | 31 |
| Overview | MD&A |
Five-year highlights | Financial statements and notes | |||||
| Strategy | ||||||||

|
Potash strategic priorities |
We are utilizing our world-class Potash network and integrated supply chain to respond to market supply and demand dynamics. We continue to invest in efficiency and new technologies to manage our costs, optimize and modernize our asset base, advance our sustainability commitments, and preserve the reliability and safety of our operations. |
|
|
Deliver initiatives that improve safety, reduce costs, increase network flexibility and improve our environmental footprint |
|||||||
| Operational excellence |
Key 2023 activities | |||||||
| • Increased annual ore tonnes cut using autonomous mining by 40 percent and continue to scale these technologies across our network |
||||||||
| • Completed ore recovery projects alongside other efficiency related initiatives to maintain an advantaged global cost position and reduce waste |
||||||||
|
|
Enhance our core business |
|||||||
|
|
Pursue opportunities that promote growth and strengthen the channel to our customers |
|||||||
| Supply chain optimization |
Key 2023 activities |
|||||||
| • Enhanced value of our integrated business by sourcing a significant majority of Retail’s North American supply needs from our six potash mines in Saskatchewan |
||||||||
|
|
Enhance our core business |
|||||||
|
Leverage flexibility and |
Ensure a flexible go-to-market strategy that responds to variable conditions, satisfies demand requirements and optimizes long-term value as the market grows
|
|||||||
| Key 2023 activities | ||||||||
| • Paused the accelerated ramp-up of our annual potash production capability to 18 million tonnes in response to market conditions and continued to advance certain in-flight projects to maximize value of capital spent and support long-term growth |
||||||||
|
|
Advance high-value strategic initiatives |
|||||||
|
|
Action our workforce strategy to deliver talent and skills for tomorrow and support our future needs |
|||||||
| Strengthen our
|
Key 2023 activities |
|||||||
| • Executed attraction and retention initiatives that strengthen our workforce and support diversity and inclusion, including local and Indigenous partnerships |
||||||||
|
|
Fortify our business for the future |
|||||||
|
|
|
|||||||
| 32 | Nutrien Annual Report 2023 |
| Overview | MD&A |
Five-year highlights | Financial statements and notes | |||||
| Strategy | ||||||||

|
Nitrogen strategic priorities |
We are enhancing our strategically positioned Nitrogen business through investment projects that improve the reliability and energy efficiency of our facilities while selectively increasing capacity and product mix flexibility. We are unwavering in our pursuit of safe, reliable and efficient operations while continuing to leverage process and product innovations to proactively address sustainability needs. |
|
|
Maintain globally competitive position, increasing product mix flexibility and improving reliability, efficiency and supply chain performance |
|||||||
| Operational |
Key 2023 activities | |||||||
| • Completed major maintenance turnarounds at our Geismar and Borger sites, addressing reliability needs and increasing efficiency |
||||||||
| • Completed initial construction and technology development of our Nitrogen Real-time Operations Center, providing troubleshooting, monitoring and optimization support across our entire network of 13 nitrogen production and upgrade facilities |
||||||||
|
|
Enhance our core business |
|||||||
|
|
Selectively invest in high-conviction, high-return growth opportunities in North America, supporting the needs of the market
|
|||||||
| Invest in our North American assets |
Key 2023 activities | |||||||
| • Expanded our Geismar facility, adding incremental ammonia and nitric acid production capacity |
||||||||
| • Completed UAN debottleneck projects at our Geismar site, allowing for the expansion of production as additional nitric acid capacity projects planned for 2024 are completed |
||||||||
|
|
Advance high-value strategic initiatives |
• Suspended work on our Geismar clean ammonia plant as we monitor cost estimates and the evolving market for clean ammonia
|
||||||
|
|
Maintain position as an industry leader in low-carbon nitrogen production and continue to leverage process and product innovations to proactively address sustainability needs
|
|||||||
| Sustainability outcomes |
Key 2023 activities | |||||||
| • Completed our GHG Phase 1 abatement program, including the CO2 tie-in at our Redwater plant and an N2O abatement project at Geismar |
||||||||
|
|
Fortify our business for the future |
• Increased our low-carbon ammonia production capability to 1.2 million tonnes across our Geismar, Redwater and Joffre sites
|
||||||
|
|
|
|||||||
| Nutrien Annual Report 2023 | 33 |
| Overview | MD&A |
Five-year highlights | Financial statements and notes | |||||
| Strategy | ||||||||

|
Phosphate strategic priorities |
We are optimizing our phosphate business by continuing to focus on safety, sustainability and operating efficiencies, while leveraging our product mix and adapting to market conditions. |
|
|
Increase base business efficiency through reliability and efficiency improvements
|
|||||||
| Operational |
Key 2023 activities | |||||||
| • Completed maintenance turnarounds at both Aurora and White Springs sites focused on key reliability improvements |
||||||||
|
|
Enhance our core business |
• Achieved a 3 percent improvement to our preventative maintenance compliance metric, a key leading reliability indicator
|
||||||
|
Premium |
Maximize value via flexibility of product portfolio mix and focus on liquid fertilizer, feed, purified, and other premium product opportunities in North America
|
|||||||
| Key 2023 activities | ||||||||
| • Fulfilled 56 percent of sales volumes attributable to higher-margin products, including liquid fertilizer, feed and purified |
||||||||
|
|
Enhance our core business |
• Increased sales of our micronized sulfur dry phosphate product, MAP+MST by 125 percent compared to 2022 levels
|
||||||
|
Reclamation and environmental risk reduction |
Continue to advance reclamation efforts and proactively address environmental risks
|
|||||||
| Key 2023 activities | ||||||||
| • Planted over 500,000 trees and continued our land reclamation efforts at our Aurora and White Springs sites
|
||||||||
|
|
Fortify our business for the future |
|||||||
|
|
|
|||||||
| 34 | Nutrien Annual Report 2023 |
| Overview | MD&A |
Five-year highlights | Financial statements and notes | |||||
| Strategy | ||||||||
Our capital allocation framework prioritizes sustaining safe and reliable operations, a healthy balance sheet, strategically investing in our business, and providing meaningful returns to our shareholders through a stable and growing dividend and share repurchases. This balanced approach supports our strategy and enables us to enhance our core business, advance high-value strategic initiatives and fortify our business for the future.
|
|
Safe and reliable operations
|
• Sustain our assets to support safe and reliable operations
• Focus on continuous improvement initiatives and investments that enhance the utilization rates, reliability and efficiency of our assets |
||
|
|
Strong balance sheet
|
• Provide sufficient and flexible access to liquidity while optimizing the cost of our capital through the cycle
• Expect to maintain adjusted net debt/adjusted EBITDA leverage ratio below three times, through the cycle |
||
|
|
Shareholder returns
|
• Return capital to shareholders through a combination of stable and growing dividends and share repurchases
• Factor reduction in share count in the decision criteria for future dividend per share growth |
||
|
|
High-value growth opportunities
|
• Selectively invest in high-value and high-conviction opportunities that are expected to generate significant long-term returns
• Evaluate investment opportunities by strategic fit, project economics using various financial return metrics and sustainability factors to align with our 2030 commitments and targets |
||
| Nutrien Annual Report 2023 | 35 |
| Overview | MD&A |
Five-year highlights | Financial statements and notes | |||||
| Strategy | ||||||||
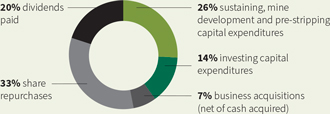
Capital allocation

|
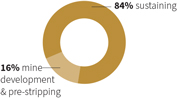
Safe and reliable operations
|
Sustaining, mine development and pre-stripping capital expenditures (2023)
(percent)
|
||||||
| Sustaining, mine development and pre-stripping capital expenditures 1 |
$1.7B 2023 |
|
||||||

|
Strong balance sheet
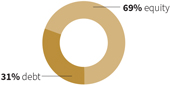
|
Debt and equity 4,5 (2023)
(percent)
|
||||||
| Adjusted Net Debt/ Adjusted EBITDA 2 | 1.9x 2023 |
|
||||||
|
|
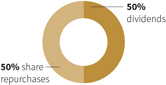
Shareholder returns
|
Cash used for dividends and share repurchases (2023)
(percent)
|
||||||
| Cash used for dividends and share repurchases 1 | $2.1B 2023 |
|
||||||
|
|
High-value growth opportunities
|
|||||||
| Investing capital expenditures 1 | $1.0B 2023 |
Investing capital expenditures 1 (2023)
(percent)
|
||||||
| Business acquisitions 3 |
$0.2B 2023 |
|||||||
| 1 | These are supplementary financial measures. See the “Other Financial Measures” section. |
| 2 | This is a capital management financial measure that includes a non-GAAP component. See the “Non-GAAP Financial Measures” and “Other Financial Measures” sections. |
| 3 | Net of cash acquired. |
| 4 | As at December 31, 2023. |
| 5 | Debt includes short-term debt, long-term debt and lease liabilities, including the current portions of each where applicable. |
| 36 | Nutrien Annual Report 2023 |
| Overview | MD&A |
Five-year highlights | Financial statements and notes | |||||
| Strategy | ||||||||
|
|
Key 2023 actions
• Completed reliability work and replaced key identified end-of-life assets across our operations, including major maintenance turnarounds and planned outages at five of our Nitrogen sites
• Invested in maintenance and safety-related initiatives for our Retail facilities |
|
|
|||
|
|
Key 2023 actions
• Maintained our BBB investment-grade credit rating
• Repaid $500 million in senior notes that matured during the year and issued a total of $1.5 billion of 5-year and 30-year senior notes
• Reduced planned capital expenditures by $300 million providing flexibility on capital allocation alternatives |
|
||||
|
|
Key 2023 actions
• Returned a total of $2.1 billion to shareholders through dividends and share repurchases
• Dividend provided an average yield of 3.3 percent in 2023
• In February 2024, we announced a 2 percent increase to our quarterly dividend to $0.54 per share, our sixth increase since 2018 |

|
||||
|
|
Key 2023 actions
• Completed 23 Retail acquisitions across the US, Australia and Brazil
• Invested in our Potash network including the procurement of additional autonomous mining machines and technology
• Completed Nitrogen brownfield expansion projects at our Geismar facility, increasing ammonia and nitric acid capability
• Invested in digital, proprietary products and sustainability related strategies to grow the business and reduce our environmental impact |
|
||||
| Nutrien Annual Report 2023 | 37 |

| Overview | MD&A
|
Five-year highlights | Financial statements and notes | |||||
| Our company | ||||||||
| Operating environment | ||||||||
| Strategy | ||||||||
| Governance | ||||||||
| Key enterprise risks | ||||||||
| Results | ||||||||
|
Bali, Indonesia
Indonesia is the world’s fourth largest producer of rice and is a key producer of oil palm, fruits and vegetables. Indonesia is one of the largest importers of potash, with strong growth prospects, which Nutrien is a key supplier through Canpotex. |
||||||||
| Nutrien Annual Report 2023
|
39 |
| Overview | MD&A |
Five-year highlights | Financial statements and notes | |||||
| Governance | ||||||||
Nutrien’s Corporate Governance Structure includes policies and processes that define the roles of the Board and the Executive Leadership Team (“ELT”). Our Board oversees risk management and the execution of our corporate strategy. Below are highlights of our corporate governance practices. For more information, see our most recent Management Information Circular.
Board diversity
Having a mix of directors on the Board from varied backgrounds and with a diverse range of experience and skills fosters enhanced decision-making capacity and promotes strong corporate governance. Our Board Diversity Policy includes a target that women comprise no fewer than 30 percent of the Board members. As of December 31, 2023, four of our directors were women (33 percent of the total number of directors).
Executive compensation
Nutrien’s compensation framework is based on a pay-for-performance philosophy, with the majority of executive compensation being at risk. Since 2020, a component of executive compensation has been tied to demonstrated sustainability performance, including the addition of progress on GHG emission reduction projects and
diversity-related metrics in 2021. Each year, we include an advisory “say on pay” vote at our annual meeting (in line with 2019 amendments in the Government of Canada’s Bill C-97).
Board skills
Our Board competencies and skills matrices are essential tools to evaluate whether the Board has the right skills, perspectives, experience and expertise for proper oversight and effective decision making. The Board regularly reviews the skills matrix.
| Core business skills 1
(percent of Board of Directors)
1 As disclosed in Nutrien’s 2023 Management Proxy Circular. |
Core industry experience 1
(percent of Board of Directors)
|
| 40 | Nutrien Annual Report 2023 |
| Overview | MD&A |
Five-year highlights | Financial statements and notes | |||||
| Governance | ||||||||
Board of Directors

|

|

|

|

|

|
|||||
| Russell Girling | Ken Seitz | Christopher Burley | Maura Clark | Michael Hennigan | Miranda Hubbs | |||||
| Chair | President and Chief Executive Officer | Director | Director | Director | Director | |||||

|

|

|

|

|

|
|||||
| Raj Kushwaha Director |
Alice Laberge Director |
Consuelo Madere Director |
Keith Martell Director |
Aaron Regent Director |
Nelson Luiz Costa Silva |
|||||
| Director |
Executive Leadership Team

|

|

|

|
|||||||
| Ken Seitz | Noralee Bradley | Pedro Farah | Andrew Kelemen | |||||||
| President and Chief Executive Officer | Executive Vice President, External Affairs and Chief Sustainability and Legal Officer | Executive Vice President and Chief Financial Officer | Executive Vice President, Corporate Development and Chief Strategy Officer | |||||||

|

|

|

|
|||||||
| Chris Reynolds | Jeff Tarsi | Mark Thompson | Trevor Williams | |||||||
| Executive Vice President and President, Potash | Executive Vice President and President, Global Retail | Executive Vice President, Chief Commercial Officer | Executive Vice President and President, Nitrogen and Phosphate |
| Nutrien Annual Report 2023 | 41 |
| Overview | MD&A |
Five-year highlights | Financial statements and notes | |||||
| Governance | ||||||||
Risk management is an integral part of doing business and is governed by our Board, which has the highest level of oversight for risk governance. The Board is responsible for overseeing the execution and alignment of Nutrien’s corporate strategy and risk management processes.
Nutrien’s ELT has the responsibility of ensuring the Company’s principal risks are being appropriately identified, assessed and addressed. Management keeps the Board and each of the Board committees regularly apprised of risks and developments relevant to their mandates.
Responsibility and accountability for risk management are embedded in all levels of our organization, and we strive to integrate risk management into key decision-making processes and strategies. By considering risk throughout
our business, we seek to effectively manage the risks that could have an impact on our ability to deliver on our strategy.
Role of the Board committees
While the Board as a whole oversees our strategy and risk management processes, each Board committee has oversight over business topics and certain risk areas relevant to their committee mandate. More information can be found in Nutrien’s Board and Board committee charters on our website at nutrien.com.
|
|
||||||
| Board/Board Committee | Oversight includes the following business topics or risk areas | |||||
|
|
||||||
| Board of Directors |
|
• Corporate strategy • Oversight of safety, health, environmental and security matters |
• Risk management • Human resources and compensation • Governance and compliance |
|||
|
|
|
|||||
|
Audit Committee |
• Accounting and financial reporting • Internal controls |
• Compliance • Financial risk management |
||||
|
|
|
|||||
|
Corporate Governance & Nominating Committee |
• Corporate governance • Board diversity |
• Director orientation and continuing education • Board evaluation |
||||
|
|
|
|||||
| Human Resources & Compensation Committee | • Executive compensation • Succession planning |
• Equity, diversity and inclusion, including the Company’s Indigenous Strategy as it relates to Indigenous employment and human resources matters with appropriate coordination with the S&S Committee
• Learning and development |
||||
|
|
|
|||||
| Safety & Sustainability (“S&S”) Committee |
• Sustainability targets and goals
• Risks, strengths and opportunities related to safety and sustainability including climate-related impacts |
• Safety and sustainability performance and strategy
• Cybersecurity and data privacy
• Status of remediation projects and environmental provisions
• The Company’s Indigenous Strategy as it relates to Indigenous engagement and stakeholder relations, with appropriate coordination with the Human Resources & Compensation Committee |
||||
| 42 | Nutrien Annual Report 2023 |
| Overview | MD&A |
Five-year highlights | Financial statements and notes | |||||
| Governance | ||||||||
Governance for climate and sustainability
The Board’s S&S Committee has oversight over Nutrien’s climate-related risks and opportunities. The S&S Committee generally meets on a quarterly basis and covers many sustainability related matters within its mandate including those related to climate. Specifically, the S&S Committee’s role includes overseeing: policies relating
to sustainability and progress towards sustainability goals; approval of Nutrien’s annual Global Sustainability Report; reviewing progress against Nutrien’s Feeding the Future Plan and associated sustainability targets and goals; and review of Nutrien’s climate-related risks and opportunities. This committee directly advises the Board on these and other sustainability matters noted above.
Risk management is integrated into our strategy and business activities to facilitate informed decision making and responsible management of resources. Our Enterprise Risk Management process is overseen by our Enterprise Risk Management Team and guided by our global risk management framework. The framework promotes consistent and integrated application of risk management principles and processes across our organization and is scalable to support all levels of the business.
Nutrien’s operating segments and corporate functions use this framework to identify, assess and develop mitigation actions for key risks that could affect their strategy, operations or future performance. Assessment criteria embedded in the risk framework allow for comparability of different types of risks, including climate-related risks. Key criteria include the likelihood of impacting our business and the potential severity of impact.
Risks are evaluated individually and collectively at the management level to fully understand Nutrien’s risk landscape and identify interdependencies between risks. A consolidated view of our risks is presented to our ELT and senior leaders for review and discussion, along with outputs from external environment scans and emerging risk workshops. Nutrien’s significant enterprise-wide risks are then presented to the Board at least annually.
| Nutrien Annual Report 2023 | 43 |

| Overview | MD&A
|
Five-year highlights | Financial statements and notes | |||||
| Our company | ||||||||
| Operating environment | ||||||||
| Strategy | ||||||||
| Governance | ||||||||
| Key enterprise risks | ||||||||
| Results | ||||||||
|
Texas, US
Last year, the US was the world’s leading exporter of cotton, exporting 2.8 million tonnes. Under our Dyna-Gro brand, Nutrien sells proprietary cotton seed across North America. Our global proprietary seed revenue has grown by over 25 percent since 2021. |
||||||||
| Nutrien Annual Report 2023
|
45 |
| Overview | MD&A |
Five-year highlights | Financial statements and notes | |||||
| Key enterprise risks | ||||||||
Key enterprise risks
Nutrien characterizes a key risk as a risk or combination of risks that could threaten the achievement of our vision, our business model, future financial performance or ability to deliver on our strategy. Our key enterprise risks are discussed below and while these represent our significant risks, we also continue to be exposed to other important general business, operational and climate-related risks. For a more detailed discussion of these key risks and other risks that may affect us, refer to Nutrien’s 2023 Annual Information Form.
| 1 | Competition and shifting market fundamentals | ||||||
| Description |
Risk management approach | |||||
| Global macroeconomic conditions and shifting market fundamentals – including trade tariffs and trade restrictions, volatility in global markets, supply chain constraints, increased price competition and/or new entrants, geopolitical conditions, and/or a significant change in agriculture production or consumption trends – could lead to a sustained environment of reduced demand for our products and/or low or volatile commodity prices and negatively impact our short- and long-term profitability. |
Our global footprint, integrated business, and portfolio of products, services and solutions are designed to enable us to respond to changing economic conditions. We have a favorable cost-structure and the flexibility to make operational changes across our portfolio in order to minimize the impact of changing market dynamics. We prioritize maintaining a strong balance sheet and focus on initiatives that strengthen the advantages of our integrated business, drive operational efficiencies and increase free cash flow. | |||||
| 2 | Agricultural changes and trends | ||||||
| Description |
Risk management approach | |||||
| The following agriculture-related factors, among others, could impact our strategy, demand for our products and/or services and/or financial performance: farm and industry consolidation; shifting grower demographics; agriculture productivity and development; changes in consumer preferences; increasing focus on sustainability in agriculture (including soil health, availability of arable land, diminishing biodiversity and water management); and technological innovation and digital business models. |
Our global footprint, integrated business and diversified portfolio are designed to adapt to changes in the agriculture industry and help position us to drive long-term value creation and provide whole-acre solutions for growers. We are focused on optimizing our Retail business, digital innovation, growth in core markets and continued development of scalable sustainability programming.
See page 28 of this report for more information on our strategic priorities. |
|||||
| 3 | Changing regulations | ||||||
| Description |
Risk management approach | |||||
| Changing laws, regulations and government policies – including those relating to the environment and climate change, including regulation of GHG emissions, as well as health and safety laws or regulations, taxes and royalties – could affect our ability to produce or sell certain products, reduce our efficiency and competitive advantage, increase our costs of raw materials, energy, transportation and compliance, or require us to make capital improvements to our operations – all of which could impact our strategy, operations, financial performance or reputation. |
Our Government & Industry Affairs Team has an active engagement strategy with governments and regulators, including participation in industry associations. This allows us to keep current on regulatory developments affecting our business or industry, allowing us to anticipate new or changing laws and regulations and put us in the best position for success while leveraging our industry association allies.
We also have initiatives and commitments supporting product stewardship, and environment and climate action as part of our Feeding the Future Plan, to assist in managing the impact of potential regulatory changes.
|
|||||
| 46 | Nutrien Annual Report 2023 |
| Overview | MD&A |
Five-year highlights | Financial statements and notes | |||||
| Key enterprise risks | ||||||||
|
4 | Climate change |
||||||
| Description |
Risk management approach | |||||
| Climate change may cause or result in, among other things, more frequent and severe weather events, diminishing biodiversity, impacts to growing seasons or crop yields, and changing weather factors such as temperature, precipitation, wind and water levels, and affect freshwater availability. Physical risks from climate change may also result in operational or supply chain disruptions, depending on the nature of the event.
Impacts from transition risks could include, but are not limited to, policy constraints on emissions, carbon pricing mechanisms, water restrictions, land use restrictions or incentives, changing consumer preferences, and market demand and supply shifts. We are also subject to reputational risks associated with climate change, including our stakeholders’ perception of the agriculture industry and our role in the transition to a lower-carbon economy. These and other factors resulting from climate change could adversely impact our business, financial condition, results of operations or liquidity. |
Our capital allocation framework and preventive maintenance programs help support the long-term reliability and efficiency of our assets. Additionally, our geographically diversified network of facilities and operations helps to minimize the overall impact of physical risk from climate change on our company.
For more information refer to page 7 of this report for our sustainability highlights and our most recent Global Sustainability Report on our website at nutrien.com, which is expected to be released in March 2024. |
|||||
| 5 | Cybersecurity threats | ||||||
| Description |
Risk management approach | |||||
| Cyberattacks, ransomware events, power outages, terrorist attacks, natural disasters, military conflicts, local epidemics or pandemics, other events, and breaches or exposure to potential computer viruses of our systems, third-party service providers’ systems, or cloud-based platforms could lead to disruptions to our operations, loss of data or the unintended disclosure of confidential information and/or personally identifiable information or property damage. Any of these could result in business disruptions, increased defense costs, reputational damage, personal injury or third-party claims, impacting our operations, financial performance or reputation. |
Our Global Information Management and Cyber-Security Team is supported by third-party specialists, oversees our network security and may assist in incident response.
We promote a strong culture of cybersecurity awareness to minimize threats and vulnerabilities, which is supported by our cybersecurity framework, policies and best practices.
Threat and risk assessments are completed for all new information technology systems, and our cybersecurity incident response processes are backstopped by external response measures. We also conduct regular simulated phishing and targeted cybersecurity training as well as incident response training.
For more information refer to our most recent Global Sustainability Report on our website at nutrien.com, which is expected to be released in March 2024.
|
|||||
| Nutrien Annual Report 2023 | 47 |
| Overview | MD&A |
Five-year highlights | Financial statements and notes | |||||
| Key enterprise risks | ||||||||
|
6 | Political, economic and social instability |
||||||
| Description |
Risk management approach | |||||
| Political, economic and social instability may affect our business including, for instance, if any of the jurisdictions in which we operate or do business introduce restrictions on monetary distributions, labor disruptions, competitive restrictions, forced divestitures or changes to or nullification of existing agreements, mining permits or leases, or the imposition of tariffs, exchange controls, international trade restrictions, embargoes, barriers or other restrictions. Instability in political or regulatory regimes could also affect our ability to do business and could impact our sales and operating results, our reputation or the value of our assets. |
Our Government & Industry Affairs Team has an active engagement strategy with governments, regulators and other stakeholders in the countries where we operate or plan to operate. We assess capital investments and project decisions against political, country and other related risk factors and avoid or reduce our exposure to jurisdictions with unacceptable risk levels. Dedicated teams regularly monitor developments and global trends that may impact us. | |||||
| 7 | Talent and organization culture | ||||||
| Description |
Risk management approach | |||||
| An inability to attract and retain qualified top talent, including for skillsets that are in high demand, could impact our business, financial condition and results of operations. Failure to provide the necessary organizational structure, programs and culture to engage and develop our employees, including providing a respectful, inclusive and diverse workplace, could impact our ability to achieve our growth objectives or expected business results. |
Our Talent Attraction and Sourcing Team focuses on building a diverse, inclusive and talented workforce. We are committed to the career development of our employees and building a culture grounded in our organizational purpose and the values of safety, inclusion, integrity and results. Our talent succession process focuses on identifying and managing critical roles and the proactive build-up of internal and external bench strength. Our incentive programs are competitive, performance-based and support our purpose-driven culture. | |||||
| 8 | Stakeholder support | ||||||
| Description |
Risk management approach | |||||
| Our stakeholders may not support our business plans, structure, strategy, sustainability initiatives, or climate commitments and social responsibilities. Our inability to meet our sustainability and climate-related commitments and targets may also have an adverse effect on our stakeholder support, among others. Loss of stakeholder confidence could impair our ability to execute our business plans, negatively impact our ability to produce or sell our products, and may lead to reputational damage, increased costs, financial losses, securityholder action or negatively impact our access to or cost of capital.
|
Our Investor Relations and Stakeholder Relations teams monitor and regularly engage with our stakeholders to identify their key issues and communicate the long- term value opportunities associated with our business. We also have an active Community Relations Team and community investment programs. Our Strategies and Feeding the Future Plan are structured to help support what matters most to our stakeholders. | |||||
| 48 | Nutrien Annual Report 2023 |
| Overview | MD&A |
Five-year highlights | Financial statements and notes | |||||
| Key enterprise risks | ||||||||
|
9 | Supply chains |
||||||
| Description |
Risk management approach | |||||
| Supply chain disruptions could result in difficulties supplying materials to our facilities and/or impair our ability (or the ability of the third parties upon which we rely) to deliver products to our customers in a timely manner. If certain key raw materials, parts and/or supplies used in our operations are not available, our business could be disrupted. Ongoing geopolitical conflicts, regulatory instability and changes to tariffs, epidemics, pandemics, or other such crises have created and could still create supply chain challenges and disruptions, and/or limit our ability to timely sell or distribute our products in the future, any of which could negatively impact our business, financial condition and operating results. |
Our integrated business provides us the flexibility to optimize operations, transportation and logistics, or increase supply chain efficiencies to adapt to potential disruption. We regularly review our suppliers to ensure we can maintain critical feedstocks and can leverage our diverse retail distribution network and expansive fertilizer terminal and transportation network to effectively manage product logistical challenges. | |||||
| 10 | Capital redeployment | ||||||
| Description |
Risk management approach | |||||
| Our inability to deploy capital to efficiently achieve sustained growth, effectively execute on opportunities or meet investor preferences – whether due to market conditions, lack of options or otherwise, or deploying capital in a manner inconsistent with our strategic priorities – could impact our returns, operations, reputation, access to or cost of capital, or potential impairment charges related to the goodwill or intangible assets. |
We continue to focus on creating long-term value through a balanced and disciplined approach to capital allocation. We prioritize maintaining safe and reliable operations, a healthy balance sheet, investing in our business and providing strong returns to shareholders.
See page 35 of this report for more information on our capital allocation priorities and key actions during the year. |
|||||
| 11 | Safety, health and environment | ||||||
| Description |
Risk management approach | |||||
| Our operations are subject to safety, health and environmental risks inherent in mining, manufacturing, transportation, storage and distribution of our products. These factors could result in injuries or fatalities, or impact air quality, biodiversity, water resources or related ecosystems near our operations, impacting our operations, financial performance or reputation. |
Our safety strategy and governance processes ensure we follow all regulatory, industry and internal standards of safety, health and environmental responsibility that involve independent audits and assessments. We have structured incident prevention and response systems in place and conduct regular security vulnerability assessments. We have crisis communication protocols and emergency response programs across our business and maintain environmental monitoring and control systems, including third-party reviews of key containment structures.
For more information refer to our most recent Global Sustainability Report on our website at nutrien.com, which is expected to be released in March 2024.
|
|||||
| Nutrien Annual Report 2023 | 49 |

| Overview | MD&A
|
Five-year highlights | Financial statements and notes | |||||
| Our company | ||||||||
| Operating environment | ||||||||
| Strategy | ||||||||
| Governance | ||||||||
| Key enterprise risks | ||||||||
| Results | ||||||||
| California, US
The US is the world’s second largest producer of lettuce. Nutrien’s network of ~1,200 selling locations in the US serves growers needs including specialty crops like lettuce and other fruits and vegetables.
• Adjusted EBITDA is the primary profit measure used to evaluate the segments’ performance as it excludes the impact of non-cash impairments and impairment reversals and other costs that are centrally managed by our corporate function. Refer to Note 3 to the consolidated financial statements for details.
• Net sales (sales less freight, transportation and distribution expenses) is the primary revenue measure used in planning and forecasting in the Potash, Nitrogen and Phosphate operating segments. |
||||||||
| Nutrien Annual Report 2023
|
51 |
| Overview | MD&A | Five-year highlights | Financial statements and notes | |||||
|
Results |
||||||||
|
|

|
2023 Nutrien Ag Solutions (“Retail”) | |
| financial performance |
Our Retail business generated adjusted EBITDA of $1.5 billion, lower than the record levels of the prior year primarily due to lower gross margin for both crop nutrients and crop protection products. Margins were pressured as crop input prices softened and higher cost inventory moved through the channel. Crop nutrients sales volumes increased by over 1 million tonnes as growers worked to replenish nutrients in the soil. As the year progressed, crop input margins in North America normalized and customers returned to more normal buying behaviors.
In Brazil, we saw continued margin compression due to decreased prices for certain crop protection products and the selling through of high cost inventory. Included with expenses for the full year of 2023, we recognized a $465 million non-cash impairment primarily to goodwill relating to our Retail – South America assets, mainly due to the impact of crop input price volatility, more moderate long-term growth assumptions and higher interest rates. We believe the long-term prospects for agriculture in Brazil are strong and it remains an important crop input market for Nutrien. In the near-term, we are focused on integration of our recent acquisitions and optimization of our cost structure in this region.
|
|
Dollars | Gross margin | Gross margin (%) | |||||||||||||||||||||||||||||
| (millions of US dollars, except as otherwise noted) |
2023 | 2022 | % Change |
2023 | 2022 | % Change |
2023 | 2022 | ||||||||||||||||||||||||
| Sales |
||||||||||||||||||||||||||||||||
| Crop nutrients |
8,379 | 10,060 | (17 | ) | 1,378 | 1,766 | (22 | ) | 16 | 18 | ||||||||||||||||||||||
| Crop protection products |
6,750 | 7,067 | (4 | ) | 1,553 | 1,936 | (20 | ) | 23 | 27 | ||||||||||||||||||||||
| Seed |
2,295 | 2,112 | 9 | 427 | 428 | – | 19 | 20 | ||||||||||||||||||||||||
| Merchandise |
1,001 | 1,019 | (2 | ) | 172 | 174 | (1 | ) | 17 | 17 | ||||||||||||||||||||||
| Nutrien Financial |
322 | 267 | 21 | 322 | 267 | 21 | 100 | 100 | ||||||||||||||||||||||||
| Services and other |
927 | 966 | (4 | ) | 710 | 749 | (5 | ) | 77 | 78 | ||||||||||||||||||||||
| Nutrien Financial elimination 1 |
(132 | ) | (141 | ) | (6 | ) | (132 | ) | (141 | ) | (6 | ) | 100 | 100 | ||||||||||||||||||
| 19,542 | 21,350 | (8 | ) | 4,430 | 5,179 | (14 | ) | 23 | 24 | |||||||||||||||||||||||
| Cost of goods sold |
15,112 | 16,171 | (7 | ) |
|
|
|
|
|
|
|
|
|
|
|
|
|
|
|
|||||||||||||
| Gross margin |
4,430 | 5,179 | (14 | ) | ||||||||||||||||||||||||||||
| Expenses 2,3 |
4,215 | 3,621 | 16 |
|
|
|
|
|
|
|
|
|
|
|
|
|
|
|
||||||||||||||
| Earnings before finance |
215 | 1,558 | (86 | ) | ||||||||||||||||||||||||||||
| Depreciation and amortization |
759 | 752 | 1 |
|
|
|
|
|
|
|
|
|
|
|
|
|
|
|
||||||||||||||
| EBITDA |
974 | 2,310 | (58 | ) | ||||||||||||||||||||||||||||
| Adjustments 3 |
485 | (17 | ) | n/m |
|
|
|
|
|
|
|
|
|
|
|
|
|
|
|
|||||||||||||
| Adjusted EBITDA |
1,459 | 2,293 | (36 | ) |
|
|
|
|
|
|
|
|
|
|
|
|
|
|
|
|||||||||||||
| 1 | Represents elimination of the interest and service fees charged by Nutrien Financial to Retail branches. |
| 2 | Includes selling expenses of $3,375 million (2022 – $3,392 million). |
| 3 | Includes non-cash impairment of assets of $465 million (2022 – nil). See Notes 3 and 14 to the consolidated financial statements. |
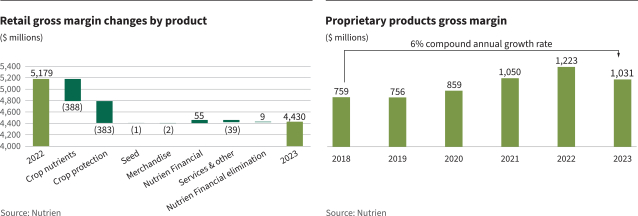
| 52 | Nutrien Annual Report 2023 |
| Overview | MD&A | Five-year highlights | Financial statements and notes | |||||
|
Results |
||||||||
|
|
The most significant contributors to the changes in our Retail financial performance were as follows:
|
|
2023 vs 2022 | |
|
Crop nutrients |
Sales and gross margin decreased in 2023 due to lower selling prices across all regions compared to the strong comparable period in 2022. Sales volumes increased in 2023 as growers returned to more normalized application rates to replenish nutrients in the soil. Sales and gross margin of our proprietary nutritional and biostimulant product lines increased compared to 2022 levels as we continued to expand our differentiated product offering and manufacturing capacity. | |
|
Crop protection products |
Sales and gross margin were lower primarily due to decreased selling prices compared to the historically strong comparable period in 2022. This was partially offset by higher fourth quarter sales in North America as growers returned to more normalized buying behaviors. Gross margin in 2023 was also impacted by the selling through of high-cost inventory. | |
|
Seed |
Sales increased in 2023 primarily due to increased corn sales in the US, while gross margin saw little change compared to 2022. | |
|
Nutrien Financial |
Sales increased in 2023 due to higher utilization of our financing offerings in the US and Australia compared to 2022. | |
|
Services and other |
Sales and gross margin decreased in 2023 mainly due to lower livestock selling prices and volumes in Australia. | |
|
Expenses |
In 2023, we recognized a $465 million non-cash impairment primarily to goodwill related to our Retail – South America assets, mainly due to the impact of crop input price volatility, more moderate long-term growth assumptions and higher interest rates. Selling expenses as a percentage of sales were higher in 2023 primarily due to lower selling prices compared to the strong comparable period in 2022. | |
|
Adjusted EBITDA |
Adjusted EBITDA decreased in 2023 primarily due to lower gross margins for crop nutrients and crop protection products. | |
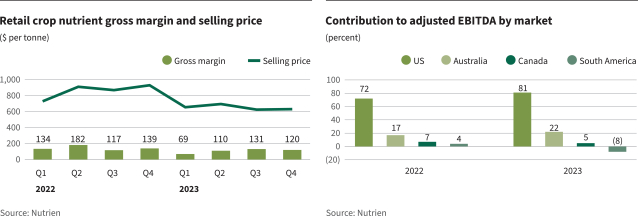
Selected Retail measures
|
|
2023 | 2022 | ||||||
| Proprietary products gross margin (millions of US dollars) |
||||||||
| Crop nutrients |
391 | 370 | ||||||
| Crop protection products |
461 | 675 | ||||||
| Seed |
168 | 166 | ||||||
| Merchandise |
11 | 12 | ||||||
| All products |
1,031 | 1,223 | ||||||
| Proprietary products margin as a percentage of product line margin (%) |
||||||||
| Crop nutrients |
28 | 21 | ||||||
| Crop protection products |
30 | 35 | ||||||
| Seed |
39 | 39 | ||||||
| Merchandise |
6 | 7 | ||||||
| All products |
23 | 24 | ||||||
| Nutrien Annual Report 2023 | 53 |
| Overview | MD&A | Five-year highlights | Financial statements and notes | |||||
|
Results |
||||||||
|
|
|
|
2023 | 2022 | ||||||
| Crop nutrients sales volumes (tonnes – thousands) |
||||||||
| North America |
8,985 | 8,106 | ||||||
| International |
3,647 | 3,407 | ||||||
| Total |
12,632 | 11,513 | ||||||
| Crop nutrients selling price per tonne |
||||||||
| North America |
697 | 916 | ||||||
| International |
581 | 774 | ||||||
| Total |
663 | 874 | ||||||
| Crop nutrients gross margin per tonne |
||||||||
| North America |
127 | 182 | ||||||
| International |
65 | 86 | ||||||
| Total |
109 | 153 | ||||||
| Financial performance measures | 2023 | 2022 | ||||||
| Retail adjusted EBITDA margin (%) 1 |
7 | 11 | ||||||
| Retail adjusted EBITDA per US selling location (thousands of US dollars) 1,2 |
1,394 | 1,923 | ||||||
| Retail adjusted average working capital to sales (%) 3 |
19 | 17 | ||||||
| Retail adjusted average working capital to sales excluding Nutrien Financial (%) 3 |
1 | 2 | ||||||
| Nutrien Financial adjusted net interest margin (%) 3 |
5.2 | 6.8 | ||||||
| Retail cash operating coverage ratio (%) 3 |
68 | 55 | ||||||
| 1 | These are supplementary financial measures. See the “Other Financial Measures” section. |
| 2 | Excluding acquisitions. |
| 3 | These are non-GAAP financial measures. See the “Non-GAAP Financial Measures” section. |
Nutrien Financial
We offer flexible financing solutions to our customers in support of Nutrien’s agricultural product and service sales. Qualifying Retail customers in the US and Australia are offered extended payment terms, typically up to one year, to facilitate the alignment of grower crop cycles with cash flows. Nutrien Financial revenues are primarily earned through interest and service fees that are charged to our Retail branches.
We hold a significant portion of receivables from customers that have historically experienced a low-default rate. We manage our credit portfolio based on a combination of review of customer credit metrics, past experience with the customer and exposure to any single customer. Nutrien Financial, which is our wholly owned finance captive, monitors and services the portfolio of our high-quality receivables from customers that have the lowest risk of default among Retail’s receivables from customers. We monitor the results of this portfolio of receivables separately because we calculate the cost of capital attributable to the high-quality receivables from customers differently from our other receivables. Specifically, we assume a debt-to-equity ratio of 7:1 in funding Nutrien Financial receivables, based on the underlying credit quality of the assets.
Nutrien Financial relies on corporate capital for funding. For 2023, we estimated the deemed interest expense using an average borrowing rate of 4.1 percent (2022 - 1.4 percent) applied to the notional debt required to fund the portfolio of receivables from customers monitored and serviced by Nutrien Financial. The balance of our Retail receivables (outside of Nutrien Financial) is subject to marginally higher credit risk.
|
|
As at December 31 | |||||||||||||||||||||||||||||||
| (millions of US dollars) | Current | <31 Days past due |
31–90 Days past due |
>90 Days past due |
Gross receivables |
Allowance 1 | 2023 Net receivables |
2022 Net receivables |
||||||||||||||||||||||||
| North America |
1,736 | 327 | 89 | 94 | 2,246 | (40 | ) | 2,206 | 2,007 | |||||||||||||||||||||||
| International |
560 | 56 | 22 | 59 | 697 | (10 | ) | 687 | 662 | |||||||||||||||||||||||
| Nutrien Financial receivables 2 |
2,296 | 383 | 111 | 153 | 2,943 | (50 | ) | 2,893 | 2,669 | |||||||||||||||||||||||
| 1 | Bad debt expense on the above receivables for the twelve months ended December 31, 2023 was $35 million (2022 – $10 million) in the Retail segment. |
| 2 | Gross receivables include $2,578 million (2022 – $2,260 million) of very low risk of default and $365 million (2022 – $445 million) of low risk of default. |
| 54 | Nutrien Annual Report 2023 |
| Overview | MD&A | Five-year highlights | Financial statements and notes | |||||
|
Results |
||||||||
|
|

|
2023 Potash financial performance |
Our Potash business delivered adjusted EBITDA of $2.4 billion as lower net realized selling prices more than offset higher North American sales volumes and lower provincial mining taxes and royalties. Potash sales volumes in North America increased due to lower channel inventory and increased grower demand supported by an extended fall application season and improved affordability. Offshore sales volumes were lower compared to last year’s record levels primarily due to logistical challenges at Canpotex’s West Coast port facilities and reduced shipments to customers in India and Southeast Asia.
|
|
Dollars | Tonnes (thousands) | Average per tonne | |||||||||||||||||||||||||||||||||
| (millions of US dollars, except as otherwise noted) |
2023 | 2022 | % Change |
2023 | 2022 | % Change |
2023 | 2022 | % Change |
|||||||||||||||||||||||||||
| Manufactured product |
||||||||||||||||||||||||||||||||||||
| Net sales |
||||||||||||||||||||||||||||||||||||
| North America |
1,683 | 2,485 | (32 | ) | 4,843 | 3,729 | 30 | 348 | 667 | (48 | ) | |||||||||||||||||||||||||
| Offshore |
2,076 | 5,414 | (62 | ) | 8,373 | 8,808 | (5 | ) | 248 | 615 | (60 | ) | ||||||||||||||||||||||||
| 3,759 | 7,899 | (52 | ) | 13,216 | 12,537 | 5 | 284 | 630 | (55 | ) | ||||||||||||||||||||||||||
| Cost of goods sold |
1,396 | 1,400 | – |
|
|
|
|
|
|
|
|
|
105 | 112 | (6 | ) | ||||||||||||||||||||
| Gross margin – total |
2,363 | 6,499 | (64 | ) | 179 | 518 | (65 | ) | ||||||||||||||||||||||||||||
| Expenses 1 |
422 | 1,173 | (64 | ) | Depreciation and amortization | 35 | 35 | – | ||||||||||||||||||||||||||||
| EBIT Depreciation and amortization |
|
1,941 463 |
|
|
5,326 443 |
|
|
(64 5 |
)
|
|
Gross margin
excluding |
|
214 | 553 | (61 | ) | ||||||||||||||||||||
| EBITDA/Adjusted EBITDA |
2,404 | 5,769 | (58 | ) | |
Potash controllable cash cost |
|
58 | 58 | – | ||||||||||||||||||||||||||
| 1 | Includes provincial mining taxes of $398 million (2022 – $1,149 million). |
| 2 | These are non-GAAP financial measures. See the “Non-GAAP Financial Measures” section. |
The most significant contributors to the changes in our Potash financial performance were as follows:
|
|
2023 vs 2022 | |
|
Sales volumes |
Overall sales volumes were higher in 2023. North America sales volumes increased in 2023 due to lower channel inventory and increased grower demand supported by an extended fall application season and improved affordability. Offshore sales volumes were lower in 2023 compared to record levels in 2022 primarily due to logistical challenges at Canpotex’s West Coast port facilities and reduced shipments to customers in India and Southeast Asia. | |
|
Net realized selling price |
Average net realized selling prices decreased in 2023 compared to the historically strong prices in 2022 due to a decline in benchmark prices and higher costs related to logistical challenges at Canpotex’s West Coast port facilities. | |
|
Cost of goods sold per tonne |
Costs decreased in 2023 mainly due to lower royalties resulting from decreased net realized selling prices. Potash controllable cash cost of product manufactured per tonne was consistent with 2022. |
|
|
Expenses |
Expenses decreased in 2023 primarily due to lower provincial mining taxes from lower average potash selling prices, which are the basis for certain taxes. We are subject to Saskatchewan provincial resource taxes, including the potash production tax and the resource surcharge. | |
|
Adjusted EBITDA |
Adjusted EBITDA decreased in 2023 due to lower net realized selling prices, which more than offset higher North American sales volumes and lower provincial mining taxes and royalties. | |
| Nutrien Annual Report 2023 | 55 |
| Overview | MD&A | Five-year highlights | Financial statements and notes | |||||
|
Results |
||||||||
|
|
Canpotex sales by market
| (percentage of sales volumes, except as otherwise noted) | 2023 | 2022 | Change | |||||||||
| Latin America |
47 | 34 | 13 | |||||||||
| Other Asian markets 1 |
28 | 34 | (6 | ) | ||||||||
| Other markets |
11 | 10 | 1 | |||||||||
| China |
9 | 14 | (5 | ) | ||||||||
| India |
5 | 8 | (3 | ) | ||||||||
| 1 | All Asian markets except China and India. |
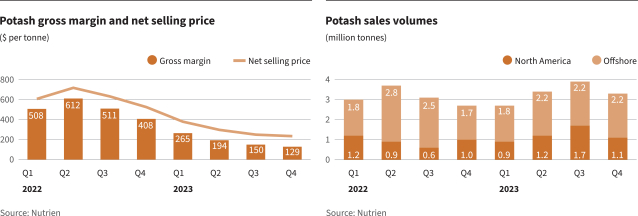
Potash production
|
|
|
Operational capability 2 | Production | |||||||||||||||||
| (million tonnes KCI) | Nameplate capacity 1 |
2024 | 2023 | 2023 | 2022 | |||||||||||||||
| Rocanville Potash |
6.5 | 5.1 | 5.2 | 4.97 | 4.89 | |||||||||||||||
| Allan Potash |
4.0 | 2.4 | 3.0 | 2.39 | 2.50 | |||||||||||||||
| Lanigan Potash |
3.8 | 3.0 | 3.1 | 2.89 | 2.46 | |||||||||||||||
| Vanscoy Potash |
3.0 | 1.1 | 1.4 | 1.05 | 1.01 | |||||||||||||||
| Cory Potash |
3.0 | 2.1 | 2.2 | 1.50 | 1.89 | |||||||||||||||
| Patience Lake Potash |
0.3 | 0.3 | 0.3 | 0.20 | 0.26 | |||||||||||||||
| Total |
20.6 | 14.0 | 15.2 | 13.00 | 13.01 | |||||||||||||||
| Shutdown weeks 3 |
|
|
|
|
|
|
|
|
|
5 | 18 | |||||||||
| 1 | Represents estimates of capacity as at December 31, 2023. Estimates based on capacity as per design specifications or Canpotex entitlements once determined. In the case of Patience Lake, estimate reflects current operational capability. Estimates for all other facilities do not necessarily represent operational capability. |
| 2 | Estimated annual achievable production based on expected staffing and operational readiness (estimated at the beginning of the year, and may vary during the year, and year-to-year, including between our facilities). Estimate does not include inventory-related shutdowns and unplanned downtime. |
| 3 | Represents weeks of full production shutdown, excluding the impact of any periods of reduced operating rates and planned routine annual maintenance shutdowns and announced workforce reductions. |
| 56 | Nutrien Annual Report 2023 |
| Overview | MD&A | Five-year highlights | Financial statements and notes | |||||
|
Results |
||||||||
|
|

|
2023 Nitrogen financial performance |
We generated adjusted EBITDA of $1.9 billion for our Nitrogen business, below the record levels of the prior year due to lower net realized selling prices for all major nitrogen products, which more than offset lower natural gas costs and higher sales volumes. Our increased sales volumes were primarily due to higher UAN production and sales, partially offset by lower ammonia availability mainly due to production outages at our plants in Trinidad. We recognized a $76 million non-cash impairment of our Trinidad property, plant and equipment due to a new natural gas contract and the resulting outlook for higher expected natural gas costs and constrained near-term availability. We expect improved natural gas availability in Trinidad as the development of additional gas fields is anticipated to add new supply starting in 2026.
|
|
Dollars | Tonnes (thousands) | Average per tonne | |||||||||||||||||||||||||||||||||
| (millions of US dollars, except as otherwise noted) |
2023 | 2022 | % Change |
2023 | 2022 | % Change |
2023 | 2022 | % Change |
|||||||||||||||||||||||||||
| Manufactured product |
||||||||||||||||||||||||||||||||||||
| Net sales |
||||||||||||||||||||||||||||||||||||
| Ammonia |
1,144 | 2,641 | (57 | ) | 2,436 | 2,715 | (10 | ) | 469 | 973 | (52 | ) | ||||||||||||||||||||||||
| Urea and ESN® 1 |
1,499 | 2,134 | (30 | ) | 3,125 | 3,014 | 4 | 480 | 708 | (32 | ) | |||||||||||||||||||||||||
| Solutions, nitrates and sulfates |
1,187 | 1,829 | (35 | ) | 4,862 | 4,551 | 7 | 244 | 402 | (39 | ) | |||||||||||||||||||||||||
| 3,830 | 6,604 | (42 | ) | 10,423 | 10,280 | 1 | 367 | 642 | (43 | ) | ||||||||||||||||||||||||||
| Cost of goods sold 1 |
2,435 | 3,370 | (28 | ) |
|
|
|
|
|
|
|
|
|
233 | 327 | (29 | ) | |||||||||||||||||||
| Gross margin – manufactured |
1,395 | 3,234 | (57 | ) | 134 | 315 | (57 | ) | ||||||||||||||||||||||||||||
| Gross margin – other 1, 2 |
(16 | ) | 47 | n/m | Depreciation and amortization | 55 | 54 | 2 | ||||||||||||||||||||||||||||
| Gross margin – total Expenses (income) 3,4 |
|
1,379 97 |
|
|
3,281 (92 |
) |
|
(58 n/m |
)
|
|
Gross margin
excluding |
|
|
189 |
|
|
369 |
|
|
(49 |
) |
|||||||||||||||
| EBIT |
1,282 | 3,373 | (62 | ) | |
Ammonia controllable
cash |
|
|
60 |
|
|
59 |
|
|
2 |
|
||||||||||||||||||||
| Depreciation and amortization |
572 | 558 | 3 | |||||||||||||||||||||||||||||||||
| EBITDA/Adjusted EBITDA |
1,854 | 3,931 | (53 | ) | ||||||||||||||||||||||||||||||||
| Adjustments 4 |
76 | – | n/m |
|
|
|
|
|
|
|
|
|
|
|
|
|
|
|
|
|
|
|||||||||||||||
| Adjusted EBITDA |
1,930 | 3,931 | (51 | ) |
|
|
|
|
|
|
|
|
|
|
|
|
|
|
|
|
|
|
||||||||||||||
| 1 | Certain immaterial 2022 figures have been reclassified. |
| 2 | Includes other nitrogen and purchased products and comprises net sales of $377 million (2022 – $929 million) less cost of goods sold of $393 million (2022 –$882 million). |
| 3 | Includes earnings from equity-accounted investees of $90 million (2022 – $233 million). |
| 4 | Includes non-cash impairment of assets of $76 million (2022 – nil). See Notes 3 and 13 to the consolidated financial statements. |
| 5 | These are non-GAAP financial measures. See the “Non-GAAP Financial Measures” section. |
| Nutrien Annual Report 2023 | 57 |
| Overview | MD&A | Five-year highlights | Financial statements and notes | |||||
|
Results |
||||||||
|
|
The most significant contributors to the changes in our Nitrogen financial performance were as follows:
|
|
2023 vs 2022 | |
|
Sales volumes |
Sales volumes were higher in 2023 primarily due to higher UAN production and sales, partially offset by lower ammonia availability mainly due to production outages at our plants in Trinidad. | |
|
Net realized selling price |
Net realized selling price was lower in 2023 for all major nitrogen products primarily due to weaker benchmark prices resulting from lower energy prices in key nitrogen producing regions. | |
|
Cost of goods sold per tonne |
Costs decreased in 2023 primarily due to lower natural gas costs. Raw materials and other input costs were also lower in 2023 compared to 2022 due to lower benchmark prices.
Ammonia controllable cash cost of product manufactured per tonne increased mainly due to the impact of lower ammonia production. |
|
|
Expenses (income) |
We recognized a $76 million non-cash impairment of our Trinidad property, plant and equipment due to a new natural gas contract and the resulting outlook for higher expected natural gas costs and constrained near-term availability. We expect improved natural gas availability in Trinidad as the development of additional gas fields is anticipated to add new supply starting in 2026. There was no comparable expense in 2022.
Other expenses (income) also increased in 2023 mainly due to lower earnings from our equity-accounted investment in Profertil. Profertil’s earnings were lower mainly due to lower urea net selling prices from lower benchmark prices. |
|
|
Adjusted EBITDA |
Adjusted EBITDA was lower in 2023 primarily due to lower net realized selling prices for all major nitrogen products, which more than offset lower natural gas costs and higher sales volumes. | |
Natural gas prices in cost of production
| (US dollars per MMBtu, except as otherwise noted) | 2023 | 2022 | % Change |
|||||||||
| Overall natural gas cost excluding realized derivative impact |
3.51 | 7.82 | (55 | ) | ||||||||
| Realized derivative impact |
(0.02 | ) | (0.05 | ) | (60 | ) | ||||||
| Overall natural gas cost |
3.49 | 7.77 | (55 | ) | ||||||||
| Average NYMEX |
2.74 | 6.64 | (59 | ) | ||||||||
| Average AECO |
2.17 | 4.28 | (49 | ) | ||||||||
|
|
2023 vs 2022 | |
|
Overall natural gas |
Natural gas prices in our cost of production decreased in 2023 as a result of lower North American natural gas index prices and decreased natural gas costs in Trinidad, where our natural gas prices are linked to ammonia benchmark prices. |
|
Selected Nitrogen measures
|
|
2023 | 2022 | ||||||
| Sales volumes (tonnes – thousands) |
||||||||
| Fertilizer 1 |
6,067 | 5,628 | ||||||
| Industrial and feed |
4,356 | 4,652 | ||||||
| Net sales (millions of US dollars) |
||||||||
| Fertilizer 1 |
2,450 | 3,726 | ||||||
| Industrial and feed |
1,380 | 2,878 | ||||||
| Net selling price per tonne |
||||||||
| Fertilizer 1 |
404 | 662 | ||||||
| Industrial and feed |
317 | 619 | ||||||
| 1 | Certain immaterial 2022 figures have been reclassified. |
| 58 | Nutrien Annual Report 2023 |
| Overview | MD&A | Five-year highlights | Financial statements and notes | |||||
|
Results |
||||||||
|
|
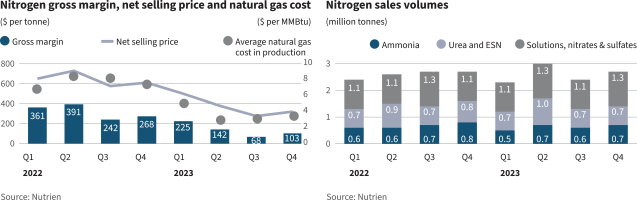
Nitrogen production
|
|
Ammonia 1 | Urea 2 | ||||||||||||||||||||||
| (million tonnes product, except as otherwise noted) | Annual capacity 3 |
Production | Annual capacity 3 |
Production | ||||||||||||||||||||
| 2023 | 2022 | 2023 | 2022 | |||||||||||||||||||||
| Trinidad Nitrogen 4 |
2.2 | 1.11 | 1.46 | 0.7 | 0.32 | 0.42 | ||||||||||||||||||
| Redwater Nitrogen |
0.9 | 0.89 | 0.78 | 0.7 | 0.76 | 0.55 | ||||||||||||||||||
| Augusta Nitrogen |
0.8 | 0.74 | 0.59 | 0.7 | 0.56 | 0.40 | ||||||||||||||||||
| Lima Nitrogen |
0.7 | 0.68 | 0.71 | 0.5 | 0.51 | 0.50 | ||||||||||||||||||
| Geismar Nitrogen |
0.5 | 0.43 | 0.58 | 0.4 | 0.30 | 0.37 | ||||||||||||||||||
| Carseland Nitrogen |
0.5 | 0.53 | 0.39 | 0.7 | 0.75 | 0.50 | ||||||||||||||||||
| Fort Saskatchewan Nitrogen |
0.5 | 0.39 | 0.47 | 0.4 | 0.35 | 0.44 | ||||||||||||||||||
| Borger Nitrogen |
0.5 | 0.24 | 0.41 | 0.6 | 0.31 | 0.49 | ||||||||||||||||||
| Joffre Nitrogen |
0.5 | 0.34 | 0.37 | – | – | – | ||||||||||||||||||
| Total |
7.1 | 5.35 | 5.76 | 4.7 | 3.86 | 3.67 | ||||||||||||||||||
| Adjusted total 5 |
|
|
|
3.90 | 3.93 |
|
|
|
|
|
|
|
|
|
||||||||||
| Ammonia operating rate 5 (%) |
|
|
|
88 | 90 |
|
|
|
|
|
|
|
|
|
||||||||||
| 1 | All figures are shown on a gross production basis. |
| 2 | Reflects capacity and production of urea liquor prior to final product upgrade. Urea liquor is used in the production of solid urea, UAN and DEF. |
| 3 | Annual capacity estimates include allowances for normal operating plant conditions. |
| 4 | In 2022 and 2023, Trinidad production was restricted due to natural gas curtailments, which are expected to extend into 2024. |
| 5 | Excludes Trinidad and Joffre. |
| Nutrien Annual Report 2023 | 59 |
| Overview | MD&A | Five-year highlights | Financial statements and notes | |||||
|
Results |
||||||||
|
|

|
2023 Phosphate financial | |||
| performance |
Our Phosphate business earned adjusted EBITDA of $470 million, lower compared to the prior year mainly due to lower net realized selling prices for fertilizer products, partially offset by lower ammonia and sulfur input costs. Our sales volumes increased primarily due to higher phosphate fertilizer demand, partially offset by lower first-half production impacting our industrial and feed sales. Our production was higher for the full year largely due to improved reliability at our Aurora plant. Included in the expenses for the full year of 2023, we recognized a $233 million non-cash impairment of our White Springs property, plant and equipment, while we had non-cash impairment reversals of our Phosphate assets of $780 million for the full year of 2022.
|
|
Dollars | Tonnes (thousands) | Average per tonne | |||||||||||||||||||||||||||||||||
| (millions of US dollars, except as otherwise noted) |
2023 | 2022 | % Change |
2023 | 2022 | % Change |
2023 | 2022 | % Change |
|||||||||||||||||||||||||||
| Manufactured product |
||||||||||||||||||||||||||||||||||||
| Net sales |
||||||||||||||||||||||||||||||||||||
| Fertilizer |
1,085 | 1,367 | (21 | ) | 1,912 | 1,696 | 13 | 568 | 806 | (30 | ) | |||||||||||||||||||||||||
| Industrial and feed |
645 | 706 | (9 | ) | 639 | 682 | (6 | ) | 1,010 | 1,035 | (2 | ) | ||||||||||||||||||||||||
| 1,730 | 2,073 | (17 | ) | 2,551 | 2,378 | 7 | 678 | 872 | (22 | ) | ||||||||||||||||||||||||||
| Cost of goods sold |
1,487 | 1,562 | (5 | ) |
|
|
|
|
|
|
|
|
|
583 | 657 | (11 | ) | |||||||||||||||||||
| Gross margin – manufactured |
243 | 511 | (52 | ) | 95 | 215 | (56 | ) | ||||||||||||||||||||||||||||
| Gross margin – other 1 |
(10 | ) | (18 | ) | (44 | ) | Depreciation and amortization | 115 | 79 | 46 | ||||||||||||||||||||||||||
| Gross margin – total Expenses (income) |
|
233 290 |
|
|
493 (693 |
) |
|
(53 n/m |
)
|
|
Gross margin
excluding |
|
210 | 294 | (29 | ) | ||||||||||||||||||||
| EBIT |
(57 | ) | 1,186 | n/m |
|
|
|
|
|
|
|
|
|
|
|
|
||||||||||||||||||||
| Depreciation and amortization |
294 | 188 | 56 | |||||||||||||||||||||||||||||||||
| EBITDA |
237 | 1,374 | (83 | ) | ||||||||||||||||||||||||||||||||
| Adjustments 3 |
233 | (780 | ) | n/m |
|
|
|
|
|
|
|
|
|
|
|
|
|
|
|
|
|
|
||||||||||||||
| Adjusted EBITDA |
470 | 594 | (21 | ) |
|
|
|
|
|
|
|
|
|
|
|
|
|
|
|
|
|
|
||||||||||||||
| 1 | Includes other phosphate and purchased products and comprises net sales of $263 million (2022 – $304 million) less cost of goods sold of $273 million (2022 – $322 million). |
| 2 | This is a non-GAAP financial measure. See the “Non-GAAP Financial Measures” section. |
| 3 | Includes non-cash impairment of assets of $233 million (2022 – reversal of non-cash impairment of assets of $780 million). See Notes 3 and 13 to the consolidated financial statements. |
The most significant contributors to the changes in our Phosphate financial performance were as follows:
|
|
2023 vs 2022 | |
|
Sales volumes |
Sales volumes increased in 2023 mostly due to higher phosphate fertilizer demand, partially offset by lower first-half year production impacting our industrial and feed sales. Production increased in 2023 largely due to improved reliability at our Aurora plant. | |
|
Net realized selling price |
Net realized selling prices decreased in 2023 primarily due to lower fertilizer net realized selling prices and lower industrial and feed net realized selling prices, which reflect the typical lag in price realizations relative to spot fertilizer prices. | |
|
Cost of goods sold per tonne |
Costs decreased in 2023 mainly due to lower ammonia and sulfur input costs, partially offset by higher depreciation and amortization resulting from the reversal of non-cash impairment of assets in 2022 (see details below). | |
|
Expenses (income) |
In 2023, we recognized a $233 million non-cash impairment of our White Springs property, plant and equipment, while we had non-cash impairment reversals of our Phosphate assets of $780 million in 2022. The impairments and impairment reversals were due to changes in our forecasted global prices driven by the prevailing macroeconomic environment. | |
|
Adjusted EBITDA |
Adjusted EBITDA decreased in 2023 mainly due to lower net realized selling prices for fertilizer products, partially offset by lower ammonia and sulfur input costs. | |
| 60 | Nutrien Annual Report 2023 |
| Overview | MD&A | Five-year highlights | Financial statements and notes | |||||
|
Results |
||||||||
|
|
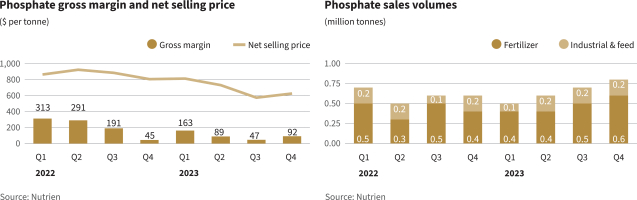
Phosphate production
|
|
Phosphate rock | Phosphoric acid (P2O5) | Liquid products | Solid fertilizer products | ||||||||||||||||||||||||||||||||||||||||||||
| (million tonnes, except as otherwise noted) |
Annual capacity |
Production | Annual capacity |
Production | Annual capacity |
Production | Annual capacity |
Production | ||||||||||||||||||||||||||||||||||||||||
| 2023 | 2022 | 2023 | 2022 | 2023 | 2022 | 2023 | 2022 | |||||||||||||||||||||||||||||||||||||||||
| Aurora Phosphate |
5.4 | 4.24 | 3.43 | 1.2 | 1.00 | 0.93 | 2.7 1 | 2.13 | 1.87 | 0.8 | 0.77 | 0.68 | ||||||||||||||||||||||||||||||||||||
| White Springs Phosphate |
2.0 | 1.27 | 1.42 | 0.5 | 0.40 | 0.42 | 0.7 2 | 0.33 | 0.39 | 0.8 | 0.33 | 0.30 | ||||||||||||||||||||||||||||||||||||
| Total |
7.4 | 5.51 | 4.85 | 1.7 | 1.40 | 1.35 | 3.4 | 2.46 | 2.26 | 1.6 | 1.10 | 0.98 | ||||||||||||||||||||||||||||||||||||
|
P2O5 operating rate (%) |
|
|
|
|
|
|
|
|
|
|
|
|
83 | 79 |
|
|
|
|
|
|
|
|
|
|
|
|
|
|
|
|
|
|
||||||||||||||||
| 1 | A substantial portion is consumed internally in the production of downstream products. The balance is exported to phosphate fertilizer producers or sold domestically to dealers who custom-mix liquid fertilizer. Capacity is composed of 2.0 million tonnes MGA and 0.7 million tonnes SPA. |
| 2 | Represents annual SPA capacity. A substantial portion is consumed internally in the production of downstream products. The balance is exported to phosphate fertilizer producers or sold domestically to dealers who custom-mix liquid fertilizer. |
In addition to the production above, annual capacity (in millions of tonnes) for phosphate feed and purified acid was 0.7 and 0.3, respectively. Production in 2023 was 0.30 and 0.16, respectively, and 2022 production was 0.33 and 0.18, respectively.
| Nutrien Annual Report 2023 | 61 |
| Overview | MD&A | Five-year highlights | Financial statements and notes | |||||
|
Results |
||||||||
|
|
2023 Corporate and Others financial performance
“Corporate and Others” is a non-operating segment comprising corporate and administrative functions that provide support and governance to our operating segments.
| (millions of US dollars, except as otherwise noted) | 2023 | 2022 | % Change | |||||||||
| Selling expense (recovery) |
– | (1 | ) | n/m | ||||||||
| General and administrative expenses |
364 | 326 | 12 | |||||||||
| Share-based compensation (recovery) expense |
(14 | ) | 63 | n/m | ||||||||
| Other expenses |
348 | 227 | 53 | |||||||||
| EBIT |
(698 | ) | (615 | ) | 13 | |||||||
| Depreciation and amortization |
81 | 71 | 14 | |||||||||
| EBITDA |
(617 | ) | (544 | ) | 13 | |||||||
| Adjustments 1 |
350 | 146 | 140 | |||||||||
| Adjusted EBITDA |
(267 | ) | (398 | ) | (33 | ) | ||||||
| 1 | See Note 3 to the consolidated financial statements. |
The most significant contributors to the changes in our Corporate and Others financial performance were as follows:
|
|
2023 vs 2022 | |
|
General and administrative expenses |
Increase in expenses was primarily due to higher staffing costs and higher depreciation and amortization expense. | |
|
Share-based compensation (recovery) expense |
Recovery in 2023 was due to decrease in the fair value of share-based awards outstanding relative to 2022. The fair value takes into consideration several factors such as our share price movement, our performance relative to our peer group and return on our invested capital. | |
|
Other expenses |
Increase in other expenses was mainly due to a $152 million higher expense related to asset retirement obligations and environmental costs resulting from changes in estimates related to our non-operating sites and a $92 million loss on Blue Chip Swaps incurred through trade transactions to remit cash from Argentina and higher foreign exchange losses in 2023. These expenses were partially offset by an $80 million gain in 2023 from amendments due to design plan changes to our other post-retirement benefit plans. Refer to Note 6 to the consolidated financial statements for details on the loss on Blue Chip Swaps. | |
Eliminations
Eliminations are not part of the Corporate and Others segment. Eliminations of sales between operating segments in 2023 were $1,650 million (2022 – $2,333 million) with a gross margin recovery of $69 million (2022 – $28 million elimination). These variances are due to lower intersegment selling prices and margins in 2023 as crop input prices decreased compared to the historical strong prices of 2022.
| 62 | Nutrien Annual Report 2023 |
| Overview | MD&A | Five-year highlights | Financial statements and notes | |||||
|
Results |
||||||||
|
|
Finance costs, income taxes and other comprehensive income (loss)
| (millions of US dollars, except as otherwise noted) | 2023 | 2022 | % Change | |||||||||
| Finance costs | 793 | 563 | 41 | |||||||||
| Income tax expense | 670 | 2,559 | (74 | ) | ||||||||
| Other comprehensive income (loss) | 81 | (177 | ) | n/m | ||||||||
The most significant contributors to the changes in our finance costs, income tax expense and other comprehensive income (loss) were as follows:
|
|
2023 vs 2022 |
|
|
|||||||
| Finance costs | Finance costs increased primarily due to higher interest rates and higher average long-term debt balances. |
|
||||||||
| Weighted Average Debt Balances and Rates (millions of US dollars, except as otherwise noted) |
||||||||||
|
|
2023 |
|
2022 | |||||||
| Short-term balance 1 | 3,988 | 3,975 | ||||||||
| Short-term rate (%) 1 | 6.1 | 3.0 | ||||||||
| Long-term balance (excluding lease obligations) | 9,112 | 7,839 | ||||||||
| Long-term rate (excluding lease obligations) (%) | 5.0 | 4.6 | ||||||||
| Lease obligations balance | 1,200 | 1,209 | ||||||||
|
|
Lease obligations rate (%) | 4.0 | 2.9 | |||||||
|
|
1 North American weighted average short-term debt balances were $3,306 million (2022 –
$3,529 million) and rates were 5.6 percent (2022 – 2.6 percent). |
|
||||||||
| Income tax expense | Income tax expense was lower in 2023 primarily as a result of lower earnings compared to 2022. The 2023 expense and effective tax rate reflect a $134 million income tax recovery due to changes to our tax declarations in Switzerland (“Swiss Tax Reform adjustment”, refer to Note 8 to the consolidated financial statements for additional information) and a $101 million income tax expense due to a change in recognition of deferred tax assets in our Retail – South America region. The 2023 effective tax rate also includes the impact of our losses in Retail – South America, wherein we did not recognize a corresponding deferred tax asset as it did not meet the accounting criteria for asset recognition. |
|
||||||||
| Effective tax rates and discrete items (millions of US dollars, except as otherwise noted) |
||||||||||
|
|
2023 |
|
2022 | |||||||
| Actual effective tax rate on earnings (%) | 33 | 25 | ||||||||
| Actual effective tax rate including discrete items (%) | 34 | 25 | ||||||||
|
|
Discrete tax adjustments that impacted the rate | 28 | 30 | |||||||
| Other comprehensive income (loss) | Other comprehensive income (loss) was primarily driven by changes in the currency translation of our Retail foreign operations primarily due to improvements of Canadian and Australian currencies relative to the US dollar in 2023. In 2023, we also recognized an actuarial gain on our defined benefit plans compared to a loss on the comparative period driven by changes in our financial and demographic assumptions and performance of our plan assets. |
|
||||||||
| Nutrien Annual Report 2023 | 63 |
| Overview | MD&A | Five-year highlights | Financial statements and notes | |||||
|
Results |
||||||||
|
|
Performance against 2023 targets
Executing on our financial and operating targets
In 2019, we set ambitious targets for 2023 focused on growing and improving the quality of our Retail earnings, increasing our potash and nitrogen volumes, and controlling our operating costs. These targets were designed to motivate our teams and align our strategies with our vision and values. We made progress towards achieving these targets during this period, however geopolitical events, supply chain disruptions and inflationary pressures impacted our results in 2023. As we enter 2024, we remain focused on our core business, improving the quality of our earnings, investing in high-value strategic initiatives and fortifying our business for the future.
|
|
2023 Target | 2023 Actuals | 2022 Actuals | |||||||||
| Nutrien Ag Solutions (“Retail”) |
||||||||||||
| Total Retail adjusted EBITDA margin (%) 1 |
>10.5 | 7.5 | 10.7 | |||||||||
| US Retail adjusted EBITDA margin (%) 1, 2 |
9.3 | 12.2 | ||||||||||
| Retail adjusted average working capital to sales (%) 3 |
17 | 19 | 17 | |||||||||
| Retail cash operating coverage ratio (%) 3 |
60 | 68 | 55 | |||||||||
| Retail adjusted EBITDA per US selling location (thousands of US dollars) 1,4 |
>1,100 | 1,394 | 1,923 | |||||||||
| Retail proprietary products as a % of total Retail margin |
29 | 23 | 24 | |||||||||
| Potash and Nitrogen |
||||||||||||
| Potash sales volumes (million tonnes) |
14.0-16.0 | 13.2 | 12.5 | |||||||||
| Potash controllable cash cost of product manufactured per tonne (US dollars) 2, 3 |
58 | 58 | ||||||||||
| Nitrogen sales volumes (million tonnes) 5 |
10.8-11.4 | 10.4 | 10.3 | |||||||||
| Ammonia operating rate (%) 6 |
96 | 88 | 90 | |||||||||
| Ammonia controllable cash cost of product manufactured per tonne (US dollars) 3 |
42 | 60 | 59 | |||||||||
| IFRS comparable information |
||||||||||||
| Potash cost of goods sold (million US dollars) 2 |
1,396 | 1,400 | ||||||||||
| Nitrogen manufactured cost of goods sold (million US dollars) 2 |
|
|
|
2,435 | 3,370 | |||||||
| 1 | This is a supplementary financial measure. See the “Other Financial Measures” section. |
| 2 | No target was provided. |
| 3 | This is a non-GAAP financial measure. See the “Non-GAAP Financial Measures” section. |
| 4 | Calculation is based on number of selling locations only, excluding acquisitions. |
| 5 | Includes manufactured product only. 2023 target includes ESN® products that prior to 2022 were included in the other category. |
| 6 | Operating rate represents production volumes divided by production capacity (excluding Joffre and Trinidad facilities). |
| 64 | Nutrien Annual Report 2023 |
| Overview | MD&A | Five-year highlights | Financial statements and notes | |||||
|
Results |
||||||||
|
|
We have revised our guidance practice in 2024 to provide forward looking estimates on those metrics that we believe are of value to our shareholders and are less impacted by fertilizer commodity prices. We continue to provide guidance for Retail adjusted EBITDA, fertilizer sales volumes and other key financial modeling metrics as well as fertilizer pricing sensitivities.
|
|
|
2024 Guidance Ranges1 as of February 21, 2024 |
|
|
||||||||||||||||||||
| (billions of US dollars, except as otherwise noted) |
|
Low |
|
High |
|
2023 Actual | ||||||||||||||||||
| Retail adjusted EBITDA |
1.65 | 1.85 | 1.5 | |||||||||||||||||||||
| Potash sales volumes (million tonnes) 2 |
13.0 | 13.8 | 13.2 | |||||||||||||||||||||
| Nitrogen sales volumes (million tonnes) 2 |
10.6 | 11.2 | 10.4 | |||||||||||||||||||||
| Phosphate sales volumes (million tonnes) 2 |
2.6 | 2.8 | 2.6 | |||||||||||||||||||||
| Depreciation and amortization |
2.2 | 2.3 | 2.2 | |||||||||||||||||||||
| Finance costs |
0.75 | 0.85 | 0.8 | |||||||||||||||||||||
| Effective tax rate on adjusted earnings (%) |
24.0 | 26.0 | 28.0 | |||||||||||||||||||||
| Capital expenditures 3 |
|
|
|
2.2 |
|
|
|
2.3 |
|
|
|
2.7 | ||||||||||||
| 1 | See the “Forward-Looking Statements” section. |
| 2 | Manufactured product only. |
| 3 | Comprised of sustaining capital expenditures, investing capital expenditures and mine development and pre-stripping capital expenditures which are supplementary financial measures. See the “Other Financial Measures” section. |
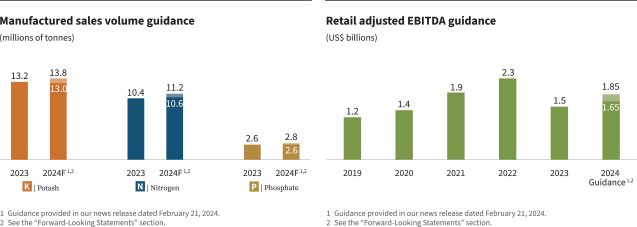
2024 Sensitivities
| 2024 Annual Sensitivities 1 | Effect on | |||||||
| (millions of US dollars, except EPS amounts) | Adjusted EBITDA | Adjusted EPS4 | ||||||
| $25/tonne change in net realized potash selling prices |
± 270 | ± 0.40 | ||||||
| $25/tonne change in net realized ammonia selling prices 2 |
± 40 | ± 0.05 | ||||||
| $25/tonne change in net realized urea and ESN® selling prices |
± 80 | ± 0.10 | ||||||
| $25/tonne change in net realized solutions, nitrates and sulfates selling prices |
± 130 | ± 0.20 | ||||||
| $1/MMBtu change in NYMEX natural gas price 3 |
± 190 | ± 0.30 | ||||||
| 1 | See the “Forward-Looking Statements” section. |
| 2 | Includes related impact on natural gas costs in Trinidad, which is linked to benchmark ammonia pricing. |
| 3 | Nitrogen related impact. |
| 4 | Assumes 496 million shares outstanding for all earnings per share (“EPS”) sensitivities. |
| Nutrien Annual Report 2023 | 65 |
| Overview | MD&A | Five-year highlights | Financial statements and notes | |||||
|
Results |
||||||||
|
|
| (millions of US dollars, except as otherwise noted) | 2023 | 2022 | 2021 | |||||||||
| Sales |
29,056 | 37,884 | 27,712 | |||||||||
| Net earnings |
1,282 | 7,687 | 3,179 | |||||||||
| Basic net earnings per share (US dollars) |
2.53 | 14.22 | 5.53 | |||||||||
| Diluted net earnings per share (US dollars) |
2.53 | 14.18 | 5.52 | |||||||||
| Total assets |
52,749 | 54,586 | 49,954 | |||||||||
| Total non-current financial liabilities |
9,912 | 8,939 | 8,455 | |||||||||
| Dividends declared per share (US dollars) |
2.12 | 1.92 | 1.84 | |||||||||
|
|
2023 vs 2022 | 2022 vs 2021 | ||
|
Sales |
Sales decreased primarily due to lower net realized selling prices compared to the historically strong prices in 2022, partially offset by higher sales volumes for crop nutrients, potash and nitrogen. | Sales increased primarily due to higher net realized selling prices from global supply uncertainties across our nutrient segments, partially offset by lower sales volumes. Strong Retail performance due to higher selling prices and increased sales of proprietary products, which more than offset a reduction in crop nutrients sales volumes from a delayed North American planting season and earlier engagement in the prior year in a rising price environment. | ||
|
Net earnings |
Net earnings and earnings per share decreased primarily due to lower net realized selling prices across our nutrient segments due to a decline in benchmark prices. In 2023, we recorded $774 million non-cash impairments of our Retail – South America assets, Phosphate White Springs and Nitrogen Trinidad property, plant and equipment compared to non-cash impairment reversals of $780 million of Phosphate assets recorded in 2022. | Net earnings and earnings per share increased due to historically strong net realized selling prices across our nutrient segments and strong Retail performance supported by the strength of agriculture fundamentals. In 2022, we recorded non-cash impairment reversals of our Phosphate Aurora and White Springs property, plant and equipment. | ||
|
Assets and |
Total assets decreased approximately 3 percent from 2022 primarily due to lower receivables and inventories as we collected and sold through our higher-valued receivables and inventories from historically strong prices in 2022 and $774 million of non-cash impairments (as described above). This is partially offset by higher capital spending on property, plant and equipment.
Non-current financial liabilities increased due to the higher long-term debt from the issuance of new senior notes. |
Total assets increased approximately 10 percent from 2021. Our working capital assets increased from higher-valued receivables and inventories along with acquisition impacts. Property, plant and equipment increased primarily due to non-cash impairment reversals in the Phosphate segment.
Non-current financial liabilities increased due to the higher long-term debt from the issuance of new senior notes. |
||
|
Dividends |
Dividends declared per share increased as we declared a quarterly dividend per share of $0.53 in 2023 compared to $0.48 in 2022. | Dividends declared per share increased as we declared a quarterly dividend per share of $0.48 in 2022 compared to $0.46 in 2021. | ||
| 66 | Nutrien Annual Report 2023 |
| Overview | MD&A | Five-year highlights | Financial statements and notes | |||||
|
Results |
||||||||
|
|
Financial condition review
Balance sheet analysis
|
|
As at |
|
|
|||||||||||||
| (millions of US dollars, except as otherwise noted) | December 31, 2023 | December 31, 2022 | $ Change | % Change | ||||||||||||
| Assets | ||||||||||||||||
| Receivables | 5,398 | 6,194 | (796 | ) | (13 | ) | ||||||||||
| Inventories | 6,336 | 7,632 | (1,296 | ) | (17 | ) | ||||||||||
| Property, plant and equipment | 22,461 | 21,767 | 694 | 3 | ||||||||||||
| Goodwill | 12,114 | 12,368 | (254 | ) | (2 | ) | ||||||||||
| Liabilities and equity | ||||||||||||||||
| Short-term debt | 1,815 | 2,142 | (327 | ) | (15 | ) | ||||||||||
| Payables and accrued charges | 9,467 | 11,291 | (1,824 | ) | (16 | ) | ||||||||||
| Long-term debt | 8,913 | 8,040 | 873 | 11 | ||||||||||||
| Share capital | 13,838 | 14,172 | (334 | ) | (2 | ) | ||||||||||
| Retained earnings | 11,531 | 11,928 | (397 | ) | (3 | ) | ||||||||||
| Assets | Liabilities |
|||||
| Receivables decreased due to lower selling prices across all of our operating segments compared to a historically strong period in 2022. These were partially offset by a strategic extension of credit terms to our Retail customers resulting in increased usage of Nutrien Financial programs.
Inventories decreased across all operating segments as we sold through our higher-cost inventories on hand as related benchmark prices decreased and from lower input costs including royalties, natural gas and sulfur. In 2022, we also strategically procured certain products at larger quantities in anticipation of supply chain challenges.
Property, plant and equipment increased from capital expenditures related to our Potash and Nitrogen capital projects and turnarounds to maintain safe and reliable operations. This is partially offset by non-cash impairments on our Phosphate White Springs and Nitrogen Trinidad property, plant and equipment of $309 million.
Goodwill decreased due to the recognition of a non-cash impairment of $422 million related to our Retail - South America assets in 2023. |
Short-term debt decreased due to lower drawdowns on our credit facilities based on our working capital requirements.
Payables and accrued charges decreased due to lower accrual of income tax in 2023 compared to 2022, when we had historically strong earnings. Certain costs including products for resale, natural gas and sulfur input costs, and expenses tied to selling prices, such as provincial mining taxes also decreased. Payables also decreased from lower customer prepayments as a result of the lower commodity price environment and lower accruals for payroll expenses.
Long-term debt increased due to the issuance of $1.5 billion of senior notes in 2023, which exceeded the repayment of $500 million in senior notes upon maturity in the same period. |
|||||
| Shareholders’ equity |
||||||
| Share capital decreased primarily from shares repurchased under our normal course issuer bid program.
Retained earnings decreased as dividends declared and share repurchases exceeded net earnings. |
||||||
We do not hold material cash and cash equivalents in currencies other than the US dollar and Canadian dollar. As at December 31, 2023, we held approximately $243 million US dollar equivalent in other jurisdictions outside the US and Canada. We do not depend on repatriation of cash from our foreign subsidiaries to meet our liquidity and capital resource needs in North America.
| Nutrien Annual Report 2023 | 67 |
| Overview | MD&A | Five-year highlights | Financial statements and notes | |||||
|
Results |
||||||||
|
|
Liquidity and capital resources
Sources and uses of liquidity
Liquidity risk arises from our general funding needs and in the management of our assets, liabilities and capital structure. We manage liquidity risk to maintain sufficient liquid financial resources to fund our financial position and meet our commitments and obligations in a cost-effective manner. Our 2023 significant liquidity sources are listed below along with our expected ongoing primary uses of liquidity:
| Primary uses of liquidity | Primary sources of liquidity | |
| – inventory purchases and production – operational expenses – seasonal working capital requirements – capital expenditures to sustain and grow our safe, reliable and cost-efficient operations – business acquisitions – shareholder returns through dividends and share repurchases – principal payments of debt securities |
– cash from operations (including customer prepayments) – commercial paper issuances – increase of credit facility limits and drawdowns – debt capital markets |
|
We believe that our internally generated cash flow, supplemented by available borrowings under new or existing financing sources, if necessary, will be sufficient to meet our anticipated capital expenditures, planned growth and development activities, and other cash requirements for the foreseeable future. We do not reasonably expect any presently known trend or uncertainty to affect our ability to access our historical sources of liquidity.
Cash requirements
The following aggregated information about our contractual obligations and other commitments summarizes our liquidity and capital resource requirements as at December 31, 2023. Commitments reflect the estimated cash outflows for these obligations.
| Consolidated |
Payments due by period | |||||||||||||||||||||||
| (millions of US dollars) | Total | Within 1 year |
1 to 3 years |
3 to 5 years |
Over 5 years |
|||||||||||||||||||
| Long-term debt |
Notes 18, 26 | 9,214 | 512 | 1,528 | 870 | 6,304 | ||||||||||||||||||
| Estimated interest payments on long-term debt |
Note 26 | 6,125 | 454 | 796 | 686 | 4,189 | ||||||||||||||||||
| Lease liabilities |
Notes 19, 26 | 1,326 | 327 | 427 | 189 | 383 | ||||||||||||||||||
| Estimated interest payments on lease liabilities |
Note 26 | 199 | 41 | 57 | 33 | 68 | ||||||||||||||||||
| Purchase commitments |
Note 26 | 1,350 | 938 | 249 | 57 | 106 | ||||||||||||||||||
| Capital commitments |
Note 26 | 172 | 153 | 19 | – | – | ||||||||||||||||||
| Other commitments |
Note 26 | 715 | 188 | 221 | 149 | 157 | ||||||||||||||||||
| Derivatives |
Note 10 | 16 | 16 | – | – | – | ||||||||||||||||||
| Asset retirement obligations and accrued environmental costs |
Note 22 | 5,029 | 150 | 214 | 140 | 4,525 | ||||||||||||||||||
| Total |
24,146 | 2,779 | 3,511 | 2,124 | 15,732 | |||||||||||||||||||
The information presented in the table above does not include planned (but not legally committed) capital expenditures, business acquisitions or shareholder returns including share repurchases and dividends.
| 68 | Nutrien Annual Report 2023 |
| Overview | MD&A | Five-year highlights | Financial statements and notes | |||||
|
Results |
||||||||
|
|
We incurred $50 million of capital expenditures related to the completion of our GHG Phase 1 abatement program since 2021. We originally anticipated investing more than $500 million to achieve at least a 30 percent reduction in GHG emissions (Scope 1 and 2) per tonne of our products produced, from a baseline year of 2018, by 2030. We continue to evaluate our strategic emissions abatement projects, including for technical and economic feasibility, as well as estimates on our expected capital expenditures to achieve our 2030 emissions intensity reduction target.
For information on income taxes and pension and other post-retirement benefits funding, refer to Note 8 and Note 21, respectively, to the consolidated financial statements. Future cash requirements are subject to changes in regulations, actuarial assumptions and our expected operating results.
On February 21, 2024, our Board of Directors approved a share repurchase program of up to a maximum of 24,728,159, representing 5 percent of Nutrien’s outstanding common shares. The 2024 normal course issuer bid, which is subject to acceptance by the Toronto Stock Exchange, will commence on March 1, 2024. The share repurchase program will expire on the earlier of February 28, 2025, the date on which we have acquired the maximum number of common shares allowable or the date we determine not to make any further repurchases.
On February 21, 2024, our Board of Directors declared and increased our quarterly dividend to $0.54 per share payable on April 11, 2024, to shareholders of record on March 28, 2024. The total estimated dividend to be paid is $265 million.
Sources and uses of cash
| Cash provided by operating activities |
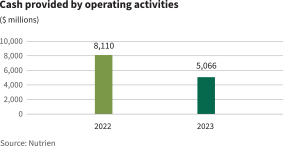
|
– Lower cash provided by operating activities from lower net realized selling prices across all segments compared to the historically strong benchmark prices in 2022. |
||
| Cash used in investing activities |
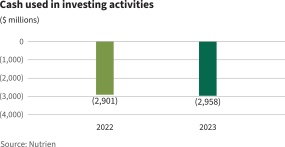
|
– Higher cash used in investing activities due to higher turnaround activities and investing capital expenditures as we completed our committed projects prior to our strategic actions to reduce capital spending. |
||
| Cash used in financing activities |
|
– Lower cash used in financing activities due to decreased share repurchases in 2023. We also had lower proceeds from our short-term and long-term debt in 2023 compared to 2022 by $500 million. |
||
| Nutrien Annual Report 2023 | 69 |
| Overview | MD&A | Five-year highlights | Financial statements and notes | |||||
|
Results |
||||||||
|
|
Capital structure and management
We manage our capital structure with a focus on maintaining a strong balance sheet, enabling a strong investment-grade credit rating.
Principal debt instruments
We use a combination of cash provided by operating activities and short-term and long-term debt to finance our operations.
Senior notes and debentures
As at December 31, 2023, our long-term debt consisted primarily of senior notes and debentures with the following maturities and interest rates:
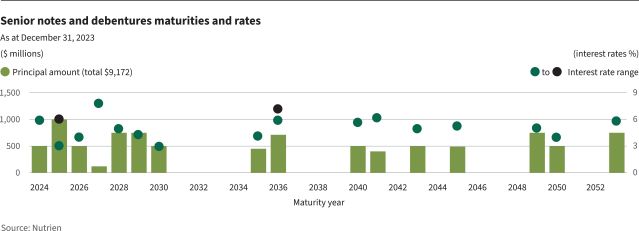
| Twelve Months Ended December 31 |
||||||||||||
|
|
Rate of interest (%) | Maturity | Amount | |||||||||
| Senior notes repaid 2023 | 1.9 | May 13, 2023 | 500 | |||||||||
| Senior notes issued 2023 | 4.9 | March 27, 2028 | 750 | |||||||||
| Senior notes issued 2023 | 5.8 | March 27, 2053 | 750 | |||||||||
|
|
|
|
|
|
|
|
1,500 | |||||
The senior notes issued in the twelve months ended December 31, 2023, are unsecured, rank equally with our existing unsecured debt, and have no sinking fund requirements prior to maturity. Each series is redeemable and has various provisions for redemption prior to maturity, at our option, at specified prices.
Credit facilities and other debt
We have several available credit facilities in the jurisdictions where we operate. We have a commercial paper program, which is limited to the undrawn amount under our $4,500 million unsecured revolving term credit facility and excess cash invested in highly liquid securities. As at December 31, 2023, we had a $1,175 million outstanding balance in commercial paper.
As at December 31, 2023, $252 million in letters of credit were outstanding and committed, with $203 million of remaining credit available under our dedicated letter of credit facilities.
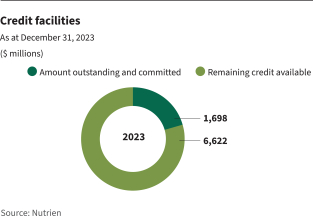
| 70 | Nutrien Annual Report 2023 |
| Overview | MD&A | Five-year highlights | Financial statements and notes | |||||
|
Results |
||||||||
|
|
Lease obligations
We also had lease obligations totaling $1,326 million (including current portion) with a weighted average effective interest rate of 4.3 percent as at December 31, 2023.
Debt covenants
Our credit facilities have financial tests and other covenants with which we must comply with at each quarter-end. Non-compliance with any such covenants could result in accelerated payment of amounts borrowed and termination of lenders’ further funding obligations under the credit facilities. We were in compliance with all such covenants as at December 31, 2023.
The table below summarizes the limit and result of our key financial covenant:
| As at December 31 | Limit | 2023 | ||||||
| Debt to capital ratio 1 | 0.65 : 1.00 | 0.33 : 1.00 | ||||||
| 1 | Refer to Note 24 to the consolidated financial statements for the detailed calculation. |
Credit ratings
Our ability to access reasonably priced debt in the capital markets depends, in part, on the quality of our credit ratings. We continue to maintain investment-grade credit ratings for our long-term debt. A downgrade of the credit rating of our long-term debt could increase the interest rates applicable to borrowings under our credit facilities.
Commercial paper markets are normally a source of same-day cash for us. Our access to the US commercial paper market primarily depends on maintaining our current short-term credit ratings as well as general conditions in the money markets.
| Long-term debt rating (outlook) | Short-term debt rating | |||||||||||||||
| As at December 31 | 2023 | 2022 | 2023 | 2022 | ||||||||||||
| Moody’s | Baa2 (stable) | Baa2 (stable) | P-2 | P-2 | ||||||||||||
| S&P | BBB (stable) | BBB (positive) | A-2 | A-2 | ||||||||||||
A credit rating is not a recommendation to buy, sell or hold securities. Such ratings may be subject to revision or withdrawal at any time by the respective credit rating agency and each rating should be evaluated independently of any other rating.
S&P’s stable outlook on Nutrien’s credit ratings means that the ratings are not likely to change (generally up to two years).
Outstanding share data
|
|
February 22, 2024 | |||
| Common shares | 494,563,180 | |||
| Options to purchase common shares | 3,214,971 | |||
For more information on our capital structure and management, see Note 24 to the consolidated financial statements.
| Nutrien Annual Report 2023 | 71 |
| Overview | MD&A | Five-year highlights | Financial statements and notes | |||||
|
Results |
||||||||
|
|
| Nature of financial information and consolidated financial statements note reference |
Description |
|
| Off-balance sheet arrangements | Principal off-balance sheet activities primarily include: | |
|
(Notes 10, 11, 22, 27 and 29) |
– Agreement to reimburse losses of Canpotex. – Issuance of guarantee contracts. – An agency arrangement with a financial institution in relation to certain customer loans. – Certain non-financial derivatives that were entered into and continued to be held for the purpose of the receipt or delivery of a non-financial item, such as grain or natural gas, in accordance with expected purchase, sale or usage requirements. Other derivatives are included on our balance sheet at fair value.
We do not reasonably expect any presently known trend or uncertainty to affect our ability to continue using these arrangements, except as indicated above. |
|
| Related party transactions
(Note 28) |
Our most significant related party is Canpotex, which provides us with low-cost marketing and logistics for the offshore potash markets that we serve. | |
| Financial instruments and other instruments
(Note 10) |
Our financial instruments are subject to various risks such as credit, liquidity and market risks. As discussed in the “Governance” section, our ELT is responsible for ensuring our principal risks, including financial risks, are being appropriately identified, assessed and addressed. |
Critical accounting estimates
We prepare our consolidated financial statements in accordance with IFRS, which requires us to make judgments, assumptions and estimates in applying accounting policies. Critical accounting estimates are those which are highly uncertain at the time they are made or where different estimates would be reasonably likely to have a material impact on our financial condition or results of operations. We have discussed the development, selection and application of our key accounting policies, and the critical accounting estimates and assumptions they involve, with the Audit Committee of the Board.
| 72 | Nutrien Annual Report 2023 |
| Overview | MD&A | Five-year highlights | Financial statements and notes | |||||
|
Results |
||||||||
|
|
Refer to the notes to the consolidated financial statements for additional information on the following critical accounting estimates including methodology used for calculating our estimates (when applicable), key assumptions used, and factors considered in our estimates and judgments.
| Consolidated financial statements note reference |
Critical accounting estimate description | |
| Note 13 and Note 30 |
Long-lived asset impairments and reversals
We review, at each reporting period, for conditions to determine whether there is any indication that an impairment exists that could potentially impact the carrying amount of our long-lived assets to be held and used. When such indicators exist, impairment testing is performed. We review, at each reporting period, for possible reversal of the impairment for non-financial assets, other than goodwill.
In 2023, we identified an impairment trigger for our Phosphate cash generating units (“CGUs”), White Springs and Aurora, primarily as a result of the decrease in our forecasted phosphate margins. As a result of the impairment analysis, we recorded a non-cash impairment of property, plant and equipment amounting to $233 million at our White Springs CGU as the recoverable amount was less than its carrying value. The White Springs CGU has a shorter expected mine life and is therefore more sensitive to changes in short- and medium-term forecasted phosphate margins. We determined there was no impairment for our Aurora CGU.
The White Springs CGU and Aurora CGU had recoverable amounts of $504 million and $2,000 million, respectively. The following table highlights sensitivities to the recoverable amounts which could result in additional impairment losses or reversals of the previously recorded losses (relating to the White Springs CGU). The sensitivities have been calculated independently of changes in other key variables. Dollar amounts are in millions, except as otherwise noted. |
|
| Change to recoverable amount ($) | ||||||||||||||||||||||||
|
|
Key assumptions as at June 30, 2023 | Change in assumption |
|
White Springs |
|
Aurora | ||||||||||||||||||
| Long-term growth rate (%) | +/-1.0 percent | n/a | +/-110 | |||||||||||||||||||||
| Pre-tax discount rate (%) | +/-1.0 percent | -/+20 | n/a | |||||||||||||||||||||
| Post-tax discount rate (%) | +/-1.0 percent | n/a | -/+190 | |||||||||||||||||||||
|
|
|
Forecasted EBITDA over forecast period ($) |
+/-5.0 percent | +/-40 | +/-220 | |||||||||||||||||||
| In 2023, we identified an impairment trigger for our Trinidad CGU, part of our Nitrogen segment, and recognized a $76 million non-cash impairment to property, plant and equipment, due to a new natural gas contract and the resulting outlook for higher expected natural gas costs and constrained near-term availability. We expect improved natural gas availability in Trinidad as the development of additional natural gas fields is anticipated to add new natural gas supply starting in 2026.
The Trinidad CGU had a recoverable amount of $676 million. The following table highlights sensitivities to the recoverable amount of our Trinidad CGU, which could result in additional impairment losses or reversals of the previously recorded losses. The sensitivities have been calculated independently of changes in other key variables. Dollar amounts are in millions, except as otherwise noted. |
|
|
Key assumptions as at December 31, 2023 | Change in assumption |
|
Change to recoverable amount ($) | ||||||||||||
| Long-term growth rate (%) | +/-1.0 percent | +/-55 | ||||||||||||||
| Post-tax discount rate (%) | +/-1.0 percent | -/+95 | ||||||||||||||
|
|
|
Forecasted EBITDA over forecast period ($) |
+/-5.0 percent | +/-100 | ||||||||||||
| Nutrien Annual Report 2023 | 73 |
| Overview | MD&A | Five-year highlights | Financial statements and notes | |||||
|
Results |
||||||||
|
|
| Financial statement reference |
Critical accounting estimate description | |
| Note 14 and Note 30 |
Goodwill impairment indicators
We test our operating segments that have goodwill allocated to them when events or circumstances indicate that there could be an impairment, or at least annually on October 1. The key assumptions with the greatest influence on the calculation of the recoverable amounts are the discount rates, terminal growth rates and forecasted EBITDA. The key forecast assumptions were based on historical data and our estimates of future results from internal sources considering industry and market information. Key assumptions in our testing models may change, and changes that could reasonably be expected to occur may cause impairment. Such change in assumptions could be driven by global supply and demand, other market factors, changes in regulations, and other future events outside our control. |
|
| Recent acquisitions in Brazil resulted in goodwill being recognized for our Retail – South America group of CGUs. Goodwill is more susceptible to impairment risk if business operating results or economic conditions deteriorate and we anticipate not meeting our forecasts. In 2023, we revised our forecasted EBITDA for the Retail – South America group of CGUs, which triggered an impairment analysis. Due to the impact of crop input price volatility, more moderate long-term growth assumptions and higher interest rates, we lowered our product margin expectations and deferred certain of our planned strategic investments. As a result, this reduced our forecasted EBITDA and growth. As at June 30, 2023, the Retail – South America group of CGUs recoverable amount was lower than its carrying amount. As a result, we fully impaired goodwill of $422 million and recorded a $43 million impairment of intangible assets for a total of $465 million for the Retail – South America group of CGUs. |
||
| The following table highlights sensitivities to the recoverable amount which could have resulted in additional impairment against the carrying amount of intangible assets and property, plant and equipment. The sensitivities have been calculated independently of changes in other key variables. Dollar amounts are in millions, except as otherwise noted. |
||
|
|
Key assumptions as at June 30, 2023 | Change in key assumption | Decrease to recoverable amount ($) |
|||||||||
| Terminal growth rate (%) | -1.0 percent | 50 | ||||||||||
| Discount rate (%) | +1.0 percent | 120 | ||||||||||
|
|
|
Forecasted EBITDA over forecast period ($) | -5.0 percent | 100 | ||||||||
| The Retail – North America group of CGUs has $6,981 million in associated goodwill and at the annual testing date of October 1, 2023, the recoverable amount did not substantially exceed its carrying amount. The Retail – North America group of CGUs recoverable amount exceeds its carrying amount by $570 million. The following table indicates the percentage by which key assumptions would need to change individually for the estimated recoverable amount to be equal to the carrying amount. Dollar amounts are in millions, except as otherwise noted. |
||
|
|
2023 Annual impairment testing | Key assumption used in impairment model |
Change required for carrying amount to equal recoverable amount |
|||||||||
| Terminal growth rate (%) | 2.5 | 0.4 percent decrease | ||||||||||
| Discount rate (%) | 8.6 | 0.2 percent increase | ||||||||||
|
|
|
Forecasted EBITDA over forecast period ($) |
8,040 | 3.0 percent decrease | ||||||||
|
Note 22 and Note 30 |
Asset retirement obligations (“AROs”) and accrued environmental costs (“ERLs”) – measurement
AROs and ERLs have a high degree of estimation uncertainty for future costs and estimated remediation timelines. The Potash and Phosphate segments have AROs and ERLs associated with their mining operations while the Corporate and Others segment has these liabilities associated with non-operational mines. |
|
| For the Nitrogen segment, there are no significant AROs recorded as there is no reasonable basis for estimating a date or range of dates of cessation of operations. We considered the historical performance of our facilities as well as our planned maintenance, major upgrades and replacements, which can extend the useful lives of our facilities indefinitely. |
||
| 74 | Nutrien Annual Report 2023 |
| Overview | MD&A | Five-year highlights | Financial statements and notes | |||||
|
Results |
||||||||
|
|
Quarterly results
| 2023 | 2022 | |||||||||||||||||||||||||||||||
| (millions of US dollars, except as otherwise noted) | Q4 | Q3 | Q2 | Q1 | Q4 | Q3 | Q2 | Q1 | ||||||||||||||||||||||||
| Sales | 5,664 | 5,631 | 11,654 | 6,107 | 7,533 | 8,188 | 14,506 | 7,657 | ||||||||||||||||||||||||
| Net earnings | 176 | 82 | 448 | 576 | 1,118 | 1,583 | 3,601 | 1,385 | ||||||||||||||||||||||||
| Net earnings attributable to equity holders of Nutrien | 172 | 75 | 440 | 571 | 1,112 | 1,577 | 3,593 | 1,378 | ||||||||||||||||||||||||
| Net earnings per share attributable to equity holders of Nutrien |
||||||||||||||||||||||||||||||||
| Basic |
0.35 | 0.15 | 0.89 | 1.14 | 2.15 | 2.95 | 6.53 | 2.49 | ||||||||||||||||||||||||
| Diluted |
0.35 | 0.15 | 0.89 | 1.14 | 2.15 | 2.94 | 6.51 | 2.49 | ||||||||||||||||||||||||
Seasonality in our business results from increased demand for products during planting season. Crop input sales are generally higher in spring and fall application seasons. Crop input inventories are normally accumulated leading up to each application season. The results of this seasonality have a corresponding effect on receivables from customers and rebates receivables, inventories, prepaid expenses and other current assets, and trade payables. Our short-term debt also fluctuates during the year to meet working capital needs. Our cash collections generally occur after the application season is complete, while customer prepayments made to us are typically concentrated in December and January and inventory prepayments paid to our vendors are typically concentrated in the period from November to January. Feed and industrial sales are more evenly distributed throughout the year.
Our earnings are significantly affected by fertilizer benchmark prices, which have been volatile over the last two years and are affected by demand-supply conditions, grower affordability and weather.
Other material transactions or events that impacted our quarterly results included:
| Quarter | Transaction or event | |
|
2023 Q2 |
$698 million non-cash impairment of assets comprising a $233 million non-cash impairment of our Phosphate White Springs property, plant and equipment due to a decrease in our forecasted phosphate margins and a $465 million non-cash impairment of our Retail – South America assets primarily related to goodwill mainly due to the impact of crop input price volatility, more moderate long-term growth assumptions and higher interest rates which lowered our forecasted earnings. |
|
|
2022 Q3 |
$330 million reversal of non-cash impairment of our Phosphate White Springs property, plant and equipment related to higher forecasted global prices and a more favorable outlook for phosphate margins. |
|
|
2022 Q2 |
$450 million reversal of non-cash impairment of our Phosphate Aurora property, plant and equipment related to higher forecasted global prices and a more favorable outlook for phosphate margins. |
|
| Nutrien Annual Report 2023 | 75 |
| Overview | MD&A | Five-year highlights | Financial statements and notes | |||||
|
Results |
||||||||
|
|
Fourth quarter financial performance
| (millions of US dollars, except as otherwise noted) |
Sales |
Gross margin |
||||||||||||||||||||||
| Three months ended December 31 | 2023 | 2022 | % Change | 2023 | 2022 | % Change | ||||||||||||||||||
| Retail | ||||||||||||||||||||||||
| Crop nutrients |
1,808 | 2,320 | (22 | ) | 346 | 349 | (1 | ) | ||||||||||||||||
| Crop protection products |
960 | 981 | (2 | ) | 333 | 413 | (19 | ) | ||||||||||||||||
| Seed |
202 | 251 | (20 | ) | 36 | 46 | (22 | ) | ||||||||||||||||
| Merchandise |
251 | 264 | (5 | ) | 41 | 41 | – | |||||||||||||||||
| Nutrien Financial |
70 | 62 | 13 | 70 | 62 | 13 | ||||||||||||||||||
| Services and other |
236 | 237 | – | 188 | 194 | (3 | ) | |||||||||||||||||
| Nutrien Financial elimination 1 |
(25 | ) | (28 | ) | (11 | ) | (25 | ) | (28 | ) | (11 | ) | ||||||||||||
| Total |
3,502 | 4,087 | (14 | ) | 989 | 1,077 | (8 | ) | ||||||||||||||||
| 1 Represents elimination for the interest and service fees charged by Nutrien Financial to Retail branches.
|
|
|||||||||||||||||||||||
| (US dollars, except as otherwise noted) | Manufactured product sales tonnes (thousands) | Manufactured product average per tonne | ||||||||||||||||||||||
| Three months ended December 31 | 2023 | 2022 | % Change | 2023 | 2022 | % Change | ||||||||||||||||||
| Potash | ||||||||||||||||||||||||
| North America |
1,089 | 959 | 14 | 342 | 560 | (39 | ) | |||||||||||||||||
| Offshore |
2,214 | 1,659 | 33 | 182 | 506 | (64 | ) | |||||||||||||||||
| Sales |
3,303 | 2,618 | 26 | 235 | 526 | (55 | ) | |||||||||||||||||
| Cost of goods sold |
|
|
|
|
|
|
|
|
|
106 | 118 | (10 | ) | |||||||||||
| Gross margin |
|
|
|
|
|
|
|
|
|
129 | 408 | (68 | ) | |||||||||||
| Nitrogen | ||||||||||||||||||||||||
| Ammonia |
651 | 776 | (16 | ) | 416 | 887 | (53 | ) | ||||||||||||||||
| Urea and ESN® 1 |
739 | 764 | (3 | ) | 428 | 666 | (36 | ) | ||||||||||||||||
| Solutions, nitrates and sulfates |
1,344 | 1,056 | 27 | 215 | 368 | (42 | ) | |||||||||||||||||
| Sales |
2,734 | 2,596 | 5 | 321 | 611 | (47 | ) | |||||||||||||||||
| Cost of goods sold 1 |
|
|
|
|
|
|
|
|
|
218 | 343 | (36 | ) | |||||||||||
| Gross margin |
|
|
|
|
|
|
|
|
|
103 | 268 | (62 | ) | |||||||||||
| Phosphate | ||||||||||||||||||||||||
| Fertilizer |
579 | 391 | 48 | 557 | 700 | (20 | ) | |||||||||||||||||
| Industrial and feed |
174 | 140 | 24 | 860 | 1,107 | (22 | ) | |||||||||||||||||
| Sales |
753 | 531 | 42 | 627 | 807 | (22 | ) | |||||||||||||||||
| Cost of goods sold |
|
|
|
|
|
|
|
|
|
535 | 762 | (30 | ) | |||||||||||
| Gross margin |
|
|
|
|
|
|
|
|
|
92 | 45 | 104 | ||||||||||||
| 1 | Certain immaterial 2022 figures have been reclassified. |
| 76 | Nutrien Annual Report 2023 |
| Overview | MD&A | Five-year highlights | Financial statements and notes | |||||
|
Results |
||||||||
|
|
|
|
|
|
Three months ended December 31 | |||||||||||||||||||||
| (millions of US dollars, except as otherwise noted) |
|
|
2023 | 2022 | % Change | |||||||||||||||||||
| Adjusted EBITDA | ||||||||||||||||||||||||
| Retail |
229 | 391 | (41 | ) | ||||||||||||||||||||
| Potash |
463 | 958 | (52 | ) | ||||||||||||||||||||
| Nitrogen |
391 | 841 | (54 | ) | ||||||||||||||||||||
| Phosphate |
130 | 28 | 364 | |||||||||||||||||||||
| Corporate and others |
(117 | ) | (180 | ) | (35 | ) | ||||||||||||||||||
| Eliminations |
(21 | ) | 57 | n/m | ||||||||||||||||||||
| Adjusted EBITDA1 |
|
|
|
|
|
|
|
|
|
1,075 | 2,095 | (49 | ) | |||||||||||
| Net earnings |
|
|
|
|
|
|
|
|
|
176 | 1,118 | (84 | ) | |||||||||||
| 1 This is a non-GAAP financial measure. See the “Non-GAAP Financial Measures” section for further information. |
||||||||||||||||||||||
Highlights of our 2023 fourth quarter compared to the 2022 fourth quarter results were as follows:
|
|
Q4 2023 vs Q4 2022 | |
|
Retail |
Gross margin decreased in 2023 primarily due to lower gross margin for crop protection products. Crop protection products sales were lower primarily due to decreased selling prices compared to the historically strong comparable period in 2022. This was partially offset by higher sales in North America as growers returned to more normalized buying behaviors. Crop nutrients sales and gross margin decreased due to lower selling prices across all regions compared to the strong comparable period in 2022. Sales volumes increased as growers returned to more normalized application rates to replenish nutrients in the soil. Seed sales and gross margin decreased due to lower soybean sales volumes and competitive market prices in Latin America. |
|
|
Potash |
Gross margin decreased due to lower net realized selling prices, which more than offset higher North American and Offshore sales volumes and lower royalties. Net realized selling price decreased compared to the historically strong period in 2022, due to a decline in benchmark prices and higher costs related to logistical challenges at Canpotex’s West Coast port facilities. Sales volumes in North America were higher due to lower channel inventory and increased grower demand supported by an extended fall application window and improved affordability. Offshore sales volumes were driven by stronger demand in Brazil and China. Cost of goods sold per tonne decreased mainly due to lower royalties and reduced turnaround activity. |
|
|
Nitrogen |
Gross margin was lower due to lower net realized selling prices for all major nitrogen products, which more than offset lower natural gas costs and higher sales volumes. Net realized selling price was lower for all major nitrogen products primarily due to weaker benchmark prices resulting from lower energy prices in key nitrogen producing regions. Sales volumes were higher primarily due to higher UAN production and sales, partially offset by lower ammonia availability mainly due to unplanned production outages at our plants in Trinidad. Cost of goods sold per tonne decreased mainly due to lower natural gas costs.
We recognized a $76 million non-cash impairment of our Trinidad property, plant and equipment due to a new natural gas contract and the resulting outlook for higher expected natural gas costs and constrained near-term availability. We expect improved natural gas availability in Trinidad as the development of additional gas fields is anticipated to add new supply starting in 2026. |
|
|
Phosphate |
Gross margin increased primarily due to lower sulfur and ammonia input costs, partially offset by lower net realized selling prices. Net realized selling price decreased primarily due to lower fertilizer net realized selling prices from weaker benchmark prices and lower industrial and feed net realized selling prices, which reflect the typical lag in price realizations relative to spot fertilizer prices. Sales volumes increased mostly due to higher phosphate fertilizer demand. Cost of goods sold per tonne decreased mainly due to lower ammonia and sulfur costs, partially offset by higher depreciation from reversal of non-cash impairments in 2022. |
|
|
Other fourth quarter financial highlights |
The Corporate and Others segment reflects $142 million of higher expenses for asset retirement obligations and accrued environmental costs related to our non-operating sites due to changes in closure cost estimates. Finance costs were higher primarily due to higher interest rates and higher average long-term debt balances. Income tax expense and effective tax rate reflect a $134 million income tax recovery due to changes to our tax declarations in Switzerland (“Swiss Tax Reform adjustment”). The fourth quarter 2023 effective tax rate also includes the impact of our losses in Retail – South America, wherein we did not recognize a corresponding deferred tax asset as it did not meet the accounting criteria for asset recognition. |
|
| Nutrien Annual Report 2023 | 77 |
| Overview | MD&A | Five-year highlights | Financial statements and notes | |||||
|
Results |
||||||||
|
|
Controls and procedures
Disclosure controls and procedures
We maintain disclosure controls and procedures designed to provide reasonable assurance that information required to be disclosed by Nutrien in its annual filings, interim filings (as these terms are defined in National Instrument 52-109 – Certification of Disclosure in Issuers’ Annual and Interim Filings (“NI 52-109”)), and other reports filed or submitted by us under securities legislation is recorded, processed, summarized and reported within the required time periods. Our Chief Executive Officer and Chief Financial Officer, after evaluating the effectiveness of our disclosure controls and procedures as of the end of the period covered by the annual filings, being December 31, 2023, have concluded that, as of such date, our disclosure controls and procedures were effective in providing reasonable assurance that information required to be disclosed by Nutrien in its annual filings, interim filings, or other reports filed or submitted by it under securities legislation is (a) recorded, processed, summarized and reported within the time periods specified in the securities legislation, and (b) accumulated and communicated to management, including our Chief Executive Officer and Chief Financial Officer, as appropriate, to allow timely decisions regarding required disclosure.
There are inherent limitations to the effectiveness of any system of disclosure controls and procedures, including the possibility of human error and the circumvention or overriding of the controls and procedures. Accordingly, even effective disclosure controls and procedures can only provide reasonable assurance of achieving their control objectives.
Internal control over financial reporting
Management is responsible for establishing and maintaining adequate internal control over financial reporting, as defined in Rules 13a-15(f) and 15d-15(f) under the Securities Exchange Act of 1934, as amended, and NI 52-109. Internal control over financial reporting is designed to provide reasonable assurance regarding the reliability of financial reporting and preparation of consolidated financial statements for external purposes in accordance with IFRS.
Under the supervision and with the participation of our management, including our Chief Executive Officer and Chief Financial Officer, we conducted an evaluation of the design and effectiveness of our internal control over financial reporting as of the end of the fiscal year covered by this report based on the framework issued by the Committee of Sponsoring Organizations of the Treadway Commission in Internal Control – Integrated Framework (2013). Based on this evaluation, our Chief Executive Officer and Chief Financial Officer concluded that, as at December 31, 2023, Nutrien Ltd. did maintain effective internal control over financial reporting. There have been no changes that have materially affected, or are reasonably likely to materially affect, our internal control over financial reporting.
The effectiveness of the Company’s internal control over financial reporting as at December 31, 2023 was audited by KPMG LLP, as reflected in their report, which is included in this 2023 Annual Report.
| 78 | Nutrien Annual Report 2023 |
| Overview | MD&A | Five-year highlights | Financial statements and notes | |||||
|
Results |
||||||||
|
|
Forward-looking statements
Certain statements and other information included in this document, including within the “2024 Guidance” section and the “Market outlook” sections for each segment, constitute “forward-looking information” or “forward-looking statements” (collectively, “forward-looking statements”) under applicable securities laws (such statements are often accompanied by words such as “anticipate”, “forecast”, “expect”, “believe”, “may”, “will”, “should”, “estimate”, “project”, “intend” or other similar words). All statements in this document, other than those relating to historical information or current conditions, are forward-looking statements, including, but not limited to:
Nutrien’s business strategies, plans, prospects and opportunities; Nutrien’s 2024 annual guidance, including expectations regarding our Retail adjusted EBITDA, Potash sales volumes, Nitrogen sales volumes, Phosphate sales volumes, depreciation and amortization, finance costs, effective tax rate on adjusted earnings and capital expenditures; our projections to generate strong cash from operations and expectations regarding our capital allocation intentions and strategies, including with respect to expansion of our portfolio of advanced nutrition products and overall growth of the Retail platform and network optimization initiatives; our ability to advance strategic initiatives and high value growth investments, including expectations regarding our ability to serve growers, maintain a low-cost position of fertilizer production assets and increase free cash flow; capital spending expectations for 2024 and beyond, including spending related to advancement of proprietary products, network optimization and digital capabilities in Retail, automation in Potash mining, and brownfield expansions in Nitrogen; expectations regarding our ability to generate free cash flow and return capital to our shareholders, including our expectations regarding stable and growing dividends; our ability to reduce our GHG emissions, and the initiatives in connection therewith, including the expected impacts in connection with the installment of our final N2O abatement project; expectations and forecasts relating to our Aurora and White Springs CGUs and the reversals and impairments (as applicable) associated therewith; our ability to advance strategic growth initiatives; the expected impacts and timing of new supply from additional gas fields in Trinidad; the resulting outlook of higher expected gas costs and lower near-term availability from the new natural gas contract related to our Trinidad property, plant and equipment in our Nitrogen segment and the impairments associated therewith; capital spending expectations for 2024 and beyond, including our intention to reduce planned capital expenditures in 2024 and our goal to continuously improve in our initiatives and make selective and strategic investments; expectations regarding Retail inventory levels in North America; expectations regarding performance of our operating segments in 2024, including increased fertilizer sales volumes and growth in Retail earnings; our operating segment market outlooks and our expectations for global market conditions and fundamentals in 2024 and beyond, including agriculture and crop nutrient markets and global energy supply, the anticipated supply and demand for our products and services, expected market, industry and growing conditions with respect to crop nutrient application rates, planted acres, grower crop investment, crop mix, including the need to replenish soil nutrient levels, production volumes and expenses, shipments, natural gas costs and availability, consumption, prices, operating rates, the impact of seasonality, import and export volumes, economic sanctions, inventories, crop development, natural gas curtailments in Trinidad and elsewhere, and global population growth expectations; the expected impact on nitrogen volume growth of completed brownfield expansions at our Geismar site and the anticipated effects of our UAN debottleneck projects; expectations concerning future product offerings; expectations regarding changes in the agriculture space, including continued farm consolidation in the US and other developed markets and the continued advancement and adoption of technology and digital innovations, including the use and anticipated effects of autonomous mining and reliability improvements, new crop input technologies, artificial technology, biostimulants, biological product technologies and advanced nutrition products, and agronomic capabilities; expectations regarding environmental compliance requirements and costs, including estimates of asset retirement obligations, federal and provincial carbon pricing, permits, approvals and site assessment and remediation costs; expectations regarding our sustainability initiatives and our proposed responses to climate change, including our GHG emissions reduction strategy and related programs and initiatives, our various sustainability performance goals, targets, costs, capital expenditures, commitments and aspirations as set out in our Feeding the Future Plan and the 2023 ESG Report; our evaluation of future opportunities with respect to the suspended Geismar clean ammonia project; the negotiation of sales and other contracts, including the expiry of existing contracts; initiatives to promote innovative, sustainable and productive agriculture; timing and impacts of plant turnarounds; acquisitions and divestitures and the anticipated benefits thereof; and expectations in connection with our ability to deliver long-term returns to shareholders.
These forward-looking statements are subject to a number of assumptions, risks and uncertainties, many of which are beyond our control, which could cause actual results to differ materially from such forward-looking statements. As such, undue reliance should not be placed on these forward-looking statements.
All of the forward-looking statements are qualified by the assumptions that are stated or inherent in such forward-looking statements, including the assumptions referred to below and elsewhere in this document. Although we believe that these assumptions are reasonable, having regard to our experience and our perception of historical trends, the assumptions set forth below are not exhaustive of the factors that may affect any of the forward-looking statements and the reader should not place undue reliance on these assumptions and such forward-looking statements. Current conditions, economic and otherwise, render assumptions, although reasonable when made, subject to greater uncertainty.
Mid-cycle scenarios are based on medium-term estimates for manufactured sales volumes and Retail adjusted EBITDA. Mid-cycle pricing assumptions are based on a ten-year historical average of fertilizer benchmark pricing from June 2013 to June 2023, plus approximately $50 per tonne. In respect of our mid-cycle scenario estimates, we have made assumptions with respect to, among other things: our expectations for global economic conditions including supply and demand for fertilizer, fertilizer and commodity prices and global potash volumes returning to historical trend line growth rates; our expectations for our logistics and production capacity; our expectations for Retail margin normalization; our ability to increase sales volumes as global demand grows; and our expectations for access to and availability of capital, foreign exchange, inflation and interest rates, costs and availability of labor and technology.
In respect of our GHG emissions reduction and other sustainability and climate-related initiatives and targets, we have made assumptions with respect to, among other things: that such target is achievable by deploying capital into N2O abatement at our nitric acid production facilities,
energy efficiency improvements, carbon capture, utilization and storage, use of natural gas to generate electricity and waste heat recovery; our ability to successfully deploy capital and pursue other operational measures, including the successful application to our current and future operations of existing and new technologies; the successful implementation by us of proposed or potential plans in respect thereof; projected capital investment levels, the flexibility of our capital spending plans and the associated sources of funding; our expectations for our production mix between nitrogen, phosphate and potash and grid decarbonization (including timing thereof); our ability to otherwise implement all
| Nutrien Annual Report 2023 | 79 |
| Overview | MD&A | Five-year highlights | Financial statements and notes | |||||
|
Results |
||||||||
|
|
technology necessary to achieve our GHG emissions reduction and other sustainability and climate-related initiatives and targets; and the development, availability and performance of technology and technological innovations and associated expected future results. Additional key assumptions that have been made in relation to the operation of our business as currently planned and our ability to achieve our business objectives include, among other things, assumptions with respect to our ability to successfully implement our business strategies, growth and capital allocation investments and initiatives that we will conduct our operations and achieve results of operations as anticipated; our ability to successfully complete, integrate and realize the anticipated benefits of our already completed and future acquisitions and divestitures, and that we will be able to implement our standards, controls, procedures and policies in respect of any acquired businesses and realize the expected synergies on the anticipated timeline or at all; that future business, regulatory and industry conditions will be within the parameters expected by us, including with respect to prices, expenses, margins, demand, supply, product availability, shipments, consumption, weather conditions, including the current El Niño weather pattern, supplier agreements, product distribution agreements, availability, inventory levels, exports, crop development and cost of labor and interest, exchange and effective tax rates; assumptions with respect to global economic conditions and the accuracy of our market outlook expectations for 2024 and beyond; assumptions related to our assessment of recoverable amount estimates of our assets, including in relation to our Retail – South America group of CGUs goodwill and intangible asset impairments; assumptions related to the calculation of recoverable amount of our Aurora and White Springs CGUs, including internal sales and input price forecasts, discount rate, long-term growth rate and end of expected mine life; assumptions with respect to the benefits of the brownfield expansions at our Geismar site; assumptions related to the impairment of our Nitrogen and Phosphate property, plant and equipment; assumptions with respect to our intention to complete share repurchases under our normal course issuer bid programs, including TSX approval, the funding of such share repurchases, existing and future market conditions, including with respect to the price of our common shares, and compliance with respect to applicable limitations under securities laws and regulations and stock exchange policies; assumptions related to our ability to fund our dividends at the current level; our expectations regarding the impacts, direct and indirect, of certain geopolitical conflicts, including the war in Eastern Europe and the conflict in the Middle East on, among other things, global supply and demand, including for crop nutrients, energy and commodity prices, global interest rates, supply chains and the global macroeconomic environment, including inflation; assumptions regarding future markets for clean ammonia; the adequacy of our cash generated from operations and our ability to access our credit facilities or capital markets for additional sources of financing; our ability to identify suitable candidates for acquisitions and divestitures and negotiate acceptable terms; our ability to maintain investment grade ratings and achieve our performance targets; our ability to successfully negotiate sales and other contracts; and our ability to successfully implement new initiatives and programs. Key assumptions with respect to our 2030 commitment of a 30% reduction in GHG emissions (Scope 1 and 2) per tonne of our products produced, from a baseline year of 2018, include growth in potash production volumes, operating rates within expected parameters and grid decarbonization progressing on expected timelines.
Events or circumstances could cause actual results to differ materially from those in the forward-looking statements.
With respect to our GHG emissions reduction and other sustainability and climate-related initiatives and targets, such events or circumstances include, but are not limited to: our ability to deploy sufficient capital to fund the necessary expenditures to implement the necessary operational changes to achieve these initiatives and targets; our ability to implement requisite operational changes; our ability to implement some or all of the technology necessary to efficiently and effectively achieve expected future results, including in respect of such GHG emissions reduction target; the availability and commercial viability and scalability of emissions reduction strategies and related technology and products; and the development and execution of implementing strategies to meet such GHG emissions reduction target.
With respect to our business generally and our ability to meet other targets, commitments, goals, strategies and related milestones and schedules disclosed in this document, such events or circumstances include, but are not limited to: general global economic, market and business conditions; failure to achieve expected results of our business strategy, capital allocation initiatives or results of operations; failure to complete announced and future acquisitions or divestitures at all or on the expected terms and within the expected timeline; seasonality; climate change and weather conditions, including the current El Niño weather pattern, and impacts from regional flooding and/or drought conditions; failure to execute on our strategies related to sustainability matters or to achieve our GHG emission and other related expectations, targets, goals and commitments; crop planted acreage, yield and prices; the supply and demand and price levels for our products; governmental and regulatory requirements and actions by governmental authorities, including changes in government policy (including tariffs, trade restrictions and climate change initiatives), government ownership requirements, and changes in environmental, tax, antitrust, and other laws or regulations and the interpretation thereof; political or military risks, including civil unrest, actions by armed groups or conflict and malicious acts including terrorism and industrial espionage; our ability to access sufficient, cost-effective and timely transportation, distribution and storage of products; the occurrence of a major environmental or safety incident or becoming subject to legal or regulatory proceedings; innovation and cybersecurity risks related to our systems, including our costs of addressing or mitigating such risks; counterparty and sovereign risk; delays in completion of turnarounds at our major facilities or challenges related to our major facilities that are out of our control; interruptions of or constraints in availability of key inputs, including natural gas and sulfur; any significant impairment of the carrying amount of certain assets; the risk that rising interest rates and/or deteriorated business operating results may result in the further impairment of assets or goodwill attributed to certain CGUs; risks related to reputational loss; certain complications that may arise in our mining processes; the ability to attract, engage and retain skilled employees and strikes or other forms of work stoppages; geopolitical conflicts, including the war in Eastern Europe and the conflict in the Middle East, and their potential impact on, among other things, global market conditions and supply and demand, including for crop nutrients, energy and commodity prices, interest rates, supply chains and the global economy generally; our ability to execute on our strategies related to environmental, social and governance matters, and achieve expectations, targets and commitments; and other risk factors detailed from time to time in Nutrien reports filed with the Canadian securities regulators and the SEC in the US.
The purpose of our 2024 Retail adjusted EBITDA, depreciation and amortization, finance costs, effective tax rate on adjusted earnings and capital expenditures guidance ranges are to assist readers in understanding our expected and targeted financial results, and this information may not be appropriate for other purposes.
The forward-looking statements in this document are made as of the date hereof and Nutrien disclaims any intention or obligation to update or revise any forward-looking statements in this document as a result of new information or future events, except as may be required under applicable Canadian securities legislation or applicable US federal securities laws.
| 80 | Nutrien Annual Report 2023 |
| Overview | MD&A | Five-year highlights | Financial statements and notes | |||||
|
Results |
||||||||
|
|
Appendix A – non-GAAP financial measures
We use both IFRS measures and certain non-GAAP financial measures to assess performance. Non-GAAP financial measures are financial measures disclosed by the Company that (a) depict historical or expected future financial performance, financial position or cash flow of the Company, (b) with respect to their composition, exclude amounts that are included in, or include amounts that are excluded from, the composition of the most directly comparable financial measure disclosed in the primary financial statements of the Company, (c) are not disclosed in the financial statements of the Company and (d) are not a ratio, fraction, percentage or similar representation. Non-GAAP ratios are financial measures disclosed by the Company that are in the form of a ratio, fraction, percentage or similar representation that has a non-GAAP financial measure as one or more of its components, and that are not disclosed in the financial statements of the Company.
These non-GAAP financial measures and non-GAAP ratios are not standardized financial measures under IFRS and, therefore, are unlikely to be comparable to similar financial measures presented by other companies. Management believes these non-GAAP financial measures and non-GAAP ratios provide transparent and useful supplemental information to help investors evaluate our financial performance, financial condition and liquidity using the same measures as management. These non-GAAP financial measures and non-GAAP ratios should not be considered as a substitute for, or superior to, measures of financial performance prepared in accordance with IFRS.
The following section outlines our non-GAAP financial measures and non-GAAP ratios, their compositions, and why management uses each measure. It also includes reconciliations to the most directly comparable IFRS measures. Except as otherwise described herein, our non-GAAP financial measures and non-GAAP ratios are calculated on a consistent basis from period to period and are adjusted for specific items in each period, as applicable. As additional non-recurring or unusual items arise in the future, we generally exclude these items in our calculations.
Adjusted EBITDA (consolidated)
Most directly comparable IFRS financial measure: Net earnings (loss).
Definition: Adjusted EBITDA is calculated as net earnings (loss) before finance costs, income taxes, depreciation and amortization, share-based compensation and certain foreign exchange gain/loss (net of related derivatives). We also adjust this measure for the following other income and expenses that are excluded when management evaluates the performance of our day-to-day operations: integration and restructuring related costs, impairment or reversal of impairment of assets, COVID-19 related expenses, gain or loss on disposal of certain businesses and investments, asset retirement obligations (“ARO”) and accrued environmental costs (“ERL”) related to our non-operating sites, and loss on remitting cash from certain foreign jurisdictions (e.g. Blue Chip Swaps). In 2023, we amended our calculation of adjusted EBITDA to adjust for the asset retirement obligations and accrued environmental costs related to our non-operating sites and the loss on remitting cash from certain foreign jurisdictions. We do not consider these to be part of our day-to-day operations. There were no similar income and expense in the comparative periods.
| Nutrien Annual Report 2023 | 81 |
| Overview | MD&A | Five-year highlights | Financial statements and notes | |||||
|
Results |
||||||||
|
|
Why we use the measure and why it is useful to investors: It is not impacted by long-term investment and financing decisions, but rather focuses on the performance of our day-to-day operations. It provides a measure of our ability to service debt and to meet other payment obligations and as a component of employee remuneration calculations.
| (millions of US dollars) | 2023 | 2022 | ||||||
| Net earnings | 1,282 | 7,687 | ||||||
| Finance costs | 793 | 563 | ||||||
| Income tax (recovery) expense | 670 | 2,559 | ||||||
| Depreciation and amortization | 2,169 | 2,012 | ||||||
| EBITDA 1 | 4,914 | 12,821 | ||||||
| Adjustments: | ||||||||
| Integration and restructuring related costs |
49 | 46 | ||||||
| Share-based compensation (recovery) expense |
(14 | ) | 63 | |||||
| Impairment (reversal of impairment) of assets |
774 | (780 | ) | |||||
| ARO/ERL expense for non-operating sites |
152 | – | ||||||
| Foreign exchange loss, net of related derivatives |
91 | 31 | ||||||
| Loss on Blue Chip Swaps |
92 | – | ||||||
| Gain on disposal of investment |
– | (19 | ) | |||||
| COVID-19 related expenses 2 |
– | 8 | ||||||
| Adjusted EBITDA | 6,058 | 12,170 | ||||||
| 1 | EBITDA is calculated as net earnings before finance costs, income taxes, and depreciation and amortization. |
| 2 | COVID-19 related expenses primarily consist of increased cleaning and sanitization costs, the purchase of personal protective equipment, discretionary supplemental employee costs, and costs related to construction delays from access limitations and other government restrictions. |
Adjusted net earnings and adjusted net earnings per share
Most directly comparable IFRS financial measure: Net earnings (loss) and diluted net earnings (loss) per share.
Definition: Adjusted net earnings and related per share information are calculated as net earnings (loss) before share-based compensation and certain foreign exchange gain/loss (net of related derivatives), net of tax. We also adjust this measure for the following other income and expenses (net of tax) that are excluded when management evaluates the performance of our day-to-day operations: certain integration and restructuring related costs, impairment or reversal of impairment of assets, COVID-19 related expenses (including those recorded under finance costs), gain or loss on disposal of certain businesses and investments, gain or loss on early extinguishment of debt or on settlement of derivatives due to discontinuance of hedge accounting, asset retirement obligations and accrued environmental costs related to our non-operating sites, loss on remitting cash from certain foreign jurisdictions (e.g. Blue Chip Swaps), change in recognition of tax losses and deductible temporary differences related to impairments and certain changes to tax declarations in Switzerland (“Swiss Tax Reform adjustment”) resulting in an income tax recovery from the recognition of a deferred tax asset. In 2023, we amended our calculation of adjusted net earnings and adjusted net earnings per share to adjust for the asset retirement obligations and accrued environmental costs related to our non-operating sites, the loss on remitting cash from certain foreign jurisdictions, the change in recognition of Retail – South America tax losses and deductible temporary differences and the Swiss Tax Reform adjustment. We do not consider these to be part of our day-to-day operations. There were no similar income and expense in the comparative periods. We generally apply the annual forecasted effective tax rate to our adjustments during the year, and at year-end, we apply the actual effective tax rate. Prior to December 31, 2023, we applied a specific tax rate for material adjustments. Effective December 31, 2023, we applied a tax rate specific to each adjustment.
| 82 | Nutrien Annual Report 2023 |
| Overview | MD&A | Five-year highlights | Financial statements and notes | |||||
|
Results |
||||||||
|
|
Why we use the measure and why it is useful to investors: Focuses on the performance of our day-to-day operations and is used as a component of employee remuneration calculations.
|
|
2023 | 2022 | ||||||||||||||||||||||
| (millions of US dollars, except as otherwise noted) |
Increases (decreases) |
Post-tax | Per diluted share |
Increases (decreases) |
Post-tax | Per diluted share |
||||||||||||||||||
| Net earnings attributable to equity holders of Nutrien |
1,258 | 2.53 | 7,660 | 14.18 | ||||||||||||||||||||
| Adjustments: |
||||||||||||||||||||||||
| Share-based compensation (recovery) expense |
(14 | ) | (11 | ) | (0.02 | ) | 63 | 47 | 0.10 | |||||||||||||||
| Foreign exchange loss, net of related derivatives |
91 | 83 | 0.17 | 31 | 23 | 0.05 | ||||||||||||||||||
| Integration and restructuring related costs |
49 | 40 | 0.08 | 46 | 35 | 0.06 | ||||||||||||||||||
| Impairment (reversal of impairment) of assets |
774 | 702 | 1.42 | (780 | ) | (619 | ) | (1.15 | ) | |||||||||||||||
| ARO/ERL expense for non-operating sites |
152 | 110 | 0.22 | – | – | – | ||||||||||||||||||
| Loss on Blue Chip Swaps |
92 | 92 | 0.18 | – | – | – | ||||||||||||||||||
| Change in recognition of deferred tax assets |
66 | 66 | 0.13 | – | – | – | ||||||||||||||||||
| Swiss Tax Reform adjustment |
(134 | ) | (134 | ) | (0.27 | ) | – | – | – | |||||||||||||||
| COVID-19 related expenses |
– | – | – | 8 | 6 | 0.01 | ||||||||||||||||||
| Gain on disposal of investment |
– | – | – | (19 | ) | (14 | ) | (0.03 | ) | |||||||||||||||
| Gain on settlement of discontinued hedge accounting derivative |
– | – | – | (18 | ) | (14 | ) | (0.03 | ) | |||||||||||||||
| Adjusted net earnings |
|
|
|
2,206 | 4.44 |
|
|
|
7,124 | 13.19 | ||||||||||||||
Gross margin excluding depreciation and amortization per tonne – manufactured
Most directly comparable IFRS financial measure: Gross margin.
Definition: Gross margin per tonne less depreciation and amortization per tonne for manufactured products. Reconciliations are provided in the “Results – Operating Segment Performance” section.
Why we use the measure and why it is useful to investors: Focuses on the performance of our day-to-day operations, which excludes the effects of items that primarily reflect the impact of long-term investment and financing decisions.
Potash controllable cash cost of product manufactured (“COPM”) per tonne
Most directly comparable IFRS financial measure: Cost of goods sold (“COGS”) for the Potash segment.
Definition: Total Potash COGS excluding depreciation and amortization expense included in COPM, royalties, natural gas costs and carbon taxes, change in inventory, and other adjustments, divided by potash production tonnes.
| Nutrien Annual Report 2023 | 83 |
| Overview | MD&A | Five-year highlights | Financial statements and notes | |||||
|
Results |
||||||||
|
|
Why we use the measure and why it is useful to investors: To assess operational performance. Potash controllable cash COPM excludes the effects of production from other periods and the impacts of our long-term investment decisions, supporting a focus on the performance of our day-to-day operations. Potash controllable cash COPM also excludes royalties and natural gas costs and carbon taxes, which management does not consider controllable, as they are primarily driven by regulatory and market conditions.
| (millions of US dollars, except as otherwise noted) | 2023 | 2022 | ||||||
| Total COGS – Potash | 1,396 | 1,400 | ||||||
| Change in inventory | (40 | ) | 58 | |||||
| Other adjustments 1 | (26 | ) | (41 | ) | ||||
| COPM | 1,330 | 1,417 | ||||||
| Depreciation and amortization in COPM | (427 | ) | (406 | ) | ||||
| Royalties in COPM | (100 | ) | (190 | ) | ||||
| Natural gas costs and carbon taxes in COPM | (46 | ) | (62 | ) | ||||
| Controllable cash COPM | 757 | 759 | ||||||
| Production tonnes (tonnes – thousands) | 12,998 | 13,007 | ||||||
| Potash controllable cash COPM per tonne | 58 | 58 | ||||||
| 1 | Other adjustments include unallocated production overhead that is recognized as part of cost of goods sold but is not included in the measurement of inventory and changes in inventory balances. |
Ammonia controllable cash COPM per tonne
Most directly comparable IFRS financial measure: Total manufactured COGS for the Nitrogen segment.
Definition: Total Nitrogen COGS excluding depreciation and amortization expense included in COGS, cash COGS for products other than ammonia, other adjustments, and natural gas and steam costs, divided by net ammonia production tonnes.
Why we use the measure and why it is useful to investors: To assess operational performance. Ammonia controllable cash COPM excludes the effects of production from other periods, the costs of natural gas and steam, and long-term investment decisions, supporting a focus on the performance of our day-to-day operations.
| (millions of US dollars, except as otherwise noted) | 2023 | 2022 | ||||||
| Total manufactured COGS – Nitrogen 1 | 2,435 | 3,370 | ||||||
| Total other COGS – Nitrogen 1 | 393 | 882 | ||||||
| Total COGS – Nitrogen | 2,828 | 4,252 | ||||||
| Depreciation and amortization in COGS | (474 | ) | (465 | ) | ||||
| Cash COGS for products other than ammonia | (1,693 | ) | (2,560 | ) | ||||
| Ammonia | ||||||||
| Total cash COGS before other adjustments |
661 | 1,227 | ||||||
| Other adjustments 2 |
(222 | ) | (210 | ) | ||||
| Total cash COPM |
439 | 1,017 | ||||||
| Natural gas and steam costs in COPM |
(304 | ) | (855 | ) | ||||
| Controllable cash COPM |
135 | 162 | ||||||
| Production tonnes (net tonnes 3 – thousands) | 2,276 | 2,754 | ||||||
| Ammonia controllable cash COPM per tonne | 60 | 59 | ||||||
| 1 | Certain immaterial 2022 figures have been reclassified. |
| 2 | Other adjustments include unallocated production overhead that is recognized as part of cost of goods sold but is not included in the measurement of inventory and changes in inventory balances. |
| 3 | Ammonia tonnes available for sale, as not upgraded to other nitrogen products. |
| 84 | Nutrien Annual Report 2023 |
| Overview | MD&A | Five-year highlights | Financial statements and notes | |||||
|
Results |
||||||||
|
|
Retail adjusted average working capital to sales and retail adjusted average working capital to sales excluding Nutrien Financial
Definition: Retail adjusted average working capital divided by Retail adjusted sales for the last four rolling quarters. We exclude in our calculations the sales and working capital of certain acquisitions during the first year following the acquisition. We also look at this metric excluding Nutrien Financial revenue and working capital.
Why we use the measure and why it is useful to investors: To evaluate operational efficiency. A lower or higher percentage represents increased or decreased efficiency, respectively. The metric excluding Nutrien Financial shows the impact that the working capital of Nutrien Financial has on the ratio.
| (millions of US dollars, except as otherwise noted) | 2023 | 2022 | ||||||
| Average current assets | 11,470 | 11,952 | ||||||
| Average current liabilities | 7,666 | 8,249 | ||||||
| Average working capital | 3,804 | 3,703 | ||||||
| Average working capital from certain recent acquisitions | – | – | ||||||
| Adjusted average working capital | 3,804 | 3,703 | ||||||
| Average Nutrien Financial working capital | (3,561 | ) | (3,311 | ) | ||||
| Adjusted average working capital excluding Nutrien Financial | 243 | 392 | ||||||
| Sales | 19,542 | 21,350 | ||||||
| Sales from certain recent acquisitions | – | – | ||||||
| Adjusted sales | 19,542 | 21,350 | ||||||
| Nutrien Financial revenue | (322 | ) | (267 | ) | ||||
| Adjusted sales excluding Nutrien Financial | 19,220 | 21,083 | ||||||
| Adjusted average working capital to sales (%) | 19 | 17 | ||||||
| Adjusted average working capital to sales excluding Nutrien Financial (%) | 1 | 2 | ||||||
Nutrien Financial adjusted net interest margin
Definition: Nutrien Financial revenue less deemed interest expense divided by average Nutrien Financial net receivables outstanding for the last four rolling quarters.
Why we use the measure and why it is useful to investors: Used by credit rating agencies and others to evaluate the financial performance of Nutrien Financial.
| (millions of US dollars, except as otherwise noted) | 2023 | 2022 | ||||||
| Nutrien Financial revenue | 322 | 267 | ||||||
| Deemed interest expense 1 | (136 | ) | (41 | ) | ||||
| Net interest | 186 | 226 | ||||||
| Average Nutrien Financial net receivables | 3,561 | 3,311 | ||||||
| Nutrien Financial adjusted net interest margin (%) | 5.2 | 6.8 | ||||||
| 1 | Average borrowing rate applied to the notional debt required to fund the portfolio of receivables from customers monitored and serviced by Nutrien Financial. |
| Nutrien Annual Report 2023 | 85 |
| Overview | MD&A | Five-year highlights | Financial statements and notes | |||||
|
Results |
||||||||
|
|
Retail cash operating coverage ratio
Definition: Retail selling, general and administrative, and other expenses (income), excluding depreciation and amortization expense, divided by Retail gross margin excluding depreciation and amortization expense in cost of goods sold, for the last four rolling quarters.
Why we use the measure and why it is useful to investors: To understand the costs and underlying economics of our Retail operations and to assess our Retail operating performance and ability to generate free cash flow.
| (millions of US dollars, except as otherwise noted) | 2023 | 2022 | ||||||
| Selling expenses | 3,375 | 3,392 | ||||||
| General and administrative expenses | 217 | 200 | ||||||
| Other expenses | 158 | 29 | ||||||
| Operating expenses | 3,750 | 3,621 | ||||||
| Depreciation and amortization in operating expenses | (749 | ) | (740 | ) | ||||
| Operating expenses excluding depreciation and amortization | 3,001 | 2,881 | ||||||
| Gross margin | 4,430 | 5,179 | ||||||
| Depreciation and amortization in cost of goods sold | 10 | 12 | ||||||
| Gross margin excluding depreciation and amortization | 4,440 | 5,191 | ||||||
| Cash operating coverage ratio (%) | 68 | 55 | ||||||
Return on invested capital (“ROIC”)
Definition: ROIC is calculated as net operating profit after taxes divided by the average invested capital for the last four rolling quarters.
Net operating profit after taxes, a non-GAAP financial measure, is calculated as earnings before finance costs and income taxes, depreciation and amortization related to the fair value adjustments as a result of the Merger (the merger of equals transaction between PotashCorp and Agrium), share-based compensation, and certain foreign exchange gain/loss (net of related derivatives) and Nutrien Financial earnings before finance costs and income taxes. The most directly comparable IFRS financial measure to net operating profit after taxes is earnings before finance costs and income taxes. We also adjust this measure for the following other income and expenses that are excluded when management evaluates the performance of our day-to-day operations: integration and restructuring related costs, impairment or reversal of impairment of assets, COVID-19 related expenses, gain or loss on disposal of certain businesses and investments, and IFRS adoption transition adjustments. A tax rate of 25 percent is applied on the calculated amount. Prior to 2023, we were adjusting for Nutrien Financial revenue; however, in 2023, we updated our calculation to adjust for Nutrien Financial earnings before finance costs and income taxes to further refine our calculations.
Invested capital is calculated as last four rolling quarter average of total assets less cash and cash equivalents; payables and accrued charges; Merger fair value adjustments on goodwill, intangible assets, and property, plant and equipment; and average Nutrien Financial working capital.
We exclude in our calculations the related financial information of certain acquisitions during the first year following the acquisition.
| 86 | Nutrien Annual Report 2023 |
| Overview | MD&A | Five-year highlights | Financial statements and notes | |||||
|
Results |
||||||||
|
|
Why we use the measure and why it is useful to investors: In 2022, we added a new financial measure to evaluate how efficiently we allocate our capital. ROIC provides useful information to evaluate our after-tax cash operating return on invested capital and is used as a component of employee remuneration calculations.
| (millions of US dollars, except as otherwise noted) | 2023 | 2022 | 2021 | |||||||||
| Earnings before finance costs and income taxes | 2,745 | 10,809 | 4,781 | |||||||||
| Merger adjustments 1 | 194 | 231 | 277 | |||||||||
| Integration and restructuring related costs | 49 | 46 | 43 | |||||||||
| Share-based compensation (recovery) expense | (14 | ) | 63 | 198 | ||||||||
| Impairment (reversal of impairment) of assets | 774 | (780 | ) | 33 | ||||||||
| ARO/ERL expense for non-operating sites | 152 | – | – | |||||||||
| COVID-19 related expenses | – | 8 | 45 | |||||||||
| Foreign exchange loss, net of related derivatives | 91 | 31 | 39 | |||||||||
| Loss on Blue Chip Swap transactions | 92 | – | – | |||||||||
| Gain on disposal of investment | – | (19 | ) | – | ||||||||
| Cloud computing transition adjustment | – | – | 36 | |||||||||
| Nutrien Financial earnings before finance costs and income taxes | (127 | ) | (234 | ) | (124 | ) | ||||||
| Net operating profit | 3,956 | 10,155 | 5,328 | |||||||||
| Tax (calculated at 25%) | 989 | 2,539 | 1,332 | |||||||||
| Net operating profit after tax | 2,967 | 7,616 | 3,996 | |||||||||
| 1 Depreciation and amortization related to the fair value adjustments as a result of the Merger (the merger of equals transaction between PotashCorp and Agrium).
|
|
|||||||||||
| Total assets | 53,874 | 54,228 | 48,880 | |||||||||
| Cash and cash equivalents | (926 | ) | (753 | ) | (862 | ) | ||||||
| Payables and accrued charges | (9,050 | ) | (10,687 | ) | (8,773 | ) | ||||||
| Merger adjustments 1 | (9,896 | ) | (10,232 | ) | (10,516 | ) | ||||||
| Average Nutrien Financial receivables | (3,561 | ) | (3,311 | ) | (2,316 | ) | ||||||
| Invested capital | 30,441 | 29,245 | 26,413 | |||||||||
|
1 Merger fair value adjustments on goodwill, intangible assets, and property, plant and equipment. |
|
|
|
|
||||||||
| Return on invested capital (%) | 10 | 26 | 15 | |||||||||
| Nutrien Annual Report 2023 | 87 |
| Overview | MD&A | Five-year highlights | Financial statements and notes | |||||
|
Results |
||||||||
|
|
Appendix B – other financial measures
Supplementary financial measures
Supplementary financial measures are financial measures disclosed by the Company that (a) are, or are intended to be, disclosed on a periodic basis to depict the historical or expected future financial performance, financial position or cash flow of the Company, (b) are not disclosed in the financial statements of the Company, (c) are not non-GAAP financial measures, and (d) are not non-GAAP ratios.
The following section provides an explanation of the composition of those supplementary financial measures if not previously provided.
Retail adjusted EBITDA margin: Retail adjusted EBITDA divided by Retail sales for the last four rolling quarters.
Sustaining capital expenditures: Represents capital expenditures that are required to sustain operations at existing levels and include major repairs and maintenance and plant turnarounds.
Investing capital expenditures: Represents capital expenditures related to significant expansions of current operations or to create cost savings (synergies). Investing capital expenditures excludes capital outlays for business acquisitions and equity-accounted investees.
Mine development and pre-stripping capital expenditures: Represents capital expenditures that are required for activities to open new areas underground and/or develop a mine or ore body to allow for future production mining and activities required to prepare and/or access the ore, i.e., removal of an overburden that allows access to the ore.
Retail adjusted EBITDA per US selling location: Calculated as total Retail US adjusted EBITDA for the last four rolling quarters, representing the organic EBITDA component, which excludes acquisitions in those quarters, divided by the number of US locations that have generated sales in the last four rolling quarters, adjusted for acquired locations in those quarters.
Cash used for dividends and share repurchases (shareholder returns): Calculated as dividends paid to Nutrien’s shareholders plus repurchase of common shares as reflected in the consolidated statements of cash flows. This measure is useful as it represents return of capital to shareholders.
| 88 | Nutrien Annual Report 2023 |
| Overview | MD&A | Five-year highlights | Financial statements and notes | |||||
|
Results |
||||||||
|
|
Capital management measures
Capital management measures are financial measures disclosed by the Company that (a) are intended to enable an individual to evaluate the Company’s objectives, policies and processes for managing the Company’s capital, (b) are not a component of a line item disclosed in the primary financial statements of the Company, (c) are disclosed in the notes of the financial statements of the Company, and (d) are not disclosed in the primary financial statements of the Company.
The following section outlines our capital management measure, its composition and why management uses the measure.
Adjusted net debt to adjusted EBITDA: Calculated as adjusted net debt to adjusted EBITDA. Both components are non-GAAP financial measures. This ratio measures financial leverage and our ability to pay our debt.
The most directly comparable measure for adjusted net debt is total short-term and long-term debt and lease liabilities less cash and cash equivalents and is defined as the total of short-term and long-term debt plus lease liabilities less cash and cash equivalents and unamortized fair value adjustments. This measure is useful as it adjusts for the unamortized fair value adjustments that arose at the time of the Merger and is non-cash in nature.
| (millions of US dollars, except as otherwise noted) | 2023 | 2022 | ||||||
| Short-term debt | 1,815 | 2,142 | ||||||
| Current portion of long-term debt | 512 | 542 | ||||||
| Current portion of lease liabilities | 327 | 305 | ||||||
| Long-term debt | 8,913 | 8,040 | ||||||
| Lease liabilities | 999 | 899 | ||||||
| Total debt | 12,566 | 11,928 | ||||||
| Cash and cash equivalents | (941 | ) | (901 | ) | ||||
| Unamortized fair value adjustments | (294 | ) | (310 | ) | ||||
| Adjusted net debt | 11,331 | 10,717 | ||||||
| Nutrien Annual Report 2023 | 89 |
| Overview | MD&A | Five-year highlights | Financial statements and notes | |||||
|
|
||||||||
|
|
The following information is not part of our MD&A on SEDAR+ and EDGAR and is furnished for those readers who may find value in the use of such information over the long term.
Summary financial information
| (millions of US dollars, except as otherwise noted) | 2023 | 2022 | 2021 | 2020 | 2019 | |||||||||||||||
| Operations |
||||||||||||||||||||
| Sales 1 |
29,056 | 37,884 | 27,712 | 20,908 | 20,084 | |||||||||||||||
| Earnings before finance costs and income taxes |
2,745 | 10,809 | 4,781 | 902 | 1,862 | |||||||||||||||
| Net earnings |
1,282 | 7,687 | 3,179 | 459 | 992 | |||||||||||||||
| Diluted net earnings per share (US dollars) |
2.53 | 14.18 | 5.52 | 0.81 | 1.70 | |||||||||||||||
| Finance costs |
793 | 563 | 613 | 520 | 554 | |||||||||||||||
| Adjusted EBITDA 2 |
6,058 | 12,170 | 7,126 | 3,667 | 4,025 | |||||||||||||||
| Cash provided by operating activities |
5,066 | 8,110 | 3,886 | 3,323 | 3,665 | |||||||||||||||
| Balance sheet |
||||||||||||||||||||
| Total assets |
52,749 | 54,586 | 49,954 | 47,192 | 46,799 | |||||||||||||||
| Short-term debt and long-term debt (including leases) |
12,566 | 11,928 | 10,846 | 11,360 | 11,104 | |||||||||||||||
| Total shareholders’ equity |
25,201 | 25,863 | 23,699 | 22,403 | 22,907 | |||||||||||||||
| Common share information |
||||||||||||||||||||
| Weighted average common shares (millions) |
497 | 540 | 571 | 570 | 583 | |||||||||||||||
| Closing share price on NYSE (US dollars) |
56.33 | 73.03 | 75.20 | 48.16 | 47.91 | |||||||||||||||
| Operating segment information |
||||||||||||||||||||
| Retail net sales 1 |
19,542 | 21,350 | 17,734 | 14,785 | 13,282 | |||||||||||||||
| Potash net sales |
3,759 | 7,899 | 4,036 | 2,146 | 2,604 | |||||||||||||||
| Nitrogen net sales |
4,207 | 7,533 | 4,689 | 2,740 | 2,848 | |||||||||||||||
| Phosphate net sales |
1,993 | 2,377 | 1,829 | 1,202 | 1,368 | |||||||||||||||
| Retail adjusted EBITDA |
1,459 | 2,293 | 1,939 | 1,430 | 1,231 | |||||||||||||||
| Potash adjusted EBITDA |
2,404 | 5,769 | 2,736 | 1,190 | 1,593 | |||||||||||||||
| Nitrogen adjusted EBITDA |
1,930 | 3,931 | 2,308 | 1,080 | 1,239 | |||||||||||||||
| Phosphate adjusted EBITDA |
470 | 594 | 540 | 232 | 194 | |||||||||||||||
| Capital allocation |
||||||||||||||||||||
| Sustaining capital expenditures 3 |
1,421 | 1,449 | 1,247 | 919 | 1,018 | |||||||||||||||
| Investing capital expenditures 3 |
988 | 792 | 510 | 511 | 772 | |||||||||||||||
| Mine development and pre-stripping expenditures 3 |
262 | 234 | 156 | 109 | 96 | |||||||||||||||
| Business acquisitions (net of cash acquired) |
153 | 407 | 88 | 233 | 911 | |||||||||||||||
| Dividends paid to Nutrien’s shareholders |
1,032 | 1,031 | 1,045 | 1,030 | 1,022 | |||||||||||||||
| Repurchase of common shares |
1,047 | 4,520 | 1,035 | 160 | 1,930 | |||||||||||||||
| 1 | Certain immaterial figures have been reclassified for 2019. |
| 2 | This is a non-GAAP financial measure. See the “Non-GAAP Financial Measures” section. Additional information relating to 2021, 2020 and 2019 is contained in the “Appendix – Non-IFRS Financial Measures” sections of Nutrien’s MD&A dated February 17, 2022 for the year ended December 31, 2021, its MD&A dated February 17, 2021 for the year ended December 31, 2020 and its MD&A dated February 19, 2020 for the year ended December 31, 2019, respectively, which information is incorporated by reference herein. Such MD&A are available on SEDAR+ at sedarplus.ca. |
| 3 | These are supplementary financial measures. See the “Other Financial Measures” section. |
| 90 | Nutrien Annual Report 2023 |
| Overview | MD&A | Five-year highlights | Financial statements and notes | |||||
|
|
||||||||
|
|
Summary non-financial information
|
|
2023 | 2022 | 2021 | 2020 | 2019 | |||||||||||||||
| Safety |
||||||||||||||||||||
| Total recordable injury frequency 1 |
1.01 | 1.16 | 1.11 | 1.13 | 1.29 | |||||||||||||||
| Lost-time injury frequency 1 |
0.24 | 0.24 | 0.27 | 0.26 | 0.31 | |||||||||||||||
| Serious injury and fatality incidents |
5 | 5 | — | 1 | 1 | |||||||||||||||
| Environment |
||||||||||||||||||||
| Scope 1 and 2 GHG emissions (Mmt CO2e) |
12.2 | 12.8 | 13.8 | 13.2 | 13.3 | |||||||||||||||
| CO2 captured and sold (Mmt) |
1.0 | 1.1 | 1.1 | 1.0 | 1.2 | |||||||||||||||
| Sustainably engaged acres (millions) 2 |
2 | 1 | n/m | n/m | n/m | |||||||||||||||
| Community |
||||||||||||||||||||
| Community investment ($ millions) |
23 | 33 | 19 | 18 | 17 | |||||||||||||||
| Employees |
||||||||||||||||||||
| Permanent employees at December 31 |
25,900 | 24,700 | 23,500 | 23,100 | 22,300 | |||||||||||||||
| Total employee turnover rate (%) |
14 | 12 | 15 | 13 | 13 | |||||||||||||||
| Proportion of women (%) |
20 | 21 | 20 | 20 | 19 | |||||||||||||||
| Proportion of women in senior leadership (%) |
23 | 21 | 21 | 19 | 15 | |||||||||||||||
| 1 | Restated 2019 to 2020 as a result of changes to classification of incidents. |
| 2 | Acres tracked in 2021 were part of the pilot program. Not applicable in 2019 to 2020. |
Summary production and sales volumes information
|
|
2023 | 2022 | 2021 | 2020 | 2019 | |||||||||||||||
| Production (thousands) |
||||||||||||||||||||
| Potash production (product tonnes) |
12,998 | 13,007 | 13,790 | 12,595 | 11,700 | |||||||||||||||
| Nitrogen production (total ammonia tonnes) 1 |
5,357 | 5,759 | 5,996 | 6,063 | 6,164 | |||||||||||||||
| Phosphate production (P2O5 tonnes) |
1,406 | 1,351 | 1,518 | 1,444 | 1,514 | |||||||||||||||
| Sales of manufactured product tonnes (thousands) |
||||||||||||||||||||
| Retail crop nutrients tonnes sold |
12,632 | 11,513 | 13,383 | 12,732 | 11,048 | |||||||||||||||
| Potash tonnes sold |
13,216 | 12,537 | 13,625 | 12,824 | 11,521 | |||||||||||||||
| Nitrogen tonnes sold |
10,423 | 10,023 | 10,725 | 10,966 | 10,270 | |||||||||||||||
| Phosphate tonnes sold |
2,551 | 2,378 | 2,619 | 2,781 | 2,889 | |||||||||||||||
| 1 | All figures are provided on a gross production basis. |
| Nutrien Annual Report 2023 | 91 |
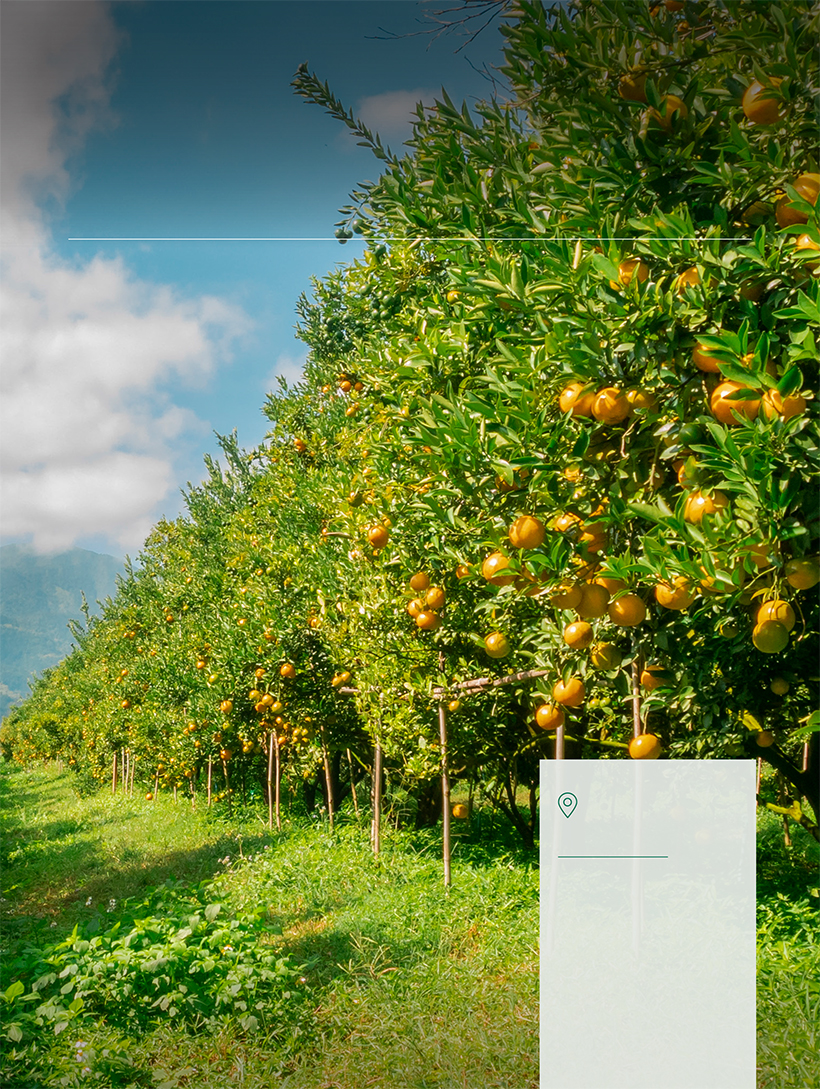
| Overview | MD&A |
Five-year highlights | Financial statements and notes | |||||
|
statements and notes |
||||||||
| Minas Gerais, Brazil
Brazil is home to almost 35 percent of the oranges produced in the world and more than half of the world’s orange juice. Nutrien has over 180 Retail locations in Brazil, including the main orange producing area of Triângulo Mineiro, also known as the Citrus Belt. |
||||||||
| 92 | Nutrien Annual Report 2023
|
| Overview | MD&A | Five-year highlights | Financial statements and notes |
|||||
Contents
| 94 | ||||
| Reports of the independent registered public accounting firm | 95 | |||
| 98 | ||||
| Consolidated statements of comprehensive income | 98 | |||
| 99 | ||||
| Consolidated statements of changes in shareholders’ equity | 100 | |||
| 101 | ||||
| Notes | ||||
| 1 | | Description of business | 102 | ||
| 2 | | Basis of presentation | 102 | ||
| 3 | | Segment information | 103 | ||
| 4 | | Nature of expenses | 106 | ||
| 5 | | Share-based compensation | 107 | ||
| 6 | | Other expenses (income) | 108 | ||
| 7 | | Financial costs | 108 | ||
| 8 | | Income taxes | 109 | ||
| 9 | | Net earnings per share | 110 | ||
| 10 | | Financial instruments and related risk management | 111 | ||
| 11 | | Receivables | 115 | ||
| 12 | | Inventories | 115 | ||
| 13 | | Property, plant and equipment | 116 | ||
| 14 | | Goodwill and intangible assets | 119 | ||
| 15 | | Investments | 121 | ||
| 16 | | Other assets | 123 | ||
| 17 | | Short-term debt | 123 | ||
| 18 | | Long-term debt | 124 | ||
| 19 | | Lease liabilities | 125 | ||
| 20 | | Payables and accrued charges | 125 | ||
| 21 | | Pension and other post-retirement benefits | 126 | ||
| 22 | | Asset retirement obligations and accrued environmental costs | 129 | ||
| 23 | | Share capital | 130 | ||
| 24 | | Capital management | 131 | ||
| 25 | | Business combinations | 132 | ||
| 26 | | Commitments | 133 | ||
| 27 | | Guarantees | 134 | ||
| 28 | | Related party transactions | 134 | ||
| 29 | | Contingencies and other matters | 135 | ||
| 30 | | Accounting policies, estimates and judgments | 137 | ||
| Nutrien Annual Report 2023
|
93 |
| Overview | MD&A | Five-year highlights | Financial statements and notes | |||||
|
Management’s responsibility |
Management’s responsibility for financial reporting
Management’s report on the consolidated financial statements
The accompanying consolidated financial statements and related financial information are the responsibility of the management of Nutrien Ltd. (the “Company”). They have been prepared in accordance with International Financial Reporting Standards (“IFRS”) as issued by the International Accounting Standards Board and include amounts based on estimates and judgments. Financial information included elsewhere in this report is consistent with the consolidated financial statements.
The consolidated financial statements are approved by the Board of Directors on the recommendation of the Audit Committee. The Audit Committee, appointed by the Board of Directors, is composed entirely of independent directors. The Audit Committee discusses and analyzes the Company’s condensed consolidated financial statements and Management’s Discussion and Analysis (“MD&A”) with management before such information is approved by the committee and submitted to securities commissions or other regulatory authorities. The Audit Committee and management also analyze the annual consolidated financial statements and MD&A prior to their approval by the Board of Directors.
The Audit Committee’s duties also include reviewing critical accounting policies and significant estimates and judgments underlying the consolidated financial statements as presented by management and approving the fees of our independent registered public accounting firm.
Our independent registered public accounting firm, KPMG LLP, performs an audit of the consolidated financial statements, the results of which are reflected in their Report of Independent Registered Public Accounting Firm for 2023. KPMG LLP has full and independent access to the Audit Committee to discuss their audit and related matters.
Management’s annual report on internal control over financial reporting
Management is responsible for establishing and maintaining adequate internal control over financial reporting, as defined in Rules 13a-15(f) and 15d-15(f) of the Securities Exchange Act of 1934, as amended, and National Instrument 52-109 – Certification of Disclosure in Issuers’ Annual and Interim Filings. Internal control over financial reporting is designed to provide reasonable assurance regarding the reliability of financial reporting and preparation of financial statements for external purposes in accordance with IFRS.
Under our supervision and with the participation of management, the Company conducted an evaluation of the design and effectiveness of our internal control over financial reporting as of the end of the fiscal year covered by this report, based on the framework issued by the Committee of Sponsoring Organizations of the Treadway Commission in Internal Control – Integrated Framework (2013). Based on this evaluation, management concluded that, as of December 31, 2023, the Company did maintain effective internal control over financial reporting.
The effectiveness of the Company’s internal control over financial reporting as of December 31, 2023 has been audited by KPMG LLP, as reflected in their Report of Independent Registered Public Accounting Firm for 2023.
|
|
|
| Ken Seitz President and Chief Executive Officer February 22, 2024 |
Pedro Farah Executive Vice President and Chief Financial Officer February 22, 2024 |
|
| 94 | Nutrien Annual Report 2023 |
| Overview | MD&A | Five-year highlights | Financial statements and notes | |||||
|
Report |
Report of independent registered public accounting firm
To the shareholders and Board of Directors of Nutrien Ltd.
Opinion on internal control over financial reporting
We have audited Nutrien Ltd. and subsidiaries’ (the “Company”) internal control over financial reporting as of December 31, 2023, based on criteria established in Internal Control – Integrated Framework (2013) issued by the Committee of Sponsoring Organizations of the Treadway Commission. In our opinion, the Company maintained, in all material respects, effective internal control over financial reporting as of December 31, 2023, based on criteria established in Internal Control – Integrated Framework (2013) issued by the Committee of Sponsoring Organizations of the Treadway Commission.
We also have audited, in accordance with the standards of the Public Company Accounting Oversight Board (United States) (“PCAOB”), the consolidated balance sheets of the Company as of December 31, 2023 and 2022, the related consolidated statements of earnings, comprehensive income, cash flows, and changes in shareholders’ equity for the years then ended, and the related notes (collectively, the “consolidated financial statements”), and our report dated February 22, 2024 expressed an unqualified opinion on those consolidated financial statements.
Basis for opinion
The Company’s management is responsible for maintaining effective internal control over financial reporting and for its assessment of the effectiveness of internal control over financial reporting, included in the accompanying Management’s Annual Report on Internal Control Over Financial Reporting. Our responsibility is to express an opinion on the Company’s internal control over financial reporting based on our audit. We are a public accounting firm registered with the PCAOB and are required to be independent with respect to the Company in accordance with the US federal securities laws and the applicable rules and regulations of the Securities and Exchange Commission and the PCAOB.
We conducted our audit in accordance with the standards of the PCAOB. Those standards require that we plan and perform the audit to obtain reasonable assurance about whether effective internal control over financial reporting was maintained in all material respects. Our audit of internal control over financial reporting included obtaining an understanding of internal control over financial reporting, assessing the risk that a material weakness exists, and testing and evaluating the design and operating effectiveness of internal control based on the assessed risk. Our audit also included performing such other procedures as we considered necessary in the circumstances. We believe that our audit provides a reasonable basis for our opinion.
Definition and limitations of internal control over financial reporting
A company’s internal control over financial reporting is a process designed to provide reasonable assurance regarding the reliability of financial reporting and the preparation of financial statements for external purposes in accordance with generally accepted accounting principles. A company’s internal control over financial reporting includes those policies and procedures that (1) pertain to the maintenance of records that, in reasonable detail, accurately and fairly reflect the transactions and dispositions of the assets of the company; (2) provide reasonable assurance that transactions are recorded as necessary to permit preparation of financial statements in accordance with generally accepted accounting principles, and that receipts and expenditures of the company are being made only in accordance with authorizations of management and directors of the company; and (3) provide reasonable assurance regarding prevention or timely detection of unauthorized acquisition, use, or disposition of the company’s assets that could have a material effect on the financial statements.
Because of its inherent limitations, internal control over financial reporting may not prevent or detect misstatements. Also, projections of any evaluation of effectiveness to future periods are subject to the risk that controls may become inadequate because of changes in conditions, or that the degree of compliance with the policies or procedures may deteriorate.
Chartered Professional Accountants
Calgary, Canada
February 22, 2024
| Nutrien Annual Report 2023 | 95 |
| Overview | MD&A | Five-year highlights | Financial statements and notes | |||||
|
Report |
Report of independent registered public accounting firm
To the shareholders and Board of Directors of Nutrien Ltd.
Opinion on the consolidated financial statements
We have audited the accompanying consolidated balance sheets of Nutrien Ltd. and subsidiaries (the “Company”) as of December 31, 2023 and 2022, the related consolidated statements of earnings, comprehensive income, cash flows, and changes in shareholders’ equity for the years then ended, and the related notes (collectively, the “consolidated financial statements”). In our opinion, the consolidated financial statements present fairly, in all material respects, the financial position of the Company as of December 31, 2023 and 2022, and its financial performance and its cash flows for the years then ended, in conformity with International Financial Reporting Standards as issued by the International Accounting Standards Board.
We also have audited, in accordance with the standards of the Public Company Accounting Oversight Board (United States) (“PCAOB”), the Company’s internal control over financial reporting as of December 31, 2023, based on criteria established in Internal Control – Integrated Framework (2013) issued by the Committee of Sponsoring Organizations of the Treadway Commission, and our report dated February 22, 2024 expressed an unqualified opinion on the effectiveness of the Company’s internal control over financial reporting.
Basis for opinion
These consolidated financial statements are the responsibility of the Company’s management. Our responsibility is to express an opinion on these consolidated financial statements based on our audits. We are a public accounting firm registered with the PCAOB and are required to be independent with respect to the Company in accordance with the US federal securities laws and the applicable rules and regulations of the Securities and Exchange Commission and the PCAOB.
We conducted our audits in accordance with the standards of the PCAOB. Those standards require that we plan and perform the audit to obtain reasonable assurance about whether the consolidated financial statements are free of material misstatement, whether due to error or fraud. Our audits included performing procedures to assess the risks of material misstatement of the consolidated financial statements, whether due to error or fraud, and performing procedures that respond to those risks. Such procedures included examining, on a test basis, evidence regarding the amounts and disclosures in the consolidated financial statements. Our audits also included evaluating the accounting principles used and significant estimates made by management, as well as evaluating the overall presentation of the consolidated financial statements. We believe that our audits provide a reasonable basis for our opinion.
Critical audit matters
The critical audit matters communicated below are matters arising from the current period audit of the consolidated financial statements that were communicated or required to be communicated to the Audit Committee and that: (1) relate to accounts or disclosures that are material to the consolidated financial statements and (2) involved our especially challenging, subjective, or complex judgments. The communication of critical audit matters does not alter in any way our opinion on the consolidated financial statements, taken as a whole, and we are not, by communicating the critical audit matters below, providing separate opinions on the critical audit matters or on the accounts or disclosures to which they relate.
Goodwill impairment assessment of the Retail North America group of cash-generating units
As discussed in Note 14 to the consolidated financial statements, the carrying amount of goodwill as of December 31, 2023 was $12,114 million, of which $6,981 million of goodwill is attributed to the Retail North America group of cash-generating units (“Retail North America CGU”). The Retail North America CGU is tested for impairment annually, and whenever events or changes in circumstances may indicate the carrying amount, including goodwill, exceeds its estimated recoverable amount. The calculation of the recoverable amount of the Retail North America CGU involved estimates including forecasted earnings before tax, interest, depreciation and amortization (“EBITDA”), terminal growth rate and the discount rate.
We identified the calculation of the recoverable amount of goodwill for the Retail North America CGU as of October 1, 2023 as a critical audit matter. A high degree of auditor judgment was required to evaluate the Company’s forecasted EBITDA, terminal growth rate and discount rate used to calculate the recoverable amount of the Retail North America CGU. Minor changes to
| 96 | Nutrien Annual Report 2023 |
| Overview | MD&A | Five-year highlights | Financial statements and notes | |||||
|
Report |
these assumptions could have had a significant effect on the Company’s calculation of the recoverable amount of the Retail North America CGU. Additionally, the audit effort associated with this estimate required specialized skills and knowledge.
The following are the primary procedures we performed to address this critical audit matter. We evaluated the design and tested the operating effectiveness of certain internal controls related to the calculation of the recoverable amount of goodwill for the Retail North America CGU. This included controls related to the determination of forecasted EBITDA, terminal growth rate and the discount rate. We evaluated the Company’s forecasted EBITDA for the Retail North America CGU by comparing to historical results and forecasted planted acreage in the United States. We evaluated the terminal growth rate by comparing to the historical growth of the Retail North America CGU and to market information, including forecasted inflation and forecasted gross domestic product in the United States. We evaluated the Company’s historical forecasts of EBITDA by comparing to actual results to assess the Company’s ability to accurately forecast. In addition, we involved valuation professionals with specialized skills and knowledge, who assisted in:
| – | evaluating the Company’s determination of the discount rate by comparing the inputs to the discount rate to publicly available market data for comparable entities and assessing the resulting discount rate, and |
| – | evaluating the Company’s estimate of the recoverable amount of the Retail North America CGU by comparing the results of the Company’s estimate to publicly available market data and valuation metrics for comparable entities. |
Goodwill impairment assessment of the Retail South America group of cash-generating units
As discussed in Note 14 to the consolidated financial statements, the Company recorded impairment of $422 million to goodwill and $43 million to intangible assets of the Retail South America group of cash-generating units (“Retail South America CGU”) during the year ended December 31, 2023. The Retail South America CGU is tested for impairment annually, and whenever events or changes in circumstances may indicate the carrying amount, including goodwill, exceeds its estimated recoverable amount. An indicator of impairment was identified as of June 30, 2023 due to a reduction to forecasted earnings and growth. The calculation of the recoverable amount of the Retail South America CGU involved estimates including forecasted earnings before tax, interest, depreciation and amortization (“EBITDA”), terminal growth rate and the discount rate.
We identified the calculation of the recoverable amount of the Retail South America CGU as of June 30, 2023 as a critical audit matter. A high degree of auditor judgment was required to evaluate the Company’s forecasted EBITDA, terminal growth rate and discount rate used to calculate the recoverable amount of the Retail South America CGU. The forecasted EBITDA and terminal growth rate assumptions were challenging to test as they represented subjective determinations of future market and economic conditions that were also sensitive to variation. Additionally, the audit effort associated with this estimate required specialized skills and knowledge.
The following are the primary procedures we performed to address this critical audit matter. We evaluated the design and tested the operating effectiveness of certain internal controls related to the calculation of the recoverable amount of the Retail South America CGU. This included controls related to the determination of forecasted EBITDA, terminal growth rate and the discount rate. We evaluated the Company’s forecasted EBITDA for the Retail South America CGU by comparing to historical results and external market forecasts of planted acreage and exports. We evaluated the terminal growth rate by comparing to the historical growth of the Retail South America CGU and to market information, including forecasted inflation and forecasted gross domestic product in Brazil and Argentina. We evaluated the Company’s historical forecasts of EBITDA by comparing to actual results to assess the Company’s ability to accurately forecast. In addition, we involved valuation professionals with specialized skills and knowledge, who assisted in:
| – | evaluating the Company’s determination of the discount rate by comparing the inputs to the discount rate to publicly available market data for comparable entities and assessing the resulting discount rate, and |
| – | evaluating the Company’s estimate of the recoverable amount of the Retail South America CGU by comparing the results of the Company’s estimate to publicly available market data and valuation metrics for comparable entities. |
Chartered Professional Accountants
We have served as the Company’s auditor since 2018.
Calgary, Canada
February 22, 2024
| Nutrien Annual Report 2023 | 97 |
| Overview | MD&A | Five-year highlights | Financial statements and notes | |||||
|
Financial statements |
Consolidated statements of earnings
| For the years ended December 31 | Note | 2023 | 2022 | |||||||||
| Sales | 3 | 29,056 | 37,884 | |||||||||
| Freight, transportation and distribution | 4 | 974 | 872 | |||||||||
| Cost of goods sold | 4, 12 | 19,608 | 21,588 | |||||||||
| Gross margin | 8,474 | 15,424 | ||||||||||
| Selling expenses | 4 | 3,397 | 3,414 | |||||||||
| General and administrative expenses | 4 | 626 | 565 | |||||||||
| Provincial mining taxes | 4 | 398 | 1,149 | |||||||||
| Share-based compensation (recovery) expense | 5 | (14 | ) | 63 | ||||||||
| Impairment (reversal of impairment) of assets | 13, 14 | 774 | (780 | ) | ||||||||
| Other expenses | 6 | 548 | 204 | |||||||||
| Earnings before finance costs and income taxes | 2,745 | 10,809 | ||||||||||
| Finance costs | 7 | 793 | 563 | |||||||||
| Earnings before income taxes | 1,952 | 10,246 | ||||||||||
| Income tax expense | 8 | 670 | 2,559 | |||||||||
| Net earnings |
|
|
|
1,282 | 7,687 | |||||||
| Attributable to | ||||||||||||
| Equity holders of Nutrien |
1,258 | 7,660 | ||||||||||
| Non-controlling interest |
|
|
|
24 | 27 | |||||||
| Net earnings |
|
|
|
1,282 | 7,687 | |||||||
| Net earnings per share attributable to equity holders of Nutrien (“EPS”) | 9 | |||||||||||
| Basic |
2.53 | 14.22 | ||||||||||
| Diluted |
|
|
|
2.53 | 14.18 | |||||||
| Weighted average shares outstanding for basic EPS | 9 | 496,381,000 | 538,475,000 | |||||||||
| Weighted average shares outstanding for diluted EPS | 9 | 496,994,000 | 540,010,000 | |||||||||
Consolidated statements of comprehensive income
| For the years ended December 31 (net of related income taxes) | Note | 2023 | 2022 | |||||||||
| Net earnings | 1,282 | 7,687 | ||||||||||
| Other comprehensive income (loss) | ||||||||||||
| Items that will not be reclassified to net earnings: |
||||||||||||
| Net actuarial (loss) gain on defined benefit plans |
21 | (17 | ) | 83 | ||||||||
| Net fair value gain (loss) on investments |
15 | 4 | (44 | ) | ||||||||
| Items that have been or may be subsequently reclassified to net earnings: |
||||||||||||
| Gain (loss) on currency translation of foreign operations |
89 | (199 | ) | |||||||||
| Other |
|
|
|
5 | (17 | ) | ||||||
| Other comprehensive income (loss) |
|
|
|
81 | (177 | ) | ||||||
| Comprehensive income |
|
|
|
1,363 | 7,510 | |||||||
| Attributable to | ||||||||||||
| Equity holders of Nutrien |
1,338 | 7,484 | ||||||||||
| Non-controlling interest |
|
|
|
25 | 26 | |||||||
| Comprehensive income |
|
|
|
1,363 | 7,510 | |||||||
(See Notes to the consolidated financial statements)
| 98 | Nutrien Annual Report 2023 | In millions of US dollars unless otherwise noted |
| Overview | MD&A | Five-year highlights | Financial statements and notes | |||||
|
Financial statements |
Consolidated statements of cash flows
| For the years ended December 31 | Note | 2023 | 2022 | |||||||||
|
|
|
|
Note 2 | |||||||||
| Operating activities | ||||||||||||
| Net earnings | 1,282 | 7,687 | ||||||||||
| Adjustments for: | ||||||||||||
| Depreciation and amortization |
2,169 | 2,012 | ||||||||||
| Share-based compensation (recovery) expense |
5 | (14 | ) | 63 | ||||||||
| Impairment (reversal of impairment) of assets |
13, 14 | 774 | (780 | ) | ||||||||
| Provision for deferred income tax |
7 | 182 | ||||||||||
| Net distributed (undistributed) earnings of equity-accounted investees |
117 | (181 | ) | |||||||||
| Gain on amendments to other post-retirement pension plans |
21 | (80 | ) | – | ||||||||
| Loss on Blue Chip Swaps |
6 | 92 | – | |||||||||
| Long-term income tax receivables and payables |
16 | (65 | ) | 273 | ||||||||
| Other long-term assets, liabilities and miscellaneous |
|
|
|
277 | 2 | |||||||
| Cash from operations before working capital changes | 4,559 | 9,258 | ||||||||||
| Changes in non-cash operating working capital: | ||||||||||||
| Receivables |
879 | (919 | ) | |||||||||
| Inventories and prepaid expenses and other current assets |
1,376 | (1,167 | ) | |||||||||
| Payables and accrued charges |
|
|
|
(1,748 | ) | 938 | ||||||
| Cash provided by operating activities |
|
|
|
5,066 | 8,110 | |||||||
| Investing activities | ||||||||||||
| Capital expenditures1 | 13, 14 | (2,671 | ) | (2,475 | ) | |||||||
| Business acquisitions, net of cash acquired | 25 | (153 | ) | (407 | ) | |||||||
| Proceeds from sales of Blue Chip Swaps, net of purchases | 6 | (92 | ) | – | ||||||||
| Net changes in non-cash working capital | (22 | ) | (44 | ) | ||||||||
| Other |
|
|
|
(20 | ) | 25 | ||||||
| Cash used in investing activities |
|
|
|
(2,958 | ) | (2,901 | ) | |||||
| Financing activities | ||||||||||||
| (Repayment of) proceeds from short-term debt, net | 17, 18 | (458 | ) | 529 | ||||||||
| Proceeds from long-term debt | 18 | 1,500 | 1,045 | |||||||||
| Repayment of long-term debt | 18 | (648 | ) | (561 | ) | |||||||
| Repayment of principal portion of lease liabilities | 18, 19 | (375 | ) | (341 | ) | |||||||
| Dividends paid to Nutrien’s shareholders | 23 | (1,032 | ) | (1,031 | ) | |||||||
| Repurchase of common shares | 23 | (1,047 | ) | (4,520 | ) | |||||||
| Issuance of common shares | 23 | 33 | 168 | |||||||||
| Other |
|
|
|
(34 | ) | (20 | ) | |||||
| Cash used in financing activities |
|
|
|
(2,061 | ) | (4,731 | ) | |||||
| Effect of exchange rate changes on cash and cash equivalents |
|
|
|
(7 | ) | (76 | ) | |||||
| Increase in cash and cash equivalents | 40 | 402 | ||||||||||
| Cash and cash equivalents – beginning of year |
|
|
|
901 | 499 | |||||||
| Cash and cash equivalents – end of year |
|
|
|
941 | 901 | |||||||
| Cash and cash equivalents is composed of: | ||||||||||||
| Cash | 909 | 775 | ||||||||||
| Short-term investments |
|
|
|
32 | 126 | |||||||
|
|
|
|
|
941 | 901 | |||||||
| Supplemental cash flows information | ||||||||||||
| Interest paid | 729 | 482 | ||||||||||
| Income taxes paid | 1,764 | 1,882 | ||||||||||
| Total cash outflow for leases |
|
|
|
501 | 459 | |||||||
| 1 | Includes additions to property, plant and equipment, and intangible assets of $2,465 and $206 (2022 – $2,253 and $222), respectively. |
(See Notes to the consolidated financial statements)
| In millions of US dollars unless otherwise noted | Nutrien Annual Report 2023 | 99 |
| Overview | MD&A | Five-year highlights | Financial statements and notes | |||||
|
Financial statements |
Consolidated statements of changes in shareholders’ equity
| Accumulated other comprehensive (loss) income (“AOCI”) |
||||||||||||||||||||||||||||||||||||||||
|
|
Number of common shares |
Share capital |
Contributed surplus |
(Loss) gain on |
Other | Total AOCI |
Retained earnings |
Equity holders of Nutrien |
Non- controlling interest |
Total equity |
||||||||||||||||||||||||||||||
| Balance – December 31, 2021 |
557,492,516 | 15,457 | 149 | (176 | ) | 30 | (146 | ) | 8,192 | 23,652 | 47 | 23,699 | ||||||||||||||||||||||||||||
| Net earnings | – | – | – | – | – | – | 7,660 | 7,660 | 27 | 7,687 | ||||||||||||||||||||||||||||||
| Other comprehensive (loss) income |
– | – | – | (198 | ) | 22 | (176 | ) | – | (176 | ) | (1 | ) | (177 | ) | |||||||||||||||||||||||||
| Shares repurchased (Note 23) |
(53,312,559 | ) | (1,487 | ) | (22 | ) | – | – | – | (2,987 | ) | (4,496 | ) | – | (4,496 | ) | ||||||||||||||||||||||||
| Dividends declared (Note 23) |
– | – | – | – | – | – | (1,019 | ) | (1,019 | ) | – | (1,019 | ) | |||||||||||||||||||||||||||
| Non-controlling interest transactions |
– | – | – | – | – | – | (1 | ) | (1 | ) | (28 | ) | (29 | ) | ||||||||||||||||||||||||||
| Effect of share-based compensation including issuance of common shares (Note 5) |
3,066,148 | 202 | (18 | ) | – | – | – | – | 184 | – | 184 | |||||||||||||||||||||||||||||
| Transfer of net loss on cash flow hedges |
– | – | – | – | 14 | 14 | – | 14 | – | 14 | ||||||||||||||||||||||||||||||
| Transfer of net actuarial gain on defined benefit plans |
– | – | – | – | (83 | ) | (83 | ) | 83 | – | – | – | ||||||||||||||||||||||||||||
| Balance – December 31, 2022 |
507,246,105 | 14,172 | 109 | (374 | ) | (17 | ) | (391 | ) | 11,928 | 25,818 | 45 | 25,863 | |||||||||||||||||||||||||||
| Net earnings |
– | – | – | – | – | – | 1,258 | 1,258 | 24 | 1,282 | ||||||||||||||||||||||||||||||
| Other comprehensive income (loss) |
– | – | – | 88 | (8 | ) | 80 | – | 80 | 1 | 81 | |||||||||||||||||||||||||||||
| Shares repurchased (Note 23) |
(13,378,189 | ) | (374 | ) | (26 | ) | – | – | – | (600 | ) | (1,000 | ) | – | (1,000 | ) | ||||||||||||||||||||||||
| Dividends declared (Note 23) |
– | – | – | – | – | – | (1,050 | ) | (1,050 | ) | – | (1,050 | ) | |||||||||||||||||||||||||||
| Non-controlling interest transactions |
– | – | – | – | – | – | (2 | ) | (2 | ) | (25 | ) | (27 | ) | ||||||||||||||||||||||||||
| Effect of share-based compensation including issuance of common shares (Note 5) |
683,814 | 40 | – | – | – | – | – | 40 | – | 40 | ||||||||||||||||||||||||||||||
| Transfer of net gain on sale of investment |
– | – | – | – | (14 | ) | (14 | ) | 14 | – | – | – | ||||||||||||||||||||||||||||
| Transfer of net loss on cash flow hedges |
– | – | – | – | 12 | 12 | – | 12 | – | 12 | ||||||||||||||||||||||||||||||
| Transfer of net actuarial loss on defined benefit plans |
– | – | – | – | 17 | 17 | (17 | ) | – | – | – | |||||||||||||||||||||||||||||
| Balance – December 31, 2023 |
494,551,730 | 13,838 | 83 | (286 | ) | (10 | ) | (296 | ) | 11,531 | 25,156 | 45 | 25,201 | |||||||||||||||||||||||||||
(See Notes to the consolidated financial statements)
| 100 | Nutrien Annual Report 2023 | In millions of US dollars unless otherwise noted |
| Overview | MD&A | Five-year highlights | Financial statements and notes | |||||
|
Financial statements |
| As at December 31 | Note | 2023 | 2022 | |||||||||
| Assets | ||||||||||||
| Current assets | ||||||||||||
| Cash and cash equivalents |
941 | 901 | ||||||||||
| Receivables |
11 | 5,398 | 6,194 | |||||||||
| Inventories |
12 | 6,336 | 7,632 | |||||||||
| Prepaid expenses and other current assets |
|
|
|
1,495 | 1,615 | |||||||
| 14,170 | 16,342 | |||||||||||
| Non-current assets | ||||||||||||
| Property, plant and equipment |
13 | 22,461 | 21,767 | |||||||||
| Goodwill |
14 | 12,114 | 12,368 | |||||||||
| Intangible assets |
14 | 2,217 | 2,297 | |||||||||
| Investments |
15 | 736 | 843 | |||||||||
| Other assets |
16 | 1,051 | 969 | |||||||||
| Total assets |
|
|
|
52,749 | 54,586 | |||||||
| Liabilities | ||||||||||||
| Current liabilities | ||||||||||||
| Short-term debt |
17 | 1,815 | 2,142 | |||||||||
| Current portion of long-term debt |
18 | 512 | 542 | |||||||||
| Current portion of lease liabilities |
19 | 327 | 305 | |||||||||
| Payables and accrued charges |
20 | 9,467 | 11,291 | |||||||||
| 12,121 | 14,280 | |||||||||||
| Non-current liabilities | ||||||||||||
| Long-term debt |
18 | 8,913 | 8,040 | |||||||||
| Lease liabilities |
19 | 999 | 899 | |||||||||
| Deferred income tax liabilities |
8 | 3,574 | 3,547 | |||||||||
| Pension and other post-retirement benefit liabilities |
21 | 252 | 319 | |||||||||
| Asset retirement obligations and accrued environmental costs |
22 | 1,489 | 1,403 | |||||||||
| Other non-current liabilities |
|
|
|
200 | 235 | |||||||
| Total liabilities |
|
|
|
27,548 | 28,723 | |||||||
| Shareholders’ equity | ||||||||||||
| Share capital |
23 | 13,838 | 14,172 | |||||||||
| Contributed surplus |
83 | 109 | ||||||||||
| Accumulated other comprehensive loss |
(296 | ) | (391 | ) | ||||||||
| Retained earnings |
|
|
|
11,531 | 11,928 | |||||||
| Equity holders of Nutrien |
25,156 | 25,818 | ||||||||||
| Non-controlling interest |
|
|
|
45 | 45 | |||||||
| Total shareholders’ equity |
|
|
|
25,201 | 25,863 | |||||||
| Total liabilities and shareholders’ equity |
|
|
|
52,749 | 54,586 | |||||||
(See Notes to the consolidated financial statements)
Approved by the Board of Directors,

|

|
|
|
|
Director |
| In millions of US dollars unless otherwise noted | Nutrien Annual Report 2023 | 101 |
| Overview | MD&A | Five-year highlights | Financial statements and notes | |||||
|
Notes |
Notes to the consolidated financial statements
Note 1 | Description of business
Nutrien Ltd. (collectively with its subsidiaries, “Nutrien”, “we”, “us”, “our” or “the Company”) is the world’s largest provider of crop inputs and services. Nutrien plays a critical role in helping growers around the globe increase food production in a sustainable manner.
The Company is a corporation organized under the laws of Canada with its registered head office located at Suite 1700, 211 19th Street East, Saskatoon, Saskatchewan, Canada, S7K 5R6. As at December 31, 2023, the Company had assets, which include as follows:
| Segment | Description | |
| Nutrien Ag Solutions (“Retail”) |
– various retail facilities across the US, Canada, Australia and South America – private label and proprietary crop protection products and nutritionals – an innovative integrated digital platform for growers and crop consultants – a financing solutions provider in support of Nutrien’s agricultural product and service sales |
|
| Potash | – 6 operations in the province of Saskatchewan – investment in Canpotex Limited (“Canpotex”), a Canadian potash export, sales and marketing company owned in equal shares by Nutrien and another potash producer |
|
| Nitrogen | – 8 production facilities in North America: 4 in Alberta, 1 in Georgia, 1 in Louisiana, 1 in Ohio and 1 in Texas – 1 large-scale operation in Trinidad – 5 upgrade facilities in North America: 3 in Alberta, 1 in Missouri and 1 in Washington – 50 percent investment in Profertil S.A. (“Profertil”), a nitrogen producer based in Argentina |
|
| Phosphate | – 2 mines and processing plants: 1 in Florida and 1 in North Carolina – phosphate feed plants in Illinois, Missouri and Nebraska – 1 industrial phosphoric acid plant in Ohio |
|
| Corporate and Others |
– 22 percent investment in Sinofert Holdings Limited (“Sinofert”), a fertilizer supplier and distributor in China – corporate offices in the US and Canada and other non-operating sites |
|
Note 2 | Basis of presentation
We prepared these consolidated financial statements in accordance with International Financial Reporting Standards (“IFRS”) as issued by the International Accounting Standards Board (“IASB”). We have consistently applied the same accounting policies throughout all periods presented, as if these policies had always been in effect, with the exception of the accounting standards adopted effective January 1, 2023, as disclosed in Note 30.
Certain immaterial 2022 figures have been reclassified in the consolidated statements of cash flows.
These consolidated financial statements were authorized for issue by the Board of Directors on February 22, 2024.
Sensitivity analyses included throughout the notes should be used with caution as the changes are hypothetical and not reflective of future performance. The sensitivities have been calculated independently of changes in other key variables. We prepared these consolidated financial statements under the historical cost basis, except for items that IFRS requires to be measured at fair value. Reference to n/a indicates information is not applicable.
| 102 | Nutrien Annual Report 2023 | In millions of US dollars unless otherwise noted |
| Overview | MD&A | Five-year highlights | Financial statements and notes | |||||
|
Notes |
The Company has four reportable operating segments: Nutrien Ag Solutions (“Retail”), Potash, Nitrogen and Phosphate. The Retail segment distributes crop nutrients, crop protection products, seed and merchandise. Retail provides services directly to growers through a network of retail locations in North America, South America and Australia. The Potash, Nitrogen and Phosphate segments are differentiated by the chemical nutrient contained in the products that each produces.
The Executive Leadership Team (“ELT”), comprised of officers at the Executive Vice President level and above, is the Chief Operating Decision Maker (“CODM”). The CODM uses adjusted EBITDA, calculated as below, to measure performance and allocate resources to the operating segments. The CODM considers adjusted EBITDA to be a meaningful measure because it is not impacted by long-term investment and financing decisions, but rather focuses on the performance of our day-to-day operations. In addition, it excludes the impact of impairments and other costs that are centrally managed by our corporate function.
We determine the composition of the reportable segments based on factors including risks and returns, internal organization, and internal reports reviewed by the CODM. We allocate certain expenses across segments based on reasonable considerations such as production capabilities or historical trends.
| 2023 | Retail | Potash | Nitrogen | Phosphate | Corporate and Others |
Eliminations | Consolidated | |||||||||||||||||||||
| Sales – third party | 19,542 | 3,735 | 3,804 | 1,975 | – | – | 29,056 | |||||||||||||||||||||
| – intersegment | – | 431 | 931 | 288 | – | (1,650 | ) | – | ||||||||||||||||||||
| Sales – total | 19,542 | 4,166 | 4,735 | 2,263 | – | (1,650 | ) | 29,056 | ||||||||||||||||||||
| Freight, transportation and distribution | – | 407 | 528 | 270 | – | (231 | ) | 974 | ||||||||||||||||||||
| Net sales | 19,542 | 3,759 | 4,207 | 1,993 | – | (1,419 | ) | 28,082 | ||||||||||||||||||||
| Cost of goods sold | 15,112 | 1,396 | 2,828 | 1,760 | – | (1,488 | ) | 19,608 | ||||||||||||||||||||
| Gross margin | 4,430 | 2,363 | 1,379 | 233 | – | 69 | 8,474 | |||||||||||||||||||||
| Selling expenses | 3,375 | 12 | 27 | 6 | – | (23 | ) | 3,397 | ||||||||||||||||||||
| General and administrative expenses | 217 | 13 | 21 | 11 | 364 | – | 626 | |||||||||||||||||||||
| Provincial mining taxes | – | 398 | – | – | – | – | 398 | |||||||||||||||||||||
| Share-based compensation recovery | – | – | – | – | (14 | ) | – | (14 | ) | |||||||||||||||||||
| Impairment of assets (Notes 13 and 14) | 465 | – | 76 | 233 | – | – | 774 | |||||||||||||||||||||
| Other expenses (income) | 158 | (1 | ) | (27 | ) | 40 | 348 | 30 | 548 | |||||||||||||||||||
| Earnings (loss) before finance costs and income taxes |
215 | 1,941 | 1,282 | (57 | ) | (698 | ) | 62 | 2,745 | |||||||||||||||||||
| Depreciation and amortization | 759 | 463 | 572 | 294 | 81 | – | 2,169 | |||||||||||||||||||||
| EBITDA 1 | 974 | 2,404 | 1,854 | 237 | (617 | ) | 62 | 4,914 | ||||||||||||||||||||
| Integration and restructuring related costs | 20 | – | – | – | 29 | – | 49 | |||||||||||||||||||||
| Share-based compensation recovery | – | – | – | – | (14 | ) | – | (14 | ) | |||||||||||||||||||
| Impairment of assets (Notes 13 and 14) | 465 | – | 76 | 233 | – | – | 774 | |||||||||||||||||||||
| ARO/ERL expense for non-operating sites 2 | – | – | – | – | 152 | – | 152 | |||||||||||||||||||||
| Foreign exchange loss, net of related derivatives |
– | – | – | – | 91 | – | 91 | |||||||||||||||||||||
| Loss on Blue Chip Swaps | – | – | – | – | 92 | – | 92 | |||||||||||||||||||||
| Adjusted EBITDA | 1,459 | 2,404 | 1,930 | 470 | (267 | ) | 62 | 6,058 | ||||||||||||||||||||
| Assets | 23,056 | 13,571 | 11,466 | 2,438 | 2,818 | (600 | ) | 52,749 | ||||||||||||||||||||
| 1 | EBITDA is calculated as net earnings (loss) before finance costs, income taxes, and depreciation and amortization. |
| 2 | ARO/ERL refers to asset retirement obligations and accrued environmental costs. |
| In millions of US dollars unless otherwise noted | Nutrien Annual Report 2023 | 103 |
| Overview | MD&A | Five-year highlights | Financial statements and notes | |||||
|
Notes |
| 2022 | Retail | Potash | Nitrogen | Phosphate | Corporate and Others |
Eliminations | Consolidated | |||||||||||||||||||||
| Sales – third party | 21,266 | 7,600 | 6,755 | 2,263 | – | – | 37,884 | |||||||||||||||||||||
| – intersegment | 84 | 599 | 1,293 | 357 | – | (2,333 | ) | – | ||||||||||||||||||||
| Sales – total | 21,350 | 8,199 | 8,048 | 2,620 | – | (2,333 | ) | 37,884 | ||||||||||||||||||||
| Freight, transportation and distribution | – | 300 | 515 | 243 | – | (186 | ) | 872 | ||||||||||||||||||||
| Net sales | 21,350 | 7,899 | 7,533 | 2,377 | – | (2,147 | ) | 37,012 | ||||||||||||||||||||
| Cost of goods sold | 16,171 | 1,400 | 4,252 | 1,884 | – | (2,119 | ) | 21,588 | ||||||||||||||||||||
| Gross margin | 5,179 | 6,499 | 3,281 | 493 | – | (28 | ) | 15,424 | ||||||||||||||||||||
| Selling expenses | 3,392 | 10 | 28 | 7 | (1 | ) | (22 | ) | 3,414 | |||||||||||||||||||
| General and administrative expenses | 200 | 9 | 17 | 13 | 326 | – | 565 | |||||||||||||||||||||
| Provincial mining taxes | – | 1,149 | – | – | – | – | 1,149 | |||||||||||||||||||||
| Share-based compensation expense | – | – | – | – | 63 | – | 63 | |||||||||||||||||||||
| Reversal of impairment of assets (Note 13) | – | – | – | (780 | ) | – | – | (780 | ) | |||||||||||||||||||
| Other expenses (income) | 29 | 5 | (137 | ) | 67 | 227 | 13 | 204 | ||||||||||||||||||||
| Earnings (loss) before finance costs and income taxes |
1,558 | 5,326 | 3,373 | 1,186 | (615 | ) | (19 | ) | 10,809 | |||||||||||||||||||
| Depreciation and amortization | 752 | 443 | 558 | 188 | 71 | – | 2,012 | |||||||||||||||||||||
| EBITDA | 2,310 | 5,769 | 3,931 | 1,374 | (544 | ) | (19 | ) | 12,821 | |||||||||||||||||||
| Integration and restructuring related costs | 2 | – | – | – | 44 | – | 46 | |||||||||||||||||||||
| Share-based compensation expense | – | – | – | – | 63 | – | 63 | |||||||||||||||||||||
| Reversal of impairment of assets (Note 13) | – | – | – | (780 | ) | – | – | (780 | ) | |||||||||||||||||||
| COVID-19 coronavirus pandemic (“COVID-19”) related expenses |
– | – | – | – | 8 | – | 8 | |||||||||||||||||||||
| Foreign exchange loss, net of related derivatives |
– | – | – | – | 31 | – | 31 | |||||||||||||||||||||
| Gain on disposal of investment | (19 | ) | – | – | – | – | – | (19 | ) | |||||||||||||||||||
| Adjusted EBITDA | 2,293 | 5,769 | 3,931 | 594 | (398 | ) | (19 | ) | 12,170 | |||||||||||||||||||
| Assets | 24,451 | 13,921 | 11,807 | 2,661 | 2,622 | (876 | ) | 54,586 | ||||||||||||||||||||
| Retail segment product line | Sales | |
| Crop nutrients |
Dry and liquid macronutrient products including potash, nitrogen and phosphate, and proprietary liquid micronutrient products. | |
| Crop protection products |
Various third-party supplier and proprietary products designed to maintain crop quality and manage plant diseases, weeds and other pests. | |
| Seed |
Various third-party supplier seed brands and proprietary seed product lines. | |
| Merchandise |
Fencing, feed supplements, livestock-related animal health products, storage and irrigation equipment, and other products. | |
| Nutrien Financial |
Financing solutions provided to US and Australia Retail branches and customers in support of Nutrien’s agricultural product and service sales. | |
| Services and other revenues |
Product application, soil and leaf testing, crop scouting and precision agriculture services, and water services. | |
| 104 | Nutrien Annual Report 2023 | In millions of US dollars unless otherwise noted |
| Overview | MD&A | Five-year highlights | Financial statements and notes | |||||
|
Notes |
| Segment | Products | Sales prices impacted by | ||
| Potash | – North America – primarily granular – Offshore (international) – primarily granular and standard |
– North American prices referenced at delivered prices (including transportation and distribution costs) – International prices pursuant to term and spot contract prices (excluding transportation and distribution costs) |
||
| Nitrogen | – Ammonia, urea and environmentally smart nitrogen (“ESN®”), and nitrogen solutions, nitrates and sulfates |
– Global energy costs and supply |
||
| Phosphate | – Solid and liquid fertilizers, and industrial and feed products |
– Global prices and supplies of ammonia and sulfur |
||
|
|
2023 | 2022 | ||||||
| Retail sales by product line | ||||||||
| Crop nutrients |
8,379 | 10,060 | ||||||
| Crop protection products |
6,750 | 7,067 | ||||||
| Seed |
2,295 | 2,112 | ||||||
| Merchandise |
1,001 | 1,019 | ||||||
| Nutrien Financial |
322 | 267 | ||||||
| Services and other |
927 | 966 | ||||||
| Nutrien Financial elimination 1 |
(132 | ) | (141 | ) | ||||
| 19,542 | 21,350 | |||||||
| Potash sales by geography | ||||||||
| Manufactured product |
||||||||
| North America |
2,090 | 2,785 | ||||||
| Offshore 2 |
2,076 | 5,414 | ||||||
| 4,166 | 8,199 | |||||||
| Nitrogen sales by product line | ||||||||
| Manufactured product |
||||||||
| Ammonia |
1,337 | 2,834 | ||||||
| Urea and ESN® 3 |
1,624 | 2,268 | ||||||
| Solutions, nitrates and sulfates |
1,367 | 1,996 | ||||||
| Other nitrogen and purchased products 3 |
407 | 950 | ||||||
| 4,735 | 8,048 | |||||||
| Phosphate sales by product line | ||||||||
| Manufactured product |
||||||||
| Fertilizer |
1,264 | 1,520 | ||||||
| Industrial and feed |
703 | 763 | ||||||
| Other phosphate and purchased products |
296 | 337 | ||||||
|
|
2,263 | 2,620 | ||||||
| 1 | Represents elimination of the interest and service fees charged by Nutrien Financial to Retail branches. |
| 2 | Relates to Canpotex, a major customer, and includes other revenue representing provisional pricing adjustments of $(394) (2022 – $(105)) (Note 28). |
| 3 | Certain immaterial 2022 figures have been reclassified. |
| In millions of US dollars unless otherwise noted | Nutrien Annual Report 2023 | 105 |
| Overview | MD&A | Five-year highlights | Financial statements and notes | |||||
|
Notes |
|
|
Sales – third party by customer location |
Non-current assets 1 | ||||||||||||||
|
|
2023 | 2022 | 2023 | 2022 | ||||||||||||
| United States | 17,656 | 20,089 | 16,001 | 15,971 | ||||||||||||
| Canada | 3,111 | 3,783 | 18,987 | 18,303 | ||||||||||||
| Australia | 3,389 | 3,877 | 1,069 | 1,105 | ||||||||||||
| Canpotex (Note 28) | 2,076 | 5,414 | – | – | ||||||||||||
| Trinidad | 29 | 15 | 661 | 688 | ||||||||||||
| Brazil | 1,048 | 1,136 | 555 | 851 | ||||||||||||
| Other South America | 876 | 2 | 1,507 | 2 | 48 | 64 | ||||||||||
| Other | 871 | 3 | 2,063 | 3 | 389 | 457 | ||||||||||
| 29,056 | 37,884 | 37,710 | 37,439 | |||||||||||||
| 1 | Excludes financial instruments (other than equity-accounted investees), deferred tax assets and post-employment benefit assets. |
| 2 | Other South America third-party sales includes sales to Argentina of $526 (2022 – $666). |
| 3 | Other third-party sales primarily relate to Europe of $314 (2022 – $856) and Others of $557 (2022 – $1,207). |
| Canpotex sales by market (%) | 2023 | 2022 | ||||||
| Latin America | 47 | 34 | ||||||
| Other Asian markets 1 | 28 | 34 | ||||||
| China | 9 | 14 | ||||||
| India | 5 | 8 | ||||||
| Other markets | 11 | 10 | ||||||
| 1 | All Asian markets except China and India. |
|
|
2023 | 2022 | ||||||
| Purchased and produced raw materials and product for resale 1 | 16,635 | 18,747 | ||||||
| Depreciation and amortization | 2,169 | 2,012 | ||||||
| Employee costs 2 | 2,858 | 2,968 | ||||||
| Freight | 1,171 | 1,094 | ||||||
| Impairment (reversal of impairment) of assets (Notes 13 and 14) | 774 | (780 | ) | |||||
| Provincial mining taxes 3 | 398 | 1,149 | ||||||
| Integration and restructuring related costs | 49 | 46 | ||||||
| Contract services | 753 | 745 | ||||||
| Lease expense | 103 | 93 | ||||||
| Fleet fuel, repairs and maintenance | 369 | 359 | ||||||
| Gain on disposal of investment | – | (19 | ) | |||||
| COVID-19 related expenses | – | 8 | ||||||
| Loss on Blue Chip Swaps | 92 | – | ||||||
| ARO/ERL non-accretion expense (Note 22) | 143 | 15 | ||||||
| Gain on amendments to other post-retirement pension plans | (80 | ) | – | |||||
| Other | 877 | 638 | ||||||
| Total cost of goods sold and expenses | 26,311 | 27,075 | ||||||
| 1 | Significant expenses include supplies, energy, fuel, purchases of raw material (natural gas – feedstock, sulfur, ammonia and reagents) and product for resale (crop nutrients, crop protection products and seed). |
| 2 | Includes salaries and wages, employee benefits, and share-based compensation. |
| 3 | Includes Saskatchewan potash production tax and Saskatchewan resource surcharge of $279 and $119 (2022 – $909 and $240), respectively, as required under Saskatchewan provincial legislation. |
| 106 | Nutrien Annual Report 2023 | In millions of US dollars unless otherwise noted |
| Overview | MD&A | Five-year highlights | Financial statements and notes | |||||
|
Notes |
Note 5 | Share-based compensation
| Plans | Eligibility | Granted | Vesting period | Maximum term | Settlement | |||||
| Stock Options | Officers and eligible employees |
Annually | 25 percent per year over four years | 10 years | Shares 1 | |||||
| Performance Share Units (“PSUs”) | Officers and eligible employees |
Annually | On third anniversary of grant date based on total shareholder return relative to PSU peer group (75 percent weighting) and return on invested capital (25 percent weighting) | Not applicable | Cash | |||||
| Restricted Share Units (“RSUs”) | Officers and eligible employees |
Annually | On third anniversary of grant date and not subject to performance conditions | Not applicable | Cash | |||||
| Deferred Share Units (“DSUs”) | Non-executive directors |
At the discretion of the Board of Directors | Fully vest upon grant | Not applicable | Cash 2 | |||||
| Stock Appreciation Rights (“SARs”)/Tandem Stock Appreciation Rights (“TSARs”) 3 | Awards no longer granted; legacy awards only |
Awards no longer granted; legacy awards only | 25 percent per year over four years | 10 years | Cash | |||||
| 1 | Stock options may also be settled by cash settlement or, if approved by the Company, by a broker-assisted “cashless exercise” arrangement or a “net exercise” arrangement. |
| 2 | Directors can redeem their DSUs for cash only when they leave the Board of Directors for an amount equal to the market value of the common shares at the time of redemption or as mandated by the Nutrien DSU Plan. |
| 3 | Holders of TSARs have the ability to choose between (a) receiving in cash the price of our shares on the date of exercise in excess of the exercise price of the right or (b) receiving common shares by paying the exercise price of the right. Our past experience and future expectation are that substantially all TSAR holders will elect to choose the first option. |
The weighted average assumptions of stock options by year of grant that impacted current year results are as follows:
|
|
|
Year of grant | ||||||||
| Stock options | Based on | 2023 | 2022 | |||||||
|
Weighted average grant date fair value per option |
Black-Scholes-Merton option-pricing model as of the date of the grant |
|
25.67 |
|
|
20.49 |
|
|||
| Weighted average assumptions: | ||||||||||
| Exercise price per option |
Quoted market closing price of common shares on the last trading day immediately preceding the date of the grant | 78.95 | 77.50 | |||||||
| Expected annual dividend yield (%) |
Annualized dividend rate as of the date of the grant | 2.49 | 2.45 | |||||||
| Expected volatility (%) |
Historical volatility of Nutrien’s shares over a period commensurate with the expected life of the grant | 33 | 30 | |||||||
| Risk-free interest rate (%) |
Zero-coupon government issues implied yield available on equivalent remaining term at the time of the grant | 3.84 | 2.00 | |||||||
| Average expected life of options (years)
|
Historical experience | 8.5 | 8.5 | |||||||
| In millions of US dollars unless otherwise noted | Nutrien Annual Report 2023 | 107 |
| Overview | MD&A | Five-year highlights | Financial statements and notes | |||||
|
Notes |
|
|
|
|
Compensation expense | |||||||||||||
|
|
Units granted in 2023 |
Units outstanding as at December 31, 2023 |
2023 | 2022 | ||||||||||||
| Stock options | 301,168 | 3,248,306 | 8 | 11 | ||||||||||||
| PSUs | 517,219 | 1,732,785 | (39 | ) | 13 | |||||||||||
| RSUs | 582,659 | 1,576,486 | 23 | 33 | ||||||||||||
| DSUs | 34,075 | 401,296 | (4 | ) | 2 | |||||||||||
| SARs/TSARs | – | 176,284 | (2 | ) | 4 | |||||||||||
|
|
|
|
|
|
|
|
(14 | ) | 63 | |||||||
Note 6 | Other expenses (income)
|
|
2023 | 2022 | ||||||
| Integration and restructuring related costs | 49 | 46 | ||||||
| Foreign exchange loss, net of related derivatives | 91 | 31 | ||||||
| Earnings of equity-accounted investees | (101 | ) | (247 | ) | ||||
| Bad debt expense | 55 | 12 | ||||||
| COVID-19 related expenses | – | 8 | ||||||
| Gain on disposal of investment | – | (19 | ) | |||||
| Project feasibility costs | 86 | 79 | ||||||
| Customer prepayment costs | 47 | 42 | ||||||
| Legal expenses | 34 | 21 | ||||||
| Consulting expenses | 21 | 29 | ||||||
| Employee special recognition award | – | 61 | ||||||
| Loss on Blue Chip Swaps | 92 | – | ||||||
| ARO/ERL expense for non-operating sites (Note 22) | 152 | – | ||||||
| Gain on amendments to other post-retirement pension plans | (80 | ) | – | |||||
| Other expenses | 102 | 141 | ||||||
|
|
548 | 204 | ||||||
The Central Bank of Argentina maintains certain currency controls that limit our ability to remit cash from Argentina. Blue Chip Swaps are trade transactions that effectively allow companies to transfer US dollars out of Argentina. Through this mechanism, we incurred a loss of $92 from the purchase of securities denominated in Argentine peso and corresponding sales in US dollars during 2023. The loss is a result of the significant divergence between the Blue Chip Swap market exchange rate and the official Argentinian Central Bank rate.
|
|
2023 | 2022 | ||||||
| Interest expense | ||||||||
| Short-term debt |
303 | 153 | ||||||
| Long-term debt |
446 | 333 | ||||||
| Lease liabilities |
48 | 35 | ||||||
| Total interest expense | 797 | 521 | ||||||
| Unwinding of discount on asset retirement obligations (Note 22) | 33 | 29 | ||||||
| Interest on net defined benefit pension and other post-retirement plan obligations (Note 21) | 5 | 8 | ||||||
| Borrowing costs capitalized to property, plant and equipment | (71 | ) | (37 | ) | ||||
| Interest income | (35 | ) | (25 | ) | ||||
| Other finance costs | 64 | 67 | ||||||
|
|
793 | 563 | ||||||
Borrowing costs capitalized to property, plant and equipment in 2023 were calculated by applying an average capitalization rate of 5.4 percent (2022 – 4.1 percent) to expenditures on qualifying assets.
| 108 | Nutrien Annual Report 2023 | In millions of US dollars unless otherwise noted |
| Overview | MD&A | Five-year highlights | Financial statements and notes | |||||
|
Notes |
|
|
2023 | 2022 | ||||||
| Current income tax | ||||||||
| Tax expense for current year |
637 | 2,314 | ||||||
| Adjustments in respect of prior years |
26 | 63 | ||||||
| Total current income tax expense | 663 | 2,377 | ||||||
| Deferred income tax | ||||||||
| Origination and reversal of temporary differences |
5 | 215 | ||||||
| Swiss Tax Reform adjustment |
(134 | ) | – | |||||
| Adjustments in respect of prior years |
31 | (41 | ) | |||||
| Change in recognition of tax losses and deductible temporary differences |
105 | 8 | ||||||
| Total deferred income tax expense | 7 | 182 | ||||||
| Income tax expense included in net earnings | 670 | 2,559 | ||||||
In 2023, we recorded a deferred tax asset of $134 related to an increase in the tax basis of our Swiss assets as a result of changes to our Switzerland tax declarations.
We operate in a specialized industry and in several tax jurisdictions; as a result, our earnings are subject to various rates of taxation.
The provision for income taxes differs from the amount that would have resulted from applying the Canadian statutory income tax rates to earnings before income taxes as follows:
|
|
2023 | 2022 | ||||||
| Earnings (loss) before income taxes | ||||||||
| Canada |
1,427 | 5,707 | ||||||
| United States |
976 | 3,447 | ||||||
| Australia |
161 | 263 | ||||||
| Trinidad |
(75 | ) | 487 | |||||
| Other |
(537 | ) | 342 | |||||
|
|
1,952 | 10,246 | ||||||
| Canadian federal and provincial statutory income tax rate (%) | 27 | 27 | ||||||
| Income tax at statutory rates | 527 | 2,766 | ||||||
| Adjusted for the effect of: | ||||||||
| Impact of foreign tax rates |
(139 | ) | (132 | ) | ||||
| Swiss Tax Reform adjustment |
(134 | ) | – | |||||
| Non-taxable income |
(67 | ) | (98 | ) | ||||
| Production-related deductions |
(54 | ) | (51 | ) | ||||
| Current year losses for which no deferred tax asset is recognized |
314 | – | ||||||
| Change in recognition of tax losses and deductible temporary differences |
105 | 8 | ||||||
| Tax authority examinations |
62 | 22 | ||||||
| Non-deductible expenses |
25 | 16 | ||||||
| Withholding taxes |
20 | 18 | ||||||
| Other |
11 | 10 | ||||||
| Income tax expense included in net earnings | 670 | 2,559 | ||||||
| In millions of US dollars unless otherwise noted | Nutrien Annual Report 2023 | 109 |
| Overview | MD&A | Five-year highlights | Financial statements and notes | |||||
|
Notes |
Deferred income taxes
|
|
Deferred income tax (assets) liabilities |
Deferred income tax (recovery) expense recognized in net earnings |
||||||||||||||
|
|
2023 | 2022 | 2023 | 2022 | ||||||||||||
| Deferred income tax assets | ||||||||||||||||
| Asset retirement obligations and accrued environmental costs |
(400 | ) | (319 | ) | (17 | ) | 35 | |||||||||
| Tax loss and other carryforwards |
(347 | ) | (396 | ) | 52 | (93 | ) | |||||||||
| Lease liabilities |
(307 | ) | (298 | ) | (8 | ) | (151 | ) | ||||||||
| Inventories |
(108 | ) | (155 | ) | 47 | (30 | ) | |||||||||
| Pension and other post-retirement benefit liabilities |
(108 | ) | (151 | ) | 50 | (1 | ) | |||||||||
| Long-term debt |
(99 | ) | (117 | ) | 18 | 21 | ||||||||||
| Payables and accrued charges |
(96 | ) | (98 | ) | 2 | (84 | ) | |||||||||
| Receivables |
(50 | ) | (48 | ) | (2 | ) | (4 | ) | ||||||||
| Other assets |
(1 | ) | (1 | ) | – | – | ||||||||||
| Deferred income tax liabilities | ||||||||||||||||
| Property, plant and equipment |
4,410 | 4,305 | 40 | 545 | ||||||||||||
| Goodwill and intangible assets |
173 | 347 | (168 | ) | (53 | ) | ||||||||||
| Other liabilities |
30 | 30 | (7 | ) | (3 | ) | ||||||||||
|
|
3,097 | 3,099 | 7 | 182 | ||||||||||||
Amounts and expiry dates of unused tax losses and unused tax credits as at December 31, 2023, were:
|
|
Amount | Expiry date | ||||||
| Unused federal operating losses | 2,056 | 2024 – Indefinite | ||||||
| Unused federal capital losses | 683 | Indefinite | ||||||
The unused tax losses and credits with no expiry dates can be carried forward indefinitely.
As at December 31, 2023, we had $1,532 of federal tax losses for which we did not recognize deferred tax assets.
We have determined that it is probable that all recognized deferred tax assets will be realized through a combination of future reversals of temporary differences and taxable income.
We did not recognize deferred tax liabilities related to temporary differences associated with investments in subsidiaries and equity-accounted investees amounting to $7,010 as at December 31, 2023 (2022 – $13,060).
Note 9 | Net earnings per share
|
|
2023 | 2022 | ||||||
| Weighted average number of common shares | 496,381,000 | 538,475,000 | ||||||
| Dilutive effect of stock options | 613,000 | 1,535,000 | ||||||
| Weighted average number of diluted common shares | 496,994,000 | 540,010,000 | ||||||
Options excluded from the calculation of diluted net earnings per share due to the option exercise prices being greater than the average market price of common shares were as follows:
|
|
2023 | 2022 | ||||||
| Number of options excluded | 821,763 | 567,409 | ||||||
| 110 | Nutrien Annual Report 2023 | In millions of US dollars unless otherwise noted |
| Overview | MD&A | Five-year highlights | Financial statements and notes | |||||
|
Notes |
Note 10 | Financial instruments and related
risk management
Our ELT, along with the Board of Directors (including Board committees), is responsible for monitoring our risk exposures and managing our policies to address these risks. Our strategic and risk management processes are integrated to ensure we understand the benefit from the relationship between strategy, risk and value creation. Outlined below are our risk management strategies we have developed to mitigate the financial market risks that we are exposed to.
| Credit risks | Risk management strategies | |
| Receivables from customers | – establish credit approval policies and procedures for new and existing customers – extend credit to qualified customers through – review of credit agency reports, financial statements and/or credit references, as available – review of existing customer accounts every 12 to 24 months based on the credit limit amounts – evaluation of customer and country risk for international customers – establish credit period: – 15 and 30 days for wholesale fertilizer customers – 30 days for industrial and feed customers – 30 to 360 days for Retail customers, including Nutrien Financial – up to 180 days for select export sales customers, including Canpotex – transact on a cash basis with certain customers who may not meet specified benchmark creditworthiness or cannot provide other evidence of ability to pay – execute agency arrangements with financial institutions or other partners with which we have only a limited recourse involvement – sell receivables to financial institutions which substantially transfer the risks and rewards – set eligibility requirements for Nutrien Financial to limit the risk of the receivables – may require security over certain crop or livestock inventories – set up provision using the lifetime expected credit loss method considering all possible default events over the expected life of a financial instrument. Receivables are grouped based on days past due and/or customer credit risk profile. Estimated losses on receivables are based on known troubled accounts and historical experience of losses incurred. Receivables are considered to be in default and are written off against the allowance when it is probable that all remaining contractual payments due will not be collected in accordance with the terms of the agreement. |
|
| Cash and cash equivalents and other receivables | – require acceptable minimum counterparty credit ratings – limit counterparty or credit exposure – select counterparties with investment-grade quality |
|
Aging of receivables (%) as at December 31:
| 2023 | 2022 | |||||||||||||||||||||||
|
|
Retail (Nutrien Financial) |
Retail Nutrien Financial) |
Potash, Nitrogen and Phosphate |
Retail (Nutrien |
Retail (excluding |
Potash, Nitrogen and Phosphate |
||||||||||||||||||
| Current | 78 | 78 | 89 | 83 | 84 | 97 | ||||||||||||||||||
| 30 days or less past due | 13 | 6 | 11 | 10 | 9 | 3 | ||||||||||||||||||
| 31 – 90 days past due | 4 | 4 | – | 3 | 4 | – | ||||||||||||||||||
| Greater than 90 days past due | 5 | 12 | – | 4 | 3 | – | ||||||||||||||||||
|
|
100 | 100 | 100 | 100 | 100 | 100 | ||||||||||||||||||
| In millions of US dollars unless otherwise noted | Nutrien Annual Report 2023 | 111 |
| Overview | MD&A | Five-year highlights | Financial statements and notes | |||||
|
Notes |
Maximum exposure to credit risk as at December 31:
|
|
2023 | 2022 | ||||||
| Cash and cash equivalents | 941 | 901 | ||||||
| Receivables (excluding income tax receivable) | 5,103 | 6,050 | ||||||
|
|
6,044 | 6,951 | ||||||
| Liquidity risk | Risk management strategies | |
| Access to cash | – establish an external borrowing policy to maintain sufficient liquid financial resources to fund our operations and meet our commitments and obligations in a cost-effective manner – maintain an optimal capital structure – maintain investment-grade credit ratings that provide ease of access to the debt capital and commercial paper markets – maintain sufficient short-term credit availability – uphold long-term relationships with a sufficient number of high-quality and diverse lenders – enter into financial arrangements (e.g., Blue Chip Swaps) to remit cash from certain foreign jurisdictions Refer to Note 17 for our available credit facilities. |
|
The following maturity analysis of our financial liabilities and gross settled derivative contracts (for which the cash flows are settled simultaneously) is based on the expected undiscounted contractual cash flows from the date of the consolidated balance sheets to the contractual maturity date.
| 2023 | Carrying amount of liability as at December 31 |
Contractual flows |
Within 1 year |
1 to 3 years |
3 to 5 years |
Over 5 years |
||||||||||||||||||
| Short-term debt 1 | 1,815 | 1,815 | 1,815 | – | – | – | ||||||||||||||||||
| Payables and accrued charges 2 | 9,024 | 9,024 | 9,024 | – | – | – | ||||||||||||||||||
| Long-term debt, including current portion 1 | 9,425 | 15,339 | 966 | 2,324 | 1,556 | 10,493 | ||||||||||||||||||
| Lease liabilities, including current portion 1 | 1,326 | 1,525 | 368 | 484 | 222 | 451 | ||||||||||||||||||
| Derivatives | 16 | 16 | 16 | – | – | – | ||||||||||||||||||
|
|
21,606 | 27,719 | 12,189 | 2,808 | 1,778 | 10,944 | ||||||||||||||||||
| 1 | Contractual cash flows include contractual interest payments related to debt obligations and lease liabilities. Interest rates on debt with variable rates are based on the prevailing rates as at December 31, 2023. |
| 2 | Excludes non-financial liabilities and includes payables of approximately $2.1 billion related to our prepaid inventory to secure product discounts. We consider these payables to be part of our working capital. For these payables, we participated in arrangements where the vendors sold their right to receive payment to financial institutions without extending the original payment terms. These payables were paid in January 2024. |
| 112 | Nutrien Annual Report 2023 | In millions of US dollars unless otherwise noted |
| Overview | MD&A | Five-year highlights | Financial statements and notes | |||||
|
Notes |
| Market risks | Type | Risk management strategies |
|
|||
| Interest rate | Short-term and long-term debt | – use a portfolio of fixed and floating rate instruments – align current and long-term assets with demand and fixed-term debt – monitor the effects of market changes in interest rates – use interest rate swaps, if desired |
We do not believe we have material exposure to interest, price or foreign exchange risk on our financial instruments as at December 31, 2023 and 2022. | |||
| Price | Natural gas derivative instruments | – diversify our forecast gas volume requirements, including a portion of annual requirements purchased at spot market prices, a portion at fixed prices (up to 10 years) and a portion indexed to the market price of ammonia – acquire a reliable supply of natural gas feedstock and fuel on a location-adjusted, cost-competitive basis and hold firm pipeline transportation to our operating sites |
||||
| Price | Investment at fair value | – ensure the security of principal amounts invested – provide for an adequate degree of liquidity – achieve a satisfactory return |
||||
| Foreign exchange |
|
– execute foreign currency derivative contracts within certain prescribed limits for both actual and forecasted expenditures to manage the impact to cash flows and earnings, including those related to our equity-accounted investees, that could occur from a reasonably possible strengthening or weakening of the US dollar |
||||
The fair value of our net foreign exchange currency derivative assets (liabilities) as at December 31, 2023 was $11 (2022 – $(18)). The following table presents the significant foreign currency derivatives that existed as at December 31:
| 2023
|
2022
|
|||||||||||||||||||||||
| Sell/buy | Notional | Maturities | Average contract rate |
Notional | Maturities | Average contract rate |
||||||||||||||||||
| Derivatives not designated as hedges | ||||||||||||||||||||||||
| Forwards |
||||||||||||||||||||||||
| USD/Canadian dollars (“CAD”) |
435 | 2024 | 1.3207 | 473 | 2023 | 1.3584 | ||||||||||||||||||
| Australian dollars/USD |
86 | 2024 | 1.5269 | 133 | 2023 | 1.5010 | ||||||||||||||||||
| Brazilian real/USD |
94 | 2024 | 4.8688 | 374 | 2023 | 5.6892 | ||||||||||||||||||
| Derivatives designated as hedges | ||||||||||||||||||||||||
| Forwards |
||||||||||||||||||||||||
| USD/CAD |
601 | 2024 | 1.3565 | 487 | 2023 | 1.3255 | ||||||||||||||||||
| In millions of US dollars unless otherwise noted | Nutrien Annual Report 2023 | 113 |
| Overview | MD&A | Five-year highlights | Financial statements and notes | |||||
|
Notes |
Fair value
Financial instruments included in the consolidated balance sheets are measured either at fair value or amortized cost.
| Financial instruments at fair value |
Fair value method and associated level within the fair value hierarchy | |
| Cash and cash equivalents |
Carrying amount (approximation to fair value assumed due to short-term nature) | |
| Equity securities |
Closing bid price of the common shares (Level 1) as at the balance sheet date | |
| Debt securities |
Closing bid price of the debt or other instruments with similar terms and credit risk (Level 2) as at the balance sheet date | |
| Foreign currency derivatives not traded in an active market |
Quoted forward exchange rates (Level 2) as at the balance sheet date | |
| Foreign exchange forward contracts, swaps and options, and natural gas swaps not traded in an active market |
Based on a discounted cash flow (“DCF”) model. Inputs included contractual cash flows based on prices for natural gas futures contracts, fixed prices and notional volumes specified by the swap contracts, the time value of money, liquidity risk, our own credit risk (related to instruments in a liability position) and counterparty credit risk (related to instruments in an asset position). Futures contract prices used as inputs in the model were supported by prices quoted in an active market and therefore categorized in Level 2. | |
| Financial instruments at amortized cost |
Fair value method | |
| Receivables, short-term debt, and payables and accrued charges |
Carrying amount (approximation to fair value assumed due to short-term nature) | |
| Long-term debt |
Quoted market prices (Level 1 or 2 depending on the market liquidity of the debt) | |
| Other long-term debt instruments |
Carrying amount (approximation to fair value) | |
The following table presents our fair value hierarchy for financial instruments carried at fair value on a recurring basis or measured at amortized cost and require fair value disclosure. The table does not include fair value information for financial instruments that are measured using their carrying amount as a reasonable approximation of fair value.
|
|
2023 | 2022 | ||||||||||||||||||||||||||||||
| Financial assets (liabilities) measured at | Carrying amount |
Level 1 | Level 2 | Level 3 | Carrying amount |
Level 1 | Level 2 | Level 3 | ||||||||||||||||||||||||
| Fair value on a recurring basis 1 | ||||||||||||||||||||||||||||||||
| Derivative instrument assets |
20 | – | 20 | – | 7 | – | 7 | – | ||||||||||||||||||||||||
| Other current financial assets – |
173 | 35 | 138 | – | 148 | 19 | 129 | – | ||||||||||||||||||||||||
| Investments at fair value through other |
190 | 180 | – | 10 | 200 | 190 | – | 10 | ||||||||||||||||||||||||
| Investments at fair value through profit |
45 | – | – | 45 | 44 | – | – | 44 | ||||||||||||||||||||||||
| Derivative instrument liabilities |
(16 | ) | – | (16 | ) | – | (35 | ) | – | (35 | ) | – | ||||||||||||||||||||
| Amortized cost | ||||||||||||||||||||||||||||||||
| Investments at amortized cost (Note 15) |
19 | 16 | – | – | – | – | – | – | ||||||||||||||||||||||||
| Current portion of long-term debt |
||||||||||||||||||||||||||||||||
| Senior notes and debentures |
(499 | ) | – | (502 | ) | – | (500 | ) | (493 | ) | – | – | ||||||||||||||||||||
| Fixed and floating rate debt |
(13 | ) | – | (13 | ) | – | (42 | ) | – | (42 | ) | – | ||||||||||||||||||||
| Long-term debt |
||||||||||||||||||||||||||||||||
| Senior notes and debentures |
(8,884 | ) | (3,110 | ) | (5,462 | ) | – | (7,910 | ) | (3,581 | ) | (3,656 | ) | – | ||||||||||||||||||
| Fixed and floating rate debt |
(29 | ) | – | (29 | ) | – | (130 | ) | – | (130 | ) | – | ||||||||||||||||||||
| 1 | During 2023 and 2022, there were no transfers between levels for financial instruments measured at fair value on a recurring basis. Our policy is to recognize transfers at the end of the reporting period. |
| 2 | Marketable securities consist of equity and debt securities. |
| 114 | Nutrien Annual Report 2023 | In millions of US dollars unless otherwise noted |
| Overview | MD&A | Five-year highlights | Financial statements and notes | |||||
|
Notes |
|
|
Segment |
2023 | 2022 | |||||||
| Receivables from customers | ||||||||||
| Third parties |
Retail (Nutrien Financial) 1 | 2,943 | 2,705 | |||||||
| Retail | 1,097 | 1,293 | ||||||||
| Potash, Nitrogen, Phosphate | 577 | 827 | ||||||||
| Related party – Canpotex |
Potash (Note 28) | 162 | 866 | |||||||
| Less allowance for expected credit losses of receivables from customers |
(111 | ) | (95 | ) | ||||||
| 4,668 | 5,596 | |||||||||
| Rebates | 198 | 172 | ||||||||
| Income taxes (Note 8) | 295 | 144 | ||||||||
| Other receivables |
|
237 | 282 | |||||||
|
|
|
5,398 | 6,194 | |||||||
| 1 | Includes $2,578 of very low risk of default and $365 of low risk of default (2022 – $2,260 of very low risk of default and $445 of low risk of default). |
Qualifying receivables from customers financed by Nutrien Financial represent high-quality receivables from customers that have been rated very low to low risk of default among Retail’s receivables from customers.
Customer credit with a financial institution of $431 as at December 31, 2023, related to our agency agreement, is not recognized in our consolidated balance sheets. Through the agency agreement, we only have a limited recourse involvement to the extent of an indemnification of the financial institution to a maximum of 5 percent (2022 – 5 percent) of the qualified customer loans. Historical indemnification losses on this arrangement have been negligible, and the average aging of the customer loans with the financial institution is current.
|
|
2023 | 2022 | ||||||
| Product purchased for resale | 4,941 | 5,885 | ||||||
| Finished products | 351 | 612 | ||||||
| Intermediate products | 160 | 184 | ||||||
| Raw materials | 299 | 425 | ||||||
| Materials and supplies | 585 | 526 | ||||||
|
|
6,336 | 7,632 | ||||||
| By segment | 2023 | 2022 | ||||||
| Retail | 5,041 | 6,035 | ||||||
| Potash | 371 | 398 | ||||||
| Nitrogen | 493 | 706 | ||||||
| Phosphate | 431 | 493 | ||||||
|
|
6,336 | 7,632 | ||||||
Inventories expensed to cost of goods sold during the year were $19,391 (2022 – $21,371).
| In millions of US dollars unless otherwise noted | Nutrien Annual Report 2023 | 115 |
| Overview | MD&A | Five-year highlights | Financial statements and notes | |||||
|
Notes |
Note 13 | Property, plant and equipment
|
|
Land and improvements |
Buildings and improvements |
Machinery and equipment |
Mine development costs |
Assets under construction |
Total | ||||||||||||||||||
| Useful life range (years) | 1 – 85 | 1 – 70 | 1 – 80 | 1 – 60 | n/a |
|
|
|
||||||||||||||||
| Carrying amount – December 31, 2022 | 1,201 | 6,340 | 11,017 | 1,108 | 2,101 | 21,767 | ||||||||||||||||||
| Acquisitions (Note 25) | – | 2 | 5 | – | – | 7 | ||||||||||||||||||
| Additions | 1 | 5 | 37 | – | 2,422 | 2,465 | ||||||||||||||||||
| Additions – Right-of-use (“ROU”) assets | 1 | 70 | 338 | – | – | 409 | ||||||||||||||||||
| Disposals | (6 | ) | (7 | ) | (37 | ) | – | (1 | ) | (51 | ) | |||||||||||||
| Transfers | 26 | 188 | 1,401 | 237 | (1,852 | ) | – | |||||||||||||||||
| Foreign currency translation and other | 12 | 32 | 94 | 3 | (165 | ) | (24 | ) | ||||||||||||||||
| Depreciation | (39 | ) | (184 | ) | (1,054 | ) | (138 | ) | – | (1,415 | ) | |||||||||||||
| Depreciation – ROU assets | (2 | ) | (60 | ) | (326 | ) | – | – | (388 | ) | ||||||||||||||
| Impairment | (19 | ) | (10 | ) | (148 | ) | (95 | ) | (37 | ) | (309 | ) | ||||||||||||
| Carrying amount – December 31, 2023 | 1,175 | 6,376 | 11,327 | 1,115 | 2,468 | 22,461 | ||||||||||||||||||
| Balance – December 31, 2023 is composed of: |
||||||||||||||||||||||||
| Cost |
1,631 | 9,050 | 23,237 | 2,938 | 2,468 | 39,324 | ||||||||||||||||||
| Accumulated depreciation and impairments |
(456 | ) | (2,674 | ) | (11,910 | ) | (1,823 | ) | – | (16,863 | ) | |||||||||||||
| Carrying amount – December 31, 2023 | 1,175 | 6,376 | 11,327 | 1,115 | 2,468 | 22,461 | ||||||||||||||||||
| Balance – December 31, 2023 is composed of: |
||||||||||||||||||||||||
| Owned property, plant and equipment ROU assets |
|
1,145 30 |
|
|
5,980 396 |
|
|
10,486 841 |
|
|
1,115 – |
|
|
2,468 – |
|
|
21,194 1,267 |
|
||||||
| Carrying amount – December 31, 2023 | 1,175 | 6,376 | 11,327 | 1,115 | 2,468 | 22,461 | ||||||||||||||||||
| Carrying amount – December 31, 2021 | 1,073 | 6,305 | 10,221 | 853 | 1,564 | 20,016 | ||||||||||||||||||
| Acquisitions (Note 25) | 12 | 40 | 23 | – | 65 | 140 | ||||||||||||||||||
| Additions | 17 | 9 | 25 | – | 2,202 | 2,253 | ||||||||||||||||||
| Additions – ROU assets | – | 51 | 230 | – | – | 281 | ||||||||||||||||||
| Disposals | (9 | ) | (13 | ) | (24 | ) | – | – | (46 | ) | ||||||||||||||
| Transfers | 35 | 163 | 1,281 | 170 | (1,649 | ) | – | |||||||||||||||||
| Foreign currency translation and other | 5 | 2 | 55 | 30 | (90 | ) | 2 | |||||||||||||||||
| Depreciation | (35 | ) | (185 | ) | (1,006 | ) | (94 | ) | – | (1,320 | ) | |||||||||||||
| Depreciation – ROU assets | (2 | ) | (58 | ) | (279 | ) | – | – | (339 | ) | ||||||||||||||
| Reversal of impairment | 105 | 26 | 491 | 149 | 9 | 780 | ||||||||||||||||||
| Carrying amount – December 31, 2022 | 1,201 | 6,340 | 11,017 | 1,108 | 2,101 | 21,767 | ||||||||||||||||||
| Balance – December 31, 2022 is composed of: |
||||||||||||||||||||||||
| Cost |
1,605 | 8,795 | 22,023 | 2,699 | 2,101 | 37,223 | ||||||||||||||||||
| Accumulated depreciation and impairments |
(404 | ) | (2,455 | ) | (11,006 | ) | (1,591 | ) | – | (15,456 | ) | |||||||||||||
| Carrying amount – December 31, 2022 | 1,201 | 6,340 | 11,017 | 1,108 | 2,101 | 21,767 | ||||||||||||||||||
| Balance – December 31, 2022 is |
|
|||||||||||||||||||||||
| Owned property, plant and equipment |
1,173 | 5,956 | 10,267 | 1,108 | 2,101 | 20,605 | ||||||||||||||||||
| ROU assets |
28 | 384 | 750 | – | – | 1,162 | ||||||||||||||||||
| Carrying amount – December 31, 2022 | 1,201 | 6,340 | 11,017 | 1,108 | 2,101 | 21,767 | ||||||||||||||||||
| 116 | Nutrien Annual Report 2023 | In millions of US dollars unless otherwise noted |
| Overview | MD&A | Five-year highlights | Financial statements and notes | |||||
|
Notes |
Depreciation of property, plant and equipment was included in the following:
|
|
2023 | 2022 | ||||||
| Freight, transportation and distribution | 165 | 148 | ||||||
| Cost of goods sold | 1,157 | 1,024 | ||||||
| Selling expenses | 453 | 424 | ||||||
| General and administrative expenses | 48 | 42 | ||||||
| Depreciation recorded in earnings | 1,823 | 1,638 | ||||||
| Depreciation recorded in inventory | 145 | 151 | ||||||
Impairments and impairment reversals
For each cash generating unit (“CGU”) or groups of CGUs in which we complete an impairment analysis, the recoverable amount estimate used the following key assumptions: our forecasted EBITDA, discount rate and long-term growth rate. For our Phosphate CGUs, we also estimate the end of expected mine life. We used key assumptions that were based on historical data and estimates of future results from internal sources, independent third-party price benchmarks, and mineral reserve technical reports (relating to Phosphate CGUs), as well as industry and market information.
Phosphate
In 2023, we identified an impairment trigger for our Phosphate CGUs, White Springs and Aurora, primarily as a result of the decrease in our forecasted phosphate margins. We completed our impairment analysis for these CGUs.
| Phosphate CGU | White Springs | Aurora | ||
| Impairment assessment date | June 30, 2023 | June 30, 2023 | ||
| Recoverable amount ($) | 504 | 2,000 | ||
| Carrying amount before impairment loss ($) |
737 |
1,660 | ||
| Pre-tax impairment loss ($) | 233 | – | ||
| Valuation methodology | Value in use (“VIU”) | Fair value less costs of disposal (“FVLCD”), a Level 3 measurement | ||
| Valuation technique | Pre-tax DCF to end of expected mine life | Five-year DCF plus terminal year to end of mine life | ||
In 2022, we completed an impairment analysis at our White Springs and Aurora CGUs as a result of revised pricing forecasts to reflect the macroeconomic environment at the time. We completed our impairment analysis for these CGUs.
| Phosphate CGU | White Springs | Aurora | ||
| Impairment reversal date | September 30, 2022 | June 30, 2022 | ||
| Recoverable amount ($) | 770 | 2,900 | ||
| Carrying amount before impairment reversal ($) |
425 | 1,200 | ||
| Pre-tax impairment reversal (net of depreciation) ($) 1 |
330 | 450 | ||
| Valuation methodology | VIU | FVLCD | ||
| Valuation technique | Pre-tax DCF to end of expected mine life | Five-year DCF plus terminal year to end of mine life | ||
| 1 | Full reversal of the previously recorded impairment losses relating to property, plant and equipment at White Springs in 2017 and 2020 of $250 and $215, respectively, and Aurora in 2020 of $545. |
| In millions of US dollars unless otherwise noted | Nutrien Annual Report 2023 | 117 |
| Overview | MD&A | Five-year highlights | Financial statements and notes | |||||
|
Notes |
|
|
White Springs | Aurora | ||||||||||
| Key assumptions 1 | 2023 | 2022 | 2022 | |||||||||
| End of mine life (proven and probable reserves) (year) 2 | 2032 | 2030 | 2050 | |||||||||
| Long-term growth rate (%) | n/a | n/a | 2.0 | |||||||||
| Pre-tax discount rate (%) | 15.6 | 15.2 | n/a | |||||||||
| Post-tax discount rate (%) | 12.0 | 12.0 | 10.4 | |||||||||
| Forecasted EBITDA 3 ($) | 720 | 980 | 3,090 | |||||||||
| 1 | At impairment loss (reversal) date. |
| 2 | The White Springs CGU has a shorter expected mine life and is therefore more sensitive to changes in short- and medium-term forecasted phosphate margins. |
| 3 | Forecasted EBITDA to 2028 (2022 – Forecasted EBITDA to 2027). |
Sensitivities
The following table highlights sensitivities to the recoverable amounts of our Phosphate CGUs, which could result in additional impairment losses or reversals of the previously recorded losses (relating to the White Springs CGU).
|
|
|
Change to recoverable amount ($) | ||||||||
| Key assumptions as at June 30, 2023 | Change in assumption | White Springs | Aurora | |||||||
| Long-term growth rate (%) | + / - 1.0 percent | n/a | n/a | + / - | 110 | |||||
| Pre-tax discount rate (%) | + / - 1.0 percent | - / + | 20 | n/a | n/a | |||||
| Post-tax discount rate (%) | + / - 1.0 percent | n/a | n/a | - / + | 190 | |||||
| Forecasted EBITDA over forecast period ($) | + / - 5.0 percent | + / - | 40 | + / - | 220 | |||||
Nitrogen
In 2023, we identified an impairment trigger for our Trinidad CGU, part of our Nitrogen segment, due to a new natural gas contract and the resulting outlook for higher expected natural gas costs and constrained near-term availability. We expect improved natural gas availability in Trinidad as the development of additional natural gas fields is anticipated to add new natural gas supply starting in 2026.
| December 31, 2023 | Trinidad | |
| Recoverable amount ($) | 676 | |
| Carrying amount before impairment loss ($) | 752 | |
| Pre-tax impairment loss ($) | 76 | |
| Valuation methodology | FVLCD, a Level 3 measurement | |
| Valuation technique | Five-year DCF plus a terminal value | |
| Key assumptions | ||
| Long-term growth rate (%) |
2.3 | |
| Post-tax discount rate 1 (%) |
13.0 | |
| Forecasted EBITDA 2,3 ($) |
1,145 | |
| 1 | Discount rate used in the previous measurement in 2020 was 12.6 percent. |
| 2 | First five years of the forecast period. |
| 3 | Includes key assumptions relating to net selling price based on forecasted future natural gas contracting and availability. |
Sensitivities
The following table highlights sensitivities to the recoverable amount of our Trinidad CGU, which could result in additional impairment losses or reversals of the previously recorded losses.
| Key assumptions as at December 31, 2023 | Change in assumption | Change to recoverable amount ($) |
||||||
| Long-term growth rate (%) | + / - 1.0 percent | + / - | 55 | |||||
| Post-tax discount rate (%) | + / - 1.0 percent | - / + | 95 | |||||
| Forecasted EBITDA over forecast period ($) | + / - 5.0 percent | + / - | 100 | |||||
| 118 | Nutrien Annual Report 2023 | In millions of US dollars unless otherwise noted |
| Overview | MD&A | Five-year highlights | Financial statements and notes | |||||
|
Notes |
Note 14 | Goodwill and intangible assets
|
|
|
Intangible assets | ||||||||||||||||||||||
|
|
Goodwill | Customer relationships 1 |
Technology | Trade names |
Other | Total | ||||||||||||||||||
| Useful life range (years) | n/a | 5 – 15 | 2 – 20 | 3 – 15 | 2 | 1 – 30 | ||||||||||||||||||
| Carrying amount – December 31, 2022 | 12,368 | 1,229 | 702 | 95 | 271 | 2,297 | ||||||||||||||||||
| Acquisitions (Note 25) | 126 | 30 | – | 7 | 1 | 38 | ||||||||||||||||||
| Additions – internally developed | – | – | 206 | – | – | 206 | ||||||||||||||||||
| Foreign currency translation and other | 42 | 9 | 49 | 4 | (1 | ) | 61 | |||||||||||||||||
| Amortization 3 | – | (164 | ) | (114 | ) | (8 | ) | (56 | ) | (342 | ) | |||||||||||||
| Impairment | (422 | ) | (43 | ) | – | – | – | (43 | ) | |||||||||||||||
| Carrying amount – December 31, 2023 | 12,114 | 1,061 | 843 | 98 | 215 | 2,217 | ||||||||||||||||||
| Balance – December 31, 2023 is composed of: | ||||||||||||||||||||||||
| Cost |
12,542 | 2,046 | 1,263 | 160 | 656 | 4,125 | ||||||||||||||||||
| Accumulated amortization and impairment |
(428 | ) | (985 | ) | (420 | ) | (62 | ) | (441 | ) | (1,908 | ) | ||||||||||||
| Carrying amount – December 31, 2023 | 12,114 | 1,061 | 843 | 98 | 215 | 2,217 | ||||||||||||||||||
| Carrying amount – December 31, 2021 | 12,220 | 1,350 | 595 | 80 | 315 | 2,340 | ||||||||||||||||||
| Acquisitions (Note 25) | 200 | 59 | – | 22 | 23 | 104 | ||||||||||||||||||
| Additions – internally developed | – | – | 216 | – | 6 | 222 | ||||||||||||||||||
| Foreign currency translation and other | (52 | ) | (13 | ) | 14 | 1 | (1 | ) | 1 | |||||||||||||||
| Disposals | – | (1 | ) | (1 | ) | – | – | (2 | ) | |||||||||||||||
| Amortization 3 | – | (166 | ) | (122 | ) | (8 | ) | (72 | ) | (368 | ) | |||||||||||||
| Carrying amount – December 31, 2022 | 12,368 | 1,229 | 702 | 95 | 271 | 2,297 | ||||||||||||||||||
| Balance – December 31, 2022 is composed of: |
|
|||||||||||||||||||||||
| Cost |
12,375 | 2,001 | 1,028 | 150 | 649 | 3,828 | ||||||||||||||||||
| Accumulated amortization and impairment |
(7 | ) | (772 | ) | (326 | ) | (55 | ) | (378 | ) | (1,531 | ) | ||||||||||||
| Carrying amount – December 31, 2022 | 12,368 | 1,229 | 702 | 95 | 271 | 2,297 | ||||||||||||||||||
| 1 | The average remaining amortization period of customer relationships as at December 31, 2023, was approximately 3 years. |
| 2 | Certain trade names have indefinite useful lives as there are no regulatory, legal, contractual, cooperative, economic or other factors that limit their useful lives. |
| 3 | Amortization of $279 was included in selling expenses during the year ended December 31, 2023 (2022 – $302). |
Goodwill impairment testing
| Goodwill by CGU or group of CGUs | 2023 | 2022 | ||||||
| Retail – North America | 6,981 | 6,898 | ||||||
| Retail – International 1 | 590 | 927 | ||||||
| Potash | 154 | 154 | ||||||
| Nitrogen | 4,389 | 4,389 | ||||||
|
|
12,114 | 12,368 | ||||||
| 1 | Includes Retail – South America group of CGUs, which had goodwill of nil as at December 31, 2023 (2022 – $348). |
| In millions of US dollars unless otherwise noted | Nutrien Annual Report 2023 | 119 |
| Overview | MD&A | Five-year highlights | Financial statements and notes | |||||
|
Notes |
In testing for impairment of goodwill, we calculate the recoverable amount for a CGU or groups of CGUs containing goodwill. We used the FVLCD methodology based on after-tax discounted cash flows (five-year projections plus a terminal value with the exception of the Retail – South America group of CGUs, which used a 10-year projection plus a terminal value) and incorporated assumptions an independent market participant would apply, including considerations related to climate-change initiatives. We adjusted discount rates for each CGU or group of CGUs for the risk associated with achieving our forecasts and for the country risk premium in which we expect to generate cash flows. FVLCD is a Level 3 measurement. We use our market capitalization (where applicable) and comparative market multiples to ensure discounted cash flow results are reasonable.
The key assumptions with the greatest influence on the calculation of the recoverable amounts are the discount rates, terminal growth rates and forecasted EBITDA. The key forecast assumptions were based on historical data and our estimates of future results from internal sources considering industry and market information.
In 2023, we revised our forecasted EBITDA for the Retail – South America group of CGUs, which triggered an impairment analysis. Due to the impact of crop input price volatility, more moderate long-term growth assumptions and higher interest rates, we lowered our product margin expectations and deferred certain of our planned strategic investments. As a result, this reduced our forecasted EBITDA and growth. Therefore, we recorded the following impairment:
| Retail – South America group of CGUs | June 30, 2023 | |||
| Recoverable amount | 1,031 | |||
| Carrying amount before impairment loss | 1,496 | |||
| Impairment recognized relating to: | ||||
| Goodwill |
422 | |||
| Intangible assets |
43 | |||
The following table highlights sensitivities to the Retail – South America group of CGUs recoverable amount, which could have resulted in additional impairment against the carrying amount of intangible assets and property, plant and equipment.
| Key assumptions as at June 30, 2023 | Key assumption | Change in key assumption |
Decrease to recoverable amount ($) |
|||||||||
| Terminal growth rate (%) | 6.0 | - 1.0 percent | 50 | |||||||||
| Discount rate (%) | 16.6 | + 1.0 percent | 120 | |||||||||
| Forecasted EBITDA over forecast period ($) | 4,300 | - 5.0 percent | 100 | |||||||||
| 1 | The discount rate used in the previous measurement was 16.0 percent, which was included as part of our Retail – International group of CGUs. |
We performed our annual impairment test on goodwill on the remaining CGUs or group of CGUs and did not identify any further impairment; however, the recoverable amount for the Retail – North America group of CGUs did not substantially exceed its carrying amount. The Retail – North America group of CGUs recoverable amount exceeds its carrying amount by $570. Goodwill is more susceptible to impairment risk if there is an increase in the discount rate or a deterioration in business operating results or economic conditions and actual results do not meet our forecasts. A reduction in the terminal growth rate, an increase in the discount rate or a decrease in forecasted EBITDA could cause impairment in the future as shown in the table below.
| 2023 Annual impairment testing | Key assumption used in impairment model |
Change required for carrying amount to equal recoverable amount |
||||||
| Terminal growth rate (%) | 2.5 | 0.4 percent decrease | ||||||
| Discount rate 1 (%) | 8.6 | 0.2 percent increase | ||||||
| Forecasted EBITDA over forecast period ($) | 8,040 | 3.0 percent decrease | ||||||
| 1 | The discount rate used in the previous measurement was 8.5 percent. |
| 120 | Nutrien Annual Report 2023 | In millions of US dollars unless otherwise noted |
| Overview | MD&A | Five-year highlights | Financial statements and notes | |||||
|
Notes |
The following table indicates the key assumptions used in testing the remaining groups of CGUs:
| Terminal growth rate (%) | Discount rate (%) | |||||||||||||||
|
|
2023 | 2022 | 2023 | 2022 | ||||||||||||
| Retail – International 1 | 2.1 | 2.0 – 6.0 | 9.0 | 8.9 – 16.0 | ||||||||||||
| Potash | 2.5 | 2.5 | 7.6 | 8.3 | ||||||||||||
| Nitrogen | 2.3 | 2.0 | 8.3 | 9.3 | ||||||||||||
| 1 | The discount rates reflect the country risk premium and size for our international groups of CGUs. The terminal growth rate and discount rate ranges in 2022 included our Retail – South America group of CGUs, which are no longer included in 2023 as goodwill for this group of CGUs is nil. |
| Name |
Principal activity |
Principal place of business and |
Proportion of and voting rights held (%) |
Carrying amount | ||||||||||||||||||||
| 2023 | 2022 | 2023 | 2022 1 | |||||||||||||||||||||
| Equity-accounted investees |
|
|||||||||||||||||||||||
| Profertil | Nitrogen producer | Argentina | 50 | 50 | 340 | 450 | ||||||||||||||||||
| Canpotex | |
Marketing and logistics of potash |
|
Canada | 50 | 50 | – | – | ||||||||||||||||
| Other associates and joint ventures |
|
|
|
|
|
|
|
|
|
|
|
|
142 | 149 | ||||||||||
| Total equity-accounted investees |
|
|
|
|
|
|
|
|
|
|
482 | 599 | ||||||||||||
| Investments at FVTOCI |
|
|||||||||||||||||||||||
| Sinofert | |
Fertilizer supplier and distributor |
|
China/Bermuda | 22 | 22 | 180 | 190 | ||||||||||||||||
| Other |
|
|
|
|
|
|
|
|
|
|
|
|
10 | 10 | ||||||||||
| Total investments at FVTOCI |
|
|
|
|
|
|
|
|
|
|
190 | 200 | ||||||||||||
| Investments at FVTPL |
|
|||||||||||||||||||||||
| Other |
|
|
|
|
|
|
|
|
|
|
|
|
45 | 44 | ||||||||||
| Total investments at FVTPL |
|
|
|
|
|
|
|
|
|
|
45 | 44 | ||||||||||||
| Investments at amortized cost |
|
|||||||||||||||||||||||
| Other |
|
|
|
|
|
|
|
|
|
|
|
|
19 | – | ||||||||||
| Total investments at amortized cost |
|
|
|
|
|
|
|
|
|
|
19 | – | ||||||||||||
| Total investments |
|
|
|
|
|
|
|
|
|
|
736 | 843 | ||||||||||||
| 1 | Certain immaterial 2022 figures have been reclassified. |
| In millions of US dollars unless otherwise noted | Nutrien Annual Report 2023 | 121 |
| Overview | MD&A | Five-year highlights | Financial statements and notes | |||||
|
Notes |
We continuously assess our ability to exercise significant influence or joint control over our investments. Our 22 percent ownership in Sinofert does not constitute significant influence as we do not have any representation on the board of directors of Sinofert. We elected to account for our investment in Sinofert as FVTOCI as it is held for strategic purposes.
| Summarized financial information of Profertil 1 For the years ended December 31 |
2023 | 2022 | ||||||
| Sales | 762 | 1,096 | ||||||
| Depreciation and amortization | 5 | 5 | ||||||
| Interest expense | 10 | 4 | ||||||
| Interest income | 170 | 136 | ||||||
| Income tax expense | 166 | 277 | ||||||
| Net earnings and total comprehensive income | 178 | 466 | ||||||
| Proportionate share of Profertil earnings | 89 | 233 | ||||||
| Elimination of unrealized profit | 1 | – | ||||||
| Total proportionate share of Profertil earnings | 90 | 233 | ||||||
| Dividends received from Profertil | 199 | 57 | ||||||
| As at December 31 | 2023 | 2022 | ||||||
| Current assets 2 | 355 | 835 | ||||||
| Non-current assets | 658 | 589 | ||||||
|
|
1,013 | 1,424 | ||||||
| Current liabilities 3 | 143 | 297 | ||||||
| Non-current liabilities 4 | 186 | 221 | ||||||
|
|
329 | 518 | ||||||
| Net assets of Profertil | 684 | 906 | ||||||
| Proportionate share of net assets of Profertil | 342 | 453 | ||||||
| Elimination of unrealized profit | (2 | ) | (3 | ) | ||||
| Carrying amount of interest in Profertil | 340 | 450 | ||||||
| 1 | Summarized financial information of Profertil, which represents the amounts included in its own financial statements, adjusted for fair value adjustments at acquisition and differences in accounting policies. |
| 2 | Includes cash and cash equivalents of $204 (2022 – $585). |
| 3 | Includes current financial liabilities (excluding trade and other payables and provisions) of $21 (2022 – $27). |
| 4 | Includes non-current financial liabilities (excluding trade and other payables and provisions) of nil (2022 – $23). |
Future conditions related to Profertil may be affected by political, economic and social instability. We are exposed to foreign exchange risk related to fluctuations in the Argentine peso against the US dollar and currency controls, which may restrict our ability to repatriate dividends from Profertil.
| 122 | Nutrien Annual Report 2023 | In millions of US dollars unless otherwise noted |
| Overview | MD&A | Five-year highlights | Financial statements and notes | |||||
|
Notes |
|
|
2023 | 2022 | ||||||
| Deferred income tax assets (Note 8) | 477 | 448 | ||||||
| Ammonia catalysts 1 | 113 | 104 | ||||||
| Long-term income tax receivable (Note 8) | 91 | 54 | ||||||
| Accrued pension benefit assets (Note 21) | 138 | 157 | ||||||
| Other | 232 | 206 | ||||||
|
|
1,051 | 969 | ||||||
| 1 | Net of accumulated amortization of $99 (2022 – $94). |
|
|
Rate of interest (%) | 2023 | 2022 | |||||||||
| Credit facilities | ||||||||||||
| Unsecured revolving term credit facility |
n/a | – | 500 | |||||||||
| Other unsecured credit facilities |
||||||||||||
| South America 1 |
5.5 – 12.2 | 219 | 453 | |||||||||
| Australia |
5.3 | 221 | 190 | |||||||||
| Other |
4.8 | 21 | 9 | |||||||||
| Commercial paper 2 | 5.5 – 5.9 | 1,175 | 783 | |||||||||
| Other short-term debt |
|
|
|
179 | 207 | |||||||
|
|
|
|
|
1,815 | 2,142 | |||||||
| 1 | Our credit facilities are either denominated in local currency or US dollars. The range of interest rates for South America excludes our Argentina facilities denominated in local currency with interest rates ranging from 102.5 percent to 107.0 percent. The balance of these Argentina facilities as at December 31, 2023 was $18. |
| 2 | We use our $4,500 commercial paper program for our short-term cash requirements. The amount available under the commercial paper program is limited to the availability of backup funds under the $4,500 unsecured revolving term credit facility and excess cash invested in highly liquid securities. |
| Credit facility limits 1 | As at December 31, 2023 | |||
| Unsecured revolving term facility 2 | 4,500 | |||
| Unsecured revolving term facility 3 | 1,500 | |||
| Uncommitted revolving demand facility | 1,000 | |||
| Other credit facilities 4 | 1,320 | |||
| 1 | Our credit facilities are renegotiated periodically. |
| 2 | Matures September 14, 2027, subject to extension at the request of Nutrien provided that the resulting maturity date may not exceed five years from the date of request. |
| 3 | In 2023, we extended the term of our unsecured revolving term credit facility to September 10, 2024 and reduced the facility limit from $2,000 to $1,500. |
| 4 | Total facility limit amounts include some facilities with maturities in excess of one year. |
Principal covenants and events of default under the unsecured revolving term credit facilities include a debt to capital ratio (refer to Note 24) and other customary events of default and covenant provisions. Non-compliance with such covenants could result in accelerated repayment and/or termination of the credit facility. We were in compliance with all covenants as at December 31, 2023.
| In millions of US dollars unless otherwise noted | Nutrien Annual Report 2023 | 123 |
| Overview | MD&A | Five-year highlights | Financial statements and notes | |||||
|
Notes |
|
|
Rate of interest (%) | Maturity | 2023 | 2022 | ||||||||||||
| Senior notes 1 | ||||||||||||||||
| 1.900 | May 13, 2023 | – | 500 | |||||||||||||
| 5.900 | November 7, 2024 | 500 | 500 | |||||||||||||
| 3.000 | April 1, 2025 | 500 | 500 | |||||||||||||
| 5.950 | November 7, 2025 | 500 | 500 | |||||||||||||
| 4.000 | December 15, 2026 | 500 | 500 | |||||||||||||
| 4.900 | March 27, 2028 | 750 | – | |||||||||||||
| 4.200 | April 1, 2029 | 750 | 750 | |||||||||||||
| 2.950 | May 13, 2030 | 500 | 500 | |||||||||||||
| 4.125 | March 15, 2035 | 450 | 450 | |||||||||||||
| 7.125 | May 23, 2036 | 212 | 212 | |||||||||||||
| 5.875 | December 1, 2036 | 500 | 500 | |||||||||||||
| 5.625 | December 1, 2040 | 500 | 500 | |||||||||||||
| 6.125 | January 15, 2041 | 401 | 401 | |||||||||||||
| 4.900 | June 1, 2043 | 500 | 500 | |||||||||||||
| 5.250 | January 15, 2045 | 489 | 489 | |||||||||||||
| 5.000 | April 1, 2049 | 750 | 750 | |||||||||||||
| 3.950 | May 13, 2050 | 500 | 500 | |||||||||||||
| 5.800 | March 27, 2053 | 750 | – | |||||||||||||
| Debentures 1 | 7.800 | February 1, 2027 | 120 | 120 | ||||||||||||
| Other credit facilities 2 | Various | Various | 42 | 165 | ||||||||||||
| Other long-term debt | n/a | Various | – | 7 | ||||||||||||
| 9,214 | 8,344 | |||||||||||||||
| Add net unamortized fair value adjustments | 294 | 310 | ||||||||||||||
| Less net unamortized debt issue costs |
|
|
|
|
|
|
(83 | ) | (72 | ) | ||||||
| 9,425 | 8,582 | |||||||||||||||
| Less current maturities |
|
|
|
|
|
|
(512 | ) | (542 | ) | ||||||
|
|
|
|
|
|
|
|
8,913 | 8,040 | ||||||||
| 1 | Each series of senior notes and debentures is unsecured and has no sinking fund requirements prior to maturity. Each series is redeemable and has various provisions that allow redemption prior to maturity, at our option, at specified prices. |
| 2 | Other credit facilities are unsecured and consist of South America facilities with debt of $40 (2022 – $162) and an interest rate of 2.3 percent and other facilities with debt of $2 (2022 – $3) and an interest rate of 4.0 percent. |
We are subject to certain customary covenants including limitation on liens, merger and change of control covenants, and customary events of default. As calculated in Note 24, we were in compliance with these covenants as at December 31, 2023.
| 124 | Nutrien Annual Report 2023 | In millions of US dollars unless otherwise noted |
| Overview | MD&A | Five-year highlights | Financial statements and notes | |||||
|
Notes |
The following is a summary of changes in liabilities arising from financing activities:
|
|
Short-term debt |
Long-term debt |
Lease liabilities |
Total | ||||||||||||
| Balance – December 31, 2022 | 2,142 | 8,582 | 1,204 | 11,928 | ||||||||||||
| Cash flows (cash inflows and outflows presented on a net basis) | (458 | ) | 832 | (375 | ) | (1 | ) | |||||||||
| Additions and other adjustments to ROU liabilities | – | – | 492 | 492 | ||||||||||||
| Foreign currency translation and other non-cash changes | 131 | 11 | 5 | 147 | ||||||||||||
| Balance – December 31, 2023 | 1,815 | 9,425 | 1,326 | 12,566 | ||||||||||||
| Balance – December 31, 2021 | 1,560 | 8,066 | 1,220 | 10,846 | ||||||||||||
| Cash flows (cash inflows and outflows presented on a net basis) | 529 | 475 | (341 | ) | 663 | |||||||||||
| Additions and other adjustments to ROU liabilities | – | – | 334 | 334 | ||||||||||||
| Foreign currency translation and other non-cash changes | 53 | 41 | (9 | ) | 85 | |||||||||||
| Balance – December 31, 2022 | 2,142 | 8,582 | 1,204 | 11,928 | ||||||||||||
|
|
Average rate of interest (%) | 2023 | 2022 | |||||||||
| Lease liabilities – non-current | 4.3 | 999 | 899 | |||||||||
| Current portion of lease liabilities | 4.5 | 327 | 305 | |||||||||
| Total |
|
|
|
1,326 | 1,204 | |||||||
Note 20 | Payables and accrued charges
|
|
2023 | 2022 | ||||||
| Trade and other payables 1 | 5,477 | 5,797 | ||||||
| Customer prepayments | 2,084 | 2,298 | ||||||
| Dividends | 262 | 244 | ||||||
| Accrued compensation | 597 | 681 | ||||||
| Current portion of asset retirement obligations and accrued environmental costs (Note 22) | 165 | 234 | ||||||
| Accrued interest | 117 | 102 | ||||||
| Current portion of share-based compensation (Note 5) | 32 | 142 | ||||||
| Current portion of derivatives | 16 | 35 | ||||||
| Income taxes (Note 8) | 14 | 899 | ||||||
| Provincial mining taxes | 1 | 114 | ||||||
| Other taxes | 62 | 59 | ||||||
| Current portion of pension and other post-retirement benefits (Note 21) | 15 | 15 | ||||||
| Other accrued charges and others | 625 | 671 | ||||||
|
|
9,467 | 11,291 | ||||||
| 1 | Includes amounts owing to Canpotex (Note 28) of $64 (2022 – $203). |
| In millions of US dollars unless otherwise noted | Nutrien Annual Report 2023 | 125 |
| Overview | MD&A | Five-year highlights | Financial statements and notes | |||||
|
Notes |
Note 21 | Pension and other post-retirement benefits
We offer the following pension and other post-retirement benefits to qualified employees: defined benefit pension plans; defined contribution pension plans; and health, dental and life insurance, referred to as other post-retirement plans. Substantially all our employees participate in at least one of these plans.
Description of defined benefit pension plans
|
|
Plan type | Contributions | ||
| United States |
– non-contributory, – guaranteed annual pension payments for life, – benefits generally depend on years of service and compensation level in the final years leading up to age 65, – benefits available starting at age 55 at a reduced rate, and – plans provide for maximum pensionable salary and maximum annual benefit limits. |
– made to meet or exceed minimum funding requirements of the Employee Retirement Income Security Act of 1974 and associated Internal Revenue Service regulations and procedures. |
||
| Canada | – made to meet or exceed minimum funding requirements based on provincial statutory requirements and associated federal taxation rules. |
|||
| Supplemental plans in US and Canada for Senior Management |
– non-contributory, – unfunded, and – supplementary pension benefits. |
– provided for by charges to earnings sufficient to meet the projected benefit obligations, and – payments to plans are made as plan payments to retirees occur. |
||
Our defined benefit pension plans are funded with separate funds that are legally separated from the Company and administered through the Pension Committee in each country, which is composed of our employees. The Pension Committee is required by law to act in the best interests of the plan participants and, in the US and Canada, is responsible for the governance of the plans, including setting certain policies (e.g., investment and contribution) of the funds. The current investment policy for each country’s plans generally does not include currency hedging strategies. Plan assets held in trusts are governed by local regulations and practices in each country, as is the nature of the relationship between the Company and the trustees and their composition.
Description of other post-retirement plans
We provide health care plans for certain eligible retired employees in the US, Canada and Trinidad. Eligibility for these benefits is generally based on a combination of age and years of service at retirement. Certain terms of the plans include
| – | coordination with government-provided medical insurance in each country; |
| – | certain unfunded cost-sharing features such as co-insurance, deductibles and co-payments – benefits subject to change; |
| – | for certain plans, maximum lifetime benefits; |
| – | at retirement, the employee’s spouse and certain dependent children may be eligible for coverage; |
| – | benefits are self-insured and are administered through third-party providers; and |
| – | generally, retirees contribute towards annual cost of the plans. |
In addition, certain Medicare eligible retired employees in the US receive an annual contribution to a Healthcare Reimbursement Account, which can be used to purchase health benefits through a private exchange. This annual contribution can be used for premiums or to pay deductibles and/or co-insurance. Finally, we provide non-contributory life insurance plans for certain retired employees who meet specific age and service eligibility requirements.
| 126 | Nutrien Annual Report 2023 | In millions of US dollars unless otherwise noted |
| Overview | MD&A | Five-year highlights | Financial statements and notes | |||||
|
Notes |
Risks
The defined benefit pension and other post-retirement plans expose us to broadly similar actuarial risks. The most significant risks include investment risk and interest rate risk as discussed below. Other risks include longevity risk.
| Investment risk | A deficit will be created if plan assets underperform the discount rate used in the defined benefit obligation valuation. To mitigate investment risk, we employ
– a diversified mix of return seeking and liability hedging (i.e., fixed income) investments; and – a risk tolerance established through careful consideration of plan liabilities, plan funded status and corporate financial condition.
Investment risk is measured and monitored on an ongoing basis through quarterly investment portfolio reviews, annual liability measurements and periodic asset/liability studies. |
|
| Interest rate risk | A decrease in bond interest rates will increase the pension liability; however, this is generally expected to be partially offset by an increase in the return on the plan’s debt investments. |
Financial information
| 2023 | 2022 | |||||||||||||||||||||||
|
|
Obligation | Plan assets |
Net | Obligation | Plan assets |
Net | ||||||||||||||||||
| Balance – beginning of year | (1,507 | ) | 1,330 | (177 | ) | (1,996 | ) | 1,731 | (265 | ) | ||||||||||||||
| Components of defined benefit expense recognized in earnings |
||||||||||||||||||||||||
| Current service cost for benefits earned during the year |
(16 | ) | – | (16 | ) | (27 | ) | – | (27 | ) | ||||||||||||||
| Interest (expense) income |
(70 | ) | 65 | (5 | ) | (60 | ) | 52 | (8 | ) | ||||||||||||||
| Past service cost, including curtailment gains and settlements 1 |
76 | – | 76 | 24 | (39 | ) | (15 | ) | ||||||||||||||||
| Foreign exchange rate changes and other |
(8 | ) | 4 | (4 | ) | 28 | (21 | ) | 7 | |||||||||||||||
| Subtotal of components of defined benefit (recovery) expense recognized in earnings |
(18 | ) | 69 | 51 | (35 | ) | (8 | ) | (43 | ) | ||||||||||||||
| Remeasurements of the net defined benefit liability recognized in OCI during the year |
||||||||||||||||||||||||
| Actuarial gain arising from: |
||||||||||||||||||||||||
| Changes in financial assumptions |
7 | – | 7 | 423 | – | 423 | ||||||||||||||||||
| Changes in demographic assumptions |
– | – | – | 21 | – | 21 | ||||||||||||||||||
| (Loss) gain on plan assets (excluding amounts included in net interest) |
– | (30 | ) | (30 | ) | – | (337 | ) | (337 | ) | ||||||||||||||
| Subtotal of remeasurements | 7 | (30 | ) | (23 | ) | 444 | (337 | ) | 107 | |||||||||||||||
| Cash flows | ||||||||||||||||||||||||
| Contributions by plan participants |
(4 | ) | 4 | – | (6 | ) | 6 | – | ||||||||||||||||
| Employer contributions |
– | 20 | 20 | – | 24 | 24 | ||||||||||||||||||
| Benefits paid |
83 | (83 | ) | – | 86 | (86 | ) | – | ||||||||||||||||
| Subtotal of cash flows | 79 | (59 | ) | 20 | 80 | (56 | ) | 24 | ||||||||||||||||
| Balance – end of year 2 | (1,439 | ) | 1,310 | (129 | ) | (1,507 | ) | 1,330 | (177 | ) | ||||||||||||||
| Balance is composed of: | ||||||||||||||||||||||||
| Non-current assets |
||||||||||||||||||||||||
| Other assets (Note 16) |
138 | 157 | ||||||||||||||||||||||
| Current liabilities |
||||||||||||||||||||||||
| Payables and accrued charges (Note 20) |
(15 | ) | (15 | ) | ||||||||||||||||||||
| Non-current liabilities |
||||||||||||||||||||||||
| Pension and other post-retirement benefit liabilities |
|
|
|
|
|
|
(252 | ) |
|
|
|
|
|
|
(319 | ) | ||||||||
| 1 | In 2023, there were design plan changes that resulted in a gain of $80 to other post-retirement pension plans. |
| 2 | Obligations arising from funded and unfunded pension plans are $1,266 and $173 (2022 – $1,255 and $252), respectively. Other post-retirement benefit plans have no plan assets and are unfunded. |
| In millions of US dollars unless otherwise noted | Nutrien Annual Report 2023 | 127 |
| Overview | MD&A | Five-year highlights | Financial statements and notes | |||||
|
Notes |
Plan assets
As at December 31, the fair value of plan assets of our defined benefit pension plans, by asset category, were as follows:
| 2023 | 2022 | |||||||||||||||||||||||
|
|
Quoted prices in active markets for identical assets |
Other 1 | Total | Quoted prices in active markets for identical assets |
Other 1 | Total | ||||||||||||||||||
| Cash and cash equivalents | 30 | 5 | 35 | 93 | 4 | 97 | ||||||||||||||||||
| Equity securities and equity funds | ||||||||||||||||||||||||
| US |
9 | 115 | 124 | 8 | 107 | 115 | ||||||||||||||||||
| International |
– | 9 | 9 | – | 14 | 14 | ||||||||||||||||||
| Debt securities 2 | – | 909 | 909 | – | 841 | 841 | ||||||||||||||||||
| Other | – | 233 | 233 | – | 263 | 263 | ||||||||||||||||||
| Total pension plan assets | 39 | 1,271 | 1,310 | 101 | 1,229 | 1,330 | ||||||||||||||||||
| 1 | Approximately 96 percent (2022 – 100 percent) of the Other plan assets are held in funds whose fair values are estimated using their net asset value per share. For the majority of these funds, the redemption frequency is immediate. The Pension Committee manages the asset allocation based upon our current liquidity and income needs. |
| 2 | Debt securities included US securities of 76 percent (2022 – 77 percent), International securities of 20 percent (2022 – 22 percent) and Mortgage-backed securities of 4 percent (2022 – 1 percent). |
We use letters of credit or surety bonds to secure certain Canadian unfunded defined benefit plan liabilities as at December 31, 2023.
We expect to contribute approximately $140 to all pension and post-retirement plans in 2024. Total contributions recognized as expense under all defined contribution plans for 2023 was $139 (2022 – $128).
We used the following significant assumptions to determine the benefit obligations and expense for our significant plans as at and for the year ended December 31. These assumptions are determined by management and are reviewed annually by our independent actuaries.
| Pension | Other | |||||||||||||||
|
|
2023 | 2022 | 2023 | 2022 | ||||||||||||
| Assumptions used to determine the benefit obligations 1: | ||||||||||||||||
| Discount rate (%) |
5.03 | 5.01 | 4.81 | 4.86 | ||||||||||||
| Rate of increase in compensation levels (%) |
4.28 | 4.29 | n/a | n/a | ||||||||||||
| Medical cost trend rate – assumed (%) 2 |
n/a | n/a | 4.50 – 6.75 | 4.50 – 7.00 | ||||||||||||
| Medical cost trend rate – year reaches ultimate trend rate |
n/a | n/a | 2033 | 2033 | ||||||||||||
| Mortality assumptions (years) 3 |
||||||||||||||||
| Life expectancy at 65 for a male member currently at age 65 |
20.7 | 20.6 | 21.0 | 20.5 | ||||||||||||
| Life expectancy at 65 for a female member currently at age 65 |
22.9 | 22.9 | 23.6 | 23.2 | ||||||||||||
| Average duration of the defined benefit obligations (years) 4 |
12.3 | 12.7 | 10.6 | 12.8 | ||||||||||||
| 1 | The current year’s expense is determined using the assumptions that existed at the end of the previous year. |
| 2 | We assumed a graded medical cost trend rate starting at 6.75 percent in 2023, moving to 4.50 percent by 2033 (2022 – starting at 7.00 percent, moving to 4.50 percent by 2033). The annual health care reimbursement amount is assumed to increase by 2.00 percent each year. |
| 3 | Based on actuarial advice in accordance with the latest available published tables, adjusted where appropriate to reflect future longevity improvements for each country. |
| 4 | Weighted average length of the underlying cash flows. |
Of the most significant assumptions, a change in discount rates has the greatest potential impact on our pension and other post-retirement benefit plans, with sensitivity to change as follows:
|
|
Change in assumption | 2023 | 2022 | |||||||||
| Benefit obligation as reported |
|
|
|
1,439 | 1,507 | |||||||
| Discount rate | 1.0 percentage point decrease | 190 | 210 | |||||||||
| 1.0 percentage point increase | (150 | ) | (170 | ) | ||||||||
| 128 | Nutrien Annual Report 2023 | In millions of US dollars unless otherwise noted |
| Overview | MD&A | Five-year highlights | Financial statements and notes | |||||
|
Notes |
Note 22 | Asset retirement obligations and accrued environmental costs
|
|
Cash flow payments |
Discounted cash |
Discount rate | |||||||||||||
| December 31, 2023 | +0.5% | -0.5% | ||||||||||||||
| Asset retirement obligations | (70 | ) | 90 | |||||||||||||
| Retail |
1 – 30 | 16 | ||||||||||||||
| Potash |
28 – 484 | 117 | ||||||||||||||
| Phosphate |
1 – 77 | 479 | ||||||||||||||
| Corporate and others 4,5 |
1 – 69 | 647 | ||||||||||||||
| Accrued environmental costs | (5 | ) | 5 | |||||||||||||
| Retail |
1 – 30 | 69 | ||||||||||||||
| Corporate and others |
1 – 15 | 326 |
|
|
|
|
|
|
||||||||
| Total |
|
|
|
1,654 |
|
|
|
|
|
|
||||||
| 1 | Time frame in which payments are expected to principally occur from December 31, 2023. Adjustments to the years can result from changes to the mine life and/or changes in the rate of tailings volumes. |
| 2 | Risk-free discount rates used to discount cash flows reflect current market assessments of the time value of money and the risks specific to the timing and jurisdiction of the obligation. Risk-free discount rates range from 3.1 percent to 5.5 percent. |
| 3 | Total undiscounted cash flows are $5.0 billion. For the Potash segment, this represents total undiscounted cash flows in the first year of decommissioning. This excludes subsequent years of tailings dissolution, fine tails capping, tailings management area reclamation, post-reclamation activities and monitoring, and final decommissioning, which are estimated to take an additional 124 to 456 years. |
| 4 | For nitrogen sites, there are no significant asset retirement obligations recorded as there is no reasonable basis for estimating a date or range of dates of cessation of operations. We considered the historical performance of our facilities as well as our planned maintenance, major upgrades and replacements, which can extend the useful lives of our facilities indefinitely. |
| 5 | Includes certain potash and phosphate sites that are non-operating sites, with the majority of phosphate site payments taking place over the next 16 years. |
|
|
Asset retirement obligations |
Accrued environmental costs |
Total | |||||||||
| Balance – December 31, 2022 | 1,187 | 450 | 1,637 | |||||||||
| Disposals | – | (2 | ) | (2 | ) | |||||||
| Change in estimate (Note 6) | 129 | 15 | 144 | |||||||||
| Settlements | (94 | ) | (68 | ) | (162 | ) | ||||||
| Accretion | 32 | 1 | 33 | |||||||||
| Foreign currency translation and other | 5 | (1 | ) | 4 | ||||||||
| Balance – December 31, 2023 | 1,259 | 395 | 1,654 | |||||||||
| Balance – December 31, 2023 is composed of: | ||||||||||||
| Current liabilities |
||||||||||||
| Payables and accrued charges (Note 20) |
135 | 30 | 165 | |||||||||
| Non-current liabilities |
||||||||||||
| Asset retirement obligations and accrued environmental costs |
1,124 | 365 | 1,489 | |||||||||
We are subject to numerous environmental requirements under federal, provincial, state and local laws in the countries in which we operate. We have gypsum stack capping, and closure and post-closure obligations through our subsidiaries, PCS Phosphate Company, Inc., in White Springs, Florida, and PCS Nitrogen, Inc., in Geismar, Louisiana, pursuant to the financial assurance regulatory requirements in those states. As at December 31, 2023, we had $492 in surety bonds and letters of credit outstanding relating to these financial assurance obligations. The recorded provisions may not necessarily reflect our obligations under these financial assurances.
| In millions of US dollars unless otherwise noted | Nutrien Annual Report 2023 | 129 |
| Overview | MD&A | Five-year highlights | Financial statements and notes | |||||
|
Notes |
Authorized
We are authorized to issue an unlimited number of common shares without par value and an unlimited number of preferred shares. The common shares are not redeemable or convertible. The preferred shares may be issued in one or more series with rights and conditions to be determined by the Board of Directors.
Share repurchase programs
|
|
Commencement date |
Expiry | Maximum shares for repurchase |
Maximum shares for repurchase (%) |
Number of shares repurchased |
|||||||||||||||
| 2021 Normal Course Issuer Bid | March 1, 2021 | February 28, 2022 | 28,468,448 | 5 | 22,186,395 | |||||||||||||||
| 2022 Normal Course Issuer Bid 1 | March 1, 2022 | February 7, 2023 | 55,111,110 | 10 | 55,111,110 | |||||||||||||||
| 2023 Normal Course Issuer Bid | March 1, 2023 | February 29, 2024 | 24,962,194 | 5 | 5,375,397 | |||||||||||||||
| 2024 Normal Course Issuer Bid 2 | March 1, 2024 | February 28, 2025 | 24,728,159 | 5 | – | |||||||||||||||
| 1 | The original expiry date was February 28, 2023, but we acquired the maximum aggregate number of common shares allowable on February 7, 2023. |
| 2 | On February 21, 2024, our Board of Directors approved a share repurchase program. The 2024 normal course issuer bid, which is subject to acceptance by the Toronto Stock Exchange, will expire earlier than the date above if we acquire the maximum number of common shares allowable or otherwise decide not to make any further repurchases. |
Purchases under the normal course issuer bids were, or may be, made through open market purchases at market prices as well as by other means permitted by applicable securities regulatory authorities, including private agreements.
| Summary of share repurchases | 2023 | 2022 | ||||||
| Number of common shares repurchased for cancellation | 13,378,189 | 53,312,559 | ||||||
| Average price per share (US dollars) | 74.73 | 84.34 | ||||||
| Total cost | 1,000 | 4,496 | ||||||
Dividends declared
During 2023, we declared dividends of $2.12 (2022 – $1.92). On February 21, 2024, our Board of Directors declared and increased our quarterly dividend to $0.54 per share payable on April 11, 2024, to shareholders of record on March 28, 2024. The total estimated dividend to be paid is $265.
| 130 | Nutrien Annual Report 2023 | In millions of US dollars unless otherwise noted |
| Overview | MD&A | Five-year highlights | Financial statements and notes | |||||
|
Notes |
Our capital allocation policy prioritizes safe and reliable operations, a healthy balance sheet, a sustainable dividend to shareholders, and a strategy to allocate remaining cash flow that maximizes shareholder value.
We include total debt, adjusted total debt, adjusted net debt and shareholders’ equity as components of our capital structure. We monitor our capital structure and, based on changes in economic conditions, may adjust the structure by adjusting the amount of dividends paid to shareholders, repurchasing shares, issuing new shares, issuing new debt or retiring existing debt.
We have access to the capital markets through our base shelf prospectus. We use a combination of short-term and long-term debt to finance our operations. We typically pay floating rates of interest on short-term debt and credit facilities, and fixed rates on senior notes and debentures.
We monitor the following measures to evaluate our ability to service debt, make strategic investments and ensure we are in compliance with our debt covenants:
|
|
2023 | 2022 | ||||||
| Adjusted net debt to adjusted EBITDA | 1.9 | 0.9 | ||||||
| Adjusted EBITDA to adjusted finance costs | 7.3 | 21.6 | ||||||
| Debt to capital (calculated as adjusted total debt to adjusted capital) (Limit: 0.65 : 1.00) | 0.33 : 1.00 | 0.32 : 1.00 | ||||||
Adjusted EBITDA is calculated in Note 3, while the calculations of the remaining components included in the above ratios are set out in the following tables:
|
|
2023 | 2022 | ||||||
| Short-term debt | 1,815 | 2,142 | ||||||
| Current portion of long-term debt | 512 | 542 | ||||||
| Current portion of lease liabilities | 327 | 305 | ||||||
| Long-term debt | 8,913 | 8,040 | ||||||
| Lease liabilities | 999 | 899 | ||||||
| Total debt | 12,566 | 11,928 | ||||||
| Letters of credit – financial | 94 | 97 | ||||||
| Adjusted total debt | 12,660 | 12,025 | ||||||
| In millions of US dollars unless otherwise noted | Nutrien Annual Report 2023 | 131 |
| Overview | MD&A | Five-year highlights | Financial statements and notes | |||||
|
Notes |
|
|
2023 | 2022 | ||||||
| Total debt | 12,566 | 11,928 | ||||||
| Cash and cash equivalents | (941 | ) | (901 | ) | ||||
| Net unamortized fair value adjustments | (294 | ) | (310 | ) | ||||
| Adjusted net debt | 11,331 | 10,717 | ||||||
|
|
2023 | 2022 | ||||||
| Total shareholders’ equity | 25,201 | 25,863 | ||||||
| Adjusted total debt | 12,660 | 12,025 | ||||||
| Adjusted capital | 37,861 | 37,888 | ||||||
|
|
2023 | 2022 | ||||||
| Finance costs | 793 | 563 | ||||||
| Unwinding of discount on asset retirement obligations | (33 | ) | (29 | ) | ||||
| Borrowing costs capitalized to property, plant and equipment | 71 | 37 | ||||||
| Interest on net defined benefit pension and other post-retirement plan obligations | (5 | ) | (8 | ) | ||||
| Adjusted finance costs | 826 | 563 | ||||||
In 2022, we filed a base shelf prospectus in Canada and the US qualifying the issuance of up to $5 billion of common shares, debt securities and other securities during a period of 25 months from March 11, 2022. In 2023 and 2022, we issued senior notes of $1.5 billion and $1 billion, respectively, pursuant to the base shelf prospectus and the applicable prospectus supplement. Refer to Note 18 for details.
Note 25 | Business combinations
|
|
Casa do Adubo S.A. (“Casa do Adubo”) | Other acquisitions | ||
| Acquisition date | October 1, 2022 | Various | ||
| Purchase price, net of cash and cash equivalents acquired, and amounts held in escrow |
$268
On the acquisition date, we acquired 100% of the issued and outstanding Casa do Adubo stock. |
$153 (preliminary) (2022 – $176) | ||
| Goodwill and expected benefits of acquisitions | $184 – Goodwill was fully impaired as part of the impairment recorded to the Retail – South America group of CGUs (Note 14). | $126 (preliminary) (2022 – $55) | ||
| The expected benefits of the acquisitions resulting in goodwill include: – synergies from expected reduction in operating costs – wider distribution channel for selling products of acquired businesses – a larger assembled workforce – potential increase in customer base – enhanced ability to innovate |
||||
| Description | An agriculture retailer in Brazil with 39 retail locations and 10 distribution centers. This acquisition is aligned with our disciplined approach to capital allocation and sustainability commitments, as we continue to expand our presence in Brazil. | 2023 – 23 Retail locations related to various agricultural services (2022 – 43 Retail locations related to various agricultural services and one wholesale warehouse location) | ||
| 132 | Nutrien Annual Report 2023 | In millions of US dollars unless otherwise noted |
| Overview | MD&A | Five-year highlights | Financial statements and notes | |||||
|
Notes |
We allocated the following values to the acquired assets and assumed liabilities based upon fair values at their respective acquisition date:
|
|
2023 | 2022 | ||||||||||
|
|
Other acquisitions 1 |
Casa do final fair value |
Other acquisitions 1 |
|||||||||
| Current assets | 17 | 275 | 2 | 116 | ||||||||
| Goodwill | 126 | 184 | 55 | |||||||||
| Other non-current assets | (2 | ) | 133 | 131 | ||||||||
| Total assets | 141 | 592 | 302 | |||||||||
| Current liabilities | 20 | 160 | 74 | |||||||||
| Other non-current liabilities | 2 | 116 | 42 | |||||||||
| Total liabilities | 22 | 276 | 116 | |||||||||
| Non-controlling interest | (8 | ) | – | – | ||||||||
| Total consideration | 127 | 316 | 186 | |||||||||
| Amounts held in escrow | 26 | (48 | ) | (10 | ) | |||||||
| Total consideration, net of cash and cash equivalents acquired, and amounts held in escrow |
153 | 268 | 176 | |||||||||
| 1 | Includes preliminary values for current year acquisitions and finalization of measurement period adjustments for prior year acquisitions. |
| 2 | Includes receivables from customers with gross contractual amounts of $169. |
We have completed our assessment of identifying and measuring all the assets acquired and liabilities assumed relating to our Casa do Adubo acquisition. This assessment included a thorough review of all internal and external sources of information available on circumstances that existed at the acquisition date, engagement of independent valuation experts, and final agreement of the purchase price with no material changes from the preliminary fair value as disclosed in the 2022 annual consolidated financial statements. For certain other acquisitions, we finalized the purchase price with no material change to the fair values disclosed in prior periods. Refer to Note 30 for details of our valuation technique and judgments applied.
|
|
Principal portion and estimated interest |
|
|
|
|
|||||||||||||||||||
| December 31, 2023 | Lease liabilities |
Long-term debt |
Purchase commitments |
Capital commitments |
Other commitments |
Total | ||||||||||||||||||
| Within 1 year | 368 | 966 | 938 | 153 | 188 | 2,613 | ||||||||||||||||||
| 1 to 3 years | 484 | 2,324 | 249 | 19 | 221 | 3,297 | ||||||||||||||||||
| 3 to 5 years | 222 | 1,556 | 57 | – | 149 | 1,984 | ||||||||||||||||||
| Over 5 years | 451 | 10,493 | 106 | – | 157 | 11,207 | ||||||||||||||||||
| Total | 1,525 | 15,339 | 1,350 | 172 | 715 | 19,101 | ||||||||||||||||||
Purchase commitments
In 2023, we renewed our natural gas purchase agreement in Trinidad. The agreement is a minimum take or pay arrangement providing for approximately 75 percent of the expected requirements of the Trinidad ammonia complex and provides for prices that vary primarily with benchmark ammonia prices and annual escalating floor prices. The commitments included in the foregoing table are based on floor prices and minimum purchase quantities.
| In millions of US dollars unless otherwise noted | Nutrien Annual Report 2023 | 133 |
| Overview | MD&A | Five-year highlights | Financial statements and notes | |||||
|
Notes |
Profertil has various natural gas contracts denominated in US dollars that expire in 2024 and 2028 and account for virtually all of Profertil’s natural gas requirements. YPF S.A., our joint venture partner in Profertil, supplies approximately 70 percent of the natural gas under these contracts.
In 2023, we entered into natural gas pipeline transportation agreements at our Geismar plant, the latest of which expires in 2033 and accounts for approximately 90 percent of the expected natural gas requirements in Geismar.
The Carseland facility has a power cogeneration agreement expiring on December 31, 2026, which provides 60 megawatt-hours of power per hour. The price for the power is based on a fixed charge adjusted for inflation and a variable charge based on the cost of natural gas provided to the facility for power generation.
Agreements for the purchase of sulfur for use in production of phosphoric acid provide for specified purchase quantities and prices based on market rates at the time of delivery. Commitments included in the foregoing table are based on expected contract prices.
Other commitments
Other commitments consist principally of pipeline capacity, technology service contracts, managed services contracts, throughput and various rail contracts, the latest of which expires in 2036, and mineral lease commitments, the latest of which expires in 2033.
In the normal course of business, we provide indemnification agreements to counterparties in transactions such as purchase and sale contracts, service agreements, director/officer contracts, and leasing transactions. The terms of these indemnification agreements
| – | may require us to compensate counterparties for costs incurred as a result of various events, including environmental liabilities and changes in (or in the interpretation of) laws and regulations, or as a result of litigation claims or statutory sanctions that may be suffered by a counterparty as a consequence of the transaction; |
| – | will vary based upon the contract, the nature of which prevents us from making a reasonable estimate of the maximum potential amount that we could be required to pay to counterparties; and |
| – | have not historically resulted in any significant payments by Nutrien and, as at December 31, 2023, no amounts have been accrued in the consolidated financial statements (except for accruals relating to certain underlying liabilities). |
We directly guarantee our share of certain commitments of Canpotex (such as railcar leases) under certain agreements with third parties. We would be required to perform on these guarantees in the event of default by the investee. No material loss is anticipated by reason of such agreements and guarantees.
Note 28 | Related party transactions
Sales and purchases of goods
We sell potash outside Canada and the US exclusively through Canpotex. Canpotex sells potash to buyers, including Nutrien, in export markets pursuant to term and spot contracts at agreed upon prices. Our total revenue is recognized at the amount received from Canpotex representing proceeds from their sale of potash, less net costs of Canpotex. Sales to Canpotex are shown in Note 3. The receivable outstanding from Canpotex is shown in Note 11 and arose from sale transactions described above. It is unsecured and bears no interest. Any credit losses held against this receivable are expected to be negligible. Purchases from Canpotex for the year ended 2023 were $92 (2022 – $415) and the amount payable to Canpotex is shown in Note 20.
| 134 | Nutrien Annual Report 2023 | In millions of US dollars unless otherwise noted |
| Overview | MD&A | Five-year highlights | Financial statements and notes | |||||
|
Notes |
Key management personnel compensation and transactions with post-employment benefit plans
|
|
2023 | 2022 | ||||||
| Salaries and other short-term benefits | 10 | 13 | ||||||
| Share-based compensation | (7 | ) | 18 | |||||
| Post-employment benefits | 2 | 3 | ||||||
| Termination benefits | 2 | 10 | ||||||
|
|
7 | 44 | ||||||
Disclosures related to our post-employment benefit plans are shown in Note 21.
Note 29 | Contingencies and other matters
Accounting estimates and judgments
The following judgments are required to determine our exposure to possible losses and gains related to environmental matters and other various claims and lawsuits pending:
| – | prediction of the outcome of uncertain events (i.e., being virtually certain, probable, remote or undeterminable); |
| – | determination of whether recognition or disclosure in the consolidated financial statements is required; and |
| – | estimation of potential financial effects. |
Where no amounts are recognized, such amounts are contingent and disclosure may be appropriate. While the amount disclosed in the consolidated financial statements may not be material, the potential for large liabilities exists and, therefore, these estimates could have a material impact on our consolidated financial statements.
Supporting information
Canpotex
Nutrien is a shareholder in Canpotex, which markets Canadian potash outside of Canada and the US. Should any operating losses or other liabilities be incurred by Canpotex, the shareholders have contractually agreed to reimburse it in proportion to each shareholder’s productive capacity. Through December 31, 2023, we are not aware of any operating losses or other liabilities.
Mining risk
The risk of underground water inflows and other underground risks is insured on a limited basis, subject to insurance market availability. Through December 31, 2023, we are not aware of any material losses or other liabilities that we have not accrued for.
Environmental remediation, legal and other matters
We are engaged in ongoing site assessment and/or remediation activities at a number of facilities and sites. Anticipated costs associated with these matters are added to accrued environmental costs in the manner described in Note 22.
We have established provisions for environmental site assessment and/or remediation matters to the extent that we consider expenses associated with those matters likely to be incurred. Except for the uncertainties described below, we do not believe that our future obligations with respect to these matters are reasonably likely to have a material adverse effect on our consolidated financial statements.
| In millions of US dollars unless otherwise noted | Nutrien Annual Report 2023 | 135 |
| Overview | MD&A | Five-year highlights | Financial statements and notes | |||||
|
Notes |
Legal matters with significant uncertainties include the following:
| – | The United States Environmental Protection Agency (“US EPA”) has an ongoing enforcement initiative directed at the phosphate industry related to the scope of an exemption for mineral processing wastes under the US Resource Conservation and Recovery Act (“RCRA”). This initiative affects the Conda Phosphate plant previously owned by Nu-West Industries, Inc. (“Nu-West”), a wholly owned subsidiary of Nutrien (Canada) Holdings ULC, and the Nutrien phosphoric acid facilities in Aurora, North Carolina; Geismar, Louisiana; and White Springs, Florida. Nutrien facilities received US EPA notices of violation (“NOVs”) for alleged violations of the RCRA and various other environmental laws. Notwithstanding the sale of the Conda Phosphate operations in January 2018, Nu-West remains responsible for certain environmental liabilities attributable to its historic activities and for resolution of the NOVs. The facilities have been and continue to be involved in ongoing discussions with the US EPA, the US Department of Justice and the related state agencies to resolve these matters, with one such settlement being reached for the Geismar facility. The Geismar consent decree was entered on October 19, 2022, and resolved the allegations associated with the historic phosphoric acid operations at that facility. Due to the nature of the allegations at the other facilities, we are uncertain as to how the matters will be resolved. Based on settlements with other members of the phosphate industry and the Geismar consent decree, we expect that a resolution could involve any or all of the following: 1) penalties, which we currently believe will not be material; 2) modification of certain operating practices; 3) capital improvement projects; 4) providing financial assurance for the future closure, maintenance and monitoring costs for the phosphogypsum stack system; and 5) addressing findings resulting from the RCRA section 3013 site investigations. |
| – | We operate in countries that are parties to the Paris Agreement adopted in December 2015 pursuant to the United Nations Framework Convention on Climate Change. Each country that is a party to the Paris Agreement submitted an Intended Nationally Determined Contribution (“INDC”) towards the control of greenhouse gas emissions. The impacts on our operations of these INDCs and other national and local efforts to limit or tax greenhouse gas emissions cannot be determined with any certainty at this time. |
In addition, various other claims and lawsuits are pending against the Company in the ordinary course of business. While it is not possible to determine the ultimate outcome of such actions at this time, and inherent uncertainties exist in predicting such outcomes, we believe that the ultimate resolution of such actions is not reasonably likely to have a material adverse effect on our consolidated financial statements.
The breadth of our operations and the global complexity of tax regulations require assessments of uncertainties and judgments in estimating the taxes we will ultimately pay. The final taxes paid are dependent upon many factors, including negotiations with taxing authorities in various jurisdictions, outcomes of tax litigation, and resolution of disputes arising from federal, provincial, state and local tax audits. The resolution of these uncertainties and the associated final taxes may result in adjustments to our tax assets and tax liabilities.
We own facilities that have been either permanently or indefinitely shut down. We expect to incur nominal annual expenditures for site security and other maintenance costs at some of these facilities. Should the facilities be dismantled, certain other shutdown-related costs may be incurred. Such costs are not expected to have a material adverse effect on our consolidated financial statements and would be recognized and recorded in the period in which they are incurred.
| 136 | Nutrien Annual Report 2023 | In millions of US dollars unless otherwise noted |
| Overview | MD&A | Five-year highlights | Financial statements and notes | |||||
|
Notes |
Note 30 | Accounting policies, estimates and judgments
The following discusses the significant accounting policies, estimates, judgments and assumptions that we have adopted and applied and how they affect the amounts reported in the consolidated financial statements. Certain of our policies involve accounting estimates and judgments because they require us to make subjective or complex judgments about matters that are inherently uncertain and because of the likelihood that materially different amounts could be reported under different conditions or using different assumptions.
Basis of consolidation
| Principal (wholly owned) operating subsidiaries | Location | Principal activity | ||
| Potash Corporation of Saskatchewan Inc. | Canada | Mining and/or processing of crop nutrients and corporate functions | ||
| Nutrien (Canada) Holdings ULC | Canada | Manufacturer and distributor of crop nutrients and corporate functions | ||
| Agrium Canada Partnership | Canada | Manufacturer and distributor of crop nutrients | ||
| Agrium Potash Ltd. | Canada | |||
| Nutrien US LLC | US | |||
| Cominco Fertilizer Partnership | US | |||
| Loveland Products Inc. | US | |||
| Nutrien Ag Solutions (Canada) Inc. | Canada | Crop input retailer | ||
| Nutrien Ag Solutions, Inc. | US | |||
| Nutrien Ag Solutions Limited | Australia | |||
| PCS Nitrogen Fertilizer, L.P. | US | Producer of nitrogen products | ||
| PCS Nitrogen Trinidad Limited | Trinidad | |||
| PCS Phosphate Company, Inc. | US | Mining and/or processing of phosphate products | ||
| PCS Sales (USA), Inc. | US | Marketing and sales of the Company’s products | ||
| Nutrien Financial US LLC | US | Provide financing to customers | ||
Climate change
Our Feeding the Future Plan includes sustainability-related commitments to help address our key climate-related risks related to climate change and to reduce our carbon footprint. Nutrien continues to execute our sustainability strategy and deliver on our action plan and monitor the development of sustainability frameworks and regulatory initiatives. We recognize that these developments could further impact our accounting estimates and judgments including, but not limited to, assessment of our asset useful lives, impairment of other long-lived assets, and asset retirement obligations and accrued environmental costs. We have monitored and will continue to monitor these developments as they affect our consolidated financial statements.
Revenue
| Transfer of control for sale of goods | Transfer of control for sale of services | |
| At the point in time when the product is – purchased at our Retail farm center, – delivered and accepted by customers at their premises, or – loaded for shipping. |
Over time as the promised service is rendered. | |
| In millions of US dollars unless otherwise noted | Nutrien Annual Report 2023 | 137 |
| Overview | MD&A | Five-year highlights | Financial statements and notes | |||||
|
Notes |
Judgment is used to determine whether we are acting as principal or agent by evaluating who
| – | has the primary responsibility for fulfilling the promised good; |
| – | bears the inventory risk including if the vendor has the right to have its product returned on demand; and |
| – | has discretion for establishing the price. |
For transactions in which we act as an agent rather than the principal, revenue is recognized net of any commissions earned. The related commissions are recognized as the sales occur or as unconditional contracts are signed.
We recognize revenue on sales to Canpotex (as described in Note 28) when there is a transfer of control, either at the time the product is loaded for shipping or delivered, depending on the terms of the contract. Sales revenue is recognized using a provisional price at the time control is transferred to Canpotex, with the final pricing determined upon Canpotex’s final sale to a third party (generally between one and three months from date of sale to Canpotex).
Our sales revenue relating to our Potash, Nitrogen and Phosphate segments is generally recorded and measured based on the “freight on board” mine, plant, warehouse or terminal price specified in the contract (except for certain vessel sales or specific product sales that are shipped and recorded on a delivered basis), which reflects the consideration we expect to be entitled to in exchange for the goods or services, adjusted for any variable consideration (e.g., any trade discounts or estimated volume rebates). Our customer contracts may provide certain product quality specification guarantees but do not generally provide for refunds or returns.
Due to the nature of goods and services sold, any single estimate would have only a negligible impact on revenue.
As the expected period between when control over a promised good or service is transferred and when the customer pays for that good or service is generally less than 12 months, we apply the practical expedient as provided in IFRS 15, “Revenue from Contracts with Customers,” and do not adjust the promised amount of consideration for the effects of financing.
Intersegment sales are made under terms that approximate market value.
Seasonality in our business results from increased demand for products during planting season. Crop input sales are generally higher in the spring and fall application seasons. Crop input inventories are normally accumulated leading up to each application season. Our cash collections generally occur after the application season is complete, while customer prepayments made to us are typically concentrated in December and January and inventory prepayments paid to our suppliers are typically concentrated in the period from November to January. Feed and industrial sales are more evenly distributed throughout the year.
Share-based compensation
Estimation involves determining
| – | stock option-pricing model assumptions as described in the weighted average assumptions table in Note 5; |
| – | forfeiture rate for options granted based on past experience and future expectations, and adjusted upon actual vesting; |
| – | projected outcome of performance conditions for PSUs, including our return on invested capital compared to Nutrien’s weighted average cost of capital, and including the relative ranking of our total shareholder return, including expected dividends, compared with a specified peer group using a Monte Carlo simulation option-pricing model; and |
| – | the number of dividend equivalent units expected to be earned. |
Income taxes
Taxation on earnings (loss) is composed of current and deferred income tax. Taxation is recognized in the statements of earnings unless it relates to items recognized either in OCI or directly in shareholders’ equity.
| Current income tax | Deferred income tax | |
| – is calculated using rates enacted or substantively enacted at the dates of the consolidated balance sheets in the countries where our subsidiaries and equity-accounted investees operate and generate taxable earnings. |
– is determined using tax rates that have been enacted or substantively enacted by the dates of the consolidated balance sheets and are expected to apply when the related deferred income tax asset is realized or the deferred income tax liability is settled. |
|
| The realized and unrealized excess tax benefits from share-based compensation arrangements are recognized in contributed surplus as current and deferred tax, respectively. | ||
| 138 | Nutrien Annual Report 2023 | In millions of US dollars unless otherwise noted |
| Overview | MD&A | Five-year highlights | Financial statements and notes | |||||
|
Notes |
The final taxes paid, and potential adjustments to tax assets and liabilities, are dependent upon many factors including
| – | negotiations with taxation authorities in various jurisdictions; |
| – | outcomes of tax litigation; and |
| – | resolution of disputes arising from federal, provincial, state and local tax audits. |
Deferred income tax is not accounted for
| – | with respect to investments in subsidiaries and equity-accounted investees where we are able to control the reversal of the temporary difference and that difference is not expected to reverse in the foreseeable future; and |
| – | if arising from initial recognition of an asset or liability in a transaction, other than a business combination, that at the time of the transaction affects neither accounting nor taxable profit or loss. |
Deferred tax assets are
| – | recognized to the extent it is probable future taxable profit will be available to use deductible temporary differences and could be reduced if projected earnings are not achieved or increased if earnings previously not projected become probable; and |
| – | reviewed at each balance sheet date and amended to the extent that it is no longer probable that the related tax benefit will be realized. |
As provided in the amendments to International Accounting Standards (“IAS”) 12, we apply the mandatory exception to recognize and disclose information about deferred tax assets and liabilities related to Pillar Two income taxes. The mandatory exception has been applied retrospectively, with no material impact on our consolidated financial statements.
Financial instruments
Financial instruments are classified and measured as follows based on the objective of the business model for managing the instrument or group of instruments and the contractual terms of the cash flows.
| Fair value classification | FVTPL |
FVTOCI | Amortized cost | |||
| Instrument type | Cash and cash equivalents, derivatives, and certain equity investments not held for trading |
Certain equity investments not held for trading for which an irrevocable election was made at initial recognition | Receivables, short-term debt, payables and accrued charges, long-term debt, lease liabilities, and other long-term debt instruments | |||
Financial instruments are recognized at trade date when we commit to purchase or sell the asset.
Derivatives are used to lock in exchange rates. For designated and qualified cash flow hedges
| – | the effective portion of the change in the fair value of the derivative is accumulated in OCI; |
| – | when the hedged forecast transaction occurs, the related gain or loss is removed from AOCI and included in the cost of inventory or property, plant and equipment; |
| – | the hedging gain or loss included in the cost of inventory is recognized in earnings when the product containing the hedged item is sold or becomes impaired; and |
| – | the ineffective portions of hedges are recorded in net earnings in the current period. |
We assess whether our derivative hedging transactions are expected to be or were highly effective, both at the hedge’s inception and on an ongoing basis, in offsetting changes in fair values of hedged items.
| Hedging transaction | Measurement of ineffectiveness | Potential sources of ineffectiveness | ||
| Foreign exchange | Comparison of the cumulative changes in fair value and the cumulative change in the fair value of a hypothetical derivative with terms based on the hedged forecast cash flows | Changes in – timing or amounts of forecasted cash flows – embedded optionality – our credit risk or the credit risk of a counterparty |
||
Financial assets and financial liabilities are offset, and the net amount is presented in the consolidated balance sheets when we
| – | currently have a legally enforceable right to offset the recognized amounts; and |
| – | intend either to settle on a net basis, or to realize the assets and settle the liabilities simultaneously. |
| In millions of US dollars unless otherwise noted | Nutrien Annual Report 2023 | 139 |
| Overview | MD&A | Five-year highlights | Financial statements and notes | |||||
|
Notes |
Fair value measurements
Estimated fair values for financial instruments are designed to approximate amounts for which the instruments could be exchanged in a current arm’s length transaction between knowledgeable, willing parties. The valuation policies and procedures for financial reporting purposes are determined by our finance department.
Fair value measurements are categorized into different levels within a fair value hierarchy based on the degree to which the lowest level inputs are observable and their significance:
| Level 1 | Level 2 | Level 3 | ||
| Unadjusted quoted prices (in active markets accessible at the measurement date for identical assets or liabilities) | Quoted prices (in markets that are not active or based on inputs that are observable for substantially the full term of the asset or liability) | Prices or valuation techniques that require inputs that are both unobservable and significant to the overall measurement | ||
Fair value estimates
| – | are at a point in time and may change in subsequent reporting periods due to market conditions or other factors; |
| – | can be determined using multiple methods, which can cause values (or a range of reasonable values) to differ; and |
| – | may require assumptions about costs/prices over time, discount and inflation rates, defaults, and other relevant variables. |
Inventories
Costs are allocated to inventory using the weighted average cost method.
Net realizable value is based on:
| Products and raw materials | Materials and supplies | |
| – selling price of the finished product (in ordinary course of business) less the estimated costs of completion and estimated costs to make the sale |
– replacement cost |
|
Inventories are valued monthly. Various factors impact our estimates of net realizable value, including inventory levels, forecasted prices of key production inputs, global nutrient capacities, crop price trends, and changes in regulations and standards employed.
Vendors may offer various incentives to purchase products for resale. Vendor rebates and prepay discounts are accounted for as a reduction of the prices of the suppliers’ products. Rebates based on the amount of materials purchased reduce cost of goods sold as inventory is sold. Rebates earned based on sales volumes of products are offset to cost of goods sold.
Rebates that are probable and can be reasonably estimated are accrued. Rebates that are not probable or estimable are accrued when certain milestones are achieved.
Estimation of rebates can be complex in nature as vendor arrangements are diverse. The amount of the accrual is determined by analyzing and reviewing historical trends to apply negotiated rates to estimated and actual purchase volumes. Estimated amounts accrued throughout the year could also be impacted if actual purchase volumes differ from projected volumes.
Property, plant and equipment
|
|
Owned | Right-of-use (leased) | ||
| Description | – majority of our tangible assets are buildings, machinery and equipment used to produce or distribute our products and render our services |
– primarily include railcars, marine vessels, real estate and mobile equipment |
| 140 | Nutrien Annual Report 2023 | In millions of US dollars unless otherwise noted |
| Overview | MD&A | Five-year highlights | Financial statements and notes | |||||
|
Notes |
|
|
Owned | Right-of-use (leased) | ||
| Measurement | – cost, which includes capitalized borrowing costs, less accumulated depreciation and any accumulated impairment losses – cost of major inspections and overhauls is capitalized – maintenance and repair expenditures that do not improve or extend productive life are expensed in the period incurred |
– cost less accumulated depreciation and any accumulated impairment losses – lease payments are allocated between finance costs and a reduction of the liability |
||
| Depreciation method | – certain property, plant and equipment directly related to our Potash, Nitrogen and Phosphate segments uses units-of-production based on the shorter of estimates of reserves or service lives – pre-stripping costs uses units-of-production over the ore mined from the mineable acreage stripped – remaining assets uses straight-line |
– straight-line over the shorter of the asset’s useful life and the lease term |
||
|
|
Estimated useful lives, expected patterns of consumption, depreciation method and residual values are reviewed at least annually. | |||
| Judgment/practical expedients |
Judgment is required in determining – costs, including income or expenses derived from an asset under construction, that are eligible for capitalization; – timing to cease cost capitalization, generally when the asset is capable of operating in the manner intended by management, but also considering the circumstances and the industry in which the asset is to be operated, normally predetermined by management with reference to such factors as productive capacity; – the appropriate level of componentization (for individual components for which different depreciation methods or rates are appropriate); – repairs and maintenance that qualify as major inspections and overhauls; and – useful life over which such costs should be depreciated, which may be impacted by changes in our strategy, process or operations as a result of climate-change initiatives. |
Judgment is required to determine whether a contract or arrangement includes a lease and if it is reasonably certain that an extension option will be exercised. We seek to maximize operational flexibility in managing our leasing activities by including extension options when negotiating new leases. Extension options are exercisable at our option and not by the lessors. In determining if a renewal period should be included in the lease term, we consider all relevant factors that create an economic incentive for us to exercise a renewal, including
– the location of the asset and the availability of suitable alternatives, – the significance of the asset to operations, and – our business strategy.
Estimation is used to determine the useful lives of ROU assets, the lease term and the appropriate discount rate applied to the lease payments to calculate the lease liability. |
||
|
|
Uncertainties are inherent in estimating reserve quantities, particularly as they relate to assumptions regarding future prices, the geology of our mines, the mining methods used, and the related costs incurred to develop and mine reserves. Changes in these assumptions could result in material adjustments to reserve estimates, which could result in impairments or changes to depreciation expense in future periods. |
We have chosen to – include the use of a single discount rate for a portfolio of leases with reasonably similar characteristics, – not separate non-lease components and instead to account for lease and non-lease components as a single arrangement, and – use exemptions for short-term and low-value leases which allow payments to be expensed as incurred. |
||
| Other | Not applicable. | Lease agreements do not contain significant covenants; however, leased assets may be used as security for lease liabilities and other borrowings. | ||
| In millions of US dollars unless otherwise noted | Nutrien Annual Report 2023 | 141 |
| Overview | MD&A | Five-year highlights | Financial statements and notes | |||||
|
Notes |
Goodwill and intangible assets
Goodwill is carried at cost less any accumulated impairment losses, is not amortized, and represents the excess of the cost of an acquisition over the fair value of the Company’s share of the net identifiable assets of the acquired subsidiary at the date of acquisition. Goodwill is allocated to a CGU or group of CGUs for impairment testing based on the level at which it is monitored by management and not at a level higher than an operating segment. The allocation is made to the CGU or group of CGUs expected to benefit from the business combination in which the goodwill arose.
Intangible assets are generally measured at cost less accumulated amortization and any accumulated impairment losses. Accumulated amortization is calculated on a straight-line basis over the asset’s useful life. We use judgment to determine which expenditures are eligible for capitalization as intangible assets. Costs incurred internally from researching and developing a product are expensed as incurred until technological feasibility is established, at which time the costs are capitalized until the product is available for its intended use. Judgment is required in determining when technological feasibility of a product is established. Intangible assets with finite lives are amortized on a straight-line basis over their estimated useful lives. At least annually, the useful lives are reviewed and adjusted if appropriate.
Impairment of long-lived assets
To assess impairment, assets are grouped at the smallest levels for which there are separately identifiable cash inflows that are largely independent of the cash inflows from other assets or groups of assets (this can be at the asset or CGU level).
At the end of each reporting period, we review conditions to determine whether there is any indication that an impairment exists that could potentially impact the carrying amounts of both our long-lived assets to be held and used (including property, plant and equipment, and investments), and our goodwill and intangible assets. When such indicators exist, impairment testing is performed. Additionally, goodwill is tested at least annually on October 1.
We review, at each reporting period, for possible reversal of the impairment for non-financial assets, other than goodwill.
Estimates and judgment involve
| – | identifying the appropriate asset, group of assets, CGU or group of CGUs; |
| – | determining the appropriate discount rate for assessing the recoverable amount; |
| – | making assumptions about future sales, market conditions, terminal growth rates and cash flow forecasts over the long-term life of the assets or CGUs; and |
| – | evaluating impacts of climate change to our strategy, processes and operations. |
We cannot predict if an event that triggers impairment or a reversal of impairment will occur, when it will occur or how it will affect reported asset amounts. Asset impairment amounts previously recorded could be affected if different assumptions were used or if market and other conditions change. Such changes could result in non-cash charges materially affecting our consolidated financial statements.
Equity-accounted investments
For equity-accounted investments reduced to zero, we do not eliminate our share of the unrealized earnings. If the investee earns a profit in the subsequent period, we then recognize our share of the earnings only after adjusting for the unrealized earnings that were not previously eliminated.
Pension and other post-retirement benefits
When a plan amendment occurs before a settlement, we recognize past service cost before any gain or loss on settlement.
Our discount rate assumptions are impacted by
| – | the weighted average interest rate at which each pension and other post-retirement plan liability could be effectively settled at the measurement date; |
| – | country specific rates; and |
| – | the use of a yield curve approach based on the respective plans’ demographics, expected future pension benefits and medical claims. Payments are measured and discounted to determine the present value of the expected future cash flows. The cash flows are discounted using yields on high-quality AA-rated non-callable bonds with cash flows of similar timing where there is a deep market for such bonds. Where we do not believe there is a deep market for such bonds (such as for terms in excess of 10 years in Canada), the cash flows are discounted using a yield curve derived from yields on provincial bonds rated AA or better to which a spread adjustment is added to reflect the additional risk of corporate bonds. |
| 142 | Nutrien Annual Report 2023 | In millions of US dollars unless otherwise noted |
| Overview | MD&A | Five-year highlights | Financial statements and notes | |||||
|
Notes |
Net actuarial gains or loss incurred during the period for defined benefit plans are closed out to retained earnings at each period-end.
Asset retirement obligations and accrued environmental costs
Asset retirement obligations and accrued environmental costs include
| – | reclamation and restoration costs at our potash and phosphate mining operations, including management of materials generated by mining and mineral processing, such as various mine tailings and gypsum; |
| – | land reclamation and revegetation programs; |
| – | decommissioning of underground and surface operating facilities; |
| – | general clean-up activities aimed at returning the areas to an environmentally acceptable condition; and |
| – | post-closure care and maintenance. |
We consider the following factors as we estimate our provisions:
| – | environmental laws and regulations and interpretations by regulatory authorities, including updates on climate change, could change or circumstances affecting our operations could change, either of which could result in significant changes to current plans; |
| – | the nature, extent and timing of current and proposed reclamation and closure techniques in view of present environmental laws and regulations; |
| – | appropriate technical resources, including outside consultants, assist us in developing specific site closure and post-closure plans in accordance with the jurisdiction requirements; and |
| – | timing of settlement of the obligations, which is typically correlated with mine life estimates except for certain land reclamation programs. |
It is reasonably possible that the ultimate costs could change in the future and that changes to these estimates could have a material effect on our consolidated financial statements. We review our estimates for any changes in assumptions at the end of each reporting period.
We recognized contingent liabilities related to our business combinations or acquisitions, which represent additional environmental costs that are present obligations although cash outflows of resources are not probable. These contingent liabilities are subsequently measured at the higher of the amount initially recognized and the amount that would be recognized if the liability becomes probable.
Share capital
Common shares are classified as equity. Incremental costs directly attributable to the issuance of common shares are recognized as a deduction from equity, net of any tax effects. When we repurchase our own common shares, share capital is reduced by the average carrying value of the shares repurchased. The excess of the purchase price over the average carrying value is recognized as a deduction from retained earnings. If the average carrying value of the shares repurchased is less than the average carrying value of the shares in share capital, the excess is recognized as an addition to share capital. Shares are cancelled upon repurchase.
| In millions of US dollars unless otherwise noted | Nutrien Annual Report 2023 | 143 |
| Overview | MD&A | Five-year highlights | Financial statements and notes | |||||
|
Notes |
Business combinations
Purchase price allocation involves judgment in identifying assets acquired and liabilities assumed, and estimation of their fair values. Key assumptions include discount rates and revenue growth rates specific to the acquired assets or liabilities assumed. We perform a thorough review of all internal and external sources of information available based on circumstances that exist at the acquisition date. We also engage independent valuation experts on certain acquisitions to assist in determining the fair value of certain assets acquired and liabilities assumed and related deferred income tax impacts. To determine fair values, we generally use the following valuation techniques:
| Account | Valuation technique and judgments applied | |
| Property, plant and equipment | Market approach for land and certain types of personal property: sales comparison that measures the value of an asset through an analysis of sales and offerings of comparable assets.
Replacement costs for all other depreciable property, plant and equipment: measures the value of an asset by estimating the costs to acquire or construct comparable assets and adjusts for age and condition of the asset. |
|
| Intangible assets | Income approach – multi-period excess earnings method: measures the value of an asset based on the present value of the incremental after-tax cash flows attributable to the asset after deducting contributory asset charges (“CACs”). Allocation of CACs is a matter of judgment and based on the nature of the acquired businesses’ operations and historical trends.
We consider several factors in determining the fair value of customer relationships, such as customers’ relationships with the acquired company and its employees, the segmentation of customers, historical customer attrition rates, and revenue growth. |
|
| Other provisions and contingent liabilities | Decision-tree approach of future costs and a risk premium to capture the compensation sought by risk-averse market participants for bearing the uncertainty inherent in the cash flows of the liability. | |
For each business combination, we elect to measure the non-controlling interest in the acquired entity either at fair value or at the proportionate share of the acquiree’s identifiable net assets. Foreign exchange hedge gains or losses that we designated a cash flow hedge are included in the consideration. The gain or loss from the cash flow hedge is deferred in OCI and subsequently recorded as an adjustment to goodwill when the business combination occurs.
Transaction costs are recorded in integration and restructuring related costs in other (income) expenses.
Standards, amendments and interpretations effective and applied
The IASB and IFRS Interpretations Committee (“IFRIC”) has issued certain standards and amendments or interpretations to existing standards that were effective, and we have applied.
In 2023, we adopted the following standards, amendments and annual improvements with no material impact on our consolidated financial statements:
| – | Deferred Tax related to Assets and Liabilities arising from a Single Transaction (IFRS 1, IAS 12) |
| – | Disclosure of Accounting Policies (Amendments to IAS 1 and IFRS Practice Statement 2) |
| – | Definition of Accounting Estimates (Amendments to IAS 8) |
| – | IFRS 17 Insurance Contracts, including amendments |
| – | International Tax Reform – Pillar Two Model Rules (Amendments to IAS 12) – Under Pillar Two legislation, we are liable to pay a top-up tax for differences between our Global Anti-Base Erosion (“GLoBE”) effective rate and the 15 percent minimum rate. For jurisdictions where we operate that have substantially enacted the Pillar Two legislation, we have determined no material impact. We also operate in jurisdictions where Pillar Two legislation may be enacted in the future. For these jurisdictions, we have preliminarily assessed our exposure to the Pillar Two legislation if it were to come into effect and based on this assessment we believe there is no material impact. |
| 144 | Nutrien Annual Report 2023 | In millions of US dollars unless otherwise noted |
| Overview | MD&A | Five-year highlights | Financial statements and notes | |||||
|
Notes |
Standards, amendments and interpretations not yet effective and not applied
The IASB and IFRIC have issued the following standards, amendments or interpretations to existing standards that were not yet effective and not applied as at December 31, 2023.
The following amendments will be adopted in 2024 and are not expected to have a material impact on our consolidated financial statements:
| – | Supplier Finance Arrangements (Amendments to IAS 7 and IFRS 7) |
| – | Lease Liability in a Sale and Leaseback (Amendments to IFRS 16) |
| – | Classification of liabilities as current or non-current (Amendments to IAS 1) |
| – | Non-current liabilities with Covenants (Amendments to IAS 1 and IFRS Practice Statement 2) |
The following amendments are being reviewed to determine the potential impact on our consolidated financial statements:
| – | Lack of Exchangeability (Amendments to IAS 21), effective January 1, 2025 |
| In millions of US dollars unless otherwise noted | Nutrien Annual Report 2023 | 145 |
| Terms |
|
|
| AECO | Alberta Energy Company, Canada | |
| ABARES | Australian Bureau of Agricultural and Resource Economics and Sciences | |
| Argus | Argus Media group, UK | |
| Bloomberg | Bloomberg Finance L.P., USA | |
| Conab | The National Supply Company (CONAB) is a public company under the Ministry of Agriculture, Livestock and Food Supply – MAPA. | |
| CME | Canadian Manufacturers & Exporters | |
| CRU | CRU International limited, UK | |
| ICE | Intercontinental Exchange | |
| IFA | International Fiscal Association | |
| IMEA | Mato Grosso Institute of Agricultural Economics | |
| Moody’s | Moody’s Corporation (NYSE: MCO), USA | |
| NYMEX | New York Mercantile Exchange, USA | |
| NYSE | New York Stock Exchange, USA | |
| S&P |
S&P Global Inc., USA | |
| SPGCI | S&P Global Commodity Insights | |
| StatsCan | Statistics Canada | |
| TTF | Title Transfer Facility | |
| TSX | Toronto Stock Exchange, Canada | |
| USDA | United States Department of Agriculture, USA | |
| CAD | Canadian dollar | |
| USD | United States dollar | |
| AUD | Australian dollar |
| Scientific terms |
|
|
||
| Potash | KCI | potassium chloride, 60–63.2% K2O (solid) | ||
| Nitrogen | CO2 | carbon dioxide | ||
|
|
CO2e | carbon dioxide equivalent | ||
|
|
DEF | diesel exhaust fluid | ||
|
|
ESN® | environmentally smart nitrogen, 44% nitrogen | ||
|
|
NH3 | ammonia (anhydrous), 82.2% N (liquid) | ||
|
|
N2O | nitrous oxide | ||
|
|
UAN | urea ammonium nitrate solution, 28–32% N (liquid) | ||
| Phosphate | AS | ammonium sulfate (solid) | ||
|
|
DAP | diammonium phosphate, 46% P2O5 (solid) | ||
|
|
MAP | monoammonium phosphate, 52% P2O5 (solid) | ||
|
|
MGA | merchant grade acid, 54% P2O5 (liquid) | ||
|
|
MST | micronized sulfur technology, P + S | ||
|
|
P2O5 | diphosphorus pentoxide | ||
|
|
SPA | superphosphoric acid, 70% P2O5 (liquid) |
| 146 | Nutrien Annual Report 2023 |
|
Product measures |
|
|||
| K2O tonne | Measures the potassium content of products having different chemical analyses | |||
| Mmt | Million metric tonnes | |||
| MMBtu | Million British thermal units | |||
| N tonne | Measures the nitrogen content of products having different chemical analyses | |||
| P2O5 tonne | Measures the phosphorus content of products having different chemical analyses | |||
| Product tonne | Standard measure of the weights of all types of potash, nitrogen and phosphate products | |||
|
Definitions |
|
|
| Brownfield | New project expanding or developing an existing facility or operation. | |
| CCUS | Carbon capture, utilization and storage. Process by which CO2 produced from various industrial processes is captured and either utilized for further industrial processes or transported to a permanent storage location to prevent release into the atmosphere. | |
| Capital expenditures | Represents the sum of: sustaining capital expenditures, investing capital expenditures and mine development and pre-stripping capital expenditures. See the “Other Financial Measures” section. | |
| Carbon offset/ inset | Carbon offsetting is a way for entities to reduce their carbon footprint by paying another entity to reduce their emissions. Carbon insetting refers to the actions taken by an organization to reduce emissions within its own supply chain. | |
| Clean ammonia | Ammonia made with direct GHG emissions reduced by at least 90 percent compared to a conventional process, produced from hydrogen obtained using the next generation of ammonia production technology, such as auto-thermal reforming or water electrolysis with renewable power; this definition does not include end product use. | |
| Community investment | Represents cash disbursements, matching of employee gifts and in-kind contributions of equipment, goods and services, and employee volunteerism (on corporate time). | |
| COVID-19 | COVID-19 coronavirus pandemic. | |
| Compound annual growth rate (“CAGR”) | Represents the rate of return that would be required for an investment to grow from its beginning balance to its ending balance assuming the profits were reinvested at the end of each year of the investment’s lifespan. | |
| EBITDA | Calculated as net earnings (loss) before finance costs, income taxes and depreciation and amortization. |
|
| Greenfield | New project on a previously undeveloped site. | |
| Greenhouse gas (“GHG”) | Gas that contributes to the greenhouse effect by absorbing infrared radiation. | |
| Latin America | South America, Central America, Caribbean and Mexico. | |
| Lost-time injury frequency | Total lost-time injuries for every 200,000 hours worked for all Nutrien employees, contractors and others on site. Calculated as the total lost-time injuries multiplied by 200,000 hours worked divided by the actual number of hours worked. | |
| Low-carbon ammonia | Ammonia made with direct GHG emissions typically reduced by approximately 60 percent but up to 80 percent compared to a conventional process, produced by primarily using carbon capture, utilization and storage (“CCUS”) or other low-emission production technologies; this definition does not include end product use. | |
| Merger | The merger of equals transaction between PotashCorp and Agrium completed effective January 1, 2018, pursuant to which PotashCorp and Agrium combined their businesses pursuant to a statutory plan of arrangement under the Canada Business Corporations Act and became wholly owned subsidiaries of Nutrien Ltd. | |
| North America | Canada and the US. | |
| Offshore | All markets except Canada and the US. | |
| Nutrien Annual Report 2023 | 147 |
|
Definitions |
|
|
| Proportion of women in senior leadership | Senior leadership is defined as director level and above. Based on permanent full-time and part-time employees. | |
| Serious injury and fatality | A work-related fatality or life-altering injury/illness experienced by an employee or directly supervised contractor conducting work on behalf of Nutrien. | |
| Scope 1 | Direct greenhouse gas emissions produced by Nutrien owned or controlled facilities. | |
| Scope 2 | Indirect greenhouse gas emissions resulting from the generation of purchased or acquired electricity, heating, cooling and steam consumed by Nutrien owned or controlled facilities. | |
| Scope 3 | Indirect greenhouse gas emissions not included in Scope 2 emissions occurring as a consequence of the activities of Nutrien, from sources not owned or controlled by Nutrien, including both upstream and downstream emissions. | |
| Sustainable agriculture | According to the United Nations Food and Agriculture Organization, sustainable agriculture means increasing farm productivity while protecting natural resources and enhancing grower resilience. | |
| Sustainable agriproduct program acres | Our Carbon Program is also referred to as a Sustainable Agriproducts Program. Sustainable agriproduct acres involve agronomic solutions leading to measurable outcomes such as carbon, soil or water, with the ability to validate and verify those outcomes. |
|
| Sustainably engaged acres | Acres participating in programs that track field level data which can be analyzed for sustainability metrics and/or acres participating in sustainable agriproducts programs that incentivize growers to adopt additional sustainable practices and products resulting in quantifiable, incremental benefits which may be verified and used for reporting purposes. | |
| Total employee turnover rate | The number of permanent employees who left the Company due to voluntary and involuntary terminations, including retirements and deaths, as a percentage of average permanent employees for the year. | |
| Total recordable injury frequency | Total recordable injuries for every 200,000 hours worked for all Nutrien employees, contractors and others on site. Calculated as the total recordable injuries multiplied by 200,000 hours worked divided by the actual number of hours worked. | |
| 148 | Nutrien Annual Report 2023 |
| Dividends |
Common share prices |
|
| Dividend amounts paid to shareholders resident in Canada are paid in Canadian dollars, calculated based on the Bank of Canada daily average exchange rate on the dividend record date. The declaration, amount and payment date of any dividend by the Company is at the discretion of the Board of Directors and will depend on numerous factors, including compliance with applicable laws and the financial performance, debt obligations, working capital requirements and future capital requirements of Nutrien and its subsidiaries. Historically dividends have been paid in January, April, July and October approximately three weeks after record dates on the last trading day of the immediately preceding month. Registered shareholders may enroll for direct deposit by contacting Computershare Investor Services Inc., the Company’s registrar and transfer agent. | The Company’s common shares are traded on the Toronto Stock Exchange and the New York Stock Exchange. Nutrien is included in the S&P/TSX 60 and the S&P/TSX Composite indices.
Ownership
On February 22, 2024, there were 852 holders of record of the Company’s common shares. |
|
|
Offices |
Investor relations |
|||
| Nutrien’s registered head office is: | We also have corporate offices at: | Investor relations department |
||
| Suite 1700, 211 19th Street East | 13131 Lake Fraser Drive SE | Email investors@nutrien.com |
||
| Saskatoon, Saskatchewan | Calgary, Alberta | |||
| Canada S7K 5R6 | Canada T2J 7E8 | |||
| 5296 Harvest Lake Drive | ||||
| Loveland, Colorado | ||||
| US 80538 | ||||
|
Transfer agent |
NYSE corporate governance |
|||
| You can contact Computershare Investor Services Inc., the Company’s transfer agent, as follows:
|
The certifications required by Section 302 of the Sarbanes-Oxley Act of 2002 are filed as exhibits to our 2023 Annual Report on Form 40-F. |
|||
| Phone | 1-888-847-9773 (toll-free within Canada and the US) |
|||
| 1-514-982-7555 | ||||
| (from any country other than Canada and the US) | ||||
| By fax | 1-888-453-0330 | |||
| (all countries) | ||||
| By mail | Computershare | |||
| 100 University Drive | ||||
| 8th Floor, North Tower | ||||
| Toronto, ON M5J 2Y1 | ||||
| Internet | Access your registered account on the Investor Centre website: | |||
| investorcentre.com | ||||

|
Iowa, US
The US Corn Belt is an area with deep fertile soils. Through the use of crop inputs and agriculture technology, from Nutrien and the industry as a whole, US corn yields have increased by more than six fold since the 1930s. |
||||||||
| Nutrien.com
facebook.com/nutrienltd
linkedin.com/company/nutrien
youtube.com/nutrien
@nutrienltd |
||||||||