UNITED STATES
SECURITIES AND EXCHANGE COMMISSION
Washington, D.C. 20549
FORM40-F
[Check one]
|
REGISTRATION STATEMENT PURSUANT TO SECTION 12 OF THE SECURITIES EXCHANGE ACT OF 1934 |
OR
|
ANNUAL REPORT PURSUANT TO SECTION 13(a) OR 15(d) OF THE SECURITIES EXCHANGE ACT OF 1934 |
For the fiscal year ended December 31, 2023
Commission File Number 001-38336
NUTRIEN LTD.
(Exact name of Registrant as specified in its charter)
Canada
(Province or other jurisdiction of incorporation or organization)
2870
(Primary Standard Industrial Classification Code Number (if applicable))
98-1400416
(I.R.S. Employer Identification Number (if applicable))
|
Suite 1700, 211 19th Street East Saskatoon, Saskatchewan, Canada S7K 5R6 |
(306) 933-8500
(Address and telephone number of Registrant’s principal executive offices)
CT Corporation System
28 Liberty St.
New York, NY 10005
(212) 894-8940
(Name, address (including zip code) and telephone number (including area code)
of agent for service in the United States)
Securities registered or to be registered pursuant to Section 12(b) of the Act:
Title of each class |
Trading Symbol(s) |
Name of each exchange on which registered |
Common Shares |
NTR |
New York Stock Exchange |
Securities registered or to be registered pursuant to Section 12(g) of the Act:
Not Applicable
(Title of Class)
Securities for which there is a reporting obligation pursuant to Section 15(d) of the Act:
Not Applicable
(Title of Class)
For annual reports, indicate by check mark the information filed with this Form:
Annual information form |
|
Audited annual financial statements |
Indicate the number of outstanding shares of each of the issuer’s classes of capital or common stock as of the close of the period covered by the annual report.
494,551,730 Common Shares outstanding as of December 31, 2023
Indicate by check mark whether the registrant (1) has filed all reports required to be filed by Section 13 or 15(d) of the Exchange Act during the preceding 12 months (or for such shorter period that the registrant was required to file such reports) and (2) has been subject to such filing requirements for the past 90 days.
Yes No |
Indicate by check mark whether the registrant has submitted electronically every Interactive Data File required to be submitted pursuant to Rule 405 of Regulation S-T (§232.405 of this chapter) during the preceding 12 months (or for such shorter period that the registrant was required to submit such files).
Yes No
Indicate by check mark whether the registrant is an emerging growth company as defined in Rule 12b-2 of the Exchange Act.
Emerging growth company
If an emerging growth company that prepares its financial statements in accordance with U.S. GAAP, indicate by check mark if the registrant has elected not to use the extended transition period for complying with any new or revised financial accounting standards† provided pursuant to Section 13(a) of the Exchange Act.
† The term “new or revised financial accounting standard” refers to any update issued by the Financial Accounting Standards Board to its Accounting Standards Codification after April 5, 2012.
Indicate by check mark whether the registrant has filed a report on and attestation to its management’s assessment of the effectiveness of its internal control over financial reporting under Section 404(b) of the Sarbanes-Oxley Act (15 U.S.C. 7262(b)) by the registered public accounting firm that prepared or issued its audit report.
If securities are registered pursuant to Section 12(b) of the Act, indicate by check mark whether the financial statements of the registrant included in the filing reflect the correction of an error to previously issued financial statements.
Indicate by check mark whether any of those error corrections are restatements that required a recovery analysis of incentive-based compensation received by any of the registrant’s executive officers during the relevant recovery period pursuant to §240.10D-1(b). The following documents have been filed as part of this Annual Report:
This Annual Report on Form 40-F shall be incorporated by reference into the Registration Statements on Form S-8 (File Nos. 333-222384, 333-222385 and 333-226295) of the registrant. In addition, the registrant’s Annual Information Form; Management’s Discussion and Analysis; Audited Annual Consolidated Financial Statements for the fiscal year ended December 31, 2023, including Management’s Annual Report on Internal Control over Financial Reporting; Consent of KPMG LLP, Independent Registered Public Accounting Firm; and Consent of Craig Funk, B.Sc., M.Sc., P.Eng., P.Geo., included as Exhibits 99.1, 99.2, 99.3, 99.4 and 99.8, respectively, to this Annual Report on Form 40-F, are incorporated by reference into and as an exhibit to the registrant’s Registration Statement on Form F-10 (File No. 333-263275).
PRINCIPAL DOCUMENTS
CONTROLS AND PROCEDURES
A. Certifications
The required disclosure is included in Exhibits 99.5, 99.6 and 99.7 to this Annual Report, and is incorporated herein by reference.
B. Evaluation of Disclosure Controls and Procedures
The required disclosure is included in “Controls and Procedures—Disclosure Controls and Procedures” in the 2023 MD&A, filed as Exhibit 99.2 to this Annual Report, and is incorporated herein by reference.
C. Management’s Annual Report on Internal Control over Financial Reporting
Management is responsible for establishing and maintaining an adequate system of internal control over financial reporting as defined in Rules 13a-15(f) and 15d-15(f) under the Securities Exchange Act of 1934, as amended. The required disclosure is included in “Management’s Responsibility—Management’s Annual Report on Internal Control over Financial Reporting” that accompanies the 2023 Audited Annual Financial Statements, filed as Exhibit 99.3 to this Annual Report, and is incorporated herein by reference.
D. Attestation Report of the Independent Registered Public Accounting Firm
The required disclosure is included in the “Report of Independent Registered Public Accounting Firm” that accompanies the 2023 Audited Annual Financial Statements, filed as Exhibit 99.3 to this Annual Report, and is incorporated herein by reference.
E. Changes in Internal Control over Financial Reporting
During the period covered by this report, there was no change in Nutrien’s internal control over financial reporting that has materially affected, or is reasonably likely to materially affect, its internal control over financial reporting. See “Controls and Procedures—Internal Control Over Financial Reporting” in the 2023 MD&A, filed as Exhibit 99.2 to this Annual Report and incorporated herein by reference.
IDENTIFICATION OF THE AUDIT COMMITTEE
The Board has a separately-designated standing audit committee established in accordance with section 3(a)(58)(A) of the Exchange Act. The members of the Audit Committee are Christopher M. Burley, Michael J. Hennigan, Alice D. Laberge, Consuelo E. Madere and Aaron W. Regent.
AUDIT COMMITTEE FINANCIAL EXPERT
The Nutrien Board of Directors (the “Board”) has determined that it has at least one “audit committee financial expert” (as such term is defined in paragraph 8(b) of General Instruction B to Form 40-F) serving on its Audit Committee. Mr. Christopher M. Burley has been determined to be such audit committee financial expert and was “independent” as such term is defined under the Canadian Securities Administrators’ National Instrument 52-110—Audit Committees and the standards of the U.S. Securities and Exchange Commission (the “SEC”) and the New York Stock Exchange (the “NYSE”) relating to the independence of audit committee members.
The Board’s designation of Mr. Christopher M. Burley as an audit committee financial expert does not impose on him any duties, obligations or liability that are greater than the duties, obligations and liability imposed on him as a member of the Audit Committee and Board in the absence of such designation or identification. In addition, the designation of Mr. Christopher M. Burley as an audit committee financial expert does not affect the duties, obligations or liability of any other member of the Audit Committee or Board. See also “Item 17—Audit Committee” of Nutrien’s 2023 AIF, filed as Exhibit 99.1 to this Annual Report, and incorporated herein by reference.
COMPLIANCE WITH NYSE LISTING STANDARDS ON CORPORATE
GOVERNANCE
Our common shares are listed on the NYSE, but as a listed foreign private issuer, the NYSE does not require us to comply with all of its listing standards regarding corporate governance. Notwithstanding this exemption, we are in compliance in all material respects with the NYSE listing standards and we intend to continue to comply with such standards so as to ensure that there are no significant differences between our corporate governance practices and those practices required by the NYSE of other publicly listed companies.
CODE OF CONDUCT AND ETHICS
Nutrien has adopted a “code of ethics” (as that term is defined in Form 40-F), entitled the Nutrien Code of Conduct that applies to all directors, officers, employees and representatives of Nutrien and its subsidiaries (the “Nutrien Code”). A copy of the Nutrien Code is posted on Nutrien’s website at https://www.nutrien.com/what-we-do/governance. Copies may be obtained, free of charge, by contacting Nutrien in writing at 211 19th Street East, Suite 1700, Saskatoon, Saskatchewan, Canada S7K 5R6, by telephone at (306) 933-8500 or on Nutrien’s website at www.nutrien.com. Nutrien intends to post any amendments to and waivers from the Nutrien Code on its website as identified above.
NOTICES PURSUANT TO REGULATION BTR
Not applicable.
PRINCIPAL ACCOUNTANT FEES AND SERVICES
The following table sets out the fees billed to Nutrien by KPMG LLP (PCAOB ID: 85; Calgary, AB, Canada) and its affiliates for professional services rendered during the years ended December 31, 2023 and 2022. During these years, KPMG LLP was the Company’s only external auditor.
Category |
Years Ended December 31, |
|
|
2023 US$ |
2022 US$ |
Audit Fees 1 |
9,481,000 |
8,777,700 |
Audit-Related Fees 2 |
26,600 |
63,000 |
Tax Fees 3 |
74,900 |
168,100 |
All Other Fees 4 |
305,100 |
302,400 |
Total |
9,887,600 |
9,311,200 |
1 For professional services rendered by KPMG LLP for the integrated audit of the Company’s annual financial statements; interim review of the Company’s interim financial statements; audits of statutory financial statements of controlled subsidiaries; attestation reporting in accordance with US environmental agency requirements and consent orders; attestation reports over various Nutrien subsidiaries for the purpose of compliance with local laws and regulations; and work in connection with the renewal of the Company's base shelf prospectus in 2022 and the Company's prospectus supplements relating to the offering of senior notes in 2023 and 2022.
2 For professional services rendered by KPMG LLP for translation of the Company’s annual and quarterly reports in 2022, and in connection with an audit of the financial statements of an employee benefit plan.
3 For professional services rendered by KPMG LLP for assistance with preparation and review of tax filings and related tax compliance, assistance in responding to tax authorities, including reassessments and tax audits, routine tax planning and advice. These amounts include fees paid to KPMG LLP specifically for tax compliance and preparation services rendered in 2023 and 2022 in the amounts of $74,900 and $168,100, respectively.
4 For professional services rendered by KPMG LLP for the preparation of subsidiary statutory financial statements; an assessment of the Company’s cyber security maturity level against a globally recognized framework and a readiness assessment for assurance over the Company’s report on cyber security key performance indicators, and subsequent assurance engagements over key performance indicators; and limited assurance over Nutrien Scope 1 and 2 GHG emissions.
AUDIT COMMITTEE’S PRE-APPROVAL POLICIES AND PROCEDURES
The required disclosure is included in “Item 17—Audit Committee—17.4—Pre-approval Policies and Procedures” of Nutrien’s 2023 AIF, filed as Exhibit 99.1 to this Annual Report, and incorporated herein by reference.
OFF-BALANCE SHEET ARRANGEMENTS
The information included in “Other Financial Information—Off-Balance Sheet Arrangements” of the 2023 MD&A, filed as Exhibit 99.2 to this Annual Report, is incorporated herein by reference.
TABULAR DISCLOSURE OF CONTRACTUAL OBLIGATIONS
The information included in “Liquidity & Capital Resources—Cash Requirements” of the 2023 MD&A, filed as Exhibit 99.2 to this Annual Report, is incorporated herein by reference.
RESERVE AND RESOURCE ESTIMATES
The disclosure included in or incorporated by reference in this Annual Report uses mineral reserves and mineral resources classification terms that comply with reporting standards in Canada and are made in accordance with National Instrument 43-101—Standards of Disclosure for Mineral Projects (“NI 43-101”), which references the Canadian Institute of Mining, Metallurgy and Petroleum Definition Standards on Mineral Resources and Mineral Reserves. NI 43-101 is a rule developed by the Canadian Securities Administrators that establishes standards for all public disclosure an issuer makes of scientific and technical information concerning mineral projects.
These standards differ from the requirements of the SEC that are applicable to domestic United States reporting companies. Any mineral reserves and mineral resources reported by the Company in accordance with NI 43-101 may not qualify as such under SEC standards. Accordingly, information included in this Annual Report and the documents incorporated by reference herein that describes the Company’s mineral reserves and mineral resources estimates may not be comparable with information made public by United States companies subject to the SEC’s reporting and disclosure requirements.
MINE SAFETY DISCLOSURE
The information concerning mine safety violations or other regulatory matters required by Section 1503(a) of the Dodd-Frank Wall Street Reform and Consumer Protection Act and Item 16 of General Instruction B to Form 40-F is included in Exhibit 99.9 to this Annual Report.
DISCLOSURE REGARDING FOREIGN JURISDICTIONS THAT PREVENT INSPECTIONS
Not applicable.
RECOVERY OF ERRONEOUSLY AWARDED COMPENSATION
Not applicable.
WEBSITE INFORMATION
Notwithstanding any reference to Nutrien’s website or other websites on the World Wide Web in this Annual Report or in the documents attached as exhibits hereto, the information contained in Nutrien’s website or any other website on the World Wide Web referred to in this Annual Report or in the documents attached as exhibits hereto, or referred to in Nutrien’s website, is not a part of this Annual Report and, therefore, is not filed with the SEC.
UNDERTAKING AND CONSENT TO SERVICE OF PROCESS
The Registrant undertakes to make available, in person or by telephone, representatives to respond to inquiries made by the SEC staff, and to furnish promptly, when requested to do so by the SEC staff, information relating to: the securities registered pursuant to Form 40-F; the securities in relation to which the obligation to file an annual report on Form 40-F arises; or transactions in said securities.
The Registrant has previously filed an Appointment of Agent for Service of Process and Undertaking on Form F-X with respect to the class of securities in relation to which the obligation to file the Form 40-F arises. Any change to the name or address of the Registrant’s agent for service of process shall be communicated promptly to the SEC by amendment to the Form F-X referencing the file number of the Registrant.
SIGNATURES
Pursuant to the requirements of the Exchange Act, the Registrant certifies that it meets all of the requirements for filing on Form 40-F and has duly caused this annual report to be signed on its behalf by the undersigned, thereto duly authorized.
|
NUTRIEN LTD.
|
|
By: |
/s/ Robert A. Kirkpatrick |
|
Name: Title: |
Robert A. Kirkpatrick Senior Vice President, General Counsel Securities & Corporate Secretary |
Date: March 1, 2024
EXHIBIT INDEX
Exhibit Number |
Description |
97.1 |
|
99.1 |
Annual Information Form for the fiscal year ended December 31, 2023 |
99.2 |
Management’s Discussion and Analysis for the fiscal year ended December 31, 2023 |
99.3 |
Audited Annual Consolidated Financial Statements for the fiscal year ended December 31, 2023 |
99.4 |
Consent of KPMG LLP, Independent Registered Public Accounting Firm |
99.5 |
Certification of Chief Executive Officer pursuant to Section 302 of the Sarbanes-Oxley Act of 2002 |
99.6 |
Certification of Chief Financial Officer pursuant to Section 302 of the Sarbanes-Oxley Act of 2002 |
99.7 |
Certifications pursuant to Section 906 of the Sarbanes-Oxley Act of 2002 |
99.8 |
|
99.9 |
|
101 |
Interactive Data File (formatted as Inline XBRL) |
104 |
Cover Page Interactive Data File (formatted as Inline XBRL and contained in Exhibit 101) |
Exhibit 97.1

RECOUPMENT POLICY
November 2, 2023
Last updated: November 2, 2023
| RECOUPMENT POLICY | ||||||
| The Code of Ethics of Nutrien Ltd. (the “Corporation”) requires all employees of the Corporation to perform their duties in a fair and ethical manner. As required pursuant to the Securities Laws (as defined below), the Board of Directors (the “Board”) of the Corporation has adopted this Compensation Recoupment Policy (the “Policy”) to empower the Corporation to recover Covered Compensation (as defined below) erroneously awarded to any Executive Officer (as defined below) in the event of an Accounting Restatement (as defined below). |
Definitions . . . . . . . . . . . . . . . . . . . . . . . . . . . . . . . . . |
|
1 |
|
||||
| Recoupment . . . . . . . . . . . . . . . . . . . . . . . . . . . . . . . |
2 | |||||||
| Clawback Exceptions . . . . . . . . . . . . . . . . . . . . . . . . |
3 | |||||||
| Prohibitions . . . . . . . . . . . . . . . . . . . . . . . . . . . . . . . . |
3 | |||||||
| Acknowledgement and Consent . . . . . . . . . . . . . . . |
3 | |||||||
| Disclosure . . . . . . . . . . . . . . . . . . . . . . . . . . . . . . . . . |
3 | |||||||
| Administration, Interpretation and Amendment of Policy . . . . . . . . . . . . . . . . . . . . . . . . . . . . . . . . . . . . . | 3 | |||||||
Notwithstanding anything in this Policy to the contrary, at all times, this Policy remains subject to interpretation and operation in accordance with the final rules and regulations promulgated by the U.S. Securities and Exchange Commission (the “SEC”), the final listing standards adopted by the Stock Exchange (as defined below), and any applicable SEC or Stock Exchange guidance or interpretations issued from time to time regarding such Covered Compensation recovery requirements (collectively, the “Final Guidance”). Questions regarding this Policy should be directed to the Senior Vice President, Chief Human Resources Officer.
Definitions
“Executive Officer” means any current or former officer of the Corporation within the meaning of Rule 16a-1(f) under the Securities Exchange Act of 1934 (the “Exchange Act”), as determined by the Board or the Human Resources & Compensation Committee of the Board (the “Committee”). Executive Officers include, at a minimum, “executive officers” as defined in Rule 3b-7 under the Exchange Act and identified under Item 401(b) of Regulation S-K.
“Incentive-Based Compensation” means, with respect to an Executive Officer, any compensation that is granted, earned, or vested based wholly or in part upon the attainment of a Financial Reporting Measure (as defined below). For purposes of clarity, Incentive-Based Compensation includes compensation that is in any plan, other than tax- qualified retirement plans, including long term disability, life insurance, and supplemental executive retirement plans, and any other compensation that is based on such Incentive-Based Compensation, such as earnings accrued on notional amounts of Incentive-Based Compensation contributed to such plans. Incentive-Based Compensation does not include awards that are subject only to service-based vesting, such as time-vesting restricted stock units, time-vesting stock options, or other time-vesting awards, so long as such awards are not granted or earned based on a Financial Reporting Measure.
“Financial Reporting Measure” is defined as a measure that is determined and presented in accordance with the accounting principles used in preparing the Corporation’s financial statements, and any measures that are derived wholly or in part from such measures. Stock price and total shareholder return are also Financial Reporting Measures.
Incentive-Based Compensation is deemed “Received” in the Corporation’s fiscal period during which the Financial Reporting Measure specified in the Incentive-Based Compensation award is attained, even if the payment or grant of the Incentive-Based Compensation occurs after the end of that period.
“Covered Compensation” means the amount of Incentive-Based Compensation Received during the applicable Recovery Period that exceeds the amount of Incentive-Based Compensation that otherwise would have been Received had it been determined based on the relevant restated amounts, and computed without regard to any taxes paid.

|
Recoupment Policy | 1 |
|
Incentive-Based Compensation Received by an Executive Officer will only qualify as Covered Compensation if: (i) it is Received after October 2, 2023; (ii) it is Received after such Executive Officer begins service as an Executive Officer; (iii) such Executive Officer served as an Executive Officer at any time during the performance period for such Incentive-Based Compensation; and (iv) it is Received while the Corporation has a class of securities listed on a national securities exchange or a national securities association.
For Incentive-Based Compensation based on stock price or total shareholder return, where the amount of erroneously awarded Covered Compensation is not subject to mathematical recalculation directly from the information in an Accounting Restatement, the amount of such Incentive-Based Compensation that is deemed to be Covered Compensation will be based on a reasonable estimate of the effect of the Accounting Restatement on the stock price or total shareholder return upon which the Incentive-Based Compensation was Received, and the Corporation will maintain and provide to the Stock Exchange documentation of the determination of such reasonable estimate.
“Recovery Period” means the three completed fiscal years immediately preceding the Trigger Date (as defined below) and, if applicable, any transition period resulting from a change in the Corporation’s fiscal year within or immediately following those three completed fiscal years (provided, however, that if a transition period between the last day of the Corporation’s previous fiscal year end and the first day of its new fiscal year comprises a period of nine to 12 months, such period would be deemed to be a completed fiscal year).
For purposes of this Policy, the “Trigger Date” as of which the Corporation is required to prepare an Accounting Restatement is the earlier to occur of: (i) the date that the Board, applicable Board committee, or officers authorized to take action if Board action is not required, concludes, or reasonably should have concluded, that the Corporation is required to prepare the Accounting Restatement or (ii) the date a court, regulator, or other legally authorized body directs the Corporation to prepare the Accounting Restatement.
“Securities Laws” means all applicable laws, regulations, rules, policies or instruments of any securities commission, stock exchange or like body in Canada and/or the United States, as of the date of this Policy.
“Stock Exchange” means the New York Stock Exchange.
Recoupment
Unless a Clawback Exception exists, the Corporation will recover reasonably promptly from each Executive Officer the Covered Compensation Received by such Executive Officer in the event that the Corporation is required to prepare an accounting restatement due to the material noncompliance of the Corporation with any financial reporting requirement under the Securities Laws, including any required accounting restatement to correct an error in previously issued financial statements that is material to the previously issued financial statements, or that would result in a material misstatement if the error were corrected in the current period or left uncorrected in the current period (each, an “Accounting Restatement”).
To the extent that the Covered Compensation is not paid to the Corporation, in addition to any other legal remedy that the Corporation may have, the Committee may set off any Covered Compensation against any amounts that may be owing from time to time by the Corporation or a subsidiary to the Executive Officer, whether as wages, bonus, Incentive-Based Compensation, deferred compensation, severance entitlement or vacation pay or in the form of any other benefit or for any other reason, in a manner consistent with Section 409A, if applicable.
If a Clawback Exception applies with respect to an Executive Officer, the Corporation may forgo such recovery under this Policy from such Executive Officer.
|
|
Recoupment Policy | 2 |
|
Clawback Exceptions
The Corporation is required to recover all Covered Compensation Received by an Executive Officer in the event of an Accounting Restatement unless (i) one of the following conditions are met and (ii) the Committee has made a determination that recovery would be impracticable in accordance with Rule 10D-1 under the Exchange Act (under such circumstances, a “Clawback Exception” applies):
| • | the direct expense paid to a third party to assist in enforcing this Policy would exceed the amount to be recovered (and the Corporation has already made a reasonable attempt to recover such erroneously awarded Covered Compensation from such Executive Officer, has documented such reasonable attempt(s) to recover, and has provided such documentation to the Stock Exchange); |
| • | recovery would violate home country law that was adopted prior to November 28, 2022 (and the Corporation has already obtained an opinion of home country counsel, acceptable to the Stock Exchange, that recovery would result in such a violation, and provided such opinion to the Stock Exchange); or |
| • | recovery would likely cause an otherwise tax-qualified retirement plan, under which benefits are broadly available to employees of the Corporation, to fail to meet the requirements of Section 401(a)(13) or Section 411(a) of the U.S. Internal Revenue Code and regulations thereunder. For purposes of clarity, this Clawback Exception only applies to U.S. tax-qualified retirement plans and does not apply to other plans, including long term disability, life insurance, and supplemental executive retirement plans, or any other compensation that is based on Incentive-Based Compensation in such plans, such as earnings accrued on notional amounts of Incentive-Based Compensation contributed to such plans. |
Prohibitions
The Corporation is prohibited from paying or reimbursing the cost of insurance for, or indemnifying, any Executive Officer against the loss of erroneously awarded Covered Compensation.
Disclosure
This Policy, and any recovery of Covered Compensation by the Corporation pursuant to this Policy that is required to be disclosed in the Corporation’s filings under the Securities Laws, will be disclosed as required by the Securities Act of 1933, as amended, the Exchange Act, and related rules and regulations, including Stock Exchange rules.
Administration, Interpretation and Amendment of Policy
In order to comply with Securities Laws (as the same may be implemented, amended, supplemented, amended and restated, substituted or re-enacted from time to time from and after the date of this Policy), the Committee may at any time in its sole discretion amend, supplement, amend and restate, substitute or repeal this Policy in whole or in part on such terms as the Committee determines in its sole discretion as to be appropriate to comply with such Securities Laws.
The Committee will administer this Policy in accordance with the Final Guidance, and all actions, interpretations and determinations pursuant to this Policy that are taken or made by the Board in good faith will be final, conclusive and binding. This Policy is in addition to and is not intended to change or interpret any Canadian or U.S. federal or state law or regulation, including the Canada Business Corporations Act, the Certificate and Articles of Incorporation of the Corporation, or Bylaw No. 1 of the Corporation. The Committee will review the Policy from time to time and will have full and exclusive authority to take any action it deems appropriate.
|
|
Recoupment Policy | 3 |
|
This Policy shall not preclude any other compensation recoupment or clawback policies, arrangements or provisions of the Company (“Other Recovery Provisions”); to the extent recovery of compensation is achieved by the Corporation under this Policy, there shall be no duplication of recovery under Other Recovery Provisions, except as may be required by law.
Date of Last Revision: November 2, 2023
|
|
Recoupment Policy | 4 |
|
Exhibit 99.1
Nutrien Ltd.
Annual Information Form
Year Ended December 31, 2023
1 – Table of Contents
Following is a table of contents of this Annual Information Form (“AIF”) referencing the applicable requirements of Form 51-102F2 – Annual Information Form of the Canadian Securities Administrators. Certain information required to be disclosed in this AIF is contained in Nutrien Ltd.’s management’s discussion and analysis (“2023 MD&A”), and Consolidated Financial Statements for the years ended December 31, 2023 and 2022 (“2023 Consolidated Financial Statements”) and is incorporated by reference herein to the extent noted below and throughout this AIF; these documents are available under Nutrien’s corporate profile on the Canadian Securities Administrators’ SEDAR+ website at sedarplus.ca and on the EDGAR section of the United States (“US”) Securities and Exchange Commission’s (“SEC”) website at sec.gov.
| Annual Information Page Reference |
Incorporated by Reference from the 2023 Consolidated Financial Statements |
|||||||
| 1 Table of Contents |
2-3 | |||||||
| 2 Advisories |
4-6 | |||||||
| 2.1 Forward-Looking Information |
4 | |||||||
| 2.2 Basis of Presentation |
6 | |||||||
| 3 Corporate Structure |
6-7 | |||||||
| 3.1 Name, Address and Incorporation |
6 | |||||||
| 3.2 Intercorporate Relationships |
7 | |||||||
| 4 General Development of the Business |
7-9 | |||||||
| 4.1 Three-Year History |
7 | Notes 13, 14, 17, 18, 23 and 25 | ||||||
| 5 Description of the Business |
9-36 | Notes 3 and 28 | ||||||
| 5.1 Nutrien Ag Solutions (“Retail”) Operations |
10 | |||||||
| 5.2 Potash Operations |
11 | |||||||
| 5.3 Nitrogen Operations |
13 | |||||||
| 5.4 Phosphate Operations |
16 | |||||||
| 5.5 Specialized Skill and Knowledge |
17 | |||||||
| 5.6 Intangible Properties |
18 | Note 14 | ||||||
| 5.7 Seasonality |
18 | |||||||
| 5.8 Environmental Matters |
18 | Notes 22 and 29 | ||||||
| 5.9 Employees |
22 | |||||||
| 5.10 Social and Environmental Policies |
23 | |||||||
| 5.11 Risk Factors |
26 | |||||||
| 5.12 Mineral Projects |
36 | |||||||
| 6 Dividends |
36 | |||||||
| 7 Description of Capital Structure |
36-38 | |||||||
| 7.1 General Description of Capital Structure |
36 | |||||||
| 7.2 Constraints |
37 | |||||||
| 7.3 Debt Ratings |
37 | |||||||
| 8 Market for Securities |
38-39 | |||||||
| 8.1 Trading Price and Volume |
38 | |||||||
| 8.2 Prior Sales |
39 | Notes 5 and 23 | ||||||
| 9 Escrowed Securities and Securities Subject to Contractual Restriction on Transfer
|
39
|
|||||||
2
| 10 Directors and Officers |
39-42 | |||||||||
| 10.1 Name, Occupation and Security Holding |
39 | |||||||||
| 10.2 Cease Trade Orders, Bankruptcies, Penalties or Sanctions |
41 | |||||||||
| 10.3 Conflicts of Interest |
42 | |||||||||
| 11 Promoters |
42 | |||||||||
| 12 Legal Proceedings and Regulatory Actions |
42 | Note 29 | ||||||||
| 13 Interest of Management and Others in Material Transactions |
43 | |||||||||
| 14 Transfer Agent, Registrar and Trustees |
43 | |||||||||
| 15 Material Contracts |
43 | |||||||||
| 16 Interests of Experts |
43 | |||||||||
| 17 Audit Committee |
43-45 | |||||||||
| 17.1 Audit Committee Charter |
43 | |||||||||
| 17.2 Composition of the Audit Committee |
43 | |||||||||
| 17.3 Relevant Education and Experience of Members of the Audit Committee |
43 | |||||||||
| 17.4 Pre-approval Policies and Procedures |
45 | |||||||||
| 17.5 External Auditor Service Fees (by Category) |
45 | |||||||||
| 18 Additional Information |
45 | |||||||||
| Schedule A Audit Committee Charter |
46-52 | |||||||||
| Schedule B Mineral Projects |
53-75 | |||||||||
| a. Material Potash Operations |
53 | |||||||||
| b. Allan Potash Operations |
64 | |||||||||
| c. Cory Potash Operations |
66 | |||||||||
| d. Lanigan Potash Operations |
68 | |||||||||
| e. Rocanville Potash Operations |
70 | |||||||||
| f. Vanscoy Potash Operations |
73
|
|||||||||
3
2 – Advisories
2.1 Forward-Looking Information
Certain statements and other information included in this AIF, including within the documents incorporated by reference, constitute “forward-looking information” or “forward-looking statements” (collectively, “forward-looking statements”) under applicable securities laws (such statements are often accompanied by words such as “anticipate”, “forecast”, “expect”, “believe”, “may”, “will”, “should”, “estimate”, “project”, “intend” or other similar words). All statements in this document, other than those relating to historical information or current conditions, are forward-looking statements, including, but not limited to:
| • | our business strategies, plans, prospects and opportunities, and our sustainability, climate change and Environmental, Social and Governance (“ESG”) initiatives and proposed responses to climate change and ESG policies and regulations; |
| • | expectations regarding performance of our operating segments; |
| • | our projections for cash from operations and expectations regarding our growth and capital allocation intentions and strategies; |
| • | our advancement of strategic growth initiatives; |
| • | capital spending expectations; |
| • | our market outlook for 2024 and our expectations for market conditions and fundamentals, including agriculture and crop nutrient markets, anticipated supply and demand for our products and services, expected market and industry and growing conditions with respect to crop nutrient application rates, planted acres, grower crop investment, crop mix, production volumes and expenses, shipments, natural gas costs and availability, consumption, prices, operating rates and the impact of seasonality, import and export volumes, economic sanctions, inventories, crop development and natural gas curtailments; |
| • | expectations concerning future product offerings; |
| • | expectations regarding continued natural gas curtailments at our Trinidad nitrogen facility and the expected improved natural gas availability and timing of completion of additional natural gas fields in Trinidad; |
| • | expectations regarding changes in the agriculture space, including continued farm consolidation in the US and other developed markets and the continued advancement and adoption of technology and digital innovations, including the use and anticipated effects of more efficient mining, including remote-controlled mobile equipment, new crop input technologies and agronomic capabilities; |
| • | expectations regarding acquisitions and divestitures; |
| • | expectations regarding environmental compliance requirements and costs, including estimates of asset retirement obligations, federal and provincial carbon pricing, permits, approvals and site assessment and remediation costs; |
| • | expectations regarding our sustainability, climate change and greenhouse gas (“GHG”) emissions reduction strategy and related programs and initiatives, including our various sustainability performance goals, targets, costs, capital expenditures, commitments and aspirations as set out in our Feeding the Future Plan and the 2023 ESG Report; |
| • | the expected timing for release of our Global Sustainability Report for the year ended December 31, 2023; |
| • | our evaluation of future opportunities with respect to the suspended Geismar clean ammonia project; |
| • | the negotiation of sales and other contracts, including the anticipated renegotiation and expiry of existing contracts; |
| • | initiatives to promote innovative, sustainable and productive agriculture; |
| • | expectations regarding future changes in our credit ratings; and |
| • | expectations regarding our mineral reserve and resource estimates, and the annual nameplate capacity and annual operational capability of our mines and associated mine life estimates. |
These forward-looking statements are subject to a number of assumptions, risks and uncertainties, many of which are beyond our control, which could cause actual results to differ materially from such forward-looking statements. As such, undue reliance should not be placed on these forward-looking statements.
All of the forward-looking statements are qualified by the assumptions that are stated or inherent in such forward-looking statements, including the assumptions referred to below and elsewhere in this document. Although we believe that these assumptions are reasonable, having regard to our experience and our perception of historical trends, the assumptions set forth below are not exhaustive of the factors that may affect any of the forward-looking statements and the reader should not place undue reliance on these assumptions and such forward-looking statements. Current conditions, economic and otherwise, render assumptions, although reasonable when made, subject to greater uncertainty.
4
In respect of our GHG emissions reduction and other sustainability and climate-related initiatives and targets, we have made assumptions with respect to, among other things: that such target is achievable by deploying capital into nitrous oxide (“N2O”) abatement at our nitric acid production facilities, energy efficiency improvements, carbon capture, utilization and storage, use of natural gas to generate electricity and waste heat recovery; our ability to successfully deploy capital and pursue other operational measures, including the successful application to our current and future operations of existing and new technologies; the successful implementation by us of proposed or potential plans in respect thereof; projected capital investment levels, the flexibility of our capital spending plans and the associated sources of funding; our ability to otherwise implement all technology necessary to achieve our GHG emissions reduction and other sustainability and climate-related initiatives and targets; and the development, availability and performance of technology and technological innovations and associated expected future results.
Additional key assumptions that have been made in relation to the operation of our business as currently planned and our ability to achieve our business objectives include, among other things:
| • | assumptions with respect to our ability to successfully complete, integrate and realize the anticipated benefits of our already completed and future acquisitions and divestitures, and that we will be able to implement our standards, controls, procedures and policies in respect of any acquired businesses and realize the expected synergies on the anticipated timeline or at all; |
| • | that future business, regulatory and industry conditions will be within the parameters expected by us, including with respect to prices, expenses, margins, demand, supply, product availability, shipments, consumption, weather conditions, supplier agreements, product distribution agreements, availability, inventory levels, exports, crop development and cost of labor and interest, exchange and effective tax rates; |
| • | assumptions with respect to global economic conditions and the accuracy of our market outlook expectations for 2024 and in the future; |
| • | assumptions related to our calculation of the Retail – South America goodwill and intangible asset impairment; |
| • | assumptions related to the impairment of our Nitrogen and Phosphate property, plant and equipment; |
| • | assumptions related to the calculation of the recoverable amount of our Aurora and White Springs cash generating units, including internal sales and input price forecasts, discount rate, long-term growth rate and end of expected mine life; |
| • | assumptions with respect to our intention to complete share repurchases under our normal course issuer bid programs, including Toronto Stock Exchange (“TSX”) approval, the funding of such share repurchases, existing and future market conditions, including with respect to the price of our common shares, and compliance with respect to applicable limitations under securities laws and regulations and stock exchange policies; |
| • | our expectations regarding the impacts, direct and indirect, of certain geopolitical conflicts, including the war between Ukraine and Russia and the conflict in the Middle East on, among other things, global supply and demand, including for crop nutrients, energy and commodity prices, global interest rates, supply chains and the global macroeconomic environment, including inflation; |
| • | assumption regarding future markets for clean ammonia; |
| • | the adequacy of our cash generated from operations and our ability to access our credit facilities or capital markets for additional sources of financing; |
| • | our ability to identify suitable candidates for acquisitions and divestitures and negotiate acceptable terms; |
| • | our ability to maintain investment grade ratings and achieve our performance targets; |
| • | our ability to successfully negotiate sales and other contracts; and |
| • | our ability to successfully implement new initiatives and programs. |
Events or circumstances could cause actual results to differ materially from those in the forward-looking statements.
With respect to our GHG emissions reduction and other sustainability and climate-related initiatives and targets, such events or circumstances include, but are not limited to: our ability to deploy sufficient capital to fund the necessary expenditures to implement the necessary operational changes to achieve these initiatives and targets; our ability to implement requisite operational changes; our ability to implement some or all of the technology necessary to efficiently and effectively achieve expected future results, including in respect of such GHG emissions reduction target; the availability and commercial viability and scalability of emissions reduction strategies and related technology and products; and the development and execution of implementing strategies to meet such GHG emissions reduction target.
With respect to our business generally and our ability to meet the other targets, commitments, goals, strategies and related milestones and schedules disclosed in this document, such events or circumstances include, but are not limited to:
| • | general global economic, market and business conditions; |
| • | failure to complete announced and future acquisitions or divestitures at all or on the expected terms and within the expected timeline; |
| • | climate change and weather conditions, including impacts from regional flooding and/or drought conditions; |
| • | failure to execute on our strategies related to sustainability matters or to achieve our GHG emission and other related expectations, targets, goals and commitments; |
5
| • | crop planted acreage, yield and prices; |
| • | the supply and demand and price levels for our products; |
| • | governmental and regulatory requirements and actions by governmental authorities, including changes in government policy (including tariffs, trade restrictions and climate change initiatives), government ownership requirements, and changes in environmental, tax, antitrust, and other laws or regulations and the interpretation thereof; |
| • | political or military risks, including civil unrest, actions by armed groups or conflict and malicious acts including terrorism and industrial espionage; |
| • | our ability to access sufficient, cost-effective and timely transportation, distribution and storage of products; |
| • | the occurrence of a major environmental or safety incident or becoming subject to legal or regulatory proceedings; |
| • | innovation and cybersecurity risks related to our systems, including our costs of addressing or mitigating such risks; |
| • | counterparty and sovereign risk; |
| • | delays in completion of turnarounds at our major facilities; |
| • | interruptions of or constraints in availability of key inputs, including natural gas and sulfur; |
| • | any significant impairment of the carrying amount of certain assets; |
| • | the risk that rising interest rates and/or deterioration of business operating results may result in the further impairment of assets or goodwill attributed to certain cash generating units; |
| • | risks related to reputational loss; |
| • | certain complications that may arise in our mining processes; |
| • | the ability to attract, engage and retain skilled employees, and strikes or other forms of work stoppages; |
| • | geopolitical conflicts, including the war between Ukraine and Russia and the conflict in the Middle East, and their potential impact on, among other things, global market conditions and supply and demand, including for crop nutrients, energy and commodity prices, interest rates, supply chains and the global economy generally; and |
| • | other risk factors detailed from time to time in Nutrien reports filed with the Canadian securities regulators and the SEC in the US. |
For additional details regarding the risks listed above, see “Risk Factors” discussed in this AIF for a description of other risk factors affecting forward-looking statements.
The forward-looking statements in this document are made as of the date hereof and we disclaim any intention or obligation to update or revise any forward-looking statements in this AIF as a result of new information or future events, except as may be required under applicable Canadian securities legislation or applicable US federal securities laws.
2.2 Basis of Presentation
Nutrien’s consolidated financial information for 2023, 2022 and 2021 presented and discussed in this AIF is prepared in accordance with International Financial Reporting Standards (“IFRS”) as issued by the International Accounting Standards Board. This AIF is dated February 22, 2024, and the information contained herein is current as of such date, unless otherwise specified.
Unless expressly stated, the information contained on, or accessible from, our website or any other website or any other report or document we file with or furnish to applicable Canadian or US securities regulatory authorities is not incorporated by reference into this AIF.
3 – Corporate Structure
In this AIF, unless otherwise specified, the term “Nutrien” refers to Nutrien Ltd. and, unless the context requires otherwise, the terms “we”, “us”, “our”, “Nutrien” and the “Company” refer to Nutrien and its direct and indirect subsidiaries, individually or in any combination, as applicable. Financial information in this AIF is presented in United States dollars and references to “dollars”, “$” and “US$” are to United States dollars and references to “CAD$” are to Canadian dollars.
3.1 Name, Address and Incorporation
Nutrien is a corporation incorporated under the Canada Business Corporations Act (“CBCA”).
Nutrien’s registered head office is Suite 1700, 211 19th Street East, Saskatoon, Saskatchewan, Canada S7K 5R6. We also have corporate offices at 13131 Lake Fraser Drive SE, Calgary, Alberta, Canada T2J 7E8 and 5296 Harvest Lake Drive, Loveland, Colorado, US 80538.
6
3.2 Intercorporate Relationships
| Principal Subsidiaries 1 | Jurisdiction of Incorporation, Formation or Organization |
Ownership | ||
| Potash Corporation of Saskatchewan Inc. (“PotashCorp”) |
Canada |
100% |
||
| Nutrien (Canada) Holdings ULC (“Agrium”) |
British Columbia, Canada |
100% |
||
| Agrium Canada Partnership |
Alberta, Canada |
100% |
||
| Agrium Potash Ltd. |
Canada |
100% |
||
| Nutrien US LLC |
Colorado, US |
100% |
||
| Cominco Fertilizer Partnership |
Texas, US |
100% |
||
| Loveland Products Inc. |
Colorado, US |
100% |
||
| Nutrien Ag Solutions (Canada) Inc. |
Canada |
100% |
||
| Nutrien Ag Solutions, Inc. |
Delaware, US |
100% |
||
| Nutrien Ag Solutions Limited |
Western Australia, Australia |
100% |
||
| PCS Nitrogen Fertilizer, L.P. |
Delaware, US |
100% |
||
| PCS Nitrogen Trinidad Limited |
Trinidad |
100% |
||
| PCS Phosphate Company, Inc. |
Delaware, US |
100% |
||
| PCS Sales (USA), Inc. |
Delaware, US |
100% |
||
| Nutrien Financial US LLC |
Delaware, US |
100% |
1 In aggregate, our remaining subsidiaries not listed herein accounted for less than 20 percent of our consolidated assets and less than 20 percent of our consolidated sales as at and for the year ended December 31, 2023.
4 – General Development of the Business
4.1 Three-Year History
Acquisitions
The table below provides information on our acquisitions of Nutrien Ag Solutions (“Retail”) businesses, including Casa do Adubo S.A. (“Casa do Adubo”), completed during the last three fiscal years.
| Casa do Adubo | Other Acquisitions | |||||||
|
Acquisition date |
October 1, 2022 | 2023 | 2022 | 2021 | ||||
| Purchase price, net of cash and cash equivalents acquired, and amounts held in escrow (US$ millions) | 268 | 153 | 176 | 88 | ||||
| Number of Retail operating locations | 39 retail locations and 10 distribution centers | 23 | 43 | 36 | ||||
| Description | Agriculture retailer in Brazil | Various retail agricultural services in North America, Australia and South America | Various retail agricultural services in North America, Australia and South America and one wholesale warehouse location | Various retail digital agriculture and proprietary products, and retail and agricultural services businesses in North America, South America and Australia | ||||
7
Asset Impairment and Reversals
| Year |
Impairment (US$ |
Description | ||
| 2023 |
233 | Phosphate White Springs non-cash impairment of property, plant and equipment due to the volatility of forecasted phosphate margins |
||
| 2023 |
465 | Retail - South America non-cash impairment of goodwill and intangible assets mainly due to the impact of crop input price volatility, more moderate long-term growth assumptions and higher interest rates |
||
| 2023 |
76 | Nitrogen Trinidad non-cash impairment of property, plant and equipment due to a new natural gas contract and the resulting outlook for higher expected natural gas costs and constrained near-term availability. We expect improved natural gas availability in Trinidad as the development of additional gas fields is anticipated to add new supply starting in 2026. |
||
| 2022 |
(450) | Phosphate Aurora non-cash impairment reversal of property, plant and equipment due to the volatility of forecasted phosphate margins |
||
| 2022 |
(330) | Phosphate White Springs non-cash impairment reversal of property, plant and equipment due to the volatility of forecasted phosphate margins |
Normal Course Issuer Bid (“NCIB”)
The table below provides information on our share repurchase programs.
| Commencement Date |
Expiry | Maximum Shares for Repurchase | ||||
| 2024 NCIB 1 |
March 1, 2024 | February 28, 2025 | 24,728,159 | |||
| 2023 NCIB |
March 1, 2023 | February 29, 2024 | 24,962,194 | |||
| 2022 NCIB 2 |
March 1, 2022 | February 7, 2023 | 55,111,110 | |||
| 2021 NCIB |
March 1, 2021 | February 28, 2022 | 28,468,448 | |||
| 2020 NCIB |
February 27, 2020 | February 26, 2021 | 28,572,458 |
1 On February 21, 2024, our Board of Directors (the “Board”) approved a share repurchase program for up to 5 percent of our outstanding common shares (the “2024 NCIB”). The 2024 NCIB, which is subject to acceptance by the TSX, will expire earlier than the date above if we acquire the maximum number of common shares allowable or otherwise decide not to make any further repurchases.
2 The original expiry date of the 2022 NCIB was February 28, 2023, but we acquired the maximum aggregate number of common shares allowable thereunder on February 7, 2023.
The table below sets forth the number of common shares we have repurchased during the last three fiscal years, in each case, under the applicable NCIB through open market purchases at market prices.
| Common Shares Repurchased | 2023 | 2022 | 2021 | |||
| Total amount (US$ millions) |
1,000 | 4,496 | 1,105 | |||
| Number of shares |
13,378,189 | 53,312,559 | 15,982,154 |
Senior Notes Issuances and Repayments
In 2022, we filed a base shelf prospectus in Canada and the US qualifying the issuance of up to $5 billion of common shares, debt securities and other securities during a period of 25 months from March 11, 2022. On March 27, 2023, we issued $1.5 billion of senior notes and on November 7, 2022, we issued $1.0 billion of senior notes as described below, each such offering pursuant to the base shelf prospectus and the applicable prospectus supplement.
The following tables summarize our long-term debt issuances and repayment activities during the last three fiscal years.
| Senior Notes Issued (Year) | Rate of Interest (%) |
Maturity Date | Amount (US$ millions) |
|||
| 2023 |
4.900 | March 27, 2028 | 750 | |||
| 2023 |
5.800 | March 27, 2053 | 750 | |||
| 2022 |
5.900 | November 7, 2024 | 500 | |||
| 2022 |
5.950 | November 7, 2025 | 500 |
8
The senior notes issued in 2023 and 2022 are unsecured, rank equally with our existing unsecured debt and have no sinking fund requirements prior to maturity. Each series is redeemable and provide for redemption prior to maturity, at our option, at specified prices. We did not issue any senior notes in 2021.
| Senior Notes Repaid (Year) |
Rate of Interest (%) |
Maturity Date | Principal Amount Repaid/Redeemed (US$ millions) |
|||
| 2023 |
1.900 | May 13, 2023 | 500 | |||
| 2022 |
3.150 | October 1, 2022 | 500 | |||
| 2021 1 |
3.500 | June 1, 2023 | 500 | |||
| 2021 1 |
3.625 | March 15, 2024 | 750 | |||
| 2021 1 |
3.375 | March 15, 2025 | 550 |
1 In 2021, we redeemed the entire outstanding principal amount of these senior notes in accordance with the optional redemption provisions provided in the indentures governing these senior notes.
In 2021, we also completed a cash tender offer to purchase the following debentures and senior notes up to a maximum aggregate purchase price of $300 million.
| Rate of Interest (%) |
Maturity Date | Principal Amount (US$ millions) |
||||
| Debentures |
7.800 | February 1, 2027 | 5 | |||
| Senior Notes |
7.125 | May 23, 2036 | 88 | |||
| Senior Notes |
6.125 | January 15, 2041 | 99 | |||
| Senior Notes |
5.250 | January 15, 2045 | 11 |
The 2021 redemption and cash tender offer were funded by using cash on hand and proceeds from the issuance of commercial paper. The total cash spend for the early redemption and tender offer, including accrued interest was $2.2 billion.
Credit Facilities
| Year
|
Description | |||
| New Facilities
|
Existing Facilities
|
|||
|
2023 |
Unsecured revolving term credit facility - Amended the terms to extend the maturity date from September 13, 2023 to September 10, 2024 - Reduced the facility limit from $2.0 billion to $1.5 billion |
|||
|
2022 |
Entered into $2.0 billion non-revolving term credit facilities in July
Entered into a $2.0 billion unsecured revolving term credit facility, with the same principal covenants and events of default as our existing $4.5 billion unsecured revolving term credit facility |
$2.0 billion unsecured non-revolving term credit facilities - Repaid drawdowns in full and terminated these facilities in September 2022
Uncommitted revolving demand credit facility - Increased our credit limit by $500 million to $1.0 billion
$4.5 billion unsecured revolving term credit facility - Amended the terms to extend the maturity date from June 4, 2026 to September 14, 2027 |
||
|
2021 |
$4.5 billion unsecured revolving term credit facility - Amended the terms to extend the maturity date from April 10, 2023 to June 4, 2026 |
|||
5 – Description of the Business
We are an integrated provider of crop inputs and services, playing a critical role in helping growers around the globe increase food production in a sustainable manner. We supply growers through our leading global Retail network – including crop nutrients, crop protection products, seed and merchandise, as well as agronomic and application services. We operate more than 2,000 retail selling locations across the US, Canada, Australia and South America, servicing approximately 500,000 grower accounts.
Nutrien is the world’s largest provider of crop inputs and services, producing potash, nitrogen and phosphate. We sold approximately 26 million metric tonnes of manufactured fertilizer in 2023 from our production facilities in Canada, the US and Trinidad.
9
As of December 31, 2023, we estimate our Potash operations represented 20 percent of global potash nameplate capacity, our Nitrogen operations represented 2 percent of global nitrogen nameplate capacity and our Phosphate operations represented approximately 3 percent of global phosphate nameplate capacity.
We report our results in four operating segments: Retail, Potash, Nitrogen and Phosphate. Our reporting structure reflects how we manage our business. Sales classified by operating segment and applicable category of products and services are provided in
Note 3 of the 2023 Consolidated Financial Statements. Sales or transfers to certain entities in which the Company has an investment that is accounted for under the equity method are provided in Note 3 of the 2023 Consolidated Financial Statements.
Established in late 2022, our global commercial organization is a single point of accountability for delivering customer service, driving supply chain efficiencies, and leading margin optimization opportunities across our integrated network. The Executive Vice President & Chief Commercial Officer also oversees Nutrien’s economics and market research team, as well as commercial development & integration activities, leading operational value creation initiatives across Nutrien’s global network.
5.1 Nutrien Ag Solutions (“Retail”) Operations
Overview
Our Retail segment markets crop nutrients, crop protection products, seed and merchandise, as well as agronomic application services and solutions, including Nutrien Financial, through more than 2,000 retail selling locations across North America, Australia and South America. In 2023, our total Retail sales represented 67 percent of our total consolidated sales (2022 – 56 percent). Retail’s products and services are as follows:
|
Product
|
% of Retail Sales
|
Description
|
||
| Crop nutrients | 2023 – 43 2022 – 47 |
- dry and liquid macronutrient products, which include potash, nitrogen and phosphate, and proprietary liquid micronutrient products, sold globally: ○ custom blended to suit specific nutrient requirements for each grower’s field typically based on soil fertility tests or plant tissue sampling |
||
| Crop protection products | 2023 – 34 2022 – 33 |
- third-party supplier and proprietary products, primarily through our Loveland Products, Inc. brands across North America, South America and Australia, designed to enhance crop quality and manage diseases, weeds, and other pests |
||
| Seed | 2023 – 12 2022 – 10 |
- third-party supplier and proprietary seed product lines, including brands such as Dyna-Gro®, Proven™, and Sementes Goiás, sold globally - seed treatments applied to seeds prior to planting to protect them from pests and disease |
||
| Nutrien Financial | 2023 – 2 2022 – 1 |
- flexible financing solutions offered to our customers in the US and Australia: ○ extended payment terms, typically up to one year, to facilitate alignment of grower crop cycles with cash flows ○ programs are coordinated with both product suppliers and local branch network |
||
| Merchandise | 2023 – 5 2022 – 5 |
- livestock-related merchandise including fencing, feed supplements, animal identification merchandise and various animal health products and services - storage and irrigation equipment and other products - primarily offered in Australia |
||
| Services and other | 2023 – 4 2022 – 4 |
- custom application services, crop scouting and precision agriculture services, soil fertility testing and plant tissue sampling - precision application allowing nutrient application rates to be adjusted when required, based on global positioning system technology and grid soil fertility test results and other data - monitoring of crop disease conditions and irrigation requirements using a system of weather tracking stations - various other services, including wool sales and marketing, livestock marketing and auction services, water services, insurance products, and real estate agency services in Australia - primarily offered in North America and Australia |
Transportation, Storage and Distribution
We have an extensive infrastructure system to store and transport our Retail products, strategically located across distribution points in regions where we operate to serve our customers across the US, Canada, Australia and South America.
10
| Number | Nature | Description | ||
| 98 | Terminals |
- used to receive large quantities of crop nutrients for redistribution to Retail centers and to growers directly |
||
| 33 | Distribution centers |
- used to distribute crop protection products and seed - used to coordinate product supply to Retail centers and allow us to manage inventory levels across our distribution network |
||
| 2,133 | Branches, satellites, plants |
- Retail locations used to provide growers with complete agriculture solutions, including crop and soil nutrients, crop protection, seed, services and digital tools - manufacturing plants used for production of crop inputs |
||
| 30,645 | Vehicles and application equipment |
- variety of on-road and on-farm vehicles used in the distribution, support and application of crop inputs |
Supply chain management, utilizing our extensive storage and distribution network and transportation capabilities, allows us to efficiently deliver crop nutrients and seed products to our customers. As growers have a short application and planting window, the precise timing of such deliveries is unpredictable due to both the seasonal nature of crop planting and the impact of weather. We regularly review our suppliers to maintain critical feedstocks, and we believe we can leverage our diverse retail distribution network and expansive fertilizer terminal network to effectively manage product logistic challenges.
Competitive Position
The market for Nutrien’s Retail products and services is highly competitive in the countries in which we operate. The principal competitors in the retail distribution of crop inputs include agricultural cooperatives, other major agriculture retailers, and smaller independent retailers and distributors. Retail produces a range of high-quality proprietary crop protection, seed and crop nutrient products that generate higher margins for our Retail segment compared to non-proprietary products. Our digital platform supports our core business offering, enhances the customer experience, and includes access to services such as crop planning, customer account management, invoice payment and financing.
5.2 Potash Operations
Overview
Our Potash operations include the mining and processing of potash, which is predominantly used as fertilizer. The Saskatchewan Ministry of Energy and Resources has granted Nutrien the exclusive right to mine potash on approximately 383,000 hectares (or approximately 947,000 acres) of Crown land pursuant to subsurface mineral leases. Of the 383,000 hectares leased from the Crown, approximately 282,000 hectares comprise our Potash operations at the Allan, Cory, Lanigan, Patience Lake, Rocanville and Vanscoy mines. Leases also exist with freehold mineral rights owners within the Crown subsurface mineral lease areas and elsewhere in Saskatchewan.
Subsurface mineral leases with the Province of Saskatchewan are for 21-year terms, renewable at our option at each of our producing mines. Our subsurface mineral leases with other parties are also for 21-year terms. Such other leases are renewable at our option, provided generally that production is continuing and that there is continuation of the applicable lease with the Province of Saskatchewan.
The potash we produce in Canada for sale to destinations outside Canada and the US is sold exclusively to Canpotex Limited (“Canpotex”). Canpotex is owned in equal shares by Nutrien and another potash producer in Canada. Canpotex, which was incorporated in 1970 and commenced operations in 1972, acts as an export company providing integrated sales, marketing and distribution for all Canadian potash produced by its shareholders/producers that is exported to destinations outside the US and Canada. Each shareholder of Canpotex has an equal voting interest as a shareholder and a right to equal representation on the Canpotex board of directors. In 2023, our total Potash sales represented 14 percent of our total consolidated sales (2022 – 22 percent). Our total offshore sales in 2023 represented 50 percent of our total Potash sales (2022 – 66 percent).
In general, Canpotex sales volumes are allocated among Canpotex producers based on production capacity. In 2023, Nutrien supplied approximately 64 percent of Canpotex’s product supply requirements (2022 – approximately 64 percent). Canpotex sells potash to buyers in export markets pursuant to term and spot contracts at agreed upon prices. Canpotex has a long history of being a reliable supplier of potash to international markets and of proven logistics and marketing capabilities. Other major potash exporting countries include Russia, Belarus, Israel and Germany.
11
Transportation, Storage and Distribution
Transportation costs can be a significant component of the total delivered cost of potash. Producers may have an advantage in serving markets close to their sources of supply depending on prevailing transportation costs. International shipping cost variances permit offshore producers to effectively compete with our potash production in many geographies.
Most of our potash for North American customers is shipped by rail. We believe we have a strategic advantage in this market with approximately 300 owned or leased potash distribution points and a fleet of approximately 5,900 owned or leased railcars as at December 31, 2023. We believe this is the most extensive domestic distribution network in the potash business. Shipments are also made by rail from each of our Saskatchewan mines to Thunder Bay, Ontario for shipment by lake vessel to our warehouses and storage facilities in Canada and the US.
In the case of our sales to Canpotex, Canpotex is responsible for managing and directing all aspects of its logistics infrastructure platform, including the transportation of its potash by way of rail to marine facilities where it is handled, stored and loaded onto ocean-going vessels. We have an equity interest in Canpotex Bulk Terminals Limited, which is a part owner of the marine facilities utilized by Canpotex in Vancouver, British Columbia. Canpotex also utilizes marine facilities in Portland, Oregon, Saint John, New Brunswick and Thunder Bay, Ontario. Other facilities may be utilized as required.
Production Methods
We produce potash primarily using conventional mining methods, except for our Patience Lake mine, which was originally a conventional underground mine, but began employing a solution mining method in 1989. In conventional operations, shafts are sunk to the ore body, which is approximately one kilometer below the surface. Mining machines cut the ore, which is then hoisted to the surface for processing. The ore is a mixture of potassium chloride, salt and insoluble particles. In solution mining, the potash is dissolved in warm brine and pumped to the surface for processing. Removing salt and insoluble particles through a milling process produces saleable potash. Six grades of potash (standard, granular, suspension, white granular, soluble and chicklets) are produced to suit different preferences of the agricultural, industrial and feed markets that we serve.
In 2023, our nameplate capacity represented 54 percent of the North American total nameplate capacity (see the table below for further information) and our potash production represented 56 percent of North American production. We allocate production among our mines on the basis of various factors, including cost efficiency and the grades of product that can be produced.
The following table sets forth, for each of the past two years, the production of ore, mill feed grade and finished product for each of our potash mines in Saskatchewan:
| Annual Nameplate Capacity 1
|
Annual Operational
|
|||||||||||||||||
|
2024
|
2023
|
2023 Production
|
2022 Production
|
|||||||||||||||
| Finished Product (millions of tonnes) |
Finished Product (millions of tonnes) |
Finished Product (millions of tonnes) |
Ore of tonnes) |
Grade % K2O |
Finished Product (millions of tonnes) |
Ore of tonnes) |
Grade % K2O |
Finished Product (millions of tonnes) |
||||||||||
|
Rocanville |
6.5 |
5.1 |
5.2 |
16.45 |
21.9 |
4.97 |
16.34 |
21.7 |
4.89 |
|||||||||
|
Allan |
4.0 |
2.4 |
3.0 |
6.70 |
25.1 |
2.39 |
6.96 |
25.0 |
2.50 |
|||||||||
|
Vanscoy |
3.0 |
1.1 |
1.4 |
3.22 |
24.3 |
1.05 |
3.03 |
25.2 |
1.01 |
|||||||||
|
Lanigan |
3.8 |
3.0 |
3.1 |
8.53 |
25.3 |
2.89 |
7.55 |
24.8 |
2.46 |
|||||||||
|
Cory |
3.0 |
2.1 |
2.2 |
5.12 |
22.5 |
1.50 |
6.07 |
23.3 |
1.89 |
|||||||||
|
Patience Lake |
0.3 |
0.3 |
0.3 |
– |
– |
0.20 |
– |
– |
0.26 |
|||||||||
|
Totals 3 |
20.6 |
14.0 |
15.2 |
40.02 |
13.00 |
39.95 |
13.01 |
|||||||||||
1 Represents estimates of capacity as of December 31, 2023. Estimates are based on capacity as per design specifications or Canpotex entitlements once determined. In the case of Patience Lake, estimate reflects current operational capability. Estimates for all other facilities do not necessarily represent operational capability.
2 Estimated annual achievable production based on expected staffing and operational readiness (estimated at the beginning of year, and may vary during the year, and year-to-year, including between our facilities). Estimate does not include inventory-related shutdowns and unplanned downtime.
3 2023 average mineral grade of 23.4 percent potassium oxide (“K2O”) mined and an average grade of 60.9 percent K2O produced. Averages are weighted proportionately to tonnes produced at our conventional mines.
12
The mining of potash is a capital-intensive business subject to the normal risks and capital expenditure requirements associated with mining operations. The production and processing of ore may be subject to delays and costs resulting from mechanical failures and hazards, such as unusual or unexpected geological conditions, subsidence, water inflows, and other conditions involved in mining potash ore.
Competitive Position
Potash is a commodity, characterized by minimal product differentiation, and, consequently, producers compete based on price, quality and service. We price competitively, sell high-quality products and provide high-quality service to our customers. Our service includes maintaining warehouses, leasing railcars and chartering vessels to enhance our delivery capabilities. The high cost of transporting potash affects competition in various geographic areas.
| Major Competitors in 2023 | ||||
| North American markets |
EuroChem Group AG |
The Mosaic Company (“Mosaic”) |
||
| Intrepid Potash Inc. |
ICL Group Ltd. (“ICL”) |
|||
| K+S Group |
PJSC Uralkali |
|||
| Offshore markets – Canpotex |
Arab Potash Company |
PA Belaruskali |
||
| EuroChem Group AG |
ICL |
|||
| K+S Group |
Sociedad Química y Minera de Chile S.A. |
|||
| PJSC Uralkali |
Asia-Potash (Laos) |
|||
In 2022 and the first half of 2023, potash production and exports from Eastern Europe were constrained below 2021 levels due to sanctions on Belarus and restrictions on Russia relating to the war between Ukraine and Russia. In the second half of 2023, global potash prices stabilized as global trade flows adjusted to this disruption and supply from Eastern Europe began to gradually return to pre-war levels.
Sources of Raw Materials
The production of potash requires a sustained fresh water supply for the milling process, which comes from nearby sources including subsurface aquifers, reservoirs and the Saskatchewan River.
5.3 Nitrogen Operations
Overview
We own and operate ammonia production facilities at which we produce and, where applicable, upgrade the following nitrogen products:
| Plant Locations | Nitrogen Products Produced | |
| Augusta, Georgia | Ammonia, urea, urea ammonium nitrate (“UAN”), urea solutions, nitric acid and ammonium nitrate | |
| Borger, Texas | Ammonia, urea and urea solutions | |
| Carseland, Alberta | Ammonia, urea and Environmentally Smart Nitrogen® (“ESN®”) | |
| Fort Saskatchewan, Alberta | Ammonia and urea | |
| Geismar, Louisiana | Ammonia, urea, UAN, urea solutions and nitric acid | |
| Joffre, Alberta | Ammonia | |
| Lima, Ohio | Ammonia, urea, UAN, urea solutions, nitric acid and ammonium nitrate | |
| Point Lisas, Trinidad | Ammonia and urea | |
| Redwater, Alberta | Ammonia, urea, ammonium nitrate liquor, UAN and ammonium sulfate |
We operate a number of facilities that upgrade ammonia and urea to other products such as UAN, ammonium nitrate, nitric acid and ESN®.
| Plant Locations | Nitrogen Products Produced | |
| Granum, Alberta | UAN | |
| Kennewick, Washington | UAN, ammonium nitrate liquor and nitric acid, calcium ammonium nitrate (“CAN”) | |
| New Madrid, Missouri | ESN® | |
| Standard, Alberta | UAN |
13
Our owned and operated facilities have a combined annual gross ammonia nameplate capacity of approximately 7.1 million tonnes.
We also have a 50 percent joint venture ownership in Profertil S.A. (“Profertil”), a joint venture that owns a nitrogen facility in Bahia Blanca, Argentina.
Transportation, Storage and Distribution
We distribute our nitrogen products by vessel, barge, pipeline, railcar and truck to our customers and, in high-consumption areas, through our strategically located storage terminals. In North America, as at December 31, 2023, we owned or leased approximately 190 nitrogen distribution points, as well as a fleet of approximately 5,700 leased railcars. We also lease dry and liquid storage capacity in Europe. These locations provide a network of field and production site storage capacity sufficient to serve local dealers during the peak seasonal demand period and are also used to provide off-season storage.
We also distribute nitrogen products from Trinidad primarily to markets in the US, South America, Europe and North Africa. We employ five long-term chartered ocean-going vessels and utilize short-term and spot charters as necessary for the transportation of ammonia for our marine distribution operations in Trinidad. All bulk urea production from Trinidad is shipped through third-party carriers. In addition, Profertil’s terminal on the Parana River includes a dedicated berth and two 100,000 tonne dry storage buildings in a key agricultural region of Argentina.
Production Methods
Ammonia is produced by taking nitrogen from the air and reacting it with a hydrogen source, usually natural gas reformed with steam. Carbon dioxide (“CO2”) is produced in ammonia production in two primary ways – first, as a product of the chemical reactions involved and, second, as a product of burning fuels that generate the heat required to make those chemical reactions occur. In most plants, the CO2 produced as a chemical byproduct is captured and used as an input to urea production. Low-carbon ammonia is made with direct GHG emissions typically reduced by approximately 60 percent but up to 80 percent compared to a conventional process, produced by primarily using carbon capture, utilization and storage or other low-emission production technologies, excluding end product use. In 2023, Nutrien increased our low-carbon ammonia production capability to 1.2 million tonnes across our Geismar, Redwater and Joffre nitrogen facilities.
Ammonia is the feedstock used to produce a full line of upgraded products, including urea, ammonium nitrate, nitric acid and nitrogen solutions, including both UAN solutions and urea solution products, ammonium sulfate and ESN®. Urea is produced by combining ammonia with CO2 and forming liquid urea, which can be further processed into a solid form. UAN solutions are liquid fertilizers that are produced by combining urea, liquid ammonium nitrate and water. Urea liquor is a urea liquid solution sold into the diesel exhaust fluid market. When combined with diesel in larger vehicles and machinery, it can improve fuel efficiency and reduce emissions. Urea liquid solutions are produced by combining liquid urea with water. Ammonium sulfate is produced by reacting ammonia and sulfuric acid, which is then granulated to form a solid granular product. We produce sulfuric acid from purchased sulfur at our Redwater facility. ESN® is a patented coated-fertilizer product that is made by coating the urea substrate with layers of polymers, allowing for more efficient delivery of nitrogen to the plant.
Ammonia, urea and nitrogen solutions are sold as fertilizers to agricultural customers and to industrial customers for various applications. Nitric acid and ammonium nitrate are sold to industrial customers for various applications. Urea is also sold for feed applications. ESN® is sold to agricultural customers. Urea solution is sold to industrial and agricultural customers.
Competitive Position
Nitrogen-based fertilizer is a global commodity, and customers, including end-users, dealers, and other fertilizer producers and distributors, base their purchasing decisions principally on the delivered price and availability of the product. The relative cost of, and availability of transportation for, raw materials and finished products to manufacturing facilities are also important competitive factors. Nitrogen is also an input into industrial production of a wide range of products. Many manufacturers want consistent quality and just-in-time delivery to keep their plants running.
14
| Major Competitors in 2023 | ||||
| North American markets |
CF Industries Holdings, Inc. |
LSB Industries, Inc. |
||
| CVR Partners, L.P. |
Incitec Pivot Ltd. |
|||
| Yara International ASA |
OCI N.V. |
|||
| Koch Industries, Inc. |
Suppliers in the Middle East, North Africa, Trinidad, China, Central and Eastern Europe and Russia |
|||
| Offshore markets |
Suppliers in the Middle East, North Africa, Trinidad, China, Central and Eastern Europe, and Russia. We also compete with a wide range of offshore and domestic producers. | |||
Our North American plants are geographically well positioned to service agriculture, industrial and feed customers across Canada and the US. Our robust North American distribution network provides in-market support, during seasonal peak demand, ensuring timely product availability. Trinidad mainly supplies our international fertilizer and industrial customers.
Our US production has continued to benefit from the low cost of natural gas and, to a greater extent, our Western Canadian production, which utilizes natural gas indexed to the Alberta Energy Company AECO Alberta benchmark natural gas price, has also benefited from the low cost of natural gas. In Trinidad, the price at which we purchase natural gas is linked to benchmark ammonia pricing, and annual escalating floor prices. Ammonia and urea predominate our offshore sales of nitrogen and originate primarily from Trinidad, with other sales coming from purchased product locations. In 2023, our total Nitrogen sales represented 16 percent of our total consolidated sales (2022 – 21 percent). For 2023, our offshore sales of nitrogen products represented 19 percent (2022 – 29 percent) of our total Nitrogen sales.
Sources of Raw Materials
Natural gas is the primary raw material used for producing ammonia, which is the base for virtually all nitrogen products. Our Joffre facility uses hydrogen as its raw material to produce ammonia.
In North America, we may enter into natural gas hedging transactions with the goal of minimizing risk from volatile gas prices. We purchase most of our natural gas from producers or marketers at the point of delivery of the natural gas into the pipeline system, then pay the pipeline company and, where applicable, the local distribution company to transport the natural gas to our nitrogen facilities. Over 90 percent of our North American consumption of natural gas by our Nitrogen operations is delivered pursuant to firm transportation contracts, which do not permit the pipeline or local distribution company to interrupt service to, or divert natural gas from, the plant.
| Trinidad natural gas contracts |
- Renewed in 2023 - Gas supply contract using a pricing formula based on benchmark ammonia pricing - Minimum take or pay arrangement providing for approximately 75 percent of the expected requirements of the Trinidad ammonia complex - 2022 and 2023 – force majeure notices received resulting in reduced operating rates |
|
| Profertil natural gas contracts |
- 70 percent of the natural gas contracts are with YPF S.A., our joint venture partner in Profertil which were renewed in 2023 and are expiring in 2024 - 30 percent of the natural gas sourced by other suppliers was renewed in 2023 and is expiring in 2028 |
|
| Carseland power cogeneration agreement |
- Expiring on December 31, 2026 - Provides 60 megawatt-hours of power per hour - Based on a fixed charge adjusted for inflation and a variable charge based on the cost of natural gas provided to the facility for power generation |
|
| Geismar natural gas pipeline transportation contracts |
- Entered in 2023 for various terms up to 10 years - Take or pay arrangement providing for approximately 90 percent of the expected natural gas requirements of Geismar as well as other production sites in Eastern United States. |
Geismar Clean Ammonia Project
In 2023, we suspended work on our proposed 1.2 million tonne Geismar clean ammonia project. This decision was due to an increase in expected capital costs compared to our initial estimates, continued uncertainty on the timing of emerging uses for clean ammonia, and prioritizing strategic capital allocation. This project is intended to manufacture clean ammonia using innovative technology. The new clean ammonia plant is expected to leverage low-cost natural gas, tidewater access to world markets, and high-quality carbon capture and sequestration infrastructure at the Company’s Geismar facility and is intended to serve growing demand in agriculture, industrial and emerging energy markets. We continue to monitor how this emerging energy market evolves and will evaluate future options for the project with the objectives of preserving value and optionality for the project.
15
5.4 Phosphate Operations
Overview
Our Phosphate operations include the manufacture and sale of solid and liquid phosphate fertilizers, phosphate feed, and purified phosphoric acid, which is used in feed and industrial products. We have phosphate mines and mineral processing plant complexes in Aurora, North Carolina and White Springs, Florida. We also have three phosphate feed plants in the US.
Our Phosphate properties include:
| Plant Locations | Primary Products Produced 1 | |
|
Aurora, North Carolina |
MAP, purified acid, merchant grade phosphoric acid (“MGA”), low magnesium SPA (“LOMAG”) and ammonium polyphosphate (“POLY”) |
|
| Cincinnati, Ohio |
Blended purified acid products |
|
| Joplin, Missouri |
Animal feed |
|
| Marseilles, Illinois |
Animal feed |
|
| Weeping Water, Nebraska |
Animal feed |
|
| White Springs, Florida |
MAP and MAP+MST, MGA 2, SPA, LOMAG and POLY |
1 The following scientific terms have the following meanings:
MAP monoammonium phosphate, 52 percent P2O5 (solid)
MAP+MST sulfur enhanced MAP
SPA superphosphoric acid, 70 percent P2O5 (liquid)
2 All of the MGA from White Springs is consumed internally in the production of additional products.
We execute offshore marketing and sales of our phosphate fertilizer through PCS Sales (USA), Inc.
Transportation, Storage and Distribution
As at December 31, 2023, we had approximately 130 owned or leased phosphate distribution points and a fleet of approximately 5,500 owned or leased railcars. We have access to ocean-based shipping terminal capacity in North Carolina through which we internationally ship the Aurora facility’s finished product. Most of our offshore Phosphate sales are shipped through the terminal at Morehead City, North Carolina. We use barges and tugboats to transport solid products and phosphoric acid between the Aurora facility and the Morehead City terminal. Raw materials and products, including sulfur, are also transported to and from the Aurora facility by rail and truck.
Sulfur is delivered to the White Springs facility by rail and truck from Canada and the US. Most of the phosphoric acid and chemical fertilizers produced at the White Springs facility are shipped to North American destinations by rail. Ammonia for the Aurora and White Springs facilities is supplied by rail and truck from our production facilities in Lima, Ohio and Augusta, Georgia.
Production Methods
We extract phosphate ore using surface mining techniques. At each mine site, the ore is mixed with recycled water to form a slurry, which is pumped from the mine site to our processing facilities. The ore is then screened to remove coarse materials, washed to remove clay and floated to remove sand to produce phosphate “rock”. The annual production capacity of our mines is currently 7.4 million tonnes of phosphate rock. During 2023, the Aurora facility’s total production of phosphate rock was 4.24 million tonnes and the White Springs facility’s total production of phosphate rock was 1.27 million tonnes. The sequence for mining portions of the Aurora property was identified in the permit issued by the US Army Corps of Engineers in June 2009. The permit authorizes mining in excess of 20 years, although the mine life has been estimated at 19 years at current production rates. Phosphate rock is the major input in our phosphate processing operations. Substantially all the phosphate rock produced is used internally for the production of phosphoric acid, SPA, chemical fertilizers, purified phosphoric acid and animal feed products.
In addition to phosphate ore, the other principal raw materials we require are sulfur and ammonia. We produce sulfuric acid at the Aurora and White Springs facilities from purchased sulfur.
Our Phosphate operations purchase all their ammonia at market rates from or through our Nitrogen sales subsidiaries. Phosphoric acid is reacted with ammonia to produce MAP and MAP+MST as well as liquid fertilizers.
16
We produce MGA at our Aurora and White Springs facilities. Some MGA from the Aurora facility is sold to foreign and domestic fertilizer producers and industrial customers. We further process the balance of the MGA to make solid fertilizers (MAP), liquid fertilizers, animal feed supplements for the poultry and livestock markets, and purified phosphoric acid for use in a wide variety of food, technical and industrial applications.
Competitive Position
Markets for phosphate fertilizer products are highly competitive and based largely on price, reliability, and deliverability. Significant low-cost capacity has been commissioned over the past few years, most notably in Morocco and Saudi Arabia. The additional capacity is needed to keep pace with steadily growing phosphate demand, both in agricultural and industrial sectors, and is serving to keep global supply and demand relatively balanced. Our principal advantages at the Aurora and White Springs facilities are that we produce higher-value, diversified products and that we operate integrated phosphate mine and phosphate processing complexes. Our in-market distribution network ensures product supply during peak demand periods.
| Major Competitors in 2023 | ||||
|
North American markets |
Mosaic |
Itafos, Inc. |
||
| J.R. Simplot Company |
Importers from Mexico, Russia, Morocco, Australia, Saudi Arabia, and various other small importers |
|||
| Offshore markets |
OCP S.A. (“OCP”) |
Producers from Africa, China, the Middle East and Russia |
||
In 2021, the US Department of Commerce issued countervailing duty (“CVD”) orders on imports of phosphate fertilizers from Morocco and Russia, which will remain in place for at least five years, resulting in an increase in phosphate fertilizer prices. In November 2023, after its first annual administrative review of the CVD, the US Department of Commerce increased the CVD rate on imports from Russia (from 9.19 percent to 28.50 percent) and decreased the CVD rate on imports from Morocco (from 19.97 percent to 2.12 percent). These decisions have been appealed and the review will continue into 2024. Within the animal feed supplement business in the Phosphate segment, opportunities exist to differentiate products based on nutritional content. We have a significant presence in the domestic feed supplement market segments. We compete with Mosaic, J.R. Simplot Company, OCP, and Chinese and Russian producers for feed sales.
Industrial products are the least commodity-like of the phosphate products as product quality is a more significant consideration for customer buying decisions. We market industrial phosphate products principally in the US and we compete with ICL, Innophos Holdings, Inc., Prayon Group, Emaphos and Chinese producers for North American industrial sales.
In 2023, our total Phosphate sales represented 8 percent of our total consolidated sales (2022 – 7 percent). For 2023, our offshore sales of phosphate products represented 12 percent (2022 – 20 percent) of our total Phosphate sales.
Sources of Raw Materials
Phosphate rock is the major input in our phosphate processing operations and is mined at our Aurora and White Springs facilities. In addition to phosphate ore, the other principal raw materials we require are sulfur and ammonia. The production of phosphoric acid requires substantial quantities of sulfur, which we purchase from third parties. Agreements for the purchase of sulfur for use in production of phosphoric acid provide for specified purchase quantities and prices based on market rates at the time of delivery. Any significant disruption in our sulfur supply to the phosphate facilities could adversely impact our Phosphate financial results. We produce sulfuric acid at the Aurora and White Springs facilities from purchased sulfur. Ammonia for our Aurora facility is primarily supplied by rail and truck from our nitrogen production facilities in Lima, Ohio and Augusta, Georgia. Ammonia for our White Springs facility is primarily supplied by truck from our nitrogen production facility in Augusta, Georgia.
5.5 Specialized Skill and Knowledge
We believe our success is dependent on the performance of our management and key operational employees, many of whom have specialized skills and knowledge relating to the retail, potash, nitrogen and phosphate industries, and to the conduct of the Retail, Potash, Nitrogen and Phosphate operations. We believe that we have adequate personnel with the specialized skills and knowledge to successfully carry out our business and operations.
17
5.6 Intangible Properties
We have registered and pending trademarks and patents in Canada, the US and other countries where our products are sold. In addition, it has been our practice to seek patent protection for inventions and improvements that are likely to be incorporated into our products, where appropriate, and to protect the freedom to use our inventions in our manufacturing processes. We consider several factors in assessing the materiality of our patents including, but not limited to, scope and breadth of claims, sales volumes of products incorporating the technology, strategic importance, and patent duration.
While these trademarks and patents constitute valuable assets, we do not regard any single trademark or patent as being material to our operations as a whole. See Note 14 of the 2023 Consolidated Financial Statements for disclosure on estimated useful lives of intangible assets.
5.7 Seasonality
Seasonality in our business results from increased demand for products during planting season. Crop input sales are generally higher in spring and fall application seasons. Crop input inventories are normally accumulated leading up to each application season. The results of this seasonality have a corresponding effect on receivables from customers and rebates receivables, inventories, prepaid expenses and other current assets and trade payables. Our short-term debt also fluctuates during the year to meet working capital needs. Our cash collections generally occur after the application season is complete, while customer prepayments made to us are typically concentrated in December and January and inventory prepayments paid to our vendors are typically concentrated in the period from November to January. Feed and industrial sales are more evenly distributed throughout the year. See “Risk Factors” below for a description of the risks related to seasonality.
5.8 Environmental Matters
Environmental Requirements, Permits, and Regulatory Approvals
Many of our operations and facilities are subject to a variety of environmental requirements under federal, provincial, state and local laws, regulations, permits, and approvals, all of which vary depending on the specific operation. Licenses, permits, and approvals at operating sites are obtained in accordance with applicable laws and regulations, which may limit or regulate: operating conditions, rates and efficiency; land, water, and raw material use and management; product storage, quality and transportation; waste storage and disposal; and emissions and other discharges. Additional legal requirements may apply where site impacts pre-date the current applicable regulatory framework, where remediation is ongoing or where there is otherwise evidence that historic remediation activities have not been successful in minimizing impacts to the environment. These additional requirements may result in an environmental remediation liability that must be mitigated.
We believe that we are currently in material compliance with existing regulatory requirements, permits, and approvals. Permits and approvals are typically required to be renewed or reissued periodically. We may also become subject to new laws or regulations that impose new requirements or require us to obtain new or additional permits or approvals; however, there can be no assurance that such permits or approvals will be issued in the ordinary course of operations. Further, the terms and conditions of future regulations, permits, and approvals may be more stringent and may require increased expenditures by the Company.
Future environmental capital expenditures are subject to a number of uncertainties, including changes to environmental laws and regulations and interpretations by regulatory authorities or changes in circumstances affecting the Company’s operations. At this time, we are unable to estimate the capital expenditures we may make in future years to meet pollution prevention and emissions control objectives, as well as other environmental requirements.
Air Quality
With respect to air emissions, we anticipate that additional actions and expenditures may be required to meet increasingly stringent federal, provincial, and state regulatory and permit requirements in the areas in which we operate, including existing and anticipated regulations under the US federal Clean Air Act. We continue to monitor developments in these various programs and assess their potential impact on our operations. In 2015, we entered a consent decree with the US Environmental Protection Agency (“EPA”) that requires reductions in sulfur dioxide emissions at specified sulfuric acid plants with the final compliance dates occurring in 2020. All such emission limits were met by the dates specified in the consent decree schedule. As such, we terminated the sulfuric acid consent decree on April 3, 2023.
18
In Canada, the Multi-Sector Air Pollutant Regulations (“MSAPR”) established oxides of nitrogen (“NOx”) emission standards for gas-fired boilers, heaters, and stationary spark-ignition engines. Facilities must ensure regulated equipment meets mandated emission standards by either 2026 or 2036, depending on the equipment’s baseline emission levels. Our Canadian Nitrogen and Potash facilities operate equipment subject to the regulations. We replaced a boiler at our Redwater nitrogen facility with a low-NOx alternative in 2022 and installed a new MSAPR-compliant ammonia loadout heater at the Fort Saskatchewan nitrogen facility in 2021. We also installed a medium pressure condensate stripper in the ammonia plant at our Carseland nitrogen facility in 2022, which virtually eliminated ammonia emissions from the ammonia reformer and reduced the facility’s NOx emissions by over 40 percent. To meet the MSAPR standards, one of our Potash facilities completed a boiler upgrade in 2023.
Water Quality
There are international, federal, provincial, and state regulatory initiatives underway that may result in new regulatory restrictions on discharges of nutrients, including discharges of nitrogen and phosphorus to waters in the US (“Nutrient Criteria”). There are also ongoing litigation efforts in several jurisdictions of the US that seek to require US environmental agencies to develop new Nutrient Criteria. These litigation and regulatory proceedings may result in new Nutrient Criteria that apply to water discharges from several of the Company’s facilities in the US. Some of the proposed restrictions imposed through Nutrient Criteria also have the potential to require our customers to reduce or eliminate their uses of the Company’s products. These Nutrient Criteria could have a material effect on either the Company or our customers, but the impact is not currently predictable or quantifiable with reasonable certainty because many of these initiatives are in relatively early stages and compliance alternatives may be available that do not create material impacts. We are closely monitoring and evaluating the impact of these initiatives on our operations.
Waste Management
The US EPA is focused on the phosphate industry as part of its National Enforcement Initiative regarding the mineral processing industry. The purpose of the EPA’s National Enforcement Initiative is to ensure that waste resulting from mineral processing is managed in accordance with regulations under The Resource Conservation and Recovery Act, which is the US federal statute that governs the generation, transportation, treatment, storage, and disposal of hazardous wastes. The EPA is also evaluating the mineral processing industry’s compliance with the Emergency Planning and Community Right to Know Act and the Comprehensive Environmental Response, Compensation and Liability Act of 1980 (“CERCLA”).
Several of the Company’s phosphoric acid production facilities have received notices of violation or entered orders with the EPA as a result of the EPA’s National Enforcement Initiative. These facilities include the Aurora, North Carolina, White Springs, Florida, and Geismar, Louisiana phosphate facilities, as well as the Conda, Idaho phosphate production facility divested in 2018, for which we retain environmental liabilities attributable to our historic activities. Nutrien settled with the EPA and the Louisiana Department of Environmental Quality at our former Geismar phosphoric acid production facility in October 2022. We are engaged in ongoing negotiations with the EPA and the relevant state environmental agencies to resolve the outstanding matters relating to the other facilities. In these negotiations, we are seeking to minimize the costs and impacts to our future operations consistent with applicable legal requirements, including financial assurance for the future closure, maintenance and monitoring of phosphogypsum stack systems. The full scope of the costs that we may ultimately incur to bring these matters to a conclusion could be material to our operations but are not currently predictable or quantifiable with reasonable certainty. See Note 29 of the 2023 Consolidated Financial Statements for additional information.
GHG Emissions and Climate Change
Nutrien generates GHG emissions directly and indirectly through the production, distribution and use of our products. Some of these emissions are subject to climate change policies and regulations, all of which are developing in unique ways within various federal, provincial and state jurisdictions. Increasing regulation of GHG emissions may impact our operations by requiring changes to our production processes or increasing raw material, energy, production or transportation costs in order to ensure compliance. There are also significant differences in the climate change policies of countries where Nutrien operates as only some are parties to the 2015 Paris Agreement under the United Nations Framework Convention on Climate Change. Furthermore, even when Nutrien operates in countries that are parties to the Paris Agreement, different jurisdictions have different compliance obligations.
19
We estimate that our production operations accounted for approximately 95 percent of our overall Scope 1 and 2 GHG emissions in 2023. Sources of GHG emissions from our production operations include emissions from the combustion of natural gas, reforming of natural gas to produce hydrogen, which is used to synthesize ammonia, and process emissions from nitric acid production. Approximately two-thirds of the natural gas required to produce ammonia – the basic building block of all nitrogen fertilizer – is used to provide the necessary hydrogen for the process. The remaining approximately one-third is used as fuel to provide heat for the ammonia production process. We have taken steps and developed strategies in an effort to improve energy efficiency in our production operations, capture and export CO2, generate lower-carbon heat and electricity, and reduce the amount of N2O emissions from our nitric acid facilities. We have also invested and continue to invest in initiatives focused on more efficient mining, including remote-controlled mobile equipment, and other advanced technologies expected to reduce our environmental impact, improve our safety performance, lower our production costs, and optimize throughput. In our Retail operations, we continue to invest in the development of new crop input technologies and agronomic capabilities that are expected to improve nutrient use efficiency, which would increase cropping intensity on existing acres while helping to minimize the impact to the environment.
Canada
Our Canadian manufacturing facilities are primarily located in the provinces of Alberta and Saskatchewan and are subject to a variety of federal and provincial requirements to reduce GHG emissions ranging from carbon taxes to emissions intensity reduction requirements. We look to minimize our Canadian compliance costs through improving our energy efficiency and implementing process improvements that allow us to reduce GHG emissions at our facilities. We aim to improve our energy efficiency and at our Carseland facility we have partnered with a Canadian energy company for the supply of steam and electricity generated by their Carseland Cogeneration Plant. Cogeneration is a more efficient way of generating useful energy as it simultaneously produces steam and electricity from one energy input (natural gas), which minimizes fuel consumption and reduces emissions. SaskPower’s Cory Cogeneration Station provides cogenerated steam to our Cory potash mine, reducing the need for less efficient, on-site, gas-fired boilers. Our Redwater nitrogen facility has been capturing and exporting CO2 into the Alberta Carbon Trunk Line since late 2019. An additional project was completed in mid-2023 to tie in the remaining ammonia plant at our Redwater facility, increasing the export capability to over 800 tonnes of CO2 per day. The Redwater facility sent approximately 245,000 tonnes of CO2 into the Alberta Carbon Trunk Line in 2023.
In 2018, Canada enacted the Greenhouse Gas Pollution Pricing Act (“GGPPA”), which establishes minimum standards for carbon pricing and makes up part of Canada’s strategy for meeting its commitments under the Paris Agreement. The GGPPA is designed to act as a backstop to apply in provinces and territories that do not establish their own carbon pricing systems that meet the minimum federal stringency criteria. The GGPPA is comprised of two parts: a federal fuel charge (“Federal Fuel Charge”) and an output-based pricing system (“OBPS”) for large industrial emitters. The Federal Fuel Charge applies to all carbon-based fuels in provincial jurisdictions that have not implemented their own provincial carbon pricing. Similarly, the federal OBPS applies in those provinces that have not enacted large emitter regimes deemed equivalent to the federal OBPS. Large emitting facilities regulated under an acceptable provincial or territorial OBPS are exempt from the Federal Fuel Charge. Pursuant to the provisions of the GGPPA the carbon price under the federal OBPS increases by CAD$15 per CO2e tonne per year for the years 2023 to 2030, resulting in a carbon price of CAD$80 in 2024 and a final carbon price of CAD$170 per CO2e tonne in 2030.
Application of Federal Fuel Charge in Alberta and Saskatchewan
As of January 1, 2023, British Columbia, Quebec and the Northwest Territories have their own provincial/territorial carbon levy regimes. The Federal Fuel Charge applies to all remaining provinces and territories, including Alberta and Saskatchewan.
Application of Federal OBPS in Alberta and Saskatchewan
As of January 1, 2024, the federal OBPS applies in Manitoba, Prince Edward Island, Yukon and Nunavut, while the remaining provinces and territory have provincial/territorial systems that have been deemed equivalent to the federal OBPS. In 2023, the Province of Saskatchewan updated its Output-Based Performance Standard Program, which has been deemed equivalent to the federal OBPS under the GGPPA, which updates include modifications to existing standards and the issuance of new standards. Under the updated Saskatchewan framework, potash facilities must achieve a 15 percent emissions intensity reduction from a site-specific three-year baseline by 2030. Beginning in 2023, the facility intensity baseline benchmark will decline at a rate of 1.25 percent per year until the full 15 percent intensity reduction target is established in 2030. All six of our potash facilities submit emission returns as required by the provincial OBPS program. Emissions returns for the 2021 and 2022 emission years have been submitted and are currently being reviewed by the Province of Saskatchewan. Emissions for 2023 are still subject to final data collection and third-party verification. The aggregated compliance cost for 2023 GHG emissions associated with our potash facilities in Saskatchewan is estimated to be approximately CAD$1 million, subject to third-party verification in the second quarter of 2024.
In Alberta, large emitters (industrial facilities emitting over 100,000 tonnes of CO2e per year) have been subject to emissions reduction requirements and a GHG pricing system in various forms since 2007. The current large emitter regulation is the Technology Innovation and Emissions Reduction (“TIER”) Regulation, which has been in place since January 1, 2020.
20
Under this program, facilities that emit 100,000 tonnes or more of CO2e per year are subject to the less stringent of a product-specific high-performance benchmark based on the emissions intensity of the most efficient facilities, or a facility-specific benchmark based on a 10 percent emissions intensity reduction relative to the facility’s own historical baseline. The stringency of facility-specific benchmarks increased by 1 percent annually through 2022. Following a regulatory review and December 2022 amendment to the TIER Regulation, a 2 percent annual tightening rate was applied to facility-specific benchmarks and high-performance benchmarks beginning in 2023. The tightening rate does not apply to industrial process emissions, which are fixed by chemistry and cannot be reduced through efficiency improvements. The TIER Regulation has been deemed equivalent to the federal OBPS under the GGPPA. Emissions in excess of the facility emission benchmark allowance are subject to a compliance obligation, including use of provincially generated offset credits, performance credits, sequestration credits or payment into a TIER fund. In 2023, the carbon price for TIER fund payments was CAD$65 per CO2e tonne. This cost increases by CAD$15 per year to $170 by 2030, consistent with the federal OBPS carbon charge rate schedule. By aligning TIER compliance costs with the federal OBPS carbon charge rate schedule, large emitting facilities in Alberta are not subject to the federal OBPS.
Under TIER, facilities that emit less than 100,000 tonnes of CO2e per year but compete with facilities subject to TIER, or facilities that belong to an energy intensive trade exposed sector regulated under TIER, may opt into the TIER program. Nutrien’s Joffre ammonia facility opted into the TIER program, which grants it an exemption from the Federal Fuel Charge on purchased fuels. Since the Joffre facility manufactures ammonia using a hydrogen byproduct feedstock supplied by an industrial neighbor rather than producing it on site from a natural gas feedstock using an emission intensive steam methane reforming process, Joffre is able to generate emission performance credits as its emissions intensity is below the Alberta TIER ammonia intensity benchmark. These credits can be banked and used to offset a portion of future TIER compliance obligations for Nutrien’s other Alberta-based large emitter facilities. A further change resulting from the 2022 review of the TIER regulation included the requirement for facilities importing more than 10,000 tonnes of hydrogen per year to participate in TIER; however, as our Joffre facility had previously opted-in, there was no additional impact to Nutrien.
Our TIER compliance reports and payment for 2023 are due by June 30, 2024. Emission quantification and compliance costs are subject to third-party verification prior to submission, and as such are not yet finalized; however, our aggregated TIER compliance costs for 2023 are estimated to be approximately CAD$7.1 million. This estimate is based on the emissions information available at the time of this report. Actual final costs may vary following collection and verification of the full year emission and production data in the second quarter of 2024.
In June of 2022, the Canadian federal government implemented a federal Clean Fuel Standard through the enactment of the Clean Fuel Regulations (“CFR”). The CFR applied to liquid fuels beginning in 2023. The CFR has been designed to incentivize the development and use of lower-carbon fuels. Nutrien is tracking the development of the Federal Clean Fuel Standard, CFR and associated compliance obligations.
Application of Canadian Net-Zero Emissions Accountability Act
On June 29, 2021, the Canadian Net-Zero Emissions Accountability Act (the “Act”) became law. Under the Act, the government must set an emissions reduction target for 2035 by December 1, 2024. To assist in setting the 2035 emissions target a virtual public engagement platform was launched on February 2, 2024 and is open until March 28, 2024 for comments. Nutrien is currently evaluating the impact of continually decreasing emission reduction targets between now and 2050, which could have a material impact to our consolidated financial statements.
United States
In the US, the EPA has issued GHG emissions regulations that establish a reporting program for emissions of CO2, methane and other GHGs, as well as a permitting program for certain large GHG emissions sources. Several legislative bills have passed or are proposed that offer incentives for clean hydrogen production and carbon sequestration, which could impact sustainability efforts. Some US states have also enacted laws concerning GHG emissions that we are monitoring for impacts on our operations.
The impacts of climate change and future restrictions on emissions of GHGs on the Company’s operations could be material but cannot be determined with any certainty at this time.
Facility and Product Security
Our Global Security team, embedded within our Safety, Health and Environment team, actively evaluates and addresses actual and potential security issues while also ensuring regulatory compliance associated with our operations using approved security vulnerability methodologies and risk mitigation strategies. In accordance with our safety management process, additional actions and expenditures may be required in the future to address identified vulnerabilities, particularly those with the potential to violate applicable regulatory standards. In the US, chemical facilities are regulated under the Maritime Transportation Security Act, the Chemical Facility Anti-Terrorism Standards (expired as of July 28, 2023 and currently in the process of renewal), and Food Safety Modernization Act (Mitigation Strategies to Protect Food Against Adulteration), in addition to the regulations established by Transport Canada and US Transportation Security Administration.
21
It is anticipated that the US Congress and other jurisdictions where Nutrien operates will continue to maintain legislation designed to reduce the risk of terrorist acts using chemicals produced and stored at our facilities, and to ensure food security. We believe that we are in material compliance with applicable security requirements and have developed and adopted security measures and enhancements beyond those presently required at both our regulated and non-regulated facilities. To date, neither the security regulations nor our expenditures on security matters have had a material adverse effect on our financial position or results of operations. We are unable to predict the potential future costs of any new governmental programs or voluntary initiatives.
Asset Retirement Obligations
The major categories of our asset retirement obligations include reclamation and restoration expenditures at our Potash and Phosphate mining operations (phosphate mining, in particular), including the management of materials generated by mining and mineral processing, such as: various mine tailings and phosphogypsum stacks; land reclamation and revegetation programs; decommissioning of underground and surface operating facilities; general clean-up activities aimed at returning the areas to an environmentally acceptable condition; and post-closure care and maintenance.
The estimation of the costs of asset retirement obligations depends on the development of environmentally acceptable closure and post-closure plans. In some cases, this may require significant research and development to identify preferred methods for such plans that are economically sound and that, in most cases, may not be implemented or completed for several decades. We continue to use appropriate technical resources, including outside consultants, to develop specific site closure and post-closure plans in accordance with the requirements of the various jurisdictions in which we operate.
Asset retirement obligations are generally incurred over an extended period. As of December 31, 2023, we had accrued a total of $1,259 million for asset retirement obligations, the current portion of which totaled $135 million. For additional information, see Note 22 of the 2023 Consolidated Financial Statements.
Site Assessment and Remediation
We are also subject to environmental statutes that may require investigation and, where appropriate, remediation of impacted properties. Canadian federal and provincial laws as well as CERCLA and other US federal and state laws impose liability on, among others, past and present owners and operators of properties or facilities at which hazardous substances have been released into the environment. Liability under these laws may be imposed jointly and severally and without regard to fault or the legality of the original actions, although such liability may be divided or allocated according to various equitable and other factors. We have incurred and expect to continue to incur costs and liabilities in respect of our current and former operations, including those of divested and acquired businesses. We have generated and, with respect to our current operations, continue to generate substances that could result in liability for us under these laws.
As at December 31, 2023, we had accrued environmental costs of $395 million for expenditures associated with site assessment and remediation, including consulting fees, related to the clean-up of impacted sites currently or formerly associated with the Company or our predecessors’ businesses. As at December 31, 2023, the current portion of these costs totaled $30 million. The accrued amounts include the Company’s and our subsidiaries’ expected final share of the costs for the site assessment and remediation matters to the extent future outflow of resources is probable and can be reliably estimated. For additional information, see Note 22 of the 2023 Consolidated Financial Statements.
It is often difficult to estimate and predict all of the potential costs and liabilities, including natural resource damages, associated with our current and former operations, and there is no guarantee that we will not in the future be identified as potentially responsible for additional costs associated with our operations, either as a result of changes in existing laws and regulations or as a result of the identification of additional matters or properties subject to environmental costs. For certain matters, we are unable to make a reliable estimate of the amount and timing of any financial effect in excess of the amounts accrued for various reasons including: complexity of the matters; early phases of most proceedings; lack of information on the nature and timing of future actions in the matters; dependency on the completion and findings of investigations and assessments; and the lack of specific information as to the nature, extent, timing and cost of future remediation with respect to those matters. Until we have greater clarity as to our liability and the extent of our financial exposure, it is not practicable to make a reliable estimate of the financial effect. For additional information, see Note 29 of the 2023 Consolidated Financial Statements.
22
5.9 Employees
At December 31, 2023, we employed approximately 25,900 employees. The approximate breakdown of employees is as follows:
| Business Unit |
Number of Employees |
|
| Retail |
17,000 |
|
| Potash |
3,200 |
|
| Nitrogen |
1,700 |
|
| Phosphate |
1,500 |
|
| Corporate |
2,100 |
|
| Shared services group 1 |
400 |
|
| Total |
25,900 |
1 Our shared services group provides sales and logistics services to our Potash, Nitrogen and Phosphate operations.
We have entered into 13 collective bargaining agreements with labor organizations representing our employees. The following table sets forth the plant locations where we have entered into collective bargaining agreements and their respective expiry dates.
| Plant Location |
Collective Bargaining Agreement Expiry Date |
|
| Allan, Saskatchewan |
April 30, 2025 |
|
| Cory, Saskatchewan |
April 30, 2025 |
|
| Lanigan, Saskatchewan |
January 31, 20241 |
|
| Patience Lake, Saskatchewan |
April 30, 2025 |
|
| Regina, Saskatchewan (Access Distribution) |
December 31, 2024 |
|
| Regina, Saskatchewan (Sites and Office) |
December 31, 2024 |
|
| Rocanville, Saskatchewan |
May 31, 20231 |
|
| Vanscoy, Saskatchewan |
April 30, 20231 |
|
| Mulberry, Florida |
May 31, 2024 |
|
| White Springs, Florida |
March 3, 2025 |
|
| Greenville, Mississippi |
August 27, 2025 |
|
| Cincinnati, Ohio |
November 1, 2024 |
|
| Lima, Ohio |
October 31, 2027 |
1 The terms of this collective bargaining agreement, including new expiry date, remain under renegotiation as of the date hereof.
In jurisdictions such as Italy, Australia and Brazil, employees are self-represented through other forms of collective bargaining such as enterprise award agreements or work councils. We believe we have an effective working relationship with our employees, and the unions representing them.
5.10 Social and Environmental Policies
Sustainability
In 2021, we launched our Feeding the Future Plan, which highlighted our priority sustainability-related commitments, targets and goals. We believe we have the ability to create lasting change and sustainably feed a growing population by committing to working with growers to feed the planet sustainably, reducing our environmental footprint and taking climate action while promoting inclusive agriculture. We aim to drive innovation in agriculture and deliver positive value to our stakeholders and our planet. We believe Nutrien is uniquely positioned to drive sustainability across the agricultural value chain for economic, social and environmental outcomes.
In 2021, we set short- and mid-term reduction targets for Scope 1 and 2 GHG emissions. We continue to work with the World Business Council for Sustainable Development, fertilizer peers and the Science Based Targets initiative to produce a sectoral decarbonization approach for the fertilizer industry, which as of December 31, 2023 had not been published for public comment.
We continue to move forward on our sustainability-related commitments and targets and expect to provide additional and/or revised targets in the future for developing key issues applicable to Nutrien. Our sustainability strategy and the 2023 ESG Report for the year ended December 31, 2022, can be viewed on the Company’s website at nutrien.com. We expect to release our Global Sustainability Report (previously ESG Report), which will focus on our relevant sustainability topics, performance and key initiatives for the year ended December 31, 2023, in March 2024.
See “Risk Factors” section below for a description of the risks related to our sustainability-related targets and initiatives.
23
Code of Conduct
Nutrien’s most important assets are our employees, customers, shareholders, value-chain partners, suppliers and the communities in which we operate. It is critical that we maintain the trust of each of these stakeholders. Our Code of Conduct (“Code”) helps us fulfill our responsibilities by: committing to the public and our stakeholders our uncompromising integrity in every aspect of our efforts; describing our values and principles of business conduct, including our own high standards and fundamental respect for the rule of law; guiding employees on how to engage in integrity-based decision making that demonstrates and sustains our commitment to doing business the right way in all our operations around the world; and outlining how our commitment supports our stakeholders. The Code also outlines our commitment to compliance with all applicable employment and human rights laws in any jurisdiction where we do business.
We actively promote integrity through the Code and numerous supporting policies, which are reinforced by risk assessments, due diligence procedures, training and our speaking up process. All Nutrien employees are required to receive formal training on the Code and other compliance-related topics. Our confidential 24-hour, 365 days a year, externally administered Integrity Helpline complements other methods of speaking up that enable employees and stakeholders to report any violations or suspected violations of the Code and other associated Nutrien policies, or any behavior that does not comply with applicable laws. The Code also clearly sets out our no-retaliation policy, which is designed to enable employees to raise good faith issues in a safe environment without fear of retaliation.
Anti-Corruption Policy
We operate in a wide range of jurisdictions and are vigilant and proactive in detecting and preventing corruption. Our Anti-Corruption Policy requires those who work on behalf of Nutrien to ensure that their own conduct fulfills Nutrien’s commitment to compliance with all applicable anti-bribery and anti-corruption laws. It applies to Nutrien’s directors, officers, employees, representatives, consultants, and other agents of Nutrien and each of its subsidiaries and in every country where we do business.
Nutrien maintains an anti-corruption program that includes:
| • | identifying high-risk third parties, including acquisition targets and potential joint venture partners, and conducting appropriate diligence; |
| • | incorporating anti-corruption clauses in contracts and/or obtaining certifications that include anti-corruption language for high-risk third parties; |
| • | requiring anti-corruption training and other risk mitigation steps where appropriate, such as annual certification or continued monitoring to identify and address any potential issues; and |
| • | maintaining appropriate books and records and an appropriate system of internal accounting controls. |
Workplace Policies
We have adopted a robust Strategic Inclusion Plan with a workplace and workforce component that focuses on increasing equity, diversity and inclusion across the Company, with a particular focus on women and Indigenous Peoples. In order to realize the benefits of an inclusive work environment, we are focused on building capacity in our talent attraction and succession planning processes to ensure competency in our people to execute, particularly functional and people leaders. We are taking action to address potential physical and cultural barriers to ensure an inclusive workplace where all employees feel they are respected, valued and belong. We maintain a Respect in the Workplace Policy and an Equal Employment and Affirmative Action Policy. Implementation of our Strategic Inclusion Plan is supported by education and online courses, employee resource groups, and ongoing monitoring of internal and external employment trends (new hires, promotion and turnover) for current and potential employees. We are committed to playing a leadership role in our industries, contributing to more equitable outcomes delivering commercial value through opportunities not only in our workforce but also in other areas where we have opportunity for impact, including our supply chain and communities in which we operate. We benchmark our inclusion maturity using a comparison of our practices to the Global Diversity and Inclusion Benchmark model as a basis for continuous improvement.
Supplier Code of Conduct (“Supplier Code”) and Procurement Policies
Nutrien is committed to responsible sourcing. In May 2023, Nutrien updated our Supplier Code, as a replacement for our Supplier Code of Ethics, which was implemented in 2019. Our Supplier Code was established to communicate Nutrien’s requirements for suppliers of goods and contractors performing services for, or on behalf of, Nutrien. Our Supplier Code is intended to apply to all suppliers that provide goods and services to Nutrien, whether directly or indirectly. It includes requirements related to human rights and labour in our supply chains, including prohibitions on illegal, forced, compulsory, child labour and human trafficking, and requirements regarding health and safety, working conditions, wages, hours of work and others.
24
Our Supplier Code is aligned with our commitment to the 10 principles of the United Nations Global Compact and international standards as well as Nutrien’s core values of Safety, Inclusion, Integrity and Results. The Supplier Code identifies the behaviors that we require our suppliers to demonstrate related to the products or services they provide to us around the world.
Commitment by our suppliers to the principles of the Supplier Code is an important part of our decision-making process. Within the Nitrogen, Phosphate, Potash and Corporate segments, our standard form supplier contract terms and conditions for the purchase of goods include terms requiring our suppliers and their employees and subcontractors to conduct their operations pursuant to the contract in accordance with our Supplier Code and we aim to maintain these provisions in final contracts and to include similar provisions in non-standard form contracts with our suppliers.
Our Procurement, Legal and Integrity teams provide guidance and support to the business regarding risk-based due diligence for suppliers, which includes ensuring that appropriate language is included in contracts with various suppliers and appropriate requirements regarding our Supplier Code are communicated. Where suppliers refuse to follow the principles of the Supplier Code or show signs that they are not committed to improving their practices to comply with its principles, Nutrien will review our relationship with the supplier. Where contractual commitments and applicable laws permit, this review may include termination of our relationship with the non-compliant supplier.
Nutrien is committed to supporting diversity and inclusion throughout the procurement process. Our procurement policies and procedures are designed to ensure that fair consideration is given to all potential suppliers. In 2023, Nutrien introduced an updated Procurement Policy, which establishes procurement rules of conduct for the Company. The policy now applies across all operating segments and regions and will help ensure we continue to work with suppliers who align with our values, while supporting the communities where we live and work.
We provide an Indigenous Content Playbook in Saskatchewan to assist suppliers in developing local Indigenous content in their own organizations and supply chains. We work with our supply network to ensure that all contracts include local Indigenous impact commitments. We continue to evolve our Potash Indigenous supply chain strategy to support and identify contract opportunities for Indigenous-owned companies. We believe in building and maintaining relationships of mutual respect with Indigenous communities through our procurement practices and extend this further by providing employment and training opportunities and community investments.
25
Safety, Health and Environment (“SH&E”)
We are committed to the care and protection of our people, environment, community and customers. We honor that commitment by making safety a core value of our organization, as we grow our world from the ground up.
Under our SH&E Policy, our goals are to:
| • | protect our people, assets, facilities, communities and environment; |
| • | proactively prevent incidents and minimize risk by continuously improving our safety, health and environmental performance; |
| • | promote employee physical and mental health and well-being; and |
| • | drive excellence in safety, health and environment across our operations and supply chain. |
We strive to accomplish these goals through our SH&E vision “Everyone home safe, every day,” which brings our SH&E Strategy (Culture of Care) and Actions (Nutrien Way) to life, guiding daily actions and behaviors. Nutrien ensures leaders, and their teams, are well supported with SH&E expertise and resources to help everyone go home safe, every day.
Our SH&E culture continues to evolve, purposefully focused on sustaining our “Culture of Care” rallying around four pillars: Lead, Collaborate, Challenge and Trust as our consistent base. Nutrien’s SH&E management further focuses on people, systems, processes and tools to accomplish continual improvement.
SH&E performance, measurement, analysis and continuous improvement occur with engagement at multiple organizational levels. The Safety and Sustainability Committee of the Board (the “S&S Committee”) has responsibility for the oversight of the Company’s activities as they relate to ensuring that appropriate policies, systems, and personnel are in place to support safe and sustainable operations and the long-term viability of the Company, including its consideration of stakeholders relevant to the creation and preservation of long-term value. This oversight includes the ongoing monitoring and development of the Company’s sustainability strategy and incorporates safety, environmental stewardship, health, climate change-related risks and opportunities, cybersecurity, and data privacy. The S&S Committee directly reports to and advises the Board on these matters. The S&S Committee oversees the Company’s general strategy, policies, resources and initiatives relating to safety as appropriate. The S&S Committee meets on a recurring basis to monitor performance against annual and longer-term performance goals, and discusses plans, strategies, and processes, in addition to reviewing our SH&E systems. Policies and strategies are reviewed annually for relevance and modified as appropriate. Committees meet on a recurring basis to monitor performance against annual and longer-term performance goals, and discuss plans, strategies and processes, in addition to evaluating opportunities for improving our SH&E systems.
Leadership, commitment, resource allocation, responsibility, communication, learning and technology are examples of our continually evolving SH&E systems. Nutrien provides further details in our defined SH&E policies, programs and processes addressing specific hazards, risks, operations and tasks.
We lead through the integration of an SH&E management system, including methods of governance, expectations, reference documentation and communication. This infrastructure provides consistency while permitting flexibility to encompass our diversity of operations, risks and geographies. Our business units and, where appropriate, individual facilities reinforce management system expectations through further evaluation, elimination, mitigation and controls necessary to manage risks unique to their operations. Development of SH&E systems, guidance, standards and continuous improvement occurs at the business unit level through operational committees integrated with the central SH&E teams. Performance and risk management conditions are continuously identified, evaluated, addressed and communicated throughout our organization.
Technical support and assurance for our operations are managed at multiple levels within the organization, including central, corporate, business unit, and site levels. We share responsibility for maintaining integrated systems, performance monitoring, providing technical expertise and conducting business unit SH&E and Process Safety Management audits. The use of an integrated and structured assurance program enables us to achieve continuous improvement and consistent management practices at our facilities and in our operations. In addition to a central SH&E team providing a consistent resource across our organization, we have established SH&E organizations in each business unit with clear lines of responsibility, accountability and visibility. This central and distributed structure enables us to focus on both oversight and governance as well as direct engagement in our operations and activities.
We maintain global, ongoing working relationships with multiple industry associations and regulatory agencies. These relationships ensure new or changing regulations are identified, understood, evaluated and communicated in advance of change. Industry association relationships enhance our risk management compliance with regulatory expectations and provide opportunities to share best practice, innovation and leading SH&E enhancement technologies.
26
5.11 Risk Factors
Our performance and our future operations are and may be affected by a wide range of risks. The following section describes our key risks and uncertainties. Any or all of these risks, or other risks not presently known to us or that we do not consider material, could have a material adverse effect on our business, financial condition, results of operations, cash flows, value of our common shares and debt securities and, in certain cases, our reputation.
Competition and shifting market fundamentals could impact our short-and-long-term profitability
Global macroeconomic conditions and shifting market fundamentals, including trade tariffs and restrictions, market volatility, and increased price competition, or a significant change in agriculture production or consumption trends, could lead to a sustained environment of reduced demand for our products, and/or low commodity prices and impact our short and long-term profitability.
We are subject to intense price competition from both domestic and foreign sources, including state-owned and government-subsidized entities. Crop nutrients, including potash, nitrogen and phosphate, are global commodities with little or no product differentiation, and customers make their purchasing decisions principally on the basis of delivered price and, to a lesser extent, on customer service and product quality. Historically, selling prices for our products have fluctuated in response to periodic changes in global and regional supply and demand conditions. Supply is affected by available capacity and operating rates, raw material costs and availability, government policies and global trade that could adversely affect our operating results.
Periods of high demand, high-capacity utilization and increasing operating margins tend to result in investment in production capacity, which may cause supply to exceed demand and capacity utilization and realized selling prices for our products to decline, resulting in possible reduced profit margins. Such conditions could also include writedowns in the value of our assets, and temporary or permanent curtailments of production. Competitors and potential new entrants in the markets for potash, nitrogen and/or phosphate have in recent years expanded capacity, begun construction of new capacity, or announced plans to expand capacity or build new facilities. The extent to which current global or local economic and financial conditions, changes in such conditions, or other factors may cause delays or cancellation of some of these ongoing or planned projects or result in the acceleration of existing or new projects, is uncertain. Future growth in demand for our products may not be sufficient to absorb excess industry capacity. Furthermore, our business is cyclical, which can result in periods of industry oversupply during which our results of operations may be negatively impacted, as the price at which we sell our products typically declines during such periods, resulting in possible reduced profit margins, and could include writedowns in the value of our assets and temporary or permanent curtailments of production.
We are impacted by global market, economic and geopolitical conditions that could adversely affect agriculture commodity trade flows and demand for crop nutrients or increase prices for, or decrease availability of, raw materials and energy necessary to produce our products. These conditions include international trade disputes (including withdrawal from or modification to existing trade agreements, negotiation of new trade agreements, non-tariff trade barriers, local content requirements, and the imposition of new or retaliatory tariffs), international crises or risks thereof (including volatility in the global market resulting from the ongoing Ukraine and Russia war and the conflict in the Middle East), rising incomes in developing countries, the relative value of the US dollar and its impact on the importation of fertilizers, foreign agricultural policies, and the existence of, or changes in, import or foreign currency exchange barriers in certain foreign markets, and other regulatory policies of foreign governments, as well as the laws and policies affecting foreign trade and investment.
The current war between Ukraine and Russia, and the conflict in the Middle East may continue to have potential wide-ranging consequences for global market volatility and economic conditions, including energy and commodity prices. Certain countries including Canada, the US, Australia and certain European countries have imposed strict financial and trade sanctions against Russia, with Russia and Belarus imposing retaliatory sanctions of their own, which have had, and may continue to have, far-reaching effects on the global economy, energy and commodity prices, food security, and crop nutrient supply and prices. The implications of the war in Ukraine and the conflict in the Middle East are difficult to predict with any degree of certainty at this time. While Nutrien does not have operations in Ukraine, Russia or the Middle East, there continues to remain uncertainty relating to the potential impact of the conflicts and their effect on global food security, growers, energy prices, supply chains, and the market outlook for crop nutrient market supply and demand fundamentals and nutrient prices, and they could have a material and adverse effect on our business, financial condition and results of operations.
Trade disputes, tariffs and other restrictions may lead to volatility in commodity prices, disruptions in historical trade flows and shifts in planting patterns that could have an adverse effect on our business, financial condition and results of operations. Additionally, some of our customers require access to credit to purchase our products and a lack of available credit to customers in one or more countries, due to this deterioration, could adversely affect demand for crop nutrients as there may be a reluctance to replenish inventories in such conditions.
27
Agricultural changes and trends could adversely impact our business
The agricultural landscape continues to evolve at an increasingly fast pace as a result of factors including, but not limited to, farm and industry consolidation, agricultural productivity, technology developments, sustainability practices, government programs and policies, climate change, and social trends, many of which vary from jurisdiction to jurisdiction.
Farm consolidation in the US and other developed markets has been ongoing for decades and is expected to continue as grower demographics shift and advancements in innovative technology and equipment enable growers to manage larger operations to create economies of scale in a lower-margin, more capital-intensive environment. Consolidation in the crop nutrient industry has resulted in greater resources dedicated to expansion, research and development opportunities, leading to increased competition in advanced product offerings and innovative technologies. Some of our competitors have greater total resources than us or are state-supported, which make them less vulnerable to industry downturns and better positioned to pursue new expansion and development opportunities.
The advancement and adoption of technology and digital innovations in agriculture and across the value chain have increased and are expected to further accelerate as grower demographics shift and pressures from consumer preferences, governments and climate change initiatives evolve. The development of seeds that require less crop nutrients, development of full or partial substitutes for our products, or developments in the application of crop nutrients such as improved nutrient use or efficiency through use of precision agriculture could also emerge, all of which have the potential to adversely affect the demand for our products and our financial condition, results of operations and cash flows.
Further, digital innovations and use of new technology in the agriculture market, among other things, by new or existing competitors could alter the competitive environment, resulting in existing business models being disrupted, which may adversely impact our Retail operations and financial performance.
Agriculture is dependent on a healthy ecosystem to sustain our global food supply. Growers are dealing with an increasing focus on sustainability in the agriculture industry including changing consumer behavior and preferences, food supply chain ethics and transparency and traceability, soil health and nutrient preservation, water use, regulatory requirements such as potential nutrient application, diminishing biodiversity, and GHG emissions, among other things.
The impact of climate change on our operations and those of our grower customers remains uncertain. The physical risks associated with climate change include changing rainfall patterns, water shortages, wildfires, rising sea levels, changing storm patterns and intensities, increasing temperature levels, drought, loss of biodiversity, and deforestation. These risks vary by geographic location and could include acute risks resulting from increased severity of extreme weather events and chronic risks resulting from longer-term changes in climate patterns. Climate change may also affect the availability and suitability of arable land and contribute to unpredictable shifts in the average growing season and types of crops produced.
These factors as well as other factors affecting long-term demand for our products and services (such as population growth and changes in dietary habits) could adversely impact our strategy, demand for our products and our financial condition, financial performance, results of operations and cash flows.
Our business may be adversely affected by changing regulations
We are subject to numerous federal, state, provincial and local environmental, health and safety laws and regulations, including laws and regulations relating to land, water and raw material use and management; the emission of contaminants to the air or water including GHG emissions; land reclamation; the generation, treatment, storage, transportation, disposal and handling of hazardous substances and wastes; the clean-up of hazardous substance releases; commercial transportation; royalties and taxes (including income taxes); and the demolition of existing plant sites upon permanent closure. Specifically, our mining and manufacturing processes release CO2 and other GHGs and consume energy generated by processes that result in GHG emissions.
We incur significant costs and associated liabilities in connection with our compliance with these laws and regulations, and violations of environmental, health and safety laws or regulations can result in substantial penalties, court orders, civil and criminal sanctions, permit revocations, investigations, possible revocation of our authority to conduct our operations or transport our products, and facility shutdowns. There are substantial uncertainties as to the nature and timing of any future regulations with many of the laws and regulations continuing to become increasingly stringent, and the cost of compliance can be expected to increase over time. New or revised laws or regulations may result from pressure on lawmakers and regulators to address climate change, product stewardship or product use concerns, transition to a low-carbon economy, or to address concerns related to fertilizer and food prices, accidents, terrorism or transportation of dangerous goods.
28
Increased or more stringent laws or regulations, including protectionist policies in certain jurisdictions or for the benefit of favored industries or sectors, if enacted, or re-interpretation of current laws and regulations, could impact our ability to produce, sell, apply, use or transport certain products, increase our raw material, energy, transportation, and compliance costs, reduce our efficiency, require us to make capital improvements to our facilities, and have a negative effect on our customer satisfaction, reputation and financial performance. Our costs to comply with, or any liabilities under such laws and regulations could have a material adverse effect on our business, financial condition, results of operations and cash flows. To the extent that such regulations, including GHG emissions restrictions, are not imposed in the countries where our competitors operate or are less stringent than regulations that may be imposed in the US, Canada or the other jurisdictions in which we operate, our competitors may have cost or other competitive advantages over us.
We hold numerous environmental, mining and other governmental permits and approvals authorizing operations at each of our facilities. Continuation and/or expansion of our operations is dependent upon renewing or securing the necessary environmental or other permits or approvals. A decision by a government agency to deny or delay issuing a new or renewed material permit or approval, or to revoke or substantially modify an existing permit or approval, could materially adversely affect our ability to continue operations at the affected facility.
Various stakeholders, including legislators and regulators, shareholders, and non-governmental organizations, as well as companies in many business sectors, including Nutrien, are continuing to examine ways to reduce GHG emissions. New or current regulation of GHG emissions could result in additional costs to Nutrien in the form of taxes or emission allowances, facilities improvements, energy costs, compliance costs or otherwise, which, in turn, could increase Nutrien’s operational costs. In addition, the regulation of GHG emissions may cause increased input costs and compliance-related costs for agricultural customers, which could result in lower demand for our products and reduced revenues. Because the impact of any future GHG-related legislative or regulatory requirements on Nutrien’s business and products is dependent on the timing and design of such requirements, in different jurisdictions, Nutrien is unable to predict with any certainty the potential impact on it at this time.
We are subject to antitrust laws in various countries throughout the world. A significant portion of our business activities is conducted in countries under existing trade agreements and regulations. Changes in antitrust laws, trade agreements or regulations may limit our operations or the operations of Canpotex and could negatively impact opportunities for future acquisitions or organic growth.
We are also subject to taxes in jurisdictions where we are organized or conduct business. Tax rates in the various jurisdictions in which we operate may be subject to significant change. Taxation matters, including changes in tax laws or rates, adverse determinations by taxing authorities, and imposition of new taxes could adversely affect our strategy, financial condition, results of operations and cash flows.
Climate change may have an adverse effect on our business
Our business and our customers are subject to risks related to or resulting from climate change, which are commonly grouped into physical risk and transition risk categories.
Physical risks include the impact that climate change could have on our operations, our grower customers, and our supply chain. Climate change may cause or result in, among other things, more frequent and severe weather events, such as storms, floods, heat waves, droughts, and/or changing weather factors such as changing temperatures, precipitation, wind, and water levels. Chronic physical impacts from climate change may also affect the availability and suitability of arable land, including crop quality and soil health, and contribute to loss of biodiversity and unpredictable shifts in the average growing season and types of crops produced and/or crop yields, which could impact the long-term demand for our products and services. The results of climate change or droughts may also affect the water levels of certain waterways used in our supply chain network or availability of water (including water use restrictions) for use in our operations. Freshwater availability is critical to our operations and our grower customers, but localized challenges can exist regarding availability and quality of water, which may be intensified by the effects of climate change. Physical risks from climate change may also result in operational or other supply chain delays, depending on the nature of the event. These events may impact the demand for our products, availability and/or cost of transportation and distribution, resource inputs, materials or insurance, or increase the costs to our operations or capital projects.
Transition risks relate to the risk inherent in changing strategies, policies or investments as society and industry work to reduce the reliance on carbon and impact on the climate. Impacts of transition risks include, among other things, policy constraints on carbon emissions, imposition of carbon pricing mechanisms and carbon taxes, enhanced climate reporting obligations, risks associated with investments in new technologies, costs to transition to lower emissions technologies, stranded assets, diminished access to capital and financing, water restrictions, land use restrictions or incentives, changing consumer behavior and preferences, and market demand and supply shifts. There are also reputational risks associated with climate change including our stakeholders’ perception of the agriculture industry and our role, strategies and capital allocation decisions relating to the transition to a lower-carbon economy.
29
There can be no assurance that our efforts to anticipate the costs associated with mitigating the physical risks of climate change and working with governments and industry on potential regulatory requirements associated with climate change will be effective or that climate change or related governmental policy action in response to climate change will not have an adverse impact on our business and negatively impact our strategy, financial condition, results of operations, and/or cash flows, and our reputation and stakeholders’ support.
See the discussions under “Agricultural changes and trends could adversely impact our business”, “Our business may be adversely affected by changing regulations” and “We may fail to meet our GHG emissions and/or other sustainability and climate targets” for further consideration of the potential impacts of climate-related events on demand for our products, on our operations and on the regulatory environment we operate within.
Our information technology systems, infrastructure and data may become the target of cybersecurity attacks
Information technology systems and operational control systems are embedded in our business and as we advance our digital platform and capabilities, financial lending programs, and process automation systems, we may become more exposed to cyberattacks, which continue to become increasingly sophisticated and costly to defend. Further, increased reliance on third-party service providers, cloud-based platforms, and remote working arrangements have required adjusted tactics to respond to a changing threat landscape and may result in increased cybersecurity risk exposure. Cybersecurity risks include attacks on information technology and infrastructure by hackers, industrial espionage, terrorist attacks, damage or loss of information due to viruses, ransom events, the unintended disclosure of confidential information and/or personally identifiable information, the misuse or loss of control over computer control systems, power outages, business and/or supply chain disruptions, and related breaches (intentional or otherwise).
Targeted attacks on our systems (or on systems of third parties that we rely on), failure or non-availability of key information or operations technology systems (whether our own systems or systems of third parties that we rely on), or a breach in security measures designed to protect our technology systems could result in property damage, theft, misuse, modification and destruction of information, including trade secrets and confidential business information and/or personally identifiable information, and cause business disruptions, reputational damage, extensive personal injury, and third-party claims, which could negatively impact our operations and our financial performance.
Nutrien collects certain personally identifiable information and other data integral to parts of its business processes and activities. This information and other data is subject to a variety of US, Canadian, and foreign laws and regulations, including oversight by various regulatory or other governmental bodies, and laws and regulations concerning the collection and use of such information and other data obtained from their residents or by businesses operating within their jurisdictions. Any inability, or perceived inability, to adequately address privacy and data protection concerns, even if unfounded, or to comply with applicable laws, regulations, policies, industry standards, contractual obligations or other legal obligations (including at newly acquired companies) could result in additional cost and liability to Nutrien or its officials, damage our reputation, inhibit sales, and otherwise adversely affect our business.
Our operations may be affected by political, economic and social instability
We are a global business with significant operations in Canada and the US as well as operations outside of North America, including Australia, South America, European countries and Trinidad, with an expanding presence in Brazil. We also hold equity investments primarily in China and Argentina.
We are subject to numerous risks and uncertainties relating to international sales and operations, including: difficulties and costs associated with complying with a wide variety of complex laws, treaties and regulations; abrupt or unexpected changes in regulatory environments; conflicting cultural practices and business practices; increased government regulation of the economy and/or state ownership of enterprises; changes in tax or royalty laws and regulations; labor disruptions; forced divestitures or changes to or nullification of existing agreements, mining permits or leases; political and economic instability in areas in which we operate or elsewhere, including the possibility for civil unrest, military or political conflicts, inflation (including volatile and/or high inflation levels), supply chain disruptions and adverse economic conditions resulting from governmental attempts to reduce inflation, such as imposition of higher interest rates and wage and price controls; nationalization of properties or assets by foreign governments; the imposition of tariffs, limitations on the repatriation of earnings and exchange controls (including, but not limited to those in Argentina), international trade sanctions, embargoes, barriers or other restrictions; restrictions on monetary distributions; public health crises, and actions taken and measures imposed by government or regulatory bodies in connection therewith; and currency exchange rate fluctuations between the US dollar and foreign currencies.
The occurrence of any of the above risks and uncertainties in the countries in which we operate or elsewhere could jeopardize or limit our ability to transact business and could adversely affect our revenue, operating results, or the value of our assets located in such countries.
30
Our governance and compliance processes, which include the review of internal control over financial reporting and specific internal controls in relation to offers of things of value to government officials and representatives of state-owned enterprises, may not prevent potential violations of law including anti-corruption or anti-bribery laws, accounting, or governance practices. Our Code, together with our mandatory policies, such as our Anti-Corruption and Anti-Fraud Policies, may not prevent instances of fraudulent behavior and dishonesty nor guarantee compliance with legal or regulatory requirements. This may lead to regulatory fines, disgorgement of profits, litigation, loss of operating licenses or reputational damage.
We may fail to attract and retain talent and/or develop the right organizational culture and resources which could have an adverse effect on our business
Our ability to attract and retain qualified top talent, including for skillsets that are in high demand in certain regions, and provide the necessary organizational structure, programs, and culture to engage and develop our employees, including providing a respectful, inclusive and diverse workplace, is crucial to our growth and achieving our business results.
Although we strive to be an employer of choice, competition for skilled employees in certain geographical areas can be significant and we may not be successful in attracting, developing or retaining such skilled employees. We could experience increases in our recruiting and training costs, and decreases in our operating efficiency, productivity, and financial performance if we are not able to attract, hire and retain a sufficient number of skilled employees to support our operations. Our success also depends in part on certain skilled employees and the loss of their services could have a material adverse effect on our business, financial condition, and results of operations.
In addition, we invest significant time and expense in training and developing our employees, which increases their value to competitors, who may seek to recruit them. Failure to develop the right organizational structure or culture or promote and foster a respectful, diverse, and inclusive workplace could result in decreased productivity, reliability, efficiency and safety performance, higher costs, or reputational harm. It could also negatively impact our ability to attract and retain employees, take on new projects or acquisitions and sustain operations, or meet diversity and inclusion goals, which might negatively affect our operations or our ability to grow.
We may fail to maintain the support of our stakeholders for our business plans
The nature of our business makes it crucial to maintain a strong reputation and positive relationships with key stakeholders, including shareholders, customers, our employees, suppliers, landowners, local and Indigenous communities, and governments, among others. Damage to our reputation can occur from our actual or perceived actions or inactions and a range of events and circumstances, including through our supply chain, many of which are out of our control. This includes with the media and in social media, which has made it easier for individuals and groups to share their opinions of us and our activities, whether accurate or not, which could damage our reputation.
Our reputation as a company doing business with integrity is essential to building and maintaining trusting relationships with stakeholders, as well as reducing our legal and financial risk. Damage to our reputation could result in, among other things, a decrease in the value of our common shares and debt securities, decreased investor confidence, challenges in attracting and retaining talent, challenges in maintaining positive relations with the communities in which we operate and other important stakeholders, and increased risks in developing our resources, any of which could have a material adverse effect on our operations, projects and financial position.
Our stakeholders may place increasing importance on the structure of our business, our ability to execute on our strategy, the customers, growers, and suppliers we do business with, and our core sustainability, social, biodiversity, and product stewardship responsibilities. Underperformance due to weak market fundamentals or business issues, inadequate communication, engagement and/or collaboration with our stakeholders, perception gaps between consumers and the agriculture industry, inadequate management of climate change, biodiversity, or other environmental or social issues, inadequate management of our products or supply chain, or dissatisfaction with our practices or strategic direction, including our capital allocation priorities and those directed to address ESG matters, may lead to a lack of support for our business plans. Loss of stakeholder confidence impairs our ability to execute on our business plans, negatively impacts our ability to produce and/or sell our products, and may also lead to reputational and financial losses, and negatively impact our access to or cost of capital or shareholder action.
We may be unable to access sufficient, cost-effective or timely transportation, distribution, and storage of our products or our supply chains may be disrupted which could have an adverse effect on our business
We rely on dependable and efficient transportation services, the disruption of which could result in difficulties supplying materials to our facilities and/or impair our ability to deliver products to customers in a timely manner. We rely on railroad, trucking, pipeline, access to navigable rivers and waterways, and other transportation service providers to transport raw materials to our manufacturing facilities, to coordinate and deliver finished products to our storage and distribution system and our Retail centers, and to ship finished products to our customers.
31
Our ability (or the ability of the third parties upon which we rely) to provide sufficient, cost-effective or timely transportation and storage of product may be challenged due to a number of factors, including labor disputes, system failures, accidents (such as spills or derailments), delays, supply chain interruptions, adverse weather or other environmental events (including high or low river water conditions and others related to climate change), explosions, fires or other unexpected outages, adverse operating conditions (including aging transportation infrastructure, railroad capacity constraints, or changes to rail or ocean freight systems), swings in demand for our products, increased shipping demand for other products, adverse economic conditions, deliberate sabotage and terrorist incidents, labor difficulties and shortages, a change in our export, sales or marketing company relationships, or otherwise. This could result in delays and increased costs, lost revenue, and reputational damage with our customers.
If certain key raw materials, parts and/or supplies used in our processing operations are not available, our business could be disrupted. Certain factors which may impact the availability of raw materials and supplies are out of our control including, but not limited to, disruptions resulting from weather, economic conditions, geopolitical factors, regulatory instability and changes to tariffs, manufacturing delays or disruptions at suppliers’ facilities or supplier operations, shortage of materials, interruption of energy supply, epidemics, pandemics, or other such crises, and unavailable or poor supplier credit conditions.
We may fail to effectively redeploy capital to achieve sustained growth
Challenges may arise in the capital allocation process due to changing market conditions, including the unavailability, due to geopolitical, market or other reasons, of appropriate capital deployment opportunities, and our ability to anticipate and incorporate such changes in our decision-making process. Inefficiencies in the capital allocation process or decisions that are not consistent with strategic priorities or that do not properly assess risk may also lead to inefficient deployment of capital. Failure to allocate capital in an effective manner may lead to reduced returns on capital invested, operational inefficiencies, damage to our reputation or limitations on our access to capital.
When we undertake any strategic initiatives, our ability to achieve the expected returns and other benefits will be affected by our degree of preparedness and ability to execute.
| • | We have undertaken and continue to undertake various projects including capital and business process improvement and transformation projects, including those intended to lower our GHG emissions intensity. These projects involve risks, including (but not limited to) changing market conditions, difficult environmental conditions, poor project prioritization and capital allocation, factors negatively impacting costs (such as escalating costs of labor and materials, unavailability and underperformance of skilled personnel, suppliers of materials or technology and other third parties we retain, design flaws or operational issues, or poor project management oversight) or poor transition through project stages. Any of the foregoing risks could impair our ability to realize the benefits we had anticipated from the projects and negatively impact our financial performance. |
| • | With respect to any completed and future acquisitions, we are dependent upon our ability to successfully consolidate functions and integrate culture, operations, technology, systems, procedures, and personnel of acquired businesses in a timely and efficient manner. The integration of assets and operations requires the dedication of management effort, time and resources, which may divert management’s focus and resources from other strategic opportunities or operational matters during the process. The integration process with respect to any completed or future acquisitions may result in the disruption of our existing business and customer relationships, which may adversely affect our ability to achieve the anticipated synergies and other benefits and may, in turn, negatively affect our financial performance, including the risk of impairment charges related to goodwill or other intangibles. |
| • | We also continue to evaluate the potential disposition of assets and operations that may no longer help us meet our objectives. When we decide to sell assets or operations, we may encounter difficulty in finding buyers or executing alternative exit strategies on acceptable terms or in a timely manner, which could delay the accomplishment of our strategic objectives. |
We may fail to maintain high levels of safety and health or to protect the environment
Our operations are subject to hazardous safety, health and environmental risks inherent in mining, manufacturing, transportation, storage and distribution of chemical fertilizers, and other chemical products, including ammonia and anhydrous hydrogen fluoride, which are highly toxic and corrosive. These risks include: incidents relating to operation of equipment and exposure by personnel to thermal, electrical, mechanical, chemical, gravitational, pneumatic and hydraulic operations, maintenance activities and road transportation/travel; underground water inflows at our potash mines; explosions; fires; severe weather and natural disasters; train derailments and collisions, vessel groundings and other transportation and maritime incidents; leaks and ruptures involving storage tanks, pipelines and railcars; spills, discharges, and releases of toxic or hazardous substances or gases; uncontrolled tailings, gypsum stack or other containment breaches; significant subsidence from mining activities; civil unrest; and deliberate sabotage and terrorist incidents. Additionally, other hazards specific to our Nitrogen and Phosphate operations include but are not limited to: engulfment; hydrogen sulfide (“H2S”) exposures; contact with electrical conductors; hazards associated with reclamation activities inclusive of work around bodies of water; and work at height hazards/fall protection exposure prevention.
32
We also have personnel who work or travel in higher-risk countries and are subject to increased safety and security risks as a result.
The potash mining process is complex and subject to certain geological conditions and hazards, including the presence of certain gases, such as those containing H2S, and the presence of water-bearing strata above and below many underground mines, which pose the risk of water inflows. It is not uncommon for water inflows of varying degrees to occur in potash mines. While it is difficult to predict if, when or to what degree such inflows could occur, we are able to better predict and prepare for mine-threatening inflows with the use of 3D seismic and accompanying mining guidance standards. At our Saskatchewan potash mines, we experienced water inflows that are being monitored and managed, as appropriate. An increase to the frequency and/or significance of inflows at our potash mines could result in increased operational costs, increased risk of personal injury, production delays or stoppages, the abandonment and closure of a mine, and/or damage to our reputation. The risk of underground water inflows, as with most other underground risks, is currently not insured.
Failure to identify, proactively mitigate or appropriately respond to a safety, health or security incident could result in injuries or fatalities among our employees, contractors or residents in communities near our operations. Such incidents may lead to civil and/or criminal liabilities arising out of personal injuries or death, operational interruptions, regulatory intervention, such as stop work orders, citations, restrictions or other enforcement actions, and shutdown or abandonment of affected facilities. Preventing or responding to incidents could require us to expend significant managerial time and effort, and financial resources to remediate safety issues, compensate injured parties or repair damaged facilities. Any of the foregoing could have an adverse impact on our ability to produce or distribute product, our financial results, and our reputation. Failure to prevent an environmental incident could impact the biodiversity, water resources, and related ecosystems near our operations, cause personal injury and significant environmental damage, and result in significant fines or penalties. Such incidents could also adversely impact our operations, financial performance or reputation.
We may fail to meet our GHG emissions and/or other sustainability and climate targets
We set a target to reduce our Scope 1 and 2 GHG emissions intensity of our operations by at least 30 percent by 2030 (based on a 2018 baseline year). Our ability to lower GHG emissions on an absolute or intensity basis (including the ability to maintain such GHG emission reductions into the future) is subject to numerous risks and uncertainties, and our actions taken in implementing these objectives may also expose us to certain additional and/or heightened financial and operational risks.
A reduction in GHG emissions is dependent on, among other things, our ability to deploy sufficient capital to fund the expenditures to implement the necessary operational changes required to achieve our target; our ability to implement requisite operational changes; our ability to implement some or all of the technology necessary to efficiently and effectively achieve expected future results, including in respect of our GHG emissions reduction targets; the availability of requisite technological advances; the commercial viability and scalability of GHG emissions reduction strategies and related technology and products; and the development and execution of implementing strategies to meet our GHG emissions reduction target.
With respect to our other climate and sustainability targets, our ability to achieve those targets is also subject to numerous risks and uncertainties and our actions taken in implementing our objectives may also expose us to certain additional and/or heightened financial and operational risks. Our ability to achieve our various sustainability commitments, performance goals and climate and sustainability targets relies on, among other things, our ability to deploy sufficient capital to fund the expenditures to implement the necessary operational changes to achieve these targets; our ability to realize expected operating rates; our ability to implement requisite operational changes; our ability to implement some or all of the technology necessary to efficiently and effectively achieve expected future results; the commercial viability and scalability of required technology and products; production mix; development and growth of end market demand for sustainable products and solutions; the performance of third parties; and the development and execution of implementing strategies to meet such targets.
In the event that we are unable to implement our GHG emissions reduction and/or other climate and sustainability strategies and technologies as planned or in the event that such strategies or technologies do not perform as expected, or production mix, operating rates and conditions are not as expected, we may be unable to meet our GHG emissions reduction targets or goals or other ESG, climate and sustainability targets on the current timelines, or at all. In addition, the costs associated with achieving our GHG emissions reduction targets and other climate and sustainability targets could be significant, and could require significant capital expenditures and resources, potentially including the acquisition of technology, with the potential that the costs required to achieve our targets could differ from our original estimates and expectations, which differences may be material. The overall cost of investing in and implementing an emissions reduction strategy and technologies in furtherance of such strategies, and the resultant change in the deployment of our resources and focus, could have a material adverse effect on our business, financial condition, and results of operations. There is also a risk that some or all of the expected benefits and opportunities of achieving the various GHG emissions reduction, climate and other sustainability goals, including as a result of a transition project or technology acquisition, may fail to materialize within the anticipated time periods or at all.
33
Failure to achieve our emissions, climate or sustainability targets could have a negative impact on our reputation, business, cash flows, results of operations, and on our access to, and cost of, capital.
An inability to successfully manage the implementation of our new enterprise resource planning system
As part of our digital transformation, we are implementing a new enterprise resource planning (“ERP”) system. This system will replace many of our existing operating and financial systems. Such an implementation is a major undertaking, both financially and from a management and personnel perspective. Any disruptions, delays or deficiencies in the design and implementation of our new ERP system could adversely affect our ability to process orders, ship products, provide services and support, send invoices and track payments, fulfill contractual obligations, or otherwise operate our business and affect our internal controls over financial reporting.
Our business and operations are subject to other general and ongoing risks, most of which are outside our control which could have a material adverse effect on our business, financial condition, results of operations, cash flows, value of our common shares and debt securities and, in certain cases, our reputation
Adverse weather conditions and/or seasonality may impact demand for our products or delay grower purchases
Our business and our customers are impacted by weather patterns and conditions including storms, floods, heat waves, droughts and other events. Adverse conditions, including as a result of climate change, that can delay or intermittently disrupt fieldwork during the planting and growing seasons may cause agricultural customers to use different forms of crop nutrients and crop protection products, which may adversely affect demand for the forms of products that we sell, or may impede growers from applying our crop nutrients and crop protection products until the following growing season or in some cases not at all, resulting in lower demand for our products and reduced revenues.
We face the significant risk and cost of continuing to carry inventory should our customers’ activities be curtailed during their normal application seasons. We must manufacture and distribute product throughout the year in order to meet peak season demand, as well as react quickly to unexpected changes in weather patterns that affect demand. Weather can also have an adverse effect on crop yields, which could lower the income of growers and impair their ability to purchase our crop nutrients, crop protection, and seed products and services. Adverse weather conditions could also impact transportation of fertilizer, which could disrupt our ability to deliver our products to our customers and growers on a timely basis. As a result, our quarterly financial results may vary significantly from one year to the next due to weather-related shifts in planting schedules and purchasing patterns, and losses due to adverse weather conditions in one quarter may not be recovered in the following season.
Additionally, our business is seasonal and varies based on several factors, including application rates, weather, soil conditions and crop mix. Growers tend to apply crop nutrients during short application periods, such as in the spring, before planting, and in the fall after harvest. As a result, the strongest demand for our products typically occurs during the spring and fall seasons. In contrast, we and other crop nutrient producers generally produce our products throughout the year, and, as a result, we generally build inventories during the low demand periods of the year to provide timely product availability during the peak sales seasons.
If sales significantly differ from our projections, our profitability, inventory levels, working capital, or liquidity may be negatively impacted. The degree of seasonality of our business can change significantly from year to year due to global weather patterns, conditions in the agriculture industry and other factors.
We may be subject to labor disruptions or disputes
A significant portion of our workforce is unionized or otherwise governed by collective bargaining or similar agreements. Five of our 13 collective bargaining agreements are subject to expiry and renegotiation in 2024. We have three collective bargaining agreements that remain under renegotiation. We are therefore subject to the possibility of organized labor disruptions. Adverse labor relations or contract negotiations that do not result in an agreement could result in strikes or slowdowns or impose additional costs to resolve these disputes. These disruptions may negatively impact our ability to produce or sell our products and/or cost of production. These disruptions may also impact our ability to recruit and retain personnel and could negatively affect our financial performance.
Canpotex may be dissolved or its ability to operate impaired
Canpotex is the offshore marketing, transportation and distribution company we rely on to deliver our potash to customers outside Canada and the US. Unexpected changes in laws or regulations, market or economic conditions, our (or our venture partner’s) business, or other unexpected developments could threaten the existence or effectiveness of Canpotex. In any of those circumstances, a trusted potash brand could be lost and our access to key offshore markets negatively impacted resulting in a less efficient logistics system, decreased sales, higher costs or lower net earnings from offshore sales.
34
We are exposed to various market risks that may impact our operating results
We are exposed to various market factors that may impact our operating results, including: changes in the price of, or ability to source, raw materials and energy, which could, among other things, impact our gross margins and profitability; commodity price volatility, including the possibility of asset impairment as a result thereof; currency volatility and devaluation risk, including as a result of the translation of foreign subsidiaries’ financial statements to US dollars for consolidation at the Nutrien level; and fluctuations in interest rates, which could negatively impact our financial results given our use of floating rate debt, floating rate credit facilities and commercial paper, as well as the refinancing of long-term debt and anticipated future financing needs. We seek to manage a portion of the risks relating to changes in commodity prices and foreign currency exchange rates by using derivative instruments; however, such instruments may be ineffective in fully mitigating such risks.
Changes in the price of raw materials and energy required to produce our products, including natural gas, which is the principal raw material used to manufacture our nitrogen products and a significant energy source in the potash milling and mining process, could have a material impact on our business. The price of raw materials and energy can fluctuate widely for a variety of reasons, including changes in availability because of additional capacity or limited availability due to curtailments, regulatory changes, including changes related to production of certain raw materials or energy sources, or other operating problems. Other external factors beyond our control can also cause volatility in raw materials prices, including, without limitation, general economic conditions, including inflationary pressures, the level of business activity in the industries that use our products, weather conditions and forecasts, competitors’ actions, trade sanctions, international events, such as the conflict in the Middle East and the current war between Ukraine and Russia, lingering impacts from the COVID-19 pandemic, and governmental regulation in the US and abroad. Because most of our products are commodities or derived from commodities, there can be no assurance that we will be able to recover increases in the price of such raw materials through an increase in the selling price of our related crop nutrient products. Conversely, when the market prices for these raw materials rapidly decrease, the selling prices for related crop nutrients can fall more rapidly than we are able to consume our raw material inventory that we purchased or committed to purchase at higher prices. As a result, our costs may not fall as rapidly as the selling prices of our products. Until we are able to consume the higher-priced raw materials, our gross margins and profitability may be adversely affected.
We generally benefit from relatively low North American natural gas prices, which can vary significantly compared to the price for natural gas in Europe and Asia. Significantly lower natural gas prices in Europe and/or Asia may give our competitors in those regions an advantage, which could, in turn, decrease international and domestic product prices and reduce our margins. In addition, higher natural gas prices, particularly in North America, during a period of low crop input selling prices could adversely affect our results of operations.
There is also a risk to production at our various facilities due to concerns over the availability of natural gas supplies. Nitrogen facilities in Argentina and Trinidad have all experienced supply strains or curtailments. Continued or increased natural gas shortages may result in reduced production available for sale and higher production costs per tonne.
We may be unable to access capital on a cost-effective or timely basis
We rely on access to debt capital markets to finance our day-to-day and long-term operations. Access to and cost of capital may be affected by factors not specific to Nutrien, such as adverse conditions in the credit markets, general and industry-specific market and economic conditions and interest rate fluctuations. Our access to and cost of capital will also be dependent on our short- and long-term credit ratings, which are determined by, among other things, the level and quality of our earnings and our ability to meet financial obligations. A credit rating downgrade could potentially limit our access to private and public credit markets and increase the costs of borrowing under our existing credit facilities. A downgrade could also limit our access to short-term debt markets and increase the cost of borrowing in the short and long-term debt markets. Inability to access capital on a cost-effective or timely basis may result in a loss of liquidity, an increase in the cost of capital or inability to execute on value-added transactions requiring significant capital, including our Nutrien Financial product offerings. Our reputation and financial performance may be impacted from being associated with carbon intensive activities and/or concerns regarding the contribution of our operations to climate change, which could include a reduction in investor confidence and constraints on our ability to access capital markets.
Our operations are exposed to counterparty risk
We are exposed to the risks associated with counterparty performance, including credit risk and performance risk. We extend trade credit and guarantee the financing for some of our growers and customers to purchase our products (and, in some cases, for extended periods of time). We may experience material financial losses in the event of customer payment default for our products or services (including Nutrien Financial) and/or financial derivative transactions. Increases in the prices of crop nutrients may exacerbate this risk.
35
We may incur non-cash charges affecting our consolidated financial statements if our assets or goodwill become impaired
We have significant investments in long-lived assets to be held and used and goodwill, and continually review the carrying amount of these assets for recoverability, considering changes in market conditions and if other events or circumstances indicate that their carrying amount may not be recoverable. If our long-lived assets or goodwill are determined to be impaired in the future, we may be required to record non-cash charges in our consolidated statement of earnings during the period in which the impairment is determined, which could be significant and have an adverse effect on our results of operations. We have, in the past, and may in the future, be required to write down the value of our goodwill or other long-lived assets, and such future writedowns could be material. See Notes 13 and 14 of the 2023 Consolidated Financial Statements for further information related to writedowns in 2023.
We also carry our inventories at the lower of cost and net realizable value. A decrease in forecasted prices of key production inputs could result in a writedown of our inventory, when the carrying amount exceeds net realizable value. Periods of a prolonged elevated commodity price environment increase the potential that prices could subsequently decrease rapidly. Other factors that could impact our estimates of net realizable value include inventory levels, global nutrient capacities, crop price trends, climate change initiatives and changes in regulations and standards employed. Any such writedown could have an adverse effect on our results of operations and the value of our assets.
We are subject to legal proceedings, the outcome of which may affect our business
We are, and may in the future be, involved in legal and regulatory proceedings, including matters arising from our activities or activities of predecessor companies, including climate-related activities. The outcome of these matters may be difficult to assess or quantify, and such matters may not be resolved in our favor. Such matters could result in unfavorable outcomes, including fines, sanctions, assessments of additional taxes (including interest and penalties), and other monetary damages against us or our directors, officers or employees. The defense of such matters may also be costly and time consuming and could divert the attention of management and key personnel from our operations. We may also be subject to adverse publicity associated with such matters, regardless of whether such allegations are valid or whether we are ultimately found liable.
Our insurance coverage may not adequately cover our losses
Nutrien maintains various insurance policies, including property, business interruption and liability insurance policies, but we are not fully insured against all potential hazards, perils and/or risks pertaining to our business. As a result, we may incur significant liability for which our insurance may not fully compensate or for which we may not have coverage, which could have a material adverse effect on our business, financial condition, results of operations and cash flows. Insurance policies are generally renewed on an annual basis and are subject to various deductibles, exclusions and conditions that could limit the nature of indemnification available to us. Insurance market conditions can change our premiums, limits, self-retentions and/or deductibles for certain insurance policies, and in some instances, the availability of some insurance coverage may be reduced or become unavailable entirely. Many factors are taken into consideration that could lead us to decide to increase our self-retentions or reduce, or possibly eliminate, coverage for certain hazards and risks.
Our reported mineral reserves and mineral resources are only estimates
Our mineral reserves have been estimated in accordance with National Instrument 43-101 – Standards of Disclosure for Mineral Projects (“NI 43-101”) as required by Canadian securities regulatory authorities, and the Canadian Institute of Mining, Metallurgy and Petroleum Classification System and our mineral reserve disclosure is not required to adhere to US requirements. The estimated mineral reserves and mineral resources may not be recovered or may not be recovered at the rates estimated. There are varying levels of certainty of the mineral reserves and mineral resources estimates, depending on sampling and geophysical imaging and, consequently, these estimates may not be representative of actual resources. Mineral reserves and mineral resources estimates may require revision (either up or down) based on new data. Further, market fluctuations in the price of potash, as well as increased production costs or reduced recovery rates (including due to policy, legal, technological, market and societal responses to climate change), may render certain mineral reserves and mineral resources uneconomic and may ultimately result in a restatement of estimated resources and/or reserves.
5.12 Mineral Projects
See “Schedule B – Mineral Projects” for information regarding our Allan, Cory, Lanigan, Rocanville and Vanscoy Potash operations.
36
6 – Dividends
The declaration, amount and payment date of any dividend by Nutrien is at the discretion of the Board and will depend on numerous factors, including compliance with applicable laws and the financial performance, debt obligations, working capital requirements and future capital requirements of Nutrien and its subsidiaries. See “5 – Description of the Business – 5.11 Risk Factors”. Other than pursuant to applicable corporate law, there is currently no restriction that could prevent Nutrien from paying dividends on the common shares.
Dividends declared by Nutrien for the years ended December 31 were as follows:
| 2023 | 2022 | 2021 | ||||||||
| Date Declared |
Per Common |
Date Declared |
Per Common Share |
Date Declared |
Per Common Share |
|||||
| February 15, 2023 |
0.53 |
February 16, 2022 |
0.48 |
February 17, 2021 |
0.46 |
|||||
| May 10, 2023 |
0.53 |
May 18, 2022 |
0.48 |
May 17, 2021 |
0.46 |
|||||
| August 2, 2023 |
0.53 |
August 4, 2022 |
0.48 |
August 9, 2021 |
0.46 |
|||||
| November 1, 2023 |
0.53 |
November 3, 2022 |
0.48 |
November 1, 2021 |
0.46 |
|||||
| Total |
2.12 |
Total |
1.92 |
Total |
1.84 |
|||||
7 – Description of Capital Structure
7.1 General Description of Capital Structure
Authorized Capital
The authorized share capital of Nutrien consists of an unlimited number of common shares and an unlimited number of preferred shares issuable in series.
As at February 22, 2024, 494,563,180 common shares were issued and outstanding and no preferred shares were issued or outstanding. The following is a general description of the material rights, privileges, restrictions and conditions attached to the common shares and the preferred shares.
Common Shares
Each common share entitles the holder to: (i) vote at all meetings of holders of common shares (except meetings at which only holders of a specified class or series of shares of Nutrien are entitled to vote as provided in the CBCA) and to one vote for each common share held on all polls taken at such meetings; (ii) receive, subject to the rights of the holders of another class of shares of Nutrien, any dividend declared by the Board from time to time, in their absolute discretion, in accordance with applicable law; and (iii) receive, subject to the rights of holders of another class or series of shares of Nutrien, the remaining property of Nutrien on the liquidation, dissolution or winding up of Nutrien or any other distribution of the assets of Nutrien for the purposes of winding up its affairs, whether voluntary or involuntary. There are no pre-emptive or conversion rights attaching to the common shares and the common shares are not subject to redemption. All common shares currently outstanding and to be outstanding upon exercise of outstanding options and other securities, as applicable, are, or will be, fully paid and non-assessable.
Our by-laws provide for certain rights of holders of our common shares in accordance with the provisions of the CBCA. Such by-laws may be amended either by a majority vote of the holders of common shares or by a majority vote of the Board. Any amendment of the by-laws by action of the Board must be submitted to the next meeting of our shareholders whereupon the by-law amendment must be confirmed, confirmed as amended or rejected by a majority vote of the shareholders voting on such matter.
Preferred Shares
The preferred shares may at any time and from time to time be issued in one or more series with the designation, rights, privileges, restrictions and conditions attaching to each series of the preferred shares to be determined by the Board.
The preferred shares of each series rank on a parity with the preferred shares of every other series, and are entitled to preference over the common shares and any other shares of the Company ranking junior to the preferred shares, with respect to (i) the payment of dividends; (ii) the distribution of property in the event of the liquidation, dissolution or winding up of Nutrien; and (iii) such other preferences as may be determined by the Board.
37
Except as specifically provided in the rights, privileges, restrictions and conditions attaching to any series of preferred shares and except as provided by the CBCA, the holders of preferred shares are not entitled to receive notice of or attend any meeting of the shareholders of the Company or to vote at any such meeting for any purpose.
The provisions attaching to the preferred shares as a class may be added to, changed or removed, and the Board may create shares ranking prior to the preferred shares, only with the approval of the holders of the preferred shares as a class, any such approval to be given by the holders of not less than 66 2/3 percent of the preferred shares in writing by the registered holders of the preferred shares or by resolution at a meeting of such holders.
7.2 Constraints
There are no constraints imposed on the ownership of Nutrien’s securities to ensure that the Company has a required level of Canadian ownership.
7.3 Debt Ratings
The following information relating to Nutrien’s credit ratings is provided as it relates to Nutrien’s financing costs, liquidity and operations and to satisfy disclosure requirements under applicable Canadian securities rules. Our ability to access reasonably priced debt in the capital markets is dependent, in part, on the quality of our credit ratings. We continue to maintain investment-grade credit ratings for our long-term debt. A downgrade of the credit rating of our long-term debt could increase the interest rates applicable to future borrowings.
Commercial paper markets are normally a source of same-day cash for the Company. Our access to the US commercial paper market primarily depends on maintaining our current short-term credit ratings as well as general conditions in the money markets.
Credit ratings are intended to provide investors with an independent measure of credit quality of an issue of securities. A credit rating is not a recommendation to buy, sell or hold securities and does not address the market price or suitability of a specific security for a particular investor. Such ratings may be subject to revision or withdrawal at any time by the respective credit rating agency and each rating should be evaluated independently of any other rating.
The following table sets out ratings the Company has received in respect of its outstanding debt securities from the ratings agencies as at the date of this AIF. The Company has paid each of S&P Global Ratings (“S&P”) and Moody’s Investors Service, Inc. (“Moody’s”) their customary fees in connection with the provision of the following ratings. The Company has not made any payments to S&P or Moody’s in the past two years for services unrelated to the provision of such ratings.
|
S&P Rating |
Moody’s Rating |
|||
| Nutrien senior notes |
BBB |
Baa2 |
||
| US$ commercial paper |
A-2 |
P-2 |
||
| Ratings outlook |
Stable |
Stable |
S&P 1
The BBB rating assigned by S&P is the fourth highest rating of S&P’s 10 rating categories for long-term debt, which range from AAA to D. Issues of debt securities rated BBB are judged by S&P to exhibit adequate protection parameters. However, adverse economic conditions or changing circumstances are more likely to weaken the obligor’s capacity to meet its financial commitments on the obligation. The ratings from AA to CCC may be modified by the addition of a plus (+) or minus (-) sign to show relative standing within the major rating categories.
The A-2 rating assigned by S&P is the second highest rating of S&P’s six rating categories for short-term debt, which range from A-1 to D. A short-term obligation rated A-2 is somewhat more susceptible to the adverse effects of changes in circumstances and economic conditions than obligations in higher rating categories. However, the obligor’s capacity to meet its financial commitments on the obligation is satisfactory.
S&P’s stable outlook on Nutrien’s credit ratings means that the ratings are not likely to change (generally up to two years).
| 1 | S&P Global Ratings Definition – June 9, 2023 |
38
Moody’s 1
The Baa2 rating assigned by Moody’s is the fourth highest rating of Moody’s nine rating categories for long-term debt, which range from Aaa to C. Moody’s appends numerical modifiers from one to three on its long-term debt ratings from Aa to Caa to indicate where the obligation ranks within a particular ranking category, with the two modifier indicating a mid-range ranking. A modifier of one indicates that the obligation ranks on the higher end of its generic rating category and a modifier of three indicates that the obligation ranks on the lower end of its generic rating category. Obligations rated Baa are defined by Moody’s as being subject to moderate credit risk. They are considered medium-grade and as such may possess speculative characteristics.
The P-2 rating assigned by Moody’s is the second highest rating of Moody’s four rating categories for short-term debt, which range from P-1 to NP. Issuers rated P-2 are defined by Moody’s as having a strong ability to repay short-term debt obligations.
Moody’s stable outlook on Nutrien’s credit ratings indicates a low likelihood of a rating change over the medium term.
8 – Market for Securities
8.1 Trading Price and Volume
During 2023, Nutrien’s common shares traded on the TSX and the New York Stock Exchange (“NYSE”) under the symbol “NTR”.
The following table sets out the trading price range and volume of our common shares traded on the TSX and the NYSE for 2023 on a monthly basis:
| TSX | NYSE | |||||||||||
| Month (2023) |
High Price |
Low Price (CAD$) |
Volume |
High Price (US$) |
Low Price (US$) |
Volume | ||||||
| January |
110.85 |
96.10 |
27,377,823 |
83.09 |
71.01 |
40,868,109 | ||||||
| February |
113.32 |
99.87 |
25,127,544 |
85.16 |
73.88 |
43,822,072 | ||||||
| March |
113.27 |
97.28 |
29,771,449 |
83.29 |
70.68 |
53,347,014 | ||||||
| April |
101.31 |
91.08 |
19,336,659 |
75.29 |
67.52 |
32,179,549 | ||||||
| May |
94.88 |
71.17 |
30,709,804 |
70.07 |
52.35 |
80,770,111 | ||||||
| June |
80.85 |
70.69 |
39,941,286 |
61.32 |
52.23 |
61,127,004 | ||||||
| July |
91.15 |
77.38 |
31,757,965 |
69.12 |
57.91 |
40,331,298 | ||||||
| August |
92.48 |
80.93 |
21,042,139 |
69.09 |
59.65 |
44,533,915 | ||||||
| September |
89.37 |
82.86 |
19,801,385 |
65.69 |
61.39 |
26,670,625 | ||||||
| October |
85.48 |
74.25 |
21,663,283 |
62.53 |
53.51 |
39,842,159 | ||||||
| November |
79.97 |
72.03 |
19,719,988 |
58.48 |
52.54 |
38,879,305 | ||||||
| December |
77.21 |
70.89 |
33,329,100 |
57.87 |
52.29 |
30,560,300 | ||||||
8.2 Prior Sales
During the year ended December 31, 2023, Nutrien issued 683,814 common shares pursuant to the exercise and settlement of outstanding share-based compensation award plans. During 2023, Nutrien also granted 301,168 stock options under its stock option plan. See Note 5 and Note 23 of the 2023 Consolidated Financial Statements for additional information.
9 – Escrowed Securities and Securities Subject to Contractual Restriction on Transfer
To the knowledge of the Company, none of the securities of the Company are subject to escrow or contractual restriction on transfer.
| 1 | Moody’s Rating Symbols and Definitions – November 9, 2023 |
39
10 – Directors and Officers
10.1 Name, Occupation and Security Holding
Information is given below with respect to each of the directors and executive officers of Nutrien as at February 22, 2024, including names, municipality and country of residence, all current positions held with the Company, present principal occupation, and principal occupations held during the last five years. The current directors will hold office until the earlier of their resignation, our next annual meeting of shareholders at which directors are elected or until such directors cease to hold office pursuant to the provisions of the CBCA.
|
Directors (Name and
Municipality of |
Director Since | Present Principal Occupation or Employment |
Prior Principal Occupation or the Preceding Five Years |
|||
| Russell K. Girling Calgary, Alberta, Canada |
2018 (Agrium from 2006 – 2017) |
Corporate Director; Board Chair of Nutrien | President and Chief Executive Officer of TransCanada PipeLines Limited and TC Energy Corporation, a North American energy infrastructure company | |||
| Christopher M. Burley 1, 3 Calgary, Alberta, Canada |
2018 (PotashCorp from 2009 – 2017) |
Corporate Director | Corporate Director | |||
| Maura J. Clark 2, 4 New York, New York, US |
2018 (Agrium from 2016 – 2017) |
Corporate Director | Corporate Director | |||
| Michael J. Hennigan 1, 3 Malvern, Pennsylvania, US |
2022 | President and Chief Executive Officer of Marathon Petroleum Corporation, a petroleum refining, natural gas processing and midstream logistics company
Chairman, President and Chief Executive Officer of MPLX LP, a natural gas processing and midstream logistics company |
Same as present | |||
| Miranda C. Hubbs 2, 4 Toronto, Ontario, Canada |
2018 (Agrium from 2016 – 2017) |
Corporate Director | Corporate Director | |||
| Raj S. Kushwaha 2, 4 Sunny Isles Beach, Florida, US |
2021 | Managing Director, Co-Head of Value Creation, and Chief Digital Officer of Warburg Pincus LLC, a private equity firm specializing in consumer, energy, financial services, health care, industrial and business services, real estate, and technology | Same as present | |||
| Alice D. Laberge 1, 3 Vancouver, British Columbia, Canada |
2018 (PotashCorp from 2003 – 2017) |
Corporate Director | Corporate Director | |||
| Consuelo E. Madere 1, 3 Destin, Florida, US |
2018 (PotashCorp from 2014 – 2017) |
President and Founder of Proven Leader Advisory, LLC, a management consulting and executive coaching firm | Same as present |
40
|
Directors (Name and
Municipality of |
Director Since | Present Principal Occupation or Employment |
Prior Principal Occupation or Employment Within the Preceding Five Years |
|||
| Keith G. Martell 4 Eagle Ridge, Saskatchewan, Canada |
2018 (PotashCorp from 2007 – 2017) |
Corporate Director | President & Chief Executive Officer and Director of First Nations Bank of Canada, a Canadian chartered bank providing financial services with a focus on the Indigenous marketplace
|
|||
| Aaron W. Regent 1, 2 Toronto, Ontario, Canada |
2018 (PotashCorp from 2015 – 2017) |
Corporate Director; Founder, Chairman and Chief Executive Officer of Magris Performance Materials Inc., a leading North American-based industrial mineral company | Same as present | |||
| Nelson L.C. Silva 2, 4 Rio de Janeiro, Brazil |
2020 | Corporate Director; Advisor to Appian Capital Advisory LLP, investment advisor in the mining sector and HSB Solomon Associates LLC, strategic advisor in the energy sector | Executive Director of Petróleo Brasileiro S.A., an oil and gas exploration and production company; Chief Executive Officer of BG Group, a multinational oil and gas company in South America | |||
| Ken A. Seitz Saskatoon, Saskatchewan, Canada |
2022 | President and Chief Executive Officer of Nutrien | Interim President and Chief Executive Officer, Nutrien; Executive Vice President and Chief Executive Officer of Potash, Nutrien; President and Chief Executive Officer, Canpotex Limited, a potash exporter |
1 Member of the Audit Committee of the Board.
2 Member of the Human Resources & Compensation Committee of the Board.
3 Member of the Corporate Governance & Nominating Committee of the Board.
4 Member of the Safety & Sustainability Committee of the Board.
|
Executive Officers (Name and Municipality of Residence) |
Present Position With the Company and Principal Occupation |
Prior Principal Occupation or Employment Within the Preceding Five Years |
||
| Ken A. Seitz Saskatoon, Saskatchewan, Canada |
President and Chief Executive Officer of Nutrien | Interim President and Chief Executive Officer, Nutrien; Executive Vice President and Chief Executive Officer of Potash, Nutrien; President and Chief Executive Officer, Canpotex Limited, a potash exporter | ||
| Noralee M. Bradley Saskatoon, Saskatchewan, Canada |
Executive Vice President, External Affairs and Chief Sustainability and Legal Officer of Nutrien
|
Executive Vice President and Chief Legal Officer, Nutrien; Partner at Blake, Cassels & Graydon LLP, a law firm
|
||
| Pedro Farah Calgary, Alberta, Canada |
Executive Vice President and Chief Financial Officer of Nutrien | Executive Vice President and Treasurer, Walmart, a multinational retail company; Executive Vice President and Chief Financial Officer, Walmex (Walmart Mexico), a multinational retail chain
|
41
|
Executive Officers (Name and Municipality of Residence) |
Present Position With the Company and Principal Occupation |
Prior Principal Occupation or Employment Within the Preceding Five Years |
||
| Andrew J. Kelemen Calgary, Alberta, Canada |
Executive Vice President, Corporate Development and Chief Strategy Officer of Nutrien
|
Senior Vice President, Corporate Development, Nutrien; Vice President, Corporate Development, Nutrien | ||
| Chris P. Reynolds Saskatoon, Saskatchewan, Canada |
Executive Vice President and President, Potash of Nutrien | Senior Vice President, Sales, Nutrien | ||
| Jeff M. Tarsi Collierville, Tennessee, US |
Executive Vice President and President, Global Retail of Nutrien | Interim President of Global Retail, Nutrien; Senior Vice President of North American Retail Operations, Nutrien
|
||
| Mark Thompson Calgary, Alberta, Canada |
Executive Vice President, Chief Commercial Officer of Nutrien | Executive Vice President, Chief Strategy and Sustainability Officer, Vice President of Business Development, Vice President of Strategy, Special Assistant to CEO, Nutrien | ||
| Trevor Williams Calgary, Alberta, Canada |
Executive Vice President and President, Nitrogen and Phosphate of Nutrien | Interim Executive Vice President, Nitrogen and Phosphate, Senior Vice President of Nitrogen Operations, Nutrien |
As at February 22, 2024, the directors and executive officers of the Company as a group beneficially own, or control or direct, directly or indirectly, 174,588 common shares, representing less than 1 percent of the outstanding common shares.
10.2 Cease Trade Orders, Bankruptcies, Penalties or Sanctions
Except as set out below, no director or executive officer of the Company was, as at the date hereof, or has been within the 10 years prior to the date hereof, a director, chief executive officer or chief financial officer of any company (including the Company), that:
| • | was subject to an order that was issued while the director or executive officer was acting in the capacity as director, chief executive officer or chief financial officer; or |
| • | was subject to an order that was issued after the director or executive officer ceased to be a director, chief executive officer or chief financial officer and which resulted from an event that occurred while that person was acting in the capacity as director, chief executive officer or chief financial officer. |
For the purposes of the above, “order” means any of the following that was in effect for a period of more than 30 consecutive days:
| • | a cease trade order; |
| • | an order similar to a cease trade order; or |
| • | an order that denied the relevant company access to an exemption under securities legislation. |
Except as set out below, no director or executive officer of the Company, or, to the knowledge of the Company, a shareholder holding a sufficient number of securities of the Company to affect materially the control of the Company:
| • | was, as at the date hereof, or has been within the 10 years prior to the date hereof, a director or executive officer of any company (including the Company) that, while that person was acting in that capacity, or within a year of that person ceasing to act in that capacity, became bankrupt, made a proposal under any legislation relating to bankruptcy or insolvency, or was subject to or instituted any proceedings, arrangement, or compromise with creditors, or had a receiver, receiver manager or trustee appointed to hold its assets; or |
| • | has, within the 10 years before the date hereof, become bankrupt, made a proposal under any legislation relating to bankruptcy or insolvency, or become subject to or instituted any proceedings, arrangement, or compromise with creditors, or had a receiver, receiver manager, or trustee appointed to hold the assets of the director, executive officer, or shareholder. |
42
Mr. Burley was a director of Parallel Energy Inc., administrator of Parallel Energy Trust (“Parallel Energy”). On or about November 9, 2015, Parallel Energy and its affiliates filed applications for protection under the Companies’ Creditors Arrangement Act (Canada) and voluntary petitions for relief under Chapter 11 of Title 12 of the United States Bankruptcy Code. Mr. Burley resigned from the board of directors of Parallel Energy Inc. on March 1, 2016. The Canadian entities of Parallel Energy each filed an assignment in bankruptcy under the Bankruptcy and Insolvency Act (Canada) on March 3, 2016. In 2015, securities regulators for the Provinces of Alberta, British Columbia, Manitoba, Ontario, Quebec, Saskatchewan and New Brunswick issued cease trade orders in relation to the securities of Parallel Energy for the failure by Parallel Energy to timely file financial statements as well as related continuous disclosure documents. Such cease trade orders continue to be in effect. The TSX delisted the trust units and debentures of Parallel Energy at the close of business on December 11, 2015.
Ms. Clark served as a director of Garrett Motion Inc. (“Garrett Motion”) from October 2018 until April 2021. In September 2020, Garrett Motion and certain affiliated companies filed voluntary petitions under Chapter 11 of Title 11 of the United States Bankruptcy Code. On April 30, 2021, Garrett Motion announced that it emerged from its Chapter 11 proceedings, successfully completing the restructuring process and implementing the plan of reorganization that was confirmed by the United States Bankruptcy Court for the Southern District of New York on April 23, 2021.
Mr. Reynolds served as a director of Fertilizantes Heringer S.A. (“Heringer”) from August 2015 until December 2018. In February 2019, Heringer filed for judicial reorganization in the Judicial District of the City of Paulínia in the State of São Paulo, Brazil, pursuant to article 51 et seq. of Law No. 11, 101/05 and article 122, sole paragraph, of the Brazilian Corporations Law. On December 14, 2019, the judicial reorganization was approved at the General Meeting of Creditors and ratified by the competent court on February 14, 2020.
Mr. Seitz served as a director of Source Energy Services Ltd. (“Source”) from May 2018 until January 2022. In December 2020, Source effected a recapitalization transaction pursuant to a plan of arrangement under the CBCA. The recapitalization transaction extended the maturity under Source’s credit facility and exchanged approximately CAD$158 million aggregate principal amount of senior secured notes of Source for approximately CAD$142 million aggregate principal amount of senior secured first lien notes and new common shares in the capital of Source. Concurrently with the completion of the arrangement, Source entered into a new term loan facility and amended its existing credit facility to enable Source to access incremental liquidity under its existing credit facility.
10.3 Conflicts of Interest
To the knowledge of the Company, no director or officer of the Company has an existing or potential material conflict of interest with the Company or any of its subsidiaries, joint ventures or partnerships.
11 – Promoters
During the two most recently completed financial years, no person or company has been a promoter of the Company.
12 – Legal Proceedings and Regulatory Actions
The information under “Environmental Remediation, Legal and Other Matters” of Note 29 of the 2023 Consolidated Financial Statements is incorporated by reference herein. For further discussion of certain environmental proceedings in which we are involved, see “Environmental Matters” above.
In the normal course of business, we are also, and expect to continue to be, subject to various other legal proceedings being brought against us. While it is not possible to determine the ultimate outcome of such actions at this time, and inherent uncertainties exist in predicting such outcomes, it is the Company’s belief that the ultimate resolution of any such known actions is not reasonably likely to have a material adverse effect on its consolidated financial statements.
13 – Interest of Management and Others in Material Transactions
To the knowledge of the Company, as of the date hereof, there were no directors or executive officers of the Company or any associate or affiliate of a director or executive officer of the Company with any material interest, direct or indirect, in any transaction within the three most recently completed financial years or during the current financial year that has materially affected or is reasonably expected to materially affect the Company.
43
14 – Transfer Agent, Registrar and Trustees
The registrar and transfer agent for the common shares is Computershare Trust Company of Canada, at its principal offices in Calgary, Alberta and Toronto, Ontario.
The trustee for the Nutrien senior notes is the Bank of New York Mellon at its principal offices in New York, New York.
15 – Material Contracts
To the knowledge of the Company, no material contracts require disclosure under this section.
16 – Interests of Experts
KPMG LLP are the auditors of the Company and have confirmed with respect to the Company that they are independent within the meaning of the relevant rules and related interpretations prescribed by the relevant professional bodies in Canada and any applicable legislation or regulations and also that they are independent accountants with respect to the Company under all relevant US professional and regulatory standards.
Craig Funk, B.Sc., M.Sc., P.Eng., P.Geo., an employee of the Company, supervised the preparation of and approved the Allan Technical Report, the Cory Technical Report, the Lanigan Technical Report, the Rocanville Technical Report and the Vanscoy Technical Report (each, as defined in Schedule B hereto). Mr. Funk is a qualified person under NI 43-101 and has reviewed and approved the scientific and technical information in this AIF relating to the Company’s Allan, Cory, Lanigan, Rocanville and Vanscoy Potash operations. Mr. Funk holds beneficially, directly or indirectly, less than 1 percent of any class of the securities of the Company or of any of the Company’s associates or affiliates.
17 – Audit Committee
17.1 Audit Committee Charter
Attached, as Schedule A, is the charter for the Company’s Audit Committee.
17.2 Composition of the Audit Committee
Members of the Audit Committee are Christopher M. Burley, Michael J. Hennigan, Alice D. Laberge, Consuelo E. Madere, and Aaron W. Regent as of February 22, 2024.
Each member of the Audit Committee is independent and financially literate (as such terms are defined in National Instrument 52-110 – Audit Committees (“NI 52-110”)).
17.3 Relevant Education and Experience of Members of the Audit Committee
|
Name (Director Since) |
Principal Occupation and Full Biography | |
| Mr. Christopher Burley (2018) (Audit Committee Chair)
B.Sc., M.B.A. Calgary, Alberta, Canada
Other Public Directorships None |
Mr. Burley is a Corporate Director and former Managing Director and Vice Chairman of Energy for Merrill Lynch Canada Inc., an investment banking firm. He has over two decades of experience in the investment banking industry. He is the Chairman and a director of WestJet Airlines Ltd., an Onex Corporation portfolio company. Mr. Burley is a graduate of the Institute of Corporate Directors’ Education Program and holds the ICD.D designation. Mr. Burley is a Member of the Institute of Corporate Directors Climate Strategy Advisory Board for the Canadian Chapter Zero of the WEF Climate Governance Initiative. Mr. Burley holds a Bachelor of Science with a Certificate of Honours Standing (Geophysics) and a Master of Business Administration from Western University. |
44
|
Name (Director Since) |
Principal Occupation and Full Biography | |
| Michael J. Hennigan
B. Sc. Malvern, Pennsylvania, US
Other Public Directorships Marathon Petroleum Corporation, energy company (NYSE) MPLX GP LLC, operates midstream energy infrastructure and provides fuel distribution services (NYSE)
|
Mr. Hennigan is the President and Chief Executive Officer of Marathon Petroleum Corporation, a petroleum refining, natural gas processing and midstream logistics company. He is also President and Chief Executive Officer of MPLX LP, a natural gas processing and midstream logistics company. He currently serves as a director of Marathon Petroleum Corporation and as chair of the board of MPLX LP. He previously served as a director of Andeavor Logistics, Energy Transfer Partners, Niska Gas Storage Management, Philadelphia Energy Solutions and SunCoke Energy. Mr. Hennigan holds a Bachelor of Science (Chemical Engineering) from Drexel University. |
|
| Ms. Alice D. Laberge (2018)
B.Sc., M.B.A. Vancouver, British Columbia, Canada
Other Public Directorships Mercer International Inc., producer of pulp and wood products and producer of bioelectricity (NASDAQ) Russel Metals Inc., a North American metal distribution company (TSX) |
Ms. Laberge is a Corporate Director and the former President and Chief Executive Officer of Fincentric Corporation, a global provider of software solutions to financial institutions. She was previously Senior Vice President and Chief Financial Officer of MacMillan Bloedel Ltd. She is a director of Mercer International Inc., Russel Metals Inc., and the Canadian Public Accountability Board and has served as a director of the Royal Bank of Canada and the B.C. Cancer Foundation. She was recognized as a Fellow of the Institute of Corporate Directors in 2015. Ms. Laberge holds a Bachelor of Science (Speech Pathology & Audiology) from the University of Alberta and a Master of Business Administration from the University of British Columbia. | |
| Consuelo E. Madere
B. Sc., M.B.A. Destin, Florida, US
Other Public Directorships Lindsay Corporation, producer of irrigation, transportation, and industrial solutions (NYSE) |
Ms. Madere is the President and Founder of Proven Leader Advisory, LLC, a management consulting and executive coaching firm. Previously she was Vice President, Global Vegetables and Asia Commercial of Monsanto Company, a global provider of agricultural products. Ms. Madere serves as a director of Lindsay Corporation, and previously served as a director of S&W Seed Company. She is a member of the Dean’s Advisory Council at the Louisiana State University Ogden Honors College. Ms. Madere is a National Association of Corporate Directors Board Leadership Fellow and holds a CERT certificate in Cybersecurity Oversight from the Software Engineering Institute at Carnegie Mellon University. She holds a Bachelor of Science (Chemical Engineering) from Louisiana State University and a Master of Business Administration from the University of Iowa. | |
| Mr. Aaron W. Regent (2018)
B.A., FCPA, FCA Toronto, Ontario, Canada
Other Public Directorships The Bank of Nova Scotia, a global financial services provider (TSX, NYSE) |
Mr. Regent is Corporate Director and the Founder, Chairman and Chief Executive Officer of Magris Performance Materials Inc., a leading North American-based materials company. Mr. Regent serves as the Chair of the Board of The Bank of Nova Scotia, serves on the board of the C.D. Howe Institute and previously served on the board of Plan International Canada. Mr. Regent has acquired significant financial experience during his time as President and Chief Executive Officer of Barrick Gold Corporation, Senior Managing Partner of Brookfield Asset Management and Co-Chief Executive Officer of the Brookfield Infrastructure Group, and as President and Chief Executive Officer of Falconbridge Limited. He is the Co-Founder and Co-Chair of Mining4Life and previously served as the Governor of the Trails Youth Initiatives. Mr. Regent is a member of the Chartered Professional Accountants of Ontario and holds a Bachelor of Arts (History) from the University of Western Ontario. |
45
17.4 Pre-approval Policies and Procedures
Subject to applicable law, the Audit Committee is directly responsible for the compensation and oversight of the work of the independent auditors. The Audit Committee has implemented a Pre-Approval Policy for Audit and Non-Audit Services for the pre-approval of services performed by our auditors. The objective of this policy is to specify the scope of services permitted to be performed by our auditors and to ensure that the independence of our auditors is not compromised through engaging them for other services. Subject to the Pre-Approval Policy for Audit and Non-Audit Services, our Audit Committee pre-approves all audit services and all permitted non-audit services provided by our external auditors and reviews on a quarterly basis whether these services affect our external auditors’ independence.
17.5 External Auditor Service Fees (by Category)
The following table sets out the fees billed to us by KPMG LLP and its affiliates for professional services rendered during the years ended December 31, 2023 and 2022. During these years, KPMG LLP was the Company’s only external auditor.
| Category | Years Ended December 31 (US$) | |||
| 2023 | 2022 |
|||
| Audit fees 1 |
9,481,000 | 8,777,700 |
||
| Audit-related fees 2 |
26,600 | 63,000 |
||
| Tax fees 3 |
74,900 | 168,100 |
||
| All other fees 4 |
305,100 | 302,400 |
||
|
Total |
9,887,600 |
9,311,200 |
||
1 For professional services rendered by KPMG LLP for the integrated audit of the Company’s annual financial statements; interim review of the Company’s interim financial statements; audits of statutory financial statements of controlled subsidiaries; attestation reporting in accordance with US environmental agency requirements and consent orders; attestation reports over various Nutrien subsidiaries for the purpose of compliance with local laws and regulations; and work in connection with the renewal of the Company’s base shelf prospectus in 2022 and the Company’s prospectus supplements relating to the offering of senior notes in 2023 and 2022.
2 For professional services rendered by KPMG LLP for translation of the Company’s annual and quarterly reports in 2022, and in connection with an audit of the financial statements of an employee benefit plan.
3 For professional services rendered by KPMG LLP for assistance with preparation and review of tax filings and related tax compliance, assistance in responding to tax authorities, including reassessments and tax audits, routine tax planning and advice. These amounts include fees paid to KPMG LLP specifically for tax compliance and preparation services rendered in 2023 and 2022 in the amounts of $74,900 and $168,100, respectively.
4 For professional services rendered by KPMG LLP for the preparation of subsidiary statutory financial statements; an assessment of the Company’s cyber security maturity level against a globally recognized framework and a readiness assessment for assurance over the Company’s report on cyber security key performance indicators, and subsequent assurance engagements over key performance indicators; and limited assurance over Nutrien Scope 1 and 2 GHG emissions.
18 – Additional Information
Additional financial information is provided in the 2023 Consolidated Financial Statements and the 2023 MD&A. Further, additional information, including historical information concerning directors’ and officers’ remuneration and indebtedness, principal holders of the Company’s securities, and securities authorized for issuance under equity compensation plans is contained in the Company’s management proxy circular dated March 20, 2023 for the annual meeting of the Company’s shareholders that took place on
May 10, 2023.
Additional information related to Nutrien may be found on the Company’s website at nutrien.com, on SEDAR+ at sedarplus.ca and on EDGAR at sec.gov.
46
Schedule A
| AUDIT COMMITTEE CHARTER |
Introduction
| The Audit Committee (the “Committee”) is established to assist the Board of Directors (the “Board”) of Nutrien Ltd. (the “Corporation”) in fulfilling its oversight responsibilities with respect to the accounting and financial reporting processes and the reviews and audits of the financial statements of the Corporation by monitoring: (i) the quality and integrity of the Corporation’s financial statements and related disclosures; (ii) the Corporation’s internal control systems, including internal control over financial reporting; (iii) specific elements of risk management (including all financial risk management) delegated to the Committee by the Board; (iv) the qualifications and independence of the external auditors of the Corporation and the recommendation of the Board to shareholders for the appointment thereof; (v) the performance of the Corporation’s Internal Audit function and external auditors; and (vi) the Corporation’s compliance with legal and regulatory |
Introduction . . . . . . . . . . . . . . . . . . . . . . . . . . . . . . |
|
1 |
|
||||
| Composition . . . . . . . . . . . . . . . . . . . . . . . . . . . . . |
1 | |||||||
| Committee Chair . . . . . . . . . . . . . . . . . . . . . . . . . . |
2 | |||||||
| Quorum . . . . . . . . . . . . . . . . . . . . . . . . . . . . . . . . . |
2 | |||||||
| Meetings . . . . . . . . . . . . . . . . . . . . . . . . . . . . . . . . |
2 | |||||||
| Responsibilities . . . . . . . . . . . . . . . . . . . . . . . . . . |
2 | |||||||
| Other Matters . . . . . . . . . . . . . . . . . . . . . . . . . . . . . |
7 | |||||||
| Annex 1: Committee Chair Position Description . . . . . . . . . . . . . . . . . . . . . . . . . . . . . . |
A-1 | |||||||
requirements with respect to matters within the Committee’s mandate and the Code of Conduct. Such oversight is all with a view to supporting the long-term viability of the Corporation, including its consideration of stakeholders relevant to the creation and preservation of long-term value.
Management is responsible for preparing the consolidated financial statements of the Corporation and the external auditors are responsible for auditing those financial statements. Nothing in this Charter is intended, or may be construed, to impose on any member of the Committee a standard of care or diligence that is in any way more onerous or extensive than the standard to which all directors are subject under applicable laws or regulatory requirements.
In this Charter, “Committee Chair” means the Chair of the Committee; “Chair” means the Board Chair; and “CEO” means the Chief Executive Officer of the Corporation.
Composition
The members of the Committee shall be appointed by the Board, on the recommendation of the Corporate Governance & Nominating Committee. Any member of the Committee may be removed or replaced at any time by the Board and shall cease to be a member of the Committee on ceasing to be a director. Subject to the above, each member of the Committee shall serve as a member of the Committee until the next annual meeting of shareholders after his or her appointment.
The Committee shall consist of not less than three and not more than eight members. Each Committee member shall be independent according to the independence standards set out in the Corporate Governance Framework, including applicable independence requirements of stock exchanges on which the Corporation is listed and securities laws, rules and regulations.
Each member of the Committee shall be “financially literate”, and at least one member of the Committee shall be designated as the “audit committee financial expert” and shall have “accounting or related financial management expertise”, in each case, as such qualification is interpreted by the Board in its business judgment and as defined by applicable requirements of stock exchanges on which the Corporation is listed and securities laws, rules and regulations.
No member of the Committee shall serve on the audit committees of more than two other publicly listed companies, unless the Board determines that such simultaneous service would not impair the ability of such member to effectively serve on the Committee and discloses such determination in the Corporation’s annual management proxy circular.
The Board may fill vacancies on the Committee from among its members, on the recommendation of the Corporate Governance & Nominating Committee. If and whenever a vacancy shall exist on the Committee, the remaining members may exercise all its powers so long as a quorum remains in place.
The members of the Committee shall be entitled to receive such remuneration for acting as members of the Committee as the Board may from time to time determine.
The Corporate Secretary or such other person acceptable to the members shall act as Secretary to the Committee.
47
Committee Chair
The Board, upon recommendation of the Corporate Governance & Nominating Committee, shall appoint a Committee Chair. The Committee Chair may be removed and replaced by the Board.
If the Committee Chair is not present at any meeting of the Committee, one of the other members of the Committee present at the meeting shall be chosen by the Committee to chair the meeting.
The Committee Chair shall have the duties and responsibilities set forth in Annex 1 which is incorporated by reference herein.
Quorum
Fifty percent of the members of the Committee shall constitute a quorum. All determinations of the Committee shall be made by a majority of its members present at a meeting duly called and held.
Meetings
All Committee members are expected to attend, in person or via teleconference, video conference, or other electronic communications facilities that permits all participants to communicate adequately, all meetings of the Committee, to come prepared for the meeting, and to remain in attendance for the duration of the meeting. The powers of the Committee may be exercised by resolution in writing signed by all members of the Committee who would have been entitled to vote on that resolution at a meeting of the Committee.
The Committee may invite such directors, officers, employees and external advisors of the Corporation as it may see fit from time to time to attend meetings of the Committee and assist in the discussion and consideration of the duties of the Committee.
The time at which and place where the meetings of the Committee shall be held, and the calling of meetings and the procedure at such meetings, shall be determined by the Committee in accordance with the Corporation’s articles, by-laws, and applicable laws.
The Committee shall meet at each Committee meeting alone without Management present, and shall meet separately with applicable senior Management, the external auditors, and the Chief Audit Executive.
Responsibilities
The Committee, to the extent required by applicable laws or rules, or otherwise considered by the Committee to be necessary or appropriate, is responsible for the oversight in respect of the Corporation’s financial disclosure and accounting practices, internal control systems (including internal control over financial reporting), specific elements of risk management (including all financial risk management) delegated to the Committee by the Board, the external auditors, the Internal Audit function, and legal and regulatory compliance with respect to matters within the Committee’s mandate and the Code of Conduct.
To fulfill its duties and responsibilities, the Committee shall:
Financial Disclosure and Accounting
| • | meet with Management and the external auditors to review and discuss, and to recommend to the Board for approval prior to public disclosure, the annual audited financial statements and the specific disclosures in “Management’s Discussion and Analysis of Financial Condition and Results of Operations” (“MD&A”); |
| • | meet with Management and the external auditors to review and discuss, and to approve prior to public disclosure, the unaudited quarterly financial statements, including the specific disclosures in the MD&A and quarterly interim reports (including annual guidance); |
| • | review and discuss with Management and the external auditors prior to public disclosure each press release that contains significant financial information respecting the Corporation or contains estimates or information regarding the Corporation’s future financial performance or prospects; and the type and presentation of information to be included in such press releases (in particular, the use of “pro forma” or “adjusted” information that is not in accordance with International Financial Reporting Standards as issued by the International Accounting Standards Board (“IFRS”)); |
| • | review and discuss with Management and the external auditors, and recommend to the Board for approval prior to public disclosure: |
| o | the portions of the Annual Information Form containing significant information within the Committee’s mandate; |
48
| o | the portions of the Corporation’s annual management proxy circular containing significant information within the Committee’s mandate; |
| o | all financial statements included in prospectuses or other offering documents; |
| o | all prospectuses and all documents which may be incorporated by reference in a prospectus, other than any pricing supplement issued pursuant to a shelf prospectus; and |
| o | significant financial information, including “pro forma” or “adjusted” non-IFRS information respecting the Corporation contained in a publicly disclosed document (other than routine investor relations or similar communications); |
| • | review and discuss with Management and the external auditors (including those of the following that are contained in any report of the external auditors): (1) any analyses prepared by Management and/or the external auditors setting forth significant financial reporting issues and judgments made in connection with the preparation of the financial statements, including analyses of the effects of alternative accounting principles in accordance with IFRS; (2) all critical accounting policies and practices to be used by the Corporation in preparing its financial statements; (3) all material alternative treatments of financial information within IFRS that have been discussed with Management, ramifications of the use of these alternative treatments, and the treatment preferred by the external auditors; and (4) other material communications between the external auditors and Management, such as any Management Representation Letter or Schedule of Unadjusted Differences; |
| • | review and discuss with Management and the external auditors significant accounting and reporting issues and understand their impact on the financial statements, including complex or unusual transactions and areas involving significant assumptions; major issues regarding accounting principles and financial statement presentation, including any significant changes in the Corporation’s selection or application of accounting principles, and the effect of regulatory and accounting initiatives, as well as off balance sheet structures, on the financial statements of the Corporation, any significant issues as to the adequacy of the Corporation’s internal controls and any special audit steps adopted in light of significant control deficiencies; |
| • | review and discuss with Management and the external auditors non-IFRS financial measures, as well as financial information and earnings guidance provided externally, including to analysts and rating agencies; |
| • | review with Management and the external auditors the results of the annual audit, including any restrictions on the scope of the external auditors’ activities or on access to requested information, and the resolution of any significant disagreements with Management; |
| • | review Management’s Internal Control Report and the related attestation by the external auditors of the Corporation’s internal controls over financial reporting; and |
| • | review with Management and the external auditors and, if necessary, legal counsel, any litigation, claim or contingency, including tax assessments, or material reports or inquiries from regulators or governmental agencies, that could have a material effect upon the financial position of the Corporation, and the manner in which these matters have been disclosed in the financial statements. |
Internal Controls
| • | assess the effectiveness of the Corporation’s internal control systems, including internal control over financial reporting and information technology strategy, risks and, in consultation with the Safety & Security Committee, cyber security controls and related matters; |
| • | understand the scope of Internal Audit’s and the external auditors’ review of internal controls over financial reporting, and obtain reports on significant findings and recommendations, together with Management’s responses; |
| • | annually review the Corporation’s disclosure controls and procedures, including any significant deficiencies in or material non-compliance with such controls and procedures; |
| • | receive and review reports from the Corporation’s Disclosure Committee and periodically review the Corporation’s Disclosure Policy; |
| • | review and discuss with the CEO and Chief Financial Officer their disclosures made during their annual and quarterly certification processes about significant deficiencies or material weaknesses in the design or operation of internal controls or any fraud that involves Management or other employees who have a significant role in the Corporation’s internal controls; |
49
| • | discuss with Management the Corporation’s material financial risk exposures and the steps Management has taken to monitor and control such exposures; and |
| • | review executive officers’ expenses and aircraft usage reports and periodically report to the Corporate Governance & Nominating Committee thereon, as appropriate. |
Risk Management
| • | regularly review with Management the Corporation’s material risks within the Committee’s scope (i.e., the principal financial risks facing the Corporation and any other risks specifically delegated to the Committee by the Board), the assessment of those risks, and how they are being managed or mitigated, including, reviewing the mid-year update report from the Corporation’s Enterprise Risk Management team; and |
| • | monitor and review at least annually Management processes and controls designed to identify, assess, monitor and manage the risks referred to above. |
Internal Audit
| • | review with Management, the external auditors, and Internal Audit (and if appropriate, approve) the Charter, plans, activities, and organizational structure of the Internal Audit function; |
| • | review the significant findings prepared by Internal Audit and recommendations issued by any external party relating to Internal Audit issues, together with Management’s response thereto; |
| • | take reasonable steps to ensure there are no unjustified or inappropriate restrictions or limitations on the functioning of the Internal Audit function, or on access to requested information; |
| • | review the adequacy of the resources of Internal Audit to satisfy itself as to the effectiveness, objectivity and independence of the Internal Audit function; |
| • | review and concur on the appointment, replacement, or dismissal of the Chief Audit Executive (or such individual in a similar capacity or position who performs a substantially similar function); and |
| • | review the performance and effectiveness of the Internal Audit function. |
External Audit
| • | meet with the external auditors prior to the annual audit to review (and if appropriate, approve) the proposed audit scope, approach and staffing (including coordination of audit efforts with Internal Audit) and budget; |
| • | monitor the progress of the annual audit; |
| • | obtain feedback about the conduct of the external audit from key employees engaged in the process; |
| • | when applicable, review the annual post-audit letter from the external auditors and Management’s response thereto and follow-up in respect of any identified weakness; |
| • | at least annually, obtain and review a report by the external auditors describing: (i) the external auditors’ internal quality control procedures, and (ii) any material issues raised by the most recent internal quality control review, or peer review, of the external auditors, or by any inquiry or investigation by governmental or professional authorities, within the preceding five years, respecting one or more independent audits carried out by the external auditors, and any steps taken to deal with any such issues; |
| • | annually receive from the external auditors, and review, a report on items required to be communicated to the Committee by applicable rules and regulations; |
| • | annually review the independence of the external auditors, including their formal written statement of independence delineating all relationships between the external auditors and the Corporation, review all such relationships, and consider applicable auditor independence standards and take any decisions and actions that are necessary and appropriate where the Committee becomes aware of the potential for a conflict (or the reasonable perception of a conflict) between the interests of the external auditors and the interests of the Corporation; |
50
| • | annually evaluate the performance of the external auditors, including the lead audit partner, and report to the Board on its conclusions regarding the external auditors and recommendation to shareholders for appointment of the external auditors; |
| • | investigate and consider whether any action is required if the external auditors resign; |
| • | ensure the rotation of the lead audit partner having primary responsibility for the audit as required by applicable law; and |
| • | set clear hiring policies for partners, employees and former partners and employees of the present and former external auditors. |
Oversight in Respect of Audit and Non-Audit Services
| • | subject to confirmation by the external auditors of their compliance with Canadian and US regulatory requirements, be directly responsible (subject to Board confirmation) for the appointment of the external auditors for the purpose of preparing or issuing any audit report or performing other audit, review or attest services for the Corporation, such appointment to be confirmed by the Corporation’s shareholders at each annual meeting; |
| • | be directly responsible (subject to Board confirmation) for the approval of fees to be paid to the external auditors for audit services, and shall pre-approve the retention of the external auditors for any permitted non-audit service to the Corporation; |
| • | be directly responsible for the retention and oversight of the services of the external auditors (including resolution of disagreements between Management and the external auditors regarding financial reporting) for the purpose of preparing or issuing an audit report or performing other audit, review or attest services for the Corporation (with the external auditors reporting directly to, and being accountable to, the Committee); |
| • | have the sole authority to pre-approve all audit services and all permitted non-audit services to the Corporation, provided that the Committee need not approve in advance non-audit services where: |
| o | the aggregate amount of all such non-audit services provided to the Corporation constitutes not more than 5% of the total amount of fees paid by the Corporation to the external auditors during the fiscal year in which the non-audit services are provided; and |
| o | such services were not recognized by the Corporation at the time of the engagement to be non-audit services; and |
| o | such services are promptly brought to the attention of the Committee and approved prior to the completion of the audit by the Committee or by one or more members of the Committee to whom authority to grant such approvals has been delegated by the Committee. |
| • | have the sole authority to delegate to one or more designated members of the Committee the authority to grant pre-approvals required by this section, provided that the decision of any member to whom authority is delegated to pre-approve a service shall be presented to the Committee at its next scheduled meeting. If the Committee approves an audit service within the scope of the engagement of the external auditors, such audit service shall be deemed to have been pre-approved for purposes of this section. |
Compliance
| • | establish procedures for: (i) the receipt, retention and treatment of complaints received by the Corporation regarding accounting, internal accounting controls or auditing matters; and (ii) the confidential, anonymous submission by employees of the Corporation of concerns regarding questionable accounting or auditing matters, and institute and oversee any special investigations as needed; |
| • | provide the Chief Integrity Officer the authority to communicate directly to the Committee about actual and alleged violations of the Code of Conduct, its associated policies, or the law, including any matters involving criminal or potential criminal conduct; |
| • | review with the Chief Integrity Officer or Chief Legal Officer (or such individual in a similar capacity or position who performs a substantially similar function) the Corporation’s significant compliance policies and any legal matters or reports or inquiries received from regulators or governmental agencies that could have a material effect upon the financial position of the Corporation and that are not subject to the oversight of another committee of the Board; |
| • | review the effectiveness of the system for monitoring compliance with laws and regulations (including those with respect to anti-fraud and anti-bribery) and the results of Management’s investigations and follow-up of any instances of non-compliance |
51
| that could have a material effect upon the financial position of the Corporation and that are not subject to the oversight of another committee of the Board; |
| • | review the process for communicating the Corporation’s Code of Conduct to the Corporation’s personnel and monitoring compliance therewith; and |
| • | report annually to shareholders describing the Committee’s composition, responsibilities and how they were discharged, and any other information required by applicable legislation or regulation, including approval of non-audit services. |
The Committee may perform such other functions as the Committee deems necessary or appropriate for the performance of its responsibilities and duties.
Delegation
The Committee may from time to time delegate any of its responsibilities to a subcommittee comprised of one or more members of the Committee and shall also carry out such other duties that may be delegated to it by the Board from time to time.
Other Matters
At the Corporation’s expense, the Committee may retain, when it considers it necessary or desirable, outside consultants and advisors to advise the Committee independently on any matter. The Committee shall have the sole authority to retain and terminate any such consultants or advisors, including sole authority to establish or review a consultant’s or advisor’s fees and other retention terms, and to direct the payment thereof.
The Corporation will provide appropriate funding, as determined by the Committee, for payment of ordinary administrative expenses of the Committee that are necessary or appropriate in carrying out its duties.
Authority to make minor technical amendments to this Charter is hereby delegated to the Corporate Secretary, who will report any amendments to the Committee at its next meeting.
The Committee’s performance and effectiveness shall be evaluated annually, in accordance with a process developed by the Corporate Governance & Nominating Committee and approved by the Board. The results of that evaluation, including progress on adopted recommendations, shall be reported to the Corporate Governance & Nominating Committee and to the Board.
On an annual basis, this Committee Charter shall be reviewed and assessed, and any proposed changes shall be submitted to the Corporate Governance & Nominating Committee for review and recommendation, and then to the Board for approval.
Date of Last Revision: November 3, 2022
52
ANNEX 1
|
AUDIT COMMITTEE CHAIR
POSITION DESCRIPTION |
The Committee Chair shall provide overall leadership to enhance the effectiveness of the Committee and be responsible to:
| • | set the “tone” for the Committee and its members to foster ethical and responsible decision making, appropriate oversight of Management and appropriate corporate governance practices; |
| • | encourage free and open discussion at meetings of the Committee; |
| • | schedule and set the agenda for Committee meetings with input from other Committee members, the Chair and Management as appropriate; |
| • | facilitate the timely, accurate and proper flow of information to and from the Committee, and arrange sufficient time during Committee meetings to fully discuss agenda items; |
| • | report to the Board following each meeting of the Committee on the activities, findings and any recommendations of the Committee; |
| • | provide advice and counsel to the senior members of Management in the areas covered by the Committee’s mandate; |
| • | proactively encourage training and education of the Committee and its members in areas falling within the Committee’s mandate; |
| • | take reasonable steps to ensure that Committee members understand the boundaries between the Committee and Management responsibilities; |
| • | organize the Committee to function independently of Management and take reasonable steps to ensure that the Committee has an opportunity at each of its meetings to meet in separate closed sessions without Management present, and with or without internal personnel or external advisors as needed or appropriate; |
| • | lead the Committee in monitoring and evaluating, in consultation with the Corporate Governance & Nominating Committee, the performance and effectiveness of the Committee as a whole and the contributions to the Committee of individual directors; and |
| • | take all other reasonable steps to ensure that the responsibilities and duties of the Committee, as outlined in its Charter, are well understood by the Committee members and executed as effectively as possible. |
53
SCHEDULE B MINERAL PROJECTS
For the purposes of NI 43-101, our Allan, Cory, Lanigan, Rocanville and Vanscoy potash operations are the properties material to Nutrien.
a) Material Potash Operations
Certain scientific and technical information regarding our:
| a) | Allan potash operations is based on the technical report titled “National Instrument 43-101 Technical Report on Allan Potash Deposit (KL 112R B), Saskatchewan, Canada” dated effective December 31, 2021 (“Allan Technical Report”), |
| b) | Cory potash operations is based on the technical report titled “National Instrument 43-101 Technical Report on Cory Potash Deposit (KL 103C), Saskatchewan, Canada” dated effective December 31, 2020 (“Cory Technical Report”), |
| c) | Lanigan potash operations is based on the technical report titled “National Instrument 43-101 Technical Report on Lanigan Potash Deposit (KLSA 001 C), Saskatchewan, Canada” dated effective December 31, 2021 (“Lanigan Technical Report”), |
| d) | Rocanville potash operations is based on the technical report titled “National Instrument 43-101 Technical Report on Rocanville Potash Deposit (KL 305), Saskatchewan, Canada” dated effective December 31, 2021 (the “Rocanville Technical Report”), and |
| e) | Vanscoy potash operations is based on the technical report titled “National Instrument 43-101 Technical Report on Vanscoy Potash Deposit (KL 114C) Saskatchewan, Canada” dated effective December 31, 2020 (“Vanscoy Technical Report”). |
Collectively, these reports comprise the “Technical Reports” for the Nutrien mines. They were prepared under the supervision of Craig Funk, B.Sc., M.Sc., P.Eng., P.Geo., who is a “qualified person” as defined in NI 43-101. The Technical Reports have been filed with the securities regulatory authorities in each of the provinces of Canada and furnished to the SEC. Portions of the following information are based on assumptions, qualifications and procedures that are not fully described herein. References should be made to the full text of the Technical Reports, as applicable.
| i) | Mineral Rights |
Mineral rights at all mines in Saskatchewan are mined pursuant to mining leases with the Province of Saskatchewan, Canada (“Crown”), and with non-Crown (“Freehold”) mineral rights owners. Crown mineral rights are governed by The Subsurface Mineral Tenure Regulations, 2015 (Saskatchewan), and Crown leases are approved and issued by the Saskatchewan Ministry of Energy and Resources (“MER”).
| ii) | History |
Ten potash mines were brought into production in Saskatchewan between 1962 to 1970. With over 50 years of production history, most potash mines have contracted or expanded production in response to the demand for potash. No new mines had been commissioned until 2017. Most of the operating mines are conventional underground mines, while three operate using solution mining methods.
Exploration drilling for potash at each of the mines was carried out in the 1950s and 1960s. Potash production began at Allan, Cory and Lanigan in 1968, at Vanscoy in 1969, and at Rocanville in 1970. With the exception of the 1970 inflow which halted Vanscoy production for two years, each of the mines have run on a continuous basis other than short-term shutdowns taken for inventory management purposes, occasional plant maintenance and construction work, or other outages that are typical for operations of this nature.
The mines were built by numerous companies in the 1960’s (a) the Allan mine was built by a consortium of companies (U.S. Borax, Homestake Potash Company, and Swift Canadian Company), (b) the Cory mine was built by a company called Duval Sulphur and Potash Company, (c) the Lanigan mine was built by a company named Alwinsal Potash of Canada Ltd., a consortium of German and French mining and fertilizer companies, (d) the Rocanville mine was built by a company called Sylvite of Canada Ltd. (a division of Hudson’s Bay Mining and Smelting Ltd.), and (e) the Vanscoy mine was built by Cominco Ltd. (formerly the Consolidated Mining and Smelting Company of Canada Limited).
PotashCorp acquired (a) a 60% ownership of the Allan mine in 1978 (through purchase of the U.S. Borax and Swift Canadian interests), became the operator of the mine in 1981, and in 1990, PotashCorp purchased the remaining 40% interest, (b) the Cory mine in 1976, (c) the Lanigan mine in 1976; and (d) the Rocanville mine in 1977. With respect to the Vanscoy mine, in 1993, Cominco Fertilizers Ltd. was formed as a separate entity from Cominco Ltd. In 1995 all Cominco Ltd., involvement in Cominco Fertilizers Ltd., who built the Vanscoy mine, ceased and shares were transferred to the new entity, Agrium.
54
Major refurbishments and expansions of the Allan and Cory mines were completed in 2013, of the Vanscoy mine in 2015, and of the Rocanville mine in 2016, increasing nameplate capacity to (a) 4.0 million tonnes for the Allan mine, (b) 3.0 million tonnes for the Cory mine, (c) 3.0 million tonnes for the Vanscoy mine, and (d) 6.5 million tonnes for the Rocanville mine of finished potash products per year. Mill rehabilitation, mine expansion and hoist improvement projects were completed at Lanigan mine between 2005 and 2010. As of December 31, 2023, the annual nameplate capacity at Lanigan is 3.8 million tonnes. The expansion construction at each of these mines was carried out without significant disruption to existing potash production from the site.
At Allan, Cory and Lanigan, potash ore has been mined and concentrated to produce saleable quantities of high- grade finished potash products since 1968, at Vanscoy since 1969 and at Rocanville since 1970.
| iii) | Geological Setting, Mineralization and Deposit Types |
Geological Setting and Mineralization
Much of southern Saskatchewan is underlain by the Prairie Evaporite Formation, a layered sequence of salts and anhydrite which contains the world’s largest deposits of potash. The potash extracted from the predominantly sylvinite ore has its main use as a fertilizer.
The 100 m to 200 m thick Prairie Evaporite Formation is overlain by approximately 400 m of Devonian carbonates followed by 100 m of Cretaceous sandstone, 400 m of Cretaceous shales, and 100m of recent Pleistocene glacial tills to surface. The Prairie Evaporite Formation is underlain by Devonian carbonates. The Phanerozoic stratigraphy of Saskatchewan is remarkable in that units are flat- lying and relatively undisturbed over very large areas.
Potash mineralization in this region of Saskatchewan is predominantly sylvinite, which is comprised mainly of the minerals sylvite (“KCl”) and halite or rock salt (“NaCl”), with trace carnallite (“KMgCl3 6H2O”) and minor water insolubles. Potash fertilizer is concentrated, nearly pure KCl (i.e., greater than 95% pure KCl), but ore grade is traditionally reported on a % K2O equivalent basis. The “% K2O equivalent” gives a standard measurement of the nutrient value of different potassium-bearing rocks and minerals. To convert from % K2O equivalent tonnes to actual KCl tonnes, multiply by 1.58. Ore grade for the mines are summarized as follows.
Summary of Ore Grade Measurements:
|
Mine |
Average Ore Grade from Drilling 1 |
Average Ore Grade from Mill Feed 2 |
Average Ore Grade from In-mine Samples 3 |
|||||||||
| %K2O Equivalent |
Number of Drillholes |
%K2O Equivalent |
%K2O Equivalent |
Number of Samples |
||||||||
|
Allan (A Zone) |
26.7% | 18 | 25.12% | 24.7% | 7,584 | |||||||
|
Cory (A Zone) |
25.5% | 11 | 22.82% | 21.9% | 5,762 | |||||||
|
Lanigan |
(A Zone) (B Zone) |
25.4% 23.2% |
20 | 24.66% | 24.3% 20.2% |
3,692 21,479 |
||||||
|
Rocanville |
22.3% | 32 | 21.80% | 23.1% | 49,580 | |||||||
|
Vanscoy (A Zone) |
24.9% | 36 | 25.24% | 24.2% | 3,173 | |||||||
Deposit Type
There are three mineable potash members within the Prairie Evaporite Formation of Saskatchewan. Stratigraphically highest to lowest, these members are: Patience Lake, Belle Plaine and Esterhazy. Potash mineralization at each mine is flat-lying and continuous and the mines operate as conventional underground potash mines.
Potash mined at Allan, Cory, Lanigan, and Vanscoy mines lies within the Patience Lake Member of Prairie Evaporite Formation. There are two potash seams named A Zone and B Zone within this member. At present, only the A Zone is being mined in the Allan, Cory, and Vanscoy areas; some test mining has been carried out in the B Zone, but no mining is done in this layer at present. Both the zones are being mined at Lanigan. Neither the Esterhazy nor the White Bear Potash Members are present in the Allan, Cory, and Vanscoy area; the Belle Plaine Potash Member is not well-developed, and therefore is not mined. The Belle Plaine
| 1 | Average ore grade from drillholes within respective Crown Subsurface Mineral Leases per the Technical Reports, as applicable. |
| 2 | The listed potash ore grade from the mill feed was the average measured over the last three years (2021, 2022, 2023). |
| 3 | Average ore grade from in-mine samples per the Technical Reports, as applicable. |
55
potash member is present at Lanigan but is not economically mineable, while the Esterhazy Member is poorly developed and not economically mineable.
Potash mined at the Rocanville mine lies within the Esterhazy Member of the Prairie Evaporite Formation. The Patience Lake Member potash beds are not present in the Rocanville Area. The Belle Plaine and White Bear Members are present, but not conventionally mineable in the Rocanville area. The potash zone at Rocanville is approximately 2.4 meters thick and occurs near the top of the Prairie Evaporite Formation. Salt cover from the ore zone to overlying units is approximately 30 meters.
Potash mineralization at Allan, Cory Lanigan, and Vanscoy occurs at about 1,000 meters depth below surface. The A Zone is approximately 3.35 meters thick and occurs near the top of the Prairie Evaporite Formation salts. Salt cover from the ore zone to overlying units is approximately 12 meters in the Allan, Cory, and Vanscoy areas. Salt cover from the top of the A Zone mining horizon at Lanigan is approximately 7 meters thick, while the salt cover from the top of the B Zone mining horizon to overlying units is approximately 14 meters thick.
| iv) | Exploration |
Before the mines were established, all exploration consisted of drilling from surface and analysis of core from these drillholes. Since mining began, exploration drilling has been infrequent at the mines. In most of southern Saskatchewan, potash mineralization is in place wherever Prairie Evaporite Formation salts exist, are flat-lying and are undisturbed. Since the surface seismic exploration method is an excellent tool for mapping the top and bottom of Prairie Evaporite salts, this has become the main potash exploration tool in any existing Saskatchewan Subsurface (potash) Mineral Lease. Historically, 2D seismic, and now the more accurate and full coverage 3D seismic methods are used to map continuity and extent of potash beds in flat-lying potash deposits. Seismic data are relied upon to identify collapse structures that must be avoided in the process of mine development since these structures can act as conduits for water ingress to the mine. Isolation pillars or mining buffer zones are left around these anomalous features. This practice reduces the overall mining extraction ratio, but the risk of inflow to mine workings is effectively mitigated. Localized and relatively small ore zone anomalies do occur and typically are not discernable (or imaged) by the seismic method and so are not mapped. When such anomalies are encountered they are dealt with in the normal course of mining and extraction through these anomalous areas is typically minimized. Where there is uncertainty in seismic interpretations, drilling is often used to confirm or refine the seismic interpretation.
Seismic coverage is outlined in the Technical Reports.
Experience has shown that the potash mining zone is continuous when seismic data are undisturbed and flat-lying. Surface seismic data are generally collected years in advance of mining. Any area recognized as seismically unusual is identified early and mine plans are adjusted to avoid these regions.
| v) | Drilling |
The primary objective of the original potash test holes drilled in the 1950s and 1960s at each of the operations was to sample the potash horizons and establish basic mining parameters. The seismic method was still novel and crude at that time and as such, 2D seismic surveys were done sparingly, so the drillhole information was relied upon heavily to evaluate potash deposits. Test holes would penetrate the evaporite section with a hydrocarbon-based drilling mud (oil-based or diesel fuel) to protect the potash mineralization from dissolution. Basic geophysical well-logs were acquired, and in many cases, drill stem tests were run on the Dawson Bay Formation to help assess water-make mine inflow potential of the caprock. Core samples from the targeted potash intersections were split or quartered, crushed, and analysed to establish potash ore grades.
Due to the remarkably consistent mineralogy and continuity of the resource as experienced through decades of mine production, very little potash exploration drilling has been done at our operations since the 1960s. Since each drillhole is a potential conduit for subsurface groundwater from overlying (or underlying) water-bearing formations into future mine workings, it is also important to minimize the amount of cross-formational drilling. Every potash test drillhole from surface sterilizes potash mineralization as a safety pillar is required around every surface drillhole once underground mining commences.
All new drilling efforts have targeted areas of geological uncertainty. Although normal ore zone conditions may occur in the tested areas, they are not targeted specifically. For this reason, and because ore grade is known to be locally variable, assays from drilling are not relied upon for ore grade estimation. Instead, grade determined from routinely collected in-mine ore zone samples are found to be most reliable. The long-term average from in-mine tends to best represent the larger ore zone as it normalizes local variability.
56
| vi) | Sampling Preparation, Analyses and Security |
Basic Approach
Drillhole sampling methods have remained essentially the same over the years. Short segments of core usually about 0.3 meters (1 foot) in length are labeled based on visible changes in mineralization, and sometimes based on fixed intervals. Each segment of core is then split using some type of rock or masonry saw. The split portion of core is then bagged and labeled and sent to a laboratory for chemical analysis. Historical potash samples remain stored at the Subsurface Geological Laboratory (Regina, Saskatchewan) of the Saskatchewan Ministry of Energy & Resources.
All in-mine samples from our operations were analysed in the mill laboratories using analysis techniques that were up to date for the era in which the sample was collected.
Regarding quality assurance for analytical results of in-mine samples, the Company participates in the Canpotex Producer Sample Exchange Program using methods developed by the Saskatchewan Potash Producers Association (“SPPA”). The Sample Exchange Program monitors the accuracy of analytical procedures used in its labs. In the early 1970s, the SPPA initiated a round- robin Sample Exchange Program, the purpose of which was to assist the potash laboratories in developing a high level of confidence in analytical results. This program, now named the Canpotex Producer Sample Exchange Program using SPPA Methods (CPSEP) has continued up to the present. Current participants include all Canpotex member potash mine site labs, the Nutrien Pilot Plant Lab, and independent third-party surveyor labs. The CPSEP provides participants with three unknown potash samples for analysis quarterly. Results for the unknown sample analysis are correlated by an independent agency that distributes statistical analysis and a summary report to all participants. Completed exchange program samples can be used for control standards as required in QA/QC sections of standard analytical procedures.
The Nutrien Pilot Plant is secured in the same way as modern office buildings are secured. Authorized personnel have access and visitors are accompanied by staff. No special security measures are taken beyond that. Currently, no external laboratory certification is held by the Nutrien Pilot Plant. On occasion, product quality check samples are sent to the Saskatchewan Research Council, a fully certified analytical facility.
In the opinion of the authors of the Technical Reports, the sample preparation, security, and analytical procedures are acceptable, are consistent with industry- standard practices, and are adequate for Mineral Resource and Reserve estimation purposes.
Assay Data Verification
The original 1950s, 1960s, and 1970s drillhole assays were studied by independent consultants chosen by the well licensee or potash operator at the time. Original assay results for core samples from historical drillholes were taken as accurate in these studies as there is no way to reliably reanalyze these samples. Most of the remaining core in storage have long since deteriorated to the point where they are not usable. More recent drillhole assay results have been analyzed by Company staff.
Ore grades of in-mine samples are measured in-house at the Allan, Cory, Lanigan, Rocanville and Vanscoy mines laboratory by Company staff using modern, standard chemical analysis tools and procedures; an independent agency does not verify these results. However, check sampling through the CPSEP does occur.
It should be noted that assay results from historical drillholes match in-mine sample results reasonably well – within 1% – even though drillhole sample spacing is much greater. This correlation is further validation of the in-mine sampling methodology. Mean mineral grade determined from in-mine samples taken over decades of mining at Allan, Cory, Lanigan, Rocanville and Vanscoy is thought to provide the most accurate measurement of potash grade for these mines, also providing a good basis for estimating ore grade in areas of future mining.
Exploration Data Verification
The purpose of any mineral exploration program is to determine extent, continuity, and grade of mineralization to a certain level of confidence and accuracy. Assay of physical samples (drillhole cores and/or in-mine samples) is the only way to gain information about mineral grade, but extent and continuity of mineralization are correctly determined using data collected from seismic surveys correlated with historic drilling information. To date surface seismic data collected at our mines have been analysed and verified by Company staff, at times in cooperation with an independent consultant.
Data for the mineral resource and reserve estimates for Allan, Cory, Lanigan, Rocanville and Vanscoy mines were verified by Company staff as follows:
| • | Review of potash assay sample information (drillholes and in-mine grade samples); |
| • | Review of surface geophysical exploration results (3D and 2D seismic data); |
57
| • | Crosscheck of mined tonnages reported by mine site technical staff with tonnages estimated from mine survey information; and |
| • | Crosscheck of mineral resource and reserve calculations carried out by corporate technical staff. |
In the opinion of the authors of the Technical Reports, this approach to data verification of potash mineral grade and surface seismic information is in accordance with generally accepted industry practice for areas adjacent and contiguous to an existing operating potash mine.
Potash Ore Density from In-Mine Mineral Grade Measurements
An estimate of in-situ rock density is used to calculate potash mineralization volumes in Mineral Resource and Reserve assessments. A common approach, and the one used by Nutrien, is to determine in-place Mineral Resource and Reserve volumes (m3), then multiply this number by in-situ bulk-rock density (tonnes / m3) to give in-place Mineral Resource and Reserve tonnes.
Well-log data from drillholes can be used to calculate bulk density if accurate and calibrated well-logs are acquired during exploration drilling. In practical terms, modern well-logs tend to meet these criteria, but historic well-logs (collected before the 1990s) do not. In Saskatchewan, almost all potash exploration drilling took place in the 1950s and 1960s, well before density logs were accurate and reliable.
Another approach, and the one used by Nutrien, is to look up density values for the minerals which constitute potash rock – values determined in a laboratory to a high degree of accuracy and published in reliable scientific journals / textbooks – then apply these densities to the bulk rock. Given that the density of each pure mineral is quantified and known, the only variable is what proportion of each mineral makes up the bulk rock. An obvious benefit of this approach is that a mean value computed on in-mine samples has a much greater confidence interval than a mean value computed from just a few drillhole assays.
The four main mineralogical components of the ore zones of Saskatchewan’s Prairie Evaporite Formation with their respective mineral densities are:
| Mineral |
Density (kg / m3) |
Components |
||||
| Halite |
2,170 | NaCl |
||||
| Sylvite |
1,990 | KCl |
||||
| Carnallite |
1,600 | KMgCl3 · 6(H2O) |
||||
| Insolubles |
2,510 – 2,870 | Anhydrite, dolomite, quartz, muscovite, and other minor mineral components (Nutrien Pilot Plant, 2018) |
All Nutrien potash mines measure and record the in-mine % K2O grade and insoluble content of the mined rock. Magnesium content is only measured at Lanigan and Rocanville since carnallite is sometimes a component of the ore at these two mines. From this set of measurements, density of the ore can be calculated.
The value for insoluble density is based on known densities of the constituent parts of the insoluble components of the mineralization and the average occurrence of these insoluble components, which is known from over 50 years of mining experience at each of our operations. Assuming the lowest plausible density of insolubles known for Saskatchewan potash deposits of this nature, the effect upon overall bulk-rock ore density and Mineral Resource and Reserve calculations would be negligible.
From thousands of in-mine samples taken at Allan, bulk density for the Allan A Zone has been determined to be:
= (halite density * % halite) + (sylvite density * % sylvite) + (insolubles density * % insolubles)
= (2,170 kg / m3 * 58.1%) + (1,990 kg / m3 * 39.3%) + (2,510 kg / m3 * 2.7%)
= 2,116 kg / m3
RHObulk-rock (Allan A Zone) = 2,116 kg / m3 = 2.11 tonnes / m3
From thousands of in-mine samples taken at Vanscoy, bulk density for the Vanscoy A Zone has been determined to be:
= (halite density * % halite) + (sylvite density * % sylvite) + (insolubles density * % insolubles)
= (2,170 kg / m3 * 57.3%) + (1,990 kg / m3 * 38.3%) + (2,510 kg / m3 * 4.4%)
= 2,110 kg / m3
RHObulk-rock (Vanscoy A Zone) = 2,110 kg / m3 = 2.12 tonnes / m3
58
Historical Cory in-mine mineral grade analyses did not include measurements of the insoluble content, so potash bulk-rock density is calculated using thousands of in-mine samples from the adjacent Vanscoy A Zone.
RHObulk-rock (Cory A Zone) = RHObulk-rock (Vanscoy A Zone) = 2,116 kg / m3 = 2.12 tonnes / m3
From thousands of in-mine samples taken at Lanigan, bulk density for the Lanigan A Zone has been determined to be:
= (halite density * % halite) + (sylvite density * % sylvite) + (insolubles density * % insolubles) + (carnallite density * % carnallite)
= (2,170 kg / m3 * 54.64%) + (1,990 kg / m3 * 38.21%) + (2,510 kg / m3 * 6.12%) + (1,600 kg / m3 * 1.03%)
= 2,138 kg / m3
RHObulk-rock (Lanigan A Zone) = 2,138 kg / m3 = 2.14 tonnes / m3
From thousands of in-mine samples taken at Lanigan, bulk density for the Lanigan B Zone has been determined to be:
= (halite density * % halite) + (sylvite density * % sylvite) + (insolubles density * % insolubles)
= (2,170 kg / m3 * 59.45%) + (1,990 kg / m3 * 30.77%) + (2,870 kg / m3 * 4.84%) + (1,600 kg / m3 * 4.94%)
= 2,120 kg / m3
RHObulk-rock (Lanigan B Zone) = 2,120 kg / m3 = 2.12 tonnes / m3
To date, not enough B Zone mining has been carried out at Allan, Cory and Vanscoy to permit a bulk density calculation based on in-mine grade samples. If further test mining of the B Zone at these mines are conducted in future, there may be enough samples with all constituent minerals measured to warrant a change from what is reported. It is expected that any such change would have only a minimal effect on bulk-rock density used in tonnage calculations. Instead, we use the potash bulk-rock density calculated using thousands of in-mine grade samples from Lanigan B Zone:
RHObulk-rock (Allan, Cory, Vanscoy B Zone) = RHObulk-rock (Lanigan B Zone) = 2,120 kg / m3 = 2.12 tonnes / m3
This estimate is considered acceptable since the B Zone at Allan, Cory and Vanscoy are the same potash seam as the Lanigan B Zone.
From thousands of in-mine samples taken at Rocanville, bulk density has been determined to be:
= (halite density * % halite) + (sylvite density * % sylvite) + (insolubles density * % insolubles) + (carnallite density * % carnallite)
= (2,170 kg / m3 * 57.5%) + (1,990 kg / m3 * 35.4%) + (2,790 kg / m3 * 1.0%) + (1,600 kg / m3 * 6.1%)
= 2,078 kg / m3
RHObulk-rock (Rocanville) = 2,078 kg / m3 = 2.08 tonnes / m3
This method is as accurate as the ore grade measurements and mineral density estimates.
| vii) | Mineral Resource and Mineral Reserve Estimates |
Definitions of Mineral Resource
The Canadian Institute of Mining and Metallurgy and Petroleum (“CIM”) has defined mineral resource in The CIM Definition Standards for Mineral Resources and Reserves (2014) as:
| 1. | Inferred Mineral Resource: that part of a mineral resource for which quantity and grade or quality are estimated on the basis of limited geological evidence and sampling. Geological evidence is sufficient to imply but not verify geological and grade or quality continuity. |
| 2. | Indicated Mineral Resource: that part of a mineral resource for which quantity, grade or quality, densities, shape and physical characteristics are estimated with sufficient confidence to allow the application of modifying factors in sufficient detail to support mine planning and evaluation of the economic viability of the deposit. Geological evidence is derived from adequately detailed and reliable exploration, sampling and testing and is sufficient to assume geological and grade quality continuity between points of observation. |
59
| 3. | Measured Mineral Resource: that part of a mineral resource for which quantity, grade or quality, densities, shape, and physical characteristics are estimated with confidence sufficient to allow the application of modifying factors to support detailed mine planning and final evaluation of the economic viability of the deposit. Geological evidence is derived from detailed and reliable exploration, sampling and testing and is sufficient to confirm geological and grade or quality continuity between points of observation. |
CIM defines Modifying Factors as “considerations used to convert mineral resources into mineral reserves. These include, but are not restricted to, mining, processing, metallurgical, infrastructure, economic, marketing, legal, environmental, social and governmental factors.”
In south-central Saskatchewan, where geological correlations are straightforward, and within a (potash) subsurface mineral lease at an operating potash mine, mineral resource categories are generally characterized by the Company as follows:
| 1. | Inferred Mineral Resource: areas of limited exploration, such as areas that have been investigated through regional geological studies, or areas with 2D regional surface seismic coverage, little or no drilling, at some distance from underground workings, and within the applicable Crown lease. |
| 2. | Indicated Mineral Resource: areas of adequate exploration, such as areas with 3D surface seismic coverage, little or no drilling, at some distance from underground workings, and within the applicable Crown lease. |
| 3. | Measured Mineral Resource: areas of detailed, physical exploration through actual drilling or mine sampling, near existing underground workings, and within the applicable Crown lease. |
Exploration information used to calculate reported Mineral Resource tonnages at each of our operations consist of both physical sampling (drillhole and in-mine) and surface seismic (2D and 3D). Based on the definitions and guidelines above, all mineral rights leased or owned by the Company, and within respective Crown Lease, are assigned to one of the three mineral resource categories. Mineral resources are reported as mineralization in-place and are exclusive of Mineral reserves.
The tonnage reported in the A Zone Measured Resource (Allan, Cory, Lanigan, and Vanscoy) is comprised of the potash that is within 1.6 km (1 mile) of a physically sampled location (i.e., drillholes or mine workings). Likewise, the tonnage reported in the Lanigan B Zone and Rocanville Measured Resource is comprised of the potash that is within 1.6 km (1 mile) of a physically sampled location (i.e., drillholes or mine workings). Also included as Measured Resource is the potash in the pillars of mined-out areas as there is the possibility of retrieving ore from the remnant mining pillars at some point in the future. An example of this is the Patience Lake mine which was successfully converted from a conventional mine to a solution mine after being lost to flooding in 1989. Since mining of remnant mining pillars is not anticipated in the near future at the Nutrien mines, in-place pillar mineralization remains as a Mineral Resource rather than a Mineral Reserve at this time.
Mineral Resource for each mine is updated when the corresponding NI43-101 Technical Report is issued. In between Technical Reports, it remains unchanged. Mineral resources are reported as mineralization in-place and are exclusive of mineral reserves. In-place tonnes were calculated for each of the Nutrien mine mineral resource categories using the following parameters.
Parameters used for Computing Resource and Reserve
| Mine | Mining Height |
Ore Density (tonnes /meter3) |
||||
|
Allan |
A Zone B Zone |
3.35 meters (11 feet) | 2.11 | |||
| 3.35 meters (11 feet) | 2.12 | |||||
|
Cory |
A Zone B Zone |
3.35 meters (11 feet) | 2.12 | |||
| 3.35 meters (11 feet) | 2.12 | |||||
|
Lanigan |
A Zone B Zone |
3.66 meters (12 feet) | 2.14 | |||
| 4.88 meters (16 feet) | 2.12 | |||||
| Rocanville | 2.51 meters (8.25 feet) | 2.08 | ||||
|
Vanscoy |
A Zone B Zone |
3.35 meters (11 feet) | 2.12 | |||
| 3.35 meters (11 feet) | 2.12 | |||||
60
The mineral resource per the corresponding Technical Reports are as follows:
Inferred, Indicated and Measured Mineral Resource
| Mine |
Inferred Mineral Resource (millions of tonnes) |
Indicated Mineral Resource (millions of tonnes) |
Measured Mineral Resource (millions of tonnes) |
Total Mineral Resource (millions of tonnes) |
||||||||||||
|
Allan |
A Zone B Zone |
1,164 | 2,333 | 2,533 | 5,078 | 1,183 | 2,890 | 10,301 | ||||||||
| 1,169 | 2,545 | 1,707 | ||||||||||||||
|
Cory |
A Zone B Zone |
1,284 | 2,570 | 612 | 1,225 | 1,056 | 2,452 | 6,247 | ||||||||
| 1,286 | 613 | 1,396 | ||||||||||||||
|
Lanigan |
A Zone B Zone |
348 | 808 | 1,458 | 3,384 | 2,299 | 5,211 | 9,403 | ||||||||
| 460 | 1,926 | 2,912 | ||||||||||||||
| Rocanville | 902 | 1,575 | 2,017 | 4,494 | ||||||||||||
|
Vanscoy |
A Zone B Zone |
932 | 1,865 | 1,850 | 3,703 | 1,975 | 4,644 | 10,212 | ||||||||
| 933 | 1,853 | 2,669 | ||||||||||||||
Definitions of Mineral Reserve
CIM defined mineral reserve in The CIM Definition Standards for Mineral Resources and Reserves (2014) as:
| 1. | Probable Mineral Reserve: the economically mineable part of an indicated, and in some circumstance, a measured, mineral resource. The confidence in the modifying factors applying to a probable mineral reserve is lower than that applying to a proven mineral reserve. |
| 2. | Proven Mineral Reserve: the economically mineable part of a measured mineral resource. A proven mineral reserve implies a high degree of confidence in the modifying factors. |
CIM defines Modifying Factors as “considerations used to convert Mineral Resources into Mineral Reserves. These include, but are not restricted to, mining, processing, metallurgical, infrastructure, economic, marketing, legal, environmental, social and governmental factors.”
For Saskatchewan, in regions adjacent and contiguous to an operating potash mine and within a (potash) subsurface mineral lease, mineral reserve categories are characterized by the Company as follows:
| 1. | Probable Mineral Reserve: identified recoverable potash mineralization classified as a measured resource, within a 1.6 km (1 mile) radius of a sampled mine entry or exploration drillhole contiguous to mine workings, and within the applicable Crown lease. |
| 2. | Proven Mineral Reserve: identified recoverable potash mineralization classified as a measured resource, delineated on at least three sides by sampled mined entries or exploration drillholes to a maximum of 3.2 km (2 miles) apart, and within the applicable Crown lease. |
Using the definitions outlined above, a portion of the Allan, Cory, Lanigan, and Vanscoy A Zone Measured Resource has been converted to Mineral Reserve. Likewise, a portion of the Lanigan B Zone Measured Resource and a portion of the Rocanville Measured Resource has been converted to Mineral Reserve. The assigned Mineral Reserve category is dependent on proximity to sampled mined entries also described above. An overall extraction ratio for each of the mines has been applied to the qualifying areas outlined as Measured Resource.
Currently at Allan, Cory, Lanigan, and Vanscoy where there are two potash ore zones, in any specific mining block, only one of the two ore zones is mined (i.e., bi-level mining is not in practice). As such, Mineral Reserve is assigned only to the ore zone that will be mined in the future so that A Zone Mineral Reserve and B Zone Mineral Reserve do not overlap. At Allan, Cory, and Vanscoy, and certain portions of Lanigan, the B Zone potash mineralization directly underlying the defined A Zone Mineral Reserve is classified as B Zone Measured Resource. In the same way, because mining occurs in both zones at Lanigan, certain portions of the A Zone potash mineralization directly underlying the defined B Zone Mineral Reserve is classified as A Zone Measured Resource.
61
Since an extraction ratio has been applied to each of these Mineral Reserve categories, Mineral Reserves are considered recoverable ore, and are reported as such. Note that only drillholes whose 1.6 km radii are contiguous to mine workings or the 1.6 km radius placed around mine workings are used to compute probable mineral reserve. The remaining non-contiguous drillholes remain in the measured resource category.
Mineral Reserve for each mine is updated when the corresponding NI43-101 Technical Report is issued. In between Technical Reports, annual production tonnages are subtracted from the Proven Mineral Reserve. The mineral reserves as of December 31, 2023 are as follows:
Probable and Proven Mineral Reserve
|
Mine |
Probable Mineral Reserve (millions of tonnes) |
Proven Mineral Reserve (millions of tonnes) |
Total Mineral Reserve (millions of tonnes) |
|||||||||
|
Allan |
A Zone | 244 | 244 | 94 | 94 | 338 | ||||||
| B Zone | Nil | Nil | ||||||||||
|
Cory |
A Zone | 141 | 141 | 56 | 56 | 197 | ||||||
| B Zone | Nil | Nil | ||||||||||
|
Lanigan |
A Zone | 194 | 432 | 38 | 117 | 549 | ||||||
| B Zone | 238 | 79 | ||||||||||
|
Rocanville |
293 | 156 | 449 | |||||||||
|
Vanscoy |
A Zone | 326 | 326 | 174 | 174 | 500 | ||||||
| B Zone | Nil | Nil | ||||||||||
| viii) | Capital and Operating Costs |
The Allan, Cory and Lanigan mines have been in operation since 1968, the Vanscoy mine has been in operation since 1969, and the Rocanville mine has been in operation since 1970. Since then, capital expenditures were made on a regular and ongoing basis to sustain production and to expand production from time to time. All construction was carried out without significant disruption to existing potash production from the sites.
Major Refurbishment and Expansion
|
Mine |
Year of Major Refurbishment and Expansion |
Increase in Nameplate Capacity of Finished Potash Products Per Year |
Description of Work Completed | |||
|
Allan |
2013 |
4.0 million tonnes | Enhancement of hoists and shaft conveyances, major expansions of both mine and mill, improvements to loadout facilities and some infrastructure improvements. |
|||
|
Cory |
2013 |
3.0 million tonnes | Increased hoist capacity, infrastructure improvements, major expansions of mine and mill, and improvements to loadout facilities. |
|||
|
Lanigan |
2005 -2010 |
3.8 million tonnes | Mill rehabilitation, mine expansion and hoist improvement projects |
|||
|
Rocanville |
2013 - 2017 |
6.5 million tonnes | Construction of a third shaft, enhancement of hoists and shaft conveyances, major expansions of both mine and mill, improvements to loadout facilities and some infrastructure improvements. |
|||
|
Vanscoy |
2015 |
3.0 million tonnes | Increased hoist capacity, infrastructure improvements, major expansions of mine, mill, and TMA. |
| ix) | Exploration, Development and Production |
Potash production in any given year at our potash mines is a function of many variables, so actual production in any given year can vary dramatically from tonnages produced in previous years. The mineral reserve tonnage and historic average production are used to estimate remaining mine life. The table below summarizes mine life for each Nutrien site from December 31, 2023, assuming the average mining rate seen over the past three years (potash ore mined and hoisted per year) is sustained, and that the mineral reserves remain unchanged.
62
Mine Life Summary from December 31st, 2023
|
Mine |
Average Yearly Mining Rate | Mineral Reserve (Total) | Mine Life | |||
|
Allan |
7.132 million tonnes | 338 | 47 years | |||
|
Cory |
5.648 million tonnes | 197 | 35 years | |||
|
Lanigan |
8.434 million tonnes | 549 | A Zone: 28 years B Zone: 38 years |
|||
|
Rocanville |
16.476 million tonnes | 449 | 27 years | |||
|
Vanscoy |
3.076 million tonnes | 500 | 163 years |
| x) | Mining Operations |
All conventional potash mines in Saskatchewan operate at 900 m to 1,200 m below surface within 9 m to 30 m of the top of the Prairie Evaporite Formation. Over the scale of any typical Saskatchewan potash mine, potash beds are tabular and regionally flat- lying, with only moderate local variations in dip. Potash ore is mined using conventional mining methods, whereby:
| • | Shafts are sunk to the potash ore body; |
| • | Continuous mining machines cut out the ore, which is hoisted to surface through the production shaft; |
| • | Raw potash is processed and concentrated in a mill on surface; and |
| • | Concentrated finished potash products (near-pure KCl) are sold and shipped to markets in North America and offshore. |
At Allan, Cory, Lanigan and Vanscoy (the Saskatoon area mines), sinking of the two original shafts (production and ventilation shafts) from surface to the potash zone was completed in early 1968, and the first potash ore was hoisted that year. The two original Rocanville shafts were completed in 1970. The mines have run on a continuous basis other than short-term shutdowns taken for inventory management purposes, occasional plant maintenance and construction work, or other outages that are typical for operations of this nature. The exception to this was Vanscoy where a major inflow in 1970 halted production for two years (described in technical report).
At Allan, Cory, Lanigan and Vanscoy, the A Zone of the Patience Lake Member is mined. Additionally, at Lanigan both the A Zone and the B Zone are mined. The seams are separated by approximately 4 m to 6 m of tabular salt. Currently, in any specific mining block at Lanigan, only one zone is mined (i.e., bi-level mining is not in practice). Per the Technical Reports, mine elevations in the A Zone range from 940 m to 1,120 m at the Saskatoon area mines. These depths to A Zone potash mineralization are anticipated over most of the lease area for these mines. Mine workings are protected from aquifers in overlying formations by approximately 12 m of overlying salt and potash beds at Allan, Cory and Vanscoy, and by approximately 7 m (A Zone) to 14 m (B Zone) at Lanigan. Furthermore, the salt plugged porosity in the Dawson Bay Formation, a carbonate layer lying immediately above potash hosting salt beds at these mines provides further protection from overlying aquifers.
Virtually all Rocanville underground mining rooms are in the Esterhazy Member of the Prairie Evaporite Formation. Per the Rocanville Technical Report, mine elevations range from approximately 895 m to 1,040 m. Within the Rocanville Crown Lease, depths to the top of the ore zone can reach up 1,250 m (the deepest potash exploration drillhole) but are expected to be shallower than 1,200 m over most of the lease area. Mine workings are protected from aquifers in overlying formations by approximately 30 m of overlying salt and potash beds, along with salt plugged porosity in the Lower Dawson Bay Formation, a carbonate layer lying immediately above potash hosting salt beds.
The highest mineral grade section at the Saskatoon area mines A Zone potash seam is approximately 3.35 m (11 feet) thick, with gradations to lower grade salts immediately above and below the mining horizon. The actual mining thickness at these mines are dictated by the height of continuous boring machines used to cut the ore which is typically either 3.35 m (11 feet) or 3.66 m (12 feet) (as described in the Technical Reports). The thickness of the B Zone mining horizon at Lanigan varies somewhat and there is some flexibility in the thickness of the potash ore that is extracted there. Production mining machines have a fixed mining height of 2.74 m (9 feet). In a normal production room ore is extracted in two lifts resulting in a mining height of approximately 4.88 m (16 feet).
Carnallite sometimes occurs in minor amounts in the basal part of the B Zone. Carnallite is an undesirable mill feed material. It is common at Lanigan to find carnallite in pod-like deposits and the larger pods can be mapped with seismic and avoided. If more than minor amounts of carnallite are detected in the floor, through physical sampling or with Ground Penetrating Radar, after the first lift of a production room in the B Zone, it is left in the floor (i.e., a second lift is not cut). In these instances, the B Zone mining height is just 2.74 m (9’). Carnallite is found in trace amounts in the A Zone; however, due to its low occurrence, mining practices remain unchanged when it is encountered.
63
The highest mineral grade section of the Rocanville potash seam is approximately 2.3 m (7.5 feet) thick, with gradations to lower grade sylvinite salts immediately above and below the mining horizon. The actual mining thickness at Rocanville is also dependent on the boring machine heights there, being either 2.44 m (8 feet) or 2.51 m (8.25 feet). Mining machines at Rocanville use potassium sensing technology to ensure that rooms are always cut in the best available potash ore.
All mines in the Saskatoon area, cuts to a marker (clay) seam that is slightly above the high-grade mineralized zone to establish a safe and stable mine roof. The top marker seam is slightly overcut by 10 to 20 cm. Clay seams are often planes of weakness, and if they are undercut, material immediately below the clay seam becomes a hazard as it may separate and fall. Since the hazard must be remediated prior to proceeding, thus slowing production, the moderately diluted mineral grade that results from the overcutting is preferable from a safety point of view.
Conservative local extraction ratios (never exceeding 45% in any mining block) are employed at all Saskatchewan mines in order to minimize potential detrimental effects of mining on overlying strata; this is common practice in flat-lying, tabular ore bodies overlain by water-bearing layers.
From the shaft-bottom, potash ore is hoisted approximately 1,000 m from the potash level through the vertical shafts to a surface mill. In addition to hoisting potash ore to surface, the production shaft also provides fresh air ventilation to the mine and serves as a secondary egress. The service shaft is used for service access, and exhaust ventilation from the mine.
| xi) | Environmental Studies, Permitting and Social or Community Impact |
The tailings management strategy at all Nutrien potash mines in Saskatchewan, is one of sequestering solid mine tailings in an engineered and provincially licensed Tailing Management Area (TMA) near the surface plant site. Emissions to air consisting primarily of particulate matter are kept below regulatory limits through various modern air pollution abatement systems (e.g. dust collection systems built into mill processes) that are provincially licensed. This same procedure is followed at all of our mines in Saskatchewan.
In Saskatchewan, all potash tailings management activities are carried out under an “Approval to Operate” granted by the Saskatchewan Ministry of Environment (MOE), the provincial regulator. Staff at the mines actively monitor and inspect operations and routinely report the observations and measurements to the Environmental Protection Branch of MOE. The current Approval to Operate for our mines has been granted to July 1, 2028, the renewal date.
In terms of long-term decommissioning, environmental regulations of the Province of Saskatchewan require that all operating potash mines in Saskatchewan create a long-term decommissioning and reclamation plan that will ensure all surface facilities are removed, and the site is left in a chemically and physically stable condition once mine operations are complete. The Company has conducted numerous studies of this topic, and the most recent decommissioning and reclamation plan was approved by MOE technical staff in January 2022. Because the current expected mine life for the sites is many decades into the future, it is not meaningful to come up with detailed engineering designs for decommissioning annually. Instead, decommissioning plans are reviewed every five years, and updated to accommodate new concepts, technological change, incorporation of new data, and adjustments of production forecasts and cost estimates. Any updated decommissioning and reclamation reports generated by this process are submitted to provincial regulatory agencies. A revised decommissioning and reclamation plan is due in June 2026 for MOE review.
In addition to the long-term decommissioning plan, provincial regulations require that every potash producing company in Saskatchewan set up an Environmental Financial Assurance Fund, which is to be held in trust for the decommissioning, restoration and rehabilitation of the plant site after mining is complete. This fund is for all mines we operate in the Province of Saskatchewan (i.e., Allan, Cory, Lanigan, Patience Lake, Rocanville, and Vanscoy).
| xii) | Taxes Relating to Potash Operations |
Royalties are paid to the Province of Saskatchewan in connection with the Company’s Potash operations, which holds most of the mineral rights in the lease areas, and royalties from Freehold lands are paid to various freeholders of mineral rights in the area. The Crown royalty rate is 3 percent and is governed by The Subsurface Mineral Royalty Regulations, 2017. The actual amount paid is dependent on selling price and production tonnes.
Municipal taxes are paid based on site property values to the applicable municipality in Saskatchewan. Saskatchewan potash production is taxed at the provincial level under The Mineral Taxation Act, 1983. This tax, governed by The Potash Production Tax Regulations, consists of a base payment and a profit tax, collectively known as the potash production tax. As a resource corporation in the Province of Saskatchewan, the Company is also subject to a resource surcharge equal to a percentage of the value of its resource sales (as defined in The Corporation Capital Tax Act of Saskatchewan). In addition to this, the Company pays federal and provincial income taxes based on corporate profits from all of its operations in Canada.
64
b) Allan Potash Operations
| i) | Project Description, Location and Access |
General
The Allan mine is located in central Saskatchewan, approximately 45 kilometers east of the city of Saskatoon, Saskatchewan. The Legal Land Description (Saskatchewan Township/Range) of the Allan surface plant is Section 22 Township 34 Range 01 West of 3rd Meridian. More precisely, the Allan Shaft #2 collar is located at:
| • | Latitude: 51 degrees 55 minutes 55.56 seconds North |
| • | Longitude: 106 degrees 04 minutes 18.84 seconds West |
| • | Elevation: 524.26 meters above mean Sea Level (SL) |
| • | Easting: 426,303.225 m |
| • | Northing: 5,754,028.978 m |
| • | Projection: UTM |
| • | Datum: NAD83 |
| • | Zone: 13 |
Per the Allan Technical Report, the Company owns approximately 3,404 hectares (8,411 acres) of surface rights required for current Allan mine operations, including all areas covered by the existing surface plant and TMA, and all surface lands required for anticipated future Allan mine and expanded milling operations.
Besides the proximity to Saskatoon, the Allan mine is served by a number of villages within 50 kilometers of the mine site. Allan is situated near the northern extent of the Great Plains of North America. Topography is relatively flat, with gently rolling hills and occasional valleys. There are no rivers or other major watercourse channels near the Allan mine site.
Mineral Rights
The original Allan Crown Subsurface Mineral Lease, numbered KL 112, was entered into in September 1962. In the following years, minor amendments were made to the Lease, resulting in Crown Subsurface Mineral Lease KL 112R. In October 2017, a large area of land was added to the Lease resulting in Crown Subsurface Mineral Lease KL 112R A. In January 2020, an additional area of land was added to KL 112R A, resulting in Crown Subsurface Mineral Lease KL 112R B (the “Allan Crown Lease”) which covers an area of approximately 80,950 hectares (200,032 acres).
Per the Allan Technical report, the Company has leased potash mineral rights for 50,688 hectares (125,253 acres) of Crown Land and owns or has leased approximately 26,298 hectares (64,984 acres) of Freehold Land within the lease boundary. The Allan Crown Lease term is for a period of 21 years from September 2004, with renewals (at the Company’s option) for 21-year periods. Freehold Lands also remain under lease providing, generally, that production is continuing and that there is a continuation of the Crown Lease.
Within the Allan Crown Lease area, 19,183 hectares (47,403 acres) are mined pursuant to unitization agreements with mineral rights holders (Crown and Freehold) within two unitized areas.
| ii) | Sampling Preparation, Analyses and Security |
Mean Potash Mineral Grade From In-Mine Samples
At Allan, in-mine grade samples are taken by collecting fine “muck” from the floor of the mine approximately once per week per active mining face. This is roughly equivalent to a sample taken every 68 m to 74 m in production panels, and a sample taken every 85 m to 128 m in development panels. Per the Allan Technical Report, in-mine potash mineral grade samples collected from the Allan A Zone were analysed in the Allan mill laboratory using analysis techniques that were up to date for the era in which the sample was collected.
The median ore grade for this family of in-mine samples is 25.4% K2O equivalent and the mean ore grade is 24.7%.
Per the Allan Technical Report, the B Zone mineral grade at Allan is reported to be 20.2% K2O equivalent, the grade observed from the in-mine samples at the Lanigan mine where the B Zone has been extensively mined. Even though Allan mine is some distance from Lanigan, this is considered to be the best estimate of expected mineral grade for this potash layer because the deposit is known to be regionally continuous from west of Vanscoy to east of Lanigan.
65
Although it is possible that once mining proceeds into the B Zone the reported grade could change from what is reported, it is expected that any such change would be minimal.
| iii) | Mineral Processing and Metallurgical Testing |
Since opening in 1968, 185.640 million tonnes of potash ore have been mined and hoisted at Allan to produce 65.593 million tonnes of finished potash products. Given this level of sustained production for over several decades, basic mineralogical processing and prospective metallurgical testing of Allan potash is not considered relevant.
| iv) | Mining Operations |
In recent years, the Allan mine underwent a major expansion which brought the nameplate capacity up to 4.0 million tonnes of finished potash products per year. In 2023, operational capability at the Allan facility was 2.4 million tonnes per year. Operational capability may vary during the year and year-to-year including as between our potash operations.
The life of mine concentration ratio (raw-ore/finished potash products) is 2.83 and the overall extraction ratio over this period is 33%.
| v) | Processing and Recovery Operations |
At Allan, potash ore has been mined and concentrated to produce saleable quantities of high grade finished potash products since 1968. Raw potash ore is processed on surface and concentrated finished potash products (near-pure KCl) are sold and shipped to markets in North America and offshore.
Over the past three years, production of finished potash products at Allan was:
| • | 2021: 2.781 million tonnes finished potash products at 61.17% K2O (average grade) |
| • | 2022: 2.501 million tonnes finished potash products at 61.18% K2O (average grade) |
| • | 2023: 2.392 million tonnes finished potash products at 61.20% K2O (average grade) |
Over the past decade actual mill recovery rates have been between 85.63% and 87.99%, averaging 86.59%. Given the long-term experience with potash geology and actual mill recovery at Allan, no fundamental potash milling problems are anticipated in the foreseeable future.
Quality control testing and monitoring geared towards fine-tuning and optimizing potash milling and concentrating processes are conducted on a continual basis at all our mine sites and research facilities. At Allan, this is no exception; test work to optimize circuit performance and ensure product quality is carried out on an ongoing basis.
| vi) | Infrastructure, Permitting and Compliance Activities |
Project Infrastructure
Infrastructure is in place to meet current and projected requirements for transportation, energy (electricity and natural gas), water and process materials at Allan.
Surface facilities are accessed by existing paved roads and highways that are part of the Saskatchewan Provincial Highway System. All finished potash products are shipped by rail over existing track.
As per the Allan Technical Report, high-voltage power capacity at Allan is 44 MVA. The ten-year projection of power utilization indicates that the utility can meet all foreseeable future demand.
The Allan operation requires a sustained fresh water supply for the milling process which is provided from a local reservoir called the Bradwell Reservoir operated by SaskWater (approximately 6 km distant). This water supply provides a sustainable source of process water for Allan milling operations with no known impact on other users of water in the area.
66
Environmental Studies, Permitting and Social or Community Impact
The Allan TMA currently covers an area of approximately 600 hectares (1,483 acres) of land owned by the Company. Solid potash mine tailings typically consist of 85% to 95% rock salt (NaCl) and 5% to 15% insoluble (carbonate mud = CaCO3, anhydrite mud = CaSO4, and clays like chlorite, illite and so on). An engineered slurry-wall (in some portions, a compacted earth trench barrier) has been constructed where required around approximately half of the Allan TMA. In future years this wall can be expanded if required for operational needs. The slurry- wall provides secondary containment for any saline mine waters, minimizing brine impacts from the TMA to surrounding surface water bodies and near-surface aquifers. Areas surrounding the TMA are closely monitored: this includes everything from daily visual perimeter inspections to annual investigations and inspections of surrounding groundwater and aquifers.
Allan currently operates two brine disposal wells near the surface plant of the Allan mine where clear salt brine (i.e., no silt, clay slimes, or other waste) is borehole injected into the Winnipeg / Deadwood Formations, deep subsurface aquifers approximately 1,500 m to 1,700 m below the surface. The disposal wells are provincially licensed and formation water in these extensive deep aquifers is naturally saline.
c) Cory Potash Operations
| i) | Project Description, Location and Access |
General
The Cory mine is located in central Saskatchewan, approximately 7 kilometers west of the city of Saskatoon, Saskatchewan. The Legal Land Description (Saskatchewan Township/Range) of the Cory surface operation is Section 18 Township 36 Range 06 West of 3rd Meridian. More precisely, the Cory service shaft collar is located at:
| • | Latitude: 52 degrees 05 minutes 30.15 seconds North |
| • | Longitude: 106 degrees 51 minutes 16.32 seconds West |
| • | Elevation: 503 meters above mean SL |
| • | Easting: 372,951 m |
| • | Northing: 5,772,861 m |
| • | Projection: UTM |
| • | Datum: NAD83 |
| • | Zone: 13 |
Per the Cory Technical Report, the Company owns approximately 2,109 hectares (5,212 acres) of surface rights required for current Cory mine operations, including all areas covered by the existing surface plant and TMA, and all surface lands required for anticipated future Cory mine and expanded milling operations.
Besides the proximity to Saskatoon, the Cory mine is served by a number of villages within 50 kilometers of the mine site. Cory is situated near the northern extent of the Great Plains of North America. Topography is relatively flat, with gently rolling hills and occasional valleys. The Cory surface plant lies approximately 10 km northwest of the South Saskatchewan River, a major continental drainage channel.
Mineral Rights
The original Cory Crown Subsurface Mineral Lease, numbered KL 103, was signed and executed in September 1962. In the following years, minor amendments were made to the Lease, resulting in Crown Subsurface Mineral Lease KL 103B. In December 2020, inaccessible land in the northern part of Nutrien’s adjacent Vanscoy Crown Lease were transferred into the Cory Crown Subsurface Mineral Lease KL 103C (the “Cory Crown Lease”) where they could be developed, KL 103C covers an area of approximately 51,438 hectares (127,107 acres).
Per the Cory Technical Report, the Company has leased potash mineral rights for 28,507 hectares (70,412 acres) of Crown Land and owns or has leased approximately 18,351 hectares (45,346 acres) of Freehold Land within the lease boundary. The Cory Crown Lease term is for a period of 21 years from September 15, 2004, with renewals (at the Company’s option) for 21-year periods. Freehold Lands also remain under lease providing, generally, that production is continuing and that there is a continuation of the Crown Lease.
Within the Cory Crown Lease area, 29,772 hectares (73,569 acres) are mined pursuant to a unitization agreement with mineral rights holders (Crown and Freehold) within one unitized area.
67
| ii) | Sampling Preparation, Analyses and Security |
Mean Potash Mineral Grade From In-Mine Samples
It has been the practice at Cory for the past several years to acquire two in-mine grade samples at the start of every cutting sequence and is done by collecting fine “muck” from the floor of the mine. The sampling frequency is equivalent to two samples taken approximately every 25 m in production panels, and two samples taken approximately every 50 m in development panels. In-mine grade sampling practices at Cory have varied over the years resulting in an irregular sample set. It is the belief of the authors that the average grade reported from these in-mine samples will become increasingly representative of Cory A Zone potash mineralization as standardized sampling continues. It will also lead to a normalized data distribution. At Cory, mill feed grade data collected over the years suggests a higher average grade than is found in the in-mine sample set.
Per the Cory Technical Report, in-mine potash mineral grade samples collected from the Cory A Zone were analysed in the Cory mill laboratory using analysis techniques that were up to date for the era in which the sample was collected.
The median ore grade for this family of in-mine samples is 23.0% K2O equivalent and the mean ore grade is 21.9%.
Per the Cory Technical Report, the B Zone mineral grade at Cory is reported to be 20.3% K2O equivalent, which is the grade observed from 20,030 in-mine samples at the Lanigan mine where the B Zone has been extensively mined. Even though Cory mine is some distance from Lanigan, this is considered to be the best estimate of expected mineral grade for this potash layer because the deposit is known to be regionally continuous from west of Vanscoy to east of Lanigan. Although it is possible that once mining proceeds into the B Zone the reported grade could change from what is reported, it is expected that any such change would be minimal.
| iii) | Mineral Processing and Metallurgical Testing |
Since opening in 1968, 140.453 million tonnes of potash ore have been mined and hoisted to produce 43.822 million tonnes of finished potash products. Given this level of sustained production over several decades, basic mineralogical processing and prospective metallurgical testing of Cory potash is not considered relevant.
| iv) | Mining Operations |
In recent years, the Cory mine underwent a major expansion which brought the nameplate capacity up to 3.0 million tonnes of finished potash products per year. In 2023, operational capability at the Cory facility was 2.1 million tonnes per year. Operational capability may vary during the year and year-to-year including as between our potash operations.
The life-of-mine concentration ratio (raw ore / finished potash products) is 3.21 and the overall extraction ratio over this period is 27%.
| v) | Processing and Recovery Operations |
At Cory, potash ore has been mined and concentrated to produce saleable quantities of high grade finished potash products since 1968. Raw potash ore is processed on surface and concentrated finished potash products (near-pure KCl) are sold and shipped to markets in North America and offshore.
Over the past three years, production of finished potash products at Cory was:
| • | 2021: 1.768 million tonnes finished potash products at 61.48% K2O (average grade) |
| • | 2022: 1.888 million tonnes finished potash products at 61.58% K2O (average grade) |
| • | 2023: 1.493 million tonnes finished potash products at 61.74% K2O (average grade) |
Over the past decade, actual mill recovery rates have been between 71.07% and 82.97%, averaging 76.63%. Historically, mill recoveries at Cory were lower than at other Nutrien plants because a larger portion, and at one point all, of Cory’s total production was made through the crystallization process. Given the long-term experience with potash geology and actual mill recovery at Cory, no fundamental potash milling problems are anticipated in the foreseeable future.
Quality control testing and monitoring geared towards fine-tuning and optimizing potash milling and concentrating processes are conducted on a continual basis at all our mine sites and research facilities. At Cory, this is no exception; test work to optimize circuit performance and ensure product quality is carried out on an ongoing basis.
68
| vi) | Infrastructure, Permitting and Compliance Activities |
Project Infrastructure
Infrastructure is in place to meet current and projected requirements for transportation, energy (electricity and natural gas), water and process materials at Cory.
Surface facilities are accessed by an existing paved road that is part of the Saskatchewan Provincial Highway System. Most finished potash products are shipped by rail over existing track, with some product shipped by truck over the North American highway system.
As per the Cory Technical Report, high-voltage power capacity at Cory is 52 MVA. The ten-year projection of power utilization indicates that the utility can meet all foreseeable future demand.
The Cory operation requires a sustained fresh water supply for the milling process which is provided by a waterline from the South Saskatchewan River (approximately 10 km distant). This water supply is provincially licensed and provides a sustainable source of process water for Cory milling operations with no known impact on other users of water in the area.
Environmental Studies, Permitting and Social or Community Impact
The Cory TMA currently covers an area of approximately 416 hectares (1,027 acres) of land owned by the Company. Solid potash mine tailings typically consist of 85% to 95% rock salt (NaCl) and 5% to 15% insolubles (carbonate mud = CaCO3, anhydrite mud = CaSO4, and clays like chlorite, illite, and so on). An engineered slurry-wall has been constructed on the north, west, and south sides of the Cory TMA in the areas where near-surface aquifers could be impacted by mine waters. Near-surface geology to the east of the TMA limits the possibility of brine migration into these areas. The slurry-wall provides secondary containment of any saline mine waters, stopping these brines from reaching surrounding near-surface aquifers. Areas surrounding the TMA are closely monitored: this includes everything from daily visual perimeter inspections to annual investigations and inspections of surrounding groundwater and aquifers.
Cory currently operates four brine disposal wells near the surface plant of the Cory mine where clear salt brine (i.e., no silt, clay slimes, or other waste) is borehole-injected into the Winnipeg / Deadwood Formations, deep subsurface aquifers approximately 1,500 m to 1,700 m below the surface. The disposal wells are provincially licensed and formation waters in these extensive deep aquifers is naturally saline.
d) Lanigan Potash Operations
| i) | Project Description, Location and Access |
General
The Lanigan mine is located in central Saskatchewan, approximately 100 kilometers east of the city of Saskatoon, Saskatchewan. The Legal Land Description (Saskatchewan Township/Range) of the Lanigan surface operation is Section 28 Township 33 Range 23 West of 2nd Meridian. More precisely, the Lanigan Shaft #2 collar is located at:
| • | Latitude: 51 degrees 51 minutes 20.48 seconds North |
| • | Longitude: 105 degrees 12 minutes 34.79 seconds West |
| • | Elevation: 535.34 meters above mean SL |
| • | Easting: 485,560.306 m |
| • | Northing: 5,745,008.726 m |
| • | Projection: UTM |
| • | Datum: NAD83 |
| • | Zone: 13 |
Per the Lanigan Technical Report, the Company owns approximately 3,980 hectares (9,836 acres) of surface rights required for current Lanigan mine operations, including all areas covered by the existing surface plant and TMA, and all surface lands required for anticipated future Lanigan mine and expanded milling operations.
Lanigan is situated near the northern extent of the Great Plains of North America. Topography is relatively flat, with gently rolling hills and occasional valleys. There are no rivers or other major watercourse channels near the Lanigan mine site.
69
Mineral Rights
The original Lanigan Crown Subsurface Mineral Lease, numbered KL 100, was entered into in March 1964. A minor amendment to this lease in September 1989 resulted in KL 100R. In November 2009, a large area of land was added to the lease resulting in KLSA 001. Shortly after that, in June 2011, a minor amendment to the lease resulted in KLSA 001 A. KLSA 001 B was issued in September 2014 when portions of the adjacent exploration permits, granted in September 2011, were added to the lease. Finally, in November 2015, a minor change to the lease resulted in KLSA 001 C (the “Lanigan Crown Lease”). The Lanigan Crown Lease covers an area of approximately 56,328 hectares (139,190 acres),
Per the Lanigan Technical Report, the Company has leased potash mineral rights for 38,188 hectares (94,365 acres) of Crown land and owns or has leased approximately 17,913 hectares (44,265 acres) of Freehold land within the lease boundary. It should be noted that there was an increase to the Crown lease in 2022. The Lanigan Crown lease term is for a period of 21 years from March 2006, with renewals (at the Company’s option) for 21-year periods. Freehold lands also remain under lease providing, generally, that production is continuing and that there is a continuation of the Crown lease.
Within the Lanigan Crown Lease area, 55,950 hectares (138,256 acres) are mined pursuant to unitization agreements with mineral rights holders (Crown and Freehold) within two unitized areas.
| ii) | Sampling Preparation, Analyses and Security |
Mean Potash Mineral Grade From In-Mine Samples
In the Lanigan A Zone, in-mine grade samples are taken by collecting fine “muck” from the floor of the mine at the start of every cutting sequence. This is equivalent to a sample taken every approximately 23 m (76 feet) in production panels, and a sample taken every approximately 47 m (155 feet) in development panels. Per the Lanigan Technical Report, in-mine potash mineral grade samples collected from the Lanigan A Zone were analysed in the Lanigan mill laboratory using up-to-date analysis techniques.
The median ore grade for this family of in-mine samples is 25.2% K2O equivalent and the mean ore grade is 24.3%.
In the Lanigan B Zone, in-mine grade samples are taken from the floor every 60 m (200 feet) in newly mined rooms. Per the Lanigan Technical Report, in-mine potash mineral grade samples collected from the Lanigan B Zone were analysed in the Lanigan mill laboratory using analysis techniques that were up to date for the era in which the sample was collected.
The median ore grade for this family of in-mine samples is 20.8% K2O equivalent and the mean ore grade is 20.2%.
In 2013, Lanigan modified its cutting practices in the B Zone to improve mine roof stability. This modification involved cutting in a slightly higher, but more stable horizon. The goal of improved mine roof stability was achieved; however, less potash and more salt is now being mined resulting in a slightly lower reported ore grade for B Zone.
| iii) | Mineral Processing and Metallurgical Testing |
Since opening in 1968, 246.184 million tonnes of potash ore have been mined and hoisted to produce 72.612 million tonnes of finished potash products. Given this level of sustained production over several decades, basic mineralogical processing, and prospective metallurgical testing of Lanigan potash is not considered relevant.
| iv) | Mining Operations |
In recent years, the Lanigan mine underwent a major expansion which brought the nameplate capacity to 3.8 million tonnes per year. In 2023, operational capability at the Lanigan facility was 3.0 million tonnes per year. Operational capability may vary during the year and year-to-year including as between our potash operations.
The life of mine concentration ratio (raw ore/finished potash products) is 3.39 and the overall extraction ratio over this period is 26%.
| v) | Processing and Recovery Operations |
At Lanigan, potash ore has been mined and concentrated to produce saleable quantities of high-grade finished potash products since 1968. Raw potash ore is processed on surface and concentrated red potash products are sold and shipped to markets in North America and offshore.
70
Over the past three years, production of finished potash products at Lanigan was:
| • | 2021: 2.912 million tonnes finished potash products at 61.00% K2O (average grade) |
| • | 2022: 2.457 million tonnes finished potash products at 60.99% K2O (average grade) |
| • | 2023: 2.889 million tonnes finished potash products at 61.03% K2O (average grade) |
Over the past decade, actual mill recovery rates have been between 80.10% and 85.90%, averaging 82.71%. Given the long-term experience with potash geology and actual mill recovery at Lanigan, no fundamental potash milling problems are anticipated in the foreseeable future.
Quality control testing and monitoring geared towards fine-tuning and optimizing potash milling and concentrating processes are conducted on a continual basis at all our mine sites and research facilities. At Lanigan, this is no exception; test work to optimize circuit performance and ensure product quality is carried out on an ongoing basis.
| vi) | Infrastructure, Permitting and Compliance Activities |
Project Infrastructure
Infrastructure is in place to meet current and projected requirements for transportation, energy (electricity and natural gas), water and process materials at Lanigan.
Surface facilities are accessed by existing paved roads and highways that are part of the Saskatchewan Provincial Highway System. All finished potash products are shipped by rail over existing track.
As per the Lanigan Technical Report, high voltage power capacity at Lanigan is 52 MVA. The ten-year projection of power utilization indicates that the utility can meet all foreseeable future demand.
The Lanigan operation requires a sustained fresh water supply for the milling process which is provided by a waterline from the Dellwood Reservoir (approximately 10 km distant) and from a regional aquifer called the Hatfield Valley Aquifer. This water supply is provincially licensed and provides a sustainable source of process water for Lanigan milling operations with no known impact on other users of water in the area.
Environmental Studies, Permitting and Social or Community Impact
The Lanigan TMA currently covers an area of approximately 708 hectares (1,750 acres) of land owned by the Company. Solid potash mine tailings typically consist of 85% to 95% rock salt (NaCl) and 5% to 15% insolubles (carbonate mud = CaCO3, anhydrite mud = CaSO4, and clays like chlorite, illite, and so on). An engineered slurry-wall has been constructed on the south and south-west sides of the Lanigan TMA in the areas where near-surface aquifers could be impacted by mine waters. Near-surface geology on all other sides of the TMA limits the possibility of brine migration into these areas. The slurry-wall provides secondary containment of any saline mine waters, stopping these brines from reaching surrounding near-surface aquifers. Areas surrounding the TMA are closely monitored; this includes everything from daily visual perimeter inspections to annual investigations and inspections of surrounding groundwater and aquifers.
Lanigan currently operates three brine disposal wells near the surface plant of the Lanigan mine where clear salt brine (i.e., no silt, clay-slimes, or other waste) is borehole-injected into the Winnipeg / Deadwood Formations, deep subsurface aquifers approximately 1,500 m to 1,700 m below surface. The disposal wells are provincially licensed and formation water in these extensive deep aquifers is naturally saline.
e) Rocanville Potash Operations
| i) | Project Description, Location and Access |
General
The Rocanville mine is located in southeastern Saskatchewan near the Saskatchewan-Manitoba Provincial Boundary, approximately 15 kilometers northeast of the town of Rocanville, Saskatchewan. The Legal Land Description (Saskatchewan Township/Range) of the Rocanville surface plant is Section 22 Township 17 Range 30 West of the 1st Meridian. More precisely, the Rocanville #2 Shaft collar is located at:
| • | Latitude: 50 degrees 28 minutes 19.54 seconds North |
| • | Longitude: 101 degrees 32 minutes 42.58 seconds West |
71
| • | Elevation: 480.36 meters above mean SL |
| • | Easting: 745,137.307 m |
| • | Northing: 5,596,826.122 m |
| • | Projection: UTM |
| • | Datum: NAD83 |
| • | Zone: 13 |
The legal description (Saskatchewan Township / Range) of the Rocanville Scissors Creek Shaft is Section 13 Township 17 Range 32 West of the 1st Meridian and is approximately 12 kilometers north-west of the town of Rocanville, Saskatchewan. More precisely, the Shaft collar is located at:
| • | Latitude: 50 degrees 27 minutes 7.0632 seconds North |
| • | Longitude: 101 degrees 46 minutes 13.58 seconds West |
| • | Elevation: 525.35 metres above mean SL |
| • | Easting: 729,253.35 m |
| • | Northing: 5,593,868.30 m |
| • | Projection: UTM |
| • | Datum: NAD83 |
| • | Zone: 13 |
Per the Rocanville Technical Report, the Company owns approximately 3,244 hectares (8,016 acres) of surface rights required for current Rocanville mine operations, including all areas covered by the existing surface plant and TMA, and all surface lands required for anticipated future Rocanville mine and expanded milling operations.
The Rocanville mine is served by a number of towns and villages within 50 kilometers of the mine site. The nearest towns are Rocanville (15 km distant), Moosomin and Esterhazy (both 50 km distant). The nearest city is Yorkton (100 km distant). Rocanville is situated near the north extent of the Great Plains of North America. Topography is relatively flat, with gently rolling hills and occasional valleys.
Mineral Rights
The original Rocanville Crown Subsurface Mineral Lease KL 111 was entered into in June 1966. In the following years various minor amendments were made to this Crown lease, resulting in Crown Subsurface Mineral Lease KL 111R. A new Crown Subsurface Mineral Lease numbered KLSA 002 was issued in February 2010 incorporating all Crown mineral rights within the existing Crown Lease KL 111R and approximately two-thirds of Crown mineral rights covered in KP 338A. The portion of the lands that were not part of the Lease amalgamation remained as Crown Exploration Permit KP 338B until December 2016 when they were converted to a Crown Subsurface Mineral Lease numbered KL 249. In October 2017, KL 305 was formed by the amalgamation of Crown Subsurface Leases KLSA 002 (KLSA 002B, following minor amendments) and KL 249. KL 305 covers an area of approximately 113,975 hectares (281,639 acres). In May 2020, a Crown Subsurface Mineral Lease numbered KL 279, was acquired from North Atlantic Potash. KL 279 covers an area of approximately 56,540 hectares (139,712 acres).
Per the Rocanville Technical Report, the Company has leased potash mineral rights for 54,184 hectares (133,892 acres) of Crown Land and owns or has leased approximately 45,612 hectares (112,710 acres) of Freehold Land within KL 305. The Rocanville Crown Lease terms are for a period of 21 years from October 2017 and May 2017, with renewals at the Company’s option for 21-year periods. Freehold Lands also remain under lease providing, generally, that production is continuing and that there is a continuation of the Crown Lease.
Within the current Rocanville Crown Lease area, 80,181 hectares (198,132 acres) are mined pursuant to unitization agreements with mineral rights holders (Crown and Freehold) within two unitized areas.
| ii) | Sampling Preparation, Analyses and Security |
Mean Potash Mineral Grade From In-Mine Samples
In-mine grade samples are taken by collecting fine “muck” from the floor of the mine at 60 m intervals in every underground mine room at Rocanville. Per the Rocanville Technical Report, in-mine ore grade samples were collected and analysed in the Rocanville mill laboratory using analysis techniques that were up to date for the era in which the sample was collected.
The mean ore grade for this family of in-mine samples is 23.1% K2O equivalent, while the median ore grade for this family of in-mine samples is 23.3% K2O.
72
| iii) | Mineral Processing and Metallurgical Testing |
Since opening in 1970, 330.604 million tonnes of potash ore have been mined and hoisted at to produce 106.256 million tonnes of finished potash product. Given this level of sustained production over several decades, basic mineralogical processing and prospective metallurgical testing of Rocanville potash is not considered relevant.
| iv) | Mining Operations |
In recent years the Rocanville mine has undergone a major expansion which brought the nameplate capacity to 6.5 million tonnes of finished potash products per year. In 2023, operational capability at the Rocanville facility was 5.1 million tonnes per year. Operational capability may vary during the year and year-to-year including as between our potash operations.
The life-of-mine average concentration ratio (raw ore/finished potash products) is 3.11 and the overall extraction ratio over this period is 31%.
| v) | Processing and Recovery Operations |
At Rocanville, potash ore has been mined and concentrated to produce saleable quantities of high-grade finished potash products since 1970. Raw potash ore is processed on surface and concentrated finished potash products (near-pure KCl) are sold and shipped to markets in North America and offshore.
Over the past three years, production of finished potash products at Rocanville was:
| • | 2021: 5.001 million tonnes finished potash products at 60.52% K2O (average grade) |
| • | 2022: 4.886 million tonnes finished potash products at 60.51% K2O (average grade) |
| • | 2023: 4.972 million tonnes finished potash products at 60.47% K2O (average grade) |
Over the past decade actual mill recovery rates have been between 82.41% and 84.44%, averaging 83.38%. Given the long-term experience with potash geology and actual mill recovery at Rocanville no fundamental potash milling problems are anticipated in the foreseeable future.
Quality control testing and monitoring geared towards fine-tuning and optimizing potash milling and concentrating processes are conducted on a continual basis at all our mine sites and research facilities. At Rocanville, this is no exception; test work to optimize circuit performance and ensure product quality is carried out on an ongoing basis.
| vi) | Infrastructure, Permitting and Compliance Activities |
Project Infrastructure
Infrastructure is in place to meet current and projected requirements for transportation, energy (electricity and natural gas), water and process materials at Rocanville.
Surface facilities are accessed by an existing paved road that is part of the Saskatchewan Provincial Highway System. Most finished potash products are shipped by rail over existing track, with some product shipped by truck over the North American highway system.
As per the Rocanville Technical Report, high voltage power utilization at the Rocanville mine is 84 MVA (i.e., 72 MVA to the Rocanville Plant site plus 12 MVA to the Scissors Creek site). The ten-year projection of power utilization indicates that the utility can meet foreseeable future demand.
The Rocanville operation requires a sustained fresh water supply for the milling process which is sourced from two subsurface reservoirs called the Welby Plains Surficial Aquifer and the Welby Plains Middle Aquifer. These aquifers provide a sustainable source of process water for Rocanville milling operations, with no known impact on other users of water drawn from these aquifers.
Environmental Studies, Permitting and Social or Community Impact
The Rocanville TMA currently covers an area of approximately 567 hectares (1,400 acres) of land owned by the Company. Solid potash mine tailings typically consist of 85% to 95% rock salt (NaCl) and 5% to 15% insolubles (carbonate mud = CaCO3, anhydrite mud = CaSO4, and clays like chlorite, illite, and so on). An engineered slurry-wall has been constructed around the entire Rocanville TMA. The slurry-wall provides secondary containment for any saline mine waters, minimizing brine impacts from the TMA to surrounding surface water bodies and near-surface aquifers.
73
Areas surrounding the TMA are closely monitored: this includes everything from daily visual perimeter inspections to annual investigations and inspections of surrounding subsurface aquifers.
Rocanville currently operates two brine disposal wells near the surface plant of the Rocanville mine where clear salt brine (i.e., no silt, clay slimes or other waste) is drillhole-injected into the Interlake Carbonates, at a depth of approximately 1,200 m to 1,400 m below surface. The disposal wells are provincially licensed and formation water in these extensive deep aquifers is naturally saline.
f) Vanscoy Potash Operations
| i) | Project Description, Location and Access |
General
The Vanscoy mine is located in central Saskatchewan, approximately 26 kilometers west of the city of Saskatoon, Saskatchewan. The Legal Land Description (Saskatchewan Township / Range) of the Vanscoy surface plant is Section 16 Township 35 Range 08 West of 3rd Meridian. More precisely, the Vanscoy service shaft collar is located at:
| • | Latitude: 52 degrees 00 minutes 28.74 seconds North |
| • | Longitude: 107 degrees 05 minutes 25.18 seconds West |
| • | Elevation: 505 meters above mean SL |
| • | Easting: 356,531 m |
| • | Northing: 5,763,989 m |
| • | Projection: UTM |
| • | Datum: NAD83 |
| • | Zone: 13 |
Per the Vanscoy Technical Report, the Company owns approximately 2,740 hectares (6,771 acres) of surface rights required for current Vanscoy mine operations, including all areas covered by the existing surface plant and TMA, and all surface lands required for anticipated near-future Vanscoy mine and expanded milling operations.
The Vanscoy mine is served by a number of villages within 50 kilometers of the mine site. The nearest city is Saskatoon (26 km distant). Vanscoy is situated near the northern extent of the Great Plains of North America. Topography is relatively flat, with gently rolling hills and occasional valleys. The Vanscoy surface plant lies approximately 20 km north-west of the South Saskatchewan River, a major continental drainage channel.
Mineral Rights
The original Vanscoy Crown Subsurface Mineral Lease, numbered KL 114, was entered into in January 1969. In the following years, minor amendments were made to the Lease, resulting in Crown Subsurface Mineral Lease KL 114B. In March 2008, the SMER approved the conversion of Agrium’s Potash Exploration Permit KP 313 to a new Crown Subsurface Mineral Lease numbered KL 204. In December 2020, after additional geological studies were completed, Vanscoy Crown Subsurface Mineral Lease KL 114C (the “Vanscoy Crown Lease”) was executed incorporating most of the lands held previously under KL 204.
Per the Vanscoy Technical Report, KL 114C covers an area of approximately 82,115 hectares (202,910 acres). At Vanscoy, the Company has leased potash mineral rights for 63,973 hectares (158,081 acres) of Crown land and owns or has leased from freeholders approximately 13,669 hectares (33,777 acres) within the lease boundary. The Vanscoy Crown Lease term is for a period of 21 years from July 1, 2012, with renewals (at the Company’s option) for 21-year periods. Freehold lands also remain under lease providing, generally, that production is continuing and that there is a continuation of the Crown Lease.
Within the Vanscoy Crown Lease area 12,671.59 hectares (31,312.17 acres) are mined pursuant to a unitization agreement with mineral rights holders (Crown and Freehold) within one unitized area.
| ii) | Sampling Preparation, Analyses and Security |
Mean Potash Mineral-Grade From In-Mine Samples
At Vanscoy, in-mine grade samples have been acquired by 1) sampling ore from the beltline, 2) channel samples from the sidewall, or 3) collecting fine “muck” from the floor of the mine. At present, fine muck sampling from the floor is most common, and each mining room is sampled at a frequency of approximately 95 m to 125 m. Since start-up in 1969 through to the end of December 2020, a total of 3,173 useable in-mine potash mineral grade samples were collected from the A Zone. All samples were analysed in the Vanscoy mill laboratory using analysis techniques that were up to date for the era in which the sample was collected.
The median ore grade for this family of in-mine samples is 25.5% K2O equivalent and the mean ore grade is 24.2%.
74
Per the Vanscoy Technical Report, the B Zone at Vanscoy, mineral grade is reported to be 20.3% K2O equivalent, the grade observed from 20,230 in-mine samples at the Lanigan mine where the B Zone has been extensively mined. Even though Vanscoy mine is some distance from Lanigan, this is considered the best estimate of expected mineral grade for this potash layer because the deposit is known to be regionally continuous from west of Vanscoy to east of Lanigan. Although it is possible that if mining proceeds into the B Zone, the reported grade could change from what is reported. It is expected that any such change would be minimal.
| iii) | Mineral Processing and Metallurgical Testing |
Since opening in 1969, 189.335 million tonnes of potash ore have been mined and hoisted to produce 63.993 million tonnes of finished potash product. Given this level of sustained production for over several decades, basic mineralogical processing and prospective metallurgical testing of Vanscoy potash is not considered relevant.
| iv) | Mining Operations |
In recent years, the Vanscoy mine underwent a major expansion which brought the nameplate capacity up to 3.0 million tonnes of finished potash products per year. In 2023, operational capability at the Vanscoy facility was 1.1 million tonnes per year. Operational capability may vary during the year and year-to-year including as between our potash operations.
The life-of-mine average concentration ratio (raw ore / finished potash products) is 2.96 and the overall extraction ratio over this period is 28%.
| v) | Processing and Recovery Operations |
At Vanscoy, potash ore has been mined and concentrated to produce saleable quantities of high grade finished potash products since 1969. Raw potash ore is processed on surface and concentrated finished potash products (near-pure KCl) are sold and shipped to markets in North America and offshore.
Over the past three years, production of finished potash products at Vanscoy was:
| • | 2021: 1.047 million tonnes finished potash products at 60.07% K2O (average grade) |
| • | 2022: 1.010 million tonnes finished potash products at 59.98% K2O (average grade) |
| • | 2023: 1.052 million tonnes finished potash products at 60.97% K2O (average grade) |
Over the past decade, actual mill recovery rates have been between 76.00% and 83.20%, averaging 80.36%. Given the long-term experience with potash geology and actual mill recovery at Vanscoy, no fundamental potash milling problems are anticipated in the foreseeable future.
Quality control testing and monitoring geared towards fine-tuning and optimizing potash milling and concentrating processes are conducted on a continual basis at our mine sites and research facilities. At Vanscoy, this is no exception; test work to optimize circuit performance and ensure product quality is carried out on an ongoing basis.
| vi) | Infrastructure, Permitting and Compliance Activities |
Project Infrastructure
Infrastructure is in place to meet current and projected requirements for transportation, energy (electricity and natural gas), water and process materials at Vanscoy.
Surface facilities are accessed by an existing paved road that is part of the Saskatchewan Provincial Highway System. Most finished potash products are shipped by rail over existing track, with some product shipped by truck over the North American highway system.
As per the Vanscoy Technical Report, high voltage power capacity at Vanscoy is 57 MVA. The ten-year projection of power utilization indicates that the utility can meet all foreseeable future demand.
The Vanscoy operation requires a sustained fresh water supply for the milling process which is provided by a waterline from the Saskatchewan River (approximately 20 km distant). This water supply is provincially licensed and provides a sustainable source of process water for Vanscoy milling operations with no known impact on other users of water in the area.
75
Environmental Studies, Permitting and Social or Community Impact
The Vanscoy TMA currently covers an area of approximately 610 hectares (1,507 acres) of land owned by the Company. Solid potash mine tailings typically consist of 85% to 95% rock salt (NaCl) and 5% to 15% insolubles (carbonate mud = CaCO3, anhydrite mud = CaSO4, and clays like chlorite, illite, and so on). An engineered slurry-wall (bentonite cut-off wall) has been constructed around the Vanscoy TMA. In future years this wall can be expanded if required for operational needs. The slurry-wall provides secondary containment for any saline mine waters, minimizing brine impacts from the TMA to surrounding surface water bodies and near-surface aquifers. Areas surrounding the TMA are closely monitored: this includes everything from daily visual perimeter inspections to annual investigations and inspections of surrounding groundwater and aquifers.
Vanscoy currently operates two brine disposal wells near the surface plant of the Vanscoy mine where clear salt brine (i.e., no silt, clay slimes, or other waste) is borehole-injected into the Winnipeg / Deadwood Formations, deep subsurface aquifers approximately 1,500 m to 1,700 m below the surface. The disposal wells are provincially licensed, and groundwater in these extensive deep aquifers is naturally saline.
76
Exhibit 99.2
2023 Management’s
Discussion & Analysis
| Overview | MD&A | Five-year highlights | Financial statements and notes | |||||
Management’s discussion
& analysis
The following management’s discussion and analysis (“MD&A”) is the responsibility of management and is dated as of February 22, 2024.
The Board of Directors (“Board”) of Nutrien carries out its responsibility for review of this disclosure principally through its Audit Committee, comprised exclusively of independent directors. The Audit Committee reviews and, prior to its publication, recommends to the Board approval of this disclosure. The Board has approved this disclosure. The term “Nutrien” refers to Nutrien Ltd. and the terms “we”, “us”, “our”, “Nutrien” and “the Company” refer to Nutrien and, as applicable, Nutrien and its direct and indirect subsidiaries on a consolidated basis. This MD&A is based on the Company’s audited consolidated financial statements for the year ended December 31, 2023 (“consolidated financial statements”) based on International Financial Reporting Standards (“IFRS”) as issued by the International Accounting Standards Board, unless otherwise stated.
This MD&A contains certain non-GAAP financial measures and ratios, which do not have a standard meaning under IFRS and, therefore, may not be comparable to similar measures presented by other issuers. Such non-GAAP financial measures and ratios include
| • | Adjusted EBITDA |
| • | Adjusted net earnings and adjusted net earnings per share |
| • | Gross margin excluding depreciation and amortization per tonne – manufactured |
| • | Potash controllable cash cost of product manufactured per tonne |
| • | Ammonia controllable cash cost of product manufactured per tonne |
| • | Retail adjusted average working capital to sales and Retail adjusted average working capital to sales excluding Nutrien Financial |
| • | Nutrien Financial adjusted net interest margin |
| • | Retail cash operating coverage ratio |
| • | Return on invested capital (“ROIC”) |
| • | Adjusted net debt |
For definitions, further information and reconciliation of these measures to the most directly comparable measures under IFRS, see the “Non-GAAP financial measures” and “Other financial measures” sections.
Also see the cautionary statement in the “Forward-looking statements” section.
All references to per share amounts pertain to diluted net earnings (loss) per share. Financial data in this annual report is stated in millions of US dollars, which is the functional currency of Nutrien and the majority of its subsidiaries, unless otherwise noted.
Information that is not meaningful is indicated by n/m. Information that is not applicable is indicated by n/a. See the “Other financial measures” and “Terms and definitions” sections for definitions, abbreviations and terms used in this annual report including the MD&A.
Additional information relating to Nutrien (which, except as otherwise noted, is not incorporated by reference herein), including our Annual Information Form for the year ended December 31, 2023, can be found on SEDAR+ at sedarplus.ca and on EDGAR at sec.gov. The Company is a foreign private issuer under the rules and regulations of the US Securities and Exchange Commission (the “SEC”).
The information contained on or accessible from our website or any other website is not incorporated by reference into this MD&A or any other report or document we file with or furnish to applicable Canadian or US securities regulatory authorities.
| 8 | Nutrien Annual Report 2023 |
| Overview | MD&A |
Five-year highlights | Financial statements and notes | |||||
Our approach to annual reporting
Our goal is to communicate how we evaluate the opportunities and challenges in our operating environment, which shape our approach to setting strategy, managing risk and governing our actions. The priorities of our key stakeholders impact the way we approach long-term value creation, including addressing key sustainability priorities. We continue to integrate sustainability-related information into our corporate reporting framework, including reporting our Scope 1 and 2 GHG emissions, in this annual report.
| 01 Our company Outlines who we are as a company, where we operate, how we create value and describes each of our operating segments
12 | How we create value 14 | Global profile 16 | Operating segments
|
03 Strategy Describes our corporate strategy and how each of our operating segments is supporting that strategy
30 | Nutrien’s strategy 31 | Operating segment focus 35 | Capital allocation |
05 Key enterprise risks Outlines the key risks that could affect our performance and our future operations
44 | Key enterprise risks
06 Results Highlights our financial results for the year 2023 and guidance for 2024
52 | Operating segment performance 64 | Performance against 2023 targets 65 | 2024 Guidance and sensitivities 66 | Annual financial information |
||||||||||
|
|
04 Governance Describes our key corporate governance principles and risk management process
40 | Corporate governance 41 | Board and executive leadership 42 | Risk governance 43 | Risk management process |
|||||||||||
|
02 Operating environment Defines factors and trends that influence the environment we operate in and outlook for 2024
20 | Megatrends 23 | Market fundamentals and outlook |

|
| Nutrien Annual Report 2023 | 9 |

| Overview | MD&A
|
Five-year highlights | Financial statements and notes | |||||
| Our company | ||||||||
| Operating environment | ||||||||
| Strategy | ||||||||
| Governance | ||||||||
| Key enterprise risks | ||||||||
| Results | ||||||||
|
01 Our company |
||||||||
| 10 | Nutrien Annual Report 2023
|

| Overview | MD&A
|
Five-year highlights | Financial statements and notes | |||||||||
| Our company | ||||||||||||
| Operating environment | ||||||||||||
| Strategy | ||||||||||||
| Governance | ||||||||||||
| Key enterprise risks | ||||||||||||
| Results | ||||||||||||
|
Alberta, Canada
Wheat is a staple food for 35 percent of the world’s population. Canada is a top exporter of wheat to approximately 60 countries worldwide. Nutrien operates 10 fertilizer production facilities in Western Canada and serves growers from our 275 Retail selling locations on the Canadian prairies. |
| Nutrien Annual Report 2023
|
11 |
| Overview | MD&A |
Five-year highlights | Financial statements and notes | |||||
| Our company | ||||||||
How we create value
Our integrated business provides a number of advantages compared to our competitors, including operational, financial and sustainability opportunities. We continue to explore ways to further enhance the capabilities of our business to capture additional benefits across the agriculture value chain.
|
1 | Advantaged position across the ag value chain
Our integrated business provides competitive advantages to optimize operations, transportation and logistics, increase supply chain efficiencies, support volume growth, and be the key connection with the grower. |
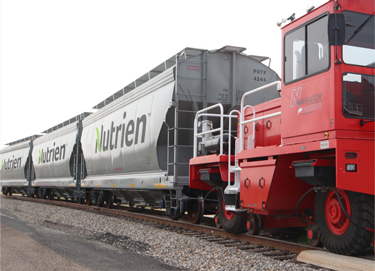
|
|||
| World-class production assets | Global supply chain | Leading ag retail network | ||||||
| 26Mmt
|
~460
|
>2,000
|
||||||
| NPK manufactured sales volumes in 2023 | wholesale fertilizer distribution points |
Retail selling locations across North America, South America and Australia |
||||||
| ~2,000
|
>1,000
|
>4,000
|
||||||
| proprietary products | crop input suppliers | crop consultants | ||||||
| 12 | Nutrien Annual Report 2023 |
| Overview | MD&A |
Five-year highlights | Financial statements and notes | |||||
| Our company | ||||||||
|
2 | Proven financial strength and stability
Our diversified Retail business enhances the stability of our earnings base and our low-cost fertilizer production assets have historically generated significant cash flow, providing the ability to invest in our business and return meaningful capital to our shareholders. |
|
| Substantial cash generation | Balanced approach to capital allocation (2019-2023) | |||
|
$4.8B
annual average cash provided
by |
(percent)
|
|
3 | Provider of sustainable agriculture solutions
Positioned to drive long-term value creation
through integration of |

|
| Carbon sequestration
|
Sustainability program
|
Collaborative partnerships
|
||||||
| 400K | 900K | Value chain collaborator |
||||||
| tonnes CO2 permanently sequestered | sustainable agriproduct | |||||||
| from our operations in 2023 | program acres | to advance sustainable agriculture
|
| Nutrien Annual Report 2023 | 13 |
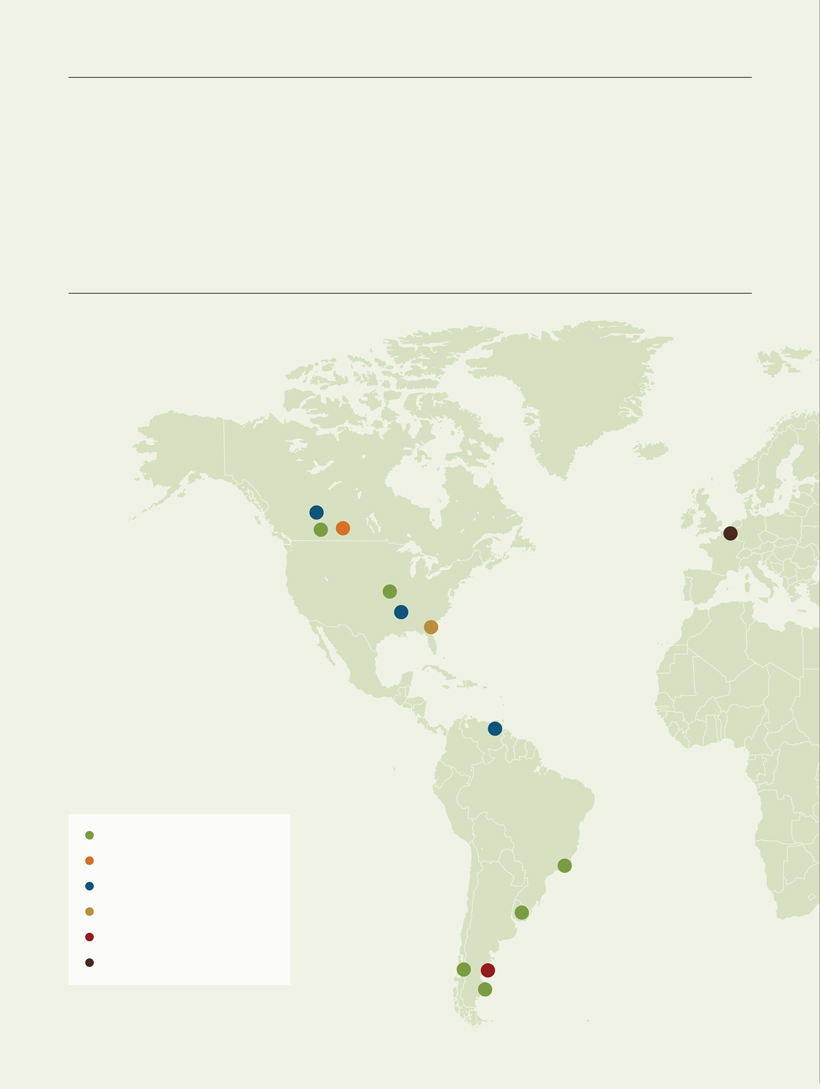
| Overview | MD&A |
Five-year highlights | Financial statements and notes | |||||
| Our company | ||||||||
| Global profile
Our world-class fertilizer manufacturing assets are primarily located in North America, with access to high-quality resources, lower cost inputs and an extensive distribution network to efficiently supply our customers. Our Retail business serves growers in key agricultural markets in North America, South America and Australia. |
| 6 | 13 | |||||||
| Potash mines in Saskatchewan |
Nitrogen production and upgrade facilities in North America and Trinidad |
| 1,475 | 6 | |||||||
| Retail selling locations in North America | Phosphate production and upgrade facilities in the US |
| Retail
|
250 Retail selling locations in South America |
|
| Potash
|
||
|
Nitrogen
|
||
|
Phosphate
|
||
|
Joint venture and investments
|
||
|
European distribution
|
||
| 14 | Nutrien Annual Report 2023
|
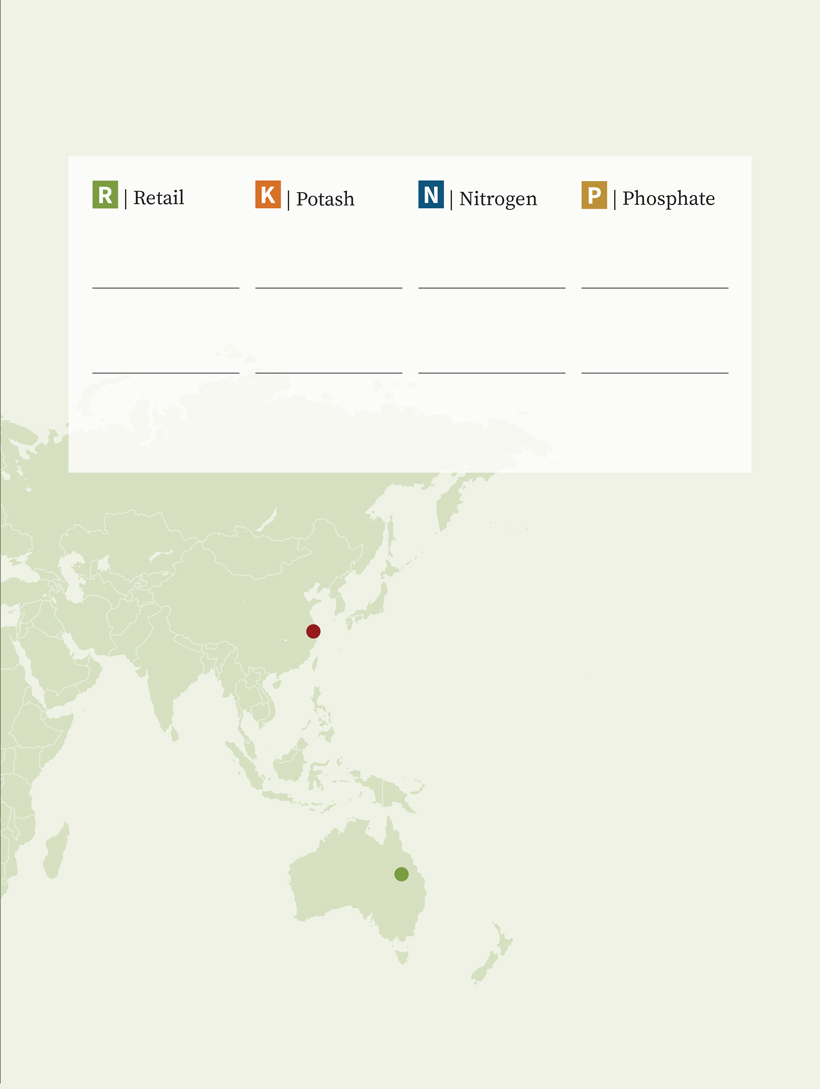
| Overview | MD&A |
Five-year highlights | Financial statements and notes | |||||
| Our company | ||||||||
| $19.5B | $3.8B | $3.8B | $1.7B | |||
| Net sales 1 | Net sales 1,2 | Net sales 1,2 | Net sales 1,2 | |||
| $1.5B | $2.4B | $1.9B | $0.5B | |||
| Adjusted | Adjusted | Adjusted | Adjusted | |||
| EBITDA 1 | EBITDA 1 | EBITDA 1 | EBITDA 1 | |||
| 17,000 | 3,200 | 1,700 | 1,500 | |||
| Number of | Number of | Number of | Number of | |||
| employees 3 | employees 3 | employees 3 | employees 3 | |||
| 1 | For the fiscal year ended December 31, 2023. |
| 2 | Related to manufactured products for Potash, Nitrogen and Phosphate. |
| 3 | As at December 31, 2023. |
| 385 | ||
| Retail selling locations in Australia |
||
| Nutrien has four reportable operating segments: Retail, Potash, Nitrogen and Phosphate. The Retail segment distributes crop nutrients, crop protection products, seed and merchandise, and provides services, including financing, directly to growers through a network of Retail selling locations in North America, South America and Australia. The Potash, Nitrogen and Phosphate segments are differentiated by the chemical nutrient contained in the products that each produces.
|
||
| Nutrien Annual Report 2023
|
15 |
| Overview | MD&A |
Five-year highlights | Financial statements and notes | |||||
| Our company | ||||||||
Operating segments
Nutrien has four reportable operating segments: Retail, Potash, Nitrogen and Phosphate. We are the world’s premier retailer of crop inputs and services and operate the largest global network of fertilizer production and distribution assets.

|
| | Retail | #1 Global ag retailer | ||
Our global Retail network of over 2,000 selling locations in seven countries provides growers with a comprehensive portfolio of value-added agronomic products and services that includes crop nutrients, crop protection products, seed and application services. The size and scale of our network provides reach and flexibility to reliably serve our customers throughout the growing season. We are focused on building leading digital capabilities that support data-driven insights to more efficiently serve our grower customers and offer competitive credit products that meet their crop input financing needs.
We produce an innovative portfolio of approximately 2,000 proprietary crop nutrient, crop protection and seed products. These proprietary products generate a
higher margin for Nutrien and enhance crop production efficiency and profitability for the grower. We are a leading provider of plant nutritional products, including biostimulants, which aim to increase crop yields through enhanced nutrient efficiency and improved plant and soil health outcomes.
Over 4,000 crop consultants support our grower customers in crop planning, seed selection, soil sampling, variable rate fertilizer application and crop monitoring. Our agronomic tools and expertise combined with our broad portfolio of value-added products supports on-farm sustainability, enabling grower adoption of products and practices that maximize productivity and minimize environmental impacts.

|
| | Potash | #1 Global potash producer | ||
We operate six low-cost potash mines in Saskatchewan, which have access to the best potash geology in the world and are located in a stable geopolitical environment, minimizing supply risk for our customers. We produce multiple grades of potash and our flexible network provides the ability to efficiently adjust operating capability in response to changing market conditions.
Our extensive North American transportation and distribution network includes approximately 5,900 owned or leased railcars serviced by multiple railway providers.
Through Canpotex – our joint venture potash export, sales and marketing company – we have access to four North American marine terminals and other facilities as needed to export potash to customers in approximately 40 countries around the world.
Our engagement practices help in building relationships and supporting our communities, including the procurement of materials and supplies from over 35 Indigenous owned and operated businesses.
| 16 | Nutrien Annual Report 2023 |
| Overview | MD&A |
Five-year highlights | Financial statements and notes | |||||
| Our company | ||||||||

|
| | Nitrogen | #3 Global nitrogen producer | ||
We produce nitrogen at nine strategically located production facilities throughout Canada, the US and Trinidad and operate four regional product upgrade sites in North America. Our North American operations, which account for approximately 85 percent of our Nitrogen sales volumes, have access to some of the lowest cost natural gas in the world and are well positioned to serve agriculture and industrial markets. Our Trinidad operations support sales to approximately 30 countries and have natural gas supply contracts indexed to ammonia prices.
We produce a diverse portfolio of nitrogen products and have flexibility to optimize product mix in changing
market conditions. Our transportation and distribution network leverages truck, rail, pipeline, barge and marine vessel modes, including direct access to tidewater in both the US and Trinidad.
We leverage CCUS at two of our facilities and have captured and sold at least 1 million tonnes of CO2 annually for the last five years. We continue to support our grower customers to reduce their environmental impact by expanding our portfolio of manufactured products, including enhanced efficiency fertilizers such as ESN®.

|
| | Phosphate | #2 North American phosphate producer | ||
Nutrien has two large integrated phosphate production facilities and four regional product upgrade sites in the US. Our high-quality phosphate rock enables production of a diverse mix of phosphate products, including solid and liquid fertilizers, feed and industrial acids. We are the largest producer of purified phosphoric acid in North America and sell the majority of our product in this market, benefiting from our extensive distribution network and customer relationships.
We have a strong focus on environmental stewardship, reclaiming thousands of acres of mined land every year to useful purposes, remediating soil and groundwater including the planting of over half a million trees in 2023, and reducing environmental risks through our commitment to sustaining our assets at the highest level.
| Nutrien Annual Report 2023 | 17 |

| Overview | MD&A
|
Five-year highlights | Financial statements and notes | |||||
| Our company | ||||||||
| Operating environment | ||||||||
| Strategy | ||||||||
| Governance | ||||||||
| Key enterprise risks | ||||||||
| Results | ||||||||
| 02 Operating environment |
||||||||
| 18 | Nutrien Annual Report 2023
|

| Overview | MD&A
|
Five-year highlights | Financial statements and notes | |||||
| Our company | ||||||||
| Operating environment | ||||||||
| Strategy | ||||||||
| Governance | ||||||||
| Key enterprise risks | ||||||||
| Results | ||||||||
|
Paraná, Brazil
Brazil is one of the largest and fastest growing agriculture markets in the world. The country produces over 150 million tonnes of soybeans annually, which requires a significant amount of potash. Brazil was the largest market for Canpotex potash sales in 2023.
|
||||||||
| Nutrien Annual Report 2023
|
19 |
| Overview | MD&A |
Five-year highlights | Financial statements and notes | |||||
| Operating environment | ||||||||
Megatrends
We define megatrends as emerging macro-level trends and global dynamics that we believe will have ongoing impacts on business, government and society that are expected to shape our operating environment over the next decade. Tracking and analyzing megatrends informs Nutrien’s strategy. See page 28 for more information on our related strategy and page 44 for our related key enterprise risks.
| Food security
Despite advances in modern agriculture, food security remains a global challenge. Producing enough nutritious food for the world’s eight billion people, and transporting it to where it is needed, is straining existing global resources. It is estimated that over 10 percent of the world’s population is food insecure. A rising population, expected to grow by close to two billion people by 2050, is further increasing the scale of this challenge.
The agricultural landscape continues to evolve and be influenced by sustainability practices, climate change and social trends that could impact the ability to address global food security challenges. Nutrien is well positioned to develop innovative products and solutions to help our customers feed a growing population while addressing the environmental and social challenges the agriculture industry is facing.
Related enterprise risks:
– Agricultural changes and trends
– Climate change
– Stakeholder support |
|
| 20 | Nutrien Annual Report 2023 |
| Overview | MD&A |
Five-year highlights | Financial statements and notes | |||||
| Operating environment | ||||||||
|
Climate change
Our business, industry, customers and other stakeholders in the agriculture value chain face long-term challenges related to climate change, including increasing expectations for climate actions and reductions of GHG emissions.
Physical risks from a changing climate can impact our operations, our customers and our supply chain. These include more intense weather events, longer droughts, rising sea levels, and changes in average temperature and precipitation patterns. Global decarbonization ambitions and the resulting energy transition are driving carbon regulations and informing capital allocation priorities of investors.
Nutrien faces evolving challenges related to potential regulatory changes, including carbon pricing. At the same time, a transition to a low-carbon economy could create significant opportunities for Nutrien to help growers manage these impacts and improve their resilience by facilitating the adoption of climate-smart agriculture practices and developing products that can improve yields in more challenging conditions. The energy transition is accelerating the development of technologies that can support our GHG emission reduction efforts.
Related enterprise risks:
– Climate change
|
Technology and digitalization
Digital technologies and access to vast amounts of data are supporting the transformation of our industry and Nutrien. In mining operations, advances in automation and autonomous mining are improving safety by removing workers from the more hazardous areas and enabling productivity increases. Agriculture and food systems are undergoing technological changes driven by big data, digital connectivity, artificial intelligence and innovations in biotechnology.
The regulatory environment around artificial intelligence continues to evolve across multiple jurisdictions. This evolution can cause uncertainty as to how these tools could be deployed and leveraged, how privacy and security safeguards will be incorporated, and levels of investment in innovation.
We also have an opportunity to help turn data into insights for our grower customers, and for our grower customers to turn those insights into actions, which presents further opportunities through the agriculture value chain.
The proliferation of technology and data also creates increased risks to our information systems and customer data. Our dependence on technology may contribute to cyber-related events becoming more disruptive and costly. As we gather increasingly more data from our customers, we are continually evolving our practices to align with data security and privacy regulations.
Related enterprise risks:
– Cybersecurity threats
– Agricultural changes and trends |
| Nutrien Annual Report 2023 | 21 |
| Overview | MD&A |
Five-year highlights | Financial statements and notes | |||||
| Operating environment | ||||||||
|
Geopolitical volatility
Geopolitical turmoil around the world is being driven by nationalism, polarization and economic instability. Due to globalization, regional events are having global impacts. In particular, the continued war in Eastern Europe and the more recent escalation of tensions in the Middle East have resulted in, and may continue to result in, supply chain disruptions and price volatility for energy and several commodities.
Global geopolitical instability and resulting disruptions could impair our ability to distribute our products in a cost-effective and timely manner to our customers or disrupt our supply chains. If significant geopolitical events occur in one of the countries where we have significant operations, the impact could be more direct and affect our operations, production or revenues. Conversely, disruptions in markets could result in improvements to our financial performance through increased market share or higher sales.
Related enterprise risks:
– Political, economic and
social instability |
Societal expectations
Stakeholders are increasingly focused on corporate sustainability performance and disclosure. Investors are considering environmental and social principles alongside traditional financial metrics in capital allocation decisions and, along with regulators, are considering those principles in evaluating disclosure enhancements. In addition to climate-related matters, societal concerns include impacts on ecosystems and biodiversity, as well as challenges faced by underrepresented groups inside and outside of the workplace.
In response to these expectations, governments may impose new regulations or increase the stringency of existing ones. If we are not able to meet stakeholder expectations for environmental and social performance and disclosure, it could be more difficult to access cost-efficient capital, retain talent or maintain our freedom to operate.
Nutrien believes that our response to these trends will not only help to address some of the world’s most pressing challenges but also create opportunities to differentiate ourselves from our competitors. Delivering on our sustainability commitments can attract new investors, support internal engagement, and help attract and retain talent.
Related enterprise risks:
– Changing regulations
– Stakeholder support
– Talent and organization culture |
| 22 | Nutrien Annual Report 2023 |
| Overview | MD&A |
Five-year highlights | Financial statements and notes | |||||
| Operating environment | ||||||||
Market fundamentals and outlook
We carefully monitor market fundamentals and our competitive landscape in order to anticipate and adapt to the environment in which we operate. Understanding our operating environment and expectations for the future positions us to better identify and manage risks that could jeopardize our ability to deliver on our strategy and capitalize on emerging opportunities.
|
|
|
|
||||

|
Retail | Crop input sales by product (2023) 1 | Crop input sales by region (2023) 1 | |||
| (percent) | (percent) | |||||
|
$130B
2023 total market crop |
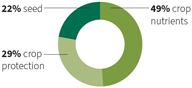
|
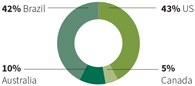
|
||||
| Source: USDA, StatsCan, ABARES, Conab, IMEA, AgbioInvestor, Nutrien | Source: USDA, StatsCan, ABARES, Conab, IMEA, AgbioInvestor, Nutrien | |||||
|
|
|
|
||||

|
Potash | Global potash demand (2023) | Global potash production (2023) | |||
| (percent) | (percent) | |||||
| 67-68Mmt
2023 global potash (KCI) demand |
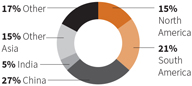
|
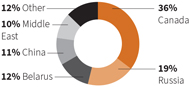
|
||||
| Source: CRU | Source: CRU | |||||
|
|
|
|
||||

|
Nitrogen | Global nitrogen demand (2023) | Global nitrogen production (2023) | |||
| (percent) | (percent) | |||||
|
~155Mmt
2023 global nitrogen (N) demand |
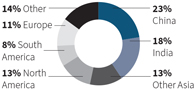
|
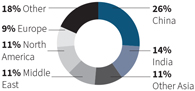
|
||||
| Source: SPGCI | Source: SPGCI | |||||
|
|
|
|
||||

|
Phosphate | Global phosphate demand (2023) | Global phosphate production (2023) | |||
| (percent) | (percent) | |||||
|
~51Mmt
2023 global phosphate |
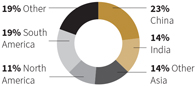
|
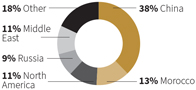
|
||||
| Source: CRU | Source: CRU | |||||
| 1 | Represents total market sales of seed, fertilizer and crop protection products in the US, Canada, Australia and Brazil. |
| Nutrien Annual Report 2023 | 23 |
| Overview | MD&A |
Five-year highlights | Financial statements and notes | |||||
| Operating environment | ||||||||

|
Retail |
Market fundamentals
Total crop protection, seed and fertilizer sales in our major Retail operating regions equated to approximately $130 billion in 2023. As the need to feed the world’s population increases, growers are challenged to sustainably increase yields from a finite arable land base. This drives growth in demand for crop inputs and agronomic services.
The agriculture retail industry is highly fragmented in most of the major markets in which we operate, primarily composed of small and medium-sized competitors. Scale, reliability of supply and the ability to provide innovative products and solutions, including digital offerings that support sustainable agriculture, are increasingly important to growers.
In North America, the largest crops grown include canola, corn, cotton, soybean and wheat. It is a more mature market with growers leveraging advanced agriculture tools and who are willing and able to invest in high-value products and services.
In Australia, growers require a full suite of crop production inputs but also solutions for livestock, water and irrigation services.
Brazil is one of the world’s largest and fastest growing agriculture markets. It is currently the largest soybean producer and the third largest producer of corn globally. Its retail industry is highly fragmented, and there remains opportunity for investment and adoption of more advanced products and services at the grower level.
Market outlook
Global grain stocks-to-use ratios remain historically low going into the 2024 growing season as tightening supplies of wheat and rice have offset increased corn supplies in the US and Brazil. We expect weather and geopolitical issues will continue to impact grain and oilseed production, exports and inventory levels.
Crop prices have declined from historically high levels in 2022, but lower crop input prices have resulted in improved demand, evidenced
by the strong North American fall application season in 2023. We expect US corn plantings to range from 91 to 92 million acres in 2024 and soybean plantings to range from 87 to 88 million acres.
In Brazil, dry weather during the summer crop growing season and lower corn prices could result in lower corn area in 2024. Brazilian growers are expected to continue to expand soybean acreage, which we anticipate will support the need for strong fertilizer imports in the second and third quarters of 2024.
In Australia, growers have benefited from multiple years of above-average yields and fundamentals remain supportive entering 2024. Timely precipitation led to higher-than-expected winter crop production, however if the El Niño weather pattern continues, it could pose a risk for the 2024 growing season.
|
US ag retail industry profile (2023)
(percent) |
US grower cash production margins 1
(US$ margin per acre) |
|||
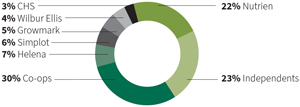
|
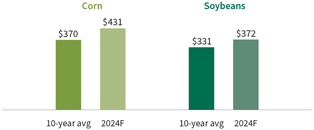
|
|||
| Source: Croplife | Source: CRU, Fertecon, USDA, Bloomberg, Nutrien
1 Forecasts use the December 2024 corn and November 2024 soybean futures contracts as of January 30, 2024. |
|||
| 24 | Nutrien Annual Report 2023 |
| Overview | MD&A |
Five-year highlights | Financial statements and notes | |||||
| Operating environment | ||||||||

|
Potash |
Market fundamentals
Potash strengthens root systems including water uptake, drought and disease tolerance and increases the uptake of other nutrients – all important in volatile growing conditions. Potash demand growth is driven by increasing nutrient requirements of higher-yielding crops and improving soil fertility practices, particularly in emerging markets where potash has been historically under-applied and crop yields lag.
High-quality potash reserves in significant quantities are limited to a small number of countries. Canada has the largest known global potash reserves, accounting for approximately 40 percent of the total. More than 75 percent of the world’s potash capacity is held by the six largest producers.
Building new production capacity requires significant capital and time to bring online. Brownfield projects have a significant per- tonne capital cost advantage over greenfield projects.
Most major potash-consuming countries in Asia and Latin America have limited or no production capability and rely on imports to meet their needs. Trade typically accounts for approximately three-quarters of demand for potash, resulting in a globally diversified marketplace.
Market outlook
Global potash demand was strong through the second half of 2023, and we estimate full-year shipments were between 67 to 68 million tonnes. The increase was supported by strong consumption and increased imports in key markets such as North America, China and Brazil.
We expect global potash demand will continue to recover towards trend levels in 2024 with full-year shipments projected between
68-71 million tonnes. We anticipate a relatively balanced global market with incremental supply
from producers in Canada, Russia, Belarus and Laos.
We are seeing strong potash demand ahead of the North American spring application season as channel inventories were tight to start the year. Potash demand in Southeast Asia is expected to increase significantly in 2024 due to much lower inventory levels compared to the prior year and favorable economics for key crops such as oil palm and rice. We expect lower potash imports from China compared to the record levels in 2023 but for demand to remain at historically high levels driven by increased consumption.
|
Global potash demand
(millions of tonnes KCl) |
Potash demand in key regions
(millions of tonnes KCl) |
|||
|
|
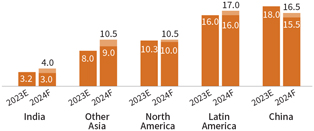
|
|||
| Source: IFA, Argus, CRU, Nutrien | Source: Industry Consultants, Nutrien | |||
| Nutrien Annual Report 2023 | 25 |
| Overview | MD&A |
Five-year highlights | Financial statements and notes | |||||
| Operating environment | ||||||||

|
Nitrogen |
Market fundamentals
Nitrogen is an essential crop nutrient and is a fundamental building block of plant proteins that improve both crop yield and quality. The necessity of nitrogen for crop yield supports a strong and growing demand source for nitrogen fertilizers. Additionally, nitrogen is used as an input in many industrial processes and has the potential to provide further value as markets for low-carbon ammonia emerge.
Production of nitrogen products is the most geographically diverse of the three primary crop nutrients due to the widespread availability of hydrogen sources. Access to reliable and competitively priced energy feedstock supply is an important driver of profitability, as recent geopolitical events have created additional volatility in certain global energy markets. North American nitrogen producers currently have an advantaged cost position due to
the relatively low price of natural gas compared to competitors in Europe and Asia.
The US remains one of the largest importers of nitrogen products and a key driver of global trade despite a significant increase in domestic capacity and production over the past decade. China and India are the largest-consuming countries of nitrogen products, accounting for approximately 40 percent of the world’s consumption.
Market outlook
We expect nitrogen supply constraints to persist in 2024, including limited Russian ammonia exports, reduced European operating rates and Chinese urea export restrictions. North American natural gas prices remain highly competitive compared to Europe and Asia, and we expect Henry Hub natural gas prices to average approximately $2.50 per MMBtu for the year.
The US nitrogen supply and demand balance is projected to be tight ahead of the spring application season, as nitrogen fertilizer net imports in the first half of the 2023/2024 fertilizer year were down an estimated 55 percent compared to the three-year average. Global industrial nitrogen demand remains a risk in 2024 as industrial production, most notably in Europe and Asia, has yet to rebound to historical levels.
|
Global ammonia demand
(millions of tonnes) |
Natural gas prices in key regions
(US$ per MMBtu) |
|||
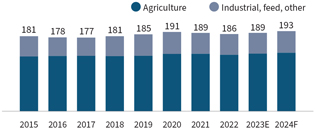
|
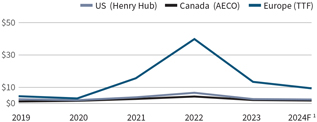
|
|||
| Source: SPGCI | Source: ICE, CME, Nutrien
1 Futures prices as of February 7, 2024. AECO based on US Henry Hub forecast less $1.00/MMBtu of basis. |
|||
| 26 | Nutrien Annual Report 2023 |
| Overview | MD&A |
Five-year highlights | Financial statements and notes | |||||
| Operating environment | ||||||||

|
Phosphate |
Market fundamentals
Phosphorus is essential to all living things and is key to energy reactions in the plant, particularly photosynthesis, and vital to plant growth. Demand for phosphate fertilizers has steadily increased over the last 20 years. Additionally, phosphate is used as an input in many feed and industrial processes.
Phosphate rock is found in significant quantity and quality in only a handful of geographic locations. Given the concentration of deposits in North Africa and the Middle East, government involvement is a major consideration when evaluating potential phosphate project developments.
The majority of new phosphate fertilizer supply over the past
decade was from producers in China, Morocco, Russia and Saudi Arabia. As a result, total US phosphate production declined by approximately 30 percent over this period.
China’s trade policy has a major impact on the global phosphate market. In 2023, Chinese DAP/MAP exports were down approximately 30 percent from 2021 levels as a result of export restrictions.
India and Brazil are the largest importers of phosphate fertilizers, with limited domestic production. In more mature markets like North America, we have seen continued demand growth for phosphate fertilizers that incorporate secondary nutrients and micronutrients like Nutrien’s MAP+MST product.
Market outlook
Phosphate fertilizer markets have remained relatively strong in the first quarter of 2024, particularly in North America where channel inventories were low entering the year. We expect Chinese phosphate export restrictions to be similar to 2023 levels and tight stocks in India to support demand ahead of their key planting season.
|
Global P2O5 demand
(millions of tonnes) |
China DAP/MAP exports
(millions of tonnes) |
|||
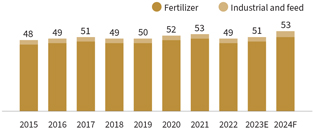
|
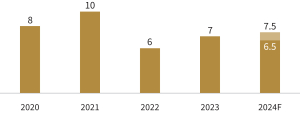
|
|||
| Source: CRU | Source: CRU, Argus, Nutrien | |||
| Nutrien Annual Report 2023 | 27 |

| Overview | MD&A |
Five-year highlights | Financial statements and notes |
|||||
| Our company | ||||||||
| Operating environment | ||||||||
| Strategy | ||||||||
| Governance | ||||||||
| Key enterprise risks | ||||||||
| Results | ||||||||
| 03 | Strategy | |||||||
| 28 | Nutrien Annual Report 2023
|

| Overview | MD&A | Five-year highlights | Financial statements and notes | |||||||
| Our company | ||||||||||
| Operating environment | ||||||||||
| Strategy | ||||||||||
| Governance | ||||||||||
| Key enterprise risks | ||||||||||
| Results | ||||||||||
|
Victoria, Australia
|
||||||||||
|
Canola is Australia’s major oilseed crop. Grown in Australia’s Grain Belt, canola production has increased significantly to an average of 3 million tonnes per year. Nutrien has 385 Retail selling locations in Australia to support growers of many different crops, including canola. |
||||||||||
| Nutrien Annual Report 2023
|
29 |
| Overview | MD&A |
Five-year highlights | Financial statements and notes | |||||
| Strategy | ||||||||
Nutrien’s strategy
Our vision is to be the leading global integrated agriculture solutions provider, delivering superior shareholder value through sustainable operations. In pursuit of our vision, we utilize our integrated business to optimize enterprise value by enhancing our core business, allocating capital to high-value strategic investments and progressing initiatives that fortify our business for the future.

|

|

|
||||||||||
| Enhance | Advance | Fortify our | ||||||||||
| our core | high-value | business | ||||||||||
| business | strategic | for the | ||||||||||
| initiatives | future | |||||||||||
|
Increase operational efficiency and asset utilization, maximize cost savings, and focus on integration and investments that enhance margins and free cash flow. |
|
Allocate capital to high-value and high-conviction investments that generate significant long-term returns for our shareholders. |
Focus on initiatives that reduce GHG emissions, enhance on-farm environmental performance, invest in our people and procurement programs, and position our Company to sustainably deliver on our current and future business needs. |
|||||||||
| 30 | Nutrien Annual Report 2023 |
| Overview | MD&A |
Five-year highlights | Financial statements and notes | |||||
| Strategy | ||||||||

|
Retail strategic priorities |
We are advancing our global Retail network through a combination of organic growth, accretive acquisitions, and optimization initiatives that expand our ability to provide whole-acre solutions for growers and enables us to be the leading customer-first ag solutions provider. |
|
|
Achieve best-in-class commercial execution, rationalize costs and maximize network efficiencies and integration synergies |
|||||||
| Business optimization |
Key 2023 activities |
|||||||
| • Centralized and modernized five locations in our core markets, allowing us to serve the customer more safely and efficiently |
||||||||
| • Paused our expansions and acquisitions in Brazil, focusing on integrating recently acquired businesses |
||||||||
|
|
Enhance our core business |
• Optimized our North American footprint through the closure and consolidation of 10 locations |
||||||
|
|
Prioritize digital capability development that supports our core business offering, improves decision-making, drives efficiency and enhances our grower value proposition |
|||||||
| Digital innovation |
Key 2023 activities |
|||||||
| • Launched a digitally enabled financing platform in Australia, enhancing our grower value proposition |
||||||||
|
|
Enhance our core business |
• Empowered our grower customer financial operations with new digital decision-making tools through advancements to our digital innovation in North America
|
||||||
|
|
Grow earnings and share in core geographies through targeted network expansion and investment in high growth categories, such as biological product technologies |
|||||||
| Targeted expansion and proprietary products |
Key 2023 activities |
|||||||
| • Contributed $1.0 billion in gross margin from our global proprietary products portfolio, with growth of 6 percent per year over the last five years |
||||||||
| • Continued to extract value from our innovation pipeline, realizing over $750 million in global proprietary plant nutrition and biostimulant sales in 2023 |
||||||||
|
|
Advance high-value strategic initiatives |
• Completed 23 acquisitions in our core Retail markets |
||||||
|
|
Development of scalable sustainability programming, featuring solutions that improve grower productivity and efficiency and generate value for Nutrien and our diverse group of partners |
|||||||
| Sustainability |
Key 2023 activities |
|||||||
| • Doubled our sustainably engaged acres to two million, continuing integration of our high-value products and services into our outcome-based sustainability programming |
||||||||
|
|
Fortify our business for the future |
• Generated first verified GHG offsets and insets from our sustainability programming, creating opportunities for deeper value-chain collaboration and partner connectivity
|
||||||
|
|
|
|||||||
| Nutrien Annual Report 2023 | 31 |
| Overview | MD&A |
Five-year highlights | Financial statements and notes | |||||
| Strategy | ||||||||

|
Potash strategic priorities |
We are utilizing our world-class Potash network and integrated supply chain to respond to market supply and demand dynamics. We continue to invest in efficiency and new technologies to manage our costs, optimize and modernize our asset base, advance our sustainability commitments, and preserve the reliability and safety of our operations. |
|
|
Deliver initiatives that improve safety, reduce costs, increase network flexibility and improve our environmental footprint |
|||||||
| Operational excellence |
Key 2023 activities | |||||||
| • Increased annual ore tonnes cut using autonomous mining by 40 percent and continue to scale these technologies across our network |
||||||||
| • Completed ore recovery projects alongside other efficiency related initiatives to maintain an advantaged global cost position and reduce waste |
||||||||
|
|
Enhance our core business |
|||||||
|
|
Pursue opportunities that promote growth and strengthen the channel to our customers |
|||||||
| Supply chain optimization |
Key 2023 activities |
|||||||
| • Enhanced value of our integrated business by sourcing a significant majority of Retail’s North American supply needs from our six potash mines in Saskatchewan |
||||||||
|
|
Enhance our core business |
|||||||
|
Leverage flexibility and |
Ensure a flexible go-to-market strategy that responds to variable conditions, satisfies demand requirements and optimizes long-term value as the market grows
|
|||||||
| Key 2023 activities | ||||||||
| • Paused the accelerated ramp-up of our annual potash production capability to 18 million tonnes in response to market conditions and continued to advance certain in-flight projects to maximize value of capital spent and support long-term growth |
||||||||
|
|
Advance high-value strategic initiatives |
|||||||
|
|
Action our workforce strategy to deliver talent and skills for tomorrow and support our future needs |
|||||||
| Strengthen our
|
Key 2023 activities |
|||||||
| • Executed attraction and retention initiatives that strengthen our workforce and support diversity and inclusion, including local and Indigenous partnerships |
||||||||
|
|
Fortify our business for the future |
|||||||
|
|
|
|||||||
| 32 | Nutrien Annual Report 2023 |
| Overview | MD&A |
Five-year highlights | Financial statements and notes | |||||
| Strategy | ||||||||

|
Nitrogen strategic priorities |
We are enhancing our strategically positioned Nitrogen business through investment projects that improve the reliability and energy efficiency of our facilities while selectively increasing capacity and product mix flexibility. We are unwavering in our pursuit of safe, reliable and efficient operations while continuing to leverage process and product innovations to proactively address sustainability needs. |
|
|
Maintain globally competitive position, increasing product mix flexibility and improving reliability, efficiency and supply chain performance |
|||||||
| Operational |
Key 2023 activities | |||||||
| • Completed major maintenance turnarounds at our Geismar and Borger sites, addressing reliability needs and increasing efficiency |
||||||||
| • Completed initial construction and technology development of our Nitrogen Real-time Operations Center, providing troubleshooting, monitoring and optimization support across our entire network of 13 nitrogen production and upgrade facilities |
||||||||
|
|
Enhance our core business |
|||||||
|
|
Selectively invest in high-conviction, high-return growth opportunities in North America, supporting the needs of the market
|
|||||||
| Invest in our North American assets |
Key 2023 activities | |||||||
| • Expanded our Geismar facility, adding incremental ammonia and nitric acid production capacity |
||||||||
| • Completed UAN debottleneck projects at our Geismar site, allowing for the expansion of production as additional nitric acid capacity projects planned for 2024 are completed |
||||||||
|
|
Advance high-value strategic initiatives |
• Suspended work on our Geismar clean ammonia plant as we monitor cost estimates and the evolving market for clean ammonia
|
||||||
|
|
Maintain position as an industry leader in low-carbon nitrogen production and continue to leverage process and product innovations to proactively address sustainability needs
|
|||||||
| Sustainability outcomes |
Key 2023 activities | |||||||
| • Completed our GHG Phase 1 abatement program, including the CO2 tie-in at our Redwater plant and an N2O abatement project at Geismar |
||||||||
|
|
Fortify our business for the future |
• Increased our low-carbon ammonia production capability to 1.2 million tonnes across our Geismar, Redwater and Joffre sites
|
||||||
|
|
|
|||||||
| Nutrien Annual Report 2023 | 33 |
| Overview | MD&A |
Five-year highlights | Financial statements and notes | |||||
| Strategy | ||||||||

|
Phosphate strategic priorities |
We are optimizing our phosphate business by continuing to focus on safety, sustainability and operating efficiencies, while leveraging our product mix and adapting to market conditions. |
|
|
Increase base business efficiency through reliability and efficiency improvements
|
|||||||
| Operational |
Key 2023 activities | |||||||
| • Completed maintenance turnarounds at both Aurora and White Springs sites focused on key reliability improvements |
||||||||
|
|
Enhance our core business |
• Achieved a 3 percent improvement to our preventative maintenance compliance metric, a key leading reliability indicator
|
||||||
|
Premium |
Maximize value via flexibility of product portfolio mix and focus on liquid fertilizer, feed, purified, and other premium product opportunities in North America
|
|||||||
| Key 2023 activities | ||||||||
| • Fulfilled 56 percent of sales volumes attributable to higher-margin products, including liquid fertilizer, feed and purified |
||||||||
|
|
Enhance our core business |
• Increased sales of our micronized sulfur dry phosphate product, MAP+MST by 125 percent compared to 2022 levels
|
||||||
|
Reclamation and environmental risk reduction |
Continue to advance reclamation efforts and proactively address environmental risks
|
|||||||
| Key 2023 activities | ||||||||
| • Planted over 500,000 trees and continued our land reclamation efforts at our Aurora and White Springs sites
|
||||||||
|
|
Fortify our business for the future |
|||||||
|
|
|
|||||||
| 34 | Nutrien Annual Report 2023 |
| Overview | MD&A |
Five-year highlights | Financial statements and notes | |||||
| Strategy | ||||||||
Capital allocation
Our capital allocation framework prioritizes sustaining safe and reliable operations, a healthy balance sheet, strategically investing in our business, and providing meaningful returns to our shareholders through a stable and growing dividend and share repurchases. This balanced approach supports our strategy and enables us to enhance our core business, advance high-value strategic initiatives and fortify our business for the future.
|
|
Safe and reliable operations
|
• Sustain our assets to support safe and reliable operations
• Focus on continuous improvement initiatives and investments that enhance the utilization rates, reliability and efficiency of our assets |
||
|
|
Strong balance sheet
|
• Provide sufficient and flexible access to liquidity while optimizing the cost of our capital through the cycle
• Expect to maintain adjusted net debt/adjusted EBITDA leverage ratio below three times, through the cycle |
||
|
|
Shareholder returns
|
• Return capital to shareholders through a combination of stable and growing dividends and share repurchases
• Factor reduction in share count in the decision criteria for future dividend per share growth |
||
|
|
High-value growth opportunities
|
• Selectively invest in high-value and high-conviction opportunities that are expected to generate significant long-term returns
• Evaluate investment opportunities by strategic fit, project economics using various financial return metrics and sustainability factors to align with our 2030 commitments and targets |
||
| Nutrien Annual Report 2023 | 35 |
| Overview | MD&A |
Five-year highlights | Financial statements and notes | |||||
| Strategy | ||||||||
Capital allocation

|
Safe and reliable operations
|
Sustaining, mine development and pre-stripping capital expenditures (2023)
(percent)
|
||||||
| Sustaining, mine development and pre-stripping capital expenditures 1 |
$1.7B 2023 |
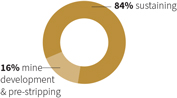
|
||||||

|
Strong balance sheet
|
Debt and equity 4,5 (2023)
(percent)
|
||||||
| Adjusted Net Debt/ Adjusted EBITDA 2 | 1.9x 2023 |
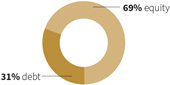
|
||||||
|
|
Shareholder returns
|
Cash used for dividends and share repurchases (2023)
(percent)
|
||||||
| Cash used for dividends and share repurchases 1 | $2.1B 2023 |
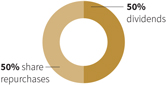
|
||||||
|
|
High-value growth opportunities
|
|||||||
| Investing capital expenditures 1 | $1.0B 2023 |
Investing capital expenditures 1 (2023)
(percent)
|
||||||
| Business acquisitions 3 |
$0.2B 2023 |
|||||||
| 1 | These are supplementary financial measures. See the “Other Financial Measures” section. |
| 2 | This is a capital management financial measure that includes a non-GAAP component. See the “Non-GAAP Financial Measures” and “Other Financial Measures” sections. |
| 3 | Net of cash acquired. |
| 4 | As at December 31, 2023. |
| 5 | Debt includes short-term debt, long-term debt and lease liabilities, including the current portions of each where applicable. |
| 36 | Nutrien Annual Report 2023 |
| Overview | MD&A |
Five-year highlights | Financial statements and notes | |||||
| Strategy | ||||||||
|
|
Key 2023 actions
• Completed reliability work and replaced key identified end-of-life assets across our operations, including major maintenance turnarounds and planned outages at five of our Nitrogen sites
• Invested in maintenance and safety-related initiatives for our Retail facilities |
|
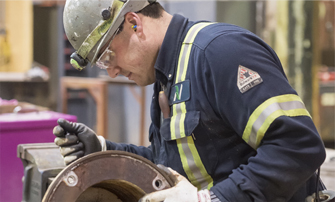
|
|||
|
|
Key 2023 actions
• Maintained our BBB investment-grade credit rating
• Repaid $500 million in senior notes that matured during the year and issued a total of $1.5 billion of 5-year and 30-year senior notes
• Reduced planned capital expenditures by $300 million providing flexibility on capital allocation alternatives |
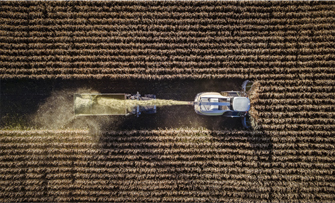
|
||||
|
|
Key 2023 actions
• Returned a total of $2.1 billion to shareholders through dividends and share repurchases
• Dividend provided an average yield of 3.3 percent in 2023
• In February 2024, we announced a 2 percent increase to our quarterly dividend to $0.54 per share, our sixth increase since 2018 |

|
||||
|
|
Key 2023 actions
• Completed 23 Retail acquisitions across the US, Australia and Brazil
• Invested in our Potash network including the procurement of additional autonomous mining machines and technology
• Completed Nitrogen brownfield expansion projects at our Geismar facility, increasing ammonia and nitric acid capability
• Invested in digital, proprietary products and sustainability related strategies to grow the business and reduce our environmental impact |
|
||||
| Nutrien Annual Report 2023 | 37 |

| Overview | MD&A
|
Five-year highlights | Financial statements and notes | |||||
| Our company | ||||||||
| Operating environment | ||||||||
| Strategy | ||||||||
| Governance | ||||||||
| Key enterprise risks | ||||||||
| Results | ||||||||
| 04 Governance | ||||||||
| 38 | Nutrien Annual Report 2023 |

| Overview | MD&A
|
Five-year highlights | Financial statements and notes | |||||
| Our company | ||||||||
| Operating environment | ||||||||
| Strategy | ||||||||
| Governance | ||||||||
| Key enterprise risks | ||||||||
| Results | ||||||||
|
Bali, Indonesia
Indonesia is the world’s fourth largest producer of rice and is a key producer of oil palm, fruits and vegetables. Indonesia is one of the largest importers of potash, with strong growth prospects, which Nutrien is a key supplier through Canpotex. |
||||||||
| Nutrien Annual Report 2023
|
39 |
| Overview | MD&A |
Five-year highlights | Financial statements and notes | |||||
| Governance | ||||||||
Corporate governance
Nutrien’s Corporate Governance Structure includes policies and processes that define the roles of the Board and the Executive Leadership Team (“ELT”). Our Board oversees risk management and the execution of our corporate strategy. Below are highlights of our corporate governance practices. For more information, see our most recent Management Information Circular.
Board diversity
Having a mix of directors on the Board from varied backgrounds and with a diverse range of experience and skills fosters enhanced decision-making capacity and promotes strong corporate governance. Our Board Diversity Policy includes a target that women comprise no fewer than 30 percent of the Board members. As of December 31, 2023, four of our directors were women (33 percent of the total number of directors).
Executive compensation
Nutrien’s compensation framework is based on a pay-for-performance philosophy, with the majority of executive compensation being at risk. Since 2020, a component of executive compensation has been tied to demonstrated sustainability performance, including the addition of progress on GHG emission reduction projects and
diversity-related metrics in 2021. Each year, we include an advisory “say on pay” vote at our annual meeting (in line with 2019 amendments in the Government of Canada’s Bill C-97).
Board skills
Our Board competencies and skills matrices are essential tools to evaluate whether the Board has the right skills, perspectives, experience and expertise for proper oversight and effective decision making. The Board regularly reviews the skills matrix.
| Core business skills 1
(percent of Board of Directors)
1 As disclosed in Nutrien’s 2023 Management Proxy Circular. |
Core industry experience 1
(percent of Board of Directors)
|
| 40 | Nutrien Annual Report 2023 |
| Overview | MD&A |
Five-year highlights | Financial statements and notes | |||||
| Governance | ||||||||
Board of Directors

|

|

|

|

|

|
|||||
| Russell Girling | Ken Seitz | Christopher Burley | Maura Clark | Michael Hennigan | Miranda Hubbs | |||||
| Chair | President and Chief Executive Officer | Director | Director | Director | Director | |||||

|

|

|

|

|

|
|||||
| Raj Kushwaha Director |
Alice Laberge Director |
Consuelo Madere Director |
Keith Martell Director |
Aaron Regent Director |
Nelson Luiz Costa Silva |
|||||
| Director |
Executive Leadership Team

|

|

|

|
|||||||
| Ken Seitz | Noralee Bradley | Pedro Farah | Andrew Kelemen | |||||||
| President and Chief Executive Officer | Executive Vice President, External Affairs and Chief Sustainability and Legal Officer | Executive Vice President and Chief Financial Officer | Executive Vice President, Corporate Development and Chief Strategy Officer | |||||||

|

|

|

|
|||||||
| Chris Reynolds | Jeff Tarsi | Mark Thompson | Trevor Williams | |||||||
| Executive Vice President and President, Potash | Executive Vice President and President, Global Retail | Executive Vice President, Chief Commercial Officer | Executive Vice President and President, Nitrogen and Phosphate |
| Nutrien Annual Report 2023 | 41 |
| Overview | MD&A |
Five-year highlights | Financial statements and notes | |||||
| Governance | ||||||||
Risk governance
Risk management is an integral part of doing business and is governed by our Board, which has the highest level of oversight for risk governance. The Board is responsible for overseeing the execution and alignment of Nutrien’s corporate strategy and risk management processes.
Nutrien’s ELT has the responsibility of ensuring the Company’s principal risks are being appropriately identified, assessed and addressed. Management keeps the Board and each of the Board committees regularly apprised of risks and developments relevant to their mandates.
Responsibility and accountability for risk management are embedded in all levels of our organization, and we strive to integrate risk management into key decision-making processes and strategies. By considering risk throughout
our business, we seek to effectively manage the risks that could have an impact on our ability to deliver on our strategy.
Role of the Board committees
While the Board as a whole oversees our strategy and risk management processes, each Board committee has oversight over business topics and certain risk areas relevant to their committee mandate. More information can be found in Nutrien’s Board and Board committee charters on our website at nutrien.com.
|
|
||||||
| Board/Board Committee | Oversight includes the following business topics or risk areas | |||||
|
|
||||||
| Board of Directors |
|
• Corporate strategy • Oversight of safety, health, environmental and security matters |
• Risk management • Human resources and compensation • Governance and compliance |
|||
|
|
|
|||||
|
Audit Committee |
• Accounting and financial reporting • Internal controls |
• Compliance • Financial risk management |
||||
|
|
|
|||||
|
Corporate Governance & Nominating Committee |
• Corporate governance • Board diversity |
• Director orientation and continuing education • Board evaluation |
||||
|
|
|
|||||
| Human Resources & Compensation Committee | • Executive compensation • Succession planning |
• Equity, diversity and inclusion, including the Company’s Indigenous Strategy as it relates to Indigenous employment and human resources matters with appropriate coordination with the S&S Committee
• Learning and development |
||||
|
|
|
|||||
| Safety & Sustainability (“S&S”) Committee |
• Sustainability targets and goals
• Risks, strengths and opportunities related to safety and sustainability including climate-related impacts |
• Safety and sustainability performance and strategy
• Cybersecurity and data privacy
• Status of remediation projects and environmental provisions
• The Company’s Indigenous Strategy as it relates to Indigenous engagement and stakeholder relations, with appropriate coordination with the Human Resources & Compensation Committee |
||||
| 42 | Nutrien Annual Report 2023 |
| Overview | MD&A |
Five-year highlights | Financial statements and notes | |||||
| Governance | ||||||||
Governance for climate and sustainability
The Board’s S&S Committee has oversight over Nutrien’s climate-related risks and opportunities. The S&S Committee generally meets on a quarterly basis and covers many sustainability related matters within its mandate including those related to climate. Specifically, the S&S Committee’s role includes overseeing: policies relating
to sustainability and progress towards sustainability goals; approval of Nutrien’s annual Global Sustainability Report; reviewing progress against Nutrien’s Feeding the Future Plan and associated sustainability targets and goals; and review of Nutrien’s climate-related risks and opportunities. This committee directly advises the Board on these and other sustainability matters noted above.
Risk management process
Risk management is integrated into our strategy and business activities to facilitate informed decision making and responsible management of resources. Our Enterprise Risk Management process is overseen by our Enterprise Risk Management Team and guided by our global risk management framework. The framework promotes consistent and integrated application of risk management principles and processes across our organization and is scalable to support all levels of the business.
Nutrien’s operating segments and corporate functions use this framework to identify, assess and develop mitigation actions for key risks that could affect their strategy, operations or future performance. Assessment criteria embedded in the risk framework allow for comparability of different types of risks, including climate-related risks. Key criteria include the likelihood of impacting our business and the potential severity of impact.
Risks are evaluated individually and collectively at the management level to fully understand Nutrien’s risk landscape and identify interdependencies between risks. A consolidated view of our risks is presented to our ELT and senior leaders for review and discussion, along with outputs from external environment scans and emerging risk workshops. Nutrien’s significant enterprise-wide risks are then presented to the Board at least annually.
| Nutrien Annual Report 2023 | 43 |

| Overview | MD&A
|
Five-year highlights | Financial statements and notes | |||||
| Our company | ||||||||
| Operating environment | ||||||||
| Strategy | ||||||||
| Governance | ||||||||
| Key enterprise risks | ||||||||
| Results | ||||||||
| 05 Key enterprise risks |
||||||||
| 44 | Nutrien Annual Report 2023
|

| Overview | MD&A
|
Five-year highlights | Financial statements and notes | |||||
| Our company | ||||||||
| Operating environment | ||||||||
| Strategy | ||||||||
| Governance | ||||||||
| Key enterprise risks | ||||||||
| Results | ||||||||
|
Texas, US
Last year, the US was the world’s leading exporter of cotton, exporting 2.8 million tonnes. Under our Dyna-Gro brand, Nutrien sells proprietary cotton seed across North America. Our global proprietary seed revenue has grown by over 25 percent since 2021. |
||||||||
| Nutrien Annual Report 2023
|
45 |
| Overview | MD&A |
Five-year highlights | Financial statements and notes | |||||
| Key enterprise risks | ||||||||
Key enterprise risks
Nutrien characterizes a key risk as a risk or combination of risks that could threaten the achievement of our vision, our business model, future financial performance or ability to deliver on our strategy. Our key enterprise risks are discussed below and while these represent our significant risks, we also continue to be exposed to other important general business, operational and climate-related risks. For a more detailed discussion of these key risks and other risks that may affect us, refer to Nutrien’s 2023 Annual Information Form.
| 1 | Competition and shifting market fundamentals | ||||||
| Description |
Risk management approach | |||||
| Global macroeconomic conditions and shifting market fundamentals – including trade tariffs and trade restrictions, volatility in global markets, supply chain constraints, increased price competition and/or new entrants, geopolitical conditions, and/or a significant change in agriculture production or consumption trends – could lead to a sustained environment of reduced demand for our products and/or low or volatile commodity prices and negatively impact our short- and long-term profitability. |
Our global footprint, integrated business, and portfolio of products, services and solutions are designed to enable us to respond to changing economic conditions. We have a favorable cost-structure and the flexibility to make operational changes across our portfolio in order to minimize the impact of changing market dynamics. We prioritize maintaining a strong balance sheet and focus on initiatives that strengthen the advantages of our integrated business, drive operational efficiencies and increase free cash flow. | |||||
| 2 | Agricultural changes and trends | ||||||
| Description |
Risk management approach | |||||
| The following agriculture-related factors, among others, could impact our strategy, demand for our products and/or services and/or financial performance: farm and industry consolidation; shifting grower demographics; agriculture productivity and development; changes in consumer preferences; increasing focus on sustainability in agriculture (including soil health, availability of arable land, diminishing biodiversity and water management); and technological innovation and digital business models. |
Our global footprint, integrated business and diversified portfolio are designed to adapt to changes in the agriculture industry and help position us to drive long-term value creation and provide whole-acre solutions for growers. We are focused on optimizing our Retail business, digital innovation, growth in core markets and continued development of scalable sustainability programming.
See page 28 of this report for more information on our strategic priorities. |
|||||
| 3 | Changing regulations | ||||||
| Description |
Risk management approach | |||||
| Changing laws, regulations and government policies – including those relating to the environment and climate change, including regulation of GHG emissions, as well as health and safety laws or regulations, taxes and royalties – could affect our ability to produce or sell certain products, reduce our efficiency and competitive advantage, increase our costs of raw materials, energy, transportation and compliance, or require us to make capital improvements to our operations – all of which could impact our strategy, operations, financial performance or reputation. |
Our Government & Industry Affairs Team has an active engagement strategy with governments and regulators, including participation in industry associations. This allows us to keep current on regulatory developments affecting our business or industry, allowing us to anticipate new or changing laws and regulations and put us in the best position for success while leveraging our industry association allies.
We also have initiatives and commitments supporting product stewardship, and environment and climate action as part of our Feeding the Future Plan, to assist in managing the impact of potential regulatory changes.
|
|||||
| 46 | Nutrien Annual Report 2023 |
| Overview | MD&A |
Five-year highlights | Financial statements and notes | |||||
| Key enterprise risks | ||||||||
|
4 | Climate change |
||||||
| Description |
Risk management approach | |||||
| Climate change may cause or result in, among other things, more frequent and severe weather events, diminishing biodiversity, impacts to growing seasons or crop yields, and changing weather factors such as temperature, precipitation, wind and water levels, and affect freshwater availability. Physical risks from climate change may also result in operational or supply chain disruptions, depending on the nature of the event.
Impacts from transition risks could include, but are not limited to, policy constraints on emissions, carbon pricing mechanisms, water restrictions, land use restrictions or incentives, changing consumer preferences, and market demand and supply shifts. We are also subject to reputational risks associated with climate change, including our stakeholders’ perception of the agriculture industry and our role in the transition to a lower-carbon economy. These and other factors resulting from climate change could adversely impact our business, financial condition, results of operations or liquidity. |
Our capital allocation framework and preventive maintenance programs help support the long-term reliability and efficiency of our assets. Additionally, our geographically diversified network of facilities and operations helps to minimize the overall impact of physical risk from climate change on our company.
For more information refer to page 7 of this report for our sustainability highlights and our most recent Global Sustainability Report on our website at nutrien.com, which is expected to be released in March 2024. |
|||||
| 5 | Cybersecurity threats | ||||||
| Description |
Risk management approach | |||||
| Cyberattacks, ransomware events, power outages, terrorist attacks, natural disasters, military conflicts, local epidemics or pandemics, other events, and breaches or exposure to potential computer viruses of our systems, third-party service providers’ systems, or cloud-based platforms could lead to disruptions to our operations, loss of data or the unintended disclosure of confidential information and/or personally identifiable information or property damage. Any of these could result in business disruptions, increased defense costs, reputational damage, personal injury or third-party claims, impacting our operations, financial performance or reputation. |
Our Global Information Management and Cyber-Security Team is supported by third-party specialists, oversees our network security and may assist in incident response.
We promote a strong culture of cybersecurity awareness to minimize threats and vulnerabilities, which is supported by our cybersecurity framework, policies and best practices.
Threat and risk assessments are completed for all new information technology systems, and our cybersecurity incident response processes are backstopped by external response measures. We also conduct regular simulated phishing and targeted cybersecurity training as well as incident response training.
For more information refer to our most recent Global Sustainability Report on our website at nutrien.com, which is expected to be released in March 2024.
|
|||||
| Nutrien Annual Report 2023 | 47 |
| Overview | MD&A |
Five-year highlights | Financial statements and notes | |||||
| Key enterprise risks | ||||||||
|
6 | Political, economic and social instability |
||||||
| Description |
Risk management approach | |||||
| Political, economic and social instability may affect our business including, for instance, if any of the jurisdictions in which we operate or do business introduce restrictions on monetary distributions, labor disruptions, competitive restrictions, forced divestitures or changes to or nullification of existing agreements, mining permits or leases, or the imposition of tariffs, exchange controls, international trade restrictions, embargoes, barriers or other restrictions. Instability in political or regulatory regimes could also affect our ability to do business and could impact our sales and operating results, our reputation or the value of our assets. |
Our Government & Industry Affairs Team has an active engagement strategy with governments, regulators and other stakeholders in the countries where we operate or plan to operate. We assess capital investments and project decisions against political, country and other related risk factors and avoid or reduce our exposure to jurisdictions with unacceptable risk levels. Dedicated teams regularly monitor developments and global trends that may impact us. | |||||
| 7 | Talent and organization culture | ||||||
| Description |
Risk management approach | |||||
| An inability to attract and retain qualified top talent, including for skillsets that are in high demand, could impact our business, financial condition and results of operations. Failure to provide the necessary organizational structure, programs and culture to engage and develop our employees, including providing a respectful, inclusive and diverse workplace, could impact our ability to achieve our growth objectives or expected business results. |
Our Talent Attraction and Sourcing Team focuses on building a diverse, inclusive and talented workforce. We are committed to the career development of our employees and building a culture grounded in our organizational purpose and the values of safety, inclusion, integrity and results. Our talent succession process focuses on identifying and managing critical roles and the proactive build-up of internal and external bench strength. Our incentive programs are competitive, performance-based and support our purpose-driven culture. | |||||
| 8 | Stakeholder support | ||||||
| Description |
Risk management approach | |||||
| Our stakeholders may not support our business plans, structure, strategy, sustainability initiatives, or climate commitments and social responsibilities. Our inability to meet our sustainability and climate-related commitments and targets may also have an adverse effect on our stakeholder support, among others. Loss of stakeholder confidence could impair our ability to execute our business plans, negatively impact our ability to produce or sell our products, and may lead to reputational damage, increased costs, financial losses, securityholder action or negatively impact our access to or cost of capital.
|
Our Investor Relations and Stakeholder Relations teams monitor and regularly engage with our stakeholders to identify their key issues and communicate the long- term value opportunities associated with our business. We also have an active Community Relations Team and community investment programs. Our Strategies and Feeding the Future Plan are structured to help support what matters most to our stakeholders. | |||||
| 48 | Nutrien Annual Report 2023 |
| Overview | MD&A |
Five-year highlights | Financial statements and notes | |||||
| Key enterprise risks | ||||||||
|
9 | Supply chains |
||||||
| Description |
Risk management approach | |||||
| Supply chain disruptions could result in difficulties supplying materials to our facilities and/or impair our ability (or the ability of the third parties upon which we rely) to deliver products to our customers in a timely manner. If certain key raw materials, parts and/or supplies used in our operations are not available, our business could be disrupted. Ongoing geopolitical conflicts, regulatory instability and changes to tariffs, epidemics, pandemics, or other such crises have created and could still create supply chain challenges and disruptions, and/or limit our ability to timely sell or distribute our products in the future, any of which could negatively impact our business, financial condition and operating results. |
Our integrated business provides us the flexibility to optimize operations, transportation and logistics, or increase supply chain efficiencies to adapt to potential disruption. We regularly review our suppliers to ensure we can maintain critical feedstocks and can leverage our diverse retail distribution network and expansive fertilizer terminal and transportation network to effectively manage product logistical challenges. | |||||
| 10 | Capital redeployment | ||||||
| Description |
Risk management approach | |||||
| Our inability to deploy capital to efficiently achieve sustained growth, effectively execute on opportunities or meet investor preferences – whether due to market conditions, lack of options or otherwise, or deploying capital in a manner inconsistent with our strategic priorities – could impact our returns, operations, reputation, access to or cost of capital, or potential impairment charges related to the goodwill or intangible assets. |
We continue to focus on creating long-term value through a balanced and disciplined approach to capital allocation. We prioritize maintaining safe and reliable operations, a healthy balance sheet, investing in our business and providing strong returns to shareholders.
See page 35 of this report for more information on our capital allocation priorities and key actions during the year. |
|||||
| 11 | Safety, health and environment | ||||||
| Description |
Risk management approach | |||||
| Our operations are subject to safety, health and environmental risks inherent in mining, manufacturing, transportation, storage and distribution of our products. These factors could result in injuries or fatalities, or impact air quality, biodiversity, water resources or related ecosystems near our operations, impacting our operations, financial performance or reputation. |
Our safety strategy and governance processes ensure we follow all regulatory, industry and internal standards of safety, health and environmental responsibility that involve independent audits and assessments. We have structured incident prevention and response systems in place and conduct regular security vulnerability assessments. We have crisis communication protocols and emergency response programs across our business and maintain environmental monitoring and control systems, including third-party reviews of key containment structures.
For more information refer to our most recent Global Sustainability Report on our website at nutrien.com, which is expected to be released in March 2024.
|
|||||
| Nutrien Annual Report 2023 | 49 |

| Overview | MD&A
|
Five-year highlights | Financial statements and notes | |||||
| Our company | ||||||||
| Operating environment | ||||||||
| Strategy | ||||||||
| Governance | ||||||||
| Key enterprise risks | ||||||||
| Results | ||||||||
| 06 Results |
| 50 | Nutrien Annual Report 2023
|

| Overview | MD&A
|
Five-year highlights | Financial statements and notes | |||||
| Our company | ||||||||
| Operating environment | ||||||||
| Strategy | ||||||||
| Governance | ||||||||
| Key enterprise risks | ||||||||
| Results | ||||||||
| California, US
The US is the world’s second largest producer of lettuce. Nutrien’s network of ~1,200 selling locations in the US serves growers needs including specialty crops like lettuce and other fruits and vegetables.
• Adjusted EBITDA is the primary profit measure used to evaluate the segments’ performance as it excludes the impact of non-cash impairments and impairment reversals and other costs that are centrally managed by our corporate function. Refer to Note 3 to the consolidated financial statements for details.
• Net sales (sales less freight, transportation and distribution expenses) is the primary revenue measure used in planning and forecasting in the Potash, Nitrogen and Phosphate operating segments. |
||||||||
| Nutrien Annual Report 2023
|
51 |
| Overview | MD&A | Five-year highlights | Financial statements and notes | |||||
|
Results |
||||||||
|
|

|
2023 Nutrien Ag Solutions (“Retail”) | |
| financial performance |
Our Retail business generated adjusted EBITDA of $1.5 billion, lower than the record levels of the prior year primarily due to lower gross margin for both crop nutrients and crop protection products. Margins were pressured as crop input prices softened and higher cost inventory moved through the channel. Crop nutrients sales volumes increased by over 1 million tonnes as growers worked to replenish nutrients in the soil. As the year progressed, crop input margins in North America normalized and customers returned to more normal buying behaviors.
In Brazil, we saw continued margin compression due to decreased prices for certain crop protection products and the selling through of high cost inventory. Included with expenses for the full year of 2023, we recognized a $465 million non-cash impairment primarily to goodwill relating to our Retail – South America assets, mainly due to the impact of crop input price volatility, more moderate long-term growth assumptions and higher interest rates. We believe the long-term prospects for agriculture in Brazil are strong and it remains an important crop input market for Nutrien. In the near-term, we are focused on integration of our recent acquisitions and optimization of our cost structure in this region.
|
|
Dollars | Gross margin | Gross margin (%) | |||||||||||||||||||||||||||||
| (millions of US dollars, except as otherwise noted) |
2023 | 2022 | % Change |
2023 | 2022 | % Change |
2023 | 2022 | ||||||||||||||||||||||||
| Sales |
||||||||||||||||||||||||||||||||
| Crop nutrients |
8,379 | 10,060 | (17 | ) | 1,378 | 1,766 | (22 | ) | 16 | 18 | ||||||||||||||||||||||
| Crop protection products |
6,750 | 7,067 | (4 | ) | 1,553 | 1,936 | (20 | ) | 23 | 27 | ||||||||||||||||||||||
| Seed |
2,295 | 2,112 | 9 | 427 | 428 | – | 19 | 20 | ||||||||||||||||||||||||
| Merchandise |
1,001 | 1,019 | (2 | ) | 172 | 174 | (1 | ) | 17 | 17 | ||||||||||||||||||||||
| Nutrien Financial |
322 | 267 | 21 | 322 | 267 | 21 | 100 | 100 | ||||||||||||||||||||||||
| Services and other |
927 | 966 | (4 | ) | 710 | 749 | (5 | ) | 77 | 78 | ||||||||||||||||||||||
| Nutrien Financial elimination 1 |
(132 | ) | (141 | ) | (6 | ) | (132 | ) | (141 | ) | (6 | ) | 100 | 100 | ||||||||||||||||||
| 19,542 | 21,350 | (8 | ) | 4,430 | 5,179 | (14 | ) | 23 | 24 | |||||||||||||||||||||||
| Cost of goods sold |
15,112 | 16,171 | (7 | ) |
|
|
|
|
|
|
|
|
|
|
|
|
|
|
|
|||||||||||||
| Gross margin |
4,430 | 5,179 | (14 | ) | ||||||||||||||||||||||||||||
| Expenses 2,3 |
4,215 | 3,621 | 16 |
|
|
|
|
|
|
|
|
|
|
|
|
|
|
|
||||||||||||||
| Earnings before finance |
215 | 1,558 | (86 | ) | ||||||||||||||||||||||||||||
| Depreciation and amortization |
759 | 752 | 1 |
|
|
|
|
|
|
|
|
|
|
|
|
|
|
|
||||||||||||||
| EBITDA |
974 | 2,310 | (58 | ) | ||||||||||||||||||||||||||||
| Adjustments 3 |
485 | (17 | ) | n/m |
|
|
|
|
|
|
|
|
|
|
|
|
|
|
|
|||||||||||||
| Adjusted EBITDA |
1,459 | 2,293 | (36 | ) |
|
|
|
|
|
|
|
|
|
|
|
|
|
|
|
|||||||||||||
| 1 | Represents elimination of the interest and service fees charged by Nutrien Financial to Retail branches. |
| 2 | Includes selling expenses of $3,375 million (2022 – $3,392 million). |
| 3 | Includes non-cash impairment of assets of $465 million (2022 – nil). See Notes 3 and 14 to the consolidated financial statements. |
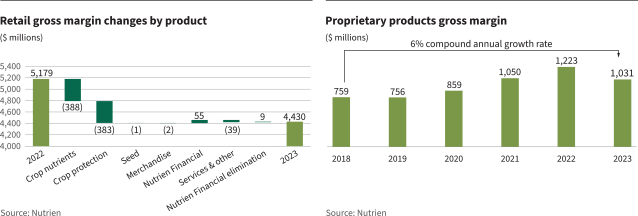
| 52 | Nutrien Annual Report 2023 |
| Overview | MD&A | Five-year highlights | Financial statements and notes | |||||
|
Results |
||||||||
|
|
The most significant contributors to the changes in our Retail financial performance were as follows:
|
|
2023 vs 2022 | |
|
Crop nutrients |
Sales and gross margin decreased in 2023 due to lower selling prices across all regions compared to the strong comparable period in 2022. Sales volumes increased in 2023 as growers returned to more normalized application rates to replenish nutrients in the soil. Sales and gross margin of our proprietary nutritional and biostimulant product lines increased compared to 2022 levels as we continued to expand our differentiated product offering and manufacturing capacity. | |
|
Crop protection products |
Sales and gross margin were lower primarily due to decreased selling prices compared to the historically strong comparable period in 2022. This was partially offset by higher fourth quarter sales in North America as growers returned to more normalized buying behaviors. Gross margin in 2023 was also impacted by the selling through of high-cost inventory. | |
|
Seed |
Sales increased in 2023 primarily due to increased corn sales in the US, while gross margin saw little change compared to 2022. | |
|
Nutrien Financial |
Sales increased in 2023 due to higher utilization of our financing offerings in the US and Australia compared to 2022. | |
|
Services and other |
Sales and gross margin decreased in 2023 mainly due to lower livestock selling prices and volumes in Australia. | |
|
Expenses |
In 2023, we recognized a $465 million non-cash impairment primarily to goodwill related to our Retail – South America assets, mainly due to the impact of crop input price volatility, more moderate long-term growth assumptions and higher interest rates. Selling expenses as a percentage of sales were higher in 2023 primarily due to lower selling prices compared to the strong comparable period in 2022. | |
|
Adjusted EBITDA |
Adjusted EBITDA decreased in 2023 primarily due to lower gross margins for crop nutrients and crop protection products. | |
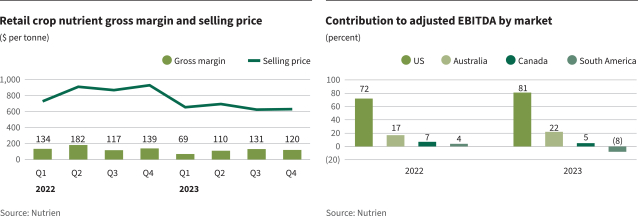
Selected Retail measures
|
|
2023 | 2022 | ||||||
| Proprietary products gross margin (millions of US dollars) |
||||||||
| Crop nutrients |
391 | 370 | ||||||
| Crop protection products |
461 | 675 | ||||||
| Seed |
168 | 166 | ||||||
| Merchandise |
11 | 12 | ||||||
| All products |
1,031 | 1,223 | ||||||
| Proprietary products margin as a percentage of product line margin (%) |
||||||||
| Crop nutrients |
28 | 21 | ||||||
| Crop protection products |
30 | 35 | ||||||
| Seed |
39 | 39 | ||||||
| Merchandise |
6 | 7 | ||||||
| All products |
23 | 24 | ||||||
| Nutrien Annual Report 2023 | 53 |
| Overview | MD&A | Five-year highlights | Financial statements and notes | |||||
|
Results |
||||||||
|
|
|
|
2023 | 2022 | ||||||
| Crop nutrients sales volumes (tonnes – thousands) |
||||||||
| North America |
8,985 | 8,106 | ||||||
| International |
3,647 | 3,407 | ||||||
| Total |
12,632 | 11,513 | ||||||
| Crop nutrients selling price per tonne |
||||||||
| North America |
697 | 916 | ||||||
| International |
581 | 774 | ||||||
| Total |
663 | 874 | ||||||
| Crop nutrients gross margin per tonne |
||||||||
| North America |
127 | 182 | ||||||
| International |
65 | 86 | ||||||
| Total |
109 | 153 | ||||||
| Financial performance measures | 2023 | 2022 | ||||||
| Retail adjusted EBITDA margin (%) 1 |
7 | 11 | ||||||
| Retail adjusted EBITDA per US selling location (thousands of US dollars) 1,2 |
1,394 | 1,923 | ||||||
| Retail adjusted average working capital to sales (%) 3 |
19 | 17 | ||||||
| Retail adjusted average working capital to sales excluding Nutrien Financial (%) 3 |
1 | 2 | ||||||
| Nutrien Financial adjusted net interest margin (%) 3 |
5.2 | 6.8 | ||||||
| Retail cash operating coverage ratio (%) 3 |
68 | 55 | ||||||
| 1 | These are supplementary financial measures. See the “Other Financial Measures” section. |
| 2 | Excluding acquisitions. |
| 3 | These are non-GAAP financial measures. See the “Non-GAAP Financial Measures” section. |
Nutrien Financial
We offer flexible financing solutions to our customers in support of Nutrien’s agricultural product and service sales. Qualifying Retail customers in the US and Australia are offered extended payment terms, typically up to one year, to facilitate the alignment of grower crop cycles with cash flows. Nutrien Financial revenues are primarily earned through interest and service fees that are charged to our Retail branches.
We hold a significant portion of receivables from customers that have historically experienced a low-default rate. We manage our credit portfolio based on a combination of review of customer credit metrics, past experience with the customer and exposure to any single customer. Nutrien Financial, which is our wholly owned finance captive, monitors and services the portfolio of our high-quality receivables from customers that have the lowest risk of default among Retail’s receivables from customers. We monitor the results of this portfolio of receivables separately because we calculate the cost of capital attributable to the high-quality receivables from customers differently from our other receivables. Specifically, we assume a debt-to-equity ratio of 7:1 in funding Nutrien Financial receivables, based on the underlying credit quality of the assets.
Nutrien Financial relies on corporate capital for funding. For 2023, we estimated the deemed interest expense using an average borrowing rate of 4.1 percent (2022 - 1.4 percent) applied to the notional debt required to fund the portfolio of receivables from customers monitored and serviced by Nutrien Financial. The balance of our Retail receivables (outside of Nutrien Financial) is subject to marginally higher credit risk.
|
|
As at December 31 | |||||||||||||||||||||||||||||||
| (millions of US dollars) | Current | <31 Days past due |
31–90 Days past due |
>90 Days past due |
Gross receivables |
Allowance 1 | 2023 Net receivables |
2022 Net receivables |
||||||||||||||||||||||||
| North America |
1,736 | 327 | 89 | 94 | 2,246 | (40 | ) | 2,206 | 2,007 | |||||||||||||||||||||||
| International |
560 | 56 | 22 | 59 | 697 | (10 | ) | 687 | 662 | |||||||||||||||||||||||
| Nutrien Financial receivables 2 |
2,296 | 383 | 111 | 153 | 2,943 | (50 | ) | 2,893 | 2,669 | |||||||||||||||||||||||
| 1 | Bad debt expense on the above receivables for the twelve months ended December 31, 2023 was $35 million (2022 – $10 million) in the Retail segment. |
| 2 | Gross receivables include $2,578 million (2022 – $2,260 million) of very low risk of default and $365 million (2022 – $445 million) of low risk of default. |
| 54 | Nutrien Annual Report 2023 |
| Overview | MD&A | Five-year highlights | Financial statements and notes | |||||
|
Results |
||||||||
|
|

|
2023 Potash financial performance |
Our Potash business delivered adjusted EBITDA of $2.4 billion as lower net realized selling prices more than offset higher North American sales volumes and lower provincial mining taxes and royalties. Potash sales volumes in North America increased due to lower channel inventory and increased grower demand supported by an extended fall application season and improved affordability. Offshore sales volumes were lower compared to last year’s record levels primarily due to logistical challenges at Canpotex’s West Coast port facilities and reduced shipments to customers in India and Southeast Asia.
|
|
Dollars | Tonnes (thousands) | Average per tonne | |||||||||||||||||||||||||||||||||
| (millions of US dollars, except as otherwise noted) |
2023 | 2022 | % Change |
2023 | 2022 | % Change |
2023 | 2022 | % Change |
|||||||||||||||||||||||||||
| Manufactured product |
||||||||||||||||||||||||||||||||||||
| Net sales |
||||||||||||||||||||||||||||||||||||
| North America |
1,683 | 2,485 | (32 | ) | 4,843 | 3,729 | 30 | 348 | 667 | (48 | ) | |||||||||||||||||||||||||
| Offshore |
2,076 | 5,414 | (62 | ) | 8,373 | 8,808 | (5 | ) | 248 | 615 | (60 | ) | ||||||||||||||||||||||||
| 3,759 | 7,899 | (52 | ) | 13,216 | 12,537 | 5 | 284 | 630 | (55 | ) | ||||||||||||||||||||||||||
| Cost of goods sold |
1,396 | 1,400 | – |
|
|
|
|
|
|
|
|
|
105 | 112 | (6 | ) | ||||||||||||||||||||
| Gross margin – total |
2,363 | 6,499 | (64 | ) | 179 | 518 | (65 | ) | ||||||||||||||||||||||||||||
| Expenses 1 |
422 | 1,173 | (64 | ) | Depreciation and amortization | 35 | 35 | – | ||||||||||||||||||||||||||||
| EBIT Depreciation and amortization |
|
1,941 463 |
|
|
5,326 443 |
|
|
(64 5 |
)
|
|
Gross margin
excluding |
|
214 | 553 | (61 | ) | ||||||||||||||||||||
| EBITDA/Adjusted EBITDA |
2,404 | 5,769 | (58 | ) | |
Potash controllable cash cost |
|
58 | 58 | – | ||||||||||||||||||||||||||
| 1 | Includes provincial mining taxes of $398 million (2022 – $1,149 million). |
| 2 | These are non-GAAP financial measures. See the “Non-GAAP Financial Measures” section. |
The most significant contributors to the changes in our Potash financial performance were as follows:
|
|
2023 vs 2022 | |
|
Sales volumes |
Overall sales volumes were higher in 2023. North America sales volumes increased in 2023 due to lower channel inventory and increased grower demand supported by an extended fall application season and improved affordability. Offshore sales volumes were lower in 2023 compared to record levels in 2022 primarily due to logistical challenges at Canpotex’s West Coast port facilities and reduced shipments to customers in India and Southeast Asia. | |
|
Net realized selling price |
Average net realized selling prices decreased in 2023 compared to the historically strong prices in 2022 due to a decline in benchmark prices and higher costs related to logistical challenges at Canpotex’s West Coast port facilities. | |
|
Cost of goods sold per tonne |
Costs decreased in 2023 mainly due to lower royalties resulting from decreased net realized selling prices. Potash controllable cash cost of product manufactured per tonne was consistent with 2022. |
|
|
Expenses |
Expenses decreased in 2023 primarily due to lower provincial mining taxes from lower average potash selling prices, which are the basis for certain taxes. We are subject to Saskatchewan provincial resource taxes, including the potash production tax and the resource surcharge. | |
|
Adjusted EBITDA |
Adjusted EBITDA decreased in 2023 due to lower net realized selling prices, which more than offset higher North American sales volumes and lower provincial mining taxes and royalties. | |
| Nutrien Annual Report 2023 | 55 |
| Overview | MD&A | Five-year highlights | Financial statements and notes | |||||
|
Results |
||||||||
|
|
Canpotex sales by market
| (percentage of sales volumes, except as otherwise noted) | 2023 | 2022 | Change | |||||||||
| Latin America |
47 | 34 | 13 | |||||||||
| Other Asian markets 1 |
28 | 34 | (6 | ) | ||||||||
| Other markets |
11 | 10 | 1 | |||||||||
| China |
9 | 14 | (5 | ) | ||||||||
| India |
5 | 8 | (3 | ) | ||||||||
| 1 | All Asian markets except China and India. |
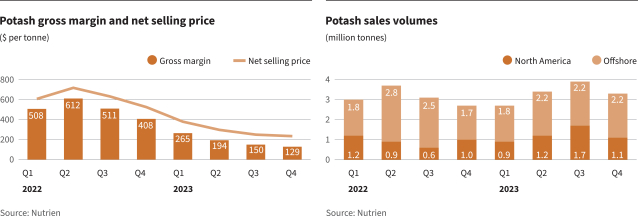
Potash production
|
|
|
Operational capability 2 | Production | |||||||||||||||||
| (million tonnes KCI) | Nameplate capacity 1 |
2024 | 2023 | 2023 | 2022 | |||||||||||||||
| Rocanville Potash |
6.5 | 5.1 | 5.2 | 4.97 | 4.89 | |||||||||||||||
| Allan Potash |
4.0 | 2.4 | 3.0 | 2.39 | 2.50 | |||||||||||||||
| Lanigan Potash |
3.8 | 3.0 | 3.1 | 2.89 | 2.46 | |||||||||||||||
| Vanscoy Potash |
3.0 | 1.1 | 1.4 | 1.05 | 1.01 | |||||||||||||||
| Cory Potash |
3.0 | 2.1 | 2.2 | 1.50 | 1.89 | |||||||||||||||
| Patience Lake Potash |
0.3 | 0.3 | 0.3 | 0.20 | 0.26 | |||||||||||||||
| Total |
20.6 | 14.0 | 15.2 | 13.00 | 13.01 | |||||||||||||||
| Shutdown weeks 3 |
|
|
|
|
|
|
|
|
|
5 | 18 | |||||||||
| 1 | Represents estimates of capacity as at December 31, 2023. Estimates based on capacity as per design specifications or Canpotex entitlements once determined. In the case of Patience Lake, estimate reflects current operational capability. Estimates for all other facilities do not necessarily represent operational capability. |
| 2 | Estimated annual achievable production based on expected staffing and operational readiness (estimated at the beginning of the year, and may vary during the year, and year-to-year, including between our facilities). Estimate does not include inventory-related shutdowns and unplanned downtime. |
| 3 | Represents weeks of full production shutdown, excluding the impact of any periods of reduced operating rates and planned routine annual maintenance shutdowns and announced workforce reductions. |
| 56 | Nutrien Annual Report 2023 |
| Overview | MD&A | Five-year highlights | Financial statements and notes | |||||
|
Results |
||||||||
|
|

|
2023 Nitrogen financial performance |
We generated adjusted EBITDA of $1.9 billion for our Nitrogen business, below the record levels of the prior year due to lower net realized selling prices for all major nitrogen products, which more than offset lower natural gas costs and higher sales volumes. Our increased sales volumes were primarily due to higher UAN production and sales, partially offset by lower ammonia availability mainly due to production outages at our plants in Trinidad. We recognized a $76 million non-cash impairment of our Trinidad property, plant and equipment due to a new natural gas contract and the resulting outlook for higher expected natural gas costs and constrained near-term availability. We expect improved natural gas availability in Trinidad as the development of additional gas fields is anticipated to add new supply starting in 2026.
|
|
Dollars | Tonnes (thousands) | Average per tonne | |||||||||||||||||||||||||||||||||
| (millions of US dollars, except as otherwise noted) |
2023 | 2022 | % Change |
2023 | 2022 | % Change |
2023 | 2022 | % Change |
|||||||||||||||||||||||||||
| Manufactured product |
||||||||||||||||||||||||||||||||||||
| Net sales |
||||||||||||||||||||||||||||||||||||
| Ammonia |
1,144 | 2,641 | (57 | ) | 2,436 | 2,715 | (10 | ) | 469 | 973 | (52 | ) | ||||||||||||||||||||||||
| Urea and ESN® 1 |
1,499 | 2,134 | (30 | ) | 3,125 | 3,014 | 4 | 480 | 708 | (32 | ) | |||||||||||||||||||||||||
| Solutions, nitrates and sulfates |
1,187 | 1,829 | (35 | ) | 4,862 | 4,551 | 7 | 244 | 402 | (39 | ) | |||||||||||||||||||||||||
| 3,830 | 6,604 | (42 | ) | 10,423 | 10,280 | 1 | 367 | 642 | (43 | ) | ||||||||||||||||||||||||||
| Cost of goods sold 1 |
2,435 | 3,370 | (28 | ) |
|
|
|
|
|
|
|
|
|
233 | 327 | (29 | ) | |||||||||||||||||||
| Gross margin – manufactured |
1,395 | 3,234 | (57 | ) | 134 | 315 | (57 | ) | ||||||||||||||||||||||||||||
| Gross margin – other 1, 2 |
(16 | ) | 47 | n/m | Depreciation and amortization | 55 | 54 | 2 | ||||||||||||||||||||||||||||
| Gross margin – total Expenses (income) 3,4 |
|
1,379 97 |
|
|
3,281 (92 |
) |
|
(58 n/m |
)
|
|
Gross margin
excluding |
|
|
189 |
|
|
369 |
|
|
(49 |
) |
|||||||||||||||
| EBIT |
1,282 | 3,373 | (62 | ) | |
Ammonia controllable
cash |
|
|
60 |
|
|
59 |
|
|
2 |
|
||||||||||||||||||||
| Depreciation and amortization |
572 | 558 | 3 | |||||||||||||||||||||||||||||||||
| EBITDA/Adjusted EBITDA |
1,854 | 3,931 | (53 | ) | ||||||||||||||||||||||||||||||||
| Adjustments 4 |
76 | – | n/m |
|
|
|
|
|
|
|
|
|
|
|
|
|
|
|
|
|
|
|||||||||||||||
| Adjusted EBITDA |
1,930 | 3,931 | (51 | ) |
|
|
|
|
|
|
|
|
|
|
|
|
|
|
|
|
|
|
||||||||||||||
| 1 | Certain immaterial 2022 figures have been reclassified. |
| 2 | Includes other nitrogen and purchased products and comprises net sales of $377 million (2022 – $929 million) less cost of goods sold of $393 million (2022 –$882 million). |
| 3 | Includes earnings from equity-accounted investees of $90 million (2022 – $233 million). |
| 4 | Includes non-cash impairment of assets of $76 million (2022 – nil). See Notes 3 and 13 to the consolidated financial statements. |
| 5 | These are non-GAAP financial measures. See the “Non-GAAP Financial Measures” section. |
| Nutrien Annual Report 2023 | 57 |
| Overview | MD&A | Five-year highlights | Financial statements and notes | |||||
|
Results |
||||||||
|
|
The most significant contributors to the changes in our Nitrogen financial performance were as follows:
|
|
2023 vs 2022 | |
|
Sales volumes |
Sales volumes were higher in 2023 primarily due to higher UAN production and sales, partially offset by lower ammonia availability mainly due to production outages at our plants in Trinidad. | |
|
Net realized selling price |
Net realized selling price was lower in 2023 for all major nitrogen products primarily due to weaker benchmark prices resulting from lower energy prices in key nitrogen producing regions. | |
|
Cost of goods sold per tonne |
Costs decreased in 2023 primarily due to lower natural gas costs. Raw materials and other input costs were also lower in 2023 compared to 2022 due to lower benchmark prices.
Ammonia controllable cash cost of product manufactured per tonne increased mainly due to the impact of lower ammonia production. |
|
|
Expenses (income) |
We recognized a $76 million non-cash impairment of our Trinidad property, plant and equipment due to a new natural gas contract and the resulting outlook for higher expected natural gas costs and constrained near-term availability. We expect improved natural gas availability in Trinidad as the development of additional gas fields is anticipated to add new supply starting in 2026. There was no comparable expense in 2022.
Other expenses (income) also increased in 2023 mainly due to lower earnings from our equity-accounted investment in Profertil. Profertil’s earnings were lower mainly due to lower urea net selling prices from lower benchmark prices. |
|
|
Adjusted EBITDA |
Adjusted EBITDA was lower in 2023 primarily due to lower net realized selling prices for all major nitrogen products, which more than offset lower natural gas costs and higher sales volumes. | |
Natural gas prices in cost of production
| (US dollars per MMBtu, except as otherwise noted) | 2023 | 2022 | % Change |
|||||||||
| Overall natural gas cost excluding realized derivative impact |
3.51 | 7.82 | (55 | ) | ||||||||
| Realized derivative impact |
(0.02 | ) | (0.05 | ) | (60 | ) | ||||||
| Overall natural gas cost |
3.49 | 7.77 | (55 | ) | ||||||||
| Average NYMEX |
2.74 | 6.64 | (59 | ) | ||||||||
| Average AECO |
2.17 | 4.28 | (49 | ) | ||||||||
|
|
2023 vs 2022 | |
|
Overall natural gas |
Natural gas prices in our cost of production decreased in 2023 as a result of lower North American natural gas index prices and decreased natural gas costs in Trinidad, where our natural gas prices are linked to ammonia benchmark prices. |
|
Selected Nitrogen measures
|
|
2023 | 2022 | ||||||
| Sales volumes (tonnes – thousands) |
||||||||
| Fertilizer 1 |
6,067 | 5,628 | ||||||
| Industrial and feed |
4,356 | 4,652 | ||||||
| Net sales (millions of US dollars) |
||||||||
| Fertilizer 1 |
2,450 | 3,726 | ||||||
| Industrial and feed |
1,380 | 2,878 | ||||||
| Net selling price per tonne |
||||||||
| Fertilizer 1 |
404 | 662 | ||||||
| Industrial and feed |
317 | 619 | ||||||
| 1 | Certain immaterial 2022 figures have been reclassified. |
| 58 | Nutrien Annual Report 2023 |
| Overview | MD&A | Five-year highlights | Financial statements and notes | |||||
|
Results |
||||||||
|
|
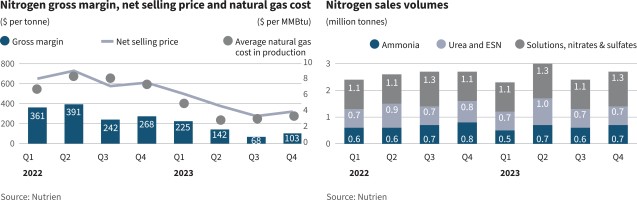
Nitrogen production
|
|
Ammonia 1 | Urea 2 | ||||||||||||||||||||||
| (million tonnes product, except as otherwise noted) | Annual capacity 3 |
Production | Annual capacity 3 |
Production | ||||||||||||||||||||
| 2023 | 2022 | 2023 | 2022 | |||||||||||||||||||||
| Trinidad Nitrogen 4 |
2.2 | 1.11 | 1.46 | 0.7 | 0.32 | 0.42 | ||||||||||||||||||
| Redwater Nitrogen |
0.9 | 0.89 | 0.78 | 0.7 | 0.76 | 0.55 | ||||||||||||||||||
| Augusta Nitrogen |
0.8 | 0.74 | 0.59 | 0.7 | 0.56 | 0.40 | ||||||||||||||||||
| Lima Nitrogen |
0.7 | 0.68 | 0.71 | 0.5 | 0.51 | 0.50 | ||||||||||||||||||
| Geismar Nitrogen |
0.5 | 0.43 | 0.58 | 0.4 | 0.30 | 0.37 | ||||||||||||||||||
| Carseland Nitrogen |
0.5 | 0.53 | 0.39 | 0.7 | 0.75 | 0.50 | ||||||||||||||||||
| Fort Saskatchewan Nitrogen |
0.5 | 0.39 | 0.47 | 0.4 | 0.35 | 0.44 | ||||||||||||||||||
| Borger Nitrogen |
0.5 | 0.24 | 0.41 | 0.6 | 0.31 | 0.49 | ||||||||||||||||||
| Joffre Nitrogen |
0.5 | 0.34 | 0.37 | – | – | – | ||||||||||||||||||
| Total |
7.1 | 5.35 | 5.76 | 4.7 | 3.86 | 3.67 | ||||||||||||||||||
| Adjusted total 5 |
|
|
|
3.90 | 3.93 |
|
|
|
|
|
|
|
|
|
||||||||||
| Ammonia operating rate 5 (%) |
|
|
|
88 | 90 |
|
|
|
|
|
|
|
|
|
||||||||||
| 1 | All figures are shown on a gross production basis. |
| 2 | Reflects capacity and production of urea liquor prior to final product upgrade. Urea liquor is used in the production of solid urea, UAN and DEF. |
| 3 | Annual capacity estimates include allowances for normal operating plant conditions. |
| 4 | In 2022 and 2023, Trinidad production was restricted due to natural gas curtailments, which are expected to extend into 2024. |
| 5 | Excludes Trinidad and Joffre. |
| Nutrien Annual Report 2023 | 59 |
| Overview | MD&A | Five-year highlights | Financial statements and notes | |||||
|
Results |
||||||||
|
|

|
2023 Phosphate financial | |||
| performance |
Our Phosphate business earned adjusted EBITDA of $470 million, lower compared to the prior year mainly due to lower net realized selling prices for fertilizer products, partially offset by lower ammonia and sulfur input costs. Our sales volumes increased primarily due to higher phosphate fertilizer demand, partially offset by lower first-half production impacting our industrial and feed sales. Our production was higher for the full year largely due to improved reliability at our Aurora plant. Included in the expenses for the full year of 2023, we recognized a $233 million non-cash impairment of our White Springs property, plant and equipment, while we had non-cash impairment reversals of our Phosphate assets of $780 million for the full year of 2022.
|
|
Dollars | Tonnes (thousands) | Average per tonne | |||||||||||||||||||||||||||||||||
| (millions of US dollars, except as otherwise noted) |
2023 | 2022 | % Change |
2023 | 2022 | % Change |
2023 | 2022 | % Change |
|||||||||||||||||||||||||||
| Manufactured product |
||||||||||||||||||||||||||||||||||||
| Net sales |
||||||||||||||||||||||||||||||||||||
| Fertilizer |
1,085 | 1,367 | (21 | ) | 1,912 | 1,696 | 13 | 568 | 806 | (30 | ) | |||||||||||||||||||||||||
| Industrial and feed |
645 | 706 | (9 | ) | 639 | 682 | (6 | ) | 1,010 | 1,035 | (2 | ) | ||||||||||||||||||||||||
| 1,730 | 2,073 | (17 | ) | 2,551 | 2,378 | 7 | 678 | 872 | (22 | ) | ||||||||||||||||||||||||||
| Cost of goods sold |
1,487 | 1,562 | (5 | ) |
|
|
|
|
|
|
|
|
|
583 | 657 | (11 | ) | |||||||||||||||||||
| Gross margin – manufactured |
243 | 511 | (52 | ) | 95 | 215 | (56 | ) | ||||||||||||||||||||||||||||
| Gross margin – other 1 |
(10 | ) | (18 | ) | (44 | ) | Depreciation and amortization | 115 | 79 | 46 | ||||||||||||||||||||||||||
| Gross margin – total Expenses (income) |
|
233 290 |
|
|
493 (693 |
) |
|
(53 n/m |
)
|
|
Gross margin
excluding |
|
210 | 294 | (29 | ) | ||||||||||||||||||||
| EBIT |
(57 | ) | 1,186 | n/m |
|
|
|
|
|
|
|
|
|
|
|
|
||||||||||||||||||||
| Depreciation and amortization |
294 | 188 | 56 | |||||||||||||||||||||||||||||||||
| EBITDA |
237 | 1,374 | (83 | ) | ||||||||||||||||||||||||||||||||
| Adjustments 3 |
233 | (780 | ) | n/m |
|
|
|
|
|
|
|
|
|
|
|
|
|
|
|
|
|
|
||||||||||||||
| Adjusted EBITDA |
470 | 594 | (21 | ) |
|
|
|
|
|
|
|
|
|
|
|
|
|
|
|
|
|
|
||||||||||||||
| 1 | Includes other phosphate and purchased products and comprises net sales of $263 million (2022 – $304 million) less cost of goods sold of $273 million (2022 – $322 million). |
| 2 | This is a non-GAAP financial measure. See the “Non-GAAP Financial Measures” section. |
| 3 | Includes non-cash impairment of assets of $233 million (2022 – reversal of non-cash impairment of assets of $780 million). See Notes 3 and 13 to the consolidated financial statements. |
The most significant contributors to the changes in our Phosphate financial performance were as follows:
|
|
2023 vs 2022 | |
|
Sales volumes |
Sales volumes increased in 2023 mostly due to higher phosphate fertilizer demand, partially offset by lower first-half year production impacting our industrial and feed sales. Production increased in 2023 largely due to improved reliability at our Aurora plant. | |
|
Net realized selling price |
Net realized selling prices decreased in 2023 primarily due to lower fertilizer net realized selling prices and lower industrial and feed net realized selling prices, which reflect the typical lag in price realizations relative to spot fertilizer prices. | |
|
Cost of goods sold per tonne |
Costs decreased in 2023 mainly due to lower ammonia and sulfur input costs, partially offset by higher depreciation and amortization resulting from the reversal of non-cash impairment of assets in 2022 (see details below). | |
|
Expenses (income) |
In 2023, we recognized a $233 million non-cash impairment of our White Springs property, plant and equipment, while we had non-cash impairment reversals of our Phosphate assets of $780 million in 2022. The impairments and impairment reversals were due to changes in our forecasted global prices driven by the prevailing macroeconomic environment. | |
|
Adjusted EBITDA |
Adjusted EBITDA decreased in 2023 mainly due to lower net realized selling prices for fertilizer products, partially offset by lower ammonia and sulfur input costs. | |
| 60 | Nutrien Annual Report 2023 |
| Overview | MD&A | Five-year highlights | Financial statements and notes | |||||
|
Results |
||||||||
|
|
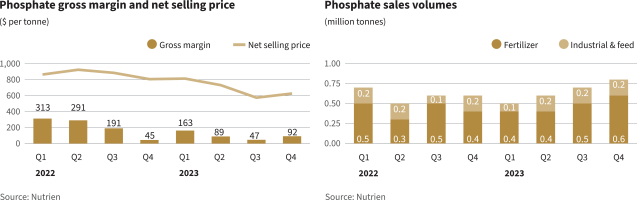
Phosphate production
|
|
Phosphate rock | Phosphoric acid (P2O5) | Liquid products | Solid fertilizer products | ||||||||||||||||||||||||||||||||||||||||||||
| (million tonnes, except as otherwise noted) |
Annual capacity |
Production | Annual capacity |
Production | Annual capacity |
Production | Annual capacity |
Production | ||||||||||||||||||||||||||||||||||||||||
| 2023 | 2022 | 2023 | 2022 | 2023 | 2022 | 2023 | 2022 | |||||||||||||||||||||||||||||||||||||||||
| Aurora Phosphate |
5.4 | 4.24 | 3.43 | 1.2 | 1.00 | 0.93 | 2.7 1 | 2.13 | 1.87 | 0.8 | 0.77 | 0.68 | ||||||||||||||||||||||||||||||||||||
| White Springs Phosphate |
2.0 | 1.27 | 1.42 | 0.5 | 0.40 | 0.42 | 0.7 2 | 0.33 | 0.39 | 0.8 | 0.33 | 0.30 | ||||||||||||||||||||||||||||||||||||
| Total |
7.4 | 5.51 | 4.85 | 1.7 | 1.40 | 1.35 | 3.4 | 2.46 | 2.26 | 1.6 | 1.10 | 0.98 | ||||||||||||||||||||||||||||||||||||
|
P2O5 operating rate (%) |
|
|
|
|
|
|
|
|
|
|
|
|
83 | 79 |
|
|
|
|
|
|
|
|
|
|
|
|
|
|
|
|
|
|
||||||||||||||||
| 1 | A substantial portion is consumed internally in the production of downstream products. The balance is exported to phosphate fertilizer producers or sold domestically to dealers who custom-mix liquid fertilizer. Capacity is composed of 2.0 million tonnes MGA and 0.7 million tonnes SPA. |
| 2 | Represents annual SPA capacity. A substantial portion is consumed internally in the production of downstream products. The balance is exported to phosphate fertilizer producers or sold domestically to dealers who custom-mix liquid fertilizer. |
In addition to the production above, annual capacity (in millions of tonnes) for phosphate feed and purified acid was 0.7 and 0.3, respectively. Production in 2023 was 0.30 and 0.16, respectively, and 2022 production was 0.33 and 0.18, respectively.
| Nutrien Annual Report 2023 | 61 |
| Overview | MD&A | Five-year highlights | Financial statements and notes | |||||
|
Results |
||||||||
|
|
2023 Corporate and Others financial performance
“Corporate and Others” is a non-operating segment comprising corporate and administrative functions that provide support and governance to our operating segments.
| (millions of US dollars, except as otherwise noted) | 2023 | 2022 | % Change | |||||||||
| Selling expense (recovery) |
– | (1 | ) | n/m | ||||||||
| General and administrative expenses |
364 | 326 | 12 | |||||||||
| Share-based compensation (recovery) expense |
(14 | ) | 63 | n/m | ||||||||
| Other expenses |
348 | 227 | 53 | |||||||||
| EBIT |
(698 | ) | (615 | ) | 13 | |||||||
| Depreciation and amortization |
81 | 71 | 14 | |||||||||
| EBITDA |
(617 | ) | (544 | ) | 13 | |||||||
| Adjustments 1 |
350 | 146 | 140 | |||||||||
| Adjusted EBITDA |
(267 | ) | (398 | ) | (33 | ) | ||||||
| 1 | See Note 3 to the consolidated financial statements. |
The most significant contributors to the changes in our Corporate and Others financial performance were as follows:
|
|
2023 vs 2022 | |
|
General and administrative expenses |
Increase in expenses was primarily due to higher staffing costs and higher depreciation and amortization expense. | |
|
Share-based compensation (recovery) expense |
Recovery in 2023 was due to decrease in the fair value of share-based awards outstanding relative to 2022. The fair value takes into consideration several factors such as our share price movement, our performance relative to our peer group and return on our invested capital. | |
|
Other expenses |
Increase in other expenses was mainly due to a $152 million higher expense related to asset retirement obligations and environmental costs resulting from changes in estimates related to our non-operating sites and a $92 million loss on Blue Chip Swaps incurred through trade transactions to remit cash from Argentina and higher foreign exchange losses in 2023. These expenses were partially offset by an $80 million gain in 2023 from amendments due to design plan changes to our other post-retirement benefit plans. Refer to Note 6 to the consolidated financial statements for details on the loss on Blue Chip Swaps. | |
Eliminations
Eliminations are not part of the Corporate and Others segment. Eliminations of sales between operating segments in 2023 were $1,650 million (2022 – $2,333 million) with a gross margin recovery of $69 million (2022 – $28 million elimination). These variances are due to lower intersegment selling prices and margins in 2023 as crop input prices decreased compared to the historical strong prices of 2022.
| 62 | Nutrien Annual Report 2023 |
| Overview | MD&A | Five-year highlights | Financial statements and notes | |||||
|
Results |
||||||||
|
|
Finance costs, income taxes and other comprehensive income (loss)
| (millions of US dollars, except as otherwise noted) | 2023 | 2022 | % Change | |||||||||
| Finance costs | 793 | 563 | 41 | |||||||||
| Income tax expense | 670 | 2,559 | (74 | ) | ||||||||
| Other comprehensive income (loss) | 81 | (177 | ) | n/m | ||||||||
The most significant contributors to the changes in our finance costs, income tax expense and other comprehensive income (loss) were as follows:
|
|
2023 vs 2022 |
|
|
|||||||
| Finance costs | Finance costs increased primarily due to higher interest rates and higher average long-term debt balances. |
|
||||||||
| Weighted Average Debt Balances and Rates (millions of US dollars, except as otherwise noted) |
||||||||||
|
|
2023 |
|
2022 | |||||||
| Short-term balance 1 | 3,988 | 3,975 | ||||||||
| Short-term rate (%) 1 | 6.1 | 3.0 | ||||||||
| Long-term balance (excluding lease obligations) | 9,112 | 7,839 | ||||||||
| Long-term rate (excluding lease obligations) (%) | 5.0 | 4.6 | ||||||||
| Lease obligations balance | 1,200 | 1,209 | ||||||||
|
|
Lease obligations rate (%) | 4.0 | 2.9 | |||||||
|
|
1 North American weighted average short-term debt balances were $3,306 million (2022 –
$3,529 million) and rates were 5.6 percent (2022 – 2.6 percent). |
|
||||||||
| Income tax expense | Income tax expense was lower in 2023 primarily as a result of lower earnings compared to 2022. The 2023 expense and effective tax rate reflect a $134 million income tax recovery due to changes to our tax declarations in Switzerland (“Swiss Tax Reform adjustment”, refer to Note 8 to the consolidated financial statements for additional information) and a $101 million income tax expense due to a change in recognition of deferred tax assets in our Retail – South America region. The 2023 effective tax rate also includes the impact of our losses in Retail – South America, wherein we did not recognize a corresponding deferred tax asset as it did not meet the accounting criteria for asset recognition. |
|
||||||||
| Effective tax rates and discrete items (millions of US dollars, except as otherwise noted) |
||||||||||
|
|
2023 |
|
2022 | |||||||
| Actual effective tax rate on earnings (%) | 33 | 25 | ||||||||
| Actual effective tax rate including discrete items (%) | 34 | 25 | ||||||||
|
|
Discrete tax adjustments that impacted the rate | 28 | 30 | |||||||
| Other comprehensive income (loss) | Other comprehensive income (loss) was primarily driven by changes in the currency translation of our Retail foreign operations primarily due to improvements of Canadian and Australian currencies relative to the US dollar in 2023. In 2023, we also recognized an actuarial gain on our defined benefit plans compared to a loss on the comparative period driven by changes in our financial and demographic assumptions and performance of our plan assets. |
|
||||||||
| Nutrien Annual Report 2023 | 63 |
| Overview | MD&A | Five-year highlights | Financial statements and notes | |||||
|
Results |
||||||||
|
|
Performance against 2023 targets
Executing on our financial and operating targets
In 2019, we set ambitious targets for 2023 focused on growing and improving the quality of our Retail earnings, increasing our potash and nitrogen volumes, and controlling our operating costs. These targets were designed to motivate our teams and align our strategies with our vision and values. We made progress towards achieving these targets during this period, however geopolitical events, supply chain disruptions and inflationary pressures impacted our results in 2023. As we enter 2024, we remain focused on our core business, improving the quality of our earnings, investing in high-value strategic initiatives and fortifying our business for the future.
|
|
2023 Target | 2023 Actuals | 2022 Actuals | |||||||||
| Nutrien Ag Solutions (“Retail”) |
||||||||||||
| Total Retail adjusted EBITDA margin (%) 1 |
>10.5 | 7.5 | 10.7 | |||||||||
| US Retail adjusted EBITDA margin (%) 1, 2 |
9.3 | 12.2 | ||||||||||
| Retail adjusted average working capital to sales (%) 3 |
17 | 19 | 17 | |||||||||
| Retail cash operating coverage ratio (%) 3 |
60 | 68 | 55 | |||||||||
| Retail adjusted EBITDA per US selling location (thousands of US dollars) 1,4 |
>1,100 | 1,394 | 1,923 | |||||||||
| Retail proprietary products as a % of total Retail margin |
29 | 23 | 24 | |||||||||
| Potash and Nitrogen |
||||||||||||
| Potash sales volumes (million tonnes) |
14.0-16.0 | 13.2 | 12.5 | |||||||||
| Potash controllable cash cost of product manufactured per tonne (US dollars) 2, 3 |
58 | 58 | ||||||||||
| Nitrogen sales volumes (million tonnes) 5 |
10.8-11.4 | 10.4 | 10.3 | |||||||||
| Ammonia operating rate (%) 6 |
96 | 88 | 90 | |||||||||
| Ammonia controllable cash cost of product manufactured per tonne (US dollars) 3 |
42 | 60 | 59 | |||||||||
| IFRS comparable information |
||||||||||||
| Potash cost of goods sold (million US dollars) 2 |
1,396 | 1,400 | ||||||||||
| Nitrogen manufactured cost of goods sold (million US dollars) 2 |
|
|
|
2,435 | 3,370 | |||||||
| 1 | This is a supplementary financial measure. See the “Other Financial Measures” section. |
| 2 | No target was provided. |
| 3 | This is a non-GAAP financial measure. See the “Non-GAAP Financial Measures” section. |
| 4 | Calculation is based on number of selling locations only, excluding acquisitions. |
| 5 | Includes manufactured product only. 2023 target includes ESN® products that prior to 2022 were included in the other category. |
| 6 | Operating rate represents production volumes divided by production capacity (excluding Joffre and Trinidad facilities). |
| 64 | Nutrien Annual Report 2023 |
| Overview | MD&A | Five-year highlights | Financial statements and notes | |||||
|
Results |
||||||||
|
|
2024 Guidance
We have revised our guidance practice in 2024 to provide forward looking estimates on those metrics that we believe are of value to our shareholders and are less impacted by fertilizer commodity prices. We continue to provide guidance for Retail adjusted EBITDA, fertilizer sales volumes and other key financial modeling metrics as well as fertilizer pricing sensitivities.
|
|
|
2024 Guidance Ranges1 as of February 21, 2024 |
|
|
||||||||||||||||||||
| (billions of US dollars, except as otherwise noted) |
|
Low |
|
High |
|
2023 Actual | ||||||||||||||||||
| Retail adjusted EBITDA |
1.65 | 1.85 | 1.5 | |||||||||||||||||||||
| Potash sales volumes (million tonnes) 2 |
13.0 | 13.8 | 13.2 | |||||||||||||||||||||
| Nitrogen sales volumes (million tonnes) 2 |
10.6 | 11.2 | 10.4 | |||||||||||||||||||||
| Phosphate sales volumes (million tonnes) 2 |
2.6 | 2.8 | 2.6 | |||||||||||||||||||||
| Depreciation and amortization |
2.2 | 2.3 | 2.2 | |||||||||||||||||||||
| Finance costs |
0.75 | 0.85 | 0.8 | |||||||||||||||||||||
| Effective tax rate on adjusted earnings (%) |
24.0 | 26.0 | 28.0 | |||||||||||||||||||||
| Capital expenditures 3 |
|
|
|
2.2 |
|
|
|
2.3 |
|
|
|
2.7 | ||||||||||||
| 1 | See the “Forward-Looking Statements” section. |
| 2 | Manufactured product only. |
| 3 | Comprised of sustaining capital expenditures, investing capital expenditures and mine development and pre-stripping capital expenditures which are supplementary financial measures. See the “Other Financial Measures” section. |
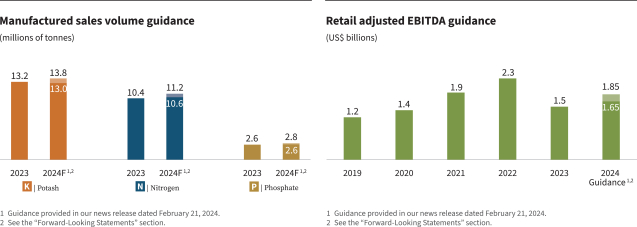
2024 Sensitivities
| 2024 Annual Sensitivities 1 | Effect on | |||||||
| (millions of US dollars, except EPS amounts) | Adjusted EBITDA | Adjusted EPS4 | ||||||
| $25/tonne change in net realized potash selling prices |
± 270 | ± 0.40 | ||||||
| $25/tonne change in net realized ammonia selling prices 2 |
± 40 | ± 0.05 | ||||||
| $25/tonne change in net realized urea and ESN® selling prices |
± 80 | ± 0.10 | ||||||
| $25/tonne change in net realized solutions, nitrates and sulfates selling prices |
± 130 | ± 0.20 | ||||||
| $1/MMBtu change in NYMEX natural gas price 3 |
± 190 | ± 0.30 | ||||||
| 1 | See the “Forward-Looking Statements” section. |
| 2 | Includes related impact on natural gas costs in Trinidad, which is linked to benchmark ammonia pricing. |
| 3 | Nitrogen related impact. |
| 4 | Assumes 496 million shares outstanding for all earnings per share (“EPS”) sensitivities. |
| Nutrien Annual Report 2023 | 65 |
| Overview | MD&A | Five-year highlights | Financial statements and notes | |||||
|
Results |
||||||||
|
|
Annual financial information
| (millions of US dollars, except as otherwise noted) | 2023 | 2022 | 2021 | |||||||||
| Sales |
29,056 | 37,884 | 27,712 | |||||||||
| Net earnings |
1,282 | 7,687 | 3,179 | |||||||||
| Basic net earnings per share (US dollars) |
2.53 | 14.22 | 5.53 | |||||||||
| Diluted net earnings per share (US dollars) |
2.53 | 14.18 | 5.52 | |||||||||
| Total assets |
52,749 | 54,586 | 49,954 | |||||||||
| Total non-current financial liabilities |
9,912 | 8,939 | 8,455 | |||||||||
| Dividends declared per share (US dollars) |
2.12 | 1.92 | 1.84 | |||||||||
|
|
2023 vs 2022 | 2022 vs 2021 | ||
|
Sales |
Sales decreased primarily due to lower net realized selling prices compared to the historically strong prices in 2022, partially offset by higher sales volumes for crop nutrients, potash and nitrogen. | Sales increased primarily due to higher net realized selling prices from global supply uncertainties across our nutrient segments, partially offset by lower sales volumes. Strong Retail performance due to higher selling prices and increased sales of proprietary products, which more than offset a reduction in crop nutrients sales volumes from a delayed North American planting season and earlier engagement in the prior year in a rising price environment. | ||
|
Net earnings |
Net earnings and earnings per share decreased primarily due to lower net realized selling prices across our nutrient segments due to a decline in benchmark prices. In 2023, we recorded $774 million non-cash impairments of our Retail – South America assets, Phosphate White Springs and Nitrogen Trinidad property, plant and equipment compared to non-cash impairment reversals of $780 million of Phosphate assets recorded in 2022. | Net earnings and earnings per share increased due to historically strong net realized selling prices across our nutrient segments and strong Retail performance supported by the strength of agriculture fundamentals. In 2022, we recorded non-cash impairment reversals of our Phosphate Aurora and White Springs property, plant and equipment. | ||
|
Assets and |
Total assets decreased approximately 3 percent from 2022 primarily due to lower receivables and inventories as we collected and sold through our higher-valued receivables and inventories from historically strong prices in 2022 and $774 million of non-cash impairments (as described above). This is partially offset by higher capital spending on property, plant and equipment.
Non-current financial liabilities increased due to the higher long-term debt from the issuance of new senior notes. |
Total assets increased approximately 10 percent from 2021. Our working capital assets increased from higher-valued receivables and inventories along with acquisition impacts. Property, plant and equipment increased primarily due to non-cash impairment reversals in the Phosphate segment.
Non-current financial liabilities increased due to the higher long-term debt from the issuance of new senior notes. |
||
|
Dividends |
Dividends declared per share increased as we declared a quarterly dividend per share of $0.53 in 2023 compared to $0.48 in 2022. | Dividends declared per share increased as we declared a quarterly dividend per share of $0.48 in 2022 compared to $0.46 in 2021. | ||
| 66 | Nutrien Annual Report 2023 |
| Overview | MD&A | Five-year highlights | Financial statements and notes | |||||
|
Results |
||||||||
|
|
Financial condition review
Balance sheet analysis
|
|
As at |
|
|
|||||||||||||
| (millions of US dollars, except as otherwise noted) | December 31, 2023 | December 31, 2022 | $ Change | % Change | ||||||||||||
| Assets | ||||||||||||||||
| Receivables | 5,398 | 6,194 | (796 | ) | (13 | ) | ||||||||||
| Inventories | 6,336 | 7,632 | (1,296 | ) | (17 | ) | ||||||||||
| Property, plant and equipment | 22,461 | 21,767 | 694 | 3 | ||||||||||||
| Goodwill | 12,114 | 12,368 | (254 | ) | (2 | ) | ||||||||||
| Liabilities and equity | ||||||||||||||||
| Short-term debt | 1,815 | 2,142 | (327 | ) | (15 | ) | ||||||||||
| Payables and accrued charges | 9,467 | 11,291 | (1,824 | ) | (16 | ) | ||||||||||
| Long-term debt | 8,913 | 8,040 | 873 | 11 | ||||||||||||
| Share capital | 13,838 | 14,172 | (334 | ) | (2 | ) | ||||||||||
| Retained earnings | 11,531 | 11,928 | (397 | ) | (3 | ) | ||||||||||
| Assets | Liabilities |
|||||
| Receivables decreased due to lower selling prices across all of our operating segments compared to a historically strong period in 2022. These were partially offset by a strategic extension of credit terms to our Retail customers resulting in increased usage of Nutrien Financial programs.
Inventories decreased across all operating segments as we sold through our higher-cost inventories on hand as related benchmark prices decreased and from lower input costs including royalties, natural gas and sulfur. In 2022, we also strategically procured certain products at larger quantities in anticipation of supply chain challenges.
Property, plant and equipment increased from capital expenditures related to our Potash and Nitrogen capital projects and turnarounds to maintain safe and reliable operations. This is partially offset by non-cash impairments on our Phosphate White Springs and Nitrogen Trinidad property, plant and equipment of $309 million.
Goodwill decreased due to the recognition of a non-cash impairment of $422 million related to our Retail - South America assets in 2023. |
Short-term debt decreased due to lower drawdowns on our credit facilities based on our working capital requirements.
Payables and accrued charges decreased due to lower accrual of income tax in 2023 compared to 2022, when we had historically strong earnings. Certain costs including products for resale, natural gas and sulfur input costs, and expenses tied to selling prices, such as provincial mining taxes also decreased. Payables also decreased from lower customer prepayments as a result of the lower commodity price environment and lower accruals for payroll expenses.
Long-term debt increased due to the issuance of $1.5 billion of senior notes in 2023, which exceeded the repayment of $500 million in senior notes upon maturity in the same period. |
|||||
| Shareholders’ equity |
||||||
| Share capital decreased primarily from shares repurchased under our normal course issuer bid program.
Retained earnings decreased as dividends declared and share repurchases exceeded net earnings. |
||||||
We do not hold material cash and cash equivalents in currencies other than the US dollar and Canadian dollar. As at December 31, 2023, we held approximately $243 million US dollar equivalent in other jurisdictions outside the US and Canada. We do not depend on repatriation of cash from our foreign subsidiaries to meet our liquidity and capital resource needs in North America.
| Nutrien Annual Report 2023 | 67 |
| Overview | MD&A | Five-year highlights | Financial statements and notes | |||||
|
Results |
||||||||
|
|
Liquidity and capital resources
Sources and uses of liquidity
Liquidity risk arises from our general funding needs and in the management of our assets, liabilities and capital structure. We manage liquidity risk to maintain sufficient liquid financial resources to fund our financial position and meet our commitments and obligations in a cost-effective manner. Our 2023 significant liquidity sources are listed below along with our expected ongoing primary uses of liquidity:
| Primary uses of liquidity | Primary sources of liquidity | |
| – inventory purchases and production – operational expenses – seasonal working capital requirements – capital expenditures to sustain and grow our safe, reliable and cost-efficient operations – business acquisitions – shareholder returns through dividends and share repurchases – principal payments of debt securities |
– cash from operations (including customer prepayments) – commercial paper issuances – increase of credit facility limits and drawdowns – debt capital markets |
|
We believe that our internally generated cash flow, supplemented by available borrowings under new or existing financing sources, if necessary, will be sufficient to meet our anticipated capital expenditures, planned growth and development activities, and other cash requirements for the foreseeable future. We do not reasonably expect any presently known trend or uncertainty to affect our ability to access our historical sources of liquidity.
Cash requirements
The following aggregated information about our contractual obligations and other commitments summarizes our liquidity and capital resource requirements as at December 31, 2023. Commitments reflect the estimated cash outflows for these obligations.
| Consolidated |
Payments due by period | |||||||||||||||||||||||
| (millions of US dollars) | Total | Within 1 year |
1 to 3 years |
3 to 5 years |
Over 5 years |
|||||||||||||||||||
| Long-term debt |
Notes 18, 26 | 9,214 | 512 | 1,528 | 870 | 6,304 | ||||||||||||||||||
| Estimated interest payments on long-term debt |
Note 26 | 6,125 | 454 | 796 | 686 | 4,189 | ||||||||||||||||||
| Lease liabilities |
Notes 19, 26 | 1,326 | 327 | 427 | 189 | 383 | ||||||||||||||||||
| Estimated interest payments on lease liabilities |
Note 26 | 199 | 41 | 57 | 33 | 68 | ||||||||||||||||||
| Purchase commitments |
Note 26 | 1,350 | 938 | 249 | 57 | 106 | ||||||||||||||||||
| Capital commitments |
Note 26 | 172 | 153 | 19 | – | – | ||||||||||||||||||
| Other commitments |
Note 26 | 715 | 188 | 221 | 149 | 157 | ||||||||||||||||||
| Derivatives |
Note 10 | 16 | 16 | – | – | – | ||||||||||||||||||
| Asset retirement obligations and accrued environmental costs |
Note 22 | 5,029 | 150 | 214 | 140 | 4,525 | ||||||||||||||||||
| Total |
24,146 | 2,779 | 3,511 | 2,124 | 15,732 | |||||||||||||||||||
The information presented in the table above does not include planned (but not legally committed) capital expenditures, business acquisitions or shareholder returns including share repurchases and dividends.
| 68 | Nutrien Annual Report 2023 |
| Overview | MD&A | Five-year highlights | Financial statements and notes | |||||
|
Results |
||||||||
|
|
We incurred $50 million of capital expenditures related to the completion of our GHG Phase 1 abatement program since 2021. We originally anticipated investing more than $500 million to achieve at least a 30 percent reduction in GHG emissions (Scope 1 and 2) per tonne of our products produced, from a baseline year of 2018, by 2030. We continue to evaluate our strategic emissions abatement projects, including for technical and economic feasibility, as well as estimates on our expected capital expenditures to achieve our 2030 emissions intensity reduction target.
For information on income taxes and pension and other post-retirement benefits funding, refer to Note 8 and Note 21, respectively, to the consolidated financial statements. Future cash requirements are subject to changes in regulations, actuarial assumptions and our expected operating results.
On February 21, 2024, our Board of Directors approved a share repurchase program of up to a maximum of 24,728,159, representing 5 percent of Nutrien’s outstanding common shares. The 2024 normal course issuer bid, which is subject to acceptance by the Toronto Stock Exchange, will commence on March 1, 2024. The share repurchase program will expire on the earlier of February 28, 2025, the date on which we have acquired the maximum number of common shares allowable or the date we determine not to make any further repurchases.
On February 21, 2024, our Board of Directors declared and increased our quarterly dividend to $0.54 per share payable on April 11, 2024, to shareholders of record on March 28, 2024. The total estimated dividend to be paid is $265 million.
Sources and uses of cash
| Cash provided by operating activities |
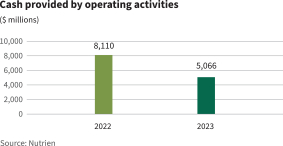
|
– Lower cash provided by operating activities from lower net realized selling prices across all segments compared to the historically strong benchmark prices in 2022. |
||
| Cash used in investing activities |
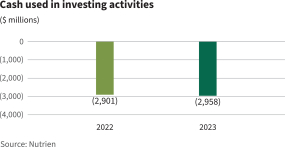
|
– Higher cash used in investing activities due to higher turnaround activities and investing capital expenditures as we completed our committed projects prior to our strategic actions to reduce capital spending. |
||
| Cash used in financing activities |
|
– Lower cash used in financing activities due to decreased share repurchases in 2023. We also had lower proceeds from our short-term and long-term debt in 2023 compared to 2022 by $500 million. |
||
| Nutrien Annual Report 2023 | 69 |
| Overview | MD&A | Five-year highlights | Financial statements and notes | |||||
|
Results |
||||||||
|
|
Capital structure and management
We manage our capital structure with a focus on maintaining a strong balance sheet, enabling a strong investment-grade credit rating.
Principal debt instruments
We use a combination of cash provided by operating activities and short-term and long-term debt to finance our operations.
Senior notes and debentures
As at December 31, 2023, our long-term debt consisted primarily of senior notes and debentures with the following maturities and interest rates:
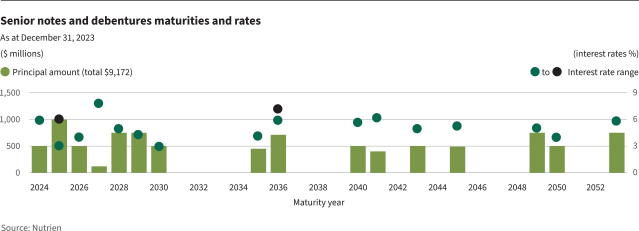
| Twelve Months Ended December 31 |
||||||||||||
|
|
Rate of interest (%) | Maturity | Amount | |||||||||
| Senior notes repaid 2023 | 1.9 | May 13, 2023 | 500 | |||||||||
| Senior notes issued 2023 | 4.9 | March 27, 2028 | 750 | |||||||||
| Senior notes issued 2023 | 5.8 | March 27, 2053 | 750 | |||||||||
|
|
|
|
|
|
|
|
1,500 | |||||
The senior notes issued in the twelve months ended December 31, 2023, are unsecured, rank equally with our existing unsecured debt, and have no sinking fund requirements prior to maturity. Each series is redeemable and has various provisions for redemption prior to maturity, at our option, at specified prices.
Credit facilities and other debt
We have several available credit facilities in the jurisdictions where we operate. We have a commercial paper program, which is limited to the undrawn amount under our $4,500 million unsecured revolving term credit facility and excess cash invested in highly liquid securities. As at December 31, 2023, we had a $1,175 million outstanding balance in commercial paper.
As at December 31, 2023, $252 million in letters of credit were outstanding and committed, with $203 million of remaining credit available under our dedicated letter of credit facilities.
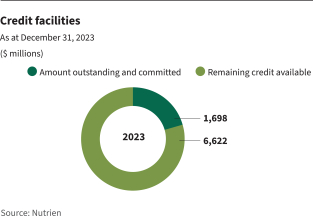
| 70 | Nutrien Annual Report 2023 |
| Overview | MD&A | Five-year highlights | Financial statements and notes | |||||
|
Results |
||||||||
|
|
Lease obligations
We also had lease obligations totaling $1,326 million (including current portion) with a weighted average effective interest rate of 4.3 percent as at December 31, 2023.
Debt covenants
Our credit facilities have financial tests and other covenants with which we must comply with at each quarter-end. Non-compliance with any such covenants could result in accelerated payment of amounts borrowed and termination of lenders’ further funding obligations under the credit facilities. We were in compliance with all such covenants as at December 31, 2023.
The table below summarizes the limit and result of our key financial covenant:
| As at December 31 | Limit | 2023 | ||||||
| Debt to capital ratio 1 | 0.65 : 1.00 | 0.33 : 1.00 | ||||||
| 1 | Refer to Note 24 to the consolidated financial statements for the detailed calculation. |
Credit ratings
Our ability to access reasonably priced debt in the capital markets depends, in part, on the quality of our credit ratings. We continue to maintain investment-grade credit ratings for our long-term debt. A downgrade of the credit rating of our long-term debt could increase the interest rates applicable to borrowings under our credit facilities.
Commercial paper markets are normally a source of same-day cash for us. Our access to the US commercial paper market primarily depends on maintaining our current short-term credit ratings as well as general conditions in the money markets.
| Long-term debt rating (outlook) | Short-term debt rating | |||||||||||||||
| As at December 31 | 2023 | 2022 | 2023 | 2022 | ||||||||||||
| Moody’s | Baa2 (stable) | Baa2 (stable) | P-2 | P-2 | ||||||||||||
| S&P | BBB (stable) | BBB (positive) | A-2 | A-2 | ||||||||||||
A credit rating is not a recommendation to buy, sell or hold securities. Such ratings may be subject to revision or withdrawal at any time by the respective credit rating agency and each rating should be evaluated independently of any other rating.
S&P’s stable outlook on Nutrien’s credit ratings means that the ratings are not likely to change (generally up to two years).
Outstanding share data
|
|
February 22, 2024 | |||
| Common shares | 494,563,180 | |||
| Options to purchase common shares | 3,214,971 | |||
For more information on our capital structure and management, see Note 24 to the consolidated financial statements.
| Nutrien Annual Report 2023 | 71 |
| Overview | MD&A | Five-year highlights | Financial statements and notes | |||||
|
Results |
||||||||
|
|
Other financial information
| Nature of financial information and consolidated financial statements note reference |
Description |
|
| Off-balance sheet arrangements | Principal off-balance sheet activities primarily include: | |
|
(Notes 10, 11, 22, 27 and 29) |
– Agreement to reimburse losses of Canpotex. – Issuance of guarantee contracts. – An agency arrangement with a financial institution in relation to certain customer loans. – Certain non-financial derivatives that were entered into and continued to be held for the purpose of the receipt or delivery of a non-financial item, such as grain or natural gas, in accordance with expected purchase, sale or usage requirements. Other derivatives are included on our balance sheet at fair value.
We do not reasonably expect any presently known trend or uncertainty to affect our ability to continue using these arrangements, except as indicated above. |
|
| Related party transactions
(Note 28) |
Our most significant related party is Canpotex, which provides us with low-cost marketing and logistics for the offshore potash markets that we serve. | |
| Financial instruments and other instruments
(Note 10) |
Our financial instruments are subject to various risks such as credit, liquidity and market risks. As discussed in the “Governance” section, our ELT is responsible for ensuring our principal risks, including financial risks, are being appropriately identified, assessed and addressed. |
Critical accounting estimates
We prepare our consolidated financial statements in accordance with IFRS, which requires us to make judgments, assumptions and estimates in applying accounting policies. Critical accounting estimates are those which are highly uncertain at the time they are made or where different estimates would be reasonably likely to have a material impact on our financial condition or results of operations. We have discussed the development, selection and application of our key accounting policies, and the critical accounting estimates and assumptions they involve, with the Audit Committee of the Board.
| 72 | Nutrien Annual Report 2023 |
| Overview | MD&A | Five-year highlights | Financial statements and notes | |||||
|
Results |
||||||||
|
|
Refer to the notes to the consolidated financial statements for additional information on the following critical accounting estimates including methodology used for calculating our estimates (when applicable), key assumptions used, and factors considered in our estimates and judgments.
| Consolidated financial statements note reference |
Critical accounting estimate description | |
| Note 13 and Note 30 |
Long-lived asset impairments and reversals
We review, at each reporting period, for conditions to determine whether there is any indication that an impairment exists that could potentially impact the carrying amount of our long-lived assets to be held and used. When such indicators exist, impairment testing is performed. We review, at each reporting period, for possible reversal of the impairment for non-financial assets, other than goodwill.
In 2023, we identified an impairment trigger for our Phosphate cash generating units (“CGUs”), White Springs and Aurora, primarily as a result of the decrease in our forecasted phosphate margins. As a result of the impairment analysis, we recorded a non-cash impairment of property, plant and equipment amounting to $233 million at our White Springs CGU as the recoverable amount was less than its carrying value. The White Springs CGU has a shorter expected mine life and is therefore more sensitive to changes in short- and medium-term forecasted phosphate margins. We determined there was no impairment for our Aurora CGU.
The White Springs CGU and Aurora CGU had recoverable amounts of $504 million and $2,000 million, respectively. The following table highlights sensitivities to the recoverable amounts which could result in additional impairment losses or reversals of the previously recorded losses (relating to the White Springs CGU). The sensitivities have been calculated independently of changes in other key variables. Dollar amounts are in millions, except as otherwise noted. |
|
| Change to recoverable amount ($) | ||||||||||||||||||||||||
|
|
Key assumptions as at June 30, 2023 | Change in assumption |
|
White Springs |
|
Aurora | ||||||||||||||||||
| Long-term growth rate (%) | +/-1.0 percent | n/a | +/-110 | |||||||||||||||||||||
| Pre-tax discount rate (%) | +/-1.0 percent | -/+20 | n/a | |||||||||||||||||||||
| Post-tax discount rate (%) | +/-1.0 percent | n/a | -/+190 | |||||||||||||||||||||
|
|
|
Forecasted EBITDA over forecast period ($) |
+/-5.0 percent | +/-40 | +/-220 | |||||||||||||||||||
| In 2023, we identified an impairment trigger for our Trinidad CGU, part of our Nitrogen segment, and recognized a $76 million non-cash impairment to property, plant and equipment, due to a new natural gas contract and the resulting outlook for higher expected natural gas costs and constrained near-term availability. We expect improved natural gas availability in Trinidad as the development of additional natural gas fields is anticipated to add new natural gas supply starting in 2026.
The Trinidad CGU had a recoverable amount of $676 million. The following table highlights sensitivities to the recoverable amount of our Trinidad CGU, which could result in additional impairment losses or reversals of the previously recorded losses. The sensitivities have been calculated independently of changes in other key variables. Dollar amounts are in millions, except as otherwise noted. |
|
|
Key assumptions as at December 31, 2023 | Change in assumption |
|
Change to recoverable amount ($) | ||||||||||||
| Long-term growth rate (%) | +/-1.0 percent | +/-55 | ||||||||||||||
| Post-tax discount rate (%) | +/-1.0 percent | -/+95 | ||||||||||||||
|
|
|
Forecasted EBITDA over forecast period ($) |
+/-5.0 percent | +/-100 | ||||||||||||
| Nutrien Annual Report 2023 | 73 |
| Overview | MD&A | Five-year highlights | Financial statements and notes | |||||
|
Results |
||||||||
|
|
| Financial statement reference |
Critical accounting estimate description | |
| Note 14 and Note 30 |
Goodwill impairment indicators
We test our operating segments that have goodwill allocated to them when events or circumstances indicate that there could be an impairment, or at least annually on October 1. The key assumptions with the greatest influence on the calculation of the recoverable amounts are the discount rates, terminal growth rates and forecasted EBITDA. The key forecast assumptions were based on historical data and our estimates of future results from internal sources considering industry and market information. Key assumptions in our testing models may change, and changes that could reasonably be expected to occur may cause impairment. Such change in assumptions could be driven by global supply and demand, other market factors, changes in regulations, and other future events outside our control. |
|
| Recent acquisitions in Brazil resulted in goodwill being recognized for our Retail – South America group of CGUs. Goodwill is more susceptible to impairment risk if business operating results or economic conditions deteriorate and we anticipate not meeting our forecasts. In 2023, we revised our forecasted EBITDA for the Retail – South America group of CGUs, which triggered an impairment analysis. Due to the impact of crop input price volatility, more moderate long-term growth assumptions and higher interest rates, we lowered our product margin expectations and deferred certain of our planned strategic investments. As a result, this reduced our forecasted EBITDA and growth. As at June 30, 2023, the Retail – South America group of CGUs recoverable amount was lower than its carrying amount. As a result, we fully impaired goodwill of $422 million and recorded a $43 million impairment of intangible assets for a total of $465 million for the Retail – South America group of CGUs. |
||
| The following table highlights sensitivities to the recoverable amount which could have resulted in additional impairment against the carrying amount of intangible assets and property, plant and equipment. The sensitivities have been calculated independently of changes in other key variables. Dollar amounts are in millions, except as otherwise noted. |
||
|
|
Key assumptions as at June 30, 2023 | Change in key assumption | Decrease to recoverable amount ($) |
|||||||||
| Terminal growth rate (%) | -1.0 percent | 50 | ||||||||||
| Discount rate (%) | +1.0 percent | 120 | ||||||||||
|
|
|
Forecasted EBITDA over forecast period ($) | -5.0 percent | 100 | ||||||||
| The Retail – North America group of CGUs has $6,981 million in associated goodwill and at the annual testing date of October 1, 2023, the recoverable amount did not substantially exceed its carrying amount. The Retail – North America group of CGUs recoverable amount exceeds its carrying amount by $570 million. The following table indicates the percentage by which key assumptions would need to change individually for the estimated recoverable amount to be equal to the carrying amount. Dollar amounts are in millions, except as otherwise noted. |
||
|
|
2023 Annual impairment testing | Key assumption used in impairment model |
Change required for carrying amount to equal recoverable amount |
|||||||||
| Terminal growth rate (%) | 2.5 | 0.4 percent decrease | ||||||||||
| Discount rate (%) | 8.6 | 0.2 percent increase | ||||||||||
|
|
|
Forecasted EBITDA over forecast period ($) |
8,040 | 3.0 percent decrease | ||||||||
|
Note 22 and Note 30 |
Asset retirement obligations (“AROs”) and accrued environmental costs (“ERLs”) – measurement
AROs and ERLs have a high degree of estimation uncertainty for future costs and estimated remediation timelines. The Potash and Phosphate segments have AROs and ERLs associated with their mining operations while the Corporate and Others segment has these liabilities associated with non-operational mines. |
|
| For the Nitrogen segment, there are no significant AROs recorded as there is no reasonable basis for estimating a date or range of dates of cessation of operations. We considered the historical performance of our facilities as well as our planned maintenance, major upgrades and replacements, which can extend the useful lives of our facilities indefinitely. |
||
| 74 | Nutrien Annual Report 2023 |
| Overview | MD&A | Five-year highlights | Financial statements and notes | |||||
|
Results |
||||||||
|
|
Quarterly results
| 2023 | 2022 | |||||||||||||||||||||||||||||||
| (millions of US dollars, except as otherwise noted) | Q4 | Q3 | Q2 | Q1 | Q4 | Q3 | Q2 | Q1 | ||||||||||||||||||||||||
| Sales | 5,664 | 5,631 | 11,654 | 6,107 | 7,533 | 8,188 | 14,506 | 7,657 | ||||||||||||||||||||||||
| Net earnings | 176 | 82 | 448 | 576 | 1,118 | 1,583 | 3,601 | 1,385 | ||||||||||||||||||||||||
| Net earnings attributable to equity holders of Nutrien | 172 | 75 | 440 | 571 | 1,112 | 1,577 | 3,593 | 1,378 | ||||||||||||||||||||||||
| Net earnings per share attributable to equity holders of Nutrien |
||||||||||||||||||||||||||||||||
| Basic |
0.35 | 0.15 | 0.89 | 1.14 | 2.15 | 2.95 | 6.53 | 2.49 | ||||||||||||||||||||||||
| Diluted |
0.35 | 0.15 | 0.89 | 1.14 | 2.15 | 2.94 | 6.51 | 2.49 | ||||||||||||||||||||||||
Seasonality in our business results from increased demand for products during planting season. Crop input sales are generally higher in spring and fall application seasons. Crop input inventories are normally accumulated leading up to each application season. The results of this seasonality have a corresponding effect on receivables from customers and rebates receivables, inventories, prepaid expenses and other current assets, and trade payables. Our short-term debt also fluctuates during the year to meet working capital needs. Our cash collections generally occur after the application season is complete, while customer prepayments made to us are typically concentrated in December and January and inventory prepayments paid to our vendors are typically concentrated in the period from November to January. Feed and industrial sales are more evenly distributed throughout the year.
Our earnings are significantly affected by fertilizer benchmark prices, which have been volatile over the last two years and are affected by demand-supply conditions, grower affordability and weather.
Other material transactions or events that impacted our quarterly results included:
| Quarter | Transaction or event | |
|
2023 Q2 |
$698 million non-cash impairment of assets comprising a $233 million non-cash impairment of our Phosphate White Springs property, plant and equipment due to a decrease in our forecasted phosphate margins and a $465 million non-cash impairment of our Retail – South America assets primarily related to goodwill mainly due to the impact of crop input price volatility, more moderate long-term growth assumptions and higher interest rates which lowered our forecasted earnings. |
|
|
2022 Q3 |
$330 million reversal of non-cash impairment of our Phosphate White Springs property, plant and equipment related to higher forecasted global prices and a more favorable outlook for phosphate margins. |
|
|
2022 Q2 |
$450 million reversal of non-cash impairment of our Phosphate Aurora property, plant and equipment related to higher forecasted global prices and a more favorable outlook for phosphate margins. |
|
| Nutrien Annual Report 2023 | 75 |
| Overview | MD&A | Five-year highlights | Financial statements and notes | |||||
|
Results |
||||||||
|
|
Fourth quarter financial performance
| (millions of US dollars, except as otherwise noted) |
Sales |
Gross margin |
||||||||||||||||||||||
| Three months ended December 31 | 2023 | 2022 | % Change | 2023 | 2022 | % Change | ||||||||||||||||||
| Retail | ||||||||||||||||||||||||
| Crop nutrients |
1,808 | 2,320 | (22 | ) | 346 | 349 | (1 | ) | ||||||||||||||||
| Crop protection products |
960 | 981 | (2 | ) | 333 | 413 | (19 | ) | ||||||||||||||||
| Seed |
202 | 251 | (20 | ) | 36 | 46 | (22 | ) | ||||||||||||||||
| Merchandise |
251 | 264 | (5 | ) | 41 | 41 | – | |||||||||||||||||
| Nutrien Financial |
70 | 62 | 13 | 70 | 62 | 13 | ||||||||||||||||||
| Services and other |
236 | 237 | – | 188 | 194 | (3 | ) | |||||||||||||||||
| Nutrien Financial elimination 1 |
(25 | ) | (28 | ) | (11 | ) | (25 | ) | (28 | ) | (11 | ) | ||||||||||||
| Total |
3,502 | 4,087 | (14 | ) | 989 | 1,077 | (8 | ) | ||||||||||||||||
| 1 Represents elimination for the interest and service fees charged by Nutrien Financial to Retail branches.
|
|
|||||||||||||||||||||||
| (US dollars, except as otherwise noted) | Manufactured product sales tonnes (thousands) | Manufactured product average per tonne | ||||||||||||||||||||||
| Three months ended December 31 | 2023 | 2022 | % Change | 2023 | 2022 | % Change | ||||||||||||||||||
| Potash | ||||||||||||||||||||||||
| North America |
1,089 | 959 | 14 | 342 | 560 | (39 | ) | |||||||||||||||||
| Offshore |
2,214 | 1,659 | 33 | 182 | 506 | (64 | ) | |||||||||||||||||
| Sales |
3,303 | 2,618 | 26 | 235 | 526 | (55 | ) | |||||||||||||||||
| Cost of goods sold |
|
|
|
|
|
|
|
|
|
106 | 118 | (10 | ) | |||||||||||
| Gross margin |
|
|
|
|
|
|
|
|
|
129 | 408 | (68 | ) | |||||||||||
| Nitrogen | ||||||||||||||||||||||||
| Ammonia |
651 | 776 | (16 | ) | 416 | 887 | (53 | ) | ||||||||||||||||
| Urea and ESN® 1 |
739 | 764 | (3 | ) | 428 | 666 | (36 | ) | ||||||||||||||||
| Solutions, nitrates and sulfates |
1,344 | 1,056 | 27 | 215 | 368 | (42 | ) | |||||||||||||||||
| Sales |
2,734 | 2,596 | 5 | 321 | 611 | (47 | ) | |||||||||||||||||
| Cost of goods sold 1 |
|
|
|
|
|
|
|
|
|
218 | 343 | (36 | ) | |||||||||||
| Gross margin |
|
|
|
|
|
|
|
|
|
103 | 268 | (62 | ) | |||||||||||
| Phosphate | ||||||||||||||||||||||||
| Fertilizer |
579 | 391 | 48 | 557 | 700 | (20 | ) | |||||||||||||||||
| Industrial and feed |
174 | 140 | 24 | 860 | 1,107 | (22 | ) | |||||||||||||||||
| Sales |
753 | 531 | 42 | 627 | 807 | (22 | ) | |||||||||||||||||
| Cost of goods sold |
|
|
|
|
|
|
|
|
|
535 | 762 | (30 | ) | |||||||||||
| Gross margin |
|
|
|
|
|
|
|
|
|
92 | 45 | 104 | ||||||||||||
| 1 | Certain immaterial 2022 figures have been reclassified. |
| 76 | Nutrien Annual Report 2023 |
| Overview | MD&A | Five-year highlights | Financial statements and notes | |||||
|
Results |
||||||||
|
|
|
|
|
|
Three months ended December 31 | |||||||||||||||||||||
| (millions of US dollars, except as otherwise noted) |
|
|
2023 | 2022 | % Change | |||||||||||||||||||
| Adjusted EBITDA | ||||||||||||||||||||||||
| Retail |
229 | 391 | (41 | ) | ||||||||||||||||||||
| Potash |
463 | 958 | (52 | ) | ||||||||||||||||||||
| Nitrogen |
391 | 841 | (54 | ) | ||||||||||||||||||||
| Phosphate |
130 | 28 | 364 | |||||||||||||||||||||
| Corporate and others |
(117 | ) | (180 | ) | (35 | ) | ||||||||||||||||||
| Eliminations |
(21 | ) | 57 | n/m | ||||||||||||||||||||
| Adjusted EBITDA1 |
|
|
|
|
|
|
|
|
|
1,075 | 2,095 | (49 | ) | |||||||||||
| Net earnings |
|
|
|
|
|
|
|
|
|
176 | 1,118 | (84 | ) | |||||||||||
| 1 This is a non-GAAP financial measure. See the “Non-GAAP Financial Measures” section for further information. |
||||||||||||||||||||||
Highlights of our 2023 fourth quarter compared to the 2022 fourth quarter results were as follows:
|
|
Q4 2023 vs Q4 2022 | |
|
Retail |
Gross margin decreased in 2023 primarily due to lower gross margin for crop protection products. Crop protection products sales were lower primarily due to decreased selling prices compared to the historically strong comparable period in 2022. This was partially offset by higher sales in North America as growers returned to more normalized buying behaviors. Crop nutrients sales and gross margin decreased due to lower selling prices across all regions compared to the strong comparable period in 2022. Sales volumes increased as growers returned to more normalized application rates to replenish nutrients in the soil. Seed sales and gross margin decreased due to lower soybean sales volumes and competitive market prices in Latin America. |
|
|
Potash |
Gross margin decreased due to lower net realized selling prices, which more than offset higher North American and Offshore sales volumes and lower royalties. Net realized selling price decreased compared to the historically strong period in 2022, due to a decline in benchmark prices and higher costs related to logistical challenges at Canpotex’s West Coast port facilities. Sales volumes in North America were higher due to lower channel inventory and increased grower demand supported by an extended fall application window and improved affordability. Offshore sales volumes were driven by stronger demand in Brazil and China. Cost of goods sold per tonne decreased mainly due to lower royalties and reduced turnaround activity. |
|
|
Nitrogen |
Gross margin was lower due to lower net realized selling prices for all major nitrogen products, which more than offset lower natural gas costs and higher sales volumes. Net realized selling price was lower for all major nitrogen products primarily due to weaker benchmark prices resulting from lower energy prices in key nitrogen producing regions. Sales volumes were higher primarily due to higher UAN production and sales, partially offset by lower ammonia availability mainly due to unplanned production outages at our plants in Trinidad. Cost of goods sold per tonne decreased mainly due to lower natural gas costs.
We recognized a $76 million non-cash impairment of our Trinidad property, plant and equipment due to a new natural gas contract and the resulting outlook for higher expected natural gas costs and constrained near-term availability. We expect improved natural gas availability in Trinidad as the development of additional gas fields is anticipated to add new supply starting in 2026. |
|
|
Phosphate |
Gross margin increased primarily due to lower sulfur and ammonia input costs, partially offset by lower net realized selling prices. Net realized selling price decreased primarily due to lower fertilizer net realized selling prices from weaker benchmark prices and lower industrial and feed net realized selling prices, which reflect the typical lag in price realizations relative to spot fertilizer prices. Sales volumes increased mostly due to higher phosphate fertilizer demand. Cost of goods sold per tonne decreased mainly due to lower ammonia and sulfur costs, partially offset by higher depreciation from reversal of non-cash impairments in 2022. |
|
|
Other fourth quarter financial highlights |
The Corporate and Others segment reflects $142 million of higher expenses for asset retirement obligations and accrued environmental costs related to our non-operating sites due to changes in closure cost estimates. Finance costs were higher primarily due to higher interest rates and higher average long-term debt balances. Income tax expense and effective tax rate reflect a $134 million income tax recovery due to changes to our tax declarations in Switzerland (“Swiss Tax Reform adjustment”). The fourth quarter 2023 effective tax rate also includes the impact of our losses in Retail – South America, wherein we did not recognize a corresponding deferred tax asset as it did not meet the accounting criteria for asset recognition. |
|
| Nutrien Annual Report 2023 | 77 |
| Overview | MD&A | Five-year highlights | Financial statements and notes | |||||
|
Results |
||||||||
|
|
Controls and procedures
Disclosure controls and procedures
We maintain disclosure controls and procedures designed to provide reasonable assurance that information required to be disclosed by Nutrien in its annual filings, interim filings (as these terms are defined in National Instrument 52-109 – Certification of Disclosure in Issuers’ Annual and Interim Filings (“NI 52-109”)), and other reports filed or submitted by us under securities legislation is recorded, processed, summarized and reported within the required time periods. Our Chief Executive Officer and Chief Financial Officer, after evaluating the effectiveness of our disclosure controls and procedures as of the end of the period covered by the annual filings, being December 31, 2023, have concluded that, as of such date, our disclosure controls and procedures were effective in providing reasonable assurance that information required to be disclosed by Nutrien in its annual filings, interim filings, or other reports filed or submitted by it under securities legislation is (a) recorded, processed, summarized and reported within the time periods specified in the securities legislation, and (b) accumulated and communicated to management, including our Chief Executive Officer and Chief Financial Officer, as appropriate, to allow timely decisions regarding required disclosure.
There are inherent limitations to the effectiveness of any system of disclosure controls and procedures, including the possibility of human error and the circumvention or overriding of the controls and procedures. Accordingly, even effective disclosure controls and procedures can only provide reasonable assurance of achieving their control objectives.
Internal control over financial reporting
Management is responsible for establishing and maintaining adequate internal control over financial reporting, as defined in Rules 13a-15(f) and 15d-15(f) under the Securities Exchange Act of 1934, as amended, and NI 52-109. Internal control over financial reporting is designed to provide reasonable assurance regarding the reliability of financial reporting and preparation of consolidated financial statements for external purposes in accordance with IFRS.
Under the supervision and with the participation of our management, including our Chief Executive Officer and Chief Financial Officer, we conducted an evaluation of the design and effectiveness of our internal control over financial reporting as of the end of the fiscal year covered by this report based on the framework issued by the Committee of Sponsoring Organizations of the Treadway Commission in Internal Control – Integrated Framework (2013). Based on this evaluation, our Chief Executive Officer and Chief Financial Officer concluded that, as at December 31, 2023, Nutrien Ltd. did maintain effective internal control over financial reporting. There have been no changes that have materially affected, or are reasonably likely to materially affect, our internal control over financial reporting.
The effectiveness of the Company’s internal control over financial reporting as at December 31, 2023 was audited by KPMG LLP, as reflected in their report, which is included in this 2023 Annual Report.
| 78 | Nutrien Annual Report 2023 |
| Overview | MD&A | Five-year highlights | Financial statements and notes | |||||
|
Results |
||||||||
|
|
Forward-looking statements
Certain statements and other information included in this document, including within the “2024 Guidance” section and the “Market outlook” sections for each segment, constitute “forward-looking information” or “forward-looking statements” (collectively, “forward-looking statements”) under applicable securities laws (such statements are often accompanied by words such as “anticipate”, “forecast”, “expect”, “believe”, “may”, “will”, “should”, “estimate”, “project”, “intend” or other similar words). All statements in this document, other than those relating to historical information or current conditions, are forward-looking statements, including, but not limited to:
Nutrien’s business strategies, plans, prospects and opportunities; Nutrien’s 2024 annual guidance, including expectations regarding our Retail adjusted EBITDA, Potash sales volumes, Nitrogen sales volumes, Phosphate sales volumes, depreciation and amortization, finance costs, effective tax rate on adjusted earnings and capital expenditures; our projections to generate strong cash from operations and expectations regarding our capital allocation intentions and strategies, including with respect to expansion of our portfolio of advanced nutrition products and overall growth of the Retail platform and network optimization initiatives; our ability to advance strategic initiatives and high value growth investments, including expectations regarding our ability to serve growers, maintain a low-cost position of fertilizer production assets and increase free cash flow; capital spending expectations for 2024 and beyond, including spending related to advancement of proprietary products, network optimization and digital capabilities in Retail, automation in Potash mining, and brownfield expansions in Nitrogen; expectations regarding our ability to generate free cash flow and return capital to our shareholders, including our expectations regarding stable and growing dividends; our ability to reduce our GHG emissions, and the initiatives in connection therewith, including the expected impacts in connection with the installment of our final N2O abatement project; expectations and forecasts relating to our Aurora and White Springs CGUs and the reversals and impairments (as applicable) associated therewith; our ability to advance strategic growth initiatives; the expected impacts and timing of new supply from additional gas fields in Trinidad; the resulting outlook of higher expected gas costs and lower near-term availability from the new natural gas contract related to our Trinidad property, plant and equipment in our Nitrogen segment and the impairments associated therewith; capital spending expectations for 2024 and beyond, including our intention to reduce planned capital expenditures in 2024 and our goal to continuously improve in our initiatives and make selective and strategic investments; expectations regarding Retail inventory levels in North America; expectations regarding performance of our operating segments in 2024, including increased fertilizer sales volumes and growth in Retail earnings; our operating segment market outlooks and our expectations for global market conditions and fundamentals in 2024 and beyond, including agriculture and crop nutrient markets and global energy supply, the anticipated supply and demand for our products and services, expected market, industry and growing conditions with respect to crop nutrient application rates, planted acres, grower crop investment, crop mix, including the need to replenish soil nutrient levels, production volumes and expenses, shipments, natural gas costs and availability, consumption, prices, operating rates, the impact of seasonality, import and export volumes, economic sanctions, inventories, crop development, natural gas curtailments in Trinidad and elsewhere, and global population growth expectations; the expected impact on nitrogen volume growth of completed brownfield expansions at our Geismar site and the anticipated effects of our UAN debottleneck projects; expectations concerning future product offerings; expectations regarding changes in the agriculture space, including continued farm consolidation in the US and other developed markets and the continued advancement and adoption of technology and digital innovations, including the use and anticipated effects of autonomous mining and reliability improvements, new crop input technologies, artificial technology, biostimulants, biological product technologies and advanced nutrition products, and agronomic capabilities; expectations regarding environmental compliance requirements and costs, including estimates of asset retirement obligations, federal and provincial carbon pricing, permits, approvals and site assessment and remediation costs; expectations regarding our sustainability initiatives and our proposed responses to climate change, including our GHG emissions reduction strategy and related programs and initiatives, our various sustainability performance goals, targets, costs, capital expenditures, commitments and aspirations as set out in our Feeding the Future Plan and the 2023 ESG Report; our evaluation of future opportunities with respect to the suspended Geismar clean ammonia project; the negotiation of sales and other contracts, including the expiry of existing contracts; initiatives to promote innovative, sustainable and productive agriculture; timing and impacts of plant turnarounds; acquisitions and divestitures and the anticipated benefits thereof; and expectations in connection with our ability to deliver long-term returns to shareholders.
These forward-looking statements are subject to a number of assumptions, risks and uncertainties, many of which are beyond our control, which could cause actual results to differ materially from such forward-looking statements. As such, undue reliance should not be placed on these forward-looking statements.
All of the forward-looking statements are qualified by the assumptions that are stated or inherent in such forward-looking statements, including the assumptions referred to below and elsewhere in this document. Although we believe that these assumptions are reasonable, having regard to our experience and our perception of historical trends, the assumptions set forth below are not exhaustive of the factors that may affect any of the forward-looking statements and the reader should not place undue reliance on these assumptions and such forward-looking statements. Current conditions, economic and otherwise, render assumptions, although reasonable when made, subject to greater uncertainty.
Mid-cycle scenarios are based on medium-term estimates for manufactured sales volumes and Retail adjusted EBITDA. Mid-cycle pricing assumptions are based on a ten-year historical average of fertilizer benchmark pricing from June 2013 to June 2023, plus approximately $50 per tonne. In respect of our mid-cycle scenario estimates, we have made assumptions with respect to, among other things: our expectations for global economic conditions including supply and demand for fertilizer, fertilizer and commodity prices and global potash volumes returning to historical trend line growth rates; our expectations for our logistics and production capacity; our expectations for Retail margin normalization; our ability to increase sales volumes as global demand grows; and our expectations for access to and availability of capital, foreign exchange, inflation and interest rates, costs and availability of labor and technology.
In respect of our GHG emissions reduction and other sustainability and climate-related initiatives and targets, we have made assumptions with respect to, among other things: that such target is achievable by deploying capital into N2O abatement at our nitric acid production facilities,
energy efficiency improvements, carbon capture, utilization and storage, use of natural gas to generate electricity and waste heat recovery; our ability to successfully deploy capital and pursue other operational measures, including the successful application to our current and future operations of existing and new technologies; the successful implementation by us of proposed or potential plans in respect thereof; projected capital investment levels, the flexibility of our capital spending plans and the associated sources of funding; our expectations for our production mix between nitrogen, phosphate and potash and grid decarbonization (including timing thereof); our ability to otherwise implement all
| Nutrien Annual Report 2023 | 79 |
| Overview | MD&A | Five-year highlights | Financial statements and notes | |||||
|
Results |
||||||||
|
|
technology necessary to achieve our GHG emissions reduction and other sustainability and climate-related initiatives and targets; and the development, availability and performance of technology and technological innovations and associated expected future results. Additional key assumptions that have been made in relation to the operation of our business as currently planned and our ability to achieve our business objectives include, among other things, assumptions with respect to our ability to successfully implement our business strategies, growth and capital allocation investments and initiatives that we will conduct our operations and achieve results of operations as anticipated; our ability to successfully complete, integrate and realize the anticipated benefits of our already completed and future acquisitions and divestitures, and that we will be able to implement our standards, controls, procedures and policies in respect of any acquired businesses and realize the expected synergies on the anticipated timeline or at all; that future business, regulatory and industry conditions will be within the parameters expected by us, including with respect to prices, expenses, margins, demand, supply, product availability, shipments, consumption, weather conditions, including the current El Niño weather pattern, supplier agreements, product distribution agreements, availability, inventory levels, exports, crop development and cost of labor and interest, exchange and effective tax rates; assumptions with respect to global economic conditions and the accuracy of our market outlook expectations for 2024 and beyond; assumptions related to our assessment of recoverable amount estimates of our assets, including in relation to our Retail – South America group of CGUs goodwill and intangible asset impairments; assumptions related to the calculation of recoverable amount of our Aurora and White Springs CGUs, including internal sales and input price forecasts, discount rate, long-term growth rate and end of expected mine life; assumptions with respect to the benefits of the brownfield expansions at our Geismar site; assumptions related to the impairment of our Nitrogen and Phosphate property, plant and equipment; assumptions with respect to our intention to complete share repurchases under our normal course issuer bid programs, including TSX approval, the funding of such share repurchases, existing and future market conditions, including with respect to the price of our common shares, and compliance with respect to applicable limitations under securities laws and regulations and stock exchange policies; assumptions related to our ability to fund our dividends at the current level; our expectations regarding the impacts, direct and indirect, of certain geopolitical conflicts, including the war in Eastern Europe and the conflict in the Middle East on, among other things, global supply and demand, including for crop nutrients, energy and commodity prices, global interest rates, supply chains and the global macroeconomic environment, including inflation; assumptions regarding future markets for clean ammonia; the adequacy of our cash generated from operations and our ability to access our credit facilities or capital markets for additional sources of financing; our ability to identify suitable candidates for acquisitions and divestitures and negotiate acceptable terms; our ability to maintain investment grade ratings and achieve our performance targets; our ability to successfully negotiate sales and other contracts; and our ability to successfully implement new initiatives and programs. Key assumptions with respect to our 2030 commitment of a 30% reduction in GHG emissions (Scope 1 and 2) per tonne of our products produced, from a baseline year of 2018, include growth in potash production volumes, operating rates within expected parameters and grid decarbonization progressing on expected timelines.
Events or circumstances could cause actual results to differ materially from those in the forward-looking statements.
With respect to our GHG emissions reduction and other sustainability and climate-related initiatives and targets, such events or circumstances include, but are not limited to: our ability to deploy sufficient capital to fund the necessary expenditures to implement the necessary operational changes to achieve these initiatives and targets; our ability to implement requisite operational changes; our ability to implement some or all of the technology necessary to efficiently and effectively achieve expected future results, including in respect of such GHG emissions reduction target; the availability and commercial viability and scalability of emissions reduction strategies and related technology and products; and the development and execution of implementing strategies to meet such GHG emissions reduction target.
With respect to our business generally and our ability to meet other targets, commitments, goals, strategies and related milestones and schedules disclosed in this document, such events or circumstances include, but are not limited to: general global economic, market and business conditions; failure to achieve expected results of our business strategy, capital allocation initiatives or results of operations; failure to complete announced and future acquisitions or divestitures at all or on the expected terms and within the expected timeline; seasonality; climate change and weather conditions, including the current El Niño weather pattern, and impacts from regional flooding and/or drought conditions; failure to execute on our strategies related to sustainability matters or to achieve our GHG emission and other related expectations, targets, goals and commitments; crop planted acreage, yield and prices; the supply and demand and price levels for our products; governmental and regulatory requirements and actions by governmental authorities, including changes in government policy (including tariffs, trade restrictions and climate change initiatives), government ownership requirements, and changes in environmental, tax, antitrust, and other laws or regulations and the interpretation thereof; political or military risks, including civil unrest, actions by armed groups or conflict and malicious acts including terrorism and industrial espionage; our ability to access sufficient, cost-effective and timely transportation, distribution and storage of products; the occurrence of a major environmental or safety incident or becoming subject to legal or regulatory proceedings; innovation and cybersecurity risks related to our systems, including our costs of addressing or mitigating such risks; counterparty and sovereign risk; delays in completion of turnarounds at our major facilities or challenges related to our major facilities that are out of our control; interruptions of or constraints in availability of key inputs, including natural gas and sulfur; any significant impairment of the carrying amount of certain assets; the risk that rising interest rates and/or deteriorated business operating results may result in the further impairment of assets or goodwill attributed to certain CGUs; risks related to reputational loss; certain complications that may arise in our mining processes; the ability to attract, engage and retain skilled employees and strikes or other forms of work stoppages; geopolitical conflicts, including the war in Eastern Europe and the conflict in the Middle East, and their potential impact on, among other things, global market conditions and supply and demand, including for crop nutrients, energy and commodity prices, interest rates, supply chains and the global economy generally; our ability to execute on our strategies related to environmental, social and governance matters, and achieve expectations, targets and commitments; and other risk factors detailed from time to time in Nutrien reports filed with the Canadian securities regulators and the SEC in the US.
The purpose of our 2024 Retail adjusted EBITDA, depreciation and amortization, finance costs, effective tax rate on adjusted earnings and capital expenditures guidance ranges are to assist readers in understanding our expected and targeted financial results, and this information may not be appropriate for other purposes.
The forward-looking statements in this document are made as of the date hereof and Nutrien disclaims any intention or obligation to update or revise any forward-looking statements in this document as a result of new information or future events, except as may be required under applicable Canadian securities legislation or applicable US federal securities laws.
| 80 | Nutrien Annual Report 2023 |
| Overview | MD&A | Five-year highlights | Financial statements and notes | |||||
|
Results |
||||||||
|
|
Appendix A – non-GAAP financial measures
We use both IFRS measures and certain non-GAAP financial measures to assess performance. Non-GAAP financial measures are financial measures disclosed by the Company that (a) depict historical or expected future financial performance, financial position or cash flow of the Company, (b) with respect to their composition, exclude amounts that are included in, or include amounts that are excluded from, the composition of the most directly comparable financial measure disclosed in the primary financial statements of the Company, (c) are not disclosed in the financial statements of the Company and (d) are not a ratio, fraction, percentage or similar representation. Non-GAAP ratios are financial measures disclosed by the Company that are in the form of a ratio, fraction, percentage or similar representation that has a non-GAAP financial measure as one or more of its components, and that are not disclosed in the financial statements of the Company.
These non-GAAP financial measures and non-GAAP ratios are not standardized financial measures under IFRS and, therefore, are unlikely to be comparable to similar financial measures presented by other companies. Management believes these non-GAAP financial measures and non-GAAP ratios provide transparent and useful supplemental information to help investors evaluate our financial performance, financial condition and liquidity using the same measures as management. These non-GAAP financial measures and non-GAAP ratios should not be considered as a substitute for, or superior to, measures of financial performance prepared in accordance with IFRS.
The following section outlines our non-GAAP financial measures and non-GAAP ratios, their compositions, and why management uses each measure. It also includes reconciliations to the most directly comparable IFRS measures. Except as otherwise described herein, our non-GAAP financial measures and non-GAAP ratios are calculated on a consistent basis from period to period and are adjusted for specific items in each period, as applicable. As additional non-recurring or unusual items arise in the future, we generally exclude these items in our calculations.
Adjusted EBITDA (consolidated)
Most directly comparable IFRS financial measure: Net earnings (loss).
Definition: Adjusted EBITDA is calculated as net earnings (loss) before finance costs, income taxes, depreciation and amortization, share-based compensation and certain foreign exchange gain/loss (net of related derivatives). We also adjust this measure for the following other income and expenses that are excluded when management evaluates the performance of our day-to-day operations: integration and restructuring related costs, impairment or reversal of impairment of assets, COVID-19 related expenses, gain or loss on disposal of certain businesses and investments, asset retirement obligations (“ARO”) and accrued environmental costs (“ERL”) related to our non-operating sites, and loss on remitting cash from certain foreign jurisdictions (e.g. Blue Chip Swaps). In 2023, we amended our calculation of adjusted EBITDA to adjust for the asset retirement obligations and accrued environmental costs related to our non-operating sites and the loss on remitting cash from certain foreign jurisdictions. We do not consider these to be part of our day-to-day operations. There were no similar income and expense in the comparative periods.
| Nutrien Annual Report 2023 | 81 |
| Overview | MD&A | Five-year highlights | Financial statements and notes | |||||
|
Results |
||||||||
|
|
Why we use the measure and why it is useful to investors: It is not impacted by long-term investment and financing decisions, but rather focuses on the performance of our day-to-day operations. It provides a measure of our ability to service debt and to meet other payment obligations and as a component of employee remuneration calculations.
| (millions of US dollars) | 2023 | 2022 | ||||||
| Net earnings | 1,282 | 7,687 | ||||||
| Finance costs | 793 | 563 | ||||||
| Income tax (recovery) expense | 670 | 2,559 | ||||||
| Depreciation and amortization | 2,169 | 2,012 | ||||||
| EBITDA 1 | 4,914 | 12,821 | ||||||
| Adjustments: | ||||||||
| Integration and restructuring related costs |
49 | 46 | ||||||
| Share-based compensation (recovery) expense |
(14 | ) | 63 | |||||
| Impairment (reversal of impairment) of assets |
774 | (780 | ) | |||||
| ARO/ERL expense for non-operating sites |
152 | – | ||||||
| Foreign exchange loss, net of related derivatives |
91 | 31 | ||||||
| Loss on Blue Chip Swaps |
92 | – | ||||||
| Gain on disposal of investment |
– | (19 | ) | |||||
| COVID-19 related expenses 2 |
– | 8 | ||||||
| Adjusted EBITDA | 6,058 | 12,170 | ||||||
| 1 | EBITDA is calculated as net earnings before finance costs, income taxes, and depreciation and amortization. |
| 2 | COVID-19 related expenses primarily consist of increased cleaning and sanitization costs, the purchase of personal protective equipment, discretionary supplemental employee costs, and costs related to construction delays from access limitations and other government restrictions. |
Adjusted net earnings and adjusted net earnings per share
Most directly comparable IFRS financial measure: Net earnings (loss) and diluted net earnings (loss) per share.
Definition: Adjusted net earnings and related per share information are calculated as net earnings (loss) before share-based compensation and certain foreign exchange gain/loss (net of related derivatives), net of tax. We also adjust this measure for the following other income and expenses (net of tax) that are excluded when management evaluates the performance of our day-to-day operations: certain integration and restructuring related costs, impairment or reversal of impairment of assets, COVID-19 related expenses (including those recorded under finance costs), gain or loss on disposal of certain businesses and investments, gain or loss on early extinguishment of debt or on settlement of derivatives due to discontinuance of hedge accounting, asset retirement obligations and accrued environmental costs related to our non-operating sites, loss on remitting cash from certain foreign jurisdictions (e.g. Blue Chip Swaps), change in recognition of tax losses and deductible temporary differences related to impairments and certain changes to tax declarations in Switzerland (“Swiss Tax Reform adjustment”) resulting in an income tax recovery from the recognition of a deferred tax asset. In 2023, we amended our calculation of adjusted net earnings and adjusted net earnings per share to adjust for the asset retirement obligations and accrued environmental costs related to our non-operating sites, the loss on remitting cash from certain foreign jurisdictions, the change in recognition of Retail – South America tax losses and deductible temporary differences and the Swiss Tax Reform adjustment. We do not consider these to be part of our day-to-day operations. There were no similar income and expense in the comparative periods. We generally apply the annual forecasted effective tax rate to our adjustments during the year, and at year-end, we apply the actual effective tax rate. Prior to December 31, 2023, we applied a specific tax rate for material adjustments. Effective December 31, 2023, we applied a tax rate specific to each adjustment.
| 82 | Nutrien Annual Report 2023 |
| Overview | MD&A | Five-year highlights | Financial statements and notes | |||||
|
Results |
||||||||
|
|
Why we use the measure and why it is useful to investors: Focuses on the performance of our day-to-day operations and is used as a component of employee remuneration calculations.
|
|
2023 | 2022 | ||||||||||||||||||||||
| (millions of US dollars, except as otherwise noted) |
Increases (decreases) |
Post-tax | Per diluted share |
Increases (decreases) |
Post-tax | Per diluted share |
||||||||||||||||||
| Net earnings attributable to equity holders of Nutrien |
1,258 | 2.53 | 7,660 | 14.18 | ||||||||||||||||||||
| Adjustments: |
||||||||||||||||||||||||
| Share-based compensation (recovery) expense |
(14 | ) | (11 | ) | (0.02 | ) | 63 | 47 | 0.10 | |||||||||||||||
| Foreign exchange loss, net of related derivatives |
91 | 83 | 0.17 | 31 | 23 | 0.05 | ||||||||||||||||||
| Integration and restructuring related costs |
49 | 40 | 0.08 | 46 | 35 | 0.06 | ||||||||||||||||||
| Impairment (reversal of impairment) of assets |
774 | 702 | 1.42 | (780 | ) | (619 | ) | (1.15 | ) | |||||||||||||||
| ARO/ERL expense for non-operating sites |
152 | 110 | 0.22 | – | – | – | ||||||||||||||||||
| Loss on Blue Chip Swaps |
92 | 92 | 0.18 | – | – | – | ||||||||||||||||||
| Change in recognition of deferred tax assets |
66 | 66 | 0.13 | – | – | – | ||||||||||||||||||
| Swiss Tax Reform adjustment |
(134 | ) | (134 | ) | (0.27 | ) | – | – | – | |||||||||||||||
| COVID-19 related expenses |
– | – | – | 8 | 6 | 0.01 | ||||||||||||||||||
| Gain on disposal of investment |
– | – | – | (19 | ) | (14 | ) | (0.03 | ) | |||||||||||||||
| Gain on settlement of discontinued hedge accounting derivative |
– | – | – | (18 | ) | (14 | ) | (0.03 | ) | |||||||||||||||
| Adjusted net earnings |
|
|
|
2,206 | 4.44 |
|
|
|
7,124 | 13.19 | ||||||||||||||
Gross margin excluding depreciation and amortization per tonne – manufactured
Most directly comparable IFRS financial measure: Gross margin.
Definition: Gross margin per tonne less depreciation and amortization per tonne for manufactured products. Reconciliations are provided in the “Results – Operating Segment Performance” section.
Why we use the measure and why it is useful to investors: Focuses on the performance of our day-to-day operations, which excludes the effects of items that primarily reflect the impact of long-term investment and financing decisions.
Potash controllable cash cost of product manufactured (“COPM”) per tonne
Most directly comparable IFRS financial measure: Cost of goods sold (“COGS”) for the Potash segment.
Definition: Total Potash COGS excluding depreciation and amortization expense included in COPM, royalties, natural gas costs and carbon taxes, change in inventory, and other adjustments, divided by potash production tonnes.
| Nutrien Annual Report 2023 | 83 |
| Overview | MD&A | Five-year highlights | Financial statements and notes | |||||
|
Results |
||||||||
|
|
Why we use the measure and why it is useful to investors: To assess operational performance. Potash controllable cash COPM excludes the effects of production from other periods and the impacts of our long-term investment decisions, supporting a focus on the performance of our day-to-day operations. Potash controllable cash COPM also excludes royalties and natural gas costs and carbon taxes, which management does not consider controllable, as they are primarily driven by regulatory and market conditions.
| (millions of US dollars, except as otherwise noted) | 2023 | 2022 | ||||||
| Total COGS – Potash | 1,396 | 1,400 | ||||||
| Change in inventory | (40 | ) | 58 | |||||
| Other adjustments 1 | (26 | ) | (41 | ) | ||||
| COPM | 1,330 | 1,417 | ||||||
| Depreciation and amortization in COPM | (427 | ) | (406 | ) | ||||
| Royalties in COPM | (100 | ) | (190 | ) | ||||
| Natural gas costs and carbon taxes in COPM | (46 | ) | (62 | ) | ||||
| Controllable cash COPM | 757 | 759 | ||||||
| Production tonnes (tonnes – thousands) | 12,998 | 13,007 | ||||||
| Potash controllable cash COPM per tonne | 58 | 58 | ||||||
| 1 | Other adjustments include unallocated production overhead that is recognized as part of cost of goods sold but is not included in the measurement of inventory and changes in inventory balances. |
Ammonia controllable cash COPM per tonne
Most directly comparable IFRS financial measure: Total manufactured COGS for the Nitrogen segment.
Definition: Total Nitrogen COGS excluding depreciation and amortization expense included in COGS, cash COGS for products other than ammonia, other adjustments, and natural gas and steam costs, divided by net ammonia production tonnes.
Why we use the measure and why it is useful to investors: To assess operational performance. Ammonia controllable cash COPM excludes the effects of production from other periods, the costs of natural gas and steam, and long-term investment decisions, supporting a focus on the performance of our day-to-day operations.
| (millions of US dollars, except as otherwise noted) | 2023 | 2022 | ||||||
| Total manufactured COGS – Nitrogen 1 | 2,435 | 3,370 | ||||||
| Total other COGS – Nitrogen 1 | 393 | 882 | ||||||
| Total COGS – Nitrogen | 2,828 | 4,252 | ||||||
| Depreciation and amortization in COGS | (474 | ) | (465 | ) | ||||
| Cash COGS for products other than ammonia | (1,693 | ) | (2,560 | ) | ||||
| Ammonia | ||||||||
| Total cash COGS before other adjustments |
661 | 1,227 | ||||||
| Other adjustments 2 |
(222 | ) | (210 | ) | ||||
| Total cash COPM |
439 | 1,017 | ||||||
| Natural gas and steam costs in COPM |
(304 | ) | (855 | ) | ||||
| Controllable cash COPM |
135 | 162 | ||||||
| Production tonnes (net tonnes 3 – thousands) | 2,276 | 2,754 | ||||||
| Ammonia controllable cash COPM per tonne | 60 | 59 | ||||||
| 1 | Certain immaterial 2022 figures have been reclassified. |
| 2 | Other adjustments include unallocated production overhead that is recognized as part of cost of goods sold but is not included in the measurement of inventory and changes in inventory balances. |
| 3 | Ammonia tonnes available for sale, as not upgraded to other nitrogen products. |
| 84 | Nutrien Annual Report 2023 |
| Overview | MD&A | Five-year highlights | Financial statements and notes | |||||
|
Results |
||||||||
|
|
Retail adjusted average working capital to sales and retail adjusted average working capital to sales excluding Nutrien Financial
Definition: Retail adjusted average working capital divided by Retail adjusted sales for the last four rolling quarters. We exclude in our calculations the sales and working capital of certain acquisitions during the first year following the acquisition. We also look at this metric excluding Nutrien Financial revenue and working capital.
Why we use the measure and why it is useful to investors: To evaluate operational efficiency. A lower or higher percentage represents increased or decreased efficiency, respectively. The metric excluding Nutrien Financial shows the impact that the working capital of Nutrien Financial has on the ratio.
| (millions of US dollars, except as otherwise noted) | 2023 | 2022 | ||||||
| Average current assets | 11,470 | 11,952 | ||||||
| Average current liabilities | 7,666 | 8,249 | ||||||
| Average working capital | 3,804 | 3,703 | ||||||
| Average working capital from certain recent acquisitions | – | – | ||||||
| Adjusted average working capital | 3,804 | 3,703 | ||||||
| Average Nutrien Financial working capital | (3,561 | ) | (3,311 | ) | ||||
| Adjusted average working capital excluding Nutrien Financial | 243 | 392 | ||||||
| Sales | 19,542 | 21,350 | ||||||
| Sales from certain recent acquisitions | – | – | ||||||
| Adjusted sales | 19,542 | 21,350 | ||||||
| Nutrien Financial revenue | (322 | ) | (267 | ) | ||||
| Adjusted sales excluding Nutrien Financial | 19,220 | 21,083 | ||||||
| Adjusted average working capital to sales (%) | 19 | 17 | ||||||
| Adjusted average working capital to sales excluding Nutrien Financial (%) | 1 | 2 | ||||||
Nutrien Financial adjusted net interest margin
Definition: Nutrien Financial revenue less deemed interest expense divided by average Nutrien Financial net receivables outstanding for the last four rolling quarters.
Why we use the measure and why it is useful to investors: Used by credit rating agencies and others to evaluate the financial performance of Nutrien Financial.
| (millions of US dollars, except as otherwise noted) | 2023 | 2022 | ||||||
| Nutrien Financial revenue | 322 | 267 | ||||||
| Deemed interest expense 1 | (136 | ) | (41 | ) | ||||
| Net interest | 186 | 226 | ||||||
| Average Nutrien Financial net receivables | 3,561 | 3,311 | ||||||
| Nutrien Financial adjusted net interest margin (%) | 5.2 | 6.8 | ||||||
| 1 | Average borrowing rate applied to the notional debt required to fund the portfolio of receivables from customers monitored and serviced by Nutrien Financial. |
| Nutrien Annual Report 2023 | 85 |
| Overview | MD&A | Five-year highlights | Financial statements and notes | |||||
|
Results |
||||||||
|
|
Retail cash operating coverage ratio
Definition: Retail selling, general and administrative, and other expenses (income), excluding depreciation and amortization expense, divided by Retail gross margin excluding depreciation and amortization expense in cost of goods sold, for the last four rolling quarters.
Why we use the measure and why it is useful to investors: To understand the costs and underlying economics of our Retail operations and to assess our Retail operating performance and ability to generate free cash flow.
| (millions of US dollars, except as otherwise noted) | 2023 | 2022 | ||||||
| Selling expenses | 3,375 | 3,392 | ||||||
| General and administrative expenses | 217 | 200 | ||||||
| Other expenses | 158 | 29 | ||||||
| Operating expenses | 3,750 | 3,621 | ||||||
| Depreciation and amortization in operating expenses | (749 | ) | (740 | ) | ||||
| Operating expenses excluding depreciation and amortization | 3,001 | 2,881 | ||||||
| Gross margin | 4,430 | 5,179 | ||||||
| Depreciation and amortization in cost of goods sold | 10 | 12 | ||||||
| Gross margin excluding depreciation and amortization | 4,440 | 5,191 | ||||||
| Cash operating coverage ratio (%) | 68 | 55 | ||||||
Return on invested capital (“ROIC”)
Definition: ROIC is calculated as net operating profit after taxes divided by the average invested capital for the last four rolling quarters.
Net operating profit after taxes, a non-GAAP financial measure, is calculated as earnings before finance costs and income taxes, depreciation and amortization related to the fair value adjustments as a result of the Merger (the merger of equals transaction between PotashCorp and Agrium), share-based compensation, and certain foreign exchange gain/loss (net of related derivatives) and Nutrien Financial earnings before finance costs and income taxes. The most directly comparable IFRS financial measure to net operating profit after taxes is earnings before finance costs and income taxes. We also adjust this measure for the following other income and expenses that are excluded when management evaluates the performance of our day-to-day operations: integration and restructuring related costs, impairment or reversal of impairment of assets, COVID-19 related expenses, gain or loss on disposal of certain businesses and investments, and IFRS adoption transition adjustments. A tax rate of 25 percent is applied on the calculated amount. Prior to 2023, we were adjusting for Nutrien Financial revenue; however, in 2023, we updated our calculation to adjust for Nutrien Financial earnings before finance costs and income taxes to further refine our calculations.
Invested capital is calculated as last four rolling quarter average of total assets less cash and cash equivalents; payables and accrued charges; Merger fair value adjustments on goodwill, intangible assets, and property, plant and equipment; and average Nutrien Financial working capital.
We exclude in our calculations the related financial information of certain acquisitions during the first year following the acquisition.
| 86 | Nutrien Annual Report 2023 |
| Overview | MD&A | Five-year highlights | Financial statements and notes | |||||
|
Results |
||||||||
|
|
Why we use the measure and why it is useful to investors: In 2022, we added a new financial measure to evaluate how efficiently we allocate our capital. ROIC provides useful information to evaluate our after-tax cash operating return on invested capital and is used as a component of employee remuneration calculations.
| (millions of US dollars, except as otherwise noted) | 2023 | 2022 | 2021 | |||||||||
| Earnings before finance costs and income taxes | 2,745 | 10,809 | 4,781 | |||||||||
| Merger adjustments 1 | 194 | 231 | 277 | |||||||||
| Integration and restructuring related costs | 49 | 46 | 43 | |||||||||
| Share-based compensation (recovery) expense | (14 | ) | 63 | 198 | ||||||||
| Impairment (reversal of impairment) of assets | 774 | (780 | ) | 33 | ||||||||
| ARO/ERL expense for non-operating sites | 152 | – | – | |||||||||
| COVID-19 related expenses | – | 8 | 45 | |||||||||
| Foreign exchange loss, net of related derivatives | 91 | 31 | 39 | |||||||||
| Loss on Blue Chip Swap transactions | 92 | – | – | |||||||||
| Gain on disposal of investment | – | (19 | ) | – | ||||||||
| Cloud computing transition adjustment | – | – | 36 | |||||||||
| Nutrien Financial earnings before finance costs and income taxes | (127 | ) | (234 | ) | (124 | ) | ||||||
| Net operating profit | 3,956 | 10,155 | 5,328 | |||||||||
| Tax (calculated at 25%) | 989 | 2,539 | 1,332 | |||||||||
| Net operating profit after tax | 2,967 | 7,616 | 3,996 | |||||||||
| 1 Depreciation and amortization related to the fair value adjustments as a result of the Merger (the merger of equals transaction between PotashCorp and Agrium).
|
|
|||||||||||
| Total assets | 53,874 | 54,228 | 48,880 | |||||||||
| Cash and cash equivalents | (926 | ) | (753 | ) | (862 | ) | ||||||
| Payables and accrued charges | (9,050 | ) | (10,687 | ) | (8,773 | ) | ||||||
| Merger adjustments 1 | (9,896 | ) | (10,232 | ) | (10,516 | ) | ||||||
| Average Nutrien Financial receivables | (3,561 | ) | (3,311 | ) | (2,316 | ) | ||||||
| Invested capital | 30,441 | 29,245 | 26,413 | |||||||||
|
1 Merger fair value adjustments on goodwill, intangible assets, and property, plant and equipment. |
|
|
|
|
||||||||
| Return on invested capital (%) | 10 | 26 | 15 | |||||||||
| Nutrien Annual Report 2023 | 87 |
| Overview | MD&A | Five-year highlights | Financial statements and notes | |||||
|
Results |
||||||||
|
|
Appendix B – other financial measures
Supplementary financial measures
Supplementary financial measures are financial measures disclosed by the Company that (a) are, or are intended to be, disclosed on a periodic basis to depict the historical or expected future financial performance, financial position or cash flow of the Company, (b) are not disclosed in the financial statements of the Company, (c) are not non-GAAP financial measures, and (d) are not non-GAAP ratios.
The following section provides an explanation of the composition of those supplementary financial measures if not previously provided.
Retail adjusted EBITDA margin: Retail adjusted EBITDA divided by Retail sales for the last four rolling quarters.
Sustaining capital expenditures: Represents capital expenditures that are required to sustain operations at existing levels and include major repairs and maintenance and plant turnarounds.
Investing capital expenditures: Represents capital expenditures related to significant expansions of current operations or to create cost savings (synergies). Investing capital expenditures excludes capital outlays for business acquisitions and equity-accounted investees.
Mine development and pre-stripping capital expenditures: Represents capital expenditures that are required for activities to open new areas underground and/or develop a mine or ore body to allow for future production mining and activities required to prepare and/or access the ore, i.e., removal of an overburden that allows access to the ore.
Retail adjusted EBITDA per US selling location: Calculated as total Retail US adjusted EBITDA for the last four rolling quarters, representing the organic EBITDA component, which excludes acquisitions in those quarters, divided by the number of US locations that have generated sales in the last four rolling quarters, adjusted for acquired locations in those quarters.
Cash used for dividends and share repurchases (shareholder returns): Calculated as dividends paid to Nutrien’s shareholders plus repurchase of common shares as reflected in the consolidated statements of cash flows. This measure is useful as it represents return of capital to shareholders.
| 88 | Nutrien Annual Report 2023 |
| Overview | MD&A | Five-year highlights | Financial statements and notes | |||||
|
Results |
||||||||
|
|
Capital management measures
Capital management measures are financial measures disclosed by the Company that (a) are intended to enable an individual to evaluate the Company’s objectives, policies and processes for managing the Company’s capital, (b) are not a component of a line item disclosed in the primary financial statements of the Company, (c) are disclosed in the notes of the financial statements of the Company, and (d) are not disclosed in the primary financial statements of the Company.
The following section outlines our capital management measure, its composition and why management uses the measure.
Adjusted net debt to adjusted EBITDA: Calculated as adjusted net debt to adjusted EBITDA. Both components are non-GAAP financial measures. This ratio measures financial leverage and our ability to pay our debt.
The most directly comparable measure for adjusted net debt is total short-term and long-term debt and lease liabilities less cash and cash equivalents and is defined as the total of short-term and long-term debt plus lease liabilities less cash and cash equivalents and unamortized fair value adjustments. This measure is useful as it adjusts for the unamortized fair value adjustments that arose at the time of the Merger and is non-cash in nature.
| (millions of US dollars, except as otherwise noted) | 2023 | 2022 | ||||||
| Short-term debt | 1,815 | 2,142 | ||||||
| Current portion of long-term debt | 512 | 542 | ||||||
| Current portion of lease liabilities | 327 | 305 | ||||||
| Long-term debt | 8,913 | 8,040 | ||||||
| Lease liabilities | 999 | 899 | ||||||
| Total debt | 12,566 | 11,928 | ||||||
| Cash and cash equivalents | (941 | ) | (901 | ) | ||||
| Unamortized fair value adjustments | (294 | ) | (310 | ) | ||||
| Adjusted net debt | 11,331 | 10,717 | ||||||
| Nutrien Annual Report 2023 | 89 |
Terms and definitions
| Terms |
|
|
| AECO | Alberta Energy Company, Canada | |
| ABARES | Australian Bureau of Agricultural and Resource Economics and Sciences | |
| Argus | Argus Media group, UK | |
| Bloomberg | Bloomberg Finance L.P., USA | |
| Conab | The National Supply Company (CONAB) is a public company under the Ministry of Agriculture, Livestock and Food Supply – MAPA. | |
| CME | Canadian Manufacturers & Exporters | |
| CRU | CRU International limited, UK | |
| ICE | Intercontinental Exchange | |
| IFA | International Fiscal Association | |
| IMEA | Mato Grosso Institute of Agricultural Economics | |
| Moody’s | Moody’s Corporation (NYSE: MCO), USA | |
| NYMEX | New York Mercantile Exchange, USA | |
| NYSE | New York Stock Exchange, USA | |
| S&P |
S&P Global Inc., USA | |
| SPGCI | S&P Global Commodity Insights | |
| StatsCan | Statistics Canada | |
| TTF | Title Transfer Facility | |
| TSX | Toronto Stock Exchange, Canada | |
| USDA | United States Department of Agriculture, USA | |
| CAD | Canadian dollar | |
| USD | United States dollar | |
| AUD | Australian dollar |
| Scientific terms |
|
|
||
| Potash | KCI | potassium chloride, 60–63.2% K2O (solid) | ||
| Nitrogen | CO2 | carbon dioxide | ||
|
|
CO2e | carbon dioxide equivalent | ||
|
|
DEF | diesel exhaust fluid | ||
|
|
ESN® | environmentally smart nitrogen, 44% nitrogen | ||
|
|
NH3 | ammonia (anhydrous), 82.2% N (liquid) | ||
|
|
N2O | nitrous oxide | ||
|
|
UAN | urea ammonium nitrate solution, 28–32% N (liquid) | ||
| Phosphate | AS | ammonium sulfate (solid) | ||
|
|
DAP | diammonium phosphate, 46% P2O5 (solid) | ||
|
|
MAP | monoammonium phosphate, 52% P2O5 (solid) | ||
|
|
MGA | merchant grade acid, 54% P2O5 (liquid) | ||
|
|
MST | micronized sulfur technology, P + S | ||
|
|
P2O5 | diphosphorus pentoxide | ||
|
|
SPA | superphosphoric acid, 70% P2O5 (liquid) |
| 146 | Nutrien Annual Report 2023 |
|
Product measures |
|
|||
| K2O tonne | Measures the potassium content of products having different chemical analyses | |||
| Mmt | Million metric tonnes | |||
| MMBtu | Million British thermal units | |||
| N tonne | Measures the nitrogen content of products having different chemical analyses | |||
| P2O5 tonne | Measures the phosphorus content of products having different chemical analyses | |||
| Product tonne | Standard measure of the weights of all types of potash, nitrogen and phosphate products | |||
|
Definitions |
|
|
| Brownfield | New project expanding or developing an existing facility or operation. | |
| CCUS | Carbon capture, utilization and storage. Process by which CO2 produced from various industrial processes is captured and either utilized for further industrial processes or transported to a permanent storage location to prevent release into the atmosphere. | |
| Capital expenditures | Represents the sum of: sustaining capital expenditures, investing capital expenditures and mine development and pre-stripping capital expenditures. See the “Other Financial Measures” section. | |
| Carbon offset/ inset | Carbon offsetting is a way for entities to reduce their carbon footprint by paying another entity to reduce their emissions. Carbon insetting refers to the actions taken by an organization to reduce emissions within its own supply chain. | |
| Clean ammonia | Ammonia made with direct GHG emissions reduced by at least 90 percent compared to a conventional process, produced from hydrogen obtained using the next generation of ammonia production technology, such as auto-thermal reforming or water electrolysis with renewable power; this definition does not include end product use. | |
| Community investment | Represents cash disbursements, matching of employee gifts and in-kind contributions of equipment, goods and services, and employee volunteerism (on corporate time). | |
| COVID-19 | COVID-19 coronavirus pandemic. | |
| Compound annual growth rate (“CAGR”) | Represents the rate of return that would be required for an investment to grow from its beginning balance to its ending balance assuming the profits were reinvested at the end of each year of the investment’s lifespan. | |
| EBITDA | Calculated as net earnings (loss) before finance costs, income taxes and depreciation and amortization. |
|
| Greenfield | New project on a previously undeveloped site. | |
| Greenhouse gas (“GHG”) | Gas that contributes to the greenhouse effect by absorbing infrared radiation. | |
| Latin America | South America, Central America, Caribbean and Mexico. | |
| Lost-time injury frequency | Total lost-time injuries for every 200,000 hours worked for all Nutrien employees, contractors and others on site. Calculated as the total lost-time injuries multiplied by 200,000 hours worked divided by the actual number of hours worked. | |
| Low-carbon ammonia | Ammonia made with direct GHG emissions typically reduced by approximately 60 percent but up to 80 percent compared to a conventional process, produced by primarily using carbon capture, utilization and storage (“CCUS”) or other low-emission production technologies; this definition does not include end product use. | |
| Merger | The merger of equals transaction between PotashCorp and Agrium completed effective January 1, 2018, pursuant to which PotashCorp and Agrium combined their businesses pursuant to a statutory plan of arrangement under the Canada Business Corporations Act and became wholly owned subsidiaries of Nutrien Ltd. | |
| North America | Canada and the US. | |
| Offshore | All markets except Canada and the US. | |
| Nutrien Annual Report 2023 | 147 |
|
Definitions |
|
|
| Proportion of women in senior leadership | Senior leadership is defined as director level and above. Based on permanent full-time and part-time employees. | |
| Serious injury and fatality | A work-related fatality or life-altering injury/illness experienced by an employee or directly supervised contractor conducting work on behalf of Nutrien. | |
| Scope 1 | Direct greenhouse gas emissions produced by Nutrien owned or controlled facilities. | |
| Scope 2 | Indirect greenhouse gas emissions resulting from the generation of purchased or acquired electricity, heating, cooling and steam consumed by Nutrien owned or controlled facilities. | |
| Scope 3 | Indirect greenhouse gas emissions not included in Scope 2 emissions occurring as a consequence of the activities of Nutrien, from sources not owned or controlled by Nutrien, including both upstream and downstream emissions. | |
| Sustainable agriculture | According to the United Nations Food and Agriculture Organization, sustainable agriculture means increasing farm productivity while protecting natural resources and enhancing grower resilience. | |
| Sustainable agriproduct program acres | Our Carbon Program is also referred to as a Sustainable Agriproducts Program. Sustainable agriproduct acres involve agronomic solutions leading to measurable outcomes such as carbon, soil or water, with the ability to validate and verify those outcomes. |
|
| Sustainably engaged acres | Acres participating in programs that track field level data which can be analyzed for sustainability metrics and/or acres participating in sustainable agriproducts programs that incentivize growers to adopt additional sustainable practices and products resulting in quantifiable, incremental benefits which may be verified and used for reporting purposes. | |
| Total employee turnover rate | The number of permanent employees who left the Company due to voluntary and involuntary terminations, including retirements and deaths, as a percentage of average permanent employees for the year. | |
| Total recordable injury frequency | Total recordable injuries for every 200,000 hours worked for all Nutrien employees, contractors and others on site. Calculated as the total recordable injuries multiplied by 200,000 hours worked divided by the actual number of hours worked. | |
| 148 | Nutrien Annual Report 2023 |
Exhibit 99.3
FINANCIAL STATEMENTS & NOTES
Management’s responsibility |
94 |
|
Notes |
|
||
Reports of independent registered public accounting firm |
95 |
|
1 |
| |
Description of business |
102 |
|
2 |
| |
Basis of presentation |
102 |
||
Consolidated statements of earnings |
98 |
|
3 |
| |
Segment information |
103 |
Consolidated statements of comprehensive income |
98 |
|
4 |
| |
Nature of expenses |
106 |
|
5 |
| |
Share-based compensation |
107 |
||
Consolidated statements of cash flows |
99 |
|
6 |
| |
Other expenses (income) |
108 |
Consolidated statements of changes in shareholders’ equity |
100 |
|
7 |
| |
Finance costs |
108 |
|
8 |
| |
Income taxes |
109 |
||
Consolidated balance sheets |
101 |
|
9 |
| |
Net earnings per share |
110 |
|
|
|
10 |
| |
Financial instruments and related risk management |
111 |
|
|
|
11 |
| |
Receivables |
115 |
|
|
|
12 |
| |
Inventories |
115 |
|
|
|
13 |
| |
Property, plant and equipment |
116 |
|
|
|
14 |
| |
Goodwill and intangible assets |
119 |
|
|
|
15 |
| |
Investments |
121 |
|
|
|
16 |
| |
Other assets |
123 |
|
|
|
17 |
| |
Short-term debt |
123 |
|
|
|
18 |
| |
Long-term debt |
124 |
|
|
|
19 |
| |
Lease liabilities |
125 |
|
|
|
20 |
| |
Payables and accrued charges |
125 |
|
|
|
21 |
| |
Pension and other post-retirement benefits |
126 |
|
|
|
22 |
| |
Asset retirement obligations and accrued environmental costs |
129 |
|
|
|
23 |
| |
Share capital |
130 |
|
|
|
24 |
| |
Capital management |
131 |
|
|
|
25 |
| |
Business combinations |
132 |
|
|
|
26 |
| |
Commitments |
133 |
|
|
|
27 |
| |
Guarantees |
134 |
|
|
|
28 |
| |
Related party transactions |
134 |
|
|
|
29 |
| |
Contingencies and other matters |
135 |
|
|
|
30 |
| |
Accounting policies, estimates and judgments |
137 |
Nutrien Annual Report 2023 | 93
Management’s responsibility
Management’s Responsibility for Financial Reporting
Management’s Report on the Consolidated Financial Statements
The accompanying consolidated financial statements and related financial information are the responsibility of the management of Nutrien Ltd. (the “Company”). They have been prepared in accordance with International Financial Reporting Standards (“IFRS”) as issued by the International Accounting Standards Board and include amounts based on estimates and judgments. Financial information included elsewhere in this report is consistent with the consolidated financial statements.
The consolidated financial statements are approved by the Board of Directors on the recommendation of the Audit Committee. The Audit Committee, appointed by the Board of Directors, is composed entirely of independent directors. The Audit Committee discusses and analyzes the Company’s condensed consolidated financial statements and Management’s Discussion and Analysis (“MD&A”) with management before such information is approved by the committee and submitted to securities commissions or other regulatory authorities. The Audit Committee and management also analyze the annual consolidated financial statements and MD&A prior to their approval by the Board of Directors.
The Audit Committee’s duties also include reviewing critical accounting policies and significant estimates and judgments underlying the consolidated financial statements as presented by management and approving the fees of our independent registered public accounting firm.
Our independent registered public accounting firm, KPMG LLP, performs an audit of the consolidated financial statements, the results of which are reflected in their Report of Independent Registered Public Accounting Firm for 2023. KPMG LLP has full and independent access to the Audit Committee to discuss their audit and related matters.
Management’s Annual Report on Internal Control Over Financial Reporting
Management is responsible for establishing and maintaining adequate internal control over financial reporting, as defined in Rules 13a-15(f) and 15d-15(f) of the Securities Exchange Act of 1934, as amended, and National Instrument 52-109 – Certification of Disclosure in Issuers’ Annual and Interim Filings. Internal control over financial reporting is designed to provide reasonable assurance regarding the reliability of financial reporting and preparation of financial statements for external purposes in accordance with IFRS.
Under our supervision and with the participation of management, the Company conducted an evaluation of the design and effectiveness of our internal control over financial reporting as of the end of the fiscal year covered by this report, based on the framework issued by the Committee of Sponsoring Organizations of the Treadway Commission in Internal Control – Integrated Framework (2013). Based on this evaluation, management concluded that, as of December 31, 2023, the Company did maintain effective internal control over financial reporting.
The effectiveness of the Company’s internal control over financial reporting as of December 31, 2023 has been audited by KPMG LLP, as reflected in their Report of Independent Registered Public Accounting Firm for 2023.
|
/s/ Ken Seitz
Ken Seitz President and Chief Executive Officer February 22, 2024 |
/s/ Pedro Farah
Pedro Farah Executive Vice President and Chief Financial Officer February 22, 2024 |
Nutrien Annual Report 2023 | 94
Report of independent registered public accounting firm
To the Shareholders and Board of Directors of Nutrien Ltd.
Opinion on Internal Control Over Financial Reporting
We have audited Nutrien Ltd. and subsidiaries’ (the “Company”) internal control over financial reporting as of December 31, 2023, based on criteria established in Internal Control – Integrated Framework (2013) issued by the Committee of Sponsoring Organizations of the Treadway Commission. In our opinion, the Company maintained, in all material respects, effective internal control over financial reporting as of December 31, 2023, based on criteria established in Internal Control – Integrated Framework (2013) issued by the Committee of Sponsoring Organizations of the Treadway Commission.
We also have audited, in accordance with the standards of the Public Company Accounting Oversight Board (United States) (“PCAOB”), the consolidated balance sheets of the Company as of December 31, 2023 and 2022, the related consolidated statements of earnings, comprehensive income, cash flows, and changes in shareholders’ equity for the years then ended, and the related notes (collectively, the “consolidated financial statements”), and our report dated February 22, 2024 expressed an unqualified opinion on those consolidated financial statements.
Basis for Opinion
The Company’s management is responsible for maintaining effective internal control over financial reporting and for its assessment of the effectiveness of internal control over financial reporting, included in the accompanying Management’s Annual Report on Internal Control Over Financial Reporting. Our responsibility is to express an opinion on the Company’s internal control over financial reporting based on our audit. We are a public accounting firm registered with the PCAOB and are required to be independent with respect to the Company in accordance with the US federal securities laws and the applicable rules and regulations of the Securities and Exchange Commission and the PCAOB.
We conducted our audit in accordance with the standards of the PCAOB. Those standards require that we plan and perform the audit to obtain reasonable assurance about whether effective internal control over financial reporting was maintained in all material respects. Our audit of internal control over financial reporting included obtaining an understanding of internal control over financial reporting, assessing the risk that a material weakness exists, and testing and evaluating the design and operating effectiveness of internal control based on the assessed risk. Our audit also included performing such other procedures as we considered necessary in the circumstances. We believe that our audit provides a reasonable basis for our opinion.
Definition and Limitations of Internal Control Over Financial Reporting
A company’s internal control over financial reporting is a process designed to provide reasonable assurance regarding the reliability of financial reporting and the preparation of financial statements for external purposes in accordance with generally accepted accounting principles. A company’s internal control over financial reporting includes those policies and procedures that (1) pertain to the maintenance of records that, in reasonable detail, accurately and fairly reflect the transactions and dispositions of the assets of the company; (2) provide reasonable assurance that transactions are recorded as necessary to permit preparation of financial statements in accordance with generally accepted accounting principles, and that receipts and expenditures of the company are being made only in accordance with authorizations of management and directors of the company; and (3) provide reasonable assurance regarding prevention or timely detection of unauthorized acquisition, use, or disposition of the company’s assets that could have a material effect on the financial statements.
Because of its inherent limitations, internal control over financial reporting may not prevent or detect misstatements. Also, projections of any evaluation of effectiveness to future periods are subject to the risk that controls may become inadequate because of changes in conditions, or that the degree of compliance with the policies or procedures may deteriorate.
/s/ KPMG LLP
Chartered Professional Accountants
Calgary, Canada
February 22, 2024
Nutrien Annual Report 2023 | 95
Report of independent registered public accounting firm
To the Shareholders and Board of Directors of Nutrien Ltd.
Opinion on the Consolidated Financial Statements
We have audited the accompanying consolidated balance sheets of Nutrien Ltd. and subsidiaries (the “Company”) as of December 31, 2023 and 2022, the related consolidated statements of earnings, comprehensive income, cash flows, and changes in shareholders’ equity for the years then ended, and the related notes (collectively, the “consolidated financial statements”). In our opinion, the consolidated financial statements present fairly, in all material respects, the financial position of the Company as of December 31, 2023 and 2022, and its financial performance and its cash flows for the years then ended, in conformity with International Financial Reporting Standards as issued by the International Accounting Standards Board.
We also have audited, in accordance with the standards of the Public Company Accounting Oversight Board (United States) (“PCAOB”), the Company’s internal control over financial reporting as of December 31, 2023, based on criteria established in Internal Control – Integrated Framework (2013) issued by the Committee of Sponsoring Organizations of the Treadway Commission, and our report dated February 22, 2024 expressed an unqualified opinion on the effectiveness of the Company’s internal control over financial reporting.
Basis for Opinion
These consolidated financial statements are the responsibility of the Company’s management. Our responsibility is to express an opinion on these consolidated financial statements based on our audits. We are a public accounting firm registered with the PCAOB and are required to be independent with respect to the Company in accordance with the US federal securities laws and the applicable rules and regulations of the Securities and Exchange Commission and the PCAOB.
We conducted our audits in accordance with the standards of the PCAOB. Those standards require that we plan and perform the audit to obtain reasonable assurance about whether the consolidated financial statements are free of material misstatement, whether due to error or fraud. Our audits included performing procedures to assess the risks of material misstatement of the consolidated financial statements, whether due to error or fraud, and performing procedures that respond to those risks. Such procedures included examining, on a test basis, evidence regarding the amounts and disclosures in the consolidated financial statements. Our audits also included evaluating the accounting principles used and significant estimates made by management, as well as evaluating the overall presentation of the consolidated financial statements. We believe that our audits provide a reasonable basis for our opinion.
Critical Audit Matters
The critical audit matters communicated below are matters arising from the current period audit of the consolidated financial statements that were communicated or required to be communicated to the Audit Committee and that: (1) relate to accounts or disclosures that are material to the consolidated financial statements and (2) involved our especially challenging, subjective, or complex judgments. The communication of critical audit matters does not alter in any way our opinion on the consolidated financial statements, taken as a whole, and we are not, by communicating the critical audit matters below, providing separate opinions on the critical audit matters or on the accounts or disclosures to which they relate.
Goodwill Impairment Assessment of the Retail North America Group of Cash-Generating Units
As discussed in Note 14 to the consolidated financial statements, the carrying amount of goodwill as of December 31, 2023 was $12,114 million, of which $6,981 million of goodwill is attributed to the Retail North America group of cash-generating units (“Retail North America CGU”). The Retail North America CGU is tested for impairment annually, and whenever events or changes in circumstances may indicate the carrying amount, including goodwill, exceeds its estimated recoverable amount. The calculation of the recoverable amount of the Retail North America CGU involved estimates including forecasted earnings before tax, interest, depreciation and amortization (“EBITDA”), terminal growth rate and the discount rate.
Nutrien Annual Report 2023 | 96
We identified the calculation of the recoverable amount of goodwill for the Retail North America CGU as of October 1, 2023 as a critical audit matter. A high degree of auditor judgment was required to evaluate the Company’s forecasted EBITDA, terminal growth rate and discount rate used to calculate the recoverable amount of the Retail North America CGU. Minor changes to these assumptions could have had a significant effect on the Company’s calculation of the recoverable amount of the Retail North America CGU. Additionally, the audit effort associated with this estimate required specialized skills and knowledge.
The following are the primary procedures we performed to address this critical audit matter. We evaluated the design and tested the operating effectiveness of certain internal controls related to the calculation of the recoverable amount of goodwill for the Retail North America CGU. This included controls related to the determination of forecasted EBITDA, terminal growth rate and the discount rate. We evaluated the Company’s forecasted EBITDA for the Retail North America CGU by comparing to historical results and forecasted planted acreage in the United States. We evaluated the terminal growth rate by comparing to the historical growth of the Retail North America CGU and to market information, including forecasted inflation and forecasted gross domestic product in the United States. We evaluated the Company’s historical forecasts of EBITDA by comparing to actual results to assess the Company’s ability to accurately forecast. In addition, we involved valuation professionals with specialized skills and knowledge, who assisted in:
• evaluating the Company’s determination of the discount rate by comparing the inputs to the discount rate to publicly available market data for comparable entities and assessing the resulting discount rate, and
• evaluating the Company’s estimate of the recoverable amount of the Retail North America CGU by comparing the results of the Company’s estimate to publicly available market data and valuation metrics for comparable entities.
Goodwill Impairment Assessment of the Retail South America Group of Cash-Generating Units
As discussed in Note 14 to the consolidated financial statements, the Company recorded impairment of $422 million to goodwill and $43 million to intangible assets of the Retail South America group of cash-generating units (“Retail South America CGU”) during the year ended December 31, 2023. The Retail South America CGU is tested for impairment annually, and whenever events or changes in circumstances may indicate the carrying amount, including goodwill, exceeds its estimated recoverable amount. An indicator of impairment was identified as of June 30, 2023 due to a reduction to forecasted earnings and growth. The calculation of the recoverable amount of the Retail South America CGU involved estimates including forecasted earnings before tax, interest, depreciation and amortization (“EBITDA”), terminal growth rate and the discount rate.
We identified the calculation of the recoverable amount of the Retail South America CGU as of June 30, 2023 as a critical audit matter. A high degree of auditor judgment was required to evaluate the Company’s forecasted EBITDA, terminal growth rate and discount rate used to calculate the recoverable amount of the Retail South America CGU. The forecasted EBITDA and terminal growth rate assumptions were challenging to test as they represented subjective determinations of future market and economic conditions that were also sensitive to variation. Additionally, the audit effort associated with this estimate required specialized skills and knowledge.
The following are the primary procedures we performed to address this critical audit matter. We evaluated the design and tested the operating effectiveness of certain internal controls related to the calculation of the recoverable amount of the Retail South America CGU. This included controls related to the determination of forecasted EBITDA, terminal growth rate and the discount rate. We evaluated the Company’s forecasted EBITDA for the Retail South America CGU by comparing to historical results and external market forecasts of planted acreage and exports. We evaluated the terminal growth rate by comparing to the historical growth of the Retail South America CGU and to market information, including forecasted inflation and forecasted gross domestic product in Brazil and Argentina. We evaluated the Company’s historical forecasts of EBITDA by comparing to actual results to assess the Company’s ability to accurately forecast. In addition, we involved valuation professionals with specialized skills and knowledge, who assisted in:
• evaluating the Company’s determination of the discount rate by comparing the inputs to the discount rate to publicly available market data for comparable entities and assessing the resulting discount rate, and
• evaluating the Company’s estimate of the recoverable amount of the Retail South America CGU by comparing the results of the Company’s estimate to publicly available market data and valuation metrics for comparable entities.
/s/ KPMG LLP
Chartered Professional Accountants
We have served as the Company’s auditor since 2018.
Calgary, Canada
February 22, 2024
Nutrien Annual Report 2023 | 97
In millions of US dollars unless otherwise noted
Consolidated statements of earnings
For the years ended December 31 |
Note |
2023 |
2022 |
|
SALES |
3 |
29,056 |
37,884 |
|
Freight, transportation and distribution |
4 |
974 |
872 |
|
Cost of goods sold |
4, 12 |
19,608 |
21,588 |
|
GROSS MARGIN |
8,474 |
15,424 |
||
Selling expenses |
4 |
3,397 |
3,414 |
|
General and administrative expenses |
4 |
626 |
565 |
|
Provincial mining taxes |
4 |
398 |
1,149 |
|
Share-based compensation (recovery) expense |
5 |
(14) |
63 |
|
Impairment (reversal of impairment) of assets |
13, 14 |
774 |
(780) |
|
Other expenses |
6 |
548 |
204 |
|
EARNINGS BEFORE FINANCE COSTS AND INCOME TAXES |
2,745 |
10,809 |
||
Finance costs |
7 |
793 |
563 |
|
EARNINGS BEFORE INCOME TAXES |
1,952 |
10,246 |
||
Income tax expense |
8 |
670 |
2,559 |
|
NET EARNINGS |
1,282 |
7,687 |
||
Attributable to |
||||
Equity holders of Nutrien |
1,258 |
7,660 |
||
Non-controlling interest |
24 |
27 |
||
NET EARNINGS |
1,282 |
7,687 |
||
NET EARNINGS PER SHARE ATTRIBUTABLE TO EQUITY HOLDERS OF NUTRIEN ("EPS") |
9 |
|||
Basic |
2.53 |
14.22 |
||
Diluted |
2.53 |
14.18 |
||
Weighted average shares outstanding for basic EPS |
9 |
496,381,000 |
538,475,000 |
|
Weighted average shares outstanding for diluted EPS |
9 |
496,994,000 |
540,010,000 |
|
Consolidated statements of comprehensive income
For the years ended December 31 (net of related income taxes) |
Note |
2023 |
2022 |
|
NET EARNINGS |
1,282 |
7,687 |
||
Other comprehensive income (loss) |
||||
Items that will not be reclassified to net earnings: |
||||
Net actuarial (loss) gain on defined benefit plans |
21 |
(17) |
83 |
|
Net fair value gain (loss) on investments |
15 |
4 |
(44) |
|
Items that have been or may be subsequently reclassified to net earnings: |
||||
Gain (loss) on currency translation of foreign operations |
89 |
(199) |
||
Other |
5 |
(17) |
||
OTHER COMPREHENSIVE INCOME (LOSS) |
81 |
(177) |
||
COMPREHENSIVE INCOME |
1,363 |
7,510 |
||
Attributable to |
||||
Equity holders of Nutrien |
1,338 |
7,484 |
||
Non-controlling interest |
25 |
26 |
||
COMPREHENSIVE INCOME |
1,363 |
7,510 |
||
(See Notes to the Consolidated Financial Statements) |
Nutrien Annual Report 2023 | 98
In millions of US dollars unless otherwise noted
Consolidated statements of cash flows
For the years ended December 31 |
Note |
2023 |
|
2022 |
|
|
|
|
Note 2 |
OPERATING ACTIVITIES |
|
|
|
|
Net earnings |
|
1,282 |
|
7,687 |
Adjustments for: |
|
|
|
|
Depreciation and amortization |
|
2,169 |
|
2,012 |
Share-based compensation (recovery) expense |
5 |
(14) |
|
63 |
Impairment (reversal of impairment) of assets |
13, 14 |
774 |
|
(780) |
Provision for deferred income tax |
|
7 |
|
182 |
Net distributed (undistributed) earnings of equity-accounted investees |
|
117 |
|
(181) |
Gain on amendments to other post-retirement pension plans |
21 |
(80) |
|
‐ |
Loss on Blue Chip Swaps |
6 |
92 |
|
‐ |
Long-term income tax receivables and payables |
16 |
(65) |
|
273 |
Other long-term assets, liabilities and miscellaneous |
|
277 |
|
2 |
Cash from operations before working capital changes |
|
4,559 |
|
9,258 |
Changes in non-cash operating working capital: |
|
|
|
|
Receivables |
|
879 |
|
(919) |
Inventories and prepaid expenses and other current assets |
|
1,376 |
|
(1,167) |
Payables and accrued charges |
|
(1,748) |
|
938 |
CASH PROVIDED BY OPERATING ACTIVITIES |
|
5,066 |
|
8,110 |
INVESTING ACTIVITIES |
|
|
|
|
Capital expenditures 1 |
13, 14 |
(2,671) |
|
(2,475) |
Business acquisitions, net of cash acquired |
25 |
(153) |
|
(407) |
Proceeds from sales of Blue Chip Swaps, net of purchases |
6 |
(92) |
|
‐ |
Net changes in non-cash working capital |
|
(22) |
|
(44) |
Other |
|
(20) |
|
25 |
CASH USED IN INVESTING ACTIVITIES |
|
(2,958) |
|
(2,901) |
FINANCING ACTIVITIES |
|
|
|
|
(Repayment of) proceeds from short-term debt, net |
17, 18 |
(458) |
|
529 |
Proceeds from long-term debt |
18 |
1,500 |
|
1,045 |
Repayment of long-term debt |
18 |
(648) |
|
(561) |
Repayment of principal portion of lease liabilities |
18, 19 |
(375) |
|
(341) |
Dividends paid to Nutrien's shareholders |
23 |
(1,032) |
|
(1,031) |
Repurchase of common shares |
23 |
(1,047) |
|
(4,520) |
Issuance of common shares |
23 |
33 |
|
168 |
Other |
|
(34) |
|
(20) |
CASH USED IN FINANCING ACTIVITIES |
|
(2,061) |
|
(4,731) |
EFFECT OF EXCHANGE RATE CHANGES ON CASH AND CASH EQUIVALENTS |
|
(7) |
|
(76) |
INCREASE IN CASH AND CASH EQUIVALENTS |
|
40 |
|
402 |
CASH AND CASH EQUIVALENTS – BEGINNING OF YEAR |
|
901 |
|
499 |
CASH AND CASH EQUIVALENTS – END OF YEAR |
|
941 |
|
901 |
Cash and cash equivalents is composed of: |
|
|
|
|
Cash |
|
909 |
|
775 |
Short-term investments |
|
32 |
|
126 |
|
|
941 |
|
901 |
SUPPLEMENTAL CASH FLOWS INFORMATION |
|
|
|
|
Interest paid |
|
729 |
|
482 |
Income taxes paid |
|
1,764 |
|
1,882 |
Total cash outflow for leases |
|
501 |
|
459 |
1 Includes additions to property, plant and equipment, and intangible assets of $2,465 and $206 (2022 – $2,253 and $222), respectively.
(See Notes to the Consolidated Financial Statements)
Nutrien Annual Report 2023 | 99
In millions of US dollars unless otherwise noted
Consolidated statements of changes in shareholders’ equity
Accumulated Other Comprehensive |
|||||||||||||||||||
(Loss) Income ("AOCI") |
|||||||||||||||||||
(Loss) Gain |
|||||||||||||||||||
on Currency |
Equity |
||||||||||||||||||
Number of |
Translation |
Holders |
Non- |
||||||||||||||||
Common |
Share |
Contributed |
of Foreign |
Total |
Retained |
of |
Controlling |
Total |
|||||||||||
Shares |
Capital |
Surplus |
Operations |
Other |
AOCI |
Earnings |
Nutrien |
Interest |
Equity |
||||||||||
BALANCE – DECEMBER 31, 2021 |
557,492,516 |
15,457 |
149 |
(176) |
30 |
(146) |
8,192 |
23,652 |
47 |
23,699 |
|||||||||
Net earnings |
‐ |
‐ |
‐ |
‐ |
‐ |
‐ |
7,660 |
7,660 |
27 |
7,687 |
|||||||||
Other comprehensive (loss) income |
‐ |
‐ |
‐ |
(198) |
22 |
(176) |
‐ |
(176) |
(1) |
(177) |
|||||||||
Shares repurchased (Note 23) |
(53,312,559) |
(1,487) |
(22) |
‐ |
‐ |
‐ |
(2,987) |
(4,496) |
‐ |
(4,496) |
|||||||||
Dividends declared (Note 23) |
‐ |
‐ |
‐ |
‐ |
‐ |
‐ |
(1,019) |
(1,019) |
‐ |
(1,019) |
|||||||||
Non-controlling interest transactions |
‐ |
‐ |
‐ |
‐ |
‐ |
‐ |
(1) |
(1) |
(28) |
(29) |
|||||||||
|
Effect of share-based compensation including issuance of common shares (Note 5) |
3,066,148 |
202 |
(18) |
‐ |
‐ |
‐ |
‐ |
184 |
‐ |
184 |
|||||||||
Transfer of net loss on cash flow hedges |
‐ |
‐ |
‐ |
‐ |
14 |
14 |
‐ |
14 |
‐ |
14 |
|||||||||
Transfer of net actuarial gain on defined benefit plans |
‐ |
‐ |
‐ |
‐ |
(83) |
(83) |
83 |
‐ |
‐ |
‐ |
|||||||||
BALANCE – DECEMBER 31, 2022 |
507,246,105 |
14,172 |
109 |
(374) |
(17) |
(391) |
11,928 |
25,818 |
45 |
25,863 |
|||||||||
Net earnings |
‐ |
‐ |
‐ |
‐ |
‐ |
‐ |
1,258 |
1,258 |
24 |
1,282 |
|||||||||
Other comprehensive income (loss) |
‐ |
‐ |
‐ |
88 |
(8) |
80 |
‐ |
80 |
1 |
81 |
|||||||||
Shares repurchased (Note 23) |
(13,378,189) |
(374) |
(26) |
‐ |
‐ |
‐ |
(600) |
(1,000) |
‐ |
(1,000) |
|||||||||
Dividends declared (Note 23) |
‐ |
‐ |
‐ |
‐ |
‐ |
‐ |
(1,050) |
(1,050) |
‐ |
(1,050) |
|||||||||
Non-controlling interest transactions |
‐ |
‐ |
‐ |
‐ |
‐ |
‐ |
(2) |
(2) |
(25) |
(27) |
|||||||||
|
Effect of share-based compensation including issuance of common shares (Note 5) |
683,814 |
40 |
‐ |
‐ |
‐ |
‐ |
‐ |
40 |
‐ |
40 |
|||||||||
Transfer of net gain on sale of investment |
‐ |
‐ |
‐ |
‐ |
(14) |
(14) |
14 |
‐ |
‐ |
‐ |
|||||||||
Transfer of net loss on cash flow hedges |
‐ |
‐ |
‐ |
‐ |
12 |
12 |
‐ |
12 |
‐ |
12 |
|||||||||
Transfer of net actuarial loss on defined benefit plans |
‐ |
‐ |
‐ |
‐ |
17 |
17 |
(17) |
‐ |
‐ |
‐ |
|||||||||
BALANCE – DECEMBER 31, 2023 |
494,551,730 |
13,838 |
83 |
(286) |
(10) |
(296) |
11,531 |
25,156 |
45 |
25,201 |
|||||||||
(See Notes to the Consolidated Financial Statements) |
|||||||||||||||||||
Nutrien Annual Report 2023 | 100
In millions of US dollars unless otherwise noted
Consolidated balance sheets
As at December 31 |
Note |
2023 |
2022 |
|
ASSETS |
||||
Current assets |
||||
Cash and cash equivalents |
941 |
901 |
||
Receivables |
11 |
5,398 |
6,194 |
|
Inventories |
12 |
6,336 |
7,632 |
|
Prepaid expenses and other current assets |
1,495 |
1,615 |
||
14,170 |
16,342 |
|||
Non-current assets |
||||
Property, plant and equipment |
13 |
22,461 |
21,767 |
|
Goodwill |
14 |
12,114 |
12,368 |
|
Intangible assets |
14 |
2,217 |
2,297 |
|
Investments |
15 |
736 |
843 |
|
Other assets |
16 |
1,051 |
969 |
|
TOTAL ASSETS |
52,749 |
54,586 |
||
LIABILITIES |
||||
Current liabilities |
||||
Short-term debt |
17 |
1,815 |
2,142 |
|
Current portion of long-term debt |
18 |
512 |
542 |
|
Current portion of lease liabilities |
19 |
327 |
305 |
|
Payables and accrued charges |
20 |
9,467 |
11,291 |
|
12,121 |
14,280 |
|||
Non-current liabilities |
||||
Long-term debt |
18 |
8,913 |
8,040 |
|
Lease liabilities |
19 |
999 |
899 |
|
Deferred income tax liabilities |
8 |
3,574 |
3,547 |
|
Pension and other post-retirement benefit liabilities |
21 |
252 |
319 |
|
Asset retirement obligations and accrued environmental costs |
22 |
1,489 |
1,403 |
|
Other non-current liabilities |
200 |
235 |
||
TOTAL LIABILITIES |
27,548 |
28,723 |
||
SHAREHOLDERS’ EQUITY |
||||
Share capital |
23 |
13,838 |
14,172 |
|
Contributed surplus |
83 |
109 |
||
Accumulated other comprehensive loss |
(296) |
(391) |
||
Retained earnings |
11,531 |
11,928 |
||
Equity holders of Nutrien |
25,156 |
25,818 |
||
Non-controlling interest |
45 |
45 |
||
TOTAL SHAREHOLDERS’ EQUITY |
25,201 |
25,863 |
||
TOTAL LIABILITIES AND SHAREHOLDERS’ EQUITY |
52,749 |
54,586 |
||
(See Notes to the Consolidated Financial Statements) |
||||
Approved by the Board of Directors,
|
/s/ Christopher Burley
Director |
/s/ Aaron Regent
Director |
Nutrien Annual Report 2023 | 101
In millions of US dollars unless otherwise noted
Notes to the consolidated financial statements
Note 1 | Description of business
Nutrien Ltd. (collectively with its subsidiaries, “Nutrien”, “we”, “us”, “our” or “the Company”) is the world’s largest provider of crop inputs and services. Nutrien plays a critical role in helping growers around the globe increase food production in a sustainable manner.
The Company is a corporation organized under the laws of Canada with its registered head office located at Suite 1700, 211 19th Street East, Saskatoon, Saskatchewan, Canada, S7K 5R6. As at December 31, 2023, the Company had assets, which include as follows:
Segment |
Description |
Nutrien Ag Solutions (“Retail”) |
|
Potash |
|
Nitrogen |
|
Phosphate |
|
Corporate and Others |
|
Note 2 | Basis of presentation
We prepared these consolidated financial statements in accordance with International Financial Reporting Standards (“IFRS”) as issued by the International Accounting Standards Board (“IASB”). We have consistently applied the same accounting policies throughout all periods presented, as if these policies had always been in effect, with the exception of the accounting standards adopted effective January 1, 2023, as disclosed in Note 30.
Certain immaterial 2022 figures have been reclassified in the consolidated statements of cash flows.
These consolidated financial statements were authorized for issue by the Board of Directors on February 22, 2024.
Sensitivity analyses included throughout the notes should be used with caution as the changes are hypothetical and not reflective of future performance. The sensitivities have been calculated independently of changes in other key variables. We prepared these consolidated financial statements under the historical cost basis, except for items that IFRS requires to be measured at fair value. Reference to n/a indicates information is not applicable.
Nutrien Annual Report 2023 | 102
In millions of US dollars unless otherwise noted
Note 3 | Segment information
The Company has four reportable operating segments: Nutrien Ag Solutions (“Retail”), Potash, Nitrogen and Phosphate. The Retail segment distributes crop nutrients, crop protection products, seed and merchandise. Retail provides services directly to growers through a network of retail locations in North America, South America and Australia. The Potash, Nitrogen and Phosphate segments are differentiated by the chemical nutrient contained in the products that each produces.
The Executive Leadership Team (“ELT”), comprised of officers at the Executive Vice President level and above, is the Chief Operating Decision Maker (“CODM”). The CODM uses adjusted EBITDA, calculated as below, to measure performance and allocate resources to the operating segments. The CODM considers adjusted EBITDA to be a meaningful measure because it is not impacted by long-term investment and financing decisions, but rather focuses on the performance of our day-to-day operations. In addition, it excludes the impact of impairments and other costs that are centrally managed by our corporate function.
We determine the composition of the reportable segments based on factors including risks and returns, internal organization, and internal reports reviewed by the CODM. We allocate certain expenses across segments based on reasonable considerations such as production capabilities or historical trends.
|
|
|
|
|
|
|
|
|
|
Corporate |
|
|
|
|
2023 |
Retail |
Potash |
Nitrogen |
Phosphate |
and Others |
Eliminations |
Consolidated |
|||||||
Sales |
– third party |
19,542 |
|
3,735 |
|
3,804 |
|
1,975 |
|
‐ |
|
‐ |
|
29,056 |
|
– intersegment |
‐ |
|
431 |
|
931 |
|
288 |
|
‐ |
|
(1,650) |
|
‐ |
Sales |
– total |
19,542 |
|
4,166 |
|
4,735 |
|
2,263 |
|
‐ |
|
(1,650) |
|
29,056 |
Freight, transportation and distribution |
‐ |
|
407 |
|
528 |
|
270 |
|
‐ |
|
(231) |
|
974 |
|
Net sales |
19,542 |
|
3,759 |
|
4,207 |
|
1,993 |
|
‐ |
|
(1,419) |
|
28,082 |
|
Cost of goods sold |
15,112 |
|
1,396 |
|
2,828 |
|
1,760 |
|
‐ |
|
(1,488) |
|
19,608 |
|
Gross margin |
4,430 |
|
2,363 |
|
1,379 |
|
233 |
|
‐ |
|
69 |
|
8,474 |
|
Selling expenses |
3,375 |
|
12 |
|
27 |
|
6 |
|
‐ |
|
(23) |
|
3,397 |
|
General and administrative expenses |
217 |
|
13 |
|
21 |
|
11 |
|
364 |
|
‐ |
|
626 |
|
Provincial mining taxes |
‐ |
|
398 |
|
‐ |
|
‐ |
|
‐ |
|
‐ |
|
398 |
|
Share-based compensation recovery |
‐ |
|
‐ |
|
‐ |
|
‐ |
|
(14) |
|
‐ |
|
(14) |
|
Impairment of assets (Notes 13 and 14) |
465 |
|
‐ |
|
76 |
|
233 |
|
‐ |
|
‐ |
|
774 |
|
Other expenses (income) |
158 |
|
(1) |
|
(27) |
|
40 |
|
348 |
|
30 |
|
548 |
|
|
Earnings (loss) before finance costs and income taxes |
215 |
|
1,941 |
|
1,282 |
|
(57) |
|
(698) |
|
62 |
|
2,745 |
|
Depreciation and amortization |
759 |
|
463 |
|
572 |
|
294 |
|
81 |
|
‐ |
|
2,169 |
|
EBITDA 1 |
974 |
|
2,404 |
|
1,854 |
|
237 |
|
(617) |
|
62 |
|
4,914 |
|
Integration and restructuring related costs |
20 |
|
‐ |
|
‐ |
|
‐ |
|
29 |
|
‐ |
|
49 |
|
Share-based compensation recovery |
‐ |
|
‐ |
|
‐ |
|
‐ |
|
(14) |
|
‐ |
|
(14) |
|
Impairment of assets (Notes 13 and 14) |
465 |
|
‐ |
|
76 |
|
233 |
|
‐ |
|
‐ |
|
774 |
|
ARO/ERL expense for non-operating sites 2 |
‐ |
|
‐ |
|
‐ |
|
‐ |
|
152 |
|
‐ |
|
152 |
|
|
Foreign exchange loss, net of related derivatives |
‐ |
|
‐ |
|
‐ |
|
‐ |
|
91 |
|
‐ |
|
91 |
|
Loss on Blue Chip Swaps |
‐ |
|
‐ |
|
‐ |
|
‐ |
|
92 |
|
‐ |
|
92 |
|
Adjusted EBITDA |
1,459 |
|
2,404 |
|
1,930 |
|
470 |
|
(267) |
|
62 |
|
6,058 |
|
Assets |
23,056 |
|
13,571 |
|
11,466 |
|
2,438 |
|
2,818 |
|
(600) |
|
52,749 |
|
1 EBITDA is calculated as net earnings (loss) before finance costs, income taxes, and depreciation and amortization.
2 ARO/ERL refers to asset retirement obligations and accrued environmental costs.
Nutrien Annual Report 2023 | 103
In millions of US dollars unless otherwise noted
|
|
|
|
|
|
|
|
|
|
Corporate |
|
|
|
|
2022 |
Retail |
|
Potash |
|
Nitrogen |
Phosphate |
|
and Others |
|
Eliminations |
|
Consolidated |
||
Sales |
– third party |
21,266 |
|
7,600 |
|
6,755 |
|
2,263 |
|
‐ |
|
‐ |
|
37,884 |
|
– intersegment |
84 |
|
599 |
|
1,293 |
|
357 |
|
‐ |
|
(2,333) |
|
‐ |
Sales |
– total |
21,350 |
|
8,199 |
|
8,048 |
|
2,620 |
|
‐ |
|
(2,333) |
|
37,884 |
Freight, transportation and distribution |
‐ |
|
300 |
|
515 |
|
243 |
|
‐ |
|
(186) |
|
872 |
|
Net sales |
21,350 |
|
7,899 |
|
7,533 |
|
2,377 |
|
‐ |
|
(2,147) |
|
37,012 |
|
Cost of goods sold |
16,171 |
|
1,400 |
|
4,252 |
|
1,884 |
|
‐ |
|
(2,119) |
|
21,588 |
|
Gross margin |
5,179 |
|
6,499 |
|
3,281 |
|
493 |
|
‐ |
|
(28) |
|
15,424 |
|
Selling expenses |
3,392 |
|
10 |
|
28 |
|
7 |
|
(1) |
|
(22) |
|
3,414 |
|
General and administrative expenses |
200 |
|
9 |
|
17 |
|
13 |
|
326 |
|
‐ |
|
565 |
|
Provincial mining taxes |
‐ |
|
1,149 |
|
‐ |
|
‐ |
|
‐ |
|
‐ |
|
1,149 |
|
Share-based compensation expense |
‐ |
|
‐ |
|
‐ |
|
‐ |
|
63 |
|
‐ |
|
63 |
|
Reversal of impairment of assets (Note 13) |
‐ |
|
‐ |
|
‐ |
|
(780) |
|
‐ |
|
‐ |
|
(780) |
|
Other expenses (income) |
29 |
|
5 |
|
(137) |
|
67 |
|
227 |
|
13 |
|
204 |
|
|
Earnings (loss) before finance costs and income taxes |
1,558 |
|
5,326 |
|
3,373 |
|
1,186 |
|
(615) |
|
(19) |
|
10,809 |
|
Depreciation and amortization |
752 |
|
443 |
|
558 |
|
188 |
|
71 |
|
‐ |
|
2,012 |
|
EBITDA |
2,310 |
|
5,769 |
|
3,931 |
|
1,374 |
|
(544) |
|
(19) |
|
12,821 |
|
Integration and restructuring related costs |
2 |
|
‐ |
|
‐ |
|
‐ |
|
44 |
|
‐ |
|
46 |
|
Share-based compensation expense |
‐ |
|
‐ |
|
‐ |
|
‐ |
|
63 |
|
‐ |
|
63 |
|
Reversal of impairment of assets (Note 13) |
‐ |
|
‐ |
|
‐ |
|
(780) |
|
‐ |
|
‐ |
|
(780) |
|
|
COVID-19 coronavirus pandemic ("COVID-19") related expenses |
‐ |
|
‐ |
|
‐ |
|
‐ |
|
8 |
|
‐ |
|
8 |
|
|
Foreign exchange loss, net of related derivatives |
‐ |
|
‐ |
|
‐ |
|
‐ |
|
31 |
|
‐ |
|
31 |
|
Gain on disposal of investment |
(19) |
|
‐ |
|
‐ |
|
‐ |
|
‐ |
|
‐ |
|
(19) |
|
Adjusted EBITDA |
2,293 |
|
5,769 |
|
3,931 |
|
594 |
|
(398) |
|
(19) |
|
12,170 |
|
Assets |
24,451 |
|
13,921 |
|
11,807 |
|
2,661 |
|
2,622 |
|
(876) |
|
54,586 |
|
Retail Segment Product Line |
Sales |
Crop nutrients |
Dry and liquid macronutrient products including potash, nitrogen and phosphate, and proprietary liquid micronutrient products. |
Crop protection products |
Various third-party supplier and proprietary products designed to maintain crop quality and manage plant diseases, weeds and other pests. |
Seed |
Various third-party supplier seed brands and proprietary seed product lines. |
Merchandise |
Fencing, feed supplements, livestock-related animal health products, storage and irrigation equipment, and other products. |
Nutrien Financial |
Financing solutions provided to US and Australia Retail branches and customers in support of Nutrien’s agricultural product and service sales. |
Services and other revenues |
Product application, soil and leaf testing, crop scouting and precision agriculture services, and water services. |
Nutrien Annual Report 2023 | 104
In millions of US dollars unless otherwise noted
Segment |
Products |
Sales Prices Impacted By |
Potash |
|
|
Nitrogen |
|
|
Phosphate |
|
|
2023 |
2022 |
||
Retail sales by product line |
|||
Crop nutrients |
8,379 |
10,060 |
|
Crop protection products |
6,750 |
7,067 |
|
Seed |
2,295 |
2,112 |
|
Merchandise |
1,001 |
1,019 |
|
Nutrien Financial |
322 |
267 |
|
Services and other |
927 |
966 |
|
Nutrien Financial elimination 1 |
(132) |
(141) |
|
19,542 |
21,350 |
||
Potash sales by geography |
|||
Manufactured product |
|||
North America |
2,090 |
2,785 |
|
Offshore 2 |
2,076 |
5,414 |
|
4,166 |
8,199 |
||
Nitrogen sales by product line |
|||
Manufactured product |
|||
Ammonia |
1,337 |
2,834 |
|
Urea and ESN® 3 |
1,624 |
2,268 |
|
Solutions, nitrates and sulfates |
1,367 |
1,996 |
|
Other nitrogen and purchased products 3 |
407 |
950 |
|
4,735 |
8,048 |
||
Phosphate sales by product line |
|||
Manufactured product |
|||
Fertilizer |
1,264 |
1,520 |
|
Industrial and feed |
703 |
763 |
|
Other phosphate and purchased products |
296 |
337 |
|
2,263 |
2,620 |
1 Represents elimination of the interest and service fees charged by Nutrien Financial to Retail branches.
2 Relates to Canpotex, a major customer, and includes other revenue representing provisional pricing adjustments of $(394) (2022 – $(105)) (Note 28).
3 Certain immaterial 2022 figures have been reclassified.
Nutrien Annual Report 2023 | 105
In millions of US dollars unless otherwise noted
|
Sales – Third Party by Customer Location |
|
Non-Current Assets 1 |
||||
|
2023 |
|
2022 |
|
2023 |
|
2022 |
United States |
17,656 |
|
20,089 |
|
16,001 |
|
15,971 |
Canada |
3,111 |
|
3,783 |
|
18,987 |
|
18,303 |
Australia |
3,389 |
|
3,877 |
|
1,069 |
|
1,105 |
Canpotex (Note 28) |
2,076 |
|
5,414 |
|
‐ |
|
‐ |
Trinidad |
29 |
|
15 |
|
661 |
|
688 |
Brazil |
1,048 |
|
1,136 |
|
555 |
|
851 |
Other South America |
876 |
2 |
1,507 |
2 |
48 |
|
64 |
Other |
871 |
3 |
2,063 |
3 |
389 |
|
457 |
|
29,056 |
|
37,884 |
|
37,710 |
|
37,439 |
1 Excludes financial instruments (other than equity-accounted investees), deferred tax assets and post-employment benefit assets.
2 Other South America third-party sales includes sales to Argentina of $526 (2022 – $666).
3 Other third-party sales primarily relate to Europe of $314 (2022 – $856) and Others of $557 (2022 – $1,207).
Canpotex sales by market (%) |
2023 |
|
2022 |
Latin America |
47 |
|
34 |
Other Asian markets 1 |
28 |
|
34 |
China |
9 |
|
14 |
India |
5 |
|
8 |
Other markets |
11 |
|
10 |
1 All Asian markets except China and India.
Note 4 | Nature of expenses
|
2023 |
|
2022 |
Purchased and produced raw materials and product for resale 1 |
16,635 |
|
18,747 |
Depreciation and amortization |
2,169 |
|
2,012 |
Employee costs 2 |
2,858 |
|
2,968 |
Freight |
1,171 |
|
1,094 |
Impairment (reversal of impairment) of assets (Notes 13 and 14) |
774 |
|
(780) |
Provincial mining taxes 3 |
398 |
|
1,149 |
Integration and restructuring related costs |
49 |
|
46 |
Contract services |
753 |
|
745 |
Lease expense |
103 |
|
93 |
Fleet fuel, repairs and maintenance |
369 |
|
359 |
Gain on disposal of investment |
‐ |
|
(19) |
COVID-19 related expenses |
‐ |
|
8 |
Loss on Blue Chip Swaps |
92 |
|
‐ |
ARO/ERL non-accretion expense (Note 22) |
143 |
|
15 |
Gain on amendments to other post-retirement pension plans |
(80) |
|
‐ |
Other |
877 |
|
638 |
Total cost of goods sold and expenses |
26,311 |
|
27,075 |
1 Significant expenses include supplies, energy, fuel, purchases of raw material (natural gas – feedstock, sulfur, ammonia and reagents) and product for resale (crop nutrients, crop protection products and seed).
2 Includes salaries and wages, employee benefits, and share-based compensation.
3 Includes Saskatchewan potash production tax and Saskatchewan resource surcharge of $279 and $119 (2022 – $909 and $240), respectively, as required under Saskatchewan provincial legislation.
Nutrien Annual Report 2023 | 106
In millions of US dollars unless otherwise noted
Note 5 | Share-based compensation
Plans |
|
Eligibility |
|
Granted |
|
Vesting Period |
|
Maximum Term |
|
Settlement |
Stock Options |
|
Officers and eligible employees |
|
Annually |
|
25 percent per year over four years |
|
10 years |
|
Shares 1 |
Performance Share Units ("PSUs") |
|
Officers and eligible employees |
|
Annually |
|
On third anniversary of grant date based on total shareholder return relative to PSU peer group (75 percent weighting) and return on invested capital (25 percent weighting) |
|
Not applicable |
|
Cash |
Restricted Share Units ("RSUs") |
|
Officers and eligible employees |
|
Annually |
|
On third anniversary of grant date and not subject to performance conditions |
|
Not applicable |
|
Cash |
Deferred Share Units ("DSUs") |
|
Non-executive directors |
|
At the discretion of the Board of Directors |
|
Fully vest upon grant |
|
Not applicable |
|
Cash 2 |
Stock Appreciation Rights ("SARs") / Tandem Stock Appreciation Rights ("TSARs") 3 |
|
Awards no longer granted; legacy awards only |
|
Awards no longer granted; legacy awards only |
|
25 percent per year over four years |
|
10 years |
|
Cash |
1 Stock options may also be settled by cash settlement or, if approved by the Company, by a broker-assisted "cashless exercise" arrangement or a “net exercise” arrangement.
2 Directors can redeem their DSUs for cash only when they leave the Board of Directors for an amount equal to the market value of the common shares at the time of redemption or as mandated by the Nutrien DSU Plan.
3 Holders of TSARs have the ability to choose between (a) receiving in cash the price of our shares on the date of exercise in excess of the exercise price of the right or (b) receiving common shares by paying the exercise price of the right. Our past experience and future expectation are that substantially all TSAR holders will elect to choose the first option.
The weighted average assumptions of stock options by year of grant that impacted current year results are as follows:
|
|
|
Year of Grant |
||
Stock options |
|
Based on |
2023 |
|
2022 |
|
Weighted average grant date fair value per option |
|
Black-Scholes-Merton option-pricing model as of the date of the grant |
25.67 |
|
20.49 |
Weighted average assumptions: |
|
|
|
|
|
Exercise price per option |
|
Quoted market closing price of common shares on the last trading day immediately preceding the date of the grant |
78.95 |
|
77.50 |
Expected annual dividend yield (%) |
|
Annualized dividend rate as of the date of the grant |
2.49 |
|
2.45 |
Expected volatility (%) |
|
Historical volatility of Nutrien's shares over a period commensurate with the expected life of the grant |
33 |
|
30 |
Risk-free interest rate (%) |
|
Zero-coupon government issues implied yield available on equivalent remaining term at the time of the grant |
3.84 |
|
2.00 |
Average expected life of options (years) |
|
Historical experience |
8.5 |
|
8.5 |
Nutrien Annual Report 2023 | 107
In millions of US dollars unless otherwise noted
|
|
|
|
|
Compensation (Recovery) Expense |
||
|
Units Granted |
|
Units Outstanding |
|
|
|
|
|
in 2023 |
|
as at December 31, 2023 |
|
2023 |
|
2022 |
Stock options |
301,168 |
|
3,248,306 |
|
8 |
|
11 |
PSUs |
517,219 |
|
1,732,785 |
|
(39) |
|
13 |
RSUs |
582,659 |
|
1,576,486 |
|
23 |
|
33 |
DSUs |
34,075 |
|
401,296 |
|
(4) |
|
2 |
SARs/TSARs |
‐ |
|
176,284 |
|
(2) |
|
4 |
|
|
|
|
|
(14) |
|
63 |
Note 6 | Other expenses (income)
|
2023 |
|
2022 |
Integration and restructuring related costs |
49 |
|
46 |
Foreign exchange loss, net of related derivatives |
91 |
|
31 |
Earnings of equity-accounted investees |
(101) |
|
(247) |
Bad debt expense |
55 |
|
12 |
COVID-19 related expenses |
‐ |
|
8 |
Gain on disposal of investment |
‐ |
|
(19) |
Project feasibility costs |
86 |
|
79 |
Customer prepayment costs |
47 |
|
42 |
Legal expenses |
34 |
|
21 |
Consulting expenses |
21 |
|
29 |
Employee special recognition award |
‐ |
|
61 |
Loss on Blue Chip Swaps |
92 |
|
‐ |
ARO/ERL expense for non-operating sites (Note 22) |
152 |
|
‐ |
Gain on amendments to other post-retirement pension plans |
(80) |
|
‐ |
Other expenses |
102 |
|
141 |
|
548 |
|
204 |
The Central Bank of Argentina maintains certain currency controls that limit our ability to remit cash from Argentina. Blue Chip Swaps are trade transactions that effectively allow companies to transfer US dollars out of Argentina. Through this mechanism, we incurred a loss of $92 from the purchase of securities denominated in Argentine peso and corresponding sales in US dollars during 2023. The loss is a result of the significant divergence between the Blue Chip Swap market exchange rate and the official Argentinian Central Bank rate.
Note 7 | Finance costs
2023 |
2022 |
||
Interest expense |
|||
Short-term debt |
303 |
153 |
|
Long-term debt |
446 |
333 |
|
Lease liabilities |
48 |
35 |
|
Total interest expense |
797 |
521 |
|
Unwinding of discount on asset retirement obligations (Note 22) |
33 |
29 |
|
Interest on net defined benefit pension and other post-retirement plan obligations (Note 21) |
5 |
8 |
|
Borrowing costs capitalized to property, plant and equipment |
(71) |
(37) |
|
Interest income |
(35) |
(25) |
|
Other finance costs |
64 |
67 |
|
793 |
563 |
Borrowing costs capitalized to property, plant and equipment in 2023 were calculated by applying an average capitalization rate of 5.4 percent (2022 – 4.1 percent) to expenditures on qualifying assets.
Nutrien Annual Report 2023 | 108
In millions of US dollars unless otherwise noted
Note 8 | Income taxes
|
2023 |
|
2022 |
Current income tax |
|
|
|
Tax expense for current year |
637 |
|
2,314 |
Adjustments in respect of prior years |
26 |
|
63 |
Total current income tax expense |
663 |
|
2,377 |
Deferred income tax |
|
|
|
Origination and reversal of temporary differences |
5 |
|
215 |
Swiss Tax Reform adjustment |
(134) |
|
‐ |
Adjustments in respect of prior years |
31 |
|
(41) |
Change in recognition of tax losses and deductible temporary differences |
105 |
|
8 |
Total deferred income tax expense |
7 |
|
182 |
Income tax expense included in net earnings |
670 |
|
2,559 |
In 2023, we recorded a deferred tax asset of $134 related to an increase in the tax basis of our Swiss assets as a result of changes to our Switzerland tax declarations.
We operate in a specialized industry and in several tax jurisdictions; as a result, our earnings are subject to various rates of taxation.
The provision for income taxes differs from the amount that would have resulted from applying the Canadian statutory income tax rates to earnings before income taxes as follows:
2023 |
2022 |
||
Earnings (loss) before income taxes |
|||
Canada |
1,427 |
5,707 |
|
United States |
976 |
3,447 |
|
Australia |
161 |
263 |
|
Trinidad |
(75) |
487 |
|
Other |
(537) |
342 |
|
1,952 |
10,246 |
||
Canadian federal and provincial statutory income tax rate (%) |
27 |
27 |
|
Income tax at statutory rates |
527 |
2,766 |
|
Adjusted for the effect of: |
|||
Impact of foreign tax rates |
(139) |
(132) |
|
Swiss Tax Reform adjustment |
(134) |
‐ |
|
Non-taxable income |
(67) |
(98) |
|
Production-related deductions |
(54) |
(51) |
|
Current year losses for which no deferred tax asset is recognized |
314 |
‐ |
|
Change in recognition of tax losses and deductible temporary differences |
105 |
8 |
|
Tax authority examinations |
62 |
22 |
|
Non-deductible expenses |
25 |
16 |
|
Withholding taxes |
20 |
18 |
|
Other |
11 |
10 |
|
Income tax expense included in net earnings |
670 |
2,559 |
Nutrien Annual Report 2023 | 109
In millions of US dollars unless otherwise noted
Deferred Income Taxes
Deferred Income Tax (Recovery) |
|||||||
Deferred Income Tax (Assets) |
Expense Recognized |
||||||
Liabilities |
in Net Earnings |
||||||
2023 |
2022 |
2023 |
2022 |
||||
Deferred income tax assets |
|||||||
Asset retirement obligations and accrued environmental costs |
(400) |
(319) |
(17) |
35 |
|||
Tax loss and other carryforwards |
(347) |
(396) |
52 |
(93) |
|||
Lease liabilities |
(307) |
(298) |
(8) |
(151) |
|||
Inventories |
(108) |
(155) |
47 |
(30) |
|||
Pension and other post-retirement benefit liabilities |
(108) |
(151) |
50 |
(1) |
|||
Long-term debt |
(99) |
(117) |
18 |
21 |
|||
Payables and accrued charges |
(96) |
(98) |
2 |
(84) |
|||
Receivables |
(50) |
(48) |
(2) |
(4) |
|||
Other assets |
(1) |
(1) |
‐ |
‐ |
|||
Deferred income tax liabilities |
|||||||
Property, plant and equipment |
4,410 |
4,305 |
40 |
545 |
|||
Goodwill and intangible assets |
173 |
347 |
(168) |
(53) |
|||
Other liabilities |
30 |
30 |
(7) |
(3) |
|||
3,097 |
3,099 |
7 |
182 |
||||
Amounts and expiry dates of unused tax losses and unused tax credits as at December 31, 2023, were:
Amount |
Expiry Date |
||
Unused federal operating losses |
2,056 |
2024 – Indefinite |
|
Unused federal capital losses |
683 |
Indefinite |
The unused tax losses and credits with no expiry dates can be carried forward indefinitely.
As at December 31, 2023, we had $1,532 of federal tax losses for which we did not recognize deferred tax assets.
We have determined that it is probable that all recognized deferred tax assets will be realized through a combination of future reversals of temporary differences and taxable income.
We did not recognize deferred tax liabilities related to temporary differences associated with investments in subsidiaries and equity-accounted investees amounting to $7,010 as at December 31, 2023 (2022 – $13,060).
Note 9 | Net earnings per share
|
2023 |
|
2022 |
Weighted average number of common shares |
496,381,000 |
|
538,475,000 |
Dilutive effect of stock options |
613,000 |
|
1,535,000 |
Weighted average number of diluted common shares |
496,994,000 |
|
540,010,000 |
Options excluded from the calculation of diluted net earnings per share due to the option exercise prices being greater than the average market price of common shares were as follows:
|
2023 |
|
2022 |
Number of options excluded |
821,763 |
|
567,409 |
Nutrien Annual Report 2023 | 110
In millions of US dollars unless otherwise noted
Note 10 | Financial instruments and related risk management
Our ELT, along with the Board of Directors (including Board committees), is responsible for monitoring our risk exposures and managing our policies to address these risks. Our strategic and risk management processes are integrated to ensure we understand the benefit from the relationship between strategy, risk and value creation. Outlined below are our risk management strategies we have developed to mitigate the financial market risks that we are exposed to.
Credit Risks |
Risk Management Strategies |
Receivables from customers |
|
Cash and cash equivalents and other receivables |
|
Aging of receivables (%) as at December 31:
|
2023 |
|
2022 |
||||||||
|
Retail (Nutrien Financial) |
|
Retail (Excluding Nutrien Financial) |
|
Potash, Nitrogen and Phosphate |
|
Retail (Nutrien Financial) |
|
Retail (Excluding Nutrien Financial) |
|
Potash, Nitrogen and Phosphate |
Current |
78 |
|
78 |
|
89 |
|
83 |
|
84 |
|
97 |
30 days or less past due |
13 |
|
6 |
|
11 |
|
10 |
|
9 |
|
3 |
31 – 90 days past due |
4 |
|
4 |
|
‐ |
|
3 |
|
4 |
|
‐ |
Greater than 90 days past due |
5 |
|
12 |
|
‐ |
|
4 |
|
3 |
|
‐ |
|
100 |
|
100 |
|
100 |
|
100 |
|
100 |
|
100 |
Nutrien Annual Report 2023 | 111
In millions of US dollars unless otherwise noted
Maximum exposure to credit risk as at December 31:
|
2023 |
|
2022 |
Cash and cash equivalents |
941 |
|
901 |
Receivables (excluding income tax receivable) |
5,103 |
|
6,050 |
|
6,044 |
|
6,951 |
Liquidity Risk |
Risk Management Strategies |
Access to cash |
Refer to Note 17 for our available credit facilities. |
The following maturity analysis of our financial liabilities and gross settled derivative contracts (for which the cash flows are settled simultaneously) is based on the expected undiscounted contractual cash flows from the date of the consolidated balance sheets to the contractual maturity date.
|
Carrying Amount |
|
Contractual |
|
|
|
|
|
|
|
|
|
of Liability as at |
|
Cash |
|
Within |
|
1 to 3 |
|
3 to 5 |
|
Over 5 |
2023 |
December 31 |
|
Flows |
|
1 Year |
|
Years |
|
Years |
|
Years |
Short-term debt 1 |
1,815 |
|
1,815 |
|
1,815 |
|
‐ |
|
‐ |
|
‐ |
Payables and accrued charges 2 |
9,024 |
|
9,024 |
|
9,024 |
|
‐ |
|
‐ |
|
‐ |
Long-term debt, including current portion 1 |
9,425 |
|
15,339 |
|
966 |
|
2,324 |
|
1,556 |
|
10,493 |
Lease liabilities, including current portion 1 |
1,326 |
|
1,525 |
|
368 |
|
484 |
|
222 |
|
451 |
Derivatives |
16 |
|
16 |
|
16 |
|
‐ |
|
‐ |
|
‐ |
|
21,606 |
|
27,719 |
|
12,189 |
|
2,808 |
|
1,778 |
|
10,944 |
1 Contractual cash flows include contractual interest payments related to debt obligations and lease liabilities. Interest rates on debt with variable rates are based on the prevailing rates as at December 31, 2023.
2 Excludes non-financial liabilities and includes payables of approximately $2.1 billion related to our prepaid inventory to secure product discounts. We consider these payables to be part of our working capital. For these payables, we participated in arrangements where the vendors sold their right to receive payment to financial institutions without extending the original payment terms. These payables were paid in January 2024.
Nutrien Annual Report 2023 | 112
In millions of US dollars unless otherwise noted
Market Risks |
Type |
Risk Management Strategies |
|
Interest rate |
Short-term and long-term debt |
|
We do not believe we have material exposure to interest, price or foreign exchange risk on our financial instruments as at December 31, 2023 and 2022. |
Price |
Natural gas derivative instruments |
|
|
Price |
Investment at fair value |
|
|
Foreign exchange |
|
|
|
The fair value of our net foreign exchange currency derivative assets (liabilities) as at December 31, 2023 was $11 (2022 – $(18)). The following table presents the significant foreign currency derivatives that existed as at December 31:
2023 |
2022 |
||||||||||
Average |
Average |
||||||||||
Contract |
Contract |
||||||||||
Sell/buy |
Notional |
Maturities |
Rate |
Notional |
Maturities |
Rate |
|||||
Derivatives not designated as hedges |
|||||||||||
Forwards |
|||||||||||
USD/Canadian dollars ("CAD") |
435 |
2024 |
1.3207 |
473 |
2023 |
1.3584 |
|||||
Australian dollars/USD |
86 |
2024 |
1.5269 |
133 |
2023 |
1.5010 |
|||||
Brazilian real/USD |
94 |
2024 |
4.8688 |
374 |
2023 |
5.6892 |
|||||
Derivatives designated as hedges |
|||||||||||
Forwards |
|||||||||||
USD/CAD |
601 |
2024 |
1.3565 |
487 |
2023 |
1.3255 |
|||||
Nutrien Annual Report 2023 | 113
In millions of US dollars unless otherwise noted
Fair Value
Financial instruments included in the consolidated balance sheets are measured either at fair value or amortized cost.
Financial Instruments at Fair Value |
Fair Value Method and Associated Level within the Fair Value Hierarchy |
Cash and cash equivalents |
Carrying amount (approximation to fair value assumed due to short-term nature) |
Equity securities |
Closing bid price of the common shares (Level 1) as at the balance sheet date |
Debt securities |
Closing bid price of the debt or other instruments with similar terms and credit risk (Level 2) as at the balance sheet date |
Foreign currency derivatives not traded in an active market |
Quoted forward exchange rates (Level 2) as at the balance sheet date |
Foreign exchange forward contracts, swaps and options, and natural gas swaps not traded in an active market |
Based on a discounted cash flow (“DCF”) model. Inputs included contractual cash flows based on prices for natural gas futures contracts, fixed prices and notional volumes specified by the swap contracts, the time value of money, liquidity risk, our own credit risk (related to instruments in a liability position) and counterparty credit risk (related to instruments in an asset position). Futures contract prices used as inputs in the model were supported by prices quoted in an active market and therefore categorized in Level 2. |
Financial Instruments at Amortized Cost |
Fair Value Method |
Receivables, short-term debt, and payables and accrued charges |
Carrying amount (approximation to fair value assumed due to short-term nature) |
Long-term debt |
Quoted market prices (Level 1 or 2 depending on the market liquidity of the debt) |
Other long-term debt instruments |
Carrying amount (approximation to fair value) |
The following table presents our fair value hierarchy for financial instruments carried at fair value on a recurring basis or measured at amortized cost and require fair value disclosure. The table does not include fair value information for financial instruments that are measured using their carrying amount as a reasonable approximation of fair value.
2023 |
2022 |
||||||||||||||
Carrying |
Carrying |
||||||||||||||
Financial assets (liabilities) measured at |
Amount |
Level 1 |
Level 2 |
Level 3 |
Amount |
Level 1 |
Level 2 |
Level 3 |
|||||||
Fair value on a recurring basis 1 |
|||||||||||||||
Derivative instrument assets |
20 |
‐ |
20 |
‐ |
7 |
‐ |
7 |
‐ |
|||||||
|
Other current financial assets – marketable securities 2 |
173 |
35 |
138 |
‐ |
148 |
19 |
129 |
‐ |
|||||||
|
Investments at fair value through other comprehensive income ("FVTOCI") (Note 15) |
190 |
180 |
‐ |
10 |
200 |
190 |
‐ |
10 |
|||||||
|
Investments at fair value through profit or loss ("FVTPL") (Note 15) |
45 |
‐ |
‐ |
45 |
44 |
‐ |
‐ |
44 |
|||||||
Derivative instrument liabilities |
(16) |
‐ |
(16) |
‐ |
(35) |
‐ |
(35) |
‐ |
|||||||
Amortized cost |
|||||||||||||||
Investments at amortized cost (Note 15) |
19 |
16 |
‐ |
‐ |
‐ |
‐ |
‐ |
‐ |
|||||||
Current portion of long-term debt |
|||||||||||||||
Senior notes and debentures |
(499) |
‐ |
(502) |
‐ |
(500) |
(493) |
‐ |
‐ |
|||||||
Fixed and floating rate debt |
(13) |
‐ |
(13) |
‐ |
(42) |
‐ |
(42) |
‐ |
|||||||
Long-term debt |
|||||||||||||||
Senior notes and debentures |
(8,884) |
(3,110) |
(5,462) |
‐ |
(7,910) |
(3,581) |
(3,656) |
‐ |
|||||||
Fixed and floating rate debt |
(29) |
‐ |
(29) |
‐ |
(130) |
‐ |
(130) |
‐ |
|||||||
1 During 2023 and 2022, there were no transfers between levels for financial instruments measured at fair value on a recurring basis. Our policy is to recognize transfers at the end of the reporting period.
2 Marketable securities consist of equity and debt securities.
Nutrien Annual Report 2023 | 114
In millions of US dollars unless otherwise noted
Note 11 | Receivables
|
|
Segment |
2023 |
|
2022 |
Receivables from customers |
|
|
|
|
|
Third parties |
Retail (Nutrien Financial) 1 |
2,943 |
|
2,705 |
|
|
|
Retail |
1,097 |
|
1,293 |
|
|
Potash, Nitrogen, Phosphate |
577 |
|
827 |
Related party – Canpotex |
Potash (Note 28) |
162 |
|
866 |
|
|
Less allowance for expected credit losses of receivables from customers |
|
(111) |
|
(95) |
|
|
|
|
4,668 |
|
5,596 |
Rebates |
198 |
|
172 |
||
Income taxes (Note 8) |
295 |
|
144 |
||
Other receivables |
237 |
|
282 |
||
|
|
|
5,398 |
|
6,194 |
1 Includes $2,578 of very low risk of default and $365 of low risk of default (2022 – $2,260 of very low risk of default and $445 of low risk of default).
Qualifying receivables from customers financed by Nutrien Financial represent high-quality receivables from customers that have been rated very low to low risk of default among Retail’s receivables from customers.
Customer credit with a financial institution of $431 as at December 31, 2023, related to our agency agreement, is not recognized in our consolidated balance sheets. Through the agency agreement, we only have a limited recourse involvement to the extent of an indemnification of the financial institution to a maximum of 5 percent (2022 – 5 percent) of the qualified customer loans. Historical indemnification losses on this arrangement have been negligible, and the average aging of the customer loans with the financial institution is current.
Note 12 | Inventories
|
2023 |
|
2022 |
Product purchased for resale |
4,941 |
|
5,885 |
Finished products |
351 |
|
612 |
Intermediate products |
160 |
|
184 |
Raw materials |
299 |
|
425 |
Materials and supplies |
585 |
|
526 |
|
6,336 |
|
7,632 |
By Segment |
2023 |
|
2022 |
Retail |
5,041 |
|
6,035 |
Potash |
371 |
|
398 |
Nitrogen |
493 |
|
706 |
Phosphate |
431 |
|
493 |
|
6,336 |
|
7,632 |
Inventories expensed to cost of goods sold during the year were $19,391 (2022 – $21,371).
Nutrien Annual Report 2023 | 115
In millions of US dollars unless otherwise noted
Note 13 | Property, plant and equipment
|
|
|
|
|
Machinery |
|
Mine |
|
|
|
|
|
Land and |
|
Buildings and |
|
and |
Development |
Assets Under |
|
|
||
Improvements |
Improvements |
|
Equipment |
|
Costs |
|
Construction |
|
Total |
||
Useful life range (years) |
1 – 85 |
|
1 – 70 |
|
1 – 80 |
|
1 – 60 |
|
n/a |
|
|
Carrying amount – December 31, 2022 |
1,201 |
|
6,340 |
|
11,017 |
|
1,108 |
|
2,101 |
|
21,767 |
Acquisitions (Note 25) |
‐ |
|
2 |
|
5 |
|
‐ |
|
‐ |
|
7 |
Additions |
1 |
|
5 |
|
37 |
|
‐ |
|
2,422 |
|
2,465 |
Additions – Right-of-use ("ROU") assets |
1 |
|
70 |
|
338 |
|
‐ |
|
‐ |
|
409 |
Disposals |
(6) |
|
(7) |
|
(37) |
|
‐ |
|
(1) |
|
(51) |
Transfers |
26 |
|
188 |
|
1,401 |
|
237 |
|
(1,852) |
|
‐ |
Foreign currency translation and other |
12 |
|
32 |
|
94 |
|
3 |
|
(165) |
|
(24) |
Depreciation |
(39) |
|
(184) |
|
(1,054) |
|
(138) |
|
‐ |
|
(1,415) |
Depreciation – ROU assets |
(2) |
|
(60) |
|
(326) |
|
‐ |
|
‐ |
|
(388) |
Impairment |
(19) |
|
(10) |
|
(148) |
|
(95) |
|
(37) |
|
(309) |
Carrying amount – December 31, 2023 |
1,175 |
|
6,376 |
|
11,327 |
|
1,115 |
|
2,468 |
|
22,461 |
Balance – December 31, 2023 is composed of: |
|
|
|
|
|
|
|
|
|
|
|
Cost |
1,631 |
|
9,050 |
|
23,237 |
|
2,938 |
|
2,468 |
|
39,324 |
Accumulated depreciation and |
|
|
|
|
|
|
|
|
|
|
|
impairments |
(456) |
|
(2,674) |
|
(11,910) |
|
(1,823) |
|
‐ |
|
(16,863) |
Carrying amount – December 31, 2023 |
1,175 |
|
6,376 |
|
11,327 |
|
1,115 |
|
2,468 |
|
22,461 |
Balance – December 31, 2023 is composed of: |
|
|
|
|
|
|
|
|
|
|
|
Owned property, plant and equipment |
1,145 |
|
5,980 |
|
10,486 |
|
1,115 |
|
2,468 |
|
21,194 |
ROU assets |
30 |
|
396 |
|
841 |
|
‐ |
|
‐ |
|
1,267 |
Carrying amount – December 31, 2023 |
1,175 |
|
6,376 |
|
11,327 |
|
1,115 |
|
2,468 |
|
22,461 |
Carrying amount – December 31, 2021 |
1,073 |
|
6,305 |
|
10,221 |
|
853 |
|
1,564 |
|
20,016 |
Acquisitions (Note 25) |
12 |
|
40 |
|
23 |
|
‐ |
|
65 |
|
140 |
Additions |
17 |
|
9 |
|
25 |
|
‐ |
|
2,202 |
|
2,253 |
Additions – ROU assets |
‐ |
|
51 |
|
230 |
|
‐ |
|
‐ |
|
281 |
Disposals |
(9) |
|
(13) |
|
(24) |
|
‐ |
|
‐ |
|
(46) |
Transfers |
35 |
|
163 |
|
1,281 |
|
170 |
|
(1,649) |
|
‐ |
Foreign currency translation and other |
5 |
|
2 |
|
55 |
|
30 |
|
(90) |
|
2 |
Depreciation |
(35) |
|
(185) |
|
(1,006) |
|
(94) |
|
‐ |
|
(1,320) |
Depreciation – ROU assets |
(2) |
|
(58) |
|
(279) |
|
‐ |
|
‐ |
|
(339) |
Reversal of impairment |
105 |
|
26 |
|
491 |
|
149 |
|
9 |
|
780 |
Carrying amount – December 31, 2022 |
1,201 |
|
6,340 |
|
11,017 |
|
1,108 |
|
2,101 |
|
21,767 |
Balance – December 31, 2022 is composed of: |
|
|
|
|
|
|
|
|
|
|
|
Cost |
1,605 |
|
8,795 |
|
22,023 |
|
2,699 |
|
2,101 |
|
37,223 |
Accumulated depreciation and |
|
|
|
|
|
|
|
|
|
|
|
impairments |
(404) |
|
(2,455) |
|
(11,006) |
|
(1,591) |
|
‐ |
|
(15,456) |
Carrying amount – December 31, 2022 |
1,201 |
|
6,340 |
|
11,017 |
|
1,108 |
|
2,101 |
|
21,767 |
Balance – December 31, 2022 is composed of: |
|
|
|
|
|
|
|
|
|
|
|
Owned property, plant and equipment |
1,173 |
|
5,956 |
|
10,267 |
|
1,108 |
|
2,101 |
|
20,605 |
ROU assets |
28 |
|
384 |
|
750 |
|
‐ |
|
‐ |
|
1,162 |
Carrying amount – December 31, 2022 |
1,201 |
|
6,340 |
|
11,017 |
|
1,108 |
|
2,101 |
|
21,767 |
Nutrien Annual Report 2023 | 116
In millions of US dollars unless otherwise noted
Depreciation of property, plant and equipment was included in the following:
2023 |
2022 |
||
Freight, transportation and distribution |
165 |
148 |
|
Cost of goods sold |
1,157 |
1,024 |
|
Selling expenses |
453 |
424 |
|
General and administrative expenses |
48 |
42 |
|
Depreciation recorded in earnings |
1,823 |
1,638 |
|
Depreciation recorded in inventory |
145 |
151 |
Impairments and Impairment Reversals
For each cash generating unit (“CGU”) or groups of CGUs in which we complete an impairment analysis, the recoverable amount estimate used the following key assumptions: our forecasted EBITDA, discount rate and long-term growth rate. For our Phosphate CGUs, we also estimate the end of expected mine life. We used key assumptions that were based on historical data and estimates of future results from internal sources, independent third-party price benchmarks, and mineral reserve technical reports (relating to Phosphate CGUs), as well as industry and market information.
Phosphate
In 2023, we identified an impairment trigger for our Phosphate CGUs, White Springs and Aurora, primarily as a result of the decrease in our forecasted phosphate margins. We completed our impairment analysis for these CGUs.
Phosphate CGU |
|
White Springs |
|
Aurora |
Impairment assessment date |
|
June 30, 2023 |
|
June 30, 2023 |
Recoverable amount ($) |
|
504 |
|
2,000 |
Carrying amount before impairment loss ($) |
|
737 |
|
1,660 |
Pre-tax impairment loss ($) |
|
233 |
|
‐ |
Valuation methodology |
|
Value in use ("VIU") |
|
Fair value less costs of disposal ("FVLCD"), a Level 3 measurement |
Valuation technique |
|
Pre-tax DCF to end of expected mine life |
|
Five-year DCF plus terminal year to end of mine life |
In 2022, we completed an impairment analysis at our White Springs and Aurora CGUs as a result of revised pricing forecasts to reflect the macroeconomic environment at the time. We completed our impairment analysis for these CGUs.
Phosphate CGU |
White Springs |
Aurora |
||
Impairment reversal date |
September 30, 2022 |
June 30, 2022 |
||
Recoverable amount ($) |
770 |
2,900 |
||
Carrying amount before impairment reversal ($) |
425 |
1,200 |
||
Pre-tax impairment reversal (net of depreciation) ($) 1 |
330 |
450 |
||
Valuation methodology |
VIU |
FVLCD |
||
Valuation technique |
Pre-tax DCF to end of expected mine life |
Five-year DCF plus terminal year to end of mine life |
1 Full reversal of the previously recorded impairment losses relating to property, plant and equipment at White Springs in 2017 and 2020 of $250 and $215, respectively, and Aurora in 2020 of $545.
Nutrien Annual Report 2023 | 117
In millions of US dollars unless otherwise noted
|
|
White Springs |
|
Aurora |
|
Key Assumptions 1 |
|
2023 |
2022 |
|
2022 |
End of mine life (proven and probable reserves) (year) 2 |
|
2032 |
2030 |
|
2050 |
Long-term growth rate (%) |
|
n/a |
n/a |
|
2.0 |
Pre-tax discount rate (%) |
|
15.6 |
15.2 |
|
n/a |
Post-tax discount rate (%) |
|
12.0 |
12.0 |
|
10.4 |
Forecasted EBITDA 3 ($) |
|
720 |
980 |
|
3,090 |
1 At impairment loss (reversal) date.
2 The White Springs CGU has a shorter expected mine life and is therefore more sensitive to changes in short- and medium-term forecasted phosphate margins.
3 Forecasted EBITDA to 2028 (2022 – Forecasted EBITDA to 2027).
Sensitivities
The following table highlights sensitivities to the recoverable amounts of our Phosphate CGUs, which could result in additional impairment losses or reversals of the previously recorded losses (relating to the White Springs CGU).
|
|
|
|
Change to Recoverable Amount ($) |
||||
Key Assumptions as at June 30, 2023 |
|
Change in Assumption |
|
White Springs |
|
Aurora |
||
Long-term growth rate (%) |
|
+ / - 1.0 percent |
|
n/a |
n/a |
|
+ / - |
110 |
Pre-tax discount rate (%) |
|
+ / - 1.0 percent |
|
- / + |
20 |
|
n/a |
n/a |
Post-tax discount rate (%) |
|
+ / - 1.0 percent |
|
n/a |
n/a |
|
- / + |
190 |
Forecasted EBITDA over forecast period ($) |
|
+ / - 5.0 percent |
|
+ / - |
40 |
|
+ / - |
220 |
Nitrogen
In 2023, we identified an impairment trigger for our Trinidad CGU, part of our Nitrogen segment, due to a new natural gas contract and the resulting outlook for higher expected natural gas costs and constrained near-term availability. We expect improved natural gas availability in Trinidad as the development of additional natural gas fields is anticipated to add new natural gas supply starting in 2026.
December 31, 2023 |
|
Trinidad |
Recoverable amount ($) |
|
676 |
Carrying amount before impairment loss ($) |
|
752 |
Pre-tax impairment loss ($) |
|
76 |
Valuation methodology |
|
FVLCD, a Level 3 measurement |
Valuation technique |
|
Five-year DCF plus a terminal value |
Key assumptions |
|
|
Long-term growth rate (%) |
|
2.3 |
Post-tax discount rate 1 (%) |
|
13.0 |
Forecasted EBITDA 2,3 ($) |
|
1,145 |
1 Discount rate used in the previous measurement in 2020 was 12.6 percent.
2 First five years of the forecast period.
3 Includes key assumptions relating to net selling price based on forecasted future natural gas contracting and availability.
Sensitivities
The following table highlights sensitivities to the recoverable amount of our Trinidad CGU, which could result in additional impairment losses or reversals of the previously recorded losses.
Key Assumptions as at December 31, 2023 |
|
Change in Assumption |
|
Change to Recoverable Amount ($) |
|
Long-term growth rate (%) |
|
+ / - 1.0 percent |
|
+ / - |
55 |
Post-tax discount rate (%) |
|
+ / - 1.0 percent |
|
- / + |
95 |
Forecasted EBITDA over forecast period ($) |
|
+ / - 5.0 percent |
|
+ / - |
100 |
Nutrien Annual Report 2023 | 118
In millions of US dollars unless otherwise noted
Note 14 | Goodwill and intangible assets
|
|
|
Intangible Assets |
||||||||
|
|
|
Customer |
|
|
|
Trade |
|
|
|
|
|
Goodwill |
|
Relationships 1 |
|
Technology |
|
Names |
|
Other |
|
Total |
Useful life range (years) |
n/a |
|
5 – 15 |
|
2 – 20 |
|
3 – 15 ² |
|
1 – 30 |
|
|
Carrying amount – December 31, 2022 |
12,368 |
|
1,229 |
|
702 |
|
95 |
|
271 |
|
2,297 |
Acquisitions (Note 25) |
126 |
|
30 |
|
‐ |
|
7 |
|
1 |
|
38 |
Additions – internally developed |
‐ |
|
‐ |
|
206 |
|
‐ |
|
‐ |
|
206 |
Foreign currency translation and other |
42 |
|
9 |
|
49 |
|
4 |
|
(1) |
|
61 |
Amortization 3 |
‐ |
|
(164) |
|
(114) |
|
(8) |
|
(56) |
|
(342) |
Impairment |
(422) |
|
(43) |
|
‐ |
|
‐ |
|
‐ |
|
(43) |
Carrying amount – December 31, 2023 |
12,114 |
|
1,061 |
|
843 |
|
98 |
|
215 |
|
2,217 |
Balance – December 31, 2023 is composed of: |
|
|
|
|
|
|
|
|
|
|
|
Cost |
12,542 |
|
2,046 |
|
1,263 |
|
160 |
|
656 |
|
4,125 |
Accumulated amortization and impairment |
(428) |
|
(985) |
|
(420) |
|
(62) |
|
(441) |
|
(1,908) |
Carrying amount – December 31, 2023 |
12,114 |
|
1,061 |
|
843 |
|
98 |
|
215 |
|
2,217 |
Carrying amount – December 31, 2021 |
12,220 |
|
1,350 |
|
595 |
|
80 |
|
315 |
|
2,340 |
Acquisitions (Note 25) |
200 |
|
59 |
|
‐ |
|
22 |
|
23 |
|
104 |
Additions – internally developed |
‐ |
|
‐ |
|
216 |
|
‐ |
|
6 |
|
222 |
Foreign currency translation and other |
(52) |
|
(13) |
|
14 |
|
1 |
|
(1) |
|
1 |
Disposals |
‐ |
|
(1) |
|
(1) |
|
‐ |
|
‐ |
|
(2) |
Amortization 3 |
‐ |
|
(166) |
|
(122) |
|
(8) |
|
(72) |
|
(368) |
Carrying amount – December 31, 2022 |
12,368 |
|
1,229 |
|
702 |
|
95 |
|
271 |
|
2,297 |
Balance – December 31, 2022 is composed of: |
|
|
|
|
|
|
|
|
|
|
|
Cost |
12,375 |
|
2,001 |
|
1,028 |
|
150 |
|
649 |
|
3,828 |
Accumulated amortization and impairment |
(7) |
|
(772) |
|
(326) |
|
(55) |
|
(378) |
|
(1,531) |
Carrying amount – December 31, 2022 |
12,368 |
|
1,229 |
|
702 |
|
95 |
|
271 |
|
2,297 |
1 The average remaining amortization period of customer relationships as at December 31, 2023, was approximately 3 years.
2 Certain trade names have indefinite useful lives as there are no regulatory, legal, contractual, cooperative, economic or other factors that limit their useful lives.
3 Amortization of $279 was included in selling expenses during the year ended December 31, 2023 (2022 – $302).
Goodwill Impairment Testing
Goodwill by CGU or Group of CGUs |
2023 |
|
2022 |
Retail – North America |
6,981 |
|
6,898 |
Retail – International 1 |
590 |
|
927 |
Potash |
154 |
|
154 |
Nitrogen |
4,389 |
|
4,389 |
|
12,114 |
|
12,368 |
1 Includes Retail – South America group of CGUs, which had goodwill of nil as at December 31, 2023 (2022 – $348).
Nutrien Annual Report 2023 | 119
In millions of US dollars unless otherwise noted
In testing for impairment of goodwill, we calculate the recoverable amount for a CGU or groups of CGUs containing goodwill. We used the FVLCD methodology based on after-tax discounted cash flows (five-year projections plus a terminal value with the exception of the Retail – South America group of CGUs, which used a 10-year projection plus a terminal value) and incorporated assumptions an independent market participant would apply, including considerations related to climate-change initiatives. We adjusted discount rates for each CGU or group of CGUs for the risk associated with achieving our forecasts and for the country risk premium in which we expect to generate cash flows. FVLCD is a Level 3 measurement. We use our market capitalization (where applicable) and comparative market multiples to ensure discounted cash flow results are reasonable.
The key assumptions with the greatest influence on the calculation of the recoverable amounts are the discount rates, terminal growth rates and forecasted EBITDA. The key forecast assumptions were based on historical data and our estimates of future results from internal sources considering industry and market information.
In 2023, we revised our forecasted EBITDA for the Retail – South America group of CGUs, which triggered an impairment analysis. Due to the impact of crop input price volatility, more moderate long-term growth assumptions and higher interest rates, we lowered our product margin expectations and deferred certain of our planned strategic investments. As a result, this reduced our forecasted EBITDA and growth. Therefore, we recorded the following impairment:
Retail - South America Group of CGUs |
|
June 30, 2023 |
Recoverable amount |
|
1,031 |
Carrying amount before impairment loss |
|
1,496 |
Impairment recognized relating to: |
|
|
Goodwill |
|
422 |
Intangible assets |
|
43 |
The following table highlights sensitivities to the Retail – South America group of CGUs recoverable amount, which could have resulted in additional impairment against the carrying amount of intangible assets and property, plant and equipment.
|
|
|
|
Change in |
|
Decrease to |
Key Assumptions as at June 30, 2023 |
|
Key Assumption |
|
Key Assumption |
|
Recoverable Amount ($) |
Terminal growth rate (%) |
|
6.0 |
|
- 1.0 percent |
|
50 |
Discount rate (%) |
|
16.6 |
|
+ 1.0 percent |
|
120 |
Forecasted EBITDA over forecast period ($) |
|
4,300 |
|
- 5.0 percent |
|
100 |
1 The discount rate used in the previous measurement was 16.0 percent, which was included as part of our Retail – International group of CGUs.
We performed our annual impairment test on goodwill on the remaining CGUs or group of CGUs and did not identify any further impairment; however, the recoverable amount for the Retail – North America group of CGUs did not substantially exceed its carrying amount. The Retail – North America group of CGUs recoverable amount exceeds its carrying amount by $570. Goodwill is more susceptible to impairment risk if there is an increase in the discount rate or a deterioration in business operating results or economic conditions and actual results do not meet our forecasts. A reduction in the terminal growth rate, an increase in the discount rate or a decrease in forecasted EBITDA could cause impairment in the future as shown in the table below.
|
|
Key Assumption |
|
Change Required for Carrying Amount |
|
2023 Annual Impairment Testing |
|
Used in Impairment Model |
|
to Equal Recoverable Amount |
|
Terminal growth rate (%) |
|
2.5 |
|
0.4 |
percent decrease |
Discount rate 1 (%) |
|
8.6 |
|
0.2 |
percent increase |
Forecasted EBITDA over forecast period ($) |
|
8,040 |
|
3.0 |
percent decrease |
1 The discount rate used in the previous measurement was 8.5 percent.
Nutrien Annual Report 2023 | 120
In millions of US dollars unless otherwise noted
The following table indicates the key assumptions used in testing the remaining groups of CGUs:
Terminal Growth Rate (%) |
Discount Rate (%) |
|||||||||||
2023 |
2022 |
2023 |
2022 |
|||||||||
Retail – International 1 |
2.1 |
2.0 |
– |
6.0 |
9.0 |
8.9 |
– |
16.0 |
||||
Potash |
2.5 |
2.5 |
7.6 |
8.3 |
||||||||
Nitrogen |
2.3 |
2.0 |
8.3 |
9.3 |
||||||||
1 The discount rates reflect the country risk premium and size for our international groups of CGUs. The terminal growth rate and discount rate ranges in 2022 included our Retail – South America group of CGUs, which are no longer included in 2023 as goodwill for this group of CGUs is nil.
Note 15 | Investments
|
|
|
Principal Place |
|
Proportion of Ownership Interest |
|
|
|
|
|
|
|
of Business and |
|
and Voting Rights Held (%) |
|
Carrying Amount |
||
Name |
Principal Activity |
|
Incorporation |
|
2023 |
2022 |
|
2023 |
2022 ¹ |
Equity-accounted investees |
|
|
|
|
|
|
|
|
|
Profertil |
Nitrogen producer |
|
Argentina |
|
50 |
50 |
|
340 |
450 |
Canpotex |
Marketing and logistics of potash |
|
Canada |
|
50 |
50 |
|
‐ |
‐ |
Other associates and joint ventures |
|
|
|
|
|
|
142 |
149 |
|
Total equity-accounted investees |
|
|
|
|
|
|
482 |
599 |
|
Investments at FVTOCI |
|
|
|
|
|
|
|
|
|
Sinofert |
Fertilizer supplier and distributor |
|
China/Bermuda |
|
22 |
22 |
|
180 |
190 |
Other |
|
|
|
|
|
|
|
10 |
10 |
Total investments at FVTOCI |
|
|
|
|
|
|
190 |
200 |
|
Investments at FVTPL |
|
|
|
|
|
|
|
|
|
Other |
|
|
|
|
|
|
|
45 |
44 |
Total investments at FVTPL |
|
|
|
|
|
|
45 |
44 |
|
Investments at amortized cost |
|
|
|
|
|
|
|
|
|
Other |
|
|
|
|
|
|
|
19 |
‐ |
Total investments at amortized cost |
|
|
|
|
|
|
19 |
‐ |
|
Total investments |
|
|
|
|
|
|
736 |
843 |
|
1 Certain immaterial 2022 figures have been reclassified.
Nutrien Annual Report 2023 | 121
In millions of US dollars unless otherwise noted
We continuously assess our ability to exercise significant influence or joint control over our investments. Our 22 percent ownership in Sinofert does not constitute significant influence as we do not have any representation on the board of directors of Sinofert. We elected to account for our investment in Sinofert as FVTOCI as it is held for strategic purposes.
Summarized Financial Information of Profertil 1 |
|
|
|
|
For the years ended December 31 |
|
2023 |
|
2022 |
Sales |
|
762 |
|
1,096 |
Depreciation and amortization |
|
5 |
|
5 |
Interest expense |
|
10 |
|
4 |
Interest income |
|
170 |
|
136 |
Income tax expense |
|
166 |
|
277 |
Net earnings and total comprehensive income |
|
178 |
|
466 |
Proportionate share of Profertil earnings |
|
89 |
|
233 |
Elimination of unrealized profit |
|
1 |
|
‐ |
Total proportionate share of Profertil earnings |
|
90 |
|
233 |
Dividends received from Profertil |
|
199 |
|
57 |
As at December 31 |
|
2023 |
|
2022 |
Current assets 2 |
|
355 |
|
835 |
Non-current assets |
|
658 |
|
589 |
|
|
1,013 |
|
1,424 |
Current liabilities 3 |
|
143 |
|
297 |
Non-current liabilities 4 |
|
186 |
|
221 |
|
|
329 |
|
518 |
Net assets of Profertil |
|
684 |
|
906 |
Proportionate share of net assets of Profertil |
|
342 |
|
453 |
Elimination of unrealized profit |
|
(2) |
|
(3) |
Carrying amount of interest in Profertil |
|
340 |
|
450 |
1 Summarized financial information of Profertil, which represents the amounts included in its own financial statements, adjusted for fair value adjustments at acquisition and differences in accounting policies.
2 Includes cash and cash equivalents of $204 (2022 – $585).
3 Includes current financial liabilities (excluding trade and other payables and provisions) of $21 (2022 – $27).
4 Includes non-current financial liabilities (excluding trade and other payables and provisions) of nil (2022 – $23).
Future conditions related to Profertil may be affected by political, economic and social instability. We are exposed to foreign exchange risk related to fluctuations in the Argentine peso against the US dollar and currency controls, which may restrict our ability to repatriate dividends from Profertil.
Nutrien Annual Report 2023 | 122
In millions of US dollars unless otherwise noted
Note 16 | Other assets
2023 |
2022 |
||
Deferred income tax assets (Note 8) |
477 |
448 |
|
Ammonia catalysts 1 |
113 |
104 |
|
Long-term income tax receivable (Note 8) |
91 |
54 |
|
Accrued pension benefit assets (Note 21) |
138 |
157 |
|
Other |
232 |
206 |
|
1,051 |
969 |
1 Net of accumulated amortization of $99 (2022 – $94).
Note 17 | Short-term debt
|
Rate of Interest (%) |
|
2023 |
|
2022 |
||
Credit facilities |
|
|
|
|
|
|
|
Unsecured revolving term credit facility |
|
|
n/a |
|
‐ |
|
500 |
Other unsecured credit facilities |
|
|
|
|
|
|
|
South America 1 |
5.5 |
– |
12.2 |
|
219 |
|
453 |
Australia |
|
|
5.3 |
|
221 |
|
190 |
Other |
|
|
4.8 |
|
21 |
|
9 |
Commercial paper 2 |
5.5 |
– |
5.9 |
|
1,175 |
|
783 |
Other short-term debt |
|
|
|
|
179 |
|
207 |
|
|
|
|
|
1,815 |
|
2,142 |
1 Our credit facilities are either denominated in local currency or US dollars. The range of interest rates for South America excludes our Argentina facilities denominated in local currency with interest rates ranging from 102.5 percent to 107.0 percent. The balance of these Argentina facilities as at December 31, 2023 was $18.
2 We use our $4,500 commercial paper program for our short-term cash requirements. The amount available under the commercial paper program is limited to the availability of backup funds under the $4,500 unsecured revolving term credit facility and excess cash invested in highly liquid securities.
Credit facility limits 1 |
|
As at December 31, 2023 |
Unsecured revolving term facility 2 |
|
4,500 |
Unsecured revolving term facility 3 |
|
1,500 |
Uncommitted revolving demand facility |
|
1,000 |
Other credit facilities 4 |
|
1,320 |
1 Our credit facilities are renegotiated periodically.
2 Matures September 14, 2027, subject to extension at the request of Nutrien provided that the resulting maturity date may not exceed five years from the date of request.
3 In 2023, we extended the term of our unsecured revolving term credit facility to September 10, 2024 and reduced the facility limit from $2,000 to $1,500.
4 Total facility limit amounts include some facilities with maturities in excess of one year.
Principal covenants and events of default under the unsecured revolving term credit facilities include a debt to capital ratio (refer to Note 24) and other customary events of default and covenant provisions. Non-compliance with such covenants could result in accelerated repayment and/or termination of the credit facility. We were in compliance with all covenants as at December 31, 2023.
Nutrien Annual Report 2023 | 123
In millions of US dollars unless otherwise noted
Note 18 | Long-term debt
|
Rate of Interest (%) |
|
Maturity |
|
2023 |
|
2022 |
||
Senior notes 1 |
|
|
|
|
|
|
|
|
|
|
|
|
1.900 |
|
May 13, 2023 |
|
‐ |
|
500 |
|
|
|
5.900 |
|
November 7, 2024 |
|
500 |
|
500 |
|
|
|
3.000 |
|
April 1, 2025 |
|
500 |
|
500 |
|
|
|
5.950 |
|
November 7, 2025 |
|
500 |
|
500 |
|
|
|
4.000 |
|
December 15, 2026 |
|
500 |
|
500 |
|
|
|
4.900 |
|
March 27, 2028 |
|
750 |
|
‐ |
|
|
|
4.200 |
|
April 1, 2029 |
|
750 |
|
750 |
|
|
|
2.950 |
|
May 13, 2030 |
|
500 |
|
500 |
|
|
|
4.125 |
|
March 15, 2035 |
|
450 |
|
450 |
|
|
|
7.125 |
|
May 23, 2036 |
|
212 |
|
212 |
|
|
|
5.875 |
|
December 1, 2036 |
|
500 |
|
500 |
|
|
|
5.625 |
|
December 1, 2040 |
|
500 |
|
500 |
|
|
|
6.125 |
|
January 15, 2041 |
|
401 |
|
401 |
|
|
|
4.900 |
|
June 1, 2043 |
|
500 |
|
500 |
|
|
|
5.250 |
|
January 15, 2045 |
|
489 |
|
489 |
|
|
|
5.000 |
|
April 1, 2049 |
|
750 |
|
750 |
|
|
|
3.950 |
|
May 13, 2050 |
|
500 |
|
500 |
|
|
|
5.800 |
|
March 27, 2053 |
|
750 |
|
‐ |
Debentures 1 |
|
|
7.800 |
|
February 1, 2027 |
|
120 |
|
120 |
Other credit facilities 2 |
|
|
Various |
|
Various |
|
42 |
|
165 |
Other long-term debt |
|
|
n/a |
|
Various |
|
‐ |
|
7 |
|
|
|
|
|
|
|
9,214 |
|
8,344 |
Add net unamortized fair value adjustments |
|
294 |
|
310 |
|||||
Less net unamortized debt issue costs |
|
(83) |
|
(72) |
|||||
|
|
|
|
|
|
|
9,425 |
|
8,582 |
Less current maturities |
|
(512) |
|
(542) |
|||||
|
|
|
|
|
|
|
8,913 |
|
8,040 |
1 Each series of senior notes and debentures is unsecured and has no sinking fund requirements prior to maturity. Each series is redeemable and has various provisions that allow redemption prior to maturity, at our option, at specified prices.
2 Other credit facilities are unsecured and consist of South America facilities with debt of $40 (2022 – $162) and an interest rate of 2.3 percent and other facilities with debt of $2 (2022 – $3) and an interest rate of 4.0 percent.
We are subject to certain customary covenants including limitation on liens, merger and change of control covenants, and customary events of default. As calculated in Note 24, we were in compliance with these covenants as at December 31, 2023.
Nutrien Annual Report 2023 | 124
In millions of US dollars unless otherwise noted
The following is a summary of changes in liabilities arising from financing activities:
Short-Term |
Long-Term |
Lease |
|||||
Debt |
Debt |
Liabilities |
Total |
||||
Balance – December 31, 2022 |
2,142 |
8,582 |
1,204 |
11,928 |
|||
Cash flows (cash inflows and outflows presented on a net basis) |
(458) |
832 |
(375) |
(1) |
|||
Additions and other adjustments to ROU liabilities |
‐ |
‐ |
492 |
492 |
|||
Foreign currency translation and other non-cash changes |
131 |
11 |
5 |
147 |
|||
Balance – December 31, 2023 |
1,815 |
9,425 |
1,326 |
12,566 |
|||
Balance – December 31, 2021 |
1,560 |
8,066 |
1,220 |
10,846 |
|||
Cash flows (cash inflows and outflows presented on a net basis) |
529 |
475 |
(341) |
663 |
|||
Additions and other adjustments to ROU liabilities |
‐ |
‐ |
334 |
334 |
|||
Foreign currency translation and other non-cash changes |
53 |
41 |
(9) |
85 |
|||
Balance – December 31, 2022 |
2,142 |
8,582 |
1,204 |
11,928 |
Note 19 | Lease liabilities
Average Rate of Interest (%) |
2023 |
2022 |
|||
Lease liabilities – non-current |
4.3 |
999 |
899 |
||
Current portion of lease liabilities |
4.5 |
327 |
305 |
||
Total |
1,326 |
1,204 |
Note 20 | Payables and accrued charges
|
2023 |
|
2022 |
Trade and other payables 1 |
5,477 |
|
5,797 |
Customer prepayments |
2,084 |
|
2,298 |
Dividends |
262 |
|
244 |
Accrued compensation |
597 |
|
681 |
Current portion of asset retirement obligations and accrued environmental costs (Note 22) |
165 |
|
234 |
Accrued interest |
117 |
|
102 |
Current portion of share-based compensation (Note 5) |
32 |
|
142 |
Current portion of derivatives |
16 |
|
35 |
Income taxes (Note 8) |
14 |
|
899 |
Provincial mining taxes |
1 |
|
114 |
Other taxes |
62 |
|
59 |
Current portion of pension and other post-retirement benefits (Note 21) |
15 |
|
15 |
Other accrued charges and others |
625 |
|
671 |
|
9,467 |
|
11,291 |
1 Includes amounts owing to Canpotex (Note 28) of $64 (2022 – $203).
Nutrien Annual Report 2023 | 125
In millions of US dollars unless otherwise noted
Note 21 | Pension and other post-retirement benefits
We offer the following pension and other post-retirement benefits to qualified employees: defined benefit pension plans; defined contribution pension plans; and health, dental and life insurance, referred to as other post-retirement plans. Substantially all our employees participate in at least one of these plans.
Description of Defined Benefit Pension Plans
|
Plan Type |
Contributions |
United States |
|
|
Canada |
|
|
Supplemental Plans in US and Canada for Senior Management |
|
|
Our defined benefit pension plans are funded with separate funds that are legally separated from the Company and administered through the Pension Committee in each country, which is composed of our employees. The Pension Committee is required by law to act in the best interests of the plan participants and, in the US and Canada, is responsible for the governance of the plans, including setting certain policies (e.g., investment and contribution) of the funds. The current investment policy for each country’s plans generally does not include currency hedging strategies. Plan assets held in trusts are governed by local regulations and practices in each country, as is the nature of the relationship between the Company and the trustees and their composition.
Description of Other Post-Retirement Plans
We provide health care plans for certain eligible retired employees in the US, Canada and Trinidad. Eligibility for these benefits is generally based on a combination of age and years of service at retirement. Certain terms of the plans include
In addition, certain Medicare eligible retired employees in the US receive an annual contribution to a Healthcare Reimbursement Account, which can be used to purchase health benefits through a private exchange. This annual contribution can be used for premiums or to pay deductibles and/or co-insurance. Finally, we provide non-contributory life insurance plans for certain retired employees who meet specific age and service eligibility requirements.
Nutrien Annual Report 2023 | 126
In millions of US dollars unless otherwise noted
Risks
The defined benefit pension and other post-retirement plans expose us to broadly similar actuarial risks. The most significant risks include investment risk and interest rate risk as discussed below. Other risks include longevity risk.
Investment risk |
A deficit will be created if plan assets underperform the discount rate used in the defined benefit obligation valuation. To mitigate investment risk, we employ
Investment risk is measured and monitored on an ongoing basis through quarterly investment portfolio reviews, annual liability measurements and periodic asset/liability studies. |
Interest rate risk |
A decrease in bond interest rates will increase the pension liability; however, this is generally expected to be partially offset by an increase in the return on the plan’s debt investments. |
Financial Information
|
2023 |
|
2022 |
||||||||
|
|
|
Plan |
|
|
|
|
|
Plan |
|
|
|
Obligation |
|
Assets |
|
Net |
|
Obligation |
|
Assets |
|
Net |
Balance – beginning of year |
(1,507) |
|
1,330 |
|
(177) |
|
(1,996) |
|
1,731 |
|
(265) |
Components of defined benefit expense recognized in earnings |
|
|
|
|
|
|
|
|
|
|
|
Current service cost for benefits earned during the year |
(16) |
|
‐ |
|
(16) |
|
(27) |
|
‐ |
|
(27) |
Interest (expense) income |
(70) |
|
65 |
|
(5) |
|
(60) |
|
52 |
|
(8) |
Past service cost, including curtailment gains and settlements 1 |
76 |
|
‐ |
|
76 |
|
24 |
|
(39) |
|
(15) |
Foreign exchange rate changes and other |
(8) |
|
4 |
|
(4) |
|
28 |
|
(21) |
|
7 |
|
Subtotal of components of defined benefit (recovery) expense recognized in earnings |
(18) |
|
69 |
|
51 |
|
(35) |
|
(8) |
|
(43) |
|
Remeasurements of the net defined benefit liability recognized in OCI during the year |
|
|
|
|
|
|
|
|
|
|
|
Actuarial gain arising from: |
|
|
|
|
|
|
|
|
|
|
|
Changes in financial assumptions |
7 |
|
‐ |
|
7 |
|
423 |
|
‐ |
|
423 |
Changes in demographic assumptions |
‐ |
|
‐ |
|
‐ |
|
21 |
|
‐ |
|
21 |
|
(Loss) gain on plan assets (excluding amounts included in net interest) |
‐ |
|
(30) |
|
(30) |
|
‐ |
|
(337) |
|
(337) |
Subtotal of remeasurements |
7 |
|
(30) |
|
(23) |
|
444 |
|
(337) |
|
107 |
Cash flows |
|
|
|
|
|
|
|
|
|
|
|
Contributions by plan participants |
(4) |
|
4 |
|
‐ |
|
(6) |
|
6 |
|
‐ |
Employer contributions |
‐ |
|
20 |
|
20 |
|
‐ |
|
24 |
|
24 |
Benefits paid |
83 |
|
(83) |
|
‐ |
|
86 |
|
(86) |
|
‐ |
Subtotal of cash flows |
79 |
|
(59) |
|
20 |
|
80 |
|
(56) |
|
24 |
Balance – end of year 2 |
(1,439) |
|
1,310 |
|
(129) |
|
(1,507) |
|
1,330 |
|
(177) |
Balance is composed of: |
|
|
|
|
|
|
|
|
|
|
|
Non-current assets |
|
|
|
|
|
|
|
|
|
|
|
Other assets (Note 16) |
|
|
|
|
138 |
|
|
|
|
|
157 |
Current liabilities |
|
|
|
|
|
|
|
|
|
|
|
Payables and accrued charges (Note 20) |
|
|
|
|
(15) |
|
|
|
|
|
(15) |
Non-current liabilities |
|
|
|
|
|
|
|
|
|
|
|
Pension and other post-retirement benefit liabilities |
|
|
|
|
(252) |
|
|
|
|
|
(319) |
1 In 2023, there were design plan changes that resulted in a gain of $80 to other post-retirement pension plans.
2 Obligations arising from funded and unfunded pension plans are $1,266 and $173 (2022 – $1,255 and $252), respectively. Other post-retirement benefit plans have no plan assets and are unfunded.
Nutrien Annual Report 2023 | 127
In millions of US dollars unless otherwise noted
Plan Assets
As at December 31, the fair value of plan assets of our defined benefit pension plans, by asset category, were as follows:
|
2023 |
|
2022 |
||||||||
|
Quoted Prices |
|
|
|
|
|
Quoted Prices |
|
|
|
|
|
in Active |
|
|
|
|
|
in Active |
|
|
|
|
|
Markets for |
|
|
|
|
|
Markets for |
|
|
|
|
|
Identical Assets |
|
Other 1 |
|
Total |
|
Identical Assets |
|
Other 1 |
|
Total |
Cash and cash equivalents |
30 |
|
5 |
|
35 |
|
93 |
|
4 |
|
97 |
Equity securities and equity funds |
|
|
|
|
|
|
|
|
|
|
|
US |
9 |
|
115 |
|
124 |
|
8 |
|
107 |
|
115 |
International |
‐ |
|
9 |
|
9 |
|
‐ |
|
14 |
|
14 |
Debt securities 2 |
‐ |
|
909 |
|
909 |
|
‐ |
|
841 |
|
841 |
Other |
‐ |
|
233 |
|
233 |
|
‐ |
|
263 |
|
263 |
Total pension plan assets |
39 |
|
1,271 |
|
1,310 |
|
101 |
|
1,229 |
|
1,330 |
1 Approximately 96 percent (2022 – 100 percent) of the Other plan assets are held in funds whose fair values are estimated using their net asset value per share. For the majority of these funds, the redemption frequency is immediate. The Pension Committee manages the asset allocation based upon our current liquidity and income needs.
2 Debt securities included US securities of 76 percent (2022 – 77 percent), International securities of 20 percent (2022 – 22 percent) and Mortgage-backed securities of 4 percent (2022 – 1 percent).
We use letters of credit or surety bonds to secure certain Canadian unfunded defined benefit plan liabilities as at December 31, 2023.
We expect to contribute approximately $140 to all pension and post-retirement plans in 2024. Total contributions recognized as expense under all defined contribution plans for 2023 was $139 (2022 – $128).
We used the following significant assumptions to determine the benefit obligations and expense for our significant plans as at and for the year ended December 31. These assumptions are determined by management and are reviewed annually by our independent actuaries.
|
Pension |
|
Other |
||||||||
|
2023 |
|
2022 |
|
|
|
2023 |
|
|
|
2022 |
Assumptions used to determine the benefit obligations 1: |
|
|
|
|
|
|
|
|
|
|
|
Discount rate (%) |
5.03 |
|
5.01 |
|
|
|
4.81 |
|
|
|
4.86 |
Rate of increase in compensation levels (%) |
4.28 |
|
4.29 |
|
|
|
n/a |
|
|
|
n/a |
Medical cost trend rate – assumed (%) 2 |
n/a |
|
n/a |
|
4.50 |
– |
6.75 |
|
4.50 |
– |
7.00 |
Medical cost trend rate – year reaches ultimate trend rate |
n/a |
|
n/a |
|
|
|
2033 |
|
|
|
2033 |
Mortality assumptions (years) 3 |
|
|
|
|
|
|
|
|
|
|
|
Life expectancy at 65 for a male member currently at age 65 |
20.7 |
|
20.6 |
|
|
|
21.0 |
|
|
|
20.5 |
Life expectancy at 65 for a female member currently at age 65 |
22.9 |
|
22.9 |
|
|
|
23.6 |
|
|
|
23.2 |
Average duration of the defined benefit obligations (years) 4 |
12.3 |
|
12.7 |
|
|
|
10.6 |
|
|
|
12.8 |
1 The current year’s expense is determined using the assumptions that existed at the end of the previous year.
2 We assumed a graded medical cost trend rate starting at 6.75 percent in 2023, moving to 4.50 percent by 2033 (2022 – starting at 7.00 percent, moving to 4.50 percent by 2033). The annual health care reimbursement amount is assumed to increase by 2.00 percent each year.
3 Based on actuarial advice in accordance with the latest available published tables, adjusted where appropriate to reflect future longevity improvements for each country.
4 Weighted average length of the underlying cash flows.
Of the most significant assumptions, a change in discount rates has the greatest potential impact on our pension and other post-retirement benefit plans, with sensitivity to change as follows:
|
Change in Assumption |
|
2023 |
|
2022 |
Benefit obligation as reported |
|
|
1,439 |
|
1,507 |
Discount rate |
1.0 percentage point decrease |
|
190 |
|
210 |
|
1.0 percentage point increase |
|
(150) |
|
(170) |
Nutrien Annual Report 2023 | 128
In millions of US dollars unless otherwise noted
Note 22 | Asset retirement obligations and accrued environmental costs
|
|
Cash Flow |
|
Discounted |
|
Discount Rate |
||
December 31, 2023 |
|
Payments (years) 1 |
|
Cash Flows 2,3 |
|
+0.5% |
|
-0.5% |
Asset retirement obligations |
|
|
|
|
|
(70) |
|
90 |
Retail |
|
1 – 30 |
|
16 |
|
|
|
|
Potash |
|
28 – 484 |
|
117 |
|
|
|
|
Phosphate |
|
1 – 77 |
|
479 |
|
|
|
|
Corporate and others 4,5 |
|
1 – 69 |
|
647 |
|
|
|
|
Accrued environmental costs |
|
|
|
|
|
(5) |
|
5 |
Retail |
|
1 – 30 |
|
69 |
|
|
|
|
Corporate and others |
|
1 – 15 |
|
326 |
|
|
|
|
Total |
|
|
|
1,654 |
|
|
|
|
1 Time frame in which payments are expected to principally occur from December 31, 2023. Adjustments to the years can result from changes to the mine life and/or changes in the rate of tailings volumes.
2 Risk-free discount rates used to discount cash flows reflect current market assessments of the time value of money and the risks specific to the timing and jurisdiction of the obligation. Risk-free discount rates range from 3.1 percent to 5.5 percent.
3 Total undiscounted cash flows are $5.0 billion. For the Potash segment, this represents total undiscounted cash flows in the first year of decommissioning. This excludes subsequent years of tailings dissolution, fine tails capping, tailings management area reclamation, post-reclamation activities and monitoring, and final decommissioning, which are estimated to take an additional 124 to 456 years.
4 For nitrogen sites, there are no significant asset retirement obligations recorded as there is no reasonable basis for estimating a date or range of dates of cessation of operations. We considered the historical performance of our facilities as well as our planned maintenance, major upgrades and replacements, which can extend the useful lives of our facilities indefinitely.
5 Includes certain potash and phosphate sites that are non-operating sites, with the majority of phosphate site payments taking place over the next 16 years.
Asset |
Accrued |
||||
Retirement |
Environmental |
||||
Obligations |
Costs |
Total |
|||
Balance – December 31, 2022 |
1,187 |
450 |
1,637 |
||
Disposals |
‐ |
(2) |
(2) |
||
Change in estimate (Note 6) |
129 |
15 |
144 |
||
Settlements |
(94) |
(68) |
(162) |
||
Accretion |
32 |
1 |
33 |
||
Foreign currency translation and other |
5 |
(1) |
4 |
||
Balance – December 31, 2023 |
1,259 |
395 |
1,654 |
||
Balance – December 31, 2023 is composed of: |
|||||
Current liabilities |
|||||
Payables and accrued charges (Note 20) |
135 |
30 |
165 |
||
Non-current liabilities |
|||||
Asset retirement obligations and accrued environmental costs |
1,124 |
365 |
1,489 |
We are subject to numerous environmental requirements under federal, provincial, state and local laws in the countries in which we operate. We have gypsum stack capping, and closure and post-closure obligations through our subsidiaries, PCS Phosphate Company, Inc., in White Springs, Florida, and PCS Nitrogen, Inc., in Geismar, Louisiana, pursuant to the financial assurance regulatory requirements in those states. As at December 31, 2023, we had $492 in surety bonds and letters of credit outstanding relating to these financial assurance obligations. The recorded provisions may not necessarily reflect our obligations under these financial assurances.
Nutrien Annual Report 2023 | 129
In millions of US dollars unless otherwise noted
Note 23 | Share capital
Authorized
We are authorized to issue an unlimited number of common shares without par value and an unlimited number of preferred shares. The common shares are not redeemable or convertible. The preferred shares may be issued in one or more series with rights and conditions to be determined by the Board of Directors.
Share Repurchase Programs
|
|
|
|
|
Maximum |
|
Maximum |
|
Number of |
|
Commencement |
|
|
|
Shares for |
|
Shares for |
|
Shares |
|
Date |
|
Expiry |
|
Repurchase |
|
Repurchase (%) |
|
Repurchased |
2021 Normal Course Issuer Bid |
March 1, 2021 |
|
February 28, 2022 |
|
28,468,448 |
|
5 |
|
22,186,395 |
2022 Normal Course Issuer Bid 1 |
March 1, 2022 |
|
February 7, 2023 |
|
55,111,110 |
|
10 |
|
55,111,110 |
2023 Normal Course Issuer Bid |
March 1, 2023 |
|
February 29, 2024 |
|
24,962,194 |
|
5 |
|
5,375,397 |
2024 Normal Course Issuer Bid 2 |
March 1, 2024 |
|
February 28, 2025 |
|
24,728,159 |
|
5 |
|
‐ |
1 The original expiry date was February 28, 2023, but we acquired the maximum aggregate number of common shares allowable on February 7, 2023.
2 On February 21, 2024, our Board of Directors approved a share repurchase program. The 2024 normal course issuer bid, which is subject to acceptance by the Toronto Stock Exchange, will expire earlier than the date above if we acquire the maximum number of common shares allowable or otherwise decide not to make any further repurchases.
Purchases under the normal course issuer bids were, or may be, made through open market purchases at market prices as well as by other means permitted by applicable securities regulatory authorities, including private agreements.
Summary of share repurchases |
2023 |
2022 |
|
Number of common shares repurchased for cancellation |
13,378,189 |
53,312,559 |
|
Average price per share (US dollars) |
74.73 |
84.34 |
|
Total cost |
1,000 |
4,496 |
Dividends Declared
During 2023, we declared dividends of $2.12 (2022 - $1.92). On February 21, 2024, our Board of Directors declared and increased our quarterly dividend to $0.54 per share payable on April 11, 2024, to shareholders of record on March 28, 2024. The total estimated dividend to be paid is $265.
Nutrien Annual Report 2023 | 130
In millions of US dollars unless otherwise noted
Note 24 | Capital management
Our capital allocation policy prioritizes safe and reliable operations, a healthy balance sheet, a sustainable dividend to shareholders, and a strategy to allocate remaining cash flow that maximizes shareholder value.
We include total debt, adjusted total debt, adjusted net debt and shareholders’ equity as components of our capital structure. We monitor our capital structure and, based on changes in economic conditions, may adjust the structure by adjusting the amount of dividends paid to shareholders, repurchasing shares, issuing new shares, issuing new debt or retiring existing debt.
We have access to the capital markets through our base shelf prospectus. We use a combination of short-term and long-term debt to finance our operations. We typically pay floating rates of interest on short-term debt and credit facilities, and fixed rates on senior notes and debentures.
We monitor the following measures to evaluate our ability to service debt, make strategic investments and ensure we are in compliance with our debt covenants:
|
2023 |
|
2022 |
Adjusted net debt to adjusted EBITDA |
1.9 |
|
0.9 |
Adjusted EBITDA to adjusted finance costs |
7.3 |
|
21.6 |
Debt to capital (calculated as adjusted total debt to adjusted capital) (Limit: 0.65 : 1.00) |
0.33 : 1.00 |
|
0.32 : 1.00 |
Adjusted EBITDA is calculated in Note 3, while the calculations of the remaining components included in the above ratios are set out in the following tables:
|
2023 |
|
2022 |
Short-term debt |
1,815 |
|
2,142 |
Current portion of long-term debt |
512 |
|
542 |
Current portion of lease liabilities |
327 |
|
305 |
Long-term debt |
8,913 |
|
8,040 |
Lease liabilities |
999 |
|
899 |
Total debt |
12,566 |
|
11,928 |
Letters of credit – financial |
94 |
|
97 |
Adjusted total debt |
12,660 |
|
12,025 |
Nutrien Annual Report 2023 | 131
In millions of US dollars unless otherwise noted
|
2023 |
|
2022 |
Total debt |
12,566 |
|
11,928 |
Cash and cash equivalents |
(941) |
|
(901) |
Net unamortized fair value adjustments |
(294) |
|
(310) |
Adjusted net debt |
11,331 |
|
10,717 |
|
2023 |
|
2022 |
Total shareholders' equity |
25,201 |
|
25,863 |
Adjusted total debt |
12,660 |
|
12,025 |
Adjusted capital |
37,861 |
|
37,888 |
|
2023 |
|
2022 |
Finance costs |
793 |
|
563 |
Unwinding of discount on asset retirement obligations |
(33) |
|
(29) |
Borrowing costs capitalized to property, plant and equipment |
71 |
|
37 |
Interest on net defined benefit pension and other post-retirement plan obligations |
(5) |
|
(8) |
Adjusted finance costs |
826 |
|
563 |
In 2022, we filed a base shelf prospectus in Canada and the US qualifying the issuance of up to $5 billion of common shares, debt securities and other securities during a period of 25 months from March 11, 2022. In 2023 and 2022, we issued senior notes of $1.5 billion and $1 billion, respectively, pursuant to the base shelf prospectus and the applicable prospectus supplement. Refer to Note 18 for details.
Note 25 | Business combinations
|
Casa do Adubo S.A. (“Casa do Adubo”) |
Other Acquisitions |
Acquisition date |
October 1, 2022 |
Various |
Purchase price, net of cash and cash equivalents acquired, and amounts held in escrow |
$268
On the acquisition date, we acquired 100% of the issued and outstanding Casa do Adubo stock. |
$153 (preliminary) (2022 – $176)
|
Goodwill and expected benefits of acquisitions |
$ 184 – Goodwill was fully impaired as part of the impairment recorded to the Retail – South America group of CGUs (Note 14). |
$ 126 (preliminary) (2022 – $ 55 ) |
The expected benefits of the acquisitions resulting in goodwill include: |
||
|
||
Description |
An agriculture retailer in Brazil with 39 retail locations and 10 distribution centers. This acquisition is aligned with our disciplined approach to capital allocation and sustainability commitments, as we continue to expand our presence in Brazil. |
2023 – 23 Retail locations related to various agricultural services (2022 – 43 Retail locations related to various agricultural services and one wholesale warehouse location) |
Nutrien Annual Report 2023 | 132
In millions of US dollars unless otherwise noted
We allocated the following values to the acquired assets and assumed liabilities based upon fair values at their respective acquisition date:
|
|
2023 |
|
2022 |
||
|
|
Other Acquisitions1 |
|
Casa do Adubo Final Fair Value |
|
Other Acquisitions1 |
Current assets |
|
17 |
|
275 |
2 |
116 |
Goodwill |
|
126 |
|
184 |
|
55 |
Other non-current assets |
|
(2) |
|
133 |
|
131 |
Total assets |
|
141 |
|
592 |
|
302 |
Current liabilities |
|
20 |
|
160 |
|
74 |
Other non-current liabilities |
|
2 |
|
116 |
|
42 |
Total liabilities |
|
22 |
|
276 |
|
116 |
Non-controlling interest |
|
(8) |
|
‐ |
|
‐ |
Total consideration |
|
127 |
|
316 |
|
186 |
Amounts held in escrow |
|
26 |
|
(48) |
|
(10) |
|
Total consideration, net of cash and cash equivalents acquired, and amounts held in escrow |
|
153 |
|
268 |
|
176 |
1 Includes preliminary values for current year acquisitions and finalization of measurement period adjustments for prior year acquisitions.
2 Includes receivables from customers with gross contractual amounts of $169.
We have completed our assessment of identifying and measuring all the assets acquired and liabilities assumed relating to our Casa do Adubo acquisition. This assessment included a thorough review of all internal and external sources of information available on circumstances that existed at the acquisition date, engagement of independent valuation experts, and final agreement of the purchase price with no material changes from the preliminary fair value as disclosed in the 2022 annual consolidated financial statements. For certain other acquisitions, we finalized the purchase price with no material change to the fair values disclosed in prior periods. Refer to Note 30 for details of our valuation technique and judgments applied.
Note 26 | Commitments
Principal Portion and |
|||||||||||
Estimated Interest |
|||||||||||
Lease |
Long-Term |
Purchase |
Capital |
Other |
|||||||
December 31, 2023 |
Liabilities |
Debt |
Commitments |
Commitments |
Commitments |
Total |
|||||
Within 1 year |
368 |
966 |
938 |
153 |
188 |
2,613 |
|||||
1 to 3 years |
484 |
2,324 |
249 |
19 |
221 |
3,297 |
|||||
3 to 5 years |
222 |
1,556 |
57 |
‐ |
149 |
1,984 |
|||||
Over 5 years |
451 |
10,493 |
106 |
‐ |
157 |
11,207 |
|||||
Total |
1,525 |
15,339 |
1,350 |
172 |
715 |
19,101 |
|||||
Purchase Commitments
In 2023, we renewed our natural gas purchase agreement in Trinidad. The agreement is a minimum take or pay arrangement providing for approximately 75 percent of the expected requirements of the Trinidad ammonia complex and provides for prices that vary primarily with benchmark ammonia prices and annual escalating floor prices. The commitments included in the foregoing table are based on floor prices and minimum purchase quantities.
Nutrien Annual Report 2023 | 133
In millions of US dollars unless otherwise noted
Profertil has various natural gas contracts denominated in US dollars that expire in 2024 and 2028 and account for virtually all of Profertil’s natural gas requirements. YPF S.A., our joint venture partner in Profertil, supplies approximately 70 percent of the natural gas under these contracts.
In 2023, we entered into natural gas pipeline transportation agreements at our Geismar plant, the latest of which expires in 2033 and accounts for approximately 90 percent of the expected natural gas requirements in Geismar.
The Carseland facility has a power cogeneration agreement expiring on December 31, 2026, which provides 60 megawatt-hours of power per hour. The price for the power is based on a fixed charge adjusted for inflation and a variable charge based on the cost of natural gas provided to the facility for power generation.
Agreements for the purchase of sulfur for use in production of phosphoric acid provide for specified purchase quantities and prices based on market rates at the time of delivery. Commitments included in the foregoing table are based on expected contract prices.
Other Commitments
Other commitments consist principally of pipeline capacity, technology service contracts, managed services contracts, throughput and various rail contracts, the latest of which expires in 2036, and mineral lease commitments, the latest of which expires in 2033.
Note 27 | Guarantees
In the normal course of business, we provide indemnification agreements to counterparties in transactions such as purchase and sale contracts, service agreements, director/officer contracts, and leasing transactions. The terms of these indemnification agreements
We directly guarantee our share of certain commitments of Canpotex (such as railcar leases) under certain agreements with third parties. We would be required to perform on these guarantees in the event of default by the investee. No material loss is anticipated by reason of such agreements and guarantees.
Note 28 | Related party transactions
Sales and Purchases of Goods
We sell potash outside Canada and the US exclusively through Canpotex. Canpotex sells potash to buyers, including Nutrien, in export markets pursuant to term and spot contracts at agreed upon prices. Our total revenue is recognized at the amount received from Canpotex representing proceeds from their sale of potash, less net costs of Canpotex. Sales to Canpotex are shown in Note 3. The receivable outstanding from Canpotex is shown in Note 11 and arose from sale transactions described above. It is unsecured and bears no interest. Any credit losses held against this receivable are expected to be negligible. Purchases from Canpotex for the year ended 2023 were $92 (2022 – $415) and the amount payable to Canpotex is shown in Note 20.
Nutrien Annual Report 2023 | 134
In millions of US dollars unless otherwise noted
Key Management Personnel Compensation and Transactions with Post-Employment Benefit Plans
2023 |
2022 |
||
Salaries and other short-term benefits |
10 |
13 |
|
Share-based compensation |
(7) |
18 |
|
Post-employment benefits |
2 |
3 |
|
Termination benefits |
2 |
10 |
|
7 |
44 |
Disclosures related to our post-employment benefit plans are shown in Note 21.
Note 29 | Contingencies and other matters
Accounting Estimates and Judgments
The following judgments are required to determine our exposure to possible losses and gains related to environmental matters and other various claims and lawsuits pending:
Where no amounts are recognized, such amounts are contingent and disclosure may be appropriate. While the amount disclosed in the consolidated financial statements may not be material, the potential for large liabilities exists and, therefore, these estimates could have a material impact on our consolidated financial statements.
Supporting Information
Canpotex
Nutrien is a shareholder in Canpotex, which markets Canadian potash outside of Canada and the US. Should any operating losses or other liabilities be incurred by Canpotex, the shareholders have contractually agreed to reimburse it in proportion to each shareholder’s productive capacity. Through December 31, 2023, we are not aware of any operating losses or other liabilities.
Mining Risk
The risk of underground water inflows and other underground risks is insured on a limited basis, subject to insurance market availability. Through December 31, 2023, we are not aware of any material losses or other liabilities that we have not accrued for.
Environmental Remediation, Legal and Other Matters
We are engaged in ongoing site assessment and/or remediation activities at a number of facilities and sites. Anticipated costs associated with these matters are added to accrued environmental costs in the manner described in Note 22.
We have established provisions for environmental site assessment and/or remediation matters to the extent that we consider expenses associated with those matters likely to be incurred. Except for the uncertainties described below, we do not believe that our future obligations with respect to these matters are reasonably likely to have a material adverse effect on our consolidated financial statements.
Nutrien Annual Report 2023 | 135
In millions of US dollars unless otherwise noted
Legal matters with significant uncertainties include the following:
In addition, various other claims and lawsuits are pending against the Company in the ordinary course of business. While it is not possible to determine the ultimate outcome of such actions at this time, and inherent uncertainties exist in predicting such outcomes, we believe that the ultimate resolution of such actions is not reasonably likely to have a material adverse effect on our consolidated financial statements.
The breadth of our operations and the global complexity of tax regulations require assessments of uncertainties and judgments in estimating the taxes we will ultimately pay. The final taxes paid are dependent upon many factors, including negotiations with taxing authorities in various jurisdictions, outcomes of tax litigation, and resolution of disputes arising from federal, provincial, state and local tax audits. The resolution of these uncertainties and the associated final taxes may result in adjustments to our tax assets and tax liabilities.
We own facilities that have been either permanently or indefinitely shut down. We expect to incur nominal annual expenditures for site security and other maintenance costs at some of these facilities. Should the facilities be dismantled, certain other shutdown-related costs may be incurred. Such costs are not expected to have a material adverse effect on our consolidated financial statements and would be recognized and recorded in the period in which they are incurred.
Nutrien Annual Report 2023 | 136
In millions of US dollars unless otherwise noted
Note 30 | Accounting policies, estimates and judgments
The following discusses the significant accounting policies, estimates, judgments and assumptions that we have adopted and applied and how they affect the amounts reported in the consolidated financial statements. Certain of our policies involve accounting estimates and judgments because they require us to make subjective or complex judgments about matters that are inherently uncertain and because of the likelihood that materially different amounts could be reported under different conditions or using different assumptions.
Basis of Consolidation
Principal (Wholly Owned) Operating Subsidiaries |
Location |
Principal Activity |
Potash Corporation of Saskatchewan Inc. |
Canada |
Mining and/or processing of crop nutrients and corporate functions |
Nutrien (Canada) Holdings ULC |
Canada |
Manufacturer and distributor of crop nutrients and corporate functions |
Agrium Canada Partnership |
Canada |
Manufacturer and distributor of crop nutrients |
Agrium Potash Ltd. |
Canada |
|
Nutrien US LLC |
US |
|
Cominco Fertilizer Partnership |
US |
|
Loveland Products Inc. |
US |
|
Nutrien Ag Solutions (Canada) Inc. |
Canada |
Crop input retailer |
Nutrien Ag Solutions, Inc. |
US |
|
Nutrien Ag Solutions Limited |
Australia |
|
PCS Nitrogen Fertilizer, L.P. |
US |
Producer of nitrogen products |
PCS Nitrogen Trinidad Limited |
Trinidad |
|
PCS Phosphate Company, Inc. |
US |
Mining and/or processing of phosphate products |
PCS Sales (USA), Inc. |
US |
Marketing and sales of the Company’s products |
Nutrien Financial US LLC |
US |
Provide financing to customers |
Climate Change
Our Feeding the Future Plan includes sustainability-related commitments to help address our key climate-related risks related to climate change and to reduce our carbon footprint. Nutrien continues to execute our sustainability strategy and deliver on our action plan and monitor the development of sustainability frameworks and regulatory initiatives. We recognize that these developments could further impact our accounting estimates and judgments including, but not limited to, assessment of our asset useful lives, impairment of other long-lived assets, and asset retirement obligations and accrued environmental costs. We have monitored and will continue to monitor these developments as they affect our consolidated financial statements.
Revenue
Transfer of Control for Sale of Goods |
Transfer of Control for Sale of Services |
|
At the point in time when the product is
|
Over time as the promised service is rendered. |
Nutrien Annual Report 2023 | 137
In millions of US dollars unless otherwise noted
Judgment is used to determine whether we are acting as principal or agent by evaluating who
For transactions in which we act as an agent rather than the principal, revenue is recognized net of any commissions earned. The related commissions are recognized as the sales occur or as unconditional contracts are signed.
We recognize revenue on sales to Canpotex (as described in Note 28) when there is a transfer of control, either at the time the product is loaded for shipping or delivered, depending on the terms of the contract. Sales revenue is recognized using a provisional price at the time control is transferred to Canpotex, with the final pricing determined upon Canpotex’s final sale to a third party (generally between one and three months from date of sale to Canpotex).
Our sales revenue relating to our Potash, Nitrogen and Phosphate segments is generally recorded and measured based on the “freight on board” mine, plant, warehouse or terminal price specified in the contract (except for certain vessel sales or specific product sales that are shipped and recorded on a delivered basis), which reflects the consideration we expect to be entitled to in exchange for the goods or services, adjusted for any variable consideration (e.g., any trade discounts or estimated volume rebates). Our customer contracts may provide certain product quality specification guarantees but do not generally provide for refunds or returns.
Due to the nature of goods and services sold, any single estimate would have only a negligible impact on revenue.
As the expected period between when control over a promised good or service is transferred and when the customer pays for that good or service is generally less than 12 months, we apply the practical expedient as provided in IFRS 15, “Revenue from Contracts with Customers,” and do not adjust the promised amount of consideration for the effects of financing.
Intersegment sales are made under terms that approximate market value.
Seasonality in our business results from increased demand for products during planting season. Crop input sales are generally higher in the spring and fall application seasons. Crop input inventories are normally accumulated leading up to each application season. Our cash collections generally occur after the application season is complete, while customer prepayments made to us are typically concentrated in December and January and inventory prepayments paid to our suppliers are typically concentrated in the period from November to January. Feed and industrial sales are more evenly distributed throughout the year.
Share-Based Compensation
Estimation involves determining
Income Taxes
Taxation on earnings (loss) is composed of current and deferred income tax. Taxation is recognized in the statements of earnings unless it relates to items recognized either in OCI or directly in shareholders’ equity.
Current Income Tax |
Deferred Income Tax |
|
|
|
|
The realized and unrealized excess tax benefits from share-based compensation arrangements are recognized in contributed surplus as current and deferred tax, respectively. |
||
Nutrien Annual Report 2023 | 138
In millions of US dollars unless otherwise noted
The final taxes paid, and potential adjustments to tax assets and liabilities, are dependent upon many factors including
Deferred income tax is not accounted for
Deferred tax assets are
As provided in the amendments to International Accounting Standards (“IAS”) 12, we apply the mandatory exception to recognize and disclose information about deferred tax assets and liabilities related to Pillar Two income taxes. The mandatory exception has been applied retrospectively, with no material impact on our consolidated financial statements.
Financial Instruments
Financial instruments are classified and measured as follows based on the objective of the business model for managing the instrument or group of instruments and the contractual terms of the cash flows.
Fair Value Classification |
FVTPL |
FVTOCI |
Amortized Cost |
Instrument type |
Cash and cash equivalents, derivatives, and certain equity investments not held for trading |
Certain equity investments not held for trading for which an irrevocable election was made at initial recognition |
Receivables, short-term debt, payables and accrued charges, long-term debt, lease liabilities, and other long-term debt instruments |
Financial instruments are recognized at trade date when we commit to purchase or sell the asset.
Derivatives are used to lock in exchange rates. For designated and qualified cash flow hedges
We assess whether our derivative hedging transactions are expected to be or were highly effective, both at the hedge’s inception and on an ongoing basis, in offsetting changes in fair values of hedged items.
Hedging Transaction |
Measurement of Ineffectiveness |
Potential Sources of Ineffectiveness |
Foreign exchange |
Comparison of the cumulative changes in fair value and the cumulative change in the fair value of a hypothetical derivative with terms based on the hedged forecast cash flows |
Changes in
|
Financial assets and financial liabilities are offset, and the net amount is presented in the consolidated balance sheets when we
Nutrien Annual Report 2023 | 139
In millions of US dollars unless otherwise noted
Fair Value Measurements
Estimated fair values for financial instruments are designed to approximate amounts for which the instruments could be exchanged in a current arm’s length transaction between knowledgeable, willing parties. The valuation policies and procedures for financial reporting purposes are determined by our finance department.
Fair value measurements are categorized into different levels within a fair value hierarchy based on the degree to which the lowest level inputs are observable and their significance:
Level 1 |
Level 2 |
Level 3 |
Unadjusted quoted prices (in active markets accessible at the measurement date for identical assets or liabilities) |
Quoted prices (in markets that are not active or based on inputs that are observable for substantially the full term of the asset or liability) |
Prices or valuation techniques that require inputs that are both unobservable and significant to the overall measurement |
Fair value estimates
Inventories
Costs are allocated to inventory using the weighted average cost method.
Net realizable value is based on:
Products and Raw Materials |
Materials and Supplies |
|
|
Inventories are valued monthly. Various factors impact our estimates of net realizable value, including inventory levels, forecasted prices of key production inputs, global nutrient capacities, crop price trends, and changes in regulations and standards employed.
Vendors may offer various incentives to purchase products for resale. Vendor rebates and prepay discounts are accounted for as a reduction of the prices of the suppliers’ products. Rebates based on the amount of materials purchased reduce cost of goods sold as inventory is sold. Rebates earned based on sales volumes of products are offset to cost of goods sold.
Rebates that are probable and can be reasonably estimated are accrued. Rebates that are not probable or estimable are accrued when certain milestones are achieved.
Estimation of rebates can be complex in nature as vendor arrangements are diverse. The amount of the accrual is determined by analyzing and reviewing historical trends to apply negotiated rates to estimated and actual purchase volumes. Estimated amounts accrued throughout the year could also be impacted if actual purchase volumes differ from projected volumes.
Property, Plant and Equipment
|
Owned |
Right-of-Use (Leased) |
Description |
|
|
Nutrien Annual Report 2023 | 140
In millions of US dollars unless otherwise noted
|
Owned |
Right-of-Use (Leased) |
Measurement |
|
|
Depreciation method |
|
|
|
Estimated useful lives, expected patterns of consumption, depreciation method and residual values are reviewed at least annually. |
|
Judgment/practical expedients |
Judgment is required in determining
|
Judgment is required to determine whether a contract or arrangement includes a lease and if it is reasonably certain that an extension option will be exercised. We seek to maximize operational flexibility in managing our leasing activities by including extension options when negotiating new leases. Extension options are exercisable at our option and not by the lessors. In determining if a renewal period should be included in the lease term, we consider all relevant factors that create an economic incentive for us to exercise a renewal, including
Estimation is used to determine the useful lives of ROU assets, the lease term and the appropriate discount rate applied to the lease payments to calculate the lease liability. |
|
Uncertainties are inherent in estimating reserve quantities, particularly as they relate to assumptions regarding future prices, the geology of our mines, the mining methods used, and the related costs incurred to develop and mine reserves. Changes in these assumptions could result in material adjustments to reserve estimates, which could result in impairments or changes to depreciation expense in future periods. |
We have chosen to
|
Other |
Not applicable. |
Lease agreements do not contain significant covenants; however, leased assets may be used as security for lease liabilities and other borrowings. |
Nutrien Annual Report 2023 | 141
In millions of US dollars unless otherwise noted
Goodwill and Intangible Assets
Goodwill is carried at cost less any accumulated impairment losses, is not amortized, and represents the excess of the cost of an acquisition over the fair value of the Company’s share of the net identifiable assets of the acquired subsidiary at the date of acquisition. Goodwill is allocated to a CGU or group of CGUs for impairment testing based on the level at which it is monitored by management and not at a level higher than an operating segment. The allocation is made to the CGU or group of CGUs expected to benefit from the business combination in which the goodwill arose.
Intangible assets are generally measured at cost less accumulated amortization and any accumulated impairment losses. Accumulated amortization is calculated on a straight-line basis over the asset’s useful life. We use judgment to determine which expenditures are eligible for capitalization as intangible assets. Costs incurred internally from researching and developing a product are expensed as incurred until technological feasibility is established, at which time the costs are capitalized until the product is available for its intended use. Judgment is required in determining when technological feasibility of a product is established. Intangible assets with finite lives are amortized on a straight-line basis over their estimated useful lives. At least annually, the useful lives are reviewed and adjusted if appropriate.
Impairment of Long-Lived Assets
To assess impairment, assets are grouped at the smallest levels for which there are separately identifiable cash inflows that are largely independent of the cash inflows from other assets or groups of assets (this can be at the asset or CGU level).
At the end of each reporting period, we review conditions to determine whether there is any indication that an impairment exists that could potentially impact the carrying amounts of both our long-lived assets to be held and used (including property, plant and equipment, and investments), and our goodwill and intangible assets. When such indicators exist, impairment testing is performed. Additionally, goodwill is tested at least annually on October 1.
We review, at each reporting period, for possible reversal of the impairment for non-financial assets, other than goodwill.
Estimates and judgment involve
We cannot predict if an event that triggers impairment or a reversal of impairment will occur, when it will occur or how it will affect reported asset amounts. Asset impairment amounts previously recorded could be affected if different assumptions were used or if market and other conditions change. Such changes could result in non-cash charges materially affecting our consolidated financial statements.
Equity-Accounted Investments
For equity-accounted investments reduced to zero, we do not eliminate our share of the unrealized earnings. If the investee earns a profit in the subsequent period, we then recognize our share of the earnings only after adjusting for the unrealized earnings that were not previously eliminated.
Pension and Other Post-Retirement Benefits
When a plan amendment occurs before a settlement, we recognize past service cost before any gain or loss on settlement.
Our discount rate assumptions are impacted by
Nutrien Annual Report 2023 | 142
In millions of US dollars unless otherwise noted
Net actuarial gains or loss incurred during the period for defined benefit plans are closed out to retained earnings at each period-end.
Asset Retirement Obligations and Accrued Environmental Costs
Asset retirement obligations and accrued environmental costs include
We consider the following factors as we estimate our provisions:
It is reasonably possible that the ultimate costs could change in the future and that changes to these estimates could have a material effect on our consolidated financial statements. We review our estimates for any changes in assumptions at the end of each reporting period.
We recognized contingent liabilities related to our business combinations or acquisitions, which represent additional environmental costs that are present obligations although cash outflows of resources are not probable. These contingent liabilities are subsequently measured at the higher of the amount initially recognized and the amount that would be recognized if the liability becomes probable.
Share Capital
Common shares are classified as equity. Incremental costs directly attributable to the issuance of common shares are recognized as a deduction from equity, net of any tax effects. When we repurchase our own common shares, share capital is reduced by the average carrying value of the shares repurchased. The excess of the purchase price over the average carrying value is recognized as a deduction from retained earnings. If the average carrying value of the shares repurchased is less than the average carrying value of the shares in share capital, the excess is recognized as an addition to share capital. Shares are cancelled upon repurchase.
Nutrien Annual Report 2023 | 143
In millions of US dollars unless otherwise noted
Business Combinations
Purchase price allocation involves judgment in identifying assets acquired and liabilities assumed, and estimation of their fair values. Key assumptions include discount rates and revenue growth rates specific to the acquired assets or liabilities assumed. We perform a thorough review of all internal and external sources of information available based on circumstances that exist at the acquisition date. We also engage independent valuation experts on certain acquisitions to assist in determining the fair value of certain assets acquired and liabilities assumed and related deferred income tax impacts. To determine fair values, we generally use the following valuation techniques:
Account |
Valuation Technique and Judgments Applied |
Property, plant and equipment |
Market approach for land and certain types of personal property: sales comparison that measures the value of an asset through an analysis of sales and offerings of comparable assets.
Replacement costs for all other depreciable property, plant and equipment: measures the value of an asset by estimating the costs to acquire or construct comparable assets and adjusts for age and condition of the asset. |
Intangible assets |
Income approach – multi-period excess earnings method: measures the value of an asset based on the present value of the incremental after-tax cash flows attributable to the asset after deducting contributory asset charges (“CACs”). Allocation of CACs is a matter of judgment and based on the nature of the acquired businesses’ operations and historical trends.
We consider several factors in determining the fair value of customer relationships, such as customers’ relationships with the acquired company and its employees, the segmentation of customers, historical customer attrition rates, and revenue growth. |
Other provisions and contingent liabilities |
Decision-tree approach of future costs and a risk premium to capture the compensation sought by risk-averse market participants for bearing the uncertainty inherent in the cash flows of the liability. |
For each business combination, we elect to measure the non-controlling interest in the acquired entity either at fair value or at the proportionate share of the acquiree’s identifiable net assets. Foreign exchange hedge gains or losses that we designated a cash flow hedge are included in the consideration. The gain or loss from the cash flow hedge is deferred in OCI and subsequently recorded as an adjustment to goodwill when the business combination occurs.
Transaction costs are recorded in integration and restructuring related costs in other (income) expenses.
Standards, Amendments and Interpretations Effective and Applied
The IASB and IFRS Interpretations Committee (“IFRIC”) has issued certain standards and amendments or interpretations to existing standards that were effective, and we have applied.
In 2023, we adopted the following standards, amendments and annual improvements with no material impact on our consolidated financial statements:
Nutrien Annual Report 2023 | 144
In millions of US dollars unless otherwise noted
Standards, Amendments and Interpretations Not Yet Effective and Not Applied
The IASB and IFRIC have issued the following standards, amendments or interpretations to existing standards that were not yet effective and not applied as at December 31, 2023.
The following amendments will be adopted in 2024 and are not expected to have a material impact on our consolidated financial statements:
The following amendments are being reviewed to determine the potential impact on our consolidated financial statements:
Nutrien Annual Report 2023 | 145
Exhibit 99.4

KPMG LLP
205 5th Avenue SW
Suite 3100
Calgary AB T2P 4B9
Tel 403-691-8000
Fax 403-691-8008
www.kpmg.ca
Consent of Independent Registered Public Accounting Firm
The Board of Directors of Nutrien Ltd.
We consent to the use of:
| • | our report dated February 22, 2024 on the consolidated financial statements of Nutrien Ltd. (the “Entity”) which comprise the consolidated balance sheets as at December 31, 2023 and December 31, 2022, the related consolidated statements of earnings, comprehensive income, cash flows, and changes in shareholders’ equity for each of the years in the two-year period ended December 31, 2023, and the related notes (collectively the “consolidated financial statements”), and |
| • | our report dated February 22, 2024 on the effectiveness of the Entity’s internal control over financial reporting as of December 31, 2023 |
each of which is included in the Annual Report on Form 40-F of the Entity for the fiscal year ended December 31, 2023.
We also consent to the incorporation by reference of such reports in the registration statements on Form S-8 of the Entity (File Nos. 333-222384, 333-222385 and 333-226295) and Form F-10, as amended by Amendment No. 1 thereto, of the Entity (File No. 333-263275).
/s/ KPMG LLP
Chartered Professional Accountants
Calgary, Canada
March 1, 2024
KPMG LLP, an Ontario limited liability partnership and member firm of the KPMG global organization of independent member firms affiliated with KPMG International Limited, a private English company limited by guarantee. KPMG Canada provides services to KPMG LLP.
Exhibit 99.5
CERTIFICATION
REQUIRED BY RULE 13a-14(a) OR RULE 15d-14(a) OF THE
SECURITIES EXCHANGE ACT OF 1934, AS ADOPTED PURSUANT TO
SECTION 302 OF THE SARBANES-OXLEY ACT OF 2002
I, Ken Seitz, certify that:
| 1. | I have reviewed this Annual Report on Form 40-F of Nutrien Ltd.; |
| 2. | Based on my knowledge, this report does not contain any untrue statement of a material fact or omit to state a material fact necessary to make the statements made, in light of the circumstances under which such statements were made, not misleading with respect to the period covered by this report; |
| 3. | Based on my knowledge, the financial statements, and other financial information included in this report, fairly present in all material respects the financial condition, results of operations and cash flows of the registrant as of, and for, the periods presented in this report; |
| 4. | The registrant’s other certifying officer(s) and I are responsible for establishing and maintaining disclosure controls and procedures (as defined in Exchange Act Rules 13a-15(e) and 15d-15(e)) and internal control over financial reporting (as defined in Exchange Act Rules 13a-15(f) and 15d-15(f)) for the registrant and have: |
(a) designed such disclosure controls and procedures, or caused such disclosure controls and procedures to be designed under our supervision, to ensure that material information relating to the registrant, including its consolidated subsidiaries, is made known to us by others within those entities, particularly during the period in which this report is being prepared;
(b) designed such internal control over financial reporting, or caused such internal control over financial reporting to be designed under our supervision, to provide reasonable assurance regarding the reliability of financial reporting and the preparation of financial statements for external purposes in accordance with generally accepted accounting principles;
(c) evaluated the effectiveness of the registrant’s disclosure controls and procedures and presented in this report our conclusions about the effectiveness of the disclosure controls and procedures, as of the end of the period covered by this report based on such evaluation; and
(d) disclosed in this report any change in the registrant’s internal control over financial reporting that occurred during the period covered by the annual report that has materially affected, or is reasonably likely to materially affect, the registrant’s internal control over financial reporting; and
| 5. | The registrant’s other certifying officer(s) and I have disclosed, based on our most recent evaluation of internal control over financial reporting, to the registrant’s auditors and the audit committee of the registrant’s board of directors (or persons performing the equivalent functions): |
(a) all significant deficiencies and material weaknesses in the design or operation of internal control over financial reporting which are reasonably likely to adversely affect the registrant’s ability to record, process, summarize and report financial information; and
(b) any fraud, whether or not material, that involves management or other employees who have a significant role in the registrant’s internal control over financial reporting.
Date: March 1, 2024
| By: | /s/ Ken Seitz |
|
| Ken Seitz | ||
| President and Chief Executive Officer |
Exhibit 99.6
CERTIFICATION
REQUIRED BY RULE 13a-14(a) OR RULE 15d-14(a) OF THE
SECURITIES EXCHANGE ACT OF 1934, AS ADOPTED PURSUANT TO
SECTION 302 OF THE SARBANES-OXLEY ACT OF 2002
I, Pedro Farah, certify that:
| 1. | I have reviewed this Annual Report on Form 40-F of Nutrien Ltd.; |
| 2. | Based on my knowledge, this report does not contain any untrue statement of a material fact or omit to state a material fact necessary to make the statements made, in light of the circumstances under which such statements were made, not misleading with respect to the period covered by this report; |
| 3. | Based on my knowledge, the financial statements, and other financial information included in this report, fairly present in all material respects the financial condition, results of operations and cash flows of the registrant as of, and for, the periods presented in this report; |
| 4. | The registrant’s other certifying officer(s) and I are responsible for establishing and maintaining disclosure controls and procedures (as defined in Exchange Act Rules 13a-15(e) and 15d-15(e)) and internal control over financial reporting (as defined in Exchange Act Rules 13a-15(f) and 15d-15(f)) for the registrant and have: |
(a) designed such disclosure controls and procedures, or caused such disclosure controls and procedures to be designed under our supervision, to ensure that material information relating to the registrant, including its consolidated subsidiaries, is made known to us by others within those entities, particularly during the period in which this report is being prepared;
(b) designed such internal control over financial reporting, or caused such internal control over financial reporting to be designed under our supervision, to provide reasonable assurance regarding the reliability of financial reporting and the preparation of financial statements for external purposes in accordance with generally accepted accounting principles;
(c) evaluated the effectiveness of the registrant’s disclosure controls and procedures and presented in this report our conclusions about the effectiveness of the disclosure controls and procedures, as of the end of the period covered by this report based on such evaluation; and
(d) disclosed in this report any change in the registrant’s internal control over financial reporting that occurred during the period covered by the annual report that has materially affected, or is reasonably likely to materially affect, the registrant’s internal control over financial reporting; and
| 5. | The registrant’s other certifying officer(s) and I have disclosed, based on our most recent evaluation of internal control over financial reporting, to the registrant’s auditors and the audit committee of the registrant’s board of directors (or persons performing the equivalent functions): |
(a) all significant deficiencies and material weaknesses in the design or operation of internal control over financial reporting which are reasonably likely to adversely affect the registrant’s ability to record, process, summarize and report financial information; and
(b) any fraud, whether or not material, that involves management or other employees who have a significant role in the registrant’s internal control over financial reporting.
Date: March 1, 2024
| By: | /s/ Pedro Farah |
|
| Pedro Farah | ||
| Executive Vice President and Chief Financial Officer |
Exhibit 99.7
CERTIFICATIONS
Pursuant to Section 906 of the Sarbanes-Oxley Act of 2002 (subsections (a) and (b) of Section 1350, Chapter 63 of Title 18, United States Code), each of the undersigned officers of Nutrien Ltd. (the “Company”), does hereby certify, to such officer’s knowledge, that:
The Annual Report on Form 40-F for the year ended December 31, 2023 (the “Form 40-F”), of the Company fully complies with the requirements of Section 13(a) or 15(d) of the Securities Exchange Act of 1934 and information contained in the Form 40-F fairly presents, in all material respects, the financial condition and results of operations of the Company.
Date: March 1, 2024
| By: | /s/ Ken Seitz |
|
| Ken Seitz | ||
| President and Chief Executive Officer |
Date: March 1, 2024
| By: | /s/ Pedro Farah |
|
| Pedro Farah | ||
| Executive Vice President and Chief Financial Officer |
Exhibit 99.8
March 1, 2024
Nutrien Ltd.
Ladies and Gentlemen:
Re: Annual Report on Form 40-F
Reference is made to the Annual Report on Form 40-F (the “Annual Report”) filed by Nutrien Ltd. under the Securities Exchange Act of 1934, as amended.
I, Craig Funk, B.Sc., M.Sc., P.Eng., P.Geo., a qualified person, am responsible for preparing or supervising the preparation of (1) the technical report entitled “National Instrument 43-101 Technical Report on Allan Potash Deposit (KL 112R B), Saskatchewan, Canada” dated effective December 31, 2021 (the “Allan Technical Report”); (2) the technical report entitled “National Instrument 43-101 Technical Report on Cory Potash Deposit (KL 103C), Saskatchewan, Canada” dated effective December 31, 2020 (the “Cory Technical Report”); (3) the technical report entitled “National Instrument 43-101 Technical Report on Lanigan Potash Deposit (KLSA 001 C), Saskatchewan, Canada” dated effective December 31, 2021 (the “Lanigan Technical Report”); (4) the technical report entitled “National Instrument 43-101 Technical Report on Rocanville Potash Deposit (KL 305), Saskatchewan, Canada” dated effective December 31, 2021 (the “Rocanville Technical Report); and (5) the technical report entitled “National Instrument 43-101 Technical Report on Vanscoy Potash Deposit (KL 114C) Saskatchewan, Canada” dated effective December 31, 2020 (together with the Allan Technical Report, the Cory Technical Report, the Lanigan Technical Report and the Rocanville Technical Report, the “Technical Reports”).
I hereby consent to the inclusion in the Annual Report of references to and information derived from the Technical Reports and to the use of my name therein. I hereby also consent to the incorporation by reference of such information in the registration statements on Form S-8 (File Nos. 333-222384, 333-222385 and 333-226295) and on Form F-10, as amended by Amendment No. 1 thereto (File No. 333-263275), of Nutrien Ltd.
Yours truly,
| /s/ Craig Funk |
| Craig Funk, B.Sc., M.Sc., P.Eng., P.Geo. |
| Director, GeoServices & Land – Engineering, Technology & Capital |
| Nutrien Ltd. |
Exhibit 99.9
Information concerning mine safety violations or other regulatory matters required by
Section 1503(a) of the Dodd-Frank Wall Street Reform and Consumer Protection Act.
The following table reflects citations, orders and notices issued to us by the United States Mine Safety and Health Administration (the “MSHA”) for the year ended December 31, 2023 (the “Reporting Period”) and contains certain additional information as required by Section 1503(a) of the Dodd-Frank Wall Street Reform and Consumer Protection Act and Item 104 of Regulation S-K, including information regarding mining-related fatalities, proposed assessments from the MSHA and legal actions (“Legal Actions”) before the United States Federal Mine Safety and Health Review Commission (“FMSHRC”), an independent adjudicative agency that provides administrative trial and appellate review of legal disputes arising under the United States Federal Mine Safety and Health Act of 1977, as amended by the Mine Improvement and New Emergency Response Act of 2006 (the “Act”).
Included below is the information required by Section 1503(a) with respect to our facilities at Aurora, North Carolina (MSHA Identification Number 31-00212) (“Aurora”) and White Springs, Florida (MSHA Identification Number 08-00798) (“White Springs”) for the Reporting Period(1):
| Aurora | White Springs |
|||||||||
| (a) |
the total number of violations of mandatory health or safety standards that could significantly and substantially contribute to the cause and effect of a coal or other mine safety or health hazard under Section 104 of the Act for which a citation was received from the MSHA | 2 | 5 | |||||||
| (b) |
the total number of orders issued under Section 104(b) of the Act | 0 | 0 | |||||||
| (c) |
the total number of citations and orders for unwarrantable failure of the Company to comply with mandatory health or safety standards under Section 104(d) of the Act | 0 | 0 | |||||||
| (d) |
the total number of flagrant violations under Section 110(b)(2) of the Act | 0 | 0 | |||||||
| (e) |
the total number of imminent danger orders issued under Section 107(a) of the Act | 0 | 1 | |||||||
| (f) |
the total dollar value of proposed assessments from the MSHA under the Act | $ | 10,222 | $ | 11,435 | |||||
| (g) |
the total number of mining-related fatalities | 0 | 0 | |||||||
| (h) |
received written notice from the MSHA of a pattern of violations under Section 104(e) of the Act | 0 | 0 | |||||||
| (i) |
received written notice from the MSHA of potential to have a pattern of violations under Section 104(e) of the Act | 0 | 0 | |||||||
| (j) |
the total number of Legal Actions pending as of the last day of the Reporting Period | 0 | 0 | |||||||
| (k) |
Legal Actions instituted during the Reporting Period | 0 | 0 | |||||||
| (l) |
Legal Actions resolved during the Reporting Period | 0 | 0 | |||||||
| (1) | The number of violations and orders as well as amounts included in the total dollar value of proposed assessments are as posted on the MSHA data retrieval system as of January 29, 2024. |