|
200 Bay Street Royal Bank Plaza Toronto, Ontario Canada M5J 2J5 Attention: Senior Vice-President, Associate General Counsel & Secretary |
1 Place Ville Marie Montreal, Quebec Canada H3B 3A9 Attention: Senior Vice-President, Associate General Counsel & Secretary |
ROYAL BANK OF CANADA |
||||||
Date: February 28, 2024 |
By: |
/s/ Nadine Ahn |
||||
Name: |
Nadine Ahn |
|||||
Title: |
Chief Financial Officer |
|||||
Exhibit |
Description of Exhibit |
|
99.1 |
First Quarter 2024 Earnings |
|
99.2 |
First Quarter 2024 Report to Shareholders (which includes management’s discussion and analysis and unaudited interim condensed consolidated financial statements) |
|
99.3 |
Return on Equity and Assets Ratios |
|
Rule 13a-14(a)/15d-14(a) |
||
31.1 |
- Certification of the Registrant’s Chief Executive Officer |
|
31.2 |
- Certification of the Registrant’s Chief Financial Officer |
|
101 |
Interactive Data File (formatted as Inline XBRL) |
|
104 |
Cover Page Interactive Data File (formatted as Inline XBRL and contained in Exhibit 101) |
|
| Exhibit 99.1 | ||

|
FIRST QUARTER 2024 EARNINGS RELEASE |
|
| ROYAL BANK OF CANADA REPORTS FIRST QUARTER 2024 RESULTS |
All amounts are in Canadian dollars and are based on financial statements presented in compliance with International Accounting Standard 34 Interim Financial Reporting, unless otherwise noted. Effective November 1, 2023, we adopted IFRS 17 Insurance Contracts (IFRS 17). Comparative amounts have been restated from those previously presented. Our Q1 2024 Report to Shareholders and Supplementary Financial Information are available at http://www.rbc.com/investorrelations and on https://www.sedarplus.com/.
| Net income
$3.6 Billion
Up 14% YoY
|
Diluted EPS1
$2.50
Up 12% YoY
|
Total PCL2
$813 Million
PCL on loans ratio3 up 3 bps4 QoQ
|
ROE5
13.1%
Up 50 bps YoY |
CET1 Ratio6
14.9%
Above regulatory requirements
|
| Adjusted net income7
$4.1 Billion
Down 5% YoY |
Adjusted Diluted EPS7
$2.85
Down 6% YoY
|
Total ACL8
$5.7 Billion
ACL on loans ratio9 up 3 bps QoQ
|
Adjusted ROE7
14.9%
Down 230 bps YoY |
LCR10
132%
Up from 131% last quarter
|
TORONTO, February 28, 2024 — Royal Bank of Canada11 (RY on TSX and NYSE) today reported net income of $3.6 billion for the quarter ended January 31, 2024, up $449 million or 14% from the prior year, which included the $1,050 million impact of the Canada Recovery Dividend (CRD) and other tax related adjustments. Diluted EPS was $2.50, up 12% over the same period. Adjusted net income7 and adjusted diluted EPS7 of $4.1 billion and $2.85 were down 5% and 6%, respectively, from the prior year.
Our consolidated results reflect an increase in total PCL of $281 million from a year ago, mainly reflecting higher provisions in Personal & Commercial Banking and Capital Markets, partially offset by lower provisions in Wealth Management. The PCL on loans ratio of 37 bps increased 12 bps from the prior year. The PCL on impaired loans ratio12 was 31 bps, up 14 bps from the prior year as provisions continue to trend upwards, reflecting the impact of higher interest rates and rising unemployment.
Results also reflected the impact of specified items relating to the planned acquisition of HSBC Bank Canada (HSBC Canada), including transaction and integration costs ($265 million before-tax and $218 million after-tax), and management of closing capital volatility ($286 million before-tax and $207 million after-tax). The cost of the Federal Deposit Insurance Corporation (FDIC) special assessment of $159 million before-tax ($115 million after-tax) also impacted results.
Pre-provision, pre-tax earnings7 of $5.2 billion were down $607 million or 11% from last year, mainly due to higher expenses, and lower revenue in Capital Markets, largely reflecting lower trading revenue compared to a strong prior year. These factors were partially offset by higher insurance investment results from favourable investment performance as we repositioned our portfolio for transition to IFRS 17. Results benefitted from higher net interest income driven by solid volume growth, as well as higher fee-based client assets reflecting market appreciation and net sales in Wealth Management.
Compared to last quarter, net income was down 9%, partly reflecting a higher effective tax rate, as results in the prior quarter included the favourable impact of the specified item relating to certain deferred tax adjustments, and higher PCL on impaired loans. Lower results in Corporate Support and Personal & Commercial Banking were partially offset by higher results in Wealth Management, Capital Markets and Insurance. Adjusted net income7 was up 8% over the same period. Pre-provision, pre-tax earnings7 were up 12% as higher revenue more than offset expense growth.
Our capital position remains robust, with a CET1 ratio6 of 14.9%, supporting solid volume growth and $1.9 billion in common share dividends.
|
“As our first quarter results show, RBC has the right strategy in place to grow today while also generating long-term value for shareholders. Underpinned by our balance sheet strength, prudent approach to risk management and diversified business model, we delivered solid, client-driven volume growth and a continued focus on expense control. As we look towards the completion of our planned HSBC Canada acquisition, we remain focused on being a trusted advisor to clients through the delivery of new and differentiated banking experiences.” – Dave McKay, President and Chief Executive Officer of Royal Bank of Canada |
| 1 | Earnings per share (EPS). |
| 2 | Provision for credit losses (PCL). |
| 3 | PCL on loans ratio is calculated as PCL on loans as a percentage of average net loans and acceptances. |
| 4 | Basis points (bps). |
| 5 | Return on equity (ROE) is calculated as net income available to common shareholders divided by average common equity. For further information, refer to the Key performance and non-GAAP measures section on pages 3 to 5 of this Earnings Release. |
| 6 | This ratio is calculated by dividing Common Equity Tier 1 (CET1) by risk-weighted assets (RWA), in accordance with Office of the Superintendent of Financial Institutions’ (OSFI) Basel III Capital Adequacy Requirements (CAR) guideline. |
| 7 | These are non-GAAP measures. For further information, including a reconciliation, refer to the Key performance and non-GAAP measures section on pages 3 to 5 of this Earnings Release. |
| 8 | Allowance for credit losses (ACL). |
| 9 | ACL on loans ratio is calculated as ACL on loans as a percentage of total loans and acceptances. |
| 10 | The Liquidity coverage ratio (LCR) is calculated in accordance with OSFI’s Liquidity Adequacy Requirements (LAR) guideline. For further details, refer to the Liquidity and funding risk section of our Q1 2024 Report to Shareholders. |
| 11 | When we say “we”, “us”, “our”, “the bank” or “RBC”, we mean Royal Bank of Canada and its subsidiaries, as applicable. |
| 12 | PCL on impaired loans ratio is calculated as PCL on impaired loans as a percentage of average net loans and acceptances. |
- 1 -
|
|
||||||||
| Q1 2024 Compared to Q1 2023 |
Reported: • Net income of $3,582 million • Diluted EPS of $2.50 • ROE of 13.1% • CET1 ratio13 of 14.9% |
h 14% h 12% h 50 bps h 220 bps |
Adjusted14: • Net income of $4,066 million • Diluted EPS of $2.85 • ROE of 14.9% |
i 5% i 6% i 230 bps |
||||
|
|
||||||||
| Q1 2024 Compared to Q4 2023 |
• Net income of $3,582 million • Diluted EPS of $2.50 • ROE of 13.1% • CET1 ratio13 of 14.9% |
i 9% i 9% i 180 bps h 40 bps |
• Net income of $4,066 million • Diluted EPS of $2.85 • ROE of 14.9% |
h 8% h 8% h 70 bps |
||||
|
|
||||||||
| Personal & Commercial Banking
|
Net income of $2,061 million decreased $65 million or 3% from a year ago, primarily attributable to higher PCL and non-interest expenses. These factors were partially offset by higher net interest income reflecting average volume growth of 9% in deposits (including 11% in personal deposits) and 5% in loans (including double-digit growth in business lending and credit cards of 14% and 13%, respectively) in Canadian Banking, and higher spreads.
Compared to last quarter, net income decreased $30 million or 1%, primarily attributable to higher PCL. This was largely offset by lower non-interest expenses, higher card service revenue, as well as higher net interest income reflecting average volume growth of 1% and higher spreads in Canadian Banking.
| Wealth Management
|
Net income of $606 million decreased $224 million or 27% from a year ago, mainly due to the cost of the FDIC special assessment of $159 million before-tax ($115 million after-tax) in U.S. Wealth Management (including City National) in the current quarter. Higher variable compensation commensurate with increased commissionable revenue, higher staff costs and professional fees, largely reflecting continued investments in the operational infrastructure of City National, and lower net interest income also contributed to the decrease. These factors were partially offset by higher fee-based client assets reflecting market appreciation and net sales.
Compared to last quarter, net income increased $391 million, as last quarter reflected the impact of the specified item relating to impairment losses on our interest in an associated company and legal provisions in U.S. Wealth Management (including City National). These factors were partially offset by the cost of the FDIC special assessment, in the current quarter, as noted above. U.S. Wealth Management (including City National) results also included the impact of releases of provisions on performing loans in the current quarter, as compared to provisions taken last quarter.
| Insurance
|
Net income of $220 million increased $153 million from a year ago, primarily due to higher insurance investment result from favourable investment performance as we repositioned our portfolio for the transition to IFRS 17. The current period also benefitted from favourable market conditions. The results in the prior period are not fully comparable as we were not managing our asset and liability portfolios under IFRS 17.
Compared to last quarter, net income increased $123 million, as the prior quarter included the impact of unfavourable annual actuarial assumption updates in insurance service result. Insurance investment result increased largely from favourable investment performance as we repositioned our portfolio for the transition to IFRS 17. The current period also benefitted from favourable market conditions. The results in the prior period are not fully comparable as we were not managing our asset and liability portfolios under IFRS 17.
| Capital Markets
|
Net income of $1,154 million decreased $87 million or 7% from a year ago, primarily driven by lower revenue in Global Markets compared to stronger results in the prior year and higher PCL. These factors were partially offset by lower taxes reflecting changes in earnings mix.
Compared to last quarter, net income increased $167 million or 17%, mainly due to higher revenue in Global Markets, largely driven by higher fixed income revenue across most regions. These factors were partially offset by higher taxes.
| Corporate Support
|
Net loss was $459 million for the current quarter, primarily due to the after-tax impact of transaction and integration costs of $218 million and the after-tax impact of management of closing capital volatility of $207 million, both of which are related to the planned acquisition of HSBC Canada and treated as specified items.
| 13 | This ratio is calculated by dividing CET1 by RWA, in accordance with OSFI’s Basel III CAR guideline. |
| 14 | These are non-GAAP measures. For further information, including a reconciliation, refer to the Key performance and non-GAAP measures section on pages 3 to 5 of this Earnings Release. |
- 2 -
Net income was $549 million in the prior quarter, primarily due to a specified item relating to certain deferred tax adjustments of $578 million, as well as a favourable impact from tax-related items. These factors were partially offset by the after-tax impact of transaction and integration costs of $167 million relating to the planned acquisition of HSBC Canada, which is treated as a specified item.
Net loss was $1,131 million in the prior year, primarily due to the impact of the CRD and other tax related adjustments of $1,050 million, which is a specified item. Asset/liability management activities and residual unallocated items also contributed to the net loss.
| Capital, Liquidity and Credit Quality
|
Capital – As at January 31, 2024, our CET1 ratio15 was 14.9%, up 40 bps from last quarter, mainly reflecting net internal capital generation, the favourable impact of fair value OCI adjustments and share issuances under the DRIP. These factors were partially offset by RWA growth (excluding FX) and the net impact of regulatory updates.
Liquidity – For the quarter ended January 31, 2024, the average LCR16 was 132%, which translates into a surplus of approximately $94 billion, compared to 131% and a surplus of approximately $91 billion in the prior quarter. Average LCR16 remained relatively stable from the prior quarter as increased wholesale funding volumes and deposits were largely offset by on-balance sheet securities and loan growth.
The Net Stable Funding Ratio17 (NSFR) as at January 31, 2024 was 113%, which translates into a surplus of approximately $112 billion, compared to 113% and a surplus of approximately $109 billion in the prior quarter. NSFR remained relatively stable from the previous quarter as lower funding requirements for loans and securities financing transactions were largely offset by additional funding requirements on securities.
Credit Quality
| Q1 2024 vs. Q1 2023 |
Total PCL increased $281 million or 53% from a year ago, mainly reflecting higher provisions in Personal & Commercial Banking and Capital Markets, partially offset by lower provisions in Wealth Management. The PCL on loans ratio increased 12 bps. The PCL on impaired loans ratio of 31 bps increased 14 bps.
PCL on performing loans decreased $40 million or 23%, mainly due to releases in the current quarter in U.S. Wealth Management (including City National), largely driven by favourable changes to our macroeconomic forecast, partially offset by unfavourable changes in credit quality, as compared to provisions taken last year.
PCL on impaired loans increased $328 million, primarily due to higher provisions in our Canadian Banking portfolios and Capital Markets, mainly in the real estate and related sector.
| Q1 2024 vs. Q4 2023 |
Total PCL increased $93 million or 13% from last quarter, mainly due to higher provisions in Personal & Commercial Banking and Capital Markets, partially offset by lower provisions in U.S. Wealth Management (including City National). The PCL on loans ratio increased 3 bps. The PCL on impaired loans ratio increased 6 bps.
PCL on performing loans decreased $61 million or 31%, mainly due to releases in the current quarter as compared to provisions in the prior quarter in U.S. Wealth Management (including City National) and lower provisions in Capital Markets, both of which were largely due to favourable changes to our macroeconomic forecast, partially offset by unfavourable changes in credit outlook. These factors were partially offset by higher provisions in our Canadian Banking portfolios, mainly due to favourable changes to our macroeconomic forecast in the prior quarter as compared to unfavourable changes this quarter, partially offset by lower unfavourable changes in credit quality.
PCL on impaired loans increased $146 million or 27%, primarily due to higher provisions in our Canadian Banking portfolios.
| Key Performance and Non-GAAP Measures
|
| Performance measures |
We measure and evaluate the performance of our consolidated operations and each business segment using a number of financial metrics, such as net income and ROE. Certain financial metrics, including ROE, do not have a standardized meaning under generally accepted accounting principles (GAAP) and may not be comparable to similar measures disclosed by other financial institutions.
| Non-GAAP measures |
We believe that certain non-GAAP measures (including non-GAAP ratios) are more reflective of our ongoing operating results and provide readers with a better understanding of management’s perspective on our performance. These measures enhance the comparability of our financial performance for the three months ended January 31, 2024 with the corresponding period in the prior year and the three months ended October 31, 2023. Non-GAAP measures do not have a standardized meaning under GAAP and may not be comparable to similar measures disclosed by other financial institutions.
| 15 | This ratio is calculated by dividing CET1 by RWA, in accordance with OSFI’s Basel III CAR guideline. |
| 16 | The LCR is calculated in accordance with OSFI’s LAR guideline. For further details, refer to the Liquidity and funding risk section of our Q1 2024 Report to Shareholders. |
| 17 | The NSFR is calculated in accordance with OSFI’s LAR guideline. For further details, refer to the Liquidity and funding risk section of our Q1 2024 Report to Shareholders. |
- 3 -
The following discussion describes the non-GAAP measures we use in evaluating our operating results.
| Pre-provision, pre-tax earnings18 |
Pre-provision, pre-tax earnings is calculated as income (Q1 2024: $3,582 million; Q4 2023: $3,939 million; Q1 2023: $3,133 million) before income taxes (Q1 2024: $766 million; Q4 2023: $(33) million; Q1 2023: $2,103 million) and PCL (Q1 2024: $813 million; Q4 2023: $720 million; Q1 2023: $532 million). We use pre-provision, pre-tax earnings to assess our ability to generate sustained earnings growth outside of credit losses, which are impacted by the cyclical nature of the credit cycle.
| Adjusted results |
We believe that providing adjusted results as well as certain measures and ratios excluding the impact of the specified items discussed below and amortization of acquisition-related intangibles enhance comparability with prior periods and enables readers to better assess trends in the underlying businesses.
Our results for all reported periods were adjusted for the following specified item:
| • | Transaction and integration costs relating to our planned acquisition of HSBC Canada. |
Our results for the three months ended January 31, 2024 were adjusted for the following specified item:
| • | Management of closing capital volatility related to the planned acquisition of HSBC Canada. For further details, refer to the Key corporate events section of our Q1 2024 Report to Shareholders. |
Our results for the three months ended October 31, 2023 were adjusted for the following specified items:
| • | Impairment losses on our interest in an associated company. |
| • | Certain deferred tax adjustments: reflects the recognition of deferred tax assets relating to realized losses in City National associated with the intercompany sale of certain debt securities. |
Our results for the three months ended January 31, 2023 were adjusted for the following specified item:
| • | CRD and other tax related adjustments: reflects the impact of the CRD and the 1.5% increase in the Canadian corporate tax rate applicable to fiscal 2022, net of deferred tax adjustments, which were announced in the Government of Canada’s 2022 budget and enacted in the first quarter of 2023. |
| 18 | Prior period amounts have been restated from those previously presented as part of the adoption of IFRS 17, effective November 1, 2023. Refer to Note 2 of our Condensed Financial Statements for further details on these changes. |
- 4 -
The following table provides a reconciliation of adjusted results to our reported results and illustrates the calculation of adjusted measures presented. The adjusted results and measures presented below are non-GAAP measures or ratios.
| Consolidated results, reported and adjusted | ||||||||||||
| As at or for the three months ended | ||||||||||||
| (Millions of Canadian dollars, except per share, number of and percentage amounts) |
January 31 2024 |
October 31 2023 (1) |
January 31 2023 (1) |
|||||||||
| Total revenue |
$ | 13,485 | $ | 12,685 | $ | 13,357 | ||||||
| PCL |
813 | 720 | 532 | |||||||||
| Non-interest expense |
8,324 | 8,059 | 7,589 | |||||||||
| Income before income taxes |
4,348 | 3,906 | 5,236 | |||||||||
| Income taxes |
766 | (33 | ) | 2,103 | ||||||||
| Net income |
$ | 3,582 | $ | 3,939 | $ | 3,133 | ||||||
| Net income available to common shareholders |
$ | 3,522 | $ | 3,870 | $ | 3,087 | ||||||
| Average number of common shares (thousands) |
1,406,324 | 1,399,337 | 1,382,754 | |||||||||
| Basic earnings per share (in dollars) |
$ | 2.50 | $ | 2.77 | $ | 2.23 | ||||||
| Average number of diluted common shares (thousands) |
1,407,641 | 1,400,465 | 1,384,536 | |||||||||
| Diluted earnings per share (in dollars) |
$ | 2.50 | $ | 2.76 | $ | 2.23 | ||||||
| ROE (2) |
13.1% | 14.9% | 12.6% | |||||||||
| Effective income tax rate |
17.6% | (0.8)% | 40.2% | |||||||||
| Total adjusting items impacting net income (before-tax) |
$ | 631 | $ | 537 | $ | 97 | ||||||
| Specified item: HSBC Canada transaction and integration costs (3) |
265 | 203 | 11 | |||||||||
| Specified item: Management of closing capital volatility related to the planned acquisition of HSBC Canada (3), (4) |
286 | - | - | |||||||||
| Specified item: Impairment losses on our interest in an associated company (5) |
- | 242 | - | |||||||||
| Amortization of acquisition-related intangibles (6) |
80 | 92 | 86 | |||||||||
| Total income taxes for adjusting items impacting net income |
$ | 147 | $ | 703 | $ | (1,032 | ) | |||||
| Specified item: HSBC Canada transaction and integration costs (3) |
47 | 36 | 3 | |||||||||
| Specified item: Management of closing capital volatility related to the planned acquisition of HSBC Canada (3), (4) |
79 | - | - | |||||||||
| Specified item: Impairment losses on our interest in an associated company (5) |
- | 65 | - | |||||||||
| Specified item: Certain deferred tax adjustments (3) |
- | 578 | - | |||||||||
| Specified item: CRD and other tax related adjustments (3), (7) |
- | - | (1,050 | ) | ||||||||
| Amortization of acquisition-related intangibles (6) |
21 | 24 | 15 | |||||||||
| Adjusted results (8) |
||||||||||||
| Income before income taxes - adjusted |
4,979 | 4,443 | 5,333 | |||||||||
| Income taxes - adjusted |
913 | 670 | 1,071 | |||||||||
| Net income - adjusted |
$ | 4,066 | $ | 3,773 | $ | 4,262 | ||||||
| Net income available to common shareholders - adjusted |
$ | 4,006 | $ | 3,704 | $ | 4,216 | ||||||
| Average number of common shares (thousands) |
1,406,324 | 1,399,337 | 1,382,754 | |||||||||
| Basic earnings per share (in dollars) - adjusted |
$ | 2.85 | $ | 2.65 | $ | 3.05 | ||||||
| Average number of diluted common shares (thousands) |
1,407,641 | 1,400,465 | 1,384,536 | |||||||||
| Diluted earnings per share (in dollars) - adjusted |
$ | 2.85 | $ | 2.65 | $ | 3.04 | ||||||
| ROE - adjusted |
14.9% | 14.2% | 17.2% | |||||||||
| Adjusted effective income tax rate |
18.3% | 15.1% | 20.1% | |||||||||
| (1) | Amounts have been restated from those previously presented as part of the adoption of IFRS 17, effective November 1, 2023. Refer to Note 2 of our Condensed Financial Statements for further details on these changes. |
| (2) | ROE is calculated as net income available to common shareholders divided by average common equity. ROE is based on actual balances of average common equity before rounding. |
| (3) | These amounts have been recognized in Corporate Support. |
| (4) | Beginning the first quarter of 2024, we included management of closing capital volatility related to the planned acquisition of HSBC Canada as a specified item for non-GAAP measures and non-GAAP ratios. For further details, refer to the Key corporate events section of our Q1 2024 Report to Shareholders. |
| (5) | During the fourth quarter of 2023, we recognized impairment losses on our interest in an associated company. This amount was recognized in Wealth Management. |
| (6) | Represents the impact of amortization of acquisition-related intangibles (excluding amortization of software), and any goodwill impairment. |
| (7) | The impact of the CRD and other tax related adjustments does not include $0.2 billion recognized in other comprehensive income. |
| (8) | Effective the second quarter of 2023, we included HSBC Canada transaction and integration costs and amortization of acquisition-related intangibles as adjusting items for non-GAAP measures and non-GAAP ratios. Therefore, comparative adjusted results for the three months ended January 31, 2023 have been revised from those previously presented to conform to our basis of presentation for this non-GAAP measure. As at January 31, 2024, the cumulative HSBC Canada transaction and integration costs (before-tax) incurred are $0.6 billion and it is currently estimated that an additional $0.9 billion will be incurred, for a total of approximately $1.5 billion. |
Additional information about ROE and other key performance and non-GAAP measures and ratios can be found under the Key performance and non-GAAP measures section of our Q1 2024 Report to Shareholders.
- 5 -
|
CAUTION REGARDING FORWARD-LOOKING STATEMENTS
|
From time to time, we make written or oral forward-looking statements within the meaning of certain securities laws, including the “safe harbour” provisions of the United States Private Securities Litigation Reform Act of 1995 and any applicable Canadian securities legislation. We may make forward-looking statements in this document, in other filings with Canadian regulators or the SEC, in reports to shareholders, and in other communications. In addition, our representatives may communicate forward-looking statements orally to analysts, investors, the media and others. Forward-looking statements in this document include, but are not limited to, statements relating to our financial performance objectives, vision and strategic goals and the expected closing of the transaction involving HSBC Canada, including transaction and integration costs, and includes statements made by our President and Chief Executive Officer. The forward-looking statements contained in this document represent the views of management and are presented for the purpose of assisting the holders of our securities and financial analysts in understanding our financial position and results of operations as at and for the periods ended on the dates presented, as well as our financial performance objectives, vision, strategic goals and priorities and anticipated financial performance, and may not be appropriate for other purposes. Forward-looking statements are typically identified by words such as “believe”, “expect”, “suggest”, “seek”, “foresee”, “forecast”, “schedule”, “anticipate”, “intend”, “estimate”, “goal”, “commit”, “target”, “objective”, “plan”, “outlook”, “timeline” and “project” and similar expressions of future or conditional verbs such as “will”, “may”, “might”, “should”, “could”, “can” or “would” or negative or grammatical variations thereof.
By their very nature, forward-looking statements require us to make assumptions and are subject to inherent risks and uncertainties, both general and specific in nature, which give rise to the possibility that our predictions, forecasts, projections, expectations or conclusions will not prove to be accurate, that our assumptions may not be correct, that our financial performance, environmental & social or other objectives, vision and strategic goals will not be achieved, and that our actual results may differ materially from such predictions, forecasts, projections, expectations or conclusions.
We caution readers not to place undue reliance on our forward-looking statements as a number of risk factors could cause our actual results to differ materially from the expectations expressed in such forward-looking statements. These factors – many of which are beyond our control and the effects of which can be difficult to predict – include, but are not limited to: credit, market, liquidity and funding, insurance, operational, regulatory compliance (which could lead to us being subject to various legal and regulatory proceedings, the potential outcome of which could include regulatory restrictions, penalties and fines), strategic, reputation, legal and regulatory environment, competitive, model, systemic risks and other risks discussed in the risk sections of our annual report for the fiscal year ended October 31, 2023 (the 2023 Annual Report) and the Risk management section of our Q1 2024 Report to Shareholders, including business and economic conditions in the geographic regions in which we operate, Canadian housing and household indebtedness, information technology, cyber and third-party risks, geopolitical uncertainty, environmental and social risk (including climate change), digital disruption and innovation, privacy and data related risks, regulatory changes, culture and conduct risks, the effects of changes in government fiscal, monetary and other policies, tax risk and transparency, and our ability to anticipate and successfully manage risks arising from all of the foregoing factors. Additional factors that could cause actual results to differ materially from the expectations in such forward-looking statements can be found in the risk sections of our 2023 Annual Report and the Risk management section of our Q1 2024 Report to Shareholders, as may be updated by subsequent quarterly reports.
We caution that the foregoing list of risk factors is not exhaustive and other factors could also adversely affect our results. When relying on our forward-looking statements to make decisions with respect to us, investors and others should carefully consider the foregoing factors and other uncertainties and potential events, as well as the inherent uncertainty of forward-looking statements. Material economic assumptions underlying the forward-looking statements contained in this document are set out in the Economic, market and regulatory review and outlook section and for each business segment under the Strategic priorities and Outlook sections in our 2023 Annual Report, as updated by the Economic, market and regulatory review and outlook section of our Q1 2024 Report to Shareholders. Such sections may be updated by subsequent quarterly reports. Assumptions about the duration and complexity of technological builds, estimates for closing costs, and estimates of costs required for post-close synergy impacts were considered in the estimation of transaction and integration costs. Except as required by law, we do not undertake to update any forward-looking statement, whether written or oral, that may be made from time to time by us or on our behalf.
Additional information about these and other factors can be found in the risk sections of our 2023 Annual Report and the Risk management section of our Q1 2024 Report to Shareholders, as may be updated by subsequent quarterly reports. Information contained in or otherwise accessible through the websites mentioned does not form part of this document. All references in this document to websites are inactive textual references and are for your information only.
ACCESS TO QUARTERLY RESULTS MATERIALS
Interested investors, the media and others may review this quarterly Earnings Release, quarterly results slides, supplementary financial information and our Q1 2024 Report to Shareholders at rbc.com/investorrelations.
Quarterly conference call and webcast presentation
Our quarterly conference call is scheduled for February 28, 2024 at 8:00 a.m. (EDT) and will feature a presentation about our first quarter results by RBC executives. It will be followed by a question and answer period with analysts. Interested parties can access the call live on a listen-only basis at rbc.com/investorrelations/quarterly-financial-statements.html or by telephone (416-340-2217 or 866-696-5910, passcode 4255087#). Please call between 7:50 a.m. and 7:55 a.m. (EDT).
Management’s comments on results will be posted on our website shortly following the call. A recording will be available by 5:00 p.m. (EDT) from February 28, 2024 until May 30, 2024 at rbc.com/investorrelations/quarterly-financial-statements.html or by telephone (905-694-9451 or 800-408-3053, passcode 7594177#).
Media Relations Contacts
Gillian McArdle, Senior Director, Corporate Communications, gillian.mcardle@rbccm.com, 416-842-4231
Fiona McLean, Director, Financial Communications, fiona.mclean@rbc.com, 437-778-3506
Investor Relations Contacts
Asim Imran, Vice President, Head of Investor Relations, asim.imran@rbc.com, 416-955-7804
Marco Giurleo, Senior Director, Investor Relations, marco.giurleo@rbc.com, 437-239-5374
ABOUT RBC
Royal Bank of Canada is a global financial institution with a purpose-driven, principles-led approach to delivering leading performance. Our success comes from the 94,000+ employees who leverage their imaginations and insights to bring our vision, values and strategy to life so we can help our clients thrive and communities prosper. As Canada’s biggest bank and one of the largest in the world, based on market capitalization, we have a diversified business model with a focus on innovation and providing exceptional experiences to our more than 17 million clients in Canada, the U.S. and 27 other countries. Learn more at rbc.com.
We are proud to support a broad range of community initiatives through donations, community investments and employee volunteer activities. See how at rbc.com/community-social-impact.
® Registered Trademarks of Royal Bank of Canada.
|
|
- 6 -

|
Royal Bank of Canada first quarter 2024 results |
| Net income $3.6 Billion Up 14% YoY |
Diluted EPS 1
$2.50 Up 12% YoY |
Total PCL 1
$813 Million PCL on loans ratio 1
up 3 bps 1 QoQ |
ROE 1, 2
13.1% Up 50 bps YoY |
CET1 Ratio 1
14.9% Above regulatory requirements |
||||||||||||
| Adjusted net income 3
$4.1 Billion Down 5% YoY |
Adjusted Diluted EPS 3
$2.85 Down 6% YoY |
Total ACL 1
$5.7 Billion ACL on loans ratio 1
up 3
bps QoQ |
Adjusted ROE 3
14.9% Down 230 bps YoY |
LCR 1
132% Up from 131% last quarter |
|
“As our first quarter results show, RBC has the right strategy in place to grow today while also generating long-term value for shareholders. Underpinned by our balance sheet strength, prudent approach to risk management and diversified business model, we delivered solid, client-driven volume growth and a continued focus on expense control. As we look towards the completion of our planned HSBC Canada acquisition, we remain focused on being a trusted advisor to clients through the delivery of new and differentiated banking experiences.” – Dave McKay, President and Chief Executive Officer of Royal Bank of Canada |
||
|
Q1 2024 Compared to Q1 2023 |
Reported: • Net income of $3,582 million • Diluted EPS of $2.50 • ROE of 13.1% • CET1 ratio of 14.9% |
h h h h |
Adjusted 3 :• Net income of $4,066 million • Diluted EPS • ROE of 14.9% |
i i i |
||||||
|
Q1 2024 Compared to Q4 2023 |
• Net income of $3,582 million • Diluted EPS of $2.50 • ROE of 13.1% • CET1 ratio of 14.9% |
i i i h |
• Net income of $4,066 million • Diluted EPS • ROE of 14.9% |
h h h |
||||||
| (1) | See Glossary section of this Q1 2024 Report to Shareholders for composition of this measure. |
| (2) | Return on equity (ROE). This measure does not have a standardized meaning under generally accepted accounting principles (GAAP). For further information, refer to the Key performance and non-GAAP measures section of this Q1 2024 Report to Shareholders. |
| (3) | These are non-GAAP measures. For further information, including a reconciliation, refer to the Key performance and non-GAAP measures section of this Q1 2024 Report to Shareholders. |
| (4) | When we say “we”, “us”, “our”, “the bank” or “RBC”, we mean Royal Bank of Canada and its subsidiaries, as applicable. |
| (5) | Pre-provision, pre-tax (PPPT) earnings is calculated as income (January 31, 2024: $3,582 million; October 31, 2023: $3,939 million; January 31, 2023: $3,133 million) before income taxes (January 31, 2024: $766 million; October 31, 2023: $(33) million; January 31, 2023: $2,103 million) and PCL (January 31, 2024: $813 million; October 31, 2023: $720 million; January 31, 2023: $532 million). This is a non-GAAP measure. PPPT earnings do not have a standardized meaning under GAAP and may not be comparable to similar measures disclosed by other financial institutions. We use PPPT earnings to assess our ability to generate sustained earnings growth outside of credit losses, which are impacted by the cyclical nature of a credit cycle. We believe that certain non-GAAP measures are more reflective of our ongoing operating results and provide readers with a better understanding of management’s perspective on our performance. |
| 11 | Key performance and non-GAAP measures | |||
| 14 | Personal & Commercial Banking | |||
| 16 | Wealth Management | |||
| 18 | Insurance | |||
| 19 | Capital Markets | |||
| 20 | Corporate Support | |||
21 |
||||
22 |
||||
| 22 | Condensed balance sheets | |||
| 23 | Off-balance sheet arrangements | |||
23 |
||||
| 23 | Credit risk | |||
| 27 | Market risk | |||
| 31 | Liquidity and funding risk | |||
39 |
||||
45 |
||||
| 45 | Summary of accounting policies and estimates | |||
| 45 | Changes in accounting policies and disclosures | |||
| 45 | Controls and procedures | |||
46 |
||||
47 |
||||
50 |
||||
51 |
(unaudited) | |||
56 |
(unaudited) |
|||
78 |
||||
|
Management’s Discussion and Analysis |
|
Caution regarding forward-looking statements |
|
Overview and outlook |
|
About Royal Bank of Canada |
|
Selected financial and other highlights |
| As at or for the three months ended | For the three months ended | |||||||||||||||||||||
(Millions of Canadian dollars, except per share, number of and percentage amounts) |
January 31 2024 |
October 31 2023
(1)
|
January 31 2023
(1)
|
Q1 2024 vs. Q4 2023 |
Q1 2024 vs. Q1 2023 |
|||||||||||||||||
Total revenue |
$ |
13,485 |
$ | 12,685 | $ | 13,357 | $ |
800 |
$ |
128 |
||||||||||||
Provision for credit losses (PCL) |
813 |
720 | 532 | 93 |
281 |
|||||||||||||||||
Non-interest expense |
8,324 |
8,059 | 7,589 | 265 |
735 |
|||||||||||||||||
Income before income taxes |
4,348 |
3,906 | 5,236 | 442 |
(888 |
) |
||||||||||||||||
Net income |
$ |
3,582 |
$ | 3,939 | $ | 3,133 | $ |
(357 |
) |
$ |
449 |
|||||||||||
Net income adjusted (2)
|
$ |
4,066 |
$ | 3,773 | $ | 4,262 | $ |
293 |
$ |
(196 |
) |
|||||||||||
Segments – net income |
||||||||||||||||||||||
Personal & Commercial Banking |
$ |
2,061 |
$ | 2,091 | $ | 2,126 | $ |
(30 |
) |
$ |
(65 |
) |
||||||||||
Wealth Management (3)
|
606 |
215 | 830 | 391 |
(224 |
) |
||||||||||||||||
Insurance |
220 |
97 | 67 | 123 |
153 |
|||||||||||||||||
Capital Markets (3)
|
1,154 |
987 | 1,241 | 167 |
(87 |
) |
||||||||||||||||
Corporate Support |
(459 |
) |
549 | (1,131 | ) | (1,008 |
) |
672 |
||||||||||||||
Net income |
$ |
3,582 |
$ | 3,939 | $ | 3,133 | $ |
(357 |
) |
$ |
449 |
|||||||||||
Selected information |
||||||||||||||||||||||
Earnings per share (EPS) – basic |
$ |
2.50 |
$ | 2.77 | $ | 2.23 | $ |
(0.27 |
) |
$ |
0.27 |
|||||||||||
– diluted |
2.50 |
2.76 | 2.23 | (0.26 |
) |
0.27 |
||||||||||||||||
Earnings per share (EPS) – basic adjusted (2)
|
2.85 |
2.65 | 3.05 | 0.20 |
(0.20 |
) |
||||||||||||||||
– diluted adjusted (2)
|
2.85 |
2.65 | 3.04 | 0.20 |
(0.19 |
) |
||||||||||||||||
Return on common equity (ROE) (4), (5)
|
13.1% |
14.9% | 12.6% | (180) bps |
50 bps |
|||||||||||||||||
Return on common equity (ROE) adjusted (2)
|
14.9% |
14.2% | 17.2% | 70 bps |
(230) bps |
|||||||||||||||||
Average common equity (4)
|
$ |
107,100 |
$ | 103,250 | $ | 97,300 | $ |
3,850 |
$ |
9,800 |
||||||||||||
Net interest margin (NIM) – on average earning assets, net (5)
|
1.41% |
1.51% | 1.47% | (10) bps |
(6) bps |
|||||||||||||||||
PCL on loans as a % of average net loans and acceptances |
0.37% |
0.34% | 0.25% | 3 bps |
12 bps |
|||||||||||||||||
PCL on performing loans as a % of average net loans and acceptances |
0.06% |
0.09% | 0.08% | (3) bps |
(2) bps |
|||||||||||||||||
PCL on impaired loans as a % of average net loans and acceptances |
0.31% |
0.25% | 0.17% | 6 bps |
14 bps |
|||||||||||||||||
Gross impaired loans (GIL) as a % of loans and acceptances |
0.48% |
0.42% | 0.31% | 6 bps |
17 bps |
|||||||||||||||||
Liquidity coverage ratio (LCR) (5), (6)
|
132% |
131% | 130% | 100 bps |
200 bps |
|||||||||||||||||
Net stable funding ratio (NSFR) (5), (6)
|
113% |
113% | 112% | – bps |
100 bps |
|||||||||||||||||
Capital, Leverage and Total loss absorbing capacity (TLAC) ratios (5), (7), (8)
|
||||||||||||||||||||||
Common Equity Tier 1 (CET1) ratio |
14.9% |
14.5% | 12.7% | 40 bps |
220 bps |
|||||||||||||||||
Tier 1 capital ratio |
16.3% |
15.7% | 13.9% | 60 bps |
240 bps |
|||||||||||||||||
Total capital ratio |
18.1% |
17.6% | 15.7% | 50 bps |
240 bps |
|||||||||||||||||
Leverage ratio |
4.4% |
4.3% | 4.4% | 10 bps |
– bps |
|||||||||||||||||
TLAC ratio |
31.4% |
31.0% | 28.2% | 40 bps |
320 bps |
|||||||||||||||||
TLAC leverage ratio |
8.5% |
8.5% | 9.0% | – bps |
(50) bps |
|||||||||||||||||
Selected balance sheet and other information (9)
|
||||||||||||||||||||||
Total assets |
$ |
1,974,405 |
$ | 2,006,531 | $ | 1,934,580 | $ |
(32,126 |
) |
$ |
39,825 |
|||||||||||
Securities, net of applicable allowance |
405,813 |
409,730 | 320,553 | (3,917 |
) |
85,260 |
||||||||||||||||
Loans, net of allowance for loan losses |
858,316 |
852,773 | 823,794 | 5,543 |
34,522 |
|||||||||||||||||
Derivative related assets |
105,038 |
142,450 | 130,120 | (37,412 |
) |
(25,082 |
) |
|||||||||||||||
Deposits |
1,241,168 |
1,231,687 | 1,203,842 | 9,481 |
37,326 |
|||||||||||||||||
Common equity |
108,360 |
107,734 | 97,923 | 626 |
10,437 |
|||||||||||||||||
Total risk-weighted assets (RWA) (5), (7), (8)
|
590,257 |
596,223 | 614,250 | (5,966 |
) |
(23,993 |
) |
|||||||||||||||
Assets under management (AUM) (5)
|
1,150,100 |
1,067,500 | 1,051,300 | 82,600 |
98,800 |
|||||||||||||||||
Assets under administration (AUA) (5), (10), (11)
|
4,490,100 |
4,338,000 | 5,783,900 | 152,100 |
(1,293,800 |
) |
||||||||||||||||
Common share information |
||||||||||||||||||||||
Shares outstanding (000s) – average basic |
1,406,324 |
1,399,337 | 1,382,754 | 6,987 |
23,570 |
|||||||||||||||||
– average diluted |
1,407,641 |
1,400,465 | 1,384,536 | 7,176 |
23,105 |
|||||||||||||||||
– end of period |
1,408,257 |
1,400,511 | 1,382,818 | 7,746 |
25,439 |
|||||||||||||||||
Dividends declared per common share |
$ |
1.38 |
$ | 1.35 | $ | 1.32 | $ |
0.03 |
$ |
0.06 |
||||||||||||
Dividend yield (5)
|
4.5% |
4.5% | 4.0% | – bps |
50 bps |
|||||||||||||||||
Dividend payout ratio (5)
|
55% |
49% | 59% | 600 bps |
(400) bps |
|||||||||||||||||
Common share price (RY on TSX) (12)
|
$ |
131.21 |
$ | 110.76 | $ | 136.16 | $ |
20.45 |
$ |
(4.95 |
) |
|||||||||||
Market capitalization (TSX) (12)
|
184,777 |
155,121 | 188,284 | 29,656 |
(3,507 |
) |
||||||||||||||||
Business information |
||||||||||||||||||||||
Employees (full-time equivalent) (FTE) |
90,166 |
91,398 | 92,662 | (1,232 |
) |
(2,496 |
) |
|||||||||||||||
Bank branches |
1,248 |
1,247 | 1,265 | 1 |
(17 |
) |
||||||||||||||||
Automated teller machines (ATMs) |
4,341 |
4,341 | 4,363 | – |
(22 |
) |
||||||||||||||||
Period average US$ equivalent of C$1.00 (13)
|
0.745 |
0.732 | 0.745 | 0.013 |
– |
|||||||||||||||||
Period-end US$ equivalent of C$1.00 |
0.744 |
0.721 | 0.752 | 0.023 |
(0.008 |
) |
||||||||||||||||
| (1) | Amounts have been restated from those previously presented as part of the adoption of IFRS 17, effective November 1, 2023. For further details on the impacts of the adoption of IFRS 17 including the description of accounting policies selected, refer to Note 2 of our Condensed Financial Statements. |
| (2) | These are non-GAAP measures. For further details, including a reconciliation, refer to the Key performance and non-GAAP measures section. Amounts have been revised from those previously presented to conform to our basis of presentation for this non-GAAP measure. |
| (3) | Effective the fourth quarter of 2023, we moved the Investor Services lending business from our Wealth Management segment to our Capital Markets segment. Therefore, comparative results for the three months ended January 31, 2023 have been revised from those previously presented. |
| (4) | Average amounts are calculated using methods intended to approximate the average of the daily balances for the period. This includes average common equity used in the calculation of ROE. For further details, refer to the Key performance and non-GAAP measures section. |
| (5) | See Glossary for composition of this measure. |
| (6) | The LCR and NSFR are calculated in accordance with the Office of the Superintendent of Financial Institutions’ (OSFI) Liquidity Adequacy Requirements (LAR) guideline. LCR is the average for the three months ended for each respective period. For further details, refer to the Liquidity and funding risk section. |
| (7) | Capital ratios and RWA are calculated using OSFI’s Capital Adequacy Requirements (CAR) guideline, the Leverage ratio is calculated using OSFI’s Leverage Requirements (LR) guideline, and both the TLAC and TLAC leverage ratios are calculated using OSFI’s TLAC guideline. The periods ended January 31, 2024 and October 31, 2023 reflect our adoption of the revised CAR and LR guidelines that came into effect in Q2 2023, as further updated on October 20, 2023 as part of OSFI’s implementation of the Basel III reforms. The period ended January 31, 2024 also reflects our adoption of the revised market risk and credit valuation adjustment (CVA) frameworks that came into effect on November 1, 2023. For further details, refer to the Capital management section. |
| (8) | As prior period restatements are not required by OSFI, there was no impact from the adoption of IFRS 17 on regulatory capital, RWA, capital ratios, leverage ratio, TLAC available and TLAC ratios for periods prior to November 1, 2023. |
| (9) | Represents period-end spot balances. |
| (10) | AUA includes $14 billion and $6 billion (October 31, 2023 – $13 billion and $7 billion; January 31, 2023 – $15 billion and $6 billion) of securitized residential mortgages and credit card loans, respectively. |
| (11) | Comparative amounts for January 31, 2023 have been revised from those previously presented. |
| (12) | Based on TSX closing market price at period-end. |
| (13) | Average amounts are calculated using month-end spot rates for the period. |
|
Economic, market and regulatory review and outlook – data as at February 27, 2024 |
|
1 |
Annualized rate |
|
Key corporate events |
|
Financial performance |
|
Overview |
| For the three months ended | ||||||||
(Millions of Canadian dollars, except per share amounts) |
Q1 2024 vs. Q1 2023 |
Q1 2024 vs. Q4 2023 |
||||||
Increase (decrease): |
||||||||
Total revenue |
$ |
36 |
$ |
(96 |
) |
|||
PCL |
2 |
(2 |
) |
|||||
Non-interest expense |
28 |
(52 |
) |
|||||
Income taxes |
– |
(4 |
) |
|||||
Net income |
6 |
(38 |
) |
|||||
Impact on EPS |
||||||||
Basic |
$ |
– |
$ |
(0.03 |
) |
|||
Diluted |
– |
(0.03 |
) |
|||||
| For the three months ended | ||||||||||||
(Average foreign currency equivalent of C$1.00) (1) |
January 31 2024 |
October 31 2023 |
January 31 2023 |
|||||||||
U.S. dollar |
0.745 |
0.732 | 0.745 | |||||||||
British pound |
0.588 |
0.594 | 0.612 | |||||||||
Euro |
0.683 |
0.687 | 0.698 | |||||||||
| (1) | Average amounts are calculated using month-end spot rates for the period. |
| For the three months ended | ||||||||||||
(Millions of Canadian dollars, except percentage amounts) |
January 31 2024 |
October 31 2023
(1)
|
January 31 2023
(1)
|
|||||||||
Interest and dividend income |
$ |
25,609 |
$ | 24,502 | $ | 19,337 | ||||||
Interest expense |
19,277 |
17,960 | 13,135 | |||||||||
Net interest income |
$ |
6,332 |
$ | 6,542 | $ | 6,202 | ||||||
NIM |
1.41% |
1.51% | 1.47% | |||||||||
Insurance service result |
$ |
187 |
$ | 137 | $ | 192 | ||||||
Insurance investment result (2)
|
141 |
64 | (73 | ) | ||||||||
Trading revenue |
804 |
408 | 1,069 | |||||||||
Investment management and custodial fees |
2,185 |
2,106 | 2,056 | |||||||||
Mutual fund revenue |
1,030 |
1,014 | 1,015 | |||||||||
Securities brokerage commissions |
388 |
363 | 361 | |||||||||
Service charges |
554 |
548 | 511 | |||||||||
Underwriting and other advisory fees |
606 |
563 | 512 | |||||||||
Foreign exchange revenue, other than trading |
262 |
248 | 433 | |||||||||
Card service revenue |
326 |
302 | 325 | |||||||||
Credit fees |
395 |
411 | 379 | |||||||||
Net gains on investment securities |
70 |
2 | 53 | |||||||||
Share of profit in joint ventures and associates |
12 |
(223 | ) | 29 | ||||||||
Other |
193 |
200 | 293 | |||||||||
Non-interest income |
7,153 |
6,143 | 7,155 | |||||||||
Total revenue |
$ |
13,485 |
$ | 12,685 | $ | 13,357 | ||||||
Additional trading information |
||||||||||||
Net interest income (3)
|
$ |
344 |
$ | 345 | $ | 186 | ||||||
Non-interest income |
804 |
408 | 1,069 | |||||||||
Total trading revenue |
$ |
1,148 |
$ | 753 | $ | 1,255 | ||||||
| (1) | Amounts have been restated from those previously presented as part of the adoption of IFRS 17, effective November 1, 2023. Refer to Note 2 of our Condensed Financial Statements for further details on these changes. |
| (2) | The 2023 restated results may not be fully comparable to the current period as we were not managing our asset and liability portfolios under IFRS 17. |
| (3) | Reflects net interest income arising from trading-related positions, including assets and liabilities that are classified or designated at fair value through profit or loss (FVTPL). |
| For the three months ended | ||||||||||||
(Millions of Canadian dollars, except percentage amounts) |
January 31 2024 |
October 31 2023 |
January 31 2023 |
|||||||||
Personal & Commercial Banking |
$ |
149 |
$ | 104 | $ | 140 | ||||||
Wealth Management |
(27 |
) |
63 | 24 | ||||||||
Capital Markets |
10 |
27 | 9 | |||||||||
Corporate Support and other (2)
|
1 |
– | – | |||||||||
PCL on performing loans |
133 |
194 | 173 | |||||||||
Personal & Commercial Banking
|
$ |
486 |
$ | 358 | $ | 262 | ||||||
Wealth Management
|
38 |
69 | 42 | |||||||||
Capital Markets
|
161 |
112 | 53 | |||||||||
PCL on impaired loans |
685 |
539 | 357 | |||||||||
PCL – Loans |
818 |
733 | 530 | |||||||||
PCL – Other (3)
|
(5 |
) |
(13 | ) | 2 | |||||||
Total PCL |
$ |
813 |
$ | 720 | $ | 532 | ||||||
| PCL on loans is comprised of: | ||||||||||||
Retail |
$ |
137 |
$ | 65 | $ | 134 | ||||||
Wholesale |
(4 |
) |
129 | 39 | ||||||||
PCL on performing loans |
133 |
194 | 173 | |||||||||
Retail |
359 |
293 | 239 | |||||||||
Wholesale |
326 |
246 | 118 | |||||||||
PCL on impaired loans |
685 |
539 | 357 | |||||||||
PCL – Loans |
$ |
818 |
$ | 733 | $ | 530 | ||||||
PCL on loans as a % of average net loans and acceptances |
0.37% |
0.34% | 0.25% | |||||||||
PCL on impaired loans as a % of average net loans and acceptances |
0.31% |
0.25% | 0.17% | |||||||||
| (1) | Information on loans represents loans, acceptances and commitments. |
| (2) | Includes PCL recorded in Corporate Support and Insurance. |
| (3) | PCL – Other includes amounts related to debt securities measured at fair value through other comprehensive income (FVOCI) and amortized cost, accounts receivable, and financial and purchased guarantees. |
| For the three months ended | ||||||||||||
(Millions of Canadian dollars, except percentage amounts) |
January 31 2024 |
October 31 2023
(1)
|
January 31 2023
(1)
|
|||||||||
Salaries |
$ |
2,078 |
$ | 2,239 | $ | 2,010 | ||||||
Variable compensation |
2,083 |
1,955 | 2,026 | |||||||||
Benefits and retention compensation |
605 |
489 | 544 | |||||||||
Share-based compensation |
397 |
(17 | ) | 270 | ||||||||
Human resources |
5,163 |
4,666 | 4,850 | |||||||||
Equipment |
619 |
612 | 569 | |||||||||
Occupancy |
407 |
401 | 404 | |||||||||
Communications |
321 |
344 | 278 | |||||||||
Professional fees |
624 |
692 | 382 | |||||||||
Amortization of other intangibles |
352 |
357 | 362 | |||||||||
Other |
838 |
987 | 744 | |||||||||
Non-interest expense |
$ |
8,324 |
$ | 8,059 | $ | 7,589 | ||||||
Efficiency ratio (2)
|
61.7% |
63.5% | 56.8% | |||||||||
Adjusted efficiency ratio (3), (4)
|
57.9% |
60.1% | 56.1% | |||||||||
| (1) | Amounts have been restated from those previously presented as part of the adoption of IFRS 17, effective November 1, 2023. Refer to Note 2 of our Condensed Financial Statements for further details on these changes. |
| (2) | Efficiency ratio is calculated as Non-interest expense divided by Total revenue. |
| (3) | This is a non-GAAP ratio. For further details, refer to the Key performance and non-GAAP measures section. |
| (4) | Effective Q2 2023, we revised the composition of this non-GAAP ratio. Comparative adjusted amounts have been revised to conform with this presentation. |
| For the three months ended | ||||||||||||
(Millions of Canadian dollars, except percentage amounts) |
January 31 2024 |
October 31 2023
(1)
|
January 31 2023
(1)
|
|||||||||
Income taxes |
$ |
766 |
$ | (33 | ) | $ | 2,103 | |||||
Income before income taxes |
4,348 |
3,906 | 5,236 | |||||||||
Effective income tax rate |
17.6% |
(0.8)% | 40.2% | |||||||||
Adjusted results (2), (3)
|
||||||||||||
Adjusted income taxes |
913 |
670 | 1,071 | |||||||||
Adjusted income before income taxes |
4,979 |
4,443 | 5,333 | |||||||||
Adjusted effective income tax rate |
18.3% |
15.1% | 20.1% | |||||||||
| (1) | Amounts have been restated from those previously presented as part of the adoption of IFRS 17, effective November 1, 2023. Refer to Note 2 of our Condensed Financial Statements for further details on these changes. |
| (2) | These are non-GAAP measures. For further details, including a reconciliation, refer to the Key performance and non-GAAP measures section. |
| (3) | Effective Q2 2023, we revised the composition of these non-GAAP measures. Comparative adjusted amounts have been revised to conform with this presentation. |
|
Business segment results |
|
How we measure and report our business segments |
|
Key performance and non-GAAP measures |
| For the three months ended | ||||||||||||||||||||||||||||||||||||
|
January 31 2024 |
October 31 2023 |
January 31 2023 |
||||||||||||||||||||||||||||||||||
|
(Millions of Canadian dollars, except percentage amounts) |
Personal & Commercial Banking |
Wealth Management |
Insurance |
Capital Markets |
Corporate Support |
Total |
Total (2) | Total (2) | ||||||||||||||||||||||||||||
Net income available to common shareholders |
$ |
2,042 |
$ |
595 |
$ |
219 |
$ |
1,137 |
$ |
(471 |
) |
$ |
3,522 |
$ | 3,870 | $ | 3,087 | |||||||||||||||||||
Total average common equity (3), (4)
|
31,200 |
22,550 |
2,150 |
31,050 |
20,150 |
107,100 |
103,250 | 97,300 | ||||||||||||||||||||||||||||
ROE (5)
|
26.0% |
10.5% |
40.5% |
14.6% |
n.m. |
13.1% |
14.9% | 12.6% | ||||||||||||||||||||||||||||
| (1) | Effective November 1, 2023, our attributed capital methodology incorporates leverage requirements to allocate capital to our business segments. For further details on changes to our attributed capital methodology, refer to the How we measure and report our business segments section. |
| (2) | Amounts have been restated from those previously presented as part of the adoption of IFRS 17, effective November 1, 2023. Refer to Note 2 of our Condensed Financial Statements for further details on these changes. |
| (3) | Total average common equity represents rounded figures. |
| (4) | The amounts for the segments are referred to as attributed capital. |
| (5) | ROE is based on actual balances of average common equity before rounding. |
| n.m. | not meaningful |
| • | Transaction and integration costs relating to our planned acquisition of HSBC Canada. |
| • | Management of closing capital volatility related to the planned acquisition of HSBC Canada. For further details, refer to the Key corporate events section. |
| • | Impairment losses on our interest in an associated company. |
| • | Certain deferred tax adjustments: reflects the recognition of deferred tax assets relating to realized losses in City National associated with the intercompany sale of certain debt securities. |
| • | CRD and other tax related adjustments: reflects the impact of the CRD and the 1.5% increase in the Canadian corporate tax rate applicable to fiscal 2022, net of deferred tax adjustments, which were announced in the Government of Canada’s 2022 budget and enacted in the first quarter of 2023. |
| As at or for the three months ended | ||||||||||||
(Millions of Canadian dollars, except per share, number of and percentage amounts) |
January 31 2024 |
October 31 2023
(1)
|
January 31 2023
(1)
|
|||||||||
Total revenue |
$ |
13,485 |
$ | 12,685 | $ | 13,357 | ||||||
PCL |
813 |
720 | 532 | |||||||||
Non-interest expense |
8,324 |
8,059 | 7,589 | |||||||||
Income before income taxes |
4,348 |
3,906 | 5,236 | |||||||||
Income taxes |
766 |
(33 | ) | 2,103 | ||||||||
Net income |
$ |
3,582 |
$ | 3,939 | $ | 3,133 | ||||||
Net income available to common shareholders |
$ |
3,522 |
$ | 3,870 | $ | 3,087 | ||||||
Average number of common shares (thousands) |
1,406,324 |
1,399,337 | 1,382,754 | |||||||||
Basic earnings per share (in dollars) |
$ |
2.50 |
$ | 2.77 | $ | 2.23 | ||||||
Average number of diluted common shares (thousands) |
1,407,641 |
1,400,465 | 1,384,536 | |||||||||
Diluted earnings per share (in dollars) |
$ |
2.50 |
$ | 2.76 | $ | 2.23 | ||||||
ROE (2)
|
13.1% |
14.9% | 12.6% | |||||||||
Effective income tax rate |
17.6% |
(0.8)% | 40.2% | |||||||||
Total adjusting items impacting net income (before-tax) |
$ |
631 |
$ | 537 | $ | 97 | ||||||
Specified item: HSBC Canada transaction and integration costs (3)
|
265 |
203 | 11 | |||||||||
Specified item: Management of closing capital volatility related to the planned acquisition of HSBC Canada (3), (4)
|
286 |
– | – | |||||||||
Specified item: Impairment losses on our interest in an associated company (5)
|
– |
242 | – |
|||||||||
Amortization of acquisition-related intangibles (6)
|
80 |
92 | 86 | |||||||||
Total income taxes for adjusting items impacting net income |
$ |
147 |
$ | 703 | $ | (1,032 | ) | |||||
Specified item: HSBC Canada transaction and integration costs (3)
|
47 |
36 | 3 | |||||||||
Specified item: Management of closing capital volatility related to the planned acquisition of HSBC Canada (3), (4)
|
79 |
– | – | |||||||||
Specified item: Impairment losses on our interest in an associated company (5)
|
– |
65 | – |
|||||||||
Specified item: Certain deferred tax adjustments (3)
|
– |
578 | – | |||||||||
Specified item: CRD and other tax related adjustments (3), (7)
|
– |
– |
(1,050 | ) | ||||||||
Amortization of acquisition-related intangibles (6)
|
21 |
24 | 15 | |||||||||
Adjusted results (8)
|
||||||||||||
Income before income taxes – adjusted |
4,979 |
4,443 | 5,333 | |||||||||
Income taxes – adjusted |
913 |
670 | 1,071 | |||||||||
Net income – adjusted |
$ |
4,066 |
$ | 3,773 | $ | 4,262 | ||||||
Net income available to common shareholders – adjusted |
$ |
4,006 |
$ | 3,704 | $ | 4,216 | ||||||
Average number of common shares (thousands) |
1,406,324 |
1,399,337 | 1,382,754 | |||||||||
Basic earnings per share (in dollars) – adjusted |
$ |
2.85 |
$ | 2.65 | $ | 3.05 | ||||||
Average number of diluted common shares (thousands) |
1,407,641 |
1,400,465 | 1,384,536 | |||||||||
Diluted earnings per share (in dollars) – adjusted |
$ |
2.85 |
$ | 2.65 | $ | 3.04 | ||||||
ROE – adjusted |
14.9% |
14.2% | 17.2% | |||||||||
Adjusted effective income tax rate |
18.3% |
15.1% | 20.1% | |||||||||
Adjusted efficiency ratio (9)
|
||||||||||||
Total revenue |
$ |
13,485 |
$ | 12,685 | $ | 13,357 | ||||||
Add specified item: Management of closing capital volatility related to the planned acquisition of HSBC Canada (before-tax) (3), (4)
|
286 |
– | – | |||||||||
Add specified item: Impairment losses on our interest in an associated company (before-tax)
(5)
|
– |
242 | – | |||||||||
Total revenue – adjusted |
$ |
13,771 |
$ | 12,927 | $ | 13,357 | ||||||
Non-interest expense |
$ |
8,324 |
$ | 8,059 | $ | 7,589 | ||||||
Less specified item: HSBC Canada transaction and integration costs (before-tax) (3)
|
265 |
203 | 11 | |||||||||
Less: Amortization of acquisition-related intangibles (before-tax) (6)
|
80 |
92 | 86 | |||||||||
Non-interest expense – adjusted |
$ |
7,979 |
$ | 7,764 | $ | 7,492 | ||||||
Efficiency ratio |
61.7% |
63.5% | 56.8% | |||||||||
Efficiency ratio – adjusted |
57.9% |
60.1% | 56.1% | |||||||||
| (1) | Amounts have been restated from those previously presented as part of the adoption of IFRS 17, effective November 1, 2023. Refer to Note 2 of our Condensed Financial Statements for further details on these changes. |
| (2) | ROE is based on actual balances of average common equity before rounding. |
| (3) | These amounts have been recognized in Corporate Support. |
| (4) | Beginning the first quarter of 2024, we included management of closing capital volatility related to the planned acquisition of HSBC Canada as a specified item for non-GAAP measures and non-GAAP ratios. Refer to the Key corporate events section for further details. |
| (5) | During the fourth quarter of 2023, we recognized impairment losses on our interest in an associated company. This amount was recognized in Wealth Management. |
| (6) | Represents the impact of amortization of acquisition-related intangibles (excluding amortization of software), and any goodwill impairment. |
| (7) | The impact of the CRD and other tax related adjustments does not include $0.2 billion recognized in other comprehensive income. |
| (8) | Effective the second quarter of 2023, we included HSBC Canada transaction and integration costs and amortization of acquisition-related intangibles as adjusting items for non-GAAP measures and non-GAAP ratios. Therefore, comparative adjusted results for the three months ended January 31, 2023 have been revised from those previously presented to conform to our basis of presentation for this non-GAAP measure. As at January 31, 2024, the cumulative HSBC Canada transaction and integration costs (before-tax) incurred are $0.6 billion and it is currently estimated that an additional $0.9 billion will be incurred, for a total of approximately $1.5 billion. |
| (9) | Effective the second quarter of 2023, we revised the composition of this non-GAAP ratio, which is calculated based on Non-interest expense adjusted divided by total revenue adjusted. Therefore, comparative adjusted results for the three months ended January 31, 2023 have been revised from those previously presented to conform to our basis of presentation for this non-GAAP ratio. |
| For the three months ended | ||||||||||||
| October 31 2023 (1) |
||||||||||||
Item excluded |
||||||||||||
| (Millions of Canadian dollars, except percentage amounts and as otherwise noted) | As reported |
Specified item (2)
|
Adjusted |
|||||||||
| Total revenue
|
$ |
4,188 |
$ |
242 |
$ |
4,430 |
||||||
| PCL
|
132 |
– |
132 |
|||||||||
| Non-interest expense |
3,749 |
– |
3,749 |
|||||||||
| Net income before income taxes
|
307 |
242 |
549 |
|||||||||
| Net income
|
$ |
215 |
$ |
177 |
$ |
392 |
||||||
| Net income available to common shareholders
|
200 |
177 |
377 |
|||||||||
| Total average common equity
(3), (4)
|
23,600 |
23,600 |
||||||||||
| Revenue by business
|
||||||||||||
| U.S. Wealth Management (including City National)
|
$ |
1,867 |
$ |
242 |
$ |
2,109 |
||||||
| U.S. Wealth Management (including City National) (US$ millions)
|
1,369 |
175 |
1,544 |
|||||||||
| Key ratios
|
||||||||||||
| ROE
(5)
|
3.4% |
6.3% |
||||||||||
| Pre-tax margin (6)
|
7.3% |
12.4% |
||||||||||
| (1) | There were no specified items impacting Wealth Management for the three months ended January 31, 2024 or January 31, 2023. |
| (2) | During the fourth quarter of 2023, we recognized impairment losses on our interest in an associated company. |
| (3) | Total average common equity represents rounded figures. |
| (4) | The amounts for the segments are referred to as attributed capital. |
| (5) | ROE is based on actual balances of average common equity before rounding. |
| (6) |
Pre-tax margin is defined as Income before income taxes divided by Total revenue. |
|
Personal & Commercial Banking |
| As at or for the three months ended | ||||||||||||
(Millions of Canadian dollars, except percentage amounts and as otherwise noted) |
January 31 2024 |
October 31 2023 |
January 31 2023 |
|||||||||
Net interest income |
$ |
4,216 |
$ | 4,188 | $ | 4,007 | ||||||
Non-interest income |
1,578 |
1,530 | 1,534 | |||||||||
Total revenue |
5,794 |
5,718 | 5,541 | |||||||||
PCL on performing assets |
150 |
103 | 141 | |||||||||
PCL on impaired assets |
484 |
348 | 260 | |||||||||
PCL |
634 |
451 | 401 | |||||||||
Non-interest expense |
2,339 |
2,410 | 2,229 | |||||||||
Income before income taxes |
2,821 |
2,857 | 2,911 | |||||||||
Net income |
$ |
2,061 |
$ | 2,091 | $ | 2,126 | ||||||
Revenue by business |
||||||||||||
Canadian Banking |
$ |
5,516 |
$ | 5,434 | $ | 5,284 | ||||||
Caribbean & U.S. Banking |
278 |
284 | 257 | |||||||||
Selected balance sheet and other information |
||||||||||||
ROE (1)
|
26.0% |
26.7% | 29.8% | |||||||||
NIM |
2.77% |
2.77% | 2.76% | |||||||||
Efficiency ratio (2)
|
40.4% |
42.1% | 40.2% | |||||||||
Operating leverage (2)
|
(0.3)% |
(0.7)% | 5.2% | |||||||||
Average total earning assets, net |
$ |
605,500 |
$ | 599,400 | $ | 575,900 | ||||||
Average loans and acceptances, net |
614,100 |
607,200 | 581,800 | |||||||||
Average deposits |
630,600 |
621,000 | 579,800 | |||||||||
AUA (3), (4)
|
362,700 |
336,800 | 353,400 | |||||||||
Average AUA |
357,200 |
341,700 | 343,500 | |||||||||
PCL on impaired loans as a % of average net loans and acceptances |
0.31% |
0.23% | 0.18% | |||||||||
Other selected information – Canadian Banking |
||||||||||||
Net income |
$ |
1,967 |
$ | 1,998 | $ | 2,056 | ||||||
NIM |
2.72% |
2.71% | 2.73% | |||||||||
Efficiency ratio |
39.2% |
40.9% | 39.0% | |||||||||
Operating leverage |
(0.7)% |
(1.4)% | 5.1% | |||||||||
| (1) | Effective November 1, 2023, our attributed capital methodology incorporates leverage requirements to allocate capital to our business segments. For further details on changes to our attributed capital methodology, refer to the How we measure and report our business segments section. |
| (2) | See Glossary for composition of this measure. |
| (3) | AUA represents period-end spot balances and includes securitized residential mortgages and credit card loans as at January 31, 2024 of $14 billion and $6 billion, respectively (October 31, 2023 – $13 billion and $7 billion; January 31, 2023 – $15 billion and $6 billion). |
| (4) | Comparative amounts for the three months ended January 31, 2023 have been revised from those previously presented. |
|
Wealth Management |
| As at or for the three months ended | ||||||||||||
(Millions of Canadian dollars, except percentage amounts and as otherwise noted) |
January 31 2024 |
October 31 2023 |
January 31 2023
(1)
|
|||||||||
Net interest income (2)
|
$ |
1,150 |
$ | 1,143 | $ | 1,216 | ||||||
Non-interest income (2)
|
3,387 |
3,045 | 3,344 | |||||||||
Total revenue |
4,537 |
4,188 | 4,560 | |||||||||
PCL on performing assets |
(27 |
) |
63 | 24 | ||||||||
PCL on impaired assets |
38 |
69 | 42 | |||||||||
PCL |
11 |
132 | 66 | |||||||||
Non-interest expense |
3,768 |
3,749 | 3,434 | |||||||||
Income before income taxes |
758 |
307 | 1,060 | |||||||||
Net income |
$ |
606 |
$ | 215 | $ | 830 | ||||||
Revenue by business |
||||||||||||
Canadian Wealth Management |
$ |
1,177 |
$ | 1,127 | $ | 1,111 | ||||||
U.S. Wealth Management (including City National) |
2,158 |
1,867 | 2,128 | |||||||||
U.S. Wealth Management (including City National) (US$ millions) |
1,609 |
1,369 | 1,585 | |||||||||
Global Asset Management |
725 |
674 | 683 | |||||||||
International Wealth Management |
317 |
338 | 288 | |||||||||
Investor Services (3)
|
160 |
182 | 350 | |||||||||
Selected balance sheet and other information |
||||||||||||
ROE (4)
|
10.5% |
3.4% | 13.4% | |||||||||
NIM |
3.07% |
2.91% | 2.73% | |||||||||
Pre-tax margin (5)
|
16.7% |
7.3% | 23.2% | |||||||||
Number of advisors (6)
|
6,125 |
6,169 | 6,199 | |||||||||
Average total earning assets, net |
$ |
149,000 |
$ | 156,000 | $ | 177,000 | ||||||
Average loans and acceptances, net |
111,900 |
114,200 | 114,200 | |||||||||
Average deposits (3)
|
155,400 |
156,600 | 185,600 | |||||||||
AUA (3), (7)
|
4,108,400 |
3,981,500 | 5,412,000 | |||||||||
U.S. Wealth Management (including City National) (7)
|
803,400 |
752,700 | 713,100 | |||||||||
U.S. Wealth Management (including City National) (US$ millions) (7)
|
597,800 |
542,800 | 536,100 | |||||||||
Investor Services (7)
|
2,508,700 |
2,488,600 | 3,974,100 | |||||||||
AUM (7)
|
1,141,200 |
1,058,900 | 1,042,900 | |||||||||
Average AUA (3)
|
4,065,000 |
4,056,200 | 5,423,100 | |||||||||
Average AUM |
1,122,100 |
1,070,100 | 1,027,300 | |||||||||
PCL on impaired loans as a % of average net loans and acceptances |
0.14% |
0.24% | 0.14% | |||||||||
Adjusted results (8)
|
||||||||||||
Total revenue – adjusted |
$ |
n.a. |
$ | 4,430 | $ | n.a. | ||||||
Income before income taxes – adjusted |
n.a. |
549 | n.a. | |||||||||
Net income – adjusted |
n.a. |
392 | n.a. | |||||||||
U.S. Wealth Management (including City National) revenue – adjusted |
n.a. |
2,109 | n.a. | |||||||||
U.S. Wealth Management (including City National) revenue (US$ millions) – adjusted |
n.a. |
1,544 | n.a. | |||||||||
Key ratios – adjusted (8)
|
||||||||||||
Selected balance sheet and other information |
||||||||||||
ROE – adjusted (4)
|
n.a. |
6.3% | n.a. | |||||||||
Pre-tax margin – adjusted |
n.a. |
12.4% | n.a. | |||||||||
|
Estimated impact of U.S. dollar, British pound and Euro translation on key income statement items (Millions of Canadian dollars, except percentage amounts) |
For the three months ended |
|||||||
|
Q1 2024 vs. Q1 2023 |
Q1 2024 vs. Q4 2023 |
|||||||
Increase (decrease): |
||||||||
Total revenue |
$ |
17 |
$ |
(38 |
) |
|||
PCL |
– |
– |
||||||
Non-interest expense |
17 |
(31 |
) |
|||||
Net income |
1 |
(6 |
) |
|||||
Percentage change in average U.S. dollar equivalent of C$1.00 |
–% |
2% |
||||||
Percentage change in average British pound equivalent of C$1.00 |
(4)% |
(1)% |
||||||
Percentage change in average Euro equivalent of C$1.00 |
(2)% |
(1)% |
||||||
| (1) | Effective the fourth quarter of 2023, we moved the Investor Services lending business from our Wealth Management segment to our Capital Markets segment. Therefore, comparative results for the three months ended January 31, 2023 have been revised from those previously presented. |
| (2) | Amounts for the three months ended January 31, 2023 have been revised from those previously presented. |
| (3) | We completed the partial sale of RBC Investor Services operations in Europe (other than U.K.) and Jersey to CACEIS on July 3, 2023 and December 1, 2023, respectively. The completion of the sale of the business of the U.K. branch of RBC Investor Services Trust remains subject to customary closing conditions. For further details, refer to Note 6 of our Condensed Financial Statements. |
| (4) | Effective November 1, 2023, our attributed capital methodology incorporates leverage requirements to allocate capital to our business segments. For further details on changes to our attributed capital methodology, refer to How we measure and report our business segments section. |
| (5) | Pre-tax margin is defined as Income before income taxes divided by Total revenue. |
| (6) | Represents client-facing advisors across all of our Wealth Management businesses. |
| (7) | Represents period-end spot balances. |
| (8) | These are non-GAAP measures and non-GAAP ratios. There were no specified items for the three months ended January 31, 2023 and January 31, 2024. During the three months ended October 31, 2023, we recognized impairment losses of $177 million (before tax $242 million) on our interest in an associated company. For further details, including a reconciliation, refer to the Key performance and non-GAAP measures section. |
| n.a. | not applicable |
|
Insurance |
| As at or for the three months ended | ||||||||||||
(Millions of Canadian dollars, except percentage amounts and as otherwise noted) |
January 31 2024 |
October 31 2023
(1), (2)
|
January 31 2023
(1), (2)
|
|||||||||
Non-interest income |
||||||||||||
| Insurance service result
|
$ |
187 |
$ | 137 | $ | 192 | ||||||
Insuran ce inve stment result |
141 |
64 | (73 | ) | ||||||||
Other income |
35 |
47 | 35 | |||||||||
Total revenue |
363 |
248 | 154 | |||||||||
PCL |
1 |
– | – | |||||||||
Non-interest expense |
71 |
89 | 70 | |||||||||
Income before income taxes |
291 |
159 | 84 | |||||||||
Net income |
$ |
220 |
$ | 97 | $ | 67 | ||||||
Selected balances and other information |
||||||||||||
ROE |
40.5% |
17.1% | 12.7% | |||||||||
Premiums and deposits (3)
|
$ |
1,346 |
$ | 1,297 | $ | 1,239 | ||||||
Contractual service margin (CSM) (4)
|
1,977 |
1,956 | 1,767 | |||||||||
| (1) | Amounts have been restated from those previously presented as part of the adoption of IFRS 17, effective November 1, 2023. Refer to Note 2 of our Condensed Financial Statements for further details on these changes. |
| (2) | The 2023 restated results may not be fully comparable to the current period as we were not managing our asset and liability portfolios under IFRS 17. |
| (3) | Premiums and deposits include premiums on risk-based individual and group insurance and annuity products as well as segregated fund deposits, consistent with insurance industry practices. |
| (4) | Represents the CSM of insurance contract assets and liabilities net of reinsurance contract held assets and liabilities. For insurance contracts, the CSM represents the unearned profit (net inflows) for providing insurance coverage. For reinsurance contracts held, the CSM represents the net cost or net gain of purchasing reinsurance. The CSM is not applicable to contracts measured using the premium allocation approach. |
|
Capital Markets |
| As at or for the three months ended | ||||||||||||
(Millions of Canadian dollars, except percentage amounts and as otherwise noted) |
January 31 2024 |
October 31 2023 |
January 31 2023
(1)
|
|||||||||
Net interest income (2)
|
$ |
661 |
$ | 729 | $ | 792 | ||||||
Non-interest income (2)
|
2,290 |
1,835 | 2,354 | |||||||||
Total revenue (2)
|
2,951 |
2,564 | 3,146 | |||||||||
PCL on performing assets |
6 |
25 | 12 | |||||||||
PCL on impaired assets |
161 |
112 | 53 | |||||||||
PCL |
167 |
137 | 65 | |||||||||
Non-interest expense |
1,642 |
1,678 | 1,701 | |||||||||
Income before income taxes |
1,142 |
749 | 1,380 | |||||||||
Net income |
$ |
1,154 |
$ | 987 | $ | 1,241 | ||||||
Revenue by business |
||||||||||||
Corporate & Investment Banking |
$ |
1,369 |
$ | 1,414 | $ | 1,323 | ||||||
Global Markets |
1,742 |
1,251 | 1,885 | |||||||||
Other |
(160 |
) |
(101 | ) | (62 | ) | ||||||
Selected balance sheet and other information |
||||||||||||
ROE (3)
|
14.6% |
14.1% | 17.1% | |||||||||
Average total assets |
$ |
1,194,900 |
$ | 1,140,600 | $ | 1,192,800 | ||||||
Average trading securities |
204,100 |
187,400 | 155,100 | |||||||||
Average loans and acceptances, net |
142,100 |
143,100 | 146,600 | |||||||||
Average deposits |
292,500 |
277,900 | 306,900 | |||||||||
PCL on impaired loans as a % of average net loans and acceptances |
0.45% |
0.31% | 0.14% | |||||||||
|
Estimated impact of U.S. dollar, British pound and Euro translation on key income statement items (Millions of Canadian dollars, except percentage amounts) |
For the three months ended |
|||||||||||
Q1 2024 vs. Q1 2023 |
Q1 2024 vs. Q4 2023 |
|||||||||||
Increase (decrease): |
||||||||||||
Total revenue |
$ |
20 |
$ |
(40 |
) |
|||||||
PCL |
– |
(2 |
) |
|||||||||
Non-interest expense |
11 |
(13 |
) |
|||||||||
Net income |
7 |
(23 |
) |
|||||||||
Percentage change in average U.S. dollar equivalent of C$1.00 |
–% |
2% |
||||||||||
Percentage change in average British pound equivalent of C$1.00 |
(4)% |
(1)% |
||||||||||
Percentage change in average Euro equivalent of C$1.00 |
(2)% |
(1)% |
||||||||||
| (1) | Effective the fourth quarter of 2023, we moved the Investor Services lending business from our Wealth Management segment to our Capital Markets segment. Therefore, comparative results for the three months ended January 31, 2023 have been revised from those previously presented. |
| (2) | The taxable equivalent basis (teb) adjustment for the three months ended January 31, 2024 was $54 million (October 31, 2023 – $117 million; January 31, 2023 – $116 million). For further discussion, refer to the How we measure and report our business segments section of our 2023 Annual Report. |
| (3) | Effective November 1, 2023, our attributed capital methodology incorporates leverage requirements to allocate capital to our business segments. For further details on changes to our attributed capital methodology, refer to the How we measure and report our business segments section. |
|
Corporate Support |
| For the three months ended | ||||||||||||
(Millions of Canadian dollars) |
January 31 2024 |
October 31 2023 |
January 31 2023 |
|||||||||
Net interest income (loss) (1), (2)
|
$ |
305 |
$ | 482 | $ | 187 | ||||||
Non-interest income (loss) (1), (2), (3)
|
(465 |
) |
(515 | ) | (231 | ) | ||||||
Total revenue (1), (3)
|
(160 |
) |
(33 | ) | (44 | ) | ||||||
Non-interest expense (3)
|
504 |
133 | 155 | |||||||||
Income (loss) before income taxes (1)
|
(664 |
) |
(166 | ) | (199 | ) | ||||||
Income taxes (recoveries) (1)
|
(205 |
) |
(715 | ) | 932 | |||||||
Net income (loss) |
$ |
(459 |
) |
$ | 549 | $ | (1,131 | ) | ||||
| (1) | Teb adjusted. |
| (2) | Amounts for the three months ended January 31, 2023 have been revised from those previously presented. |
| (3) | Revenue for the three months ended January 31, 2024 included gains of $222 million (October 31, 2023 and January 31, 2023 – losses of $150 million and gains of $121 million, respectively) on economic hedges of our U.S. Wealth Management (including City National) share-based compensation plans, and non-interest expense included $206 million (October 31, 2023 and January 31, 2023 – $(128) million and $100 million, respectively) of share-based compensation expense driven by changes in the fair value of liabilities relating to our U.S. Wealth Management (including City National) share-based compensation plans. |
|
Quarterly results and trend analysis |
2024 |
2023 (2)
|
2022 | ||||||||||||||||||||||||||||||||||||||
(Millions of Canadian dollars, except per share and percentage amounts) |
Q1 |
Q4 | Q3 | Q2 | Q1 | Q4 | Q3 | Q2 | ||||||||||||||||||||||||||||||||
Personal & Commercial Banking |
$ |
5,794 |
$ | 5,718 | $ | 5,563 | $ | 5,298 | $ | 5,541 | $ | 5,419 | $ | 5,182 | $ | 4,739 | ||||||||||||||||||||||||
Wealth Management (3)
|
4,537 |
4,188 | 4,402 | 4,394 | 4,560 | 4,287 | 3,997 | 3,973 | ||||||||||||||||||||||||||||||||
Insurance (4)
|
363 |
248 | 336 | 272 | 154 | 644 | 1,233 | 234 | ||||||||||||||||||||||||||||||||
Capital Markets (3), (5)
|
2,951 |
2,564 | 2,679 | 2,662 | 3,146 | 2,505 | 1,889 | 2,531 | ||||||||||||||||||||||||||||||||
Corporate Support (5)
|
(160 |
) |
(33 | ) | (3 | ) | (181 | ) | (44 | ) | (288 | ) | (169 | ) | (257 | ) | ||||||||||||||||||||||||
Total revenue |
13,485 |
12,685 | 12,977 | 12,445 | 13,357 | 12,567 | 12,132 | 11,220 | ||||||||||||||||||||||||||||||||
PCL |
813 |
720 | 616 | 600 | 532 | 381 | 340 | (342 | ) | |||||||||||||||||||||||||||||||
PBCAE (6)
|
n.a. |
n.a. | n.a. | n.a. | n.a. | 116 | 850 | (180 | ) | |||||||||||||||||||||||||||||||
Non-interest expense |
8,324 |
8,059 | 7,765 | 7,400 | 7,589 | 7,209 | 6,386 | 6,434 | ||||||||||||||||||||||||||||||||
Income before income taxes |
4,348 |
3,906 | 4,596 | 4,445 | 5,236 | 4,861 | 4,556 | 5,308 | ||||||||||||||||||||||||||||||||
Income taxes |
766 |
(33 | ) | 736 | 765 | 2,103 | 979 | 979 | 1,055 | |||||||||||||||||||||||||||||||
Net income |
$ |
3,582 |
$ | 3,939 | $ | 3,860 | $ | 3,680 | $ | 3,133 | $ | 3,882 | $ | 3,577 | $ | 4,253 | ||||||||||||||||||||||||
EPS – basic |
$ |
2.50 |
$ | 2.77 | $ | 2.73 | $ | 2.60 | $ | 2.23 | $ | 2.75 | $ | 2.52 | $ | 2.97 | ||||||||||||||||||||||||
– diluted |
2.50 |
2.76 | 2.73 | 2.60 | 2.23 | 2.74 | 2.51 | 2.96 | ||||||||||||||||||||||||||||||||
Effective income tax rate |
17.6% |
(0.8)% | 16.0% | 17.2% | 40.2% | 20.1% | 21.5% | 19.9% | ||||||||||||||||||||||||||||||||
Period average US$ equivalent of C$1.00 |
$ |
0.745 |
$ | 0.732 | $ | 0.750 | $ | 0.737 | $ | 0.745 | $ | 0.739 | $ | 0.783 | $ | 0.789 | ||||||||||||||||||||||||
| (1) | Fluctuations in the Canadian dollar relative to other foreign currencies have affected our consolidated results over the period. |
| (2) | Amounts have been restated from those previously presented as part of the adoption of IFRS 17, effective November 1, 2023. Refer to Note 2 of our Condensed Financial Statements for further details on these changes. |
| (3) | Effective the fourth quarter of 2023, we moved the Investor Services lending business from our Wealth Management segment to our Capital Markets segment. Therefore, comparative results for the three months ended January 31, 2023 have been revised from those previously presented. |
| (4) | Effective November 1, 2023, we adopted IFRS 17. The quarterly trend for the Insurance segment will not be fully comparable across the periods presented as they have been prepared under a different basis of accounting. The 2023 results have been restated as part of our adoption of IFRS 17 while results for the fiscal 2022 periods are reported in accordance with IFRS 4 Insurance Contracts. |
| (5) | Teb adjusted. For further discussion, refer to the How we measure and report our business segments section of our 2023 Annual Report. |
| (6) | As part of our adoption of IFRS 17, Insurance policyholder benefits, claims and acquisition expense (PBCAE) is no longer applicable. 2023 amounts have been restated from those previously presented. |
| n.a. | not applicable |
|
Financial condition |
|
Condensed balance sheets |
| |
||||||||
(Millions of Canadian dollars) |
January 31 2024 |
October 31 2023
(1)
|
||||||
Assets |
||||||||
Cash and due from banks |
$ |
74,347 |
$ | 61,989 | ||||
Interest-bearing deposits with banks |
61,080 |
71,086 | ||||||
Securities, net of applicable allowance (2)
|
405,813 |
409,730 | ||||||
Assets purchased under reverse repurchase agreements and securities borrowed |
347,871 |
340,191 | ||||||
Loans |
||||||||
Retail |
569,894 |
569,951 | ||||||
Wholesale |
293,721 |
287,826 | ||||||
Allowance for loan losses |
(5,299 |
) |
(5,004 | ) | ||||
Other – Derivatives |
105,038 |
142,450 | ||||||
– Other |
121,940 |
128,312 | ||||||
Total assets |
$ |
1,974,405 |
$ | 2,006,531 | ||||
Liabilities |
||||||||
Deposits |
$ |
1,241,168 |
$ | 1,231,687 | ||||
Other – Derivatives |
106,974 |
142,629 | ||||||
– Other |
498,250 |
505,682 | ||||||
Subordinated debentures |
11,525 |
11,386 | ||||||
Total liabilities |
1,857,917 |
1,891,384 | ||||||
Equity attributable to shareholders |
116,391 |
115,048 | ||||||
Non-controlling interests |
97 |
99 | ||||||
Total equity |
116,488 |
115,147 | ||||||
Total liabilities and equity |
$ |
1,974,405 |
$ | 2,006,531 | ||||
| (1) | Amounts have been restated from those previously presented as part of the adoption of IFRS 17, effective November 1, 2023. Refer to Note 2 of our Condensed Financial Statements for further details on these changes. |
| (2) | Securities are comprised of trading and investment securities. |
|
Off-balance sheet arrangements |
|
Risk management |
|
Credit risk |
As at January 31, 2024 |
||||||||||||||||||||||||||||||
|
(Millions of Canadian dollars, except percentage amounts) |
Residential mortgages |
Home equity lines of credit |
||||||||||||||||||||||||||||
|
Insured |
Uninsured |
Total |
Total |
|||||||||||||||||||||||||||
Region (4)
|
||||||||||||||||||||||||||||||
Canada |
||||||||||||||||||||||||||||||
Atlantic provinces |
$ |
8,448 |
44 |
% |
$ |
10,840 |
56 |
% |
$ |
19,288 |
$ |
1,637 |
||||||||||||||||||
Quebec |
11,708 |
27 |
31,778 |
73 |
43,486 |
3,137 |
||||||||||||||||||||||||
Ontario |
30,167 |
15 |
169,410 |
85 |
199,577 |
16,744 |
||||||||||||||||||||||||
Alberta |
18,714 |
45 |
22,602 |
55 |
41,316 |
4,352 |
||||||||||||||||||||||||
Saskatchewan and Manitoba |
8,473 |
42 |
11,846 |
58 |
20,319 |
1,741 |
||||||||||||||||||||||||
B.C. and territories |
11,737 |
16 |
62,374 |
84 |
74,111 |
7,083 |
||||||||||||||||||||||||
Total Canada (5)
|
89,247 |
22 |
308,850 |
78 |
398,097 |
34,694 |
||||||||||||||||||||||||
U.S. |
– |
– |
32,374 |
100 |
32,374 |
1,986 |
||||||||||||||||||||||||
Other International |
– |
– |
3,093 |
100 |
3,093 |
1,582 |
||||||||||||||||||||||||
Total International |
– |
– |
35,467 |
100 |
35,467 |
3,568 |
||||||||||||||||||||||||
Total |
$ |
89,247 |
21 |
% |
$ |
344,317 |
79 |
% |
$ |
433,564 |
$ |
38,262 |
||||||||||||||||||
| As at October 31, 2023 | ||||||||||||||||||||||||||||||
|
(Millions of Canadian dollars, except percentage amounts) |
Residential mortgages | Home equity lines of credit (2) |
||||||||||||||||||||||||||||
| Insured (3) | Uninsured | Total | Total | |||||||||||||||||||||||||||
Region (4)
|
||||||||||||||||||||||||||||||
Canada |
||||||||||||||||||||||||||||||
Atlantic provinces |
$ | 8,474 | 44 | % | $ | 10,765 | 56 | % | $ | 19,239 | $ | 1,630 | ||||||||||||||||||
Quebec |
11,831 | 27 | 31,741 | 73 | 43,572 | 3,111 | ||||||||||||||||||||||||
Ontario |
30,359 | 15 | 168,264 | 85 | 198,623 | 16,558 | ||||||||||||||||||||||||
Alberta |
18,840 | 45 | 22,596 | 55 | 41,436 | 4,403 | ||||||||||||||||||||||||
Saskatchewan and Manitoba |
8,546 | 42 | 11,803 | 58 | 20,349 | 1,749 | ||||||||||||||||||||||||
B.C. and territories |
11,911 | 16 | 62,475 | 84 | 74,386 | 7,048 | ||||||||||||||||||||||||
Total Canada (5)
|
89,961 | 23 | 307,644 | 77 | 397,605 | 34,499 | ||||||||||||||||||||||||
U.S. |
– | – | 33,683 | 100 | 33,683 | 2,090 | ||||||||||||||||||||||||
Other International |
– | – | 3,213 | 100 | 3,213 | 1,538 | ||||||||||||||||||||||||
Total International |
– | – | 36,896 | 100 | 36,896 | 3,628 | ||||||||||||||||||||||||
Total |
$ | 89,961 | 21 | % | $ | 344,540 | 79 | % | $ | 434,501 | $ | 38,127 | ||||||||||||||||||
| (1) | Disclosure is provided in accordance with the requirements of OSFI’s Guideline B-20 (Residential Mortgage Underwriting Practices and Procedures). |
| (2) | Includes $38,242 million and $20 million of uninsured and insured home equity lines of credit, respectively (October 31, 2023 – $38,108 million and $19 million, respectively), reported within the personal loan category. The amounts in U.S. and Other International include term loans collateralized by residential properties. |
| (3) | Insured residential mortgages are mortgages whereby our exposure to default is mitigated by insurance through the Canadian Mortgage and Housing Corporation or other private mortgage default insurers. |
| (4) | Region is based upon the address of the property mortgaged. The Atlantic provinces are comprised of Newfoundland and Labrador, Prince Edward Island, Nova Scotia and New Brunswick; B.C. and territories are comprised of British Columbia, Nunavut, Northwest Territories and Yukon. |
| (5) | Total consolidated residential mortgages in Canada of $398 billion (October 31, 2023 – $398 billion) includes $12 billion (October 31, 2023 – $12 billion) of mortgages with commercial clients in Canadian Banking, of which $9 billion (October 31, 2023 – $9 billion) are insured, and $18 billion (October 31, 2023 – $18 billion) of residential mortgages in Capital Markets, of which $18 billion (October 31, 2023 – $18 billion) are held for securitization purposes. All of the residential mortgages held for securitization purposes are insured (October 31, 2023 – all insured). |
| As at | ||||||||||||||||||||||||||
|
January 31 2024 |
October 31 2023 |
|||||||||||||||||||||||||
|
Canada |
U.S. and other International |
Total |
Canada (2) | U.S. and other International |
Total | |||||||||||||||||||||
Amortization period |
||||||||||||||||||||||||||
≤ 25 years |
58 |
% |
27 |
% |
55 |
% |
57 | % | 26 | % | 55 | % | ||||||||||||||
> 25 years ≤ 30 years |
21 |
73 |
25 |
20 | 74 | 24 | ||||||||||||||||||||
> 30 years ≤ 35 years |
1 |
– |
1 |
1 | – | 1 | ||||||||||||||||||||
> 35 years |
20 |
– |
19 |
22 | – | 20 | ||||||||||||||||||||
Total |
100 |
% |
100 |
% |
100 |
% |
100 | % | 100 | % | 100 | % | ||||||||||||||
| (1) | Disclosure is provided in accordance with the requirements of OSFI’s Guideline B-20 (Residential Mortgage Underwriting Practices and Procedures). |
| (2) | Our policy is to originate mortgages with amortization periods of 30 years or less. Amortization periods greater than 30 years reflect the impact of increases in interest rates on our variable rate mortgage portfolios. For these loans, the amortization period resets to the original amortization schedule upon renewal. We do not originate mortgage products with a structure that would result in negative amortization, as payments on variable rate mortgages automatically increase to ensure accrued interest is covered. |
| For the three months ended | ||||||||||||||||||
|
January 31 2024 |
October 31 2023 |
|||||||||||||||||
Uninsured |
Uninsured | |||||||||||||||||
|
Residential mortgages |
RBC Homeline Plan products |
Residential mortgages (2) |
RBC Homeline Plan products (3) |
|||||||||||||||
Average of newly originated and acquired for the period, by region (4)
|
||||||||||||||||||
Atlantic provinces |
70 |
% |
69 |
% |
71 | % | 71 | % | ||||||||||
Quebec |
69 |
68 |
69 | 69 | ||||||||||||||
Ontario |
70 |
62 |
70 | 62 | ||||||||||||||
Alberta |
72 |
68 |
72 | 70 | ||||||||||||||
Saskatchewan and Manitoba |
71 |
71 |
72 | 72 | ||||||||||||||
B.C. and territories |
67 |
61 |
67 | 62 | ||||||||||||||
U.S. |
72 |
n.m |
. |
73 | n.m | . | ||||||||||||
Other International |
73 |
n.m |
. |
66 | n.m | . | ||||||||||||
Average of newly originated and acquired for the period (5), (6)
|
70 |
% |
64 |
% |
70 | % | 65 | % | ||||||||||
Total Canadian Banking residential mortgages portfolio (7)
|
58 |
% |
48 |
% |
55 | % | 47 | % | ||||||||||
| (1) | Disclosure is provided in accordance with the requirements of OSFI’s Guideline B-20 (Residential Mortgage Underwriting Practices and Procedures). |
| (2) | Residential mortgages exclude residential mortgages within the RBC Homeline Plan products. |
| (3) | RBC Homeline Plan products are comprised of both residential mortgages and home equity lines of credit. |
| (4) | Region is based upon the address of the property mortgaged. The Atlantic provinces are comprised of Newfoundland and Labrador, Prince Edward Island, Nova Scotia and New Brunswick; B.C. and territories are comprised of British Columbia, Nunavut, Northwest Territories and Yukon. |
| (5) | The average LTV ratios for newly originated and acquired uninsured residential mortgages and RBC Homeline Plan products are calculated on a weighted basis by mortgage amounts at origination. |
| (6) | For newly originated mortgages and RBC Homeline Plan products, LTV is calculated based on the total facility amount for the residential mortgage and RBC Homeline Plan product divided by the value of the related residential property. |
| (7) | Weighted by mortgage balances and adjusted for property values based on the Teranet-National Bank House Price Index ‡ |
| n.m. | not meaningful |
| As at | ||||||||||||||||||||||||||||||||||||||||||
|
January 31 2024 |
October 31 2023 |
|||||||||||||||||||||||||||||||||||||||||
Asset type |
Client type |
|||||||||||||||||||||||||||||||||||||||||
| (Millions of Canadian dollars) | Loans Outstanding |
Securities |
Repo-style transactions |
Derivatives |
Financials |
Sovereign |
Corporate |
Total |
Total (7) | |||||||||||||||||||||||||||||||||
Europe (excluding U.K.) |
$ |
14,918 |
$ |
24,967 |
$ |
5,661 |
$ |
3,367 |
$ |
22,001 |
$ |
11,175 |
$ |
15,737 |
$ |
48,913 |
$ | 43,766 | ||||||||||||||||||||||||
U.K. |
12,435 |
26,966 |
3,193 |
2,397 |
14,289 |
19,860 |
10,842 |
44,991 |
42,104 | |||||||||||||||||||||||||||||||||
Caribbean |
5,428 |
11,984 |
1,539 |
1,141 |
9,720 |
4,083 |
6,289 |
20,092 |
21,592 | |||||||||||||||||||||||||||||||||
Asia-Pacific |
5,279 |
38,732 |
4,432 |
1,142 |
17,508 |
28,131 |
3,946 |
49,585 |
47,774 | |||||||||||||||||||||||||||||||||
Other (4)
|
2,525 |
1,853 |
2,357 |
65 |
2,283 |
1,825 |
2,692 |
6,800 |
6,726 | |||||||||||||||||||||||||||||||||
Net International exposure (5), (6)
|
$ |
40,585 |
$ |
104,502 |
$ |
17,182 |
$ |
8,112 |
$ |
65,801 |
$ |
65,074 |
$ |
39,506 |
$ |
170,381 |
$ | 161,962 | ||||||||||||||||||||||||
| (1) | Geographic profile is based on country of risk, which reflects our assessment of the geographic risk associated with a given exposure. Typically, this is the residence of the borrower. |
| (2) | Exposures are calculated on a fair value basis and net of collateral, which includes $383 billion against repo-style transactions (October 31, 2023 – $374 billion) and $15 billion against derivatives (October 31, 2023 – $17 billion). |
| (3) | Securities include $14 billion of trading securities (October 31, 2023 – $13 billion), $50 billion of deposits (October 31, 2023 – $44 billion), and $41 billion of investment securities (October 31, 2023 – $38 billion). |
| (4) | Includes exposures in the Middle East, Africa and Latin America. |
| (5) | Excludes $5,789 million (October 31, 2023 – $5,686 million) of exposures to supranational agencies. |
| (6) | Reflects $2,211 million of mitigation through credit default swaps, which are largely used to hedge single name exposures and market risk (October 31, 2023 – $2,533 million). |
| (7) | Amounts have been revised from those previously presented. Collateral amounts are now reflected net of haircuts, consistent with OSFI’s CAR guidelines. |
| As at and for the three months ended | ||||||||
(Millions of Canadian dollars, except percentage amounts) |
January 31 2024 |
October 31 2023 |
||||||
Personal & Commercial Banking |
$ |
2,402 |
$ | 1,905 | ||||
Wealth Management |
554 |
514 | ||||||
Capital Markets |
1,242 |
1,285 | ||||||
Total GIL |
$ |
4,198 |
$ | 3,704 | ||||
Impaired loans, beginning balance |
$ |
3,704 |
$ | 3,284 | ||||
Classified as impaired during the period (new impaired) (1)
|
1,494 |
1,063 | ||||||
Net repayments (1)
|
(165 |
) |
(166 | ) | ||||
Amounts written off |
(610 |
) |
(466 | ) | ||||
Other (2)
|
(225 |
) |
(11 | ) | ||||
Impaired loans, balance at end of period |
$ |
4,198 |
$ | 3,704 | ||||
GIL as a % of related loans and acceptances |
||||||||
Total GIL as a % of related loans and acceptances |
0.48% |
0.42% | ||||||
Personal & Commercial Banking |
0.39% |
0.31% | ||||||
Canadian Banking |
0.35% |
0.26% | ||||||
Caribbean Banking |
3.29% |
3.45% | ||||||
Wealth Management |
0.50% |
0.44% | ||||||
Capital Markets |
0.85% |
0.89% | ||||||
| (1) | Certain GIL movements for Canadian Banking retail and wholesale portfolios are generally allocated to new impaired, as Net repayments and certain Other movements are not reasonably determinable. Certain GIL movements for Caribbean Banking retail and wholesale portfolios are generally allocated to Net repayments and new impaired, as Net repayments and certain Other movements are not reasonably determinable. |
| (2) | Includes return to performing status during the period, recoveries of loans and advances previously written off, sold, and foreign exchange translation and other movements. |
| As at | ||||||||
(Millions of Canadian dollars) |
January 31 2024 |
October 31 2023 |
||||||
Personal & Commercial Banking |
$ |
3,980 |
$ | 3,718 | ||||
Wealth Management |
548 |
618 | ||||||
Capital Markets |
1,101 |
1,012 | ||||||
Corporate Support and other |
1 |
– | ||||||
ACL on loans |
5,630 |
5,348 | ||||||
ACL on other financial assets (1)
|
20 |
18 | ||||||
Total ACL |
$ |
5,650 |
$ | 5,366 | ||||
ACL on loans is comprised of: |
||||||||
Retail |
$ |
2,725 |
$ | 2,591 | ||||
Wholesale |
1,605 |
1,609 | ||||||
ACL on performing loans |
$ |
4,330 |
$ | 4,200 | ||||
ACL on impaired loans |
1,300 |
1,148 | ||||||
| (1) | ACL on other financial assets mainly represents allowances on debt securities measured at FVOCI and amortized cost, accounts receivable and financial guarantees. |
|
Market risk |
January 31, 2024 |
October 31, 2023 | January 31, 2023 (1) | ||||||||||||||||||||||||||||||||||
For the three months ended |
For the three months ended |
For the three months ended |
||||||||||||||||||||||||||||||||||
| (Millions of Canadian dollars) | As at |
Average |
High |
Low |
As at | Average | As at | Average | ||||||||||||||||||||||||||||
Equity |
$ |
10 |
$ |
9 |
$ |
13 |
$ |
6 |
$ | 10 | $ | 8 | $ | 11 | $ | 15 | ||||||||||||||||||||
Foreign exchange |
3 |
4 |
7 |
2 |
4 | 5 | 3 | 3 | ||||||||||||||||||||||||||||
Commodities |
5 |
5 |
7 |
4 |
5 | 5 | 5 | 6 | ||||||||||||||||||||||||||||
Interest rate (2)
|
30 |
34 |
44 |
26 |
38 | 37 | 23 | 31 | ||||||||||||||||||||||||||||
Credit specific (3)
|
8 |
7 |
8 |
7 |
7 | 6 | 5 | 5 | ||||||||||||||||||||||||||||
Diversification (4)
|
(31 |
) |
(29 |
) |
n.m. |
n.m. |
(35 | ) | (33 | ) | (27 | ) | (34 | ) | ||||||||||||||||||||||
Trading VaR |
$ |
25 |
$ |
30 |
$ |
40 |
$ |
23 |
$ | 29 | $ | 28 | $ | 20 | $ | 26 | ||||||||||||||||||||
Total VaR |
$ |
123 |
$ |
122 |
$ |
138 |
$ |
109 |
$ | 121 | $ | 68 | $ | 42 | $ | 55 | ||||||||||||||||||||
| (1) | Amounts have been revised from those previously presented to align with a trading VaR view. |
| (2) | General credit spread risk and funding spread risk associated with uncollateralized derivatives are included under interest rate VaR. |
| (3) | Credit specific risk captures issuer-specific credit spread volatility. |
| (4) | Trading VaR is less than the sum of the individual risk factor VaR results due to risk factor diversification. |
| n.m. | not meaningful |

| (1) | Trading revenue (teb) in the chart above excludes the impact of loan underwriting commitments. |
| (2) | In Q4 2023, VaR amounts in the chart above were revised from those previously presented to reflect Trading VaR corresponding to our trading portfolios. |
|
January 31 2024 |
October 31 2023 |
January 31 2023 |
||||||||||||||||||||||||||||||||||||||||||||
|
EVE risk |
NII risk |
|||||||||||||||||||||||||||||||||||||||||||||
| (Millions of Canadian dollars) | Canadian dollar impact |
U.S. dollar impact |
Total |
Canadian dollar impact |
U.S. dollar impact |
Total |
EVE risk | NII risk (1) | EVE risk | NII risk (1) | ||||||||||||||||||||||||||||||||||||
Before-tax impact of: |
||||||||||||||||||||||||||||||||||||||||||||||
100 bps increase in rates |
$ |
(1,619 |
) |
$ |
(30 |
) |
$ |
(1,649 |
) |
$ |
296 |
$ |
239 |
$ |
535 |
$ | (1,552 | ) | $ | 651 | $ | (2,069 | ) | $ | 663 | |||||||||||||||||||||
100 bps decrease in rates |
1,574 |
(265 |
) |
1,309 |
(331 |
) |
(291 |
) |
(622 |
) |
1,353 | (751 | ) | 1,808 | (776 | ) | ||||||||||||||||||||||||||||||
| (1) | Represents the 12-month NII exposure to an instantaneous and sustained shift in interest rates. |
| 1 | Amounts have been restated from those previously presented as part of the adoption of IFRS 17, effective November 1, 2023. Refer to Note 2 of our Condensed Financial Statements for further details on these changes. |
As at January 31, 2024 |
||||||||||||||
Market risk measure |
||||||||||||||
| (Millions of Canadian dollars) | Balance sheet amount |
Traded risk |
Non-traded risk |
Non-traded riskprimary risk sensitivity |
||||||||||
Assets subject to market risk |
||||||||||||||
Cash and due from banks |
$ |
74,347 |
$ |
– |
$ |
74,347 |
Interest rate |
|||||||
Interest-bearing deposits with banks |
61,080 |
1 |
61,079 |
Interest rate |
||||||||||
Securities |
||||||||||||||
Trading |
193,597 |
171,135 |
22,462 |
Interest rate, credit spread |
||||||||||
Investment, net of applicable allowance |
212,216 |
– |
212,216 |
Interest rate, credit spread, equity |
||||||||||
Assets purchased under reverse repurchase agreements and securities borrowed |
347,871 |
312,834 |
35,037 |
Interest rate |
||||||||||
Loans |
||||||||||||||
Retail |
569,894 |
2 |
569,892 |
Interest rate |
||||||||||
Wholesale |
293,721 |
7,144 |
286,577 |
Interest rate |
||||||||||
Allowance for loan losses |
(5,299 |
) |
– |
(5,299 |
) |
Interest rate |
||||||||
Other |
||||||||||||||
Derivatives |
105,038 |
101,688 |
3,350 |
Interest rate, foreign exchange |
||||||||||
Other assets |
106,130 |
9,017 |
97,113 |
Interest rate |
||||||||||
Assets not subject to market risk (3)
|
15,810 |
|||||||||||||
Total assets |
$ |
1,974,405 |
$ |
601,821 |
$ |
1,356,774 |
||||||||
Liabilities subject to market risk |
||||||||||||||
Deposits |
$ |
1,241,168 |
$ |
56,202 |
$ |
1,184,966 |
Interest rate |
|||||||
Other |
||||||||||||||
Obligations related to securities sold short |
35,012 |
35,007 |
5 |
Interest rate, equity |
||||||||||
Obligations related to assets sold under repurchase agreements and securities loaned |
334,490 |
313,197 |
21,293 |
Interest rate |
||||||||||
Derivatives |
106,974 |
98,998 |
7,976 |
Interest rate, foreign exchange |
||||||||||
Other liabilities |
107,065 |
13,166 |
93,899 |
Interest rate |
||||||||||
Subordinated debentures |
11,525 |
– |
11,525 |
Interest rate |
||||||||||
Liabilities not subject to market risk (4)
|
21,683 |
|||||||||||||
Total liabilities |
$ |
1,857,917 |
$ |
516,570 |
$ |
1,319,664 |
||||||||
Total equity |
116,488 |
|||||||||||||
Total liabilities and equity |
$ |
1,974,405 |
||||||||||||
| (1) | Traded risk includes positions that are classified or designated as FVTPL and positions whose revaluation gains and losses are reported in revenue within our trading portfolios. Market risk measures of VaR and stress tests are used as risk controls for traded risk. |
| (2) |
Non-traded risk includes positions used in the management of IRRBB and other non-trading portfolios. Other material non-trading portfolios include positions from RBC Insurance and investment securities, net of applicable allowance, not included in IRRBB. |
| (3) | Assets not subject to market risk include physical and other assets. |
| (4) | Liabilities not subject to market risk include payroll related and other liabilities. |
| As at October 31, 2023 (1) | ||||||||||||||
| Market risk measure | ||||||||||||||
| (Millions of Canadian dollars) | Balance sheet amount |
Traded risk (2) |
Non-traded
risk (3) |
Non-traded riskprimary risk sensitivity |
||||||||||
Assets subject to market risk |
||||||||||||||
Cash and due from banks |
$ | 61,989 | $ | – | $ | 61,989 | Interest rate | |||||||
Interest-bearing deposits with banks |
71,086 | 1 | 71,085 | Interest rate | ||||||||||
Securities |
||||||||||||||
Trading |
190,151 | 171,483 | 18,668 | Interest rate, credit spread | ||||||||||
Investment, net of applicable allowance |
219,579 | – | 219,579 | Interest rate, credit spread, equity | ||||||||||
Assets purchased under reverse repurchase agreements and securities borrowed |
340,191 | 304,672 | 35,519 | Interest rate | ||||||||||
Loans |
||||||||||||||
Retail |
569,951 | – | 569,951 | Interest rate | ||||||||||
Wholesale |
287,826 | 3,134 | 284,692 | Interest rate | ||||||||||
Allowance for loan losses |
(5,004 | ) | – | (5,004 | ) | Interest rate | ||||||||
Other |
||||||||||||||
Derivatives |
142,450 | 139,011 | 3,439 | Interest rate, foreign exchange | ||||||||||
Other assets |
112,477 | 8,699 | 103,778 | Interest rate | ||||||||||
Assets not subject to market risk (4)
|
15,835 | |||||||||||||
Total assets |
$ | 2,006,531 | $ | 627,000 | $ | 1,363,696 | ||||||||
Liabilities subject to market risk |
||||||||||||||
Deposits |
$ | 1,231,687 | $ | 51,025 | $ | 1,180,662 | Interest rate | |||||||
Other |
||||||||||||||
Obligations related to securities sold short |
33,651 | 33,555 | 96 | Interest rate, equity | ||||||||||
Obligations related to assets sold under repurchase agreements and securities loaned |
335,238 | 312,551 | 22,687 | Interest rate | ||||||||||
Derivatives |
142,629 | 130,094 | 12,535 | Interest rate, foreign exchange | ||||||||||
Other liabilities |
116,445 | 12,491 | 103,954 | Interest rate | ||||||||||
Subordinated debentures |
11,386 | – | 11,386 | Interest rate | ||||||||||
Liabilities not subject to market risk (5)
|
20,348 | |||||||||||||
Total liabilities |
$ | 1,891,384 | $ | 539,716 | $ | 1,331,320 | ||||||||
Total equity |
115,147 | |||||||||||||
Total liabilities and equity |
$ | 2,006,531 | ||||||||||||
| (1) | Amounts have been restated from those previously presented as part of the adoption of IFRS 17, effective November 1, 2023. Refer to Note 2 of our Condensed Financial Statements for further details on these changes. |
| (2) | Traded risk includes positions that are classified or designated as FVTPL and positions whose revaluation gains and losses are reported in revenue within our trading portfolios. Market risk measures of VaR and stress tests are used as risk controls for traded risk. |
| (3) |
Non-traded risk includes positions used in the management of IRRBB and other non-trading portfolios. Other material non-trading portfolios include positions from RBC Insurance and investment securities, net of applicable allowance, not included in IRRBB. |
| (4) | Assets not subject to market risk include physical and other assets. |
| (5) | Liabilities not subject to market risk include payroll related and other liabilities. |
|
Liquidity and funding risk |
As at January 31, 2024 |
||||||||||||||||||||||||
| (Millions of Canadian dollars) | Bank-owned liquid assets |
Securities received as collateral from securities financing and derivative transactions |
Total liquid assets |
Encumbered liquid assets |
Unencumbered liquid assets |
|||||||||||||||||||
Cash and deposits with banks (1)
|
$ |
137,887 |
$ |
– |
$ |
137,887 |
$ |
3,075 |
$ |
134,812 |
||||||||||||||
Securities issued or guaranteed by sovereigns, central banks or multilateral development banks (2)
|
320,261 |
373,167 |
693,428 |
438,250 |
255,178 |
|||||||||||||||||||
Other securities |
138,801 |
126,761 |
265,562 |
157,158 |
108,404 |
|||||||||||||||||||
Other liquid assets (3)
|
27,886 |
– |
27,886 |
24,768 |
3,118 |
|||||||||||||||||||
Total liquid assets |
$ |
624,835 |
$ |
499,928 |
$ |
1,124,763 |
$ |
623,251 |
$ |
501,512 |
||||||||||||||
As at October 31, 2023 |
||||||||||||||||||||||||
| (Millions of Canadian dollars) |
Bank-owned
liquid assets |
Securities received as collateral from securities financing and derivative transactions |
Total liquid assets |
Encumbered liquid assets |
Unencumbered liquid assets |
|||||||||||||||||||
Cash and deposits with banks (1)
|
$ | 135,353 | $ | – | $ | 135,353 | $ | 3,329 | $ | 132,024 | ||||||||||||||
Securities issued or guaranteed by sovereigns, central banks or multilateral development banks (2)
|
325,002 | 363,377 | 688,379 | 425,109 | 263,270 | |||||||||||||||||||
Other securities |
130,209 | 118,651 | 248,860 | 153,700 | 95,160 | |||||||||||||||||||
Other liquid assets (3)
|
31,706 | – | 31,706 | 28,953 | 2,753 | |||||||||||||||||||
Total liquid assets |
$ | 622,270 | $ | 482,028 | $ | 1,104,298 | $ | 611,091 | $ | 493,207 | ||||||||||||||
| As at | ||||||||||||||||||||||||
(Millions of Canadian dollars) |
January 31 2024 |
October 31 2023 |
||||||||||||||||||||||
Royal Bank of Canada |
$ |
215,036 |
$ | 210,191 | ||||||||||||||||||||
Foreign branches |
76,053 |
79,947 | ||||||||||||||||||||||
Subsidiaries |
210,423 |
203,069 | ||||||||||||||||||||||
Total unencumbered liquid assets |
$ |
501,512 |
$ | 493,207 | ||||||||||||||||||||
| (1) | Includes balances that are classified as held for sale and presented in Other assets. For further details, refer to Note 6 of our Condensed Financial Statements. |
| (2) | Includes liquid securities issued by provincial governments and U.S. government-sponsored entities working under U.S. Federal government’s conservatorship (e.g., Federal National Mortgage Association and Federal Home Loan Mortgage Corporation). |
| (3) | Encumbered liquid assets amount represents cash collateral and margin deposit amounts pledged related to over-the-counter |
| As at | ||||||||||||||||||||||||||||||||||||||||||||||||
|
January 31 2024 |
October 31 2023 |
|||||||||||||||||||||||||||||||||||||||||||||||
Encumbered |
Unencumbered |
Encumbered | Unencumbered | |||||||||||||||||||||||||||||||||||||||||||||
| (Millions of Canadian dollars) |
Pledged as collateral |
Other |
Available as collateral |
Other |
Total |
Pledged as collateral |
Other (1) | Available as collateral (2) |
Other (3) | Total | ||||||||||||||||||||||||||||||||||||||
Cash and deposits with banks (4)
|
$ |
– |
$ |
3,075 |
$ |
134,812 |
$ |
– |
$ |
137,887 |
$ | – | $ | 3,329 | $ | 132,024 | $ | – | $ | 135,353 | ||||||||||||||||||||||||||||
Securities |
||||||||||||||||||||||||||||||||||||||||||||||||
Trading |
94,705 |
– |
108,905 |
2,302 |
205,912 |
99,990 | – | 100,517 | 2,252 | 202,759 | ||||||||||||||||||||||||||||||||||||||
Investment, net of applicable allowance |
7,850 |
– |
204,366 |
– |
212,216 |
7,752 | – | 211,827 | – | 219,579 | ||||||||||||||||||||||||||||||||||||||
Assets purchased under reverse repurchase agreements and securities borrowed (5)
|
512,994 |
27,480 |
10,936 |
1,986 |
553,396 |
495,233 | 27,343 | 6,876 | 1,862 | 531,314 | ||||||||||||||||||||||||||||||||||||||
Loans |
||||||||||||||||||||||||||||||||||||||||||||||||
Retail |
||||||||||||||||||||||||||||||||||||||||||||||||
Mortgage securities |
26,090 |
– |
28,879 |
– |
54,969 |
26,365 | – | 28,079 | – | 54,444 | ||||||||||||||||||||||||||||||||||||||
Mortgage loans |
72,716 |
– |
34,489 |
271,390 |
378,595 |
69,802 | – | 37,313 | 272,942 | 380,057 | ||||||||||||||||||||||||||||||||||||||
Non-mortgage loans |
5,997 |
– |
– |
130,333 |
136,330 |
6,775 | – | – | 128,675 | 135,450 | ||||||||||||||||||||||||||||||||||||||
Wholesale |
– |
– |
24,279 |
269,716 |
293,995 |
– | – | 10,056 | 278,052 | 288,108 | ||||||||||||||||||||||||||||||||||||||
Allowance for loan losses |
– |
– |
– |
(5,299 |
) |
(5,299 |
) |
– | – | – | (5,004 | ) | (5,004 | ) | ||||||||||||||||||||||||||||||||||
Segregated fund net assets |
– |
– |
– |
– |
– |
– | – | – | 2,760 | 2,760 | ||||||||||||||||||||||||||||||||||||||
Other |
||||||||||||||||||||||||||||||||||||||||||||||||
Derivatives |
– |
– |
– |
105,038 |
105,038 |
– | – | – | 142,450 | 142,450 | ||||||||||||||||||||||||||||||||||||||
Others (6)
|
24,768 |
– |
3,118 |
91,320 |
119,206 |
28,953 | – | 2,753 | 89,747 | 121,453 | ||||||||||||||||||||||||||||||||||||||
Total assets |
$ |
745,120 |
$ |
30,555 |
$ |
549,784 |
$ |
866,786 |
$ |
2,192,245 |
$ | 734,870 | $ | 30,672 | $ | 529,445 | $ | 913,736 | $ | 2,208,723 | ||||||||||||||||||||||||||||
| (1) | Includes assets restricted from use to generate secured funding due to legal or other constraints. |
| (2) | Represents assets that are immediately available for use as collateral, including National Housing Act Mortgage-Backed Securities (NHA MBS), our unencumbered mortgage loans that qualify as eligible collateral at FHLB, as well as loans that qualify as eligible collateral for discount window facility available to us and lodged at the FRBNY. |
| (3) | Other unencumbered assets are not subject to any restrictions on their use to secure funding or as collateral but would not be considered immediately available. |
| (4) | Includes balances that are classified as held for sale and presented in Other assets. For further details, refer to Note 6 of our Condensed Financial Statements. |
| (5) | Includes bank-owned liquid assets and securities received as collateral from off-balance sheet securities financing, derivative transactions, and margin lending. Includes $27 billion (October 31, 2023 – $27 billion) of collateral received through reverse repurchase transactions that cannot be rehypothecated in its current legal form. |
| (6) | The Pledged as collateral amount represents cash collateral and margin deposit amounts pledged related to OTC and exchange-traded derivative transactions. |
|
Programs by geography |
Canada |
U.S. |
Europe/Asia |
||
• Canadian Shelf Program – $25 billion |
• U.S. Shelf Program – US$75 billion |
• European Debt Issuance Program – US$75 billion |
||
• Global Covered Bond Program – € 75 billion |
||||
• Japanese Issuance Programs – ¥1 trillion |
||||
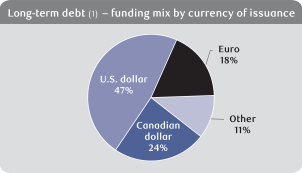
|
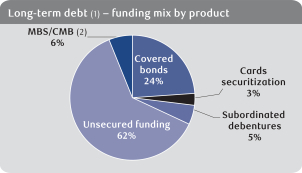
|
|
(1) Includes unsecured and secured long-term funding and subordinated debentures with an original term to maturity greater than 1 year |
(1) Includes unsecured and secured long-term funding and subordinated debentures with an original term to maturity greater than 1 year |
|
(2) Mortgage-backed securities and Canada Mortgage Bonds |
As at January 31, 2024 |
||||||||||||||||||||||||||||||||
| (Millions of Canadian dollars) |
Less than 1 month |
1 to 3 months |
3 to 6 months |
6 to 12 months |
Less than 1 year sub-total
|
1 year to 2 years |
2 years and greater |
Total |
||||||||||||||||||||||||
Deposits from banks (2)
|
$ |
6,568 |
$ |
136 |
$ |
344 |
$ |
20 |
$ |
7,068 |
$ |
– |
$ |
– |
$ |
7,068 |
||||||||||||||||
Certificates of deposit and commercial paper (3), (4)
|
7,850 |
12,466 |
26,019 |
22,190 |
68,525 |
– |
– |
68,525 |
||||||||||||||||||||||||
Asset-backed commercial paper (5)
|
4,466 |
5,417 |
6,025 |
1,666 |
17,574 |
– |
– |
17,574 |
||||||||||||||||||||||||
Senior unsecured medium-term notes (4), (6)
|
43 |
691 |
13,797 |
16,683 |
31,214 |
17,205 |
56,171 |
104,590 |
||||||||||||||||||||||||
Senior unsecured structured notes (7)
|
1,483 |
1,362 |
1,980 |
3,205 |
8,030 |
5,726 |
16,270 |
30,026 |
||||||||||||||||||||||||
Mortgage securitization |
– |
362 |
1,065 |
841 |
2,268 |
2,243 |
10,297 |
14,808 |
||||||||||||||||||||||||
Covered bonds/asset-backed securities (8)
|
– |
– |
– |
3,831 |
3,831 |
11,780 |
45,799 |
61,410 |
||||||||||||||||||||||||
Subordinated liabilities |
– |
– |
1,500 |
1,500 |
3,000 |
3,266 |
5,700 |
11,966 |
||||||||||||||||||||||||
Other (4), (9)
|
6,637 |
2,223 |
1,728 |
1,612 |
12,200 |
15,658 |
133 |
27,991 |
||||||||||||||||||||||||
Total |
$ |
27,047 |
$ |
22,657 |
$ |
52,458 |
$ |
51,548 |
$ |
153,710 |
$ |
55,878 |
$ |
134,370 |
$ |
343,958 |
||||||||||||||||
Of which: |
||||||||||||||||||||||||||||||||
– Secured |
$ |
10,998 |
$ |
7,811 |
$ |
8,553 |
$ |
6,338 |
$ |
33,700 |
$ |
14,023 |
$ |
56,096 |
$ |
103,819 |
||||||||||||||||
– Unsecured |
16,049 |
14,846 |
43,905 |
45,210 |
120,010 |
41,855 |
78,274 |
240,139 |
||||||||||||||||||||||||
| As at October 31, 2023 | ||||||||||||||||||||||||||||||||
| (Millions of Canadian dollars) | Less than 1 month |
1 to 3 months |
3 to 6 months |
6 to 12 months |
Less than 1 year sub-total
|
1 year to 2 years |
2 years and greater |
Total | ||||||||||||||||||||||||
Deposits from banks (2)
|
$ | 4,606 | $ | 460 | $ | 319 | $ | 355 | $ | 5,740 | $ | – | $ | – | $ | 5,740 | ||||||||||||||||
Certificates of deposit and commercial paper (3), (4)
|
11,558 | 8,231 | 12,575 | 28,202 | 60,566 | 69 | – | 60,635 | ||||||||||||||||||||||||
Asset-backed commercial paper (5)
|
4,533 | 3,829 | 6,354 | 2,155 | 16,871 | – | – | 16,871 | ||||||||||||||||||||||||
Senior unsecured medium-term notes (4), (6)
|
1,118 | 6,311 | 733 | 18,828 | 26,990 | 22,790 | 54,070 | 103,850 | ||||||||||||||||||||||||
Senior unsecured structured notes (7)
|
1,343 | 1,898 | 2,081 | 3,343 | 8,665 | 5,495 | 15,744 | 29,904 | ||||||||||||||||||||||||
Mortgage securitization |
– | 530 | 375 | 1,484 | 2,389 | 2,225 | 9,607 | 14,221 | ||||||||||||||||||||||||
Covered bonds/asset-backed securities (8)
|
– | 3,236 | – | 1,685 | 4,921 | 10,844 | 44,733 | 60,498 | ||||||||||||||||||||||||
Subordinated liabilities |
– | – | – | 1,500 | 1,500 | 2,748 | 7,791 | 12,039 | ||||||||||||||||||||||||
Other (4), (9)
|
6,415 | 3,887 | 976 | 1,289 | 12,567 | 14,058 | 90 | 26,715 | ||||||||||||||||||||||||
Total |
$ | 29,573 | $ | 28,382 | $ | 23,413 | $ | 58,841 | $ | 140,209 | $ | 58,229 | $ | 132,035 | $ | 330,473 | ||||||||||||||||
Of which: |
||||||||||||||||||||||||||||||||
– Secured |
$ | 10,861 | $ | 10,124 | $ | 7,483 | $ | 5,324 | $ | 33,792 | $ | 13,069 | $ | 54,340 | $ | 101,201 | ||||||||||||||||
– Unsecured |
18,712 | 18,258 | 15,930 | 53,517 | 106,417 | 45,160 | 77,695 | 229,272 | ||||||||||||||||||||||||
| (1) | Excludes bankers’ acceptances and repos. |
| (2) | Excludes deposits associated with services we provide to banks (e.g., custody, cash management). |
| (3) | Includes bearer deposit notes (unsecured). |
| (4) | We have changed our presentation to include bearer deposit notes (unsecured) within Certificates of deposit and commercial paper and to include floating rate notes (unsecured) within Senior unsecured medium-term notes to better align with how we view our composition of wholesale funding. These amounts were previously included in Other. Prior period amounts have been revised from those previously presented to conform to the presentation adopted in the current period. |
| (5) | Only includes consolidated liabilities, including our collateralized commercial paper program. |
| (6) | Includes deposit notes and floating rate notes (unsecured). |
| (7) | Includes notes where the payout is tied to movements in foreign exchange, commodities and equities. |
| (8) | Includes covered bonds collateralized with residential mortgages and securities backed by credit card receivables. |
| (9) | Includes tender option bonds (secured) of $4,987 million (October 31, 2023 – $5,104 million), other long-term structured deposits (unsecured) of $17,774 million (October 31, 2023 – $16,896 million), FHLB advances (secured) of $5,040 million (October 31, 2023 – $4,507 million) and wholesale guaranteed interest certificates of $190 million (October 31, 2023 – $208 million). |
As at February 27, 2024 |
||||||||||||||||
Short-term
debt |
Legacy senior long-term debt
|
Senior long- term debt |
Outlook |
|||||||||||||
Moody’s (4)
|
P-1 |
Aa1 |
A1 |
stable |
||||||||||||
Standard & Poor’s (5)
|
A-1+ |
AA- |
A |
stable |
||||||||||||
Fitch Ratings (6)
|
F1+ |
AA |
AA- |
stable |
||||||||||||
DBRS (7)
|
R-1 (high) |
AA (high) |
AA |
stable |
||||||||||||
| (1) | Credit ratings are not recommendations to purchase, sell or hold a financial obligation in as much as they do not comment on market price or suitability for a particular investor. Ratings are determined by the rating agencies based on criteria established from time to time by them and are subject to revision or withdrawal at any time by the rating organization. |
| (2) | Includes senior long-term debt issued prior to September 23, 2018 and senior long-term debt issued on or after September 23, 2018 which is excluded from the Bail-in regime. |
| (3) | Includes senior long-term debt issued on or after September 23, 2018 which is subject to conversion under the Bail-in regime. |
| (4) | On November 6, 2023, Moody’s ‡ |
| (5) | On May 25, 2023, Standard & Poor’s ‡ |
| (6) | On June 20, 2023, Fitch Ratings ‡ |
| (7) | On May 12, 2023, DBRS ‡ |
| As at | ||||||||||||||||||||||||||
|
January 31 2024 |
October 31 2023 |
|||||||||||||||||||||||||
| (Millions of Canadian dollars) | One-notch
downgrade |
Two-notch
downgrade |
Three-notch
downgrade |
One-notch
downgrade |
Two-notch
downgrade |
Three-notch
downgrade |
||||||||||||||||||||
Contractual derivatives funding or margin requirements |
$ |
327 |
$ |
90 |
$ |
186 |
$ | 217 | $ | 138 | $ | 199 | ||||||||||||||
Other contractual funding or margin requirements (1)
|
45 |
55 |
50 |
41 | 57 | 42 | ||||||||||||||||||||
| (1) | Includes Guaranteed Investment Certificates (GICs) issued by our municipal markets business out of New York. |
| For the three months ended | ||||||||
|
January 31 2024 |
||||||||
| (Millions of Canadian dollars, except percentage amounts) | Total unweighted value (average) |
Total weighted value (average) |
||||||
High-quality liquid assets |
||||||||
Total high-quality liquid assets (HQLA) |
$ |
392,630 |
||||||
Cash outflows |
||||||||
Retail deposits and deposits from small business customers, of which: |
$ |
363,040 |
$ |
35,566 |
||||
Stable deposits (3)
|
120,813 |
3,624 |
||||||
Less stable deposits |
242,227 |
31,942 |
||||||
Unsecured wholesale funding, of which: |
409,784 |
200,846 |
||||||
Operational deposits (all counterparties) and deposits in networks of cooperative banks (4)
|
150,386 |
35,636 |
||||||
Non-operational deposits |
227,840 |
133,652 |
||||||
Unsecured debt |
31,558 |
31,558 |
||||||
Secured wholesale funding |
40,385 |
|||||||
Additional requirements, of which: |
353,698 |
81,253 |
||||||
Outflows related to derivative exposures and other collateral requirements |
66,777 |
20,393 |
||||||
Outflows related to loss of funding on debt products |
10,616 |
10,616 |
||||||
Credit and liquidity facilities |
276,305 |
50,244 |
||||||
Other contractual funding obligations (5)
|
29,759 |
29,759 |
||||||
Other contingent funding obligations (6)
|
767,922 |
12,630 |
||||||
Total cash outflows |
$ |
400,439 |
||||||
Cash inflows |
||||||||
Secured lending (e.g., reverse repos) |
$ |
332,652 |
$ |
53,217 |
||||
Inflows from fully performing exposures |
16,526 |
10,106 |
||||||
Other cash inflows |
38,732 |
38,732 |
||||||
Total cash inflows |
$ |
102,055 |
||||||
Total adjusted value |
||||||||
Total HQLA |
$ |
392,630 |
||||||
Total net cash outflows |
298,384 |
|||||||
Liquidity coverage ratio |
132% |
|||||||
|
October 31 2023 |
||||||||
| (Millions of Canadian dollars, except percentage amounts) | Total adjusted value |
|||||||
Total HQLA |
$ | 384,290 | ||||||
Total net cash outflows |
293,328 | |||||||
Liquidity coverage ratio |
131% | |||||||
| (1) | The LCR is calculated in accordance with OSFI’s LAR guideline, which, in turn, reflects liquidity-related requirements issued by the BCBS. The LCR for the quarter ended January 31, 2024 is calculated as an average of 62 daily positions. |
| (2) | With the exception of other contingent funding obligations, unweighted inflow and outflow amounts are items maturing or callable in 30 days or less. Other contingent funding obligations also include debt securities with remaining maturity greater than 30 days. |
| (3) | As defined by the BCBS, stable deposits from retail and small business customers are deposits that are insured and are either held in transactional accounts or the bank has an established relationship with the client making the withdrawal unlikely. |
| (4) | Operational deposits from customers other than retail and small and medium-sized enterprises, are deposits which clients need to keep with the bank in order to facilitate their access and ability to use payment and settlement systems primarily for clearing, custody and cash management activities. |
| (5) | Other contractual funding obligations primarily include outflows from unsettled securities trades and outflows from obligations related to securities sold short. |
| (6) | Other contingent funding obligations include outflows related to other off-balance sheet facilities that carry low LCR runoff factors (0% – 5%). |
As at January 31, 2024 |
||||||||||||||||||||
|
Unweighted value by residual maturity |
||||||||||||||||||||
| (Millions of Canadian dollars, except percentage amounts) | No maturity |
< 6 months |
6 months to < 1 year |
≥
1 year |
Weighted value |
|||||||||||||||
Available Stable Funding (ASF) Item |
||||||||||||||||||||
Capital: |
$ |
118,158 |
$ |
– |
$ |
– |
$ |
10,725 |
$ |
128,883 |
||||||||||
Regulatory Capital |
118,158 |
– |
– |
10,725 |
128,883 |
|||||||||||||||
Other Capital Instruments |
– |
– |
– |
– |
– |
|||||||||||||||
Retail deposits and deposits from small business customers: |
304,380 |
109,114 |
47,799 |
61,878 |
477,615 |
|||||||||||||||
Stable deposits (3)
|
94,154 |
47,886 |
23,966 |
29,546 |
187,252 |
|||||||||||||||
Less stable deposits |
210,226 |
61,228 |
23,833 |
32,332 |
290,363 |
|||||||||||||||
Wholesale funding: |
277,649 |
509,942 |
55,897 |
153,115 |
352,374 |
|||||||||||||||
Operational deposits (4)
|
157,806 |
– |
– |
– |
78,903 |
|||||||||||||||
Other wholesale funding |
119,843 |
509,942 |
55,897 |
153,115 |
273,471 |
|||||||||||||||
Liabilities with matching interdependent assets (5)
|
95 |
2,858 |
1,686 |
21,100 |
– |
|||||||||||||||
Other liabilities: |
46,771 |
261,818 |
15,953 |
|||||||||||||||||
NSFR derivative liabilities |
28,712 |
|||||||||||||||||||
All other liabilities and equity not included in the above categories |
46,771 |
216,345 |
1,616 |
15,145 |
15,953 |
|||||||||||||||
Total ASF |
$ |
974,825 |
||||||||||||||||||
Required Stable Funding (RSF) Item |
||||||||||||||||||||
Total NSFR high-quality liquid assets (HQLA) |
$ |
44,946 |
||||||||||||||||||
Deposits held at other financial institutions for operational purposes |
– |
1,781 |
– |
– |
891 |
|||||||||||||||
Performing loans and securities: |
218,925 |
328,794 |
121,820 |
510,882 |
703,457 |
|||||||||||||||
Performing loans to financial institutions secured by Level 1 HQLA |
– |
114,445 |
14,433 |
287 |
13,401 |
|||||||||||||||
Performing loans to financial institutions secured by non-Level 1 HQLA and unsecured performing loans to financial institutions |
4,553 |
114,187 |
29,661 |
25,298 |
56,785 |
|||||||||||||||
Performing loans to non-financial corporate clients, loans to retail and small business customers, and loans to sovereigns, central banks and PSEs, of which: |
138,789 |
66,198 |
34,772 |
162,597 |
306,147 |
|||||||||||||||
With a risk weight of less than or equal to 35% under the Basel II standardized approach for credit risk |
– |
711 |
752 |
2,661 |
2,461 |
|||||||||||||||
Performing residential mortgages, of which: |
36,968 |
26,639 |
41,071 |
302,402 |
272,444 |
|||||||||||||||
With a risk weight of less than or equal to 35% under the Basel II standardized approach for credit risk |
36,968 |
26,619 |
41,057 |
301,540 |
271,694 |
|||||||||||||||
Securities that are not in default and do not qualify as HQLA, including exchange-traded equities |
38,615 |
7,325 |
1,883 |
20,298 |
54,680 |
|||||||||||||||
Assets with matching interdependent liabilities (5)
|
95 |
2,858 |
1,686 |
21,100 |
– |
|||||||||||||||
Other assets: |
3,035 |
338,721 |
83,488 |
|||||||||||||||||
Physical traded commodities, including gold |
3,035 |
2,580 |
||||||||||||||||||
Assets posted as initial margin for derivative contracts and contributions to default funds of CCPs |
19,987 |
16,989 |
||||||||||||||||||
NSFR derivative assets |
29,743 |
1,031 |
||||||||||||||||||
NSFR derivative liabilities before deduction of variation margin posted |
53,453 |
2,673 |
||||||||||||||||||
All other assets not included in the above categories |
– |
178,193 |
17 |
57,328 |
60,215 |
|||||||||||||||
Off-balance sheet items |
778,355 |
29,565 |
||||||||||||||||||
Total RSF |
$ |
862,347 |
||||||||||||||||||
Net Stable Funding Ratio (%) |
113% |
|||||||||||||||||||
| As at October 31, 2023 | ||||||||||||||||||||
| (Millions of Canadian dollars, except percentage amounts) |
Weighted value |
|||||||||||||||||||
Total ASF |
$ | 972,239 | ||||||||||||||||||
Total RSF |
863,631 | |||||||||||||||||||
Net Stable Funding Ratio (%) |
113% | |||||||||||||||||||
| (1) | The NSFR is calculated in accordance with OSFI’s LAR guideline, which, in turn, reflects liquidity-related requirements issued by the BCBS. |
| (2) | Totals for the following rows encompass the residual maturity categories of less than 6 months, 6 months to less than 1 year, and greater than or equal to 1 year in accordance with the requirements of the common disclosure template prescribed by OSFI: Other liabilities, NSFR derivative liabilities, Other assets, Assets posted as initial margin for derivative contracts and contributions to default funds of central counterparties (CCPs), NSFR derivative assets, NSFR derivative liabilities before deduction of variation margin posted and Off-balance sheet items. |
| (3) | As defined by the BCBS, stable deposits from retail and small business customers are deposits that are insured and are either held in transactional accounts or the bank has an established relationship with the client making the withdrawal unlikely. |
| (4) | Operational deposits from customers other than retail and small- and medium-sized enterprises, are deposits which clients need to keep with the bank in order to facilitate their access and ability to use payment and settlement systems primarily for clearing, custody and cash management activities. |
| (5) | Interdependent assets and liabilities represent NHA MBS liabilities, including liabilities arising from transactions involving the Canada Mortgage Bond program and their corresponding encumbered mortgages. |
As at January 31, 2024 |
||||||||||||||||||||||||||||||||||||||||
| (Millions of Canadian dollars) | Less than 1 month |
1 to 3 months |
3 to 6 months |
6 to 9 months |
9 to 12 months |
1 year to 2 years |
2 years to 5 years |
5 years and greater |
With no specific maturity |
Total |
||||||||||||||||||||||||||||||
Assets |
||||||||||||||||||||||||||||||||||||||||
Cash and deposits with banks |
$ |
132,774 |
$ |
5 |
$ |
– |
$ |
– |
$ |
– |
$ |
– |
$ |
– |
$ |
– |
$ |
2,648 |
$ |
135,427 |
||||||||||||||||||||
Securities |
||||||||||||||||||||||||||||||||||||||||
Trading (1) |
116,462 |
317 |
224 |
45 |
42 |
65 |
644 |
11,155 |
64,643 |
193,597 |
||||||||||||||||||||||||||||||
Investment, net of applicable allowance |
3,568 |
5,477 |
5,230 |
2,497 |
5,256 |
43,151 |
67,090 |
78,731 |
1,216 |
212,216 |
||||||||||||||||||||||||||||||
Assets purchased under reverse repurchase agreements and securities borrowed (2) |
153,149 |
81,540 |
55,243 |
16,142 |
20,274 |
294 |
– |
– |
21,229 |
347,871 |
||||||||||||||||||||||||||||||
Loans, net of applicable allowance |
33,721 |
25,246 |
35,402 |
40,527 |
48,927 |
206,339 |
302,877 |
75,492 |
89,785 |
858,316 |
||||||||||||||||||||||||||||||
Other |
||||||||||||||||||||||||||||||||||||||||
Customers’ liability under acceptances |
12,613 |
4,216 |
– |
– |
2 |
– |
5 |
– |
(43 |
) |
16,793 |
|||||||||||||||||||||||||||||
Derivatives |
7,533 |
8,518 |
5,694 |
4,695 |
6,271 |
13,128 |
26,658 |
32,541 |
– |
105,038 |
||||||||||||||||||||||||||||||
Other financial assets |
35,206 |
5,883 |
2,703 |
324 |
622 |
229 |
268 |
2,387 |
3,669 |
51,291 |
||||||||||||||||||||||||||||||
Total financial assets |
495,026 |
131,202 |
104,496 |
64,230 |
81,394 |
263,206 |
397,542 |
200,306 |
183,147 |
1,920,549 |
||||||||||||||||||||||||||||||
Other non-financial assets |
6,335 |
2,510 |
2,035 |
155 |
123 |
2,087 |
2,410 |
9,506 |
28,695 |
53,856 |
||||||||||||||||||||||||||||||
Total assets |
$ |
501,361 |
$ |
133,712 |
$ |
106,531 |
$ |
64,385 |
$ |
81,517 |
$ |
265,293 |
$ |
399,952 |
$ |
209,812 |
$ |
211,842 |
$ |
1,974,405 |
||||||||||||||||||||
Liabilities and equity |
||||||||||||||||||||||||||||||||||||||||
Deposits (3) |
||||||||||||||||||||||||||||||||||||||||
Unsecured borrowing |
$ |
97,982 |
$ |
59,352 |
$ |
91,861 |
$ |
64,454 |
$ |
73,303 |
$ |
58,648 |
$ |
77,653 |
$ |
35,045 |
$ |
576,489 |
$ |
1,134,787 |
||||||||||||||||||||
Secured borrowing |
4,208 |
7,152 |
8,936 |
2,455 |
1,321 |
6,997 |
13,421 |
8,881 |
– |
53,371 |
||||||||||||||||||||||||||||||
Covered bonds |
– |
– |
– |
1,705 |
2,130 |
10,465 |
33,778 |
4,932 |
– |
53,010 |
||||||||||||||||||||||||||||||
Other |
||||||||||||||||||||||||||||||||||||||||
Acceptances |
12,613 |
4,216 |
– |
– |
2 |
– |
5 |
– |
– |
16,836 |
||||||||||||||||||||||||||||||
Obligations related to securities sold short |
35,012 |
– |
– |
– |
– |
– |
– |
– |
– |
35,012 |
||||||||||||||||||||||||||||||
Obligations related to assets sold under repurchase agreements and securities loaned (2) |
223,426 |
66,813 |
21,780 |
5 |
46 |
290 |
– |
– |
22,130 |
334,490 |
||||||||||||||||||||||||||||||
Derivatives |
6,992 |
10,924 |
6,126 |
5,134 |
8,001 |
13,373 |
25,702 |
30,722 |
– |
106,974 |
||||||||||||||||||||||||||||||
Other financial liabilities |
39,291 |
8,200 |
3,021 |
1,551 |
1,695 |
983 |
2,289 |
15,209 |
1,460 |
73,699 |
||||||||||||||||||||||||||||||
Subordinated debentures |
– |
– |
– |
– |
– |
1,920 |
– |
9,605 |
– |
11,525 |
||||||||||||||||||||||||||||||
Total financial liabilities |
419,524 |
156,657 |
131,724 |
75,304 |
86,498 |
92,676 |
152,848 |
104,394 |
600,079 |
1,819,704 |
||||||||||||||||||||||||||||||
Other non-financial liabilities |
1,096 |
1,013 |
175 |
134 |
3,679 |
940 |
1,574 |
19,502 |
10,100 |
38,213 |
||||||||||||||||||||||||||||||
Equity |
– |
– |
– |
– |
– |
– |
– |
– |
116,488 |
116,488 |
||||||||||||||||||||||||||||||
Total liabilities and equity |
$ |
420,620 |
$ |
157,670 |
$ |
131,899 |
$ |
75,438 |
$ |
90,177 |
$ |
93,616 |
$ |
154,422 |
$ |
123,896 |
$ |
726,667 |
$ |
1,974,405 |
||||||||||||||||||||
Off-balance sheet items |
||||||||||||||||||||||||||||||||||||||||
Financial guarantees |
$ |
1,228 |
$ |
2,477 |
$ |
3,432 |
$ |
4,472 |
$ |
3,409 |
$ |
880 |
$ |
7,594 |
$ |
639 |
$ |
25 |
$ |
24,156 |
||||||||||||||||||||
Commitments to extend credit |
3,984 |
10,766 |
12,593 |
13,918 |
20,943 |
57,965 |
198,205 |
25,485 |
4,204 |
348,063 |
||||||||||||||||||||||||||||||
Other credit-related commitments |
15,281 |
1,143 |
1,814 |
1,666 |
1,528 |
149 |
386 |
66 |
80,653 |
102,686 |
||||||||||||||||||||||||||||||
Other commitments |
5 |
10 |
16 |
15 |
17 |
61 |
151 |
196 |
909 |
1,380 |
||||||||||||||||||||||||||||||
Total off-balance sheet items |
$ |
20,498 |
$ |
14,396 |
$ |
17,855 |
$ |
20,071 |
$ |
25,897 |
$ |
59,055 |
$ |
206,336 |
$ |
26,386 |
$ |
85,791 |
$ |
476,285 |
||||||||||||||||||||
| (1) | With the exception of debt securities within the Insurance segment, trading debt securities classified as FVTPL have been included in the less than 1 month category as there is no expectation to hold these assets to their contractual maturity. |
| (2) | Open reverse repo and repo contracts, which have no set maturity date and are typically short term, have been included in the with no specific maturity category. |
| (3) | A major portion of relationship-based deposits are repayable on demand or at short notice on a contractual basis while, in practice, these customer balances form a core base for our operations and liquidity needs, as explained in the preceding Deposit and funding profile section. |
| As at October 31, 2023 (1) | ||||||||||||||||||||||||||||||||||||||||
| (Millions of Canadian dollars) | Less than 1 month |
1 to 3 months |
3 to 6 months |
6 to 9 months |
9 to 12 months |
1 year to 2 years |
2 years to 5 years |
5 years and greater |
With no specific maturity |
Total | ||||||||||||||||||||||||||||||
Assets |
||||||||||||||||||||||||||||||||||||||||
Cash and deposits with banks |
$ | 130,121 | $ | 8 | $ | – | $ | – | $ | – | $ | – | $ | – | $ | – | $ | 2,946 | $ | 133,075 | ||||||||||||||||||||
Securities |
||||||||||||||||||||||||||||||||||||||||
Trading (2) |
117,373 | 56 | 103 | 26 | 46 | 99 | 127 | 8,997 | 63,324 | 190,151 | ||||||||||||||||||||||||||||||
Investment, net of applicable allowance |
5,090 | 6,436 | 3,890 | 5,547 | 8,678 | 41,734 | 66,047 | 81,337 | 820 | 219,579 | ||||||||||||||||||||||||||||||
Assets purchased under reverse repurchase agreements and securities borrowed (3) |
146,722 | 71,346 | 60,468 | 20,475 | 16,889 | 3,754 | – | – | 20,537 | 340,191 | ||||||||||||||||||||||||||||||
Loans, net of applicable allowance |
30,889 | 23,026 | 31,442 | 37,978 | 41,285 | 201,479 | 320,082 | 77,460 | 89,132 | 852,773 | ||||||||||||||||||||||||||||||
Other |
||||||||||||||||||||||||||||||||||||||||
Customers’ liability under acceptances |
16,493 | 5,247 | – | – | – | – | 5 | – | (50 | ) | 21,695 | |||||||||||||||||||||||||||||
Derivatives |
10,074 | 13,655 | 9,292 | 6,955 | 6,173 | 18,905 | 33,260 | 44,136 | – | 142,450 | ||||||||||||||||||||||||||||||
Other financial assets |
41,115 | 2,803 | 3,205 | 212 | 588 | 191 | 279 | 2,513 | 3,170 | 54,076 | ||||||||||||||||||||||||||||||
Total financial assets |
497,877 | 122,577 | 108,400 | 71,193 | 73,659 | 266,162 | 419,800 | 214,443 | 179,879 | 1,953,990 | ||||||||||||||||||||||||||||||
Other non-financial assets |
5,651 | 666 | 1,765 | 190 | 2,550 | 1,976 | 2,422 | 8,615 | 28,706 | 52,541 | ||||||||||||||||||||||||||||||
Total assets |
$ | 503,528 | $ | 123,243 | $ | 110,165 | $ | 71,383 | $ | 76,209 | $ | 268,138 | $ | 422,222 | $ | 223,058 | $ | 208,585 | $ | 2,006,531 | ||||||||||||||||||||
Liabilities and equity |
||||||||||||||||||||||||||||||||||||||||
Deposits (4) |
||||||||||||||||||||||||||||||||||||||||
Unsecured borrowing |
$ | 109,666 | $ | 59,128 | $ | 62,531 | $ | 76,957 | $ | 66,846 | $ | 59,845 | $ | 77,782 | $ | 27,314 | $ | 588,165 | $ | 1,128,234 | ||||||||||||||||||||
Secured borrowing |
4,992 | 6,044 | 7,337 | 4,100 | 1,489 | 6,965 | 13,616 | 8,706 | – | 53,249 | ||||||||||||||||||||||||||||||
Covered bonds |
– | 2,543 | – | – | 1,687 | 9,422 | 31,847 | 4,705 | – | 50,204 | ||||||||||||||||||||||||||||||
Other |
||||||||||||||||||||||||||||||||||||||||
Acceptances |
16,493 | 5,247 | – | – | – | – | 5 | – | – | 21,745 | ||||||||||||||||||||||||||||||
Obligations related to securities sold short |
33,651 | – | – | – | – | – | – | – | – | 33,651 | ||||||||||||||||||||||||||||||
Obligations related to assets sold under repurchase agreements and securities loaned (3) |
254,955 | 37,121 | 19,509 | (6 | ) | (1 | ) | 279 | – | – | 23,381 | 335,238 | ||||||||||||||||||||||||||||
Derivatives |
9,716 | 16,359 | 9,311 | 6,346 | 5,974 | 19,290 | 32,400 | 43,233 | – | 142,629 | ||||||||||||||||||||||||||||||
Other financial liabilities |
43,397 | 5,295 | 3,028 | 1,382 | 1,673 | 959 | 2,253 | 14,402 | 3,945 | 76,334 | ||||||||||||||||||||||||||||||
Subordinated debentures |
– | – | – | – | – | – | 1,937 | 9,449 | – | 11,386 | ||||||||||||||||||||||||||||||
Total financial liabilities |
472,870 | 131,737 | 101,716 | 88,779 | 77,668 | 96,760 | 159,840 | 107,809 | 615,491 | 1,852,670 | ||||||||||||||||||||||||||||||
Other non-financial liabilities |
1,856 | 6,422 | 221 | 216 | 150 | 1,048 | 2,009 | 17,228 | 9,564 | 38,714 | ||||||||||||||||||||||||||||||
Equity |
– | – | – | – | – | – | – | – | 115,147 | 115,147 | ||||||||||||||||||||||||||||||
Total liabilities and equity |
$ | 474,726 | $ | 138,159 | $ | 101,937 | $ | 88,995 | $ | 77,818 | $ | 97,808 | $ | 161,849 | $ | 125,037 | $ | 740,202 | $ | 2,006,531 | ||||||||||||||||||||
Off-balance sheet items |
||||||||||||||||||||||||||||||||||||||||
Financial guarantees |
$ | 544 | $ | 2,013 | $ | 3,528 | $ | 3,691 | $ | 4,716 | $ | 784 | $ | 7,314 | $ | 701 | $ | 23 | $ | 23,314 | ||||||||||||||||||||
Commitments to extend credit |
7,086 | 8,338 | 14,774 | 14,447 | 18,361 | 58,978 | 205,504 | 23,181 | 5,524 | 356,193 | ||||||||||||||||||||||||||||||
Other credit-related commitments |
14,799 | 1,173 | 1,563 | 1,858 | 1,659 | 169 | 435 | 49 | 95,099 | 116,804 | ||||||||||||||||||||||||||||||
Other commitments |
91 | 10 | 15 | 15 | 15 | 55 | 128 | 178 | 985 | 1,492 | ||||||||||||||||||||||||||||||
Total off-balance sheet items |
$ | 22,520 | $ | 11,534 | $ | 19,880 | $ | 20,011 | $ | 24,751 | $ | 59,986 | $ | 213,381 | $ | 24,109 | $ | 101,631 | $ | 497,803 | ||||||||||||||||||||
| (1) | Amounts have been restated from those previously presented as part of the adoption of IFRS 17, effective November 1, 2023. Refer to Note 2 of our Condensed Financial Statements for further details on these changes. |
| (2) | Trading debt securities classified as FVTPL have been included in the less than 1 month category as there is no expectation to hold these assets to their contractual maturity. |
| (3) | Open reverse repo and repo contracts, which have no set maturity date and are typically short term, have been included in the with no specific maturity category. |
| (4) | A major portion of relationship-based deposits are repayable on demand or at short notice on a contractual basis while, in practice, these customer balances form a core base for our operations and liquidity needs, as explained in the preceding Deposit and funding profile section. |
|
Capital management |
|
Basel III capital, leverage and TLAC ratios |
OSFI regulatory target requirements for large banks under Basel III |
RBC capital, leverage and TLAC ratios as at January 31, 2024 |
Domestic Stability Buffer (3)
|
Minimum including Capital Buffers, D-SIB/G-SIB surcharge and Domestic Stability Buffer as at January 31, 2024 (4)
|
||||||||||||||||||||||||||||
Minimum |
Capital Buffers |
Minimum including Capital Buffers |
D-SIB/G-SIB surcharge (1)
|
Minimum including Capital Buffers and D-SIB/G-SIB surcharge (1), (2)
|
||||||||||||||||||||||||||||
| Common Equity Tier 1 | 4.5% | 2.6% | 7.1% | 1.0% | 8.1% | 14.9% | 3.5% | 11.6% | ||||||||||||||||||||||||
| Tier 1 capital | 6.0% | 2.6% | 8.6% | 1.0% | 9.6% | 16.3% | 3.5% | 13.1% | ||||||||||||||||||||||||
| Total capital | 8.0% | 2.6% | 10.6% | 1.0% | 11.6% | 18.1% | 3.5% | 15.1% | ||||||||||||||||||||||||
| Leverage ratio | 3.5% | n.a. | 3.5% | n.a. | 3.5% | 4.4% | n.a. | 3.5% | ||||||||||||||||||||||||
| TLAC ratio | 21.6% | n.a. | 21.6% | n.a. | 21.6% | 31.4% | 3.5% | 25.1% | ||||||||||||||||||||||||
| TLAC leverage ratio | 7.25% | n.a. | 7.25% | n.a. | 7.25% | 8.5% | n.a. | 7.25% | ||||||||||||||||||||||||
| (1) | A capital surcharge, equal to the higher of our D-SIB surcharge and the BCBS’s G-SIB surcharge, is applicable to risk-weighted capital. |
| (2) | The capital buffers include the capital conservation buffer of 2.5% and the countercyclical capital buffer (CCyB) as prescribed by OSFI. The CCyB, calculated in accordance with OSFI’s CAR guidelines, was 0.06% as at January 31, 2024 (October 31, 2023 – 0.06%; January 31, 2023 – 0.03%). |
| (3) | The DSB can range from 0% to 4% of total RWA and is currently set at 3.5%. |
| (4) | Minimum target requirements reflect CCyB requirements as at January 31, 2024 which are subject to change based on exposures held at the reporting date. |
| n.a. | not applicable |
| As at | ||||||||||||
(Millions of Canadian dollars, except percentage amounts and as otherwise noted) |
January 31 2024 |
October 31 2023 |
January 31 2023 |
|||||||||
Capital (1), (2)
|
||||||||||||
CET1 capital |
$ |
88,106 |
$ | 86,611 | $ | 78,055 | ||||||
Tier 1 capital |
96,140 |
93,904 | 85,357 | |||||||||
Total capital |
106,865 |
104,952 | 96,438 | |||||||||
RWA used in calculation of capital ratios (1), (2)
|
||||||||||||
Credit risk |
$ |
474,677 |
$ | 475,842 | $ | 502,807 | ||||||
Market risk |
30,980 |
40,498 | 32,635 | |||||||||
Operational risk |
84,600 |
79,883 | 78,808 | |||||||||
Total RWA |
$ |
590,257 |
$ | 596,223 | $ | 614,250 | ||||||
Capital ratios and Leverage ratio (1), (2)
|
||||||||||||
CET1 ratio |
14.9% |
14.5% | 12.7% | |||||||||
Tier 1 capital ratio |
16.3% |
15.7% | 13.9% | |||||||||
Total capital ratio |
18.1% |
17.6% | 15.7% | |||||||||
Leverage ratio |
4.4% |
4.3% | 4.4% | |||||||||
Leverage ratio exposure (billions) |
$ |
2,173 |
$ | 2,180 | $ | 1,921 | ||||||
TLAC available and ratios (1), (3)
|
||||||||||||
TLAC available |
$ |
185,556 |
$ | 184,916 | $ | 173,179 | ||||||
TLAC ratio |
31.4% |
31.0% | 28.2% | |||||||||
TLAC leverage ratio |
8.5% |
8.5% | 9.0% | |||||||||
| (1) | As prior period restatements are not required by OSFI, there was no impact from the adoption of IFRS 17 on regulatory capital, RWA, capital ratios, leverage ratio, TLAC available and TLAC ratios for periods prior to November 1, 2023. |
| (2) | Capital, RWA, and capital ratios are calculated using OSFI’s CAR guideline and the Leverage ratio is calculated using OSFI’s LR guideline. Both the CAR guideline and LR guideline are based on the Basel III framework. The periods ended January 31, 2024 and October 31, 2023 reflect our adoption of the revised CAR and LR guidelines that came into effect in Q2 2023, as further updated on October 20, 2023 as part of OSFI’s implementation of the Basel III reforms. The period ended January 31, 2024 also reflects our adoption of the revised market risk and CVA frameworks that came into effect on November 1, 2023. |
| (3) | TLAC available and TLAC ratios are calculated using OSFI’s TLAC guideline. The TLAC standard is applied at the resolution entity level which for us is deemed to be Royal Bank of Canada and its subsidiaries. A resolution entity and its subsidiaries are collectively called a resolution group. The TLAC ratio and TLAC leverage ratio are calculated using the TLAC available as a percentage of total RWA and leverage exposure, respectively. |
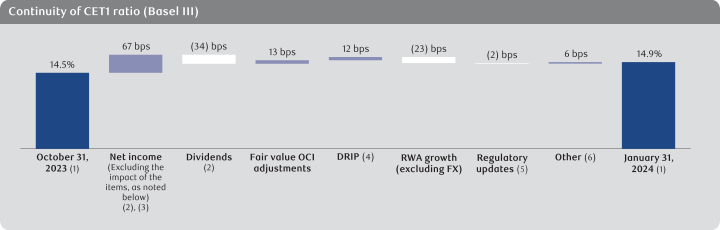
| (1) | Represents rounded figures. |
| (2) | Represents net internal capital generation of $2 billion or 33 bps consisting of Net income available to shareholders excluding the impact of specified items, less common and preferred share dividends and distributions on other equity instruments. |
| (3) | Excludes specified items for transaction and integration costs relating to the planned acquisition of HSBC Canada and the management of closing capital volatility related to the planned acquisition of HSBC Canada. |
| (4) | For further details about the Dividend reinvestment plan (DRIP), refer to Note 11 of our Condensed Financial Statements. |
| (5) | Includes an unfavourable impact from the adoption of IFRS 17 of 13 bps, partially offset by a favourable impact of 11 bps from the second phase of OSFI’s adoption of the Basel III reforms discussed above. |
| (6) | Includes the impact of specified items noted above. |
For the three months ended January 31, 2024 |
||||||||||||
| (Millions of Canadian dollars, except number of shares) |
Issuance or redemption date |
Number of shares |
Amount |
|||||||||
Tier 1 capital |
||||||||||||
Common shares activity |
||||||||||||
Issued in connection with share-based compensation plans (1)
|
400 |
$ |
38 |
|||||||||
Issued under the DRIP (2)
|
6,135 |
720 |
||||||||||
Redemption of preferred shares, Series C-2 (3)
|
November 7, 2023 |
(15 |
) |
(23 |
) |
|||||||
Issuance of preferred shares, Series BU (3), (4)
|
January 25, 2024 |
750 |
750 |
|||||||||
| (1) | Amounts include cash received for stock options exercised during the period and fair value adjustments to stock options. |
| (2) | During the three months ended January 31, 2024, the requirements of the DRIP were satisfied through shares issued from treasury. |
| (3) | For further details, refer to Note 11 of our Condensed Financial Statements. |
| (4) |
Non-Viability Contingent Capital (NVCC) instruments. |
As at January 31, 2024 |
||||||||||||
| (Millions of Canadian dollars, except number of shares and as otherwise noted) |
Number of shares |
Amount |
Dividends declared per share |
|||||||||
Common shares issued |
1,408,908 |
$ |
20,156 |
$ |
1.38 |
|||||||
Treasury shares – common shares (2)
|
(651 |
) |
(84 |
) |
||||||||
Common shares outstanding |
1,408,257 |
$ |
20,072 |
|||||||||
Stock options and awards |
||||||||||||
Outstanding |
9,059 |
|||||||||||
Exercisable |
4,549 |
|||||||||||
First preferred shares issued |
||||||||||||
Non-cumulative Series AZ (3), (4)
|
20,000 |
$ |
500 |
$ |
0.23 |
|||||||
Non-cumulative Series BB (3), (4)
|
20,000 |
500 |
0.23 |
|||||||||
Non-cumulative Series BD (3), (4)
|
24,000 |
600 |
0.20 |
|||||||||
Non-cumulative Series BF (3), (4)
|
12,000 |
300 |
0.19 |
|||||||||
Non-cumulative Series BH (4)
|
6,000 |
150 |
0.31 |
|||||||||
Non-cumulative Series BI (4)
|
6,000 |
150 |
0.31 |
|||||||||
Non-cumulative Series BO (3), (4)
|
14,000 |
350 |
0.30 |
|||||||||
Non-cumulative Series BT (3), (4), (5)
|
750 |
750 |
4.20% |
|||||||||
Non-cumulative Series BU (3), (4), (5)
|
750 |
750 |
7.41% |
|||||||||
Other equity instruments issued |
||||||||||||
Limited recourse capital notes Series 1 (3), (4), (6), (7)
|
1,750 |
1,750 |
4.50% |
|||||||||
Limited recourse capital notes Series 2 (3), (4), (6), (7)
|
1,250 |
1,250 |
4.00% |
|||||||||
Limited recourse capital notes Series 3 (3), (4), (6), (7)
|
1,000 |
1,000 |
3.65% |
|||||||||
Preferred shares and other equity instruments issued |
107,500 |
8,050 |
||||||||||
Treasury instruments – preferred shares and other equity instruments (2)
|
(34 |
) |
(19 |
) |
||||||||
Preferred shares and other equity instruments outstanding |
107,466 |
$ |
8,031 |
|||||||||
Dividends on common shares |
$ |
1,944 |
||||||||||
Dividends on preferred shares and distributions on other equity instruments (8)
|
58 |
|||||||||||
| (1) | For further details about our capital management activity, refer to Note 11 of our Condensed Financial Statements. |
| (2) | Positive amounts represent a short position and negative amounts represent a long position. |
| (3) | Dividend rate will reset every five years. |
| (4) | NVCC instruments. |
| (5) | The dividends declared per share represent the per annum dividend rate applicable to the shares issued as at the reporting date. |
| (6) | For Limited Recourse Capital Notes (LRCN) Series, the number of shares represent the number of notes issued and the dividends declared per share represent the annual interest rate percentage applicable to the notes issued as at the reporting date. |
| (7) | In connection with the issuance of LRCN Series 1, on July 28, 2020, we issued $1,750 million of First Preferred Shares Series BQ (Series BQ); in connection with the issuance of LRCN Series 2, on November 2, 2020, we issued $1,250 million of First Preferred Shares Series BR (Series BR); and in connection with the issuance of LRCN Series 3, on June 8, 2021, we issued $1,000 million of First Preferred Shares Series BS (Series BS). The Series BQ, BR and BS preferred shares were issued at a price of $1,000 per share and were issued to a consolidated trust to be held as trust assets in connection with the LRCN structure. For further details, refer to Note 20 of our 2023 Annual Consolidated Financial Statements. |
| (8) | Excludes distributions to non-controlling interests. |
(Millions of Canadian dollars) |
October 31 2023 |
October 31 2022 |
||||||
Cross-jurisdictional activity (2)
|
||||||||
Cross-jurisdictional claims |
$ |
1,095,074 |
$ | 1,046,441 | ||||
Cross-jurisdictional liabilities |
822,122 |
819,735 | ||||||
Size (3)
|
||||||||
Total exposures as defined for use in the Basel III leverage ratio |
2,205,597 |
2,107,274 | ||||||
Interconnectedness (4)
|
||||||||
Intra-financial system assets |
178,747 |
185,901 | ||||||
Intra-financial system liabilities |
154,580 |
182,473 | ||||||
Securities outstanding |
453,282 |
470,005 | ||||||
Substitutability/financial institution infrastructure (5)
|
||||||||
Payment activity |
48,548,510 |
50,504,158 | ||||||
Assets under custody |
3,903,071 |
4,214,247 | ||||||
Underwritten transactions in debt and equity markets |
217,449 |
224,039 | ||||||
Trading volume |
||||||||
Fixed income |
8,692,240 |
7,484,605 | ||||||
Equities and other securities |
5,488,456 |
5,086,612 | ||||||
Complexity (6)
|
||||||||
Notional amount of over-the-counter |
26,584,099 |
25,226,394 | ||||||
Trading and investment securities |
79,676 |
71,774 | ||||||
Level 3 assets |
5,190 |
4,552 | ||||||
| (1) | The G-SIBs indicators are prepared based on the methodology prescribed in BCBS updated guidelines published in July 2018, and are disclosed in accordance with OSFI’s Global Systemically Important Banks – Public Disclosure Requirements Advisory. The indicators are based on the regulatory scope of consolidation, which excludes RBC Insurance subsidiaries, unless otherwise specified by the assessment methodology. For our 2023 standalone G-SIB disclosure, please refer to our Regulatory Disclosures at rbc.com/investorrelations. |
| (2) | Represents a bank’s level of interaction outside its domestic jurisdiction. |
| (3) | Represents the total on- and off- balance sheet exposures of the bank, as determined by leverage ratio rules, which reflect OSFI’s implementation of the final Basel III reforms, prior to regulatory adjustments. |
| (4) | Represents transactions with other financial institutions. |
| (5) | Represents the extent to which the bank’s services could be substituted by other institutions. |
| (6) | Includes the level of complexity and volume of a bank’s trading activities represented through derivatives, trading securities, investment securities and level 3 assets. |
|
Accounting and control matters |
|
Summary of accounting policies and estimates |
|
Changes in accounting policies and disclosures |
|
Controls and procedures |
|
Related party transactions |
|
Glossary |
|
Enhanced Disclosure Task Force recommendations index |
Location of disclosure |
||||||||||
Type of Risk |
Recommendation |
Disclosure |
RTS page |
Annual Report page |
SFI page |
|||||
General |
1 | Table of contents for EDTF risk disclosure |
50 | 132 | 1 | |||||
| 2 | Define risk terminology and measures |
65-70,
130-131 |
– | |||||||
| 3 | Top and emerging risks |
63-65 |
– | |||||||
| 4 | New regulatory ratios |
39-42 | 109-114 |
– | ||||||
Risk governance, risk management and business model |
5 | Risk management organization |
65-70 |
– | ||||||
| 6 | Risk culture |
65-70 |
– | |||||||
| 7 | Risk in the context of our business activities |
117 | – | |||||||
| 8 | Stress testing |
68-69, 81 |
– | |||||||
Capital adequacy and risk-weighted assets (RWA) |
9 | Minimum Basel III capital ratios and Domestic systemically important bank surcharge |
40 | 109-114 |
– | |||||
| 10 | Composition of capital and reconciliation of the accounting balance sheet to the regulatory balance sheet |
– | * | |||||||
| 11 | Flow statement of the movements in regulatory capital |
– | 19 | |||||||
| 12 | Capital strategic planning |
109-114 |
– | |||||||
| 13 | RWA by business segments |
– | 20 | |||||||
| 14 | Analysis of capital requirement, and related measurement model information |
71-74 |
* | |||||||
| 15 | RWA credit risk and related risk measurements |
– | * | |||||||
| 16 | Movement of RWA by risk type |
– | 20 | |||||||
| 17 | Basel back-testing |
68, 71-73
|
31 | |||||||
|
Liquidity |
18 | Quantitative and qualitative analysis of our liquidity reserve |
31-32 | 88-89, 94-95 |
– | |||||
Funding |
19 | Encumbered and unencumbered assets by balance sheet category, and contractual obligations for rating downgrades |
32, 34 | 90, 93 | – | |||||
| 20 | Maturity analysis of consolidated total assets, liabilities and off-balance sheet commitments analyzed by remaining contractual maturity at the balance sheet date |
38-39 | 97-98 |
– | ||||||
21 |
Sources of funding and funding strategy |
32-34 |
90-92 |
– |
||||||
Market risk |
22 | Relationship between the market risk measures for trading and non-trading portfolios and the balance sheet |
29-30 | 85-86 |
– | |||||
| 23 | Decomposition of market risk factors |
27-28 | 81-86 |
– | ||||||
| 24 | Market risk validation and back-testing |
81 | – | |||||||
| 25 | Primary risk management techniques beyond reported risk measures and parameters |
81-84 |
– | |||||||
Credit risk |
26 |
Bank’s credit risk profile |
23-26 |
71-81, 178-185 |
21-31,* |
|||||
Quantitative summary of aggregate credit risk exposures that reconciles to the balance sheet |
66-70 |
124-129 |
* |
|||||||
| 27 | Policies for identifying impaired loans |
73-75, 119, 149-151 |
– | |||||||
| 28 | Reconciliation of the opening and closing balances of impaired loans and impairment allowances during the year |
– | 23, 28 | |||||||
| 29 | Quantification of gross notional exposure for over-the-counter |
76 | 32 | |||||||
| 30 | Credit risk mitigation, including collateral held for all sources of credit risk |
74-75 |
* | |||||||
Other |
31 | Other risk types |
100-109 |
– | ||||||
| 32 | Publicly known risk events |
104-105, 223-224 |
– | |||||||
| * | These disclosure requirements are satisfied or partially satisfied by disclosures provided in our Pillar 3 Report for the quarter ended January 31, 2024 and for the year ended October 31, 2023. |
| Interim Condensed Consolidated Financial Statements |
| Interim Condensed Consolidated Balance Sheets |
| As at | ||||||||
(Millions of Canadian dollars) |
January 31 2024 |
October 31 2023 (Restated – Note 2) |
||||||
| Assets |
||||||||
| Cash and due from banks |
$ |
74,347 |
$ | 61,989 | ||||
| Interest-bearing deposits with banks |
|
61,080 |
|
|
71,086 |
| ||
| Securities |
||||||||
| Trading |
193,597 |
190,151 | ||||||
| Investment, net of applicable allowance (Note 4)
|
212,216 |
219,579 | ||||||
405,813 |
409,730 | |||||||
| Assets purchased under reverse repurchase agreements and securities borrowed |
|
347,871 |
|
|
340,191 |
| ||
| Loans (Note 5)
|
||||||||
| Retail |
569,894 |
569,951 | ||||||
| Wholesale |
293,721 |
287,826 | ||||||
863,615 |
857,777 | |||||||
| Allowance for loan losses (Note 5)
|
(5,299 |
) |
(5,004 | ) | ||||
858,316 |
852,773 | |||||||
| Other |
||||||||
| Customers’ liability under acceptances |
16,793 |
21,695 | ||||||
| Derivatives |
105,038 |
142,450 | ||||||
| Premises and equipment |
6,633 |
6,749 | ||||||
| Goodwill |
12,430 |
12,594 | ||||||
| Other intangibles |
5,790 |
5,903 | ||||||
| Other assets |
80,294 |
81,371 | ||||||
226,978 |
270,762 | |||||||
| Total assets |
$ |
1,974,405 |
$ | 2,006,531 | ||||
| Liabilities and equity |
||||||||
| Deposits (Note 7)
|
||||||||
| Personal |
$ |
452,189 |
$ | 441,946 | ||||
| Business and government |
743,772 |
745,075 | ||||||
| Bank |
45,207 |
44,666 | ||||||
1,241,168 |
1,231,687 | |||||||
| Other |
||||||||
| Acceptances |
16,836 |
21,745 | ||||||
| Obligations related to securities sold short |
35,012 |
33,651 | ||||||
| Obligations related to assets sold under repurchase agreements and securities loaned |
334,490 |
335,238 | ||||||
| Derivatives |
106,974 |
142,629 | ||||||
| Insurance contract liabilities (Note 8)
|
21,342 |
19,026 | ||||||
| Other liabilities |
90,570 |
96,022 | ||||||
605,224 |
648,311 | |||||||
| Subordinated debentures (Note 1
1 ) |
|
11,525 |
|
|
11,386 |
| ||
| Total liabilities |
1,857,917 |
1,891,384 | ||||||
| Equity attributable to shareholders |
||||||||
| Preferred shares and other equity instruments |
8,031 |
7,314 | ||||||
| Common shares (Note 1
1 ) |
20,072 |
19,167 | ||||||
| Retained earnings |
82,049 |
81,715 | ||||||
| Other components of equity |
6,239 |
6,852 | ||||||
116,391 |
115,048 | |||||||
| Non-controlling interests |
97 |
99 | ||||||
| Total equity |
116,488 |
115,147 | ||||||
| Total liabilities and equity |
$ |
1,974,405 |
$ | 2,006,531 | ||||
| Interim Condensed Consolidated Statements of Income |
| For the three months ended | ||||||||
(Millions of Canadian dollars, except per share amounts) |
January 31 2024 |
January 31 2023 (Restated – Note 2) |
||||||
| Interest and dividend income (Note 3)
|
||||||||
| Loans |
$ |
12,269 |
$ | 9,997 | ||||
| Securities |
4,554 |
3,003 | ||||||
| Assets purchased under reverse repurchase agreements and securities borrowed |
7,221 |
4,766 | ||||||
| Deposits and other |
1,565 |
1,571 | ||||||
25,609 |
19,337 | |||||||
| Interest expense (Note 3)
|
||||||||
| Deposits and other |
11,305 |
7,772 | ||||||
| Other liabilities |
7,786 |
5,225 | ||||||
| Subordinated debentures |
186 |
138 | ||||||
19,277 |
13,135 | |||||||
| Net interest income |
6,332 |
6,202 | ||||||
| Non-interest income |
||||||||
| Insurance service result (Note 8)
|
187 |
192 | ||||||
| Insurance investment result (Note 8)
|
141 |
(73 | ) | |||||
| Trading revenue |
804 |
1,069 | ||||||
| Investment management and custodial fees |
2,185 |
2,056 | ||||||
| Mutual fund revenue |
1,030 |
1,015 | ||||||
| Securities brokerage commissions |
388 |
361 | ||||||
| Service charges |
554 |
511 | ||||||
| Underwriting and other advisory fees |
606 |
512 | ||||||
| Foreign exchange revenue, other than trading |
262 |
433 | ||||||
| Card service revenue |
326 |
325 | ||||||
| Credit fees |
395 |
379 | ||||||
| Net gains on investment securities |
70 |
53 | ||||||
| Share of profit in joint ventures and associates |
12 |
29 | ||||||
| Other |
193 |
293 | ||||||
7,153 |
7,155 | |||||||
| Total revenue |
13,485 |
13,357 | ||||||
| Provision for credit losses (Notes 4 and 5)
|
813 |
532 | ||||||
| Non-interest expense |
||||||||
| Human resources (Note 9)
|
5,163 |
4,850 | ||||||
| Equipment |
619 |
569 | ||||||
| Occupancy |
407 |
404 | ||||||
| Communications |
321 |
278 | ||||||
| Professional fees |
624 |
382 | ||||||
| Amortization of other intangibles |
352 |
362 | ||||||
| Other |
838 |
744 | ||||||
8,324 |
7,589 | |||||||
| Income before income taxes |
4,348 |
5,236 | ||||||
| Income taxes |
766 |
2,103 | ||||||
| Net income |
$ |
3,582 |
$ | 3,133 | ||||
| Net income attributable to: |
||||||||
| Shareholders |
$ |
3,580 |
$ | 3,131 | ||||
| Non-controlling interests |
2 |
2 | ||||||
$ |
3,582 |
$ | 3,133 | |||||
| Basic earnings per share (in dollars) (Note 1
2 ) |
$ |
2.50 |
$ | 2.23 | ||||
| Diluted earnings per share (in dollars) (Note 1
2 ) |
2.50 |
2.23 | ||||||
| Dividends per common share (in dollars)
|
1.38 |
1.32 | ||||||
|
Interim Condensed Consolidated Statements of Comprehensive Income |
| For the three months ended | ||||||||
(Millions of Canadian dollars) |
January 31
2024
|
January 31
2023
(Restated – Note 2)
|
||||||
Net income |
$ |
3,582 |
$ | 3,133 | ||||
Other comprehensive income (loss), net of taxes |
||||||||
Items that will be reclassified subsequently to income: |
||||||||
Net change in unrealized gains (losses) on debt securities and loans at fair value through other comprehensive income |
||||||||
Net unrealized gains (losses) on debt securities and loans at fair value through other comprehensive income |
788 |
632 | ||||||
Reclassification of net losses (gains) on debt securities and loans at fair value through other comprehensive income to income |
(49 |
) |
(32 | ) | ||||
739 |
600 | |||||||
Foreign currency translation adjustments |
||||||||
Unrealized foreign currency translation gains (losses) |
(2,151 |
) |
(955 | ) | ||||
Net foreign currency translation gains (losses) from hedging activities |
922 |
64 | ||||||
Reclassification of losses (gains) on net investment hedging activities to income |
1 |
– | ||||||
(1,228 |
) |
(891 | ) | |||||
Net change in cash flow hedges |
||||||||
Net gains (losses) on derivatives designated as cash flow hedges |
(602 |
) |
(398 | ) | ||||
Reclassification of losses (gains) on derivatives designated as cash flow hedges to income |
(181 |
) |
2 | |||||
(783 |
) |
(396 | ) | |||||
Items that will not be reclassified subsequently to income: |
||||||||
Remeasurement gains (losses) on employee benefit plans (Note 9)
|
42 |
(230 | ) | |||||
Net gains (losses) from fair value changes due to credit risk on financial liabilities designated at fair value through profit or loss |
(701 |
) |
(796 | ) | ||||
Net gains (losses) on equity securities designated at fair value through other comprehensive income |
55 |
10 | ||||||
(604 |
) |
(1,016 | ) | |||||
Total other comprehensive income (loss), net of taxes |
(1,876 |
) |
(1,703 | ) | ||||
Total comprehensive income (loss) |
$ |
1,706 |
$ | 1,430 | ||||
Total comprehensive income attributable to: |
||||||||
Shareholders |
$ |
1,707 |
$ | 1,431 | ||||
Non-controlling interests |
(1 |
) |
(1 | ) | ||||
$ |
1,706 |
$ | 1,430 | |||||
| For the three months ended | ||||||||
(Millions of Canadian dollars) |
January 31 2024 |
January 31
2023
|
||||||
Income taxes on other comprehensive income |
||||||||
Net unrealized gains (losses) on debt securities and loans at fair value through other comprehensive income |
$ |
303 |
$ | 171 | ||||
Reclassification of net losses (gains) on debt securities and loans at fair value through other comprehensive income to income |
(16 |
) |
(9 | ) | ||||
Unrealized foreign currency translation gains (losses) |
(17 |
) |
– | |||||
Net foreign currency translation gains (losses) from hedging activities |
340 |
162 | ||||||
Net gains (losses) on derivatives designated as cash flow hedges |
(262 |
) |
(64 | ) | ||||
Reclassification of losses (gains) on derivatives designated as cash flow hedges to income |
(68 |
) |
1 | |||||
Remeasurement gains (losses) on employee benefit plans |
22 |
(23 | ) | |||||
Net gains (losses) from fair value changes due to credit risk on financial liabilities designated at fair value through profit or loss |
(271 |
) |
(306 | ) | ||||
Net gains (losses) on equity securities designated at fair value through other comprehensive income |
20 |
12 | ||||||
Total income tax expenses (recoveries) |
$ |
51 |
$ | (56 | ) | |||
| Interim Condensed Consolidated Statements of Changes in Equity |
For the three months ended January 31, 2024 |
||||||||||||||||||||||||||||||||||||||||||||||||
Other components of equity |
||||||||||||||||||||||||||||||||||||||||||||||||
| (Millions of Canadian dollars) | Preferred shares and other equity instruments |
Common shares |
Treasury – preferred shares and other equity instruments |
Treasury – common shares |
Retained earnings |
FVOCI securities and loans |
Foreign currency translation |
Cash flow hedges |
Total other components of equity |
Equity attributable to shareholders |
Non-controlling interests |
Total equity |
||||||||||||||||||||||||||||||||||||
| Restated balance at beginning of period |
$ |
7,323 |
$ |
19,398 |
$ |
(9 |
) |
$ |
(231 |
) |
$ |
81,715 |
$ |
(2,516 |
) |
$ |
6,612 |
$ |
2,756 |
$ |
6,852 |
$ |
115,048 |
$ |
99 |
$ |
115,147 |
|||||||||||||||||||||
| Transition adjustment (Note 2)
|
– |
– |
– |
– |
(656 |
) |
656 |
– |
– |
656 |
– |
– |
– |
|||||||||||||||||||||||||||||||||||
| Restated balance at beginning of period |
$ |
7,323 |
$ |
19,398 |
$ |
(9 |
) |
$ |
(231 |
) |
$ |
81,059 |
$ |
(1,860 |
) |
$ |
6,612 |
$ |
2,756 |
$ |
7,508 |
$ |
115,048 |
$ |
99 |
$ |
115,147 |
|||||||||||||||||||||
| Changes in equity |
||||||||||||||||||||||||||||||||||||||||||||||||
| Issues of share capital and other equity instruments |
750 |
758 |
– |
– |
(6 |
) |
– |
– |
– |
– |
1,502 |
– |
1,502 |
|||||||||||||||||||||||||||||||||||
| Redemption of preferred shares and other equity instruments |
(23 |
) |
– |
– |
– |
2 |
– |
– |
– |
– |
(21 |
) |
– |
(21 |
) | |||||||||||||||||||||||||||||||||
| Sales of treasury shares and other equity instruments |
– |
– |
113 |
1,227 |
– |
– |
– |
– |
– |
1,340 |
– |
1,340 |
||||||||||||||||||||||||||||||||||||
| Purchases of treasury shares and other equity instruments |
– |
– |
(123 |
) |
(1,080 |
) |
– |
– |
– |
– |
– |
(1,203 |
) |
– |
(1,203 |
) | ||||||||||||||||||||||||||||||||
| Share-based compensation awards |
– |
– |
– |
– |
8 |
– |
– |
– |
– |
8 |
– |
8 |
||||||||||||||||||||||||||||||||||||
| Dividends on common shares |
– |
– |
– |
– |
(1,944 |
) |
– |
– |
– |
– |
(1,944 |
) |
– |
(1,944 |
) | |||||||||||||||||||||||||||||||||
| Dividends on preferred shares and distributions on other equity instruments |
– |
– |
– |
– |
(58 |
) |
– |
– |
– |
– |
(58 |
) |
(1 |
) |
(59 |
) | ||||||||||||||||||||||||||||||||
| Other |
– |
– |
– |
– |
12 |
– |
– |
– |
– |
12 |
– |
12 |
||||||||||||||||||||||||||||||||||||
| Net income |
– |
– |
– |
– |
3,580 |
– |
– |
– |
– |
3,580 |
2 |
3,582 |
||||||||||||||||||||||||||||||||||||
| Total other comprehensive income (loss), net of taxes |
– |
– |
– |
– |
(604 |
) |
739 |
(1,225 |
) |
(783 |
) |
(1,269 |
) |
(1,873 |
) |
(3 |
) |
(1,876 |
) | |||||||||||||||||||||||||||||
| Balance at end of period |
$ |
8,050 |
$ |
20,156 |
$ |
(19 |
) |
$ |
(84 |
) |
$ |
82,049 |
$ |
(1,121 |
) |
$ |
5,387 |
$ |
1,973 |
$ |
6,239 |
$ |
116,391 |
$ |
97 |
$ |
116,488 |
|||||||||||||||||||||
| For the three months ended January 31, 2023 (Restated – Note 2) | ||||||||||||||||||||||||||||||||||||||||||||||||
| Other components of equity | ||||||||||||||||||||||||||||||||||||||||||||||||
| (Millions of Canadian dollars) | Preferred shares and other equity instruments |
Common shares |
Treasury – preferred shares and other equity instruments |
Treasury – common shares |
Retained earnings |
FVOCI securities and loans |
Foreign currency translation |
Cash flow hedges |
Total other components of equity |
Equity attributable to shareholders |
Non-controlling interests |
Total equity |
||||||||||||||||||||||||||||||||||||
| Balance at beginning of period |
$ | 7,323 | $ | 17,318 | $ | (5 | ) | $ | (334 | ) | $ | 78,037 | $ | (2,357 | ) | $ | 5,688 | $ | 2,394 | $ | 5,725 | $ | 108,064 | $ | 111 | $ | 108,175 | |||||||||||||||||||||
| Transition adjustment (Note 2)
|
– | – | – | – | (2,359 | ) | – | – | – | – | (2,359 | ) | – | (2,359 | ) | |||||||||||||||||||||||||||||||||
| Restated balance at beginning of period |
$ | 7,323 | $ | 17,318 | $ | (5 | ) | $ | (334 | ) | $ | 75,678 | $ | (2,357 | ) | $ | 5,688 | $ | 2,394 | $ | 5,725 | $ | 105,705 | $ | 111 | $ | 105,816 | |||||||||||||||||||||
| Changes in equity |
||||||||||||||||||||||||||||||||||||||||||||||||
| Issues of share capital and other equity instruments |
– | 24 | – | – | 1 | – | – | – | – | 25 | – | 25 | ||||||||||||||||||||||||||||||||||||
| Redemption of preferred shares and other equity instruments |
– | – | – | – | – | – | – | – | – | – | – | – | ||||||||||||||||||||||||||||||||||||
| Sales of treasury shares and other equity instruments |
– | – | 277 | 742 | – | – | – | – | – | 1,019 | – | 1,019 | ||||||||||||||||||||||||||||||||||||
| Purchases of treasury shares and other equity instruments |
– | – | (262 | ) | (797 | ) | – | – | – | – | – | (1,059 | ) | – | (1,059 | ) | ||||||||||||||||||||||||||||||||
| Share-based compensation awards |
– | – | – | – | 5 | – | – | – | – | 5 | – | 5 | ||||||||||||||||||||||||||||||||||||
| Dividends on common shares |
– | – | – | – | (1,829 | ) | – | – | – | – | (1,829 | ) | – | (1,829 | ) | |||||||||||||||||||||||||||||||||
| Dividends on preferred shares and distributions on other equity instruments |
– | – | – | – | (44 | ) | – | – | – | – | (44 | ) | (7 | ) | (51 | ) | ||||||||||||||||||||||||||||||||
| Other |
– | – | – | – | 3 | – | – | – | – | 3 | – | 3 | ||||||||||||||||||||||||||||||||||||
| Net income |
– | – | – | – | 3,131 | – | – | – | – | 3,131 | 2 | 3,133 | ||||||||||||||||||||||||||||||||||||
| Total other comprehensive income (loss), net of taxes |
– | – | – | – | (1,016 | ) | 600 | (888 | ) | (396 | ) | (684 | ) | (1,700 | ) | (3 | ) | (1,703 | ) | |||||||||||||||||||||||||||||
| Restated balance at end of period |
$ | 7,323 | $ | 17,342 | $ | 10 | $ | (389 | ) | $ | 75,929 | $ | (1,757 | ) | $ | 4,800 | $ | 1,998 | $ | 5,041 | $ | 105,256 | $ | 103 | $ | 105,359 | ||||||||||||||||||||||
| Interim Condensed Consolidated Statements of Cash Flows |
| For the three months ended | ||||||||
(Millions of Canadian dollars) |
January 31 2024 |
January 31 2023 (Restated – Note 2) |
||||||
| Cash flows from operating activities |
||||||||
| Net income |
$ |
3,582 |
$ | 3,133 | ||||
| Adjustments for non-cash items and others |
||||||||
| Provision for credit losses |
813 |
532 | ||||||
| Depreciation |
320 |
315 | ||||||
| Deferred income taxes |
(606 |
) |
(261 | ) | ||||
| Amortization and impairment of other intangibles |
354 |
373 | ||||||
| Net changes in investments in joint ventures and associates |
(12 |
) |
(29 | ) | ||||
| Losses (Gains) on investment securities |
(70 |
) |
(53 | ) | ||||
| Losses (Gains) on disposition of businesses |
(4 |
) |
– | |||||
| Adjustments for net changes in operating assets and liabilities |
||||||||
| Insurance contract liabilities |
2,316 |
991 | ||||||
| Net change in accrued interest receivable and payable |
175 |
397 | ||||||
| Current income taxes |
315 |
883 | ||||||
| Derivative assets |
37,412 |
24,156 | ||||||
| Derivative liabilities |
(35,655 |
) |
(21,999 | ) | ||||
| Trading securities |
(2,521 |
) |
2,688 | |||||
| Loans, net of securitizations |
(5,838 |
) |
(4,704 | ) | ||||
| Assets purchased under reverse repurchase agreements and securities borrowed |
(7,680 |
) |
(10,534 | ) | ||||
| Obligations related to assets sold under repurchase agreements and securities loaned |
(748 |
) |
16,420 | |||||
| Obligations related to securities sold short |
1,361 |
(264 | ) | |||||
| Deposits, net of securitizations |
9,481 |
16,145 | ||||||
| Brokers and dealers receivable and payable |
(497 |
) |
(971 | ) | ||||
| Other |
(4,141 |
) |
(9,359 | ) | ||||
| Net cash from (used in) operating activities |
(1,643 |
) |
17,859 | |||||
| Cash flows from investing activities |
||||||||
| Change in interest-bearing deposits with banks |
10,006 |
(3,666 | ) | |||||
| Proceeds from sales and maturities of investment securities |
65,480 |
34,282 | ||||||
| Purchases of investment securities |
(60,887 |
) |
(40,515 | ) | ||||
| Net acquisitions of premises and equipment and other intangibles |
(482 |
) |
(698 | ) | ||||
| Net proceeds from (cash transferred for) dispositions |
9 |
– | ||||||
| Net cash from (used in) investing activities |
14,126 |
(10,597 | ) | |||||
| Cash flows from financing activities |
||||||||
| Issuance of subordinated debentures |
– |
1,500 | ||||||
| Repayment of subordinated debentures |
– |
(60 | ) | |||||
| Issue of common shares, net of issuance costs |
36 |
22 | ||||||
| Issue of preferred shares and other equity instruments, net of issuance costs |
744
|
– | ||||||
| Redemption of preferred shares and other equity instruments |
(21
|
) |
– | |||||
| Sales of treasury shares and other equity instruments |
1,340 |
1,019 | ||||||
| Purchases of treasury shares and other equity instruments |
(1,203 |
) |
(1,059 | ) | ||||
| Dividends paid on shares and distributions paid on other equity instruments |
(1,240 |
) |
(1,841 | ) | ||||
| Dividends/distributions paid to non-controlling interests |
(1 |
) |
(7 | ) | ||||
| Change in short-term borrowings of subsidiaries |
533 |
4,491 | ||||||
| Repayment of lease liabilities |
(153 |
) |
(166 | ) | ||||
| Net cash from (used in) financing activities |
35 |
3,899 | ||||||
| Effect of exchange rate changes on cash and due from banks |
(160 |
) |
2,719 | |||||
| Net change in cash and due from banks |
12,358 |
13,880 | ||||||
| Cash and due from banks at beginning of period (1)
|
61,989 |
72,397 | ||||||
| Cash and due from banks at end of period (1)
|
$ |
74,347 |
$ | 86,277 | ||||
| Cash flows from operating activities include: |
||||||||
| Amount of interest paid |
$ |
18,920 |
$ | 11,226 | ||||
| Amount of interest received |
24,950 |
17,492 | ||||||
| Amount of dividends received |
1,058 |
832 | ||||||
| Amount of income taxes paid |
855 |
1,436 | ||||||
| (1) | We are required to maintain balances due to regulatory requirements or contractual restrictions from central banks, other regulatory authorities, and other counterparties. The total balances were $3 billion as at January 31, 2024 (October 31, 2023 – $3 billion; January 31, 2023 – $2 billion; October 31, 2022 – $2 billion). |
| Note 1 General information |
| Note 2 Summary of significant accounting policies, estimates and judgments |
• |
For insurance contracts with direct participating features (applicable primarily to our segregated fund insurance contracts), the variable fee approach (VFA) is applied. |
• |
For insurance contracts and reinsurance contracts held with a short duration of one year or less (applicable primarily to our creditor reinsurance contracts issued, group life and health insurance contracts and travel insurance contracts), the premium allocation approach (PAA) is applied. |
• |
The general measurement method (GMM) is applied to all remaining contracts. |
• |
Insurance revenue is recognized as we provide insurance contract services under the groups of insurance contracts. For contracts measured using the PAA, the insurance revenue is generally recognized based on allocating expected premium receipts over the passage of time. For contracts measured using the GMM and VFA, insurance revenue represents the amount of consideration we expect to be entitled to in exchange for services in the period, which includes expected claims and expenses directly attributable to fulfilling insurance contracts (excluding any investment components), release of the risk adjustment for the period, CSM amortization to reflect services provided in the period, an allocation of premiums that relates to recovering insurance acquisition expenses and experience adjustments for premium receipts relating to current or past services. |
• |
Insurance service expense arising from insurance contracts include incurred claims and other directly attributable expenses in the current period (excluding investment components), amortization and impairment losses relating to insurance acquisition cash flows where applicable, changes relating to past or current services and changes in loss components of onerous groups of contracts. |
• |
Net income (expense) from reinsurance contracts held represents the amounts recovered from the reinsurers less the allocation of premiums paid on reinsurance contracts held. |
• |
Net investment income primarily comprises interest and dividend income and net gains (losses) on financial assets, including segregated fund assets, and derivatives relating to the Insurance segment. Financial assets supporting the Insurance segment are primarily measured at FVTPL and FVOCI. |
• |
Insurance and reinsurance finance income (expense) represents the net effect of and changes in the time value of money (including the time value of money relating to risk adjustment on non-financial risks) and financial risks on insurance contracts and reinsurance contracts held respectively. |
|
Note 2 Summary of significant accounting policies, estimates and judgments (continued)
|
| (Millions of Canadian dollars) | As at November 1, 2022 before transition |
Transition adjustments |
As at November 1, 2022 after transition |
|||||||||
Assets |
||||||||||||
Segregated fund net assets (1)
|
$ | 2,638 | $ | (2,638 | ) | $ | – | |||||
Other |
||||||||||||
Other assets (2)
|
80,300 | 4,261 | 84,561 | |||||||||
Total assets |
$ | 1,917,219 | $ | 1,623 | $ | 1,918,842 | ||||||
Liabilities |
||||||||||||
Segregated fund net liabilities (3)
|
$ | 2,638 | $ | (2,638 | ) | $ | – | |||||
Other |
||||||||||||
Insurance claims and policy benefit liabilities (4)
|
11,511 | (11,511 | ) | – | ||||||||
Insurance contract liabilities (4)
|
– | 18,226 | 18,226 | |||||||||
Other liabilities (5)
|
95,235 | (95 | ) | 95,140 | ||||||||
Total liabilities |
$ | 1,809,044 | $ | 3,982 | $ | 1,813,026 | ||||||
Total equity |
108,175 | (2,359 | ) | 105,816 | ||||||||
Total liabilities and equity |
$ | 1,917,219 | $ | 1,623 | $ | 1,918,842 | ||||||
| (1) | Segregated fund net assets are now presented within Other assets. |
| (2) | The increase is primarily attributable to the inclusion of segregated fund net assets, the increase in insurance contract assets, reinsurance contracts held assets and the tax effects of the IFRS 17 transition adjustment. |
| (3) | Segregated fund insurance contracts are now presented within Insurance contract liabilities. |
| (4) | Insurance claims and policy benefit liabilities measured under IFRS 4 is replaced with Insurance contract liabilities measured under IFRS 17. The increase in these balances is attributable to presentation changes and remeasurement impacts including the establishment of the CSM for in-force contracts at transition. |
| (5) | Certain liabilities that were previously presented in Other liabilities are now included in the measurement of insurance contracts or reinsurance contracts held. |
• |
$8.3 billion of securities and $2.0 billion of loans from designated as FVTPL to classified as FVTPL; |
• |
$0.5 billion of securities and $0.3 billion of loans from designated as FVTPL to classified as FVOCI; |
• |
$1.7 billion of securities from classified as FVOCI to classified as FVTPL; and |
• |
$0.3 billion of securities from classified as FVTPL to designated as FVOCI. |
|
Note 3 Fair value of financial instruments |
As at January 31, 2024 |
||||||||||||||||||||||||||||||||||||
Carrying value and fair value |
Carrying value |
Fair value |
||||||||||||||||||||||||||||||||||
| (Millions of Canadian dollars) | Financial instruments classified as FVTPL |
Financial instruments designated as FVTPL |
Financial instruments classified as FVOCI |
Financial instruments designated as FVOCI |
Financial instruments measured at amortized cost |
Financial instruments measured at amortized cost |
Total carrying amount |
Total fair value |
||||||||||||||||||||||||||||
Financial assets |
||||||||||||||||||||||||||||||||||||
Interest-bearing deposits with banks |
$ |
– |
$ |
51,812 |
$ |
– |
$ |
– |
$ |
9,268 |
$ |
9,268 |
$ |
61,080 |
$ |
61,080 |
||||||||||||||||||||
Securities |
||||||||||||||||||||||||||||||||||||
Trading |
192,679 |
918 |
– |
– |
– |
– |
193,597 |
193,597 |
||||||||||||||||||||||||||||
Investment, net of applicable allowance |
– |
– |
120,281 |
1,239 |
90,696 |
85,727 |
212,216 |
207,247 |
||||||||||||||||||||||||||||
192,679 |
918 |
120,281 |
1,239 |
90,696 |
85,727 |
405,813 |
400,844 |
|||||||||||||||||||||||||||||
Assets purchased under reverse repurchase agreements and securities borrowed |
292,204 |
– |
– |
– |
55,667 |
55,667 |
347,871 |
347,871 |
||||||||||||||||||||||||||||
Loans, net of applicable allowance |
||||||||||||||||||||||||||||||||||||
Retail |
490 |
– |
390 |
– |
566,006 |
550,375 |
566,886 |
551,255 |
||||||||||||||||||||||||||||
Wholesale |
12,740 |
1,318 |
952 |
– |
276,420 |
271,120 |
291,430 |
286,130 |
||||||||||||||||||||||||||||
13,230 |
1,318 |
1,342 |
– |
842,426 |
821,495 |
858,316 |
837,385 |
|||||||||||||||||||||||||||||
Other |
||||||||||||||||||||||||||||||||||||
Derivatives |
105,038 |
– |
– |
– |
– |
– |
105,038 |
105,038 |
||||||||||||||||||||||||||||
Other assets (1)
|
8,892 |
6 |
– |
– |
59,389 |
59,389 |
68,287 |
68,287 |
||||||||||||||||||||||||||||
Financial liabilities |
||||||||||||||||||||||||||||||||||||
Deposits |
||||||||||||||||||||||||||||||||||||
Personal |
$ |
241 |
$ |
28,089 |
$ |
423,859 |
$ |
423,208 |
$ |
452,189 |
$ |
451,538 |
||||||||||||||||||||||||
Business and government (2)
|
180 |
151,518 |
592,074 |
592,014 |
743,772 |
743,712 |
||||||||||||||||||||||||||||||
Bank (3)
|
– |
9,401 |
35,806 |
35,807 |
45,207 |
45,208 |
||||||||||||||||||||||||||||||
421 |
189,008 |
1,051,739 |
1,051,029 |
1,241,168 |
1,240,458 |
|||||||||||||||||||||||||||||||
Other |
||||||||||||||||||||||||||||||||||||
Obligations related to securities sold short |
35,012 |
– |
– |
– |
35,012 |
35,012 |
||||||||||||||||||||||||||||||
Obligations related to assets sold under repurchase agreements and securities loaned |
– |
300,662 |
33,828 |
33,828 |
334,490 |
334,490 |
||||||||||||||||||||||||||||||
Derivatives |
106,974 |
– |
– |
– |
106,974 |
106,974 |
||||||||||||||||||||||||||||||
Other liabilities (4)
|
(1,099 |
) |
6 |
84,201 |
84,356 |
83,108 |
83,263 |
|||||||||||||||||||||||||||||
Subordinated debentures |
– |
– |
11,525 |
11,511 |
11,525 |
11,511 |
||||||||||||||||||||||||||||||
|
Note 3 Fair value of financial instruments (continued)
|
| As at October 31, 2023 (Restated – Note 2) | ||||||||||||||||||||||||||||||||||||
| Carrying value and fair value | Carrying value | Fair value | ||||||||||||||||||||||||||||||||||
| (Millions of Canadian dollars) | Financial instruments classified as FVTPL |
Financial instruments designated as FVTPL |
Financial instruments classified as FVOCI |
Financial instruments designated as FVOCI |
Financial instruments measured at amortized cost |
Financial instruments measured at amortized cost |
Total carrying amount |
Total fair value | ||||||||||||||||||||||||||||
Financial assets |
||||||||||||||||||||||||||||||||||||
Interest-bearing deposits with banks |
$ | – | $ | 60,856 | $ | – | $ | – | $ | 10,230 | $ | 10,230 | $ | 71,086 | $ | 71,086 | ||||||||||||||||||||
Securities |
||||||||||||||||||||||||||||||||||||
Trading |
180,651 | 9,500 | – | – | – | – | 190,151 | 190,151 | ||||||||||||||||||||||||||||
Investment, net of applicable allowance |
– | – | 127,624 | 842 | 91,113 | 83,667 | 219,579 | 212,133 | ||||||||||||||||||||||||||||
| 180,651 | 9,500 | 127,624 | 842 | 91,113 | 83,667 | 409,730 | 402,284 | |||||||||||||||||||||||||||||
Assets purchased under reverse repurchase agreements and securities borrowed |
285,869 | – | – | – | 54,322 | 54,322 | 340,191 | 340,191 | ||||||||||||||||||||||||||||
Loans, net of applicable allowance |
||||||||||||||||||||||||||||||||||||
Retail |
114 | 362 | 280 | – | 566,376 | 542,480 | 567,132 | 543,236 | ||||||||||||||||||||||||||||
Wholesale |
5,629 | 3,619 | 597 | – | 275,796 | 268,843 | 285,641 | 278,688 | ||||||||||||||||||||||||||||
| 5,743 | 3,981 | 877 | – | 842,172 | 811,323 | 852,773 | 821,924 | |||||||||||||||||||||||||||||
Other |
||||||||||||||||||||||||||||||||||||
Derivatives |
142,450 | – | – | – | – | – | 142,450 | 142,450 | ||||||||||||||||||||||||||||
Other assets (1)
|
7,579 | 5 | – | – | 68,450 | 68,450 | 76,034 | 76,034 | ||||||||||||||||||||||||||||
Financial liabilities |
||||||||||||||||||||||||||||||||||||
Deposits |
||||||||||||||||||||||||||||||||||||
Personal |
$ | 109 | $ | 26,702 | $ | 415,135 | $ | 412,886 | $ | 441,946 | $ | 439,697 | ||||||||||||||||||||||||
Business and government (2)
|
174 | 137,454 | 607,447 | 605,260 | 745,075 | 742,888 | ||||||||||||||||||||||||||||||
Bank (3)
|
– | 11,462 | 33,204 | 33,160 | 44,666 | 44,622 | ||||||||||||||||||||||||||||||
| 283 | 175,618 | 1,055,786 | 1,051,306 | 1,231,687 | 1,227,207 | |||||||||||||||||||||||||||||||
Other |
||||||||||||||||||||||||||||||||||||
Obligations related to securities sold short |
33,651 | – | – | – | 33,651 | 33,651 | ||||||||||||||||||||||||||||||
Obligations related to assets sold under repurchase agreements and securities loaned |
– | 298,679 | 36,559 | 36,559 | 335,238 | 335,238 | ||||||||||||||||||||||||||||||
Derivatives |
142,629 | – | – | – | 142,629 | 142,629 | ||||||||||||||||||||||||||||||
Other liabilities (4)
|
(937 | ) | 11 | 92,539 | 92,441 | 91,613 | 91,515 | |||||||||||||||||||||||||||||
Subordinated debentures |
– | – | 11,386 | 11,213 | 11,386 | 11,213 | ||||||||||||||||||||||||||||||
| (1) | Includes Customers’ liability under acceptances and financial instruments recognized in Other assets. |
| (2) | Business and government deposits include deposits from regulated deposit-taking institutions other than banks. |
| (3) | Bank deposits refer to deposits from regulated banks and central banks. |
| (4) | Includes Acceptances and financial instruments recognized in Other liabilities. |
| As at | ||||||||||||||||||||||||||||||||||||||||||
January 31, 2024 |
October 31, 2023 (Restated – Note 2) | |||||||||||||||||||||||||||||||||||||||||
Fair value measurements using |
Netting adjustments |
|
Fair value measurements using |
Netting
adjustments
|
|
|||||||||||||||||||||||||||||||||||||
| (Millions of Canadian dollars) | Level 1 |
Level 2 |
Level 3 |
Fair value |
Level 1 | Level 2 | Level 3 | Fair value | ||||||||||||||||||||||||||||||||||
Financial assets |
||||||||||||||||||||||||||||||||||||||||||
Interest-bearing deposits with banks |
$ |
– |
$ |
51,812 |
$ |
– |
$ |
$ |
51,812 |
$ | – | $ | 60,856 | $ | – | $ | $ | 60,856 | ||||||||||||||||||||||||
Securities |
||||||||||||||||||||||||||||||||||||||||||
Trading |
||||||||||||||||||||||||||||||||||||||||||
Debt issued or guaranteed by: |
||||||||||||||||||||||||||||||||||||||||||
Canadian government (1)
|
||||||||||||||||||||||||||||||||||||||||||
Federal |
19,907 |
3,320 |
– |
23,227 |
26,675 | 2,581 | – | 29,256 | ||||||||||||||||||||||||||||||||||
Provincial and municipal |
– |
17,816 |
– |
17,816 |
– | 16,389 | – | 16,389 | ||||||||||||||||||||||||||||||||||
U.S. federal, state, municipal and agencies (1), (2)
|
1,734 |
55,806 |
– |
57,540 |
2,249 | 50,439 | – | 52,688 | ||||||||||||||||||||||||||||||||||
Other OECD government (3)
|
2,047 |
2,942 |
– |
4,989 |
2,055 | 2,577 | – | 4,632 | ||||||||||||||||||||||||||||||||||
Mortgage-backed securities (1)
|
– |
2 |
– |
2 |
– | 2 | – | 2 | ||||||||||||||||||||||||||||||||||
Asset-backed securities |
||||||||||||||||||||||||||||||||||||||||||
Non-CDO securities (4)
|
– |
1,205 |
– |
1,205 |
– | 1,245 | – | 1,245 | ||||||||||||||||||||||||||||||||||
Corporate debt and other debt |
– |
24,175 |
– |
24,175 |
– | 22,615 | – | 22,615 | ||||||||||||||||||||||||||||||||||
Equities |
60,184 |
2,173 |
2,286 |
64,643 |
58,826 | 2,232 | 2,266 | 63,324 | ||||||||||||||||||||||||||||||||||
83,872 |
107,439 |
2,286 |
193,597 |
89,805 | 98,080 | 2,266 | 190,151 | |||||||||||||||||||||||||||||||||||
Investment |
||||||||||||||||||||||||||||||||||||||||||
Debt issued or guaranteed by: |
||||||||||||||||||||||||||||||||||||||||||
Canadian government (1)
|
||||||||||||||||||||||||||||||||||||||||||
Federal |
313 |
3,730 |
– |
4,043 |
2,731 | 3,528 | – | 6,259 | ||||||||||||||||||||||||||||||||||
Provincial and municipal |
– |
1,957 |
– |
1,957 |
– | 2,748 | – | 2,748 | ||||||||||||||||||||||||||||||||||
U.S. federal, state, municipal and agencies (1)
|
729 |
63,053 |
– |
63,782 |
275 | 73,020 | – | 73,295 | ||||||||||||||||||||||||||||||||||
Other OECD government |
2,029 |
7,620 |
– |
9,649 |
– | 6,192 | – | 6,192 | ||||||||||||||||||||||||||||||||||
Mortgage-backed securities (1)
|
– |
2,502 |
30 |
2,532 |
– | 2,672 | 29 | 2,701 | ||||||||||||||||||||||||||||||||||
Asset-backed securities |
||||||||||||||||||||||||||||||||||||||||||
CDO |
– |
7,766 |
– |
7,766 |
– | 8,265 | – | 8,265 | ||||||||||||||||||||||||||||||||||
Non-CDO securities |
– |
410 |
– |
410 |
– | 441 | – | 441 | ||||||||||||||||||||||||||||||||||
Corporate debt and other debt |
– |
29,994 |
148 |
30,142 |
– | 27,574 | 149 | 27,723 | ||||||||||||||||||||||||||||||||||
Equities |
369 |
408 |
462 |
1,239 |
38 | 338 | 466 | 842 | ||||||||||||||||||||||||||||||||||
3,440 |
117,440 |
640 |
121,520 |
3,044 | 124,778 | 644 | 128,466 | |||||||||||||||||||||||||||||||||||
Assets purchased under reverse repurchase agreements and securities borrowed |
– |
292,204 |
– |
292,204 |
– | 285,869 | – | 285,869 | ||||||||||||||||||||||||||||||||||
Loans |
– |
14,075 |
1,815 |
15,890 |
– | 8,742 | 1,859 | 10,601 | ||||||||||||||||||||||||||||||||||
Other |
||||||||||||||||||||||||||||||||||||||||||
Derivatives |
||||||||||||||||||||||||||||||||||||||||||
Interest rate contracts |
– |
30,982 |
329 |
31,311 |
– | 39,243 | 290 | 39,533 | ||||||||||||||||||||||||||||||||||
Foreign exchange contracts |
– |
59,066 |
9 |
59,075 |
– | 89,644 | 4 | 89,648 | ||||||||||||||||||||||||||||||||||
Credit derivatives |
– |
160 |
– |
160 |
– | 224 | – | 224 | ||||||||||||||||||||||||||||||||||
Other contracts |
2,478 |
14,187 |
42 |
16,707 |
2,352 | 13,927 | 111 | 16,390 | ||||||||||||||||||||||||||||||||||
Valuation adjustments |
– |
(1,503 |
) |
4 |
(1,499 |
) |
– | (1,805 | ) | 4 | (1,801 | ) | ||||||||||||||||||||||||||||||
Total gross derivatives |
2,478 |
102,892 |
384 |
105,754 |
2,352 | 141,233 | 409 | 143,994 | ||||||||||||||||||||||||||||||||||
Netting adjustments |
(716) |
(716 |
) |
(1,544) | (1,544 | ) | ||||||||||||||||||||||||||||||||||||
Total derivatives |
105,038 |
142,450 | ||||||||||||||||||||||||||||||||||||||||
Other assets |
4,602 |
4,286 |
10 |
8,898 |
4,152 | 3,421 | 11 | 7,584 | ||||||||||||||||||||||||||||||||||
$ |
94,392 |
$ |
690,148 |
$ |
5,135 |
$ |
(716) |
$ |
788,959 |
$ | 99,353 | $ | 722,979 | $ | 5,189 | $ | (1,544) | $ | 825,977 | |||||||||||||||||||||||
Financial liabilities |
||||||||||||||||||||||||||||||||||||||||||
Deposits |
||||||||||||||||||||||||||||||||||||||||||
Personal |
$ |
– |
$ |
27,901 |
$ |
429 |
$ |
$ |
28,330 |
$ | – | $ | 26,428 | $ | 383 | $ | $ | 26,811 | ||||||||||||||||||||||||
Business and government |
– |
151,698 |
– |
151,698 |
– | 137,628 | – | 137,628 | ||||||||||||||||||||||||||||||||||
Bank |
– |
9,401 |
– |
9,401 |
– | 11,462 | – | 11,462 | ||||||||||||||||||||||||||||||||||
Other |
||||||||||||||||||||||||||||||||||||||||||
Obligations related to securities sold short |
13,343 |
21,669 |
– |
35,012 |
14,391 | 19,260 | – | 33,651 | ||||||||||||||||||||||||||||||||||
Obligations related to assets sold under repurchase agreements and securities loaned |
– |
300,662 |
– |
300,662 |
– | 298,679 | – | 298,679 | ||||||||||||||||||||||||||||||||||
Derivatives |
||||||||||||||||||||||||||||||||||||||||||
Interest rate contracts |
– |
28,964 |
864 |
29,828 |
– | 41,249 | 952 | 42,201 | ||||||||||||||||||||||||||||||||||
Foreign exchange contracts |
– |
51,620 |
58 |
51,678 |
– | 81,750 | 53 | 81,803 | ||||||||||||||||||||||||||||||||||
Credit derivatives |
– |
166 |
– |
166 |
– | 176 | – | 176 | ||||||||||||||||||||||||||||||||||
Other contracts |
3,411 |
22,894 |
391 |
26,696 |
3,119 | 17,306 | 549 | 20,974 | ||||||||||||||||||||||||||||||||||
Valuation adjustments |
– |
(678 |
) |
– |
(678 |
) |
– | (982 | ) | 1 | (981 | ) | ||||||||||||||||||||||||||||||
Total gross derivatives |
3,411 |
102,966 |
1,313 |
107,690 |
3,119 | 139,499 | 1,555 | 144,173 | ||||||||||||||||||||||||||||||||||
Netting adjustments |
(716) |
(716 |
) |
(1,544) | (1,544 | ) | ||||||||||||||||||||||||||||||||||||
Total derivatives |
106,974 |
142,629 | ||||||||||||||||||||||||||||||||||||||||
Other liabilities |
394 |
(1,487 |
) |
– |
(1,093 |
) |
370 | (1,296 | ) | – | (926 | ) | ||||||||||||||||||||||||||||||
$ |
17,148 |
$ |
612,810 |
$ |
1,742 |
$ |
(716) |
$ |
630,984 |
$ | 17,880 | $ | 631,660 | $ | 1,938 | $ | (1,544) | $ | 649,934 | |||||||||||||||||||||||
| (1) | As at January 31, 2024, residential and commercial mortgage-backed securities (MBS) included in all fair value levels of trading securities were $13,307 million and $nil (October 31, 2023 – $14,345 million and $nil), respectively, and in all fair value levels of Investment securities were $26,826million and $2,454million October 31, 2023 – $24,365 million and $2,618 million), respectively. (
|
| (2) | United States (U.S.). |
| (3) | Organisation for Economic Co-operation and Development (OECD). |
| (4) | Collateralized debt obligations (CDO). |
|
Note 3 Fair value of financial instruments (continued)
|
For the three months ended January 31, 2024 |
||||||||||||||||||||||||||||||||||||
| (Millions of Canadian dollars) | Fair value at beginning of period |
Gains (losses) included in earnings |
Gains (losses) included in OCI |
Purchases (issuances) |
Settlement (sales) and other |
Transfers into Level 3 |
Transfers out of Level 3 |
Fair value at end of period |
Gains (losses) included in earnings for positions still held |
|||||||||||||||||||||||||||
Assets |
||||||||||||||||||||||||||||||||||||
Securities |
||||||||||||||||||||||||||||||||||||
Trading |
||||||||||||||||||||||||||||||||||||
Debt issued or guaranteed by: |
||||||||||||||||||||||||||||||||||||
U.S. state, municipal and agencies |
$ |
– |
$ |
– |
$ |
– |
$ |
– |
$ |
– |
$ |
– |
$ |
– |
$ |
– |
$ |
– |
||||||||||||||||||
Asset-backed securities |
||||||||||||||||||||||||||||||||||||
Non-CDO securities |
– |
– |
– |
– |
– |
– |
– |
– |
– |
|||||||||||||||||||||||||||
Corporate debt and other debt |
– |
– |
– |
– |
– |
– |
– |
– |
– |
|||||||||||||||||||||||||||
Equities |
2,266 |
(18 |
) |
(36 |
) |
98 |
(24 |
) |
– |
– |
2,286 |
1 |
||||||||||||||||||||||||
2,266 |
(18 |
) |
(36 |
) |
98 |
(24 |
) |
– |
– |
2,286 |
1 |
|||||||||||||||||||||||||
Investment |
||||||||||||||||||||||||||||||||||||
Mortgage-backed securities |
29 |
– |
1 |
– |
– |
– |
– |
30 |
n.a. |
|||||||||||||||||||||||||||
Corporate debt and other debt |
149 |
– |
3 |
– |
(4 |
) |
– |
– |
148 |
n.a. |
||||||||||||||||||||||||||
Equities |
466 |
– |
(4 |
) |
– |
– |
– |
– |
462 |
n.a. |
||||||||||||||||||||||||||
644 |
– |
– |
– |
(4 |
) |
– |
– |
640 |
n.a. |
|||||||||||||||||||||||||||
Loans |
1,859 |
(46 |
) |
(8 |
) |
165 |
(193 |
) |
38 |
– |
1,815 |
(44 |
) |
|||||||||||||||||||||||
Other |
||||||||||||||||||||||||||||||||||||
Net derivative balances (3)
|
||||||||||||||||||||||||||||||||||||
Interest rate contracts |
(662 |
) |
80 |
– |
12 |
16 |
17 |
2 |
(535 |
) |
84 |
|||||||||||||||||||||||||
Foreign exchange contracts |
(49 |
) |
(11 |
) |
1 |
5 |
5 |
– |
– |
(49 |
) |
(11 |
) |
|||||||||||||||||||||||
Other contracts |
(438 |
) |
(123 |
) |
14 |
(15 |
) |
(2 |
) |
(7 |
) |
222 |
(349 |
) |
(71 |
) |
||||||||||||||||||||
Valuation adjustments |
3 |
– |
– |
1 |
– |
– |
– |
4 |
– |
|||||||||||||||||||||||||||
Other assets |
11 |
– |
– |
– |
(1 |
) |
– |
– |
10 |
– |
||||||||||||||||||||||||||
$ |
3,634 |
$ |
(118 |
) |
$ |
(29 |
) |
$ |
266 |
$ |
(203 |
) |
$ |
48 |
$ |
224 |
$ |
3,822 |
$ |
(41 |
) |
|||||||||||||||
Liabilities |
||||||||||||||||||||||||||||||||||||
Deposits |
$ |
(383 |
) |
$ |
(47 |
) |
$ |
3 |
$ |
(122 |
) |
$ |
13 |
$ |
(1 |
) |
$ |
108 |
$ |
(429 |
) |
$ |
(33 |
) |
||||||||||||
$ |
(383 |
) |
$ |
(47 |
) |
$ |
3 |
$ |
(122 |
) |
$ |
13 |
$ |
(1 |
) |
$ |
108 |
$ |
(429 |
) |
$ |
(33 |
) |
|||||||||||||
| For the three months ended January 31, 2023 | ||||||||||||||||||||||||||||||||||||
| (Millions of Canadian dollars) | Fair value at beginning of period |
Gains (losses) included in earnings |
Gains (losses) included in OCI (1) |
Purchases (issuances) |
Settlement (sales) and other (2) |
Transfers into Level 3 |
Transfers out of Level 3 |
Fair value at end of period |
Gains
(losses) included
in earnings for positions still held |
|||||||||||||||||||||||||||
Assets |
||||||||||||||||||||||||||||||||||||
Securities |
||||||||||||||||||||||||||||||||||||
Trading |
||||||||||||||||||||||||||||||||||||
Debt issued or guaranteed by: |
||||||||||||||||||||||||||||||||||||
U.S. state, municipal and agencies |
$ | 4 | $ | – | $ | – | $ | – | $ | (4 | ) | $ | – | $ | – | $ | – | $ | – | |||||||||||||||||
Asset-backed securities |
||||||||||||||||||||||||||||||||||||
Non-CDO securities |
2 | – | – | – | (2 | ) | – | – | – | – | ||||||||||||||||||||||||||
Corporate debt and other debt |
7 | – | – | – | – | – | (7 | ) | – | – | ||||||||||||||||||||||||||
Equities |
1,874 | (14 | ) | (25 | ) | 250 | (20 | ) | 41 | – | 2,106 | (32 | ) | |||||||||||||||||||||||
| 1,887 | (14 | ) | (25 | ) | 250 | (26 | ) | 41 | (7 | ) | 2,106 | (32 | ) | |||||||||||||||||||||||
Investment |
||||||||||||||||||||||||||||||||||||
Mortgage-backed securities |
28 | – | – | – | – | – | – | 28 | n.a. | |||||||||||||||||||||||||||
Corporate debt and other debt |
151 | – | (1 | ) | – | (1 | ) | – | – | 149 | n.a. | |||||||||||||||||||||||||
Equities |
397 | – | 24 | – | (1 | ) | – | – | 420 | n.a. | ||||||||||||||||||||||||||
| 576 | – | 23 | – | (2 | ) | – | – | 597 | n.a. | |||||||||||||||||||||||||||
Loans |
1,692 | (52 | ) | (7 | ) | 1,193 | (120 | ) | 28 | (137 | ) | 2,597 | (15 | ) | ||||||||||||||||||||||
Other |
||||||||||||||||||||||||||||||||||||
Net derivative balances (3)
|
||||||||||||||||||||||||||||||||||||
Interest rate contracts |
(859 | ) | 5 | 5 | (20 | ) | 173 | 18 | 24 | (654 | ) | 8 | ||||||||||||||||||||||||
Foreign exchange contracts |
(132 | ) | 5 | 8 | 4 | 37 | – | 15 | (63 | ) | 8 | |||||||||||||||||||||||||
Other contracts |
(785 | ) | (55 | ) | 17 | (8 | ) | 62 | (31 | ) | 253 | (547 | ) | (26 | ) | |||||||||||||||||||||
Valuation adjustments |
53 | – | – | – | (36 | ) | – | – | 17 | – | ||||||||||||||||||||||||||
Other assets |
15 | – | – | – | (2 | ) | – | – | 13 | – | ||||||||||||||||||||||||||
| $ | 2,447 | $ | (111 | ) | $ | 21 | $ | 1,419 | $ | 86 | $ | 56 | $ | 148 | $ | 4,066 | $ | (57 | ) | |||||||||||||||||
Liabilities |
||||||||||||||||||||||||||||||||||||
Deposits |
$ | (241 | ) | $ | (20 | ) | $ | 1 | $ | (35 | ) | $ | 2 | $ | (34 | ) | $ | 77 | $ | (250 | ) | $ | (14 | ) | ||||||||||||
| $ | (241 | ) | $ | (20 | ) | $ | 1 | $ | (35 | ) | $ | 2 | $ | (34 | ) | $ | 77 | $ | (250 | ) | $ | (14 | ) | |||||||||||||
| (1) | These amounts include the foreign currency translation gains or losses arising on consolidation of foreign subsidiaries relating to the Level 3 instruments, where applicable. The unrealized gains on Investment securities recognized in other comprehensive income (OCI) were $10 million for the three months ended January 31, 2024 (January 31, 2023 – gains of $18 million), excluding the translation gains or losses arising on consolidation. |
| (2) | Other includes amortization of premiums or discounts recognized in net income. |
| (3) | Net derivatives as at January 31, 2024 included derivative assets of $384 million (January 31, 2023 – $336 million) and derivative liabilities of $1,313million (January 31, 2023 – $1,583 million). |
| n.a. | not applicable |
| Note 3 Fair value of financial instruments (continued)
|
For the three months ended |
||||||||
(Millions of Canadian dollars) |
January 31 2024 |
January 31 2023 |
||||||
| Interest and dividend income (1), (2)
|
||||||||
| Financial instruments measured at fair value through profit or loss |
$ |
9,474 |
$ | 6,709 | ||||
| Financial instrume nt s measured at fair value through other comprehensive income |
1,608 |
942 | ||||||
| Financial instruments measured at amortized cost |
14,527 |
11,686 | ||||||
25,609 |
19,337 | |||||||
| Interest expense (1)
|
||||||||
| Financial instruments measured at fair value through profit or loss |
9,084 |
6,240 | ||||||
| Financial instruments measured at amortized cost |
10,193 |
6,895 | ||||||
19,277 |
13,135 | |||||||
| Net interest income |
$ |
6,332 |
$ | 6,202 | ||||
| (1) | Excludes interest and dividend income of $272 million (January 31, 2023 – $143 |
| (2) | Includes dividend income for the three months ended January 31, 2024 of $ 957 milliono nsolidated Statements of Income. |
| Note 4 Securities |
| As at | ||||||||||||||||||||||||||||||||||
January 31, 2024
(3)
|
October 31, 2023 | |||||||||||||||||||||||||||||||||
| (Millions of Canadian dollars) | Cost/ Amortized cost |
Gross unrealized gains |
Gross unrealized losses |
Fair value |
Cost/ Amortized cost |
Gross unrealized gains |
Gross unrealized losses |
Fair value | ||||||||||||||||||||||||||
| Debt issued or guaranteed by: |
||||||||||||||||||||||||||||||||||
| Canadian government |
||||||||||||||||||||||||||||||||||
| Federal |
$ |
4,058 |
$ |
3 |
$ |
(18 |
) |
$ |
4,043 |
$ | 6,609 | $ | 1 | $ | (351 | ) | $ | 6,259 | ||||||||||||||||
| Provincial and municipal |
1,937 |
48 |
(28 |
) |
1,957 |
3,396 | 2 | (650 | ) | 2,748 | ||||||||||||||||||||||||
| U.S. federal, state, municipal and agencies |
65,178 |
367 |
(1,763 |
) |
63,782 |
75,326 | 343 | (2,374 | ) | 73,295 | ||||||||||||||||||||||||
| Other OECD government |
9,664 |
6 |
(21 |
) |
9,649 |
6,200 | 1 | (9 | ) | 6,192 | ||||||||||||||||||||||||
| Mortgage-backed securities |
2,566 |
1 |
(35 |
) |
2,532 |
2,762 | – | (61 | ) | 2,701 | ||||||||||||||||||||||||
| Asset-backed securities |
||||||||||||||||||||||||||||||||||
| CDO |
7,769 |
9 |
(12 |
) |
7,766 |
8,308 | 3 | (46 | ) | 8,265 | ||||||||||||||||||||||||
| Non-CDO securities |
414 |
– |
(4 |
) |
410 |
444 | 2 | (5 | ) | 441 | ||||||||||||||||||||||||
| Corporate debt and other debt |
30,131 |
95 |
(84 |
) |
30,142 |
27,774 | 44 | (95 | ) | 27,723 | ||||||||||||||||||||||||
| Equities |
816 |
429 |
(6 |
) |
1,239 |
493 | 357 | (8 | ) | 842 | ||||||||||||||||||||||||
$ |
122,533 |
$ |
958 |
$ |
(1,971 |
) |
$ |
121,520 |
$ | 131,312 | $ | 753 | $ | (3,599 | ) | $ | 128,466 | |||||||||||||||||
| (1) | Excludes $90,696 million of held-to-collect |
| (2) | Gross unrealized gains and losses includes $(33) million |
(3) |
These amounts reflect certain reclassifications made upon the adoption of IFRS 17 as at November 1, 2023 with no restatement of comparative information. Refer to Note 2 for further details. |
| • | Transfers between stages, which are presumed to occur before any corresponding remeasurement of the allowance. |
| • | Purchases, which reflect the allowance related to assets newly recognized during the period, including those assets that were derecognized following a modification of terms. |
| • | Sales and maturities, which reflect the allowance related to assets derecognized during the period without a credit loss being incurred, including those assets that were derecognized following a modification of terms. |
| • | Changes in risk, parameters and exposures, which comprise the impact of changes in model inputs or assumptions, including changes in forward-looking macroeconomic conditions; partial repayments; changes in the measurement following a transfer between stages; and unwinding of the time value discount due to the passage of time. |
| For the three months ended | ||||||||||||||||||||||||||||||||||||||||||||
January 31, 2024 |
January 31, 2023 | |||||||||||||||||||||||||||||||||||||||||||
Performing |
Impaired |
Performing | Impaired | |||||||||||||||||||||||||||||||||||||||||
| (Millions of Canadian dollars) | Stage 1 |
Stage 2 |
Stage 3 |
Total |
Stage 1 | Stage 2 | Stage 3 (2) | Total | ||||||||||||||||||||||||||||||||||||
| Balance at beginning of period |
$ |
4 |
$ |
– |
$ |
(37 |
) |
$ |
(33 |
) |
$ | 3 | $ | 1 | $ | (23 | ) | $ | (19 | ) | ||||||||||||||||||||||||
| Provision for credit losses |
||||||||||||||||||||||||||||||||||||||||||||
| Transfers to stage 1 |
– |
– |
– |
– |
– | – | – | – | ||||||||||||||||||||||||||||||||||||
| Transfers to stage 2 |
– |
– |
– |
– |
– | – | – | – | ||||||||||||||||||||||||||||||||||||
| Transfers to stage 3 |
– |
– |
– |
– |
– | – | – | – | ||||||||||||||||||||||||||||||||||||
| Purchases |
3 |
– |
– |
3 |
2 | – | – | 2 | ||||||||||||||||||||||||||||||||||||
| S a les and maturities |
(1 |
) |
– |
– |
(1 |
) |
– | – | – | – | ||||||||||||||||||||||||||||||||||
| Changes in risk, parameters and exposures |
(2 |
) |
– |
(2 |
) |
(4 |
) |
(1 | ) | – | (2 | ) | (3 | ) | ||||||||||||||||||||||||||||||
| Exchange rate and other |
– |
– |
2 |
2 |
– | – | 1 | 1 | ||||||||||||||||||||||||||||||||||||
| Balance at end of period |
$ |
4 |
$ |
– |
$ |
(37 |
) |
$ |
(33 |
) |
$ | 4 | $ | 1 | $ | (24 | ) | $ | (19 | ) | ||||||||||||||||||||||||
| (1) | Expected credit losses on debt securities at FVOCI are not separately recognized on the balance sheet as the related securities are recorded at fair value. The cumulative amount of credit losses recognized in income is presented in Other components of equity. |
| (2) | Reflects changes in the allowance for purchased credit impaired securities. |
| For the three months ended | ||||||||||||||||||||||||||||||||||||||||||||
January 31, 2024 |
January 31, 2023 | |||||||||||||||||||||||||||||||||||||||||||
Performing |
Impaired |
Performing | Impaired | |||||||||||||||||||||||||||||||||||||||||
| (Millions of Canadian dollars) | Stage 1 |
Stage 2 |
Stage 3 |
Total |
Stage 1 | Stage 2 | Stage 3 | Total | ||||||||||||||||||||||||||||||||||||
| Balance at beginning of period |
$ |
8 |
$ |
15 |
$ |
– |
$ |
23 |
$ | 8 | $ | 14 | $ | – | $ | 22 | ||||||||||||||||||||||||||||
| Provision for credit losses |
||||||||||||||||||||||||||||||||||||||||||||
| Transfers to stage 1 |
– |
– |
– |
– |
– | – | – | – | ||||||||||||||||||||||||||||||||||||
| Transfers to stage 2 |
– |
– |
– |
– |
– | – | – | – | ||||||||||||||||||||||||||||||||||||
| Transfers to stage 3 |
– |
– |
– |
– |
– | – | – | – | ||||||||||||||||||||||||||||||||||||
| Purchases |
3 |
– |
– |
3 |
4 | – | – | 4 | ||||||||||||||||||||||||||||||||||||
| Sales and maturities |
– |
– |
– |
– |
– | – | – | – | ||||||||||||||||||||||||||||||||||||
| Changes in risk, parameters and exposures |
(2 |
) |
– |
– |
(2 |
) |
(2 | ) | (1 | ) | – | (3 | ) | |||||||||||||||||||||||||||||||
| Exchange rate and other |
– |
(1 |
) |
– |
(1 |
) |
– | – | – | – | ||||||||||||||||||||||||||||||||||
| Balance at end of period |
$ |
9 |
$ |
14 |
$ |
– |
$ |
23 |
$ | 10 | $ | 13 | $ | – | $ | 23 | ||||||||||||||||||||||||||||
| As at | ||||||||||||||||||||||||||||||||||||||||||||
January 31, 2024 |
October 31, 2023 |
|||||||||||||||||||||||||||||||||||||||||||
Performing |
Impaired |
Performing |
Impaired |
|||||||||||||||||||||||||||||||||||||||||
(Millions of Canadian dollars) |
Stage 1 |
Stage 2 |
Stage 3 |
Total |
Stage 1 |
Stage 2 |
Stage 3 (1) |
Total |
||||||||||||||||||||||||||||||||||||
| Investment securities |
||||||||||||||||||||||||||||||||||||||||||||
| Securities at FVOCI |
||||||||||||||||||||||||||||||||||||||||||||
| Investment grade |
$ |
119,277 |
$ |
8 |
$ |
– |
$ |
119,285 |
$ | 126,732 | $ | 1 | $ | – | $ | 126,733 | ||||||||||||||||||||||||||||
| Non-investment grade |
848 |
– |
– |
848 |
742 | – | – | 742 | ||||||||||||||||||||||||||||||||||||
| Impaired |
– |
– |
148 |
148 |
– | – | 149 | 149 | ||||||||||||||||||||||||||||||||||||
120,125 |
8 |
148 |
120,281 |
127,474 | 1 | 149 | 127,624 | |||||||||||||||||||||||||||||||||||||
| Items not subject to impairment (2)
|
1,239 |
842 | ||||||||||||||||||||||||||||||||||||||||||
$ |
121,520 |
$ | 128,466 | |||||||||||||||||||||||||||||||||||||||||
| Securities at amortized cost |
||||||||||||||||||||||||||||||||||||||||||||
| Investment grade |
$ |
89,598 |
$ |
– |
$ |
– |
$ |
89,598 |
$ | 89,947 | $ | – | $ | – | $ | 89,947 | ||||||||||||||||||||||||||||
| Non-investment grade |
941 |
180 |
– |
1,121 |
990 | 199 | – | 1,189 | ||||||||||||||||||||||||||||||||||||
| Impaired |
– |
– |
– |
– |
– | – | – | – | ||||||||||||||||||||||||||||||||||||
90,539 |
180 |
– |
90,719 |
90,937 | 199 | – | 91,136 | |||||||||||||||||||||||||||||||||||||
| Allowance for credit losses |
9 |
14 |
– |
23 |
8 | 15 | – | 23 | ||||||||||||||||||||||||||||||||||||
$ |
90,530 |
$ |
166 |
$ |
– |
$ |
90,696 |
$ | 90,929 | $ | 184 | $ | – | $ | 91,113 | |||||||||||||||||||||||||||||
| (1) | Reflects $148 |
| (2) | Investment securities at FVOCI not subject to impairment represent equity securities designated as FVOCI. |
|
Note 5 Loans and allowance for credit losses |
| For the three months ended | ||||||||||||||||||||||||||||||||||||||||||
January 31, 2024 |
January 31, 2023 | |||||||||||||||||||||||||||||||||||||||||
| (Millions of Canadian dollars) | Balance at beginning of period |
Provision for credit losses |
Net write-offs
|
Exchange rate and other |
Balance at end of period |
Balance at beginning of period |
Provision for credit losses |
Net write-offs
|
Exchange rate and other |
Balance at end of period |
||||||||||||||||||||||||||||||||
Retail |
||||||||||||||||||||||||||||||||||||||||||
Residential mortgages |
$ |
481 |
$ |
74 |
$ |
(1 |
) |
$ |
(12 |
) |
$ |
542 |
$ | 432 | $ | 51 | $ | (5 | ) | $ | (9 | ) | $ | 469 | ||||||||||||||||||
Personal |
1,228 |
202 |
(139 |
) |
(4 |
) |
1,287 |
1,043 | 169 | (83 | ) | – | 1,129 | |||||||||||||||||||||||||||||
Credit cards |
1,069 |
183 |
(150 |
) |
(1 |
) |
1,101 |
893 | 136 | (102 | ) | (1 | ) | 926 | ||||||||||||||||||||||||||||
Small business |
194 |
37 |
(15 |
) |
(4 |
) |
212 |
194 | 17 | (9 | ) | 2 | 204 | |||||||||||||||||||||||||||||
Wholesale |
2,326 |
329 |
(149 |
) |
(61 |
) |
2,445 |
1,574 | 161 | (17 | ) | (38 | ) | 1,680 | ||||||||||||||||||||||||||||
Customers’ liability under acceptances |
50 |
(7 |
) |
– |
–
|
43 |
45 | (4 | ) | – | – | 41 | ||||||||||||||||||||||||||||||
$ |
5,348 |
$ |
818 |
$ |
(454 |
) |
$ |
(82 |
) |
$ |
5,630 |
$ | 4,181 | $ | 530 | $ | (216 | ) | $ | (46 | ) | $ | 4,449 | |||||||||||||||||||
Presented as: |
||||||||||||||||||||||||||||||||||||||||||
Allowance for loan losses |
$ |
5,004 |
$ |
5,299 |
$ | 3,753 | $ | 3,999 | ||||||||||||||||||||||||||||||||||
Other liabilities – Provisions |
288 |
282 |
378 | 403 | ||||||||||||||||||||||||||||||||||||||
Customers’ liability under acceptances |
50 |
43 |
45 | 41 | ||||||||||||||||||||||||||||||||||||||
Other components of equity |
6 |
6 |
5 | 6 | ||||||||||||||||||||||||||||||||||||||
| • | Transfers between stages, which are presumed to occur before any corresponding remeasurements of the allowance. |
| • | Originations, which reflect the allowance related to assets newly recognized during the period, including those assets that were derecognized following a modification of terms. |
| • | Maturities, which reflect the allowance related to assets derecognized during the period without a credit loss being incurred, including those assets that were derecognized following a modification of terms. |
| • | Changes in risk, parameters and exposures, which comprise the impact of changes in model inputs or assumptions, including changes in forward-looking macroeconomic conditions; partial repayments and additional draws on existing facilities; changes in the measurement following a transfer between stages; and unwinding of the time value discount due to the passage of time in stage 1 and stage 2. |
| For the three months ended | ||||||||||||||||||||||||||||||||||||||
January 31, 2024 |
January 31, 2023 | |||||||||||||||||||||||||||||||||||||
Performing |
Impaired |
Performing | Impaired | |||||||||||||||||||||||||||||||||||
| (Millions of Canadian dollars) | Stage 1 |
Stage 2 |
Stage 3 |
Total |
Stage 1 | Stage 2 | Stage 3 | Total | ||||||||||||||||||||||||||||||
Residential mortgages |
||||||||||||||||||||||||||||||||||||||
Balance at beginning of period |
$ |
223 |
$ |
90 |
$ |
168 |
$ |
481 |
$ | 235 | $ | 65 | $ | 132 | $ | 432 | ||||||||||||||||||||||
Provision for credit losses |
||||||||||||||||||||||||||||||||||||||
Transfers to stage 1 |
17 |
(17 |
) |
– |
– |
13 | (13 | ) | – | – | ||||||||||||||||||||||||||||
Transfers to stage 2 |
(6 |
) |
10 |
(4 |
) |
– |
(6 | ) | 10 | (4 | ) | – | ||||||||||||||||||||||||||
Transfers to stage 3 |
(1 |
) |
(8 |
) |
9 |
– |
– | (3 | ) | 3 | – | |||||||||||||||||||||||||||
Originations |
19 |
– |
– |
19 |
30 | – | – | 30 | ||||||||||||||||||||||||||||||
Maturities |
(4 |
) |
(4 |
) |
– |
(8 |
) |
(4 | ) | (2 | ) | – | (6 | ) | ||||||||||||||||||||||||
Changes in risk, parameters and exposures |
(1 |
) |
40 |
24 |
63 |
(13 | ) | 25 | 15 | 27 | ||||||||||||||||||||||||||||
Write-offs |
– |
– |
(4 |
) |
(4 |
) |
– | – | (8 | ) | (8 | ) | ||||||||||||||||||||||||||
Recoveries |
– |
– |
3 |
3 |
– | – | 3 | 3 | ||||||||||||||||||||||||||||||
Exchange rate and other |
(2 |
) |
(1 |
) |
(9 |
) |
(12 |
) |
(1 | ) | – | (8 | ) | (9 | ) | |||||||||||||||||||||||
Balance at end of period |
$ |
245 |
$ |
110 |
$ |
187 |
$ |
542 |
$ | 254 | $ | 82 | $ | 133 | $ | 469 | ||||||||||||||||||||||
Personal |
||||||||||||||||||||||||||||||||||||||
Balance at beginning of period |
$ |
280 |
$ |
793 |
$ |
155 |
$ |
1,228 |
$ | 285 | $ | 661 | $ | 97 | $ | 1,043 | ||||||||||||||||||||||
Provision for credit losses |
||||||||||||||||||||||||||||||||||||||
Transfers to stage 1 |
125 |
(125 |
) |
– |
– |
150 | (150 | ) | – | – | ||||||||||||||||||||||||||||
Transfers to stage 2 |
(19 |
) |
20 |
(1 |
) |
– |
(23 | ) | 23 | – | – | |||||||||||||||||||||||||||
Transfers to stage 3 |
(1 |
) |
(28 |
) |
29 |
– |
– | (13 | ) | 13 | – | |||||||||||||||||||||||||||
Originations |
22 |
– |
– |
22 |
23 | – | – | 23 | ||||||||||||||||||||||||||||||
Maturities |
(12 |
) |
(46 |
) |
– |
(58 |
) |
(12 | ) | (25 | ) | – | (37 | ) | ||||||||||||||||||||||||
Changes in risk, parameters and exposures |
(114 |
) |
229 |
123 |
238 |
(138 | ) | 231 | 90 | 183 | ||||||||||||||||||||||||||||
Write-offs |
– |
– |
(169 |
) |
(169 |
) |
– | – | (112 | ) | (112 | ) | ||||||||||||||||||||||||||
Recoveries |
– |
– |
30 |
30 |
– | – | 29 | 29 | ||||||||||||||||||||||||||||||
Exchange rate and other |
(1 |
) |
– |
(3 |
) |
(4 |
) |
1 | (2 | ) | 1 | – | ||||||||||||||||||||||||||
Balance at end of period |
$ |
280 |
$ |
843 |
$ |
164 |
$ |
1,287 |
$ | 286 | $ | 725 | $ | 118 | $ | 1,129 | ||||||||||||||||||||||
Credit cards |
||||||||||||||||||||||||||||||||||||||
Balance at beginning of period |
$ |
203 |
$ |
866 |
$ |
– |
$ |
1,069 |
$ | 177 | $ | 716 | $ | – | $ | 893 | ||||||||||||||||||||||
Provision for credit losses |
||||||||||||||||||||||||||||||||||||||
Transfers to stage 1 |
137 |
(137 |
) |
– |
– |
164 | (164 | ) | – | – | ||||||||||||||||||||||||||||
Transfers to stage 2 |
(28 |
) |
28 |
– |
– |
(20 | ) | 20 | – | – | ||||||||||||||||||||||||||||
Transfers to stage 3 |
(1 |
) |
(108 |
) |
109 |
– |
– | (94 | ) | 94 | – | |||||||||||||||||||||||||||
Originations |
3 |
– |
– |
3 |
4 | – | – | 4 | ||||||||||||||||||||||||||||||
Maturities |
(1 |
) |
(8 |
) |
– |
(9 |
) |
(1 | ) | (7 | ) | – | (8 | ) | ||||||||||||||||||||||||
Changes in risk, parameters and exposures |
(125 |
) |
272 |
42 |
189 |
(139 | ) | 271 | 8 | 140 | ||||||||||||||||||||||||||||
Write-offs |
– |
– |
(259 |
) |
(259 |
) |
– | – | (142 | ) | (142 | ) | ||||||||||||||||||||||||||
Recoveries |
– |
– |
109 |
109 |
– | – | 40 | 40 | ||||||||||||||||||||||||||||||
Exchange rate and other |
– |
– |
(1 |
) |
(1 |
) |
(1 | ) | – | – | (1 | ) | ||||||||||||||||||||||||||
Balance at end of period |
$ |
188 |
$ |
913 |
$ |
– |
$ |
1,101 |
$ | 184 | $ | 742 | $ | – | $ | 926 | ||||||||||||||||||||||
Small business |
||||||||||||||||||||||||||||||||||||||
Balance at beginning of period |
$ |
70 |
$ |
66 |
$ |
58 |
$ |
194 |
$ | 73 | $ | 73 | $ | 48 | $ | 194 | ||||||||||||||||||||||
Provision for credit losses |
||||||||||||||||||||||||||||||||||||||
Transfers to stage 1 |
5 |
(5 |
) |
– |
– |
10 | (10 | ) | – | – | ||||||||||||||||||||||||||||
Transfers to stage 2 |
(5 |
) |
5 |
– |
– |
(3 | ) | 3 | – | – | ||||||||||||||||||||||||||||
Transfers to stage 3 |
– |
(2 |
) |
2 |
– |
– | (2 | ) | 2 | – | ||||||||||||||||||||||||||||
Originations |
9 |
– |
– |
9 |
8 | – | – | 8 | ||||||||||||||||||||||||||||||
Maturities |
(3 |
) |
(5 |
) |
– |
(8 |
) |
(4 | ) | (6 | ) | – | (10 | ) | ||||||||||||||||||||||||
Changes in risk, parameters and exposures |
(5 |
) |
15 |
26 |
36 |
(12 | ) | 13 | 18 | 19 | ||||||||||||||||||||||||||||
Write-offs |
– |
– |
(18 |
) |
(18 |
) |
– | – | (11 | ) | (11 | ) | ||||||||||||||||||||||||||
Recoveries |
– |
– |
3 |
3 |
– | – | 2 | 2 | ||||||||||||||||||||||||||||||
Exchange rate and other |
1 |
– |
(5 |
) |
(4 |
) |
1 | 2 | (1 | ) | 2 | |||||||||||||||||||||||||||
Balance at end of period |
$ |
72 |
$ |
74 |
$ |
66 |
$ |
212 |
$ | 73 | $ | 73 | $ | 58 | $ | 204 | ||||||||||||||||||||||
Wholesale |
||||||||||||||||||||||||||||||||||||||
Balance at beginning of period |
$ |
774 |
$ |
785 |
$ |
767 |
$ |
2,326 |
$ | 597 | $ | 585 | $ | 392 | $ | 1,574 | ||||||||||||||||||||||
Provision for credit losses |
||||||||||||||||||||||||||||||||||||||
Transfers to stage 1 |
50 |
(50 |
) |
– |
– |
51 | (51 | ) | – | – | ||||||||||||||||||||||||||||
Transfers to stage 2 |
(55 |
) |
58 |
(3 |
) |
– |
(20 | ) | 21 | (1 | ) | – | ||||||||||||||||||||||||||
Transfers to stage 3 |
(3 |
) |
(9 |
) |
12 |
– |
(3 | ) | (14 | ) | 17 | – | ||||||||||||||||||||||||||
Originations |
124 |
– |
– |
124 |
153 | – | – | 153 | ||||||||||||||||||||||||||||||
Maturities |
(97 |
) |
(87 |
) |
– |
(184 |
) |
(118 | ) | (71 | ) | – | (189 | ) | ||||||||||||||||||||||||
Changes in risk, parameters and exposures |
(101 |
) |
173 |
317 |
389 |
(55 | ) | 150 | 102 | 197 | ||||||||||||||||||||||||||||
Write-offs |
– |
– |
(160 |
) |
(160 |
) |
– | – | (26 | ) | (26 | ) | ||||||||||||||||||||||||||
Recoveries |
– |
– |
11 |
11 |
– | – | 9 | 9 | ||||||||||||||||||||||||||||||
Exchange rate and other |
17 |
(17 |
) |
(61 |
) |
(61 |
) |
(5 | ) | (8 | ) | (25 | ) | (38 | ) | |||||||||||||||||||||||
Balance at end of period |
$ |
709 |
$ |
853 |
$ |
883 |
$ |
2,445 |
$ | 600 | $ | 612 | $ | 468 | $ | 1,680 | ||||||||||||||||||||||
|
Note 5 Loans and allowance for credit losses (continued)
|
| • | Unemployment rates in are expected to rise to 6.2%C anada
, peaking at 6.6% in Q2 2024 with the U.S. to rise to 3.9%, peaking at
Q3 2024 then reverting to long run equilibrium towards themiddle |
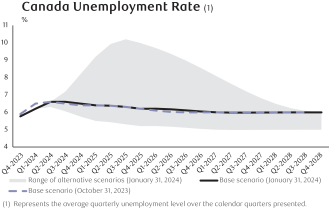 |
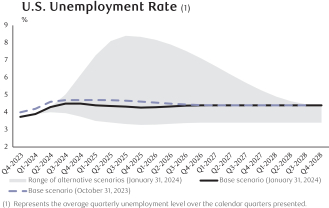 |
| • | Gross Domestic Product (GDP ) In our base forecast, we expect Canadian GDP to grow continuously following calendar Q1 2024, while U.S. GDP is expected to decline initially followed by continuous growth in calendar Q3 2024 and thereafter. GDP in calendar Q4 2024 is expected to be % and 0.4% above Q4 2023 levels in Canada and the U.S., respectively.
|
 |
 |
| • | Oil price (West Texas Intermediate in US$) . As at October 31, 2023, our base forecast included an average price of $81 per barrel for the next 12 months and $67 per barrel for the following 2 to 5 years. |
| • | Canadian housing price index |
|
Note 5 Loans and allowance for credit losses (continued)
|
As at |
||||||||||||||||||||||||||||||||||
January 31, 2024 |
October 31, 2023 |
|||||||||||||||||||||||||||||||||
(Millions of Canadian dollars) |
Stage 1 |
Stage 2 |
Stage 3 |
Total |
Stage 1 |
Stage 2 |
Stage 3 |
Total |
||||||||||||||||||||||||||
Retail |
||||||||||||||||||||||||||||||||||
Loans outstanding – Residential mortgages |
||||||||||||||||||||||||||||||||||
Low risk |
$ |
347,982 |
$ |
2,453 |
$ |
– |
$ |
350,435 |
$ | 349,001 | $ | 1,630 | $ | – | $ | 350,631 | ||||||||||||||||||
Medium risk |
19,103 |
1,586 |
– |
20,689 |
19,126 | 1,610 | – | 20,736 | ||||||||||||||||||||||||||
High risk |
1,463 |
5,499 |
– |
6,962 |
1,582 | 4,927 | – | 6,509 | ||||||||||||||||||||||||||
Not rated (1)
|
52,733 |
1,402 |
– |
54,135 |
54,247 | 1,220 | – | 55,467 | ||||||||||||||||||||||||||
Impaired |
– |
– |
853 |
853 |
– | – | 682 | 682 | ||||||||||||||||||||||||||
421,281 |
10,940 |
853 |
433,074 |
423,956 | 9,387 | 682 | 434,025 | |||||||||||||||||||||||||||
Items not subject to impairment (2)
|
490 |
476 | ||||||||||||||||||||||||||||||||
Total |
$ |
433,564 |
$ | 434,501 | ||||||||||||||||||||||||||||||
Loans outstanding – Personal |
||||||||||||||||||||||||||||||||||
Low risk |
$ |
76,351 |
$ |
1,741 |
$ |
– |
$ |
78,092 |
$ | 75,572 | $ | 1,676 | $ | – | $ | 77,248 | ||||||||||||||||||
Medium risk |
5,720 |
2,937 |
– |
8,657 |
5,587 | 2,915 | – | 8,502 | ||||||||||||||||||||||||||
High risk |
468 |
2,145 |
– |
2,613 |
477 | 2,088 | – | 2,565 | ||||||||||||||||||||||||||
Not rated (1)
|
9,330 |
266 |
– |
9,596 |
9,982 | 157 | – | 10,139 | ||||||||||||||||||||||||||
Impaired |
– |
– |
317 |
317 |
– | – | 280 | 280 | ||||||||||||||||||||||||||
Total |
$ |
91,869 |
$ |
7,089 |
$ |
317 |
$ |
99,275 |
$ | 91,618 | $ | 6,836 | $ | 280 | $ | 98,734 | ||||||||||||||||||
Loans outstanding – Credit cards |
||||||||||||||||||||||||||||||||||
Low risk |
$ |
16,331 |
$ |
162 |
$ |
– |
$ |
16,493 |
$ | 16,331 | $ | 135 | $ | – | $ | 16,466 | ||||||||||||||||||
Medium risk |
1,709 |
2,134 |
– |
3,843 |
1,771 | 2,132 | – | 3,903 | ||||||||||||||||||||||||||
High risk |
45 |
1,851 |
– |
1,896 |
41 | 1,734 | – | 1,775 | ||||||||||||||||||||||||||
Not rated (1)
|
741 |
32 |
– |
773 |
856 | 35 | – | 891 | ||||||||||||||||||||||||||
Total |
$ |
18,826 |
$ |
4,179 |
$ |
– |
$ |
23,005 |
$ | 18,999 | $ | 4,036 | $ | – | $ | 23,035 | ||||||||||||||||||
Loans outstanding – Small business |
||||||||||||||||||||||||||||||||||
Low risk |
$ |
8,724 |
$ |
899 |
$ |
– |
$ |
9,623 |
$ | 8,641 | $ | 920 | $ | – | $ | 9,561 | ||||||||||||||||||
Medium risk |
2,275 |
969 |
– |
3,244 |
2,238 | 936 | – | 3,174 | ||||||||||||||||||||||||||
High risk |
122 |
785 |
– |
907 |
99 | 592 | – | 691 | ||||||||||||||||||||||||||
Not rated (1)
|
8 |
– |
– |
8 |
11 | – | – | 11 | ||||||||||||||||||||||||||
Impaired |
– |
– |
268 |
268 |
– | – | 244 | 244 | ||||||||||||||||||||||||||
Total |
$ |
11,129 |
$ |
2,653 |
$ |
268 |
$ |
14,050 |
$ | 10,989 | $ | 2,448 | $ | 244 | $ | 13,681 | ||||||||||||||||||
Undrawn loan commitments – Retail |
||||||||||||||||||||||||||||||||||
Low risk |
$ |
264,315 |
$ |
769 |
$ |
– |
$ |
265,084 |
$ | 266,209 | $ | 610 | $ | – | $ | 266,819 | ||||||||||||||||||
Medium risk |
11,705 |
332 |
– |
12,037 |
10,759 | 298 | – | 11,057 | ||||||||||||||||||||||||||
High risk |
1,122 |
465 |
– |
1,587 |
956 | 434 | – | 1,390 | ||||||||||||||||||||||||||
Not rated (1)
|
6,953 |
161 |
– |
7,114 |
6,686 | 138 | – | 6,824 | ||||||||||||||||||||||||||
Total |
$ |
284,095 |
$ |
1,727 |
$ |
– |
$ |
285,822 |
$ | 284,610 | $ | 1,480 | $ | – | $ | 286,090 | ||||||||||||||||||
Wholesale – Loans outstanding |
||||||||||||||||||||||||||||||||||
Investment grade |
$ |
91,756 |
$ |
356 |
$ |
– |
$ |
92,112 |
$ | 89,037 | $ | 416 | $ | – | $ | 89,453 | ||||||||||||||||||
Non-investment grade |
149,767 |
24,149 |
– |
173,916 |
156,211 | 19,210 | – | 175,421 | ||||||||||||||||||||||||||
Not rated (1)
|
10,676 |
199 |
– |
10,875 |
10,968 | 238 | – | 11,206 | ||||||||||||||||||||||||||
Impaired |
– |
– |
2,760 |
2,760 |
– | – | 2,498 | 2,498 | ||||||||||||||||||||||||||
252,199 |
24,704 |
2,760 |
279,663 |
256,216 | 19,864 | 2,498 | 278,578 | |||||||||||||||||||||||||||
Items not subject to impairment (2)
|
14,058 |
9,248 | ||||||||||||||||||||||||||||||||
Total |
$ |
293,721 |
$ | 287,826 | ||||||||||||||||||||||||||||||
Undrawn loan commitments – Wholesale |
||||||||||||||||||||||||||||||||||
Investment grade |
$ |
311,697 |
$ |
45 |
$ |
– |
$ |
311,742 |
$ | 312,178 | $ | 186 | $ | – | $ | 312,364 | ||||||||||||||||||
Non-investment grade |
129,709 |
14,604 |
– |
144,313 |
130,994 | 13,947 | – | 144,941 | ||||||||||||||||||||||||||
Not rated (1)
|
5,440 |
1 |
– |
5,441 |
4,176 | – | – | 4,176 | ||||||||||||||||||||||||||
Total |
$ |
446,846 |
$ |
14,650 |
$ |
– |
$ |
461,496 |
$ | 447,348 | $ | 14,133 | $ | – | $ | 461,481 | ||||||||||||||||||
| (1) | In certain cases where an internal risk rating is not assigned, we use other approved credit risk assessment or rating methodologies, policies and tools to manage our credit risk. |
| (2) | Items not subject to impairment are loans held at FVTPL. |
| As at | ||||||||||||||||||||||||||
January 31, 2024 |
October 31, 2023 | |||||||||||||||||||||||||
| (Millions of Canadian dollars) | 30 to 89 days |
90 days and greater |
Total |
30 to 89 days | 90 days and greater |
Total | ||||||||||||||||||||
Retail |
$ |
1,933 |
$ |
224 |
$ |
2,157 |
$ | 1,840 | $ | 208 | $ | 2,048 | ||||||||||||||
Wholesale |
1,220 |
57 |
1,277 |
1,823 | 49 | 1,872 | ||||||||||||||||||||
$ |
3,153 |
$ |
281 |
$ |
3,434 |
$ | 3,663 | $ | 257 | $ | 3,920 | |||||||||||||||
| (1) | Excludes loans less than 30 days past due as they are not generally representative of the borrowers’ ability to meet their payment obligations. |
| (2) | Amounts presented may include loans past due as a result of administrative processes, such as mortgage loans on which payments are restrained pending payout due to sale or refinancing, which can fluctuate based on business volumes. Past due loans arising from administrative processes are not representative of the borrowers’ ability to meet their payment obligations. |
|
Note 6 Significant acquisition and disposition |
|
Note 7 Deposits |
| As at | ||||||||||||||||||||||||||||||||||
January 31, 2024 |
October 31, 2023 | |||||||||||||||||||||||||||||||||
| (Millions of Canadian dollars) |
Demand |
Notice |
Term |
Total |
Demand (1) | Notice (2) | Term (3) | Total | ||||||||||||||||||||||||||
Personal |
$ |
183,035 |
$ |
59,654 |
$ |
209,500 |
$ |
452,189 |
$ | 186,530 | $ | 57,614 | $ | 197,802 | $ | 441,946 | ||||||||||||||||||
Business and government |
308,455 |
16,663 |
418,654 |
743,772 |
316,200 | 19,056 | 409,819 | 745,075 | ||||||||||||||||||||||||||
Bank |
7,994 |
688 |
36,525 |
45,207 |
7,996 | 769 | 35,901 | 44,666 | ||||||||||||||||||||||||||
$ |
499,484 |
$ |
77,005 |
$ |
664,679 |
$ |
1,241,168 |
$ | 510,726 | $ | 77,439 | $ | 643,522 | $ | 1,231,687 | |||||||||||||||||||
Non-interest-bearing (4)
|
||||||||||||||||||||||||||||||||||
Canada |
$ |
128,063 |
$ |
6,187 |
$ |
193 |
$ |
134,443 |
$ | 132,994 | $ | 6,107 | $ | 168 | $ | 139,269 | ||||||||||||||||||
United States |
36,514 |
– |
– |
36,514 |
40,646 | – | – | 40,646 | ||||||||||||||||||||||||||
Europe (5)
|
11 |
– |
– |
11 |
17 | – | – | 17 | ||||||||||||||||||||||||||
Other International |
7,262 |
– |
– |
7,262 |
7,265 | – | – | 7,265 | ||||||||||||||||||||||||||
Interest-bearing (4)
|
||||||||||||||||||||||||||||||||||
Canada |
300,806 |
14,502 |
515,934 |
831,242 |
302,746 | 14,641 | 493,347 | 810,734 | ||||||||||||||||||||||||||
United States |
16,206 |
55,499 |
83,225 |
154,930 |
16,210 | 55,895 | 78,837 | 150,942 | ||||||||||||||||||||||||||
Europe (5)
|
5,154 |
771 |
48,402 |
54,327 |
5,353 | 726 | 51,812 | 57,891 | ||||||||||||||||||||||||||
Other International |
5,468 |
46 |
16,925 |
22,439 |
5,495 | 70 | 19,358 | 24,923 | ||||||||||||||||||||||||||
$ |
499,484 |
$ |
77,005 |
$ |
664,679 |
$ |
1,241,168 |
$ | 510,726 | $ | 77,439 | $ | 643,522 | $ | 1,231,687 | |||||||||||||||||||
| (1) | Demand deposits are deposits for which we do not have the right to require notice of withdrawal, which include both savings and chequing accounts. |
| (2) | Notice deposits are deposits for which we can legally require notice of withdrawal. These deposits are primarily savings accounts. |
| (3) | Term deposits are deposits payable on a fixed date, and include term deposits, guaranteed investment certificates and similar instruments. |
| (4) | The geographical splits of the deposits are based on the point of origin of the deposits and where the revenue is recognized. As at January 31, 2024, deposits denominated in U.S. dollars, British pounds, Euro and other foreign currencies were $453 billion billion ,
billion an d $30billion ,
|
| (5) | Europe includes the United Kingdom and the Channel Islands. |
|
Note 7 Deposits (continued)
|
As at |
||||||||
(Millions of Canadian dollars) |
January 31 2024 |
October 31 2023 |
||||||
Within 1 year: |
||||||||
less than 3 months |
$ |
168,694 |
$ | 182,373 | ||||
3 to 6 months |
100,797 |
69,868 | ||||||
6 to 12 months |
145,368 |
151,079 | ||||||
1 to 2 years |
76,110 |
76,232 | ||||||
2 to 3 years |
55,812 |
49,965 | ||||||
3 to 4 years |
39,359 |
36,774 | ||||||
4 to 5 years |
29,681 |
36,506 | ||||||
Over 5 years |
48,858 |
40,725 | ||||||
$ |
664,679 |
$ | 643,522 | |||||
Aggregate amount of term deposits in denominations of one hundred thousand dollars or more |
$ |
602,000 |
$ | 586,000 | ||||
|
Note 8 Insurance and reinsurance |
| As at | ||||||||||||||||||||||||||||||||||
January 31, 2024 |
October 31, 2023 | |||||||||||||||||||||||||||||||||
| (Millions of Canadian dollars) | Estimates of present value of future cash flows |
Risk adjustment for non-financial
risk |
CSM |
Total |
Estimates of present value of future cash flows |
Risk adjustment for non-financial
risk |
CSM | Total | ||||||||||||||||||||||||||
Insurance contract assets (
2 ) |
$ |
1,952 |
$ |
(630 |
) |
$ |
(558 |
) |
$ |
764 |
$ | 1,790 | $ | (544 | ) | $ | (565 | ) | $ | 681 | ||||||||||||||
Insurance contract liabilities (
3 ) |
||||||||||||||||||||||||||||||||||
Insurance contract liabilities for segregated funds |
$ |
(3,236 |
) |
$ |
(16 |
) |
$ |
(54 |
) |
$ |
(3,306 |
) |
$ | (2,553 | ) | $ | (15 | ) | $ | (64 | ) | $ | (2,632 | ) | ||||||||||
Insurance contract liabilities excluding segregated funds |
(13,227 |
) |
(2,664 |
) |
(2,145 |
) |
(18,036 |
) |
(11,955 | ) | (2,308 | ) | (2,131 | ) | (16,394 | ) | ||||||||||||||||||
$ |
(16,463 |
) |
$ |
(2,680 |
) |
$ |
(2,199 |
) |
$ |
(21,342 |
) |
$ | (14,508 | ) | $ | (2,323 | ) | $ | (2,195 | ) | $ | (19,026 | ) | |||||||||||
Reinsurance contracts held assets (
2 ), (3 ) |
$ |
360 |
$ |
555 |
$ |
780 |
$ |
1,695 |
$ | 327 | $ | 469 | $ | 786 | $ | 1,582 | ||||||||||||||||||
Reinsurance contracts held liabilities (
4 ) |
$ |
– |
$ |
– |
$ |
– |
$ |
– |
$ | (42 | ) | $ | 6 | $ | 18 | $ | (18 | ) | ||||||||||||||||
CSM for insurance contracts, net of reinsurance contracts held |
$ |
(1,977 |
) |
$ | (1,956 | ) | ||||||||||||||||||||||||||||
(1) |
Includes contracts measured using the GMM and VFA that have CSM and contracts measured using the PAA in which CSM is not applicable. |
(2) |
Presented in Other assets. |
(3) |
Insurance contract liabilities and reinsurance contract held assets primarily relate to balances for remaining coverage for future services on contracts measured using the GMM or VFA. |
(4) |
Presented in Other liabilities. |
| For the three months ended | ||||||||
(Millions of Canadian dollars) |
January 31 2024 |
January 31
2023
(1)
|
||||||
Insurance service result |
||||||||
Insurance revenue |
$ |
1,205 |
$ | 1,104 | ||||
Insurance service expense |
(984 |
) |
(853 | ) | ||||
Net income (expense) from reinsurance contracts held |
(34 |
) |
(59 | ) | ||||
$ |
187 |
$ | 192 | |||||
Insurance investment result |
||||||||
Net investment income |
$ |
2,018 |
$ | 1,019 | ||||
Insurance finance income (expense) |
(1,976 |
) |
(1,134 | ) | ||||
Reinsurance finance income (expense) |
99 |
42 | ||||||
$ |
141 |
$ | (73 | ) | ||||
Insurance service and insurance investment results |
$ |
328 |
$ | 119 | ||||
| (1) | The 2023 amounts may not be fully comparable to the current period as we were not managing our asset and liability portfolios under IFRS 17 and Net investment income was not restated for the reclassifications of certain eligible financial assets. Refer to Note 2 for further |
|
Note 9 Employee benefits – Pension and other post-employment benefits |
| For the three months ended | ||||||||||||||||||
| Pension plans | Other post-employment benefit plans |
|||||||||||||||||
(Millions of Canadian dollars) |
January 31 2024 |
January 31
2023
|
January 31 2024 |
January 31
2023
|
||||||||||||||
Current service costs |
$ |
46 |
$ | 48 | $ |
8 |
$ | 8 | ||||||||||
Past service costs |
– |
– | – |
– | ||||||||||||||
Net interest expense (income) |
(38 |
) |
(40 | ) | 20 |
19 | ||||||||||||
Remeasurements of other long-term benefits |
– |
– | 10 |
2 | ||||||||||||||
Administrative expense |
4 |
3 | – |
– | ||||||||||||||
Defined benefit pension expense (1)
|
12 |
11 | 38 |
29 | ||||||||||||||
Defined contribution pension expense (1)
|
106 |
85 | – |
– | ||||||||||||||
$ |
118 |
$ | 96 | $ |
38 |
$ | 29 | |||||||||||
| (1) | Pension expenses are primarily reported in Non-Interest expense – Human resources with a portion reported in Insurance service result when such expenses are directly attributable to insurance or reinsurance contracts. |
| For the three months ended | ||||||||||||||||||
| Defined benefit pension plans | Other post-employment benefit plans |
|||||||||||||||||
(Millions of Canadian dollars) |
January 31 2024 |
January 31
2023
|
January 31 2024 |
January 31
2023
|
||||||||||||||
Actuarial (gains) losses: |
||||||||||||||||||
Changes in financial assumptions (2)
|
$ |
1,271 |
$ | 772 | $ |
120 |
$ | 75 | ||||||||||
Experience adjustments |
– |
– | 1 |
– | ||||||||||||||
Return on plan assets (excluding interest based on discount rate) |
(1,469 |
) |
(594 | ) | – |
– | ||||||||||||
$ |
(198 |
) |
$ | 178 | $ |
121 |
$ | 75 | ||||||||||
| (1) | Market based assumptions, including Changes in financial assumptions and Return on plan assets, are reviewed on a quarterly basis. All other assumptions are updated during our annual review of plan assumptions. |
(2) |
Changes in financial assumptions in our defined benefit pension plans primarily relate to changes in discount rates. |
|
Note 10 Income taxes |
|
Note 1 1 Significant capital and funding transactions |
| For the three months ended | ||||||||||||||||||
January 31, 2024 |
January 31, 2023 | |||||||||||||||||
| (Millions of Canadian dollars, except number of shares) | Number of shares (thousands) |
Amount |
Number of shares (thousands) |
Amount | ||||||||||||||
Issued in connection with share-based compensation plans (1)
|
400 |
$ |
38 |
269 | $ | 24 | ||||||||||||
Issued in connection with dividend reinvestment plan (2)
|
6,135 |
720 |
– | – | ||||||||||||||
6,535 |
$ |
758 |
269 | $ | 24 | |||||||||||||
| (1) | Amounts include cash received for stock options exercised during the period and the fair value adjustment to stock options. |
(2) |
The requirements of our dividend reinvestment plan (DRIP) are satisfied through either open market share purchases or shares issued from treasury. During the three months ended January 31, 2024 our DRIP requirements were satisfied through shares issued from treasury. During the three months ended January 31, 2023 our DRIP requirements were satisfied through open market share purchases. |
|
Note 1 2 Earnings per share |
| For the three months ended | ||||||||
| (Millions of Canadian dollars, except share and per share amounts) |
January 31 2024 |
January 31
2023
(Restated – Note 2)
|
||||||
Basic earnings per share |
||||||||
Net income |
$ |
3,582 |
$ | 3,133 | ||||
Dividends on preferred shares and distributions on other equity instruments |
(58 |
) |
(44 | ) | ||||
Net income attributable to non-controlling interests |
(2 |
) |
(2 | ) | ||||
Net income available to common shareholders |
$ |
3,522 |
$ | 3,087 | ||||
Weighted average number of common shares (in thousands) |
1,406,324 |
1,382,754 | ||||||
Basic earnings per share (in dollars) |
$ |
2.50 |
$ | 2.23 | ||||
Diluted earnings per share |
||||||||
Net income available to common shareholders |
$ |
3,522 |
$ | 3,087 | ||||
Weighted average number of common shares (in thousands) |
1,406,324 |
1,382,754 | ||||||
Stock options (1)
|
1,291 |
1,756 | ||||||
Issuable under other share-based compensation plans |
26 |
26 | ||||||
Average number of diluted common shares (in thousands) |
1,407,641 |
1,384,536 | ||||||
Diluted earnings per share (in dollars) |
$ |
2.50 |
$ | 2.23 | ||||
| (1) | The dilutive effect of stock options was calculated using the treasury stock method. When the exercise price of options outstanding is greater than the average market price of our common shares, the options are excluded from the calculation of diluted earnings per share. For the three months ended January 31, 2024, an average of 2,216,903 outstanding options with an average exercise price of $130.78 were excluded from the calculation of diluted earnings per share. For the three months ended January 31, 2023, an average of 591,472 outstanding options with an average exercise price of $131.64 were excluded from the calculation of diluted earnings per share. |
| Note 13 Legal and regulatory matters |
| Note 1 4 Results by business segment |
For the three months ended January 31, 2024 |
||||||||||||||||||||||||
| (Millions of Canadian dollars) | Personal & Commercial Banking |
Wealth Management |
Insurance |
Capital Markets |
Corporate Support |
Total |
||||||||||||||||||
| Net interest income (2)
|
$ |
4,216 |
$ |
1,150 |
$ |
– |
$ |
661 |
$ |
305 |
$ |
6,332 |
||||||||||||
| Non-interest income |
1,578 |
3,387 |
363 |
2,290 |
(465 |
) |
7,153 |
|||||||||||||||||
| Total revenue |
5,794 |
4,537 |
363 |
2,951 |
(160 |
) |
13,485 |
|||||||||||||||||
| Provision for credit losses |
634 |
11 |
1 |
167 |
– |
813 |
||||||||||||||||||
| Non-interest expense |
2,339 |
3,768 |
71 |
1,642 |
504 |
8,324 |
||||||||||||||||||
| Income (loss) before income taxes |
2,821 |
758 |
291 |
1,142 |
(664 |
) |
4,348 |
|||||||||||||||||
| Income taxes (recoveries) |
760 |
152 |
71 |
(12 |
) |
(205 |
) |
766 |
||||||||||||||||
| Net income |
$ |
2,061 |
$ |
606 |
$ |
220 |
$ |
1,154 |
$ |
(459 |
) |
$ |
3,582 |
|||||||||||
| Non-interest expense includes: |
||||||||||||||||||||||||
| Depreciation and amortization |
$ |
235 |
$ |
311 |
$ |
4 |
$ |
124 |
$ |
(2
|
) |
$ |
672 |
|||||||||||
| For the three months ended January 31, 2023 (Restated – Note 2) | ||||||||||||||||||||||||
| (Millions of Canadian dollars) | Personal & Commercial Banking |
Wealth Management (3), (4) |
Insurance | Capital Markets (1), (4) |
Corporate Support (1), (3) |
Total | ||||||||||||||||||
| Net interest income (
2 ) |
$ | 4,007 | $ | 1,216 | $ | – | $ | 792 | $ | 187 | $ | 6,202 | ||||||||||||
| Non-interest income |
1,534 | 3,344 | 154 | 2,354 | (231 | ) | 7,155 | |||||||||||||||||
| Total revenue |
5,541 | 4,560 | 154 | 3,146 | (44 | ) | 13,357 | |||||||||||||||||
| Provision for credit losses |
401 | 66 | – | 65 | – | 532 | ||||||||||||||||||
| Non-interest expense |
2,229 | 3,434 | 70 | 1,701 | 155 | 7,589 | ||||||||||||||||||
| Income (loss) before income taxes |
2,911 | 1,060 | 84 | 1,380 | (199 | ) | 5,236 | |||||||||||||||||
| Income taxes (recoveries) |
785 | 230 | 17 | 139 | 932 | 2,103 | ||||||||||||||||||
| Net income |
$ | 2,126 | $ | 830 | $ | 67 | $ | 1,241 | $ | (1,131 | ) | $ | 3,133 | |||||||||||
| Non-interest expense includes: |
||||||||||||||||||||||||
| Depreciation and amortization |
$ | 241 | $ | 301 | $ | 8 | $ | 127 | $ | – | $ | 677 | ||||||||||||
(1) |
Taxable equivalent basis. |
(2) |
Interest revenue is reported net of interest expense as we rely primarily on net interest income as a performance measure. |
(3) |
Amounts for the three months ended January 31, 2023 have been revised from those previously presented. |
(4) |
Effective the fourth quarter of 2023, we moved the Investor Services lending business from our Wealth Management segment to our Capital Markets segment. Therefore, comparative results for the three months ended January 31, 2023 have been revised from those previously presented. |
As at January 31, 2024 |
||||||||||||||||||||||||
| (Millions of Canadian dollars) | Personal & Commercial Banking |
Wealth Management |
Insurance |
Capital Markets |
Corporate Support |
Total |
||||||||||||||||||
| Total assets |
$ |
640,193 |
$ |
175,270 |
$ |
26,956 |
$ |
1,069,398 |
$ |
62,588 |
$ |
1,974,405 |
||||||||||||
| Total liabilities |
640,114 |
174,043 |
26,904 |
1,069,685 |
(52,829 |
) |
1,857,917 |
|||||||||||||||||
| As at October 31, 2023 (Restated – Note 2) | ||||||||||||||||||||||||
| (Millions of Canadian dollars) | Personal & Commercial Banking |
Wealth Management |
Insurance | Capital Markets |
Corporate Support |
Total | ||||||||||||||||||
| Total assets |
$ | 636,046 | $ | 179,227 | $ | 24,130 | $ | 1,100,172 | $ | 66,956 | $ | 2,006,531 | ||||||||||||
| Total liabilities |
635,952 | 177,389 | 24,895 | 1,099,893 | (46,745 | ) | 1,891,384 | |||||||||||||||||
|
Note 1 5 Capital management |
| As at | ||||||||
(Millions of Canadian dollars, except percentage amounts and as otherwise noted) |
January 31 2024 |
October 31
2023
|
||||||
Capital (1), (2)
|
||||||||
CET1 capital |
$ |
88,106 |
$ | 86,611 | ||||
Tier 1 capital |
96,140 |
93,904 | ||||||
Total capital |
106,865 |
104,952 | ||||||
Risk-weighted assets (RWA) used in calculation of capital ratios (1), (2)
|
||||||||
Credit risk |
$ |
474,677 |
$ | 475,842 | ||||
Market risk |
30,980 |
40,498 | ||||||
Operational risk |
84,600 |
79,883 | ||||||
Total RWA |
$ |
590,257 |
$ | 596,223 | ||||
Capital ratios and Leverage ratio (1), (2)
|
||||||||
CET1 ratio |
14.9% |
14.5% | ||||||
Tier 1 capital ratio |
16.3% |
15.7% | ||||||
Total capital ratio |
18.1% |
17.6% | ||||||
Leverage ratio |
4.4% |
4.3% | ||||||
Leverage ratio exposure (billions) |
$ |
2,173 |
$ | 2,180 | ||||
TLAC available and ratios (1), (3)
|
||||||||
TLAC available |
$ |
185,556 |
$ | 184,916 | ||||
TLAC ratio |
31.4% |
31.0% | ||||||
TLAC leverage ratio |
8.5% |
8.5% | ||||||
| (1) | As prior period restatements are not required by OSFI, there was no impact from the adoption of IFRS 17 on regulatory capital, RWA, capital ratios, leverage ratio, TLAC available and TLAC ratios for periods prior to November 1, 2023. |
| (2) | Capital, RWA, and capital ratios are calculated using OSFI’s Capital Adequacy Requirements (CAR) guideline and the Leverage ratio is calculated using OSFI’s Leverage Requirements (LR) guideline. Both the CAR guideline and LR guideline are based on the Basel III framework. The periods ended January 31, 2024 and October 31, 2023 reflect our adoption of the revised CAR and LR guidelines that came into effect in Q2 2023, as further updated on October 20, 2023 as part of OSFI’s implementation of the Basel III reforms. The period ended January 31, 2024 also reflects our adoption of the revised market risk and CVA frameworks that came into effect on November 1, 2023. |
| (3) | TLAC available and TLAC ratios are calculated using OSFI’s TLAC guideline. The TLAC standard is applied at the resolution entity level which for us is deemed to be Royal Bank of Canada and its subsidiaries. A resolution entity and its subsidiaries are collectively called a resolution group. The TLAC ratio and TLAC leverage ratio are calculated using the TLAC available as percentage of total RWA and leverage exposure, respectively. |
Exhibit 99.3
Return on Equity and Assets Ratios
| Q1 2024 | For the Year-Ended October 2023(1) |
For the Year-Ended October 2022 |
For the Year-Ended October 2021 |
|||||||||||||
| Return on Assets |
0.68 | % | 0.73 | % | 0.84 | % | 0.96 | % | ||||||||
| Return on Equity |
13.1 | % | 14.3 | % | 16.4 | % | 18.6 | % | ||||||||
| Return on Equity |
55 | % | 52 | % | 45 | % | 39 | % | ||||||||
| (1) | Amounts have been restated from those previously presented as part of the adoption of IFRS 17, effective November 1, 2023. |
Exhibit 31.1
SOX 302 Certification
I, David McKay, certify that:
| 1. | I have reviewed this quarterly report for the period ended January 31, 2024 (the “report”) of Royal Bank of Canada (the “registrant”); |
| 2. | Based on my knowledge, this report does not contain any untrue statement of a material fact or omit to state a material fact necessary to make the statements made, in light of the circumstances under which such statements were made, not misleading with respect to the period covered by this report; |
| 3. | Based on my knowledge, the financial statements, and other financial information included in this report, fairly present in all material respects the financial condition, results of operations and cash flows of the registrant as of, and for, the periods presented in this report; |
| 4. | The registrant’s other certifying officer and I are responsible for establishing and maintaining disclosure controls and procedures (as defined in Exchange Act Rules 13a-15(e) and 15d-15(e)) and internal control over financial reporting (as defined in Exchange Act Rules 13a-15(f) and 15d-15(f)) for the registrant and have: |
| a. | Designed such disclosure controls and procedures, or caused such disclosure controls and procedures to be designed under our supervision, to ensure that material information relating to the registrant, including its consolidated subsidiaries, is made known to us by others within those entities, particularly during the period in which this report is being prepared; |
| b. | Designed such internal control over financial reporting, or caused such internal control over financial reporting to be designed under our supervision, to provide reasonable assurance regarding the reliability of financial reporting and the preparation of financial statements for external purposes in accordance with generally accepted accounting principles; |
| c. | Evaluated the effectiveness of the registrant’s disclosure controls and procedures and presented in this report our conclusions about the effectiveness of the disclosure controls and procedures, as of the end of the period covered by this report based on such evaluation; and |
| d. | Disclosed in this report any change in the registrant’s internal control over financial reporting that occurred during the registrant’s most recent fiscal quarter that has materially affected, or is reasonably likely to materially affect, the registrant’s internal control over financial reporting; and |
| 5. | The registrant’s other certifying officer and I have disclosed, based on our most recent evaluation of internal control over financial reporting, to the registrant’s auditors and the audit committee of the registrant’s board of directors (or persons performing the equivalent functions): |
| a. | All significant deficiencies and material weaknesses in the design or operation of internal control over financial reporting which are reasonably likely to adversely affect the registrant’s ability to record, process, summarize and report financial information; and |
| b. | Any fraud, whether or not material, that involves management or other employees who have a significant role in the registrant’s internal control over financial reporting. |
Date: February 28, 2024
| /s/ David McKay |
||
| Name: | David McKay | |
| Title: | President and Chief Executive Officer | |
Exhibit 31.2
SOX 302 Certification
I, Nadine Ahn, certify that:
| 1. | I have reviewed this quarterly report for the period ended January 31, 2024 (the “report”) of Royal Bank of Canada (the “registrant”); |
| 2. | Based on my knowledge, this report does not contain any untrue statement of a material fact or omit to state a material fact necessary to make the statements made, in light of the circumstances under which such statements were made, not misleading with respect to the period covered by this report; |
| 3. | Based on my knowledge, the financial statements, and other financial information included in this report, fairly present in all material respects the financial condition, results of operations and cash flows of the registrant as of, and for, the periods presented in this report; |
| 4. | The registrant’s other certifying officer and I are responsible for establishing and maintaining disclosure controls and procedures (as defined in Exchange Act Rules 13a-15(e) and 15d-15(e)) and internal control over financial reporting (as defined in Exchange Act Rules 13a-15(f) and 15d-15(f)) for the registrant and have: |
| a. | Designed such disclosure controls and procedures, or caused such disclosure controls and procedures to be designed under our supervision, to ensure that material information relating to the registrant, including its consolidated subsidiaries, is made known to us by others within those entities, particularly during the period in which this report is being prepared; |
| b. | Designed such internal control over financial reporting, or caused such internal control over financial reporting to be designed under our supervision, to provide reasonable assurance regarding the reliability of financial reporting and the preparation of financial statements for external purposes in accordance with generally accepted accounting principles; |
| c. | Evaluated the effectiveness of the registrant’s disclosure controls and procedures and presented in this report our conclusions about the effectiveness of the disclosure controls and procedures, as of the end of the period covered by this report based on such evaluation; and |
| d. | Disclosed in this report any change in the registrant’s internal control over financial reporting that occurred during the registrant’s most recent fiscal quarter that has materially affected, or is reasonably likely to materially affect, the registrant’s internal control over financial reporting; and |
| 5. | The registrant’s other certifying officer and I have disclosed, based on our most recent evaluation of internal control over financial reporting, to the registrant’s auditors and the audit committee of the registrant’s board of directors (or persons performing the equivalent functions): |
| a. | All significant deficiencies and material weaknesses in the design or operation of internal control over financial reporting which are reasonably likely to adversely affect the registrant’s ability to record, process, summarize and report financial information; and |
| b. | Any fraud, whether or not material, that involves management or other employees who have a significant role in the registrant’s internal control over financial reporting. |
Date: February 28, 2024
| /s/ Nadine Ahn |
||
| Name: | Nadine Ahn | |
| Title: | Chief Financial Officer | |