UNITED STATES
SECURITIES AND EXCHANGE COMMISSION
Washington, D.C. 20549
FORM 6-K
REPORT OF FOREIGN PRIVATE ISSUER
PURSUANT TO RULE 13a-16 OR 15d-16
UNDER THE SECURITIES EXCHANGE ACT OF 1934
For the month of February 2024
Commission File Number: 001-41404
Woodside Energy Group Ltd
(ABN 55 004 898 962)
(Registrant’s name)
Woodside Energy Group Ltd
Mia Yellagonga, 11 Mount Street
Perth, Western Australia 6000
Australia
(Address of principal executive offices)
Indicate by check mark whether the registrant files or will file annual reports under cover of Form 20-F or Form 40-F.
Form 20-F ☒ Form 40-F ☐
Indicate by check mark if the registrant is submitting the Form 6-K in paper as permitted by Regulation S-T Rule 101(b)(1): ☐
Indicate by check mark if the registrant is submitting the Form 6-K in paper as permitted by Regulation S-T Rule 101(b)(7): ☐
EXHIBIT INDEX
SIGNATURES
Pursuant to the requirements of the Securities Exchange Act of 1934, the registrant has duly caused this report to be signed on its behalf by the undersigned, thereunto duly authorized.
Dated: February 27, 2024
| WOODSIDE ENERGY GROUP LTD | ||
| By: | /s/ Warren Baillie |
|
| Warren Baillie | ||
| Corporate Secretary | ||
Exhibit 99.1

2023 ANNUAL INCORPORATING REPORT APPENDIX 4E
ANNUAL REPORT 2023 This Annual Report 2023 is a summary of Woodside’s operations and activities for the 12-month period ended 31 December 2023 and financial position as at 31 December 2023. Woodside Energy Group Ltd (ABN 55 004 898 962) is the ultimate holding company of the Woodside group of companies. In this report, unless otherwise stated, references to ‘Woodside’, the ‘Group’, the ‘company’, ‘we’, ‘us’ and ‘our’ refer to Woodside Energy Group Ltd and/or its controlled entities, as a whole. The text does not distinguish between the activities of the ultimate holding company and those of its controlled entities. This report contains references to woodside.com, and our Climate Transition Action Plan and 2023 Progress Report. These references are for the readers’ convenience only and are not incorporated by reference into this report. Similarly, the content of any other websites referred to in this report does not form part of it. Please refer to section 6.7—Glossary, units of measure and conversation factors for definitions of terms captured in this report. IMPORTANT CAUTIONARY INFORMATION This report contains forward-looking statements, greenhouse gas emissions data, industry, market and competitive position data and Woodside’s Financial Statements. Please refer to section 6.8—Information about this report for important cautionary information relating to these matters. NON-IFRS MEASURES Certain parts of this report contain financial measures that have not been prepared in accordance with International Financial Reporting Standards (IFRS) and are also ‘non-GAAP financial measures’ (as defined in Item 10(e) of Regulation S-K under the US Securities Act of 1933, as amended). Refer to section 6.6—Alternative performance measures for further details and a reconciliation of these measures to the most directly comparable IFRS measure presented in Woodside’s Financial Statements. These non-IFRS financial measures are defined in section 6.7—Glossary, units of measure and conversion factors. CLIMATE AND SUSTAINABILITY Climate and sustainability considerations are factored into Woodside’s business activities and investment decisions. A summary of Woodside’s approach to climate change for 2023 and climate-related plans, are included in our Climate Transition Action Plan and 2023 Progress Report. Further information on Woodside’s sustainability performance can be found at woodside.com. ACKNOWLEDGING COUNTRY Woodside recognises Aboriginal and Torres Strait Islander peoples as Australia’s First Peoples. We acknowledge their connection to land, waters and the environment and pay our respects to ancestors and Elders, past and present. We extend this recognition and respect to First Nations peoples and communities around the world. Appendix 4E 20232022 Results for announcement to the market Revenue from ordinary activities Decreased 17% to US$13,994 million US$16,817 million Profit from ordinary activities after tax attributable to members Decreased 74% to US$1,660 million US$6,498 million Net profit for the period attributable to members Decreased 74% to US$1,660 million US$6,498 million DividendsAmountFranked amount per security Final dividend (US cents per share) Ordinary 60¢ Ordinary 60¢ Interim dividend (US cents per share) Ordinary 80¢ Ordinary 80¢ None of the dividends are foreign sourced Previous corresponding period: Final dividend (US cents per share) Ordinary 144¢ Ordinary 144¢ Interim dividend (US cents per share) Ordinary 109¢ Ordinary 109¢ Ex-dividend date 7 March 2024 Record date for determining entitlements to the final dividend 8 March 2024 Payment date for the final dividend 4 April 2024 31 December 2023 31 December 2022 Net tangible asset per ordinary security1,2 $15.91 $16.68 1 Includes lease assets of $1,230 million and lease liabilities of $1,615 million (2022: $1,264 million and $1,634 million) as a result of AASB 16 Leases. 2 This is an alternative performance measure (APM) which is a non-IFRS measure that is unaudited. Woodside believes this non-IFRS measure provides useful performance information, however it should not be considered as an indication of, or as a substitute for, statutory measures as an indicator of actual operating performance (such as net profit after tax or net cash from operating activities) or any other measure of financial performance or position presented in accordance with IFRS. For more information on non-IFRS measures, including reconciliations to Woodside’s Financial Statements, refer to section 6.6—Alternative performance measures. II ANNUAL REPORT 2023
Contents 1. Overview 4 1.1 About Woodside 4 1.2 2023 summary 5 1.3 Chair’s report 8 1.4 Chief Executive Officer’s report 9 1.5 Focus areas 10 2. Strategy and Financial Performance 12 2.1 Woodside’s strategy 12 2.2 Capital management 13 2.3 Financial overview 16 2.4 Energy markets 18 2.5 Business model and value chain 19 3. Our Business 20 3.1 Australian operations 20 3.2 International operations 22 3.3 Marketing and trading 23 3.4 Projects 24 3.5 Decommissioning 26 3.6 Exploration and development 27 3.7 New energy and carbon solutions 28 3.8 Climate and sustainability 29 3.9 Risk factors 40 3.10 Reserves and Resources Statement 48 4. Governance 52 4.1 Corporate Governance Statement 53 Corporate governance at Woodside 53 Board of directors 54 Board committees 62 Executive Leadership Team 65 Promoting responsible and ethical behaviour 67 Risk management and internal control 69 Inclusion and diversity 71 Other governance disclosures 74 Shareholders 75 4.2 Directors’ report 76 4.3 Remuneration Report 80 5. Financial Statements 105 5.1 Financial statements 105 6. Additional Information 172 6.1 Supplementary information on oil and gas—unaudited 172 6.2 Three-year financial analysis 178 6.3 Additional disclosures 183 6.4 Shareholder statistics 195 6.5 Asset facts 203 6.6 Alternative performance measures 207 6.7 Glossary, units of measure and conversion factors 210 6.8 Information about this report 214 6.9 Ten-year comparative data summary 216 WOODSIDE ENERGY GROUP LTD III
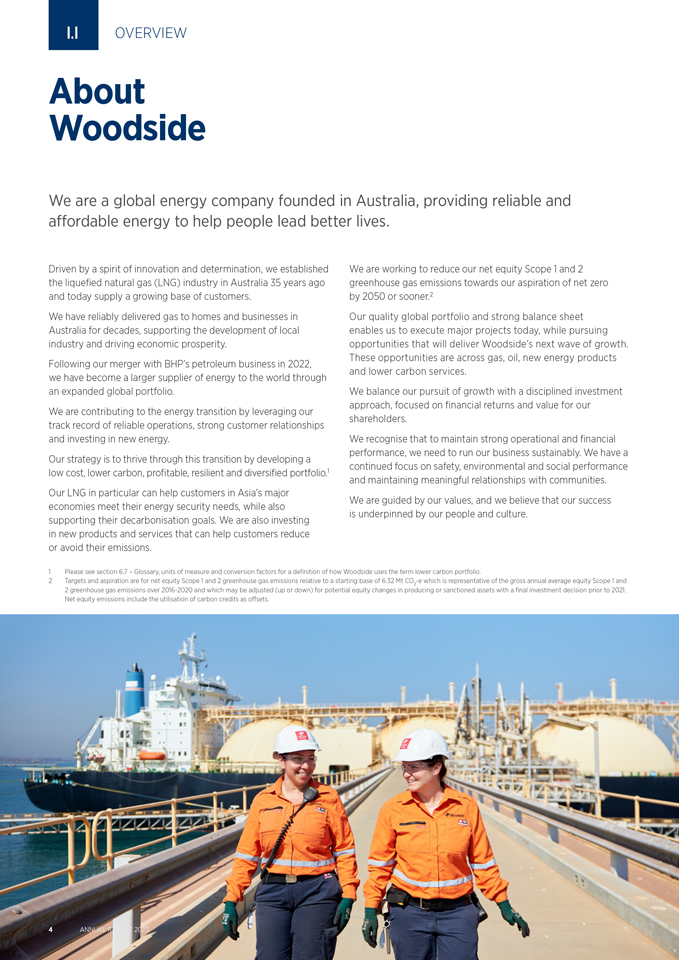
1.1 OVERVIEW About Woodside We are a global energy company founded in Australia, providing reliable and affordable energy to help people lead better lives. Driven by a spirit of innovation and determination, we established the liquefied natural gas (LNG) industry in Australia 35 years ago and today supply a growing base of customers.We have reliably delivered gas to homes and businesses in Australia for decades, supporting the development of local industry and driving economic prosperity. Following our merger with BHP’s petroleum business in 2022, we have become a larger supplier of energy to the world through an expanded global portfolio. We are contributing to the energy transition by leveraging our track record of reliable operations, strong customer relationships and investing in new energy. Our strategy is to thrive through this transition by developing a low cost, lower carbon, profitable, resilient and diversified portfolio.1 Our LNG in particular can help customers in Asia’s major economies meet their energy security needs, while also supporting their decarbonisation goals. We are also investing in new products and services that can help customers reduce or avoid their emissions. We are working to reduce our net equity Scope 1 and 2 greenhouse gas emissions towards our aspiration of net zero by 2050 or sooner.2 Our quality global portfolio and strong balance sheet enables us to execute major projects today, while pursuing opportunities that will deliver Woodside’s next wave of growth. These opportunities are across gas, oil, new energy products and lower carbon services. We balance our pursuit of growth with a disciplined investment approach, focused on financial returns and value for our shareholders. We recognise that to maintain strong operational and financial performance, we need to run our business sustainably. We have a continued focus on safety, environmental and social performance and maintaining meaningful relationships with communities. We are guided by our values, and we believe that our success is underpinned by our people and culture. 1 Please see section 6.7 – Glossary, units of measure and conversion factors for a definition of how Woodside uses the term lower carbon portfolio. 2 Targets and aspiration are for net equity Scope 1 and 2 greenhouse gas emissions relative to a starting base of 6.32 Mt CO -e which is representative of the gross annual average equity Scope 1 and 2 greenhouse gas emissions over 2016-2020 and which may be adjusted (up or down) for potential equity changes in producing 2 or sanctioned assets with a final investment decision prior to 2021. Net equity emissions include the utilisation of carbon credits as offsets. 4 ANNUAL REPORT 2023
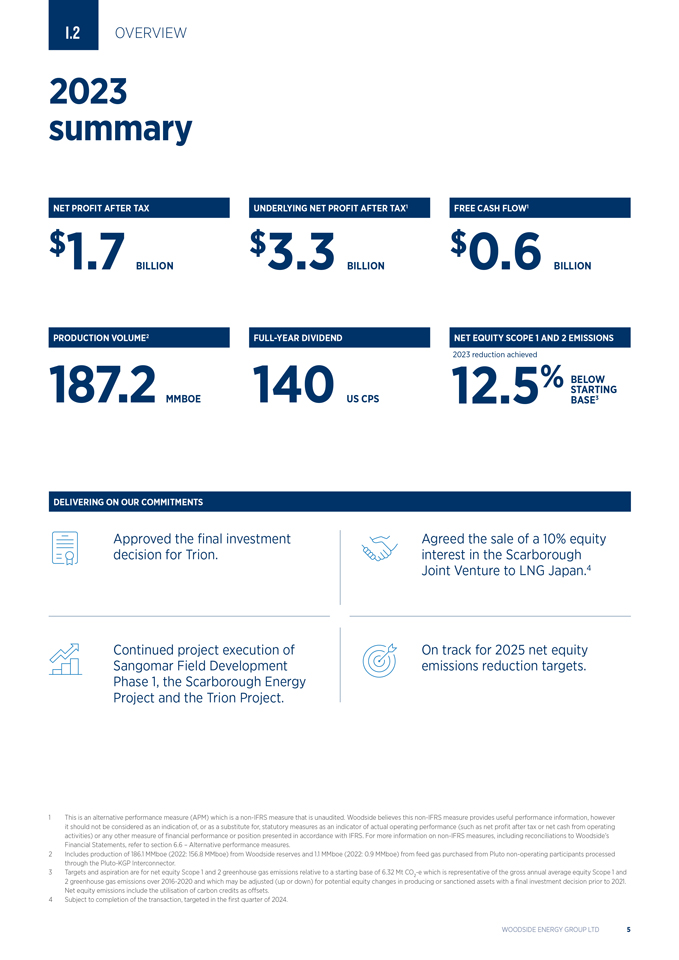
1.2 OVERVIEW 2023 summary NET PROFIT AFTER TAX UNDERLYING NET PROFIT AFTER TAX1 FREE CASH FLOW1 $1.7 BILLION $3.3 BILLIONX% $0.6 BILLION PRODUCTION VOLUME2 FULL-YEAR DIVIDEND NET EQUITY SCOPE 1 AND 2 EMISSIONS 2023 reduction achieved BELOW 187.2 140 12.5% STARTING MMBOE US CPS BASE3 DELIVERING ON OUR COMMITMENTS Approved the final investment Agreed the sale of a 10% equity decision for Trion. interest in the Scarborough Joint Venture to LNG Japan.4 Continued project execution of On track for 2025 net equity Sangomar Field Development emissions reduction targets. Phase 1, the Scarborough Energy Project and the Trion Project. 1 This is an alternative performance measure (APM) which is a non-IFRS measure that is unaudited. Woodside believes this non-IFRS measure provides useful performance information, however it should not be considered as an indication of, or as a substitute for, statutory measures as an indicator of actual operating performance (such as net profit after tax or net cash from operating activities) or any other measure of financial performance or position presented in accordance with IFRS. For more information on non-IFRS measures, including reconciliations to Woodside’s Financial Statements, refer to section 6.6 – Alternative performance measures. 2 Includes production of 186.1 MMboe (2022: 156.8 MMboe) from Woodside reserves and 1.1 MMboe (2022: 0.9 MMboe) from feed gas purchased from Pluto non-operating participants processed through the Pluto-KGP Interconnector. 3 Targets and aspiration are for net equity Scope 1 and 2 greenhouse gas emissions relative to a starting base of 6.32 Mt CO -e which is representative of the gross annual average equity Scope 1 and 2 greenhouse gas emissions over 2016-2020 and which may be adjusted (up or down) for potential equity changes in producing 2 or sanctioned assets with a final investment decision prior to 2021. Net equity emissions include the utilisation of carbon credits as offsets. 4 Subject to completion of the transaction, targeted in the first quarter of 2024. WOODSIDE ENERGY GROUP LTD 5
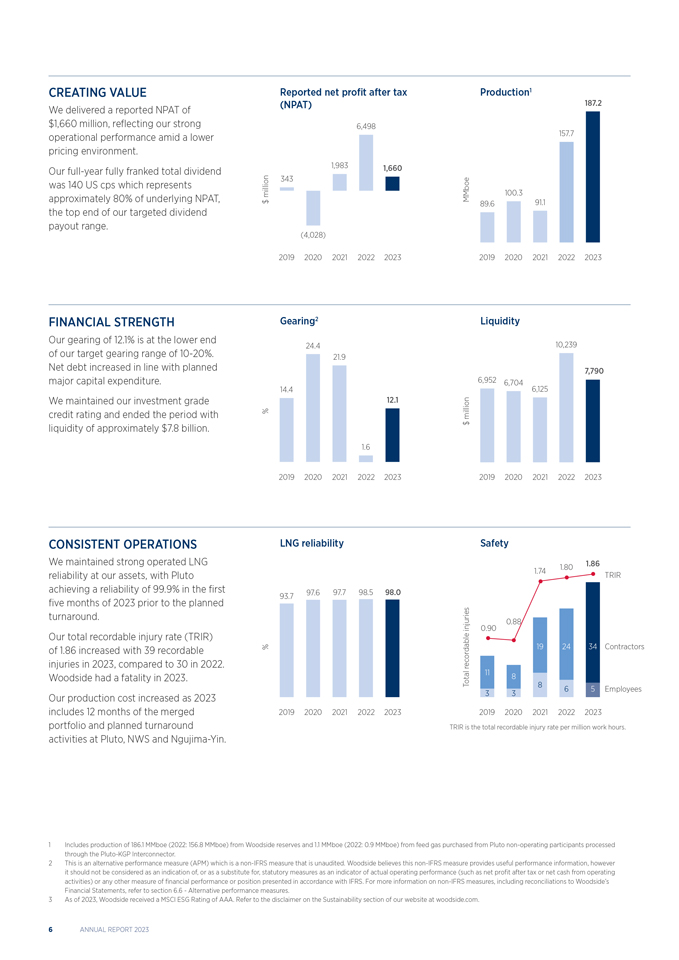
CREATING VALUE Reported net profit after taxProduction1 We delivered a reported NPAT of (NPAT)187.2 $1,660 million, reflecting our strong 6,498 operational performance amid a lower 157.7 pricing environment. Our full-year fully franked total dividend 1,9831,660 was 140 US cps which represents 343 approximately 80% of underlying NPAT, million MMboe100.3 $ 89.691.1 the top end of our targeted dividend payout range. (4,028) 2019 2020 20212022202320192020 202120222023 FINANCIAL STRENGTH Gearing2Liquidity Our gearing of 12.1% is at the lower end 24.410,239 of our target gearing range of 10-20%. 21.9 Net debt increased in line with planned 7,790 major capital expenditure. 6,9526,704 14.4 6,125 We maintained our investment grade 12.1 credit rating and ended the period with % million liquidity of approximately $7.8 billion. $ 1.6 2019 2020 20212022202320192020 202120222023 CONSISTENT OPERATIONS LNG reliabilitySafety We maintained strong operated LNG 1.801.86 reliability at our assets, with Pluto 1.74TRIR achieving a reliability of 99.9% in the first 97.697.798.598.0 93.7 five months of 2023 prior to the planned turnaround. 0.88 injuries0.90 Our total recordable injury rate (TRIR) of 1.86 increased with 39 recordable % 192434 Contractors injuries in 2023, compared to 30 in 2022. recordable Woodside had a fatality in 2023. Total118 865 Employees Our production cost increased as 2023 33 includes 12 months of the merged 2019 202020212022202320192020 202120222023 portfolio and planned turnaround TRIR is the total recordable injury rate per million work hours. activities at Pluto, NWS and Ngujima-Yin. Includes production of 186.1 MMboe (2022: 156.8 MMboe) from Woodside reserves and 1.1 MMboe (2022: 0.9 MMboe) from feed gas purchased from Pluto non-operating participants processed through the Pluto-KGP Interconnector. This is an alternative performance measure (APM) which is a non-IFRS measure that is unaudited. Woodside believes this non-IFRS measure provides useful performance information, however it should not be considered as an indication of, or as a substitute for, statutory measures as an indicator of actual operating performance (such as net profit after tax or net cash from operating activities) or any other measure of financial performance or position presented in accordance with IFRS. For more information on non-IFRS measures, including reconciliations to Woodside’s Financial Statements, refer to section 6.6—Alternative performance measures. As of 2023, Woodside received a MSCI ESG Rating of AAA. Refer to the disclaimer on the Sustainability section of our website at woodside.com. ANNUAL REPORT 2023
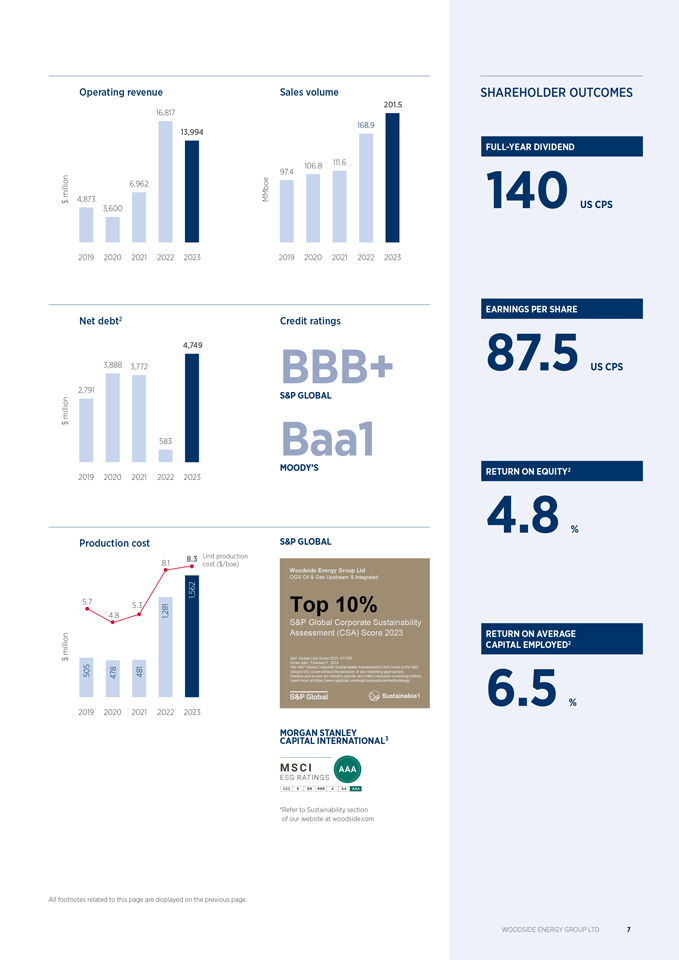
Operating revenue Sales volumeSHAREHOLDER OUTCOMES 201.5 16,817 168.9 13,994 FULL-YEAR DIVIDEND 106.8 111.6 97.4 6,962 million 4,873 MMboe $ 140US CPS 3,600 2019 2020 2021 2022 20232019 2020 2021 2022 2023 EARNINGS PER SHARE Net debt2 Credit ratings 4,749 3,888 3,772BBB+87.5US CPS 2,791 S&P GLOBAL million $ 583Baa1 MOODY’SRETURN ON EQUITY2 2019 2020 2021 2022 2023 4.8 % Production cost S&P GLOBAL 8.3Unit production 8.1cost ($/boe) Woodside Energy Group Ltd OGX Oil & Gas Upstream & Integrated 1,562 5.7 5.3 Top 10% 4.8 1,281 S&P Global Corporate Sustainability Assessment (CSA) Score 2023RETURN ON AVERAGE million CAPITAL EMPLOYED2 $ S&P Global CSA Score 2023: 67/100 Score date: February 7, 2024 The S&P Global Corporate Sustainability Assessment (CSA) Score is the S&P Global ESG Score without the inclusion of any modelling approaches. 505 478 481Position and scores are industry specific and reflect exclusion screening criteria. Learn more at https://www.spglobal.com/esg/csa/yearbook/methodology/6.5 % 2019 2020 2021 2022 2023 MORGAN STANLEY CAPITAL INTERNATIONAL3 *Refer to Sustainability section of our website at woodside.com All footnotes related to this page are displayed on the previous page. WOODSIDE ENERGY GROUP LTD 7
1.3 OVERVIEW Chair’s report At a time of rising cost of living pressures, we are tremendously proud to return value to our shareholders and communities. Sadly, our 2023 performance was overshadowed by the fatality of our colleague Michael Jurman at the North Rankin Complex in June. We must improve on safety and do all we can to ensure everyone who works on Woodside’s assets and facilities returns home safely. Creating value through performance Record production from our expanded portfolio further established Woodside as a global energy supplier. We achieved strong financial performance in 2023. While oil and gas prices eased from 2022’s record highs, robust product demand continued. In 2023, we recorded an annual net profit after tax of $1.7 billion and an underlying net profit after tax of $3.3 billion. Based on this, the Board has determined a fully- franked final dividend of 60 US cents per share, resulting in a total full-year dividend of 140 US cents per share. When Woodside performs well, the communities in which we operate also benefit. In 2023, Woodside paid a record A$5 billion to the Australian Government in tax and royalty payments. A clear growth strategy Woodside’s strategy is to thrive through the energy transition, by building a low cost, lower carbon, profitable, resilient and diversified portfolio.1 Our pipeline of longer-term opportunities across different commodities supports this. Our major growth projects including Sangomar, Scarborough and Trion are well placed to support the demand needs of our customers. Our strong performance and disciplined capital management will help us to meet this demand and continue delivering growth and returns. Supporting the energy transition In 2023, I spoke to many investors who want to learn more about our plans to respond to the challenges of climate change and this was a regular focus of Board meetings throughout the year. We also continued to review our approach to Scope 3 targets in response to investor feedback and have decided to supplement our existing investment target with a new complementary emissions abatement target. We have evolved our climate disclosures, which will be put to an advisory shareholder vote at our 2024 Annual General Meeting. — Richard Goyder, AO We will continue to listen carefully to investors to inform our approach, including how we consider future investments. Reflecting on 2023, conflicts in the Middle East and Europe contributed to another volatile year on global energy markets. Coupled with a strong focus on energy security, this further indicates the transition will not be smooth or linear and our strategy needs to be responsive. We are confident gas will continue to play a crucial role in the global energy mix, including as back up support for electricity grids powered by renewables. We are also working to diversify our portfolio into new energy products and lower carbon services. Strong leadership On behalf of the Board, it was a pleasure to welcome Ashok Belani who started as non-executive director on 29 January 2024. Ashok has extensive experience in new energy and petroleum sector decarbonisation and will be a valuable asset to the Woodside Board. I would also like to thank our Chief Executive Officer Meg O’Neill and the entire Woodside team for another successful year. Meg is calm, methodical and inclusive. She is the right leader to seize the opportunities the energy transition brings and work through its challenges. Thank you also to our shareholders, for investing and placing your trust in Woodside. In 2024, Woodside is celebrating its 70th anniversary and 40 years of production from the North West Shelf, the birthplace of Australia’s LNG industry. It is an opportunity to reflect on the significant contribution Woodside has made to Australia’s prosperity and regional energy security. We plan to build on this legacy for years to come. Richard Goyder, AO Chair of the Board 27 February 2024 Please see section 6.7 – Glossary, units of measure and conversion factors for a definition of how Woodside uses the term lower carbon portfolio. ANNUAL REPORT 2023 1.4 OVERVIEW Officer’s Chief Executive report The past year has seen Woodside deliver record production while laying the foundations for future growth and value.
We bedded down our transition to a larger, global energy company following the merger with BHP’s petroleum business, working effectively as one team across multiple locations. Safety must improve When I reflect on 2023 I will always think of our colleague Michael Jurman, who lost his life while working at our North Rankin Complex. His death continues to affect many of us, and I again offer my deepest condolences to Michael’s family and friends. Safety is our number one priority and we must improve. In 2023, we commissioned an external review of our safety systems and this will guide our efforts to improve safety performance. Strong, reliable production We achieved record full-year production of 187.2 MMboe (513 Mboe/day) from our expanded global portfolio. Reliability at Pluto LNG and the Karratha Gas Plant (KGP) in Western Australia was excellent at 98%. Planned turnarounds and maintenance activities were successfully completed at major assets. This strong operational performance allowed us to leverage continued robust demand for our products. Operating revenue for 2023 was $14 billion, driving an annual reported net profit after tax of $1.7 billion. We achieved this record production while continuing to reduce our net equity Scope 1 and 2 emissions, which in 2023 were 12.5% below our starting base (compared to 11% in 2022).1 Delivering the next wave of growth During the year we made good progress at our key growth projects. By the end of 2023, our Scarborough Energy Project was more than 55% complete and on track for first LNG cargo in 2026.2 At year end, fabrication of the Pluto Train 2 modules was underway with six of the 51 complete, and site works were well progressed. Key environmental approvals were accepted in late 2023 and following this our seismic program was successfully completed. Our sale and purchase agreement with LNG Japan, for the sale of a 10% equity interest in the Scarborough Joint Venture, was a key 2023 achievement.3 — Meg O’Neill The Sangomar project off Senegal was 93% complete at the end of 2023, with 17 of 23 wells drilled and completed.4 The floating production storage and offloading (FPSO) facility sailed away from the Singapore shipyard in December. We are targeting first oil in mid-2024. In June, we took a final investment decision (FID) on the Trion Project in the Gulf of Mexico. Procurement activities commenced for the floating production unit (FPU) materials and subsea equipment. We are targeting first oil from Trion in 2028. In our new energy portfolio, we took FID on the Hydrogen Refueller @H2Perth. We are targeting supply of hydrogen to Western Australian industrial and public customers in 2025. We are also advancing several carbon capture and storage (CCS) projects. Progress is also being made on our proposed H2OK hydrogen project in Oklahoma, United States and the proposed Woodside Solar project near Karratha, Western Australia. Sustainable performance As Woodside’s global presence increases, our sustainability performance becomes ever more important. In 2023 we updated our Sustainability Strategy, further embedding sustainability performance into everything we do. In closing, I am proud of the Woodside team and proud to work in this industry. I have seen first-hand how safe, reliable energy transforms lives. We cannot lose sight of this as we work towards a stable energy transition that benefits future generations. Meg O’Neill Chief Executive Officer and Managing Director 27 February 2024 1 Targets and aspiration are for net equity Scope 1 and 2 greenhouse gas emissions relative to a starting base of 6.32 Mt CO -e which is representative of the gross annual average equity Scope 1 and 2 greenhouse gas emissions over 2016-2020 and which may be adjusted (up or down) for potential equity changes in producing 2 or sanctioned assets with a final investment decision prior to 2021. Net equity emissions include the utilisation of carbon credits as offsets. 2 The completion percentage excludes the Pluto Train 1 modifications project. 3 Subject to completion of the transaction, targeted in the first quarter of 2024. 4 The progress of the project has been updated to 93% following a 0.2% correction identified subsequent to the period.
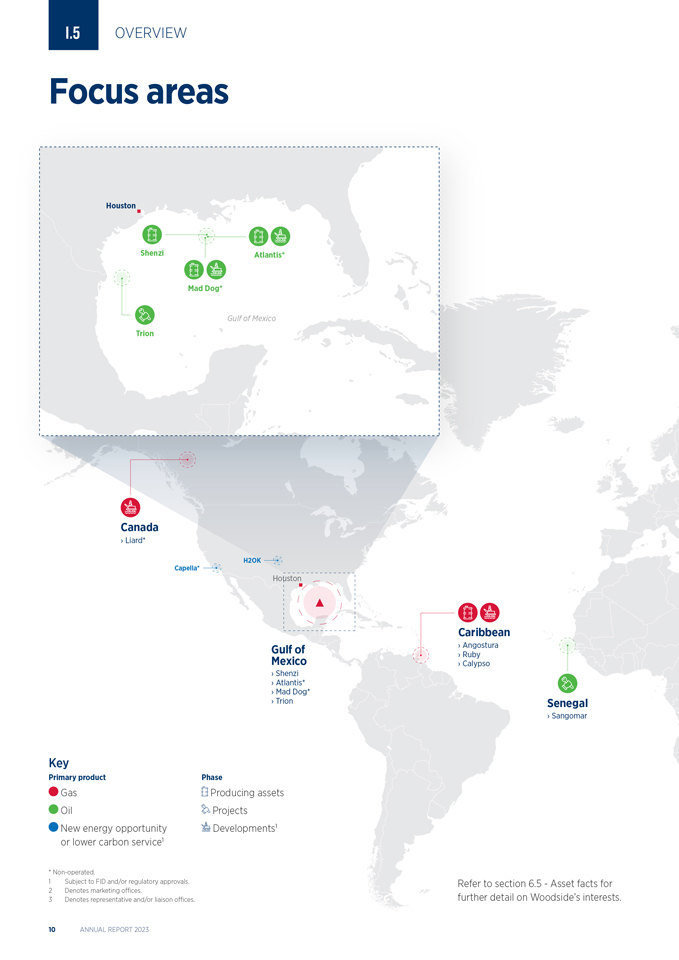
WOODSIDE ENERGY GROUP LTD 9 1.5 OVERVIEW Focus areas Houston Shenzi Atlantis* Mad Dog* Gulf of Mexico Trion Canada › Liard* H2OK Capella* Houston Caribbean Gulf of › Angostura › Ruby Mexico › Calypso › Shenzi › Atlantis* › Mad Dog* › Trion Senegal › Sangomar Key Primary product Phase Gas Producing assets Oil Projects New energy opportunity Developments1 or lower carbon service1 * Non-operated. 1 Subject to FID and/or regulatory approvals. Refer to section 6.5—Asset facts for 2 Denotes marketing offices. 3 Denotes representative and/or liaison offices. further detail on Woodside’s interests.
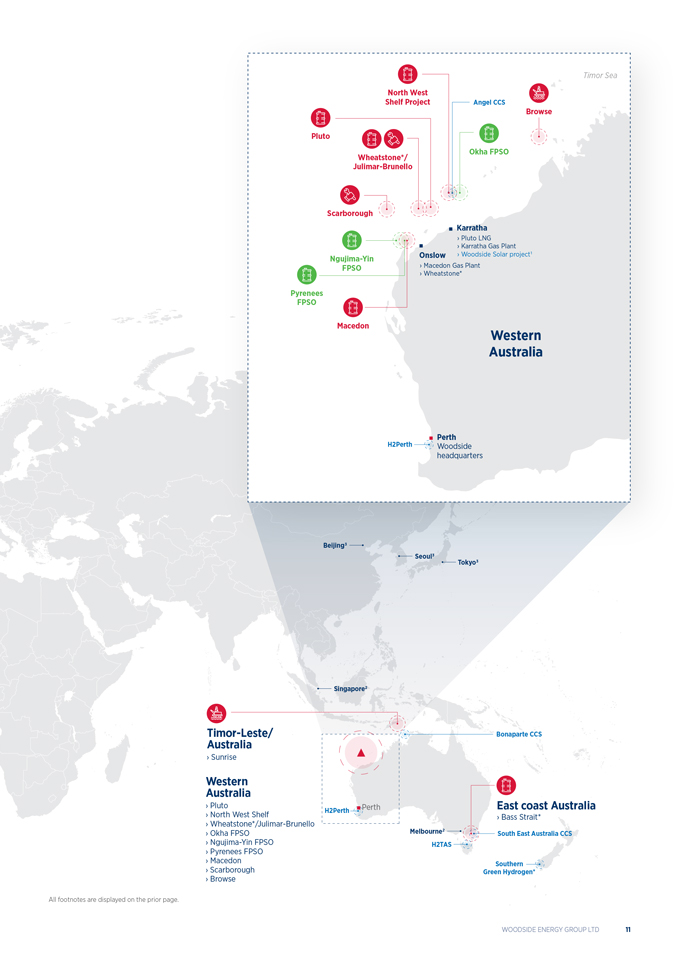
10 ANNUAL REPORT 2023 Timor Sea North West Shelf Project Angel CCS Browse Pluto Okha FPSO Wheatstone*/ Julimar-Brunello Scarborough Karratha › Pluto LNG › Karratha Gas Plant Onslow › Woodside Solar project• Ngujima-Yin FPSO › Macedon Gas Plant › Wheatstone* Pyrenees FPSO Macedon Western Australia H2Perth Perth Woodside headquarters Beijing‡ Seoul‡ Tokyo‡ Singapore‰ Timor-Leste/ Australia Bonaparte CCS › Sunrise Australia Western › Pluto Perth East coast Australia H2Perth › North West Shelf › Bass Strait* › Wheatstone*/Julimar-Brunello Melbourne‰ › Okha FPSO South East Australia CCS › Ngujima-Yin FPSO H2TAS › Pyrenees FPSO › Macedon Southern › Scarborough Green Hydrogen* › Browse All footnotes are displayed on the prior page.
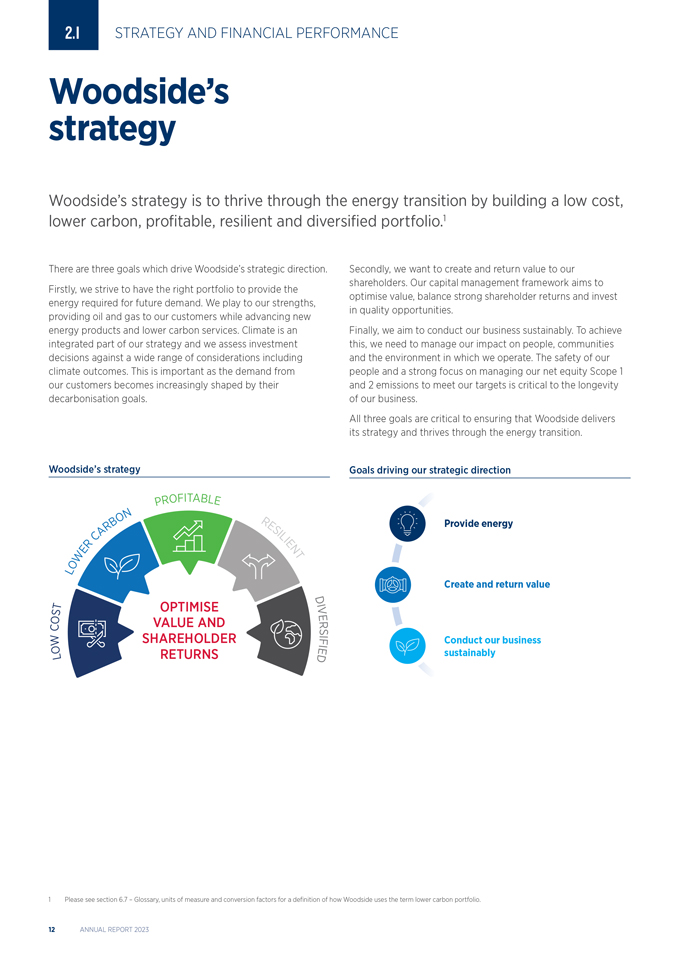
WOODSIDE ENERGY GROUP LTD 11 2.1 STRATEGY AND FINANCIAL PERFORMANCE Woodside’s strategy Woodside’s strategy is to thrive through the energy transition by building a low cost, lower carbon, profitable, resilient and diversified portfolio.1 There are three goals which drive Woodside’s strategic direction. Firstly, we strive to have the right portfolio to provide the energy required for future demand. We play to our strengths, providing oil and gas to our customers while advancing new energy products and lower carbon services. Climate is an integrated part of our strategy and we assess investment decisions against a wide range of considerations including climate outcomes. This is important as the demand from our customers becomes increasingly shaped by their decarbonisation goals. Secondly, we want to create and return value to our shareholders. Our capital management framework aims to optimise value, balance strong shareholder returns and invest in quality opportunities. Finally, we aim to conduct our business sustainably. To achieve this, we need to manage our impact on people, communities and the environment in which we operate. The safety of our people and a strong focus on managing our net equity Scope 1 and 2 emissions to meet our targets is critical to the longevity of our business. All three goals are critical to ensuring that Woodside delivers its strategy and thrives through the energy transition. Woodside’s strategy Goals driving our strategic direction PROFITABLE N R B O RES Provide energy A I L R C I E E NT W L O Create and return value D T OPTIMISE I S V O VALUE AND E C R S W SHAREHOLDER F I Conduct our business O RETURNS E I sustainably L D 1 Please see section 6.7 – Glossary, units of measure and conversion factors for a definition of how Woodside uses the term lower carbon portfolio. 12 ANNUAL REPORT 2023 2.2 STRATEGY AND FINANCIAL PERFORMANCE Capital management Woodside’s capital management framework provides us with the flexibility to optimise value and shareholder returns delivered from our portfolio of opportunities.
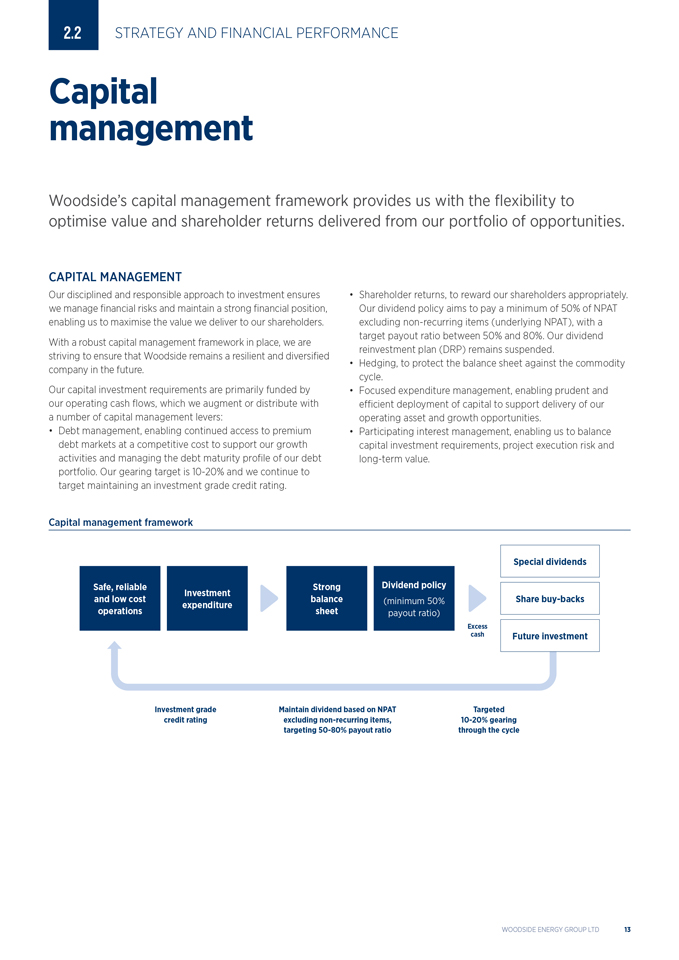
CAPITAL MANAGEMENT Our disciplined and responsible approach to investment ensures we manage financial risks and maintain a strong financial position, enabling us to maximise the value we deliver to our shareholders. With a robust capital management framework in place, we are striving to ensure that Woodside remains a resilient and diversified company in the future. Our capital investment requirements are primarily funded by our operating cash flows, which we augment or distribute with a number of capital management levers: • Debt management, enabling continued access to premium debt markets at a competitive cost to support our growth activities and managing the debt maturity profile of our debt portfolio. Our gearing target is 10-20% and we continue to target maintaining an investment grade credit rating. Shareholder returns, to reward our shareholders appropriately. Our dividend policy aims to pay a minimum of 50% of NPAT excluding non-recurring items (underlying NPAT), with a target payout ratio between 50% and 80%. Our dividend reinvestment plan (DRP) remains suspended. Hedging, to protect the balance sheet against the commodity cycle. Focused expenditure management, enabling prudent and efficient deployment of capital to support delivery of our operating asset and growth opportunities. Participating interest management, enabling us to balance capital investment requirements, project execution risk and long-term value. Capital management framework Special dividends Safe, reliable Strong Dividend policy Investment and low cost balance (minimum 50% Share buy-backs expenditure operations sheet payout ratio) Excess cash Future investment Investment grade Maintain dividend based on NPAT Targeted credit rating excluding non-recurring items, 10-20% gearing targeting 50-80% payout ratio through the cycle WOODSIDE ENERGY GROUP LTD 13 CAPITAL ALLOCATION Woodside’s high margin portfolio is made up of quality assets which have the scale and resilience to deliver ongoing value.
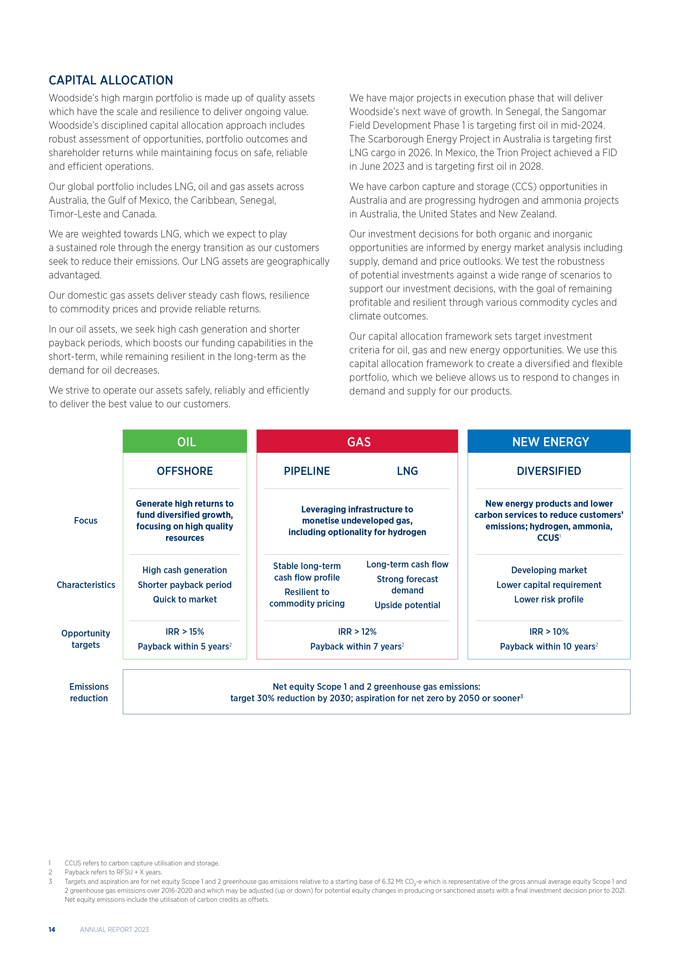
Woodside’s disciplined capital allocation approach includes robust assessment of opportunities, portfolio outcomes and shareholder returns while maintaining focus on safe, reliable and efficient operations. Our global portfolio includes LNG, oil and gas assets across Australia, the Gulf of Mexico, the Caribbean, Senegal, Timor-Leste and Canada. We are weighted towards LNG, which we expect to play a sustained role through the energy transition as our customers seek to reduce their emissions. Our LNG assets are geographically advantaged. Our domestic gas assets deliver steady cash flows, resilience to commodity prices and provide reliable returns. In our oil assets, we seek high cash generation and shorter payback periods, which boosts our funding capabilities in the short-term, while remaining resilient in the long-term as the demand for oil decreases. We strive to operate our assets safely, reliably and efficiently to deliver the best value to our customers. We have major projects in execution phase that will deliver Woodside’s next wave of growth. In Senegal, the Sangomar Field Development Phase 1 is targeting first oil in mid-2024. The Scarborough Energy Project in Australia is targeting first LNG cargo in 2026. In Mexico, the Trion Project achieved a FID in June 2023 and is targeting first oil in 2028. We have carbon capture and storage (CCS) opportunities in Australia and are progressing hydrogen and ammonia projects in Australia, the United States and New Zealand. Our investment decisions for both organic and inorganic opportunities are informed by energy market analysis including supply, demand and price outlooks. We test the robustness of potential investments against a wide range of scenarios to support our investment decisions, with the goal of remaining profitable and resilient through various commodity cycles and climate outcomes. Our capital allocation framework sets target investment criteria for oil, gas and new energy opportunities. We use this capital allocation framework to create a diversified and flexible portfolio, which we believe allows us to respond to changes in demand and supply for our products. OIL GASNEW ENERGY OFFSHORE PIPELINE LNGDIVERSIFIED Generate high returns to New energy products and lower Leveraging infrastructure to fund diversified growth, carbon services to reduce customers’ Focus monetise undeveloped gas, focusing on high quality emissions; hydrogen, ammonia, including optionality for hydrogen resources CCUS1 High cash generation Stable long-term Long-term cash flowDeveloping market cash flow profile Strong forecast Characteristics Shorter payback period Lower capital requirement Resilient to demand Quick to market commodity pricing Upside potentialLower risk profile Opportunity IRR > 15% IRR > 12%IRR > 10% targets Payback within 5 years2 Payback within 7 years2Payback within 10 years2 Emissions Net equity Scope 1 and 2 greenhouse gas emissions: reduction target 30% reduction by 2030; aspiration for net zero by 2050 or sooner3 1 CCUS refers to carbon capture utilisation and storage. 2 Payback refers to RFSU + X years. 3 Targets and aspiration are for net equity Scope 1 and 2 greenhouse gas emissions relative to a starting base of 6.32 Mt CO -e which is representative of the gross annual average equity Scope 1 and 2 greenhouse gas emissions over 2016-2020 and which may be adjusted (up or down) for potential equity changes in producing 2 or sanctioned assets with a final investment decision prior to 2021. Net equity emissions include the utilisation of carbon credits as offsets. 14 ANNUAL REPORT 2023 When assessing opportunities, we consider a broad range of portfolio evaluation and opportunity evaluation factors relevant to the opportunity.
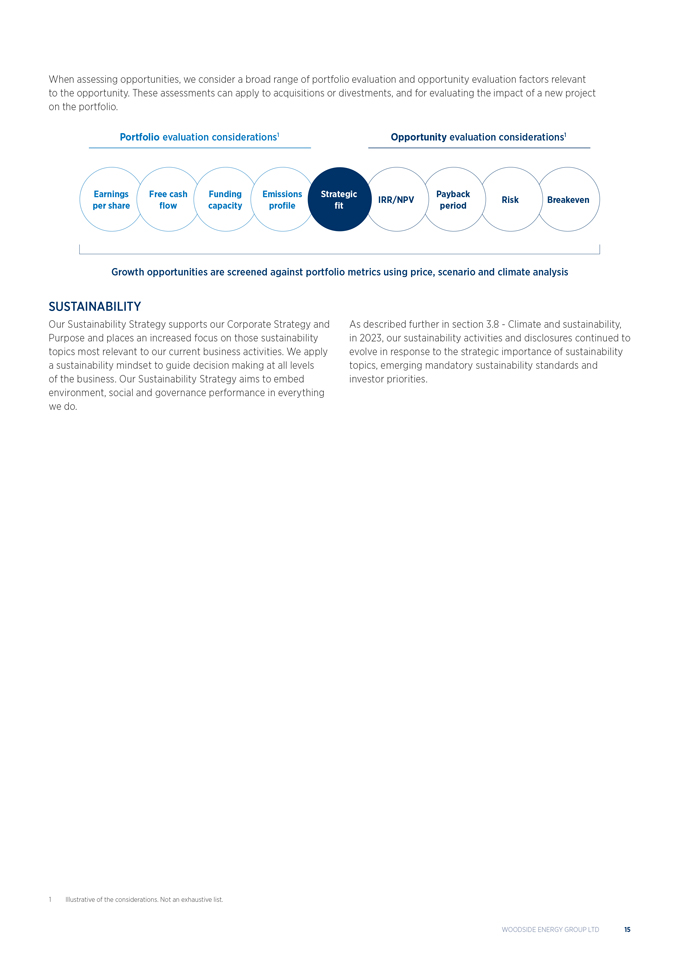
These assessments can apply to acquisitions or divestments, and for evaluating the impact of a new project on the portfolio. Portfolio evaluation considerations1 Opportunity evaluation considerations1 Earnings Free cash FundingEmissionsStrategicPayback IRR/NPVRiskBreakeven per share flow capacityprofilefitperiod Growth opportunities are screened against portfolio metrics using price, scenario and climate analysis SUSTAINABILITY Our Sustainability Strategy supports our Corporate Strategy and Purpose and places an increased focus on those sustainability topics most relevant to our current business activities. We apply a sustainability mindset to guide decision making at all levels of the business. Our Sustainability Strategy aims to embed environment, social and governance performance in everything we do. As described further in section 3.8—Climate and sustainability, in 2023, our sustainability activities and disclosures continued to evolve in response to the strategic importance of sustainability topics, emerging mandatory sustainability standards and investor priorities. 1 Illustrative of the considerations. Not an exhaustive list. WOODSIDE ENERGY GROUP LTD 15 2.3 STRATEGY AND FINANCIAL PERFORMANCE Financial overview KEY METRICS The financial summary below includes both IFRS and non-IFRS measures.
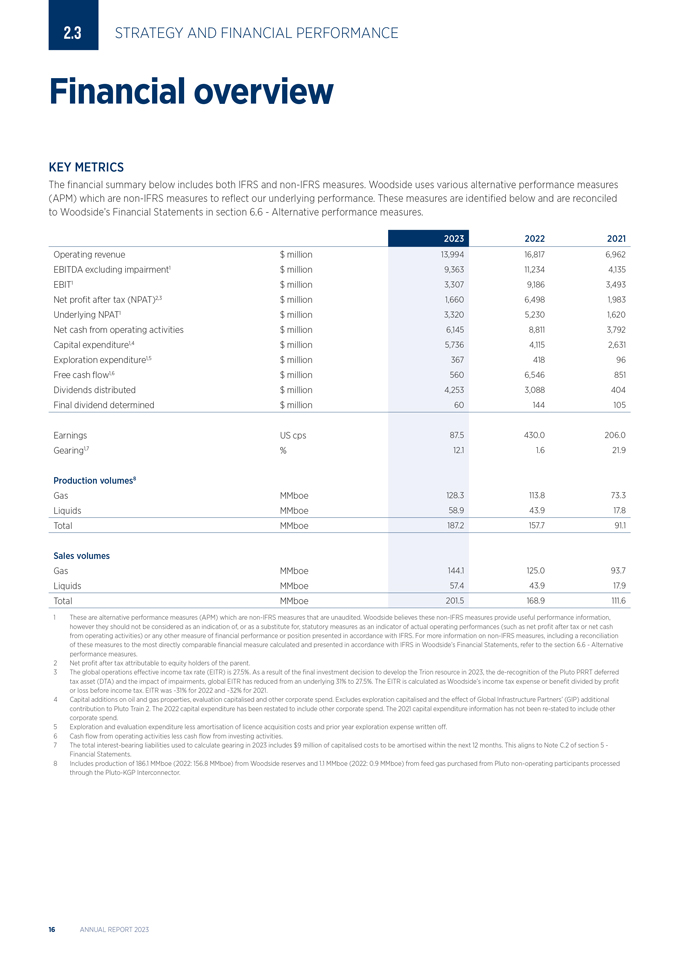
Woodside uses various alternative performance measures (APM) which are non-IFRS measures to reflect our underlying performance. These measures are identified below and are reconciled to Woodside’s Financial Statements in section 6.6—Alternative performance measures. 2023 2022 2021 Operating revenue $ million 13,994 16,817 6,962 EBITDA excluding impairment(1) $ million 9,363 11,234 4,135 EBIT(1) $ million 3,307 9,186 3,493 Net profit after tax (NPAT)(2,3) $ million 1,660 6,498 1,983 Underlying NPAT(1) $ million 3,320 5,230 1,620 Net cash from operating activities $ million 6,145 8,811 3,792 Capital expenditure(1,4) $ million 5,736 4,115 2,631 Exploration expenditure(1,5) $ million 367 418 96 Free cash flow(1,6) $ million 560 6,546 851 Dividends distributed $ million 4,253 3,088 404 Final dividend determined $ million 60 144 105 Earnings US cps 87.5 430.0 206.0 Gearing(1,7) % 12.1 1.6 21.9 Production volumes(8) Gas MMboe 128.3 113.8 73.3 Liquids MMboe 58.9 43.9 17.8 Total MMboe 187.2 157.7 91.1 Sales volumes Gas MMboe 144.1 125.0 93.7 Liquids MMboe 57.4 43.9 17.9 Total MMboe 201.5 168.9 111.6 1 These are alternative performance measures (APM) which are non-IFRS measures that are unaudited. Woodside believes these non-IFRS measures provide useful performance information, however they should not be considered as an indication of, or as a substitute for, statutory measures as an indicator of actual operating performances (such as net profit after tax or net cash from operating activities) or any other measure of financial performance or position presented in accordance with IFRS. For more information on non-IFRS measures, including a reconciliation of these measures to the most directly comparable financial measure calculated and presented in accordance with IFRS in Woodside’s Financial Statements, refer to the section 6.6—Alternative performance measures. 2 Net profit after tax attributable to equity holders of the parent. 3 The global operations effective income tax rate (EITR) is 27.5%. As a result of the final investment decision to develop the Trion resource in 2023, the de-recognition of the Pluto PRRT deferred tax asset (DTA) and the impact of impairments, global EITR has reduced from an underlying 31% to 27.5%. The EITR is calculated as Woodside’s income tax expense or benefit divided by profit or loss before income tax. EITR was ~31% for 2022 and ~32% for 2021. 4 Capital additions on oil and gas properties, evaluation capitalised and other corporate spend. Excludes exploration capitalised and the effect of Global Infrastructure Partners’ (GIP) additional contribution to Pluto Train 2. The 2022 capital expenditure has been restated to include other corporate spend. The 2021 capital expenditure information has not been re-stated to include other corporate spend. 5 Exploration and evaluation expenditure less amortisation of licence acquisition costs and prior year exploration expense written off. 6 Cash flow from operating activities less cash flow from investing activities. 7 The total interest-bearing liabilities used to calculate gearing in 2023 includes $9 million of capitalised costs to be amortised within the next 12 months. This aligns to Note C.2 of section 5—Financial Statements. 8 Includes production of 186.1 MMboe (2022: 156.8 MMboe) from Woodside reserves and 1.1 MMboe (2022: 0.9 MMboe) from feed gas purchased from Pluto non-operating participants processed through the Pluto-KGP Interconnector. 16 ANNUAL REPORT 2023 CAPITAL MANAGEMENT Final dividend and dividend reinvestment plan A 2023 fully franked final dividend of 60 US cps has been determined.
The total amount of the final dividend payment is $1,139 million which represents approximately 80% of underlying NPAT for the second half of 2023.1 The dividend reinvestment plan (DRP) remains suspended. Liquidity and debt service Woodside’s primary sources of liquidity are cash and cash equivalents, net cash generated by operating activities, unused borrowing capacity under its bilateral facilities and syndicated facilities, issuances of debt or equity securities and other sources, such as sales of non-strategic assets. During the year, Woodside generated $6,145 million of cash flow from operating activities and delivered positive free cash flow of $560 million.2,3 Woodside increased its standby debt facilities from $4,050 million to $6,050 million and repaid $284 million of maturing debt. At the end of the period, drawn debt was $4,874 million, with no principle debt payable in 2024 and liquidity was $7,790 million. Additional details of Woodside’s credit facilities, including total commitments, maturity and interest and amount outstanding as at 31 December 2023, can be found in section 5—Financial Statements and Note C.2 to the audited Financial Statements of Woodside as at 31 December 2023 and 2022. Woodside’s principal ongoing uses of cash are to meet working capital requirements, fund debt obligations and finance Woodside’s capital expenditure and acquisitions. We believe working capital is sufficient for our present requirements. Woodside’s capital expenditure for 2024 is expected to be between $5,000 million and $5,500 million primarily due to Sangomar, Scarborough and Trion project expenditure. This excludes the impact of any subsequent asset sell-downs, acquisitions or other changes in equity. We are targeting first oil in mid-2024 for Sangomar, first LNG cargo in 2026 for Scarborough and first oil in 2028 for Trion. Woodside has no off-balance sheet arrangements that have, or are reasonably likely to have, a current or future material effect on the Woodside’s financial condition, revenues or expenses, results of operations, liquidity, capital expenditures or capital resources. Balance sheet Woodside’s commitment to an investment grade credit rating remains unchanged and supports Woodside’s aims of providing sustainable returns to shareholders and investing in future growth opportunities, in accordance with our capital allocation framework. In 2023, Woodside’s credit ratings of BBB+ and Baa1 by S&P Global and Moody’s respectively were both maintained.4 Woodside’s gearing at the end of 2023 was 12.1%, within the lower end of our target range of 10-20%. Woodside’s gearing may at times fall outside the target range of 10-20% as the balance sheet is managed through the investment cycle.5 Commodity price risk management Woodside hedges to protect the balance sheet against downside commodity price risk, particularly during periods of high capital expenditure. Woodside hedged approximately 22 MMboe of 2023 volumes. The realised value of these oil price hedges was a pre-tax expense of approximately $200 million. As at 31 December 2023, Woodside has placed oil price hedges for approximately 29 MMboe of 2024 production at an average price of approximately $76 per barrel. Woodside has also placed hedges for Corpus Christi LNG volumes to protect against downside pricing risk. These hedges are Henry Hub and Title Transfer Facility (TTF) commodity swaps. An average of 63% of 2024 volumes and 17% of 2025 volumes have reduced pricing risk as a result of hedging activities. 1 Underlying NPAT is a non-IFRS measures. Refer to section 6.6—Alternative performance measures for a reconciliation of these measures to Woodside’s Financial Statements. 2 Free cash flow is a non-IFRS measure. Refer to section 6.6- Alternative performance measures for a reconciliation of these measures to Woodside’s Financial Statements. 3 Cash flow from operating activities less cash flow from investing activities. 4 Credit ratings are forward-looking opinions on credit risk. S&P Global’s and Moody’s credit ratings express the opinion of each agency on the ability and willingness of Woodside to meet its financial obligations in full and on time. A credit rating is not a recommendation to buy, sell or hold securities and may be subject to suspension, reduction or withdrawal at any time by an assigning rating agency. Any rating should be evaluated independently of any other information. 5 Gearing and net debt are non-IFRS measures. Refer to section 6.6—Alternative performance measures for a reconciliation of these measures to Woodside’s Financial Statements. WOODSIDE ENERGY GROUP LTD 17 2.4 STRATEGY AND FINANCIAL PERFORMANCE Energy markets Geopolitical events continued to disrupt energy markets throughout 2023, reinforcing the importance of providing customers with reliable, affordable and secure energy.
Recent events, including the energy security situation in Europe and the conflict in the Middle East, have resulted in both positive and negative drivers for the energy transition. Increased demand for oil and natural gas has highlighted the need for continued production of and investment in hydrocarbons, while policy support for renewables and lower carbon services has continued to be robust. MACROECONOMIC The global economy proved resilient in 2023 despite the dual challenges of persistently high inflation levels and rising interest rates; gross domestic product (GDP) grew at 3.0%.1 Hawkish monetary policy from 2022 was adopted, curbing inflation. Many advanced economies are passing peak interest rates; however, longer-term macroeconomic impacts of policy are unknown. China presents uncertainty as the economy struggles with tepid demand, lower confidence and the real estate sector faces liquidity issues. However, recent government stimulus is a positive sign for future growth enabling China to meet its 2023 official GDP growth target of approximately 5%. The world’s population is expected to increase by approximately two billion people by 2050 and GDP is forecast to almost double, driving increased energy demand.2 OIL OPEC+ continues to exert control in balancing oil markets and has committed to further production cuts in 2024.3 However, non-OPEC production volumes, particularly in the US Lower 48, Canada, Brazil and Guyana will continue to grow into 2024 potentially offsetting OPEC+ cuts. Dated Brent averaged US$83/bbl in 2023, 18% below average 2022 prices which were elevated by the energy crisis and 14% above the five-year average.4 Oil prices are expected to remain elevated into 2024 supported by a geopolitical risk premium, OPEC+ production management and a slower growth rate for non-OPEC production. LIQUIFIED NATURAL GAS In 2023, global gas markets began to rebalance but remained tight, exacerbated by Russian LNG sanction uncertainty. Although North East Asian LNG prices averaged half of 2022 average prices at US$14/MMBtu, global gas prices remain robust and consistent with long-term expectations.4 Wood Mackenzie forecasts in its base case scenario that global LNG demand will grow 53% to 2033, supported by growth in Europe (until 2029), China and emerging Asian markets.5 NEW ENERGY PRODUCTS Globally, investment in new energy technology has increased, spurred by government incentives such as REPowerEU and the US Inflation Reduction Act and a common goal to reduce long-term emissions. Subsidies have driven early growth in wind and solar followed by refinement of technology and large-scale manufacturing which has improved affordability. Although the environment for new energy products remains challenged by uncertainty in proving technologies, securing future demand for product, lack of clarity on the application of incentives, and unfavourable project economics, Woodside believes that new energy products will play an important role in the energy transition. AUSTRALIAN DOMESTIC GAS MARKETS The Australian domestic gas market experienced supply shortfalls in 2023 as demand outpaced supply. In Western Australia, demand was supported by the progressive retirement of coal fired power generation, numerous outages and project delays. Demand is expected to exceed supply by up to 11% until 2029 with an increasing supply gap to 2032 as coal supply is retired.6 Despite the Federal government implementing a price cap of A$12/GJ for new supplies in 2023 to improve affordability, further investment in supply and infrastructure will be needed in the future to ensure that demand can be met. International Monetary Fund, January 2024. “World Economic Outlook Update”. Wood Mackenzie, September 2023. “Energy Transition Outlook 2023”. OPEC Monthly Oil Market Report, January 2024. Thompson Reuters Eikon. Wood Mackenzie, October 2023. “Global Gas Investment Horizon Outlook”. Australian Energy Market Operator, 2023. “Western Australian Gas Statement of Opportunities”.
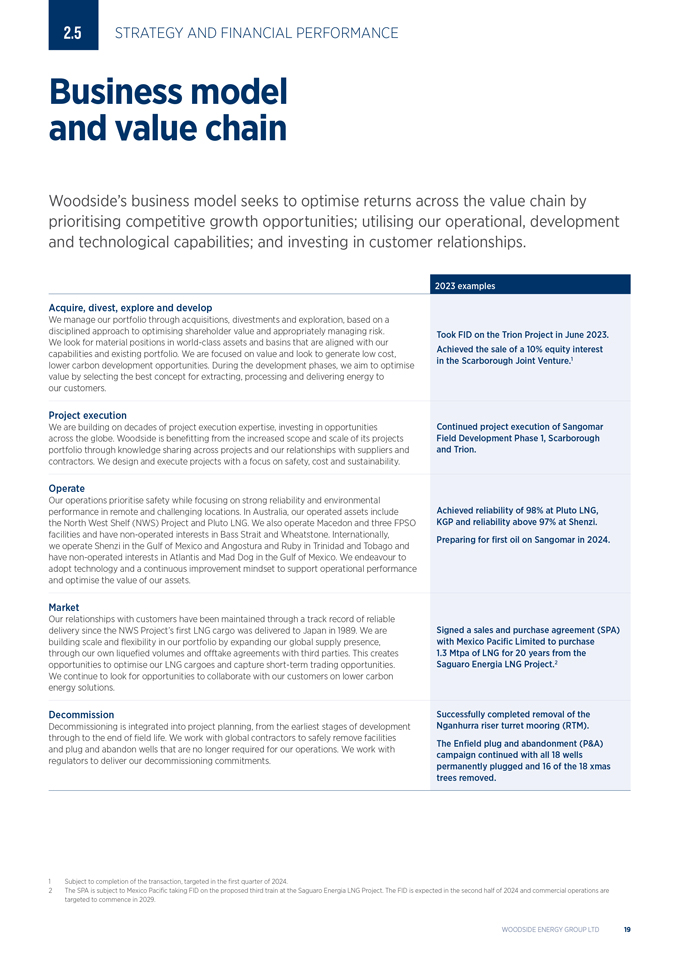
ANNUAL REPORT 2023 2.5 STRATEGY AND FINANCIAL PERFORMANCE Business and value model chain Woodside’s business model seeks to optimise returns across the value chain by prioritising competitive growth opportunities; utilising our operational, development and technological capabilities; and investing in customer relationships. 2023 examples Acquire, divest, explore and develop We manage our portfolio through acquisitions, divestments and exploration, based on a disciplined approach to optimising shareholder value and appropriately managing risk. Took FID on the Trion Project in June 2023. We look for material positions in world-class assets and basins that are aligned with our capabilities and existing portfolio. We are focused on value and look to generate low cost, Achieved the sale of a 10% equity interest lower carbon development opportunities. During the development phases, we aim to optimise in the Scarborough Joint Venture.1 value by selecting the best concept for extracting, processing and delivering energy to our customers. Project execution We are building on decades of project execution expertise, investing in opportunities Continued project execution of Sangomar across the globe. Woodside is benefitting from the increased scope and scale of its projects Field Development Phase 1, Scarborough portfolio through knowledge sharing across projects and our relationships with suppliers and and Trion. contractors. We design and execute projects with a focus on safety, cost and sustainability. Operate Our operations prioritise safety while focusing on strong reliability and environmental performance in remote and challenging locations. In Australia, our operated assets include Achieved reliability of 98% at Pluto LNG, the North West Shelf (NWS) Project and Pluto LNG. We also operate Macedon and three FPSO KGP and reliability above 97% at Shenzi. facilities and have non-operated interests in Bass Strait and Wheatstone. Internationally, Preparing for first oil on Sangomar in 2024. we operate Shenzi in the Gulf of Mexico and Angostura and Ruby in Trinidad and Tobago and have non-operated interests in Atlantis and Mad Dog in the Gulf of Mexico. We endeavour to adopt technology and a continuous improvement mindset to support operational performance and optimise the value of our assets. Market Our relationships with customers have been maintained through a track record of reliable delivery since the NWS Project’s first LNG cargo was delivered to Japan in 1989. We are Signed a sales and purchase agreement (SPA) building scale and flexibility in our portfolio by expanding our global supply presence, with Mexico Pacific Limited to purchase through our own liquefied volumes and offtake agreements with third parties. This creates 1.3 Mtpa of LNG for 20 years from the opportunities to optimise our LNG cargoes and capture short-term trading opportunities. Saguaro Energia LNG Project.2 We continue to look for opportunities to collaborate with our customers on lower carbon energy solutions. Decommission Successfully completed removal of the Decommissioning is integrated into project planning, from the earliest stages of development Nganhurra riser turret mooring (RTM). through to the end of field life. We work with global contractors to safely remove facilities The Enfield plug and abandonment (P&A) and plug and abandon wells that are no longer required for our operations. We work with campaign continued with all 18 wells regulators to deliver our decommissioning commitments. permanently plugged and 16 of the 18 xmas trees removed. Subject to completion of the transaction, targeted in the first quarter of 2024. The SPA is subject to Mexico Pacific taking FID on the proposed third train at the Saguaro Energia LNG Project. The FID is expected in the second half of 2024 and commercial operations are targeted to commence in 2029. WOODSIDE ENERGY GROUP LTD 19 3.1 OUR BUSINESS Australian operations Woodside’s Australian portfolio consists of operated and non-operated oil and gas projects across Australia.
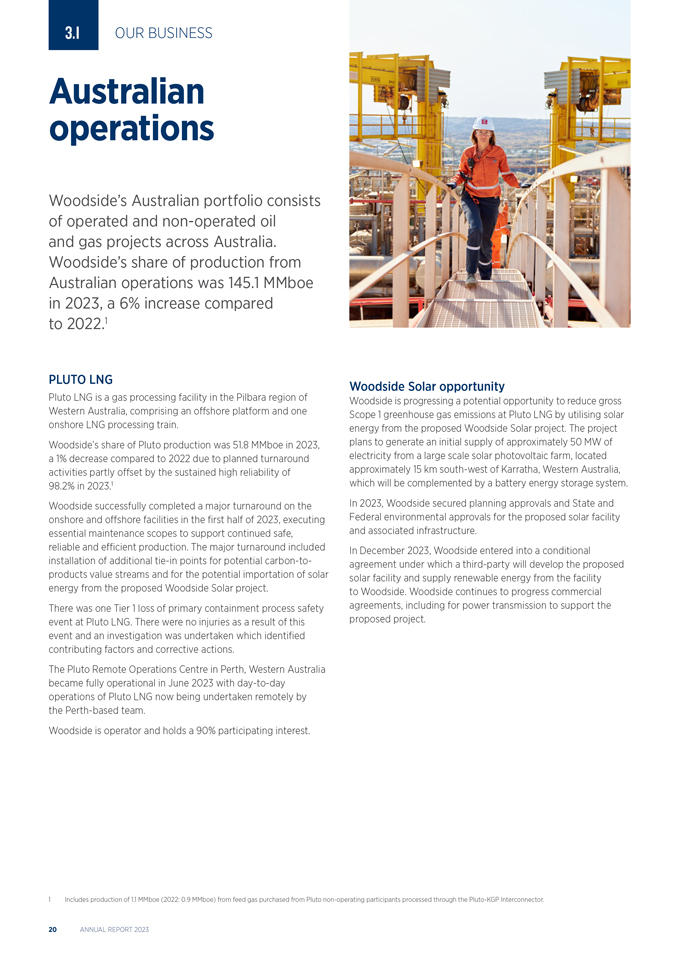
Woodside’s share of production from Australian operations was 145.1 MMboe in 2023, a 6% increase compared to 2022.1 PLUTO LNG Pluto LNG is a gas processing facility in the Pilbara region of Western Australia, comprising an offshore platform and one onshore LNG processing train. Woodside’s share of Pluto production was 51.8 MMboe in 2023, a 1% decrease compared to 2022 due to planned turnaround activities partly offset by the sustained high reliability of 98.2% in 2023.1 Woodside successfully completed a major turnaround on the onshore and offshore facilities in the first half of 2023, executing essential maintenance scopes to support continued safe, reliable and efficient production. The major turnaround included installation of additional tie-in points for potential carbon-to-products value streams and for the potential importation of solar energy from the proposed Woodside Solar project. There was one Tier 1 loss of primary containment process safety event at Pluto LNG. There were no injuries as a result of this event and an investigation was undertaken which identified contributing factors and corrective actions. The Pluto Remote Operations Centre in Perth, Western Australia became fully operational in June 2023 with day-to-day operations of Pluto LNG now being undertaken remotely by the Perth-based team. Woodside is operator and holds a 90% participating interest. Woodside Solar opportunity Woodside is progressing a potential opportunity to reduce gross Scope 1 greenhouse gas emissions at Pluto LNG by utilising solar energy from the proposed Woodside Solar project. The project plans to generate an initial supply of approximately 50 MW of electricity from a large scale solar photovoltaic farm, located approximately 15 km south-west of Karratha, Western Australia, which will be complemented by a battery energy storage system. In 2023, Woodside secured planning approvals and State and Federal environmental approvals for the proposed solar facility and associated infrastructure. In December 2023, Woodside entered into a conditional agreement under which a third-party will develop the proposed solar facility and supply renewable energy from the facility to Woodside. Woodside continues to progress commercial agreements, including for power transmission to support the proposed project. Includes production of 1.1 MMboe (2022: 0.9 MMboe) from feed gas purchased from Pluto non-operating participants processed through the Pluto-KGP Interconnector. ANNUAL REPORT 2023 NORTH WEST SHELF PROJECT The NWS Project consists of three offshore platforms and the onshore KGP, which includes five onshore LNG processing trains.
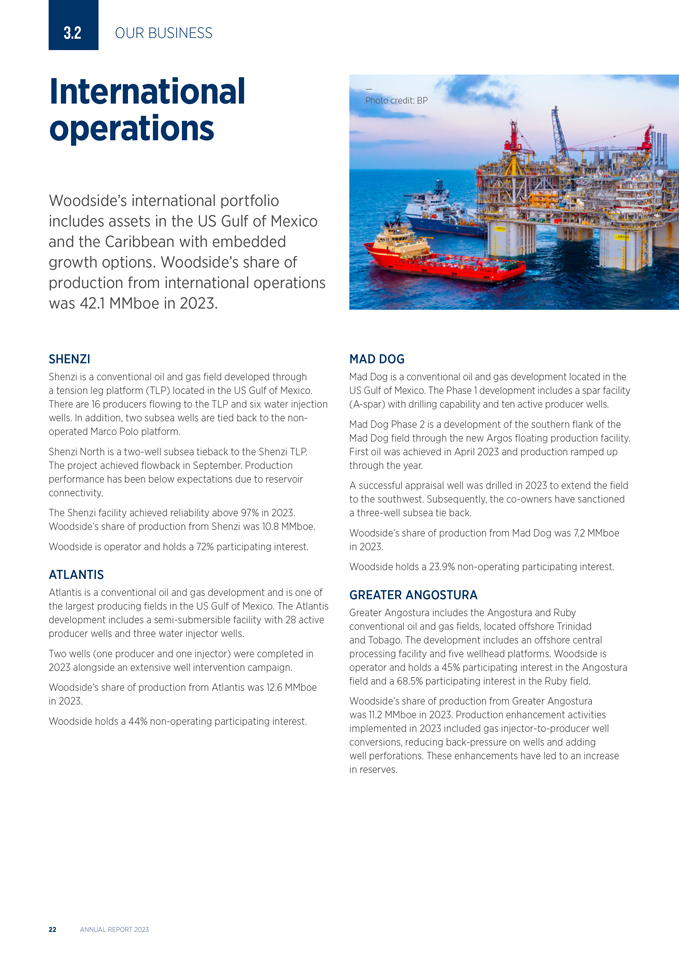
Woodside’s share of NWS Project production was 40.8 MMboe in 2023. This was an 11% increase compared to 2022, due to the increase of Woodside’s equity share following completion of the merger with BHP Petroleum in June 2022. In 2023, 11.2 MMboe of Pluto gas was processed at KGP through the Pluto-KGP Interconnector. The Interconnector enables gas from Pluto LNG to be transported to KGP for processing. In June 2023, a fatality occurred at the North Rankin Complex. The tragic loss of our colleague, a contractor employee, has led to the implementation of additional operational controls based on preliminary investigation insights into the incident. The external investigations into the incident are ongoing. KGP is expected to have increased ullage in 2024 due to a combination of natural field decline and limited third-party gas processing demand. To optimise utilisation of onshore infrastructure, NWS is planning to take one LNG train offline in 2024. Discussions continue between NWS and other resource owners for the processing of third-party gas and NWS continues to progress the development of infill and nearfield opportunities to utilise ullage at KGP. The NWS Project started processing Waitsia gas in 2023 at low rates and will commence processing at a large scale when the Waitsia Stage 2 facility comes online which is expected in 2024. State and Commonwealth regulatory approval processes continue for the North West Shelf Project Extension, which supports long-term operations and processing of future third-party gas resources at KGP. Woodside successfully completed planned turnaround and maintenance activities on the North Rankin Complex, Goodwyn Platform and KGP in the second half of 2023. Woodside is operator and holds a 33.33% participating interest. WHEATSTONE AND JULIMAR-BRUNELLO Wheatstone is an LNG processing facility near Onslow, Western Australia, comprising an offshore production platform and two onshore LNG processing trains. It processes gas from several offshore gas fields including Julimar and Brunello. Woodside’s share of Wheatstone production was 13.5 MMboe in 2023, an increase from 12.2 MMboe in 2022, which was impacted by a major facility turnaround. The FID on Julimar-Brunello Phase 3 was approved in April 2023. The project involves the drilling of up to four development wells tied-back from the Julimar field to the existing Julimar field production system. Woodside is operator and holds a 65% participating interest in the Julimar-Brunello fields. Woodside holds a 13% non-operated interest in the Wheatstone project. BASS STRAIT Bass Strait is located in the south-east of Australia and produces oil and gas through a network of offshore platforms, pipelines and onshore processing facilities. The Bass Strait assets include the Gippsland Basin Joint Venture (GBJV) and the Kipper Unit Joint Venture (KUJV). Woodside’s share of production from the Bass Strait was 22.8 MMboe in 2023, driven by lower Australian east coast gas market demand due to a number of factors including a warmer winter. All of Woodside’s share of the gas produced by the GBJV is supplied into the eastern Australian domestic gas market, supporting Australia’s energy needs. As production rates decline, progress has been made to optimise facilities through the Gas Asset Streamlining project. This project will support the implementation of a gas focused business. The Kipper Compression project has progressed and is expected to enable continued supply of gas to the domestic market in 2024. Woodside holds a 50% non-operating interest in the GBJV and a 32.5% non-operating interest in the KUJV. OTHER AUSTRALIAN OIL AND GAS ASSETS Woodside operates three FPSO facilities off the north-west coast of Western Australia. These are the Ngujima-Yin FPSO (Woodside interest: 60%), Okha FPSO (Woodside interest: 50%) and Pyrenees FPSO (Woodside interest: 40% in WA-43-L and 71.4% in WA-42-L). Woodside’s share of production from the FPSO assets was 8.0 MMboe, down from 10.6 MMboe in 2022 primarily due to the planned five-yearly Ngujima-Yin FPSO maintenance turnaround. The Ngujima-Yin FPSO turnaround performed in Singapore was completed safely in June 2023. The Pyrenees turnaround is planned for the first half of 2024. Macedon (Woodside interest: 71.4%), also operated by Woodside, is a gas project located near Onslow, Western Australia which produces pipeline gas for the Western Australian domestic gas market. Woodside’s share of production from Macedon in 2023 was 8.2 MMboe. The Macedon facility delivered approximately 17% of the Western Australian domestic gas market supply in 2023. WOODSIDE ENERGY GROUP LTD 21 3.2 OUR BUSINESS International operations Woodside’s international portfolio includes assets in the US Gulf of Mexico and the Caribbean with embedded growth options.
Woodside’s share of production from international operations was 42.1 MMboe in 2023. SHENZI Shenzi is a conventional oil and gas field developed through a tension leg platform (TLP) located in the US Gulf of Mexico. There are 16 producers flowing to the TLP and six water injection wells. In addition, two subsea wells are tied back to the non-operated Marco Polo platform. Shenzi North is a two-well subsea tieback to the Shenzi TLP. The project achieved flowback in September. Production performance has been below expectations due to reservoir connectivity. The Shenzi facility achieved reliability above 97% in 2023. Woodside’s share of production from Shenzi was 10.8 MMboe. Woodside is operator and holds a 72% participating interest. ATLANTIS Atlantis is a conventional oil and gas development and is one of the largest producing fields in the US Gulf of Mexico. The Atlantis development includes a semi-submersible facility with 28 active producer wells and three water injector wells. Two wells (one producer and one injector) were completed in 2023 alongside an extensive well intervention campaign. Woodside’s share of production from Atlantis was 12.6 MMboe in 2023. Woodside holds a 44% non-operating participating interest. — Photo credit: BP MAD DOG Mad Dog is a conventional oil and gas development located in the US Gulf of Mexico. The Phase 1 development includes a spar facility (A-spar) with drilling capability and ten active producer wells. Mad Dog Phase 2 is a development of the southern flank of the Mad Dog field through the new Argos floating production facility. First oil was achieved in April 2023 and production ramped up through the year. A successful appraisal well was drilled in 2023 to extend the field to the southwest. Subsequently, the co-owners have sanctioned a three-well subsea tie back. Woodside’s share of production from Mad Dog was 7.2 MMboe in 2023. Woodside holds a 23.9% non-operating participating interest. GREATER ANGOSTURA Greater Angostura includes the Angostura and Ruby conventional oil and gas fields, located offshore Trinidad and Tobago. The development includes an offshore central processing facility and five wellhead platforms. Woodside is operator and holds a 45% participating interest in the Angostura field and a 68.5% participating interest in the Ruby field. Woodside’s share of production from Greater Angostura was 11.2 MMboe in 2023. Production enhancement activities implemented in 2023 included gas injector-to-producer well conversions, reducing back-pressure on wells and adding well perforations. These enhancements have led to an increase in reserves.
22 ANNUAL REPORT 2023 3.3 OUR BUSINESS Marketing and trading Woodside has a global portfolio with positions in the Asia-Pacific and Atlantic basins and has a proven track record in our integrated shipping, operations, marketing and trading activities across LNG, condensate, crude and natural gas liquid (NGL) cargoes. The marketing segment’s profit before tax in 2023 was $375 million. This reflected the optimisation activities and incremental value generated through the marketing, trading and shipping of Woodside’s oil and gas and through third-party purchased values. Woodside’s LNG portfolio is managed through a mix of short, mid and long-term contracts, supplied with cargoes sourced from producing assets or purchased from third parties. In 2023, Woodside’s exposure of produced LNG to gas hub indices was 30%. Woodside’s LNG trading activities seek to maximise value of our LNG portfolio. Third-party cargoes are purchased from Corpus Christi LNG through a long-term offtake agreement and from the spot market through our relationships with other producers and traders. The marketing of crude, condensate and NGLs is predominantly based on short-term sales and supplemented by term arrangements. In the Gulf of Mexico, crude oil is sold to refiners and traders on the US Gulf Coast. Woodside has also increased its operational flexibility through the ability to export crude oil to international markets. In Trinidad and Tobago, crude oil is sold to international markets and natural gas is sold into the domestic market. Natural gas is sold domestically in both Western Australia and the east coast of Australia. In Western Australia, Woodside’s domestic gas obligations are met from multiple producing assets. All of Woodside’s production from Bass Strait is sold into the east coast domestic market. In 2023, Woodside’s Western Australian assets produced 76 petajoules (PJ) of gas, representing approximately 19% of Western Australia’s domestic gas supply. Woodside’s share of Bass Strait production was 97 PJ and that represented approximately 19% of all gas supplied to the east coast market. Woodside’s marketing and trading portfolio is supported by our shipping capacity which includes six vessels under long-term contract and multiple vessels on short-term charter. Woodside has chartered an additional five new-build LNG ships to support the delivery of Scarborough LNG cargoes and growth in trading activities. The new-build vessels are expected to be delivered between 2024 and 2026. In April 2023, a long-term gas sale and purchase agreement (GSPA) with Perdaman Chemicals and Fertiliser Pty Ltd became unconditional. Supply under the GSPA is for approximately 130 TJ per day of gas over a term of 20 years expected to commence in 2026 or 2027. Woodside also executed several natural gas sale agreements for the combined supply of approximately 128 PJ of pipeline gas to both the east coast and Western Australian domestic customers including retailers and commercial and industrial users. Delivery has commenced and is expected to continue to 2026. In addition, Woodside also signed a SPA with Pilgangoora Operations Pty Ltd, a 100% owned subsidiary of Pilbara Minerals, for the supply of domestic LNG from the Pluto Truck Loading Facility. Supply under the SPA is contracted to commence in 2024 for a period of five years. In August 2023, Woodside and LJ Scarborough Pty Ltd (LNG Japan) entered into a non-binding heads of agreement for the sale and purchase of 12 LNG cargoes per year (approximately 0.9 million tonnes per annum (Mtpa)) for ten years commencing in 2026.1 This agreement is part of a broader strategic relationship with LNG Japan and its parent entities which includes the sale of a 10% non-operating participating interest in Scarborough Joint Venture and collaboration on opportunities in new energy.2 In December 2023, Woodside signed a SPA with Mexico Pacific Limited (Mexico Pacific) for the purchase of 1.3 Mtpa of LNG over 20 years from Mexico Pacific’s Saguaro Energia LNG project on the Pacific coast of Mexico. The SPA is subject to Mexico Pacific taking a FID on the proposed third train which is expected in the second half of 2024. Commercial operations are targeted to commence in 2029. Subsequent to the period, Woodside and JERA entered into a non-binding heads of agreement for the sale and purchase of six LNG cargoes on a delivered ex-ship basis per year for 10 years commencing in 2026 from Woodside’s global portfolio. This agreement is part of a broader strategic relationship with JERA which includes equity in the Scarborough Joint Venture and collaboration on opportunities in new energy and lower carbon services. 1 LJ Scarborough Pty Ltd is currently a wholly owned subsidiary of LNG Japan Corporation, which is a 50:50 joint venture between Sumitomo Corporation and Sojitz Corporation. 2 Subject to completion of the transaction, targeted in the first quarter of 2024. WOODSIDE ENERGY GROUP LTD 23 3.4 OUR BUSINESS Projects Woodside’s portfolio of projects is underpinned by project delivery capability that is focused on safety, low cost and lower carbon solutions.
SCARBOROUGH ENERGY PROJECT The Scarborough gas field is located in the Carnarvon Basin, approximately 375 km off the coast of Western Australia. The field is being developed through new offshore facilities connected by an approximately 430 km pipeline to a second LNG train at the existing Pluto LNG onshore facility. The development of the Scarborough field includes the installation of a FPU with eight wells drilled in the initial phase and 13 wells drilled throughout the life of the field. Expansion of Pluto LNG includes the construction of a second LNG train (Pluto Train 2), installation of additional domestic gas processing facilities and supporting infrastructure and modifications to the existing Pluto Train 1 to allow it to process Scarborough gas. Scarborough gas is expected to produce approximately 5 Mtpa of LNG from Pluto Train 2, and up to 3 Mtpa of LNG from the existing Pluto Train 1. The Scarborough reservoir contains less than 0.1% CO . Combined with processing design efficiencies at the offshore floating 2 production unit and onshore Pluto Train 2 the Scarborough Energy Project will be one of the lowest carbon intensity sources of LNG delivered into North Asian markets.1 At the end of 2023, the project was 55% complete.2 Fabrication of the FPU is ongoing with the living quarters commissioning underway and the hull and topsides progressing. Subsequent to the period, the hull exited its first drydock and the flare boom was installed on the topsides. Fabrication of the subsea flowlines and trunkline are complete. The environment plans for the seismic, drilling, subsea and trunkline installation activities were accepted by the regulator in December. Following this approval, the seismic program was successfully completed. Subsequent to the period, the first subsea flowline was installed, drilling of the production wells commenced and work on the nearshore pipeline installation completed. Work on the remainder of the pipeline in Commonwealth waters is underway. Pluto Train 2 site works are well progressed in preparation for delivery of equipment and modules throughout 2024. At the end of 2023, approximately 33,000 m3 of concrete has been poured, 564 tonnes of structural steel erected and 3 km of piping has been installed. Fabrication of six modules was complete, with a further 38 modules underway. Additional modules were completed subsequent to the period. The engineering, procurement and construction management (EPCM) contractor was selected for Pluto Train 1 modifications, with engineering and procurement of long-lead items progressing. Preparatory works for the Pluto Train 2 tie-in were carried out during the Pluto LNG turnaround in May 2023. Woodside took a FID for the Scarborough Integrated Remote Operations Centre (IROC) in November 2023. The IROC will allow Scarborough and the Pluto facility to be remotely operated from Perth. In August 2023, Woodside entered into an agreement with LNG Japan for the sale of a 10% non-operating participating interest in the Scarborough Joint Venture.3 Subsequent to the period, Woodside entered into an agreement with JERA for the sale of a 15.1% non-operating participating interest in the Scarborough Joint Venture.4 Woodside is operator and holds a 100% participating interest in Scarborough, 51% participating interest in Pluto Train 2 and 90% participating interest in Pluto LNG.5 Woodside is targeting first LNG cargo in 2026. SANGOMAR The Sangomar oil and gas field, located approximately 100 km south of Dakar, is Senegal’s first offshore oil project. The Sangomar Field Development Phase 1 is developing the less complex reservoir units and testing other reservoirs to support potential future phases. Oil will be produced through a stand-alone FPSO facility with 23 subsea wells and supporting subsea infrastructure. It is designed to allow the tie-in of subsequent phases. The FPSO Léopold Sédar Senghor is a converted oil tanker with new topsides, turret and mooring systems and has production capacity of 100,000 bbl/day. The FPSO departed Singapore in December 2023 and arrived offshore Senegal subsequent to the period in February 2024. The Phase 1 drilling and completions campaign includes 23 production, gas and water injection wells. The reinjection of gas and water is intended to help maximise the recovery of the oil and enable gas to be stored for future use. At the end of 2023, 17 wells were completed and six further wells were partially complete. Wood Mackenzie Emissions Benchmarking. The completion percentage excludes the Pluto Train 1 modifications project. LJ Scarborough Pty Ltd (LNG Japan) is currently a wholly owned subsidiary of LNG Japan Corporation, which is a 50:50 joint venture between Sumitomo Corporation and Sojitz Corporation. Subject to completion of the transaction, targeted in the first quarter of 2024. The sale and purchase agreement is with JERA Scarborough Pty Ltd which is a wholly owned subsidiary of JERA Co., Inc. Subject to completion of the transaction, targeted for the second half of 2024. Following completion of the transactions with LNG Japan and JERA, Woodside will hold a 74.9% interest in the Scarborough Joint Venture and remain as operator. Completion is targeted for the first quarter of 2024 for the transaction with LNG Japan and the second half of 2024 for the transaction with JERA. ANNUAL REPORT 2023
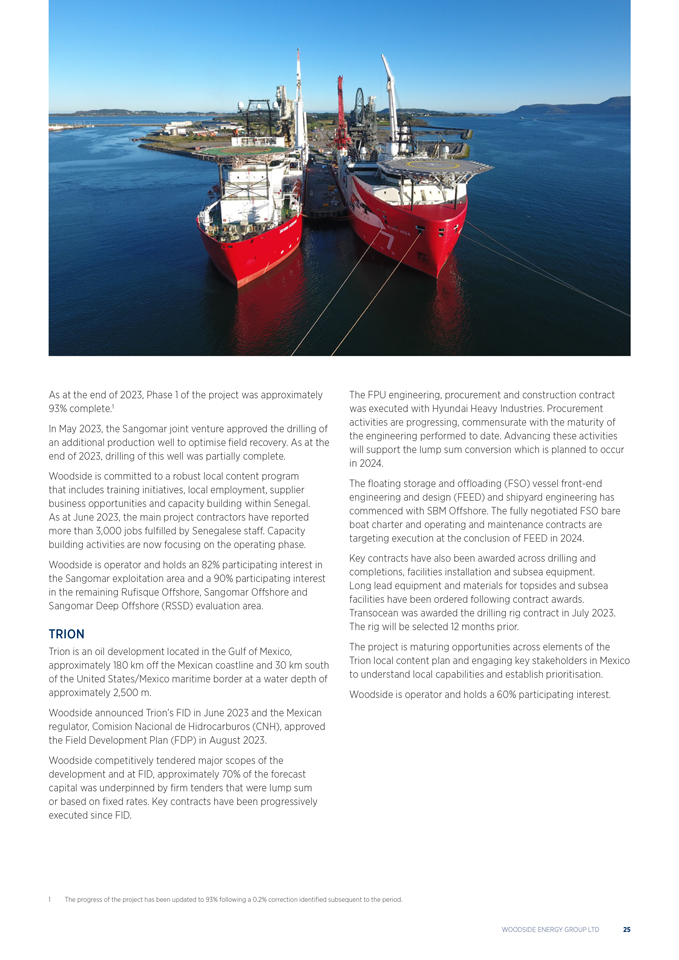
As at the end of 2023, Phase 1 of the project was approximately 93% complete.1 In May 2023, the Sangomar joint venture approved the drilling of an additional production well to optimise field recovery. As at the end of 2023, drilling of this well was partially complete. Woodside is committed to a robust local content program that includes training initiatives, local employment, supplier business opportunities and capacity building within Senegal. As at June 2023, the main project contractors have reported more than 3,000 jobs fulfilled by Senegalese staff. Capacity building activities are now focusing on the operating phase. Woodside is operator and holds an 82% participating interest in the Sangomar exploitation area and a 90% participating interest in the remaining Rufisque Offshore, Sangomar Offshore and Sangomar Deep Offshore (RSSD) evaluation area. TRION Trion is an oil development located in the Gulf of Mexico, approximately 180 km off the Mexican coastline and 30 km south of the United States/Mexico maritime border at a water depth of approximately 2,500 m. Woodside announced Trion’s FID in June 2023 and the Mexican regulator, Comision Nacional de Hidrocarburos (CNH), approved the Field Development Plan (FDP) in August 2023. Woodside competitively tendered major scopes of the development and at FID, approximately 70% of the forecast capital was underpinned by firm tenders that were lump sum or based on fixed rates. Key contracts have been progressively executed since FID. The FPU engineering, procurement and construction contract was executed with Hyundai Heavy Industries. Procurement activities are progressing, commensurate with the maturity of the engineering performed to date. Advancing these activities will support the lump sum conversion which is planned to occur in 2024. The floating storage and offloading (FSO) vessel front-end engineering and design (FEED) and shipyard engineering has commenced with SBM Offshore. The fully negotiated FSO bare boat charter and operating and maintenance contracts are targeting execution at the conclusion of FEED in 2024. Key contracts have also been awarded across drilling and completions, facilities installation and subsea equipment. Long lead equipment and materials for topsides and subsea facilities have been ordered following contract awards. Transocean was awarded the drilling rig contract in July 2023. The rig will be selected 12 months prior. The project is maturing opportunities across elements of the Trion local content plan and engaging key stakeholders in Mexico to understand local capabilities and establish prioritisation. Woodside is operator and holds a 60% participating interest. 1 The progress of the project has been updated to 93% following a 0.2% correction identified subsequent to the period. WOODSIDE ENERGY GROUP LTD 25
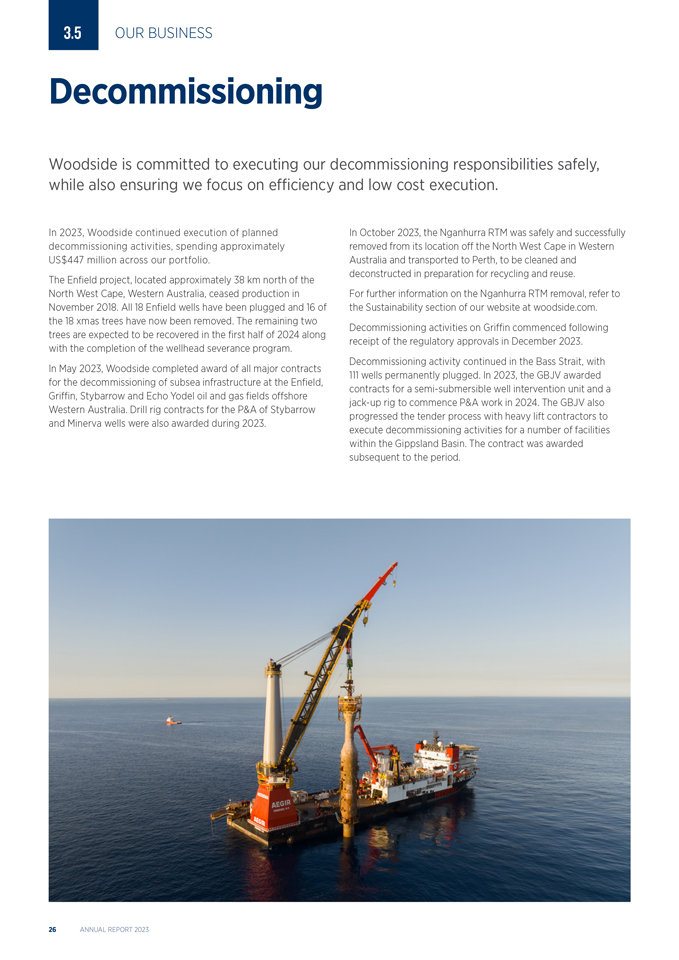
3.5 OUR BUSINESS Decommissioning Woodside is committed to executing our decommissioning responsibilities safely, while also ensuring we focus on efficiency and low cost execution. In 2023, Woodside continued execution of planned decommissioning activities, spending approximately US$447 million across our portfolio. The Enfield project, located approximately 38 km north of the North West Cape, Western Australia, ceased production in November 2018. All 18 Enfield wells have been plugged and 16 of the 18 xmas trees have now been removed. The remaining two trees are expected to be recovered in the first half of 2024 along with the completion of the wellhead severance program. In May 2023, Woodside completed award of all major contracts for the decommissioning of subsea infrastructure at the Enfield, Griffin, Stybarrow and Echo Yodel oil and gas fields offshore Western Australia. Drill rig contracts for the P&A of Stybarrow and Minerva wells were also awarded during 2023. In October 2023, the Nganhurra RTM was safely and successfully removed from its location off the North West Cape in Western Australia and transported to Perth, to be cleaned and deconstructed in preparation for recycling and reuse. For further information on the Nganhurra RTM removal, refer to the Sustainability section of our website at woodside.com. Decommissioning activities on Griffin commenced following receipt of the regulatory approvals in December 2023. Decommissioning activity continued in the Bass Strait, with 111 wells permanently plugged. In 2023, the GBJV awarded contracts for a semi-submersible well intervention unit and a jack-up rig to commence P&A work in 2024. The GBJV also progressed the tender process with heavy lift contractors to execute decommissioning activities for a number of facilities within the Gippsland Basin. The contract was awarded subsequent to the period. ANNUAL REPORT 2023
3.6 OUR BUSINESS Exploration and development Woodside’s portfolio of developments and targeted exploration program is focused on identifying and addressing key technical and commercial elements to allow resources to compete for capital. CALYPSO Calypso is located approximately 220 km off the coast of Trinidad in 2,100 m water depth. The resource comprises several gas discoveries in Block 23(a) and Block TTDAA 14. The development is located in a region with existing infrastructure and a favourable demand outlook. In the first half of 2023, Woodside completed conceptual studies and selected an infield host as the preferred development concept. Pre-FEED engineering commenced in the second half of 2023 to mature the definition of the concept. Marketing and commercial discussions continue with key stakeholders to evaluate options to monetise the resource. Woodside is operator and holds a 70% participating interest. BROWSE Browse comprises the Calliance, Brecknock and Torosa gas and condensate fields in the offshore Browse Basin, located approximately 425 km north of Broome, Western Australia. Key work activities continued in support of the proposed Browse to NWS Project development, including engagements with environmental regulators on approvals and progressing commercial agreements. A CCS solution has been incorporated into the offshore design to abate a significant proportion of Browse reservoir CO . The Browse Joint Venture is evaluating further carbon abatement 2 and energy efficiency opportunities to reduce and manage greenhouse gas emissions. Woodside is operator and holds a 30.6% participating interest. LIARD The Liard field is an unconventional gas field located in British Columbia, Canada. In 2023, Woodside completed a transaction whereby Calgary-based Paramount Resources took a 50% equity interest in, and operatorship of, 28 leases of the Liard field. Woodside signed an agreement to join the Rockies LNG partnership as an option to potentially export LNG via the west coast of Canada. The Rockies LNG Partnership is collaborating with Western LNG and the Nisga’ Nation, the developers of the Ksi Lisims LNG project in British Columbia. Woodside holds a 50% participating interest in the Liard field. SUNRISE Sunrise comprises the Sunrise and Troubadour gas and condensate fields which are located approximately 450 km north-west of Darwin, Australia and 150 km south of Timor-Leste. In 2023, the Sunrise Joint Venture (SJV) participants continued to engage the Australian and Timor-Leste Governments on a new Greater Sunrise Production Sharing Contract and other related documents. The SJV also agreed with the Timor-Leste and Australian Governments to undertake a concept study for the potential development to inform relevant stakeholders in 2024. The study will consider the key issues for developing, processing and marketing gas via both Timor-Leste and Australia. In addition to this, retention lease renewals were granted for Australian titles NT/RL2 and NT/RL4. Woodside is operator and holds a 33.44% participating interest. EXPLORATION Woodside’s exploration strategy remains focused on accessing, testing and developing low cost, lower carbon, value-adding opportunities with the characteristics and project pace to be resilient through the energy transition. In the US Gulf of Mexico, Woodside was awarded five leases in lease sale 259 and was the highest bidder on 18 leases in lease sale 261.1 Woodside acquired a 44% working interest in two leases in the Green Canyon protraction area and participated in the drilling of the Spinel well (non-operated), which did not encounter hydrocarbons. Also acquired, was a 30% working interest in 11 leases in the Atwater Valley protraction area. The Egyptian regulator approved Woodside’s acquisition of a 27% interest in two non-operated blocks in the Herodotus Basin. Woodside signed an option agreement to acquire at least a 56% interest in Petroleum Exploration License 87, located offshore Namibia in the Orange Basin. Seismic acquisition was completed and a decision on exercising the option to enter will follow evaluation of the seismic data in 2024. Woodside continued to optimise its exploration portfolio, exiting blocks no longer considered prospective. This included a decision to exit Block 5 in deepwater Trinidad and Tobago and completing formal exit activities in offshore Canada, Republic of Korea, Peru and Myanmar Block A-6. 1 The final award of leases under lease sale 261 is pending regulatory approval. WOODSIDE ENERGY GROUP LTD 27
3.7 OUR BUSINESS New energy and carbon solutions Woodside is focusing on the development of new energy products and lower carbon services, to help Woodside and our customers reduce emissions. NEW ENERGY United States H2OK H2OK is a proposed liquid hydrogen project to be located in Ardmore, Oklahoma, expected to produce up to 60 tonnes per day (tpd) of liquid hydrogen. Woodside continued to progress technical, regulatory and contracting activities in 2023. Woodside is evaluating the proposed US Federal Government tax incentive criteria to determine implications for the project and is working to finalise customer offtake agreements to support a potential FID. Woodside is operator and holds a 100% participating interest. US Gulf Coast In 2023, Woodside assessed locations and progressed the early stages of an opportunity for a potential large scale ammonia production and export facility. Heliogen Collaboration Woodside and Heliogen have a project agreement to deploy a 5 MW demonstration module of Heliogen’s artificial intelligence- enabled concentrated solar energy technology in California, known as the Capella project. In 2023, the project completed FEED. Asia-Pacific H2Perth is a proposed hydrogen and ammonia production facility to be located in Perth, Western Australia. In 2023, primary environmental approval application documents were submitted to both the Commonwealth and Western Australian regulators. The Hydrogen Refueller @H2Perth is a proposed self-contained hydrogen production, storage and refuelling station which achieved a FID in 2023. H2TAS is a proposed renewable ammonia and hydrogen production facility to be located in the Bell Bay area of Tasmania. In 2023, Woodside continued to evaluate power solutions and offtake opportunities. Southern Green Hydrogen is a proposed renewable ammonia production facility to be located in Southland, New Zealand.1 In 2023, work continued to finalise commercial arrangements for Southern Green Hydrogen. CARBON CAPTURE AND STORAGE (CCS) Woodside, as a participant in various joint ventures, holds three greenhouse gas assessment permits and is a participant in the proposed South East Australia (SEA) CCS Project.2 In 2023, Woodside entered into three non-binding memoranda of understanding to enable studies of a potential CCS value chain between Japan and Australia. Project3 Angel (Operated) Bonaparte (Non-operated)SEA CCS (Non-operated) Description Proposed large-scale multi-user CCS hub Proposed large-scale multi-user CCS hubProposed multi-phased CCS project. Phase 1 aimed at capturing carbon emitted by aimed at capturing carbon emitted by of the project would use existing infrastructure multiple industries. multiple industries. to store COâ,, in the depleted Bream field. Location Offshore, North West Australia Offshore, Northern AustraliaOffshore, South East Australia Interest 20% 21%50% 2023 Activities Commenced pre-FEED studies and progressing Commenced concept select in August 2023.Progressed Phase 1 of the project to FEED. activities to support submission of the environmental referral. CARBON CREDITS PORTFOLIO4 Woodside utilises carbon credits to offset equity Scope 1 and 2 greenhouse gas emissions that are above our net emissions reduction targets. In 2023, Woodside planted approximately 2.7 million mixed biodiverse seedlings in Western Australia as part of our Native Reforestation Project across approximately 4,700 hectares of land at Woodside owned properties.5 In Senegal, Woodside is funding the restoration of up to 7,000 hectares of mangroves in the Sine Saloum and Casamance regions. Woodside is expected to receive up to 1.4 million carbon credits from this project over 30 years. CARBON TO PRODUCTS Woodside is focused on collaborating with carbon capture and utilisation (CCU) technology developers and is assessing opportunities to deploy their technologies in demonstration-scale pilot projects, ahead of their potential deployment on a larger-scale. Following agreements entered in 2022, Woodside completed a number of engineering studies with CCU technology developers LanzaTech, NovoNutrients, StringBio and several engineering firms in 2023. Woodside’s equity in Southern Green Hydrogen is subject to finalising commercial agreements. Refer to section 6.5 – Asset facts for information on our Greenhouse gas assessment permits and the Climate Transition Action Plan and 2023 Progress Report for further information on Woodside’s CCS projects. This table provides information about proposed CCS opportunities focused on Scope 3 emissions. We are also working to develop additional opportunities not shown here. Refer to section 3.4 – The use of carbon credits in the Climate Transition Action Plan and 2023 Progress Report for further information on Woodside’s use of carbon credits. The project has a potential to sequester approximately 2,000 kt COâ,,-e over 25 years. ANNUAL REPORT 2023
3.8 OUR BUSINESS Climate and sustainability We apply a sustainability mindset to guide decision making at all levels of the business. In 2023, our sustainability activities and disclosures continued to evolve in response to the strategic importance of sustainability topics, emerging mandatory sustainability standards and investor priorities. As such, we elevated summary disclosures of our material sustainability topics to the Annual Report, retired the publication of a standalone annual Sustainable Development Report and included additional information at woodside.com. CLIMATE TRANSITION ACTION PLAN AND 2023 PROGRESS REPORT The Climate Transition Action Plan and 2023 Progress Report summarises Woodside’s climate-related plans, activities, progress and climate-related data for the period 1 January 2023 to 31 December 2023. Woodside considers that the Climate Transition Action Plan and 2023 Progress Report contains disclosures consistent with TCFD’s four recommendations and 11 recommended disclosures, noting its Guidance for all Sectors and Guidance for Non-Financial Groups.1,2 This Annual Report should be read in conjunction with Woodside’s Climate Transition Action Plan and 2023 Progress Report.3 SUSTAINABILITY STRATEGY We refreshed our Sustainability Strategy in 2023, to incorporate relevant sustainability-related risks and opportunities and reflect the direction of our business. The Sustainability Strategy supports our Corporate Strategy and places an increased focus on those sustainability topics most relevant to our current business activities and the communities where we are active. Our Sustainability Strategy is built on the foundation of the following principles: • Integrity, accountability and transparency drive our environmental, social and governance aspirations and guide decision making at all levels of our business. • We strive to operate responsibly across our business activities. • Enduring and meaningful relationships with communities are fundamental to our social performance. • We recognise that our success is driven by our people and our culture. We value diversity and we strive to keep each other safe. More information regarding our Sustainability Strategy is available at woodside.com. MATERIALITY PROCESS Woodside conducts a materiality assessment process to inform our understanding of which sustainability topics are most relevant to our business activities and stakeholders. This considers potential risks, opportunities and impacts of sustainability topics upon our financial performance, as well as the potential impacts of our operations on stakeholders. This process involves a study by internal subject matter experts drawing from a range of internal and external inputs, including from our Executive Leadership Team and Directors. We also continue to monitor developments, trends and stakeholder views throughout the year. Our approach seeks to understand the topics relevant to our business activities and to our stakeholders. Potential risks, opportunities and impacts on the economy, environment and people, including impacts on human rights, are taken into account. Engagements with stakeholders via online surveys and interviews help verify and prioritise relevant topics. We engage with stakeholders such as customers, employees, investors, banks and ratings agencies, joint venture participants, First Nations communities, local communities, local, state and national governments, non-government organisations, suppliers and contractors. We classify the topics into three categories of material, significant or important. This is followed by an endorsement process with our Executive Leadership Team and the Board’s Sustainability Committee. Our 2023 material sustainability topics remain consistent with the previous year, including Climate, Health safety and wellbeing, Environment and biodiversity and First Nations cultural heritage and engagement.4 Climate Health, safety and wellbeing Environment First Nations cultural heritage and biodiversity and engagement 1 Financial Stability Board, 2017. “Recommendations of the Task Force on Climate-related Financial Disclosures. Final Report.” Figure 4, p. 14. Some elements of the TCFD’s four recommendations and 11 recommended disclosure have been presented in different order to enhance readability. 2 Financial Stability Board, 2021. “Implementing the Recommendations of the Task Force on Climate-related Financial Disclosures.” 3 Woodside notes that following the completion of its 2023 status report, the TCFD has fulfilled its remit and disbanded. The Financial Security Board of the Bank of International Settlements has asked the International Financial Reporting Standards (IFRS) Foundation to take over the monitoring of the progress of companies climate-related disclosures. 4 For the purposes of Woodside’s sustainability disclosures we classify the topics into three categories of material, significant or important. For these purposes, ‘material topic’ means a 2023 sustainability topic described in this report, determined as part of the 2023 materiality assessment process undertaken by Woodside. Classification of any topic as material, significant or important should not be read as a determination of whether that topic may necessarily rise to the level of materiality of disclosures required by law, including the laws of Australia, the United States and the United Kingdom. WOODSIDE ENERGY GROUP LTD 29
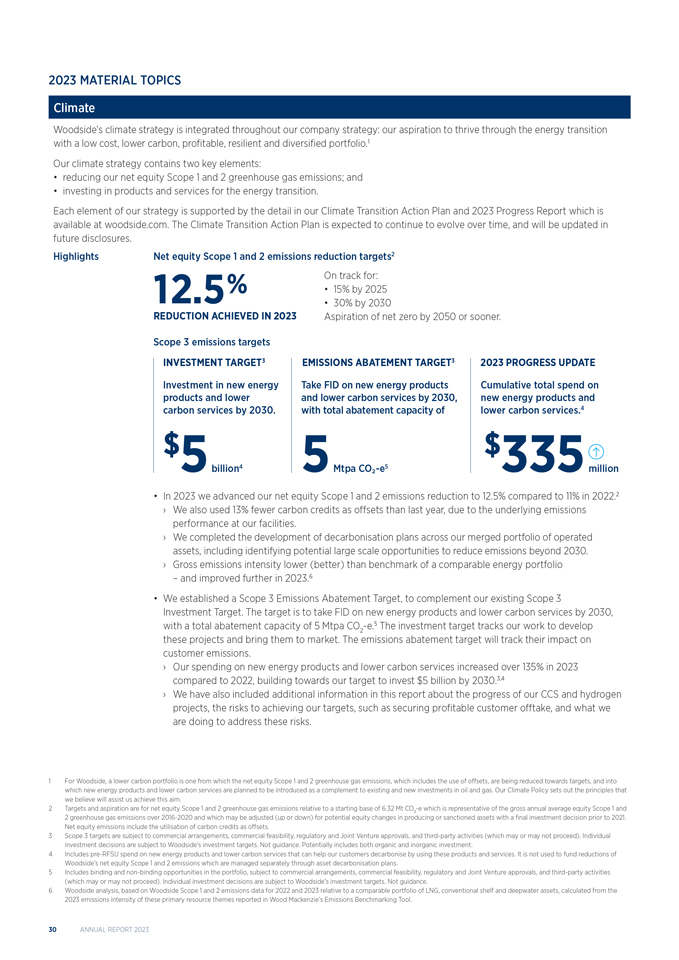
2023 MATERIAL TOPICS Climate Woodside’s climate strategy is integrated throughout our company strategy: our aspiration to thrive through the energy transition with a low cost, lower carbon, profitable, resilient and diversified portfolio.1 Our climate strategy contains two key elements: • reducing our net equity Scope 1 and 2 greenhouse gas emissions; and • investing in products and services for the energy transition. Each element of our strategy is supported by the detail in our Climate Transition Action Plan and 2023 Progress Report which is available at woodside.com. The Climate Transition Action Plan is expected to continue to evolve over time, and will be updated in future disclosures. Highlights Net equity Scope 1 and 2 emissions reduction targets2 On track for: 12.5 % • 15% by 2025 • 30% by 2030 REDUCTION ACHIEVED IN 2023 Aspiration of net zero by 2050 or sooner. Scope 3 emissions targets INVESTMENT TARGET3 EMISSIONS ABATEMENT TARGET3 2023 PROGRESS UPDATE Investment in new energy Take FID on new energy products Cumulative total spend on products and lower and lower carbon services by 2030, new energy products and carbon services by 2030. with total abatement capacity of lower carbon services.4 $5 billion4 5 Mtpa CO5 $335 million • In 2023 we advanced our net equity Scope 1 and 2 emissions reduction to 12.5% compared to 11% in 2022.2 › We also used 13% fewer carbon credits as offsets than last year, due to the underlying emissions performance at our facilities. › We completed the development of decarbonisation plans across our merged portfolio of operated assets, including identifying potential large scale opportunities to reduce emissions beyond 2030. › Gross emissions intensity lower (better) than benchmark of a comparable energy portfolio – and improved further in 2023.6 • We established a Scope 3 Emissions Abatement Target, to complement our existing Scope 3 Investment Target. The target is to take FID on new energy products and lower carbon services by 2030, with a total abatement capacity of 5 Mtpa CO -e.5 The investment target tracks our work to develop these projects and bring them to market. The 2 emissions abatement target will track their impact on customer emissions. › Our spending on new energy products and lower carbon services increased over 135% in 2023 compared to 2022, building towards our target to invest $5 billion by 2030.3,4 › We have also included additional information in this report about the progress of our CCS and hydrogen projects, the risks to achieving our targets, such as securing profitable customer offtake, and what we are doing to address these risks. 1 For Woodside, a lower carbon portfolio is one from which the net equity Scope 1 and 2 greenhouse gas emissions, which includes the use of offsets, are being reduced towards targets, and into which new energy products and lower carbon services are planned to be introduced as a complement to existing and new investments in oil and gas. Our Climate Policy sets out the principles that we believe will assist us achieve this aim. 2 Targets and aspiration are for net equity Scope 1 and 2 greenhouse gas emissions relative to a starting base of 6.32 Mt CO -e which is representative of the gross annual average equity Scope 1 and 2 greenhouse gas emissions over 2016-2020 and which may be adjusted (up or down) for potential equity changes in producing 2 or sanctioned assets with a final investment decision prior to 2021. Net equity emissions include the utilisation of carbon credits as offsets. 3 Scope 3 targets are subject to commercial arrangements, commercial feasibility, regulatory and Joint Venture approvals, and third-party activities (which may or may not proceed). Individual investment decisions are subject to Woodside’s investment targets. Not guidance. Potentially includes both organic and inorganic investment. 4 Includes pre-RFSU spend on new energy products and lower carbon services that can help our customers decarbonise by using these products and services. It is not used to fund reductions of Woodside’s net equity Scope 1 and 2 emissions which are managed separately through asset decarbonisation plans. 5 Includes binding and non-binding opportunities in the portfolio, subject to commercial arrangements, commercial feasibility, regulatory and Joint Venture approvals, and third-party activities (which may or may not proceed). Individual investment decisions are subject to Woodside’s investment targets. Not guidance. 6 Woodside analysis, based on Woodside Scope 1 and 2 emissions data for 2022 and 2023 relative to a comparable portfolio of LNG, conventional shelf and deepwater assets, calculated from the 2023 emissions intensity of these primary resource themes reported in Wood Mackenzie’s Emissions Benchmarking Tool. 30 ANNUAL REPORT 2023
Our climate-related opportunities and risks are outlined below and also described in detail in section 5.0 of the Climate Transition Action Plan and 2023 Progress Report. This includes detail of how these processes are integrated into Woodside’s overall risk management framework. Potential The categories of potential climate-related opportunities include: resources efficiency, energy sources, opportunities products and services, markets and resilience. Potential risks The categories of potential climate-related risks include: transition risks such as policy and legal risks, technology, market, and reputation; physical risks such as acute, and chronic. See also section 3.9—Risk factors. Our approach This is an abbreviated summary of our Climate Transition Action Plan and 2023 Progress Report which should be read in full, and is available at woodside.com. REDUCE OUR NET EQUITY SCOPE 1 AND 2 GREENHOUSE GAS EMISSIONS Woodside is targeting a reduction of net equity Scope 1 and 2 greenhouse gas emissions of 15% by 2025 and 30% by 2030, with an aspiration of net zero by 2050 or sooner.1 Our performance against these targets is highlighted in the highlights section. Reducing our net equity Scope 1 and 2 greenhouse gas emissions is supported by three levers: • avoiding emissions in design • reducing emissions in operations and • offsetting the remainder with carbon credits. Woodside has a long standing focus on energy efficiency. Our first formal climate-related target was a 5% energy efficiency target over the period 2016-2020. We exceeded this target, achieving 8%. Decarbonisation planning Our priority is to avoid and reduce emissions. All Woodside operated assets and projects must draw up decarbonisation plans to identify the technical opportunities to reduce emissions at the facility, so that the opportunities can be further assessed for engineering and commercial viability. Opportunities that are estimated to cost less than our internal long-term cost of carbon of $80/t CO -e (real terms 2022) are 2 incorporated into asset or project level business plans.2 These opportunities are at varying levels of maturity. To date: • Opportunities that we estimate could avoid approximately 16 million tonnes CO -e (cumulatively to 2050) have been incorporated 2 into the design of the Scarborough, Pluto Train 2 and Trion projects3 • Around a further 70 opportunities, which we estimate could avoid approximately 12 million tonnes CO -e (cumulatively to 2050) 2 are targeted for completion at our existing facilities by 2030.3 We estimate that the opportunities still to be implemented at our existing operating facilities could have a combined capital cost of around $200 million.3 Large scale abatement plan Emissions reduction opportunities that are estimated to cost more than $80/t CO -e are reviewed by our Executive Leadership 2 Team.2 They are subject to more engineering, cost reduction or technology maturation in a company-wide large scale abatement plan, as depicted in the chart below. If they can be matured to an appropriate level, they will be reassessed by the Executive Leadership Team and progressed where appropriate. The proposed Woodside Solar project is an example of a project likely costing more than $80/t CO -e that is progressing. 2 LNG facilities are the source of the majority of our emissions. They arise from reservoir CO , power generation, mechanical turbines and our flaring system. Electrification (using renewable or lower carbon power), CCS and hydrogen 2 fuelling of turbines are all options that could reduce these emissions, creating choices in the optimal mix. 1 Targets and aspiration are for net equity Scope 1 and 2 greenhouse gas emissions relative to a starting base of 6.32 Mt CO -e which is representative of the gross annual average equity Scope 1 and 2 greenhouse gas emissions over 2016-2020 and which may be adjusted (up or down) for potential equity changes in producing 2 or sanctioned assets with a final investment decision prior to 2021. Net equity emissions include the utilisation of carbon credits as offsets. 2 Woodside’s assumptions on carbon cost pricing include a long-term carbon price of US$80/tonne of emissions (real terms 2022). Woodside continues to monitor the uncertainty around climate change risks and will revise carbon pricing assumptions accordingly. 3 Indicative only, not guidance. Potential impact of opportunities identified in asset decarbonisation plans assuming all opportunities identified progress to execution, which is not certain and remains subject to further maturity of cost and engineering definition. Greenhouse gas quantities are estimated using engineering judgement by Woodside engineers. Please refer to Climate Transition Action Plan section 7.6 “Disclaimer, risks, emissions data and other important information” for important cautionary information relating to forward looking statements. WOODSIDE ENERGY GROUP LTD 31
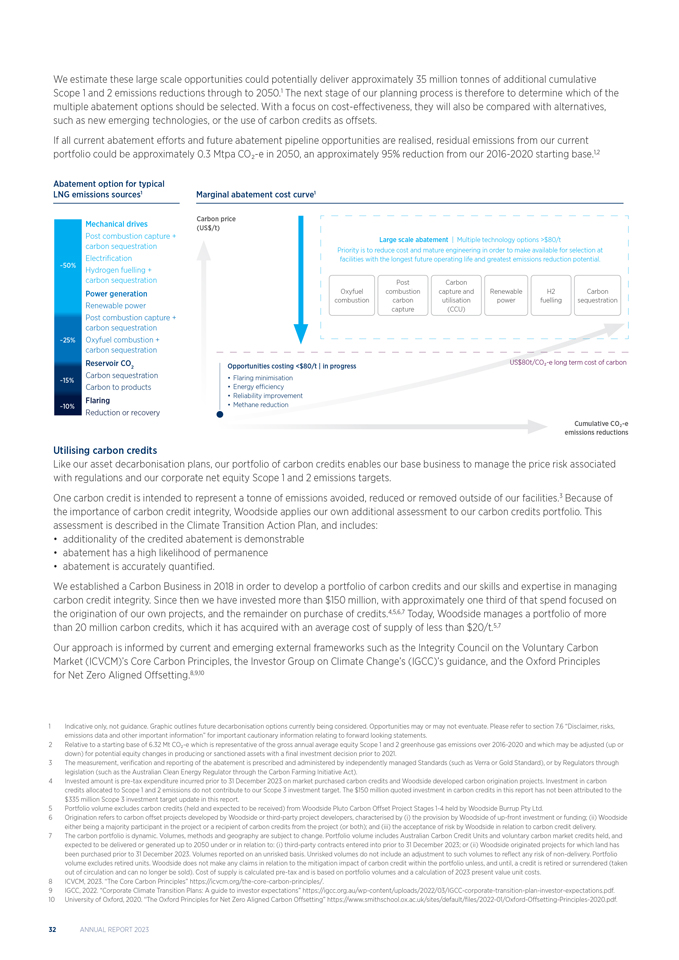
We estimate these large scale opportunities could potentially deliver approximately 35 million tonnes of additional cumulative Scope 1 and 2 emissions reductions through to 2050.1 The next stage of our planning process is therefore to determine which of the multiple abatement options should be selected. With a focus on cost-effectiveness, they will also be compared with alternatives, such as new emerging technologies, or the use of carbon credits as offsets. If all current abatement efforts and future abatement pipeline opportunities are realised, residual emissions from our current portfolio could be approximately 0.3 Mtpa COâ,,-e in 2050, an approximately 95% reduction from our 2016-2020 starting base.1,2 Abatement option for typical LNG emissions sources1 Marginal abatement cost curve1 Carbon price Mechanical drives (US$/t) Post combustion capture + Large scale abatement | Multiple technology options >$80/t carbon sequestration Priority is to reduce cost and mature engineering in order to make available for selection at Electrification facilities with the longest future operating life and greatest emissions reduction potential. ~50% Hydrogen fuelling + carbon sequestration PostCarbon Power generation Oxyfuel combustioncapture andRenewableH2Carbon combustion carbonutilisationpowerfuelling sequestration Renewable power capture(CCU) Post combustion capture + carbon sequestration ~25% Oxyfuel combustion + carbon sequestration Reservoir CO2 Opportunities costing <$80/t | in progress US$80t/COâ,,-e long term cost of carbon ~15% Carbon sequestration • Flaring minimisation Carbon to products • Energy efficiency Flaring • Reliability improvement ~10% • Methane reduction Reduction or recovery Cumulative COâ,,-e emissions reductions Utilising carbon credits Like our asset decarbonisation plans, our portfolio of carbon credits enables our base business to manage the price risk associated with regulations and our corporate net equity Scope 1 and 2 emissions targets. One carbon credit is intended to represent a tonne of emissions avoided, reduced or removed outside of our facilities.3 Because of the importance of carbon credit integrity, Woodside applies our own additional assessment to our carbon credits portfolio. This assessment is described in the Climate Transition Action Plan, and includes: • additionality of the credited abatement is demonstrable • abatement has a high likelihood of permanence • abatement is accurately quantified. We established a Carbon Business in 2018 in order to develop a portfolio of carbon credits and our skills and expertise in managing carbon credit integrity. Since then we have invested more than $150 million, with approximately one third of that spend focused on the origination of our own projects, and the remainder on purchase of credits.4,5,6,7 Today, Woodside manages a portfolio of more than 20 million carbon credits, which it has acquired with an average cost of supply of less than $20/t.5,7 Our approach is informed by current and emerging external frameworks such as the Integrity Council on the Voluntary Carbon Market (ICVCM)’s Core Carbon Principles, the Investor Group on Climate Change’s (IGCC)’s guidance, and the Oxford Principles for Net Zero Aligned Offsetting.8,9,10 1 Indicative only, not guidance. Graphic outlines future decarbonisation options currently being considered. Opportunities may or may not eventuate. Please refer to section 7.6 “Disclaimer, risks, emissions data and other important information” for important cautionary information relating to forward looking statements. 2 Relative to a starting base of 6.32 Mt COâ,,-e which is representative of the gross annual average equity Scope 1 and 2 greenhouse gas emissions over 2016-2020 and which may be adjusted (up or down) for potential equity changes in producing or sanctioned assets with a final investment decision prior to 2021. 3 The measurement, verification and reporting of the abatement is prescribed and administered by independently managed Standards (such as Verra or Gold Standard), or by Regulators through legislation (such as the Australian Clean Energy Regulator through the Carbon Farming Initiative Act). 4 Invested amount is pre-tax expenditure incurred prior to 31 December 2023 on market purchased carbon credits and Woodside developed carbon origination projects. Investment in carbon credits allocated to Scope 1 and 2 emissions do not contribute to our Scope 3 investment target. The $150 million quoted investment in carbon credits in this report has not been attributed to the $335 million Scope 3 investment target update in this report. 5 Portfolio volume excludes carbon credits (held and expected to be received) from Woodside Pluto Carbon Offset Project Stages 1-4 held by Woodside Burrup Pty Ltd. 6 Origination refers to carbon offset projects developed by Woodside or third-party project developers, characterised by (i) the provision by Woodside of up-front investment or funding; (ii) Woodside either being a majority participant in the project or a recipient of carbon credits from the project (or both); and (iii) the acceptance of risk by Woodside in relation to carbon credit delivery. 7 The carbon portfolio is dynamic. Volumes, methods and geography are subject to change. Portfolio volume includes Australian Carbon Credit Units and voluntary carbon market credits held, and expected to be delivered or generated up to 2050 under or in relation to: (i) third-party contracts entered into prior to 31 December 2023; or (ii) Woodside originated projects for which land has been purchased prior to 31 December 2023. Volumes reported on an unrisked basis. Unrisked volumes do not include an adjustment to such volumes to reflect any risk of non-delivery. Portfolio volume excludes retired units. Woodside does not make any claims in relation to the mitigation impact of carbon credit within the portfolio unless, and until, a credit is retired or surrendered (taken out of circulation and can no longer be sold). Cost of supply is calculated pre-tax and is based on portfolio volumes and a calculation of 2023 present value unit costs. 8 ICVCM, 2023. “The Core Carbon Principles” https://icvcm.org/the-core-carbon-principles/. 9 IGCC, 2022. “Corporate Climate Transition Plans: A guide to investor expectations” https://igcc.org.au/wp-content/uploads/2022/03/IGCC-corporate-transition-plan-investor-expectations.pdf. 10 University of Oxford, 2020. “The Oxford Principles for Net Zero Aligned Carbon Offsetting” https://www.smithschool.ox.ac.uk/sites/default/files/2022-01/Oxford-Offsetting-Principles-2020.pdf. 32 ANNUAL REPORT 2023
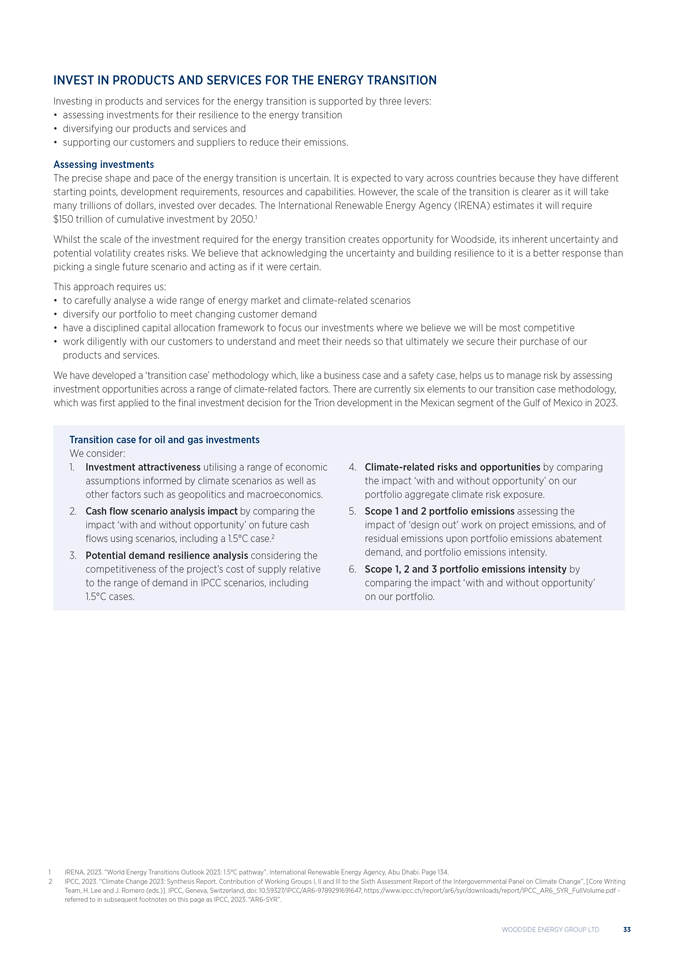
INVEST IN PRODUCTS AND SERVICES FOR THE ENERGY TRANSITION Investing in products and services for the energy transition is supported by three levers: • assessing investments for their resilience to the energy transition • diversifying our products and services and • supporting our customers and suppliers to reduce their emissions. Assessing investments The precise shape and pace of the energy transition is uncertain. It is expected to vary across countries because they have different starting points, development requirements, resources and capabilities. However, the scale of the transition is clearer as it will take many trillions of dollars, invested over decades. The International Renewable Energy Agency (IRENA) estimates it will require $150 trillion of cumulative investment by 2050.1 Whilst the scale of the investment required for the energy transition creates opportunity for Woodside, its inherent uncertainty and potential volatility creates risks. We believe that acknowledging the uncertainty and building resilience to it is a better response than picking a single future scenario and acting as if it were certain. This approach requires us: • to carefully analyse a wide range of energy market and climate-related scenarios • diversify our portfolio to meet changing customer demand • have a disciplined capital allocation framework to focus our investments where we believe we will be most competitive • work diligently with our customers to understand and meet their needs so that ultimately we secure their purchase of our products and services. We have developed a ‘transition case’ methodology which, like a business case and a safety case, helps us to manage risk by assessing investment opportunities across a range of climate-related factors. There are currently six elements to our transition case methodology, which was first applied to the final investment decision for the Trion development in the Mexican segment of the Gulf of Mexico in 2023. Transition case for oil and gas investments We consider: 1. Investment attractiveness utilising a range of economic 4.Climate-related risks and opportunities by comparing assumptions informed by climate scenarios as well as the impact ‘with and without opportunity’ on our other factors such as geopolitics and macroeconomics. portfolio aggregate climate risk exposure. 2. Cash flow scenario analysis impact by comparing the 5.Scope 1 and 2 portfolio emissions assessing the impact ‘with and without opportunity’ on future cash impact of ‘design out’ work on project emissions, and of flows using scenarios, including a 1.5°C case.2 residual emissions upon portfolio emissions abatement 3. Potential demand resilience analysis considering the demand, and portfolio emissions intensity. competitiveness of the project’s cost of supply relative 6. Scope 1, 2 and 3 portfolio emissions intensity by to the range of demand in IPCC scenarios, including comparing the impact ‘with and without opportunity’ 1.5°C cases. on our portfolio. 1 IRENA, 2023. “World Energy Transitions Outlook 2023: 1.5°C pathway”. International Renewable Energy Agency, Abu Dhabi. Page 134. 2 IPCC, 2023. “Climate Change 2023: Synthesis Report. Contribution of Working Groups I, II and III to the Sixth Assessment Report of the Intergovernmental Panel on Climate Change”, [Core Writing Team, H. Lee and J. Romero (eds.)]. IPCC, Geneva, Switzerland, doi: 10.59327/IPCC/AR6-9789291691647, https://www.ipcc.ch/report/ar6/syr/downloads/report/IPCC_AR6_SYR_FullVolume.pdf—referred to in subsequent footnotes on this page as IPCC, 2023. “AR6-SYR”. WOODSIDE ENERGY GROUP LTD 33

Diversifying our portfolio Woodside is working to diversify its portfolio by adding new products and services alongside our existing products, where we believe we have a competitive advantage to supply them successfully through the energy transition. In 2021, Woodside set a Scope 3 investment target – aiming to invest $5 billion in new energy products and lower carbon services by 2030.1,2 At the end of 2023, we have cumulatively spent more than $335 million towards this target, with 2023 expenditure increased by over 135% compared to 2022.1,2 We expect expenditure to continue to ramp up towards the back end of the target period, subject to markets developing, because most project expenditure occurs in the construction phase. Woodside has set a complementary Scope 3 emissions abatement target, to indicate the potential abatement impact of these products and services upon customer Scope 1 or 2 emissions. This target is to take final investment decisions on new energy products and lower carbon services by 2030, with total abatement capacity of 5 Mtpa CO -e.1,3 2 The investment target tracks our work to develop these projects and bring them to market. The emissions abatement target will track their potential impact on customer emissions. Other elements of our approach are described in more detail in our Climate Transition Action Plan and 2023 Progress Report. Our performance See the ‘highlights’ section above, and the Climate Transition Action Plan and 2023 Progress Report for more information. 1 Scope 3 targets are subject to commercial arrangements, commercial feasibility, regulatory and Joint Venture approvals, and third-party activities (which may or may not proceed). Individual investment decisions are subject to Woodside’s investment targets. Not guidance. Potentially includes both organic and inorganic investment. 2 Includes pre-RFSU spend on new energy products and lower carbon services that can help our customers decarbonise by using these products and services. It is not used to fund reductions of Woodside’s net equity Scope 1 and 2 emissions which are managed separately through asset decarbonisation plans. 3 Includes binding and non-binding opportunities in the portfolio, subject to commercial arrangements, commercial feasibility, regulatory and Joint Venture approvals, and third-party activities (which may or may not proceed). Individual investment decisions are subject to Woodside’s investment targets. Not guidance. 34 ANNUAL REPORT 2023
Health, safety and wellbeing Protecting the health and safety of our people, our contractors and our host communities is a top priority at Woodside. We focus on health and safety because we believe that everyone should be able to go home in the same condition as they started the day. We aim to be an industry leader in health and safety outcomes to protect people, communities and environments. We expect all our workers (including employees and contractors) to prioritise their own health and safety and that of others to keep each other safe. We strongly believe in embedding a safety culture where our people are empowered to take action to prevent injuries and maintain a safe working environment. The fatality of our colleague, a contractor employee, on the North Rankin Complex (NRC) continues to affect many of us. Our response prioritised the immediate safety and wellbeing of the workforce on the NRC. The Woodside Board convened and members of our Board and Executive Leadership Team visited our operational sites to meet with our workers (including employees and contractors) and offer their support. We completed a significant internal investigation into the incident and presented the findings and agreed actions to the Board and the National Offshore Petroleum Safety and Environmental Management Authority. In the fourth quarter of 2023, we facilitated an external review of our integrated safety and operational systems and plan to incorporate recommendations of this review into actions as part of a continuous improvement to our safety performance. Highlights • Employee survey results showed us that our people feel empowered to speak up and act on health and safety issues. • The framework for our new Woodside Field Leadership Program was developed and we commenced testing with our Australian based workforce. • Integration of our global approach to wellbeing, event reporting and investigations, health, safety and environment (HSE) in contracting and performance monitoring was progressed. Potential • Continue to learn from the incident on the NRC that led to the fatality of our colleague employed opportunities by a contractor company and other significant events. • Embed our Field Leadership Program to strengthen understanding of our work practices and make improvements to HSE risk controls. • Improve tracking and visibility of leading indicators of HSE performance. Potential risks • Significant loss of primary containment process safety events. • Failure to effectively plan and execute high-risk work activities. • Failure to apply lessons from investigations and Field Leadership Program engagements leading to repeated events. See also section 3.9—Risk factors. Our approach At Woodside everything we do is guided by Our Values. Everyone has the right to come to work and feel safe. Woodside continues its longstanding commitment to building and maintaining a work environment that is free from all forms of discrimination and inappropriate behaviour including sexual harassment. Our Code of Conduct defines the expected behaviours of everyone working at Woodside. Implementation of our Working Respectfully Policy supports the psychological safety of our workforce. Refer to woodside.com for our Code of Conduct and Working Respectfully Policy. Our We Care value, guides us to keep each other safe and care for communities. We prioritise safety and promote a positive safety culture by encouraging everyone to speak up and intervene on safety issues. We acknowledge providing energy to the world in the form of oil, gas and new energy potentially presents safety risks. We aim to control or mitigate the potential impacts of these risks on people, the economy and the environment. Our Health and Safety Policy outlines the objectives and principles that shape our approach. This approach is consistent across all our business operations. When assessing safety risks, we consider the potential negative impacts of our business activities to communities and our workforce, including impacts on human rights. We implement systems and processes to identify, assess and control safety risks by applying the hierarchy of controls. Our expectations and procedures set mandatory requirements for managing high-risk work, including obligations to stop unsafe work to prevent potential fatalities and high-consequence injuries. We take action to protect the health of our workforce and facilitate earliest recovery from work-related injury or illness. We aim to eliminate or mitigate workplace health hazards at the design stage of projects or control them as far as reasonably practicable based on the level of assessed risk. If hazards remain and there is a risk of exposure, we strive to ensure that worker exposure does not exceed legal limits through implementation of the hierarchy of controls method. WOODSIDE ENERGY GROUP LTD 35
We perform health surveillance in accordance with applicable law to detect the early signs of occupational illness so intervention, and if necessary, rehabilitation, can be initiated. Potentially harmful workplace health hazards include uncontrolled exposure to noise, hazardous substances (e.g. benzene, toluene, ethylbenzene, and xylene (BTEX), and mercury), naturally occurring radioactive material (NORM), infectious disease (e.g. COVID-19), hazardous manual tasks and psychological hazards. Refer to woodside.com for additional information about our approach to Health, safety and wellbeing. Our performance A fatality of our colleague on the NRC occurred in June 2023. Three additional high-consequence injuries were also recorded for 2023. Two musculoskeletal injuries that required surgery with extended recovery beyond six months and partial amputation of a thumb following a crush injury. Following insights from event investigations, we are focusing on field leadership and engagement, risk assessments and equipment management processes. In 2023, Woodside experienced two Tier 1 and one Tier 2 loss of primary containment (LOPC) process safety events (PSE). All events were investigated, and actions were put in place to address the root causes, including preventative actions across our facilities. We are also embedding lessons learned relating to equipment selection and maintenance. The workforce exposure hours in 2023 (total hours 20,914,483) increased by 25%, when compared to 2022 (total hours 16,699,730). The increase in exposure hours in 2023 was due to increasing project activity and merger integration. Our total recordable injury rate (TRIR) of 1.86 increased with 39 recordable injuries in 2023, compared to 30 in 2022. The main injury types were lacerations, wounds and soft tissue injuries. Our total recordable occupational illness frequency (TROIF) increased to 1.15 per million hours worked from 0.72 in 2022. The 24 recordable occupational illnesses comprised 12 noise induced hearing loss, five psychological illnesses, four musculoskeletal conditions and three skin reactions. Process safety We recognise the critical importance of effective Process Safety Management (PSM) to avoid major accident and environmental events due to loss of control of hazardous substances. We continue to focus on process safety leadership to ensure consistent awareness of contemporary PSM approaches, organisational status, personal expectations, and accountabilities. In 2023, we rationalised and improved our competency curriculum and continued with regular assessment and assurance of process safety critical roles across global operations. Future focus areas include continuing our efforts to embed a strong process safety culture, building competency across our hydrocarbon business and increasing process safety applications in our new energy and carbon business areas. In 2024, we are targeting a 95% company-wide completion of competency assessments for people in process safety critical roles requiring a skilled (advanced) level of competency. Field Leadership Program Woodside’s Field Leadership Program provides a structured approach to work team engagement, where leaders build their understanding of onsite work practices and develop the leadership skills that aim to lead to a safer workplace. The program has been designed to be applied at all worksite types from operating assets to the office environment. A key objective is to learn from frontline workers which is aligned with Our Values and Human Organisational Performance (HOP) principles. Outcomes from the program include increased organisational knowledge of risks and controls, a sustainable method to identify and improve organisational factors, and to further develop our culture of care. In 2023, the Field Leadership Program framework was tested with operational groups. This required extensive workforce engagement to listen and learn from current approaches to HSE and work management so that the program can be tailored to enable a safer Woodside. In 2024, the program will evolve by listening and supporting end users through training and coaching activities. We aim to develop and implement a strategy to rollout and sustain the program across our global sites. Mental health and wellbeing Our wellbeing vision is to be recognised as an employer of choice. We aim to cultivate a work environment where everyone can flourish by focusing on people, empowerment, and quality leadership. To achieve this, we have expanded and refreshed our Global Wellbeing Framework to focus on six key elements: (1) protecting from harm, (2) promoting health and wellbeing, (3) connection and community, (4) work-life balance, (5) opportunities for growth, and (6) meaning and purpose. Each element has a strategic goal, enabling activities and metrics to track progress, including the use of our employee survey to seek regular feedback from our people. In 2024, we plan to launch our refreshed wellbeing framework across our global business areas, and work with our leaders to commence enabling activities. 36 ANNUAL REPORT 2023
Environment and biodiversity Woodside recognises the importance of managing and conserving the environment and biodiversity to support sustainable development in the communities where we are active. We are committed to doing our part. We understand and embrace our responsibility to undertake activities in an environmentally sustainable way that positively contributes towards biodiversity and assists to reverse biodiversity loss. Highlights • No hydrocarbon spills or hazardous non-hydrocarbon spills greater than 1 bbl. In 2023, obtained secondary approvals for construction-related environment plans for the Scarborough Energy project. We supported a number of scientific programs and industry working groups to further our knowledge and understanding on noise-related issues and offshore whale species. Through these programs, bespoke underwater noise controls were developed to avoid and minimise marine noise impacts for offshore projects. A consultation approach for Environment Plans in Australia which has successfully addressed evolving regulatory requirements was developed. Invested in science and biodiversity programs and conservation partnerships to support improved knowledge outcomes. Established Woodside’s Biodiversity Positive Program framework. In 2023, Woodside planted approximately 2.7 million mixed biodiverse seedlings across approximately 4,700 hectares of land at Woodside owned properties. These activities bring the total number of hectares planted to approximately 10,000 hectares since the Native Reforestation Project began in 2020. Potential • Integrating the Environment and Biodiversity Policy into environmental management decision-making opportunities processes. Assess biodiversity positive opportunities for individual Woodside assets. Begin to invest in biodiversity positive projects in the regions where we are active. Continue to collect knowledge on environmental and biodiversity benefits of in-situ decommissioning. Ongoing development of technology to identify the seasonality of offshore cetaceans and further manage our underwater noise impacts. Potential risks • Increased regulatory landscape and stakeholder expectations leading to extended timeframes for assessment and complexity of environmental approvals. Failure to progress biodiversity positive outcomes in a timely manner in the regions and areas where we operate. Potential incident resulting in significant loss of hydrocarbon to the environment. See also section 3.9—Risk factors. Our approach The nature of our operations are accompanied by certain environmental impacts and risks. We work to minimise our impacts by integrating environmental management into our activities, including the design, construction, operation and decommissioning of our facilities. We continue this integration by reviewing our processes and commitments, identifying areas of strength to build on and look to embed renewed environmental standards across Woodside and set appropriate targets and metrics against these. Our focus on implementing leading environmental management and mitigation strategies has allowed us to avoid and minimise our environmental impacts and maintain a more than 30 year record of oil and gas operations without any major environmental incidents. We recognise that it is not just how we approach environmental management, such as the use of a risk-based assessment which matters, but that we also need to be clear and transparent. We engage with our stakeholders to better understand the possible impacts of our activities and to further understand preferred methods and frequency of engagement. Our hydrocarbon spill preparedness and response framework continues to be a focus across the company’s global portfolio. The approach is underpinned by a comprehensive process informed by international best practice conventions. These require all activities to assess credible spill scenarios to marine environment, evaluate surface and subsea response options and recommend appropriate response techniques. These activity specific plans are supplemented by corporate plans, regional equipment, and locally trained resources. Environmental management We recognise our activities have an environmental footprint and we seek to avoid or minimise adverse environmental impacts to the natural environment in the regions we operate. We do this by adopting a risk based approach that allows us to address the environmental impacts and risks associated with our activities in a consistent way. It allows us to focus our effort and resources on the most significant risks associated with our activities no matter where we operate or what a regulatory regime may require. WOODSIDE ENERGY GROUP LTD 37
Our performance Our operations and growth strategy depends on obtaining and maintaining our social licence to operate. Given this and the growing pressure on our natural environment, the environmental performance and the management of our environmental impacts is critical to the future success of our business. In 2023, there were no environmental incidents involving hydrocarbon or hazardous non-hydrocarbon spills greater than 1 bbl released to the environment. As part of our commitment to reducing impacts and risks, our hydrocarbon spill preparedness and response framework was embedded across our global portfolio of activities and operations. This enables our business to plan and evaluate spill risks to the marine environment in accordance with our environmental approach. In 2023, we developed new oil pollution emergency plans that contributed to regulatory acceptance of 11 environmental approvals across our Australian assets. We also delivered capability and training programs for regions where we operate. We continue to engage with regional and international industry groups to assist in proactively managing and monitoring emerging risks. From 2023, Woodside has committed to supporting positive biodiversity outcomes in the regions in which we operate. Our approach builds on existing biodiversity positive projects, that commenced in the years prior to 2023. Woodside developed a framework in 2023 to assess and implement future projects. Woodside seeks to support biodiversity positive projects that have a measurable biodiversity outcome, that enhance stakeholder involvement and adequately manage risks. We continue to invest in science to support better environmental performance and outcomes across our global portfolio. We also continue to progress our environmental regulatory authorisations across Australia, Trinidad and Tobago, the United States, Mexico and Senegal to advance our projects. See section 3.7—New energy and carbon solutions. First Nations cultural heritage and engagement We acknowledge the unique connection that First Nations communities have to land, waters and the environment. We believe First Nations cultural heritage and industry can successfully coexist. We seek to ensure Traditional Owners and Custodians are central to heritage management so that cultural values are understood and remain protected. We understand the importance of identifying and working with those who have longstanding cultural and spiritual connections to land and waters where we have a presence, and we are guided by them in our efforts to avoid or minimise potential impact of our operations on those First Nations communities. We partner with First Nations communities to create positive outcomes that leave a lasting legacy. We acknowledge the diversity of the First Nations communities in the areas where we are present. When communicating with a wide audience, Woodside uses the term Indigenous and First Nations interchangeably. On a local level, Woodside will be guided by the community as to the appropriate terms of reference. Highlights • Extensive consultations in relation to cultural heritage management approvals. Progression of relationships in New Zealand with the Ngāi Tahu iwi relevant to the Southern Green Hydrogen Project, with a continued focus on strengthening stakeholder relationships. Provision of support for consultation with First Nations stakeholders relevant to environment plan approvals. Continued commitment to support submerged heritage research at Murujuga to inform project implementation and manage possible impacts. First Nations Advisory Group Roundtable discussions. Potential • Pursue initiatives in addition to existing Reconciliation Action Plan targets. opportunities • Further develop relationships with First Nations communities in the areas where we are active. Pursue and formalise First Nations partnerships in the areas where we are active. Potential risks • Woodside contributes to negative impacts to Murujuga Rock Art. Woodside does not meet local content outcomes for First Nations communities. Woodside does not meet expectations of First Nations communities in areas where we are active. See also section 3.9—Risk factors. Our approach Our First Nations Communities Policy defines our approach and is regularly reviewed and updated as required. Woodside employees, contractors and joint venture partners engaged in activities under Woodside’s operational control, are collectively responsible for the application of the Policy and are provided with training to ensure they are able to do so. The Policy notes that Woodside is to be guided by the United Nations Declaration on the Rights of Indigenous Peoples which demonstrates our commitment to understanding the relevant human rights considerations as we engage with different First Nations communities. 38 ANNUAL REPORT 2023
In Australia, we maintain relationships with First Nations communities in the Pilbara, Kimberley, South West and Perth. Due to recent changes to regulatory compliance requirements our approach to consultation has been extended. In 2023, Woodside’s First Nations relations team consulted with a range of First Nations communities, in Australia, from Esperance to the Tiwi Islands and as far east as Melbourne. The diversity of the environments we are operating in as a global company has expanded our engagements with a range of community stakeholders in the United States, Mexico, Trinidad and Tobago, and New Zealand. Refer to woodside.com for our First Nations Community Policy. Our performance In 2023, new relationships were formed and new land use and relationship agreements were executed. Woodside remains committed to close consultation with the relevant persons in the areas in which we operate by way of community and individual meetings, attending community-initiated events, and ensuring accessibility for feedback or questions as needed. A key element of our consultation efforts is our willingness to be flexible and adaptable in our consultation format to suit the audience. Cultural heritage Woodside’s Cultural Heritage Management Procedure reflects our publicly available First Nations Communities Policy. This policy includes engaging with affected communities of First Nations peoples in ways that are consistent with the principles of seeking Free, Prior and Informed Consent (FPIC). Our approach to the identification, management and protection of tangible and intangible cultural heritage seeks to avoid impacts, or if avoidance is not possible, to minimise and mitigate those impacts. We seek to ensure Traditional Owners and Custodians are central to heritage management so that cultural values are understood and remain protected. Woodside also prepares detailed Cultural Heritage Management Plans (CHMPs) for nearshore and onshore facilities and projects and completes heritage audits and surveys with Traditional Custodians and independent heritage experts. Woodside is also committed to ensuring our management of cultural heritage is thorough, transparent and underpinned by consultation and continued engagement with First Nations communities, which is illustrated through our extensive consultation on our Environment Plans, completed heritage surveys for the proposed Woodside Solar project, and support for Murujuga’s World Heritage Listing. Cultural heritage management approvals Woodside’s activities are the subject of environmental assessments by a range of regulators including the Australian National Offshore Petroleum Safety and Environmental Management Authority. Woodside has consulted extensively with Indigenous stakeholders on a variety of activities in 2023. These consultations have included the tangible and intangible cultural heritage of the environments in which we plan to operate, as well as the environmental values. In 2023, we also agreed the Scarborough Cultural Heritage Management Plan with Murujuga Aboriginal Corporation (MAC), which is publicly available on our website at woodside.com. The CHMP is designed to ensure that impacts to heritage sites and values, including to Murujuga’s National Heritage Listed and World Tentative Heritage Listed values, are adequately protected in a manner agreed between Woodside and Traditional Owners and Custodians represented through MAC. It aims to preserve the tangible and intangible heritage values and protect the cultural and spiritual values of the Traditional Owners and Custodians. Woodside is also progressing the agreement of a CHMP with Ngarluma Aboriginal Corporation for the development of a proposed solar photovoltaic farm on the Maitland Strategic Industrial Estate. Our continued commitment to reconciliation Woodside has been part of Reconciliation Australia’s Reconciliation Action Plan (RAP) program since 2009. Woodside’s vision for reconciliation is to partner with Indigenous communities to create positive economic, social and cultural outcomes. It is also to reflect on our shared history, empower Indigenous voices to speak and be heard so all Australians can learn, and work together towards a better, shared future. We are continuing to move away from recording completed activities, in favour of measuring longer-term impact outcomes. Woodside reports annually on progress towards the committed outcomes that support our four Reconciliation Action Plan pillars: respect for culture and heritage, capability and capacity, economic participation and stronger communities. In 2023, Woodside made donations to the Aboriginal and Torres Strait Islander Voice Referendum activities that were aligned with Our Values, the principles set out within our 2021-2025 Reconciliation Action Plan and our First Nations Communities Policy. Our donations supported organisations to disseminate information and advocate in favour of formalising a pathway for Indigenous Australians to share their views on policies that impact them. Woodside’s contribution aligns with our support for the Uluru Statement from the Heart, which called for the establishment of an Indigenous voice to Parliament, agreement making and truth-telling. For further information, please see the Corporate Governance Statement included in this report and the Sustainability section of our website at woodside.com. WOODSIDE ENERGY GROUP LTD 39
3.9 OUR BUSINESS Risk factors Woodside recognises that taking risk is necessary for our business and the effective management of risk is vital to meeting our objectives. We are committed to managing risks in a proactive, informed and effective manner as a source of competitive advantage. Our approach is intended to enable risk informed decision making, which will protect us against potential negative impacts and enable us to seek the right opportunities. The objective of our risk management framework is to provide a single consolidated view of risks across the company to understand our full risk exposure and prioritise risk management and governance. For more information on our risk management process, refer to our Risk Management Policy, available on our website at woodside.com. Woodside’s risk management process is presented as an iterative sequence that we undertake in a coordinated manner. The process helps us implement risk management to effectively identify, assess, and control risks, thereby enhancing the likelihood of achieving our objectives. The process involves: • communication and consultation with key stakeholders • define risk scope, context and criteria • risk assessment • risk treatment • monitor and review risk management process; and • record and report risks. The process is defined in our risk management procedure which is designed to provide a consistent process for the identification, management and reporting of risks that have the potential to materially impact the achievement of Woodside’s business objectives. The Audit & Risk Committee plays a crucial role in enabling the Board to meet its oversight responsibility in relation to Woodside’s risk management. The Sustainability Committee also focuses on sustainability-related risk management. Refer to section 4.1.3—Board committees for more information on the Audit & Risk Committee and the Sustainability Committee. We categorise risks into three categories: 1. Strategic risks Risks that could affect our organisation’s ability to achieve its strategic objectives. 2. Entity risks Risks that could affect our organisation’s ability to achieve our business objectives. They can be positive, negative, or both; and can address, create, or result in opportunities and threats. 3. Emerging risks Risks defined as an external threat or opportunity that has a high degree of uncertainty due to rapid or non-linear evolution. They have the potential to materially impact the achievement of strategic objectives. Woodside’s risk appetite statement is a vital element of our risk framework. In 2023 the statement was updated to reflect the merged organisation’s appetite to take risk and tolerance to outcomes. The statement is designed to enable our organisation to make risk informed decisions. 40 ANNUAL REPORT 2023
OVERVIEW OF OUR RISK FACTORS Climate change The global response to climate change is changing the way the world produces and consumes energy. The complex and pervasive nature of climate change means transition risks are interconnected with and may amplify other risks. Additionally, the inherent uncertainty of potential societal responses to climate change may create a systemic risk to the global economy. Climate change may also create significant physical risks, such as increased frequency and severity of storms, wildfires, floods and other climatic events, as well as chronic shifts in temperature and precipitation patterns. How is this factor relevant to Woodside? Woodside’s risks associated with climate change and the transition to a lower carbon economy include possible impacts to demand (and pricing) for oil, gas and its substitutes, the policy and legal environment for its exploration, development and production, and Woodside’s reputation and operating environment. We may also face risks related to climate change’s potential to cause physical damage or disruptions to our assets or our supply chains. Woodside is an energy company and in order for us to meet the ongoing needs of our customers and the communities in which we operate, we must understand, forecast and manage several critical risks to evolve and prosper through this transition. These elements include: • the demand and pricing of oil, gas, new energy products and lower carbon services • the regulation of oil and gas exploration, production and consumption • the timing and rate of the global transition to a lower carbon economy • public perception of Woodside and the broader oil and gas industry • access to, and value of, carbon credits or emission allowances; and • uncertainties associated with changing weather patterns. Examples of how this factor may impact Woodside • Physical impacts on our assets or those of our suppliers, customers • Availability and cost of emission allowances or carbon credits could or communities caused by increased frequency or intensity of severe impact Woodside’s ability to meet its 2025 and 2030 net equity Scope weather events. 1 and 2 emissions reduction targets. • Over or under investing in oil and gas reserves leading to an imbalance • Failure of other organisations to meet emissions targets across the between our supply and global demand. broader oil and gas industry. • Failure to transition to new energy at a pace that serves the global • Reputational risks with respect to Woodside or the oil and gas industry demand, or stakeholder sentiments, or to develop and implement in general. lower carbon technologies on which Woodside’s strategy may depend. • Financial risks, including limits on availability of funding, changes in • Climate-driven changes to legislation, regulation and policy or financing terms for oil and gas projects or ability to access capital climate-related litigation resulting in additional costs, prevent or markets. restrict Woodside from conducting activities and adversely impacting Woodside’s reputation. These impacts may lead to a loss in shareholder value, loss of market share to competitors, delays or stoppages in our operations, reduced capacity to fund capital projects, delayed or suspended regulatory approvals, legal liabilities and adverse impacts on Woodside’s reputation, social licence to operate and on the delivery of our strategy. How is Woodside managing these risks? Woodside is working to meet its net equity Scope 1 and 2 greenhouse We engage and advocate with key industry and governance gas emissions reduction targets, and to invest in the products and stakeholders. Our Climate Transition Action Plan and 2023 Progress services for the energy transition. This includes oil, gas, new energy Report includes further information on Woodside’s approach to products and lower carbon services.1 managing climate change risks. For more information on this topic, refer to woodside.com and the Climate Transition Action Plan and 2023 Progress Report. 1 Targets and aspiration are for net equity Scope 1 and 2 greenhouse gas emissions relative to a starting base of 6.32 Mt CO -e which is representative of the gross annual average equity Scope 1 and 2 greenhouse gas emissions over 2016-2020 and which may be adjusted (up or down) for potential equity changes in producing 2 or sanctioned assets with a final investment decision prior to 2021. Net equity emissions include the utilisation of carbon credits as offsets. WOODSIDE ENERGY GROUP LTD 41
Social licence to operate Risks associated with actual or perceived deviation from social or business expectations of ethical behaviour (including breaches of laws or regulations) and social responsibility (including environmental impact and community contribution), particularly as these expectations evolve and as Woodside expands its global operations. How is this factor relevant to Woodside? Woodside relies on maintaining healthy relationships with our numerous stakeholders in order for us to achieve our objectives. Our employees, host communities, Traditional Owners and Custodians, government authorities, investors and other groups form significant relationships with our organisation. These relationships are built on the trust that Woodside will meet our stakeholders’ expectations. We must also consider the role our commercial agreements play in relation to human rights around the world, as we have a responsibility to ensure the rights of all humans are not negatively affected by our organisation. Some of the most significant risks to our relationships with stakeholders include: • Engaging in activities that have real or perceived adverse impacts on the environment, biodiversity, human rights or cultural heritage. • Failing to meet our net equity Scope 1 and 2 emissions reduction targets or investment targets in new energy. • Inadequately responding to quickly evolving expectations of Woodside (including expectations that may significantly differ in the various jurisdictions in which we operate). Additionally, third-party risks that are outside of our control could negatively impact our reputation and licence to operate, such as oil spills or other disasters or scandals that cause collateral damage to Woodside’s licence to operate via reputational damage to the oil and gas industry at large. Failure to maintain healthy relationships with our various stakeholders may result in violation of local or national laws or regulations, significant reputational damage, delayed approvals, civil suits and ultimately the deterioration of our licence to operate. Examples of how this factor may impact Woodside • Limited, delayed or failed approvals from local and national These impacts may lead to a loss in shareholder value, loss of market government bodies. share to competitors, decreases in the value of assets, delays or • Lost or limited stakeholder support for our current business stoppages in our operations or infringements on our ability to execute and future opportunities. and complete transactions, reduced capacity to fund capital projects, • Risks related to class action lawsuits, litigation and activism, delayed or suspended regulatory approvals, legal liabilities and adverse including allegations of greenwashing. impacts on Woodside’s reputation, social licence to operate and on the • Reductions in the availability, or less favourable terms, of financing. delivery of our strategy. • Decreased ability to attract and retain a talented workforce, and other operational concerns. How is Woodside managing these risks? Woodside proactively maintains and builds our social licence to operate Our fraud and corruption framework aims to prevent, detect and through the application of our values, effective stakeholder engagement respond to unethical behaviour. It incorporates policies, standards, strategies, our regulatory compliance framework and our anti-fraud and guidelines and training, which will enable us to conduct our activities corruption program. ethically and to a high standard. Our regulatory compliance framework assists Woodside to proactively Our business conduct is informed by the United Nations Guiding maintain relationships with governments and regulators within countries Principles on Business and Human Rights (UNGPs), which set a global that support base business and future growth opportunities. standard of conduct for all businesses wherever they operate. These principles exist over and above compliance with national laws and Woodside maintains meaningful relationships with stakeholders, regulations protecting human rights. seeking proactive engagement to inform decisions and gain support for changes. 1 Individual investment decisions are subject to Woodside’s investment targets. Not guidance. Potentially includes both organic and inorganic investment 42 ANNUAL REPORT 2023
Growth Risks associated with delivery of both major and complex multi-year execution project activities and transactions (including acquisitions and divestments) across multiple global locations, including a reliance on third parties for materials, products and services. How is this factor relevant to Woodside? Oil and gas In order to maintain our production levels and deliver shareholder value, Woodside must continue to identify growth opportunities, organic and inorganic, and commercialise them. To maintain a stable pipeline of future projects and realise the full value of growth opportunities, Woodside will need to compete with major oil companies, national oil companies (NOCs), independent oil and gas companies, individual producers and new energy companies. Failure to effectively compete with these companies may result in the inability to continue to expand Woodside’s current operations and meet our objectives. Woodside must continue to effectively manage relationships with industry partners, for example, at times we enter joint ventures with organisations which may also be a competing oil and gas supplier. It is essential that our voice is heard both within our industry and more broadly. In order for us to effectively communicate, we may at times align with industry bodies to advocate what we believe is right. In addition, our current and planned projects involve uncertainties and operating risks that could prevent us from realising profits or result in the total or partial loss of our investment. New energy We have set targets for our new energy products and lower carbon services.1,2 However, there is uncertainty around the pace of required technological innovation and the reliability of technologies that will be needed to transition to a lower carbon environment. In addition, new sources of energy, such as hydrogen or ammonia, may be more difficult to commercialise than expected or may not be able to be commercialised safely or as efficiently as expected at scale. Woodside may also face unforeseen obstacles in the commercialisation of a future carbon capture business and in the implementation of other lower carbon services and emission reduction efforts. Examples of how this factor may impact Woodside • An unbalanced portfolio of oil and gas and new energy, which may • An inability to obtain financing at acceptable costs, or at all, for the not meet the market’s needs. development of new energy projects. • Limited or reduced market share resulting in a loss of shareholder • Failure to implement our new energy plans within our anticipated time value. frame and in line with global demands. • Our competitors may be able to pay more for exploratory prospects • Failure to identify, execute and/or implement strategic transactions, and productive oil and natural gas properties and may be able to including acquisitions and divestments, or to achieve the full benefits define, evaluate, bid for and purchase a greater number of properties of those transactions. and prospects, including operatorships and licences, than our financial • Failure to remain commercially and technologically competitive to or human resources permit. efficiently develop and operate an attractive portfolio of assets, to • Our projects could experience project implementation schedule obtain access to new opportunities and to keep pace with deployment slippage, permitting delays, shortages of or delays in the delivery of of new technologies and products. equipment or purpose-built components from suppliers, escalation • Higher than expected competition in the markets for new energy in capital cost estimates, possible shortages of construction or other products and lower carbon services in which Woodside expects personnel, other labour shortages, environmental occurrences during to participate. construction that result in a failure to comply with environmental regulations or conditions on development, or delays and higher-than- These impacts may lead to a loss in shareholder value, loss of market expected costs due to the remote location of the projects, the impact share to competitors, decreases in the value of assets, delays or of global conflicts on the relevant workforce or supply chain, other stoppages in our operations, reduced capacity to fund capital projects, unanticipated natural disasters, accidents, miscalculations, political or delayed or suspended regulatory approvals, legal liabilities and adverse other opposition, litigation, acts of terrorism, operational difficulties, impacts on Woodside’s reputation, social licence to operate and on the climate change related risks or other events associated with that delivery of our strategy. construction that may result in the delay, suspension or termination of our projects. How is Woodside managing these risks? Our opportunity management framework is flexible and adaptable We aim to identify and progress a suite of commercially attractive with the primary objective to realise the value of an opportunity while and sustainable opportunities that complement our existing assets, mitigating the risk of a suboptimal outcome for our organisation, enable portfolio diversity and optimise our commercial position. our shareholders and our communities. Please see section 6.7 – Glossary, units of measure and conversion factors for a definition of how Woodside uses the term lower carbon portfolio. Scope 3 targets are subject to commercial arrangements, commercial feasibility, regulatory and Joint Venture approvals, and third-party activities (which may or may not proceed). Individual investment decisions are subject to Woodside’s investment targets. Not guidance. Potentially includes both organic and inorganic investment. WOODSIDE ENERGY GROUP LTD 43
Operations Due to the nature of our operations, Woodside and our communities are potentially exposed to a broad range of risks; some are beyond Woodside’s control. This is a result of factors such as the geographical range, operational diversity and technical complexity of our assets. Health and safety: Our operations are subject to risks related to safety or major hazard events in connection with our activities or facilities, and may also include unanticipated or unforeseeable adverse events which impact our ability to respond, manage and recover from such events. Commercial: We manage commercial risks within our operations, including third-party relationships such as joint venture partners, contract counterparties and our supply chain. Regulation: Woodside is subject to extensive governmental oversight and regulation in the jurisdictions in which we operate, and such regulations may change in ways that adversely affect our business, results of operations and financial condition. In addition, we are required to comply with securities regulations in Australia, the US and the UK. Reserves and resources estimates: We manage the estimation of proved oil and gas reserves by using judgement and the application of complex rules, and subsequent downward adjustments of Woodside’s reported reserves estimates are possible. How is this factor relevant to Woodside? General operational risks: Our operating assets are subject to a range of operating risks associated with process safety incidents, breaches of cybersecurity, extreme weather events and supply chain disruptions. Disruptions to our supply chain, or failure of our contractual counterparties to fulfill their obligations, could adversely impact our production, operations and our financial performance, result in litigation or class actions and cause long-term damage to our reputation. Health and safety: At Woodside, one of our competitive advantages is our ability to operate safely. Failure to continue to do so could result in sustained production interruptions leading to an inability to meet production forecasts, as well as potential reputational damage with customers, employees, commercial partners and other stakeholders. Commercial: The majority of our major projects and operations are conducted in joint ventures, which may limit our control over, and our ability to effectively manage risks associated with, such projects. Joint venture participants may have economic or business interests or objectives that are inconsistent with or opposed to our interests and objectives. For projects in which we are not the operator, we may be unable to control the behaviour, performance and cost of operations of joint ventures in which we participate. In these cases, we will be dependent on joint venture participants acting as operators and their ability to direct operations or manage the timing and performance of any activity or the costs or risks involved may be reduced. Regulation: We are subject, in each of the countries in which we operate, to various national and local laws, regulations and approvals relating to the exploration, development, production, marketing, pricing, transportation and storage of our products, as well as the management, decommissioning, clean up and restoration of our properties, and management and disclosure of our operations and impacts. The exploration, production, and transportation of oil and gas involves risk that releases to the environment may occur, which could cause substantial harm to the environment, natural resources, or human health and safety. These laws and regulations could change, and any such changes could have a material adverse effect on our business and financial condition. Because such laws and regulations are subject to amendment and reinterpretation over time, we are unable to predict the future cost or impact of complying with such laws. Moreover, we cannot predict whether new legislation to regulate the oil and gas industries might be proposed, what proposals, if any, might actually be enacted and what effect, if any, the proposals might have on our operations. The adoption and implementation of new or more stringent legislation, regulations or other regulatory initiatives that result in the imposition of more stringent standards for greenhouse gas emissions from the oil and gas industry could restrict the areas in which this sector may operate, and could result in increased compliance costs and changes in product pricing, which could impact consumer demand for our products. Additionally, the conduct of Woodside, our employees and our third-party partners could result in actual or alleged breaches of laws, regulations and approvals, including fraud, corruption, anti-competitive behaviour, money laundering, breaching trade or financial sanctions, market manipulation, privacy breaches, ethical misconduct and wider organisational cultural failings. We have incurred and will continue to incur operating and capital expenditures, some of which may be material, to comply with applicable laws, regulations and approvals. Reserves and resources estimates: Estimating proved oil and gas reserves involves subjective judgements and determinations based on available geological, technical, contractual and economic information. New information from production or drilling activities, changes in economic factors, such as oil and gas prices, alterations in the regulatory policies of host governments in the jurisdictions in which we operate, or other events may cause estimates to change over time. Additionally, estimates may change to reflect acquisitions, divestments, new discoveries, extensions of existing fields and improved recovery techniques. 44 ANNUAL REPORT 2023
Examples of how this factor may impact Woodside • A loss of containment event or other operational incident on or related • An operational incident could result in multiple fatalities. to our property or operations could occur, which could have significant • Supply chain disruptions such as long wait times for critical spares impacts including to human health and safety, the environment, may cause extended outages at our operations. natural resources or cultural resources, as well as financial, legal and • Joint participants or contractual counterparties may be primarily reputational impacts. responsible for the adequacy of the human or technical competencies • Certain activities are undertaken in deep waters where operations, and capabilities which they bring to bear on the joint project, which support services and decommissioning activities are more difficult and may not be adequate. costly than in shallower waters. The deep waters in the Gulf of Mexico, • The suspension, revocation, failure to renew or alteration of, or as well as international deepwater locations, lack the physical and challenges to, the terms of the licences, permits, government contracts oilfield service infrastructure present in shallower waters. As a result, or approvals required for our operations. deepwater operations may have additional risks, such as a blowout, • Sanctions for non-compliance with laws and regulations may include and require significant time between a discovery and the time that administrative, civil and criminal penalties, demand for reimbursement Woodside can market its production. for government or regulatory actions, government orders, suspension • Natural disasters, earthquakes, social unrest, pandemic diseases or revocation of licences, permits, government contracts or approvals, (such as COVID-19) and criminal actions by external parties could and corrective action orders. result in injuries, loss of life, disruption of our operations or the loss or • Government policy objectives in the countries in which we do suspension of permits or other approvals. business, now or in the future, could take the form of increased • Our joint venture partners may have the ability to exercise veto rights governmental regulations (including in respect of restoration, to block certain key decisions or actions that we believe are in our or protection of the environment, greenhouse gas emissions, natural the joint venture’s best interests or approve those matters without our resources, and worker health and safety), redirection of product support. distribution (such as domestic gas reservation policies), changes in • Our partners and contractual counterparties may not be able to meet taxation regulation or enforcement (including, for example, changes in their financial or other obligations to the projects. In addition, the tax rates or increased focus on audits), taxation subsidies or royalties, actions of our partners, contractors and subcontractors could result nationalisation of resource assets or restrictions or moratoriums on in legal liability and financial loss for Woodside. our operations on government leases, limitations on periods of lease • Applicable laws and regulations may obligate Woodside to identify, retention, interference with the confidentiality and availability of avoid, mitigate and disclose environmental risks in various operational information, forced renegotiation of contracts, changes in laws and practices, which in turn could materially adversely affect our business, policies governing operations of foreign-based companies, trade financial condition or results of operations. We may also be required to sanctions, currency restrictions and exchange rate fluctuations and maintain financial assurance through bonds or insurance. other governmental steps. • A failure to comply with applicable laws, regulations and approvals • Actual or alleged violations of the securities laws that we are subject may result in the assessment of sanctions, including administrative, to could result in private or governmental litigation, civil penalties, civil, and criminal penalties, the imposition of investigatory, remedial, regulatory action and shareholder class actions. and corrective action obligations or the incurrence of capital • Downward adjustments of our reported reserves estimates could expenditures, the occurrence of restrictions, delays or cancellations indicate lower future production volumes or the impairment of assets. in the permitting, development or expansion of current or proposed projects, and issuance of injunctions restricting or prohibiting some These impacts may lead to a loss in shareholder value, loss of market or all of our activities in a particular area. share to competitors, decreases in the value of assets, delays or stoppages in our operations, reduced capacity to fund capital projects, delayed or suspended regulatory approvals, legal liabilities and adverse impacts on Woodside’s reputation, social licence to operate and on the delivery of our strategy. Woodside had a fatality in 2023. The tragic loss of our colleague, a contractor employee, has led to the implementation of additional controls based on preliminary investigation insights into the incident. The external investigations into the incident are ongoing. How is Woodside managing these risks? • Safe operation is fundamentally embedded through an extensive • Decommissioning is integrated into project planning. We work framework of controls that deliver strong operational performance in with our partners and technical experts to identify sustainable and our base business. beneficial post-closure options that minimise financial, social and • The framework includes production processes, drilling and environmental impacts. completions and well integrity management processes, inspection and • The framework is adaptable to enable us to maintain and improve maintenance procedures and performance standards. The framework our operating model and performance, target reliability, cost is supported and inspected on an ongoing basis by our regulators. discipline, emissions reductions and strong safety and environmental performance for both our existing business and future growth opportunities. WOODSIDE ENERGY GROUP LTD 45
Finance and market Risks associated with the ability to capture value whether markets are stable or volatile, and manage the risks associated with interest rate, commodity price and foreign exchange fluctuations and inflation. Generally, Woodside does not have control over the factors that affect market development and prices. How is this factor relevant to Woodside? Woodside must be financially well positioned in order to pursue our strategic objectives and remain resilient during times of economic challenge. Several factors can affect our position, including: Market and commodity price: Woodside’s revenues are primarily derived from the sale of hydrocarbons. The prices Woodside receives for these products are variable and are impacted by global economic factors beyond Woodside’s control. We seek to forecast changes in the economic factors to enable us to maintain a strong market position during challenging economic times. Refer to section 6.3—Additional disclosures and section A in the Notes to the Financial Statements for further information. Capital management: For Woodside to continue to operate sustainably we must make risk informed decisions related to allocation of capital. We seek to apply a disciplined and balanced approach to capital management through the commodity price cycle. Refer to section 2.2 – Capital management for further information. Foreign exchange risk: Woodside is exposed to foreign currency risk from future commitments, financial assets and financial liabilities that are not denominated in US dollars. Refer to section A in the Notes to the Financial Statements for further information. Interest rate risk: This is the risk that Woodside’s financial position will fluctuate due to changes in market interest rates. Woodside’s risk relates primarily to financial instruments with floating interest rates including long-term debt obligations, cash and short-term deposits. Refer to section C in the Notes to the Financial Statements for further information. Examples of how this factor may impact Woodside • A reduced ability to fund our strategy including our projects. • Inability to achieve anticipated synergies and cost savings on expected • Significant volatility in energy prices, such as the volatility timeline or at all. experienced in recent years, may increase the challenges associated • Unforeseen costs relating to the integration of development, extraction with long-term plans. and production operational systems, IT systems and financial and • An imbalance in supply and demand can impact commodity prices accounting systems of both businesses. and our ability to forecast market conditions determines whether • Impairments of assets, goodwill or other intangible assets could have we are impacted positively or negatively. a significant negative effect on our reported net income and our ability • Woodside may become a less attractive joint venture partner. to pay dividends in one or more accounting periods if the level of • Reduced shareholder returns due to lower commodity prices. impairment were to exceed profits available for distribution. • If we inaccurately forecast the global demand for our LNG products These impacts may lead to a loss in shareholder value, loss of market we may face difficulties obtaining longer term sales contracts with share to competitors, decreases in the value of assets, delays or desirable commercial terms. stoppages in our operations, reduced capacity to fund capital projects, • If counterparties to our derivative instruments are unable to fulfill their delayed or suspended regulatory approvals, legal liabilities and adverse obligations, a larger percentage of our future oil and gas production impacts on Woodside’s reputation, social licence to operate and on the could be subject to price changes. delivery of our strategy. How is Woodside managing these risks? • The delivery of our strategic portfolio objectives requires significant • The US dollar reflects the majority of Woodside’s underlying cash capital expenditure, supported by strong underlying cash flows. flows and is used in our financial reporting, reducing our exposure to Uncertainty associated with product demand is mitigated by selling currency fluctuations. Refer to section A in the Notes to the Financial LNG in a portfolio manner and under long-term take or pay sale Statements for further information. Refer to section C in the Notes to agreements, in addition to the spot market. Our low cost of production the Financial Statements for further information on interest rate risk and prudent approach to balance sheet risk management further management. mitigates this exposure. Refer to section 6.3—Additional disclosures • We maintain insurance in line with industry practice and sufficient and section A in the Notes to the Financial Statements for further to cover normal operational risks. However, Woodside is not insured information. against all potential risks because not all risks can be insured and • A flexible approach to capital management enables this overall level because of constraints on the availability of commercial insurance in of investment in the different areas of our business and the mix to be global markets. Insurance coverage is determined by the availability adjusted to reflect the external environment. Our capital management of commercial options and cost/benefit analysis, taking into account strategy focuses on capital allocation, capital discipline and efficiency, Woodside’s risk management program. Losses that are not insured and active balance sheet management including commodity and could impact Woodside’s financial performance. For example, foreign exchange hedging. Woodside does not purchase insurance for the loss of revenue • Woodside hedges to protect the balance sheet against downside arising from an operational interruption. Our extensive framework of commodity price risk, particularly during periods of high capital financial controls, including monitoring of counterparties, enables the expenditure. management of these risks. 46 ANNUAL REPORT 2023
People and culture Risks associated with the ability to attract, retain, develop and motivate key employees to succeed and safeguard both current or future performance and growth. How is this factor relevant to Woodside? People are key to the success of Woodside. We must build and maintain a capable workforce if we are to achieve our objectives. An effective operating model with a balanced organisation structure will allow us to conduct our operations and pursue new energy opportunities. For Woodside to remain an employer of choice, our culture must support our current employees and attract the best new candidates. Examples of how this factor may impact Woodside • During periods of high demand for skilled resources, Woodside may These impacts may lead to a loss in shareholder value, loss of market be unable to fill critical roles at acceptable costs or at all, leading to share to competitors, decreases in the value of assets, delays or operational impacts. stoppages in our operations, reduced capacity to fund capital projects, • A limited ability to operate due to our people leaving critical roles. delayed or suspended regulatory approvals, legal liabilities and adverse • An inability to pursue innovation opportunities due to a skills shortage. impacts on Woodside’s reputation, social licence to operate and on the • Loss of key personnel or expert knowledge. delivery of our strategy. • An inability to reach timely agreements with employees including where represented by third parties may result in industrial action. How is Woodside managing these risks? Woodside has a set of resourcing frameworks to attract, retain and We employ a direct engagement model to maintain effective develop our workforce to support both base business and growth employee and industrial relations. We engage with employees and opportunities. We recognise and value the benefits of creating an their representatives where required and strive to maintain positive inclusive and diverse working environment. relationships. We proactively engage our major contractors and suppliers to strengthen alignment with expectations, securing capability and pricing to meet future business needs. Digital and cybersecurity Risks associated with adopting and implementing new technologies, whilst safeguarding our digital information and landscape (including from cyber threats) across our value chain. How is this factor relevant to Woodside? Woodside must relentlessly protect the confidentiality, integrity and availability of digital information and operational technologies. Woodside’s technology systems including artificial intelligence and machine learning technologies, may be targeted by an internal or external malicious act or our systems may be disrupted unintentionally. Additionally, the cost of implementing and maintaining effective technology systems may be higher than anticipated. While our technology controls are designed to protect against all causes of disruption, we cannot be certain that they will protect our systems in all cases. Refer to section 4.1.6—Risk management and internal control and section 6.3—Additional disclosures for further information on cybersecurity. Examples of how this factor may impact Woodside • In the event of a cyber attack, Woodside’s confidential or sensitive These impacts may lead to a loss in shareholder value, loss of market information may be made public or held for ransom. share to competitors, decreases in the value of assets, delays or • Our operations may be disrupted if an attacker gains access to our stoppages in our operations, loss of revenue, increased expenses, control systems. reduced capacity to fund capital projects, delayed or suspended • Litigation and governmental proceedings arising from the occurrence regulatory approvals, legal liabilities and adverse impacts on Woodside’s of a cyber attack. reputation, social licence to operate and on the delivery of our strategy. • Potential adverse impacts on our reputation and the safety of our employees and the communities in which we operate. How is Woodside managing these risks? We are committed to the protection of our people, assets, reputation Our operating model aims to continuously assess and determine and brand through securely enabled digital technologies. access permissions to critical information or data, while consolidating, Digital risks are identified, assessed and managed based on the business simplifying and automating security controls. criticality of our people, data and systems, and may be required to be Our exposure to cyber risk is managed by a control framework to segregated and isolated. Digital risks include third parties, including identify, contain and recover from cyber events in a timely manner, and suppliers and service providers, within our supply chain. embeds a cyber-safe culture across the company, with our joint venture participants and in our supply chain. However, due to the rapid evolution of cyber threats, there can be no certainty that such controls will be sufficient to prevent all security breaches. WOODSIDE ENERGY GROUP LTD 47
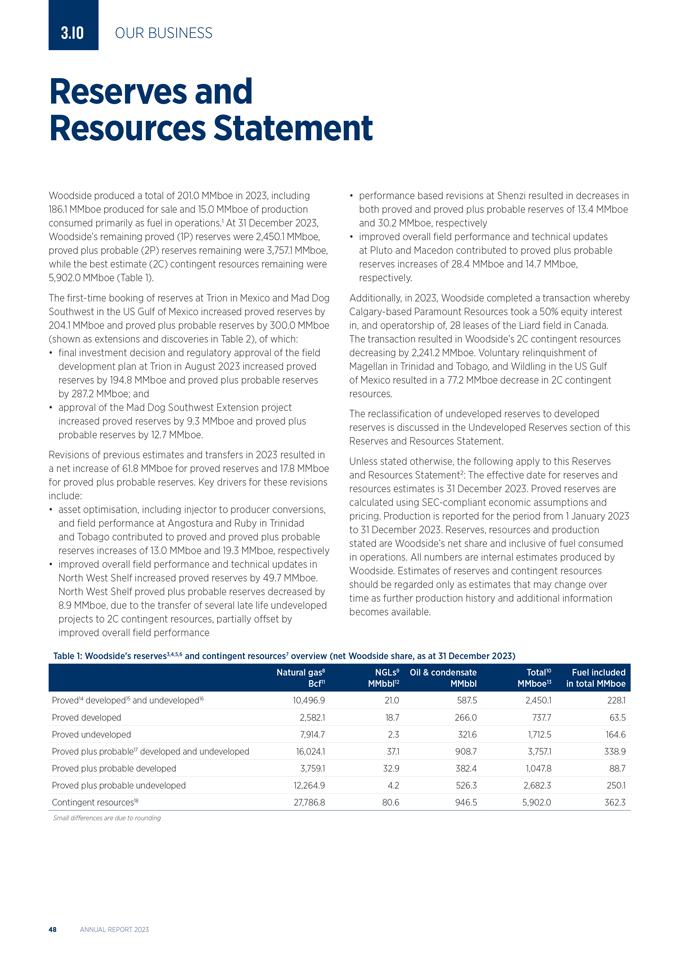
3.10 OUR BUSINESS Resources Reserves and Statement Woodside produced a total of 201.0 MMboe in 2023, including 186.1 MMboe produced for sale and 15.0 MMboe of production consumed primarily as fuel in operations.1 At 31 December 2023, Woodside’s remaining proved (1P) reserves were 2,450.1 MMboe, proved plus probable (2P) reserves remaining were 3,757.1 MMboe, while the best estimate (2C) contingent resources remaining were 5,902.0 MMboe (Table 1). The first-time booking of reserves at Trion in Mexico and Mad Dog Southwest in the US Gulf of Mexico increased proved reserves by 204.1 MMboe and proved plus probable reserves by 300.0 MMboe (shown as extensions and discoveries in Table 2), of which: • final investment decision and regulatory approval of the field development plan at Trion in August 2023 increased proved reserves by 194.8 MMboe and proved plus probable reserves by 287.2 MMboe; and • approval of the Mad Dog Southwest Extension project increased proved reserves by 9.3 MMboe and proved plus probable reserves by 12.7 MMboe. Revisions of previous estimates and transfers in 2023 resulted in a net increase of 61.8 MMboe for proved reserves and 17.8 MMboe for proved plus probable reserves. Key drivers for these revisions include: • asset optimisation, including injector to producer conversions, and field performance at Angostura and Ruby in Trinidad and Tobago contributed to proved and proved plus probable reserves increases of 13.0 MMboe and 19.3 MMboe, respectively • improved overall field performance and technical updates in North West Shelf increased proved reserves by 49.7 MMboe. North West Shelf proved plus probable reserves decreased by 8.9 MMboe, due to the transfer of several late life undeveloped projects to 2C contingent resources, partially offset by improved overall field performance • performance based revisions at Shenzi resulted in decreases in both proved and proved plus probable reserves of 13.4 MMboe and 30.2 MMboe, respectively • improved overall field performance and technical updates at Pluto and Macedon contributed to proved plus probable reserves increases of 28.4 MMboe and 14.7 MMboe, respectively. Additionally, in 2023, Woodside completed a transaction whereby Calgary-based Paramount Resources took a 50% equity interest in, and operatorship of, 28 leases of the Liard field in Canada. The transaction resulted in Woodside’s 2C contingent resources decreasing by 2,241.2 MMboe. Voluntary relinquishment of Magellan in Trinidad and Tobago, and Wildling in the US Gulf of Mexico resulted in a 77.2 MMboe decrease in 2C contingent resources. The reclassification of undeveloped reserves to developed reserves is discussed in the Undeveloped Reserves section of this Reserves and Resources Statement. Unless stated otherwise, the following apply to this Reserves and Resources Statement2: The effective date for reserves and resources estimates is 31 December 2023. Proved reserves are calculated using SEC-compliant economic assumptions and pricing. Production is reported for the period from 1 January 2023 to 31 December 2023. Reserves, resources and production stated are Woodside’s net share and inclusive of fuel consumed in operations. All numbers are internal estimates produced by Woodside. Estimates of reserves and contingent resources should be regarded only as estimates that may change over time as further production history and additional information becomes available. Table 1: Woodside’s reserves3,4,5,6 and contingent resources7 overview (net Woodside share, as at 31 December 2023) Natural gas8 NGLs9 Oil & condensateTotal10Fuel included Bcf11 MMbbl12 MMbblMMboe13in total MMboe Proved14 developed15 and undeveloped16 10,496.9 21.0587.52,450.1228.1 Proved developed 2,582.1 18.7266.0737.763.5 Proved undeveloped 7,914.7 2.3321.61,712.5164.6 Proved plus probable17 developed and undeveloped 16,024.1 37.1908.73,757.1338.9 Proved plus probable developed 3,759.1 32.9382.41,047.888.7 Proved plus probable undeveloped 12,264.9 4.2526.32,682.3250.1 Contingent resources18 27,786.8 80.6946.55,902.0362.3 Small differences are due to rounding 48 ANNUAL REPORT 2023
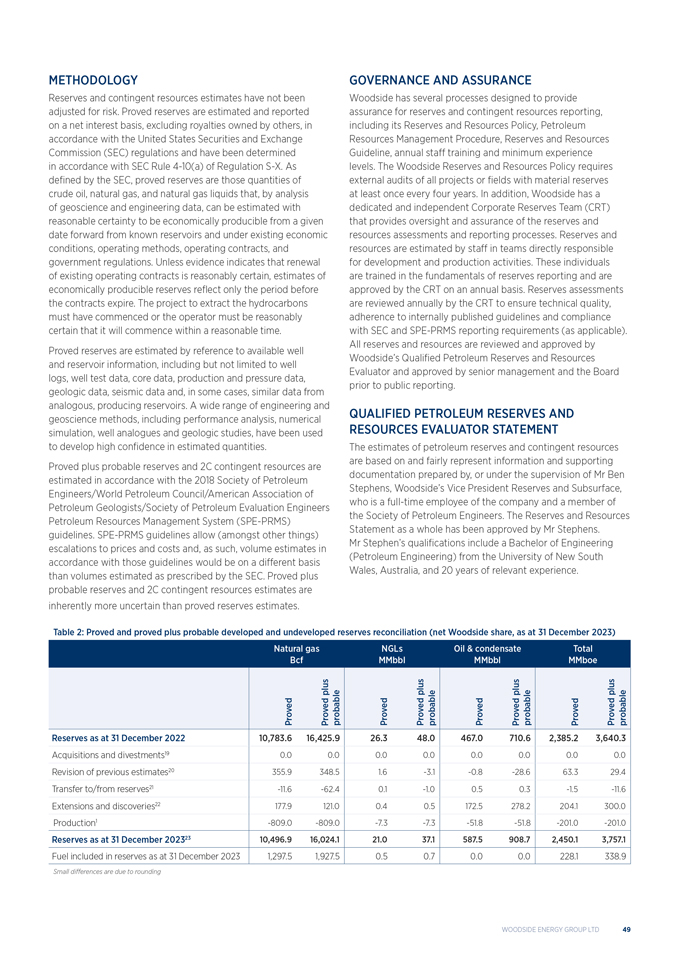
METHODOLOGY Reserves and contingent resources estimates have not been adjusted for risk. Proved reserves are estimated and reported on a net interest basis, excluding royalties owned by others, in accordance with the United States Securities and Exchange Commission (SEC) regulations and have been determined in accordance with SEC Rule 4-10(a) of Regulation S-X. As defined by the SEC, proved reserves are those quantities of crude oil, natural gas, and natural gas liquids that, by analysis of geoscience and engineering data, can be estimated with reasonable certainty to be economically producible from a given date forward from known reservoirs and under existing economic conditions, operating methods, operating contracts, and government regulations. Unless evidence indicates that renewal of existing operating contracts is reasonably certain, estimates of economically producible reserves reflect only the period before the contracts expire. The project to extract the hydrocarbons must have commenced or the operator must be reasonably certain that it will commence within a reasonable time. Proved reserves are estimated by reference to available well and reservoir information, including but not limited to well logs, well test data, core data, production and pressure data, geologic data, seismic data and, in some cases, similar data from analogous, producing reservoirs. A wide range of engineering and geoscience methods, including performance analysis, numerical simulation, well analogues and geologic studies, have been used to develop high confidence in estimated quantities. Proved plus probable reserves and 2C contingent resources are estimated in accordance with the 2018 Society of Petroleum Engineers/World Petroleum Council/American Association of Petroleum Geologists/Society of Petroleum Evaluation Engineers Petroleum Resources Management System (SPE-PRMS) guidelines. SPE-PRMS guidelines allow (amongst other things) escalations to prices and costs and, as such, volume estimates in accordance with those guidelines would be on a different basis than volumes estimated as prescribed by the SEC. Proved plus probable reserves and 2C contingent resources estimates are inherently more uncertain than proved reserves estimates. GOVERNANCE AND ASSURANCE Woodside has several processes designed to provide assurance for reserves and contingent resources reporting, including its Reserves and Resources Policy, Petroleum Resources Management Procedure, Reserves and Resources Guideline, annual staff training and minimum experience levels. The Woodside Reserves and Resources Policy requires external audits of all projects or fields with material reserves at least once every four years. In addition, Woodside has a dedicated and independent Corporate Reserves Team (CRT) that provides oversight and assurance of the reserves and resources assessments and reporting processes. Reserves and resources are estimated by staff in teams directly responsible for development and production activities. These individuals are trained in the fundamentals of reserves reporting and are approved by the CRT on an annual basis. Reserves assessments are reviewed annually by the CRT to ensure technical quality, adherence to internally published guidelines and compliance with SEC and SPE-PRMS reporting requirements (as applicable). All reserves and resources are reviewed and approved by Woodside’s Qualified Petroleum Reserves and Resources Evaluator and approved by senior management and the Board prior to public reporting. QUALIFIED PETROLEUM RESERVES AND RESOURCES EVALUATOR STATEMENT The estimates of petroleum reserves and contingent resources are based on and fairly represent information and supporting documentation prepared by, or under the supervision of Mr Ben Stephens, Woodside’s Vice President Reserves and Subsurface, who is a full-time employee of the company and a member of the Society of Petroleum Engineers. The Reserves and Resources Statement as a whole has been approved by Mr Stephens. Mr Stephen’s qualifications include a Bachelor of Engineering (Petroleum Engineering) from the University of New South Wales, Australia, and 20 years of relevant experience. Table 2: Proved and proved plus probable developed and undeveloped reserves reconciliation (net Woodside share, as at 31 December 2023) Natural gas NGLs Oil & condensateTotal Bcf MMbblMMbblMMboe plus plusplusplus Proved Proved probable ProvedProved probableProvedProved probableProvedProved probable Reserves as at 31 December 2022 10,783.6 16,425.926.348.0467.0710.62,385.23,640.3 Acquisitions and divestments19 0.0 0.00.00.00.00.00.00.0 Revision of previous estimates20 355.9 348.51.6-3.1-0.8-28.663.329.4 Transfer to/from reserves21 -11.6 -62.40.1-1.00.50.3-1.5-11.6 Extensions and discoveries22 177.9 121.00.40.5172.5278.2204.1300.0 Production1 -809.0 -809.0-7.3-7.3-51.8-51.8-201.0-201.0 Reserves as at 31 December 202323 10,496.9 16,024.121.037.1587.5908.72,450.13,757.1 Fuel included in reserves as at 31 December 2023 1,297.5 1,927.50.50.70.00.0228.1338.9 Small differences are due to rounding WOODSIDE ENERGY GROUP LTD 49
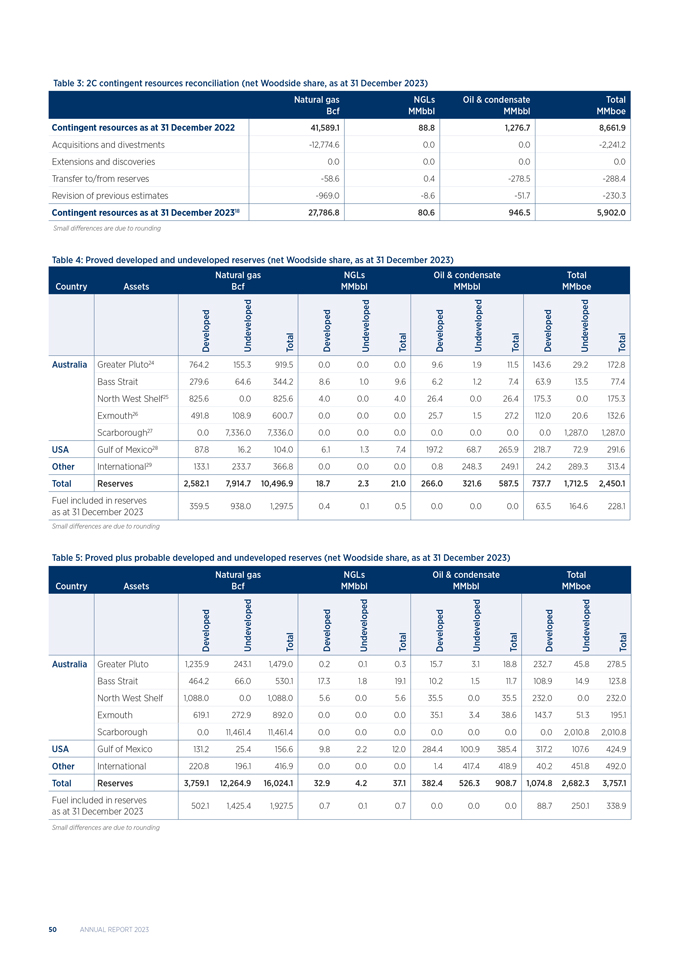
Table 3: 2C contingent resources reconciliation (net Woodside share, as at 31 December 2023) Natural gasNGLsOil & condensateTotal BcfMMbblMMbblMMboe Contingent resources as at 31 December 2022 41,589.188.81,276.78,661.9 Acquisitions and divestments -12,774.60.00.0-2,241.2 Extensions and discoveries 0.00.00.00.0 Transfer to/from reserves -58.60.4-278.5-288.4 Revision of previous estimates -969.0-8.6-51.7-230.3 Contingent resources as at 31 December 202318 27,786.880.6946.55,902.0 Small differences are due to rounding Table 4: Proved developed and undeveloped reserves (net Woodside share, as at 31 December 2023) Natural gasNGLsOil & condensateTotal Country Assets BcfMMbblMMbblMMboe Developed UndevelopedTotalDevelopedUndevelopedTotalDevelopedUndevelopedTotalDevelopedUndevelopedTotal Australia Greater Pluto24 764.2155.3919.50.00.00.09.61.911.5143.629.2172.8 Bass Strait 279.6 64.6344.28.61.09.66.21.27.463.913.577.4 North West Shelf25 825.6 0.0825.64.00.04.026.40.026.4175.30.0175.3 Exmouth26 491.8 108.9600.70.00.00.025.71.527.2112.020.6132.6 Scarborough27 0.0 7,336.07,336.00.00.00.00.00.00.00.01,287.01,287.0 USA Gulf of Mexico28 87.816.2104.06.11.37.4197.268.7265.9218.772.9291.6 Other International29 133.1233.7366.80.00.00.00.8248.3249.124.2289.3313.4 Total Reserves 2,582.17,914.710,496.918.72.321.0266.0321.6587.5737.71,712.52,450.1 Fuel included in reserves as at 31 December 2023 359.5 938.01,297.50.40.10.50.00.00.063.5164.6228.1 Small differences are due to rounding Table 5: Proved plus probable developed and undeveloped reserves (net Woodside share, as at 31 December 2023) Natural gasNGLsOil & condensateTotal Country Assets BcfMMbblMMbblMMboe Developed UndevelopedTotalDevelopedUndevelopedTotalDevelopedUndevelopedTotalDevelopedUndevelopedTotal Australia Greater Pluto 1,235.9243.11,479.00.20.10.315.73.118.8232.745.8278.5 Bass Strait 464.2 66.0530.117.31.819.110.21.511.7108.914.9123.8 North West Shelf 1,088.0 0.01,088.05.60.05.635.50.035.5232.00.0232.0 Exmouth 619.1 272.9892.00.00.00.035.13.438.6143.751.3195.1 Scarborough 0.0 11,461.411,461.40.00.00.00.00.00.00.02,010.82,010.8 USA Gulf of Mexico 131.225.4156.69.82.212.0284.4100.9385.4317.2107.6424.9 Other International 220.8196.1416.90.00.00.01.4417.4418.940.2451.8492.0 Total Reserves 3,759.112,264.916,024.132.94.237.1382.4526.3908.71,074.82,682.33,757.1 Fuel included in reserves as at 31 December 2023 502.1 1,425.41,927.50.70.10.70.00.00.088.7250.1338.9 Small differences are due to rounding 50 ANNUAL REPORT 2023
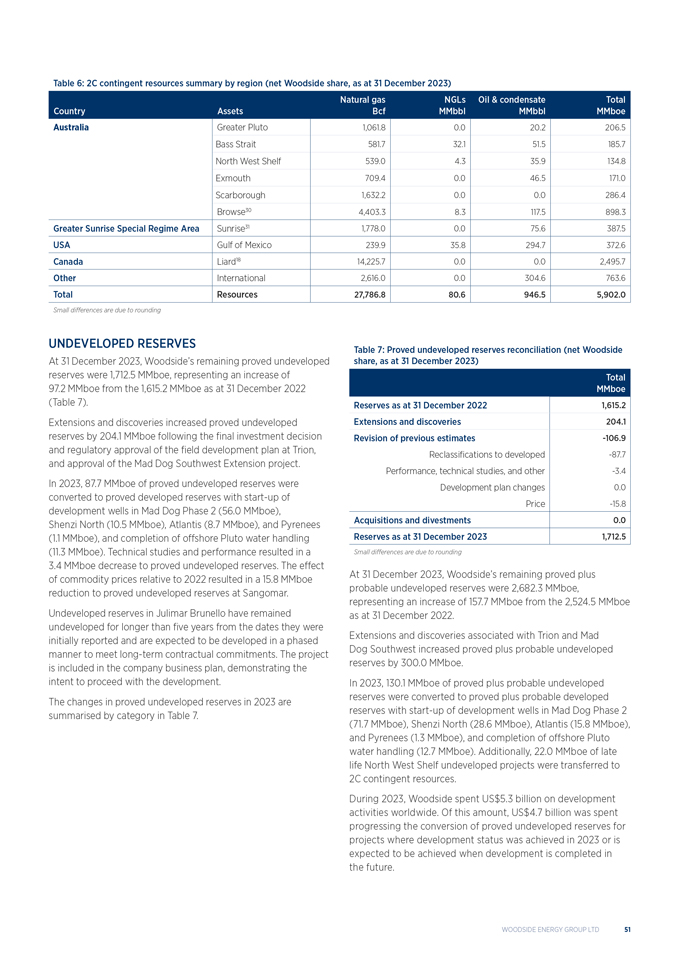
Table 6: 2C contingent resources summary by region (net Woodside share, as at 31 December 2023) Natural gas NGLsOil & condensateTotal Country Assets BcfMMbblMMbblMMboe Australia Greater Pluto 1,061.80.020.2206.5 Bass Strait 581.7 32.151.5185.7 North West Shelf 539.0 4.335.9134.8 Exmouth 709.4 0.046.5171.0 Scarborough 1,632.2 0.00.0286.4 Browse30 4,403.3 8.3117.5898.3 Greater Sunrise Special Regime Area Sunrise31 1,778.00.075.6387.5 USA Gulf of Mexico 239.935.8294.7372.6 Canada Liard18 14,225.70.00.02,495.7 Other International 2,616.00.0304.6763.6 Total Resources 27,786.880.6946.55,902.0 Small differences are due to rounding UNDEVELOPED RESERVES At 31 December 2023, Woodside’s remaining proved undeveloped reserves were 1,712.5 MMboe, representing an increase of 97.2 MMboe from the 1,615.2 MMboe as at 31 December 2022 (Table 7). Extensions and discoveries increased proved undeveloped reserves by 204.1 MMboe following the final investment decision and regulatory approval of the field development plan at Trion, and approval of the Mad Dog Southwest Extension project. In 2023, 87.7 MMboe of proved undeveloped reserves were converted to proved developed reserves with start-up of development wells in Mad Dog Phase 2 (56.0 MMboe), Shenzi North (10.5 MMboe), Atlantis (8.7 MMboe), and Pyrenees (1.1 MMboe), and completion of offshore Pluto water handling (11.3 MMboe). Technical studies and performance resulted in a 3.4 MMboe decrease to proved undeveloped reserves. The effect of commodity prices relative to 2022 resulted in a 15.8 MMboe reduction to proved undeveloped reserves at Sangomar. Undeveloped reserves in Julimar Brunello have remained undeveloped for longer than five years from the dates they were initially reported and are expected to be developed in a phased manner to meet long-term contractual commitments. The project is included in the company business plan, demonstrating the intent to proceed with the development. The changes in proved undeveloped reserves in 2023 are summarised by category in Table 7. Table 7: Proved undeveloped reserves reconciliation (net Woodside share, as at 31 December 2023) Total MMboe Reserves as at 31 December 2022 1,615.2 Extensions and discoveries 204.1 Revision of previous estimates -106.9 Reclassifications to developed -87.7 Performance, technical studies, and other -3.4 Development plan changes 0.0 Price -15.8 Acquisitions and divestments 0.0 Reserves as at 31 December 2023 1,712.5 Small differences are due to rounding At 31 December 2023, Woodside’s remaining proved plus probable undeveloped reserves were 2,682.3 MMboe, representing an increase of 157.7 MMboe from the 2,524.5 MMboe as at 31 December 2022. Extensions and discoveries associated with Trion and Mad Dog Southwest increased proved plus probable undeveloped reserves by 300.0 MMboe. In 2023, 130.1 MMboe of proved plus probable undeveloped reserves were converted to proved plus probable developed reserves with start-up of development wells in Mad Dog Phase 2 (71.7 MMboe), Shenzi North (28.6 MMboe), Atlantis (15.8 MMboe), and Pyrenees (1.3 MMboe), and completion of offshore Pluto water handling (12.7 MMboe). Additionally, 22.0 MMboe of late life North West Shelf undeveloped projects were transferred to 2C contingent resources. During 2023, Woodside spent US$5.3 billion on development activities worldwide. Of this amount, US$4.7 billion was spent progressing the conversion of proved undeveloped reserves for projects where development status was achieved in 2023 or is expected to be achieved when development is completed in the future. WOODSIDE ENERGY GROUP LTD 51
ADDITIONAL INFORMATION FOR US INVESTORS The SEC prohibits oil and gas companies, in their filings with the SEC, from disclosing estimates of oil or gas resources other than ‘reserves’ (as that term is defined by the SEC). In this report, Woodside includes estimates of quantities of oil and gas using certain terms, such as ‘proved plus probable (2P) reserves,’ ‘best estimate (2C) contingent resources,’ ‘reserves and contingent resources,’ ‘proved plus probable,’ ‘developed and undeveloped,’ ‘probable developed,’ ‘probable undeveloped,’ ‘contingent resources’ or other descriptions of volumes of reserves, which terms include quantities of oil and gas that may not meet the SEC’s definitions of proved, probable and possible reserves, and which the SEC’s guidelines strictly prohibit Woodside from including in filings with the SEC. These estimates are by their nature more speculative than estimates of proved reserves and would require substantial capital spending over a significant number of years to implement recovery, and accordingly are subject to substantially greater risk of being recovered by Woodside. In addition, actual locations drilled and quantities that may be ultimately recovered from Woodside’s properties may differ substantially. Woodside has made no commitment to drill, and likely will not drill, all drilling locations that have been attributable to these quantities. US investors are urged to consider closely the disclosures in Woodside’s filings with the SEC, which are available at www.sec.gov. NOTES TO THE RESERVES AND RESOURCES STATEMENT 1 ‘Production’ is the volume of natural gas, natural gas liquids (NGLs), condensate and oil produced during the period from 1 January 2023 to 31 December 2023 and converted to ‘MMboe’ for the specific purpose of reserves reconciliation. The production volume figures in this Reserves and Resources Statement differ from the production volume figures reported elsewhere in this report and in Woodside’s quarterly reports, because the production volume figures reported in this Reserves and Resources Statement include all fuel consumed in operations but exclude 1.1 MMboe in excess of reserves working interest percentage from Pluto non-operating participants processed via the Pluto-KGP Interconnector. Small differences are due to rounding. 2 Woodside is an Australian company listed on the Australian Securities Exchange, the New York Stock Exchange, and the London Stock Exchange. Woodside reports its proved reserves in accordance with SEC regulations, which are also compliant with SPE-PRMS guidelines, and prepares and reports its proved plus probable reserves and 2C contingent resources in accordance with SPE-PRMS guidelines. Woodside reports all petroleum resource estimates using definitions consistent with SPE-PRMS. 3 For offshore oil projects, the reference point is defined as the outlet of the floating production storage and offloading facility (FPSO) or platform, while for the onshore gas projects the reference point is defined as the outlet of the downstream (onshore) gas processing facility. 4 ‘Reserves’ are estimated quantities of petroleum that have been demonstrated to be producible from known accumulations in which the company has a material interest from a given date forward, at commercial rates, under presently anticipated production methods, operating conditions, prices, and costs. Woodside reports reserves inclusive of all fuel consumed in operations. Proved reserves are estimated and reported in accordance with SEC regulations which are also compliant with SPE-PRMS guidelines. SEC-compliant proved reserves estimates use a more restrictive, rules-based approach and are generally lower than estimates prepared solely in accordance with SPE-PRMS guidelines due to, among other things, the requirement to use commodity prices based on the average of first of month prices during the 12-month period in the reporting company’s fiscal year. Proved plus probable reserves are estimated and reported in accordance with SPE-PRMS guidelines and are not compliant with SEC regulations. 5 Assessment of the economic value in support of an SPE-PRMS (2018) reserves and resources classification, uses Woodside Portfolio Economic Assumptions (Woodside PEAs). The Woodside PEAs are reviewed on an annual basis, or more often if required. The review is based on historical data and forecast estimates for economic variables such as product prices and exchange rates. The Woodside PEAs are approved by the Woodside Board. Specific contractual arrangements for individual projects are also taken into account. 6 Woodside uses both deterministic and probabilistic methods for the estimation of reserves and contingent resources at the field and project levels. All proved reserves estimates have been estimated using deterministic methods and reported on a net interest basis in accordance with the SEC regulations and have been determined in accordance with SEC Rule 4-10(a) of Regulation S-X. Unless otherwise stated, all petroleum estimates reported at the company or region level are aggregated by arithmetic summation by category. The aggregated proved reserves may be a conservative estimate due to the portfolio effects of arithmetic summation. ‘Contingent resources’ are those quantities of petroleum estimated, as of a given date, to be potentially recoverable from known accumulations, but the applied project(s) are not yet considered mature enough for commercial development due to one or more contingencies. Contingent resources are estimated and reported in accordance with SPE-PRMS guidelines and may include, for example, projects for which there are currently no viable markets, or where commercial recovery is dependent on technology under development, or where evaluation of the accumulation is insufficient to clearly assess commerciality. Woodside reports contingent resources inclusive of all fuel consumed in operations. Contingent resources are different from, and should not be construed as, reserves. Contingent resources estimates may not always mature to reserves and do not necessarily represent future reserves bookings. Contingent resources volumes are reported at the ‘Best Estimate’ (P50) confidence level. 2C contingent resources are not compliant with SEC regulations. The SEC prohibits disclosure of oil and gas resources, including contingent resources, in SEC filings. However, Australian securities regulatory authorities allow disclosure of oil and gas resources, including contingent resources. ‘Natural gas’ is defined as the gas product associated with liquefied natural gas (LNG) and pipeline gas. Liquid volumes of crude oil, condensate and NGLs are reported separately. ‘Natural gas liquids’ or ‘NGLs’ is defined as the product associated with liquified petroleum gas (LPG) and consists of propane, butane, and ethane—individually or as a mixture. ‘Total’ includes fuel consumed in operations. ‘Bcf’ means Billions (109) of cubic feet of gas at standard oilfield conditions of 14.696 psi (101.325 kPa) and 60 degrees Fahrenheit (15.56 degrees Celsius). ‘MMbbl’ means millions (106) of barrels of NGLs, oil and condensate at standard oilfield conditions of 14.696 psi (101.325 kPa) and 60 degrees Fahrenheit (15.56 degrees Celsius). ‘MMboe’ means millions (106) of barrels of oil equivalent. Natural Gas volumes are converted to oil equivalent volumes via a constant conversion factor, which for Woodside is 5.7 Bcf of dry gas per 1 MMboe. Volumes of NGLs, oil and condensate are converted from MMbbl to MMboe on a 1:1 ratio. ‘Proved reserves’ are those quantities of crude oil, condensate, natural gas and NGLs that, by analysis of geoscience and engineering data, can be estimated with reasonable certainty to be economically producible from a given date forward from known reservoirs and under existing economic conditions, operating methods, operating contracts, and government regulations. Proved reserves are estimated and reported on a net interest basis in accordance with the SEC regulations and have been determined in accordance with SEC Rule 4-10(a) of Regulation S-X. ‘Developed reserves’ are those reserves that are producible through currently existing completions and installed facilities for treatment, compression, transportation and delivery, using existing operating methods and standards. ‘Undeveloped reserves’ are those reserves for which wells and facilities have not been installed or executed but are expected to be recovered through future significant investments. ‘Probable reserves’ are those reserves which analysis of geological and engineering data suggests are more likely than not to be recoverable. Proved plus probable reserves represent the best estimate of recoverable quantities. Where probabilistic methods are used, there is at least a 50% probability that the actual quantities recovered will equal or exceed the sum of estimated proved plus probable reserves. Proved plus probable reserves are estimated and reported in accordance with SPE-PRMS guidelines and are not compliant with SEC regulations. ‘Liard’ comprises unconventional contingent resources in the Liard Basin. As at 31 December 2023, Liard represents approximately 42% of Woodside’s 2C contingent resources. ‘Acquisitions and divestments’ are revisions that represent changes (either upward or downward) in previous estimates of reserves or contingent resources, which result from either purchase or sale of interests and/or execution of contracts conveying entitlement. ‘Revision of previous estimates’ are changes (either upward or downward) in previous estimates of reserves or contingent resources, resulting from new information normally obtained from development drilling and production history, or resulting from a change in economic factors. ‘Transfer to/from reserves’ are revisions that represent changes (either upward or downward) in previous estimates of reserves or contingent resources, which are a result of re-classification of petroleum resources estimates (i.e. from reserves to contingent resources or vice versa) associated with one or more project(s). ‘Extensions and discoveries’ represent additions to reserves or contingent resources that result from increased areal extensions of previously discovered fields demonstrated to exist subsequent to the original discovery and/or discovery of reserves or contingent resources in new fields or new reservoirs in old fields. Proved reserves at 31 December 2023 are estimated and reported in accordance with SEC regulations. Proved plus probable reserves and contingent resources at 31 December 2023 are estimated and reported in accordance with SPE-PRMS guidelines. ‘Greater Pluto’ consists of the Pluto, Xena, Pyxis, Larsen, Martell, Martin, Noblige, and Remy fields. ‘North West Shelf’ consists of all oil and gas fields within the North West Shelf Project Area. ‘Exmouth’ consists of the Pyrenees, Macedon, Julimar-Brunello, and Ngujima-Yin fields. ‘Scarborough’ consists of Scarborough, Thebe, and Jupiter fields. Scarborough proved undeveloped reserves as at 31 December 2023 are 7,336.0 Bcf (1,287.0 MMboe). Development activities are underway. In this Reserves and Resources Statement, Scarborough estimates are based on one hundred per cent interest in the Scarborough Joint Venture until completion of the transaction with LNG Japan referenced in the announcement on 8 August 2023 entitled “Woodside to Sell 10% Scarborough Interest to LNG Japan”. ‘Gulf of Mexico’ consists of the Shenzi, Shenzi North, Atlantis, and Mad Dog fields. ‘International’ consists of the Angostura, Ruby, Trinidad and Tobago Deep Water, Trion, and Sangomar fields which are under Production/Revenue Sharing-type agreements. These fields represent approximately 13% of proved reserves, proved plus probable reserves, and 2C contingent resources. Woodside net economic interest volumes are reported. ‘Browse’ consists of the Brecknock, Calliance, and Torosa fields. ‘Sunrise’ consists of the Sunrise and Troubadour fields. 52 ANNUAL REPORT 2023
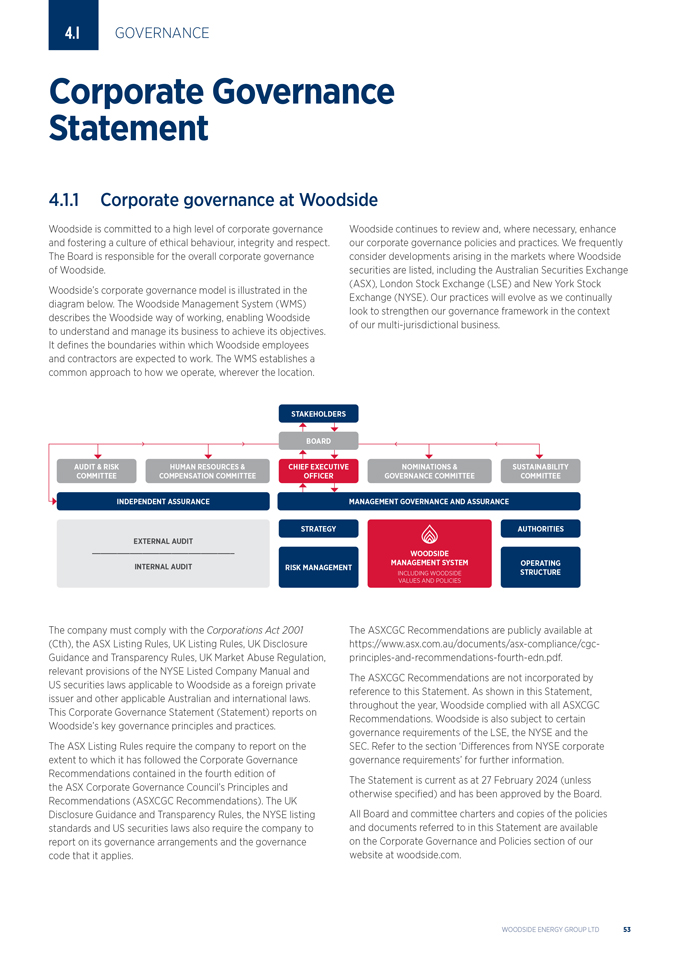
4.1 GOVERNANCE Statement Corporate Governance 4.1.1 Corporate governance at Woodside Woodside is committed to a high level of corporate governance and fostering a culture of ethical behaviour, integrity and respect. The Board is responsible for the overall corporate governance of Woodside. Woodside’s corporate governance model is illustrated in the diagram below. The Woodside Management System (WMS) describes the Woodside way of working, enabling Woodside to understand and manage its business to achieve its objectives. It defines the boundaries within which Woodside employees and contractors are expected to work. The WMS establishes a common approach to how we operate, wherever the location. Woodside continues to review and, where necessary, enhance our corporate governance policies and practices. We frequently consider developments arising in the markets where Woodside securities are listed, including the Australian Securities Exchange (ASX), London Stock Exchange (LSE) and New York Stock Exchange (NYSE). Our practices will evolve as we continually look to strengthen our governance framework in the context of our multi-jurisdictional business. STAKEHOLDERS BOARD AUDIT & RISK HUMAN RESOURCES & CHIEF EXECUTIVENOMINATIONS &SUSTAINABILITY COMMITTEE COMPENSATION COMMITTEE OFFICERGOVERNANCE COMMITTEECOMMITTEE INDEPENDENT ASSURANCE MANAGEMENT GOVERNANCE AND ASSURANCE STRATEGY AUTHORITIES EXTERNAL AUDIT WOODSIDE INTERNAL AUDIT RISK MANAGEMENT MANAGEMENT SYSTEMOPERATING INCLUDING WOODSIDESTRUCTURE VALUES AND POLICIES The company must comply with the Corporations Act 2001 (Cth), the ASX Listing Rules, UK Listing Rules, UK Disclosure Guidance and Transparency Rules, UK Market Abuse Regulation, relevant provisions of the NYSE Listed Company Manual and US securities laws applicable to Woodside as a foreign private issuer and other applicable Australian and international laws. This Corporate Governance Statement (Statement) reports on Woodside’s key governance principles and practices. The ASX Listing Rules require the company to report on the extent to which it has followed the Corporate Governance Recommendations contained in the fourth edition of the ASX Corporate Governance Council’s Principles and Recommendations (ASXCGC Recommendations). The UK Disclosure Guidance and Transparency Rules, the NYSE listing standards and US securities laws also require the company to report on its governance arrangements and the governance code that it applies. The ASXCGC Recommendations are publicly available at https://www.asx.com.au/documents/asx-compliance/cgc-principles-and-recommendations-fourth-edn.pdf. The ASXCGC Recommendations are not incorporated by reference to this Statement. As shown in this Statement, throughout the year, Woodside complied with all ASXCGC Recommendations. Woodside is also subject to certain governance requirements of the LSE, the NYSE and the SEC. Refer to the section ‘Differences from NYSE corporate governance requirements’ for further information. The Statement is current as at 27 February 2024 (unless otherwise specified) and has been approved by the Board. All Board and committee charters and copies of the policies and documents referred to in this Statement are available on the Corporate Governance and Policies section of our website at woodside.com. WOODSIDE ENERGY GROUP LTD 53
4.1.2 Board of directors Board role and responsibilities The Constitution provides that the business and affairs of the company are to be managed by or under the direction of the Board. The central role of the Board is to set the company’s strategic direction, to select and appoint a Chief Executive Officer (CEO) and to oversee the company’s management and business activities. The Board’s role, powers, duties and functions are formalised in a Board Charter. Each year the Board performs its central role as set out in the Charter. The Charter sets out the matters and functions that are specifically reserved to the Board and the powers that are delegated to the CEO and management. The Board Charter and the delegation of Board authority to the CEO and management are reviewed regularly. Some of the key activities of the Board undertaken during the year include overseeing: • management’s response to key safety events, including the fatality of a colleague employed by a contractor at the North Rankin Complex • Woodside’s strategy and providing input and guidance including on management’s execution of strategy • the monitoring of impact of certain macroeconomic and geopolitical events on the global energy market • the appointment of Liz Westcott as Executive Vice President Australian Operations effective June 2023 • the plan to implement emissions reductions to meet the company’s near and medium-term emissions reduction targets and support Woodside’s pathway towards its aspiration of net zero equity Scope 1 and 2 greenhouse gas emissions by 2050 or sooner1 and consideration of adopting a Scope 3 emissions abatement target • the final investment decision to develop the Trion resource in Mexico • management’s response to policy and regulatory developments, including legal challenges to regulatory decision making in Australia • the sale of a 10% non-operating participating interest in the Scarborough Joint Venture to LNG Japan2 • the progression of carbon capture and storage studies and the H2OK hydrogen project • the Scarborough and Pluto Expansion Projects and the Sangomar Field Development • the commencement of production from the Mad Dog Phase 2 project and the Shenzi North project in the deepwater US Gulf of Mexico • the appointment of two new directors to the Board. Board composition The Constitution provides that the company is not to have more than 12, nor less than three directors. At the date of this report, the Board is comprised of 11 independent non-executive directors and the CEO. The following page shows each of the current directors and those directors who served during the year and the date of their appointment as a director. Target is for net equity Scope 1 and 2 greenhouse gas emissions, relative to a starting base representative of the gross annual average equity Scope 1 and 2 greenhouse gas emissions over 2016- 2020 and may be adjusted (up or down) for potential equity changes in producing or sanctioned assets with an FID prior to 2021. Subject to completion of the transaction, targeted in the first quarter of 2024. ANNUAL REPORT 2023

Richard Goyder, AO Meg O’Neill Larry Archibald BCom, FAICD BSc (Ocean Engineering), BSc (Chemical BSc (Geosciences), BA (Geology), MBA Engineering), MSc (Ocean Systems Management) Chair: Chair since April 2018. CEO and Managing Director Term of office: Director since February 2017, Term of office: Director since August 2017, Term of office: Director since August 2021. re-election required at AGM in 2026. re-election required at AGM in 2024. Independent: No Independent: Yes Independent: Yes Experience: Ms O’Neill joined Woodside in Experience: Mr Archibald previously worked Experience: Mr Goyder spent 24 years 2018 and has performed a number of senior at ConocoPhillips, where he spent eight with Wesfarmers Limited, where he served executive positions including Chief Operations years in senior executive positions including as Managing Director and Chief Executive Officer, Executive Vice President Development Senior Vice President, Business Development Officer from 2005 to late 2017. Mr Goyder and Executive Vice President Development and Exploration and Senior Vice President, also served as Chair of the Australian B20 and Marketing. From April 2021 to August Exploration. Prior to joining ConocoPhillips, (the key business advisory body to the 2021, Ms O’Neill was acting CEO until she was Mr Archibald spent 29 years at Amoco from international economic forum which includes formally appointed to the position. 1980 to 1998 and BP from 1998 to 2008 in business leaders from all G20 economies) from various positions including leading exploration Prior to joining Woodside, Ms O’Neill spent 23 February 2013 to December 2014. years with ExxonMobil in a variety of technical, programs covering many world regions. Committee membership: Chair of the operational and senior leadership roles. Committee membership: Audit & Risk, Sustainability and Nominations & Governance Attends Nominations other & Board Governance committee Committee. meetings. Committee membership: Attends Board Committees. committee meetings. Current directorships/other interests: Current directorships/other interests: Current directorships/other interests: Chair: Qantas Airways Limited (since 2018), Chair: University of Arizona Geosciences Chair: Australian Energy Producers Channel 7 Telethon Trust (since 2018), West (since 2022). Advisory Board (since 2019). Australian Symphony Orchestra (WASO) Other directorships of listed entities within Director: American Petroleum Institute (since 2018) and Australian Football League the past three years: Nil. Commission (since 2017). Mr Goyder will retire (API) (since 2022), Reconciliation WA (since as chairman of Qantas Airways Limited before 2022), WA Venues & Events Pty Ltd (WAVE) the next Qantas Annual General Meeting in (since 2019) and West Australian Symphony late 2024. Orchestra (WASO) (since 2019). Other directorships of listed entities within Member: Chief Executive Women, National the past three years: Nil. Petroleum Council (US) and UWA Business School Advisory Board. Other: Honorary Governor of the American Chamber of Commerce (AmCham). Other directorships of listed entities within the past three years: Nil. WOODSIDE ENERGY GROUP LTD 55
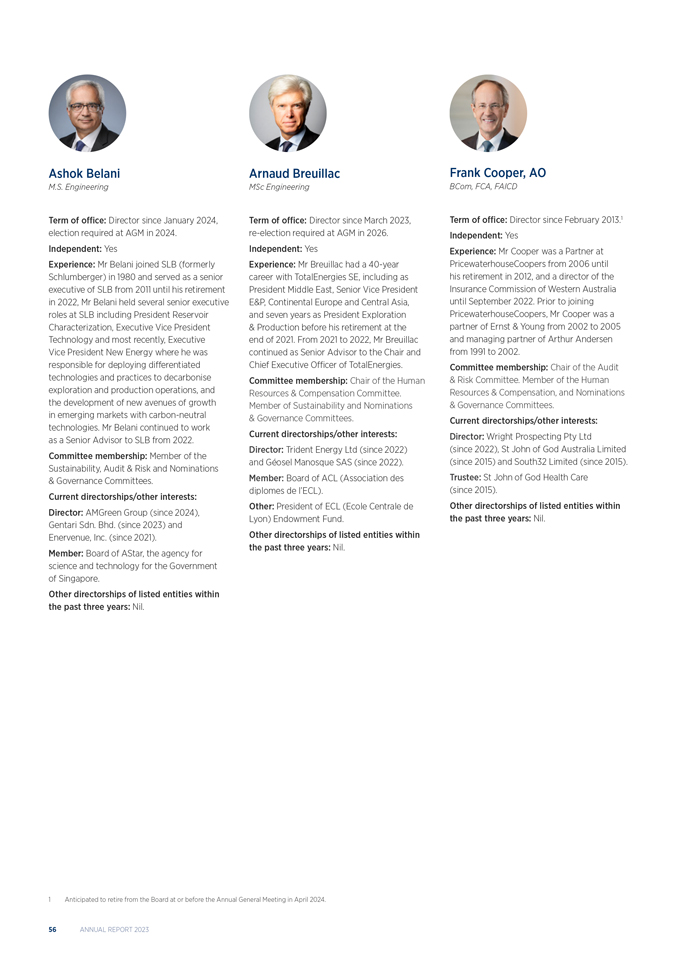
Ashok Belani Arnaud Breuillac Frank Cooper, AO M.S. Engineering MSc Engineering BCom, FCA, FAICD Term of office: Director since January 2024, Term of office: Director since March 2023, Term of office: Director since February 2013.1 election required at AGM in 2024. re-election required at AGM in 2026. Independent: Yes Independent: Yes Independent: Yes Experience: Mr Cooper was a Partner at Experience: Mr Belani joined SLB (formerly Experience: Mr Breuillac had a 40-year PricewaterhouseCoopers from 2006 until Schlumberger) in 1980 and served as a senior career with TotalEnergies SE, including as his retirement in 2012, and a director of the executive of SLB from 2011 until his retirement President Middle East, Senior Vice President Insurance Commission of Western Australia in 2022, Mr Belani held several senior executive E&P, Continental Europe and Central Asia, until September 2022. Prior to joining roles at SLB including President Reservoir and seven years as President Exploration PricewaterhouseCoopers, Mr Cooper was a Characterization, Executive Vice President & Production before his retirement at the partner of Ernst & Young from 2002 to 2005 Technology and most recently, Executive end of 2021. From 2021 to 2022, Mr Breuillac and managing partner of Arthur Andersen Vice President New Energy where he was continued as Senior Advisor to the Chair and from 1991 to 2002. responsible for deploying differentiated Chief Executive Officer of TotalEnergies. Committee membership: Chair of the Audit technologies and practices to decarbonise Committee membership: Chair of the Human & Risk Committee. Member of the Human exploration and production operations, and Resources & Compensation Committee. Resources & Compensation, and Nominations the development of new avenues of growth Member of Sustainability and Nominations & Governance Committees. in emerging markets with carbon-neutral & Governance Committees. Current directorships/other interests: technologies. Mr Belani continued to work as a Senior Advisor to SLB from 2022. Current directorships/other interests: Director: Wright Prospecting Pty Ltd Director: Trident Energy Ltd (since 2022) (since 2022), St John of God Australia Limited Committee membership: Member of the and Géosel Manosque SAS (since 2022). (since 2015) and South32 Limited (since 2015). Sustainability, Audit & Risk and Nominations & Governance Committees. Member: Board of ACL (Association des Trustee: St John of God Health Care Current directorships/other interests: diplomes de l’ECL). (since 2015). Other: President of ECL (Ecole Centrale de Other directorships of listed entities within Director: AMGreen Group (since 2024), Lyon) Endowment Fund. the past three years: Nil. Gentari Sdn. Bhd. (since 2023) and Enervenue, Inc. (since 2021). Other directorships of listed entities within Member: Board of AStar, the agency for the past three years: Nil. science and technology for the Government of Singapore. Other directorships of listed entities within the past three years: Nil. 1 Anticipated to retire from the Board at or before the Annual General Meeting in April 2024. 56 ANNUAL REPORT 2023

Swee Chen Goh Ian Macfarlane Angela Minas BSc (Information Science), MBA Former Australian Federal Minister (Resources; MBA Finance, BA Managerial Studies Energy; Industry and Innovation), FAICD Term of office: Director since January 2020, Term of office: Director since November 2016, Term of office: Director since April 2023, re-election required at AGM in 2026. re-election required at AGM in 2026. re-election required at AGM in 2026. Independent: Yes Independent: Yes Independent: Yes Experience: Ms Goh joined Shell in 2003 and Experience: Mr Macfarlane served as director Experience: Ms Minas is an experienced was the Chair of Shell Companies in Singapore of METS Ignited Ltd and was Australia’s financial executive with strong capital markets from 2014 until her retirement in 2019. longest serving Federal Resources and Energy experience, including six years as a public During her tenure at Shell, Ms Goh served on Minister, and the Coalition’s longest serving company Chief Financial Officer (CFO) at the boards of a number of Shell joint ventures Federal Industry and Innovation Minister, with Constellation Energy Partners LLC and DCP in China, Korea and Saudi Arabia. Prior to over 14 years of experience in both Cabinet Midstream LLC. Ms Minas spent the first 20 joining Shell, Ms Goh worked at Procter & and shadow ministerial positions. Prior to years of her career in investment banking Gamble and IBM. entering politics, Mr Macfarlane was the and management consulting, including as President of the Queensland Graingrowers Arthur Andersen’s Partner leading the North Committee membership: Member of Association from 1991 to 1998 and the American oil and gas consulting practice and the Human Resources & Compensation, President of the Grains Council of Australia at Leidos (formerly known as SAIC) as Senior Sustainability and Nominations & Governance from 1994 to 1996. VP, global consulting leader. Committees. Committee membership: Member of Committee membership: Member of the Current directorships/other interests: the Human Resources & Compensation, Audit & Risk, Sustainability and Nominations Chair: Nanyang Technological University (since Sustainability and Nominations & Governance & Governance Committees. 2021) and National Arts Council (since 2019). Committees. Current directorships/other interests: Director: Carbon Solutions Holdings Pte Current directorships/other interests: Director: Vallourec S.A. (since 2021). Ltd (since 2022), Carbon Solutions Platform Pte Ltd (since 2022), Carbon Solutions Director: Sovereign Manufacturing Automation Member: Rice University Business School for Composites Cooperative Research Board of Advisors, National Association Investments Pte Ltd (since 2022), Carbon Centre (since 2023), CSIRO (since 2021) and of Corporate Directors, Women Corporate Solutions Services Pte Ltd (since 2022), JTC Corporation (since 2022), Singapore Airlines Toowomba and Surat Basin Enterprise Board Directors. (since 2018). Ltd (since 2019) and Singapore Power Ltd Other directorships of listed entities within (since 2019). Member: Fellow of the Australian Institute of the past three years: Westlake Chemical Company Directors, Toowoomba Community Member: Singapore Legal Services Partners (2016 to 2023) and Crestwood Equity Advisory Committee of the University Commission, Centre for Liveable Cities Partners L.P. (2022 to 2023). of Queensland Rural Clinical School and Advisory Panel and Singapore Research, Mooloolaba and the Spit Association. Innovation and Enterprise Council. Other directorships of listed entities within Other directorships of listed entities within the past three years: Nil. the past three years: CapitaLand Investment Limited (2017 to 2022). WOODSIDE ENERGY GROUP LTD 57
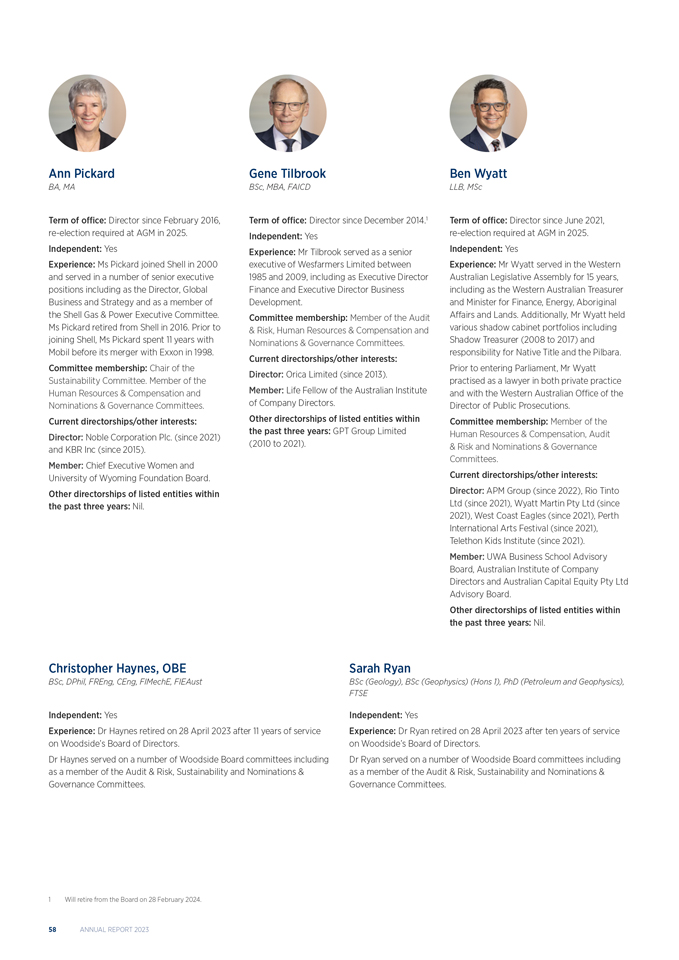
Ann Pickard Gene Tilbrook Ben Wyatt BA, MA BSc, MBA, FAICD LLB, MSc Term of office: Director since February 2016, Term of office: Director since December 2014.1 Term of office: Director since June 2021, re-election required at AGM in 2025. Independent: Yes re-election required at AGM in 2025. Independent: Yes Experience: Mr Tilbrook served as a senior Independent: Yes Experience: Ms Pickard joined Shell in 2000 executive of Wesfarmers Limited between Experience: Mr Wyatt served in the Western and served in a number of senior executive 1985 and 2009, including as Executive Director Australian Legislative Assembly for 15 years, positions including as the Director, Global Finance and Executive Director Business including as the Western Australian Treasurer Business and Strategy and as a member of Development. and Minister for Finance, Energy, Aboriginal the Shell Gas & Power Executive Committee. Committee membership: Member of the Audit Affairs and Lands. Additionally, Mr Wyatt held Ms Pickard retired from Shell in 2016. Prior to & Risk, Human Resources & Compensation and various shadow cabinet portfolios including joining Shell, Ms Pickard spent 11 years with Nominations & Governance Committees. Shadow Treasurer (2008 to 2017) and Mobil before its merger with Exxon in 1998. responsibility for Native Title and the Pilbara. Current directorships/other interests: Committee membership: Chair of the Prior to entering Parliament, Mr Wyatt Director: Orica Limited (since 2013). Sustainability Committee. Member of the practised as a lawyer in both private practice Human Resources & Compensation and Member: Life Fellow of the Australian Institute and with the Western Australian Office of the Nominations & Governance Committees. of Company Directors. Director of Public Prosecutions. Current directorships/other interests: Other directorships of listed entities within Committee membership: Member of the Director: Noble Corporation Plc. (since 2021) the past three years: GPT Group Limited Human Resources & Compensation, Audit and KBR Inc (since 2015). (2010 to 2021). & Risk and Nominations & Governance Member: Chief Executive Women and Committees. University of Wyoming Foundation Board. Current directorships/other interests: Other directorships of listed entities within Director: APM Group (since 2022), Rio Tinto the past three years: Nil. Ltd (since 2021), Wyatt Martin Pty Ltd (since 2021), West Coast Eagles (since 2021), Perth International Arts Festival (since 2021), Telethon Kids Institute (since 2021). Member: UWA Business School Advisory Board, Australian Institute of Company Directors and Australian Capital Equity Pty Ltd Advisory Board. Other directorships of listed entities within the past three years: Nil. Christopher Haynes, OBE Sarah Ryan BSc, DPhil, FREng, CEng, FIMechE, FIEAust BSc (Geology), BSc (Geophysics) (Hons 1), PhD (Petroleum and Geophysics), FTSE Independent: Yes Independent: Yes Experience: Dr Haynes retired on 28 April 2023 after 11 years of service Experience: Dr Ryan retired on 28 April 2023 after ten years of service on Woodside’s Board of Directors. on Woodside’s Board of Directors. Dr Haynes served on a number of Woodside Board committees including Dr Ryan served on a number of Woodside Board committees including as a member of the Audit & Risk, Sustainability and Nominations & as a member of the Audit & Risk, Sustainability and Nominations & Governance Committees. Governance Committees. 1 Will retire from the Board on 28 February 2024. 58 ANNUAL REPORT 2023
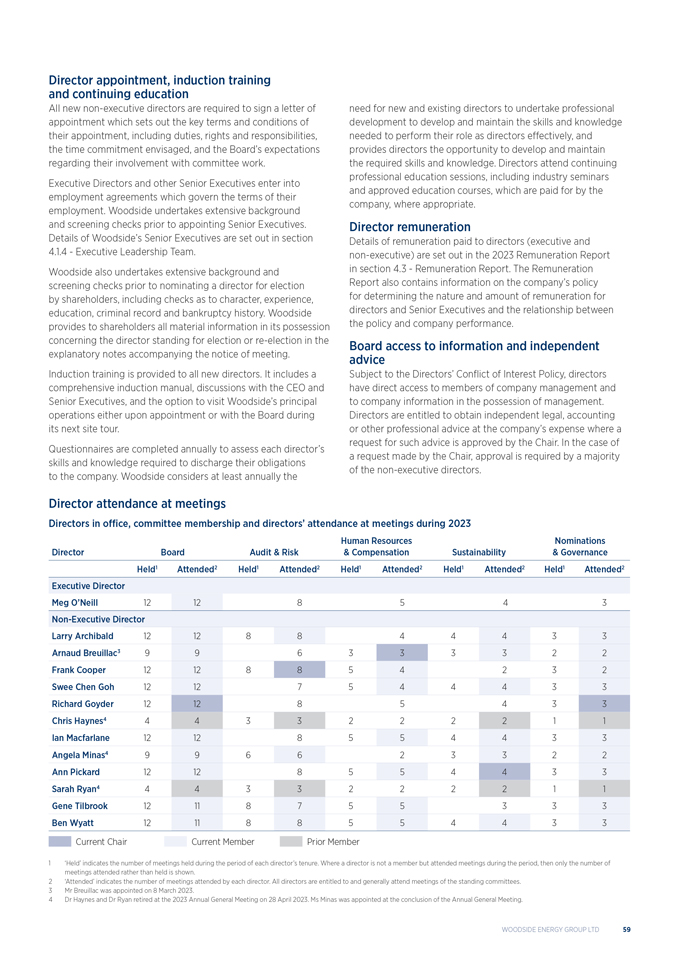
Director appointment, induction training and continuing education All new non-executive directors are required to sign a letter of appointment which sets out the key terms and conditions of their appointment, including duties, rights and responsibilities, the time commitment envisaged, and the Board’s expectations regarding their involvement with committee work. Executive Directors and other Senior Executives enter into employment agreements which govern the terms of their employment. Woodside undertakes extensive background and screening checks prior to appointing Senior Executives. Details of Woodside’s Senior Executives are set out in section 4.1.4—Executive Leadership Team. Woodside also undertakes extensive background and screening checks prior to nominating a director for election by shareholders, including checks as to character, experience, education, criminal record and bankruptcy history. Woodside provides to shareholders all material information in its possession concerning the director standing for election or re-election in the explanatory notes accompanying the notice of meeting. Induction training is provided to all new directors. It includes a comprehensive induction manual, discussions with the CEO and Senior Executives, and the option to visit Woodside’s principal operations either upon appointment or with the Board during its next site tour. Questionnaires are completed annually to assess each director’s skills and knowledge required to discharge their obligations to the company. Woodside considers at least annually the need for new and existing directors to undertake professional development to develop and maintain the skills and knowledge needed to perform their role as directors effectively, and provides directors the opportunity to develop and maintain the required skills and knowledge. Directors attend continuing professional education sessions, including industry seminars and approved education courses, which are paid for by the company, where appropriate. Director remuneration Details of remuneration paid to directors (executive and non-executive) are set out in the 2023 Remuneration Report in section 4.3—Remuneration Report. The Remuneration Report also contains information on the company’s policy for determining the nature and amount of remuneration for directors and Senior Executives and the relationship between the policy and company performance. Board access to information and independent advice Subject to the Directors’ Conflict of Interest Policy, directors have direct access to members of company management and to company information in the possession of management. Directors are entitled to obtain independent legal, accounting or other professional advice at the company’s expense where a request for such advice is approved by the Chair. In the case of a request made by the Chair, approval is required by a majority of the non-executive directors. Director attendance at meetings Directors in office, committee membership and directors’ attendance at meetings during 2023 Human ResourcesNominations Director BoardAudit & Risk& CompensationSustainability& Governance Held1 Attended2 Held1Attended2Held1Attended2Held1Attended2Held1Attended2 Executive Director Meg O’Neill 12 128543 Non-Executive Director Larry Archibald 12 128844433 Arnaud Breuillac3 9 96333322 Frank Cooper 12 128854232 Swee Chen Goh 12 127544433 Richard Goyder 12 1285433 Chris Haynes4 4 433222211 Ian Macfarlane 12 128554433 Angela Minas4 9 96623322 Ann Pickard 12 128554433 Sarah Ryan4 4 433222211 Gene Tilbrook 12 118755333 Ben Wyatt 12 1188554433 Current Chair Current MemberPrior Member 1 ‘Held’ indicates the number of meetings held during the period of each director’s tenure. Where a director is not a member but attended meetings during the period, then only the number of meetings attended rather than held is shown. 2 ‘Attended’ indicates the number of meetings attended by each director. All directors are entitled to and generally attend meetings of the standing committees. 3 Mr Breuillac was appointed on 8 March 2023. 4 Dr Haynes and Dr Ryan retired at the 2023 Annual General Meeting on 28 April 2023. Ms Minas was appointed at the conclusion of the Annual General Meeting. WOODSIDE ENERGY GROUP LTD 59
Board performance evaluation Board performance evaluations are conducted annually. The Board performance evaluation process is conducted by way of questionnaires appropriate in scope and content to effectively review: • the performance of the Board and each of its committees against the requirements of their respective charters; • the individual performance of the Chair and each director; and • the interface between Board and management. The Board performance evaluation process may also involve interviews with directors and senior management, and observation of Board and committee meetings by an external consultant. The reports on Board and committee performance are provided to all directors and discussed by the Board. The report on the Chair’s performance is provided to the Chair and two committee chairs for discussion. A report on each individual director is also provided to the individual and to the Chair. The Chair meets individually with each director to discuss the findings of their report. The Board, through the Nominations & Governance Committee, considers and discusses the final report in detail. The performance of each director retiring at the next AGM is taken into account by the Board in determining whether or not the Board should support the re-election of the director. The directors seeking re-election will be asked to reconfirm that they have sufficient time to meet their responsibilities. The Human Resources & Compensation Committee reviews and makes recommendations to the Board on the criteria for the evaluation of the performance of the CEO. The Board conducts the evaluation of the performance of the CEO and considers senior executive succession planning. In 2023, performance evaluations for the Board, its committees, directors and Senior Executives took place in accordance with the process disclosed above, and in the section on ‘Performance evaluation of Executive Leadership Team’ on page 66 and in the Remuneration Report. Directors’ retirement and re-election The Woodside Constitution sets out the requirements for the retirement and re-election of directors. With the exception of the CEO/Managing Director, directors must retire at the third AGM following their election or most recent re-election. At least one director must stand for election at each AGM. Board support for a director’s re-election is not automatic and is subject to satisfactory director performance and assessment of overall Board composition and capabilities. Director independence In accordance with the Policy on Independence of Directors, the Board assesses independence with reference to whether a director is non-executive, not a member of management and is free of any business or other relationship that could materially interfere with, or could reasonably be perceived to materially interfere with, the independent exercise of their judgement. In making this assessment, the Board considers all relevant facts and circumstances. In particular, the Board focuses on the factors relevant to assessing the independence of a director set out in Box 2.3 of the ASXCGC Recommendations. The Board has reviewed the independence of each of the non-executive directors in office at the date of this Statement and determined they are all independent. The CEO, Meg O’Neill, is not considered independent as she is an Executive Director and a member of management. Frank Cooper was re-elected at the 2022 AGM and has served 11 years on the Board in February 2024. The Board reviewed the independence of Mr Cooper and determined that he remained independent, notwithstanding his length of tenure on the Board. Conflicts of interest The Board has approved a Directors’ Conflict of Interest Policy which applies if there is, or may be, a conflict between the personal interests of a director, or the duties a director owes to another company, and the duties the director owes to Woodside. Directors are required to disclose circumstances that may affect, or be perceived to affect, their ability to exercise independent judgement so that the Board can assess independence on a regular basis. Under Woodside’s Constitution, directors must comply with the Corporations Act in relation to disclosure and voting on matters involving material personal interests. Subject to the Corporations Act: • a director may be counted in a quorum at a Board meeting that considers, and may vote on, any matter in which that director has an interest • the company may proceed with any transaction that relates to the interest and the director may participate in the execution of any relevant document by or on behalf of the company • the director may retain benefits under the transaction even though the director has an interest • the company cannot avoid the transaction merely because of the existence of the interest. Under Woodside’s Constitution, a director may be a director of or hold any other office or position in any corporation promoted by the company or in which the company may be interested. The Board may exercise the voting power conferred by the shares in any corporation held or owned by the company, and a director may vote in favour of exercising those voting rights despite the fact that the director is, or may be about to be appointed, a director of that other corporation and may be interested in the exercise of those voting rights. An interested director is to be counted in a quorum despite the interest. Under Woodside’s Constitution, the Board may exercise all the powers of the company to raise or borrow money, guarantee the debts or obligations of any person or enter into any other financing arrangements on the terms it thinks fit. If any director or officer of the company is personally liable for the payment of any sum which is or may become primarily due from the company, the Board may charge the whole or any part of the assets of the company by way of indemnity to secure the director or officer from any loss in respect of the liability. 60 ANNUAL REPORT 2023
Areas of competence and skills of the Board of Directors The directors on the Board collectively have a combination of skills and experience which are necessary to direct the company in accordance with high standards of corporate governance and oversee Woodside’s management and business activities. The competences and skills are set out in the skills matrix below. The Board uses this skills matrix to assess the skills and experience of each director and the combined capabilities of the Board, to identify potential areas of focus for director recruitment and to identify any professional development opportunities that may benefit directors. Leadership and culture Business leadership•Public listed company Values and behavioursexperience Finance Accounting and audit•Insurance Financial acumen•Taxation Business strategy Corporate financing•Capital projects and treasury Business strategy Commercial Gas/LNG marketing•Legal and regulatory Mergers and acquisitionscompliance Business development•US regulatory compliance • Risk management Sustainability and stakeholder management Health and safety•Environment Community relations•Public and regulatory policy Corporate governance Climate change Policy and legal risks•Technology Market•Reputation People and capability People and culture•Remuneration Industrial relations Industry Oil and gas experience•Major projects New energy and renewables•Digital Technology and innovation•Cybersecurity International International oil and gas•International experience exploration, development and production The skills matrix is reviewed annually and updated regularly to ensure it remains appropriate for Woodside’s strategy, operations and risk profile and any other emerging issues. The 2023 review confirmed that the Board collectively have the necessary skills and competencies. As discussed in the Board performance evaluation section, the review also informed and supported the Board’s review of succession priorities. The Board supplements its expertise with internal and external subject matter experts as appropriate (for example, regular attendance at Board meetings by relevant executives and other independent advisers). The Sustainability Committee received regular briefings and education on climate change from Woodside’s Senior Executive responsible for climate change, to inform its oversight of related matters with input from climate change science and expert advice. Chair The Chair of the Board, Richard Goyder, is an independent, non-executive director and an Australian resident and citizen. The Chair is responsible for leadership and effective performance of the Board and for the maintenance of relations between directors and management that are open, cordial and conducive to productive cooperation. The Board has arrangements in place to ensure ongoing leadership if unforeseen circumstances mean Mr Goyder is not available. Mr Goyder’s office is located in the company’s headquarters in Perth, Western Australia. The Board is satisfied that Mr Goyder commits the time necessary to discharge his role effectively. The Chair’s responsibilities are set out in more detail in the Board Charter. Company Secretaries Details of the Company Secretaries are set out in section 4.2 - Directors’ report—Company Secretaries. All directors have direct access to the Company Secretaries who are accountable directly to the Board, through the Chair, on all matters to do with the proper functioning of the Board. The Company Secretaries’ responsibilities are set out in more detail in the Board Charter. Board succession planning The Board manages its succession planning with the assistance of the Nominations & Governance Committee which annually reviews the size, composition and diversity of the Board. In conducting the review, the Board skills matrix and the tenure of each director is considered. The Nominations & Governance Committee is also responsible for evaluating Board candidates and recommending individuals for appointment to the Board. The Committee evaluates prospective candidates against a range of criteria including the skills, experience, expertise and diversity that will best complement Board effectiveness at the time. The Board may engage an independent recruitment firm to undertake a search for suitable candidates. Refer to the ‘Board composition’ section for information about recent changes to the Board’s composition. WOODSIDE ENERGY GROUP LTD 61
4.1.3 Board committees The Board has four standing committees to assist in the discharge of its responsibilities. The committees operate principally in a review or advisory capacity, except in cases where powers are specifically conferred on a committee by the Board. Each committee has a charter, detailing its role, duties and membership requirements. The committee charters are reviewed regularly and updated as required. Membership of the committees is based on directors’ qualifications, skills and experience. Each standing committee is comprised of: • only non-executive directors • at least three members, the majority of whom are independent • a chair appointed by the Board who is one of the independent non-executive directors. The Audit & Risk Committee and the Human Resources & Compensation Committee have additional membership requirements as set out in their respective charters. Each committee is entitled to seek information from any employee of the company and to obtain any professional advice it requires in order to perform its duties. All directors are entitled to and generally attend meetings of the standing committees. Audit & Risk Committee Assists with overseeing the company’s financial reporting, compliance with legal and regulatory requirements, risk management and the internal and external audit functions in accordance with the Committee Charter. Members • Frank Cooper (Committee Chair) • Angela Minas • Larry Archibald • Gene Tilbrook • Ashok Belani (from January 2024) • Ben Wyatt (from December 2023) Some of the FY23 key activities undertaken by the Committee include: • overseeing the ongoing integration activities in connection • reviewing the Group’s key risks and risk management with the merger with BHP Petroleum including Sarbanes- framework and reviewing reports from management on the Oxley compliance and monitoring SAP S/4 HANA migration effectiveness of the Group’s management of its material • overseeing developments in accounting, financial reporting business risks including contemporary and emerging risks such and taxation relevant to Woodside as cybersecurity, conduct risk, technology and innovation, • reviewing significant accounting policies and practices privacy and data breaches, sustainability and climate change • reviewing and making recommendations to the Board for • overseeing the establishment of the new ethics and the adoption of the Group’s half-year and annual Financial compliance team and revised governance structures post Statements merger • approving the fees and reviewing the external auditor’s • overseeing matters and informing the Board of any material scope and plan for the 2023 external audit, considering and concerns raised under the Code of Conduct, the Anti-Bribery approving non-audit services provided by the external auditor and Corruption and Whistleblower Policies that call into and reviewing the independence and performance of the question the culture of the organisation external auditor • overseeing the revocation of the deed of cross guarantee and • reviewing Internal Audit reports and material post-investment entry into a new deed of cross guarantee reviews and approval of the 2024/2025 Internal Audit program • informing the Board of the company’s compliance with material legal and regulatory requirements and any conduct that is materially inconsistent with the company’s values or Code of Conduct. Audit committee financial expert Woodside’s Board has determined that Frank Cooper, who serves on the Audit & Risk Committee, meets the audit committee financial expert requirements under SEC Rules. The Board has also determined that he is independent under applicable NYSE rules. 62 ANNUAL REPORT 2023
Nominations & Governance Committee Assists the Board with reviewing Board composition, performance and succession planning, including identifying, evaluating and recommending candidates for the Board in accordance with the Committee Charter. Members • Richard Goyder (Committee Chair) • Ian Macfarlane • Larry Archibald • Angela Minas • Ashok Belani (from January 2024) • Ann Pickard • Arnaud Breuillac • Gene Tilbrook • Frank Cooper • Ben Wyatt • Swee Chen Goh Some of the FY23 key activities undertaken by the Committee include: • identifying and recommending to the Board new • Board succession planning directors to join the Woodside Board in 2023 • recommending to the Board directors for re-election • reviewing the size and composition of the Board • recommending for Board approval the Woodside Corporate • reviewing the director skills matrix Governance Statement • reviewing the directors’ material interests • approving the process for the annual Board performance evaluation. Human Resources & Compensation Committee Assists with establishing human resources and compensation policies and practices in accordance with the Committee Charter. Members • Arnaud Breuillac (Committee Chair) • Ann Pickard • Frank Cooper • Gene Tilbrook • Swee Chen Goh • Ben Wyatt • Ian Macfarlane Some of the FY23 key activities undertaken by the Committee include: • overseeing Woodside’s response to key safety events including • reviewing the company’s remuneration policies and practices the North Rankin Complex fatality involving a colleague globally and considering advice on the remuneration of employed by a contractor Woodside’s key management personnel • considering industrial relations issues relevant to Woodside’s • overseeing the implementation of the payroll harmonisation onshore and offshore assets • reviewing the company’s recruitment and retention strategies • approving changes to the leadership structure, including • oversight of programs to assess and monitor culture (including the appointment and remuneration packages of executives survey findings), including across all areas of our Integrated reporting directly to the CEO Culture Framework (values, safety, risk and compliance) • considering organisation requirements design, and policy • reviewing progress against the 2021-2025 Inclusion and changes required to meet changing regulatory requirements Diversity strategy and consideration of global differences • endorsing for Board approval a new Mandatory Clawback • overseeing progress against measurable objectives in respect Policy to meet US regulatory requirements of gender diversity and endorsing for Board approval the 2024 • overseeing amendments to Woodside’s employee and measurable objectives executive equity plans • reviewing and making recommendations to the Board on: • overseeing Woodside’s response to Australian, US and UK ›remuneration for non-executive directors legislative and corporate governance developments, including ›the remuneration of the CEO Workplace Gender Equality Agency legislation reforms, ›the criteria for the evaluation of the CEO’s performance and stakeholder feedback, in relation to employment and ›incentives payable to the CEO remuneration matters relevant to Woodside ›employee equity-based plans › the annual Remuneration Report. WOODSIDE ENERGY GROUP LTD 63
Sustainability Committee Assists the Board in meeting its oversight responsibilities in relation to the company’s sustainability policies and practices in accordance with the Committee Charter. Members • Ann Pickard (Committee Chair) • Swee Chen Goh • Larry Archibald • Ian Macfarlane • Ashok Belani (from January 2024) • Angela Minas • Arnaud Breuillac • Ben Wyatt (until December 2023) Some of the FY23 key activities undertaken by the Committee include: • overseeing Woodside’s response to key safety events • considering Woodside’s management of climate change risk including the North Rankin Complex fatality involving a and opportunities colleague employed by a contractor • overseeing and reviewing the proposed content for • overseeing the company’s in-year Scope 1 and 2 greenhouse Woodside’s Climate Transition Action Plan and 2023 Progress gas emissions performance, and its plans for meeting Report, and approach to climate-related disclosures emissions targets • considering First Nations affairs, including cultural heritage • reviewing Woodside’s environmental performance, including and land access matters major incident prevention • endorsing for Board approval changes to the Group Human • overseeing the Group’s health and personal safety Rights Policy performance • reviewing Woodside’s activities supporting local content in • considering for Board approval the company’s approach to our supply chain climate reporting • overseeing Woodside’s social performance and social • overseeing Woodside’s process safety performance including contribution in our host communities major incident prevention • reviewing Woodside’s reputational performance and issues • reviewing Woodside’s quality management of significance to our communities and stakeholders • considering security and emergency management • overseeing publication of the Reconciliation Action Plan performance, including major incident prevention and Report 2022 response and business continuity • endorsing for Board approval Woodside’s Modern Slavery Statement 2022 and reviewing related human rights issues. 64 ANNUAL REPORT 2023

4.1.4 Executive Leadership Team Graham Tiver1 Shiva McMahon1 Elizabeth (Liz) Westcott1 Executive Vice President and Chief Financial Executive Vice President International Executive Vice President Australian Operations Officer Operations BCom, BEng (Hons), GAICD BBus, FCPA MA, BA Joined Woodside: 2022 Joined Woodside: 2022 Joined Woodside: June 2023 Experience: Graham is responsible for Experience: Shiva is responsible for Experience: Elizabeth (Liz) is responsible for Finance; Treasury; Tax; Investor Relations; Woodside’s International operations portfolio. Woodside’s Australian operations portfolio. Governance, Risk and Compliance; Audit; Shiva has 30 years of industry experience Liz has 30 years of industry experience in and Mergers and Acquisitions. Prior to and prior to joining Woodside held senior operations and project roles and prior to joining Woodside, Graham spent 28 years leadership roles at both BHP and BP. Shiva joining Woodside held senior leadership with BHP and WMC Resources where he spent a large part of her career at BP in roles roles at EnergyAustralia and ExxonMobil. held significant financial, commercial and including CFO Global Lubricants, Chief of Her roles spanned strategic planning, leadership roles across multiple business Staff Upstream Executive Office and CFO operations, project management, and safety, sectors. He has extensive international Trinidad and Tobago. technical and commercial leadership. experience, having worked in North and Directorship: Greater Houston Partnership Directorship: Beyond Bank Australia Limited. South America as well as in a variety of roles (since 2022) and National Ocean Industries around Australia. Association (NOIA). Directorship: Nil. Julie Fallon Shaun Gregory Daniel Kalms Executive Vice President Corporate Services Executive Vice President New Energy Executive Vice President Technical Services BEng (Hons) (ChemEng) BSc (Hons), MBT BEng (Hons) (ChemEng), MBA Joined Woodside: 1998 Joined Woodside: 1995 Joined Woodside: 2001 Experience: Julie is responsible for Legal; Experience: Shaun is responsible for new Experience: Daniel is responsible for Digital; Ethics and Compliance; Health, Safety and energy and carbon solutions. Shaun has over Technology; Surface Engineering; and Environment; Security and Emergency 30 years of industry experience and has had Subsurface and Reserves. Daniel has over 25 Management; Supply Chain; and Human senior leadership roles across Woodside’s years of industry experience and has held Resources. Julie has 30 years of industry value chain from Exploration acreage capture senior leadership roles across development, experience and has held a number of senior and evaluation, through to Development projects, operations and corporate. leadership roles at Woodside including concept selection and technology Senior Vice President Pluto and Senior Vice development. President Engineering. 1 Identified as key management personnel (KMP). WOODSIDE ENERGY GROUP LTD 65

Mark Abbotsford Tony Cudmore Executive Vice President Marketing and Trading Executive Vice President Strategy and Climate BEc (Hons), MPhil, MBA BA, GCIR Joined Woodside: 2002 Joined Woodside: 2022 Experience: Mark is responsible for Experience: Tony is responsible for Corporate Woodside’s global commodity marketing, Strategy, Climate and Sustainability, External trading and shipping portfolio. Mark has over Environment and Corporate Affairs. Tony 20 years’ industry experience and has held a has over 20 years’ industry experience and number of senior leadership positions across prior to joining Woodside, Tony worked for commercial, finance and marketing in various ExxonMobil and BHP where he held senior global locations. Prior to joining Woodside, leadership positions including Chief Public Mark had roles at Treasury (Western Affairs Officer, and Group Sustainability and Australia) and BHP Iron Ore. Public Policy Officer. Andy Drummond Matthew Ridolfi Executive Vice President Exploration Executive Vice President Projects and Development BEng (Hons) (MechEng) BEng (Hons) (ChemEng) Joined Woodside: 2022 Joined Woodside: 2022 Experience: Andy is responsible for Experience: Matthew is responsible for exploration and development activities at Woodside’s project execution activities Woodside. Andy has over 25 years’ industry globally. Matthew has more than 30 years experience. Prior to joining Woodside, Andy of industry experience and prior to joining held senior leadership positions at BHP and Woodside held a number of senior leadership Marathon Oil Corporation, including Vice positions at BHP including Vice President of President of Sustainability and Innovation for Major Developments for BHP’s petroleum BHP’s petroleum business. business and Vice President of Health, Safety, Environment and Community. Performance evaluation of Executive Leadership Team With respect to executives, their performance is reviewed annually, which considers and assesses the executive’s performance against a list of key performance indicators. All executives had a performance evaluation in FY2023 and further details are set out in section 4.3—Remuneration Report. Details of the CEO’s performance evaluation (process and outcomes) are set out in section 4.3—Remuneration Report and ‘Board Performance Evaluation’ on page 60. 66 ANNUAL REPORT 2023
4.1.5 Promoting responsible and ethical behaviour OUR VALUES Everything we do is guided by Our Values and inspired by our common purpose. We are one team, we care, we innovate every day, our results matter and we build and maintain trust. CODE OF CONDUCT AND ANTI-BRIBERY AND CORRUPTION POLICY The Code of Conduct and the Anti-Bribery and Corruption Policy (ABC Policy) cover matters such as compliance with laws and regulations, responsibilities to shareholders and the community, sound employment practices, confidentiality, privacy, conflicts of interest, giving and accepting business courtesies and the protection and proper use of Woodside’s assets. All directors, officers and employees are required to comply with the Code of Conduct and the ABC Policy and managers are expected to take reasonable steps to ensure that employees, contractors, consultants, agents and partners under their supervision are aware of both policies. Substantiated breaches of the Code of Conduct and ABC Policy are reported to the Audit & Risk Committee. WHISTLEBLOWER POLICY Woodside’s Whistleblower Policy documents our commitment to maintaining an open working environment in which Woodside personnel and other stakeholders can report instances of unethical, unlawful or undesirable conduct without fear of intimidation or reprisal. Whistleblower submissions are assessed and investigated in accordance with internal investigation guidance and applicable whistleblower protection laws. The Whistleblower Policy also links the EthicsPoint whistleblower service available for submitting anonymous reports of alleged improper conduct. Substantiated incidents reported under Woodside’s Whistleblower Policy are reported to the Audit & Risk Committee and in line with applicable whistleblower protection laws. SECURITIES DEALING POLICY Woodside’s Securities Dealing Policy applies to all directors, employees, contractors, consultants and advisers. It prohibits directors and employees from dealing in the company’s securities when they are in possession of price-sensitive information that is not generally available to the market. It also prohibits dealings by directors and certain restricted employees during ‘black-out’ periods, such as during the period between the end of the financial half and full-year and the day following the announcement of the results. The Securities Dealing Policy also sets out our approach to transactions which limit the economic risk of participating in equity-based remuneration schemes. WOODSIDE ENERGY GROUP LTD 67
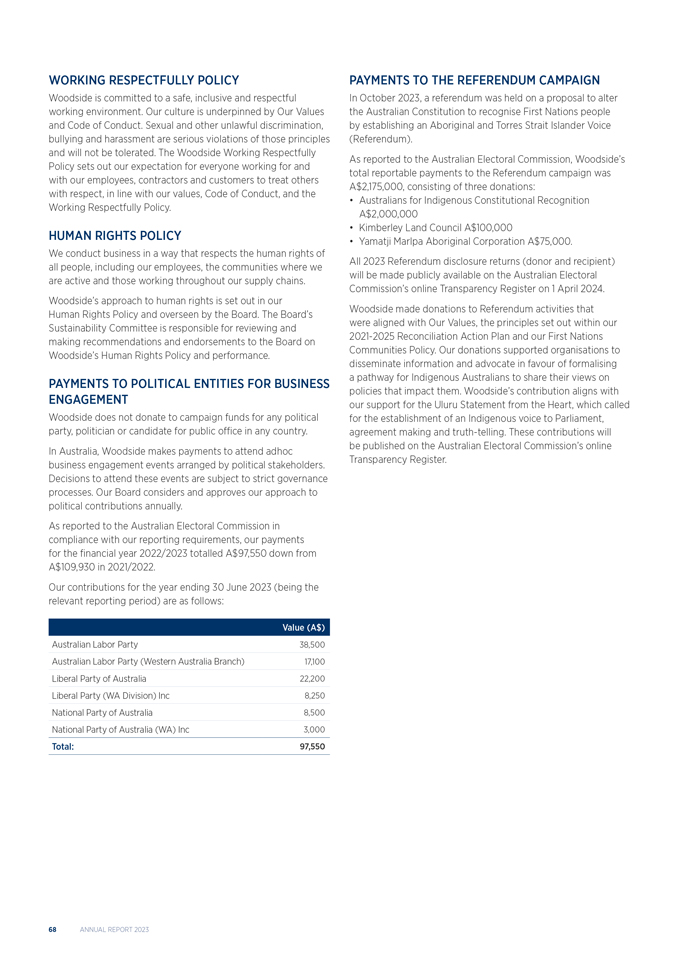
WORKING RESPECTFULLY POLICY Woodside is committed to a safe, inclusive and respectful working environment. Our culture is underpinned by Our Values and Code of Conduct. Sexual and other unlawful discrimination, bullying and harassment are serious violations of those principles and will not be tolerated. The Woodside Working Respectfully Policy sets out our expectation for everyone working for and with our employees, contractors and customers to treat others with respect, in line with our values, Code of Conduct, and the Working Respectfully Policy. HUMAN RIGHTS POLICY We conduct business in a way that respects the human rights of all people, including our employees, the communities where we are active and those working throughout our supply chains. Woodside’s approach to human rights is set out in our Human Rights Policy and overseen by the Board. The Board’s Sustainability Committee is responsible for reviewing and making recommendations and endorsements to the Board on Woodside’s Human Rights Policy and performance. PAYMENTS TO POLITICAL ENTITIES FOR BUSINESS ENGAGEMENT Woodside does not donate to campaign funds for any political party, politician or candidate for public office in any country. In Australia, Woodside makes payments to attend adhoc business engagement events arranged by political stakeholders. Decisions to attend these events are subject to strict governance processes. Our Board considers and approves our approach to political contributions annually. As reported to the Australian Electoral Commission in compliance with our reporting requirements, our payments for the financial year 2022/2023 totalled A$97,550 down from A$109,930 in 2021/2022. Our contributions for the year ending 30 June 2023 (being the relevant reporting period) are as follows: Value (A$) Australian Labor Party 38,500 Australian Labor Party (Western Australia Branch) 17,100 Liberal Party of Australia 22,200 Liberal Party (WA Division) Inc 8,250 National Party of Australia 8,500 National Party of Australia (WA) Inc 3,000 Total: 97,550 PAYMENTS TO THE REFERENDUM CAMPAIGN In October 2023, a referendum was held on a proposal to alter the Australian Constitution to recognise First Nations people by establishing an Aboriginal and Torres Strait Islander Voice (Referendum). As reported to the Australian Electoral Commission, Woodside’s total reportable payments to the Referendum campaign was A$2,175,000, consisting of three donations: • Australians for Indigenous Constitutional Recognition A$2,000,000 • Kimberley Land Council A$100,000 • Yamatji Marlpa Aboriginal Corporation A$75,000. All 2023 Referendum disclosure returns (donor and recipient) will be made publicly available on the Australian Electoral Commission’s online Transparency Register on 1 April 2024. Woodside made donations to Referendum activities that were aligned with Our Values, the principles set out within our 2021-2025 Reconciliation Action Plan and our First Nations Communities Policy. Our donations supported organisations to disseminate information and advocate in favour of formalising a pathway for Indigenous Australians to share their views on policies that impact them. Woodside’s contribution aligns with our support for the Uluru Statement from the Heart, which called for the establishment of an Indigenous voice to Parliament, agreement making and truth-telling. These contributions will be published on the Australian Electoral Commission’s online Transparency Register. 68 ANNUAL REPORT 2023
4.1.6 Risk management and internal control RISK MANAGEMENT Approach to risk management Woodside is committed to managing risks in a proactive and effective manner as a source of competitive advantage. Our approach is intended to protect us against potential negative impacts and improve our resilience against emerging risks. These include conduct risk, technology and innovation, cybersecurity, privacy and data breaches, sustainability and climate change. Woodside’s Risk Management Policy describes the manner in which Woodside: • provides a consolidated view of risks across the company to understand risk exposure and prioritise risk management and governance • confers responsibility on Woodside staff at all levels to pro-actively identify, assess and treat risks relating to the objectives they are accountable for delivering. Board, Audit & Risk Committee and management The Board is responsible for reviewing and approving Woodside’s risk management framework, policy and performance. The Board is also responsible for satisfying itself that management has developed and implemented a sound system of risk management and internal control. The Board has delegated oversight of the Risk Management Policy, including review (at least annually) of the effectiveness of Woodside’s internal control system and risk management framework, to the Audit & Risk Committee. The Audit & Risk Committee also regularly reviews Woodside’s Risk Appetite Statement and oversees Internal Audit’s activities and reviews Internal Audit’s performance. Management is responsible for promoting and applying the Risk Management Policy. In 2023, the Audit & Risk Committee reviewed and confirmed the company’s risk management framework was sound, and that the company was operating with due regard to the risk appetite endorsed by the Board. In 2023, Woodside also identified opportunities to change the risk management framework and updated the risk matrix and risk appetite statement to represent today’s organisation. Additionally, Woodside’s approach to managing risk will follow a three lines model, this model clarifies roles and responsibilities of all areas of the business related to managing risk. These changes enable risk informed decision making and effective management of current risks. As part of its oversight of the Risk Management Policy, the Audit & Risk Committee oversees risks from cybersecurity threats. The Audit & Risk Committee aims to hold at least five regular meetings a year with cybersecurity risks and the Group’s management of such risks reviewed as part of those meetings. The identification and direct management of cybersecurity risks and threats are performed by Woodside’s cybersecurity function, with subject matter expertise provided as part of our cyber resilience process. The cybersecurity function is led by Woodside’s Chief Information Security Officer (CISO) and a group of competent and experienced cybersecurity professionals. Our CISO has over a decade of industry experience and has held multiple technology and business facing roles. The cyber resilience process as described previously includes the monitoring, prevention, detection, mitigation and remediation of cybersecurity risks and incidents. The Woodside Board and the Audit & Risk Committee are kept informed of any material cybersecurity risks and incidents through formal risk registers, briefing papers, internal audit reports and periodic reporting in person at Audit & Risk Committee meetings or as required through our Crisis and Emergency Management process if and when a major cyber security incident were to occur. Woodside’s cybersecurity resilience and risk management strategy and process are based on the National Institute of Standards and Technology Cybersecurity Framework. This process is documented within the WMS. Internal Audit function Internal Audit provides assurance that the design and operation of the Group’s risk management and internal control system is effective. A risk-based audit approach is used to ensure that higher risk activities are prioritised in the audit program. Internal Audit is independent of both business management and of the activities it reviews and has all necessary access to management and information to fulfill its role. Internal Audit is staffed by industry professionals including qualified accountants and engineers. The head of Internal Audit is jointly accountable to the Audit & Risk Committee and the Executive Vice President, Finance and Chief Financial Officer (CFO). Governance, Risk and Compliance function The Governance, Risk and Compliance function is responsible for Woodside’s risk management framework, development of risk management capability, and providing risk management oversight to senior levels of management and the Audit & Risk Committee on the strategic risk profile and the Group’s risk management performance. Material risks Our material risks (including environmental and social risks) and how they are managed are disclosed in section 3.9—Risk factors. WOODSIDE ENERGY GROUP LTD 69
EXTERNAL AUDIT AND REPORTING External Auditor In accordance with Woodside’s External Auditor Policy, the Audit & Risk Committee oversees the engagement of Woodside’s external auditor, governed by the External Auditor Guidance Policy. Internal audit and external audit are separate and independent of each other. The Audit & Risk Committee evaluates the objectivity and independence of the external auditor and the quality and effectiveness of the external audit arrangements, including through: • review of all non-audit services for actual and perceived independence threats • confirmation that non-audit service fee commitment does not exceed 70% of audit fees for the year • confirmation that Woodside fees does not exceed 10% of PricewaterhouseCoopers (PwC) Perth aggregate revenues for the prior period • annual review of auditor performance. External Auditor independence The guidance policy includes provisions directed at maintaining the independence of the external auditor and assessing whether the proposed provision of any non-audit services by the external auditor is appropriate. The External Auditor Guidance Policy classifies a range of non-audit services which could potentially be provided by the external auditor as acceptable within limits, requiring Audit & Risk Committee pre-approval or not acceptable. The Audit & Risk Committee reviews the auditor independence annually. The Audit & Risk Committee did not waive the pre-approval requirement under paragraph (c)(7)(i) of Rule 2-01 of SEC Regulation S-X in 2023. With effect from 2022, PwC was appointed as auditor of the Group, replacing Ernst & Young (EY). Under SEC regulations, the remuneration of the auditors (PwC) of $9.6 million (2022: $5.4 million (PwC)) is required to be presented as follows: audit fees represent 84% (2022: 76%); audit-related fees 5% (2022: 18%); tax fees 11% (2022: 5%); and all other fees nil (2022: 1%). The nature of the services comprising each category of fees is described below: • Audit – work that constitutes the agreed fees for the audit of Woodside’s consolidated financial statements, report on Woodside’s internal controls over financial reporting, and statutory audits of Woodside’s controlled entities (including interim reviews). › Audit-related – includes assurance services and agreed upon procedures. This is work that is outside the scope of the statutory audits of Woodside and its controlled entities but is consistent with the role of the external statutory auditor. The work is reasonably related to the performance of an audit or review, is of a compliance or procedural nature, and is work that the external auditors must or are best placed to undertake and is permissible within the framework of the Sarbanes-Oxley Act and other relevant independence standards. • Tax services – tax related work, including tax compliance services, that is outside the scope of the statutory audits of Woodside and its controlled entities but is permissible within the framework of the Sarbanes-Oxley Act and other relevant independence standards. • Other services – other work that is permissible within the framework of the Sarbanes-Oxley Act and other relevant independence standards. Verification of periodic corporate reports The Board has adopted a Continuous Disclosure and Market Communications Policy (Disclosure Policy) that applies to all disclosures to the market, including periodic corporate reports that are not audited by an external auditor. Management has developed practices and guidance material that are intended to ensure that periodic corporate reports provide clear, concise and effective disclosure, in accordance with the Disclosure Policy. Authority has been delegated to the Disclosure Committee to ensure the implementation of the reporting and communications processes and controls set out in the Disclosure Policy and associated guidance material. Reports are prepared by, or under the supervision of, subject matter experts and material statements in the reports are reviewed for accuracy. Reports are also reviewed for compliance with applicable legal and regulatory requirements. This process is intended to ensure that all applicable laws, regulations and company policies have been complied with, and that appropriate approvals are obtained before a report is released to the market. CEO and CFO assurance Before approving the Financial Statements for a financial period, the Board receives from the CEO and CFO a declaration stating that: • in their opinion Woodside’s financial records have been properly maintained, comply with the appropriate accounting standards and give a true and fair view of Woodside’s financial position and performance • the opinion has been formed on the basis of a sound system of risk management and internal control which is operating effectively. 70 ANNUAL REPORT 2023
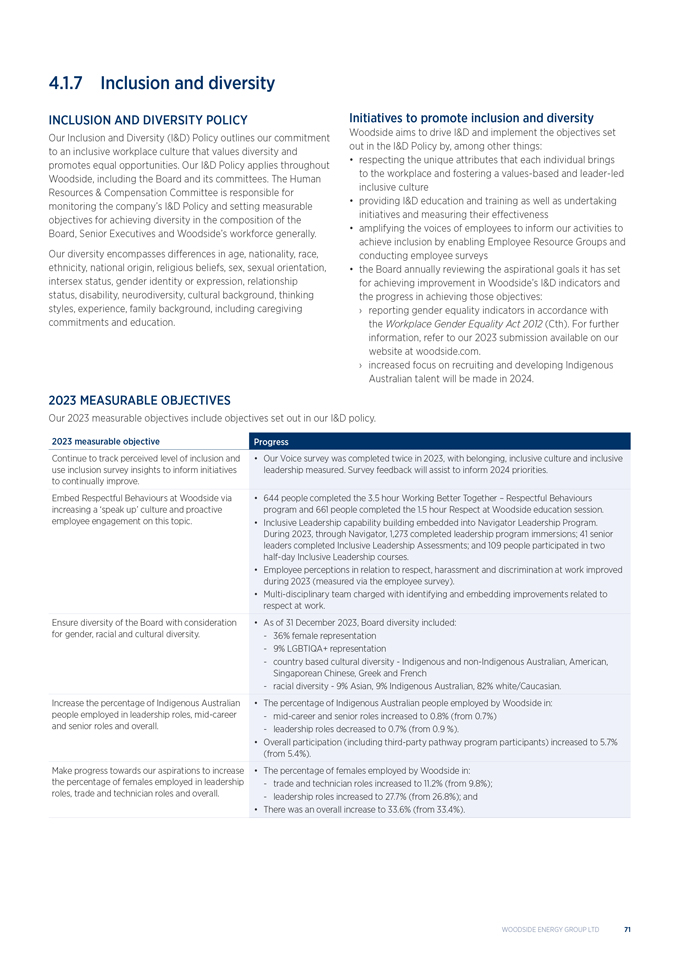
4.1.7 Inclusion and diversity INCLUSION AND DIVERSITY POLICY Our Inclusion and Diversity (I&D) Policy outlines our commitment to an inclusive workplace culture that values diversity and promotes equal opportunities. Our I&D Policy applies throughout Woodside, including the Board and its committees. The Human Resources & Compensation Committee is responsible for monitoring the company’s I&D Policy and setting measurable objectives for achieving diversity in the composition of the Board, Senior Executives and Woodside’s workforce generally. Our diversity encompasses differences in age, nationality, race, ethnicity, national origin, religious beliefs, sex, sexual orientation, intersex status, gender identity or expression, relationship status, disability, neurodiversity, cultural background, thinking styles, experience, family background, including caregiving commitments and education. Initiatives to promote inclusion and diversity Woodside aims to drive I&D and implement the objectives set out in the I&D Policy by, among other things: • respecting the unique attributes that each individual brings to the workplace and fostering a values-based and leader-led inclusive culture • providing I&D education and training as well as undertaking initiatives and measuring their effectiveness • amplifying the voices of employees to inform our activities to achieve inclusion by enabling Employee Resource Groups and conducting employee surveys • the Board annually reviewing the aspirational goals it has set for achieving improvement in Woodside’s I&D indicators and the progress in achieving those objectives: › reporting gender equality indicators in accordance with the Workplace Gender Equality Act 2012 (Cth). For further information, refer to our 2023 submission available on our website at woodside.com. › increased focus on recruiting and developing Indigenous Australian talent will be made in 2024. 2023 MEASURABLE OBJECTIVES Our 2023 measurable objectives include objectives set out in our I&D policy. 2023 measurable objective Progress Continue to track perceived level of inclusion and • Our Voice survey was completed twice in 2023, with belonging, inclusive culture and inclusive use inclusion survey insights to inform initiatives leadership measured. Survey feedback will assist to inform 2024 priorities. to continually improve. Embed Respectful Behaviours at Woodside via • 644 people completed the 3.5 hour Working Better Together – Respectful Behaviours increasing a ‘speak up’ culture and proactive program and 661 people completed the 1.5 hour Respect at Woodside education session. employee engagement on this topic. • Inclusive Leadership capability building embedded into Navigator Leadership Program. During 2023, through Navigator, 1,273 completed leadership program immersions; 41 senior leaders completed Inclusive Leadership Assessments; and 109 people participated in two half-day Inclusive Leadership courses. Employee perceptions in relation to respect, harassment and discrimination at work improved during 2023 (measured via the employee survey). Multi-disciplinary team charged with identifying and embedding improvements related to respect at work. Ensure diversity of the Board with consideration • As of 31 December 2023, Board diversity included: for gender, racial and cultural diversity. - 36% female representation - 9% LGBTIQA+ representation - country based cultural diversity—Indigenous and non-Indigenous Australian, American, Singaporean Chinese, Greek and French - racial diversity—9% Asian, 9% Indigenous Australian, 82% white/Caucasian. Increase the percentage of Indigenous Australian • The percentage of Indigenous Australian people employed by Woodside in: people employed in leadership roles, mid-career - mid-career and senior roles increased to 0.8% (from 0.7%) and senior roles and overall. - leadership roles decreased to 0.7% (from 0.9 %). Overall participation (including third-party pathway program participants) increased to 5.7% (from 5.4%). Make progress towards our aspirations to increase • The percentage of females employed by Woodside in: the percentage of females employed in leadership - trade and technician roles increased to 11.2% (from 9.8%); roles, trade and technician roles and overall. - leadership roles increased to 27.7% (from 26.8%); and There was an overall increase to 33.6% (from 33.4%). WOODSIDE ENERGY GROUP LTD 71
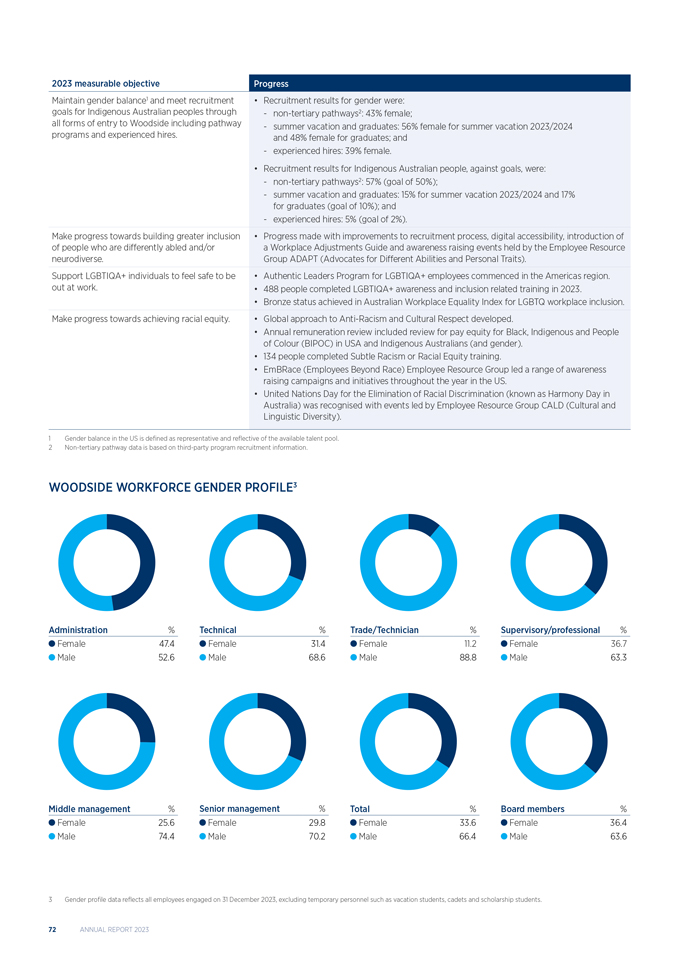
2023 measurable objective Progress Maintain gender balance1 and meet recruitment • Recruitment results for gender were: goals for Indigenous Australian peoples through -non-tertiary pathways2: 43% female; all forms of entry to Woodside including pathway -summer vacation and graduates: 56% female for summer vacation 2023/2024 programs and experienced hires. and 48% female for graduates; and - experienced hires: 39% female. Recruitment results for Indigenous Australian people, against goals, were: - non-tertiary pathways2: 57% (goal of 50%); - summer vacation and graduates: 15% for summer vacation 2023/2024 and 17% for graduates (goal of 10%); and - experienced hires: 5% (goal of 2%). Make progress towards building greater inclusion • Progress made with improvements to recruitment process, digital accessibility, introduction of of people who are differently abled and/or a Workplace Adjustments Guide and awareness raising events held by the Employee Resource neurodiverse. Group ADAPT (Advocates for Different Abilities and Personal Traits). Support LGBTIQA+ individuals to feel safe to be • Authentic Leaders Program for LGBTIQA+ employees commenced in the Americas region. out at work. • 488 people completed LGBTIQA+ awareness and inclusion related training in 2023. Bronze status achieved in Australian Workplace Equality Index for LGBTQ workplace inclusion. Make progress towards achieving racial equity. • Global approach to Anti-Racism and Cultural Respect developed. Annual remuneration review included review for pay equity for Black, Indigenous and People of Colour (BIPOC) in USA and Indigenous Australians (and gender). 134 people completed Subtle Racism or Racial Equity training. EmBRace (Employees Beyond Race) Employee Resource Group led a range of awareness raising campaigns and initiatives throughout the year in the US. United Nations Day for the Elimination of Racial Discrimination (known as Harmony Day in Australia) was recognised with events led by Employee Resource Group CALD (Cultural and Linguistic Diversity). Gender balance in the US is defined as representative and reflective of the available talent pool. Non-tertiary pathway data is based on third-party program recruitment information. WOODSIDE WORKFORCE GENDER PROFILE3 Administration % Technical%Trade/Technician%Supervisory/professional% Female 47.4 Female31.4Female11.2Female36.7 Male 52.6 Male68.6Male88.8Male63.3 Middle management % Senior management%Total%Board members% Female 25.6 Female29.8Female33.6Female36.4 Male 74.4 Male70.2Male66.4Male63.6 Gender profile data reflects all employees engaged on 31 December 2023, excluding temporary personnel such as vacation students, cadets and scholarship students. ANNUAL REPORT 2023
BOARD AND EXECUTIVE MANAGEMENT DIVERSITY The UK Listing Rules require listed companies to publish information on gender and ethnic representation on their boards and in executive management. In addition, the UK Listing Rules require companies to disclose their progress against three specified diversity targets, being: • At least 40% of the directors are women • At least one director is from an ethnic minority background • At least one of the senior positions on the board is held by a woman Under the UK Listing Rules, the senior positions on the Board are the Chair, CEO, CFO and Senior Independent Director (SID). For Woodside, the senior positions on the Board are only the Chair and the CEO. In line with market practice for Australian listed companies, the CFO does not sit on the Board and Woodside does not have a SID as this role is not required under the corporate governance code Woodside applies, being the ASXCGC Recommendations. As at 31 December 2023, Woodside had at least one of the senior positions on the Board held by a woman and at least one director from an ethnic minority background. 36% of the Board were women which is below the 40% figure set out in the UK Listing Rules. The I&D Policy includes a commitment to improve diversity on the Board, with a key focus on reaching 40% female representation. As part of Board succession planning, the Nominations & Governance Committee evaluates prospective candidates against a range of criteria including the skills, experience, expertise and diversity that will best complement Board effectiveness at the time. The tables below set out the diversity information required under the UK Listing Rules as at 31 December 2023. The data presented in those tables was collected by requesting all members of the Board, Executive Leadership Team and Group Company Secretary to self-report in questionnaires about their cultural background, languages spoken, racial identity, LGBTIQA+ identity and gender. In accordance with UK Listing Rule 14.3.33, these tables set out the Board and executive management diversity data as at 31 December 2023. Woodside notes that the ethnic/racial background groupings do not align to groupings common in some regions but has presented the data in this way to comply with UK Listing requirements. Gender identity Number of senior positions on theNumber inPercentage Number of Percentage Board (CEO, CFO,executiveof executive Board members of the Board SID and Chair)1management2management Men 7 64%1862% Women 4 36%1538% Not specified/ prefer not to say Ethnic/racial background Number of senior positions on theNumber inPercentage Number of Percentage Board (CEO, CFO,executiveof executive Board members of the Board SID and Chair)1management2management White British or other White 9 82%21185% (including minority-white groups) Mixed/multiple ethnic groups 215% Asian/Asian British 1 9% Black/African/Caribbean/Black British Other ethnic group, including Arab 1 9% Not specified/prefer not to say 1 As noted above, for Woodside the senior positions on the Board are only the Chair and the CEO. 2 In accordance with the UK Listing Rules, ‘executive management’ includes the Executive Leadership Team (the most senior executive body below the Board) and the Group Company Secretary, excluding administrative and support staff. WOODSIDE ENERGY GROUP LTD 73
4.1.8 Other governance disclosures EVALUATION OF DISCLOSURE CONTROLS AND PROCEDURES Woodside’s management, with the participation of its CEO and CFO, have evaluated, as required by Rule 13a-15(b) under the US Securities Exchange Act of 1934 (Exchange Act), the effectiveness of Woodside’s disclosure controls and procedures (as defined in Exchange Act Rule 13a-15(e)) as at 31 December 2023. Based on that evaluation, the CEO and CFO concluded that Woodside’s disclosure controls and procedures were effective, as at 31 December 2023, in ensuring that information required to be disclosed by Woodside in the reports that it files or submits under the Exchange Act is recorded, processed, summarised and reported within the time periods specified in the SEC’s rules and forms, including that such information is accumulated and communicated to Woodside’s management, including the CEO and CFO, to allow timely decisions regarding required disclosure. Management’s annual report on internal control over financial reporting The management of Woodside is responsible for establishing and maintaining adequate internal control over financial reporting (as defined in Rule 13a-15(f) and Rule 15d-15(f) under the Exchange Act). Under the supervision and with the participation of management, including our CEO and CFO, the effectiveness of Woodside’s internal control over financial reporting was evaluated based on the framework and criteria established in Internal Controls – Integrated Framework (2013), issued by the Committee of the Sponsoring Organizations of the Treadway Commission. Based on this evaluation, management concluded that internal control over financial reporting was effective as at 31 December 2023. Because of its inherent limitations, internal control over financial reporting may not prevent or detect misstatements and, even when determined to be effective, can only provide reasonable assurance with respect to financial statement preparation and presentation. Projections of any evaluation of effectiveness to future periods are subject to the risk that controls may become inadequate because of changes in conditions, or the degree of compliance with the policies or procedures may deteriorate. There were no changes in our internal control over financial reporting during FY2023 that materially affected or were reasonably likely to materially affect our internal control over financial reporting. Attestation report of the registered public accounting firm The effectiveness of internal control over financial reporting as of 31 December 2023 has been audited by PwC, an independent registered accounting firm that also audits Woodside’s Financial Statements. Their audit report on the internal control over financial reporting is included in the Financial Statements. DIFFERENCES FROM NYSE CORPORATE GOVERNANCE REQUIREMENTS Woodside’s ADSs are listed on the New York Stock Exchange (NYSE) and, accordingly, Woodside is subject to the listing standards of the NYSE (NYSE Listing Rules). The NYSE Listing Rules include certain accommodations in the corporate governance requirements that allow foreign private issuers, such as Woodside, to follow ‘home country’ corporate governance practices in lieu of the otherwise applicable corporate governance standards of the NYSE. Woodside has elected to comply with certain home country rules in lieu of the applicable NYSE requirements, as more fully described below. Woodside may in the future decide to use other foreign private issuer exemptions with respect to other NYSE Listing Rules. Following Woodside’s home country governance practices, as opposed to the requirements that would otherwise apply to a company listed on the NYSE, may provide less protection than is accorded to investors under the NYSE Listing Rules applicable to US domestic issuers. If, at any time, Woodside ceases to be a foreign private issuer, it will take all action necessary to comply with the SEC and NYSE Listing Rules. Quorum The NYSE Listing Rules generally require that a listed company’s by-laws provide for a quorum for any meeting of the holders of such company’s voting shares that is sufficiently high to ensure a representative vote. Pursuant to the NYSE Listing Rules, Woodside, as a foreign private issuer, has elected to comply with practices that are permitted under Australian securities laws in lieu of the provisions of the NYSE Listing Rules. The Woodside Constitution provides that a quorum for a meeting of Woodside Shareholders is three eligible Woodside Shareholders entitled to vote. Audit committee requirements Under Section 303A.06 of the NYSE Listing Rules and the requirements of Rule 10A-3 under the Exchange Act (Rule 10A-3), a US listed company is required to have an audit committee of such company’s board of directors consisting entirely of independent members that comply with the requirements of Rule 10A-3. In addition, the audit committee must have a written charter which is compliant with the requirements of Section 303A.07(b) of the NYSE Listing Rules, the listed company must have an internal audit function and the listed company must fulfill all other requirements of the NYSE Listing Rules and Rule 10A-3. Foreign private issuers must comply with the audit committee standard set forth in Rule 10A-3, subject to limited exemptions, but may elect to follow ‘home country’ practices in lieu of the additional audit committee requirements in the NYSE Listing Rules. Rule 10A-3 requires NYSE-listed companies to ensure their audit committees are directly responsible for the appointment, compensation, retention and oversight of the work of the external auditor unless the company’s governing law or documents or other home country legal requirements require or permit shareholders to ultimately vote on or approve these matters. While Woodside’s Audit & Risk Committee is 74 ANNUAL REPORT 2023
directly responsible for remuneration and oversight of the external auditor, ultimate responsibility for the appointment of the external auditor rests with Woodside shareholders, in accordance with Australian law and the Woodside Constitution. However, in accordance with the limited exemptions set forth in Rule 10A-3, the Audit & Risk Committee is responsible for the annual auditor engagement and if there is any proposal to change auditors, the committee does make recommendations to the Woodside Board on any change of auditor, which are then considered by Woodside shareholders at the annual meeting of Woodside shareholders. Refer to section 4.1.3—Board committees—Audit & Risk Committee for information on Audit and Risk Committee requirements under the ASX Recommendations. Code of Ethics The Woodside Board has adopted the Code of Conduct, which applies to the Woodside Board and Woodside’s CEO and CFO, along with all other Woodside employees. During 2023, we refreshed our Code of Conduct to align it with global best practices. 4.1.9 Shareholders Shareholder communications Shareholders are encouraged to receive electronic communications from the company and can elect to receive email notification when key materials are posted to our website. Shareholders can also receive an email notification of Woodside’s announcements and media releases. Shareholders can communicate directly with Woodside by submitting questions or comments on the Contact Us section of our website. The Shareholder Services section of our website also sets out the email address for Woodside’s share registry, Computershare. Investor relations program Woodside has an investor relations program to facilitate effective two-way communication with investors. Our Continuous Disclosure and Market Communications Policy facilitates this by requiring: the full and timely disclosure of information about Woodside’s material activities to the ASX and other relevant exchanges and our website (where they are retained for at least three years) that all disclosures, including notices of meetings and other shareholder communications, are drafted clearly and concisely the conduct of briefings for investors from time to time (such as the annual and half-year results, and Investor Briefing Days). Investor briefings are webcast and presentation material for briefings or speeches containing new and substantive information is first disclosed to the market and other relevant exchanges and posted to our website. Shareholder meetings The company recognises the importance of shareholder participation in general meetings and supports and encourages that participation. The company has direct voting arrangements in place, allowing shareholders unable to attend the AGM to vote on resolutions without having to appoint someone else as a proxy. Voting on any substantial resolution at an AGM is conducted by poll. Continuous disclosure and Woodside’s Continuous Disclosure and Market Communications Policy and associated guidelines market communications reinforce Woodside’s commitment to continuous disclosure and outline management’s accountabilities and the processes to be followed for ensuring compliance. A Disclosure Committee manages compliance with market disclosure obligations and is responsible for implementing and overseeing reporting processes and controls and setting guidelines for the release of information. The Disclosure Committee is comprised of senior leaders. Employees considered to hold higher risk roles are required to participate in annual continuous disclosure training. The Board and Senior Executives are provided with copies of all information disclosed pursuant to all applicable stock exchange rules. WOODSIDE ENERGY GROUP LTD 75
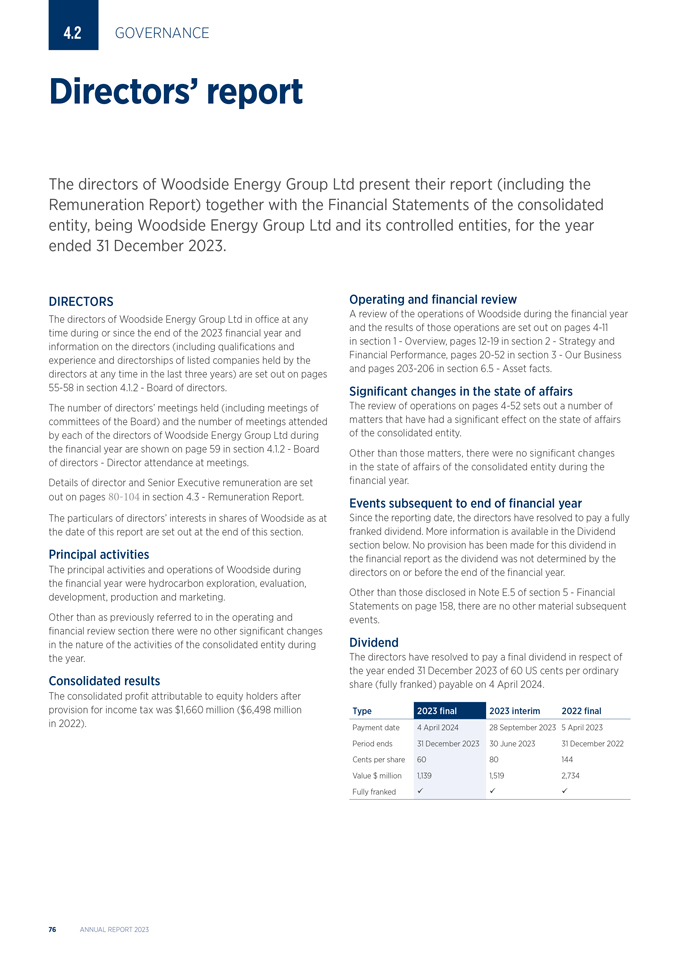
GOVERNANCE Directors’ report The directors of Woodside Energy Group Ltd present their report (including the Remuneration Report) together with the Financial Statements of the consolidated entity, being Woodside Energy Group Ltd and its controlled entities, for the year ended 31 December 2023. DIRECTORS The directors of Woodside Energy Group Ltd in office at any time during or since the end of the 2023 financial year and information on the directors (including qualifications and experience and directorships of listed companies held by the directors at any time in the last three years) are set out on pages 55-58 in section 4.1.2—Board of directors. The number of directors’ meetings held (including meetings of committees of the Board) and the number of meetings attended by each of the directors of Woodside Energy Group Ltd during the financial year are shown on page 59 in section 4.1.2—Board of directors—Director attendance at meetings. Details of director and Senior Executive remuneration are set out on pages 80-104 in section 4.3—Remuneration Report. The particulars of directors’ interests in shares of Woodside as at the date of this report are set out at the end of this section. Principal activities The principal activities and operations of Woodside during the financial year were hydrocarbon exploration, evaluation, development, production and marketing. Other than as previously referred to in the operating and financial review section there were no other significant changes in the nature of the activities of the consolidated entity during the year. Consolidated results The consolidated profit attributable to equity holders after provision for income tax was $1,660 million ($6,498 million in 2022). Operating and financial review A review of the operations of Woodside during the financial year and the results of those operations are set out on pages 4-11 in section 1—Overview, pages 12-19 in section 2—Strategy and Financial Performance, pages 20-52 in section 3—Our Business and pages 203-206 in section 6.5—Asset facts. Significant changes in the state of affairs The review of operations on pages 4-52 sets out a number of matters that have had a significant effect on the state of affairs of the consolidated entity. Other than those matters, there were no significant changes in the state of affairs of the consolidated entity during the financial year. Events subsequent to end of financial year Since the reporting date, the directors have resolved to pay a fully franked dividend. More information is available in the Dividend section below. No provision has been made for this dividend in the financial report as the dividend was not determined by the directors on or before the end of the financial year. Other than those disclosed in Note E.5 of section 5—Financial Statements on page 158, there are no other material subsequent events. Dividend The directors have resolved to pay a final dividend in respect of the year ended 31 December 2023 of 60 US cents per ordinary share (fully franked) payable on 4 April 2024. Type 2023 interim 2022 final Payment date 4 April 2024 28 September 2023 5 April 2023 Period ends 31 December 2023 30 June 2023 31 December 2022 Cents per share 60 80 144 Value $ million 1,139 1,519 2,734 Fully franked
Likely developments, business strategies, future prospects and expected results In general terms, the review of operations of Woodside as set out on pages 4-52 gives an indication of likely developments, business strategies, prospects for future financial years, and the expected results of the operations. In the opinion of the directors, disclosure of any further information would be likely to result in unreasonable prejudice to Woodside. Page 214 of section 6.8—Information about this report includes further details regarding Woodside’s reliance on the unreasonable prejudice exemption. Environmental compliance Woodside is subject to a range of environmental legislation in Australia and other countries in which it operates. In 2023, there were no incidents involving spills of hydrocarbons or hazardous non-hydrocarbons greater than 1 bbl released to the environment. Through its Environment and Biodiversity Policy, Woodside plans and performs activities so that adverse effects on the environment are avoided or minimised as much as reasonably practicable. For the financial year ended 31 December 2023, we recorded no fines or prosecutions relating to our environmental performance. Research and development Woodside is leveraging technology to drive cost efficiencies and exploring a range of technology options to support step change abatement. Woodside has a number of technology collaborations and pursues opportunities through technology across operations including for emissions reduction. For further information on examples of the Group’s activities in the field of research and development see section 3.7—New energy and carbon solutions on page 28. Company Secretaries The following individuals have acted as Company Secretary during 2023: Warren Baillie LLB, BCom, Grad. Dip. CSP Group Company Secretary Mr Baillie joined Woodside in 2005 and was appointed Group Company Secretary effective 1 February 2012. Mr Baillie is a solicitor and chartered secretary. He is a former President of the board of the Governance Institute of Australia. Lucy Bowman MA (Oxon), Jurisprudence Joint Company Secretary Ms Bowman joined Woodside in 2021 as Senior Legal Counsel and was appointed Joint Company Secretary effective 20 October 2022. She is a graduate member of the Australian Institute of Company Directors. Branches Woodside Energy Group Ltd, through various subsidiaries, has established branches in a number of countries. Indemnification and insurance of directors and officers Woodside Energy Group Ltd’s constitution requires Woodside Energy Group Ltd to indemnify each director, secretary, executive officer or employee of Woodside Energy Group Ltd or its wholly owned subsidiaries against liabilities (to the extent Woodside Energy Group Ltd is not precluded by law from doing so) incurred in or arising out of the conduct of the business of Woodside Energy Group Ltd or the discharge of the duties of any such person. Woodside Energy Group Ltd enters into deeds of indemnity with directors, secretaries, certain Senior Executives and employees serving as officers on wholly owned or partly owned companies of Woodside in terms consistent with the indemnity provided under Woodside Energy Group Ltd’s constitution. From time to time, Woodside engages its external auditor, PricewaterhouseCoopers, to conduct non-statutory audit work and provide other services in accordance with Woodside’s External Auditor Guidance Policy. The terms of engagement include an indemnity in favour of PricewaterhouseCoopers: • against all losses, claims, costs, expenses, actions, demands, damages, liabilities or any proceedings (liabilities) incurred by PricewaterhouseCoopers in respect of third-party claims arising from a breach by Woodside under the engagement terms • for all liabilities PricewaterhouseCoopers has to Woodside or any third party as a result of reliance on information provided by Woodside that is false, misleading or incomplete. Woodside Energy Group Ltd has paid a premium under a contract insuring each director, officer, secretary and employee who is concerned with the management of Woodside Energy Group Ltd or its subsidiaries against liability incurred in that capacity. Disclosure of the nature of the liability covered by and the amount of the premium payable for such insurance is subject to a confidentiality clause under the contract of insurance. Woodside Energy Group Ltd has not provided any insurance for the external auditor of Woodside Energy Group Ltd or a body corporate related to the external auditor. During the financial year ended 31 December 2023 and as at the date of this Directors’ report, no indemnity in favour of a current or former director, officer or external auditor of the Group has been called on. WOODSIDE ENERGY GROUP LTD 77
Non-audit services and auditor independence declaration Details of the amounts paid or payable to the external auditor of the company, PricewaterhouseCoopers for audit and non-audit services provided during the year are disclosed in Note E.4 of section 5—Financial Statements. Based on advice provided by the Audit & Risk Committee, the directors are satisfied that the provision of non-audit services by the external auditor during the financial year is compatible with the general standard of independence for auditors imposed by the Corporations Act 2001 for the following reasons: all non-audit services were provided in accordance with Woodside’s External Auditor Policy and External Auditor Guidance Policy all non-audit services were subject to the corporate governance processes adopted by the company and have been reviewed by the Audit & Risk Committee to ensure that they do not affect the integrity or objectivity of the auditor. The auditor’s independence declaration, as required under section 307C of the Corporations Act 2001, is set out on page 79 and forms part of this report. Financial instruments For further information on Woodside’s financial risk management objectives and policies, hedging and exposure to price risk, credit risk, liquidity risk and cash flow risk, refer to sections A, C and D on pages 115, 140 and 144 in section 5—Financial Statements and Quantitative and qualitative disclosures about market risk on pages 186-187 in section 6.3—Additional disclosures. Proceedings on behalf of the company No proceedings have been brought on behalf of the company, nor has any application been made in respect of the company, under section 237 of the Corporations Act 2001. Rounding of amounts Woodside Energy Group Limited is an entity to which the Australian Securities and Investments Commission (ASIC) Corporations (Rounding in Financial/Directors’ Reports) Instrument 2016/191 (ASIC Instrument 2016/191) applies. Amounts in this report have been rounded in accordance with ASIC Instrument 2016/191. This means that amounts contained in this report have been rounded to the nearest million dollars unless otherwise stated. Information in other parts of the Annual Report Where this Directors’ report refers to other parts of the Annual Report, those pages form part of this report. Directors’ relevant interests in Woodside Energy Group Ltd shares as at the date of this report Director Relevant interest in shares Larry Archibald 13,524 Ashok Belani2 Nil Arnaud Breuillac2 Nil Frank Cooper 16,142 Swee Chen Goh 14,953 Richard Goyder 26,163 Ian Macfarlane 11,376 Angela Minas2 Nil Meg O’Neill1 432,621 Ann Pickard 15,870 Gene Tilbrook 9,947 Ben Wyatt 3,054 Meg O’Neill is the only Woodside Energy Group Ltd director who has rights on issue and her rights holdings are set out on page 97 in section 4.3—Remuneration Report. Woodside Energy Group Ltd does not have any options on issue. Mr Breuillac, Ms Minas and Mr Belani are participating in the Non-Executive Directors’ Share Plan and will acquire shares going forward under this plan.
Auditors independence declaration to the Directors of Woodside Energy Group Ltd Auditor’s Independence Declaration As lead auditor for the audit of Woodside Energy Group Ltd for the year ended 31 December 2023, I declare that to the best of my knowledge and belief, there have been: (a) no contraventions of the auditor independence requirements of the Corporations Act 2001 in relation to the audit, and (b) no contraventions of any applicable code of professional conduct in relation to the audit. This declaration is in respect of Woodside Energy Group Ltd and the entities it controlled during the period. N M Henry Perth Partner 27 February 2024 PricewaterhouseCoopers PricewaterhouseCoopers, ABN 52 780 433 757 Brookfield Place, 125 St Georges Terrace, PERTH WA 6000, GPO Box D198, PERTH WA 6840 T: +61 8 9238 3000, F: +61 8 9238 3999, www.pwc.com.au Liability limited by a scheme approved under Professional Standards Legislation. WOODSIDE ENERGY GROUP LTD 79
4.3 GOVERNANCE Remuneration Report CONTENTS 4.3.1 Committee Chair’s letter 81 4.3.2 Remuneration Report (audited) 83 KMP and summary of Woodside’s five-year performance 83 Executive KMP 84 Remuneration policy 84 Executive Incentive Scheme 84 Executive KMP remuneration structure 86 Remuneration changes and benchmarking 89 Corporate Scorecard measures and outcomes for 2023 90 Executive KMP KPIs and outcomes for 2023 91 Contracts for Executive KMP 97 Non-executive directors (NEDs) 98 Remuneration policy 98 Minimum Shareholding Requirements (MSR) Policy 98 NEDs remuneration structure 98 Human Resources & Compensation Committee 99 Loans and transactions 99 Use of remuneration consultants 99 Reporting notes 99 Reporting in United States dollars 99 Statutory tables 100 4.3.3 Glossary 104 80 ANNUAL REPORT 2023
4.3.1 Committee Chair’s letter 27 February 2024 Dear Shareholders On behalf of the Board, I am pleased to present the Remuneration Report for the year ended 31 December 2023. I would like to acknowledge that, in June, one of our colleagues tragically lost his life while working at the North Rankin Complex. Protecting the health and safety of our employees and our contractors is our top priority, and we must ensure we remain focused on our commitment to prevent injuries. We are resolved to strive to achieve industry-leading safety performance. In 2023, our expanded global portfolio has delivered record and reliable production, good progress has been made on our key growth projects and we achieved strong emissions performance at our facilities. While our operating performance was strong in 2023, lower realised oil and gas prices contributed to earnings before interest, taxes, depreciation, and amortisation, excluding impairment (EBITDA) being below target. These results are reflected in our 2023 Executive key management personnel (KMP) remuneration outcomes outlined below and in further detail in this report. The Board considers the 2023 remuneration outcomes align with overall corporate performance and shareholder’s return, while maintaining Woodside’s ability to attract and retain talented executive capability in a globally competitive market. Business performance In 2023, the Corporate Scorecard continued to have a strong link between executive reward and our shareholders’ experience. It was based on Woodside’s performance across four equally weighted measures of financial, base business, material sustainability issues, and strategy and growth. The health and safety performance measure, which contributes to 10% of the total 2023 scorecard outcome, was zero. This reflects the tragic fatality at our North Rankin Complex, together with below target TRIR and disappointing process safety performance. The Board recognises we must improve on safety. The financial measure for EBITDA was US$9,363 million, below the target of US$11,860 million due to lower realised prices. While LNG prices remained above the long-term average, they were less than budget. Operating Expenditure was $47 million higher than the target of US$2,208 million. Our expanded global portfolio delivered record production in 2023 (187.2 MMboe) due to reliable operating performance. This was achieved while beating our internal gross equity Scope 1 and 2 emissions1 target by 5%. Over the year, we made good progress on our key growth projects with the Scarborough Energy Project on track for first LNG cargo in 2026. First oil is targeted for mid-2024 on our Sangomar project off Senegal and we achieved FID on the Trion Project in the Gulf of Mexico. On our new energy projects, work continues on our proposed H2OK hydrogen project in Oklahoma and several CCS opportunities are advancing. In Western Australia, State and Federal environmental approvals were secured for the proposed Woodside Solar Project near Karratha. The company’s performance across the four Corporate Scorecard measures gave an overall corporate performance outcome of 4.8 (out of a maximum of 10). The 2024 Corporate Scorecard has been reviewed and approved by the Board and reflects Woodside’s balanced approach to operational performance against material sustainability criteria. It includes a distinct standalone measure for each of safety and climate, at 15% each of the total 2024 scorecard. These changes are described in further detail in the 2024 Corporate Scorecard section of this report. Executive Incentive Scheme outcomes Variable Annual Reward (VAR) is delivered under the Woodside Executive Incentive Scheme (EIS). Each executive’s award is based on their individual performance against key performance indicators (KPIs) and the company’s performance through the Corporate Scorecard. In 2023, the individual performance of the CEO was assessed against five equally weighted measures of growth agenda, effective execution, enterprise capability, culture, reputation, and shareholder focus. At the end of the year, the Board reviewed the CEO’s performance, which together with the Corporate Scorecard outcome, resulted in an EIS award at 104% of the target opportunity. 1 Gross equity emissions are calculated prior to retirement of carbon credits as offsets, focusing the organisational priorities on avoiding and reducing emissions. This contributes to our company target to reduce net equity Scope 1 and 2 emissions. Further information on this company target is provided in section 3.8—Climate and sustainability. WOODSIDE ENERGY GROUP LTD 81
The CEO proposed to the Board her final EIS award be reduced by 5% in light of the fatality at our North Rankin Complex. The Board exercised its discretion to reduce the EIS award to 99% of the target opportunity (66% of the maximum opportunity). The Board will consider whether any further action is appropriate as Woodside’s response to the fatality continues. Senior Executive individual performance was evaluated against the same performance measures as the CEO, with individual KPIs set relevant to each Executive’s area of responsibility. Senior Executive EIS awards ranged from 101% to 105% of target opportunity. The Board has reviewed the 2023 EIS outcomes and believes they appropriately align with overall corporate performance and shareholder experience. Executive remuneration CEO and Senior Executives remuneration, both fixed and variable, is reviewed annually with regard for accountabilities, experience and individual performance. It is also supported by external benchmarking. Effective 1 January 2024, the Board determined that the CEO’s Fixed Annual Reward (FAR) would increase by 3%. The VAR component of the CEO’s remuneration package remained unchanged. Senior Executive FAR was also reviewed during 2023. The Board determined that FAR would increase by 5% for Mr Graham Tiver and Ms Shiva McMahon, effective 1 April 2023. The VAR structure and opportunity of Senior Executive remuneration remained unchanged. External benchmarking was conducted by external remuneration consultants, against ASX 20 companies, selected peers in the Australian materials and energy sector, and international oil and gas companies. The Board believes this review brings the total remuneration of the CEO and Senior Executives to a competitive position in the selected peer groups. These changes are described in further detail in the remuneration changes section of this report. The Board appointed Ms Liz Westcott as Executive Vice President Australian Operations effective 1 June 2023. Details of Ms Westcott’s FAR and key contract terms are set out in this report. Chair and non-executive director fees Fees for the Chair, and non-executive directors are reviewed annually against benchmarking from external remuneration consultants. The fees for the Chair and non-executive directors and committee membership were last increased by 5% on 1 January 2023, the first increase since 2019. This increase considered benchmarking conducted by external independent remuneration consultants KPMG against the ASX 20 and selected international oil and gas companies. No changes to Chair or non-executive director fees are proposed for 2024. Governance The Human Resources & Compensation Committee continued to review the company’s remuneration policies and practices globally to ensure these remain competitive in local markets and meet changing regulatory requirements. In 2023, this included adopting a Mandatory Clawback Policy consistent with the requirements of Section 303.A14 of the New York Stock Exchange Listed Company Manual. More detail on the Committee’s activities in 2023 is available in the Corporate Governance Statement 2023. Conclusion On behalf of the Board, I would like to thank Mr Gene Tilbrook who served as Chair of the Committee from 2019 until December 2023. As Committee Chair, Gene has overseen the introduction of activities to assess and monitor culture and brought a focus to investor engagement on executive remuneration and its connection to the strategy and shareholder experience. We look forward to our ongoing engagement with you and sharing in Woodside’s future success. Yours sincerely, Arnaud Breuillac Chair of Human Resources & Compensation Committee 82 ANNUAL REPORT 2023 4.3.2 Remuneration Report (audited) KMP AND SUMMARY OF WOODSIDE’S FIVE-YEAR PERFORMANCE This report outlines the remuneration arrangements and outcomes achieved for Woodside’s key management personnel (KMP) during 2023.
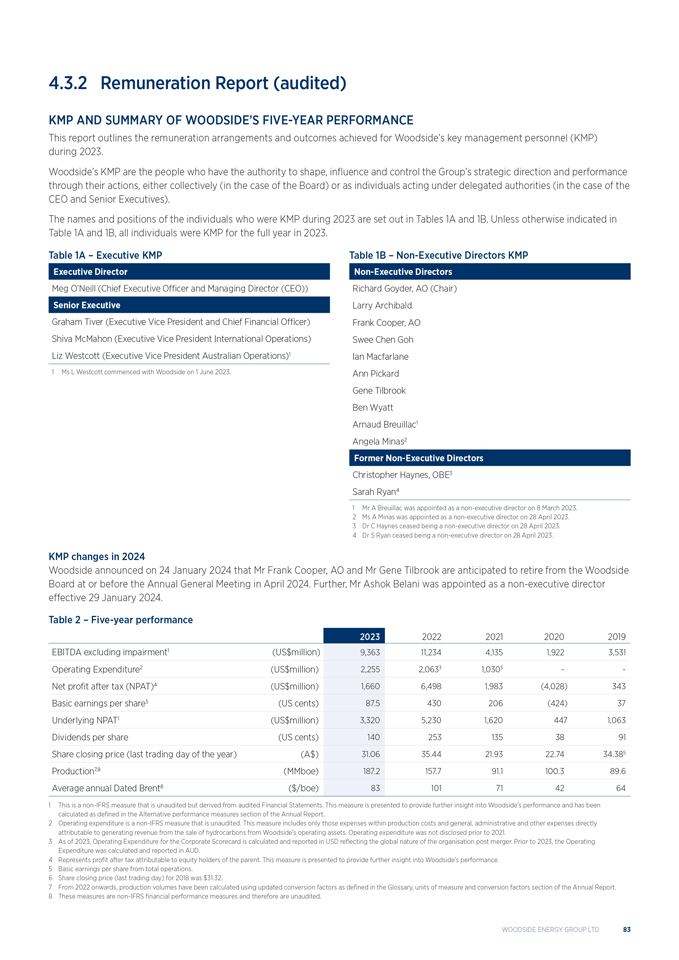
Woodside’s KMP are the people who have the authority to shape, influence and control the Group’s strategic direction and performance through their actions, either collectively (in the case of the Board) or as individuals acting under delegated authorities (in the case of the CEO and Senior Executives). Table 1A – Executive KMP Executive Director Meg O’Neill (Chief Executive Officer and Managing Director (CEO)) Senior Executive Graham Tiver (Executive Vice President and Chief Financial Officer) Shiva McMahon (Executive Vice President International Operations) Liz Westcott (Executive Vice President Australian Operations)1 1 Ms L Westcott commenced with Woodside on 1 June 2023. Table 1B – Non-Executive Directors KMP Non-Executive Directors Richard Goyder, AO (Chair) Larry Archibald Frank Cooper, AO Swee Chen Goh Ian Macfarlane Ann Pickard Gene Tilbrook Ben Wyatt Arnaud Breuillac1 Angela Minas2 Former Non-Executive Directors Christopher Haynes, OBE3 Sarah Ryan4 1 Mr A Breuillac was appointed as a non-executive director on 8 March 2023. 2 Ms A Minas was appointed as a non-executive director on 28 April 2023. 3 Dr C Haynes ceased being a non-executive director on 28 April 2023. 4 Dr S Ryan ceased being a non-executive director on 28 April 2023. KMP changes in 2024 Woodside announced on 24 January 2024 that Mr Frank Cooper, AO and Mr Gene Tilbrook are anticipated to retire from the Woodside Board at or before the Annual General Meeting in April 2024. Further, Mr Ashok Belani was appointed as a non-executive director effective 29 January 2024. Table 2 – Five-year performance 2023 2022 2021 2020 2019 EBITDA excluding impairment1 (US$million) 9,363 11,234 4,135 1,922 3,531 Operating Expenditure2 (US$million) 2,255 2,0633 1,0303 - - Net profit after tax (NPAT)4 (US$million) 1,660 6,498 1,983 (4,028) 343 Basic earnings per share5 (US cents) 87.5 430 206 (424) 37 Underlying NPAT1 (US$million) 3,320 5,230 1,620 447 1,063 Dividends per share (US cents) 140 253 135 38 91 Share closing price (last trading day of the year) (A$) 31.06 35.44 21.93 22.74 34.385 Production7,8 (MMboe) 187.2 157.7 91.1 100.3 89.6 Average annual Dated Brent8 ($/boe) 83 101 71 42 64 1 This is a non-IFRS measure that is unaudited but derived from audited Financial Statements. This measure is presented to provide further insight into Woodside’s performance and has been calculated as defined in the Alternative performance measures section of the Annual Report. 2 Operating expenditure is a non-IFRS measure that is unaudited. This measure includes only those expenses within production costs and general, administrative and other expenses directly attributable to generating revenue from the sale of hydrocarbons from Woodside’s operating assets. Operating expenditure was not disclosed prior to 2021. 3 As of 2023, Operating Expenditure for the Corporate Scorecard is calculated and reported in USD reflecting the global nature of the organisation post merger. Prior to 2023, the Operating Expenditure was calculated and reported in AUD. 4 Represents profit after tax attributable to equity holders of the parent. This measure is presented to provide further insight into Woodside’s performance. 5 Basic earnings per share from total operations. 6 Share closing price (last trading day) for 2018 was $31.32. 7 From 2022 onwards, production volumes have been calculated using updated conversion factors as defined in the Glossary, units of measure and conversion factors section of the Annual Report. 8 These measures are non-IFRS financial performance measures and therefore are unaudited. WOODSIDE ENERGY GROUP LTD 83 Individual and Company Performance The EIS delivers a single variable reward linked to challenging individual and company annual targets set by the Board.
EXECUTIVE KMP Remuneration policy Woodside’s strategy is to thrive through the energy transition by building a low cost, lower carbon, profitable, resilient and diversified portfolio. There are three goals which drive this strategic direction. First, we strive to have the right portfolio to provide the energy required for future demand. We play to our strengths, providing oil and gas to our customers while advancing new energy products and lower carbon services. Climate is an integrated part of our strategy and we assess investment decisions against a wide range of considerations including climate outcomes. This is important as the demand from our customers becomes increasingly shaped by their decarbonisation goals. Secondly, we want to create and return value to our shareholders. Our capital management framework aims to optimise value, balance strong shareholder returns and invest in quality opportunities. Finally, we aim to conduct our business sustainably. To achieve this, we need to manage our impact on people, communities and the environment in which we operate. The safety of our people and a strong focus on managing our net equity Scope 1 and 2 emissions to meet our targets is critical to the longevity of our business. All three goals are critical to ensuring that Woodside delivers its strategy and thrives through the energy transition. To do so, the company must be able to attract and retain executive capability in a globally competitive market. The Board structures remuneration so that it rewards those who perform, is valued by Executives, and is aligned with the company’s values, strategic direction and the creation of enduring value to shareholders, and other stakeholders. Fixed Annual Reward (FAR) is determined having regard to the scope of each Executive’s role and their level of knowledge, skills and experience. Variable Annual Reward (VAR) is calculated annually, based on performance measures set by the Board aimed at aligning executive remuneration with short and long-term shareholder returns. VAR aligns shareholder and executive remuneration outcomes by making a significant portion of executive remuneration at risk, while rewarding performance. Executive remuneration is reviewed annually, having regard to the accountabilities, experience and performance of each individual. FAR and VAR are compared against domestic and international competitors at target, to maintain Woodside’s capacity to attract and retain talent and to ensure appropriate motivation is provided to Executives to deliver on the company’s strategic objectives. Executive Incentive Scheme VAR is delivered under the Woodside Executive Incentive Scheme (EIS). The EIS is structured having regard to the key objectives of executive engagement, alignment with the shareholder experience and strategic fit. ALIGNMENT WITH THE EXECUTIVE ENGAGEMENT SHAREHOLDER EXPERIENCE STRATEGIC FIT Enable Woodside to attract and retain Promote significant share ownership Measures which determine the executive capability in a globally through equity awards. Equity awards quantum of the EIS award are selected competitive environment by providing are delivered as a combination of for alignment with Woodside strategy Executives with a clear remuneration Restricted Shares and Performance and award deferral periods reflect structure giving line of sight to Rights. The Performance Rights are Woodside’s strategic time horizons. how performance is reflected in Relative Total Shareholder Return Together these drive Executives to remuneration outcomes. (RTSR) tested against comparator deliver our strategic objectives with groups, after five years. discipline and collaboration, in turn creating shareholder value. 84 ANNUAL REPORT 2023

Each Executive KMP’s award is based upon two components: individual performance against KPIs (30% weighting) and the company’s performance against the Corporate Scorecard (70% weighting). Individual performance measures are designed to ensure Executives focus on driving Woodside’s culture and values whilst executing Woodside’s strategic imperatives. The Board has strong oversight and governance to ensure that appropriate and challenging individual targets are set to create a clear link between performance and reward. The 2023 Corporate Scorecard for Executive KMP was based on four equally weighted measures that were chosen because they impact short-term and long-term shareholder value. This includes measures selected for alignment with Woodside strategy, covering operational efficiency, financial outcomes and performance against key sustainability measures. Financial Base business Sustainability Strategy and growth EBITDA is a key contributor to Revenue is maximised and value Material sustainability issues Business priorities focus on annual profitability, and controlling generated from our assets when include personal and process progress and milestones of capital Operating Expenditure brings a they are fully utilised in production. safety, environment, emissions projects, business developments, focus on efficient operations, reductions, and our social licence and balance sheet management. cost competitiveness and to operate. shareholder returns. 25% 25% 25% 25% Calculation of Award The EIS award is subject to performance in each 12-month period and is determined at the conclusion of each performance year. Individual performance is rated on a scale between 0 and 5 and is assessed by the Board in the case of the CEO, and by the CEO and the Human Resources & Compensation Committee in the case of Senior Executives. Corporate performance is rated on a scale between 0 and 10, with a score of 5 for an outcome at target and a maximum of 10 on each measure. The sum of these two components determines the award. Exceeding targets results in an increased award with a linear calculation up to the maximum, while under-performance will result in a reduced award. The minimum award that an Executive can receive is zero if the performance conditions are not achieved on either company or individual performance. The decision to pay or allocate an EIS award is subject to the overriding discretion of the Board, which may adjust outcomes, both upwards and downwards, to better reflect shareholder outcomes and company or management performance. Each year, the Board conducts a holistic assessment of Woodside’s performance on all significant factors, before considering whether it is appropriate to adjust EIS outcomes, either upwards or downwards. Target variable reward opportunity for 2023 Each Executive is given a target VAR opportunity and a maximum VAR opportunity which is expressed as percentage of the Executive’s FAR. The opportunities for 2023 are outlined below.
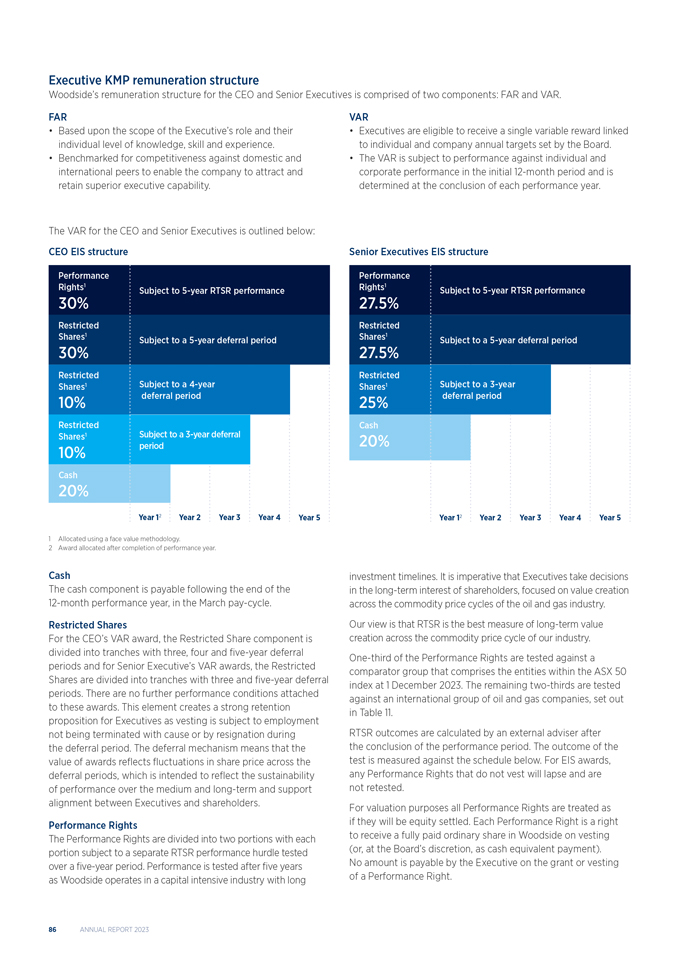
Minimum opportunity Target opportunity Maximum opportunity Position (% of FAR) (% of FAR) (% of FAR) CEO Zero 280 420 Senior Executives Zero 160 256 CEO remuneration at target Senior Executives remuneration at target Fixed reward 26% Variable reward 74% Fixed reward 38% Variable reward 62% WOODSIDE ENERGY GROUP LTD 85 Executive KMP remuneration structure Woodside’s remuneration structure for the CEO and Senior Executives is comprised of two components: FAR and VAR. FAR VAR • Based upon the scope of the Executive’s role and their • Executives are eligible to receive a single variable reward linked individual level of knowledge, skill and experience. to individual and company annual targets set by the Board. • Benchmarked for competitiveness against domestic and • The VAR is subject to performance against individual and international peers to enable the company to attract and corporate performance in the initial 12-month period and is retain superior executive capability. determined at the conclusion of each performance year. The VAR for the CEO and Senior Executives is outlined below: CEO EIS structure Senior Executives EIS structure Performance Performance Rights1 Subject to 5-year RTSR performance Rights1 Subject to 5-year RTSR performance 30% 27.5% Restricted Restricted Shares1 Subject to a 5-year deferral period Shares1 Subject to a 5-year deferral period 30% 27.5% Restricted Restricted Shares1 Subject to a 4-year Shares1 Subject to a 3-year 10% deferral period 25% deferral period Restricted Cash Shares1 Subject to a 3-year deferral 20% 10% period Cash 20% Year 12 Year 2 Year 3 Year 4 Year 5 Year 12 Year 2 Year 3 Year 4 Year 5 1 Allocated using a face value methodology. Cash The cash component is payable following the end of the 12-month performance year, in the March pay-cycle. Restricted Shares For the CEO’s VAR award, the Restricted Share component is divided into tranches with three, four and five-year deferral periods and for Senior Executive’s VAR awards, the Restricted Shares are divided into tranches with three and five-year deferral periods. There are no further performance conditions attached to these awards. This element creates a strong retention proposition for Executives as vesting is subject to employment not being terminated with cause or by resignation during the deferral period. The deferral mechanism means that the value of awards reflects fluctuations in share price across the deferral periods, which is intended to reflect the sustainability of performance over the medium and long-term and support alignment between Executives and shareholders. Performance Rights The Performance Rights are divided into two portions with each portion subject to a separate RTSR performance hurdle tested over a five-year period. Performance is tested after five years as Woodside operates in a capital intensive industry with long investment timelines. It is imperative that Executives take decisions in the long-term interest of shareholders, focused on value creation across the commodity price cycles of the oil and gas industry. Our view is that RTSR is the best measure of long-term value creation across the commodity price cycle of our industry. One-third of the Performance Rights are tested against a comparator group that comprises the entities within the ASX 50 index at 1 December 2023. The remaining two-thirds are tested against an international group of oil and gas companies, set out in Table 11. RTSR outcomes are calculated by an external adviser after the conclusion of the performance period. The outcome of the test is measured against the schedule below. For EIS awards, any Performance Rights that do not vest will lapse and are not retested. For valuation purposes all Performance Rights are treated as if they will be equity settled. Each Performance Right is a right to receive a fully paid ordinary share in Woodside on vesting (or, at the Board’s discretion, as cash equivalent payment). No amount is payable by the Executive on the grant or vesting of a Performance Right.
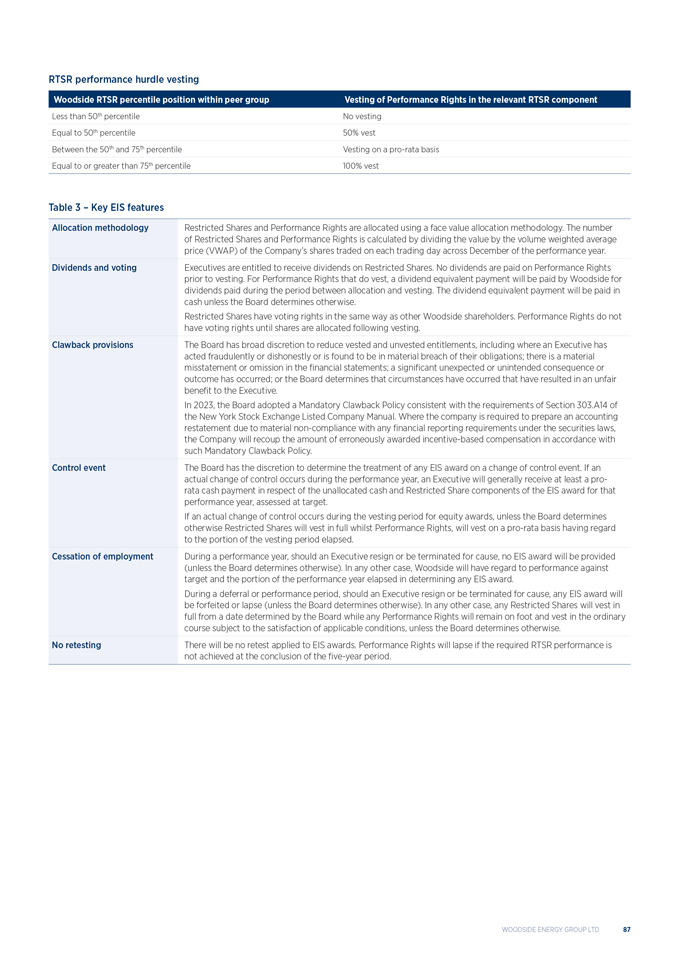
86 ANNUAL REPORT 2023 RTSR performance hurdle vesting Woodside RTSR percentile position within peer group Vesting of Performance Rights in the relevant RTSR component Less than 50th percentile No vesting Equal to 50th percentile 50% vest Between the 50th and 75th percentile Vesting on a pro-rata basis Equal to or greater than 75th percentile 100% vest Table 3 – Key EIS features Allocation methodology Restricted Shares and Performance Rights are allocated using a face value allocation methodology. The number of Restricted Shares and Performance Rights is calculated by dividing the value by the volume weighted average price (VWAP) of the Company’s shares traded on each trading day across December of the performance year. Dividends and voting Executives are entitled to receive dividends on Restricted Shares. No dividends are paid on Performance Rights prior to vesting. For Performance Rights that do vest, a dividend equivalent payment will be paid by Woodside for dividends paid during the period between allocation and vesting. The dividend equivalent payment will be paid in cash unless the Board determines otherwise. Restricted Shares have voting rights in the same way as other Woodside shareholders. Performance Rights do not have voting rights until shares are allocated following vesting. Clawback provisions The Board has broad discretion to reduce vested and unvested entitlements, including where an Executive has acted fraudulently or dishonestly or is found to be in material breach of their obligations; there is a material misstatement or omission in the financial statements; a significant unexpected or unintended consequence or outcome has occurred; or the Board determines that circumstances have occurred that have resulted in an unfair benefit to the Executive. In 2023, the Board adopted a Mandatory Clawback Policy consistent with the requirements of Section 303.A14 of the New York Stock Exchange Listed Company Manual. Where the company is required to prepare an accounting restatement due to material non-compliance with any financial reporting requirements under the securities laws, the Company will recoup the amount of erroneously awarded incentive-based compensation in accordance with such Mandatory Clawback Policy. Control event The Board has the discretion to determine the treatment of any EIS award on a change of control event. If an actual change of control occurs during the performance year, an Executive will generally receive at least a pro- rata cash payment in respect of the unallocated cash and Restricted Share components of the EIS award for that performance year, assessed at target. If an actual change of control occurs during the vesting period for equity awards, unless the Board determines otherwise Restricted Shares will vest in full whilst Performance Rights, will vest on a pro-rata basis having regard to the portion of the vesting period elapsed. Cessation of employment During a performance year, should an Executive resign or be terminated for cause, no EIS award will be provided (unless the Board determines otherwise). In any other case, Woodside will have regard to performance against target and the portion of the performance year elapsed in determining any EIS award. During a deferral or performance period, should an Executive resign or be terminated for cause, any EIS award will be forfeited or lapse (unless the Board determines otherwise). In any other case, any Restricted Shares will vest in full from a date determined by the Board while any Performance Rights will remain on foot and vest in the ordinary course subject to the satisfaction of applicable conditions, unless the Board determines otherwise. No retesting There will be no retest applied to EIS awards. Performance Rights will lapse if the required RTSR performance is not achieved at the conclusion of the five-year period. WOODSIDE ENERGY GROUP LTD 87 Other equity plans Woodside has a history of providing employees with the opportunity to participate in ownership of shares in the company and using equity to support a competitive base remuneration position.
Details of prior year allocations are provided in Table 12. The terms applying to prior year grants are described in past Woodside Annual Reports. Supplementary Woodside Equity Plan (SWEP) In October 2011, the Board approved the establishment of the SWEP to enable the offering of targeted retention awards of Equity Rights (ERs) for key capability. The SWEP was updated in 2022 to broaden eligibility to all employees of a subsidiary of Woodside Energy Group Ltd and ensure compliance in all jurisdictions in which Woodside operates. This facilitated the offer of replacement unvested incentives as required under transitional arrangements for eligible heritage BHP employees transitioning from BHP Group Long-Term Incentive (LTI) plans to VAR offered under Woodside’s VAR arrangements. The SWEP awards have service conditions and no performance conditions. Each ER entitles the participant to receive a Woodside share on the vesting date. ERs under the SWEP may vest prior to the vesting date on a change of control or on a pro-rata basis, at the discretion of the CEO, limited to the following circumstances; redundancy, retirement (after six months’ participation), death, termination due to illness or incapacity or total and permanent disablement of a participating employee. An employee whose employment is terminated by resignation or for cause prior to the vesting date will forfeit all their unvested ERs. In relation to the applicable cessation of employment treatment for SWEP ERs granted as replacement awards to heritage BHP employees, unless the Board determines otherwise, unvested SWEP ERs will vest on a pro-rata basis in the following circumstances; redundancy, death, termination due to medical illness or incapacity or total and permanent disablement of the participant. For cessation in other circumstances, (and other than where employment is terminated by resignation or for cause), Woodside’s CEO (or Committee of the Board, as applicable) has discretion to permit pro-rata vesting. There is no entitlement to dividends on ERs and ERs do not carry voting rights. Minimum Shareholding Requirements (MSR) Policy The Executive MSR Policy reflects the long-term focus of management and aims to further strengthen alignment with shareholders. The MSR Policy requires Senior Executives to have acquired and maintained Woodside shares for a minimum total purchase price of at least 100% of their FAR after a period of five years, and in the case of the CEO a minimum of 200% of FAR after a period of five years. Of the Executive KMP, Ms O’Neill, Mr Tiver and Ms McMahon meet the MSR requirements. Ms Westcott commenced with Woodside in 2023 and will acquire Woodside shares to meet the MSR requirements. See Table 14 for details. Minimum Shareholding Requirements (MSR) Policy The Executive MSR Policy reflects the long-term focus of management and aims to further strengthen alignment with shareholders. The MSR Policy requires Senior Executives to have acquired and maintained Woodside shares for a minimum total purchase price of at least 100% of their FAR after a period of five years, and in the case of the CEO a minimum of 200% of FAR after a period of five years. Of the Executive KMP, Ms O’Neill, Mr Tiver and Ms McMahon meet the MSR requirements. Ms Westcott commenced with Woodside in 2023 and will acquire Woodside shares to meet the MSR requirements. See Table 14 for details.
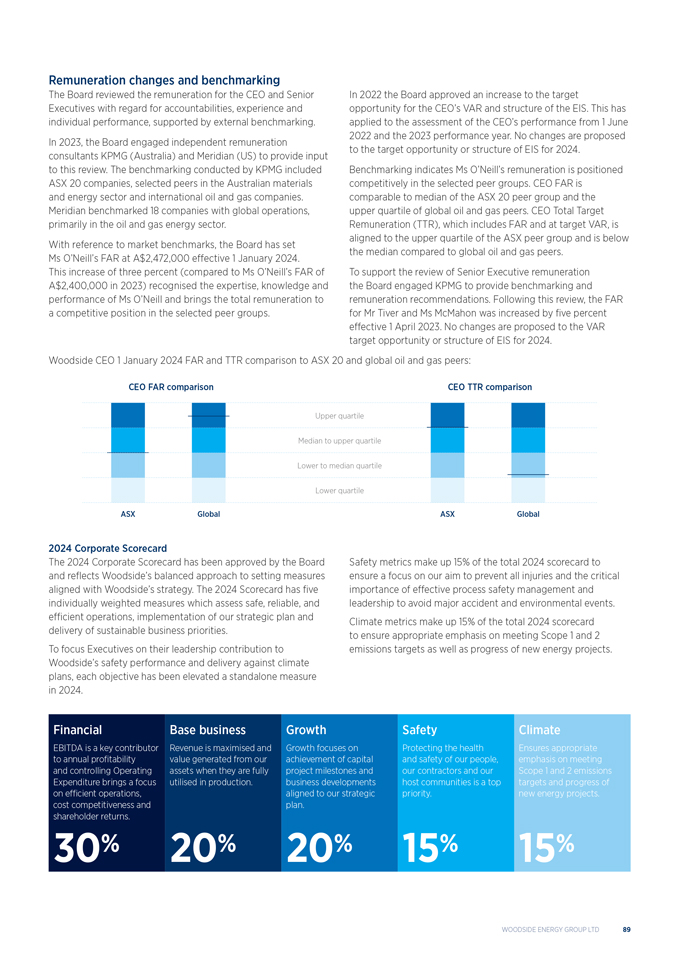
88 ANNUAL REPORT 2023 Remuneration changes and benchmarking The Board reviewed the remuneration for the CEO and Senior In 2022 the Board approved an increase to the target Executives with regard for accountabilities, experience and opportunity for the CEO’s VAR and structure of the EIS. This has individual performance, supported by external benchmarking. applied to the assessment of the CEO’s performance from 1 June In 2023, the Board engaged independent remuneration 2022 and the 2023 performance year. No changes are proposed consultants KPMG (Australia) and Meridian (US) to provide input to the target opportunity or structure of EIS for 2024. to this review. The benchmarking conducted by KPMG included Benchmarking indicates Ms O’Neill’s remuneration is positioned ASX 20 companies, selected peers in the Australian materials competitively in the selected peer groups. CEO FAR is and energy sector and international oil and gas companies. comparable to median of the ASX 20 peer group and the Meridian benchmarked 18 companies with global operations, upper quartile of global oil and gas peers. CEO Total Target primarily in the oil and gas energy sector. Remuneration (TTR), which includes FAR and at target VAR, is With reference to market benchmarks, the Board has set aligned to the upper quartile of the ASX peer group and is below Ms O’Neill’s FAR at A$2,472,000 effective 1 January 2024. the median compared to global oil and gas peers. This increase of three percent (compared to Ms O’Neill’s FAR of To support the review of Senior Executive remuneration A$2,400,000 in 2023) recognised the expertise, knowledge and the Board engaged KPMG to provide benchmarking and performance of Ms O’Neill and brings the total remuneration to remuneration recommendations. Following this review, the FAR a competitive position in the selected peer groups. for Mr Tiver and Ms McMahon was increased by five percent effective 1 April 2023. No changes are proposed to the VAR target opportunity or structure of EIS for 2024. Woodside CEO 1 January 2024 FAR and TTR comparison to ASX 20 and global oil and gas peers: 2024 Corporate Scorecard The 2024 Corporate Scorecard has been approved by the Board Safety metrics make up 15% of the total 2024 scorecard to and reflects Woodside’s balanced approach to setting measures ensure a focus on our aim to prevent all injuries and the critical aligned with Woodside’s strategy. The 2024 Scorecard has five importance of effective process safety management and individually weighted measures which assess safe, reliable, and leadership to avoid major accident and environmental events. efficient operations, implementation of our strategic plan and Climate metrics make up 15% of the total 2024 scorecard delivery of sustainable business priorities. to ensure appropriate emphasis on meeting Scope 1 and 2 To focus Executives on their leadership contribution to emissions targets as well as progress of new energy projects. Woodside’s safety performance and delivery against climate plans, each objective has been elevated a standalone measure in 2024. Financial Base business Growth Safety Climate EBITDA is a key contributor Revenue is maximised and Growth focuses on Protecting the health Ensures appropriate to annual profitability value generated from our achievement of capital and safety of our people, emphasis on meeting and controlling Operating assets when they are fully project milestones and our contractors and our Scope 1 and 2 emissions Expenditure brings a focus utilised in production. business developments host communities is a top targets and progress of on efficient operations, aligned to our strategic priority. new energy projects. cost competitiveness and plan. shareholder returns. 30% 20% 20% 15% 15% WOODSIDE ENERGY GROUP LTD 89 Corporate Scorecard measures and outcomes for 2023 Financial (25%) MID-POINT MAX Outcome 3.3 EBITDA excluding impairment is a key contributor to annual profitability and is influenced by both management performance and commodity prices.
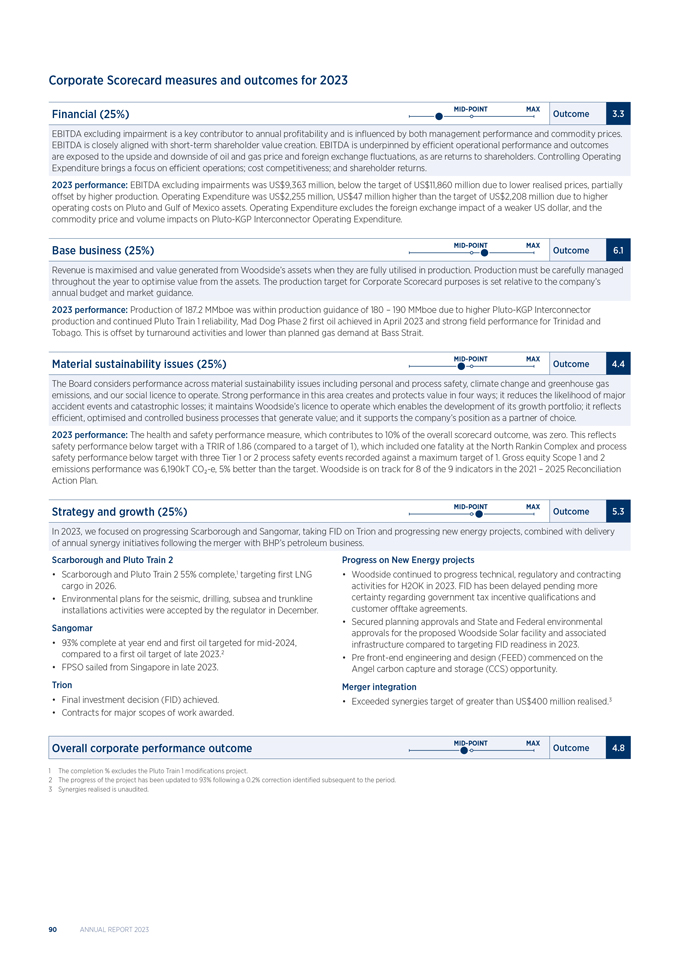
EBITDA is closely aligned with short-term shareholder value creation. EBITDA is underpinned by efficient operational performance and outcomes are exposed to the upside and downside of oil and gas price and foreign exchange fluctuations, as are returns to shareholders. Controlling Operating Expenditure brings a focus on efficient operations; cost competitiveness; and shareholder returns. 2023 performance: EBITDA excluding impairments was US$9,363 million, below the target of US$11,860 million due to lower realised prices, partially offset by higher production. Operating Expenditure was US$2,255 million, US$47 million higher than the target of US$2,208 million due to higher operating costs on Pluto and Gulf of Mexico assets. Operating Expenditure excludes the foreign exchange impact of a weaker US dollar, and the commodity price and volume impacts on Pluto-KGP Interconnector Operating Expenditure. Base business (25%) MID-POINT MAX Outcome 6.1 Revenue is maximised and value generated from Woodside’s assets when they are fully utilised in production. Production must be carefully managed throughout the year to optimise value from the assets. The production target for Corporate Scorecard purposes is set relative to the company’s annual budget and market guidance. 2023 performance: Production of 187.2 MMboe was within production guidance of 180 – 190 MMboe due to higher Pluto-KGP Interconnector production and continued Pluto Train 1 reliability, Mad Dog Phase 2 first oil achieved in April 2023 and strong field performance for Trinidad and Tobago. This is offset by turnaround activities and lower than planned gas demand at Bass Strait. Material sustainability issues (25%) MID-POINT MAX Outcome 4.4 The Board considers performance across material sustainability issues including personal and process safety, climate change and greenhouse gas emissions, and our social licence to operate. Strong performance in this area creates and protects value in four ways; it reduces the likelihood of major accident events and catastrophic losses; it maintains Woodside’s licence to operate which enables the development of its growth portfolio; it reflects efficient, optimised and controlled business processes that generate value; and it supports the company’s position as a partner of choice. 2023 performance: The health and safety performance measure, which contributes to 10% of the overall scorecard outcome, was zero. This reflects safety performance below target with a TRIR of 1.86 (compared to a target of 1), which included one fatality at the North Rankin Complex and process safety performance below target with three Tier 1 or 2 process safety events recorded against a maximum target of 1. Gross equity Scope 1 and 2 emissions performance was 6,190kT COâ,,-e, 5% better than the target. Woodside is on track for 8 of the 9 indicators in the 2021 – 2025 Reconciliation Action Plan. Strategy and growth (25%) MID-POINT MAX Outcome 5.3 In 2023, we focused on progressing Scarborough and Sangomar, taking FID on Trion and progressing new energy projects, combined with delivery of annual synergy initiatives following the merger with BHP’s petroleum business. Scarborough and Pluto Train 2 Progress on New Energy projects Scarborough and Pluto Train 2 55% complete,1 targeting first LNG • Woodside continued to progress technical, regulatory and contracting cargo in 2026. activities for H2OK in 2023. FID has been delayed pending more Environmental plans for the seismic, drilling, subsea and trunkline certainty regarding government tax incentive qualifications and installations activities were accepted by the regulator in December. customer offtake agreements. • Secured planning approvals and State and Federal environmental Sangomar approvals for the proposed Woodside Solar facility and associated 93% complete at year end and first oil targeted for mid-2024, infrastructure compared to targeting FID readiness in 2023. compared to a first oil target of late 2023.2 • Pre front-end engineering and design (FEED) commenced on the FPSO sailed from Singapore in late 2023. Angel carbon capture and storage (CCS) opportunity. Trion Merger integration Final investment decision (FID) achieved. • Exceeded synergies target of greater than US$400 million realised.3 Contracts for major scopes of work awarded. Overall corporate performance outcome MID-POINT MAX Outcome 4.8 1 The completion % excludes the Pluto Train 1 modifications project. 2 The progress of the project has been updated to 93% following a 0.2% correction identified subsequent to the period. 3 Synergies realised is unaudited.
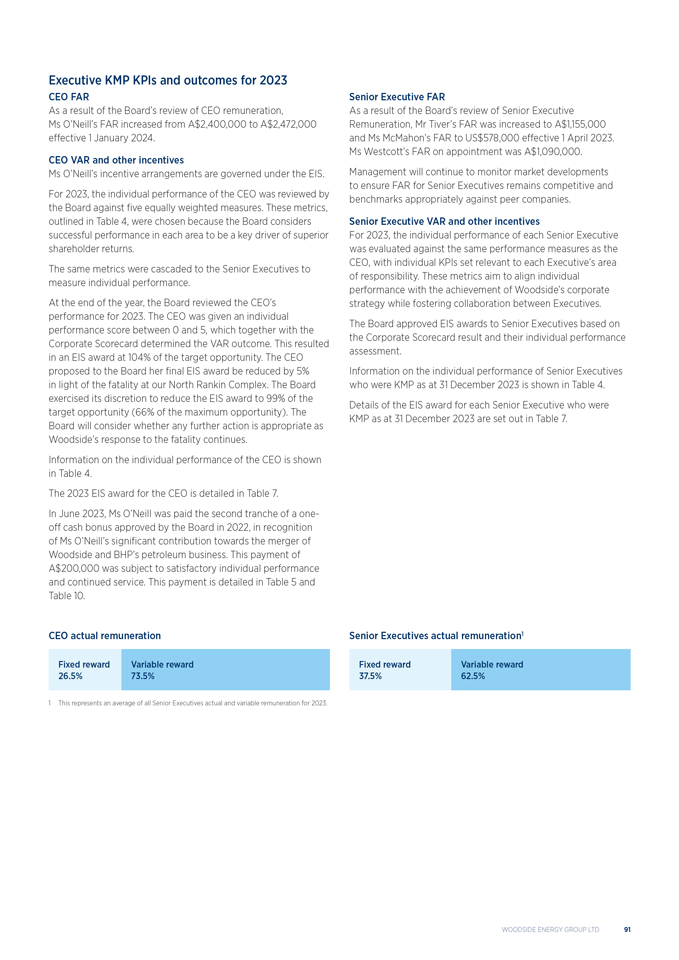
90 ANNUAL REPORT 2023 Executive KMP KPIs and outcomes for 2023 CEO FAR Senior Executive FAR As a result of the Board’s review of CEO remuneration, As a result of the Board’s review of Senior Executive Ms O’Neill’s FAR increased from A$2,400,000 to A$2,472,000 Remuneration, Mr Tiver’s FAR was increased to A$1,155,000 effective 1 January 2024. and Ms McMahon’s FAR to US$578,000 effective 1 April 2023. Ms Westcott’s FAR on appointment was A$1,090,000. CEO VAR and other incentives Ms O’Neill’s incentive arrangements are governed under the EIS. Management will continue to monitor market developments to ensure FAR for Senior Executives remains competitive and For 2023, the individual performance of the CEO was reviewed by benchmarks appropriately against peer companies. the Board against five equally weighted measures. These metrics, outlined in Table 4, were chosen because the Board considers Senior Executive VAR and other incentives successful performance in each area to be a key driver of superior For 2023, the individual performance of each Senior Executive shareholder returns. was evaluated against the same performance measures as the The same metrics were cascaded to the Senior Executives to CEO, with individual KPIs set relevant to each Executive’s area measure individual performance. of responsibility. These metrics aim to align individual performance with the achievement of Woodside’s corporate At the end of the year, the Board reviewed the CEO’s strategy while fostering collaboration between Executives. performance for 2023. The CEO was given an individual performance score between 0 and 5, which together with the The Board approved EIS awards to Senior Executives based on Corporate Scorecard determined the VAR outcome. This resulted the Corporate Scorecard result and their individual performance in an EIS award at 104% of the target opportunity. The CEO assessment. proposed to the Board her final EIS award be reduced by 5% Information on the individual performance of Senior Executives in light of the fatality at our North Rankin Complex. The Board who were KMP as at 31 December 2023 is shown in Table 4. exercised its discretion to reduce the EIS award to 99% of the Details of the EIS award for each Senior Executive who were target opportunity (66% of the maximum opportunity). The KMP as at 31 December 2023 are set out in Table 7. Board will consider whether any further action is appropriate as Woodside’s response to the fatality continues. Information on the individual performance of the CEO is shown in Table 4. The 2023 EIS award for the CEO is detailed in Table 7. In June 2023, Ms O’Neill was paid the second tranche of a one- off cash bonus approved by the Board in 2022, in recognition of Ms O’Neill’s significant contribution towards the merger of Woodside and BHP’s petroleum business. This payment of A$200,000 was subject to satisfactory individual performance and continued service. This payment is detailed in Table 5 and Table 10. CEO actual remuneration Senior Executives actual remuneration1 Fixed reward Variable reward Fixed reward Variable reward 26.5% 73.5% 37.5% 62.5% 1 This represents an average of all Senior Executives actual and variable remuneration for 2023. WOODSIDE ENERGY GROUP LTD 91 Table 4—CEO and Senior Executive individual performance for 2023 EIS Meg O’Neill—CEO and Managing Director KPI Performance Outcome Growth agenda • Matured the corporate strategy, focusing the company on areas Above target Assesses the alignment of growth opportunities to of LNG, deepwater oil, integrated carbon solutions and lower shareholder return; portfolio balance; the achievement carbon energy.
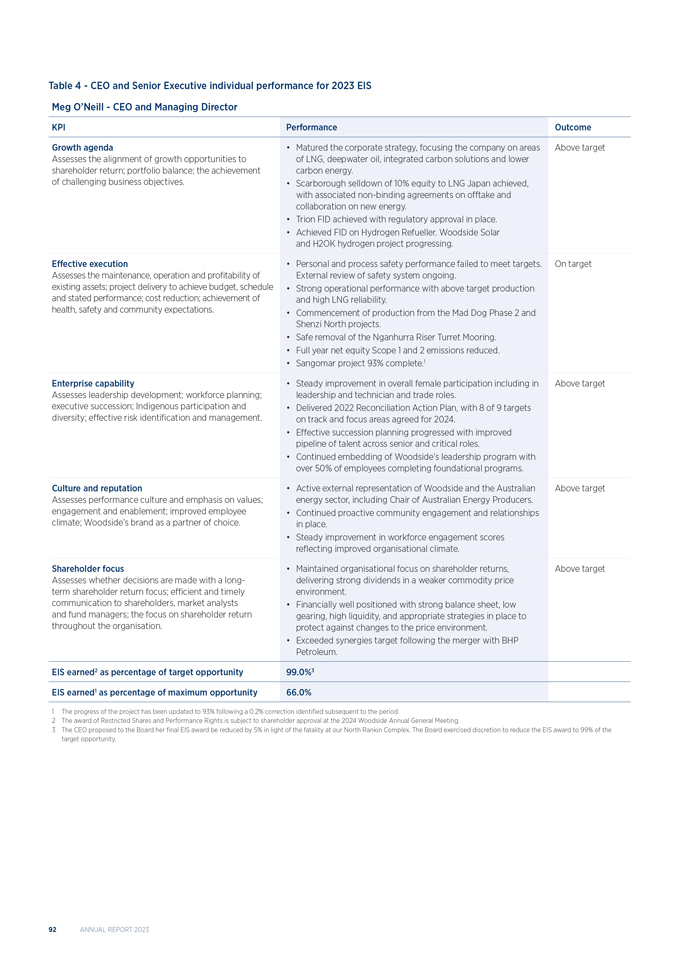
of challenging business objectives. • Scarborough selldown of 10% equity to LNG Japan achieved, with associated non-binding agreements on offtake and collaboration on new energy. • Trion FID achieved with regulatory approval in place. • Achieved FID on Hydrogen Refueller. Woodside Solar and H2OK hydrogen project progressing. Effective execution • Personal and process safety performance failed to meet targets. On target Assesses the maintenance, operation and profitability of External review of safety system ongoing. existing assets; project delivery to achieve budget, schedule • Strong operational performance with above target production and stated performance; cost reduction; achievement of and high LNG reliability. health, safety and community expectations. • Commencement of production from the Mad Dog Phase 2 and Shenzi North projects. • Safe removal of the Nganhurra Riser Turret Mooring. • Full year net equity Scope 1 and 2 emissions reduced. • Sangomar project 93% complete.1 Enterprise capability • Steady improvement in overall female participation including in Above target Assesses leadership development; workforce planning; leadership and technician and trade roles. executive succession; Indigenous participation and • Delivered 2022 Reconciliation Action Plan, with 8 of 9 targets diversity; effective risk identification and management. on track and focus areas agreed for 2024. • Effective succession planning progressed with improved pipeline of talent across senior and critical roles. • Continued embedding of Woodside’s leadership program with over 50% of employees completing foundational programs. Culture and reputation • Active external representation of Woodside and the Australian Above target Assesses performance culture and emphasis on values; energy sector, including Chair of Australian Energy Producers. engagement and enablement; improved employee • Continued proactive community engagement and relationships climate; Woodside’s brand as a partner of choice. in place. • Steady improvement in workforce engagement scores reflecting improved organisational climate. Shareholder focus • Maintained organisational focus on shareholder returns, Above target Assesses whether decisions are made with a long- delivering strong dividends in a weaker commodity price term shareholder return focus; efficient and timely environment. communication to shareholders, market analysts • Financially well positioned with strong balance sheet, low and fund managers; the focus on shareholder return gearing, high liquidity, and appropriate strategies in place to throughout the organisation. protect against changes to the price environment. • Exceeded synergies target following the merger with BHP Petroleum. EIS earned2 as percentage of target opportunity 99.0%3 EIS earned1 as percentage of maximum opportunity 66.0% 1 The progress of the project has been updated to 93% following a 0.2% correction identified subsequent to the period. 2 The award of Restricted Shares and Performance Rights is subject to shareholder approval at the 2024 Woodside Annual General Meeting. 3 The CEO proposed to the Board her final EIS award be reduced by 5% in light of the fatality at our North Rankin Complex. The Board exercised discretion to reduce the EIS award to 99% of the target opportunity.
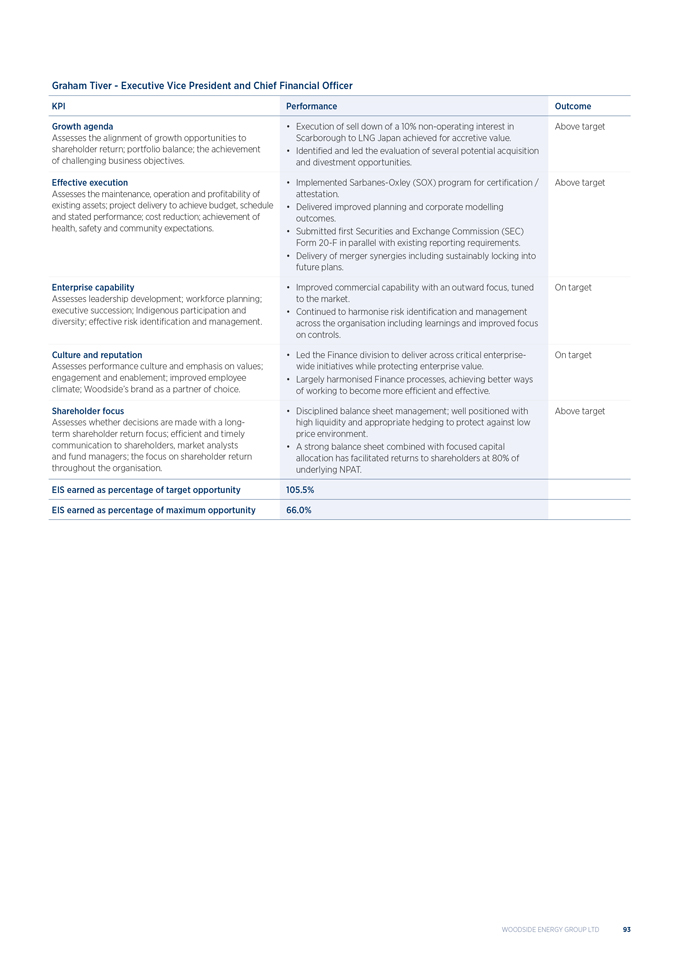
92 ANNUAL REPORT 2023 Graham Tiver—Executive Vice President and Chief Financial Officer KPI Performance Outcome Growth agenda • Execution of sell down of a 10% non-operating interest in Above target Assesses the alignment of growth opportunities to Scarborough to LNG Japan achieved for accretive value. shareholder return; portfolio balance; the achievement • Identified and led the evaluation of several potential acquisition of challenging business objectives. and divestment opportunities. Effective execution • Implemented Sarbanes-Oxley (SOX) program for certification / Above target Assesses the maintenance, operation and profitability of attestation. existing assets; project delivery to achieve budget, schedule • Delivered improved planning and corporate modelling and stated performance; cost reduction; achievement of outcomes. health, safety and community expectations. • Submitted first Securities and Exchange Commission (SEC) Form 20-F in parallel with existing reporting requirements. • Delivery of merger synergies including sustainably locking into future plans. Enterprise capability • Improved commercial capability with an outward focus, tuned On target Assesses leadership development; workforce planning; to the market. executive succession; Indigenous participation and • Continued to harmonise risk identification and management diversity; effective risk identification and management. across the organisation including learnings and improved focus on controls. Culture and reputation • Led the Finance division to deliver across critical enterprise- On target Assesses performance culture and emphasis on values; wide initiatives while protecting enterprise value. engagement and enablement; improved employee • Largely harmonised Finance processes, achieving better ways climate; Woodside’s brand as a partner of choice. of working to become more efficient and effective. Shareholder focus • Disciplined balance sheet management; well positioned with Above target Assesses whether decisions are made with a long- high liquidity and appropriate hedging to protect against low term shareholder return focus; efficient and timely price environment. communication to shareholders, market analysts • A strong balance sheet combined with focused capital and fund managers; the focus on shareholder return allocation has facilitated returns to shareholders at 80% of throughout the organisation. underlying NPAT. EIS earned as percentage of target opportunity 105.5% EIS earned as percentage of maximum opportunity 66.0% WOODSIDE ENERGY GROUP LTD 93 Shiva McMahon—Executive Vice President International Operations KPI Performance Outcome Growth agenda • Strong collaboration with operator to deliver Mad Dog Phase 2 On target Assesses the alignment of growth opportunities to remediation work and start-up.
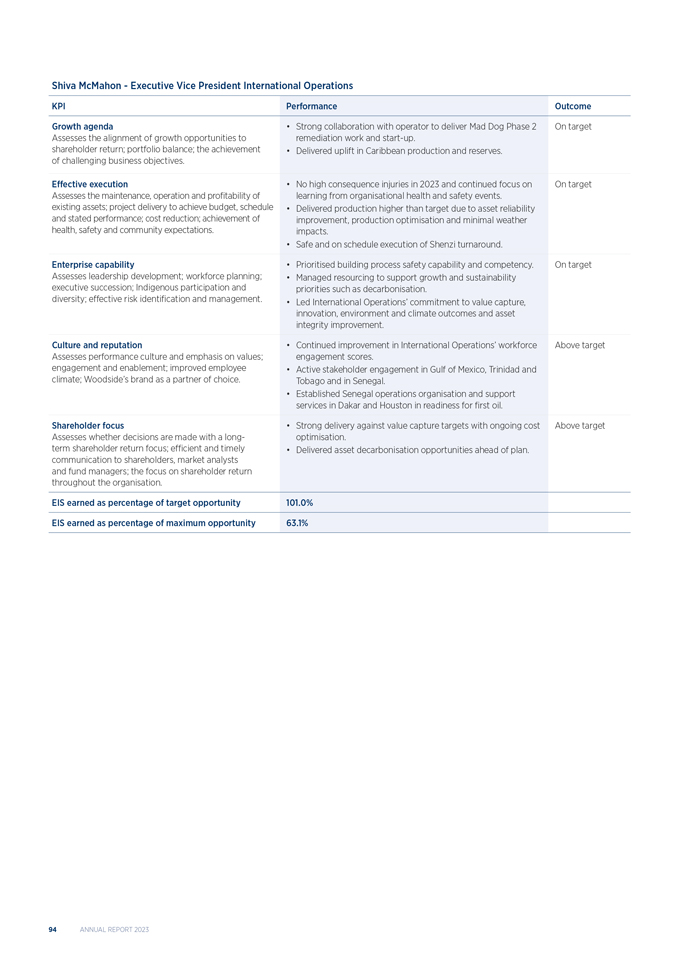
shareholder return; portfolio balance; the achievement • Delivered uplift in Caribbean production and reserves. of challenging business objectives. Effective execution • No high consequence injuries in 2023 and continued focus on On target Assesses the maintenance, operation and profitability of learning from organisational health and safety events. existing assets; project delivery to achieve budget, schedule • Delivered production higher than target due to asset reliability and stated performance; cost reduction; achievement of improvement, production optimisation and minimal weather health, safety and community expectations. impacts. • Safe and on schedule execution of Shenzi turnaround. Enterprise capability • Prioritised building process safety capability and competency. On target Assesses leadership development; workforce planning; • Managed resourcing to support growth and sustainability executive succession; Indigenous participation and priorities such as decarbonisation. diversity; effective risk identification and management. • Led International Operations’ commitment to value capture, innovation, environment and climate outcomes and asset integrity improvement. Culture and reputation • Continued improvement in International Operations’ workforce Above target Assesses performance culture and emphasis on values; engagement scores. engagement and enablement; improved employee • Active stakeholder engagement in Gulf of Mexico, Trinidad and climate; Woodside’s brand as a partner of choice. Tobago and in Senegal. • Established Senegal operations organisation and support services in Dakar and Houston in readiness for first oil. Shareholder focus • Strong delivery against value capture targets with ongoing cost Above target Assesses whether decisions are made with a long- optimisation. term shareholder return focus; efficient and timely • Delivered asset decarbonisation opportunities ahead of plan. communication to shareholders, market analysts and fund managers; the focus on shareholder return throughout the organisation. EIS earned as percentage of target opportunity 101.0% EIS earned as percentage of maximum opportunity 63.1% 94 ANNUAL REPORT 2023 Liz Westcott—Executive Vice President Australian Operations KPI Performance Outcome Growth agenda • Maximised facility utilisation with focus on optimisation and Above target Assesses the alignment of growth opportunities to infill opportunities.
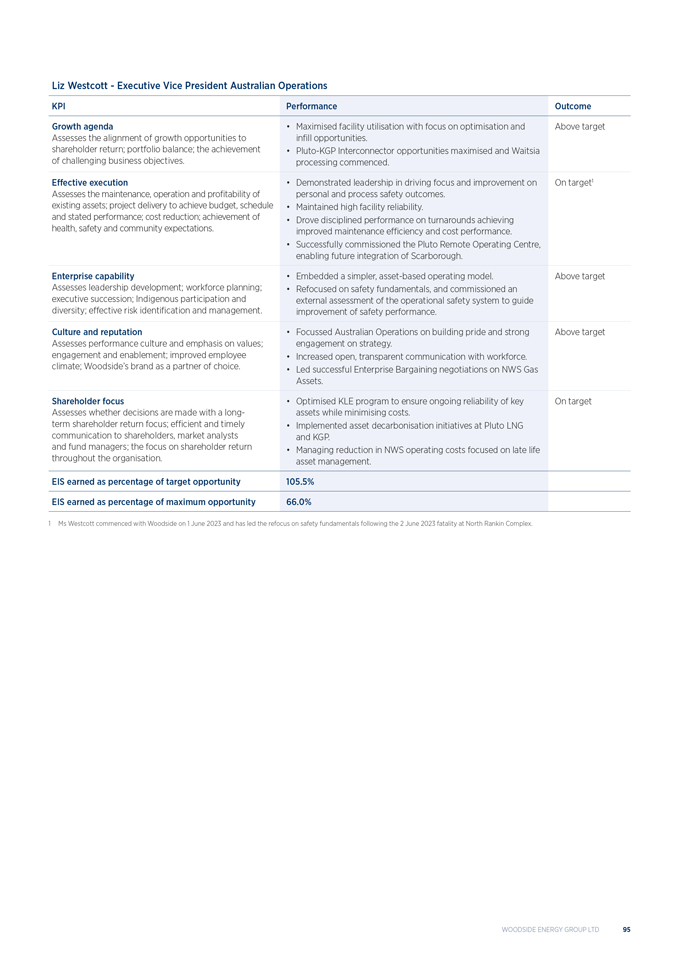
shareholder return; portfolio balance; the achievement • Pluto-KGP Interconnector opportunities maximised and Waitsia of challenging business objectives. processing commenced. Effective execution • Demonstrated leadership in driving focus and improvement on On target1 Assesses the maintenance, operation and profitability of personal and process safety outcomes. existing assets; project delivery to achieve budget, schedule • Maintained high facility reliability. and stated performance; cost reduction; achievement of • Drove disciplined performance on turnarounds achieving health, safety and community expectations. improved maintenance efficiency and cost performance. • Successfully commissioned the Pluto Remote Operating Centre, enabling future integration of Scarborough. Enterprise capability • Embedded a simpler, asset-based operating model. Above target Assesses leadership development; workforce planning; • Refocused on safety fundamentals, and commissioned an executive succession; Indigenous participation and external assessment of the operational safety system to guide diversity; effective risk identification and management. improvement of safety performance. Culture and reputation • Focussed Australian Operations on building pride and strong Above target Assesses performance culture and emphasis on values; engagement on strategy. engagement and enablement; improved employee • Increased open, transparent communication with workforce. climate; Woodside’s brand as a partner of choice. • Led successful Enterprise Bargaining negotiations on NWS Gas Assets. Shareholder focus • Optimised KLE program to ensure ongoing reliability of key On target Assesses whether decisions are made with a long- assets while minimising costs. term shareholder return focus; efficient and timely • Implemented asset decarbonisation initiatives at Pluto LNG communication to shareholders, market analysts and KGP. and fund managers; the focus on shareholder return • Managing reduction in NWS operating costs focused on late life throughout the organisation. asset management. EIS earned as percentage of target opportunity 105.5% EIS earned as percentage of maximum opportunity 66.0% 1 Ms Westcott commenced with Woodside on 1 June 2023 and has led the refocus on safety fundamentals following the 2 June 2023 fatality at North Rankin Complex. WOODSIDE ENERGY GROUP LTD 95 Table 5—CEO and Senior Executive take home pay table (non-IFRS information)1 The following table provides greater transparency to shareholders of the take home pay received or receivable by the CEO and Senior Executives, in 2022 and 2023.
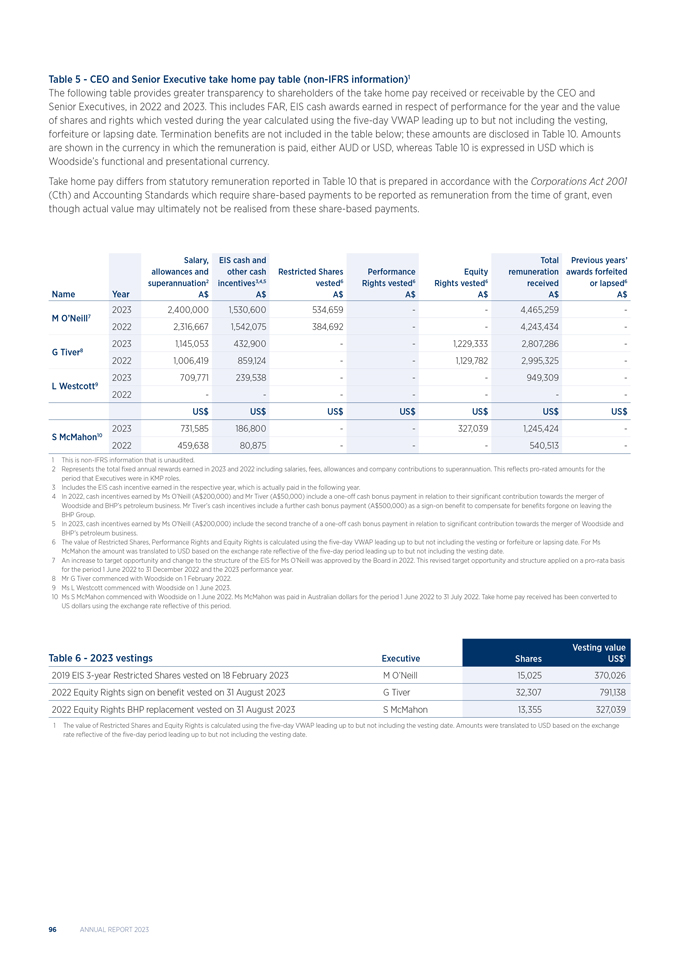
This includes FAR, EIS cash awards earned in respect of performance for the year and the value of shares and rights which vested during the year calculated using the five-day VWAP leading up to but not including the vesting, forfeiture or lapsing date. Termination benefits are not included in the table below; these amounts are disclosed in Table 10. Amounts are shown in the currency in which the remuneration is paid, either AUD or USD, whereas Table 10 is expressed in USD which is Woodside’s functional and presentational currency. Take home pay differs from statutory remuneration reported in Table 10 that is prepared in accordance with the Corporations Act 2001 (Cth) and Accounting Standards which require share-based payments to be reported as remuneration from the time of grant, even though actual value may ultimately not be realised from these share-based payments. Salary, EIS cash and Total Previous years’ allowances and other cash Restricted Shares Performance Equity remuneration awards forfeited superannuation2 incentives3,4,5 vested6 Rights vested6 Rights vested6 received or lapsed6 Name Year A$A$A$A$A$A$A$ 2023 2,400,000 1,530,600 534,659 - - 4,465,259 - M O’Neill7 2022 2,316,667 1,542,075 384,692 - - 4,243,434 - 2023 1,145,053 432,900 - - 1,229,333 2,807,286 - G Tiver8 2022 1,006,419 859,124 - - 1,129,782 2,995,325 - 2023 709,771 239,538 - - - 949,309 - L Westcott9 2022 - - - - - - - US$US$US$US$US$US$US$ 2023 731,585 186,800 - - 327,039 1,245,424 - S McMahon10 2022 459,638 80,875 - - - 540,513 - 1 This is non-IFRS information that is unaudited. 2 Represents the total fixed annual rewards earned in 2023 and 2022 including salaries, fees, allowances and company contributions to superannuation. This reflects pro-rated amounts for the period that Executives were in KMP roles. 3 Includes the EIS cash incentive earned in the respective year, which is actually paid in the following year. 4 In 2022, cash incentives earned by Ms O’Neill (A$200,000) and Mr Tiver (A$50,000) include a one-off cash bonus payment in relation to their significant contribution towards the merger of Woodside and BHP’s petroleum business. Mr Tiver’s cash incentives include a further cash bonus payment (A$500,000) as a sign-on benefit to compensate for benefits forgone on leaving the BHP Group. 5 In 2023, cash incentives earned by Ms O’Neill (A$200,000) include the second tranche of a one-off cash bonus payment in relation to significant contribution towards the merger of Woodside and BHP’s petroleum business. 6 The value of Restricted Shares, Performance Rights and Equity Rights is calculated using the five-day VWAP leading up to but not including the vesting or forfeiture or lapsing date. For Ms McMahon the amount was translated to USD based on the exchange rate reflective of the five-day period leading up to but not including the vesting date. 7 An increase to target opportunity and change to the structure of the EIS for Ms O’Neill was approved by the Board in 2022. This revised target opportunity and structure applied on a pro-rata basis for the period 1 June 2022 to 31 December 2022 and the 2023 performance year. 8 Mr G Tiver commenced with Woodside on 1 February 2022. 9 Ms L Westcott commenced with Woodside on 1 June 2023. 10 Ms S McMahon commenced with Woodside on 1 June 2022. Ms McMahon was paid in Australian dollars for the period 1 June 2022 to 31 July 2022. Take home pay received has been converted to US dollars using the exchange rate reflective of this period. Vesting value Table 6—2023 vestings Executive Shares US$1 2019 EIS 3-year Restricted Shares vested on 18 February 2023 M O’Neill 15,025 370,026 2022 Equity Rights sign on benefit vested on 31 August 2023 G Tiver 32,307 791,138 2022 Equity Rights BHP replacement vested on 31 August 2023 S McMahon 13,355 327,039 1 The value of Restricted Shares and Equity Rights is calculated using the five-day VWAP leading up to but not including the vesting date.
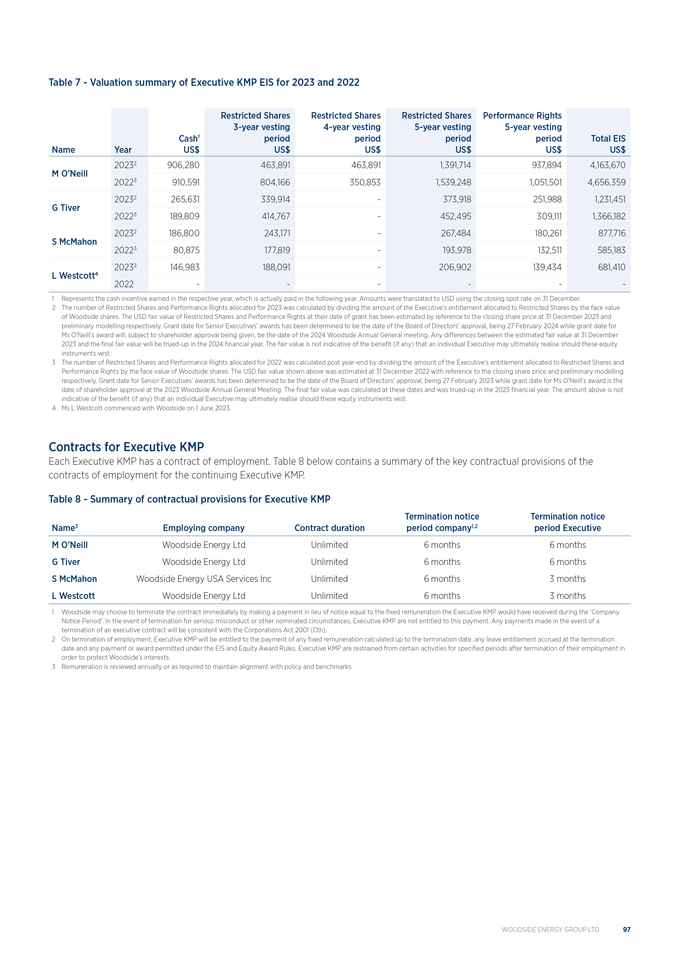
Amounts were translated to USD based on the exchange rate reflective of the five-day period leading up to but not including the vesting date. 96 ANNUAL REPORT 2023 Table 7—Valuation summary of Executive KMP EIS for 2023 and 2022 Restricted Shares Restricted Shares Restricted Shares Performance Rights 3-year vesting 4-year vesting 5-year vesting 5-year vesting Cash1 period period period period Total EIS Name Year US$US$US$US$US$US$ 20232 906,280 463,891 463,891 1,391,714 937,894 4,163,670 M O’Neill 20223 910,591 804,166 350,853 1,539,248 1,051,501 4,656,359 20232 265,631 339,914 - 373,918 251,988 1,231,451 G Tiver 20223 189,809 414,767 - 452,495 309,111 1,366,182 20232 186,800 243,171 - 267,484 180,261 877,716 S McMahon 20223 80,875 177,819 - 193,978 132,511 585,183 20232 146,983 188,091 - 206,902 139,434 681,410 L Westcott4 2022 - - - - - - 1 Represents the cash incentive earned in the respective year, which is actually paid in the following year. Amounts were translated to USD using the closing spot rate on 31 December. 2 The number of Restricted Shares and Performance Rights allocated for 2023 was calculated by dividing the amount of the Executive’s entitlement allocated to Restricted Shares by the face value of Woodside shares. The USD fair value of Restricted Shares and Performance Rights at their date of grant has been estimated by reference to the closing share price at 31 December 2023 and preliminary modelling respectively. Grant date for Senior Executives’ awards has been determined to be the date of the Board of Directors’ approval, being 27 February 2024 while grant date for Ms O’Neill’s award will, subject to shareholder approval being given, be the date of the 2024 Woodside Annual General meeting. Any differences between the estimated fair value at 31 December 2023 and the final fair value will be trued-up in the 2024 financial year. The fair value is not indicative of the benefit (if any) that an individual Executive may ultimately realise should these equity instruments vest. 3 The number of Restricted Shares and Performance Rights allocated for 2022 was calculated post year-end by dividing the amount of the Executive’s entitlement allocated to Restricted Shares and Performance Rights by the face value of Woodside shares. The USD fair value shown above was estimated at 31 December 2022 with reference to the closing share price and preliminary modelling respectively. Grant date for Senior Executives’ awards has been determined to be the date of the Board of Directors’ approval, being 27 February 2023 while grant date for Ms O’Neill’s award is the date of shareholder approval at the 2023 Woodside Annual General Meeting. The final fair value was calculated at these dates and was trued-up in the 2023 financial year. The amount above is not indicative of the benefit (if any) that an individual Executive may ultimately realise should these equity instruments vest. 4 Ms L Westcott commenced with Woodside on 1 June 2023. Contracts for Executive KMP Each Executive KMP has a contract of employment. Table 8 below contains a summary of the key contractual provisions of the contracts of employment for the continuing Executive KMP. Table 8—Summary of contractual provisions for Executive KMP Termination notice Termination notice Name3 Employing company Contract duration period company1,2 period Executive M O’Neill Woodside Energy Ltd Unlimited 6 months 6 months G Tiver Woodside Energy Ltd Unlimited 6 months 6 months S McMahon Woodside Energy USA Services Inc Unlimited 6 months 3 months L Westcott Woodside Energy Ltd Unlimited 6 months 3 months 1 Woodside may choose to terminate the contract immediately by making a payment in lieu of notice equal to the fixed remuneration the Executive KMP would have received during the ‘Company Notice Period’. In the event of termination for serious misconduct or other nominated circumstances, Executive KMP are not entitled to this payment. Any payments made in the event of a termination of an executive contract will be consistent with the Corporations Act 2001 (Cth). 2 On termination of employment, Executive KMP will be entitled to the payment of any fixed remuneration calculated up to the termination date, any leave entitlement accrued at the termination date and any payment or award permitted under the EIS and Equity Award Rules. Executive KMP are restrained from certain activities for specified periods after termination of their employment in order to protect Woodside’s interests. 3 Remuneration is reviewed annually or as required to maintain alignment with policy and benchmarks.
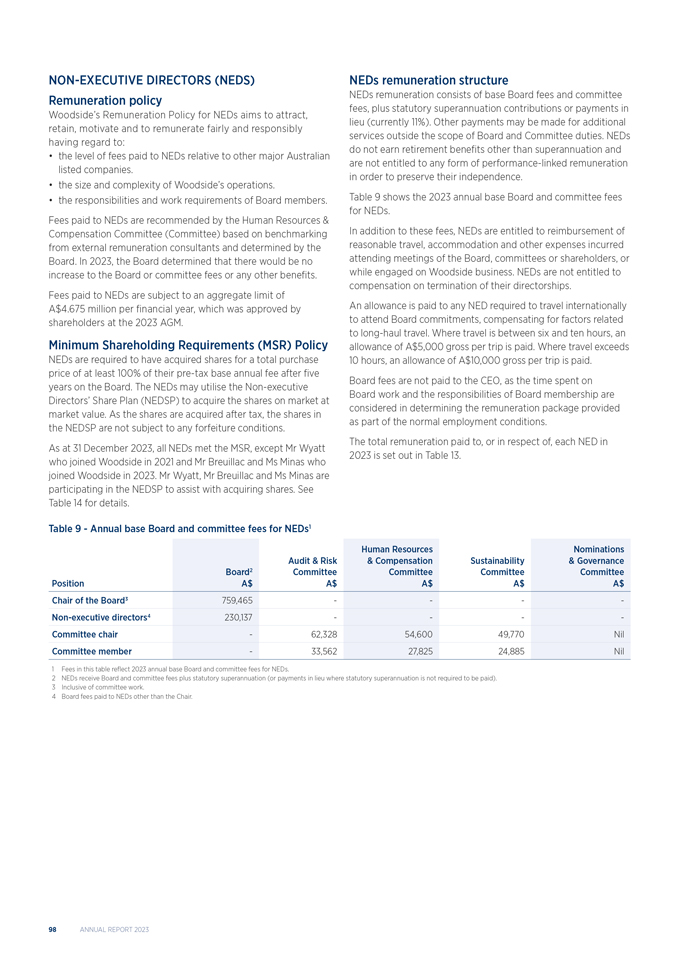
WOODSIDE ENERGY GROUP LTD 97 NON-EXECUTIVE DIRECTORS (NEDS) Remuneration policy Woodside’s Remuneration Policy for NEDs aims to attract, retain, motivate and to remunerate fairly and responsibly having regard to: • the level of fees paid to NEDs relative to other major Australian listed companies. • the size and complexity of Woodside’s operations. • the responsibilities and work requirements of Board members. Fees paid to NEDs are recommended by the Human Resources & Compensation Committee (Committee) based on benchmarking from external remuneration consultants and determined by the Board. In 2023, the Board determined that there would be no increase to the Board or committee fees or any other benefits. Fees paid to NEDs are subject to an aggregate limit of A$4.675 million per financial year, which was approved by shareholders at the 2023 AGM. Minimum Shareholding Requirements (MSR) Policy NEDs are required to have acquired shares for a total purchase price of at least 100% of their pre-tax base annual fee after five years on the Board. The NEDs may utilise the Non-executive Directors’ Share Plan (NEDSP) to acquire the shares on market at market value. As the shares are acquired after tax, the shares in the NEDSP are not subject to any forfeiture conditions. As at 31 December 2023, all NEDs met the MSR, except Mr Wyatt who joined Woodside in 2021 and Mr Breuillac and Ms Minas who joined Woodside in 2023. Mr Wyatt, Mr Breuillac and Ms Minas are participating in the NEDSP to assist with acquiring shares. See Table 14 for details. NEDs remuneration structure NEDs remuneration consists of base Board fees and committee fees, plus statutory superannuation contributions or payments in lieu (currently 11%). Other payments may be made for additional services outside the scope of Board and Committee duties. NEDs do not earn retirement benefits other than superannuation and are not entitled to any form of performance-linked remuneration in order to preserve their independence. Table 9 shows the 2023 annual base Board and committee fees for NEDs. In addition to these fees, NEDs are entitled to reimbursement of reasonable travel, accommodation and other expenses incurred attending meetings of the Board, committees or shareholders, or while engaged on Woodside business. NEDs are not entitled to compensation on termination of their directorships. An allowance is paid to any NED required to travel internationally to attend Board commitments, compensating for factors related to long-haul travel. Where travel is between six and ten hours, an allowance of A$5,000 gross per trip is paid. Where travel exceeds 10 hours, an allowance of A$10,000 gross per trip is paid. Board fees are not paid to the CEO, as the time spent on Board work and the responsibilities of Board membership are considered in determining the remuneration package provided as part of the normal employment conditions. The total remuneration paid to, or in respect of, each NED in 2023 is set out in Table 13. Table 9—Annual base Board and committee fees for NEDs1 Human Resources Nominations Audit & Risk & Compensation Sustainability & Governance Board2 Committee Committee Committee Committee Position A$A$A$A$A$ Chair of the Board3 759,465 - - - - Non-executive directors4 230,137 - - - - Committee chair - 62,328 54,600 49,770 Nil Committee member - 33,562 27,825 24,885 Nil 1 Fees in this table reflect 2023 annual base Board and committee fees for NEDs. 2 NEDs receive Board and committee fees plus statutory superannuation (or payments in lieu where statutory superannuation is not required to be paid). 3 Inclusive of committee work. 4 Board fees paid to NEDs other than the Chair. 98 ANNUAL REPORT 2023 HUMAN RESOURCES & COMPENSATION COMMITTEE The Committee assists the Board to determine appropriate remuneration policies and structures for NEDs and Executives.
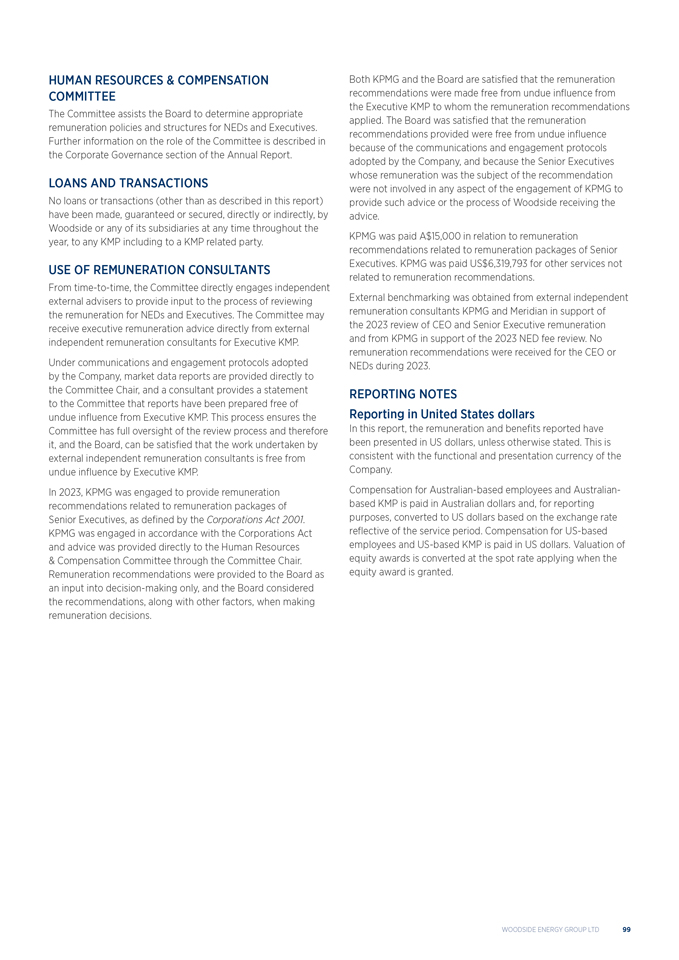
Further information on the role of the Committee is described in the Corporate Governance section of the Annual Report. LOANS AND TRANSACTIONS No loans or transactions (other than as described in this report) have been made, guaranteed or secured, directly or indirectly, by Woodside or any of its subsidiaries at any time throughout the year, to any KMP including to a KMP related party. USE OF REMUNERATION CONSULTANTS From time-to-time, the Committee directly engages independent external advisers to provide input to the process of reviewing the remuneration for NEDs and Executives. The Committee may receive executive remuneration advice directly from external independent remuneration consultants for Executive KMP. Under communications and engagement protocols adopted by the Company, market data reports are provided directly to the Committee Chair, and a consultant provides a statement to the Committee that reports have been prepared free of undue influence from Executive KMP. This process ensures the Committee has full oversight of the review process and therefore it, and the Board, can be satisfied that the work undertaken by external independent remuneration consultants is free from undue influence by Executive KMP. In 2023, KPMG was engaged to provide remuneration recommendations related to remuneration packages of Senior Executives, as defined by the Corporations Act 2001. KPMG was engaged in accordance with the Corporations Act and advice was provided directly to the Human Resources & Compensation Committee through the Committee Chair. Remuneration recommendations were provided to the Board as an input into decision-making only, and the Board considered the recommendations, along with other factors, when making remuneration decisions. Both KPMG and the Board are satisfied that the remuneration recommendations were made free from undue influence from the Executive KMP to whom the remuneration recommendations applied. The Board was satisfied that the remuneration recommendations provided were free from undue influence because of the communications and engagement protocols adopted by the Company, and because the Senior Executives whose remuneration was the subject of the recommendation were not involved in any aspect of the engagement of KPMG to provide such advice or the process of Woodside receiving the advice. KPMG was paid A$15,000 in relation to remuneration recommendations related to remuneration packages of Senior Executives. KPMG was paid US$6,319,793 for other services not related to remuneration recommendations. External benchmarking was obtained from external independent remuneration consultants KPMG and Meridian in support of the 2023 review of CEO and Senior Executive remuneration and from KPMG in support of the 2023 NED fee review. No remuneration recommendations were received for the CEO or NEDs during 2023. REPORTING NOTES Reporting in United States dollars In this report, the remuneration and benefits reported have been presented in US dollars, unless otherwise stated. This is consistent with the functional and presentation currency of the Company. Compensation for Australian-based employees and Australian-based KMP is paid in Australian dollars and, for reporting purposes, converted to US dollars based on the exchange rate reflective of the service period. Compensation for US-based employees and US-based KMP is paid in US dollars. Valuation of equity awards is converted at the spot rate applying when the equity award is granted.
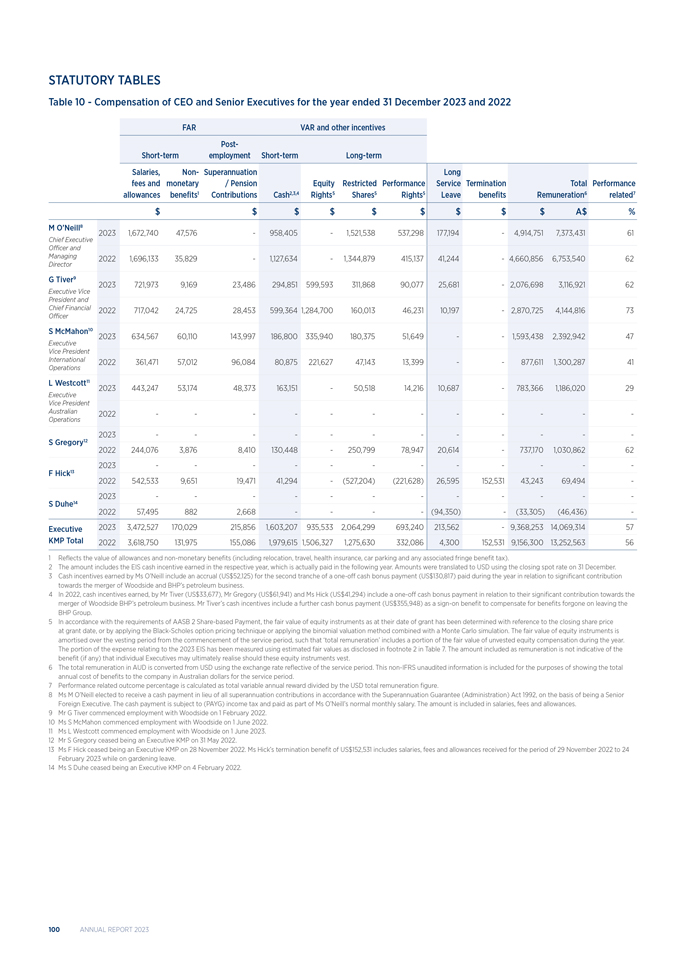
WOODSIDE ENERGY GROUP LTD 99 STATUTORY TABLES Table 10—Compensation of CEO and Senior Executives for the year ended 31 December 2023 and 2022 FAR VAR and other incentives Post- Short-term employment Short-term Long-term Salaries, Non- Superannuation Long fees and monetary / Pension Equity Restricted Performance Service Termination Total Performance allowances benefits1 Contributions Cash2,3,4 Rights5 Shares5 Rights5 Leave benefits Remuneration6 related7 $ $$$$$$$$A$% M O’Neill8 2023 1,672,740 47,576 - 958,405 - 1,521,538 537,298 177,194 - 4,914,751 7,373,431 61 Chief Executive Officer and Managing 2022 1,696,133 35,829 - 1,127,634 - 1,344,879 415,137 41,244 - 4,660,856 6,753,540 62 Director G Tiver9 2023 721,973 9,169 23,486 294,851 599,593 311,868 90,077 25,681 - 2,076,698 3,116,921 62 Executive Vice President and Chief Financial 2022 717,042 24,725 28,453 599,364 1,284,700 160,013 46,231 10,197 - 2,870,725 4,144,816 73 Officer S McMahon10 2023 634,567 60,110 143,997 186,800 335,940 180,375 51,649 - - 1,593,438 2,392,942 47 Executive Vice President International 2022 361,471 57,012 96,084 80,875 221,627 47,143 13,399 - - 877,611 1,300,287 41 Operations L Westcott11 2023 443,247 53,174 48,373 163,151 - 50,518 14,216 10,687 - 783,366 1,186,020 29 Executive Vice President Australian 2022 - - - - - - - - - - - - Operations 2023 - - - - - - - - - - - - S Gregory12 2022 244,076 3,876 8,410 130,448 - 250,799 78,947 20,614 - 737,170 1,030,862 62 2023 - - - - - - - - - - - - F Hick13 2022 542,533 9,651 19,471 41,294 - (527,204) (221,628) 26,595 152,531 43,243 69,494 - 2023 - - - - - - - - - - - - S Duhe14 2022 57,495 882 2,668 - - - - (94,350) - (33,305) (46,436) - Executive 2023 3,472,527 170,029 215,856 1,603,207 935,533 2,064,299 693,240 213,562 - 9,368,253 14,069,314 57 KMP Total 2022 3,618,750 131,975 155,086 1,979,615 1,506,327 1,275,630 332,086 4,300 152,531 9,156,300 13,252,563 56 1 Reflects the value of allowances and non-monetary benefits (including relocation, travel, health insurance, car parking and any associated fringe benefit tax). 2 The amount includes the EIS cash incentive earned in the respective year, which is actually paid in the following year. Amounts were translated to USD using the closing spot rate on 31 December. 3 Cash incentives earned by Ms O’Neill include an accrual (US$52,125) for the second tranche of a one-off cash bonus payment (US$130,817) paid during the year in relation to significant contribution towards the merger of Woodside and BHP’s petroleum business. 4 In 2022, cash incentives earned, by Mr Tiver (US$33,677), Mr Gregory (US$61,941) and Ms Hick (US$41,294) include a one-off cash bonus payment in relation to their significant contribution towards the merger of Woodside BHP’s petroleum business. Mr Tiver’s cash incentives include a further cash bonus payment (US$355,948) as a sign-on benefit to compensate for benefits forgone on leaving the BHP Group. 5 In accordance with the requirements of AASB 2 Share-based Payment, the fair value of equity instruments as at their date of grant has been determined with reference to the closing share price at grant date, or by applying the Black-Scholes option pricing technique or applying the binomial valuation method combined with a Monte Carlo simulation. The fair value of equity instruments is amortised over the vesting period from the commencement of the service period, such that ‘total remuneration’ includes a portion of the fair value of unvested equity compensation during the year. The portion of the expense relating to the 2023 EIS has been measured using estimated fair values as disclosed in footnote 2 in Table 7. The amount included as remuneration is not indicative of the benefit (if any) that individual Executives may ultimately realise should these equity instruments vest. 6 The total remuneration in AUD is converted from USD using the exchange rate reflective of the service period. This non-IFRS unaudited information is included for the purposes of showing the total annual cost of benefits to the company in Australian dollars for the service period. 7 Performance related outcome percentage is calculated as total variable annual reward divided by the USD total remuneration figure. 8 Ms M O’Neill elected to receive a cash payment in lieu of all superannuation contributions in accordance with the Superannuation Guarantee (Administration) Act 1992, on the basis of being a Senior Foreign Executive. The cash payment is subject to (PAYG) income tax and paid as part of Ms O’Neill’s normal monthly salary. The amount is included in salaries, fees and allowances. 9 Mr G Tiver commenced employment with Woodside on 1 February 2022. 10 Ms S McMahon commenced employment with Woodside on 1 June 2022. 11 Ms L Westcott commenced employment with Woodside on 1 June 2023. 12 Mr S Gregory ceased being an Executive KMP on 31 May 2022. 13 Ms F Hick ceased being an Executive KMP on 28 November 2022. Ms Hick’s termination benefit of US$152,531 includes salaries, fees and allowances received for the period of 29 November 2022 to 24 February 2023 while on gardening leave. 14 Ms S Duhe ceased being an Executive KMP on 4 February 2022.
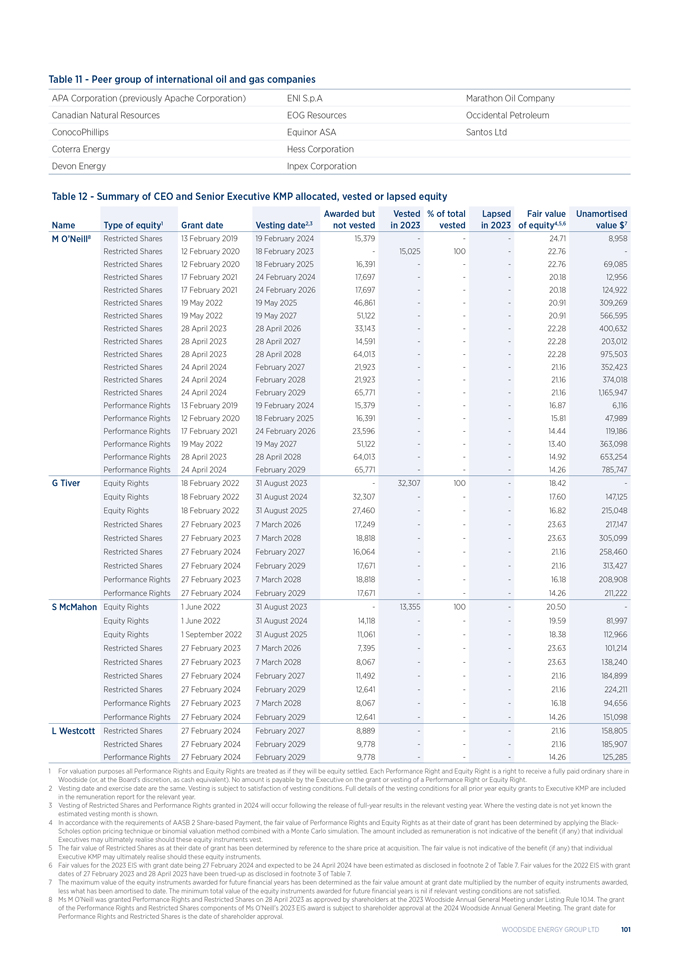
100 ANNUAL REPORT 2023 Table 11—Peer group of international oil and gas companies APA Corporation (previously Apache Corporation) ENI S.p.A Marathon Oil Company Canadian Natural Resources EOG Resources Occidental Petroleum ConocoPhillips Equinor ASA Santos Ltd Coterra Energy Hess Corporation Devon Energy Inpex Corporation Table 12—Summary of CEO and Senior Executive KMP allocated, vested or lapsed equity Awarded but Vested % of total Lapsed Fair value Unamortised Name Type of equity1 Grant date Vesting date2,3 not vested in 2023 vested in 2023 of equity4,5,6 value $7 M O’Neill8 Restricted Shares 13 February 2019 19 February 2024 15,379 - - - 24.71 8,958 Restricted Shares 12 February 2020 18 February 2023 - 15,025 100 - 22.76 - Restricted Shares 12 February 2020 18 February 2025 16,391 - - - 22.76 69,085 Restricted Shares 17 February 2021 24 February 2024 17,697 - - - 20.18 12,956 Restricted Shares 17 February 2021 24 February 2026 17,697 - - - 20.18 124,922 Restricted Shares 19 May 2022 19 May 2025 46,861 - - - 20.91 309,269 Restricted Shares 19 May 2022 19 May 2027 51,122 - - - 20.91 566,595 Restricted Shares 28 April 2023 28 April 2026 33,143 - - - 22.28 400,632 Restricted Shares 28 April 2023 28 April 2027 14,591 - - - 22.28 203,012 Restricted Shares 28 April 2023 28 April 2028 64,013 - - - 22.28 975,503 Restricted Shares 24 April 2024 February 2027 21,923 - - - 21.16 352,423 Restricted Shares 24 April 2024 February 2028 21,923 - - - 21.16 374,018 Restricted Shares 24 April 2024 February 2029 65,771 - - - 21.16 1,165,947 Performance Rights 13 February 2019 19 February 2024 15,379 - - - 16.87 6,116 Performance Rights 12 February 2020 18 February 2025 16,391 - - - 15.81 47,989 Performance Rights 17 February 2021 24 February 2026 23,596 - - - 14.44 119,186 Performance Rights 19 May 2022 19 May 2027 51,122 - - - 13.40 363,098 Performance Rights 28 April 2023 28 April 2028 64,013 - - - 14.92 653,254 Performance Rights 24 April 2024 February 2029 65,771 - - - 14.26 785,747 G Tiver Equity Rights 18 February 2022 31 August 2023 - 32,307 100 - 18.42 - Equity Rights 18 February 2022 31 August 2024 32,307 - - - 17.60 147,125 Equity Rights 18 February 2022 31 August 2025 27,460 - - - 16.82 215,048 Restricted Shares 27 February 2023 7 March 2026 17,249 - - - 23.63 217,147 Restricted Shares 27 February 2023 7 March 2028 18,818 - - - 23.63 305,099 Restricted Shares 27 February 2024 February 2027 16,064 - - - 21.16 258,460 Restricted Shares 27 February 2024 February 2029 17,671 - - - 21.16 313,427 Performance Rights 27 February 2023 7 March 2028 18,818 - - - 16.18 208,908 Performance Rights 27 February 2024 February 2029 17,671 - - - 14.26 211,222 S McMahon Equity Rights 1 June 2022 31 August 2023 - 13,355 100 - 20.50 - Equity Rights 1 June 2022 31 August 2024 14,118 - - - 19.59 81,997 Equity Rights 1 September 2022 31 August 2025 11,061 - - - 18.38 112,966 Restricted Shares 27 February 2023 7 March 2026 7,395 - - - 23.63 101,214 Restricted Shares 27 February 2023 7 March 2028 8,067 - - - 23.63 138,240 Restricted Shares 27 February 2024 February 2027 11,492 - - - 21.16 184,899 Restricted Shares 27 February 2024 February 2029 12,641 - - - 21.16 224,211 Performance Rights 27 February 2023 7 March 2028 8,067 - - - 16.18 94,656 Performance Rights 27 February 2024 February 2029 12,641 - - - 14.26 151,098 L Westcott Restricted Shares 27 February 2024 February 2027 8,889 - - - 21.16 158,805 Restricted Shares 27 February 2024 February 2029 9,778 - - - 21.16 185,907 Performance Rights 27 February 2024 February 2029 9,778 - - - 14.26 125,285 1 For valuation purposes all Performance Rights and Equity Rights are treated as if they will be equity settled. Each Performance Right and Equity Right is a right to receive a fully paid ordinary share in Woodside (or, at the Board’s discretion, as cash equivalent). No amount is payable by the Executive on the grant or vesting of a Performance Right or Equity Right. 2 Vesting date and exercise date are the same. Vesting is subject to satisfaction of vesting conditions. Full details of the vesting conditions for all prior year equity grants to Executive KMP are included in the remuneration report for the relevant year. 3 Vesting of Restricted Shares and Performance Rights granted in 2024 will occur following the release of full-year results in the relevant vesting year. Where the vesting date is not yet known the estimated vesting month is shown. 4 In accordance with the requirements of AASB 2 Share-based Payment, the fair value of Performance Rights and Equity Rights as at their date of grant has been determined by applying the Black-Scholes option pricing technique or binomial valuation method combined with a Monte Carlo simulation. The amount included as remuneration is not indicative of the benefit (if any) that individual Executives may ultimately realise should these equity instruments vest. 5 The fair value of Restricted Shares as at their date of grant has been determined by reference to the share price at acquisition. The fair value is not indicative of the benefit (if any) that individual Executive KMP may ultimately realise should these equity instruments. 6 Fair values for the 2023 EIS with grant date being 27 February 2024 and expected to be 24 April 2024 have been estimated as disclosed in footnote 2 of Table 7. Fair values for the 2022 EIS with grant dates of 27 February 2023 and 28 April 2023 have been trued-up as disclosed in footnote 3 of Table 7. 7 The maximum value of the equity instruments awarded for future financial years has been determined as the fair value amount at grant date multiplied by the number of equity instruments awarded, less what has been amortised to date. The minimum total value of the equity instruments awarded for future financial years is nil if relevant vesting conditions are not satisfied. 8 Ms M O’Neill was granted Performance Rights and Restricted Shares on 28 April 2023 as approved by shareholders at the 2023 Woodside Annual General Meeting under Listing Rule 10.14. The grant of the Performance Rights and Restricted Shares components of Ms O’Neill’s 2023 EIS award is subject to shareholder approval at the 2024 Woodside Annual General Meeting. The grant date for Performance Rights and Restricted Shares is the date of shareholder approval. WOODSIDE ENERGY GROUP LTD 101 Table 13—Total remuneration paid to NEDs in 2023 and 2022 The following table provides a detailed breakdown of the components of remuneration for each of the company’s NEDs.
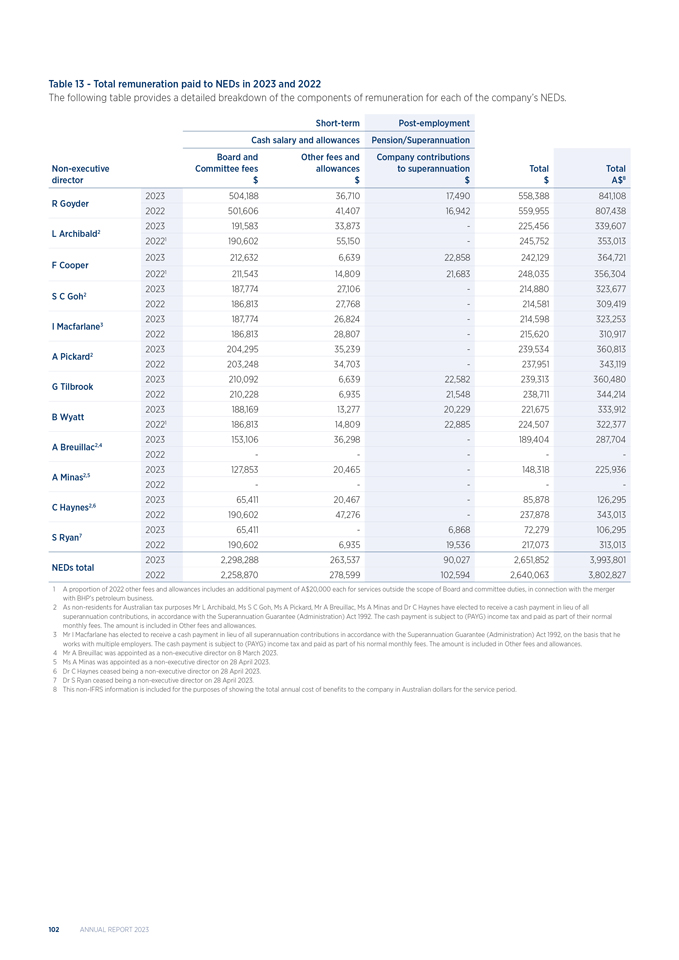
Short-term Post-employment Cash salary and allowances Pension/Superannuation Board and Other fees and Company contributions Non-executive Committee fees allowances to superannuation Total Total director $$$$A$8 2023 504,188 36,710 17,490 558,388 841,108 R Goyder 2022 501,606 41,407 16,942 559,955 807,438 2023 191,583 33,873 - 225,456 339,607 L Archibald2 20221 190,602 55,150 - 245,752 353,013 2023 212,632 6,639 22,858 242,129 364,721 F Cooper 20221 211,543 14,809 21,683 248,035 356,304 2023 187,774 27,106 - 214,880 323,677 S C Goh2 2022 186,813 27,768 - 214,581 309,419 2023 187,774 26,824 - 214,598 323,253 I Macfarlane3 2022 186,813 28,807 - 215,620 310,917 2023 204,295 35,239 - 239,534 360,813 A Pickard2 2022 203,248 34,703 - 237,951 343,119 2023 210,092 6,639 22,582 239,313 360,480 G Tilbrook 2022 210,228 6,935 21,548 238,711 344,214 2023 188,169 13,277 20,229 221,675 333,912 B Wyatt 20221 186,813 14,809 22,885 224,507 322,377 2023 153,106 36,298 - 189,404 287,704 A Breuillac2,4 2022 - - - - - 2023 127,853 20,465 - 148,318 225,936 A Minas2,5 2022 - - - - - 2023 65,411 20,467 - 85,878 126,295 C Haynes2,6 2022 190,602 47,276 - 237,878 343,013 2023 65,411 - 6,868 72,279 106,295 S Ryan7 2022 190,602 6,935 19,536 217,073 313,013 2023 2,298,288 263,537 90,027 2,651,852 3,993,801 NEDs total 2022 2,258,870 278,599 102,594 2,640,063 3,802,827 1 A proportion of 2022 other fees and allowances includes an additional payment of A$20,000 each for services outside the scope of Board and committee duties, in connection with the merger with BHP’s petroleum business. 2 As non-residents for Australian tax purposes Mr L Archibald, Ms S C Goh, Ms A Pickard, Mr A Breuillac, Ms A Minas and Dr C Haynes have elected to receive a cash payment in lieu of all superannuation contributions, in accordance with the Superannuation Guarantee (Administration) Act 1992. The cash payment is subject to (PAYG) income tax and paid as part of their normal monthly fees. The amount is included in Other fees and allowances. 3 Mr I Macfarlane has elected to receive a cash payment in lieu of all superannuation contributions in accordance with the Superannuation Guarantee (Administration) Act 1992, on the basis that he works with multiple employers. The cash payment is subject to (PAYG) income tax and paid as part of his normal monthly fees. The amount is included in Other fees and allowances. 4 Mr A Breuillac was appointed as a non-executive director on 8 March 2023. 5 Ms A Minas was appointed as a non-executive director on 28 April 2023. 6 Dr C Haynes ceased being a non-executive director on 28 April 2023. 7 Dr S Ryan ceased being a non-executive director on 28 April 2023. 8 This non-IFRS information is included for the purposes of showing the total annual cost of benefits to the company in Australian dollars for the service period.
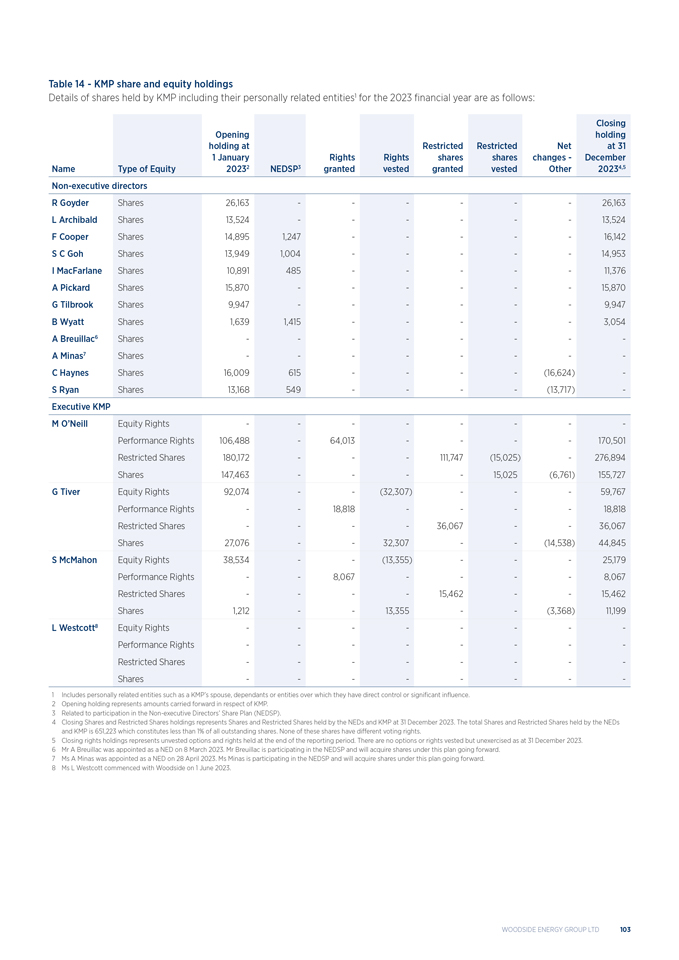
102 ANNUAL REPORT 2023 Table 14—KMP share and equity holdings Details of shares held by KMP including their personally related entities1 for the 2023 financial year are as follows: Closing Opening holding holding at Restricted Restricted Net at 31 1 January Rights Rights shares shares changes - December Name Type of Equity 20232 NEDSP3 granted vested granted vested Other 20234,5 Non-executive directors R Goyder Shares 26,163 - - - - - - 26,163 L Archibald Shares 13,524 - - - - - - 13,524 F Cooper Shares 14,895 1,247 - - - - - 16,142 S C Goh Shares 13,949 1,004 - - - - - 14,953 I MacFarlane Shares 10,891 485 - - - - - 11,376 A Pickard Shares 15,870 - - - - - - 15,870 G Tilbrook Shares 9,947 - - - - - - 9,947 B Wyatt Shares 1,639 1,415 - - - - - 3,054 A Breuillac6 Shares - - - - - - - - A Minas7 Shares - - - - - - - - C Haynes Shares 16,009 615 - - - - (16,624) - S Ryan Shares 13,168 549 - - - - (13,717) - Executive KMP M O’Neill Equity Rights - - - - - - - - Performance Rights 106,488 - 64,013 - - - - 170,501 Restricted Shares 180,172 - - - 111,747 (15,025) - 276,894 Shares 147,463 - - - - 15,025 (6,761) 155,727 G Tiver Equity Rights 92,074 - - (32,307) - - - 59,767 Performance Rights - - 18,818 - - - - 18,818 Restricted Shares - - - - 36,067 - - 36,067 Shares 27,076 - - 32,307 - - (14,538) 44,845 S McMahon Equity Rights 38,534 - - (13,355) - - - 25,179 Performance Rights - - 8,067 - - - - 8,067 Restricted Shares - - - - 15,462 - - 15,462 Shares 1,212 - - 13,355 - - (3,368) 11,199 L Westcott8 Equity Rights - - - - - - - - Performance Rights - - - - - - - - Restricted Shares - - - - - - - - Shares - - - - - - - - 1 Includes personally related entities such as a KMP’s spouse, dependants or entities over which they have direct control or significant influence. 2 Opening holding represents amounts carried forward in respect of KMP. 3 Related to participation in the Non-executive Directors’ Share Plan (NEDSP). 4 Closing Shares and Restricted Shares holdings represents Shares and Restricted Shares held by the NEDs and KMP at 31 December 2023. The total Shares and Restricted Shares held by the NEDs and KMP is 651,223 which constitutes less than 1% of all outstanding shares. None of these shares have different voting rights. 5 Closing rights holdings represents unvested options and rights held at the end of the reporting period. There are no options or rights vested but unexercised as at 31 December 2023. 6 Mr A Breuillac was appointed as a NED on 8 March 2023. Mr Breuillac is participating in the NEDSP and will acquire shares under this plan going forward. 7 Ms A Minas was appointed as a NED on 28 April 2023. Ms Minas is participating in the NEDSP and will acquire shares under this plan going forward. 8 Ms L Westcott commenced with Woodside on 1 June 2023.
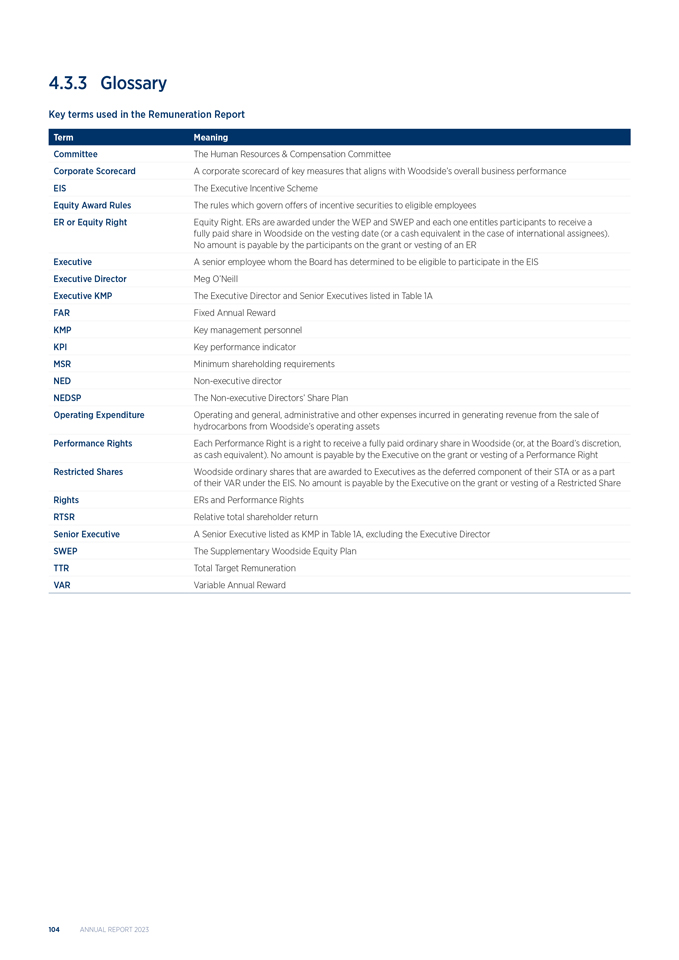
WOODSIDE ENERGY GROUP LTD 103 4.3.3 Glossary Key terms used in the Remuneration Report Term Meaning Committee The Human Resources & Compensation Committee Corporate Scorecard A corporate scorecard of key measures that aligns with Woodside’s overall business performance EIS The Executive Incentive Scheme Equity Award Rules The rules which govern offers of incentive securities to eligible employees ER or Equity Right Equity Right. ERs are awarded under the WEP and SWEP and each one entitles participants to receive a fully paid share in Woodside on the vesting date (or a cash equivalent in the case of international assignees). No amount is payable by the participants on the grant or vesting of an ER Executive A senior employee whom the Board has determined to be eligible to participate in the EIS Executive Director Meg O’Neill Executive KMP The Executive Director and Senior Executives listed in Table 1A FAR Fixed Annual Reward KMP Key management personnel KPI Key performance indicator MSR Minimum shareholding requirements NED Non-executive director NEDSP The Non-executive Directors’ Share Plan Operating Expenditure Operating and general, administrative and other expenses incurred in generating revenue from the sale of hydrocarbons from Woodside’s operating assets Performance Rights Each Performance Right is a right to receive a fully paid ordinary share in Woodside (or, at the Board’s discretion, as cash equivalent). No amount is payable by the Executive on the grant or vesting of a Performance Right Restricted Shares Woodside ordinary shares that are awarded to Executives as the deferred component of their STA or as a part of their VAR under the EIS.
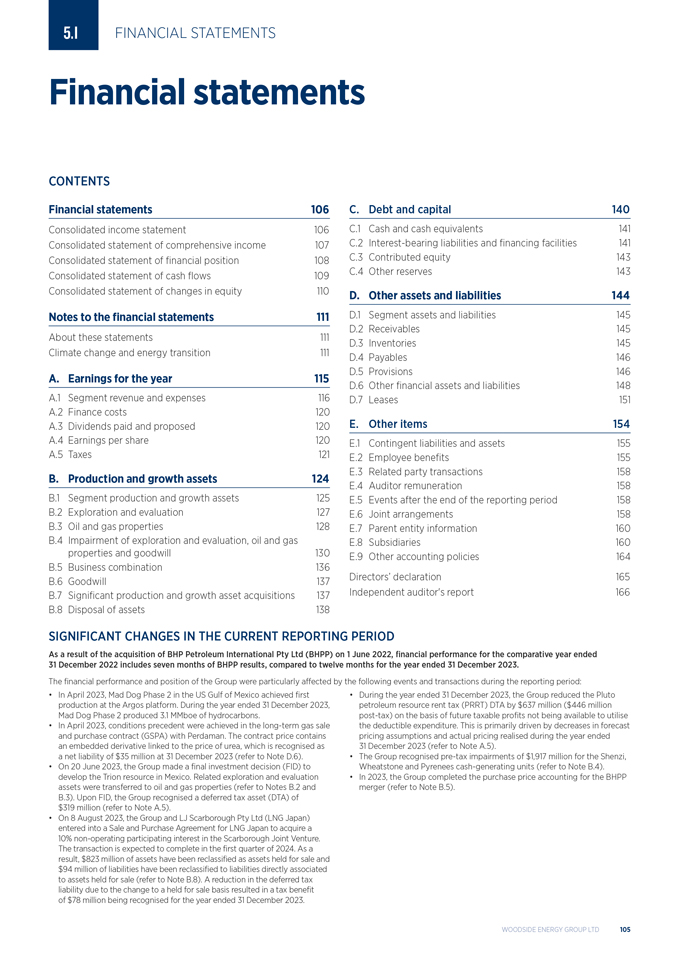
No amount is payable by the Executive on the grant or vesting of a Restricted Share Rights ERs and Performance Rights RTSR Relative total shareholder return Senior Executive A Senior Executive listed as KMP in Table 1A, excluding the Executive Director SWEP The Supplementary Woodside Equity Plan TTR Total Target Remuneration VAR Variable Annual Reward 104 ANNUAL REPORT 2023 5.1 FINANCIAL STATEMENTS Financial statements CONTENTS Financial statements 106 Consolidated income statement 106 Consolidated statement of comprehensive income 107 Consolidated statement of financial position 108 Consolidated statement of cash flows 109 Consolidated statement of changes in equity 110 Notes to the financial statements 111 About these statements 111 Climate change and energy transition 111 A. Earnings for the year 115 A.1 Segment revenue and expenses 116 A.2 Finance costs 120 A.3 Dividends paid and proposed 120 A.4 Earnings per share 120 A.5 Taxes 121 B. Production and growth assets 124 B.1 Segment production and growth assets 125 B.2 Exploration and evaluation 127 B.3 Oil and gas properties 128 B.4 Impairment of exploration and evaluation, oil and gas properties and goodwill 130 B.5 Business combination 136 B.6 Goodwill 137 B.7 Significant production and growth asset acquisitions 137 B.8 Disposal of assets 138 C. Debt and capital 140 C.1 Cash and cash equivalents 141 C.2 Interest-bearing liabilities and financing facilities 141 C.3 Contributed equity 143 C.4 Other reserves 143 D. Other assets and liabilities 144 D.1 Segment assets and liabilities 145 D.2 Receivables 145 D.3 Inventories 145 D.4 Payables 146 D.5 Provisions 146 D.6 Other financial assets and liabilities 148 D.7 Leases 151 E. Other items 154 E.1 Contingent liabilities and assets 155 E.2 Employee benefits 155 E.3 Related party transactions 158 E.4 Auditor remuneration 158 E.5 Events after the end of the reporting period 158 E.6 Joint arrangements 158 E.7 Parent entity information 160 E.8 Subsidiaries 160 E.9 Other accounting policies 164 Directors’ declaration 165 Independent auditor’s report 166 SIGNIFICANT CHANGES IN THE CURRENT REPORTING PERIOD As a result of the acquisition of BHP Petroleum International Pty Ltd (BHPP) on 1 June 2022, financial performance for the comparative year ended 31 December 2022 includes seven months of BHPP results, compared to twelve months for the year ended 31 December 2023. The financial performance and position of the Group were particularly affected by the following events and transactions during the reporting period: • In April 2023, Mad Dog Phase 2 in the US Gulf of Mexico achieved first production at the Argos platform. During the year ended 31 December 2023, Mad Dog Phase 2 produced 3.1 MMboe of hydrocarbons. • In April 2023, conditions precedent were achieved in the long-term gas sale and purchase contract (GSPA) with Perdaman. The contract price contains an embedded derivative linked to the price of urea, which is recognised as a net liability of $35 million at 31 December 2023 (refer to Note D.6). • On 20 June 2023, the Group made a final investment decision (FID) to develop the Trion resource in Mexico. Related exploration and evaluation assets were transferred to oil and gas properties (refer to Notes B.2 and B.3). Upon FID, the Group recognised a deferred tax asset (DTA) of $319 million (refer to Note A.5). • On 8 August 2023, the Group and LJ Scarborough Pty Ltd (LNG Japan) entered into a Sale and Purchase Agreement for LNG Japan to acquire a 10% non-operating participating interest in the Scarborough Joint Venture. The transaction is expected to complete in the first quarter of 2024. As a result, $823 million of assets have been reclassified as assets held for sale and $94 million of liabilities have been reclassified to liabilities directly associated to assets held for sale (refer to Note B.8). A reduction in the deferred tax liability due to the change to a held for sale basis resulted in a tax benefit of $78 million being recognised for the year ended 31 December 2023. • During the year ended 31 December 2023, the Group reduced the Pluto petroleum resource rent tax (PRRT) DTA by $637 million ($446 million post-tax) on the basis of future taxable profits not being available to utilise the deductible expenditure. This is primarily driven by decreases in forecast pricing assumptions and actual pricing realised during the year ended 31 December 2023 (refer to Note A.5). • The Group recognised pre-tax impairments of $1,917 million for the Shenzi, Wheatstone and Pyrenees cash-generating units (refer to Note B.4). • In 2023, the Group completed the purchase price accounting for the BHPP merger (refer to Note B.5).
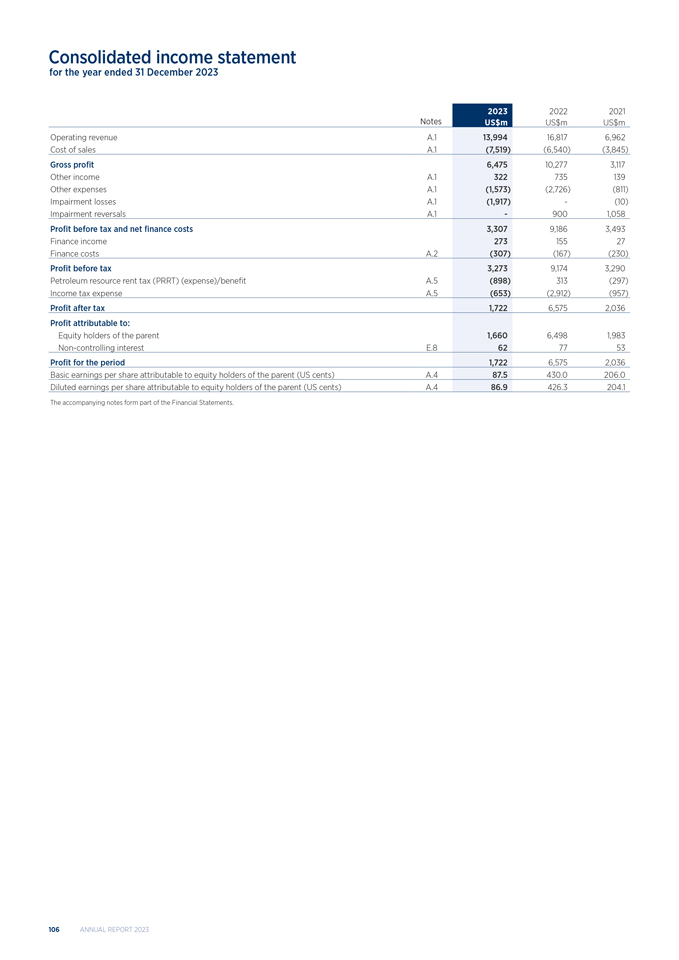
WOODSIDE ENERGY GROUP LTD 105 Consolidated income statement for the year ended 31 December 2023 2023 2022 2021 Notes US$m US$m US$m Operating revenue A.1 13,994 16,817 6,962 Cost of sales A.1 (7,519) (6,540) (3,845) Gross profit 6,475 10,277 3,117 Other income A.1 322 735 139 Other expenses A.1 (1,573) (2,726) (811) Impairment losses A.1 (1,917) - (10) Impairment reversals A.1 - 900 1,058 Profit before tax and net finance costs 3,307 9,186 3,493 Finance income 273 155 27 Finance costs A.2 (307) (167) (230) Profit before tax 3,273 9,174 3,290 Petroleum resource rent tax (PRRT) (expense)/benefit A.5 (898) 313 (297) Income tax expense A.5 (653) (2,912) (957) Profit after tax 1,722 6,575 2,036 Profit attributable to: Equity holders of the parent 1,660 6,498 1,983 Non-controlling interest E.8 62 77 53 Profit for the period 1,722 6,575 2,036 Basic earnings per share attributable to equity holders of the parent (US cents) A.4 87.5 430.0 206.0 Diluted earnings per share attributable to equity holders of the parent (US cents) A.4 86.9 426.3 204.1 The accompanying notes form part of the Financial Statements. 106 ANNUAL REPORT 2023 Notes to the financial statements for the year ended 31 December 2023 ABOUT THESE STATEMENTS Woodside Energy Group Ltd and its controlled entities (Woodside or the Group) is a for-profit entity limited by shares, incorporated and domiciled in Australia.
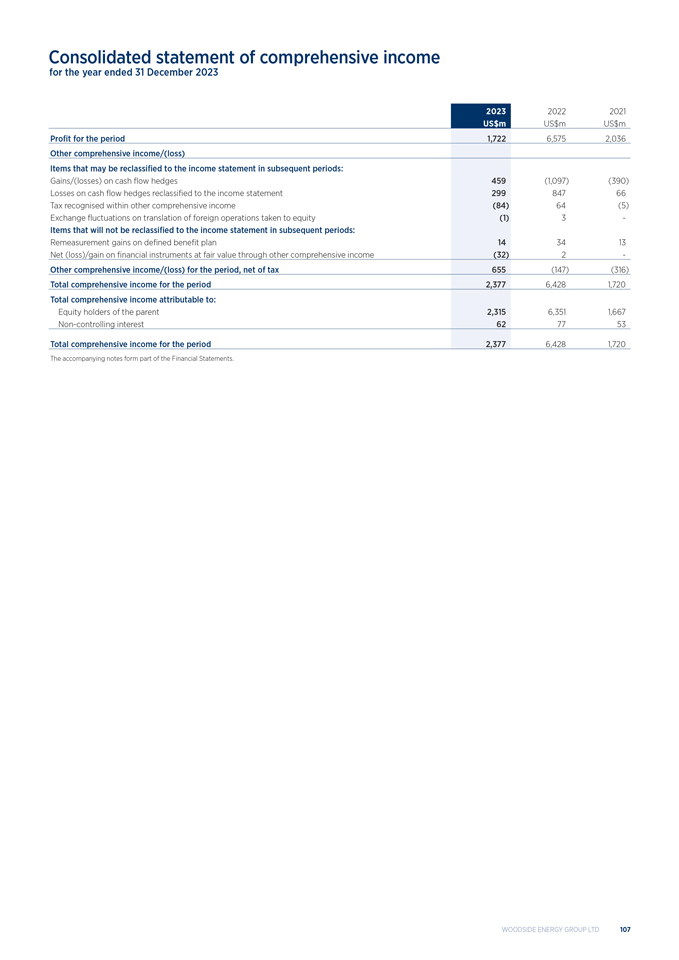
Consolidated statement of comprehensive income for the year ended 31 December 2023 2023 2022 2021 US$m US$m US$m Profit for the period 1,722 6,575 2,036 Other comprehensive income/(loss) Items that may be reclassified to the income statement in subsequent periods: Gains/(losses) on cash flow hedges 459 (1,097) (390) Losses on cash flow hedges reclassified to the income statement 299 847 66 Tax recognised within other comprehensive income (84) 64 (5) Exchange fluctuations on translation of foreign operations taken to equity (1) 3 - Items that will not be reclassified to the income statement in subsequent periods: Remeasurement gains on defined benefit plan 14 34 13 Net (loss)/gain on financial instruments at fair value through other comprehensive income (32) 2 - Other comprehensive income/(loss) for the period, net of tax 655 (147) (316) Total comprehensive income for the period 2,377 6,428 1,720 Total comprehensive income attributable to: Equity holders of the parent 2,315 6,351 1,667 Non-controlling interest 62 77 53 Total comprehensive income for the period 2,377 6,428 1,720 The accompanying notes form part of the Financial Statements. WOODSIDE ENERGY GROUP LTD 107
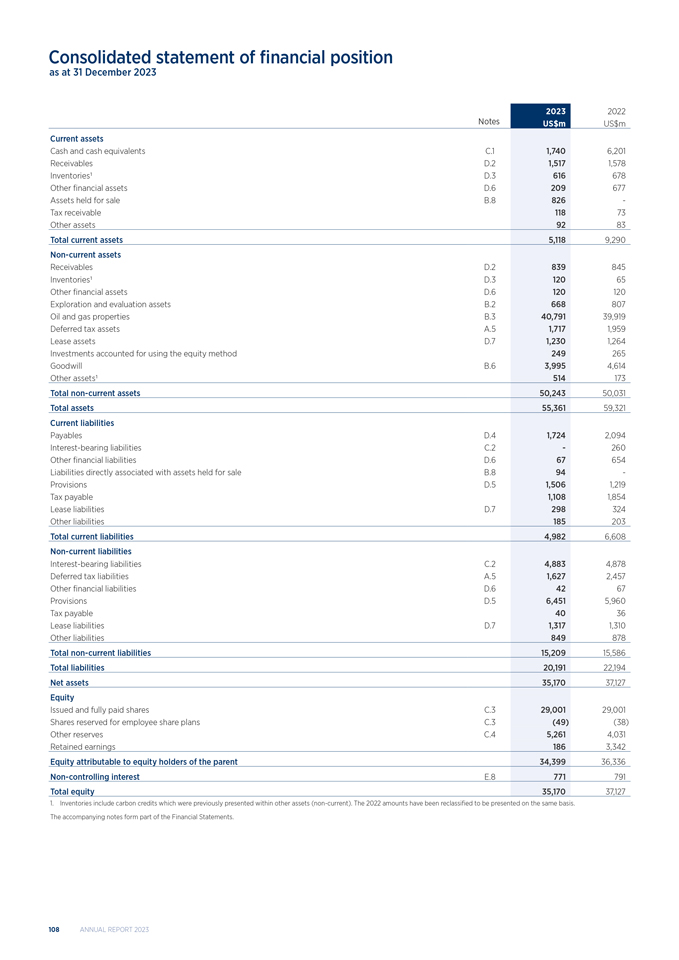
Consolidated statement of financial position as at 31 December 2023 2023 2022 Notes US$m US$m Current assets Cash and cash equivalents C.1 1,740 6,201 Receivables D.2 1,517 1,578 Inventories1 D.3 616 678 Other financial assets D.6 209 677 Assets held for sale B.8 826 - Tax receivable 118 73 Other assets 92 83 Total current assets 5,118 9,290 Non-current assets Receivables D.2 839 845 Inventories1 D.3 120 65 Other financial assets D.6 120 120 Exploration and evaluation assets B.2 668 807 Oil and gas properties B.3 40,791 39,919 Deferred tax assets A.5 1,717 1,959 Lease assets D.7 1,230 1,264 Investments accounted for using the equity method 249 265 Goodwill B.6 3,995 4,614 Other assets1 514 173 Total non-current assets 50,243 50,031 Total assets 55,361 59,321 Current liabilities Payables D.4 1,724 2,094 Interest-bearing liabilities C.2 - 260 Other financial liabilities D.6 67 654 Liabilities directly associated with assets held for sale B.8 94 - Provisions D.5 1,506 1,219 Tax payable 1,108 1,854 Lease liabilities D.7 298 324 Other liabilities 185 203 Total current liabilities 4,982 6,608 Non-current liabilities Interest-bearing liabilities C.2 4,883 4,878 Deferred tax liabilities A.5 1,627 2,457 Other financial liabilities D.6 42 67 Provisions D.5 6,451 5,960 Tax payable 40 36 Lease liabilities D.7 1,317 1,310 Other liabilities 849 878 Total non-current liabilities 15,209 15,586 Total liabilities 20,191 22,194 Net assets 35,170 37,127 Equity Issued and fully paid shares C.3 29,001 29,001 Shares reserved for employee share plans C.3 (49) (38) Other reserves C.4 5,261 4,031 Retained earnings 186 3,342 Equity attributable to equity holders of the parent 34,399 36,336 Non-controlling interest E.8 771 791 Total equity 35,170 37,127 1. Inventories include carbon credits which were previously presented within other assets (non-current). The 2022 amounts have been reclassified to be presented on the same basis. The accompanying notes form part of the Financial Statements. 108 ANNUAL REPORT 2023
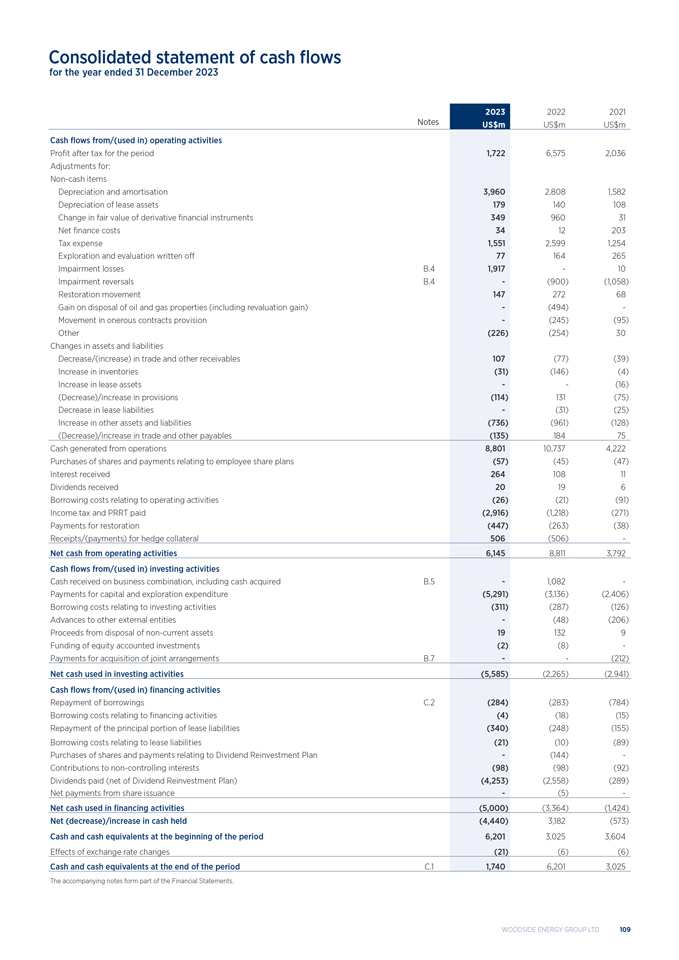
Consolidated statement of cash flows for the year ended 31 December 2023 2023 2022 2021 Notes US$m US$m US$m Cash flows from/(used in) operating activities Profit after tax for the period 1,722 6,575 2,036 Adjustments for: Non-cash items Depreciation and amortisation 3,960 2,808 1,582 Depreciation of lease assets 179 140 108 Change in fair value of derivative financial instruments 349 960 31 Net finance costs 34 12 203 Tax expense 1,551 2,599 1,254 Exploration and evaluation written off 77 164 265 Impairment losses B.4 1,917 - 10 Impairment reversals B.4 - (900) (1,058) Restoration movement 147 272 68 Gain on disposal of oil and gas properties (including revaluation gain) - (494) - Movement in onerous contracts provision - (245) (95) Other (226) (254) 30 Changes in assets and liabilities Decrease/(increase) in trade and other receivables 107 (77) (39) Increase in inventories (31) (146) (4) Increase in lease assets - - (16) (Decrease)/increase in provisions (114) 131 (75) Decrease in lease liabilities - (31) (25) Increase in other assets and liabilities (736) (961) (128) (Decrease)/increase in trade and other payables (135) 184 75 Cash generated from operations 8,801 10,737 4,222 Purchases of shares and payments relating to employee share plans (57) (45) (47) Interest received 264 108 11 Dividends received 20 19 6 Borrowing costs relating to operating activities (26) (21) (91) Income tax and PRRT paid (2,916) (1,218) (271) Payments for restoration (447) (263) (38) Receipts/(payments) for hedge collateral 506 (506) - Net cash from operating activities 6,145 8,811 3,792 Cash flows from/(used in) investing activities Cash received on business combination, including cash acquired B.5 - 1,082 - Payments for capital and exploration expenditure (5,291) (3,136) (2,406) Borrowing costs relating to investing activities (311) (287) (126) Advances to other external entities - (48) (206) Proceeds from disposal of non-current assets 19 132 9 Funding of equity accounted investments (2) (8) - Payments for acquisition of joint arrangements B.7 - - (212) Net cash used in investing activities (5,585) (2,265) (2,941) Cash flows from/(used in) financing activities Repayment of borrowings C.2 (284) (283) (784) Borrowing costs relating to financing activities (4) (18) (15) Repayment of the principal portion of lease liabilities (340) (248) (155) Borrowing costs relating to lease liabilities (21) (10) (89) Purchases of shares and payments relating to Dividend Reinvestment Plan - (144) - Contributions to non-controlling interests (98) (98) (92) Dividends paid (net of Dividend Reinvestment Plan) (4,253) (2,558) (289) Net payments from share issuance - (5) - Net cash used in financing activities (5,000) (3,364) (1,424) Net (decrease)/increase in cash held (4,440) 3,182 (573) Cash and cash equivalents at the beginning of the period 6,201 3,025 3,604 Effects of exchange rate changes (21) (6) (6) Cash and cash equivalents at the end of the period C.1 1,740 6,201 3,025 The accompanying notes form part of the Financial Statements. WOODSIDE ENERGY GROUP LTD 109
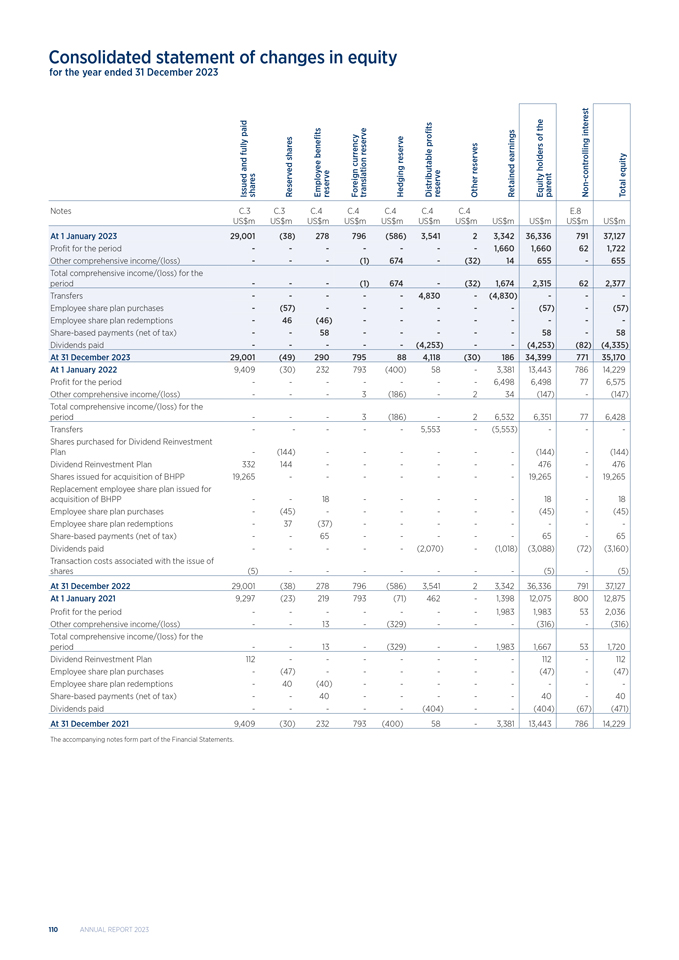
Consolidated statement of changes in equity for the year ended 31 December 2023 paid the interest fully shares benefits currency reserve reserve profits earnings of and equity Issuedshares Reserved Employeereserve Foreigntranslation Hedging Distributablereserve Other reserves Retained Equity holders parent Non—controlling Total Notes C.3 C.3 C.4 C.4 C.4 C.4 C.4 E.8 US$m US$m US$m US$m US$m US$m US$m US$m US$m US$m US$m At 1 January 2023 29,001 (38) 278 796 (586) 3,541 2 3,342 36,336 791 37,127 Profit for the period - - - - - - - 1,660 1,660 62 1,722 Other comprehensive income/(loss) - - - (1) 674 - (32) 14 655 - 655 Total comprehensive income/(loss) for the period - - - (1) 674 - (32) 1,674 2,315 62 2,377 Transfers - - - - - 4,830 - (4,830) - - - Employee share plan purchases - (57) - - - - - - (57) - (57) Employee share plan redemptions - 46 (46) - - - - - - - - Share-based payments (net of tax) - - 58 - - - - - 58 - 58 Dividends paid - - - - - (4,253) - - (4,253) (82) (4,335) At 31 December 2023 29,001 (49) 290 795 88 4,118 (30) 186 34,399 771 35,170 At 1 January 2022 9,409 (30) 232 793 (400) 58 - 3,381 13,443 786 14,229 Profit for the period - - - - - - - 6,498 6,498 77 6,575 Other comprehensive income/(loss) - - - 3 (186) - 2 34 (147) - (147) Total comprehensive income/(loss) for the period - - - 3 (186) - 2 6,532 6,351 77 6,428 Transfers - - - - - 5,553 - (5,553) - - - Shares purchased for Dividend Reinvestment Plan - (144) - - - - - - (144) - (144) Dividend Reinvestment Plan 332 144 - - - - - - 476 - 476 Shares issued for acquisition of BHPP 19,265 - - - - - - - 19,265 - 19,265 Replacement employee share plan issued for acquisition of BHPP - - 18 - - - - - 18 - 18 Employee share plan purchases - (45) - - - - - - (45) - (45) Employee share plan redemptions - 37 (37) - - - - - - - - Share-based payments (net of tax) - - 65 - - - - - 65 - 65 Dividends paid - - - - - (2,070) - (1,018) (3,088) (72) (3,160) Transaction costs associated with the issue of shares (5) - - - - - - - (5) - (5) At 31 December 2022 29,001 (38) 278 796 (586) 3,541 2 3,342 36,336 791 37,127 At 1 January 2021 9,297 (23) 219 793 (71) 462 - 1,398 12,075 800 12,875 Profit for the period - - - - - - - 1,983 1,983 53 2,036 Other comprehensive income/(loss) - - 13 - (329) - - - (316) - (316) Total comprehensive income/(loss) for the period - - 13 - (329) - - 1,983 1,667 53 1,720 Dividend Reinvestment Plan 112 - - - - - - - 112 - 112 Employee share plan purchases - (47) - - - - - - (47) - (47) Employee share plan redemptions - 40 (40) - - - - - - - - Share-based payments (net of tax) - - 40 - - - - - 40 - 40 Dividends paid - - - - - (404) - - (404) (67) (471) At 31 December 2021 9,409 (30) 232 793 (400) 58 - 3,381 13,443 786 14,229 The accompanying notes form part of the Financial Statements. 110 ANNUAL REPORT 2023
Its shares are publicly traded on the Australian Securities Exchange (ASX), on the Main Market for listed securities of the London Stock Exchange (LSE) (with trades settled in the form of UK Depository Interests) and on the New York Stock Exchange (NYSE) (in the form of Woodside American Depositary Shares). The nature of the operations and the principal activities of the Group are described in the Directors’ Report and in the segment information in Note A.1. The financial statements were authorised for issue in accordance with a resolution of the Directors on 27 February 2024. Statement of compliance The financial statements are general purpose financial statements, which have been prepared in accordance with the requirements of the Corporations Act 2001, Australian Accounting Standards and other authoritative pronouncements of the Australian Accounting Standards Board (AASB). The financial statements comply with International Financial Reporting Standards (IFRS) as issued by the International Accounting Standards Board. They also include additional disclosures required for foreign registrants by the United States Securities and Exchange Commission (US SEC). The Group’s accounting policies are consistent with those disclosed in the Group’s 2022 Financial Statements. Adoption of new or amended standards and interpretations effective 1 January 2023 did not result in any significant changes to the Group’s accounting policies. Estimates have been revised, where required, to reflect current market conditions including the impact of climate change. Updated assumptions used for depreciation methodology and asset useful lives, impairment assessments, business combinations and restoration obligations are disclosed in Notes B.3, B.4, B.5 and D.5 respectively; these assumptions could change in the future. New estimates and judgements relating to the sell-down of the Scarborough joint venture and an embedded commodity derivative are disclosed in Notes B.8 and D.6 respectively. Currency The functional and presentation currency of Woodside and all its material subsidiaries is the US dollar. Transactions in foreign currencies are initially recorded in the functional currency of the transacting entity at the exchange rates ruling at the date of transaction. Monetary assets and liabilities denominated in foreign currencies at the reporting date are translated at the rates of exchange ruling at that date. Exchange differences in the consolidated financial statements are taken to the income statement. Rounding of amounts The amounts contained in these financial statements have been rounded to the nearest million dollars under the option available to the Group under Australian Securities and Investments Commission (ASIC) Corporations (Rounding in Financial/ Directors’ Reports) Instrument 2016/191, unless otherwise stated. Basis of preparation The financial statements have been prepared on a historical cost basis, except for derivative financial instruments and certain other financial assets and financial liabilities, which have been measured at fair value or amortised cost adjusted for changes in fair value attributable to the risks that are being hedged in effective hedge relationships. Where not carried at fair value, if the carrying value of financial assets and financial liabilities does not approximate their fair value, the fair value has been included in the notes to the financial statements. The financial statements comprise the financial position and results of the Group as at and for the year ended 31 December 2023 (refer to Note E.8). Subsidiaries are fully consolidated from the date on which control is obtained by the Group and cease to be consolidated from the date at which the Group ceases to have control. The material subsidiaries of the Group apply the same reporting period and accounting policies as the parent company in their financial statements. All intercompany balances and transactions, including unrealised profits and losses arising from intra-group transactions, have been eliminated in full. Non-controlling interests are allocated their share of the net profit after tax in the consolidated income statement and their share of other comprehensive income net of tax in the consolidated statement of comprehensive income, and are presented within equity in the consolidated statement of financial position, separately from parent shareholders’ equity. The consolidated financial statements provide comparative information in respect of the previous periods. Where required, a reclassification of items in the financial statements of the previous periods has been made in accordance with the classification of items in the financial statements of the current period. CLIMATE CHANGE AND ENERGY TRANSITION Climate considerations Woodside has considered the impact of climate and the energy transition in assessing the carrying values of its assets and liabilities. This note describes climate-related assumptions that underpin key areas of the financial statements and the potential short-term and long-term impacts differing scenarios could have on the financial results and financial position of Woodside. WOODSIDE ENERGY GROUP LTD 111
Notes to the financial statements for the year ended 31 December 2023 CLIMATE CHANGE AND ENERGY TRANSITION (CONT.) Financial planning and assumptions Woodside considers a range of climate and macroeconomic scenarios to help benchmark our long-term price assumptions and inform our decision-making to maintain a resilient financial position. These scenarios are informed by a wide range of externally published data, including Paris-aligned and non-Paris-aligned outcomes, and are part of a broad consideration of risks, opportunities, competitiveness and resilience. The assumptions applied in assessing amounts within the financial statements require significant judgement and are in each case calculated in accordance with the requirements of the applicable accounting standards. Our long-term price assumptions reflect management’s current ‘best estimate’ scenario in which global governments pursue decarbonisation goals as well as other goals such as energy security and economic development. Price assumptions consider current legislation in the locations where Woodside operates and place some weight on scenarios in which the transition to a lower carbon energy system is sufficiently rapid to meet the goals of the Paris Agreement, as well as scenarios in which the transition is not, or may not be, sufficiently rapid. They also place some weight on a range of other assumptions which can drive prices (e.g. inflation) and which are not related to the Paris goals. Woodside’s facilities are subject to physical risks such as oceanic conditions and are located in regions that experience tropical cyclones, hurricanes and high ambient temperatures. Woodside has significant experience designing and operating facilities located in challenging environments. The high degree of uncertainty around the nature, timing and magnitude of climate-related risks, and the uncertainty as to how the energy transition will evolve, makes it difficult to determine the risks and their potential impacts with precision. Woodside continues to monitor the uncertainty around climate change risks and expects to take into account ongoing developments into its assumptions, including assumptions concerning commodity and carbon pricing, as considered appropriate. Oil and gas investment cases include a carbon price assumption which takes into consideration uncertainty around the impact of climate change. Commodity pricing assumptions are key value drivers with greater significance to assets and liabilities than carbon pricing. Impairment of exploration and evaluation, oil and gas properties and goodwill In accordance with the Group’s accounting policies and applicable accounting standards, elements of Woodside’s financial statements are based on reasonable and supportable assumptions that represent management’s current best estimate of the range of economic conditions that may exist in the foreseeable future. The estimation of recoverable amounts for impairment testing includes estimating what an independent market participant would pay to acquire the asset as at the reporting date. Market participants will be guided by their own views on future economic and technical conditions and therefore Woodside considers a range of data sources in determining a future price forecast, including industry and market benchmarks along with asset sales transaction data to support the recoverable amount. The sale of the 10% non-operating participating interest in the Scarborough Joint Venture to LNG Japan announced in August 2023 is a clear example of an independent market valuation fully supporting the carrying value of the multi-decade asset. Price forecasts are adjusted for premiums and discounts based on the nature and quality of the product. Commodity oil price estimates have considered the impacts of climate policies along with other factors such as industry investment and cost trends. There remains significant uncertainty around how society will respond to the climate challenge. The energy transition is expected to bring volatility and there is uncertainty as to how commodity prices will develop. The IEA’s World Energy Outlook 2023 (WEO) explores three main climate change scenarios. The IEA scenarios are not predictions and the IEA does not have a single view on the future of the energy system. There is significant uncertainty as to whether any of these scenarios will eventuate. Because Woodside considers what a market participant would pay to acquire an asset in assessing impairments, these external scenarios are not necessarily consistent with the pricing assumptions used for the Group’s impairment assessment as disclosed in Table A below and Note B.4. 112 ANNUAL REPORT 2023
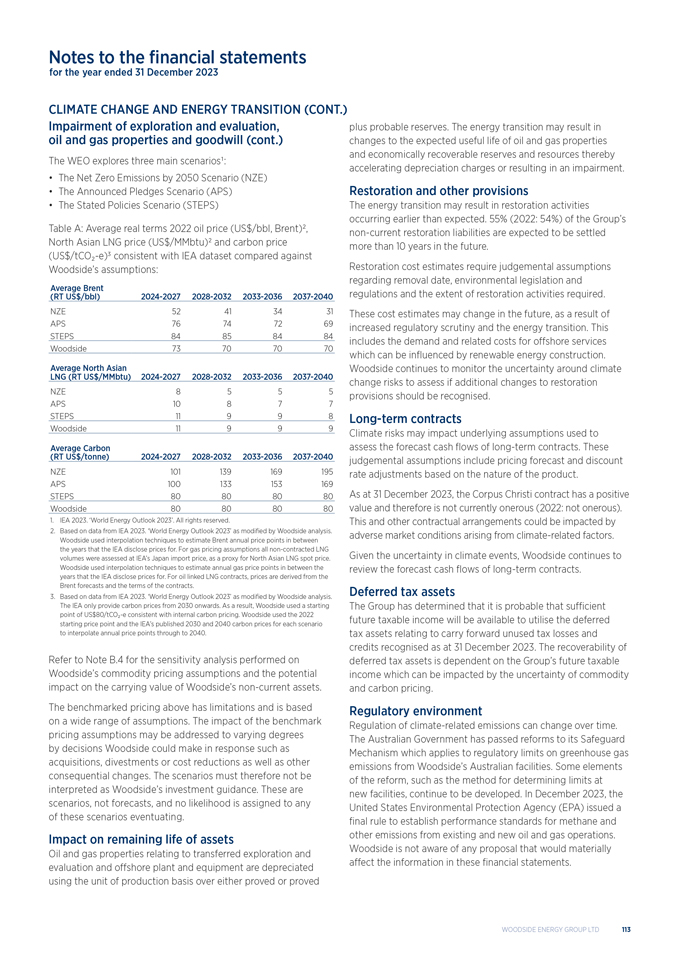
Notes to the financial statements for the year ended 31 December 2023 CLIMATE CHANGE AND ENERGY TRANSITION (CONT.) Impairment of exploration and evaluation, oil and gas properties and goodwill (cont.) The WEO explores three main scenarios1: • The Net Zero Emissions by 2050 Scenario (NZE) • The Announced Pledges Scenario (APS) • The Stated Policies Scenario (STEPS) Table A: Average real terms 2022 oil price (US$/bbl, Brent)2, North Asian LNG price (US$/MMbtu)2 and carbon price (US$/tCOâ,,-e)3 consistent with IEA dataset compared against Woodside’s assumptions: Average Brent (RT US$/bbl) 2024-2027 2028-2032 2033-2036 2037-2040 NZE 52 41 34 31 APS 76 74 72 69 STEPS 84 85 84 84 Woodside 73 70 70 70 Average North Asian LNG (RT US$/MMbtu) 2024-2027 2028-2032 2033-2036 2037-2040 NZE 8 5 5 5 APS 10 8 7 7 STEPS 11 9 9 8 Woodside 11 9 9 9 Average Carbon (RT US$/tonne) 2024-2027 2028-2032 2033-2036 2037-2040 NZE 101 139 169 195 APS 100 133 153 169 STEPS 80 80 80 80 Woodside 80 80 80 80 1. IEA 2023. ‘World Energy Outlook 2023’. All rights reserved. 2. Based on data from IEA 2023. ‘World Energy Outlook 2023’ as modified by Woodside analysis. Woodside used interpolation techniques to estimate Brent annual price points in between the years that the IEA disclose prices for. For gas pricing assumptions all non-contracted LNG volumes were assessed at IEA’s Japan import price, as a proxy for North Asian LNG spot price. Woodside used interpolation techniques to estimate annual gas price points in between the years that the IEA disclose prices for. For oil linked LNG contracts, prices are derived from the Brent forecasts and the terms of the contracts. 3. Based on data from IEA 2023. ‘World Energy Outlook 2023’ as modified by Woodside analysis. The IEA only provide carbon prices from 2030 onwards. As a result, Woodside used a starting point of US$80/tCOâ,,-e consistent with internal carbon pricing. Woodside used the 2022 starting price point and the IEA’s published 2030 and 2040 carbon prices for each scenario to interpolate annual price points through to 2040. Refer to Note B.4 for the sensitivity analysis performed on Woodside’s commodity pricing assumptions and the potential impact on the carrying value of Woodside’s non-current assets. The benchmarked pricing above has limitations and is based on a wide range of assumptions. The impact of the benchmark pricing assumptions may be addressed to varying degrees by decisions Woodside could make in response such as acquisitions, divestments or cost reductions as well as other consequential changes. The scenarios must therefore not be interpreted as Woodside’s investment guidance. These are scenarios, not forecasts, and no likelihood is assigned to any of these scenarios eventuating. Impact on remaining life of assets Oil and gas properties relating to transferred exploration and evaluation and offshore plant and equipment are depreciated using the unit of production basis over either proved or proved plus probable reserves. The energy transition may result in changes to the expected useful life of oil and gas properties and economically recoverable reserves and resources thereby accelerating depreciation charges or resulting in an impairment. Restoration and other provisions The energy transition may result in restoration activities occurring earlier than expected. 55% (2022: 54%) of the Group’s non-current restoration liabilities are expected to be settled more than 10 years in the future. Restoration cost estimates require judgemental assumptions regarding removal date, environmental legislation and regulations and the extent of restoration activities required. These cost estimates may change in the future, as a result of increased regulatory scrutiny and the energy transition. This includes the demand and related costs for offshore services which can be influenced by renewable energy construction. Woodside continues to monitor the uncertainty around climate change risks to assess if additional changes to restoration provisions should be recognised. Long-term contracts Climate risks may impact underlying assumptions used to assess the forecast cash flows of long-term contracts. These judgemental assumptions include pricing forecast and discount rate adjustments based on the nature of the product. As at 31 December 2023, the Corpus Christi contract has a positive value and therefore is not currently onerous (2022: not onerous). This and other contractual arrangements could be impacted by adverse market conditions arising from climate-related factors. Given the uncertainty in climate events, Woodside continues to review the forecast cash flows of long-term contracts. Deferred tax assets The Group has determined that it is probable that sufficient future taxable income will be available to utilise the deferred tax assets relating to carry forward unused tax losses and credits recognised as at 31 December 2023. The recoverability of deferred tax assets is dependent on the Group’s future taxable income which can be impacted by the uncertainty of commodity and carbon pricing. Regulatory environment Regulation of climate-related emissions can change over time. The Australian Government has passed reforms to its Safeguard Mechanism which applies to regulatory limits on greenhouse gas emissions from Woodside’s Australian facilities. Some elements of the reform, such as the method for determining limits at new facilities, continue to be developed. In December 2023, the United States Environmental Protection Agency (EPA) issued a final rule to establish performance standards for methane and other emissions from existing and new oil and gas operations. Woodside is not aware of any proposal that would materially affect the information in these financial statements. WOODSIDE ENERGY GROUP LTD 113
Notes to the financial statements for the year ended 31 December 2023 Financial and capital risk management The Board of Directors has overall responsibility for the establishment and oversight of the Group’s risk management framework, including review and approval of the Group’s risk management strategy, policy and key risk parameters. The Board of Directors and the Audit and Risk Committee have oversight of the Group’s internal control system and risk management process, including oversight of the internal audit function. The Group’s management of financial and capital risks is aimed at ensuring that available capital, funding and cash flows are sufficient to: • meet the Group’s financial commitments as and when they fall due; • maintain the capacity to fund its committed project developments; • pay a reasonable dividend; and • maintain a long-term credit rating of not less than ‘investment grade’. The Group monitors and tests its forecast financial position against these criteria and, in general, will undertake hedging activity when necessary to ensure that these objectives are achieved. Other circumstances that may lead to hedging include the management of exposures relating to trading activities. It is, and has been throughout the period, the Group Treasury policy that no speculative trading in financial instruments shall be undertaken. Refer to section 3.9—Risk factors for more information on the Group’s objectives, policies and processes for managing financial risk. The below risks arise in the normal course of the Group’s business. Risk information can be found in the following sections: Section A Commodity price risk management Page 115 Section A Foreign exchange risk management Page 115 Section C Capital risk management Page 140 Section C Liquidity risk management Page 140 Section C Interest rate risk management Page 140 Section D Credit risk management Page 144 Key estimates and judgements In applying the Group’s accounting policies, management regularly evaluates judgements, estimates and assumptions based on experience and other factors, including expectations of future events that may have an impact on the Group. All judgements, estimates and assumptions made are believed to be reasonable based on the most current set of circumstances known to management, and actual results may differ. Significant judgements, estimates and assumptions made by management in the preparation of these financial statements are found in the following notes: Note A.1 Revenue from contracts with customers Page 116 Note A.5 Taxes Page 121 Note B.2 Exploration and evaluation Page 127 Note B.3 Oil and gas properties Page 128 Note B.4 Impairment of exploration and evaluation, Page 130 oil and gas properties and goodwill Note B.5 Business combination Page 136 Note B.6 Goodwill Page 137 Note B.7 Significant production and growth asset Page 137 acquisitions Note B.8 Disposal of assets Page 138 Note D.5 Provisions Page 146 Note D.6 Other financial assets and liabilities Page 148 Note D.7 Leases Page 151 Note E.6 Joint arrangements Page 158 114 ANNUAL REPORT 2023
Notes to the financial statements A. Earnings for the year for the year ended 31 December 2023 IN THIS SECTION This section addresses financial performance of the Group for the reporting period including, where applicable, the accounting policies applied and the key estimates and judgements made. This section also includes the tax position of the Group for and at the end of the reporting period. A. Earnings for the year A.1 Segment revenue and expenses Page 116 A.2 Finance costs Page 120 A.3 Dividends paid and proposed Page 120 A.4 Earnings per share Page 120 A.5 Taxes Page 121 KEY FINANCIAL AND CAPITAL RISKS IN THIS SECTION Commodity price risk management The Group’s revenue is exposed to commodity price fluctuations through the sale of hydrocarbons. Commodity price risks are measured by monitoring and stress testing the Group’s forecast financial position to sustained periods of low oil and gas prices. This analysis is regularly performed on the Group’s portfolio and as required for discrete projects and transactions. The Group’s management of commodity price risk includes the use of commodity derivatives to hedge its exposure (refer to Note D.6). The hedged exposure includes oil-linked revenue related to produced volumes and revenues derived from trading operations. Commodity derivatives protect the Group against downside price risk within its corporate and trading portfolios. As at the reporting date, the Group held commodity hedging financial instruments with a net asset carrying value of $123 million (2022: $557 million net liability) exposed to commodity price risk. An increase in relevant commodity prices of 10% would decrease the instruments’ carrying value by $172 million, the effect of which would be recognised within reserves and/or the income statement in accordance with hedge accounting application. A 10% decrease would have the same but opposite effect. This analysis assumes that all other variables remain constant (including the price on underlying physical exposures). Foreign exchange risk management Foreign exchange risk arises from future commitments, financial assets and financial liabilities that are not denominated in US dollars. The majority of the Group’s revenue is denominated in US dollars. The Group is exposed to foreign currency risk arising from operating and capital expenditure incurred in currencies other than US dollars, particularly Australian dollars. The Group’s management of foreign exchange risk relating to capital expenditure includes the use of forward exchange contract derivatives to hedge its exposure (refer to Note D.6). The Group entered into foreign exchange forward contracts to fix the Australian dollar to US dollar exchange rate in relation to a portion of the Australian dollar denominated capital expenditure incurred or expected to be incurred under the Scarborough development (refer to Note D.6). Through the use of foreign exchange forward contracts, the Group also hedged its Australian dollar to US dollar exchange rate exposure in relation to the Australian dollar denominated tax payments which have matured. As at the reporting date, the Group held hedging foreign currency financial instruments with a net asset carrying value of $8 million (2022: net liability carrying value of $17 million) exposed to foreign exchange risk. Measuring the exposure to foreign exchange risk is achieved by regularly monitoring and performing sensitivity analysis on the Group’s financial position. A reasonably possible change in the exchange rate of the US dollar to the Australian dollar (+12%/-12% (2022: +12%/-12%)), with all other variables held constant, would not have a material impact on the Group’s equity or the income statement. Refer to Notes C1, C2, D2, D4 and D7 for details of the denominations of cash and cash equivalents, interest-bearing liabilities, receivables, payables and lease liabilities held at 31 December 2023. WOODSIDE ENERGY GROUP LTD 115
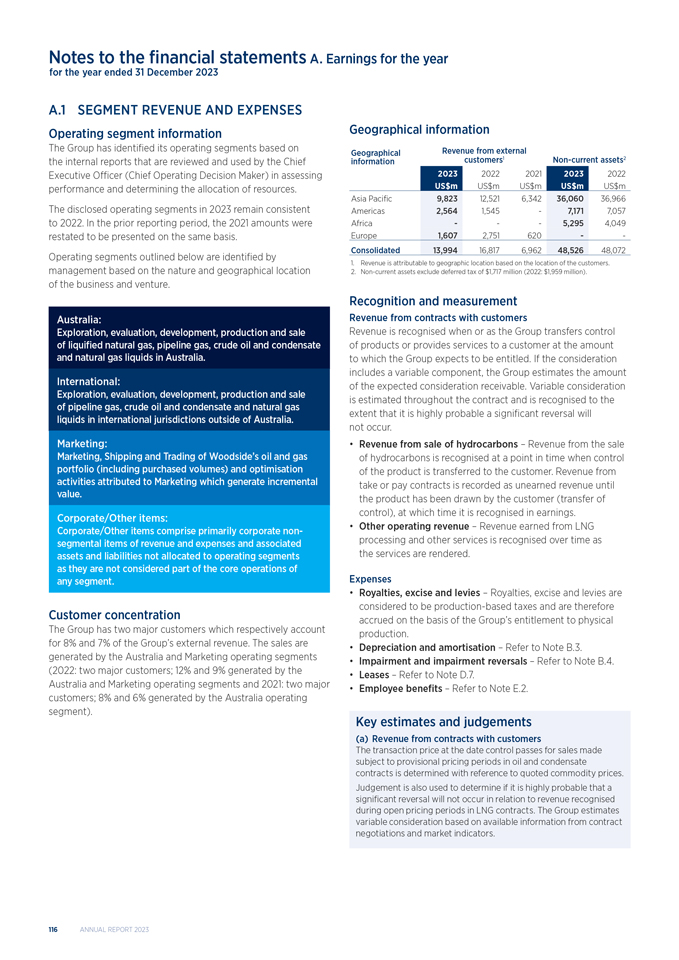
Notes to the financial statements A. Earnings for the year for the year ended 31 December 2023 A.1 SEGMENT REVENUE AND EXPENSES Operating segment information The Group has identified its operating segments based on the internal reports that are reviewed and used by the Chief Executive Officer (Chief Operating Decision Maker) in assessing performance and determining the allocation of resources. The disclosed operating segments in 2023 remain consistent to 2022. In the prior reporting period, the 2021 amounts were restated to be presented on the same basis. Operating segments outlined below are identified by management based on the nature and geographical location of the business and venture. Australia: Exploration, evaluation, development, production and sale of liquified natural gas, pipeline gas, crude oil and condensate and natural gas liquids in Australia. International: Exploration, evaluation, development, production and sale of pipeline gas, crude oil and condensate and natural gas liquids in international jurisdictions outside of Australia. Marketing: Marketing, Shipping and Trading of Woodside’s oil and gas portfolio (including purchased volumes) and optimisation activities attributed to Marketing which generate incremental value. Corporate/Other items: Corporate/Other items comprise primarily corporate non- segmental items of revenue and expenses and associated assets and liabilities not allocated to operating segments as they are not considered part of the core operations of any segment. Customer concentration The Group has two major customers which respectively account for 8% and 7% of the Group’s external revenue. The sales are generated by the Australia and Marketing operating segments (2022: two major customers; 12% and 9% generated by the Australia and Marketing operating segments and 2021: two major customers; 8% and 6% generated by the Australia operating segment). Geographical information Geographical Revenue from external information customers1 Non-current assets2 2023 2022 2021 2023 2022 US$m US$m US$m US$m US$m Asia Pacific 9,823 12,521 6,342 36,060 36,966 Americas 2,564 1,545 - 7,171 7,057 Africa - - - 5,295 4,049 Europe 1,607 2,751 620 - - Consolidated 13,994 16,817 6,962 48,526 48,072 1. Revenue is attributable to geographic location based on the location of the customers. 2. Non-current assets exclude deferred tax of $1,717 million (2022: $1,959 million). Recognition and measurement Revenue from contracts with customers Revenue is recognised when or as the Group transfers control of products or provides services to a customer at the amount to which the Group expects to be entitled. If the consideration includes a variable component, the Group estimates the amount of the expected consideration receivable. Variable consideration is estimated throughout the contract and is recognised to the extent that it is highly probable a significant reversal will not occur. • Revenue from sale of hydrocarbons – Revenue from the sale of hydrocarbons is recognised at a point in time when control of the product is transferred to the customer. Revenue from take or pay contracts is recorded as unearned revenue until the product has been drawn by the customer (transfer of control), at which time it is recognised in earnings. • Other operating revenue – Revenue earned from LNG processing and other services is recognised over time as the services are rendered. Expenses • Royalties, excise and levies – Royalties, excise and levies are considered to be production-based taxes and are therefore accrued on the basis of the Group’s entitlement to physical production. • Depreciation and amortisation – Refer to Note B.3. • Impairment and impairment reversals – Refer to Note B.4. • Leases – Refer to Note D.7. • Employee benefits – Refer to Note E.2. Key estimates and judgements (a) Revenue from contracts with customers The transaction price at the date control passes for sales made subject to provisional pricing periods in oil and condensate contracts is determined with reference to quoted commodity prices. Judgement is also used to determine if it is highly probable that a significant reversal will not occur in relation to revenue recognised during open pricing periods in LNG contracts. The Group estimates variable consideration based on available information from contract negotiations and market indicators. 116 ANNUAL REPORT 2023
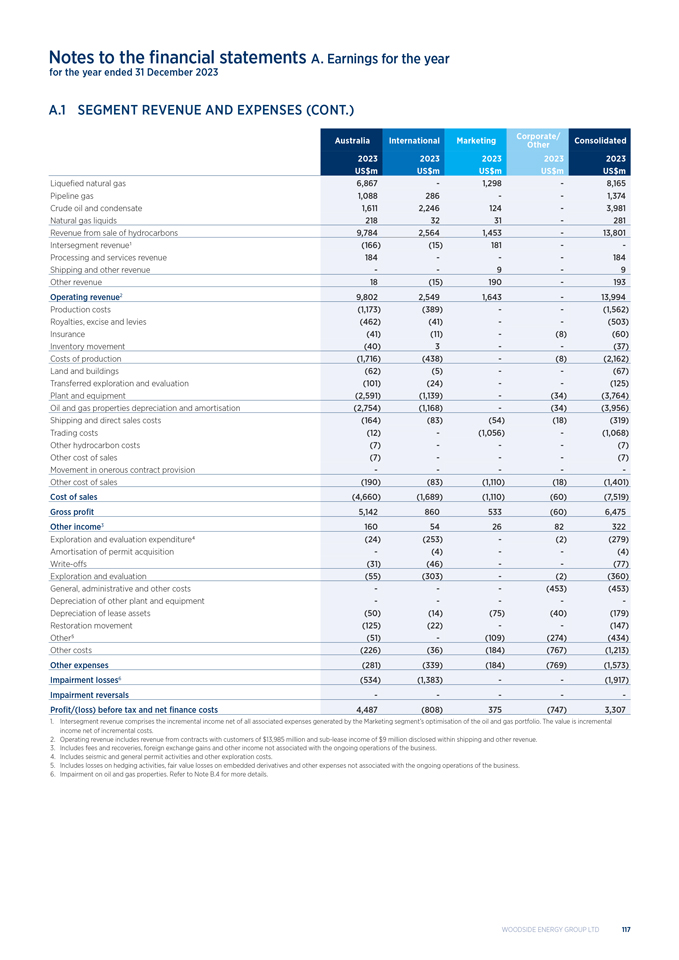
Notes to the financial statements A. Earnings for the year for the year ended 31 December 2023 A.1 SEGMENT REVENUE AND EXPENSES (CONT.) Corporate/ Australia International Marketing Consolidated Other 2023 2023 2023 2023 2023 US$m US$m US$m US$m US$m Liquefied natural gas 6,867 - 1,298 - 8,165 Pipeline gas 1,088 286 - - 1,374 Crude oil and condensate 1,611 2,246 124 - 3,981 Natural gas liquids 218 32 31 - 281 Revenue from sale of hydrocarbons 9,784 2,564 1,453 - 13,801 Intersegment revenue1 (166) (15) 181 - - Processing and services revenue 184 - - - 184 Shipping and other revenue - - 9 - 9 Other revenue 18 (15) 190 - 193 Operating revenue2 9,802 2,549 1,643 - 13,994 Production costs (1,173) (389) - - (1,562) Royalties, excise and levies (462) (41) - - (503) Insurance (41) (11) - (8) (60) Inventory movement (40) 3 - - (37) Costs of production (1,716) (438) - (8) (2,162) Land and buildings (62) (5) - - (67) Transferred exploration and evaluation (101) (24) - - (125) Plant and equipment (2,591) (1,139) - (34) (3,764) Oil and gas properties depreciation and amortisation (2,754) (1,168) - (34) (3,956) Shipping and direct sales costs (164) (83) (54) (18) (319) Trading costs (12) - (1,056) - (1,068) Other hydrocarbon costs (7) - - - (7) Other cost of sales (7) - - - (7) Movement in onerous contract provision - - - - - Other cost of sales (190) (83) (1,110) (18) (1,401) Cost of sales (4,660) (1,689) (1,110) (60) (7,519) Gross profit 5,142 860 533 (60) 6,475 Other income3 160 54 26 82 322 Exploration and evaluation expenditure4 (24) (253) - (2) (279) Amortisation of permit acquisition - (4) - - (4) Write-offs (31) (46) - - (77) Exploration and evaluation (55) (303) - (2) (360) General, administrative and other costs - - - (453) (453) Depreciation of other plant and equipment - - - - - Depreciation of lease assets (50) (14) (75) (40) (179) Restoration movement (125) (22) - - (147) Other5 (51) - (109) (274) (434) Other costs (226) (36) (184) (767) (1,213) Other expenses (281) (339) (184) (769) (1,573) Impairment losses6 (534) (1,383) - - (1,917) Impairment reversals - - - - - Profit/(loss) before tax and net finance costs 4,487 (808) 375 (747) 3,307 1. Intersegment revenue comprises the incremental income net of all associated expenses generated by the Marketing segment’s optimisation of the oil and gas portfolio. The value is incremental income net of incremental costs. 2. Operating revenue includes revenue from contracts with customers of $13,985 million and sub-lease income of $9 million disclosed within shipping and other revenue. 3. Includes fees and recoveries, foreign exchange gains and other income not associated with the ongoing operations of the business. 4. Includes seismic and general permit activities and other exploration costs. 5. Includes losses on hedging activities, fair value losses on embedded derivatives and other expenses not associated with the ongoing operations of the business. 6. Impairment on oil and gas properties. Refer to Note B.4 for more details. WOODSIDE ENERGY GROUP LTD 117

Notes to the financial statements A. Earnings for the year for the year ended 31 December 2023 A.1 SEGMENT REVENUE AND EXPENSES (CONT.) Corporate/ Australia International Marketing Consolidated Other 2022 2022 2022 2022 2022 US$m US$m US$m US$m US$m Liquefied natural gas 8,855 - 2,434 - 11,289 Pipeline gas 1,086 276 - - 1,362 Crude oil and condensate 2,467 1,273 18 - 3,758 Natural gas liquids 171 26 9 - 206 Revenue from sale of hydrocarbons 12,579 1,575 2,461 - 16,615 Intersegment revenue1 (455) (5) 460 - - Processing and services revenue 175 - - - 175 Shipping and other revenue - - 27 - 27 Other revenue (280) (5) 487 - 202 Operating revenue2 12,299 1,570 2,948 - 16,817 Production costs (975) (313) - 7 (1,281) Royalties, excise and levies (540) (39) - (17) (596) Insurance (35) (7) - (1) (43) Inventory movement 44 (3) - - 41 Costs of production (1,506) (362) - (11) (1,879) Land and buildings (51) (3) - - (54) Transferred exploration and evaluation (107) - - - (107) Plant and equipment (2,168) (436) - (33) (2,637) Oil and gas properties depreciation and amortisation (2,326) (439) - (33) (2,798) Shipping and direct sales costs (312) (36) (73) 142 (279) Trading costs (14) - (1,763) - (1,777) Other hydrocarbon costs (19) - - - (19) Other cost of sales (4) - - - (4) Movement in onerous contract provision3 - - 216 - 216 Other cost of sales (349) (36) (1,620) 142 (1,863) Cost of sales (4,181) (837) (1,620) 98 (6,540) Gross profit 8,118 733 1,328 98 10,277 Other income4 722 4 5 4 735 Exploration and evaluation expenditure5 (20) (277) - 1 (296) Amortisation of permit acquisition (1) (9) - - (10) Write-offs6 - (164) - - (164) Exploration and evaluation (21) (450) - 1 (470) General, administrative and other costs7 (13) (21) (10) (747) (791) Depreciation of other plant and equipment - - - - - Depreciation of lease assets (49) (11) - (80) (140) Restoration movement (234) (46) - 8 (272) Other8 (8) (84) (475) (486) (1,053) Other costs (304) (162) (485) (1,305) (2,256) Other expenses (325) (612) (485) (1,304) (2,726) Impairment losses - - - - - Impairment reversals9 900 - - - 900 Profit/(loss) before tax and net finance costs 9,415 125 848 (1,202) 9,186 1. Intersegment revenue comprises the incremental income net of all associated expenses generated by the Marketing segment’s optimisation of the oil and gas portfolio. The value is incremental income net of incremental costs. 2. Operating revenue includes revenue from contracts with customers of $16,790 million and sub-lease income of $27 million disclosed within shipping and other revenue. 3. Comprises changes in estimates of $245 million offset by provisions used of $29 million. Refer to Note D.5 for further details. 4. Includes initial gain on Train 2 sell-down of $427 million, revaluation gain on the remeasurement of the Train 2 sell-down variable consideration of $71 million, fees and recoveries, foreign exchange gains and other income not associated with the ongoing operations of the business. 5. Includes $142 million for various costs relating to the Group’s exit from the Orphan Basin exploration licences in Canada. 6. $125 million relates to costs of unsuccessful wells that have been written off. Refer to Note B.2. 7. Transaction costs of $419 million incurred as a result of the BHPP merger on 1 June 2022 are included in the Corporate/Other segment. Refer to Note B.5 for details. 8. Includes losses on hedging activities and changes in fair value of derivative financial instruments of $960 million in the Marketing and Corporate/Other segments and other expenses not associated with the ongoing operations of the business. 9. Impairment reversals on oil and gas properties. Refer to Note B.4 for more details. 118 ANNUAL REPORT 2023
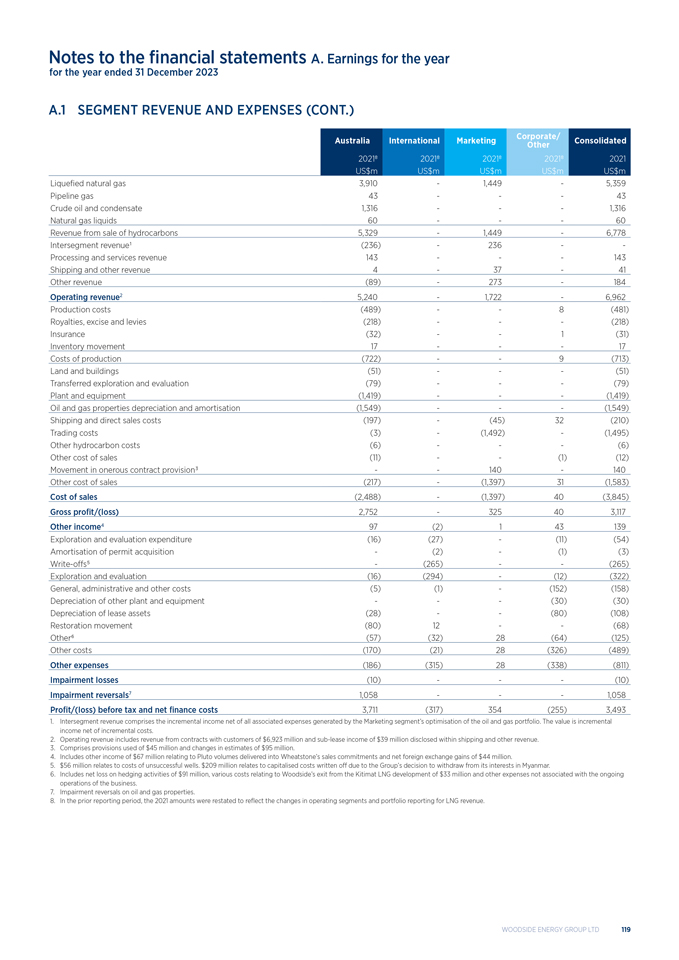
Notes to the financial statements A. Earnings for the year for the year ended 31 December 2023 A.1 SEGMENT REVENUE AND EXPENSES (CONT.) Corporate/ Australia International Marketing Consolidated Other 20218 20218 20218 20218 2021 US$m US$m US$m US$m US$m Liquefied natural gas 3,910 - 1,449 - 5,359 Pipeline gas 43 - - - 43 Crude oil and condensate 1,316 - - - 1,316 Natural gas liquids 60 - - - 60 Revenue from sale of hydrocarbons 5,329 - 1,449 - 6,778 Intersegment revenue1 (236) - 236 - - Processing and services revenue 143 - - - 143 Shipping and other revenue 4 - 37 - 41 Other revenue (89) - 273 - 184 Operating revenue2 5,240 - 1,722 - 6,962 Production costs (489) - - 8 (481) Royalties, excise and levies (218) - - - (218) Insurance (32) - - 1 (31) Inventory movement 17 - - - 17 Costs of production (722) - - 9 (713) Land and buildings (51) - - - (51) Transferred exploration and evaluation (79) - - - (79) Plant and equipment (1,419) - - - (1,419) Oil and gas properties depreciation and amortisation (1,549) - - - (1,549) Shipping and direct sales costs (197) - (45) 32 (210) Trading costs (3) - (1,492) - (1,495) Other hydrocarbon costs (6) - - - (6) Other cost of sales (11) - - (1) (12) Movement in onerous contract provision3 - - 140 - 140 Other cost of sales (217) - (1,397) 31 (1,583) Cost of sales (2,488) - (1,397) 40 (3,845) Gross profit/(loss) 2,752 - 325 40 3,117 Other income4 97 (2) 1 43 139 Exploration and evaluation expenditure (16) (27) - (11) (54) Amortisation of permit acquisition - (2) - (1) (3) Write-offs5 - (265) - - (265) Exploration and evaluation (16) (294) - (12) (322) General, administrative and other costs (5) (1) - (152) (158) Depreciation of other plant and equipment - - - (30) (30) Depreciation of lease assets (28) - - (80) (108) Restoration movement (80) 12 - - (68) Other6 (57) (32) 28 (64) (125) Other costs (170) (21) 28 (326) (489) Other expenses (186) (315) 28 (338) (811) Impairment losses (10) - - - (10) Impairment reversals7 1,058 - - - 1,058 Profit/(loss) before tax and net finance costs 3,711 (317) 354 (255) 3,493 1. Intersegment revenue comprises the incremental income net of all associated expenses generated by the Marketing segment’s optimisation of the oil and gas portfolio. The value is incremental income net of incremental costs. 2. Operating revenue includes revenue from contracts with customers of $6,923 million and sub-lease income of $39 million disclosed within shipping and other revenue. 3. Comprises provisions used of $45 million and changes in estimates of $95 million. 4. Includes other income of $67 million relating to Pluto volumes delivered into Wheatstone’s sales commitments and net foreign exchange gains of $44 million. 5. $56 million relates to costs of unsuccessful wells. $209 million relates to capitalised costs written off due to the Group’s decision to withdraw from its interests in Myanmar. 6. Includes net loss on hedging activities of $91 million, various costs relating to Woodside’s exit from the Kitimat LNG development of $33 million and other expenses not associated with the ongoing operations of the business. 7. Impairment reversals on oil and gas properties. 8. In the prior reporting period, the 2021 amounts were restated to reflect the changes in operating segments and portfolio reporting for LNG revenue. WOODSIDE ENERGY GROUP LTD 119
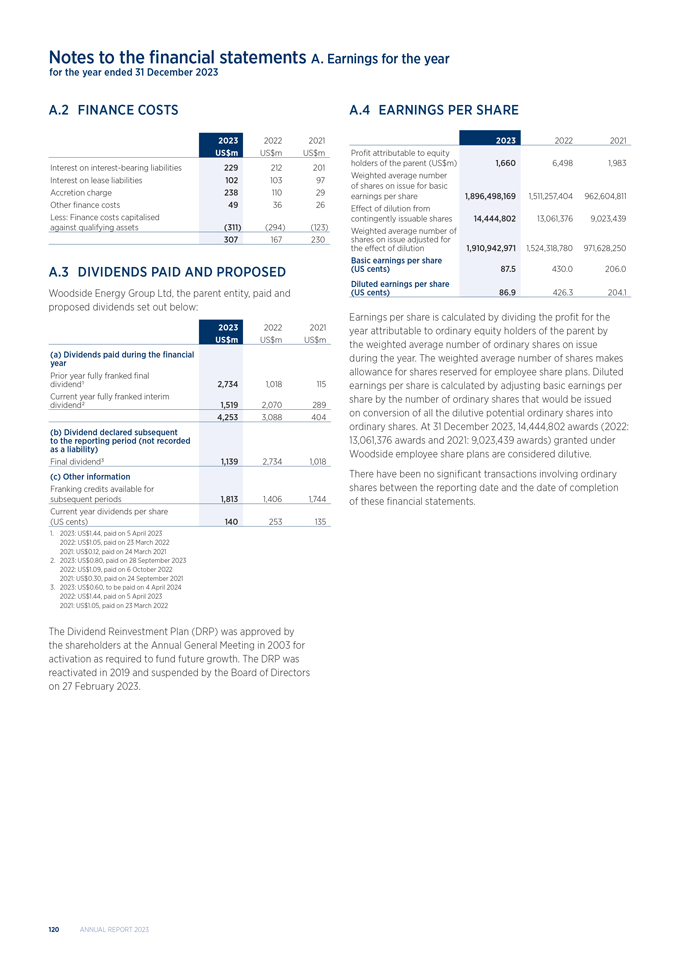
Notes to the financial statements A. Earnings for the year for the year ended 31 December 2023 A.2 FINANCE COSTS 2023 2022 2021 US$m US$m US$m Interest on interest-bearing liabilities 229 212 201 Interest on lease liabilities 102 103 97 Accretion charge 238 110 29 Other finance costs 49 36 26 Less: Finance costs capitalised against qualifying assets (311) (294) (123) 307 167 230 A.3 DIVIDENDS PAID AND PROPOSED Woodside Energy Group Ltd, the parent entity, paid and proposed dividends set out below: 2023 2022 2021 US$m US$m US$m (a) Dividends paid during the financial year Prior year fully franked final dividend1 2,734 1,018 115 Current year fully franked interim dividend2 1,519 2,070 289 4,253 3,088 404 (b) Dividend declared subsequent to the reporting period (not recorded as a liability) Final dividend3 1,139 2,734 1,018 (c) Other information Franking credits available for subsequent periods 1,813 1,406 1,744 Current year dividends per share (US cents) 140 253 135 1. 2023: US$1.44, paid on 5 April 2023 2022: US$1.05, paid on 23 March 2022 2021: US$0.12, paid on 24 March 2021 2. 2023: US$0.80, paid on 28 September 2023 2022: US$1.09, paid on 6 October 2022 2021: US$0.30, paid on 24 September 2021 3. 2023: US$0.60, to be paid on 4 April 2024 2022: US$1.44, paid on 5 April 2023 2021: US$1.05, paid on 23 March 2022 The Dividend Reinvestment Plan (DRP) was approved by the shareholders at the Annual General Meeting in 2003 for activation as required to fund future growth. The DRP was reactivated in 2019 and suspended by the Board of Directors on 27 February 2023. A.4 EARNINGS PER SHARE 2023 2022 2021 Profit attributable to equity holders of the parent (US$m) 1,660 6,498 1,983 Weighted average number of shares on issue for basic earnings per share 1,896,498,169 1,511,257,404 962,604,811 Effect of dilution from contingently issuable shares 14,444,802 13,061,376 9,023,439 Weighted average number of shares on issue adjusted for the effect of dilution 1,910,942,971 1,524,318,780 971,628,250 Basic earnings per share (US cents) 87.5 430.0 206.0 Diluted earnings per share (US cents) 86.9 426.3 204.1 Earnings per share is calculated by dividing the profit for the year attributable to ordinary equity holders of the parent by the weighted average number of ordinary shares on issue during the year. The weighted average number of shares makes allowance for shares reserved for employee share plans. Diluted earnings per share is calculated by adjusting basic earnings per share by the number of ordinary shares that would be issued on conversion of all the dilutive potential ordinary shares into ordinary shares. At 31 December 2023, 14,444,802 awards (2022: 13,061,376 awards and 2021: 9,023,439 awards) granted under Woodside employee share plans are considered dilutive. There have been no significant transactions involving ordinary shares between the reporting date and the date of completion of these financial statements. 120 ANNUAL REPORT 2023
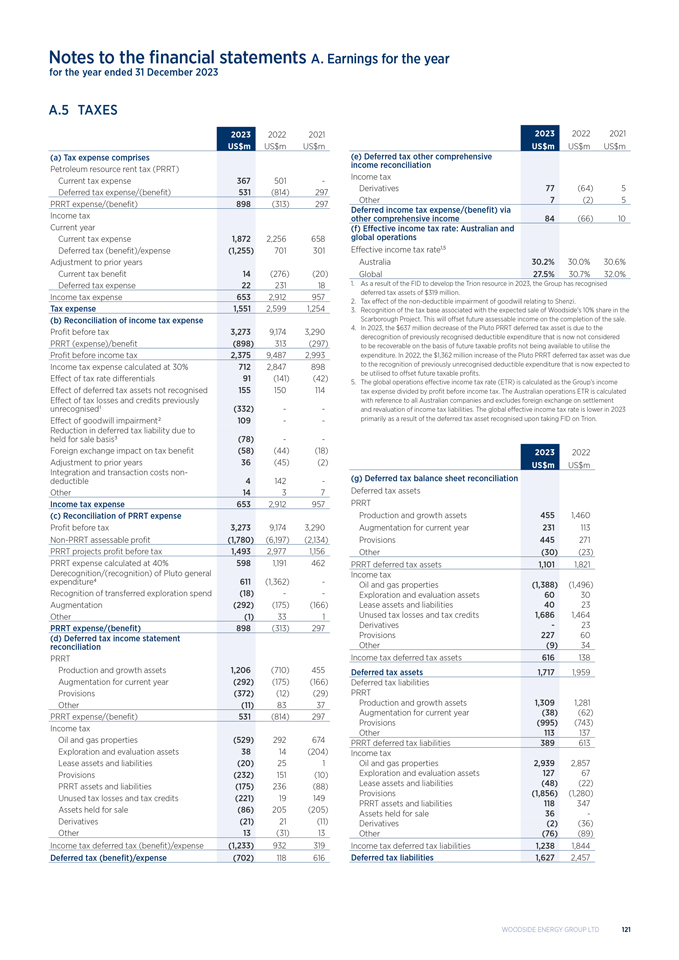
Notes to the financial statements A. Earnings for the year for the year ended 31 December 2023 A.5 TAXES 2023 2022 2021 US$m US$m US$m (a) Tax expense comprises Petroleum resource rent tax (PRRT) Current tax expense 367 501 - Deferred tax expense/(benefit) 531 (814) 297 PRRT expense/(benefit) 898 (313) 297 Income tax Current year Current tax expense 1,872 2,256 658 Deferred tax (benefit)/expense (1,255) 701 301 Adjustment to prior years Current tax benefit 14 (276) (20) Deferred tax expense 22 231 18 Income tax expense 653 2,912 957 Tax expense 1,551 2,599 1,254 (b) Reconciliation of income tax expense Profit before tax 3,273 9,174 3,290 PRRT (expense)/benefit (898) 313 (297) Profit before income tax 2,375 9,487 2,993 Income tax expense calculated at 30% 712 2,847 898 Effect of tax rate differentials 91 (141) (42) Effect of deferred tax assets not recognised 155 150 114 Effect of tax losses and credits previously unrecognised1 (332) - - Effect of goodwill impairment2 109 - - Reduction in deferred tax liability due to held for sale basis3 (78) - - Foreign exchange impact on tax benefit (58) (44) (18) Adjustment to prior years 36 (45) (2) Integration and transaction costs non- deductible 4 142 - Other 14 3 7 Income tax expense 653 2,912 957 (c) Reconciliation of PRRT expense Profit before tax 3,273 9,174 3,290 Non-PRRT assessable profit (1,780) (6,197) (2,134) PRRT projects profit before tax 1,493 2,977 1,156 PRRT expense calculated at 40% 598 1,191 462 Derecognition/(recognition) of Pluto general expenditure4 611 (1,362) - Recognition of transferred exploration spend (18) - - Augmentation (292) (175) (166) Other (1) 33 1 PRRT expense/(benefit) 898 (313) 297 (d) Deferred tax income statement reconciliation PRRT Production and growth assets 1,206 (710) 455 Augmentation for current year (292) (175) (166) Provisions (372) (12) (29) Other (11) 83 37 PRRT expense/(benefit) 531 (814) 297 Income tax Oil and gas properties (529) 292 674 Exploration and evaluation assets 38 14 (204) Lease assets and liabilities (20) 25 1 Provisions (232) 151 (10) PRRT assets and liabilities (175) 236 (88) Unused tax losses and tax credits (221) 19 149 Assets held for sale (86) 205 (205) Derivatives (21) 21 (11) Other 13 (31) 13 Income tax deferred tax (benefit)/expense (1,233) 932 319 Deferred tax (benefit)/expense (702) 118 616 2023 2022 2021 US$m US$m US$m (e) Deferred tax other comprehensive income reconciliation Income tax Derivatives 77 (64) 5 Other 7 (2) 5 Deferred income tax expense/(benefit) via other comprehensive income 84 (66) 10 (f) Effective income tax rate: Australian and global operations Effective income tax rate1,5 Australia 30.2% 30.0% 30.6% Global 27.5% 30.7% 32.0% 1. As a result of the FID to develop the Trion resource in 2023, the Group has recognised deferred tax assets of $319 million. 2. Tax effect of the non-deductible impairment of goodwill relating to Shenzi. 3. Recognition of the tax base associated with the expected sale of Woodside’s 10% share in the Scarborough Project. This will offset future assessable income on the completion of the sale. 4. In 2023, the $637 million decrease of the Pluto PRRT deferred tax asset is due to the derecognition of previously recognised deductible expenditure that is now not considered to be recoverable on the basis of future taxable profits not being available to utilise the expenditure. In 2022, the $1,362 million increase of the Pluto PRRT deferred tax asset was due to the recognition of previously unrecognised deductible expenditure that is now expected to be utilised to offset future taxable profits. 5. The global operations effective income tax rate (ETR) is calculated as the Group’s income tax expense divided by profit before income tax. The Australian operations ETR is calculated with reference to all Australian companies and excludes foreign exchange on settlement and revaluation of income tax liabilities. The global effective income tax rate is lower in 2023 primarily as a result of the deferred tax asset recognised upon taking FID on Trion. 2023 2022 US$m US$m (g) Deferred tax balance sheet reconciliation Deferred tax assets PRRT Production and growth assets 455 1,460 Augmentation for current year 231 113 Provisions 445 271 Other (30) (23) PRRT deferred tax assets 1,101 1,821 Income tax Oil and gas properties (1,388) (1,496) Exploration and evaluation assets 60 30 Lease assets and liabilities 40 23 Unused tax losses and tax credits 1,686 1,464 Derivatives - 23 Provisions 227 60 Other (9) 34 Income tax deferred tax assets 616 138 Deferred tax assets 1,717 1,959 Deferred tax liabilities PRRT Production and growth assets 1,309 1,281 Augmentation for current year (38) (62) Provisions (995) (743) Other 113 137 PRRT deferred tax liabilities 389 613 Income tax Oil and gas properties 2,939 2,857 Exploration and evaluation assets 127 67 Lease assets and liabilities (48) (22) Provisions (1,856) (1,280) PRRT assets and liabilities 118 347 Assets held for sale 36 - Derivatives (2) (36) Other (76) (89) Income tax deferred tax liabilities 1,238 1,844 Deferred tax liabilities 1,627 2,457 WOODSIDE ENERGY GROUP LTD 121
Notes to the financial statements A. Earnings for the year for the year ended 31 December 2023 A.5 TAXES (CONT.) Tax transparency code Woodside participates in the Australian Board of Taxation’s voluntary Tax Transparency Code (TTC). To increase public confidence in the contributions and compliance of corporate taxpayers, the TTC recommends public disclosure of tax information. Part A of the recommended disclosures is addressed within this Taxes note and Part B disclosed within the Sustainability section on our website. Recognition and measurement Current tax assets and liabilities are measured at the amount expected to be recovered from or paid to the taxation authorities. Deferred tax assets and liabilities are measured at the tax rates that are expected to apply in the period in which the liability is settled or the asset is realised. The tax rates and laws used to determine the amount are based on those that have been enacted or substantially enacted by the end of the reporting period. Income taxes relating to items recognised directly in equity are recognised in equity. Current taxes Current tax expense is the expected tax payable on the taxable income for the current year and any adjustment to tax paid in respect of previous years. Deferred taxes Deferred tax expense represents movements in the temporary differences between the carrying amount of an asset or liability in the consolidated statement of financial position and its tax base. With the exception of those noted below, deferred tax liabilities are recognised for all taxable temporary differences. Deferred tax assets are recognised for deductible temporary differences, unused tax losses and tax credits only if it is probable that sufficient future taxable income will be available to utilise those temporary differences and losses. Deferred tax is not recognised if the temporary difference arises from goodwill or from the initial recognition (other than in a business combination) of assets and liabilities in a transaction that affects neither accounting profit nor the taxable profit. In relation to PRRT, the impact of future augmentation on expenditure is included in the determination of future taxable profits when assessing the extent to which a deferred tax asset can be recognised in the consolidated statement of financial position. Offsetting deferred tax balances Deferred tax assets and liabilities are offset only if there is a legally enforceable right to offset current tax assets and liabilities and when they relate to income taxes levied by the same taxation authority on either the same taxable entity or different taxable entities that the Group intends to settle its current tax assets and liabilities on a net basis. Refer to Notes E.8 and E.9 for detail on the tax consolidated groups. Key estimates and judgements (a) Income tax classification Judgement is required when determining whether a particular tax is an income tax or another type of tax. PRRT is considered, for accounting purposes, to be an income tax. Accounting for deferred tax is applied to income taxes as described above, but is not applied to other types of taxes, e.g. North West Shelf royalties, excise and levies which are recognised in cost of sales in the income statement. (b) Deferred tax asset recognition The Group has two separate USA Tax Consolidation Groups (USA TCG) as at 31 December 2023. Income tax losses and credits: Deferred tax assets (DTAs) relating to carry forward unused tax losses and credits arising from the USA TCG of $1,248 million (2022: $1,371 million) and $333 million (2022: $93 million) arising from countries other than Australia and the USA have been recognised. The Group has determined that it is probable that sufficient future taxable income will be available to utilise those losses and credits within those countries. Refer to Note E.9(a) for details of tax consolidated groups. DTAs relating to carry forward unused tax losses and credits of $232 million (2022: $250 million) from the USA TCG, $189 million (2022: $146 million) from USA entities outside of the USA TCG and $763 million (2022: $1,061 million) from countries other than Australia and the USA have not been recognised as it is not currently probable that the losses and credits will be utilised based on current planned activities in those countries. As a result of the FID to develop the Trion resource in 2023, the Group has recognised deferred tax assets of $319 million. PRRT: The recoverability of PRRT deferred tax assets is primarily assessed with regard to future oil price assumptions impacting forecast future taxable profits. During the year ended 31 December 2023, the Group reduced the Pluto PRRT DTA by $637 million ($446 million post-tax) on the basis of future taxable profits not being available to utilise the deductible expenditure. This is primarily driven by decreases in forecast pricing assumptions and actual pricing realised during the year ended 31 December 2023. In determining the amount of DTA that is considered probable and eligible for recognition, forecast future taxable profits are risk-adjusted where appropriate by a market premium risk rate to reflect uncertainty inherent in long-term forecasts. A long-term bond rate of 3.2% (31 December 2022: 3.2%) was used for the purposes of augmentation. Certain deferred tax assets on deductible temporary differences have not been recognised on the basis that deductions from future augmentation of the recognised deductible temporary difference will be sufficient to offset future taxable profits. $7,428 million (2022: $6,523 million) relates to the North West Shelf Project, $872 million (2022: $189 million) relates to remaining Pluto quarantined exploration expenditure and $758 million (2022: $831 million) relates to Wheatstone. A long-term bond rate of 3.2% (31 December 2022: 3.2%) was used for the purposes of augmentation. Had an alternative approach been used to assess recovery of the deferred tax assets, whereby future augmentation was not included in the assessment, additional deferred tax assets would be recognised, with a corresponding benefit to tax expense. It was determined that the approach adopted provides the most meaningful information on the implications of the PRRT regime, whilst ensuring compliance with AASB 112/IAS 12 Income Taxes. 122 ANNUAL REPORT 2023

Notes to the financial statements A. Earnings for the year for the year ended 31 December 2023 A.5 TAXES (CONT.) Key estimates and judgements (cont.) (c) Uncertain tax positions The Group has tax matters, litigation and other claims, for which the timing of resolution and potential economic outflows are uncertain. Where the Group assesses an outcome for any tax matter, litigation or other claim as more likely than not to be accepted by the relevant tax authority, the position is adopted in the reported tax balances. Because of the complexity of some of these positions, the ultimate outcome may differ from the current estimate of the position. These differences will be reflected as increases or decreases to tax expense in the period in which new information is available. Tax matters without a probable economic outflow and/or presently cannot be measured reliably are contingent liabilities and disclosed in Note E.1 Contingent liabilities and assets. WOODSIDE ENERGY GROUP LTD 123

Notes to the financial statements B. Production and growth assets for the year ended 31 December 2023 IN THIS SECTION This section addresses the strategic growth (exploration and evaluation), core producing and development (oil and gas properties) assets position of the Group at the end of the reporting period including, where applicable, the accounting policies and key estimates and judgements applied. This section also includes the impairment position of the Group at the end of the reporting period. B. Production and growth assets B.1 Segment production and growth assets Page 125 B.2 Exploration and evaluation Page 127 B.3 Oil and gas properties Page 128 B.4 Impairment of exploration and evaluation, oil and gas properties and goodwill Page 130 B.5 Business combination Page 136 B.6 Goodwill Page 137 B.7 Significant production and growth asset acquisitions Page 137 B.8 Disposal of assets Page 138 124 ANNUAL REPORT 2023
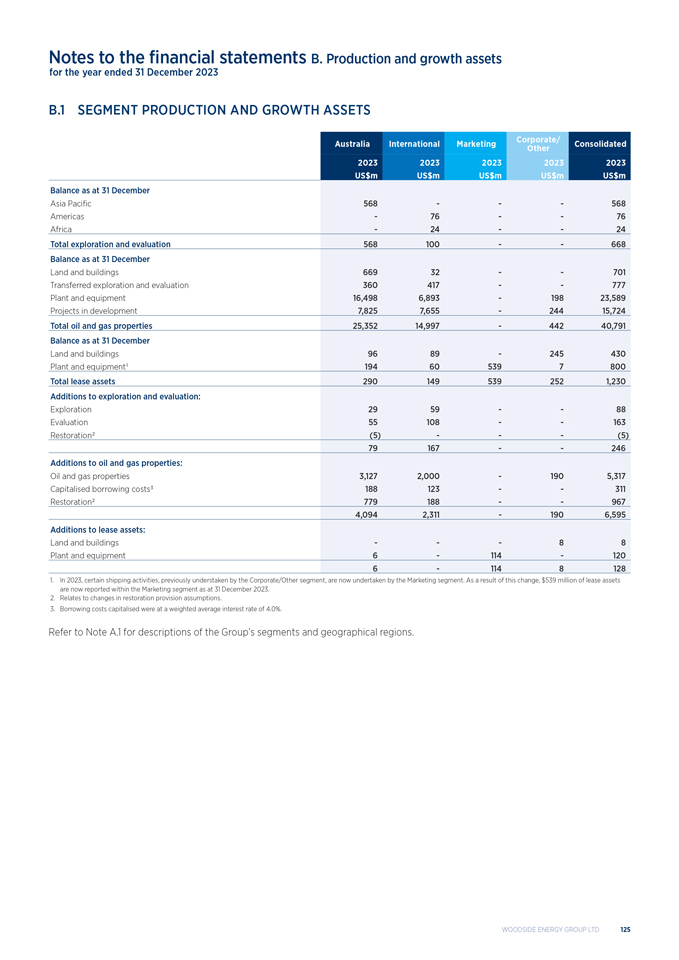
Notes to the financial statements B. Production and growth assets for the year ended 31 December 2023 B.1 SEGMENT PRODUCTION AND GROWTH ASSETS Corporate/ Australia International Marketing Consolidated Other 20232023 2023 2023 2023 US$m US$m US$m US$m US$m Balance as at 31 December Asia Pacific 568 - - - 568 Americas - 76 - - 76 Africa - 24 - - 24 Total exploration and evaluation 568 100 - - 668 Balance as at 31 December Land and buildings 669 32 - - 701 Transferred exploration and evaluation 360 417 - - 777 Plant and equipment 16,498 6,893 - 198 23,589 Projects in development 7,825 7,655 - 244 15,724 Total oil and gas properties 25,352 14,997 - 442 40,791 Balance as at 31 December Land and buildings 96 89 - 245 430 Plant and equipment1 194 60 539 7 800 Total lease assets 290 149 539 252 1,230 Additions to exploration and evaluation: Exploration 29 59 - - 88 Evaluation 55 108 - - 163 Restoration2 (5) - - - (5) 79 167 - - 246 Additions to oil and gas properties: Oil and gas properties 3,127 2,000 - 190 5,317 Capitalised borrowing costs3 188 123 - - 311 Restoration2 779 188 - - 967 4,094 2,311 - 190 6,595 Additions to lease assets: Land and buildings - - - 8 8 Plant and equipment 6 - 114 - 120 6 - 114 8 128 1. In 2023, certain shipping activities, previously understaken by the Corporate/Other segment, are now undertaken by the Marketing segment. As a result of this change, $539 million of lease assets are now reported within the Marketing segment as at 31 December 2023. 2. Relates to changes in restoration provision assumptions. 3. Borrowing costs capitalised were at a weighted average interest rate of 4.0%. Refer to Note A.1 for descriptions of the Group’s segments and geographical regions. WOODSIDE ENERGY GROUP LTD 125
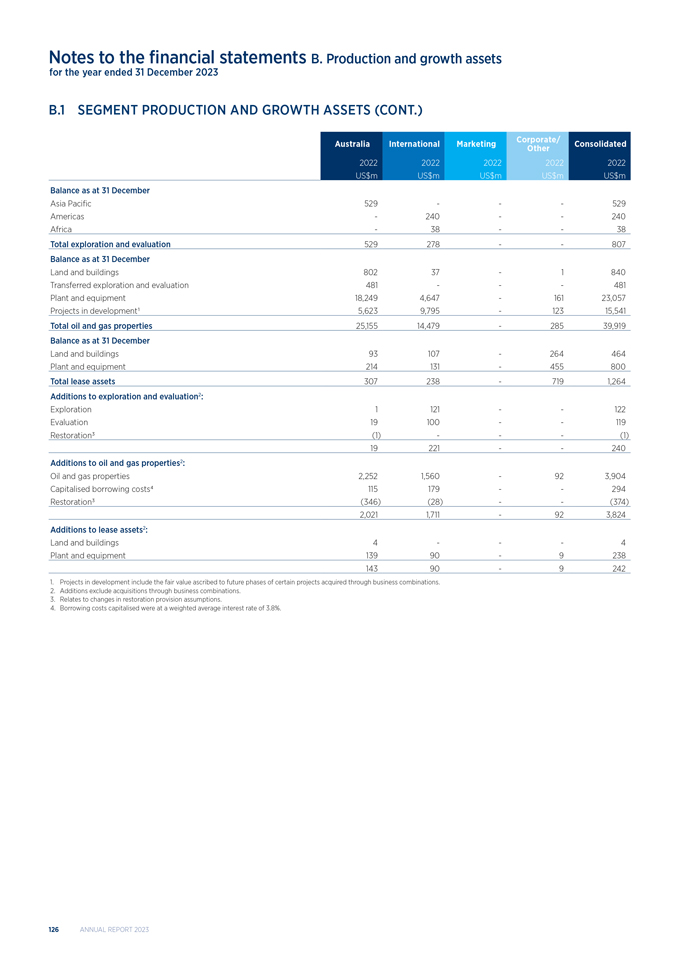
Notes to the financial statements B. Production and growth assets for the year ended 31 December 2023 B.1 SEGMENT PRODUCTION AND GROWTH ASSETS (CONT.) Corporate/ Australia International Marketing Consolidated Other 2022 2022 2022 2022 2022 US$m US$m US$m US$m US$m Balance as at 31 December Asia Pacific 529 - - - 529 Americas - 240 - - 240 Africa - 38 - - 38 Total exploration and evaluation 529 278 - - 807 Balance as at 31 December Land and buildings 802 37 - 1 840 Transferred exploration and evaluation 481 - - - 481 Plant and equipment 18,249 4,647 - 161 23,057 Projects in development1 5,623 9,795 - 123 15,541 Total oil and gas properties 25,155 14,479 - 285 39,919 Balance as at 31 December Land and buildings 93 107 - 264 464 Plant and equipment 214 131 - 455 800 Total lease assets 307 238 - 719 1,264 Additions to exploration and evaluation2: Exploration 1 121 - - 122 Evaluation 19 100 - - 119 Restoration3 (1) - - - (1) 19 221 - - 240 Additions to oil and gas properties2: Oil and gas properties 2,252 1,560 - 92 3,904 Capitalised borrowing costs4 115 179 - - 294 Restoration3 (346) (28) - - (374) 2,021 1,711 - 92 3,824 Additions to lease assets2: Land and buildings 4 - - - 4 Plant and equipment 139 90 - 9 238 143 90 - 9 242 1. Projects in development include the fair value ascribed to future phases of certain projects acquired through business combinations. 2. Additions exclude acquisitions through business combinations. 3. Relates to changes in restoration provision assumptions. 4. Borrowing costs capitalised were at a weighted average interest rate of 3.8%. 126 ANNUAL REPORT 2023
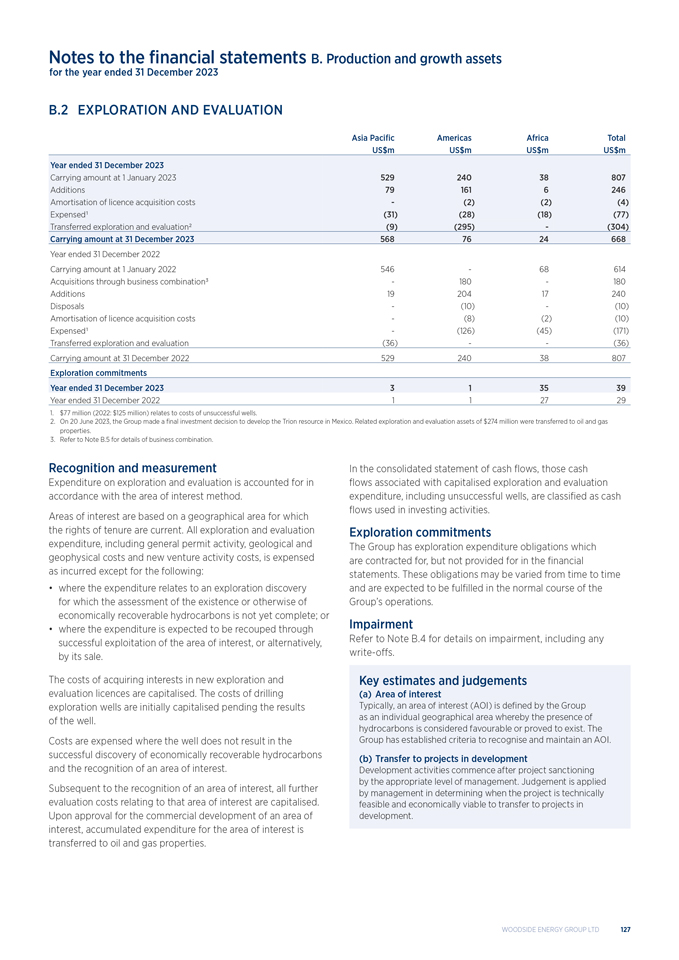
Notes to the financial statements B. Production and growth assets for the year ended 31 December 2023 B.2 EXPLORATION AND EVALUATION Asia Pacific Americas Africa Total US$m US$m US$m US$m Year ended 31 December 2023 Carrying amount at 1 January 2023 529 240 38 807 Additions 79 161 6 246 Amortisation of licence acquisition costs - (2) (2) (4) Expensed1 (31) (28) (18) (77) Transferred exploration and evaluation2 (9) (295) - (304) Carrying amount at 31 December 2023 568 76 24 668 Year ended 31 December 2022 Carrying amount at 1 January 2022 546 - 68 614 Acquisitions through business combination3 - 180 - 180 Additions 19 204 17 240 Disposals - (10) - (10) Amortisation of licence acquisition costs - (8) (2) (10) Expensed1 - (126) (45) (171) Transferred exploration and evaluation (36) - - (36) Carrying amount at 31 December 2022 529 240 38 807 Exploration commitments Year ended 31 December 2023 3 1 35 39 Year ended 31 December 2022 1 1 27 29 1. $77 million (2022: $125 million) relates to costs of unsuccessful wells. 2. On 20 June 2023, the Group made a final investment decision to develop the Trion resource in Mexico. Related exploration and evaluation assets of $274 million were transferred to oil and gas properties. 3. Refer to Note B.5 for details of business combination. Recognition and measurement Expenditure on exploration and evaluation is accounted for in accordance with the area of interest method. Areas of interest are based on a geographical area for which the rights of tenure are current. All exploration and evaluation expenditure, including general permit activity, geological and geophysical costs and new venture activity costs, is expensed as incurred except for the following: • where the expenditure relates to an exploration discovery for which the assessment of the existence or otherwise of economically recoverable hydrocarbons is not yet complete; or • where the expenditure is expected to be recouped through successful exploitation of the area of interest, or alternatively, by its sale. The costs of acquiring interests in new exploration and evaluation licences are capitalised. The costs of drilling exploration wells are initially capitalised pending the results of the well. Costs are expensed where the well does not result in the successful discovery of economically recoverable hydrocarbons and the recognition of an area of interest. Subsequent to the recognition of an area of interest, all further evaluation costs relating to that area of interest are capitalised. Upon approval for the commercial development of an area of interest, accumulated expenditure for the area of interest is transferred to oil and gas properties. In the consolidated statement of cash flows, those cash flows associated with capitalised exploration and evaluation expenditure, including unsuccessful wells, are classified as cash flows used in investing activities. Exploration commitments The Group has exploration expenditure obligations which are contracted for, but not provided for in the financial statements. These obligations may be varied from time to time and are expected to be fulfilled in the normal course of the Group’s operations. Impairment Refer to Note B.4 for details on impairment, including any write-offs. Key estimates and judgements (a) Area of interest Typically, an area of interest (AOI) is defined by the Group as an individual geographical area whereby the presence of hydrocarbons is considered favourable or proved to exist. The Group has established criteria to recognise and maintain an AOI. (b) Transfer to projects in development Development activities commence after project sanctioning by the appropriate level of management. Judgement is applied by management in determining when the project is technically feasible and economically viable to transfer to projects in development.
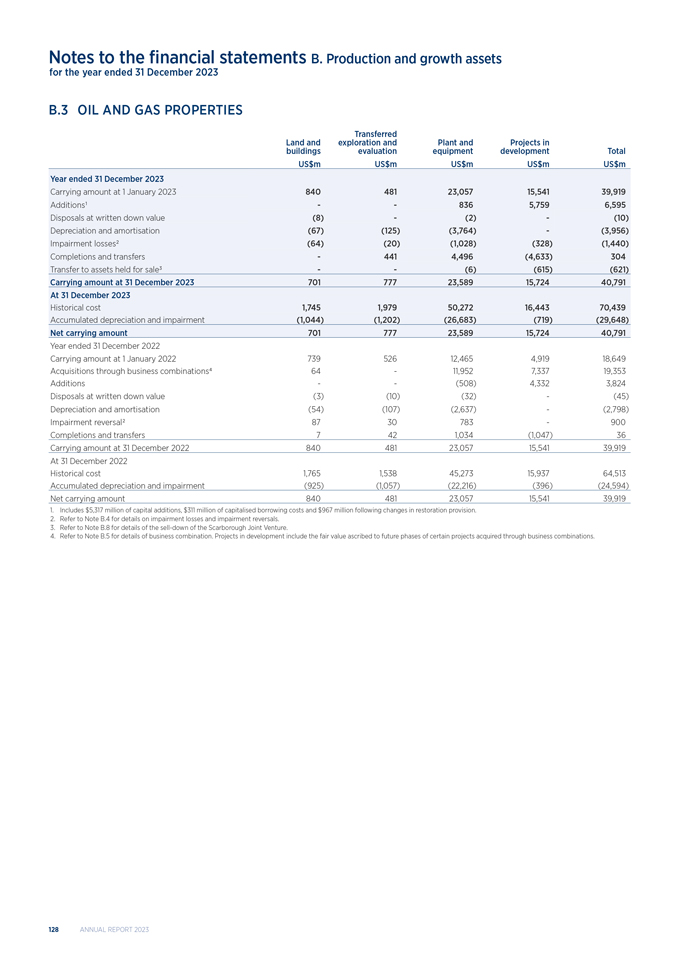
Notes to the financial statements B. Production and growth assets for the year ended 31 December 2023 B.3 OIL AND GAS PROPERTIES Transferred Land and exploration and Plant and Projects in buildings evaluation equipment development Total US$m US$m US$m US$m US$m Year ended 31 December 2023 Carrying amount at 1 January 2023 840 481 23,057 15,541 39,919 Additions1 - - 836 5,759 6,595 Disposals at written down value (8) - (2) - (10) Depreciation and amortisation (67) (125) (3,764) - (3,956) Impairment losses2 (64) (20) (1,028) (328) (1,440) Completions and transfers - 441 4,496 (4,633) 304 Transfer to assets held for sale3 - - (6) (615) (621) Carrying amount at 31 December 2023 701 777 23,589 15,724 40,791 At 31 December 2023 Historical cost 1,745 1,979 50,272 16,443 70,439 Accumulated depreciation and impairment (1,044) (1,202) (26,683) (719) (29,648) Net carrying amount 701 777 23,589 15,724 40,791 Year ended 31 December 2022 Carrying amount at 1 January 2022 739 526 12,465 4,919 18,649 Acquisitions through business combinations4 64 - 11,952 7,337 19,353 Additions - - (508) 4,332 3,824 Disposals at written down value (3) (10) (32) - (45) Depreciation and amortisation (54) (107) (2,637) - (2,798) Impairment reversal2 87 30 783 - 900 Completions and transfers 7 42 1,034 (1,047) 36 Carrying amount at 31 December 2022 840 481 23,057 15,541 39,919 At 31 December 2022 Historical cost 1,765 1,538 45,273 15,937 64,513 Accumulated depreciation and impairment (925) (1,057) (22,216) (396) (24,594) Net carrying amount 840 481 23,057 15,541 39,919 1. Includes $5,317 million of capital additions, $311 million of capitalised borrowing costs and $967 million following changes in restoration provision. 2. Refer to Note B.4 for details on impairment losses and impairment reversals. 3. Refer to Note B.8 for details of the sell-down of the Scarborough Joint Venture. 4. Refer to Note B.5 for details of business combination. Projects in development include the fair value ascribed to future phases of certain projects acquired through business combinations. 128 ANNUAL REPORT 2023
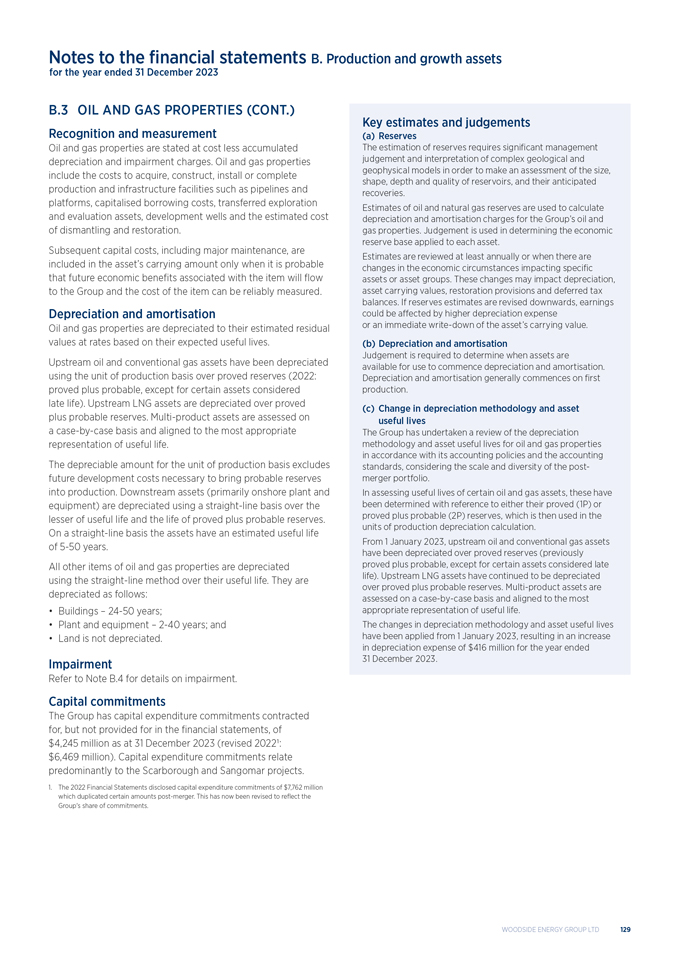
Notes to the financial statements B. Production and growth assets for the year ended 31 December 2023 B.3 OIL AND GAS PROPERTIES (CONT.) Recognition and measurement Oil and gas properties are stated at cost less accumulated depreciation and impairment charges. Oil and gas properties include the costs to acquire, construct, install or complete production and infrastructure facilities such as pipelines and platforms, capitalised borrowing costs, transferred exploration and evaluation assets, development wells and the estimated cost of dismantling and restoration. Subsequent capital costs, including major maintenance, are included in the asset’s carrying amount only when it is probable that future economic benefits associated with the item will flow to the Group and the cost of the item can be reliably measured. Depreciation and amortisation Oil and gas properties are depreciated to their estimated residual values at rates based on their expected useful lives. Upstream oil and conventional gas assets have been depreciated using the unit of production basis over proved reserves (2022: proved plus probable, except for certain assets considered late life). Upstream LNG assets are depreciated over proved plus probable reserves. Multi-product assets are assessed on a case-by-case basis and aligned to the most appropriate representation of useful life. The depreciable amount for the unit of production basis excludes future development costs necessary to bring probable reserves into production. Downstream assets (primarily onshore plant and equipment) are depreciated using a straight-line basis over the lesser of useful life and the life of proved plus probable reserves. On a straight-line basis the assets have an estimated useful life of 5-50 years. All other items of oil and gas properties are depreciated using the straight-line method over their useful life. They are depreciated as follows: • Buildings – 24-50 years; • Plant and equipment – 2-40 years; and • Land is not depreciated. Impairment Refer to Note B.4 for details on impairment. Capital commitments The Group has capital expenditure commitments contracted for, but not provided for in the financial statements, of $4,245 million as at 31 December 2023 (revised 20221: $6,469 million). Capital expenditure commitments relate predominantly to the Scarborough and Sangomar projects. 1. The 2022 Financial Statements disclosed capital expenditure commitments of $7,762 million which duplicated certain amounts post-merger. This has now been revised to reflect the Group’s share of commitments. Key estimates and judgements (a) Reserves The estimation of reserves requires significant management judgement and interpretation of complex geological and geophysical models in order to make an assessment of the size, shape, depth and quality of reservoirs, and their anticipated recoveries. Estimates of oil and natural gas reserves are used to calculate depreciation and amortisation charges for the Group’s oil and gas properties. Judgement is used in determining the economic reserve base applied to each asset. Estimates are reviewed at least annually or when there are changes in the economic circumstances impacting specific assets or asset groups. These changes may impact depreciation, asset carrying values, restoration provisions and deferred tax balances. If reserves estimates are revised downwards, earnings could be affected by higher depreciation expense or an immediate write-down of the asset’s carrying value. (b) Depreciation and amortisation Judgement is required to determine when assets are available for use to commence depreciation and amortisation. Depreciation and amortisation generally commences on first production. (c) Change in depreciation methodology and asset useful lives The Group has undertaken a review of the depreciation methodology and asset useful lives for oil and gas properties in accordance with its accounting policies and the accounting standards, considering the scale and diversity of the post-merger portfolio. In assessing useful lives of certain oil and gas assets, these have been determined with reference to either their proved (1P) or proved plus probable (2P) reserves, which is then used in the units of production depreciation calculation. From 1 January 2023, upstream oil and conventional gas assets have been depreciated over proved reserves (previously proved plus probable, except for certain assets considered late life). Upstream LNG assets have continued to be depreciated over proved plus probable reserves. Multi-product assets are assessed on a case-by-case basis and aligned to the most appropriate representation of useful life. The changes in depreciation methodology and asset useful lives have been applied from 1 January 2023, resulting in an increase in depreciation expense of $416 million for the year ended 31 December 2023. WOODSIDE ENERGY GROUP LTD 129
Notes to the financial statements B. Production and growth assets for the year ended 31 December 2023 B.4 IMPAIRMENT OF EXPLORATION AND EVALUATION, OIL AND GAS PROPERTIES AND GOODWILL Exploration and evaluation Impairment testing The recoverability of the carrying amount of exploration and evaluation assets is dependent on successful development and commercial exploitation, or alternatively sale of the respective AOI. Each AOI is reviewed half-yearly to determine whether economic quantities of hydrocarbons have been found, or whether further exploration and evaluation work is underway or planned to support continued carry forward of capitalised costs. Where a potential impairment is indicated for an AOI, an assessment is performed using a fair value less costs to dispose (FVLCD) method to determine its recoverable amount. Upon approval for commercial development, exploration and evaluation assets are assessed for impairment before they are transferred to oil and gas properties. Impairment calculations If the carrying amount of an AOI exceeds its recoverable amount, the AOI is written down to its recoverable amount and an impairment loss is recognised in the consolidated income statement. Oil and gas properties Impairment testing The carrying amounts of oil and gas properties are assessed half-yearly to determine whether there is an indicator of impairment or impairment reversal for those assets which have previously been impaired. Indicators of impairment and impairment reversals include changes in reserves, expected future sales prices or costs. Oil and gas properties are assessed for impairment indicators and impairments on a cash-generating unit (CGU) basis. CGUs are determined as offshore and onshore facilities, infrastructure and associated oil and/or gas fields. If there is an indicator of impairment or impairment reversal for a CGU, its recoverable amount is calculated and compared with the CGU’s carrying value (refer to impairment calculations below). Goodwill For the purpose of impairment testing, goodwill acquired in a business combination is, from the acquisition date, allocated to each of the Group’s cash-generating units (CGUs) that are expected to benefit from the combination, irrespective of whether other assets or liabilities of the acquiree are assigned to those units. Goodwill is tested for impairment at least annually and more frequently if events or changes in circumstances indicate that it might be impaired. Impairment of goodwill is determined by assessing the recoverable amount of each CGU to which the goodwill relates and comparing it with its carrying value, which includes deferred taxes (refer to impairment calculations below and Note B.5). When part of an operation is disposed of, any goodwill associated with the disposed operation is included in the carrying amount of the operation in determining the gain or loss on disposal. Goodwill and oil and gas impairment calculations The recoverable amount of an asset or CGU is determined as the higher of its value in use (VIU) and FVLCD. VIU is determined by estimating future cash flows after taking into account the risks specific to the asset and discounting to present value using an appropriate discount rate. FVLCD is the price that would be received to sell the asset in an orderly transaction between market participants and does not reflect the effects of factors that may be specific to the Group. In determining FVLCD, recent market transactions are considered. If no such transactions can be identified, an appropriate valuation model, such as discounted cash flow techniques, is applied on a post-tax basis using an appropriate discount rate and estimates are made about the assumptions market participants would use when pricing the asset or CGU. If the carrying amount of an asset or CGU, including any allocated goodwill, exceeds its recoverable amount, the asset or CGU is written down to its recoverable amount and an impairment loss is recognised in the consolidated income statement. Any impairment losses are first allocated to reduce the carrying amount of any goodwill allocated, with the remaining impairment losses allocated to the relevant assets. If the recoverable amount of an asset or CGU exceeds its carrying amount, and that asset has previously been impaired, the impairment is reversed. The carrying amount of the asset or CGU is increased to its recoverable amount, but only to the extent that the carrying amount does not exceed the value that would have been determined, net of depreciation or amortisation, if no impairment had been recognised. Impairments of goodwill are not reversed. 130 ANNUAL REPORT 2023
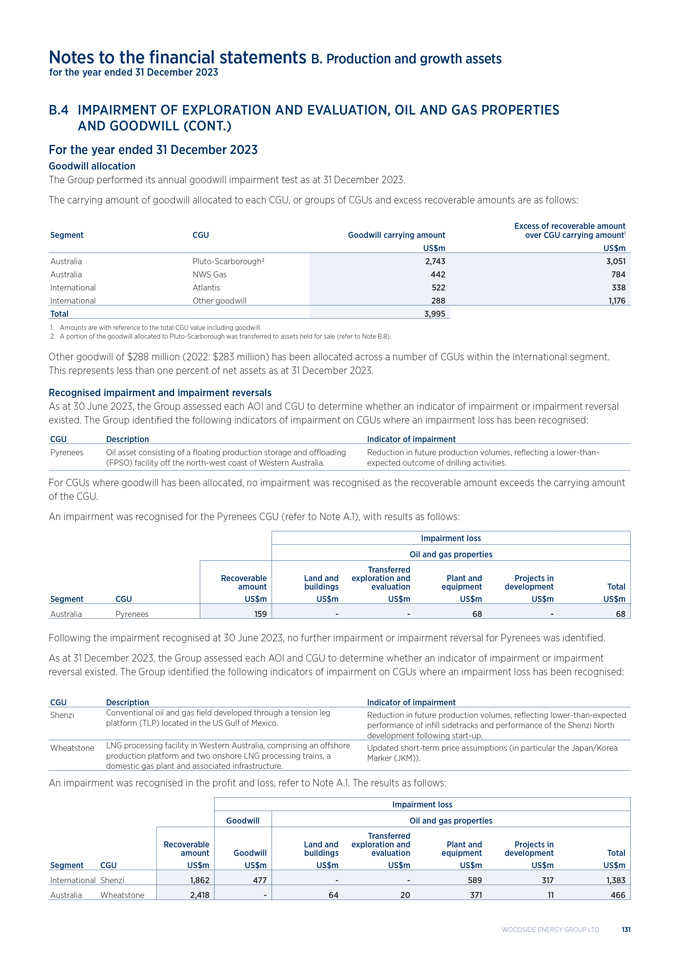
Notes to the financial statements B. Production and growth assets for the year ended 31 December 2023 B.4 IMPAIRMENT OF EXPLORATION AND EVALUATION, OIL AND GAS PROPERTIES AND GOODWILL (CONT.) For the year ended 31 December 2023 Goodwill allocation The Group performed its annual goodwill impairment test as at 31 December 2023. The carrying amount of goodwill allocated to each CGU, or groups of CGUs and excess recoverable amounts are as follows: Excess of recoverable amount Segment CGU Goodwill carrying amount over CGU carrying amount1 US$m US$m Australia Pluto-Scarborough2 2,743 3,051 Australia NWS Gas 442 784 International Atlantis 522 338 International Other goodwill 288 1,176 Total 3,995 2. A portion of the goodwill allocated to Pluto-Scarborough was transferred to assets held for sale (refer to Note B.8). Other goodwill of $288 million (2022: $283 million) has been allocated across a number of CGUs within the International segment. This represents less than one percent of net assets as at 31 December 2023. Recognised impairment and impairment reversals As at 30 June 2023, the Group assessed each AOI and CGU to determine whether an indicator of impairment or impairment reversal existed. The Group identified the following indicators of impairment on CGUs where an impairment loss has been recognised: CGU Description Indicator of impairment Pyrenees Oil asset consisting of a floating production storage and offloading Reduction in future production volumes, reflecting a lower-than- (FPSO) facility off the north-west coast of Western Australia. expected outcome of drilling activities. For CGUs where goodwill has been allocated, no impairment was recognised as the recoverable amount exceeds the carrying amount of the CGU. An impairment was recognised for the Pyrenees CGU (refer to Note A.1), with results as follows: Impairment loss Oil and gas properties Transferred Recoverable Land and exploration and Plant and Projects in amount buildings evaluation equipment development Total Segment CGU US$m US$m US$m US$m US$m US$m Australia Pyrenees 159 - - 68 - 68 Following the impairment recognised at 30 June 2023, no further impairment or impairment reversal for Pyrenees was identified. As at 31 December 2023, the Group assessed each AOI and CGU to determine whether an indicator of impairment or impairment reversal existed. The Group identified the following indicators of impairment on CGUs where an impairment loss has been recognised: CGU Description Indicator of impairment Shenzi Conventional oil and gas field developed through a tension leg Reduction in future production volumes, reflecting lower-than-expected platform (TLP) located in the US Gulf of Mexico. performance of infill sidetracks and performance of the Shenzi North development following start-up. Wheatstone LNG processing facility in Western Australia, comprising an offshore Updated short-term price assumptions (in particular the Japan/Korea production platform and two onshore LNG processing trains, a Marker (JKM)). domestic gas plant and associated infrastructure. An impairment was recognised in the profit and loss, refer to Note A.1. The results as follows: Impairment loss Goodwill Oil and gas properties Transferred Recoverable Land and exploration and Plant and Projects in amount Goodwill buildings evaluation equipment development Total Segment CGU US$m US$m US$m US$m US$m US$m US$m International Shenzi 1,862 477 - - 589 317 1,383 Australia Wheatstone 2,418 - 64 20 371 11 466 WOODSIDE ENERGY GROUP LTD 131
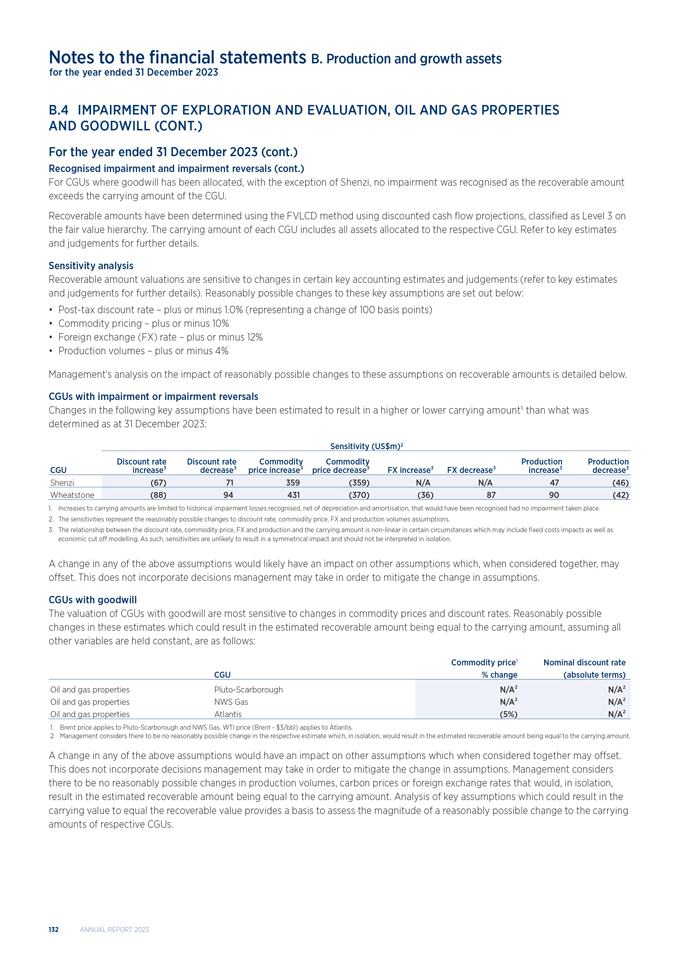
WOODSIDE ENERGY GROUP LTD 127 Notes to the financial statements B. Production and growth assets for the year ended 31 December 2023 B.4 IMPAIRMENT OF EXPLORATION AND EVALUATION, OIL AND GAS PROPERTIES AND GOODWILL (CONT.) For the year ended 31 December 2023 (cont.) Recognised impairment and impairment reversals (cont.) For CGUs where goodwill has been allocated, with the exception of Shenzi, no impairment was recognised as the recoverable amount exceeds the carrying amount of the CGU. Recoverable amounts have been determined using the FVLCD method using discounted cash flow projections, classified as Level 3 on the fair value hierarchy. The carrying amount of each CGU includes all assets allocated to the respective CGU. Refer to key estimates and judgements for further details. Sensitivity analysis Recoverable amount valuations are sensitive to changes in certain key accounting estimates and judgements (refer to key estimates and judgements for further details). Reasonably possible changes to these key assumptions are set out below: • Post-tax discount rate – plus or minus 1.0% (representing a change of 100 basis points) • Commodity pricing – plus or minus 10% • Foreign exchange (FX) rate – plus or minus 12% • Production volumes – plus or minus 4% Management’s analysis on the impact of reasonably possible changes to these assumptions on recoverable amounts is detailed below. CGUs with impairment or impairment reversals Changes in the following key assumptions have been estimated to result in a higher or lower carrying amount1 than what was determined as at 31 December 2023: Sensitivity (US$m)2 Discount rate Discount rate Commodity Commodity Production Production CGU increase³ decrease³ price increase³ price decrease³ FX increase³ FX decrease³ increase³ decrease³ Shenzi (67) 71 359 (359) N/A N/A 47 (46) Wheatstone (88) 94 431 (370) (36) 87 90 (42) 1. Increases to carrying amounts are limited to historical impairment losses recognised, net of depreciation and amortisation, that would have been recognised had no impairment taken place. 2. The sensitivities represent the reasonably possible changes to discount rate, commodity price, FX and production volumes assumptions. 3. The relationship between the discount rate, commodity price, FX and production and the carrying amount is non-linear in certain circumstances which may include fixed costs impacts as well as economic cut off modelling. As such, sensitivities are unlikely to result in a symmetrical impact and should not be interpreted in isolation. A change in any of the above assumptions would likely have an impact on other assumptions which, when considered together, may offset. This does not incorporate decisions management may take in order to mitigate the change in assumptions. CGUs with goodwill The valuation of CGUs with goodwill are most sensitive to changes in commodity prices and discount rates. Reasonably possible changes in these estimates which could result in the estimated recoverable amount being equal to the carrying amount, assuming all other variables are held constant, are as follows: Commodity price1 Nominal discount rate CGU % change (absolute terms) Oil and gas properties Pluto-Scarborough N/A² N/A² Oil and gas properties NWS Gas N/A² N/A² Oil and gas properties Atlantis (5%) N/A² 1. Brent price applies to Pluto-Scarborough and NWS Gas. WTI price (Brent—$3/bbl) applies to Atlantis. 2. Management considers there to be no reasonably possible change in the respective estimate which, in isolation, would result in the estimated recoverable amount being equal to the carrying amount. A change in any of the above assumptions would have an impact on other assumptions which when considered together may offset. This does not incorporate decisions management may take in order to mitigate the change in assumptions. Management considers there to be no reasonably possible changes in production volumes, carbon prices or foreign exchange rates that would, in isolation, result in the estimated recoverable amount being equal to the carrying amount. Analysis of key assumptions which could result in the carrying value to equal the recoverable value provides a basis to assess the magnitude of a reasonably possible change to the carrying amounts of respective CGUs. 132 ANNUAL REPORT 2023
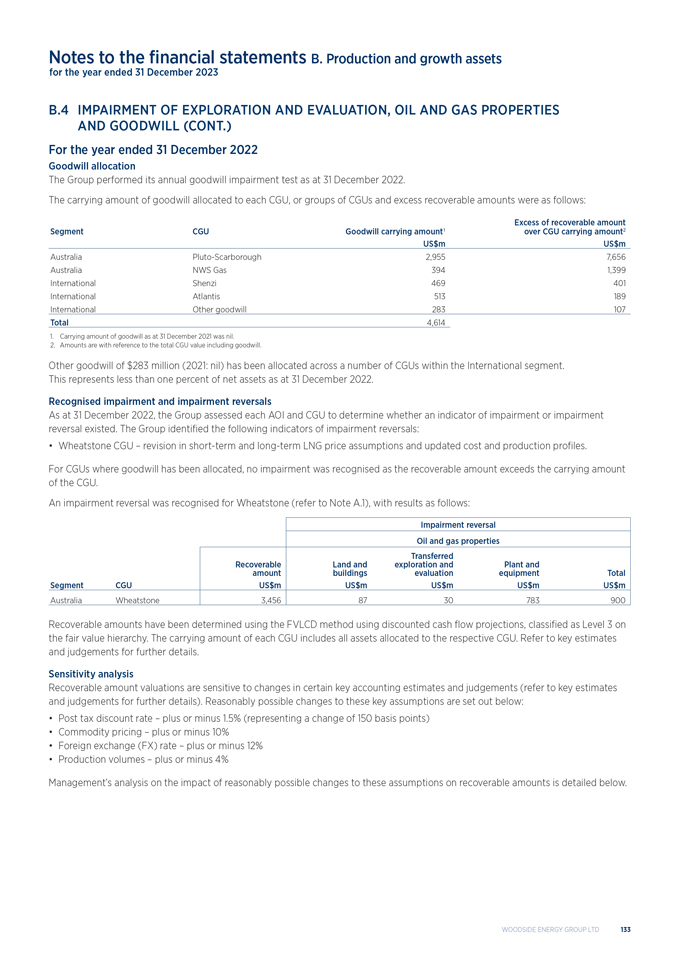
Notes to the financial statements B. Production and growth assets for the year ended 31 December 2023 B.4 IMPAIRMENT OF EXPLORATION AND EVALUATION, OIL AND GAS PROPERTIES AND GOODWILL (CONT.) For the year ended 31 December 2022 Goodwill allocation The Group performed its annual goodwill impairment test as at 31 December 2022. The carrying amount of goodwill allocated to each CGU, or groups of CGUs and excess recoverable amounts were as follows: Excess of recoverable amount Segment CGU Goodwill carrying amount1 over CGU carrying amount2 US$m US$m Australia Pluto-Scarborough 2,955 7,656 Australia NWS Gas 394 1,399 International Shenzi 469 401 International Atlantis 513 189 International Other goodwill 283 107 Total 4,614 1. Carrying amount of goodwill as at 31 December 2021 was nil. 2. Amounts are with reference to the total CGU value including goodwill. Other goodwill of $283 million (2021: nil) has been allocated across a number of CGUs within the International segment. This represents less than one percent of net assets as at 31 December 2022. Recognised impairment and impairment reversals As at 31 December 2022, the Group assessed each AOI and CGU to determine whether an indicator of impairment or impairment reversal existed. The Group identified the following indicators of impairment reversals: • Wheatstone CGU – revision in short-term and long-term LNG price assumptions and updated cost and production profiles. For CGUs where goodwill has been allocated, no impairment was recognised as the recoverable amount exceeds the carrying amount of the CGU. An impairment reversal was recognised for Wheatstone (refer to Note A.1), with results as follows: Impairment reversal Oil and gas properties Transferred Recoverable Land and exploration and Plant and amount buildings evaluation equipment Total Segment CGU US$m US$m US$m US$m US$m Australia Wheatstone 3,456 87 30 783 900 Recoverable amounts have been determined using the FVLCD method using discounted cash flow projections, classified as Level 3 on the fair value hierarchy. The carrying amount of each CGU includes all assets allocated to the respective CGU. Refer to key estimates and judgements for further details. Sensitivity analysis Recoverable amount valuations are sensitive to changes in certain key accounting estimates and judgements (refer to key estimates and judgements for further details). Reasonably possible changes to these key assumptions are set out below: • Post tax discount rate – plus or minus 1.5% (representing a change of 150 basis points) • Commodity pricing – plus or minus 10% • Foreign exchange (FX) rate – plus or minus 12% • Production volumes – plus or minus 4% Management’s analysis on the impact of reasonably possible changes to these assumptions on recoverable amounts is detailed below. WOODSIDE ENERGY GROUP LTD 133
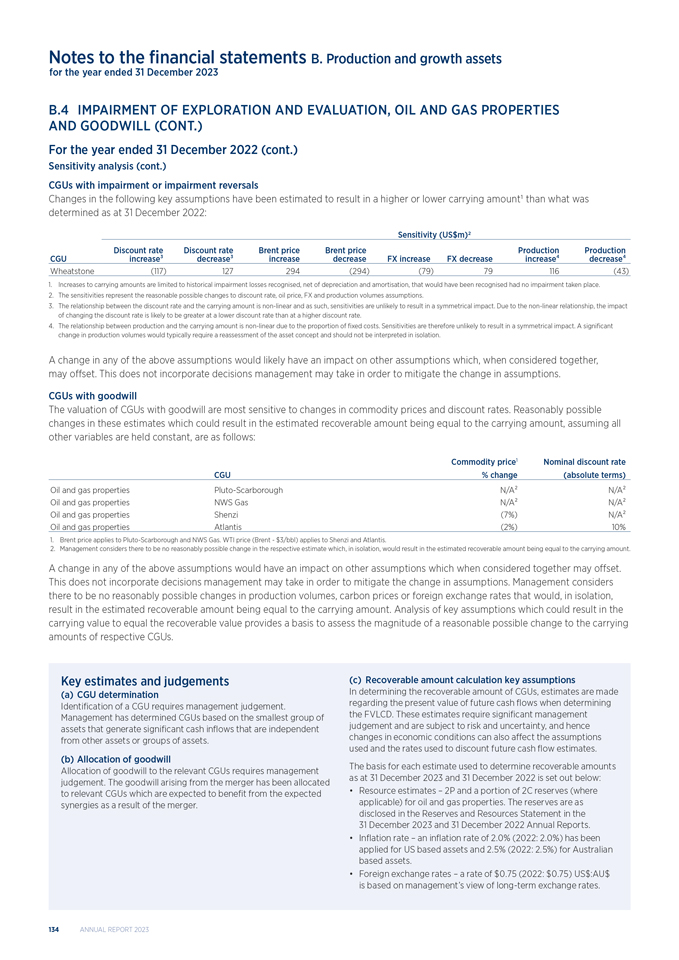
Notes to the financial statements B. Production and growth assets for the year ended 31 December 2023 B.4 IMPAIRMENT OF EXPLORATION AND EVALUATION, OIL AND GAS PROPERTIES AND GOODWILL (CONT.) For the year ended 31 December 2022 (cont.) Sensitivity analysis (cont.) CGUs with impairment or impairment reversals Changes in the following key assumptions have been estimated to result in a higher or lower carrying amount1 than what was determined as at 31 December 2022: Sensitivity (US$m)2 Discount rate Discount rate Brent price Brent price Production Production CGU increase³ decrease³ increase decrease FX increase FX decrease increaseâ´ decreaseâ´ Wheatstone (117) 127 294 (294) (79) 79 116 (43) 1. Increases to carrying amounts are limited to historical impairment losses recognised, net of depreciation and amortisation, that would have been recognised had no impairment taken place. 2. The sensitivities represent the reasonable possible changes to discount rate, oil price, FX and production volumes assumptions. 3. The relationship between the discount rate and the carrying amount is non-linear and as such, sensitivities are unlikely to result in a symmetrical impact. Due to the non-linear relationship, the impact of changing the discount rate is likely to be greater at a lower discount rate than at a higher discount rate. 4. The relationship between production and the carrying amount is non-linear due to the proportion of fixed costs. Sensitivities are therefore unlikely to result in a symmetrical impact. A significant change in production volumes would typically require a reassessment of the asset concept and should not be interpreted in isolation. A change in any of the above assumptions would likely have an impact on other assumptions which, when considered together, may offset. This does not incorporate decisions management may take in order to mitigate the change in assumptions. CGUs with goodwill The valuation of CGUs with goodwill are most sensitive to changes in commodity prices and discount rates. Reasonably possible changes in these estimates which could result in the estimated recoverable amount being equal to the carrying amount, assuming all other variables are held constant, are as follows: Commodity price1 Nominal discount rate CGU % change (absolute terms) Oil and gas properties Pluto-Scarborough N/A² N/A² Oil and gas properties NWS Gas N/A² N/A² Oil and gas properties Shenzi (7%) N/A² Oil and gas properties Atlantis (2%) 10% 1. Brent price applies to Pluto-Scarborough and NWS Gas. WTI price (Brent—$3/bbl) applies to Shenzi and Atlantis. 2. Management considers there to be no reasonably possible change in the respective estimate which, in isolation, would result in the estimated recoverable amount being equal to the carrying amount. A change in any of the above assumptions would have an impact on other assumptions which when considered together may offset. This does not incorporate decisions management may take in order to mitigate the change in assumptions. Management considers there to be no reasonably possible changes in production volumes, carbon prices or foreign exchange rates that would, in isolation, result in the estimated recoverable amount being equal to the carrying amount. Analysis of key assumptions which could result in the carrying value to equal the recoverable value provides a basis to assess the magnitude of a reasonable possible change to the carrying amounts of respective CGUs. Key estimates and judgements (a) CGU determination Identification of a CGU requires management judgement. Management has determined CGUs based on the smallest group of assets that generate significant cash inflows that are independent from other assets or groups of assets. (b) Allocation of goodwill Allocation of goodwill to the relevant CGUs requires management judgement. The goodwill arising from the merger has been allocated to relevant CGUs which are expected to benefit from the expected synergies as a result of the merger. (c) Recoverable amount calculation key assumptions In determining the recoverable amount of CGUs, estimates are made regarding the present value of future cash flows when determining the FVLCD. These estimates require significant management judgement and are subject to risk and uncertainty, and hence changes in economic conditions can also affect the assumptions used and the rates used to discount future cash flow estimates. The basis for each estimate used to determine recoverable amounts as at 31 December 2023 and 31 December 2022 is set out below: • Resource estimates – 2P and a portion of 2C reserves (where applicable) for oil and gas properties. The reserves are as disclosed in the Reserves and Resources Statement in the 31 December 2023 and 31 December 2022 Annual Reports. • Inflation rate – an inflation rate of 2.0% (2022: 2.0%) has been applied for US based assets and 2.5% (2022: 2.5%) for Australian based assets. • Foreign exchange rates – a rate of $0.75 (2022: $0.75) US$:AU$ is based on management’s view of long-term exchange rates. 134 ANNUAL REPORT 2023
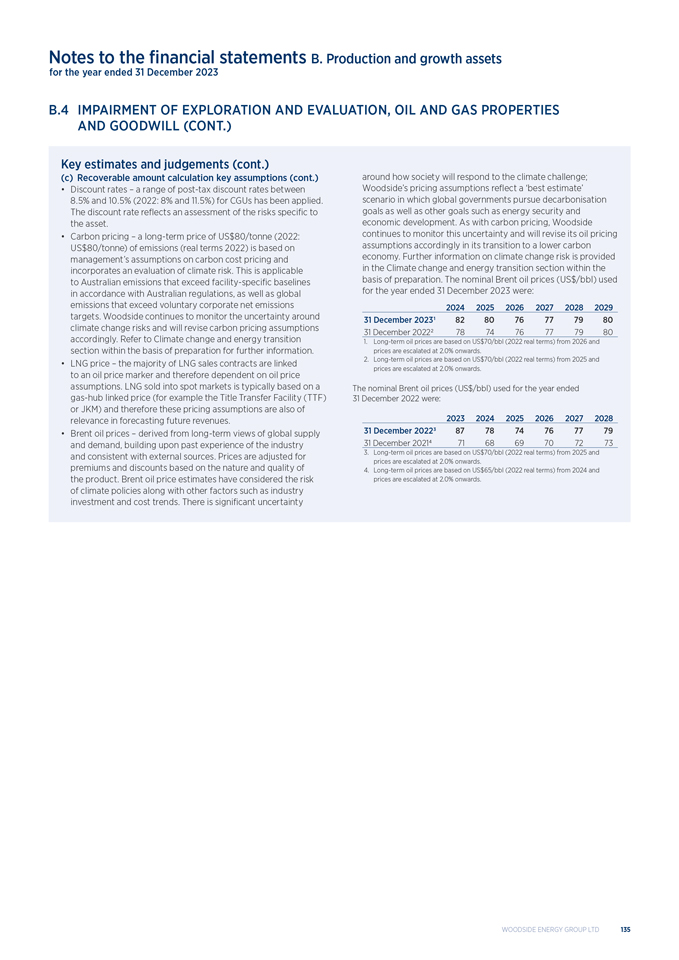
Notes to the financial statements B. Production and growth assets for the year ended 31 December 2023 B.4 IMPAIRMENT OF EXPLORATION AND EVALUATION, OIL AND GAS PROPERTIES AND GOODWILL (CONT.) Key estimates and judgements (cont.) (c) Recoverable amount calculation key assumptions (cont.) • Discount rates – a range of post-tax discount rates between 8.5% and 10.5% (2022: 8% and 11.5%) for CGUs has been applied. The discount rate reflects an assessment of the risks specific to the asset. • Carbon pricing – a long-term price of US$80/tonne (2022: US$80/tonne) of emissions (real terms 2022) is based on management’s assumptions on carbon cost pricing and incorporates an evaluation of climate risk. This is applicable to Australian emissions that exceed facility-specific baselines in accordance with Australian regulations, as well as global emissions that exceed voluntary corporate net emissions targets. Woodside continues to monitor the uncertainty around climate change risks and will revise carbon pricing assumptions accordingly. Refer to Climate change and energy transition section within the basis of preparation for further information. • LNG price – the majority of LNG sales contracts are linked to an oil price marker and therefore dependent on oil price assumptions. LNG sold into spot markets is typically based on a gas-hub linked price (for example the Title Transfer Facility (TTF) or JKM) and therefore these pricing assumptions are also of relevance in forecasting future revenues. • Brent oil prices – derived from long-term views of global supply and demand, building upon past experience of the industry and consistent with external sources. Prices are adjusted for premiums and discounts based on the nature and quality of the product. Brent oil price estimates have considered the risk of climate policies along with other factors such as industry investment and cost trends. There is significant uncertainty around how society will respond to the climate challenge; Woodside’s pricing assumptions reflect a ‘best estimate’ scenario in which global governments pursue decarbonisation goals as well as other goals such as energy security and economic development. As with carbon pricing, Woodside continues to monitor this uncertainty and will revise its oil pricing assumptions accordingly in its transition to a lower carbon economy. Further information on climate change risk is provided in the Climate change and energy transition section within the basis of preparation. The nominal Brent oil prices (US$/bbl) used for the year ended 31 December 2023 were: 2024 2025 2026 2027 2028 2029 31 December 20231 82 80 76 77 79 80 31 December 20222 78 74 76 77 79 80 1. Long-term oil prices are based on US$70/bbl (2022 real terms) from 2026 and prices are escalated at 2.0% onwards. 2. Long-term oil prices are based on US$70/bbl (2022 real terms) from 2025 and prices are escalated at 2.0% onwards. The nominal Brent oil prices (US$/bbl) used for the year ended 31 December 2022 were: 2023 2024 2025 2026 2027 2028 31 December 20223 87 78 74 76 77 79 31 December 20214 71 68 69 70 72 73 3. Long-term oil prices are based on US$70/bbl (2022 real terms) from 2025 and prices are escalated at 2.0% onwards. 4. Long-term oil prices are based on US$65/bbl (2022 real terms) from 2024 and prices are escalated at 2.0% onwards. WOODSIDE ENERGY GROUP LTD 135
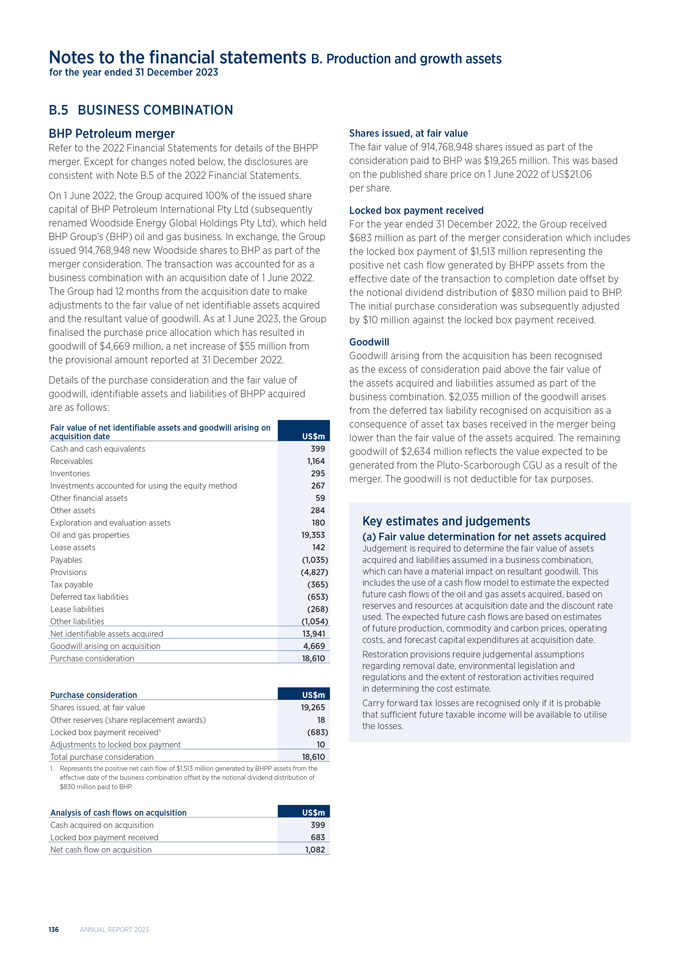
Notes to the financial statements B. Production and growth assets for the year ended 31 December 2023 B.5 BUSINESS COMBINATION BHP Petroleum merger Refer to the 2022 Financial Statements for details of the BHPP merger. Except for changes noted below, the disclosures are consistent with Note B.5 of the 2022 Financial Statements. On 1 June 2022, the Group acquired 100% of the issued share capital of BHP Petroleum International Pty Ltd (subsequently renamed Woodside Energy Global Holdings Pty Ltd), which held BHP Group’s (BHP) oil and gas business. In exchange, the Group issued 914,768,948 new Woodside shares to BHP as part of the merger consideration. The transaction was accounted for as a business combination with an acquisition date of 1 June 2022. The Group had 12 months from the acquisition date to make adjustments to the fair value of net identifiable assets acquired and the resultant value of goodwill. As at 1 June 2023, the Group finalised the purchase price allocation which has resulted in goodwill of $4,669 million, a net increase of $55 million from the provisional amount reported at 31 December 2022. Details of the purchase consideration and the fair value of goodwill, identifiable assets and liabilities of BHPP acquired are as follows: Fair value of net identifiable assets and goodwill arising on acquisition date US$m Cash and cash equivalents 399 Receivables 1,164 Inventories 295 Investments accounted for using the equity method 267 Other financial assets 59 Other assets 284 Exploration and evaluation assets 180 Oil and gas properties 19,353 Lease assets 142 Payables (1,035) Provisions (4,827) Tax payable (365) Deferred tax liabilities (653) Lease liabilities (268) Other liabilities (1,054) Net identifiable assets acquired 13,941 Goodwill arising on acquisition 4,669 Purchase consideration 18,610 Purchase consideration US$m Shares issued, at fair value 19,265 Other reserves (share replacement awards) 18 Locked box payment received1 (683) Adjustments to locked box payment 10 Total purchase consideration 18,610 1. Represents the positive net cash flow of $1,513 million generated by BHPP assets from the effective date of the business combination offset by the notional dividend distribution of $830 million paid to BHP. Analysis of cash flows on acquisition US$m Cash acquired on acquisition 399 Locked box payment received 683 Net cash flow on acquisition 1,082 Shares issued, at fair value The fair value of 914,768,948 shares issued as part of the consideration paid to BHP was $19,265 million. This was based on the published share price on 1 June 2022 of US$21.06 per share. Locked box payment received For the year ended 31 December 2022, the Group received $683 million as part of the merger consideration which includes the locked box payment of $1,513 million representing the positive net cash flow generated by BHPP assets from the effective date of the transaction to completion date offset by the notional dividend distribution of $830 million paid to BHP. The initial purchase consideration was subsequently adjusted by $10 million against the locked box payment received. Goodwill Goodwill arising from the acquisition has been recognised as the excess of consideration paid above the fair value of the assets acquired and liabilities assumed as part of the business combination. $2,035 million of the goodwill arises from the deferred tax liability recognised on acquisition as a consequence of asset tax bases received in the merger being lower than the fair value of the assets acquired. The remaining goodwill of $2,634 million reflects the value expected to be generated from the Pluto-Scarborough CGU as a result of the merger. The goodwill is not deductible for tax purposes. Key estimates and judgements (a) Fair value determination for net assets acquired Judgement is required to determine the fair value of assets acquired and liabilities assumed in a business combination, which can have a material impact on resultant goodwill. This includes the use of a cash flow model to estimate the expected future cash flows of the oil and gas assets acquired, based on reserves and resources at acquisition date and the discount rate used. The expected future cash flows are based on estimates of future production, commodity and carbon prices, operating costs, and forecast capital expenditures at acquisition date. Restoration provisions require judgemental assumptions regarding removal date, environmental legislation and regulations and the extent of restoration activities required in determining the cost estimate. Carry forward tax losses are recognised only if it is probable that sufficient future taxable income will be available to utilise the losses. 136 ANNUAL REPORT 2023
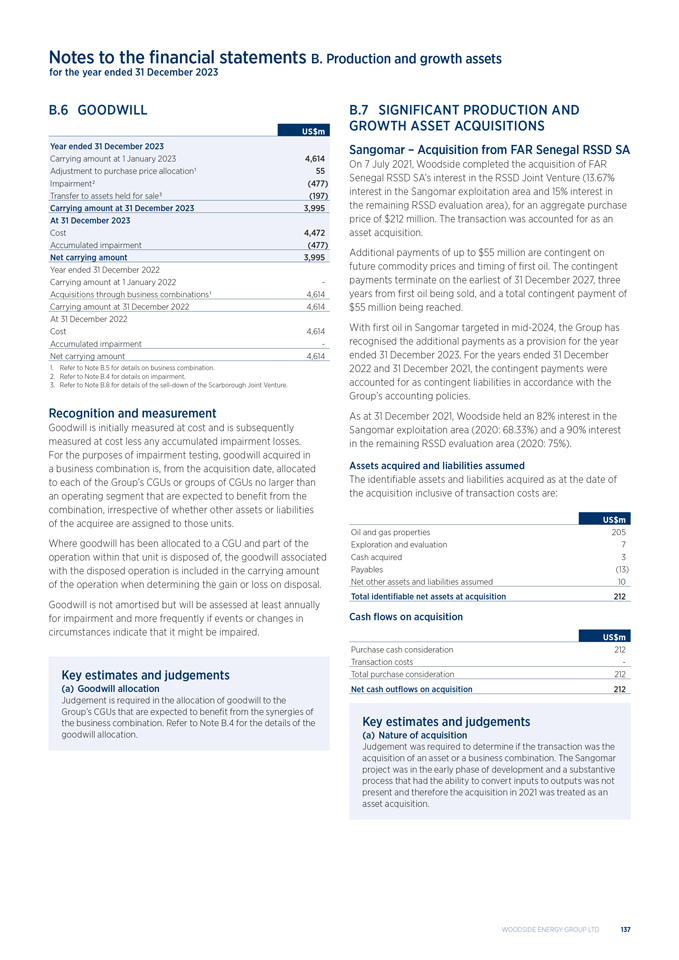
Notes to the financial statements B. Production and growth assets for the year ended 31 December 2023 B.6 GOODWILL US$m Year ended 31 December 2023 Carrying amount at 1 January 2023 4,614 Adjustment to purchase price allocation1 55 Impairment2 (477) Transfer to assets held for sale3 (197) Carrying amount at 31 December 2023 3,995 At 31 December 2023 Cost 4,472 Accumulated impairment (477) Net carrying amount 3,995 Year ended 31 December 2022 Carrying amount at 1 January 2022 - Acquisitions through business combinations1 4,614 Carrying amount at 31 December 2022 4,614 At 31 December 2022 Cost 4,614 Accumulated impairment - Net carrying amount 4,614 1. Refer to Note B.5 for details on business combination. 2. Refer to Note B.4 for details on impairment. 3. Refer to Note B.8 for details of the sell-down of the Scarborough Joint Venture. Recognition and measurement Goodwill is initially measured at cost and is subsequently measured at cost less any accumulated impairment losses. For the purposes of impairment testing, goodwill acquired in a business combination is, from the acquisition date, allocated to each of the Group’s CGUs or groups of CGUs no larger than an operating segment that are expected to benefit from the combination, irrespective of whether other assets or liabilities of the acquiree are assigned to those units. Where goodwill has been allocated to a CGU and part of the operation within that unit is disposed of, the goodwill associated with the disposed operation is included in the carrying amount of the operation when determining the gain or loss on disposal. Goodwill is not amortised but will be assessed at least annually for impairment and more frequently if events or changes in circumstances indicate that it might be impaired. Key estimates and judgements (a) Goodwill allocation Judgement is required in the allocation of goodwill to the Group’s CGUs that are expected to benefit from the synergies of the business combination. Refer to Note B.4 for the details of the goodwill allocation. B.7 SIGNIFICANT PRODUCTION AND GROWTH ASSET ACQUISITIONS Sangomar – Acquisition from FAR Senegal RSSD SA On 7 July 2021, Woodside completed the acquisition of FAR Senegal RSSD SA’s interest in the RSSD Joint Venture (13.67% interest in the Sangomar exploitation area and 15% interest in the remaining RSSD evaluation area), for an aggregate purchase price of $212 million. The transaction was accounted for as an asset acquisition. Additional payments of up to $55 million are contingent on future commodity prices and timing of first oil. The contingent payments terminate on the earliest of 31 December 2027, three years from first oil being sold, and a total contingent payment of $55 million being reached. With first oil in Sangomar targeted in mid-2024, the Group has recognised the additional payments as a provision for the year ended 31 December 2023. For the years ended 31 December 2022 and 31 December 2021, the contingent payments were accounted for as contingent liabilities in accordance with the Group’s accounting policies. As at 31 December 2021, Woodside held an 82% interest in the Sangomar exploitation area (2020: 68.33%) and a 90% interest in the remaining RSSD evaluation area (2020: 75%). Assets acquired and liabilities assumed The identifiable assets and liabilities acquired as at the date of the acquisition inclusive of transaction costs are: US$m Oil and gas properties 205 Exploration and evaluation 7 Cash acquired 3 Payables (13) Net other assets and liabilities assumed 10 Total identifiable net assets at acquisition 212 Cash flows on acquisition US$m Purchase cash consideration 212 Transaction costs - Total purchase consideration 212 Net cash outflows on acquisition 212 Key estimates and judgements (a) Nature of acquisition Judgement was required to determine if the transaction was the acquisition of an asset or a business combination. The Sangomar project was in the early phase of development and a substantive process that had the ability to convert inputs to outputs was not present and therefore the acquisition in 2021 was treated as an asset acquisition. WOODSIDE ENERGY GROUP LTD 137
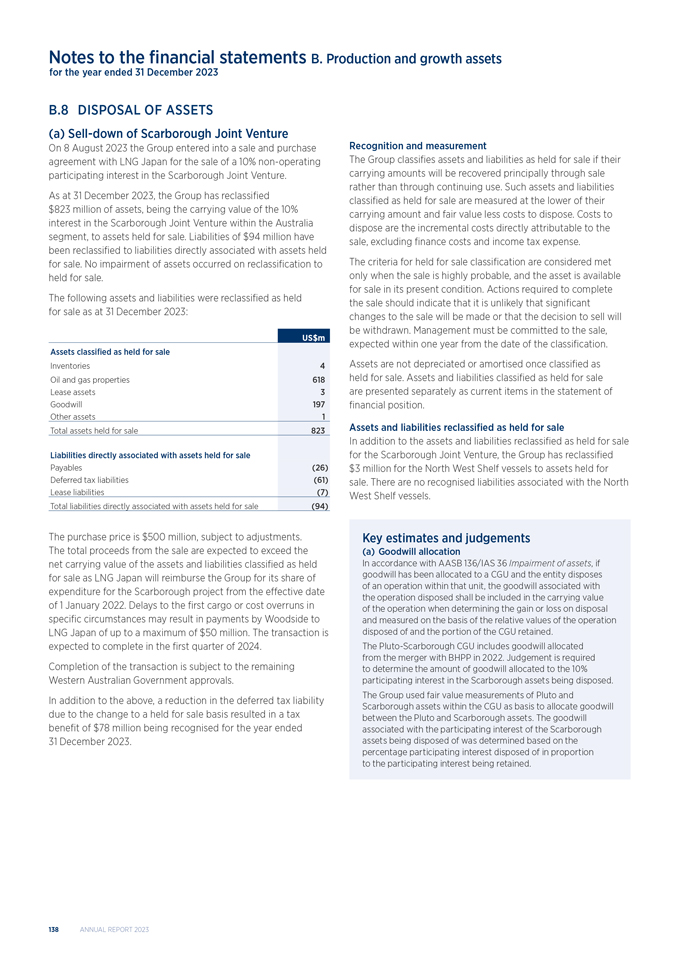
Notes to the financial statements B. Production and growth assets for the year ended 31 December 2023 B.8 DISPOSAL OF ASSETS (a) Sell-down of Scarborough Joint Venture On 8 August 2023 the Group entered into a sale and purchase agreement with LNG Japan for the sale of a 10% non-operating participating interest in the Scarborough Joint Venture. As at 31 December 2023, the Group has reclassified $823 million of assets, being the carrying value of the 10% interest in the Scarborough Joint Venture within the Australia segment, to assets held for sale. Liabilities of $94 million have been reclassified to liabilities directly associated with assets held for sale. No impairment of assets occurred on reclassification to held for sale. The following assets and liabilities were reclassified as held for sale as at 31 December 2023: US$m Assets classified as held for sale Inventories 4 Oil and gas properties 618 Lease assets 3 Goodwill 197 Other assets 1 Total assets held for sale 823 Liabilities directly associated with assets held for sale Payables (26) Deferred tax liabilities (61) Lease liabilities (7) Total liabilities directly associated with assets held for sale (94) The purchase price is $500 million, subject to adjustments. The total proceeds from the sale are expected to exceed the net carrying value of the assets and liabilities classified as held for sale as LNG Japan will reimburse the Group for its share of expenditure for the Scarborough project from the effective date of 1 January 2022. Delays to the first cargo or cost overruns in specific circumstances may result in payments by Woodside to LNG Japan of up to a maximum of $50 million. The transaction is expected to complete in the first quarter of 2024. Completion of the transaction is subject to the remaining Western Australian Government approvals. In addition to the above, a reduction in the deferred tax liability due to the change to a held for sale basis resulted in a tax benefit of $78 million being recognised for the year ended 31 December 2023. Recognition and measurement The Group classifies assets and liabilities as held for sale if their carrying amounts will be recovered principally through sale rather than through continuing use. Such assets and liabilities classified as held for sale are measured at the lower of their carrying amount and fair value less costs to dispose. Costs to dispose are the incremental costs directly attributable to the sale, excluding finance costs and income tax expense. The criteria for held for sale classification are considered met only when the sale is highly probable, and the asset is available for sale in its present condition. Actions required to complete the sale should indicate that it is unlikely that significant changes to the sale will be made or that the decision to sell will be withdrawn. Management must be committed to the sale, expected within one year from the date of the classification. Assets are not depreciated or amortised once classified as held for sale. Assets and liabilities classified as held for sale are presented separately as current items in the statement of financial position. Assets and liabilities reclassified as held for sale In addition to the assets and liabilities reclassified as held for sale for the Scarborough Joint Venture, the Group has reclassified $3 million for the North West Shelf vessels to assets held for sale. There are no recognised liabilities associated with the North West Shelf vessels. Key estimates and judgements (a) Goodwill allocation In accordance with AASB 136/IAS 36 Impairment of assets, if goodwill has been allocated to a CGU and the entity disposes of an operation within that unit, the goodwill associated with the operation disposed shall be included in the carrying value of the operation when determining the gain or loss on disposal and measured on the basis of the relative values of the operation disposed of and the portion of the CGU retained. The Pluto-Scarborough CGU includes goodwill allocated from the merger with BHPP in 2022. Judgement is required to determine the amount of goodwill allocated to the 10% participating interest in the Scarborough assets being disposed. The Group used fair value measurements of Pluto and Scarborough assets within the CGU as basis to allocate goodwill between the Pluto and Scarborough assets. The goodwill associated with the participating interest of the Scarborough assets being disposed of was determined based on the percentage participating interest disposed of in proportion to the participating interest being retained. 138 ANNUAL REPORT 2023
B.8 DISPOSAL OF ASSETS (CONT.) (b) Sell-down of Train 2 On 15 November 2021 the Group entered into a sale and purchase agreement with Global Infrastructure Partners (GIP) for the sale of a 49% non-operating participating interest in the Pluto Train 2 Joint Venture. As at 31 December 2021, the Group reclassified the carrying value of the 49% interest in the Pluto Train 2 assets to assets held for sale. There were no recognised liabilities associated with the assets held for sale. The transaction completed on 18 January 2022, reducing the Group’s participating interest from 100% to 51%. The Group recognised an initial pre-tax gain on sale of $427 million for the year ended 31 December 2022. The arrangements require GIP to fund its 49% share of capital expenditure from 1 October 2021 and an additional amount of construction capital expenditure of $822 million on behalf of the Group. If the total capital expenditure incurred is less than $5,800 million, GIP will pay Woodside an additional amount equal to 49% of the under-spend. In the event of a cost overrun, Woodside will fund up to $822 million of GIP’s share of the overrun. Delays to the expected start-up of production will result in payments by Woodside to GIP in certain circumstances. The arrangements include provisions for GIP to be compensated for exposure to additional Scope 1 emissions liabilities above agreed baselines, and to sell its 49% interest back to Woodside if the status of key regulatory approvals materially changes. Given judgement was used to determine the consideration received, the Group is required to remeasure the variable consideration at each reporting period. As at 31 December 2023, the variable consideration has been reassessed with no revaluation gain or loss being recognised (2022: $71 million revaluation gain recognised as other income, with a corresponding reduction to other liabilities). The fair value of the remaining unpaid funding from GIP has been netted against the other liabilities and will be recognised as oil and gas properties in the future. Key estimates and judgements (a) Sell-down of Train 2 Given the arrangements include provisions for GIP to sell its 49% interest back to Woodside if the status of key regulatory environmental approvals materially changes and the requirement for Woodside to fund up to $822 million of GIP’s share in the event of a cost overrun, judgement is required to determine if the sell-down of Train 2 constitutes a sale and if a portion of the transaction price should be considered as variable consideration. Judgement was used to determine that the sell-down of Train 2 constituted a sale given the various conditions included in the sale and purchase agreement. The Group determined that a sale occurred as control of the 49% interest was passed to GIP on completion date. Control is determined as the ability to direct the use of, and obtain substantially all of the economic benefits of, the associated interest. Judgement was used to determine if it is highly probable that a significant reversal will not occur in relation to the consideration received. The Group estimated the variable consideration based on the construction capital expenditure cost profile, the development schedule, and assessing the probability and impact of any event which may result in a significant reversal. The constraining estimates of variable consideration have been applied resulting in the initial pre-tax gain on sale of $427 million for the year ended 31 December 2022. The variable consideration is remeasured at each reporting period with any changes recognised through the consolidated income statement. As at 31 December 2023, the variable consideration has been reassessed with no revaluation gain or loss being recognised (2022: $71 million revaluation gain recognised as other income). WOODSIDE ENERGY GROUP LTD 139
Notes to the financial statements C. Debt and capital for the year ended 31 December 2023 IN THIS SECTION This section addresses cash, debt and the capital position of the Group at the end of the reporting period including, where applicable, the accounting policies applied and the key estimates and judgements made. C. Debt and capital C.1 Cash and cash equivalents Page 141 C.2 Interest-bearing liabilities and financing facilities Page 141 C.3 Contributed equity Page 143 C.4 Other reserves Page 143 KEY FINANCIAL AND CAPITAL RISKS IN THIS SECTION Capital risk management Group Treasury is responsible for the Group’s capital management including cash, debt and equity. Capital management is undertaken to ensure that a secure, cost-effective and flexible supply of funds is available to meet the Group’s operating and capital expenditure requirements. A stable capital base is maintained from which the Group can pursue its growth aspirations, whilst maintaining a flexible capital structure that allows access to a range of debt and equity markets to both draw upon and repay capital. The Dividend Reinvestment Plan (DRP) was approved by shareholders at the Annual General Meeting in 2003 for activation as required to fund future growth. The DRP was reactivated in 2019 and suspended by the Board of Directors on 27 February 2023. A range of financial metrics are monitored, including gearing and cash flow leverage, and Treasury policy breaches and exceptions. Liquidity risk management Liquidity risk arises from the financial liabilities of the Group and the Group’s subsequent ability to meet its obligations to repay financial liabilities as and when they fall due. The liquidity position of the Group is managed to ensure sufficient liquid funds are available to meet its financial commitments in a timely and cost-effective manner. The Group’s liquidity is continually reviewed, including cash flow forecasts to determine the forecast liquidity position and maintain appropriate liquidity levels. At 31 December 2023, the Group had a total of $7,790 million (2022: $10,239 million) of available undrawn facilities and cash at its disposal. The maturity profile of interest-bearing liabilities is disclosed in Note C.2, trade and other payables are disclosed in Note D.4 and lease liabilities are disclosed in Note D.7. Financing facilities available to the Group are disclosed in Note C.2. Interest rate risk management Interest rate risk is the risk that the Group’s financial position will fluctuate due to changes in market interest rates. The Group’s exposure to the risk of changes in market interest rates relates primarily to financial instruments with floating interest rates including long-term debt obligations, cash and short-term deposits. The Group manages its interest rate risk by maintaining an appropriate mix of fixed and floating rate debt. To manage the ratio of fixed rate debt to floating rate debt, the Group may enter into interest rate swaps. The Group holds interest rate swaps to hedge the interest rate risk associated with the $600 million syndicated facility. Refer to Notes C.2 and D.6 for further details. At the reporting date, the Group was exposed to various benchmark interest rates that were not designated in cash flow hedges, primarily through $1,605 million (2022: $6,143 million) on cash and cash equivalents, nil (2022: $83 million) on interest-bearing liabilities (excluding transaction costs), nil (2022: $167 million) of other financial assets and nil (2022: $5 million) on cross-currency interest rate swaps. A reasonably possible change in the Secured Overnight Financing Rate (SOFR) (+2.0%/-2.0% (2022: USD London Interbank Offered Rate (USD LIBOR) +1.5%/-1.5%)), with all variables held constant, would not have a material impact on the Group’s equity or the income statement in the current period. During the period, the Group has completed the transition of its financial liabilities from USD LIBOR to SOFR. The transition during the year ended 31 December 2023 did not result in a material impact to the Group. 140 ANNUAL REPORT 2023
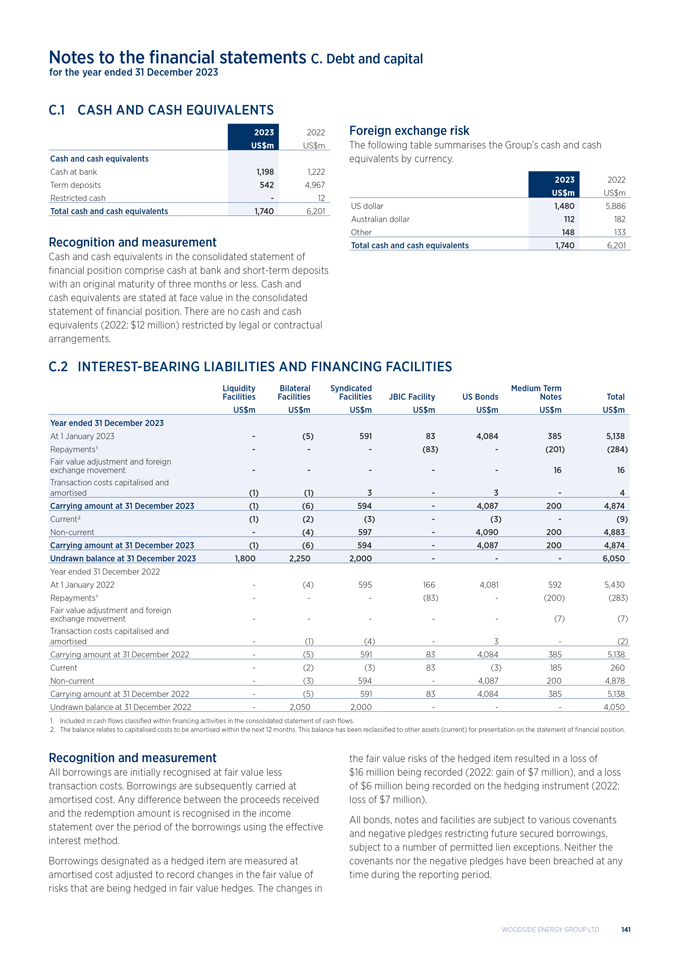
Notes to the financial statements C. Debt and capital for the year ended 31 December 2023 C.1 CASH AND CASH EQUIVALENTS 2023 2022 US$m US$m Cash and cash equivalents Cash at bank 1,198 1,222 Term deposits 542 4,967 Restricted cash - 12 Total cash and cash equivalents 1,740 6,201 Recognition and measurement Cash and cash equivalents in the consolidated statement of financial position comprise cash at bank and short-term deposits with an original maturity of three months or less. Cash and cash equivalents are stated at face value in the consolidated statement of financial position. There are no cash and cash equivalents (2022: $12 million) restricted by legal or contractual arrangements. Foreign exchange risk The following table summarises the Group’s cash and cash equivalents by currency. 2023 2022 US$m US$m US dollar 1,480 5,886 Australian dollar 112 182 Other 148 133 Total cash and cash equivalents 1,740 6,201 C.2 INTEREST-BEARING LIABILITIES AND FINANCING FACILITIES Liquidity Bilateral Syndicated Medium Term Facilities Facilities Facilities JBIC Facility US Bonds Notes Total US$m US$m US$m US$m US$m US$m US$m Year ended 31 December 2023 At 1 January 2023 - (5) 591 83 4,084 385 5,138 Repayments1 - - - (83) - (201) (284) Fair value adjustment and foreign exchange movement - - - - - 16 16 Transaction costs capitalised and amortised (1) (1) 3 - 3 - 4 Carrying amount at 31 December 2023 (1) (6) 594 - 4,087 200 4,874 Current2 (1) (2) (3) - (3) - (9) Non-current - (4) 597 - 4,090 200 4,883 Carrying amount at 31 December 2023 (1) (6) 594 - 4,087 200 4,874 Undrawn balance at 31 December 2023 1,800 2,250 2,000 - - - 6,050 Year ended 31 December 2022 At 1 January 2022 - (4) 595 166 4,081 592 5,430 Repayments1 - - - (83) - (200) (283) Fair value adjustment and foreign exchange movement - - - - - (7) (7) Transaction costs capitalised and amortised - (1) (4) - 3 - (2) Carrying amount at 31 December 2022 - (5) 591 83 4,084 385 5,138 Current - (2) (3) 83 (3) 185 260 Non-current - (3) 594 - 4,087 200 4,878 Carrying amount at 31 December 2022 - (5) 591 83 4,084 385 5,138 1. Included in cash flows classified within financing activities in the consolidated statement of cash flows. 2. The balance relates to capitalised costs to be amortised within the next 12 months. This balance has been reclassified to other assets (current) for presentation on the statement of financial position. Recognition and measurement All borrowings are initially recognised at fair value less transaction costs. Borrowings are subsequently carried at amortised cost. Any difference between the proceeds received and the redemption amount is recognised in the income statement over the period of the borrowings using the effective interest method. Borrowings designated as a hedged item are measured at amortised cost adjusted to record changes in the fair value of risks that are being hedged in fair value hedges. The changes in the fair value risks of the hedged item resulted in a loss of $16 million being recorded (2022: gain of $7 million), and a loss of $6 million being recorded on the hedging instrument (2022: loss of $7 million). All bonds, notes and facilities are subject to various covenants and negative pledges restricting future secured borrowings, subject to a number of permitted lien exceptions. Neither the covenants nor the negative pledges have been breached at any time during the reporting period. WOODSIDE ENERGY GROUP LTD 141
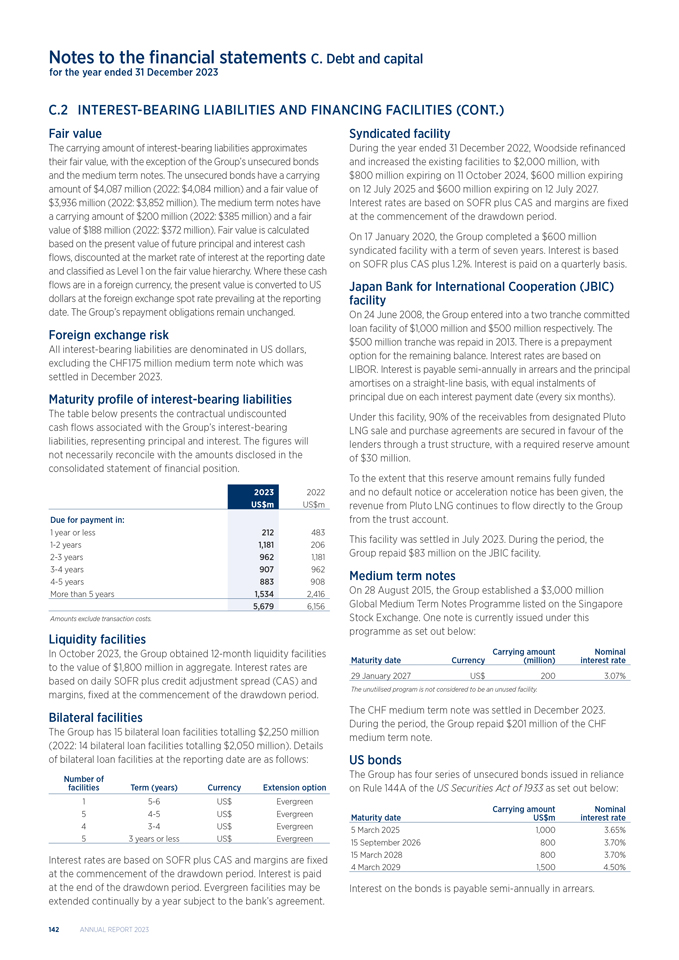
Notes to the financial statements C. Debt and capital for the year ended 31 December 2023 C.2 INTEREST-BEARING LIABILITIES AND FINANCING FACILITIES (CONT.) Fair value The carrying amount of interest-bearing liabilities approximates their fair value, with the exception of the Group’s unsecured bonds and the medium term notes. The unsecured bonds have a carrying amount of $4,087 million (2022: $4,084 million) and a fair value of $3,936 million (2022: $3,852 million). The medium term notes have a carrying amount of $200 million (2022: $385 million) and a fair value of $188 million (2022: $372 million). Fair value is calculated based on the present value of future principal and interest cash flows, discounted at the market rate of interest at the reporting date and classified as Level 1 on the fair value hierarchy. Where these cash flows are in a foreign currency, the present value is converted to US dollars at the foreign exchange spot rate prevailing at the reporting date. The Group’s repayment obligations remain unchanged. Foreign exchange risk All interest-bearing liabilities are denominated in US dollars, excluding the CHF175 million medium term note which was settled in December 2023. Maturity profile of interest-bearing liabilities The table below presents the contractual undiscounted cash flows associated with the Group’s interest-bearing liabilities, representing principal and interest. The figures will not necessarily reconcile with the amounts disclosed in the consolidated statement of financial position. 2023 2022 US$m US$m Due for payment in: 1 year or less 212 483 1-2 years 1,181 206 2-3 years 962 1,181 3-4 years 907 962 4-5 years 883 908 More than 5 years 1,534 2,416 5,679 6,156 Amounts exclude transaction costs. Liquidity facilities In October 2023, the Group obtained 12-month liquidity facilities to the value of $1,800 million in aggregate. Interest rates are based on daily SOFR plus credit adjustment spread (CAS) and margins, fixed at the commencement of the drawdown period. Bilateral facilities The Group has 15 bilateral loan facilities totalling $2,250 million (2022: 14 bilateral loan facilities totalling $2,050 million). Details of bilateral loan facilities at the reporting date are as follows: Number of facilities Term (years) Currency Extension option 1 5-6 US$Evergreen 5 4-5 US$Evergreen 4 3-4 US$Evergreen 5 3 years or less US$Evergreen Interest rates are based on SOFR plus CAS and margins are fixed at the commencement of the drawdown period. Interest is paid at the end of the drawdown period. Evergreen facilities may be extended continually by a year subject to the bank’s agreement. Syndicated facility During the year ended 31 December 2022, Woodside refinanced and increased the existing facilities to $2,000 million, with $800 million expiring on 11 October 2024, $600 million expiring on 12 July 2025 and $600 million expiring on 12 July 2027. Interest rates are based on SOFR plus CAS and margins are fixed at the commencement of the drawdown period. On 17 January 2020, the Group completed a $600 million syndicated facility with a term of seven years. Interest is based on SOFR plus CAS plus 1.2%. Interest is paid on a quarterly basis. Japan Bank for International Cooperation (JBIC) facility On 24 June 2008, the Group entered into a two tranche committed loan facility of $1,000 million and $500 million respectively. The $500 million tranche was repaid in 2013. There is a prepayment option for the remaining balance. Interest rates are based on LIBOR. Interest is payable semi-annually in arrears and the principal amortises on a straight-line basis, with equal instalments of principal due on each interest payment date (every six months). Under this facility, 90% of the receivables from designated Pluto LNG sale and purchase agreements are secured in favour of the lenders through a trust structure, with a required reserve amount of $30 million. To the extent that this reserve amount remains fully funded and no default notice or acceleration notice has been given, the revenue from Pluto LNG continues to flow directly to the Group from the trust account. This facility was settled in July 2023. During the period, the Group repaid $83 million on the JBIC facility. Medium term notes On 28 August 2015, the Group established a $3,000 million Global Medium Term Notes Programme listed on the Singapore Stock Exchange. One note is currently issued under this programme as set out below: Carrying amount Nominal Maturity date Currency (million) interest rate 29 January 2027 US$200 3.07% The unutilised program is not considered to be an unused facility. The CHF medium term note was settled in December 2023. During the period, the Group repaid $201 million of the CHF medium term note. US bonds The Group has four series of unsecured bonds issued in reliance on Rule 144A of the US Securities Act of 1933 as set out below: Carrying amount Nominal Maturity date US$m interest rate 5 March 2025 1,000 3.65% 15 September 2026 800 3.70% 15 March 2028 800 3.70% 4 March 2029 1,500 4.50% Interest on the bonds is payable semi-annually in arrears. 142 ANNUAL REPORT 2023
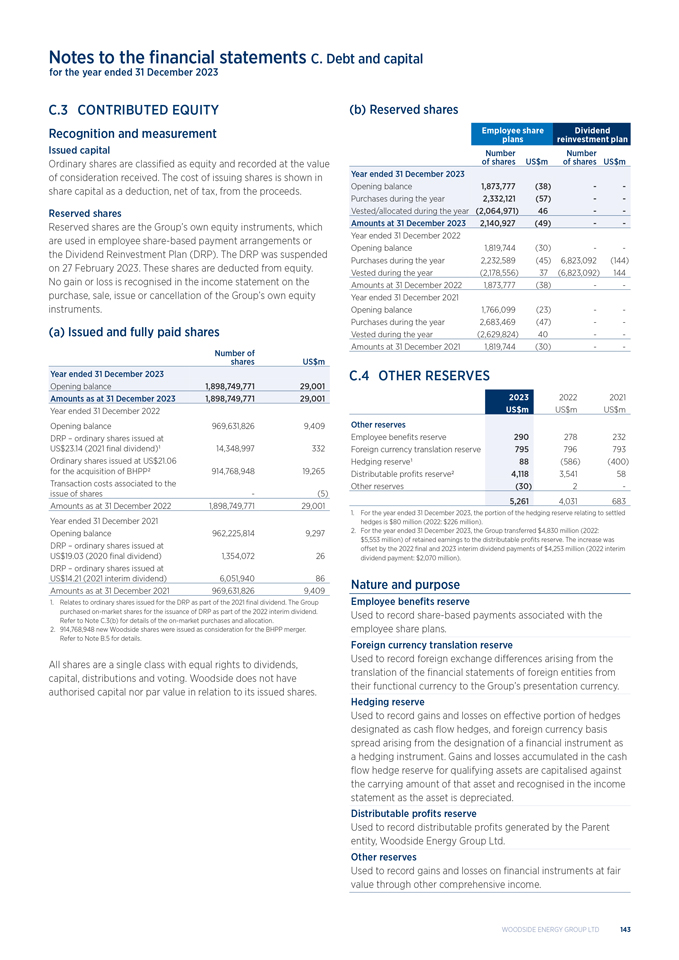
Notes to the financial statements C. Debt and capital for the year ended 31 December 2023 C.3 CONTRIBUTED EQUITY Recognition and measurement Issued capital Ordinary shares are classified as equity and recorded at the value of consideration received. The cost of issuing shares is shown in share capital as a deduction, net of tax, from the proceeds. Reserved shares Reserved shares are the Group’s own equity instruments, which are used in employee share-based payment arrangements or the Dividend Reinvestment Plan (DRP). The DRP was suspended on 27 February 2023. These shares are deducted from equity. No gain or loss is recognised in the income statement on the purchase, sale, issue or cancellation of the Group’s own equity instruments. (a) Issued and fully paid shares Number of shares US$m Year ended 31 December 2023 Opening balance 1,898,749,771 29,001 Amounts as at 31 December 2023 1,898,749,771 29,001 Year ended 31 December 2022 Opening balance 969,631,826 9,409 DRP – ordinary shares issued at US$23.14 (2021 final dividend)1 14,348,997 332 Ordinary shares issued at US$21.06 for the acquisition of BHPP2 914,768,948 19,265 Transaction costs associated to the issue of shares - (5) Amounts as at 31 December 2022 1,898,749,771 29,001 Year ended 31 December 2021 Opening balance 962,225,814 9,297 DRP – ordinary shares issued at US$19.03 (2020 final dividend) 1,354,072 26 DRP – ordinary shares issued at US$14.21 (2021 interim dividend) 6,051,940 86 Amounts as at 31 December 2021 969,631,826 9,409 1. Relates to ordinary shares issued for the DRP as part of the 2021 final dividend. The Group purchased on-market shares for the issuance of DRP as part of the 2022 interim dividend. Refer to Note C.3(b) for details of the on-market purchases and allocation. 2. 914,768,948 new Woodside shares were issued as consideration for the BHPP merger. Refer to Note B.5 for details. All shares are a single class with equal rights to dividends, capital, distributions and voting. Woodside does not have authorised capital nor par value in relation to its issued shares. (b) Reserved shares Employee share Dividend plans reinvestment plan Number Number of shares US$m of shares US$m Year ended 31 December 2023 Opening balance 1,873,777 (38) - - Purchases during the year 2,332,121 (57) - - Vested/allocated during the year (2,064,971) 46 - - Amounts at 31 December 2023 2,140,927 (49) - - Year ended 31 December 2022 Opening balance 1,819,744 (30) - - Purchases during the year 2,232,589 (45) 6,823,092 (144) Vested during the year (2,178,556) 37 (6,823,092) 144 Amounts at 31 December 2022 1,873,777 (38) - - Year ended 31 December 2021 Opening balance 1,766,099 (23) - - Purchases during the year 2,683,469 (47) - - Vested during the year (2,629,824) 40 - - Amounts at 31 December 2021 1,819,744 (30) - - C.4 OTHER RESERVES 2023 2022 2021 US$m US$m US$m Other reserves Employee benefits reserve 290 278 232 Foreign currency translation reserve 795 796 793 Hedging reserve1 88 (586) (400) Distributable profits reserve2 4,118 3,541 58 Other reserves (30) 2 - 5,261 4,031 683 1. For the year ended 31 December 2023, the portion of the hedging reserve relating to settled hedges is $80 million (2022: $226 million). 2. For the year ended 31 December 2023, the Group transferred $4,830 million (2022: $5,553 million) of retained earnings to the distributable profits reserve. The increase was offset by the 2022 final and 2023 interim dividend payments of $4,253 million (2022 interim dividend payment: $2,070 million). Nature and purpose Employee benefits reserve Used to record share-based payments associated with the employee share plans. Foreign currency translation reserve Used to record foreign exchange differences arising from the translation of the financial statements of foreign entities from their functional currency to the Group’s presentation currency. Hedging reserve Used to record gains and losses on effective portion of hedges designated as cash flow hedges, and foreign currency basis spread arising from the designation of a financial instrument as a hedging instrument. Gains and losses accumulated in the cash flow hedge reserve for qualifying assets are capitalised against the carrying amount of that asset and recognised in the income statement as the asset is depreciated. Distributable profits reserve Used to record distributable profits generated by the Parent entity, Woodside Energy Group Ltd. Other reserves Used to record gains and losses on financial instruments at fair value through other comprehensive income. WOODSIDE ENERGY GROUP LTD 143
Notes to the financial statements D. Other assets and liabilities for the year ended 31 December 2023 IN THIS SECTION This section addresses the other assets and liabilities position at the end of the reporting period including, where applicable, the accounting policies applied and the key estimates and judgements made. D. Other assets and liabilities D.1 Segment assets and liabilities Page 145 D.2 Receivables Page 145 D.3 Inventories Page 145 D.4 Payables Page 146 D.5 Provisions Page 146 D.6 Other financial assets and liabilities Page 148 D.7 Leases Page 151 KEY FINANCIAL AND CAPITAL RISKS IN THIS SECTION Credit risk management Credit risk is the risk that a counterparty will not meet its payment obligation under a financial instrument or customer contract, leading to a financial loss to the Group. Credit risk arises from the financial assets of the Group, which comprise trade and other receivables, loans receivables and deposits with banks and financial institutions. The Group manages its credit risk on trade receivables and financial instruments by predominantly dealing with counterparties with an investment grade credit rating. Sufficient financial security is obtained to mitigate the risk of financial loss when transacting with counterparties with below investment grade credit ratings. Customers who wish to trade on unsecured credit terms are subject to credit assessment procedures. Receivable balances are monitored on an ongoing basis. As a result, the Group’s exposure to bad debts is not significant. The Group’s maximum credit exposure is limited to the carrying amount of its financial assets. Customer credit risk is managed by the Treasury function subject to the Group’s established policy, procedures and controls relating to customer credit risk management. The credit quality of a customer is assessed based on various credit metrics, including its credit rating, and individual credit limits and requirements are defined in accordance with this assessment. Outstanding customer receivables are regularly monitored. At 31 December 2023, the Group had nineteen customers (2022: nineteen customers) that owed the Group more than $10 million each and accounted for approximately 82% (2022: 79%) of product-related trade receivables. Depending on the product, standard settlement terms are 7 to 30 days from the date of invoice or bill of lading. The Group considers the probability of default upon initial recognition of the asset and whether there has been a significant depreciation in credit quality on an ongoing basis. A significant decrease in credit quality is defined as a debtor being greater than 30 days past due in making a contractual payment. Credit losses for trade receivables (including lease receivables) and contract assets are determined by applying the simplified approach and are measured at an amount equal to lifetime expected loss. Under the simplified approach, determination of the loss allowance provision and expected loss rate incorporates past experience and forward-looking information, including the outlook for market demand and forward-looking interest rates. A default on other financial assets is considered to be when the counterparty fails to make contractual payments within 60 days of when they fall due. At 31 December 2023, the Group had a provision for credit losses of nil (2022: nil). Subsequent to 31 December 2023, 97% (2022: 99%) of product-related trade receivables balance of $885 million (2022: $1,067 million) has been received. Credit risk from balances with banks is managed by the Treasury function in accordance with the Group’s policy. The Group places funds from time to time as short-term deposits with reputable financial institutions with investment grade credit ratings. At 31 December 2023 and 31 December 2022, there were no significant concentrations of credit risk within the Group and financial instruments are spread amongst a number of financial institutions to minimise the risk of counterparty default. The maximum exposure to financial institution credit risk is represented by the sum of all cash deposits plus accrued interest, bank account balances and fair value of derivative assets. The Group’s counterparty credit policy limits this exposure to commercial and investment banks, according to approved credit limits based on the counterparty’s credit rating. 144 ANNUAL REPORT 2023
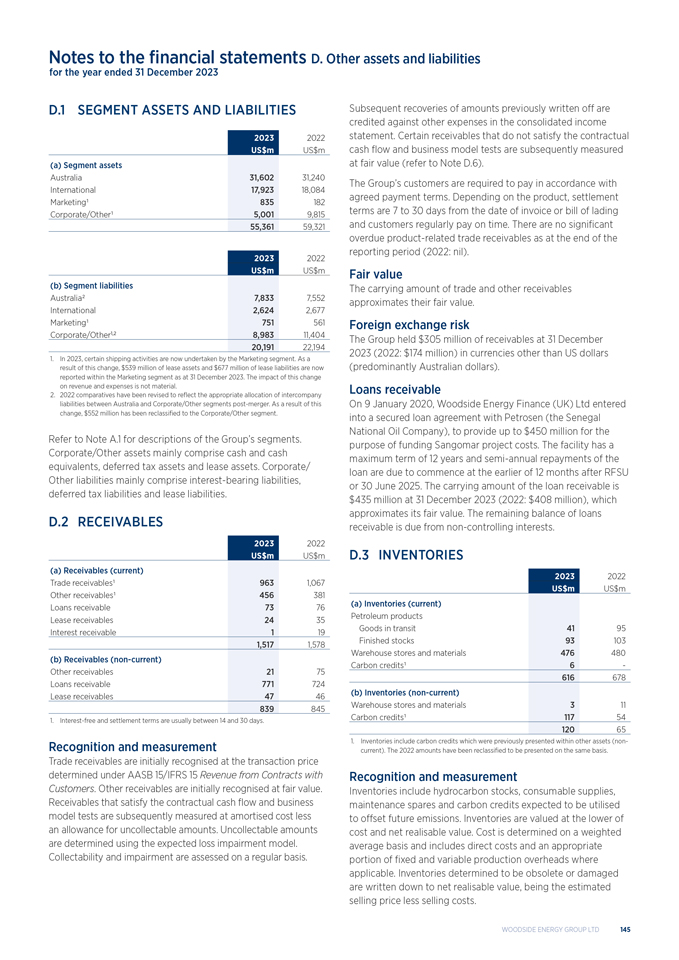
Notes to the financial statements D. Other assets and liabilities for the year ended 31 December 2023 D.1 SEGMENT ASSETS AND LIABILITIES 2023 2022 US$m US$m (a) Segment assets Australia 31,602 31,240 International 17,923 18,084 Marketing1 835 182 Corporate/Other1 5,001 9,815 55,361 59,321 2023 2022 US$m US$m (b) Segment liabilities Australia2 7,833 7,552 International 2,624 2,677 Marketing1 751 561 Corporate/Other1,2 8,983 11,404 20,191 22,194 1. In 2023, certain shipping activities are now undertaken by the Marketing segment. As a result of this change, $539 million of lease assets and $677 million of lease liabilities are now reported within the Marketing segment as at 31 December 2023. The impact of this change on revenue and expenses is not material. 2. 2022 comparatives have been revised to reflect the appropriate allocation of intercompany liabilities between Australia and Corporate/Other segments post-merger. As a result of this change, $552 million has been reclassified to the Corporate/Other segment. Refer to Note A.1 for descriptions of the Group’s segments. Corporate/Other assets mainly comprise cash and cash equivalents, deferred tax assets and lease assets. Corporate/ Other liabilities mainly comprise interest-bearing liabilities, deferred tax liabilities and lease liabilities. D.2 RECEIVABLES 2023 2022 US$m US$m (a) Receivables (current) Trade receivables1 963 1,067 Other receivables1 456 381 Loans receivable 73 76 Lease receivables 24 35 Interest receivable 1 19 1,517 1,578 (b) Receivables (non-current) Other receivables 21 75 Loans receivable 771 724 Lease receivables 47 46 839 845 1. Interest-free and settlement terms are usually between 14 and 30 days. Recognition and measurement Trade receivables are initially recognised at the transaction price determined under AASB 15/IFRS 15 Revenue from Contracts with Customers. Other receivables are initially recognised at fair value. Receivables that satisfy the contractual cash flow and business model tests are subsequently measured at amortised cost less an allowance for uncollectable amounts. Uncollectable amounts are determined using the expected loss impairment model. Collectability and impairment are assessed on a regular basis. Subsequent recoveries of amounts previously written off are credited against other expenses in the consolidated income statement. Certain receivables that do not satisfy the contractual cash flow and business model tests are subsequently measured at fair value (refer to Note D.6). The Group’s customers are required to pay in accordance with agreed payment terms. Depending on the product, settlement terms are 7 to 30 days from the date of invoice or bill of lading and customers regularly pay on time. There are no significant overdue product-related trade receivables as at the end of the reporting period (2022: nil). Fair value The carrying amount of trade and other receivables approximates their fair value. Foreign exchange risk The Group held $305 million of receivables at 31 December 2023 (2022: $174 million) in currencies other than US dollars (predominantly Australian dollars). Loans receivable On 9 January 2020, Woodside Energy Finance (UK) Ltd entered into a secured loan agreement with Petrosen (the Senegal National Oil Company), to provide up to $450 million for the purpose of funding Sangomar project costs. The facility has a maximum term of 12 years and semi-annual repayments of the loan are due to commence at the earlier of 12 months after RFSU or 30 June 2025. The carrying amount of the loan receivable is $435 million at 31 December 2023 (2022: $408 million), which approximates its fair value. The remaining balance of loans receivable is due from non-controlling interests. D.3 INVENTORIES 2023 2022 US$m US$m (a) Inventories (current) Petroleum products Goods in transit 41 95 Finished stocks 93 103 Warehouse stores and materials 476 480 Carbon credits1 6 - 616 678 (b) Inventories (non-current) Warehouse stores and materials 3 11 Carbon credits1 117 54 120 65 1. Inventories include carbon credits which were previously presented within other assets (non- current). The 2022 amounts have been reclassified to be presented on the same basis. Recognition and measurement Inventories include hydrocarbon stocks, consumable supplies, maintenance spares and carbon credits expected to be utilised to offset future emissions. Inventories are valued at the lower of cost and net realisable value. Cost is determined on a weighted average basis and includes direct costs and an appropriate portion of fixed and variable production overheads where applicable. Inventories determined to be obsolete or damaged are written down to net realisable value, being the estimated selling price less selling costs. WOODSIDE ENERGY GROUP LTD 145
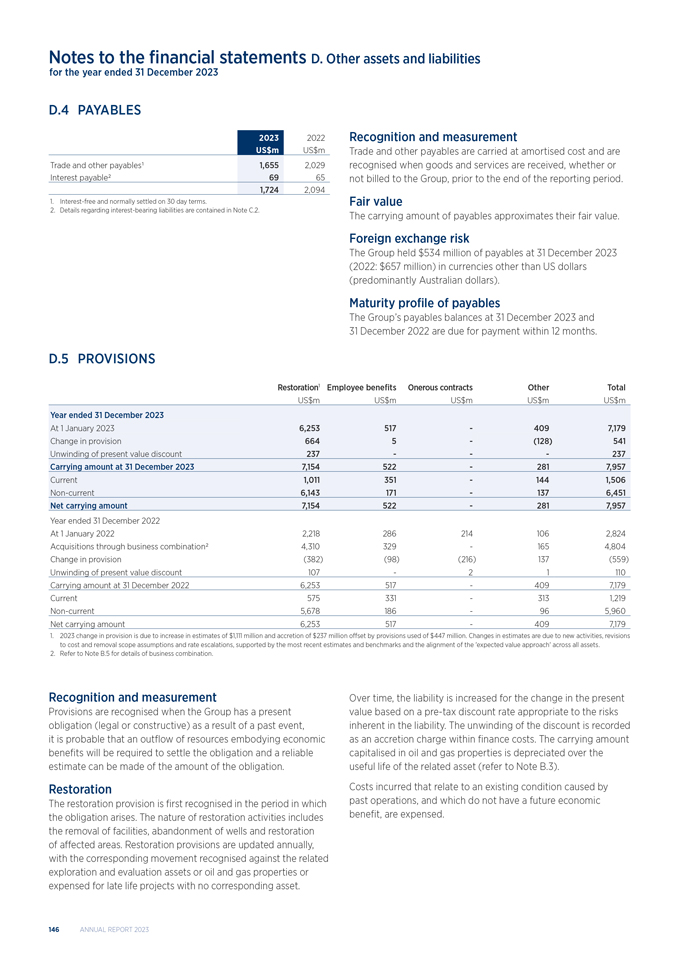
Notes to the financial statements D. Other assets and liabilities for the year ended 31 December 2023 D.4 PAYABLES 2023 2022 US$m US$ Trade and other payables1 1,655 2,029 Interest payable2 69 65 1,724 2,094 1. Interest-free and normally settled on 30 day terms. 2. Details regarding interest-bearing liabilities are contained in Note C.2. Recognition and measurement Trade and other payables are carried at amortised cost and are recognised when goods and services are received, whether or not billed to the Group, prior to the end of the reporting period. Fair value The carrying amount of payables approximates their fair value. Foreign exchange risk The Group held $534 million of payables at 31 December 2023 (2022: $657 million) in currencies other than US dollars (predominantly Australian dollars). Maturity profile of payables The Group’s payables balances at 31 December 2023 and 31 December 2022 are due for payment within 12 months. D.5 PROVISIONS Restoration1 Employee benefits Onerous contracts Other Total US$m US$m US$m US$m US$m Year ended 31 December 2023 At 1 January 2023 6,253 517 - 409 7,179 Change in provision 664 5 - (128) 541 Unwinding of present value discount 237 - - - 237 Carrying amount at 31 December 2023 7,154 522 - 281 7,957 Current 1,011 351 - 144 1,506 Non-current 6,143 171 - 137 6,451 Net carrying amount 7,154 522 - 281 7,957 Year ended 31 December 2022 At 1 January 2022 2,218 286 214 106 2,824 Acquisitions through business combination2 4,310 329 - 165 4,804 Change in provision (382) (98) (216) 137 (559) Unwinding of present value discount 107 - 2 1 110 Carrying amount at 31 December 2022 6,253 517 - 409 7,179 Current 575 331 - 313 1,219 Non-current 5,678 186 - 96 5,960 Net carrying amount 6,253 517 - 409 7,179 1. 2023 change in provision is due to increase in estimates of $1,111 million and accretion of $237 million offset by provisions used of $447 million. Changes in estimates are due to new activities, revisions to cost and removal scope assumptions and rate escalations, supported by the most recent estimates and benchmarks and the alignment of the ‘expected value approach’ across all assets. 2. Refer to Note B.5 for details of business combination. Recognition and measurement Provisions are recognised when the Group has a present obligation (legal or constructive) as a result of a past event, it is probable that an outflow of resources embodying economic benefits will be required to settle the obligation and a reliable estimate can be made of the amount of the obligation. Restoration The restoration provision is first recognised in the period in which the obligation arises. The nature of restoration activities includes the removal of facilities, abandonment of wells and restoration of affected areas. Restoration provisions are updated annually, with the corresponding movement recognised against the related exploration and evaluation assets or oil and gas properties or expensed for late life projects with no corresponding asset. Over time, the liability is increased for the change in the present value based on a pre-tax discount rate appropriate to the risks inherent in the liability. The unwinding of the discount is recorded as an accretion charge within finance costs. The carrying amount capitalised in oil and gas properties is depreciated over the useful life of the related asset (refer to Note B.3). Costs incurred that relate to an existing condition caused by past operations, and which do not have a future economic benefit, are expensed. 146 ANNUAL REPORT 2023
Notes to the financial statements D. Other assets and liabilities for the year ended 31 December 2023 D.5 PROVISIONS (CONT.) Employee benefits Provision is made for employee benefits accumulated as a result of employees rendering services up to the end of the reporting period. These benefits include wages, salaries, annual leave and long service leave. Liabilities in respect of employees’ services rendered that are not expected to be wholly settled within one year after the end of the period in which the employees render the related services are recognised as long-term employee benefits. Key estimates and judgements (a) Restoration obligations The Group estimates the future decommissioning and remediation costs of offshore oil and gas platforms, offshore and onshore production facilities, wells and pipelines at different stages of the development and construction of assets or facilities. In many instances, decommissioning of assets occurs many years into the future. The Group’s restoration obligations are based on compliance with the requirements of relevant regulations which vary for different jurisdictions. For example Australian regulations require full removal for offshore assets unless regulator approval is received to decommission in-situ. It is currently the Group’s assumption that in some regulatory jurisdictions and environments, certain infrastructures are decommissioned in-situ where it can be demonstrated that this will deliver equal or better environmental outcomes than full removal and that regulatory approval is obtained where arrangements are satisfactory to the regulator. The Group maintains technical expertise to ensure that industry learnings, scientific research and local and international guidelines are reviewed in assessing its restoration obligations. The restoration obligation requires judgemental assumptions regarding removal date, environmental legislation and regulations, the extent of restoration activities required, the engineering methodology for estimating cost, technologies used in determining the decommissioning cost, and liability-specific discount rates to determine the present value of these cash flows. For the year ended 31 December 2022, the Group applied either the ‘expected outcome’ approach or ‘expected value’ approach in assessing the cost estimate. Both approaches are supported by AASB137/IAS 37 Provisions, Contingent Liabilities and Contingent Assets, produce reliable estimates and are widely used in practice. The ‘expected outcome’ approach was used for heritage Woodside assets (assets held by the Group prior to the BHPP merger) and those assets commonly held by both heritage entities. The ’expected value’ approach was used for heritage BHPP assets (assets acquired from BHP) but excludes assets held by both heritage entities. For the year ended 31 December 2023, the Group has aligned to the ‘expected value’ approach and consistently applied it across all assets. This has not resulted in a material change to the prior estimate. The alignment reflects a change to the estimate and not a policy change, therefore no retrospective restatement is required. These liabilities are measured at the present value of the estimated future cash outflow to the employees using the projected unit credit method. Liabilities expected to be wholly settled within one year after the end of the period in which the employees render the related services are classified as short-term benefits and are measured at the amount due to be paid. Onerous contract provision Provision is made for loss-making contracts at the present value of the lower of the net cost of fulfilling and the cost arising from failure to fulfill each contract. Expected value approach For both onshore and offshore assets, provision has been made taking into consideration a risked range of possible removal outcomes, including full removal of certain assets or project-specific risks (where applicable). Individual site provisions are an estimate of the expected value of future cash flows required to rehabilitate the relevant site using current restoration standards and techniques and taking into account risks and uncertainties. Individual site provisions are discounted to their present value using risk free country-specific discount rates aligned to the estimated timing of cash outflows. This approach takes into consideration the possibility that full removal of all assets may be required. Inherent uncertainties The basis of the restoration obligation provision for assets with approved decommissioning plans or general directions issued by the regulator can differ from the assumptions disclosed above. Whilst the provisions reflect the Group’s best estimate based on current knowledge and information, further studies and detailed analysis of the restoration activities for individual assets will be ongoing to ensure that the most accurate information is available when detailed decommissioning plans are required to be submitted to the relevant regulatory authorities. Actual costs and cash outflows can materially differ from the current estimate as a result of changes in regulations and their application, prices, analysis of site conditions, further studies, timing of restoration and changes in removal technology. These uncertainties may result in actual expenditure differing from amounts included in the provision recognised as at 31 December 2023. A range of pre-tax discount rates between 3.7% and 5.0% (2022: 3.4% to 4.7%) has been applied. If the discount rates were decreased by 0.5% then the provision would be $365 million higher. If the cost estimates were increased by 10% then the provision would be $718 million higher. The proportion of the non-current balance not expected to be settled within 10 years is 55% (2022: 54%). WOODSIDE ENERGY GROUP LTD 147
Notes to the financial statements D. Other assets and liabilities for the year ended 31 December 2023 D.5 PROVISIONS (CONT.) (b) Onerous contracts The onerous contract provision assessment requires management to make certain estimates regarding the unavoidable costs and the expected economic benefits from the contract. These estimates require significant management judgement and are subject to risk and uncertainty, and hence changes in economic conditions can affect the assumptions. As at 31 December 2023, the Corpus Christi contract has a positive value and therefore is not currently onerous (2022: nil onerous contract provision). Changes in assumptions predominantly relating to the narrowing of the spread between the sales price and purchase price could result in the contract becoming onerous in the future. Assumptions used to determine the present value as at 31 December 2023 are set out below: Discount rate – a pre-tax, risk free US government bond rate of 4.04% (2022: 4.10%) has been applied. LNG pricing – forecast sales and purchase prices are subject to a number of price markers. Price assumptions are based on the best information on the market available at measurement date and derived from short- and long-term views of global supply and demand, building upon past experience of the industry and consistent with external sources. The forecasted sales are linked to gas hub prices (Title Transfer Facility (TTF)) at which physical sales are expected to occur and incorporate known sales pricing information1. The long-term gas sales price is estimated on the basis of the Group’s Brent price forecast. The estimated purchase price is linked to US gas hub prices (Henry Hub (HH)) at which physical purchases are expected to occur. The nominal TTF, Brent oil prices and HH gas prices used at 31 December 2023 were: 2024 2025202620272028 TTF (US$/MMBtu) 13.9 14.28.88.99.1 Brent (US$/bbl) 82 80767779² HH (US$/MMBtu) 3.4 3.53.53.53.63 1. For committed volumes, contracted pricing has been applied. 2. Long-term oil prices are based on US$70/bbl (2022 real terms) from 2026 and prices are escalated at 2.0% onwards. 3. Long-term gas prices are based on US$3.2/MMBtu (2022 real terms) from 2026 and US$3.8/MMBtu (2022 real terms) from 2030. All long-term prices are escalated at 2.0%. D.6 OTHER FINANCIAL ASSETS AND LIABILITIES 2023 2022 US$m US$m Other financial assets Financial instruments at fair value through profit and loss Derivative financial instruments designated as hedges 248 207 Other financial assets 53 22 Financial instruments at amortised cost Hedge collateral (including interest) - 509 Other financial assets - 30 Financial instruments at fair value through other comprehensive income Other financial assets 28 29 Total other financial assets 329 797 Current 209 677 Non-current 120 120 Net carrying amount 329 797 Other financial liabilities Financial instruments at fair value through profit and loss Derivative financial instruments designated as hedges 74 721 Embedded derivative 35 - Total other financial liabilities 109 721 Current 67 654 Non-current 42 67 Net carrying amount 109 721 Recognition and measurement Other financial assets and liabilities Receivables subject to provisional pricing adjustments are initially recognised at the transaction price and subsequently measured at fair value with movements recognised in the consolidated income statement. Derivative financial instruments Derivative financial instruments that are designated within qualifying hedge relationships are initially recognised at fair value on the date the contract is entered into. For relationships designated as fair value hedges, subsequent fair value movements of the derivative are recognised in the consolidated income statement. For relationships designated as cash flow hedges, subsequent fair value movements of the derivative for the effective portion of the hedge are recognised in other comprehensive income and accumulated in reserves in equity; fair value movements for the ineffective portion are recognised immediately in the consolidated income statement. Costs of hedging have been separated from the hedging arrangements and deferred to other comprehensive income and accumulated in reserves in equity. Amounts accumulated in equity are reclassified to the consolidated income statement in the periods when the hedged item affects profit or loss. 148 ANNUAL REPORT 2023
Notes to the financial statements D. Other assets and liabilities for the year ended 31 December 2023 D.6 OTHER FINANCIAL ASSETS AND LIABILITIES (CONT.) Derivative financial instruments (cont.) Hedge effectiveness is determined at the inception of the hedge relationship, and through periodic prospective effectiveness assessments to ensure that an economic relationship exists between the hedged exposure and the hedging instrument. The Group assesses whether the derivative designated in each hedging relationship has been, and is expected to be, effective in offsetting changes in cash flows of the hedged exposure using the hypothetical derivative method. Ineffectiveness is recognised where the cumulative change in the designated component value of the hedging instrument on an absolute basis exceeds the change in value of the hedged exposure attributable to the hedged risk. Ineffectiveness may arise where the timing of the transaction changes from what was originally estimated such as delayed shipments or changes in timing of forecast sales. This may also arise where the commodity swap pricing terms do not perfectly match the pricing terms of the revenue contracts. Fair value Except for the other financial assets and other financial liabilities set out in this note, there are no material financial assets or financial liabilities carried at fair value. The fair value of commodity derivative financial instruments is determined based on observable quoted forward pricing and swap models and is classified as Level 2 on the fair value hierarchy. The most frequently applied valuation techniques include forward pricing and swap models that use present value calculations. The models incorporate various inputs including the credit quality of counterparties and forward rate curves of the underlying commodity. The fair value of interest rate swaps is calculated by discounting estimated future cash flows based on the terms of maturity of each contract, using market interest rates for a similar instrument at the reporting date, and is classified as Level 2 on the fair value hierarchy. The fair value of foreign exchange forward contracts is determined using quoted forward exchange rates at the reporting date and present value calculations based on high credit quality yield curves in the respective currencies and is classified as Level 2 on the fair value hierarchy. The fair values of other financial assets and other financial liabilities are predominantly determined based on observable quoted forward pricing and are predominantly classified as Level 2 on the fair value hierarchy. Embedded commodity derivatives are classified as Level 3 on the fair value hierarchy with no market observable inputs. Foreign exchange The derivative financial instruments include foreign exchange forward contracts that are denominated in Australian dollars. The Group had no material other financial assets and liabilities denominated in currencies other than US dollars. Hedging activities During the period, the following hedging activities were undertaken: • As at 31 December 2023, the Group hedged approximately 29.3 MMboe of 2024 production at an average price of approximately $75.7 per barrel. • Through the use of foreign exchange forward contracts, the Group hedged its Australian dollar to US dollar exchange rate in relation to a portion of the Australian dollar denominated capital expenditure expected to be incurred under the Scarborough development. • In 2022, the Group placed $506 million (excluding interest) as collateral against the oil hedge positions to reduce counterparty credit risk exposure. The collateral was returned to the Group in 2023. • Through the use of foreign exchange forward contracts, the Group also hedged its Australian dollar to US dollar exchange rate in relation to the Australian dollar denominated tax payments which have matured. WOODSIDE ENERGY GROUP LTD 149
Notes to the financial statements D. Other assets and liabilities for the year ended 31 December 2023 D.6 OTHER FINANCIAL ASSETS AND LIABILITIES (CONT.) Hedging activities (cont.) 2023 2022 Oil swaps (cash flow hedges) Carrying amount (US$m) (14) (114) Notional amount (MMbbl)1 29 18 Maturity date 2024 2023 Hedge ratio 1:1 1:1 Weighted average hedged rate (US$/MMbbl) 76 79 HH Corpus Christi commodity swaps (cash flow hedges) Carrying amount (US$m) (44) 26 Notional amount (TBtu)1 38 58 Maturity date 2024-2025 2023-2024 Hedge ratio 1:1 1:1 Weighted average hedged rate (US$/MMBtu) 4 4 TTF Corpus Christi commodity swaps (cash flow hedges) Carrying amount (US$m) 181 (469) Notional amount (TBtu)1 32 50 Maturity date 2024-2025 2023-2024 Hedge ratio 1:1 1:1 Weighted average hedged rate (US$/MMBtu) 18 16 Interest rate swap (cash flow hedges) Carrying amount (US$m) 43 55 Notional amount (US$m)1 600 600 Maturity date 2027 2027 Hedge ratio 1:1 1:1 Weighted average hedged rate 1.7% 1.7% Cross currency interest rate swap (cash flow and fair value hedges) Carrying amount (US$m) - 5 Notional amount (Swiss Franc)1 - 175 Maturity date - 2023 Hedge ratio - 1:1 Three month USD LIBOR Weighted average hedged rate - +2.8% FX forwards (cash flow hedges) Carrying amount (US$m) 8 (17) Notional amount (AUD$m)1 1,834 1,037 Maturity date 2024-2025 2023-2025 Hedge Ratio 1:1 1:1 Weighted average hedged rate (AUD:USD) 0.68 0.68 1. The notional amounts relate to unrealised volumes of the hedge item included in the cash flow hedge reserve. Hedge ineffectiveness loss of $15 million (2022: $72 million loss) has been recognised in the profit and loss. Interest Rate Benchmark Reform A fundamental reform of major interest rate benchmarks is being undertaken globally, including the replacement of some interbank offered rates (IBORs) with alternative nearly risk-free rates (referred to as ‘IBOR reform’). In 2020, the Federal Reserve announced that the three-month and six-month LIBOR will be phased out and eventually replaced by June 2023. The Group had exposures to IBORs on its financial instruments that were impacted as part of these market-wide initiatives. During the period, the Group has transitioned its financial liabilities from USD London Inter-Bank Offered Rate (USD LIBOR) to SOFR. The transition of a number of the Group’s financial liabilities from USD LIBOR to SOFR during the year ended 31 December 2023 did not result in a material impact to the Group. Embedded commodity derivative In 2023, the Group entered into a revised long-term gas sale and purchase contract (GSPA) with Perdaman with conditions precedent being satisfied during the year, where a component of the selling price is linked to the price of urea. The contract has been assessed to contain an embedded commodity derivative that is required to be separated and recognised at fair value through profit and loss. The carrying value of the embedded derivative at 31 December 2023 amounted to a net liability of $35 million (31 December 2022: nil). The derivative is remeasured to fair value at each reporting date in accordance with the Urea price at that date. As at 31 December 2023, the unrealised loss of $35 million has been recognised through other expenses. 150 ANNUAL REPORT 2023
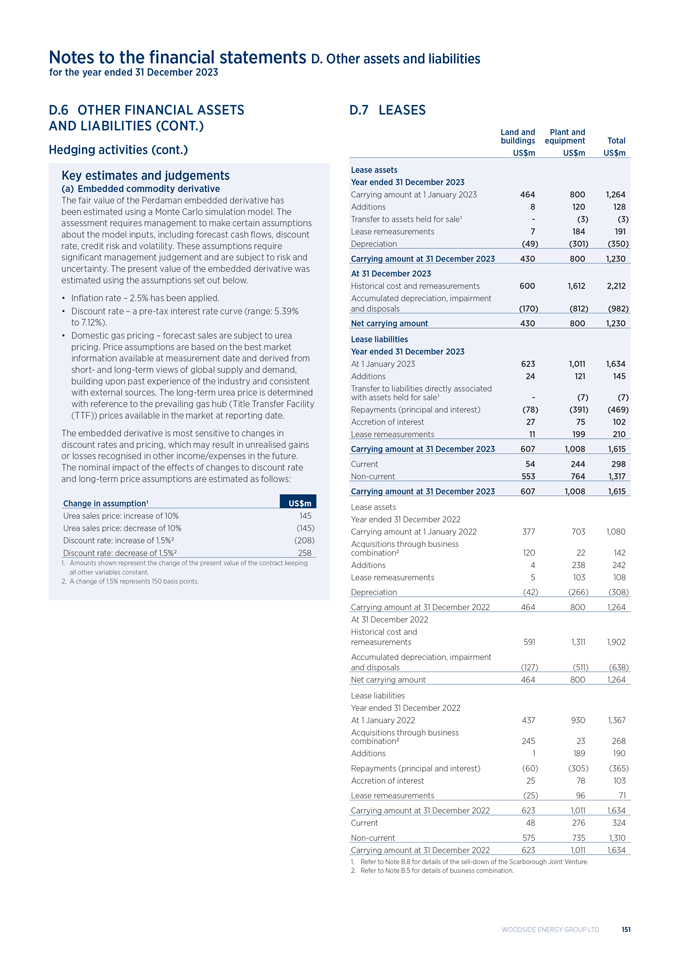
Notes to the financial statements D. Other assets and liabilities for the year ended 31 December 2023 D.6 OTHER FINANCIAL ASSETS AND LIABILITIES (CONT.) Hedging activities (cont.) Key estimates and judgements (a) Embedded commodity derivative The fair value of the Perdaman embedded derivative has been estimated using a Monte Carlo simulation model. The assessment requires management to make certain assumptions about the model inputs, including forecast cash flows, discount rate, credit risk and volatility. These assumptions require significant management judgement and are subject to risk and uncertainty. The present value of the embedded derivative was estimated using the assumptions set out below. • Inflation rate – 2.5% has been applied. • Discount rate – a pre-tax interest rate curve (range: 5.39% to 7.12%). • Domestic gas pricing – forecast sales are subject to urea pricing. Price assumptions are based on the best market information available at measurement date and derived from short- and long-term views of global supply and demand, building upon past experience of the industry and consistent with external sources. The long-term urea price is determined with reference to the prevailing gas hub (Title Transfer Facility (TTF)) prices available in the market at reporting date. The embedded derivative is most sensitive to changes in discount rates and pricing, which may result in unrealised gains or losses recognised in other income/expenses in the future. The nominal impact of the effects of changes to discount rate and long-term price assumptions are estimated as follows: Change in assumption1 US$m Urea sales price: increase of 10% 145 Urea sales price: decrease of 10% (145) Discount rate: increase of 1.5%2 (208) Discount rate: decrease of 1.5%2 258 1. Amounts shown represent the change of the present value of the contract keeping all other variables constant. 2. A change of 1.5% represents 150 basis points. D.7 LEASES Land and Plant and buildings equipmentTotal US$m US$mUS$m Lease assets Year ended 31 December 2023 Carrying amount at 1 January 2023 464 8001,264 Additions 8 120128 Transfer to assets held for sale1 - (3)(3) Lease remeasurements 7 184191 Depreciation (49) (301)(350) Carrying amount at 31 December 2023 430 8001,230 At 31 December 2023 Historical cost and remeasurements 600 1,6122,212 Accumulated depreciation, impairment and disposals (170) (812)(982) Net carrying amount 430 8001,230 Lease liabilities Year ended 31 December 2023 At 1 January 2023 623 1,0111,634 Additions 24 121145 Transfer to liabilities directly associated with assets held for sale1 - (7)(7) Repayments (principal and interest) (78) (391)(469) Accretion of interest 27 75102 Lease remeasurements 11 199210 Carrying amount at 31 December 2023 607 1,0081,615 Current 54 244298 Non-current 553 7641,317 Carrying amount at 31 December 2023 607 1,0081,615 Lease assets Year ended 31 December 2022 Carrying amount at 1 January 2022 377 7031,080 Acquisitions through business combination2 120 22142 Additions 4 238242 Lease remeasurements 5 103108 Depreciation (42) (266)(308) Carrying amount at 31 December 2022 464 8001,264 At 31 December 2022 Historical cost and remeasurements 591 1,3111,902 Accumulated depreciation, impairment and disposals (127) (511)(638) Net carrying amount 464 8001,264 Lease liabilities Year ended 31 December 2022 At 1 January 2022 437 9301,367 Acquisitions through business combination2 245 23268 Additions 1 189190 Repayments (principal and interest) (60) (305)(365) Accretion of interest 25 78103 Lease remeasurements (25) 9671 Carrying amount at 31 December 2022 623 1,0111,634 Current 48 276324 Non-current 575 7351,310 Carrying amount at 31 December 2022 623 1,0111,634 1. Refer to Note B.8 for details of the sell-down of the Scarborough Joint Venture. 2. Refer to Note B.5 for details of business combination. WOODSIDE ENERGY GROUP LTD 151
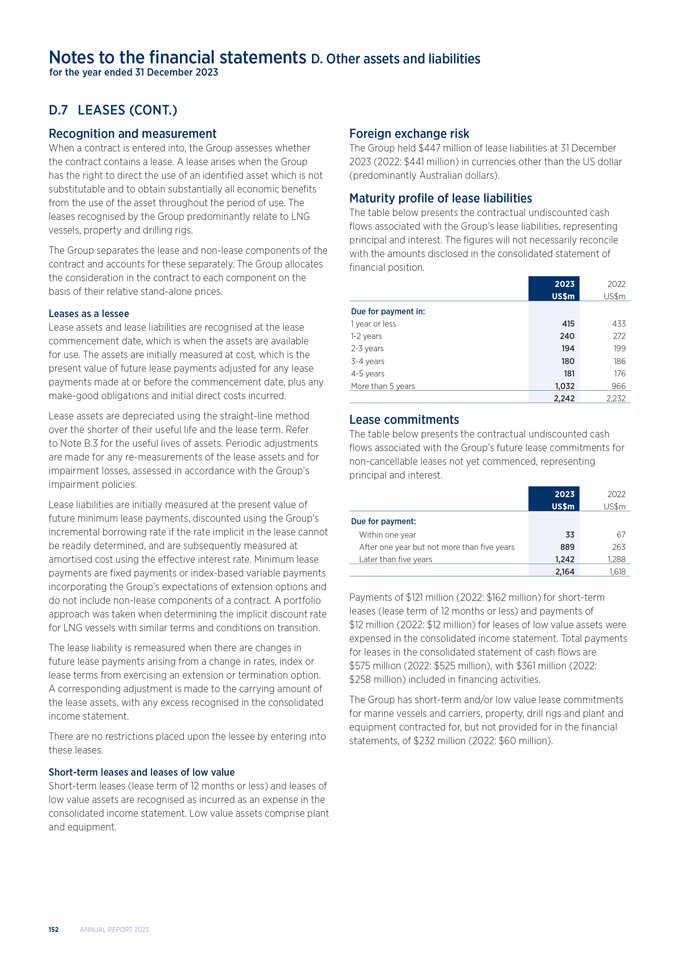
Notes to the financial statements D. Other assets and liabilities for the year ended 31 December 2023 D.7 LEASES (CONT.) Recognition and measurement When a contract is entered into, the Group assesses whether the contract contains a lease. A lease arises when the Group has the right to direct the use of an identified asset which is not substitutable and to obtain substantially all economic benefits from the use of the asset throughout the period of use. The leases recognised by the Group predominantly relate to LNG vessels, property and drilling rigs. The Group separates the lease and non-lease components of the contract and accounts for these separately. The Group allocates the consideration in the contract to each component on the basis of their relative stand-alone prices. Leases as a lessee Lease assets and lease liabilities are recognised at the lease commencement date, which is when the assets are available for use. The assets are initially measured at cost, which is the present value of future lease payments adjusted for any lease payments made at or before the commencement date, plus any make-good obligations and initial direct costs incurred. Lease assets are depreciated using the straight-line method over the shorter of their useful life and the lease term. Refer to Note B.3 for the useful lives of assets. Periodic adjustments are made for any re-measurements of the lease assets and for impairment losses, assessed in accordance with the Group’s impairment policies. Lease liabilities are initially measured at the present value of future minimum lease payments, discounted using the Group’s incremental borrowing rate if the rate implicit in the lease cannot be readily determined, and are subsequently measured at amortised cost using the effective interest rate. Minimum lease payments are fixed payments or index-based variable payments incorporating the Group’s expectations of extension options and do not include non-lease components of a contract. A portfolio approach was taken when determining the implicit discount rate for LNG vessels with similar terms and conditions on transition. The lease liability is remeasured when there are changes in future lease payments arising from a change in rates, index or lease terms from exercising an extension or termination option. A corresponding adjustment is made to the carrying amount of the lease assets, with any excess recognised in the consolidated income statement. There are no restrictions placed upon the lessee by entering into these leases. Short-term leases and leases of low value Short-term leases (lease term of 12 months or less) and leases of low value assets are recognised as incurred as an expense in the consolidated income statement. Low value assets comprise plant and equipment. Foreign exchange risk The Group held $447 million of lease liabilities at 31 December 2023 (2022: $441 million) in currencies other than the US dollar (predominantly Australian dollars). Maturity profile of lease liabilities The table below presents the contractual undiscounted cash flows associated with the Group’s lease liabilities, representing principal and interest. The figures will not necessarily reconcile with the amounts disclosed in the consolidated statement of financial position. 2023 2022 US$m US$m Due for payment in: 1 year or less 415 433 1-2 years 240 272 2-3 years 194 199 3-4 years 180 186 4-5 years 181 176 More than 5 years 1,032 966 2,242 2,232 Lease commitments The table below presents the contractual undiscounted cash flows associated with the Group’s future lease commitments for non-cancellable leases not yet commenced, representing principal and interest. 2023 2022 US$m US$m Due for payment: Within one year 33 67 After one year but not more than five years 889 263 Later than five years 1,242 1,288 2,164 1,618 Payments of $121 million (2022: $162 million) for short-term leases (lease term of 12 months or less) and payments of $12 million (2022: $12 million) for leases of low value assets were expensed in the consolidated income statement. Total payments for leases in the consolidated statement of cash flows are $575 million (2022: $525 million), with $361 million (2022: $258 million) included in financing activities. The Group has short-term and/or low value lease commitments for marine vessels and carriers, property, drill rigs and plant and equipment contracted for, but not provided for in the financial statements, of $232 million (2022: $60 million). 152 ANNUAL REPORT 2023
Notes to the financial statements D. Other assets and liabilities for the year ended 31 December 2023 D.7 LEASES (CONT.) Key estimates and judgements (a) Control Judgement is required to assess whether a contract is or contains a lease at inception by assessing whether the Group has the right to direct the use of the identified asset and obtain substantially all the economic benefits from the use of that asset. (b) Lease term Judgement is required when assessing the term of the lease and whether to include optional extension and termination periods. Option periods are only included in determining the lease term at inception when they are reasonably certain to be exercised. Lease terms are reassessed when a significant change in circumstances occurs. On this basis, possible additional lease payments amounting to $2,000 million (2022: $2,323 million) were not included in the measurement of lease liabilities. (c) lnterest in joint arrangements Judgement is required to determine the Group’s rights and obligations for lease contracts within joint operations, to assess whether lease liabilities are recognised gross (100%) or in proportion to the Group’s participating interest in the joint operation. This includes an evaluation of whether the lease arrangement contains a sublease with the joint operation. (d) Discount rates Judgement is required to determine the discount rate, where the discount rate is the Group’s incremental borrowing rate if the rate implicit in the lease cannot be readily determined. The incremental borrowing rate is determined with reference to the Group’s borrowing portfolio at the inception of the arrangement or the time of the modification. WOODSIDE ENERGY GROUP LTD 153

Notes to the financial statements E. Other items for the year ended 31 December 2023 IN THIS SECTION This section addresses information on items which require disclosure to comply with Australian Accounting Standards and the Corporations Act 2001, however are not considered critical in understanding the financial performance or position of the Group. This section includes Group structure information and other disclosures. E. Other items E.1 Contingent liabilities and assets Page 155 E.2 Employee benefits Page 155 E.3 Related party transactions Page 158 E.4 Auditor remuneration Page 158 E.5 Events after the end of the reporting period Page 158 E.6 Joint arrangements Page 158 E.7 Parent entity information Page 160 E.8 Subsidiaries Page 160 E.9 Other accounting policies Page 164 154 ANNUAL REPORT 2023
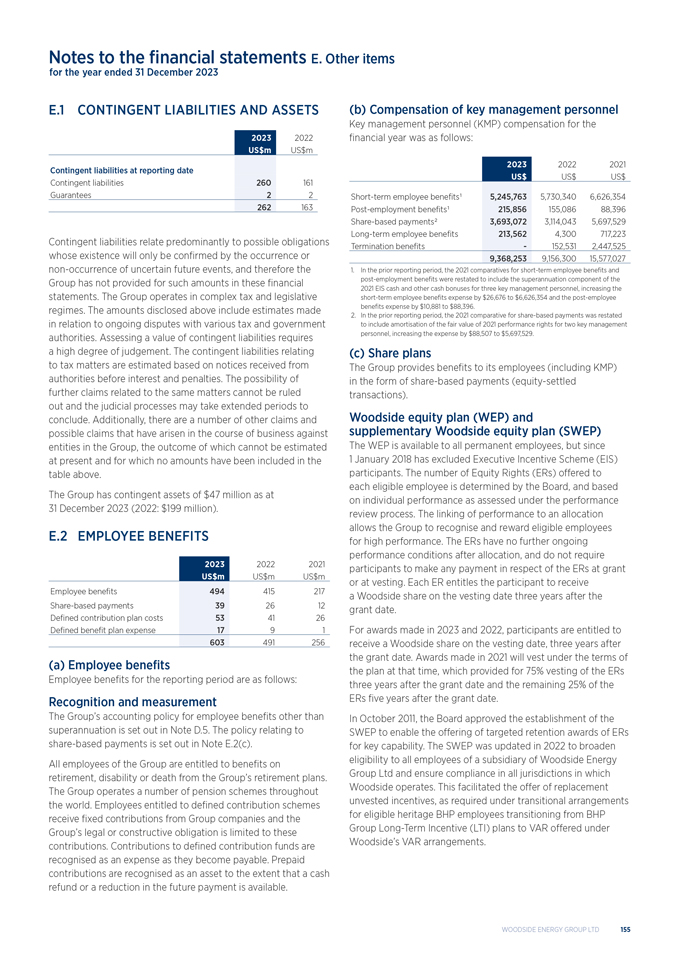
Notes to the financial statements E. Other items for the year ended 31 December 2023 E.1 CONTINGENT LIABILITIES AND ASSETS 2023 2022 US$m US$m Contingent liabilities at reporting date Contingent liabilities 260 161 Guarantees 2 2 262 163 Contingent liabilities relate predominantly to possible obligations whose existence will only be confirmed by the occurrence or non-occurrence of uncertain future events, and therefore the Group has not provided for such amounts in these financial statements. The Group operates in complex tax and legislative regimes. The amounts disclosed above include estimates made in relation to ongoing disputes with various tax and government authorities. Assessing a value of contingent liabilities requires a high degree of judgement. The contingent liabilities relating to tax matters are estimated based on notices received from authorities before interest and penalties. The possibility of further claims related to the same matters cannot be ruled out and the judicial processes may take extended periods to conclude. Additionally, there are a number of other claims and possible claims that have arisen in the course of business against entities in the Group, the outcome of which cannot be estimated at present and for which no amounts have been included in the table above. The Group has contingent assets of $47 million as at 31 December 2023 (2022: $199 million). E.2 EMPLOYEE BENEFITS 2023 2022 2021 US$m US$m US$m Employee benefits 494 415217 Share-based payments 39 2612 Defined contribution plan costs 53 4126 Defined benefit plan expense 17 91 603 491 256 (a) Employee benefits Employee benefits for the reporting period are as follows: Recognition and measurement The Group’s accounting policy for employee benefits other than superannuation is set out in Note D.5. The policy relating to share-based payments is set out in Note E.2(c). All employees of the Group are entitled to benefits on retirement, disability or death from the Group’s retirement plans. The Group operates a number of pension schemes throughout the world. Employees entitled to defined contribution schemes receive fixed contributions from Group companies and the Group’s legal or constructive obligation is limited to these contributions. Contributions to defined contribution funds are recognised as an expense as they become payable. Prepaid contributions are recognised as an asset to the extent that a cash refund or a reduction in the future payment is available. (b) Compensation of key management personnel Key management personnel (KMP) compensation for the financial year was as follows: 2023 20222021 US$US$US$ Short-term employee benefits1 5,245,763 5,730,3406,626,354 Post-employment benefits1 215,856 155,08688,396 Share-based payments2 3,693,072 3,114,0435,697,529 Long-term employee benefits 213,562 4,300717,223 Termination benefits - 152,5312,447,525 9,368,253 9,156,30015,577,027 1. In the prior reporting period, the 2021 comparatives for short-term employee benefits and post-employment benefits were restated to include the superannuation component of the 2021 EIS cash and other cash bonuses for three key management personnel, increasing the short-term employee benefits expense by $26,676 to $6,626,354 and the post-employee benefits expense by $10,881 to $88,396. 2. In the prior reporting period, the 2021 comparative for share-based payments was restated to include amortisation of the fair value of 2021 performance rights for two key management personnel, increasing the expense by $88,507 to $5,697,529. (c) Share plans The Group provides benefits to its employees (including KMP) in the form of share-based payments (equity-settled transactions). Woodside equity plan (WEP) and supplementary Woodside equity plan (SWEP) The WEP is available to all permanent employees, but since 1 January 2018 has excluded Executive Incentive Scheme (EIS) participants. The number of Equity Rights (ERs) offered to each eligible employee is determined by the Board, and based on individual performance as assessed under the performance review process. The linking of performance to an allocation allows the Group to recognise and reward eligible employees for high performance. The ERs have no further ongoing performance conditions after allocation, and do not require participants to make any payment in respect of the ERs at grant or at vesting. Each ER entitles the participant to receive a Woodside share on the vesting date three years after the grant date. For awards made in 2023 and 2022, participants are entitled to receive a Woodside share on the vesting date, three years after the grant date. Awards made in 2021 will vest under the terms of the plan at that time, which provided for 75% vesting of the ERs three years after the grant date and the remaining 25% of the ERs five years after the grant date. In October 2011, the Board approved the establishment of the SWEP to enable the offering of targeted retention awards of ERs for key capability. The SWEP was updated in 2022 to broaden eligibility to all employees of a subsidiary of Woodside Energy Group Ltd and ensure compliance in all jurisdictions in which Woodside operates. This facilitated the offer of replacement unvested incentives, as required under transitional arrangements for eligible heritage BHP employees transitioning from BHP Group Long-Term Incentive (LTI) plans to VAR offered under Woodside’s VAR arrangements. WOODSIDE ENERGY GROUP LTD 155
Notes to the financial statements E. Other items for the year ended 31 December 2023 E.2 EMPLOYEE BENEFITS (CONT.) Woodside equity plan (WEP) and supplementary Woodside equity plan (SWEP) (cont.) Each ER entitles the participant to receive a Woodside share on vesting date. Participants do not make any payment in respect of the ERs at grant or at vesting. Executive Incentive Scheme (EIS) The EIS was introduced for the 2018 performance year for all Executives including Executive KMP. The EIS is delivered in the form of a cash incentive, Restricted Shares and Performance Rights. The grant date of the Restricted Shares and Performance Rights has been determined to be subsequent to the performance year, being the date of the Board of Directors’ approval. Accordingly, the 2022 Restricted Shares and Performance Rights were granted on 27 February 2023 for Executives and 28 April 2023 for the CEO and have been included in the table below. The expense estimated as at 31 December 2022 in relation to the 2022 performance year was updated to the fair value on grant date during the period. The 2023 Restricted Shares and Performance Rights have not been included in the table below as they have not been approved as at 31 December 2023. An expense related to the 2023 performance year has been estimated for the Restricted Shares and Performance Rights, using fair value estimates based on inputs at 31 December 2023. Performance Based Pay Plus (PBP Plus) PBP Plus is available to senior, permanent employees who are not Executives. Participants receive an annual award of cash and Restricted Shares based on corporate and individual performance, recognising and rewarding eligible employees for high performance. The grant date of the Restricted Shares has been determined to be subsequent to the performance year, being the date of the Board of Directors’ approval. Accordingly, the 2022 Restricted Shares were granted on 27 February 2023 and have been included in the table below. The expense estimated as at 31 December 2022 in relation to the 2022 performance year was updated to the fair value on grant date during the period. The 2023 Restricted Shares have not been included in the table below as they have not been approved as at 31 December 2023. An expense related to the 2023 performance year has been estimated for the Restricted Shares, using fair value estimates based on inputs at 31 December 2023. Recognition and measurement All compensation under WEP, SWEP, PBP Plus and EIS Restricted Shares and Performance Rights is accounted for as share-based payments to employees for services provided. The cost of equity-settled transactions with employees is measured by reference to the fair values of the equity instruments at the date at which they are granted. The fair value of share-based payments is recognised, together with the corresponding increase in equity, over the period in which the vesting conditions are fulfilled, ending on the date on which the relevant employee becomes fully entitled to the shares. At each balance sheet date, the Group reassesses the number of awards that are expected to vest based on service conditions. The expense recognised each year takes into account the most recent estimate. The fair value of the benefit provided for the WEP and SWEP is estimated using the Black-Scholes option pricing technique. The fair value of the Restricted Shares is estimated as the closing share price at grant date. The fair value of the benefit provided for the relative total shareholder return Performance Rights is calculated using the Binomial or Black-Scholes option pricing technique combined with a Monte Carlo simulation methodology, where relevant, using historical volatility to estimate the volatility of the share price in the future. 156 ANNUAL REPORT 2023
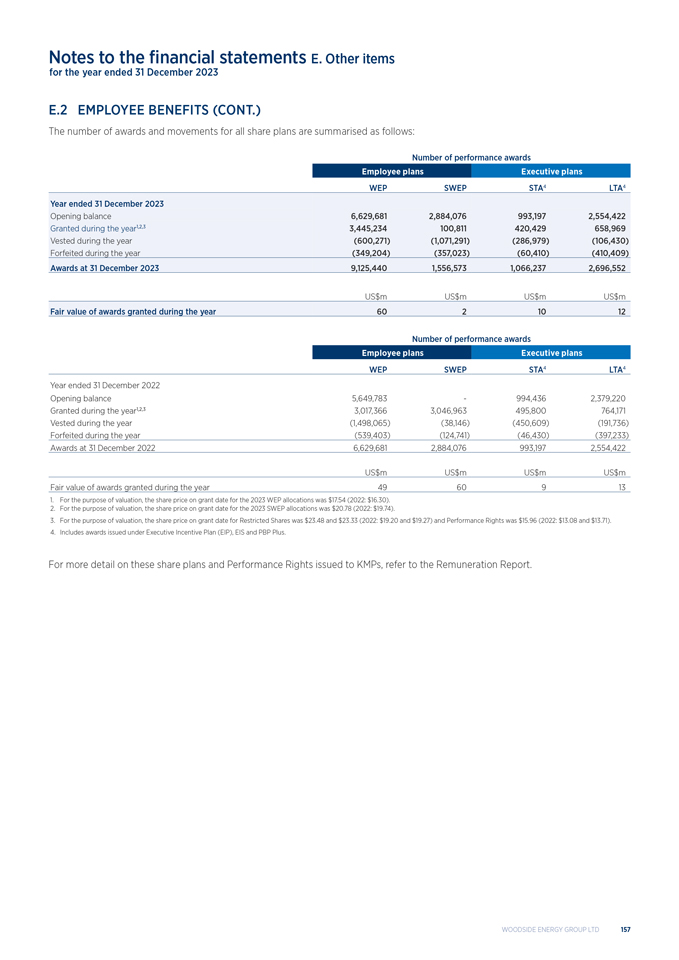
Notes to the financial statements E. Other items for the year ended 31 December 2023 E.2 EMPLOYEE BENEFITS (CONT.) The number of awards and movements for all share plans are summarised as follows: Number of performance awards Employee plans Executive plans WEP SWEPSTA4LTA4 Year ended 31 December 2023 Opening balance 6,629,681 2,884,076993,1972,554,422 Granted during the year1,2,3 3,445,234 100,811420,429658,969 Vested during the year (600,271) (1,071,291)(286,979)(106,430) Forfeited during the year (349,204) (357,023)(60,410)(410,409) Awards at 31 December 2023 9,125,440 1,556,5731,066,2372,696,552 US$m US$mUS$mUS$m Fair value of awards granted during the year 60 21012 Number of performance awards Employee plans Executive plans WEP SWEPSTA4LTA4 Year ended 31 December 2022 Opening balance 5,649,783 -994,4362,379,220 Granted during the year1,2,3 3,017,366 3,046,963495,800764,171 Vested during the year (1,498,065) (38,146)(450,609)(191,736) Forfeited during the year (539,403) (124,741)(46,430)(397,233) Awards at 31 December 2022 6,629,681 2,884,076993,1972,554,422 US$m US$mUS$mUS$m Fair value of awards granted during the year 49 60913 1. For the purpose of valuation, the share price on grant date for the 2023 WEP allocations was $17.54 (2022: $16.30). 2. For the purpose of valuation, the share price on grant date for the 2023 SWEP allocations was $20.78 (2022: $19.74). 3. For the purpose of valuation, the share price on grant date for Restricted Shares was $23.48 and $23.33 (2022: $19.20 and $19.27) and Performance Rights was $15.96 (2022: $13.08 and $13.71). 4. Includes awards issued under Executive Incentive Plan (EIP), EIS and PBP Plus. For more detail on these share plans and Performance Rights issued to KMPs, refer to the Remuneration Report. WOODSIDE ENERGY GROUP LTD 157
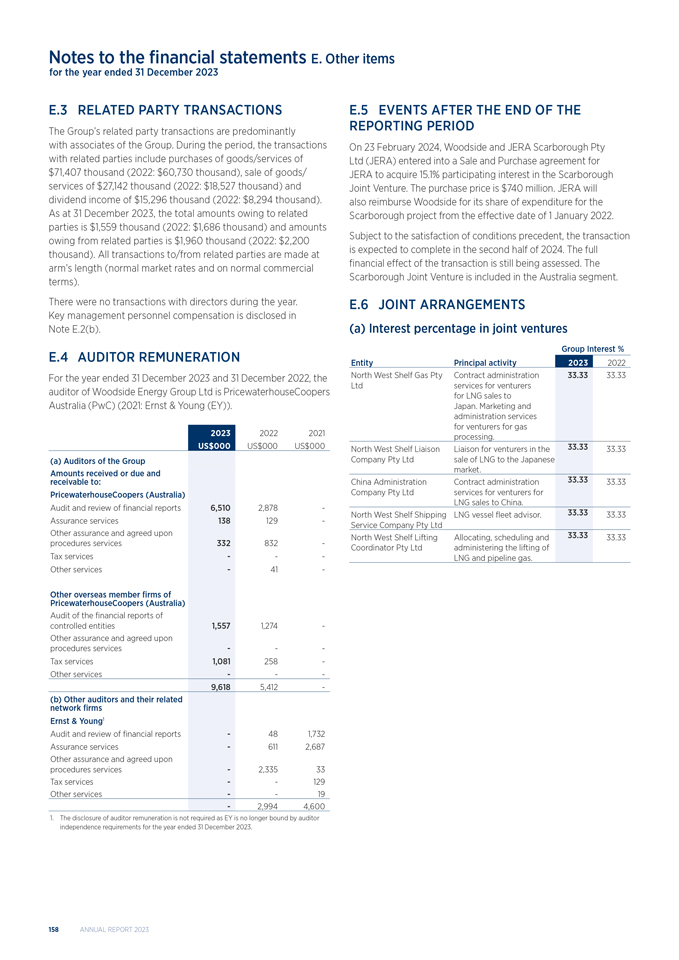
Notes to the financial statements E. Other items for the year ended 31 December 2023 E.3 RELATED PARTY TRANSACTIONS The Group’s related party transactions are predominantly with associates of the Group. During the period, the transactions with related parties include purchases of goods/services of $71,407 thousand (2022: $60,730 thousand), sale of goods/ services of $27,142 thousand (2022: $18,527 thousand) and dividend income of $15,296 thousand (2022: $8,294 thousand). As at 31 December 2023, the total amounts owing to related parties is $1,559 thousand (2022: $1,686 thousand) and amounts owing from related parties is $1,960 thousand (2022: $2,200 thousand). All transactions to/from related parties are made at arm’s length (normal market rates and on normal commercial terms). There were no transactions with directors during the year. Key management personnel compensation is disclosed in Note E.2(b). E.4 AUDITOR REMUNERATION For the year ended 31 December 2023 and 31 December 2022, the auditor of Woodside Energy Group Ltd is PricewaterhouseCoopers Australia (PwC) (2021: Ernst & Young (EY)). 2023 2022 2021 US$000 US$000 US$000 (a) Auditors of the Group Amounts received or due and receivable to: PricewaterhouseCoopers (Australia) Audit and review of financial reports 6,510 2,878- Assurance services 138 129- Other assurance and agreed upon procedures services 332 832- Tax services - -- Other services - 41- Other overseas member firms of PricewaterhouseCoopers (Australia) Audit of the financial reports of controlled entities 1,557 1,274- Other assurance and agreed upon procedures services - -- Tax services 1,081 258- Other services - -- 9,618 5,412 - (b) Other auditors and their related network firms Ernst & Young1 Audit and review of financial reports - 481,732 Assurance services - 6112,687 Other assurance and agreed upon procedures services - 2,33533 Tax services - -129 Other services - -19 - 2,994 4,600 1. The disclosure of auditor remuneration is not required as EY is no longer bound by auditor independence requirements for the year ended 31 December 2023. E.5 EVENTS AFTER THE END OF THE REPORTING PERIOD On 23 February 2024, Woodside and JERA Scarborough Pty Ltd (JERA) entered into a Sale and Purchase agreement for JERA to acquire 15.1% participating interest in the Scarborough Joint Venture. The purchase price is $740 million. JERA will also reimburse Woodside for its share of expenditure for the Scarborough project from the effective date of 1 January 2022. Subject to the satisfaction of conditions precedent, the transaction is expected to complete in the second half of 2024. The full financial effect of the transaction is still being assessed. The Scarborough Joint Venture is included in the Australia segment. E.6 JOINT ARRANGEMENTS (a) Interest percentage in joint ventures Group Interest % Entity Principal activity 20232022 North West Shelf Gas Pty Contract administration 33.3333.33 Ltd services for venturers for LNG sales to Japan. Marketing and administration services for venturers for gas processing. North West Shelf Liaison Liaison for venturers in the 33.3333.33 Company Pty Ltd sale of LNG to the Japanese market. China Administration Contract administration 33.3333.33 Company Pty Ltd services for venturers for LNG sales to China. North West Shelf Shipping LNG vessel fleet advisor. 33.3333.33 Service Company Pty Ltd North West Shelf Lifting Allocating, scheduling and 33.3333.33 Coordinator Pty Ltd administering the lifting of LNG and pipeline gas. 158 ANNUAL REPORT 2023
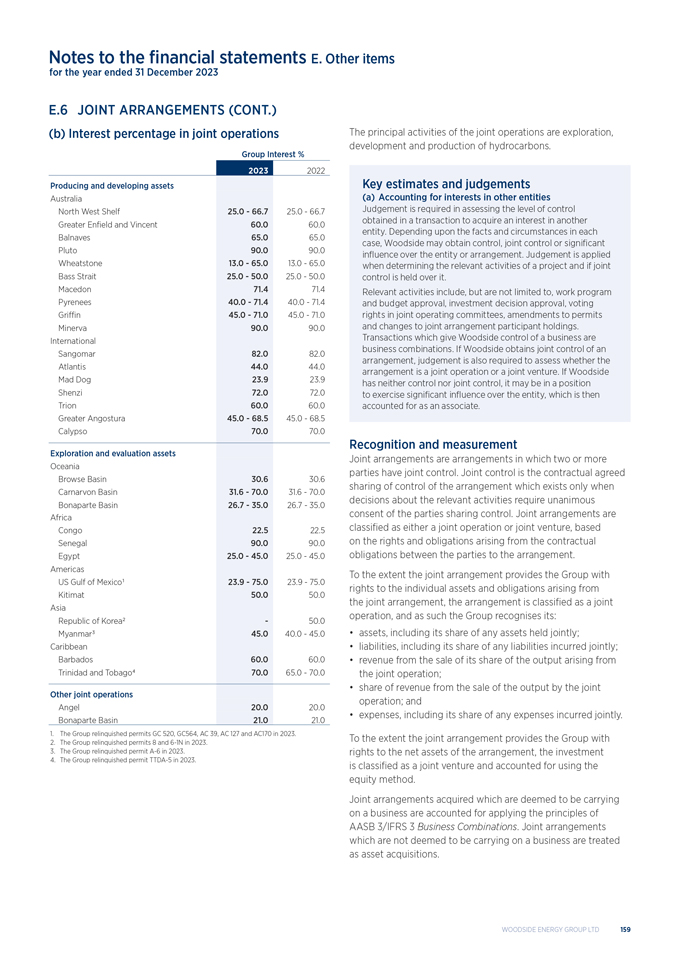
Notes to the financial statements E. Other items for the year ended 31 December 2023 E.6 JOINT ARRANGEMENTS (CONT.) (b) Interest percentage in joint operations Group Interest % 2023 2022 Producing and developing assets Australia North West Shelf 25.0—66.7 25.0—66.7 Greater Enfield and Vincent 60.0 60.0 Balnaves 65.0 65.0 Pluto 90.0 90.0 Wheatstone 13.0—65.0 13.0—65.0 Bass Strait 25.0—50.0 25.0—50.0 Macedon 71.4 71.4 Pyrenees 40.0—71.4 40.0—71.4 Griffin 45.0—71.0 45.0—71.0 Minerva 90.0 90.0 International Sangomar 82.0 82.0 Atlantis 44.0 44.0 Mad Dog 23.9 23.9 Shenzi 72.0 72.0 Trion 60.0 60.0 Greater Angostura 45.0—68.5 45.0—68.5 Calypso 70.0 70.0 Exploration and evaluation assets Oceania Browse Basin 30.6 30.6 Carnarvon Basin 31.6—70.0 31.6—70.0 Bonaparte Basin 26.7—35.0 26.7—35.0 Africa Congo 22.5 22.5 Senegal 90.0 90.0 Egypt 25.0—45.0 25.0—45.0 Americas US Gulf of Mexico1 23.9—75.0 23.9—75.0 Kitimat 50.0 50.0 Asia Republic of Korea2 - 50.0 Myanmar3 45.0 40.0—45.0 Caribbean Barbados 60.0 60.0 Trinidad and Tobago4 70.0 65.0—70.0 Other joint operations Angel 20.0 20.0 Bonaparte Basin 21.0 21.0 1. The Group relinquished permits GC 520, GC564, AC 39, AC 127 and AC170 in 2023. 2. The Group relinquished permits 8 and 6-1N in 2023. 3. The Group relinquished permit A-6 in 2023. 4. The Group relinquished permit TTDA-5 in 2023. The principal activities of the joint operations are exploration, development and production of hydrocarbons. Key estimates and judgements (a) Accounting for interests in other entities Judgement is required in assessing the level of control obtained in a transaction to acquire an interest in another entity. Depending upon the facts and circumstances in each case, Woodside may obtain control, joint control or significant influence over the entity or arrangement. Judgement is applied when determining the relevant activities of a project and if joint control is held over it. Relevant activities include, but are not limited to, work program and budget approval, investment decision approval, voting rights in joint operating committees, amendments to permits and changes to joint arrangement participant holdings. Transactions which give Woodside control of a business are business combinations. If Woodside obtains joint control of an arrangement, judgement is also required to assess whether the arrangement is a joint operation or a joint venture. If Woodside has neither control nor joint control, it may be in a position to exercise significant influence over the entity, which is then accounted for as an associate. Recognition and measurement Joint arrangements are arrangements in which two or more parties have joint control. Joint control is the contractual agreed sharing of control of the arrangement which exists only when decisions about the relevant activities require unanimous consent of the parties sharing control. Joint arrangements are classified as either a joint operation or joint venture, based on the rights and obligations arising from the contractual obligations between the parties to the arrangement. To the extent the joint arrangement provides the Group with rights to the individual assets and obligations arising from the joint arrangement, the arrangement is classified as a joint operation, and as such the Group recognises its: • assets, including its share of any assets held jointly; • liabilities, including its share of any liabilities incurred jointly; • revenue from the sale of its share of the output arising from the joint operation; • share of revenue from the sale of the output by the joint operation; and • expenses, including its share of any expenses incurred jointly. To the extent the joint arrangement provides the Group with rights to the net assets of the arrangement, the investment is classified as a joint venture and accounted for using the equity method. Joint arrangements acquired which are deemed to be carrying on a business are accounted for applying the principles of AASB 3/IFRS 3 Business Combinations. Joint arrangements which are not deemed to be carrying on a business are treated as asset acquisitions. WOODSIDE ENERGY GROUP LTD 159
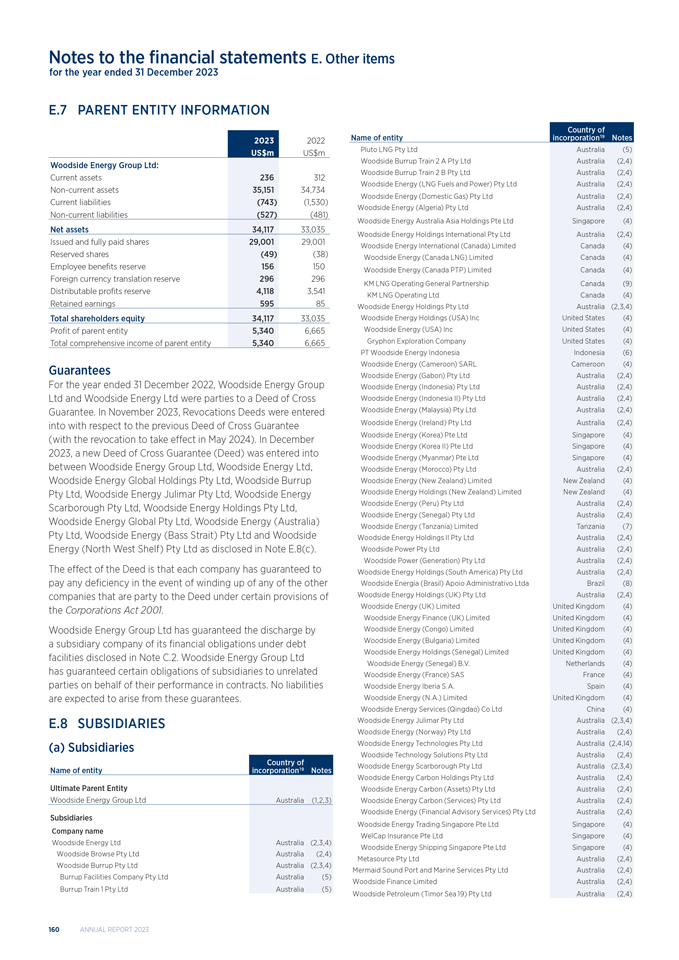
Notes to the financial statements E. Other items for the year ended 31 December 2023 E.7 PARENT ENTITY INFORMATION 2023 2022 US$m US$m Woodside Energy Group Ltd: Current assets 236 312 Non-current assets 35,151 34,734 Current liabilities (743) (1,530) Non-current liabilities (527) (481) Net assets 34,117 33,035 Issued and fully paid shares 29,001 29,001 Reserved shares (49) (38) Employee benefits reserve 156 150 Foreign currency translation reserve 296 296 Distributable profits reserve 4,118 3,541 Retained earnings 595 85 Total shareholders equity 34,117 33,035 Profit of parent entity 5,340 6,665 Total comprehensive income of parent entity 5,340 6,665 Guarantees For the year ended 31 December 2022, Woodside Energy Group Ltd and Woodside Energy Ltd were parties to a Deed of Cross Guarantee. In November 2023, Revocations Deeds were entered into with respect to the previous Deed of Cross Guarantee (with the revocation to take effect in May 2024). In December 2023, a new Deed of Cross Guarantee (Deed) was entered into between Woodside Energy Group Ltd, Woodside Energy Ltd, Woodside Energy Global Holdings Pty Ltd, Woodside Burrup Pty Ltd, Woodside Energy Julimar Pty Ltd, Woodside Energy Scarborough Pty Ltd, Woodside Energy Holdings Pty Ltd, Woodside Energy Global Pty Ltd, Woodside Energy (Australia) Pty Ltd, Woodside Energy (Bass Strait) Pty Ltd and Woodside Energy (North West Shelf) Pty Ltd as disclosed in Note E.8(c). The effect of the Deed is that each company has guaranteed to pay any deficiency in the event of winding up of any of the other companies that are party to the Deed under certain provisions of the Corporations Act 2001. Woodside Energy Group Ltd has guaranteed the discharge by a subsidiary company of its financial obligations under debt facilities disclosed in Note C.2. Woodside Energy Group Ltd has guaranteed certain obligations of subsidiaries to unrelated parties on behalf of their performance in contracts. No liabilities are expected to arise from these guarantees. E.8 SUBSIDIARIES (a) Subsidiaries Country of Name of entity incorporation19 Notes Ultimate Parent Entity Woodside Energy Group Ltd Australia (1,2,3) Subsidiaries Company name Woodside Energy Ltd Australia (2,3,4) Woodside Browse Pty Ltd Australia (2,4) Woodside Burrup Pty Ltd Australia (2,3,4) Burrup Facilities Company Pty Ltd Australia (5) Burrup Train 1 Pty Ltd Australia (5) Country of Name of entity incorporation19 Notes Pluto LNG Pty Ltd Australia (5) Woodside Burrup Train 2 A Pty Ltd Australia (2,4) Woodside Burrup Train 2 B Pty Ltd Australia (2,4) Woodside Energy (LNG Fuels and Power) Pty Ltd Australia (2,4) Woodside Energy (Domestic Gas) Pty Ltd Australia (2,4) Woodside Energy (Algeria) Pty Ltd Australia (2,4) Woodside Energy Australia Asia Holdings Pte Ltd Singapore (4) Woodside Energy Holdings International Pty Ltd Australia (2,4) Woodside Energy International (Canada) Limited Canada (4) Woodside Energy (Canada LNG) Limited Canada (4) Woodside Energy (Canada PTP) Limited Canada (4) KM LNG Operating General Partnership Canada (9) KM LNG Operating Ltd Canada (4) Woodside Energy Holdings Pty Ltd Australia (2,3,4) Woodside Energy Holdings (USA) Inc United States (4) Woodside Energy (USA) Inc United States (4) Gryphon Exploration Company United States (4) PT Woodside Energy Indonesia Indonesia (6) Woodside Energy (Cameroon) SARL Cameroon (4) Woodside Energy (Gabon) Pty Ltd Australia (2,4) Woodside Energy (Indonesia) Pty Ltd Australia (2,4) Woodside Energy (Indonesia II) Pty Ltd Australia (2,4) Woodside Energy (Malaysia) Pty Ltd Australia (2,4) Woodside Energy (Ireland) Pty Ltd Australia (2,4) Woodside Energy (Korea) Pte Ltd Singapore (4) Woodside Energy (Korea II) Pte Ltd Singapore (4) Woodside Energy (Myanmar) Pte Ltd Singapore (4) Woodside Energy (Morocco) Pty Ltd Australia (2,4) Woodside Energy (New Zealand) Limited New Zealand (4) Woodside Energy Holdings (New Zealand) Limited New Zealand (4) Woodside Energy (Peru) Pty Ltd Australia (2,4) Woodside Energy (Senegal) Pty Ltd Australia (2,4) Woodside Energy (Tanzania) Limited Tanzania (7) Woodside Energy Holdings II Pty Ltd Australia (2,4) Woodside Power Pty Ltd Australia (2,4) Woodside Power (Generation) Pty Ltd Australia (2,4) Woodside Energy Holdings (South America) Pty Ltd Australia (2,4) Woodside Energia (Brasil) Apoio Administrativo Ltda Brazil (8) Woodside Energy Holdings (UK) Pty Ltd Australia (2,4) Woodside Energy (UK) Limited United Kingdom (4) Woodside Energy Finance (UK) Limited United Kingdom (4) Woodside Energy (Congo) Limited United Kingdom (4) Woodside Energy (Bulgaria) Limited United Kingdom (4) Woodside Energy Holdings (Senegal) Limited United Kingdom (4) Woodside Energy (Senegal) B.V. Netherlands (4) Woodside Energy (France) SAS France (4) Woodside Energy Iberia S.A. Spain (4) Woodside Energy (N.A.) Limited United Kingdom (4) Woodside Energy Services (Qingdao) Co Ltd China (4) Woodside Energy Julimar Pty Ltd Australia (2,3,4) Woodside Energy (Norway) Pty Ltd Australia (2,4) Woodside Energy Technologies Pty Ltd Australia (2,4,14) Woodside Technology Solutions Pty Ltd Australia (2,4) Woodside Energy Scarborough Pty Ltd Australia (2,3,4) Woodside Energy Carbon Holdings Pty Ltd Australia (2,4) Woodside Energy Carbon (Assets) Pty Ltd Australia (2,4) Woodside Energy Carbon (Services) Pty Ltd Australia (2,4) Woodside Energy (Financial Advisory Services) Pty Ltd Australia (2,4) Woodside Energy Trading Singapore Pte Ltd Singapore (4) WelCap Insurance Pte Ltd Singapore (4) Woodside Energy Shipping Singapore Pte Ltd Singapore (4) Metasource Pty Ltd Australia (2,4) Mermaid Sound Port and Marine Services Pty Ltd Australia (2,4) Woodside Finance Limited Australia (2,4) Woodside Petroleum (Timor Sea 19) Pty Ltd Australia (2,4) 160 ANNUAL REPORT 2023
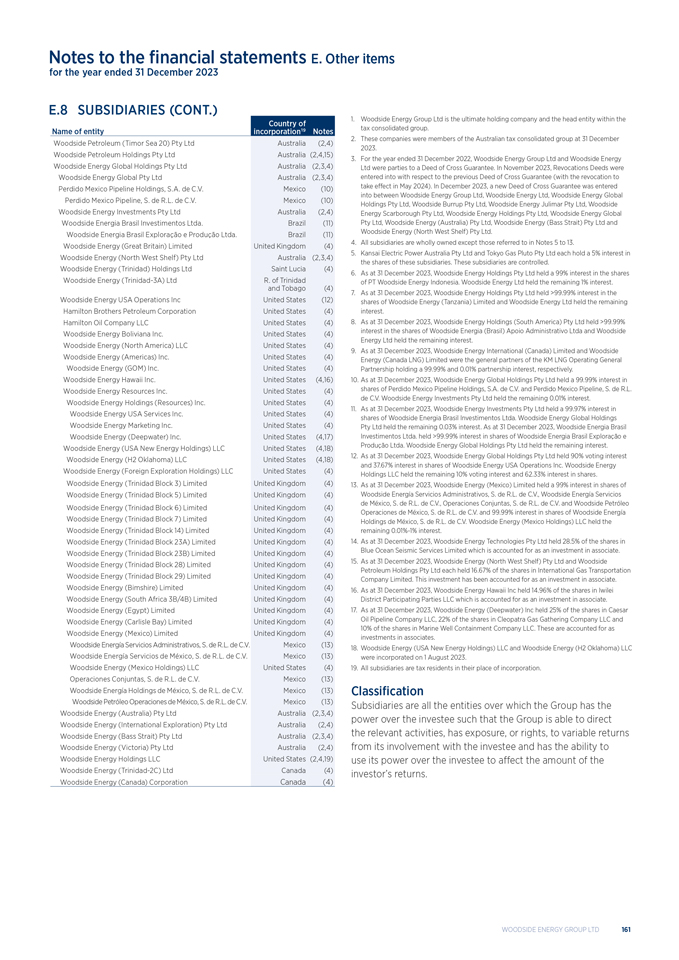
Notes to the financial statements E. Other items for the year ended 31 December 2023 E.8 SUBSIDIARIES (CONT.) Country of Name of entity incorporation19 Notes Woodside Petroleum (Timor Sea 20) Pty Ltd Australia (2,4) Woodside Petroleum Holdings Pty Ltd Australia (2,4,15) Woodside Energy Global Holdings Pty Ltd Australia (2,3,4) Woodside Energy Global Pty Ltd Australia (2,3,4) Perdido Mexico Pipeline Holdings, S.A. de C.V. Mexico (10) Perdido Mexico Pipeline, S. de R.L. de C.V. Mexico (10) Woodside Energy Investments Pty Ltd Australia (2,4) Woodside Energia Brasil Investimentos Ltda. Brazil (11) Woodside Energia Brasil Exploração e Produção Ltda. Brazil (11) Woodside Energy (Great Britain) Limited United Kingdom (4) Woodside Energy (North West Shelf) Pty Ltd Australia (2,3,4) Woodside Energy (Trinidad) Holdings Ltd Saint Lucia (4) Woodside Energy (Trinidad-3A) Ltd R. of Trinidad and Tobago (4) Woodside Energy USA Operations Inc United States (12) Hamilton Brothers Petroleum Corporation United States (4) Hamilton Oil Company LLC United States (4) Woodside Energy Boliviana Inc. United States (4) Woodside Energy (North America) LLC United States (4) Woodside Energy (Americas) Inc. United States (4) Woodside Energy (GOM) Inc. United States (4) Woodside Energy Hawaii Inc. United States (4,16) Woodside Energy Resources Inc. United States (4) Woodside Energy Holdings (Resources) Inc. United States (4) Woodside Energy USA Services Inc. United States (4) Woodside Energy Marketing Inc. United States (4) Woodside Energy (Deepwater) Inc. United States (4,17) Woodside Energy (USA New Energy Holdings) LLC United States (4,18) Woodside Energy (H2 Oklahoma) LLC United States (4,18) Woodside Energy (Foreign Exploration Holdings) LLC United States (4) Woodside Energy (Trinidad Block 3) Limited United Kingdom (4) Woodside Energy (Trinidad Block 5) Limited United Kingdom (4) Woodside Energy (Trinidad Block 6) Limited United Kingdom (4) Woodside Energy (Trinidad Block 7) Limited United Kingdom (4) Woodside Energy (Trinidad Block 14) Limited United Kingdom (4) Woodside Energy (Trinidad Block 23A) Limited United Kingdom (4) Woodside Energy (Trinidad Block 23B) Limited United Kingdom (4) Woodside Energy (Trinidad Block 28) Limited United Kingdom (4) Woodside Energy (Trinidad Block 29) Limited United Kingdom (4) Woodside Energy (Bimshire) Limited United Kingdom (4) Woodside Energy (South Africa 3B/4B) Limited United Kingdom (4) Woodside Energy (Egypt) Limited United Kingdom (4) Woodside Energy (Carlisle Bay) Limited United Kingdom (4) Woodside Energy (Mexico) Limited United Kingdom (4) Woodside Energía Servicios Administrativos, S. de R.L. de C.V. Mexico (13) Woodside Energía Servicios de México, S. de R.L. de C.V. Mexico (13) Woodside Energy (Mexico Holdings) LLC United States (4) Operaciones Conjuntas, S. de R.L. de C.V. Mexico (13) Woodside Energía Holdings de México, S. de R.L. de C.V. Mexico (13) Woodside Petróleo Operaciones de México, S. de R.L. de C.V. Mexico (13) Woodside Energy (Australia) Pty Ltd Australia (2,3,4) Woodside Energy (International Exploration) Pty Ltd Australia (2,4) Woodside Energy (Bass Strait) Pty Ltd Australia (2,3,4) Woodside Energy (Victoria) Pty Ltd Australia (2,4) Woodside Energy Holdings LLC United States (2,4,19) Woodside Energy (Trinidad-2C) Ltd Canada (4) Woodside Energy (Canada) Corporation Canada (4) 1. Woodside Energy Group Ltd is the ultimate holding company and the head entity within the tax consolidated group. 2. These companies were members of the Australian tax consolidated group at 31 December 2023. 3. For the year ended 31 December 2022, Woodside Energy Group Ltd and Woodside Energy Ltd were parties to a Deed of Cross Guarantee. In November 2023, Revocations Deeds were entered into with respect to the previous Deed of Cross Guarantee (with the revocation to take effect in May 2024). In December 2023, a new Deed of Cross Guarantee was entered into between Woodside Energy Group Ltd, Woodside Energy Ltd, Woodside Energy Global Holdings Pty Ltd, Woodside Burrup Pty Ltd, Woodside Energy Julimar Pty Ltd, Woodside Energy Scarborough Pty Ltd, Woodside Energy Holdings Pty Ltd, Woodside Energy Global Pty Ltd, Woodside Energy (Australia) Pty Ltd, Woodside Energy (Bass Strait) Pty Ltd and Woodside Energy (North West Shelf) Pty Ltd. 4. All subsidiaries are wholly owned except those referred to in Notes 5 to 13. 5. Kansai Electric Power Australia Pty Ltd and Tokyo Gas Pluto Pty Ltd each hold a 5% interest in the shares of these subsidiaries. These subsidiaries are controlled. 6. As at 31 December 2023, Woodside Energy Holdings Pty Ltd held a 99% interest in the shares of PT Woodside Energy Indonesia. Woodside Energy Ltd held the remaining 1% interest. 7. As at 31 December 2023, Woodside Energy Holdings Pty Ltd held >99.99% interest in the shares of Woodside Energy (Tanzania) Limited and Woodside Energy Ltd held the remaining interest. 8. As at 31 December 2023, Woodside Energy Holdings (South America) Pty Ltd held >99.99% interest in the shares of Woodside Energia (Brasil) Apoio Administrativo Ltda and Woodside Energy Ltd held the remaining interest. 9. As at 31 December 2023, Woodside Energy International (Canada) Limited and Woodside Energy (Canada LNG) Limited were the general partners of the KM LNG Operating General Partnership holding a 99.99% and 0.01% partnership interest, respectively. 10. As at 31 December 2023, Woodside Energy Global Holdings Pty Ltd held a 99.99% interest in shares of Perdido Mexico Pipeline Holdings, S.A. de C.V. and Perdido Mexico Pipeline, S. de R.L. de C.V. Woodside Energy Investments Pty Ltd held the remaining 0.01% interest. 11. As at 31 December 2023, Woodside Energy Investments Pty Ltd held a 99.97% interest in shares of Woodside Energia Brasil Investimentos Ltda. Woodside Energy Global Holdings Pty Ltd held the remaining 0.03% interest. As at 31 December 2023, Woodside Energia Brasil Investimentos Ltda. held >99.99% interest in shares of Woodside Energia Brasil Exploração e Produção Ltda. Woodside Energy Global Holdings Pty Ltd held the remaining interest. 12. As at 31 December 2023, Woodside Energy Global Holdings Pty Ltd held 90% voting interest and 37.67% interest in shares of Woodside Energy USA Operations Inc. Woodside Energy Holdings LLC held the remaining 10% voting interest and 62.33% interest in shares. 13. As at 31 December 2023, Woodside Energy (Mexico) Limited held a 99% interest in shares of Woodside Energía Servicios Administrativos, S. de R.L. de C.V., Woodside Energía Servicios de México, S. de R.L. de C.V., Operaciones Conjuntas, S. de R.L. de C.V. and Woodside Petróleo Operaciones de México, S. de R.L. de C.V. and 99.99% interest in shares of Woodside Energía Holdings de México, S. de R.L. de C.V. Woodside Energy (Mexico Holdings) LLC held the remaining 0.01%-1% interest. 14. As at 31 December 2023, Woodside Energy Technologies Pty Ltd held 28.5% of the shares in Blue Ocean Seismic Services Limited which is accounted for as an investment in associate. 15. As at 31 December 2023, Woodside Energy (North West Shelf) Pty Ltd and Woodside Petroleum Holdings Pty Ltd each held 16.67% of the shares in International Gas Transportation Company Limited. This investment has been accounted for as an investment in associate. 16. As at 31 December 2023, Woodside Energy Hawaii Inc held 14.96% of the shares in Iwilei District Participating Parties LLC which is accounted for as an investment in associate. 17. As at 31 December 2023, Woodside Energy (Deepwater) Inc held 25% of the shares in Caesar Oil Pipeline Company LLC, 22% of the shares in Cleopatra Gas Gathering Company LLC and 10% of the shares in Marine Well Containment Company LLC. These are accounted for as investments in associates. 18. Woodside Energy (USA New Energy Holdings) LLC and Woodside Energy (H2 Oklahoma) LLC were incorporated on 1 August 2023. 19. All subsidiaries are tax residents in their place of incorporation. Classification Subsidiaries are all the entities over which the Group has the power over the investee such that the Group is able to direct the relevant activities, has exposure, or rights, to variable returns from its involvement with the investee and has the ability to use its power over the investee to affect the amount of the investor’s returns. WOODSIDE ENERGY GROUP LTD 161
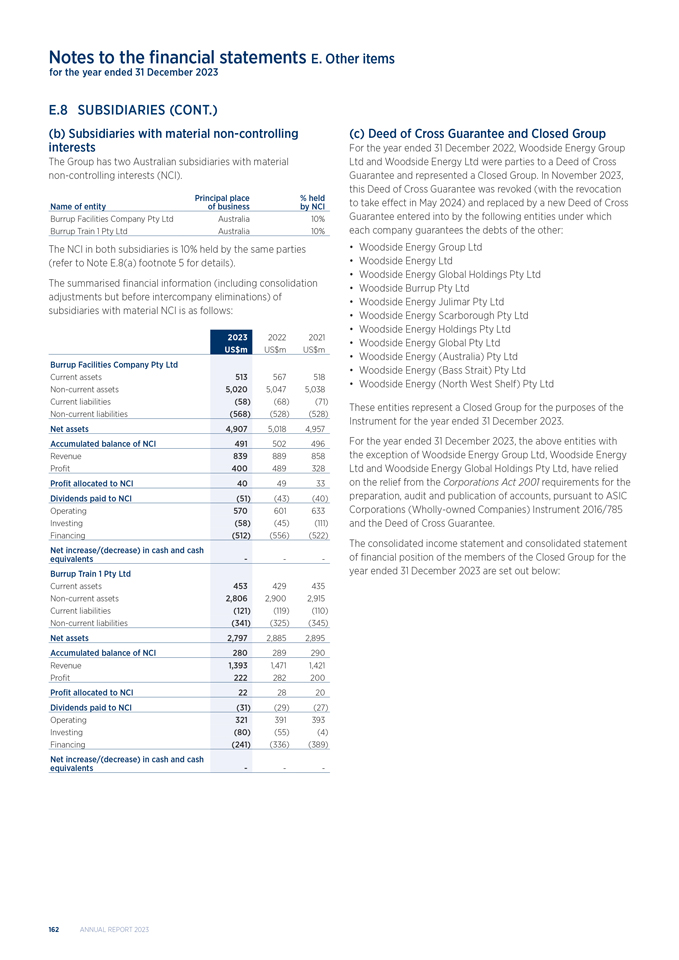
Notes to the financial statements E. Other items for the year ended 31 December 2023 E.8 SUBSIDIARIES (CONT.) (b) Subsidiaries with material non-controlling interests The Group has two Australian subsidiaries with material non-controlling interests (NCI). Principal place % held Name of entity of business by NCI Burrup Facilities Company Pty Ltd Australia 10% Burrup Train 1 Pty Ltd Australia 10% The NCI in both subsidiaries is 10% held by the same parties (refer to Note E.8(a) footnote 5 for details). The summarised financial information (including consolidation adjustments but before intercompany eliminations) of subsidiaries with material NCI is as follows: 2023 2022 2021 US$m US$m US$m Burrup Facilities Company Pty Ltd Current assets 513 567518 Non-current assets 5,020 5,0475,038 Current liabilities (58) (68)(71) Non-current liabilities (568) (528)(528) Net assets 4,907 5,0184,957 Accumulated balance of NCI 491 502496 Revenue 839 889858 Profit 400 489328 Profit allocated to NCI 40 4933 Dividends paid to NCI (51) (43)(40) Operating 570 601633 Investing (58) (45)(111) Financing (512) (556)(522) Net increase/(decrease) in cash and cash equivalents - -- Burrup Train 1 Pty Ltd Current assets 453 429435 Non-current assets 2,806 2,9002,915 Current liabilities (121) (119)(110) Non-current liabilities (341) (325)(345) Net assets 2,797 2,8852,895 Accumulated balance of NCI 280 289290 Revenue 1,393 1,4711,421 Profit 222 282200 Profit allocated to NCI 22 2820 Dividends paid to NCI (31) (29)(27) Operating 321 391393 Investing (80) (55)(4) Financing (241) (336)(389) Net increase/(decrease) in cash and cash equivalents - -- (c) Deed of Cross Guarantee and Closed Group For the year ended 31 December 2022, Woodside Energy Group Ltd and Woodside Energy Ltd were parties to a Deed of Cross Guarantee and represented a Closed Group. In November 2023, this Deed of Cross Guarantee was revoked (with the revocation to take effect in May 2024) and replaced by a new Deed of Cross Guarantee entered into by the following entities under which each company guarantees the debts of the other: • Woodside Energy Group Ltd • Woodside Energy Ltd • Woodside Energy Global Holdings Pty Ltd • Woodside Burrup Pty Ltd • Woodside Energy Julimar Pty Ltd • Woodside Energy Scarborough Pty Ltd • Woodside Energy Holdings Pty Ltd • Woodside Energy Global Pty Ltd • Woodside Energy (Australia) Pty Ltd • Woodside Energy (Bass Strait) Pty Ltd • Woodside Energy (North West Shelf) Pty Ltd These entities represent a Closed Group for the purposes of the Instrument for the year ended 31 December 2023. For the year ended 31 December 2023, the above entities with the exception of Woodside Energy Group Ltd, Woodside Energy Ltd and Woodside Energy Global Holdings Pty Ltd, have relied on the relief from the Corporations Act 2001 requirements for the preparation, audit and publication of accounts, pursuant to ASIC Corporations (Wholly-owned Companies) Instrument 2016/785 and the Deed of Cross Guarantee. The consolidated income statement and consolidated statement of financial position of the members of the Closed Group for the year ended 31 December 2023 are set out below: 162 ANNUAL REPORT 2023
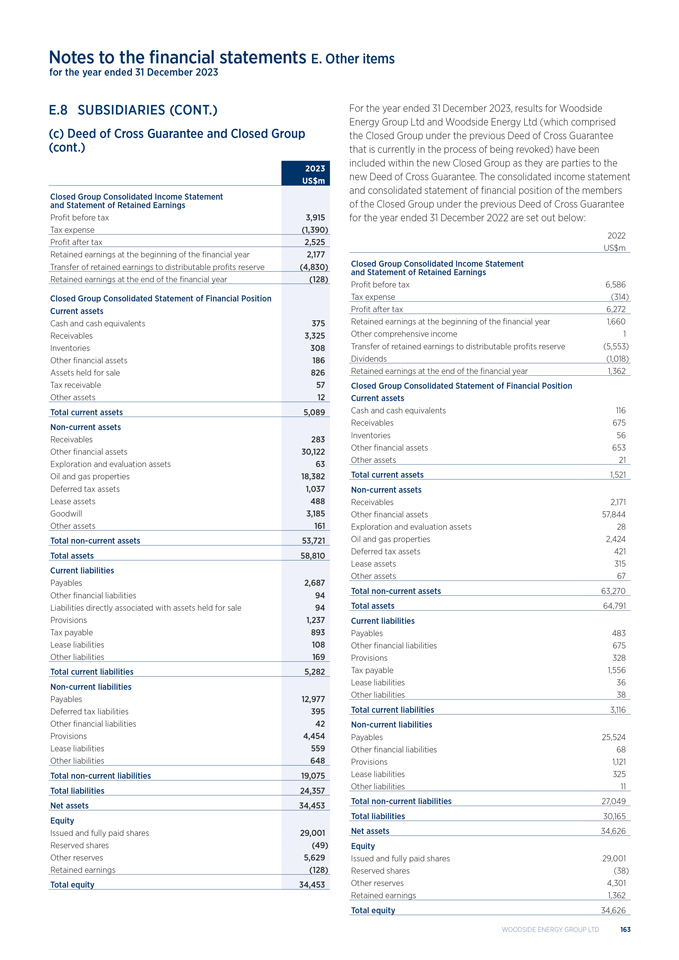
Notes to the financial statements E. Other items for the year ended 31 December 2023 E.8 SUBSIDIARIES (CONT.) (c) Deed of Cross Guarantee and Closed Group (cont.) 2023 US$m Closed Group Consolidated Income Statement and Statement of Retained Earnings Profit before tax 3,915 Tax expense (1,390) Profit after tax 2,525 Retained earnings at the beginning of the financial year 2,177 Transfer of retained earnings to distributable profits reserve (4,830) Retained earnings at the end of the financial year (128) Closed Group Consolidated Statement of Financial Position Current assets Cash and cash equivalents 375 Receivables 3,325 Inventories 308 Other financial assets 186 Assets held for sale 826 Tax receivable 57 Other assets 12 Total current assets 5,089 Non-current assets Receivables 283 Other financial assets 30,122 Exploration and evaluation assets 63 Oil and gas properties 18,382 Deferred tax assets 1,037 Lease assets 488 Goodwill 3,185 Other assets 161 Total non-current assets 53,721 Total assets 58,810 Current liabilities Payables 2,687 Other financial liabilities 94 Liabilities directly associated with assets held for sale 94 Provisions 1,237 Tax payable 893 Lease liabilities 108 Other liabilities 169 Total current liabilities 5,282 Non-current liabilities Payables 12,977 Deferred tax liabilities 395 Other financial liabilities 42 Provisions 4,454 Lease liabilities 559 Other liabilities 648 Total non-current liabilities 19,075 Total liabilities 24,357 Net assets 34,453 Equity Issued and fully paid shares 29,001 Reserved shares (49) Other reserves 5,629 Retained earnings (128) Total equity 34,453 For the year ended 31 December 2023, results for Woodside Energy Group Ltd and Woodside Energy Ltd (which comprised the Closed Group under the previous Deed of Cross Guarantee that is currently in the process of being revoked) have been included within the new Closed Group as they are parties to the new Deed of Cross Guarantee. The consolidated income statement and consolidated statement of financial position of the members of the Closed Group under the previous Deed of Cross Guarantee for the year ended 31 December 2022 are set out below: 2022 US$m Closed Group Consolidated Income Statement and Statement of Retained Earnings Profit before tax 6,586 Tax expense (314) Profit after tax 6,272 Retained earnings at the beginning of the financial year 1,660 Other comprehensive income 1 Transfer of retained earnings to distributable profits reserve (5,553) Dividends (1,018) Retained earnings at the end of the financial year 1,362 Closed Group Consolidated Statement of Financial Position Current assets Cash and cash equivalents 116 Receivables 675 Inventories 56 Other financial assets 653 Other assets 21 Total current assets 1,521 Non-current assets Receivables 2,171 Other financial assets 57,844 Exploration and evaluation assets 28 Oil and gas properties 2,424 Deferred tax assets 421 Lease assets 315 Other assets 67 Total non-current assets 63,270 Total assets 64,791 Current liabilities Payables 483 Other financial liabilities 675 Provisions 328 Tax payable 1,556 Lease liabilities 36 Other liabilities 38 Total current liabilities 3,116 Non-current liabilities Payables 25,524 Other financial liabilities 68 Provisions 1,121 Lease liabilities 325 Other liabilities 11 Total non-current liabilities 27,049 Total liabilities 30,165 Net assets 34,626 Equity Issued and fully paid shares 29,001 Reserved shares (38) Other reserves 4,301 Retained earnings 1,362 Total equity 34,626 WOODSIDE ENERGY GROUP LTD 163
Notes to the financial statements E. Other items for the year ended 31 December 2023 E.9 OTHER ACCOUNTING POLICIES (a) Summary of other material accounting policies Australia tax consolidation The parent and its wholly owned Australian controlled entities have elected to enter a tax consolidation, with Woodside Energy Group Ltd as the head entity of the tax consolidated group. The members of the Australian tax consolidated group are identified in Note E.8(a). The tax expense/benefit, deferred tax liabilities and deferred tax assets arising from temporary differences of the members of the tax consolidated group are recognised in the separate financial statements of the members of the tax consolidated group, using the stand-alone approach. Entities within the tax consolidated group have entered into a tax funding arrangement and a tax sharing agreement with the head entity. Under the tax funding agreement, Woodside Energy Group Ltd and each of the entities in the tax consolidated group have agreed to pay or receive a tax equivalent payment to or from the head entity, based on the current tax liability or current tax asset of the entity. The tax sharing agreement entered into between members of the tax consolidated group provides for the determination of the allocation of income tax liabilities between the entities, should the head entity default on its tax payment obligations. No amounts have been recognised in the financial statements in respect of this agreement as payment of any amounts under the tax sharing agreement is considered remote. US tax consolidation Woodside Energy USA Operations Inc and its wholly owned USA controlled entities have elected to file a consolidated tax return, with Woodside Energy USA Operations Inc as the parent of the tax consolidated group. The tax expense/benefit, deferred tax liabilities and deferred tax assets arising from temporary differences of the members of the tax consolidated group are computed on a separate company basis. Entities within the tax consolidated group have entered into a tax sharing agreement. Under the tax sharing agreement, the tax liability for the consolidated group or the utilisation of tax attributes are settled periodically between the members of the group. No amounts have been recognised in the financial statements in respect of this agreement as payment of any amounts under the tax sharing agreement is considered remote. (b) New standards and interpretations New and amended accounting standards adopted A number of amended standards became applicable for the current reporting period. The Group did not make any significant changes to its accounting policies and did not make retrospective adjustments as a result of adopting these amended standards. These amendments did not materially impact the accounting policies or amounts disclosed in the year end financial statements of the Group. New standards and interpretations not yet adopted Certain new accounting standards, amendments to accounting standards and interpretations have been published that are not mandatory for the 31 December 2023 reporting period and have not been early adopted by the Group. These standards, amendments or interpretations are not expected to have a material impact to the Group in the current or future reporting periods and on foreseeable future transactions with the exception of the amendments to AASB 112/IAS 12 Income Taxes where the impact is under assessment. Pillar Two reforms In December 2021, the Organisation for Economic Co-operation and Development (OECD) published its Pillar Two model rules. The Pillar Two model rules: • aim to ensure that large multinational groups pay a minimum amount of tax on income arising in each jurisdiction in which they operate; and • would achieve a minimum effective tax rate in each jurisdiction of 15% from the reporting period commencing 1 January 2024. For the year ended 31 December 2023, the Group paid $2,916 million of income tax and PRRT and reported a global effective income tax rate of 27.5%. The Group’s impact assessment will depend on the extent to which the Pillar Two legislation has been enacted in the various jurisdictions the Group operates in and when it comes into effect. The Group will continue to monitor and assess the expected impact of the Pillar Two reform. 164 ANNUAL REPORT 2023
Directors’ declaration In accordance with a resolution of directors of Woodside Energy Group Ltd, we state that: 1. In the opinion of the directors: (a) the financial statements and notes thereto, and the disclosures included in the audited 2023 Remuneration Report, comply with Australian Accounting Standards and the Corporations Act 2001; (b) the financial statements and notes thereto give a true and fair view of the financial position of the Group as at 31 December 2023 and of the performance of the Group for the financial year ended 31 December 2023; (c) the financial statements and notes thereto also comply with International Financial Reporting Standards as disclosed in the ‘About these statements’ section within the notes to the 2023 Financial Statements; (d) there are reasonable grounds to believe that Woodside Energy Group Ltd will be able to pay its debts as and when they become due and payable; and (e) there are reasonable grounds to believe that the members of the Closed Group identified in Note E.8 will be able to meet any obligations or liabilities which they are or may become subject to, by virtue of the Deed of Cross Guarantee. 2. This declaration has been made after receiving the declarations required to be made to the directors in accordance with section 295A of the Corporations Act 2001 for the year ended 31 December 2023. For the purposes of the UK Disclosure Guidance and Transparency Rules, the directors confirm that to the best of their knowledge: (a) the financial statements, prepared in accordance with applicable accounting standards, give a true and fair view of the assets, liabilities, financial position and profit or loss of Woodside Energy Group Ltd (and the undertakings included in the consolidation as a whole); and (b) the management report includes a fair review of the development and performance of the business and the position of Woodside Energy Group Ltd (and the undertakings included in the consolidation taken as a whole), together with a description of the principal risks and uncertainties they face. For and on behalf of the Board R J Goyder, AO M E O’Neill Chair of the Board Chief Executive Officer and Managing Director Perth, Western Australia Sydney, New South Wales 27 February 2024 27 February 2024 WOODSIDE ENERGY GROUP LTD 165
Independent auditor’s report Independent auditor’s report To the members of Woodside Energy Group Ltd Report on the audit of the financial report Our opinion In our opinion: The accompanying financial report of Woodside Energy Group Ltd (the Company) and its controlled entities (together the Group) is in accordance with the Corporations Act 2001, including: (a) giving a true and fair view of the Group’s financial position as at 31 December 2023 and of its financial performance for the year then ended (b) complying with Australian Accounting Standards and the Corporations Regulations 2001. What we have audited The Group financial report comprises: • the consolidated statement of financial position as at 31 December 2023 • the consolidated income statement for the year then ended • the consolidated statement of comprehensive income for the year then ended • the consolidated statement of cash flows for the year then ended • the consolidated statement of changes in equity for the year then ended • the notes to the consolidated financial statements, including material accounting policy information and other explanatory information • the directors’ declaration. Basis for opinion We conducted our audit in accordance with Australian Auditing Standards and International Standards on Auditing. Our responsibilities under those standards are further described in the Auditor’s responsibilities for the audit of the financial report section of our report. We believe that the audit evidence we have obtained is sufficient and appropriate to provide a basis for our opinion. Independence We are independent of the Group in accordance with the auditor independence requirements of the Corporations Act 2001 and the ethical requirements of the Accounting Professional & Ethical Standards Board’s APES 110 Code of Ethics for Professional Accountants (including Independence Standards) (the Code) and the International Code of Ethics for Professional Accountants (including International Independence Standards) issued by the International Ethics Standards Board for Accountants (IESBA Code) that are relevant to our audit of the financial report in Australia. We have also fulfilled our other ethical responsibilities in accordance with the Code and the IESBA Code. Brookfield PricewaterhouseCoopers, Place, 125 St Georges ABN 52 Terrace, 780 433 PERTH 757 WA 6000, GPO Box D198, PERTH WA 6840 T: +61 8 9238 3000, F: +61 8 9238 3999, www.pwc.com.au Liability limited by a scheme approved under Professional Standards Legislation. 166 ANNUAL REPORT 2023
Our audit approach An audit is designed to provide reasonable assurance about whether the financial report is free from material misstatement. Misstatements may arise due to fraud or error. They are considered material if individually or in aggregate, they could reasonably be expected to influence the economic decisions of users taken on the basis of the financial report. We tailored the scope of our audit to ensure that we performed enough work to be able to give an opinion on the financial report as a whole, taking into account the geographic and management structure of the Group, its accounting processes and controls and the industry in which it operates. Audit scope Key audit matters • Our audit focused on where the Group made •Amongst other relevant topics, we subjective judgements; for example, communicated the following key audit matters significant accounting estimates involving to the Audit & Risk Committee: assumptions and inherently uncertain future -Carrying value of cash generating units events. (CGUs) with goodwill and oil and gas • The Group has major business units in properties – Shenzi and Wheatstone, Australia and the United States of America. In -Valuation of the Petroleum Resource establishing the overall approach to the Rent Tax (PRRT) deferred tax assets Group audit, we determined the type of work (DTAs) – Pluto. that needed to be performed by us, as the Group engagement team, and by component • These are further described in the Key audit auditors under our instruction. matters section of our report. Key audit matters Key audit matters are those matters that, in our professional judgement, were of most significance in our audit of the financial report for the current period. The key audit matters were addressed in the context of our audit of the financial report as a whole, and in forming our opinion thereon, and we do not provide a separate opinion on these matters. Further, any commentary on the outcomes of a particular audit procedure is made in that context. Key audit matter How our audit addressed the key audit matter Carrying value of cash generating units (CGUs) with goodwill and oil and gas properties – Shenzi and Wheatstone As described in Note B.4 to the Group financial Our procedures included, among others: report, the Group conducted its annual goodwill (i) testing the effectiveness of controls relating impairment testing for CGUs with goodwill and to the Group’s assessment of the significant estimated the recoverable amount of CGUs with estimates and assumptions included within an impairment indicator at 31 December 2023. the impairment models, This resulted in the recognition of pre-tax (ii) assessing the appropriateness of significant impairment charges of $1,383 million for the estimates and assumptions applied by the Shenzi CGU and $466 million for the Wheatstone Group, CGU. The recoverable amounts for the Shenzi and Wheatstone CGUs were estimated using the fair value less costs of disposal approach utilising WOODSIDE ENERGY GROUP LTD 167
Key audit matter cash flow models. The Group’s cash flow models included significant judgements and assumptions relating to oil and gas reserves and resources, estimates of future production and commodity prices, forecast expenditures incorporating expected inflation and foreign exchange rates, discount rate assumptions, and estimates of carbon costs. The principal considerations for our determination that performing procedures relating to the assessment of the carrying value of the Shenzi and Wheatstone CGUs is a key audit matter are: (i) there is a significant level of judgement applied by the Group, including the use of the Group’s experts, in the determination of the significant estimates and assumptions included in the impairment models, (ii) this in turn led to a high degree of auditor judgement, effort and subjectivity in performing procedures and evaluating the Group’s significant assumptions and estimates, and (iii) the nature and extent of audit effort required to perform the procedures and evaluate the Group’s significant assumptions and estimates required the use of professionals with specialised skill and knowledge. How our audit addressed the key audit matter (iii) evaluating the work of the Group’s experts involved in the determination of significant estimates and assumptions, (iv) evaluating the disclosures made regarding the impairment of goodwill and oil and gas properties in the Group financial report against the requirements of Australian Accounting Standards, and (v) professionals with specialised skill and knowledge were used to assist in evaluating the appropriateness of the Group’s recoverable amount estimates. Valuation of the Petroleum Resource Rent Tax (PRRT) deferred tax assets (DTAs) – Pluto As described in Note A.5 to the Group financial report, the Group has recognised deferred tax assets of $1,717 million as of 31 December 2023, of which $1,101 million relates to PRRT, including the Pluto PRRT DTA which reduced by $637 million during the year on the basis of future taxable profits not being available to utilise the deductible expenditure. PRRT is considered, for accounting purposes, to be an income tax. PRRT DTAs are based on estimates of future taxable profits available to recover incurred general and exploration expenditure. Our procedures included, among others: (i) testing the effectiveness of controls relating to the Group’s assessment of the significant judgements and assumptions included within the PRRT modelling and recoverability assessment, (ii) assessing the appropriateness of significant judgements and assumptions applied by the Group to estimate the recoverable amount of DTAs, (iii) evaluating the work of the Group’s experts involved in the determination of significant judgements and estimates, 168 ANNUAL REPORT 2023
Key audit matter The Group’s estimation of the PRRT DTAs involves significant judgements and assumptions including assessing the forecast future taxable profits (which are risk-adjusted where appropriate by a market premium risk rate to reflect uncertainty inherent in long-term forecasts) generated from the Australian assets, which have regard to the future commodity price assumptions, and forecast assessable revenues, exploration and general expenditure. The principal considerations for our determination that performing procedures relating to valuation of the Pluto PRRT DTAs is a key audit matter are: (i) there is a significant level of judgement applied by the Group in determining the recoverability of the PRRT DTAs, including having regard to the judgements and assumptions mentioned above, and considering the specialised knowledge and input of the Group’s experts informing significant estimates and assumptions, (ii) this in turn led to a high degree of auditor judgement, effort and subjectivity in performing procedures and evaluating the Group’s methodology, significant assumptions and estimates, and (iii) the nature and extent of audit effort required to perform the procedures and evaluate the Group’s methodology, significant assumptions and estimates, required the use of professionals with specialised skill and knowledge. How our audit addressed the key audit matter (iv) evaluating the disclosures made regarding the PRRT DTAs recognised in the Group financial report against the requirements of Australian Accounting Standards, and (v) professionals with specialised skill and knowledge were used to assist in evaluating the appropriateness of the Group’s assessment of recoverability of the PRRT DTAs including certain significant assumptions. Other information The directors are responsible for the other information. The other information comprises the information included in the annual report for the year ended 31 December 2023, but does not include the financial report and our auditor’s report thereon. Our opinion on the financial report does not cover the other information and accordingly we do not express any form of assurance conclusion thereon through our opinion on the financial report. We have issued a separate opinion on the remuneration report. In connection with our audit of the financial report, our responsibility is to read the other information and, in doing so, consider whether the other information is materially inconsistent with the financial report or our knowledge obtained in the audit, or otherwise appears to be materially misstated. WOODSIDE ENERGY GROUP LTD 169
If, based on the work we have performed on the other information that we obtained prior to the date of this auditor’s report, we conclude that there is a material misstatement of this other information, we are required to report that fact. We have nothing to report in this regard. Responsibilities of the directors for the financial report The directors of the Company are responsible for the preparation of the financial report that gives a true and fair view in accordance with Australian Accounting Standards and the Corporations Act 2001 and for such internal control as the directors determine is necessary to enable the preparation of the financial report that gives a true and fair view and is free from material misstatement, whether due to fraud or error. In preparing the financial report, the directors are responsible for assessing the ability of the Group to continue as a going concern, disclosing, as applicable, matters related to going concern and using the going concern basis of accounting unless the directors either intend to liquidate the Group or to cease operations, or have no realistic alternative but to do so. Auditor’s responsibilities for the audit of the financial report Our objectives are to obtain reasonable assurance about whether the financial report as a whole is free from material misstatement, whether due to fraud or error, and to issue an auditor’s report that includes our opinion. Reasonable assurance is a high level of assurance, but is not a guarantee that an audit conducted in accordance with the Australian Auditing Standards and International Standards on Auditing will always detect a material misstatement when it exists. Misstatements can arise from fraud or error and are considered material if, individually or in the aggregate, they could reasonably be expected to influence the economic decisions of users taken on the basis of the financial report. A further description of our responsibilities for the audit of the financial report is located at the Auditing and Assurance Standards Board website at: https://www.auasb.gov.au/admin/file/content102/c3/ar1_2020.pdf. This description forms part of our auditor’s report. Report on the remuneration report Our opinion on the remuneration report We have audited the remuneration report included in the directors’ report for the year ended 31 December 2023. In our opinion, the remuneration report of Woodside Energy Group Ltd for the year ended 31 December 2023 complies with section 300A of the Corporations Act 2001. 170 ANNUAL REPORT 2023
Responsibilities The directors of the Company are responsible for the preparation and presentation of the remuneration report in accordance with section 300A of the Corporations Act 2001. Our responsibility is to express an opinion on the remuneration report, based on our audit conducted in accordance with Australian Auditing Standards. PricewaterhouseCoopers N M Henry A G B Hodge Partner Partner Perth 27 February 2024 Perth 27 February 2024 WOODSIDE ENERGY GROUP LTD 171
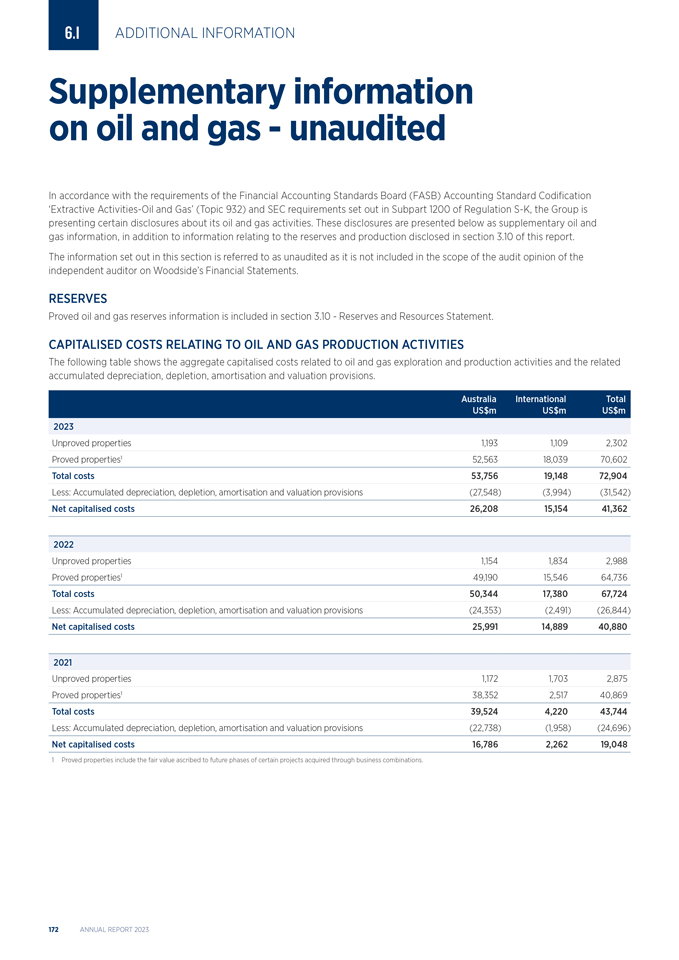
6.1 ADDITIONAL INFORMATION on Supplementary oil and gas— unaudited information In accordance with the requirements of the Financial Accounting Standards Board (FASB) Accounting Standard Codification ‘Extractive Activities-Oil and Gas’ (Topic 932) and SEC requirements set out in Subpart 1200 of Regulation S-K, the Group is presenting certain disclosures about its oil and gas activities. These disclosures are presented below as supplementary oil and gas information, in addition to information relating to the reserves and production disclosed in section 3.10 of this report. The information set out in this section is referred to as unaudited as it is not included in the scope of the audit opinion of the independent auditor on Woodside’s Financial Statements. RESERVES Proved oil and gas reserves information is included in section 3.10—Reserves and Resources Statement. CAPITALISED COSTS RELATING TO OIL AND GAS PRODUCTION ACTIVITIES The following table shows the aggregate capitalised costs related to oil and gas exploration and production activities and the related accumulated depreciation, depletion, amortisation and valuation provisions. Australia International Total US$m US$m US$m 2023 Unproved properties 1,193 1,1092,302 Proved properties1 52,563 18,03970,602 Total costs 53,756 19,14872,904 Less: Accumulated depreciation, depletion, amortisation and valuation provisions (27,548) (3,994)(31,542) Net capitalised costs 26,208 15,15441,362 2022 Unproved properties 1,154 1,8342,988 Proved properties1 49,190 15,54664,736 Total costs 50,344 17,38067,724 Less: Accumulated depreciation, depletion, amortisation and valuation provisions (24,353) (2,491)(26,844) Net capitalised costs 25,991 14,88940,880 2021 Unproved properties 1,172 1,7032,875 Proved properties1 38,352 2,51740,869 Total costs 39,524 4,22043,744 Less: Accumulated depreciation, depletion, amortisation and valuation provisions (22,738) (1,958)(24,696) Net capitalised costs 16,786 2,26219,048 1 Proved properties include the fair value ascribed to future phases of certain projects acquired through business combinations. 172 ANNUAL REPORT 2023
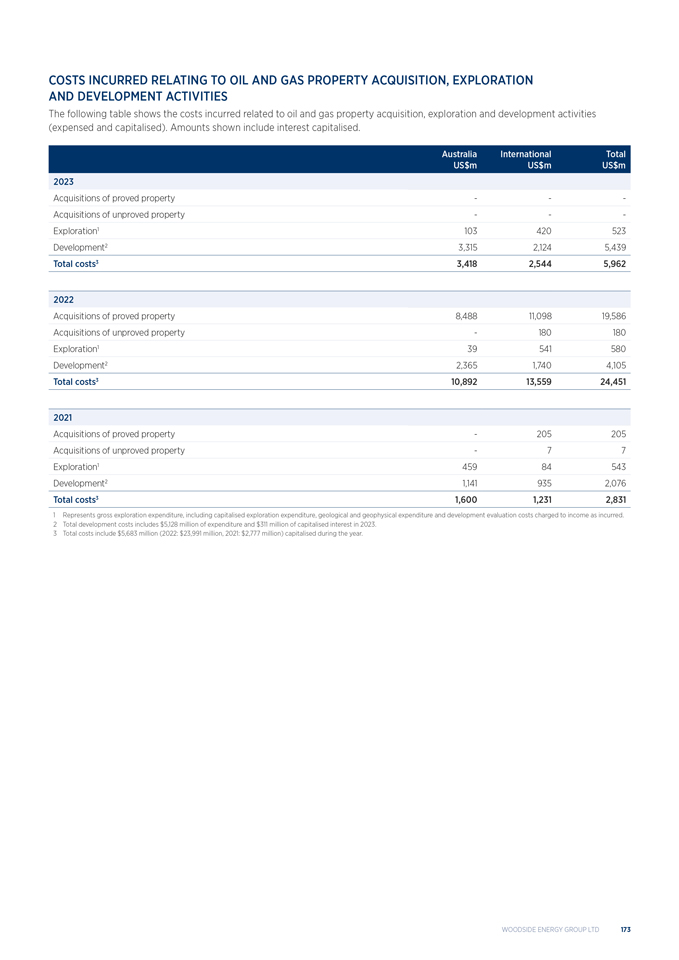
COSTS INCURRED RELATING TO OIL AND GAS PROPERTY ACQUISITION, EXPLORATION AND DEVELOPMENT ACTIVITIES The following table shows the costs incurred related to oil and gas property acquisition, exploration and development activities (expensed and capitalised). Amounts shown include interest capitalised. Australia International Total US$m US$m US$m 2023 Acquisitions of proved property - -- Acquisitions of unproved property - -- Exploration1 103 420523 Development2 3,315 2,1245,439 Total costs3 3,418 2,5445,962 2022 Acquisitions of proved property 8,488 11,09819,586 Acquisitions of unproved property - 180180 Exploration1 39 541580 Development2 2,365 1,7404,105 Total costs3 10,892 13,55924,451 2021 Acquisitions of proved property - 205205 Acquisitions of unproved property - 77 Exploration1 459 84543 Development2 1,141 9352,076 Total costs3 1,600 1,2312,831 1 Represents gross exploration expenditure, including capitalised exploration expenditure, geological and geophysical expenditure and development evaluation costs charged to income as incurred. 2 Total development costs includes $5,128 million of expenditure and $311 million of capitalised interest in 2023. 3 Total costs include $5,683 million (2022: $23,991 million, 2021: $2,777 million) capitalised during the year. WOODSIDE ENERGY GROUP LTD 173
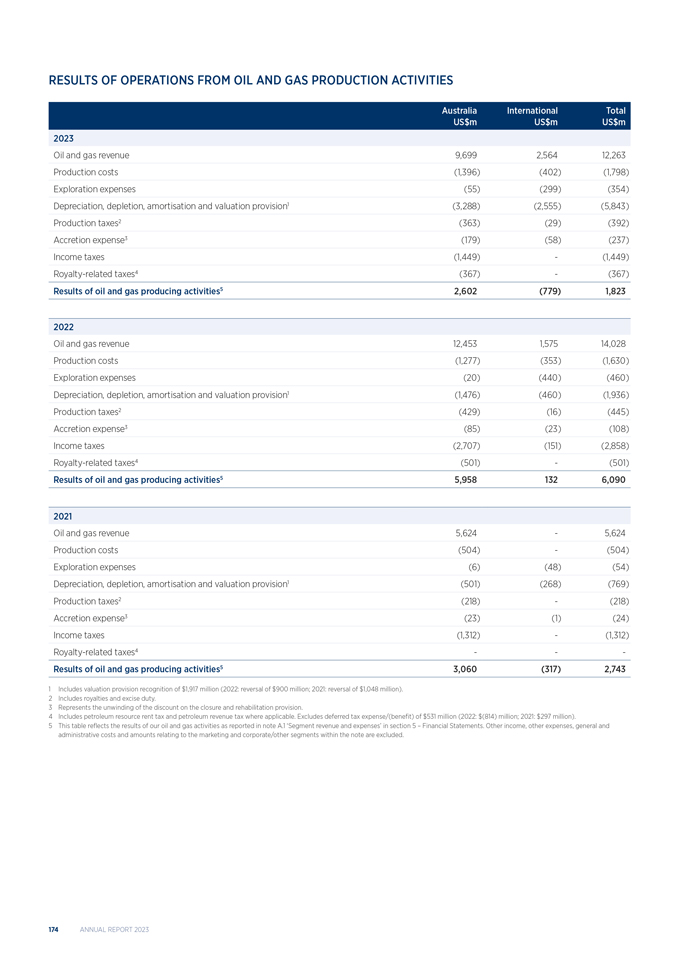
RESULTS OF OPERATIONS FROM OIL AND GAS PRODUCTION ACTIVITIES Australia International Total US$m US$m US$m 2023 Oil and gas revenue 9,699 2,56412,263 Production costs (1,396) (402)(1,798) Exploration expenses (55) (299)(354) Depreciation, depletion, amortisation and valuation provision1 (3,288) (2,555)(5,843) Production taxes2 (363) (29)(392) Accretion expense3 (179) (58)(237) Income taxes (1,449) -(1,449) Royalty-related taxes4 (367) -(367) Results of oil and gas producing activities5 2,602 (779)1,823 2022 Oil and gas revenue 12,453 1,57514,028 Production costs (1,277) (353)(1,630) Exploration expenses (20) (440)(460) Depreciation, depletion, amortisation and valuation provision1 (1,476) (460)(1,936) Production taxes2 (429) (16)(445) Accretion expense3 (85) (23)(108) Income taxes (2,707) (151)(2,858) Royalty-related taxes4 (501) -(501) Results of oil and gas producing activities5 5,958 1326,090 2021 Oil and gas revenue 5,624 -5,624 Production costs (504) -(504) Exploration expenses (6) (48)(54) Depreciation, depletion, amortisation and valuation provision1 (501) (268)(769) Production taxes2 (218) -(218) Accretion expense3 (23) (1)(24) Income taxes (1,312) -(1,312) Royalty-related taxes4 - -- Results of oil and gas producing activities5 3,060 (317)2,743 1 Includes valuation provision recognition of $1,917 million (2022: reversal of $900 million; 2021: reversal of $1,048 million). 2 Includes royalties and excise duty. 3 Represents the unwinding of the discount on the closure and rehabilitation provision. 4 Includes petroleum resource rent tax and petroleum revenue tax where applicable. Excludes deferred tax expense/(benefit) of $531 million (2022: $(814) million; 2021: $297 million). 5 This table reflects the results of our oil and gas activities as reported in note A.1 ‘Segment revenue and expenses’ in section 5 – Financial Statements. Other income, other expenses, general and administrative costs and amounts relating to the marketing and corporate/other segments within the note are excluded. 174 ANNUAL REPORT 2023
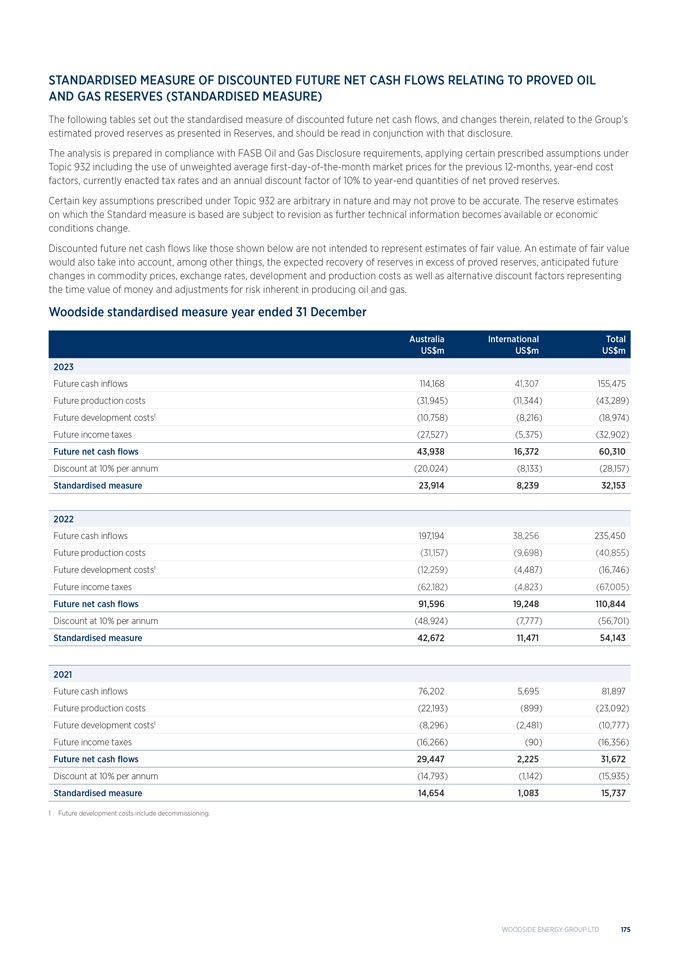
STANDARDISED MEASURE OF DISCOUNTED FUTURE NET CASH FLOWS RELATING TO PROVED OIL AND GAS RESERVES (STANDARDISED MEASURE) The following tables set out the standardised measure of discounted future net cash flows, and changes therein, related to the Group’s estimated proved reserves as presented in Reserves, and should be read in conjunction with that disclosure. The analysis is prepared in compliance with FASB Oil and Gas Disclosure requirements, applying certain prescribed assumptions under Topic 932 including the use of unweighted average first-day-of-the-month market prices for the previous 12-months, year-end cost factors, currently enacted tax rates and an annual discount factor of 10% to year-end quantities of net proved reserves. Certain key assumptions prescribed under Topic 932 are arbitrary in nature and may not prove to be accurate. The reserve estimates on which the Standard measure is based are subject to revision as further technical information becomes available or economic conditions change. Discounted future net cash flows like those shown below are not intended to represent estimates of fair value. An estimate of fair value would also take into account, among other things, the expected recovery of reserves in excess of proved reserves, anticipated future changes in commodity prices, exchange rates, development and production costs as well as alternative discount factors representing the time value of money and adjustments for risk inherent in producing oil and gas. Woodside standardised measure year ended 31 December Australia International Total US$m US$m US$m 2023 Future cash inflows 114,168 41,307155,475 Future production costs (31,945) (11,344)(43,289) Future development costs1 (10,758) (8,216)(18,974) Future income taxes (27,527) (5,375)(32,902) Future net cash flows 43,938 16,37260,310 Discount at 10% per annum (20,024) (8,133)(28,157) Standardised measure 23,914 8,23932,153 2022 Future cash inflows 197,194 38,256235,450 Future production costs (31,157) (9,698)(40,855) Future development costs1 (12,259) (4,487)(16,746) Future income taxes (62,182) (4,823)(67,005) Future net cash flows 91,596 19,248110,844 Discount at 10% per annum (48,924) (7,777)(56,701) Standardised measure 42,672 11,47154,143 2021 Future cash inflows 76,202 5,69581,897 Future production costs (22,193) (899)(23,092) Future development costs1 (8,296) (2,481)(10,777) Future income taxes (16,266) (90)(16,356) Future net cash flows 29,447 2,22531,672 Discount at 10% per annum (14,793) (1,142)(15,935) Standardised measure 14,654 1,08315,737 1 Future development costs include decommissioning. WOODSIDE ENERGY GROUP LTD 175
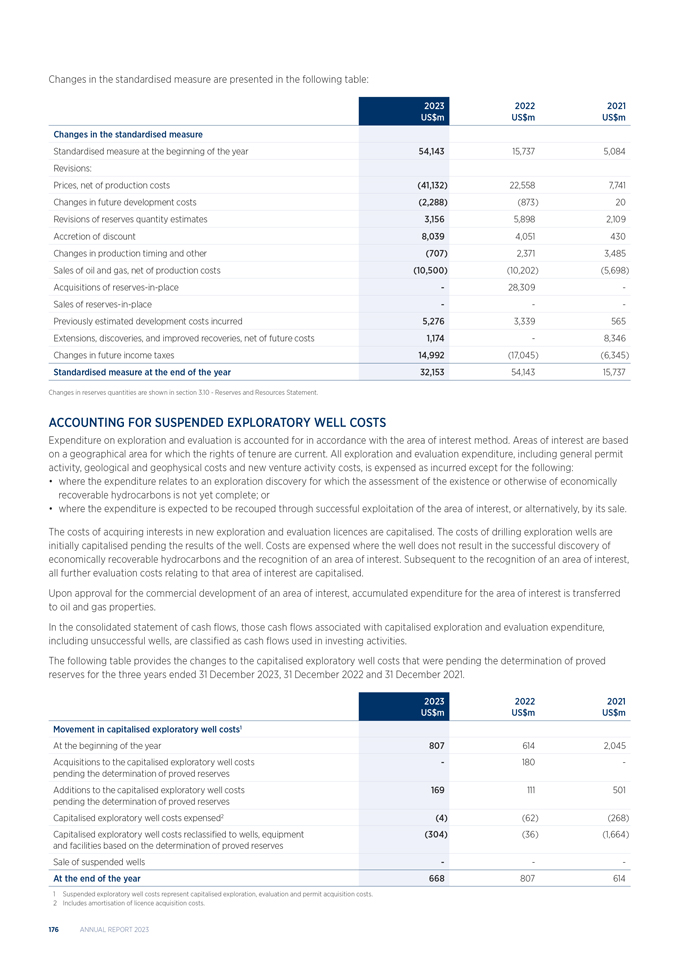
Changes in the standardised measure are presented in the following table: 2023 2022 2021 US$m US$m US$m Changes in the standardised measure Standardised measure at the beginning of the year 54,143 15,7375,084 Revisions: Prices, net of production costs (41,132) 22,5587,741 Changes in future development costs (2,288) (873)20 Revisions of reserves quantity estimates 3,156 5,8982,109 Accretion of discount 8,039 4,051430 Changes in production timing and other (707) 2,3713,485 Sales of oil and gas, net of production costs (10,500) (10,202)(5,698) Acquisitions of reserves-in-place - 28,309- Sales of reserves-in-place - -- Previously estimated development costs incurred 5,276 3,339565 Extensions, discoveries, and improved recoveries, net of future costs 1,174 -8,346 Changes in future income taxes 14,992 (17,045)(6,345) Standardised measure at the end of the year 32,153 54,14315,737 Changes in reserves quantities are shown in section 3.10—Reserves and Resources Statement. ACCOUNTING FOR SUSPENDED EXPLORATORY WELL COSTS Expenditure on exploration and evaluation is accounted for in accordance with the area of interest method. Areas of interest are based on a geographical area for which the rights of tenure are current. All exploration and evaluation expenditure, including general permit activity, geological and geophysical costs and new venture activity costs, is expensed as incurred except for the following: • where the expenditure relates to an exploration discovery for which the assessment of the existence or otherwise of economically recoverable hydrocarbons is not yet complete; or • where the expenditure is expected to be recouped through successful exploitation of the area of interest, or alternatively, by its sale. The costs of acquiring interests in new exploration and evaluation licences are capitalised. The costs of drilling exploration wells are initially capitalised pending the results of the well. Costs are expensed where the well does not result in the successful discovery of economically recoverable hydrocarbons and the recognition of an area of interest. Subsequent to the recognition of an area of interest, all further evaluation costs relating to that area of interest are capitalised. Upon approval for the commercial development of an area of interest, accumulated expenditure for the area of interest is transferred to oil and gas properties. In the consolidated statement of cash flows, those cash flows associated with capitalised exploration and evaluation expenditure, including unsuccessful wells, are classified as cash flows used in investing activities. The following table provides the changes to the capitalised exploratory well costs that were pending the determination of proved reserves for the three years ended 31 December 2023, 31 December 2022 and 31 December 2021. 2023 20222021 US$m US$mUS$m Movement in capitalised exploratory well costs1 At the beginning of the year 807 6142,045 Acquisitions to the capitalised exploratory well costs - 180- pending the determination of proved reserves Additions to the capitalised exploratory well costs 169 111501 pending the determination of proved reserves Capitalised exploratory well costs expensed2 (4) (62)(268) Capitalised exploratory well costs reclassified to wells, equipment (304) (36)(1,664) and facilities based on the determination of proved reserves Sale of suspended wells - -- At the end of the year 668 807614 1 Suspended exploratory well costs represent capitalised exploration, evaluation and permit acquisition costs. 2 Includes amortisation of licence acquisition costs. 176 ANNUAL REPORT 2023
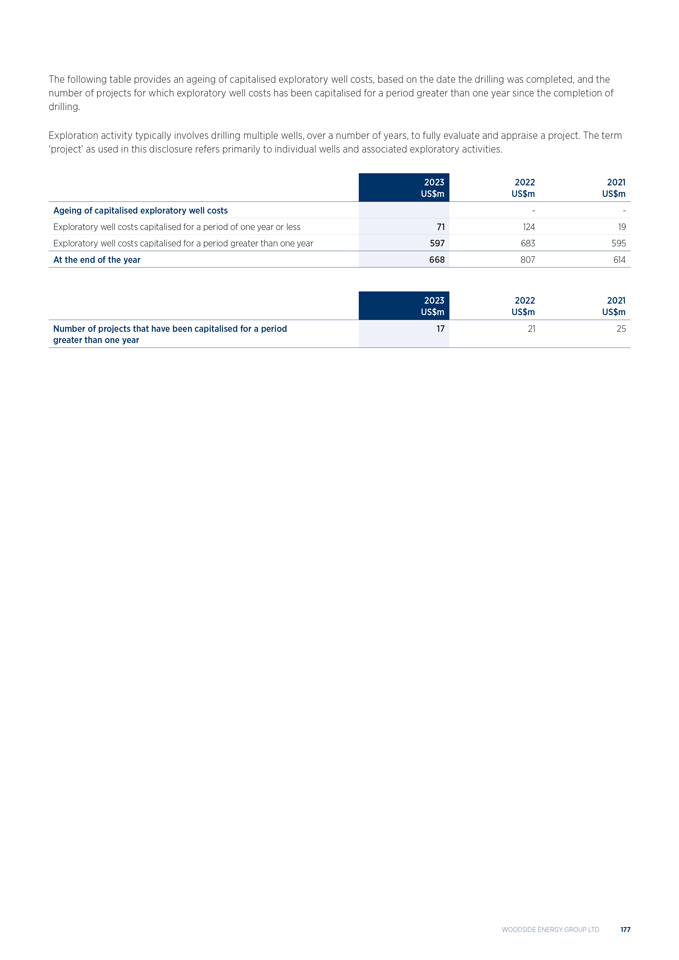
The following table provides an ageing of capitalised exploratory well costs, based on the date the drilling was completed, and the number of projects for which exploratory well costs has been capitalised for a period greater than one year since the completion of drilling. Exploration activity typically involves drilling multiple wells, over a number of years, to fully evaluate and appraise a project. The term ‘project’ as used in this disclosure refers primarily to individual wells and associated exploratory activities. 2023 2022 2021 US$m US$m US$m Ageing of capitalised exploratory well costs -- Exploratory well costs capitalised for a period of one year or less 71 12419 Exploratory well costs capitalised for a period greater than one year 597 683595 At the end of the year 668 807614 2023 2022 2021 US$m US$m US$m Number of projects that have been capitalised for a period 17 2125 greater than one year WOODSIDE ENERGY GROUP LTD 177
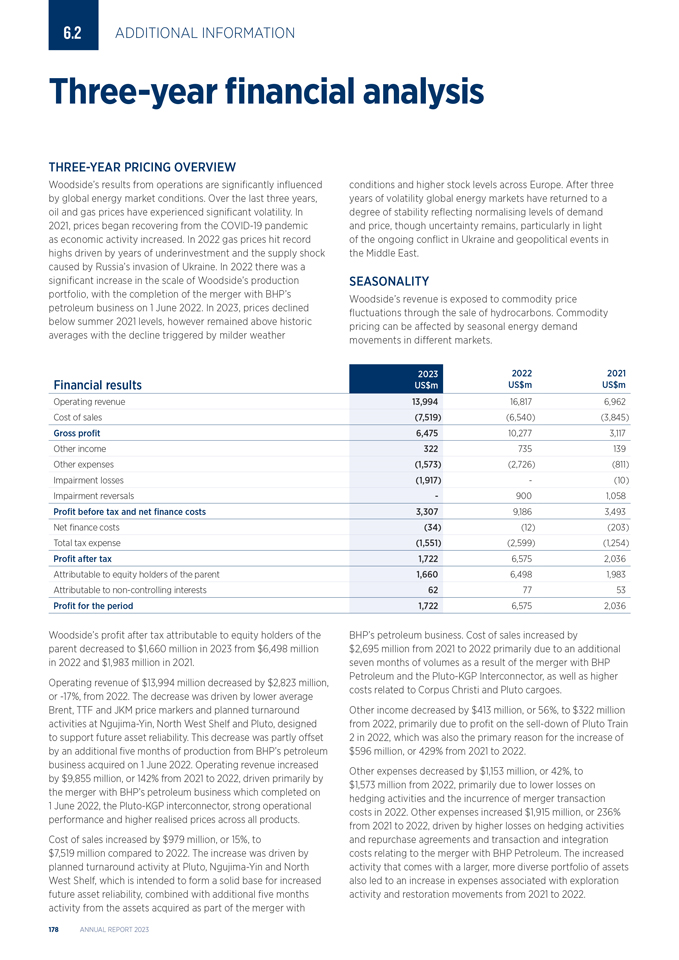
6.2 ADDITIONAL INFORMATION Three-year financial analysis THREE-YEAR PRICING OVERVIEW Woodside’s results from operations are significantly influenced by global energy market conditions. Over the last three years, oil and gas prices have experienced significant volatility. In 2021, prices began recovering from the COVID-19 pandemic as economic activity increased. In 2022 gas prices hit record highs driven by years of underinvestment and the supply shock caused by Russia’s invasion of Ukraine. In 2022 there was a significant increase in the scale of Woodside’s production portfolio, with the completion of the merger with BHP’s petroleum business on 1 June 2022. In 2023, prices declined below summer 2021 levels, however remained above historic averages with the decline triggered by milder weather conditions and higher stock levels across Europe. After three years of volatility global energy markets have returned to a degree of stability reflecting normalising levels of demand and price, though uncertainty remains, particularly in light of the ongoing conflict in Ukraine and geopolitical events in the Middle East. SEASONALITY Woodside’s revenue is exposed to commodity price fluctuations through the sale of hydrocarbons. Commodity pricing can be affected by seasonal energy demand movements in different markets. 2023 2022 2021 Financial results US$m US$mUS$m Operating revenue 13,994 16,8176,962 Cost of sales (7,519) (6,540)(3,845) Gross profit 6,475 10,2773,117 Other income 322 735139 Other expenses (1,573) (2,726)(811) Impairment losses (1,917) -(10) Impairment reversals - 9001,058 Profit before tax and net finance costs 3,307 9,1863,493 Net finance costs (34) (12)(203) Total tax expense (1,551) (2,599)(1,254) Profit after tax 1,722 6,5752,036 Attributable to equity holders of the parent 1,660 6,4981,983 Attributable to non-controlling interests 62 7753 Profit for the period 1,722 6,5752,036 Woodside’s profit after tax attributable to equity holders of the parent decreased to $1,660 million in 2023 from $6,498 million in 2022 and $1,983 million in 2021. Operating revenue of $13,994 million decreased by $2,823 million, or -17%, from 2022. The decrease was driven by lower average Brent, TTF and JKM price markers and planned turnaround activities at Ngujima-Yin, North West Shelf and Pluto, designed to support future asset reliability. This decrease was partly offset by an additional five months of production from BHP’s petroleum business acquired on 1 June 2022. Operating revenue increased by $9,855 million, or 142% from 2021 to 2022, driven primarily by the merger with BHP’s petroleum business which completed on 1 June 2022, the Pluto-KGP interconnector, strong operational performance and higher realised prices across all products. Cost of sales increased by $979 million, or 15%, to $7,519 million compared to 2022. The increase was driven by planned turnaround activity at Pluto, Ngujima-Yin and North West Shelf, which is intended to form a solid base for increased future asset reliability, combined with additional five months activity from the assets acquired as part of the merger with BHP’s petroleum business. Cost of sales increased by $2,695 million from 2021 to 2022 primarily due to an additional seven months of volumes as a result of the merger with BHP Petroleum and the Pluto-KGP Interconnector, as well as higher costs related to Corpus Christi and Pluto cargoes. Other income decreased by $413 million, or 56%, to $322 million from 2022, primarily due to profit on the sell-down of Pluto Train 2 in 2022, which was also the primary reason for the increase of $596 million, or 429% from 2021 to 2022. Other expenses decreased by $1,153 million, or 42%, to $1,573 million from 2022, primarily due to lower losses on hedging activities and the incurrence of merger transaction costs in 2022. Other expenses increased $1,915 million, or 236% from 2021 to 2022, driven by higher losses on hedging activities and repurchase agreements and transaction and integration costs relating to the merger with BHP Petroleum. The increased activity that comes with a larger, more diverse portfolio of assets also led to an increase in expenses associated with exploration activity and restoration movements from 2021 to 2022. 178 ANNUAL REPORT 2023
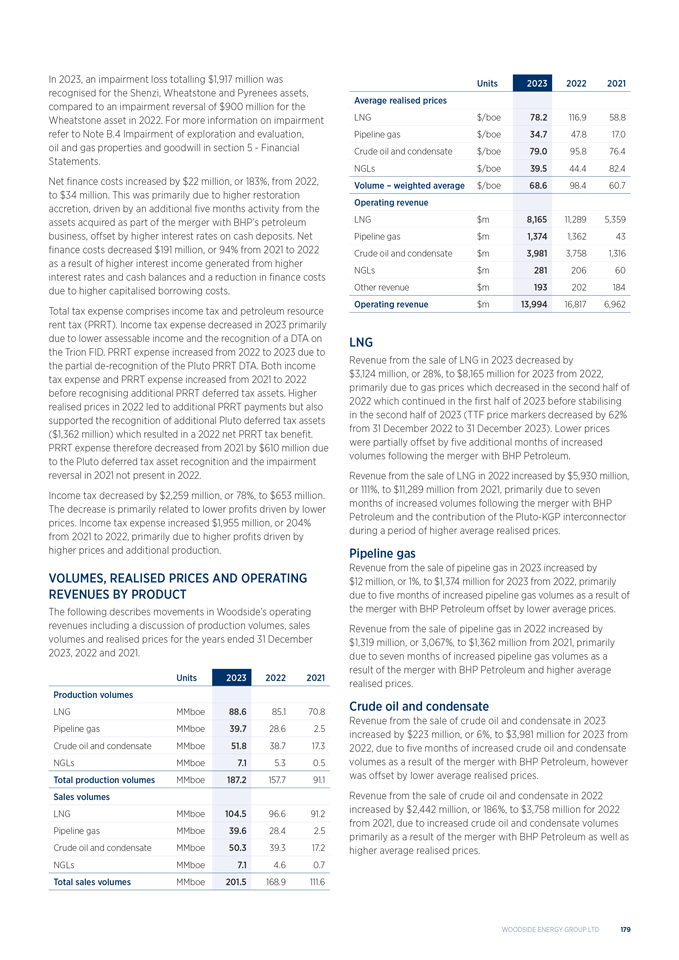
In 2023, an impairment loss totalling $1,917 million was recognised for the Shenzi, Wheatstone and Pyrenees assets, compared to an impairment reversal of $900 million for the Wheatstone asset in 2022. For more information on impairment refer to Note B.4 Impairment of exploration and evaluation, oil and gas properties and goodwill in section 5—Financial Statements. Net finance costs increased by $22 million, or 183%, from 2022, to $34 million. This was primarily due to higher restoration accretion, driven by an additional five months activity from the assets acquired as part of the merger with BHP’s petroleum business, offset by higher interest rates on cash deposits. Net finance costs decreased $191 million, or 94% from 2021 to 2022 as a result of higher interest income generated from higher interest rates and cash balances and a reduction in finance costs due to higher capitalised borrowing costs. Total tax expense comprises income tax and petroleum resource rent tax (PRRT). Income tax expense decreased in 2023 primarily due to lower assessable income and the recognition of a DTA on the Trion FID. PRRT expense increased from 2022 to 2023 due to the partial de-recognition of the Pluto PRRT DTA. Both income tax expense and PRRT expense increased from 2021 to 2022 before recognising additional PRRT deferred tax assets. Higher realised prices in 2022 led to additional PRRT payments but also supported the recognition of additional Pluto deferred tax assets ($1,362 million) which resulted in a 2022 net PRRT tax benefit. PRRT expense therefore decreased from 2021 by $610 million due to the Pluto deferred tax asset recognition and the impairment reversal in 2021 not present in 2022. Income tax decreased by $2,259 million, or 78%, to $653 million. The decrease is primarily related to lower profits driven by lower prices. Income tax expense increased $1,955 million, or 204% from 2021 to 2022, primarily due to higher profits driven by higher prices and additional production. VOLUMES, REALISED PRICES AND OPERATING REVENUES BY PRODUCT The following describes movements in Woodside’s operating revenues including a discussion of production volumes, sales volumes and realised prices for the years ended 31 December 2023, 2022 and 2021. Units 2023 20222021 Production volumes LNG MMboe 88.685.170.8 Pipeline gas MMboe 39.728.62.5 Crude oil and condensate MMboe 51.838.717.3 NGLs MMboe 7.15.30.5 Total production volumes MMboe 187.2157.791.1 Sales volumes LNG MMboe 104.596.691.2 Pipeline gas MMboe 39.628.42.5 Crude oil and condensate MMboe 50.339.317.2 NGLs MMboe 7.14.60.7 Total sales volumes MMboe 201.5168.9111.6 Units 2023 20222021 Average realised prices LNG $/boe 78.2116.958.8 Pipeline gas $/boe 34.747.817.0 Crude oil and condensate $/boe 79.095.876.4 NGLs $/boe 39.544.482.4 Volume – weighted average $/boe 68.698.460.7 Operating revenue LNG $m 8,16511,2895,359 Pipeline gas $m 1,3741,36243 Crude oil and condensate $m 3,9813,7581,316 NGLs $m 28120660 Other revenue $m 193202184 Operating revenue $m 13,99416,8176,962 LNG Revenue from the sale of LNG in 2023 decreased by $3,124 million, or 28%, to $8,165 million for 2023 from 2022, primarily due to gas prices which decreased in the second half of 2022 which continued in the first half of 2023 before stabilising in the second half of 2023 (TTF price markers decreased by 62% from 31 December 2022 to 31 December 2023). Lower prices were partially offset by five additional months of increased volumes following the merger with BHP Petroleum. Revenue from the sale of LNG in 2022 increased by $5,930 million, or 111%, to $11,289 million from 2021, primarily due to seven months of increased volumes following the merger with BHP Petroleum and the contribution of the Pluto-KGP interconnector during a period of higher average realised prices. Pipeline gas Revenue from the sale of pipeline gas in 2023 increased by $12 million, or 1%, to $1,374 million for 2023 from 2022, primarily due to five months of increased pipeline gas volumes as a result of the merger with BHP Petroleum offset by lower average prices. Revenue from the sale of pipeline gas in 2022 increased by $1,319 million, or 3,067%, to $1,362 million from 2021, primarily due to seven months of increased pipeline gas volumes as a result of the merger with BHP Petroleum and higher average realised prices. Crude oil and condensate Revenue from the sale of crude oil and condensate in 2023 increased by $223 million, or 6%, to $3,981 million for 2023 from 2022, due to five months of increased crude oil and condensate volumes as a result of the merger with BHP Petroleum, however was offset by lower average realised prices. Revenue from the sale of crude oil and condensate in 2022 increased by $2,442 million, or 186%, to $3,758 million for 2022 from 2021, due to increased crude oil and condensate volumes primarily as a result of the merger with BHP Petroleum as well as higher average realised prices. WOODSIDE ENERGY GROUP LTD 179
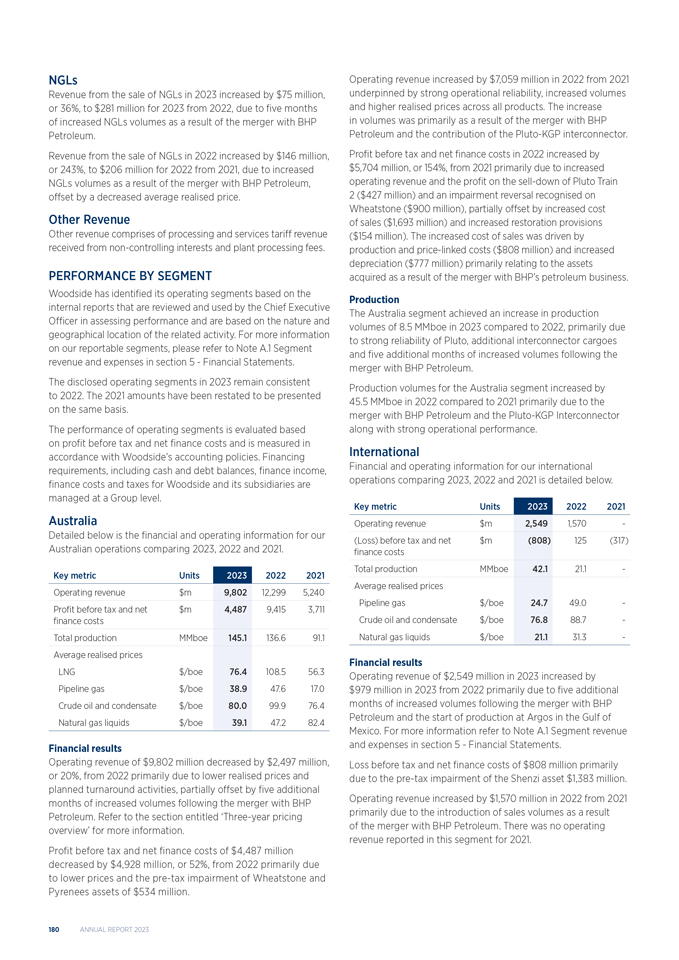
NGLs Revenue from the sale of NGLs in 2023 increased by $75 million, or 36%, to $281 million for 2023 from 2022, due to five months of increased NGLs volumes as a result of the merger with BHP Petroleum. Revenue from the sale of NGLs in 2022 increased by $146 million, or 243%, to $206 million for 2022 from 2021, due to increased NGLs volumes as a result of the merger with BHP Petroleum, offset by a decreased average realised price. Other Revenue Other revenue comprises of processing and services tariff revenue received from non-controlling interests and plant processing fees. PERFORMANCE BY SEGMENT Woodside has identified its operating segments based on the internal reports that are reviewed and used by the Chief Executive Officer in assessing performance and are based on the nature and geographical location of the related activity. For more information on our reportable segments, please refer to Note A.1 Segment revenue and expenses in section 5—Financial Statements. The disclosed operating segments in 2023 remain consistent to 2022. The 2021 amounts have been restated to be presented on the same basis. The performance of operating segments is evaluated based on profit before tax and net finance costs and is measured in accordance with Woodside’s accounting policies. Financing requirements, including cash and debt balances, finance income, finance costs and taxes for Woodside and its subsidiaries are managed at a Group level. Australia Detailed below is the financial and operating information for our Australian operations comparing 2023, 2022 and 2021. Key metric Units 202320222021 Operating revenue $m 9,80212,2995,240 Profit before tax and net $m 4,4879,4153,711 finance costs Total production MMboe 145.1136.691.1 Average realised prices LNG $/boe 76.4108.556.3 Pipeline gas $/boe 38.947.617.0 Crude oil and condensate $/boe 80.099.976.4 Natural gas liquids $/boe 39.147.282.4 Financial results Operating revenue of $9,802 million decreased by $2,497 million, or 20%, from 2022 primarily due to lower realised prices and planned turnaround activities, partially offset by five additional months of increased volumes following the merger with BHP Petroleum. Refer to the section entitled ‘Three-year pricing overview’ for more information. Profit before tax and net finance costs of $4,487 million decreased by $4,928 million, or 52%, from 2022 primarily due to lower prices and the pre-tax impairment of Wheatstone and Pyrenees assets of $534 million. Operating revenue increased by $7,059 million in 2022 from 2021 underpinned by strong operational reliability, increased volumes and higher realised prices across all products. The increase in volumes was primarily as a result of the merger with BHP Petroleum and the contribution of the Pluto-KGP interconnector. Profit before tax and net finance costs in 2022 increased by $5,704 million, or 154%, from 2021 primarily due to increased operating revenue and the profit on the sell-down of Pluto Train 2 ($427 million) and an impairment reversal recognised on Wheatstone ($900 million), partially offset by increased cost of sales ($1,693 million) and increased restoration provisions ($154 million). The increased cost of sales was driven by production and price-linked costs ($808 million) and increased depreciation ($777 million) primarily relating to the assets acquired as a result of the merger with BHP’s petroleum business. Production The Australia segment achieved an increase in production volumes of 8.5 MMboe in 2023 compared to 2022, primarily due to strong reliability of Pluto, additional interconnector cargoes and five additional months of increased volumes following the merger with BHP Petroleum. Production volumes for the Australia segment increased by 45.5 MMboe in 2022 compared to 2021 primarily due to the merger with BHP Petroleum and the Pluto-KGP Interconnector along with strong operational performance. International Financial and operating information for our international operations comparing 2023, 2022 and 2021 is detailed below. Key metric Units 202320222021 Operating revenue $m 2,5491,570- (Loss) before tax and net $m (808)125(317) finance costs Total production MMboe 42.121.1- Average realised prices Pipeline gas $/boe 24.749.0- Crude oil and condensate $/boe 76.888.7- Natural gas liquids $/boe 21.131.3- Financial results Operating revenue of $2,549 million in 2023 increased by $979 million in 2023 from 2022 primarily due to five additional months of increased volumes following the merger with BHP Petroleum and the start of production at Argos in the Gulf of Mexico. For more information refer to Note A.1 Segment revenue and expenses in section 5—Financial Statements. Loss before tax and net finance costs of $808 million primarily due to the pre-tax impairment of the Shenzi asset $1,383 million. Operating revenue increased by $1,570 million in 2022 from 2021 primarily due to the introduction of sales volumes as a result of the merger with BHP Petroleum. There was no operating revenue reported in this segment for 2021. 180 ANNUAL REPORT 2023
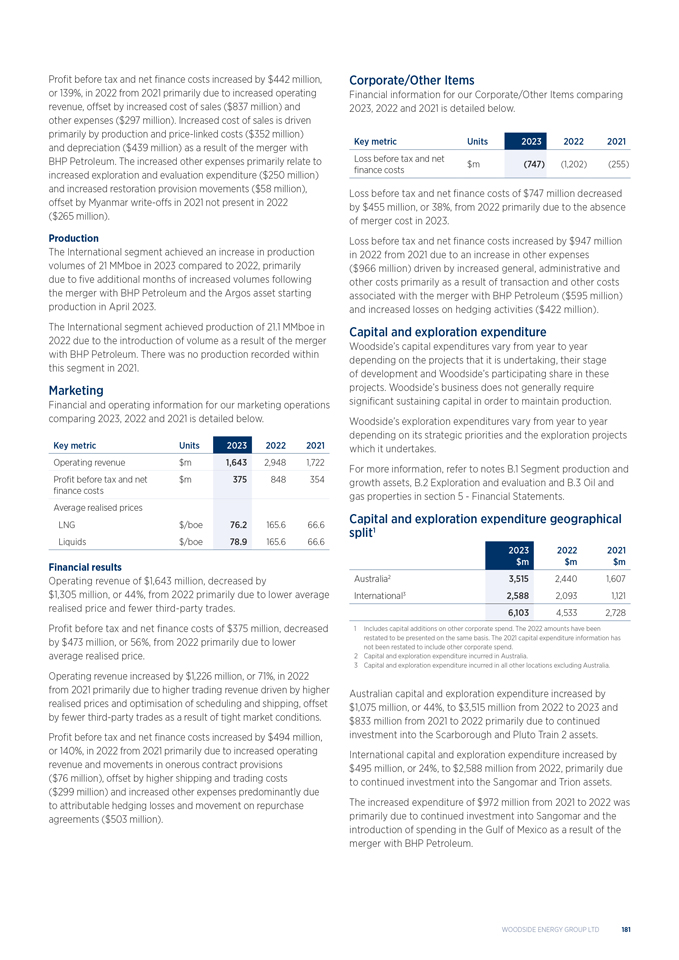
Profit before tax and net finance costs increased by $442 million, or 139%, in 2022 from 2021 primarily due to increased operating revenue, offset by increased cost of sales ($837 million) and other expenses ($297 million). Increased cost of sales is driven primarily by production and price-linked costs ($352 million) and depreciation ($439 million) as a result of the merger with BHP Petroleum. The increased other expenses primarily relate to increased exploration and evaluation expenditure ($250 million) and increased restoration provision movements ($58 million), offset by Myanmar write-offs in 2021 not present in 2022 ($265 million). Production The International segment achieved an increase in production volumes of 21 MMboe in 2023 compared to 2022, primarily due to five additional months of increased volumes following the merger with BHP Petroleum and the Argos asset starting production in April 2023. The International segment achieved production of 21.1 MMboe in 2022 due to the introduction of volume as a result of the merger with BHP Petroleum. There was no production recorded within this segment in 2021. Marketing Financial and operating information for our marketing operations comparing 2023, 2022 and 2021 is detailed below. Key metric Units 202320222021 Operating revenue $m 1,6432,9481,722 Profit before tax and net $m 375848354 finance costs Average realised prices LNG $/boe 76.2165.666.6 Liquids $/boe 78.9165.666.6 Financial results Operating revenue of $1,643 million, decreased by $1,305 million, or 44%, from 2022 primarily due to lower average realised price and fewer third-party trades. Profit before tax and net finance costs of $375 million, decreased by $473 million, or 56%, from 2022 primarily due to lower average realised price. Operating revenue increased by $1,226 million, or 71%, in 2022 from 2021 primarily due to higher trading revenue driven by higher realised prices and optimisation of scheduling and shipping, offset by fewer third-party trades as a result of tight market conditions. Profit before tax and net finance costs increased by $494 million, or 140%, in 2022 from 2021 primarily due to increased operating revenue and movements in onerous contract provisions ($76 million), offset by higher shipping and trading costs ($299 million) and increased other expenses predominantly due to attributable hedging losses and movement on repurchase agreements ($503 million). Corporate/Other Items Financial information for our Corporate/Other Items comparing 2023, 2022 and 2021 is detailed below. Key metric Units 202320222021 Loss before tax and net $m (747)(1,202)(255) finance costs Loss before tax and net finance costs of $747 million decreased by $455 million, or 38%, from 2022 primarily due to the absence of merger cost in 2023. Loss before tax and net finance costs increased by $947 million in 2022 from 2021 due to an increase in other expenses ($966 million) driven by increased general, administrative and other costs primarily as a result of transaction and other costs associated with the merger with BHP Petroleum ($595 million) and increased losses on hedging activities ($422 million). Capital and exploration expenditure Woodside’s capital expenditures vary from year to year depending on the projects that it is undertaking, their stage of development and Woodside’s participating share in these projects. Woodside’s business does not generally require significant sustaining capital in order to maintain production. Woodside’s exploration expenditures vary from year to year depending on its strategic priorities and the exploration projects which it undertakes. For more information, refer to notes B.1 Segment production and growth assets, B.2 Exploration and evaluation and B.3 Oil and gas properties in section 5—Financial Statements. Capital and exploration expenditure geographical split1 2023 2022 2021 $m $m $m Australia2 3,515 2,4401,607 International3 2,588 2,0931,121 6,103 4,533 2,728 1 Includes capital additions on other corporate spend. The 2022 amounts have been restated to be presented on the same basis. The 2021 capital expenditure information has not been restated to include other corporate spend. 2 Capital and exploration expenditure incurred in Australia. 3 Capital and exploration expenditure incurred in all other locations excluding Australia. Australian capital and exploration expenditure increased by $1,075 million, or 44%, to $3,515 million from 2022 to 2023 and $833 million from 2021 to 2022 primarily due to continued investment into the Scarborough and Pluto Train 2 assets. International capital and exploration expenditure increased by $495 million, or 24%, to $2,588 million from 2022, primarily due to continued investment into the Sangomar and Trion assets. The increased expenditure of $972 million from 2021 to 2022 was primarily due to continued investment into Sangomar and the introduction of spending in the Gulf of Mexico as a result of the merger with BHP Petroleum. WOODSIDE ENERGY GROUP LTD 181
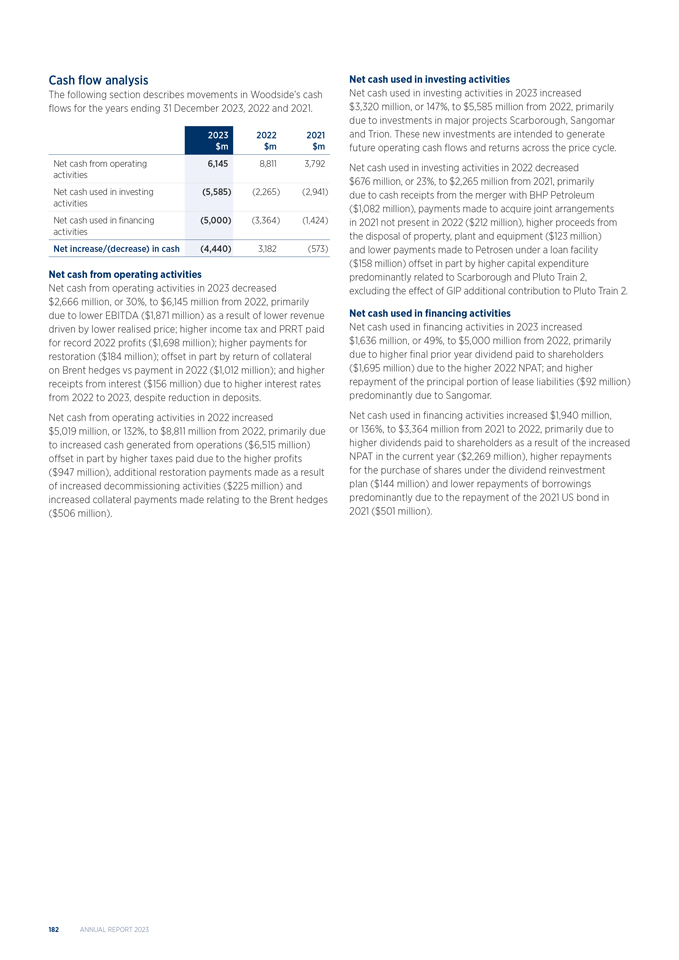
Cash flow analysis The following section describes movements in Woodside’s cash flows for the years ending 31 December 2023, 2022 and 2021. 2023 2022 2021 $m $m $m Net cash from operating 6,145 8,8113,792 activities Net cash used in investing (5,585) (2,265)(2,941) activities Net cash used in financing (5,000) (3,364)(1,424) activities Net increase/(decrease) in cash (4,440) 3,182(573) Net cash from operating activities Net cash from operating activities in 2023 decreased $2,666 million, or 30%, to $6,145 million from 2022, primarily due to lower EBITDA ($1,871 million) as a result of lower revenue driven by lower realised price; higher income tax and PRRT paid for record 2022 profits ($1,698 million); higher payments for restoration ($184 million); offset in part by return of collateral on Brent hedges vs payment in 2022 ($1,012 million); and higher receipts from interest ($156 million) due to higher interest rates from 2022 to 2023, despite reduction in deposits. Net cash from operating activities in 2022 increased $5,019 million, or 132%, to $8,811 million from 2022, primarily due to increased cash generated from operations ($6,515 million) offset in part by higher taxes paid due to the higher profits ($947 million), additional restoration payments made as a result of increased decommissioning activities ($225 million) and increased collateral payments made relating to the Brent hedges ($506 million). Net cash used in investing activities Net cash used in investing activities in 2023 increased $3,320 million, or 147%, to $5,585 million from 2022, primarily due to investments in major projects Scarborough, Sangomar and Trion. These new investments are intended to generate future operating cash flows and returns across the price cycle. Net cash used in investing activities in 2022 decreased $676 million, or 23%, to $2,265 million from 2021, primarily due to cash receipts from the merger with BHP Petroleum ($1,082 million), payments made to acquire joint arrangements in 2021 not present in 2022 ($212 million), higher proceeds from the disposal of property, plant and equipment ($123 million) and lower payments made to Petrosen under a loan facility ($158 million) offset in part by higher capital expenditure predominantly related to Scarborough and Pluto Train 2, excluding the effect of GIP additional contribution to Pluto Train 2. Net cash used in financing activities Net cash used in financing activities in 2023 increased $1,636 million, or 49%, to $5,000 million from 2022, primarily due to higher final prior year dividend paid to shareholders ($1,695 million) due to the higher 2022 NPAT; and higher repayment of the principal portion of lease liabilities ($92 million) predominantly due to Sangomar. Net cash used in financing activities increased $1,940 million, or 136%, to $3,364 million from 2021 to 2022, primarily due to higher dividends paid to shareholders as a result of the increased NPAT in the current year ($2,269 million), higher repayments for the purchase of shares under the dividend reinvestment plan ($144 million) and lower repayments of borrowings predominantly due to the repayment of the 2021 US bond in 2021 ($501 million). 182 ANNUAL REPORT 2023
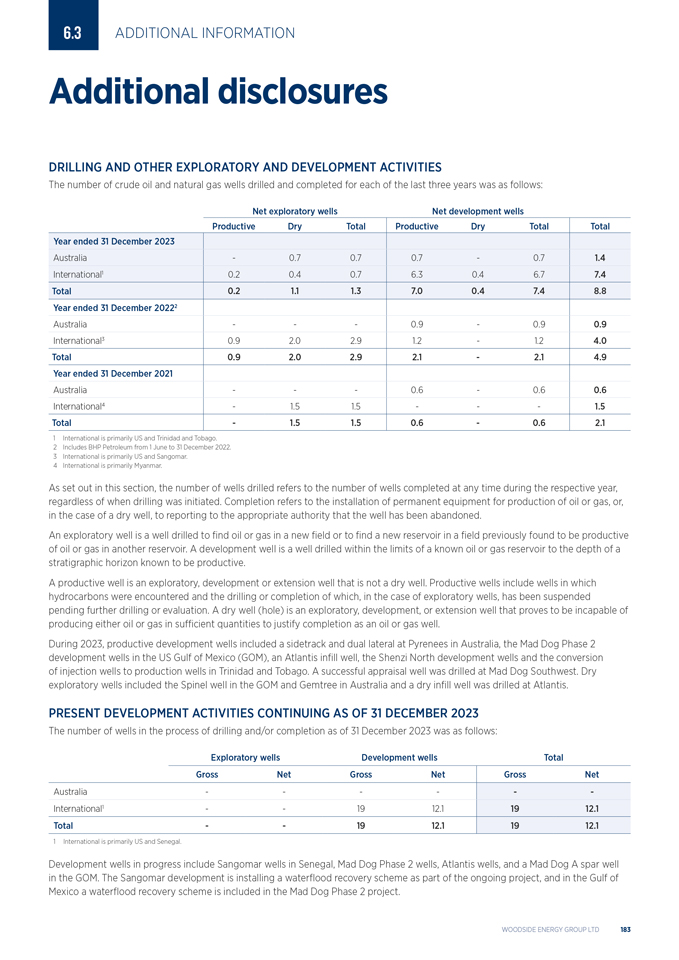
6.3 ADDITIONAL INFORMATION Additional disclosures DRILLING AND OTHER EXPLORATORY AND DEVELOPMENT ACTIVITIES The number of crude oil and natural gas wells drilled and completed for each of the last three years was as follows: Net exploratory wells Net development wells Productive Dry TotalProductiveDryTotalTotal Year ended 31 December 2023 Australia - 0.70.70.7-0.71.4 International1 0.2 0.40.76.30.46.77.4 Total 0.2 1.11.37.00.47.48.8 Year ended 31 December 20222 Australia - --0.9-0.90.9 International3 0.9 2.02.91.2-1.24.0 Total 0.9 2.02.92.1-2.14.9 Year ended 31 December 2021 Australia - --0.6-0.60.6 International4 - 1.51.5---1.5 Total - 1.51.50.6-0.62.1 1 International is primarily US and Trinidad and Tobago. 2 Includes BHP Petroleum from 1 June to 31 December 2022. 3 International is primarily US and Sangomar. 4 International is primarily Myanmar. As set out in this section, the number of wells drilled refers to the number of wells completed at any time during the respective year, regardless of when drilling was initiated. Completion refers to the installation of permanent equipment for production of oil or gas, or, in the case of a dry well, to reporting to the appropriate authority that the well has been abandoned. An exploratory well is a well drilled to find oil or gas in a new field or to find a new reservoir in a field previously found to be productive of oil or gas in another reservoir. A development well is a well drilled within the limits of a known oil or gas reservoir to the depth of a stratigraphic horizon known to be productive. A productive well is an exploratory, development or extension well that is not a dry well. Productive wells include wells in which hydrocarbons were encountered and the drilling or completion of which, in the case of exploratory wells, has been suspended pending further drilling or evaluation. A dry well (hole) is an exploratory, development, or extension well that proves to be incapable of producing either oil or gas in sufficient quantities to justify completion as an oil or gas well. During 2023, productive development wells included a sidetrack and dual lateral at Pyrenees in Australia, the Mad Dog Phase 2 development wells in the US Gulf of Mexico (GOM), an Atlantis infill well, the Shenzi North development wells and the conversion of injection wells to production wells in Trinidad and Tobago. A successful appraisal well was drilled at Mad Dog Southwest. Dry exploratory wells included the Spinel well in the GOM and Gemtree in Australia and a dry infill well was drilled at Atlantis. PRESENT DEVELOPMENT ACTIVITIES CONTINUING AS OF 31 DECEMBER 2023 The number of wells in the process of drilling and/or completion as of 31 December 2023 was as follows: Exploratory wells Development wells Total Gross NetGrossNetGrossNet Australia - ----- International1 - -1912.11912.1 Total - -1912.11912.1 1 International is primarily US and Senegal. Development wells in progress include Sangomar wells in Senegal, Mad Dog Phase 2 wells, Atlantis wells, and a Mad Dog A spar well in the GOM. The Sangomar development is installing a waterflood recovery scheme as part of the ongoing project, and in the Gulf of Mexico a waterflood recovery scheme is included in the Mad Dog Phase 2 project. WOODSIDE ENERGY GROUP LTD 183
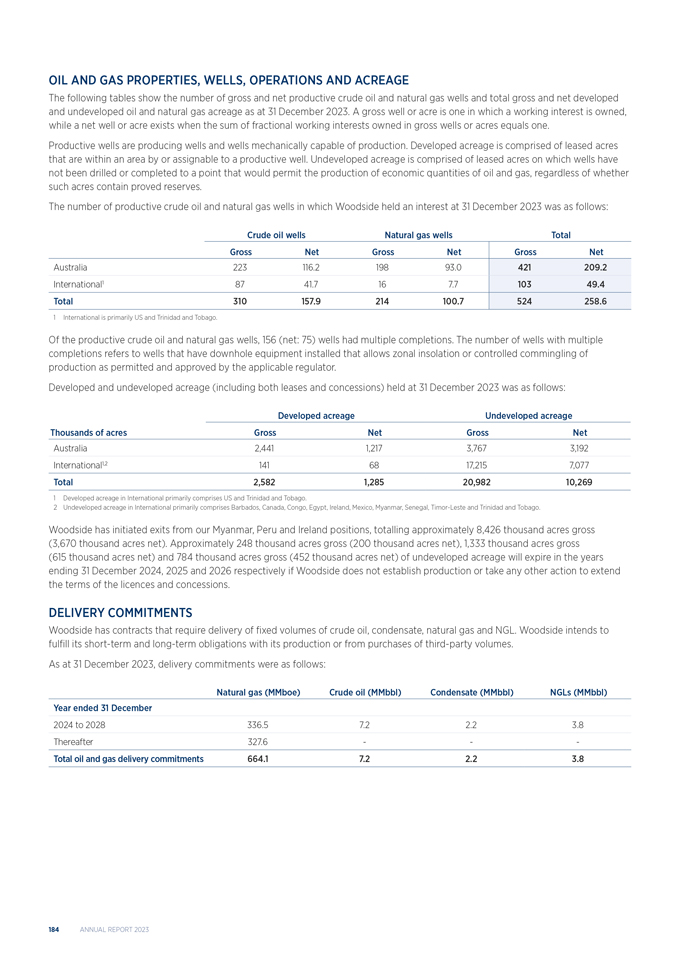
OIL AND GAS PROPERTIES, WELLS, OPERATIONS AND ACREAGE The following tables show the number of gross and net productive crude oil and natural gas wells and total gross and net developed and undeveloped oil and natural gas acreage as at 31 December 2023. A gross well or acre is one in which a working interest is owned, while a net well or acre exists when the sum of fractional working interests owned in gross wells or acres equals one. Productive wells are producing wells and wells mechanically capable of production. Developed acreage is comprised of leased acres that are within an area by or assignable to a productive well. Undeveloped acreage is comprised of leased acres on which wells have not been drilled or completed to a point that would permit the production of economic quantities of oil and gas, regardless of whether such acres contain proved reserves. The number of productive crude oil and natural gas wells in which Woodside held an interest at 31 December 2023 was as follows: Crude oil wells Natural gas wellsTotal Gross Net GrossNetGrossNet Australia 223 116.219893.0421209.2 International1 87 41.7167.710349.4 Total 310 157.9214100.7524258.6 1 International is primarily US and Trinidad and Tobago. Of the productive crude oil and natural gas wells, 156 (net: 75) wells had multiple completions. The number of wells with multiple completions refers to wells that have downhole equipment installed that allows zonal insolation or controlled commingling of production as permitted and approved by the applicable regulator. Developed and undeveloped acreage (including both leases and concessions) held at 31 December 2023 was as follows: Developed acreageUndeveloped acreage Thousands of acres Gross NetGrossNet Australia 2,441 1,2173,7673,192 International1,2 141 6817,2157,077 Total 2,582 1,28520,98210,269 1 Developed acreage in International primarily comprises US and Trinidad and Tobago. 2 Undeveloped acreage in International primarily comprises Barbados, Canada, Congo, Egypt, Ireland, Mexico, Myanmar, Senegal, Timor-Leste and Trinidad and Tobago. Woodside has initiated exits from our Myanmar, Peru and Ireland positions, totalling approximately 8,426 thousand acres gross (3,670 thousand acres net). Approximately 248 thousand acres gross (200 thousand acres net), 1,333 thousand acres gross (615 thousand acres net) and 784 thousand acres gross (452 thousand acres net) of undeveloped acreage will expire in the years ending 31 December 2024, 2025 and 2026 respectively if Woodside does not establish production or take any other action to extend the terms of the licences and concessions. DELIVERY COMMITMENTS Woodside has contracts that require delivery of fixed volumes of crude oil, condensate, natural gas and NGL. Woodside intends to fulfill its short-term and long-term obligations with its production or from purchases of third-party volumes. As at 31 December 2023, delivery commitments were as follows: Natural gas (MMboe) Crude oil (MMbbl)Condensate (MMbbl)NGLs (MMbbl) Year ended 31 December 2024 to 2028 336.5 7.22.23.8 Thereafter 327.6 --- Total oil and gas delivery commitments 664.1 7.22.23.8 184 ANNUAL REPORT 2023
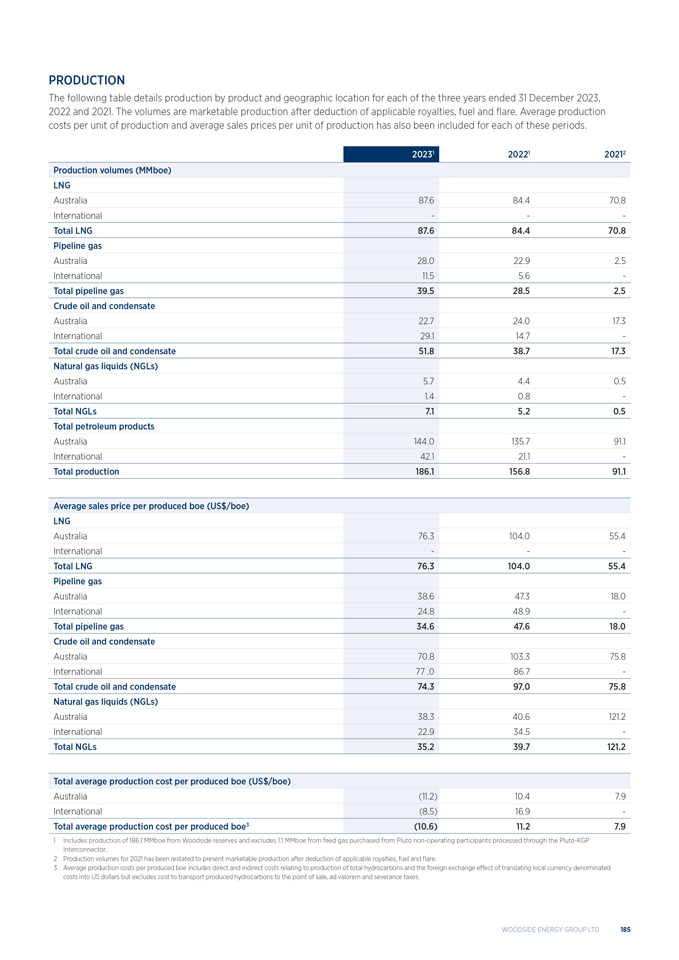
PRODUCTION The following table details production by product and geographic location for each of the three years ended 31 December 2023, 2022 and 2021. The volumes are marketable production after deduction of applicable royalties, fuel and flare. Average production costs per unit of production and average sales prices per unit of production has also been included for each of these periods. 20231 20221 20212 Production volumes (MMboe) LNG Australia 87.6 84.470.8 International - -- Total LNG 87.6 84.470.8 Pipeline gas Australia 28.0 22.92.5 International 11.5 5.6- Total pipeline gas 39.5 28.52.5 Crude oil and condensate Australia 22.7 24.017.3 International 29.1 14.7- Total crude oil and condensate 51.8 38.717.3 Natural gas liquids (NGLs) Australia 5.7 4.40.5 International 1.4 0.8- Total NGLs 7.1 5.20.5 Total petroleum products Australia 144.0 135.791.1 International 42.1 21.1- Total production 186.1 156.891.1 Average sales price per produced boe (US$/boe) LNG Australia 76.3 104.055.4 International - -- Total LNG 76.3 104.055.4 Pipeline gas Australia 38.6 47.318.0 International 24.8 48.9- Total pipeline gas 34.6 47.618.0 Crude oil and condensate Australia 70.8 103.375.8 International 77 .0 86.7- Total crude oil and condensate 74.3 97.075.8 Natural gas liquids (NGLs) Australia 38.3 40.6121.2 International 22.9 34.5- Total NGLs 35.2 39.7121.2 Total average production cost per produced boe (US$/boe) Australia (11.2) 10.47.9 International (8.5) 16.9- Total average production cost per produced boe3 (10.6) 11.27.9 1 Includes production of 186.1 MMboe from Woodside reserves and excludes 1.1 MMboe from feed gas purchased from Pluto non-operating participants processed through the Pluto-KGP Interconnector. 2 Production volumes for 2021 has been restated to present marketable production after deduction of applicable royalties, fuel and flare. 3 Average production costs per produced boe includes direct and indirect costs relating to production of total hydrocarbons and the foreign exchange effect of translating local currency denominated costs into US dollars but excludes cost to transport produced hydrocarbons to the point of sale, ad valorem and severance taxes. WOODSIDE ENERGY GROUP LTD 185
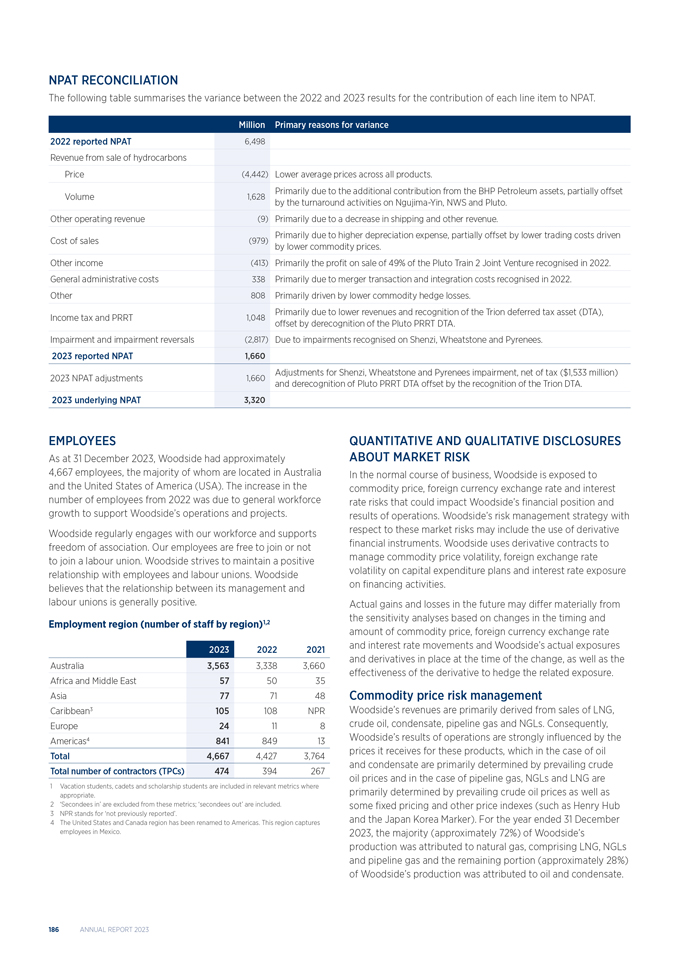
NPAT RECONCILIATION The following table summarises the variance between the 2022 and 2023 results for the contribution of each line item to NPAT. Million Primary reasons for variance 2022 reported NPAT 6,498 Revenue from sale of hydrocarbons Price (4,442) Lower average prices across all products. Volume 1,628 Primarily due to the additional contribution from the BHP Petroleum assets, partially offset by the turnaround activities on Ngujima-Yin, NWS and Pluto. Other operating revenue (9) Primarily due to a decrease in shipping and other revenue. Cost of sales (979) Primarily due to higher depreciation expense, partially offset by lower trading costs driven by lower commodity prices. Other income (413) Primarily the profit on sale of 49% of the Pluto Train 2 Joint Venture recognised in 2022. General administrative costs 338 Primarily due to merger transaction and integration costs recognised in 2022. Other 808 Primarily driven by lower commodity hedge losses. Income tax and PRRT 1,048 Primarily due to lower revenues and recognition of the Trion deferred tax asset (DTA), offset by derecognition of the Pluto PRRT DTA. Impairment and impairment reversals (2,817) Due to impairments recognised on Shenzi, Wheatstone and Pyrenees. 2023 reported NPAT 1,660 2023 NPAT adjustments 1,660 Adjustments for Shenzi, Wheatstone and Pyrenees impairment, net of tax ($1,533 million) and derecognition of Pluto PRRT DTA offset by the recognition of the Trion DTA. 2023 underlying NPAT 3,320 EMPLOYEES As at 31 December 2023, Woodside had approximately 4,667 employees, the majority of whom are located in Australia and the United States of America (USA). The increase in the number of employees from 2022 was due to general workforce growth to support Woodside’s operations and projects. Woodside regularly engages with our workforce and supports freedom of association. Our employees are free to join or not to join a labour union. Woodside strives to maintain a positive relationship with employees and labour unions. Woodside believes that the relationship between its management and labour unions is generally positive. Employment region (number of staff by region)1,2 2023 20222021 Australia 3,563 3,3383,660 Africa and Middle East 57 5035 Asia 77 7148 Caribbean3 105 108NPR Europe 24 118 Americas4 841 84913 Total 4,667 4,4273,764 Total number of contractors (TPCs) 474 394267 1 Vacation students, cadets and scholarship students are included in relevant metrics where appropriate. 2 ‘Secondees in’ are excluded from these metrics; ‘secondees out’ are included. 3 NPR stands for ‘not previously reported’. 4 The United States and Canada region has been renamed to Americas. This region captures employees in Mexico. QUANTITATIVE AND QUALITATIVE DISCLOSURES ABOUT MARKET RISK In the normal course of business, Woodside is exposed to commodity price, foreign currency exchange rate and interest rate risks that could impact Woodside’s financial position and results of operations. Woodside’s risk management strategy with respect to these market risks may include the use of derivative financial instruments. Woodside uses derivative contracts to manage commodity price volatility, foreign exchange rate volatility on capital expenditure plans and interest rate exposure on financing activities. Actual gains and losses in the future may differ materially from the sensitivity analyses based on changes in the timing and amount of commodity price, foreign currency exchange rate and interest rate movements and Woodside’s actual exposures and derivatives in place at the time of the change, as well as the effectiveness of the derivative to hedge the related exposure. Commodity price risk management Woodside’s revenues are primarily derived from sales of LNG, crude oil, condensate, pipeline gas and NGLs. Consequently, Woodside’s results of operations are strongly influenced by the prices it receives for these products, which in the case of oil and condensate are primarily determined by prevailing crude oil prices and in the case of pipeline gas, NGLs and LNG are primarily determined by prevailing crude oil prices as well as some fixed pricing and other price indexes (such as Henry Hub and the Japan Korea Marker). For the year ended 31 December 2023, the majority (approximately 72%) of Woodside’s production was attributed to natural gas, comprising LNG, NGLs and pipeline gas and the remaining portion (approximately 28%) of Woodside’s production was attributed to oil and condensate. 186 ANNUAL REPORT 2023
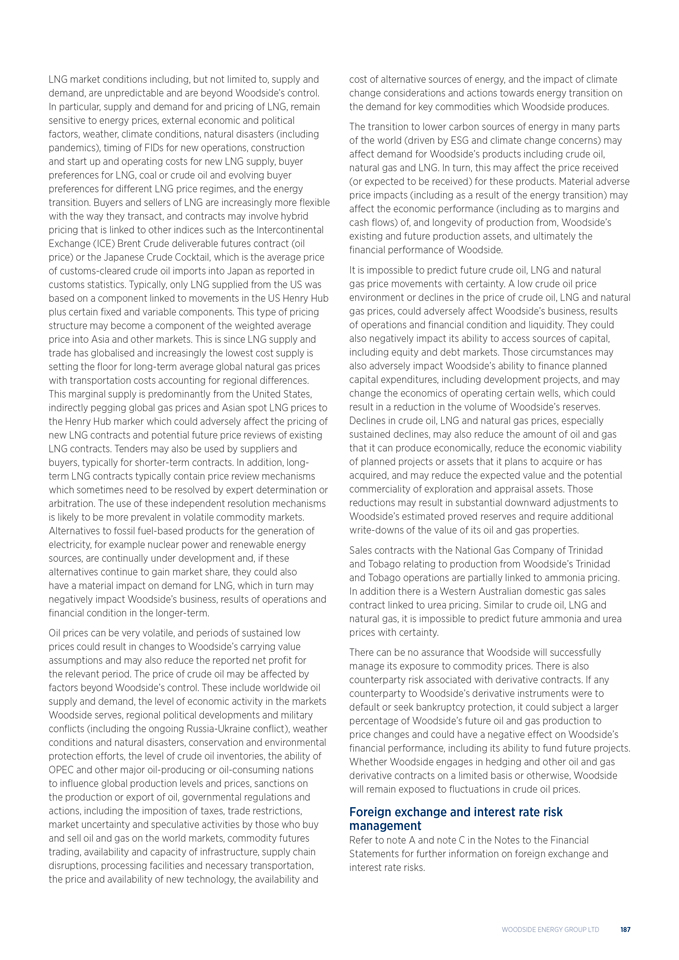
LNG market conditions including, but not limited to, supply and demand, are unpredictable and are beyond Woodside’s control. In particular, supply and demand for and pricing of LNG, remain sensitive to energy prices, external economic and political factors, weather, climate conditions, natural disasters (including pandemics), timing of FIDs for new operations, construction and start up and operating costs for new LNG supply, buyer preferences for LNG, coal or crude oil and evolving buyer preferences for different LNG price regimes, and the energy transition. Buyers and sellers of LNG are increasingly more flexible with the way they transact, and contracts may involve hybrid pricing that is linked to other indices such as the Intercontinental Exchange (ICE) Brent Crude deliverable futures contract (oil price) or the Japanese Crude Cocktail, which is the average price of customs-cleared crude oil imports into Japan as reported in customs statistics. Typically, only LNG supplied from the US was based on a component linked to movements in the US Henry Hub plus certain fixed and variable components. This type of pricing structure may become a component of the weighted average price into Asia and other markets. This is since LNG supply and trade has globalised and increasingly the lowest cost supply is setting the floor for long-term average global natural gas prices with transportation costs accounting for regional differences. This marginal supply is predominantly from the United States, indirectly pegging global gas prices and Asian spot LNG prices to the Henry Hub marker which could adversely affect the pricing of new LNG contracts and potential future price reviews of existing LNG contracts. Tenders may also be used by suppliers and buyers, typically for shorter-term contracts. In addition, long-term LNG contracts typically contain price review mechanisms which sometimes need to be resolved by expert determination or arbitration. The use of these independent resolution mechanisms is likely to be more prevalent in volatile commodity markets. Alternatives to fossil fuel-based products for the generation of electricity, for example nuclear power and renewable energy sources, are continually under development and, if these alternatives continue to gain market share, they could also have a material impact on demand for LNG, which in turn may negatively impact Woodside’s business, results of operations and financial condition in the longer-term. Oil prices can be very volatile, and periods of sustained low prices could result in changes to Woodside’s carrying value assumptions and may also reduce the reported net profit for the relevant period. The price of crude oil may be affected by factors beyond Woodside’s control. These include worldwide oil supply and demand, the level of economic activity in the markets Woodside serves, regional political developments and military conflicts (including the ongoing Russia-Ukraine conflict), weather conditions and natural disasters, conservation and environmental protection efforts, the level of crude oil inventories, the ability of OPEC and other major oil-producing or oil-consuming nations to influence global production levels and prices, sanctions on the production or export of oil, governmental regulations and actions, including the imposition of taxes, trade restrictions, market uncertainty and speculative activities by those who buy and sell oil and gas on the world markets, commodity futures trading, availability and capacity of infrastructure, supply chain disruptions, processing facilities and necessary transportation, the price and availability of new technology, the availability and cost of alternative sources of energy, and the impact of climate change considerations and actions towards energy transition on the demand for key commodities which Woodside produces. The transition to lower carbon sources of energy in many parts of the world (driven by ESG and climate change concerns) may affect demand for Woodside’s products including crude oil, natural gas and LNG. In turn, this may affect the price received (or expected to be received) for these products. Material adverse price impacts (including as a result of the energy transition) may affect the economic performance (including as to margins and cash flows) of, and longevity of production from, Woodside’s existing and future production assets, and ultimately the financial performance of Woodside. It is impossible to predict future crude oil, LNG and natural gas price movements with certainty. A low crude oil price environment or declines in the price of crude oil, LNG and natural gas prices, could adversely affect Woodside’s business, results of operations and financial condition and liquidity. They could also negatively impact its ability to access sources of capital, including equity and debt markets. Those circumstances may also adversely impact Woodside’s ability to finance planned capital expenditures, including development projects, and may change the economics of operating certain wells, which could result in a reduction in the volume of Woodside’s reserves. Declines in crude oil, LNG and natural gas prices, especially sustained declines, may also reduce the amount of oil and gas that it can produce economically, reduce the economic viability of planned projects or assets that it plans to acquire or has acquired, and may reduce the expected value and the potential commerciality of exploration and appraisal assets. Those reductions may result in substantial downward adjustments to Woodside’s estimated proved reserves and require additional write-downs of the value of its oil and gas properties. Sales contracts with the National Gas Company of Trinidad and Tobago relating to production from Woodside’s Trinidad and Tobago operations are partially linked to ammonia pricing. In addition there is a Western Australian domestic gas sales contract linked to urea pricing. Similar to crude oil, LNG and natural gas, it is impossible to predict future ammonia and urea prices with certainty. There can be no assurance that Woodside will successfully manage its exposure to commodity prices. There is also counterparty risk associated with derivative contracts. If any counterparty to Woodside’s derivative instruments were to default or seek bankruptcy protection, it could subject a larger percentage of Woodside’s future oil and gas production to price changes and could have a negative effect on Woodside’s financial performance, including its ability to fund future projects. Whether Woodside engages in hedging and other oil and gas derivative contracts on a limited basis or otherwise, Woodside will remain exposed to fluctuations in crude oil prices. Foreign exchange and interest rate risk management Refer to note A and note C in the Notes to the Financial Statements for further information on foreign exchange and interest rate risks. WOODSIDE ENERGY GROUP LTD 187
CYBERSECURITY Our Cyber Resilience Process and Risk Management Woodside’s approach to managing material risks from cybersecurity threats is integrated into our overall risk management processes as disclosed in section 4.1.6—Risk management and internal control. Woodside’s cybersecurity resilience and risk management strategy and process are based on the National Institute of Standards and Technology (NIST) Cybersecurity Framework. Woodside’s Cyber Resilience Process consists of various Group-wide policies, procedures and guidelines concerning cybersecurity matters. These documents are published within the Woodside Management System (WMS) and aim to: 1. Design, build and maintain Woodside’s Information Technology (IT), Operational Technology (OT) and Industrial Internet of Things systems with the right cybersecurity controls to support confidentiality, integrity and availability. 2. Monitor and strengthen Woodside’s cybersecurity posture while preventing, detecting, analysing and responding to cybersecurity incidents. 3. Embed a cyber-safe culture across Woodside and foster industry collaboration. 4. Enable compliance with all applicable legislation. The process involves five key activities: identify, protect, detect, respond and recover. In addition to the Cyber Resilience Process, the Data, Information and Systems Management process documented within the WMS, includes the Woodside Information Technology Systems – Conditions of Use Procedure. This procedure sets out Woodside’s mandatory conditions applicable to the use of Woodside’s IT, OT and digital Systems. Woodside manages cybersecurity risks utilising the same Woodside risk management process as described in section 3.9—Risk factors. Our Cyber Resilience Process Assurance Woodside’s Cybersecurity team engages third-party vendors as part of our Cyber Resilience Process to perform a variety of technical assessments such as penetration testing. As part of these assessments, the third parties test our internal and external defenses, and help us with identifying any weaknesses and vulnerabilities within our environment. These assessment findings are risk ranked and prioritised for remediation. Woodside internal audit team conducts audits on cybersecurity on a biennial basis. The internal audit function engages external expertise to conduct the audits. The most recent cybersecurity audit concluded in 2023. Third Party Cybersecurity Risk Management Woodside identifies and manages risks from cybersecurity threats associated with third parties accessing, storing and processing Woodside data, through up-front cybersecurity assessment processes that leverage independently verified security programs including ISO 27001 certification and SOC 2 compliance, and through contractual terms and conditions. Woodside manages risk of third-party access to Woodside systems through on-boarding and induction processes for personnel including mandatory training. Third-party personnel accessing Woodside systems are subject to the same cyber security controls as Woodside staff. This includes the requirement to complete annual cybersecurity training. Higher risk scenarios such as direct network connectivity from third-party networks are not permitted. Material Impact from cybersecurity risks, threats or previous cybersecurity incidents Risk from cybersecurity threats have the potential to materially affect Woodside’s business strategy, results of operations and financial conditions. This risk is described in section 3.9—Risk factors. Woodside continuously monitors its digital information landscape and has various threat detection measures in place. Woodside is not aware of any cybersecurity incidents or threats that have materially affected or are reasonably likely to materially affect our business strategy, results of operations or financial conditions. GOVERNMENT REGULATIONS Woodside’s assets and exploration, development, extraction and production operations are subject to a wide range of laws and regulations imposed by governments and regulatory bodies. These regulations touch all aspects of our assets, including how we extract, process and explore for oil and natural gas and how we conduct our business, including regulations governing matters such as environmental protection, land rehabilitation and facilities decommissioning, occupational health and safety, human rights, the rights and interests of First Nations peoples, competition, foreign investment, export, marketing of oil and natural gas, royalties and taxes. The ability to extract and process oil and natural gas is fundamental to our business. In most jurisdictions, the rights to explore for and extract petroleum deposits are owned by the government. We obtain the right to access the land and extract the product by entering into licences or leases with the government that owns the oil or natural gas deposit. Usually, the right to explore for oil and natural gas carries with it the obligation to spend a defined amount of money on the exploration, or to undertake particular exploration activities. We also rely on governments to grant the rights necessary to transport and treat the extracted petroleum to prepare it for sale. The terms of the right, including the time period of the right, vary depending on the laws of the relevant government or terms negotiated with the relevant government. In certain jurisdictions where we have assets, such as Trinidad and Tobago and Senegal, a production sharing contract (PSC) governs the relationship between the government and companies (typically referred to as ‘Contractor’) concerning, among other things, how much of the oil and gas extracted from the country each party will receive. Under PSCs, the government awards exclusive rights for the execution of exploration, development and production activities to the Contractor in accordance with the PSC’s terms. Generally speaking, the Contractor bears the financial risk of the initiative to explore, develop and ultimately produce the field. When successful, the Contractor is permitted to use a certain 188 ANNUAL REPORT 2023
set percentage of produced oil and gas to recover its capital and operational expenditures, often called ‘cost oil.’ The remaining production is split between the government and the Contractor at a rate determined by the government and set out in the PSC. The PSC may also include additional fiscal terms such as royalties, production bonuses and tax treatment, and other contractual terms addressing domestic supply obligations, local content, measurement and valuation. PSCs are bilateral contracts negotiated between the Contractor and the government and so each is necessarily on different terms. Applicable laws and regulations, and any permits that Woodside is required to obtain under these laws, may obligate Woodside to identify, avoid, mitigate and disclose environmental risks in various operational practices, including, among others, through pursuing and obtaining permits before commencing activities, restricting air and water emissions and waste discharges, limiting the type, quantity and concentration of various substances that can be utilised or released into the environment, addressing potential or actual impacts to protected species or cultural resources, monitoring or remediating contamination under certain circumstances, establishing and following certain inspection, testing, maintenance and decommissioning protocols, and disclosing certain operational practices. Moreover, environmental permits required for our operations may be subject to legal challenges by third parties, and such challenges can materially and adversely affect our operations to the extent they delay or prevent obtaining approvals or permits required for our operations, or otherwise require incurring increased costs in order to obtain such approvals or permits. Applicable environmental laws and regulations may also dictate worker health and safety and community notification procedures. In addition, from time to time, certain trade sanctions are adopted by the United Nations (UN) Security Council and/ or various governments, including in the United Kingdom, the United States, the European Union (EU), China and Australia against certain countries, entities or individuals, that may restrict our ability to sell extracted minerals, oil or natural gas to, and/or our ability to purchase goods or services from, these countries, entities or individuals. This summary focuses on the Australian and United States regulatory regimes, as well as certain regulations in Senegal. It is not a full summary of the regulatory regimes in those jurisdictions nor is it a complete list of the legislation and regulation that applies to Woodside. Woodside is also subject to environmental and other regulations to varying degrees in each of the jurisdictions in which it has assets and operations. Australia In Australia, petroleum exploration and development takes place within a legal framework characterised by a division of responsibilities between the federal and the state or territory governments. Exploration and production activities conducted onshore and within three nautical miles of the territorial sea baseline of the relevant state or territory are the responsibility of the individual state or territory governments. The Australian Federal government has legislative responsibility for Australian offshore petroleum exploration and production beyond the three nautical mile territorial sea, which encompasses the area of most relevance to Woodside’s offshore activities. In addition, Woodside has certain onshore operations in Victoria and Western Australia which are subject to various state legislation. Environmental regulation Woodside’s Australian operations are subject to federal, state and local environmental laws and regulations. For offshore petroleum activities, these laws and regulations generally require the acquisition of an approval before an activity commences, and require that for an activity, environmental risks are identified and controls put in place to reduce or eliminate the risks. For exploration drilling and seismic activities in the federal jurisdiction, this is outlined in an Environment Plan accepted by the National Offshore Petroleum Safety and Environmental Management Authority (NOPSEMA), an independent statutory authority; as an operation goes into construction, commissioning and production, a whole offshore project proposal and new or revised environment plan is required as the initial document to be submitted for approval. Subsequent environment plans for each activity are required to be submitted after the offshore project proposal has been approved. These laws and regulations also restrict the type, quantity and concentration of various substances that can be utilised or released into the environment in connection with marine and land-based activities; limit or prohibit drilling and seismic or production activities in and near certain environmentally sensitive or protected areas; and impose criminal and civil liabilities for pollution or other unauthorised impacts to the environment resulting from oil, natural gas and petrochemical operations. The National Greenhouse and Energy Reporting Act 2007 (Cth) requires corporations that meet certain reporting thresholds to report company information about greenhouse gas (GHG) emissions and energy production and consumption as part of a single, national reporting scheme and establishes the Safeguard Mechanism which aims to keep certain GHG emissions at or below legislated limits, known as baselines, for Australia’s largest industrial facilities. In March 2023, the Safeguard Mechanism (Crediting) Amendment Bill 2023 was passed, which applied reforms to the Safeguard Mechanism from 1 July 2023 intended to reduce Scope 1 GHG emissions from Australia’s largest industrial facilities on a trajectory consistent with achieving Australia’s GHG emission reduction targets of 43% below 2005 levels by 2030 and net zero by 2050. There is ongoing public pressure in Australia on the government to accelerate its carbon emissions reduction program. As such, there remains significant uncertainty regarding the future of climate change regulation in Australia and the effect it may have on Woodside’s business. WOODSIDE ENERGY GROUP LTD 189
In addition, Australian environmental laws and regulations also include restrictions on air emissions and water discharges resulting from the operation of drilling equipment, processing facilities, pipelines and transport vessels. These laws also regulate the use, management and disposal of hazardous materials and general waste; prohibit the clearing of native vegetation without approval; manage biodiversity and manage and authorise impacts to Aboriginal heritage; and require Woodside to prepare and implement safety and environmental management plans. Woodside is required to provide bonds or maintain other forms of financial assurance for rehabilitation, clean-up or pollution prevention work that may be necessary as a result of the construction, operation, decommissioning or removal of a pipeline or other infrastructure and to report, monitor or remediate contamination under certain circumstances. Woodside is subject to ‘strict liability’ for oil spills, rendering it liable without regard to potential negligence or fault and may be subject to fines and other penalties for breaches of laws, regulations, licences or other approvals. The requirements imposed by environmental laws and regulations are subject to change and have tended to become increasingly restrictive over time. The modification of existing foreign or domestic laws or regulations or the adoption of new laws or regulations curtailing exploratory or development drilling for oil and gas for economic, political, social, environmental or other reasons could have a material adverse effect on Woodside’s business, financial condition or results of operations. Fair Work Act and other related amendments A significant number of changes to the Fair Work Act 2009 (Cth) (FW Act) and other related laws have been introduced over the past year. In December 2022, the Australian Federal Government passed the Fair Work Legislation Amendment (Secure Jobs, Better Pay) Act 2022 (Cth) (SJBP Act) which introduced a raft of amendments into the FW Act with phased commencement dates over the course of 2023. All key provisions of the SJBP Act have now become effective. Key material employment changes to the FW Act arising from the SJBP Act included expanded rights for employees to enforce flexible working arrangements, new restrictions on the use of fixed term (including ‘maximum term’) employment contracts, prohibitions against pay secrecy, expanding the protected attributes (namely gender identity, intersex status and breastfeeding) against which discriminatory and other conduct are prohibited, broadening the ability of employees to extend and enforce unpaid parental leave, and providing additional avenues for workers to seek recourse against sexual harassment. The sexual harassment-related amendments in particular complement the commencement in December 2022 of a new positive duty to prevent sexual harassment in the Sex Discrimination Act 1984 (Cth) which the Australian Human Rights Commission can enforce from 12 December 2023. Additionally, the Australian Human Rights Commission Amendment (Costs Protection) Bill 2023 (Cth) is currently before Parliament and, if passed, will reduce the financial barriers for sexual harassment complainants to bring claims. The SJBP Act also introduced a series of significant industrial relations changes to enterprise bargaining, including expanding the ability of employees and unions to seek multi-employer enterprise agreements, broadening the power of the Fair Work Commission to resolve (through mediation or conciliation) bargaining disputes before industrial action is taken and to intervene and make workplace determinations where bargaining becomes ‘intractable’. Other changes to bargaining introduced by the SJBP Act included amendments making it easier for employee bargaining representatives to commence bargaining to renew existing single-enterprise agreements, changes to the Fair Work Commission’s enterprise agreement approval-related requirements (including consideration of whether a proposed agreement has been genuinely agreed to and passes the ‘better-off-overall’ test) and substantially restricting the ability of employers to terminate nominally-expired enterprise agreements. In June 2023, the Fair Work Legislation Amendment (Protecting Worker Entitlements) Act 2023 (Cth) was introduced, bringing further changes to the FW Act. Key changes arising from this Act include the expansion of unpaid parental leave rights (from 1 July 2023) and enshrining superannuation payments as an enforceable National Employment Standard under the FW Act (from 1 January 2024). A further package of significant reforms is contained in the Australian Federal Government’s Fair Work Legislation Amendment (Closing Loopholes) Act 2023 (Cth) (Closing Loopholes Act). While various key aspects of the Closing Loopholes Act are the subject of a Senate Committee Inquiry (to be concluded from February 2024 onwards), numerous reforms contained in this reform package passed both houses of Parliament on 7 December 2023. Key provisions that have passed include new ‘same job, same pay’ provisions which give the Fair Work Commission the ability to make orders upon application requiring employers (excluding service contractors) to pay their employees who perform work for a ‘regulated host’ the same rate of pay as employees of that host (provided that the host’s employees perform work of the same kind). Among other provisions, new rights for workplace delegates to paid time off to attend training as well as reasonable time and access to employer facilities to communicate with eligible union members have also passed, as has a new criminal wage theft offence in respect of intentional underpayments. The Closing Loopholes Act received Royal Assent on 14 December 2023. As such, many of the amendments from the Closing Loopholes Act – excluding the provisions relating to wage theft – commenced on 15 December 2023 (although same job, same pay-related regulated labour hire arrangement orders can only take effect on and after 1 November 2024). Proposed outstanding amendments that are the subject of the Senate Committee Inquiry, include changes to the definition of employment (including casual employment), increased civil penalties for underpayment contraventions, new right of entry rights relating to suspected underpayments and further limitations to the Fair Work Commission’s powers to reduce employee entitlements in the context of intractable bargaining disputes. 190 ANNUAL REPORT 2023
Woodside believes that it is well placed to confirm its compliance with the numerous new employment and industrial relations obligations that have been introduced over the past year. Moving forward, increased compliance-related demands are expected, especially given the further reforms that are anticipated in 2024. Decommissioning liability amendments On 2 September 2021, the Australian Federal parliament passed the Offshore Petroleum and Greenhouse Gas Storage Amendment (Titles Administration and Other Measures) Act 2021 (Cth) which, among other changes, amends the Offshore Petroleum and Greenhouse Gas Storage Act (Cth) (OPGGSA) to expand the trailing liability provisions. The amendments took effect from 2 March 2022. The expanded trailing liability regime gives NOPSEMA and the responsible Commonwealth Minister the ability to recall any titleholders, former titleholders and their respective related bodies corporate and ‘related persons’ to undertake decommissioning activities on a title area. These powers are retrospective in their application and apply to titles that are currently in force as well as to titles that ceased to be in force on or after 1 January 2021. Santos Barossa decision and Environment Plans In December 2022, the Full Court of the Federal Court of Australia handed down its decision in Santos NA Barossa Pty Ltd v Tipakalippa [2002] FCAFC 193 (Appeal Decision). The Appeal Decision decided certain aspects of the requirements for consultation associated with the acceptance of environment plans for offshore petroleum activities by NOPSEMA, as required under the OPGGSA. Subsequently, NOPSEMA published a guideline for industry entitled “Consultation in the course of preparing an environment plan”. As a consequence of these events, Woodside has experienced delays in obtaining Environment Plans for petroleum activities in Commonwealth waters. In September 2023, the Federal Court of Australia, in Cooper v National Offshore Petroleum Safety and Environmental Management Authority (No. 2) [2023] FCA 1158, found that NOPSEMA’s decision to accept, with conditions, Woodside’s environment plan for seismic surveys associated with the Scarborough project was invalid. Woodside was a party to this matter. Woodside submitted a revised environment plan for this activity in October 2023. Woodside’s revised environment plan was accepted by NOPSEMA in December 2023 and work was completed under the accepted environment plan in December 2023. Refer to section 3.9 – Risk factors for further information on risks related to government regulations and other legal developments. Domestic gas reservation policy Under a Western Australian State Government policy (WA Domestic Gas Policy), introduced in 2006, gas equivalent to 15% of LNG production from LNG export projects is required to be reserved for domestic use as a condition of State approvals required for LNG projects. The policy is typically implemented through domestic gas commitment agreements entered into between project proponents and the State, allowing negotiations to occur on a case-by-case basis regarding the method by which the LNG project proponents fulfil their domestic gas commitments, including from alternative sources. Woodside and (where applicable) its joint venture participants have domestic gas contractual commitments in place with the Western Australian State Government in respect to the North West Shelf (NWS), Pluto LNG, Scarborough and Wheatstone projects. In 2015, the NWS State Agreement (North West Gas Development (Woodside) Agreement 1979) was amended to include a new domestic gas commitment of 15% (or lesser approved amount) of total LNG quantity approved for use, supply or sale overseas to bring the NWS Project in line with the WA Domestic Gas Policy. In 2006, in connection with the final investment decision taken in respect of the Pluto LNG project, Woodside entered into an arrangement with the Western Australian State Government to market and make available for supply a quantity of domestic gas from Pluto, provided that Woodside was not required to supply domestic gas if it is not commercially viable to do so. In January 2021, Woodside signed a further agreement with the Western Australian State Government in which Woodside agreed to market and make available 45.6 PJ of additional domestic gas from its share of NWS Project gas, separate and in addition to the 2015 commitment from the NWS Joint Venture. In November 2021, Woodside signed a further domestic gas commitment agreement with the Western Australian State Government with respect to the Scarborough project pursuant to which, consistent with the WA Domestic Gas Policy, the Scarborough Joint Venture will make gas equivalent to 15% of its LNG exports available to the domestic market. In January 2021, Woodside signed a further domestic gas commitment agreement with the Western Australian State Government with respect to the Pluto acceleration project pursuant to which, consistent with the WA Domestic Gas Policy, Woodside will make gas equivalent to 15% of its LNG exports processed at the NWS Project as part of the Pluto acceleration project available to the domestic market. Woodside also has domestic gas commitments in respect to its interest in the Wheatstone LNG Project under a 2011 agreement with the Western Australian State Government. Additional major legislation and regulations Woodside’s Australian offshore operations beyond coastal waters are primarily governed by the OPGGSA and related legislation, which establishes a joint authority (Joint Authority) whereby relevant Australian state, territory and federal governments cooperate in the administration and supervision of petroleum activities in offshore areas beyond coastal waters. The OPGGSA provides for the grant of exploration permits, retention leases, production licences, pipeline licences and facilities licences within the areas of the OPGGSA’s jurisdictional operation. Within the coastal waters, petroleum operations are covered by the relevant state or Northern Territory legislation that is substantively similar to the OPGGSA. The Offshore Petroleum and Greenhouse Gas Storage (Resource Management and Administration) Regulations 2011 (Cth) contain resource management provisions, including a requirement for the holder of a production licence to have in place a Field Development Plan approved by the Joint Authority before petroleum production can commence. WOODSIDE ENERGY GROUP LTD 191
Many of Woodside’s operations rely on pipeline licences to transport oil and gas from the point of production to processing facilities and relevant markets. As mentioned above, the OPGGSA also provides for the grant of pipeline licences within the areas of the OPGGSA’s jurisdictional operation. Pipelines within the coastal waters of Western Australia are licensed under the Petroleum (Submerged Lands) Act 1982 (WA) and pipelines within the coastal waters of Victoria are licensed under the Offshore Petroleum and Greenhouse Gas Storage Act 2010 (Vic). Onshore pipelines in Western Australia are licensed under the Petroleum Pipelines Act 1969 (WA) and onshore pipelines in Victoria are licensed under the Pipelines Act 2005 (Vic). Woodside is also subject to the following laws, among others: • Various petroleum taxes, including royalties, excise taxes, temporary levies, and the Petroleum Resource Rent Tax (PRRT). In May 2023, the Australian Government announced rules aimed at ensuring offshore LNG projects make minimum PRRT payments once 7 years from first production have elapsed. The rules are intended to be effective from 1 July 2023. The related amendments to PRRT legislation were introduced into the Federal parliament on 16 November 2023. It is not yet clear when these amendments will receive Royal Assent. Subject to becoming law, these rules are expected to apply to the Pluto LNG Project from 1 July 2023 and the Wheatstone LNG Project from 1 July 2024. The announcement also included a commitment to remake the Petroleum Resource Rent Tax Assessment Regulation 2015 (Cth) (GTP Regulation). The price of sales gas, which is processed into LNG, and the treatment of tolling arrangements are determined under the GTP Regulation. On 22 December 2023, the Australian Government released an Exposure Draft of a remade GTP Regulation for consultation. • Australia’s competition laws contained in the Competition and Consumer Act 2010 (Cth), which prohibit, among other things, engaging in conduct with the purpose or effect of substantially lessening competition, price fixing, cartel conduct, market sharing, concerted practices or bid rigging. The Act was also recently amended by the Competition and Consumer (Gas Market Code) Regulations 2023 (Cth) (Gas Code), which became effective on 11 July 2023, to allow for the imposition of gas price controls in the eastern Australian gas market. Currently, the price of gas produced by Woodside and supplied into the eastern Australian gas market is capped at $12/ GJ until 1 July 2025. The price cap may be updated by the Australian Competition and Consumer Commission every two years. The Gas Code also introduces a mandatory code of conduct that establishes minimum conduct and process standards for commercial negotiations for wholesale gas contracts, including good faith obligations and a ‘reasonable pricing’ provision. • The Australian Domestic Gas Security Mechanism (ADGSM), established pursuant to the Customs (Prohibited Exports) Regulations 1958 (Cth) and the Customs (Prohibited Exports) (Operation of the Australian Domestic Gas Security Mechanism) Guidelines 2023 (Cth), by which the Australian Government can require LNG projects to prohibit exports or find offsetting sources of gas, to ensure that there are sufficient supplies of natural gas for domestic use. The ADGSM is intended to be a measure of last resort where market based solutions and other regulatory interventions have failed. • Laws protecting the rights and interests of First Nations Australians and their cultural heritage. Since 1992, Australian common law has recognised that, in certain circumstances, First Nations Australians may have rights and interests over land and waters in accordance with their traditional laws and customs. The Native Title Act 1993 (Cth) (NTA) and complimentary state legislation recognise and protect the native title rights and interests of native title holders and registered native title claimants. Multiple pieces of Australian state and federal government legislation protect Aboriginal cultural heritage, rights and access to land in Australia and many of these laws are subject to review and change to ensure a greater level of involvement of First Nations Australians in decisions that may impact cultural heritage and other rights and interests. • The Greater Sunrise Special Regime (GSSR), established pursuant to the Maritime Boundaries Treaty which came into force on 30 August 2019. Woodside holds production sharing contracts and retention leases covering its petroleum interests within GSSR under joint Australian/Timor-Leste administrative control. • The Foreign Acquisitions and Takeovers Act 1975 (Cth) (FATA), regulations under the FATA and Australia’s Foreign Investment Policy, which are intended to encourage foreign investment in Australia that is not contrary to the Australian national interest. As Woodside is a reporting entity of a critical gas asset within the meaning of the Security of Critical Infrastructure Act 2018 (Cth), it is considered a ‘national security business’ under the FATA, meaning that certain investments by foreign investors (including foreign government investors) must be notified to the Australian Government and require prior approval from the Australian Treasurer in accordance with the FATA. • There is legislation covering work health and safety (WHS) in both state and federal jurisdictions, with separate onshore and offshore regulation. WHS laws aim to protect workers’ health and safety by imposing obligations on all parties who are in a position to contribute to the management of workplace risks, including manufacturers and suppliers of equipment and substances, as well as employers and workers (including employees and contractors). Among other things, Woodside, as operator of both onshore and offshore facilities, is required to develop and comply with a comprehensive ‘safety case’ which describes the facility and provides details on the hazards and risks associated with the facility, the risk controls and the safety management system that will be used to minimise relevant risks. • State legislation regulates matters such as long service leave, workers’ compensation, as well as anti-discrimination and equal opportunity. • The OPGGSA also provides the legislative framework for CCS and CCUS projects in offshore areas beyond coastal waters and the grant of assessment permits, holding leases and injection licences. Within Western Australian coast waters, on 29 November 2023, the Western Australian Government recently introduced the Petroleum Legislation Amendment Bill 2023 (WA) to enable the transportation and geological storage of GHG in Western Australia. 192 ANNUAL REPORT 2023
United States In the United States, numerous federal agencies regulate specific portions of the industry and Woodside’s US operations. The US Federal Government directly regulates the development of hydrocarbon interests on federal lands, including those in the US Gulf of Mexico (GOM) and elsewhere in the Outer Continental Shelf (OCS). Federal leasing activities in recent years have been subject to political scrutiny and motivations, material uncertainties, delays, and legal challenges relating to potential impacts from climate change related to new offshore exploration and production or the adequacy of federal environmental reviews performed in connection with GOM lease auctions. Woodside is also subject to the following laws and regulatory agencies, among others. OCS regulation The Outer Continental Shelf Lands Act (OCSLA) governs Woodside’s hydrocarbon activities on federal offshore oil and natural gas leases in the GOM. The OCSLA empowers the Department of the Interior (DOI), through its agencies the Bureau of Safety and Environmental Enforcement (BSEE), the Bureau of Ocean Energy Management (BOEM) and the Office of Natural Resources Revenue (ONRR), to administer and create regulations concerning the exploration and development of minerals in the OCS. Leases on the OCS, which contain relatively standardised terms, are awarded under OSCLA authority through scheduled lease sales by BOEM based on competitive bidding and require compliance with detailed BSEE and BOEM regulations and orders issued pursuant to various federal laws, including the National Environmental Policy Act (NEPA) and the Coastal Zone Management Act (CZMA). For certain exploration and development activities, lessees are also required to obtain environmental permits from agencies such as the US Environmental Protection Agency (EPA). Certain OCS activities are also subject to regulation under US Maritime Law by the US Coast Guard. In addition, offshore pipelines, including those located in the GOM, are subject to federal regulation including under the jurisdiction of the Federal Energy Regulatory Commission (FERC) and the Pipeline and Hazardous Materials Safety Administration (PHMSA), under the US Department of Transportation. BSEE has also adopted regulations for offshore pipelines under its jurisdiction covering similar matters. Moreover, our US operations in the GOM are subject to extensive requirements related to the plugging and abandonment of wells and decommissioning of offshore structures and equipment. We may be required to post substantial financial assurance, such as surety bonds, or to otherwise demonstrate financial capability to support these decommissioning obligations, such as through access to insurance, the costs of which could be material. Further, BOEM is currently considering, through proposed updated financial assurance regulations, increasing its supplemental bonding requirements. Any such increase could generally drive up our operating costs by increasing the amount of security we are required to post and, in turn, stress the capacity of the surety bond market to provide sufficient bonds to meet resulting demands from the offshore oil and gas industry. Environmental regulation The Clean Air Act and comparable state laws and regulations govern emissions of various air pollutants through the issuance of permits and other authorisation requirements. Since 2009, the EPA has been monitoring and regulating GHG emissions, including carbon dioxide and methane, from certain sources in the oil and gas sector due to their association with climate change. In addition, international climate efforts, including the 2015 Paris Agreement and the 2021 and 2022 Conferences of the Parties of the UN Framework Convention on Climate Change have resulted in commitments from many countries to reduce GHG emissions and have called for parties to eliminate certain fossil fuel subsidies and pursue further action on non-carbon dioxide GHGs. In August 2022, President Biden signed into law the Inflation Reduction Act of 2022 (IRA), which expands policy support and incentives for deployment of CCUS, hydrogen and other low-carbon projects, including several enhancements to federal tax credits. The IRA also establishes a charge on methane emissions above a certain methane intensity threshold for facilities that report their GHG emissions under the EPA’s GHG Emissions Reporting Program Part 98 regulations. The methane emissions charge will be imposed beginning with respect to emissions reported for calendar year 2024. The methane emissions charge could increase our operating costs, which could adversely impact our business, financial condition and cash flows. In December 2023, the EPA published a final rule to reduce methane and other pollution from oil and natural gas operations. Among other things, the final rule will phase out routine flaring of natural gas from new oil wells, require all well sites and compressor stations to be routinely monitored for leaks and provide companies greater flexibility to use innovative and cost-effective methane detection technologies. The IRA and the final rule will impact Woodside’s Shenzi asset and any future acquired GOM-operated assets. The exploration, production, and transportation of crude oil and natural gas involves risk that hazardous liquids or flammable gases may be released into the environment and may cause substantial harm to the environment, natural resources, or human health and safety. Such incidents, as well as failure to comply with applicable environmental laws and regulations, may result in material expenditures for response actions, significant government civil or criminal fines and penalties, liability to government agencies for natural resources damages, and significant business interruption. In addition, a spill on or related to our properties and operations could expose us to joint and several and strict liability, without regard to fault. Existing and new laws and regulations could require us to evaluate and upgrade existing infrastructure and operational practices on an accelerated basis or pursue additional capital projects, any or all of which could result in increased operating costs, which in turn could have a material adverse effect on our business, financial condition or results of operations. Laws and regulations are frequently subject to change, and the general trend in the United States has been for these governmental agencies to continue to evaluate and, as necessary, develop and implement new, more restrictive permitting, performance and disclosure requirements, particularly with respect to the protection of the environment, GHG emissions, natural resources, and worker health and safety. The 2024 US election cycle (including a presidential election) contributes to uncertainty on the future WOODSIDE ENERGY GROUP LTD 193
direction of regulatory change. In addition, offshore wind and carbon sequestration have the potential to increase competing uses of the OCS, which may limit future opportunities for offshore oil and gas operations. The modification of existing laws or regulations or the adoption of new laws or regulations curtailing or imposing greater restrictions on exploratory or development drilling for oil and gas for economic, political, social, environmental or other reasons could have a material adverse effect on our business, financial condition or results of operations. Senegal In Senegal, Woodside’s PSC and the prospecting, exploration, exploitation and transportation of hydrocarbons, as well as the tax rules for such activities, are primarily governed by Law no. 98-05 dated 8 January 1998 (Petroleum Code) and its implementing decree no. 98-810 dated 6 October 1998. The Petroleum Code determines that the Senegalese Ministry of Petroleum and Energy is the competent authority for its implementation and is responsible for authorising activities for oil and gas prospecting, exploration, exploitation and transportation. While a revised Petroleum Code was introduced in 2019, the terms of that legislation state that any PSC issued prior to the introduction of the 2019 Petroleum Code retain their legal regime, and as such, the 1998 Petroleum Code continues to apply to Woodside’s PSC. There is also other legislation and regulation that applies to Woodside’s activities in Senegal including, without limitation, in respect of the environment and local content requirements. MATERIAL LIMITATIONS Woodside has certain obligations as part of its operations in Western Australia to provide natural gas into the Western Australian domestic market. Please refer to ‘Government regulations—Domestic gas reservation policy’ in this section for further information. Woodside is subject to ordinary course production sharing contract limitations in Senegal. Refer to ‘Government regulations - Other jurisdictions’ in this section for further information. SUMMARY OF MATERIAL LEGAL PROCEEDINGS Woodside is involved from time to time in legal proceedings and governmental investigations of a character normally incidental to its business, including claims and pending actions against it seeking damages, or clarification or prosecution of legal rights and regulatory inquiries regarding business practices. Insurance or other indemnification protection may offset the financial impact on Woodside of a successful claim. Except as set forth below, there are no governmental, legal or arbitral proceedings (including any such proceedings which are pending or threatened and of which Woodside is aware) which may have, or have had during the 12 months prior to the date of this report, a significant effect on Woodside’s financial position or profitability: • In June 2022, the Australian Conservation Foundation Incorporated (ACF) (represented by the Environmental Defenders Office Ltd) commenced Federal Court of Australia proceedings in relation to the environmental assessment of the Scarborough project. The ACF is seeking a final injunction to restrain Woodside from carrying out offshore project activities for the Scarborough project. The trial has been set down for an estimate of three weeks, commencing on 2 September 2024. • In addition, the proceedings arising from the application filed by the Conservation Council of Western Australia (CCWA) seeking judicial review of a decision by the CEO of the Western Australian Department of Water and Environmental Regulation to grant Woodside a works approval for the Pluto Train 2 project were settled in 2023. 194 ANNUAL REPORT 2023
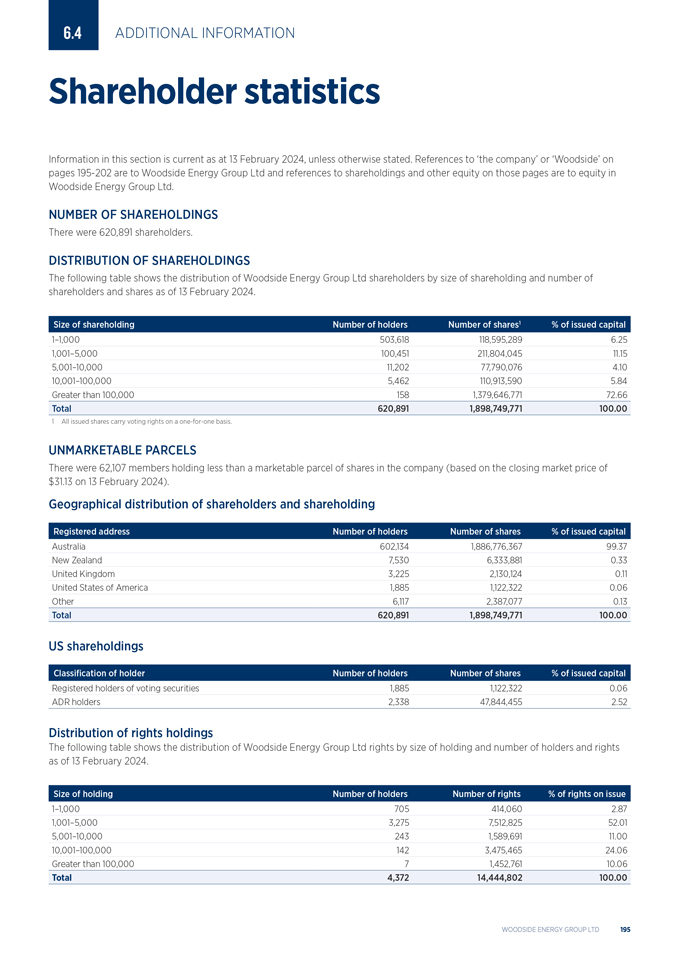
6.4 ADDITIONAL INFORMATION Shareholder statistics Information in this section is current as at 13 February 2024, unless otherwise stated. References to ‘the company’ or ‘Woodside’ on pages 195-202 are to Woodside Energy Group Ltd and references to shareholdings and other equity on those pages are to equity in Woodside Energy Group Ltd. NUMBER OF SHAREHOLDINGS There were 620,891 shareholders. DISTRIBUTION OF SHAREHOLDINGS The following table shows the distribution of Woodside Energy Group Ltd shareholders by size of shareholding and number of shareholders and shares as of 13 February 2024. Size of shareholding Number of holders Number of shares1% of issued capital 1–1,000 503,618 118,595,2896.25 1,001–5,000 100,451 211,804,04511.15 5,001–10,000 11,202 77,790,0764.10 10,001–100,000 5,462 110,913,5905.84 Greater than 100,000 158 1,379,646,77172.66 Total 620,891 1,898,749,771100.00 1 All issued shares carry voting rights on a one-for-one basis. UNMARKETABLE PARCELS There were 62,107 members holding less than a marketable parcel of shares in the company (based on the closing market price of $31.13 on 13 February 2024). Geographical distribution of shareholders and shareholding Registered address Number of holders Number of shares% of issued capital Australia 602,134 1,886,776,36799.37 New Zealand 7,530 6,333,8810.33 United Kingdom 3,225 2,130,1240.11 United States of America 1,885 1,122,3220.06 Other 6,117 2,387,0770.13 Total 620,891 1,898,749,771100.00 US shareholdings Classification of holder Number of holders Number of shares% of issued capital Registered holders of voting securities 1,885 1,122,3220.06 ADR holders 2,338 47,844,4552.52 Distribution of rights holdings The following table shows the distribution of Woodside Energy Group Ltd rights by size of holding and number of holders and rights as of 13 February 2024. Size of holding Number of holders Number of rights% of rights on issue 1–1,000 705 414,0602.87 1,001–5,000 3,275 7,512,82552.01 5,001–10,000 243 1,589,69111.00 10,001–100,000 142 3,475,46524.06 Greater than 100,000 7 1,452,76110.06 Total 4,372 14,444,802100.00 WOODSIDE ENERGY GROUP LTD 195
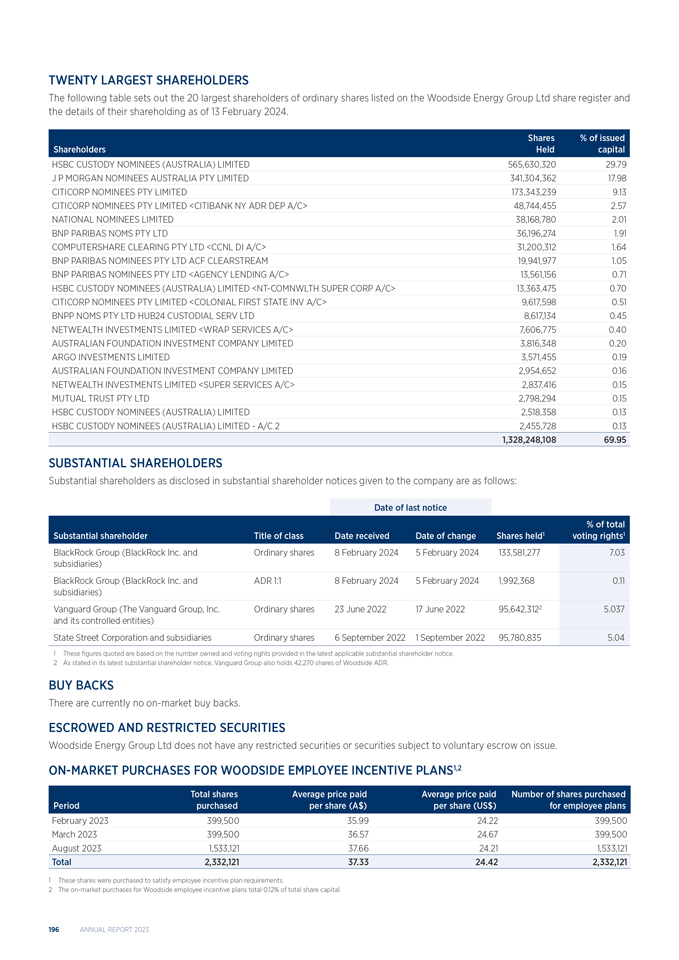
TWENTY LARGEST SHAREHOLDERS The following table sets out the 20 largest shareholders of ordinary shares listed on the Woodside Energy Group Ltd share register and the details of their shareholding as of 13 February 2024. Shares % of issued Shareholders Held capital HSBC CUSTODY NOMINEES (AUSTRALIA) LIMITED 565,630,320 29.79 J P MORGAN NOMINEES AUSTRALIA PTY LIMITED 341,304,362 17.98 CITICORP NOMINEES PTY LIMITED 173,343,239 9.13 CITICORP NOMINEES PTY LIMITED <CITIBANK NY ADR DEP A/C> 48,744,455 2.57 NATIONAL NOMINEES LIMITED 38,168,780 2.01 BNP PARIBAS NOMS PTY LTD 36,196,274 1.91 COMPUTERSHARE CLEARING PTY LTD <CCNL DI A/C> 31,200,312 1.64 BNP PARIBAS NOMINEES PTY LTD ACF CLEARSTREAM 19,941,977 1.05 BNP PARIBAS NOMINEES PTY LTD <AGENCY LENDING A/C> 13,561,156 0.71 HSBC CUSTODY NOMINEES (AUSTRALIA) LIMITED <NT-COMNWLTH SUPER CORP A/C> 13,363,475 0.70 CITICORP NOMINEES PTY LIMITED <COLONIAL FIRST STATE INV A/C> 9,617,598 0.51 BNPP NOMS PTY LTD HUB24 CUSTODIAL SERV LTD 8,617,134 0.45 NETWEALTH INVESTMENTS LIMITED <WRAP SERVICES A/C> 7,606,775 0.40 AUSTRALIAN FOUNDATION INVESTMENT COMPANY LIMITED 3,816,348 0.20 ARGO INVESTMENTS LIMITED 3,571,455 0.19 AUSTRALIAN FOUNDATION INVESTMENT COMPANY LIMITED 2,954,652 0.16 NETWEALTH INVESTMENTS LIMITED <SUPER SERVICES A/C> 2,837,416 0.15 MUTUAL TRUST PTY LTD 2,798,294 0.15 HSBC CUSTODY NOMINEES (AUSTRALIA) LIMITED 2,518,358 0.13 HSBC CUSTODY NOMINEES (AUSTRALIA) LIMITED—A/C 2 2,455,728 0.13 1,328,248,108 69.95 SUBSTANTIAL SHAREHOLDERS Substantial shareholders as disclosed in substantial shareholder notices given to the company are as follows: Date of last notice % of total Substantial shareholder Title of class Date receivedDate of changeShares held1voting rights1 BlackRock Group (BlackRock Inc. and Ordinary shares 8 February 20245 February 2024133,581,2777.03 subsidiaries) BlackRock Group (BlackRock Inc. and ADR 1:1 8 February 20245 February 20241,992,3680.11 subsidiaries) Vanguard Group (The Vanguard Group, Inc. Ordinary shares 23 June 202217 June 202295,642,31225.037 and its controlled entities) State Street Corporation and subsidiaries Ordinary shares 6 September 20221 September 202295,780,8355.04 1 These figures quoted are based on the number owned and voting rights provided in the latest applicable substantial shareholder notice. 2 As stated in its latest substantial shareholder notice, Vanguard Group also holds 42,270 shares of Woodside ADR. BUY BACKS There are currently no on-market buy backs. ESCROWED AND RESTRICTED SECURITIES Woodside Energy Group Ltd does not have any restricted securities or securities subject to voluntary escrow on issue. ON-MARKET PURCHASES FOR WOODSIDE EMPLOYEE INCENTIVE PLANS1,2 Total shares Average price paid Average price paidNumber of shares purchased Period purchased per share (A$)per share (US$)for employee plans February 2023 399,500 35.9924.22399,500 March 2023 399,500 36.5724.67399,500 August 2023 1,533,121 37.6624.211,533,121 Total 2,332,121 37.3324.422,332,121 1 These shares were purchased to satisfy employee incentive plan requirements. 2 The on-market purchases for Woodside employee incentive plans total 0.12% of total share capital. 196 ANNUAL REPORT 2023
ANNUAL GENERAL MEETING The 2024 Annual General Meeting (AGM) of Woodside Energy Group Ltd will be held on 24 April 2024. Details of the business of the meeting will be provided in the AGM notice. The AGM will be webcast live on the internet. An archived version of the webcast will be placed on the Woodside website to enable the proceedings to be viewed at a later time. The closing date for receipt of director nominations was 19 February 2024. DOCUMENTS ON DISPLAY Documents filed by Woodside on the ASX are available at asx.com.au and documents filed with the Financial Conduct Authority (FCA) in the UK, including copies of announcements made to the LSE, are available at data.fca.org.uk/#/nsm/ nationalstoragemechanism. Woodside files Annual Reports and other reports and information with the US Securities and Exchange Commission (SEC). These filings are available on the SEC’s website at sec.gov. Documents filed on the ASX or with the FCA or SEC are not incorporated by reference into this report. The documents referred to in this report as being available on our website, woodside.com, are not incorporated by reference and do not form part of this report. WOODSIDE ENERGY GROUP LTD Woodside was registered under Australian corporate law in 1971 and listed on the ASX on 18 November 1971. Woodside’s shares are currently listed on the ASX and LSE under the ticker symbol ‘WDS’ and its American Depositary Shares (ADS) are listed on the NYSE under the symbol ‘WDS’. Following the approval of Woodside shareholders at Woodside’s Annual General Meeting on 19 May 2022, Woodside changed its name from ‘Woodside Petroleum Ltd.’ to ‘Woodside Energy Group Ltd’ effective 20 May 2022. Woodside’s registered office is Mia Yellagonga, 11 Mount Street, Perth, Western Australia 6000, Australia, telephone +61 8 9348 4000. Additional information about Woodside can be found on its website at woodside.com. DIVIDEND PAYMENTS Woodside determines its dividends in US dollars as this is our functional and presentation currency. Woodside pays its dividends in Australian dollars, unless a shareholder’s registered address is in the United Kingdom (UK), where they are paid in UK pounds sterling, or in the United States of America (USA), where they are paid in US dollars, or in New Zealand (NZ), where they are paid in NZ dolllars. Shareholders may have their dividends paid directly into any bank or building society account in Australia, the USA, the UK or NZ. Payments are electronically credited on the dividend payment date and confirmed by payment advice. To request direct crediting of dividend payments, please contact the share registry or visit the share registry website (investorcentre.com/wds). Shareholders must make an election to alter their dividend currency by the business day after the record date for the dividend. Shareholders who reside outside the USA, the UK, Australia and NZ may elect to receive their dividend electronically in their local currency using the share registry’s Global Wire Payment Service. For a list of currencies offered and how to subscribe to the service, please contact the share registry. For more information on this topic, refer to Woodside’s website for the history of dividends paid by the company at woodside.com CHANGE OF ADDRESS OR BANKING DETAILS Shareholders should immediately notify the share registry of any change to their address or banking arrangements for dividends electronically credited to a bank account. For more information on this topic, refer to the share registry website to change details at investorcentre.com/wds AUSTRALIAN SECURITIES EXCHANGE Investors who hold Woodside shares listed on the ASX seeking information about their shareholdings should contact Woodside’s Australian share registry: Computershare Investor Services Pty Limited Address: Level 17, 221 St Georges Terrace Perth WA 6000 Postal address: GPO Box D182 Perth WA 6840 Telephone: 1300 558 507 (within Australia) +61 3 9415 4632 (outside Australia) Email: web.queries@computershare.com.au Website: investorcentre.com/wds The share registry can assist with queries on share transfers, dividend payments, the dividend reinvestment plan, notification of tax file numbers and changes of name, address or bank account details. For security reasons, you will need your Security Reference Number (SRN) or Holder Identification Number (HIN) when communicating with the share registry. The share registry website allows shareholders to make changes to address and banking details online. For more information on this topic, refer to the share registry website to change details at investorcentre.com/wds. WOODSIDE ENERGY GROUP LTD 197
LONDON STOCK EXCHANGE Woodside shares are traded on the Main Market for listed securities of the London Stock Exchange (with trades settled in the form of UK Depository Interests) under the symbol ‘WDS’. Woodside has appointed Computershare Investor Services PLC as its registrar. If you have a query regarding your shareholding, please contact Computershare in the United Kingdom: Computershare Investor Services Pty Limited Postal address: Computershare Investor Services PLC The Pavilions, Bridgwater Road Bristol BS99 6ZZ Telephone: +44 (0) 370 703 6075 Email: WebCorres@computershare.co.uk Website: computershare.com/uk AMERICAN DEPOSITARY RECEIPTS We have an American Depositary Receipts (ADR) program. The ADR program has a 1:1 ordinary share to American Depositary Share (ADS) ratio. Depositary fees Citibank serves as the depositary bank for our ADR program. ADR holders agree to the terms in the deposit agreement filed with the SEC for depositing ADSs or surrendering the ADSs for cancellation and for certain services as provided by Citibank. Holders are required to pay all fees for general depositary services provided by Citibank in each of our ADR programs, as set forth in the table below. Service Fees Issuance of ADSs upon deposit Up to $0.05 per ADS issued. of shares. Cancellation of ADSs. Up to $0.05 per ADS cancelled. Distribution of cash dividends or Up to $0.05 per ADS held. other cash distributions. Distribution of securities other Up to $0.05 per ADS held. than ADSs or rights to purchase additional ADSs. ADS Services. Up to $0.05 per ADS held on the applicable record date(s) established by the Depositary. Registration of ADS transfers. Up to $0.05 per ADS transferred. Conversion of ADSs of one series Up to $0.05 per ADS converted. for ADSs of another series. FEES PAYABLE BY THE DEPOSITARY TO THE ISSUER Citibank reimburses Woodside for certain expenses Woodside incurs in connection with its ADR program, subject to certain ceilings. These reimbursable expenses currently include, but are not limited to, legal, accounting and reserve engineer fees, listing fees, expenses related to investor relations in the United States, fees payable to service providers for the distribution of material to ADR holders and expenses to remain in compliance with applicable US laws and NYSE listing standards. Citibank has further agreed to waive certain fees in connection with Woodside’s ADR program. These waived expenses currently include, but are not limited to, standard costs associated with the administration of the ADR program and certain fees in connection with issuance of ADRs under Woodside’s equity compensatory plans. For the year ended 31 December 2023, direct reimbursements and waived fees totalled approximately US$1,633,000. Under certain circumstances, including termination of our ADS program or removal of our Depositary, we may be required to repay to the Depositary a portion of the amounts reimbursed in prior periods. The ADSs issued under our ADR programs trade on the NYSE under the stock ticker WDS. As of 13 February 2024, there were 47,844,455 ADSs on issue and outstanding in the Woodside ADS program. ADR holders should deal directly with Citibank on all matters related to their ADRs, using the details below. Enquiries should be directed to: Citibank Shareholder Services Address: PO Box 43077 Providence Rhode Island 02940-3077 USA Toll Free: 1-877-CITI-ADR International: +1 781 575 4555 Email: citibank@shareholders-online.com Investor Relations enquiries Address: Woodside Energy Group Ltd Mia Yellagonga 11 Mount Street Perth WA 6000 Postal address: GPO Box D188 Perth WA 6840 Telephone: +61 8 9348 4000 Email: investor@woodside.com Website: woodside.com EXCHANGE CONTROLS Under Australian foreign exchange controls currently in effect, transfers of capital to and from Australia are not subject to prior government approval and, except as described below, Australia does not restrict the flow of currency into or out of the country. Regulations may be made under the Anti-Money Laundering and Counter-Terrorism Financing Act 2006 (Cth) of Australia (AML/CTF Act) prohibiting the entering into of transactions involving prescribed foreign countries. As of the date of this report, no such regulations are in place. To control tax evasion and money laundering, the AML/CTF Act also requires certain transactions to be reported to the Australian Transaction Reports and Analysis Centre (AUSTRAC) and prohibits reporting entities from providing certain ‘designated services’ to customers without having complied with certain obligations under the AML/CTF Act (for example ‘know your customer’ checks). In addition, the Financial Transaction Reports Act 1988 (Cth) (FTR Act) imposes certain obligations on solicitors and ‘cash dealers’ to report ‘significant cash transactions’. The Autonomous 198 ANNUAL REPORT 2023
Sanctions Regulations 2011 (Cth) promulgated under the Autonomous Sanctions Act 2011 (Cth) of Australia, the Charter of the United Nations Act 1945 (Cth) of Australia and other acts and regulations in Australia restrict or prohibit payments, transactions or other dealings with assets having a proscribed connection with certain countries or named individuals or entities subject to financial sanctions or identified with terrorism. The Australian Department of Foreign Affairs and Trade (DFAT) maintains a list of all persons and entities subject to financial sanctions or having a proscribed connection with terrorism which is available to the public at DFAT’s website. There are no specific restrictions regarding the remittance of profits, dividends or capital. TAXATION This section describes the material United States and Australian Federal income tax consequences to a US holder (as defined below) of owning shares or ADSs (together, ‘Woodside Securities’). It applies to you only if you acquire your shares or ADSs and you hold your shares or ADSs as capital assets for tax purposes. This discussion addresses only United States and Australian Federal income taxation and does not discuss all of the tax consequences that may be relevant to you in light of your individual circumstances, including foreign, state or local tax consequences, estate and gift tax consequences, and tax consequences arising under the Medicare contribution tax on net investment income or the alternative minimum tax. This section does not apply to you if you are a member of a special class of holders subject to special rules, including: • a dealer in securities, • a trader in securities that elects to use a mark-to-market method of accounting for securities holdings, • a tax-exempt organisation, • a life insurance company, • a person that actually or constructively owns 10% or more of the combined voting power of our voting stock or of the total value of our stock, • a person that holds shares or ADSs as part of a straddle or a hedging or conversion transaction, • a person that purchases or sells shares or ADSs as part of a wash sale for tax purposes, or • a person whose functional currency is not the US dollar. This section is based on the Internal Revenue Code of 1986, as amended, its legislative history, existing and proposed regulations, published rulings and court decisions, all as currently in effect, as well as on the Convention Between the United States of America and Australia (the ‘Treaty’). These authorities are subject to change, possibly on a retroactive basis. In addition, this section is based in part upon the representations of the Depositary and the assumption that each obligation in the Deposit Agreement will be performed in accordance with its terms. You are a US holder if you are a beneficial owner of shares or ADSs and you are, for United States Federal income tax purposes: • a citizen or resident of the United States, • a domestic corporation, • an estate whose income is subject to United States Federal income tax regardless of its source, or • a trust if a United States court can exercise primary supervision over the trust’s administration and one or more United States persons are authorised to control all substantial decisions of the trust. If an entity or arrangement that is treated as a partnership for United States Federal income tax purposes holds the shares or ADSs, the United States Federal income tax treatment of a partner will generally depend on the status of the partner and the tax treatment of the partnership. A partner in a partnership holding the shares or ADSs should consult its tax advisor with regard to the United States Federal income tax treatment of an investment in the shares or ADSs. You should consult your own tax advisor regarding the United States Federal, state and local and Australian Federal tax consequences of owning and disposing of shares and ADSs in your particular circumstances. In particular, you should confirm whether you qualify for the benefits of the Treaty and the consequences of failing to do so. In general, and taking into account the earlier assumptions, for United States Federal income tax purposes, if you hold ADRs evidencing ADSs, you will be treated as the owner of the shares represented by those ADRs. Exchanges of shares for ADRs, and ADRs for shares, generally will not be subject to United States Federal income tax. Material United States Federal Income Tax Consequences The tax treatment of your shares or ADSs will depend in part on whether or not we are classified as a passive foreign investment company, or PFIC, for United States Federal income tax purposes. Except as discussed below under ‘PFIC Classification’, this discussion assumes that we are not classified as a PFIC for United States Federal income tax purposes. Taxation of Distributions Under the United States Federal income tax laws, the gross amount of any distribution we pay out of our current or accumulated earnings and profits (as determined for United States Federal income tax purposes), other than certain pro-rata distributions of our shares, will be treated as a dividend that is subject to United States Federal income taxation. If you are a non-corporate US holder, dividends that constitute qualified dividend income will be taxable to you at the preferential rates applicable to long-term capital gains provided that you hold the shares or ADSs for more than 60 days during the 121-day period beginning 60 days before the ex-dividend date and meet other holding period requirements. Dividends we pay with respect to the shares or ADSs generally will be qualified dividend income provided that, in the year that you receive the dividend, we are eligible for the benefits of the Treaty. We believe that we are currently eligible for the benefits of the Treaty and we therefore expect that dividends on the shares and ADS will be qualified dividend income, but there can be no assurance that we will continue to be eligible for the benefits of the Treaty. You must include any Australian tax withheld from the dividend payment in this gross amount even though you do not in fact receive it. The dividend is taxable to you when you, in the case WOODSIDE ENERGY GROUP LTD 199
of shares, or the Depositary, in the case of ADSs, receive the dividend, actually or constructively. The dividend will not be eligible for the dividends-received deduction generally allowed to United States corporations in respect of dividends received from other United States corporations. The amount of the dividend distribution that you must include in your income will be the US dollar value of the Australian dollar payments made, determined at the spot Australian dollar/US dollar rate on the date the dividend is distributed, regardless of whether the payment is in fact converted into US dollars. Generally, any gain or loss resulting from currency exchange fluctuations during the period from the date the dividend is distributed to the date you convert the payment into US dollars will be treated as ordinary income or loss and will not be eligible for the special tax rate applicable to qualified dividend income. The gain or loss generally will be income or loss from sources within the United States for foreign tax credit limitation purposes. Distributions in excess of current and accumulated earnings and profits, as determined for United States Federal income tax purposes, will be treated as a non-taxable return of capital to the extent of your basis in the shares or ADSs and thereafter as capital gain. However, we do not expect to calculate earnings and profits in accordance with United States Federal income tax principles. Accordingly, you should expect to generally treat distributions we make as dividends. Subject to certain limitations, the Australian tax withheld in accordance with the Treaty and paid over to Australia will generally be creditable against your United States Federal income tax liability. To the extent a reduction or refund of the tax withheld is available to you under Australian law or under the Treaty, the amount of tax withheld that could have been reduced or that is refundable will not be eligible for credit against your United States Federal income tax liability. Dividends will generally be income from sources outside the United States and will generally be ‘passive’ income for purposes of computing the foreign tax credit allowable to you. Taxation of Capital Gains If you are a US holder and you sell or otherwise dispose of your shares or ADSs, you will recognise capital gain or loss for United States Federal income tax purposes equal to the difference between the US dollar value of the amount that you realise and your tax basis, determined in US dollars, in your shares or ADSs. Your tax basis would generally equal the cost of your shares or ADSs, or if you received the shares or ADSs pursuant to a taxable distribution, the fair market value of the shares or ADSs at the time of such distribution, reduced by any distributions on the shares or ADSs that were treated as a return of capital for United States Federal income tax purposes. Capital gain of a non-corporate US holder is generally taxed at preferential rates where the property is held for more than one year. The gain or loss will generally be income or loss from sources within the United States for foreign tax credit limitation purposes. Your ability to deduct capital losses is subject to limitations. PFIC Classification We believe that we should not be currently classified as a PFIC for United States Federal income tax purposes and we do not expect to become a PFIC in the foreseeable future. However, this conclusion is a factual determination that is made annually and thus may be subject to change. It is therefore possible that we could become a PFIC in a future taxable year. In general, we will be a PFIC in a taxable year if: • at least 75% of our gross income for the taxable year is passive income; or • at least 50% of the value, determined on the basis of a quarterly average, of our assets in such taxable year is attributable to assets that produce or are held for the production of passive income. If we were to be treated as a PFIC and you are a US holder, gain realised on the sale or other disposition of your shares or ADSs would in general not be treated as capital gain. Instead, you would generally be treated as if you had realised such gain and certain ‘excess distributions’ ratably over your holding period for the shares or ADSs and would be taxed at the highest tax rate in effect for each previous year to which the gain was allocated in which we were a PFIC with respect to you, together with an interest charge in respect of the tax attributable to each such year. With certain exceptions, your shares or ADSs will be treated as stock in a PFIC if we were a PFIC at any time during your holding period in your shares or ADSs. Dividends that you receive from us will not be eligible for the special tax rates applicable to qualified dividend income if we are a PFIC or are treated as a PFIC with respect to you either in the taxable year of the distribution or the preceding taxable year, but instead will be taxable at rates applicable to ordinary income. If you own shares or ADSs during any year that we are a PFIC with respect to you, you may be required to file Internal Revenue Service (‘IRS’) Form 8621. Material Australian tax considerations This section is based on the Income Tax Assessment Act 1936 (Cth) and the Income Tax Assessment Act 1997 (Cth), as amended, its legislative history, existing and proposed regulations, published rulings and court decisions, all as currently in effect, as well as on the Convention Between the United States of America and Australia (the ‘Treaty’). These authorities are subject to change, possibly on a retroactive basis. Dividends (including other distributions treated as dividends for Australian tax purposes) paid by Woodside to a US Holder that is not an Australian resident for Australian tax purposes will generally not be subject to Australian withholding tax if they are fully franked (broadly, where a dividend is franked, tax paid by Woodside is imputed to the shareholders). 200 ANNUAL REPORT 2023
Dividends paid to such US Holders, which are not fully franked, will generally be subject to Australian withholding tax not exceeding 15% only to the extent (if any) that the dividend is neither: • franked; nor • declared by Woodside to be conduit foreign income. (Broadly, this means that the relevant part of the dividend is declared to have been paid out of foreign source amounts received by Woodside that are not subject to tax in Australia, such as dividends remitted to Australia by foreign subsidiaries). The Australian withholding tax outcome described above applies to US Holders who are eligible for benefits under the Tax Convention between Australia and the US as to the Avoidance of Double Taxation (the Australian Tax Treaty). Otherwise, the rate of Australian withholding tax may be 30%. In contrast, dividends (including other distributions treated as dividends for Australian tax purposes) paid by Woodside to a US Holder may instead by taxed by assessment in Australia if the US Holder: • is an Australian resident for Australian tax purposes (although tax will generally not exceed 15% where the US Holder is eligible for benefits under the Australian Tax Treaty as a treaty resident of the US and any franking credits may be creditable against their Australian income tax liability); or • carries on business in Australia through a permanent establishment as defined in the Australian Tax Treaty, or performs personal services from a fixed base in Australia, and the shareholding in respect of which the dividend is paid is effectively connected with that permanent establishment or fixed base, (however, in such a case any franking credits may be creditable against the Australian income tax liability). The treatment of dividends outlined above may be modified where the shareholding in Woodside is held through a trust, limited partnership, limited liability company, pension fund, sovereign wealth fund or other investment vehicle. Affected US Holders should seek their own advice in relation to such arrangements. Material Australian tax considerations—disposals of Woodside Securities Gains made by US Holders on the sale of Woodside Securities will generally not be taxed in Australia. However, the precise Australian tax treatment of gains made by US Holders on the sale of Woodside Securities generally depends on whether or not the gain is an Australian sourced gain of an income nature for Australian income tax purposes. Where the gain is of an income nature, a US Holder will generally only be liable to Australian income tax on an assessment basis (whether or not they are also an Australian resident for Australian tax purposes) if: • they are not eligible for benefits under the Australian Tax Treaty and the gain is sourced in Australia for Australian tax purposes; or • they are eligible for benefits under the Australian Tax Treaty but the gain constitutes any of the following (in which case the gain will be deemed to have an Australian source): › business profits of an enterprise attributable to a permanent establishment situated in Australia through which the enterprise carries on business in Australia; or › income or gains from the alienation of property that form part of the business property of a permanent establishment of an enterprise that the US Holder has in Australia, or pertain to a fixed base available to the US Holder in Australia for the purpose of performing independent personal services; or › income derived from the disposition of shares in a company, the assets of which consist wholly or principally of real property (which includes rights to exploit or to explore for nature resources) situated in Australia, whether such assets are held directly or indirectly through one or more interposed entities. Where the gain is not taxed as Australian sourced income, the US Holder will generally only be liable to Australian capital gains tax on an assessment basis if they acquired (or are deemed to have acquired) their Woodside Securities after 19 September 1985 and one or more of the following applies: • the US Holder is an Australian resident for Australian tax purposes; or • the Woodside Securities have been used by the US Holder in carrying on a business through permanent establishment in Australia; or • the Woodside Securities constitute an ‘indirect Australian real properly interest’ for Australian CGT purposes – this will generally be the case if the US Holder (either alone or together with associates) directly or indirectly owns or owned 10% or more of the issued share capital of Woodside at the time of disposal or throughout a 12-month period during the two years prior to the time of disposal and, at the time of the disposal, the sum of market values of Woodside’s assets (held directly or through interposed entities) that are not taxable Australian real property at that time (which, for these purposes includes mining, quarrying or prospecting rights in respect of minerals, petroleum or quarry materials situated in Australia); or • the US Holder is an individual who is not eligible for benefits under the Australian Tax Treaty as a treaty resident of the US and elected on becoming a non-resident of Australia to continue to have the Woodside Securities subject to Australian capital gains tax. In certain circumstances, if the Woodside Securities constitute an ‘indirect Australian real property interest’ for Australian CGT purposes, the purchaser may be required to withhold under the non-resident CGT withholding regime an amount equal to 12.5% of the purchase price in situations including where the acquisition is undertaken by way of an off-market transfer. It has been announced this withholding rate will be increased to 15% in respect of sale contracts entered into on or after 1 January 2025. Affected US Holders should seek their own advice in relation to how this withholding regime may apply to them. The comments above on the sale of Woodside Securities do not apply: • to temporary residents of Australia who should seek advice that is specific to their circumstances; or • if the Investment Management Regime (IMR) applies to the US Holder, which exempts from the Australian income tax and capital gains tax gains made on disposal by certain categories of non-resident funds – called IMR entities – of (relevantly) portfolio interests in Australian public companies (subject to a number of conditions). The IMR exemptions broadly apply to widely held WOODSIDE ENERGY GROUP LTD 201
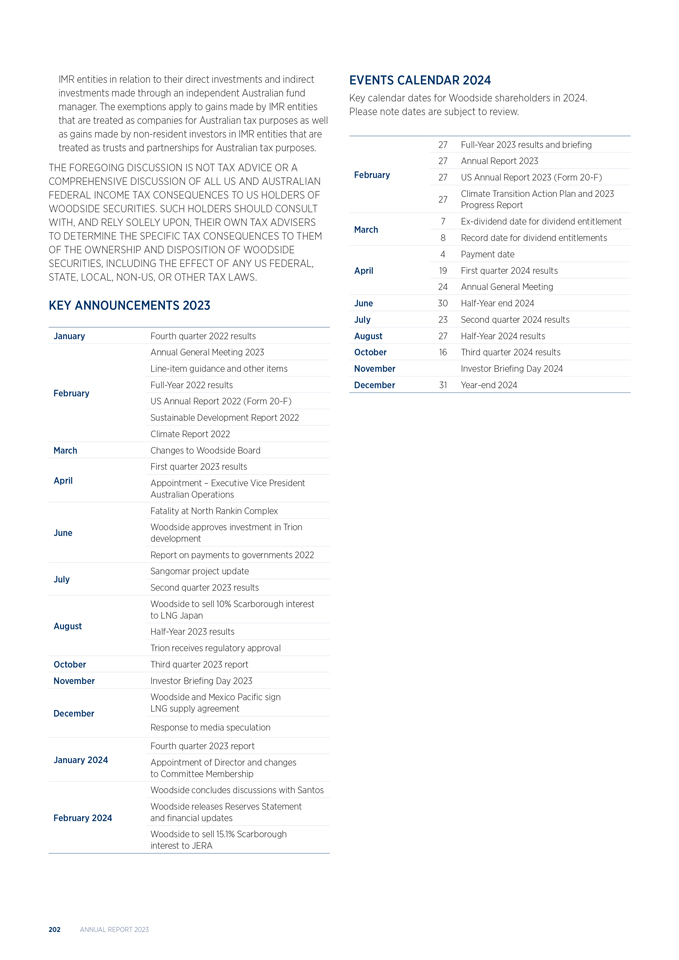
IMR entities in relation to their direct investments and indirect investments made through an independent Australian fund manager. The exemptions apply to gains made by IMR entities that are treated as companies for Australian tax purposes as well as gains made by non-resident investors in IMR entities that are treated as trusts and partnerships for Australian tax purposes. THE FOREGOING DISCUSSION IS NOT TAX ADVICE OR A COMPREHENSIVE DISCUSSION OF ALL US AND AUSTRALIAN FEDERAL INCOME TAX CONSEQUENCES TO US HOLDERS OF WOODSIDE SECURITIES. SUCH HOLDERS SHOULD CONSULT WITH, AND RELY SOLELY UPON, THEIR OWN TAX ADVISERS TO DETERMINE THE SPECIFIC TAX CONSEQUENCES TO THEM OF THE OWNERSHIP AND DISPOSITION OF WOODSIDE SECURITIES, INCLUDING THE EFFECT OF ANY US FEDERAL, STATE, LOCAL, NON-US, OR OTHER TAX LAWS. KEY ANNOUNCEMENTS 2023 January Fourth quarter 2022 results Annual General Meeting 2023 Line-item guidance and other items Full-Year 2022 results February US Annual Report 2022 (Form 20-F) Sustainable Development Report 2022 Climate Report 2022 March Changes to Woodside Board First quarter 2023 results April Appointment – Executive Vice President Australian Operations Fatality at North Rankin Complex June Woodside approves investment in Trion development Report on payments to governments 2022 Sangomar project update July Second quarter 2023 results Woodside to sell 10% Scarborough interest to LNG Japan August Half-Year 2023 results Trion receives regulatory approval October Third quarter 2023 report November Investor Briefing Day 2023 Woodside and Mexico Pacific sign December LNG supply agreement Response to media speculation Fourth quarter 2023 report January 2024 Appointment of Director and changes to Committee Membership Woodside concludes discussions with Santos Woodside releases Reserves Statement February 2024 and financial updates Woodside to sell 15.1% Scarborough interest to JERA EVENTS CALENDAR 2024 Key calendar dates for Woodside shareholders in 2024. Please note dates are subject to review. 27 Full-Year 2023 results and briefing 27 Annual Report 2023 February 27 US Annual Report 2023 (Form 20-F) 27 Climate Transition Action Plan and 2023 Progress Report 7 Ex-dividend date for dividend entitlement March 8 Record date for dividend entitlements 4 Payment date April 19 First quarter 2024 results 24 Annual General Meeting June 30 Half-Year end 2024 July 23 Second quarter 2024 results August 27 Half-Year 2024 results October 16 Third quarter 2024 results November Investor Briefing Day 2024 December 31 Year-end 2024 202 ANNUAL REPORT 2023
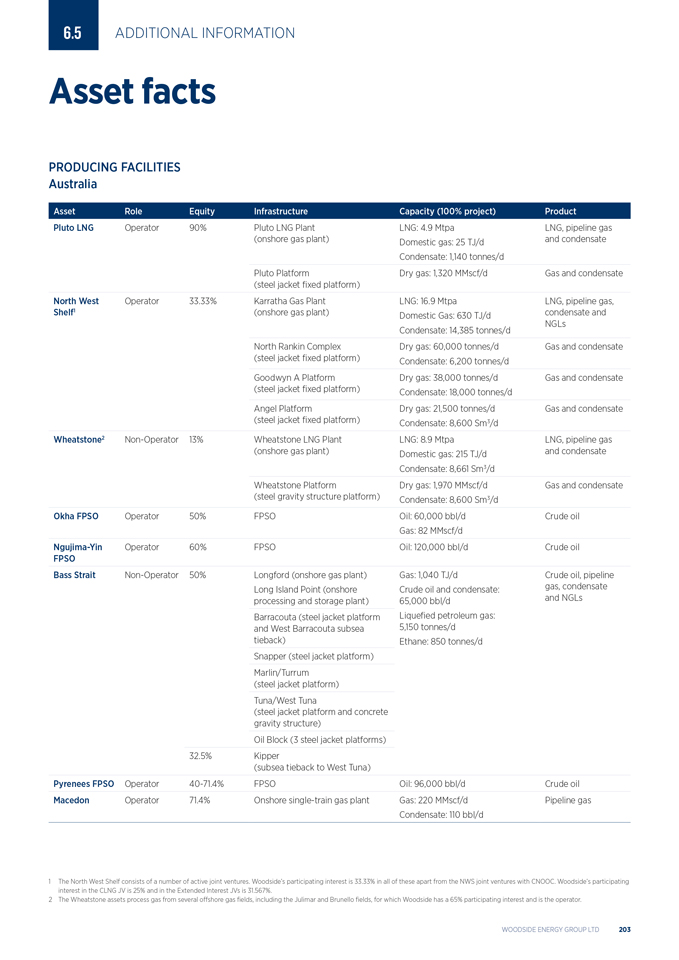
6.5 ADDITIONAL INFORMATION Asset facts PRODUCING FACILITIES Australia Asset Role EquityInfrastructureCapacity (100% project)Product Pluto LNG Operator 90%Pluto LNG PlantLNG: 4.9 MtpaLNG, pipeline gas (onshore gas plant)Domestic gas: 25 TJ/dand condensate Condensate: 1,140 tonnes/d Pluto PlatformDry gas: 1,320 MMscf/dGas and condensate (steel jacket fixed platform) North West Operator 33.33%Karratha Gas PlantLNG: 16.9 MtpaLNG, pipeline gas, Shelf1 (onshore gas plant)Domestic Gas: 630 TJ/dcondensate and Condensate: 14,385 tonnes/dNGLs North Rankin ComplexDry gas: 60,000 tonnes/dGas and condensate (steel jacket fixed platform)Condensate: 6,200 tonnes/d Goodwyn A PlatformDry gas: 38,000 tonnes/dGas and condensate (steel jacket fixed platform)Condensate: 18,000 tonnes/d Angel PlatformDry gas: 21,500 tonnes/dGas and condensate (steel jacket fixed platform)Condensate: 8,600 Sm3/d Wheatstone2 Non-Operator 13%Wheatstone LNG PlantLNG: 8.9 MtpaLNG, pipeline gas (onshore gas plant)Domestic gas: 215 TJ/dand condensate Condensate: 8,661 Sm3/d Wheatstone PlatformDry gas: 1,970 MMscf/dGas and condensate (steel gravity structure platform)Condensate: 8,600 Sm3/d Okha FPSO Operator 50%FPSOOil: 60,000 bbl/dCrude oil Gas: 82 MMscf/d Ngujima-Yin Operator 60%FPSOOil: 120,000 bbl/dCrude oil FPSO Bass Strait Non-Operator 50%Longford (onshore gas plant)Gas: 1,040 TJ/dCrude oil, pipeline Long Island Point (onshoreCrude oil and condensate:gas, condensate processing and storage plant)65,000 bbl/dand NGLs Barracouta (steel jacket platformLiquefied petroleum gas: and West Barracouta subsea5,150 tonnes/d tieback)Ethane: 850 tonnes/d Snapper (steel jacket platform) Marlin/Turrum (steel jacket platform) Tuna/West Tuna (steel jacket platform and concrete gravity structure) Oil Block (3 steel jacket platforms) 32.5% Kipper (subsea tieback to West Tuna) Pyrenees FPSO Operator 40-71.4%FPSOOil: 96,000 bbl/dCrude oil Macedon Operator 71.4%Onshore single-train gas plantGas: 220 MMscf/dPipeline gas Condensate: 110 bbl/d 1 The North West Shelf consists of a number of active joint ventures. Woodside’s participating interest is 33.33% in all of these apart from the NWS joint ventures with CNOOC. Woodside’s participating interest in the CLNG JV is 25% and in the Extended Interest JVs is 31.567%. 2 The Wheatstone assets process gas from several offshore gas fields, including the Julimar and Brunello fields, for which Woodside has a 65% participating interest and is the operator. WOODSIDE ENERGY GROUP LTD 203
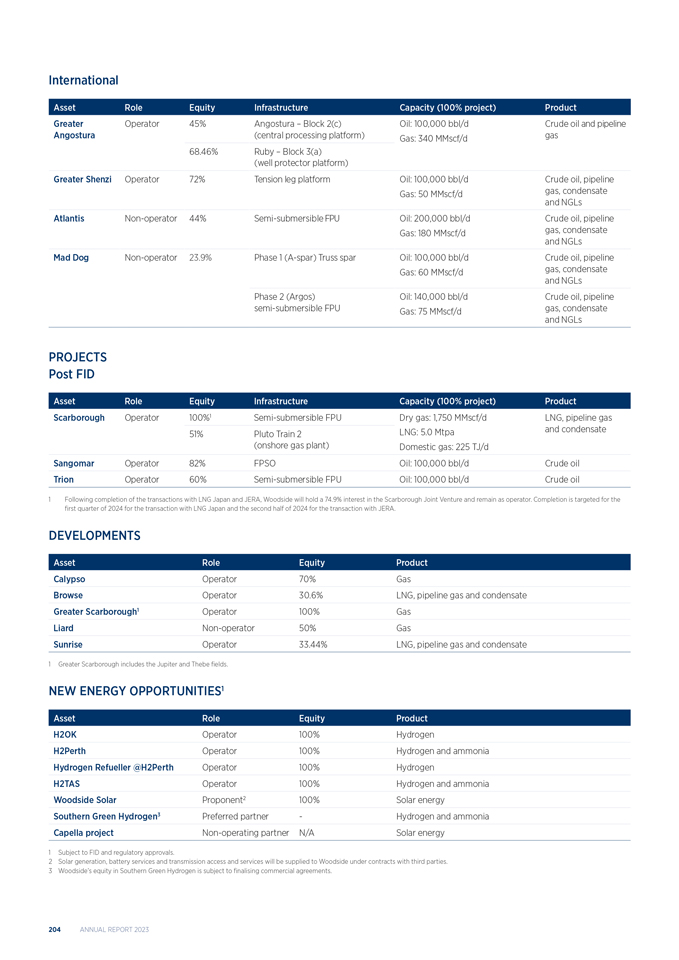
International Asset Role Equity Infrastructure Capacity (100% project) Product Greater Operator 45% Angostura – Block 2(c) Oil: 100,000 bbl/d Crude oil and pipeline Angostura (central processing platform) Gas: 340 MMscf/d gas 68.46% Ruby – Block 3(a) (well protector platform) Greater Shenzi Operator 72% Tension leg platform Oil: 100,000 bbl/d Crude oil, pipeline Gas: 50 MMscf/d gas, condensate and NGLs Atlantis Non-operator 44% Semi-submersible FPU Oil: 200,000 bbl/d Crude oil, pipeline Gas: 180 MMscf/d gas, condensate and NGLs Mad Dog Non-operator 23.9% Phase 1 (A-spar) Truss spar Oil: 100,000 bbl/d Crude oil, pipeline Gas: 60 MMscf/d gas, condensate and NGLs Phase 2 (Argos) Oil: 140,000 bbl/d Crude oil, pipeline semi-submersible FPU Gas: 75 MMscf/d gas, condensate and NGLs PROJECTS Post FID Asset Role Equity Infrastructure Capacity (100% project) Product Scarborough Operator 100%(1) Semi-submersible FPU Dry gas: 1,750 MMscf/d LNG, pipeline gas 51% Pluto Train 2 LNG: 5.0 Mtpa and condensate (onshore gas plant) Domestic gas: 225 TJ/d Sangomar Operator 82% FPSO Oil: 100,000 bbl/d Crude oil Trion Operator 60% Semi-submersible FPU Oil: 100,000 bbl/d Crude oil 1 Following completion of the transactions with LNG Japan and JERA, Woodside will hold a 74.9% interest in the Scarborough Joint Venture and remain as operator. Completion is targeted for the first quarter of 2024 for the transaction with LNG Japan and the second half of 2024 for the transaction with JERA. DEVELOPMENTS Asset Role Equity Product Calypso Operator 70% Gas Browse Operator 30.6% LNG, pipeline gas and condensate Greater Scarborough(1) Operator 100% Gas Liard Non-operator 50% Gas Sunrise Operator 33.44% LNG, pipeline gas and condensate 1 Greater Scarborough includes the Jupiter and Thebe fields. NEW ENERGY OPPORTUNITIES(1) Asset Role Equity Product H2OK Operator 100% Hydrogen H2Perth Operator 100% Hydrogen and ammonia Hydrogen Refueller @H2Perth Operator 100% Hydrogen H2TAS Operator 100% Hydrogen and ammonia Woodside Solar Proponent(2) 100% Solar energy Southern Green Hydrogen(3) Preferred partner — Hydrogen and ammonia Capella project Non-operating partner N/A Solar energy 1 Subject to FID and regulatory approvals. 2 Solar generation, battery services and transmission access and services will be supplied to Woodside under contracts with third parties. 3 Woodside’s equity in Southern Green Hydrogen is subject to finalising commercial agreements. 204 ANNUAL REPORT 2023
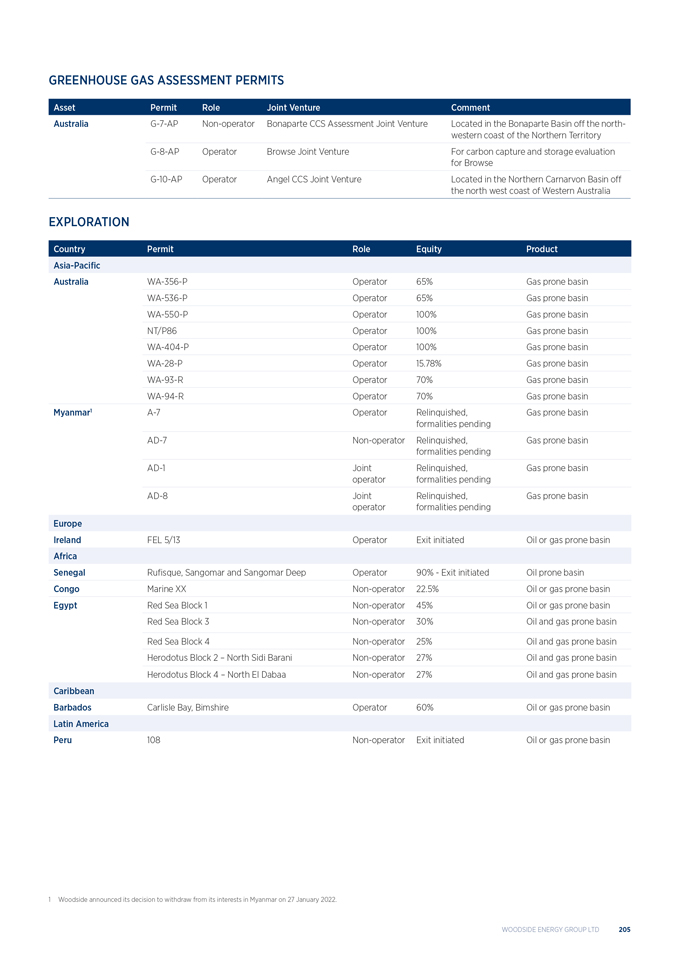
GREENHOUSE GAS ASSESSMENT PERMITS Asset Permit Role Joint Venture Comment Australia G-7-AP Non-operator Bonaparte CCS Assessment Joint Venture Located in the Bonaparte Basin off the north- western coast of the Northern Territory G-8-AP Operator Browse Joint Venture For carbon capture and storage evaluation for Browse G-10-AP Operator Angel CCS Joint Venture Located in the Northern Carnarvon Basin off the north west coast of Western Australia EXPLORATION Country Permit Role Equity Product Asia-Pacific Australia WA-356-P Operator 65% Gas prone basin WA-536-P Operator 65% Gas prone basin WA-550-P Operator 100% Gas prone basin NT/P86 Operator 100% Gas prone basin WA-404-P Operator 100% Gas prone basin WA-28-P Operator 15.78% Gas prone basin WA-93-R Operator 70% Gas prone basin WA-94-R Operator 70% Gas prone basin Myanmar(1) A-7 Operator Relinquished, Gas prone basin formalities pending AD-7 Non-operator Relinquished, Gas prone basin formalities pending AD-1 Joint Relinquished, Gas prone basin operator formalities pending AD-8 Joint Relinquished, Gas prone basin operator formalities pending Europe Ireland FEL 5/13 Operator Exit initiated Oil or gas prone basin Africa Senegal Rufisque, Sangomar and Sangomar Deep Operator 90%—Exit initiated Oil prone basin Congo Marine XX Non-operator 22.5% Oil or gas prone basin Egypt Red Sea Block 1 Non-operator 45% Oil or gas prone basin Red Sea Block 3 Non-operator 30% Oil and gas prone basin Red Sea Block 4 Non-operator 25% Oil and gas prone basin Herodotus Block 2 – North Sidi Barani Non-operator 27% Oil and gas prone basin Herodotus Block 4 – North El Dabaa Non-operator 27% Oil and gas prone basin Caribbean Barbados Carlisle Bay, Bimshire Operator 60% Oil or gas prone basin Latin America Peru 108 Non-operator Exit initiated Oil or gas prone basin 1 Woodside announced its decision to withdraw from its interests in Myanmar on 27 January 2022. WOODSIDE ENERGY GROUP LTD 205
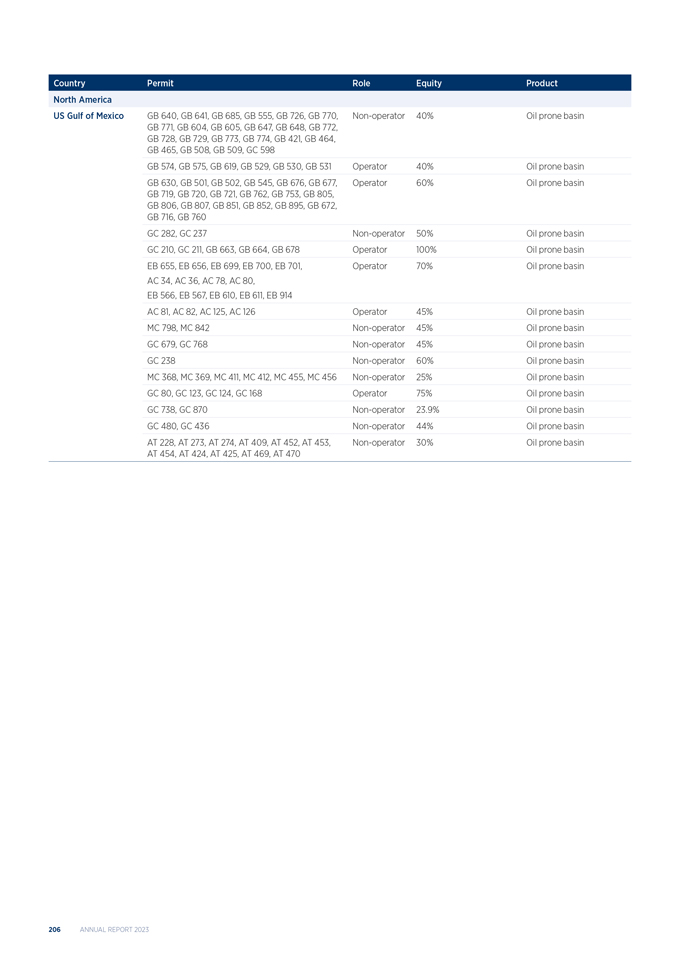
Country Permit Role Equity Product North America US Gulf of Mexico GB 640, GB 641, GB 685, GB 555, GB 726, GB 770, Non-operator 40% Oil prone basin GB 771, GB 604, GB 605, GB 647, GB 648, GB 772, GB 728, GB 729, GB 773, GB 774, GB 421, GB 464, GB 465, GB 508, GB 509, GC 598 GB 574, GB 575, GB 619, GB 529, GB 530, GB 531 Operator 40% Oil prone basin GB 630, GB 501, GB 502, GB 545, GB 676, GB 677, Operator 60% Oil prone basin GB 719, GB 720, GB 721, GB 762, GB 753, GB 805, GB 806, GB 807, GB 851, GB 852, GB 895, GB 672, GB 716, GB 760 GC 282, GC 237 Non-operator 50% Oil prone basin GC 210, GC 211, GB 663, GB 664, GB 678 Operator 100% Oil prone basin EB 655, EB 656, EB 699, EB 700, EB 701, Operator 70% Oil prone basin AC 34, AC 36, AC 78, AC 80, EB 566, EB 567, EB 610, EB 611, EB 914 AC 81, AC 82, AC 125, AC 126 Operator 45% Oil prone basin MC 798, MC 842 Non-operator 45% Oil prone basin GC 679, GC 768 Non-operator 45% Oil prone basin GC 238 Non-operator 60% Oil prone basin MC 368, MC 369, MC 411, MC 412, MC 455, MC 456 Non-operator 25% Oil prone basin GC 80, GC 123, GC 124, GC 168 Operator 75% Oil prone basin GC 738, GC 870 Non-operator 23.9% Oil prone basin GC 480, GC 436 Non-operator 44% Oil prone basin AT 228, AT 273, AT 274, AT 409, AT 452, AT 453, Non-operator 30% Oil prone basin AT 454, AT 424, AT 425, AT 469, AT 470 206 ANNUAL REPORT 2023
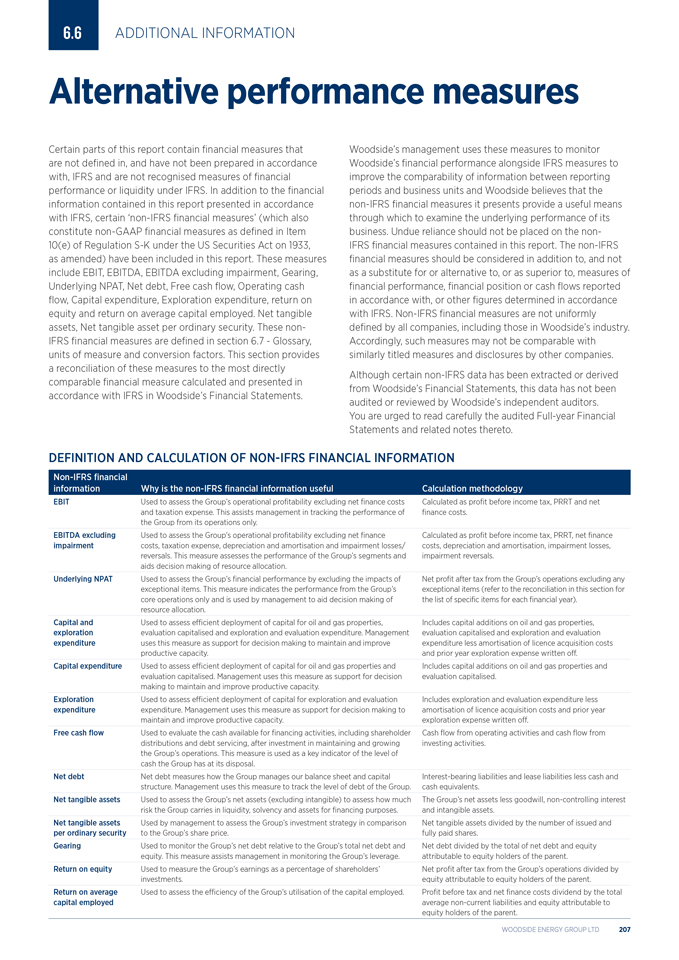
6.6 ADDITIONAL INFORMATION Alternative performance measures Certain parts of this report contain financial measures that are not defined in, and have not been prepared in accordance with, IFRS and are not recognised measures of financial performance or liquidity under IFRS. In addition to the financial information contained in this report presented in accordance with IFRS, certain ‘non-IFRS financial measures’ (which also constitute non-GAAP financial measures as defined in Item 10(e) of Regulation S-K under the US Securities Act on 1933, as amended) have been included in this report. These measures include EBIT, EBITDA, EBITDA excluding impairment, Gearing, Underlying NPAT, Net debt, Free cash flow, Operating cash flow, Capital expenditure, Exploration expenditure, return on equity and return on average capital employed. Net tangible assets, Net tangible asset per ordinary security. These non-IFRS financial measures are defined in section 6.7—Glossary, units of measure and conversion factors. This section provides a reconciliation of these measures to the most directly comparable financial measure calculated and presented in accordance with IFRS in Woodside’s Financial Statements. Woodside’s management uses these measures to monitor Woodside’s financial performance alongside IFRS measures to improve the comparability of information between reporting periods and business units and Woodside believes that the non-IFRS financial measures it presents provide a useful means through which to examine the underlying performance of its business. Undue reliance should not be placed on the non-IFRS financial measures contained in this report. The non-IFRS financial measures should be considered in addition to, and not as a substitute for or alternative to, or as superior to, measures of financial performance, financial position or cash flows reported in accordance with, or other figures determined in accordance with IFRS. Non-IFRS financial measures are not uniformly defined by all companies, including those in Woodside’s industry. Accordingly, such measures may not be comparable with similarly titled measures and disclosures by other companies. Although certain non-IFRS data has been extracted or derived from Woodside’s Financial Statements, this data has not been audited or reviewed by Woodside’s independent auditors. You are urged to read carefully the audited Full-year Financial Statements and related notes thereto. DEFINITION AND CALCULATION OF NON-IFRS FINANCIAL INFORMATION Non-IFRS financial information Why is the non-IFRS financial information useful Calculation methodology EBIT Used to assess the Group’s operational profitability excluding net finance costs Calculated as profit before income tax, PRRT and net and taxation expense. This assists management in tracking the performance of finance costs. the Group from its operations only. EBITDA excluding Used to assess the Group’s operational profitability excluding net finance Calculated as profit before income tax, PRRT, net finance impairment costs, taxation expense, depreciation and amortisation and impairment losses/ costs, depreciation and amortisation, impairment losses, reversals. This measure assesses the performance of the Group’s segments and impairment reversals. aids decision making of resource allocation. Underlying NPAT Used to assess the Group’s financial performance by excluding the impacts of Net profit after tax from the Group’s operations excluding any exceptional items. This measure indicates the performance from the Group’s exceptional items (refer to the reconciliation in this section for core operations only and is used by management to aid decision making of the list of specific items for each financial year). resource allocation. Capital and Used to assess efficient deployment of capital for oil and gas properties, Includes capital additions on oil and gas properties, exploration evaluation capitalised and exploration and evaluation expenditure. Management evaluation capitalised and exploration and evaluation expenditure uses this measure as support for decision making to maintain and improve expenditure less amortisation of licence acquisition costs productive capacity. and prior year exploration expense written off. Capital expenditure Used to assess efficient deployment of capital for oil and gas properties and Includes capital additions on oil and gas properties and evaluation capitalised. Management uses this measure as support for decision evaluation capitalised. making to maintain and improve productive capacity. Exploration Used to assess efficient deployment of capital for exploration and evaluation Includes exploration and evaluation expenditure less expenditure expenditure. Management uses this measure as support for decision making to amortisation of licence acquisition costs and prior year maintain and improve productive capacity. exploration expense written off. Free cash flow Used to evaluate the cash available for financing activities, including shareholder Cash flow from operating activities and cash flow from distributions and debt servicing, after investment in maintaining and growing investing activities. the Group’s operations. This measure is used as a key indicator of the level of cash the Group has at its disposal. Net debt Net debt measures how the Group manages our balance sheet and capital Interest-bearing liabilities and lease liabilities less cash and structure. Management uses this measure to track the level of debt of the Group. cash equivalents. Net tangible assets Used to assess the Group’s net assets (excluding intangible) to assess how much The Group’s net assets less goodwill, non-controlling interest risk the Group carries in liquidity, solvency and assets for financing purposes. and intangible assets. Net tangible assets Used by management to assess the Group’s investment strategy in comparison Net tangible assets divided by the number of issued and per ordinary security to the Group’s share price. fully paid shares. Gearing Used to monitor the Group’s net debt relative to the Group’s total net debt and Net debt divided by the total of net debt and equity equity. This measure assists management in monitoring the Group’s leverage. attributable to equity holders of the parent. Return on equity Used to measure the Group’s earnings as a percentage of shareholders’ Net profit after tax from the Group’s operations divided by investments. equity attributable to equity holders of the parent. Return on average Used to assess the efficiency of the Group’s utilisation of the capital employed. Profit before tax and net finance costs dividend by the total capital employed average non-current liabilities and equity attributable to equity holders of the parent. WOODSIDE ENERGY GROUP LTD 207
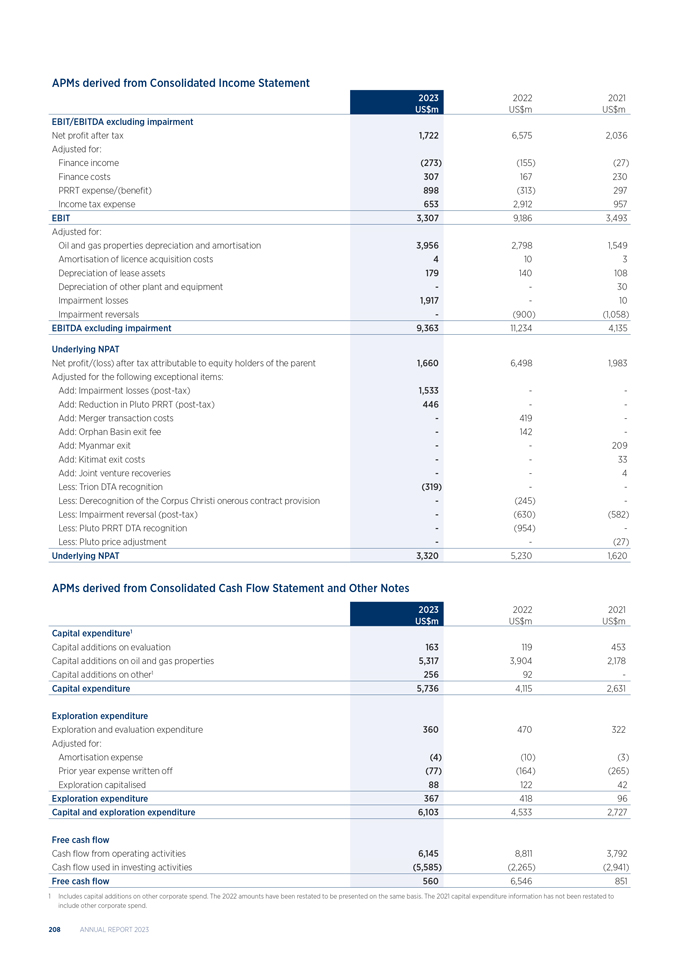
APMs derived from Consolidated Income Statement 2023 2022 2021 US$m US$m US$m EBIT/EBITDA excluding impairment Net profit after tax 1,722 6,575 2,036 Adjusted for: Finance income (273) (155) (27) Finance costs 307 167 230 PRRT expense/(benefit) 898 (313) 297 Income tax expense 653 2,912 957 EBIT 3,307 9,186 3,493 Adjusted for: Oil and gas properties depreciation and amortisation 3,956 2,798 1,549 Amortisation of licence acquisition costs 4 10 3 Depreciation of lease assets 179 140 108 Depreciation of other plant and equipment — — 30 Impairment losses 1,917 10 Impairment reversals — (900) (1,058) EBITDA excluding impairment 9,363 11,234 4,135 Underlying NPAT Net profit/(loss) after tax attributable to equity holders of the parent 1,660 6,498 1,983 Adjusted for the following exceptional items: Add: Impairment losses (post-tax) 1,533 - Add: Reduction in Pluto PRRT (post-tax) 446 — - Add: Merger transaction costs — 419 - Add: Orphan Basin exit fee — 142 - Add: Myanmar exit — 209 Add: Kitimat exit costs — 33 Add: Joint venture recoveries — 4 Less: Trion DTA recognition (319) — - Less: Derecognition of the Corpus Christi onerous contract provision — (245) - Less: Impairment reversal (post-tax) — (630) (582) Less: Pluto PRRT DTA recognition — (954) - Less: Pluto price adjustment — (27) Underlying NPAT 3,320 5,230 1,620 APMs derived from Consolidated Cash Flow Statement and Other Notes 2023 2022 2021 US$m US$m US$m Capital expenditure(1) Capital additions on evaluation 163 119 453 Capital additions on oil and gas properties 5,317 3,904 2,178 Capital additions on other(1) 256 92 - Capital expenditure 5,736 4,115 2,631 Exploration expenditure Exploration and evaluation expenditure 360 470 322 Adjusted for: Amortisation expense (4) (10) (3) Prior year expense written off (77) (164) (265) Exploration capitalised 88 122 42 Exploration expenditure 367 418 96 Capital and exploration expenditure 6,103 4,533 2,727 Free cash flow Cash flow from operating activities 6,145 8,811 3,792 Cash flow used in investing activities (5,585) (2,265) (2,941) Free cash flow 560 6,546 851 1 Includes capital additions on other corporate spend. The 2022 amounts have been restated to be presented on the same basis. The 2021 capital expenditure information has not been restated to include other corporate spend. 208 ANNUAL REPORT 2023
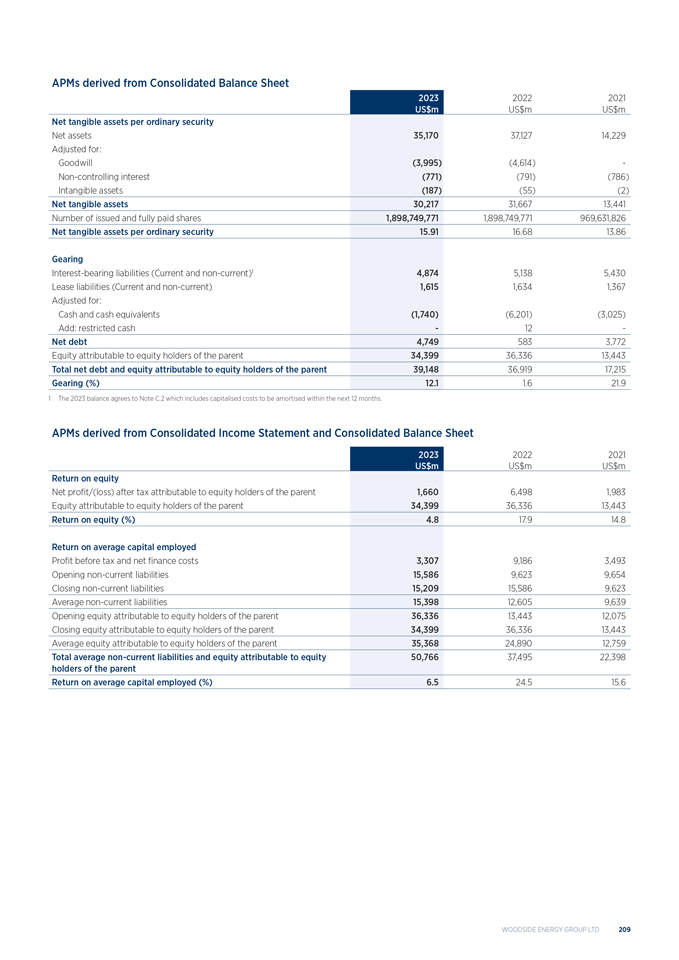
APMs derived from Consolidated Balance Sheet 2023 2022 2021 US$m US$m US$m Net tangible assets per ordinary security Net assets 35,170 37,127 14,229 Adjusted for: Goodwill (3,995) (4,614) - Non-controlling interest (771) (791) (786) Intangible assets (187) (55) (2) Net tangible assets 30,217 31,667 13,441 Number of issued and fully paid shares 1,898,749,771 1,898,749,771 969,631,826 Net tangible assets per ordinary security 15.91 16.68 13.86 Gearing Interest-bearing liabilities (Current and non-current)(1) 4,874 5,138 5,430 Lease liabilities (Current and non-current) 1,615 1,634 1,367 Adjusted for: Cash and cash equivalents (1,740) (6,201) (3,025) Add: restricted cash — 12 - Net debt 4,749 583 3,772 Equity attributable to equity holders of the parent 34,399 36,336 13,443 Total net debt and equity attributable to equity holders of the parent 39,148 36,919 17,215 Gearing (%) 12.1 1.6 21.9 1 The 2023 balance agrees to Note C.2 which includes capitalised costs to be amortised within the next 12 months. APMs derived from Consolidated Income Statement and Consolidated Balance Sheet 2023 2022 2021 US$m US$m US$m Return on equity Net profit/(loss) after tax attributable to equity holders of the parent 1,660 6,498 1,983 Equity attributable to equity holders of the parent 34,399 36,336 13,443 Return on equity (%) 4.8 17.9 14.8 Return on average capital employed Profit before tax and net finance costs 3,307 9,186 3,493 Opening non-current liabilities 15,586 9,623 9,654 Closing non-current liabilities 15,209 15,586 9,623 Average non-current liabilities 15,398 12,605 9,639 Opening equity attributable to equity holders of the parent 36,336 13,443 12,075 Closing equity attributable to equity holders of the parent 34,399 36,336 13,443 Average equity attributable to equity holders of the parent 35,368 24,890 12,759 Total average non-current liabilities and equity attributable to equity 50,766 37,495 22,398 holders of the parent Return on average capital employed (%) 6.5 24.5 15.6 WOODSIDE ENERGY GROUP LTD 209
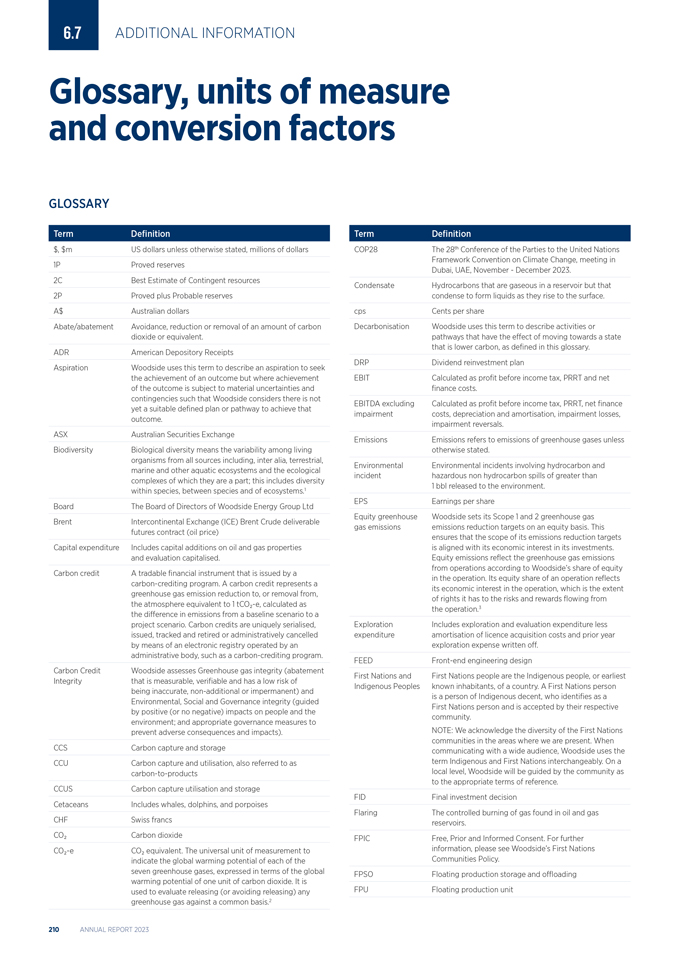
6.7 ADDITIONAL INFORMATION Glossary, units of measure and conversion factors GLOSSARY Term Definition $, $m US dollars unless otherwise stated, millions of dollars 1P Proved reserves 2C Best Estimate of Contingent resources 2P Proved plus Probable reserves A$ Australian dollars Abate/abatement Avoidance, reduction or removal of an amount of carbon dioxide or equivalent. ADR American Depository Receipts Aspiration Woodside uses this term to describe an aspiration to seek the achievement of an outcome but where achievement of the outcome is subject to material uncertainties and contingencies such that Woodside considers there is not yet a suitable defined plan or pathway to achieve that outcome. ASX Australian Securities Exchange Biodiversity Biological diversity means the variability among living organisms from all sources including, inter alia, terrestrial, marine and other aquatic ecosystems and the ecological complexes of which they are a part; this includes diversity within species, between species and of ecosystems.1 Board The Board of Directors of Woodside Energy Group Ltd Brent Intercontinental Exchange (ICE) Brent Crude deliverable futures contract (oil price) Capital expenditure Includes capital additions on oil and gas properties and evaluation capitalised. Carbon credit A tradable financial instrument that is issued by a carbon-crediting program. A carbon credit represents a greenhouse gas emission reduction to, or removal from, the atmosphere equivalent to 1 tCOâ,,-e, calculated as the difference in emissions from a baseline scenario to a project scenario. Carbon credits are uniquely serialised, issued, tracked and retired or administratively cancelled by means of an electronic registry operated by an administrative body, such as a carbon-crediting program. Carbon Credit Woodside assesses Greenhouse gas integrity (abatement Integrity that is measurable, verifiable and has a low risk of being inaccurate, non-additional or impermanent) and Environmental, Social and Governance integrity (guided by positive (or no negative) impacts on people and the environment; and appropriate governance measures to prevent adverse consequences and impacts). CCS Carbon capture and storage CCU Carbon capture and utilisation, also referred to as carbon-to-products CCUS Carbon capture utilisation and storage Cetaceans Includes whales, dolphins, and porpoises CHF Swiss francs COâ,, Carbon dioxide COâ,,-e COâ,, equivalent. The universal unit of measurement to indicate the global warming potential of each of the seven greenhouse gases, expressed in terms of the global warming potential of one unit of carbon dioxide. It is used to evaluate releasing (or avoiding releasing) any greenhouse gas against a common basis.2 Term Definition COP28 The 28th Conference of the Parties to the United Nations Framework Convention on Climate Change, meeting in Dubai, UAE, November—December 2023. Condensate Hydrocarbons that are gaseous in a reservoir but that condense to form liquids as they rise to the surface. cps Cents per share Decarbonisation Woodside uses this term to describe activities or pathways that have the effect of moving towards a state that is lower carbon, as defined in this glossary. DRP Dividend reinvestment plan EBIT Calculated as profit before income tax, PRRT and net finance costs. EBITDA excluding Calculated as profit before income tax, PRRT, net finance impairment costs, depreciation and amortisation, impairment losses, impairment reversals. Emissions Emissions refers to emissions of greenhouse gases unless otherwise stated. Environmental Environmental incidents involving hydrocarbon and incident hazardous non hydrocarbon spills of greater than 1 bbl released to the environment. EPS Earnings per share Equity greenhouse Woodside sets its Scope 1 and 2 greenhouse gas gas emissions emissions reduction targets on an equity basis. This ensures that the scope of its emissions reduction targets is aligned with its economic interest in its investments. Equity emissions reflect the greenhouse gas emissions from operations according to Woodside’s share of equity in the operation. Its equity share of an operation reflects its economic interest in the operation, which is the extent of rights it has to the risks and rewards flowing from the operation.3 Exploration Includes exploration and evaluation expenditure less expenditure amortisation of licence acquisition costs and prior year exploration expense written off. FEED Front-end engineering design First Nations and First Nations people are the Indigenous people, or earliest Indigenous Peoples known inhabitants, of a country. A First Nations person is a person of Indigenous decent, who identifies as a First Nations person and is accepted by their respective community. NOTE: We acknowledge the diversity of the First Nations communities in the areas where we are present. When communicating with a wide audience, Woodside uses the term Indigenous and First Nations interchangeably. On a local level, Woodside will be guided by the community as to the appropriate terms of reference. FID Final investment decision Flaring The controlled burning of gas found in oil and gas reservoirs. FPIC Free, Prior and Informed Consent. For further information, please see Woodside’s First Nations Communities Policy. FPSO Floating production storage and offloading FPU Floating production unit 210 ANNUAL REPORT 2023
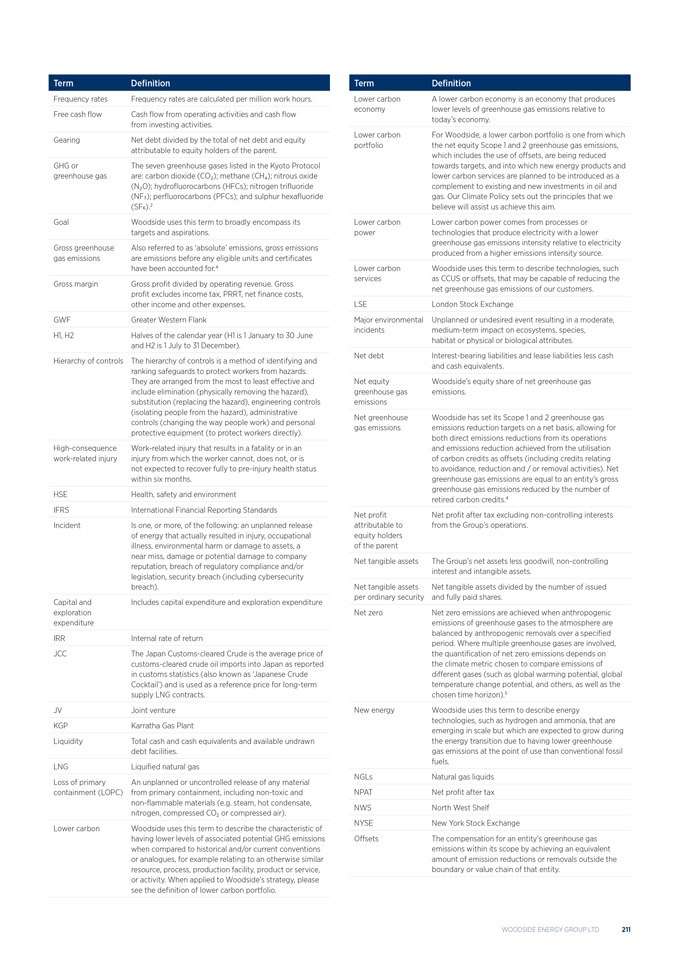
Term Definition Frequency rates Frequency rates are calculated per million work hours. Free cash flow Cash flow from operating activities and cash flow from investing activities. Gearing Net debt divided by the total of net debt and equity attributable to equity holders of the parent. GHG or The seven greenhouse gases listed in the Kyoto Protocol greenhouse gas are: carbon dioxide (COâ,,); methane (CHâ,„); nitrous oxide (Nâ,,O); hydrofluorocarbons (HFCs); nitrogen trifluoride (NF3); perfluorocarbons (PFCs); and sulphur hexafluoride (SF6).2 Goal Woodside uses this term to broadly encompass its targets and aspirations. Gross greenhouse Also referred to as ‘absolute’ emissions, gross emissions gas emissions are emissions before any eligible units and certificates have been accounted for.4 Gross margin Gross profit divided by operating revenue. Gross profit excludes income tax, PRRT, net finance costs, other income and other expenses. GWF Greater Western Flank H1, H2 Halves of the calendar year (H1 is 1 January to 30 June and H2 is 1 July to 31 December). Hierarchy of controls The hierarchy of controls is a method of identifying and ranking safeguards to protect workers from hazards. They are arranged from the most to least effective and include elimination (physically removing the hazard), substitution (replacing the hazard), engineering controls (isolating people from the hazard), administrative controls (changing the way people work) and personal protective equipment (to protect workers directly). High-consequence Work-related injury that results in a fatality or in an work-related injury injury from which the worker cannot, does not, or is not expected to recover fully to pre-injury health status within six months. HSE Health, safety and environment IFRS International Financial Reporting Standards Incident Is one, or more, of the following: an unplanned release of energy that actually resulted in injury, occupational illness, environmental harm or damage to assets, a near miss, damage or potential damage to company reputation, breach of regulatory compliance and/or legislation, security breach (including cybersecurity breach). Capital and Includes capital expenditure and exploration expenditure exploration expenditure IRR Internal rate of return JCC The Japan Customs-cleared Crude is the average price of customs-cleared crude oil imports into Japan as reported in customs statistics (also known as ‘Japanese Crude Cocktail’) and is used as a reference price for long-term supply LNG contracts. JV Joint venture KGP Karratha Gas Plant Liquidity Total cash and cash equivalents and available undrawn debt facilities. LNG Liquified natural gas Loss of primary An unplanned or uncontrolled release of any material containment (LOPC) from primary containment, including non-toxic and non-flammable materials (e.g. steam, hot condensate, nitrogen, compressed COâ,, or compressed air). Lower carbon Woodside uses this term to describe the characteristic of having lower levels of associated potential GHG emissions when compared to historical and/or current conventions or analogues, for example relating to an otherwise similar resource, process, production facility, product or service, or activity. When applied to Woodside’s strategy, please see the definition of lower carbon portfolio. Term Definition Lower carbon A lower carbon economy is an economy that produces economy lower levels of greenhouse gas emissions relative to today’s economy. Lower carbon For Woodside, a lower carbon portfolio is one from which portfolio the net equity Scope 1 and 2 greenhouse gas emissions, which includes the use of offsets, are being reduced towards targets, and into which new energy products and lower carbon services are planned to be introduced as a complement to existing and new investments in oil and gas. Our Climate Policy sets out the principles that we believe will assist us achieve this aim. Lower carbon Lower carbon power comes from processes or power technologies that produce electricity with a lower greenhouse gas emissions intensity relative to electricity produced from a higher emissions intensity source. Lower carbon Woodside uses this term to describe technologies, such services as CCUS or offsets, that may be capable of reducing the net greenhouse gas emissions of our customers. LSE London Stock Exchange Major environmental Unplanned or undesired event resulting in a moderate, incidents medium-term impact on ecosystems, species, habitat or physical or biological attributes. Net debt Interest-bearing liabilities and lease liabilities less cash and cash equivalents. Net equity Woodside’s equity share of net greenhouse gas greenhouse gas emissions. emissions Net greenhouse Woodside has set its Scope 1 and 2 greenhouse gas gas emissions emissions reduction targets on a net basis, allowing for both direct emissions reductions from its operations and emissions reduction achieved from the utilisation of carbon credits as offsets (including credits relating to avoidance, reduction and / or removal activities). Net greenhouse gas emissions are equal to an entity’s gross greenhouse gas emissions reduced by the number of retired carbon credits.4 Net profit Net profit after tax excluding non-controlling interests attributable to from the Group’s operations. equity holders of the parent Net tangible assets The Group’s net assets less goodwill, non-controlling interest and intangible assets. Net tangible assets Net tangible assets divided by the number of issued per ordinary security and fully paid shares. Net zero Net zero emissions are achieved when anthropogenic emissions of greenhouse gases to the atmosphere are balanced by anthropogenic removals over a specified period. Where multiple greenhouse gases are involved, the quantification of net zero emissions depends on the climate metric chosen to compare emissions of different gases (such as global warming potential, global temperature change potential, and others, as well as the chosen time horizon).5 New energy Woodside uses this term to describe energy technologies, such as hydrogen and ammonia, that are emerging in scale but which are expected to grow during the energy transition due to having lower greenhouse gas emissions at the point of use than conventional fossil fuels. NGLs Natural gas liquids NPAT Net profit after tax NWS North West Shelf NYSE New York Stock Exchange Offsets The compensation for an entity’s greenhouse gas emissions within its scope by achieving an equivalent amount of emission reductions or removals outside the boundary or value chain of that entity. WOODSIDE ENERGY GROUP LTD 211
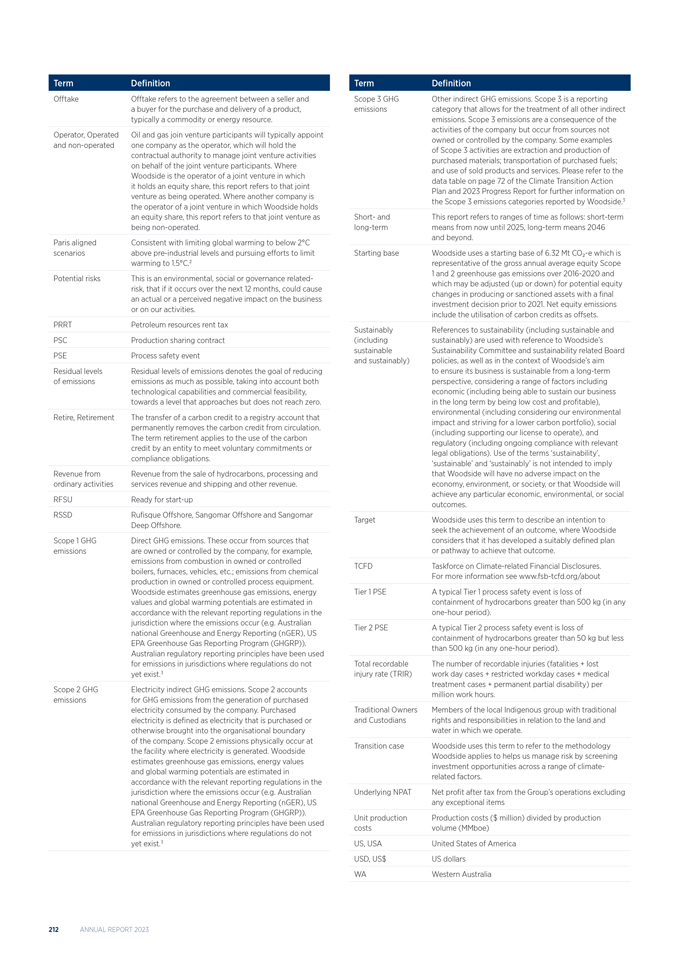
Term Definition Offtake Offtake refers to the agreement between a seller and a buyer for the purchase and delivery of a product, typically a commodity or energy resource. Operator, Operated Oil and gas join venture participants will typically appoint and non-operated one company as the operator, which will hold the contractual authority to manage joint venture activities on behalf of the joint venture participants. Where Woodside is the operator of a joint venture in which it holds an equity share, this report refers to that joint venture as being operated. Where another company is the operator of a joint venture in which Woodside holds an equity share, this report refers to that joint venture as being non-operated. Paris aligned Consistent with limiting global warming to below 2°C scenarios above pre-industrial levels and pursuing efforts to limit warming to 1.5°C.(2) Potential risks This is an environmental, social or governance related- risk, that if it occurs over the next 12 months, could cause an actual or a perceived negative impact on the business or on our activities. PRRT Petroleum resources rent tax PSC Production sharing contract PSE Process safety event Residual levels Residual levels of emissions denotes the goal of reducing of emissions emissions as much as possible, taking into account both technological capabilities and commercial feasibility, towards a level that approaches but does not reach zero. Retire, Retirement The transfer of a carbon credit to a registry account that permanently removes the carbon credit from circulation. The term retirement applies to the use of the carbon credit by an entity to meet voluntary commitments or compliance obligations. Revenue from Revenue from the sale of hydrocarbons, processing and ordinary activities services revenue and shipping and other revenue. RFSU Ready for start-up RSSD Rufisque Offshore, Sangomar Offshore and Sangomar Deep Offshore. Scope 1 GHG Direct GHG emissions. These occur from sources that emissions are owned or controlled by the company, for example, emissions from combustion in owned or controlled boilers, furnaces, vehicles, etc.; emissions from chemical production in owned or controlled process equipment. Woodside estimates greenhouse gas emissions, energy values and global warming potentials are estimated in accordance with the relevant reporting regulations in the jurisdiction where the emissions occur (e.g. Australian national Greenhouse and Energy Reporting (nGER), US EPA Greenhouse Gas Reporting Program (GHGRP)). Australian regulatory reporting principles have been used for emissions in jurisdictions where regulations do not yet exist.(3) Scope 2 GHG Electricity indirect GHG emissions. Scope 2 accounts emissions for GHG emissions from the generation of purchased electricity consumed by the company. Purchased electricity is defined as electricity that is purchased or otherwise brought into the organisational boundary of the company. Scope 2 emissions physically occur at the facility where electricity is generated. Woodside estimates greenhouse gas emissions, energy values and global warming potentials are estimated in accordance with the relevant reporting regulations in the jurisdiction where the emissions occur (e.g. Australian national Greenhouse and Energy Reporting (nGER), US EPA Greenhouse Gas Reporting Program (GHGRP)). Australian regulatory reporting principles have been used for emissions in jurisdictions where regulations do not yet exist.(3) Term Definition Scope 3 GHG Other indirect GHG emissions. Scope 3 is a reporting emissions category that allows for the treatment of all other indirect emissions. Scope 3 emissions are a consequence of the activities of the company but occur from sources not owned or controlled by the company. Some examples of Scope 3 activities are extraction and production of purchased materials; transportation of purchased fuels; and use of sold products and services. Please refer to the data table on page 72 of the Climate Transition Action Plan and 2023 Progress Report for further information on the Scope 3 emissions categories reported by Woodside.3 Short- and This report refers to ranges of time as follows: short-term long-term means from now until 2025, long-term means 2046 and beyond. Starting base Woodside uses a starting base of 6.32 Mt COâ,,-e which is representative of the gross annual average equity Scope 1 and 2 greenhouse gas emissions over 2016-2020 and which may be adjusted (up or down) for potential equity changes in producing or sanctioned assets with a final investment decision prior to 2021. Net equity emissions include the utilisation of carbon credits as offsets. Sustainably References to sustainability (including sustainable and (including sustainably) are used with reference to Woodside’s sustainable Sustainability Committee and sustainability related Board and sustainably) policies, as well as in the context of Woodside’s aim to ensure its business is sustainable from a long-term perspective, considering a range of factors including economic (including being able to sustain our business in the long term by being low cost and profitable), environmental (including considering our environmental impact and striving for a lower carbon portfolio), social (including supporting our license to operate), and regulatory (including ongoing compliance with relevant legal obligations). Use of the terms ‘sustainability’, ‘sustainable’ and ‘sustainably’ is not intended to imply that Woodside will have no adverse impact on the economy, environment, or society, or that Woodside will achieve any particular economic, environmental, or social outcomes. Target Woodside uses this term to describe an intention to seek the achievement of an outcome, where Woodside considers that it has developed a suitably defined plan or pathway to achieve that outcome. TCFD Taskforce on Climate-related Financial Disclosures. For more information see www.fsb-tcfd.org/about Tier 1 PSE A typical Tier 1 process safety event is loss of containment of hydrocarbons greater than 500 kg (in any one-hour period). Tier 2 PSE A typical Tier 2 process safety event is loss of containment of hydrocarbons greater than 50 kg but less than 500 kg (in any one-hour period). Total recordable The number of recordable injuries (fatalities + lost injury rate (TRIR) work day cases + restricted workday cases + medical treatment cases + permanent partial disability) per million work hours. Traditional Owners Members of the local Indigenous group with traditional and Custodians rights and responsibilities in relation to the land and water in which we operate. Transition case Woodside uses this term to refer to the methodology Woodside applies to helps us manage risk by screening investment opportunities across a range of climate- related factors. Underlying NPAT Net profit after tax from the Group’s operations excluding any exceptional items Unit production Production costs ($ million) divided by production costs volume (MMboe) US, USA United States of America USD, US$ US dollars WA Western Australia 212 ANNUAL REPORT 2023
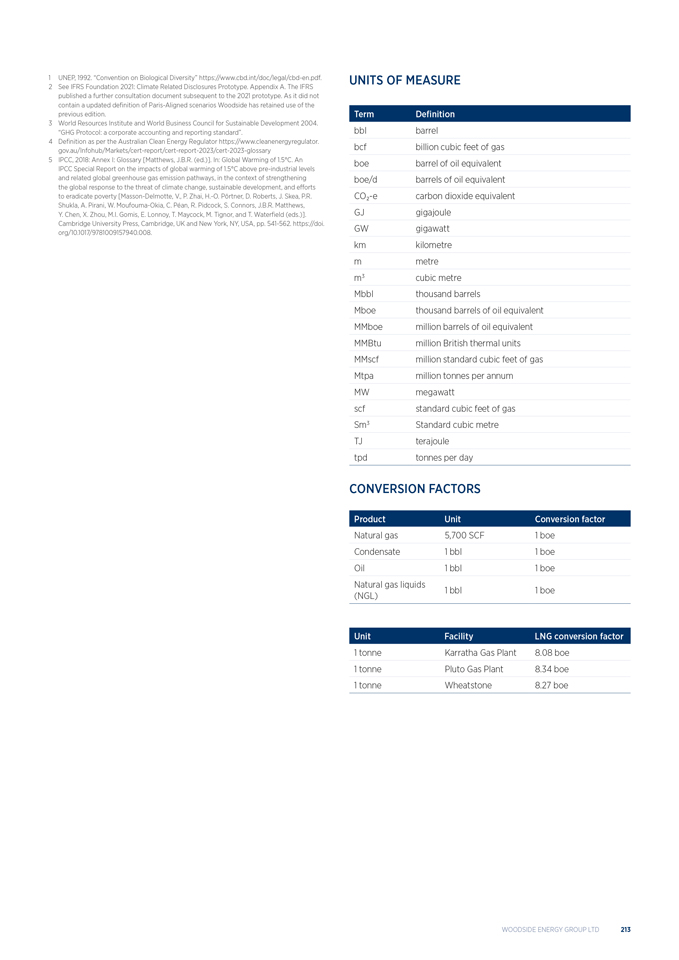
1 UNEP, 1992. “Convention on Biological Diversity” https://www.cbd.int/doc/legal/cbd-en.pdf. 2 See IFRS Foundation 2021: Climate Related Disclosures Prototype. Appendix A. The IFRS published a further consultation document subsequent to the 2021 prototype. As it did not contain a updated definition of Paris-Aligned scenarios Woodside has retained use of the previous edition. 3 World Resources Institute and World Business Council for Sustainable Development 2004. “GHG Protocol: a corporate accounting and reporting standard”. 4 Definition as per the Australian Clean Energy Regulator https://www.cleanenergyregulator. gov.au/Infohub/Markets/cert-report/cert-report-2023/cert-2023-glossary 5 IPCC, 2018: Annex I: Glossary [Matthews, J.B.R. (ed.)]. In: Global Warming of 1.5°C. An IPCC Special Report on the impacts of global warming of 1.5°C above pre-industrial levels and related global greenhouse gas emission pathways, in the context of strengthening the global response to the threat of climate change, sustainable development, and efforts to eradicate poverty [Masson-Delmotte, V., P. Zhai, H.-O. Pörtner, D. Roberts, J. Skea, P.R. Shukla, A. Pirani, W. Moufouma-Okia, C. Péan, R. Pidcock, S. Connors, J.B.R. Matthews, Y. Chen, X. Zhou, M.I. Gomis, E. Lonnoy, T. Maycock, M. Tignor, and T. Waterfield (eds.)]. Cambridge University Press, Cambridge, UK and New York, NY, USA, pp. 541-562. https://doi. org/10.1017/9781009157940.008. UNITS OF MEASURE Term Definition bbl barrel bcf billion cubic feet of gas boe barrel of oil equivalent boe/d barrels of oil equivalent COâ,,-e carbon dioxide equivalent GJ gigajoule GW gigawatt km kilometre m metre m3 cubic metre Mbbl thousand barrels Mboe thousand barrels of oil equivalent MMboe million barrels of oil equivalent MMBtu million British thermal units MMscf million standard cubic feet of gas Mtpa million tonnes per annum MW megawatt scf standard cubic feet of gas Sm3 Standard cubic metre TJ terajoule tpd tonnes per day CONVERSION FACTORS Product UnitConversion factor Natural gas 5,700 SCF1 boe Condensate 1 bbl1 boe Oil 1 bbl1 boe Natural gas liquids 1 bbl 1 boe (NGL) Unit FacilityLNG conversion factor 1 tonne Karratha Gas Plant8.08 boe 1 tonne Pluto Gas Plant8.34 boe 1 tonne Wheatstone8.27 boe WOODSIDE ENERGY GROUP LTD 213
6.8 ADDITIONAL INFORMATION Information about this report UNREASONABLE PREJUDICE As permitted by sections 299(3) and 299A(3) of the Corporations Act 2001, we have omitted certain information from our operating and financial review and Directors’ report in relation to our business strategy, future prospects and likely developments in our operations and the expected results of those operations in future financial years. We have done this on the basis that such information, if disclosed, would be likely to result in unreasonable prejudice to Woodside (for example, because the information is premature, commercially sensitive, confidential or could give a third-party a commercial advantage). The omitted information relates to our internal budgets, forecasts and estimates, details of our business strategy, and LNG contractual pricing. FORWARD-LOOKING STATEMENTS This report contains forward-looking statements with respect to Woodside’s business and operations, market conditions, results of operations and financial condition, including, for example, but not limited to, outcomes of transactions, statements regarding long-term demand for Woodside’s products, development, completion and execution of Woodside’s projects, expectations regarding future capital expenditures, the payment of future dividends and the amount thereof, future results of projects, operating activities and new energy products, expectations and plans for renewables production capacity and investments in, and development of, renewables projects, expectations and guidance with respect to production, capital and exploration expenditure and gas hub exposure, and expectations regarding the achievement of Woodside’s net equity Scope 1 and 2 greenhouse gas emissions reduction and new energy investment targets and other climate and sustainability goals. All statements, other than statements of historical or present facts, are forward-looking statements and generally may be identified by the use of forward-looking words such as ‘guidance’, ‘foresee’, ‘likely’, ‘potential’, ‘anticipate’, ‘believe’, ‘aim’, ‘aspire’, ‘estimate’, ‘expect’, ‘intend’, ‘may’, ‘target’, ‘plan’, ‘strategy’, ‘forecast’, ‘outlook’, ‘project’, ‘schedule’, ‘will’, ‘should’, ‘seek’ and other similar words or expressions. Similarly, statements that describe the objectives, plans, goals or expectations of Woodside are forward-looking statements. Forward-looking statements in this report are not guidance, forecasts, guarantees or predictions of future events or performance, but are in the nature of future expectations that are based on management’s current expectations and assumptions. Those statements and any assumptions on which they are based are subject to change without notice and are subject to inherent known and unknown risks, uncertainties, assumptions and other factors, many of which are beyond the control of Woodside, its related bodies corporate and their respective officers, directors, employees, advisers or representatives. Important factors that could cause actual results to differ materially from those in the forward-looking statements include, but are not limited to, fluctuations in commodity prices, actual demand for Woodside products, currency fluctuations, geotechnical factors, drilling and production results, gas commercialisation, development progress, operating results, engineering estimates, reserve and resource estimates, loss of market, industry competition, environmental risks, climate related risks, physical risks, legislative, fiscal and regulatory developments, changes in accounting standards, economic and financial markets conditions in various countries and regions, political risks, the actions of third parties, project delay or advancement, regulatory approvals, the impact of armed conflict and political instability (such as the ongoing conflict in Ukraine) on economic activity and oil and gas supply and demand, cost estimates, the effect of future regulatory or legislative actions on Woodside or the industries in which it operates, including potential changes to tax laws, the impact of general economic conditions, inflationary conditions, prevailing exchange rates and interest rates and conditions in financial markets, and risks associated with acquisitions, mergers and joint ventures, including difficulties integrating businesses, uncertainty associated with financial projections, restructuring, increased costs and adverse tax consequences, and uncertainties and liabilities associated with acquired and divested properties and businesses. A more detailed summary of the key risks relating to Woodside and its business can be found in section 3.9—Risk factors. You should review and have regard to these risks when considering the information contained in this report. If any of the assumptions on which a forward-looking statement is based were to change or be found to be incorrect, this would likely cause outcomes to differ from the statements made in this report. Investors are strongly cautioned not to place undue reliance on any forward-looking statements. Actual results or performance may vary materially from those expressed in, or implied by, any forward-looking statements. None of Woodside nor any of its related bodies corporate, nor any of their respective officers, directors, employees, advisers or representatives, nor any person named in this report or involved in the preparation of the information in this report, makes any representation, assurance, guarantee or warranty (either express or implied) as to the accuracy or likelihood of fulfilment of any forward-looking statement, or any outcomes, events or results expressed or implied in any forward-looking statement in this report. 214 ANNUAL REPORT 2023
All forward-looking statements contained in this report reflect Woodside’s views held as at the date of this report and, except as required by applicable law, neither Woodside, its related bodies corporate, nor any of their respective officers, directors, employees, advisers or representatives intends to, undertakes to, or assumes any obligation to, provide any additional information or update or revise any of these statements after the date of this report, either to make them conform to actual results or as a result of new information, future events, changes in Woodside’s expectations or otherwise. Past performance (including historical financial and operational information) is given for illustrative purposes only. It should not be relied on as, and is not necessarily, a reliable indicator of future performance, including future security prices. CLIMATE STRATEGY AND EMISSIONS DATA All greenhouse gas emissions data in this report are estimates, due to the inherent uncertainty and limitations in measuring or quantifying greenhouse gas emissions, and our methodologies for measuring or quantifying greenhouse gas emissions may evolve as best practices continue to develop and data quality and quantity continue to improve. Woodside ‘greenhouse gas’ or ‘emissions’ information reported are net equity Scope 1 GHG emissions, Scope 2 GHG emissions, and/or Scope 3 GHG emissions, as the context requires. The glossary and footnotes to this report provide further clarification of ‘lower carbon’ where applicable. Woodside uses the term ‘lower-carbon services’ to describe technologies, such as CCUS or offsets, that may be capable of reducing the net greenhouse gas emissions of our customers. For more information on Woodside’s climate strategy, including references to ‘lower carbon’ as part of that strategy, and emissions data refer to Woodside’s Climate Transition Action Plan and 2023 Progress Report available at woodside.com. INDUSTRY AND MARKET DATA This report contains industry, market and competitive position data based on industry publications and studies conducted by third parties, as well as Woodside’s internal estimates and research. These industry publications and third-party studies generally state that the information they contain has been obtained from sources believed to be reliable, although they do not guarantee the accuracy or completeness of such information. While Woodside believes that each of these publications and third-party studies is reliable and has been prepared by a reputable source, Woodside has not independently verified the market and industry data obtained from these third-party sources and cannot guarantee the accuracy or completeness of such data. Accordingly, undue reliance should not be placed on any of the industry, market and competitive position data contained in this report. Forecasts and other forward-looking information obtained from these sources are subject to the same qualifications and uncertainties as the other forward-looking statements contained in this report and may differ among third-party sources. These forecasts and forward-looking information are subject to uncertainty and risk due to a variety of factors, including those described in section 3.9—Risk factors and in this section, section 6.8—Information about this report. These and other factors could cause results to differ materially from those expressed in Woodside’s forecasts or estimates or those of independent third parties. While Woodside believes its internal research is reliable and its selection of industry publications and third-party studies and the description of its market and industry are appropriate, neither such research nor these descriptions have been verified by any independent source. BASIS OF PRESENTATION Woodside’s Financial Statements are prepared in accordance with the Australian Accounting Standards and other authoritative pronouncements of the Australian Accounting Standards Board (AASB) and comply with the International Financial Reporting Standards (IFRS) as issued by the International Accounting Standards Board (IASB). OTHER IMPORTANT INFORMATION In this report, references to a year are to the calendar and financial year ended 31 December 2023 unless otherwise stated. All references to dollars, cents of $ in this report are references to US currency and are stated in Woodside share, unless otherwise stated. Unless otherwise stated, all Woodside results set out in this Annual Report 2023 include the performance of the interests acquired as part of the merger with BHP’s petroleum business from 1 June 2022. WOODSIDE ENERGY GROUP LTD 215
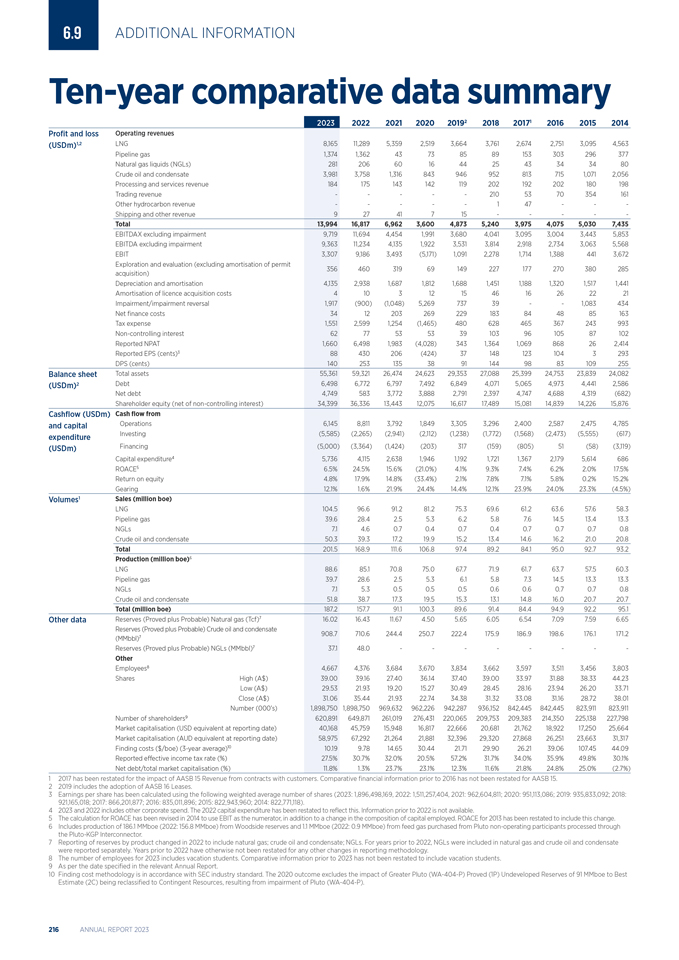
6.9 ADDITIONAL INFORMATION Ten-year comparative data summary 202320222021202020192201820171201620152014 Profit and loss Operating revenues (USDm)1,2 LNG 8,16511,2895,3592,5193,6643,7612,6742,7513,0954,563 Pipeline gas 1,3741,36243738589153303296377 Natural gas liquids (NGLs) 2812066016442543343480 Crude oil and condensate 3,9813,7581,3168439469528137151,0712,056 Processing and services revenue 184175143142119202192202180198 Trading revenue -----2105370354161 Other hydrocarbon revenue -----147--- Shipping and other revenue 92741715----- Total 13,99416,8176,9623,6004,8735,2403,9754,0755,0307,435 EBITDAX excluding impairment 9,71911,6944,4541,9913,6804,0413,0953,0043,4435,853 EBITDA excluding impairment 9,36311,2344,1351,9223,5313,8142,9182,7343,0635,568 EBIT 3,3079,1863,493(5,171)1,0912,2781,7141,3884413,672 Exploration and evaluation (excluding amortisation of permit 356 46031969149227177270380285 acquisition) Depreciation and amortisation 4,1352,9381,6871,8121,6881,4511,1881,3201,5171,441 Amortisation of licence acquisition costs 4 10312154616262221 Impairment/impairment reversal 1,917(900)(1,048)5,26973739--1,083434 Net finance costs 3412203269229183844885163 Tax expense 1,5512,5991,254(1,465)480628465367243993 Non-controlling interest 62775353391039610587102 Reported NPAT 1,6606,4981,983(4,028)3431,3641,069868262,414 Reported EPS (cents)3 88430206(424)371481231043293 DPS (cents) 14025313538911449883109255 Balance sheet Total assets 55,36159,32126,47424,62329,35327,08825,39924,75323,83924,082 (USDm)2 Debt 6,4986,7726,7977,4926,8494,0715,0654,9734,4412,586 Net debt 4,7495833,7723,8882,7912,3974,7474,6884,319(682) Shareholder equity (net of non-controlling interest) 34,399 36,33613,44312,07516,61717,48915,08114,83914,22615,876 Cashflow (USDm) Cash flow from and capital Operations 6,1458,8113,7921,8493,3053,2962,4002,5872,4754,785 expenditure Investing (5,585)(2,265)(2,941)(2,112)(1,238)(1,772)(1,568)(2,473)(5,555)(617) (USDm) Financing (5,000)(3,364)(1,424)(203)317(159)(805)51(58)(3,119) Capital expenditure4 5,7364,1152,6381,9461,1921,7211,3672,1795,614686 ROACE5 6.5%24.5%15.6%(21.0%)4.1%9.3%7.4%6.2%2.0%17.5% Return on equity 4.8%17.9%14.8%(33.4%)2.1%7.8%7.1%5.8%0.2%15.2% Gearing 12.1%1.6%21.9%24.4%14.4%12.1%23.9%24.0%23.3%(4.5%) Volumes1 Sales (million boe) LNG 104.596.691.281.275.369.661.263.657.658.3 Pipeline gas 39.628.42.55.36.25.87.614.513.413.3 NGLs 7.14.60.70.40.70.40.70.70.70.8 Crude oil and condensate 50.339.317.219.915.213.414.616.221.020.8 Total 201.5168.9111.6106.897.489.284.195.092.793.2 Production (million boe)6 LNG 88.685.170.875.067.771.961.763.757.560.3 Pipeline gas 39.728.62.55.36.15.87.314.513.313.3 NGLs 7.15.30.50.50.50.60.60.70.70.8 Crude oil and condensate 51.838.717.319.515.313.114.816.020.720.7 Total (million boe) 187.2157.791.1100.389.691.484.494.992.295.1 Other data Reserves (Proved plus Probable) Natural gas (Tcf)7 16.0216.4311.674.505.656.056.547.097.596.65 Reserves (Proved plus Probable) Crude oil and condensate 908.7 710.6244.4250.7222.4175.9186.9198.6176.1171.2 (MMbbl)7 Reserves (Proved plus Probable) NGLs (MMbbl)7 37.1 48.0-------- Other Employees8 4,6674,3763,6843,6703,8343,6623,5973,5113,4563,803 Shares High (A$) 39.0039.1627.4036.1437.4039.0033.9731.8838.3344.23 Low (A$) 29.5321.9319.2015.2730.4928.4528.1623.9426.2033.71 Close (A$) 31.0635.4421.9322.7434.3831.3233.0831.1628.7238.01 Number (000’s) 1,898,7501,898,750969,632962,226942,287936,152842,445842,445823,911823,911 Number of shareholders9 620,891649,871261,019276,431220,065209,753209,383214,350225,138227,798 Market capitalisation (USD equivalent at reporting date) 40,168 45,75915,94816,81722,66620,68121,76218,92217,25025,664 Market capitalisation (AUD equivalent at reporting date) 58,975 67,29221,26421,88132,39629,32027,86826,25123,66331,317 Finding costs ($/boe) (3-year average)10 10.19 9.7814.6530.4421.7129.9026.2139.06107.4544.09 Reported effective income tax rate (%) 27.5% 30.7%32.0%20.5%57.2%31.7%34.0%35.9%49.8%30.1% Net debt/total market capitalisation (%) 11.8% 1.3%23.7%23.1%12.3%11.6%21.8%24.8%25.0%(2.7%) 1 2017 has been restated for the impact of AASB 15 Revenue from contracts with customers. Comparative financial information prior to 2016 has not been restated for AASB 15. 2 2019 includes the adoption of AASB 16 Leases. 3 Earnings per share has been calculated using the following weighted average number of shares (2023: 1,896,498,169, 2022: 1,511,257,404, 2021: 962,604,811; 2020: 951,113,086; 2019: 935,833,092; 2018: 921,165,018; 2017: 866,201,877; 2016: 835,011,896; 2015: 822,943,960; 2014: 822,771,118). 4 2023 and 2022 includes other corporate spend. The 2022 capital expenditure has been restated to reflect this. Information prior to 2022 is not available. 5 The calculation for ROACE has been revised in 2014 to use EBIT as the numerator, in addition to a change in the composition of capital employed. ROACE for 2013 has been restated to include this change. 6 Includes production of 186.1 MMboe (2022: 156.8 MMboe) from Woodside reserves and 1.1 MMboe (2022: 0.9 MMboe) from feed gas purchased from Pluto non-operating participants processed through the Pluto-KGP Interconnector. 7 Reporting of reserves by product changed in 2022 to include natural gas; crude oil and condensate; NGLs. For years prior to 2022, NGLs were included in natural gas and crude oil and condensate were reported separately. Years prior to 2022 have otherwise not been restated for any other changes in reporting methodology. 8 The number of employees for 2023 includes vacation students. Comparative information prior to 2023 has not been restated to include vacation students. 9 As per the date specified in the relevant Annual Report. 10 Finding cost methodology is in accordance with SEC industry standard. The 2020 outcome excludes the impact of Greater Pluto (WA-404-P) Proved (1P) Undeveloped Reserves of 91 MMboe to Best Estimate (2C) being reclassified to Contingent Resources, resulting from impairment of Pluto (WA-404-P). 216 ANNUAL REPORT 2023

WOODSIDE ENERGY GROUP LTD 217

218 ANNUAL REPORT 2023

WOODSIDE ENERGY GROUP LTD 219

Head Office Woodside Energy Group Ltd Mia Yellagonga 11 Mount Street Perth WA 6000 Postal Address GPO Box D188 Perth WA 6840 Australia T +61 8 9348 4000 E companyinfo@woodside.com Woodside Energy Group Ltd ABN 55 004 898 962 woodside.com
Exhibit 99.2

Woodside Energy Group Ltd
ACN 004 898 962
Mia Yellagonga
11 Mount Street
Perth WA 6000
Australia
T +61 8 9348 4000
www.woodside.com
ASX: WDS
NYSE: WDS
LSE: WDS
Announcement
Tuesday, 27 February 2024
WOODSIDE RELEASES FULL-YEAR 2023 RESULTS
Woodside has achieved record production of 187.2 MMboe (513 Mboe/d) and excellent operated LNG reliability of 98%. We recorded full-year net profit after tax (NPAT) of $1,660 million, and underlying NPAT of $3,320 million when adjusted for exceptional items, and operating cash flow was $6,145 million.1
The Directors have determined a final dividend of US 60 cents per share (cps), bringing the full-year dividend to US 140 cps. The dividend is fully franked. The value of the total full-year dividend is $2,658 million.
Woodside CEO Meg O’Neill said she was tremendously proud that at a time of inflationary pressures, Woodside continued to return strong dividends to shareholders while delivering on our strategy to thrive through the energy transition.
“Woodside is supplying energy the world needs from a high-quality portfolio which is geographically advantaged to meet growing demand for LNG.
“Our focus on disciplined capital management has allowed us to deliver consistently strong returns to shareholders. Underlying profit was strong, enabling us to maintain an 80% dividend payout ratio.
“While realised prices were down year-on-year to levels closer to historic norms, annual sales volume topped 200 million barrels of oil equivalent (over 548 Mboe/d), generating revenue of almost $14 billion. Free cash flow of $560 million was a significant achievement in a period of major capital expenditure and normalised prices.
“We are contributing to Australia. Our tax contribution in Australia was a record A$5 billion in 2023 and we are committed to maintaining the delivery of affordable, reliable gas to Australian customers. For over almost 40 years of operations in WA, Woodside has supplied domestic gas volumes equivalent to more than one third of our exported liquefied natural gas (LNG) volumes.
“Climate is integral to our company strategy and we are on track to meet our net equity Scope 1 and 2 emissions reduction targets. Across our business in 2023 Woodside achieved a reduction in net equity Scope 1 and 2 emissions of 12.5% below the starting base, against our target of 15% by 2025.2
“The 2023 result was built on record annual production of 187.2 million barrels of oil equivalent (513 Mboe/d) in the first full year following the completion of the merger with BHP’s petroleum business. The production outcome was underpinned by another outstanding year at our operated LNG assets, which achieved 98% reliability over the year. Despite the inflationary environment, unit production cost was steady at $8.3/boe.
| 1 | Non-IFRS financial measure. Refer to the glossary section of the attached presentation for the definition. |
| 2 | Targets and aspiration are for net equity Scope 1 and 2 greenhouse gas emissions relative to a starting base of 6.32 Mt CO2-e which is representative of the gross annual average equity Scope 1 and 2 greenhouse gas emissions over 2016-2020 and which may be adjusted (up or down) for potential equity changes in producing or sanctioned assets with a final investment decision prior to 2021. Net equity emissions include the utilisation of carbon credits as offsets. |
“Our debt-free merger with BHP Petroleum added cash generating assets and strengthened Woodside’s balance sheet, giving us capacity for future capital investments as well as ongoing returns. Gearing at year-end was 12.1% and our total available liquidity was $7.8 billion, helping maintain our investment-grade credit ratings.
“We achieved our value objectives for the sale of 10% equity in the Scarborough Joint Venture to LNG Japan.3 This was followed in 2024 by the sale of 15.1% equity to JERA.4 These transactions demonstrate the ongoing demand for new gas supplies to support regional energy security.
“Across the industry, contracts for LNG continue to be signed with long durations, signalling confidence in the future strength of the market from both buyers and sellers. Woodside is geographically advantaged to meet the forecast growing demand for LNG in Asia.
“Significant progress was made on Woodside’s major growth projects over the course of the year. The floating production storage and offloading facility arrived at the Sangomar oil field off Senegal in February and with 17 wells now drilled and completed at the project, we are on track for first production in mid-2024.
“The Scarborough Energy Project received four key environmental approvals in December 2023 and was 55% complete at the end of the year. We welcome the Australian Government’s plans to reform the system for offshore approvals and are participating in the current consultation process.
“Since the start of 2024, we’ve completed the initial drydock of the hull for the Scarborough floating production unit and the first modules for Pluto Train 2 have arrived and been installed on site in Western Australia.
“In 2023, we took a final investment decision (FID) on Trion, which is a large, high-quality resource and will be Mexico’s first deepwater oil development. Expected returns from the development exceed Woodside’s capital allocation framework targets and the asset will be a strong contributor to Woodside’s future cashflows.
“Woodside’s safety performance in 2023 was again below the standard we set for ourselves, with the tragic loss of a colleague at the North Rankin Complex. We have taken action to prevent a repeat of such events, commissioning an external review of our safety systems. It is imperative that we do better in 2024.
“In our Climate Transition Action Plan released today, Woodside announced a new target to take FID on new energy products and lower carbon services with total greenhouse gas emissions abatement capacity of 5 million tonnes per annum by 2030. This will complement our existing target to invest $5 billion in such products and services in the same timeframe with a focus on the abatement impact of these products.
“We continued to be disciplined and value-focused in pursuing new energy opportunities. We progressed H2OK to technical readiness for FID and are evaluating the proposed US Federal tax incentive criteria. We also commenced concept select for Angel carbon capture and storage, which has the potential to address Woodside Scope 1 emissions and customer emissions.
“In 2024, we are looking forward to celebrating 40 years of safe, reliable domestic gas supply to Western Australia and 35 years of LNG supply to customers overseas.
“We are focused on delivering first oil from Sangomar and progressing the Scarborough Energy Project and Trion development.”
| 3 | LNG Japan transaction subject to completion of the transaction, targeted for the first quarter of 2024. |
| 4 | The sale and purchase agreement is with JERA Scarborough Pty Ltd which is a wholly owned subsidiary of JERA Co., Inc. Subject to completion of the transaction, targeted for the second half of 2024. |
Page 2 of 6
Financial headlines
| Metric |
Units | FY23 | FY22 | Change | ||||||||||
| NPAT |
$million | 1,660 | 6,498 | (74 | %) | |||||||||
| Underlying NPAT5 |
$million | 3,320 | 5,230 | (37 | %) | |||||||||
| Operating revenue |
$million | 13,994 | 16,817 | (17 | %) | |||||||||
| Operating cashflow |
$million | 6,145 | 8,811 | (30 | %) | |||||||||
| Free cash flow5 |
$million | 560 | 6,546 | (91 | %) | |||||||||
| Annual sales volume |
MMboe | 201.5 | 168.9 | 19 | % | |||||||||
| Mboe/d | 552 | 463 | ||||||||||||
| Averaged realised price |
$/boe | 68.6 | 98.4 | (30 | %) | |||||||||
| Unit production cost |
$/boe | 8.3 | 8.1 | 2 | % | |||||||||
| Fully franked final dividend |
US cps | 60 | 144 | (58 | %) | |||||||||
| Full-year fully franked dividend |
US cps | 140 | 253 | (45 | %) | |||||||||
Compared with 2022, 2023 full-year financial statements primarily reflected lower prices across all commodities, partly offset by higher sales volumes.
Reported results include non-cash post-tax asset impairments amounting to $1,533 million ($1,917 million pre-tax), reflecting approximately $1,178 million ($1,383 million pre-tax) impairment for the Shenzi asset. This is primarily related to goodwill and a portion of the purchase price assigned to Shenzi on completion of the merger with BHP Petroleum. The goodwill and purchase price allocation resulted from application of acquisition accounting principles and reflect both higher hydrocarbon prices and Woodside’s share price at the merger completion date. Goodwill is not amortised and, once impaired, is not subject to a future impairment reversal. For reference, Shenzi represented approximately 5% of 2023 production and approximately 2% of 2023 year-end proved plus probable reserves.
Key business activities
Strategic achievements
| • | Delivered record production in the first full-year period following the merger with BHP petroleum |
| • | Signed multiple agreements to sell an equity interest in the Scarborough Joint Venture to LNG Japan and, subsequent to the period, JERA, and established a broader strategic relationship which includes potential LNG offtake and collaboration on opportunities in new energy and carbon management6 |
| • | Approved a final investment decision (FID) on the Trion project, which is expected to generate strong returns and commence production in 2028 |
| • | Signed a sales and purchase agreement (SPA) with Mexico Pacific, strategically expanding our trading portfolio7 |
Operations and projects
| • | Delivered annual production of 187.2 MMboe (513 Mboe/d) |
| • | Maintained strong operated LNG reliability of 98% |
| • | Reduced net equity Scope 1 and 2 emissions 12.5% below starting base8 |
| • | Achieved first oil at Mad Dog Phase 2 Argos facility, in the US Gulf of Mexico |
| • | Continued to unlock additional phases of existing projects including FIDs at Mad Dog Southwest, Julimar Brunello Phase 3 and Lambert West9 |
| • | Progressed future growth projects at Sangomar and Scarborough |
| 5 | Non-IFRS financial measure. Refer to the glossary section of the attached presentation for the definition. |
| 6 | LNG Japan transaction subject to completion of the transaction, targeted for the first quarter of 2024. JERA transaction is subject to completion of the transaction, targeted for the second half of 2024. |
| 7 | The SPA is subject to Mexico Pacific taking FID on the proposed third train at the Saguaro Energia LNG Project. The FID is expected in the second half of 2024 and commercial operations are targeted to commence in 2029. |
| 8 | Targets and aspiration are for net equity Scope 1 and 2 greenhouse gas emissions relative to a starting base of 6.32 Mt CO2-e which is representative of the gross annual average equity Scope 1 and 2 greenhouse gas emissions over 2016-2020 and which may be adjusted (up or down) for potential equity changes in producing or sanctioned assets with a final investment decision prior to 2021. Net equity emissions include the utilisation of carbon credits as offsets. |
| 9 | Lambert West was approved subsequent to the period. |
Page 3 of 6
Full-year reporting
Woodside’s Annual Report 2023 provides further detail on our operations, activities and our financial position for the 12-month period ended 31 December 2023.
Woodside’s approach to climate is an integral part of our company strategy. Woodside’s Climate Transition Action Plan 2023 (CTAP) outlines our approach to climate change and strategy for Woodside to thrive through the energy transition as a low cost, lower carbon energy provider.
Full-year results teleconference
A teleconference providing an overview of the full-year 2023 results and a question-and-answer session will be hosted by Woodside CEO and Managing Director, Meg O’Neill, and Chief Financial Officer, Graham Tiver, today at 10:00 AEDT / 07:00 AWST (17:00 CST on Monday, 26 February 2024).
We recommend participants pre-register 5 to 10 minutes prior to the event with one of the following links:
| • |
https://webcast.openbriefing.com/wds-fyr-2024/ to view the presentation and listen to a live stream of the question-and-answer session |
| • | https://s1.c-conf.com/diamondpass/10035979-fh876t.html to participate in the question-and-answer session. Following pre-registration, participants will receive the teleconference details and a unique access passcode. |
The full-year results briefing pack follows this announcement and will be referred to during the teleconference. The briefing pack, Annual Report 2023, CTAP 2023, and teleconference archive will also be available on the Woodside website (www.woodside.com).
Climate Transition Action Plan presentation
A teleconference to provide an overview of Woodside’s Climate Transition Action Plan 2023 will be hosted on Tuesday, 12 March 2024 at 09:30 AEDT / 06:30 AWST / 17:30 CDT (Monday, 11 March 2014).
We recommend participants pre-register 5 to 10 minutes prior to the event with the following link:
| • | https://s1.c-conf.com/diamondpass/10035868-hf74t6.html to view the presentation and listen to a live stream of the question and answer. |
Annual General Meeting
Woodside’s Annual General Meeting will be held in Perth, Western Australia, on Wednesday, 24 April 2024 at 13:00 AEDT / 10.00 AWST (Tuesday, 23 April 20:00 CST).
| Contacts: | ||
| INVESTORS | MEDIA | |
| Marcela Louzada | Christine Forster | |
| M: +61 456 994 243 | M: +61 484 112 469 | |
| E: investor@woodside.com | E: christine.forster@woodside.com | |
This announcement was approved and authorised for release by Woodside’s Disclosure Committee.
Page 4 of 6
Forward-looking statements
This announcement contains forward-looking statements with respect to Woodside’s business and operations, market conditions, results of operations and financial condition, including, for example, but not limited to, statements regarding development, completion and execution of Woodside’s projects, expectations regarding future capital expenditures, future results of projects, operating activities, new energy products, expectations and plans for renewables production capacity and investments in, and development of, renewables projects, expectations and guidance with respect to production, investment expenditure and gas hub exposure for 2024, and expectations regarding the achievement of Woodside’s net equity Scope 1 and 2 greenhouse gas emissions targets. All statements, other than statements of historical or present facts, are forward-looking statements and generally may be identified by the use of forward-looking words such as ‘guidance’, ‘foresee’, ‘likely’, ‘potential’, ‘anticipate’, ‘believe’, ‘aim’, ‘estimate’, ‘expect’, ‘intend’, ‘may’, ‘target’, ‘plan’, ‘strategy’, ‘forecast’, ‘outlook’, ‘project’, ‘schedule’, ‘will’, ‘should’, ‘seek’ and other similar words or expressions. Similarly, statements that describe the objectives, plans, goals or expectations of Woodside are forward-looking statements.
Forward-looking statements in this presentation are not guidance, forecasts, guarantees or predictions of future events or performance, but are in the nature of future expectations that are based on management’s current expectations and assumptions. Those statements and any assumptions on which they are based are subject to change without notice and are subject to inherent known and unknown risks, uncertainties, assumptions and other factors, many of which are beyond the control of Woodside, its related bodies corporate and their respective Beneficiaries. Important factors that could cause actual results to differ materially from those in the forward-looking statements include, but are not limited to, fluctuations in commodity prices, actual demand for Woodside products, currency fluctuations, geotechnical factors, drilling and production results, gas commercialisation, development progress, operating results, engineering estimates, reserve and resource estimates, loss of market, industry competition, environmental risks, climate related risks, physical risks, legislative, fiscal and regulatory developments, changes in accounting standards, economic and financial markets conditions in various countries and regions, political risks, project delay or advancement, regulatory approvals, the impact of armed conflict and political instability (such as the ongoing conflict in Ukraine) on economic activity and oil and gas supply and demand, cost estimates, and the effect of future regulatory or legislative actions on Woodside or the industries in which it operates, including potential changes to tax laws, and the impact of general economic conditions, inflationary conditions, prevailing exchange rates and interest rates and conditions in financial markets.
A more detailed summary of the key risks relating to Woodside and its business can be found in the “Risk” section of Woodside’s most recent Annual Report released to the Australian Securities Exchange and the London Stock Exchange and in Woodside’s most recent Annual Report on Form 20-F filed with the United States Securities and Exchange Commission (SEC) and available on the Woodside website at https://www.woodside.com/investors/reports-investor-briefings. You should review and have regard to these risks when considering the information contained in this presentation.
Investors are strongly cautioned not to place undue reliance on any forward-looking statements. Actual results or performance may vary materially from those expressed in, or implied by, any forward-looking statements.
Announcement contains inside information
This announcement contains inside information. Marcela Louzada, Vice President Investor Relations is responsible for release of this announcement.
Non-IFRS Financial Measures
Throughout this presentation, a range of financial and non-financial measures are used to assess Woodside’s performance, including a number of financial measures that are not defined in, and have not been prepared in accordance with, International Financial Reporting Standards (IFRS) and are not recognised measures of financial performance or liquidity under IFRS (Non-IFRS Financial Measures). These measures include EBIT, EBITDA, EBITDA excluding impairment, Gearing, Underlying NPAT, Underlying earnings per share, Net debt, Free cash flow, Cash margin, Capital expenditure, and Exploration expenditure. These Non-IFRS Financial Measures are defined in the glossary section of this presentation. A quantitative reconciliation of these measures to the most directly comparable financial measure calculated and presented in accordance with IFRS can be found in Woodside’s Annual Report for the period ended 31 December 2023.
Page 5 of 6
Woodside’s management uses these measures to monitor Woodside’s financial performance alongside IFRS measures to improve the comparability of information between reporting periods and business units and Woodside believes that the Non-IFRS Financial Measures it presents provide a useful means through which to examine the underlying performance of its business.
Undue reliance should not be placed on the Non-IFRS Financial Measures contained in this presentation and these Non-IFRS Financial Measures should be considered in addition to, and not as a substitute for, or as superior to, measures of financial performance, financial position or cash flows reported in accordance with IFRS. Non-IFRS Financial Measures are not uniformly defined by all companies, including those in Woodside’s industry. Accordingly, they may not be comparable with similarly titled measures and disclosures by other companies.
Other important information
All references to dollars, cents or $ in this presentation are to US currency, unless otherwise stated.
References to “Woodside” may be references to Woodside Energy Group Ltd and/or its applicable subsidiaries (as the context requires).
Page 6 of 6

FULL-YEAR RESULTS BRIEFING 2023 27 February 2024 www.woodside.com investor@woodside.com

Disclaimer, important notes and assumptions Information historical or present facts, are forward-looking statements and generally may be identified by the use of forward-looking words such as ‘guidance’, ‘foresee’, ‘likely’, ‘potential’, ‘anticipate’, ‘believe’, ‘aim’, ‘estimate’, ‘expect’, ‘intend’, ‘may’, • This presentation has been prepared by Woodside Energy Group Ltd (“Woodside”). ‘target’, ‘plan’, ‘strategy’, ‘forecast’, ‘outlook’, ‘project’, ‘schedule’, ‘will’, ‘should’, ‘seek’ and other similar words or • All information included in this presentation, including any forward-looking statements, reflects Woodside’s views held as expressions. Similarly, statements that describe the objectives, plans, goals or expectations of Woodside are forward- at the date of this presentation and, except as required by applicable law, neither Woodside, its related bodies corporate, looking statements. nor any of their respective officers, directors, employees, advisers or representatives (“Beneficiaries”) intends to, or • Forward-looking statements in this presentation are not guidance, forecasts, guarantees or predictions of future events or undertakes to, or assumes any obligation to, provide any additional information or update or revise any information or performance, but are in the nature of future expectations that are based on management’s current expectations and forward-looking statements in this presentation after the date of this presentation, either to make them conform to actual assumptions. Those statements and any assumptions on which they are based are subject to change without notice and results or as a result of new information, future events, changes in Woodside’s expectations or otherwise. are subject to inherent known and unknown risks, uncertainties, assumptions and other factors, many of which are • This presentation may contain industry, market and competitive position data that is based on industry publications and beyond the control of Woodside, its related bodies corporate and their respective Beneficiaries. Important factors that studies conducted by third parties as well as Woodside’s internal estimates and research. While Woodside believes that could cause actual results to differ materially from those in the forward-looking statements include, but are not limited each of these publications and third party studies is reliable and has been prepared by a reputable source, Woodside has to, fluctuations in commodity prices, actual demand for Woodside products, currency fluctuations, geotechnical factors, not independently verified the market and industry data obtained from these third party sources and cannot guarantee drilling and production results, gas commercialisation, development progress, operating results, engineering estimates, the accuracy or completeness of such data. Accordingly, undue reliance should not be placed on any of the industry, reserve and resource estimates, loss of market, industry competition, environmental risks, climate related risks, physical market and competitive position data contained in this presentation. risks, legislative, fiscal and regulatory developments, changes in accounting standards, economic and financial markets • To the maximum extent permitted by law, neither Woodside, its related bodies corporate, nor any of their respective conditions in various countries and regions, political risks, project delay or advancement, regulatory approvals, the impact Beneficiaries, assume any liability (including liability for equitable, statutory or other damages) in connection with, any of armed conflict and political instability (such as the ongoing conflict in Ukraine) on economic activity and oil and gas responsibility for, or make any representation or warranty (express or implied) as to, the fairness, currency, accuracy, supply and demand, cost estimates, and the effect of future regulatory or legislative actions on Woodside or the adequacy, reliability or completeness of the information or any opinions expressed in this presentation or the industries in which it operates, including potential changes to tax laws, and the impact of general economic conditions, reasonableness of any underlying assumptions. inflationary conditions, prevailing exchange rates and interest rates and conditions in financial markets. No offer or advice • A more detailed summary of the key risks relating to Woodside and its business can be found in the “Risk” section of Woodside’s most recent Annual Report released to the Australian Securities Exchange and the London Stock Exchange • This presentation is not intended to and does not constitute, form part of, or contain an offer or invitation to sell to and in Woodside’s most recent Annual Report on Form 20-F filed with the United States Securities and Exchange Woodside shareholders (or any other person), or a solicitation of an offer from Woodside shareholders (or any other Commission (SEC) and available on the Woodside website at https://www.woodside.com/investors/reports-investor- person), or a solicitation of any vote or approval from Woodside shareholders (or any other person) in any jurisdiction. briefings. You should review and have regard to these risks when considering the information contained in this • This presentation has been prepared without reference to the investment objectives, financial and taxation situation or presentation. particular needs of any Woodside shareholder or any other person. The information contained in this presentation does • Investors are strongly cautioned not to place undue reliance on any forward-looking statements. Actual results or not constitute, and should not be taken as, financial product or investment advice. Woodside encourages you to seek performance may vary materially from those expressed in, or implied by, any forward-looking statements. independent legal, financial, taxation and other professional advice before making any investment decision. Notes to petroleum resource estimates • This presentation shall not be distributed, transmitted, published, reproduced or otherwise made available to any other person, in whole or in part, directly or indirectly, for any purposes whatsoever. In particular, this presentation and the • Unless otherwise stated, all petroleum resource estimates are quoted as at the effective date (i.e. 31 December 2023) of information contained herein may not be taken or transmitted, in, into or from and may not be copied, forwarded, the Reserves and Resources Statement included in Woodside’s most recent Annual Report released to the Australian distributed or transmitted in or into any jurisdiction in which such release, publication or distribution would be unlawful. Securities Exchange and the London Stock Exchange and in Woodside’s most recent Annual Report on Form 20-F filed The release, presentation, publication or distribution of this presentation, in whole or in part, in certain jurisdictions may with the SEC and available on the Woodside website at https://www.woodside.com/investors/reports-investor-briefings, be restricted by law or regulation, and persons into whose possession this presentation comes should inform themselves net Woodside share at standard oilfield conditions of 14.696 psi (101.325 kPa) and 60 degrees Fahrenheit (15.56 degrees about, and observe, any such restrictions. Any failure to comply with these restrictions may constitute a violation of the Celsius). laws of the relevant jurisdiction. Woodside does not accept liability to any person in relation to the distribution or • Woodside estimates and reports its Proved (1P) Reserves in accordance with the SEC regulations, which are also possession of this document in or from any such jurisdiction. compliant with SPE-PRMS guidelines. SEC-compliant Proved (1P) Reserves estimates use a more restrictive, rules-based Forward-looking statements approach and are generally lower than estimates prepared solely in accordance with SPE-PRMS guidelines due to, among other things, the requirement to use commodity prices based on the average of first of month prices during the 12- • This presentation contains forward-looking statements with respect to Woodside’s business and operations, market month period in the reporting company’s fiscal year. Woodside estimates and reports its Proved plus Probable (2P) conditions, results of operations and financial condition, including, for example, but not limited to, statements regarding Reserves and Best Estimate (2C) Contingent Resources in accordance with SPE-PRMS guidelines. development, completion and execution of Woodside’s projects, expectations regarding future capital expenditures, future results of projects, operating activities, new energy products, expectations and plans for renewables production • Woodside is not aware of any new information or data that materially affects the information included in the Reserves capacity and investments in, and development of, renewables projects, expectations and guidance with respect to and Resources Update. All the material assumptions and technical parameters underpinning the estimates in the Reserves production, investment expenditure and gas hub exposure for 2024, and expectations regarding the achievement of and Resources Update continue to apply and have not materially changed. Woodside’s net equity Scope 1 and 2 greenhouse gas emissions targets. All statements, other than statements of 2

Disclaimer, important notes and assumptions (continued) Notes to petroleum resource estimates (continued) third parties and regulatory approvals being obtained in the timeframe contemplated or at all. Woodside expresses no view as to whether its joint venture participants will agree with and support Woodside’s current position in relation to • Woodside reports its petroleum resource estimates inclusive of all fuel consumed in operations. these opportunities, or such commercial arrangements and regulatory approvals will be obtained. Additional assumptions • For offshore oil projects, the reference point is defined as the outlet of the floating production storage and offloading relevant to particular targets or other statements in this presentation may be set out in the relevant slides. Any such facility (FPSO) or platform, while for the onshore gas projects the reference point is defined as the outlet of the additional assumptions are in addition to the assumptions and qualifications applicable to the presentation as a whole. downstream (onshore) gas processing facility. Climate strategy and emissions data • Woodside uses both deterministic and probabilistic methods for the estimation of Reserves and Contingent Resources at • All greenhouse gas emissions data in this presentation are estimates, due to the inherent uncertainty and limitations in the field and project levels. All Proved (1P) Reserves estimates have been estimated using deterministic methodology and measuring or quantifying greenhouse gas emissions, and our methodologies for measuring or quantifying greenhouse reported on a net interest basis in accordance with the SEC regulations and have been determined in accordance with gas emissions may evolve as best practices continue to develop and data quality and quantity continue to improve. SEC Rule 4-10(a) of Regulation S-X. Unless otherwise stated, all petroleum estimates reported at the company or region level are aggregated by arithmetic summation by category. The aggregated Proved (1P) Reserves may be a conservative • Woodside “greenhouse gas” or “emissions” information reported are net equity Scope 1 greenhouse gas emissions, estimate due to the portfolio effects of arithmetic summation. Scope 2 greenhouse gas emissions, and/or Scope 3 greenhouse gas emissions, unless otherwise stated. 6 • ‘MMboe’ means millions (10 ) of barrels of oil equivalent. Natural gas volumes are converted to oil equivalent volumes • For more information on Woodside's climate strategy and performance, including further details regarding Woodside's via a constant conversion factor, which for Woodside is 5.7 Bcf of dry gas per 1 MMboe. Volumes of natural gas liquids, targets, aspirations and goals and the underlying methodology, judgements, assumptions and contingencies, refer to oil and condensate are converted from MMbbl to MMboe on a 1:1 ratio. Woodside's Climate Transition Action Plan 2023 (CTAP) available on the Woodside website at https://www.woodside.com/sustainability/climate-change. The glossary and footnotes to this presentation provide Disclosure of reserve information and cautionary note to US investors clarification regarding the use of terms such as lower carbon under Woodside's climate strategy. A full glossary of terms • Woodside is an Australian company listed on the Australian Securities Exchange, the New York Stock Exchange and the used in connection with Woodside's climate strategy is contained in the CTAP. London Stock Exchange. As noted above, Woodside estimates and reports its Proved (1P) Reserves in accordance with the Non-IFRS Financial Measures SEC regulations, which are also compliant with SPE-PRMS guidelines, and estimates and reports its Proved plus Probable (2P) Reserves and Best Estimate (2C) Contingent Resources in accordance with SPE-PRMS guidelines. Woodside reports all • Throughout this presentation, a range of financial and non-financial measures are used to assess Woodside’s of its petroleum resource estimates using definitions consistent with the 2018 Society of Petroleum Engineers (SPE)/World performance, including a number of financial measures that are not defined in, and have not been prepared in Petroleum Council (WPC)/American Association of Petroleum Geologists (AAPG)/Society of Petroleum Evaluation accordance with, International Financial Reporting Standards (IFRS) and are not recognised measures of financial Engineers (SPEE) Petroleum Resources Management System (PRMS). performance or liquidity under IFRS (Non-IFRS Financial Measures). These measures include EBIT, EBITDA, EBITDA excluding impairment, Gearing, Underlying NPAT, Underlying EPS, Net debt, Free cash flow, Cash margin, Capital • The SEC permits oil and gas companies, in their filings with the SEC, to disclose only Proved, Probable and Possible expenditure, and Exploration expenditure. These Non-IFRS Financial Measures are defined in the glossary section of this Reserves, and only when such Reserves have been determined in accordance with the SEC guidelines. In this presentation, presentation. A quantitative reconciliation of these measures to the most directly comparable financial measure Woodside includes estimates of quantities of oil and gas using certain terms, such as “Proved plus Probable (2P) calculated and presented in accordance with IFRS can be found in Woodside’s Annual Report for the period ended 31 Reserves”, “Best Estimate (2C) Contingent Resources”, “Reserves and Contingent Resources”, “Proved plus Probable”, December 2023. “Developed and Undeveloped”, “Probable Developed”, “Probable Undeveloped”, “Contingent Resources” or other descriptions of volumes of reserves, which terms include quantities of oil and gas that may not meet the SEC’s definitions • Woodside’s management uses these measures to monitor Woodside’s financial performance alongside IFRS measures to of proved, probable and possible reserves, and which the SEC’s guidelines strictly prohibit Woodside from including in improve the comparability of information between reporting periods and business units and Woodside believes that the filings with the SEC. These types of estimates do not represent, and are not intended to represent, any category of Non-IFRS Financial Measures it presents provide a useful means through which to examine the underlying performance of reserves based on SEC definitions, and may differ from and may not be comparable to the same or similarly-named its business. measures used by other companies. These estimates are by their nature more speculative than estimates of proved • Undue reliance should not be placed on the Non-IFRS Financial Measures contained in this presentation and these Non- reserves and would require substantial capital spending over a significant number of years to implement recovery, and IFRS Financial Measures should be considered in addition to, and not as a substitute for, or as superior to, measures of accordingly are subject to substantially greater risk of being recovered by Woodside. In addition, actual locations drilled financial performance, financial position or cash flows reported in accordance with IFRS. Non-IFRS Financial Measures are and quantities that may be ultimately recovered from Woodside’s properties may differ substantially. Woodside has not uniformly defined by all companies, including those in Woodside’s industry. Accordingly, they may not be made no commitment to drill, and likely will not drill, all drilling locations that have been attributable to these quantities. comparable with similarly titled measures and disclosures by other companies. US investors are urged to consider closely the disclosures in Woodside’s most recent Annual Report on Form 20-F filed Other important information with the SEC and available on the Woodside website at https://www.woodside.com/investors/reports-investor-briefings • All references to dollars, cents or $ in this presentation are to US currency, unless otherwise stated. and its other filings with the SEC, which are available from Woodside at https://www.woodside.com. These reports can also be obtained from the SEC at www.sec.gov. • References to “Woodside” may be references to Woodside Energy Group Ltd and/or its applicable subsidiaries (as the context requires). Assumptions • This presentation does not include any express or implied prices at which Woodside will buy or sell financial products. • Unless otherwise indicated, the targets set out in this presentation have been estimated on the basis of a variety of economic assumptions including: (1) US$70/bbl Brent long-term oil price (2022 real terms, inflated at 2.0%); (2) currently • A securities rating is not a recommendation to buy, sell or hold securities and may be subject to revision or withdrawal at sanctioned projects being delivered in accordance with their current project schedules; and (3) applicable growth any time. opportunities being sanctioned and delivered in accordance with the target schedules provided in this presentation. 3 These growth opportunities are subject to relevant joint venture participant approvals, commercial arrangements with

Delivering strong returns and building future value 2 Record production of 187.2 MMboe Providing energy through a high-quality portfolio, Consistent high operated LNG reliability of 98% geographically advantaged to meet 1 growing LNG demand Next wave of growth progressed; Sangomar, Scarborough, Trion 3 $1.7 billion reported NPAT; $3.3 billion underlying NPAT Creating and returning value Fully-franked final dividend of 60 US cps, top of payout ratio range through disciplined capital 3 management Positive free cash flow of $0.6 billion in a period of major capital expenditure 4 Conducting our Reduced net equity Scope 1 and 2 emissions to 12.5% below starting base business sustainably Published Climate Transition Action Plan through contribution to environment and communities Safety needs improvement; key focus for 2024 1. Global LNG demand is forecast to grow 53% to 2033, supported by Europe, China and emerging Asia. Base case scenario. Wood Mackenzie Global Gas Investment Horizon Outlook, October 2023. 2. Includes production of 186.1 MMboe (2022: 156.8 MMboe) from Woodside reserves and 1.1 MMboe (2022: 0.9 MMboe) from feed gas purchased from Pluto non-operating participants processed through the Pluto-KGP Interconnector. 3. Non-IFRS financial measure. Refer to the glossary section of this presentation for the definition. 4. Targets and aspiration are for net equity Scope 1 and 2 greenhouse gas emissions relative to a starting base of 6.32 Mt CO -e which is representative of the gross annual average equity Scope 1 and 2 greenhouse gas emissions over 2016-2020 and which may 2 4 be adjusted (up or down) for potential equity changes in producing or sanctioned assets with a final investment decision prior to 2021. Net equity emissions include the utilisation of carbon credits as offsets.

Safety needs improvement Actions 2023 performance ▪ Investigations into work practices and effectiveness of our safety ▪ Tragic fatality of our colleague, a contractor employee, on the controls North Rankin Complex ▪ Review integrity management and major incident prevention ▪ Two Tier 1, one Tier 2 process safety events ▪ Strengthened safety leadership and training program content Total recordable injuries (TRI) and total recordable injury rate (TRIR) Next steps 45 2.00 1.86 1.80 TRIR per million 1.74 work hours 1.80 40 ▪ Act on external assessment insights as part of our refreshed 1.60 35 safety improvement strategy 1.40 30 1.20 ▪ Simplify processes and develop tools to enhance frontline safety 25 0.90 1.00 Contractor TRI 34 ▪ Promote learnings and leverage our data to help prevent repeat 20 0.80 24 19 0.88 events 15 0.60 10 0.40 11 8 5 0.20 8 Employee TRI 6 5 3 3 - - 2019 2020 2021 2022 2023 5

Provide Create Sustainable energy value business Volatility emphasises the importance of energy security Oil and gas prices WDS average realised price WDS average realised price WDS average realised price $60.3/boe $98.4/boe $68.6/boe 160 90 Energy markets disrupted by geopolitical events 120 60 Prices normalised following highs of 2022 80 Lower prices reflected in full-year 2023 30 results, $68.6/boe realised price 40 0 0 2021 2022 2023 Dated Brent (LHS) JCC - 3 Month Lag (LHS) JKM (RHS) 6 US$/bbl January February March April May June July August September October November December January February March April May June July August September October November December January February March April May June July August September October November December US$/MMBtu

Provide Create Sustainable energy value business Woodside geographically advantaged to meet LNG demand in Asia 4 4 Global LNG contracts by destination Global LNG contracts by duration 50 50 Global LNG demand forecast to grow 53% to 2033, driven by Europe, China 4 Rest of World 1 and emerging Asia North East Asia 40 40 (excl-China) Increase in long duration LNG contracts 20 years or China 30 30 more signed, signaling confidence of buyers and sellers in long-term demand South and 20 20 South East Asia 11-19 years Scarborough sell-downs to LNG Japan and JERA reinforce confidence in long- 10 10 2,3 5-10 years term LNG demand Europe Less than 5 years 0 0 2019 2020 2021 2022 2023 2019 2020 2021 2022 2023 1. Base case scenario. Wood Mackenzie Global Gas Investment Horizon Outlook, October 2023. 2. Scarborough sell-down to LNG Japan is subject to completion of the transaction, targeted in the first quarter of 2024. 3. Scarborough sell-down to JERA was subsequent to the period. The sale and purchase agreement is with JERA Scarborough Pty Ltd which is a wholly owned subsidiary of JERA Co., Inc. Subject to completion of the transaction, targeted for the second half of 2024. 7 4. WoodMackenzie LNG Contract Trends, December 2023. Dataset includes global contracts by many producers, including Woodside. Only includes sale and purchase agreements. End-user contracts only. Rest of World refers to South America, Middle East & Africa and North America. Annual Contract Quantity (Mtpa) Annual Contract Quantity (Mtpa)

Provide Create Sustainable energy value business High-quality portfolio providing energy now and into the future Production (MMboe) Strong operational performance ▪ Record production of 187 MMboe (513 Mboe/day), notwithstanding planned 105% 1 turnarounds 185 - 195 ▪ 98% reliability from operated LNG; consistent high performance 187 ▪ Mad Dog Phase 2 and Shenzi North start-up, FID on Mad Dog Southwest 158 2 ▪ FID on Julimar Brunello Phase 3 and Lambert West Project Positioned for the future 100 ▪ Building Senegal’s first offshore oil project; targeting first oil mid 2024 91 90 ▪ Scarborough Energy Project; targeting first LNG cargo in 2026 ▪ Took FID on the Trion Project; targeting first oil in 2028 ▪ 158% of production replaced with proved plus probable reserves in 2023, top quartile 3 proved reserves life against peers 4 ▪ Building Pacific LNG position via offtake from Mexico Pacific LNG 2019 2020 2021 2022 2023 2024 guidance ▪ Building capability to deliver hydrogen through FID on the H2 Refueller Project 1. Includes production of 186.1 MMboe (2022: 156.8 MMboe) from Woodside reserves and 1.1 MMboe (2022: 0.9 MMboe) from feed gas purchased from Pluto non-operating participants processed through the Pluto-KGP Interconnector. 2. FID on Lambert West Project was subsequent to the period. 3. Peer set is APA, ConocoPhillips, Coterra Energy, Devon, ENI, EOG, Equinor, Hess, Inpex, Marathon, OXY and Santos. Comparison is relative to 2022 Annual Reports. Canadian oil sands companies are excluded. Reserve replacement is the extent to which the year's production has been replaced by reserves added to our reserve base. This includes changes resulting from extensions and discoveries, transfers, revisions to previous estimates, and acquisitions and divestments. 8 4. See “Woodside and Mexico Pacific sign LNG supply agreement” announced 6 December 2023.

Provide Create Sustainable energy value business Sangomar: building Senegal’s first offshore oil project 1 93% complete at end of 2023 ▪ FPSO arrived in Senegal in February 2024 ▪ 17 wells drilled and completed; six wells partially completed 2 ▪ Subsea scope for FPSO hookup complete 2 ▪ All mooring chains connected to FPSO ▪ Subsea installation campaign continuing; overall subsea work scope 98% complete ▪ First oil mid-2024 Ramp up expected through 2024 FPSO in field 1. The progress of the project has been updated to 93% following a 0.2% correction identified subsequent to the period. 9 2. Subsequent to the period.

Provide Create Sustainable energy value business Scarborough Energy Project: targeting first LNG cargo in 2026 1 55% complete at end of 2023 ▪ Offshore environment plans accepted ▪ Seismic program completed ▪ Sale of 10% participating interest in Scarborough 2 Joint Venture to LNG Japan and 15.1% 3,4 participating interest to JERA ▪ Fabrication of the FPU hull and topsides progressing, first dry dock of the floating 3 production unit hull complete ▪ Fabrication of six of the 51 Pluto Train 2 modules completed, first three Pluto Train 2 modules 3 arrived in Karratha ▪ Commenced offshore subsea installation and 3 spud the first production well Pluto LNG and Pluto Train 2 site 1. Excludes Train 1 modifications. 2. Subject to completion of the transaction, targeted in the first quarter of 2024. 3. Subsequent to the period. 10 4. The sale and purchase agreement is with JERA Scarborough Pty Ltd which is a wholly owned subsidiary of JERA Co., Inc. Subject to completion of the transaction, targeted for the second half of 2024.

Provide Create Sustainable energy value business Strong underlying NPAT; maintaining 80% payout ratio Financial performance Dividend distribution ▪ Final dividend payment of $1.1 billion, fully franked, returning value to ▪ $9.4 billion EBITDA, impacted by lower operating revenue, offset by 1 shareholders reduced trading costs ▪ Maintaining 80% payout ratio, top of the targeted payout range ▪ $8.3/boe unit production cost, maintained in an inflationary environment ▪ Average realised price of $68.6/boe 1 2 Underlying NPAT ($ billion) Dividend per share (cps) 5.2 253 3.3 140 135 1.6 91 1.1 38 0.4 2019 2020 2021 2022 2023 2019 2020 2021 2022 2023 Total dividend BHP merger completion payment 1. Non-IFRS financial measure. Refer to the glossary section of this presentation for the definition. 11 2. The interim 2022 fully franked dividend of 109 US cps consisted of an ordinary dividend component of 76 US cps and an additional dividend component relating to the BHP merger completion payment of 33 US cps.

Provide Create Sustainable energy value business Resilient cash margin supporting major capital investment and returns Cash Balance sheet ▪ Cash margin of ~80%, maintained during turnaround activity, amid ▪ Gearing of 12.1% at the lower end of target range reduced commodity price and inflationary environment ▪ Available liquidity of $7.8 billion supporting major capital investment ▪ $6.1 billion operating cash flow, strong operational performance and returns 1 ▪ $0.6 billion free cash flow , impacted by higher major capital ▪ Investment grade credit ratings providing efficient access to debt 2 expenditure and higher tax payments on record 2022 profit capital ▪ Record A$5 billion paid in Australian taxes Cash margin (%) Liquidity ($ billion) 10.2 7.8 7.0 6.7 6.1 78% 80% 80% Cash margin 83% 85% Undrawn facilities Production costs 14% 11% 13% 9% 9% Cash Other cash costs 9% 8% 8% 7% 6% 2019 2020 2021 2022 2023 2019 2020 2021 2022 2023 1. Non-IFRS financial measure. Refer to the glossary section of this presentation for the definition. 12 2. Corporate debt credit ratings. BBB+ by S&P Global, Baa1 by Moody’s.

Provide Create Sustainable energy value business Capital management framework unchanged 1 1 1 Operating cash flow Investing cash flow Net debt Final dividend determined $ $ $ $ 1.1B 6.1B 5.6B 4.7B (Full-year of $2.7B) Special dividends Safe, reliable and Dividend policy Investment Strong balance low cost (minimum 50% Share buy-backs expenditure sheet payout ratio) operations Excess Future investment cash Investment Maintain dividend based on NPAT Targeting 10-20% grade credit excluding non-recurring items, gearing through the rating targeting 50-80% payout ratio cycle 2 BBB+/Baa1 80% payout ratio 12.1% Final dividend of 60 US cps 1. Non-IFRS financial measure. Refer to the glossary section of this presentation for the definition. 13 2. Corporate debt credit ratings. BBB+ by S&P Global, Baa1 by Moody’s. A securities rating is not a recommendation to buy, sell or hold securities and may be subject to revision or withdrawal at any time.

Provide Create Sustainable energy value business Strong balance sheet capacity for returns and investment 1 Indicative cash generation and uses (2024 – 2028, $ billion) $50/bbl $70/bbl 40 40 Major project start-ups expected to generate ~$32B significant cash flow with operating cash flow increasing from 2026; expected to average 30 30 1,2 $7 billion over 2027 and 2028 ~$20B Decisions on surplus cash allocation to be 20 20 guided by capital management framework Current gearing of 12%, capacity to move within 10 10 target gearing range Indicative cash flow forecasts exclude the impact 0 1,2 0 of Scarborough sell-down to JERA Sources Uses Sources Uses Divestment Available cash for Investing cash Underlying Cash flow from proceeds investment, financing 5 4 outflow dividend at 80% operations 3 (LNG Japan) or additional returns 1. Please refer to the “Disclaimer, important notes and assumptions” section (including under the heading “Forward-looking statements”) for important cautionary information relating to forward-looking statements. US$50/bbl and US$70/bbl Brent oil price (2022 real terms) with a long-term inflation rate of 2.0%). Indicative only, not guidance. 2. Expected average cash flow excludes the impact of the 15.1% sell-down of Scarborough interest to JERA, which was subsequent to the period. The sale and purchase agreement is with JERA Scarborough Pty Ltd which is a wholly owned subsidiary of JERA Co., Inc. Subject to completion of the transaction, targeted for the second half of 2024. 3. Includes proceeds from 10% sell-down of Scarborough interest to LNG Japan, which is subject to completion of the transaction (expected in Q1 2024). Refer to Woodside announcement ‘Woodside to sell 10% Scarborough interest to LNG Japan” dated 8 August 2023. 4. Woodside’s dividend policy aims to pay a minimum of 50% of NPAT excluding non-recurring items (underlying NPAT). Woodside targets a payout ratio between 50% and 80%. 14 5. Includes all cash flows used in investing activities inclusive of committed capital. Excludes proceeds from 10% sell-down of Scarborough interest to LNG Japan.

Provide Create Sustainable energy value business Value unlocked through the merger; building a truly global company Rendition of the Trion floating production unit Portfolio Capabilities ▪ Reviewed Trion concept and resource, taking FID in 2023▪ Expanded global marketing presence creating value enhancement opportunities ▪ Cash generative and debt free assets transformed balance sheet; capacity for investments and shareholder returns▪ Combined capability and globally diverse workforce ▪ Start-up of Mad Dog Phase 2 expanded high quality Gulf of Mexico ▪ Implemented initiatives from BHPP merger to deliver targeted $400m 1 position in synergies ahead of original schedule 15 1. As disclosed in Woodside’s Full-Year 2022 Results and Briefing, released 27 February 2023.

Provide Create Sustainable 1,2 On track to meet 15% Scope 1 and 2 net equity emissions reduction target by 2025 energy value business 1 2023 highlights Net equity Scope 1 and 2 emissions (Mt CO -e) 2 ▪ Net equity Scope 1 and 2 emissions 12.5% below starting base 8 ▪ Achieved through emissions avoided or reduced at facilities and offsets ▪ Asset decarbonisation planning completed across merged portfolio of operated assets Estimated avoided 5 emissions ▪ Further planning undertaken to support aspiration of net zero Scope 1 and 2 emissions by 2050 Merged entity 1 starting base 6 Offset Asset decarbonisation in practice emissions 11% below Woodside net 12.5% starting 15% base in equity emissions below target 2022 starting by 2025 Allowance for BHP base in asset emissions 30% (pre-merger) 4 2023 target by 2030 2 3 Flaring minimisation: Angostura Lower carbon power: Pluto ▪ Updated and implemented 12 standing ▪ Modifications substantially completed at operational procedures to minimise gas Pluto LNG to receive power from the flaring during facility startup proposed Woodside Solar project 0 4 4 ▪ Estimated emissions reduction : ▪ Estimated emissions reduction : 2022 2023 2025 target 2030 target 26.5 Ktpa CO -e 150 Ktpa CO -e 2 2 1. Targets and aspiration are for net equity Scope 1 and 2 greenhouse gas emissions relative to a starting base of 6.32 Mt CO2-e which is representative of the gross annual average equity Scope 1 and 2 greenhouse gas emissions over 2016-2020 and which may be adjusted (up or down) for potential equity changes in producing or sanctioned assets with a final investment decision prior to 2021. Net equity emissions include the utilisation of carbon credits as offsets. 2. Please refer to the “Disclaimer, important notes and assumptions” section (including under the heading “Forward-looking statements”) for important cautionary information relating to forward-looking statements. 3. Implementation is subject to commercial arrangements, regulatory & JV approvals and third party activities (which may or may not proceed). 4. The Scope 1 and 2 emissions reductions are estimated using engineering judgment by appropriately skilled and experienced Woodside engineers. All examples are for gross emission reductions, not equity share. 5. Quantification of avoided emissions is inherently uncertain. However, it is possible to provide an estimate by comparison to benchmarks of a comparable portfolio of LNG, conventional shelf and deepwater assets producing 187.2 MMboe (Woodside equity production 2023) with a similar product mix to Woodside. There are a number of potential benchmarks providing estimates of the 2023 global average emissions intensity of oil and gas operations. Based on Wood Mackenzie’s Emissions Benchmarking Tool, an estimate of avoided emissions is around 391 kt CO -e, whereas based on the industry average 2 emissions reported in Table 3.1 of IEA’s “The Oil and Gas Industry in Net Zero Transitions” (November 2023), an estimate of avoided emissions is around 1,705 kt CO -e. The Estimated Avoided Emissions shown in this Graph represents the range between the two estimates. Woodside does not independently 2 verify the data behind these estimates. Woodside does not independently verify the data behind these estimates. Contributions to this were made by the intrinsic characteristics of our oil and gas resources, the design of our facilities, the 2016-2020 energy efficiency target, and the implementation of asset 16 decarbonisation plans from 2021 onwards.

Provide Create Sustainable energy value business New complementary Scope 3 emissions abatement target Scope 3 targets 2023 progress Existing New complementary 1 update Investment target Emissions abatement 1 target H2 Refueller Project rendition Investment in new Cumulative total Take FID on new energy energy products and spend on new energy 2023 highlights products and lower carbon lower carbon services services by 2030, with total products and lower by 2030 abatement capacity of carbon services ▪ Approved FID on H2 Refueller Project ▪ Procured H2OK long lead items (electrolysers and liquefaction trains) $ $ 4 2 3▪ Technical readiness to support FID 5 335MILLION BILLION 5 MTPA CO -e 2 ▪ Evaluating the proposed US Federal Government tax incentive criteria 5 ▪ Commenced concept definition for Angel CCS ▪ Continued collaborations aiming to accelerate development of CCU technologies (Lanzatech, NovoNutrients, and StringBio) 1. Scope 3 targets are subject to commercial arrangements, commercial feasibility, regulatory and Joint Venture approvals, and third party activities (which may or may not proceed). Individual investment decisions are subject to Woodside’s investment targets. Not guidance. Potentially includes both organic and inorganic investment. For further information on Woodside’s Scope 3 targets refer to pages 7 and 34 of Woodside’s Climate Transition Action Plan 2023 (CTAP), released 27 February 2024. 2. Includes pre-RFSU spend on new energy products and lower carbon services that can help our customers decarbonise by using these products and services. It is not used to fund reductions of Woodside’s net equity Scope 1 and 2 emissions which are managed separately through asset decarbonisation plans. 3. Includes binding and non-binding opportunities in the portfolio, subject to commercial arrangements, commercial feasibility, regulatory and Joint Venture approvals, and third party activities (which may or may not proceed). Individual investment decisions are subject to Woodside’s investment targets. Not guidance. 4. A project is considered FID-ready if it has completed and/or obtained the necessary studies, permits and designs so that a final investment decision can be made. This decision is made based on a range of financial, technical and strategic factors, and is a requirement for construction and implementation of a project to commence. 17 5. Angel CCS has the potential to address Woodside’s Scope 1 and 2 emissions as well as customer emissions. For further information refer to page 39 of Woodside’s Climate Transition Action Plan 2023 (CTAP), released 27 February 2024.

Focused on building future value through our 2024 priorities ▪ Operate base business reliably and efficiently Providing energy through a high-quality portfolio, ▪ Achieve first oil for Sangomar geographically advantaged to meet 1 growing LNG demand▪ Progress Scarborough and Trion ▪ Continue to manage cost in inflationary environment Creating and returning value ▪ Maintain disciplined capital management through disciplined capital ▪ Actively manage debt and liquidity profile to fund capital expenditure and returns management Conducting our ▪ Improve safety performance business sustainably ▪ Continue to implement and identify emissions reductions opportunities through contribution to environment and communities▪ Progress customer-led and scalable hydrogen and CCS opportunities 18 1. Global LNG demand is forecast to grow 53% to 2033, supported by Europe, China and emerging Asia. Base case scenario. Wood Mackenzie Global Gas Investment Horizon Outlook, October 2023.

The investment case – positioned to thrive through the energy transition High-quality Disciplined capital Conducting our business portfolio management sustainably ▪ On track to deliver net equity Scope ▪ Geographically advantaged to ▪ Strong and consistent cash margin 2 1 1 and 2 emissions reduction targets meet growing LNG demand ▪ Committed to shareholder returns ▪ Progressing customer-led and ▪ Track record of LNG delivery from ▪ Clear capital allocation and scalable hydrogen and CCS reliable assets capital management frameworks opportunities ▪ Progressing next wave of growth ▪ Strong balance sheet to support ▪ Returning value to governments returns and growth and communities 1. Global LNG demand is forecast to grow 53% to 2033, supported by Europe, China and emerging Asia. Base case scenario. Wood Mackenzie Global Gas Investment Horizon Outlook, October 2023. 2. Targets and aspiration are for net equity Scope 1 and 2 greenhouse gas emissions relative to a starting base of 6.32 Mt CO2-e which is representative of the gross annual average equity Scope 1 and 2 greenhouse gas emissions over 2016-2020 and which may 19 be adjusted (up or down) for potential equity changes in producing or sanctioned assets with a final investment decision prior to 2021. Net equity emissions include the utilisation of carbon credits as offsets.

Q&A Meg O’Neill Chief Executive Officer and Managing Director 20

ANNEXURE 21

Disciplined capital allocation OIL GAS NEW ENERGY OFFSHORE PIPELINE LNG DIVERSIFIED Generate high returns to fund New energy products and lower Leveraging infrastructure to monetise undeveloped diversified growth, focusing on carbon services to reduce customers’ FOCUS gas, including optionality for hydrogen 1 high quality resources emissions; hydrogen, ammonia, CCUS Stable long-term cash High cash generation Long-term cash flow Developing market flow profile Shorter payback period Strong forecast demand Lower capital requirement CHARACTERISTICS Resilient to commodity Quick to market Upside potential Lower risk profile pricing IRR > 15% IRR > 12% IRR > 10% OPPORTUNITY 2 2 2 TARGETS Payback within 5 years Payback within 7 years Payback within 10 years EMISSIONS 3 30% net emissions reduction target by 2030, net zero aspiration by 2050 or sooner REDUCTIONS 1. CCUS refers to carbon capture utilisation and storage. 2. Payback refers to RFSU + X years. 3. Woodside’s net emissions reduction targets are for net equity Scope 1 and 2 greenhouse gas emissions, with a targeted reduction of 15% by 2025, 30% by 2030, with an aspiration of net zero by 2050. The net emissions reduction targets are relative to a starting base representative of the gross annual average equity Scope 1 and 2 greenhouse gas emissions over 2016-2020 and may be adjusted (up or down) for potential equity changes in producing or sanctioned assets with a final investment decision prior to 2021. 22 Please refer to the Glossary starting on page 59 and the section on decarbonisation strategy starting on page 28 of Woodside’s Climate Report 2022 for further information on the definition and calculation of Scope 1 and 2 net equity greenhouse gas emissions.

Net profit after tax reconciliation; primarily driven by price GENERAL, ADMINISTRATIVE, TAX SALES COST OF SALES FINAL DIVIDEND, FULLY FRANKED AND OTHER Volume from former BHPP assets offset Cost impact of additional Fully franked final dividend One-off transactions and tax impacts by lower realised prices and impact of BHP assets, depreciation of 60 US cps planned turnarounds and reduced prices 2,181 (3,146) Additional five months of Impairment former BHPP losses on assets, change in 6,498 Shenzi, depreciation Post-tax impairment on Shenzi, Reduced Wheatstone policy Wheatstone and Pyrenees (607) trading and Pyrenees, ($1,533m), post-tax reduction in (1,688) opportunities reversal of Additional five Pluto PRRT ($446m), recognition Lower income in lower price Wheatstone in months of of Trion DTA (-$319m). tax expense on Lower average environment 2022 former BHPP lower taxable prices across 1,660 Planned (534) assets 3,320 income commodities maintenance (2,817) Lower shutdowns commodity (Pluto, NWS, hedge losses 1,048 1,660 Ngujima-Yin) 725 2022 reported Produced Produced Produced Cost of sales Trading margin Impairment loss Other Income tax 2023 reported 2023 NPAT 2023 underlying 1 NPAT revenue - revenue - revenue - (excl. trading) and PRRT NPAT adjustments NPAT volume (BHPP) price volume (excl. BHPP) 23 1. Non-IFRS financial measure. Refer to the glossary section of this presentation for the definition. $ million

Expanded portfolio offsetting lower prices and planned turnarounds 1 1,2 Operating revenue EBITDA Underlying NPAT 16.8 14.0 11.2 9.4 7.0 5.2 4.9 4.1 3.6 3.5 3.3 1.9 1.6 1.1 0.4 2019 2020 2021 2022 2023 2019 2020 2021 2022 2023 2019 2020 2021 2022 2023 Lower revenue primarily driven by lower average prices across all commodities, offset by higher sales volumes from the full-year contribution from former BHPP assets and contribution of the Pluto-KGP Interconnector Strong EBITDA performance from high-quality assets, impacted by price, turnarounds and increased cost of sales from full-year contribution of former BHPP assets 1. Non-IFRS financial measure. Refer to the glossary section of this presentation for the definition. 24 2. 2023 NPAT adjustments include the post-tax impacts of impairment on Shenzi, Wheatstone and Pyrenees ($1,533m), post tax reduction in Pluto PRRT ($446m) offset by the recognition of Trion DTA ($319m). $ billion $ billion $ billion

Investing in growth 1 2 Operating cash flow Investing cash flow Free cash flow 8.8 2022: includes $0.8B contribution 6.5 from GIP and 6.1 $1.1B merger 5.6 completion payment 4.2 3.8 0.8 3.3 2.9 1.1 2.1 2.1 1.8 1.2 0.9 2.3 0.6 2019 2020 2021 2022 2023 2019 2020 2021 2022 2023 -0.3 2019 2020 2021 2022 2023 Free cash flow impacted by lower EBITDA and higher tax payments Higher investing cash outflow due to capital expenditure on Scarborough, Sangomar and Trion 1. 2022 investing cash flow of $2.3 billion includes the impact of GIP’s contribution to Pluto Train 2 ($0.8 billion) and cash received on completion of the merger with BHP Petroleum ($1.1 billion). Without these items, investing cash flow would be $4.2 billion. 25 2. Non-IFRS financial measure. Refer to the glossary section of this presentation for the definition. $ billion $ billion $ billion

Unit production cost maintained in inflationary environment Production cost (LHS) and unit production cost (RHS) 2.0 9.0 Unit production cost 8.3 8.1 (RHS) Unit production cost excluding major Full period contribution of former BHPP assets 1,2 turnarounds (RHS) 7.3 1.6 changing cost mix 5.7 6.0 5.3 1.2 4.8 Completed planned major turnarounds on Pluto LNG and Ngujima-Yin FPSO 4.5 0.8 Major turnaround 1,2 costs 3.0 Interconnector continuing to drive value Production cost (BHPP) 0.4 Interconnector cost Production cost Managing inflationary pressures (WDS) 0.0 0.0 2019 2020 2021 2022 2023 1. Major turnarounds completed at Pluto LNG and Ngujima-Yin FPSO in 2023. Includes the production cost and expected volume impact. 26 2. Major turnaround completed at Pluto LNG in 2019. Refer to “Woodside Full-Year 2019 Results” dated 13 February 2020. $ billion (LHS) $/boe (RHS)

Strong balance sheet; executing major capital expenditure and balancing returns 1 Net debt 4.7 3.9 3.8 Gearing of 12.1% within lower end of target range 2.8 (10 – 20%) 0.6 Actively managing debt portfolio 2019 2020 2021 2022 2023 Total available liquidity of $7.8 billion 1 Debt maturity profile 3 Scarborough sell-down proceeds supporting liquidity: ▪ 10% participating interest in Scarborough Joint 2 2 Venture to LNG Japan expected in Q1 2024 and; ▪ 15.1% participating interest in Scarborough Joint 3 Venture to JERA expected in H2 2024 1 0 2024 2025 2026 2027 2028 2029 2030 2031 2032 1. As at 31 December 2023. Drawn Undrawn 2. Subject to completion of the transaction, targeted in the first quarter of 2024. 3. Subsequent to the period. The sale and purchase agreement is with JERA Scarborough Pty Ltd which is a wholly owned subsidiary of JERA Co., Inc. Subject to completion of the transaction, targeted for the second half of 27 2024. $ billion $ billion

Record A$5 billion paid in Australian taxes; 85% increase 4,5 Australian tax contribution 6000 5.0 5000 1 4000 Largest payer of PRRT in Australia A$3,521m | Corporate income tax 2 3000 2.7 More than US$500 million of foreign tax paid in 2023 2000 3 Global all-in effective tax rate of 42% A$681m | PRRT 1000 0.7 0.7 0.7 A$486m | Federal royalties A$148m | Federal excise A$82m | Offshore petroleum levy A$71m | Fringe benefits tax and payroll tax 0 2019 2020 2021 2022 2023 1. Based on the Australian Taxation Office’s 2021-2022 report of entity tax information (data.gov.au/). 2. Includes Trinidad and Tobago production entitlements, which are paid in-kind. 3. For the 2023 financial year. Determined by total tax expense, royalties, excise, levies and other taxes, divided by profit before such taxes, adjusted for exceptional items. The global all-in effective tax rate increases to 57% with exceptional items included. 4. Includes data relevant to the assets acquired through the merger with BHP’s petroleum business from 1 June 2022. 28 5. Figures are reported on a cash basis (net of any refunds received, for example, refunds of tax overpaid in prior periods) and are rounded to the nearest million. A$ billion

1 2024 full-year guidance 2 Capital expenditure Gas hub exposure Production (Unchanged) (Unchanged) (Unchanged) ▪ Woodside’s full-year 2024 production guidance is ▪ Woodside’s full-year 2024 capital expenditure ▪ Woodside expects approximately 26-33% of its 185 – 195 MMboe (505 – 533 Mboe/day) guidance is US$5.0 – 5.5 billion, assuming no 2024 produced LNG to be sold at prices linked to 7 change to current participating interests gas hub indices ▪ The approximate split by product type is: ▪ The approximate split by activity area is: 3 Sangomar ~10% LNG ~45% 4 Scarborough ~40% Pipeline gas ~20% 5 Trion ~15% Crude and condensate ~30% 6 Other ~35% Natural gas liquids ~5% 1. Please refer to the “Disclaimer, important notes and assumptions” section (including under the heading “Forward-looking statements”) for important cautionary information relating to forward-looking statements. 2. Capital expenditure includes capital additions on oil and gas properties and evaluation capitalised. Exploration expenditure includes exploration and evaluation expenditure less amortisation of licence acquisition costs and prior year exploration expense written off. 3. Sangomar at 82% participating interest. 4. Scarborough at 90% participating interest; Pluto Train 2 at 51% participating interest. 5. Trion at 60% participating interest. Capital expenditure includes Pemex carry. 6. Other includes expenditure for new energy. 29 7. Gas hub indices include Japan Korea Marker (JKM), TTF and National Balancing Point (NBP). It excludes Henry Hub.

Asset tables Depreciation and 1 1,3 Operating revenue EBITDA EBIT Capital expenditure Production costs 2 Asset amortisation $ million $ million $ million $ million $ million $ million Australia 2,993 2,381 759 1,622 121 202 North West Shelf 3,817 3,287 822 2,465 232 415 Pluto 944 803 913 (110) 61 72 Wheatstone 1,173 909 421 488 80 242 Bass Strait 197 157 61 96 21 24 Macedon 233 166 218 (52) 73 62 Pyrenees 286 112 122 (10) 9 111 Ngujima-Yin 159 98 18 80 4 45 Okha - 7 2 5 2,538 - Scarborough - (95) 2 (97) 26 - Other Australia Total Australia 9,802 7,825 3,338 4,487 3,165 1,173 International 360 293 149 144 3 44 Trinidad & Tobago 850 659 336 323 191 153 Atlantis 791 639 1,846 (1,207) 146 135 Shenzi 4 530 452 198 254 270 57 Mad Dog - - - - 273 - Trion - (18) 1 (19) 1,071 - Sangomar 18 (264) 39 (303) 129 - Other International Total International 2,549 1,761 2,569 (808) 2,083 389 Marketing 1,643 450 75 375 2 - Corporate/Other - (673) 74 (747) 451 - Total 13,994 9,363 6,056 3,307 5,701 1,562 1. Non-IFRS financial measures. Refer to the glossary section of this presentation for the definitions. 2. Includes exploration permit cost amortisation, impairment losses and impairment reversals. Depreciation and amortisation includes impairment expense at Shenzi $1,383m, Wheatstone $466m and Pyrenees $68m. Total impairment expense of $1,917. 30 3. EBIT excluding total impairment expense of $1,917 is $5,224m. 4. Includes Mad Dog and Mad Dog Phase 2.

Realised price Products Units 2023 2022 Variance 1 LNG produced $/boe 79 109 (30) 2 LNG traded $/boe 76 166 (90) Pipeline gas $/boe 35 48 (13) Oil and condensate $/boe 79 96 (17) NGLs $/boe 40 44 (4) Liquids traded $/boe 79 - 79 Average realised price $/boe 69 98 (29) Average Dated Brent $/bbl 83 101 (18) WTI $/bbl 78 94 (16) JCC (lagged three months) $/bbl 89 98 (9) JKM $/MMBtu 16 34 (18) 3 TTF $/MMBtu 15 40 (25) Henry Hub $/MMBtu 3 7 (4) 1. Realised prices include the impact of periodic adjustments reflecting the arrangements governing Wheatstone LNG sales. 2. Excludes any additional benefit attributed to produced LNG through third-party trading activities. 31 3. TTF is converted from EUR/MWh to US$/MMBtu using published exchange rates and conversion factors.

Financial KPIs 2023 2022 Production volume MMboe 187.2 157.7 Operating revenue $ million 13,994 16,817 1 EBITDA $ million 9,363 11,234 1 EBIT $ million 3,307 9,186 Net finance income/(cost) $ million (34) (12) Tax benefit/(expense) $ million (1,551) (2,599) Non-controlling interest $ million 62 77 2 NPAT $ million 1,660 6,498 1 Underlying NPAT $ million 3,320 5,230 1. Non-IFRS financial measure. Refer to the glossary section of this presentation for the definition. 32 2. NPAT attributable to equity holders.

Glossary $, $m, $B US dollar unless otherwise stated, millions of dollars, billions of dollars Woodside sets its Scope 1 and 2 greenhouse gas emissions reduction targets on an equity basis. This ensures that the scope of its emissions reduction targets is aligned with its economic interest in its A$, AUD Australian dollar Equity greenhouse gas emissions investments. Equity emissions reflect the greenhouse gas emissions from operations according to Woodside uses this term to describe an aspiration to seek the achievement of an outcome but where Woodside’s share of equity in the operation. Its equity share of an operation reflects its economic interest 2 Aspiration achievement of the outcome is subject to material uncertainties and contingencies such that Woodside in the operation, which is the extent of rights it has to the risks and rewards flowing from the operation considers there is not yet a suitable defined plan or pathway to achieve that outcome. Exploration expenditure includes exploration and evaluation expenditure less amortisation of licence Exploration expenditure Bcf Billion cubic feet acquisition costs and prior year exploration expense written off Woodside Energy Global Holdings Pty Ltd ACN 006 923 897 (formerly known as BHP Petroleum FDP Field development plan International Pty Ltd) and, unless context otherwise requires, its subsidiaries. References to “Woodside FEED Front-end engineering design BHP Petroleum or BHPP Energy Global Holdings Pty Ltd” or “BHP Petroleum International Pty Ltd” are references to Woodside Energy Global Holdings Pty Ltd ACN 006 923 897 (formerly known as BHP Petroleum International Pty FID Final investment decision Ltd) excluding its subsidiaries. Flaring The controlled burning of gas found in oil and gas reservoirs Barrel of oil equivalent, thousand barrels of oil equivalent, million barrels of oil equivalent, billion boe, kboe, MMboe, Bboe barrels of oil equivalent FPSO Floating production storage and offloading Capital expenditure Includes capital additions on oil and gas properties and evaluation capitalised FPU Floating production unit Revenue from sale of produced hydrocarbons less production costs, royalties, excise and levies, Free cash flow Cash flow from operating activities less cash flow from investing activities insurance, inventory movement, shipping and direct sales costs and other hydrocarbon costs; divided Cash margin Gearing Net debt divided by net debt and equity attributable to the equity holders of the parent by revenue from the sale of produced hydrocarbons (sales volume). Excludes exploration and evaluation, general administrative and other costs, depreciation and amortisation, PRRT and income tax The seven greenhouse gases listed in the Kyoto Protocol are: carbon dioxide (CO ); methane (CH ); nitrous 2 4 CCS Carbon capture and storage GHG or greenhouse gas oxide (N O); hydrofluorocarbons (HFCs); nitrogen trifluoride (NF ); perfluorocarbons (PFCs); and sulphur 2 3 3 hexafluoride (SF ) 6 CCU Carbon capture and utilisation IFRS International Financial Reporting Standards Foundation. For more information see www.ifrs.org CCUS Carbon capture, utilisation and storage Investing cash flow Cash flow from investing activities CH Methane 4 IRR Internal rate of return CO Carbon dioxide 2 The Japan customs-cleared crude is the average price of customs-cleared crude oil imports into Japan as CO₂ equivalent. The universal unit of measurement to indicate the global warming potential JCC reported in customs statistics (also known as ‘Japanese crude cocktail’) and is used as a reference price for of each of the seven greenhouse gases, expressed in terms of the global warming potential CO -e long-term supply LNG contracts 2 of one unit of carbon dioxide. It is used to evaluate releasing (or avoiding releasing) any greenhouse gas against a common basis. Japan Korea Marker is the North-east Asian spot price index for LNG delivered ex-ship to Japan, South JKM Korea, China and Taiwan. cps Cents per share JV Joint venture Woodside uses this term to describe activities or pathways that have the effect of moving towards a Decarbonisation state that is lower carbon, as defined in this glossary KGP Karratha Gas Plant DTA Deferred tax asset Liquidity Cash and undrawn facilities EBIT Calculated as a profit before income tax, PRRT and net finance costs LNG Liquefied natural gas Calculated as profit before income tax, PRRT, net finance costs, depreciation and amortisation, Woodside uses this term to describe the characteristic of having lower levels of associated potential GHG EBITDA impairment losses, impairment reversals Lower carbon emissions when compared to historical and/or current conventions or analogues, for example relating to an otherwise similar resource, process, production facility, product or service, or activity A lower carbon economy is an economy that produces lower levels of greenhouse gas emissions relative Lower carbon economy to today’s economy 1. Definition as per the Australian Government Climate Change Authority. https://www.climatechangeauthority.gov.au/sites/default/files/2022-08/Review%20of%20International%20Offsets%20-%20Report%20-%20August%202022.pdf 2. World Resources Institute and World Business Council for Sustainable Development 2004. “GHG Protocol: a corporate accounting and reporting standard”. 33 3. Convention on Biological Diversity (1992).

Glossary Lower carbon energy provider Woodside uses this term to describe its aspiration to develop a lower carbon portfolio An unplanned or uncontrolled loss of primary containment (LOPC) of any material including non-toxic Process safety event (Tier 1 and and nonflammable materials from a process, or an undesired event or condition. Process safety events are For Woodside, a lower carbon portfolio is one from which the net equity scope 1 and 2 greenhouse gas Tier 2) classified as Tier 1 – LOPC of greatest consequence or Tier 2 – LOPC of lesser consequence. As defined by emissions, which includes the use of offsets, are being reduced towards targets, and into which new American Petroleum Institute (API) recommended practice 754 Lower carbon portfolio energy products and lower carbon services are planned to be introduced as a complement to existing PRRT Petroleum resource rent tax and new investments in oil and gas. Woodside’s Climate Policy sets out the principles that we believe will assist us achieve this aim Reserves replacement is the extent to which the year’s production has been replaced by reserves added to Lower carbon power comes from processes or technologies that produce electricity with Reserves replacement our reserve base. This includes changes resulting from extensions and discoveries, transfers, revisions to previous estimates, and acquisitions and divestments Lower carbon power a lower greenhouse gas emissions intensity relative to electricity produced from a higher emissions intensity source RFSU Ready for start-up Woodside uses this term to describe technologies, such as CCUS or offsets, that may be capable of Lower carbon services Direct GHG emissions. These occur from sources that are owned or controlled by the company, for reducing the net greenhouse gas emissions of our customers example, emissions from combustion in owned or controlled boilers, furnaces, vehicles, etc.; emissions from chemical production in owned or controlled process equipment. Woodside estimates greenhouse MMbbl Million barrels Scope 1 greenhouse gas gas emissions, energy values and global warming potentials are estimated in accordance with the relevant MMBtu Million British thermal units emissions reporting regulations in the jurisdiction where the emissions occur (e.g. Australian National Greenhouse and Energy Reporting (NGER), US EPA Greenhouse Gas Reporting Program (GHGRP)). Australian Mtpa Million tonnes per annum regulatory reporting principles have been used for emissions in jurisdictions where regulations do not yet 2 exist Net debt Interest-bearing liabilities and lease liabilities less cash and cash equivalents Electricity indirect GHG emissions. Scope 2 accounts for GHG emissions from the generation of purchased Net equity greenhouse gas Woodside’s equity share of net greenhouse gas emissions which includes the utilisation of electricity consumed by the company. Purchased electricity is defined as electricity that is purchased or emissions carbon credits as offsets. otherwise brought into the organisational boundary of the company. Scope 2 emissions physically occur Net zero emissions are achieved when anthropogenic emissions of greenhouse gases to the Scope 2 greenhouse gas at the facility where electricity is generated. Woodside estimates greenhouse gas emissions, energy values emissions and global warming potentials are estimated in accordance with the relevant reporting regulations in the atmosphere are balanced by anthropogenic removals over a specified period. Where multiple Net zero greenhouse gases are involved, the quantification of net zero emissions depends on the climate metric jurisdiction where the emissions occur (e.g. Australian National Greenhouse and Energy Reporting (NGER), US EPA Greenhouse Gas Reporting Program (GHGRP)). Australian regulatory reporting principles have chosen to compare emissions of different gases (such as global warming potential, global temperature 2 1 been used for emissions in jurisdictions where regulations do not yet exist change potential, and others, as well as the chosen time horizon) Woodside uses this term to describe energy technologies, such as hydrogen or ammonia, Other indirect GHG emissions. Scope 3 is a reporting category that allows for the treatment of all other indirect emissions. Scope 3 emissions are a consequence of the activities of the company, but occur from that are emerging in scale but which are expected to grow during the energy transition due New energy to having lower greenhouse gas emissions at the point of use than conventional fossil fuels. Scope 3 greenhouse gas sources not owned or controlled by the company. Some examples of Scope 3 activities are extraction and emissions production of purchased materials; transportation of purchased fuels; and use of sold products and May include new energy products that have been manufactured from fossil fuels services. Please refer to the data table on page 73 for further information on the Scope 3 emissions NGLs Natural gas liquids 2 categories reported by Woodside NPAT Net profit after tax This report refers to ranges of time as follows: short-term means from now until 2025; medium-term means 2026-2035; long-term means 2036 and beyond. Woodside also refers to “near-term” and “medium- NWS North West Shelf Short-, medium and term” in the specific context of its net equity Scope 1 and 2 greenhouse gas emissions reduction targets. long-term In this context, near-term refers to the 2025 as a point in time, and medium term refers to 2030 as a point The compensation for an entity’s greenhouse gas emissions within its scope by achieving an equivalent Offsets amount of emission reductions or removals outside the boundary or value chain of that entity in time, being the years to which the targets relate For its net equity Scope 1 and 2 emissions targets, Woodside uses a starting base of 6.32 Mt CO -e which Operating cash flow Cash flow from operating activities 2 is representative of the gross annual average equity Scope 1 and 2 greenhouse gas emissions over 2016- Oil and gas joint venture participants will typically appoint one company as the operator, which will Starting base 2020 and which may be adjusted (up or down) for potential equity changes in producing or sanctioned hold the contractual authority to manage joint venture activities on behalf of the joint venture assets with a final investment decision prior to 2021. Net equity emissions include the utilisation of carbon Operator, Operated and participants. Where Woodside is the operator of a joint venture in which it holds an equity share, this credits as offsets. non-operated report refers to that joint venture as being operated. Where another company is the operator of a joint SURF Subsea, umbilicals, risers and flowlines (SURF) venture in which Woodside holds an equity share, this report refers to that joint venture as being non- operated 1. IPCC, 2018: Annex I: Glossary [Matthews, J.B.R. (ed.)]. In: Global Warming of 1.5°C. An IPCC Special Report on the impacts of global warming of 1.5°C above pre-industrial levels and related global greenhouse gas emission pathways, in the context of strengthening the global response to the threat of climate change, sustainable development, and efforts to eradicate poverty [Masson-Delmotte, V., P. Zhai, H.-O. Pörtner, D. Roberts, J. Skea, P.R. Shukla, A. Pirani, W. Moufouma-Okia, C. Péan, R. Pidcock, S. Connors, J.B.R. Matthews, Y. Chen, X. Zhou, M.I. Gomis, E. Lonnoy, T. Maycock, M. Tignor, and T. Waterfield (eds.)]. In Press. Page 555. 34 2. World Resources Institute and World Business Council for Sustainable Development 2004. “GHG Protocol: a corporate accounting and reporting standard”.

Glossary References to sustainability (including sustainable and sustainably) are used with reference to Woodside’s Sustainability Committee and sustainability related Board policies, as well as in the context of Woodside’s aim to ensure its business is sustainable from a long-term perspective, considering a range of factors including economic (including being able to sustain our business in the long term by being low cost and Sustainability (including profitable), environmental (including considering our environmental impact and striving for a lower sustainable and sustainably) carbon portfolio), social (including supporting our license to operate), and regulatory (including ongoing compliance with relevant legal obligations). Use of the terms ‘sustainability’, ‘sustainable’ and ‘sustainably’ is not intended to imply that Woodside will have no adverse impact on the economy, environment, or society, or that Woodside will achieve any particular economic, environmental, or social outcomes. Woodside uses this term to describe an intention to seek the achievement of an outcome, where Target Woodside considers that it has developed a suitably defined plan or pathway to achieve that outcome TTF Title transfer facility TRI Total recordable injuries TRIR Total recordable injury rate Underlying earnings per share or Underlying net profit after tax divided by weighted average number of shares on issue underlying EPS Underlying net profit after tax or Net profit after tax excluding any exceptional items underlying NPAT Unit production cost or UPC Production costs ($ million) divided by production volume (MMboe) USD United States dollar Woodside Woodside Energy Group Ltd ACN 004 898 962 or its applicable subsidiaries YTD Year to date 35

Head Office: Woodside Energy Group Ltd Mia Yellagonga 11 Mount Street Perth WA 6000 Postal Address: GPO Box D188 Perth WA 6840 Australia T: +61 8 9348 4000 F: +61 8 9214 2777 E: companyinfo@woodside.com Woodside Energy Group Ltd ABN 55 004 898 962 woodside.com
Exhibit 99.3
|
THRIVING THROUGH THE ENERGY TRANSITION Climate Transition Action Plan and 2023 Progress Report
|
Climate and 2023 Transition Progress Action Report Plan ACKNOWLEDGING COUNTRY Woodside recognises Aboriginal and Torres Strait Islander peoples as Australia?s First Peoples. We acknowledge their connection to land, waters and the environment and pay our respects to ancestors and Elders, past and present. We extend this recognition and respect to First Nations peoples and communities around the world. ABOUT THIS REPORT This Climate Transition Action Plan and 2023 Progress Report summarises Woodside?s climate-related plans, activities, progress and climate-related data for the period 1 January 2023 to 31 December 2023. It aims to provide a balance of disclosures that meet the recommendations of the Task Force on Climate-related Financial Disclosures (TCFD), while avoiding overwhelming readers with information. Woodside considers that this report contains disclosures consistent with TCFD?s four recommendations and 11 recommended disclosures, noting its Guidance for all Sectors and Guidance for Non-Financial Groups.1,2 Woodside notes that following the completion of its 2023 status report, the TCFD has fulfilled its remit and disbanded. The Financial Security Board of the Bank of International Settlements has asked the International Financial Reporting Standards (IFRS) Foundation to take over the monitoring of the progress of companies? climate-related disclosures. This report has also been prepared with reference to selected relevant metrics from the Sustainable Accounting Standards Board (SASB) Oil and Gas Exploration and Production Standard.3 See page 80 for an index which cross-references content in this report to these recommendations. Given the focus of this Climate Transition Action Plan, it is necessarily oriented towards future events and contains forward looking information regarding the plans, strategies, objectives, targets, aspirations and the like of Woodside in relation to climate change. Neither our plan to help us achieve our strategic aim, nor the content of this report more generally, is a statement, guarantee or prediction that future events will or are likely to occur. Further detail regarding the scope of this report including a disclaimer, risks, emissions data and other important information is contained on pages 81-82. All dollar ?gures are expressed in US currency, Woodside share, unless otherwise stated. Emissions refers to greenhouse gas emissions unless otherwise stated. Woodside Energy Group Ltd (ABN 55 004 898 962) is the ultimate holding company of the Woodside group of companies. In this report, unless otherwise stated, references to ?Woodside?, ?our?, ?us? or ?we? refer to Woodside Energy Group Ltd and its controlled entities. ANNUAL REPORT 2023 Our Annual Report 2023 provides a summary of Woodside?s operations and activities for the 12 month period ended 31 December 2023 and Woodside?s financial position as at 31 December 2023. It also provides a summary of Woodside?s sustainability approach, health and safety performance and other information for the 12 month period ended 31 December 2023. The Annual Report 2023 and this Climate Transition Action Plan and 2023 Progress Report together provide a complementary review of Woodside?s business. The reports are available on our website at woodside.com. REPORT FEEDBACK We welcome feedback on this Climate Transition Action Plan and 2023 Progress Report via companyinfo@woodside.com EXTERNAL ASSURANCE Limited assurance has been undertaken in respect of selected greenhouse gas emissions data by GHD Pty Ltd. Please refer to page 83 for more information on the scope of assurance. ON THE COVER The cover features the skyline of Tokyo, Japan. 1 Financial Stability Board, 2017. ?Recommendations of the Task Force on Climate-related Financial Disclosures. Final Report.? Figure 4, p. 14. Some elements of the TCFD?s four recommendations and 11 recommended disclosure have been presented in different order to enhance readability. A cross reference between the TCFD and this report is provided on p. 80. 2 Financial Stability Board, 2021. ?Implementing the Recommendations of the Task Force on Climate-related Financial Disclosures.? 3 SASB, 2018. ?Oil & Gas ? Exploration and Production. Sustainability Accounting Standard. Version 2018-10.? Table 1, p. 6. WOODSIDE?S CLIMATE TRANSITION ACTION PLAN AND 2023 PROGRESS REPORT WOODSIDE ENERGY GROUP LTD II
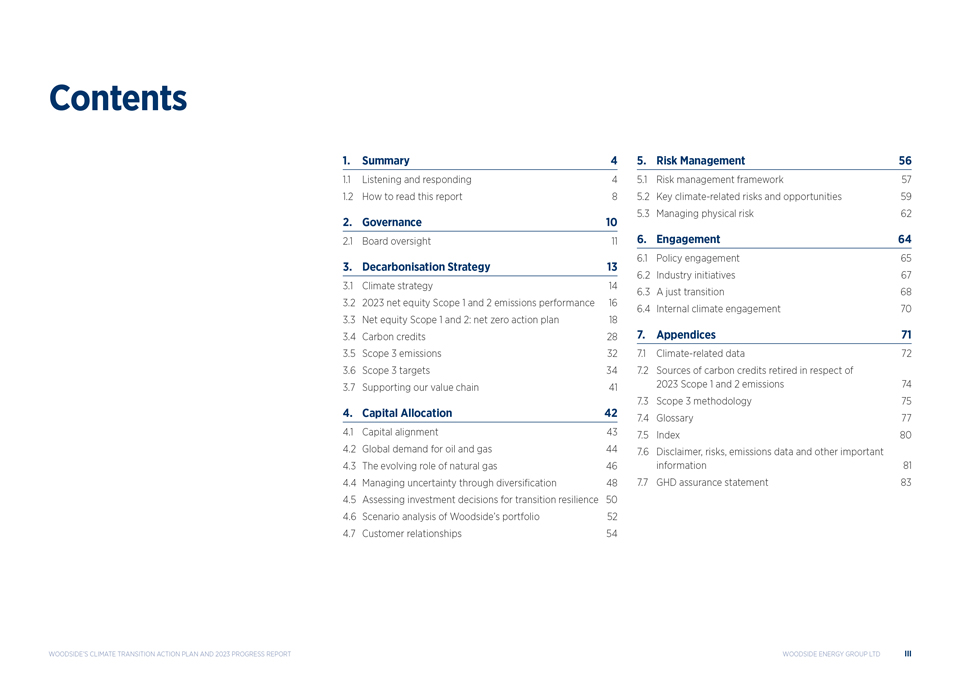
|
Contents 1. Summary 4 1.1 Listening and responding 4 1.2 How to read this report 8 2. Governance 10 2.1 Board oversight 11 3. Decarbonisation Strategy 13 3.1 Climate strategy 14 3.2 2023 net equity Scope 1 and 2 emissions performance 16 3.3 Net equity Scope 1 and 2: net zero action plan 18 3.4 Carbon credits 28 3.5 Scope 3 emissions 32 3.6 Scope 3 targets 34 3.7 Supporting our value chain 41 4. Capital Allocation 42 4.1 Capital alignment 43 4.2 Global demand for oil and gas 44 4.3 The evolving role of natural gas 46 4.4 Managing uncertainty through diversi?cation 48 4.5 Assessing investment decisions for transition resilience 50 4.6 Scenario analysis of Woodside?s portfolio 52 4.7 Customer relationships 54 5. Risk Management 56 5.1 Risk management framework 57 5.2 Key climate-related risks and opportunities 59 5.3 Managing physical risk 62 6. Engagement 64 6.1 Policy engagement 65 6.2 Industry initiatives 67 6.3 A just transition 68 6.4 Internal climate engagement 70 7. Appendices 71 7.1 Climate-related data 72 7.2 Sources of carbon credits retired in respect of 2023 Scope 1 and 2 emissions 74 7.3 Scope 3 methodology 75 7.4 Glossary 77 7.5 Index 80 7.6 Disclaimer, risks, emissions data and other important information 81 7.7 GHD assurance statement 83 WOODSIDE?S CLIMATE TRANSITION ACTION PLAN AND 2023 PROGRESS REPORT WOODSIDE ENERGY GROUP LTD III
|
Listening and responding Woodside?s response to climate change is integrated throughout our company strategy to thrive through the energy transition. During 2023, I listened carefully to our investors, who told me they want more detailed information about our climate action plans. So this Climate Transition Action Plan is an evolution of our previous disclosures. Updates also re?ect the progress and re?nement of our plans to reduce our net equity Scope 1 and 2 emissions and invest in products and services for the energy transition. DEMAND FOR OUR PRODUCTS A key request from investors has been to explain more about future demand for our products through the transition, and why we believe that Woodside?s projects will be competitive. This is key to successfully and profitably converting global demand for energy into realised sales of our products. As a result, we have included additional information in this report including: Analysis of how global energy markets might evolve, including in scenarios that could limit warming to 1.5C, The potential role of natural gas in the energy transition, How we assess our investments for their resilience to key aspects of the energy transition, How we collaborate with customers to strengthen our trading relationships and understand policies in our key markets. The sale of 10% of the Scarborough Joint Venture to LNG Japan and of 15.1% to JERA, is an example of mutual con?dence in demand.1 These strategic relationships also include potential LNG offtake and collaboration on opportunities in new energy. SCOPE 1 AND 2 EMISSIONS We have also provided important updates on our progress on Scope 1 and 2 emissions reductions, and our plans for the future. In 2023 we achieved a reduction in our net equity Scope 1 and 2 emissions of 12.5% below the starting base. This compares to 11% in 2022.2 We used 13% fewer carbon credits as offsets than last year due to the underlying emissions performance at our facilities. We completed decarbonisation planning across our merged portfolio of operated assets, identifying multiple technical options to reduce gross Scope 1 and 2 emissions from our current portfolio. The technologies in these plans are also available to design out emissions from our growth opportunities. We have continued to develop our portfolio of carbon credits. We have included additional information about its size and composition, and the due diligence process we use to assess its integrity. All footnotes related to this page are displayed on the next page. WOODSIDE?S CLIMATE TRANSITION ACTION PLAN AND 2023 PROGRESS REPORT WOODSIDE ENERGY GROUP LTD 4
|
SCOPE 3 EMISSIONS Our Scope 3 approach includes the introduction of new products and services into our portfolio, like hydrogen and carbon capture utilisation and storage (CCUS). These products and services can help our customers avoid or reduce their Scope 1 or 2 emissions and therefore reduce the life cycle (Scopes 1, 2 and 3) emissions intensity of our portfolio. In 2023, we continued to review our approach to Scope 3 targets in response to investor feedback and have decided to supplement our existing investment target with a new complementary emissions abatement target. This target is to take ?nal investment decisions on new energy products and lower carbon services by 2030, with total abatement capacity of 5 Mtpa CO -e.3 2 The investment target tracks our work to develop these projects and bring them to market. The emissions abatement target will track their impact on customer emissions. Spending on carbon capture and storage (CCS) and hydrogen opportunities was more than $235 million in 2023, up over 135% compared to 2022, building towards our target to invest $5 billion in new energy products and lower carbon services by 2030.3,4 We have included additional information in this report about the progress of our CCS and hydrogen projects, the risks to achieving our targets ? such as securing profitable customer offtake ? and what we are doing to address these risks. GOVERNANCE The Board of Directors, led by our Chair Richard Goyder, oversees our climate work so that our governance of climate change re?ects its strategic importance to our company. As part of our continuous review of Board skills and composition, changes were made to enhance our Board and Committees in 2023, with the intention that they are best placed to support our global operations, as well as our strategic growth opportunities through the energy transition. The Board has also decided to amend our executive remuneration framework, so that targets for gross Scope 1 and 2 emissions performance and new energy projects progress will impact the outcomes of performance based remuneration for the Executive Leadership Team. As well as disclosing our policy advocacy activities, we have reviewed our industry association memberships, including an assessment of whether industry association activities support the goals of the Paris Agreement. We have published the results of the review on our website. This Climate Transition Action Plan will be put to an advisory shareholder vote at our Annual General Meeting (AGM) in April 2024. I believe it deserves the firm support of our shareholders ? it is a thorough review of our plans, our progress and our challenges. But it is not intended to be the last word. Our strategy and our performance has and will continue to evolve in the years ahead. Feedback from our shareholders will continue to be actively sought. Progress reports will be published in future years, with a further vote on an updated plan intended in three years? time, or sooner if exceptional circumstances require. Meg O?Neill Chief Executive Officer and Managing Director February 2024 1 See announcements titled ?Woodside to sell 10% Scarborough interest to LNG Japan? (8 August 2023) and ?Woodside to sell 15.1% Scarborough interest to JERA? (23 February 2024) at woodside.com. Greenhouse gas emissions data including charts and estimates of future abatement plans in this Climate Transition Action Plan have not been updated to reflect changes in Woodside?s equity share of the Scarborough Joint Venture as a consequence of the sale of 15.1% interest to JERA. 2 Targets and aspiration are for net equity Scope 1 and 2 greenhouse gas emissions relative to a starting base of 6.32 Mt CO -e which is representative of the gross annual average equity Scope 1 and 2 greenhouse gas emissions over 2016-2020 and which may be adjusted (up or down) for potential 2 equity changes in producing or sanctioned assets with a ?nal investment decision prior to 2021. Net equity emissions include the utilisation of carbon credits as offsets. 3 Scope 3 targets are subject to commercial arrangements, commercial feasibility, regulatory and Joint Venture approvals, and third party activities (which may or may not proceed). Individual investment decisions are subject to Woodside?s investment targets. Not guidance. Potentially includes both organic and inorganic investment. 4 Includes pre-RFSU spend on new energy products and lower carbon services that can help our customers decarbonise by using these products and services. It is not used to fund reductions of Woodside?s net equity Scope 1 and 2 emissions which are managed separately through asset decarbonisation plans. WOODSIDE?S CLIMATE TRANSITION ACTION PLAN AND 2023 PROGRESS REPORT WOODSIDEWOODSIDE ENERGY GROUP ENERGY LTD GROUP LTD 5
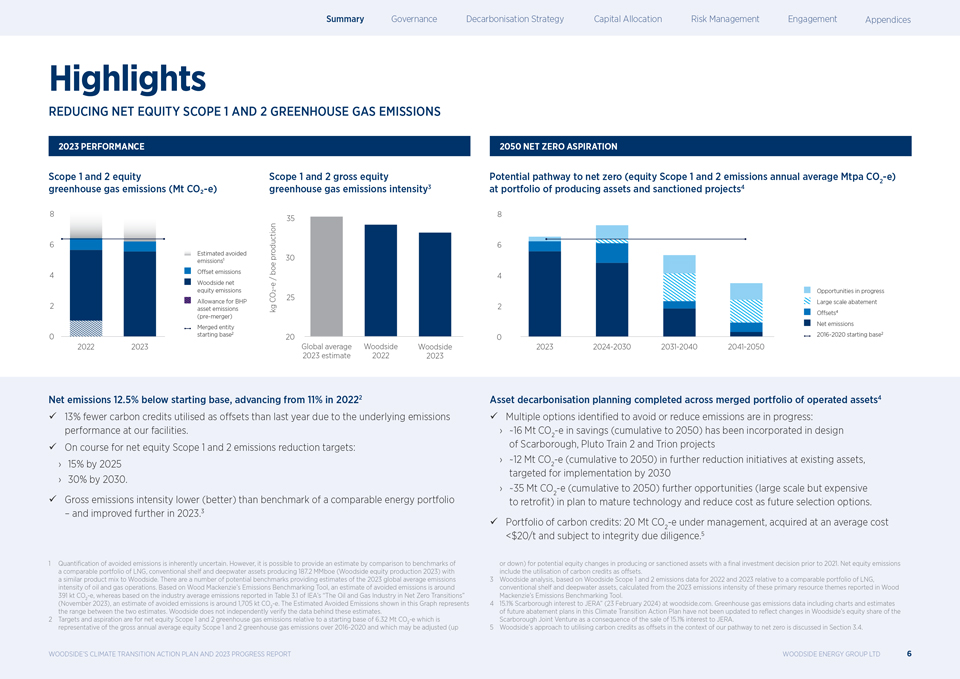
|
Highlights REDUCING NET EQUITY SCOPE 1 AND 2 GREENHOUSE GAS EMISSIONS 2023 PERFORMANCE Scope 1 and 2 equity Scope 1 and 2 gross equity greenhouse gas emissions (Mt CO?-e) greenhouse gas emissions intensity3 8 35 6 Estimated avoided production emissions1 30 Offset emissions boe 4 / Woodside net e equity emissions -CO2 25 Allowance for BHP 2 asset emissions kg (pre-merger) Merged entity 0 starting base2 20 2022 2023 Global average Woodside Woodside 2023 estimate 2022 2023 2050 NET ZERO ASPIRATION Potential pathway to net zero (equity Scope 1 and 2 emissions annual average Mtpa CO -e) 4 2 at portfolio of producing assets and sanctioned projects 8 6 4 Opportunities in progress Large scale abatement 2 Offsets4 Net emissions 0 2016-2020 starting base2 2023 2024-2030 2031-2040 2041-2050 Net emissions 12.5% below starting base, advancing from 11% in 20222 ? 13% fewer carbon credits utilised as offsets than last year due to the underlying emissions performance at our facilities. ? On course for net equity Scope 1 and 2 emissions reduction targets: 15% by 2025 30% by 2030. ? Gross emissions intensity lower (better) than benchmark of a comparable energy portfolio ? and improved further in 2023.3 1 Quantification of avoided emissions is inherently uncertain. However, it is possible to provide an estimate by comparison to benchmarks of a comparable portfolio of LNG, conventional shelf and deepwater assets producing 187.2 MMboe (Woodside equity production 2023) with a similar product mix to Woodside. There are a number of potential benchmarks providing estimates of the 2023 global average emissions intensity of oil and gas operations. Based on Wood Mackenzie?s Emissions Benchmarking Tool, an estimate of avoided emissions is around 391 kt CO -e, whereas based on the industry average emissions reported in Table 3.1 of IEA?s ?The Oil and Gas Industry in Net Zero Transitions? 2 (November 2023), an estimate of avoided emissions is around 1,705 kt CO -e. The Estimated Avoided Emissions shown in this Graph represents 2 the range between the two estimates. Woodside does not independently verify the data behind these estimates. 2 Targets and aspiration are for net equity Scope 1 and 2 greenhouse gas emissions relative to a starting base of 6.32 Mt CO -e which is 2 representative of the gross annual average equity Scope 1 and 2 greenhouse gas emissions over 2016-2020 and which may be adjusted (up Asset decarbonisation planning completed across merged portfolio of operated assets4 ? Multiple options identi?ed to avoid or reduce emissions are in progress: ~16 Mt CO -e in savings (cumulative to 2050) has been incorporated in design of Scarborough, 2 Pluto Train 2 and Trion projects ~12 Mt CO -e (cumulative to 2050) in further reduction initiatives at existing assets, targeted for 2 implementation by 2030 ~35 Mt CO -e (cumulative to 2050) further opportunities (large scale but expensive to retro?t)2 in plan to mature technology and reduce cost as future selection options. ? Portfolio of carbon credits: 20 Mt CO -e under management, acquired at an average cost 2 <$20/t and subject to integrity due diligence.5 or down) for potential equity changes in producing or sanctioned assets with a ?nal investment decision prior to 2021. Net equity emissions include the utilisation of carbon credits as offsets. 3 Woodside analysis, based on Woodside Scope 1 and 2 emissions data for 2022 and 2023 relative to a comparable portfolio of LNG, conventional shelf and deepwater assets, calculated from the 2023 emissions intensity of these primary resource themes reported in Wood Mackenzie?s Emissions Benchmarking Tool. 4 15.1% Scarborough interest to JERA? (23 February 2024) at woodside.com. Greenhouse gas emissions data including charts and estimates of future abatement plans in this Climate Transition Action Plan have not been updated to reflect changes in Woodside?s equity share of the Scarborough Joint Venture as a consequence of the sale of 15.1% interest to JERA. 5 Woodside?s approach to utilising carbon credits as offsets in the context of our pathway to net zero is discussed in Section 3.4. WOODSIDE?S CLIMATE TRANSITION ACTION PLAN AND 2023 PROGRESS REPORT WOODSIDE ENERGY GROUP LTD 6
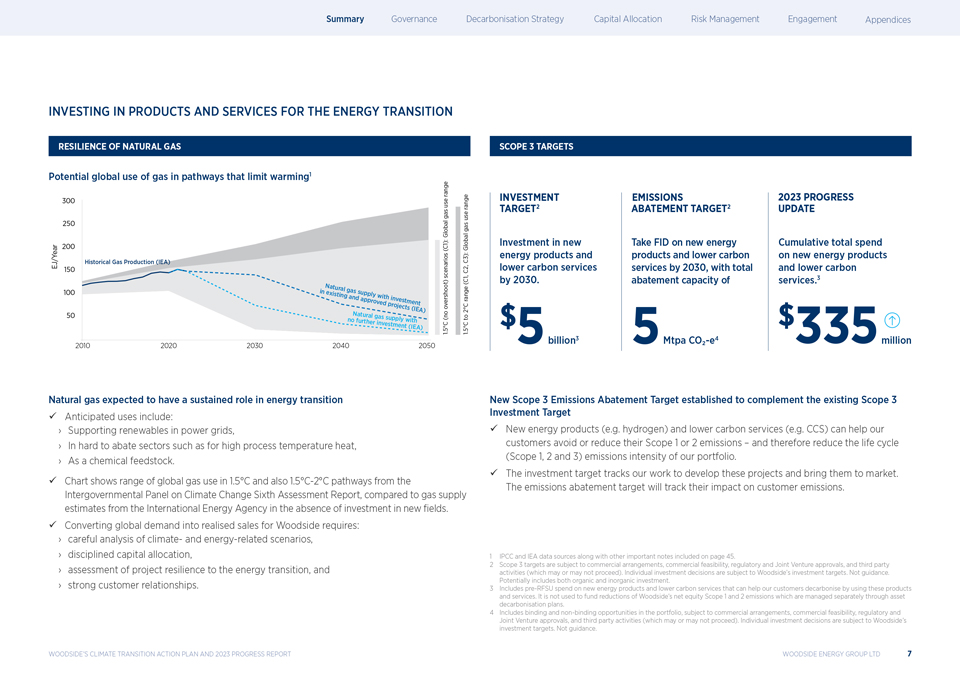
|
INVESTING IN PRODUCTS AND SERVICES FOR THE ENERGY TRANSITION RESILIENCE OF NATURAL GAS Potential global use of gas in pathways that limit warming1 range 300 use gas range 250 use Globalgas 200 (C1): Global C3): Historical Gas Production (IEA) EJ/Year 150 C2, scenarios (C1, Natural 100 in exis gas supply ting and with appr inves range oved projectmen ts t overshoot) (IEA) 2C 50 Natural gas supply (noto no further with investmen t (IEA) 5C 5C 1 . 1 . 2010 2020 2030 2040 2050 SCOPE 3 TARGETS INVESTMENT EMISSIONS 2023 PROGRESS TARGET2 ABATEMENT TARGET2 UPDATE Investment in new Take FID on new energy Cumulative total spend energy products and products and lower carbon on new energy products lower carbon services services by 2030, with total and lower carbon by 2030. abatement capacity of services.3 $ $ 5billion3 5Mtpa CO?-e4 335million Natural gas expected to have a sustained role in energy transition ? Anticipated uses include: Supporting renewables in power grids, In hard to abate sectors such as for high process temperature heat, As a chemical feedstock. ? Chart shows range of global gas use in 1.5C and also 1.5C-2C pathways from the Intergovernmental Panel on Climate Change Sixth Assessment Report, compared to gas supply estimates from the International Energy Agency in the absence of investment in new ?elds. ? Converting global demand into realised sales for Woodside requires: careful analysis of climate- and energy-related scenarios, disciplined capital allocation, assessment of project resilience to the energy transition, and strong customer relationships. New Scope 3 Emissions Abatement Target established to complement the existing Scope 3 Investment Target ? New energy products (e.g. hydrogen) and lower carbon services (e.g. CCS) can help our customers avoid or reduce their Scope 1 or 2 emissions ? and therefore reduce the life cycle (Scope 1, 2 and 3) emissions intensity of our portfolio. ? The investment target tracks our work to develop these projects and bring them to market. The emissions abatement target will track their impact on customer emissions. 1 IPCC and IEA data sources along with other important notes included on page 45. 2 Scope 3 targets are subject to commercial arrangements, commercial feasibility, regulatory and Joint Venture approvals, and third party activities (which may or may not proceed). Individual investment decisions are subject to Woodside?s investment targets. Not guidance. Potentially includes both organic and inorganic investment. 3 Includes pre-RFSU spend on new energy products and lower carbon services that can help our customers decarbonise by using these products and services. It is not used to fund reductions of Woodside?s net equity Scope 1 and 2 emissions which are managed separately through asset decarbonisation plans. 4 Includes binding and non-binding opportunities in the portfolio, subject to commercial arrangements, commercial feasibility, regulatory and Joint Venture approvals, and third party activities (which may or may not proceed). Individual investment decisions are subject to Woodside?s investment targets. Not guidance. WOODSIDE?S CLIMATE TRANSITION ACTION PLAN AND 2023 PROGRESS REPORT WOODSIDE ENERGY GROUP LTD 7
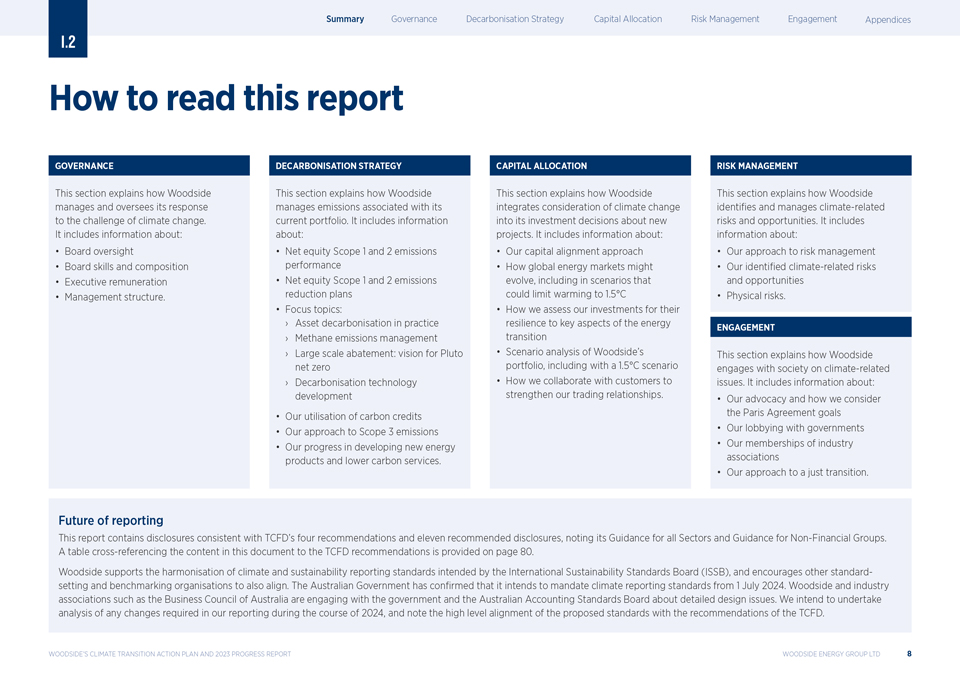
|
How to read this report GOVERNANCE This section explains how Woodside manages and oversees its response to the challenge of climate change. It includes information about: Board oversight Board skills and composition Executive remuneration Management structure. DECARBONISATION STRATEGY This section explains how Woodside manages emissions associated with its current portfolio. It includes information about: Net equity Scope 1 and 2 emissions performance Net equity Scope 1 and 2 emissions reduction plans Focus topics: Asset decarbonisation in practice Methane emissions management Large scale abatement: vision for Pluto net zero Decarbonisation technology development Our utilisation of carbon credits Our approach to Scope 3 emissions Our progress in developing new energy products and lower carbon services. CAPITAL ALLOCATION This section explains how Woodside integrates consideration of climate change into its investment decisions about new projects. It includes information about: Our capital alignment approach How global energy markets might evolve, including in scenarios that could limit warming to 1.5C How we assess our investments for their resilience to key aspects of the energy transition Scenario analysis of Woodside?s portfolio, including with a 1.5C scenario How we collaborate with customers to strengthen our trading relationships. RISK MANAGEMENT This section explains how Woodside identi?es and manages climate-related risks and opportunities. It includes information about: Our approach to risk management Our identi?ed climate-related risks and opportunities Physical risks. ENGAGEMENT This section explains how Woodside engages with society on climate-related issues. It includes information about: Our advocacy and how we consider the Paris Agreement goals Our lobbying with governments Our memberships of industry associations Our approach to a just transition. Future of reporting This report contains disclosures consistent with TCFD?s four recommendations and eleven recommended disclosures, noting its Guidance for all Sectors and Guidance for Non-Financial Groups. A table cross-referencing the content in this document to the TCFD recommendations is provided on page 80. Woodside supports the harmonisation of climate and sustainability reporting standards intended by the International Sustainability Standards Board (ISSB), and encourages other standard-setting and benchmarking organisations to also align. The Australian Government has con?rmed that it intends to mandate climate reporting standards from 1 July 2024. Woodside and industry associations such as the Business Council of Australia are engaging with the government and the Australian Accounting Standards Board about detailed design issues. We intend to undertake analysis of any changes required in our reporting during the course of 2024, and note the high level alignment of the proposed standards with the recommendations of the TCFD. WOODSIDE?S CLIMATE TRANSITION ACTION PLAN AND 2023 PROGRESS REPORT WOODSIDE ENERGY GROUP LTD 8

|
Gas can be used in residential and commercial cooking. Response to investor feedback Updated content in this Climate Transition Action Plan relative to the Woodside Climate Report 2022 includes: Page Targets and Woodside?s plans to achieve them Progress against targets 6-7, 16-17 Extension of asset decarbonisation plans across merged portfolio 15, 18 Emissions reduction between 2030 and 2050 19-21 Decarbonisation project pipeline 15, 18-21, 24-5 Scope 3 emissions abatement target 32-34 New energy and lower carbon services project pipeline 36-40 Utilisation of carbon credits as offsets Woodside?s approach to utilising offsets 28-31 Reporting of carbon credit retirements 74 Reporting of unretired carbon credits portfolio 31 Resilience of demand for Woodside products Scope 3 emissions sources 32-33, 72-73 Customer demand in the energy transition 44-47, 54-55 Approach to capital allocation 43, 48-53 Governance Board skills and composition 11 Management structure 12 Climate-related targets in executive remuneration 12 Policy engagement Woodside advocacy activities 65-69 Review of industry association activities 65, 67 WOODSIDE?S CLIMATE TRANSITION ACTION PLAN AND 2023 PROGRESS REPORT WOODSIDE ENERGY GROUP LTD 9

|
GOVERNANCE Gas is used in the generation of electricity to power our homes.
|
Board oversight The Board of Woodside is responsible for the approval and oversight of our climate change strategy. Climate change is a standing agenda item at each regular meeting of the Sustainability Committee, or the Board when the Sustainability Committee does not meet, with information presented by management, external advisers or third party specialists where appropriate. The Board oversees our climate strategy and receives regular performance updates from management. During 2023, the Board and its Committees were informed about and considered climate-related issues on multiple occasions, including when reviewing and guiding strategy, risk management, annual budgets and business plans, and overseeing major capital expenditure, as well as when setting the Group?s performance objectives and monitoring implementation and performance. The Board continuously reviews progress towards our climate-related targets and our 2050 aspiration by receiving regular updates from the Executive Leadership Team and reports from other management involved in implementing the Group?s climate strategy. The Chair undertakes an annual Governance Roadshow with key institutional investors and investor organisations, including members of Climate Action 100+, to discuss Woodside?s approach to climate change and also listen to any concerns raised by investors. In 2023 the Chair held 43 such meetings. This engagement is supported by our Investor Relations function which had 70 meetings specifically on climate change. BOARD SKILLS AND COMPOSITION The non-executive directors contribute diverse operational and international experience, an understanding of the industry in which Woodside operates, knowledge of ?nancial markets and an understanding of the health, safety, environmental, community and other sustainability matters that are important to Woodside. The Board supplements its climate change awareness by seeking the input of executives and external advisers and specialists to further inform its decisions. The competencies and skills of the directors are set out in the skills matrix described in the Annual Report 2023, in section 4.1. In 2021, the Board skills matrix was updated to include energy transition and climate-related components to reflect the increasing importance of these issues to Woodside?s operations. The Board uses this skills matrix to assess the skills and experience of each director and the combined capabilities of the Board, to identify potential areas of focus for director recruitment and to identify any professional development opportunities that may bene?t directors. In 2023 and early 2024, Woodside announced changes to the membership of its Board of Directors, as part of its continuous review of Board skills and composition. These changes were intended to enhance Woodside?s Board and Committees so that they are best placed to support Woodside?s global operations and strategic growth opportunities through the energy transition. Further information on Board skills and composition is included in the Corporate Governance Statement in section 4.1 of the Annual Report 2023. BOARD COMMITTEES The Board has four standing committees to assist in the discharge of its responsibilities, including on climate change risk. The Sustainability Committee?s responsibilities include reviewing, and making recommendations to the Board on, the Company?s policy and performance in relation to sustainability-related matters, including climate change. The Audit & Risk Committee assists the Board to meet its oversight responsibilities in relation to the company?s financial reporting, compliance with legal and regulatory requirements, internal control structure, risk management and insurance procedures and the internal and external audit functions. Given the importance of climate change as a strategic risk to Woodside, and potential implications relating to financial reporting, it is one of the key risks considered by the Audit & Risk Committee during the review of the company?s risk management framework. The Committee also considers the inclusion of climate-related risks within Woodside?s internal audit program and the appropriateness of disclosures on climate-related risk within the consolidated financial statements. The Nominations & Governance Committee assists the Board with reviewing Board composition, performance and succession planning. This includes identifying, evaluating and recommending candidates for the Board, taking into account the factors set out in the Board skills matrix in section 4.1 of the Annual Report 2023, including energy transition and climate change. The Human Resources & Compensation Committee assists the Board with establishing human resources and compensation policies and practices. Performance based remuneration for the CEO, senior leadership team and all other permanent employees include metrics related to achieving our climate change strategy. Further details are provided in the 2023 Remuneration Report in section 4.3 of the Annual Report 2023. WOODSIDE?S CLIMATE TRANSITION ACTION PLAN AND 2023 PROGRESS REPORT WOODSIDE ENERGY GROUP LTD 11
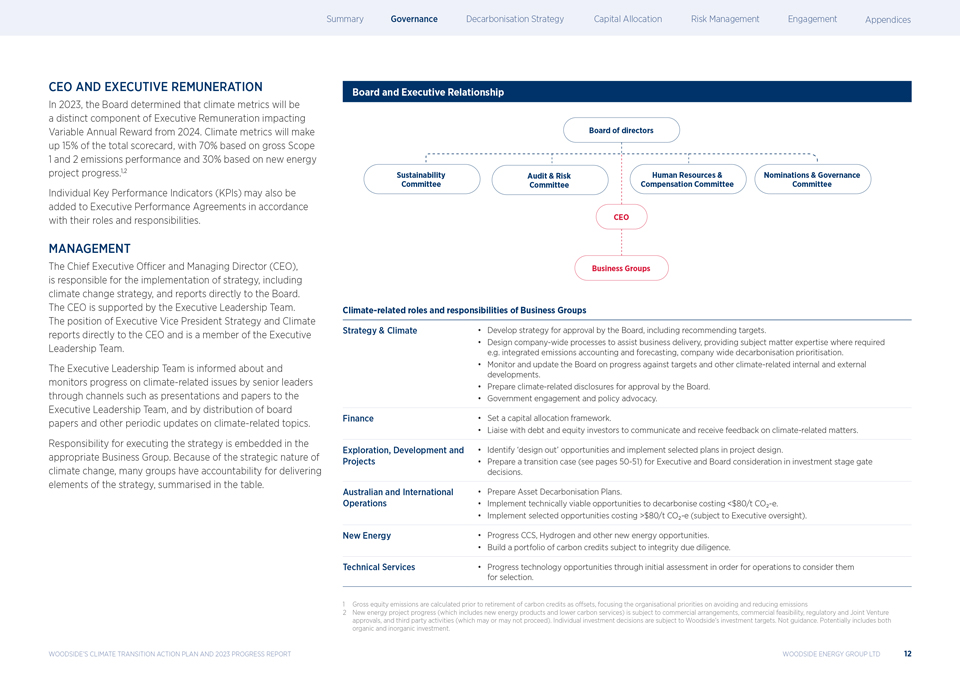
|
CEO AND EXECUTIVE REMUNERATION In 2023, the Board determined that climate metrics will be a distinct component of Executive Remuneration impacting Variable Annual Reward from 2024. Climate metrics will make up 15% of the total scorecard, with 70% based on gross Scope 1 and 2 emissions performance and 30% based on new energy project progress.1,2 Individual Key Performance Indicators (KPIs) may also be added to Executive Performance Agreements in accordance with their roles and responsibilities. MANAGEMENT The Chief Executive Officer and Managing Director (CEO), is responsible for the implementation of strategy, including climate change strategy, and reports directly to the Board. The CEO is supported by the Executive Leadership Team. The position of Executive Vice President Strategy and Climate reports directly to the CEO and is a member of the Executive Leadership Team. The Executive Leadership Team is informed about and monitors progress on climate-related issues by senior leaders through channels such as presentations and papers to the Executive Leadership Team, and by distribution of board papers and other periodic updates on climate-related topics. Responsibility for executing the strategy is embedded in the appropriate Business Group. Because of the strategic nature of climate change, many groups have accountability for delivering elements of the strategy, summarised in the table. Board and Executive Relationship Board of directors Sustainability Audit & Risk Human Resources & Nominations & Governance Committee Committee Compensation Committee Committee CEO Business Groups Climate-related roles and responsibilities of Business Groups Strategy & Climate Develop strategy for approval by the Board, including recommending targets. Design company-wide processes to assist business delivery, providing subject matter expertise where required e.g. integrated emissions accounting and forecasting, company wide decarbonisation prioritisation. Monitor and update the Board on progress against targets and other climate-related internal and external developments. Prepare climate-related disclosures for approval by the Board. Government engagement and policy advocacy. Finance Set a capital allocation framework. Liaise with debt and equity investors to communicate and receive feedback on climate-related matters. Exploration, Development and Identify ?design out? opportunities and implement selected plans in project design. Projects Prepare a transition case (see pages 50-51) for Executive and Board consideration in investment stage gate decisions. Australian and International Prepare Asset Decarbonisation Plans. Operations Implement technically viable opportunities to decarbonise costing <$80/t CO -e. Implement selected opportunities costing >$80/t CO -e (subject to Executive oversight). New Energy Progress CCS, Hydrogen and other new energy opportunities. Build a portfolio of carbon credits subject to integrity due diligence. Technical Services Progress technology opportunities through initial assessment in order for operations to consider them for selection. 1 Gross equity emissions are calculated prior to retirement of carbon credits as offsets, focusing the organisational priorities on avoiding and reducing emissions 2 New energy project progress (which includes new energy products and lower carbon services) is subject to commercial arrangements, commercial feasibility, regulatory and Joint Venture approvals, and third party activities (which may or may not proceed). Individual investment decisions are subject to Woodside?s investment targets. Not guidance. Potentially includes both organic and inorganic investment. WOODSIDE?S CLIMATE TRANSITION ACTION PLAN AND 2023 PROGRESS REPORT WOODSIDE ENERGY GROUP LTD 12
|
DECARBONISATION STRATEGY Gas is used in a variety of high temperature industrial processes, such as glass production.
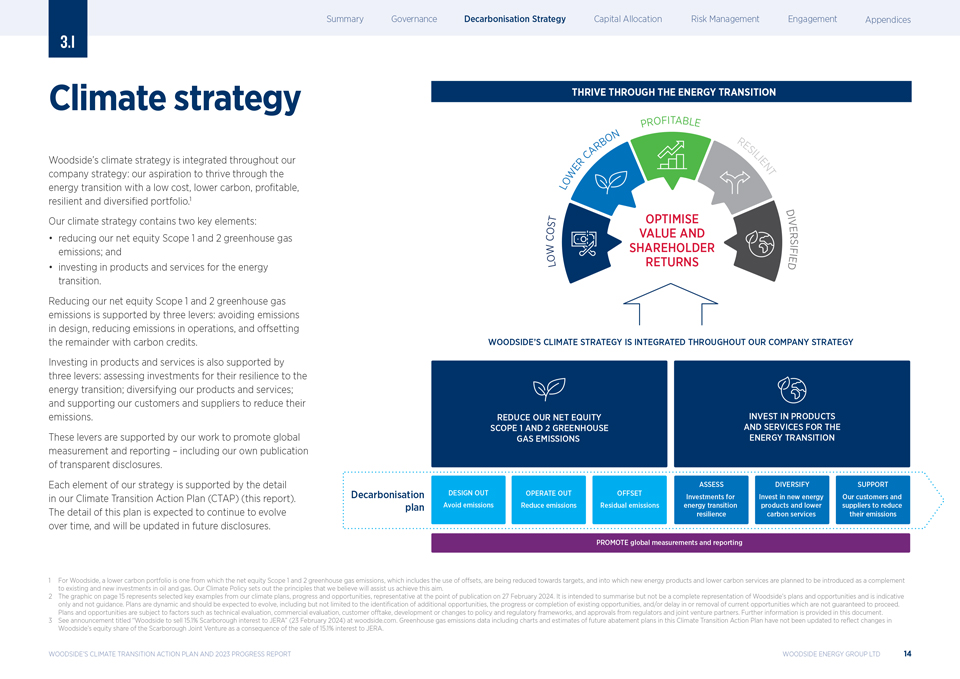
|
Climate strategy Woodside?s climate strategy is integrated throughout our company strategy: our aspiration to thrive through the energy transition with a low cost, lower carbon, profitable, resilient and diversified portfolio.1 Our climate strategy contains two key elements: reducing our net equity Scope 1 and 2 greenhouse gas emissions; and investing in products and services for the energy transition. Reducing our net equity Scope 1 and 2 greenhouse gas emissions is supported by three levers: avoiding emissions in design, reducing emissions in operations, and offsetting the remainder with carbon credits. Investing in products and services is also supported by three levers: assessing investments for their resilience to the energy transition; diversifying our products and services; and supporting our customers and suppliers to reduce their emissions. These levers are supported by our work to promote global measurement and reporting ? including our own publication of transparent disclosures. Each element of our strategy is supported by the detail in our Climate Transition Action Plan (CTAP) (this report). The detail of this plan is expected to continue to evolve over time, and will be updated in future disclosures. THRIVE THROUGH THE ENERGY TRANSITION PROFITABLE N B O R R ES A I L R C I E E NT W L O D T OPTIMISE I S V O VALUE AND E C R S W SHAREHOLDER F I O RETURNS E I L D WOODSIDE?S CLIMATE STRATEGY IS INTEGRATED THROUGHOUT OUR COMPANY STRATEGY Decarbonisation plan 1 For Woodside, a lower carbon portfolio is one from which the net equity Scope 1 and 2 greenhouse gas emissions, which includes the use of offsets, are being reduced towards targets, and into which new energy products and lower carbon services are planned to be introduced as a complement to existing and new investments in oil and gas. Our Climate Policy sets out the principles that we believe will assist us achieve this aim. 2 The graphic on page 15 represents selected key examples from our climate plans, progress and opportunities, representative at the point of publication on 27 February 2024. It is intended to summarise but not be a complete representation of Woodside?s plans and opportunities and is indicative only and not guidance. Plans are dynamic and should be expected to evolve, including but not limited to the identification of additional opportunities, the progress or completion of existing opportunities, and/or delay in or removal of current opportunities which are not guaranteed to proceed. Plans and opportunities are subject to factors such as technical evaluation, commercial evaluation, customer offtake, development or changes to policy and regulatory frameworks, and approvals from regulators and joint venture partners. Further information is provided in this document. 3 See announcement titled ?Woodside to sell 15.1% Scarborough interest to JERA? (23 February 2024) at woodside.com. Greenhouse gas emissions data including charts and estimates of future abatement plans in this Climate Transition Action Plan have not been updated to reflect changes in Woodside?s equity share of the Scarborough Joint Venture as a consequence of the sale of 15.1% interest to JERA. WOODSIDE?S CLIMATE TRANSITION ACTION PLAN AND 2023 PROGRESS REPORT WOODSIDE ENERGY GROUP LTD 14
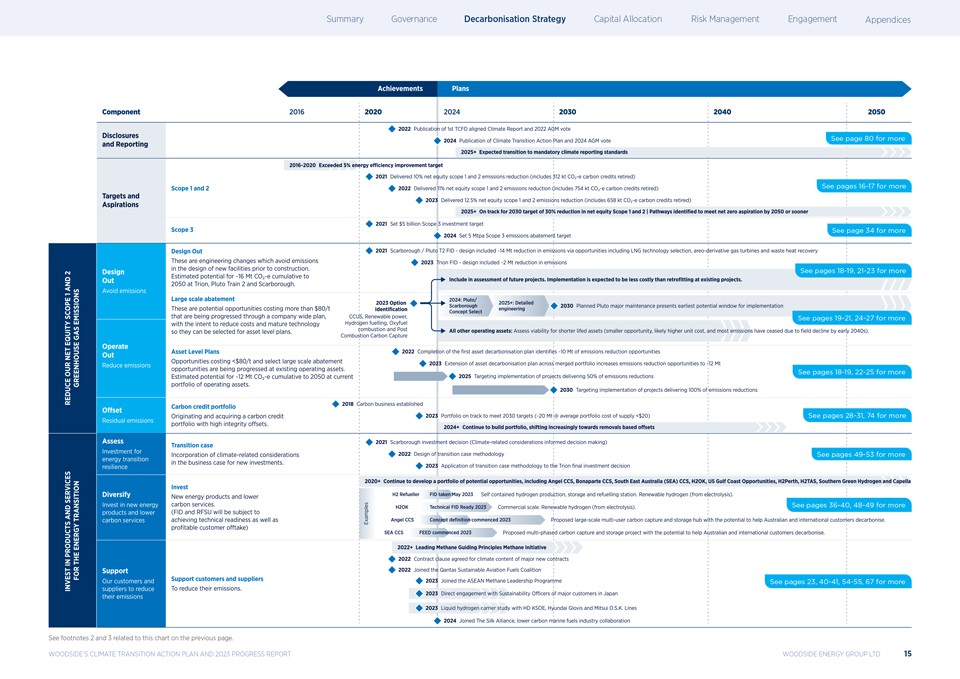
|
See footnotes 2 and 3 related to this chart on the previous page. WOODSIDE?S CLIMATE TRANSITION ACTION PLAN AND 2023 PROGRESS REPORT WOODSIDE ENERGY GROUP LTD 15
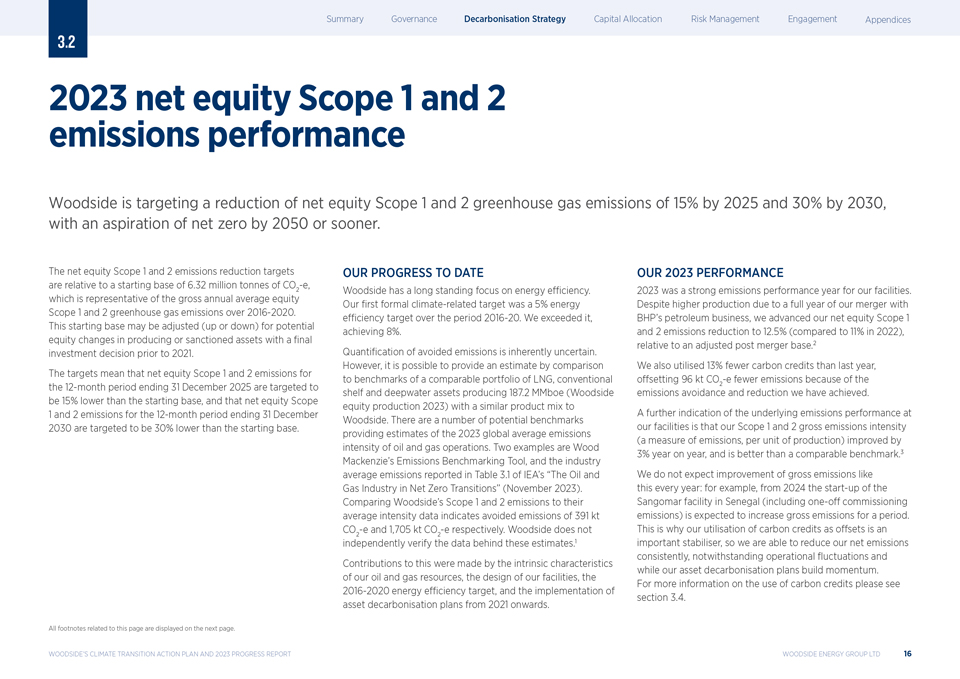
|
2023 emissions net equity performance Scope 1 and 2 Woodside is targeting a reduction of net equity Scope 1 and 2 greenhouse gas emissions of 15% by 2025 and 30% by 2030, with an aspiration of net zero by 2050 or sooner. The net equity Scope 1 and 2 emissions reduction targets are relative to a starting base of 6.32 million tonnes of CO -e, which is representative of the gross annual average equity 2 Scope 1 and 2 greenhouse gas emissions over 2016-2020. This starting base may be adjusted (up or down) for potential equity changes in producing or sanctioned assets with a ?nal investment decision prior to 2021. The targets mean that net equity Scope 1 and 2 emissions for the 12-month period ending 31 December 2025 are targeted to be 15% lower than the starting base, and that net equity Scope 1 and 2 emissions for the 12-month period ending 31 December 2030 are targeted to be 30% lower than the starting base. OUR PROGRESS TO DATE Woodside has a long standing focus on energy efficiency. Our ?rst formal climate-related target was a 5% energy efficiency target over the period 2016-20. We exceeded it, achieving 8%. Quantification of avoided emissions is inherently uncertain. However, it is possible to provide an estimate by comparison to benchmarks of a comparable portfolio of LNG, conventional shelf and deepwater assets producing 187.2 MMboe (Woodside equity production 2023) with a similar product mix to Woodside. There are a number of potential benchmarks providing estimates of the 2023 global average emissions intensity of oil and gas operations. Two examples are Wood Mackenzie?s Emissions Benchmarking Tool, and the industry average emissions reported in Table 3.1 of IEA?s ?The Oil and Gas Industry in Net Zero Transitions? (November 2023). Comparing Woodside?s Scope 1 and 2 emissions to their average intensity data indicates avoided emissions of 391 kt CO -e and 1,705 kt CO -e respectively. Woodside does not 2 2 independently verify the data behind these estimates.1 Contributions to this were made by the intrinsic characteristics of our oil and gas resources, the design of our facilities, the 2016-2020 energy efficiency target, and the implementation of asset decarbonisation plans from 2021 onwards. OUR 2023 PERFORMANCE 2023 was a strong emissions performance year for our facilities. Despite higher production due to a full year of our merger with BHP?s petroleum business, we advanced our net equity Scope 1 and 2 emissions reduction to 12.5% (compared to 11% in 2022), relative to an adjusted post merger base.2 We also utilised 13% fewer carbon credits than last year, offsetting 96 kt CO -e fewer emissions because of the emissions avoidance 2 and reduction we have achieved. A further indication of the underlying emissions performance at our facilities is that our Scope 1 and 2 gross emissions intensity (a measure of emissions, per unit of production) improved by 3% year on year, and is better than a comparable benchmark.3 We do not expect improvement of gross emissions like this every year: for example, from 2024 the start-up of the Sangomar facility in Senegal (including one-off commissioning emissions) is expected to increase gross emissions for a period. This is why our utilisation of carbon credits as offsets is an important stabiliser, so we are able to reduce our net emissions consistently, notwithstanding operational ?uctuations and while our asset decarbonisation plans build momentum. For more information on the use of carbon credits please see section 3.4. All footnotes related to this page are displayed on the next page. WOODSIDE?S CLIMATE TRANSITION ACTION PLAN AND 2023 PROGRESS REPORT WOODSIDE ENERGY GROUP LTD 16
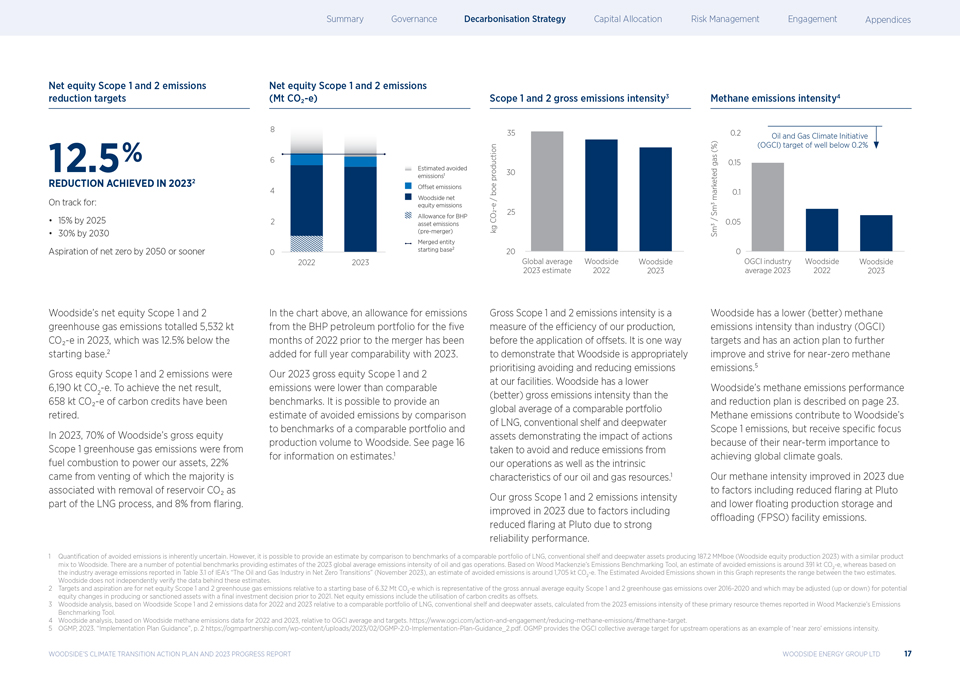
|
Net equity Scope 1 and 2 emissions reduction targets 12.5% REDUCTION ACHIEVED IN 20232 On track for: 15% by 2025 30% by 2030 Aspiration of net zero by 2050 or sooner Net equity Scope 1 and 2 emissions (Mt CO -e) 8 6 Estimated avoided emissions1 4 Offset emissions Woodside net equity emissions Allowance for BHP 2 asset emissions (pre-merger) Merged entity 0 starting base2 2022 2023 Scope 1 and 2 gross emissions intensity3 35 production 30 boe / e CO2—25 kg 20 Global average Woodside Woodside 2023 estimate 2022 2023 Methane emissions intensity4 0.2 Oil and Gas Climate Initiative (%) (OGCI) target of well below 0.2% gas 0.15 marketed 0.1 Sm3 / Sm3 0.05 0 OGCI industry Woodside Woodside average 2023 2022 2023 Woodside?s net equity Scope 1 and 2 greenhouse gas emissions totalled 5,532 kt CO?-e in 2023, which was 12.5% below the starting base.2 Gross equity Scope 1 and 2 emissions were 6,190 kt CO -e. To achieve the net result, 658 kt CO?-2e of carbon credits have been retired. In 2023, 70% of Woodside?s gross equity Scope 1 greenhouse gas emissions were from fuel combustion to power our assets, 22% came from venting of which the majority is associated with removal of reservoir CO? as part of the LNG process, and 8% from flaring. In the chart above, an allowance for emissions from the BHP petroleum portfolio for the ?ve months of 2022 prior to the merger has been added for full year comparability with 2023. Our 2023 gross equity Scope 1 and 2 emissions were lower than comparable benchmarks. It is possible to provide an estimate of avoided emissions by comparison to benchmarks of a comparable portfolio and production volume to Woodside. See page 16 for information on estimates.1 Gross Scope 1 and 2 emissions intensity is a measure of the efficiency of our production, before the application of offsets. It is one way to demonstrate that Woodside is appropriately prioritising avoiding and reducing emissions at our facilities. Woodside has a lower (better) gross emissions intensity than the global average of a comparable portfolio of LNG, conventional shelf and deepwater assets demonstrating the impact of actions taken to avoid and reduce emissions from our operations as well as the intrinsic characteristics of our oil and gas resources.1 Our gross Scope 1 and 2 emissions intensity improved in 2023 due to factors including reduced ?aring at Pluto due to strong reliability performance. Woodside has a lower (better) methane emissions intensity than industry (OGCI) targets and has an action plan to further improve and strive for near-zero methane emissions.5 Woodside?s methane emissions performance and reduction plan is described on page 23. Methane emissions contribute to Woodside?s Scope 1 emissions, but receive specific focus because of their near-term importance to achieving global climate goals. Our methane intensity improved in 2023 due to factors including reduced ?aring at Pluto and lower ?oating production storage and offloading (FPSO) facility emissions. 1 Quantification of avoided emissions is inherently uncertain. However, it is possible to provide an estimate by comparison to benchmarks of a comparable portfolio of LNG, conventional shelf and deepwater assets producing 187.2 MMboe (Woodside equity production 2023) with a similar product mix to Woodside. There are a number of potential benchmarks providing estimates of the 2023 global average emissions intensity of oil and gas operations. Based on Wood Mackenzie?s Emissions Benchmarking Tool, an estimate of avoided emissions is around 391 kt CO -e, whereas based on 2 the industry average emissions reported in Table 3.1 of IEA?s ?The Oil and Gas Industry in Net Zero Transitions? (November 2023), an estimate of avoided emissions is around 1,705 kt CO -e. The Estimated Avoided Emissions shown in this Graph represents the range between the two estimates. 2 Woodside does not independently verify the data behind these estimates. 2 Targets and aspiration are for net equity Scope 1 and 2 greenhouse gas emissions relative to a starting base of 6.32 Mt CO -e which is representative of the gross annual average equity Scope 1 and 2 greenhouse gas emissions over 2016-2020 and which may be adjusted (up or down) for potential 2 equity changes in producing or sanctioned assets with a final investment decision prior to 2021. Net equity emissions include the utilisation of carbon credits as offsets. 3 Woodside analysis, based on Woodside Scope 1 and 2 emissions data for 2022 and 2023 relative to a comparable portfolio of LNG, conventional shelf and deepwater assets, calculated from the 2023 emissions intensity of these primary resource themes reported in Wood Mackenzie?s Emissions Benchmarking Tool. 4 Woodside analysis, based on Woodside methane emissions data for 2022 and 2023, relative to OGCI average and targets. https://www.ogci.com/action-and-engagement/reducing-methane-emissions/#methane-target. 5 OGMP, 2023. ?Implementation Plan Guidance?, p. 2 https://ogmpartnership.com/wp-content/uploads/2023/02/OGMP-2.0-Implementation-Plan-Guidance_2.pdf. OGMP provides the OGCI collective average target for upstream operations as an example of ?near zero? emissions intensity. WOODSIDE?S CLIMATE TRANSITION ACTION PLAN AND 2023 PROGRESS REPORT WOODSIDE ENERGY GROUP LTD 17
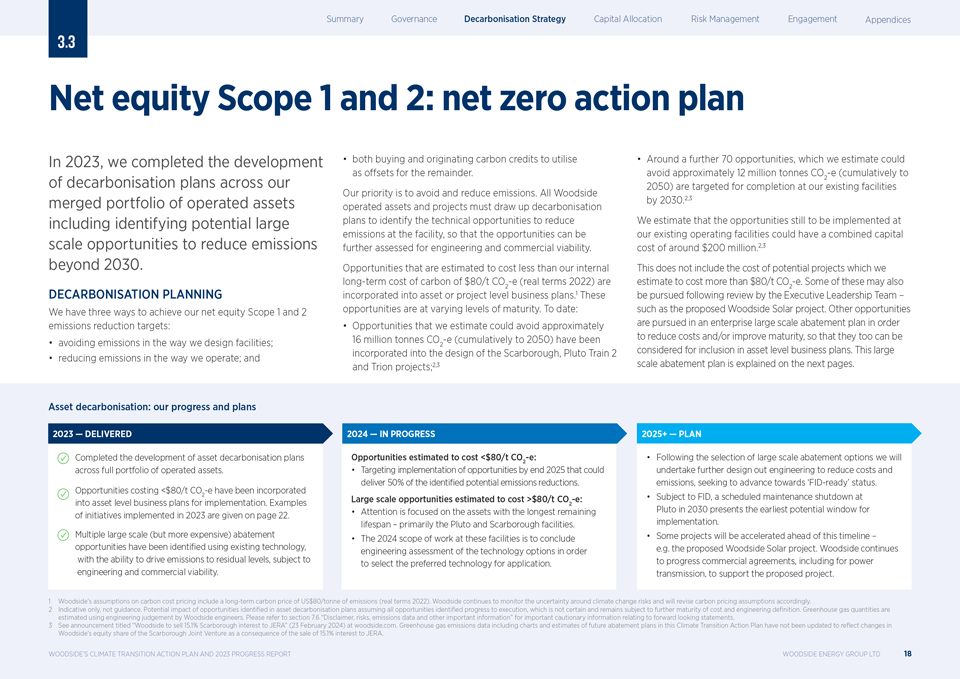
|
Net equity Scope 1 and 2: net zero action plan In 2023, we completed the development of decarbonisation plans across our merged portfolio of operated assets including identifying potential large scale opportunities to reduce emissions beyond 2030. DECARBONISATION PLANNING We have three ways to achieve our net equity Scope 1 and 2 emissions reduction targets: avoiding emissions in the way we design facilities; reducing emissions in the way we operate; and both buying and originating carbon credits to utilise as offsets for the remainder. Our priority is to avoid and reduce emissions. All Woodside operated assets and projects must draw up decarbonisation plans to identify the technical opportunities to reduce emissions at the facility, so that the opportunities can be further assessed for engineering and commercial viability. Opportunities that are estimated to cost less than our internal long-term cost of carbon of $80/t CO -e (real terms 2022) are 2 incorporated into asset or project level business plans.1 These opportunities are at varying levels of maturity. To date: Opportunities that we estimate could avoid approximately 16 million tonnes CO -e (cumulatively to 2050) have been incorporated into the 2 design of the Scarborough, Pluto Train 2 and Trion projects;2,3 Around a further 70 opportunities, which we estimate could avoid approximately 12 million tonnes CO -e (cumulatively to 2050) are targeted for completion at our 2 existing facilities by 2030.2,3 We estimate that the opportunities still to be implemented at our existing operating facilities could have a combined capital cost of around $200 million.2,3 This does not include the cost of potential projects which we estimate to cost more than $80/t CO -e. Some of these may also be pursued following review by the Executive 2 Leadership Team ? such as the proposed Woodside Solar project. Other opportunities are pursued in an enterprise large scale abatement plan in order to reduce costs and/or improve maturity, so that they too can be considered for inclusion in asset level business plans. This large scale abatement plan is explained on the next pages. Asset decarbonisation: our progress and plans 2023 ? DELIVERED Completed the development of asset decarbonisation plans across full portfolio of operated assets. Opportunities costing <$80/t CO -e have been incorporated 2 into asset level business plans for implementation. Examples of initiatives implemented in 2023 are given on page 22. Multiple large scale (but more expensive) abatement opportunities have been identi?ed using existing technology, with the ability to drive emissions to residual levels, subject to engineering and commercial viability. 2024 ? IN PROGRESS Opportunities estimated to cost <$80/t CO -e: 2 Targeting implementation of opportunities by end 2025 that could deliver 50% of the identi?ed potential emissions reductions. Large scale opportunities estimated to cost >$80/t CO -e: 2 Attention is focused on the assets with the longest remaining lifespan ? primarily the Pluto and Scarborough facilities. The 2024 scope of work at these facilities is to conclude engineering assessment of the technology options in order to select the preferred technology for application. 2025+ ? PLAN Following the selection of large scale abatement options we will undertake further design out engineering to reduce costs and emissions, seeking to advance towards ?FID-ready? status. Subject to FID, a scheduled maintenance shutdown at Pluto in 2030 presents the earliest potential window for implementation. Some projects will be accelerated ahead of this timeline ? e.g. the proposed Woodside Solar project. Woodside continues to progress commercial agreements, including for power transmission, to support the proposed project. 1 Woodside?s assumptions on carbon cost pricing include a long-term carbon price of US$80/tonne of emissions (real terms 2022). Woodside continues to monitor the uncertainty around climate change risks and will revise carbon pricing assumptions accordingly. 2 Indicative only, not guidance. Potential impact of opportunities identified in asset decarbonisation plans assuming all opportunities identified progress to execution, which is not certain and remains subject to further maturity of cost and engineering definition. Greenhouse gas quantities are estimated using engineering judgement by Woodside engineers. Please refer to section 7.6 ?Disclaimer, risks, emissions data and other important information? for important cautionary information relating to forward looking statements. 3 See announcement titled ?Woodside to sell 15.1% Scarborough interest to JERA? (23 February 2024) at woodside.com. Greenhouse gas emissions data including charts and estimates of future abatement plans in this Climate Transition Action Plan have not been updated to reflect changes in Woodside?s equity share of the Scarborough Joint Venture as a consequence of the sale of 15.1% interest to JERA. WOODSIDE?S CLIMATE TRANSITION ACTION PLAN AND 2023 PROGRESS REPORT WOODSIDE ENERGY GROUP LTD 18
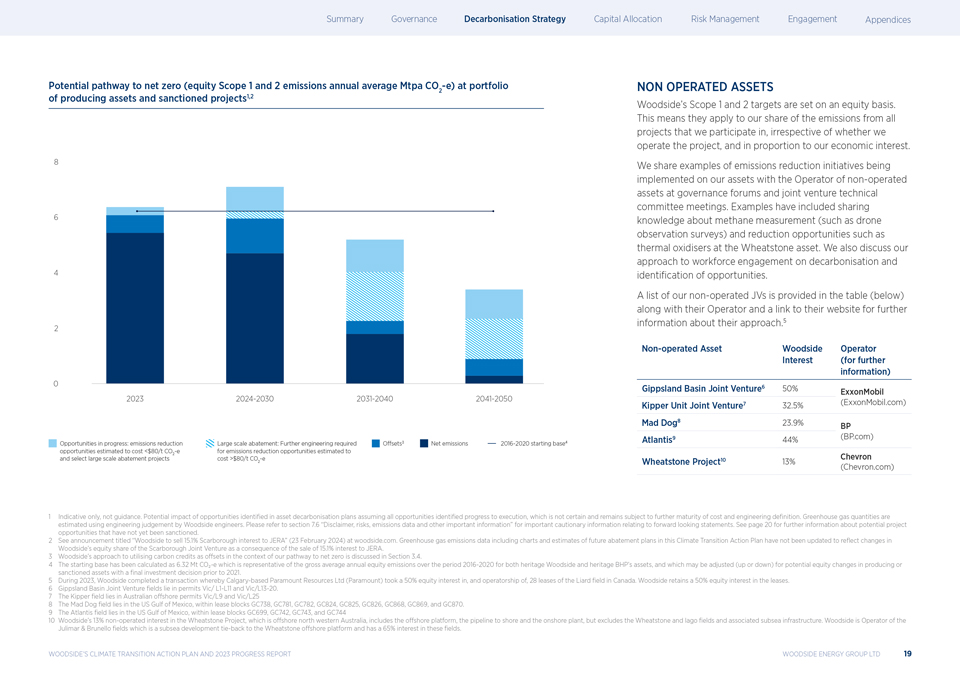
|
Potential pathway to net zero (equity Scope 1 and 2 emissions annual average Mtpa CO -e) at portfolio 1,2 2 of producing assets and sanctioned projects 8 6 4 2 0 2023 2024-2030 2031-2040 2041-2050 Opportunities in progress: emissions reduction Large scale abatement: Further engineering required Offsets3 Net emissions 2016-2020 starting base4 opportunities estimated to cost <$80/t CO -e for emissions reduction opportunities estimated to 2 and select large scale abatement projects cost >$80/t CO -e 2 NON OPERATED ASSETS Woodside?s Scope 1 and 2 targets are set on an equity basis. This means they apply to our share of the emissions from all projects that we participate in, irrespective of whether we operate the project, and in proportion to our economic interest. We share examples of emissions reduction initiatives being implemented on our assets with the Operator of non-operated assets at governance forums and joint venture technical committee meetings. Examples have included sharing knowledge about methane measurement (such as drone observation surveys) and reduction opportunities such as thermal oxidisers at the Wheatstone asset. We also discuss our approach to workforce engagement on decarbonisation and identification of opportunities. A list of our non-operated JVs is provided in the table (below) along with their Operator and a link to their website for further information about their approach.5 Non-operated Asset Woodside Operator Interest (for further information) Gippsland Basin Joint Venture6 50% ExxonMobil Kipper Unit Joint Venture7 32.5% (ExxonMobil.com) Mad Dog8 23.9% BP Atlantis9 44% (BP.com) 10 Chevron Wheatstone Project 13% (Chevron.com) 1 Indicative only, not guidance. Potential impact of opportunities identified in asset decarbonisation plans assuming all opportunities identified progress to execution, which is not certain and remains subject to further maturity of cost and engineering definition. Greenhouse gas quantities are estimated using engineering judgement by Woodside engineers. Please refer to section 7.6 ?Disclaimer, risks, emissions data and other important information? for important cautionary information relating to forward looking statements. See page 20 for further information about potential project opportunities that have not yet been sanctioned. 2 See announcement titled ?Woodside to sell 15.1% Scarborough interest to JERA? (23 February 2024) at woodside.com. Greenhouse gas emissions data including charts and estimates of future abatement plans in this Climate Transition Action Plan have not been updated to reflect changes in Woodside?s equity share of the Scarborough Joint Venture as a consequence of the sale of 15.1% interest to JERA. 3 Woodside?s approach to utilising carbon credits as offsets in the context of our pathway to net zero is discussed in Section 3.4. 4 The starting base has been calculated as 6.32 Mt CO?-e which is representative of the gross average annual equity emissions over the period 2016-2020 for both heritage Woodside and heritage BHP?s assets, and which may be adjusted (up or down) for potential equity changes in producing or sanctioned assets with a final investment decision prior to 2021. 5 During 2023, Woodside completed a transaction whereby Calgary-based Paramount Resources Ltd (Paramount) took a 50% equity interest in, and operatorship of, 28 leases of the Liard ?eld in Canada. Woodside retains a 50% equity interest in the leases. 6 Gippsland Basin Joint Venture ?elds lie in permits Vic/ L1-L11 and Vic/L13-20. 7 The Kipper ?eld lies in Australian offshore permits Vic/L9 and Vic/L25 8 The Mad Dog ?eld lies in the US Gulf of Mexico, within lease blocks GC738, GC781, GC782, GC824, GC825, GC826, GC868, GC869, and GC870. 9 The Atlantis ?eld lies in the US Gulf of Mexico, within lease blocks GC699, GC742, GC743, and GC744 10 Woodside?s 13% non-operated interest in the Wheatstone Project, which is offshore north western Australia, includes the offshore platform, the pipeline to shore and the onshore plant, but excludes the Wheatstone and Iago fields and associated subsea infrastructure. Woodside is Operator of the Julimar & Brunello fields which is a subsea development tie-back to the Wheatstone offshore platform and has a 65% interest in these fields. WOODSIDE?S CLIMATE TRANSITION ACTION PLAN AND 2023 PROGRESS REPORT WOODSIDE ENERGY GROUP LTD 19
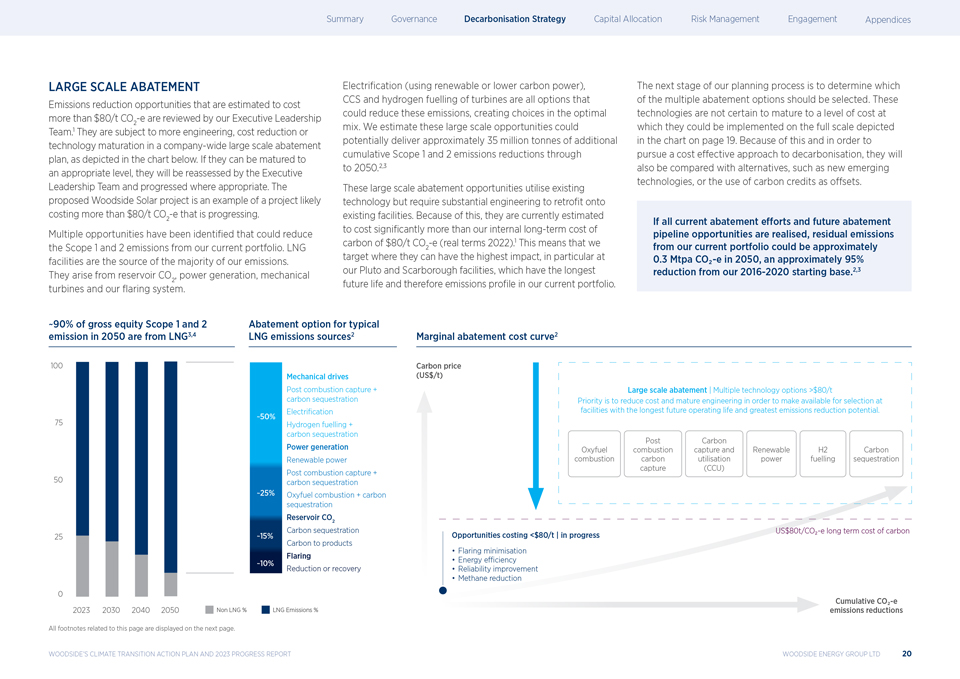
|
LARGE SCALE ABATEMENT Emissions reduction opportunities that are estimated to cost more than $80/t CO -e are reviewed by our Executive Leadership 2 Team.1 They are subject to more engineering, cost reduction or technology maturation in a company-wide large scale abatement plan, as depicted in the chart below. If they can be matured to an appropriate level, they will be reassessed by the Executive Leadership Team and progressed where appropriate. The proposed Woodside Solar project is an example of a project likely costing more than $80/t CO -e that is progressing. 2 Multiple opportunities have been identi?ed that could reduce the Scope 1 and 2 emissions from our current portfolio. LNG facilities are the source of the majority of our emissions. They arise from reservoir CO , power generation, mechanical turbines and our ?aring system 2 . Electri?cation (using renewable or lower carbon power), CCS and hydrogen fuelling of turbines are all options that could reduce these emissions, creating choices in the optimal mix. We estimate these large scale opportunities could potentially deliver approximately 35 million tonnes of additional cumulative Scope 1 and 2 emissions reductions through to 2050.2,3 These large scale abatement opportunities utilise existing technology but require substantial engineering to retro?t onto existing facilities. Because of this, they are currently estimated to cost signi?cantly more than our internal long-term cost of carbon of $80/t CO -e (real terms 2022).1 This means that we target where they can 2 have the highest impact, in particular at our Pluto and Scarborough facilities, which have the longest future life and therefore emissions pro?le in our current portfolio. The next stage of our planning process is to determine which of the multiple abatement options should be selected. These technologies are not certain to mature to a level of cost at which they could be implemented on the full scale depicted in the chart on page 19. Because of this and in order to pursue a cost effective approach to decarbonisation, they will also be compared with alternatives, such as new emerging technologies, or the use of carbon credits as offsets. If all current abatement efforts and future abatement pipeline opportunities are realised, residual emissions from our current portfolio could be approximately 0.3 Mtpa CO?-e in 2050, an approximately 95% reduction from our 2016-2020 starting base.2,3 ~90% of gross equity Scope 1 and 2 Abatement option for typical emission in 2050 are from LNG3,4 LNG emissions sources2 100 Mechanical drives Post combustion capture + carbon sequestration Electri?cation ~50% 75 Hydrogen fuelling + carbon sequestration Power generation Renewable power 50 Post combustion capture + carbon sequestration ~25% Oxyfuel combustion + carbon sequestration Reservoir CO 2 Carbon sequestration 25 ~15% Carbon to products ~10% Flaring Reduction or recovery 0 2023 2030 2040 2050 Non LNG % LNG Emissions % Marginal abatement cost curve2 Carbon price (US$/t) Large scale abatement | Multiple technology options >$80/t Priority is to reduce cost and mature engineering in order to make available for selection at facilities with the longest future operating life and greatest emissions reduction potential. Post Carbon Oxyfuel combustion capture and Renewable H2 Carbon combustion carbon utilisation power fuelling sequestration capture (CCU) US$80t/CO?-e long term cost of carbon Opportunities costing <$80/t | in progress Flaring minimisation Energy efficiency Reliability improvement Methane reduction Cumulative CO?-e emissions reductions All footnotes related to this page are displayed on the next page. WOODSIDE?S CLIMATE TRANSITION ACTION PLAN AND 2023 PROGRESS REPORT WOODSIDE ENERGY GROUP LTD 20
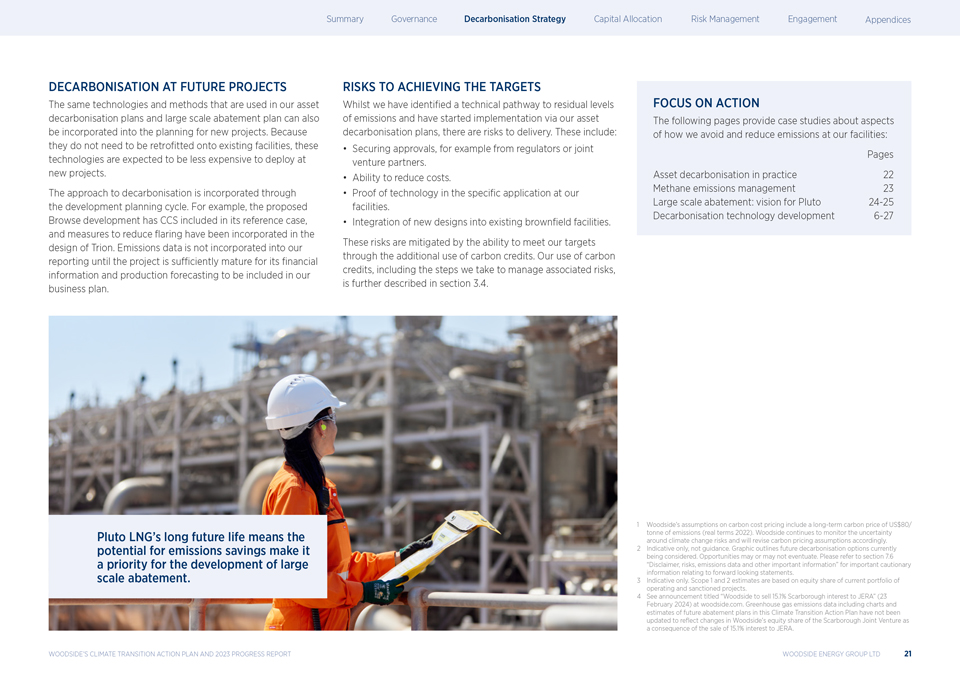
|
DECARBONISATION AT FUTURE PROJECTS The same technologies and methods that are used in our asset decarbonisation plans and large scale abatement plan can also be incorporated into the planning for new projects. Because they do not need to be retro?tted onto existing facilities, these technologies are expected to be less expensive to deploy at new projects. The approach to decarbonisation is incorporated through the development planning cycle. For example, the proposed Browse development has CCS included in its reference case, and measures to reduce ?aring have been incorporated in the design of Trion. Emissions data is not incorporated into our reporting until the project is sufficiently mature for its ?nancial information and production forecasting to be included in our business plan. RISKS TO ACHIEVING THE TARGETS Whilst we have identi?ed a technical pathway to residual levels of emissions and have started implementation via our asset decarbonisation plans, there are risks to delivery. These include: Securing approvals, for example from regulators or joint venture partners. Ability to reduce costs. Proof of technology in the speci?c application at our facilities. Integration of new designs into existing brown?eld facilities. These risks are mitigated by the ability to meet our targets through the additional use of carbon credits. Our use of carbon credits, including the steps we take to manage associated risks, is further described in section 3.4. FOCUS ON ACTION The following pages provide case studies about aspects of how we avoid and reduce emissions at our facilities: Pages Asset decarbonisation in practice 22 Methane emissions management 23 Large scale abatement: vision for Pluto 24-25 Decarbonisation technology development 6-27 Pluto LNG?s long future life means the potential for emissions savings make it a priority for the development of large scale abatement. 1 Woodside?s assumptions on carbon cost pricing include a long-term carbon price of US$80/ tonne of emissions (real terms 2022). Woodside continues to monitor the uncertainty around climate change risks and will revise carbon pricing assumptions accordingly. 2 Indicative only, not guidance. Graphic outlines future decarbonisation options currently being considered. Opportunities may or may not eventuate. Please refer to section 7.6 ?Disclaimer, risks, emissions data and other important information? for important cautionary information relating to forward looking statements. 3 Indicative only. Scope 1 and 2 estimates are based on equity share of current portfolio of operating and sanctioned projects. 4 See announcement titled ?Woodside to sell 15.1% Scarborough interest to JERA? (23 February 2024) at woodside.com. Greenhouse gas emissions data including charts and estimates of future abatement plans in this Climate Transition Action Plan have not been updated to reflect changes in Woodside?s equity share of the Scarborough Joint Venture as a consequence of the sale of 15.1% interest to JERA. WOODSIDE?S CLIMATE TRANSITION ACTION PLAN AND 2023 PROGRESS REPORT WOODSIDE ENERGY GROUP LTD 21
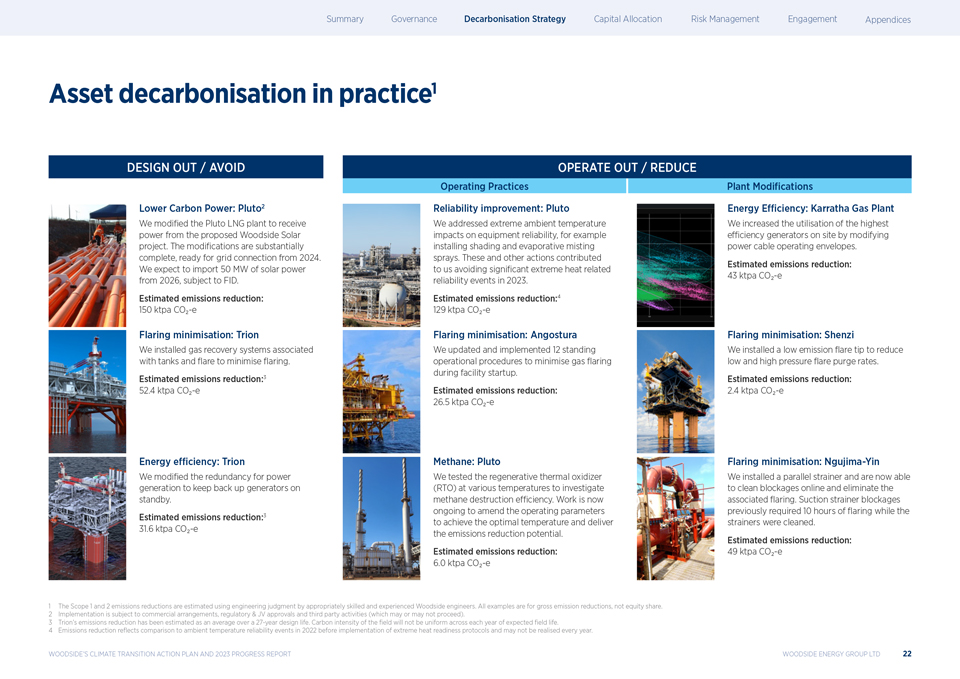
|
Asset decarbonisation in practice1 DESIGN OUT / AVOID Lower Carbon Power: Pluto2 We modi?ed the Pluto LNG plant to receive power from the proposed Woodside Solar project. The modi?cations are substantially complete, ready for grid connection from 2024. We expect to import 50 MW of solar power from 2026, subject to FID. Estimated emissions reduction: 150 ktpa CO?-e Flaring minimisation: Trion We installed gas recovery systems associated with tanks and ?are to minimise ?aring. Estimated emissions reduction:3 52.4 ktpa CO?-e Energy efficiency: Trion We modi?ed the redundancy for power generation to keep back up generators on standby. Estimated emissions reduction:3 31.6 ktpa CO?-e OPERATE OUT / REDUCE Operating Practices Plant Modi?cations Reliability improvement: Pluto Energy Efficiency: Karratha Gas Plant We addressed extreme ambient temperature We increased the utilisation of the highest impacts on equipment reliability, for example efficiency generators on site by modifying installing shading and evaporative misting power cable operating envelopes. sprays. These and other actions contributed Estimated emissions reduction: to us avoiding signi?cant extreme heat related 43 ktpa CO?-e reliability events in 2023. Estimated emissions reduction:4 129 ktpa CO?-e Flaring minimisation: Angostura Flaring minimisation: Shenzi We updated and implemented 12 standing We installed a low emission ?are tip to reduce operational procedures to minimise gas ?aring low and high pressure ?are purge rates. during facility startup. Estimated emissions reduction: Estimated emissions reduction: 2.4 ktpa CO?-e 26.5 ktpa CO?-e Methane: Pluto Flaring minimisation: Ngujima-Yin We tested the regenerative thermal oxidizer We installed a parallel strainer and are now able (RTO) at various temperatures to investigate to clean blockages online and eliminate the methane destruction efficiency. Work is now associated ?aring. Suction strainer blockages ongoing to amend the operating parameters previously required 10 hours of ?aring while the to achieve the optimal temperature and deliver strainers were cleaned. the emissions reduction potential. Estimated emissions reduction: Estimated emissions reduction: 49 ktpa CO?-e 6.0 ktpa CO?-e 1 The Scope 1 and 2 emissions reductions are estimated using engineering judgment by appropriately skilled and experienced Woodside engineers. All examples are for gross emission reductions, not equity share. 2 Implementation is subject to commercial arrangements, regulatory & JV approvals and third party activities (which may or may not proceed). 3 Trion?s emissions reduction has been estimated as an average over a 27-year design life. Carbon intensity of the field will not be uniform across each year of expected field life. 4 Emissions reduction re?ects comparison to ambient temperature reliability events in 2022 before implementation of extreme heat readiness protocols and may not be realised every year. WOODSIDE?S CLIMATE TRANSITION ACTION PLAN AND 2023 PROGRESS REPORT WOODSIDE ENERGY GROUP LTD 22
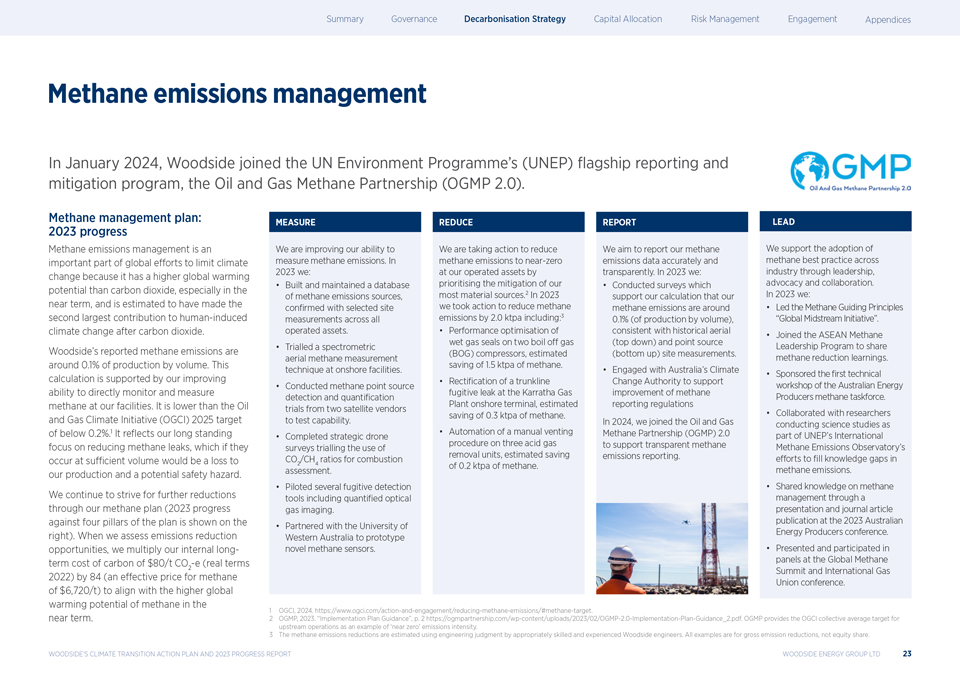
|
Methane emissions management In January 2024, Woodside joined the UN Environment Programme?s (UNEP) flagship reporting and mitigation program, the Oil and Gas Methane Partnership (OGMP 2.0). Methane management plan: 2023 progress Methane emissions management is an important part of global efforts to limit climate change because it has a higher global warming potential than carbon dioxide, especially in the near term, and is estimated to have made the second largest contribution to human-induced climate change after carbon dioxide. Woodside?s reported methane emissions are around 0.1% of production by volume. This calculation is supported by our improving ability to directly monitor and measure methane at our facilities. It is lower than the Oil and Gas Climate Initiative (OGCI) 2025 target of below 0.2%.1 It re?ects our long standing focus on reducing methane leaks, which if they occur at sufficient volume would be a loss to our production and a potential safety hazard. We continue to strive for further reductions through our methane plan (2023 progress against four pillars of the plan is shown on the right). When we assess emissions reduction opportunities, we multiply our internal long-term cost of carbon of $80/t CO -e (real terms 2022) by 84 (an effective price for 2 methane of $6,720/t) to align with the higher global warming potential of methane in the near term. MEASURE We are improving our ability to measure methane emissions. In 2023 we: Built and maintained a database of methane emissions sources, con?rmed with selected site measurements across all operated assets. Trialled a spectrometric aerial methane measurement technique at onshore facilities. Conducted methane point source detection and quanti?cation trials from two satellite vendors to test capability. Completed strategic drone surveys trialling the use of CO /CH ratios for combustion assessment 2 4 . Piloted several fugitive detection tools including quanti?ed optical gas imaging. Partnered with the University of Western Australia to prototype novel methane sensors. REDUCE We are taking action to reduce methane emissions to near-zero at our operated assets by prioritising the mitigation of our most material sources.2 In 2023 we took action to reduce methane emissions by 2.0 ktpa including:3 Performance optimisation of wet gas seals on two boil off gas (BOG) compressors, estimated saving of 1.5 ktpa of methane. Recti?cation of a trunkline fugitive leak at the Karratha Gas Plant onshore terminal, estimated saving of 0.3 ktpa of methane. Automation of a manual venting procedure on three acid gas removal units, estimated saving of 0.2 ktpa of methane. REPORT We aim to report our methane emissions data accurately and transparently. In 2023 we: Conducted surveys which support our calculation that our methane emissions are around 0.1% (of production by volume), consistent with historical aerial (top down) and point source (bottom up) site measurements. Engaged with Australia?s Climate Change Authority to support improvement of methane reporting regulations In 2024, we joined the Oil and Gas Methane Partnership (OGMP) 2.0 to support transparent methane emissions reporting. LEAD We support the adoption of methane best practice across industry through leadership, advocacy and collaboration. In 2023 we: Led the Methane Guiding Principles ?Global Midstream Initiative?. Joined the ASEAN Methane Leadership Program to share methane reduction learnings. Sponsored the ?rst technical workshop of the Australian Energy Producers methane taskforce. Collaborated with researchers conducting science studies as part of UNEP?s International Methane Emissions Observatory?s efforts to fill knowledge gaps in methane emissions. Shared knowledge on methane management through a presentation and journal article publication at the 2023 Australian Energy Producers conference. Presented and participated in panels at the Global Methane Summit and International Gas Union conference. 1 OGCI, 2024. https://www.ogci.com/action-and-engagement/reducing-methane-emissions/#methane-target. 2 OGMP, 2023. ?Implementation Plan Guidance?, p. 2 https://ogmpartnership.com/wp-content/uploads/2023/02/OGMP-2.0-Implementation-Plan-Guidance_2.pdf. OGMP provides the OGCI collective average target for upstream operations as an example of ?near zero? emissions intensity. 3 The methane emissions reductions are estimated using engineering judgment by appropriately skilled and experienced Woodside engineers. All examples are for gross emission reductions, not equity share. WOODSIDE?S CLIMATE TRANSITION ACTION PLAN AND 2023 PROGRESS REPORT WOODSIDE ENERGY GROUP LTD 23
|
Large scale abatement: vision for Pluto net zero1 Pluto LNG?s long future life means the potential for emissions savings make it a priority for the development of large scale abatement. ABATEMENT OPPORTUNITIES: DELIVERED Energy Efficiency: ? High efficiency air ?lters installed on gas turbines ? Optimised?power generation operating strategy ? Increased operating pressure of Pluto Train 1 ? Pluto water handling reduced minimum turndown rates ? Improved air cooler ?n fan blades Flaring: ? Focus on high reliability operations to reduce ?aring ? Operation of dual boil off gas compressors to reduce??aring associated with ship loading Methane: ? Compressor seal gas vents routed to ?are system ? Multi-modal site surveys and remediation for fugitive methane ABATEMENT OPPORTUNITIES: IN PROGRESS Energy Efficiency: Aero-derivative turbine driven Optimised Cascade process for Train 22 Turbine compressor drivers with inlet air chilling and low NOx?technology for Train 2 Electric drive selected for smaller compressors in Train 2 Integrated Train 2 power supply with existing Train 1 system Waste heat recovery on gas turbines Flow coated trunkline to reduce roughness Battery energy storage system Flaring: Flare tip replacement and combustion system upgrades Nitrogen ?are purge Methane: Thermal oxidizer installed to remove methane from waste streams FUTURE POTENTIAL In the longer term, ?rmed lower carbon power and CCUS could underpin large scale abatement.3 Mechanical drives (gas turbines) and power generation account for the majority of emissions at Pluto. Integration of technologies including hydrogen fuelling and / or post combustion carbon capture could materially reduce these emissions. Installation of tie-ins during the 2023 turnaround has also made Pluto ?CCU-ready?, creating the potential to add value by turning CO into saleable products. 2 These options are not technically or economically certain to proceed. With a focus on cost-effectiveness, they will also be compared with alternatives, such as new emerging technologies, or the use of carbon credits as offsets. 1 Vision for Pluto net zero is a range of future potential decarbonisation abatement options currently being considered to potentially reduce net emissions from the onshore Pluto LNG facility. Options are conceptual only and subject to change. Images are not to scale, implementation is subject to technology maturity, technical and commercial feasibility, commercial arrangements, regulatory & JV approvals and third party activities (which may or may not proceed). 2 For more information about the Conoco Phillips Optimised Cascade process see https://lnglicensing.conocophillips.com/what-we-do/lng-technology/optimized-cascade-process/. 3 Please see glossary for the de?nition of how Woodside uses the term lower carbon. WOODSIDE?S CLIMATE TRANSITION ACTION PLAN AND 2023 PROGRESS REPORT WOODSIDE ENERGY GROUP LTD 24
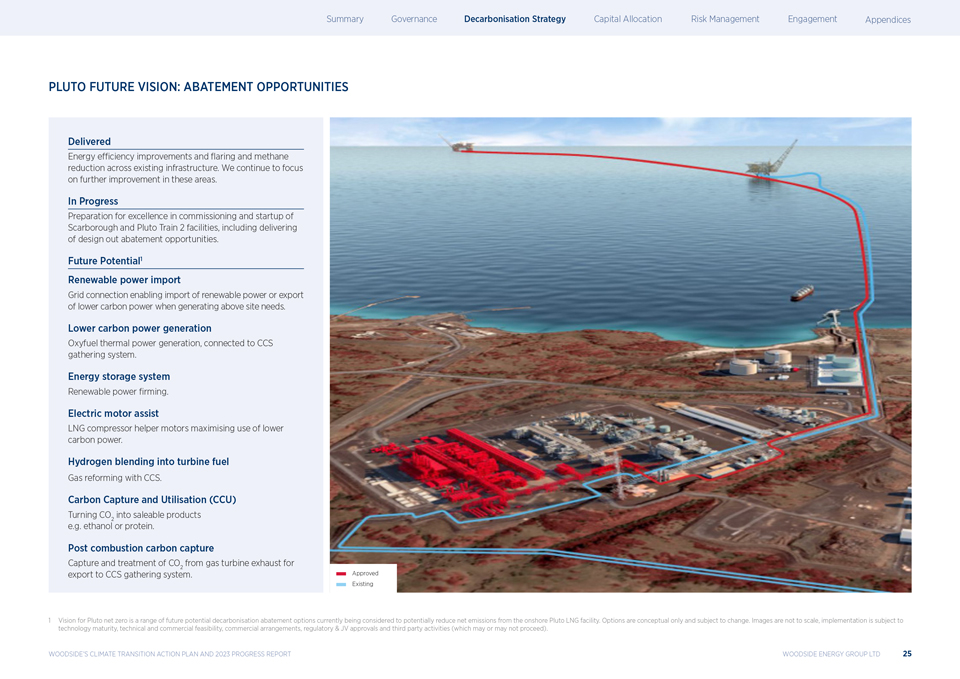
|
PLUTO FUTURE VISION: ABATEMENT OPPORTUNITIES Delivered Energy efficiency improvements and ?aring and methane reduction across existing infrastructure. We continue to focus on further improvement in these areas. In Progress Preparation for excellence in commissioning and startup of Scarborough and Pluto Train 2 facilities, including delivering of design out abatement opportunities. Future Potential1 Renewable power import Grid connection enabling import of renewable power or export of lower carbon power when generating above site needs. Lower carbon power generation Oxyfuel thermal power generation, connected to CCS gathering system. Energy storage system Renewable power ?rming. Electric motor assist LNG compressor helper motors maximising use of lower carbon power. Hydrogen blending into turbine fuel Gas reforming with CCS. Carbon Capture and Utilisation (CCU) Turning CO into saleable products e.g. ethanol2 or protein. Post combustion carbon capture Capture and treatment of CO from gas turbine exhaust for export to CCS gathering system 2 . 1 Vision for Pluto net zero is a range of future potential decarbonisation abatement options currently being considered to potentially reduce net emissions from the onshore Pluto LNG facility. Options are conceptual only and subject to change. Images are not to scale, implementation is subject to technology maturity, technical and commercial feasibility, commercial arrangements, regulatory & JV approvals and third party activities (which may or may not proceed). WOODSIDE?S CLIMATE TRANSITION ACTION PLAN AND 2023 PROGRESS REPORT WOODSIDE ENERGY GROUP LTD 25
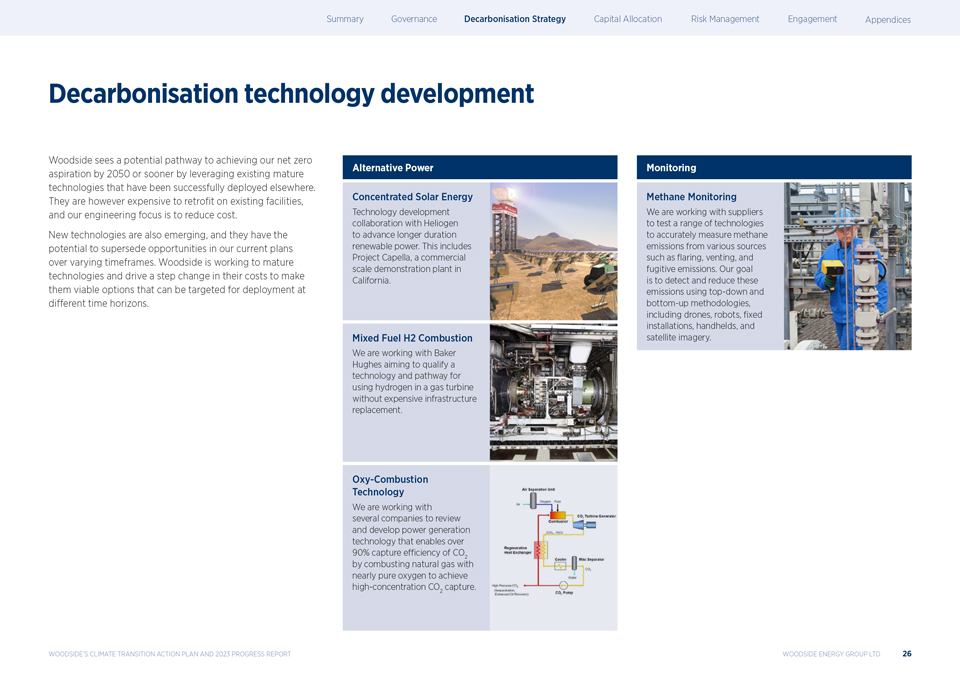
|
Decarbonisation technology development Woodside sees a potential pathway to achieving our net zero aspiration by 2050 or sooner by leveraging existing mature technologies that have been successfully deployed elsewhere. They are however expensive to retro?t on existing facilities, and our engineering focus is to reduce cost. New technologies are also emerging, and they have the potential to supersede opportunities in our current plans over varying timeframes. Woodside is working to mature technologies and drive a step change in their costs to make them viable options that can be targeted for deployment at different time horizons. Alternative Power Concentrated Solar Energy Technology development collaboration with Heliogen to advance longer duration renewable power. This includes Project Capella, a commercial scale demonstration plant in California. Mixed Fuel H2 Combustion We are working with Baker Hughes aiming to qualify a technology and pathway for using hydrogen in a gas turbine without expensive infrastructure replacement. Oxy-Combustion Technology We are working?with several companies to review and?develop power generation technology that enables over 90% capture efficiency of CO by combusting natural gas with 2 nearly pure oxygen to achieve high-concentration CO capture. 2 Monitoring Methane Monitoring We are working with suppliers to test a range of technologies to accurately measure methane emissions from various sources such as ?aring, venting, and fugitive emissions. Our goal is to detect and reduce these emissions using top-down and bottom-up methodologies, including drones, robots, ?xed installations, handhelds, and satellite imagery.? WOODSIDE?S CLIMATE TRANSITION ACTION PLAN AND 2023 PROGRESS REPORT WOODSIDE ENERGY GROUP LTD 26
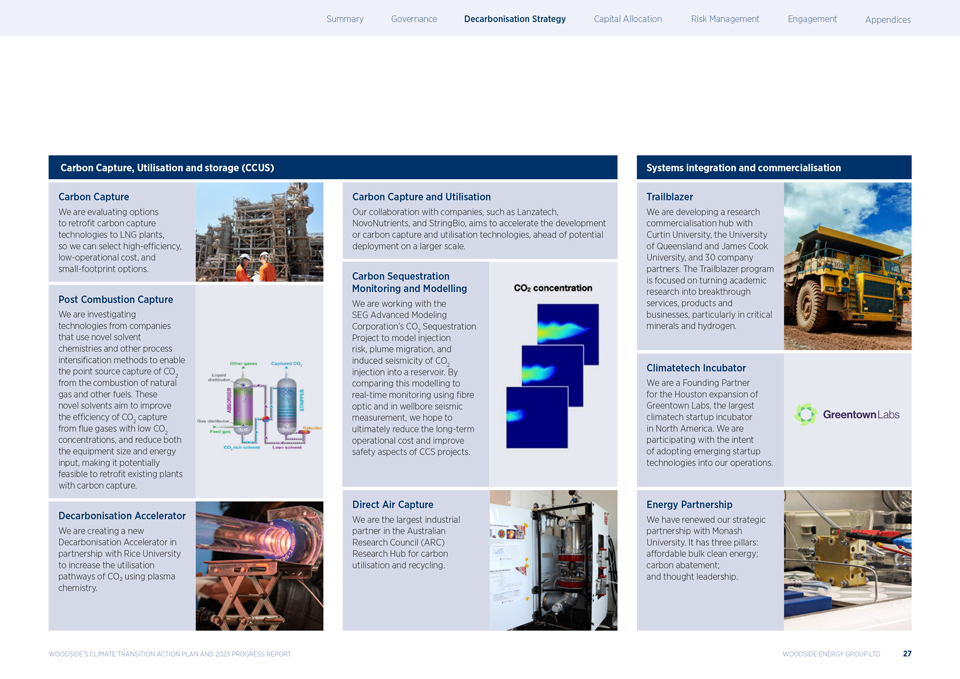
|
Carbon Capture, Utilisation and storage (CCUS) Carbon Capture We are evaluating options to retro?t carbon capture technologies to LNG plants, so we can select high-efficiency, low-operational cost, and small-footprint options. Post Combustion Capture We are investigating technologies from companies that use novel solvent chemistries and other process intensi?cation methods to enable the point source capture of CO from the combustion of natural2 gas and other fuels. These novel solvents aim to improve the efficiency of CO capture from ?ue gases with2 low CO concentrations, and reduce both 2 the equipment size and energy input, making it potentially feasible to retro?t existing plants with carbon capture. Decarbonisation Accelerator We are creating a new Decarbonisation Accelerator in partnership with Rice University to increase the utilisation pathways of CO? using plasma chemistry. Carbon Capture and Utilisation Our collaboration with companies, such as Lanzatech, NovoNutrients, and StringBio, aims to accelerate the development or carbon capture and utilisation technologies, ahead of potential deployment on a larger scale. Carbon Sequestration Monitoring and Modelling We are working with the SEG Advanced Modeling Corporation?s CO Sequestration Project to model 2 injection risk, plume migration, and induced seismicity of CO injection into a reservoir. 2 By comparing this modelling to real-time monitoring using ?bre optic and in wellbore seismic measurement, we hope to ultimately reduce the long-term operational cost and improve safety aspects of CCS projects. Direct Air Capture We are the largest industrial partner in the Australian Research Council (ARC) Research Hub for carbon utilisation and recycling. Systems integration and commercialisation Trailblazer We are developing a research commercialisation hub with Curtin University, the University of Queensland and James Cook University, and 30 company partners. The Trailblazer program is focused on turning academic research into breakthrough services, products and businesses, particularly in critical minerals and hydrogen. Climatetech Incubator We are a Founding Partner for the Houston expansion of Greentown Labs, the largest climatech startup incubator in North America. We are participating with the intent of adopting emerging startup technologies into our operations. Energy Partnership We have renewed our strategic partnership with Monash University. It has three pillars: affordable bulk clean energy; carbon abatement; and thought leadership. WOODSIDE?S CLIMATE TRANSITION ACTION PLAN AND 2023 PROGRESS REPORT WOODSIDE ENERGY GROUP LTD 27
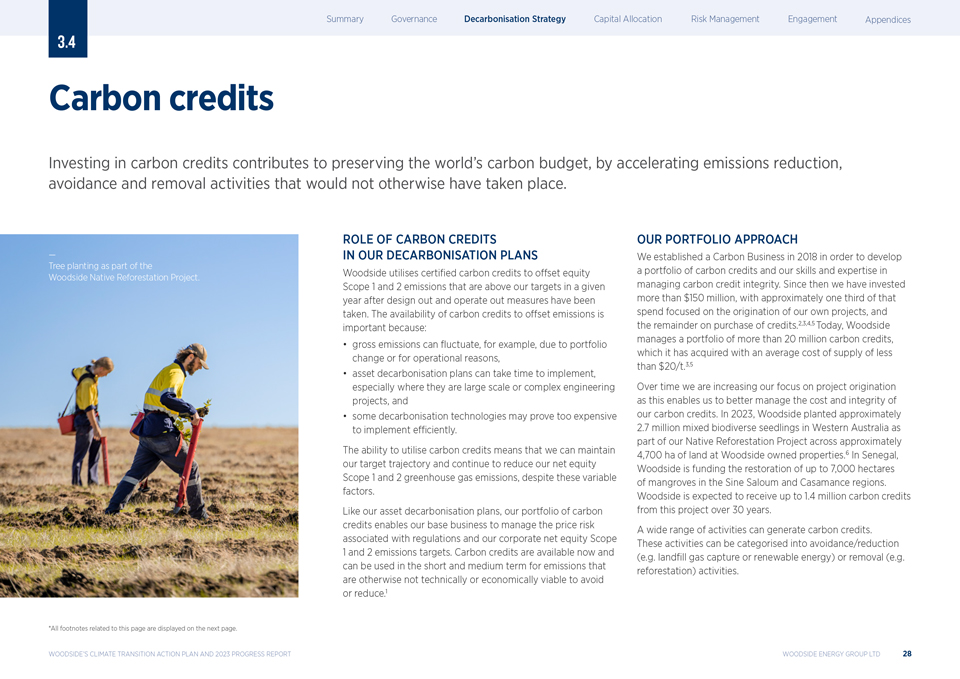
|
Carbon credits Investing in carbon credits contributes to preserving the world?s carbon budget, by accelerating emissions reduction, avoidance and removal activities that would not otherwise have taken place. ? Tree planting as part of the Woodside Native Reforestation Project. ROLE OF CARBON CREDITS IN OUR DECARBONISATION PLANS Woodside utilises certified carbon credits to offset equity Scope 1 and 2 emissions that are above our targets in a given year after design out and operate out measures have been taken. The availability of carbon credits to offset emissions is important because: gross emissions can fluctuate, for example, due to portfolio change or for operational reasons, asset decarbonisation plans can take time to implement, especially where they are large scale or complex engineering projects, and some decarbonisation technologies may prove too expensive to implement efficiently. The ability to utilise carbon credits means that we can maintain our target trajectory and continue to reduce our net equity Scope 1 and 2 greenhouse gas emissions, despite these variable factors. Like our asset decarbonisation plans, our portfolio of carbon credits enables our base business to manage the price risk associated with regulations and our corporate net equity Scope 1 and 2 emissions targets. Carbon credits are available now and can be used in the short and medium term for emissions that are otherwise not technically or economically viable to avoid or reduce.1 OUR PORTFOLIO APPROACH We established a Carbon Business in 2018 in order to develop a portfolio of carbon credits and our skills and expertise in managing carbon credit integrity. Since then we have invested more than $150 million, with approximately one third of that spend focused on the origination of our own projects, and the remainder on purchase of credits.2,3,4,5 Today, Woodside manages a portfolio of more than 20 million carbon credits, which it has acquired with an average cost of supply of less than $20/t.3,5 Over time we are increasing our focus on project origination as this enables us to better manage the cost and integrity of our carbon credits. In 2023, Woodside planted approximately 2.7 million mixed biodiverse seedlings in Western Australia as part of our Native Reforestation Project across approximately 4,700 ha of land at Woodside owned properties.6 In Senegal, Woodside is funding the restoration of up to 7,000 hectares of mangroves in the Sine Saloum and Casamance regions. Woodside is expected to receive up to 1.4 million carbon credits from this project over 30 years. A wide range of activities can generate carbon credits. These activities can be categorised into avoidance/reduction (e.g. land?ll gas capture or renewable energy) or removal (e.g. reforestation) activities. *All footnotes related to this page are displayed on the next page. WOODSIDE?S CLIMATE TRANSITION ACTION PLAN AND 2023 PROGRESS REPORT WOODSIDE ENERGY GROUP LTD 28
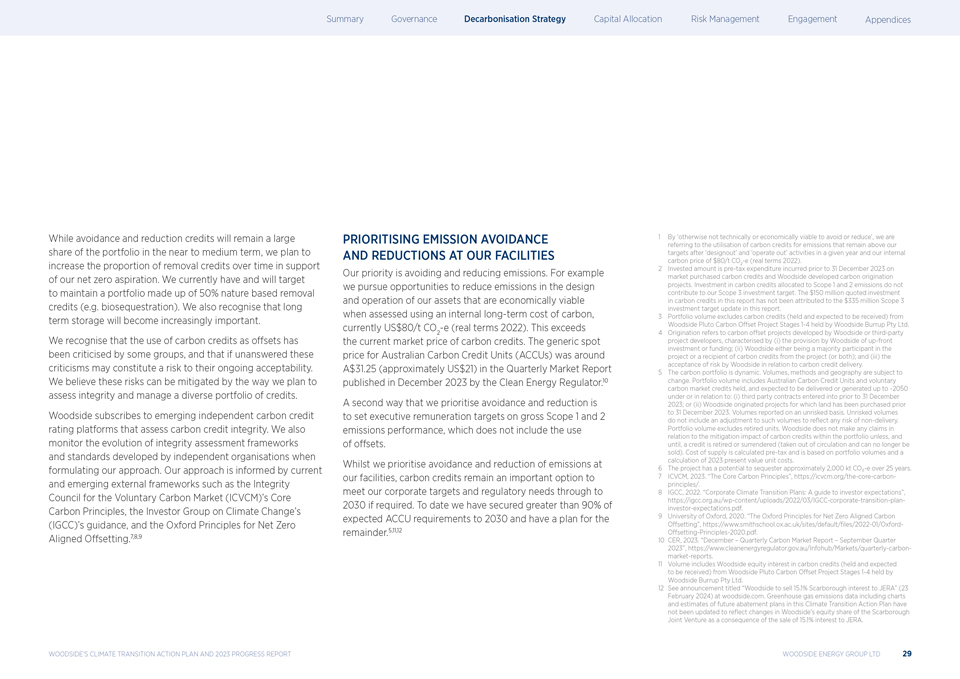
|
While avoidance and reduction credits will remain a large share of the portfolio in the near to medium term, we plan to increase the proportion of removal credits over time in support of our net zero aspiration. We currently have and will target to maintain a portfolio made up of 50% nature based removal credits (e.g. biosequestration). We also recognise that long term storage will become increasingly important. We recognise that the use of carbon credits as offsets has been criticised by some groups, and that if unanswered these criticisms may constitute a risk to their ongoing acceptability. We believe these risks can be mitigated by the way we plan to assess integrity and manage a diverse portfolio of credits. Woodside subscribes to emerging independent carbon credit rating platforms that assess carbon credit integrity. We also monitor the evolution of integrity assessment frameworks and standards developed by independent organisations when formulating our approach. Our approach is informed by current and emerging external frameworks such as the Integrity Council for the Voluntary Carbon Market (ICVCM)?s Core Carbon Principles, the Investor Group on Climate Change?s (IGCC)?s guidance, and the Oxford Principles for Net Zero Aligned Offsetting.7,8,9 PRIORITISING EMISSION AVOIDANCE AND REDUCTIONS AT OUR FACILITIES Our priority is avoiding and reducing emissions. For example we pursue opportunities to reduce emissions in the design and operation of our assets that are economically viable when assessed using an internal long-term cost of carbon, currently US$80/t CO -e (real terms 2022). This exceeds the current market price 2 of carbon credits. The generic spot price for Australian Carbon Credit Units (ACCUs) was around A$31.25 (approximately US$21) in the Quarterly Market Report published in December 2023 by the Clean Energy Regulator.10 A second way that we prioritise avoidance and reduction is to set executive remuneration targets on gross Scope 1 and 2 emissions performance, which does not include the use of offsets. Whilst we prioritise avoidance and reduction of emissions at our facilities, carbon credits remain an important option to meet our corporate targets and regulatory needs through to 2030 if required. To date we have secured greater than 90% of expected ACCU requirements to 2030 and have a plan for the remainder.5,11,12 1 By ?otherwise not technically or economically viable to avoid or reduce?, we are referring to the utilisation of carbon credits for emissions that remain above our targets after ?designout? and ?operate out? activities in a given year and our internal carbon price of $80/t CO -e (real terms 2022). 2 2 Invested amount is pre-tax expenditure incurred prior to 31 December 2023 on market purchased carbon credits and Woodside developed carbon origination projects. Investment in carbon credits allocated to Scope 1 and 2 emissions do not contribute to our Scope 3 investment target. The $150 million quoted investment in carbon credits in this report has not been attributed to the $335 million Scope 3 investment target update in this report. 3 Portfolio volume excludes carbon credits (held and expected to be received) from Woodside Pluto Carbon Offset Project Stages 1-4 held by Woodside Burrup Pty Ltd. 4 Origination refers to carbon offset projects developed by Woodside or third-party project developers, characterised by (i) the provision by Woodside of up-front investment or funding; (ii) Woodside either being a majority participant in the project or a recipient of carbon credits from the project (or both); and (iii) the acceptance of risk by Woodside in relation to carbon credit delivery. 5 The carbon portfolio is dynamic. Volumes, methods and geography are subject to change. Portfolio volume includes Australian Carbon Credit Units and voluntary carbon market credits held, and expected to be delivered or generated up to ~2050 under or in relation to: (i) third party contracts entered into prior to 31 December 2023; or (ii) Woodside originated projects for which land has been purchased prior to 31 December 2023. Volumes reported on an unrisked basis. Unrisked volumes do not include an adjustment to such volumes to re?ect any risk of non-delivery. Portfolio volume excludes retired units. Woodside does not make any claims in relation to the mitigation impact of carbon credits within the portfolio unless, and until, a credit is retired or surrendered (taken out of circulation and can no longer be sold). Cost of supply is calculated pre-tax and is based on portfolio volumes and a calculation of 2023 present value unit costs. 6 The project has a potential to sequester approximately 2,000 kt CO?-e over 25 years. 7 ICVCM, 2023. ?The Core Carbon Principles?, https://icvcm.org/the-core-carbon-principles/. 8 IGCC, 2022. ?Corporate Climate Transition Plans: A guide to investor expectations?, https://igcc.org.au/wp-content/uploads/2022/03/IGCC-corporate-transition-plan-investor-expectations.pdf. 9 University of Oxford, 2020. ?The Oxford Principles for Net Zero Aligned Carbon Offsetting?, https://www.smithschool.ox.ac.uk/sites/default/files/2022-01/Oxford-Offsetting-Principles-2020.pdf. 10 CER, 2023. ?December ? Quarterly Carbon Market Report ? September Quarter 2023?, https://www.cleanenergyregulator.gov.au/Infohub/Markets/quarterly-carbon-market-reports. 11 Volume includes Woodside equity interest in carbon credits (held and expected to be received) from Woodside Pluto Carbon Offset Project Stages 1-4 held by Woodside Burrup Pty Ltd. 12 See announcement titled ?Woodside to sell 15.1% Scarborough interest to JERA? (23 February 2024) at woodside.com. Greenhouse gas emissions data including charts and estimates of future abatement plans in this Climate Transition Action Plan have not been updated to reflect changes in Woodside?s equity share of the Scarborough Joint Venture as a consequence of the sale of 15.1% interest to JERA.
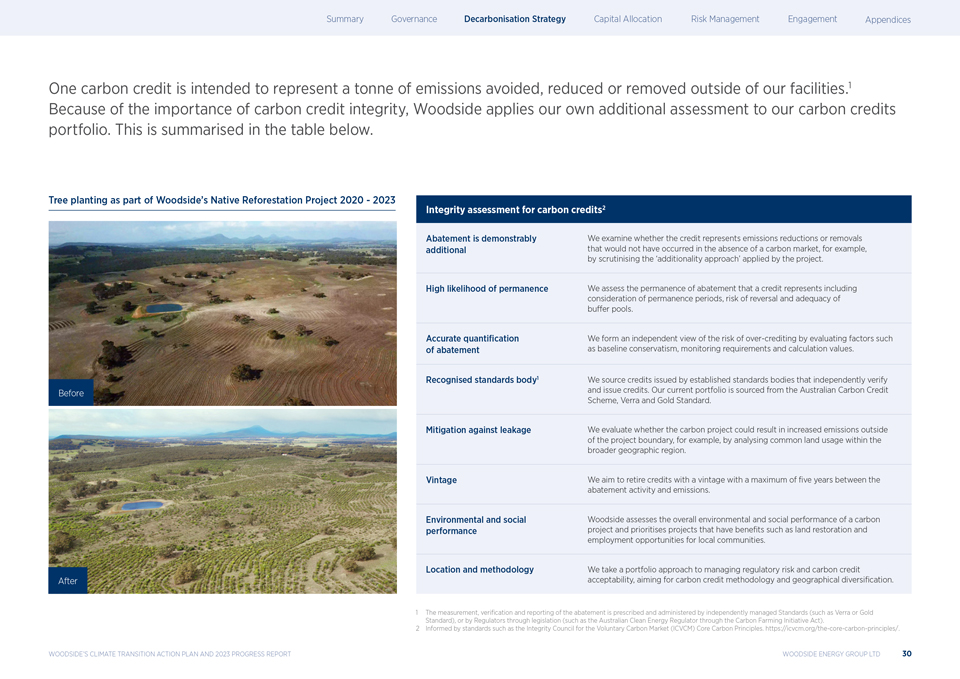
|
One carbon credit is intended to represent a tonne of emissions avoided, reduced or removed outside of our facilities.1 Because of the importance of carbon credit integrity, Woodside applies our own additional assessment to our carbon credits portfolio. This is summarised in the table below. Tree planting as part of Woodside?s Native Reforestation Project 2020—2023 Integrity assessment for carbon credits2 Abatement is demonstrably We examine whether the credit represents emissions reductions or removals additional that would not have occurred in the absence of a carbon market, for example, by scrutinising the ?additionality approach? applied by the project. High likelihood of permanence We assess the permanence of abatement that a credit represents including consideration of permanence periods, risk of reversal and adequacy of buffer pools. Accurate quanti?cation We form an independent view of the risk of over-crediting by evaluating factors such of abatement as baseline conservatism, monitoring requirements and calculation values. Recognised standards body1 We source credits issued by established standards bodies that independently verify and issue credits. Our current portfolio is sourced from the Australian Carbon Credit Scheme, Verra and Gold Standard. Mitigation against leakage We evaluate whether the carbon project could result in increased emissions outside of the project boundary, for example, by analysing common land usage within the broader geographic region. Vintage We aim to retire credits with a vintage with a maximum of ?ve years between the abatement activity and emissions. Environmental and social Woodside assesses the overall environmental and social performance of a carbon performance project and prioritises projects that have bene?ts such as land restoration and employment opportunities for local communities. Location and methodology We take a portfolio approach to managing regulatory risk and carbon credit acceptability, aiming for carbon credit methodology and geographical diversi?cation. 1 The measurement, veri?cation and reporting of the abatement is prescribed and administered by independently managed Standards (such as Verra or Gold Standard), or by Regulators through legislation (such as the Australian Clean Energy Regulator through the Carbon Farming Initiative Act). 2 Informed by standards such as the Integrity Council for the Voluntary Carbon Market (ICVCM) Core Carbon Principles. https://icvcm.org/the-core-carbon-principles/. WOODSIDE?S CLIMATE TRANSITION ACTION PLAN AND 2023 PROGRESS REPORT WOODSIDE ENERGY GROUP LTD 30
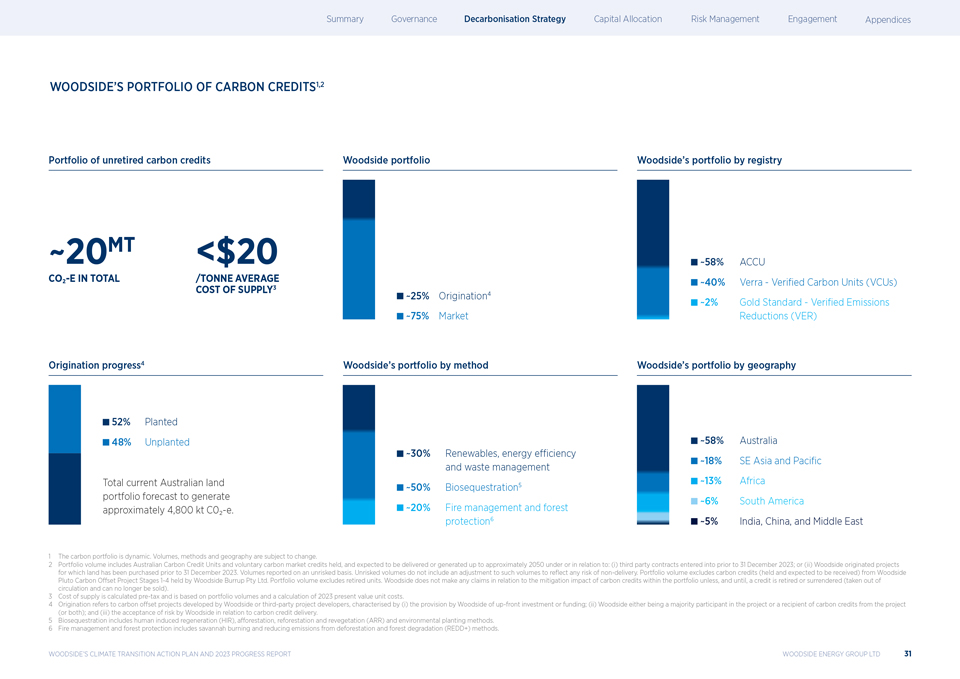
|
WOODSIDE?S PORTFOLIO OF CARBON CREDITS1,2 Portfolio of unretired carbon credits Woodside portfolio Woodside?s portfolio by registry ~20MT <$20 CO?-E IN TOTAL /TONNE AVERAGE COST OF SUPPLY3 ~25% Origination4 ~75% Market ~58% ACCU ~40% Verra—Veri?ed Carbon Units (VCUs) ~2% Gold Standard—Veri?ed Emissions Reductions (VER) Origination progress4 Woodside?s portfolio by method Woodside?s portfolio by geography 52% Planted 48% Unplanted Total current Australian land portfolio forecast to generate approximately 4,800 kt C0 -e. ~30% Renewables, energy efficiency and waste management ~50% Biosequestration5 ~20% Fire management and forest protection6 ~58% Australia ~18% SE Asia and Paci?c ~13% Africa ~6% South America ~5% India, China, and Middle East 1 The carbon portfolio is dynamic. Volumes, methods and geography are subject to change. 2 Portfolio volume includes Australian Carbon Credit Units and voluntary carbon market credits held, and expected to be delivered or generated up to approximately 2050 under or in relation to: (i) third party contracts entered into prior to 31 December 2023; or (ii) Woodside originated projects for which land has been purchased prior to 31 December 2023. Volumes reported on an unrisked basis. Unrisked volumes do not include an adjustment to such volumes to re?ect any risk of non-delivery. Portfolio volume excludes carbon credits (held and expected to be received) from Woodside Pluto Carbon Offset Project Stages 1-4 held by Woodside Burrup Pty Ltd. Portfolio volume excludes retired units. Woodside does not make any claims in relation to the mitigation impact of carbon credits within the portfolio unless, and until, a credit is retired or surrendered (taken out of circulation and can no longer be sold). 3 Cost of supply is calculated pre-tax and is based on portfolio volumes and a calculation of 2023 present value unit costs. 4 Origination refers to carbon offset projects developed by Woodside or third-party project developers, characterised by (i) the provision by Woodside of up-front investment or funding; (ii) Woodside either being a majority participant in the project or a recipient of carbon credits from the project (or both); and (iii) the acceptance of risk by Woodside in relation to carbon credit delivery. 5 Biosequestration includes human induced regeneration (HIR), afforestation, reforestation and revegetation (ARR) and environmental planting methods. 6 Fire management and forest protection includes savannah burning and reducing emissions from deforestation and forest degradation (REDD+) methods. WOODSIDE?S CLIMATE TRANSITION ACTION PLAN AND 2023 PROGRESS REPORT WOODSIDE ENERGY GROUP LTD 31
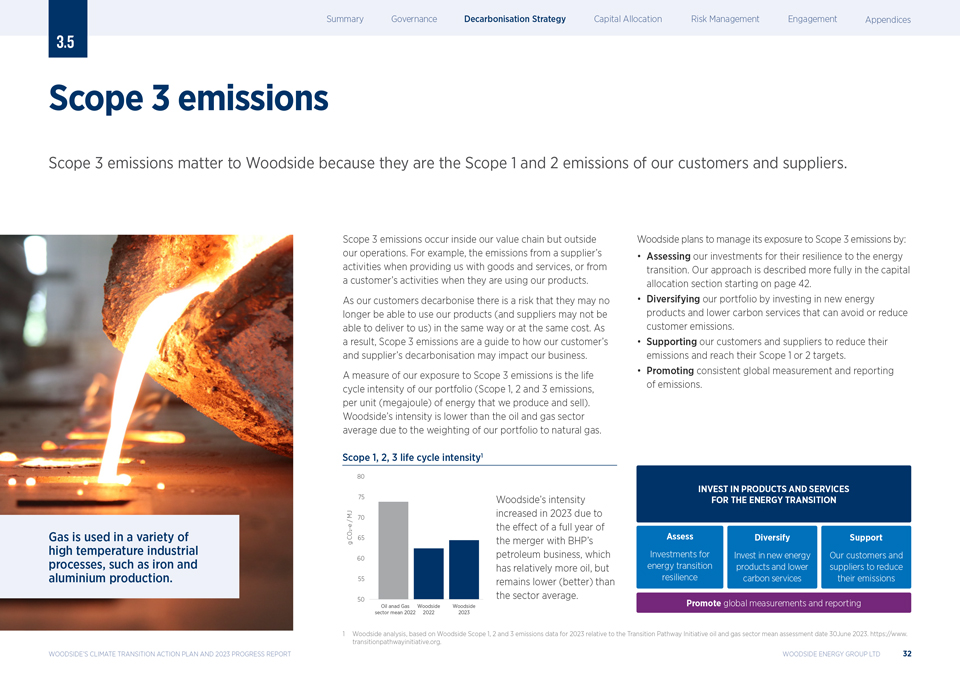
|
3.5 Scope 3 emissions Scope 3 emissions matter to Woodside because they are the Scope 1 and 2 emissions of our customers and suppliers. Scope 3 emissions occur inside our value chain but outside our operations. For example, the emissions from a supplier?s activities when providing us with goods and services, or from a customer?s activities when they are using our products. As our customers decarbonise there is a risk that they may no longer be able to use our products (and suppliers may not be able to deliver to us) in the same way or at the same cost. As a result, Scope 3 emissions are a guide to how our customer?s and supplier?s decarbonisation may impact our business. A measure of our exposure to Scope 3 emissions is the life cycle intensity of our portfolio (Scope 1, 2 and 3 emissions, per unit (megajoule) of energy that we produce and sell). Woodside?s intensity is lower than the oil and gas sector average due to the weighting of our portfolio to natural gas. Woodside plans to manage its exposure to Scope 3 emissions by: Assessing our investments for their resilience to the energy transition. Our approach is described more fully in the capital allocation section starting on page 42. Diversifying our portfolio by investing in new energy products and lower carbon services that can avoid or reduce customer emissions. Supporting our customers and suppliers to reduce their emissions and reach their Scope 1 or 2 targets. Promoting consistent global measurement and reporting of emissions. Gas is used in a variety of high temperature industrial processes, such as iron and aluminium production. Scope 1, 2, 3 life cycle intensity1 Woodside?s intensity increased in 2023 due to the effect of a full year of the merger with BHP?s petroleum business, which has relatively more oil, but remains lower (better) than the sector average. WOODSIDE?S CLIMATE TRANSITION ACTION PLAN AND 2023 PROGRESS REPORT 1 Woodside analysis, based on Woodside Scope 1, 2 and 3 emissions data for 2023 relative to the Transition Pathway Initiative oil and gas sector mean assessment date 30June 2023. https://www. transitionpathwayinitiative.org. WOODSIDE ENERGY GROUP LTD 32
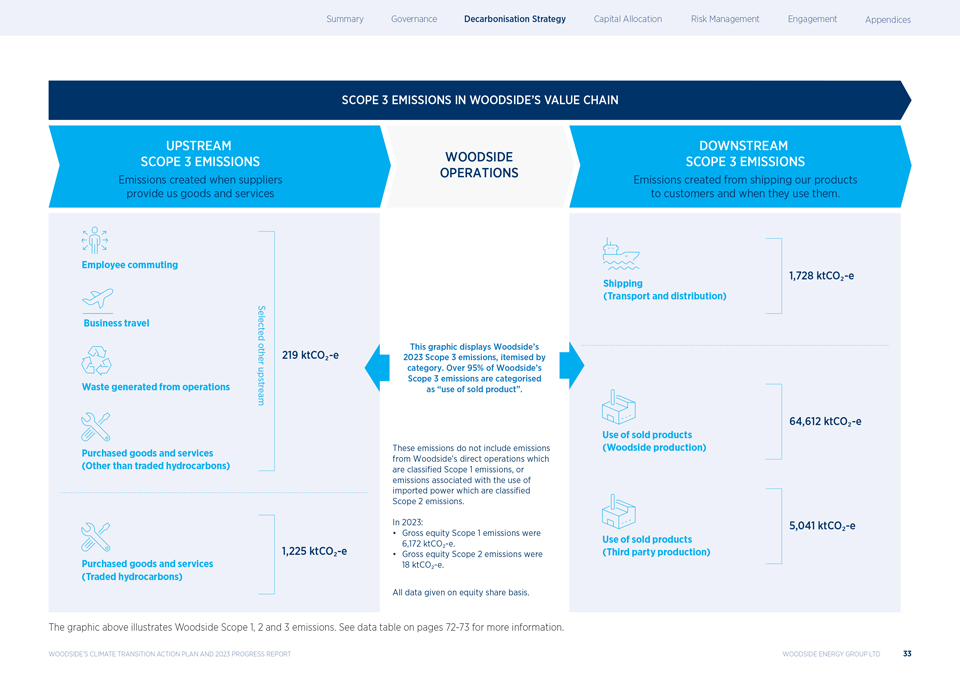
|
UPSTREAM SCOPE 3 EMISSIONS Emissions created when suppliers provide us goods and services WOODSIDE OPERATIONS DOWNSTREAM SCOPE 3 EMISSIONS Emissions created from shipping our products to customers and when they use them. Employee commuting Business travel Waste generated from operations Purchased goods and services (Other than traded hydrocarbons) Purchased goods and services (Traded hydrocarbons) Selected other upstream 219 ktCO_-e 1,225 ktCO_-e Shipping (Transport and distribution) 1,728 ktCO_-e Use of sold products (Woodside production) 64,612 ktCO_-e Use of sold products (Third party production) 5,041 ktCO_-e This graphic displays Woodside?s 2023 Scope 3 emissions, itemised by category. Over 95% of Woodside?s Scope 3 emissions are categorised as ?use of sold product?. These emissions do not include emissions from Woodside?s direct operations which are classified Scope 1 emissions, or emissions associated with the use of imported power which are classified Scope 2 emissions. In 2023: Gross equity Scope 1 emissions were 6,172 ktCO-e. Gross equity Scope 2 emissions were 18 ktCO-e. All data given on equity share basis. The graphic above illustrates Woodside Scope 1, 2 and 3 emissions. See data table on pages 72-73 for more information. WOODSIDE?S CLIMATE TRANSITION ACTION PLAN AND 2023 PROGRESS REPORT WOODSIDE ENERGY GROUP LTD 33
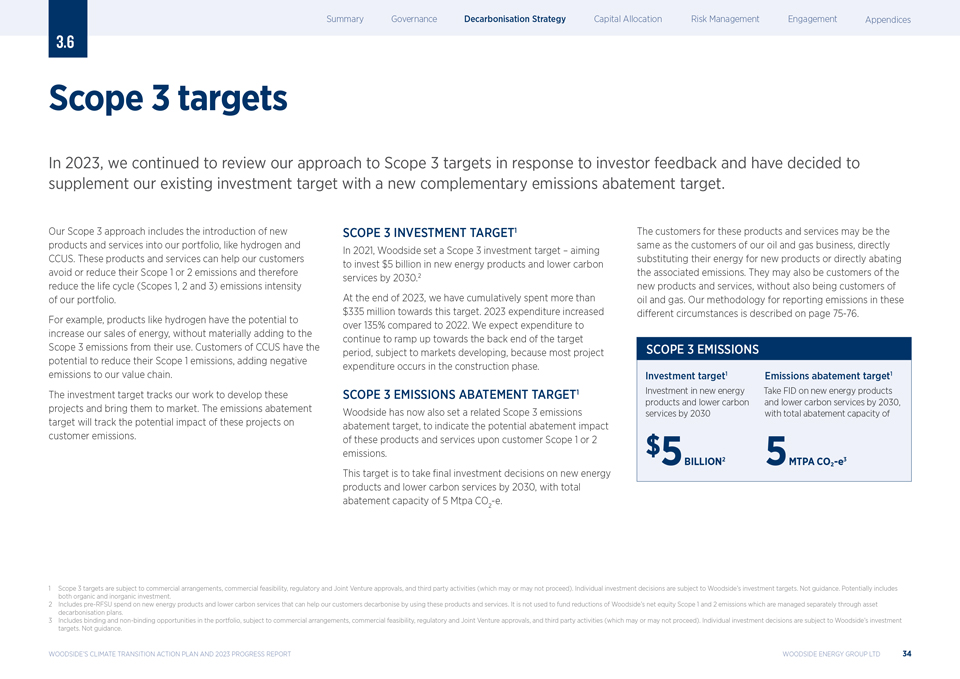
|
3.6 Scope 3 targets In 2023, we continued to review our approach to Scope 3 targets in response to investor feedback and have decided to supplement our existing investment target with a new complementary emissions abatement target. Our Scope 3 approach includes the introduction of new products and services into our portfolio, like hydrogen and CCUS. These products and services can help our customers avoid or reduce their Scope 1 or 2 emissions and therefore reduce the life cycle (Scopes 1, 2 and 3) emissions intensity of our portfolio. For example, products like hydrogen have the potential to increase our sales of energy, without materially adding to the Scope 3 emissions from their use. Customers of CCUS have the potential to reduce their Scope 1 emissions, adding negative emissions to our value chain. The investment target tracks our work to develop these projects and bring them to market. The emissions abatement target will track the potential impact of these projects on customer emissions. SCOPE 3 INVESTMENT TARGET1 In 2021, Woodside set a Scope 3 investment target ? aiming to invest $5 billion in new energy products and lower carbon services by 2030.2 At the end of 2023, we have cumulatively spent more than $335 million towards this target. 2023 expenditure increased over 135% compared to 2022. We expect expenditure to continue to ramp up towards the back end of the target period, subject to markets developing, because most project expenditure occurs in the construction phase. SCOPE 3 EMISSIONS ABATEMENT TARGET1 Woodside has now also set a related Scope 3 emissions abatement target, to indicate the potential abatement impact of these products and services upon customer Scope 1 or 2 emissions. This target is to take ?nal investment decisions on new energy products and lower carbon services by 2030, with total abatement capacity of 5 Mtpa CO -e. 2 The customers for these products and services may be the same as the customers of our oil and gas business, directly substituting their energy for new products or directly abating the associated emissions. They may also be customers of the new products and services, without also being customers of oil and gas. Our methodology for reporting emissions in these different circumstances is described on page 75-76. SCOPE 3 EMISSIONS Investment target1 Emissions abatement target1 Investment in new energy Take FID on new energy products products and lower carbon and lower carbon services by 2030, services by 2030 with total abatement capacity of $ 5BILLION2 5MTPA CO?-e3 1 Scope 3 targets are subject to commercial arrangements, commercial feasibility, regulatory and Joint Venture approvals, and third party activities (which may or may not proceed). Individual investment decisions are subject to Woodside?s investment targets. Not guidance. Potentially includes both organic and inorganic investment. 2 Includes pre-RFSU spend on new energy products and lower carbon services that can help our customers decarbonise by using these products and services. It is not used to fund reductions of Woodside?s net equity Scope 1 and 2 emissions which are managed separately through asset decarbonisation plans. 3 Includes binding and non-binding opportunities in the portfolio, subject to commercial arrangements, commercial feasibility, regulatory and Joint Venture approvals, and third party activities (which may or may not proceed). Individual investment decisions are subject to Woodside?s investment targets. Not guidance. WOODSIDE?S CLIMATE TRANSITION ACTION PLAN AND 2023 PROGRESS REPORT WOODSIDE ENERGY GROUP LTD 34

|
Gas is a feedstock for ammonia which is used for fertilizers in agriculture. WOODSIDE?S CLIMATE TRANSITION ACTION PLAN AND 2023 PROGRESS REPORT WOODSIDE ENERGY GROUP LTD 35
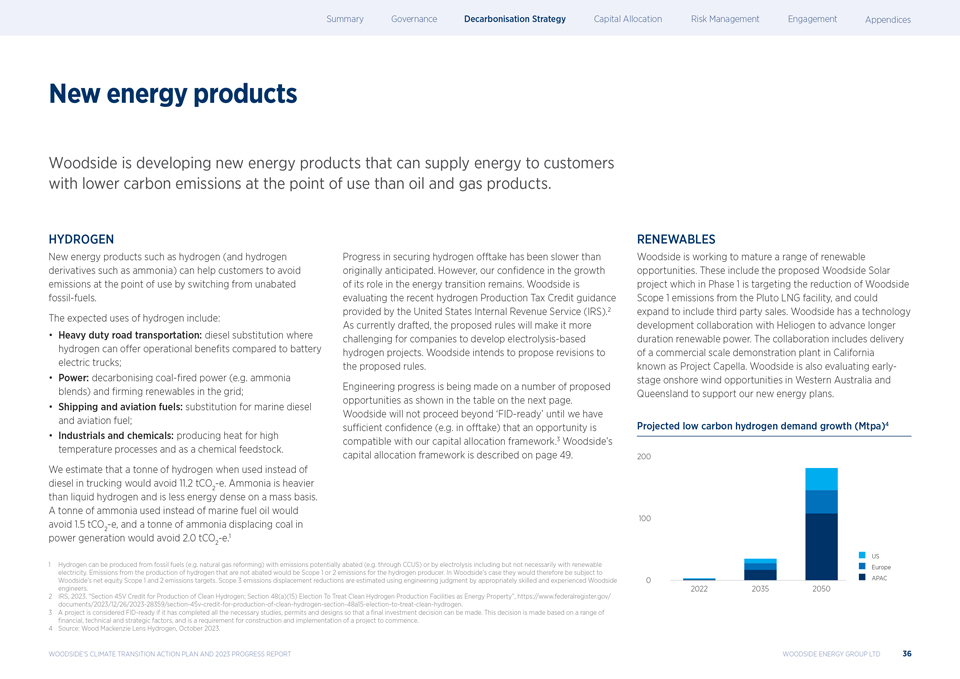
|
New energy products Woodside is developing new energy products that can supply energy to customers with lower carbon emissions at the point of use than oil and gas products. HYDROGEN New energy products such as hydrogen (and hydrogen derivatives such as ammonia) can help customers to avoid emissions at the point of use by switching from unabated fossil-fuels. The expected uses of hydrogen include: Heavy duty road transportation: diesel substitution where hydrogen can offer operational bene?ts compared to battery electric trucks; Power: decarbonising coal-?red power (e.g. ammonia blends) and ?rming renewables in the grid; Shipping and aviation fuels: substitution for marine diesel and aviation fuel; Industrials and chemicals: producing heat for high temperature processes and as a chemical feedstock. We estimate that a tonne of hydrogen when used instead of diesel in trucking would avoid 11.2 tCO -e. Ammonia is heavier than liquid hydrogen and is less energy 2 dense on a mass basis. A tonne of ammonia used instead of marine fuel oil would avoid 1.5 tCO -e, and a tonne of ammonia displacing coal in 2 power generation would avoid 2.0 tCO -e.1 2 Progress in securing hydrogen offtake has been slower than originally anticipated. However, our con?dence in the growth of its role in the energy transition remains. Woodside is evaluating the recent hydrogen Production Tax Credit guidance provided by the United States Internal Revenue Service (IRS).2 As currently drafted, the proposed rules will make it more challenging for companies to develop electrolysis-based hydrogen projects. Woodside intends to propose revisions to the proposed rules. Engineering progress is being made on a number of proposed opportunities as shown in the table on the next page. Woodside will not proceed beyond ?FID-ready? until we have sufficient confidence (e.g. in offtake) that an opportunity is compatible with our capital allocation framework.3 Woodside?s capital allocation framework is described on page 49. RENEWABLES Woodside is working to mature a range of renewable opportunities. These include the proposed Woodside Solar project which in Phase 1 is targeting the reduction of Woodside Scope 1 emissions from the Pluto LNG facility, and could expand to include third party sales. Woodside has a technology development collaboration with Heliogen to advance longer duration renewable power. The collaboration includes delivery of a commercial scale demonstration plant in California known as Project Capella. Woodside is also evaluating early-stage onshore wind opportunities in Western Australia and Queensland to support our new energy plans. Projected low carbon hydrogen demand growth (Mtpa)4 1 Hydrogen can be produced from fossil fuels (e.g. natural gas reforming) with emissions potentially abated (e.g. through CCUS) or by electrolysis including but not necessarily with renewable electricity. Emissions from the production of hydrogen that are not abated would be Scope 1 or 2 emissions for the hydrogen producer. In Woodside?s case they would therefore be subject to Woodside?s net equity Scope 1 and 2 emissions targets. Scope 3 emissions displacement reductions are estimated using engineering judgment by appropriately skilled and experienced Woodside engineers. 2 IRS, 2023. ?Section 45V Credit for Production of Clean Hydrogen; Section 48(a)(15) Election To Treat Clean Hydrogen Production Facilities as Energy Property?, https://www.federalregister.gov/ documents/2023/12/26/2023-28359/section-45v-credit-for-production-of-clean-hydrogen-section-48a15-election-to-treat-clean-hydrogen. 3 A project is considered FID-ready if it has completed all the necessary studies, permits and designs so that a ?nal investment decision can be made. This decision is made based on a range of ?nancial, technical and strategic factors, and is a requirement for construction and implementation of a project to commence. 4 Source: Wood Mackenzie Lens Hydrogen, October 2023. WOODSIDE?S CLIMATE TRANSITION ACTION PLAN AND 2023 PROGRESS REPORT WOODSIDE ENERGY GROUP LTD 36
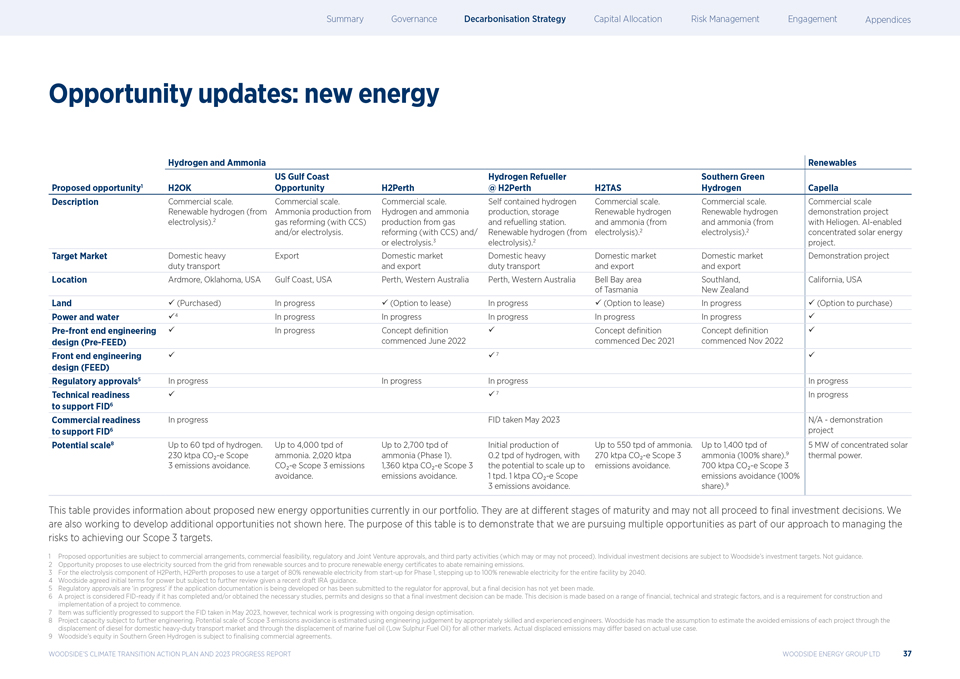
|
Opportunity updates: new energy Hydrogen and Ammonia Renewables US Gulf Coast Hydrogen Refueller Southern Green Proposed opportunity1 H2OK Opportunity H2Perth @ H2Perth H2TAS Hydrogen Capella Description Commercial scale. Commercial scale. Commercial scale. Self contained hydrogen Commercial scale. Commercial scale. Commercial scale Renewable hydrogen (from Ammonia production from Hydrogen and ammonia production, storage Renewable hydrogen Renewable hydrogen demonstration project electrolysis).2 gas reforming (with CCS) production from gas and refuelling station. and ammonia (from and ammonia (from with Heliogen. AI-enabled and/or electrolysis. reforming (with CCS) and/ Renewable hydrogen (from electrolysis).2 electrolysis).2 concentrated solar energy or electrolysis.3 electrolysis).2 project. Target Market Domestic heavy Export Domestic market Domestic heavy Domestic market Domestic market Demonstration project duty transport and export duty transport and export and export Location Ardmore, Oklahoma, USA Gulf Coast, USA Perth, Western Australia Perth, Western Australia Bell Bay area Southland, California, USA of Tasmania New Zealand Land ??(Purchased) In progress ??(Option to lease) In progress ??(Option to lease) In progress ??(Option to purchase) Power and water ?4 In progress In progress In progress In progress In progress ? Pre-front end engineering ? In progress Concept de?nition ? Concept de?nition Concept de?nition ? design (Pre-FEED) commenced June 2022 commenced Dec 2021 commenced Nov 2022 Front end engineering ? ??7 ? design (FEED) Regulatory approvals5 In progress In progress In progress In progress Technical readiness ? ??7 In progress to support FID6 Commercial readiness In progress FID taken May 2023 N/A—demonstration to support FID6 project Potential scale8 Up to 60 tpd of hydrogen. Up to 4,000 tpd of Up to 2,700 tpd of Initial production of Up to 550 tpd of ammonia. Up to 1,400 tpd of 5 MW of concentrated solar 230 ktpa CO?-e Scope ammonia. 2,020 ktpa ammonia (Phase 1). 0.2 tpd of hydrogen, with 270 ktpa CO?-e Scope 3 ammonia (100% share).9 thermal power. 3 emissions avoidance. CO?-e Scope 3 emissions 1,360 ktpa CO?-e Scope 3 the potential to scale up to emissions avoidance. 700 ktpa CO?-e Scope 3 avoidance. emissions avoidance. 1 tpd. 1 ktpa CO?-e Scope emissions avoidance (100% 3 emissions avoidance. share).9 This table provides information about proposed new energy opportunities currently in our portfolio. They are at different stages of maturity and may not all proceed to ?nal investment decisions. We are also working to develop additional opportunities not shown here. The purpose of this table is to demonstrate that we are pursuing multiple opportunities as part of our approach to managing the risks to achieving our Scope 3 targets. 1 Proposed opportunities are subject to commercial arrangements, commercial feasibility, regulatory and Joint Venture approvals, and third party activities (which may or may not proceed). Individual investment decisions are subject to Woodside?s investment targets. Not guidance. 2 Opportunity proposes to use electricity sourced from the grid from renewable sources and to procure renewable energy certi?cates to abate remaining emissions. 3 For the electrolysis component of H2Perth, H2Perth proposes to use a target of 80% renewable electricity from start-up for Phase 1, stepping up to 100% renewable electricity for the entire facility by 2040. 4 Woodside agreed initial terms for power but subject to further review given a recent draft IRA guidance. 5 Regulatory approvals are ?in progress? if the application documentation is being developed or has been submitted to the regulator for approval, but a final decision has not yet been made. 6 A project is considered FID-ready if it has completed and/or obtained the necessary studies, permits and designs so that a ?nal investment decision can be made. This decision is made based on a range of ?nancial, technical and strategic factors, and is a requirement for construction and implementation of a project to commence. 7 Item was sufficiently progressed to support the FID taken in May 2023, however, technical work is progressing with ongoing design optimisation. 8 Project capacity subject to further engineering. Potential scale of Scope 3 emissions avoidance is estimated using engineering judgement by appropriately skilled and experienced engineers. Woodside has made the assumption to estimate the avoided emissions of each project through the displacement of diesel for domestic heavy-duty transport market and through the displacement of marine fuel oil (Low Sulphur Fuel Oil) for all other markets. Actual displaced emissions may differ based on actual use case. 9 Woodside?s equity in Southern Green Hydrogen is subject to finalising commercial agreements. WOODSIDE?S CLIMATE TRANSITION ACTION PLAN AND 2023 PROGRESS REPORT WOODSIDE ENERGY GROUP LTD 37
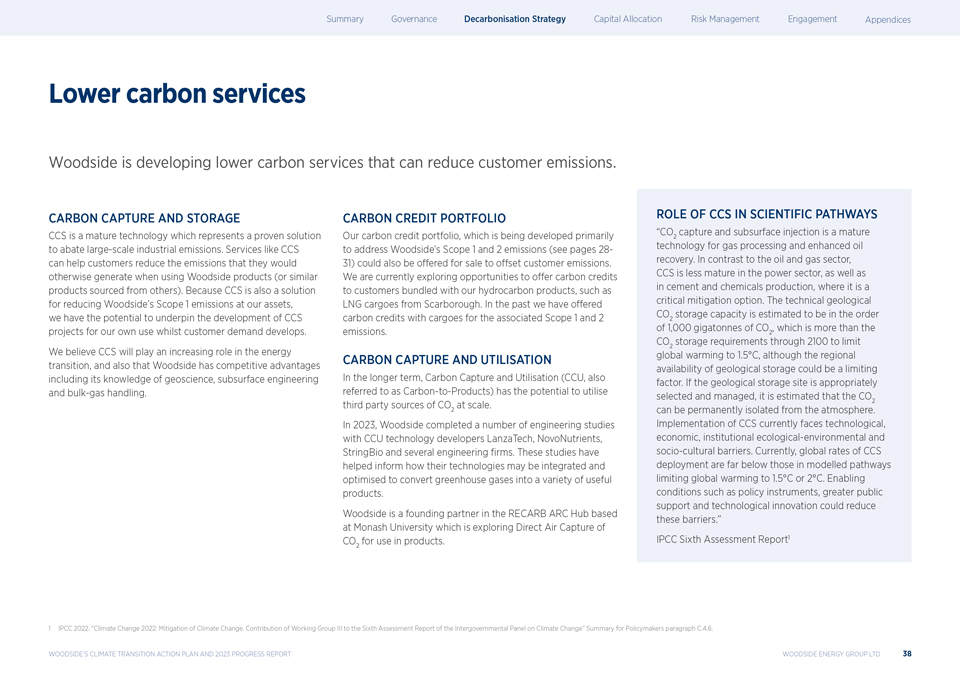
|
Lower carbon services Woodside is developing lower carbon services that can reduce customer emissions. CARBON CAPTURE AND STORAGE CCS is a mature technology which represents a proven solution to abate large-scale industrial emissions. Services like CCS can help customers reduce the emissions that they would otherwise generate when using Woodside products (or similar products sourced from others). Because CCS is also a solution for reducing Woodside?s Scope 1 emissions at our assets, we have the potential to underpin the development of CCS projects for our own use whilst customer demand develops. We believe CCS will play an increasing role in the energy transition, and also that Woodside has competitive advantages including its knowledge of geoscience, subsurface engineering and bulk-gas handling. CARBON CREDIT PORTFOLIO Our carbon credit portfolio, which is being developed primarily to address Woodside?s Scope 1 and 2 emissions (see pages 28-31) could also be offered for sale to offset customer emissions. We are currently exploring opportunities to offer carbon credits to customers bundled with our hydrocarbon products, such as LNG cargoes from Scarborough. In the past we have offered carbon credits with cargoes for the associated Scope 1 and 2 emissions. CARBON CAPTURE AND UTILISATION In the longer term, Carbon Capture and Utilisation (CCU, also referred to as Carbon-to-Products) has the potential to utilise third party sources of CO at scale. 2 In 2023, Woodside completed a number of engineering studies with CCU technology developers LanzaTech, NovoNutrients, StringBio and several engineering ?rms. These studies have helped inform how their technologies may be integrated and optimised to convert greenhouse gases into a variety of useful products. Woodside is a founding partner in the RECARB ARC Hub based at Monash University which is exploring Direct Air Capture of CO for use in products. 2 ROLE OF CCS IN SCIENTIFIC PATHWAYS ?CO capture and subsurface injection is a mature technology 2 for gas processing and enhanced oil recovery. In contrast to the oil and gas sector, CCS is less mature in the power sector, as well as in cement and chemicals production, where it is a critical mitigation option. The technical geological CO storage capacity is estimated to be in the order of 1,000 2 gigatonnes of CO , which is more than the CO storage requirements 2 through 2100 to limit global 2 warming to 1.5C, although the regional availability of geological storage could be a limiting factor. If the geological storage site is appropriately selected and managed, it is estimated that the CO can be permanently isolated from the atmosphere2 . Implementation of CCS currently faces technological, economic, institutional ecological-environmental and socio-cultural barriers. Currently, global rates of CCS deployment are far below those in modelled pathways limiting global warming to 1.5C or 2C. Enabling conditions such as policy instruments, greater public support and technological innovation could reduce these barriers.? IPCC Sixth Assessment Report1 1 IPCC 2022. ?Climate Change 2022: Mitigation of Climate Change. Contribution of Working Group III to the Sixth Assessment Report of the Intergovernmental Panel on Climate Change? Summary for Policymakers paragraph C.4.6. WOODSIDE?S CLIMATE TRANSITION ACTION PLAN AND 2023 PROGRESS REPORT WOODSIDE ENERGY GROUP LTD 38
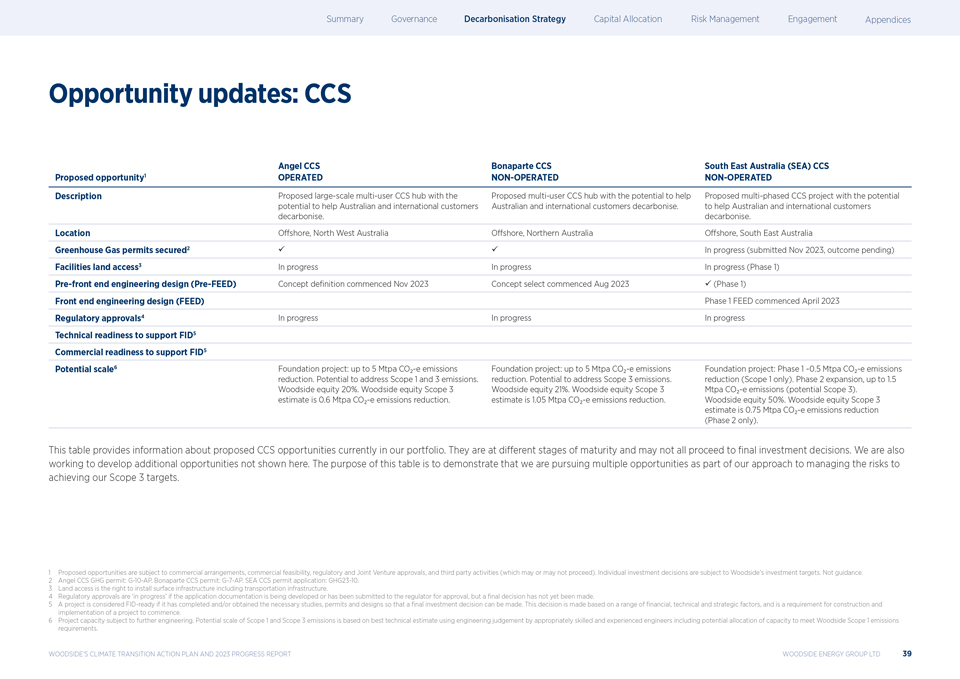
|
Opportunity updates: CCS Angel CCS Bonaparte CCS South East Australia (SEA) CCS Proposed opportunity(1) OPERATED NON-OPERATED NON-OPERATED Description Proposed large-scale multi-user CCS hub with the Proposed multi-user CCS hub with the potential to help Proposed multi-phased CCS project with the potential potential to help Australian and international customers Australian and international customers decarbonise. to help Australian and international customers decarbonise. decarbonise. Location Offshore, North West Australia Offshore, Northern Australia Offshore, South East Australia Greenhouse Gas permits secured(2) 9 9 In progress (submitted Nov 2023, outcome pending) Facilities land access(3) In progress In progress In progress (Phase 1) Pre-front end engineering design (Pre-FEED) Concept definition commenced Nov 2023 Concept select commenced Aug 2023 9 (Phase 1) Front end engineering design (FEED) Phase 1 FEED commenced April 2023 Regulatory approvals(4) In progress In progress In progress Technical readiness to support FID(5) Commercial readiness to support FID(5) Potential scale(6) Foundation project: up to 5 Mtpa CO -e emissions Foundation project: up to 5 Mtpa CO -e emissions Foundation project: Phase 1 ~0.5 Mtpa CO -e emissions reduction. Potential to address Scope 1 and 3 emissions. reduction. Potential to address Scope 3 emissions. reduction (Scope 1 only). Phase 2 expansion, up to 1.5 Woodside equity 20%. Woodside equity Scope 3 Woodside equity 21%. Woodside equity Scope 3 Mtpa CO -e emissions (potential Scope 3). estimate is 0.6 Mtpa CO -e emissions reduction. estimate is 1.05 Mtpa CO -e emissions reduction. Woodside equity 50%. Woodside equity Scope 3 estimate is 0.75 Mtpa CO -e emissions reduction (Phase 2 only). This table provides information about proposed CCS opportunities currently in our portfolio. They are at different stages of maturity and may not all proceed to ?nal investment decisions. We are also working to develop additional opportunities not shown here. The purpose of this table is to demonstrate that we are pursuing multiple opportunities as part of our approach to managing the risks to achieving our Scope 3 targets. 1 Proposed opportunities are subject to commercial arrangements, commercial feasibility, regulatory and Joint Venture approvals, and third party activities (which may or may not proceed). Individual investment decisions are subject to Woodside?s investment targets. Not guidance. 2 Angel CCS GHG permit: G-10-AP. Bonaparte CCS permit: G-7-AP. SEA CCS permit application: GHG23-10. 3 Land access is the right to install surface infrastructure including transportation infrastructure. 4 Regulatory approvals are ?in progress? if the application documentation is being developed or has been submitted to the regulator for approval, but a final decision has not yet been made. 5 A project is considered FID-ready if it has completed and/or obtained the necessary studies, permits and designs so that a ?nal investment decision can be made. This decision is made based on a range of ?nancial, technical and strategic factors, and is a requirement for construction and implementation of a project to commence. 6 Project capacity subject to further engineering. Potential scale of Scope 1 and Scope 3 emissions is based on best technical estimate using engineering judgement by appropriately skilled and experienced engineers including potential allocation of capacity to meet Woodside Scope 1 emissions requirements. WOODSIDE?S CLIMATE TRANSITION ACTION PLAN AND 2023 PROGRESS REPORT WOODSIDE ENERGY GROUP LTD 39
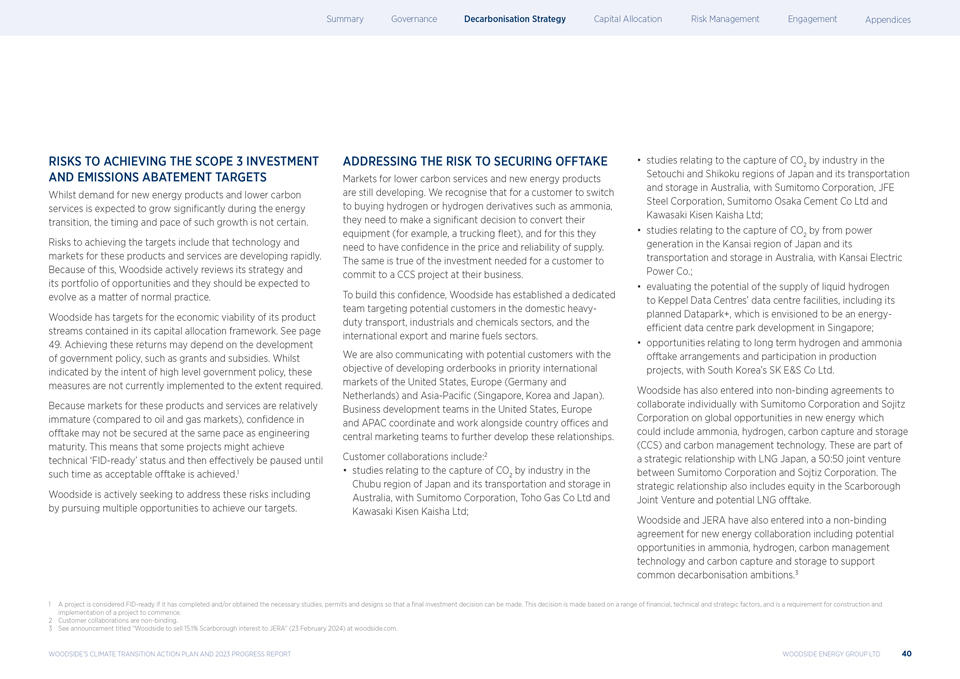
|
RISKS TO ACHIEVING THE SCOPE 3 INVESTMENT AND EMISSIONS ABATEMENT TARGETS Whilst demand for new energy products and lower carbon services is expected to grow signi?cantly during the energy transition, the timing and pace of such growth is not certain. Risks to achieving the targets include that technology and markets for these products and services are developing rapidly. Because of this, Woodside actively reviews its strategy and its portfolio of opportunities and they should be expected to evolve as a matter of normal practice. Woodside has targets for the economic viability of its product streams contained in its capital allocation framework. See page 49. Achieving these returns may depend on the development of government policy, such as grants and subsidies. Whilst indicated by the intent of high level government policy, these measures are not currently implemented to the extent required. Because markets for these products and services are relatively immature (compared to oil and gas markets), confidence in offtake may not be secured at the same pace as engineering maturity. This means that some projects might achieve technical ?FID-ready? status and then effectively be paused until such time as acceptable offtake is achieved.1 Woodside is actively seeking to address these risks including by pursuing multiple opportunities to achieve our targets. ADDRESSING THE RISK TO SECURING OFFTAKE Markets for lower carbon services and new energy products are still developing. We recognise that for a customer to switch to buying hydrogen or hydrogen derivatives such as ammonia, they need to make a signi?cant decision to convert their equipment (for example, a trucking ?eet), and for this they need to have con?dence in the price and reliability of supply. The same is true of the investment needed for a customer to commit to a CCS project at their business. To build this con?dence, Woodside has established a dedicated team targeting potential customers in the domestic heavy-duty transport, industrials and chemicals sectors, and the international export and marine fuels sectors. We are also communicating with potential customers with the objective of developing orderbooks in priority international markets of the United States, Europe (Germany and Netherlands) and Asia-Paci?c (Singapore, Korea and Japan). Business development teams in the United States, Europe and APAC coordinate and work alongside country offices and central marketing teams to further develop these relationships. Customer collaborations include:2 studies relating to the capture of CO by industry in the Chubu region of Japan and its transportation 2 and storage in Australia, with Sumitomo Corporation, Toho Gas Co Ltd and Kawasaki Kisen Kaisha Ltd; studies relating to the capture of CO by industry in the Setouchi and Shikoku regions of Japan 2 and its transportation and storage in Australia, with Sumitomo Corporation, JFE Steel Corporation, Sumitomo Osaka Cement Co Ltd and Kawasaki Kisen Kaisha Ltd; studies relating to the capture of CO by from power generation in the Kansai region of Japan 2 and its transportation and storage in Australia, with Kansai Electric Power Co.; evaluating the potential of the supply of liquid hydrogen to Keppel Data Centres? data centre facilities, including its planned Datapark+, which is envisioned to be an energy-efficient data centre park development in Singapore; opportunities relating to long term hydrogen and ammonia offtake arrangements and participation in production projects, with South Korea?s SK E&S Co Ltd. Woodside has also entered into non-binding agreements to collaborate individually with Sumitomo Corporation and Sojitz Corporation on global opportunities in new energy which could include ammonia, hydrogen, carbon capture and storage (CCS) and carbon management technology. These are part of a strategic relationship with LNG Japan, a 50:50 joint venture between Sumitomo Corporation and Sojtiz Corporation. The strategic relationship also includes equity in the Scarborough Joint Venture and potential LNG offtake. Woodside and JERA have also entered into a non-binding agreement for new energy collaboration including potential opportunities in ammonia, hydrogen, carbon management technology and carbon capture and storage to support common decarbonisation ambitions.3 1 A project is considered FID-ready if it has completed and/or obtained the necessary studies, permits and designs so that a ?nal investment decision can be made. This decision is made based on a range of ?nancial, technical and strategic factors, and is a requirement for construction and implementation of a project to commence. 2 Customer collaborations are non-binding. 3 See announcement titled ?Woodside to sell 15.1% Scarborough interest to JERA? (23 February 2024) at woodside.com. WOODSIDE?S CLIMATE TRANSITION ACTION PLAN AND 2023 PROGRESS REPORT WOODSIDE ENERGY GROUP LTD 40
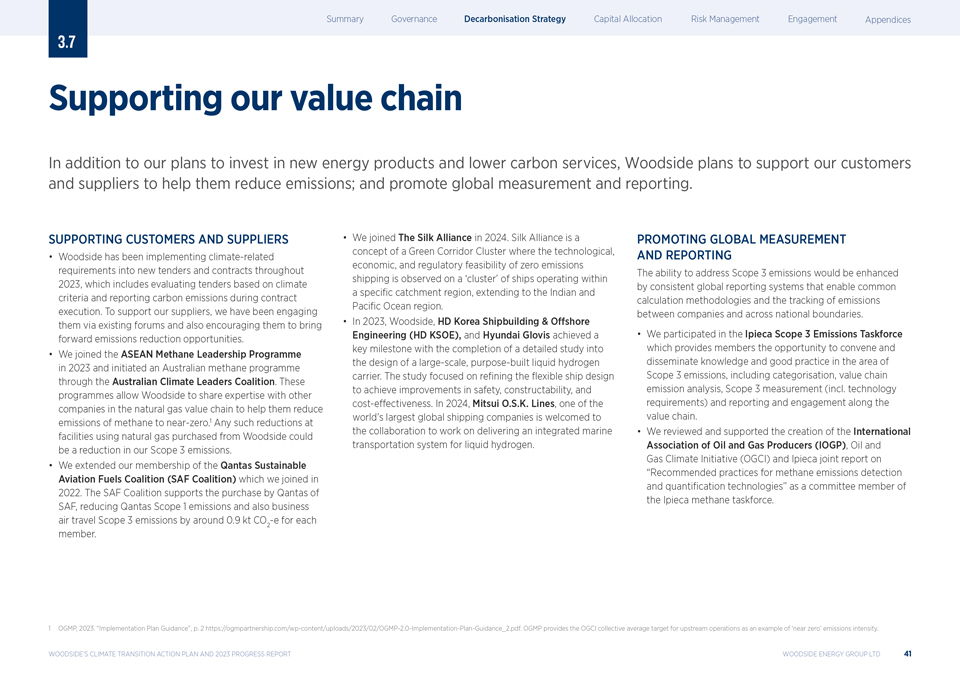
|
3.7 Supporting our value chain In addition to our plans to invest in new energy products and lower carbon services, Woodside plans to support our customers and suppliers to help them reduce emissions; and promote global measurement and reporting. SUPPORTING CUSTOMERS AND SUPPLIERS Woodside has been implementing climate-related requirements into new tenders and contracts throughout 2023, which includes evaluating tenders based on climate criteria and reporting carbon emissions during contract execution. To support our suppliers, we have been engaging them via existing forums and also encouraging them to bring forward emissions reduction opportunities. We joined the ASEAN Methane Leadership Programme in 2023 and initiated an Australian methane programme through the Australian Climate Leaders Coalition. These programmes allow Woodside to share expertise with other companies in the natural gas value chain to help them reduce emissions of methane to near-zero.1 Any such reductions at facilities using natural gas purchased from Woodside could be a reduction in our Scope 3 emissions. We extended our membership of the Qantas Sustainable Aviation Fuels Coalition (SAF Coalition) which we joined in 2022. The SAF Coalition supports the purchase by Qantas of SAF, reducing Qantas Scope 1 emissions and also business air travel Scope 3 emissions by around 0.9 kt CO -e for each member. 2 We joined The Silk Alliance in 2024. Silk Alliance is a concept of a Green Corridor Cluster where the technological, economic, and regulatory feasibility of zero emissions shipping is observed on a ?cluster? of ships operating within a specific catchment region, extending to the Indian and Pacific Ocean region. In 2023, Woodside, HD Korea Shipbuilding & Offshore Engineering (HD KSOE), and Hyundai Glovis achieved a key milestone with the completion of a detailed study into the design of a large-scale, purpose-built liquid hydrogen carrier. The study focused on re?ning the ?exible ship design to achieve improvements in safety, constructability, and cost-effectiveness.?In 2024, Mitsui O.S.K. Lines, one of the world?s largest global shipping companies is welcomed to the collaboration to work on delivering an integrated marine transportation system for liquid hydrogen. PROMOTING GLOBAL MEASUREMENT AND REPORTING The ability to address Scope 3 emissions would be enhanced by consistent global reporting systems that enable common calculation methodologies and the tracking of emissions between companies and across national boundaries. We participated in the Ipieca Scope 3 Emissions Taskforce which provides members the opportunity to convene and disseminate knowledge and good practice in the area of Scope 3 emissions, including categorisation, value chain emission analysis, Scope 3 measurement (incl. technology requirements) and reporting and engagement along the value chain. We reviewed and supported the creation of the International Association of Oil and Gas Producers (IOGP), Oil and Gas Climate Initiative (OGCI) and Ipieca joint report on ?Recommended practices for methane emissions detection and quantification technologies? as a committee member of the Ipieca methane taskforce. 1 OGMP, 2023. ?Implementation Plan Guidance?, p. 2 https://ogmpartnership.com/wp-content/uploads/2023/02/OGMP-2.0-Implementation-Plan-Guidance_2.pdf. OGMP provides the OGCI collective average target for upstream operations as an example of ?near zero? emissions intensity. WOODSIDE?S CLIMATE TRANSITION ACTION PLAN AND 2023 PROGRESS REPORT WOODSIDE ENERGY GROUP LTD 41

|
4.0 CAPITAL ALLOCATION When used to generate electricity gas typically produces half the emissions of coal.
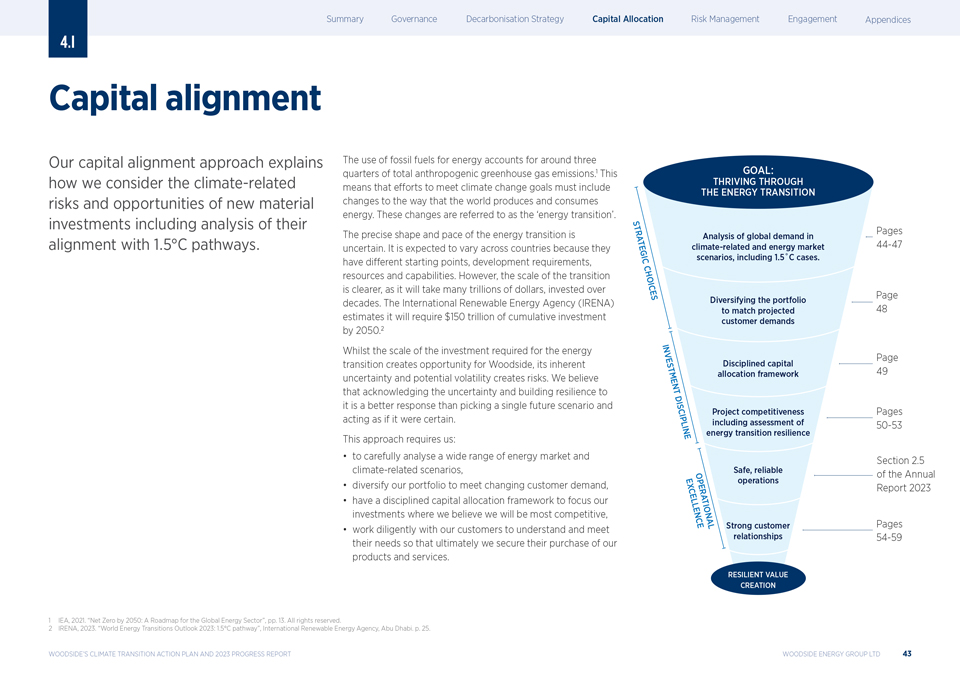
|
4.1 Capital alignment Our capital alignment approach explains how we consider the climate-related risks and opportunities of new material investments including analysis of their alignment with 1.5C pathways. The use of fossil fuels for energy accounts for around three quarters of total anthropogenic greenhouse gas emissions.1 This means that efforts to meet climate change goals must include changes to the way that the world produces and consumes energy. These changes are referred to as the ?energy transition?. The precise shape and pace of the energy transition is uncertain. It is expected to vary across countries because they have different starting points, development requirements, resources and capabilities. However, the scale of the transition is clearer, as it will take many trillions of dollars, invested over decades. The International Renewable Energy Agency (IRENA) estimates it will require $150 trillion of cumulative investment by 2050.2 Whilst the scale of the investment required for the energy transition creates opportunity for Woodside, its inherent uncertainty and potential volatility creates risks. We believe that acknowledging the uncertainty and building resilience to it is a better response than picking a single future scenario and acting as if it were certain. This approach requires us: to carefully analyse a wide range of energy market and climate-related scenarios, diversify our portfolio to meet changing customer demand, have a disciplined capital allocation framework to focus our investments where we believe we will be most competitive, work diligently with our customers to understand and meet their needs so that ultimately we secure their purchase of our products and services. 1 IEA, 2021. ?Net Zero by 2050: A Roadmap for the Global Energy Sector?, pp. 13. All rights reserved. 2 IRENA, 2023. ?World Energy Transitions Outlook 2023: 1.5C pathway?, International Renewable Energy Agency, Abu Dhabi. p. 25. WOODSIDE?S CLIMATE TRANSITION ACTION PLAN AND 2023 PROGRESS REPORT WOODSIDE ENERGY GROUP LTD 43
|
4.2 Global demand for oil and gas Woodside?s strategy to thrive through the energy transition starts with acknowledging the uncertainty in its precise future course, and building resilience in our portfolio. We believe this is a better response than picking a single future scenario and acting as if it were certain. GLOBAL OIL AND GAS USE According to the United Nation?s Intergovernmental Panel on Climate Change (IPCC), there are multiple feasible and effective options available to reduce greenhouse gas emissions and adapt to human-caused climate change.1 In 2023, the IPCC concluded its Sixth Assessment Report.2 It found that there are many pathways that can limit warming to within the goals of the Paris Agreement. These include 97 pathways that can limit warming to 1.5C with no or limited overshoot (modelled global emissions pathways Category C1, the most ambitious subset assessed by the IPCC).3 The report also includes pathways with a 50% or greater probability of returning warming to 1.5C after a high overshoot (C2), a 67% or greater probability of limiting warming to 2C (C3) and other higher temperature outcomes up to those exceeding 4C (C8). Demand for oil and gas remains through the remainder of this century in all of these pathways, but to varying degrees. Different variables contribute to the temperature outcomes in these pathways. For example, C1 pathways with higher gas use typically also have higher uses of CCUS.4 The range of oil and gas use in each of the particular temperature outcome pathways arises because choices in one sector can be compensated for by choices in another while being consistent with the same assessed level of global warming.4 The level of global oil and gas use is an important but not sole determinant of temperature outcomes. Other in?uential factors include coal use, total primary energy use, emissions from outside the energy sector and levels of abatement and carbon dioxide removals. Moreover, it is expected that different options will be pursued by different countries consistent with what the Paris Agreement calls ?the principle of equity and common but differentiated responsibilities and respective capabilities, in the light of different national circumstances?.5 IN KEEPING WITH THE SCIENCE At the COP28 global climate summit, world governments agreed to ?transitioning away from fossil fuels in energy systems, in a just, orderly and equitable manner, accelerating action in this critical decade, so as to achieve net zero by 2050 in keeping with the science?.6 In this section we explore the implications for oil and gas demand of transitioning ?in keeping with the science?. Further information about the proceedings of COP28 is provided on page 65. The charts (next page) plot the ranges for gas and oil use respectively in the IPCC?s C1 and C1—C3 categories.7 They also show the IEA?s cases for gas and oil supply respectively, both in the absence of any further investment, and in the case where investment is limited to existing and approved projects.8 In these cases, supply falls due to the depletion of existing ?elds. The charts show that whilst there are some pathways in the IPCC C1 category which have levels of oil and gas use consistent with those that do not require additional investment, there are other pathways with higher levels of oil and gas use that have the same probability of this temperature outcome. 1 IPCC, 2023. ?Urgent climate action can secure a liveable future for all?, https://www.ipcc.ch/report/ar6/syr/downloads/press/IPCC_AR6_SYR_ 4 IPCC 2022. ?Climate Change 2022: Mitigation of Climate Change. Contribution of Working Group III to the Sixth Assessment Report of the PressRelease_en.pdf. Intergovernmental Panel on Climate Change?. Summary for Policymakers paragraph C.3.2. 2 IPCC, 2023. ?Climate Change 2023: Synthesis Report. Contribution of Working Groups I, II and III to the Sixth Assessment Report of the 5 UNFCCC, 2015. ?Paris Agreement?, Preamble. https://unfccc.int/sites/default/files/english_paris_agreement.pdf. Intergovernmental Panel on Climate Change?, [Core Writing Team, H. Lee and J. Romero (eds.)]. IPCC, Geneva, Switzerland, doi: 10.59327/ 6 UNFCCC, 2023. ?Outcome of the first global stocktake? (Advance unedited version). https://unfccc.int/documents/636584, Section II, IPCC/AR6-9789291691647, https://www.ipcc.ch/report/ar6/syr/downloads/report/IPCC_AR6_SYR_FullVolume.pdf—referred to in subsequent Subsection A, Clause 28.(d) footnotes on this page as IPCC, 2023. ?AR6-SYR?. 7 IPCC, 2022. ?AR6-WG3? pp. 78. doi: 10.1017/9781009157926.002. See Glossary for full reference. 3 Overshoot means the temporary exceedance of a speci?ed level of global warming, such as 1.5C. Overshoot implies a peak followed by a 8 IEA, 2023. ?The Oil and Gas Industry in Net Zero Transitions?, https://www.iea.org/reports/the-oil-and-gas-industry-in-net-zero-transitions, decline in global warming, achieved through anthropogenic removal of CO? exceeding remaining CO? emissions globally. License: CC BY 4.0. WOODSIDE?S CLIMATE TRANSITION ACTION PLAN AND 2023 PROGRESS REPORT WOODSIDE ENERGY GROUP LTD 44
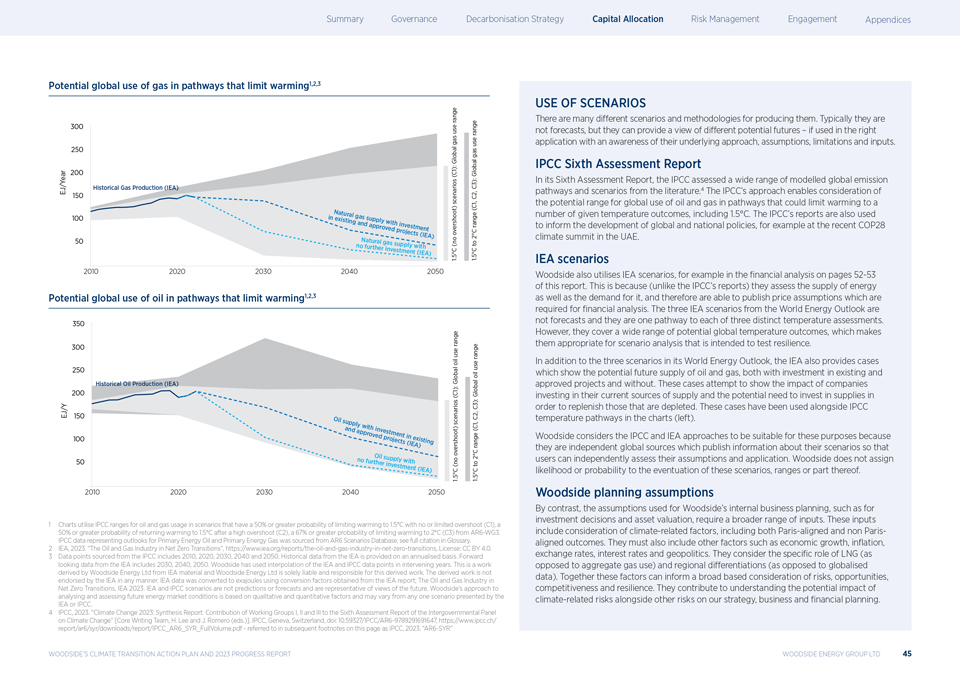
|
Potential global use of gas in pathways that limit warming1,2,3 Potential global use of oil in pathways that limit warming1,2,3 USE OF SCENARIOS There are many different scenarios and methodologies for producing them. Typically they are not forecasts, but they can provide a view of different potential futures ? if used in the right application with an awareness of their underlying approach, assumptions, limitations and inputs. IPCC Sixth Assessment Report In its Sixth Assessment Report, the IPCC assessed a wide range of modelled global emission pathways and scenarios from the literature.4 The IPCC?s approach enables consideration of the potential range for global use of oil and gas in pathways that could limit warming to a number of given temperature outcomes, including 1.5C. The IPCC?s reports are also used to inform the development of global and national policies, for example at the recent COP28 climate summit in the UAE. IEA scenarios Woodside also utilises IEA scenarios, for example in the financial analysis on pages 52-53 of this report. This is because (unlike the IPCC?s reports) they assess the supply of energy as well as the demand for it, and therefore are able to publish price assumptions which are required for financial analysis. The three IEA scenarios from the World Energy Outlook are not forecasts and they are one pathway to each of three distinct temperature assessments. However, they cover a wide range of potential global temperature outcomes, which makes them appropriate for scenario analysis that is intended to test resilience. In addition to the three scenarios in its World Energy Outlook, the IEA also provides cases which show the potential future supply of oil and gas, both with investment in existing and approved projects and without. These cases attempt to show the impact of companies investing in their current sources of supply and the potential need to invest in supplies in order to replenish those that are depleted. These cases have been used alongside IPCC temperature pathways in the charts (left). Woodside considers the IPCC and IEA approaches to be suitable for these purposes because they are independent global sources which publish information about their scenarios so that users can independently assess their assumptions and application. Woodside does not assign likelihood or probability to the eventuation of these scenarios, ranges or part thereof. Woodside planning assumptions By contrast, the assumptions used for Woodside?s internal business planning, such as for investment decisions and asset valuation, require a broader range of inputs. These inputs include consideration of climate-related factors, including both Paris-aligned and non Paris-aligned outcomes. They must also include other factors such as economic growth, inflation, exchange rates, interest rates and geopolitics. They consider the specific role of LNG (as opposed to aggregate gas use) and regional differentiations (as opposed to globalised data). Together these factors can inform a broad based consideration of risks, opportunities, competitiveness and resilience. They contribute to understanding the potential impact of climate-related risks alongside other risks on our strategy, business and financial planning. 1 Charts utilise IPCC ranges for oil and gas usage in scenarios that have a 50% or greater probability of limiting warming to 1.5C with no or limited overshoot (C1), a 50% or greater probability of returning warming to 1.5C after a high overshoot (C2), a 67% or greater probability of limiting warming to 2C (C3) from AR6-WG3. IPCC data representing outlooks for Primary Energy Oil and Primary Energy Gas was sourced from AR6 Scenarios Database, see full citation in Glossary. 2 IEA, 2023. ?The Oil and Gas Industry in Net Zero Transitions?, https://www.iea.org/reports/the-oil-and-gas-industry-in-net-zero-transitions, License: CC BY 4.0. 3 Data points sourced from the IPCC includes 2010, 2020, 2030, 2040 and 2050. Historical data from the IEA is provided on an annualised basis. Forward looking data from the IEA includes 2030, 2040, 2050. Woodside has used interpolation of the IEA and IPCC data points in intervening years. This is a work derived by Woodside Energy Ltd from IEA material and Woodside Energy Ltd is solely liable and responsible for this derived work. The derived work is not endorsed by the IEA in any manner. IEA data was converted to exajoules using conversion factors obtained from the IEA report; The Oil and Gas Industry in Net Zero Transitions, IEA 2023. IEA and IPCC scenarios are not predictions or forecasts and are representative of views of the future. Woodside?s approach to analysing and assessing future energy market conditions is based on qualitative and quantitative factors and may vary from any one scenario presented by the IEA or IPCC. 4 IPCC, 2023. ?Climate Change 2023: Synthesis Report. Contribution of Working Groups I, II and III to the Sixth Assessment Report of the Intergovernmental Panel on Climate Change? [Core Writing Team, H. Lee and J. Romero (eds.)]. IPCC, Geneva, Switzerland, doi: 10.59327/IPCC/AR6-9789291691647, https://www.ipcc.ch/ report/ar6/syr/downloads/report/IPCC_AR6_SYR_FullVolume.pdf—referred to in subsequent footnotes on this page as IPCC, 2023. ?AR6-SYR? WOODSIDE?S CLIMATE TRANSITION ACTION PLAN AND 2023 PROGRESS REPORT WOODSIDE ENERGY GROUP LTD 45
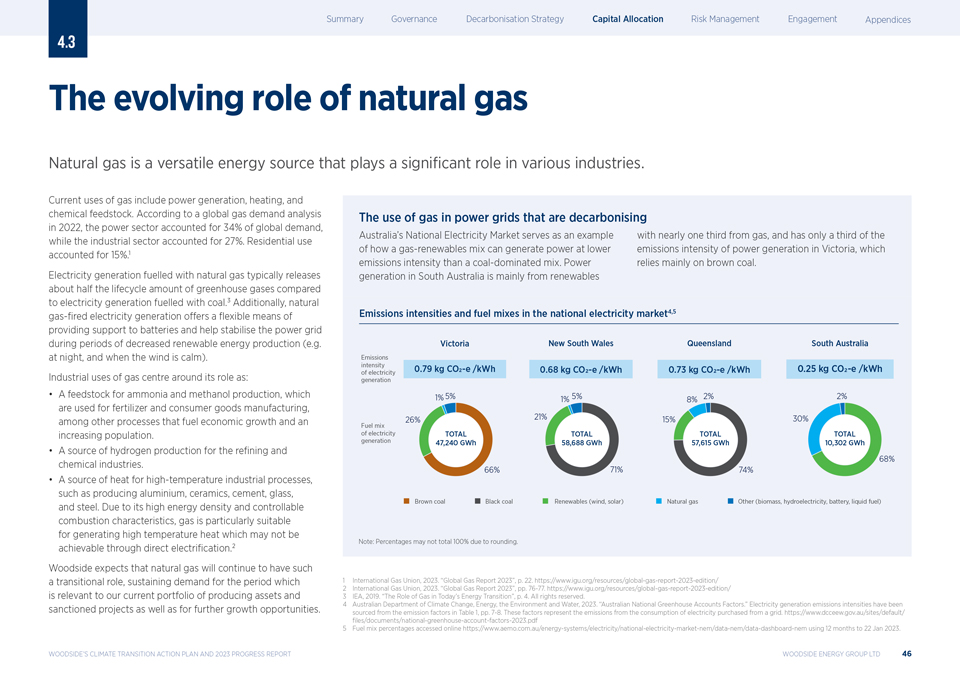
|
4.3 The evolving role of natural gas Natural gas is a versatile energy source that plays a signi?cant role in various industries. Current uses of gas include power generation, heating, and chemical feedstock. According to a global gas demand analysis in 2022, the power sector accounted for 34% of global demand, while the industrial sector accounted for 27%. Residential use accounted for 15%.1 Electricity generation fuelled with natural gas typically releases about half the lifecycle amount of greenhouse gases compared to electricity generation fuelled with coal.3 Additionally, natural gas-?red electricity generation offers a ?exible means of providing support to batteries and help stabilise the power grid during periods of decreased renewable energy production (e.g. at night, and when the wind is calm). Industrial uses of gas centre around its role as: A feedstock for ammonia and methanol production, which are used for fertilizer and consumer goods manufacturing, among other processes that fuel economic growth and an increasing population. A source of hydrogen production for the re?ning and chemical industries. A source of heat for high-temperature industrial processes, such as producing aluminium, ceramics, cement, glass, and steel. Due to its high energy density and controllable combustion characteristics, gas is particularly suitable for generating high temperature heat which may not be achievable through direct electri?cation.2 Woodside expects that natural gas will continue to have such a transitional role, sustaining demand for the period which is relevant to our current portfolio of producing assets and sanctioned projects as well as for further growth opportunities. The use of gas in power grids that are decarbonising Australia?s National Electricity Market serves as an example of how a gas-renewables mix can generate power at lower emissions intensity than a coal-dominated mix. Power generation in South Australia is mainly from renewables with nearly one third from gas, and has only a third of the emissions intensity of power generation in Victoria, which relies mainly on brown coal. Emissions intensities and fuel mixes in the national electricity market4,5 1 International Gas Union, 2023. ?Global Gas Report 2023?, p. 22. https://www.igu.org/resources/global-gas-report-2023-edition/ 2 International Gas Union, 2023. ?Global Gas Report 2023?, pp. 76-77. https://www.igu.org/resources/global-gas-report-2023-edition/ 3 IEA, 2019. ?The Role of Gas in Today?s Energy Transition?, p. 4. All rights reserved. 4 Australian Department of Climate Change, Energy, the Environment and Water, 2023. ?Australian National Greenhouse Accounts Factors.? Electricity generation emissions intensities have been sourced from the emission factors in Table 1, pp. 7-8. These factors represent the emissions from the consumption of electricity purchased from a grid. https://www.dcceew.gov.au/sites/default/ files/documents/national-greenhouse-account-factors-2023.pdf 5 Fuel mix percentages accessed online https://www.aemo.com.au/energy-systems/electricity/national-electricity-market-nem/data-nem/data-dashboard-nem using 12 months to 22 Jan 2023. WOODSIDE ENERGY GROUP LTD 46 WOODSIDE?S CLIMATE TRANSITION ACTION PLAN AND 2023 PROGRESS REPORT
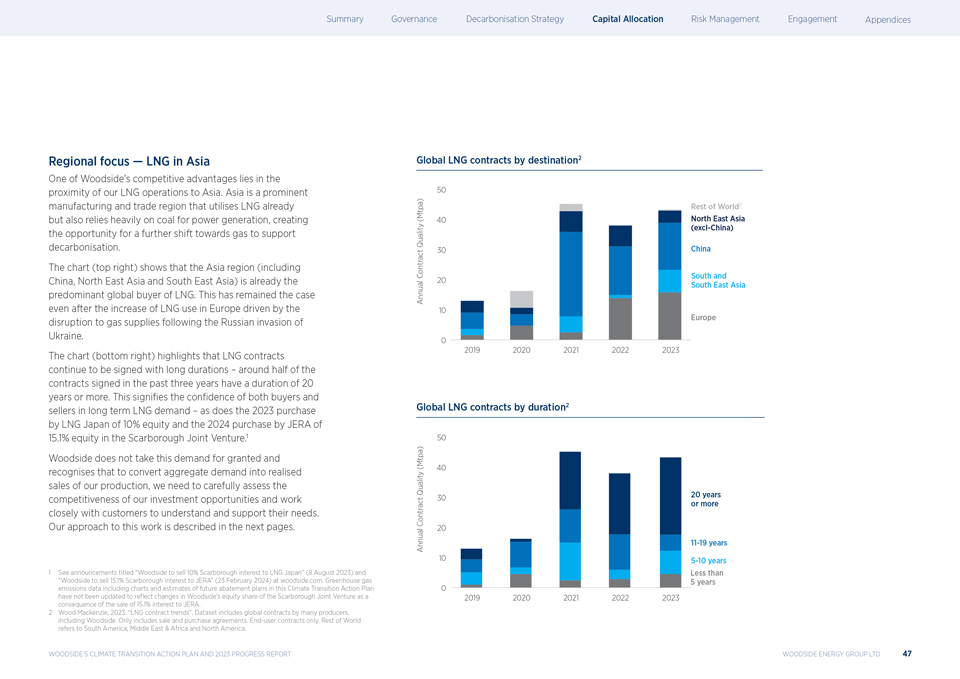
|
Regional focus ? LNG in Asia One of Woodside?s competitive advantages lies in the proximity of our LNG operations to Asia. Asia is a prominent manufacturing and trade region that utilises LNG already but also relies heavily on coal for power generation, creating the opportunity for a further shift towards gas to support decarbonisation. The chart (top right) shows that the Asia region (including China, North East Asia and South East Asia) is already the predominant global buyer of LNG. This has remained the case even after the increase of LNG use in Europe driven by the disruption to gas supplies following the Russian invasion of Ukraine. The chart (bottom right) highlights that LNG contracts continue to be signed with long durations ? around half of the contracts signed in the past three years have a duration of 20 years or more. This signifies the confidence of both buyers and sellers in long term LNG demand ? as does the 2023 purchase by LNG Japan of 10% equity and the 2024 purchase by JERA of 15.1% equity in the Scarborough Joint Venture.1 Woodside does not take this demand for granted and recognises that to convert aggregate demand into realised sales of our production, we need to carefully assess the competitiveness of our investment opportunities and work closely with customers to understand and support their needs. Our approach to this work is described in the next pages. Global LNG contracts by destination2 Global LNG contracts by duration2 1 See announcements titled ?Woodside to sell 10% Scarborough interest to LNG Japan? (8 August 2023) and ?Woodside to sell 15.1% Scarborough interest to JERA? (23 February 2024) at woodside.com. Greenhouse gas emissions data including charts and estimates of future abatement plans in this Climate Transition Action Plan have not been updated to reflect changes in Woodside?s equity share of the Scarborough Joint Venture as a consequence of the sale of 15.1% interest to JERA. 2 Wood Mackenzie, 2023. ?LNG contract trends?. Dataset includes global contracts by many producers, including Woodside. Only includes sale and purchase agreements. End-user contracts only. Rest of World refers to South America, Middle East & Africa and North America. WOODSIDE?S CLIMATE TRANSITION ACTION PLAN AND 2023 PROGRESS REPORT WOODSIDE ENERGY GROUP LTD 47
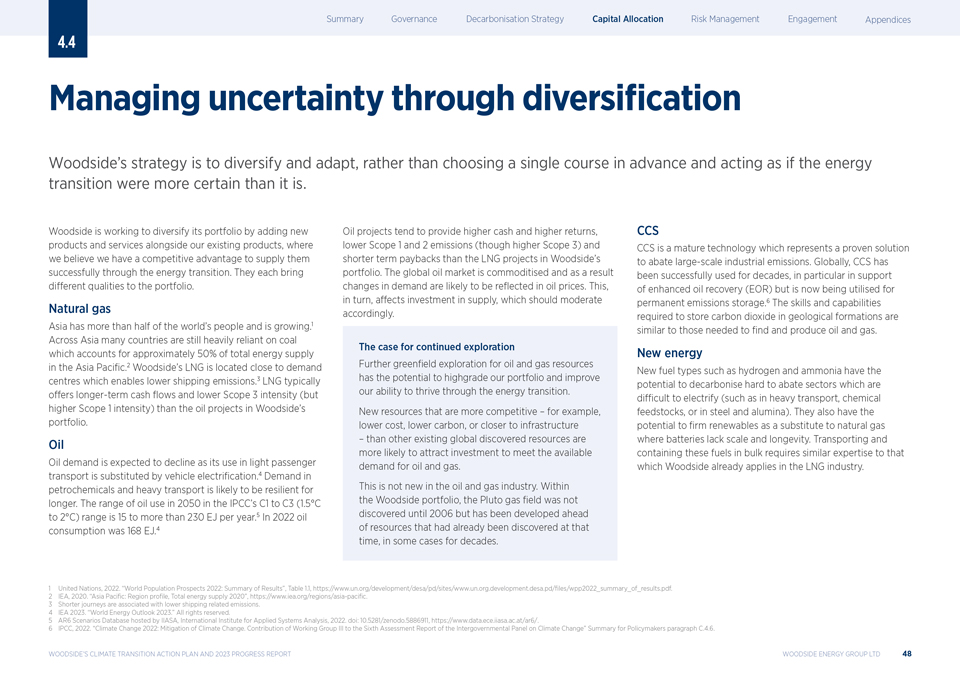
|
4.4 Managing uncertainty through diversi?cation Woodside?s strategy is to diversify and adapt, rather than choosing a single course in advance and acting as if the energy transition were more certain than it is. Woodside is working to diversify its portfolio by adding new products and services alongside our existing products, where we believe we have a competitive advantage to supply them successfully through the energy transition. They each bring different qualities to the portfolio. Natural gas Asia has more than half of the world?s people and is growing.1 Across Asia many countries are still heavily reliant on coal which accounts for approximately 50% of total energy supply in the Asia Paci?c.2 Woodside?s LNG is located close to demand centres which enables lower shipping emissions.3 LNG typically offers longer-term cash flows and lower Scope 3 intensity (but higher Scope 1 intensity) than the oil projects in Woodside?s portfolio. Oil Oil demand is expected to decline as its use in light passenger transport is substituted by vehicle electri?cation.4 Demand in petrochemicals and heavy transport is likely to be resilient for longer. The range of oil use in 2050 in the IPCC?s C1 to C3 (1.5C to 2C) range is 15 to more than 230 EJ per year.5 In 2022 oil consumption was 168 EJ.4 Oil projects tend to provide higher cash and higher returns, lower Scope 1 and 2 emissions (though higher Scope 3) and shorter term paybacks than the LNG projects in Woodside?s portfolio. The global oil market is commoditised and as a result changes in demand are likely to be reflected in oil prices. This, in turn, affects investment in supply, which should moderate accordingly. The case for continued exploration Further green?eld exploration for oil and gas resources has the potential to highgrade our portfolio and improve our ability to thrive through the energy transition. New resources that are more competitive ? for example, lower cost, lower carbon, or closer to infrastructure ? than other existing global discovered resources are more likely to attract investment to meet the available demand for oil and gas. This is not new in the oil and gas industry. Within the Woodside portfolio, the Pluto gas ?eld was not discovered until 2006 but has been developed ahead of resources that had already been discovered at that time, in some cases for decades. CCS CCS is a mature technology which represents a proven solution to abate large-scale industrial emissions. Globally, CCS has been successfully used for decades, in particular in support of enhanced oil recovery (EOR) but is now being utilised for permanent emissions storage.6 The skills and capabilities required to store carbon dioxide in geological formations are similar to those needed to ?nd and produce oil and gas. New energy New fuel types such as hydrogen and ammonia have the potential to decarbonise hard to abate sectors which are difficult to electrify (such as in heavy transport, chemical feedstocks, or in steel and alumina). They also have the potential to ?rm renewables as a substitute to natural gas where batteries lack scale and longevity. Transporting and containing these fuels in bulk requires similar expertise to that which Woodside already applies in the LNG industry. 1 United Nations, 2022. ?World Population Prospects 2022: Summary of Results?, Table 1.1, https://www.un.org/development/desa/pd/sites/www.un.org.development.desa.pd/files/wpp2022_summary_of_results.pdf. 2 IEA, 2020. ?Asia Pacific: Region profile, Total energy supply 2020?, https://www.iea.org/regions/asia-pacific. 3 Shorter journeys are associated with lower shipping related emissions. 4 IEA 2023. ?World Energy Outlook 2023.? All rights reserved. 5 AR6 Scenarios Database hosted by IIASA, International Institute for Applied Systems Analysis, 2022. doi: 10.5281/zenodo.5886911, https://www.data.ece.iiasa.ac.at/ar6/. 6 IPCC, 2022. ?Climate Change 2022: Mitigation of Climate Change. Contribution of Working Group III to the Sixth Assessment Report of the Intergovernmental Panel on Climate Change? Summary for Policymakers paragraph C.4.6. WOODSIDE?S CLIMATE TRANSITION ACTION PLAN AND 2023 PROGRESS REPORT WOODSIDE ENERGY GROUP LTD 48
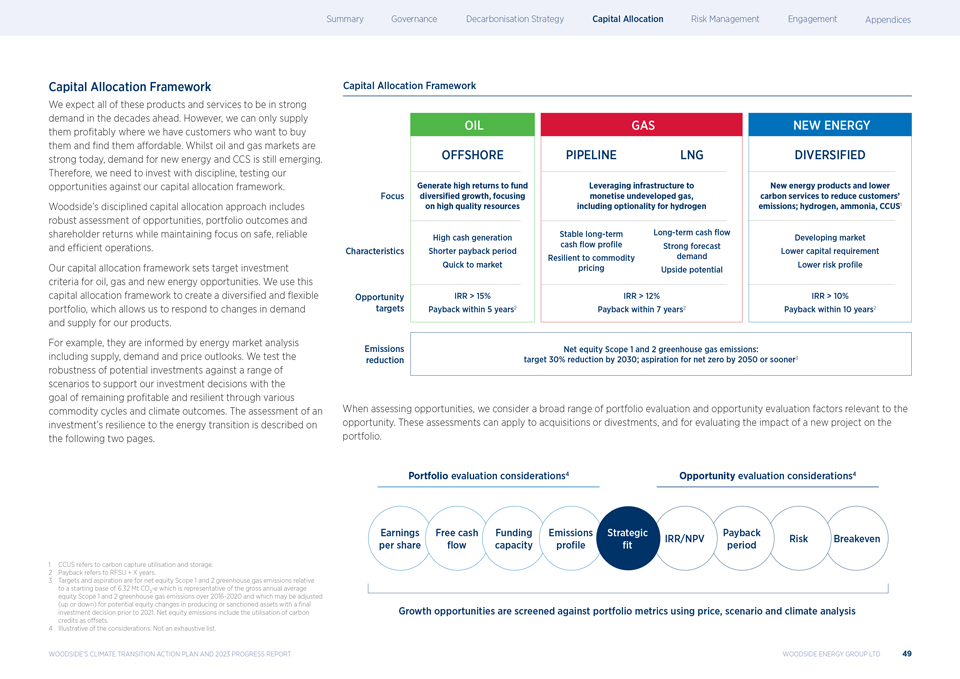
|
Capital Allocation Framework We expect all of these products and services to be in strong demand in the decades ahead. However, we can only supply them pro?tably where we have customers who want to buy them and ?nd them affordable. Whilst oil and gas markets are strong today, demand for new energy and CCS is still emerging. Therefore, we need to invest with discipline, testing our opportunities against our capital allocation framework. Woodside?s disciplined capital allocation approach includes robust assessment of opportunities, portfolio outcomes and shareholder returns while maintaining focus on safe, reliable and efficient operations. Our capital allocation framework sets target investment criteria for oil, gas and new energy opportunities. We use this capital allocation framework to create a diversi?ed and ?exible portfolio, which allows us to respond to changes in demand and supply for our products. For example, they are informed by energy market analysis including supply, demand and price outlooks. We test the robustness of potential investments against a range of scenarios to support our investment decisions with the goal of remaining profitable and resilient through various commodity cycles and climate outcomes. The assessment of an investment?s resilience to the energy transition is described on the following two pages. Capital Allocation Framework OIL GAS NEW ENERGY OFFSHORE PIPELINE LNG DIVERSIFIED Generate high returns to fund Leveraging infrastructure to New energy products and lower Focus diversi?ed growth, focusing monetise undeveloped gas, carbon services to reduce customers? on high quality resources including optionality for hydrogen emissions; hydrogen, ammonia, CCUS1 Stable long-term Long-term cash ?ow High cash generation Developing market cash ?ow pro?le Strong forecast Characteristics Shorter payback period Lower capital requirement Quick to market Resilient to commodity demand Lower risk pro?le pricing Upside potential Opportunity IRR > 15% IRR > 12% IRR > 10% targets Payback within 5 years2 Payback within 7 years2 Payback within 10 years2 Emissions Net equity Scope 1 and 2 greenhouse gas emissions: reduction target 30% reduction by 2030; aspiration for net zero by 2050 or sooner3 When assessing opportunities, we consider a broad range of portfolio evaluation and opportunity evaluation factors relevant to the opportunity. These assessments can apply to acquisitions or divestments, and for evaluating the impact of a new project on the portfolio. Portfolio evaluation considerations4 Opportunity evaluation considerations4 Earnings Free cash Funding Emissions Strategic Payback IRR/NPV Risk Breakeven per share ?ow capacity pro?le ?t period Growth opportunities are screened against portfolio metrics using price, scenario and climate analysis 1 CCUS refers to carbon capture utilisation and storage. 2 Payback refers to RFSU + X years. 3 Targets and aspiration are for net equity Scope 1 and 2 greenhouse gas emissions relative to a starting base of 6.32 Mt CO -e which is representative of the gross annual average 2 equity Scope 1 and 2 greenhouse gas emissions over 2016-2020 and which may be adjusted (up or down) for potential equity changes in producing or sanctioned assets with a ?nal investment decision prior to 2021. Net equity emissions include the utilisation of carbon credits as offsets. 4 Illustrative of the considerations. Not an exhaustive list. WOODSIDE?S CLIMATE TRANSITION ACTION PLAN AND 2023 PROGRESS REPORT WOODSIDE ENERGY GROUP LTD
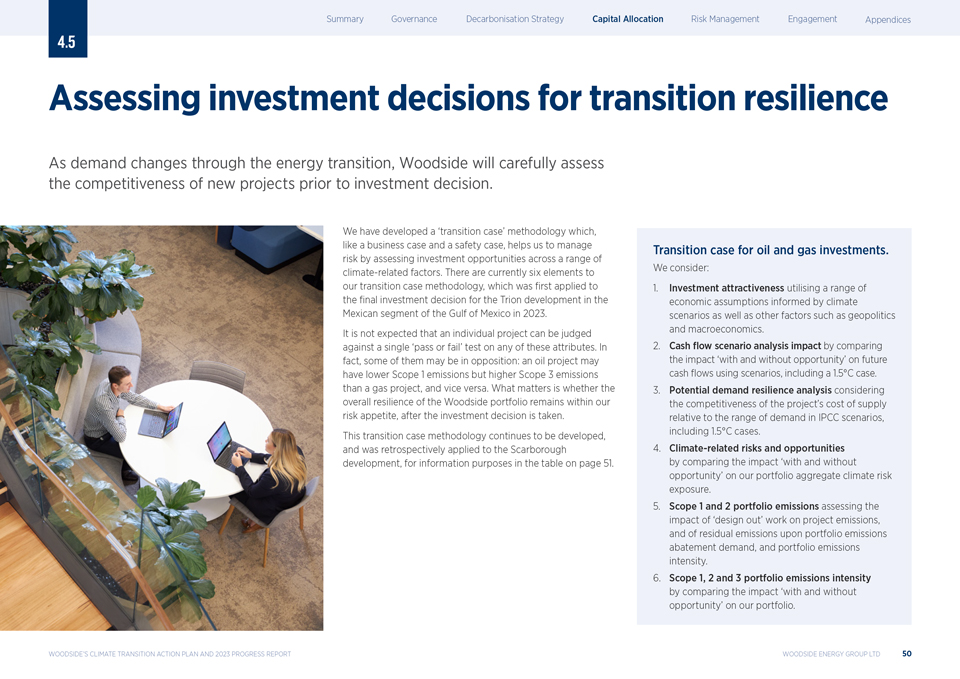
|
4.5 Assessing investment decisions for transition resilience As demand changes through the energy transition, Woodside will carefully assess the competitiveness of new projects prior to investment decision. We have developed a ?transition case? methodology which, like a business case and a safety case, helps us to manage risk by assessing investment opportunities across a range of climate-related factors. There are currently six elements to our transition case methodology, which was first applied to the final investment decision for the Trion development in the Mexican segment of the Gulf of Mexico in 2023. It is not expected that an individual project can be judged against a single ?pass or fail? test on any of these attributes. In fact, some of them may be in opposition: an oil project may have lower Scope 1 emissions but higher Scope 3 emissions than a gas project, and vice versa. What matters is whether the overall resilience of the Woodside portfolio remains within our risk appetite, after the investment decision is taken. This transition case methodology continues to be developed, and was retrospectively applied to the Scarborough development, for information purposes in the table on page 51. Transition case for oil and gas investments. We consider: 1. Investment attractiveness utilising a range of economic assumptions informed by climate scenarios as well as other factors such as geopolitics and macroeconomics. 2. Cash ?ow scenario analysis impact by comparing the impact ?with and without opportunity? on future cash ?ows using scenarios, including a 1.5C case. 3. Potential demand resilience analysis considering the competitiveness of the project?s cost of supply relative to the range of demand in IPCC scenarios, including 1.5C cases. 4. Climate-related risks and opportunities by comparing the impact ?with and without opportunity? on our portfolio aggregate climate risk exposure. 5. Scope 1 and 2 portfolio emissions assessing the impact of ?design out? work on project emissions, and of residual emissions upon portfolio emissions abatement demand, and portfolio emissions intensity. 6. Scope 1, 2 and 3 portfolio emissions intensity by comparing the impact ?with and without opportunity? on our portfolio. WOODSIDE?S CLIMATE TRANSITION ACTION PLAN AND 2023 PROGRESS REPORT WOODSIDE ENERGY GROUP LTD 50
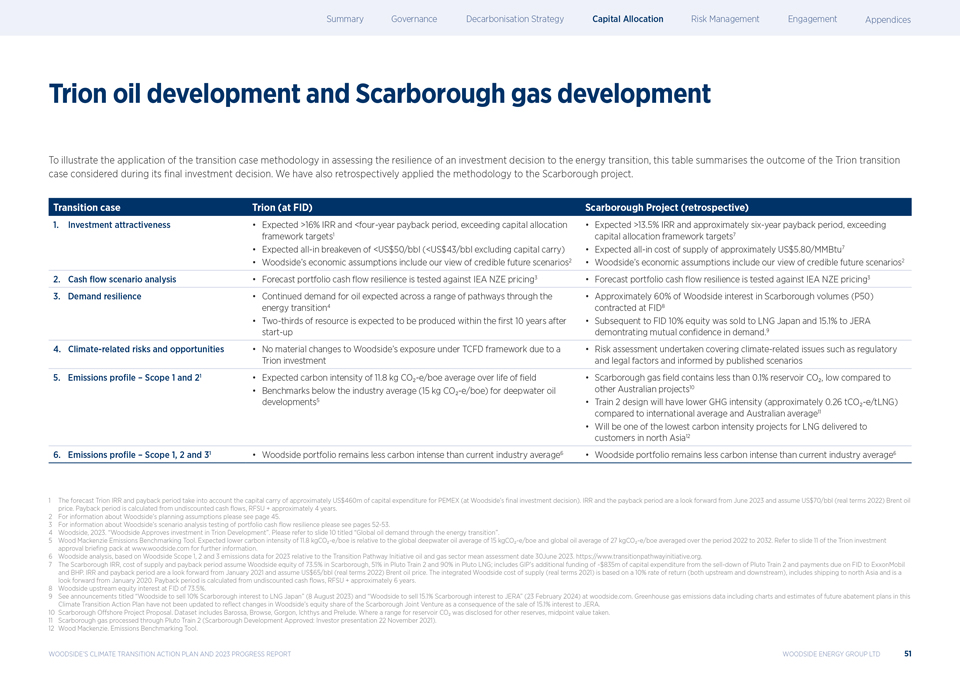
|
Trion oil development and Scarborough gas development To illustrate the application of the transition case methodology in assessing the resilience of an investment decision to the energy transition, this table summarises the outcome of the Trion transition case considered during its ?nal investment decision. We have also retrospectively applied the methodology to the Scarborough project. Transition case Trion (at FID) Scarborough Project (retrospective) 1. Investment attractiveness Expected >16% IRR and <four-year payback period, exceeding capital allocation Expected >13.5% IRR and approximately six-year payback period, exceeding framework targets1 capital allocation framework targets7 Expected all-in breakeven of <US$50/bbl (<US$43/bbl excluding capital carry) Expected all-in cost of supply of approximately US$5.80/MMBtu7 Woodside?s economic assumptions include our view of credible future scenarios2 Woodside?s economic assumptions include our view of credible future scenarios2 2. Cash ?ow scenario analysis Forecast portfolio cash ?ow resilience is tested against IEA NZE pricing3 Forecast portfolio cash flow resilience is tested against IEA NZE pricing3 3. Demand resilience Continued demand for oil expected across a range of pathways through the Approximately 60% of Woodside interest in Scarborough volumes (P50) energy transition4 contracted at FID8 Two-thirds of resource is expected to be produced within the ?rst 10 years after Subsequent to FID 10% equity was sold to LNG Japan and 15.1% to JERA start-up demontrating mutual con?dence in demand.9 4. Climate-related risks and opportunities No material changes to Woodside?s exposure under TCFD framework due to a Risk assessment undertaken covering climate-related issues such as regulatory Trion investment and legal factors and informed by published scenarios 5. Emissions profile ? Scope 1 and 21 Expected carbon intensity of 11.8 kg CO?-e/boe average over life of ?eld Scarborough gas field contains less than 0.1% reservoir CO?, low compared to Benchmarks below the industry average (15 kg CO?-e/boe) for deepwater oil other Australian projects10 developments5 Train 2 design will have lower GHG intensity (approximately 0.26 tCO?-e/tLNG) compared to international average and Australian average11 Will be one of the lowest carbon intensity projects for LNG delivered to customers in north Asia12 6. Emissions profile ? Scope 1, 2 and 31 Woodside portfolio?remains less carbon intense than current industry average6 Woodside portfolio?remains less carbon intense than current industry average6 1 The forecast Trion IRR and payback period take into account the capital carry of approximately US$460m of capital expenditure for PEMEX (at Woodside?s final investment decision). IRR and the payback period are a look forward from June 2023 and assume US$70/bbl (real terms 2022) Brent oil price. Payback period is calculated from undiscounted cash flows, RFSU + approximately 4 years. 2 For information about Woodside?s planning assumptions please see page 45. 3 For information about Woodside?s scenario analysis testing of portfolio cash flow resilience please see pages 52-53. 4 Woodside, 2023. ?Woodside Approves investment in Trion Development?. Please refer to slide 10 titled ?Global oil demand through the energy transition?. 5 Wood Mackenzie Emissions Benchmarking Tool. Expected lower carbon intensity of 11.8 kgCO?-e/boe is relative to the global deepwater oil average of 15 kgCO?-e/boe and global oil average of 27 kgCO?-e/boe averaged over the period 2022 to 2032. Refer to slide 11 of the Trion investment approval brie?ng pack at www.woodside.com for further information. 6 Woodside analysis, based on Woodside Scope 1, 2 and 3 emissions data for 2023 relative to the Transition Pathway Initiative oil and gas sector mean assessment date 30June 2023. https://www.transitionpathwayinitiative.org. 7 The Scarborough IRR, cost of supply and payback period assume Woodside equity of 73.5% in Scarborough, 51% in Pluto Train 2 and 90% in Pluto LNG; includes GIP?s additional funding of ~$835m of capital expenditure from the sell-down of Pluto Train 2 and payments due on FID to ExxonMobil and BHP. IRR and payback period are a look forward from January 2021 and assume US$65/bbl (real terms 2022) Brent oil price. The integrated Woodside cost of supply (real terms 2021) is based on a 10% rate of return (both upstream and downstream), includes shipping to north Asia and is a look forward from January 2020. Payback period is calculated from undiscounted cash flows, RFSU + approximately 6 years. 8 Woodside upstream equity interest at FID of 73.5%. 9 See announcements titled ?Woodside to sell 10% Scarborough interest to LNG Japan? (8 August 2023) and ?Woodside to sell 15.1% Scarborough interest to JERA? (23 February 2024) at woodside.com. Greenhouse gas emissions data including charts and estimates of future abatement plans in this Climate Transition Action Plan have not been updated to reflect changes in Woodside?s equity share of the Scarborough Joint Venture as a consequence of the sale of 15.1% interest to JERA. 10 Scarborough Offshore Project Proposal. Dataset includes Barossa, Browse, Gorgon, Ichthys and Prelude. Where a range for reservoir CO? was disclosed for other reserves, midpoint value taken. 11 Scarborough gas processed through Pluto Train 2 (Scarborough Development Approved: Investor presentation 22 November 2021). 12 Wood Mackenzie. Emissions Benchmarking Tool. WOODSIDE?S CLIMATE TRANSITION ACTION PLAN AND 2023 PROGRESS REPORT WOODSIDE ENERGY GROUP LTD 51
|
4.6 Scenario analysis of Woodside?s portfolio Woodside?s current portfolio is financially robust to a range of climate-related scenarios.1 Summary of insights Woodside uses a range of climate scenarios to test the ?nancial resilience of our portfolio of producing assets and sanctioned projects. The analysis described here concludes that: The Woodside portfolio is free cash ?ow (FCF) positive for all relevant periods showing the resilience of the business including in the NZE scenario and the IEA Announced Pledges Scenario (APS) that are aligned with the Paris Agreement temperature goals. FCF from 2024-2027 is lower than 2028-2032 (under all three scenarios) due to high capital expenditure during this period for Scarborough, Pluto Train 2 and the Trion development. FCF peaks under all three scenarios in 2028-2032 as Scarborough and Trion are operating, and then declines consistent with the natural ?eld decline of older assets within our portfolio and because the analysis assumes no new green?eld oil and gas investments by Woodside. Oil and gas prices are the key value drivers and have a greater impact on FCF through to 2040 than carbon pricing. Scenario analysis methodology In the analysis in this section, we use three scenarios from the IEA?s 2023 World Energy Outlook (WEO) because they are publicly available and widely understood.1 They cover a broad range of temperature outcomes, including a 1.5C outcome as well as above 2C outcomes. More information about different types of scenarios and how we use them is provided on page 45. We use annual average FCF generation as the assessed metric because it is a measure of our ability to fund future capital investment and shareholder returns and is unaffected by accounting treatment. Our analysis uses the most recent pricing assumptions from the IEA (in their World Energy Outlook 2023), and has included the Trion oil development in Mexico for the ?rst time, following its ?nal investment decision during the year.2,3 The analysis applies a price on carbon for all emissions that exceed the pro?le created by our regulatory obligations, our net equity Scope 1 and 2 greenhouse gas emissions reduction targets of 15% by 2025 and 30% by 2030, and our aspiration for net zero equity Scope 1 and 2 greenhouse gas emissions by 2050 or sooner.4 The analysis is relatively insensitive to the carbon price impact upon Woodside?s Scope 1 and 2 emissions. The impact of carbon pricing upon Scope 3 emissions is accounted for in the demand (and therefore commodity price calculated) in each scenario by the IEA World Energy Model.5 This commodity price impact is the cause of 95% of the variation between the scenarios. We will continue to review the best form of scenario analysis to meet the requirements of climate-related disclosure standards. 1 See announcement titled ?Woodside to sell 15.1% Scarborough interest to JERA? (23 February 2024) at woodside.com. Greenhouse gas emissions data including charts and estimates of future abatement plans in this Climate Action Transition Plan have not been updated to reflect changes in Woodside?s equity share of the Scarborough Joint Venture as a consequence of the sale of 15.1% interest to JERA. 2 IEA, 2023. ?World Energy Outlook 2023.? All rights reserved. https://iea.blob.core.windows.net/assets/42b23c45-78bc-4482-b0f9-eb826ae2da3d/WorldEnergyOutlook2023.pdf 3 Modelled based on current equity assumptions within portfolio: Scarborough 90%, Pluto Train 2 51%, Trion 60%. 4 Targets and aspiration are for net equity Scope 1 and 2 greenhouse gas emissions relative to a starting base of 6.32 Mt CO -e which is representative of the gross annual average equity Scope 1 and 2 greenhouse gas emissions over 2016-2020 and which may be adjusted (up or down) for potential 2 equity changes in producing or sanctioned assets with a ?nal investment decision prior to 2021. Net equity emissions include the utilisation of carbon credits as offsets. 5 IEA, 2023. ?World Energy Model Documentation?. All rights reserved. https://iea.blob.core.windows.net/assets/ff3a195d-762d-4284-8bb5-bd062d260cc5/GlobalEnergyandClimateModelDocumentation2023.pdf WOODSIDE?S CLIMATE TRANSITION ACTION PLAN AND 2023 PROGRESS REPORT WOODSIDE ENERGY GROUP LTD 52
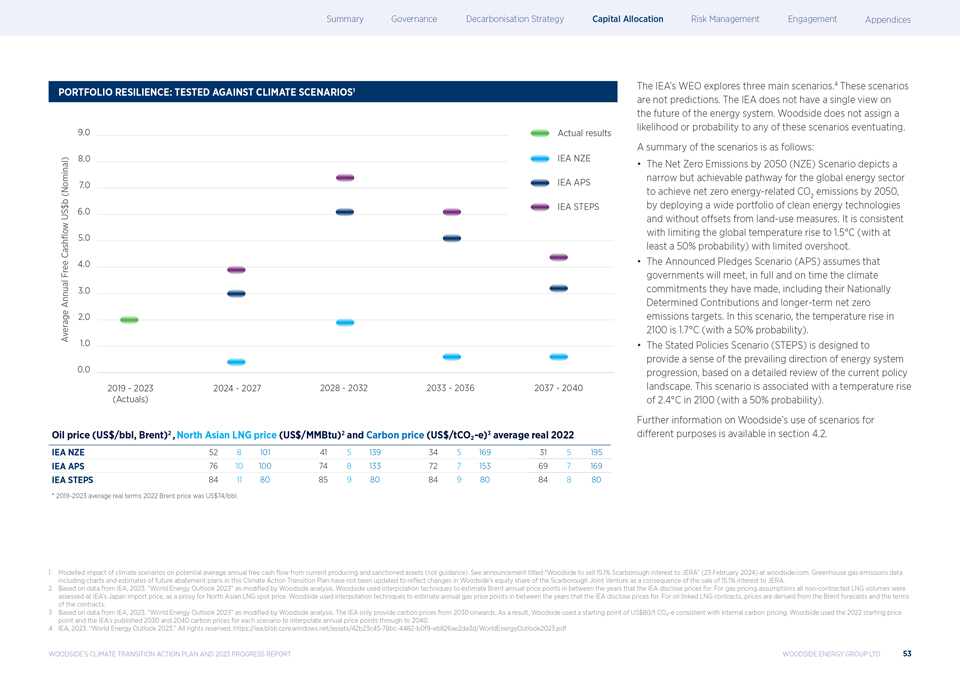
|
PORTFOLIO RESILIENCE: TESTED AGAINST CLIMATE SCENARIOS1 Oil price (US$/bbl, Brent)2 , North Asian LNG price (US$/MMBtu)2 and Carbon price (US$/tCO?-e)3 average real 2022 IEA NZE 52 8 101 41 5 139 34 5 169 31 5 195 IEA APS 76 10 100 74 8 133 72 7 153 69 7 169 IEA STEPS 84 11 80 85 9 80 84 9 80 84 8 80 * 2019-2023 average real terms 2022 Brent price was US$74/bbl. The IEA?s WEO explores three main scenarios.4 These scenarios are not predictions. The IEA does not have a single view on the future of the energy system. Woodside does not assign a likelihood or probability to any of these scenarios eventuating. A summary of the scenarios is as follows: The Net Zero Emissions by 2050 (NZE) Scenario depicts a narrow but achievable pathway for the global energy sector to achieve net zero energy-related CO emissions by 2050, by deploying a wide portfolio of clean 2energy technologies and without offsets from land-use measures. It is consistent with limiting the global temperature rise to 1.5C (with at least a 50% probability) with limited overshoot. The Announced Pledges Scenario (APS) assumes that governments will meet, in full and on time the climate commitments they have made, including their Nationally Determined Contributions and longer-term net zero emissions targets. In this scenario, the temperature rise in 2100 is 1.7C (with a 50% probability). The Stated Policies Scenario (STEPS) is designed to provide a sense of the prevailing direction of energy system progression, based on a detailed review of the current policy landscape. This scenario is associated with a temperature rise of 2.4C in 2100 (with a 50% probability). Further information on Woodside?s use of scenarios for different purposes is available in section 4.2. 1 Modelled impact of climate scenarios on potential average annual free cash flow from current producing and sanctioned assets (not guidance). See announcement titled ?Woodside to sell 15.1% Scarborough interest to JERA? (23 February 2024) at woodside.com. Greenhouse gas emissions data including charts and estimates of future abatement plans in this Climate Action Transition Plan have not been updated to reflect changes in Woodside?s equity share of the Scarborough Joint Venture as a consequence of the sale of 15.1% interest to JERA. 2 Based on data from IEA, 2023. ?World Energy Outlook 2023? as modified by Woodside analysis. Woodside used interpolation techniques to estimate Brent annual price points in between the years that the IEA disclose prices for. For gas pricing assumptions all non-contracted LNG volumes were assessed at IEA?s Japan import price, as a proxy for North Asian LNG spot price. Woodside used interpolation techniques to estimate annual gas price points in between the years that the IEA disclose prices for. For oil linked LNG contracts, prices are derived from the Brent forecasts and the terms of the contracts. 3 Based on data from IEA, 2023. ?World Energy Outlook 2023? as modified by Woodside analysis. The IEA only provide carbon prices from 2030 onwards. As a result, Woodside used a starting point of US$80/t CO?-e consistent with internal carbon pricing. Woodside used the 2022 starting price point and the IEA?s published 2030 and 2040 carbon prices for each scenario to interpolate annual price points through to 2040. 4 IEA, 2023. ?World Energy Outlook 2023.? All rights reserved. https://iea.blob.core.windows.net/assets/42b23c45-78bc-4482-b0f9-eb826ae2da3d/WorldEnergyOutlook2023.pdf WOODSIDE?S CLIMATE TRANSITION ACTION PLAN AND 2023 PROGRESS REPORT WOODSIDE ENERGY GROUP LTD 53
|
4.7 Customer relationships The existence of strong demand for our products and the disciplined approach we take to capital allocation and climate-screening are pre-requisites to converting demand into sales. We also foster strong customer relationships based on reliable competitive supply. PROJECT COMPETITIVENESS Woodside?s existing portfolio of assets has key strengths in the competition to supply our traditional markets. These include: Location The proximity of Woodside?s Australian LNG operations to Asia is a competitive advantage for our business. We have four large LNG customer markets on our doorstep. Japan and South Korea are approximately 25% reliant on coal for their energy needs today.1 China and India?s reliance on coal is significantly higher at 61% and 43% respectively.1 Closer to home, in Australia the National Electricity Market fuel mix in 2023 was 63% coal, and just 5% gas.2 This indicates growth potential for gas as the National Electricity Market (NEM) transitions from coal towards an 82% renewables target (from today?s 23%) and expands in size to meet emerging demand from vehicle electrification.2 Scale and ?exibility Woodside has a diverse and ?exible marketing portfolio of supply and delivery points across both the Asia Paci?c and Atlantic basins. We are actively looking for opportunities to grow our global supply portfolio and to build scale through cost competitive equity and third-party LNG. Shipping Our sales strategy is underpinned by ex-ship sales and strong, logistical capability. Woodside is advantaged through our long shipping position, which enables Woodside to create upside value through short-term trading and portfolio optimisation activities. Lower carbon Woodside continues to monitor the market on its appetite to pay a premium for lower carbon production. For example, regulatory frameworks such as the European Union?s Carbon Border Adjustment Mechanism maybe an indication that policy will increasingly reward lower carbon production in the future. The CLEAN (Coalition for LNG Emission Abatement toward Net Zero) initiative announced by the United States of America, the Republic of Korea, Australia, the European Commission, and Japan at the LNG Producer-Consumer Conference 2023 is another example.3 CONTRACTING STRATEGY We have taken the approach of layering contracts throughout market cycles to enable a balanced approach to revenue certainty with the opportunity for upside pricing, making strategic choices about the proportion of contracts to enter into relative to spot sales, and which benchmarks to link pricing to. Woodside?s revenue is predominantly exposed to the oil price, with the remainder being fixed price or other low-volatility constructs, all linked to gas hub prices such as JKM or TTF. The strategic capability that has been established through decades of experience as a LNG marketer is the same capability that can navigate demand fluctuation in the energy transition. The sale of 10% of the Scarborough Joint Venture to LNG Japan and of 15.1% to JERA was a clear expression of confidence in the importance of that project to Japan?s energy security and decarbonisation goals.4 MARKETING In addition to the intrinsic competitiveness of our products and our approach to contracting, Woodside maintains active representation in key markets in order to maintain relationships with buyers that are rooted in decades of trust, and a deep understanding of their needs. In 2023, Woodside?s climate and sustainability executives conducted a specific climate-related engagement roadshow to discuss the energy transition with sustainability executives in Tokyo and Osaka. 1 IEA, 2020. ?IEA World Energy Balances?, https://www.iea.org/regions/asia-pacific. 2 Fuel mix percentages accessed online https://www.aemo.com.au/energy-systems/electricity/national-electricity-market-nem/data-nem/data-dashboard-nem on using 12 months to 22 Jan 2023. 3 https://www.jogmec.go.jp/english/news/release/news_10_00041.html 4 See announcements titled ?Woodside to sell 10% Scarborough interest to LNG Japan? (8 August 2023) and ?Woodside to sell 15.1% Scarborough interest to JERA? (23 February 2024) at woodside.com. Greenhouse gas emissions data including charts and estimates of future abatement plans in this Climate Transition Action Plan have not been updated to reflect changes in Woodside?s equity share of the Scarborough Joint Venture as a consequence of the sale of 15.1% interest to JERA. WOODSIDE?S CLIMATE TRANSITION ACTION PLAN AND 2023 PROGRESS REPORT WOODSIDE ENERGY GROUP LTD 54
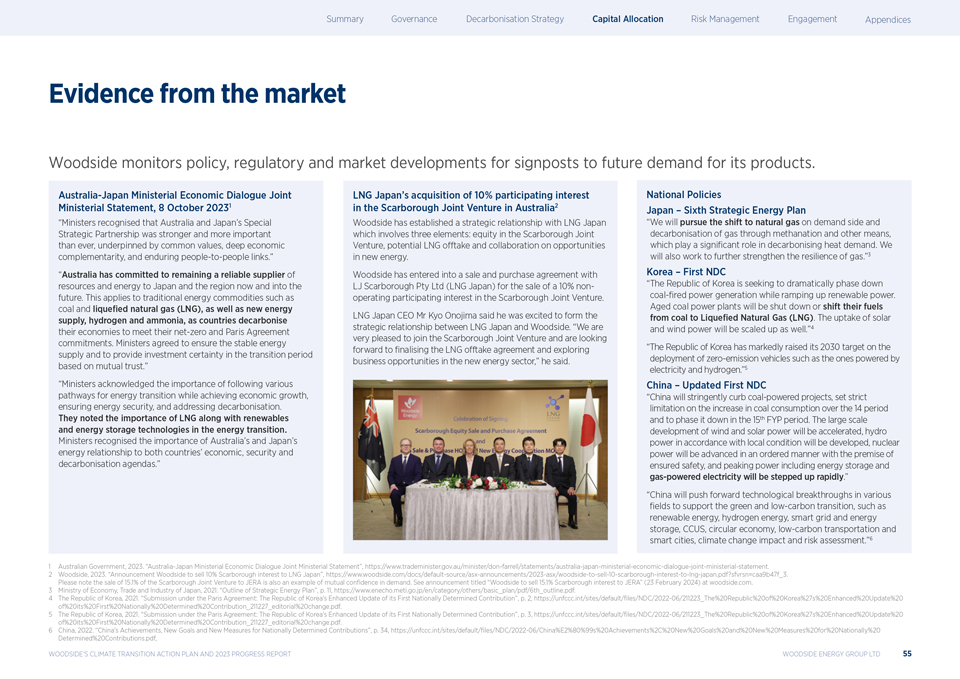
|
Evidence from the market Woodside monitors policy, regulatory and market developments for signposts to future demand for its products. Australia-Japan Ministerial Economic Dialogue Joint Ministerial Statement, 8 October 20231 ?Ministers recognised that Australia and Japan?s Special Strategic Partnership was stronger and more important than ever, underpinned by common values, deep economic complementarity, and enduring people-to-people links.? ?Australia has committed to remaining a reliable supplier of resources and energy to Japan and the region now and into the future. This applies to traditional energy commodities such as coal and lique?ed natural gas (LNG), as well as new energy supply, hydrogen and ammonia, as countries decarbonise their economies to meet their net-zero and Paris Agreement commitments. Ministers agreed to ensure the stable energy supply and to provide investment certainty in the transition period based on mutual trust.? ?Ministers acknowledged the importance of following various pathways for energy transition while achieving economic growth, ensuring energy security, and addressing decarbonisation. They noted the importance of LNG along with renewables and energy storage technologies in the energy transition. Ministers recognised the importance of Australia?s and Japan?s energy relationship to both countries? economic, security and decarbonisation agendas.? LNG Japan?s acquisition of 10% participating interest in the Scarborough Joint Venture in Australia2 Woodside has established a strategic relationship with LNG Japan which involves three elements: equity in the Scarborough Joint Venture, potential LNG offtake and collaboration on opportunities in new energy. Woodside has entered into a sale and purchase agreement with LJ Scarborough Pty Ltd (LNG Japan) for the sale of a 10% non-operating participating interest in the Scarborough Joint Venture. LNG Japan CEO Mr Kyo Onojima said he was excited to form the strategic relationship between LNG Japan and Woodside. ?We are very pleased to join the Scarborough Joint Venture and are looking forward to ?nalising the LNG offtake agreement and exploring business opportunities in the new energy sector,? he said. National Policies Japan ? Sixth Strategic Energy Plan ?We will pursue the shift to natural gas on demand side and decarbonisation of gas through methanation and other means, which play a significant role in decarbonising heat demand. We will also work to further strengthen the resilience of gas.?3 Korea ? First NDC ?The Republic of Korea is seeking to dramatically phase down coal-fired power generation while ramping up renewable power. Aged coal power plants will be shut down or shift their fuels from coal to Lique?ed Natural Gas (LNG). The uptake of solar and wind power will be scaled up as well.?4 ?The Republic of Korea has markedly raised its 2030 target on the deployment of zero-emission vehicles such as the ones powered by electricity and hydrogen.?5 China ? Updated First NDC ?China will stringently curb coal-powered projects, set strict limitation on the increase in coal consumption over the 14 period and to phase it down in the 15th FYP period. The large scale development of wind and solar power will be accelerated, hydro power in accordance with local condition will be developed, nuclear power will be advanced in an ordered manner with the premise of ensured safety, and peaking power including energy storage and gas-powered electricity will be stepped up rapidly.? ?China will push forward technological breakthroughs in various fields to support the green and low-carbon transition, such as renewable energy, hydrogen energy, smart grid and energy storage, CCUS, circular economy, low-carbon transportation and smart cities, climate change impact and risk assessment.?6 1 Australian Government, 2023. ?Australia-Japan Ministerial Economic Dialogue Joint Ministerial Statement?, https://www.trademinister.gov.au/minister/don-farrell/statements/australia-japan-ministerial-economic-dialogue-joint-ministerial-statement. 2 Woodside, 2023. ?Announcement Woodside to sell 10% Scarborough interest to LNG Japan?, https://www.woodside.com/docs/default-source/asx-announcements/2023-asx/woodside-to-sell-10-scarborough-interest-to-lng-japan.pdf?sfvrsn=caa9b47f_3. Please note the sale of 15.1% of the Scarborough Joint Venture to JERA is also an example of mutual confidence in demand. See announcement titled ?Woodside to sell 15.1% Scarborough interest to JERA? (23 February 2024) at woodside.com. 3 Ministry of Economy, Trade and Industry of Japan, 2021. ?Outline of Strategic Energy Plan?, p. 11, https://www.enecho.meti.go.jp/en/category/others/basic_plan/pdf/6th_outline.pdf. 4 The Republic of Korea, 2021. ?Submission under the Paris Agreement: The Republic of Korea?s Enhanced Update of its First Nationally Determined Contribution?, p. 2, https://unfccc.int/sites/default/files/NDC/2022-06/211223_The%20Republic%20of%20Korea%27s%20Enhanced%20Update%20 of%20its%20First%20Nationally%20Determined%20Contribution_211227_editorial%20change.pdf. 5 The Republic of Korea, 2021. ?Submission under the Paris Agreement: The Republic of Korea?s Enhanced Update of its First Nationally Determined Contribution?, p. 3, https://unfccc.int/sites/default/files/NDC/2022-06/211223_The%20Republic%20of%20Korea%27s%20Enhanced%20Update%20 of%20its%20First%20Nationally%20Determined%20Contribution_211227_editorial%20change.pdf. 6 China, 2022. ?China?s Achievements, New Goals and New Measures for Nationally Determined Contributions?, p. 34, https://unfccc.int/sites/default/files/NDC/2022-06/China%E2%80%99s%20Achievements%2C%20New%20Goals%20and%20New%20Measures%20for%20Nationally%20 Determined%20Contributions.pdf, WOODSIDE?S CLIMATE TRANSITION ACTION PLAN AND 2023 PROGRESS REPORT WOODSIDE ENERGY GROUP LTD 55

|
5.0 RISK MANAGEMENT Gas can be used in the production of construction materials such as steel and concrete.
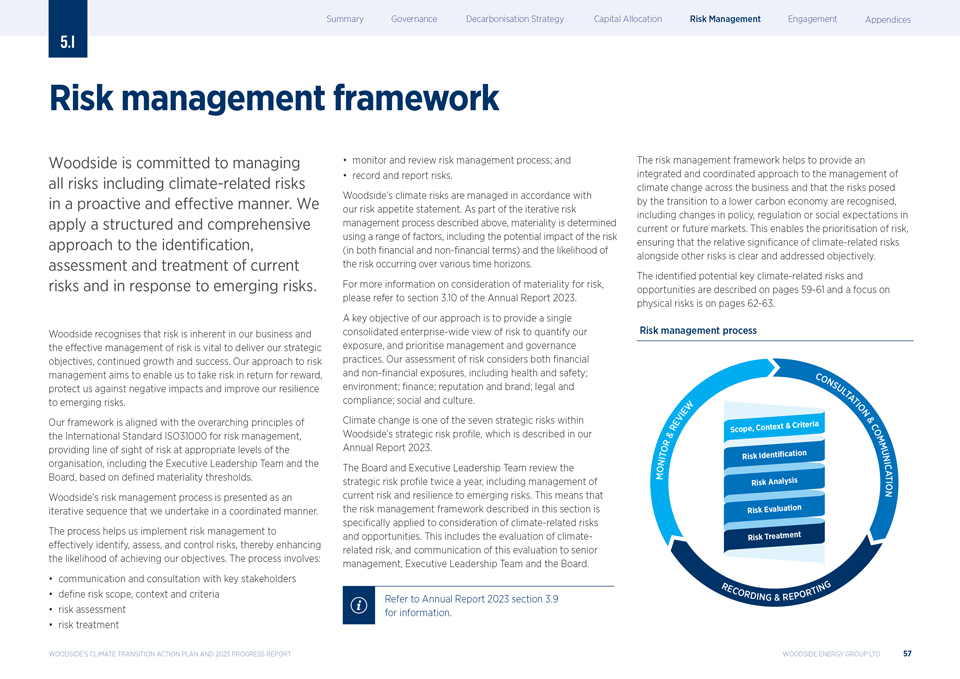
|
5.1 Risk management framework Woodside is committed to managing all risks including climate-related risks in a proactive and effective manner. We apply a structured and comprehensive approach to the identification, assessment and treatment of current risks and in response to emerging risks. Woodside recognises that risk is inherent in our business and the effective management of risk is vital to deliver our strategic objectives, continued growth and success. Our approach to risk management aims to enable us to take risk in return for reward, protect us against negative impacts and improve our resilience to emerging risks. Our framework is aligned with the overarching principles of the International Standard ISO31000 for risk management, providing line of sight of risk at appropriate levels of the organisation, including the Executive Leadership Team and the Board, based on defined materiality thresholds. Woodside?s risk management process is presented as an iterative sequence that we undertake in a coordinated manner. The process helps us implement risk management to effectively identify, assess, and control risks, thereby enhancing the likelihood of achieving our objectives. The process involves: communication and consultation with key stakeholders define risk scope, context and criteria risk assessment risk treatment monitor and review risk management process; and record and report risks. Woodside?s climate risks are managed in accordance with our risk appetite statement. As part of the iterative risk management process described above, materiality is determined using a range of factors, including the potential impact of the risk (in both ?nancial and non-?nancial terms) and the likelihood of the risk occurring over various time horizons. For more information on consideration of materiality for risk, please refer to section 3.10 of the Annual Report 2023. A key objective of our approach is to provide a single consolidated enterprise-wide view of risk to quantify our exposure, and prioritise management and governance practices. Our assessment of risk considers both ?nancial and non-?nancial exposures, including health and safety; environment; ?nance; reputation and brand; legal and compliance; social and culture. Climate change is one of the seven strategic risks within Woodside?s strategic risk profile, which is described in our Annual Report 2023. The Board and Executive Leadership Team review the strategic risk pro?le twice a year, including management of current risk and resilience to emerging risks. This means that the risk management framework described in this section is speci?cally applied to consideration of climate-related risks and opportunities. This includes the evaluation of climate-related risk, and communication of this evaluation to senior management, Executive Leadership Team and the Board. Refer to Annual Report 2023 section 3.9 for information. The risk management framework helps to provide an integrated and coordinated approach to the management of climate change across the business and that the risks posed by the transition to a lower carbon economy are recognised, including changes in policy, regulation or social expectations in current or future markets. This enables the prioritisation of risk, ensuring that the relative signi?cance of climate-related risks alongside other risks is clear and addressed objectively. The identi?ed potential key climate-related risks and opportunities are described on pages 59-61 and a focus on physical risks is on pages 62-63. Risk management process WOODSIDE?S CLIMATE TRANSITION ACTION PLAN AND 2023 PROGRESS REPORT WOODSIDE ENERGY GROUP LTD 57

|
RISK APPETITE Woodside?s Risk Appetite Statement is a set of principles-based, qualitative statements that present a collective and aligned view of the Board?s appetite to take risk in pursuit of our strategic objectives. It provides guidance to the executive and senior management team on the type and amount of risk that is acceptable and is intended to encourage conscious engagement and informed decision making, consistent with other company policies, including our Climate Policy. OUR RISK AND COMPLIANCE BEHAVIOURS Woodside recognises that when faced with challenge and uncertainty, it is the actions, behaviours and responses of our leaders at all levels that shapes our culture. In 2023, Woodside updated ?Our Risk and Compliance Behaviours? framework to provide guidance on the positive behaviours that promote a strong risk and compliance culture. These behaviours recognise that the world we live and work in is constantly changing and we need to adapt in order to thrive as a business. They recognise the need to confront and embrace risk, challenge our conventional ways of working and make courageous decisions, while keeping each other safe, complying with the law and maintaining our social licence to operate. RISK REGISTER Woodside prioritises risk management actions and governance through use of risk register tools. The functionality within the register provides transparency and enhances the ability of senior leaders to effectively manage and govern climate-related risks, including checking that identi?ed actions to address or manage risk have been closed out. RISKS AND OPPORTUNITIES The table (next 3 pages) describes the potential for climate-related risks and opportunities to impact Woodside?s business, strategy, and financial planning, including potential impacts on both financial position and performance and potential mitigations. This does not necessarily mean that the risks have materialised in practice or that the mitigations are currently being pursued. The table is presented using the TCFD framework. Gas is used in a variety of high temperature industrial processes, such as the production of bricks and ceramics. WOODSIDE?S CLIMATE TRANSITION ACTION PLAN AND 2023 PROGRESS REPORT WOODSIDE ENERGY GROUP LTD 58
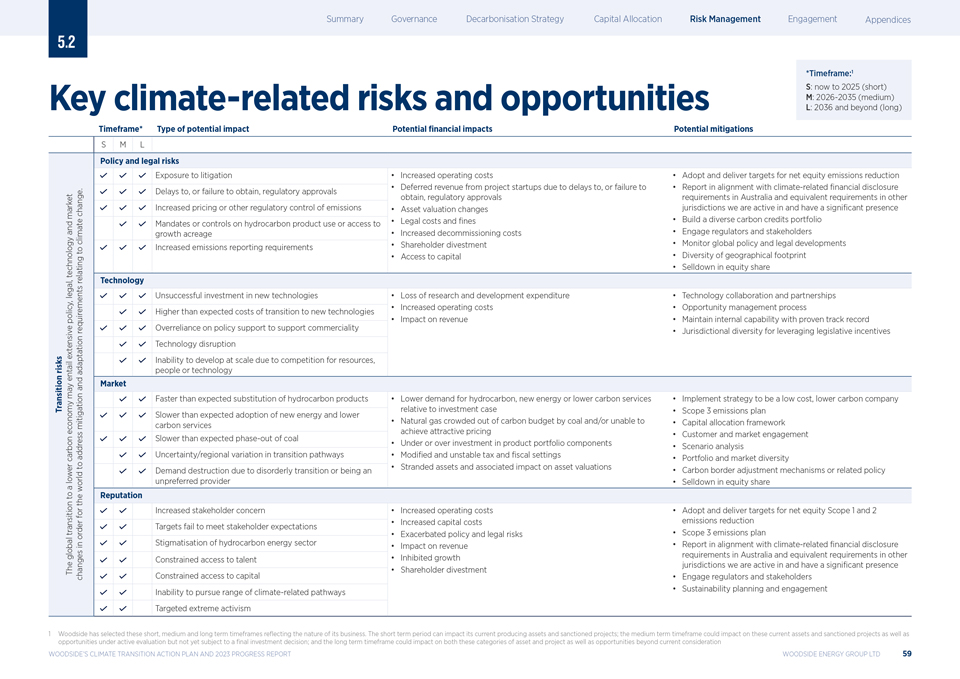
|
5.2 *Timeframe:1 S: now to 2025 (short) Key climate-related risks and opportunities M: 2026-2035 (medium) L: 2036 and beyond (long) Timeframe* Type of potential impact Potential ?nancial impacts Potential mitigations S M L Policy and legal risks Exposure to litigation Increased operating costs Adopt and deliver targets for net equity emissions reduction . Deferred revenue from project startups due to delays to, or failure to Report in alignment with climate-related ?nancial disclosure Delays to, or failure to obtain, regulatory approvals obtain, regulatory approvals requirements in Australia and equivalent requirements in other change Increased pricing or other regulatory control of emissions Asset valuation changes jurisdictions we are active in and have a significant presence market Mandates or controls on hydrocarbon product use or access to Legal costs and fines Build a diverse carbon credits portfolio and growth acreage Increased decommissioning costs Engage regulators and stakeholders climate Increased emissions reporting requirements Shareholder divestment Monitor global policy and legal developments to Diversity of geographical footprint Access to capital technology Selldown in equity share relating Technology legal, Unsuccessful investment in new technologies Loss of research and development expenditure Technology collaboration and partnerships Increased operating costs Opportunity management process Higher than expected costs of transition to new technologies policy, Impact on revenue Maintain internal capability with proven track record requirements Overreliance on policy support to support commerciality Jurisdictional diversity for leveraging legislative incentives extensive Technology disruption Inability to develop at scale due to competition for resources, risks adaptation people or technology entail and Market may Faster than expected substitution of hydrocarbon products Lower demand for hydrocarbon, new energy or lower carbon services Implement strategy to be a low cost, lower carbon company Transition relative to investment case Scope 3 emissions plan Slower than expected adoption of new energy and lower Natural gas crowded out of carbon budget by coal and/or unable to Capital allocation framework mitigation carbon services economy achieve attractive pricing Slower than expected phase-out of coal Customer and market engagement Under or over investment in product portfolio components Scenario analysis carbon address Uncertainty/regional variation in transition pathways Modified and unstable tax and fiscal settings Portfolio and market diversity to lower Demand destruction due to disorderly transition or being an Stranded assets and associated impact on asset valuations Carbon border adjustment mechanisms or related policy unpreferred provider Selldown in equity share a world to Reputation the for Increased stakeholder concern Increased operating costs Adopt and deliver targets for net equity Scope 1 and 2 Increased capital costs emissions reduction Targets fail to meet stakeholder expectations transition order Exacerbated policy and legal risks Scope 3 emissions plan in Stigmatisation of hydrocarbon energy sector Impact on revenue Report in alignment with climate-related ?nancial disclosure global requirements in Australia and equivalent requirements in other Inhibited growth Constrained access to talent jurisdictions we are active in and have a significant presence The Shareholder divestment changes Constrained access to capital Engage regulators and stakeholders Inability to pursue range of climate-related pathways Sustainability planning and engagement Targeted extreme activism 1 Woodside has selected these short, medium and long term timeframes re?ecting the nature of its business. The short term period can impact its current producing assets and sanctioned projects; the medium term timeframe could impact on these current assets and sanctioned projects as well as opportunities under active evaluation but not yet subject to a ?nal investment decision; and the long term timeframe could impact on both these categories of asset and project as well as opportunities beyond current consideration WOODSIDE?S CLIMATE TRANSITION ACTION PLAN AND 2023 PROGRESS REPORT WOODSIDE ENERGY GROUP LTD 59
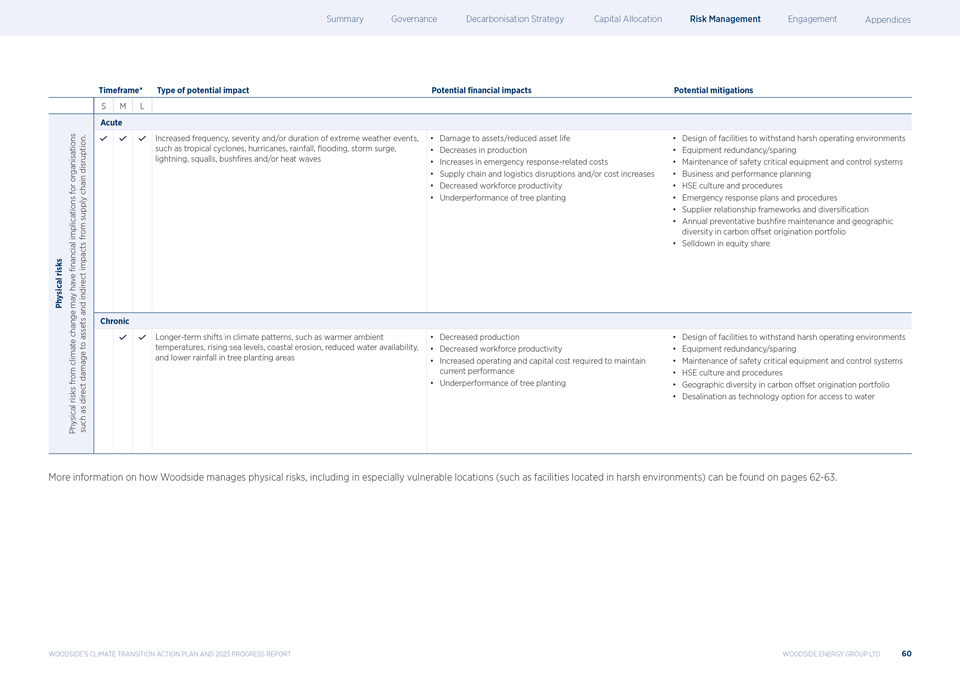
|
Timeframe* Type of potential impact Potential ?nancial impacts Potential mitigations S M L Acute . Increased frequency, severity and/or duration of extreme weather events, Damage to assets/reduced asset life Design of facilities to withstand harsh operating environments such as tropical cyclones, hurricanes, rainfall, flooding, storm surge, Decreases in production Equipment redundancy/sparing disruption lightning, squalls, bushfires and/or heat waves Increases in emergency response-related costs Maintenance of safety critical equipment and control systems organisations Supply chain and logistics disruptions and/or cost increases Business and performance planning for chain Decreased workforce productivity HSE culture and procedures Underperformance of tree planting Emergency response plans and procedures supply Supplier relationship frameworks and diversi?cation Annual preventative bushfire maintenance and geographic implications from diversity in carbon offset origination portfolio financial impacts Selldown in equity share risks have indirect Physical may and change Chronic assets Longer-term shifts in climate patterns, such as warmer ambient Decreased production Design of facilities to withstand harsh operating environments to temperatures, rising sea levels, coastal erosion, reduced water availability, Decreased workforce productivity Equipment redundancy/sparing climate and lower rainfall in tree planting areas Increased operating and capital cost required to maintain Maintenance of safety critical equipment and control systems damage current performance HSE culture and procedures from Underperformance of tree planting Geographic diversity in carbon offset origination portfolio risks direct Desalination as technology option for access to water as Physical such More information on how Woodside manages physical risks, including in especially vulnerable locations (such as facilities located in harsh environments) can be found on pages 62-63. WOODSIDE?S CLIMATE TRANSITION ACTION PLAN AND 2023 PROGRESS REPORT WOODSIDE ENERGY GROUP LTD 60
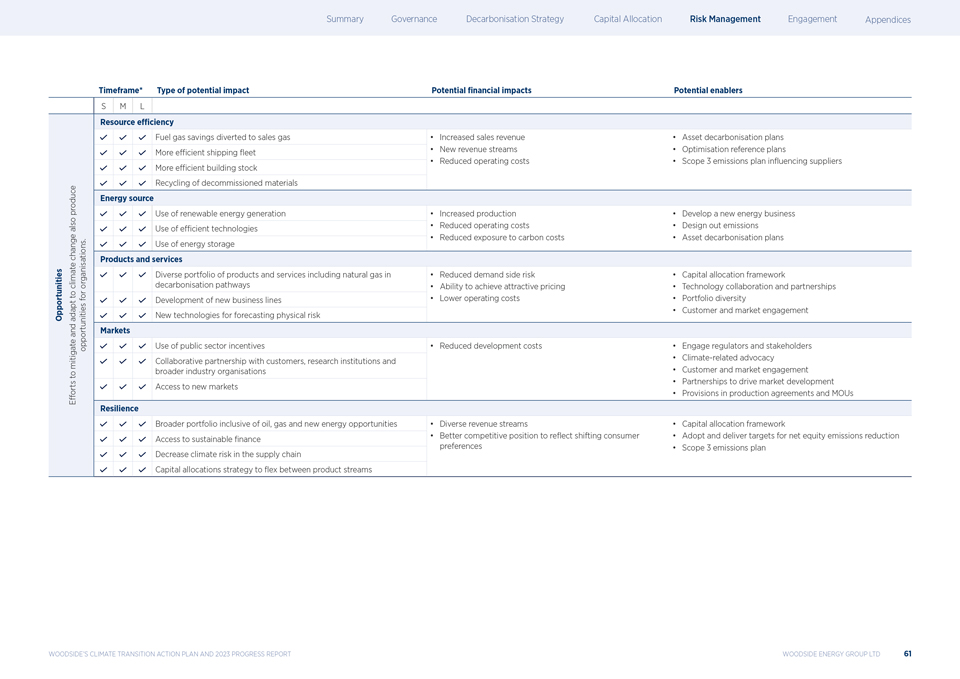
|
Timeframe* Type of potential impact Potential ?nancial impacts Potential enablers S M L Resource efficiency Fuel gas savings diverted to sales gas Increased sales revenue Asset decarbonisation plans More efficient shipping fleet New revenue streams Optimisation reference plans Reduced operating costs Scope 3 emissions plan in?uencing suppliers More efficient building stock Recycling of decommissioned materials produce Energy source Use of renewable energy generation Increased production Develop a new energy business also Use of efficient technologies Reduced operating costs Design out emissions Reduced exposure to carbon costs Asset decarbonisation plans change . Use of energy storage Products and services Diverse portfolio of products and services including natural gas in Reduced demand side risk Capital allocation framework climate organisations decarbonisation pathways Ability to achieve attractive pricing Technology collaboration and partnerships to for Development of new business lines Lower operating costs Portfolio diversity Customer and market engagement Opportunities adapt New technologies for forecasting physical risk and Markets opportunities Use of public sector incentives Reduced development costs Engage regulators and stakeholders mitigate Collaborative partnership with customers, research institutions and Climate-related advocacy to broader industry organisations Customer and market engagement Access to new markets Partnerships to drive market development Efforts Provisions in production agreements and MOUs Resilience Broader portfolio inclusive of oil, gas and new energy opportunities Diverse revenue streams Capital allocation framework Access to sustainable finance Better competitive position to reflect shifting consumer Adopt and deliver targets for net equity emissions reduction Decrease climate risk in the supply chain preferences Scope 3 emissions plan Capital allocations strategy to ?ex between product streams WOODSIDE?S CLIMATE TRANSITION ACTION PLAN AND 2023 PROGRESS REPORT WOODSIDE ENERGY GROUP LTD 61
|
5.3 Managing physical risk Woodside?s assets are designed to withstand extreme weather events, we have specialised teams that support the safe and reliable design and operation of our facilities. Physical risks can arise from both event driven (acute) and longer-term shifts (chronic) in climate patterns. These physical risks may have ?nancial implications for organisations. For example, in the oil and gas industry, this might include harsh weather or ocean conditions that can damage or disrupt the ability to safely operate offshore facilities, shipping and onshore processing plants. Woodside has decades of experience designing and operating facilities located in harsh environments. Woodside?s facilities are subject to oceanic conditions and are located in regions that experience tropical cyclones, hurricanes and high ambient temperatures. Physical risks could also impact emerging new businesses in new energy products and lower carbon services. For example, this could include bush?re or drought risk for nature-based carbon origination projects, or access to water for use in electrolysis for hydrogen. DESIGN OF WOODSIDE?S FACILITIES Each Woodside facility is built in accordance with a basis of design (BOD). This details, amongst other things, the climatic conditions that facilities need to withstand. Each BOD is reviewed against updates to climatic conditions and, where required, actions are taken to update procedures or replace/ refurbish equipment to withstand the revised conditions. For new facilities and refurbishments, the requirements for maximum air temperature and sea level in the BODs are aligned to IPCC Shared Socioeconomic Pathway 2-4.5 (the SSP 2-4.5) in which global temperatures rise by 2.7C by the end of the century. Design sensitivities are also performed against SSP 5-8.5 pathway in which global temperatures rise by 4.4C. (Note that the BOD is intended to describe harsh environmental conditions that a facility may need to withstand, hence the alignment with and sensitivities for higher temperature outcomes by 2100 rather than 2C or 1.5C global temperature rise outcomes).1 Woodside designs its assets to withstand extreme weather events that occur in the range of 1 in 1,000 years to 1 in 10,000 years. This is also speci?ed in each BOD.2 These time periods and the approach of using IPCC SSPs has historically been used at heritage Woodside assets and will be incorporated across the merged portfolio for new assets. WOODSIDE?S CAPABILITY Some relevant teams within the Woodside organisation include: Meteorology Metocean specialists quantify the potential and impact and effect of meteorological and Oceanography oceanographic conditions on Woodside?s (Metocean) facilities. This includes waves, climate variability, tropical cyclones, hurricanes, air temperature and rainfall. This analysis is used to de?ne technical requirements for existing and new facilities. Health, Health, safety and environment specialists Safety and support the business by providing guidelines Environment on safe operating conditions. Examples include the wellbeing of people working in high ambient temperature environments and maintenance of safety critical systems and equipment. Asset Asset management teams are responsible for Management managing asset speci?c risks, such as structural integrity risks from weather related events and risks to production forecasts from weather related outages. Regular risk governance meetings are held to review the management of these risks. Emergency Emergency management specialists support Management the business in the development of emergency response plans and capabilities and with response to any emergency events. This includes preparation for and response to tropical cyclones and hurricanes. 1 This is based on outputs from the Coupled Model Intercomparison Project (CMIP). CMIP coordinates climate model simulations worldwide under the World Climate Research Program (WCRP). CMIP supports the IPCC Shared Socioeconomic Pathways. These Shared Socioeconomic Pathways explore the implications of future socioeconomic development on climate change mitigation, adaptation and land use. 2 Acquired assets are not designed by Woodside and the historic asset owner may have speci?ed different extreme weather events in the BOD. Ruby and Angostura were both designed to withstand extreme weather events that occur in the range of 1 in 100 years. WOODSIDE?S CLIMATE TRANSITION ACTION PLAN AND 2023 PROGRESS REPORT WOODSIDE ENERGY GROUP LTD 62
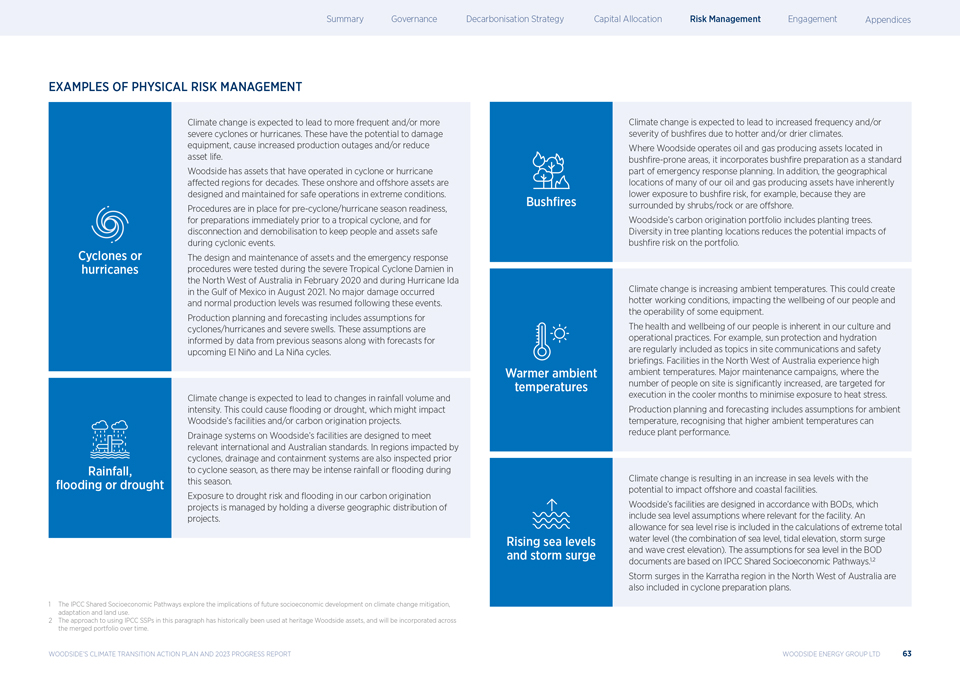
|
EXAMPLES OF PHYSICAL RISK MANAGEMENT Climate change is expected to lead to more frequent and/or more severe cyclones or hurricanes. These have the potential to damage equipment, cause increased production outages and/or reduce asset life. Woodside has assets that have operated in cyclone or hurricane affected regions for decades. These onshore and offshore assets are designed and maintained for safe operations in extreme conditions. Procedures are in place for pre-cyclone/hurricane season readiness, for preparations immediately prior to a tropical cyclone, and for disconnection and demobilisation to keep people and assets safe during cyclonic events. The design and maintenance of assets and the emergency response procedures were tested during the severe Tropical Cyclone Damien in the North West of Australia in February 2020 and during Hurricane Ida in the Gulf of Mexico in August 2021. No major damage occurred and normal production levels was resumed following these events. Production planning and forecasting includes assumptions for cyclones/hurricanes and severe swells. These assumptions are informed by data from previous seasons along with forecasts for upcoming El Ni?o and La Ni?a cycles. Climate change is expected to lead to changes in rainfall volume and intensity. This could cause flooding or drought, which might impact Woodside?s facilities and/or carbon origination projects. Drainage systems on Woodside?s facilities are designed to meet relevant international and Australian standards. In regions impacted by cyclones, drainage and containment systems are also inspected prior to cyclone season, as there may be intense rainfall or flooding during this season. Exposure to drought risk and ?ooding in our carbon origination projects is managed by holding a diverse geographic distribution of projects. Climate change is expected to lead to increased frequency and/or severity of bush?res due to hotter and/or drier climates. Where Woodside operates oil and gas producing assets located in bush?re-prone areas, it incorporates bush?re preparation as a standard part of emergency response planning. In addition, the geographical locations of many of our oil and gas producing assets have inherently lower exposure to bush?re risk, for example, because they are surrounded by shrubs/rock or are offshore. Woodside?s carbon origination portfolio includes planting trees. Diversity in tree planting locations reduces the potential impacts of bushfire risk on the portfolio. Climate change is increasing ambient temperatures. This could create hotter working conditions, impacting the wellbeing of our people and the operability of some equipment. The health and wellbeing of our people is inherent in our culture and operational practices. For example, sun protection and hydration are regularly included as topics in site communications and safety brie?ngs. Facilities in the North West of Australia experience high ambient temperatures. Major maintenance campaigns, where the number of people on site is signi?cantly increased, are targeted for execution in the cooler months to minimise exposure to heat stress. Production planning and forecasting includes assumptions for ambient temperature, recognising that higher ambient temperatures can reduce plant performance. Climate change is resulting in an increase in sea levels with the potential to impact offshore and coastal facilities. Woodside?s facilities are designed in accordance with BODs, which include sea level assumptions where relevant for the facility. An allowance for sea level rise is included in the calculations of extreme total water level (the combination of sea level, tidal elevation, storm surge and wave crest elevation). The assumptions for sea level in the BOD documents are based on IPCC Shared Socioeconomic Pathways.1,2 Storm surges in the Karratha region in the North West of Australia are also included in cyclone preparation plans. 1 The IPCC Shared Socioeconomic Pathways explore the implications of future socioeconomic development on climate change mitigation, adaptation and land use. 2 The approach to using IPCC SSPs in this paragraph has historically been used at heritage Woodside assets, and will be incorporated across the merged portfolio over time. WOODSIDE?S CLIMATE TRANSITION ACTION PLAN AND 2023 PROGRESS REPORT WOODSIDE ENERGY GROUP LTD 63

|
6.0 ENGAGEMENT
|
6.1 Policy engagement Woodside aligns its advocacy to support the goals of the Paris Agreement. We also review our membership of industry associations and encourage them to align their positions and advocacy activities with the goals of the Paris Agreement. CONSTRUCTIVE DIALOGUE AND DIVERSE VIEWS Woodside transparently discloses its advocacy, including the submissions that it makes to government. We also have periodically published a review of our industry association memberships and their activities. We acknowledge that not everyone shares our views, for example about the role of natural gas in the energy transition, just as some people will debate the desirability of nuclear power, wind farms, or carbon capture. We respect that some people will have policy preferences, but we do not accept the claim that advocating for natural gas is at odds with climate goals ? instead we try to explain clearly, through our engagements with investors and public reports, the basis for our perspective. This is a key difference in our analysis of climate-related advocacy and that of groups such as InfluenceMap, who describe our support for the role of oil and gas in the energy mix as ?at odds with the findings of the Intergovernmental Panel on Climate Change (IPCC) and the International Energy Agency (IEA)?.1 Woodside engages with In?uenceMap and has explained that we reject that opinion, for the reasons stated in this report. WOODSIDE?S CLIMATE TRANSITION ACTION PLAN AND 2023 PROGRESS REPORT Our disclosures are intended to help investors assess our performance transparently and determine if our approach aligns with their risk appetite. Disagreement with our approach can contribute to constructive debate and we welcome feedback to keep our transition plans responsive to shareholder expectations. There are varying opinions in public discourse as to which 1.5C pathways and other transition choices are preferred. Some groups may choose to label approaches that they do not agree with as ?greenwashing?. Greenwashing is a real phenomenon which should be regulated and publicly criticised, but misuse of it as a label is also detrimental to public understanding and may have the effect of inhibiting the free exchange of knowledge and ideas that could advance the energy transition. INDUSTRY ASSOCIATIONS Woodside engages in policy advocacy both as an individual organisation and via a range of industry association memberships. We aim to align both our own policy engagement and that of our associations (where possible) in support of the temperature goals of the Paris Agreement. Our detailed Industry Association Review was updated in 2023 and is available at woodside.com. PARIS ALIGNMENT The temperature goals of the Paris Agreement is to limit ?the increase in the global average temperature to well below 2C above pre-industrial levels and to pursue efforts to limit the temperature increase to 1.5C?.2 This goal was reaffirmed at the COP28 global climate summit in the United Arab Emirates in December 2023, which also underscored the importance of the 1.5C goal and resolved to pursue it.3 We encourage readers to review the whole COP28 decision text at www.unfccc.int, as we can only provide an abridged version here to draw attention to the most critical links with our business. These links are provided in the table, right. Decision text at COP28 ?Outcome of the first global stocktake? (abridged, section referenced)3 Link to Woodside in this report The Conference of the Parties serving as the meeting of the Parties to the Paris Agreement: calls on Parties to contribute to the following global efforts, in a nationally determined manner, taking into account the Paris Agreement and their different national circumstances, pathways and approaches (Section 28) See pages 43-55 for a description of how Woodside integrates analysis of different national circumstances, pathways and approaches into its business planning. —Transitioning away from fossil fuels in energy systems, in a just, orderly and equitable manner, accelerating action in this critical decade, so as to achieve net zero by 2050 in keeping with the science (Section 28 (d)) See pages 44-45 for a description of oil and gas in energy pathways in keeping with the science —Accelerating zero- and low-emission technologies, including, inter alia, renewables, nuclear, abatement and removal technologies such as carbon capture and utilisation and storage, particularly in hard-to-abate sectors, and low-carbon hydrogen production (Section 28 (e)) See pages 36-40 for a description of Woodside?s development of some of these technologies (CCUS, hydrogen and renewables) —Accelerating and substantially reducing non-carbon-dioxide emissions globally, including in particular methane emissions by 2030 (Section 28 (f)) See page 23 for an update on Woodside?s methane performance and plan Recognises that transitional fuels can play a See pages 46-47 for a role in facilitating the energy transition while discussion of the transitional ensuring energy security (Section 29) role of natural gas Emphasises the urgent need for accelerated implementation of domestic mitigation measures in accordance with Article 4, paragraph 2, of the Paris Agreement, as well as the use of voluntary cooperation, referred to in Article 6, paragraph 1, of the Paris Agreement (Section 31) See pages 28-31, 74 for a description of Woodside?s participation in voluntary carbon markets, and pages 65-66 for a summary of its advocacy for implementation of Article 6. InfluenceMap, 2023. ?Woodside?s Climate Policy Engagement: A Real-World Metric of the Company?s Climate Strategy?, https://influencemap.org/report/Woodside-s-Real-Climate- Strategy-22060. UNFCCC, 2015. ?Paris Agreement?, Article 2. https://unfccc.int/sites/default/files/english_ paris_agreement.pdf UNFCCC, 2023. ?Outcome of the first global stocktake? (Advance unedited version). https://unfccc.int/documents/636584 WOODSIDE ENERGY GROUP LTD 65
|
2023 CLIMATE-RELATED ADVOCACY Below is a list of speeches and submissions that contain climate-related content or positions. Further information is available at woodside.com. Submissions about government policy Australia Safeguard Mechanism Consultation Paper Consultation on setting, tracking and achieving Australia?s emissions reduction targets Future of Gas Strategy Climate related ?nancial disclosure: second consultation round Carbon leakage review Inquiry into London Protocol ACCU Review implementation plan Review of the Singapore Australia Green Energy Agreement (GEA) A mandatory code of conduct to guide behaviour in the gas market Senate inquiry into the Gas Market Code of Conduct Consultation in the course of preparing an environment plan Inquiry into the WA Domestic Gas Policy National Electricity Amendment (Concessional Finance for Transmission Network Service Providers) rule United States Department of Energy (DOE) Office of Clean Energy Demonstrations? Notice of Intent to establish a Demand-side Support Mechanism Department of Energy (DOE) Clean Hydrogen Hub (con?dential) In?ation Reduction Act Section 45V clean hydrogen production tax credit Parliamentary hearing appearances Australian House of Representatives Inquiry into the London Protocol (relating to cross-border transport of CO? for CCS) Australian Senate inquiry into the Safeguard Mechanism Keynotes and speeches delivered by Executives Australia 2023 Australian Oil and Gas (AOG) Energy Conference: Maximising value and energy growth American Chamber of Commerce in Australia (AmCham): Business Luncheon with Meg O?Neill Australian Domestic Gas Outlook (ADGO) 2023 Conference: Keynote Australian Energy Producers (AEP) 2023 Conference & Exhibition: Opening Address Business News: Success and Leadership Breakfast Committee for Economic Development of Australia (CEDA) WA Energy Transition Summit: Infrastructure for a green transition Committee for Economic Development of Australia (CEDA) The Future of Gas in WA Event: Keynote Address National Press Club: Energy Security through the energy transition Society of Petroleum Engineers Western Australia Season Opening: What are the leadership skills needed in complex and difficult times WA Korea Economic Forum: Keynote World Energy Cities Partnership AGM Event International 2023 Energy Intelligence Forum: Leadership Dialogue CERAWeek 2023: Oil and Gas ? Playing the Long Game CERAWeek 2023: Navigating Volatile Energy Markets CERAWeek 2023: Diversity in the Workforce: Creating Value Gastech Global Business Leadership CEO Panel discussion: Transforming global energy through collaborative business models and constructive partnerships LNG2023 Plenary 2: Challenges of a Turbulent Energy Transition Offshore Technology Conference 2023: Timor-Leste on the Rise with its Greater Sunrise Fields Society of Petroleum Engineers Annual Technical Conference and Exhibition: Expanding the Opportunities to Sustainably Fuel the World Trinidad and Tobago Energy Conference 2023: Navigating a Complex Energy Future Wood Mackenzie?s Global Energy Summit: Keynote Case Study: Safeguard Mechanism advocacy The Safeguard Mechanism is Australia?s principal regulation for the reduction of emissions from industrial facilities. Woodside advocated for a fair, robust and transparent mechanism to lead to a reduction in Australia emissions, including by encouraging businesses to invest, innovate and adopt smarter practices and technologies in line with Australia?s emissions reduction targets.1 Our advocacy on the reforms continues to include: Changes to important emissions reduction opportunities such as renewable electricity import and CCS are incentivised. Accelerating bilateral arrangements for international carbon crediting under Article 6 of the Paris Agreement. Tailoring the support for ?energy intensive trade exposed? industries. Technical advice on the quanti?cation of baselines including for new facilities. Focus on our work with Ipieca Ipieca is the global oil and gas association for advancing environmental and social performance across the energy transition, and was founded in 1974 at the request of the United Nations Environment Programme.2 Woodside is an active participant: Woodside?s representative is a member of Ipieca?s global executive and designated their ?climate champion?; Woodside?s representative chaired the taskforce that developed and published a fact sheet on the role of oil and gas in energy transitions; Woodside experts participated in taskforces to develop guidance on Scope 3 emissions accounting, the role of carbon- compensated products, and approaches to the Just Transition; A Woodside expert attended the IPCC?s conference to conclude the Sixth Assessment (AR6) Synthesis Report (Summary for Policymakers) on behalf of Ipieca. Woodside, 2023. ?Safeguard Mechanism Consultation Paper?, https://www.woodside.com/docs/default-source/sustainability-documents/transparency-documents/2023-government- submissions-reports/submission-to-safeguard-mechanism-consultation-paper-woodside.pdf?sfvrsn=2a208822_3. Ipieca. ?About us?, https://www.ipieca.org/about. WOODSIDE?S CLIMATE TRANSITION ACTION PLAN AND 2023 PROGRESS REPORT WOODSIDE ENERGY GROUP LTD 66
|
6.2 Industry initiatives Woodside has joined a range of industry initiatives to provide leadership and advocacy, learn from our peers, and check that our approach is consistent with appropriate global practice. 1 COP28 UAE, 2023. ?Oil & Gas Decarbonization Charter?, https:// www.cop28.com/en/news/2023/12/Oil-Gas-Decarbonization-Charter-launched-to—accelerate-climate-action. 2 TCFD, 2017. ?Recommendations of the Task Force on Climate-related Financial Disclosures?, https://assets.bbhub.io/company/ sites/60/2021/10/FINAL-2017-TCFD-Report.pdf 3 https://www.unep.org/explore-topics/energy/what-we-do/ methane/oil-gas-methane-partnership-20-ogmp-20 4 OGCI, 2021. ?Aiming for Zero Methane Emissions Initiative?. https:// aimingforzero.ogci.com/wp-content/uploads/2022/05/Aiming-for-Zero-text.pdf 5 OGMP, 2023. ?Implementation Plan Guidance?, p. 2 https:// ogmpartnership.com/wp-content/uploads/2023/02/OGMP-2.0-Implementation-Plan-Guidance_2.pdf. OGMP provides the OGCI collective average target for upstream operations as an example of ?near zero? emissions intensity. 6 MGP, 2017. ?The Methane Guiding Principles?. https:// methaneguidingprinciples.org/about/the-methane-guiding-principles/ 7 World Bank, 2015. ?Global Initiative to Reduce Gas Flaring: Zero Routine Flaring by 2030?. https://thedocs.worldbank.org/en/doc/ a903b5e6456991faf3b5e079bba0391a-0400072021/related/ZRF-Initiative-text-list-map-104.pdf Oil & Gas Decarbonization Charter (OGDC)1 In 2023, Woodside became the ?rst Australian company to sign the Oil & Gas Decarbonization Charter (OGDC). During COP28 the COP28 Presidency and the Kingdom of Saudi Arabia announced 50 oil and gas companies had joined the Oil and Gas Decarbonization Charter, a global industry Charter dedicated to high-scale impact, and to speed up climate action within the industry. Task Force on Climate Related Financial Disclosures (TCFD)2 Woodside became an official supporter of TCFD in 2021. The TCFD released climate-related ?nancial disclosure recommendations designed to help companies provide better information to support informed capital allocation. The disclosure recommendations are structured around four thematic areas that represent core elements of how companies operate: governance, strategy, risk management, and metrics and targets. Following the completion of its 2023 status report, the TCFD organization has been disbanded and its work will be taken forward by the International Financial Reporting Standards (IFRS) Foundation. The IFRS Foundation is hosting the work of the International Sustainability Standards Board (ISSB) whose reporting standards build upon the work of the TCFD. Woodside continues to utilise TCFD recommendations while awaiting the implementation of climate-related ?nancial disclosure requirements in Australia and equivalent requirements in other jurisdictions we are active in and have a signi?cant presence. Oil and Gas Methane Partnership 2.0 (OGMP)3 Woodside joined OGMP 2.0 in 2024. The OGMP 2.0 is the United Nations Environment Programme?s flagship oil and gas reporting and mitigation programme. OGMP 2.0 is the only comprehensive, measurement-based reporting framework for the oil and gas industry that improves the accuracy and transparency of methane emissions reporting. This is key to prioritising methane mitigation actions in the sector. Methane Guiding Principles (MGP)6 Woodside joined the MGP in 2018. The MGP focus on ?ve priority areas for action to reduce methane emissions across the natural gas supply chain. They were developed collaboratively in 2017 by a coalition of industry and civil society organizations. The 5 priority areas are: 1. Continually reduce methane emissions 2. Advance strong performance across the gas supply chain 3. Improve accuracy of methane emissions data 4. Advocate sound policy and regulations on methane emissions 5. Increase transparency Aiming for Zero Methane Emissions Initiative4 In 2022, Woodside Energy became the ?rst Australasian company to sign the Aiming for Zero Initiative. The initiative was launched by the Oil and Gas Climate Initiative (OGCI) to encourage the oil and gas industry to cut methane emissions to near-zero.5 It calls for an all-in approach that treats methane emissions as seriously as the oil and gas industry already treats safety: aiming for zero and striving to do what is needed to get there. Aiming for Zero acts as a complement for key initiatives such as MGP, OGMP 2.0 and the Global Methane Pledge. Zero Routine Flaring by 2030 (ZRF) Initiative7 Woodside joined ZRF in 2017. The Initiative was launched by the World Bank and is managed by the Global Flaring and Methane Reduction Partnership (GFMR). It commits governments and companies to end routine ?aring no later than 2030. The Initiative is designed to facilitate cooperation between all stakeholders so that solutions to ending routine gas ?aring can be identi?ed and implemented. WOODSIDE?S CLIMATE TRANSITION ACTION PLAN AND 2023 PROGRESS REPORT WOODSIDE ENERGY GROUP LTD 67
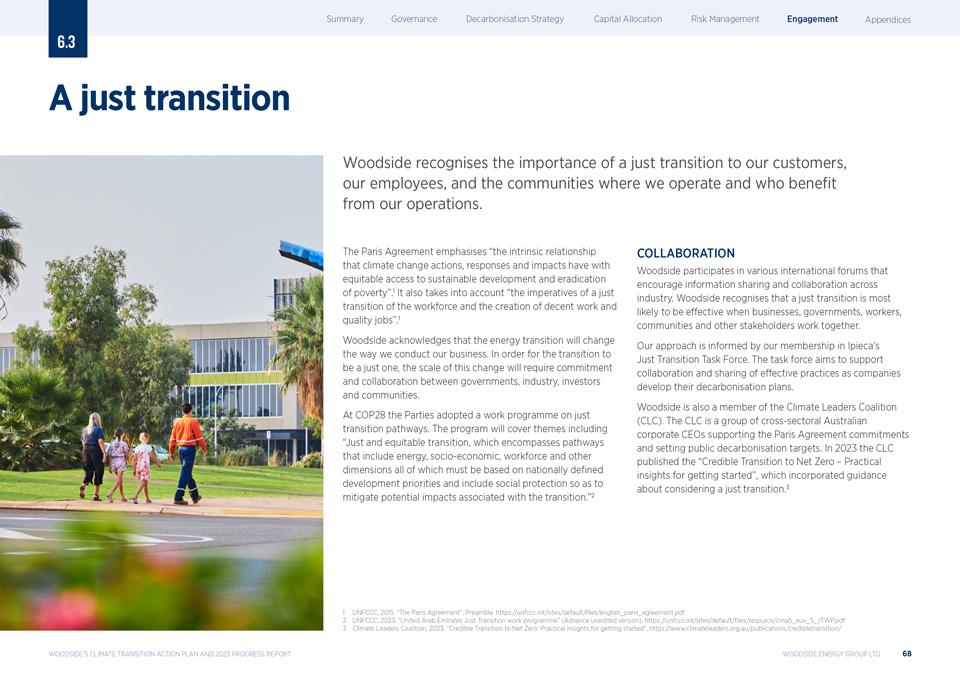
|
6.3 A just transition Woodside recognises the importance of a just transition to our customers, our employees, and the communities where we operate and who bene?t from our operations. The Paris Agreement emphasises ?the intrinsic relationship that climate change actions, responses and impacts have with equitable access to sustainable development and eradication of poverty?.1 It also takes into account ?the imperatives of a just transition of the workforce and the creation of decent work and quality jobs?.1 Woodside acknowledges that the energy transition will change the way we conduct our business. In order for the transition to be a just one, the scale of this change will require commitment and collaboration between governments, industry, investors and communities. At COP28 the Parties adopted a work programme on just transition pathways. The program will cover themes including ?Just and equitable transition, which encompasses pathways that include energy, socio-economic, workforce and other dimensions all of which must be based on nationally defined development priorities and include social protection so as to mitigate potential impacts associated with the transition.?2 COLLABORATION Woodside participates in various international forums that encourage information sharing and collaboration across industry. Woodside recognises that a just transition is most likely to be effective when businesses, governments, workers, communities and other stakeholders work together. Our approach is informed by our membership in Ipieca?s Just Transition Task Force. The task force aims to support collaboration and sharing of effective practices as companies develop their decarbonisation plans. Woodside is also a member of the Climate Leaders Coalition (CLC). The CLC is a group of cross-sectoral Australian corporate CEOs supporting the Paris Agreement commitments and setting public decarbonisation targets. In 2023 the CLC published the ?Credible Transition to Net Zero ? Practical insights for getting started?, which incorporated guidance about considering a just transition.3 UNFCCC, 2015. ?The Paris Agreement?, Preamble. https://unfccc.int/sites/default/files/english_paris_agreement.pdf UNFCCC, 2023. ?United Arab Emirates Just Transition work programme? (Advance unedited version). https://unfccc.int/sites/default/files/resource/cma5_auv_5_JTWP.pdf Climate Leaders Coalition, 2023. ?Credible Transition to Net Zero: Practical insights for getting started?, https://www.climateleaders.org.au/publications/credibletransition/ WOODSIDE?S CLIMATE TRANSITION ACTION PLAN AND 2023 PROGRESS REPORT WOODSIDE ENERGY GROUP LTD 68
|
WOODSIDE?S APPROACH Access to energy We consider our role in providing energy as core to our contribution to a just energy transition. United Nations Sustainable Development Goal 7 is to ?ensure access to affordable, reliable, sustainable and modern energy for all?. Decommissioning Decommissioning oil and gas assets at the end of their productive life is an inherent part of the oil and gas industry lifecycle. In 2023, Woodside spent approximately $530 million executing decommissioning work across our portfolio. Planning for decommissioning starts well in advance of asset end of life, and includes stakeholder engagement to address environmental, regulatory and social outcomes for the communities we operate in. Stakeholder engagement Woodside is committed to engaging in a social dialogue with our workforce, the communities in which we operate, affected stakeholders and businesses with whom we have a relationship. Social Impact Management We build relationships to enable ongoing engagement across all phases of our activities. Understanding the impacts of our activities, both environmental and social including human rights, is embedded into our Project Management Framework. Our updated social impact assessment for our onshore gas operations near Karratha in Western Australia included engagement with the local community on a range of scenarios including growth and decline. Our Social Performance Framework guides our approach in sharing timely information about our activities and understanding the expectations of the communities where we are active and have a signi?cant presence. We work with our suppliers to embed this approach into our value chain and will continue to do so through the transition. We currently employ approximately 240 people across our new energy and lower carbon services teams, the majority of whom have been redeployed from our base business. Where possible, we will continue to look to retrain and reskill our current workforce so that they can transition into these opportunities. More information about our approach can be found on our website. Just transition key stakeholders Woodside has identi?ed that our workforce, our suppliers, our host communities and our customers are the key stakeholders relevant to a just transition.? We can help prepare for and manage the transition through our commitment to regular stakeholder engagement, local content in our projects and building capability and capacity through social investment and employee development all of which are well established across the organisation. More information about stakeholder engagement can be found on our website. Workforce We support an inclusive workplace which allows us to leverage the diversity of thought which can come from teams with different knowledge, experience, approaches and ways of thinking. Suppliers We work with suppliers that align with our vision and share our commitment to deliver better outcomes for our business, customers and communities. Host Communities Woodside supports host communities by helping to improve local capability and capacity. Updates on our social contribution available at woodside.com. [Graphic Appears Here] Customers We collaborate with our customers on innovative lower carbon energy solutions. For example, services like CCS can help customers reduce the emissions they would otherwise generate when using Woodside products (or similar products sourced from others). WOODSIDE?S CLIMATE TRANSITION ACTION PLAN AND 2023 PROGRESS REPORT WOODSIDE ENERGY GROUP LTD 69
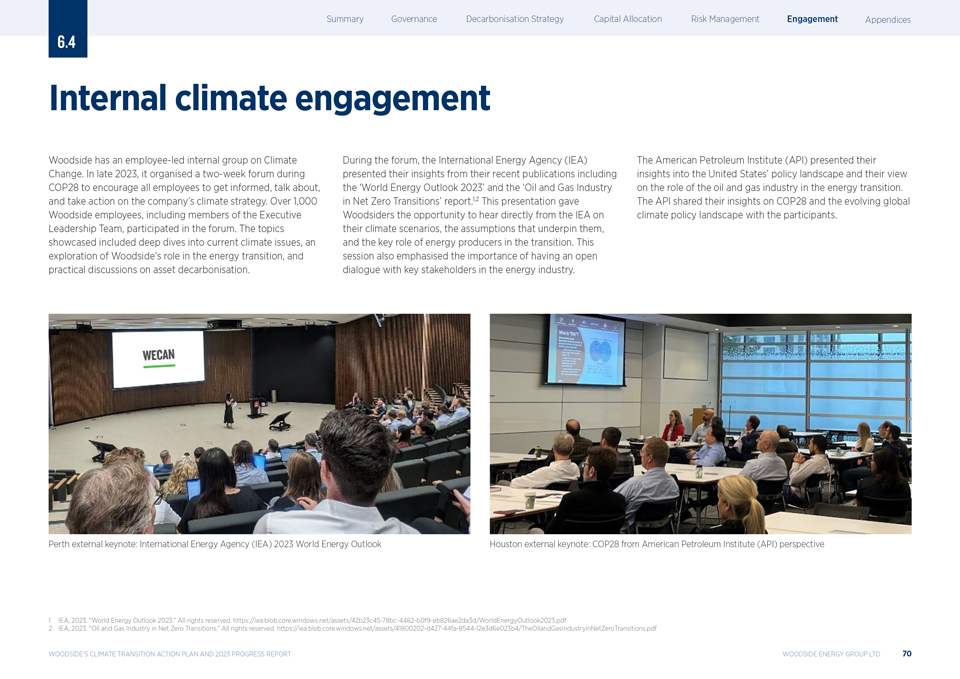
|
6.4 Internal climate engagement Woodside has an employee-led internal group on Climate Change. In late 2023, it organised a two-week forum during COP28 to encourage all employees to get informed, talk about, and take action on the company?s climate strategy. Over 1,000 Woodside employees, including members of the Executive Leadership Team, participated in the forum. The topics showcased included deep dives into current climate issues, an exploration of Woodside?s role in the energy transition, and practical discussions on asset decarbonisation. During the forum, the International Energy Agency (IEA) presented their insights from their recent publications including the ?World Energy Outlook 2023? and the ?Oil and Gas Industry in Net Zero Transitions? report.1,2 This presentation gave Woodsiders the opportunity to hear directly from the IEA on their climate scenarios, the assumptions that underpin them, and the key role of energy producers in the transition. This session also emphasised the importance of having an open dialogue with key stakeholders in the energy industry. The American Petroleum Institute (API) presented their insights into the United States? policy landscape and their view on the role of the oil and gas industry in the energy transition. The API shared their insights on COP28 and the evolving global climate policy landscape with the participants. Perth external keynote: International Energy Agency (IEA) 2023 World Energy Outlook Houston external keynote: COP28 from American Petroleum Institute (API) perspective IEA, 2023. ?World Energy Outlook 2023.? All rights reserved. https://iea.blob.core.windows.net/assets/42b23c45-78bc-4482-b0f9-eb826ae2da3d/WorldEnergyOutlook2023.pdf IEA, 2023. ?Oil and Gas Industry in Net Zero Transitions.? All rights reserved. https://iea.blob.core.windows.net/assets/41800202-d427-44fa-8544-12e3d6e023b4/TheOilandGasIndustryinNetZeroTransitions.pdf WOODSIDE?S CLIMATE TRANSITION ACTION PLAN AND 2023 PROGRESS REPORT WOODSIDE ENERGY GROUP LTD 70

|
7.0 APPENDICES Natural gas and lique?ed petroleum gas (LPG) are both used as fuel for cooking, such as for outdoor BBQs.
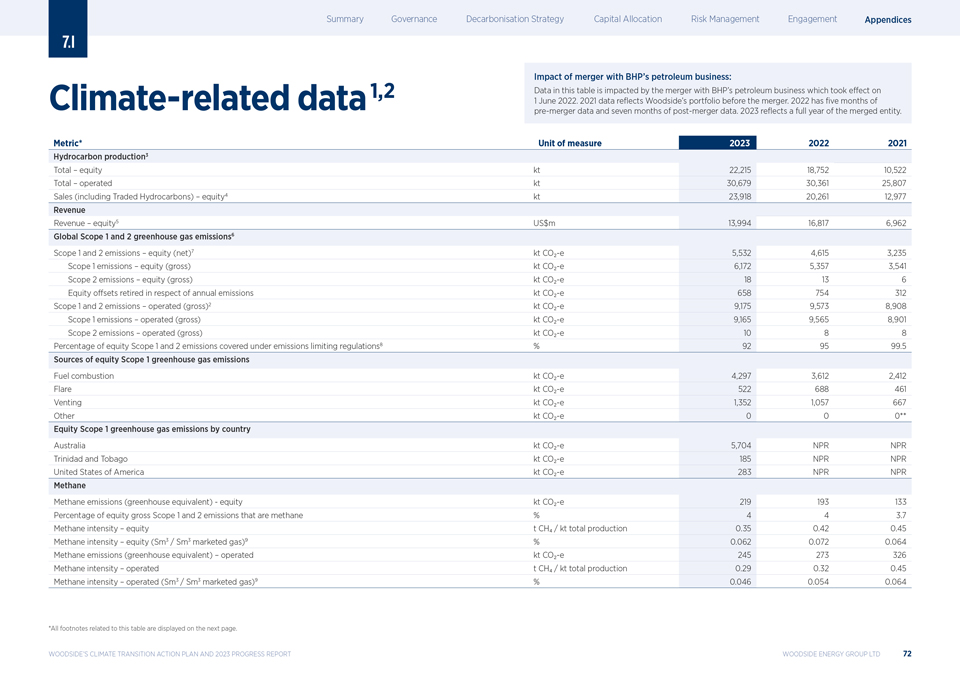
|
7.1 Climate-related data1,2 Impact of merger with BHP?s petroleum business: Data in this table is impacted by the merger with BHP?s petroleum business which took effect on 1 June 2022. 2021 data reflects Woodside?s portfolio before the merger. 2022 has five months of pre-merger data and seven months of post-merger data. 2023 re?ects a full year of the merged entity. Metric* Unit of measure 2023 2022 2021 Hydrocarbon production3 Total ? equity kt 22,215 18,752 10,522 Total ? operated kt 30,679 30,361 25,807 Sales (including Traded Hydrocarbons) ? equity4 kt 23,918 20,261 12,977 Revenue Revenue ? equity5 US$m 13,994 16,817 6,962 Global Scope 1 and 2 greenhouse gas emissions6 Scope 1 and 2 emissions ? equity (net)7 kt CO?-e 5,532 4,615 3,235 Scope 1 emissions ? equity (gross) kt CO?-e 6,172 5,357 3,541 Scope 2 emissions ? equity (gross) kt CO?-e 18 13 6 Equity offsets retired in respect of annual emissions kt CO?-e 658 754 312 Scope 1 and 2 emissions ? operated (gross)2 kt CO?-e 9,175 9,573 8,908 Scope 1 emissions ? operated (gross) kt CO?-e 9,165 9,565 8,901 Scope 2 emissions ? operated (gross) kt CO?-e 10 8 8 Percentage of equity Scope 1 and 2 emissions covered under emissions limiting regulations8 % 92 95 99.5 Sources of equity Scope 1 greenhouse gas emissions Fuel combustion kt CO?-e 4,297 3,612 2,412 Flare kt CO?-e 522 688 461 Venting kt CO?-e 1,352 1,057 667 Other kt CO?-e 0 0 0** Equity Scope 1 greenhouse gas emissions by country Australia kt CO?-e 5,704 NPR NPR Trinidad and Tobago kt CO?-e 185 NPR NPR United States of America kt CO?-e 283 NPR NPR Methane Methane emissions (greenhouse equivalent)—equity kt CO?-e 219 193 133 Percentage of equity gross Scope 1 and 2 emissions that are methane % 4 4 3.7 Methane intensity ? equity t CH? / kt total production 0.35 0.42 0.45 Methane intensity ? equity (Sm3 / Sm3 marketed gas)9 % 0.062 0.072 0.064 Methane emissions (greenhouse equivalent) ? operated kt CO?-e 245 273 326 Methane intensity ? operated t CH? / kt total production 0.29 0.32 0.45 Methane intensity ? operated (Sm3 / Sm3 marketed gas)9 % 0.046 0.054 0.064 *All footnotes related to this table are displayed on the next page. WOODSIDE?S CLIMATE TRANSITION ACTION PLAN AND 2023 PROGRESS REPORT WOODSIDE ENERGY GROUP LTD 72
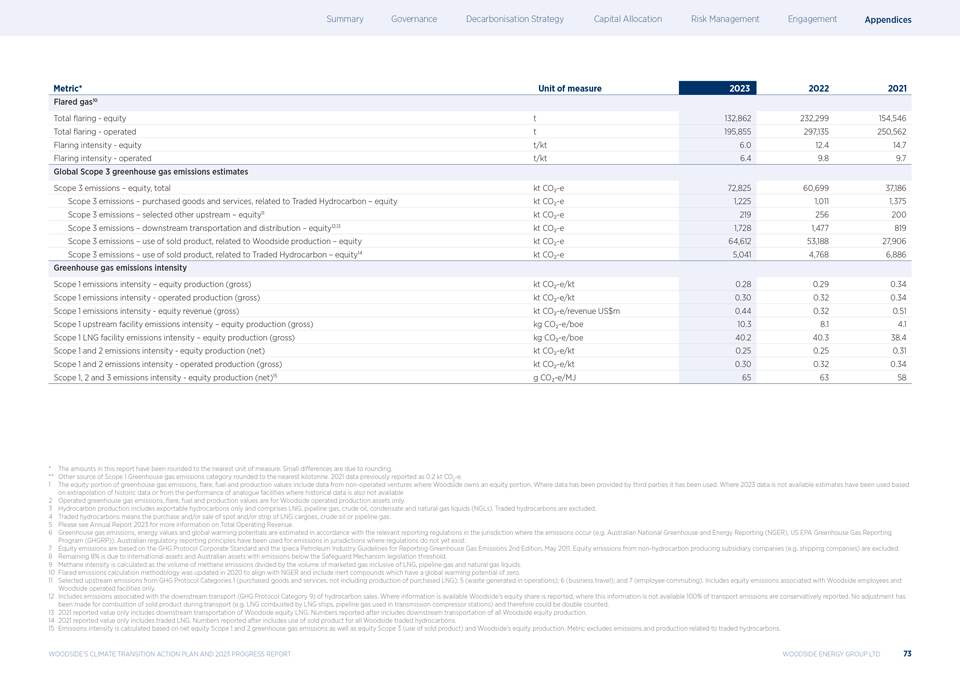
|
Metric* Unit of measure 2023 2022 2021 Flared gas10 Total ?aring—equity t 132,862 232,299 154,546 Total ?aring—operated t 195,855 297,135 250,562 Flaring intensity—equity t/kt 6.0 12.4 14.7 Flaring intensity—operated t/kt 6.4 9.8 9.7 Global Scope 3 greenhouse gas emissions estimates Scope 3 emissions ? equity, total kt CO?-e 72,825 60,699 37,186 Scope 3 emissions ? purchased goods and services, related to Traded Hydrocarbon ? equity kt CO?-e 1,225 1,011 1,375 Scope 3 emissions ? selected other upstream ? equity11 kt CO?-e 219 256 200 Scope 3 emissions ? downstream transportation and distribution ? equity12,13 kt CO?-e 1,728 1,477 819 Scope 3 emissions ? use of sold product, related to Woodside production ? equity kt CO?-e 64,612 53,188 27,906 Scope 3 emissions ? use of sold product, related to Traded Hydrocarbon ? equity14 kt CO?-e 5,041 4,768 6,886 Greenhouse gas emissions intensity Scope 1 emissions intensity ? equity production (gross) kt CO?-e/kt 0.28 0.29 0.34 Scope 1 emissions intensity—operated production (gross) kt CO?-e/kt 0.30 0.32 0.34 Scope 1 emissions intensity—equity revenue (gross) kt CO?-e/revenue US$m 0.44 0.32 0.51 Scope 1 upstream facility emissions intensity ? equity production (gross) kg CO?-e/boe 10.3 8.1 4.1 Scope 1 LNG facility emissions intensity ? equity production (gross) kg CO?-e/boe 40.2 40.3 38.4 Scope 1 and 2 emissions intensity—equity production (net) kt CO?-e/kt 0.25 0.25 0.31 Scope 1 and 2 emissions intensity—operated production (gross) kt CO?-e/kt 0.30 0.32 0.34 Scope 1, 2 and 3 emissions intensity—equity production (net)15 g CO?-e/MJ 65 63 58 * The amounts in this report have been rounded to the nearest unit of measure. Small differences are due to rounding. ** Other source of Scope 1 Greenhouse gas emissions category rounded to the nearest kilotonne. 2021 data previously reported as 0.2 kt CO -e. 2 1 The equity portion of greenhouse gas emissions, ?are, fuel and production values include data from non-operated ventures where Woodside owns an equity portion. Where data has been provided by third parties it has been used. Where 2023 data is not available estimates have been used based on extrapolation of historic data or from the performance of analogue facilities where historical data is also not available 2 Operated greenhouse gas emissions, ?are, fuel and production values are for Woodside operated production assets only. 3 Hydrocarbon production includes exportable hydrocarbons only and comprises LNG, pipeline gas, crude oil, condensate and natural gas liquids (NGLs). Traded hydrocarbons are excluded. 4 Traded hydrocarbons means the purchase and/or sale of spot and/or strip of LNG cargoes, crude oil or pipeline gas. 5 Please see Annual Report 2023 for more information on Total Operating Revenue. 6 Greenhouse gas emissions, energy values and global warming potentials are estimated in accordance with the relevant reporting regulations in the jurisdiction where the emissions occur (e.g. Australian National Greenhouse and Energy Reporting (NGER), US EPA Greenhouse Gas Reporting Program (GHGRP)). Australian regulatory reporting principles have been used for emissions in jurisdictions where regulations do not yet exist. 7 Equity emissions are based on the GHG Protocol Corporate Standard and the Ipieca Petroleum Industry Guidelines for Reporting Greenhouse Gas Emissions 2nd Edition, May 2011. Equity emissions from non-hydrocarbon producing subsidiary companies (e.g. shipping companies) are excluded. 8 Remaining 8% is due to international assets and Australian assets with emissions below the Safeguard Mechanism legislation threshold. 9 Methane intensity is calculated as the volume of methane emissions divided by the volume of marketed gas inclusive of LNG, pipeline gas and natural gas liquids. 10 Flared emissions calculation methodology was updated in 2020 to align with NGER and include inert compounds which have a global warming potential of zero. 11 Selected upstream emissions from GHG Protocol Categories 1 (purchased goods and services, not including production of purchased LNG); 5 (waste generated in operations); 6 (business travel); and 7 (employee commuting). Includes equity emissions associated with Woodside employees and Woodside operated facilities only. 12 Includes emissions associated with the downstream transport (GHG Protocol Category 9) of hydrocarbon sales. Where information is available Woodside?s equity share is reported, where this information is not available 100% of transport emissions are conservatively reported. No adjustment has been made for combustion of sold product during transport (e.g. LNG combusted by LNG ships, pipeline gas used in transmission compressor stations) and therefore could be double counted. 13 2021 reported value only includes downstream transportation of Woodside equity LNG. Numbers reported after includes downstream transportation of all Woodside equity production. 14 2021 reported value only includes traded LNG. Numbers reported after includes use of sold product for all Woodside traded hydrocarbons. 15 Emissions intensity is calculated based on net equity Scope 1 and 2 greenhouse gas emissions as well as equity Scope 3 (use of sold product) and Woodside?s equity production. Metric excludes emissions and production related to traded hydrocarbons. WOODSIDE?S CLIMATE TRANSITION ACTION PLAN AND 2023 PROGRESS REPORT WOODSIDE ENERGY GROUP LTD 73
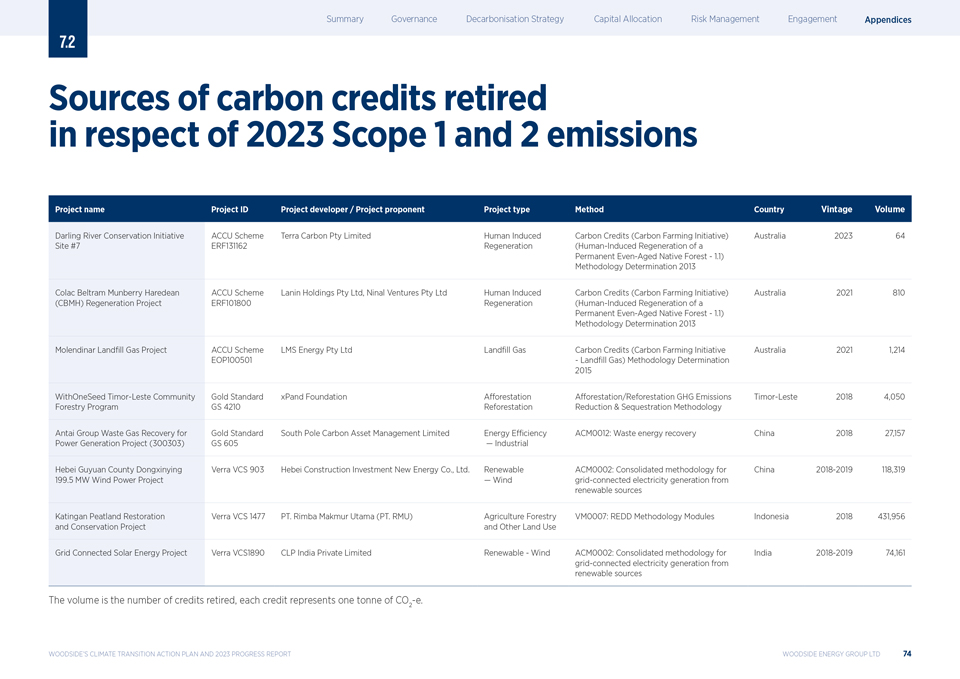
|
7.2 in Sources respect of of carbon 2023 credits Scope 1 retired and 2 emissions Project name Project ID Project developer / Project proponent Project type Method Country Vintage Volume Darling River Conservation Initiative ACCU Scheme Terra Carbon Pty Limited Human Induced Carbon Credits (Carbon Farming Initiative) Australia 2023 64 Site #7 ERF131162 Regeneration (Human-Induced Regeneration of a Permanent Even-Aged Native Forest—1.1) Methodology Determination 2013 Colac Beltram Munberry Haredean ACCU Scheme Lanin Holdings Pty Ltd, Ninal Ventures Pty Ltd Human Induced Carbon Credits (Carbon Farming Initiative) Australia 2021 810 (CBMH) Regeneration Project ERF101800 Regeneration (Human-Induced Regeneration of a Permanent Even-Aged Native Forest—1.1) Methodology Determination 2013 Molendinar Land?ll Gas Project ACCU Scheme LMS Energy Pty Ltd Land?ll Gas Carbon Credits (Carbon Farming Initiative Australia 2021 1,214 EOP100501—Land?ll Gas) Methodology Determination 2015 WithOneSeed Timor-Leste Community Gold Standard xPand Foundation Afforestation Afforestation/Reforestation GHG Emissions Timor-Leste 2018 4,050 Forestry Program GS 4210 Reforestation Reduction & Sequestration Methodology Antai Group Waste Gas Recovery for Gold Standard South Pole Carbon Asset Management Limited Energy Efficiency ACM0012: Waste energy recovery China 2018 27,157 Power Generation Project (300303) GS 605 ? Industrial Hebei Guyuan County Dongxinying Verra VCS 903 Hebei Construction Investment New Energy Co., Ltd. Renewable ACM0002: Consolidated methodology for China 2018-2019 118,319 199.5 MW Wind Power Project ? Wind grid-connected electricity generation from renewable sources Katingan Peatland Restoration Verra VCS 1477 PT. Rimba Makmur Utama (PT. RMU) Agriculture Forestry VM0007: REDD Methodology Modules Indonesia 2018 431,956 and Conservation Project and Other Land Use Grid Connected Solar Energy Project Verra VCS1890 CLP India Private Limited Renewable—Wind ACM0002: Consolidated methodology for India 2018-2019 74,161 grid-connected electricity generation from renewable sources The volume is the number of credits retired, each credit represents one tonne of CO -e. 2 WOODSIDE?S CLIMATE TRANSITION ACTION PLAN AND 2023 PROGRESS REPORT WOODSIDE ENERGY GROUP LTD 74
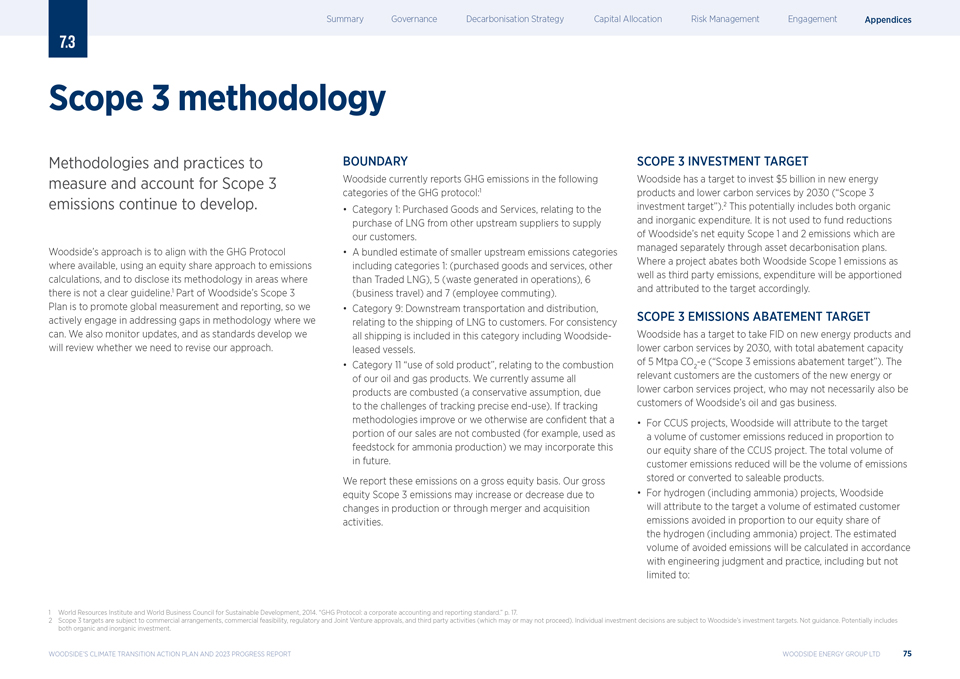
|
7.3 Scope 3 methodology Methodologies and practices to measure and account for Scope 3 emissions continue to develop. Woodside?s approach is to align with the GHG Protocol where available, using an equity share approach to emissions calculations, and to disclose its methodology in areas where there is not a clear guideline.1 Part of Woodside?s Scope 3 Plan is to promote global measurement and reporting, so we actively engage in addressing gaps in methodology where we can. We also monitor updates, and as standards develop we will review whether we need to revise our approach. BOUNDARY Woodside currently reports GHG emissions in the following categories of the GHG protocol:1 Category 1: Purchased Goods and Services, relating to the purchase of LNG from other upstream suppliers to supply our customers. A bundled estimate of smaller upstream emissions categories including categories 1: (purchased goods and services, other than Traded LNG), 5 (waste generated in operations), 6 (business travel) and 7 (employee commuting). Category 9: Downstream transportation and distribution, relating to the shipping of LNG to customers. For consistency all shipping is included in this category including Woodside-leased vessels. Category 11 ?use of sold product?, relating to the combustion of our oil and gas products. We currently assume all products are combusted (a conservative assumption, due to the challenges of tracking precise end-use). If tracking methodologies improve or we otherwise are confident that a portion of our sales are not combusted (for example, used as feedstock for ammonia production) we may incorporate this in future. We report these emissions on a gross equity basis. Our gross equity Scope 3 emissions may increase or decrease due to changes in production or through merger and acquisition activities. SCOPE 3 INVESTMENT TARGET Woodside has a target to invest $5 billion in new energy products and lower carbon services by 2030 (?Scope 3 investment target?).2 This potentially includes both organic and inorganic expenditure. It is not used to fund reductions of Woodside?s net equity Scope 1 and 2 emissions which are managed separately through asset decarbonisation plans. Where a project abates both Woodside Scope 1 emissions as well as third party emissions, expenditure will be apportioned and attributed to the target accordingly. SCOPE 3 EMISSIONS ABATEMENT TARGET Woodside has a target to take FID on new energy products and lower carbon services by 2030, with total abatement capacity of 5 Mtpa CO -e (?Scope 3 emissions abatement target?). The relevant customers 2 are the customers of the new energy or lower carbon services project, who may not necessarily also be customers of Woodside?s oil and gas business. For CCUS projects, Woodside will attribute to the target a volume of customer emissions reduced in proportion to our equity share of the CCUS project. The total volume of customer emissions reduced will be the volume of emissions stored or converted to saleable products. For hydrogen (including ammonia) projects, Woodside will attribute to the target a volume of estimated customer emissions avoided in proportion to our equity share of the hydrogen (including ammonia) project. The estimated volume of avoided emissions will be calculated in accordance with engineering judgment and practice, including but not limited to: 1 World Resources Institute and World Business Council for Sustainable Development, 2014. ?GHG Protocol: a corporate accounting and reporting standard.? p. 17. 2 Scope 3 targets are subject to commercial arrangements, commercial feasibility, regulatory and Joint Venture approvals, and third party activities (which may or may not proceed). Individual investment decisions are subject to Woodside?s investment targets. Not guidance. Potentially includes both organic and inorganic investment. WOODSIDE?S CLIMATE TRANSITION ACTION PLAN AND 2023 PROGRESS REPORT WOODSIDE ENERGY GROUP LTD 75
|
Gas is utilised as a direct heating source for homes or indirectly through electricity. the equivalent diesel consumption based on energy density and converted to t CO -e assuming the diesel is combusted, in the case sales2 to the heavy duty road transport sector; the equivalent bunker fuel based on energy density and converted to t CO -e assuming the bunker fuel is combusted, in the case 2 of sales to the marine fuels sector; the equivalent coal consumption based on energy density and converted to t CO -e assuming the coal is combusted, in the case of sales to the 2 power generation sector. For renewable power projects, Woodside will attribute to the target an estimated volume of avoided emissions in proportion to our equity share in the renewable power project. The estimated volume of avoided emissions will be calculated in accordance with engineering judgment and practice, including but not limited to comparison with the average emissions intensity of the power grid in the relevant location. REPORTING GROSS AND NET SCOPE 3 EMISSIONS When reporting Scope 3 emissions, Woodside will separately report its Scope 3 emissions (including those arising from its sales of oil and gas products) from its estimation of avoided or reduced customer emissions as a consequence of projects pursued in support of the targets. MERGERS AND ACQUISITIONS The Board may, in its sole discretion, change either of the Scope 3 targets to re?ect changes due to mergers and acquisitions. WOODSIDE?S CLIMATE TRANSITION ACTION PLAN AND 2023 PROGRESS REPORT WOODSIDE ENERGY GROUP LTD 76
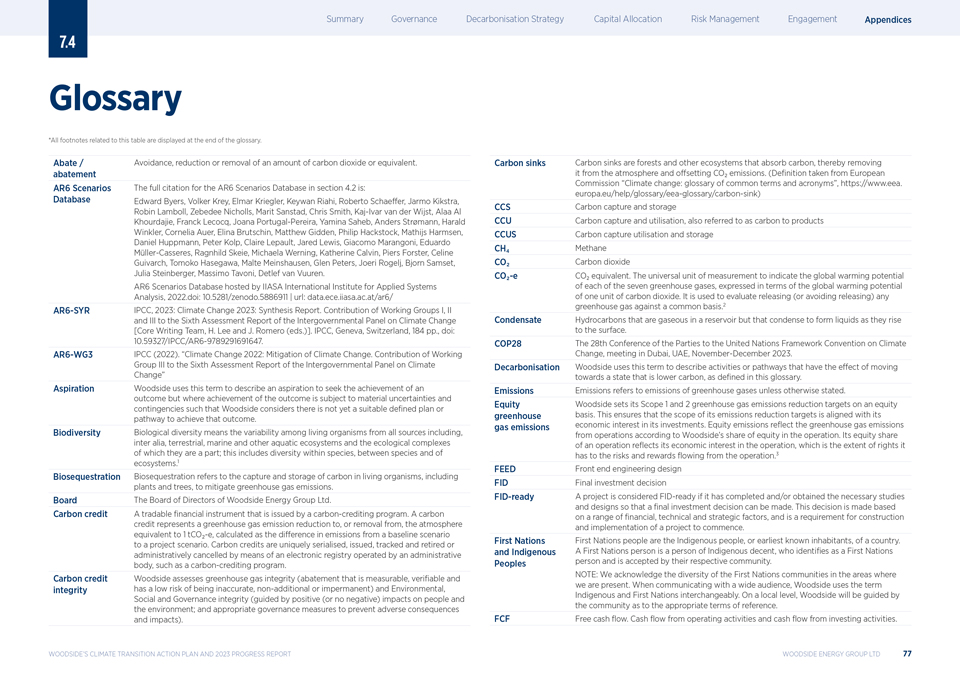
|
7.4 Glossary *All footnotes related to this table are displayed at the end of the glossary. Abate / Avoidance, reduction or removal of an amount of carbon dioxide or equivalent. abatement AR6 Scenarios The full citation for the AR6 Scenarios Database in section 4.2 is: Database Edward Byers, Volker Krey, Elmar Kriegler, Keywan Riahi, Roberto Schaeffer, Jarmo Kikstra, Robin Lamboll, Zebedee Nicholls, Marit Sanstad, Chris Smith, Kaj-Ivar van der Wijst, Alaa Al Khourdajie, Franck Lecocq, Joana Portugal-Pereira, Yamina Saheb, Anders Str?mann, Harald Winkler, Cornelia Auer, Elina Brutschin, Matthew Gidden, Philip Hackstock, Mathijs Harmsen, Daniel Huppmann, Peter Kolp, Claire Lepault, Jared Lewis, Giacomo Marangoni, Eduardo M?ller-Casseres, Ragnhild Skeie, Michaela Werning, Katherine Calvin, Piers Forster, Celine Guivarch, Tomoko Hasegawa, Malte Meinshausen, Glen Peters, Joeri Rogelj, Bjorn Samset, Julia Steinberger, Massimo Tavoni, Detlef van Vuuren. AR6 Scenarios Database hosted by IIASA International Institute for Applied Systems Analysis, 2022.doi: 10.5281/zenodo.5886911 | url: data.ece.iiasa.ac.at/ar6/ AR6-SYR IPCC, 2023: Climate Change 2023: Synthesis Report. Contribution of Working Groups I, II and III to the Sixth Assessment Report of the Intergovernmental Panel on Climate Change [Core Writing Team, H. Lee and J. Romero (eds.)]. IPCC, Geneva, Switzerland, 184 pp., doi: 10.59327/IPCC/AR6-9789291691647. AR6-WG3 IPCC (2022). ?Climate Change 2022: Mitigation of Climate Change. Contribution of Working Group III to the Sixth Assessment Report of the Intergovernmental Panel on Climate Change? Aspiration Woodside uses this term to describe an aspiration to seek the achievement of an outcome but where achievement of the outcome is subject to material uncertainties and contingencies such that Woodside considers there is not yet a suitable de?ned plan or pathway to achieve that outcome. Biodiversity Biological diversity means the variability among living organisms from all sources including, inter alia, terrestrial, marine and other aquatic ecosystems and the ecological complexes of which they are a part; this includes diversity within species, between species and of ecosystems.1 Biosequestration Biosequestration refers to the capture and storage of carbon in living organisms, including plants and trees, to mitigate greenhouse gas emissions. Board The Board of Directors of Woodside Energy Group Ltd. Carbon credit A tradable ?nancial instrument that is issued by a carbon-crediting program. A carbon credit represents a greenhouse gas emission reduction to, or removal from, the atmosphere equivalent to 1 tCO?-e, calculated as the difference in emissions from a baseline scenario to a project scenario. Carbon credits are uniquely serialised, issued, tracked and retired or administratively cancelled by means of an electronic registry operated by an administrative body, such as a carbon-crediting program. Carbon credit Woodside assesses greenhouse gas integrity (abatement that is measurable, veri?able and integrity has a low risk of being inaccurate, non-additional or impermanent) and Environmental, Social and Governance integrity (guided by positive (or no negative) impacts on people and the environment; and appropriate governance measures to prevent adverse consequences and impacts). Carbon sinks Carbon sinks are forests and other ecosystems that absorb carbon, thereby removing it from the atmosphere and offsetting CO? emissions. (Definition taken from European Commission ?Climate change: glossary of common terms and acronyms?, https://www.eea. europa.eu/help/glossary/eea-glossary/carbon-sink) CCS Carbon capture and storage CCU Carbon capture and utilisation, also referred to as carbon to products CCUS Carbon capture utilisation and storage CH? Methane CO? Carbon dioxide CO?-e CO? equivalent. The universal unit of measurement to indicate the global warming potential of each of the seven greenhouse gases, expressed in terms of the global warming potential of one unit of carbon dioxide. It is used to evaluate releasing (or avoiding releasing) any greenhouse gas against a common basis.2 Condensate Hydrocarbons that are gaseous in a reservoir but that condense to form liquids as they rise to the surface. COP28 The 28th Conference of the Parties to the United Nations Framework Convention on Climate Change, meeting in Dubai, UAE, November-December 2023. Decarbonisation Woodside uses this term to describe activities or pathways that have the effect of moving towards a state that is lower carbon, as de?ned in this glossary. Emissions Emissions refers to emissions of greenhouse gases unless otherwise stated. Equity Woodside sets its Scope 1 and 2 greenhouse gas emissions reduction targets on an equity greenhouse basis. This ensures that the scope of its emissions reduction targets is aligned with its gas emissions economic interest in its investments. Equity emissions reflect the greenhouse gas emissions from operations according to Woodside?s share of equity in the operation. Its equity share of an operation reflects its economic interest in the operation, which is the extent of rights it has to the risks and rewards flowing from the operation.3 FEED Front end engineering design FID Final investment decision FID-ready A project is considered FID-ready if it has completed and/or obtained the necessary studies and designs so that a ?nal investment decision can be made. This decision is made based on a range of ?nancial, technical and strategic factors, and is a requirement for construction and implementation of a project to commence. First Nations First Nations people are the Indigenous people, or earliest known inhabitants, of a country. and Indigenous A First Nations person is a person of Indigenous decent, who identi?es as a First Nations Peoples person and is accepted by their respective community. NOTE: We acknowledge the diversity of the First Nations communities in the areas where we are present. When communicating with a wide audience, Woodside uses the term Indigenous and First Nations interchangeably. On a local level, Woodside will be guided by the community as to the appropriate terms of reference. FCF Free cash ?ow. Cash ?ow from operating activities and cash ?ow from investing activities. WOODSIDE?S CLIMATE TRANSITION ACTION PLAN AND 2023 PROGRESS REPORT WOODSIDE ENERGY GROUP LTD 77
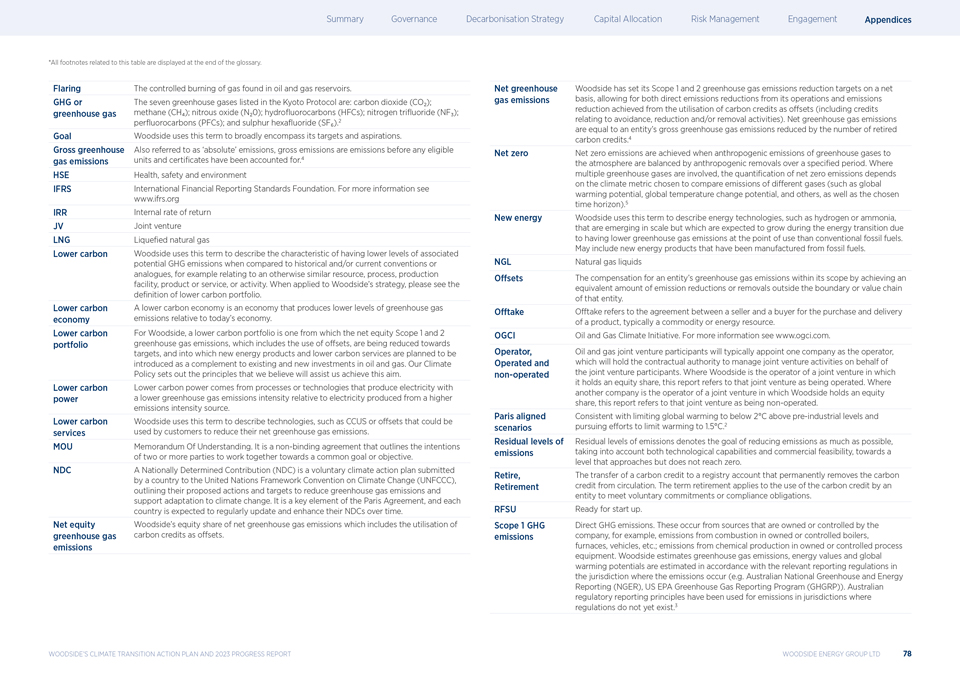
|
*All footnotes related to this table are displayed at the end of the glossary. Flaring The controlled burning of gas found in oil and gas reservoirs. GHG or The seven greenhouse gases listed in the Kyoto Protocol are: carbon dioxide (CO?); greenhouse gas methane (CH?); nitrous oxide (N?0); hydro?uorocarbons (HFCs); nitrogen tri?uoride (NF?); per?uorocarbons (PFCs); and sulphur hexa?uoride (SF?).2 Goal Woodside uses this term to broadly encompass its targets and aspirations. Gross greenhouse Also referred to as ?absolute? emissions, gross emissions are emissions before any eligible gas emissions units and certi?cates have been accounted for.4 HSE Health, safety and environment IFRS International Financial Reporting Standards Foundation. For more information see www.ifrs.org IRR Internal rate of return JV Joint venture LNG Lique?ed natural gas Lower carbon Woodside uses this term to describe the characteristic of having lower levels of associated potential GHG emissions when compared to historical and/or current conventions or analogues, for example relating to an otherwise similar resource, process, production facility, product or service, or activity. When applied to Woodside?s strategy, please see the definition of lower carbon portfolio. Lower carbon A lower carbon economy is an economy that produces lower levels of greenhouse gas economy emissions relative to today?s economy. Lower carbon For Woodside, a lower carbon portfolio is one from which the net equity Scope 1 and 2 portfolio greenhouse gas emissions, which includes the use of offsets, are being reduced towards targets, and into which new energy products and lower carbon services are planned to be introduced as a complement to existing and new investments in oil and gas. Our Climate Policy sets out the principles that we believe will assist us achieve this aim. Lower carbon Lower carbon power comes from processes or technologies that produce electricity with power a lower greenhouse gas emissions intensity relative to electricity produced from a higher emissions intensity source. Lower carbon Woodside uses this term to describe technologies, such as CCUS or offsets that could be services used by customers to reduce their net greenhouse gas emissions. MOU Memorandum Of Understanding. It is a non-binding agreement that outlines the intentions of two or more parties to work together towards a common goal or objective. NDC A Nationally Determined Contribution (NDC) is a voluntary climate action plan submitted by a country to the United Nations Framework Convention on Climate Change (UNFCCC), outlining their proposed actions and targets to reduce greenhouse gas emissions and support adaptation to climate change. It is a key element of the Paris Agreement, and each country is expected to regularly update and enhance their NDCs over time. Net equity Woodside?s equity share of net greenhouse gas emissions which includes the utilisation of greenhouse gas carbon credits as offsets. emissions Net greenhouse Woodside has set its Scope 1 and 2 greenhouse gas emissions reduction targets on a net gas emissions basis, allowing for both direct emissions reductions from its operations and emissions reduction achieved from the utilisation of carbon credits as offsets (including credits relating to avoidance, reduction and/or removal activities). Net greenhouse gas emissions are equal to an entity?s gross greenhouse gas emissions reduced by the number of retired carbon credits.4 Net zero Net zero emissions are achieved when anthropogenic emissions of greenhouse gases to the atmosphere are balanced by anthropogenic removals over a speci?ed period. Where multiple greenhouse gases are involved, the quanti?cation of net zero emissions depends on the climate metric chosen to compare emissions of different gases (such as global warming potential, global temperature change potential, and others, as well as the chosen time horizon).5 New energy Woodside uses this term to describe energy technologies, such as hydrogen or ammonia, that are emerging in scale but which are expected to grow during the energy transition due to having lower greenhouse gas emissions at the point of use than conventional fossil fuels. May include new energy products that have been manufactured from fossil fuels. NGL Natural gas liquids Offsets The compensation for an entity?s greenhouse gas emissions within its scope by achieving an equivalent amount of emission reductions or removals outside the boundary or value chain of that entity. Offtake Offtake refers to the agreement between a seller and a buyer for the purchase and delivery of a product, typically a commodity or energy resource. OGCI Oil and Gas Climate Initiative. For more information see www.ogci.com. Operator, Oil and gas joint venture participants will typically appoint one company as the operator, Operated and which will hold the contractual authority to manage joint venture activities on behalf of non-operated the joint venture participants. Where Woodside is the operator of a joint venture in which it holds an equity share, this report refers to that joint venture as being operated. Where another company is the operator of a joint venture in which Woodside holds an equity share, this report refers to that joint venture as being non-operated. Paris aligned Consistent with limiting global warming to below 2C above pre-industrial levels and scenarios pursuing efforts to limit warming to 1.5C.2 Residual levels of Residual levels of emissions denotes the goal of reducing emissions as much as possible, emissions taking into account both technological capabilities and commercial feasibility, towards a level that approaches but does not reach zero. Retire, The transfer of a carbon credit to a registry account that permanently removes the carbon Retirement credit from circulation. The term retirement applies to the use of the carbon credit by an entity to meet voluntary commitments or compliance obligations. RFSU Ready for start up. Scope 1 GHG Direct GHG emissions. These occur from sources that are owned or controlled by the emissions company, for example, emissions from combustion in owned or controlled boilers, furnaces, vehicles, etc.; emissions from chemical production in owned or controlled process equipment. Woodside estimates greenhouse gas emissions, energy values and global warming potentials are estimated in accordance with the relevant reporting regulations in the jurisdiction where the emissions occur (e.g. Australian National Greenhouse and Energy Reporting (NGER), US EPA Greenhouse Gas Reporting Program (GHGRP)). Australian regulatory reporting principles have been used for emissions in jurisdictions where regulations do not yet exist.3 WOODSIDE?S CLIMATE TRANSITION ACTION PLAN AND 2023 PROGRESS REPORT WOODSIDE ENERGY GROUP LTD 78
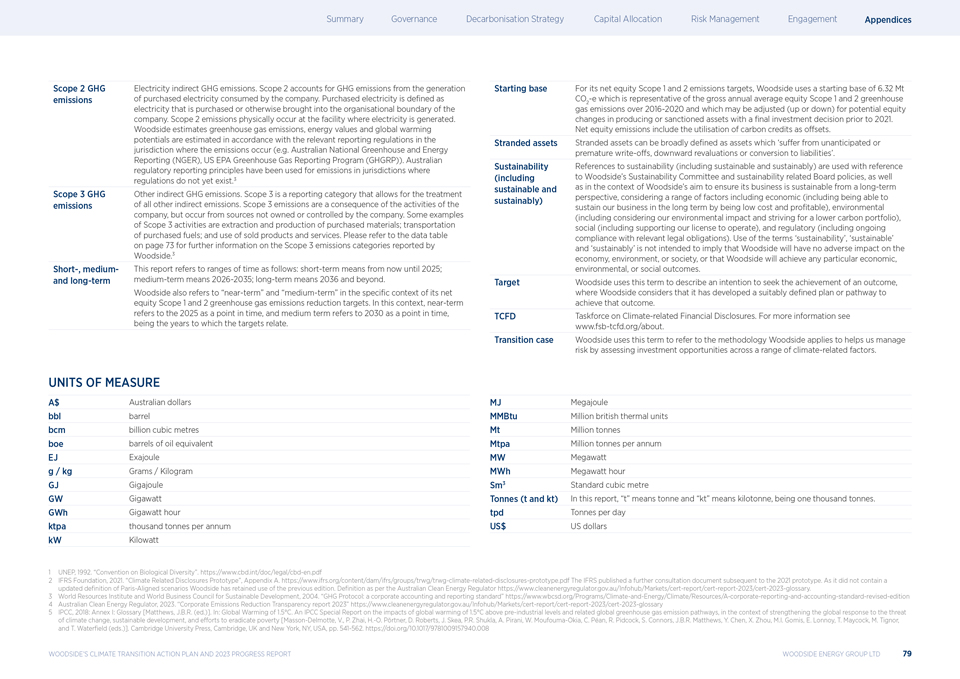
|
Scope 2 GHG Electricity indirect GHG emissions. Scope 2 accounts for GHG emissions from the generation emissions of purchased electricity consumed by the company. Purchased electricity is de?ned as electricity that is purchased or otherwise brought into the organisational boundary of the company. Scope 2 emissions physically occur at the facility where electricity is generated. Woodside estimates greenhouse gas emissions, energy values and global warming potentials are estimated in accordance with the relevant reporting regulations in the jurisdiction where the emissions occur (e.g. Australian National Greenhouse and Energy Reporting (NGER), US EPA Greenhouse Gas Reporting Program (GHGRP)). Australian regulatory reporting principles have been used for emissions in jurisdictions where regulations do not yet exist.3 Scope 3 GHG Other indirect GHG emissions. Scope 3 is a reporting category that allows for the treatment emissions of all other indirect emissions. Scope 3 emissions are a consequence of the activities of the company, but occur from sources not owned or controlled by the company. Some examples of Scope 3 activities are extraction and production of purchased materials; transportation of purchased fuels; and use of sold products and services. Please refer to the data table on page 73 for further information on the Scope 3 emissions categories reported by Woodside.3 Short-, medium- This report refers to ranges of time as follows: short-term means from now until 2025; and long-term medium-term means 2026-2035; long-term means 2036 and beyond. Woodside also refers to ?near-term? and ?medium-term? in the specific context of its net equity Scope 1 and 2 greenhouse gas emissions reduction targets. In this context, near-term refers to the 2025 as a point in time, and medium term refers to 2030 as a point in time, being the years to which the targets relate. Starting base For its net equity Scope 1 and 2 emissions targets, Woodside uses a starting base of 6.32 Mt CO -e which is representative of the gross annual average equity Scope 1 and 2 greenhouse 2 gas emissions over 2016-2020 and which may be adjusted (up or down) for potential equity changes in producing or sanctioned assets with a ?nal investment decision prior to 2021. Net equity emissions include the utilisation of carbon credits as offsets. Stranded assets Stranded assets can be broadly defined as assets which ?suffer from unanticipated or premature write-offs, downward revaluations or conversion to liabilities?. Sustainability References to sustainability (including sustainable and sustainably) are used with reference (including to Woodside?s Sustainability Committee and sustainability related Board policies, as well sustainable and as in the context of Woodside?s aim to ensure its business is sustainable from a long-term sustainably) perspective, considering a range of factors including economic (including being able to sustain our business in the long term by being low cost and profitable), environmental (including considering our environmental impact and striving for a lower carbon portfolio), social (including supporting our license to operate), and regulatory (including ongoing compliance with relevant legal obligations). Use of the terms ?sustainability?, ?sustainable? and ?sustainably? is not intended to imply that Woodside will have no adverse impact on the economy, environment, or society, or that Woodside will achieve any particular economic, environmental, or social outcomes. Target Woodside uses this term to describe an intention to seek the achievement of an outcome, where Woodside considers that it has developed a suitably de?ned plan or pathway to achieve that outcome. TCFD Taskforce on Climate-related Financial Disclosures. For more information see www.fsb-tcfd.org/about. Transition case Woodside uses this term to refer to the methodology Woodside applies to helps us manage risk by assessing investment opportunities across a range of climate-related factors. UNITS OF MEASURE A$ Australian dollars MJ Megajoule bbl barrel MMBtu Million british thermal units bcm billion cubic metres Mt Million tonnes boe barrels of oil equivalent Mtpa Million tonnes per annum EJ Exajoule MW Megawatt g / kg Grams / Kilogram MWh Megawatt hour GJ Gigajoule Sm3 Standard cubic metre GW Gigawatt Tonnes (t and kt) In this report, ?t? means tonne and ?kt? means kilotonne, being one thousand tonnes. GWh Gigawatt hour tpd Tonnes per day ktpa thousand tonnes per annum US$ US dollars kW Kilowatt 1 UNEP, 1992. ?Convention on Biological Diversity?. https://www.cbd.int/doc/legal/cbd-en.pdf 2 IFRS Foundation, 2021. ?Climate Related Disclosures Prototype?, Appendix A. https://www.ifrs.org/content/dam/ifrs/groups/trwg/trwg-climate-related-disclosures-prototype.pdf The IFRS published a further consultation document subsequent to the 2021 prototype. As it did not contain a updated definition of Paris-Aligned scenarios Woodside has retained use of the previous edition. Definition as per the Australian Clean Energy Regulator https://www.cleanenergyregulator.gov.au/Infohub/Markets/cert-report/cert-report-2023/cert-2023-glossary. 3 World Resources Institute and World Business Council for Sustainable Development, 2004. ?GHG Protocol: a corporate accounting and reporting standard? https://www.wbcsd.org/Programs/Climate-and-Energy/Climate/Resources/A-corporate-reporting-and-accounting-standard-revised-edition 4 Australian Clean Energy Regulator, 2023. ?Corporate Emissions Reduction Transparency report 2023? https://www.cleanenergyregulator.gov.au/Infohub/Markets/cert-report/cert-report-2023/cert-2023-glossary 5 IPCC, 2018: Annex I: Glossary [Matthews, J.B.R. (ed.)]. In: Global Warming of 1.5C. An IPCC Special Report on the impacts of global warming of 1.5C above pre-industrial levels and related global greenhouse gas emission pathways, in the context of strengthening the global response to the threat of climate change, sustainable development, and efforts to eradicate poverty [Masson-Delmotte, V., P. Zhai, H.-O. P?rtner, D. Roberts, J. Skea, P.R. Shukla, A. Pirani, W. Moufouma-Okia, C. P?an, R. Pidcock, S. Connors, J.B.R. Matthews, Y. Chen, X. Zhou, M.I. Gomis, E. Lonnoy, T. Maycock, M. Tignor, and T. Water?eld (eds.)]. Cambridge University Press, Cambridge, UK and New York, NY, USA, pp. 541-562. https://doi.org/10.1017/9781009157940.008 WOODSIDE?S CLIMATE TRANSITION ACTION PLAN AND 2023 PROGRESS REPORT WOODSIDE ENERGY GROUP LTD 79
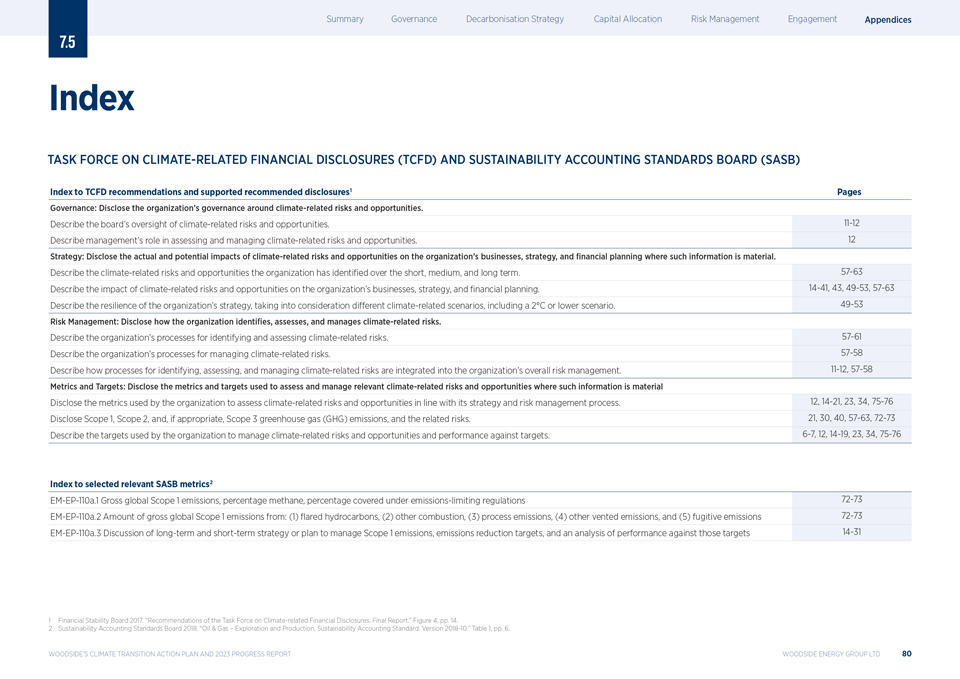
|
7.5 Index TASK FORCE ON CLIMATE-RELATED FINANCIAL DISCLOSURES (TCFD) AND SUSTAINABILITY ACCOUNTING STANDARDS BOARD (SASB) Index to TCFD recommendations and supported recommended disclosures1 Pages Governance: Disclose the organization?s governance around climate-related risks and opportunities. Describe the board?s oversight of climate-related risks and opportunities. 11-12 Describe management?s role in assessing and managing climate-related risks and opportunities. 12 Strategy: Disclose the actual and potential impacts of climate-related risks and opportunities on the organization?s businesses, strategy, and financial planning where such information is material. Describe the climate-related risks and opportunities the organization has identified over the short, medium, and long term. 57-63 Describe the impact of climate-related risks and opportunities on the organization?s businesses, strategy, and financial planning. 14-41, 43, 49-53, 57-63 Describe the resilience of the organization?s strategy, taking into consideration different climate-related scenarios, including a 2C or lower scenario. 49-53 Risk Management: Disclose how the organization identi?es, assesses, and manages climate-related risks. Describe the organization?s processes for identifying and assessing climate-related risks. 57-61 Describe the organization?s processes for managing climate-related risks. 57-58 Describe how processes for identifying, assessing, and managing climate-related risks are integrated into the organization?s overall risk management. 11-12, 57-58 Metrics and Targets: Disclose the metrics and targets used to assess and manage relevant climate-related risks and opportunities where such information is material Disclose the metrics used by the organization to assess climate-related risks and opportunities in line with its strategy and risk management process. 12, 14-21, 23, 34, 75-76 Disclose Scope 1, Scope 2, and, if appropriate, Scope 3 greenhouse gas (GHG) emissions, and the related risks. 21, 30, 40, 57-63, 72-73 Describe the targets used by the organization to manage climate-related risks and opportunities and performance against targets. 6-7, 12, 14-19, 23, 34, 75-76 Index to selected relevant SASB metrics2 EM-EP-110a.1 Gross global Scope 1 emissions, percentage methane, percentage covered under emissions-limiting regulations 72-73 EM-EP-110a.2 Amount of gross global Scope 1 emissions from: (1) ?ared hydrocarbons, (2) other combustion, (3) process emissions, (4) other vented emissions, and (5) fugitive emissions 72-73 EM-EP-110a.3 Discussion of long-term and short-term strategy or plan to manage Scope 1 emissions, emissions reduction targets, and an analysis of performance against those targets 14-31 1 Financial Stability Board 2017. ?Recommendations of the Task Force on Climate-related Financial Disclosures. Final Report.? Figure 4, pp. 14. 2 Sustainability Accounting Standards Board 2018. ?Oil & Gas ? Exploration and Production. Sustainability Accounting Standard. Version 2018-10.? Table 1, pp. 6. WOODSIDE?S CLIMATE TRANSITION ACTION PLAN AND 2023 PROGRESS REPORT WOODSIDE ENERGY GROUP LTD 80
|
7.6 Disclaimer, and other important risks, emissions information data 1. This report has been prepared to provide our investors and potential investors with information on our plan to help us achieve our strategic aim to thrive through the energy transition and how we are progressing against that strategic aim. 2. This report has been structured to address the Task Force on Climate-related Financial Disclosures (TCFD) recommendations framework. It aims to provide a balance of disclosures that meet the recommendations of the TCFD, while avoiding overwhelming readers with information. Woodside considers that it addresses TCFD?s four recommendations and eleven recommended disclosures, having had regard to the Guidance for All Sectors and Supplemental Guidance for Non-Financial Groups. Our approach to the disclosures included in this report differs from our approach to the disclosures we include in our mandatory regulatory reports, including our filings with the Australian Securities Exchange (ASX), the U.S. Securities and Exchange Commission (SEC) and the London Stock Exchange (LSE). This report is intended to provide information from a different perspective and in more detail than that required to be included in other regulatory reports, including our filings with the ASX and the SEC. 3. This report has not been prepared as ?nancial or investment advice or to provide any guidance in relation to our future performance. It should be read in conjunction with our periodic reporting and other announcements made to the ASX, SEC and LSE. 4. This report is not intended to, and does not constitute, form part of, or contain an offer or invitation to sell to Woodside (or any other person) or a solicitation of an offer from Woodside (or any other person) in any jurisdiction. 5. Given the focus of this report, it is necessarily oriented towards future events and contains forward looking information regarding the plans, strategies, objectives, targets, aspirations and the like of Woodside in relation to climate change. 6. This report is designed to provide a level of insight into how we currently intend to direct the management of our assets and to deploy our capital, to help us achieve our strategic aim. The matters disclosed in this report are a ?point in time? disclosure and reflect management?s expectations, judgments, assessments, assumptions, estimates and other information available at the date of this report and/ or the date of our planning processes. We operate in a dynamic and uncertain market and external environment. Plans and strategies can and must adapt in response to dynamic market conditions, joint venture decisions, new opportunities that might arise or other changing circumstances. Investors should not assume that any plan (including any pathway we have articulated to achieve a strategic aim) is locked in and will not evolve and be updated as time passes. Additionally, a number of aspects of our plans involve developments or strategies that are complex and may be delayed, more costly than anticipated or unsuccessful for many reasons, including reasons that are outside of Woodside?s control. 7. Actual performance against Woodside?s targets (including items that are described as a target) and aspirations or goals may be affected by various risks associated with the Woodside business, the uncertainty as to how the global energy transition to a lower carbon economy will evolve, 8. and physical risks associated with climate change, many of which are beyond Woodside?s control. Further detail on certain of these risks can be found in the Risk Management section of this report and the Risk Factors section of our Annual Report 2023. These risks include, but are not limited to: The risk that a transition to a lower carbon economy may impact demand (and pricing) for oil, gas, new energy products and lower carbon services and their substitutes, the policy and legal environment for their production, our reputation and our operating environment. Further, the imposition of further regulation and the availability and cost of emission allowances or carbon offsets could adversely impact costs of operations; The potential for higher than expected costs of transition to new technologies, and poor efficacy of new technologies that could adversely impact the costs of operations and reduce demand for hydrocarbon products, new energy or lower carbon services; and The decarbonisation plans of other countries. Readers, including investors and prospective investors, should review and have regard to these risks and the other risks identi?ed in this report when considering the information contained in this report. Readers should also note that the high degree of uncertainty around the nature, timing and magnitude of climate-related risks, and the uncertainty as to how the energy transition will evolve, makes it difficult to determine and disclose the risks and their potential impacts with precision. WOODSIDE?S CLIMATE TRANSITION ACTION PLAN AND 2023 PROGRESS REPORT WOODSIDE ENERGY GROUP LTD 81
|
9. There are inherent limitations with scenario analysis, including the limitations set out on pages 44-45 of this report, and it is difficult to predict which, if any, of the scenarios might eventuate. Scenario analysis relies on assumptions that may or may not be, or prove to be, correct and that may or may not eventuate and scenarios may also be impacted by additional factors to the assumptions disclosed. As part of its scenario analysis, Woodside has used climate scenarios published in the IEA?s 2023 World Energy Outlook (pages 52-53 of this report describes limitations and uncertainties associated with the use of the IEA scenarios).1 10. The forward looking statements contained in this report are not guidance, forecasts, guarantees or predictions of future events or performance. No representation or warranty, express or implied, is given as to the accuracy, completeness or correctness, likelihood of achievement or reasonable basis of any forward-looking information contained in this report. Readers are cautioned not to place undue reliance on any forward looking statements contained in this report, particularly in light of the long time horizon which this report discusses and the inherent uncertainty in possible policy, market and technological developments in the future. 11. The forward looking information contained in this report may be affected by a variety of variables and changes in underlying assumptions which could cause actual results to differ materially from those expressed in the statements contained in this report. In addition to the risks referenced above, these include price ?uctuations, actual demand, currency ?uctuations, drilling and production results, reserve estimates, loss of market, industry competition, environmental risks, transition risks, physical risks, legislative, policy, ?scal and regulatory developments, changes in accounting standards, economic and ?nancial market conditions in various countries and regions, political risks, abatement able to be delivered through engineering or operational changes, project delay or advancement, approvals and cost estimates. Some matters are subject to approval of joint venture participants. The targets, aspirations and opportunities described in this report may also change materially if Woodside changes its strategic aim set out in this report. For more information, see the Forward-Looking Statements section of our Annual Report 2023. 12. Woodside does not undertake to provide ongoing market updates on forward looking information, including its plans to achieve its strategic aim or targets, or on performance against its plans or targets, except to the extent it has a legal obligation to do so. Past performance cannot be relied on as a guide to future performance. 13. Subject to any terms implied by law which cannot be excluded, Woodside accepts no responsibility for any loss, damage, cost or expense (whether direct or indirect) incurred by you as a result of any error, omission or misrepresentation in information in this report. 14. This report does not include any express or implied prices at which Woodside will buy or sell ?nancial products. 15. This report may contain industry, market and competitive position data that is based on industry publications and studies conducted by third parties as well as Woodside?s internal estimates and research. While Woodside believes that each of these publications and third party studies is reliable and has been prepared by a reputable source, Woodside has not independently verified the market and industry data obtained from these third party sources and cannot guarantee the completeness or accuracy of such data. Undue reliance should not be placed on any of the industry, market or competitive position data contained in this report. 16. Certain other information contained in this report may be based on information prepared by third parties. Woodside does not make any representation or guarantee that this third party material is accurate, complete or up-to-date. 17. All greenhouse gas emissions data in this report are estimates, due to the inherent uncertainty and limitations in measuring or quantifying greenhouse gas emissions, including those uncertainties set out in the GHD Assurance Statement on page 83 of this report. 18. Further information regarding the calculation of Woodside?s greenhouse gas emissions is contained in the supporting table of climate-related data provided on page 73 of this report. 19. There may be differences in the way third parties calculate or report greenhouse gas emissions compared to Woodside, which means third party data may not be comparable to Woodside?s data. 1 The Task Force on Climate-related Financial Disclosures (2020). ?Guidance on Scenario Analysis for Non-Financial Companies?. WOODSIDE?S CLIMATE TRANSITION ACTION PLAN AND 2023 PROGRESS REPORT WOODSIDE ENERGY GROUP LTD 82
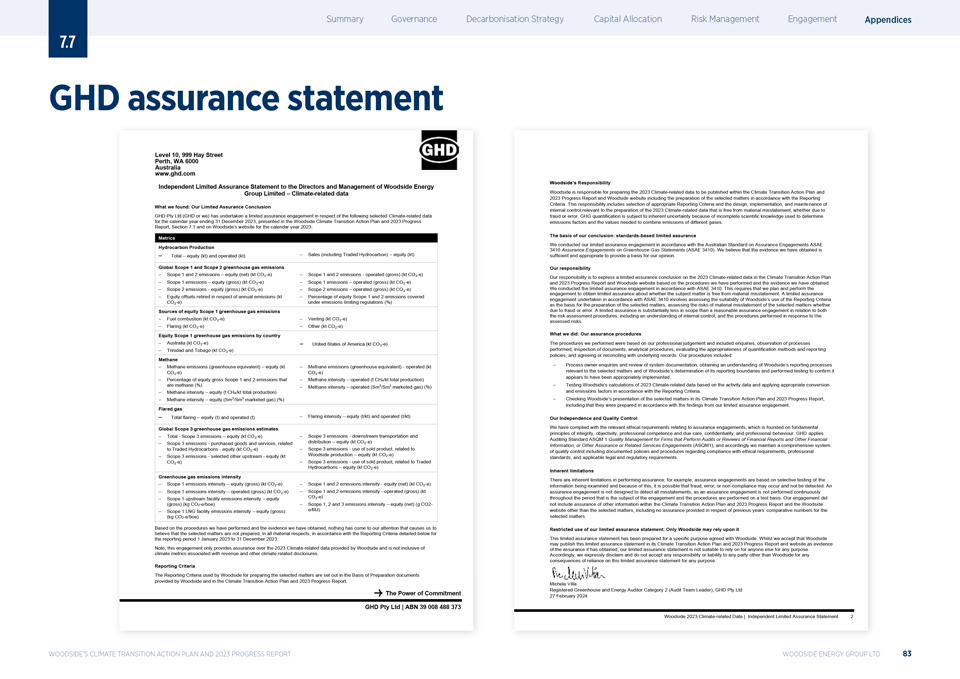
|
7.7 GHD assurance statement Level Perth, 10, WA 999 6000 Hay Street Australia www.ghd. com Independent Limited Assurance Statement to the Directors and Management of Woodside Energy Group Limited ? Climate-related data What we found: Our Limited Assurance Conclusion GHD Pty Ltd (GHD or we) has undertaken a limited assurance engagement in respect of the following selected Climate-related data for the calendar year ending 31 December 2023, presented in the Woodside Climate Transition Action Plan and 2023 Progress Report, Section 7.1 and on Woodside?s website for the calendar year 2023: Metrics Hydrocarbon Production ? Total ? equity (kt) and operated (kt) ? Sales (including Traded Hydrocarbon) ? equity (kt) Global Scope 1 and Scope 2 greenhouse gas emissions ? Scope 1 and 2 emissions ? equity (net) (kt CO?-e) ? Scope 1 and 2 emissions—operated (gross) (kt CO?-e) ? Scope 1 emissions ? equity (gross) (kt CO?-e) ? Scope 1 emissions ? operated (gross) (kt CO?-e) ? Scope 2 emissions—equity (gross) (kt CO?-e) ? Scope 2 emissions ? operated (gross) (kt CO?-e) ? Equity offsets retired in respect of annual emissions (kt ? Percentage of equity Scope 1 and 2 emissions covered CO?-e) under emissions limiting regulations (%) Sources of equity Scope 1 greenhouse gas emissions ? Fuel combustion (kt CO?-e) ? Venting (kt CO?-e) ? Flaring (kt CO?-e) ? Other (kt CO?-e) Equity Scope 1 greenhouse gas emissions by country ? Australia (kt CO?-e) ? United States of America (kt CO?-e) ? Trinidad and Tobago (kt CO?-e) Methane ? Methane emissions (greenhouse equivalent) ? equity (kt ? Methane emissions (greenhouse equivalent)—operated (kt CO?-e) CO?-e) ? Percentage of equity gross Scope 1 and 2 emissions that ? Methane intensity ? operated (t CH4/kt total production) are methane (%) ? Methane intensity ? operated (Sm3/Sm3 marketed gas) (%) ? Methane intensity ? equity (t CH4/kt total production) ? Methane intensity ? equity (Sm3/Sm3 marketed gas) (%) Flared gas ? Total flaring ? equity (t) and operated (t) ? Flaring intensity ? equity (t/kt) and operated (t/kt) Global Scope 3 greenhouse gas emissions estimates ? Total—Scope 3 emissions ? equity (kt CO?-e) ? Scope 3 emissions—downstream transportation and ? Scope 3 emissions—purchased goods and services, related distribution ? equity (kt CO?-e) to Traded Hydrocarbons—equity (kt CO?-e) ? Scope 3 emissions—use of sold product, related to ? Scope 3 emissions—selected other upstream—equity (kt Woodside production ? equity (kt CO?-e) CO?-e) ? Scope 3 emissions—use of sold product, related to Traded Hydrocarbons ? equity (kt CO?-e) Greenhouse gas emissions intensity ? Scope 1 emissions intensity ? equity (gross) (kt CO?-e) ? Scope 1 and 2 emissions intensity—equity (net) (kt CO?-e) ? Scope 1 emissions intensity ? operated (gross) (kt CO?-e) ? Scope 1 and 2 emissions intensity—operated (gross) (kt ? Scope 1 upstream facility emissions intensity ? equity CO?-e) (gross) (kg CO2-e/boe) ? Scope 1, 2 and 3 emissions intensity ? equity (net) (g CO2- ? Scope 1 LNG facility emissions intensity ? equity (gross) e/MJ) (kg CO2-e/boe) believe that the selected matters are not prepared, in all material respects, in accordance with the Reporting Criteria detailed below for the reporting period 1 January 2023 to 31 December 2023. Note, this engagement only provides assurance over the 2023 Climate-related data provided by Woodside and is not inclusive of climate metrics associated with revenue and other climate related disclosures. Reporting Criteria The Reporting Criteria used by Woodside for preparing the selected matters are set out in the Basis of Preparation documents provided by Woodside and in the Climate Transition Action Plan and 2023 Progress Report. The Power of Commitment GHD Pty Ltd | ABN 39 008 488 373 Woodside?s Responsibility Woodside is responsible for preparing the 2023 Climate-related data to be published within the Climate Transition Action Plan and 2023 Progress Report and Woodside website including the preparation of the selected matters in accordance with the Reporting Criteria. This responsibility includes selection of appropriate Reporting Criteria and the design, implementation, and maintenance of internal control relevant to the preparation of the 2023 Climate-related data that is free from material misstatement, whether due to fraud or error. GHG quantification is subject to inherent uncertainty because of incomplete scientific knowledge used to determine emissions factors and the values needed to combine emissions of different gases. The basis of our conclusion: standards-based limited assurance We conducted our limited assurance engagement in accordance with the Australian Standard on Assurance Engagements ASAE 3410 Assurance Engagements on Greenhouse Gas Statements (ASAE 3410). We believe that the evidence we have obtained is sufficient and appropriate to provide a basis for our opinion. Our responsibility Our responsibility is to express a limited assurance conclusion on the 2023 Climate-related data in the Climate Transition Action Plan and 2023 Progress Report and Woodside website based on the procedures we have performed and the evidence we have obtained. We conducted the limited assurance engagement in accordance with ASAE 3410. This requires that we plan and perform the engagement to obtain limited assurance about whether the subject matter is free from material misstatement. A limited assurance engagement undertaken in accordance with ASAE 3410 involves assessing the suitability of Woodside?s use of the Reporting Criteria as the basis for the preparation of the selected matters, assessing the risks of material misstatement of the selected matters whether due to fraud or error. A limited assurance is substantially less in scope than a reasonable assurance engagement in relation to both the risk assessment procedures, including an understanding of internal control, and the procedures performed in response to the assessed risks. What we did: Our assurance procedures The procedures we performed were based on our professional judgement and included enquiries, observation of processes performed, inspection of documents, analytical procedures, evaluating the appropriateness of quantification methods and reporting policies, and agreeing or reconciling with underlying records. Our procedures included: ? Process owner enquiries and review of system documentation, obtaining an understanding of Woodside?s reporting processes relevant to the selected matters and of Woodside?s determination of its reporting boundaries and performed testing to confirm appears to have been appropriately implemented. ? Testing Woodside?s calculations of 2023 Climate-related data based on the activity data and applying appropriate conversion and emissions factors in accordance with the Reporting Criteria. ? Checking Woodside?s presentation of the selected matters in its Climate Transition Action Plan and 2023 Progress Report, including that they were prepared in accordance with the findings from our limited assurance engagement. Our Independence and Quality Control We have complied with the relevant ethical requirements relating to assurance engagements, which is founded on fundamental principles of integrity, objectivity, professional competence and due care, confidentiality, and professional behaviour. GHD applies Auditing Standard ASQM 1 Quality Management for Firms that Perform Audits or Reviews of Financial Reports and Other Financial Information, or Other Assurance or Related Services Engagements (ASQM1), and accordingly we maintain a comprehensive system of quality control including documented policies and procedures regarding compliance with ethical requirements, professional standards, and applicable legal and regulatory requirements. Inherent limitations There are inherent limitations in performing assurance; for example, assurance engagements are based on selective testing of the information being examined and because of this, it is possible that fraud, error, or non-compliance may occur and not be detected. assurance engagement is not designed to detect all misstatements, as an assurance engagement is not performed continuously throughout the period that is the subject of the engagement and the procedures are performed on a test basis. Our engagement did not include assurance of other information within the Climate Transition Action Plan and 2023 Progress Report and the Woodside website other than the selected matters, including no assurance provided in respect of previous years? comparative numbers for the selected matters. Restricted use of our limited assurance statement: Only Woodside may rely upon it This limited assurance statement has been prepared for a specific purpose agreed with Woodside. Whilst we accept that Woodside may publish this limited assurance statement in its Climate Transition Action Plan and 2023 Progress Report and website as evidence of the assurance it has obtained, our limited assurance statement is not suitable to rely on for anyone else for any purpose. Accordingly, we expressly disclaim and do not accept any responsibility or liability to any party other than Woodside for any consequences of reliance on this limited assurance statement for any purpose. Michele Villa Registered Greenhouse and Energy Auditor Category 2 (Audit Team Leader), GHD Pty Ltd 27 February 2024 WOODSIDE?S CLIMATE TRANSITION ACTION PLAN AND 2023 PROGRESS REPORT WOODSIDE ENERGY GROUP LTD 83

|
Head Office Woodside Energy Group Ltd Mia Yellagonga 11 Mount Street Perth WA 6000 Postal Address GPO Box D188 Perth WA 6840 Australia T +61 8 9348 4000 F +61 8 9214 2777 E companyinfo@woodside.com Woodside Energy Group Ltd ABN 55 004 898 962 woodside.com
Exhibit 99.4

Woodside Energy Group Ltd
ACN 004 898 962
Mia Yellagonga
11 Mount Street
Perth WA 6000
Australia
T +61 8 9348 4000
www.woodside.com
ASX: WDS
NYSE: WDS
LSE: WDS
Announcement
Tuesday, 27 February 2024
CHANGES TO WOODSIDE BOARD
Retirement of Gene Tilbrook from the Woodside Board
The Board of Woodside announces the retirement of Mr Gene Tilbrook as a Director of Woodside, effective 28 February 2024.
Mr Tilbrook joined the Woodside Board in December 2014 bringing extensive experience in corporate strategy, investment and finance. This included senior executive roles at Wesfarmers Limited between 1985-2009. Mr Tilbrook has served on the Audit & Risk Committee, Nominations & Governance Committee, and Human Resources & Compensation Committee of which he was appointed Chair from 2019-2023.
Woodside Chair Richard Goyder said Mr Tilbrook had made an invaluable contribution to Woodside over his ten years on the Board.
“Gene’s tenure has coincided with a transformative period in Woodside’s 70-year history. Gene has overseen the appointment of Meg O’Neill as CEO, the successful completion of Woodside’s merger with BHP’s petroleum business in 2022, and a number of Woodside’s major milestones including final investment decisions on the Sangomar, Trion and Scarborough Energy Projects.
“As Chair of the Human Resource & Compensation Committee, Gene has been instrumental in developing Woodside’s 2021-2025 Reconciliation Action Plan and 2021-2025 Inclusion & Diversity Strategy.
“The Woodside Board has greatly benefited from Gene’s commitment and expertise and on behalf of the Board, I’d like to extend our sincere thanks to Gene for his dedicated service to Woodside.”
| Contacts: | ||
| INVESTORS |
MEDIA | |
| Marcela Louzada | Christine Forster | |
| M: +61 456 994 243 | M: +61 484 112 469 | |
| E: investor@woodside.com | E: christine.forster@woodside.com | |
This announcement was approved and authorised for release by Woodside’s Disclosure Committee.
Page 1 of 1
Exhibit 99.5

Woodside Energy Group Ltd
ACN 004 898 962
Mia Yellagonga
11 Mount Street
Perth WA 6000
Australia
T +61 8 9348 4000
www.woodside.com
ASX: WDS
NYSE: WDS
LSE: WDS
Announcement
Tuesday, 27 February 2024
FULL-YEAR 2023 RESULTS BRIEFING TRANSCRIPT
Date: 27 February 2024
Time: 10:00 AEDT / 07:00 AWST / 17:00 CST (Monday, 26 February 2024)
Start of Transcript
Operator: Thank you for standing by and welcome to the Woodside Energy Group Limited full-year 2023 results. All participants are in a listen-only mode. There will be a presentation followed by a question-and- answer session. If you wish to ask a question, you will need to press the star key followed by the number one on your telephone keypad.
I would now like to hand the conference over to Ms Meg O’Neill, Chief Executive Officer and Managing Director. Please go ahead.
Meg O’Neill: Good morning, everyone. Welcome to Woodside’s 2023 full-year results presentation. We are presenting from Sydney. I would like to begin by acknowledging the traditional custodians of this land, the Gadigal people of the Eora Nation, and pay my respects to their Elders past, present and emerging.
Today I am joined on the call by our Chief Financial Officer, Graham Tiver. Together we will provide an overview of our 2023 performance before opening up to Q&A. Please take the time to read the disclaimers, assumptions and other important information. I’d like to remind you that all dollar figures in today’s presentations are in US dollars unless otherwise indicated.
At Woodside, our strategy is to thrive through the energy transition. This is underpinned by three strategic priorities. And in 2023, we delivered on all three.
The first is providing energy through a high-quality portfolio now and into the future. I’m pleased to report that in 2023 we delivered record full-year production with excellent LNG reliability. We also made significant progress on our major growth projects.
Our second strategic priority is creating and returning value through disciplined capital management. In 2023, our underlying net profit after tax was $3.3 billion. Based on this, our Board has determined a fully franked dividend of US$0.60 per share. This represents a payout ratio of 80% of underlying NPAT, which is at the top end of our range. We also generated $0.6 billion of free cash flow. This is a significant achievement in a period of major capital expenditure and normalised prices.
Page 1 of 15
Our third strategic priority is to conduct our business sustainably. I’m pleased to report we have further reduced our net equity Scope 1 and 2 emissions in 2023 and we are now 12.5% below our starting base. I’d like to highlight that we are launching our Climate Transition Action Plan today and we will be hosting a special investor briefing about our climate plans on 12 March. Please take this as a sign of our continued commitments to action and transparency.
Conducting our business sustainably means more than reducing emissions. It includes ensuring everyone who works here goes home safely and we did not achieve that in 2023, so I’d like to reflect on that. We are steadfast in our commitment to learning from the tragic death of a colleague at the North Rankin Complex last year. We commissioned an external review of our safety systems and we will work relentlessly to improve our processes, tools and training programs. There is nothing more important to us in 2024 than improving safety.
I’d like to look now at the macroeconomic backdrop. As you can see on the charts, we saw extraordinary volatility in 2022, resulting from Russia’s invasion of Ukraine and subsequent impacts on global oil and gas trade. These periods of volatility underline the importance of LNG in ensuring global energy security. During this time, we were able to provide our customers with reliable, affordable and secure energy. At the same time, the fundamentals of long-term LNG demand remain strong. Global demand for LNG is forecast to grow 53% in the coming decade between now and 2033. Much of this demand is expected to emerge from China and South East Asia, markets our assets are geographically advantaged to supply.
Looking at the second graph, in 2023, the majority of contracts signed in the global LNG market were for durations of 20 or more years. This long-term demand for LNG supports our conviction that gas will be a key part of the global energy mix for decades to come. The sell-down of Scarborough to LNG Japan and JERA at full value provides further evidence of Asian players looking to secure access to long-term LNG as they navigate the energy transition. With strong fundamentals, our high-quality portfolio is positioned to provide energy now and into the future.
Focusing now on our portfolio, we see clear benefits of our merger with BHP’s petroleum business. Looking at the green line on slide 8, you can see our production has more than doubled compared to pre-merger levels. Our outstanding LNG reliability contributed to this record overall production which we achieved while also successfully delivering planned turnarounds. We also took steps to further increase our capacity to supply our customers with LNG in the future. For example, we signed an offtake deal with Mexico Pacific LNG and expect first cargo in 2029. This strengthens our position as a portfolio player, supplying our own LNG as well as third-party volumes to our customers. At the same time, we have made significant progress on our major projects.
Going to slide 9, the Sangomar Project was 93% complete at the end of 2023. Since then, the FPSO has arrived safely in Senegal and as you can see, the mooring chains have been connected to the FPSO. Seventeen wells have been drilled and completed. We are targeting first oil in mid-2024 and expect production to ramp up through the year.
Moving to Australia, at year end, Scarborough was 55% complete and is targeting first LNG cargo in 2026. A key achievement was four offshore environment plans were accepted by the regulator in December 2023. The seismic work is now done. The pipelay and drilling are underway. We’ve also made progress across the other workstreams we have for our Scarborough Energy Project. We have recently completed the initial drydock of the FPU hull. As you can see, siteworks are well advanced at the Pluto Train 2 site where we will process the gas.
Let’s now have a look at our financial performance. Overall, commodity prices were lower compared to the highs we saw in 2022 and this is reflected in our financial performance. But thanks to our strong underlying business, we have demonstrated resilience across our financial metrics. Our unit production cost of $8.30 per barrel of oil equivalent has remained steady despite the inflationary environment and planned turnarounds, demonstrating our focus on cost efficiency.
Page 2 of 15
Now what makes us tremendously proud is that in this inflationary environment we continued to return strong dividends to our shareholders. We target paying between 50% and 80% of our underlying net profit in dividends and over the last decade, we have consistently paid at the top end of the range.
I’ll now hand over to Graham to take you through our capital management.
Graham Tiver: Thanks, Meg. Hello, everyone.
Our cash flow generation in 2023 was strong. Looking at the chart on the left, you can see we have delivered a cash margin of 80%. Importantly, we’ve achieved positive free cash flow of $0.6 billion in a heavy capital investment year with record tax payments.
Turning to the balance sheet, our gearing of 12% is at the lower end of the target range and we close the year with liquidity of $7.8 billion. We have also sustained credit ratings of BBB+ or equivalent. Our strong balance sheet supports major capital investments, which provides our near-term growth. It also allows us to continue providing strong returns to our shareholders.
Our financial performance and balance sheet have remained resilient because of our strong underlying business and our consistent approach to capital management. The main point I’d like to highlight is that our capital management framework remains unchanged as do our priorities for cash. As we seek to create value, we will continue to be disciplined to ensure the business remains resilient.
Looking at our sources of cash in the period 2024 to 2028, we expect a significant increase in our cash generation as each of our three major projects - Sangomar, Scarborough and Trion - come online. Assuming an oil price of $70 per barrel, we expect to generate cash flow from operations that more than covers our current budgeted capital expenditure and dividends, creating a projected surplus of cash through the period of 2024 to 2028. Decisions on surplus of cash allocation will be guided by our capital management framework, continuously balancing investing for growth, managing our balance sheet and strong returns to our shareholders. Those decisions will be influenced by a number of factors, including macroeconomic conditions and growth pipeline at a particular point in time.
In addition, there is further optionality within our gearing range, so we are currently sitting towards the lower end of our target range of 10% to 20% gearing. We expect that after 2026 our operating cash flow will increase significantly, creating even more capacity in our balance sheet.
These graphs on the slide do not include the impact of our recent Scarborough sell-down to JERA, which is subject to completion. We are pleased with this transaction and the value it creates for Woodside. In addition to the sale of 15.1% interest in Scarborough, we are also partnering with JERA for an offtake agreement and collaboration in new energy. This deal is further evidence of market confidence in the quality of Scarborough and as Meg said, underlines the long-term value our partners see in the assets. And this positive cash story has been bolstered by our merger with BHP’s petroleum business in 2022.
Trion is an example of how we unlocked value as part of the merger. It was an asset which came into Woodside’s portfolio and we progressed it to a positive final investment decision, adding cash generative and debt free assets, the merger transformed our balance sheet. It has also enabled us to bring together global capabilities and bolster our marketing and trading expertise. We implemented initiatives to deliver over $400 million in synergies within the first seven months of operating as a merged company. This is how we have created and returned value in 2023.
I’ll now hand back to Meg.
Meg O’Neill: Thanks, Graham. At Woodside we are committed to running our business sustainably, it’s why I am pleased to report we are on track to meet our targets to reduce our net equity Scope 1 and 2 emissions by 15% below our starting base by the end of next year. We also progressed our asset decarbonisation plans, for example, the picture on the left of slide 16 shows the modifications we’ve made at Pluto LNG to be ready to receive power from the proposed Woodside solar project.
Page 3 of 15
Over the course of 2023, we listened to a wide range of stakeholders in the climate space. We consistently heard requests for more information about our Scope 3 emissions plan. Today, we are announcing a new, complementary Scope 3 emissions abatement target. This target is to take final investment decisions on new energy products and lower carbon services by 2030, with total abatement capacity of 5 million tonne per annum of CO2 equivalent.
This will complement our existing $5 billion investment target, which remains a key part of our Scope 3 plan and tracks our work to bring these new products and services to markets. The new emissions abatement target will allow us to track the potential impact of these investments on our customers’ emissions. With that I would like to look at where we are going from here and finish with a recap of our investment case. We are focused on building value in 2024 and beyond. We will do this by operating our base business reliably and efficiently, while progressing our next wave of growth through value creating major projects. We will maintain a disciplined approach to capital management, and on this point I’d like to emphasise that I am pleased with our portfolio as it stands.
We will only pursue growth opportunities that are value accretive. We will also continue to implement and identify emissions reduction opportunities and, above all else, we will work to improve safety.
In closing, our investment case is clear. Woodside is positioned to thrive through the energy transition, we have a high-quality portfolio, geographically advantaged to meet growing LNG demands. We are a reliable supplier, celebrating 35 years of LNG delivery in 2024. We deliver strong and consistent returns to our shareholders, and we are on track to deliver our emissions reduction targets. I am immensely proud of our achievements in 2023, they demonstrate disciplined adherence to our strategic goals.
We will now open the call to questions, may I request that you ask one or two each so that everybody has an opportunity to participate?
Operator: If you wish to ask a question, please press star one on your telephone and wait for your name to be announced. If you wish to cancel your request, please press star then two. If you are on a speakerphone, please pick up the handset to ask your question. The first question today comes from James Redfern with Bank of America, please go ahead.
James Redfern: (Bank of America, Analyst) Good morning Meg and Graham. Two questions please, the first one if we focus on the targeted reduction in Scope 1 and 2 emissions by 2030, just wondering if you could please maybe walk through what the key drivers will be in achieving that target of a 30% reduction by 2030 please? Thank you.
Meg O’Neill: Sure, thanks James, and great to have an emissions-oriented question. As I said, we released today our Climate Transition Action PlanClimate Transition Action Plan which provides a fair amount of detail on the work that we are doing. Our focus in the near term is very much on the asset decarbonisation plan, which provides a roadmap and a list of opportunities for each of our existing assets to try to reduce their emissions.
In the Climate Transition Action PlanClimate Transition Action Plan document you’ll see some good examples of the work that we’re progressing on this front. Probably the biggest low-hanging fruit is to bring solar power, low emissions power into the Pluto LNG facility. So, I’d encourage you to take a look at the Climate Transition Action PlanClimate Transition Action Plan. As we’ve said, we also have a strong focus on designing out, and you’ll be aware, James, that we’ve got three new facilities starting up between now and 2030.
Page 4 of 15
We’ve taken a number of steps in the design of those assets to really ensure that we are avoiding emissions rather than having to operate out later. So, there are key steps in the design phase, there’s steps in the operate phase and then as we need to, we’ve built a carbon portfolio to be able to offset any further emissions. Just to be really sharp, it is our net equity Scope 1 and 2 emissions, so it’s our working interest share across all of our assets - operated and non.
James Redfern: (Bank of America, Analyst) Perfect, thanks Meg. Second question is if I can please, just maybe some comments around Woodside’s growth strategy with regards to inorganic growth. I’m just wondering the preference between expanding or growing Woodside’s LNG portfolio, or deep water oil projects. I guess I’m asking whether it’s between deep water oil and the LNG in terms of organic growth opportunities? Thank you.
Meg O’Neill: Thanks, James, and I know that’s a question that many on the call are interested in. So, let me first and foremost start off by the fact that we are in the process of recapitalising the business already with our very significant investment in Sangomar, Scarborough, Pluto Train 2 and Trion. We are very comfortable with the portfolio as it stands and we’re very pleased with the progress that we’re making on these growth projects. Now as we look further down the track, we are always going to be looking for ways to profitably grow the business in line with our capital management framework.
We have assets that are in our portfolio today and teams working on the best way to unlock value from those assets. We do spend modestly and in a risk-managed way on exploration, we have new energy opportunities as well that we are pursuing, largely from ground up at this stage and we’ve been really clear that our strategic priorities are LNG, deep water oil and new energy, and we will look at a range of other ways to grow in those spaces. But as I said in the call, we’re pleased with the portfolio as it stands today.
James Redfern: (Bank of America, Analyst) Okay, thanks Meg.
Meg O’Neill: Thanks, James.
Operator: Your next question comes from Nik Burns with Jarden Australia, please go ahead.
Nik Burns: (Jarden Australia, Analyst) Thanks, Meg and Graham. First of all, just on Pluto, it’s pleasing to see an increase in Pluto 2P reserves prior to production in a recent reserve statement and production there’s been extremely strong. I guess the flipside of high production is shorter reserve life. I’m calculating 1P and 2P reserves life there around three or four years at current production rates.
Can you just talk through how we should think about Pluto’s production profile from here, how much longer will you be able to process gas at the KGP, and when should we start seeing natural field decline start to kick in and then once Scarborough starts up, how should we think about Pluto production from there? Thank you.
Meg O’Neill: That’s a very comprehensive question on Pluto. We are very pleased with how Pluto’s been performing, Nik, it’s one of our crown jewel assets and I think it’s a great proof point of the merit of taking a project through with high working interest as you get significant benefits. So, once you get into that operational phase.
I think we’ve been public about this in the past, but the agreement to process gas at KGP is a four year agreement, so we’re two years through that, continuing to look for opportunities to maximise value of the asset and maximise near term cash generation. We were very pleased with the reserve add, again we’re seeing really pretty positive resource performance from the Pluto set of assets.
One of the things that is important to bear in mind is that when Scarborough comes online, we will ramp back Pluto gas production. So, we’re still working the details of this, but you’re right to observe that we are past the 50% mark with Pluto, but again it’s a fantastic asset and it’s generating tremendous cash that enabling us to continue to invest in profitable growth and return value to shareholders who have stuck with us through the cycle.
Page 5 of 15
Nik Burns: (Jarden Australia, Analyst) Maybe another reserve question. Just on Shenzi and Shenzi North reserve downgrade. I’m just trying to gain some confidence in your Gulf of Mexico portfolio. It’s a relatively new portfolio to a number of us and there’s not a lot of detail except for what was in the independent expert report. Can you give us some confidence that say Mad Dog Phase 2 is performing in line with expectations? Have you undertaken a broader review of the undeveloped reserves in the portfolio? If you can just talk to those, thank you.
Meg O’Neill: Sure, probably worth some framing comments, so Shenzi represents about 5% of our production last year, so it is a reasonably modest contributor to the business. You’ll probably recall, Nik, that there have been a couple of campaigns to test the extent of the Shenzi and the Greater Shenzi area. The Wildling opportunity we pursued in 2022, and that was unsuccessful. Shenzi North was a project that was sanctioned in ‘21.
I’m pleased with the project execution, we were able to bring the program online ahead of schedule and under budget, but unfortunately the resource performance has disappointed. So, I feel like we’ve got our arms around where Shenzi is at this point in time. We’ll continue to watch the reservoir performance closely and update our models, and we’ll see if there’s further infill. But, at this point in time, we’re focused on maximising value from that asset.
Mad Dog Phase 2, you’ll recall we were limiting, we’re managing performance, sorry managing production last year because we were continuing to work through some of those integrity issues, those have been worked through, the flex joint replacement campaign was conducted late last year, early this year, and pleased with what we’re seeing from the subsurface at this point in time.
To the non-operated assets, we feel like those are performing well and perhaps another proof point is the Mad Dog Southwest appraisal well that gave us confidence in further expansion in the Mad Dog resource.
Nik Burns: (Jarden Australia, Analyst) That’s great, thanks Meg.
Operator: The next question comes from Gordon Ramsay with RBC Capital Markets, please go ahead.
Gordon Ramsay: (RBC Capital Markets, Analyst) Thank you very much, great result, Meg. Just on the maintenance plan this year for the North West Shelf LNG train, can you confirm which train that is?
Meg O’Neill: Sorry, Gordon, are you asking which train is likely to be decommissioned?
Gordon Ramsay: (RBC Capital Markets, Analyst) No, I know there’s some maintenance work I thought was planned in the third quarter on one of the trains? Am I misunderstanding that?
Meg O’Neill: Yes, I think we’ll have to get back to you on that, Gordon. At this point in time I think we’ve been signalling that as that we’ve got capacity in the plants, in the Karratha Gas Plant already, to the extent that we are likely to take, or we are planning to take one LNG train offline this year, that train is LNG train 2 but the fact that we’ve got spare capacity this year means that any train maintenance we do ahead of that point in time will have a pretty modest impact on production.
Gordon Ramsay: (RBC Capital Markets, Analyst) Okay, and then secondly, just on the impairment charge with respect to Wheatstone, it was related to the outlook on short-term LNG pricing. Can you just explain what that means, why it was taken?
Meg O’Neill: This is a great feature of the accounting treatments where we’ve - and if you went back over time, Gordon, you would have seen we’ve impaired and unimpaired Wheatstone a couple of times. The accounting standards drive that, I’ll let Graham as our accountant, give you some of those details.
Page 6 of 15
Graham Tiver: Thank you, Meg. Yes, in terms of - we had an impairment reversal in the prior year in 2022 and that was predominantly driven by short-term pricing, which was the extreme highs of 2022, when you factor the price deck for the short-term and then into the long-term, it resulted in a position where the carrying value was potentially below its full value, so we had to provide that impairment reversal. This year with prices dropping, it’s seen a part of that unwind, and where Wheatstone is today, we’re watching those prices very closely, Gordon, but it’s very, very clear this is nothing to do with the underlying performance of Wheatstone itself. Wheatstone is performing very well, this is just the nature of accounting treatments, when we get into impairing assets you have to check those on an annual basis.
Gordon Ramsay: (RBC Capital Markets, Analyst) Okay, thank you very much.
Operator: The next question comes from James Byrne at Citi, please go ahead.
James Byrne: (Citi, Analyst) Good morning team, you know I’m going to ask a question on slide 14, sources and uses of cash. Firstly, thank you just for tightening up that disclosure and making it a little less ambiguous, that’s very helpful. Just firstly can I confirm that the gas hub prices that you have used to determine the source of the cash is the same as what you gave us in November at the IBD? Just because if you’ve mark-to-market there for lower futures prices then that would infer that the business is performing better than what you’d given us a few months ago.
Graham Tiver: James, that is correct, no change to the assumptions which we produced as part of the IBD. As you clarified, it’s based on $70, current oil price today is $80.
Meg O’Neill: The gas hub prices is important too to include in your models, James.
James Byrne: (Citi, Analyst) Okay, so no change to gas hub prices. Graham, in your section, earlier you said you are balancing investing for growth, maintaining a strong balance sheet and strong capital returns back to shareholders. The dividend component of the uses of cash there is call it a 3.7% yield at the last close. Let’s say you wanted to bring that up to 5% with some specials, that’s going to eat into around half of your surplus capital bucket there.
The remaining surplus cash though would push gearing over 20% on my numbers if you wanted to reinvest in the business of flat production, of course you need projects to invest in that could be organic or inorganic. But nonetheless, I still really struggle with how you’re going to satisfy those three things around growth, balance sheet and capital returns. I’d love to use this Q&A as a forum for you to suggest where I might be wrong in that conclusion, which of course largely relies on your own disclosures as opposed to my assumptions.
Meg O’Neill: James, let me start with some framing points and then I’ll hand over to Graham. First and foremost, we’d never said that we target flat production. I think the industry is littered with companies that have targeted production growth or maintaining production at the detriment of shareholder value. So, we are focused on profitably investing in assets that will deliver shareholder value over the long-term. Our existing slate of projects I think is a great example of that. So, we want to make sure that we continue to be disciplined and let the capital management framework guide how we think about the business.
Graham Tiver: I think Meg’s hit the nail on the head in terms of we’ll always continually balance how we allocate our surplus of cash.
So, look in the next few years, as we mature the growth opportunities for the 2030s, we will have to balance investment in growth and potential of additional shareholder returns and we’ll take into account the macro environment when we look at this, we take into account our growth pipeline, the returns on those growth pipelines, just among other factors.
Page 7 of 15
But it’s really important, as Nik touched on, that the core of all this and how we look at it is through the capital management framework. So, I’m not sure if there’s any more to say, James. The capital management framework is how we look, we’re very clear on what’s fundamental, that’s our gearing, it’s our stated dividend policy which is driven off of NPAT. We start at 50% payout ratio and we’ve had a history of paying at the top end of that.
And we look at our credit rating. Once we have that surplus cash, we will then look at what we do with that. That could be based on returns on those projects, it could be returning back to shareholders in the forms of special dividends or share buybacks.
James Byrne: (Citi, Analyst) Got it, okay. I might then, so the second question to follow up on James Redfern’s questions about M&A. Six months ago at the sell side briefing, Meg you talked about Gulf of Mexico, deep water, US LNG, then you bid for - enter discussions rather with Santos and more recently, Meg, in Saudi Arabia, at a conference you talked about potential deals in the Middle East and collaborating with Saudi Aramco.
From the outside looking in, that’s quite a breadth of things that you’re looking at. I’m happy to admit I’m perhaps a little bit confused about the strategic rationale of some of these actions and the rhetoric. Can you, perhaps, go into a little bit more detail around some of that strategic rationale around inorganic growth? What you’re trying to solve for - you’re looking at development assets, producing assets. Where should we expect you to focus?
Meg O’Neill: I think I gave the answer pretty clearly to James, which is we’re very pleased with the portfolio that we have today. We’ve got opportunities and options to grow the business in our portfolio today. That includes things like Calypso, Browse, Sunrise. It includes our new energy opportunities. Then in the inorganic space, our focus is on LNG, deep water oil and new energy.
The opportunities that we’re pursuing are really consistent with that strategic framework around thriving through the energy transition, ensuring we’re meeting customers’ energy needs today and into the future, creating and delivering value to our shareholders.
Graham Tiver: Maybe just to add, James, I think from our perspective, there is always - we’ll always look at M&A. But we don’t need to do deals, we don’t need M&A, the base business is performing well. We’ve got three great projects ahead of us. As Meg touched on, deals need to be compelling to be value for our shareholders. That’s really important for us.
James Byrne: (Citi, Analyst) That’s clear. Thank you. Appreciate it.
Meg O’Neill: Thanks James.
Operator: The next question comes from Saul Kavonic with MST. Please, go ahead.
Saul Kavonic: (MST, Analyst) Thank you. Hi Meg, hi Graham. I have a couple of questions. Just the first one on the Scarborough sell-down to JERA on Friday, I think macro’s probably come off since you did the LNG Japan deal the middle of last year. There’s also, obviously, been some of those EP delay issues. The price tag, I think, is 1.5% below the LNG Japan sale.
Could you just give us your thoughts on the sell-down price tag to JERA and perhaps some comments on, do you have any idea why you think the market has not really reacted positively in that regard? Even though it does appear that value has been maintained despite that macro drop over the last nine months.
Meg O’Neill: Thanks for the question, Saul. Appreciate your analysis. You’re spot on that the JERA and LNG Japan buy-in price is, essentially, the same within a couple percent. We’re really thrilled to be forming a strategic, comprehensive partnership with JERA. JERA is one of the world’s most significant LNG customers, a very significant player in the LNG market holistically, so we’re absolutely thrilled to be bringing them into Scarborough and to also be progressing things like an LNG offtake agreement with them and an agreement to collaborate on new energy.
Page 8 of 15
I think the market’s - we - for a variety of scheduling reasons - we announced on a Friday. That was probably a factor in why things weren’t picked up on Friday. Then there was a bit of market softness overall yesterday.
I think those are some of the things that have influenced where the market has - or how the market has responded. But overall, it is a fantastic deal with a Tier 1 buyer, a fully priced transaction.
I mean we are getting wonderful value. That’s - Saul, as you said - despite the fact that we’ve derisked the project from the point in time when we had the LNG Japan transaction.
Saul Kavonic: (MST, Analyst) Thank you. Second question. I guess I’m going to come back to some of the M&A side of things. I think Graham mentioned only pursuing M&A if it’s compelling. I need to ask, I guess what happened with the merger talks and why was it found to not be compelling?
Meg O’Neill: Let me speak strategically. As I said, we’ve been looking to grow our LNG position and potentially bringing Woodside and Santos together would’ve created a very significant Pacific basin LNG position. That was the strategic underpinning for the conversation. As we communicated to the market, we got to a point where it was no longer in either party’s best interest to continue to progress.
Saul Kavonic: (MST, Analyst) Great. Thank you. I’ll jump back in the queue.
Meg O’Neill: Thanks Saul.
Operator: The next question comes from Tom Allen with UBS. Please, go ahead.
Tom Allen: (UBS, Analyst) Good morning, Meg, Graham and the broader team. Congratulations on the sell-down of Scarborough equity to JERA. Just following up the last comments. If I’m correct, over the first 10 years of Scarborough production, that takes Woodside to 33% of its share of production from Scarborough now sold with binding LNG SPAs? Recognising there are a couple of non-binding HOAs to JERA in LNG Japan that could add to that level.
But can you please share some colour on why the LNG Japan and JERA - in committing to a share of equity and production in Scarborough - have only entered non-binding HOAs for incremental Woodside share of LNG production? Perhaps some comments made on your broader marketing efforts?
Meg O’Neill: Sure. Thanks Tom. One of the things to remind the group about is that, over the years, we have changed our approach to LNG marketing. So, if you went back in time to North-West Shelf, for example, we had everything contracted on a project basis. Actually, even in Pluto, we had a lot of the LNG offtake contracted on a project basis. That was to give certainty to the banks, largely, that the venture would be able to repay its capital.
Now, over the last decade, we’ve been moving towards portfolio marketing, so we’re not doing point to point marketing anymore. That’s something that the sellers and buyers value. We actually don’t think of our portfolio in the terms of a certain percentage of certain assets being contracted. We take a look at our overall portfolio position. One of the things that’s important is to continue to be in the market through the ups and downs of the cycle. I think that has served us extremely well if you look at some of the deals that we’ve concluded over the past few years with buyers, like RWE and Uniper. Now with the agreements with LNG Japan and JERA.
We will continue to be in the market ensuring that we’ve got the appropriate balance between long-term contracted volumes, and then volumes that we have available to sell on the shorter-term markets where, potentially, you can capture the upside associated with the volatility that we’ve seen over the past couple of years.
Tom Allen: (UBS, Analyst) Thanks Meg. Maybe just following up, recognising the incremental supply in LNG coming out of the US. The Qatar gas announcement over the weekend as a further expansion of the North Field. Just some comments please on how Woodside will manage its exposure to gas hub indices, as oodles of LNG is added globally from ‘26 to ‘30? Meg O’Neill: You’re spot on, Tom, that there is a fair amount of LNG hitting the markets.
Page 9 of 15
Meg O’Neill: Oodles, that’s a new quantity of measurement. We’ll have to incorporate that in our presentation.
[Laughter]
This year there’s not a lot of new volume coming in. In ’25, we start to see some more come out of the US, and then ’26 is when we start to see some of the bigger volumes from Qatar.
We’ve been, I think, pretty upfront with the market around a few guiding factors. Firstly, we see that the oil and gas markets are diverging. If you went back in time, you would’ve seen them closely linked. But we are now seeing that gas, as a commodity, is being considered and traded separately from oil.
The other important point to note is that gas does, and will continue to have, more volatility than oil. If you ask, how do you make money in a trading situation? You make money from volatility. We’ve been, I think, quite deliberate around our strategy to ensure we’ve got the ability to capture that volatility. But with [inaudible] into the market, it is an active conversation that we’re having with the marketing team around what level of exposure do we want, particularly in the late 2020s, as that additional supply lands in the market place.
The things that we do control, the thing that differentiates Woodside from others, is our competitive cost of supply. I’ve said this before, but the Qataris, obviously, are incredibly cost competitive. They have a giant resource that they develop at a very low unit cost. But we beat the US projects. On a delivered cost of supply to our North Asian customers, we beat the US projects. Continuing to have that sharp focus on cost efficiency will ensure that we are better positioned than many others to compete for the attractive customers and those attractive contracts over the long-term.
Tom Allen: (UBS, Analyst) Thanks Meg.
Meg O’Neill: Thanks Tom.
Operator: The next question comes from Dale Koenders with Barrenjoey. Please, go ahead.
Dale Koenders: (Barrenjoey, Analyst) Morning Meg and team. I guess, when we look at the net debt position reported, $4.7 billion, it was quite a bit higher than consensus, about $1 billion. Just wondering, when you’ve obviously reviewed the results relative to consensus prior to today, anything you can call out to help explain why the cash result was so soft?
Graham Tiver: Thanks Dale. I think in terms of cash, I think it’s worthwhile calling out in a very heavy capex period, we were free cash flow positive, $0.6 billion in cash generated after we reduce our capital expenditure off of our operating cash flow. We’re very, very happy with that.
In terms of net debt, it’s still at very moderate levels. When you look at our gearing - which flows into our gearing - we’re at the bottom end of the range. So, coming out of a - well, it’s not coming out of, but we’re in a high capex period as we invest in our near-term growth with Sangomar, Scarborough and Trion. This is not unexpected to us. We planned for it and we’re at the low end of our range.
Meg O’Neill: Dale, perhaps it’s worth reiterating to yourself and everyone on the call, if you look at Woodside’s history, last year was a peak year from a capital investment period, so $5.6 billion invested in capital. It was also a year of significant cash outlay for taxes. That’s the Australia $5 billion. I’ll ballpark it, but USD, that’s roughly $3.5 billion.
Page 10 of 15
And then of course it also was a big dividend year for us as we paid out the significant dividend, the 2022 full year and the 2023 half year. So, all of those things affected our cash position and thus, we’re starting the year with a higher net debt. But again, that shouldn’t have been a surprise.
Dale Koenders: (Barrenjoey, Analyst) Ok so not really answering the question. But maybe then digging deeper. Just the $2.9 billion of tax and PRRT payments, is that just one off? Is that timing? Can you talk maybe about as PRRT payment increased, Pluto from mid-year with the change in timing?
Also, the $0.5 billion of restoration provisions, just confirming this is where that goes? I think it was about $1 billion of restoration you called out for this year, at the investor day, it’s in here and it’s above capex.
Graham Tiver: Dale, the majority of the tax was driven off of finalisation of the 2022 tax returns, which were the result of an extremely high prices. So, in arrears if you want to call it. It’s a catch up. That is the fundamental driver. Now we’ve normalised our tax payments and PRRT will normalise as well. Sorry, what was your last question?
Meg O’Neill: Restoration payments.
Graham Tiver: Yes, you’ll see in our accounts, we – I think we spent just under $500 million this year in actual decommissioning activities in cash. As we provided guidance in – wasn’t guidance, but we highlighted at the IBD, we have about $900 million for this year. Once again planned, scheduled and t’s not unexpected and factored into our considerations and plans.
Dale Koenders: (Barrenjoey, Analyst) Ok sorry, then payments for Pluto? Have you started to pay more PRRT tax in second half of this year?
Graham Tiver: I’d have to come back to you on that. But…
Meg O’Neill: No. Pluto’s not paying PRRT. Our PRRT paying assets are Bass Strait and Enfield.
Dale Koenders: (Barrenjoey, Analyst) Thank you.
Operator: The next question comes from Henry Meyer with Goldman Sachs. Please, go ahead.
Henry Meyer: (Goldman Sachs, Analyst) Morning Meg and Graham. Thanks for the update. Just keen to expand on some of the previous commentary around LNG contracting in the portfolio in Scarborough. Are you able to touch on if the HOAs are converted to SPAs with JERA and LNG Japan?
Will that get you to your 30%, 35% Hub exposure over the next few years or is there more contracting required there?
Meg O’Neill: Henry, as I said, we’re always in the market looking to do LNG deals of short, medium and long-term. The two that we’ve talked about are within the public domain at this point in time. When we have other deals to announce, we will.
Henry Meyer: (Goldman Sachs, Analyst) Thanks Meg. A more specific one on Pluto LNG. Tokyo Gas is selling their 5% stake. I think we’re expecting that to complete last year, but just in the last few weeks, seen that Inpex pre-empted that sale of the stake in Ichthys. Are you able to share if that process is still ongoing for Pluto? If you’re in a position to potentially pre-empt that as well, of if you’ve already made a decision?
Meg O’Neill: We’ll reserve our rights, Henry. To the best of our knowledge, that process is still continuing. That’s what we hear from Tokyo Gas. We will always reserve our rights when it comes to pre-emption. Pluto, as I’m sure you would appreciate, is a significant crown jewel asset for Woodside, so we will, obviously, want to take a close look at it.
Henry Meyer: (Goldman Sachs, Analyst) Thanks Meg.
Page 11 of 15
Meg O’Neill: Thanks Henry.
Operator: The next question comes from Adam Martin with E&P. Please, go ahead.
Adam Martin: (E&P, Analyst) Morning Meg, Graham. Just thoughts around potential for future capital management? Thinking about special dividends versus the buy backs? I mean, historically, we’ve probably thought maybe special dividends is more likely. But also the share price has been weaker the last four months to five months.
I’ll just note that you’ve got LNG Japan to settle and you’ve got JERA to settle in the next six months to 12 months, so that should see gearing through 10% on our forecast. Just any thoughts? Are buy backs realistic or do you think special dividends is what you think about?
Graham Tiver: Thanks Adam. I’ll just revert you to our capital management framework. As I was explaining earlier, yes, I think our gearing is in a great place and is core to our capital management framework, and so is our dividend policy, and so is our investment grade credit rating. When the time comes to make decisions on dividends, we will always weigh those three factors up in our - as part of our capital management framework.
We’ll look at what is the best option for that cash - is it special dividends, is it share buy backs? Do we have other high returning opportunities on the table to look at? I just encourage you to continue to look back at the capital management framework on how we think about it.
Adam Martin: (E&P, Analyst) OK, just on Scarborough. Would you look to sell any more? Where do you want to end up there, on just equity ownerships of Scarborough? Also, just timing and LNG Japan, is that still first quarter or has that slipped?
Meg O’Neill: First and foremost, Adam, we are delighted to bring two quality counter-parties like LNG Japan and JERA into the Scarborough joint venture. As Pluto was the crown jewel of Woodside for the 2010s and the first half of the 2020s, Scarborough will be our crown jewel for the upcoming 20 years, starting in 2026. I’m feeling pretty happy with the equity position that we have today.
[Over speaking]
Meg O’Neill: We do expect that to close in the first quarter, aka next month.
Adam Martin: (E&P, Analyst) Perfect. Thanks for that.
Operator: The next question comes from Mark Busuttil with J.P. Morgan. Please, go ahead.
Mark Busuttil: (J.P. Morgan, Analyst) Good morning. Just want to ask a real simple question, if you don’t mind. Just wondering, given the release that came out earlier in the month, whether the Santos deal is completely off the table for good?
Meg O’Neill: Look, I described the strategic rationale. We’re keen to grow our LNG position, but we are not in any further discussion with Santos at this point in time.
Mark Busuttil: (J.P. Morgan, Analyst) Okay. Then a little bit more detailed question, just around the LNG strategy. You’ve made comments in that release on 7 February about the global LNG sector providing significant potential for value creation. You’ve talked about the Mexico Pacific LNG deal, you’ve done Corpus Christi in the past and you’ve basically said that you’re only doing portfolio sales now.
I’m just wondering what’s the benefit of all of this? How do you benefit from becoming a portfolio producer of LNG versus selling point to point? Meg O’Neill: Sure.
Page 12 of 15
First and foremost, I would point you to our segment financials. One of the things we’ve done in the last couple years is pull out the marketing segment to illustrate to our shareholders the value created by that business. Last year was really a banner year, it was $850 million of profits. This year, a little bit more subdued as market conditions were more subdued, but it was $375 million.
To give you some flavour for how we get benefits. We’re able to optimise within our existing portfolio. If we have a cargo that’s from one project that’s headed for a certain customer, we have the ability to perhaps replace that with a cargo that we either purchase on market or is coming from somewhere closer to that customer and create value through optimising the business within the portfolio. We are trading more actively with a number of important and rigorous controls around how we do that, but the trading position also allows us to participate in the market in different ways that can generate value.
Mark Busuttil: (J.P. Morgan, Analyst) Okay, fabulous. Thank you.
Operator: The next question comes from Rob Koh with MS. Please go ahead.
Rob Koh: (MS, Analyst) Good morning. Please excuse me if I sound like I’m shivering. I’m in a really, really cold office which is where the world would be without your products. The first question is about your new Scope 3 target of five million tonnes per annum of abatement. I wonder if you could just give us a bit of colour about how you’ve gone about sizing and estimating that. I get it to be about 7% of group Scope 3 emissions and also if you could just comment on the estimation challenge for, I guess, avoidance credits which is what these types of abatements would be if they’re hydrogen projects please.
Meg O’Neill: Sure. Great question, Rob. One of the things and maybe I’ll give you a bit of why we’ve added this. We get a lot of questions from our investors who say we hear your intention to invest $5 billion in new energy product and services, but what does that mean from a climate perspective? This is trying to answer that question. The five billion tonnes of emissions avoided directly correspond to the project slate that is associated with our $5 billion of investment.
Now, of course all of this is subject to our capital management framework and the critical path on progressing any of these opportunities at this point in time is getting customers to sign up for these kinds of projects and services that they’re not using today. The way we calculate the avoidance is in a very rigorous manner. We take a look at the product that we are providing and what is the customer using it for and what would the customer use today?
For example, our Oklahoma project where we’re providing hydrogen with a target of displacing diesel and ground transportation, we can calculate if diesel were used for those same trucking routes that we would envision using hydrogen for, what would the emissions be from that diesel fleet? That’s how we do it. It’s product by product specific. So, if there were ammonia for power gen, again it would be specific to whatever the fuel is that’s being displaced.
Rob Koh: (MS, Analyst) Okay, great. Sounds very thorough. My second question refers to slide 14, the free cashflow estimates for 2024 to 2028. Just wondering if you could give us a bit more detail on what gas price assumptions are in those towers. I guess I’m not interpreting anything, that they’re no longer fuzzy towers, they’re hard towers, I figure that’s just a formatting issue. I guess just I’m asking about the gas price assumptions in the context of you’ve talked about the benefits of your marketing segment, your transition to a platform trading, so I’m guessing it has to be more than just simple price and quantities for the gas component.
Graham Tiver: What I’d say, Rob, is consistent with previous with your question is that there’s no change to what we included or the assumptions we included in the IBD. If you are looking at the JKM pricing, which I think is listed in the footnote, in the IBD you’re looking around the mid-teens, around that $14 mark in 2024 and then it moves down to $12 to $13 from 2026 beyond [Correction: approximately $10 nominal from 2024 and beyond].
Page 13 of 15
Rob Koh: (MS, Analyst) Okay, great. That’s very, very helpful. I appreciate that. Can I sneak in one further?
Graham Tiver: Sorry, I just…
Rob Koh: (MS, Analyst) Yes.
Graham Tiver: I just want to reconfirm, on the oil side, we have factored in $70 as you know but with current prices at $80. I’ll just keep re-emphasising, it’s up on that at the moment.
Rob Koh: (MS, Analyst) Yes, excellent. All right. No, thank you Mr Tiver. That’s really, really helpful. May I just sneak in one further one which you may wish to take on notice. I guess the Workplace Gender Equality Agency today released company-specific gender pay gap data. Woodside’s figure there is a little higher than the industry average against which its compared, industry average of 15%. I’m just wondering if you can give us any colour on that number and the activities going on within the Company to work on that one.
Meg O’Neill: Sure. Thanks Rob and appreciate your interest in the topic. We will send you a link to a page that we have put up on our website that describes what we’re doing. Let me first and foremost say that we have very rigorous processes to ensure that for people doing like work with like levels of experience and like levels of performance that they are paid the same regardless of gender. We have rigorous processes in place to ensure that that is true.
Now, when you step back and look at Woodside as a whole, there are some things that skew our gender pay as reported through the WGEA Agency. One is the predominance of men in trade and technician roles. I am really pleased with work we have done over the past few years to grow our percent of women in that, we are up to 11% which is fantastic, but that is a category of the workforce that is male-dominated that is paid pretty well. Then in the leadership ranks, we have women in leadership of about 27%. Women overall in the Company is about 33% and that’s another part of the business where again, like for like, men and women get paid the same, there’s just more men in those higher paying roles.
Rob Koh: (MS, Analyst) Great, thanks very much. Appreciate it.
Meg O’Neill: Thanks Rob.
Operator: Your next question comes from Fiona Manning with the Australian Council of Superannuation Investors.
Fiona Manning: (Australian Council of Superannuation Investors, Analyst) Hi Meg and Graham and I am delighted on that note to be enhancing gender diversity on this call. I’ve just got two questions. The first one, noting the new Scope 3 emissions abatement targets, are there any other changes to climate-related targets or strategies?
Meg O’Neill: Fiona, I’d just point you to our Climate Transition Action Plan document which outlines a number of the actions that we are taking. The Scope 3 emission abatement target is the big headline for new items but I know of interest to your members will be a change that we have made to the scorecard for both executive remuneration and we have pushed it through for the Company’s scorecard as well which affects all staff, to separate climate and safety and have those as two standalone elements of the scorecard to ensure that there is appropriate organisational focus on delivering on our emissions reduction targets and our emissions abatement plans. Those are probably the two big headlines in terms of new content.
Fiona Manning: (Australian Council of Superannuation Investors, Analyst) Great, thank you very much. Just a second one. H2OK has been stuck in the evaluating incentive phase for a while. Just wondering what’s causing the delay in that process and what sort of timeframe a decision is likely to be made.
Page 14 of 15
Meg O’Neill: Sure. We have been continuing to do work on the technical front. We are well positioned in terms of the maturity of the project. Another item to highlight in our Climate Transition Action Plan will highlight that we spent $200 plus million in 2023 on new energy opportunities and a good chunk of that is long leads for H2OK, so we are moving ahead. The issue that we have been grappling with for the last few months is the US Government finally released their requirements to achieve the full production, the full hydrogen production tax credits and we are participating in their consultation process.
They’ve unfortunately set targets that are somewhere between very difficult and impossible to achieve around the matching frequency of green credits to green hydrogen production and so we are participating in the consultation trying to get a more pragmatic approach so that will unlock the ability to move the project forward.
Fiona Manning: (Australian Council of Superannuation Investors, Analyst) Okay and how long is that consultation expected to take?
Meg O’Neill: We sent our submission in just a few days ago, this week. Hopefully we will hear back from the government in the next month or so, but look, that said Fiona, we continue to talk to customers about their ability to offtake and their willingness to offtake even if we don’t have the production tax credit at that full $3 level.
Fiona Manning: (Australian Council of Superannuation Investors, Analyst) Yes, okay. Thank you very much.
Meg O’Neill: Thanks, Fiona. All right, I think that is a wrap for us. Thank you all for listening in, and participating in the call. Please remember that we are hosting a special investor briefing about our climate plans on 12 March and our AGM will be on 24 April. I look forward to speaking to you at these events and continuing to share how we are delivering on our strategy to thrive through the energy transition. Thank you.
Operator: That does conclude our conference for today. Thank you for participating. You may now disconnect.
End of Transcript
| Contacts:
|
||
| INVESTORS
Marcela Louzada M: +61 456 994 243 E: investor@woodside.com |
MEDIA
Christine Forster M: +61 484 112 469 E: christine.forster@woodside.com |
This announcement was approved and authorised for release by Woodside’s Disclosure Committee.
Page 15 of 15