UNITED STATES
SECURITIES AND EXCHANGE COMMISSION
Washington, D.C. 20549
Form 6-K
REPORT OF FOREIGN PRIVATE ISSUER
PURSUANT TO RULE 13a-16 OR 15d-16
UNDER THE SECURITIES EXCHANGE ACT OF 1934
February 20, 2024
BHP GROUP LIMITED
(ABN 49 004 028 077)
(Exact name of Registrant as specified in its charter)
VICTORIA, AUSTRALIA
(Jurisdiction of incorporation or organisation)
171 COLLINS STREET, MELBOURNE,
VICTORIA 3000 AUSTRALIA
(Address of principal executive offices)
Indicate by check mark whether the registrant files or will file annual reports under cover of Form 20-F or Form 40-F: ☒ Form 20-F ☐ Form 40-F
Indicate by check mark if the registrant is submitting the Form 6-K in paper as permitted by Regulation S-T Rule 101(b)(1): ☐
Indicate by check mark if the registrant is submitting the Form 6-K in paper as permitted by Regulation S-T Rule 101(b)(7): ☐
Indicate by check mark whether the registrant by furnishing the information contained in this Form is also thereby furnishing the information to the Commission pursuant to Rule 12g3-2(b) under the Securities Exchange Act of 1934: ☐ Yes ☒ No
If “Yes” is marked, indicate below the file number assigned to the registrant in connection with Rule 12g3-2(b): n/a
December 2023 Half year results Western Australia Iron Ore
Disclaimer The information in this presentation is current as at 20 February 2024. It is in summary form and is not necessarily complete. It should be read together with the BHP Results for the half year ended 31 December 2023. Forward-looking statements This presentation contains forward-looking statements, which involve risks and uncertainties. Forward-looking statements include all statements other than statements of historical or present facts, including: statements regarding: trends in commodity prices and currency exchange rates; demand for commodities; global market conditions; guidance; reserves and resources and production forecasts; expectations, plans, strategies and objectives of management; our expectations, commitments, targets, goals and objectives with respect to social value or sustainability; climate scenarios; approval of certain projects and consummation of certain transactions; closure, divestment, acquisition or integration of certain assets, operations or facilities (including associated costs or benefits); anticipated production or construction commencement dates; capital expenditure or costs and scheduling; operating costs, and supply of materials and skilled employees; anticipated productive lives of projects, mines and facilities; the availability, implementation and adoption of new technologies; provisions and contingent liabilities; and tax, legal and other regulatory developments. Forward-looking statements may be identified by the use of terminology, including, but not limited to, ‘intend’, ‘aim’, ‘ambition’, ‘aspiration’, ‘goal’, ‘target’, ‘prospect’, ‘project’, ‘see’, ‘anticipate’, ‘estimate’, ‘plan’, ‘objective’, ‘believe’, ‘expect’, ‘commit’, ‘may’, ‘should’, ‘need’, ‘must’, ‘will’, ‘would’, ‘continue’, ‘forecast’, ‘guidance’, ‘outlook’, ‘trend’ or similar words. These statements discuss future expectations or performance, or provide other forward-looking information. Forward-looking statements are based on management’s expectations and reflect judgements, assumptions, estimates and other information available as at the date made. BHP cautions against reliance on any forward-looking statements. These statements do not represent guarantees or predictions of future financial or operational performance, and involve known and unknown risks, uncertainties and other factors, many of which are beyond our control, and which may cause actual results to differ materially from those expressed in the statements contained in this presentation. For example, our future revenues from our assets, projects or mines described in this presentation will be based, in part, on the market price of the commodities produced, which may vary significantly from current levels. These variations, if materially adverse, may affect the timing or the feasibility of the development of a particular project, the expansion of certain facilities or mines, or the continuation of existing assets. In addition, there are limitations with respect to scenario analysis, including any climate-related scenario analysis, and it is difficult to predict which, if any, of the scenarios might eventuate. Scenario analysis is not an indication of probable outcomes and relies on assumptions that may or may not prove to be correct or eventuate. Other factors that may affect the actual construction or production commencement dates, revenues, costs or production output and anticipated lives of assets, mines or facilities include our ability to profitably produce and deliver the products extracted to applicable markets; the impact of economic and geopolitical factors, including foreign currency exchange rates on the market prices of the commodities we produce and competition in the markets in which we operate; activities of government authorities in the countries where we sell our products and in the countries where we are exploring or developing projects, facilities or mines, including increases in taxes and royalties or implementation of trade or export restrictions; changes in environmental and other regulations; political or geopolitical uncertainty; labour unrest; weather, climate variability or other manifestations of climate change; and other factors identified in the risk factors discussed in section 8.1 of the Operating and Financial Review (OFR) in the BHP Annual Report 2023 and BHP’s filings with the U.S. Securities and Exchange Commission (the ‘SEC’) (including in Annual Reports on Form 20-F) which are available on the SEC’s website at www.sec.gov. Except as required by applicable regulations or by law, BHP does not undertake to publicly update or review any forward-looking statements, whether as a result of new information or future events. Past performance cannot be relied on as a guide to future performance. Presentation of data Unless expressly stated otherwise: variance analysis relates to the relative performance of BHP and/or its operations during the half year ended 31 December 2023 compared with the half year ended 31 December 2022; total operations refers to the combination of continuing and discontinued operations; continuing operations refers to data presented excluding Petroleum from the 2021 financial year onwards; references to Underlying EBITDA margin exclude third party trading activities; data from subsidiaries are shown on a 100% basis and data from equity accounted investments and other operations is presented, with the exception of net operating assets, reflecting BHP’s share; medium term refers to a five-year horizon, unless otherwise noted. Throughout this presentation, production volumes and financials for the operations from BHP’s acquisition of OZ Minerals Limited (OZL) during FY2023 are for the period of 1 May to 30 June 2023, whilst the acquisition completion date was 2 May 2023. Unless expressly stated otherwise, information and data in this presentation related to BHP’s social value or sustainability position or performance does not reflect BHP’s acquisition of OZL nor BHP’s interest in non-operated assets. Due to the inherent uncertainty and limitations in measuring greenhouse gas (GHG) emissions under the calculation methodologies used in the preparation of such data, all GHG emissions data or references to GHG emissions (including ratios or percentages) in this presentation are estimates. Emissions calculation and reporting methodologies may change or be progressively refined over time resulting in the need to restate previously reported data. There may also be differences in the manner that third parties calculate or report GHG emissions compared to BHP, which means that third-party data may not be comparable to our data. For information on how we calculate our GHG emissions, refer to the BHP Scopes 1, 2 and 3 GHG Emissions Calculation Methodology 2023, available at bhp.com. Numbers presented may not add up precisely to the totals provided due to rounding. All footnote content (except in the Annexures) is contained on slide 20. Non-IFRS information We use various Non-IFRS information to reflect our underlying performance. For further information, the reconciliation of non-IFRS financial information to our statutory measures, reasons for usefulness and calculation methodology, please refer to ‘Non-IFRS financial information’ on pages 55 to 68 of the BHP Results for the half year ended 31 December 2023. No offer of securities Nothing in this presentation should be construed as either an offer or a solicitation of an offer to buy or sell BHP securities, in any jurisdiction, or be treated or relied upon as a recommendation or advice by BHP. No offer of securities shall be made in the United States absent registration under the U.S. Securities Act of 1933, as amended, or pursuant to an exemption from, or in a transaction not subject to, such registration requirements. Reliance on third party information The views expressed in this presentation contain information that has been derived from publicly available sources that have not been independently verified. No representation or warranty is made as to the accuracy, completeness or reliability of the information. This presentation should not be relied upon as a recommendation or forecast by BHP. BHP and its subsidiaries In this presentation, the terms ‘BHP’, the ‘Company, the ‘Group’, ‘BHP Group’, ‘our business’, ‘organisation’, ‘we’, ‘us’, ‘our’ and ourselves’ refer to BHP Group Limited and, except where the context otherwise requires, our subsidiaries. Refer to note 30 ‘Subsidiaries’ of the Financial Statements in the BHP Annual Report 2023 for a list of our significant subsidiaries. Those terms do not include non-operated assets. This presentation covers BHP’s functions and assets (including those under exploration, projects in development or execution phases, sites and closed operations) that have been wholly owned and/or operated by BHP or that have been owned as a joint venture1 operated by BHP (referred to in this presentation as ‘operated assets’ or ‘operations’) during the period from 1 July 2023 to 31 December 2023. BHP also holds interests in assets that are owned as a joint venture but not operated by BHP (referred to in this presentation as ‘non-operated joint ventures’ or ‘non-operated assets’). Notwithstanding that this presentation may include production, financial and other information from non-operated assets, non-operated assets are not included in the BHP Group and, as a result, statements regarding our operations, assets and values apply only to our operated assets unless expressly stated otherwise. 1. References in this presentation to a ‘joint venture’ are used for convenience to collectively describe assets that are not wholly owned by BHP. Such references are not intended to characterise the legal relationship between the owners of the asset. Financial results 20 February 2024 2
Performance summary Half year ended 31 December 2023 Mike Henry Chief Executive Officer Escondida
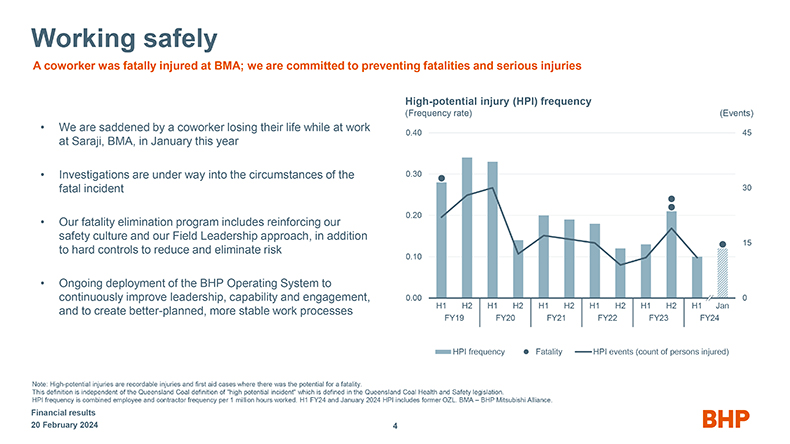
Working safely A coworker was fatally injured at BMA; we are committed to preventing fatalities and serious injuries We are saddened by a coworker losing their life while at work at Saraji, BMA, in January this year Investigations are under way into the circumstances of the fatal incident Our fatality elimination program includes reinforcing our safety culture and our Field Leadership approach, in addition to hard controls to reduce and eliminate risk Ongoing deployment of the BHP Operating System to continuously improve leadership, capability and engagement, and to create better-planned, more stable work processes High-potential injury (HPI) frequency (Frequency rate) (Events) 0.40 45 0.30 30 0.20 15 0.10 0.00 0 H1 H2 H1 H2 H1 H2 H1 H2 H1 H2 H1 Jan FY19 FY20 FY21 FY22 FY23 FY24 HPI frequency Fatality HPI events (count of persons injured) Note: High-potential injuries are recordable injuries and first aid cases where there was the potential for a fatality. This definition is independent of the Queensland Coal definition of “high potential incident” which is defined in the Queensland Coal Health and Safety legislation. HPI frequency is combined employee and contractor frequency per 1 million hours worked. H1 FY24 and January 2024 HPI includes former OZL. BMA – BHP Mitsubishi Alliance. Financial results 20 February 2024 4
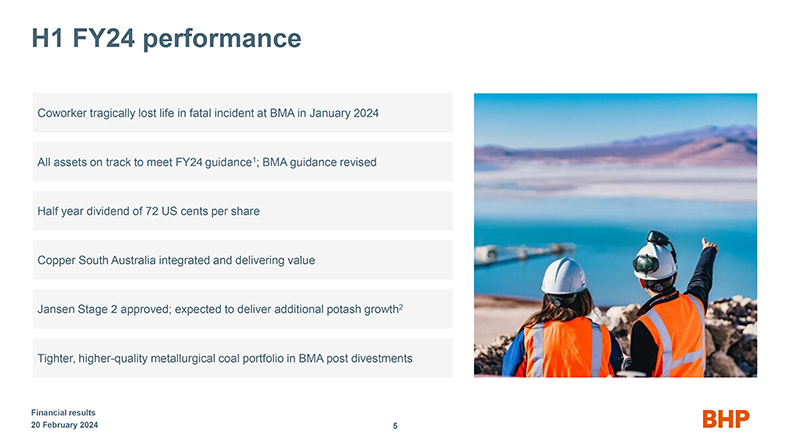
H1 FY24 performance Coworker tragically lost life in fatal incident at BMA in January 2024 All assets on track to meet FY24 guidance1; BMA guidance revised Half year dividend of 72 US cents per share Copper South Australia integrated and delivering value Jansen Stage 2 approved; expected to deliver additional potash growth2 Tighter, higher-quality metallurgical coal portfolio in BMA post divestments Financial results 20 February 2024 5
Financial results Half year ended 31 December 2023 David Lamont Chief Financial Officer Jansen
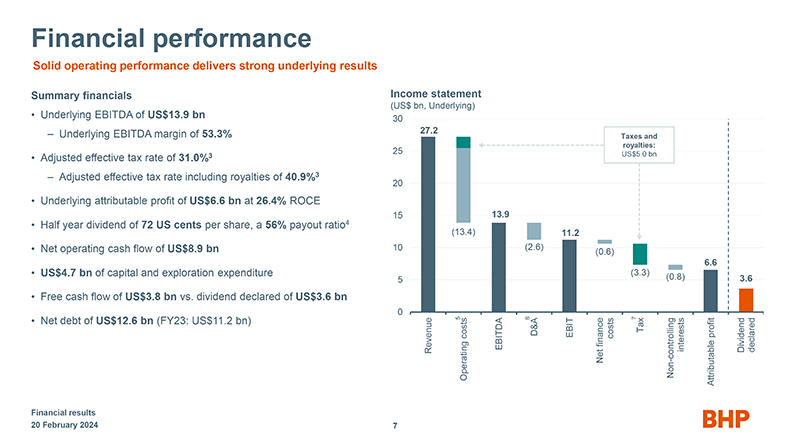
Financial performance Solid operating performance delivers strong underlying results Summary financials • Underlying EBITDA of US$13.9 bn – Underlying EBITDA margin of 53.3% • Adjusted effective tax rate of 31.0%3 – Adjusted effective tax rate including royalties of 40.9%3 • Underlying attributable profit of US$6.6 bn at 26.4% ROCE • Half year dividend of 72 US cents per share, a 56% payout ratio4 • Net operating cash flow of US$8.9 bn • US$4.7 bn of capital and exploration expenditure • Free cash flow of US$3.8 bn vs. dividend declared of US$3.6 bn • Net debt of US$12.6 bn (FY23: US$11.2 bn) Income statement (US$ bn, Underlying) 30 27.2 Taxes and royalties: 25 US$5.0 bn 20 15 13.9 (13.4) 11.2 10 (2.6) (0.6) 6.6 (3.3) 5 (0.8) 3.6 0 5costs 6D&A EBIT costs 7Tax profit finance Revenue EBITDA controlling interests Dividend declared Operating Net Non—Attributable Financial results 20 February 2024 7
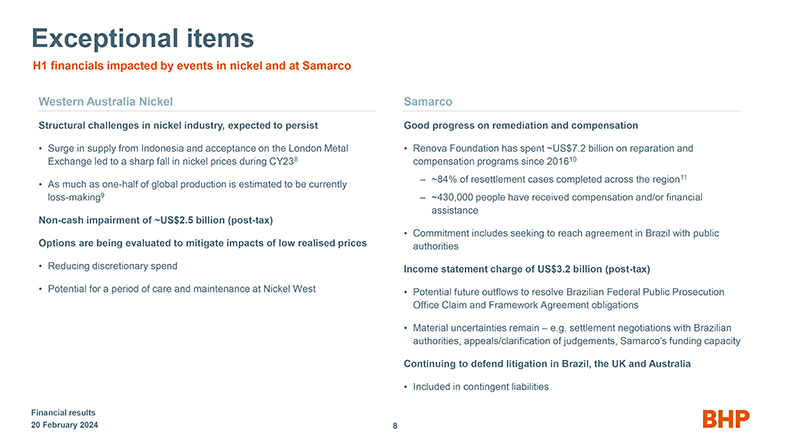
Exceptional items H1 financials impacted by events in nickel and at Samarco Western Australia Nickel Structural challenges in nickel industry, expected to persist • Surge in supply from Indonesia and acceptance on the London Metal Exchange led to a sharp fall in nickel prices during CY238 • As much as one-half of global production is estimated to be currently loss-making9 Non-cash impairment of ~US$2.5 billion (post-tax) Options are being evaluated to mitigate impacts of low realised prices • Reducing discretionary spend • Potential for a period of care and maintenance at Nickel West Samarco Good progress on remediation and compensation • Renova Foundation has spent ~US$7.2 billion on reparation and compensation programs since 201610 – ~84% of resettlement cases completed across the region11 – ~430,000 people have received compensation and/or financial assistance • Commitment includes seeking to reach agreement in Brazil with public authorities Income statement charge of US$3.2 billion (post-tax) • Potential future outflows to resolve Brazilian Federal Public Prosecution Office Claim and Framework Agreement obligations • Material uncertainties remain – e.g. settlement negotiations with Brazilian authorities, appeals/clarification of judgements, Samarco’s funding capacity Continuing to defend litigation in Brazil, the UK and Australia • Included in contingent liabilities Financial results 20 February 2024 8
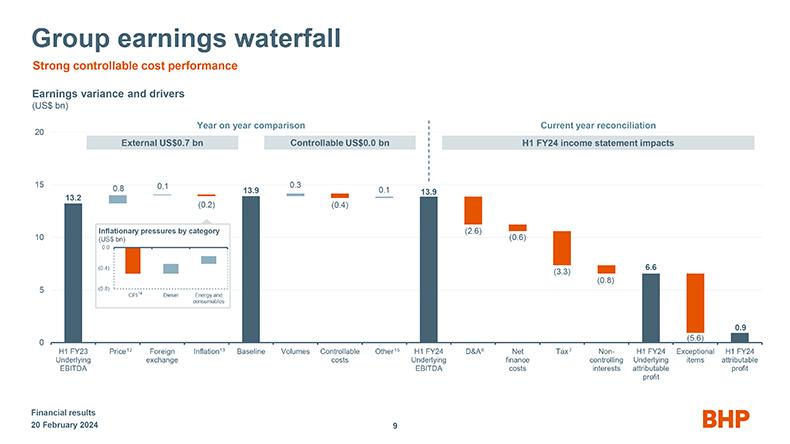
Group earnings waterfall Strong controllable cost performance Earnings variance and drivers (US$ bn) Year on year comparison Current year reconciliation 20 External US$0.7 bn Controllable US$0.0 bn H1 FY24 income statement impacts 15 0.1 0.3 0.8 13.9 0.1 13.9 13.2 (0.2) (0.4) Inflationary pressures by category (2.6) 10 (US$ bn) (0.6) 0.0 (0.4) (3.3) 6.6 (0.8) 5 (0.8) CPI14 Diesel Energy and consumables 0.9 (5.6) 0 H1 FY23 Price12 Foreign Inflation13 Baseline Volumes Controllable Other15 H1 FY24 D&A6 Net Tax7 Non- H1 FY24 Exceptional H1 FY24 Underlying exchange costs Underlying finance controlling Underlying items attributable EBITDA EBITDA costs interests attributable profit profit Financial results 20 February 2024 9
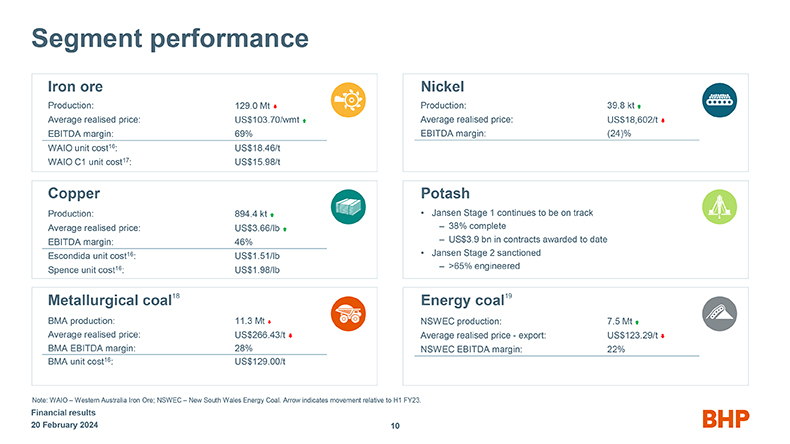
Segment performance Iron ore Production: 129.0 Mtïƒ^ Average realised price: US$103.70/wmt EBITDA margin: 69% WAIO unit cost16: US$18.46/t WAIO C1 unit cost17: US$15.98/t Copper Production: 894.4 kt Average realised price: US$3.66/lb EBITDA margin: 46% Escondida unit cost16: US$1.51/lb Spence unit cost16: US$1.98/lb Metallurgical coal18 BMA production: 11.3 Mt ïƒ^ Average realised price: US$266.43/tïƒ^ BMA EBITDA margin: 28% BMA unit cost16: US$129.00/t Nickel Production: 39.8 kt  Average realised price: US$18,602/tïƒ^ EBITDA margin: (24)% Potash • Jansen Stage 1 continues to be on track – 38% complete – US$3.9 bn in contracts awarded to date • Jansen Stage 2 sanctioned – >65% engineered Energy coal19 NSWEC production: 7.5 Mt  Average realised price—export: US$123.29/t ïƒ^ NSWEC EBITDA margin: 22% Note: WAIO – Western Australia Iron Ore; NSWEC – New South Wales Energy Coal. Arrow indicates movement relative to H1 FY23. Financial results 20 February 2024 10
Business update Half year ended 31 December 2023 Mike Henry Chief Executive Officer Copper South Australia
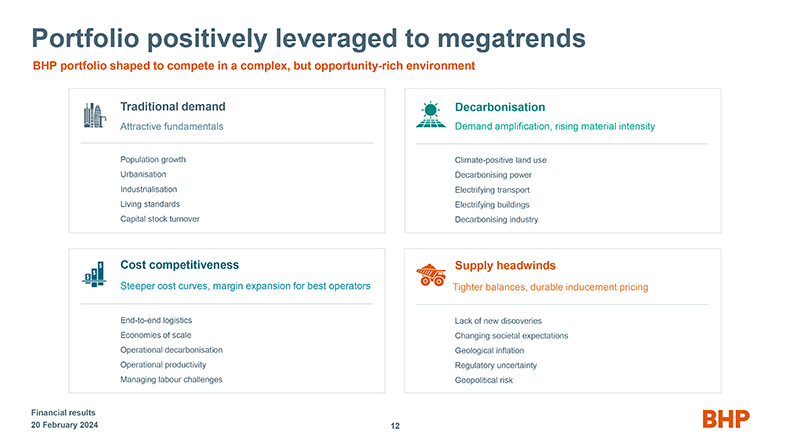
Portfolio positively leveraged to megatrends BHP portfolio shaped to compete in a complex, but opportunity-rich environment Traditional demand Attractive fundamentals Population growth Urbanisation Industrialisation Living standards Capital stock turnover Cost competitiveness Steeper cost curves, margin expansion for best operators End-to-end logistics Economies of scale Operational decarbonisation Operational productivity Managing labour challenges Decarbonisation Demand amplification, rising material intensity Climate-positive land use Decarbonising power Electrifying transport Electrifying buildings Decarbonising industry Supply headwinds Tighter balances, durable inducement pricing Lack of new discoveries Changing societal expectations Geological inflation Regulatory uncertainty Geopolitical risk Financial results 20 February 2024 12
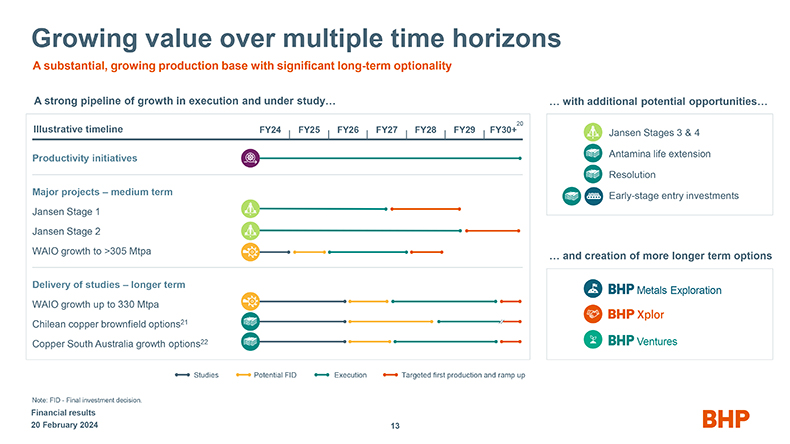
Growing value over multiple time horizons A substantial, growing production base with significant long-term optionality A strong pipeline of growth in execution and under study… 20 Illustrative timeline FY24 FY25 FY26 FY27 FY28 FY29 FY30+ Productivity initiatives Major projects – medium term Jansen Stage 1 Jansen Stage 2 WAIO growth to >305 Mtpa Delivery of studies – longer term WAIO growth up to 330 Mtpa Chilean copper brownfield options21 Copper South Australia growth options22 Studies Potential FID Execution Targeted first production and ramp up Note: FID - Final investment decision. Financial results 20 February 2024 with additional potential opportunities… Jansen Stages 3 & 4 Antamina life extension Resolution Early-stage entry investments and creation of more longer term options Metals Exploration Ventures 13
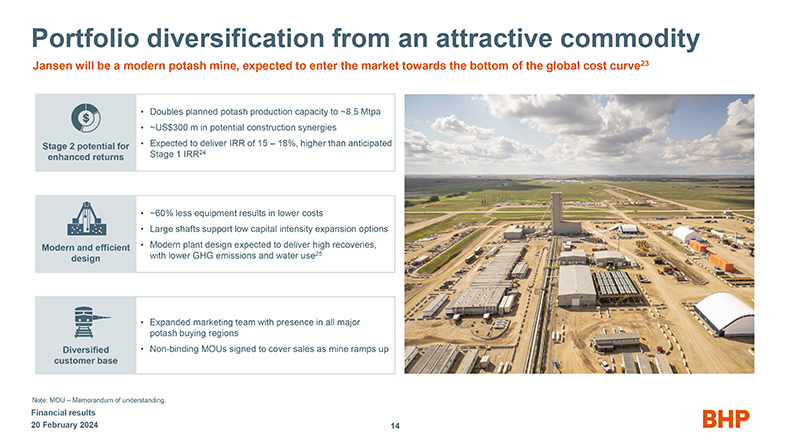
Portfolio diversification from an attractive commodity Jansen will be a modern potash mine, expected to enter the market towards the bottom of the global cost curve23 Stage 2 potential for enhanced returns Modern and efficient design Diversified customer base Doubles planned potash production capacity to ~8.5 Mtpa ~US$300 m in potential construction synergies Expected to deliver IRR of 15 – 18%, higher than anticipated Stage 1 IRR24 ~60% less equipment results in lower costs Large shafts support low capital intensity expansion options Modern plant design expected to deliver high recoveries, with lower GHG emissions and water use25 Expanded marketing team with presence in all major potash buying regions Non-binding MOUs signed to cover sales as mine ramps up Note: MOU – Memorandum of understanding. Financial results 20 February 2024 14
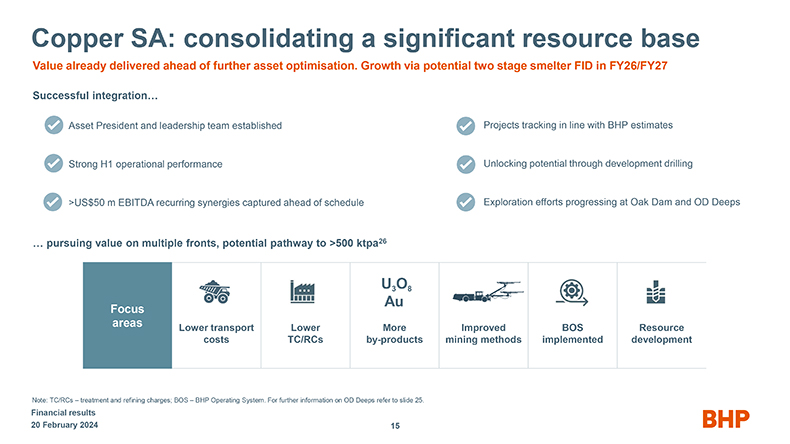
Copper SA: consolidating a significant resource base Value already delivered ahead of further asset optimisation. Growth via potential two stage smelter FID in FY26/FY27 Successful integration… Asset President and leadership team established Strong H1 operational performance >US$50 m EBITDA recurring synergies captured ahead of schedule … pursuing value on multiple fronts, potential pathway to >500 ktpa26 Projects tracking in line with BHP estimates Unlocking potential through development drilling Exploration efforts progressing at Oak Dam and OD Deeps U3 O8 FocusAu areasLower transportLowerMoreImprovedBOSResource costsTC/RCsby-productsmining methodsimplementeddevelopment Note: TC/RCs – treatment and refining charges; BOS – BHP Operating System. For further information on OD Deeps refer to slide 25. Financial results 20 February 2024 15
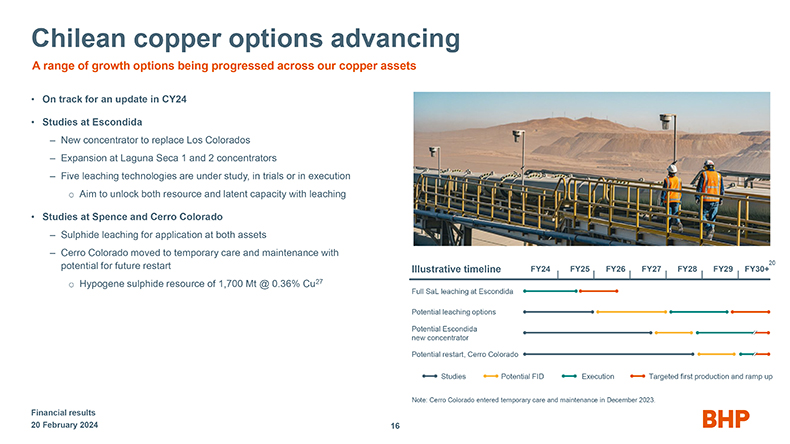
Chilean copper options advancing A range of growth options being progressed across our copper assets • On track for an update in CY24 • Studies at Escondida – New concentrator to replace Los Colorados – Expansion at Laguna Seca 1 and 2 concentrators – Five leaching technologies are under study, in trials or in execution o Aim to unlock both resource and latent capacity with leaching • Studies at Spence and Cerro Colorado – Sulphide leaching for application at both assets – Cerro Colorado moved to temporary care and maintenance with potential for future restart o Hypogene sulphide resource of 1,700 Mt @ 0.36% Cu27 FY24 FY25 FY26 FY27 FY28 FY29 FY30+20 Illustrative timeline Full SaL leaching at Escondida Potential leaching options Potential Escondida new concentrator Potential restart, Cerro Colorado Studies Potential FID Execution Targeted first production and ramp up Note: Cerro Colorado entered temporary care and maintenance in December 2023. Financial results 20 February 2024 16
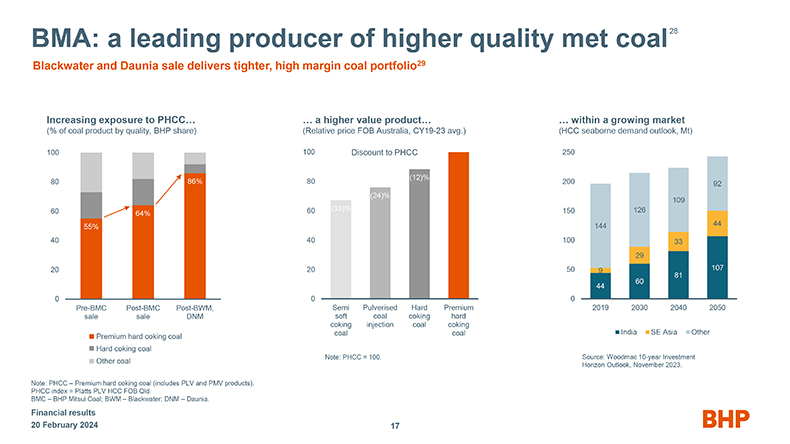
BMA: a leading producer of higher quality met coal28 Blackwater and Daunia sale delivers tighter, high margin coal portfolio29 Increasing exposure to PHCC… (% of coal product by quality, BHP share) 100 80 86% 60 64% 55% 40 20 0 Pre-BMC Post-BMC Post-BWM, sale sale DNM Premium hard coking coal Hard coking coal Other coal Note: PHCC – Premium hard coking coal (includes PLV and PMV products). PHCC index = Platts PLV HCC FOB Qld. BMC – BHP Mitsui Coal; BWM – Blackwater; DNM – Daunia. Financial results 20 February 2024 … a higher value product… (Relative price FOB Australia, CY19-23 avg.) 100 Discount to PHCC (12)% 80 (24)% 60 (33)% 40 20 0 Semi Pulverised Hard Premium soft coal coking hard coking injection coal coking coal coal Note: PHCC = 100. … within a growing market (HCC seaborne demand outlook, Mt) 250 200 92 109 150 126 144 44 100 33 29 50 9 107 60 81 44 0 2019 2030 2040 2050 India SE Asia Other Source: Woodmac 10-year Investment Horizon Outlook, November 2023. 17
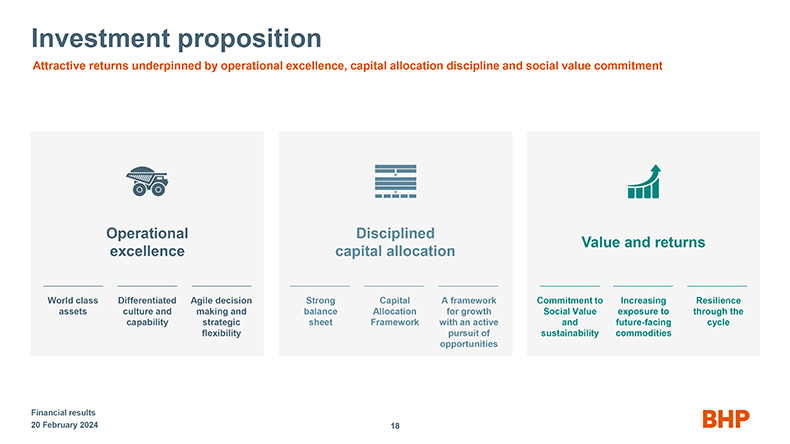
Investment proposition Attractive returns underpinned by operational excellence, capital allocation discipline and social value commitment Operational Disciplined Value and returns excellence capital allocation World class Differentiated Agile decision Strong Capital A framework Commitment to Increasing Resilience assets culture and making and balance Allocation for growth Social Value exposure to through the capability strategic sheet Framework with an active and future-facing cycle flexibility pursuit of sustainability commodities opportunities Financial results 20 February 2024 18

BHP
Footnotes 1. Slide 5: FY24 production guidance ranges remain unchanged for all assets, with the exception of BMA which has been lowered to between 23 and 25 Mt (46 – 50 Mt at 100%) excluding Blackwater and Daunia from the expected sale completion date of 2 April 2024. WAIO, Escondida and Spence are expected to be within their respective unit cost guidance ranges at FY24, with BMA unit cost guidance for FY24 increasing to between US$110/t and US$116/t as a result of the lowered production guidance. 2. Slide 5: For more information refer to BHP’s 31 October 2023 news release, available to view on www.bhp.com. 3. Slide 7: Adjusted effective tax rate and Adjusted effective tax rate including royalties: excludes the influence of exchange rate movements and exceptional items. 4. Slide 7: Dividend per share refers to cash dividends. Payout ratio on underlying attributable profit. 5. Slide 7: Operating costs net of other income and of profit/(loss) from equity accounted investments, related impairments and expenses. 6. Slide 7 and 9: D&A: represents depreciation and amortisation expense and net impairments. 7. Slide 7 and 9: Tax: includes foreign exchange movements in tax expense. 8. Slide 8: During CY23, London Metal Exchange benchmark nickel prices fell considerably as both the supply of nickel from Indonesia significantly increased and the London Metal Exchange began accepting Indonesian-origin nickel products as part of its efforts to respond to evolving industry dynamics. 9. Slide 8: BHP analysis based on the Q4 2023 Wood Mackenzie cash cost plus sustaining capex nickel supply curve. Note that the analysis assumes all producers face spot prices and does not account for any hedge positions or management actions to reduce costs taken after the curve was finalised. Operators can take urgent actions on their cost base that make it difficult to estimate true cost in real-time. Therefore, the analysis presented should be taken as a rough approximation of industry conditions at a specific point in time, not as a precise estimate with an extended period of validity. 10. Slide 8: Refers to Renova Foundation spend since 2016 (100% basis). 11. Slide 8: Figure calculated considering total of 727 cases, which is the total of known cases as at 31 December 2023. Resettlement cases completed includes completed construction (families either moved in or handover to families in progress) or cash payment made. 12. Slide 9: Price: net of price-linked costs. 13. Slide 9: Inflation: includes CPI increases across the cost base, and price changes for consumable costs including diesel and energy. 14. Slide 9: CPI is exclusive of any CPI relating to diesel, energy and other consumable materials. 15. Slide 9: Other includes US$240 m relating to new and acquired operations including the OZ Minerals Ltd acquisition and US$(119) m of non-cash movements. 16. Slide 10: Average realised exchange rates for H1 FY24 of AUD/USD 0.65 (FY24 guidance rate AUD/USD 0.67) and USD/CLP 874 (FY24 guidance rate USD/CLP 810). 17. Slide 10: WAIO C1 cost: excludes royalties (government and third party royalties), net inventory movements, depletion of production stripping, exploration expenses, marketing purchases, demurrage, exchange rate gains/losses, and other income. There may be differences in the manner that third parties calculate or report unit costs data compared to BHP, which means third party data may not be comparable with our data. 18. Slide 10: BMA figures for H1 FY24 include Blackwater and Daunia. 19. Slide 10: Total revenue from thermal coal sales, including BMA and NSWEC, was US$980 m (H1 FY23: US$2,123 m). 20. Slide 13 and 16: Represents FY30 and the proceeding decade. 21. Slide 13: Illustrative timeline for Chilean copper brownfield options is based on the range of timelines for potential leaching options and potential Escondida new concentrator as shown on slide 16. 22. Slide 13: Timing of Copper South Australia growth options are aligned and subject to approval of the introduction of two-stage smelting at Olympic Dam. 23. Slide 14: First production from Jansen Stage 1 is expected to be delivered at the end of CY26. Jansen Stage 1 is forecast to be first quartile when it reaches full production. 24. Slide 14: Jansen Stage 2 IRR is post-tax, nominal and reflects Argus and CRU prices (Average 2029-2039: US$369/t Argus and US$466/t CRU). The IRR is the expected internal rate of return based on incremental Jansen Stage 2 cashflow across approximately 50-year mine life. 25. Slide 14: Jansen is expected to have ~50% less operational (Scopes 1 and 2) greenhouse gas emissions per tonne of product and use up to ~60% less fresh water compared to average potash mine in Saskatchewan, Canada. 26. Slide 15 and 24: Represents our current aspiration for Copper South Australia, and not intended to be a projection, forecast or production target. Includes potential increases in production rates, as well as potential impacts from our exploration program and assets acquired as part of the OZ Minerals acquisition. 27. Slide 16: Refer to the BHP Annual Report 2023 Mineral Resources and Ore Reserves for Cerro Colorado. Resources included in this presentation are produced in accordance with the Australian Securities Exchange (ASX) Listing Rules Chapter 5 and the Australasian Code for Reporting of Exploration Results, Mineral Resources and Ore Reserves, December 2012 (JORC Code) and are not produced in accordance with U.S. rules set forth in S-K 1300. 28. Slide 17: Over 85% of BMA’s products are expected to reference the Premium Hard Coking Coal FOB Australia indices, reflecting the high quality of our metallurgical coal portfolio. 29. Slide 17: The completion of the divestment of Blackwater and Daunia is expected to occur on 2 April 2024. Financial results 20 February 2024 20

BHP Appendix
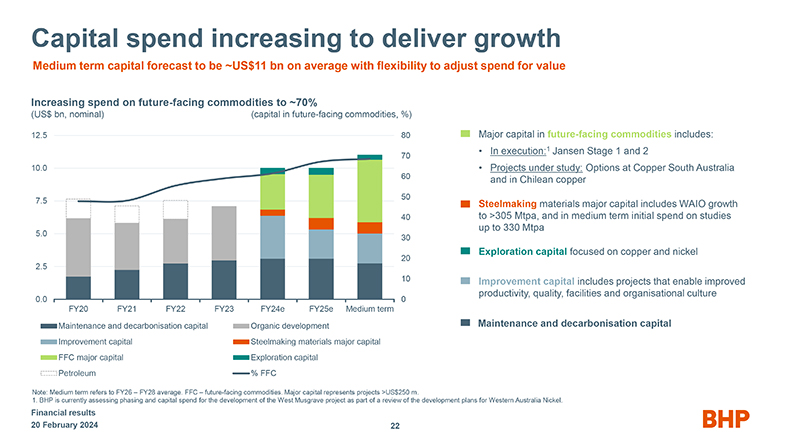
Capital spend increasing to deliver growth Medium term capital forecast to be ~US$11 bn on average with flexibility to adjust spend for value Increasing spend on future-facing commodities to ~70% (US$ bn, nominal) (capital in future-facing commodities, %) 12.5 80 70 10.0 60 50 7.5 40 5.0 30 20 2.5 10 0.0 0 FY20 FY21 FY22 FY23 FY24e FY25e Medium term Maintenance and decarbonisation capital Organic development Improvement capital Steelmaking materials major capital FFC major capital Exploration capital Petroleum % FFC Note: Medium term refers to FY26 – FY28 average. FFC – future-facing commodities. Major capital represents projects >US$250 m. 1. BHP is currently assessing phasing and capital spend for the development of the West Musgrave project as part of a review of the development plans for Western Australia Nickel. Financial results 20 February 2024 22 Major capital in future-facing commodities includes: • In execution:1 Jansen Stage 1 and 2 • Projects under study: Options at Copper South Australia and in Chilean copper Steelmaking materials major capital includes WAIO growth to >305 Mtpa, and in medium term initial spend on studies up to 330 Mtpa Exploration capital focused on copper and nickel Improvement capital includes projects that enable improved productivity, quality, facilities and organisational culture Maintenance and decarbonisation capital 22
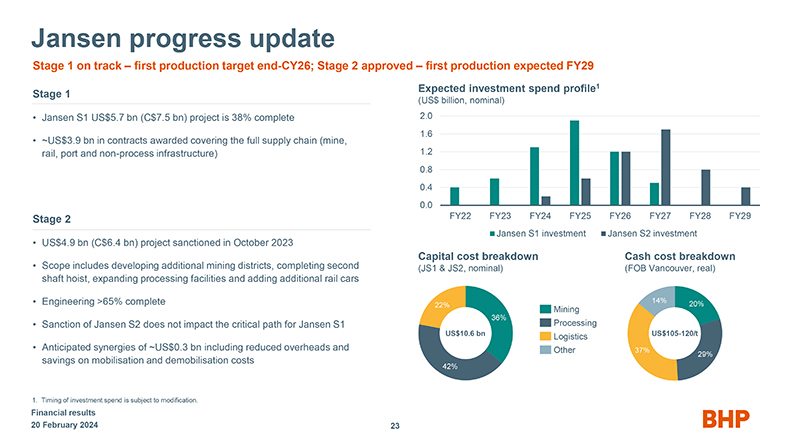
Jansen progress update Stage 1 on track – first production target end-CY26; Stage 2 approved – first production expected FY29 Stage 1 • Jansen S1 US$5.7 bn (C$7.5 bn) project is 38% complete • ~US$3.9 bn in contracts awarded covering the full supply chain (mine, rail, port and non-process infrastructure) Stage 2 • US$4.9 bn (C$6.4 bn) project sanctioned in October 2023 • Scope includes developing additional mining districts, completing second shaft hoist, expanding processing facilities and adding additional rail cars • Engineering >65% complete • Sanction of Jansen S2 does not impact the critical path for Jansen S1 • Anticipated synergies of ~US$0.3 bn including reduced overheads and savings on mobilisation and demobilisation costs 1. Timing of investment spend is subject to modification. Financial results 20 February 2024 Expected investment spend profile1 (US$ billion, nominal) 2.0 1.6 1.2 0.8 0.4 0.0 FY22 FY23 FY24 FY25 FY26 FY27 FY28 FY29 Jansen S1 investment Jansen S2 investment Capital cost breakdown Cash cost breakdown (JS1 & JS2, nominal) (FOB Vancouver, real) 14% 22% 20% Mining 36% Processing US$10.6 bn Logistics US$105-120/t Other 37% 29% 42% 23
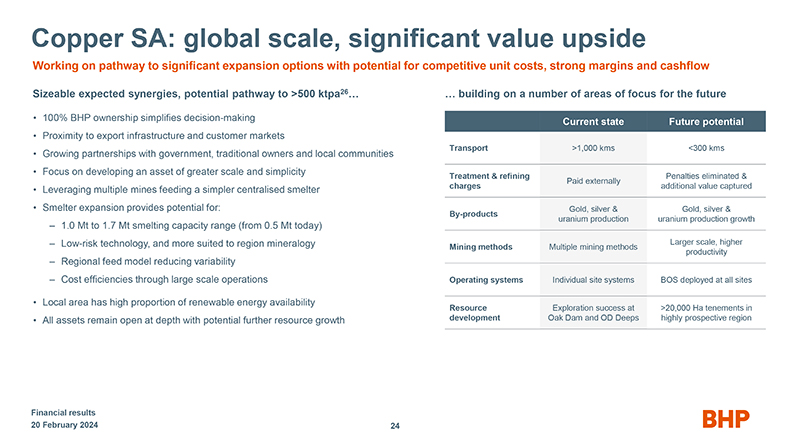
Copper SA: global scale, significant value upside Working on pathway to significant expansion options with potential for competitive unit costs, strong margins and cashflow Sizeable expected synergies, potential pathway to >500 ktpa26… • 100% BHP ownership simplifies decision-making • Proximity to export infrastructure and customer markets • Growing partnerships with government, traditional owners and local communities • Focus on developing an asset of greater scale and simplicity • Leveraging multiple mines feeding a simpler centralised smelter • Smelter expansion provides potential for: – 1.0 Mt to 1.7 Mt smelting capacity range (from 0.5 Mt today) – Low-risk technology, and more suited to region mineralogy – Regional feed model reducing variability – Cost efficiencies through large scale operations • Local area has high proportion of renewable energy availability • All assets remain open at depth with potential further resource growth … building on a number of areas of focus for the future Current state Future potential Transport >1,000 kms <300 kms Treatment & refining Penalties eliminated & Paid externally charges additional value captured Gold, silver & Gold, silver & By-products uranium production uranium production growth Larger scale, higher Mining methods Multiple mining methods productivity Operating systems Individual site systems BOS deployed at all sites Resource Exploration success at >20,000 Ha tenements in development Oak Dam and OD Deeps highly prospective region Financial results 20 February 2024 24
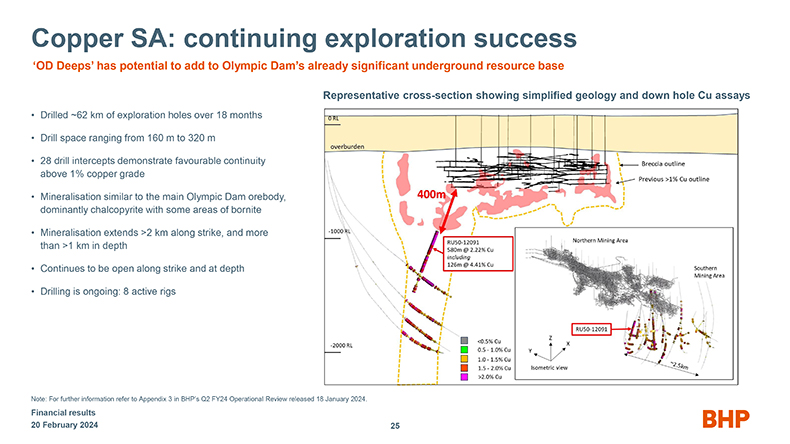
Copper SA: continuing exploration success ‘OD Deeps’ has potential to add to Olympic Dam’s already significant underground resource base • Drilled ~62 km of exploration holes over 18 months • Drill space ranging from 160 m to 320 m • 28 drill intercepts demonstrate favourable continuity above 1% copper grade • Mineralisation similar to the main Olympic Dam orebody, dominantly chalcopyrite with some areas of bornite • Mineralisation extends >2 km along strike, and more than >1 km in depth • Continues to be open along strike and at depth • Drilling is ongoing: 8 active rigs Note: For further information refer to Appendix 3 in BHP’s Q2 FY24 Operational Review released 18 January 2024. Financial results 20 February 2024 Representative cross-section showing simplified geology and down hole Cu assays 25
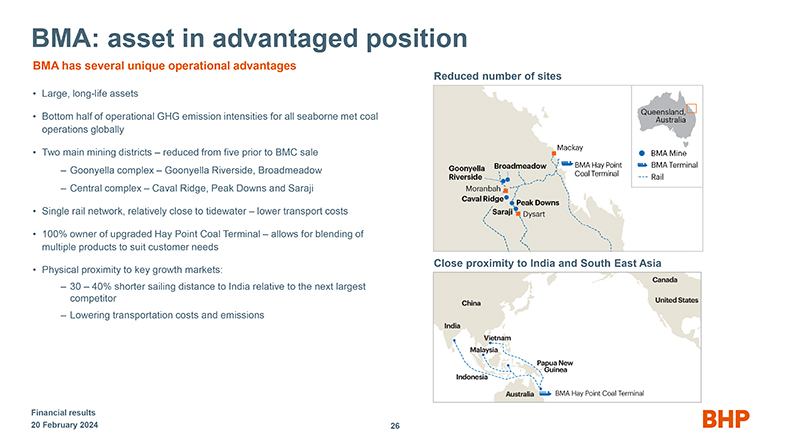
BMA: asset in advantaged position BMA has several unique operational advantages Reduced number of sites • Large, long-life assets • Bottom half of operational GHG emission intensities for all seaborne met coal operations globally • Two main mining districts – reduced from five prior to BMC sale – Goonyella complex – Goonyella Riverside, Broadmeadow – Central complex – Caval Ridge, Peak Downs and Saraji • Single rail network, relatively close to tidewater – lower transport costs • 100% owner of upgraded Hay Point Coal Terminal – allows for blending of multiple products to suit customer needs Close proximity to India and South East Asia • Physical proximity to key growth markets: – 30 – 40% shorter sailing distance to India relative to the next largest competitor – Lowering transportation costs and emissions Financial results 20 February 2024 26
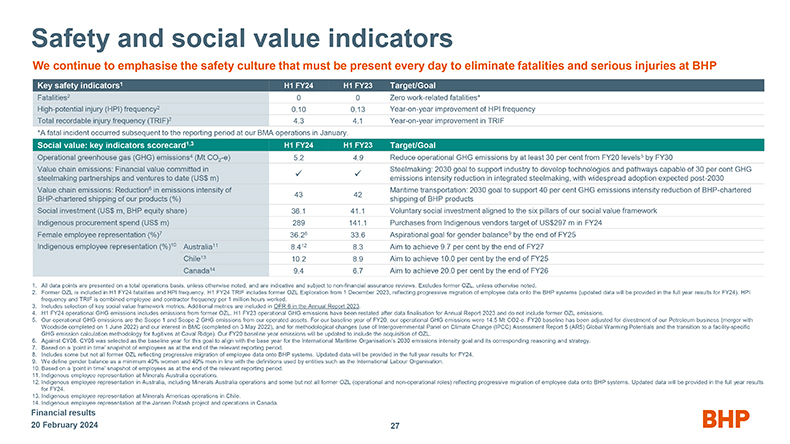
Safety and social value indicators We continue to emphasise the safety culture that must be present every day to eliminate fatalities and serious injuries at BHP Key safety indicators1 H1 FY24 H1 FY23 Target/Goal Fatalities2 0 0 Zero work-related fatalities* High-potential injury (HPI) frequency2 0.10 0.13 Year-on-year improvement of HPI frequency Total recordable injury frequency (TRIF)2 4.3 4.1 Year-on-year improvement in TRIF *A fatal incident occurred subsequent to the reporting period at our BMA operations in January. Social value: key indicators scorecard1,3 H1 FY24 H1 FY23 Target/Goal Operational greenhouse gas (GHG) emissions4 (Mt CO2-e) 5.2 4.9 Reduce operational GHG emissions by at least 30 per cent from FY20 levels5 by FY30 Value chain emissions: Financial value committed in Steelmaking: 2030 goal to support industry to develop technologies and pathways capable of 30 per cent GHG steelmaking partnerships and ventures to date (US$ m) ??emissions intensity reduction in integrated steelmaking, with widespread adoption expected post-2030 Value chain emissions: Reduction6 in emissions intensity of Maritime transportation: 2030 goal to support 40 per cent GHG emissions intensity reduction of BHP-chartered 43 42 BHP-chartered shipping of our products (%) shipping of BHP products Social investment (US$ m, BHP equity share) 36.1 41.1 Voluntary social investment aligned to the six pillars of our social value framework Indigenous procurement spend (US$ m) 289 141.1 Purchases from Indigenous vendors target of US$297 m in FY24 Female employee representation (%)7 36.28 33.6 Aspirational goal for gender balance9 by the end of FY25 Indigenous employee representation (%)10 Australia11 8.412 8.3 Aim to achieve 9.7 per cent by the end of FY27 Chile13 10.2 8.9 Aim to achieve 10.0 per cent by the end of FY25 Canada14 9.4 6.7 Aim to achieve 20.0 per cent by the end of FY26 1. All data points are presented on a total operations basis, unless otherwise noted, and are indicative and subject to non-financial assurance reviews. Excludes former OZL, unless otherwise noted. 2. Former OZL is included in H1 FY24 fatalities and HPI frequency. H1 FY24 TRIF includes former OZL Exploration from 1 December 2023, reflecting progressive migration of employee data onto the BHP systems (updated data will be provided in the full year results for FY24). HPI frequency and TRIF is combined employee and contractor frequency per 1 million hours worked. 3. Includes selection of key social value framework metrics. Additional metrics are included in OFR 6 in the Annual Report 2023. 4. H1 FY24 operational GHG emissions includes emissions from former OZL. H1 FY23 operational GHG emissions have been restated after data finalisation for Annual Report 2023 and do not include former OZL emissions. 5. Our operational GHG emissions are the Scope 1 and Scope 2 GHG emissions from our operated assets. For our baseline year of FY20, our operational GHG emissions were 14.5 Mt CO2-e. FY20 baseline has been adjusted for divestment of our Petroleum business (merger with Woodside completed on 1 June 2022) and our interest in BMC (completed on 3 May 2022), and for methodological changes (use of Intergovernmental Panel on Climate Change (IPCC) Assessment Report 5 (AR5) Global Warming Potentials and the transition to a facility-specific GHG emission calculation methodology for fugitives at Caval Ridge). Our FY20 baseline year emissions will be updated to include the acquisition of OZL. 6. Against CY08. CY08 was selected as the baseline year for this goal to align with the base year for the International Maritime Organisation’s 2030 emissions intensity goal and its corresponding reasoning and strategy. 7. Based on a ‘point in time’ snapshot of employees as at the end of the relevant reporting period. 8. Includes some but not all former OZL reflecting progressive migration of employee data onto BHP systems. Updated data will be provided in the full year results for FY24. 9. We define gender balance as a minimum 40% women and 40% men in line with the definitions used by entities such as the International Labour Organisation. 10. Based on a ‘point in time’ snapshot of employees as at the end of the relevant reporting period. 11. Indigenous employee representation at Minerals Australia operations. 12. Indigenous employee representation in Australia, including Minerals Australia operations and some but not all former OZL (operational and non-operational roles) reflecting progressive migration of employee data onto BHP systems. Updated data will be provided in the full year results for FY24. 13. Indigenous employee representation at Minerals Americas operations in Chile. 14. Indigenous employee representation at the Jansen Potash project and operations in Canada. Financial results 20 February 2024 27
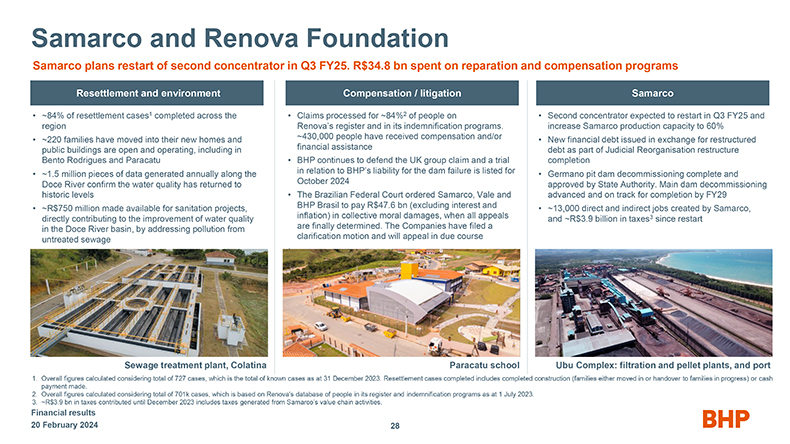
Samarco and Renova Foundation Samarco plans restart of second concentrator in Q3 FY25. R$34.8 bn spent on reparation and compensation programs Resettlement and environment • ~84% of resettlement cases1 completed across the region • ~220 families have moved into their new homes and public buildings are open and operating, including in Bento Rodrigues and Paracatu • ~1.5 million pieces of data generated annually along the Doce River confirm the water quality has returned to historic levels • ~R$750 million made available for sanitation projects, directly contributing to the improvement of water quality in the Doce River basin, by addressing pollution from untreated sewage Compensation / litigation • Claims processed for ~84%2 of people on Renova’s register and in its indemnification programs. ~430,000 people have received compensation and/or financial assistance • BHP continues to defend the UK group claim and a trial in relation to BHP’s liability for the dam failure is listed for October 2024 • The Brazilian Federal Court ordered Samarco, Vale and BHP Brasil to pay R$47.6 bn (excluding interest and inflation) in collective moral damages, when all appeals are finally determined. The Companies have filed a clarification motion and will appeal in due course Samarco • Second concentrator expected to restart in Q3 FY25 and increase Samarco production capacity to 60% • New financial debt issued in exchange for restructured debt as part of Judicial Reorganisation restructure completion • Germano pit dam decommissioning complete and approved by State Authority. Main dam decommissioning advanced and on track for completion by FY29 • ~13,000 direct and indirect jobs created by Samarco, and ~R$3.9 billion in taxes3 since restart Sewage treatment plant, Colatina Paracatu school Ubu Complex: filtration and pellet plants, and port 1. Overall figures calculated considering total of 727 cases, which is the total of known cases as at 31 December 2023. Resettlement cases completed includes completed construction (families either moved in or handover to families in progress) or cash payment made. 2. Overall figures calculated considering total of 701k cases, which is based on Renova’s database of people in its register and indemnification programs as at 1 July 2023. 3. ~R$3.9 bn in taxes contributed until December 2023 includes taxes generated from Samarco’s value chain activities. Financial results 20 February 2024 28
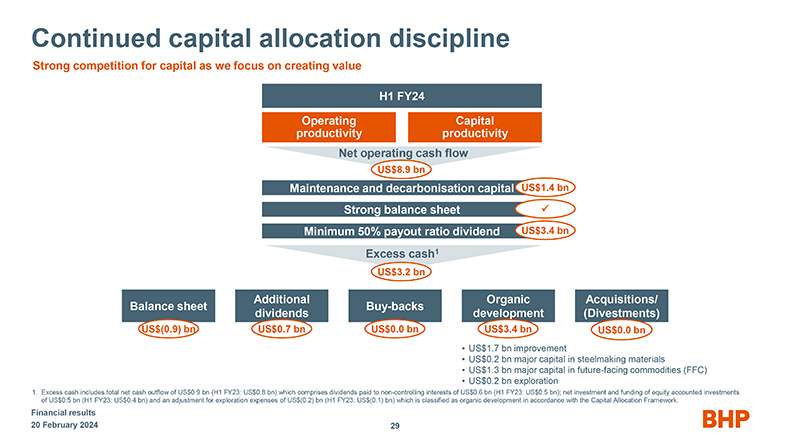
Continued capital allocation discipline Strong competition for capital as we focus on creating value H1 FY24 Operating Capital productivity productivity Net operating cash flow US$8.9 bn Maintenance and decarbonisation capital US$1.4 bn Strong balance sheet Minimum 50% payout ratio dividend US$3.4 bn Excess cash1 US$3.2 bn Additional Organic Acquisitions/ Balance sheet Buy-backs dividends development (Divestments) US$(0.9) bn US$0.7 bn US$0.0 bn US$3.4 bn US$0.0 bn • US$1.7 bn improvement • US$0.2 bn major capital in steelmaking materials • US$1.3 bn major capital in future-facing commodities (FFC) • US$0.2 bn exploration 1. Excess cash includes total net cash outflow of US$0.9 bn (H1 FY23: US$0.8 bn) which comprises dividends paid to non-controlling interests of US$0.6 bn (H1 FY23: US$0.5 bn); net investment and funding of equity accounted investments of US$0.5 bn (H1 FY23: US$0.4 bn) and an adjustment for exploration expenses of US$(0.2) bn (H1 FY23: US$(0.1) bn) which is classified as organic development in accordance with the Capital Allocation Framework. Financial results 20 February 2024 29
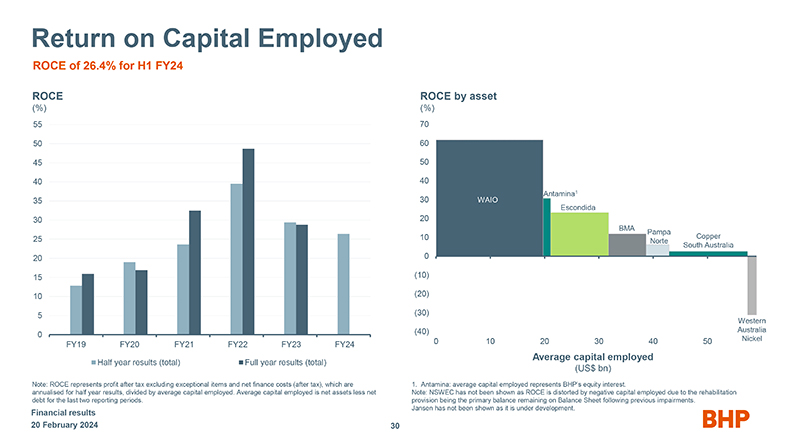
Return on Capital Employed ROCE of 26.4% for H1 FY24 ROCE (%) 55 50 45 40 35 30 25 20 15 10 5 0 FY19 FY20 FY21 FY22 FY23 FY24 Half year results (total) Full year results (total) Note: ROCE represents profit after tax excluding exceptional items and net finance costs (after tax), which are annualised for half year results, divided by average capital employed. Average capital employed is net assets less net debt for the last two reporting periods. Financial results 20 February 2024 ROCE by asset (%) 70 60 50 40 Antamina1 30 WAIO Escondida 20 BMA Pampa 10 Copper Norte South Australia 0 (10) (20) (30) Western (40) Australia 0 10 20 30 40 50 Nickel Average capital employed (US$ bn) 1. Antamina: average capital employed represents BHP’s equity interest. Note: NSWEC has not been shown as ROCE is distorted by negative capital employed due to the rehabilitation provision being the primary balance remaining on Balance Sheet following previous impairments. Jansen has not been shown as it is under development. 30
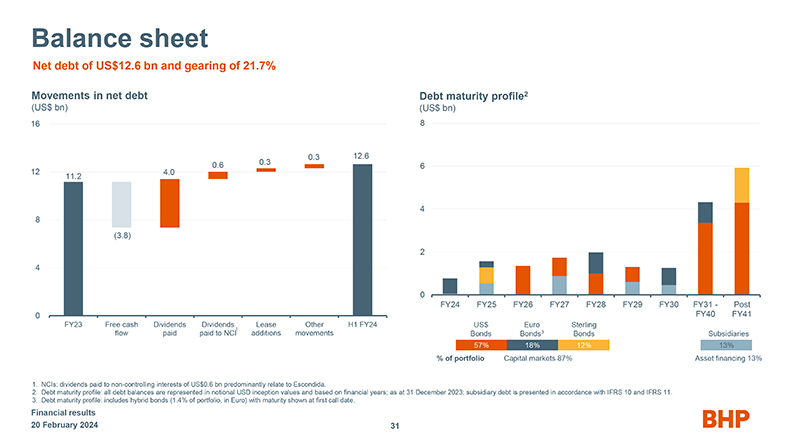
Balance sheet Net debt of US$12.6 bn and gearing of 21.7% Movements in net debt (US$ bn) 16 0.3 12.6 0.6 0.3 12 4.0 11.2 8 (3.8) 4 0 FY23 Free cash Dividends Dividends 1 Lease Other H1 FY24 flow paid paid to NCI additions movements Debt maturity profile2 (US$ bn) 8 6 4 2 0 FY24 FY25 FY26 FY27 FY28 FY29 FY30 FY31—Post FY40 FY41 US$ Euro Sterling Bonds Bonds3 Bonds Subsidiaries 57% 18% 12% 13% % of portfolio Capital markets 87% Asset financing 13% 1. NCIs: dividends paid to non-controlling interests of US$0.6 bn predominantly relate to Escondida. 2. Debt maturity profile: all debt balances are represented in notional USD inception values and based on financial years; as at 31 December 2023; subsidiary debt is presented in accordance with IFRS 10 and IFRS 11. 3. Debt maturity profile: includes hybrid bonds (1.4% of portfolio, in Euro) with maturity shown at first call date. Financial results 20 February 2024 31
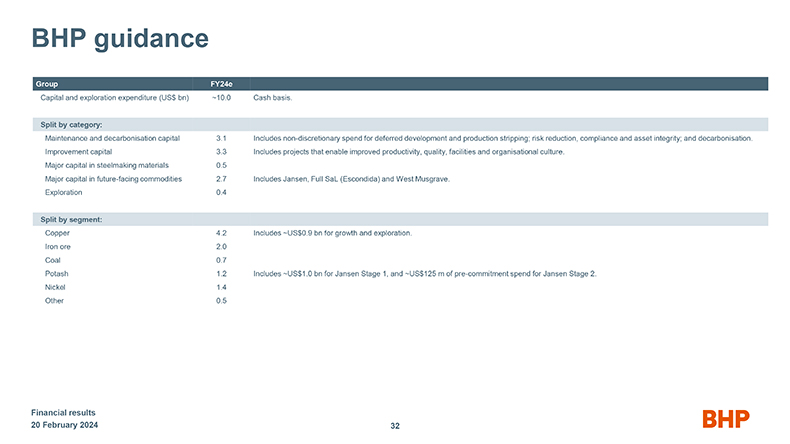
BHP guidance Group FY24e Capital and exploration expenditure (US$ bn) ~10.0 Cash basis. Split by category: Maintenance and decarbonisation capital 3.1 Includes non-discretionary spend for deferred development and production stripping; risk reduction, compliance and asset integrity; and decarbonisation. Improvement capital 3.3 Includes projects that enable improved productivity, quality, facilities and organisational culture. Major capital in steelmaking materials 0.5 Major capital in future-facing commodities 2.7 Includes Jansen, Full SaL (Escondida) and West Musgrave. Exploration 0.4 Split by segment: Copper 4.2 Includes ~US$0.9 bn for growth and exploration. Iron ore 2.0 Coal 0.7 Potash 1.2 Includes ~US$1.0 bn for Jansen Stage 1, and ~US$125 m of pre-commitment spend for Jansen Stage 2. Nickel 1.4 Other 0.5 Financial results 20 February 2024 32
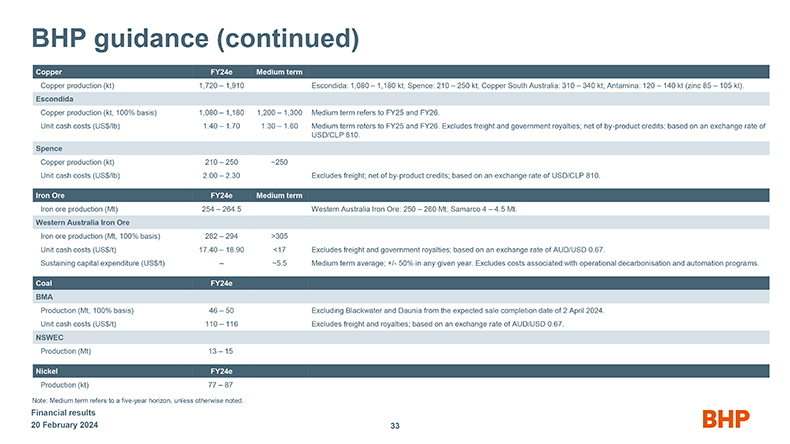
BHP guidance (continued) Copper FY24e Medium term Copper production (kt) 1,720 – 1,910 Escondida: 1,080 – 1,180 kt; Spence: 210 – 250 kt; Copper South Australia: 310 – 340 kt; Antamina: 120 – 140 kt (zinc 85 – 105 kt). Escondida Copper production (kt, 100% basis) 1,080 – 1,180 1,200 – 1,300 Medium term refers to FY25 and FY26. Unit cash costs (US$/lb) 1.40 – 1.70 1.30 – 1.60 Medium term refers to FY25 and FY26. Excludes freight and government royalties; net of by-product credits; based on an exchange rate of USD/CLP 810. Spence Copper production (kt) 210 – 250 ~250 Unit cash costs (US$/lb) 2.00 – 2.30 Excludes freight; net of by-product credits; based on an exchange rate of USD/CLP 810. Iron Ore FY24e Medium term Iron ore production (Mt) 254 – 264.5 Western Australia Iron Ore: 250 – 260 Mt; Samarco 4 – 4.5 Mt. Western Australia Iron Ore Iron ore production (Mt, 100% basis) 282 – 294 >305 Unit cash costs (US$/t) 17.40 – 18.90 <17 Excludes freight and government royalties; based on an exchange rate of AUD/USD 0.67. Sustaining capital expenditure (US$/t) – ~5.5 Medium term average; +/- 50% in any given year. Excludes costs associated with operational decarbonisation and automation programs. Coal FY24e BMA Production (Mt, 100% basis) 46 – 50 Excluding Blackwater and Daunia from the expected sale completion date of 2 April 2024. Unit cash costs (US$/t) 110 – 116 Excludes freight and royalties; based on an exchange rate of AUD/USD 0.67. NSWEC Production (Mt) 13 – 15 Nickel FY24e Production (kt) 77 – 87 Note: Medium term refers to a five-year horizon, unless otherwise noted. Financial results 20 February 2024 33
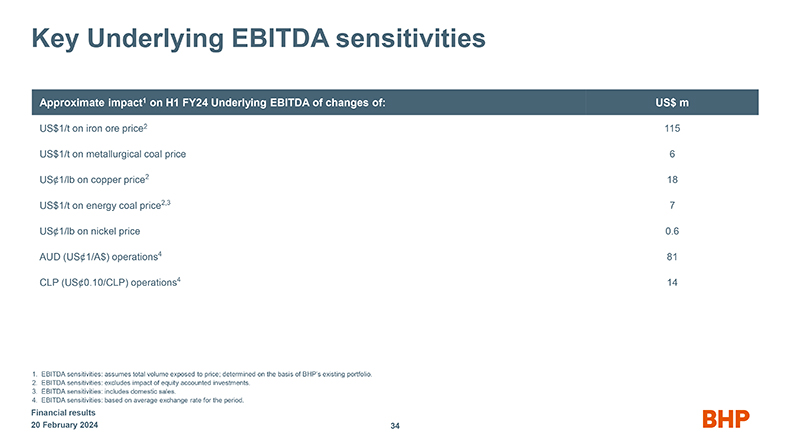
Key Underlying EBITDA sensitivities Approximate impact1 on H1 FY24 Underlying EBITDA of changes of: US$ m US$1/t on iron ore price2 115 US$1/t on metallurgical coal price 6 US¢1/lb on copper price2 18 US$1/t on energy coal price2,3 7 US¢1/lb on nickel price 0.6 AUD (USË~1/A$) operations4 81 CLP (US¢0.10/CLP) operations4 14 1. EBITDA sensitivities: assumes total volume exposed to price; determined on the basis of BHP’s existing portfolio. 2. EBITDA sensitivities: excludes impact of equity accounted investments. 3. EBITDA sensitivities: includes domestic sales. 4. EBITDA sensitivities: based on average exchange rate for the period. Financial results 20 February 2024 34

BHP
SIGNATURES
Pursuant to the requirements of the Securities Exchange Act of 1934, the registrant has duly caused this report to be signed on its behalf by the undersigned, thereunto duly authorized.
| BHP Group Limited | ||||||
| Date: February 20, 2024 | By: | /s/ Stefanie Wilkinson |
||||
| Name: | Stefanie Wilkinson | |||||
| Title: | Group Company Secretary | |||||