| ☐ | REGISTRATION STATEMENT PURSUANT TO SECTION 12 OF THE SECURITIES EXCHANGE ACT OF 1934 |
| ☑ | ANNUAL REPORT PURSUANT TO SECTION 13(a) OR 15(d) OF THE SECURITIES EXCHANGE ACT OF 1934 |
For the fiscal year ended
December 31 , 2023 |
Commission file number 1-14942
|
| Title of each class |
Trading Symbol(s) |
Name of each exchange on which registered | ||
Common Shares |
MFC |
New York Stock Exchange |
|
☑
Annual Information Form |
☑
Audited Annual Financial Statements |
Common Shares |
1,806,039,020 |
|||
Class A Shares Series 2 |
14,000,000 |
|||
Class A Shares Series 3 |
12,000,000 |
|||
Class 1 Shares Series 3 |
6,537,903 |
|||
Class 1 Shares Series 4 |
1,462,097 |
|||
Class 1 Shares Series 9 |
10,000,000 |
|||
Class 1 Shares Series 11 |
8,000,000 |
|||
Class 1 Shares Series 13 |
8,000,000 |
|||
Class 1 Shares Series 15 |
8,000,000 |
|||
Class 1 Shares Series 17 |
14,000,000 |
|||
Class 1 Shares Series 19 |
10,000,000 |
|||
Class 1 Shares Series 25 |
10,000,000 |
|||
Class 1 Shares Series 27 1
|
2,000,000 |
|||
Class 1 Shares Series 28 2
|
1,200,000 |
|||
Class 1 Shares Series 29 3
|
1,000,000 |
| † | The term “new or revised financial accounting standard” refers to any update issued by the Financial Accounting Standards Board to its Accounting Standards Codification after April 5, 2012. |
Auditor Name: Ernst & Young LLP |
Auditor Location: Toronto, Ontario, Canada |
| (a) | Consolidated Financial Statements for the fiscal year ended December 31, 2023; |
| (b) | Management’s Discussion and Analysis for the fiscal year ended December 31, 2023; and |
| (c) | Annual Information Form dated February 14, 2024 for the fiscal year ended December 31, 2023. |
| • | Adding text to underscore that employees are expected to follow all internal controls; |
| • | Adding explicit references to the international labour standards Manulife already follows, and; |
| • | Providing guidance regarding the use of emerging technologies, such as generative Artificial Intelligence (e.g., ChatGPT). |
| Note 9 | Risk Management - Securities Lending, Repurchase and Reverse Repurchase Transactions | |
| Note 18 | Interests in Structured Entities | |
| Note 19 | Commitments and Contingencies |
A. |
Undertaking. |
B. |
Consent to Service of Process. |
Manulife Financial Corporation |
||
| By: | /s/ James D. Gallagher |
|
| Name: | James D. Gallagher | |
| Title: | General Counsel | |
Exhibit |
Description |
|
| 97.1 | Executive Officer Clawback Policy | |
| 99.1 | Consolidated Financial Statements for the fiscal year ended December 31, 2023 | |
| 99.2 | Management’s Discussion and Analysis for the fiscal year ended December 31, 2023 | |
| 99.3 | Annual Information Form dated February 14, 2024 for the fiscal year ended December 31, 2023 | |
| 99.4 | Certification of Chief Executive Officer pursuant to Rule 13a-14(a) or 15d-14(a) of the Securities Exchange Act of 1934 |
|
| 99.5 | Certification of Chief Financial Officer pursuant to Rule 13a-14(a) or 15d-14(a) of the Securities Exchange Act of 1934 |
|
| 99.6 | Section 1350 Certification of Chief Executive Officer | |
| 99.7 | Section 1350 Certification of Chief Financial Officer | |
| 99.8 | Consent of Independent Registered Public Accounting Firm | |
| 99.9 | Consent of Appointed Actuary | |
| 101 | Interactive Data File (formatted as Inline XBRL) | |
| 104 | Cover Page Interactive Data File (formatted as Inline XBRL and contained in Exhibit 101) | |
Exhibit 97.1
EXECUTIVE OFFICER CLAWBACK POLICY
The Board of Directors (the “Board”) of Manulife Financial Corporation (the “Company”) believes that it is in the best interests of the Company and its shareholders to adopt this Clawback Policy (the “Policy”), which provides for the recovery of certain incentive compensation in the event of an Accounting Restatement (as defined below). This Policy is designed to comply with, and shall be interpreted consistent with, Section 10D of the Securities Exchange Act of 1934, as amended (the “Exchange Act”), Rule 10D-1 promulgated under the Exchange Act (“Rule 10D-1”) and Section 303A.14 of the New York Stock Exchange (“NYSE”) Listed Company Manual (the “Listing Standards”).
This Policy is separate from, and in addition to, any other policy of the Company or any of its subsidiaries now or hereafter in existence, that relates to the clawback of incentive awards or other forms of compensation from directors, executive officers or employees of the Company or its subsidiaries (any such other clawback policy being referred to herein as a “Discretionary Clawback Policy”). In the event of any conflict or inconsistency between this Policy and any Discretionary Clawback Policy, the terms and conditions of this Policy shall prevail.
| 1. | Administration |
Except as specifically set forth herein, this Policy shall be administered by the Management Resources and Compensation Committee (the “MRCC”) of the Board (the “Administrator”). The Administrator is authorized to interpret and construe this Policy and to make all determinations necessary, appropriate, or advisable for the administration of this Policy. Any determinations made by the Administrator shall be final and binding on all affected individuals and need not be uniform with respect to each individual covered by the Policy. In the administration of this Policy, the Administrator is authorized and directed to consult with the full Board or such other committees of the Board, such as the Audit Committee or the Risk Committee, as may be necessary or appropriate as to matters within the scope of such other committee’s responsibility and authority. Subject to any limitation at applicable law, the Administrator may authorize and empower any officer or employee of the Company to take any and all actions necessary or appropriate to carry out the purpose and intent of this Policy (other than with respect to any recovery under this Policy involving such officer or employee), and the Administrator may retain the services of external consultants of other service providers if determined to be necessary or appropriate.
| 2. | Definitions |
As used in this Policy, the following definitions shall apply:
| • | “Accounting Restatement” means an accounting restatement of the Company’s financial statements due to the Company’s material noncompliance with any financial reporting requirement under the securities laws, including any required accounting restatement to correct an error in previously issued financial statements that is material to the previously issued financial statements, or that would result in a |
| material misstatement if the error were corrected in the current period or left uncorrected in the current period. |
| • | “Administrator” has the meaning set forth in Section 1 hereof. |
| • | “Applicable Period” means the three completed fiscal years immediately preceding the date on which the Company is required to prepare an Accounting Restatement, as well as any transition period (that results from a change in the Company’s fiscal year) within or immediately following those three completed fiscal years (except that a transition period that comprises a period of at least nine months shall count as a completed fiscal year). The “date on which the Company is required to prepare an Accounting Restatement” is the earlier to occur of (a) the date the Board concludes, or reasonably should have concluded, that the Company is required to prepare an Accounting Restatement, or (b) the date a court, regulator, or other legally authorized body directs the Company to prepare an Accounting Restatement, in each case regardless of if or when the restated financial statements are filed. |
| • | “Covered Executives” means the Company’s current and former executive officers, as determined by the Administrator in accordance with the definition of executive officer set forth in Rule 10D-1 and the Listing Standards. |
| • | “Erroneously Awarded Compensation” has the meaning set forth in Section 5 of this Policy. |
| • | A “Financial Reporting Measure” is any measure that is determined and presented in accordance with the accounting principles used in preparing the Company’s financial statements, and any measure that is derived wholly or in part from such measure. A Financial Reporting Measure need not be presented within the Company’s financial statements or included in a filing with the Securities Exchange Commission. |
| • | “Incentive-Based Compensation” means any compensation that is granted, earned, or vested based wholly or in part upon the attainment of a Financial Reporting Measure. Incentive-Based Compensation is “received” for purposes of this Policy in the Company’s fiscal period during which the Financial Reporting Measure specified in the Incentive-Based Compensation award is attained, even if the payment or grant of such Incentive-Based Compensation occurs after the end of that period. |
| 3. | Covered Executives; Incentive-Based Compensation |
Without limiting the terms and conditions of any Discretionary Clawback Policy, this Policy applies to Incentive-Based Compensation received by a Covered Executive (a) after beginning services as a Covered Executive; (b) if that person served as a Covered Executive at any time during the performance period for such Incentive-Based Compensation; and (c) while the Company had a listed class of securities on a national securities exchange.
2
| 4. | Required Recoupment of Erroneously Awarded Compensation in the event of an Accounting Restatement |
In the event the Company is required to prepare an Accounting Restatement, the Company shall promptly recoup the amount of any Erroneously Awarded Compensation received by any Covered Executive, as calculated pursuant to Section 5 hereof, during the Applicable Period.
| 5. | Erroneously Awarded Compensation: Amount Subject to Recovery |
The amount of “Erroneously Awarded Compensation” subject to recovery under the Policy, as determined by the Administrator, is the amount of Incentive-Based Compensation received by the Covered Executive that exceeds the amount of Incentive-Based Compensation that would have been received by the Covered Executive had it been determined based on the restated amounts.
Erroneously Awarded Compensation shall be computed by the Administrator without regard to any taxes paid in any and all applicable jurisdictions by the Covered Executive in respect of the Erroneously Awarded Compensation.
By way of example, with respect to any compensation plans or programs that take into account Incentive-Based Compensation, the amount of Erroneously Awarded Compensation subject to recovery hereunder includes, but is not limited to, the amount contributed to any notional account based on Erroneously Awarded Compensation and any earnings accrued to date on that notional amount.
For Incentive-Based Compensation based on stock price or total shareholder return (“TSR”): (a) the Administrator shall determine the amount of Erroneously Awarded Compensation based on a reasonable estimate of the effect of the Accounting Restatement on the stock price or TSR upon which the Incentive-Based Compensation was received; and (b) the Company shall maintain documentation of the determination of that reasonable estimate and provide such documentation to NYSE.
| 6. | Method of Recoupment |
The Administrator shall determine, in its sole discretion, the timing and method for promptly recouping Erroneously Awarded Compensation hereunder, which may include without limitation (a) seeking reimbursement of all or part of any cash or equity-based award, (b) cancelling prior cash or equity-based awards, whether vested or unvested or paid or unpaid, (c) canceling or offsetting against any planned future cash or equity-based awards, (d) forfeiture of deferred compensation, subject to compliance with Section 409A of the Internal Revenue Code and the regulations promulgated thereunder, and (e) any other method authorized by applicable law or contract. Subject to compliance with any applicable law, the Administrator may affect recovery under this Policy from any amount otherwise payable to the Covered Executive, including amounts payable to such individual under any otherwise applicable Company plan or program, including base salary, bonuses or commissions and compensation previously deferred by the Covered Executive.
The Company is authorized and directed pursuant to this Policy to recoup Erroneously Awarded Compensation in compliance with this Policy unless the MRCC has determined that recovery would be impracticable solely for the following limited reasons, and subject to the following procedural and disclosure requirements:
3
| • | The direct expense paid to a third party to assist in enforcing the Policy would exceed the amount to be recovered. Before concluding that it would be impracticable to recover any amount of Erroneously Awarded Compensation based on expense of enforcement, the Administrator must make a reasonable attempt to recover such erroneously awarded compensation, document such reasonable attempt(s) to recover, and provide that documentation to NYSE; |
| • | Recovery would violate home country law of the issuer where that law was adopted prior to November 28, 2022. Before concluding that it would be impracticable to recover any amount of Erroneously Awarded Compensation based on violation of home country law of the issuer, the Administrator must satisfy the applicable opinion and disclosure requirements of Rule 10D-1 and the Listing Standards; or |
| • | Recovery would likely cause an otherwise tax-qualified retirement plan, under which benefits are broadly available to employees of the Company, to fail to meet the requirements of 26 U.S.C. 401(a)(13) or 26 U.S.C. 411(a) and regulations thereunder. |
| 7. | No Indemnification of Covered Executives |
Notwithstanding the terms of any indemnification or insurance policy or any contractual arrangement with any Covered Executive that may be interpreted to the contrary, the Company shall not indemnify any Covered Executives against the loss of any Erroneously Awarded Compensation, including any payment or reimbursement for the cost of third-party insurance purchased by any Covered Executives to fund potential clawback obligations under this Policy.
| 8. | Administrator Indemnification |
Any members of the Administrator, and any other members of the Board who assist in the administration of this Policy, shall not be personally liable for any action, determination or interpretation made with respect to this Policy and shall be fully indemnified by the Company to the fullest extent under applicable law and Company policy with respect to any such action, determination or interpretation. The foregoing sentence shall not limit any other rights to indemnification of the members of the Board under applicable law or Company policy.
| 9. | Effective Date; Retroactive Application |
This Policy shall be effective as of October 2, 2023 (the “Effective Date”). The terms of this Policy shall apply to any Incentive-Based Compensation that is received by Covered Executives on or after the Effective Date, even if such Incentive-Based Compensation was approved, awarded, granted or paid to Covered Executives prior to the Effective Date. Without limiting the generality of Section 6 hereof, and subject to applicable law, the Administrator may affect recovery under this Policy from any amount of compensation approved, awarded, granted, payable or paid to the Covered Executive prior to, on or after the Effective Date.
4
| 10. | Amendment; Termination |
The MRCC may amend, modify, supplement, rescind or replace all or any portion of this Policy at any time and from time to time in its discretion, and shall amend this Policy as it deems necessary to comply with applicable law or any rules or standards adopted by a national securities exchange on which the Company’s securities are listed.
| 11. | Other Recoupment Rights; Company Claims |
The MRCC intends that this Policy shall be applied to the fullest extent of the law. Any right of recoupment under this Policy is in addition to, and not in lieu of, any other remedies or rights of recoupment that may be available to the Company under applicable law or pursuant to the terms of any similar policy in any employment agreement, equity award agreement, or similar agreement and any other legal remedies available to the Company.
Nothing contained in this Policy, and no recoupment or recovery as contemplated by this Policy, shall limit any claims, damages or other legal remedies the Company or any of its affiliates may have against a Covered Executive arising out of or resulting from any actions or omissions by the Covered Executive.
| 12. | Successors |
This Policy shall be binding and enforceable against all Covered Executives and their beneficiaries, heirs, executors, administrators or other legal representatives.
| 13. | Exhibit Filing Requirement |
A copy of this Policy and any amendments thereto shall be posted on the Company’s website and filed as an exhibit to the Company’s annual report on Form 40-F.
5


Roy Gori President and Chief Executive Officer |

Colin Simpson Chief Financial Officer |

 |
155 |
|
|
157 |
|
|
159 |
IFRS 17 Insurance Contracts Adoption |
||
Description of the matter |
On January 1, 2023, the Company adopted IFRS 17 ‘Insurance Contracts’ which replaced IFRS 4 ‘Insurance Contracts’ with an effective date of January 1, 2022. As described in Note 25 ‘Adoption of IFRS 17’ of the accompanying financial statements, the Company applied the Full Retrospective Approach to most contracts issued on or after January 1, 2021, and applied the Fair Value Approach for contracts issued prior to this date. Note 25 of the accompanying financial statements also provides quantitative and qualitative information on the impact of the new standard and certain accounting policy choices made by the Company. Auditing the Company’s transition to IFRS 17 was complex as it related to the measurement of the Company’s insurance contract liabilities including the transition Contractual Service Margin (transition CSM) included therein. This required the application of significant auditor judgment due to the complexity of the models, and in the determination of key assumptions, specifically the discount rate and risk adjustment relating to the measurement of the insurance contract liabilities, and the development of fair value assumptions used in the determination of the transition CSM. The audit effort involved professionals with specialized skills and knowledge to assist in evaluating the audit evidence obtained. |
|
How we addressed the matter in our audit |
We obtained an understanding, evaluated the design, and tested the operating effectiveness of management’s controls over the transition to the new standard for insurance contract liabilities including the transition CSM. The controls we tested included, among others, controls related to management’s selection of accounting policies and the related determination of the transition approach, as well as controls related to the development of fair value and actuarial models, the integrity of data used, implementation of new systems and models, and assumption setting and implementation processes. To audit the impact of the Company’s adoption of IFRS 17 on the insurance contract liabilities including the transition CSM, our audit procedures included, among others, involving our actuarial specialists to evaluate the related accounting policies, the elections involved in transition, and to assess the appropriateness of the determination of where the Full Retrospective Approach was impracticable. In relation to the key assumptions used in the measurement of the insurance contract liabilities including the transition CSM, with the involvement of our actuarial specialists, we assessed the appropriateness and consistency of key assumptions by comparing to publicly available market data, our knowledge of the products and the requirements of IFRS 17. These procedures also included testing underlying support and documentation, such as executed policyholder insurance contracts. We tested the methodology and calculations of the IFRS 17 insurance contract liabilities and transition CSM either through review of the calculation logic within the newly implemented models, or through calculating an independent estimate of the insurance contract liability for a sample of insurance contracts and comparing the results to those determined by the Company. In addition, we assessed the adequacy of the disclosures related to the adoption of IFRS 17. |
|
Valuation of Insurance Contract Liabilities |
||
Description of the matter |
The Company recorded insurance contract liabilities of $482 billion at December 31, 2023 on its consolidated statement of financial position, of which $355 billion as disclosed in Note 7 has been measured under the variable fee approach (VFA) and the general measurement model (GMM). At initial recognition, the Company measures a group of insurance contracts as the total of: (a) fulfilment cash flows, which comprise of estimates of future cash flows, adjusted to reflect the time value of money and financial risks, and a risk adjustment for
non-financial risk; and (b) a contractual service margin (CSM), which represents the estimate of unearned profit the Company will recognize as it provides service under the insurance contracts. When projecting future cash flows for these insurance contract liabilities, the Company primarily uses deterministic projections using best estimate assumptions. Key assumptions are subjective and complex and include mortality, morbidity, investment returns, policy termination rates, premium persistency, directly attributable expenses, taxes, and policyholder dividends. Disclosures on this matter are found in Note 1 ‘Nature of Operations and Material Accounting Policy Information’ and Note 7 ‘Insurance and Reinsurance Contract Assets and Liabilities’ of the consolidated financial statements.Auditing the valuation of these insurance contract liabilities was complex and required the application of significant auditor judgment due to the complexity of the cash flow models, the selection and use of assumptions, and the interrelationship of these variables in measuring insurance contract liabilities. The audit effort involved professionals with specialized skills and knowledge to assist in evaluating the audit evidence obtained. |
|
How we addressed the matter in our audit |
We obtained an understanding, evaluated the design, and tested the operating effectiveness of management’s controls over the valuation of insurance contract liabilities. The controls we tested related to, among other areas, actuarial methodology, integrity of data used, controls over relevant information technology, and the assumption setting and implementation processes used by management. To test the valuation of insurance contract liabilities, our audit procedures included, among other procedures, involving our actuarial specialists to assess the methodology and assumptions with respect to compliance with the Company’s policies. We performed audit procedures over key assumptions, including the implementation of those assumptions into the models. These procedures included testing underlying support and documentation, including reviewing a sample of experience studies supporting specific assumptions, challenging the nature, timing, and completeness of changes recorded, and assessing whether individual changes were errors or refinements of estimates. We also tested the methodology and calculation of the insurance contract liabilities through both review of the calculation logic within the models, and through calculating an independent estimate of the fulfillment cashflows for a sample of insurance contracts and comparing the results to those determined by the Company. Additionally, we have performed an independent calculation of the CSM for a sample of groups of insurance contracts and compared the amounts to the Company’s results. In addition, we assessed the adequacy of the disclosures related to the valuation of insurance contract liabilities. |
|
|
|
161 |
Valuation of Invested Assets and Derivatives with Significant Non-Observable Market Inputs |
||
Description of the matter |
The Company recorded invested assets of $87.6 billion, as disclosed in Note 4 ‘Invested Assets and Investment Income’, and derivative assets and liabilities of $0.6 billion and $2.7 billion, respectively, as disclosed in Note 5 ‘Derivative and Hedging Instruments’ at December 31, 2023 within its consolidated statement of financial position which are both (a) measured at fair value and (b) classified as Level 3 within the Company’s hierarchy of fair value measurements. The Level 3 invested assets include private placements, commercial mortgages, real estate, timber and agriculture, and private equities valued using internal models. There is increased measurement uncertainty in determining the fair value of these invested assets and derivatives due to volatility in the current economic environment. Fair values are based on internal models or third-party appraisals that incorporate assumptions with a high-level of subjectivity. Examples of such assumptions include discount rates, credit ratings and related spreads, expected future cash flows, transaction prices of comparable assets, volatilities, and correlations. Disclosures on this matter are found in Note 1 ‘Nature of Operations and Material Accounting Policy Information’, Note 4 ‘Invested Assets and Investment Income’, and Note 5 ‘Derivative and Hedging Instruments’ of the consolidated financial statements.
Auditing the valuation of these invested assets and derivatives was complex and required the application of significant auditor judgment in assessing the valuation methodologies and
non-observable inputs used. The valuation is sensitive to the significant non-observable market inputs described above, which are inherently forward-looking and could be affected by future economic and market conditions. The audit effort involved professionals with specialized skills and knowledge to assist in evaluating the audit evidence obtained. |
|
How we addressed the matter in our audit |
We obtained an understanding, evaluated the design, and tested the operating effectiveness of management’s controls over the valuation processes. The controls we tested related to, among other areas, management’s determination and approval of assumptions and methodologies used in model-based valuations.
To test the valuation, our audit procedures included, among other procedures, involving our valuation specialists to assess the methodologies and significant assumptions used by management. These procedures included assessing the valuation methodologies used with respect to the Company’s policies, valuation guidelines, and industry practice and comparing a sample of valuation assumptions used against benchmarks including comparable transactions where applicable. We also performed independent investment valuations on a sample basis to evaluate management’s recorded values. In addition, we assessed the adequacy of the disclosures related to the valuation of invested assets and derivatives.
|
|
IFRS 9 Hedge Accounting |
||
Description of the matter |
The Company has designated new hedge accounting relationships with the objective to reduce potential accounting mismatches between changes in the fair value of derivatives in income and financial risk of insurance contract liabilities and financial assets in other comprehensive income. Specifically, the Company has established relationships to hedge the fair value changes of a group of the Company’s insurance contract liabilities due to changes in the benchmark interest rate. Related to the application of this hedge, the Company recognized changes in value of the hedged items of ($53) million for the year ended December 31, 2023. The Company has also established relationships to hedge the risk of fair value changes of foreign currency denominated debt instruments attributable to changes in the benchmark interest rate and foreign exchange rates. Related to the application of this hedge, the Company recognized changes in value of the hedged items of $742 million for the year ended December 31, 2023. Disclosures on this matter are found in Note 1 ‘Nature of Operations and Material Accounting Policy Information’ and Note 5 ‘Derivative and Hedging Instruments’ of the consolidated financial statements.
Auditing the design and application of hedge accounting was complex and required the application of significant auditor judgment related to assessing the appropriateness of the designation of a risk component such as the benchmark interest rate and foreign exchange rate as eligible hedged items, that the hedge ratio between the hedging instrument and the hedged item was consistent with the risk objectives, and the determination and amortization of the resulting accumulated fair value adjustments. The audit effort involved professionals with specialized skills and knowledge to assist in evaluating the audit evidence obtained.
|
|
How we addressed the matter in our audit |
We obtained an understanding, evaluated the design, and tested the operating effectiveness of management’s controls over the implementation of the above hedge strategies, the application and execution of those strategies, and the measurements of the accumulated fair value adjustments. The controls we tested included, among others, controls related to management’s development and approval of the new strategies, the review of the completeness, accuracy, and eligibility of the hedged items and hedging instruments included in the hedging relationships, determination of the hedge ratio between the hedging instrument and the hedged item with reference to the risk objectives, and the determination and amortization of the resulting accumulated fair value adjustments.
To assess the Company’s consistent application of these new hedge accounting strategies under IFRS 9, our audit procedures included, among other procedures, involving our actuarial specialists to support our assessment of the eligibility of hedging the specific risk components. Our derivative specialists also supported our independent testing of the application of the hedge ratio by the Company and the valuation of a sample of the accumulated fair value adjustments. Other procedures performed include testing over the completeness and accuracy of the hedged items and hedging instruments designated in these relationships and the determination and amortization of the resulting accumulated fair value adjustments. In addition, we assessed the adequacy of the disclosures related to hedge accounting.
|
|
|
|
163 |
|
As at (Canadian $ in millions)
|
December 31, 2023 |
Restated (note 2)
December 31, 2022
|
Restated (note 2)
January 1, 2022
|
|||||||||
Assets |
||||||||||||
Cash and short-term securities |
$ |
20,338 |
$ | 19,153 | $ | 22,594 | ||||||
Debt securities |
212,149 |
203,842 | 224,139 | |||||||||
Public equities |
25,531 |
23,519 | 28,067 | |||||||||
Mortgages |
52,421 |
51,765 | 53,948 | |||||||||
Private placements |
45,606 |
42,010 | 47,289 | |||||||||
Loans to Bank clients |
2,436 |
2,781 | 2,506 | |||||||||
Real estate |
13,049 |
14,269 | 14,269 | |||||||||
Other invested assets |
45,680 |
42,803 | 35,291 | |||||||||
Total invested assets (note 4) |
417,210 |
400,142 | 428,103 | |||||||||
Other assets |
||||||||||||
Accrued investment income |
2,678 |
2,635 | 2,428 | |||||||||
Derivatives (note 5) |
8,546 |
8,588 | 17,503 | |||||||||
Insurance contract assets (note 7) |
145 |
673 | 972 | |||||||||
Reinsurance contract held assets (note 7) |
42,651 |
45,871 | 52,829 | |||||||||
Deferred tax assets |
6,739 |
6,708 | 7,767 | |||||||||
Goodwill and intangible assets (note 6) |
10,310 |
10,519 | 9,919 | |||||||||
Miscellaneous |
9,751 |
9,991 | 8,911 | |||||||||
Total other assets |
80,820 |
84,985 | 100,329 | |||||||||
Segregated funds net assets (note 23) |
377,544 |
348,562 | 399,788 | |||||||||
Total assets |
$ |
875,574 |
$ | 833,689 | $ | 928,220 | ||||||
Liabilities and Equity |
||||||||||||
Liabilities |
||||||||||||
Insurance contract liabilities, excluding those for account of segregated fund holders (note 7) |
$ |
367,996 |
$ | 354,849 | $ | 405,621 | ||||||
Reinsurance contract held liabilities (note 7) |
2,831 |
2,391 | 2,079 | |||||||||
Investment contract liabilities (note 8) |
11,816 |
10,079 | 10,064 | |||||||||
Deposits from Bank clients |
21,616 |
22,507 | 20,720 | |||||||||
Derivatives (note 5) |
11,730 |
14,289 | 10,038 | |||||||||
Deferred tax liabilities |
1,697 |
1,536 | 1,713 | |||||||||
Other liabilities |
18,879 |
18,894 | 19,443 | |||||||||
Long-term debt (note 10) |
6,071 |
6,234 | 4,882 | |||||||||
Capital instruments (note 11) |
6,667 |
6,122 | 6,980 | |||||||||
Total liabilities, excluding those for account of segregated fund holders |
449,303 |
436,901 | 481,540 | |||||||||
Insurance contract liabilities for account of segregated fund holders (note 7) |
114,143 |
110,216 | 130,836 | |||||||||
Investment contract liabilities for account of segregated fund holders |
263,401 |
238,346 | 268,952 | |||||||||
Insurance and investment contract liabilities for account of segregated fund holders (note 23) |
377,544 |
348,562 | 399,788 | |||||||||
Total liabilities |
826,847 |
785,463 | 881,328 | |||||||||
Equity |
||||||||||||
Preferred shares and other equity (note 12) |
6,660 |
6,660 | 6,381 | |||||||||
Common shares (note 12) |
21,527 |
22,178 | 23,093 | |||||||||
Contributed surplus |
222 |
238 | 262 | |||||||||
Shareholders and other equity holders’ retained earnings |
4,819 |
3,947 | 9,656 | |||||||||
Shareholders and other equity holders’ accumulated other comprehensive income (loss) (“AOCI”): |
||||||||||||
Insurance finance income (expenses) |
30,010 |
38,057 | (17,117 | ) | ||||||||
Reinsurance finance income (expenses) |
(4,634 |
) |
(5,410 | ) | 984 | |||||||
Fair value through other comprehensive income (“OCI”) investments |
(16,262 |
) |
(24,645 | ) | 17,764 | |||||||
Translation of foreign operations |
4,801 |
5,918 | 4,578 | |||||||||
Other |
(104 |
) |
(67 |
) |
(246 |
) |
||||||
Total shareholders and other equity holders’ equity |
47,039 |
46,876 | 45,355 | |||||||||
Participating policyholders’ equity |
257 |
(77 | ) | 101 | ||||||||
Non-controlling interests |
1,431 |
1,427 | 1,436 | |||||||||
Total equity |
48,727 |
48,226 | 46,892 | |||||||||
Total liabilities and equity |
$ |
875,574 |
$ | 833,689 | $ | 928,220 | ||||||
|
Roy Gori President and Chief Executive Officer |

Don Lindsay Chair of the Board of Directors |
| For the years ended December 31, (Canadian $ in millions except per share amounts) |
2023 |
Restated (note 2) 2022 |
||||||
| Insurance service result |
|
|
|
|
|
| ||
| Insurance revenue (note 7) |
$ |
23,972 |
$ | 23,118 | ||||
| Insurance service expenses (note 7) |
(19,382 |
) |
(19,335 | ) | ||||
| Net expenses from reinsurance contracts held (note 7) |
(613 |
) |
(623 | ) | ||||
| Total insurance service result |
3,977 |
3,160 | ||||||
| Investment result |
|
|
|
|
|
| ||
| Investment income (note 4) |
|
|
|
|
|
| ||
| Investment income |
16,180 |
15,204 | ||||||
| Realized and unrealized gains (losses) on assets supporting insurance and investment contract liabilities |
3,138 |
(13,646 | ) | |||||
| Investment expenses |
(1,297 |
) |
(1,221 | ) | ||||
| Net investment income (loss) |
18,021 |
337 | ||||||
| Insurance finance income (expenses) and effect of movement in foreign exchange rates (note 7) |
(13,894 |
) |
(6,616 | ) | ||||
| Reinsurance finance income (expenses) and effect of movement in foreign exchange rates (note 7) |
(734 |
) |
309 | |||||
| Decrease (increase) in investment contract liabilities |
(435 |
) |
(399 | ) | ||||
|
|
2,958 |
(6,369 | ) | |||||
| Segregated funds investment result (note 23) |
|
|
|
|
|
| ||
| Investment income related to segregated funds net assets |
49,346 |
(56,487 | ) | |||||
| Financial changes related to insurance and investment contract liabilities for account of segregated fund holders |
(49,346 |
) |
56,487 | |||||
| Net segregated funds investment result |
– |
– | ||||||
| Total investment result |
2,958 |
(6,369 | ) | |||||
| Other revenue (note 14) |
6,746 |
6,186 | ||||||
| General expenses |
(4,330 |
) |
(3,731 | ) | ||||
| Commissions related to non-insurance contracts |
(1,345 |
) |
(1,333 | ) | ||||
| Interest expenses |
(1,554 |
) |
(1,051 | ) | ||||
| Net income (loss) before income taxes |
6,452 |
(3,138 | ) | |||||
| Income tax recoveries (expenses) |
(845 |
) |
1,159 | |||||
| Net income (loss) |
$ |
5,607 |
$ | (1,979 | ) | |||
| Net income (loss) attributed to: |
|
|
|
|
|
| ||
| Non-controlling interests |
$ |
144 |
$ | 121 | ||||
| Participating policyholders |
360 |
(167 | ) | |||||
| Shareholders and other equity holders |
5,103 |
(1,933 | ) | |||||
|
|
$ |
5,607 |
$ | (1,979 | ) | |||
| Net income (loss) attributed to shareholders |
$ |
5,103 |
$ | (1,933 | ) | |||
| Preferred share dividends and other equity distributions |
(303 |
) |
(260 | ) | ||||
| Common shareholders’ net income (loss) |
$ |
4,800 |
$ | (2,193 | ) | |||
| Earnings per share |
|
|
|
|
|
| ||
| Basic earnings per common share (note 12) |
$ |
2.62 |
$ | (1.15 |
)
| |||
| Diluted earnings per common share (note 12) |
2.61 |
(1.15 |
)
| |||||
| Dividends per common share |
1.46 |
1.32 | ||||||
| |
1 65
|
| For the years ended December 31, (Canadian $ in millions) |
2023 |
Restated (note 2) 2022 |
||||||
| Net income (loss) |
$ |
5,607 |
$ | (1,979 | ) | |||
| Other comprehensive income (loss) (“OCI”), net of tax: |
|
|
|
|
|
| ||
| Items that may be subsequently reclassified to net income: |
|
|
|
|
|
| ||
| Foreign exchange gains (losses) on: |
|
|
|
|
|
| ||
| Translation of foreign operations |
(1,301 |
) |
1,755 | |||||
| Net investment hedges |
183 |
(415 | ) | |||||
| Insurance finance income (expenses) |
(9,745 |
) |
58,772 | |||||
| Reinsurance finance income (expenses) |
787 |
(6,364 | ) | |||||
| Fair value through OCI investments: |
|
|
|
|
|
| ||
| Unrealized gains (losses) arising during the year on assets supporting insurance and investment contract liabilities |
9,251 |
(47,494 | ) | |||||
| Reclassification of net realized gains (losses) and provision for credit losses recognized in income |
256 |
1,347 | ||||||
| Other |
37 |
159 | ||||||
| |
|
|
|
|
|
|
|
|
| Total items that may be subsequently reclassified to net income |
(532 |
) |
7,760 | |||||
| Items that will not be reclassified to net income |
(70 |
) |
16 | |||||
| Other comprehensive income (loss), net of tax |
(602 |
) |
7,776 | |||||
| Total comprehensive income (loss), net of tax |
$ |
5,005 |
$ | 5,797 | ||||
| Total comprehensive income (loss) attributed to: |
|
|
|
|
|
| ||
| Non-controlling interests |
$ |
18 |
$ | 17 | ||||
| Participating policyholders |
334 |
(177 | ) | |||||
| Shareholders and other equity holders |
4,653 |
5,957 | ||||||
| For the years ended December 31, (Canadian $ in millions) |
2023 |
Restated (note 2) 2022 |
||||||
| Income tax expenses (recoveries) on: |
|
|
|
|
|
| ||
| Unrealized foreign exchange gains (losses) on translation of foreign operations |
$ |
(1 |
) |
$ | 2 | |||
| Unrealized foreign exchange gains (losses) on net investment hedges |
13 |
(29 | ) | |||||
| Insurance / reinsurance finance income (expenses) |
(1,853 |
) |
12,002 | |||||
| Unrealized gains (losses) on fair value through OCI investments |
1,863 |
(9,599 | ) | |||||
| Reclassification of net realized gains (losses) on fair value through OCI investments |
(8 |
) |
270 | |||||
| Other |
(20 |
) |
65 | |||||
| Total income tax expenses (recoveries) |
$ |
(6 |
) |
$ | 2,711 | |||
| For the years ended December 31, (Canadian $ in millions) |
2023 |
Restated (note 2) 2022 |
||||||
| Preferred shares and other equity |
|
|
|
|
|
| ||
| Balance, beginning of year |
$ |
6,660 |
$ | 6,381 | ||||
| Issued (note 12) |
– |
1,000 | ||||||
| Redeemed (note 12) |
– |
(711 | ) | |||||
| Issuance costs, net of tax |
– |
(10 | ) | |||||
| Balance, end of year |
6,660 |
6,660 | ||||||
| Common shares |
|
|
|
|
|
| ||
| Balance, beginning of year |
22,178 |
23,093 | ||||||
| Repurchased (note 12) |
(745 |
) |
(938 | ) | ||||
| Issued on exercise of stock options and deferred share units |
94 |
23 | ||||||
| Balance, end of year |
21,527 |
22,178 | ||||||
| Contributed surplus |
|
|
|
|
|
| ||
| Balance, beginning of year |
238 |
262 | ||||||
| Exercise of stock options and deferred share units |
(18 |
) |
(4 | ) | ||||
| Stock option expense |
2 |
5 | ||||||
| Acquisition of non-controlling interest |
– |
(25 | ) | |||||
| Balance, end of year |
222 |
238 | ||||||
| Shareholders’ and other equity holders’ retained earnings |
|
|
|
|
|
| ||
| Balance, beginning of year |
3,947 |
23,492 | ||||||
| Opening adjustment of insurance contracts at adoption of IFRS 17 |
– |
(3,191 | ) | |||||
| Opening adjustment of financial assets at adoption of IFRS 9 / IFRS 17 |
(409 |
) |
(10,645 | ) | ||||
| Restated balance, beginning of year |
3,538 |
9,656 | ||||||
| Net income (loss) attributed to shareholders and other equity holders |
5,103 |
(1,933 | ) | |||||
| Common shares repurchased (note 12) |
(850 |
) |
(946 | ) | ||||
| Preferred share dividends and other equity distributions |
(303 |
) |
(260 | ) | ||||
| Preferred shares redeemed (note 12) |
– |
(14 | ) | |||||
| Common share dividends |
(2,669 |
) |
(2,513 | ) | ||||
| Acquisition of non-controlling interest |
– |
(43 | ) | |||||
| Balance, end of year |
4,819 |
3,947 | ||||||
| Shareholders’ and other equity holders’ accumulated other comprehensive income (loss) (“AOCI”) |
|
|
|
|
|
| ||
| Balance, beginning of year |
13,853 |
5,180 | ||||||
| Opening adjustment of insurance contracts at adoption of IFRS 17 |
– |
(16,133 | ) | |||||
| Opening adjustment of financial assets at adoption of IFRS 9 / IFRS 17 |
408 |
16,916 | ||||||
| Restated balance, beginning of year |
14,261 |
5,963 | ||||||
| Change in unrealized foreign exchange gains (losses) on net foreign operations |
(1,117 |
) |
1,340 | |||||
| Changes in insurance / reinsurance finance income (expenses) |
(7,222 |
) |
48,780 | |||||
| Change in unrealized gains (losses) on fair value through OCI investments |
7,923 |
(42,407 | ) | |||||
| Other changes in OCI attributed to shareholders and other equity holders |
(34 |
) |
177 | |||||
| Balance, end of year |
13,811 |
13,853 | ||||||
| Total shareholders’ and other equity holders’ equity, end of year |
47,039 |
46,876 | ||||||
| Participating policyholders’ equity |
|
|
|
|
|
| ||
| Balance, beginning of year |
(77 |
) |
(1,233 | ) | ||||
| Opening adjustment of insurance contracts at adoption of IFRS 17 |
– |
707 | ||||||
| Opening adjustment of financial assets at adoption of IFRS 9 / IFRS 17 |
– |
626 | ||||||
| Restated balance, beginning of year |
(77 |
) |
100 | |||||
| Net income (loss) attributed to participating policyholders |
360 |
(167 | ) | |||||
| Other comprehensive income (losses) attributed to policyholders |
(26 |
) |
(10 | ) | ||||
| Balance, end of year |
257 |
(77 | ) | |||||
| Non-controlling interests |
|
|
|
|
|
| ||
| Balance, beginning of year |
1,427 |
1,694 | ||||||
| Opening adjustment of insurance contracts at adoption of IFRS 17 |
– |
(258 | ) | |||||
| Opening adjustment of financial assets at adoption of IFRS 9 / IFRS 17 |
– |
– | ||||||
| Restated balance, beginning of year |
1,427 |
1,436 | ||||||
| Net income (loss) attributed to non-controlling interests |
144 |
121 | ||||||
| Other comprehensive income (losses) attributed to non-controlling interests |
(126 |
) |
(104 | ) | ||||
| Contributions (distributions and acquisition), net |
(14 |
) |
(26 | ) | ||||
| Balance, end of year |
1,431 |
1,427 | ||||||
| Total equity, end of year |
$ |
48,727 |
$ | 48,226 | ||||
| |
1 67
|
| For the years ended December 31, (Canadian $ in millions) |
2023 |
Restated (note 2) 2022 |
||||||
| Operating activities |
|
|
|
|
|
| ||
| Net income (loss) |
$ |
5,607 |
$ | (1,979) | ||||
| Adjustments: |
|
|
|
|
|
| ||
| Increase (decrease) in net insurance contract liabilities (note 7) |
10,697 |
5,016 | ||||||
| Increase (decrease) in investment contract liabilities |
435 |
399 | ||||||
| (Increase) decrease in reinsurance contract assets, excluding reinsurance transaction noted below (note 7) |
974 |
710 | ||||||
| Amortization of (premium) discount on invested assets |
(141 |
) |
(131 | ) | ||||
| |
|
|
|
|
|
|
|
|
| Contractual service margin (“CSM”) amortization |
(1,998 |
) |
(1,993 | ) | ||||
| Other amortization |
581 |
519 | ||||||
| Net realized and unrealized (gains) losses and impairment on assets |
(2,845 |
) |
13,660 | |||||
| Deferred income tax expenses (recoveries) |
470 |
(1,994 | ) | |||||
| Stock option expense |
2 |
5 | ||||||
| Gain on U.S. variable annuity reinsurance transaction (pre-tax) (note 7) |
– |
(1,070 | ) | |||||
| Gain on derecognition of joint venture interest during Manulife Fund Management Co., Ltd. acquisition (pre-tax) (notes 3 & 6)
|
– |
(95 | ) | |||||
| Cash provided by operating activities before undernoted items |
13,782 |
13,047 | ||||||
| Changes in policy related and operating receivables and payables |
6,641 |
4,958 | ||||||
| Cash decrease due to U.S. variable annuity reinsurance transaction (note 7) |
– |
(1,377 | ) | |||||
| Cash provided by (used in) operating activities |
20,423 |
16,628 | ||||||
| Investing activities |
|
|
|
|
|
| ||
| Purchases and mortgage advances |
(84,021 |
) |
(111,558 | ) | ||||
| Disposals and repayments |
70,281 |
93,407 | ||||||
| Change in investment broker net receivables and payables |
21 |
(67 | ) | |||||
| Net cash increase (decrease) from sale (purchase) of subsidiaries |
(1 |
) |
(182 | ) | ||||
| Cash provided by (used in) investing activities |
(13,720 |
) |
(18,400 | ) | ||||
| Financing activities |
|
|
|
|
|
| ||
| Change in repurchase agreements and securities sold but not yet purchased |
(693 |
) |
346 | |||||
| Issue of long-term debt (note 10) |
– |
946 | ||||||
| Issue of capital instruments, net (note 11) |
1,194 |
– | ||||||
| |
|
|
|
|
|
|
|
|
| Redemption of capital instruments (note 11) |
(600 |
) |
(1,000
|
) | ||||
| Secured borrowing from securitization transactions |
|
537 |
|
437 | ||||
| Change in deposits from Bank clients, net |
(895 |
) |
1,703 | |||||
| Lease payments |
(98 |
) |
(120 |
)
| ||||
| Shareholders’ dividends and other equity distributions |
(2,972 |
) |
(2,787 | ) | ||||
| Contributions from (distributions to) non-controlling interests, net |
(14 |
) |
(51 | ) | ||||
| Common shares repurchased (note 12) |
(1,595 |
) |
(1,884 | ) | ||||
| Common shares issued, net (note 12) |
94 |
23 | ||||||
| Preferred shares and other equity issued, net (note 12) |
– |
990 | ||||||
| Preferred shares redeemed, net (note 12) |
– |
(711 | ) | |||||
| Cash provided by (used in) financing activities |
(5,042 |
) |
(2,108 | ) | ||||
| Cash and short-term securities |
|
|
|
|
|
| ||
| Increase (decrease) during the year |
1,661 |
(3,880 | ) | |||||
| Effect of foreign exchange rate changes on cash and short-term securities |
(412 |
) |
585 | |||||
| Balance, beginning of year |
18,635 |
21,930 | ||||||
| Balance, end of year |
19,884 |
18,635 | ||||||
| Cash and short-term securities |
|
|
|
|
|
| ||
| Beginning of year |
|
|
|
|
|
| ||
| Gross cash and short-term securities |
19,153 |
22,594 | ||||||
| Net payments in transit, included in other liabilities |
(518 |
) |
(664 | ) | ||||
| Net cash and short-term securities, beginning of year |
18,635 |
21,930 | ||||||
| End of year |
|
|
|
|
|
| ||
| Gross cash and short-term securities |
20,338 |
19,153 | ||||||
| Net payments in transit, included in other liabilities |
(454 |
) |
(518 | ) | ||||
| Net cash and short-term securities, end of year |
$ |
19,884 |
$ | 18,635 | ||||
| Supplemental disclosures on cash flow information |
|
|
|
|
|
| ||
| Interest received |
$ |
12,768 |
$ | 11,873 | ||||
| Interest paid |
1,548 |
955 | ||||||
| Income taxes paid |
436 |
1,238 | ||||||
Page Number |
Note |
|||
170 |
Note 1 |
|||
184 |
Note 2 |
|||
187 |
Note 3 |
|||
187 |
Note 4 |
|||
196 |
Note 5 |
|||
205 |
Note 6 |
|||
207 |
Note 7 |
|||
229 |
Note 8 |
|||
230 |
Note 9 |
|||
243 |
Note 10 |
|||
244 |
Note 11 |
|||
246 |
Note 12 |
|||
248 |
Note 13 |
|||
249 |
Note 14 |
|||
250 |
Note 15 |
|||
251 |
Note 16 |
|||
256 |
Note 17 |
|||
258 |
Note 18 |
|||
260 |
Note 19 |
|||
262 |
Note 20 |
|||
264 |
Note 21 |
|||
265 |
Note 22 |
|||
266 |
Note 23 |
|||
266 |
Note 24 |
|||
272 |
Note 25 |
|||
276 |
Note 26 |
| |
169 |
| |
1 71
|
| • | Probability of default (“PD”) is an estimate of the likelihood of default over a given time horizon. |
| • | Loss given default (“LGD”), is an estimate of the loss arising on a future default. This is based on the difference between the contractual cash flows due and those that the Company expects to receive, including from collateral. It is based on credit default studies performed based on internal credit experience. |
| |
1 73
|
| • | Exposure at default (“EAD”), is an estimate of the exposure at a future default date, considering both the period of exposure and the amount of exposure at a given reporting date. The EADs are determined by modelling the range of possible exposure outcomes at various points in time, corresponding to the multiple economic scenarios. The probabilities are then assigned to each economic scenario based on the outcome of the models. |
| • | Stage 1 comprise all performing financial instruments that have not experienced a SICR since initial recognition. The determination of SICR varies by instrument and considers the relative change in the risk of default since origination. 12-month ECLs are recognized for all Stage 1 financial instruments. 12-month ECLs represent the portion of lifetime ECLs that result from default events possible within 12 months of the reporting date. These expected 12-month default probabilities are applied to a forecast EAD, multiplied by the expected LGD, and discounted by the original EIR. This calculation is made for each of four macroeconomic scenarios. |
| • | Stage 2 comprise all performing financial instruments that have experienced a SICR since original recognition or have become 30 days in arrears for principal or interest payments, whichever happens first. When assets move to Stage 2, full lifetime ECLs are recognized, which represent ECLs that result from all possible default events over the remaining lifetime of the financial instrument. The mechanics are consistent with Stage 1, except PDs and LGDs are estimated over the remaining lifetime of the instrument instead of over the coming year. In subsequent reporting periods, if the credit risk of a financial instrument improves such that there is no longer a SICR compared to credit risk at initial recognition, the financial instrument will migrate back to Stage 1 and 12-month ECLs will be recognized. |
| • | Stage 3 comprise financial instruments identified as credit-impaired. Similar to Stage 2 assets, full lifetime ECLs are recognized for Stage 3 financial instruments, but the PD is set at 100%. A Stage 3 ECL is calculated using the unpaid principal balance multiplied by LGD which reflects the difference between the asset’s carrying amount and its discounted expected future cash flows. |
| |
1 75
|
• |
Derivatives embedded within insurance contracts which contains risks and characteristics that are not closely related to those of the host contract, unless the embedded derivative itself meets the definition of an insurance contract; |
• |
Distinct investment components which represent cash flows paid (received) in all circumstances regardless of whether an insured event has occurred or not. Investment components are distinct if they are not highly interrelated with insurance component cash flows and if they could be issued on a standalone basis; and |
• |
Distinct service components which are promises to transfer goods or non-insurance services if the policyholder can benefit from it either on its own or with other resources that are readily available to the policyholder. The service components are distinct if they are not highly interrelated with the insurance components and the Company provides no significant service in integrating the service component with the insurance component. |
• |
Date of issue: the period cannot be longer than one year. Most of the Company’s insurance contracts are aggregated into annual cohorts; and |
• |
Expected profitability at inception into one of three categories: onerous contracts, contracts with no significant risk of becoming onerous and other remaining contracts. Onerous contracts are those contracts that at initial inception, the Company expects to generate net outflow, without considering investment returns or the benefit of any reinsurance contracts held. |
| • | Variable fee approach (“VFA”): The Company applies this approach to insurance contracts with direct participation features such as participating life insurance contracts, unit linked contracts, and variable annuity contracts. The direct participating feature is identified at inception, where the Company has the obligation to pay the policyholder an amount equal to the fair value of the underlying items less a variable fee in exchange for investment services provided. |
| • | Premium allocation approach (“PAA”): The Company applies this simplified approach for certain insurance contracts and reinsurance contracts with duration of typically one year or less, such as Canadian Group Benefit products, some Canadian Affinity products, and some Asia short-term individual and group products. |
| • | General measurement model (“GMM”): The Company applies this model to the remaining insurance contracts and reinsurance contracts not measured using the VFA or the PAA. |
| • | The beginning of the coverage period of the group of contracts, |
| • | The date when the first payment from a policyholder in the group is due or when the first payment is received if there is no due date, and |
| • | For a group of onerous contracts, as soon as facts and circumstances indicate that the group is onerous. |
| • | The liability for remaining coverage (“LRC”), which comprise the fulfilment cash flows that relate to services to be provided in the future and any remaining CSM at that date; and |
| • | The liability for incurred claims (“LIC”), which comprise the fulfilment cash flows for incurred claims and expenses that have not yet been paid. |
| (a) | effect of new contracts added to the group; |
| (b) | interest accreted on the carrying amount of CSM, measured at the locked-in discount rate. The locked-in discount rate is the weighted average of the rates applicable at the date of initial recognition of contracts that joined a group over a 12-month period, and is determined using the bottom-up approach; |
| |
177 |
| (c) | changes in fulfilment cash flows that relate to future services such as: |
| • | Experience differences between actual and expected premiums and related cash flows at the beginning of the period measured at the locked-in rate. |
| • | Non-financial changes in estimates of the present value of future cash flows measured at the locked-in rate. |
| • | Changes in the risk adjustment for non-financial risk that relate to future service measured at the locked-in rate. |
| • | Differences between actual and expected investment component that becomes payable in the period. The same applies to a policyholder loan that becomes repayable; |
| (d) | effect of any currency exchange differences on the CSM; |
| (e) | CSM amortization, which is the recognition of unearned profit into insurance revenue for services provided in the period. The CSM is recognized into insurance revenue over the duration of the group of insurance contracts based on the respective coverage units as insurance services are provided. The number of coverage units is the quantity of services provided by the contracts in the group, determined by considering the quantity of benefits provided and its expected coverage period. The coverage units are reviewed and updated at each reporting date. The Company allocates the CSM equally to each coverage unit and recognizes the amount allocated to coverage units provided and expected to be provided in each period. |
| • | Non-financial changes adjust the CSM at the current discount rate, there is no interest accretion on CSM at the locked-in rate, |
| • | Changes in the effect of the time value of money and financial risks such as the effect of financial guarantees adjust the CSM, however, income or expenses would be impacted if the risk mitigation option is elected. |
| • | Changes in the shareholders’ share adjust the CSM, however, income or expenses would be impacted if the risk mitigation option is elected, |
| • | Changes in the policyholders’ share are recognized in income or expenses or OCI. |
| • | The LRC at beginning of the period; plus |
| • | Premium received in the period; minus |
| • | Directly attributable acquisition costs net of related amortization (unless expensed as incurred); minus |
| • | Amount recognized as insurance revenue for the period; minus |
| • | Investment component paid or transferred to the LIC. |
| • | Insurance acquisition cash flows directly attributable to a group of contracts that will include future expected renewals of in-force contracts; and |
| • | Insurance acquisition cash flows directly attributable to a portfolio of insurance contracts, which will include future new business. |
| • | The beginning of the coverage period of the group of reinsurance contracts held. However, the Company delays the recognition of a group of reinsurance contracts held that provide proportionate coverage until the date when any underlying insurance contract is initially recognized, if that date is later than the beginning of the coverage period of the group of reinsurance contracts held, and |
| • | The date the Company recognizes an onerous group of underlying insurance contracts if the Company entered into the related reinsurance contract held in the group of reinsurance contracts held at or before that date. |
| |
179 |
| • | The asset for remaining coverage (“ARC”), which comprise the fulfilment cash flows that relate to services to be received under the contracts in future periods, and any remaining CSM at that date; and |
| • | The asset for incurred claims (“AIC”), which comprise the fulfilment cash flows for incurred claims and expenses that have not yet been received. |
| • | Income recognized to cover the losses from onerous underlying contracts also adjusts the carrying amount of CSM; |
| • | Reversals of the loss-recovery component, to the extent that those reversals are not changes in fulfilment cash flows of the group of reinsurance contract held, also adjusts the carrying amount of CSM; and |
| • | Changes in fulfilment cash flows related to future services also adjusts the carrying amount of CSM provided that changes in fulfillment cash flows related to the group of underlying insurance contracts also adjust the CSM. |
• |
For groups of insurance contracts for which changes in assumptions that relate to financial risk do not have a substantial effect on the amounts paid to the policyholders, the Company systematically allocates expected total insurance finance income or expenses over the duration of the group of contracts to income or expenses using discount rates determined on initial recognition of the group of contracts. |
• |
For groups of insurance contracts for which changes in assumptions that relate to financial risk have a substantial effect on the amounts paid to the policyholders, the Company systematically allocates expected total insurance finance income or expenses over the duration of the group of contracts to income or expenses using either a constant rate, or an allocation that is based on the amounts credited in the period and expected to be credited in future periods for fulfillment cash flows. The CSM accretion rate would use the discount rates determined on initial recognition of the group of contracts for contractual service margin. |
| |
181 |
| |
18 3
|
| • | Effects from applying IFRS 17 asset classification changes among FVTPL, AFS and amortized cost under IAS 39 to FVOCI and FVTPL under IFRS 9 resulted in a reduction in retained earnings of $10,645, net of tax, and an increase in OCI of $16,916, net of tax, as at January 1, 2022 when IFRS 17’s transition option was elected. These were presented under “Opening adjustment of financial assets at adoption of IFRS 9 / IFRS 17” in the Consolidated Statements of Changes in Equity. |
| • | The adoption of IFRS 9 resulted in recognition of ECL of $724. Loss allowances when applied to assets held at amortized cost reduce the carrying value of the assets and reduce equity. Loss allowances do not affect the fair value of assets held at FVOCI and therefore do not affect their carrying value. Loss allowances for assets held at FVOCI do not change total equity, instead result in movement between OCI and retained earnings. |
| • | The impact of adopting IFRS 9’s ECL impairment methodology resulted in a reduction to retained earnings of $409, net of tax, and an increase to |
| • | As at January 1, 2023, the retrospective application of IFRS 9 to the cost of hedging for currency basis spread resulted with a net $22 reclassification from cash flow hedge and foreign currency translation reserve to a new separate component of accumulated OCI, the cost of hedging. Other IFRS 9 hedge accounting principles had $nil impact as at January 1, 2023 for these Consolidated Financial Statements. |
| • | The impact of changes made as at January 1, 2023 were presented under line items labeled “Opening adjustment of financial assets at adoption of IFRS 9 / IFRS 17” in the Consolidated Statements of Changes in Equity. |
| |
18 5
|
| December 31, 2022 IAS 39 Impairment allowance |
January 1, 2023 IFRS 9 ECL allowance |
|||||||
| Debt securities at FVOCI under IFRS 9 |
$ |
– |
$ |
348 |
||||
| Private placements at FVOCI under IFRS 9 |
– |
255 |
||||||
| Private placements at amortized cost under IAS 39 |
25 |
– |
||||||
| Mortgages at FVOCI under IFRS 9 |
– |
83 |
||||||
| Mortgages at amortized cost under IAS 39 |
10 |
– |
||||||
| Other invested assets at FVOCI under IFRS 9 |
– |
13 |
||||||
| Financial assets at amortized cost under IFRS 9 |
– |
14 |
||||||
| Mortgages at amortized cost under IAS 39 |
7 |
– |
||||||
| Loans to Bank clients under IAS 39 |
5 |
– |
||||||
| Total on-balance sheet exposures |
47 |
713 |
||||||
| Allowance for credit losses on off-balance sheet exposures |
– |
11 |
||||||
| Total |
$ |
47 |
$ |
724 |
||||
| Measurement category |
December 31, 2022 IAS 39 Total carrying value |
Impact of classification and measurement changes (1),(2)
|
January 1, 2023 IFRS 9 Total carrying value |
|||||||||||||
| Investment contract liabilities |
FVTPL | $ |
796 |
$ |
2 |
$ |
798 |
|||||||||
| Amortized cost | 2,452 |
6,829 |
9,281 |
|||||||||||||
| Deposits from Bank clients |
Amortized cost | 22,507 |
– |
22,507 |
||||||||||||
| Derivative liabilities |
FVTPL | 14,289 |
– |
14,289 |
||||||||||||
| Other liabilities |
Amortized cost | 17,421 |
1,473 |
18,894 |
||||||||||||
| Long-term debt |
Amortized cost | 6,234 |
– |
6,234 |
||||||||||||
| Capital instruments |
Amortized cost | 6,122 |
– |
6,122 |
||||||||||||
| Total in-scope financial liabilities |
$ |
69,821 |
$ |
8,304 |
$ |
78,125 |
||||||||||
|
(1) |
Investment contract liabilities held at amortized cost of $6,829 were reclassified from insurance contract liabilities under IFRS 4. |
|
(2) |
Other liabilities include amounts not in scope of IFRS 9, for example pension obligations. Other liabilities of $1,473 held at amortized cost under IFRS 9 were reclassified from insurance contract liabilities under IFRS 4. |
As at December 31, 2023 |
FVTPL (1)
|
FVOCI (2)
|
Other (3)
|
Total carrying value |
Total fair value (4)
|
|||||||||||||||
| Cash and short-term securities (5)
|
$ |
1 |
$ |
13,993 |
$ |
6,344 |
$ |
20,338 |
$ |
20,338 |
||||||||||
| Debt securities (6),(7)
|
||||||||||||||||||||
| Canadian government and agency |
1,219 |
19,769 |
– |
20,988 |
20,988 |
|||||||||||||||
| U.S. government and agency |
1,303 |
26,287 |
888 |
28,478 |
28,251 |
|||||||||||||||
| Other government and agency |
90 |
30,576 |
– |
30,666 |
30,666 |
|||||||||||||||
| Corporate |
2,372 |
127,190 |
484 |
130,046 |
129,899 |
|||||||||||||||
| Mortgage / asset-backed securities |
16 |
1,955 |
– |
1,971 |
1,971 |
|||||||||||||||
| Public equities (FVTPL mandatory) |
25,531 |
– |
– |
25,531 |
25,531 |
|||||||||||||||
| Mortgages |
1,055 |
28,473 |
22,893 |
52,421 |
52,310 |
|||||||||||||||
| Private placements (7)
|
654 |
44,952 |
– |
45,606 |
45,606 |
|||||||||||||||
| Loans to Bank clients |
– |
– |
2,436 |
2,436 |
2,411 |
|||||||||||||||
| Real estate |
||||||||||||||||||||
| Own use property (8),(9)
|
– |
– |
2,591 |
2,591 |
2,716 |
|||||||||||||||
| Investment property |
– |
– |
10,458 |
10,458 |
10,458 |
|||||||||||||||
| Other invested assets |
||||||||||||||||||||
| Alternative long-duration assets (10)
|
29,671 |
360 |
11,403 |
41,434 |
42,313 |
|||||||||||||||
| Various other (11)
|
126 |
– |
4,120 |
4,246 |
4,246 |
|||||||||||||||
| Total invested assets |
$ |
62,038 |
$ |
293,555 |
$ |
61,617 |
$ |
417,210 |
$ |
417,704 |
||||||||||
| |
1 87
|
| As at December 31, 2022 | FVTPL (1)
|
FVOCI (2)
|
Other (3)
|
Total carrying value |
Total fair value (4)
|
|||||||||||||||
| Cash and short-term securities (5)
|
$ | – | $ | 12,859 | $ | 6,294 | $ | 19,153 | $ | 19,153 | ||||||||||
| Debt securities (6),(7)
|
||||||||||||||||||||
| Canadian government and agency |
987 | 20,279 | – | 21,266 | 21,266 | |||||||||||||||
| U.S. government and agency |
1,378 | 22,446 | 912 | 24,736 | 24,494 | |||||||||||||||
| Other government and agency |
159 | 26,314 | – | 26,473 | 26,473 | |||||||||||||||
| Corporate |
2,209 | 126,371 | 499 | 129,079 | 128,910 | |||||||||||||||
| Mortgage / asset-backed securities |
22 | 2,266 | – | 2,288 | 2,288 | |||||||||||||||
| Public equities (FVTPL mandatory) |
23,519 | – | – | 23,519 | 23,519 | |||||||||||||||
| Mortgages |
1,138 | 28,621 | 22,006 | 51,765 | 51,372 | |||||||||||||||
| Private placements (7)
|
516 | 41,494 | – | 42,010 | 42,010 | |||||||||||||||
| Loans to Bank clients |
– | – | 2,781 | 2,781 | 2,760 | |||||||||||||||
| Real estate |
||||||||||||||||||||
| Own use property (8),(9)
|
– | – | 2,852 | 2,852 | 3,008 | |||||||||||||||
| Investment property |
– | – | 11,417 | 11,417 | 11,417 | |||||||||||||||
| Other invested assets |
||||||||||||||||||||
| Alternative long-duration assets (10)
|
26,938 | 296 | 11,226 | 38,460 | 39,225 | |||||||||||||||
| Various other (11)
|
130 | – | 4,213 | 4,343 | 4,343 | |||||||||||||||
| Total invested assets |
$ | 56,996 | $ | 280,946 | $ | 62,200 | $ | 400,142 | $ | 400,238 | ||||||||||
|
(1) |
FVTPL classification was elected for debt instruments backing certain insurance contract liabilities to substantially reduce any accounting mismatch arising from changes in the fair value of these assets, or changes in the carrying value of the related insurance contract liabilities. |
|
(2) |
FVOCI classification for debt instruments backing certain insurance contract liabilities inherently reduces any accounting mismatch arising from changes in the fair value of these assets, or changes in the carrying value of the related insurance contract liabilities. |
|
(3) |
Other includes mortgages and loans to Bank clients held at amortized cost, own use properties, investment properties, equity method accounted investments, and leveraged leases. Also includes debt securities, which qualify as having SPPI, are held to collect contractual cash flows and are carried at amortized cost. |
|
(4) |
Invested assets above include debt securities, mortgages, private placements and approximately $ 360 (2022 – $302 ) of other invested assets, which primarily qualify as SPPI. Invested assets which do not have SPPI qualifying cash flows as at December 31, 2023 include debt securities, private placements and other invested assets with fair values of $nil , $115 and $539 , respectively (2022 – $nil, $98 and $507 , respectively). The change in the fair value of these invested assets for the year ended December 31, 2023 was $49 increase (202 2 – $94 decrease). The methodologies used in determining fair values of invested assets are described in note 1 (c) and note 4 (g). |
|
(5) |
Includes short-term securities with maturities of less than one year at acquisition amounting to $ 6,162 (2022 – $4,148 ), cash equivalents with maturities of less than 90 days at acquisition amounting to $7,832 (2022 – $8,711 ) and cash of $6,344 (2022 – $6,294 ). |
|
(6) |
Debt securities include securities which were acquired with maturities of less than one year and less than 90 days of $ 1,294 and $1,413 , respectively (2022 – $1,787 and $870 , respectively). |
|
(7) |
Floating rate invested assets above which are subject to interest rate benchmark reform, but have not yet transitioned to replacement reference rates, include debt securities benchmarked to CDOR and AUD BBSW of $ 167 and $16
, respectively (2022 – $173 and $15 , respectively), and private placements benchmarked to AUD BBSW and NZD BKBM of $198 and $61
, respectively (2022 – $199 and $43 , respectively). USD LIBOR was decommissioned on June 30, 2023. Exposures indexed to CDOR represent floating rate invested assets with maturity dates beyond June 28, 2024. The interest rate benchmark reform is expected to have an impact on the valuation of invested assets whose value is tied to the affected interest rate benchmarks. The Company has assessed its exposure at the contract level, by benchmark and instrument type. The Company is monitoring market developments with respect to alternative reference rates and the time horizon during which they will evolve. As at December 31, 2023, the interest rate benchmark reform has not resulted in significant changes in the Company’s risk management strategy. |
|
(8) |
Includes accumulated depreciation of $57 (2022 – $411). |
|
( 9 ) |
Own use property of $ 2,430 as at December 31, 2023 (December 31, 2022 – $2,682 ), are underlying items for insurance contracts with direct participating features and are measured at fair value as if they were investment properties, as permitted by IAS 16. Own use property of $161 (December 31, 2022 – $170) is carried at cost less accumulated depreciation and any accumulated impairment losses. |
|
(1 0 ) |
ALDA include investments in private equity of $ 15,445 , infrastructure of $14,950 , timber and agriculture of $5,719 , energy of $1,859 and various other ALDA of $3,461 (2022 – $14,153 , $12,751 , $5,979 , $2,347 and $3,230 , respectively). |
|
(1 1 ) |
Includes $ 3,790 (2022 – $3,840 ) of leveraged leases. Refer to note 1 (e). |
2023 |
2022 |
|||||||||||||||||||
As at December 31, |
Carrying value |
% of total |
Carrying value |
% of total |
||||||||||||||||
| Leveraged leases |
$ |
3,790 |
35 |
$ | 3,840 | 37 | ||||||||||||||
| Infrastructure |
3,942 |
37 |
3,298 | 32 | ||||||||||||||||
| Timber and agriculture |
854 |
8 |
822 | 8 | ||||||||||||||||
| Real estate |
1,704 |
16 |
1,876 | 18 | ||||||||||||||||
| Other |
443 |
4 |
487 | 5 | ||||||||||||||||
| Total |
$ |
10,733 |
100 |
$ | 10,323 | 100 | ||||||||||||||
For the year ended December 31, 2023 |
FVTPL |
FVOCI |
Other (1)
|
Total |
||||||||||||
Cash and short-term securities |
||||||||||||||||
Interest income |
$ |
– |
$ |
837 |
$ |
– |
$ |
837 |
||||||||
Gains (losses) (2)
|
– |
10 |
– |
10 |
||||||||||||
Debt securities |
||||||||||||||||
Interest income |
212 |
7,437 |
28 |
7,677 |
||||||||||||
Gains (losses) (2)
|
152 |
262 |
– |
414 |
||||||||||||
Impairment loss, net (3)
|
– |
(4 |
) |
– |
(4 |
) |
||||||||||
Public equities |
||||||||||||||||
Dividend income |
625 |
– |
– |
625 |
||||||||||||
Gains (losses) (2)
|
2,255 |
– |
– |
2,255 |
||||||||||||
Impairment loss, net (3)
|
– |
– |
– |
– |
||||||||||||
Mortgages |
||||||||||||||||
Interest income |
– |
2,290 |
– |
2,290 |
||||||||||||
Gains (losses) (2)
|
99 |
– |
– |
99 |
||||||||||||
Provision, net |
– |
– |
(150 |
) |
(150 |
) |
||||||||||
Private placements |
||||||||||||||||
Interest income |
– |
2,318 |
– |
2,318 |
||||||||||||
Gains (losses) (2)
|
20 |
355 |
– |
375 |
||||||||||||
Impairment loss, net (3)
|
– |
(72 |
) |
– |
(72 |
) |
||||||||||
Loans to Bank clients |
||||||||||||||||
Interest income |
– |
– |
201 |
201 |
||||||||||||
Provision, net |
– |
– |
(3 |
) |
(3 |
) |
||||||||||
Real estate |
||||||||||||||||
Rental income, net of depreciation (4)
|
– |
– |
496 |
496 |
||||||||||||
Gains (losses) (2)
|
– |
– |
(1,286 |
) |
(1,286 |
) |
||||||||||
Impairment loss, net (3)
|
– |
– |
– |
– |
||||||||||||
Derivatives |
||||||||||||||||
Interest income, net |
(561 |
) |
– |
– |
(561 |
) |
||||||||||
Gains (losses) (2)
|
1,147 |
– |
– |
1,147 |
||||||||||||
Other invested assets |
||||||||||||||||
Interest income |
17 |
23 |
– |
40 |
||||||||||||
Energy, timber, agriculture and other income |
2,197 |
– |
– |
2,197 |
||||||||||||
Gains (losses) (2)
|
487 |
– |
1 |
488 |
||||||||||||
Impairment loss, net (3)
|
(74 |
) |
– |
(1 |
) |
(75 |
) |
|||||||||
Total investment income (loss) |
$ |
6,576 |
$ |
13,456 |
$ |
(714 |
) |
$ |
19,318 |
|||||||
Investment income |
||||||||||||||||
Interest income |
$ |
(332 |
) |
$ |
12,905 |
$ |
229 |
$ |
12,802 |
|||||||
Dividends, rental income and other income |
2,822 |
– |
496 |
3,318 |
||||||||||||
Impairments, provisions and recoveries, net (3)
|
(74 |
) |
(76 |
) |
(154 |
) |
(304 |
) |
||||||||
Other |
372 |
(12 |
) |
4 |
364 |
|||||||||||
2,788 |
12,817 |
575 |
16,180 |
|||||||||||||
Realized and unrealized gains (losses) on assets supporting insurance and investment contract liabilities |
||||||||||||||||
Debt securities |
153 |
277 |
– |
430 |
||||||||||||
Public equities |
2,157 |
– |
– |
2,157 |
||||||||||||
Mortgages |
99 |
– |
– |
99 |
||||||||||||
Private placements |
20 |
355 |
– |
375 |
||||||||||||
Real estate |
– |
– |
(1,289 |
) |
(1,289 |
) |
||||||||||
Other invested assets |
484 |
7 |
– |
491 |
||||||||||||
Derivatives |
875 |
– |
– |
875 |
||||||||||||
3,788 |
639 |
(1,289 |
) |
3,138 |
||||||||||||
Total investment income (loss) |
$ |
6,576 |
$ |
13,456 |
$ |
(714 |
) |
$ |
19,318 |
|||||||
Investment expenses |
(1,297 |
) |
||||||||||||||
Net investment income (loss) |
$ |
18,021 |
||||||||||||||
|
(1) |
Primarily includes investment income on loans carried at amortized cost, own use real estate properties, investment real estate properties, derivative and hedging instruments in cash flow hedging relationships, equity method accounted investments, energy investments and leveraged leases. |
|
(2) |
Includes net realized and unrealized gains (losses) for financial instruments at FVTPL, investment real estate properties, and other invested assets measured at fair value. Also includes net realized gains (losses) for financial instruments at FVOCI and other invested assets carried at amortized cost. |
|
(3) |
The Company adopted IFRS 9’s ECL impairment requirements as at January 1, 2023 without restating the comparative period. Impairments for 2023 are based on IFRS 9’s ECL requirements and impairments for 2022 are based on IAS 39’s incurred loss impairment requirements. |
|
(4) |
Rental income from investment real estate properties is net of direct operating expenses. |
| |
1 89
|
For the year ended December 31, 2022 |
FVTPL |
FVOCI |
Other (1)
|
Total |
||||||||||||
Cash and short-term securities |
||||||||||||||||
Interest income |
$ |
– | $ | 313 |
$ | – |
$ | 313 | ||||||||
Gains (losses) (2)
|
– | 121 |
– |
121 | ||||||||||||
Debt securities |
||||||||||||||||
Interest income |
139 | 6,990 |
26 |
7,155 | ||||||||||||
Gains (losses) (2)
|
– | (1,050 |
)
|
– |
(1,050 | ) | ||||||||||
Impairment loss, net (3)
|
– | – |
– |
– | ||||||||||||
Public equities |
||||||||||||||||
Dividend income |
548 | – |
– |
548 | ||||||||||||
Gains (losses) (2)
|
(3,995 |
)
|
– |
– |
(3,995 | ) | ||||||||||
Impairment loss, net (3)
|
– |
– |
– |
– | ||||||||||||
Mortgages |
||||||||||||||||
Interest income |
– |
1,914 |
– |
1,914 | ||||||||||||
Gains (losses) (2)
|
– |
(52 |
)
|
– |
(52 | ) | ||||||||||
Provision, net |
– |
– |
1 |
1 | ||||||||||||
Private placements |
||||||||||||||||
Interest income |
– |
2,008 |
– |
2,008 | ||||||||||||
Gains (losses) (2)
|
– |
233 |
– |
233 | ||||||||||||
Impairment loss, net (3)
|
– |
– |
– |
– | ||||||||||||
Loans to Bank clients |
||||||||||||||||
Interest income |
– |
– |
138 |
138 | ||||||||||||
Provision, net |
– |
– |
(4 |
) |
(4 | ) | ||||||||||
Real estate |
||||||||||||||||
Rental income, net of depreciation (4)
|
– |
– |
490 |
490 | ||||||||||||
Gains (losses) (2)
|
– |
– |
(591 |
) |
(591 | ) | ||||||||||
Impairment loss, net (3)
|
– |
– |
– |
– | ||||||||||||
Derivatives |
||||||||||||||||
Interest income, net |
515 |
– |
– |
515 |
||||||||||||
Gains (losses) (2)
|
(10,639 |
) |
– |
– |
(10,639 |
) |
||||||||||
Other invested assets |
||||||||||||||||
Interest income |
14 |
6 |
– |
20 | ||||||||||||
Energy, timber, agriculture and other income |
2,862 |
– |
– |
2,862 | ||||||||||||
Gains (losses) (2)
|
1,641 |
4 |
– |
1,645 |
||||||||||||
Impairment loss, net (3)
|
(74 |
) |
– |
– |
(74 | ) | ||||||||||
Total investment income (loss) |
$ |
(8,989 | ) | $ |
10,487 | $ |
60 |
$ |
1,558 | |||||||
Investment income |
||||||||||||||||
Interest income |
$ |
668 |
$ |
11,231 |
$ |
164 |
$ |
12,063 | ||||||||
Dividend, rental and other income |
3,410 |
– |
490 |
3,900 | ||||||||||||
Impairments, provisions and recoveries, net (3)
|
(74 |
) |
– |
(3
|
) |
(77 | ) | |||||||||
Other |
(121 |
) |
(548 |
) |
(13 |
) |
(682 | ) | ||||||||
| 3,883 | 10,683 | 638 |
15,204 | |||||||||||||
Realized and unrealized gains (losses) on assets supporting insurance and investment contract liabilities |
||||||||||||||||
Debt securities |
– |
(504 |
)
|
– | (504 | ) | ||||||||||
Public equities |
(3,825 |
)
|
– |
– | (3,825 | ) | ||||||||||
Mortgages |
– |
(52 |
)
|
– | (52 | ) | ||||||||||
Private placements |
– |
234 |
– | 234 | ||||||||||||
Real estate |
– |
|
– |
(578 |
) |
(578 | ) | |||||||||
Other invested assets |
1,665 |
126 |
– | 1,791 | ||||||||||||
Derivatives |
(10,712 |
)
|
– |
– | (10,712 | ) | ||||||||||
| (12,872 | ) | (196 | ) | (578 |
) |
(13,646 | ) | |||||||||
Total investment income (loss) |
$ | (8,989 | ) | $ | 10,487 | $ | 60
|
$ |
1,558 | |||||||
Investment expenses |
(1,221 | ) | ||||||||||||||
Net investment income (loss) |
$ | 337 | ||||||||||||||
For the years ended December 31, |
2023 |
2022 |
||||||
| Related to invested assets |
$ |
720 |
$ | 679 | ||||
| Related to segregated, mutual and other funds |
577 |
542 | ||||||
| Total investment expenses |
$ |
1,297 |
$ | 1,221 | ||||
For the years ended December 31, |
2023 |
2022 |
||||||
| Rental income from investment properties |
$ |
840 |
$ | 825 | ||||
| Direct operating expenses of rental investment properties |
(473 |
) |
(458 | ) | ||||
| Total |
$ |
367 |
$ | 367 | ||||
As at December 31, 2023 |
Securitized assets |
|||||||||||||||||||
Securitization program |
Securitized mortgages |
Restricted cash and short-term securities |
Total |
Secured borrowing liabilities (2)
|
Net |
|||||||||||||||
| HELOC securitization (1)
|
$ |
2,880 |
$ |
32 |
$ |
2,912 |
$ |
2,750 |
$ |
162 |
||||||||||
| CMB securitization (3)
|
2,900 |
– |
2,900 |
2,806 |
94 |
|||||||||||||||
| Total |
$ |
5,780 |
$ |
32 |
$ |
5,812 |
$ |
5,556 |
$ |
256 |
||||||||||
| As at December 31, 2022 | Securitized assets | |||||||||||||||||||
| Securitization program | Securitized mortgages |
Restricted cash and short-term securities |
Total | Secured borrowing liabilities (2)
|
Net | |||||||||||||||
| HELOC securitization (1)
|
$ | 2,880 | $ | 44 | $ | 2,924 | $ | 2,750 | $ | 174 | ||||||||||
| CMB securitization (3)
|
2,318 | – | 2,318 | 2,273 | 45 | |||||||||||||||
| Total |
$ | 5,198 | $ | 44 | $ | 5,242 | $ | 5,023 | $ | 219 | ||||||||||
|
(1) |
Manulife Bank, a subsidiary, securitizes a portion of its HELOC receivables through PCMT II. PCMT II funds the purchase of the co-ownership interests from Manulife Bank by issuing term notes collateralized by an underlying pool of uninsured HELOCs to institutional investors. The restricted cash balance for the HELOC securitization reflects a cash reserve fund established in relation to the transactions. The reserve will be drawn upon only in the event of insufficient cash flows from the underlying HELOCs to satisfy the secured borrowing liabilities. |
|
(2) |
The PCMT II notes payable have floating rates of interest and are secured by the PCMT II assets. Under the terms of the agreements, of $27 is expected to be repaid within one year, $1,973 within 1-3 years, $750 within 3-5 years and $nil beyond 5 years
, respectively (2022 – $nil, $1,209, $1,049 and $492 , r |
(3) |
Manulife Bank also securitizes insured amortizing mortgages under the National Housing Act Mortgage-Backed Securities (“NHA MBS”) program sponsored by CMHC. Manulife Bank participates in CMB programs by selling NHA MBS securities to Canada Housing Trust (“CHT”), as a source of fixed rate funding. |
| |
1 91
|
As at December 31, 2023 |
Total fair value |
Level 1 |
Level 2 |
Level 3 |
||||||||||||
| Cash and short-term securities |
||||||||||||||||
| FVOCI |
$ |
13,993 |
$ |
– |
$ |
13,993 |
$ |
– |
||||||||
| FVTPL |
1 |
– |
1 |
– |
||||||||||||
| Other |
6,343 |
6,343 |
– |
– |
||||||||||||
| Debt securities |
||||||||||||||||
| FVOCI |
||||||||||||||||
| Canadian government and agency |
19,769 |
– |
19,769 |
– |
||||||||||||
| U.S. government and agency |
26,287 |
– |
26,287 |
– |
||||||||||||
| Other government and agency |
30,576 |
– |
30,566 |
10 |
||||||||||||
| Corporate |
127,190 |
– |
126,959 |
231 |
||||||||||||
| Residential mortgage-backed securities |
6 |
– |
6 |
– |
||||||||||||
| Commercial mortgage-backed securities |
370 |
– |
370 |
– |
||||||||||||
| Other asset-backed securities |
1,579 |
– |
1,558 |
21 |
||||||||||||
| FVTPL |
||||||||||||||||
| Canadian government and agency |
1,219 |
– |
1,219 |
– |
||||||||||||
| U.S. government and agency |
1,303 |
– |
1,303 |
– |
||||||||||||
| Other government and agency |
90 |
– |
90 |
– |
||||||||||||
| Corporate |
2,372 |
– |
2,372 |
– |
||||||||||||
| Commercial mortgage-backed securities |
1 |
– |
1 |
– |
||||||||||||
| Other asset-backed securities |
15 |
– |
15 |
– |
||||||||||||
| Private placements
(1)
|
||||||||||||||||
| FVOCI |
44,952 |
– |
37,270 |
7,682 |
||||||||||||
| FVTPL |
654 |
– |
575 |
79 |
||||||||||||
| Mortgages |
||||||||||||||||
| FVOCI |
28,473 |
– |
– |
28,473 |
||||||||||||
| FVTPL |
1,055 |
– |
– |
1,055 |
||||||||||||
| Public equities |
||||||||||||||||
| FVTPL |
25,531 |
25,423 |
67 |
41 |
||||||||||||
| Real estate
(2)
|
||||||||||||||||
| Investment property |
10,458 |
– |
– |
10,458 |
||||||||||||
| Own use property |
2,430 |
– |
– |
2,430 |
||||||||||||
| Other invested assets
(3)
|
33,653 |
68 |
– |
33,585 |
||||||||||||
| Segregated funds net assets
(4)
|
377,544 |
343,061 |
30,991 |
3,492 |
||||||||||||
| Total |
$ |
755,864 |
$ |
374,895 |
$ |
293,412 |
$ |
87,557 |
||||||||
(1) |
Fair value of private placements is determined through an internal valuation methodology using both observable and non-market observable inputs. Non-market observable inputs include credit assumptions and liquidity spread adjustments. Private placements are classified within Level 2 unless the liquidity adjustment constitutes a significant price impact, in which case the securities are classified as Level 3. |
|
(2) |
For real estate properties, the significant non-market observable inputs are capitalization rates 2.72 % to 10.75 % during the year ended December 31, 2023 (2022 – ranging from 2.25 % to 9.00
%), terminal capitalization rates3.00 % to 10.00 % during the year ended December 31, 2023
(2022 – ranging from 3.25 % to 9.50
%) and discount rates3.20 % to 14.00 % during the year ended December 31, 2023 (2022 – ranging from 3.30 % to 11.00
%). Holding other factors constant, a lower capitalization or terminal capitalization rate will tend to increase the fair value of an investment property. Changes in fair value based on variations in non-market observable inputs generally cannot be extrapolated because the relationship between the directional changes of each input is not usually linear. |
|
(3) |
Other invested assets measured at fair value are held in infrastructure and timber sectors and include fund investments of $27,532 recorded at net asset value. The significant inputs used in the valuation of the Company’s infrastructure investments are primarily future distributable cash flows, terminal values and discount rates. Holding other factors constant, an increase to future distributable cash flows or terminal values would tend to increase the fair value of an infrastructure investment, while an increase in the discount rate would have the opposite effect. Discount rates during the year ended December 31, 2023 ranged from 7.35 % to 15.60 % (2022 – ranged from 7.15 % to 15.60 %). Disclosure of distributable cash flow and terminal value ranges are not meaningful given the disparity in estimates by project. The significant inputs used in the valuation of the Company’s investments in timberland properties are timber prices and discount rates. Holding other factors constant, an increase to timber prices would tend to increase the fair value of a timberland investment, while an increase in the discount rates would have the opposite effect. Discount rates during the year ended December 31, 2023 ranged from 4.00% to 7.00% (2022 – ranged from 4.25% to 7.00%). A range of prices for timber is not meaningful as the market price depends on factors such as property location and proximity to markets and export yards. |
|
(4) |
Segregated funds net assets are measured at fair value. The Company’s Level 3 segregated funds underlying assets are predominantly investment properties and timberland properties valued as described above. |
| As at December 31, 2022 | Total fair value | Level 1 | Level 2 | Level 3 | ||||||||||||
| Cash and short-term securities |
||||||||||||||||
| FVOCI |
$ | 12,859 | $ | – | $ | 12,859 | $ | – | ||||||||
| Other |
6,294 | 6,294 | – | – | ||||||||||||
| Debt securities |
||||||||||||||||
| FVOCI |
||||||||||||||||
| Canadian government and agency |
20,279 | – | 20,279 | – | ||||||||||||
| U.S. government and agency |
22,446 | – | 22,446 | – | ||||||||||||
| Other government and agency |
26,314 | – | 26,305 | 9 | ||||||||||||
| Corporate |
126,371 | – | 126,339 | 32 | ||||||||||||
| Residential mortgage-backed securities |
7 | – | 7 | – | ||||||||||||
| Commercial mortgage-backed securities |
589 | – | 589 | – | ||||||||||||
| Other asset-backed securities |
1,670 | – | 1,644 | 26 | ||||||||||||
| FVTPL |
||||||||||||||||
| Canadian government and agency |
987 | – | 987 | – | ||||||||||||
| U.S. government and agency |
1,378 | – | 1,378 | – | ||||||||||||
| Other government and agency |
159 | – | 159 | – | ||||||||||||
| Corporate |
2,209 | – | 2,209 | – | ||||||||||||
| Commercial mortgage-backed securities |
6 | – | 6 | – | ||||||||||||
| Other asset-backed securities |
16 | – | 16 | – | ||||||||||||
| Private placements
(1)
|
||||||||||||||||
| FVOCI |
41,494 | – | 33,666 | 7,828 | ||||||||||||
| FVTPL |
516 | – | 485 | 31 | ||||||||||||
| Mortgages |
||||||||||||||||
| FVOCI |
28,621 | – | – | 28,621 | ||||||||||||
| FVTPL |
1,138 | – | – | 1,138 | ||||||||||||
| Public equities |
||||||||||||||||
| FVTPL |
23,519 | 23,448 | – | 71 | ||||||||||||
| Real estate
(2)
|
||||||||||||||||
| Investment property |
11,417 | – | – | 11,417 | ||||||||||||
| Own use property |
2,682 | – | – | 2,682 | ||||||||||||
| Other invested assets
(3)
|
31,095 | 26 | – | 31,069 | ||||||||||||
| Segregated funds net assets
(4)
|
348,562 | 314,436 | 30,141 | 3,985 | ||||||||||||
| Total |
$ | 710,628 | $ | 344,204 | $ | 279,515 | $ | 86,909 | ||||||||
As at December 31, 2023 |
Carrying value |
Total fair value |
Level 1 |
Level 2 |
Level 3 |
|||||||||||||||
| Short-term securities |
$ |
1 |
$ |
1 |
$ |
– |
$ |
1 |
$ |
– |
||||||||||
| Mortgages (1)
|
22,893 |
22,782 |
– |
– |
22,782 |
|||||||||||||||
| Loans to Bank clients (2)
|
2,436 |
2,411 |
– |
2,411 |
– |
|||||||||||||||
| Real estate – own use property (3)
|
161 |
286 |
– |
– |
286 |
|||||||||||||||
| Public bonds held at amortized cost |
1,372 |
998 |
– |
998 |
– |
|||||||||||||||
| Other invested assets (4)
|
12,027 |
12,906 |
240 |
– |
12,666 |
|||||||||||||||
| Total invested assets disclosed at fair value |
$ |
38,890 |
$ |
39,384 |
$ |
240 |
$ |
3,410 |
$ |
35,734 |
||||||||||
| As at December 31, 2022 | Carrying value | Total fair value | Level 1 | Level 2 | Level 3 | |||||||||||||||
| Mortgages (1)
|
$ |
22,006 | $ |
21,613 | $ |
– | $ |
– | $ |
21,613 | ||||||||||
| Loans to Bank clients (2)
|
2,781 | 2,760 | – | 2,760 | – | |||||||||||||||
| Real estate – own use property (3)
|
170 | 326 | – | – | 326 | |||||||||||||||
| Public bonds held at amortized cost |
1,411 | 1,000 | – | 1,000 | – | |||||||||||||||
| Other invested assets(4) |
11,708 | 12,473 | 72 | – | 12,401 | |||||||||||||||
| Total invested assets disclosed at fair value |
$ | 38,076 | $ | 38,172 | $ | 72 | $ | 3,760 | $ | 34,340 | ||||||||||
(1) |
Fair value of commercial mortgages is determined through an internal valuation methodology using both observable and non-market observable inputs. Non-market observable inputs include credit assumptions and liquidity spread adjustments. Fair value of fixed-rate residential mortgages is determined using the discounted cash flow method. Inputs used for valuation are primarily comprised of prevailing interest rates and prepayment rates, if applicable. Fair value of variable-rate residential mortgages is assumed to be their carrying value. |
(2) |
Fair value of fixed-rate loans to Bank clients is determined using the discounted cash flow method. Inputs used for valuation are primarily comprised of current interest rates. Fair value of variable-rate loans is assumed to be their carrying value. |
(3) |
Fair value of own use real estate and the fair value hierarchy are determined in accordance with the methodologies described for real estate – investment property in note 1(e). |
(4) |
Primarily includes leveraged leases of $3,790 (2022 – $3,840 ), and equity method accounted other invested assets. Fair value of leveraged leases is disclosed at their carrying values as fair value is not routinely calculated on these investments. Fair value for energy properties is determined using external appraisals based on discounted cash flow methodology. Inputs used in valuation are primarily comprised of forecasted price curves, planned production, as well as capital expenditures, and operating costs. Fair value of equity method accounted other invested assets is determined using a variety of valuation techniques including discounted cash flows and market comparable approaches. Inputs vary based on the specific investment. |
| |
19 3
|
| For the year ended December 31, 2023 |
Balance, January 1, 2023 |
Total gains (losses) included in net income (1)
|
Total gains (losses) included in AOCI (2)
|
Purchases |
Sales |
Settlements |
Transfer in (3)
|
Transfer out (3),(4)
|
Currency movement |
Balance, December 31, 2023 |
Change in unrealized gains (losses) on assets still held |
|||||||||||||||||||||||||||||||||
| Debt instruments |
||||||||||||||||||||||||||||||||||||||||||||
| FVOCI |
||||||||||||||||||||||||||||||||||||||||||||
| Other government & agency |
$ |
9 |
$ |
– |
$ |
– |
$ |
2 |
$ |
– |
$ |
– |
$ |
– |
$ |
– |
$ |
(1 |
) |
$ |
10 |
$ |
– |
|||||||||||||||||||||
| Corporate |
32 |
– |
3 |
178 |
– |
(7 |
) |
25 |
– |
– |
231 |
– |
||||||||||||||||||||||||||||||||
| Other securitized assets |
26 |
– |
1 |
– |
– |
(5 |
) |
– |
– |
(1 |
) |
21 |
– |
|||||||||||||||||||||||||||||||
| Public equities |
||||||||||||||||||||||||||||||||||||||||||||
| FVTPL |
71 |
– |
– |
37 |
– |
– |
– |
(67 |
) |
– |
41 |
– |
||||||||||||||||||||||||||||||||
| Private placements |
||||||||||||||||||||||||||||||||||||||||||||
| FVOCI |
7,828 |
(4 |
) |
258 |
1,942 |
(497 |
) |
(1,172 |
) |
2,546 |
(2,907 |
) |
(312 |
) |
7,682 |
– |
||||||||||||||||||||||||||||
| FVTPL |
31 |
44 |
– |
17 |
– |
(1 |
) |
34 |
(47 |
) |
1 |
79 |
44 |
|||||||||||||||||||||||||||||||
| Mortgages |
||||||||||||||||||||||||||||||||||||||||||||
| FVOCI |
28,621 |
65 |
830 |
1,984 |
(1,626 |
) |
(856 |
) |
– |
– |
(545 |
) |
28,473 |
– |
||||||||||||||||||||||||||||||
| FVTPL |
1,138 |
37 |
– |
160 |
(239 |
) |
(39 |
) |
– |
– |
(2 |
) |
1,055 |
– |
||||||||||||||||||||||||||||||
| Investment property |
11,417 |
(1,054 |
) |
– |
416 |
(122 |
) |
– |
– |
– |
(199 |
) |
10,458 |
(1,055 |
) | |||||||||||||||||||||||||||||
| Own use property |
2,682 |
(234 |
) |
– |
20 |
– |
– |
– |
– |
(38 |
) |
2,430 |
(234 |
) | ||||||||||||||||||||||||||||||
| Other invested assets |
31,069 |
423 |
7 |
4,760 |
(522 |
) |
(1,219 |
) |
– |
(68 |
) |
(865 |
) |
33,585 |
647 |
|||||||||||||||||||||||||||||
| Total invested assets |
82,924 |
(723 |
) |
1,099 |
9,516 |
(3,006 |
) |
(3,299 |
) |
2,605 |
(3,089 |
) |
(1,962 |
) |
84,065 |
(598 |
) | |||||||||||||||||||||||||||
| Derivatives, net |
(3,188 |
) |
(144 |
) |
– |
– |
– |
960 |
– |
165 |
41 |
(2,166 |
) |
17 |
||||||||||||||||||||||||||||||
| Segregated funds net assets |
3,985 |
(97 |
) |
– |
110 |
(466 |
) |
24 |
– |
(15 |
) |
(49 |
) |
3,492 |
32 |
|||||||||||||||||||||||||||||
| Total |
$ |
83,721 |
$ |
(964 |
) |
$ |
1,099 |
$ |
9,626 |
$ |
(3,472 |
) |
$ |
(2,315 |
) |
$ |
2,605 |
$ |
(2,939 |
) |
$ |
(1,970 |
) |
$ |
85,391 |
$ |
(549 |
) | ||||||||||||||||
(1) |
These amounts are included in net investment income on the Consolidated Statements of Income except for the amount related to segregated funds net assets, where the amount is recorded in Investment income related to segregated funds net assets. Refer to notes 1 (h) and 23. |
(2) |
These amounts are included in AOCI on the Consolidated Statements of Financial Position. |
(3) |
The Company uses fair values of the assets at the beginning of the year for assets transferred into and out of Level 3 except for derivatives, where the Company uses fair value at the end of the year and at the beginning of the year, respectively. |
(4) |
Private placement bonds of $1,771 with maturity dates beyond 30 years were reclassed from Level 3 to Level 2 in the current period to align with the fair value leveling treatment of public bonds. |
|
For the year ended December 31, 2022 |
Balance, January 1, 2022 |
Total gains (losses) included in net income (1)
|
Total gains (losses) included in AOCI (2)
|
Purchases |
Sales |
Settlements |
Transfer in (3)
|
Transfer out (3)
|
Currency movement |
Balance, December 31, 2022 |
Change in unrealized gains (losses) on assets still held |
|||||||||||||||||||||||||||||||||
Debt instruments |
||||||||||||||||||||||||||||||||||||||||||||
FVOCI |
||||||||||||||||||||||||||||||||||||||||||||
Other government & agency |
$ | – | $ | – | $ | – | $ | – | $ | – | $ | – | $ | 9 | $ | – | $ | – | $ | 9 | $ | – | ||||||||||||||||||||||
Corporate |
41 | – | (1 |
) |
27 | – | (1 | ) | 6 | (42 | ) | 2 | 32 | – | ||||||||||||||||||||||||||||||
Other securitized assets |
28 | – | 2 |
– |
– | (4 | ) | – | – |
– |
26 | – | ||||||||||||||||||||||||||||||||
Public equities |
||||||||||||||||||||||||||||||||||||||||||||
FVTPL |
– | (6 |
) |
– |
69 |
(84 |
) |
– | 87 |
– |
5 |
71 | (13 | ) | ||||||||||||||||||||||||||||||
Private placements |
||||||||||||||||||||||||||||||||||||||||||||
FVOCI |
5,136 | (9 |
) |
(1,453 |
) |
1,697 |
(89 |
) |
(188 |
) |
2,876 |
(362 |
) |
220 |
7,828 | – | ||||||||||||||||||||||||||||
FVTPL |
30 | (7 |
) |
– |
– |
– |
(1 |
) |
9 |
– |
– |
31 | (7 | ) | ||||||||||||||||||||||||||||||
Mortgages |
||||||||||||||||||||||||||||||||||||||||||||
FVOCI |
31,798 | (76 |
) |
(4,692 |
) |
3,511 |
(2,411 |
) |
(757 |
) |
– |
– |
1,248 |
28,621 | – | |||||||||||||||||||||||||||||
FVTPL |
1,203 | (117 |
) |
– |
110 |
(22 |
) |
(38 |
) |
– |
– |
2 |
1,138 | – | ||||||||||||||||||||||||||||||
Investment property |
11,443 | (443 | ) | – |
312 | (237 | ) | – |
17 | – |
325 | 11,417 | (445 | ) | ||||||||||||||||||||||||||||||
Own use property |
2,661 | (120 |
) |
– |
20 |
– | – |
(15 |
) |
– |
136 |
2,682 | (120 | ) | ||||||||||||||||||||||||||||||
Other invested assets |
24,884 | 1,934 | 5 | 4,938 | (668 | ) | (1,519 | ) | 248 | – |
1,247 | 31,069 | 2,057 | |||||||||||||||||||||||||||||||
Total invested assets |
77,224 | 1,156 | (6,139 | ) | 10,684 | (3,511 | ) | (2,508 | ) | 3,237 | (404 | ) | 3,185 | 82,924 | 1,472 | |||||||||||||||||||||||||||||
Derivatives, net |
2,101 | (5,429 | ) | (7 | ) | (109 | ) | – | 775 | – | (356 | ) | (163 | ) | (3,188 | ) | (3,527 | ) | ||||||||||||||||||||||||||
Segregated funds net assets |
4,281 | 475 | – | 246 | (1,113 | ) | (46 | ) | – | (1 | ) | 143 | 3,985 | 79 | ||||||||||||||||||||||||||||||
Total |
$ | 83,606 | $ | (3,798 | ) | $ | (6,146 | ) | $ | 10,821 | $ |
(4,624 | ) | $ | (1,779 | ) | $ | 3,237 | $ | (761 | ) | $ | 3,165 | $ | 83,721 | $ | (1,976 | ) | ||||||||||||||||
Remaining terms to maturities (1)
|
||||||||||||||||||||||||||||
As at December 31, 2023 |
Less than 1 year |
1 to 3 years |
3 to 5 years |
5 to 10 years |
Over 10 years |
With no specific maturity |
Total |
|||||||||||||||||||||
Cash and short-term securities |
$ |
20,338 |
$ |
– |
$ |
– |
$ |
– |
$ |
– |
$ |
– |
$ |
20,338 |
||||||||||||||
Debt securities |
||||||||||||||||||||||||||||
Canadian government and agency |
657 |
1,435 |
1,580 |
3,656 |
13,660 |
– |
20,988 |
|||||||||||||||||||||
U.S. government and agency |
297 |
725 |
744 |
4,504 |
22,208 |
– |
28,478 |
|||||||||||||||||||||
Other government and agency |
412 |
1,052 |
1,892 |
3,864 |
23,446 |
– |
30,666 |
|||||||||||||||||||||
Corporate |
8,475 |
15,512 |
18,548 |
33,361 |
54,100 |
50 |
130,046 |
|||||||||||||||||||||
Mortgage / asset-backed securities |
106 |
153 |
279 |
556 |
877 |
– |
1,971 |
|||||||||||||||||||||
Public equities |
– |
– |
– |
– |
– |
25,531 |
25,531 |
|||||||||||||||||||||
Mortgages |
3,363 |
12,076 |
10,181 |
7,690 |
9,644 |
9,467 |
52,421 |
|||||||||||||||||||||
Private placements |
1,418 |
3,486 |
4,704 |
9,137 |
26,790 |
71 |
45,606 |
|||||||||||||||||||||
Loans to Bank clients |
39 |
23 |
1 |
– |
– |
2,373 |
2,436 |
|||||||||||||||||||||
Real estate |
||||||||||||||||||||||||||||
Own use property |
– |
– |
– |
– |
– |
2,591 |
2,591 |
|||||||||||||||||||||
Investment property |
– |
– |
– |
– |
– |
10,458 |
10,458 |
|||||||||||||||||||||
Other invested assets |
||||||||||||||||||||||||||||
Alternative long-duration assets |
– |
67 |
22 |
82 |
732 |
40,531 |
41,434 |
|||||||||||||||||||||
Various other (2)
|
– |
– |
19 |
1,528 |
2,242 |
457 |
4,246 |
|||||||||||||||||||||
Total invested assets |
$ |
35,105 |
$ |
34,529 |
$ |
37,970 |
$ |
64,378 |
$ |
153,699 |
$ |
91,529 |
$ |
417,210 |
||||||||||||||
(1) |
Represents contractual maturities. Actual maturities may differ due to prepayment privileges in the applicable contract. |
(2) |
Primarily includes equity method accounted investments and leveraged leases. |
| |
1 95
|
Remaining terms to maturities (1)
|
||||||||||||||||||||||||||||
As at December 31, 2022 |
Less than 1 year |
1 to 3 years |
3 to 5 years |
5 to 10 years |
Over 10 years |
With no specific maturity |
Total |
|||||||||||||||||||||
Cash and short-term securities |
$ | 19,153 | $ | – | $ | – | $ | – | $ | – | $ | –
|
$ | 19,153 | ||||||||||||||
Debt securities |
||||||||||||||||||||||||||||
Canadian government and agency |
738 | 1,242 | 2,536 | 3,811 | 12,939 | – | 21,266 | |||||||||||||||||||||
U.S. government and agency |
380 | 775 | 505 | 3,560 | 19,516 | – | 24,736 | |||||||||||||||||||||
Other government and agency |
457 | 753 | 1,490 | 3,801 | 19,972 | – | 26,473 | |||||||||||||||||||||
Corporate |
8,599 | 14,542 | 16,767 | 36,778 | 52,392 | 1 | 129,079 | |||||||||||||||||||||
Mortgage / asset-backed securities |
6 | 89 | 265 | 574 | 1,354 | – | 2,288 | |||||||||||||||||||||
Public equities |
– | – | – | – | – | 23,519 | 23,519 | |||||||||||||||||||||
Mortgages |
3,288 | 7,838 | 10,911 | 7,906 | 11,629 | 10,193 | 51,765 | |||||||||||||||||||||
Private placements |
1,485 | 2,962 | 4,090 | 7,958 | 25,440 | 75 | 42,010 | |||||||||||||||||||||
Loans to Bank clients |
40 | 18 | 5 | – | 2 | 2,716 | 2,781 | |||||||||||||||||||||
Real estate |
||||||||||||||||||||||||||||
Own use property |
– | – | – | – | – | 2,852 | 2,852 | |||||||||||||||||||||
Investment property |
– | – | – | – | – | 11,417 | 11,417 | |||||||||||||||||||||
Other invested assets |
||||||||||||||||||||||||||||
Alternative long-duration assets |
1 | 46 | 22 | 35 | 674 | 37,682 | 38,460 | |||||||||||||||||||||
Various other (2)
|
105 | – | 19 | 509 | 3,206 | 504 | 4,343 | |||||||||||||||||||||
Total invested assets |
$ | 34,252 | $ | 28,265 | $ | 36,610 | $ | 64,932 | $ | 147,124 | $ | 88,959 | $ | 400,142 | ||||||||||||||
As at December 31, |
2023 |
2022 |
||||||||||||||||||||||||||||
Notional amount |
Fair value |
Notional amount |
Fair value |
|||||||||||||||||||||||||||
Type of hedge |
Instrument type |
Assets |
Liabilities |
Assets |
Liabilities |
|||||||||||||||||||||||||
Qualifying hedge accounting relationships |
||||||||||||||||||||||||||||||
Fair value hedges |
Interest rate swaps | $ |
184,309 |
$ |
2,627 |
$ |
3,044 |
$ |
– |
$ |
– |
$ |
– |
|||||||||||||||||
| Foreign currency swaps | 9,055 |
78 |
1,518 |
48 |
5 |
– |
||||||||||||||||||||||||
| Forward contracts | 23,461 |
165 |
2,672 |
– |
– |
– |
||||||||||||||||||||||||
Cash flow hedges |
Interest rate swaps | 8,372 |
20 |
48 |
– |
– |
– |
|||||||||||||||||||||||
| Foreign currency swaps | 1,150 |
35 |
181 |
1,155 |
40 |
203 |
||||||||||||||||||||||||
Forward contracts |
– |
– |
– |
– |
– |
– |
||||||||||||||||||||||||
| Equity contracts | 240 |
3 |
– |
173 |
3 |
– |
||||||||||||||||||||||||
Net investment hedges |
Forward contracts | 654 |
– |
16 |
626 |
– |
28 |
|||||||||||||||||||||||
Total derivatives in qualifying hedge accounting relationships |
227,241 |
2,928 |
7,479 |
2,002 | 48 | 231 | ||||||||||||||||||||||||
Derivatives not designated in qualifying hedge accounting relationships |
||||||||||||||||||||||||||||||
| Interest rate swaps | 103,806 |
2,361 |
3,098 |
268,081 |
5,751 |
7,557 |
||||||||||||||||||||||||
| Interest rate futures | 9,449 |
– |
– |
11,772 |
– |
– |
||||||||||||||||||||||||
| Interest rate options | 5,841 |
33 |
– |
6,090 |
98 |
– |
||||||||||||||||||||||||
| Foreign currency swaps | 33,148 |
1,873 |
398 |
39,667 |
2,029 |
1,579 |
||||||||||||||||||||||||
| Currency rate futures | 2,581 |
– |
– |
2,319 |
– |
– |
||||||||||||||||||||||||
| Forward contracts | 34,080 |
769 |
597 |
45,124 |
295 |
4,697 |
||||||||||||||||||||||||
| Equity contracts | 19,760 |
579 |
115 |
16,930 |
363 |
225 |
||||||||||||||||||||||||
| Credit default swaps | 131 |
3 |
– |
159 |
4 |
– |
||||||||||||||||||||||||
| Equity futures | 4,040 |
– |
– |
3,813 |
– |
– |
||||||||||||||||||||||||
Total derivatives not designated in qualifying hedge accounting relationships |
212,836 |
5,618 |
4,208 |
393,955 | 8,540 | 14,058 | ||||||||||||||||||||||||
Total derivatives |
$ |
440,077 |
$ |
8,546 |
$ |
11,687 |
$ | 395,957 | $ | 8,588 | $ | 14,289 | ||||||||||||||||||
Remaining term to maturity |
||||||||||||||||||||
As at December 31, 2023 |
Less than 1 year |
1 to 3 years |
3 to 5 years |
Over 5 years |
Total |
|||||||||||||||
Derivative assets |
$ |
1,189 |
$ |
603 |
$ |
573 |
$ |
6,181 |
$ |
8,546 |
||||||||||
Derivative liabilities |
1,561 |
1,982 |
717 |
7,427 |
11,687 |
|||||||||||||||
Remaining term to maturity |
||||||||||||||||||||
As at December 31, 2022 |
Less than 1 year |
1 to 3 years |
3 to 5 years |
Over 5 years |
Total |
|||||||||||||||
Derivative assets |
$ |
580 |
$ |
556 |
$ |
556 |
$ |
6,896 |
$ |
8,588 |
||||||||||
Derivative liabilities |
2,656 |
1,956 |
1,146 |
8,531 |
14,289 |
|||||||||||||||
| |
197 |
Remaining term to maturity (notional amounts) |
Fair value |
Capital requirement (2)
|
||||||||||||||||||||||||||||||||||||||
As at December 31, 2023 |
Under 1 year |
1 to 5 years |
Over 5 years |
Total |
Positive |
Negative |
Net |
Credit equivalent amount (1)
|
||||||||||||||||||||||||||||||||
Interest rate contracts |
||||||||||||||||||||||||||||||||||||||||
OTC swap contracts |
$ |
4,645 |
$ |
20,923 |
$ |
106,445 |
$ |
132,013 |
$ |
5,295 |
$ |
(6,850 |
) |
$ |
(1,555 |
) |
$ |
300 |
$ |
7 |
||||||||||||||||||||
Cleared swap contracts |
4,634 |
33,082 |
126,758 |
164,474 |
220 |
(180 |
) |
40 |
– |
– |
||||||||||||||||||||||||||||||
Forward contracts |
17,809 |
16,182 |
– |
33,991 |
771 |
(2,986 |
) |
(2,215 |
) |
– |
– |
|||||||||||||||||||||||||||||
Futures |
9,449 |
– |
– |
9,449 |
– |
– |
– |
– |
– |
|||||||||||||||||||||||||||||||
Options purchased |
795 |
1,362 |
3,684 |
5,841 |
33 |
– |
33 |
8 |
– |
|||||||||||||||||||||||||||||||
Subtotal |
37,332 |
71,549 |
236,887 |
345,768 |
6,319 |
(10,016 |
) |
(3,697 |
) |
308 |
7 |
|||||||||||||||||||||||||||||
Foreign exchange |
||||||||||||||||||||||||||||||||||||||||
Swap contracts |
2,110 |
11,782 |
29,461 |
43,353 |
1,978 |
(2,179 |
) |
(201 |
) |
1,087 |
19 |
|||||||||||||||||||||||||||||
Forward contracts |
24,204 |
– |
– |
24,204 |
163 |
(299 |
) |
(136 |
) |
19 |
– |
|||||||||||||||||||||||||||||
Futures |
2,581 |
– |
– |
2,581 |
– |
– |
– |
– |
– |
|||||||||||||||||||||||||||||||
Subtotal |
28,895 |
11,782 |
29,461 |
70,138 |
2,141 |
(2,478 |
) |
(337 |
) |
1,106 |
19 |
|||||||||||||||||||||||||||||
Credit derivatives |
14 |
117 |
– |
131 |
4 |
– |
4 |
– |
– |
|||||||||||||||||||||||||||||||
Equity contracts |
||||||||||||||||||||||||||||||||||||||||
Swap contracts |
1,452 |
723 |
– |
2,175 |
18 |
(78 |
) |
(60 |
) |
32 |
– |
|||||||||||||||||||||||||||||
Futures |
4,040 |
– |
– |
4,040 |
– |
– |
– |
– |
– |
|||||||||||||||||||||||||||||||
Options purchased |
14,830 |
2,995 |
– |
17,825 |
562 |
(28 |
) |
534 |
215 |
2 |
||||||||||||||||||||||||||||||
Subtotal |
20,336 |
3,835 |
– |
24,171 |
584 |
(106 |
) |
478 |
247 |
2 |
||||||||||||||||||||||||||||||
Subtotal including accrued interest |
86,563 |
87,166 |
266,348 |
440,077 |
9,044 |
(12,600 |
) |
(3,556 |
) |
1,661 |
28 |
|||||||||||||||||||||||||||||
Less accrued interest |
– |
– |
– |
– |
498 |
(913 |
) |
(415 |
) |
– |
– |
|||||||||||||||||||||||||||||
Total |
$ |
86,563 |
$ |
87,166 |
$ |
266,348 |
$ |
440,077 |
$ |
8,546 |
$ |
(11,687 |
) |
$ |
(3,141 |
) |
$ |
1,661 |
$ |
28 |
||||||||||||||||||||
| Remaining term to maturity (notional amounts) | Fair value |
Capital
requirement
(2)
|
||||||||||||||||||||||||||||||||||||||
| As at December 31, 2022 | Under 1 year |
1 to 5
years
|
Over
5 years
|
Total | Positive | Negative | Net |
Credit
equivalent amount
(1)
|
||||||||||||||||||||||||||||||||
Interest rate contracts |
||||||||||||||||||||||||||||||||||||||||
OTC swap contracts |
$ | 8,817 | $ | 19,253 | $ | 98,380 | $ | 126,450 | $ | 5,992 | $ | (8,135 | ) | $ | (2,143 | ) | $ | 419 | $ | 9 | ||||||||||||||||||||
Cleared swap contracts |
2,494 | 16,823 | 122,314 | 141,631 | 254 | (219 | ) | 35 | – | – | ||||||||||||||||||||||||||||||
Forward contracts |
14,290 | 13,926 | 198 | 28,414 | 70 | (4,468 | ) | (4,398 | ) | 8 | – | |||||||||||||||||||||||||||||
Futures |
11,772 | – | – | 11,772 | – | – | – | – | – | |||||||||||||||||||||||||||||||
Options purchased |
1,199 | 1,069 | 3,822 | 6,090 | 98 | – | 98 | 64 | 4 | |||||||||||||||||||||||||||||||
Subtotal |
38,572 | 51,071 | 224,714 | 314,357 | 6,414 | (12,822 | ) | (6,408 | ) | 491 | 13 | |||||||||||||||||||||||||||||
Foreign exchange |
||||||||||||||||||||||||||||||||||||||||
Swap contracts |
2,026 | 10,475 | 28,369 | 40,870 | 2,067 | (1,846 | ) | 221 | 1,166 | 23 | ||||||||||||||||||||||||||||||
Forward contracts |
17,336 | – | – | 17,336 | 226 | (258 | ) | (32 | ) | 89 | – | |||||||||||||||||||||||||||||
Futures |
2,319 | – | – | 2,319 | – | – | – | – | – | |||||||||||||||||||||||||||||||
Subtotal |
21,681 | 10,475 | 28,369 | 60,525 | 2,293 | (2,104 | ) | 189 | 1,255 | 23 | ||||||||||||||||||||||||||||||
Credit derivatives |
15 | 144 | – | 159 | 4 | – | 4 | – | – | |||||||||||||||||||||||||||||||
Equity contracts |
||||||||||||||||||||||||||||||||||||||||
Swap contracts |
547 | 396 | – | 943 | 26 | (7 | ) | 19 | 24 | – | ||||||||||||||||||||||||||||||
Futures |
3,813 | – | – | 3,813 | – | – | – | – | – | |||||||||||||||||||||||||||||||
Options purchased |
12,634 | 3,526 | – | 16,160 | 335 | (218 | ) | 117 | 232 | 2 | ||||||||||||||||||||||||||||||
Subtotal |
17,009 | 4,066 | – | 21,075 | 365 | (225 | ) | 140 | 256 | 2 | ||||||||||||||||||||||||||||||
Subtotal including accrued interest |
77,262 | 65,612 | 253,083 | 395,957 | 9,072 | (15,151 | ) | (6,079 | ) | 2,002 | 38 | |||||||||||||||||||||||||||||
Less accrued interest |
– | – | – | – | 484 | (862 | ) | (378 | ) | – | – | |||||||||||||||||||||||||||||
Total |
$ | 77,262 | $ | 65,612 | $ | 253,083 | $ | 395,957 | $ | 8,588 | $ | (14,289 | ) | $ | (5,701 | ) | $ | 2,002 | $ | 38 | ||||||||||||||||||||
|
(1) |
Credit equivalent amount is the sum of replacement cost and the potential future credit exposure less any collateral held. Replacement cost represents the current cost of replacing all contracts with a positive fair value. The amounts take into consideration legal contracts that permit offsetting of positions. The potential future credit exposure is calculated based on a formula prescribed by the Office of the Superintendent of Financial Institutions (“OSFI”). |
|
(2) |
Capital requirement represents the credit equivalent amount, weighted according to the creditworthiness of the counterparty, as prescribed by OSFI. |
As at December 31, 2023 |
Remaining term to maturity (notional amounts) |
Fair value |
||||||||||||||||||||||||||||||||||||||
Hedged item |
Hedging instrument |
Average rate |
Under 1 year |
1 to 5 years |
Over 5 years |
Total |
Positive |
Negative |
Net |
|||||||||||||||||||||||||||||||
Inflation risk |
||||||||||||||||||||||||||||||||||||||||
Inflation linked insurance liabilities |
Interest rate swaps | CPI rate: 290.13 | $ |
87 |
$ |
459 |
$ |
7,826 |
$ |
8,372 |
$ |
20 |
$ |
(48 |
) |
$ |
(28 |
) |
||||||||||||||||||||||
Foreign exchange risk |
||||||||||||||||||||||||||||||||||||||||
Fixed rate liabilities |
Foreign currency swaps | SGD/CAD: 0.93503 | 500 |
– |
– |
500 |
35 |
– |
35 |
|||||||||||||||||||||||||||||||
Foreign exchange and interest rate risk |
||||||||||||||||||||||||||||||||||||||||
Floating rate foreign currency liabilities |
Foreign currency swaps | CAD/USD: 0.86655 | – |
– |
650 |
650 |
– |
(181 |
) |
(181 |
) |
|||||||||||||||||||||||||||||
Debt securities at fair value through OCI |
Foreign currency swaps | CAD/USD: 1.22914 | – |
46 |
– |
46 |
5 |
– |
5 |
|||||||||||||||||||||||||||||||
Equity risk |
||||||||||||||||||||||||||||||||||||||||
Stock-based compensation |
Equity contracts | MFC price: $26.28 | 11 |
229 |
– |
240 |
3 |
– |
3 |
|||||||||||||||||||||||||||||||
Total |
$ |
598 |
$ |
734 |
$ |
8,476 |
$ |
9,808 |
$ |
63 |
$ |
(229 |
) |
$ |
(166 |
) |
||||||||||||||||||||||||
As at December 31, 2022 |
Remaining term to maturity (notional amounts) |
Fair value |
||||||||||||||||||||||||||||||||||||||
Hedged item |
Hedging instrument |
Average rate |
Under 1 year |
1 to 5 years |
Over 5 years |
Total |
Positive |
Negative |
Net |
|||||||||||||||||||||||||||||||
Foreign exchange risk |
||||||||||||||||||||||||||||||||||||||||
Fixed rate liabilities |
Foreign currency swaps | SGD/CAD: 0.93503 | $ | – | $ | 505 | $ | – | $ | 505 | $ | 40 | $ | – | $ | 40 | ||||||||||||||||||||||||
Foreign exchange and interest rate risk |
||||||||||||||||||||||||||||||||||||||||
Floating rate foreign currency liabilities |
Foreign currency swaps | CAD/USD: 0.86655 | – | – | 650 | 650 | – | (203 | ) | (203 | ) | |||||||||||||||||||||||||||||
Debt securities at fair value through OCI |
Foreign currency swaps | CAD/USD: 1.22914 | – | 48 | – | 48 | 5 | – | 5 | |||||||||||||||||||||||||||||||
Equity risk |
||||||||||||||||||||||||||||||||||||||||
Stock-based compensation |
Equity contracts | MFC price: $25.39 | 9 | 164 | – | 173 | 3 | – | 3 | |||||||||||||||||||||||||||||||
Total |
$ | 9 | $ | 717 | $ | 650 | $ | 1,376 | $ | 48 | $ | (203 | ) | $ | (155 | ) | ||||||||||||||||||||||||
As at December 31, 2023
|
Fair value |
Level 1 |
Level 2 |
Level 3 |
||||||||||||
Derivative assets |
||||||||||||||||
Interest rate contracts |
$ |
5,813 |
$ |
– |
$ |
5,262 |
$ |
551 |
||||||||
Foreign exchange contracts |
2,148 |
– |
2,148 |
– |
||||||||||||
Equity contracts |
582 |
– |
572 |
10 |
||||||||||||
Credit default swaps |
3 |
– |
3 |
– |
||||||||||||
Total derivative assets |
$ |
8,546 |
$ |
– |
$ |
7,985 |
$ |
561 |
||||||||
Derivative liabilities |
||||||||||||||||
Interest rate contracts |
$ |
9,176 |
$ |
– |
$ |
6,451 |
$ |
2,725 |
||||||||
Foreign exchange contracts |
2,396 |
– |
2,395 |
1 |
||||||||||||
Equity contracts |
115 |
– |
114 |
1 |
||||||||||||
Total derivative liabilities |
$ |
11,687 |
$ |
– |
$ |
8,960 |
$ |
2,727 |
||||||||
| |
1 99
|
As at December 31, 2022 |
Fair value | Level 1 | Level 2 | Level 3 | ||||||||||||
Derivative assets |
||||||||||||||||
Interest rate contracts |
$ | 5,919 | $ | – | $ | 5,766 | $ | 153 | ||||||||
Foreign exchange contracts |
2,299 | – | 2,298 | 1 | ||||||||||||
Equity contracts |
366 | – | 361 | 5 | ||||||||||||
Credit default swaps |
4 | – | 4 | – | ||||||||||||
Total derivative assets |
$ | 8,588 | $ | – | $ | 8,429 | $ | 159 | ||||||||
Derivative liabilities |
||||||||||||||||
Interest rate contracts |
$ | 12,025 | $ | – | $ | 8,689 | $ | 3,336 | ||||||||
Foreign exchange contracts |
2,039 | – | 2,037 | 2 | ||||||||||||
Equity contracts |
225 | – | 216 | 9 | ||||||||||||
Total derivative liabilities |
$ | 14,289 | $ | – | $ | 10,942 | $ | 3,347 | ||||||||
• |
The Company designates a specific risk component or a combination of risk components as the hedged risk, including benchmark interest rate, foreign exchange rate, equity price and consumer price index components. All these risk components are observable in the relevant market environment and the changes in fair value or variability in cash flows attributable to these risk components can be reliably measured for hedged items. The hedged risk is generally the most significant risk component of the overall changes in fair value or in cash flows. The Company acquires derivatives for economic hedging purposes with underlying characteristics that offset the hedged risk based on the risk management strategy. |
• |
The Company executes hedging derivatives with counterparties with high credit quality and monitors the creditworthiness of the counterparties to ensure they are expected to meet cash flow obligations on the hedging instruments as they come due, and that the probability of counterparty default is remote. Further, changes in the Company’s own credit risk are immaterial and have insignificant impact to the hedging relationships. |
• |
A hedge ratio is calculated as the ratio between the quantity of the hedged item that the Company hedges and the quantity of the hedging instrument the Company uses to hedge that quantity of hedged item. |
¡ |
For group fair value hedges of interest rate risk of insurance liabilities and group fair value hedges of foreign exchange and interest rate risk of foreign currency denominated debt instruments, the Company constructs the hedge relationship by comparing interest rate sensitivities of the group of hedging derivatives and the group of hedged items in the same currency. Interest rate sensitivities are compared by estimating the change in the present value of cash flows of hedged items and of hedging derivatives from an instantaneous shock to interest rates, assuming no rebalancing actions are undertaken. |
¡ |
For the rest of the Company’s hedge accounting relationships, the Company generally constructs the hedge relationships by comparing the notional amounts of the hedging derivatives with that of the hedged items. |
| Interest rate risk |
Foreign currency risk |
Equity risk |
Consumer price index risk |
|||||||||||||
Mismatches in some critical terms of hedging instrument and hedged item |
✓ |
✓ |
✓ |
✓ |
||||||||||||
Differences in valuation methodologies including discounting factor |
✓ |
✓ |
✓ |
|||||||||||||
Changes in timing and amount of forecasted hedged items |
✓ |
✓ |
||||||||||||||
Differences due to the use of non-zero fair value hedging instruments |
✓ |
✓ |
||||||||||||||
| For the year ended December 31, 2023 |
Change in value of the hedged item for ineffectiveness measurement |
Change in value of the hedging instrument for ineffectiveness measurement |
Ineffectiveness recognized in Total investment result |
Carrying amount for hedged items (1)
|
Accumulated fair value adjustments on hedged items |
Accumulated fair value adjustments on de-designated hedged items |
||||||||||||||||||
| Assets |
||||||||||||||||||||||||
| Interest rate risk |
||||||||||||||||||||||||
| Debt securities at FVOCI |
$ |
– |
$ |
– |
$ |
– |
$ |
– |
$ |
– |
$ |
241 |
||||||||||||
| Foreign currency and interest rate risk |
||||||||||||||||||||||||
| Debt securities at FVOCI |
742 |
(778 |
) |
(36 |
) |
9,191 |
576 |
(405 |
) | |||||||||||||||
| Total assets |
$ |
742 |
$ |
(778 |
) |
$ |
(36 |
) |
$ |
9,191 |
$ |
576 |
$ |
(164 |
) | |||||||||
| Liabilities |
||||||||||||||||||||||||
| Interest rate risk |
||||||||||||||||||||||||
| Insurance contract liabilities |
$ |
(53 |
) |
$ |
185 |
$ |
132 |
$ |
29,133 |
$ |
(2,658 |
) |
$ |
2,642 |
||||||||||
| Total liabilities |
$ |
(53 |
) |
$ |
185 |
$ |
132 |
$ |
29,133 |
$ |
(2,658 |
) |
$ |
2,642 |
||||||||||
| For the year ended December 31, 2022 |
Change in value of the hedged item for ineffectiveness measurement |
Change in value of the hedging instrument for ineffectiveness measurement |
Ineffectiveness recognized in Total investment result |
Carrying amount for hedged items |
Accumulated fair value adjustments on hedged items |
Accumulated fair value adjustments on de-designated hedged items |
||||||||||||||||||
| Assets
(2)
|
||||||||||||||||||||||||
| Interest rate risk |
||||||||||||||||||||||||
| Debt securities at FVOCI |
$ | – | $ | – | $ | – | $ | – | $ | – | $ | 265 | ||||||||||||
| Foreign currency and interest rate risk |
||||||||||||||||||||||||
| Debt securities at FVOCI |
7 | (5 | ) | 2 | 31 | 7 | – | |||||||||||||||||
| Total assets |
$ | 7 | $ | (5 | ) | $ | 2 | $ | 31 | $ | 7 | $ | 265 | |||||||||||
| Total liabilities |
$ | – | $ | – | $ | – | $ | – | $ | – | $ | – | ||||||||||||
|
(1) |
The carrying amounts for hedged items presented are related to hedged items in active hedging relationships as at the reporting date. Out of the $ 9,191 related to assets, $9,160 relates to new hedge relationships designated under IFRS 9 and accordingly, no amounts related to these new hedge relationships are presented for the comparative period. Further, $29,133 related to liabilities are new hedge relationships designated under IFRS 9 and accordingly, no amounts related to these new hedge relationships are presented for the comparative period. |
|
(2) |
Represents hedge relationships previously designated under IAS 39. |
| |
201 |
| For the year ended December 31, 2023 |
Hedged items in qualifying cash flow hedging relationships |
Change in fair value of hedged items for ineffectiveness measurement |
Change in fair value of hedging instruments for ineffectiveness measurement |
Gains (losses) deferred in AOCI on derivatives |
Gains (losses) reclassified from AOCI into Total investment result |
Ineffectiveness recognized in Total investment result |
||||||||||||||||
| Interest rate risk |
||||||||||||||||||||||
| Treasury locks |
Forecasted liability issuance |
$ |
(1 |
) |
$ |
1 |
$ |
1 |
$ |
– |
$ |
– |
||||||||||
| Foreign exchange risk |
||||||||||||||||||||||
| Foreign currency swaps |
Fixed rate liabilities |
10 |
(10 |
) |
(10 |
) |
(8 |
) |
– |
|||||||||||||
| Interest and foreign exchange risk |
||||||||||||||||||||||
| Foreign currency swaps |
Floating rate liabilities |
(23 |
) |
23 |
23 |
16 |
– |
|||||||||||||||
| Equity price risk |
||||||||||||||||||||||
| Equity contracts |
Stock-based compensation |
(40 |
) |
40 |
40 |
3 |
– |
|||||||||||||||
| CPI risk |
||||||||||||||||||||||
| Interest rate swaps (1)
|
Inflation linked insurance liabilities |
4 |
(4 |
) |
(4 |
) |
81 |
– |
||||||||||||||
| Total |
$ |
(50 |
) |
$ |
50 |
$ |
50 |
$ |
92 |
$ |
– |
|||||||||||
| For the year ended December 31, 2022 |
Hedged items in qualifying cash flow hedging relationships |
Change in fair value of hedged items for ineffectiveness measurement |
Change in fair value of hedging instruments for ineffectiveness measurement |
Gains (losses) deferred in AOCI on derivatives |
Gains (losses) reclassified from AOCI into Total investment result |
Ineffectiveness recognized in Total investment result |
||||||||||||||||
| Foreign exchange risk |
||||||||||||||||||||||
| Foreign currency swaps |
Fixed rate assets |
$ | 1 | $ | (1 | ) | $ | (1 | ) | $ | (1 | ) | $ | – | ||||||||
| Fixed rate liabilities |
(34 | ) | 34 | 34 | 35 | – | ||||||||||||||||
| Interest and foreign exchange risk |
||||||||||||||||||||||
| Foreign currency swaps |
Floating rate liabilities |
(175 | ) | 175 | 175 | (49 | ) | – | ||||||||||||||
| Equity price risk |
||||||||||||||||||||||
| Equity contracts |
Stock-based compensation |
(2 | ) | 2 | 2 | 6 | – | |||||||||||||||
| Total |
$ | (210 | ) | $ | 210 | $ | 210 | $ | (9 | ) | $ | – | ||||||||||
|
(1) |
Gains (losses) deferred in AOCI on derivatives are presented in AOCI under Insurance finance income (expense s ). |
As at December 31, |
2023 |
2022 |
||||||
| Balances in the cash flow hedge reserve for continuing hedges |
$ |
(149 |
) |
$ | (107 |
) | ||
| Balances remaining in the cash flow hedge reserve on de-designated hedges |
– |
– |
||||||
| Total |
$ |
(149 |
) |
$ | (107 |
) | ||
For the year ended December 31, 2023 |
Change in fair value of hedged items for ineffectiveness measurement |
Change in fair value of hedging instruments for ineffectiveness measurement |
Gains (losses) deferred in AOCI |
Gains (losses) reclassified from AOCI into Total investment result |
Ineffectiveness recognized in Total investment result |
|||||||||||||||
| Non-functional currency denominated debt |
$ |
(195 |
) |
$ |
195 |
$ |
195 |
$ |
– |
$ |
– |
|||||||||
| Forward currency contracts |
(1 |
) |
1 |
1 |
– |
– |
||||||||||||||
| Total |
$ |
(196 |
) |
$ |
196 |
$ |
196 |
$ |
– |
$ |
– |
|||||||||
| For the year ended December 31, 2022 | Change in fair value of hedged items for ineffectiveness measurement |
Change in fair value of hedging instruments for ineffectiveness measurement |
Gains (losses) deferred in AOCI |
Gains (losses) reclassified from AOCI into Total investment result |
Ineffectiveness recognized in Total investment result |
|||||||||||||||
| Non-functional currency denominated debt |
$ | 458 | $ | (458 | ) | $ | (458 | ) | $ | – | $ | – | ||||||||
| Forward currency contracts |
(14 | ) | 14 | 14 | – | – | ||||||||||||||
| Total |
$ | 444 | $ | (444 | ) | $ | (444 | ) | $ | – | $ | – | ||||||||
As at December 31, |
2023 |
2022 |
||||||
| Balances in the foreign currency translation reserve for continuing hedges |
$ |
59 |
$ | (137 | ) | |||
| Balances remaining in the net investment hedge reserve on de-designated hedges |
– |
– | ||||||
| Total |
$ |
59 |
$ | (137 | ) | |||
For the year ended December 31, 2023 |
Accumulated other comprehensive income (loss), beginning of the year |
Hedging gains (losses) recognized in AOCI during the year |
Reclassification from AOCI to income |
Accumulated other comprehensive income (loss), end of the year |
Reclassification adjustment related to de-designated hedges as hedged item affects income |
Reclassification adjustment related to items for which the hedged future cash flows are no longer expected to occur |
||||||||||||||||||
| Interest rate risk |
$ |
– |
$ |
1 |
$ |
– |
$ |
1 |
$ |
– |
$ |
– |
||||||||||||
| Interest rate and foreign exchange risk |
(114 |
) |
23 |
16 |
(107 |
) |
– |
– |
||||||||||||||||
| Foreign exchange translation risk |
5 |
(10 |
) |
(8 |
) |
3 |
– |
– |
||||||||||||||||
| CPI risk |
– |
(4 |
) |
81 |
(85 |
) |
– |
– |
||||||||||||||||
| Equity price risk |
2 |
40 |
3 |
39 |
– |
– |
||||||||||||||||||
| Total |
$ |
(107 |
) |
$ |
50 |
$ |
92 |
$ |
(149 |
) |
$ |
– |
$ |
– |
||||||||||
| For the year ended December 31, 2022 | Accumulated other comprehensive income (loss), beginning of the year |
Hedging gains (losses) recognized in AOCI during the year |
Reclassification from AOCI to income |
Accumulated other comprehensive income (loss), end of the year |
Reclassification adjustment related to de-designated hedges as hedged item affects income |
Reclassification adjustment related to items for which the hedged future cash flows are no longer expected to occur |
||||||||||||||||||
| Interest rate risk |
$ | – | $ | – | $ | – | $ | – | $ | – | $ | – | ||||||||||||
| Interest rate and foreign exchange risk |
(313 | ) | 175 | (49 | ) | (89 | ) | – | – | |||||||||||||||
| Foreign exchange translation risk |
3 | 33 | 34 | 2 | – | – | ||||||||||||||||||
| CPI risk |
– | – | – | – | – | – | ||||||||||||||||||
| Equity price risk |
6 | 2 | 6 | 2 | – | – | ||||||||||||||||||
| Total |
$ | (304 | ) | $ | 210 | $ | (9 | ) | $ | (85 | ) | $ | – | $ | – | |||||||||
| |
203 |
For the year ended December 31, 2023 |
Accumulated other comprehensive income (loss), beginning of the year |
Hedging gains (losses) recognized in AOCI during the year |
Reclassification from AOCI to income |
Accumulated other comprehensive income (loss), end of the year |
Reclassification adjustment related to de- designated hedges as hedged item affects income |
Reclassification adjustment related to items for which the hedged future cash flows are no longer expected to occur |
||||||||||||||||||
| Foreign exchange translation risk |
$ |
(137 |
) |
$ |
196 |
$ |
– |
$ |
59 |
$ |
– |
$ |
– |
|||||||||||
| For the year ended December 31, 2022 | Accumulated other comprehensive income (loss), beginning of the year |
Hedging gains (losses) recognized in AOCI during the year |
Reclassification from AOCI to income |
Accumulated other comprehensive income (loss), end of the year |
Reclassification adjustment related to de- designated hedges as hedged item affects income |
Reclassification adjustment related to items for which the hedged future cash flows are no longer expected to occur |
||||||||||||||||||
| Foreign exchange translation risk |
$ | 307 | $ | (444 | ) | $ | – | $ | (137 | ) | $ | – | $ | – | ||||||||||
For the year ended December 31, 2023 |
||||
| Foreign exchange risk |
||||
| Balance, beginning of year |
$ |
(3 |
) | |
| Changes in fair value |
5 |
|||
| Amount reclassified to profit or loss |
2 |
|||
| Balance, end of year |
$ |
– |
||
| Foreign exchange and interest rate risk |
||||
| Balance, beginning of year |
$ |
25 |
||
| Changes in fair value |
(8 |
) | ||
| Amount reclassified to profit or loss |
(1 |
) | ||
| Balance, end of year |
$ |
18 |
||
For the years ended December 31, |
2023 |
2022 |
||||||
| Interest rate swaps |
$ |
667 |
$ | (3,428 | ) | |||
| Interest rate futures |
57 |
(431 | ) | |||||
| Interest rate options |
(13 |
) |
(258 | ) | ||||
| Foreign currency swaps |
(4 |
) |
1,171 | |||||
| Currency rate futures |
(22 |
) |
(103 | ) | ||||
| Forward contracts |
612 |
(7,561 | ) | |||||
| Equity futures |
(449 |
) |
794 | |||||
| Equity contracts |
325 |
(818 | ) | |||||
| Total |
$ |
1,173 |
$ | (10,634 | ) | |||
For the year ended December 31, 2023 |
Balance, January 1, 2023 |
Net additions/ (disposals) |
Amortization expense |
Effect of changes in foreign exchange rates |
Balance, December 31, 2023 |
|||||||||||||||
Goodwill |
$ |
6,014 |
$ |
– |
$ |
n/a |
$ |
(95 |
) |
$ |
5,919 |
|||||||||
Indefinite life intangible assets |
||||||||||||||||||||
Brand |
813 |
– |
n/a |
(22 |
) |
791 |
||||||||||||||
Fund management contracts and other (1)
|
1,048 |
– |
n/a |
(14 |
) |
1,034 |
||||||||||||||
1,861 |
– |
n/a |
(36 |
) |
1,825 |
|||||||||||||||
Finite life intangible assets (2)
|
||||||||||||||||||||
Distribution networks |
881 |
31 |
(53 |
) |
(25 |
) |
834 |
|||||||||||||
Customer relationships |
643 |
(4 |
) |
(53 |
) |
(4 |
) |
582 |
||||||||||||
Software |
1,068 |
274 |
(217 |
) |
(23 |
) |
1,102 |
|||||||||||||
Other |
52 |
11 |
(5 |
) |
(10 |
) |
48 |
|||||||||||||
2,644 |
312 |
(328 |
) |
(62 |
) |
2,566 |
||||||||||||||
Total intangible assets |
4,505 |
312 |
(328 |
) |
(98 |
) |
4,391 |
|||||||||||||
Total goodwill and intangible assets |
$ |
10,519 |
$ |
312 |
$ |
(328 |
) |
$ |
(193 |
) |
$ |
10,310 |
||||||||
| For the year ended December 31, 2022 | Balance, January 1, 2022 |
Net additions/ (disposals) (3),(4)
|
Amortization expense |
Effect of changes in foreign exchange rates |
Balance, December 31, 2022 |
|||||||||||||||
Goodwill |
$ | 5,651 | $ | 255 | $ | n/a | $ | 108 | $ | 6,014 | ||||||||||
Indefinite life intangible assets |
||||||||||||||||||||
Brand |
761 | – | n/a | 52 | 813 | |||||||||||||||
Fund management contracts and other (1)
|
788 | 228 | n/a | 32 | 1,048 | |||||||||||||||
| 1,549 | 228 | n/a | 84 | 1,861 | ||||||||||||||||
Finite life intangible assets (2)
|
||||||||||||||||||||
Distribution networks |
888 | 6 | (47 | ) | 34 | 881 | ||||||||||||||
Customer relationships |
687 | – | (56 | ) | 12 | 643 | ||||||||||||||
Software |
1,091 | 192 | (235 | ) | 20 | 1,068 | ||||||||||||||
Other |
49 | 7 | (6 | ) | 2 | 52 | ||||||||||||||
| 2,715 | 205 | (344 | ) | 68 | 2,644 | |||||||||||||||
Total intangible assets |
4,264 | 433 | (344 | ) | 152 | 4,505 | ||||||||||||||
Total goodwill and intangible assets |
$ | 9,915 | $ | 688 | $ | (344 | ) | $ | 260 | $ | 10,519 | |||||||||
|
(1) |
Fund management contracts are mostly allocated to Canada WAM and U.S. WAM CGUs with carrying values of $ 273 (2022 – $273 ) and $386 (2022 – $397 ), respectively. |
|
(2) |
Gross carrying amount of finite life intangible assets was $ 2,955 for software, $1,511 for distribution networks, $1,136 for customer relationships and $138 for other (2022 – $2,736 , $1,517 , $1,146 and $136 ), respectively. |
|
(3) |
In November 2022, the Company acquired control of Manulife Fund Management Co., Ltd., formerly known as Manulife TEDA Fund Management Co., Ltd, through the purchase of the remaining
51 % of shares that it did not already own from its joint venture partner. The transaction included cash consideration of $334 and derecognition of the Company’s previous joint venture interest with a fair value of $321 . Goodwill, indefinite life fund management contracts and distribution networks, and finite life management contracts, included in Other, of $255, $185, $52 and $3 were recognized. |
|
(4) |
In January 2022, the Company paid $ 256 |
| |
205 |
|
For the year ended December 31, 2023 CGU or group of CGUs |
Balance, January 1, 2023 |
Net additions/ (disposals) |
Effect of changes in foreign exchange rates |
Balance, December 31, 2023 |
||||||||||||
Asia |
||||||||||||||||
Asia Insurance (excluding Japan) |
$ |
162 |
$ |
– |
$ |
(3 |
) |
$ |
159 |
|||||||
Japan Insurance |
360 |
– |
(32 |
) |
328 |
|||||||||||
Canada Insurance |
1,960 |
– |
(2 |
) |
1,958 |
|||||||||||
U.S. Insurance |
360 |
– |
(10 |
) |
350 |
|||||||||||
Global Wealth and Asset Management |
||||||||||||||||
Asia WAM |
450 |
– |
(12 |
) |
438 |
|||||||||||
Canada WAM |
1,436 |
– |
– |
1,436 |
||||||||||||
U.S. WAM |
1,286 |
– |
(36 |
) |
1,250 |
|||||||||||
Total |
$ |
6,014 |
$ |
– |
$ |
(95 |
) |
$ |
5,919 |
|||||||
|
For the year ended December 31, 2022
CGU or group of CGUs
|
Balance, January 1, 2022 |
Net additions/ (disposals) |
Effect of changes in foreign exchange rates |
Balance, December 31, 2022 |
||||||||||||
Asia |
||||||||||||||||
Asia Insurance (excluding Japan) |
$ | 152 |
$ | – | $ | 10 |
$ | 162 |
||||||||
Japan Insurance |
386 |
– | (26 |
) |
360 |
|||||||||||
Canada Insurance |
1,955 |
– | 5 |
1,960 |
||||||||||||
U.S. Insurance |
336 |
– | 24 |
360 |
||||||||||||
Global Wealth and Asset Management |
||||||||||||||||
Asia WAM |
183 |
255 |
12 |
450 |
||||||||||||
Canada WAM |
1,436 |
– | – | 1,436 |
||||||||||||
U.S. WAM |
|
1,203 |
|
|
– |
|
|
83 |
|
|
1,286 |
|
||||
Total |
$ | 5,651 | $ | 255 | $ | 108 | $ | 6,014 | ||||||||
As at December 31, |
2023 |
2022 |
||||||||||||||||||||||||||||||||||
Insurance contract assets |
Insurance contract liabilities |
Insurance contract liabilities for account of segregated fund holders |
Net insurance contract liabilities |
Insurance contract assets |
Insurance contract liabilities |
Insurance contract liabilities for account of segregated fund holders |
Net insurance contract liabilities |
|||||||||||||||||||||||||||||
| Asia |
$ |
(108 |
) |
$ |
131,729 |
$ |
22,696 |
$ |
154,317 |
|
|
|
$ | (527 | ) | $ | 121,105 | $ | 21,005 | $ | 141,583 | |||||||||||||||
| Canada |
(33 |
) |
80,169 |
36,085 |
116,221 |
|
|
|
(81 | ) | 74,876 | 35,695 | 110,490 | |||||||||||||||||||||||
| U.S. |
– |
157,699 |
55,362 |
213,061 |
|
|
|
(56 | ) | 159,501 | 53,516 | 212,961 | ||||||||||||||||||||||||
| Corporate and Other |
(4 |
) |
(781 |
) |
– |
(785 |
) |
|
|
|
– | 163 | – | 163 | ||||||||||||||||||||||
| Insurance contract balances |
(145 |
) |
368,816 |
114,143 |
482,814 |
(664 | ) | 355,645 | 110,216 | 465,197 | ||||||||||||||||||||||||||
| Assets for insurance acquisition cash flows |
– |
(820 |
) |
– |
(820 |
) |
|
|
|
(9 | ) | (796 | ) | – | (805 | ) | ||||||||||||||||||||
| Total |
$ |
(145 |
) |
$ |
367,996 |
$ |
114,143 |
$ |
481,994 |
|
|
|
$ | (673 | ) | $ | 354,849 | $ | 110,216 | $ | 464,392 | |||||||||||||||
2023 |
2022 |
|||||||||||||||||||||||||||
As at December 31, |
Assets |
Liabilities |
Net reinsurance contract held assets |
Assets |
Liabilities |
Net reinsurance contract held assets |
||||||||||||||||||||||
| Asia |
$ |
3,540 |
$ |
(1,909 |
) |
$ |
1,631 |
$ | 3,306 | $ | (1,462 | ) | $ | 1,844 | ||||||||||||||
| Canada |
1,922 |
(913 |
) |
1,009 |
1,756 | (911 | ) | 845 | ||||||||||||||||||||
| U.S. |
37,437 |
(14 |
) |
37,423 |
40,384 | (18 | ) | 40,366 | ||||||||||||||||||||
| Corporate and Other |
(248 |
) |
5 |
(243 |
) |
425 | – | 425 | ||||||||||||||||||||
| Total |
$ |
42,651 |
$ |
(2,831 |
) |
$ |
39,820 |
$ | 45,871 | $ | (2,391 | ) | $ | 43,480 | ||||||||||||||
As at December 31, |
2023 |
2022 |
||||||
| Net insurance contract held liabilities |
$ |
481,994 |
$ | 464,392 | ||||
| Net reinsurance contract held assets |
(39,820 |
) |
(43,480 | ) | ||||
| Net insurance and reinsurance contract held liabilities |
$ |
442,174 |
$ | 420,912 | ||||
• |
Tables which analyze movements in the net assets or liabilities for remaining coverage and for incurred claims separately and reconcile them to the relevant Consolidated Statements of Income and Consolidated Statements of Comprehensive Income line items. |
• |
Tables which analyze movements of contracts by measurement components including estimates of the present value of future cash flows, risk adjustment and CSM for portfolios. |
| |
207 |
Liabilities for remaining coverage |
Liabilities for incurred claims |
|||||||||||||||||||||||||||||||
Excluding loss component |
Loss component |
Products not under PAA |
PAA Estimates of PV of future cash flows |
PAA Risk adjustment for non-financial risk
|
Assets for insurance acquisition cash flows |
Total |
||||||||||||||||||||||||||
| Opening insurance contract assets |
$ |
(659 |
) |
$ |
– |
$ |
7 |
$ |
(12 |
) |
$ |
– |
$ |
(9 |
) |
$ |
(673 |
) | ||||||||||||||
| Opening insurance contract liabilities |
336,981 |
1,328 |
5,857 |
10,877 |
602 |
(796 |
) |
354,849 |
||||||||||||||||||||||||
| Opening insurance contract liabilities for account of segregated fund holders |
110,216 |
– |
– |
– |
– |
– |
110,216 |
|||||||||||||||||||||||||
| Net opening balance, January 1, 2023 |
446,538 |
1,328 |
5,864 |
10,865 |
602 |
(805 |
) |
464,392 |
||||||||||||||||||||||||
| Insurance revenue |
||||||||||||||||||||||||||||||||
| Expected incurred claims and other insurance service result |
(13,165 |
) |
– |
– |
– |
– |
– |
(13,165 |
) | |||||||||||||||||||||||
| Change in risk adjustment for non-financial risk expired |
(1,497 |
) |
– |
– |
– |
– |
– |
(1,497 |
) | |||||||||||||||||||||||
| CSM recognized for services provided |
(2,162 |
) |
– |
– |
– |
– |
– |
(2,162 |
) | |||||||||||||||||||||||
| Recovery of insurance acquisition cash flows |
(853 |
) |
– |
– |
– |
– |
– |
(853 |
) | |||||||||||||||||||||||
| Contracts under PAA |
(6,295 |
) |
– |
– |
– |
– |
– |
(6,295 |
) | |||||||||||||||||||||||
(23,972 |
) |
– |
– |
– |
– |
– |
(23,972 |
) | ||||||||||||||||||||||||
| Insurance service expense |
||||||||||||||||||||||||||||||||
| Incurred claims and other insurance service expenses |
– |
(320 |
) |
13,446 |
6,136 |
254 |
– |
19,516 |
||||||||||||||||||||||||
| Losses and reversal of losses on onerous contracts (future service) |
– |
90 |
– |
– |
– |
– |
90 |
|||||||||||||||||||||||||
| Changes to liabilities for incurred claims (past service) |
– |
– |
(31 |
) |
(1,605 |
) |
(242 |
) |
– |
(1,878 |
) | |||||||||||||||||||||
| Amortization of insurance acquisition cash flows |
1,654 |
– |
– |
– |
– |
– |
1,654 |
|||||||||||||||||||||||||
| Net impairment of assets for insurance acquisition cash flows |
– |
– |
– |
– |
– |
– |
– |
|||||||||||||||||||||||||
1,654 |
(230 |
) |
13,415 |
4,531 |
12 |
– |
19,382 |
|||||||||||||||||||||||||
| Investment components and premium refunds |
(19,080 |
) |
– |
17,148 |
1,932 |
– |
– |
– |
||||||||||||||||||||||||
| Insurance service result |
(41,398 |
) |
(230 |
) |
30,563 |
6,463 |
12 |
– |
(4,590 |
) | ||||||||||||||||||||||
| Insurance finance (income) expenses |
24,268 |
32 |
15 |
848 |
11 |
– |
25,174 |
|||||||||||||||||||||||||
| Effects of movements in foreign exchange rates |
(9,657 |
) |
(38 |
) |
(71 |
) |
(12 |
) |
– |
7 |
(9,771 |
) | ||||||||||||||||||||
| Total changes in income and OCI |
(26,787 |
) |
(236 |
) |
30,507 |
7,299 |
23 |
7 |
10,813 |
|||||||||||||||||||||||
| Cash flows |
||||||||||||||||||||||||||||||||
| Premiums and premium tax received |
48,381 |
– |
– |
– |
– |
– |
48,381 |
|||||||||||||||||||||||||
| Claims and other insurance service expenses paid, including investment components |
– |
– |
(30,706 |
) |
(7,719 |
) |
– |
– |
(38,425 |
) | ||||||||||||||||||||||
| Insurance acquisition cash flows |
(6,920 |
) |
– |
– |
– |
– |
– |
(6,920 |
) | |||||||||||||||||||||||
| Total cash flows |
41,461 |
– |
(30,706 |
) |
(7,719 |
) |
– |
– |
3,036 |
|||||||||||||||||||||||
| Allocation from assets for insurance acquisition cash flows to groups of insurance contracts |
(152 |
) |
– |
– |
– |
– |
152 |
– |
||||||||||||||||||||||||
| Acquisition cash flows incurred in the year |
– |
– |
– |
– |
– |
(174 |
) |
(174 |
) | |||||||||||||||||||||||
| Movements related to insurance contract liabilities for account of segregated fund holders |
3,927 |
– |
– |
– |
– |
– |
3,927 |
|||||||||||||||||||||||||
| Net closing balance |
464,987 |
1,092 |
5,665 |
10,445 |
625 |
(820 |
) |
481,994 |
||||||||||||||||||||||||
| Closing insurance contract assets |
(201 |
) |
– |
56 |
– |
– |
– |
(145 |
) | |||||||||||||||||||||||
| Closing insurance contract liabilities |
351,045 |
1,092 |
5,609 |
10,445 |
625 |
(820 |
) |
367,996 |
||||||||||||||||||||||||
| Closing insurance contract liabilities for account of segregated fund holders |
114,143 |
– |
– |
– |
– |
– |
114,143 |
|||||||||||||||||||||||||
| Net closing balance, December 31, 2023 |
$ |
464,987 |
$ |
1,092 |
$ |
5,665 |
$ |
10,445 |
$ |
625 |
$ |
(820 |
) |
$ |
481,994 |
|||||||||||||||||
| Insurance finance (income) expenses (“IFIE”) |
||||||||||||||||||||||||||||||||
| Insurance finance (income) expenses, per disclosure above |
$ |
25,174 |
||||||||||||||||||||||||||||||
| Reclassification of derivative OCI to IFIE – cash flow hedges |
|
3 |
||||||||||||||||||||||||||||||
| Reclassification of derivative (income) loss changes to IFIE – fair value hedge |
|
(185 |
) | |||||||||||||||||||||||||||||
| Insurance finance (income) expenses, per disclosure in note 7 (f) |
|
$ |
24,992 |
|||||||||||||||||||||||||||||
Liabilities for remaining coverage |
Liabilities for incurred claims |
|||||||||||||||||||||||||||||||
Excluding loss component |
Loss component |
Products not under PAA |
PAA Estimates of PV of future cash flows |
PAA Risk adjustment for non-financial risk
|
Assets for insurance acquisition cash flows |
Total |
||||||||||||||||||||||||||
| Opening insurance contract assets |
$ | (842 | ) | $ | – | $ | 60 | $ | 27 | $ | – | $ | (217 | ) | $ | (972 | ) | |||||||||||||||
| Opening insurance contract liabilities |
388,585 | 303 | 4,342 | 12,230 | 689 | (528 | ) | 405,621 | ||||||||||||||||||||||||
| Opening insurance contract liabilities for account of segregated fund holders |
130,836 | – | – | – | – | – | 130,836 | |||||||||||||||||||||||||
| Net opening balance, January 1, 2022 |
518,579 | 303 | 4,402 | 12,257 | 689 | (745 | ) | 535,485 | ||||||||||||||||||||||||
| Insurance revenue |
||||||||||||||||||||||||||||||||
| Expected incurred claims and other insurance service result |
(13,019 | ) | – | – | – | – | – | (13,019 | ) | |||||||||||||||||||||||
| Change in risk adjustment for non-financial risk expired |
(1,665 | ) | – | – | – | – | – | (1,665 | ) | |||||||||||||||||||||||
| CSM recognized for service provided |
(2,298 | ) | – | – | – | – | – | (2,298 | ) | |||||||||||||||||||||||
| Recovery of insurance acquisition cash flows |
(534 | ) | – | – | – | – | – | (534 | ) | |||||||||||||||||||||||
| Contracts under PAA |
(5,602 | ) | – | – | – | – | – | (5,602 | ) | |||||||||||||||||||||||
| (23,118 | ) | – | – | – | – | – | (23,118 | ) | ||||||||||||||||||||||||
| Insurance service expense |
||||||||||||||||||||||||||||||||
| Incurred claims and other insurance service expenses |
– | 233 | 12,775 | 5,982 | 266 | – | 19,256 | |||||||||||||||||||||||||
| Losses and reversal of losses on onerous contracts (future service) |
– | 742 | – | – | – | – | 742 | |||||||||||||||||||||||||
| Changes to liabilities for incurred claims (past service) |
– | – | (41 | ) | (1,554 | ) | (353 | ) | – | (1,948 | ) | |||||||||||||||||||||
| Amortization of insurance acquisition cash flows |
1,285 | – | – | – | – | – | 1,285 | |||||||||||||||||||||||||
| Net impairment of assets for insurance acquisition cash flows |
– | – | – | – | – | – | – | |||||||||||||||||||||||||
| 1,285 | 975 | 12,734 | 4,428 | (87 | ) | – | 19,335 | |||||||||||||||||||||||||
| Investment components and premium refunds |
(18,222 | ) | – | 16,514 | 1,708 | – | – | – | ||||||||||||||||||||||||
| Insurance service result |
(40,055 | ) | 975 | 29,248 | 6,136 | (87 | ) | – | (3,783 | ) | ||||||||||||||||||||||
| Insurance finance (income) expenses |
(68,366 | ) | 9 | 753 | (1,229 | ) | – | – | (68,833 | ) | ||||||||||||||||||||||
| Effects of movements in foreign exchange rates |
15,886 | 41 | 136 | 12 | – | (14 | ) | 16,061 | ||||||||||||||||||||||||
| Total changes in income and OCI |
(92,535 | ) | 1,025 | 30,137 | 4,919 | (87 | ) | (14 | ) | (56,555 | ) | |||||||||||||||||||||
| Cash flows |
||||||||||||||||||||||||||||||||
| Premiums and premium tax received |
47,526 | – | – | – | – | – | 47,526 | |||||||||||||||||||||||||
| Claims and other insurance service expenses paid, including investment components |
– | – | (28,675 | ) | (6,311 | ) | – | – | (34,986 | ) | ||||||||||||||||||||||
| Insurance acquisition cash flows |
(6,266 | ) | – | – | – | – | – | (6,266 | ) | |||||||||||||||||||||||
| Total cash flows |
41,260 | – | (28,675 | ) | (6,311 | ) | – | – | 6,274 | |||||||||||||||||||||||
| Allocation from assets for insurance acquisition cash flows to groups of insurance contracts |
(146 | ) | – | – | – | – | 146 | – | ||||||||||||||||||||||||
| Acquisition cash flows incurred in the year |
– | – | – | – | – | (192 | ) | (192 | ) | |||||||||||||||||||||||
| Movements related to insurance contract liabilities for account of segregated fund holders |
(20,620 | ) | – | – | – | – | – | (20,620 | ) | |||||||||||||||||||||||
| Net closing balance |
446,538 | 1,328 | 5,864 | 10,865 | 602 | (805 | ) | 464,392 | ||||||||||||||||||||||||
| Closing insurance contract assets |
(659 | ) | – | 7 | (12 | ) | – | (9 | ) | (673 | ) | |||||||||||||||||||||
| Closing insurance contract liabilities |
336,981 | 1,328 | 5,857 | 10,877 | 602 | (796 | ) | 354,849 | ||||||||||||||||||||||||
| Closing insurance contract liabilities for account of segregated fund holders |
110,216 | – | – | – | – | – | 110,216 | |||||||||||||||||||||||||
| Net closing balance, December 31, 2022 |
$ | 446,538 | $ | 1,328 | $ | 5,864 | $ | 10,865 | $ | 602 | $ | (805 | ) | $ | 464,392 | |||||||||||||||||
| Insurance finance (income) expenses |
||||||||||||||||||||||||||||||||
| Insurance finance (income) expenses, per disclosure above |
$ | (68,833 | ) | |||||||||||||||||||||||||||||
| Reclassification of derivative OCI to IFIE – cash flow hedges |
|
– | ||||||||||||||||||||||||||||||
| Reclassification of derivative (income) loss changes to IFIE – fair value hedge |
|
– | ||||||||||||||||||||||||||||||
| Insurance finance (income) expenses, per disclosure in note 7 (f) |
|
$ | (68,833 | ) | ||||||||||||||||||||||||||||
| |
209 |
CSM |
||||||||||||||||||||||||
Estimates of PV of future cash flows |
Risk adjustment for non-financial risk
|
Fair value |
Other |
Assets for insurance acquisition cash flows |
Total |
|||||||||||||||||||
| Opening GMM and VFA insurance contract assets |
$ |
(1,827 |
) |
$ |
512 |
$ |
100 |
$ |
557 |
$ |
– |
$ |
(658 |
) | ||||||||||
| Opening GMM and VFA insurance contract liabilities |
297,967 |
25,750 |
17,105 |
2,087 |
(56 |
) |
342,853 |
|||||||||||||||||
| Opening PAA insurance contract net liabilities |
12,125 |
605 |
– |
– |
(749 |
) |
11,981 |
|||||||||||||||||
| Opening insurance contract liabilities for account of segregated fund holders |
110,216 |
– |
– |
– |
– |
110,216 |
||||||||||||||||||
| Net opening balance, January 1, 2023 |
418,481 |
26,867 |
17,205 |
2,644 |
(805 |
) |
464,392 |
|||||||||||||||||
| CSM recognized for services provided |
– |
– |
(1,812 |
) |
(350 |
) |
– |
(2,162 |
) | |||||||||||||||
| Change in risk adjustment for non-financial risk for risk expired |
– |
(1,620 |
) |
– |
– |
– |
(1,620 |
) | ||||||||||||||||
| Experience adjustments |
152 |
– |
– |
– |
– |
152 |
||||||||||||||||||
| Changes that relate to current services |
152 |
(1,620 |
) |
(1,812 |
) |
(350 |
) |
– |
(3,630 |
) | ||||||||||||||
| Contracts initially recognized during the year |
(3,295 |
) |
1,180 |
– |
2,368 |
– |
253 |
|||||||||||||||||
| Changes in estimates that adjust the CSM |
1,585 |
(3,859 |
) |
2,214 |
60 |
– |
– |
|||||||||||||||||
| Changes in estimates that relate to losses and reversal of losses on onerous contracts |
(174 |
) |
12 |
– |
– |
– |
(162 |
) | ||||||||||||||||
| Changes that relate to future services |
(1,884 |
) |
(2,667 |
) |
2,214 |
2,428 |
– |
91 |
||||||||||||||||
| Adjustments to liabilities for incurred claims |
(28 |
) |
(4 |
) |
– |
– |
– |
(32 |
) | |||||||||||||||
| Changes that relate to past services |
(28 |
) |
(4 |
) |
– |
– |
– |
(32 |
) | |||||||||||||||
| Insurance service result |
(1,760 |
) |
(4,291 |
) |
402 |
2,078 |
– |
(3,571 |
) | |||||||||||||||
| Insurance finance (income) expenses |
22,340 |
1,646 |
244 |
76 |
– |
24,306 |
||||||||||||||||||
| Effects of movements in foreign exchange rates |
(8,405 |
) |
(779 |
) |
(438 |
) |
(107 |
) |
– |
(9,729 |
) | |||||||||||||
| Total changes in income and OCI |
12,175 |
(3,424 |
) |
208 |
2,047 |
– |
11,006 |
|||||||||||||||||
| Total cash flows |
2,081 |
– |
– |
– |
– |
2,081 |
||||||||||||||||||
| Allocation from assets for insurance acquisition cash flows to groups of insurance contracts |
(5 |
) |
– |
– |
– |
5 |
– |
|||||||||||||||||
| Acquisition cash flows incurred in the year |
– |
– |
– |
– |
(8 |
) |
(8 |
) | ||||||||||||||||
| Change in PAA balance |
587 |
21 |
– |
– |
(12 |
) |
596 |
|||||||||||||||||
| Movements related to insurance contract liabilities for account of segregated fund holders |
3,927 |
– |
– |
– |
– |
3,927 |
||||||||||||||||||
| Net closing balance |
437,246 |
23,464 |
17,413 |
4,691 |
(820 |
) |
481,994 |
|||||||||||||||||
| Closing GMM and VFA insurance contract assets |
(416 |
) |
141 |
32 |
99 |
– |
(144 |
) | ||||||||||||||||
| Closing GMM and VFA insurance contract liabilities |
310,807 |
22,697 |
17,381 |
4,592 |
(59 |
) |
355,418 |
|||||||||||||||||
| Closing PAA insurance contract net liabilities |
12,712 |
626 |
– |
– |
(761 |
) |
12,577 |
|||||||||||||||||
| Closing insurance contract liabilities for account of segregated fund insurance holders |
114,143 |
– |
– |
– |
– |
114,143 |
||||||||||||||||||
| Net closing balance, December 31, 2023 |
$ |
437,246 |
$ |
23,464 |
$ |
17,413 |
$ |
4,691 |
$ |
(820 |
) |
$ |
481,994 |
|||||||||||
| Insurance finance (income) expenses |
||||||||||||||||||||||||
| Insurance finance (income) expenses, per disclosure above |
$ |
24,306 |
||||||||||||||||||||||
| Reclassification of derivative OCI to IFIE – cash flow hedges |
3 |
|||||||||||||||||||||||
| Reclassification of derivative (income) loss changes to IFIE – fair value hedge |
(120 |
) | ||||||||||||||||||||||
| PAA items: |
||||||||||||||||||||||||
| PAA IFIE per disclosure |
868 |
|||||||||||||||||||||||
| PAA Reclassification of derivative OCI to IFIE – cash flow hedges |
|
– |
||||||||||||||||||||||
| PAA Reclassification of derivative (income) loss changes to IFIE – fair value hedge |
|
(65 |
) | |||||||||||||||||||||
| Insurance finance (income) expenses, per disclosure in note 7 (f) |
|
$ |
24,992 |
|||||||||||||||||||||
CSM |
||||||||||||||||||||||||
Estimates of PV of future cash flows |
Risk adjustment for non-financial risk
|
Fair value |
Other |
Assets for insurance acquisition cash flows |
Total |
|||||||||||||||||||
| Opening GMM and VFA insurance contract assets |
$ | (1,955 | ) | $ | 365 | $ | 179 | $ | 453 | $ | – | $ | (958 | ) | ||||||||||
| Opening GMM and VFA insurance contract liabilities |
341,125 | 30,780 | 19,842 | 992 | (54 | ) | 392,685 | |||||||||||||||||
| Opening PAA insurance contract net liabilities |
12,919 | 694 | – | – | (691 | ) | 12,922 | |||||||||||||||||
| Opening insurance contract liabilities for account of segregated fund holders |
130,836 | – | – | – | – | 130,836 | ||||||||||||||||||
Net opening balance, January 1, 2022 |
482,925 | 31,839 | 20,021 | 1,445 | (745 | ) | 535,485 | |||||||||||||||||
| CSM recognized for services provided |
– | – | (2,064 | ) | (234 | ) | – | (2,298 | ) | |||||||||||||||
| Change in risk adjustment for non-financial risk for risk expired |
– | (1,582 | ) | – | – | – | (1,582 | ) | ||||||||||||||||
| Experience adjustments |
6 | – | – | – | – | 6 | ||||||||||||||||||
| Changes that relate to current services |
6 | (1,582 | ) | (2,064 | ) | (234 | ) | – | (3,874 | ) | ||||||||||||||
| Contracts initially recognized during the year |
(2,880 | ) | 1,396 | 35 | 1,963 | – | 514 | |||||||||||||||||
| Changes in estimates that adjust the CSM |
3,377 | (994 | ) | (1,737 | ) | (646 | ) | – | – | |||||||||||||||
| Changes in estimates that relate to losses and reversal of losses on onerous contracts |
229 | (2 | ) | – | – | – | 227 | |||||||||||||||||
| Changes that relate to future services |
726 | 400 | (1,702 | ) | 1,317 | – | 741 | |||||||||||||||||
| Adjustments to liabilities for incurred claims |
(33 | ) | (7 | ) | – | – | – | (40 | ) | |||||||||||||||
| Changes that relate to past services |
(33 | ) | (7 | ) | – | – | – | (40 | ) | |||||||||||||||
| Insurance service result |
699 | (1,189 | ) | (3,766 | ) | 1,083 | – | (3,173 | ) | |||||||||||||||
| Insurance finance (income) expenses |
(62,812 | ) | (5,105 | ) | 311 | 31 | – | (67,575 | ) | |||||||||||||||
| Effects of movements in foreign exchange rates |
13,898 | 1,411 | 639 | 85 | – | 16,033 | ||||||||||||||||||
| Total changes in income and OCI |
(48,215 | ) | (4,883 | ) | (2,816 | ) | 1,199 | – | (54,715 | ) | ||||||||||||||
| Total cash flows |
5,190 | – | – | – | – | 5,190 | ||||||||||||||||||
| Allocation from assets for insurance acquisition cash flows to groups of insurance contracts |
(5 | ) | – | – | – | 5 | – | |||||||||||||||||
| Acquisition cash flows incurred in the year |
– | – | – | – | (7 | ) | (7 | ) | ||||||||||||||||
| Change in PAA balance |
(794 | ) | (89 | ) | – | – | (58 | ) | (941 | ) | ||||||||||||||
| Movements related to insurance contract liabilities for account of segregated fund holders |
(20,620 | ) | – | – | – | – | (20,620 | ) | ||||||||||||||||
| Net closing balance |
418,481 | 26,867 | 17,205 | 2,644 | (805 | ) | 464,392 | |||||||||||||||||
| Closing GMM and VFA insurance contract assets |
(1,827 | ) | 512 | 100 | 557 | – | (658 | ) | ||||||||||||||||
| Closing GMM and VFA insurance contract liabilities |
297,967 | 25,750 | 17,105 | 2,087 | (56 | ) | 342,853 | |||||||||||||||||
| Closing PAA insurance contract net liabilities |
12,125 | 605 | – | – | (749 | ) | 11,981 | |||||||||||||||||
| Closing insurance contract liabilities for account of segregated fund insurance holders |
110,216 | – | – | – | – | 110,216 | ||||||||||||||||||
| Net closing balance, December 31, 2022 |
$ | 418,481 | $ | 26,867 | $ | 17,205 | $ | 2,644 | $ | (805 | ) | $ | 464,392 | |||||||||||
| Insurance finance (income) expenses |
||||||||||||||||||||||||
| Insurance finance (income) expenses, per disclosure above |
$ | (67,575 | ) | |||||||||||||||||||||
| Reclassification of derivative OCI to IFIE – cash flow hedges |
– | |||||||||||||||||||||||
| Reclassification of derivative (income) loss changes to IFIE – fair value hedge |
|
|
|
|
|
|
|
|
|
|
|
|
|
|
|
– |
| |||||||
| PAA items: |
||||||||||||||||||||||||
| PAA IFIE per disclosure |
(1,258 | ) | ||||||||||||||||||||||
| PAA Reclassification of derivative OCI to IFIE – cash flow hedges |
|
– | ||||||||||||||||||||||
| PAA Reclassification of derivative (income) loss changes to IFIE – fair value hedge |
|
– | ||||||||||||||||||||||
| Insurance finance (income) expenses, per disclosure in note 7 (f) |
|
$ | (68,833 | ) | ||||||||||||||||||||
| |
21 1
|
Assets (liabilities) for remaining coverage |
Assets (liabilities) for incurred claims |
|||||||||||||||||||||||||||
Excluding loss recovery component |
Loss recovery component |
Products not under PAA |
PAA Estimates of PV of future cash flows |
PAA Risk adjustment for non-financial risk
|
Total |
|||||||||||||||||||||||
| Opening reinsurance contract held assets |
$ |
37,853 |
$ |
209 |
$ |
7,521 |
$ |
280 |
$ |
8 |
$ |
45,871 |
||||||||||||||||
| Opening reinsurance contract held liabilities |
(2,196 |
) |
4 |
(137 |
) |
(62 |
) |
– |
(2,391 |
) | ||||||||||||||||||
| Net opening balance, January 1, 2023 |
35,657 |
213 |
7,384 |
218 |
8 |
43,480 |
||||||||||||||||||||||
| Changes in income and OCI |
||||||||||||||||||||||||||||
| Allocation of reinsurance premium paid |
(6,430 |
) |
– |
– |
– |
– |
(6,430 |
) | ||||||||||||||||||||
| Amounts recoverable from reinsurers |
||||||||||||||||||||||||||||
| Recoveries of incurred claims and other insurance service |
– |
(45 |
) |
5,228 |
568 |
– |
5,751 |
|||||||||||||||||||||
| Recoveries and reversals of recoveries of losses on onerous underlying contracts |
– |
77 |
– |
– |
– |
77 |
||||||||||||||||||||||
| Adjustments to assets for incurred claims |
– |
– |
5 |
(24 |
) |
8 |
(11 |
) | ||||||||||||||||||||
| Insurance service result |
(6,430 |
) |
32 |
5,233 |
544 |
8 |
(613 |
) | ||||||||||||||||||||
| Investment components and premium refunds |
(1,519 |
) |
– |
1,519 |
– |
– |
– |
|||||||||||||||||||||
| Net expenses from reinsurance contracts |
(7,949 |
) |
32 |
6,752 |
544 |
8 |
(613 |
) | ||||||||||||||||||||
| Net finance (income) expenses from reinsurance contracts |
719 |
8 |
(97 |
) |
9 |
– |
639 |
|||||||||||||||||||||
| Effect of changes in non-performance risk of reinsurers |
(14 |
) |
– |
– |
– |
– |
(14 |
) | ||||||||||||||||||||
| Effects of movements in foreign exchange rates |
(924 |
) |
(5 |
) |
(169 |
) |
– |
– |
(1,098 |
) | ||||||||||||||||||
| Contracts measured under PAA |
– |
– |
– |
– |
– |
– |
||||||||||||||||||||||
| Total changes in income and OCI |
(8,168 |
) |
35 |
6,486 |
553 |
8 |
(1,086 |
) | ||||||||||||||||||||
| Cash flows |
||||||||||||||||||||||||||||
| Premiums paid |
4,956 |
– |
– |
– |
– |
4,956 |
||||||||||||||||||||||
| Amounts received |
– |
– |
(6,971 |
) |
(559 |
) |
– |
(7,530 |
) | |||||||||||||||||||
| Total cash flows |
4,956 |
– |
(6,971 |
) |
(559 |
) |
– |
(2,574 |
) | |||||||||||||||||||
| Net closing balance |
32,445 |
248 |
6,899 |
212 |
16 |
39,820 |
||||||||||||||||||||||
| Closing reinsurance contract held assets |
35,079 |
246 |
7,035 |
275 |
16 |
42,651 |
||||||||||||||||||||||
| Closing reinsurance contract held liabilities |
(2,634 |
) |
2 |
(136 |
) |
(63 |
) |
– |
(2,831 |
) | ||||||||||||||||||
| Net closing balance, December 31, 2023 |
$ |
32,445 |
$ |
248 |
$ |
6,899 |
$ |
212 |
$ |
16 |
$ |
39,820 |
||||||||||||||||
Assets (liabilities) for remaining coverage |
Assets (liabilities) for incurred claims |
|||||||||||||||||||||||||||
Excluding loss recovery component |
Loss recovery component |
Products not under PAA |
PAA Estimates of PV of future cash flows |
PAA Risk adjustment for non-financial risk
|
Total |
|||||||||||||||||||||||
| Opening reinsurance contract held assets |
$ | 45,699 | $ | 79 | $ | 6,740 | $ | 303 | $ | 8 | $ | 52,829 | ||||||||||||||||
| Opening reinsurance contract held liabilities |
(2,030 | ) | 19 | (27 | ) | (41 | ) | – | (2,079 | ) | ||||||||||||||||||
| Net opening balance, January 1, 2022 |
43,669 | 98 | 6,713 | 262 | 8 | 50,750 | ||||||||||||||||||||||
| Changes in income and OCI |
||||||||||||||||||||||||||||
| Allocation of reinsurance premium paid |
(6,024 | ) | – | – | – | – | (6,024 | ) | ||||||||||||||||||||
| Amounts recoverable from reinsurers |
||||||||||||||||||||||||||||
| Recoveries of incurred claims and other insurance service expenses |
– | (30 | ) | 4,925 | 417 | (4 | ) | 5,308 | ||||||||||||||||||||
| Recoveries and reversals of recoveries of losses on onerous underlying contracts |
– | 132 | – | – | – | 132 | ||||||||||||||||||||||
| Adjustments to assets for incurred claims |
– | – | 3 | (33 | ) | (9 | ) | (39 | ) | |||||||||||||||||||
| Insurance service result |
(6,024 | ) | 102 | 4,928 | 384 | (13 | ) | (623 | ) | |||||||||||||||||||
| Investment components and premium refunds |
(1,341 | ) | – | 1,341 | – | – | – | |||||||||||||||||||||
| Net expenses from reinsurance contracts |
(7,365 | ) | 102 | 6,269 | 384 | (13 | ) | (623 | ) | |||||||||||||||||||
| Net finance (income) expenses from reinsurance contracts |
(9,586 | ) | 5 | 446 | (14 | ) | 13 | (9,136 | ) | |||||||||||||||||||
| Effect of changes in non-performance risk of reinsurers |
97 | – | – | – | – | 97 | ||||||||||||||||||||||
| Effects of movements in foreign exchange rates |
2,683 | 8 | 455 | – | – | 3,146 | ||||||||||||||||||||||
| Contracts measured under PAA |
– | – | – | – | – | – | ||||||||||||||||||||||
| Total changes in income and OCI |
(14,171 | ) | 115 | 7,170 | 370 | – | (6,516 | ) | ||||||||||||||||||||
| Cash flows |
||||||||||||||||||||||||||||
| Premiums paid |
6,159 | – | – | – | – | 6,159 | ||||||||||||||||||||||
| Amounts received |
– | – | (6,499 | ) | (414 | ) | – | (6,913 | ) | |||||||||||||||||||
| Total cash flows |
6,159 | – | (6,499 | ) | (414 | ) | – | (754 | ) | |||||||||||||||||||
| Net closing balance |
35,657 | 213 | 7,384 | 218 | 8 | 43,480 | ||||||||||||||||||||||
| Closing reinsurance contract held assets |
37,853 | 209 | 7,521 | 280 | 8 | 45,871 | ||||||||||||||||||||||
| Closing reinsurance contract held liabilities |
(2,196 | ) | 4 | (137 | ) | (62 | ) | – | (2,391 | ) | ||||||||||||||||||
| Net closing balance, December 31, 2022 |
$ | 35,657 | $ | 213 | $ | 7,384 | $ | 218 | $ | 8 | $ | 43,480 | ||||||||||||||||
| |
213 |
CSM |
||||||||||||||||||||
Estimates of PV of future cash flows |
Risk adjustment for non-financial
risk |
Fair value |
Other |
Total |
||||||||||||||||
| Opening reinsurance contract held assets |
$ |
39,656 |
$ |
4,049 |
$ |
1,774 |
$ |
99 |
$ |
45,578 |
||||||||||
| Opening reinsurance contract held liabilities |
(3,919 |
) |
1,574 |
(39 |
) |
38 |
(2,346 |
) | ||||||||||||
| Opening PAA reinsurance contract net assets |
240 |
8 |
– |
– |
248 |
|||||||||||||||
| Net opening balance, January 1, 2023 |
35,977 |
5,631 |
1,735 |
137 |
43,480 |
|||||||||||||||
| CSM recognized for services received |
– |
– |
(217 |
) |
53 |
(164 |
) | |||||||||||||
| Change in risk adjustment for non-financial risk for risk expired |
– |
(478 |
) |
– |
– |
(478 |
) | |||||||||||||
| Experience adjustments |
(19 |
) |
– |
– |
– |
(19 |
) | |||||||||||||
| Changes that relate to current services |
(19 |
) |
(478 |
) |
(217 |
) |
53 |
(661 |
) | |||||||||||
| Contracts initially recognized during the year |
(64 |
) |
399 |
– |
(263 |
) |
72 |
|||||||||||||
| Changes in recoveries of losses on onerous underlying contracts that adjust the CSM |
– |
– |
(36 |
) |
17 |
(19 |
) | |||||||||||||
| Changes in estimates that adjust the CSM |
1,433 |
(821 |
) |
(821 |
) |
209 |
– |
|||||||||||||
| Changes in estimates that relate to losses and reversal of losses on onerous contracts |
43 |
(20 |
) |
– |
– |
23 |
||||||||||||||
| Changes that relate to future services |
1,412 |
(442 |
) |
(857 |
) |
(37 |
) |
76 |
||||||||||||
| Adjustments to liabilities for incurred claims |
5 |
– |
– |
– |
5 |
|||||||||||||||
| Changes that relate to past services |
5 |
– |
– |
– |
5 |
|||||||||||||||
| Insurance service result |
1,398 |
(920 |
) |
(1,074 |
) |
16 |
(580 |
) | ||||||||||||
| Insurance finance (income) expenses from reinsurance contracts |
173 |
447 |
41 |
(31 |
) |
630 |
||||||||||||||
| Effects of changes in non-performance risk of reinsurers |
(14 |
) |
– |
– |
– |
(14 |
) | |||||||||||||
| Effects of movements in foreign exchange rates |
(916 |
) |
(160 |
) |
(21 |
) |
– |
(1,097 |
) | |||||||||||
| Total changes in income and OCI |
641 |
(633 |
) |
(1,054 |
) |
(15 |
) |
(1,061 |
) | |||||||||||
| Total cash flows |
(2,606 |
) |
– |
– |
– |
(2,606 |
) | |||||||||||||
| Change in PAA balance |
(1 |
) |
8 |
– |
– |
7 |
||||||||||||||
| Net closing balance |
34,011 |
5,006 |
681 |
122 |
39,820 |
|||||||||||||||
| Closing reinsurance contract held assets |
38,156 |
3,685 |
565 |
(51 |
) |
42,355 |
||||||||||||||
| Closing reinsurance contract held liabilities |
(4,384 |
) |
1,305 |
116 |
173 |
(2,790 |
) | |||||||||||||
| Closing PAA reinsurance contract net assets |
239 |
16 |
– |
– |
255 |
|||||||||||||||
| Net closing balance, December 31, 2023 |
$ |
34,011 |
$ |
5,006 |
$ |
681 |
$ |
122 |
$ |
39,820 |
||||||||||
| CSM | ||||||||||||||||||||
| Estimates of PV of future cash flows |
Risk adjustment for non-financial risk |
Fair value | Other | Total | ||||||||||||||||
Opening reinsurance contract held assets |
$ | 46,025 | $ | 4,977 | $ | 2,012 | $ | (501 | ) | $ | 52,513 | |||||||||
Opening reinsurance contract held liabilities |
(5,138 | ) | 1,719 | 1,262 | 105 | (2,052 | ) | |||||||||||||
Opening PAA reinsurance contract net assets |
281 | 8 | – | – | 289 | |||||||||||||||
Net opening balance, January 1, 2022 |
41,168 | 6,704 | 3,274 | (396 | ) | 50,750 | ||||||||||||||
CSM recognized for services received |
– | – | (231 | ) | (74 | ) | (305 | ) | ||||||||||||
Change in risk adjustment for non-financial risk for risk expired |
– | (424 | ) | – | – | (424 | ) | |||||||||||||
Experience adjustments |
9 | – | – | – | 9 | |||||||||||||||
Changes that relate to current services |
9 | (424 | ) | (231 | ) | (74 | ) | (720 | ) | |||||||||||
Contracts initially recognized during the year |
(1,276 | ) | 717 | (7 | ) | 717 | 151 | |||||||||||||
Changes in recoveries of losses on onerous underlying contracts that adjust the CSM |
– | – | (15 | ) | (50 | ) | (65 | ) | ||||||||||||
Changes in estimates that adjust the CSM |
1,337 | 173 | (1,440 | ) | (70 | ) | – | |||||||||||||
Changes in estimates that relate to losses and reversal of losses on onerous contracts |
106 | (60 | ) | – | – | 46 | ||||||||||||||
Changes that relate to future services |
167 | 830 | (1,462 | ) | 597 | 132 | ||||||||||||||
Adjustments to liabilities for incurred claims |
3 | – | – | – | 3 | |||||||||||||||
Changes that relate to past services |
3 | – | – | – | 3 | |||||||||||||||
Insurance service result |
179 | 406 | (1,693 | ) | 523 | (585 | ) | |||||||||||||
Insurance finance (income) expenses from reinsurance contracts |
(7,463 | ) | (1,715 | ) | 56 | (14 | ) | (9,136 | ) | |||||||||||
Effects of changes in non-performance risk of reinsurers |
97 | – | – | – | 97 | |||||||||||||||
Effects of movements in foreign exchange rates |
2,787 | 236 | 98 | 24 | 3,145 | |||||||||||||||
Total changes in income and OCI |
(4,400 | ) | (1,073 | ) | (1,539 | ) | 533 | (6,479 | ) | |||||||||||
Total cash flows |
(750 | ) | – | – | – | (750 | ) | |||||||||||||
Change in PAA balance |
(41 | ) | – | – | – | (41 | ) | |||||||||||||
Net closing balance |
35,977 | 5,631 | 1,735 | 137 | 43,480 | |||||||||||||||
Closing reinsurance contract held assets |
39,656 | 4,049 | 1,774 | 99 | 45,578 | |||||||||||||||
Closing reinsurance contract held liabilities |
(3,919 | ) | 1,574 | (39 | ) | 38 | (2,346 | ) | ||||||||||||
Closing PAA reinsurance contract net assets |
240 | 8 | – | – | 248 | |||||||||||||||
Net closing balance, December 31, 2022 |
$ | 35,977 | $ | 5,631 | $ | 1,735 | $ | 137 | $ | 43,480 | ||||||||||
| |
215 |
Excluding contracts applying the PAA |
Contracts applying the PAA |
CSM |
||||||||||||||||||||||||||||||
As at December 31, 2023 |
Estimates of PV of future cash flows |
Risk adjustment for non-financial
risk |
Estimates of PV of future cash flows |
Risk adjustment for non-financial risk
|
Fair value |
Other |
Assets for insurance acquisition cash flows |
Total insurance contract liabilities (assets) |
||||||||||||||||||||||||
Asia |
$ |
132,135 |
$ |
6,764 |
$ |
1,242 |
$ |
5 |
$ |
10,431 |
$ |
3,740 |
$ |
(271 |
) |
$ |
154,046 |
|||||||||||||||
Canada |
96,455 |
3,649 |
11,153 |
621 |
3,851 |
492 |
(549 |
) |
115,672 |
|||||||||||||||||||||||
U.S. |
196,921 |
12,438 |
– |
– |
3,243 |
459 |
– |
213,061 |
||||||||||||||||||||||||
Corporate and Other |
(977 |
) |
(13 |
) |
317 |
– |
(112 |
) |
– |
– |
(785 |
) |
||||||||||||||||||||
|
|
$ |
424,534 |
$ |
22,838 |
$ |
12,712 |
$ |
626 |
$ |
17,413 |
$ |
4,691 |
$ |
(820 |
) |
$ |
481,994 |
|||||||||||||||
Excluding contracts applying the PAA |
Contracts applying the PAA |
CSM |
||||||||||||||||||||||||||||||
As at December 31, 2022 |
Estimates of PV of future cash flows |
Risk adjustment for non-financial risk |
Estimates of PV of future cash flows |
Risk adjustment for non-financial risk
|
Fair value |
Other |
Assets for insurance acquisition cash flows |
Total insurance contract liabilities (assets) |
||||||||||||||||||||||||
Asia |
$ | 120,180 | $ | 10,017 | $ | 1,136 | $ | 2 | $ |
8,067 | $ | 2,181 | $ | (283 | ) | $ | 141,300 | |||||||||||||||
Canada |
91,599 | 3,764 | 10,532 | 603 | 3,811 | 181 | (522 | ) | 109,968 | |||||||||||||||||||||||
U.S. |
194,766 | 12,494 | – | – | 5,419 | 282 | – | 212,961 | ||||||||||||||||||||||||
Corporate and Other |
(189 | ) | (13 | ) | 457 | – | (92 | ) | – | – | 163 | |||||||||||||||||||||
|
|
$ |
406,356 | $ |
26,262 | $ |
12,125 | $ |
605 | $ |
17,205 | $ |
2,644 | $ |
(805 | ) | $ |
464,392 | |||||||||||||||
Excluding contracts applying the PAA |
Contracts applying the PAA |
CSM |
||||||||||||||||||||||||||
As at December 31, 2023 |
Estimates of PV of future cash flows |
Risk adjustment for non-financial risk
|
Estimates of PV of future cash flows |
Risk adjustment for non-financial risk
|
Fair value |
Other |
Total reinsurance contract liabilities (assets) |
|||||||||||||||||||||
Asia |
$ |
(351 |
) |
$ |
1,326 |
$ |
(37 |
) |
$ |
– |
$ |
623 |
$ |
70 |
$ |
1,631 |
||||||||||||
Canada |
(1,238 |
) |
1,674 |
275 |
16 |
338 |
(56 |
) |
1,009 |
|||||||||||||||||||
U.S. |
35,461 |
1,997 |
– |
– |
(143 |
) |
108 |
37,423 |
||||||||||||||||||||
Corporate and Other |
(100 |
) |
(7 |
) |
1 |
– |
(137 |
) |
– |
(243 |
) |
|||||||||||||||||
$ |
33,772 |
$ |
4,990 |
$ |
239 |
$ |
16 |
$ |
681 |
$ |
122 |
$ |
39,820 |
|||||||||||||||
Excluding contracts applying the PAA |
Contracts applying the PAA |
CSM |
||||||||||||||||||||||||||
As at December 31, 2022 |
Estimates of PV of future cash flows |
Risk adjustment for non-financial risk
|
Estimates of PV of future cash flows |
Risk adjustment for non-financial risk
|
Fair value |
Other |
Total reinsurance contract liabilities (assets) |
|||||||||||||||||||||
Asia |
$ | (147 | ) | $ | 1,895 | $ | (39 | ) | $ | – | $ | 203 | $ | (68 | ) | $ | 1,844 | |||||||||||
Canada |
(1,427 | ) | 1,672 | 277 | 8 | 374 | (59 | ) | 845 | |||||||||||||||||||
U.S. |
36,735 | 2,065 | – | – | 1,302 | 264 | 40,366 | |||||||||||||||||||||
Corporate and Other |
576 | (9 | ) | 2 | – | (144 | ) | – | 425 | |||||||||||||||||||
|
|
$ |
35,737 | $ |
5,623 | $ |
240 | $ |
8 | $ |
1,735 | $ |
137 | $ |
43,480 | ||||||||||||||
For the year ended December 31, 2023 |
Asia |
Canada |
U.S. |
Other |
Total |
|||||||||||||||
Contracts under the fair value method |
$ |
2,499 |
$ |
3,288 |
$ |
10,123 |
$ |
(18 |
) |
$ |
15,892 |
|||||||||
Contracts under the full retrospective method |
531 |
48 |
152 |
– |
731 |
|||||||||||||||
Other contracts |
2,026 |
5,283 |
(81 |
) |
121 |
7,349 |
||||||||||||||
Total |
$ |
5,056 |
$ |
8,619 |
$ |
10,194 |
$ |
103 |
$ |
23,972 |
||||||||||
| For the year ended December 31, 2022 | Asia | Canada | U.S. | Other | Total | |||||||||||||||
Contracts under the fair value method |
$ | 2,656 | $ | 3,370 | $ | 9,901 | $ | (96 | ) | $ | 15,831 | |||||||||
Contracts under the full retrospective method |
666 | 122 | 76 | – | 864 | |||||||||||||||
Other contracts |
1,412 | 4,625 | 268 | 118 | 6,423 | |||||||||||||||
Total |
$ | 4,734 | $ | 8,117 | $ | 10,245 | $ | 22 | $ | 23,118 | ||||||||||
Asia |
Canada |
U.S. |
Total |
|||||||||||||||||||||||||||||
As at December 31, 2023 |
Non-Onerous |
Onerous |
Non-Onerous |
Onerous |
Non-Onerous |
Onerous |
Non-Onerous |
Onerous |
||||||||||||||||||||||||
New business insurance contracts |
||||||||||||||||||||||||||||||||
Estimates of present value of cash outflows |
$ |
16,209 |
$ |
2,399 |
$ |
3,478 |
$ |
271 |
$ |
2,524 |
$ |
1,126 |
$ |
22,211 |
$ |
3,796 |
||||||||||||||||
Insurance acquisition cash flows |
3,011 |
322 |
608 |
68 |
676 |
233 |
4,295 |
623 |
||||||||||||||||||||||||
Claims and other insurance service expenses payable |
13,198 |
2,077 |
2,870 |
203 |
1,848 |
893 |
17,916 |
3,173 |
||||||||||||||||||||||||
Estimates of present value of cash inflows |
(18,765 |
) |
(2,330 |
) |
(3,823 |
) |
(286 |
) |
(2,953 |
) |
(1,145 |
) |
(25,541 |
) |
(3,761 |
) |
||||||||||||||||
Risk adjustment for non-financial risk |
679 |
89 |
115 |
41 |
168 |
88 |
962 |
218 |
||||||||||||||||||||||||
Contractual service margin |
1,877 |
– |
230 |
– |
261 |
– |
2,368 |
– |
||||||||||||||||||||||||
Amount included in insurance contract liabilities for the year |
$ |
– |
$ |
158 |
$ |
– |
$ |
26 |
$ |
– |
$ |
69 |
$ |
– |
$ |
253 |
||||||||||||||||
| Asia | Canada | U.S. | Total | |||||||||||||||||||||||||||||
| As at December 31, 2022 |
Non-Onerous | Onerous | Non-Onerous | Onerous | Non-Onerous | Onerous | Non-Onerous | Onerous | ||||||||||||||||||||||||
New business insurance contracts |
||||||||||||||||||||||||||||||||
Estimates of present value of cash outflows |
$ | 8,470 | $ | 3,953 | $ | 3,604 | $ | 390 | $ | 1,845 | $ | 1,237 | $ | 13,919 | $ | 5,580 | ||||||||||||||||
Insurance acquisition cash flows |
2,244 |
499 |
600 |
119 |
568 |
228 |
3,412 |
846 |
||||||||||||||||||||||||
Claims and other insurance service expenses payable |
6,226 |
3,454 |
3,004 |
271 |
1,277 |
1,009 |
10,507 |
4,734 |
||||||||||||||||||||||||
Estimates of present value of cash inflows |
(10,759 | ) |
(3,772 | ) | (3,901 | ) | (431 | ) |
(2,289 | ) |
(1,227 | ) | (16,949 | ) | (5,430 | ) | ||||||||||||||||
Risk adjustment for non-financial risk |
704 | 153 | 107 | 92 | 221 | 119 | 1,032 | 364 | ||||||||||||||||||||||||
Contractual service margin |
1,585 | – | 190 | – |
223 | – | 1,998 | – | ||||||||||||||||||||||||
Amount included in insurance contract liabilities for the year |
$ | – | $ | 334 | $ | – | $ | 51 | $ | – | $ | 129 | $ | – | $ | 514 | ||||||||||||||||
As at December 31, 2023 |
Asia |
Canada |
U.S. |
Total |
||||||||||||
New business reinsurance contracts |
||||||||||||||||
Estimates of present value of cash outflows |
$ |
(916 |
) |
$ |
(331 |
) |
$ |
(750 |
) |
$ |
(1,997 |
) |
||||
Estimates of present value of cash inflows |
815 |
319 |
799 |
1,933 |
||||||||||||
Risk adjustment for non-financial risk |
170 |
76 |
153 |
399 |
||||||||||||
Contractual service margin |
(57 |
) |
(51 |
) |
(155 |
) |
(263 |
) |
||||||||
Amount included in reinsurance assets for the year |
$ |
12 |
$ |
13 |
$ |
47 |
$ |
72 |
||||||||
| As at December 31, 2022 | Asia | Canada | U.S. | Total | ||||||||||||
New business reinsurance contracts |
||||||||||||||||
Estimates of present value of cash outflows |
$ | (519 | ) | $ | (291 | ) | $ | (7,084 | ) | $ | (7,894 | ) | ||||
Estimates of present value of cash inflows |
453 | 261 | 5,904 | 6,618 | ||||||||||||
Risk adjustment for non-financial risk |
125 | 77 | 515 | 717 | ||||||||||||
Contractual service margin |
(22 | ) | (15 | ) | 747 | 710 | ||||||||||
Amount included in reinsurance assets for the year |
$ | 37 | $ | 32 | $ | 82 | $ | 151 | ||||||||
As at December 31, 2023 |
Less than 1 year |
1 to 5 years |
5 to 10 years |
10 to 20 years |
More than 20 years |
Total |
||||||||||||||||||
| Canada |
||||||||||||||||||||||||
| Insurance contracts issued |
$ |
379 |
$ |
1,213 |
$ |
1,016 |
$ |
1,084 |
$ |
651 |
$ |
4,343 |
||||||||||||
| Reinsurance contracts held |
(36 |
) |
(83 |
) |
(52 |
) |
(46 |
) |
(65 |
) |
(282 |
) | ||||||||||||
343 |
1,130 |
964 |
1,038 |
586 |
4,061 |
|||||||||||||||||||
| U.S. |
||||||||||||||||||||||||
| Insurance contracts issued |
388 |
1,235 |
968 |
823 |
288 |
3,702 |
||||||||||||||||||
| Reinsurance contracts held |
(50 |
) |
(139 |
) |
(35 |
) |
90 |
169 |
35 |
|||||||||||||||
338 |
1,096 |
933 |
913 |
457 |
3,737 |
|||||||||||||||||||
| Asia |
||||||||||||||||||||||||
| Insurance contracts issued |
1,273 |
4,066 |
3,320 |
3,308 |
2,204 |
14,171 |
||||||||||||||||||
| Reinsurance contracts held |
(44 |
) |
(202 |
) |
(173 |
) |
(105 |
) |
(169 |
) |
(693 |
) | ||||||||||||
1,229 |
3,864 |
3,147 |
3,203 |
2,035 |
13,478 |
|||||||||||||||||||
| Corporate |
||||||||||||||||||||||||
| Insurance contracts issued |
(8 |
) |
(28 |
) |
(28 |
) |
(34 |
) |
(14 |
) |
(112 |
) | ||||||||||||
| Reinsurance contracts held |
10 |
51 |
53 |
19 |
4 |
137 |
||||||||||||||||||
2 |
23 |
25 |
(15 |
) |
(10 |
) |
25 |
|||||||||||||||||
| Total |
$ |
1,912 |
$ |
6,113 |
$ |
5,069 |
$ |
5,139 |
$ |
3,068 |
$ |
21,301 |
||||||||||||
As at December 31, 2022 |
Less than 1 year |
1 to 5 years |
5 to 10 years |
10 to 20 years |
More than 20 years |
Total |
||||||||||||||||||
| Canada |
||||||||||||||||||||||||
| Insurance contracts issued |
$ |
333 |
$ |
1,088 |
$ |
936 |
$ |
1,015 |
$ |
620 |
$ |
3,992 |
||||||||||||
| Reinsurance contracts held |
(36 |
) |
(100 |
) |
(69 |
) |
(62 |
) |
(48 |
) |
(315 |
) | ||||||||||||
297 |
988 |
867 |
953 |
572 |
3,677 |
|||||||||||||||||||
| U.S. |
||||||||||||||||||||||||
| Insurance contracts issued |
541 |
1,770 |
1,468 |
1,375 |
547 |
5,701 |
||||||||||||||||||
| Reinsurance contracts held |
(189 |
) |
(586 |
) |
(433 |
) |
(296 |
) |
(62 |
) |
(1,566 |
) | ||||||||||||
352 |
1,184 |
1,035 |
1,079 |
485 |
4,135 |
|||||||||||||||||||
| Asia |
||||||||||||||||||||||||
| Insurance contracts issued |
922 |
2,933 |
2,442 |
2,435 |
1,516 |
10,248 |
||||||||||||||||||
| Reinsurance contracts held |
(17 |
) |
(79 |
) |
(55 |
) |
5 |
11 |
(135 |
) | ||||||||||||||
905 |
2,854 |
2,387 |
2,440 |
1,527 |
10,113 |
|||||||||||||||||||
| Corporate |
||||||||||||||||||||||||
| Insurance contracts issued |
(8 |
) |
(27 |
) |
(23 |
) |
(24 |
) |
(10 |
) |
(92 |
) | ||||||||||||
| Reinsurance contracts held |
12 |
40 |
35 |
38 |
19 |
144 |
||||||||||||||||||
4 |
13 |
12 |
14 |
9 |
52 |
|||||||||||||||||||
| Total |
$ |
1,558 |
$ |
5,039 |
$ |
4,301 |
$ |
4,486 |
$ |
2,593 |
$ |
17,977 |
||||||||||||
For the year ended December 31, 202 3 |
Insurance contracts |
Non-insurance (1)
|
Total | |||||||||
| Investment return |
||||||||||||
| Investment related income |
$ |
13,036 |
$ |
3,079 |
$ |
16,115 |
||||||
| Net gains (losses) on financial assets at FVTPL |
2,176 |
506 |
2,682 |
|||||||||
| Unrealized gains (losses) on FVOCI assets |
11,212 |
1,018 |
12,230 |
|||||||||
| Impairment loss on financial assets |
(247 |
) |
(57 |
) |
(304 |
) | ||||||
| Investment expenses |
(540 |
) |
(757 |
) |
(1,297 |
) | ||||||
| Interest on required surplus |
521 |
(521 |
) |
– |
||||||||
| Total investment return |
26,158 |
3,268 |
29,426 |
|||||||||
| Portion recognized in income (expenses) |
15,830 |
2,191 |
18,021 |
|||||||||
| Portion recognized in OCI |
10,328 |
1,077 |
11,405 |
|||||||||
| Insurance finance income (expenses) from insurance contracts issued and effect of movement in exchange rates |
||||||||||||
| Interest accreted to insurance contracts using locked-in rate |
(8,214 |
) |
28 |
(8,186 |
) | |||||||
| Due to changes in interest rates and other financial assumptions |
(11,008 |
) |
21 |
(10,987 |
) | |||||||
| Changes in fair value of underlying items of direct participation contracts |
(7,384 |
) |
– |
(7,384 |
) | |||||||
| Effects of risk mitigation option |
1,267 |
– |
1,267 |
|||||||||
| Net foreign exchange income (expenses) |
(80 |
) |
– |
(80 |
) | |||||||
| Hedge accounting offset from insurance contracts issued |
(41 |
) |
– |
(41 |
) | |||||||
| Reclassification of derivative OCI to IFIE – cash flow hedges |
(3 |
) |
– |
(3 |
) | |||||||
| Reclassification of derivative income (loss) changes to IFIE – fair value hedge |
185 |
– |
185 |
|||||||||
| Other |
237 |
– |
237 |
|||||||||
| Total insurance finance income (expenses) from insurance contracts issued |
(25,041 |
) |
49 |
(24,992 |
) | |||||||
| Effect of movements in foreign exchange rates |
(952 |
) |
– |
(952 |
) | |||||||
| Total insurance finance income (expenses) from insurance contracts issued and effect of movement in foreign exchange rates |
(25,993 |
) |
49 |
(25,944 |
) | |||||||
| Portion recognized in income (expenses), including effects of exchange rates |
(13,930 |
) |
36 |
(13,894 |
) | |||||||
| Portion recognized in OCI, including effects of exchange rates |
(12,063 |
) |
13 |
(12,050 |
) | |||||||
| Reinsurance finance income (expenses) from reinsurance contracts held and effect of movement in foreign exchange rates |
||||||||||||
| Interest accreted to insurance contracts using locked-in rate |
241 |
(12 |
) |
229 |
||||||||
| Due to changes in interest rates and other financial assumptions |
598 |
(28 |
) |
570 |
||||||||
| Changes in risk of non-performance of reinsurer |
(15 |
) |
– |
(15 |
) | |||||||
| Other |
(159 |
) |
– |
(159 |
) | |||||||
| Total reinsurance finance income (expenses) from reinsurance contracts held |
665 |
(40 |
) |
625 |
||||||||
| Effect of movements in foreign exchange rates |
(120 |
) |
– |
(120 |
) | |||||||
| Total reinsurance finance income (expenses) from reinsurance contracts held and effect of movement in foreign exchange rates |
545 |
(40 |
) |
505 |
||||||||
| Portion recognized in income (expenses), including effects of foreign exchange rates |
(719 |
) |
(15 |
) |
(734 |
) | ||||||
| Portion recognized in OCI, including effects of exchange rates |
1,264 |
(25 |
) |
1,239 |
||||||||
| Decrease (increase) in investment contract liabilities |
(17 |
) |
(418 |
) |
(435 |
) | ||||||
| Total net investment income (loss), insurance finance income (expenses) and reinsurance finance income (expenses) |
693 |
2,859 |
3,552 |
|||||||||
| Amounts recognized in income (expenses) |
1,164 |
1,794 |
2,958 |
|||||||||
| Amounts recognized in OCI |
(471 |
) |
1,065 |
594 |
||||||||
|
(1) |
Non-insurance includes consolidations and eliminations of transactions between operating segments. |
|
|
219 |
For the year ended December 31, 2022 |
Insurance contracts |
Non-insurance
(1)
|
Total |
|||||||||
| Investment return |
||||||||||||
| Investment related income |
$ | 13,991 | $ | 1,973 | $ | 15,964 | ||||||
| Net gains (losses) on financial assets at FVTPL |
(14,017 | ) | (246 | ) | (14,263 | ) | ||||||
| Unrealized gains (losses) on FVOCI assets |
(46,900 | ) | (8,428 | ) | (55,328 | ) | ||||||
| Impairment loss on financial assets |
(59 | ) | (18 | ) | (77 | ) | ||||||
| Investment expenses |
(464 | ) | (757 | ) | (1,221 | ) | ||||||
| Interest on required surplus |
515 | (515 | ) | – | ||||||||
| Total investment return |
(46,934 | ) | (7,991 | ) | (54,925 | ) | ||||||
| Portion recognized in income (expenses) |
358 | (21 | ) | 337 | ||||||||
| Portion recognized in OCI |
(47,292 | ) | (7,970 | ) | (55,262 | ) | ||||||
| Insurance finance income (expenses) from insurance contracts issued and effect of movement in exchange rates |
||||||||||||
| Interest accreted to insurance contracts using locked-in rate |
(6,448 | ) | 14 | (6,434 | ) | |||||||
| Due to changes in interest rates and other financial assumptions |
63,174 | (272 | ) | 62,902 | ||||||||
| Changes in fair value of underlying items of direct participation contracts |
9,417 | – | 9,417 | |||||||||
| Effects of risk mitigation option |
2,827 | – | 2,827 | |||||||||
| Net foreign exchange income (expenses) |
(95 | ) | – | (95 | ) | |||||||
| Hedge accounting offset from insurance contracts issued |
– | – | – | |||||||||
| Reclassification of derivative OCI to IFIE – cash flow hedges |
– | – | – | |||||||||
| Reclassification of derivative income (loss) changes to IFIE – fair value hedge |
– | – | – | |||||||||
| Other |
218 | (2 | ) | 216 | ||||||||
| Total insurance finance income (expenses) from insurance contracts issued |
69,093 | (260 | ) | 68,833 | ||||||||
| Effect of movements in foreign exchange rates |
(1,665 | ) | (9 | ) | (1,674 | ) | ||||||
| Total insurance finance income (expenses) from insurance contracts issued and effect of movement in foreign exchange rates |
67,428 | (269 | ) | 67,159 | ||||||||
| Portion recognized in income (expenses), including effects of exchange rates |
(6,582 | ) | (34 | ) | (6,616 | ) | ||||||
| Portion recognized in OCI, including effects of exchange rates |
74,010 | (235 | ) | 73,775 | ||||||||
| Reinsurance finance income (expenses) from reinsurance contracts held and effect of movement in foreign exchange rates |
||||||||||||
| Interest accreted to insurance contracts using locked-in rate |
832 | (8 | ) | 824 | ||||||||
| Due to changes in interest rates and other financial assumptions |
(10,218 | ) | 67 | (10,151 | ) | |||||||
| Changes in risk of non-performance of reinsurer |
96 | – | 96 | |||||||||
| Other |
191 | – | 191 | |||||||||
| Total reinsurance finance income (expenses) from reinsurance contracts held |
(9,099 |
) |
59
|
(9,040 |
) | |||||||
| Effect of movements in foreign exchange rates |
(16 | ) | – | (16 | ) | |||||||
| Total reinsurance finance income (expenses) from reinsurance contracts held and effect of movement in foreign exchange rates |
(9,115 | ) | 59 | (9,056 | ) | |||||||
| Portion recognized in income (expenses), including effects of foreign exchange rates |
322 | (13 | ) | 309 | ||||||||
| Portion recognized in OCI, including effects of exchange rates |
(9,437 | ) | 72 | (9,365 | ) | |||||||
| Decrease (increase) in investment contract liabilities |
(56 | ) | (343 | ) | (399 | ) | ||||||
| Total net investment income (loss), insurance finance income (expenses) and reinsurance finance income (expenses) |
11,323 | (8,544 | ) | 2,779 | ||||||||
| Amounts recognized in income (expenses) |
(5,958 | ) | (411 | ) | (6,369 | ) | ||||||
| Amounts recognized in OCI |
17,281 | (8,133 | ) | 9,148 | ||||||||
|
(1) |
Non-insurance includes consolidations and eliminations of transactions between operating segments. |
Insurance and reinsurance contracts |
||||||||||||||||||||||||
For the year ended December 31, 2023 |
Asia |
Canada |
U.S. |
Corporate |
Non-insurance
(1)
|
Total |
||||||||||||||||||
| Total investment return |
||||||||||||||||||||||||
| Portion recognized in income (expenses) |
$ |
7,095 |
$ |
3,514 |
$ |
5,193 |
$ |
28 |
$ |
2,191 |
$ |
18,021 |
||||||||||||
| Portion recognized in OCI |
4,675 |
2,454 |
3,197 |
2 |
1,077 |
11,405 |
||||||||||||||||||
11,770 |
5,968 |
8,390 |
30 |
3,268 |
29,426 |
|||||||||||||||||||
| Total insurance finance income (expenses) from insurance contracts issued and effect of movement in foreign exchange rates |
||||||||||||||||||||||||
| Portion recognized in income (expenses), including effects of exchange rates |
(6,436 |
) |
(3,315 |
) |
(4,868 |
) |
689 |
36 |
(13,894 |
) | ||||||||||||||
| Portion recognized in OCI, including effects of exchange rates |
(4,601 |
) |
(2,394 |
) |
(5,068 |
) |
– |
13 |
(12,050 |
) | ||||||||||||||
(11,037 |
) |
(5,709 |
) |
(9,936 |
) |
689 |
49 |
(25,944 |
) | |||||||||||||||
| Total reinsurance finance income (expenses) from reinsurance contracts held and effect of movement in foreign exchange rates |
||||||||||||||||||||||||
| Portion recognized in income (expenses), including effects of foreign exchange rates |
(105 |
) |
57 |
11 |
(682 |
) |
(15 |
) |
(734 |
) | ||||||||||||||
| Portion recognized in OCI, including effects of exchange rates |
117 |
33 |
1,114 |
– |
(25 |
) |
1,239 |
|||||||||||||||||
12 |
90 |
1,125 |
(682 |
) |
(40 |
) |
505 |
|||||||||||||||||
| (1) Non-insurance includes consolidations and eliminations of transactions between operating segments. |
| |||||||||||||||||||||||
Insurance and reinsurance contracts |
||||||||||||||||||||||||
For the year ended December 31, 2022 |
Asia |
Canada |
U.S. |
Corporate |
Non-insurance
(1)
|
Total |
||||||||||||||||||
| Total investment return |
||||||||||||||||||||||||
| Portion recognized in income (expenses) |
$ |
1,422 |
$ |
(1,967 |
) |
$ |
894 |
$ |
9 |
$ (21 |
) |
$ |
337 |
|||||||||||
| Portion recognized in OCI |
(14,200 |
) |
(11,332 |
) |
(21,741 |
) |
(19 |
) |
(7,970 |
) |
(55,262 |
) | ||||||||||||
(12,778 |
) |
(13,299 |
) |
(20,847 |
) |
(10 |
) |
(7,991 |
) |
(54,925 |
) | |||||||||||||
| Total insurance finance income (expenses) from insurance contracts issued and effect of movement in foreign exchange rates |
||||||||||||||||||||||||
| Portion recognized in income (expenses), including effects of exchange rates |
(1,654 |
) |
(219 |
) |
(4,867 |
) |
158 |
(34 |
) |
(6,616 |
) | |||||||||||||
| Portion recognized in OCI, including effects of exchange rates |
14,532 |
14,731 |
44,748 |
(1 |
) |
(235 |
) |
73,775 |
||||||||||||||||
12,878 |
14,512 |
39,881 |
157 |
(269 |
) |
67,159 |
||||||||||||||||||
| Total reinsurance finance income (expenses) from reinsurance contracts held and effect of movement in foreign exchange rates |
||||||||||||||||||||||||
| Portion recognized in income (expenses), including effects of foreign exchange rates |
(63 |
) |
(102 |
) |
641 |
(154 |
) |
(13 |
) |
309 |
||||||||||||||
| Portion recognized in OCI, including effects of exchange rates |
(126 |
) |
(150 |
) |
(9,161 |
) |
- |
72 |
(9,365 |
) | ||||||||||||||
(189 |
) |
(252 |
) |
(8,520 |
) |
(154 |
) |
59 |
(9,056 |
) | ||||||||||||||
(1) |
Non-insurance includes consolidations and eliminations of transactions between operating segments. |
• |
Estimate of future cash flows |
• |
An adjustment to reflect the time value of money and the financial risk related to future cash flows if not included in the estimate of future cash flows |
• |
A risk adjustment for non-financial risk |
|
|
221 |
| Nature of factors and assumption methodology |
Risk management | |||
Mortality |
Mortality relates to the occurrence of death. Mortality is a key assumption for life insurance and certain forms of annuities. Mortality assumptions are based on the Company’s internal experience as well as past and emerging industry experience. Assumptions are differentiated by sex, underwriting class, policy type and geographic market. Assumptions are made for future mortality improvements. |
The Company maintains underwriting standards to determine the insurability of applicants. Claim trends are monitored on an ongoing basis. Exposure to large claims is managed by establishing policy retention limits, which vary by market and geographic location. Policies in excess of the limits are reinsured with other companies. Mortality is monitored monthly and the overall 2023 experience was favourable (2022 – unfavourable) when compared to the Company’s assumptions. | ||
Morbidity |
Morbidity relates to the occurrence of accidents and sickness for insured risks. Morbidity is a key assumption for long-term care insurance, disability insurance, critical illness and other forms of individual and group health benefits. Morbidity assumptions are based on the Company’s internal experience as well as past and emerging industry experience and are established for each type of morbidity risk and geographic market. Assumptions are made for future morbidity improvements. |
The Company maintains underwriting standards to determine the insurability of applicants. Claim trends are monitored on an ongoing basis. Exposure to large claims is managed by establishing policy retention limits, which vary by market and geographic location. Policies in excess of the limits are reinsured with other companies. Morbidity is also monitored monthly and the overall 2023 experience was favourable (2022 – favourable) when compared to the Company’s assumptions. | ||
Policy termination and premium persistency |
Policies are terminated through lapses and surrenders, where lapses represent the termination of policies due to non-payment of premiums and surrenders represent the voluntary termination of policies by policyholders. Premium persistency represents the level of ongoing deposits on contracts where there is policyholder discretion as to the amount and timing of deposits. Policy termination and premium persistency assumptions are primarily based on the Company’s recent experience adjusted for expected future conditions. Assumptions reflect differences by type of contract within each geographic market. |
The Company seeks to design products that minimize financial exposure to lapse, surrender and premium persistency risk. The Company monitors lapse, surrender and persistency experience. In aggregate, 2023 policyholder termination and premium persistency experience was unfavourable (2022 – unfavourable) when compared to the Company’s assumptions used in the computation of actuarial liabilities. | ||
Directly attributable expenses |
Directly attributable operating expense assumptions reflect the projected costs of maintaining and servicing in-force policies, including associated directly attributable overhead expenses. The directly attributable expenses are derived from internal cost studies projected into the future with an allowance for inflation. For some developing businesses, there is an expectation that unit costs will decline as these businesses grow. Directly attributable acquisitions expenses are derived from internal cost studies. |
The Company prices its products to cover the expected costs of servicing and maintaining them. In addition, the Company monitors expenses monthly, including comparisons of actual expenses to expense levels allowed for in pricing and valuation. Maintenance expenses for 2023 were unfavourable (2022 – unfavourable) when compared to the Company’s assumptions used in the computation of actuarial liabilities. | ||
Tax |
Taxes reflect assumptions for future premium taxes and other non-income related taxes. |
The Company prices its products to cover the expected cost of taxes. | ||
Policyholder dividends, experience rating refunds, and other adjustable policy elements |
The best estimate projections for policyholder dividends and experience rating refunds, and other adjustable elements of policy benefits are determined to be consistent with management’s expectation of how these elements will be managed should experience emerge consistently with the best estimate assumptions. |
The Company monitors policy experience and adjusts policy benefits and other adjustable elements to reflect this experience. Policyholder dividends are reviewed annually for all businesses under a framework of Board-approved policyholder dividend policies. | ||
December 31, 2023 |
|||||||||||||||||||||||||||||||||||||
Currency |
Liquidity category |
Observable years |
Ultimate year |
1 year |
5 years |
10 years |
20 years |
30 years |
Ultimate |
||||||||||||||||||||||||||||
| Canada |
CAD |
Illiquid |
30 |
70 |
5.17 % |
4.33 % |
4.92% |
4.86% |
4.80% |
4.40% |
|||||||||||||||||||||||||||
More liquid |
30 |
70 |
5.14% |
4.22% |
4.69% |
4.72% |
4.69% |
4.40% |
|||||||||||||||||||||||||||||
| U.S. |
USD |
Illiquid |
30 |
70 |
5.38% |
4.54% |
5.37% |
5.65% |
5.27% |
5.00% |
|||||||||||||||||||||||||||
More liquid |
30 |
70 |
5.32% |
4.57% |
5.25% |
5.56% |
5.18% |
4.88% |
|||||||||||||||||||||||||||||
| Japan |
JPY |
Mixed |
30 |
70 |
0.53% |
0.77% |
1.08% |
1.75% |
2.24% |
1.60% |
|||||||||||||||||||||||||||
| Hong Kong |
HKD |
Illiquid |
15 |
55 |
4.20% |
4.01% |
4.98% |
4.61% |
4.19% |
3.80% |
|||||||||||||||||||||||||||
| December 31, 2022 | |||||||||||||||||||||||||||||||||||||
Currency |
Liquidity category |
Observable years |
Ultimate year |
1 year | 5 years | 10 years | 20 years | 30 years | Ultimate | ||||||||||||||||||||||||||||
| Canada |
CAD | Illiquid | 30 | 70 | 5.29% | 4.81% | 5.35% | 5.35% | 5.03% | 4.40% | |||||||||||||||||||||||||||
| More liquid | 30 | 70 | 5.21% | 4.63% | 4.97% | 5.02% | 4.91% | 4.40% | |||||||||||||||||||||||||||||
| U.S. |
USD | Illiquid | 30 | 70 | 5.28% | 4.87% | 5.74% | 5.86% | 5.34% | 5.00% | |||||||||||||||||||||||||||
| More liquid | 30 | 70 | 5.23% | 4.88% | 5.61% | 5.76% | 5.23% | 4.88% | |||||||||||||||||||||||||||||
| Japan |
JPY | Mixed | 30 | 70 | 0.72% | 0.98% | 0.91% | 1.70% | 2.22% | 1.60% | |||||||||||||||||||||||||||
| Hong Kong |
HKD | Illiquid | 15 | 55 | 4.69% | 4.95% | 5.60% | 4.99% | 4.36% | 3.80% | |||||||||||||||||||||||||||
| |
223 |
2023 |
2022 |
|||||||||||||||||||||||||||
As at December 31, |
Participating |
Variable annuity |
Unit linked |
Participating |
Variable annuity |
Unit linked |
||||||||||||||||||||||
| Underlying assets |
||||||||||||||||||||||||||||
| Debt securities |
$ |
44,682 |
$ |
– |
$ |
– |
$ | 39,894 | $ | – | $ | – | ||||||||||||||||
| Public equities |
14,442 |
– |
– |
12,119 | – | – | ||||||||||||||||||||||
| Mortgages |
4,449 |
– |
– |
3,813 | – | – | ||||||||||||||||||||||
| Private placements |
6,720 |
– |
– |
5,666 | – | – | ||||||||||||||||||||||
| Real estate |
3,907 |
– |
– |
3,190 | – | – | ||||||||||||||||||||||
| Other |
27,017 |
68,749 |
15,539 |
26,009 | 69,033 | 13,476 | ||||||||||||||||||||||
| Total |
$ |
101,217 |
$ |
68,749 |
$ |
15,539 |
$ | 90,691 | $ | 69,033 | $ | 13,476 | ||||||||||||||||
2023 |
2022 |
|||||||||||||||||||||||||||||||||||
As at December 31, |
Less than 1 year |
1-5 years |
More than 5 years |
Total |
Less than 1 year |
1-5 years |
More than 5 years |
Total |
||||||||||||||||||||||||||||
| Asia |
$ |
59 |
$ |
150 |
$ |
62 |
$ |
271 |
$ |
58 |
$ |
150 |
$ |
75 |
$ |
283 |
||||||||||||||||||||
| Canada |
72 |
205 |
272 |
549 |
73 |
200 |
249 |
522 |
||||||||||||||||||||||||||||
| Total |
$ |
131 |
$ |
355 |
$ |
334 |
$ |
820 |
$ |
131 |
$ |
350 |
$ |
324 |
$ |
805 |
||||||||||||||||||||
As at December 31, 2023 |
||||||||||||||||||||||||||||
Payments due by period |
Less than 1 year |
1 to 2 years |
2 to 3 years |
3 to 4 years |
4 to 5 years |
Over 5 years |
Total |
|||||||||||||||||||||
| Insurance contract liabilities (1)
|
$ |
3,400 |
$ |
5,546 |
$ |
6,766 |
$ |
8,849 |
$ |
11,320 |
$ |
1,074,764 |
$ |
1,110,645 |
||||||||||||||
| Reinsurance contract held liabilities (1)
|
332 |
460 |
492 |
592 |
475 |
6,097 |
8,448 |
|||||||||||||||||||||
| As at December 31, 2022 | ||||||||||||||||||||||||||||
Payments due by period |
Less than 1 year |
1 to 2 years |
2 to 3 years |
3 to 4 years |
4 to 5 years |
Over 5 years |
Total | |||||||||||||||||||||
| Insurance contract liabilities (1)
|
$ | 3,091 | $ | 4,976 | $ | 7,224 | $ | 9,212 | $ | 11,223 | $ | 996,460 | $ | 1,032,186 | ||||||||||||||
| Reinsurance contract held liabilities (1)
|
235 | 237 | 250 | 243 | 337 | 5,320 | 6,622 | |||||||||||||||||||||
(1) |
Insurance contract liabilities cash flows include estimates related to the timing and payment of death and disability claims, policy surrenders, policy maturities, annuity payments, minimum guarantees on segregated fund products, policyholder dividends, commissions and premium taxes offset by contractual future premiums on in-force contracts and exclude amounts from insurance contract liabilities for account of segregated fund holders. These estimated cash flows are based on the best estimate assumptions used in the determination of insurance contract liabilities. These amounts are undiscounted. Reinsurance contract held liabilities cash flows include estimates related to the timing and payment of future reinsurance premiums offset by recoveries on in-force reinsurance agreements. Due to the use of assumptions, actual cash flows may differ from these estimates. Cash flows include embedded derivatives measured separately at fair value. |
2023 |
2022 |
|||||||||||||||||||
As at December 31, |
Amounts payable on demand |
Carrying amount |
Amounts payable on demand |
Carrying amount |
||||||||||||||||
| Asia |
$ |
100,060 |
$ |
129,117 |
$ |
95,777 |
$ |
117,737 |
||||||||||||
| Canada |
28,264 |
56,887 |
25,745 |
52,300 |
||||||||||||||||
| U.S. |
44,360 |
63,092 |
45,394 |
63,374 |
||||||||||||||||
| Total |
$ |
172,684 |
$ |
249,096 |
$ |
166,916 |
$ |
233,411 |
||||||||||||
For the three and nine months ended September 30, 2023 |
For the three months ended December 31, 2023 |
For the year ended December 31, 2023 |
||||||||||
| Canada variable annuity product review |
$ |
(133 |
) |
$ |
– |
$ |
(133 |
) | ||||
| Mortality and morbidity updates |
265 |
– |
265 |
|||||||||
| Lapse and policyholder behaviour updates |
98 |
– |
98 |
|||||||||
| Methodology and other updates |
(577 |
) |
(2,850 |
) |
(3,427 |
) | ||||||
| Impact of changes in actuarial methods and assumptions, pre-tax |
$ |
(347 |
) |
$ |
(2,850 |
) |
$ |
(3,197 |
) | |||
|
(1) |
Excludes the portion related to non-controlling interests of $103 for the three and nine months ended September 30, 2023, and $97 for the three months ended December 31, 2023, respectively. |
|
|
2 25 |
For the three and nine months ended September 30, 2023 |
For the three months ended December 31, 2023 |
For the year ended December 31, 2023 |
||||||||||
| Portion recognized in net income (loss) attributed to: |
||||||||||||
| Participating policyholders |
$ |
58 |
$ |
115 |
$ |
173 |
||||||
| Shareholders and other equity holders |
27 |
144 |
171 |
|||||||||
85 |
259 |
344 |
||||||||||
| Portion recognized in OCI attributed to: |
||||||||||||
| Participating policyholders |
– |
(21 |
) |
(21 |
) | |||||||
| Shareholders and other equity holders |
146 |
(26 |
) |
120 |
||||||||
146 |
(47 |
) |
99 |
|||||||||
| Portion recognized in CSM |
116 |
2,638 |
2,754 |
|||||||||
| Impact of changes in actuarial methods and assumptions, pre-tax |
$ |
347 |
$ |
2,850 |
$ |
3,197 |
||||||
|
(1) |
Excludes the portion related to non-controlling interests, of which $72 is related to CSM for the three and nine months ended September 30, 2023, and $87 is related to CSM for the three months ended December 31, 2023. |
| For the year ended December 31, 2022 | Total | |||
| Long-term care triennial review |
$ | 118 | ||
| Mortality and morbidity updates |
83 | |||
| Lapse and policyholder behaviour updates |
234 | |||
| Methodology and other updates |
(243 | ) | ||
| Impact of changes in actuarial methods and assumptions, pre-tax |
$ | 192 | ||
|
(1) |
Excludes the portion related to non-controlling interests of $8. |
For the year ended December 31, 2022 |
Total |
|||
| Portion recognized in net income (loss) attributed to: |
||||
| Participating policyholders |
$ | (26 | ) | |
| Shareholders and other equity holders |
23 | |||
| (3 | ) | |||
| Portion recognized in OCI attributed to: |
||||
| Participating policyholders |
– | |||
| Shareholders and other equity holders |
90 | |||
| 90 | ||||
| Portion recognized in CSM |
(279 | ) | ||
| Impact of changes in actuarial methods and assumptions, pre-tax |
$ |
(192 | ) | |
|
(1) |
Excludes the portion related to non-controlling interests, of which $nil is related to CSM. |
|
|
2 27
|
1 |
First generation policies issued prior to 2002. |
2 |
Second generation policies with an average issue date of 2007 and Group policies with an average issue date of 2003. |
3 |
The mortality rate of LTC policyholders who are currently not on claim. |
4 |
Actual experience obtaining premium increases could be materially different than what the Company has assumed, resulting in further increases or decreases in insurance contract liabilities, which could be material. See “Caution regarding forward-looking statements” above. |
For the years ended December 31, |
2023 |
2022 |
||||||
Balance, excluding those for account of segregated fund holders, January 1 |
$ |
798 |
$ | 825 | ||||
New contracts |
48 |
79 | ||||||
Changes in market conditions |
47 |
(56 | ) | |||||
Redemptions, surrenders and maturities |
(122 |
) |
(99 | ) | ||||
Impact of changes in foreign exchange rates |
(22 |
) |
49 | |||||
Balance, excluding those for account of segregated fund holders, December 31 |
749 |
798 | ||||||
Investment contract liabilities for account of segregated fund holders |
263,401 |
238,346 | ||||||
Balance, December 31 |
$ |
264,150 |
$ | 239,144 | ||||
2023 |
2022 |
|||||||||||||||||||
As at December 31, |
Amortized cost, gross of reinsurance ceded (1)
|
Fair value |
Amortized cost, gross of reinsurance ceded (1)
|
Fair value |
||||||||||||||||
Asia |
$ |
451 |
$ |
438 |
$ | 636 | $ | 607 | ||||||||||||
Canada |
7,642 |
7,534 |
6,699 | 6,474 | ||||||||||||||||
U.S. |
1,381 |
1,440 |
1,535 | 1,571 | ||||||||||||||||
GWAM |
1,593 |
1,582 |
411 | 382 |
||||||||||||||||
Investment contract liabilities |
$ |
11,067 |
$ |
10,994 |
$ | 9,281 | $ | 9,034 | ||||||||||||
|
(1) |
As at December 31, 2023, investment contract liabilities with carrying value and fair value of $27 and $27, respectively (2022 – $38 and $38, respectively), were reinsured by the Company. The net carrying value and fair value of investment contract liabilities were $11,040 and $10,967 (2022 – $9,243 and $8,996, respectively ). |
| |
2 2
9
|
For the years ended December 31, |
2023 |
2022 |
||||||
Balance, January 1 |
$ |
9,281 |
$ | 9,239 | ||||
Policy deposits |
3,365 |
1,634
|
||||||
Interest |
218 |
150
|
||||||
Withdrawals |
(1,629 |
) |
(1,882
|
) |
||||
Fees |
1 |
– |
||||||
Impact of changes in foreign exchange rates |
(108 |
) |
81
|
|||||
Other |
(61 |
) |
59 |
|||||
Balance, December 31 |
$ |
11,067 |
$ | 9,281 | ||||
|
As at December 31, Payments due by period |
Less than 1 year |
1 to 3 years |
3 to 5 years |
Over 5 years |
Total |
|||||||||||||||
2023 |
$ |
268,537 |
$ |
2,978 |
$ |
1,408 |
$ |
3,488 |
$ |
276,411 |
||||||||||
2022
|
241,301 |
2,749 |
1,789 |
3,932 |
249,771 | |||||||||||||||
|
(1) |
Due to the nature of the products, the timing of net cash flows may be before contract maturity. Cash flows are undiscounted. |
Market risk management strategy is governed by the Global Asset Liability Committee which oversees the overall market and liquidity risk program. The Company’s overall strategy to manage its market risks incorporates several component strategies, each targeted to manage one or more of the market risks arising from the Company’s businesses. At an enterprise level, these strategies are designed to manage the Company’s aggregate exposures to market risks against limits associated with earnings and capital volatility. |
||||||||||
|
The following table outlines the Company’s key market risks and identifies the risk management strategies which contribute to managing these risks.
|
||||||||||
Risk Management Strategy |
Key Market Risk |
|||||||||
Public Equity Risk |
Interest Rate and Spread Risk |
ALDA Risk |
Foreign Currency Exchange Risk |
Liquidity Risk |
||||||
Product design and pricing |
✓ |
✓ |
✓ |
✓ |
✓ |
|||||
Variable annuity guarantee dynamic hedging |
✓ |
✓ |
✓ |
✓ |
||||||
Macro equity risk hedging |
✓ |
✓ |
✓ |
|||||||
Asset liability management |
✓ |
✓ |
✓ |
✓ |
✓ |
|||||
Foreign currency exchange management |
✓ |
✓ |
||||||||
Liquidity risk management |
✓ |
|||||||||
|
The Company’s policies, standards, and guidelines with respect to product design and pricing are designed with the objective of aligning its product offerings with its risk taking philosophy and risk appetite, and in particular, ensuring that incremental risk generated from new sales aligns with its strategic risk objectives and risk limits. The specific design features of Manulife’s product offerings, including level of benefit guarantees, policyholder options, fund offerings and availability restrictions as well as its associated investment strategies, help to mitigate the level of underlying risk. Manulife regularly reviews and modifies key features within its product offerings, including premiums and fee charges with a goal of meeting profit targets and staying within risk limits. Certain of the Company’s general fund adjustable benefit products have minimum rate guarantees. The rate guarantees for any particular policy are set at the time the policy is issued and governed by insurance regulation in each jurisdiction where the products are sold. The contractual provisions allow crediting rates to be re-set at pre-established intervals subject to the established minimum crediting rate guarantees. The Company may partially mitigate the interest rate exposure by setting new rates on new business and by adjusting rates on in-force business where permitted. In addition, the Company partially mitigates this interest rate risk through its asset liability management process, product design elements, and crediting rate strategies. All material new product, reinsurance and underwriting initiatives must be reviewed and approved by the Chief Risk Officer or key individuals within risk management functions. |
|
The Company’s exposure to movement in public equity market values primarily arises from insurance contract liabilities related to variable annuity guarantees and general fund public equity investments. Dynamic hedging is the primary hedging strategy for variable annuity market risks. Dynamic hedging is employed for new variable annuity guarantees business when written or as soon as practical thereafter. Manulife seeks to manage public equity risk arising from unhedged exposures in its insurance contract liabilities through the macro equity risk hedging strategy. The Company seeks to manage interest rate risk arising from variable annuity business not dynamically hedged through its asset liability management strategy. |
|
The variable annuity dynamic hedging strategy is designed to hedge the sensitivity of variable annuity guarantee insurance contract liabilities to fund performance (both public equity and bond funds) and interest rate movements. The objective of the variable annuity dynamic hedging strategy is to offset, as closely as possible, the change in the economic value of guarantees with the profit and loss from the hedge asset portfolio. The Company’s variable annuity hedging program uses a variety of exchange-traded and over-the-counter The Company’s variable annuity guarantee dynamic hedging strategy is not designed to completely offset the sensitivity of insurance contract liabilities to all risks associated with the guarantees embedded in these products. The profit (loss) on the hedge instruments will not completely offset the underlying losses (gains) related to the guarantee liabilities hedged because: • Policyholder behaviour and mortality experience are not hedged; • Risk adjustment related to cost of guarantees in the insurance contract liabilities is largely hedged; • A portion of interest rate risk is not hedged; • Credit spreads may widen and actions might not be taken to adjust accordingly; • Fund performance on a small portion of the underlying funds is not hedged due to lack of availability of effective exchange-traded hedge instruments; • Performance of the underlying funds hedged may differ from the performance of the corresponding hedge instruments; • Correlations between interest rates and equity markets could lead to unfavourable material impacts; • Unfavourable hedge rebalancing costs can be incurred during periods of high volatility from equity markets, bond markets and/or interest rates. The impact is magnified when these impacts occur concurrently; and • Not all other risks are hedged. |
|
|
2 31
|
|
The objective of the macro equity risk hedging program is to maintain the Company’s overall earnings sensitivity to public equity market movements within the Board approved risk appetite limits. The macro equity risk hedging program is designed to hedge earnings sensitivity due to movements in public equity markets arising from all sources (outside of dynamically hedged exposures). Sources of equity market sensitivity addressed by the macro equity risk hedging program include: • Residual equity and currency exposure from variable annuity guarantees not dynamically hedged; • General fund equity holdings backing guaranteed, adjustable liabilities and variable universal life; and • Host contract fees related to variable annuity guarantees are not dynamically hedged. |
|
Manulife’s asset liability management strategy is designed to help ensure that the market risks embedded in its assets and liabilities held in the Company’s general fund are effectively managed and that risk exposures arising from these assets and liabilities are maintained within risk limits. The embedded market risks include risks related to the level and movement of interest rates and credit and swap spreads, public equity market performance, ALDA performance and foreign currency exchange rate movements. General fund product liabilities are categorized into groups with similar characteristics in order to support them with a specific asset strategy. The Company seeks to align the asset strategy for each group to the premium and benefit patterns, policyholder options and guarantees, and crediting rate strategies of the products they support. The strategies are set using portfolio analysis techniques intended to optimize returns, subject to considerations related to regulatory and economic capital requirements, and risk tolerances. They are designed to achieve broad diversification across asset classes and individual investment risks while being suitably aligned with the liabilities they support. The strategies encompass asset mix, quality rating, term profile, liquidity, currency and industry concentration targets. |
Manulife’s policy is to generally match the currency of its assets with the currency of the liabilities they support. Where assets and liabilities are not currency matched, the Company seeks to hedge this exposure where appropriate to stabilize its earnings and capital positions and remain within its enterprise foreign exchange risk limits. |
|
Global liquidity management policies and procedures are designed to provide adequate liquidity to cover cash and collateral obligations as they come due, and to sustain and grow operations in both normal and stressed conditions. They consider legal, regulatory, tax, operational or economic impediments to inter-entity funding. The asset mix of the Company’s balance sheet takes into account the need to hold adequate unencumbered and appropriate liquid assets to satisfy the requirements arising under stressed scenarios and to allow Manulife’s liquidity ratios to remain strong. Manulife manages liquidity centrally and closely monitors the liquidity positions of its principal subsidiaries. Manulife seeks to mitigate liquidity risk by diversifying its business across different products, markets, geographical regions and policyholders. The Company designs insurance products to encourage policyholders to maintain their policies in-force, to help generate a diversified and stable flow of recurring premiums. The Company designs the policyholder termination features with the goal of mitigating the financial exposure and liquidity risk related to unexpected policyholder terminations. The Company establishes and implements investment strategies intended to match the term profile of the assets to the liabilities they support, taking into account the potential for unexpected policyholder terminations and resulting liquidity needs. Liquid assets represent a large portion of the Company’s total assets. Manulife aims to reduce liquidity risk in the Company’s businesses by diversifying its funding sources and appropriately managing the term structure of its funding. The Company forecasts and monitors daily operating liquidity and cash movements in various individual entities and operations as well as centrally, aiming to ensure liquidity is available and cash is employed optimally. The Company also maintains centralized cash pools and access to other sources of liquidity and contingent liquidity such as repurchase funding agreements. Manulife’s centralized cash pools consist of cash or near-cash, high quality short-term investments that are continually monitored for their credit quality and market liquidity. Manulife has established a variety of contingent liquidity sources. These include, among others, a $500 committed unsecured revolving credit facility with certain Canadian chartered banks available for the Company, and a US$500 committed unsecured revolving credit facility with certain U.S. banks available to the Company and certain of its U.S. subsidiaries. There were no outstanding borrowings under these facilities as of December 31, 2023 (2022 – $ nil). In addition, JHUSA is a member of the Federal Home Loan Bank of Indianapolis (“FHLBI”), which enables the Company to obtain loans from FHLBI as an alternative source of liquidity that is collateralizable by qualifying mortgage loans, mortgage-backed securities and U.S. Treasury and Agency securities. As of December 31, 2023, JHUSA had an estimated maximum borrowing capacity of US$4.3 billion (2022 – US$3.8 billion) based on regulatory limitations with an outstanding balance of US$500 (2022 – US$500), under the FHLBI facility. |
As at December 31, 2023 |
Less than 1 year |
1 to 3 years |
3 to 5 years |
Over 5 years |
Total |
|||||||||||||||
Long-term debt |
$ |
– |
$ |
1,672 |
$ |
920 |
$ |
3,479 |
$ |
6,071 |
||||||||||
Capital instruments |
594 |
– |
– |
6,073 |
6,667 |
|||||||||||||||
Derivatives |
1,561 |
1,982 |
717 |
7,427 |
11,687 |
|||||||||||||||
Deposits from Bank clients (2)
|
16,814 |
2,963 |
1,839 |
– |
21,616 |
|||||||||||||||
Lease liabilities |
100 |
133 |
68 |
49 |
350 |
|||||||||||||||
|
(1) The amounts shown above are net of the related unamortized deferred issue costs.(2) Carrying value and fair value of deposits from Bank clients as at December 31, 2023 was $21,616 and $21,518, respectively (2022 – $22,507 and $22,271 respectively). Fair value is determined by discounting contractual cash flows, using market interest rates currently offered for deposits with similar terms and conditions. All deposits from Bank clients were categorized in Level 2 of the fair value hierarchy (2022 – Level 2). |
|
|||||||||||||||||||
|
Guarantees on variable annuity products and segregated funds may include one or more of death, maturity, income and withdrawal guarantees. Variable annuity and segregated fund guarantees are contingent and only payable upon the occurrence of the relevant event, if fund values at that time are below guarantee values. Depending on future equity market levels, liabilities on current in-force business would be due primarily in the period from 2023 to 2043.Manulife seeks to mitigate a portion of the risks embedded in its retained (i.e., net of reinsurance) variable annuity and segregated fund guarantee business through the combination of dynamic and macro hedging strategies (see “Publicly traded equity performance risk sensitivities and exposure measures” below). |
|
The table below shows selected information regarding the Company’s variable annuity and segregated fund investment-related guarantees gross and net of reinsurance.
|
2023 |
2022 |
|||||||||||||||||||||||||||
As at December 31, |
Guarantee value (1)
|
Fund value |
Net amount at risk (1),(2),(3)
|
Guarantee value (1)
|
Fund value |
Net amount at risk (1),(2),(3)
|
||||||||||||||||||||||
Guaranteed minimum income benefit |
$ |
3,864 |
$ |
2,735 |
$ |
1,156 |
$ |
4,357 |
$ |
2,723 |
$ |
1,639 |
||||||||||||||||
Guaranteed minimum withdrawal benefit |
34,833 |
33,198 |
4,093 |
38,319 |
34,203 |
5,734 |
||||||||||||||||||||||
Guaranteed minimum accumulation benefit |
18,996 |
19,025 |
116 |
20,035 |
19,945 |
221 |
||||||||||||||||||||||
Gross living benefits (4)
|
57,693 |
54,958 |
5,365 |
62,711 |
56,871 |
7,594 |
||||||||||||||||||||||
Gross death benefits (5)
|
9,133 |
17,279 |
975 |
10,465 |
15,779 |
2,156 |
||||||||||||||||||||||
Total gross of reinsurance |
66,826 |
72,237 |
6,340 |
73,176 |
72,650 |
9,750 |
||||||||||||||||||||||
Living benefits reinsured |
24,208 |
23,146 |
3,395 |
26,999 |
23,691 |
4,860 |
||||||||||||||||||||||
Death benefits reinsured |
3,400 |
2,576 |
482 |
3,923 |
2,636 |
1,061 |
||||||||||||||||||||||
Total reinsured |
27,608 |
25,722 |
3,877 |
30,922 |
26,327 |
5,921 |
||||||||||||||||||||||
Total, net of reinsurance |
$ |
39,218 |
$ |
46,515 |
$ |
2,463 |
$ |
42,254 |
$ |
46,323 |
$ |
3,829 |
||||||||||||||||
|
(1)
(2) Amount at risk (in-the-money (3) The amount at risk net of reinsurance at December 31, 2023 was $2,463 (2022 – $3,829) of which: US$391 (2022 – US$737) was on the Company’s U.S. business, $1,559 (2022 – $2,154) was on the Company’s Canadian business, US$140 (2022 – US$275) was on the Company’s Japan business and US$155 (2022 – US$224) was related to Asia (other than Japan) and the Company’s
run-off reinsurance business.(4) Where a policy includes both living and death benefits, the guarantee in excess of the living benefit is included in the death benefit category as outlined in footnote 5.(5) Death benefits include standalone guarantees and guarantees in excess of living benefit guarantees where both death and living benefits are provided on a policy. |
||||||||||||||
| |
2 33 |
Variable contracts with guarantees, including variable annuities and variable life, are invested, at the policyholder’s discretion subject to contract limitations, in various fund types within the segregated fund accounts and other investments. The account balances by investment category are set out below. |
||||
|
As at December 31, Investment category |
2023 |
2022 | ||||||
| Equity funds | $ |
45,593 |
$ | 42,506 | ||||
Balanced funds |
35,801 |
36,290 | ||||||
Bond funds |
8,906 |
9,336 | ||||||
Money market funds |
1,559 |
1,924 | ||||||
Other fixed interest rate investments |
1,907 |
2,029 | ||||||
Total |
$ |
93,766 |
$ | 92,085 | ||||
In the sections that follow, the Company provides sensitivities and risk exposure measures for certain risks. These include sensitivities due to specific changes in market prices and interest rate levels projected using internal models as at a specific date , and are measured relative to a starting level reflecting the Company’s assets and liabilities at that date. The risk exposures measure the impact of changing one factor at a time and assume that all other factors remain unchanged. Actual results can differ significantly from these estimates for a variety of reasons including the interaction among these factors when more than one changes; changes in liabilities from updates to non-economic assumptions, changes in business mix, effective tax rates and other market factors; and the general limitations of the Company’s internal models. For these reasons, the sensitivities should only be viewed as directional estimates of the underlying sensitivities for the respective factors based on the assumptions outlined below. Given the nature of these calculations, the Company cannot provide assurance that the actual impact on CSM, net income attributed to shareholders, other comprehensive income attributed to shareholders, and total comprehensive income attributed to shareholders will be as indicated. |
Net income attributed to shareholders |
||||||||||||||||||||||||
As at December 31, 2023 |
-30% |
-20% |
-10% |
+10% |
+20% |
+30% |
||||||||||||||||||
Underlying sensitivity |
||||||||||||||||||||||||
Variable annuity guarantees (2)
|
$ |
(2,370 |
) |
$ |
(1,460 |
) |
$ |
(670 |
) |
$ |
550 |
$ |
1,010 |
$ |
1,390 |
|||||||||
General fund equity investments (3)
|
(1,170 |
) |
(770 |
) |
(390 |
) |
380 |
760 |
1,140 |
|||||||||||||||
Total underlying sensitivity before hedging |
(3,540 |
) |
(2,230 |
) |
(1,060 |
) |
930 |
1,770 |
2,530 |
|||||||||||||||
Impact of macro and dynamic hedge assets (4)
|
880 |
530 |
240 |
(190 |
) |
(340 |
) |
(460 |
) |
|||||||||||||||
Net potential impact on net income attributed to shareholders after impact of hedging and before impact of reinsurance |
(2,660 |
) |
(1,700 |
) |
(820 |
) |
740 |
1,430 |
2,070 |
|||||||||||||||
Impact of reinsurance |
1,470 |
900 |
420 |
(350 |
) |
(650 |
) |
(910 |
) |
|||||||||||||||
Net potential impact on net income attributed to shareholders after impact of hedging and reinsurance |
$ |
(1,190 |
) |
$ |
(800 |
) |
$ |
(400 |
) |
$ |
390 |
$ |
780 |
$ |
1,160 |
|||||||||
Net income attributed to shareholders |
||||||||||||||||||||||||
As at December 31, 2022 |
-30% |
-20% |
-10% |
+10% |
+20% |
+30% |
||||||||||||||||||
Underlying sensitivity |
||||||||||||||||||||||||
Variable annuity guarantees (2)
|
$ |
(2,110 |
) |
$ |
(1,310 |
) |
$ |
(610 |
) |
$ |
530 |
$ |
980 |
$ |
1,360 |
|||||||||
General fund equity investments (3)
|
(1,450 |
) |
(920 |
) |
(420 |
) |
400 |
780 |
1,170 |
|||||||||||||||
Total underlying sensitivity before hedging |
(3,560 |
) |
(2,230 |
) |
(1,030 |
) |
930 |
1,760 |
2,530 |
|||||||||||||||
Impact of macro and dynamic hedge assets (4)
|
930 |
570 |
260 |
(220 |
) |
(400 |
) |
(540 |
) |
|||||||||||||||
Net potential impact on net income attributed to shareholders after impact of hedging and before impact of reinsurance |
(2,630 |
) |
(1,660 |
) |
(770 |
) |
710 |
1,360 |
1,990 |
|||||||||||||||
Impact of reinsurance |
1,170 |
740 |
350 |
(310 |
) |
(580 |
) |
(810 |
) |
|||||||||||||||
Net potential impact on net income attributed to shareholders after impact of hedging and reinsurance |
$ |
(1,460 |
) |
$ |
(920 |
) |
$ |
(420 |
) |
$ |
400 |
$ |
780 |
$ |
1,180 |
|||||||||
(1) |
See “Caution related to sensitivities” above. |
(2) |
For variable annuity contracts measured under VFA the impact of financial risk and changes in interest rates adjusts CSM, unless the risk mitigation option applies. The Company has elected to apply risk mitigation and therefore a portion of the impact is reported in net income attributed to shareholders instead of adjusting the CSM. If the CSM for a group of variable annuity contracts is exhausted the full impact is reported in net income attributed to shareholders. |
(3) |
This impact for general fund equity investments includes general fund investments supporting the Company’s insurance contract liabilities, investment in seed money investments (in segregated and mutual funds made by Global WAM segment) and the impact on insurance contract liabilities related to the projected future fee income on variable universal life and other unit linked products. The impact does not include any potential impact on public equity weightings. The participating policy funds are largely self-supporting and generate no material impact on net income attributed to shareholders as a result of changes in equity markets. |
(4) |
Includes the impact of assumed rebalancing of equity hedges in the macro and dynamic hedging program. The impact of dynamic hedge represents the impact of equity hedges offsetting 95% of the dynamically hedged variable annuity liability movement that occurs as a result of market changes, but does not include any impact in respect of other sources of hedge accounting ineffectiveness (e.g. , fund tracking, realized volatility and equity, interest rate correlations different from expected among other factors). |
As at December 31, 2023 |
-30% |
-20% |
-10% |
+10% |
+20% |
+30% |
||||||||||||||||||
| Variable annuity guarantees reported in CSM |
$ |
(3,810 |
) |
$ |
(2,370 |
) |
$ |
(1,100 |
) |
$ |
940 |
$ |
1,760 |
$ |
2,470 |
|||||||||
| Impact of risk mitigation—hedging (4)
|
1,150 |
700 |
310 |
(250 |
) |
(450 |
) |
(600 |
) | |||||||||||||||
| Impact of risk mitigation—reinsurance (4)
|
1,850 |
1,140 |
530 |
(450 |
) |
(830 |
) |
(1,150 |
) | |||||||||||||||
| VA net of risk mitigation |
(810 |
) |
(530 |
) |
(260 |
) |
240 |
480 |
720 |
|||||||||||||||
| General fund equity |
(940 |
) |
(610 |
) |
(300 |
) |
290 |
590 |
870 |
|||||||||||||||
| Contractual service margin (pre-tax)
|
$ |
(1,750 |
) |
$ |
(1,140 |
) |
$ |
(560 |
) |
$ |
530 |
$ |
1,070 |
$ |
1,590 |
|||||||||
| Other comprehensive income attributed to shareholders
(post-tax)
(5)
|
$ |
(730 |
) |
$ |
(490 |
) |
$ |
(240 |
) |
$ |
230 |
$ |
460 |
$ |
680 |
|||||||||
| Total comprehensive income attributed to shareholders (post-tax)
|
$ |
(1,920 |
) |
$ |
(1,290 |
) |
$ |
(640 |
) |
$ |
620 |
$ |
1,240 |
$ |
1,840 |
|||||||||
As at December 31, 2022 |
-30% |
-20% | -10% | +10% | +20% | +30% | ||||||||||||||||||
| Variable annuity guarantees reported in CSM |
$ | (3,410 | ) | $ | (2,140 | ) | $ | (1,010 | ) | $ | 890 | $ | 1,670 | $ | 2,360 | |||||||||
| Impact of risk mitigation—hedging (4)
|
1,200 | 740 | 340 | (280 | ) | (510 | ) | (690 | ) | |||||||||||||||
| Impact of risk mitigation—reinsurance (4)
|
1,480 | 930 | 440 | (390 | ) | (730 | ) | (1,030 | ) | |||||||||||||||
| VA net of risk mitigation |
(730 | ) | (470 | ) | (230 | ) | 220 | 430 | 640 | |||||||||||||||
| General fund equity |
(520 | ) | (370 | ) | (210 | ) | 240 | 490 | 730 | |||||||||||||||
| Contractual service margin (pre-tax)
|
$ | (1,250 | ) | $ | (840 | ) | $ | (440 | ) | $ | 460 | $ | 920 | $ | 1,370 | |||||||||
| Other comprehensive income attributed to shareholders
(post-tax)
(5)
|
$ | (620 | ) | $ | (410 | ) | $ | (210 | ) | $ | 210 | $ | 400 | $ | 600 | |||||||||
| Total comprehensive income attributed to shareholders (post-tax)
|
$ | (2,080 | ) | $ | (1,330 | ) | $ | (630 | ) | $ | 610 | $ | 1,180 | $ | 1,780 | |||||||||
(1) |
See “Caution related to sensitivities” above. |
(2) |
This estimate assumes that the performance of the dynamic hedging program would not completely offset the gain/loss from the dynamically hedged variable annuity guarantee liabilities. It assumes that the hedge assets are based on the actual position at the period end, and that equity hedges in the dynamic program offset 95% of the hedged variable annuity liability movement that occur as a result of market changes. |
(3) |
OSFI rules for segregated fund guarantees reflect full capital impacts of shocks over 20 quarters within a prescribed range. As such, the deterioration in equity markets could lead to further increases in capital requirements after the initial shock. |
(4) |
For variable annuity contracts measured under VFA the impact of financial risk and changes in interest rates adjusts CSM, unless the risk mitigation option applies. The Company has elected to apply risk mitigation and therefore a portion of the impact is reported in net income attributed to shareholders instead of adjusting the CSM. If the CSM for a group of variable annuity contracts is exhausted the full impact is reported in net income attributed to shareholders. |
(5) |
The impact of financial risk and changes to interest rates for variable annuity contracts is not expected to generate sensitivity in Other Comprehensive Income. |
| |
235 |
| As at December 31, 2023, the Company estimated the sensitivity of net income attributed to shareholders to a basis point parallel decline in interest rates to be a benefit of $100, and to a basis point parallel increase in interest rates to be a charge of $100. |
| The table below shows the potential impacts from a 50 basis point parallel move in interest rates on CSM, net income attributed to shareholders, other comprehensive income attributed to shareholders, and total comprehensive income attributed to shareholders. This includes a change in current government, swap and corporate rates for all maturities across all markets with no change in credit spreads between government, swap and corporate rates. Also shown separately are the potential impacts from a 50 basis point parallel move in corporate spreads and a 20 basis point parallel move in swap spreads. The impacts reflect the net impact of movements in asset values in liability and surplus segments and movements in the present value of cash flows for insurance contracts including those with cash flows that vary with the returns of underlying items where the present value is measured by stochastic modelling. The method used for deriving sensitivity information and significant assumptions made did not change from the previous period. The disclosed interest rate sensitivities reflect the accounting designations of the Company’s financial assets and corresponding insurance contract liabilities. In most cases these assets and liabilities are designated as FVOCI and as a result, impacts from changes to interest rates are largely in other comprehensive income. There are also changes in interest rates that impact the CSM for VFA contracts that relate to amounts that are not passed through to policyholders. In addition, changes in interest rates impact net income as it relates to derivatives not in hedge accounting relationships and on VFA contracts where the CSM has been exhausted. The disclosed interest rate sensitivities assume no hedge accounting ineffectiveness, as the Company’s hedge accounting programs are optimized for parallel movements in interest rates, leading to immaterial net income impacts under these shocks. However, the actual hedge accounting ineffectiveness is sensitive to non-parallel interest rate movements and will depend on the shape and magnitude of the interest rate movements which could lead to variations in the impact to net income attributed to shareholders.The Company’s sensitivities vary across all regions in which it operates, and the impacts of yield curve changes will vary depending upon the geography where the change occurs. Furthermore, the impacts from non-parallel movements may be materially different from the estimated impacts of parallel movements.The interest rate and spread risk sensitivities are determined in isolation of each other and therefore do not reflect the combined impact of changes in government rates and credit spreads between government, swap and corporate rates occurring simultaneously. As a result, the impact of the summation of each individual sensitivity may be materially different from the impact of sensitivities to simultaneous changes in interest rate and spread risk. The potential impacts also do not take into account other potential effects of changes in interest rate levels, for example, CSM at recognition on the sale of new business or lower interest earned on future fixed income asset purchases. The impacts do not reflect any potential effect of changing interest rates on the value of the Company’s ALDA. Rising interest rates could negatively impact the value of the Company’s ALDA. More information on ALDA can be found below under “Alternative long-duration asset performance risk sensitivities and exposure measures”. |
As at December 31, 2023 |
Interest rates |
Corporate spreads |
Swap spreads |
|||||||||||||||||||||||||||||||
(post-tax except CSM) |
-50bp |
+50bp |
-50bp |
+50bp |
-20bp |
+20bp |
||||||||||||||||||||||||||||
| CSM |
$ |
– |
$ |
(100 |
) |
$ |
– |
$ |
(100 |
) |
$ |
– |
$ |
– |
||||||||||||||||||||
| Net income attributed to shareholders |
100 |
(100 |
) |
– |
– |
100 |
(100 |
) | ||||||||||||||||||||||||||
| Other comprehensive income attributed to shareholders |
(300 |
) |
300 |
(200 |
) |
300 |
(100 |
) |
100 |
|||||||||||||||||||||||||
| Total comprehensive income attributed to shareholders |
(200 |
) |
200 |
(200 |
) |
300 |
– |
– |
||||||||||||||||||||||||||
As at December 31, 2022 |
Interest rates | Corporate spreads | Swap spreads | |||||||||||||||||||||||||||||||
( post-tax except CSM) |
-50bp | +50bp | -50bp | +50bp | -20bp | +20bp | ||||||||||||||||||||||||||||
| CSM |
$ | (100 | ) | $ | – | $ | (100 | ) | $ | – | $ | – | $ | – | ||||||||||||||||||||
| Net income attributed to shareholders |
1,700 | (1,500 | ) | – | – | – | – | |||||||||||||||||||||||||||
| Other comprehensive income attributed to shareholders |
(1,900 | ) | 1,600 | – | – | – | – | |||||||||||||||||||||||||||
| Total comprehensive income attributed to shareholders |
(200 | ) | 100 | – | – | – | – | |||||||||||||||||||||||||||
(1) |
See “Caution related to sensitivities” above. |
(2) |
Estimates include changes to the net actuarial gains/losses with respect to the Company’s pension obligations as a result of changes in interest rates. |
(3) |
Includes guaranteed insurance and annuity products, including variable annuity contracts as well as adjustable benefit products where benefits are generally adjusted as interest rates and investment returns change, a portion of which have minimum credited rate guarantees. For adjustable benefit products subject to minimum rate guarantees, the sensitivities are based on the assumption that credited rates will be floored at the minimum. |
(4) |
The Company adopted IFRS 9 hedge accounting prospectively from January 1, 2023, as such the sensitivity results for 2023 and 2022 are based on different accounting basis in which 2023 includes the impacts of hedge accounting and 2022 does not. |
As at |
December 31, 2023 |
December 31, 2022 |
||||||||||||||||||||||
(post-tax except CSM) |
-10% |
+10% |
-10% |
+10% |
||||||||||||||||||||
| CSM excluding NCI |
|
|
|
$ |
(100 |
) |
$ |
100 |
|
|
|
|
$ | (100 | ) | $ | 100 | |||||||
| Net income attributed to shareholders |
|
|
|
|
(2,400 |
) |
2,400 |
|
|
|
|
(2,500 | ) | 2,500 | ||||||||||
| Other comprehensive income attributed to shareholders |
|
|
|
|
(200 |
) |
200 |
|
|
|
|
(100 | ) | 100 | ||||||||||
| Total comprehensive income attributed to shareholders |
|
|
|
|
(2,600 |
) |
2,600 |
|
|
|
|
(2,600 | ) | 2,600 | ||||||||||
(1) |
See “Caution related to sensitivities” above. |
1 |
Energy includes legacy oil and gas equity interests related to upstream and midstream assets that are in runoff, and Energy Transition private equity interests in areas supportive of the transition to lower carbon forms of energy, such as wind, solar, batteries and magnets. |
|
|
237 |
As at December 31, 2023 |
Stage 1 |
Stage 2 |
Stage 3 |
Total |
||||||||||||
Debt securities |
||||||||||||||||
Investment grade |
$ |
198,935 |
$ |
2,252 |
$ |
– |
$ |
201,187 |
||||||||
Non-investment grade |
5,367 |
596 |
– |
5,963 |
||||||||||||
Default |
– |
– |
– |
– |
||||||||||||
Total |
204,302 |
2,848 |
– |
207,150 |
||||||||||||
Allowance for credit losses on assets measured at amortized cost |
– |
1 |
– |
1 |
||||||||||||
Net of allowance |
204,302 |
2,847 |
– |
207,149 |
||||||||||||
Allowance for credit losses on assets measured at FVOCI |
283 |
54 |
6 |
343 |
||||||||||||
Private placements |
||||||||||||||||
Investment grade |
37,722 |
1,644 |
– |
39,366 |
||||||||||||
Non-investment grade |
5,210 |
295 |
81 |
5,586 |
||||||||||||
Total |
42,932 |
1,939 |
81 |
44,952 |
||||||||||||
Allowance for credit losses on assets measured at amortized cost |
– |
– |
– |
– |
||||||||||||
Net of allowance |
42,932 |
1,939 |
81 |
44,952 |
||||||||||||
Allowance for credit losses on assets measured at FVOCI |
126 |
108 |
83 |
317 |
||||||||||||
Commercial mortgages |
||||||||||||||||
AAA |
279 |
– |
– |
279 |
||||||||||||
AA |
6,815 |
– |
– |
6,815 |
||||||||||||
A |
14,259 |
134 |
– |
14,393 |
||||||||||||
BBB |
5,513 |
984 |
– |
6,497 |
||||||||||||
BB |
10 |
532 |
– |
542 |
||||||||||||
B and lower |
145 |
71 |
107 |
323 |
||||||||||||
Total |
27,021 |
1,721 |
107 |
28,849 |
||||||||||||
Allowance for credit losses on assets measured at amortized cost |
1 |
2 |
– |
3 |
||||||||||||
Net of allowance |
27,020 |
1,719 |
107 |
28,846 |
||||||||||||
Allowance for credit losses on assets measured at FVOCI |
40 |
42 |
143 |
225 |
||||||||||||
Residential mortgages |
||||||||||||||||
Performing |
20,898 |
1,570 |
– |
22,468 |
||||||||||||
Non-performing |
– |
– |
60 |
60 |
||||||||||||
Total |
20,898 |
1,570 |
60 |
22,528 |
||||||||||||
Allowance for credit losses on assets measured at amortized cost |
4 |
2 |
2 |
8 |
||||||||||||
Net of allowance |
20,894 |
1,568 |
58 |
22,520 |
||||||||||||
Allowance for credit losses on assets measured at FVOCI |
– |
– |
– |
– |
||||||||||||
Loans to Bank clients |
||||||||||||||||
Performing |
2,387 |
44 |
– |
2,431 |
||||||||||||
Non-performing |
– |
– |
8 |
8 |
||||||||||||
Total |
2,387 |
44 |
8 |
2,439 |
||||||||||||
Allowance for credit losses on assets measured at amortized cost |
2 |
– |
1 |
3 |
||||||||||||
Net of allowance |
2,385 |
44 |
7 |
2,436 |
||||||||||||
Allowance for credit losses on assets measured at FVOCI |
– |
– |
– |
– |
||||||||||||
Other invested assets |
||||||||||||||||
Investment grade |
3,791 |
– |
– |
3,791 |
||||||||||||
Below investment grade |
360 |
– |
– |
360 |
||||||||||||
Default |
– |
– |
– |
– |
||||||||||||
Total |
4,151 |
– |
– |
4,151 |
||||||||||||
Allowance for credit losses on assets measured at amortized cost |
1 |
– |
– |
1 |
||||||||||||
Net of allowance |
4,150 |
– |
– |
4,150 |
||||||||||||
Allowance for credit losses on assets measured at FVOCI |
16 |
– |
– |
16 |
||||||||||||
Loan commitments |
||||||||||||||||
Allowance for credit losses |
9 |
1 |
2 |
12 |
||||||||||||
Net of allowance, total |
$ |
301,683 |
$ |
8,117 |
$ |
253 |
$ |
310,053 |
||||||||
As at December 31, 2023 |
Stage 1 |
Stage 2 |
Stage 3 |
Total |
||||||||||||
| Balance, beginning of year |
$ |
511 |
$ |
141 |
$ |
72 |
$ |
724 |
||||||||
| Net re - measurement due to transfers |
4 |
6 |
(10 |
) |
– |
|||||||||||
| Transfer to stage 1 |
12 |
(11 |
) |
(1 |
) |
– |
||||||||||
| Transfer to stage 2 |
(6 |
) |
28 |
(22 |
) |
– |
||||||||||
| Transfer to stage 3 |
(2 |
) |
(11 |
) |
13 |
– |
||||||||||
| Net originations, purchases and disposals |
45 |
8 |
(23 |
) |
30 |
|||||||||||
| Repayments |
– |
– |
– |
– |
||||||||||||
| Changes to risk, parameters, and models |
(71 |
) |
48 |
233 |
210 |
|||||||||||
| Foreign exchange and other adjustments |
(7 |
) |
7 |
(35 |
) |
(35 |
) | |||||||||
| Balance, end of year |
$ |
482 |
$ |
210 |
$ |
237 |
$ |
929 |
||||||||
| Past due but not impaired | ||||||||||||||||
| As at December 31, 2022 | Less than 90 days |
90 days and greater |
Total | Total impaired |
||||||||||||
| Debt securities (1),(2)
|
||||||||||||||||
| FVTPL |
$ | 2,059 | $ | 71 | $ | 2,130 | $ | 9 | ||||||||
| AFS |
922 | – | 922 | – | ||||||||||||
| Private placements (1)
|
317 | 152 | 469 | 229 | ||||||||||||
| Mortgages and loans to Bank clients |
103 | – | 103 | 74 | ||||||||||||
| Other financial assets |
36 | 34 | 70 | 1 | ||||||||||||
| Total |
$ | 3,437 | $ | 257 | $ | 3,694 | $ | 313 | ||||||||
|
(1) |
Payments of $12 on $3,297 of financial assets past due less than 90 days were delayed. |
|
(2) |
Payments of $4 on $224 of financial assets past due greater than 90 days were delayed. |
Base case scenario |
Upside scenario |
Downside scenario 1 |
Downside scenario 2 |
|||||||||||||||||||||||||||||||||||||||||||||
As at December 31, 2023 |
Current quarter |
Next 12 months |
Ensuing 4 years |
Next 12 months |
Ensuing 4 years |
Next 12 months |
Ensuing 4 years |
Next 12 months |
Ensuing 4 years |
|||||||||||||||||||||||||||||||||||||||
| Canada |
||||||||||||||||||||||||||||||||||||||||||||||||
| Gross Domestic Product (GDP), in U.S. $ billions |
$ 1,448 |
1.6% |
2.0% |
3.6% |
2.3% |
(2.1%) |
2.2% |
(4.1%) |
2.1% |
|||||||||||||||||||||||||||||||||||||||
| Unemployment rate |
5.8% |
6.0% |
5.8% |
5.3% |
4.9% |
7.9% |
7.7% |
9.2% |
9.3% |
|||||||||||||||||||||||||||||||||||||||
| NYMEX Light Sweet Crude Oil (in U.S. dollars, per barrel) |
$ 85.7 |
82.8 |
71.4 |
85.3 |
71.7 |
68.0 |
64.8 |
58.9 |
58.6 |
|||||||||||||||||||||||||||||||||||||||
| U.S. |
||||||||||||||||||||||||||||||||||||||||||||||||
| Gross Domestic Product (GDP), in U.S. $ billions |
$ 22,531 |
1.3% |
2.3% |
3.6% |
2.4% |
(2.5%) |
2.6% |
(4.2%) |
2.5% |
|||||||||||||||||||||||||||||||||||||||
| Unemployment rate |
3.9% |
3.9% |
4.0% |
3.2% |
3.3% |
6.5% |
5.8% |
6.9% |
7.6% |
|||||||||||||||||||||||||||||||||||||||
| 7-10 Year BBB U.S. Corporate Index |
6.6% |
6.5% |
6.0% |
6.2% |
6.1% |
6.0% |
5.4% |
6.6% |
5.3% |
|||||||||||||||||||||||||||||||||||||||
| Japan |
||||||||||||||||||||||||||||||||||||||||||||||||
| Gross Domestic Product (GDP), in JPY billions |
¥559,492 |
0.4% |
0.8% |
2.5% |
1.0% |
(4.6%) |
1.1% |
(8.3%) |
1.7% |
|||||||||||||||||||||||||||||||||||||||
| Unemployment rate |
2.7% |
2.7% |
2.4% |
2.6% |
2.2% |
3.2% |
3.1% |
3.3% |
3.7% |
|||||||||||||||||||||||||||||||||||||||
| Hong Kong |
||||||||||||||||||||||||||||||||||||||||||||||||
| Unemployment rate |
2.8% |
2.9% |
3.2% |
2.6% |
2.8% |
4.0% |
4.0% |
4.4% |
4.8% |
|||||||||||||||||||||||||||||||||||||||
| Hang Seng Index |
19,316 |
20.9% |
5.1% |
35.4% |
4.7% |
(13.6%) |
11.3% |
(34.1%) |
14.8% |
|||||||||||||||||||||||||||||||||||||||
| China |
||||||||||||||||||||||||||||||||||||||||||||||||
| Gross Domestic Product (GDP), in CNY billions |
$108,251 |
6.0% |
4.3% |
9.5% |
4.4% |
(1.2%) |
4.6% |
(4.7%) |
3.9% |
|||||||||||||||||||||||||||||||||||||||
| FTSE Xinhua A200 Index |
9,852 |
7.3% |
5.0% |
26.6% |
3.0% |
(31.4%) |
11.9% |
(42.0%) |
13.4% |
|||||||||||||||||||||||||||||||||||||||
| |
239 |
As at |
December 31, 2023 |
|||
| Probability-weighted ECLs |
$ |
929 |
||
| Base ECLs |
$ |
659 |
||
| Difference – in amount |
$ |
270 |
||
| Difference – in percentage |
29.08 |
% | ||
As at December 31, 2023 |
Notional amount (1)
|
Fair value | Weighted average maturity (in years) (2)
|
|||||||||
| Single name CDS
(3),(4)
|
||||||||||||
| AA |
$ |
23 |
$ |
1 |
4 |
|||||||
| A |
94 |
2 |
3 |
|||||||||
| BBB |
14 |
– |
1 |
|||||||||
| Total single name CDS |
$ |
131 |
$ |
3 |
3 |
|||||||
| Total CDS protection sold |
$ |
131 |
$ |
3 |
3 |
|||||||
| As at December 31, 2022 | Notional amount (1)
|
Fair value | Weighted average maturity (in years) (2)
|
|||||||||
| Single name CDS (3),(4)
– Corporate debt |
||||||||||||
| AA |
$ | – | $ | – | – | |||||||
| A |
133 | 4 | 4 | |||||||||
| BBB |
26 | – | 1 | |||||||||
| Total single name CDS |
$ | 159 | $ | 4 | 4 | |||||||
| Total CDS protection sold |
$ | 159 | $ | 4 | 4 | |||||||
|
(1) |
Notional amounts represent the maximum future payments the Company would have to pay its counterparties assuming a default of the underlying credit and zero recovery on the underlying issuer obligations. |
|
(2) |
The weighted average maturity of the CDS is weighted based on notional amounts. |
|
(3) |
Ratings are based on S&P where available followed by Moody’s, DBRS, and Fitch. If no rating is available from a rating agency, an internally developed rating is used. |
|
(4) |
The Company held no purchased credit protection as at December 31, 2023 and December 31, 2022. |
| Related amounts not set off in the Consolidated Statements of Financial Position |
||||||||||||||||||||
As at December 31, 2023 |
Gross amounts of financial instruments (1)
|
Amounts subject to an enforceable master netting arrangement or similar agreements |
Financial and cash collateral pledged (received) (2)
|
Net amounts including financing entity (3)
|
Net amounts excluding financing entity |
|||||||||||||||
Financial assets |
||||||||||||||||||||
Derivative assets |
$ |
9,044 |
$ |
(6,516 |
) |
$ |
(2,374 |
) |
$ |
154 |
$ |
154 |
||||||||
Securities lending |
626 |
– |
(626 |
) |
– |
– |
||||||||||||||
Reverse repurchase agreements |
466 |
(202 |
) |
(264 |
) |
– |
– |
|||||||||||||
Total financial assets |
$ |
10,136 |
$ |
(6,718 |
) |
$ |
(3,264 |
) |
$ |
154 |
$ |
154 |
||||||||
Financial liabilities |
||||||||||||||||||||
Derivative liabilities |
$ |
(12,600 |
) |
$ |
6,516 |
$ |
5,958 |
$ |
(126 |
) |
$ |
(57 |
) |
|||||||
Repurchase agreements |
(202 |
) |
202 |
– |
– |
– |
||||||||||||||
Total financial liabilities |
$ |
(12,802 |
) |
$ |
6,718 |
$ |
5,958 |
$ |
(126 |
) |
$ |
(57 |
) |
|||||||
| Related amounts not set off in the Consolidated Statements of Financial Position |
||||||||||||||||||||
| As at December 31, 2022 | Gross amounts of financial instruments (1)
|
Amounts subject to an enforceable master netting arrangement or similar agreements |
Financial and cash collateral pledged (received) (2)
|
Net amounts including financing entity (3)
|
Net amounts excluding financing entity |
|||||||||||||||
Financial assets |
||||||||||||||||||||
Derivative assets |
$ | 9,072 | $ | (7,170 | ) | $ | (1,687 | ) | $ | 215 | $ | 215 | ||||||||
Securities lending |
723 | – | (723 | ) | – | – | ||||||||||||||
Reverse repurchase agreements |
895 | (779 | ) | (116 | ) | – | – | |||||||||||||
Total financial assets |
$ | 10,690 | $ | (7,949 | ) | $ | (2,526 | ) | $ | 215 | $ | 215 | ||||||||
Financial liabilities |
||||||||||||||||||||
Derivative liabilities |
$ | (15,151 | ) | $ | 7,170 | $ | 7,834 | $ | (147 | ) | $ | (103 | ) | |||||||
Repurchase agreements |
(895 | ) | 779 | 116 | – | – | ||||||||||||||
Total financial liabilities |
$ | (16,046 | ) | $ | 7,949 | $ | 7,950 | $ | (147 | ) | $ | (103 | ) | |||||||
|
(1) |
Financial assets and liabilities include accrued interest of $502 and $913 respectively (2022 – $488 and $862 respectively). |
|
(2) |
Financial and cash collateral exclude over-collateralization. As at December 31, 2023, the Company was over-collateralized on OTC derivative assets, OTC derivative liabilities, securities lending and reverse repurchase agreements and repurchase agreements in the amounts of $424, $1,420 , $20 and $nil respectively (2022 – $507, $1,528, $63 and $nil respectively). As at December 31, 2023, collateral pledged (received) does not include collateral-in-transit on OTC instruments or initial margin on exchange traded contracts or cleared contracts. |
|
(3) |
Includes derivative contracts entered between the Company and its unconsolidated financing entity. The Company does not exchange collateral on derivative contracts entered with this entity. Refer to note 18. |
|
|
241 |
As at December 31, 2023 |
Gross amounts of financial instruments |
Amounts subject to an enforceable netting arrangement |
Net amounts of financial instruments |
|||||||||
Credit linked note (1)
|
$ |
1,276 |
$ |
(1,276 |
) |
$ |
– |
|||||
Variable surplus note |
(1,276 |
) |
1,276 |
– |
||||||||
| As at December 31, 2022 | Gross amounts of financial instruments |
Amounts subject to an enforceable netting arrangement |
Net amounts of financial instruments |
|||||||||
Credit linked note (1)
|
$ | 1,242 | $ (1,242 | ) | $ | – | ||||||
Variable surplus note |
(1,242 | ) | 1,242 | – | ||||||||
|
(1) |
As at December 31, 2023 and 2022, the Company had no fixed surplus notes outstanding . R efer to note 19 (g |
As at December 31, |
2023 |
2022 |
||||||
Debt securities and private placements rated as investment grade BBB or higher (1)
|
95% |
96% | ||||||
Government debt securities as a per cent of total debt securities |
38% |
36% | ||||||
Government private placements as a per cent of total private placements |
10% |
10% | ||||||
Highest exposure to a single non-government debt security and private placement issuer |
$ |
1,131 |
$ | 1,006 | ||||
Largest single issuer as a per cent of the total equity portfolio |
2% |
2% | ||||||
Income producing commercial office properties (2023 – 37% of real estate, 2022 – 41%) |
$ |
4,829 |
$ | 5,486 | ||||
Largest concentration of mortgages and real estate (2) – Ontario Canada (2023 – 29%, 2022 – 27%) |
$ |
19,003 |
$ | 18,343 | ||||
|
(1) |
Investment grade debt securities and private placements include 38% rated A, 17% rated AA and 15% rated AAA (2022 – 39%, 17% and 14%) investments based on external ratings where available. |
|
(2) |
Mortgages and real estate investments are diversified geographically and by property type. |
2023 |
2022 |
|||||||||||||||||||
As at December 31, |
Carrying value |
% of total |
Carrying value |
% of total |
||||||||||||||||
Government and agency |
$ |
84,739 |
33 |
$ | 77,236 | 31 | ||||||||||||||
Utilities |
45,952 |
18 |
46,315 | 18 | ||||||||||||||||
Financial |
39,069 |
15 |
38,808 | 15 | ||||||||||||||||
Consumer |
31,181 |
12 |
31,556 | 13 | ||||||||||||||||
Energy |
15,782 |
6 |
16,314 | 7 | ||||||||||||||||
Industrial |
24,209 |
9 |
23,823 | 9 | ||||||||||||||||
Other |
16,823 |
7 |
16,909 | 7 | ||||||||||||||||
Total |
$ |
257,755 |
100 |
$ | 250,961 | 100 | ||||||||||||||
As at December 31, 2023 |
Insurance contract liabilities |
Investment contract liabilities |
Reinsurance assets |
Net liabilities |
||||||||||||
U.S. and Canada |
$ |
327,458 |
$ |
260,046 |
$ |
(39,080 |
) |
$ |
548,424 |
|||||||
Asia and Other |
154,536 |
15,171 |
(1,169 |
) |
168,538 |
|||||||||||
Total |
$ |
481,994 |
$ |
275,217 |
$ |
(40,249 |
) |
$ |
716,962 |
|||||||
As at December 31, 2022 |
Insurance contract liabilities |
Investment contract liabilities |
Reinsurance assets |
Net liabilities |
||||||||||||
U.S. and Canada |
$ | 322,265 | $ | 233,460 | $ | (42,573 | ) | $ | 513,152 | |||||||
Asia and Other |
142,127 | 14,965 | (1,480 | ) | 155,612 | |||||||||||
Total |
$ | 464,392 | $ | 248,425 | $ | (44,053 |
)
|
$ | 668,764 | |||||||
As at December 31, |
Issue date |
Maturity date |
Par value |
2023 |
2022 |
|||||||||
3.050% Senior notes (1),(2)
|
August 27, 2020 |
August 27, 2060 |
US$ 1,155 |
$ |
1,519 |
$ | 1,559 | |||||||
5.375% Senior notes (1),(3)
|
March 4, 2016 |
March 4, 2046 |
US$ 750 |
977 |
1,004 | |||||||||
3.703% Senior notes (1),(4)
|
March 16, 2022 |
March 16, 2032 |
US$ 750 |
983 |
1,011 | |||||||||
2.396% Senior notes (1),(5)
|
June 1, 2020 |
June 1, 2027 |
US$ 200 |
263 |
270 | |||||||||
2.484% Senior notes (1),(5)
|
May 19, 2020 |
May 19, 2027 |
US$ 500 |
657 |
674 | |||||||||
3.527% Senior notes (1),(3)
|
December 2, 2016 |
December 2, 2026 |
US$ 270 |
356 |
365 | |||||||||
4.150% Senior notes (1),(3)
|
March 4, 2016 |
March 4, 2026 |
US$ 1,000 |
1,316 |
1,351 | |||||||||
Total |
$ |
6,071 |
$ | 6,234 | ||||||||||
|
(1) |
These U.S. dollar senior notes have been designated as hedges of the Company’s net investment in its U.S. operations which reduces the earnings volatility that would otherwise arise from the re-measurement of these senior notes into Canadian dollars. |
|
(2) |
MFC may redeem the notes in whole, but not in part, on August 27, 2025, and thereafter on every August 27 at a redemption price equal to par, together with accrued and unpaid interest. Issuance costs are amortized to the earliest par redemption date. |
|
(3) |
MFC may redeem the senior notes in whole or in part, at any time, at a redemption price equal to the greater of par and a price based on the yield of a comparable U.S. Treasury bond with a tenor approximately equal to the period, from the redemption date to the respective maturity date, plus a specified number of basis points, together with accrued and unpaid interest. The specified number of basis points is as follows: 5.375% - bps, 3.527% - bps, and 4.150% - bps. Issuance costs are amortized over the term of the debt. |
|
(4) |
MFC may redeem the senior notes in whole or in part, at any time, at a redemption price equal to the greater of par and a price based on the yield of a comparable U.S. Treasury bond with a tenor approximately equal to the period, from the redemption date to December 16, 2031, plus 25 bps, together with accrued and unpaid interest. Issuance costs are amortized over the term of the debt. |
|
(5) |
MFC may redeem the senior notes in whole or in part, at any time, at a redemption price equal to the greater of par and a price based on the yield of a comparable U.S. Treasury bond with a tenor approximately equal to the period, from the redemption date to two months before the respective maturity date, plus a specified number of basis points, together with accrued and unpaid interest. The specified number of basis points is as follows: 2.396% - bps, and 2.484% - bps. For the period from two months before the respective maturity date, MFC may redeem the senior notes, in whole or in part, at a redemption price equal to par, together with accrued and unpaid interest. Issuance costs are amortized over the term of the debt. |
| |
243 |
As at December 31, |
Less than 1 year |
1 to 3 years |
3 to 5 years |
Over 5 years |
Total |
|||||||||||||||
|
2023 |
$ |
– |
$
|
1,672 |
$ |
920 |
$ |
3,479 |
$ |
6,071 |
||||||||||
|
2022
|
– | – | 2,661 | 3,573 | 6,234 | |||||||||||||||
As at December 31, |
Issuance date |
Earliest par redemption date |
Maturity date |
Par value |
2023 |
2022 |
||||||||||||||||||
JHFC Subordinated notes (1),(2)
|
December 14, 2006 | n/a | December 15, 2036 | $ | 650 | $ |
647 |
$ | 647 | |||||||||||||||
2.818 % MFC Subordinated debentures(1),(3)
|
May 12, 2020 | May 13, 2030 | May 13, 2035 | $ | 1,000 | 996 |
996 | |||||||||||||||||
5.409 % MFC Subordinated debentures(1),(4)
|
March 10, 2023 | March 10, 2028 | March 10, 2033 | $ | 1,200 | 1,195 |
– | |||||||||||||||||
4.061 % MFC Subordinated notes(1),(5),(6)
|
February 24, 2017 | February 24, 2027 | February 24, 2032 | US$ | 750 | 987 |
1,013 | |||||||||||||||||
2.237 % MFC Subordinated debentures(1),(7)
|
May 12, 2020 | May 12, 2025 | May 12, 2030 | $ | 1,000 | 999 |
998 | |||||||||||||||||
3.00 % MFC Subordinated notes(1),(8)
|
November 21, 2017 | November 21, 2024 | November 21, 2029 | S$ | 500 | 499 |
504 | |||||||||||||||||
3.049 % MFC Subordinated debentures(1),(9)
|
August 18, 2017 | August 20, 2024 | August 20, 2029 | $ | 750 | 750 |
749 | |||||||||||||||||
7.375 % JHUSA Surplus notes(10)
|
February 25, 1994 | n/a | February 15, 2024 | US$ | 450 | 594 |
615 | |||||||||||||||||
3.317 % MFC Subordinated debentures(1),(11)
|
May 9, 2018 | May 9, 2023 | May 9, 2028 | $ | 600 | – |
600 | |||||||||||||||||
Total |
$ |
6,667 |
$ | 6,122 | ||||||||||||||||||||
|
(1) |
The Company is monitoring regulatory and market developments globally with respect to the interest rate benchmark reform. The Company will take appropriate actions in due course to accomplish any necessary transitions or replacements. As at December 31, 2023, capital instruments of $647 (2022 – $647 ) have an interest rate referencing CDOR. In addition, capital instruments of $2,745 , $987 , and 499 (2022 – $3,343 , $1,013 ,504 , respectively) have interest rate resets in the future referencing CDOR, the US Dollar Mid-Swap rate (based on LIBOR), and the Singapore Dollar Swap Offer rate, respectively. Future rate resets for these capital instruments may rely on alternative reference rates such as the Canadian Overnight Repo Rate Average (CORRA), the alternative rate for CDOR, the Secured Overnight Financing Rate (SOFR), the alternative rate for USD LIBOR, and the Singapore Overnight Rate Average (SORA), the alternative rate for the Singapore Swap Offer Rate (SOR). |
|
(2) |
Issued by Manulife Holdings (Delaware) LLC (“MHDLL”), now John Hancock Financial Corporation (“JHFC”), a wholly owned subsidiary of MFC, to Manulife Finance (Delaware) LLC (“MFLLC”), a subsidiary of Manulife Finance (Delaware) L.P. (“MFLP”). MFLP and its subsidiaries are wholly owned unconsolidated related parties of the Company. The notes bear interest at a floating rate equal to the 90-day Bankers’ Acceptance rate plus 0.72%. With regulatory approval, JHFC may redeem the note, in whole or in part, at any time, at par, together with accrued and unpaid interest. Refer to note 18. |
|
(3) |
After May 13, 2030, the interest rate will reset to equal 3-month CDOR plus 1.82 %. With regulatory approval, MFC may redeem the debentures, in whole or in part, on or after May 13, 2025, at a redemption price together with accrued and unpaid interest. If the redemption date is on or after May 13, 2025, but prior to May 13, 2030, the redemption price shall be the greater of: (i) the Canada yield price as defined in the prospectus; and (ii) par. If the redemption date is on or after May 13, 2030, the redemption price shall be equal to par. |
|
(4) |
Issued by MFC during the first quarter of 2023, interest is payable semi-annually. After March 10, 2028, the interest rate will reset to equal the Daily Compounded CORRA plus 1.85 %. With regulatory approval, MFC may redeem the debentures, in whole, or in part, on or after March 10, 2028, at a redemption price equa together with accrued and unpaid interest. l to par
,
|
|
(5) |
On the earliest par redemption date, the interest rate will reset to equal the 5-Year US Dollar Mid-Swap Rate plus 1.647%. With regulatory approval, MFC may redeem the debentures, in whole, but not in part, on the earliest par redemption date, at a redemption price equal to par, together with accrued and unpaid interest. |
|
(6) |
Designated as a hedge of the Company’s net investment in its U.S. operations which reduces the earnings volatility that would otherwise arise from the re-measurement of the subordinated notes into Canadian dollars. |
|
(7) |
Issued by MFC, interest is payable semi-annually. After May 12, 2025, the interest rate will reset to equal 3-month CDOR plus 1.49 %. With regulatory approval, MFC may redeem the debentures, in whole, or in part, on or after May 12, 2025, at a redemption price equal to par, together with accrued and unpaid interest. |
|
(8) |
On the earliest par redemption date, the interest rate will reset to equal the 5-Year Singapore Dollar Swap Rate plus 0.832%. With regulatory approval, MFC may redeem the debentures, in whole, but not in part, on the earliest par redemption date and thereafter on each interest payment date, at a redemption price equal to par, together with accrued and unpaid interest. |
|
(9) |
Interest is fixed for the period up to the earliest par redemption date, thereafter, the interest rate will reset to a floating rate equal to 3-month CDOR plus 1.05%. With regulatory approval, MFC may redeem the debentures, in whole or in part, on or after the earliest par redemption date, at a redemption price equal to par, together with accrued and unpaid interest. |
|
(10) |
Issued by John Hancock Mutual Life Insurance Company, now John Hancock Life Insurance Company (U.S.A.). Any payment of interest or principal on the surplus notes requires prior approval from the Department of Insurance and Financial Services of the State of Michigan. The carrying value of the surplus notes reflects an unamortized fair value increment of US$ 1 (2022 – US$5 ), which arose as a result of the acquisition of John Hancock Financial Services, Inc. The amortization of the fair value adjustment is recorded in interest expense. |
|
(11) |
MFC redeemed in full the 3.317 % MFC Subordinated debentures at par on May 9, 2023 , the earliest par redemption date. |
| |
24 5
|
| • | an unlimited number of common shares without nominal or par value; and |
| • | an unlimited number of Class A, Class B and Class 1 preferred shares without nominal or par value, issuable in series. |
| As at December 31, 2023 |
Issue date |
Annual dividend / distribution rate (1)
|
Earliest redemption date (2),(3)
|
Number of shares (in millions) |
Face amount |
Net amount (4)
|
||||||||||||||||||
2023 |
2022 |
|||||||||||||||||||||||
| Preferred shares |
||||||||||||||||||||||||
| Class A preferred shares |
||||||||||||||||||||||||
| Series 2 |
February 18, 2005 |
4.65% | n/a |
14 | $ | 350 | $ |
344 |
$ | 344 | ||||||||||||||
| Series 3 |
January 3, 2006 |
4.50% | n/a |
12 | 300 | 294 |
294 | |||||||||||||||||
| Class 1 preferred shares |
||||||||||||||||||||||||
| Series 3 (5),(6)
|
March 11, 2011 |
2.348% | June 19, 2026 |
7 | 163 | 160 |
160 | |||||||||||||||||
| Series 4 (7)
|
June 20, 2016 |
floating | June 19, 2026 |
1 | 37 | 36 |
36 | |||||||||||||||||
| Series 9 (5),(6)
|
May 24, 2012 |
5.978% | September 19, 2027 |
10 | 250 | 244 |
244 | |||||||||||||||||
| Series 11 (5),(6),(8)
|
December 4, 2012 |
6.159% | March 19, 2028 |
8 | 200 | 196 |
196 | |||||||||||||||||
| Series 13 (5),(6),(9)
|
June 21, 2013 |
6.350% | September 19, 2028 |
8 | 200 | 196 |
196 | |||||||||||||||||
| Series 15 (5),(6)
|
February 25, 2014 |
3.786% | June 19, 2024 |
8 | 200 | 195 |
195 | |||||||||||||||||
| Series 17 (5),(6)
|
August 15, 2014 |
3.800% | December 19, 2024 |
14 | 350 | 343 |
343 | |||||||||||||||||
| Series 19 (5),(6)
|
December 3, 2014 |
3.675% | March 19, 2025 |
10 | 250 | 246 |
246 | |||||||||||||||||
| Series 25 (5),(6),(10)
|
February 20, 2018 |
5.942% | June 19, 2028 |
10 | 250 | 245 |
245 | |||||||||||||||||
| Other equity instruments |
||||||||||||||||||||||||
| Limited recourse capital notes (
LRCN )(11)
|
||||||||||||||||||||||||
| Series 1 (12)
|
February 19, 2021 |
3.375% | May 19, 2026 |
n/a | 2,000 | 1,982 |
1,982 | |||||||||||||||||
| Series 2 (12)
|
November 12, 2021 |
4.100% | February 19, 2027 |
n/a | 1,200 | 1,189 |
1,189 | |||||||||||||||||
| Series 3 (12)
|
June 16, 2022 |
7.117% | June 19, 2027 |
n/a | 1,000 | 990 |
990 | |||||||||||||||||
| Total |
102 | $ | 6,750 | $ |
6,660 |
$ | 6,660 | |||||||||||||||||
|
(1) |
Holders of Class A and Class 1 preferred shares are entitled to receive non-cumulative preferential cash dividends on a quarterly basis, as and when declared by the Board of Directors. Non-deferrable distributions are payable to all LRCN holders semi-annually at the Company’s discretion. |
|
(2) |
Redemption of all preferred shares is subject to regulatory approval. MFC may redeem each series, in whole or in part, at par, on the earliest redemption date or every five years thereafter, except for Class A Series 2, Class A Series 3 and Class 1 Series 4 preferred shares. Class A Series 2 and Series 3 preferred shares are past their respective earliest redemption date and MFC may redeem these preferred shares, in whole or in part, at par at any time, subject to regulatory approval, as noted. MFC may redeem the Class 1 Series 4 preferred shares, in whole or in part, at any time, at $ 25.00 per share if redeemed on June 19, 2026 (the earliest redemption date) and on June 19 every five years thereafter, or at $25.50 per share if redeemed on any other date after June 19, 2021, subject to regulatory approval, as noted. |
|
(3) |
Redemption of all LRCN series is subject to regulatory approval. MFC may at its option redeem each series in whole or in part, at a redemption price equal to par, together with accrued and unpaid interest. The redemption period for Series 1 is every five years during the period from May 19 and including June 19, commencing in 2026. The redemption period for Series 2 is every five years during the period from February 19 and including March 19, commencing in 2027. After the first redemption date, the redemption period for Series 3 is every five years during the period from May 19 to and including June 19, commencing in 2032. |
|
(4) |
Net of after-tax issuance costs. |
|
(5) |
On the earliest redemption date and every five years thereafter, the annual dividend rate will be reset to the five-year Government of Canada bond yield plus a yield specified for each series. The specified yield for Class 1 preferred shares is: Series 3 – 1.41 %, Series 9 – 2.86 %, Series 11 – 2.61 %, Series 13 – 2.22 %, Series 15 – 2.16 %, Series 17 – 2.36 %, Series 19 – 2.30 %, and Series 25 – 2.55 %. |
|
(6) |
On the earliest redemption date and every five years thereafter, Class 1 preferred shares are convertible at the option of the holder into a new series that is one number higher than their existing series, and the holders are entitled to non-cumulative preferential cash dividends, payable quarterly if and when declared by the Board of Directors, at a rate equal to the three-month Government of Canada Treasury bill yield plus the rate specified in footnote 5 above. |
|
(7) |
The floating dividend rate for the Class 1 Series 4 shares equals the three-month Government of Canada Treasury bill yield plus 1.41%. |
|
(8) |
MFC did not exercise its right to redeem the outstanding Class 1 Shares Series 11 on March 19, 2023 , which was the earliest redemption date. The dividend rate was reset as specified in footnote 5 above to an annual fixed rate of 6.159 %, for a five-year period commencing on March 20, 2023. |
|
(9) |
MFC did not exercise its right to redeem the outstanding Class 1 Shares Series 13 on September 19, 2023, which was the earliest redemption date. The dividend rate was reset as specified in footnote 5 above to an annual fixed rate of 6.350 %, for a five-year period commencing on September 20, 2023. |
|
(10) |
MFC did not exercise its right to redeem the outstanding Class 1 Shares Series 25 on June 19, 2023, which was the earliest redemption date. The dividend rate was reset as specified in footnote 5 above to an annual fixed rate of 5.942 %, for a five-year period commencing on June 20, 2023. |
|
(11) |
Non-payment of distributions or principal on any LRCN series when due will result in a recourse event. The recourse of each noteholder will be limited to their proportionate amount of the Limited Recourse Trust’s assets which comprise of Class 1 Series 27 preferred shares for LRCN Series 1, Class 1 Series 28 preferred shares for LRCN Series 2, and Class 1 Series 29 preferred shares for LRCN Series 3. All claims of the holders of LRCN series against MFC will be extinguished upon receipt of the corresponding trust assets. The Class 1 Series 27, Class 1 Series 28, and Class 1 Series 29 preferred shares are eliminated on consolidation while being held in the Limited Recourse Trust. |
|
(12) |
The LRCN Series 1 distribute at a fixed rate of 3.375 % payable semi-annually, until June 18, 2026; on June 19, 2026 and every five years thereafter until June 19, 2076, the rate will be reset at a rate equal to the five-year Government of Canada yield as defined in the prospectus, plus 2.839%. The LRCN Series 2 distribute at a fixed rate of 4.10 % payable semi-annually, until March 18, 2027; on March 19, 2027 and every five years thereafter until March 19, 2077, the rate will be reset at a rate equal to the five-year Government of Canada yield as defined in the prospectus, plus 2.704%. The LRCN Series 3 distribute at a fixed rate of 7.117 % payable semi-annually, until June 18, 2027; on June 19, 2027 and every five years thereafter until June 19, 2077, the rate will be reset at a rate equal to the five-year Government of Canada yield as defined in the prospectus, plus 3.95%. |
2023 |
2022 |
|||||||||||||||||||
For the years ended December 31, |
Number of shares (in millions) |
Amount |
Number of shares (in millions) |
Amount |
||||||||||||||||
| Balance, beginning of year |
1,865 |
$ |
22,178 |
1,943 | $ |
23,093 | ||||||||||||||
| Repurchased for cancellation |
(63 |
) |
(745 |
) |
(79 | ) | (938 |
) | ||||||||||||
| Issued on exercise of stock options and deferred share units |
4 |
94 |
1 | 23 | ||||||||||||||||
| Balance, end of year |
1,806 |
$ |
21,527 |
1,865 | $ |
22,178 | ||||||||||||||
For the years ended December 31, |
2023 |
2022 | ||||||
| Basic earnings per common share |
$ |
2.62 |
$ |
(1.15
|
) | |||
| Diluted earnings per common share |
2.61 |
(1.15 | ) | |||||
For the years ended December 31, |
2023 |
2022 |
||||||
| Weighted average number of common shares (in millions) |
1,834 |
1,910 | ||||||
| Dilutive stock-based awards (1) (in millions) |
4 |
3 | ||||||
| Weighted average number of diluted common shares (in millions) |
1,838 |
1,913 | ||||||
|
(1) |
The dilutive effect of stock-based awards was calculated using the treasury stock method. This method calculates the number of incremental shares by assuming the outstanding stock-based awards are (i) exercised and (ii) then reduced by the number of shares assumed to be repurchased from the issuance proceeds, using the average market price of MFC common shares for the year. Excluded from the calculation was a weighted average of nil million (2022 – nil million) anti-dilutive stock-based awards. |
| |
247 |
| Class A Shares Series 2 – $ 0.29063 per share |
Class 1 Shares Series 13 – $ 0.396875 per share | |
| Class A Shares Series 3 – $ 0.28125 per share |
Class 1 Shares Series 15 – $ 0.236625 per share | |
| Class 1 Shares Series 3 – $ 0.14675 per share |
Class 1 Shares Series 17 – $ 0.2375 per share | |
| Class 1 Shares Series 4 – $ 0.402395 per share |
Class 1 Shares Series 19 – $ 0.229688 per share | |
| Class 1 Shares Series 9 – $ 0.373625 per share |
Class 1 Shares Series 25 – $ 0.371375 per share | |
| Class 1 Shares Series 11 – $ 0.384938 per share |
• |
Operating with sufficient capital to be able to honour all commitments to its policyholders and creditors with a high degree of confidence; |
• |
Retaining the ongoing confidence of regulators, policyholders, rating agencies, investors and other creditors in order to ensure access to capital markets; and |
• |
Optimizing return on capital to meet shareholders’ expectations subject to constraints and considerations of adequate levels of capital established to meet the first two objectives. |
As at December 31, |
2023 |
2022 |
||||||
| Total equity |
$ |
48,727 |
$ | 48,226 | ||||
| Exclude AOCI gain |
26 |
8 | ||||||
| Total equity excluding AOCI on cash flow hedges |
48,701 |
48,218 | ||||||
| Post-tax CSM |
18,503 |
15,251 | ||||||
| Qualifying capital instruments |
6,667 |
6,122 | ||||||
| Consolidated capital |
$ |
73,871 |
$ | 69,591 | ||||
|
248 2023 Annual Report | Notes to Consolidated Financial Statements
|
For the year ended December 31, 2023 |
Global WAM |
Asia, Canada, U.S., and Corporate and Other |
Total |
|||||||||
| Investment management and other related fees |
$ |
3,298 |
$ |
(412 |
) |
$ |
2,886 |
|||||
| Transaction processing, administration, and service fees |
2,566 |
269 |
2,835 |
|||||||||
| Distribution fees and other |
842 |
54 |
896 |
|||||||||
| Total included in other revenue |
6,706 |
(89 |
) |
6,617 |
||||||||
| Revenue from non-service lines |
3 |
126 |
129 |
|||||||||
| Total other revenue |
$ |
6,709 |
$ |
37 |
$ |
6,746 |
||||||
| Real estate management services included in net investment income |
$ |
– |
$ |
303 |
$ |
303 |
||||||
| For the year ended December 31, 2022 | Global WAM |
Asia, Canada, U.S., and Corporate and Other |
Total | |||||||||
| Investment management and other related fees |
$ | 3,079 | $ | (315 | ) | $ | 2,764 | |||||
| Transaction processing, administration, and service fees |
2,416 | 268 | 2,684 | |||||||||
| Distribution fees and other |
910 | 89 | 999 | |||||||||
| Total included in other revenue |
6,405 | 42 | 6,447 | |||||||||
| Revenue from non-service lines |
(14 | ) | (247 | ) | (261 | ) | ||||||
| Total other revenue |
$ | 6,391 | $ | (205 | ) | $ | 6,186 | |||||
| Real estate management services included in net investment income |
$ | – | $ | 305 | $ |
305 | ||||||
| |
24 9
|
2023 |
2022 |
|||||||||||||||||||
For the years ended December 31, |
Number of options (in millions) |
Weighted average exercise price |
Number of options (in millions) |
Weighted average exercise price |
||||||||||||||||
| Outstanding, January 1 |
20 |
$ |
22.42 |
21 |
$ |
22.09 |
||||||||||||||
| Exercised |
(4 |
) |
21.02 |
(1 |
) |
16.15 |
||||||||||||||
| Expired |
– |
22.60 |
– |
24.63 |
||||||||||||||||
| Forfeited |
– |
24.27 |
– |
23.96 |
||||||||||||||||
| Outstanding, December 31 |
16 |
$ |
22.73 |
20 |
$ |
22.42 |
||||||||||||||
| Exercisable, December 31 |
9 |
$ |
21.99 |
10 |
$ |
20.91 |
||||||||||||||
Options outstanding |
Options exercisable |
|||||||||||||||||||||||||||
For the year ended December 31, 2023 |
Number of options (in millions) |
Weighted average exercise price |
Weighted average remaining contractual life (in years) |
Number of options (in millions) |
Weighted average exercise price |
Weighted average remaining contractual life (in years) |
||||||||||||||||||||||
| $17.59 - $20.99 |
3 |
$ |
17.59 |
2.14 |
3 |
$ |
17.59 |
2.14 |
||||||||||||||||||||
| $21.00 - $24.73 |
13 |
$ |
23.79 |
4.49 |
6 |
$ |
23.92 |
3.09 |
||||||||||||||||||||
| Total |
16 |
$ |
22.73 |
4.09 |
9 |
$ |
21.99 |
2.80 |
||||||||||||||||||||
| For the years ended December 31, Number of DSUs (in thousands) |
2023 |
2022 |
||||||
| Outstanding, January 1 |
2,373 |
2,079 | ||||||
| Issued |
206 |
252 | ||||||
| Reinvested |
131 |
126 | ||||||
| Redeemed |
(744 |
) |
(75 | ) | ||||
| Forfeitures and cancellations |
(3 |
) |
(9 | ) | ||||
| Outstanding, December 31 |
1,963 |
2,373 | ||||||
|
250 2023 Annual Report | Notes to Consolidated Financial Statements
|
| |
2 51
|
| • | A decline in discount rates that increases the defined benefit obligations by more than the change in value of plan assets; |
| • | Lower than expected rates of mortality; and |
| • | For retiree welfare plans, higher than expected health care costs. |
Pension plans |
Retiree welfare plans |
|||||||||||||||||||
For the years ended December 31, |
2023 |
2022 |
2023 |
2022 |
||||||||||||||||
Changes in defined benefit obligation: |
||||||||||||||||||||
Opening balance |
$ |
3,794 |
$ | 4,560 | $ |
466 |
$ | 584 | ||||||||||||
Current service cost |
41 |
43 | – |
– | ||||||||||||||||
Past service cost - amendment |
– |
(6 | ) | – |
– | |||||||||||||||
Interest cost |
184 |
127 | 22 |
16 | ||||||||||||||||
Plan participants’ contributions |
– |
– | 3 |
3 | ||||||||||||||||
Actuarial losses (gains) due to: |
||||||||||||||||||||
Experience |
11 |
5 | (10 |
) |
(13 | ) | ||||||||||||||
Demographic assumption changes |
14 |
– | 1 |
– | ||||||||||||||||
Economic assumption changes |
119 |
(835 | ) | 16 |
(112 | ) | ||||||||||||||
Benefits paid |
(308 |
) |
(299 | ) | (38 |
) |
(40 | ) | ||||||||||||
Impact of changes in foreign exchange rates |
(66 |
) |
199 | (10 |
) |
28 | ||||||||||||||
Defined benefit obligation, December 31 |
$ |
3,789 |
$ | 3,794 | $ |
450 |
$ | 466 | ||||||||||||
Pension plans |
Retiree welfare plans |
|||||||||||||||||||
For the years ended December 31, |
2023 |
2022 |
2023 |
2022 |
||||||||||||||||
Change in plan assets: |
||||||||||||||||||||
Fair value of plan assets, opening balance |
$ |
3,722 |
$ | 4,510 | $ |
523 |
$ | 587 | ||||||||||||
Interest income |
181 |
127 | 25 |
16 | ||||||||||||||||
Return on plan assets (excluding interest income) |
129 |
(869 | ) | 17 |
(91 | ) | ||||||||||||||
Employer contributions |
59 |
59 | 12 |
11 | ||||||||||||||||
Plan participants’ contributions |
– |
– | 3 |
3 | ||||||||||||||||
Benefits paid |
(308 |
) |
(299 | ) | (38 |
) |
(40 | ) | ||||||||||||
Administration costs |
(10 |
) |
(11 | ) | (1 |
) |
(2 | ) | ||||||||||||
Impact of changes in foreign exchange rates |
(67 |
) |
205 | (15 |
) |
39 | ||||||||||||||
Fair value of plan assets, December 31 |
$ |
3,706 |
$ | 3,722 | $ |
526 |
$ | 523 | ||||||||||||
Pension plans |
Retiree welfare plans |
|||||||||||||||||||
As at December 31, |
2023 |
2022 |
2023 |
2022 |
||||||||||||||||
Development of net defined benefit liability |
||||||||||||||||||||
Defined benefit obligation |
$ |
3,789 |
$ | 3,794 | $ |
450 |
$ | 466 | ||||||||||||
Fair value of plan assets |
3,706 |
3,722 | 526 |
523 | ||||||||||||||||
Deficit (surplus) |
83 |
72 | (76 |
) |
(57 | ) | ||||||||||||||
Effect of asset limit (1)
|
41 |
48 | – |
– | ||||||||||||||||
Deficit (surplus) and net defined benefit liability (asset) |
124 |
120 | (76 |
) |
(57 | ) | ||||||||||||||
Deficit is comprised of: |
||||||||||||||||||||
Funded or partially funded plans |
(422 |
) |
(441 | ) | (190 |
) |
(168 | ) | ||||||||||||
Unfunded plans |
546 |
561 | 114 |
111 | ||||||||||||||||
Deficit (surplus) and net defined benefit liability (asset) |
$ |
124 |
$ | 120 | $ |
(76 |
) |
$ | (57 | ) | ||||||||||
|
(1) |
The asset limit relates to a registered pension plan in Canada. The surplus in that plan is above the present value of economic benefits that can be derived by the Company through reductions in future contributions. For other funded pension plans in surplus position, the present value of the economic benefits available in the form of reductions in future contributions to the plans r emains greater than the current surplus. |
U.S. plans |
Canadian plans |
|||||||||||||||||||||||||||||||||||
Pension plans |
Retiree welfare plans |
Pension plans |
Retiree welfare plans |
|||||||||||||||||||||||||||||||||
As at December 31, |
2023 |
2022 |
2023 |
2022 |
2023 |
2022 |
2023 |
2022 |
||||||||||||||||||||||||||||
| Active members |
$ |
526 |
$ | 509 | $ |
9 |
$ | 11 | $ |
116 |
$ | 125 | $ |
– |
$ | – | ||||||||||||||||||||
| Inactive and retired members |
1,907 |
2,006 | 327 |
344 | 1,240 |
1,154 | 114 |
111 | ||||||||||||||||||||||||||||
| Total |
$ |
2,433 |
$ | 2,515 | $ |
336 |
$ | 355 | $ |
1,356 |
$ | 1,279 | $ |
114 |
$ | 111 | ||||||||||||||||||||
| |
2 53
|
U.S. plans (1)
|
Canadian plans (2)
|
|||||||||||||||||||||||||||||||||||
Pension plans |
Retiree welfare plans |
Pension plans |
Retiree welfare plans |
|||||||||||||||||||||||||||||||||
As at December 31, 2023 |
Fair value |
% of total |
Fair value |
% of total |
Fair value |
% of total |
Fair value |
% of total |
||||||||||||||||||||||||||||
| Cash and cash equivalents |
$ |
28 |
1% |
$ |
25 |
5% |
$ |
15 |
1% |
$ |
– |
– |
||||||||||||||||||||||||
| Public equity securities (3)
|
315 |
13% |
39 |
7% |
195 |
17% |
– |
– |
||||||||||||||||||||||||||||
| Public debt securities |
1,437 |
57% |
448 |
85% |
974 |
82% |
– |
– |
||||||||||||||||||||||||||||
| Other investments (4)
|
741 |
29% |
14 |
3% |
1 |
0% |
– |
– |
||||||||||||||||||||||||||||
| Total |
$ |
2,521 |
100% |
$ |
526 |
100% |
$ |
1,185 |
100% |
$ |
– |
– |
||||||||||||||||||||||||
U.S. plans (1)
|
Canadian plans (2)
|
|||||||||||||||||||||||||||||||||||
Pension plans |
Retiree welfare plans |
Pension plans |
Retiree welfare plans |
|||||||||||||||||||||||||||||||||
As at December 31, 2022 |
Fair value |
% of total |
Fair value |
% of total |
Fair value |
% of total |
Fair value |
% of total |
||||||||||||||||||||||||||||
| Cash and cash equivalents |
$ | 35 | 1% | $ | 22 | 4% | $ | 9 | 1% | $ | – | – | ||||||||||||||||||||||||
| Public equity securities (3)
|
377 | 15% | 41 | 8% | 233 | 20% | – | – | ||||||||||||||||||||||||||||
| Public debt securities |
1,509 | 58% | 445 | 85% | 898 | 79% | – | – | ||||||||||||||||||||||||||||
| Other investments (4)
|
660 | 26% | 15 | 3% | 1 | 0% | – | – | ||||||||||||||||||||||||||||
| Total |
$ | 2,581 | 100% | $ | 523 | 100% | $ | 1,141 | 100% | $ | – | – | ||||||||||||||||||||||||
|
(1) |
The U.S. pension and retiree welfare plan assets have daily quoted prices in active markets, except for the private debt, infrastructure, private equity, real estate, timber and agriculture assets. In the aggregate, the latter assets represent approximately 16 % of all U.S. pension and retiree welfare plan assets as at December 31, 2023 (2022 – 15 %). |
|
(2) |
All the Canadian pension plan assets have daily quoted prices in active markets, except for the group annuity contract assets that represent approximately 0.1% of all Canadian pension plan assets as at December 31, 2023 (2022 – 0.1 %). |
|
(3) |
Equity securities include direct investments in MFC common shares of $ 1.4 (2022 – $1.2 ) in the U.S. retiree welfare plan. |
|
(4) |
Other U.S. plan assets include investment in real estate, private debt, infrastructure, private equity, timberland and agriculture and managed futures. Other Canadian pension plan assets include investment in the group annuity contract. |
Pension plans |
Retiree welfare plans |
|||||||||||||||||||
For the years ended December 31, |
2023 |
2022 |
2023 |
2022 |
||||||||||||||||
| Defined benefit current service cost (1)
|
$ |
41 |
$ | 43 | $ |
– |
$ | – | ||||||||||||
| Defined benefit administrative expenses |
10 |
11 | 1 |
2 | ||||||||||||||||
| Past service cost - plan amendments and curtailments |
– |
(6 | ) | – |
– | |||||||||||||||
| Service cost |
51 |
48 | 1 |
2 | ||||||||||||||||
| Interest on net defined benefit (asset) liability |
5 |
2 | (3 |
) |
– | |||||||||||||||
| Defined benefit cost |
56 |
50 | (2 |
) |
2 | |||||||||||||||
| Defined contribution cost |
93 |
85 | – |
– | ||||||||||||||||
| Net benefit cost |
$ |
149 |
$ | 135 | $ |
(2 |
) |
$ | 2 | |||||||||||
|
(1) |
There are no significant current service costs for the retiree welfare plans as they are closed and mostly frozen. The re-measurement gain or loss on these plans is due to the volatility of discount rates and investment returns. |
Pension plans |
Retiree welfare plans |
|||||||||||||||||||
For the years ended December 31, |
2023 |
2022 |
2023 |
2022 |
||||||||||||||||
| Actuarial gains (losses) on defined benefit obligations due to: |
||||||||||||||||||||
| Experience |
$ |
(11 |
) |
$ | (5 | ) | $ |
10 |
$ | 13 | ||||||||||
| Demographic assumption changes |
(14 |
) |
– | (1 |
) |
– | ||||||||||||||
| Economic assumption changes |
(119 |
) |
835 | (16 |
) |
112 | ||||||||||||||
| Return on plan assets (excluding interest income) |
129 |
(869 | ) | 17 |
(91 | ) | ||||||||||||||
| Change in effect of asset limit (excluding interest) |
10 |
(10 | ) | – |
– | |||||||||||||||
| Total re-measurement effects |
$ |
(5) |
$ | (49 | ) | $ |
10 |
$ | 34 | |||||||||||
U.S. Plans |
Canadian Plans |
|||||||||||||||||||||||||||||||||||
Pension plans |
Retiree welfare plans |
Pension plans |
Retiree welfare plans |
|||||||||||||||||||||||||||||||||
For the years ended December 31, |
2023 |
2022 |
2023 |
2022 |
2023 |
2022 |
2023 |
2022 |
||||||||||||||||||||||||||||
| To determine the defined benefit obligation at end of year (1)
: |
||||||||||||||||||||||||||||||||||||
| Discount rate |
4.8% |
5.0% | 4.8% |
5.0% | 4.6% |
5.3% | 4.7% |
5.3% | ||||||||||||||||||||||||||||
| Initial health care cost trend rate (2)
|
n/a |
n/a | 9.0% |
7.8% | n/a |
n/a | 3.9% |
5.3% | ||||||||||||||||||||||||||||
| To determine the defined benefit cost for the year (1)
: |
||||||||||||||||||||||||||||||||||||
| Discount rate |
5.0% |
2.7% | 5.0% |
2.7% | 5.3% |
3.1% | 5.3% |
3.2% | ||||||||||||||||||||||||||||
| Initial health care cost trend rate (2)
|
n/a |
n/a | 7.8% |
7.0% | n/a |
n/a | 5.3% |
5.4% | ||||||||||||||||||||||||||||
|
(1) |
Inflation and salary increase assumptions are not shown as they do not materially affect obligations and cost. |
|
(2) |
The health care cost trend rate used to measure the U.S. based retiree welfare obligation was 9.0 % grading to 4.8 % for 2041 7.8 % grading to 4.8 % for 2035 and years thereafter ) and to measure the net benefit cost was 7.8 % grading to 4.8 % for 2035 and years thereafter (2022 – 7.0 % grading to 4.5 % for 2032 and years thereafter). In Canada, the rate used to measure the retiree welfare obligation was 5.1 % in grading to 2023
and 3.9% in 2024, 4.0 % for 2029 and years thereafter (2022 – 5.3 % grading to 4.8 % for 2026 and years thereafter ) and to measure the net benefit cost was 5.3 % grading to 4.8 % for 2026 and years thereafter (2022 – 5.4 % grading to 4.8 % for 2026 and years thereafter ). |
As at December 31, 2023 |
U.S. |
Canada |
||||||
| Life expectancy (in years) for those currently age 65 |
||||||||
| Males |
22.2 |
24.3 |
||||||
| Females |
23.7 |
26.2 |
||||||
| Life expectancy (in years) at age 65 for those currently age 45 |
||||||||
| Males |
23.6 |
25.3 |
||||||
| Females |
25.0 |
27.1 |
||||||
As at December 31, 2023 |
Pension plans |
Retiree welfare plans |
||||||
| Discount rate: |
||||||||
| Impact of a 1% increase |
$ |
(274 |
) |
$ |
(38 |
) | ||
| Impact of a 1% decrease |
316 |
44 |
||||||
| Health care cost trend rate: |
||||||||
| Impact of a 1% increase |
n/a |
11 |
||||||
| Impact of a 1% decrease |
n/a |
(10 |
) | |||||
| Mortality rates (1) |
||||||||
| Impact of a 10% decrease |
89 |
6 |
||||||
|
(1) |
If the actuarial estimates of mortality are adjusted in the future to reflect unexpected decreases in mortality, the effect of a 10 % decrease in mortality rates at each future age would be an increase in life expectancy at age 65 of 0.8 years for U.S. and males and femalesCanadian
.
|
Pension plans |
Retiree welfare plans |
|||||||||||||||||||
As at December 31, |
2023 |
2022 |
2023 |
2022 |
||||||||||||||||
U.S. plans |
8.4 |
8.2 | 8.2 |
8.2 | ||||||||||||||||
Canadian plans |
9.9 |
10.6 | 11.1 |
11.1 | ||||||||||||||||
| |
2 55
|
Pension plans |
Retiree welfare plans |
|||||||||||||||||||
For the years ended December 31, |
2023 |
2022 |
2023 |
2022 |
||||||||||||||||
Defined benefit plans |
$ |
59 |
$ | 59 | $ |
12 |
$ | 11 | ||||||||||||
Defined contribution plans |
93 |
85 | – |
– | ||||||||||||||||
Total |
$ |
152 |
$ | 144 | $ |
12 |
$ | 11 | ||||||||||||
For the years ended December 31, |
2023 |
2022 |
||||||
Current tax |
||||||||
Current year |
$ |
568 |
$ | 1,098 | ||||
Adjustments related to prior years |
(193 |
) |
(263 | ) | ||||
Total current tax |
375 |
835 | ||||||
Deferred tax |
||||||||
Change related to temporary differences |
489 |
(1,975 | ) | |||||
Adjustments related to prior years |
(19 |
) |
226 | |||||
Effects of change in tax rates in Canada |
– |
(245 | ) | |||||
Total deferred tax |
470 |
(1,994 | ) | |||||
Income tax expenses (recoveries) |
$ |
845 |
$ | (1,159 | ) | |||
For the years ended December 31, |
2023 |
2022 |
||||||
Recognized in other comprehensive income |
||||||||
Current income tax expenses (recoveries) |
$ |
320 |
$ | (323 | ) | |||
Deferred income tax expenses (recoveries) |
(326 |
) |
3,034 | |||||
Total recognized in other comprehensive income |
$ |
(6 |
) |
$ | 2,711 | |||
Recognized in equity, other than other comprehensive income |
||||||||
Current income tax expenses (recoveries) |
$ |
5 |
$ | 5 | ||||
Deferred income tax expenses (recoveries) |
(4 |
) |
(8 | ) | ||||
Total income tax recognized directly in equity |
$ |
1 |
$ | (3 | ) | |||
For the years ended December 31, |
2023 |
2022 |
||||||
Net income (loss) before income taxes |
$ |
6,452 |
$ | (3,138 | ) | |||
Income tax expenses (recoveries) at Canadian statutory tax rate |
$ |
1,794 |
$ | (863 | ) | |||
Increase (decrease) in income taxes due to: |
||||||||
Tax-exempt investment income |
(199 |
) |
(206 | ) | ||||
Differences in tax rate on income not subject to tax in Canada |
(770 |
) |
118 | |||||
Adjustments to taxes related to prior years |
(212 |
) |
(37 | ) | ||||
Tax losses and temporary differences not recognized as deferred taxes |
(38 |
) |
78 | |||||
Tax rate change in Canada |
– |
(245 | ) | |||||
Other differences |
270 |
(4 | ) | |||||
Income tax expenses (recoveries) |
$ |
845 |
$ | (1,159 | ) | |||
As at December 31, |
2023 |
2022 |
||||||
Deferred tax assets |
$ |
6,739 |
$ | 6,708 | ||||
Deferred tax liabilities |
(1,697 |
) |
(1,536 | ) | ||||
Net deferred tax assets (liabilities) |
$ |
5,042 |
$ | 5,172 | ||||
For the year ended December 31, |
Balance, January 1, 2023 |
Disposals |
Recognized in income |
Recognized in other comprehensive income |
Recognized in equity |
Translation and other |
Balance, December 31, 2023 |
|||||||||||||||||||||
Loss carryforwards |
$ |
701 |
$ |
– |
$ |
(18 |
) |
$ |
– |
$ |
(8 |
) |
$ |
(5 |
) |
$ |
670 |
|||||||||||
Actuarial liabilities |
4,507 |
– |
188 |
1,198 |
– |
(80 |
) |
5,813 |
||||||||||||||||||||
Pensions and post-employment benefits |
142 |
– |
4 |
26 |
– |
(1 |
) |
171 |
||||||||||||||||||||
Tax credits |
109 |
– |
15 |
– |
– |
(2 |
) |
122 |
||||||||||||||||||||
Accrued interest |
1 |
– |
– |
– |
– |
– |
1 |
|||||||||||||||||||||
Real estate |
(1,317 |
) |
– |
168 |
– |
– |
14 |
(1,135 |
) |
|||||||||||||||||||
Lease liability |
47 |
– |
(7 |
) |
– |
– |
(2 |
) |
38 |
|||||||||||||||||||
Right of use asset and sublease receivable |
(41 |
) |
– |
7 |
– |
– |
– |
(34 |
) |
|||||||||||||||||||
Securities and other investments |
1,560 |
– |
(293 |
) |
(1,245 |
) |
2 |
62 |
86 |
|||||||||||||||||||
Sale of investments |
(30 |
) |
– |
12 |
– |
– |
– |
(18 |
) |
|||||||||||||||||||
Goodwill and intangible assets |
(828 |
) |
– |
(12 |
) |
– |
– |
18 |
(822 |
) |
||||||||||||||||||
Other |
321 |
– |
(534 |
) |
347 |
10 |
6 |
150 |
||||||||||||||||||||
Total |
$ |
5,172 |
$ |
– |
$ |
(470 |
) |
$ |
326 |
$ |
4 |
$ |
10 |
$ |
5,042 |
|||||||||||||
|
For the year ended December 31, |
Balance, January 1, 2022 |
Disposals | Recognized in income |
Recognized in other comprehensive income |
Recognized in equity |
Translation and other |
Balance, December 31, 2022 |
|||||||||||||||||||||
Loss carryforwards |
$ | 517 | $ | – | $ | 184 | $ | – | $ | – | $ | – | $ | 701 | ||||||||||||||
Actuarial liabilities |
13,731 | – | 2,334 | (12,005 | ) | 11 | 436 | 4,507 | ||||||||||||||||||||
Pensions and post-employment benefits |
161 | – | (2 | ) | (17 | ) | – | – | 142 | |||||||||||||||||||
Tax credits |
46 | – | 63 | – | – | – | 109 | |||||||||||||||||||||
Accrued interest |
1 | – | – | – | – | – | 1 | |||||||||||||||||||||
Real estate |
(1,287 | ) | – | 10 | (1 | ) | – | (39 | ) | (1,317 | ) | |||||||||||||||||
Lease liability |
26 | – | 17 | – | 3 | 1 | 47 | |||||||||||||||||||||
Right of use asset and sublease receivable |
(22 | ) | – | (18 | ) | – | (2 | ) | 1 | (41 | ) | |||||||||||||||||
Securities and other investments |
(6,484 | ) | – | (702 | ) | 8,984 | (10 | ) | (228 | ) | 1,560 | |||||||||||||||||
Sale o f inv estments |
(40 | ) | – | 10 | – | – | – | (30 | ) | |||||||||||||||||||
Goodwill and intangible assets |
(804 | ) | – | (6 | ) | – | – | (18 | ) | (828 | ) | |||||||||||||||||
Other |
209 | – | 104 | 5 | 6 | (3 | ) | 321 | ||||||||||||||||||||
Total |
$ | 6,054 | $ | – | $ | 1,994 | $ (3,034 | ) | $ | 8 | $ | 150 | $ | 5,172 | ||||||||||||||
| |
2 57
|
Company’s investment (1)
|
Company’s maximum exposure to loss (2)
|
|||||||||||||||||||
As at December 31, |
2023 |
2022 |
2023 |
2022 |
||||||||||||||||
| Leveraged leases (3)
|
$ |
3,790 |
$ | 3,840 | $ |
3,790 |
$ | 3,840 | ||||||||||||
| Infrastructure companies (4)
|
|
|
2,468
|
|
|
|
2,156 |
|
|
|
|
|
|
|
3,035
|
|
|
|
2,704 |
|
| Timberland companies (5)
|
811 |
816 | 811 |
816 | ||||||||||||||||
| Real estate companies (6)
|
676 |
465 | 676 |
465 | ||||||||||||||||
| Total |
$ |
7,745 |
$ | 7,277 | $ |
8,312 |
$ | 7,825 | ||||||||||||
(1) |
The Company’s investments in these unconsolidated SEs are included in invested assets and the Company’s returns from them are included in net investment income and OCI. |
(2) |
The Company’s maximum exposure to loss from each SE is limited to amounts invested in each, plus unfunded capital commitments, if any. The Company’s investment commitments are disclosed in note 19. The maximum loss is expected to occur only upon the entity’s bankruptcy/liquidation. |
(3) |
These entities are statutory business trusts which use capital provided by the Company and senior debt provided by other parties to finance the acquisition of assets. These assets are leased to third-party lessees under long-term leases. The Company owns equity capital in these business trusts. The Company does not consolidate any of the trusts that are party to the lease arrangements because the Company does not have decision-making power over them. |
(4) |
These entities invest in infrastructure assets. The Company invests in their equity. The Company’s returns include investment income, investment management fees, and performance fees. The Company does not control these entities because it either does not have the power to govern their financial and operating policies or does not have significant variable returns from them, or both. |
(5) |
These entities own and operate timberlands. The Company invests in their equity and debt. The Company’s returns include investment income, investment advisory fees, forestry management fees and performance advisory fees. The Company does not control these entities because it either does not have the power to govern their financial and operating policies or does not have significant variable returns from them, or both. |
(6) |
These entities, which include the Manulife U.S. REIT, own and manage commercial real estate. The Company invests in their equity. The Company’s returns include investment income, investment management fees, property management fees, acquisition/disposition fees and leasing fees. The Company does not control these entities because it either does not have the power to govern their financial and operating policies or does not have significant variable returns from them, or both. |
Company’s interests (1)
|
||||||||
As at December 31, |
2023 |
2022 |
||||||
| Manulife Finance (Delaware), L.P. (2)
|
$ |
709 |
$ | 691 | ||||
| Total |
$ |
709 |
$ | 691 | ||||
(1) |
The Company’s interests include amounts borrowed from the SE; the Company’s investment in its equity and subordinated capital; and foreign currency and interest rate swaps with it. |
(2) |
This entity is a wholly owned partnership used to facilitate the Company’s financing. Refer to notes 11 and 19. |
2023 |
2022 | |||||||||||||||||||||||
As at December 31, |
CMBS | RMBS | ABS | Total | Total | |||||||||||||||||||
AAA |
$ |
425 |
$ |
4 |
$ |
946 |
$ |
1,375 |
$ | 1,770 | ||||||||||||||
AA |
– |
– |
227 |
227 |
9 | |||||||||||||||||||
A |
– |
3 |
435 |
438 |
574 | |||||||||||||||||||
BBB |
– |
– |
107 |
107 |
219 | |||||||||||||||||||
BB and below |
– |
– |
7 |
7 |
3 | |||||||||||||||||||
Total exposure |
$ |
425 |
$ |
7 |
$ |
1,722 |
$ |
2,154 |
$ | 2,575 | ||||||||||||||
| |
2 59
|
For the year ended December 31, 2023 |
MFC (Guarantor) |
Other
subsidiaries
on a combined basis
|
Consolidation adjustments |
Total consolidated amounts |
MFLP |
|||||||||||||||||||
Insurance service result |
$ |
– |
$ |
3,977 |
$ |
– |
$ |
3,977 |
$ |
– |
||||||||||||||
Investment result |
638 |
3,646 |
(1,326) |
2,958 |
51 |
|||||||||||||||||||
Other revenue |
14 |
6,736 |
(4) |
6,746 |
(7 |
) |
||||||||||||||||||
Net income (loss) attributed to shareholders and other equity holders |
5,103 |
4,785 |
(4,785) |
5,103 |
1 |
|||||||||||||||||||
For the year ended December 31, 2022 |
MFC (Guarantor) |
Other subsidiaries on a combined basis |
Consolidation adjustments |
Total consolidated amounts |
MFLP |
|||||||||||||||||||
Insurance service result |
$ |
– |
$ |
3,160 |
$ |
– |
$ |
3,160 |
$ |
– |
||||||||||||||
Investment result |
554 |
(5,823 |
) |
(1,100 |
) |
(6,369 |
) |
49 |
||||||||||||||||
Other revenue |
(36 |
) |
6,225 |
(3 |
) |
6,186 |
15 |
|||||||||||||||||
Net income (loss) attributed to shareholders and other equity holders |
(1,933 |
) |
(2,156 |
) |
2,156 |
(1,933 |
) |
21 |
||||||||||||||||
As at December 31, 2023 |
MFC
(Guarantor)
|
Other
subsidiaries
on a combined basis
|
Consolidation
adjustments
|
Total
consolidated
amounts
|
MFLP | |||||||||||||||||||
Invested assets |
$ |
86 |
$ |
417,124 |
$ |
– |
$ |
417,210 |
$ |
9 |
||||||||||||||
Insurance contract assets |
– |
145 |
– |
145 |
– |
|||||||||||||||||||
Reinsurance contract held assets |
– |
42,651 |
– |
42,651 |
– |
|||||||||||||||||||
Total other assets |
59,023 |
42,411 |
(63,410 |
) |
38,024 |
969 |
||||||||||||||||||
Segregated funds net assets |
– |
377,544 |
– |
377,544 |
– |
|||||||||||||||||||
Insurance contract liabilities, excluding those for account of segregated fund holders |
– |
367,996 |
– |
367,996 |
– |
|||||||||||||||||||
Reinsurance contract held liabilities |
– |
2,831 |
– |
2,831 |
– |
|||||||||||||||||||
Investment contract liabilities |
– |
11,816 |
– |
11,816 |
– |
|||||||||||||||||||
Total other liabilities |
12,070 |
55,129 |
(539 |
) |
66,660 |
718 |
||||||||||||||||||
Insurance contract liabilities for account of segregated fund holders |
– |
114,143 |
– |
114,143 |
– |
|||||||||||||||||||
Investment contract liabilities for account of segregated fund holders |
– |
263,401 |
– |
263,401 |
– |
|||||||||||||||||||
As at December 31, 2022 |
MFC (Guarantor) |
Other
subsidiaries on a combined basis
|
Consolidation adjustments |
Total consolidated amounts |
MFLP |
|||||||||||||||||||
Invested assets |
$ | 63 | $ | 400,079 | $ | – | $ | 400,142 | $ | 21 | ||||||||||||||
Insurance contract assets |
– | 673 | – | 673 | – | |||||||||||||||||||
Reinsurance contract held assets |
– | 45,871 | – | 45,871 | – | |||||||||||||||||||
Total other assets |
58,357 | 42,751 | (62,667 | ) | 38,441 | 950 | ||||||||||||||||||
Segregated funds net assets |
– | 348,562 | – | 348,562 | – | |||||||||||||||||||
Insurance contract liabilities, excluding those for account of segregated fund holders |
– | 354,849 | – | 354,849 | – | |||||||||||||||||||
Reinsurance contract held liabilities |
– | 2,391 | – | 2,391 | – | |||||||||||||||||||
Investment contract liabilities |
– | 10,079 | – | 10,079 | – | |||||||||||||||||||
Total other liabilities |
11,544 | 58,482 | (444 | ) | 69,582 | 712 | ||||||||||||||||||
Insurance contract liabilities for account of segregated fund holders |
– | 110,216 | – | 110,216 | – | |||||||||||||||||||
Investment contract liabilities for account of segregated fund holders |
– | 238,346 | – | 238,346 | – | |||||||||||||||||||
2023 |
2022 |
|||||||||||||||||||
As at December 31, |
Debt securities |
Other |
Debt securities |
Other |
||||||||||||||||
| In respect of: |
||||||||||||||||||||
| Derivatives |
$ |
10,431 |
$ |
26 |
$ | 11,944 | $ | 23 | ||||||||||||
| Secured borrowings |
– |
2,220 |
– | 2,241 | ||||||||||||||||
| Regulatory requirements |
307 |
74 |
320 | 77 | ||||||||||||||||
| Repurchase agreements |
201 |
– |
886 | – | ||||||||||||||||
| Non-registered retirement plans in trust |
– |
298 |
– | 326 | ||||||||||||||||
| Other |
– |
283 |
– |
404 |
||||||||||||||||
| Total |
$ |
10,939 |
$ |
2,901 |
$ | 13,150 | $ |
3,071 | ||||||||||||
| |
2 61
|
For the year ended December 31, 2023 |
Asia |
Canada |
U.S. |
Global WAM |
Corporate and Other |
Total |
||||||||||||||||||
| Insurance service result |
||||||||||||||||||||||||
| Life, health and property and casualty insurance |
$ |
2,070 |
$ |
995 |
$ |
526 |
$ |
– |
$ |
236 |
$ |
3,827 |
||||||||||||
| Annuities and pensions |
(129 |
) |
198 |
81 |
– |
– |
150 |
|||||||||||||||||
| Total insurance service result |
1,941 |
1,193 |
607 |
– |
236 |
3,977 |
||||||||||||||||||
| Net investment income (loss) |
7,057 |
5,048 |
5,236 |
(771 |
) |
1,451 |
18,021 |
|||||||||||||||||
| Insurance finance income (expenses) |
||||||||||||||||||||||||
| Life, health and property and casualty insurance |
(4,970 |
) |
(3,288 |
) |
(4,815 |
) |
– |
723 |
(12,350 |
) | ||||||||||||||
| Annuities and pensions |
(1,466 |
) |
(27 |
) |
(51 |
) |
– |
– |
(1,544 |
) | ||||||||||||||
| Total insurance finance income (expenses) |
(6,436 |
) |
(3,315 |
) |
(4,866 |
) |
– |
723 |
(13,894 |
) | ||||||||||||||
| Reinsurance finance income (expenses) |
||||||||||||||||||||||||
| Life, health and property and casualty insurance |
(106 |
) |
58 |
385 |
– |
(697 |
) |
(360 |
) | |||||||||||||||
| Annuities and pensions |
1 |
(1 |
) |
(374 |
) |
– |
– |
(374 |
) | |||||||||||||||
| Total reinsurance finance income (expenses) |
(105 |
) |
57 |
11 |
– |
(697 |
) |
(734 |
) | |||||||||||||||
| Decrease (increase) in investment contract liabilities |
(38 |
) |
(73 |
) |
(148 |
) |
(175 |
) |
(1 |
) |
(435 |
) | ||||||||||||
| Net segregated fund investment result |
– |
– |
– |
– |
– |
– |
||||||||||||||||||
| Total investment result |
478 |
1,717 |
233 |
(946 |
) |
1,476 |
2,958 |
|||||||||||||||||
| Other revenue |
67 |
272 |
79 |
6,709 |
(381 |
) |
6,746 |
|||||||||||||||||
| Other expenses |
(231 |
) |
(569 |
) |
(153 |
) |
(4,252 |
) |
(470 |
) |
(5,675 |
) | ||||||||||||
| Interest expenses |
(11 |
) |
(1,004 |
) |
(15 |
) |
(14 |
) |
(510 |
) |
(1,554 |
) | ||||||||||||
| Net income (loss) before income taxes |
2,244 |
1,609 |
751 |
1,497 |
351 |
6,452 |
||||||||||||||||||
| Income tax reco ve ries (expenses) |
(440 |
) |
(373 |
) |
(112 |
) |
(198 |
) |
278 |
(845 |
) | |||||||||||||
| Net income (loss) |
1,804 |
1,236 |
639 |
1,299 |
629 |
5,607 |
||||||||||||||||||
| Less net income (loss) attributed to: |
||||||||||||||||||||||||
| Non-controlling interests |
141 |
– |
– |
2 |
1 |
144 |
||||||||||||||||||
| Participating policyholders |
315 |
45 |
– |
– |
– |
360 |
||||||||||||||||||
| Net income (loss) attributed to shareholders and other equity holders |
$ |
1,348 |
$ |
1,191 |
$ |
639 |
$ |
1,297 |
$ |
628 |
$ |
5,103 |
||||||||||||
| Total assets |
$ |
177,623 |
$ |
157,111 |
$ |
244,659 |
$ |
257,764 |
$ |
38,417 |
$ |
875,574 |
||||||||||||
For the year ended December 31, 2022 |
Asia |
Canada |
U.S. |
Global WAM |
Corporate and Other |
Total |
||||||||||||||||||
| Insurance service result |
||||||||||||||||||||||||
| Life, health and property and casualty insurance |
$ | 1,718 | $ | 928 | $ | 361 | $ | – | $ | (117 | ) | $ | 2,890 | |||||||||||
| Annuities and pensions |
(164 | ) | 262 | 172 | – | – | 270 | |||||||||||||||||
| Total insurance service result |
1,554 | 1,190 | 533 | – | (117 | ) | 3,160 | |||||||||||||||||
| Net investment income (loss) |
1,417 | (930 | ) | 911 | (1,082 | ) | 21 | 337 | ||||||||||||||||
| Insurance finance income (expenses) |
||||||||||||||||||||||||
| Life, health and property and casualty insurance |
608 | (723 | ) | (5,058 | ) | – | 122 | (5,051 | ) | |||||||||||||||
| Annuities and pensions |
(2,261 | ) | 504 | 191 | 1 | – | (1,565 | ) | ||||||||||||||||
| Total insurance finance income (expenses) |
(1,653 | ) | (219 | ) | (4,867 | ) | 1 | 122 | (6,616 | ) | ||||||||||||||
| Reinsurance finance income (expenses) |
||||||||||||||||||||||||
| Life, health and property and casualty insurance |
(61 | ) | (100 | ) | 994 | – | (167 | ) | 666 | |||||||||||||||
| Annuities and pensions |
(3 | ) | (2 | ) | (352 | ) | – | – | (357 | ) | ||||||||||||||
| Total reinsurance finance income (expenses) |
(64 | ) | (102 | ) | 642 | – | (167 | ) | 309 | |||||||||||||||
| Decrease (increase) in investment contract liabilities |
(70 | ) | (49 | ) | (179 | ) | (119 | ) | 18 | (399 | ) | |||||||||||||
| Net segregated fund investment result |
– | – | – | – | – | – | ||||||||||||||||||
| Total investment result |
(370 | ) | (1,300 | ) | (3,493 | ) | (1,200 | ) | (6 | ) | (6,369 | ) | ||||||||||||
| Other revenue |
56 | 262 | 101 | 6,391 | (624 | ) | 6,186 | |||||||||||||||||
| Other expenses |
(318 | ) | (573 | ) | (136 | ) | (3,893 | ) | (144 | ) | (5,064 | ) | ||||||||||||
| Interest expenses |
(12 | ) | (548 | ) | (16 | ) | (7 | ) | (468 | ) | (1,051 | ) | ||||||||||||
| Net income (loss) before income taxes |
910 | (969 | ) | (3,011 | ) | 1,291 | (1,359 | ) | (3,138 | ) | ||||||||||||||
| Income tax recoveries (expenses) |
(318 | ) | 510 | 695 | (170 | ) | 442 | 1,159 | ||||||||||||||||
| Net income (loss) |
592 | (459 | ) | (2,316 | ) | 1,121 | (917 | ) | (1,979 | ) | ||||||||||||||
| Less net income (loss) attributed to: |
||||||||||||||||||||||||
| Non-controlling interests |
120 | – | – | – | 1 | 121 | ||||||||||||||||||
| Participating policyholders |
(211 | ) | 44 | – | – | – | (167 | ) | ||||||||||||||||
| Net income (loss) attributed to shareholders and other equity holders |
$ | 683 | $ | (503 | ) | $ | (2,316 | ) | $ | 1,121 | $ | (918 | ) | $ | (1,933 | ) | ||||||||
| Total assets |
$ | 164,605 | $ | 151,761 | $ | 244,904 | $ | 231,433 | $ | 40,986 | $ | 833,689 | ||||||||||||
For the year ended December 31, 2023 |
Asia |
Canada |
U.S. |
Other |
Total |
|||||||||||||||
Insurance service result |
||||||||||||||||||||
Life, health and property and casualty insurance |
$ |
2,087 |
$ |
981 |
$ |
511 |
$ |
248 |
$ |
3,827 |
||||||||||
Annuities and pensions |
(128 |
) |
198 |
80 |
– |
150 |
||||||||||||||
Total insurance service result |
1,959 |
1,179 |
591 |
248 |
3,977 |
|||||||||||||||
Net investment income (loss) |
7,259 |
5,724 |
4,975 |
63 |
18,021 |
|||||||||||||||
Insurance finance income (expenses) |
||||||||||||||||||||
Life, health and property and casualty insurance |
(4,971 |
) |
(2,606 |
) |
(4,793 |
) |
20 |
(12,350 |
) |
|||||||||||
Annuities and pensions |
(1,466 |
) |
(27 |
) |
(51 |
) |
– |
(1,544 |
) |
|||||||||||
Total insurance finance income (expenses) |
(6,437 |
) |
(2,633 |
) |
(4,844 |
) |
20 |
(13,894 |
) |
|||||||||||
Reinsurance finance income (expenses) |
||||||||||||||||||||
Life, health and property and casualty insurance |
(121 |
) |
(623 |
) |
384 |
– |
(360 |
) |
||||||||||||
Annuities and pensions |
1 |
(1 |
) |
(374 |
) |
– |
(374 |
) |
||||||||||||
Total reinsurance finance income (expenses) |
(120 |
) |
(624 |
) |
10 |
– |
(734 |
) |
||||||||||||
Decrease (increase) in investment contract liabilities |
(220 |
) |
(130 |
) |
(79 |
) |
(6 |
) |
(435 |
) |
||||||||||
Net segregated fund investment result |
– |
– |
– |
– |
– |
|||||||||||||||
Total investment result |
$ |
482 |
$ |
2,337 |
$ |
62 |
$ |
77 |
$ |
2,958 |
||||||||||
Other revenue |
$ |
1,332 |
$ |
2,147 |
$ |
3,239 |
$ |
28 |
$ |
6,746 |
||||||||||
| |
2 63
|
For the year ended December 31, 2022 |
Asia |
Canada |
U.S. |
Other |
Total |
|||||||||||||||
Insurance service result |
||||||||||||||||||||
Life, health and property and casualty insurance |
$ | 1,873 | $ | 909 | $ | 208 | $ | (100 | ) | $ | 2,890 | |||||||||
Annuities and pensions |
(164 | ) | 262 | 172 | – | 270 | ||||||||||||||
Total insurance service result |
1,709 | 1,171 | 380 | (100 | ) | 3,160 | ||||||||||||||
Net investment income (loss) |
1,264 | (1,061 | ) | (189 | ) | 323 | 337 | |||||||||||||
Insurance finance income (expenses) |
||||||||||||||||||||
Life, health and property and casualty insurance |
607 | (578 | ) | (5,088 | ) | 8 | (5,051 | ) | ||||||||||||
Annuities and pensions |
(2,261 | ) | 504 | 192 | – | (1,565 | ) | |||||||||||||
Total insurance finance income (expenses) |
(1,654 | ) | (74 | ) | (4,896 | ) | 8 | (6,616 | ) | |||||||||||
Reinsurance finance income (expenses) |
||||||||||||||||||||
Life, health and property and casualty insurance |
(74 | ) | (254 | ) | 994 | – | 666 | |||||||||||||
Annuities and pensions |
(3 | ) | (2 | ) | (352 | ) | – | (357 | ) | |||||||||||
Total reinsurance finance income (expenses) |
(77 | ) | (256 | ) | 642 | – | 309 | |||||||||||||
Decrease (increase) in investment contract liabilities |
(126 | ) | (79 | ) | (194 | ) | – | (399 | ) | |||||||||||
Net segregated fund investment result |
– | – | – | – | – | |||||||||||||||
Total investment result |
$ | (593 | ) | $ | (1,470 | ) | $ | (4,637 | ) | $ | 331 | $ | (6,369 | ) | ||||||
Other revenue |
$ | 1,294 | $ | 2,044 | $ | 2,907 | $ | (59 | ) | $ | 6,186 | |||||||||
For the years ended December 31, |
2023 |
2022 | ||||||
Short-term employee benefits |
$ |
83 |
$ |
73 | ||||
Post-employment benefits |
6 |
6 | ||||||
Share-based payments |
73 |
73 | ||||||
Termination benefits |
3 |
– | ||||||
Other long-term benefits |
3 |
3 | ||||||
Total |
$ |
168 |
$ | 155 | ||||
|
As at December 31, 2023 (100% owned unless otherwise noted in brackets beside company name) |
Equity interest |
Address |
Description |
|||||
The Manufacturers Life Insurance Company |
$ |
58,655 |
Toronto, Canada |
A leading financial services group with principal operations in Asia, Canada and the United States that offers a diverse range of financial protection products and wealth management services |
||||
Manulife Holdings (Alberta) Limited |
$ |
18,489 |
Calgary, Canada |
Holding company |
||||
John Hancock Financial Corporation |
Boston, U.S.A. |
Holding company |
||||||
The Manufacturers Investment Corporation |
Boston, U.S.A. |
Holding company |
||||||
John Hancock Reassurance Company Ltd. |
Boston, U.S.A. |
Captive insurance subsidiary that provides life, annuity and long-term care reinsurance to affiliates |
||||||
John Hancock Life Insurance Company (U.S.A.) |
Boston, U.S.A. |
U.S. life insurance company licensed in all states, except New York |
||||||
John Hancock Subsidiaries LLC |
Boston, U.S.A. |
Holding company |
||||||
John Hancock Financial Network, Inc. |
Boston, U.S.A. |
Financial services distribution organization |
||||||
John Hancock Investment Management LLC |
Boston, U.S.A. |
Investment advisor |
||||||
John Hancock Investment Management Distributors LLC |
Boston, U.S.A. |
Broker-dealer |
||||||
Manulife Investment Management (US) LLC |
Boston, U.S.A. |
Investment advisor |
||||||
Manulife Investment Management Timberland and Agriculture Inc. |
Boston, U.S.A. |
Manager of globally diversified timberland and agricultural portfolios |
||||||
John Hancock Life Insurance Company of New York |
New York, U.S.A. |
U.S. life insurance company licensed in New York |
||||||
John Hancock Variable Trust Advisers LLC |
Boston, U.S.A. |
Investment advisor for open-end mutual funds |
||||||
John Hancock Life & Health Insurance Company |
Boston, U.S.A. |
U.S. life insurance company licensed in all states |
||||||
John Hancock Distributors LLC |
Boston, U.S.A. |
Broker-dealer |
||||||
John Hancock Insurance Agency, Inc. |
Boston, U.S.A. |
Insurance agency |
||||||
Manulife Reinsurance Limited |
Hamilton, Bermuda |
Provides life and financial reinsurance to affiliates |
||||||
Manulife Reinsurance (Bermuda) Limited |
Hamilton, Bermuda |
Provides life and financial reinsurance to affiliates |
||||||
Manulife Bank of Canada |
$ |
1,793 |
Waterloo, Canada |
Provides integrated banking products and service options not available from an insurance company |
||||
Manulife Investment Management Holdings (Canada) Inc. |
$ |
1,318 |
Toronto, Canada |
Holding company |
||||
Manulife Investment Management Limited |
Toronto, Canada |
Provides investment counseling, portfolio and mutual fund management in Canada |
||||||
First North American Insurance Company |
$ |
7 |
Toronto, Canada |
Property and casualty insurance company |
||||
Manulife Securities Investment Services Inc. |
$ |
84 |
Oakville, Canada |
Mutual fund dealer for Canadian operations |
||||
Manulife Holdings (Bermuda) Limited |
$ |
20,695 |
Hamilton, Bermuda |
Holding company |
||||
Manufacturers P&C Limited |
St. Michael, Barbados |
Provides property and casualty reinsurance |
||||||
Manulife Financial Asia Limited |
Hong Kong, China |
Holding company |
||||||
Manulife (Cambodia) PLC |
Phnom Penh, Cambodia |
Life insurance company |
||||||
Manulife Myanmar Life Insurance Company Limited |
Yangon, Myanmar |
Life insurance company |
||||||
Manufacturers Life Reinsurance Limited |
St. Michael, Barbados |
Provides life and annuity reinsurance to affiliates |
||||||
Manulife (Vietnam) Limited |
Ho Chi Minh City, Vietnam |
Life insurance company |
||||||
Manulife Investment Fund Management (Vietnam) Company Limited |
Ho Chi Minh City, Vietnam |
Fund management company |
||||||
Manulife International Holdings Limited |
Hong Kong, China |
Holding company |
||||||
Manulife (International) Limited |
Hong Kong, China |
Life insurance company |
||||||
Manulife-Sinochem Life Insurance Co. Ltd. (51%) |
Shanghai, China |
Life insurance company |
||||||
Manulife Investment Management International Holdings Limited |
Hong Kong, China |
Holding company |
||||||
Manulife Investment Management (Hong Kong) Limited |
Hong Kong, China |
Investment management and advisory company marketing mutual funds |
||||||
| |
2 65
|
| As at December 31, 2023 (100% owned unless otherwise noted in brackets beside company name) |
Equity interest |
Address |
Description | |||||
| Manulife Investment Management (Taiwan) Co., Ltd. |
Taipei, Taiwan (China) |
Investment management company | ||||||
| Manulife Life Insurance Company (Japan) |
Tokyo, Japan |
Life insurance company | ||||||
| Manulife Investment Management (Japan) Limited |
Tokyo, Japan |
Investment management and advisory company and mutual fund business | ||||||
| Manulife Holdings Berhad (62.0%) |
Kuala Lumpur, Malaysia |
Holding company | ||||||
| Manulife Insurance Berhad (62.0%) |
Kuala Lumpur, Malaysia |
Life insurance company | ||||||
| Manulife Investment Management (Malaysia) Berhad (62.0%) |
Kuala Lumpur, Malaysia |
Asset management company | ||||||
| Manulife (Singapore) Pte. Ltd. |
Singapore |
Life insurance company | ||||||
| Manulife Investment Management (Singapore) Pte. Ltd. |
Singapore |
Asset management company | ||||||
| Manulife Fund Management Co., Ltd. |
Beijing, China |
Mutual fund company in China | ||||||
| The Manufacturers Life Insurance Co. (Phils.), Inc. |
Makati City, Philippines |
Life insurance company | ||||||
| Manulife Chinabank Life Assurance Corporation (60%) |
Makati City, Philippines |
Life insurance company | ||||||
| PT Asuransi Jiwa Manulife Indonesia |
Jakarta, Indonesia |
Life insurance company | ||||||
| PT Manulife Aset Manajemen Indonesia |
Jakarta, Indonesia |
Investment management and investment advisor | ||||||
| Manulife Investment Management (Europe) Limited |
$ |
42 |
London, England |
Investment management company providing advisory services for Manulife Investment Management’s funds, internationally | ||||
| Manulife Assurance Company of Canada |
$ |
66 |
Toronto, Canada |
Life insurance company | ||||
| EIS Services (Bermuda) Limited |
$ |
1,028 |
Hamilton, Bermuda |
Investment holding company | ||||
| Berkshire Insurance Services Inc. |
$ |
1,968 |
Toronto, Canada |
Investment holding company | ||||
| JH Investments (Delaware) LLC |
Boston, U.S.A. |
Investment holding company | ||||||
| Manulife Securities Incorporated |
$ |
213 |
Oakville, Canada |
Investment dealer | ||||
| Manulife Investment Management (North America) Limited |
$ |
4 |
Toronto, Canada |
Investment advisor | ||||
| |
2 67
|
As at December 31, 2023 |
MFC (Guarantor) |
JHUSA (Issuer) |
Other subsidiaries |
Consolidation adjustments |
Consolidated MFC |
|||||||||||||||
| Assets |
||||||||||||||||||||
| Invested assets |
$ |
86 |
$ |
109,433 |
$ |
307,930 |
$ |
(239 |
) |
$ |
417,210 |
|||||||||
| Investments in unconsolidated subsidiaries |
58,694 |
8,674 |
17,916 |
(85,284 |
) |
– |
||||||||||||||
| Insurance contract assets |
– |
– |
217 |
(72 |
) |
145 |
||||||||||||||
| Reinsurance contract held assets |
– |
42,418 |
10,380 |
(10,147 |
) |
42,651 |
||||||||||||||
| Other assets |
329 |
8,731 |
32,700 |
(3,736 |
) |
38,024 |
||||||||||||||
| Segregated funds net assets |
– |
188,067 |
191,241 |
(1,764 |
) |
377,544 |
||||||||||||||
| Total assets |
$ |
59,109 |
$ |
357,323 |
$ |
560,384 |
$ |
(101,242 |
) |
$ |
875,574 |
|||||||||
| Liabilities and equity |
||||||||||||||||||||
| Insurance contract liabilities, excluding those for account of segregated fund holders |
$ |
– |
$ |
145,589 |
$ |
232,972 |
$ |
(10,565 |
) |
$ |
367,996 |
|||||||||
| Reinsurance contract held liabilities |
– |
– |
2,831 |
– |
2,831 |
|||||||||||||||
| Investment contract liabilities |
– |
3,487 |
8,928 |
(599 |
) |
11,816 |
||||||||||||||
| Other liabilities |
573 |
5,869 |
51,266 |
(3,786 |
) |
53,922 |
||||||||||||||
| Long-term debt |
6,071 |
– |
– |
– |
6,071 |
|||||||||||||||
| Capital instruments |
5,426 |
594 |
647 |
– |
6,667 |
|||||||||||||||
| Insurance contract liabilities for account of segregated fund holders |
– |
51,719 |
62,424 |
– |
114,143 |
|||||||||||||||
| Investment contract liabilities for account of segregated fund holders |
– |
136,348 |
128,817 |
(1,764 |
) |
263,401 |
||||||||||||||
| Shareholders’ and other equity |
47,039 |
13,773 |
70,755 |
(84,528 |
) |
47,039 |
||||||||||||||
| Participating policyholders’ equity |
– |
(56 |
) |
313 |
– |
257 |
||||||||||||||
| Non-controlling interests |
– |
– |
1,431 |
– |
1,431 |
|||||||||||||||
| Total liabilities and equity |
$ |
59,109 |
$ |
357,323 |
$ |
560,384 |
$ |
(101,242 |
) |
$ |
875,574 |
|||||||||
| Restated (note 2) | ||||||||||||||||||||
| As at December 31, 2022 | MFC (Guarantor) |
JHUSA (Issuer) |
Other subsidiaries |
Consolidation adjustments |
Consolidated MFC |
|||||||||||||||
| Assets |
||||||||||||||||||||
| Invested assets |
$ | 63 | $ | 109,332 | $ | 291,266 | $ | (519 | ) | $ | 400,142 | |||||||||
| Investments in unconsolidated subsidiaries |
58,024 | 8,584 | 18,018 | (84,626 | ) | – | ||||||||||||||
| Insurance contract assets |
– | – | 739 | (66 | ) | 673 | ||||||||||||||
| Reinsurance contract held assets |
– | 44,849 | 11,215 | (10,193 | ) | 45,871 | ||||||||||||||
| Other assets |
333 | 8,899 | 33,082 | (3,873 | ) | 38,441 | ||||||||||||||
| Segregated funds net assets |
– | 173,417 | 177,361 | (2,216 | ) | 348,562 | ||||||||||||||
| Total assets |
$ | 58,420 | $ | 345,081 | $ | 531,681 | $ | (101,493 | ) | $ | 833,689 | |||||||||
| Liabilities and equity |
||||||||||||||||||||
| Insurance contract liabilities, excluding those for account of segregated fund holders |
$ | – | $ | 147,440 | $ | 217,942 | $ | (10,533 | ) | $ | 354,849 | |||||||||
| Reinsurance contract held liabilities |
– | – | 2,391 | – | 2,391 | |||||||||||||||
| Investment contract liabilities |
– | 2,585 | 8,207 | (713 | ) | 10,079 | ||||||||||||||
| Other liabilities |
450 | 7,206 | 53,186 | (3,616 | ) | 57,226 | ||||||||||||||
| Long-term debt |
6,234 | – | – | – | 6,234 | |||||||||||||||
| Capital instruments |
4,860 | 614 | 648 | – | 6,122 | |||||||||||||||
| Insurance contract liabilities for account of segregated fund holders |
– | 49,947 | 60,269 | – | 110,216 | |||||||||||||||
| Investment contract liabilities for account of segregated fund holders |
– | 123,470 | 117,092 | (2,216 | ) | 238,346 | ||||||||||||||
| Shareholders’ and other equity |
46,876 | 13,865 | 70,550 | (84,415 | ) | 46,876 | ||||||||||||||
| Participating policyholders’ equity |
– | (46 | ) | (31 | ) | – | (77 | ) | ||||||||||||
| Non-controlling interests |
– | – | 1,427 | – | 1,427 | |||||||||||||||
| Total liabilities and equity |
$ | 58,420 | $ | 345,081 | $ | 531,681 | $ | (101,493 | ) | $ | 833,689 | |||||||||
For the year ended December 31, 2023 |
MFC (Guarantor) |
JHUSA (Issuer) |
Other subsidiaries |
Consolidation adjustments |
Consolidated MFC |
|||||||||||||||
| Insurance service result |
||||||||||||||||||||
| Insurance revenue |
$ |
– |
$ |
9,858 |
$ |
15,754 |
$ |
(1,640 |
) |
$ |
23,972 |
|||||||||
| Insurance service expenses |
– |
(8,928 |
) |
(12,195 |
) |
1,741 |
(19,382 |
) | ||||||||||||
| Net expenses from reinsurance contracts held |
– |
(315 |
) |
(175 |
) |
(123 |
) |
(613 |
) | |||||||||||
| Total insurance service result |
– |
615 |
3,384 |
(22 |
) |
3,977 |
||||||||||||||
| Investment result |
||||||||||||||||||||
| Net investment income (loss) |
638 |
4,232 |
14,179 |
(1,028 |
) |
18,021 |
||||||||||||||
| Insurance / reinsurance finance income (expenses) |
– |
(4,723 |
) |
(9,993 |
) |
88 |
(14,628 |
) | ||||||||||||
| Other investment result |
– |
100 |
(432 |
) |
(103 |
) |
(435 |
) | ||||||||||||
| Total investment result |
638 |
(391 |
) |
3,754 |
(1,043 |
) |
2,958 |
|||||||||||||
| Other revenue |
14 |
790 |
6,384 |
(442 |
) |
6,746 |
||||||||||||||
| Other expenses |
(55 |
) |
(1,112 |
) |
(4,776 |
) |
268 |
(5,675 |
) | |||||||||||
| Interest expenses |
(433 |
) |
(79 |
) |
(2,281 |
) |
1,239 |
(1,554 |
) | |||||||||||
| Net income (loss) before income taxes |
164 |
(177 |
) |
6,465 |
– |
6,452 |
||||||||||||||
| Income tax (expenses) recoveries |
7 |
175 |
(1,027 |
) |
– |
(845 |
) | |||||||||||||
| Net income (loss) after income taxes |
171 |
(2 |
) |
5,438 |
– |
5,607 |
||||||||||||||
| Equity in net income (loss) of unconsolidated subsidiaries |
4,932 |
811 |
809 |
(6,552 |
) |
– |
||||||||||||||
| Net income (loss) |
$ |
5,103 |
$ |
809 |
$ |
6,247 |
$ |
(6,552 |
) |
$ |
5,607 |
|||||||||
| Net income (loss) attributed to: |
||||||||||||||||||||
| Non-controlling interests |
$ |
– |
$ |
– |
$ |
144 |
$ |
– |
$ |
144 |
||||||||||
| Participating policyholders |
– |
(74 |
) |
360 |
74 |
360 |
||||||||||||||
| Shareholders and other equity holders |
5,103 |
883 |
5,743 |
(6,626 |
) |
5,103 |
||||||||||||||
$ |
5,103 |
$ |
809 |
$ |
6,247 |
$ |
(6,552 |
) |
$ |
5,607 |
||||||||||
Restated (note 2) |
||||||||||||||||||||
For the year ended December 31, 2022 |
MFC (Guarantor) |
JHUSA (Issuer) |
Other subsidiaries |
Consolidation adjustments |
Consolidated MFC |
|||||||||||||||
| Insurance service result |
||||||||||||||||||||
| Insurance revenue |
$ | – | $ | 9,946 | $ | 14,760 | $ | (1,588 | ) | $ | 23,118 | |||||||||
| Insurance service expenses |
– | (10,652 | ) |
(12,417 | ) | 3,734 | (19,335 | ) | ||||||||||||
| Net expenses from reinsurance contracts held |
– | (570 | ) |
281 | (334 | ) | (623 | ) | ||||||||||||
| Total insurance service result |
– | (1,276 | ) |
2,624 | 1,812 | 3,160 | ||||||||||||||
| Investment result |
||||||||||||||||||||
| Net investment income (loss) |
554 | (53 | ) |
781 | (945 | ) | 337 | |||||||||||||
| Insurance / reinsurance finance income (expenses) |
– | (325 | ) |
(4,376 | ) | (1,606 | ) | (6,307 | ) | |||||||||||
| Other investment result |
– | 36 | (426 | ) | (9 | ) | (399 | ) | ||||||||||||
| Total investment result |
554 | (342 | ) |
(4,021 | ) | (2,560 | ) | (6,369 | ) | |||||||||||
| Other revenue |
(36 | ) | 505 | 6,181 | (464 | ) | 6,186 | |||||||||||||
| Other expenses |
(42 | ) | (841 | ) |
(4,455 | ) | 274 | (5,064 | ) | |||||||||||
| Interest expenses |
(439 | ) | (54 | ) |
(1,496 | ) | 938 | (1,051 | ) | |||||||||||
| Net income (loss) before income taxes |
37 | (2,008 | ) |
(1,167 | ) | – | (3,138 | ) | ||||||||||||
| Income tax (expenses) recoveries |
32 | 624 | 503 | – | 1,159 | |||||||||||||||
| Net income (loss) after income taxes |
69 | (1,384 | ) |
(664 | ) | – | (1,979 | ) | ||||||||||||
| Equity in net income (loss) of unconsolidated subsidiaries |
(2,002 | ) | 638 | (746 | ) | 2,110 | – | |||||||||||||
| Net income (loss) |
$ | (1,933 | ) | $ | (746 | ) |
$ | (1,410 | ) | $ | 2,110 | $ | (1,979 | ) | ||||||
| Net income (loss) attributed to: |
||||||||||||||||||||
| Non-controlling interests |
$ | – | $ | – | $ | 121 | $ | – | $ | 121 | ||||||||||
| Participating policyholders |
– | (530 | ) |
288 | 75 | (167 | ) | |||||||||||||
| Shareholde rs a nd other equity holders |
(1,933 | ) | (216 | ) |
(1,819 | ) | 2,035 | (1,933 | ) | |||||||||||
| $ | (1,933 | ) | $ | (746 | ) |
$ | (1,410 | ) | $ | 2,110 | $ | (1,979 | ) | |||||||
| |
2 69
|
For the year ended December 31, 2023 |
MFC (Guarantor) |
JHUSA (Issuer) |
Other subsidiaries |
Consolidation adjustments |
Consolidated MFC |
|||||||||||||||
| Operating activities |
||||||||||||||||||||
| Net income (loss) |
$ |
5,103 |
$ |
809 |
$ |
6,247 |
$ |
(6,552 |
) |
$ |
5,607 |
|||||||||
| Adjustments: |
||||||||||||||||||||
| Equity in net income of unconsolidated subsidiaries |
(4,932 |
) |
(811 |
) |
(809 |
) |
6,552 |
– |
||||||||||||
| Increase (decrease) in net insurance contract liabilities |
– |
455 |
10,242 |
– |
10,697 |
|||||||||||||||
| Increase (decrease) in investment contract liabilities |
– |
(112 |
) |
547 |
– |
435 |
||||||||||||||
| (Increase) decrease in reinsurance contract assets, excluding reinsurance transactions |
– |
28 |
946 |
– |
974 |
|||||||||||||||
| Amortization of (premium) discount on invested assets |
– |
30 |
(171 |
) |
– |
(141 |
) | |||||||||||||
| Contractual service margin (“CSM”) amortization |
– |
(455 |
) |
(1,543 |
) |
– |
(1,998 |
) | ||||||||||||
| Other amortization |
10 |
147 |
424 |
– |
581 |
|||||||||||||||
| Net realized and unrealized (gains) losses and impairment on assets |
3 |
471 |
(3,319 |
) |
– |
(2,845 |
) | |||||||||||||
| Deferred income tax expenses (recoveries) |
(11 |
) |
(141 |
) |
622 |
– |
470 |
|||||||||||||
| Stock option expense |
– |
(3 |
) |
5 |
– |
2 |
||||||||||||||
| Cash provided by (used in) operating activities before undernoted items |
173 |
418 |
13,191 |
– |
13,782 |
|||||||||||||||
| Dividends from unconsolidated subsidiaries
|
5,600 |
386 |
(679 |
) |
(5,307 |
) |
– |
|||||||||||||
| Changes in policy related and operating receivables and payables |
(4 |
) |
(649 |
) |
7,294 |
– |
6,641 |
|||||||||||||
| Cash provided by (used in) operating activities |
5,769 |
155 |
19,806 |
(5,307 |
) |
20,423 |
||||||||||||||
| Investing activities |
||||||||||||||||||||
| Purchases and mortgage advances |
– |
(15,165 |
) |
(68,856 |
) |
– |
(84,021 |
) | ||||||||||||
| Disposals and repayments |
– |
16,159 |
54,122 |
– |
70,281 |
|||||||||||||||
| Changes in investment broker net receivables and payables |
– |
12 |
9 |
– |
21 |
|||||||||||||||
| Net cash increase (decrease) from sale (purchase) of subsidiaries
|
– |
– |
(1 |
) |
– |
(1 |
) | |||||||||||||
| Investment in common shares of subsidiaries |
(1,843 |
) |
– |
– |
1,843 |
– |
||||||||||||||
| Capital contribution to unconsolidated subsidiaries |
|
|
–
|
|
|
|
(1
|
) |
|
|
–
|
|
|
|
1
|
|
|
|
–
|
|
| Return of capital from unconsolidated subsidiaries |
|
|
–
|
|
|
|
5
|
|
|
|
–
|
|
|
|
(5 |
) |
|
|
–
|
|
| Notes receivable from parent |
– |
– |
(4 |
) |
4 |
– |
||||||||||||||
| Notes receivable from subsidiaries |
(25 |
) |
– |
– |
25 |
– |
||||||||||||||
| Cash provided by (used in) investing activities |
(1,868 |
) |
1,010 |
(14,730 |
) |
1,868 |
(13,720 |
) | ||||||||||||
| Financing activities |
||||||||||||||||||||
| Change in repurchase agreements and securities sold but not yet purchased |
– |
– |
(693 |
) |
– |
(693 |
) | |||||||||||||
| Issue of capital instruments, net |
1,194 |
– |
– |
– |
1,194 |
|||||||||||||||
| Redemption of capital instruments |
(600 |
) |
– |
– |
– |
(600 |
) | |||||||||||||
| Secured borrowing from securitization transactions |
– |
– |
537 |
– |
537 |
|||||||||||||||
| Changes in deposits from Bank clients, net |
– |
– |
(895 |
) |
– |
(895 |
) | |||||||||||||
| Lease payments |
– |
(3 |
) |
(95 |
) |
– |
(98 |
) | ||||||||||||
| Shareholders’ dividends and other equity distributions |
(2,972 |
) |
– |
– |
– |
(2,972 |
) | |||||||||||||
| Common shares repurchased |
(1,595 |
) |
– |
– |
– |
(1,595 |
) | |||||||||||||
| Common shares issued, net |
94 |
– |
1,843 |
(1,843 |
) |
94 |
||||||||||||||
| Contributions from (distributions to) non-controlling interests, net |
– |
– |
(14 |
) |
– |
(14 |
) | |||||||||||||
| Dividends paid to parent |
– |
679 |
(5,986 |
) |
5,307 |
– |
||||||||||||||
| Capital contributions by parent |
|
|
–
|
|
|
|
–
|
|
|
|
1
|
|
|
|
(1 |
) |
|
|
–
|
|
| Return of capital to parent |
|
|
–
|
|
|
|
–
|
|
|
|
(5 |
) |
|
|
5
|
|
|
|
–
|
|
| Notes payable to parent |
– |
– |
25 |
(25 |
) |
– |
||||||||||||||
| Notes payable to subsidiaries |
4 |
– |
– |
(4 |
) |
– |
||||||||||||||
| Cash provided by (used in) financing activities |
(3,875 |
) |
676 |
(5,282 |
) |
3,439 |
(5,042 |
) | ||||||||||||
| Cash and short-term securities |
||||||||||||||||||||
| Increase (decrease) during the year |
26 |
1,841 |
(206 |
) |
– |
1,661 |
||||||||||||||
| Effect of foreign exchange rate changes on cash and short-term securities |
(3 |
) |
(52 |
) |
(357 |
) |
– |
(412 |
) | |||||||||||
| Balance, beginning of year |
63 |
2,215 |
16,357 |
– |
18,635 |
|||||||||||||||
| Balance, end of year |
86 |
4,004 |
15,794 |
– |
19,884 |
|||||||||||||||
| Cash and short-term securities |
||||||||||||||||||||
| Beginning of year |
||||||||||||||||||||
| Gross cash and short-term securities |
63 |
2,614 |
16,476 |
– |
19,153 |
|||||||||||||||
| Net payments in transit, included in other liabilities |
– |
(399 |
) |
(119 |
) |
– |
(518 |
) | ||||||||||||
| Net cash and short-term securities, beginning of year |
63 |
2,215 |
16,357 |
– |
18,635 |
|||||||||||||||
| End of year |
||||||||||||||||||||
| Gross cash and short-term securities |
86 |
4,329 |
15,923 |
– |
20,338 |
|||||||||||||||
| Net payments in transit, included in other liabilities |
– |
(325 |
) |
(129 |
) |
– |
(454 |
) | ||||||||||||
| Net cash and short-term securities, end of year |
$ |
86 |
$ |
4,004 |
$ |
15,794 |
$ |
– |
$ |
19,884 |
||||||||||
| Supplemental disclosures on cash flow information: |
||||||||||||||||||||
| Interest received |
$ |
650 |
$ |
3,369 |
$ |
10,166 |
$ |
(1,417 |
) |
$ |
12,768 |
|||||||||
| Interest paid |
418 |
115 |
2,432 |
(1,417 |
) |
1,548 |
||||||||||||||
| Income taxes paid (refund) |
2 |
(1 |
) |
435 |
– |
436 |
||||||||||||||
Restated (note 2) |
||||||||||||||||||||
For the year ended December 31, 2022 |
MFC (Guarantor) |
JHUSA (Issuer) |
Other subsidiaries |
Consolidation adjustments |
Consolidated MFC |
|||||||||||||||
| Operating activities |
||||||||||||||||||||
| Net income (loss) |
$ | (1,933 | ) | $ | (746 | ) | $ | (1,410 | ) | $ | 2,110 | $ | (1,979 | ) | ||||||
| Adjustments: |
||||||||||||||||||||
| Equity in net income of unconsolidated subsidiaries |
2,002 | (638 | ) | 746 | (2,110 | ) | – | |||||||||||||
| Increase (decrease) in net insurance contract liabilities |
– | 2,051 | 2,965 | – | 5,016 | |||||||||||||||
| Increase (decrease) in investment contract liabilities |
– | (111 | ) | 510 | – | 399 | ||||||||||||||
| (Increase) decrease in reinsurance contract assets, excluding reinsurance transactions |
– | 2 | 708 | – | 710 | |||||||||||||||
| Amortization of (premium) discount on invested assets |
– | 33 | (164 | ) | – | (131 | ) | |||||||||||||
| Contractual service margin (“CSM”) amortization |
– | (578 | ) | (1,415 | ) | – | (1,993 | ) | ||||||||||||
| Other amortization |
9 | 156 | 354 | – | 519 | |||||||||||||||
| Net realized and unrealized (gains) losses and impairment on assets |
(36 | ) | 4,854 | 8,842 | – | 13,660 | ||||||||||||||
| Gain on U.S. variable annuity reinsurance transaction (pre-tax) |
– | (1,026 | ) | (44 | ) | – | (1,070 | ) | ||||||||||||
| Gain on derecognition of Joint Venture interest during Manulife TEDA acquisition (pre-tax) |
– | – | (95 | ) | – | (95 | ) | |||||||||||||
| Deferred income tax expenses (recoveries) |
(33 | ) | (354 | ) | (1,607 | ) | – | (1,994 | ) | |||||||||||
| Stock option expense |
– | (3 | ) | 8 | – | 5 | ||||||||||||||
| Cash provided by (used in) operating activities before undernoted items |
9 | 3,640 | 9,398 | – | 13,047 | |||||||||||||||
| Dividends from unconsolidated subsidiaries |
6,200 | 399 | 734 | (7,333 | ) | – | ||||||||||||||
| Changes in policy related and operating receivables and payables |
44 | 1,644 | 3,270 | – | 4,958 | |||||||||||||||
| Cash decrease due to U.S. variable annuity reinsurance transaction |
– | (1,263 | ) | (114 | ) | – | (1,377 | ) | ||||||||||||
| Cash provided by (used in) operating activities |
6,253 | 4,420 | 13,288 | (7,333 | ) | 16,628 | ||||||||||||||
| Investing activities |
||||||||||||||||||||
| Purchases and mortgage advances |
– | (28,685 | ) | (82,873 | ) | – | (111,558 | ) | ||||||||||||
| Disposals and repayments |
1 | 23,429 | 69,977 | – | 93,407 | |||||||||||||||
| Changes in investment broker net receivables and payables |
– | (11 | ) | (56 | ) | – | (67 | ) | ||||||||||||
| Net cash increase (decrease) from sale (purchase) of subsidiaries |
– | – | (182 | ) | – | (182 | ) | |||||||||||||
| Investment in common shares of subsidiaries |
(2,479 | ) | – | – | 2,479 | – | ||||||||||||||
| Capital contribution to unconsolidated subsidiaries |
– | (1 | ) | – | 1 | – | ||||||||||||||
| Return of capital from unconsolidated subsidiaries |
– | 19 | – | (19 | ) | – | ||||||||||||||
| Notes receivable from parent |
– | – | 415 | (415 | ) | – | ||||||||||||||
| Notes receivable from subsidiaries |
46 | (7 | ) | – | (39 | ) | – | |||||||||||||
| Cash provided by (used in) investing activities |
(2,432 | ) | (5,256 | ) | (12,719 | ) | 2,007 | (18,400 | ) | |||||||||||
| Financing activities |
||||||||||||||||||||
| Change in repurchase agreements and securities sold but not yet purchased |
– | – | 346 | – | 346 | |||||||||||||||
| Issue of long-term debt, net |
946 | – | – | – | 946 | |||||||||||||||
| Redemption of capital instruments |
– | – | (1,000 | ) | – | (1,000 | ) | |||||||||||||
| Secured borrowing from securitization transactions |
– | – | 437 | – | 437 | |||||||||||||||
| Changes in deposits from Bank clients, net |
– | – | 1,703 | – | 1,703 | |||||||||||||||
| Lease payments |
– | (5 | ) | (115 | ) | – | (120 | ) | ||||||||||||
| Shareholders’ dividends and other equity distributions |
(2,787 | ) | – | – | – | (2,787 | ) | |||||||||||||
| Common shares repurchased |
(1,884 | ) | – | – | – | (1,884 | ) | |||||||||||||
| Common shares issued, net |
23 | – | 2,479 | (2,479 | ) | 23 | ||||||||||||||
| Preferred shares and other equity issued, net |
990 | – | – | – | 990 | |||||||||||||||
| Preferred shares redeemed, net |
(711 | ) | – | – | – | (711 | ) | |||||||||||||
| Contributions from (distributions to) non-controlling interests, net |
– | – | (51 | ) | – | (51 | ) | |||||||||||||
| Dividends paid to parent |
– | (734 | ) | (6,599 | ) | 7,333 | – | |||||||||||||
| Capital contributions by parent |
– | – | 1 | (1 | ) | – | ||||||||||||||
| Return of capital to parent |
– | – | (19 | ) | 19 | – | ||||||||||||||
| Notes payable to parent |
– | – | (39 | ) | 39 | – | ||||||||||||||
| Notes payable to subsidiaries |
(415 | ) | – | – | 415 | – | ||||||||||||||
| Cash provided by (used in) financing activities |
(3,838 | ) | (739 | ) | (2,857 | ) | 5,326 | (2,108 | ) | |||||||||||
| Cash and short-term securities |
||||||||||||||||||||
| Increase (decrease) during the year |
(17 | ) | (1,575 | ) | (2,288 | ) | – | (3,880 | ) | |||||||||||
| Effect of foreign exchange rate changes on cash and short-term securities |
2 | 225 | 358 | – | 585 | |||||||||||||||
| Balance, beginning of year |
78 | 3,565 | 18,287 | – | 21,930 | |||||||||||||||
| Balance, end of year |
63 | 2,215 | 16,357 | – | 18,635 | |||||||||||||||
| Cash and short-term securities |
||||||||||||||||||||
| Beginning of ye ar |
||||||||||||||||||||
| Gross cash and short-term securities |
78 | 4,087 | 18,429 | – | 22,594 | |||||||||||||||
| Net payments in transit, included in other liabilities |
– | (522 | ) | (142 | ) | – | (664 | ) | ||||||||||||
| Net cash and short-term securities, beginning of year |
78 | 3,565 | 18,287 | – | 21,930 | |||||||||||||||
| End of year |
||||||||||||||||||||
| Gross cash and short-term securities |
63 | 2,614 | 16,476 | – | 19,153 | |||||||||||||||
| Net payments in transit, included in other liabilities |
– | (399 | ) | (119 | ) | – | (518 | ) | ||||||||||||
| Net cash and short-term securities, end of year |
$ | 63 | $ | 2,215 | $ | 16,357 | $ | – | $ | 18,635 | ||||||||||
| Supplemental disclosures on cash flow information: |
||||||||||||||||||||
| Interest received |
$ | 512 | $ | 3,850 | $ | 8,672 | $ | (1,161 | ) | $ | 11,873 | |||||||||
| Interest paid |
424 | 84 | 1,608 | (1,161 | ) | 955 | ||||||||||||||
| Income taxes paid (refund) |
– | 124 | 1,114 | – | 1,238 | |||||||||||||||
| |
2 71
|
| • | Identified, recognized, and measured each group of contracts as if IFRS 17 had always applied, unless it was impracticable (see Full Retrospective Approach and Fair Value Approach below); |
| • | Identified, recognized, and measured assets for insurance acquisition cash flows as if IFRS 17 had always applied, unless it was impracticable. However, no recoverability assessment was performed before the transition date; |
| • | Derecognized any balances that would not exist had IFRS 17 always applied; |
| • | Measured own use real estate properties that were underlying items of insurance contracts with direct participation features at fair value; and |
| • | Recognized any resulting net difference in equity. |
| • | Identify groups of insurance contracts; |
| • | Determine whether an insurance contract meets the definition of an insurance contract with direct participation features; |
| • | Identify discretionary cash flows for insurance contracts without direct participation features; and |
| • | Determine whether an investment contract meets the definition of an investment contract with discretionary participation features. |
| • | For some GMM and PAA groups of contracts where the fair value approach was applied, the cumulative OCI was set retrospectively only if reasonable and supportable information was available, otherwise it was set to zero at the transition date. |
| • | For GMM groups of contracts where the full retrospective approach was applied, the cumulative balance was calculated as if the Company had been applying the OCI option since inception of the contracts. |
| • | For VFA contracts, the cumulative OCI at transition was set equal to the difference between the market value and carrying value of the underlying items. |
| |
273 |
December 31, 2021 |
Impact of IFRS 17 amendments |
January 1, 2022 |
||||||||||||||||||||||||||||||||||||||
|
IAS 39 Measurement category |
Total carrying value |
Measurement differences |
Presentation differences |
Total carrying value |
Measurement category |
|||||||||||||||||||||||||||||||||||
Cash and short-term securities |
AFS | $ |
14,339 |
$ |
– |
$ |
2,214 |
$ |
16,553 |
FVOCI (1) |
||||||||||||||||||||||||||||||
| FVTPL | 2,214 |
– |
(2,214 |
) |
– |
FVTPL (2)
|
||||||||||||||||||||||||||||||||||
| Amortized cost | 6,041 |
– |
– |
6,041 |
Amortized cost (3)
|
|||||||||||||||||||||||||||||||||||
22,594 |
– |
– |
22,594 |
|||||||||||||||||||||||||||||||||||||
Debt securities |
AFS | 33,097 |
– |
184,365 |
217,462 |
FVOCI (1) |
||||||||||||||||||||||||||||||||||
| FVTPL | 189,722 |
– |
(184,365 |
) |
5,357 |
FVTPL (2)
|
||||||||||||||||||||||||||||||||||
| Amortized cost | 1,320 |
– |
– |
1,320 |
Amortized cost (3)
|
|||||||||||||||||||||||||||||||||||
224,139 |
– |
– |
224,139 |
|||||||||||||||||||||||||||||||||||||
Public equities |
AFS | 2,351 |
– |
(2,351 |
) |
– |
||||||||||||||||||||||||||||||||||
| FVTPL | 25,716 |
– |
2,351 |
28,067 |
FVTPL (2)
|
|||||||||||||||||||||||||||||||||||
28,067 |
– |
– |
28,067 |
|||||||||||||||||||||||||||||||||||||
Mortgages |
AFS | – |
1,897 |
29,901 |
31,798 |
FVOCI ( 1)
|
||||||||||||||||||||||||||||||||||
| FVTPL | – |
37 |
1,166 |
1,203 |
FVTPL (2)
|
|||||||||||||||||||||||||||||||||||
| Amortized cost | 52,014 |
– |
(31,067 |
) |
20,947 |
Amortized cost (3)
|
||||||||||||||||||||||||||||||||||
52,014 |
1,934 |
– |
53,948 |
|||||||||||||||||||||||||||||||||||||
Private placements |
AFS | – |
4,407 |
42,175 |
46,582 |
FVOCI ( 1)
|
||||||||||||||||||||||||||||||||||
| FVTPL | – |
40 |
667 |
707 |
FVTPL (2)
|
|||||||||||||||||||||||||||||||||||
| Amortized cost | 42,842 |
– |
(42,842 |
) |
– |
Amortized cost (3)
|
||||||||||||||||||||||||||||||||||
42,842 |
4,447 |
– |
47,289 |
|||||||||||||||||||||||||||||||||||||
Policy loans |
Amortized cost | 6,397 |
– |
(6,397 |
) |
– |
N/A (4)
|
|||||||||||||||||||||||||||||||||
Loans to Bank clients |
Amortized cost | 2,506 |
– |
– |
2,506 |
Amortized cost (3)
|
||||||||||||||||||||||||||||||||||
Other invested assets |
AFS | 89 |
(4 |
) |
238 |
323 |
FVOCI ( 1) |
|||||||||||||||||||||||||||||||||
| FVTPL | 21,157 |
(10 |
) |
617 |
21,764 |
FVTPL (2)
|
||||||||||||||||||||||||||||||||||
| Amortized cost | 855 |
– |
(855 |
) |
– |
Amortized cost (3)
|
||||||||||||||||||||||||||||||||||
22,101 |
(14 |
) |
– |
22,087 |
||||||||||||||||||||||||||||||||||||
Total in-scope invested assets |
400,660 |
6,367 |
(6,397 |
) |
400,630 |
|||||||||||||||||||||||||||||||||||
Out-of-scope (5)
|
Other | 26,438 |
1,035 |
– |
27,473 |
Other (5)
|
||||||||||||||||||||||||||||||||||
Total Invested Assets |
$ |
427,098 |
$ |
7,402 |
$ |
(6,397 |
) |
$ |
428,103 |
|||||||||||||||||||||||||||||||
(1) |
The reclassification of unrealized gains (losses), net of tax, of $11,868 from retained earnings to accumulated other comprehensive income (AOCI) related to FVOCI classification of debt investments classified as FVTPL under IAS 39. |
(2) |
The reclassification of unrealized gains (losses), net of tax, of $268 from AOCI to retained earnings related to FVTPL classification of debt securities classified as FVOCI under IAS 39. |
(3) |
The re-measurement of debt securities from amortized cost to FVOCI or FVTPL resulted in an increase in carrying value of $6,367. The impact on AOCI and retained earnings, net of tax, was $5,041 and $952, respectively. |
(4) |
Policy loans were reclassified from invested assets to insurance contract liabilities under IFRS 17 with no re-measurement and no impact to equity. |
(5) |
Own use real estate properties which are underlying items for insurance contracts with direct participating features were remeasured to fair value as if they were investment properties, as permitted by IFRS 17. This re-measurement resulted in an increase of carrying value of $1,035. The impact to retained earnings, net of tax, was $915. |
|
274 2023 Annual Report | Notes to Consolidated Financial Statements
|
|
IFRS 4 & IAS 39 December 31, 2021 |
Opening IFRS balance sheet adjustments |
IFRS 17 & IAS 39 January 1, 2022 |
||||||||||||||||||
Measurement differences |
||||||||||||||||||||
Transition CSM |
Contract measurement |
Presentation differences |
||||||||||||||||||
Assets |
||||||||||||||||||||
Total invested assets |
$ |
427,098 |
$ |
– |
$ |
7,402 |
$ |
(6,397 |
) |
$ |
428,103 |
|||||||||
Total other assets |
90,757 |
2,877 |
5,617 |
1,078 |
100,329 |
|||||||||||||||
Segregated funds net assets |
399,788 |
– |
– |
– |
399,788 |
|||||||||||||||
Total assets |
$ |
917,643 |
$ |
2,877 |
$ |
13,019 |
$ |
(5,319 |
) |
$ |
928,220 |
|||||||||
Liabilities and Equity |
||||||||||||||||||||
Insurance contract liabilities, excluding those for account of segregated fund holders |
$ |
392,275 |
$ |
21,466 |
(1) |
$ |
10,014 |
$ |
(18,134 |
) |
$ |
405,621 |
||||||||
Investment contract liabilities |
3,116 |
– |
– |
6,948 |
10,064 |
|||||||||||||||
Other liabilities |
63,595 |
(2,823 |
) |
(784 |
) |
5,867 |
65,855 |
|||||||||||||
Insurance contract liabilities for account of segregated fund holders |
– |
– |
– |
130,836 |
130,836 |
|||||||||||||||
Investment contract liabilities for account of segregated fund holders |
– |
– |
– |
268,952 |
268,952 |
|||||||||||||||
Segregated funds net liabilities |
399,788 |
– |
– |
(399,788 |
) |
– |
||||||||||||||
Total liabilities |
858,774 |
18,643 |
9,230 |
(5,319 |
) |
881,328 |
||||||||||||||
Equity |
||||||||||||||||||||
Shareholders and other equity holders’ retained earnings |
23,492 |
(13,607 |
) |
(229 |
) |
– |
9,656 |
|||||||||||||
Shareholders’ accumulated other comprehensive income (loss) |
||||||||||||||||||||
Insurance finance income (expenses) |
– |
– |
(17,117 |
) |
– |
(17,117 |
) |
|||||||||||||
Reinsurance finance income (expenses) |
– |
– |
984 |
– |
984 |
|||||||||||||||
FVOCI investments |
848 |
– |
16,916 |
– |
17,764 |
|||||||||||||||
Other equity items |
34,068 |
– |
– |
– |
34,068 |
|||||||||||||||
Total shareholders’ equity |
58,408 |
(13,607 |
) |
554 |
– |
45,355 |
||||||||||||||
Participating policyholders’ equity |
(1,233 |
) |
(1,440 |
) (1) |
2,774 |
– |
101 |
|||||||||||||
Non-controlling interests |
1,694 |
(719 |
) (1) |
461 |
– |
1,436 |
||||||||||||||
Total equity |
58,869 |
(15,766 |
) |
|
3,789
|
|
– |
46,892 |
||||||||||||
Total liabilities and equity
|
$ |
917,643 |
$ |
2,877 |
$ |
13,019 |
$ |
(5,319 |
) |
$ |
928,220 |
|||||||||
(1) |
The post-tax CSM in the participating policyholders’ fund of $1.4 billion is expected to be recognized in shareholder net income over time. In addition, $0.7 billion of post-tax CSM is attributable to non-controlling interests. |
| |
2 75
|
| Measurement Differences |
Description | |
| Transition CSM |
Contractual Service Margin (CSM) is a new liability that represents future unearned profits on insurance contracts written. For this measurement step, the amount recognized as at the transition date, January 1, 2022, was $21,466. The impact on equity was $15,766, net of tax. | |
| Contract Measurement |
Under IFRS 17 other components of insurance contracts, aside from the CSM, are also remeasured. This measurement step includes the following changes: Risk Adjustment (+2.1 billion to equity) (1) : non-economic risk on application of the IFRS 17 standard;Discount Rates (-1.5
billion to equity) (1) : Other Revaluation Changes (+3.1 billion to equity): | |
| Participating and Non-Controlling Interest Equity |
In previous steps all impacts to equity were shown in shareholders’ equity. This step shows the geography of the impacts between shareholders’ equity, participating policyholders’ equity and non-controlling interests. | |
|
(1) |
Excluding impacts on variable annuity guarantee contracts. |
| • | Policy loans invested assets |
| • | Contract classification |
| • | Insurance receivables & payables |
| • | Embedded derivatives |
| • | Reinsurance funds withheld |
| • | Deferred acquisition cost |
| • | Insurance and investment contract liabilities for account of segregated fund holders |
|
276 2023 Annual Report | Notes to Consolidated Financial Statements
|
Exhibit 99.2
Manulife Financial Corporation
Management’s Discussion & Analysis
For the year ended December 31, 2023
Caution regarding forward-looking statements
From time to time, Manulife Financial Corporation (“MFC”) makes written and/or oral forward-looking statements, including in this document. In addition, our representatives may make forward-looking statements orally to analysts, investors, the media and others. All such statements are made pursuant to the “safe harbour” provisions of Canadian provincial securities laws and the U.S. Private Securities Litigation Reform Act of 1995.
The forward-looking statements in this document include, but are not limited to, statements with respect to possible share buybacks under our normal course issuer bid, the Company’s strategic priorities and targets for its highest potential businesses, net promoter score, straight-through-processing, ongoing expense efficiency, portfolio optimization, core earnings contribution from LTC and VA businesses, employee engagement, its medium-term financial and operating targets, its ability to achieve our financed emissions and absolute scope 1 and 2 emissions targets, the estimated timing and amount of state approved future premium increases on our U.S. LTC business, the closing of the reinsurance transaction in respect of certain legacy blocks and the associated capital release, the closing of the acquisition of CQS, the impact of changes in tax laws, the probability and impact of LICAT scenario switches, and our journey to net zero, and also relate to, among other things, our objectives, goals, strategies, intentions, plans, beliefs, expectations and estimates, and can generally be identified by the use of words such as “may”, “will”, “could”, “should”, “would”, “likely”, “suspect”, “outlook”, “expect”, “intend”, “estimate”, “anticipate”, “believe”, “plan”, “forecast”, “objective”, “seek”, “aim”, “continue”, “goal”, “restore”, “embark” and “endeavour” (or the negative thereof) and words and expressions of similar import, and include statements concerning possible or assumed future results. Although we believe that the expectations reflected in such forward-looking statements are reasonable, such statements involve risks and uncertainties, and undue reliance should not be placed on such statements and they should not be interpreted as confirming market or analysts’ expectations in any way.
Certain material factors or assumptions are applied in making forward-looking statements and actual results may differ materially from those expressed or implied in such statements. Important factors that could cause actual results to differ materially from expectations include but are not limited to: general business and economic conditions (including but not limited to the performance, volatility and correlation of equity markets, interest rates, credit and swap spreads, inflation rates, currency rates, investment losses and defaults, market liquidity and creditworthiness of guarantors, reinsurers and counterparties); the ongoing prevalence of COVID-19, including any variants, as well as actions that have been, or may be taken by governmental authorities in response to COVID-19, including the impacts of any variants; changes in laws and regulations; changes in accounting standards applicable in any of the territories in which we operate; changes in regulatory capital requirements; our ability to obtain premium rate increases on in-force policies; our ability to execute strategic plans and changes to strategic plans; downgrades in our financial strength or credit ratings; our ability to maintain our reputation; impairments of goodwill or intangible assets or the establishment of provisions against future tax assets; the accuracy of estimates relating to morbidity, mortality and policyholder behaviour; the accuracy of other estimates used in applying accounting policies, actuarial methods and embedded value methods; our ability to implement effective hedging strategies and unforeseen consequences arising from such strategies; our ability to source appropriate assets to back our long-dated liabilities; level of competition and consolidation; our ability to market and distribute products through current and future distribution channels; unforeseen liabilities or asset impairments arising from acquisitions and dispositions of businesses; the realization of losses arising from the sale of investments classified as fair value through other comprehensive income; our liquidity, including the availability of financing to satisfy existing financial liabilities on expected maturity dates when required; obligations to pledge additional collateral; the availability of letters of credit to provide capital management flexibility; accuracy of information received from counterparties and the ability of counterparties to meet their obligations; the availability, affordability and adequacy of reinsurance; legal and regulatory proceedings, including tax audits, tax litigation or similar proceedings; our ability to adapt products and services to the changing market; our ability to attract and retain key executives, employees and agents; the appropriate use and interpretation of complex models or deficiencies in models used; political, legal, operational and other risks associated with our non-North American operations; geopolitical uncertainty, including international conflicts; acquisitions and our ability to complete acquisitions including the availability of equity and debt financing for this purpose; the disruption of or changes to key elements of the Company’s or public infrastructure systems; environmental concerns including climate change; our ability to protect our intellectual property and exposure to claims of infringement; our inability to withdraw cash from subsidiaries; the fact that the amount and timing of any future common share repurchases will depend on the earnings, cash requirements and financial condition of Manulife, market conditions, capital requirements (including under LICAT capital standards), common share issuance requirements, applicable law and regulations (including Canadian and U.S. securities laws and Canadian insurance company regulations), and other factors deemed relevant by Manulife, and may be subject to regulatory approval or conditions; and the timing to close the reinsurance transactions and CQS transaction described in this document.
Additional information about material risk factors that could cause actual results to differ materially from expectations and about material factors or assumptions applied in making forward-looking statements may be found in this document under “Risk Management and Risk Factors” and “Critical Actuarial and Accounting Policies” and in the “Risk Management” note to the Annual Consolidated Financial Statements as well as elsewhere in our filings with Canadian and U.S. securities regulators.
The forward-looking statements in this document are, unless otherwise indicated, stated as of the date hereof and are presented for the purpose of assisting investors and others in understanding our financial position and results of operations, our future operations, as well as our objectives and strategic priorities, and may not be appropriate for other purposes. We do not undertake to update any forward-looking statements, except as required by law.
| Management’s Discussion and Analysis | 10 | |||||
| 1. | Manulife Financial Corporation | 10 | ||||
| 2. | Asia | 25 | ||||
| 3. | Canada | 29 | ||||
| 4. | U.S. | 31 | ||||
| 5. | Global Wealth and Asset Management | 34 | ||||
| 6. | Corporate and Other | 38 | ||||
| 7. | Investments | 39 | ||||
| 8. | Fourth Quarter Financial Highlights | 44 | ||||
| 9. | Risk Management and Risk Factors | 48 | ||||
| 10. | Capital Management Framework | 85 | ||||
| 11. | Critical Actuarial and Accounting Policies | 88 | ||||
| 12. | Controls and Procedures | 99 | ||||
| 13. | Non-GAAP and Other Financial Measures | 100 | ||||
| 14. | Additional Disclosures | 151 | ||||
| Management’s Discussion and Analysis |

|
This Management’s Discussion and Analysis (“MD&A”) is current as of February 14, 2024.
1. Manulife Financial Corporation
Manulife Financial Corporation is a leading international financial services provider, helping people make their decisions easier and lives better. With our global headquarters in Toronto, Canada, we provide financial advice and insurance, operating as Manulife across Canada, Asia, and Europe, and primarily as John Hancock in the United States. Through Manulife Investment Management, the global brand for our Global Wealth and Asset Management segment, we serve individuals, institutions and retirement plan members worldwide. At the end of 2023, we had more than 38,000 employees, over 98,000 agents, and thousands of distribution partners, serving over 35 million customers. At the end of 2023, we had $1.4 trillion (US$1.1 trillion) in assets under management and administration1, including total invested assets of $0.4 trillion (US$0.3 trillion), and segregated funds net assets of $0.4 trillion (US$0.3 trillion). We trade as ‘MFC’ on the Toronto, New York, and the Philippine stock exchanges, and under ‘945’ in Hong Kong.
Our reporting segments are:
| • | Asia – providing insurance products and insurance-based wealth accumulation products in Asia. |
| • | Canada – providing insurance products, insurance-based wealth accumulation products, and banking services in Canada and has an in-force variable annuity business. |
| • | U.S. – providing life insurance products and insurance-based wealth accumulation products and has an in-force long-term care insurance business and an in-force annuity business. |
| • | Global Wealth and Asset Management (“Global WAM”) – providing investment advice and innovative solutions to our retail, retirement, and institutional clients around the world under the Manulife Investment Management (“MIM”) brand. |
| • | Corporate and Other – comprised of investment performance on assets backing capital, net of amounts allocated to operating segments; financing costs; costs incurred by the corporate office related to shareholder activities (not allocated to operating segments); our Property and Casualty (“P&C”) Reinsurance business; and run-off reinsurance business lines. |
In this document, the terms “Company”, “Manulife”, “we” and “our” mean Manulife Financial Corporation (“MFC”) and its subsidiaries. The term “MLI” means The Manufacturers Life Insurance Company and its subsidiaries.
Implementation of IFRS 17 and IFRS 9
Manulife adopted IFRS 17 “Insurance Contracts” and IFRS 9 “Financial Instruments” effective January 1, 2023, applied retrospectively. See notes 2 and 25 of the Consolidated Financial Statements for the year ended December 31, 2023. Our quarterly and full year 2022 results have been restated in accordance with IFRS 17, including the other comprehensive income option2, and IFRS 9.
The 2022 comparative results restated in this MD&A may not be fully representative of our market risk profile, as the transition of our general fund portfolio for asset-liability matching purposes under IFRS 17 and IFRS 9 was not completed until early 2023. Consequently, year-over-year variations between our 2023 results compared with the 2022 results should be viewed in this context.
In addition, our 2022 results are also not directly comparable with 2023 results because IFRS 9 hedge accounting and expected credit loss (“ECL”) principles are applied prospectively effective January 1, 2023. Accordingly, we have also presented comparative quarterly and full year 2022 results as if IFRS had allowed such principles to be implemented for 2022 (the “IFRS 9 transitional impacts”). This presentation will only be reported in our MD&A for 2023 for certain 2022 comparative results.
These 2022 comparative results are non-GAAP and denoted as being “transitional” and include the financial measures noted below:
| • | Transitional net income (loss) attributed to shareholders; |
| • | Transitional net income (loss) before income taxes; |
| • | Transitional net income (loss); |
| • | Transitional net income (loss) attributed to shareholders before income taxes; |
| • | Common shareholders’ transitional net income (loss); |
| • | Transitional return on common shareholders’ equity (“Transitional ROE”); |
| • | Transitional basic earnings (loss) per common share; and |
| • | Transitional diluted earnings (loss) per common share. |
| 1 | This item is a non-GAAP financial measure. See “Non-GAAP and Other Financial Measures” below for more information. |
| 2 | More information about the other comprehensive income option can be found in note 25 of the Consolidated Financial Statements for the year ended December 31, 2023. |
10 | 2023 Annual Report | Management’s Discussion and Analysis
Adoption of IFRS 17 and IFRS 9 has also resulted in additional definitions and revisions to the following financial measures:
| • | New non-GAAP financial measures: post-tax contractual service margin (“post-tax CSM”); post-tax contractual service margin net of non-controlling interests (“NCI”) (“post-tax CSM net of NCI”); Drivers of Earnings (“DOE”) line items for net investment result, other, income tax (expenses) recoveries and transitional net income attributed to participating policyholders and NCI; and core DOE line items for core net insurance service result, core net investment result, other core earnings, and core income tax (expenses) recoveries. |
| • | New non-GAAP ratios: expenditure efficiency ratio with its component non-GAAP financial measures: total expenditures and core expenditures (for 2022 and 2023 quarterly and full year results only); and adjusted book value per common share. |
| • | Revised definitions of non-GAAP and other financial measures: core earnings; expense efficiency ratio with its new component non-GAAP financial measures: total expenses and core expenses; consolidated capital; and financial leverage ratio. |
Profitability
Profitability
| As at and for the years ended December 31, ($ millions, unless otherwise stated) |
2023 | 2022 Transitional |
||||||
| Net income (loss) attributed to shareholders(1) |
$ | 5,103 | $ | 3,498 | ||||
| Return on common shareholders’ equity (“ROE”)(1) |
11.9% | 8.2% | ||||||
| Diluted earnings (loss) per common share ($)(1) |
$ | 2.61 | $ | 1.69 | ||||
| As at and for the years ended December 31, ($ millions, unless otherwise stated) |
2023 | 2022 | ||||||
| Net income (loss) attributed to shareholders(1) |
$ | 5,103 | $ | (1,933 | ) | |||
| Core earnings(2) |
$ | 6,684 | $ | 5,801 | ||||
| Diluted earnings (loss) per common share ($) |
$ | 2.61 | $ | (1.15 | ) | |||
| Diluted core earnings per common share (“Core EPS”) ($)(3) |
$ | 3.47 | $ | 2.90 | ||||
| ROE |
11.9% | (5.5)% | ||||||
| Core return on shareholders’ equity (“Core ROE”)(3) |
15.9% | 14.0% | ||||||
| Expense efficiency ratio(3) |
45.5% | 45.7% | ||||||
| Expenditure efficiency ratio(3) |
52.2% | 52.8% | ||||||
| General expenses |
$ | 4,330 | $ | 3,731 | ||||
| Core expenses(2) |
$ | 6,550 | $ | 5,762 | ||||
| Core expenditures(2) |
$ | 8,571 | $ | 7,671 | ||||
| (1) | 2022 results for transitional net income attributed to shareholders, transitional diluted earnings per common share and transitional ROE are adjusted to include IFRS 9 hedge accounting and expected credit loss principles (“IFRS 9 transitional impacts”). See “Implementation of IFRS 17 and IFRS 9” above for more information. For 2023, there are no IFRS 9 transitional adjustments as ECL and hedge accounting is effective January 1, 2023 and therefore the impact is included in net income attributed to shareholders. |
| (2) | This item is a non-GAAP financial measure. See “Non-GAAP and Other Financial Measures” below for more information. |
| (3) | This item is a non-GAAP ratio. See “Non-GAAP and Other Financial Measures” below for more information. |
Our net income attributed to shareholders was $5.1 billion in 2023 compared with a net loss attributed to shareholders of $1.9 billion in 2022 and transitional net income attributed to shareholders of $3.5 billion in 2022. The 2022 transitional net income attributed to shareholders includes $5.4 billion of IFRS 9 transitional impacts. Net income attributed to shareholders is comprised of core earnings (consisting of items we believe reflect the underlying earnings capacity of the business), which amounted to $6.7 billion in 2023 compared with $5.8 billion in 2022, and items excluded from core earnings of $1.6 billion of net charges in 2023 compared with a net charge of $7.7 billion in 2022. Items excluded from core earnings in 2022 on a transitional basis amounted to a net charge of $2.3 billion.
The $1.6 billion increase in net income attributed to shareholders in 2023 compared with the transitional net income attributed to shareholders in 2022 was primarily driven by growth in core earnings and a smaller net charge from market experience. The net charge from market experience in 2023 was primarily related to lower-than-expected returns (including fair value changes) relative to long-term assumptions on alternative long-duration assets (“ALDA”) mainly related to real estate, private equity and energy, as well as a charge from derivatives and hedge accounting ineffectiveness. Net income attributed to shareholders in 2023 increased by $7.0 billion compared with 2022, driven by the factors noted above and the $5.4 billion of IFRS 9 transitional impacts (transitional impacts are geography-related and do not impact total shareholders’ equity as the corresponding offset is in other comprehensive income).
In 2023, core earnings increased $0.9 billion or 13%1 on a constant exchange rate basis compared with 2022. The increase was driven by an increase in expected investment earnings related to higher investment yields and business growth, gains in our P&C Reinsurance business from updates to prior years’ hurricane provisions of $95 million in 2023 compared with a charge of $256 million in 2022 including Hurricane Ian, improved insurance experience reflecting more favourable experience in Canada and improved, although unfavourable, experience in the U.S., and higher returns on surplus assets net of higher cost of debt financing. These were partially offset by higher performance-related costs in Corporate and Other and Global WAM, and higher investments in technology, an increase in the
| 1 | Percentage growth / declines in core earnings, pre-tax core earnings, total expenses, core expenses, total expenditures, core expenditures, general expenses, contractual service margin net of NCI, new business CSM, assets under management and administration, assets under management, core EBITDA, and Manulife Bank average net lending assets are stated on a constant exchange rate basis, a non-GAAP ratio. See “Non-GAAP and Other Financial Measures” below for more information. |
|
|
11 |
2023 ECL provision, and lower expected earnings on insurance contracts due to a slower contractual service margin (“CSM”) amortization on certain variable fee approach (“VFA”) contracts and the impact of the 2022 U.S. variable annuity reinsurance transactions, partially offset by the net impact of updates to actuarial methods and assumptions and business growth in Canada. In addition, 2023 core earnings benefited from growth in Global WAM’s net fee income, from higher fee spreads and average assets under management and administration (“average AUMA”)1, as well as higher performance fees in Institutional Asset Management, partially offset by lower earnings from its seed capital investments due to repatriations. Actions to improve the capital efficiency of our legacy business resulted in $29 million lower core earnings in 2023 compared with 2022.
Core earnings by segment is presented in the following table. See Asia, Canada, U.S., and Global WAM sections below.
| For the years ended December 31, ($ millions) |
2023 | 2022 | % change(1) 2023 vs 2022 |
|||||||||||||
| Core earnings by segment(2) |
||||||||||||||||
| Asia |
$ | 2,048 | $ | 1,812 | 13% | |||||||||||
| Canada |
1,487 | 1,387 | 7% | |||||||||||||
| U.S. |
1,759 | 1,566 | 12% | |||||||||||||
| Global Wealth and Asset Management |
1,321 | 1,299 | 2% | |||||||||||||
| Corporate and Other |
69 | (263 | ) | – | ||||||||||||
| Total core earnings |
$ | 6,684 | $ | 5,801 | 15% | |||||||||||
| (1) | Percentage change is on an actual exchange rate basis. |
| (2) | Effective January 1, 2023, we have made a number of changes to the composition of reporting segments to better align our financial reporting with our business strategy and operations. Our international high net worth business was reclassified from the U.S. segment to the Asia segment to reflect the contributions of our Bermuda operations alongside the high net worth business that we report in our Singapore and Hong Kong operations. Our investment in the start-up capital of segregated and mutual funds, and investment-related revenue and expense were reclassified from the Corporate and Other segment to the Global WAM segment to more closely align with Global WAM’s management practices. Refinements were made to the allocations of corporate overhead and interest on surplus among segments. Prior period comparative information has been restated to reflect the changes in segment reporting. |
The table below presents transitional net income attributed to shareholders and net income attributed to shareholders consisting of core earnings and items excluded from core earnings.
| For the years ended December 31, ($ millions) |
2023 | 2022 | ||||||
| Core earnings |
$ | 6,684 | $ | 5,801 | ||||
| Items excluded from core earnings: |
||||||||
| Market experience gains (losses)(1) |
(1,790 | ) | (2,585 | ) | ||||
| Realized gains (losses) on debt instruments |
(130 | ) | (1,161 | ) | ||||
| Derivatives and hedge accounting ineffectiveness |
(152 | ) | 267 | |||||
| Actual less expected long-term returns on public equity |
103 | (1,291 | ) | |||||
| Actual less expected long-term returns on ALDA |
(1,623 | ) | (32 | ) | ||||
| Other investment results |
12 | (368 | ) | |||||
| Changes in actuarial methods and assumptions that flow directly through income(2) |
105 | 26 | ||||||
| Restructuring charge(3) |
(36 | ) | – | |||||
| Reinsurance transactions, tax-related items and other(4) |
140 | 256 | ||||||
| Total items excluded from core earnings |
(1,581 | ) | (2,303 | ) | ||||
| Transitional net income attributed to shareholders |
$ | n/a | $ | 3,498 | ||||
| Less: IFRS 9 transitional impacts: |
||||||||
| Change in expected credit loss |
(35 | ) | ||||||
| Hedge accounting |
7,356 | |||||||
| Total IFRS 9 transitional impacts (pre-tax) |
7,321 | |||||||
| Tax on IFRS 9 transitional impacts |
(1,890 | ) | ||||||
| Total IFRS 9 transitional impacts (post-tax) |
5,431 | |||||||
| Net income (loss) attributed to shareholders |
$ | 5,103 | $ | (1,933 | ) | |||
| (1) | Market experience was a net charge of $1,790 million in 2023 primarily driven by lower-than-expected returns (including fair value changes) relative to long-term assumptions on ALDA mainly related to real estate, private equity and energy, a net charge from derivatives and hedge accounting ineffectiveness, as well as net realized losses from the sale of debt instruments which are classified as fair value through other comprehensive income (“FVOCI”) partially offset by gains from higher-than-expected returns relative to long-term assumptions on public equity. Market experience was a net charge of $2,585 million in 2022 consisting of lower-than-expected returns relative to long-term assumptions on public equity, net realized losses from the sale of debt instruments which are classified as FVOCI, and a net loss from changes in foreign currency exchange rates, partially offset by a net gain on derivatives and hedge accounting ineffectiveness. A modest net charge from ALDA was driven by lower-than-expected returns (including fair value changes) relative to long-term assumptions on real estate, partially offset by private equity. |
| (2) | See “Critical Actuarial and Accounting Policies – Review of Actuarial Methods and Assumptions” section below for further information on the 2023 and the 2022 net gain. |
| (3) | In the fourth quarter of 2023 (“4Q23”) we reported a restructuring charge of $36 million post-tax ($46 million pre-tax) in Global WAM. |
| (4) | In 2023, the net gain of $140 million included a one-time tax benefit of $290 million. This was partially offset by $46 million related to a provision for the cancellation of certain policies in our Vietnam operations, other tax related net true-ups of $39 million, a $38 million charge for an investment impairment in Asia and a charge of $33 million related to legal settlements in the U.S. In 2022, the net gain of $256 million consisted of tax benefits of $269 million as a result of an increase in the Canadian corporate tax rate, and a net gain of $86 million related to acquiring full ownership interest of Manulife Fund Management Co., Ltd. (“MFM”), partially offset by a charge of $71 million related to withholding tax on anticipated remittances resulting from the U.S. variable annuity reinsurance transaction, a charge of $15 million resulting from actuarial model adjustments in Asia, and a $13 million increase to an existing legal provision in the U.S. |
| 1 | For more information on this metric, see “Non-GAAP and Other Financial Measures” below. |
12 | 2023 Annual Report | Management’s Discussion and Analysis
Transitional net income attributed to shareholders by segment and net income attributed to shareholders by segment is presented in the following tables. See Asia, Canada, U.S., and Global WAM sections below.
| For the years ended December 31, ($ millions) |
2023 | 2022 Transitional |
% change(1) 2023 vs 2022 Transitional |
|||||||||
| Transitional net income (loss) attributed to shareholders by segment(2) |
||||||||||||
| Asia |
$ | 1,348 | $ | 647 | 108% | |||||||
| Canada |
1,191 | 1,198 | (1)% | |||||||||
| U.S. |
639 | 1,448 | (56)% | |||||||||
| Global Wealth and Asset Management |
1,297 | 1,121 | 16% | |||||||||
| Corporate and Other |
628 | (916 | ) | – | ||||||||
| Total transitional net income (loss) attributed to shareholders |
$ | 5,103 | $ | 3,498 | 46% | |||||||
| For the years ended December 31, ($ millions) |
2023 | 2022 | % change(1) 2023 vs 2022 |
|||||||||
| Net income (loss) attributed to shareholders by segment(2) |
||||||||||||
| Asia |
$ | 1,348 | $ | 683 | 97% | |||||||
| Canada |
1,191 | (503 | ) | – | ||||||||
| U.S. |
639 | (2,316 | ) | – | ||||||||
| Global Wealth and Asset Management |
1,297 | 1,121 | 16% | |||||||||
| Corporate and Other |
628 | (918 | ) | – | ||||||||
| Total net income (loss) attributed to shareholders |
$ | 5,103 | $ | (1,933 | ) | – | ||||||
| (1) | Percentage change is on an actual exchange rate basis. |
| (2) | Effective January 1, 2023, we have made a number of changes to the composition of reporting segments to better align our financial reporting with our business strategy and operations. Our international high net worth business was reclassified from the U.S. segment to the Asia segment to reflect the contributions of our Bermuda operations alongside the high net worth business that we report in our Singapore and Hong Kong operations. Our investment in the start-up capital of segregated and mutual funds, and investment-related revenue and expense were reclassified from the Corporate and Other segment to the Global WAM segment to more closely align with Global WAM’s management practices. Refinements were made to the allocations of corporate overhead and interest on surplus among segments. Prior period comparative information has been restated to reflect the changes in segment reporting. |
Diluted earnings (loss) per common share (“EPS”) was $2.61 in 2023, compared with $(1.15) in 2022 and a transitional diluted earnings per common share of $1.69 in 2022. The increase compared with 2022 diluted EPS and 2022 transitional diluted EPS is primarily related to the increase in net income attributed to common shareholders. Diluted core earnings per common share was $3.47 in 2023, compared with $2.90 in 2022 primarily related to the increase in core earnings. The diluted weighted average common shares outstanding was 1,838 million in 2023 and 1,913 million in 2022.
Return on common shareholders’ equity (“ROE”) for 2023 was 11.9%, compared with (5.5)% for 2022 and a transitional ROE of 8.2% in 2022. The increase in ROE reflects higher net income attributed to common shareholders in 2023 compared with a net loss attributed to common shareholders in 2022, and the increase in ROE in 2023 compared with transitional ROE in 2022 is primarily due to higher net income attributed to common shareholders. The core return on common shareholders’ equity (“core ROE”) was 15.9% in 2023 compared with 14.0% in 2022. The increase in 2023 core ROE was primarily driven by an increase in common shareholders’ core earnings.
Expenditure efficiency ratio and expense efficiency ratio
In 2018 we introduced our strategic priority of expense efficiency.
The expense efficiency ratio is a financial measure which we use to measure progress on this priority. The expense efficiency ratio reflects only those expenses that flow directly through core earnings (“core expenses”). Due to changes introduced by IFRS 17, certain costs that are directly attributable to acquire new business are capitalized into the CSM instead of directly flowing through core earnings and are now excluded from the ratio.
To provide a reference point to our expense efficiency ratio prior to the adoption of IFRS 17, we are temporarily introducing an additional efficiency ratio, the expenditure efficiency ratio, for 2022 and 2023 only, which captures all expenses, including costs that are directly attributable to the acquisition of new business (“core expenditures”).
The expenditure efficiency ratio was 52.2% in 2023, compared with 52.8% in 2022. The 0.6 percentage point decrease in the ratio compared with 2022 was driven by a 12% increase in pre-tax core earnings1, partially offset by a 10% increase in core expenditures. 2023 core expenditures increased as a result of higher performance-related costs, investments in technology, higher distribution costs reflecting stronger top-line growth, additional expenses related to the impact of now consolidating 100% of MFM and higher travel and return to pre-pandemic activities. Costs directly attributable to the acquisition of new business that are capitalized into the CSM represented approximately 24% and 25% of total core expenditures in 2023 and 2022, respectively.
| 1 | This item is a non-GAAP financial measure. See “Non-GAAP and Other Financial Measures” below for more information. |
|
|
13 |
The expense efficiency ratio was 45.5% in 2023, compared with 45.7% in 2022. The 0.2 percentage point decrease in the ratio compared with 2022 was driven by the items noted above related to the decrease in the expenditure efficiency ratio excluding those costs that are directly attributable to the acquisition of new business which are reflected in the CSM under IFRS 17.
Total 2023 general expenses increased 16% on an actual exchange rate basis and 14% on a constant exchange rate basis compared with 2022 driven by the items noted above related to the decrease in the expenditure efficiency ratio and items excluded from core earnings. General expenses excluded from core earnings consisted primarily of a true-up of an existing legal provision and a restructuring charge in Global WAM in 2023 compared with a true-up of an existing legal provision and acquisition and integration expenses in 2022. General expenses are also net of directly attributable maintenance expenses and directly attributable acquisition expenses for products measured using the premium allocation approach (“PAA”) which are included in insurance service expenses on our financial statements. Directly attributable maintenance expenses and directly attributable acquisition expenses for products measured using the PAA increased 11% on a constant exchange rate basis and 12% on an actual exchange rate basis in 2023 compared with 2022.
Business Performance
Business performance1
| As at and for the years ended December 31, ($ millions, unless otherwise stated) |
2023 | 2022 | ||||||
| Asia APE sales |
$ | 4,469 | $ | 3,793 | ||||
| Canada APE sales |
1,409 | 1,261 | ||||||
| U.S. APE sales |
562 | 599 | ||||||
| Total APE sales(1) |
6,440 | 5,653 | ||||||
| Asia new business value |
1,627 | 1,537 | ||||||
| Canada new business value |
490 | 362 | ||||||
| U.S. new business value |
207 | 164 | ||||||
| Total new business value(1),(2) |
2,324 | 2,063 | ||||||
| Asia new business CSM(3) |
1,549 | 1,309 | ||||||
| Canada new business CSM |
224 | 199 | ||||||
| U.S. new business CSM |
394 | 387 | ||||||
| Total new business CSM(3) |
2,167 | 1,895 | ||||||
| Asia CSM net of NCI |
12,617 | 9,420 | ||||||
| Canada CSM |
4,060 | 3,675 | ||||||
| U.S. CSM |
3,738 | 4,136 | ||||||
| Corporate and Other CSM |
25 | 52 | ||||||
| Total CSM net of NCI |
20,440 | 17,283 | ||||||
| Post-tax CSM net of NCI(4) |
17,748 | 14,659 | ||||||
| Global WAM gross flows ($ billions)(1) |
143.4 | 136.9 | ||||||
| Global WAM net flows ($ billions)(1) |
4.5 | 3.2 | ||||||
| Global WAM assets under management and administration ($ billions)(4),(5) |
849.2 | 782.3 | ||||||
| Global WAM total invested assets ($ billions) |
7.1 | 5.8 | ||||||
| Global WAM segregated funds net assets ($ billions)(5) |
248.1 | 224.2 | ||||||
| Total assets under management and administration ($ billions)(4) |
1,388.8 | 1,301.1 | ||||||
| Total invested assets ($ billions) |
417.2 | 400.1 | ||||||
| Total net segregated funds net assets ($ billions) |
377.5 | 348.6 | ||||||
| (1) | For more information on this metric, see “Non-GAAP and Other Financial Measures” below. |
| (2) | 2022 new business value (“NBV”) has not been restated as a result of the adoption of IFRS 17. The impact of not restating 2022 is not material. |
| (3) | New business CSM is net of NCI. |
| (4) | This item is a non-GAAP financial measure. See “Non-GAAP and Other Financial Measures” below for more information. |
| (5) | The Global WAM portion of AUMA as at December 31, 2023 was $849.2 billion, an increase of 11% compared with December 31, 2022, driven by the net favourable impact of interest rate and equity markets and net inflows. The Global WAM segregated funds net assets were $248.1 billion as at December 31, 2023, an increase of 11% compared with December 31, 2022 on an actual exchange rate basis driven by the net favourable impact of interest rate and equity markets. |
Annualized premium equivalent (“APE”) sales were $6.4 billion in 2023, an increase of 12%2 compared with 2022. In Asia, APE sales increased 15% compared with 2022, driven by growth in Hong Kong, mainland China and Singapore, partially offset by a decrease in Vietnam and Japan. The increase was led by demand across various markets in Asia after the lifting of all COVID-19 containment measures in early 2023. In Hong Kong, APE sales increased 58% compared with 2022, reflecting strong growth in our broker, bancassurance and agency channels, primarily driven by a return of demand from mainland Chinese visitor (“MCV”) customers following the reopening of the border between Hong Kong and mainland China. Mainland China APE sales increased 62% compared with 2022, reflecting growth in
| 1 | Effective January 1, 2023, our international high net worth business was reclassified from the U.S. segment to the Asia segment to reflect the contributions of our Bermuda operations alongside the high net worth business that we report in our Singapore and Hong Kong operations. Prior period comparative information has been restated to reflect the reclassification. |
| 2 | Percentage growth / declines in APE sales, gross flows and NBV are stated on a constant exchange rate basis. |
14 | 2023 Annual Report | Management’s Discussion and Analysis
bancassurance and agency channels. Singapore APE sales were up 4% compared with 2022, reflecting growth in the broker channel. Vietnam APE sales were down 56% compared with 2022, reflecting a decline in agency and bancassurance channels, driven by the industry and macro-economic environment in this market. Japan APE sales decreased 9% compared with 2022, reflecting lower corporate-owned life insurance (“COLI”) and other wealth sales. Other Emerging Markets1 and International High Net Worth business APE sales were in line with 2022. In Canada, APE sales increased 12% in 2023 compared with 2022, driven by a large affinity markets sale, higher Group Insurance sales in all group benefits markets, partially offset by lower sales of segregated fund products. In the U.S., APE sales were down 10% compared with 2022 due to the adverse impact of higher short-term interest rates on accumulation insurance products for most of 2023, particularly for our affluent customers.
New business value (“NBV”) was $2.3 billion in 2023, an increase of 10% compared with 2022. In Asia, NBV increased 3% compared with 2022, driven by growth in Hong Kong, mainland China, Japan and our International High Net Worth business, partially offset by lower NBV in Vietnam, Singapore and Other Emerging Markets. In Canada, NBV increased 35% compared with 2022, driven by higher sales volumes in Individual Insurance and Group Insurance and higher margins in Group Insurance and Annuities, partially offset by lower segregated funds sales. In the U.S., NBV increased 21% compared with 2022, primarily due to pricing actions, product mix and higher interest rates, partially offset by lower sales volumes.
New business contractual service margin (“New business CSM”) was $2,167 million in 2023, an increase of 12% compared with 2022. Asia new business CSM increased 16% in 2023 compared with 2022, reflecting growth in Hong Kong, mainland China, Singapore, the International High Net Worth business and Other Emerging Markets, partially offset by decreases in Vietnam and Japan. In Canada, new business CSM increased 13% compared with 2022, driven by higher margins in Individual Insurance and Annuities, partially offset by lower sales volumes in Annuities. Under IFRS 17, the majority of Group Insurance and affinity products are classified as premium allocation approach and do not generate CSM. In the U.S., new business CSM decreased 2% compared with 2022 driven by lower sales volumes, partially offset by pricing actions.
The contractual service margin (“CSM”) net of NCI was $20,440 million as at December 31, 2023, an increase of $3,157 million or 21% compared with December 31, 2022. The increase in CSM net of NCI reflects an increase in total CSM movement of $3,324 million, net of an increase in NCI of $167 million. Organic CSM movement was an increase of $890 million or 5%2 in 2023, driven by the impact of new insurance business and expected movements related to finance income or expenses, partially offset by amounts recognized for service provided in 2023 earnings and a net reduction from insurance experience. Inorganic CSM movement was an increase of $2,434 million in 2023, primarily driven by changes in actuarial methods and assumptions that adjust the CSM, partially offset by changes in foreign currency exchange rates.
Global WAM gross flows of $143.4 billion increased $6.5 billion or 2% compared with 2022, primarily driven by higher gross flows in Institutional Asset Management and Retirement, partially offset by lower gross flows in Retail. See “Global Wealth and Asset Management” section below for further details.
Global WAM net inflows were $4.5 billion in 2023, compared with net inflows of $3.2 billion in 2022. Net outflows in Retirement were $4.0 billion in 2023, compared with net outflows of $0.1 billion in 2022, driven by large case pension plan redemptions by a single sponsor in the U.S. in the third quarter of 2023 (“3Q23”) and 4Q23. This was partially offset by growth in member contributions. Net outflows in Retail were $0.5 billion in 2023, compared with net outflows of $1.6 billion in 2022, driven by lower mutual fund redemption rates and the launch of our Global Semiconductors strategy in Japan in 3Q23. This was partially offset by lower demand as investors continued to favour short-term cash and money market instruments amid market volatility and higher interest rates. Net inflows in Institutional Asset Management were $9.0 billion in 2023, compared with net inflows of $4.9 billion in 2022, driven by higher net inflows in timberland, real estate, private equity and credit mandates, and the impact of acquiring full ownership of MFM in 4Q223, as well as new institutional product launches totaling $1.6 billion in 2023.
Assets under Management and Administration (“AUMA”)
AUMA as at December 31, 2023 was $1.4 trillion, an increase of 9% compared with December 31, 2022, primarily due to the favourable impact of markets and net inflows. Total invested assets and segregated funds net assets increased 4% and 8%, respectively, on an actual exchange rate basis, primarily due to the net impact of interest rate and equity markets.
Assets under Management and Administration
| As at December 31, ($ millions) |
2023 | 2022 | ||||||
| Total invested assets |
$ | 417,210 | $ | 400,142 | ||||
| Segregated funds net assets(1) |
377,544 | 348,562 | ||||||
| Mutual funds, institutional asset management and other(1),(2) |
411,961 | 381,630 | ||||||
| Total assets under management |
1,206,715 | 1,130,334 | ||||||
| Other assets under administration |
182,046 | 170,768 | ||||||
| Total assets under management and administration |
$ | 1,388,761 | $ | 1,301,102 | ||||
| (1) | These assets are not available to satisfy the liabilities of the Company’s general fund. |
| (2) | Other funds represent pension funds, pooled funds, endowment funds and other institutional funds managed by the Company on behalf of others. |
| 1 | Other Emerging Markets includes Indonesia, the Philippines, Malaysia, Thailand, Cambodia and Myanmar. |
| 2 | Percentage growth / decline in organic CSM is stated on a constant exchange rate basis. |
| 3 | Manulife Fund Management (“MFM”) was formerly known as Manulife TEDA Fund Management Co., Ltd (“MTEDA”). In 4Q22, we acquired full ownership of MTEDA by purchasing the remaining 51% of the shares from our joint venture partner. In 2023, we report 100% of the gross and net flows from MFM, compared with reporting only 49% of the joint venture’s gross and net flows in 2022. |
|
|
15 |
Financial Strength
Financial strength metrics
| As at and for the years ended December 31, ($ millions, unless otherwise stated) |
2023 | 2022 | ||||||
| MLI’s LICAT ratio(1) |
137% | 131% | ||||||
| Financial leverage ratio(2) |
24.3% | 25.1% | ||||||
| Consolidated capital ($ billions)(3) |
$ | 73.9 | $ | 69.6 | ||||
| Book value per common share ($) |
$ | 22.36 | $ | 21.56 | ||||
| Adjusted book value per common share ($)(2) |
$ | 32.19 | $ | 29.42 | ||||
| (1) | This item is disclosed under the Office of the Superintendent of Financial Institutions (“OSFI”) Life Insurance Capital Adequacy Test Public Disclosure Requirements guideline. The comparative 2022 LICAT ratio is as reported in 2022 and has not been restated for the implementation of IFRS 17. |
| (2) | This item is a non-GAAP ratio. See “Non-GAAP and Other Financial Measures” below for more information. |
| (3) | This item is a capital management measure. For more information on this metric, see “Non-GAAP and Other Financial Measures” below. |
The Life Insurance Capital Adequacy Test (“LICAT”) ratio for MLI was 137% as at December 31, 2023, compared with 131% as at December 31, 2022. The six percentage point increase from December 31, 2022 was primarily driven by the transition to the IFRS 17 accounting basis. Other positive movements included earnings and capital initiatives, partially offset by the capital impacts of market movements, capital market actions and shareholder dividends.
MFC’s financial leverage ratio1 as at December 31, 2023 was 24.3%, a decrease of 0.8 percentage points from 25.1% as at December 31, 2022. The decrease in the ratio was driven by higher post-tax CSM and an increase in total equity, partially offset by the net issuance of subordinated debt2. The increase in total equity was due to growth in retained earnings, partially offset by common share buybacks.
MFC’s consolidated capital1 was $73.9 billion as at December 31, 2023, an increase of $4.3 billion compared with $69.6 billion as at December 31, 2022. The increase was driven by higher post-tax CSM, an increase in total equity, and the net issuance of subordinated debt2. The increase in total equity was due to growth in retained earnings, partially offset by common share buybacks.
Remittances3 were $5.5 billion in 2023 of which Asia and U.S. operations delivered $1.7 billion and $1.5 billion, respectively. Remittances in 2023 decreased by $1.4 billion compared with 2022 as prior year remittances benefited from the U.S. variable annuity transaction. Refer to “Remittance of Capital” below for more information.
Cash and cash equivalents and marketable securities4 were $250.7 billion as at December 31, 2023 compared with $241.1 billion as at December 31, 2022. The increase of $9.6 billion was primarily driven by the higher market value of fixed income instruments due to interest rate movement and an increase in the market value of public equities due to higher equity markets. Refer to “Liquidity Risk Management Strategy” below for more information.
Book value per common share as at December 31, 2023 was $22.36, a 4% increase compared with $21.56 as at December 31, 2022. The number of common shares outstanding was 1,806 million as at December 31, 2023, a decrease of 59 million common shares from 1,865 million as at December 31, 2022, primarily due to common share buybacks.
Adjusted book value per common share as at December 31, 2023 was $32.19, a 9% increase compared with $29.42 as at December 31, 2022, driven by an increase in adjusted book value5 and a lower number of common shares outstanding. Adjusted book value increased $3.3 billion due to an increase in post-tax CSM and growth in common shareholder’s equity. The increase in common shareholder’s equity reflects the growth in retained earnings, partially offset by common share buybacks.
Impact of Foreign Currency Exchange Rates
We have worldwide operations, including in Canada, the United States and various markets in Asia, and generate revenues and incur expenses in local currencies in these jurisdictions, all of which are translated into Canadian dollars. The bulk of our exposure to foreign currency exchange rates is to movements in the U.S. dollar.
| 1 | Effective January 1, 2022, the calculation of financial leverage ratio and consolidated capital now includes the impact of post-tax CSM. See “Non-GAAP and Other Financial Measures” below for more information. |
| 2 | The net issuance of subordinated debt consists of the issuance of $1.2 billion in the first quarter of 2023 and the redemption of $0.6 billion in the second quarter of 2023. |
| 3 | For more information on this metric, see “Non-GAAP and Other Financial Measures” below. |
| 4 | Includes cash & cash equivalents, comprised of cash on deposit, Canadian and U.S. Treasury Bills and high quality short-term investments, and marketable assets, comprised of investment grade government and agency bonds, investment grade corporate bonds, investment grade securitized instruments, publicly traded common stocks and preferred shares. |
| 5 | This item is a non-GAAP financial measure. See “Non-GAAP and Other Financial Measures” below for more information. |
16 | 2023 Annual Report | Management’s Discussion and Analysis
Items impacting our Consolidated Statements of Income are translated to Canadian dollars using average exchange rates for the respective quarterly period. For items impacting our Consolidated Statements of Financial Position, period end rates are used for currency translation purposes. The following table provides the most relevant foreign currency exchange rates for 2023 and 2022.
| Exchange rate | Quarterly | Full Year | ||||||||||||||||||||||||||||||
| 4Q23 | 3Q23 | 2Q23 | 1Q23 | 4Q22 | 2023 | 2022 | ||||||||||||||||||||||||||
| Average(1) |
||||||||||||||||||||||||||||||||
| U.S. dollar |
1.3612 | 1.3411 | 1.3430 | 1.3524 | 1.3575 | 1.3494 | 1.3015 | |||||||||||||||||||||||||
| Japanese yen |
0.0092 | 0.0093 | 0.0098 | 0.0102 | 0.0096 | 0.0096 | 0.0099 | |||||||||||||||||||||||||
| Hong Kong dollar |
0.1742 | 0.1714 | 0.1713 | 0.1726 | 0.1736 | 0.1724 | 0.1662 | |||||||||||||||||||||||||
| Period end |
||||||||||||||||||||||||||||||||
| U.S. dollar |
1.3186 | 1.3520 | 1.3233 | 1.3534 | 1.3549 | 1.3186 | 1.3549 | |||||||||||||||||||||||||
| Japanese yen |
0.0094 | 0.0091 | 0.0092 | 0.0102 | 0.0103 | 0.0094 | 0.0103 | |||||||||||||||||||||||||
| Hong Kong dollar |
0.1689 | 0.1726 | 0.1689 | 0.1724 | 0.1736 | 0.1689 | 0.1736 | |||||||||||||||||||||||||
| (1) | Average rates for the quarter are from Bank of Canada which are applied against Consolidated Statements of Income items for each period. Average rate for the full year is a 4-point average of the quarterly average rates. |
Net income attributed to shareholders, transitional net income attributed to shareholders and core earnings from the Company’s foreign operations are translated to Canadian dollars, and in general, our net income attributed to shareholders, transitional net income attributed to shareholders and core earnings benefit from a weakening Canadian dollar and are adversely affected by a strengthening Canadian dollar. However, in a period of net losses in foreign operations, the weakening of the Canadian dollar has the effect of increasing the losses. The relative impact of foreign currency exchange in any given period is driven by the movement of currency rates as well as the proportion of earnings generated in our foreign operations.
Changes in foreign currency exchange rates increased core earnings by $136 million in 2023 compared with the same period of 2022, due to a weaker Canadian dollar compared with the U.S. dollar. The impact of foreign currency exchange rates on items excluded from core earnings does not provide relevant information given the nature of these items.
|
|
17 |
Strategic Priorities Progress Update
Strategy
Our ambition is to be the most digital, customer-centric global company in our industry. The goals for our stakeholders are:

|
Customers Improve Net Promoter Score (“NPS”) by +36 points and delight customers1 |
|||

|
Employees Engage our employees — maintain top quartile engagement2 |
|||

|
Shareholders Deliver top quartile returns3 |
|||
Our mission, strategic priorities and values are summarized below:

Our values enable the achievement of our mission and strategic priorities, reflect our culture, inform our behaviours, and help define how we work together:
| • | Obsess about customers – Predict their needs and do everything in our power to satisfy them. |
| • | Do the right thing – Act with integrity and do what we say. |
| • | Think big – Anything is possible. We can always find a better way. |
| • | Get it done together – We’re surrounded by an amazing team. Do it better by working together. |
| • | Own it – Feel empowered to make decisions and take action to deliver our mission. |
| • | Share your humanity – Build a supportive, diverse and thriving workplace. |
| 1 | As compared to a baseline of 1 in 2017. 2023 results are discussed in the “Strategic Priorities” section below. |
| 2 | Top quartile employee engagement compared to global financial services companies and insurance peers. 2023 results are discussed in the “Strategic Priorities” section below. |
| 3 | MFC’s Total Shareholder Return was 67th percentile compared with our performance peer group for the five-year period ended December 31, 2023. Please refer to Manulife’s most recent Management Information Circular for more information on our performance peer group. |
18 | 2023 Annual Report | Management’s Discussion and Analysis
Strategic Priorities
Our strategy is underpinned by five strategic priorities which we introduced in 2018, and we have made substantial progress on the ambitious targets that we set for ourselves.
| Accelerate Growth |
|
We strive to increase the core earnings contribution from our highest potential businesses1 and the Asia region (our Asia segment and Asia wealth and asset management (“Asia WAM”)).
Focus areas: • Execute on organic and inorganic growth opportunities in Asia and Global WAM • Leverage global footprint and business diversity to allocate capital and resources to higher growth opportunities • Expand North American behavioural insurance offerings to provide innovative solutions and support positive health for customers • Drive new business growth and persistency in group benefits in Canada |
| Baseline | Targets2 | |||||||||||||||||||||||
| 2023 | 2022 | 2017 (IFRS 4)3 | 2025 | |||||||||||||||||||||
| Core earnings from highest potential businesses |
60% | 61% | 54% | 75% | ||||||||||||||||||||
| Core earnings from Asia region |
37% | 37% | 36% | 50% | ||||||||||||||||||||
In 2023, 60% of core earnings were generated from our highest potential businesses compared with 61% in 2022, as the increase in core earnings from highest potential businesses was mostly in line with the increase in total company core earnings.
Since 2017, these businesses have been supported by a strong execution track record against our strategic priorities, coupled with robust inorganic growth opportunities in Asia and Global WAM markets. Our position as the third largest Pan-Asian life insurer, a scalable Global WAM platform that enables an integrated operating model and distribution capabilities, and greater demand for our North American behavioural insurance products reinforced this growth. Looking forward, we will continue to drive momentum through a strong and professional agency force, successful bancassurance partnerships, transformational digital offerings, and strategic expansion into high-potential markets in Asia.
In addition, inorganic optimization actions to transform our portfolio will further shift our focus and business mix towards our highest-potential businesses. In December 2023, we entered into an agreement with Global Atlantic to reinsure a combined $13 billion4 of insurance and investment contract net liabilities across four in-force blocks of legacy and low ROE business. The blocks include portions of U.S. LTC, U.S. structured settlements, and two Japan whole life products; the transaction is expected to close by the end of February 2024.2
Asia segment core earnings in 2023 increased 11% compared with 2022 after adjusting for the impact of changes in foreign currency exchange rates, primarily reflecting higher investment yields and business growth, as well as the net impact of updates to actuarial methods and assumptions on our CSM and risk adjustment. Due to an uneven recovery following the pandemic, a challenging macroeconomic environment, and the conversion to IFRS 17 which defers the recognition of new business into CSM, we are extending our 2025 target of Asia region’s 50% contribution to total company core earnings, to 2027.2 Asia contributed to over 60%5 of the total company CSM balance as at December 31, 2023 and over 70%5 of the total company increase in CSM from new business in 2023, demonstrating that accelerating growth is at the heart of our ambition and our commitment to delivering 50% of total company core earnings from the Asia region.
Global WAM core earnings increased $22 million, a decline of 1% compared with 2022 on a constant exchange rate basis, reflecting an increase in performance-related costs and lower earnings from seed capital investments due to repatriations were offset by growth in net fee income, from higher fee spreads and average AUMA, as well as higher performance fees in Institutional Asset Management, and a lower effective tax rate in 2023.
Canada group insurance core earnings in 2023 benefited from more favourable insurance experience, business growth, and higher expected investment earnings from higher yields and business growth.
We continue to innovate and scale our behavioural insurance offerings in North America.
Confidence in the strength of our diverse, global franchise, balance sheet and financial flexibility position us well to capitalize on attractive opportunities for our highest potential businesses.
| 1 | Highest potential businesses include Asia segment, Global WAM, Canada group benefits and North American behavioural insurance products. |
| 2 | See “Caution regarding forward-looking statements” above. |
| 3 | 2017 core earnings is a non-GAAP financial measure. See “Non-GAAP and Other Financial Measures” below. |
| 4 | Insurance and investment contract net liabilities amounts are as at September 30, 2023. |
| 5 | CSM closing balance and 2023 new business recognized into CSM are net of non-controlling interests (pre-tax). |
|
|
19 |
2023 Highlights
| • | In Asia: |
| ¡ | Continued to enhance our MCV capabilities to complement our prominent domestic franchise in Hong Kong with the support from the launch of an expanded hospital network covering more than 3,000 hospitals in mainland China and the opening of our second prestige service centre in Hong Kong. Our continued investments in MCV capabilities have contributed to robust MCV APE sales in 2023, more than double that of our 2019 pre-pandemic levels; and |
| ¡ | Continued to drive agency productivity and professionalization across the region, with the initial roll out of Manulife Pro in Singapore and Vietnam, a comprehensive premier recognition and activation program, providing selected agents with differentiated resources and tools, including dedicated underwriting support and enhanced customer engagement services with access to customer leads. |
| • | In Global WAM: |
| ¡ | Entered an agreement to acquire multi-sector alternative credit manager CQS, headquartered in London. The acquisition will give MIM and CQS clients enhanced access to our combined global investment solutions. We will retain CQS’s rigorous investment philosophy and process and bring its differentiated capabilities to new investors by leveraging our global footprint. The CQS credit platform has approximately $18.8 billion in assets under management as of October 31, 2023, and the transaction is expected to close in the first half of 2024 subject to customary closing conditions and regulatory approvals; and |
| ¡ | Continued to meet investor needs for wealth solutions through the expansion of our product offerings with the launch of the Global Semiconductors strategy in Japan Asia Retail which garnered more than $0.8 billion in net flows since its launch in 3Q23. |
| • | In Canada: |
| ¡ | Partnered with League, a leading healthcare technology provider, to offer our group benefits members more personalized and integrated digital healthcare experiences, enabling them to connect their benefits directly with healthcare options; and |
| ¡ | Partnered with Cleveland Clinic Canada, using its global healthcare expertise to enhance product offering and services to over five million group benefits plan members, including their families, by providing industry research, thought leadership, and education materials. |
| • | In the U.S.: |
| ¡ | Expanded our reach into the employer market by introducing a Premier Benefit Indexed Universal Life product. This permanent life insurance product, available through the workplace, offers a streamlined digital process for employees to purchase individual coverage and includes our John Hancock Vitality PLUS feature; |
| ¡ | Launched a distribution relationship with JPMorgan Chase & Co. enabling new sales of our suite of products, including our John Hancock Vitality Program, through its network of more than 6,900 advisors; and |
| ¡ | Enhanced our John Hancock Vitality Program by extending eligibility to access GRAIL’s Galleri® multi-cancer early detection test to additional members, expanding eligibility for preventative care and early detection behaviours through annual skin cancer screenings, and introducing a personalized way to incentivize members to be more physically active through a new Active Rewards feature. |
| Digital, Customer Leader |
|
We strive to continue improving our digital, customer leadership through the NPS and straight-through-processing (“STP”)1 lens.
Focus areas: • Harness customer feedback to enhance the experience delivered • Build differentiated, market-leading priority customer experiences • Extend customer relationships through value-added advice, and new services in health and wellness • Drive NPS through a robust NPS system that spans across the customer journey |
| Baseline | Targets2 | |||||||||||||||||||||||||||
| 2023 | 2022 | 2018 | 2017 | 2025 | ||||||||||||||||||||||||
| Net promoter score |
23 | 20 | n/a | 1 | 37 | |||||||||||||||||||||||
| Straight-through-processing (STP) |
85% | 83% | 68% | n/a | 88% | |||||||||||||||||||||||
We have made significant progress against our NPS ambition, driving a 3-point improvement from 2022 and a 22-point improvement from our 2017 baseline of 1, leading or on par with peers3 across the majority of our business lines. Despite this progress, headwinds experienced in select markets have impacted our momentum, and while we remain committed to digital, customer leadership as a strategic priority, we are extending our 2025 NPS target of 37, to 2027. We are focused on driving customer experience improvements across our business portfolio and progressing our mission to make decisions easier, lives better.
| 1 | Straight-through processing represents customer interactions that are completely digital, and includes money movement. |
| 2 | See “Caution regarding forward-looking statements” above. |
| 3 | Based on studies conducted in 2023 by IPSOS, a global market research company. |
20 | 2023 Annual Report | Management’s Discussion and Analysis
We are making consistent progress on our global STP objective, with a 2 percentage point improvement from 2022 and a 17 percentage point improvement from the 2018 baseline across segments in a variety of areas. In 2023, we continued to invest in digital capabilities through the delivery of multiple technology transformation initiatives across segments, notably the group benefits claims system transformation in Canada, enhancement of websites/portals enabling customer self service capabilities globally, and the launch of targeted campaigns to drive digital adoption globally.
Customer centricity is at the heart of our ambition and we remain focused on achieving our NPS and STP targets of 37 and 88%, respectively.
2023 Highlights
| • | In Asia: |
| ¡ | Completed Phase 1 of the policy administration system modernization in mainland China, launching new business and underwriting modules on the new cloud-native solution, together with the seamless data migration of more than three million customers. This enables scale and efficiency, and lays the foundation for improved customer, distributor and partner experience; this milestone will enable faster speed to market through collaborative product development and easier integration with our digital partners’ ecosystems; |
| ¡ | Made it easier for customers to manage their policies through the continued enhancement of our voice bot capabilities at our contact center in Japan, including the migration of our telephony systems to Amazon Connect1. This has contributed to a year-over-year 13 percentage point increase in 2023 in the proportion of customer-initiated interactions that are handled by interactive voice response system without any human intervention; and |
| ¡ | Enhanced customer experience at point of sales in Vietnam through the roll-out of a first-in-market digital pre-issuance verification tool, providing customers with an easier way to review their policy before issuance, and ensure that it fully addresses their insurance needs. |
| • | In Global WAM: |
| ¡ | Continued to enhance and broaden our wealth planning and advice business in Canada Retail through strategic agreements with Fidelity Clearing Canada and Envestnet that will provide access to leading advisory technology and portfolio management platforms, which combined will deliver an enhanced digital client experience and improved advisor productivity; |
| ¡ | Increased our mobile application user count in Canada Retirement by 38% in 2023 following the delivery of new features (fund switch and TFSA lump sum contributions) and experience enhancements (deep linking and personalized nudges enhancements); |
| ¡ | Continued to improve “Join Now”, our digital enrolment process in Canada Retirement, with features that have enabled us to deploy it to 92% of eligible sponsors, representing an increase of 10% compared with 2022. This contributed to 49,500 new digital enrolments in 2023; and |
| ¡ | Accelerated customer adoption of digital applications in Canada Retirement through our “Say Goodbye to Paper” campaign which contributed to a 165% increase in members converting to e-statements over the campaign period, which spanned from June to August, and an increase in satisfaction with their digital experience. |
| • | In Canada: |
| ¡ | Grew our annual Manulife mobile app downloads by 18%, supported by upgrades designed to enhance our customers’ digital experience and a successful communication campaign highlighting the ease and speed of online claims submissions; |
| ¡ | Expanded our Personalized Medicine program to all group benefits extended healthcare plans, making this service available to more customers, while enabling them to learn about medications that best meet their needs and work with healthcare providers on customized treatment plans that can lead to better outcomes; and |
| ¡ | Increased our use of Amazon Connect1, which enabled a more holistic digital customer experience and drove operational efficiency. This contributed to a 25% reduction of call transfer rates year over year for contact centres that had moved to Amazon Connect. |
| • | In the U.S.: |
| ¡ | Optimized the customer registration experience across our customer websites resulting in a 26% increase in online registrations in 2023, contributing to a 19% improvement in unique website traffic; |
| ¡ | Eliminated over 7.8 million pieces of paper and mail by automating key back-end processes and increasing digital communications, including our first e-delivery of life insurance policy prospectuses; and |
| ¡ | Enhanced our interactive voice response authentication enabling 29% of inbound calls to be completed with no human interaction. |
| Expense Efficiency |
|
We remain focused on driving efficient growth by effectively managing expense growth at a rate below the pace of our topline growth, while ensuring outstanding customer experience and digital ways of working.
Focus areas: • Leverage global scale and operating environment • Streamline business processes and eliminate activities not valued by end customers • Continue to sustain a culture of expense efficiency and driving efficient growth |
| 1 | Amazon Connect from Amazon Web Services Inc. |
|
|
21 |
| Baseline | Target1 | |||||||||||||||||||||||
| 2023 | 2022 | 2017 (IFRS 4)2 |
2022 and onwards | |||||||||||||||||||||
| Expense efficiency ratio |
45.5% | 45.7% | 55.4% | <50% | ||||||||||||||||||||
We previously delivered on our 2022 target of $1 billion in expense efficiencies in 2020, two years ahead of schedule. Progress on our expense efficiency ratio compared with the 2017 baseline, reflects a cultural shift throughout the organization that rightsized our expense base by eliminating significant costs and allowing us to be more nimble.
The expense efficiency ratio was 45.5% for 2023, compared with 45.7% in 2022. The 0.2 percentage point decrease in the ratio compared with 2022 was driven by a 12% increase in pre-tax core earnings, offset by a 12% increase in core expenses. Core expenses increased in comparison with 2022 as a result of higher performance-related costs, investments in technology, additional expenses related to the impact of now consolidating 100% of MFM and higher travel and return to pre-pandemic activities.
Expense efficiency continues to be an important lever in our current operating environment, and we remain committed to consistently achieving a ratio of less than 50%.
2023 Highlights
| • | Continued to improve expense efficiency by lowering unit costs and improving scalability of our operations through: |
| ¡ | Digitizing to improve automation and straight-through processing; |
| ¡ | Simplifying and standardizing processes; |
| ¡ | Optimizing organizational structure; |
| ¡ | Actively managing third-party spend and procurement; and |
| ¡ | Rationalizing real estate expenditures. |
| • | Achieved annual savings of approximately $250 million (pre-tax) in 2023 resulting from the restructuring action in the first half of 2021. |
| Portfolio Optimization |
|
We will continue to optimize our legacy businesses and reduce the combined contributions from long-term care insurance (“LTC”) and variable annuities (“VA”) businesses.
Focus areas: • Deliver capital release from legacy or low ROE businesses, including variable annuity, long-term care insurance and select long-duration, guaranteed insurance products • Optimize portfolio to improve our risk profile and ROE • Create value for customers and shareholders through in-force management initiatives |
| Baseline | Target1 | |||||||||||||||||||||||
| 2023 | 2022 | 2017 (IFRS 4) |
2025 | |||||||||||||||||||||
| Core earnings contribution from LTC and VA |
12% | 16% | 24% | <15% | ||||||||||||||||||||
We previously achieved our 2022 target to release $5.0 billion of capital in 2019, three years ahead of schedule, when we reduced the size of our legacy businesses, freed up capital, and improved core ROE through actions such as reinsurance transactions in North America, buy-back programs on guaranteed minimum withdrawal benefit (“GMWB”) blocks, repricing life insurance blocks, and reinsurance
renegotiations and recaptures. In 2022, we completed two transactions to reinsure over 80% of our legacy U.S. variable annuity block, releasing $2.5 billion of capital and significantly reducing our risk. In December 2023, we entered into an agreement with Global Atlantic to reinsure four in-force blocks of legacy or low ROE businesses, including $6 billion3 of LTC insurance contract net liabilities; in 2024, this transaction is expected to release $1.2 billion of capital4, reducing our risk profile and unlocking significant value for shareholders. With this transaction and other portfolio optimization efforts, we have released over $10 billion4 of capital since 2018.
| 1 | See “Caution regarding forward-looking statements” above. |
| 2 | 2017 expense efficiency ratio is a non-GAAP ratio. |
| 3 | Insurance contract net liabilities amounts are as at September 30, 2023. |
| 4 | Pro-forma. Includes $9 billion of capital release from 2018 to 2022 under IFRS 4, $0.2 billion from 2023 initiatives under IFRS 17, and an estimated $1.2 billion capital release under IFRS 17 from this transaction to be recognized in 2024. |
22 | 2023 Annual Report | Management’s Discussion and Analysis In 2023, we achieved our 2025 target of less than 15% of core earnings contribution from LTC and VA, two years ahead of schedule. Contribution to core earnings from these businesses was 12% in 2023, a decrease of 4 percentage points as compared with 2022, primarily driven by core earnings growth in other businesses and lower combined core earnings from LTC and VA. The decrease in combined core earnings from LTC and VA was driven by lower CSM recognized and more unfavourable LTC insurance experience in 2023 compared to 2022. The reinsurance transaction noted above is expected to further reduce the core earnings contribution from LTC and VA by 1 percentage point1. A dedicated team working exclusively on portfolio optimization, and our proactive, disciplined approach in optimizing the in-force business, are key success factors to these achievements.
We aim to create strategic and financial flexibility to deliver on our Total Shareholder Return objectives by continuing to assess inorganic options, taking into account policyholder considerations and the impacts to our risk profile and ROE. We are also confident in our ability to effectively manage the LTC and VA blocks of business to maturity, most importantly by seeking premium increases for LTC for which we have a strong track record of success1. We are also investing and leveraging technologies to transform the LTC customer experience, providing significant value to our customers and shareholders.
2023 Highlights
| • | Entered into an agreement to reinsure $13 billion2 of insurance and investment contract net liabilities: |
| ¡ | U.S. LTC ($6 billion), and structured settlements ($1.6 billion) and two Japan whole life products ($5.6 billion); |
| ¡ | In 2024, this transaction is expected to release $1.2 billion3 of capital; |
| • | Released $217 million of capital through various other reinsurance optimization opportunities in 2023; and |
| • | In the LTC business, expanded anti-fraud, waste and abuse initiatives, as well as wellness programs, and began buyout offerings while continuing to gain approval on the assumed premium increases. |
| High Performing Team |
|
We are committed to enabling a high performing team and maintaining top quartile employee engagement compared to global financial services and insurance peers.
Focus areas: • Organizational effectiveness and speed of decision making • Diversity, equity, and inclusion • Developing our talent with differentiated capabilities • Continuing to strengthen our value proposition to attract and retain top talent |
| Baseline | Target1 | |||||||||||||||||||||||
| 2023 | 2022 | 20174 | 2022 and onwards | |||||||||||||||||||||
| Employee Engagement |
1st quartile | 1st quartile | 2nd quartile | 1st quartile | ||||||||||||||||||||
We achieved a top quartile employee engagement rank5 in each of 2020, 2021, 2022 and 2023. Our employee engagement score has improved steadily from 2017 to 2022, and in 2023 we have maintained our top quartile position.
Our high performing team has been a key enabler of accomplishments to date, and we remain committed to achieving top quartile employee engagement going forward.
2023 Highlights
| • | Awarded the Gallup Exceptional Workplace Award, recognizing our focus on engagement and prioritization of the employee experience that creates an authentic, unique culture that empowers our colleague population to do and achieve more; |
| • | Named to Bloomberg’s 2023 Gender-Equality Index for the fifth consecutive year, highlighting our commitment to support gender equality through policy development, representation, and transparency; |
| • | Recognized globally across various markets by a number of organizations: |
| ¡ | By Mediacorp Canada Inc. as one of Canada’s Top 100 Employers for the third year in a row, and as one of Canada’s Top Employers for Young People in 2023; |
| ¡ | By Forbes as one of Canada’s Best Employers for the seventh consecutive year, one of Canada’s Best Employers for Diversity in 2023, and as one of the World’s Best Employers for the fourth consecutive year; and, |
| ¡ | By HR Asia as one of the “Best Companies to work for in Asia 2023” across six of our Asian markets6; and |
| 1 | See “Caution regarding forward-looking statements” above. |
| 2 | Insurance and investment contract net liabilities amounts are as at September 30, 2023. |
| 3 | Pro-forma. Estimated capital release under IFRS 17 from this transaction to be recognized in 2024. |
| 4 | Starting in 2019, engagement surveys were transitioned to the Gallup methodology. |
| 5 | Based on the annual global employee engagement survey conducted by Gallup. Ranking is measured by the engagement grand mean as compared to Gallup’s Finance and Insurance Company level database. |
| 6 | mainland China, Hong Kong, Malaysia, Vietnam, Indonesia and the Philippines. |
|
|
23 |
| • | Appointed to the Dow Jones Sustainability North America Index ranking in the 93rd percentile of its GICS® Industry Group, as one of only eight insurers across North America to be included in the index overall; this recognition underscores our leading sustainable business practices and proven ability to deliver long-term shareholder value. |
Medium-term financial and operating targets1
Our medium-term financial targets, as communicated in May 2022, remain unchanged:
| • | Core EPS growth of 10% to 12%; |
| • | Core ROE of 15%+; |
| • | Leverage ratio of 25%; |
| • | Common share core dividend payout ratio2 range of 35% to 45%; |
| • | CSM balance growth of 8% to 10% per year; and |
| • | New business CSM growth of 15% per year. |
| 1 | See “Caution regarding forward-looking statements” above. |
| 2 | This item is a non-GAAP ratio. See “Non-GAAP and Other Financial Measures” below for more information. |
24 | 2023 Annual Report | Management’s Discussion and Analysis
Our Asia segment is a leading provider of insurance products and insurance-based wealth accumulation products, driven by a customer-centric strategy, and leveraging the asset management expertise and products managed by our Global Wealth and Asset Management segment. Present in many of Asia’s largest and fastest growing economies, we are well positioned to capitalize on the attractive underlying demographics of the region, underpinned by a rigorous focus on creating value for our customers, employees and shareholders.
We have insurance operations in 12 markets: Hong Kong, Macau, Japan, Bermuda, mainland China, Singapore, Vietnam, Indonesia, the Philippines, Malaysia, Cambodia, and Myanmar.
We have a diversified multi-channel distribution network, including approximately 98,000 contracted agents and over 100 bank partnerships. We also work with many independent agents, financial advisors, and brokers. Among our bancassurance partnerships we have 10 exclusive partnerships, including a long-term partnership with DBS Bank across Singapore, Hong Kong, mainland China, and Indonesia, and our recently extended partnership with Alliance Bank in Malaysia, that give us access to over 35 million bank customers.
In 2023, our Asia segment contributed 31%2 of the Company’s core earnings from operating segments and, as at December 31, 2023, accounted for 12% of the Company’s assets under management and administration.
Profitability
Asia reported net income attributed to shareholders of $1,348 million in 2023 compared with net income attributed to shareholders of $683 million and transitional net income attributed to shareholders of $647 million in 2022. The 2022 transitional net income attributed to shareholders includes a charge of $36 million from IFRS 9 transitional impacts. Net income attributed to shareholders is comprised of core earnings, which were $2,048 million in 2023 compared with $1,812 million in 2022, and items excluded from core earnings, which amounted to a net charge of $700 million for 2023 compared with a net charge of $1,129 million in 2022. Items excluded from core earnings in 2022 on a transitional basis amounted to a net charge of $1,165 million. See section 13 “Non-GAAP and Other Financial Measures” below, for a reconciliation of core earnings to net income (loss) attributed to shareholders for 2023 and core earnings and transitional net income (loss) attributed to shareholders to net income (loss) attributed to shareholders for 2022. The changes in net income attributed to shareholders and core earnings expressed in Canadian dollars were due to the factors described below and, in addition, the change in core earnings reflected a net $38 million favourable impact due to changes in various foreign currency exchange rates versus the Canadian dollar.
Expressed in U.S. dollars, the presentation currency of the segment, net income attributed to shareholders was US$995 million in 2023 compared with net income attributed to shareholders of US$516 million and transitional net income attributed to shareholders of US$481 million in 2022. Core earnings were US$1,518 million in 2023 compared with US$1,392 million in 2022 and items excluded from core earnings amounted to a net charge of US$523 million in 2023 compared with a net charge of US$876 million in 2022. Items excluded from core earnings in 2022 on a transitional basis were a net charge of US$911 million. Items excluded from core earnings are outlined in the table below.
Core earnings in 2023 increased 11% compared with 2022, after adjusting for the impact of changes in foreign currency exchange rates. The changes in core earnings by geography are primarily due to the following:
| • | Hong Kong increased 9% driven by improved insurance experience, an increase in expected earnings on insurance contracts, primarily reflecting the net impact of updates to actuarial methods and assumptions on our CSM and risk adjustment partially offset by slower CSM amortization on certain VFA contracts, and higher expected investment income due to business growth; |
| • | Singapore increased 15% driven by favourable insurance experience and an increase in CSM amortization reflecting the impact of updates to actuarial methods and assumptions, partially offset by lower investment results; |
| • | Vietnam increased 23% benefiting from higher investment yields and improved claims experience, partially offset by lower CSM amortization; |
| • | Mainland China increased 77% reflecting higher expected investment income due to business growth, and improved new business results on onerous contracts as a result of product actions; |
| • | Other Emerging Markets increased 15% reflecting higher investment yields; |
| • | Japan increased 8% reflecting higher expected investment income due to higher investment yields and business growth; and |
| • | International High Net Worth business decreased 4% due to modestly unfavourable claims experience, partially offset by an increase in CSM amortization reflecting the impact of updates to actuarial methods and assumptions. |
| 1 | Effective January 1, 2023, we have made a change to the composition of reporting segments to better align our financial reporting with our business strategy and operations. Our international high net worth business was reclassified from the U.S. segment to the Asia segment (in Asia Other) to reflect the contributions of our Bermuda operations alongside the high net worth business that we report in our Singapore and Hong Kong operations. Refinements were made to the allocations of corporate overhead and interest on surplus among segments. Prior period comparative information has been restated to reflect the changes in segment reporting. |
| 2 | This item is a non-GAAP ratio. See “Non-GAAP and Other Financial Measures” below for more information. |
|
|
25 |
The table below presents net income attributed to shareholders (2023 and 2022) and transitional net income attributed to shareholders (2022) for Asia consisting of core earnings and items excluded from core earnings.
| For the years ended December 31, ($ millions) |
Canadian $ | US $ | ||||||||||||||||||
| 2023 | 2022 | 2023 | 2022 | |||||||||||||||||
| Core earnings |
$ | 2,048 | $ | 1,812 | $ | 1,518 | $ | 1,392 | ||||||||||||
| Items excluded from core earnings:(1) |
||||||||||||||||||||
| Market experience gains (losses) |
(553 | ) | (1,141 | ) | (413 | ) | (893 | ) | ||||||||||||
| Realized gains (losses) on debt instruments |
(113 | ) | (241 | ) | (83 | ) | (183 | ) | ||||||||||||
| Derivatives and hedge accounting ineffectiveness |
(264 | ) | (135 | ) | (197 | ) | (100 | ) | ||||||||||||
| Actual less expected long-term returns on public equity |
12 | (488 | ) | 8 | (385 | ) | ||||||||||||||
| Actual less expected long-term returns on ALDA |
(72 | ) | 42 | (54 | ) | 36 | ||||||||||||||
| Other investment results |
(116 | ) | (319 | ) | (87 | ) | (261 | ) | ||||||||||||
| Changes in actuarial methods and assumptions that flow directly through income |
(68 | ) | (9 | ) | (51 | ) | (7 | ) | ||||||||||||
| Reinsurance transactions, tax-related items and other |
(79 | ) | (15 | ) | (59 | ) | (11 | ) | ||||||||||||
| Total items excluded from core earnings |
(700 | ) | (1,165 | ) | (523 | ) | (911 | ) | ||||||||||||
| Transitional net income attributed to shareholders |
n/a | $ | 647 | n/a | $ | 481 | ||||||||||||||
| Less: IFRS 9 transitional impacts: |
||||||||||||||||||||
| Change in expected credit loss |
(34 | ) | (26 | ) | ||||||||||||||||
| Hedge accounting |
(80 | ) | (71 | ) | ||||||||||||||||
| Total IFRS 9 transitional impacts (pre-tax) |
(114 | ) | (97 | ) | ||||||||||||||||
| Tax on IFRS 9 transitional impacts |
78 | 62 | ||||||||||||||||||
| Total IFRS 9 transitional impacts (post-tax) |
(36 | ) | (35 | ) | ||||||||||||||||
| Net income (loss) attributed to shareholders |
$ | 1,348 | $ | 683 | $ | 995 | $ | 516 | ||||||||||||
| (1) | For explanations of items excluded from core earnings, see “Items excluded from core earnings” table in the total Company “Profitability” section above. |
Business Performance
(All percentages quoted are on a constant exchange rate basis)
APE sales in 2023 were US$3,313 million in 2023, representing an increase of 15% compared with 2022. APE sales increased in Hong Kong, mainland China, and Singapore, and were partially offset by a decrease in Vietnam and Japan. The increase was led by demand across various markets in Asia after the lifting of all COVID-19 containment measures in early 2023.
In Hong Kong, APE sales were US$904 million in 2023, a 58% increase compared with 2022, reflecting strong growth in our broker, bancassurance and agency channels, primarily driven by a return of demand from MCV customers following the reopening of the border between Hong Kong and mainland China. Mainland China APE sales were US$738 million in 2023, a 62% increase compared with 2022, reflecting growth in bancassurance and agency channels. Singapore APE sales were US$817 million in 2023, a 4% increase compared with 2022, reflecting growth in the broker channel. Vietnam APE sales were US$147 million in 2023, a 56% decrease compared with 2022, reflecting a decline in agency and bancassurance channels, driven by the industry and macro-economic environment in this market. Japan APE sales were US$262 million in 2023, a decrease of 9% compared with 2022, reflecting lower COLI and other wealth sales. Other Emerging Markets and International High Net Worth business APE sales in 2023 were in line with 2022.
New business value (“NBV”) was US$1,206 million in 2023, an increase of 3% compared with 2022. NBV was higher in Hong Kong, mainland China, Japan, and our International High Net Worth business, partially offset by lower NBV in Vietnam, Singapore, and Other Emerging Markets.
| • | In Hong Kong, NBV was US$538 million in 2023, a 20% increase compared with 2022, reflecting higher sales volumes, partially offset by a higher proportion of lower margin savings products. |
| • | In mainland China, NBV was US$111 million in 2023, a 139% increase compared with 2022, reflecting higher sales volumes and product mix. |
| • | In Japan, NBV was US$117 million in 2023, an increase of 22% compared with 2022 due to product mix and management actions, partially offset by lower sales volume. |
| • | NBV of International High Net Worth business was US$155 million in 2023, an 8% increase compared with 2022 due to product mix. |
| • | In Vietnam, NBV was US$25 million in 2023, an 86% decrease compared with 2022, reflecting lower sales volumes and the impact of updates to actuarial methods and assumptions. |
| • | In Singapore, NBV was US$207 million in 2023, a 2% decrease compared with 2022 due to increase in the cost of reinsurance, partially offset by higher sales volumes and product mix. |
| • | NBV of Other Emerging Markets was US$53 million, a 4% decrease compared with 2022 due to changes in product mix. |
26 | 2023 Annual Report | Management’s Discussion and Analysis
The new business value margin (“NBV margin”)1 was 41.2% in 2023, a decrease of 3.3 percentage points compared with 2022.
New business CSM was US$1,148 million in 2023, a 16% increase compared with 2022. New business CSM was higher in Hong Kong, mainland China, Singapore, the International High Net Worth business and Other Emerging Markets, partially offset by lower new business CSM in Vietnam and Japan.
| • | In Hong Kong, new business CSM was US$501 million in 2023, a 49% increase compared with 2022, reflecting higher sales volumes and the impact of updates to actuarial methods and assumptions, partially offset by higher proportion of lower margin savings products. |
| • | In mainland China, new business CSM was US$103 million in 2023, a nine-fold increase compared with the US$10 million reported in 2022, reflecting higher sales volumes, product mix and the impact of updates to actuarial methods and assumptions. |
| • | In Singapore, new business CSM was US$181 million in 2023, a 21% increase compared with 2022, reflecting higher sales volumes, product mix and the impact of updates to actuarial methods and assumptions. |
| • | New business CSM of International High Net Worth business was US$172 million in 2023, a 15% increase compared with 2022, reflecting product mix. |
| • | New business CSM of Other Emerging Markets was US$34 million, a 59% increase compared with 2022, reflecting product mix and the impact of updates to actuarial methods and assumptions. |
| • | In Vietnam, new business CSM was US$64 million in 2023, a 73% decrease compared with 2022, reflecting lower sales volumes and the impact of updates to actuarial methods and assumptions. |
| • | In Japan, new business CSM was US$93 million in 2023, a decrease of 7% compared with 2022 due to lower sales volume and model refinements, partially offset by product mix. |
CSM net of NCI was US$9,570 million as at December 31, 2023, an increase of US$2,760 million net of a US$141 million increase attributed to NCI compared with December 31, 2022. Organic CSM movement was an increase of US$537 million in 2023 driven by the impact of new insurance business and expected movements related to finance income or expenses, partially offset by amounts recognized for service provided in 2023 earnings and a net reduction from insurance experience. Inorganic CSM movement was an increase of US$2,223 million in 2023 largely due to changes in actuarial methods and assumptions that adjust the CSM.
Business Performance
| For the years ended December 31, ($ millions) |
Canadian $ | US $ | ||||||||||||||||||
| 2023 | 2022 | 2023 | 2022 | |||||||||||||||||
| Annualized premium equivalent sales |
$ | 4,469 | $ | 3,793 | $ | 3,313 | $ | 2,920 | ||||||||||||
| New business value |
$ | 1,627 | $ | 1,537 | $ | 1,206 | $ | 1,181 | ||||||||||||
| New business contractual service margin net of NCI |
$ | 1,549 | $ | 1,309 | $ | 1,148 | $ | 1,006 | ||||||||||||
| Contractual service margin net of NCI |
$ | 12,617 | $ | 9,420 | $ | 9,570 | $ | 6,951 | ||||||||||||
Assets under Management2 (“AUM”)
Asia’s assets under management were US$128.4 billion as at December 31, 2023, an increase of US$13.2 billion or 13% compared with December 31, 2022. The increase was driven by lower interest rates and positive equity market performance in 2023 on invested assets and segregated funds net assets, and business growth.
Assets under Management
| As at December 31, ($ millions) |
Canadian $ | US $ | ||||||||||||||||||
| 2023 | 2022 | 2023 | 2022 | |||||||||||||||||
| Total invested assets |
$ | 144,433 | $ | 132,808 | $ | 109,533 | $ | 98,007 | ||||||||||||
| Segregated funds net assets |
24,854 | 23,227 | 18,846 | 17,138 | ||||||||||||||||
| Total assets under management |
$ | 169,287 | $ | 156,035 | $ | 128,379 | $ | 115,145 | ||||||||||||
Strategic Highlights
Asia continues to be a core driver of growth for Manulife, supported by a clear strategy, a focus on execution, a strong team, and a diversified footprint in 12 markets. Our growth is underpinned by powerful economic secular trends including middle-class emergence, low insurance penetration and an estimated mortality protection gap of more than US$100 trillion by 20303 driving continued demand for financial solutions.
| 1 | For more information on this metric, see “Non-GAAP and Other Financial Measures” below. |
| 2 | This item is a non-GAAP financial measure. See “Non-GAAP and Other Financial Measures” below. |
| 3 | Closing Asia’s mortality protection gap, Swiss Re, July 2020. |
|
|
27 |
We continued to invest in our diversified distribution platform to accelerate growth. In 2023 we:
| • | Continued to enhance our MCV capabilities to complement our prominent domestic franchise in Hong Kong with support from the launch of an expanded hospital network covering more than 3,000 hospitals in mainland China and the opening of our second prestige service centre in Hong Kong. Our continued investments in MCV capabilities have contributed to robust MCV APE sales in 2023, more than double that of our 2019 pre-pandemic levels; |
| • | Launched a unified high net worth onboarding platform in Bermuda, Hong Kong, and Singapore. The new platform makes new business application, underwriting and compliance processes simpler and faster, enabling more streamlined interactions and an overall enhanced experience for both our brokers and customers; |
| • | Continued to drive agency productivity and professionalization across the region, with the initial roll out of Manulife Pro in Singapore and Vietnam, a comprehensive premier recognition and activation program, providing selected agents with differentiated resources and tools, including dedicated underwriting support and enhanced customer engagement services with access to customer leads; and |
| • | Further leveraged our exclusive partnership with a general insurer to generate cross-referrals in Hong Kong by promoting our partner’s travel insurance solutions, capturing the increased demand for travel post-pandemic. This has provided us with a further opportunity to address the life insurance needs of our customers. |
In 2023, we continued to invest in our digital capabilities to enhance the customer and distributor experience.
| • | Completed Phase 1 of the policy administration system modernization in mainland China, launching new business and underwriting modules on the new cloud-native solution, together with the seamless data migration of more than three million customers. This enables scale and efficiency, and lays the foundation for improved customer, distributor and partner experience; this milestone will enable faster speed to market through collaborative product development and easier integration with our digital partners’ ecosystems; |
| • | Made it easier for customers to manage their policies through the continued enhancement of our voice bot capabilities at our contact center in Japan, including the migration of our telephony systems to Amazon Connect1. This has contributed to a year-over-year 13 percentage point increase in 2023 in the proportion of customer-initiated interactions that are handled by interactive voice response system without any human intervention; and |
| • | Enhanced customer experience at point of sales in Vietnam through the roll-out of a first-in-market digital pre-issuance verification tool, providing customers with an easier way to review their policy before issuance, and ensure that it fully addresses their insurance needs. |
In addition, in 4Q23 we entered into an agreement to reinsure two whole-life products in Japan, representing insurance contract net liabilities of $5.6 billion as of September 30, 2023, as part of a reinsurance transaction with Global Atlantic that includes legacy long-term care and structured settlement businesses in the U.S.
We continued to maintain a diverse and engaged culture and make Manulife a great place to work. Manulife has been recognized by HR Asia as one of the “Best Companies to Work for in Asia 2023” in six of our Asian markets—mainland China, Hong Kong, Malaysia, Vietnam, Indonesia and the Philippines.
| 1 | Amazon Connect from Amazon Web Services Inc. |
28 | 2023 Annual Report | Management’s Discussion and Analysis
Our Canada segment is a leading financial services provider, offering insurance products, insurance-based wealth accumulation and decumulation products, and banking solutions, has an in-force variable annuity business, and leverages the asset management expertise and products managed by our Global Wealth and Asset Management segment. The comprehensive solutions we offer target a broad range of customer needs and foster holistic long-lasting relationships.
We offer financial protection solutions to individuals, families and business owners through a combination of competitive products, professional advice and quality customer service. We provide group life, health and disability insurance solutions to Canadian employers, with approximately 27,000 Canadian businesses and organizations entrusting their employee benefit programs to Manulife’s Group Insurance. We also provide life, health, disability and specialty products, such as mortgage creditor and travel insurance, through advisors, sponsor groups and associations, as well as direct-to-customer. We continue to increase the proportion of products with behavioural insurance features.
Manulife Bank offers flexible debt and cash flow management solutions as part of a customer’s overall financial plan. Products include savings and chequing accounts, guaranteed investment certificates, lines of credit, investment loans, mortgages and other specialized lending programs, offered through financial advisors and mortgage brokers supported by a broad distribution network.
In 2023, our Canada segment contributed 22% of the Company’s core earnings from operating segments and, as at December 31, 2023, accounted for 11% of the Company’s assets under management and administration.
Profitability
Canada’s reported net income attributed to shareholders of $1,191 million in 2023 compared with a net loss attributed to shareholders of $503 million and transitional net income attributed to shareholders of $1,198 million in 2022. The 2022 transitional net income includes a gain of $1,701 million from IFRS 9 transitional impacts. Net income attributed to shareholders is comprised of core earnings, which were $1,487 million in 2023 compared with $1,387 million in 2022, and items excluded from core earnings, which amounted to a net charge of $296 million in 2023 compared with a net charge of $1,890 million in 2022. Items excluded from core earnings in 2022 on a transitional basis amounted to a net charge of $189 million. Items excluded from core earnings are outlined in the table below. See section 13 “Non-GAAP and Other Financial Measures” below, for a reconciliation of core earnings to net income (loss) attributed to shareholders for 2023 and core earnings and transitional net income (loss) attributed to shareholders to net income (loss) attributed to shareholders for 2022.
The $100 million increase in core earnings was driven by more favourable insurance experience, higher expected investment earnings from higher yields and business growth, and business growth in Group Insurance, partially offset by slower CSM amortization on certain VFA contracts.
The table below presents net income attributed to shareholders (2023 and 2022) and transitional net income attributed to shareholders (2022) for Canada consisting of core earnings and items excluded from core earnings.
| For the years ended December 31, ($ millions) |
2023 | 2022 | ||||||
| Core earnings |
$ | 1,487 | $ | 1,387 | ||||
| Items excluded from core earnings:(1) |
||||||||
| Market experience gains (losses) |
(341 | ) | (196 | ) | ||||
| Realized gains (losses) on debt instruments |
(10 | ) | (74 | ) | ||||
| Derivatives and hedge accounting ineffectiveness |
65 | 93 | ||||||
| Actual less expected long-term returns on public equity |
(13 | ) | (90 | ) | ||||
| Actual less expected long-term returns on ALDA |
(327 | ) | (278 | ) | ||||
| Other investment results |
(56 | ) | 153 | |||||
| Changes in actuarial methods and assumptions that flow directly through income |
41 | 47 | ||||||
| Reinsurance transactions, tax-related items and other |
4 | (40 | ) | |||||
| Total items excluded from core earnings |
(296 | ) | (189 | ) | ||||
| Transitional net income attributed to shareholders |
n/a | $ | 1,198 | |||||
| Less: IFRS 9 transitional impacts: |
||||||||
| Change in expected credit loss |
(22 | ) | ||||||
| Hedge accounting |
2,690 | |||||||
| Total IFRS 9 transitional impacts (pre-tax) |
2,668 | |||||||
| Tax on IFRS 9 transitional impacts |
(967 | ) | ||||||
| Total IFRS 9 transitional impacts (post-tax) |
1,701 | |||||||
| Net income (loss) attributed to shareholders |
$ | 1,191 | $ | (503 | ) | |||
| (1) | For explanations of items excluded from core earnings, see “Items excluded from core earnings” table in the total Company “Profitability” section above. |
| 1 | Effective January 1, 2023, refinements were made to the allocations of corporate overhead and interest on surplus among segments. Prior period comparative information has been restated to reflect the changes in segment reporting. |
|
|
29 |
Business Performance
APE sales were $1,409 million in 2023, an increase of 12% compared with 2022. Individual Insurance APE sales of $564 million in 2023 increased 36% compared with 2022, driven by a large affinity markets sale, partially offset by lower participating insurance sales. Group Insurance APE sales of $644 million in 2023 increased 12% compared with 2022, reflecting higher sales in all group benefits markets. Annuities APE sales of $201 million in 2023 decreased 26% compared with 2022, primarily due to lower sales of segregated fund products, partially offset by higher fixed product sales.
CSM was $4,060 million as at December 31, 2023, an increase of $385 million compared with December 31, 2022. Organic CSM movement was an increase of $71 million in 2023 driven by the impact of new insurance business, expected movements related to finance income or expenses, and insurance experience gains, partially offset by amounts recognized for service provided in 2023 earnings. Inorganic CSM movement was an increase of $314 million in 2023 largely due to changes in actuarial methods and assumptions, partially offset by the unfavourable impact of markets, primarily driven by high interest rates on certain variable annuity contracts.
Manulife Bank average net lending assets1 were $25.1 billion in 2023, up $0.9 billion or 4% compared with 2022, driven by improved retention and business growth.
Business Performance
| For the years ended December 31, ($ millions) |
2023 | 2022 | ||||||
| APE sales |
$ | 1,409 | $ | 1,261 | ||||
| Contractual service margin |
$ | 4,060 | $ | 3,675 | ||||
| Manulife Bank average net lending assets(1) |
$ | 25,050 | $ | 24,113 | ||||
| (1) | This item is a non-GAAP financial measure. See “Non-GAAP and Other Financial Measures” below for more information. |
Assets under Management
Canada’s assets under management of $147.5 billion as at December 31, 2023 increased $4.9 billion or 3% from $142.6 billion as at December 31, 2022, due to higher total invested assets from business growth and the impact of changes in interest rates.
Assets under Management
| As at December 31, ($ millions) |
2023 | 2022 | ||||||
| Total invested assets |
$ | 111,456 | $ | 106,929 | ||||
| Segregated funds net assets |
36,085 | 35,695 | ||||||
| Total assets under management |
$ | 147,541 | $ | 142,624 | ||||
Strategic Highlights
We added innovative customer-centric enhancements across our product shelf and formed key external partnerships to help Canadians focus on improving their health and wellness. During 2023, we:
| • | Improved our customer experiences across our various businesses: |
| ¡ | Grew our annual Manulife mobile app downloads by 18%, supported by upgrades designed to enhance our customers’ digital experience and a successful communication campaign highlighting the ease and speed of online claims submissions; |
| ¡ | Expanded our Personalized Medicine program to all group benefits extended healthcare plans, making this service available to more customers, while enabling them to learn about medications that best meet their needs and work with healthcare providers on customized treatment plans that can lead to better outcomes; and |
| ¡ | Increased our use of Amazon Connect2, which enabled a more holistic digital customer experience and drove operational efficiency. This contributed to a 25% reduction of call transfer rates year over year for contact centres that had moved to Amazon Connect; |
| • | Established strategic partnerships to provide meaningful and customized health and wellness information to our clients: |
| ¡ | Partnered with League, a leading healthcare technology provider, to offer our group benefits members more personalized and integrated digital healthcare experiences, enabling them to connect their benefits directly with healthcare options; and |
| ¡ | Partnered with Cleveland Clinic Canada, using its global healthcare expertise to enhance product offering and services to over five million group benefits plan members, including their families, by providing industry research, thought leadership, and education materials; and |
| • | Re-entered the individual payout annuities market in Canada to new sales, reflecting our commitment to better address our customers’ demand for stable income with an enhanced suite of products for Canadians seeking retirement income solutions. |
| 1 | This item is a non-GAAP financial measure. See “Non-GAAP and Other Financial Measures” below for more information. |
| 2 | Amazon Connect from Amazon Web Services Inc. |
30 | 2023 Annual Report | Management’s Discussion and Analysis
Our U.S. segment provides a range of life insurance products and insurance-based wealth accumulation products, and has an in-force long-term care insurance business and an in-force annuity business.
The insurance products we offer are designed to provide customers with estate, business and income-protection solutions, and to leverage the asset management expertise and products managed by our Global Wealth and Asset Management segment. The primary distribution channel of our products is licensed financial advisors. We aim to establish lifelong customer relationships that benefit from our holistic protection and wealth product offerings.
As a life insurer, we believe we can and should help our customers live longer, healthier, better lives, and are a leader in making behavioural insurance features standard on all our insurance product offerings. Those features are primarily available through the John Hancock Vitality Program, which rewards customers for the everyday steps they take toward better long-term health. The program is underpinned by a network of companies, including Verily, Amazon, Apple, GRAIL, and ŌURA, who share our commitment to helping people gain a better understanding of their personal health and achieve better outcomes.
Our in-force business includes long-term care insurance policies which provide coverage for the cost of long-term services and support, and fixed deferred, variable deferred, and payout annuity products.
In 2023, our U.S. segment contributed 27% of the Company’s core earnings from operating segments and, as at December 31, 2023, accounted for 15% of the Company’s assets under management and administration.
Profitability
U.S. reported net income attributed to shareholders of $639 million in 2023 compared with a net loss attributed to shareholders of $2,316 million and transitional net income attributed to shareholders of $1,448 million in 2022. The 2022 transitional net income includes a gain of $3,764 million from IFRS 9 transitional impacts. Net income attributed to shareholders is comprised of core earnings, which was $1,759 million in 2023 compared with $1,566 million in 2022, and items excluded from core earnings, which amounted to a net charge of $1,120 million in 2023 compared with a net charge of $3,882 million in 2022. Items excluded from core earnings in 2022 on a transitional basis amounted to a net charge of $118 million. See section 13 “Non-GAAP and Other Financial Measures” below, for a reconciliation of core earnings to net income (loss) attributed to shareholders for 2023 and core earnings and transitional net income (loss) attributed to shareholders to net income (loss) attributed to shareholders for 2022. The changes in core earnings expressed in Canadian dollars were due to the factors described below and additionally, reflected a $60 million favourable impact from the strengthening of the U.S. dollar compared with the Canadian dollar.
Expressed in U.S. dollars, the functional currency of the segment, net income attributed to shareholders was US$473 million in 2023 compared with a net loss attributed to shareholders of US$1,809 million and transitional net income attributed to shareholders of US$1,139 million in 2022. Core earnings were US$1,304 million in 2023 compared with US$1,202 million in 2022 and items excluded from core earnings amounted to a net charge of US$831 million in 2023 compared with a net charge of US$3,011 million in 2022. Items excluded from core earnings on a transitional basis in 2022 were a net charge of US$63 million. Items excluded from core earnings are outlined in the table below.
The US$102 million or 8% increase in core earnings was driven by increased expected investment earnings due to higher investment yields and business growth as well as improved, although unfavourable, net insurance experience primarily driven by the non-recurrence of excess mortality claims related to COVID-19 in the first quarter of 2022. These impacts were partially offset by an increase in the ECL provision in 2023 primarily related to certain commercial mortgages, electric utility bonds and private placements compared with a reduction in the provision in 2022, and lower CSM recognized into earnings. The lower CSM recognized is due to a slower CSM amortization on certain VFA contracts, the reinsurance of a significant portion of the variable annuities block in the prior year, and the impact of the update of actuarial methods and assumptions. Long-term care insurance experience included in core earnings was more unfavourable in 2023 compared with 2022.
| 1 | Effective January 1, 2023, we have made a number of changes to the composition of reporting segments to better align our financial reporting with our business strategy and operations. Our international high net worth business was reclassified from U.S. Insurance in the U.S. segment to the Asia segment to reflect the contributions of our Bermuda operations alongside the high net worth business that we report in our Singapore and Hong Kong operations. Refinements were made to the allocations of corporate overhead and interest on surplus among segments. Prior period comparative information has been restated to reflect the changes in segment reporting. |
|
|
31 |
The table below presents net income attributed to shareholders (2023 and 2022) and transitional net income attributed to shareholders (2022) for the U.S. consisting of core earnings and items excluded from core earnings.
| For the years ended December 31, ($ millions) |
Canadian $ | US $ | ||||||||||||||||||
| 2023 | 2022 | 2023 | 2022 | |||||||||||||||||
| Core earnings |
$ | 1,759 | $ | 1,566 | $ | 1,304 | $ | 1,202 | ||||||||||||
| Items excluded from core earnings:(1) |
||||||||||||||||||||
| Market experience gains (losses) |
(1,196 | ) | (93 | ) | (887 | ) | (44 | ) | ||||||||||||
| Realized gains (losses) on debt instruments |
(6 | ) | (426 | ) | (5 | ) | (325 | ) | ||||||||||||
| Derivatives and hedge accounting ineffectiveness |
(14 | ) | 285 | (10 | ) | 225 | ||||||||||||||
| Actual less expected long-term returns on public equity |
6 | (136 | ) | 5 | (107 | ) | ||||||||||||||
| Actual less expected long-term returns on ALDA |
(1,212 | ) | 167 | (899 | ) | 150 | ||||||||||||||
| Other investment results |
30 | 17 | 22 | 13 | ||||||||||||||||
| Changes in actuarial methods and assumptions that flow directly through income |
132 | (12 | ) | 98 | (9 | ) | ||||||||||||||
| Reinsurance transactions, tax-related items and other |
(56 | ) | (13 | ) | (42 | ) | (10 | ) | ||||||||||||
| Total items excluded from core earnings |
(1,120 | ) | (118 | ) | (831 | ) | (63 | ) | ||||||||||||
| Transitional net income attributed to shareholders |
n/a | $ | 1,448 | n/a | $ | 1,139 | ||||||||||||||
| Less: IFRS 9 transitional impacts: |
||||||||||||||||||||
| Change in expected credit loss |
19 | 14 | ||||||||||||||||||
| Hedge accounting |
4,745 | 3,718 | ||||||||||||||||||
| Total IFRS 9 transitional impacts (pre-tax) |
4,764 | 3,732 | ||||||||||||||||||
| Tax on IFRS 9 transitional impacts |
(1,000 | ) | (784 | ) | ||||||||||||||||
| Total IFRS 9 transitional impacts (post-tax) |
3,764 | 2,948 | ||||||||||||||||||
| Net income (loss) attributed to shareholders |
$ | 639 | $ | (2,316 | ) | $ | 473 | $ | (1,809 | ) | ||||||||||
| (1) | For explanations of items excluded from core earnings, see “Items excluded from core earnings” table in the total Company “Profitability” section above. |
Business Performance
U.S. APE sales of US$416 million in 2023 decreased 10% compared with 2022 due to the adverse impact of higher short-term interest rates on accumulation insurance products for most of 2023, particularly for our affluent customers. APE sales of products with the John Hancock Vitality PLUS feature decreased 5%, and represented 75% of overall U.S. sales compared with 72% in 2022.
CSM was US$2,828 million as at December 31, 2023, a decrease of US$225 million compared with December 31, 2022. Organic CSM movement was an increase of US$88 million in 2023 driven by the impact of new insurance business and expected movements related to finance income or expenses, partially offset by amounts recognized for service provided in 2023 earnings and a net reduction from insurance experience. The net reduction in insurance experience was modestly unfavourable, with unfavourable life experience offset by favourable long-term care experience. Inorganic CSM movement was a decrease of US$313 million in 2023 due to changes in actuarial methods and assumptions primarily related to life insurance, partially offset by favourable market impacts from equity market experience and higher interest rates mainly on variable annuity contracts.
Business Performance
| For the years ended December 31, ($ millions) |
Canadian $ | US $ | ||||||||||||||||||
| 2023 | 2022 | 2023 | 2022 | |||||||||||||||||
| APE sales |
$ | 562 | $ | 599 | $ | 416 | $ | 461 | ||||||||||||
| Contractual service margin |
$ | 3,738 | $ | 4,136 | $ | 2,828 | $ | 3,053 | ||||||||||||
Assets under Management
U.S. assets under management of US$154 billion as at December 31, 2023 increased 5% from December 31, 2022. The increase in total invested assets and segregated funds net assets was primarily due to the net impact from interest rate and equity markets.
Assets under Management
| As at December 31, ($ millions) |
Canadian $ | US $ | ||||||||||||||||||
| 2023 | 2022 | 2023 | 2022 | |||||||||||||||||
| Total invested assets |
$ | 133,959 | $ | 133,635 | $ | 101,592 | $ | 98,628 | ||||||||||||
| Segregated funds net assets |
68,585 | 65,490 | 52,014 | 48,333 | ||||||||||||||||
| Total assets under management |
$ | 202,544 | $ | 199,125 | $ | 153,606 | $ | 146,961 | ||||||||||||
32 | 2023 Annual Report | Management’s Discussion and Analysis
Strategic Highlights
At John Hancock, we are focused on growing our insurance business by expanding our product offerings, modernizing the buying and delivery process, and enhancing customer experience. In addition, we continued to make significant progress to optimize our portfolio through both organic initiatives and strategic reinsurance transactions, and create tangible shareholder value through various in-force management actions. In 2023, we:
| • | Entered into an agreement to reinsure approximately $6.0 billion of long-term care and $1.6 billion of structured settlements insurance and investment contract net liabilities1 with Global Atlantic as noted above. This is the largest ever long-term care reinsurance transaction; |
| • | Expanded our reach into the employer market by introducing a Premier Benefit Indexed Universal Life product. This permanent life insurance product, available through the workplace, offers a streamlined digital process for employees to purchase individual coverage and includes our John Hancock Vitality PLUS feature; |
| • | Furthered our mission of helping customers live longer, healthier, better lives and differentiating ourselves from other U.S. life insurance carriers by hosting ‘Longer.Healthier.Better.’ – the first longevity symposium in the industry – that brought together 250 life insurance brokers, leadership from reinsurance companies, media, and local government officials to give them a first-hand look at the innovations and science shaping the future of longevity; |
| • | Launched a distribution relationship with JPMorgan Chase & Co. enabling new sales of our suite of products, including our John Hancock Vitality Program, through its network of more than 6,900 advisors; and |
| • | Enhanced our John Hancock Vitality Program by extending eligibility to access GRAIL’s Galleri® multi-cancer early detection test to additional members, expanding eligibility for preventative care and early detection behaviours through annual skin cancer screenings, and introducing a personalized way to incentivize members to be more physically active through a new Active Rewards feature. |
In 2023, we achieved the following digital successes, improving the producer and customer experience while also contributing to a more cost-efficient operation:
| • | Optimized the customer registration experience across our customer websites resulting in a 26% increase in online registrations in 2023, contributing to a 19% improvement in unique website traffic; |
| • | Eliminated over 7.8 million pieces of paper and mail by automating key back-end processes and increasing digital communications, including our first e-delivery of life insurance policy prospectuses; |
| • | Enhanced our interactive voice response authentication enabling 29% of inbound calls to be completed with no human interaction; and |
| • | Created a more seamless, digital customer experience through the launch of single sign-on for John Hancock Vitality Program members between John Hancock Life and Vitality websites as well as the expansion of our JH.com Enterprise Chatbot’s self-service capabilities. |
Our focus on continual digital improvements contributed to being recognized by LIBRA Insurance Partners, the largest independently owned life insurance marketing organization in the U.S.2, as one of the carriers who provide a best-in-class experience on an electronic platform for permanent life insurance products.
| 1 | Insurance and investment contract net liabilities amounts are as at September 30, 2023. |
| 2 | Based on gross annual production according to Paradigm Partners International, a third-party research firm specializing in the insurance landscape. |
|
|
33 |
5. Global Wealth and Asset Management1
Our Global Wealth and Asset Management segment, branded as Manulife Investment Management, provides investment advice and innovative solutions to retirement, retail and institutional clients. Our leading capabilities in public and private markets are strengthened by an investment footprint that spans 19 geographies2, including 10 in Asia where we have over 120 years of on-the-ground experience in the region.
In Retirement, we provide financial guidance, advice, investment solutions and recordkeeping services to nearly 9 million plan participants and rollover individuals in North America and Asia while they are in the accumulation phase with their employer, and increasingly as they prepare for retirement outside their employer’s plan. In North America, our Canadian retirement business focuses on providing retirement solutions through defined contribution plans, and also to group plan members when they retire or leave their plan; and in the United States, we provide employer sponsored retirement plans as well as personal retirement accounts when individuals leave their plan. In Asia, we provide retirement offerings to employers and individuals, including Mandatory Provident Fund (“MPF”) schemes and administration in Hong Kong. Additionally, we provide retirement solutions in several emerging retirement markets in Asia, including Indonesia and Malaysia.
In Retail, we distribute investment funds to clients through our proprietary advice channels in Canada and Asia, as well as through intermediaries and banks in North America and Asia, and offer investment strategies across the world, through affiliated and select unaffiliated asset managers. In Canada, we also provide holistic personal advice to individual clients and investment management, private banking and wealth and estate solutions to high net worth clients. In addition, we provide wealth management expertise for insurance-based wealth accumulation products that are distributed through Manulife’s insurance segments, as well as through our own proprietary advice channels.
Our Institutional Asset Management business provides comprehensive asset management solutions for pension plans, foundations, endowments, financial institutions, and other institutional investors worldwide. Our solutions span all major asset classes including equities, fixed income, and alternative assets (including real estate, timberland, farmland, private equity/debt, infrastructure, and liquid alternatives). In addition, we offer multi-asset investment solutions covering a broad range of clients’ investment needs.
Sustainable asset management is integral to our investment approach. We believe that identifying and assessing material sustainability factors helps us manage systemic risks and explore related investment opportunities for our clients. We endeavor to enhance the resiliency of our clients’ assets through our robust program of stewardship, which includes company engagement, responsible asset operations, and participation in the development of global sustainability standards.
In 2023, our Global WAM segment contributed 20% of the Company’s core earnings from operating segments and, as at December 31, 2023, represented 61% of the Company’s total assets under management and administration.
Profitability
Global WAM’s net income attributed to shareholders was $1,297 million in 2023 compared with $1,121 million in 2022, and core earnings were $1,321 million in 2023 compared with $1,299 million in 2022. Items excluded from core earnings are outlined in the table below and amounted to a net charge of $24 million in 2023 compared with a net charge of $178 million in 2022. See section 13 “Non-GAAP and Other Financial Measures” below, for a reconciliation of quarterly core earnings to net income (loss) attributed to shareholders for 2023 and quarterly core earnings and transitional net income (loss) attributed to shareholders to net income (loss) attributed to shareholders for 2022.
Core earnings increased $22 million, a decline of 1% compared with 2022 on a constant exchange rate basis. An increase in performance-related costs and lower earnings from seed capital investments due to repatriations were offset by growth in net fee income, from higher fee spreads and average AUMA, as well as higher performance fees in Institutional Asset Management, and a lower effective tax rate in 2023.
| 1 | Effective January 1, 2023, we have made a number of changes to the composition of reporting segments to better align our financial reporting with our business strategy and operations. Our investment in the start-up capital of segregated and mutual funds, and investment-related revenue and expense were reclassified from the Corporate and Other segment to the Global WAM segment to more closely align with Global WAM’s management practices. Refinements were made to the allocations of corporate overhead and interest on surplus among segments. Prior period comparative information has been restated to reflect the changes in segment reporting. |
| 2 | United States, Canada, Japan, Hong Kong, Singapore, Taiwan, Indonesia, Vietnam, Malaysia, India, the Philippines, England, Ireland, Switzerland, Germany, and mainland China. In addition, we have timberland/farmland operations in Australia, New Zealand, and Chile. |
34 | 2023 Annual Report | Management’s Discussion and Analysis
The table below presents net income attributed to shareholders for the Global WAM segment for 2023 and 2022 consisting of core earnings and items excluded from core earnings.
| For the years ended December 31, ($ millions) |
2023 | 2022 | ||||||
| Core earnings |
||||||||
| Retirement |
$ | 745 | $ | 673 | ||||
| Retail |
502 | 571 | ||||||
| Institutional |
74 | 55 | ||||||
| Core earnings |
1,321 | 1,299 | ||||||
| Items excluded from core earnings:(1) |
||||||||
| Market experience gains (losses) |
10 | (260 | ) | |||||
| Realized gains (losses) on debt instruments |
– | – | ||||||
| Derivatives and hedge accounting ineffectiveness |
– | – | ||||||
| Actual less expected long-term returns on public equity |
10 | (260 | ) | |||||
| Actual less expected long-term returns on ALDA |
– | – | ||||||
| Other investment results |
– | – | ||||||
| Reinsurance transactions, tax-related items and other |
(34 | ) | 82 | |||||
| Total items excluded from core earnings |
(24 | ) | (178 | ) | ||||
| Net income attributed to shareholders |
$ | 1,297 | $ | 1,121 | ||||
| (1) | For explanations of items excluded from core earnings, see “Items excluded from core earnings” table in the total Company “Profitability” section above. |
In 2023, core EBITDA1 for Global WAM was $1,771 million, $450 million higher than core earnings. In 2022, core EBITDA was $1,773 million, $474 million higher than core earnings. Core EBITDA decreased $2 million or 2%, compared with 2022, driven by higher performance-related costs and lower earnings from seed capital investments, partially offset by higher net fee income.
Core EBITDA margin2 was 24.9% in 2023 compared with 27.2% in 2022. The 230 basis point decrease was primarily driven by higher performance-related costs. See section 13 “Non-GAAP and Other Financial Measures” below, for additional information on core EBITDA and core EBITDA margin.
Core EBITDA
| For the years ended December 31, ($ millions) |
2023 | 2022 | ||||||
| Core earnings |
$ | 1,321 | $ | 1,299 | ||||
| Amortization of deferred acquisition costs and other depreciation |
166 | 154 | ||||||
| Amortization of deferred sales commissions |
80 | 98 | ||||||
| Core income tax expenses (recoveries) |
204 | 222 | ||||||
| Core EBITDA |
$ | 1,771 | $ | 1,773 | ||||
| Core EBITDA margin (%) |
24.9% | 27.2% | ||||||
Business Performance
Gross Flows and Net Flows
Gross flows were $143.4 billion in 2023, an increase of 2% compared with 2022. By business line, the results were:
| • | Retirement gross flows were $55.4 billion in 2023, an increase of 3% compared with 2022, driven by growth in member contributions. |
| • | Retail gross flows were $60.7 billion in 2023, a decrease of 12% compared with 2022, reflecting lower demand as investors continued to favor short-term cash and money market instruments amid market volatility and higher interest rates. This was partially offset by higher gross flows in mainland China where full year 2023 gross flows reflected the impact of acquiring full ownership interest of MFM in 4Q22 and the launch of our Global Semiconductors strategy in Japan in 3Q23. |
| • | Institutional Asset Management gross flows were $27.3 billion in 2023, an increase of 57% compared with 2022, driven by higher sales in mainland China and the impact of acquiring full ownership interest of MFM as noted above, new product launches totaling $1.6 billion in 2023 and higher sales of real estate, private equity and credit mandates. |
Net inflows were $4.5 billion in 2023, compared with net inflows of $3.2 billion in 2022. By business line, the results were:
| • | Retirement net outflows were $4.0 billion in 2023 compared with net outflows of $0.1 billion in 2022, driven by large case pension plan redemptions by a single sponsor in the U.S. in 3Q23 and 4Q23. This was partially offset by growth in member contributions. |
| • | Retail net outflows were $0.5 billion in 2023 compared with net outflows of $1.6 billion in 2022, driven by lower mutual fund redemption rates and the launch of our Global Semiconductors strategy in Japan in 3Q23. This was partially offset by lower demand as investors continued to favour short-term cash and money market instruments amid market volatility and higher interest rates. |
| 1 | This item is a non-GAAP financial measure. See “Non-GAAP and Other Financial Measures” below. |
| 2 | This item is a non-GAAP ratio. See “Non-GAAP and Other Financial Measures” below for more information. |
|
|
35 |
| • | Institutional Asset Management net inflows were $9.0 billion in 2023 compared with net inflows of $4.9 billion in 2022, driven by higher net inflows of timberland, real estate, private equity and credit mandates, the impact of acquiring full ownership interest of MFM, as well as new product launches totaling $1.6 billion in 2023. |
Gross Flows and Net Flows
| For the years ended December 31, ($ millions) |
2023 | 2022 | ||||||
| Gross flows |
$ | 143,389 | $ | 136,933 | ||||
| Net flows |
$ | 4,548 | $ | 3,189 | ||||
Assets under Management and Administration
As of December 31, 2023, AUMA for our wealth and asset management businesses were $849.2 billion, an increase of 11% compared with December 31, 2022, driven by the net impact of interest rates and equity markets, and net inflows. As of December 31, 2023, Global WAM also managed $205.8 billion in assets for the Company’s non-WAM reporting segments. Including those assets, AUMA managed by Global WAM1 were $1,055.0 billion compared with $984.3 billion as at December 31, 2022.
Segregated funds net assets were $248.1 billion for December 31, 2023, 11% higher compared with December 31, 2022 on an actual exchange rate basis, driven by the favourable net impact of interest rates and equity markets. Total invested assets in our general fund form a small portion of Global WAM AUMA.
Changes in Assets under Management and Administration
| For the years ended December 31, ($ millions) |
2023 | 2022 | ||||||
| Balance January 1, |
$ | 782,340 | $ | 855,926 | ||||
| Acquisitions/Dispositions |
(410 | ) | 8,789 | |||||
| Net flows |
4,548 | 3,189 | ||||||
| Investment income (loss) and other |
62,685 | (85,564 | ) | |||||
| Balance December 31, |
$ | 849,163 | $ | 782,340 | ||||
| Average assets under management and administration |
$ | 812,662 | $ | 790,268 | ||||
Assets under Management and Administration
| As at December 31, ($ millions) |
2023 | 2022 | ||||||
| Total invested assets |
$ | 7,090 | $ | 5,752 | ||||
| Segregated funds net assets(1) |
248,066 | 224,190 | ||||||
| Mutual funds, institutional asset management and other(2) |
411,961 | 381,630 | ||||||
| Total assets under management |
667,117 | 611,572 | ||||||
| Other assets under administration |
182,046 | 170,768 | ||||||
| Total assets under management and administration |
$ | 849,163 | $ | 782,340 | ||||
| (1) | Segregated funds net assets are comprised of Retirement assets under management (“AUM”), consisting primarily of fee-based products with little or no guarantees. |
| (2) | Other funds represent pension funds, pooled funds, endowment funds and other institutional funds managed by the Company on behalf of others. |
Strategic Highlights
Leveraging our integrated business model and global scale, we have a clear strategy to pursue high-growth opportunities in the most attractive markets globally through our three business lines: Retirement, Retail and Institutional Asset Management. Our strategy includes being a global retirement leader by supporting financial wellness; expanding our presence in retail distribution platforms across the globe; leveraging a multi-manager model; and providing differentiated institutional active asset management capabilities across high performing equity and fixed income strategies, outcome-oriented solutions and alternative assets.
We executed on a number of initiatives to accelerate growth in our franchise. In 2023, we:
| • | Entered an agreement to acquire multi-sector alternative credit manager CQS, headquartered in London. The acquisition will give MIM and CQS clients enhanced access to our combined global investment solutions. We will retain CQS’s rigorous investment philosophy and process and bring its differentiated capabilities to new investors by leveraging our global footprint. The CQS credit platform has approximately $18.8 billion in assets under management as of October 31, 2023, and the transaction is expected to close in the first half of 2024 subject to customary closing conditions and regulatory approvals; and |
| • | Continued to meet investor needs for wealth solutions through the expansion of our product offerings with the launch of the Global Semiconductors strategy in Japan Asia Retail which garnered more than $0.8 billion in net flows since its launch in 3Q23. |
| 1 | This item is a non-GAAP financial measure. See “Non-GAAP and Other Financial Measures” below. |
36 | 2023 Annual Report | Management’s Discussion and Analysis
We continued to make progress on our digital customer leader strategy. In 2023, we:
| • | Continued to enhance and broaden our wealth planning and advice business in Canada Retail through strategic agreements with Fidelity Clearing Canada and Envestnet that will provide access to leading advisory technology and portfolio management platforms, which combined will deliver an enhanced digital client experience and improved advisor productivity; |
| • | Increased our mobile application user count in Canada Retirement by 38% in 2023 following the delivery of new features (fund switch and TFSA lump sum contributions) and experience enhancements (deep linking and personalized nudges enhancements); |
| • | Continued to improve “Join Now”, our digital enrolment process in Canada Retirement, with features that have enabled us to deploy it to 92% of eligible sponsors, representing an increase of 10% compared with 2022. This contributed to 49,500 new digital enrolments in 2023; and |
| • | Accelerated customer adoption of digital applications in Canada Retirement through our “Say Goodbye to Paper” campaign which contributed to a 165% increase in members converting to e-statements over the campaign period, which spanned from June to August, and an increase in satisfaction with their digital experience. |
In addition, we received numerous industry awards and recognition in 2023. Most notably, Institutional Asset Management was recognized as the world’s largest natural capital investment manager1 by IPE Real Assets. Our Hong Kong Retirement business won a total of 19 awards in “The 2023 MPF Awards”, including “People’s Choice” for the fifth consecutive year, and our U.S. Retail’s thought leadership content, Market Intelligence, was named “Digital Marketing Campaign of the Year” at the With Intelligence Mutual Fund & ETF Awards.
| 1 | Ranking based on total Natural Capital AUM, which includes forestry/timberland and agriculture/farmland AUM. |
|
|
37 |
Corporate and Other is comprised of investment performance on assets backing capital, net of amounts allocated to the operating segments; financing costs; costs incurred by the corporate office related to shareholder activities (not allocated to the operating segments); our P&C Reinsurance business; as well as our run-off reinsurance operation including variable annuities and accident and health. In addition, for segment reporting purposes, consolidations and eliminations of transactions between operating segments are also included in Corporate and Other earnings.
Profitability
Corporate and Other reported net income attributed to shareholders of $628 million in 2023 compared with a net loss attributed to shareholders of $918 million and a transitional net loss attributed to shareholders of $916 million in 2022. The 2022 transitional net loss includes a gain of $2 million from IFRS 9 transitional impacts. Net income (loss) attributed to shareholders is comprised of core earnings and items excluded from core earnings. Core earnings was $69 million in 2023 compared with a core loss of $263 million in 2022. Items excluded from core earnings amounted to a net gain of $559 million in 2023 compared with a net charge of $655 million in 2022. Items excluded from core loss in 2022 on a transitional basis amounted to a net charge of $653 million. Items excluded from core earnings are outlined in the table below. See section 13 “Non-GAAP and Other Financial Measures” below, for a reconciliation of core earnings to net income (loss) attributed to shareholders for 2023 and core earnings and transitional net income (loss) attributed to shareholders to net income (loss) attributed to shareholders for 2022.
The favourable variance in core earnings of $332 million was primarily attributable to the non-recurrence of a $256 million charge in our P&C Reinsurance business for estimated losses relating to Hurricane Ian in 2022 followed by favourable updates to our prior years’ hurricane provisions of $95 million in 2023 and higher yields on debt instruments, net of higher cost of debt financing. These items were partially offset by higher core expenses due to performance-related costs as well as investments in technology.
The table below presents net income (loss) attributed to shareholders (2023 and 2022) and transitional net income (loss) attributed to shareholders (2022) for Corporate and Other consisting of core earnings (loss) and items excluded from core earnings (loss).
| For the years ended December 31, ($ millions) |
2023 | 2022 | ||||||
| Core earnings (loss) |
$ | 69 | $ | (263 | ) | |||
| Items excluded from core earnings (loss):(1) |
||||||||
| Market experience gains (losses) |
290 | (895 | ) | |||||
| Realized gains (losses) on debt instruments |
(1 | ) | (420 | ) | ||||
| Derivatives and hedge accounting ineffectiveness |
61 | 24 | ||||||
| Actual less expected long-term returns on public equity |
88 | (317 | ) | |||||
| Actual less expected long-term returns on ALDA |
(12 | ) | (26 | ) | ||||
| Other investment results |
154 | (156 | ) | |||||
| Changes in actuarial methods and assumptions that flow directly through income |
– | – | ||||||
| Reinsurance transactions, tax-related items and other |
269 | 242 | ||||||
| Total items excluded from core earnings (loss) |
559 | (653 | ) | |||||
| Transitional net income (loss) attributed to shareholders |
n/a | $ | (916 | ) | ||||
| Less: IFRS 9 transitional impacts: |
||||||||
| Change in expected credit loss |
2 | |||||||
| Hedge accounting |
1 | |||||||
| Total IFRS 9 transitional impacts (pre-tax) |
3 | |||||||
| Tax on IFRS 9 transitional impacts |
(1 | ) | ||||||
| Total IFRS 9 transitional impacts (post-tax) |
2 | |||||||
| Net income (loss) attributed to shareholders |
$ | 628 | $ | (918) | ||||
| (1) | For explanations of items excluded from core earnings, see “Items excluded from core earnings” table in the total Company “Profitability” section above. |
Strategic Highlights
Our P&C Reinsurance business provides substantial retrocessional capacity for a select clientele in the property and casualty reinsurance market. The business is largely non-correlated to Manulife’s other businesses and helps diversify our overall business mix. We manage the risk exposure of this business in relation to the total Company balance sheet risk and volatility as well as the prevailing market pricing conditions. The business is renewable annually, and we currently estimate our exposure limit in 2024 for a single event to be approximately US$250 million (net of reinstatement premiums) and for multiple events to be approximately US$500 million (net of all premiums).2
| 1 | Effective January 1, 2023, we have made a number of changes to the composition of reporting segments to better align our financial reporting with our business strategy and operations. Our investment in the start-up capital of segregated and mutual funds, and investment-related revenue and expense were reclassified from the Corporate and Other segment to the Global WAM segment to more closely align with Global WAM’s management practices. Refinements were made to the allocations of corporate overhead and interest on surplus among segments. Prior period comparative information has been restated to reflect the changes in segment reporting. |
| 2 | See “Caution regarding forward-looking statements” above. |
38 | 2023 Annual Report | Management’s Discussion and Analysis
Our investment philosophy for the general fund is to invest in an asset mix that optimizes our risk adjusted returns and matches the characteristics of our underlying liabilities. We follow a bottom-up approach which combines our strong asset management skills with an in-depth understanding of the characteristics of each investment. We invest in a diversified mix of assets and our diversification strategy has historically produced superior risk adjusted returns while reducing overall risk. We use a disciplined approach across all asset classes. Our risk management strategy is outlined in the “Risk Management and Risk Factors” section below.
General Fund Assets
As at December 31, 2023, our general fund invested assets totaled $417.2 billion compared with $400.1 billion at the end of 2022. The following table shows the asset class composition as at December 31, 2023 and December 31, 2022.
| 2023 | 2022 | |||||||||||||||||||||||||||
| As at December 31, ($ billions) |
Carrying value | % of total | Fair value | Carrying value | % of total | Fair value | ||||||||||||||||||||||
| Cash and short-term securities |
$ | 20.3 | 5 | $ | 20.3 | $ | 19.2 | 5 | $ | 19.2 | ||||||||||||||||||
| Debt securities and private placement debt |
||||||||||||||||||||||||||||
| Government bonds |
80.1 | 19 | 79.9 | 72.5 | 18 | 72.2 | ||||||||||||||||||||||
| Corporate bonds |
130.1 | 31 | 129.9 | 129.1 | 32 | 129.0 | ||||||||||||||||||||||
| Mortgage / asset-backed securities |
2.0 | 1 | 2.0 | 2.3 | 1 | 2.3 | ||||||||||||||||||||||
| Private placement debt |
45.6 | 10 | 45.6 | 42.0 | 10 | 42.0 | ||||||||||||||||||||||
| Mortgages |
52.4 | 13 | 52.3 | 51.8 | 13 | 51.4 | ||||||||||||||||||||||
| Loans to Bank clients |
2.4 | 1 | 2.4 | 2.8 | 1 | 2.8 | ||||||||||||||||||||||
| Public equities |
25.5 | 6 | 25.5 | 23.5 | 6 | 23.5 | ||||||||||||||||||||||
| Alternative long-duration assets (“ALDA”) |
||||||||||||||||||||||||||||
| Real estate |
13.0 | 3 | 13.2 | 14.3 | 4 | 14.4 | ||||||||||||||||||||||
| Infrastructure |
15.0 | 3 | 15.3 | 12.8 | 3 | 13.0 | ||||||||||||||||||||||
| Timber and agriculture |
5.7 | 1 | 6.3 | 5.9 | 1 | 6.5 | ||||||||||||||||||||||
| Private equity |
15.4 | 4 | 15.4 | 14.2 | 3 | 14.2 | ||||||||||||||||||||||
| Energy |
1.9 | 1 | 1.9 | 2.3 | 1 | 2.3 | ||||||||||||||||||||||
| Various other ALDA |
3.5 | 1 | 3.4 | 3.2 | 1 | 3.2 | ||||||||||||||||||||||
| Leveraged leases and other |
4.3 | 1 | 4.3 | 4.2 | 1 | 4.2 | ||||||||||||||||||||||
| Total general fund invested assets |
$ | 417.2 | 100 | $ | 417.7 | $ | 400.1 | 100 | $ | 400.2 | ||||||||||||||||||
The carrying values for invested assets are generally equal to their fair values, however, residential mortgages and some commercial mortgages are carried at amortized cost; company own use properties, with the exception of one property which is held at depreciated cost, are held at fair value; loans to Bank clients are carried at unpaid principal balances less allowance for credit losses; and private equity investments, including power and infrastructure, energy, and timber, are accounted for as associates using the equity method, or at fair value. Certain public bonds are classified as held to maturity and held at amortized cost, with the remaining public and private bonds being classified as either “fair value through other comprehensive income” or as “fair value through profit or loss”.
As at December 31, 2023, the carrying value of renewable energy assets was $13.4 billion (2022 – $13.6 billion). These assets include renewable bonds, renewable private equity, and energy efficient bonds.
Shareholders’ accumulated other comprehensive pre-tax income (loss) at December 31, 2023 consisted of a $15.4 billion loss for bonds (2022 – loss of $24.2 billion), a $2.8 billion loss for private placements (2022 – loss of $5.0 billion), and a $1.7 billion loss for mortgages (2022 – loss of $2.8 billion). Included in the $15.4 billion loss for bonds was a $411 million loss related to the fair value hedge basis adjustments attributable to the hedged risk of certain FVOCI bonds that are in a gain position (2022 – loss of $276 million).
Debt Securities and Private Placement Debt
We manage our high-quality fixed income portfolio to optimize yield and quality while ensuring that asset portfolios remain diversified by sector, industry, issuer, and geography. As at December 31, 2023, our fixed income portfolio of $257.8 billion (2022 – $245.9 billion) was 96% investment grade (rated BBB or better) and 71% was rated A or higher (2022 – 96% and 71%, respectively). Our private placement debt holdings provide diversification benefits (issuer, industry, and geography) and, because they often have stronger protective covenants and collateral than debt securities, they typically provide better credit protection and potentially higher recoveries in the event of default. Geographically, our fixed income portfolio is well-diversified. 22% is invested in Canada (2022 – 22%), 48% is invested in the U.S. (2022 – 48%), 6% is invested in Europe (2022 – 5%) and the remaining 24% is invested in Asia and other geographic areas (2022 – 25%).
|
|
39 |
Debt Securities and Private Placement Debt – by Credit Quality(1)
| As at December 31, ($ billions) |
2023 | 2022 | ||||||||||||||||||||||||||||||||||
| Debt securities |
Private placement debt |
Total | % of Total |
Debt securities |
Private placement debt |
Total | % of Total |
|||||||||||||||||||||||||||||
| AAA |
$ | 38.2 | $ | 0.7 | $ | 38.9 | 15 | $ | 33.7 | $ | 0.8 | $ | 34.5 | 14 | ||||||||||||||||||||||
| AA |
35.8 | 7.8 | 43.6 | 17 | 36.3 | 6.2 | 42.5 | 17 | ||||||||||||||||||||||||||||
| A |
84.6 | 15.2 | 99.8 | 39 | 83.6 | 14.3 | 97.9 | 40 | ||||||||||||||||||||||||||||
| BBB |
47.6 | 16.3 | 63.9 | 25 | 46.1 | 15.5 | 61.6 | 25 | ||||||||||||||||||||||||||||
| BB |
4.8 | 0.8 | 5.6 | 2 | 3.9 | 0.9 | 4.8 | 2 | ||||||||||||||||||||||||||||
| B & lower, and unrated |
1.2 | 4.8 | 6.0 | 2 | 0.3 | 4.3 | 4.6 | 2 | ||||||||||||||||||||||||||||
| Total carrying value |
$ | 212.2 | $ | 45.6 | $ | 257.8 | 100 | $ | 203.9 | $ | 42.0 | $ | 245.9 | 100 | ||||||||||||||||||||||
| (1) | Reflects credit quality ratings as assigned by Nationally Recognized Statistical Rating Organizations (“NRSRO”) using the following priority sequence order: S&P Global Ratings (“S&P”), Moody’s Investors Services (“Moody’s”), DBRS Limited and its affiliated entities (“Morningstar DBRS”), Fitch Ratings Inc. (“Fitch”), Rating and Investment information, and Japan Credit Rating. For those assets where ratings by NRSRO are not available, disclosures are based upon internal ratings as described in the “Risk Management and Risk Factors” section below. |
Debt Securities and Private Placement Debt – by Sector
| As at December 31, (Per cent of carrying value, unless otherwise stated) |
2023 | 2022 | ||||||||||||||||||||||||||
| Debt securities |
Private placement debt |
Total | Debt securities |
Private placement debt |
Total | |||||||||||||||||||||||
| Government and agency |
38 | 10 | 33 | 36 | 11 | 31 | ||||||||||||||||||||||
| Utilities |
14 | 35 | 18 | 14 | 37 | 18 | ||||||||||||||||||||||
| Financial |
16 | 12 | 15 | 16 | 11 | 16 | ||||||||||||||||||||||
| Industrial |
8 | 15 | 9 | 9 | 13 | 9 | ||||||||||||||||||||||
| Consumer (non-cyclical) |
8 | 14 | 9 | 8 | 14 | 9 | ||||||||||||||||||||||
| Energy |
6 | 4 | 6 | 7 | 4 | 7 | ||||||||||||||||||||||
| Consumer (cyclical) |
3 | 6 | 3 | 3 | 6 | 3 | ||||||||||||||||||||||
| Securitized (MBS/ABS) |
1 | 1 | 1 | 1 | 1 | 1 | ||||||||||||||||||||||
| Telecommunications |
2 | 0 | 2 | 2 | 0 | 2 | ||||||||||||||||||||||
| Basic materials |
2 | 3 | 2 | 2 | 3 | 2 | ||||||||||||||||||||||
| Technology |
1 | 0 | 1 | 1 | 0 | 1 | ||||||||||||||||||||||
| Media and internet and other |
1 | 0 | 1 | 1 | 0 | 1 | ||||||||||||||||||||||
| Total per cent |
100 | 100 | 100 | 100 | 100 | 100 | ||||||||||||||||||||||
| Total carrying value ($ billions) |
$ | 212.2 | $ | 45.6 | $ | 257.8 | $ | 203.9 | $ | 42.0 | $ | 245.9 | ||||||||||||||||
As at December 31, 2023, gross unrealized losses on our fixed income holdings were $23.6 billion or 9% of the amortized cost of these holdings (2022 – $33.3 billion or 12%). Of this amount, $10.7 billion (2022 – $8.4 billion) related to debt securities trading below 80% of amortized cost for more than 6 months. Securitized assets represented $141 million of the gross unrealized losses and $6 million of the amounts traded below amortized cost for more than 6 months (2022 – $228 million and $nil, respectively). After adjusting for debt securities supporting participating policyholder and pass-through products and the provisions for credit included in the insurance and investment contract liabilities, the potential impact to shareholders’ pre-tax earnings for debt securities trading at less than 80% of amortized cost for greater than 6 months was approximately $8.3 billion as at December 31, 2023 (2022 – $6.6 billion).
40 | 2023 Annual Report | Management’s Discussion and Analysis
Mortgages
As at December 31, 2023, our mortgage portfolio of $52.4 billion represented 13% of invested assets (2022 – $51.8 billion and 13%, respectively). Geographically, 69% of the portfolio is invested in Canada (2022 – 66%) and 31% is invested in the U.S. (2022 – 34%). The overall portfolio is also diversified by geographic region, property type, and borrower. Of the total mortgage portfolio, 14% is insured (2022 – 13%), primarily by the Canada Mortgage and Housing Corporation (“CMHC”) – Canada’s AAA rated government-backed national housing agency, with 32% of residential mortgages insured (2022 – 31%) and 1% of commercial mortgages insured (2022 – 1%).
| As at December 31, ($ billions) |
2023 | 2022 | ||||||||||||||||||
| Carrying value | % of total | Carrying value | % of total | |||||||||||||||||
| Commercial |
||||||||||||||||||||
| Retail |
$ | 7.9 | 15 | $ | 8.1 | 16 | ||||||||||||||
| Office |
7.7 | 15 | 8.4 | 16 | ||||||||||||||||
| Multi-family residential |
6.5 | 12 | 6.5 | 12 | ||||||||||||||||
| Industrial |
4.9 | 9 | 4.3 | 8 | ||||||||||||||||
| Other commercial |
2.6 | 5 | 2.6 | 5 | ||||||||||||||||
| 29.6 | 56 | 29.9 | 57 | |||||||||||||||||
| Other mortgages |
||||||||||||||||||||
| Manulife Bank single-family residential |
22.5 | 43 | 21.6 | 42 | ||||||||||||||||
| Agricultural |
0.3 | 1 | 0.3 | 1 | ||||||||||||||||
| Total mortgages |
$ | 52.4 | 100 | $ | 51.8 | 100 | ||||||||||||||
Our commercial mortgage loans are originated with a hold-for-investment philosophy. They have low loan-to-value ratios, high debt-service coverage ratios, and as at December 31, 2023 there were six loans in arrears, one loan with missed payments in the U.S. and five loans (two in Canada and three in the U.S.) in the process of foreclosure. Geographically, of the total commercial mortgage loans, 45% are in Canada and 55% are in the U.S. (2022 – 44% and 56%, respectively). We are diversified by property type and largely avoid risky market segments such as hotels, construction loans, and second liens.
Non-CMHC Insured Commercial Mortgages(1)
| 2023 | 2022 | |||||||||||||||||||
| As at December 31, | Canada | U.S. | Canada | U.S. | ||||||||||||||||
| Loan-to-Value ratio(2) |
63% | 60% | 60% | 56% | ||||||||||||||||
| Debt-Service Coverage ratio(2) |
1.60x | 1.89x | 1.57x | 1.90x | ||||||||||||||||
| Average duration (years) |
4.08 | 5.90 | 4.27 | 6.31 | ||||||||||||||||
| Average loan size ($ millions) |
$ | 21.6 | $ | 20.1 | $ | 21.5 | $ | 21.1 | ||||||||||||
| Loans in arrears(3) |
0.70% | 0.99% | 0.00% | 0.00% | ||||||||||||||||
| (1) | Excludes Manulife Bank commercial mortgage loans of $338 million (2022 – $381 million). |
| (2) | Loan-to-Value and Debt-Service Coverage are based on re-underwritten cash flows. |
| (3) | Arrears defined as three or more missed monthly payments or in the process of foreclosure in Canda and two or more missed monthly payments or in the process of foreclosure in the U.S. |
Public Equities
As at December 31, 2023, public equity holdings of $25.5 billion represented 6% (2022 – $23.5 billion and 6%) of invested assets and, when excluding assets supporting participating policyholder and pass-through products, represented 1% (2022 – 1%) of invested assets. The portfolio is diversified by industry sector and issuer. Geographically, 26% (2022 – 29%) is held in Canada; 29% (2022 – 31%) is held in the U.S.; and the remaining 45% (2022 – 40%) is held in Asia, Europe, and other geographic areas.
Public Equities – classified by type of product-line supported(1)
| As at December 31, ($ billions) |
2023 | 2022 | ||||||||||||||||||
| Carrying value | % of total | Carrying value | % of total | |||||||||||||||||
| Participating policyholders |
$ | 14.6 | 57 | $ | 12.3 | 52 | ||||||||||||||
| Non-participating products and pass-through products |
8.3 | 33 | 8.4 | 36 | ||||||||||||||||
| Global Wealth and Asset Management(2) |
1.5 | 6 | 1.5 | 6 | ||||||||||||||||
| Corporate and Other segment |
1.1 | 4 | 1.3 | 6 | ||||||||||||||||
| Total public equities |
$ | 25.5 | 100 | $ | 23.5 | 100 | ||||||||||||||
| (1) | Effective January 1, 2023, we have made a number of changes to the composition of reporting segments to better align our financial reporting with our business strategy and operations. Our investment in the start-up capital of segregated and mutual funds was reclassified from the Corporate and Other segment to the Global WAM segment to more closely align with Global WAM’s management practices. Prior period comparative information has been restated to reflect the changes in segment reporting. |
| (2) | Includes $1.3 billion of seed money investments in new segregated and mutual funds. |
|
|
41 |
Alternative Long-Duration Assets (“ALDA”)
Our ALDA portfolio is comprised of a diverse range of asset classes with varying degrees of correlations. The portfolio typically consists of private assets representing investments in varied sectors of the economy which act as a natural hedge against future inflation and serve as an alternative source of asset supply to long-term corporate bonds. In addition to being a suitable match for our long-duration liabilities, these assets provide enhanced long-term yields and diversification relative to traditional fixed income markets. The majority of our ALDA are managed in-house.
As at December 31, 2023, carrying value of ALDA of $54.5 billion represented 13% (2022 – $52.7 billion and 13%) of invested assets. The fair value of total ALDA was $55.5 billion at December 31, 2023 (2022 – $53.6 billion). The carrying value and corresponding fair value by sector and/or asset type are outlined above (see table in the section “General Fund Assets”).
Real Estate
Our real estate portfolio is diversified by geographic region; of the total fair value of this portfolio, 43% is located in the U.S., 39% in Canada, and 18% in Asia and Other as at December 31, 2023 (2022 – 44%, 39%, and 17%, respectively). This high-quality portfolio has very low leverage and is well-diversified by property type, including industrial, multi-family, urban office, suburban office, and company own use buildings. The portfolio is well-positioned with an average occupancy rate of 87% (2022 – 89%) and an average lease term of 4.9 years (2022 – 5.1 years). During 2023, we executed 2 acquisitions representing $0.17 billion market value of commercial real estate assets (2022 – 2 acquisitions and $0.09 billion). As part of ongoing portfolio management initiatives, 8 commercial real estate assets totaling $0.12 billion were sold during 2023.
The composition of our real estate portfolio based on fair value is as follows:
| As at December 31, ($ billions) |
2023 | 2022 | ||||||||||||||||||
| Fair value | % of total | Fair value | % of total | |||||||||||||||||
| Company Own Use |
$ | 2.7 | 20 | $ | 3.0 | 21 | ||||||||||||||
| Office – Downtown |
3.9 | 30 | 4.3 | 30 | ||||||||||||||||
| Office – Suburban |
0.9 | 7 | 1.1 | 8 | ||||||||||||||||
| Industrial |
2.3 | 17 | 2.7 | 19 | ||||||||||||||||
| Residential |
2.1 | 16 | 2.2 | 15 | ||||||||||||||||
| Retail |
0.3 | 2 | 0.4 | 3 | ||||||||||||||||
| Other |
1.0 | 8 | 0.7 | 4 | ||||||||||||||||
| Total real estate(1) |
$ | 13.2 | 100 | $ | 14.4 | 100 | ||||||||||||||
| (1) | These figures represent the fair value of the real estate portfolio excluding real estate interests. The carrying value of the portfolio was $13.0 billion and $14.3 billion as at December 31, 2023 and December 31, 2022, respectively. |
Infrastructure
We invest both directly and through funds in a variety of industry specific asset classes, listed below. The portfolio is well-diversified with over 600 portfolio companies. The portfolio is predominantly invested in the U.S. and Canada, but also in Western Europe, the United Kingdom, Australia, Asia and Latin America. Our power and infrastructure holdings are as follows:
| As at December 31, ($ billions) |
2023 | 2022 | ||||||||||||||||||
| Carrying value | % of total | Carrying value | % of total | |||||||||||||||||
| Renewable power generation |
$ | 3.2 | 22 | $ | 3.0 | 24 | ||||||||||||||
| Thermal power generation |
1.4 | 9 | 1.3 | 10 | ||||||||||||||||
| Transportation (including roads, ports) |
3.9 | 26 | 3.6 | 28 | ||||||||||||||||
| Electric and gas regulated utilities |
0.8 | 5 | 0.6 | 5 | ||||||||||||||||
| Electricity transmission |
– | – | 0.2 | 2 | ||||||||||||||||
| Water distribution |
0.4 | 3 | 0.4 | 3 | ||||||||||||||||
| Midstream gas infrastructure |
0.8 | 5 | 0.8 | 6 | ||||||||||||||||
| Maintenance service, efficiency and social infrastructure |
1.0 | 6 | 0.4 | 3 | ||||||||||||||||
| Digital infrastructure |
3.4 | 23 | 2.3 | 18 | ||||||||||||||||
| Other infrastructure |
0.1 | 1 | 0.2 | 1 | ||||||||||||||||
| Total infrastructure |
$ | 15.0 | 100 | $ | 12.8 | 100 | ||||||||||||||
Timber and Agriculture
Our timber and agriculture assets are managed by a proprietary entity, Manulife Investment Management Timberland and Agriculture (“MIM Timberland and Agriculture”). In addition to being the world’s largest timberland investment manager for institutional investors1, with timberland properties in the U.S., New Zealand, Australia, Chile, Brazil, and Canada, MIM Timberland and Agriculture also manages farmland properties in the U.S., Australia, Chile, and Canada. The general fund’s timber holdings comprised 21% of MIM’s total timberland AUM (2022 – 22%). The farmland portfolio includes annual (row) crops, fruit crops, wine grapes, and nut crops. The general fund’s farmland holdings comprised 41% of MIM’s total farmland AUM (2022 – 41%).
| 1 | Based on the global timber investment management organization ranking in the RISI International Timberland Ownership and Investment Database. |
42 | 2023 Annual Report | Management’s Discussion and Analysis
Private Equities
Our private equity portfolio of $15.4 billion (2022 – $14.2 billion) includes both directly held private equity and private equity funds. Both are diversified across vintage years and industry sectors.
Energy
This category is comprised of $1.9 billion (2022 – $2.3 billion), which includes legacy oil and gas equity interests related to upstream and midstream assets that are in runoff, and Energy Transition private equity interests in areas supportive of the transition to lower carbon forms of energy, such as wind, solar, batteries, and magnets.
Investment Income
| For the years ended December 31, ($ millions, unless otherwise stated) |
2023 | 2022 | ||||||
| Interest income |
$ | 12,802 | $ | 12,063 | ||||
| Dividend, rental income and other income(1) |
3,318 | 3,900 | ||||||
| Impairments, provisions and recoveries, net(2) |
(304 | ) | (77 | ) | ||||
| Other |
364 | (682 | ) | |||||
| 16,180 | 15,204 | |||||||
| Realized and unrealized gains (losses) on assets supporting insurance and investment contract liabilities |
||||||||
| Debt securities |
430 | (504 | ) | |||||
| Public equities |
2,157 | (3,825 | ) | |||||
| Mortgages |
99 | (52 | ) | |||||
| Private placements |
375 | 234 | ||||||
| Real estate |
(1,289 | ) | (578 | ) | ||||
| Other invested assets |
491 | 1,791 | ||||||
| Derivatives |
875 | (10,712 | ) | |||||
| 3,138 | (13,646 | ) | ||||||
| Investment expenses |
(1,297 | ) | (1,221 | ) | ||||
| Total investment income (loss) |
$ | 18,021 | $ | 337 | ||||
| (1) | Rental income from investment properties is net of direct operating expenses. |
| (2) | The Company adopted IFRS 9’s ECL impairment requirements as at January 1, 2023 without restating the comparative period. Impairments for 2023 are based on IFRS 9’s ECL requirements and impairments for 2022 are based on IAS 39’s incurred loss impairment requirements. |
In 2023, the $18.0 billion of investment income (2022 – income of $0.3 billion) consisted of:
| • | $16.2 billion of investment income before net realized and unrealized gains on assets supporting insurance and investment contract liabilities (2022 – gains of $15.2 billion); |
| • | $3.1 billion of net realized and unrealized gains on assets supporting insurance and investment contract liabilities (2022 – losses of $13.6 billion); and |
| • | $1.3 billion of investment expenses (2022 – $1.2 billion). |
The $1.0 billion increase in net investment income before unrealized and realized gains was primarily due to the impact of a higher interest rate environment.
In 2023, net realized and unrealized gains on assets supporting insurance and investment contract liabilities were $3.1 billion compared with losses of $13.6 billion in 2022. The 2023 gains were primarily due to higher equity markets, partially offset by losses on real estate relating to declining office property values. The 2022 losses were primarily due to the impact of interest rate increases and lower equity markets.
|
|
43 |
8. Fourth Quarter Financial Highlights
Profitability
| Quarterly Results | ||||||||
| ($ millions, unless otherwise stated) | 4Q23 | 4Q22 Transitional |
||||||
| Net income (loss) attributed to shareholders(1) |
$ | 1,659 | $ | 1,228 | ||||
| Return on common shareholders’ equity (“ROE”) (1) |
15.3% | 11.0% | ||||||
| Diluted earnings (loss) per common share ($)(1) |
$ | 0.86 | $ | 0.60 | ||||
| Quarterly Results | ||||||||
| ($ millions, unless otherwise stated) | 4Q23 | 4Q22 | ||||||
| Net income (loss) attributed to shareholders(1) |
$ | 1,659 | $ | 915 | ||||
| Core earnings |
$ | 1,773 | $ | 1,543 | ||||
| Diluted earnings (loss) per common share ($) |
$ | 0.86 | $ | 0.43 | ||||
| Diluted core earnings per common share (“Core EPS”) ($) |
$ | 0.92 | $ | 0.77 | ||||
| ROE |
15.3% | 8.0% | ||||||
| Core return on shareholders’ equity (“Core ROE”) |
16.4% | 14.1% | ||||||
| Expense efficiency ratio |
45.5% | 47.0% | ||||||
| Expenditure efficiency ratio |
52.1% | 54.2% | ||||||
| General expenses |
$ | 1,180 | $ | 1,002 | ||||
| Core expenses |
$ | 1,725 | $ | 1,576 | ||||
| Core expenditures |
$ | 2,249 | $ | 2,108 | ||||
| (1) | 2022 results for transitional net income attributed to shareholders, transitional diluted earnings per common share and transitional ROE are adjusted to include IFRS 9 hedge accounting and expected credit loss principles (“IFRS 9 transitional impacts”). See section 1 “Implementation of IFRS 17 and IFRS 9” of the MD&A above for more information. For 2023, there are no IFRS 9 transitional adjustments as ECL and hedge accounting is effective January 1, 2023 and therefore the impact is included in net income attributed to shareholders. |
Manulife’s 4Q23 net income attributed to shareholders was $1,659 million compared with net income attributed to shareholders of $915 million and transitional net income attributed to shareholders of $1,228 million in 4Q22. The 4Q22 transitional net income attributed to shareholders includes $313 million of IFRS 9 transitional impacts. Net income attributed to shareholders is comprised of core earnings (consisting of items we believe reflect the underlying earnings capacity of the business), which amounted to $1,773 million in 4Q23 compared with $1,543 million in 4Q22, and items excluded from core earnings, which amounted to a net charge of $114 million in 4Q23 compared with a net charge of $628 million in 4Q22. Items excluded from core earnings in 4Q22 on a transitional basis amounted to a net charge of $315 million.
Net income attributed to shareholders in 4Q23 increased $431 million compared with 4Q22 transitional net income attributed to shareholders primarily driven by a smaller net charge from market experience, growth in core earnings and the favourable impact of updates to actuarial methods and assumptions in 4Q23. In addition, 4Q22 included the favourable impact on our deferred tax assets due to an increase in the Canadian corporate tax rate. The net charge from market experience in 4Q23 was primarily related to lower-than-expected returns (including fair value changes) relative to long-term assumptions on ALDA mainly related to real estate and private equity, partially offset by higher-than-expected returns relative to long-term assumptions on public equity. Net income attributed to shareholders in 4Q23 increased $744 million compared with 4Q22, driven by the factors noted above and the $313 million of IFRS 9 transitional impacts (transitional impacts are geography-related and do not impact total shareholders’ equity as the corresponding offset is in other comprehensive income).
The 15% increase in core earnings on a constant exchange rate basis compared with 4Q22 was driven by the net favourable impact of rising interest rates, higher average AUMA and fee spreads in Global WAM, the impact of updates to actuarial methods and assumptions, primarily in Asia, as well as higher earnings in our P&C Reinsurance business as a result of a $60 million reduction to our prior years’ provisions. Business growth contributed to the increase in expected earnings on investments and on Group Insurance and affinity markets businesses in Canada. These are partially offset by higher performance-related costs.
Core earnings by segment is presented in the table below for the periods presented.
| For the quarters ended December 31, ($ millions) |
2023 | 2022 | ||||||
| Core earnings by segment(1) |
||||||||
| Asia |
$ | 564 | $ | 496 | ||||
| Canada |
352 | 296 | ||||||
| U.S. |
474 | 408 | ||||||
| Global Wealth and Asset Management |
353 | 274 | ||||||
| Corporate and Other |
30 | 69 | ||||||
| Total core earnings |
$ | 1,773 | $ | 1,543 | ||||
| (1) | Effective January 1, 2023, we have made a number of changes to the composition of reporting segments to better align our financial reporting with our business strategy and operations. Our international high net worth business was reclassified from the U.S. segment to the Asia segment to reflect the contributions of our Bermuda operations alongside the high net worth business that we report in our Singapore and Hong Kong operations. Our investment in the start-up capital of segregated and mutual funds, and investment-related revenue and expense were reclassified from the Corporate and Other segment to the Global WAM segment to more closely align with Global WAM’s management practices. Refinements were made to the allocations of corporate overhead and interest on surplus among segments. Prior period comparative information has been restated to reflect the changes in segment reporting. |
44 | 2023 Annual Report | Management’s Discussion and Analysis
In Asia, core earnings were $564 million in 4Q23 compared with $496 million in 4Q22. The 14% increase on a constant exchange rate basis was driven by an increase in expected earnings on insurance contracts, primarily reflecting the net impact of updates to actuarial methods and assumptions on our CSM and risk adjustment and higher expected investment income due to business growth and higher investment yields.
In Canada, core earnings were $352 million in 4Q23 compared with $296 million in 4Q22. The 19% increase primarily reflected business growth in Group Insurance and affinity markets, a lower ECL provision, improved insurance experience gains, and the year-to-date impact of changes in corporate tax rates recorded in 4Q22.
In the U.S., core earnings were $474 million in 4Q23 compared with $408 million in 4Q22. The 16% increase on a constant exchange rate basis was primarily due to an increase in expected investment earnings driven by higher investment yields and business growth. Insurance experience improved compared with 4Q22 primarily due to net favourable life experience, partially offset by unfavourable long-term care experience.
Global WAM core earnings were $353 million in 4Q23 compared with $274 million in 4Q22. The 29% increase was driven by growth in net fee income from higher average AUMA reflecting the favourable impact of markets in 2023 and higher fee spreads, as well as a lower effective tax rate in 4Q23.
Corporate and Other core earnings were $30 million in 4Q23 compared with $69 million in 4Q22. The $39 million decrease in core earnings was primarily driven by higher core expenses due to performance-related costs and higher cost of debt financing. These items were partially offset by gains in our P&C Reinsurance business from a $60 million update in the quarter to prior years’ provisions for estimated losses, primarily related to Hurricane Ian.
The table below presents transitional net income attributed to shareholders and net income attributed to shareholders consisting of core earnings and the items excluded from core earnings.
| For the quarters ended December 31, ($ millions) |
2023 | 2022 | ||||||
| Core earnings |
$ | 1,773 | $ | 1,543 | ||||
| Items excluded from core earnings: |
||||||||
| Market experience gains (losses)(1) |
(133 | ) | (655 | ) | ||||
| Realized gains (losses) on debt instruments |
(51 | ) | (453 | ) | ||||
| Derivatives and hedge accounting ineffectiveness |
34 | (182 | ) | |||||
| Actual less expected long-term returns on public equity |
182 | 274 | ||||||
| Actual less expected long-term returns on ALDA |
(381 | ) | (634 | ) | ||||
| Other investment results |
83 | 340 | ||||||
| Changes in actuarial methods and assumptions that flow directly through income |
119 | – | ||||||
| Restructuring charge |
(36 | ) | – | |||||
| Reinsurance transactions, tax-related items and other(2) |
(64 | ) | 340 | |||||
| Total items excluded from core earnings |
(114 | ) | (315 | ) | ||||
| Transitional net income attributed to shareholders |
n/a | $ | 1,228 | |||||
| Less: IFRS 9 transitional impacts: |
||||||||
| Change in expected credit loss |
(27 | ) | ||||||
| Hedge accounting |
461 | |||||||
| Total IFRS 9 transitional impacts (pre-tax) |
434 | |||||||
| Tax on IFRS 9 transitional impacts |
(121 | ) | ||||||
| Total IFRS 9 transitional impacts (post-tax) |
313 | |||||||
| Net income (loss) attributed to shareholders |
$ | 1,659 | $ | 915 | ||||
| (1) | Market experience was a net charge of $133 million in 4Q23 primarily driven by lower-than-expected returns (including fair value changes) relative to long-term assumptions on ALDA related to real estate and private equity, partially offset by higher-than-expected returns relative to long-term assumptions on public equity. Market experience was a net charge of $655 million in 4Q22 consisting of lower-than-expected returns (including fair value changes) relative to long-term assumptions on ALDA mainly related to real estate, net realized losses from the sale of debt instruments which are classified as FVOCI and a charge from derivatives and hedge accounting ineffectiveness, partially offset by a net gain primarily from changes in foreign currency exchange rates and higher-than-expected returns relative to long-term assumptions on public equity. |
| (2) | The 4Q23 net charge of $64 million mainly included a $38 million for an investment impairment in Asia and a charge for tax-related true-ups of $23 million. The 4Q22 net gain of $340 million included a net gain of $86 million related to acquiring full ownership interest of Manulife Fund Management Co., Ltd. (“MFM”), formerly known as Manulife TEDA Fund Management Co., Ltd (“MTEDA”) by purchasing the remaining 51% of shares from our joint venture partner, partially offset by a charge of $15 million resulting from actuarial model adjustments in Asia. In addition, 4Q22 included the favourable impact of $269 million on our deferred tax assets due to an increase in the Canadian corporate tax rate. |
|
|
45 |
Transitional net income attributed to shareholders by segment and net income attributed to shareholders by segment are presented in the following tables.
| Transitional net income (loss) attributed to shareholders by segment(1) | Quarterly Results | |||||||
| ($ millions) | 4Q23 | 4Q22 Transitional |
||||||
| Asia |
$ | 615 | $ | 493 | ||||
| Canada |
365 | 120 | ||||||
| U.S. |
198 | (106 | ) | |||||
| Global Wealth and Asset Management |
365 | 401 | ||||||
| Corporate and Other |
116 | 320 | ||||||
| Total transitional net income (loss) attributed to shareholders |
$ | 1,659 | $ | 1,228 | ||||
| Net income (loss) attributed to shareholders by segment(1) | Quarterly Results | |||||||
| ($ millions) | 4Q23 | 4Q22 | ||||||
| Asia |
$ | 615 | $ | 315 | ||||
| Canada |
365 | (73 | ) | |||||
| U.S. |
198 | (44 | ) | |||||
| Global Wealth and Asset Management |
365 | 401 | ||||||
| Corporate and Other |
116 | 316 | ||||||
| Total net income (loss) attributed to shareholders |
$ | 1,659 | $ | 915 | ||||
| (1) | Effective January 1, 2023, we have made a number of changes to the composition of reporting segments to better align our financial reporting with our business strategy and operations. Our international high net worth business was reclassified from the U.S. segment to the Asia segment to reflect the contributions of our Bermuda operations alongside the high net worth business that we report in our Singapore and Hong Kong operations. Our investment in the start-up capital of segregated and mutual funds, and investment-related revenue and expense were reclassified from the Corporate and Other segment to the Global WAM segment to more closely align with Global WAM’s management practices. Refinements were made to the allocations of corporate overhead and interest on surplus among segments. Prior period comparative information has been restated to reflect the changes in segment reporting. |
Expenditure efficiency ratio and expense efficiency ratio
The expenditure efficiency ratio was 52.1% in 4Q23, compared with 54.2% in 4Q22. The 2.1 percentage point decrease in the ratio compared with 4Q22 was driven by a 16% increase in pre-tax core earnings, partially offset by a 7% increase in core expenditures. 4Q23 core expenditures increased as a result of higher performance-related costs and investments in technology. Costs directly attributable to the acquisition of new business that are capitalized into the CSM represented approximately 23% and 25% of total core expenditures in 4Q23 and 4Q22, respectively.
The expense efficiency ratio was 45.5% in 4Q23, compared with 47.0% in 4Q22. The 1.5 percentage point decrease in the ratio compared with 4Q22 was driven by the items noted above related to the decrease in the core expenditures efficiency ratio but is net of costs directly attributable to the acquisition of new business.
Total general expenses in 4Q23 increased 18% on an actual exchange rate basis and 17% on a constant exchange rate basis compared with 4Q22 driven by the items noted above related to the decrease in the expenditure efficiency ratio and items excluded from core earnings. In 4Q23, the items excluded from core earnings primarily reflected a restructuring charge of $46 million pre-tax in Global WAM and were not material in 4Q22. General expenses are also net of directly attributable maintenance expenses and directly attributable acquisition expenses for products measured using the PAA which are included in insurance service expenses on our financial statements. Directly attributable maintenance expenses and directly attributable acquisition expenses for products measured using the PAA increased 3% on a constant exchange rate basis and 2% on an actual exchange rate basis in 4Q23 compared with 4Q22.
46 | 2023 Annual Report | Management’s Discussion and Analysis
Business Performance1
| As at and for the quarters ended December 31, ($ millions, unless otherwise stated) |
2023 | 2022 | ||||||
| Asia APE sales |
$ | 995 | $ | 893 | ||||
| Canada APE sales |
363 | 252 | ||||||
| U.S. APE sales |
192 | 143 | ||||||
| Total APE sales |
1,550 | 1,288 | ||||||
| Asia new business value |
417 | 395 | ||||||
| Canada new business value |
139 | 87 | ||||||
| U.S. new business value |
74 | 42 | ||||||
| Total new business value |
630 | 524 | ||||||
| Asia new business CSM |
414 | 324 | ||||||
| Canada new business CSM |
70 | 47 | ||||||
| U.S. new business CSM |
142 | 71 | ||||||
| Total new business CSM |
626 | 442 | ||||||
| Asia CSM net of NCI |
12,617 | 9,420 | ||||||
| Canada CSM |
4,060 | 3,675 | ||||||
| U.S. CSM |
3,738 | 4,136 | ||||||
| Corporate and Other CSM |
25 | 52 | ||||||
| Total CSM net of NCI |
20,440 | 17,283 | ||||||
| Post-tax CSM net of NCI |
17,748 | 14,659 | ||||||
| Global WAM gross flows ($ billions) |
35.1 | 32.5 | ||||||
| Global WAM net flows ($ billions) |
(1.3 | ) | (8.4 | ) | ||||
| Global WAM assets under management and administration ($ billions) |
849.2 | 782.3 | ||||||
| Global WAM total invested assets ($ billions) |
7.1 | 5.8 | ||||||
| Global WAM segregated funds net assets ($ billions) |
248.1 | 224.2 | ||||||
| Total assets under management and administration ($ billions) |
1,388.8 | 1,301.1 | ||||||
| Total invested assets ($ billions) |
417.2 | 400.1 | ||||||
| Total net segregated funds net assets ($ billions) |
377.5 | 348.6 | ||||||
APE sales were $1.6 billion in 4Q23, an increase of 20% compared with 4Q22. In Asia, APE sales increased 11%, driven by growth in Hong Kong and Asia Other2, partially offset by lower sales in Japan. In Hong Kong, APE sales increased 55% compared with 4Q22, reflecting growth in our broker, agency and bancassurance channels, primarily driven by a return of demand from MCV customers. In Japan, APE sales decreased 12%, compared with 4Q22 due to lower other wealth sales. APE sales in Asia Other increased 1% compared with 4Q22. Higher bancassurance sales in mainland China and higher broker sales in Singapore were partially offset by lower agency and bancassurance sales in Vietnam, and lower broker sales in our International High Net Worth business. In Canada, APE sales increased 44% compared with 4Q22, primarily due to higher large-case and mid-size sales in Group Insurance and higher fixed annuity sales, partially offset by lower travel sales. U.S. APE sales increased 34% compared with 4Q22, reflecting a rebound in demand from affluent customers.
New business value (“NBV”) was $630 million in 4Q23, an increase of 20% compared with 4Q22. In Asia, NBV increased 5% compared with 4Q22, driven by higher sales volumes partially offset by business mix. In Canada, NBV increased 60% compared with 4Q22 driven by higher sales volumes in Group Insurance and higher margins in Individual Insurance and Annuities. In the U.S., NBV increased 74% compared with 4Q22, driven by higher sales volumes, product mix and pricing actions.
New business contractual service margin (“New business CSM”) was $626 million in 4Q23, an increase of 41% compared with 4Q22. Asia new business CSM increased 27% compared with 4Q22, primarily due to higher sales volumes and the impact of updates to actuarial methods and assumptions. In Canada, new business CSM increased 49% compared with 4Q22, driven by higher margins in Individual Insurance and Annuities. In the U.S., new business CSM increased 102% compared with 4Q22, driven by higher sales volumes, pricing actions and product mix.
Global WAM net outflows were $1.3 billion in 4Q23 compared with net outflows of $8.4 billion in 4Q22. Net outflows in Retirement were $2.5 billion in 4Q23 compared with net outflows of $4.6 billion in 4Q22, driven by lower pension plan redemptions in the U.S. and growth in new pension plan sales and member contributions. Net outflows in Retail were $1.0 billion in 4Q23 compared with net outflows of $4.7 billion in 4Q22, driven by lower mutual fund redemption rates. Net inflows in Institutional Asset Management were $2.1 billion compared with net inflows of $0.9 billion in 4Q22, driven by higher sales of real estate, private equity and credit mandates.
Global WAM gross flows were $35.1 billion in 4Q23, an increase of 8% compared with 4Q22. Retirement gross flows were $13.3 billion in 4Q23, an increase of 9% compared with 4Q22, driven by higher new pension plan sales and growth in member contributions. Retail gross flows were $15.2 billion in 4Q23, in line with 4Q22, driven by higher equity fund sales in Canada and higher separately managed accounts sales in the U.S., offset by lower money market sales in mainland China. Institutional Asset Management gross flows were $6.7 billion in 4Q23, an increase of 31% compared with 4Q22, primarily driven by higher sales of real estate, private equity and credit mandates.
| 1 | Effective January 1, 2023, our international high net worth business was reclassified from the U.S. segment to the Asia segment to reflect the contributions of our Bermuda operations alongside the high net worth business that we report in our Singapore and Hong Kong operations. Prior period comparative information has been restated to reflect the reclassification. |
| 2 | Asia Other excludes Hong Kong and Japan. |
|
|
47 |
9. Risk Management and Risk Factors
This section provides an overview of our overall risk management approach along with detailed description of specific risks.
Enterprise Risk Management Framework
Delivering on our mission “Decisions made easier. Lives made better”, our ambition is to be the most digital, customer-centric global company in our industry. The activities required to achieve these results involve elements of risk taking.
Our approach to risk management is governed by our Enterprise Risk Management (“ERM”) Framework.
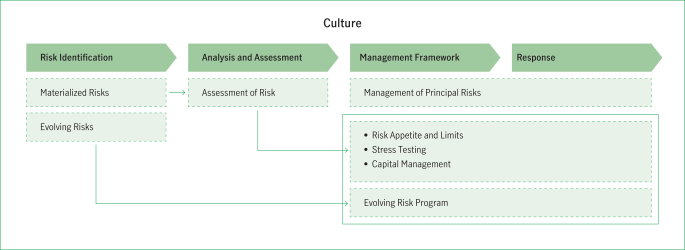
Our ERM Framework provides a structured approach to risk taking and risk management activities across the enterprise. It is communicated through risk policies and standards, which are intended to enable consistent design and execution of strategies across the organization. Our risk policies and standards cover:
| • | Governance, risk roles and authorities – Assignment of accountability and delegation of authority for risk oversight and risk management at various levels within the Company, as well as accountability principles and risk appetite, which drives risk limits and policies; |
| • | Strategy – The types and levels of risk the Company faces given its strategic plan, and the risk assessment of the internal and external environment; |
| • | Execution – Risk identification, measurement, assessment, and mitigation which enable those accountable for risks to manage and monitor the risk profile; and |
| • | Evaluation – Validation and oversight to confirm the Company’s risk profile, root cause analysis of any notable variation, and any action required to maintain risk at its desired level. |
Our risk management practices are influenced by external and internal factors, including economic conditions, political environments, technology and risk culture, which can significantly impact the levels and types of risks we might face in pursuit of strategically optimized risk taking and risk management. Our ERM Framework addresses relevant risk drivers and assessments, as well as mitigating actions, as appropriate.
Three Lines of Defense Model
A strong risk culture and a consistent approach are integral to Manulife’s risk management practices. Management is responsible for managing risk within risk appetite and has established risk management strategies and monitoring practices. Our approach includes a “three lines of defense” governance model that segregates duties among risk taking activities, risk monitoring and risk oversight, and establishes appropriate accountability for those who assume risk versus those who oversee risk.
Our first line of defense includes the Chief Executive Officer (“CEO”), Segment and Business Unit General Managers, Global Function Heads and all business operations personnel. The Segment General Managers are ultimately accountable for their business results, the risks they assume to achieve those results, and for the day-to-day management of the risks and related controls, and the Global Function Heads are accountable for the management of the risks and related controls for their function.
The second line of defense is comprised of the Company’s Chief Risk Officer (“CRO”), the Company’s Chief Compliance Officer, and the Company’s Chief Actuary, each with their respective teams, as well as other global oversight functions. Collectively, this group provides independent oversight of risk taking and risk management activities across the enterprise. Risk oversight committees, through broad-based membership, are an integral part of the risk oversight and management governance infrastructure.
48 | 2023 Annual Report | Management’s Discussion and Analysis
The third line of defense is Audit Services, which provides independent, objective assurance that controls are effective and appropriate relative to the risk inherent in the business and that risk mitigation programs and risk oversight functions are effective in managing risks.
Risk Culture
To enable the achievement of our mission and strategic priorities, we are committed to a set of shared values, which reflect our culture, inform our behaviours, and help define how we work together:
| • | Obsess about customers – Assess their needs and do everything in our power to satisfy them. |
| • | Do the right thing – Act with integrity and do what we say. |
| • | Think big – Anything is possible. We can always find a better way. |
| • | Get it done together – We’re part of an amazing team. Do it better by working together. |
| • | Own it – Feel empowered to make decisions and take action to deliver our mission. |
| • | Share your humanity – Build a supportive, diverse and thriving workplace. |
Risk Culture Vision – Within this context, we strive for a risk aware culture, where colleagues feel comfortable communicating openly, taking accountability and making decisions that align to the Company’s goals and values.
Risk Culture Framework – We have set a framework of desired behaviours to foster a strong risk aware culture. The framework is assessed against a set of qualitative and quantitative indicators and regularly reported to the risk committee of MFC’s board of directors (the “Board”) and executive leadership, with the intent to continuously identify opportunities to increase risk awareness across all geographies, businesses and layers of management and staff.
We believe that risk culture is strengthened once desired organizational behaviours and attitudes are reinforced through effective application of our corporate values. As such, we communicate key elements of our values through a risk lens to build a strong risk aware culture, including:
| • | Communication – The potential range of outcomes are discussed openly to arrive at informed decisions. Issues are escalated before they become significant problems. Mistakes and failures are used as lessons learned to be shared broadly. |
| • | Accountability – Individuals have a clear understanding of their roles and responsibilities, take ownership of their decisions and behaviours, and are held accountable for them. |
| • | Incentives – Incentives are aligned to the Company’s objectives and encourage behaviours aligned with the Company’s values, while discouraging undesired behaviours or inappropriate risk taking. |
Risk Governance
The Board oversees our culture of integrity and ethics, strategic planning, risk management, and corporate governance, among other things. The Board carries out its responsibilities directly and through its four standing committees:
| • | Risk Committee – Oversees the management of our principal risks, and our programs, policies and procedures to manage those risks. |
| • | Audit Committee – Oversees internal control over financial reporting and our finance, actuarial, internal audit and global compliance functions, serves as the conduct review committee, reviews our compliance with legal and regulatory requirements and oversees the performance, qualifications and independence of our external auditors. |
| • | Management Resources and Compensation Committee – Oversees our global human resources strategy, policies, programs, management succession, executive compensation, and pension plan governance. |
| • | Corporate Governance and Nominating Committee – Develops our corporate governance policies and procedures, including environmental, social and governance related matters, including climate change, among other activities. |
The CEO is directly accountable to the Board for our results and operations and all risk taking activities and risk management practices required to achieve those results. The CEO is supported by the CRO as well as by the Executive Risk Committee (“ERC”). Together, they shape and promote our risk culture, guide risk taking throughout our global operations and strategically manage our overall risk profile.
The ERC approves and oversees the execution of the Company’s enterprise risk management program. It establishes and presents for approval to the Board the Company’s risk appetite and enterprise-wide risk limits and monitors our overall risk profile, including evolving risks and risk management activities. As part of these activities, the ERC monitors material risk exposures, endorses and reviews strategic risk management priorities, and reviews and assesses the impact of business strategies, opportunities and initiatives on our overall risk position. The ERC is supported by a number of oversight sub-committees including:
| • | Credit Committee – Establishes credit risk policies and risk management standards of practice and oversees the credit risk management program. Also monitors the Company’s overall credit risk profile and approves large individual credits and investments. |
| • | Product Oversight Committee – Oversees insurance risk and reviews risks in new product and new business reinsurance initiatives. Also monitors product design, new product pricing, and insurance risk exposures and trends. |
| • | Global Asset Liability Committee – Oversees market and liquidity risk, hedging, and asset liability management programs and strategies. Also monitors market risk profile, risk exposures, risk mitigation activities and compliance with related policies. |
|
|
49 |
| • | Operational Risk Committee – Oversees operational risk appetite, exposures and associated governance, risk processes, risk management activities and compliance with related policies. |
| • | Capital Outlook Committee – Oversees capital management policy and capital positions. Provides direction on strategic capital matters. Identifies key evolving risks impacting capital and the ability to remit earnings from subsidiaries. |
We also have segment risk committees, each with mandates similar to the ERC except with a focus at the applicable segment.
Global Risk Management (“GRM”), under the direction of the CRO, establishes and maintains our ERM Framework and oversees the execution of individual risk management programs across the enterprise.
Risk Appetite
The Company’s strategic direction drives and is informed by our overall risk appetite. All risk taking activities are managed within the Company’s overall risk appetite, which defines the amount and types of risks the Company is willing to assume in pursuit of its objectives. The Company’s risk appetite is comprised of three components: overall risk taking philosophy, risk appetite statements, and risk limits and tolerances.
Risk Philosophy – Manulife is a global financial institution offering insurance, wealth and asset management products and other financial services. The activities required to achieve our mission of “Decisions made easier. Lives made better” are guided by our values and involve elements of prudent risk taking. As such, when making decisions about risk taking and risk management, the Company places a priority on the following objectives:
| • | Safeguarding the commitments and expectations established with our customers, creditors, regulators, shareholders and employees; |
| • | Operating within the Company’s risk governance structure as defined by our risk frameworks and policies; |
| • | Supporting the successful design and delivery of customer solutions through the development and deployment of innovative product solutions, and through providing customer-centric digital experiences while remaining within risk appetite; |
| • | Prudently and effectively deploying shareholder capital invested in the Company to achieve appropriate risk/return profiles; |
| • | Maintaining the Company’s targeted financial strength rating; |
| • | Achieving and maintaining a high level of operational and financial resilience; |
| • | Investing all assets, including in the wealth and asset management business, consistent with customers’ objectives; |
| • | Safeguarding the well-being of our employees, and promoting a diverse, equitable and inclusive business environment; |
| • | Considering environmental, social, and governance (“ESG”) impacts across our business activities; and |
| • | Safeguarding or enhancing the Company’s reputation and brand. |
As an integrated component of our business model, risk management assists the Company in achieving our objectives and in reaching higher levels of operational excellence, while encouraging transparency, prudence, and organizational learning. While we only pursue risks that we believe we can appropriately analyze and monitor, we accept that we are exposed to risks both within our control and outside of our direct influence. We manage each risk by taking actions designed to keep exposures within desired levels, and in accordance with the risk objectives articulated above.
Risk Appetite Statements – At least annually, we establish and/or reaffirm that our risk appetite and the Company’s strategy are aligned. The risk appetite statements provide ‘guideposts’ on our appetite for the level of identified risks, any conditions placed on associated risk taking and direction for where quantitative risk limits should be established. The Company’s risk appetite statements are as follows:
| • | Manulife accepts a total level of risk that provides a very high level of confidence to meeting customer obligations while targeting an appropriate overall return to shareholders over time; |
| • | Manulife pursues product risks that add customer and shareholder value where there is competence to assess and monitor them, and for which appropriate compensation is received; |
| • | Manulife believes a diversified investment portfolio reduces overall risk and enhances returns; therefore, it accepts credit and alternative long-duration asset related risks; |
| • | Capital market risks are acceptable when they are managed within specific risk limits and tolerances; |
| • | Manulife accepts that operational risks are an inherent part of the business and are managed by implementing appropriate controls that provide reasonable assurance that we are within our risk thresholds and tolerances. Management will protect its business and customers’ assets through cost-effective operational risk mitigation; and |
| • | Manulife expects its directors, officers and employees to act in accordance with the Company’s values, ethics and standards; and to protect its brand and reputation. |
Risk Limits and Tolerances – Risk limits and tolerances are established for risks within our risk classification framework that are inherent in our strategies in order to define the types and amount of risk the Company will assume. Risk tolerance levels are set for risks deemed to be most significant to the Company and are established in relation to capital and earnings.
Risk Identification, Measurement and Assessment
We have a consistent approach and process to identify, measure, and assess the risks that we assume. We evaluate all potential new business initiatives, acquisitions, product offerings, reinsurance arrangements, and investment and financing transactions on a
50 | 2023 Annual Report | Management’s Discussion and Analysis
comparable risk adjusted basis. Segments and functional groups are responsible for identifying and assessing key and evolving risks on an ongoing basis. A standard inventory of risks is used in all aspects of risk identification, measurement and assessment, as well as monitoring and reporting.
Risk exposures are evaluated using a variety of measures focused on both short-term and long-term economic value, with certain measures used across all risk categories, and others applied only to some risks or a single risk type. Evaluation tools include stress tests such as sensitivity tests, scenario impact analyses and stochastic scenario modeling. In addition, qualitative risk assessments are performed, including for those risk types that cannot be reliably quantified.
We perform a variety of stress tests on earnings and earnings-at-risk, regulatory and economic capital, as well as liquidity. We also perform integrated complex scenario tests to assess key risks and their interaction.
Economic capital and earnings-at-risk provide measures of enterprise-wide risk that can be aggregated and compared across business activities and risk types. Economic capital measures the amount of capital required to meet obligations with a high and pre-defined confidence level. Our earnings-at-risk metric measures the potential variance from quarterly expected earnings at a specified confidence level. Economic capital and earnings-at-risk are both determined using internal models.
Risk Monitoring and Reporting
Under the direction of the CRO, GRM oversees monitoring and reporting on all significant risks at the Company-wide level. Risk exposures are also discussed at various risk oversight committees, along with any exceptions or proposed remedial actions, as required.
On at least a quarterly basis, the ERC and the Board’s Risk Committee review risk reports that present an overview of our overall risk profile and exposures across our principal risks. The reports incorporate both quantitative risk exposure measures and sensitivities, and qualitative assessments. The reports also highlight key risk management activities and facilitate monitoring compliance with key risk policy limits.
The results of the Financial Condition Test and Own Risk and Solvency Assessment are presented to the Board annually by our Chief Actuary and CRO, respectively. Our Chief Auditor reports annually the results of our internal audits’ assessment of risk management processes and controls to the Board’s Audit Committee and the Board’s Risk Committee. Management reviews annually the implementation of key risk management strategies, and their effectiveness, with the Board’s Risk Committee.
Risk Control and Mitigation
Risk control activities in place throughout the Company are designed to mitigate risks within established risk limits. We believe our controls, which include policies, procedures, systems and processes, are appropriate and commensurate with the key risks faced at all levels across the Company. Such controls are an integral part of day-to-day activity, business management and decision making.
GRM establishes and oversees review and approval processes for product offerings, insurance underwriting, reinsurance, investment activities and other material business activities, based on the nature, size and complexity of the risk taking activity involved. Authority for assuming risk at the transaction level is delegated to specific individuals based on their mandates.
Principal Risk Categories
Our insurance, wealth and asset management and other financial services businesses subject Manulife to a broad range of risks. Management has identified the following key risks grouped under five principal risk categories: strategic risk, market risk, credit risk, product risk and operational risk. The following sections describe the risk management strategies and risk factors for each principal risk category.
The risks described below are not the only ones we face. Additional risks not presently known to us or that are currently immaterial could impair our businesses, operations and financial condition in the future. If any such risks should occur, the trading price of our securities, including common shares, preferred shares and debt securities, could decline, and investors may lose all or part of their investment.
Strategic Risk
Strategic risk is the risk of loss resulting from the inability to adequately plan or implement an appropriate business strategy that allows us to effectively compete in the markets in which we operate, or to adapt to change in the external business, political or regulatory environment.
We compete for customers with both insurance and non-insurance financial services companies. Customer loyalty and retention, and access to distributors, are important to the Company’s success and are influenced by many factors, including our distribution practices and regulations, product features, service levels including digital capabilities, prices, investment performance, and our financial strength ratings and reputation. Our ability to effectively compete is highly dependent upon being quick to react and adapt to changes from the external environment while continuing to proactively drive innovation.
|
|
51 |
Strategic Risk Management Strategy
The CEO and Executive Leadership Team establish and oversee execution of business strategies and have accountability to identify and manage the risks embedded in these strategies. They are supported by a number of processes:
| • | Strategic business, risk and capital planning that is reviewed with the Board, Executive Leadership Team, and the ERC; |
| • | Performance and risk reviews of all key businesses with the CEO and annual reviews with the Board; |
| • | Risk based capital allocation designed to encourage a consistent decision-making framework across the organization; and |
| • | Review and approval of significant acquisitions and divestitures by the CEO and, where appropriate, the Board. |
Reputation risk is the risk that the Company’s corporate image may be eroded by adverse publicity, potentially causing long-term or even irreparable damage to the Company’s franchise value. Reputation risk arises from both internal and external environmental factors and cannot be managed in isolation from other risks.
The Company’s Global Reputation Risk Policy requires that internal processes and controls, management decisions, and business decisions, include considerations for how the Company’s reputation and brand could be impacted. Any incident with the potential to harm Manulife’s reputation is of high priority and senior management is to be alerted. An essential component of the Global Reputation Risk Policy requires that all employees should conduct themselves in accordance with our values, as well as the Code of Business Conduct and Ethics.
Environmental, Social and Governance Risks
Environmental, social and governance (“ESG”) risks could arise from our inability to adapt to evolving ESG issues, including climate change, and may impact our investments, underwriting, and operations, which could lead to adverse financial, operational, legal, reputational, or brand value risks for Manulife due to our actual or perceived actions, or inaction in relation to ESG issues.
The Board’s Corporate Governance and Nominating Committee (“CGNC”) oversees Manulife’s ESG framework, including matters related to climate change. On a regular basis, the CGNC is updated on relevant ESG topics, including our progress against the commitments set out in Manulife’s Climate Action Plan. Each member of the CGNC also participates in at least one externally facilitated ESG-related education session every two years. The CGNC’s oversight complements Manulife’s Executive Sustainability Council (“ESC”), which consists of the CEO, the Chief Sustainability Officer, the CRO and other members of the Executive Leadership Team. As part of its mandate, the ESC is responsible for guiding the development and execution of our climate strategy, including climate-related risk management activities. The ESC meets monthly and is supported by the ESG Centre of Expertise (“CoE”), which consists of corporate function and business unit leads tasked with integrating sustainability into our business practices and a Legal and Compliance ESG CoE, whose purpose is to share information and advice relating to ESG activities across Manulife. Manulife’s Climate Change Taskforce, a cross-functional team, is responsible for the execution of the Climate Action Plan and manages climate-related performance and disclosures. Additionally, our global executive Diversity, Equity and Inclusion (“DEI”) Council, which includes members of the Executive Leadership Team and is chaired by the CEO, meets quarterly and guides, supports, and facilitates the implementation of our DEI strategy, encourages innovative thinking about DEI challenges and opportunities, and drives and builds accountability for DEI throughout the organization.
Climate Risk
Consistent with the Financial Stability Board’s Taskforce on Climate-Related Financial Disclosures (“TCFD”), Manulife defines climate-related risks as the potential negative impacts from climate change, which may be experienced directly (e.g., through financial loss) or indirectly (e.g., through reputational harm), resulting from the physical impacts of climate change or the transition to a low-carbon economy.
Climate risk is a risk with unique characteristics given the diverse set of pathways through which it can manifest. As such, it is a transversal risk, that has the potential to impact any of our principal risks, including strategic, market, credit, product, or operational risk, as well as legal and reputational risk. Climate risk, therefore, is viewed as a modifier or an accelerator of existing risk types, and failure to adequately prepare for the potential impacts of climate change can have material adverse impacts on our balance sheet or our ability to operate.
Potential impacts of climate change may include but are not limited to: business losses or disruption resulting from extreme weather conditions; challenges in adapting to changes in climate-related legal or regulatory frameworks; reputational damage; devaluation of our debt or equity asset exposures to fossil-fuel-related or high-emitting industries; or increased insurance contract liabilities arising from climate-related impacts on morbidity or mortality.
We continue to enhance the integration of climate-related risks into our enterprise risk management framework to ensure that they are managed in a manner consistent with our approach to risk management (refer to “Risk Identification, Measurement and Assessment” above). Our Environmental Risk Policy and other relevant policies and standards are used to guide business operations on climate risk identification and assessment. GRM continues to enhance risk management practices to consider the potential impacts from climate-related risk, including in our investment decision-making processes, life insurance underwriting due diligence, and assessment of operational risks and controls.
The Executive Risk Committee and the Risk Committee of the Board consider climate-related risks and opportunities through the ongoing monitoring and reporting of evolving risks. Risk management activities addressing climate-related risks are expected to continue to evolve over time as knowledge and capabilities further mature, and as applicable standards, frameworks and methodologies continue to emerge and coalesce. Manulife is a long-term oriented underwriter and investor. Therefore, climate-related risks and opportunities, including
52 | 2023 Annual Report | Management’s Discussion and Analysis
changes in the physical environment and policy and technological changes associated with the transition to a low-carbon economy, are strategically relevant and, in some cases, could become material to our business over time. In 2023, we continued to monitor climate-related risks and opportunities within our business strategy over short (1-5 years), medium (5-15 years), and long (beyond 15 years) time horizons to better assess the relative significance of potential impacts and how and when actions will be required to address such impacts.
Our Climate Action Plan focuses on three areas: our operations, our general fund investments, and the products and services we offer to clients. It includes a commitment to achieve net zero financed emissions by 2050, and a commitment to reduce our absolute scope 1 and 2 emissions by 40% by 20351. In our General Account, we have set near term decarbonization targets for general fund invested assets in support of our net zero commitment. In-scope asset classes currently covered by science-based targets include project finance of power generation and listed debt and equity (excluding sovereigns). Our interim targets are developed in line with the ambition of Science-based Target Initiative guidance for Financial Institutions with criteria for well-below 2 degrees celsius of warming. Through our general fund we continue to target investment in green and transition assets, directing funds with known use of proceeds to aspects such as energy efficiency projects, sustainably certified timberlands, and renewable energy development. Through MIM, development of investment strategies for climate change mitigation and resilience remains ongoing.
Our total exposure to carbon-related assets, held in our General Account, was $68.0 billion, or 16% of the total portfolio as of December 31, 2023. Carbon-related assets are identified based on internal sub-sector classifications. Sub-sectors in scope are informed by TCFD guidance and at this time, include oil and gas; oil and gas services; pipelines; coal; electric and gas utilities; building materials, and basic materials. Carbon-related assets are based on sectors recommended by the TCFD and represent sectors that may be financially vulnerable to climate transition risks such as rising costs of carbon, that could lead to possible devaluation, impairment or stranding of assets.
For additional information regarding strategic risks associated with Manulife’s sustainability commitments, see “Strategic Risk Factors – We may not be able to achieve our sustainability commitments, or our commitments may not meet the expectations of stakeholders or regulators”. Please also refer to our annual “Environmental, Social and Governance Report”, published in the second quarter of each year, for detailed disclosure on our alignment with the TCFD recommendations and our ESG performance.
Strategic Risk Factors
We may not be successful in executing our business strategies or these strategies may not achieve our objectives.
| • | The global macroeconomic environment has a significant impact on our financial plans and ability to implement our business strategy. The macroeconomic environment can be significantly impacted by the actions of both the government sector (including central banks) and the private sector. The macroeconomic environment may also be affected by natural and human-made catastrophes. |
| • | Our business strategy and associated financial plans are developed by considering forecasts of economic growth, both globally and in the specific countries in which we operate. Actual economic growth can be significantly impacted by the macroeconomic environment and can deviate significantly from forecasts, thus impacting our financial results and the ability to implement our business strategy. |
| • | Any plans to expand our global operations in markets where we operate and potentially in new markets may require considerable management time, as well as start-up expenses for market development before any significant revenues and earnings are generated. Operations in new markets may achieve low margins or may be unprofitable, and expansion in existing markets may be affected by local economic and market conditions. |
| • | Changes in the macroeconomic environment can also have a significant impact on financial markets, including movements in interest rates, spreads on fixed income assets, and returns on public equity and ALDA assets. Our financial plan, including income, balance sheet, and capital projections are based on certain assumptions with respect to future interest rates and spreads on fixed income assets, and future returns from our public equity and ALDA investments. Actual experience is highly variable and can deviate significantly from our assumptions, thus impacting our financial results. In addition, changes in the macroeconomic environment may result in changes to financial assumptions, which would also impact our financial results. |
| • | Specific changes in the macroeconomic environment can have very different impacts across different parts of the business. For example, a rise in interest rates is generally beneficial to us in the long-term as higher interest rates may facilitate financial product development and exceed our product pricing assumptions, but can adversely affect valuations of some ALDA assets, especially those that have expected returns substantially dependent on long-dated contractual cash flows. |
| • | A rise in geopolitical tensions and political risk either within or outside of jurisdictions in which we operate can trigger changes in the macroeconomic environment and overall regulatory landscape which can have various impacts across our business. For example, economic sanctions imposed on a country could adversely impact our ability to achieve specific business objectives. Military conflicts could drive financial and economic dislocations across global capital markets, supply chains or commodity markets. See also “Operational Risk Factors – Our operations face political, legal, operational and other risks that could negatively affect those operations or our results of operations and financial condition.” |
| • | The spending and savings patterns of our customers could be significantly influenced by the macroeconomic environment and could have an impact on the products and services we offer to our customers. |
| 1 | See “Caution regarding forward-looking statements” above. |
|
|
53 |
| • | Customer behaviour and emergence of claims on our liabilities can be significantly impacted by the macroeconomic environment. For example, a prolonged period of economic weakness could impact the health and well-being of our customers and that could result in increased claims for certain insurance risks. |
| • | An elevated risk for stagflation, increased unemployment, inflation and economic uncertainty in certain parts of the global markets may result in adverse policyholders’ behaviour (such as higher withdrawals, lapses, lower premium deposits and lower policy persistency than anticipated), higher expenses and cost of fundings, along with other adverse impacts from higher rates due to inflationary pressure as noted in the Market Risk Factors section. These impacts could have a material adverse effect on our business, financial condition, results of operations, and cash flows. |
Adverse publicity, litigation or regulatory action resulting from our business practices or actions by our employees, representatives and/or business partners, could erode our corporate image and damage our franchise value and/or create losses.
| • | Manulife’s reputation is one of its most valuable assets. Harm to a company’s reputation is often a consequence of risk control failure, whether associated with complex financial transactions or routine operational activities. Manulife’s reputation could also be harmed by the actions of third parties with whom we do business. Our representatives include affiliated broker-dealers, agents, wholesalers and independent distributors, such as broker-dealers and banks, on whose services and representations our customers rely. Business partners include, among others, joint venture partners and third parties to whom we outsource certain functions and that we rely on to fulfill various obligations. |
| • | If any of these representatives or business partners fail to adequately perform their responsibilities, or monitor their own risks, these failures could affect our business reputation and operations. While we seek to maintain adequate internal risk management policies and procedures and protect against performance failures, events may occur involving our representatives or our business partners that could cause us to lose customers or cause us or our representatives or business partners to become subject to legal, regulatory, economic or trade sanctions, which could have a material adverse effect on our reputation, our business, and our results of operations. For further discussion of government regulation and legal proceedings refer to “Government Regulation” in MFC’s Annual Information Form dated February 14, 2024 and note 19 of the 2023 Annual Consolidated Financial Statements. |
Our businesses are heavily regulated, and changes in regulation or laws, or in the interpretation or enforcement of regulation and laws, may reduce our profitability and limit our growth.
| • | Our operations are subject to a wide variety of insurance and other laws and regulations including with respect to financial crimes (which include, but are not limited to, money laundering, bribery and economic or trade sanctions), privacy, market conduct, consumer protection, business conduct, prudential and other generally applicable non-financial requirements. Insurance and securities regulators in Canada, the United States, Asia and other jurisdictions regularly re-examine existing laws and regulations applicable to insurance companies, investment advisors, broker-dealers and their products. Compliance with applicable laws and regulations is time consuming and personnel-intensive, and changes in these laws and regulations or in the interpretation or enforcement thereof, may materially increase our direct and indirect compliance costs and other expenses of doing business, thus having a material adverse effect on our results of operations and financial condition. |
| • | Future regulatory capital, actuarial and accounting changes, including changes with a retroactive impact, could have a material adverse effect on the Company’s consolidated financial condition, results of operations and regulatory capital both on transition and going forward. In addition, such changes could have a material adverse effect on the Company’s position relative to that of other Canadian and international financial institutions with which Manulife competes for business and capital. |
| • | In Canada, MFC and its principal operating subsidiary, MLI, are governed by the Insurance Companies Act (Canada) (“ICA”). The ICA is administered, and the activities of the Company are supervised, by the Office of the Superintendent of Financial Institutions (“OSFI”). MLI is also subject to regulation and supervision under the insurance laws of each of the provinces and territories of Canada. Regulatory oversight is vested in various governmental agencies having broad administrative power with respect to, among other things, dividend payments, capital adequacy and risk based capital requirements, asset and reserve valuation requirements, permitted investments and the sale and marketing of insurance contracts. These regulations are intended to protect policyholders and beneficiaries rather than investors and may adversely impact shareholder value. |
| • | Some recent examples of regulatory and professional standard developments, which could impact our net income attributed to shareholders and/or capital position are provided below. |
| ¡ | OSFI published the Parental Stand-alone (Solo) Capital Framework in September 2023 with an effective date of January 1, 2024. The Solo Capital Framework applies to all life insurers designated by OSFI as internationally active insurance groups (IAIGs). The objective of this framework is to assess the sufficiency of capital that is readily available to the domestic parent operating life insurer on a solo basis and to assess the parent’s ability to act as a source of strength for its subsidiaries and/or other affiliates. MLI is in scope for this framework and meets the requirement. |
| ¡ | In January 2023, a revised LICAT guideline, aligning with the IFRS 17 accounting changes, took effect. This will be followed by an update to the capital rules for Segregated Fund Guarantees, expected to be effective in January 2025. OSFI’s LICAT capital regime applies to our business globally on a group consolidated basis. We continue to meet OSFI’s requirements and maintain capital in excess of regulatory expectations. |
| ¡ | At its annual meeting in November 2019, the IAIS adopted a risk based global Insurance Capital Standard (“ICS”), that is being further developed over a five-year monitoring period that commenced in 2020. While broadly supportive of the goals of ICS, OSFI |
54 | 2023 Annual Report | Management’s Discussion and Analysis
| stated that it did not support the current ICS design, adopted by the IAIS in November 2019, citing that it was ‘not fit for purpose for the Canadian market’. While the IAIS intend to adopt ICS in November 2024, the final form and timing of ICS that will be implemented in different jurisdictions, remains the sole responsibility of the local regulators. Without OSFI’s adoption, the IAIS rules will not apply in Canada or to Canadian companies on a group-wide basis, while other regulators may use the ICS framework, adapted for their local market, for calculating capital in their specific markets. We will continue to monitor developments as the ICS methodology and its applicability evolve. |
| ¡ | The National Association of Insurance Commissioners (“NAIC”) continues to review and revise reserving and capital methodologies as well as the overall risk management framework as required to keep pace with an evolving landscape. These reviews will affect U.S. life insurers, including John Hancock, and could lead to increased reserving and/or capital requirements for our business in the U.S. In addition, in December 2020 the NAIC adopted a group capital calculation (“GCC”) and amendments to the NAIC Insurance Holding Company System Regulatory Act which exempt certain insurance holding groups, including John Hancock and Manulife, from the requirements relating to the GCC. In Michigan, which is the lead state for NAIC regulation of John Hancock, the Michigan Insurance Code was recently amended to adopt the NAIC GCC model language and the Michigan Department of Insurance and Financial Services (“DIFS”) is promulgating the associated rules. OSFI has been working with the NAIC to achieve mutual recognition and treatment of internationally active insurance groups domiciled in Canada with U.S. operations. Mutual recognition will avoid redundant group oversight, and Manulife and John Hancock have taken a leadership role to ensure the NAIC process could accommodate a process that OSFI could and would undertake. With the ongoing NAIC mutual recognition process, Michigan DIFS issued guidance providing a narrowly tailored waiver that relieves John Hancock of any additional reporting obligations in 2024. |
| ¡ | Regulators in various jurisdictions in which we operate continue to reform their respective capital regulations. We continue to closely monitor the developments. |
| • | Increasingly, global financial regulators are promulgating guidance related to climate change and its potential impacts on financial services firms. OSFI, the SEC and several regulators across Asia have been engaging industry to assess the impacts of climate change and to set expectations on establishing climate transition plans, including ensuring effective risk management and governance structures to manage climate change-related risks and have begun releasing guidance. There are also increasing expectations from investors, regulators, and other stakeholders to provide comparable, decision-useful data and reporting on climate change-related risks and opportunities, including performance metrics such as an organization’s Scope 1, 2 and 3 carbon emissions. Regulatory disclosure requirements are guided by private sector bodies, where there is a convergence in the industry around sustainability reporting frameworks. The IFRS Foundation’s International Sustainability Standards Board (“ISSB”) is one such body and has published draft standards for a comprehensive global baseline of sustainability disclosures for capital markets. |
| • | In the United States, state insurance laws regulate most aspects of our business, and our U.S. insurance subsidiaries are regulated by the insurance departments of the states in which they are domiciled and the states in which they are licensed. State laws grant insurance regulatory authorities broad administrative powers with respect to, among other things: licensing companies and agents to transact business; calculating the value of assets to determine compliance with statutory requirements; mandating certain insurance benefits; regulating certain premium rates; reviewing and approving policy forms; regulating unfair trade and claims practices, including through the imposition of restrictions on marketing and sales practices, distribution arrangements and payment of inducements; regulating advertising; protecting privacy; establishing statutory capital and reserve requirements and solvency standards; fixing maximum interest rates on insurance policy loans and minimum rates for guaranteed crediting rates on life insurance policies and annuity contracts; approving changes in control of insurance companies; restricting the payment of dividends and other transactions between affiliates; and regulating the types, amounts and valuation of investments. Changes in any such laws and regulations, or in the interpretation or enforcement thereof by regulators, could significantly affect our business, results of operations and financial condition. |
| • | Currently, the U.S. federal government does not directly regulate the business of insurance. However, federal legislation and administrative policies in several areas can significantly and adversely affect state regulated insurance companies. These areas include financial services regulation, securities regulation, pension regulation, privacy, tort reform legislation, and taxation. In addition, under the Dodd-Frank Wall Street Reform and Consumer Protection Act (“Dodd-Frank”), the U.S. Board of Governors of the Federal Reserve has supervisory powers over non-bank financial companies that are determined to be systemically important. |
| • | Insurance guaranty associations in Canada and the United States have the right to assess insurance companies doing business in their jurisdiction for funds to help pay the obligations of insolvent insurance companies to policyholders and claimants. Typically, an insurer is assessed an amount related to its proportionate share of the line of business written by all insurers in the relevant jurisdiction. Because the amount and timing of an assessment is beyond our control, the liabilities that we have currently established for these potential liabilities may not be adequate, particularly if there is an increase in the number of insolvent insurers or if the insolvent insurers operated in the same lines of business and in the same jurisdictions in which we operate. |
| • | Manulife operates in numerous jurisdictions in Asia. These operations are subject to the regulations and laws in each local jurisdiction, with the structure or model for oversight of insurance differing by jurisdiction. We are encouraged to see further regional economic and trade integration in Asia, with most jurisdictions supportive of foreign investment and many regulators’ increasing willingness to benchmark domestic law and regulation against international standards and best practices. However, the increasing geopolitical complexity, rising political and regulatory uncertainty, and regulatory tightening in some jurisdictions have created heightened complexity and risk for Manulife to mitigate and navigate, which may adversely impact shareholder value. |
|
|
55 |
| • | While many of the laws and regulations to which we are subject are intended to protect policyholders, beneficiaries, depositors and investors in our products and services, others also set standards and requirements for the governance of our operations. Failure to comply with applicable laws or regulations could result in financial penalties or sanctions, and damage our reputation. |
| • | All aspects of Manulife’s Global WAM businesses are subject to various laws and regulations around the world. These laws and regulations are primarily intended to protect investment advisory clients, investors in registered and unregistered funds, and clients of Manulife’s global retirement businesses. Agencies that regulate investment advisors, investment funds and retirement plan products and services have broad administrative powers, including the power to limit, restrict or prohibit the regulated entity or person from carrying on business if it fails to comply with such laws and regulations. Possible sanctions for significant compliance failures include the suspension of individual employees, limitations on engaging in certain lines of business for specified periods of time, revocation of investment advisor and other registrations and censures and fines both for individuals and Manulife, along with the resulting damage to our reputation. |
| • | From time to time, regulators raise issues during examinations or audits of Manulife that could have a material adverse impact on us. We cannot predict whether or when regulatory actions may be taken that could adversely affect our operations. Our failure to comply with existing and evolving regulatory requirements could also result in regulatory sanctions and could affect our relationships with regulatory authorities and our ability to execute our business strategies and plans. For further discussion of government regulation and legal proceedings refer to “Government Regulation” in MFC’s Annual Information Form dated February 14, 2024 and note 19 of the 2023 Annual Consolidated Financial Statements. See also “Operational Risk Factors – Our operations face political, legal, operational and other risks that could negatively affect those operations or our results of operations and financial condition” for further discussion on the impact to our operations. |
Changes to International Financial Reporting Standards could have a material impact on our financial results.
| • | New standards or modifications to existing standards could have a material adverse impact on our financial results and regulatory capital position (the regulatory capital framework in Canada uses IFRS as a base). Additionally, any mismatch between the underlying economics of our business and new accounting standards could have significant unintended negative consequences on our business model; and potentially affect our customers, shareholders and our access to capital markets. |
Changes in tax laws, tax regulations, or interpretations of such laws or regulations could make some of our products less attractive to consumers, could increase our corporate taxes or cause us to change the value of our deferred tax assets and liabilities as well as our tax assumptions included in the valuation of our insurance and investment contract liabilities. This could have a material adverse effect on our business, results of operations and financial condition.
| • | Many of the products that the Company sells benefit from one or more forms of preferred tax treatment under current income tax regimes. For example, the Company sells life insurance policies that benefit from the deferral or elimination of taxation on earnings accrued under the policy, as well as permanent exclusion of certain death benefits that may be paid to policyholders’ beneficiaries. We also sell annuity contracts that allow the policyholders to defer the recognition of taxable income earned within the contract. Other products that the Company sells, such as certain employer-paid health and dental plans, also enjoy similar, as well as other, types of tax advantages. The Company also benefits from certain tax benefits, including tax-exempt interest, dividends-received deductions, tax credits (such as foreign tax credits), and favourable tax rates and/or income measurement rules for tax purposes. |
| • | There is risk that tax legislation could be enacted that would lessen or eliminate some or all of the tax advantages currently benefiting the Company or its policyholders or its other clients. This could occur in the context of deficit reduction or other tax reforms. The effects of any such changes could result in materially lower product sales, lapses of policies currently held, and/or our incurrence of materially higher corporate taxes, any of which could have a material adverse effect on our business, results of operations and financial condition. |
| • | Additionally, the Company may be required to change its provision for income taxes or carrying amount of deferred tax assets or liabilities if the characterization of certain items is successfully challenged by taxing authorities or if future transactions or events, which could include changes in tax laws, tax regulations or interpretations of such laws or regulations, occur. Any such changes could significantly affect the amounts reported in the consolidated financial statements in the year these changes occur. |
| • | In 2021, 136 of the 140 members of the Organization for Economic Co-Operation and Development (“OECD”) / G20 Inclusive Framework agreed on a two-pillar solution to address tax challenges from the digital economy, and to close the gaps in international tax systems. These include a new approach to allocating certain profits of multinational entities amongst countries and a global minimum income tax rate of 15%. On July 12, 2023, the Canadian government reaffirmed its commitment to the two-pillar solution and the target date of December 31, 2023 for implementation of the Pillar 2 global minimum tax. This would first apply to the Company’s 2024 fiscal year if enacted on this timeline. The Company is closely monitoring developments and potential impacts and, in particular, for issues unique to the insurance industry. If enacted, we expect an increase in the effective tax rate, pending further details on timing and specific implementation in both Canada and other affected countries. |
| • | In Canada, the 1.5% corporate tax rate increase on Canadian taxable income over $100 million effective in 2022, had an immediate favourable impact on the value of our existing deferred tax assets in the fourth quarter of 2022 that will be offset over time by a slight increase to our effective tax rate as future Canadian insurance and banking earnings are taxed at the new higher federal corporate tax rate of 16.5%. |
| • | Rules to govern the transition to IFRS 17 for Canadian tax purposes were enacted in late 2022 and became effective January 1, 2023. A five-year transition period for both insurance reserves and revaluations of investments under IFRS 9 should generally smooth the current tax impact of the change in accounting standards but is not expected to have a material effect on the Company’s annual cash tax payable. |
56 | 2023 Annual Report | Management’s Discussion and Analysis
| • | The U.S. Inflation Reduction Act of 2022 was signed into law on August 16, 2022, which includes a 15% minimum tax based on financial statement income, starting in 2023. Many related regulations remain to be drafted to clarify how the tax will operate, but at this time we do not expect our IFRS effective tax rate to be materially affected by this new tax, though the timing of cash tax payments could be accelerated. |
| • | Canada’s 2023 Budget statement proposed to deny financial institutions of the traditional tax deduction of dividends received on shares of Canadian corporations when such shares are held as mark-to-market property. The affected property is a small component of the investment portfolio that supports the Company’s business. Should this rule be enacted as proposed, the Company would expect its tax expense on investment income to increase starting in 2024, though not significantly1. The resulting negative impact on net investment income would also reduce the value of certain in-force insurance policies and could result in upward pressure on policy pricing going forward. |
| • | On December 27, 2023, Bermuda enacted a 15% domestic corporate income tax regime applicable to large multinational entities that will come into force in 2025. Bermuda has also introduced a transition process intended to phase in the tax impact to affected taxpayers over a number of years. There are no immediate consequences to Manulife from the passage of this tax reform and the longer-term impact on the Company’s income tax expense is not expected to be material. |
Access to capital may be negatively impacted by market conditions.
| • | Disruptions, uncertainty or volatility in the financial markets may limit or delay our access to the capital markets to raise capital required to operate our business, satisfy regulatory capital requirements or meet our refinancing needs. Under extreme conditions, we may be forced, among other things, to delay raising capital, issue different types of capital than we would otherwise under normal conditions, issue shorter term securities than we prefer, or issue securities that bear an unattractive cost of capital which could decrease our financial flexibility, profitability, and/or dilute our existing shareholders. |
As a holding company, MFC depends on the ability of its subsidiaries to transfer funds to it to meet MFC’s obligations and pay dividends. Subsidiaries’ remittance of capital depends on subsidiaries’ earnings, regulatory requirements and restrictions, macroeconomic and market conditions.
| • | MFC is a holding company and relies on dividends and interest payments from our insurance and other subsidiaries as the principal source of cash flow to meet MFC’s obligations and pay dividends. As a result, MFC’s cash flows and ability to service its obligations are dependent upon the earnings of its subsidiaries and the distribution of those earnings and other funds by its subsidiaries to MFC. Substantially all of MFC’s business is currently conducted through its subsidiaries. |
| • | The ability of MFC’s insurance subsidiaries to pay dividends to MFC in the future will depend on their earnings, macroeconomic and market conditions, and their respective local regulatory requirements and restrictions, including capital adequacy and requirements, exchange controls and economic or trade sanctions. |
| • | MFC’s insurance subsidiaries are subject to a variety of insurance and other laws and regulations that vary by jurisdiction and are intended to protect policyholders and beneficiaries in that jurisdiction first and foremost, rather than investors. These subsidiaries are generally required to maintain solvency and capital standards as set by their local regulators and may also be subject to other regulatory restrictions, all of which may limit the ability of subsidiary companies to pay dividends or make distributions to MFC. |
| • | Potential changes to regulatory capital and actuarial and accounting standards could also limit the ability of the insurance subsidiaries to pay dividends or make distributions and could have a material adverse effect on internal capital mobility. We may be required to raise additional capital, which could be dilutive to existing shareholders, or to limit the new business we write, or to pursue actions that would support capital needs but adversely impact our subsequent earnings potential. In addition, the timing and outcome of these initiatives could have a significantly adverse impact on our competitive position relative to that of other Canadian and international financial institutions with which we compete for business and capital. |
| • | The Company seeks to maintain capital in its regulated subsidiaries in excess of the minimum required in all jurisdictions in which the Company does business. The minimum requirements in each jurisdiction may increase due to regulatory changes and we may decide to maintain additional capital in our operating subsidiaries for competitive reasons, to fund expected growth of the business or to deal with changes in the risk profile of such subsidiaries. Any such increases in the level of capital may reduce the ability of the operating companies to pay dividends. |
| • | The payment of dividends to MFC by MLI is subject to restrictions set out in the ICA. The ICA prohibits the declaration or payment of any dividend on shares of an insurance company if there are reasonable grounds for believing: (i) the company does not have adequate capital and adequate and appropriate forms of liquidity; or (ii) the declaration or the payment of the dividend would cause the company to be in contravention of any regulation made under the ICA respecting the maintenance of adequate capital and adequate and appropriate forms of liquidity, or of any order made to the company by the Superintendent. All of our U.S. and Asian operating life insurance companies are subsidiaries of MLI. Accordingly, a restriction on dividends from MLI would restrict MFC’s ability to obtain dividends from its U.S. and Asian businesses. |
| • | Certain of MFC’s U.S. insurance subsidiaries also are subject to insurance laws in Michigan, New York and Massachusetts, the jurisdictions in which these subsidiaries are domiciled, which impose general limitations on the payment of dividends and other upstream distributions by these subsidiaries to MLI. |
| • | Our Asian insurance subsidiaries are also subject to restrictions in the jurisdictions in which these subsidiaries are domiciled which could affect their ability to pay dividends to MLI in certain circumstances. |
| 1 | See “Caution regarding forward-looking statements” above. |
|
|
57 |
We may experience future downgrades in our financial strength or credit ratings, which may materially adversely impact our financial condition and results of operations.
| • | Credit rating agencies publish financial strength ratings on life insurance companies that are indicators of an insurance company’s ability to meet contract holder and policyholder obligations. Credit rating agencies also assign credit ratings, which are indicators of an issuer’s ability to meet the terms of its obligations in a timely manner and are important factors in a company’s overall funding profile and ability to access external capital. Ratings reflect the views held by each credit agency, which are subject to change based on various factors that may be within or beyond a company’s control. |
| • | Ratings are important factors in establishing the competitive position of insurance companies, maintaining public confidence in products being offered, and determining the cost of capital. A ratings downgrade, or the potential for such a downgrade could adversely affect our operations and financial condition. A downgrade could, among other things, increase our cost of capital and limit our access to the capital and loan markets; cause some of our existing liabilities to be subject to acceleration, additional collateral support, changes in terms, or additional financial obligations; result in the termination of our relationships with broker-dealers, banks, agents, wholesalers and other distributors of our products and services; increase our cost of hedging; unfavourably impact our ability to execute on our hedging strategies; materially increase the number of surrenders, for all or a portion of the net cash values, by the owners of policies and contracts we have issued; impact our ability to obtain reinsurance at reasonable prices or at all; and materially increase the number of withdrawals by policyholders of cash values from their policies; and reduce new sales. |
Competitive factors may adversely affect our market share and profitability.
| • | The insurance, wealth and asset management industries are highly competitive. Our competitors include other insurers, securities firms, investment advisors, asset managers, banks and other financial institutions. The rapid advancement of new technologies, such as blockchain, artificial intelligence and advanced analytics, may enable other non-traditional firms (e.g., big technology competitors providing financial products and services) to compete directly in the industry space, or offer services to our traditional competitors to enhance their value propositions. The impact from technological disruption may result in our competitors improving their customer experience, product offerings and business costs. Our competitors compete with us for customers, access to distribution channels such as brokers and independent agents, and for employees. In some cases, competitors may be subject to less onerous regulatory requirements, have lower operating costs or have the ability to absorb greater risk while maintaining their financial strength ratings, thereby allowing them to price their products more competitively or offer features that make their products more attractive. These competitive pressures could result in lower new business volumes and increased pricing pressures on a number of our products and services that may harm our ability to maintain or increase our profitability. Due to the highly competitive nature of the financial services industry, there can be no assurance that we will continue to effectively compete with our traditional and non-traditional industry rivals, and competitive pressure may have a material adverse effect on our business, results of operations and financial condition. |
We may experience difficulty in marketing and distributing products through our current and future distribution channels.
| • | We distribute our insurance and wealth management products through a variety of distribution channels, including brokers, independent agents, broker-dealers, banks, wholesalers, affinity partners, other third-party organizations and our own sales force in Asia. We generate a significant portion of our business through individual third-party arrangements. We periodically negotiate provisions and renewals of these relationships, and there can be no assurance that such terms will remain acceptable to us or relevant third parties. An interruption in our continuing relationship with certain of these third parties could significantly affect our ability to market our products and could have a material adverse effect on our business, results of operations and financial condition. |
Industry trends could adversely affect the profitability of our businesses.
| • | Our business segments continue to be influenced by a variety of trends that affect our business and the financial services industry in general. The impact of the volatility and instability of the financial markets on our business is difficult to predict and the results of operations and our financial condition may be significantly impacted by general business and economic trends in the geographies in which we operate. These conditions include, but are not limited to, market factors, such as public equity, foreign currency, interest rate and other market risks, demographic shifts, consumer behaviours (e.g., spending habits and debt levels), and governmental policies (e.g., fiscal, monetary, and global trade). The Company’s business plans, results of operations, and financial condition have been negatively impacted in the past and may be negatively affected in the future. |
We may face unforeseen liabilities or asset impairments arising from possible mergers with, or acquisitions and dispositions of, or strategic investments in, businesses or difficulties integrating acquired businesses.
| • | We have engaged in mergers with, acquisitions and dispositions of, or strategic investments in, businesses in the past and expect to continue to do so in the future as we may deem appropriate. There could be unforeseen liabilities or asset impairments, including goodwill impairments that arise in connection with the businesses that we may sell, have acquired, or may acquire in the future. In addition, there may be liabilities or asset impairments that we fail, or are unable, to discover in the course of performing due diligence investigations on acquisition targets. Furthermore, the use of our own funds as consideration in any acquisition would consume capital resources that would no longer be available for other corporate purposes. |
| • | Our ability to achieve some or all of the benefits we anticipate from any mergers with, acquisitions and dispositions of, or strategic investments in, businesses will depend in large part upon our ability to successfully integrate the businesses in an efficient and effective manner. We may not be able to integrate the businesses smoothly or successfully, and the process may take longer than expected. The integration of operations may require the dedication of significant management resources, which may distract management’s attention |
58 | 2023 Annual Report | Management’s Discussion and Analysis
| from our day-to-day business. Mergers with, acquisitions and dispositions of, or strategic investments in, operations outside of North America, especially any acquisition in a jurisdiction in which we do not currently operate, may be particularly challenging or costly to integrate. If we are unable to successfully integrate the operations of any acquired businesses, we may be unable to realize the benefits we expect to achieve as a result of the acquisitions and the results of operations may be less than expected. |
If our businesses do not perform well, or if the outlook for our businesses is significantly lower than historical trends, we may be required to recognize an impairment of goodwill or intangible assets or to establish a valuation allowance against our deferred tax assets, which could have a material adverse effect on our results of operations and financial condition.
| • | Goodwill represents the excess of the amounts we paid to acquire subsidiaries and other businesses over the fair value of their net identifiable assets at the date of acquisition. Intangible assets represent assets that are separately identifiable at the time of an acquisition and provide future benefits such as the John Hancock brand. |
| • | As outlined below under “Critical Actuarial and Accounting Policies – Goodwill and Intangible Assets”, goodwill and intangible assets with indefinite lives are tested at least annually for impairment at the cash generating unit (“CGU”) or group of CGUs level, representing the smallest group of assets that is capable of generating largely independent cash flows. Going forward, as a result of the impact of economic conditions and changes in product mix and the granular level of goodwill testing under IFRS, additional impairment charges could occur in the future. Any impairment in goodwill would not affect LICAT capital. |
| • | If market conditions deteriorate in the future and, in particular, if MFC’s common share price is low relative to book value per share, if the Company’s actions to limit risk associated with its products or investments cause a significant change in any one CGU’s recoverable amount, or if the outlook for a CGU’s results deteriorate, the Company may need to reassess the value of goodwill and/or intangible assets which could result in impairments during 2024 or subsequent periods. Such impairments could have a material adverse effect on our results of operations and financial condition. |
| • | Deferred income tax balances represent the expected future tax effects of the differences between the book and tax basis of assets and liabilities, loss carry forwards and tax credits. Deferred tax assets are recorded when the Company expects to claim deductions on tax returns in the future for expenses that have already been recorded in the financial statements. |
| • | The availability of those deductions is dependent on future taxable income against which the deductions can be made. Deferred tax assets are assessed periodically by management to determine if they are realizable. |
| • | Factors in management’s determination include the performance of the business including the ability to generate gains from a variety of sources and tax planning strategies. If based on information available at the time of the assessment, it is determined that the deferred tax asset will not be realized, then the deferred tax asset is reduced to the extent that it is no longer probable that the tax benefit will be realized. |
We may not be able to protect our intellectual property and may be subject to infringement claims.
| • | We rely on a combination of registrations, contractual rights and copyright, trademark, patent and trade secret laws to establish and protect our intellectual property. In particular, we have invested considerable resources in promoting and protecting the brand names “Manulife” and “John Hancock” and expect to continue to do so. Although we use a broad range of measures to protect our intellectual property rights, third parties may infringe or misappropriate our intellectual property. As the occurrence of potential infringements or misappropriations against our intellectual property increases, we may have to litigate more often to enforce and protect our copyrights, trademarks, patents, trade secrets and know-how or to determine their scope, validity or enforceability, which represents a diversion of resources that may be significant in amount and may not prove successful. The loss of intellectual property protection or the inability to secure or enforce the protection of our intellectual property assets could have a material adverse effect on our business and our ability to compete. |
| • | We also may be subject to costly litigation in the event that another party alleges our operations or activities infringe upon its intellectual property rights. Third parties may have, or may eventually be issued, patents that could be infringed by our products, methods, processes or services. Any party that holds such a patent could make a claim of infringement against us. We may also be subject to claims by third parties for breach of copyright, trademark, trade secret or license usage rights. Any such claims and any resulting litigation could result in significant liability for damages. If we were found to have infringed a third-party patent or other intellectual property rights, we could incur substantial liability, and in some circumstances could be enjoined from providing certain products or services to our customers or utilizing and benefiting from certain methods, processes, copyrights, trademarks, trade secrets or licenses, or alternatively could be required to enter into costly licensing arrangements with third parties, all of which could have a material adverse effect on our business, results of operations and financial condition. |
Applicable laws may discourage takeovers and business combinations that common shareholders of MFC might consider in their best interests.
| • | The ICA contains restrictions on the purchase or other acquisition, issue, transfer and voting of the shares of an insurance company. In addition, under applicable U.S. insurance laws and regulations in states where certain of our insurance company subsidiaries are domiciled, no person may acquire control of MFC without obtaining prior approval of those states’ insurance regulatory authorities. These restrictions may delay, defer, prevent, or render more difficult a takeover attempt that common shareholders of MFC might consider in their best interests. For instance, they may prevent shareholders of MFC from receiving the benefit from any premium to the market price of MFC’s common shares offered by a bidder in a takeover context. Even in the absence of a takeover attempt, the existence of these provisions may adversely affect the prevailing market price of MFC’s common shares if they are viewed as discouraging takeover attempts in the future. |
|
|
59 |
Entities within the MFC group are interconnected which may make separation difficult.
| • | MFC operates in local markets through subsidiaries and branches of subsidiaries. These local operations are financially and operationally interconnected to lessen expenses, share and reduce risk, and efficiently utilize financial resources. In general, external capital required for companies in the Manulife group has been raised at the MFC level in recent years and then transferred to other entities primarily as equity or debt capital as appropriate. Other linkages include policyholder and other creditor guarantees and other forms of internal support between various entities, loans, capital maintenance agreements, derivatives, shared services and affiliate reinsurance treaties. Accordingly, the risks undertaken by a subsidiary may be transferred to or shared by affiliates through financial and operational linkages. Some of the consequences of this are: |
| ¡ | Financial difficulties at a subsidiary may not be isolated and could cause material adverse effects on affiliates and the group as a whole. |
| ¡ | Linkages may make it difficult to dispose of or separate a subsidiary or business within the group by way of a spin-off or similar transaction and the disposition or separation of a subsidiary or business may not fully eliminate the liability of the Company and its remaining subsidiaries for shared risks. Issues raised by such a transaction could include: (i) the Company cannot terminate, without policyholder consent and in certain jurisdictions regulator consent, parental guarantees on in-force policies and therefore would continue to have residual risk under any such non-terminated guarantees; (ii) internal capital mobility and efficiency could be limited; (iii) significant potential tax consequences; (iv) uncertainty about the accounting and regulatory outcomes of such a transaction; (v) obtaining any other required approvals; (vi) there may be a requirement for significant capital injections; and (vii) the transaction may result in increased sensitivity of net income attributed to shareholders and capital of MFC and its remaining subsidiaries to market declines. |
We may not be able to achieve our sustainability commitments, or our commitments may not meet the expectations of stakeholders or regulators.
| • | We continue to build on our sustainability commitments, including our climate-related commitments, as set out in our sustainability strategy, and continue to adopt policies and processes to manage these commitments, in alignment with our business priorities. Internal or external circumstances could affect our ability to successfully meet some or all of our sustainability commitments. Our commitments could also materially change in the future and this could affect stakeholders’ evaluation of us and lead to adverse impacts to our business operations and reputation. |
| • | Our progress towards the commitments is disclosed periodically, which allows our stakeholders, including shareholders, customers and employees, to evaluate our business based on our advancement towards these commitments. Our reporting on our progress relies on various external frameworks, methodologies, taxonomies and other standards, which may change over time, resulting in changes to or restatements of our reporting processes and results. Stakeholders may also evaluate our business by their own sustainability criteria which may not be consistent with our own criteria or performance indicators, which could result in varying levels of expectations for which we may not be able to entirely satisfy. |
| • | The availability of quality and reliable data, including issuer data, is a notable factor in our ability to set targets, make effective decisions against, and report on our progress towards our targets and strategic areas of focus, for our general fund. However, as a consequence of incomplete, inadequate, or unavailable data, our targets, and our progress toward achieving them, may need to be revisited. |
| • | Interim targets support us in understanding how our investments can contribute to decarbonization of the real economy and provide guideposts against which to measure our progress towards our long-term commitments. However, our targets, and our progress toward achieving them, may need to be revisited if the assumptions underlying net zero scenarios and pathways prove incorrect, or if regulatory, economic, technological and other external factors needed to enable such scenarios and pathways fail to evolve. |
| • | As regulators start to adopt mandatory sustainability related disclosure requirements and investment criteria and taxonomies, there is an increasing possibility of regulatory sanctions, including fines, and litigation resulting from inaccurate or misleading statements, often referred to as “greenwashing”. As a result, we may face adverse investor, media, or public scrutiny which may negatively impact our financial results and reputation. |
| • | With respect to our asset management business, we may be subject to competing demands from investors who have divergent views on ESG matters and may choose to invest or not invest in our products based on their assessment of how we address ESG in our investment process. This divergence increases the risk that action, or inaction, on ESG matters will be perceived negatively by at least some stakeholders and impact their investment decisions potentially adversely impacting our business. |
60 | 2023 Annual Report | Management’s Discussion and Analysis
Market Risk
Market risk is the risk of loss resulting from market price volatility, interest rate change, credit and swap spread changes, and adverse foreign currency exchange rate movements. Market price volatility primarily relates to changes in prices of publicly traded equities and alternative long-duration assets. The profitability of our insurance and annuity products, as well as the fees we earn in our investment management business, are subject to market risk.
IFRS 7 Disclosures
Text and tables in this and the following section (“Market Risk Sensitivities and Market Risk Exposure Measures”) include disclosures on market and liquidity risk in accordance with IFRS 7, “Financial Instruments – Disclosures”, and discussions on how we measure risk and our objectives, policies and methodologies for managing them. Disclosures in accordance with IFRS 7 are identified by a vertical line in the left margin of each page. The identified text and tables represent an integral part of our audited 2023 Annual Consolidated Financial Statements. The fact that certain text and tables are considered an integral part of the 2023 Annual Consolidated Financial Statements does not imply that the disclosures are of any greater importance than the sections not part of the disclosure. Accordingly, the “Risk Management and Risk Factors” disclosure should be read in its entirety.
Market Risk Management Strategy
| Market risk management strategy is governed by the Global Asset Liability Committee which oversees the overall market and liquidity risk program. Our overall strategy to manage our market risks incorporates several component strategies, each targeted to manage one or more of the market risks arising from our businesses. At an enterprise level, these strategies are designed to manage our aggregate exposures to market risks against limits associated with earnings and capital volatility.
The following table outlines our key market risks and identifies the risk management strategies which contribute to managing these risks. |
||||||||||||||
| Risk Management Strategy | Key Market Risk | |||||||||||||
| Public Equity Risk |
Interest Rate and Spread Risk |
ALDA Risk |
Foreign Currency Exchange Risk |
Liquidity Risk | ||||||||||
| Product design and pricing |
✓ | ✓ | ✓ | ✓ | ✓ | |||||||||
| Variable annuity guarantee dynamic hedging |
✓ | ✓ | ✓ | ✓ | ||||||||||
| Macro equity risk hedging |
✓ | ✓ | ✓ | |||||||||||
| Asset liability management |
✓ | ✓ | ✓ | ✓ | ✓ | |||||||||
| Foreign currency exchange management |
✓ | ✓ | ||||||||||||
| Liquidity risk management |
✓ | |||||||||||||
Public Equity Risk – To manage public equity risk from our insurance and annuity businesses, we primarily use a variable annuity and segregated fund guarantee dynamic hedging strategy which is complemented by a general macro equity risk hedging strategy, in addition to asset liability management strategies. Our strategies employed for dynamic hedging of variable annuity and segregated fund guarantees and macro equity risk hedging expose the Company to additional risks. See “Market Risk Factors” below.
Interest Rate and Spread Risk – To manage interest rate and spread risk, we primarily employ asset liability management strategies to manage the duration of our fixed income investments and execute interest rate hedges.
ALDA Risk – We seek to limit concentration risk associated with ALDA performance by investing in a diversified basket of assets including commercial real estate, timber, farmland, private equities, infrastructure, and energy assets. We further diversify risk by managing investments against established investment and risk limits.
Foreign Currency Exchange Risk – Our policy is to generally match the currency of our assets with the currency of the liabilities they support. Where assets and liabilities are not currency matched, we seek to hedge this exposure where appropriate to stabilize our capital positions and remain within our enterprise foreign exchange risk limits.
Liquidity Risk – We are exposed to liquidity risk, which is the risk of not having access to sufficient funds or liquid assets to meet both expected and unexpected cash outflows and collateral demands in our operating and holding companies. In the operating companies, cash and collateral demands arise day-to-day to fund policyholder benefits, customer withdrawals, reinsurance settlements, derivative instrument settlements/collateral pledging, expenses, and investment and hedging activities. Under stressed conditions, additional cash and collateral demands could arise from changes to policyholder termination or policy renewal rates, withdrawals of customer deposit balances, borrowers renewing or extending their loans when they mature, derivative settlements or collateral demands, and reinsurance settlements.
Our liquidity risk management framework is designed to provide adequate liquidity to cover cash and collateral obligations as they come due, and to sustain and grow operations in both normal and stressed conditions. Refer to “Liquidity Risk Management Strategy” below for more information.
|
|
61 |
Product Design and Pricing Strategy
| Our policies, standards, and guidelines with respect to product design and pricing are designed with the objective of aligning our product offerings with our risk taking philosophy and risk appetite, and in particular, ensuring that incremental risk generated from new sales aligns with our strategic risk objectives and risk limits. The specific design features of our product offerings, including level of benefit guarantees, policyholder options, fund offerings and availability restrictions as well as our associated investment strategies, help to mitigate the level of underlying risk. We regularly review and modify key features within our product offerings, including premiums and fee charges with a goal of meeting profit targets and staying within risk limits. Certain of our general fund adjustable benefit products have minimum rate guarantees. The rate guarantees for any particular policy are set at the time the policy is issued and governed by insurance regulation in each jurisdiction where the products are sold. The contractual provisions allow crediting rates to be re-set at pre-established intervals subject to the established minimum crediting rate guarantees. The Company may partially mitigate the interest rate exposure by setting new rates on new business and by adjusting rates on in-force business where permitted. In addition, the Company partially mitigates this interest rate risk through its asset liability management process, product design elements, and crediting rate strategies. All material new product, reinsurance and underwriting initiatives must be reviewed and approved by the CRO or key individuals within risk management functions.
|
Hedging Strategies for Variable Annuity and Other Equity Risks
| The Company’s exposure to movement in public equity market values primarily arises from insurance contract liabilities related to variable annuity guarantees and general fund public equity investments.
Dynamic hedging is the primary hedging strategy for variable annuity market risks. Dynamic hedging is employed for new variable annuity guarantees business when written or as soon as practical thereafter.
We seek to manage public equity risk arising from unhedged exposures in our insurance contract liabilities through our macro equity risk hedging strategy. We seek to manage interest rate risk arising from variable annuity business not dynamically hedged through our asset liability management strategy.
|
Variable Annuity Dynamic Hedging Strategy
| The variable annuity dynamic hedging strategy is designed to hedge the sensitivity of variable annuity guarantee insurance contract liabilities to fund performance (both public equity and bond funds) and interest rate movements. The objective of the variable annuity dynamic hedging strategy is to offset, as closely as possible, the change in the economic value of guarantees with the profit and loss from our hedge asset portfolio.
Our variable annuity hedging program uses a variety of exchange-traded and over-the-counter (“OTC”) derivative contracts to offset the change in value of variable annuity guarantees. The main derivative instruments used are equity index futures, government bond futures, currency futures, interest rate swaps, total return swaps, equity options and interest rate swaptions. The hedge instruments’ positions against insurance contract liabilities are continuously monitored as market conditions change. As necessary, the hedge asset positions will be dynamically rebalanced in order to stay within established limits. We may also utilize other derivatives with the objective to improve hedge effectiveness opportunistically.
Our variable annuity guarantee dynamic hedging strategy is not designed to completely offset the sensitivity of insurance contract liabilities to all risks associated with the guarantees embedded in these products. The profit (loss) on the hedge instruments will not completely offset the underlying losses (gains) related to the guarantee liabilities hedged because:
• Policyholder behaviour and mortality experience are not hedged; • Risk adjustment related to cost of guarantees in the insurance contract liabilities is largely hedged; • A portion of interest rate risk is not hedged; • Credit spreads may widen and actions might not be taken to adjust accordingly; • Fund performance on a small portion of the underlying funds is not hedged due to lack of availability of effective exchange-traded hedge instruments; • Performance of the underlying funds hedged may differ from the performance of the corresponding hedge instruments; • Correlations between interest rates and equity markets could lead to unfavourable material impacts; • Unfavourable hedge rebalancing costs can be incurred during periods of high volatility from equity markets, bond markets and/or interest rates. The impact is magnified when these impacts occur concurrently; and • Not all other risks are hedged.
|
62 | 2023 Annual Report | Management’s Discussion and Analysis
Macro Equity Risk Hedging Strategy
| The objective of the macro equity risk hedging program is to maintain our overall earnings sensitivity to public equity market movements within our Board approved risk appetite limits. The macro equity risk hedging program is designed to hedge earnings sensitivity due to movements in public equity markets arising from all sources (outside of dynamically hedged exposures). Sources of equity market sensitivity addressed by the macro equity risk hedging program include:
• Residual equity and currency exposure from variable annuity guarantees not dynamically hedged; • General fund equity holdings backing guaranteed, adjustable liabilities and variable universal life; and • Host contract fees related to variable annuity guarantees are not dynamically hedged.
|
Asset Liability Management Strategy
| Our asset liability management strategy is designed to help ensure that the market risks embedded in our assets and liabilities held in the Company’s general fund are effectively managed and that risk exposures arising from these assets and liabilities are maintained within risk limits. The embedded market risks include risks related to the level and movement of interest rates and credit and swap spreads, public equity market performance, ALDA performance and foreign currency exchange rate movements.
General fund product liabilities are categorized into groups with similar characteristics in order to support them with a specific asset strategy. We seek to align the asset strategy for each group to the premium and benefit patterns, policyholder options and guarantees, and crediting rate strategies of the products they support. The strategies are set using portfolio analysis techniques intended to optimize returns, subject to considerations related to regulatory and economic capital requirements, and risk tolerances. They are designed to achieve broad diversification across asset classes and individual investment risks while being suitably aligned with the liabilities they support. The strategies encompass asset mix, quality rating, term profile, liquidity, currency and industry concentration targets.
|
Products which feature guaranteed liability cash flows (i.e., where the projected net flows are not materially dependent upon economic scenarios) are managed to a target return investment strategy. The products backed by this asset group include:
| • | Accumulation annuities (other than annuities with pass-through features), which are primarily short-to-medium-term obligations and offer interest rate guarantees for specified terms on single premiums. Withdrawals may or may not have market value adjustments; |
| • | Payout annuities, which have no surrender options and include predictable and very long-dated obligations; and |
| • | Insurance products, with recurring premiums extending many years in the future, and which also include a significant component of very long-dated obligations. |
We seek to manage the assets backing these long-dated benefits to achieve a target return sufficient to support the obligations over their lifetime, subject to established risk tolerances and the impact of regulatory and economic capital requirements. Fixed income assets are managed to a benchmark developed to minimize interest rate risk against the liability cash flows. Utilizing ALDA and public equity investments provides a suitable match for long-duration liabilities that also enhances long-term investment returns and reduces aggregate risk through diversification.
For insurance and annuity products where significant pass-through features exist, a total return strategy approach is used, generally combining fixed income with ALDA plus public equity investments. ALDA and public equity may be included to enhance long-term investment returns and reduce aggregate risk through diversification. Target investment strategies are established using portfolio analysis techniques that seek to optimize long-term investment returns while considering the risks related to embedded product guarantees and policyholder withdrawal options, the impact of regulatory and economic capital requirements and considering management tolerances with respect to short-term income volatility and long-term tail risk exposure. For these pass-through products such as participating insurance and universal life insurance, the investment performance of assets supporting the liabilities will be largely passed through to policyholders as changes in the amounts of dividends declared or rates of interest credited, subject to embedded minimum guarantees. Shorter duration liabilities such as fixed deferred annuities do not incorporate ALDA plus public equity investments into their target asset mixes. Authority to manage our investment portfolios is delegated to investment professionals who manage to benchmarks derived from the target investment strategies established for each group, including interest rate risk tolerances.
Our asset liability management strategy incorporates a wide variety of risk measurement, risk mitigation and risk management, and hedging processes. The liabilities and risks to which the Company is exposed, however, cannot be completely matched or hedged due to both limitations on instruments available in investment markets and uncertainty of impact on liability cash flows from policyholder experience/behaviour.
Foreign Currency Exchange Risk Management Strategy
| Our policy is to generally match the currency of our assets with the currency of the liabilities they support. Where assets and liabilities are not currency matched, we seek to hedge this exposure where appropriate to stabilize our earnings and capital positions, and remain within our enterprise foreign exchange risk limits. |
Risk from small balance sheet mismatches is accepted if managed within set risk limits. Risk exposures are measured in terms of potential changes in capital ratios, due to foreign currency exchange rate movements, determined to represent a specified likelihood of occurrence based on internal models.
|
|
63 |
Liquidity Risk Management Strategy
| Global liquidity management policies and procedures are designed to provide adequate liquidity to cover cash and collateral obligations as they come due, and to sustain and grow operations in both normal and stressed conditions. They consider legal, regulatory, tax, operational or economic impediments to inter-entity funding. The asset mix of our balance sheet takes into account the need to hold adequate unencumbered and appropriate liquid assets to satisfy the requirements arising under stressed scenarios and to allow our liquidity ratios to remain strong. We manage liquidity centrally and closely monitor the liquidity positions of our principal subsidiaries.
We seek to mitigate liquidity risk by diversifying our business across different products, markets, geographical regions and policyholders. We design insurance products to encourage policyholders to maintain their policies in-force, to help generate a diversified and stable flow of recurring premiums. We design the policyholder termination features with the goal of mitigating the financial exposure and liquidity risk related to unexpected policyholder terminations. We establish and implement investment strategies intended to match the term profile of the assets to the liabilities they support, taking into account the potential for unexpected policyholder terminations and resulting liquidity needs. Liquid assets represent a large portion of our total assets. We aim to reduce liquidity risk in our businesses by diversifying our funding sources and appropriately managing the term structure of our funding. We forecast and monitor daily operating liquidity and cash movements in various individual entities and operations as well as centrally, aiming to ensure liquidity is available and cash is employed optimally.
We also maintain centralized cash pools and access to other sources of liquidity and contingent liquidity such as repurchase funding agreements. Our centralized cash pools consist of cash or near-cash, high quality short-term investments that are continually monitored for their credit quality and market liquidity. |
As at December 31, 2023, the Company held $250.7 billion in cash and cash equivalents, comprised of cash on deposit, Canadian and U.S. Treasury Bills and high quality short-term investments, and marketable securities comprised of investment grade government and agency bonds, investment grade corporate bonds, investment grade securitized instruments, publicly traded common stocks and preferred shares, compared with $241.1 billion as at December 31, 2022 as noted in the table below.
| As at December 31, ($ millions, unless otherwise stated) |
2023 | 2022 | ||||||
| Cash and cash equivalents |
$ | 20,338 | $ | 19,153 | ||||
| Marketable securities |
||||||||
| Government bonds (investment grade) |
77,191 | 70,508 | ||||||
| Corporate bonds (investment grade) |
126,992 | 126,893 | ||||||
| Securitized — ABS, CMBS, RMBS (investment grade) |
1,971 | 2,286 | ||||||
| Public equities |
24,211 | 22,221 | ||||||
| Total marketable assets |
230,365 | 221,908 | ||||||
| Total cash and cash equivalents and marketable securities(1) |
$ | 250,703 | $ | 241,061 | ||||
| (1) | Including $11.0 billion encumbered cash and cash equivalents and marketable securities as at December 31, 2023 (2022 – $13.3 billion). |
| We have established a variety of contingent liquidity sources. These include, among others, a $500 million committed unsecured revolving credit facility with certain Canadian chartered banks available for MFC, and a US$500 million committed unsecured revolving credit facility with certain U.S. banks available for MFC and certain of its U.S. subsidiaries. There were no outstanding borrowings under these facilities as of December 31, 2023 (2022 – $nil). In addition, John Hancock Life Insurance Company (U.S.A.) (“JHUSA”) is a member of the Federal Home Loan Bank of Indianapolis (“FHLBI”), which enables the company to obtain loans from FHLBI as an alternative source of liquidity that is collateralizable by qualifying mortgage loans, mortgage-backed securities and U.S. Treasury and Agency securities. As of December 31, 2023, JHUSA had an estimated maximum borrowing capacity of US$4.3 billion (2022 – US$3.8 billion) based on regulatory limitations with an outstanding balance of US$500 million (2022 – US$500 million), under the FHLBI facility.
|
||||
| The following table outlines the maturity of the Company’s significant financial liabilities. |
Maturity of financial liabilities(1)
| As at December 31, 2023 ($ millions) |
Less than 1 year |
1 to 3 years |
3 to 5 years |
Over 5 years |
Total | |||||||||||||||||||
| Long-term debt |
$ | – | $ | 1,672 | $ | 920 | $ | 3,479 | $ | 6,071 | ||||||||||||||
| Capital instruments |
594 | – | – | 6,073 | 6,667 | |||||||||||||||||||
| Derivatives |
1,561 | 1,982 | 717 | 7,427 | 11,687 | |||||||||||||||||||
| Deposits from Bank clients(2) |
16,814 | 2,963 | 1,839 | – | 21,616 | |||||||||||||||||||
| Lease liabilities |
100 | 133 | 68 | 49 | 350 | |||||||||||||||||||
| (1) The amounts shown above are net of the related unamortized deferred issue costs. (2) Carrying value and fair value of deposits from Bank clients as at December 31, 2023 was $21,616 million and $21,518 million, respectively (2022 – $22,507 million and $22,271 million, respectively). Fair value is determined by discounting contractual cash flows, using market interest rates currently offered for deposits with similar terms and conditions. All deposits from Bank clients were categorized in Level 2 of the fair value hierarchy (2022 – Level 2). |
|
|||||||||||||||||||||||
64 | 2023 Annual Report | Management’s Discussion and Analysis
| Through the normal course of business, pledging of assets is required to comply with jurisdictional regulatory and other requirements including collateral pledged to partially mitigate derivative counterparty credit risk, assets pledged to exchanges as initial margin and assets held as collateral for repurchase funding agreements. Total unencumbered assets were $470.2 billion as at December 31, 2023 (2022 – $477.7 billion). |
||||||||||||||
Market Risk Sensitivities and Market Risk Exposure Measures
Variable Annuity and Segregated Fund Guarantees Sensitivities and Risk Exposure Measures
| Guarantees on variable annuity products and segregated funds may include one or more of death, maturity, income and withdrawal guarantees. Variable annuity and segregated fund guarantees are contingent and only payable upon the occurrence of the relevant event, if fund values at that time are below guarantee values. Depending on future equity market levels, liabilities on current in-force business would be due primarily in the period from 2023 to 2043.
We seek to mitigate a portion of the risks embedded in our retained (i.e. net of reinsurance) variable annuity and segregated fund guarantee business through the combination of our dynamic and macro hedging strategies (see “Publicly Traded Equity Performance Risk” below).
The table below shows selected information regarding the Company’s variable annuity and segregated fund investment-related guarantees gross and net of reinsurance. |
Variable annuity and segregated fund guarantees, net of reinsurance
| As at December 31, ($ millions) |
2023 | 2022 | ||||||||||||||||||||||||||||||
| Guarantee value(1) |
Fund value | Net amount at risk(1),(2),(3) |
Guarantee value(1) |
Fund value | Net amount at risk(1),(2),(3) |
|||||||||||||||||||||||||||
| Guaranteed minimum income benefit |
$ | 3,864 | $ | 2,735 | $ | 1,156 | $ | 4,357 | $ | 2,723 | $ | 1,639 | ||||||||||||||||||||
| Guaranteed minimum withdrawal benefit |
34,833 | 33,198 | 4,093 | 38,319 | 34,203 | 5,734 | ||||||||||||||||||||||||||
| Guaranteed minimum accumulation benefit |
18,996 | 19,025 | 116 | 20,035 | 19,945 | 221 | ||||||||||||||||||||||||||
| Gross living benefits(4) |
57,693 | 54,958 | 5,365 | 62,711 | 56,871 | 7,594 | ||||||||||||||||||||||||||
| Gross death benefits(5) |
9,133 | 17,279 | 975 | 10,465 | 15,779 | 2,156 | ||||||||||||||||||||||||||
| Total gross of reinsurance |
66,826 | 72,237 | 6,340 | 73,176 | 72,650 | 9,750 | ||||||||||||||||||||||||||
| Living benefits reinsured |
24,208 | 23,146 | 3,395 | 26,999 | 23,691 | 4,860 | ||||||||||||||||||||||||||
| Death benefits reinsured |
3,400 | 2,576 | 482 | 3,923 | 2,636 | 1,061 | ||||||||||||||||||||||||||
| Total reinsured |
27,608 | 25,722 | 3,877 | 30,922 | 26,327 | 5,921 | ||||||||||||||||||||||||||
| Total, net of reinsurance | $ | 39,218 | $ | 46,515 | $ | 2,463 | $ | 42,254 | $ | 46,323 | $ | 3,829 | ||||||||||||||||||||
|
(1) Guarantee Value and Net Amount at Risk in respect of guaranteed minimum withdrawal business in Canada and the U.S. reflect the time value of money of these claims. (2) Amount at risk (in-the-money amount) is the excess of guarantee values over fund values on all policies where the guarantee value exceeds the fund value. For guaranteed minimum death benefit, the amount at risk is defined as the current guaranteed minimum death benefit in excess of the current account balance and assumes that all claims are immediately payable. In practice, guaranteed death benefits are contingent and only payable upon the eventual death of policyholders if fund values remain below guarantee values. For guaranteed minimum withdrawal benefit, the amount at risk assumes that the benefit is paid as a lifetime annuity commencing at the earliest contractual income start age. These benefits are also contingent and only payable at scheduled maturity/income start dates in the future, if the policyholders are still living and have not terminated their policies and fund values remain below guarantee values. For all guarantees, the amount at risk is floored at zero at the single contract level. (3) The amount at risk net of reinsurance at December 31, 2023 was $2,463 million (December 31, 2022 – $3,829 million) of which: US$391 million (December 31, 2022 – US$737 million) was on our U.S. business, $1,559 million (December 31, 2022 – $2,154 million) was on our Canadian business, US$140 million (December 31, 2022 – US$275 million) was on our Japan business and US$155 million (December 31, 2022 – US$224 million) was related to Asia (other than Japan) and our run-off reinsurance business. (4) Where a policy includes both living and death benefits, the guarantee in excess of the living benefit is included in the death benefit category as outlined in footnote 5. (5) Death benefits include standalone guarantees and guarantees in excess of living benefit guarantees where both death and living benefits are provided on a policy. |
|
|||||||||||||||||||||||||||||||
Investment categories for variable contracts with guarantees
| Variable contracts with guarantees, including variable annuities and variable life, are invested, at the policyholder’s discretion subject to contract limitations, in various fund types within the segregated fund accounts and other investments. The account balances by investment category are set out below. | ||||||||
| As at December 31, ($ millions) Investment category |
2023 | 2022 | ||||||||||
| Equity funds | $ | 45,593 | $ | 42,506 | ||||||||
| Balanced funds |
35,801 | 36,290 | ||||||||||
| Bond funds |
8,906 | 9,336 | ||||||||||
| Money market funds |
1,559 | 1,924 | ||||||||||
| Other fixed interest rate investments |
1,907 | 2,029 | ||||||||||
| Total |
$ | 93,766 | $ | 92,085 | ||||||||
|
|
65 |
Caution Related to Sensitivities
| In the sections that follow, we provide sensitivities and risk exposure measures for certain risks. These include sensitivities due to specific changes in market prices and interest rate levels projected using internal models as at a specific date, and are measured relative to a starting level reflecting the Company’s assets and liabilities at that date. The risk exposures measure the impact of changing one factor at a time and assume that all other factors remain unchanged. Actual results can differ significantly from these estimates for a variety of reasons including the interaction among these factors when more than one changes; changes in liabilities from updates to non-economic assumptions, changes in business mix, effective tax rates and other market factors; and the general limitations of our internal models. For these reasons, the sensitivities should only be viewed as directional estimates of the underlying sensitivities for the respective factors based on the assumptions outlined below. Given the nature of these calculations, we cannot provide assurance that the actual impact on contractual service margin (“CSM”), net income attributed to shareholders, other comprehensive income attributed to shareholders, and total comprehensive income attributed to shareholders or on MLI’s LICAT ratio will be as indicated.
|
Market movements affect LICAT capital sensitivities through the available capital, surplus allowance and required capital components of the regulatory capital framework. The LICAT available capital component is primarily affected by total comprehensive income and the CSM.
Publicly Traded Equity Performance Risk Sensitivities and Exposure Measures
As outlined above, we have net exposure to equity risk through asset and liability mismatches; our variable annuity guarantee dynamic hedging strategy is not designed to completely offset the sensitivity of insurance contract liabilities to all risks associated with the guarantees embedded in these products. The macro hedging strategy is designed to mitigate public equity risk arising from variable annuity guarantees not dynamically hedged and from other unhedged exposures in our insurance contracts.
Changes in public equity prices may impact other items including, but not limited to, asset-based fees earned on assets under management and administration or policyholder account value, and estimated profits and amortization of deferred policy acquisition and other costs. These items are not hedged.
| The tables below include the potential impacts from an immediate 10%, 20% and 30% change in market values of publicly traded equities on CSM, net income attributed to shareholders, other comprehensive income attributed to shareholders, and total comprehensive income attributed to shareholders. The potential impact is shown after taking into account the impact of the change in markets on the hedge assets. While we cannot reliably estimate the amount of the change in dynamically hedged variable annuity guarantee liabilities that will not be offset by the change in the dynamic hedge assets, we make certain assumptions for the purposes of estimating the impact on net income attributed to shareholders.
This estimate assumes that the performance of the dynamic hedging program would not completely offset the gain/loss from the dynamically hedged variable annuity guarantee liabilities. It assumes that the hedge assets are based on the actual position at the period end, and that equity hedges in the dynamic program offset 95% of the hedged variable annuity liability movement that occurs as a result of market changes.
It is also important to note that these estimates are illustrative, and that the dynamic and macro hedging programs may underperform these estimates, particularly during periods of high realized volatility and/or periods where both interest rates and equity market movements are unfavourable. The adoption of IFRS 17 did not change the method or assumptions used for deriving sensitivity information. |
Changes in equity markets impact our available and required components of the LICAT ratio. The second set of tables shows the potential impact to MLI’s LICAT ratio resulting from changes in public equity market values.
66 | 2023 Annual Report | Management’s Discussion and Analysis
Potential immediate impact on net income attributed to shareholders arising from changes to public equity returns(1)
| As at December 31, 2023 ($ millions) |
Net income attributed to shareholders | |||||||||||||||||||||||||||
| -30% | -20% | -10% | +10% | +20% | +30% | |||||||||||||||||||||||
| Underlying sensitivity |
||||||||||||||||||||||||||||
| Variable annuity guarantees(2) |
$ | (2,370 | ) | $ | (1,460 | ) | $ | (670 | ) | $ | 550 | $ | 1,010 | $ | 1,390 | |||||||||||||
| General fund equity investments(3) |
(1,170 | ) | (770 | ) | (390 | ) | 380 | 760 | 1,140 | |||||||||||||||||||
| Total underlying sensitivity before hedging |
(3,540 | ) | (2,230 | ) | (1,060 | ) | 930 | 1,770 | 2,530 | |||||||||||||||||||
| Impact of macro and dynamic hedge assets(4) |
880 | 530 | 240 | (190 | ) | (340 | ) | (460 | ) | |||||||||||||||||||
| Net potential impact on net income attributed to shareholders after impact of hedging and before impact of reinsurance |
(2,660 | ) | (1,700 | ) | (820 | ) | 740 | 1,430 | 2,070 | |||||||||||||||||||
| Impact of reinsurance |
1,470 | 900 | 420 | (350 | ) | (650 | ) | (910 | ) | |||||||||||||||||||
| Net potential impact on net income attributed to shareholders after impact of hedging and reinsurance |
$ | (1,190 | ) | $ | (800 | ) | $ | (400 | ) | $ | 390 | $ | 780 | $ | 1,160 | |||||||||||||
| As at December 31, 2022 ($ millions) |
Net income attributed to shareholders | |||||||||||||||||||||||||||
| -30% | -20% | -10% | +10% | +20% | +30% | |||||||||||||||||||||||
| Underlying sensitivity |
||||||||||||||||||||||||||||
| Variable annuity guarantees(2) |
$ | (2,110 | ) | $ | (1,310 | ) | $ | (610 | ) | $ | 530 | $ | 980 | $ | 1,360 | |||||||||||||
| General fund equity investments(3) |
(1,450 | ) | (920 | ) | (420 | ) | 400 | 780 | 1,170 | |||||||||||||||||||
| Total underlying sensitivity before hedging |
(3,560 | ) | (2,230 | ) | (1,030 | ) | 930 | 1,760 | 2,530 | |||||||||||||||||||
| Impact of macro and dynamic hedge assets(4) |
930 | 570 | 260 | (220 | ) | (400 | ) | (540 | ) | |||||||||||||||||||
| Net potential impact on net income attributed to shareholders after impact of hedging and before impact of reinsurance |
(2,630 | ) | (1,660 | ) | (770 | ) | 710 | 1,360 | 1,990 | |||||||||||||||||||
| Impact of reinsurance |
1,170 | 740 | 350 | (310 | ) | (580 | ) | (810 | ) | |||||||||||||||||||
| Net potential impact on net income attributed to shareholders after impact of hedging and reinsurance |
$ | (1,460 | ) | $ | (920 | ) | $ | (420 | ) | $ | 400 | $ | 780 | $ | 1,180 | |||||||||||||
| (1) See “Caution related to sensitivities” above. (2) For variable annuity contracts measured under VFA the impact of financial risk and changes in interest rates adjusts CSM, unless the risk mitigation option applies. The Company has elected to apply risk mitigation and therefore a portion of the impact is reported in net income attributed to shareholders instead of adjusting the CSM. If the CSM for a group of variable annuity contracts is exhausted the full impact is reported in net income attributed to shareholders. (3) This impact for general fund equity investments includes general fund investments supporting our insurance contract liabilities, investment in seed money investments (in segregated and mutual funds made by Global WAM segment) and the impact on insurance contract liabilities related to the projected future fee income on variable universal life and other unit linked products. The impact does not include any potential impact on public equity weightings. The participating policy funds are largely self-supporting and generate no material impact on net income attributed to shareholders as a result of changes in equity markets. (4) Includes the impact of assumed rebalancing of equity hedges in the macro and dynamic hedging program. The impact of dynamic hedge represents the impact of equity hedges offsetting 95% of the dynamically hedged variable annuity liability movement that occurs as a result of market changes, but does not include any impact in respect of other sources of hedge accounting ineffectiveness (e.g. fund tracking, realized volatility and equity, interest rate correlations different from expected among other factors). |
|
|||||||||||||||||||||||||||
|
|
67 |
Potential immediate impact on contractual service margin, other comprehensive income to shareholders, total comprehensive income to shareholders and MLI’s LICAT ratio from changes to public equity market values(1),(2),(3)
| As at December 31, 2023 | -30% | -20% | -10% | +10% | +20% | +30% | ||||||||||||||||||||||
| Variable annuity guarantees reported in CSM |
$ | (3,810 | ) | $ | (2,370 | ) | $ | (1,100 | ) | $ | 940 | $ | 1,760 | $ | 2,470 | |||||||||||||
| Impact of risk mitigation — hedging(4) |
1,150 | 700 | 310 | (250 | ) | (450 | ) | (600 | ) | |||||||||||||||||||
| Impact of risk mitigation — reinsurance(4) |
1,850 | 1,140 | 530 | (450 | ) | (830 | ) | (1,150 | ) | |||||||||||||||||||
| VA net of risk mitigation |
(810 | ) | (530 | ) | (260 | ) | 240 | 480 | 720 | |||||||||||||||||||
| General fund equity |
(940 | ) | (610 | ) | (300 | ) | 290 | 590 | 870 | |||||||||||||||||||
| Contractual service margin ($ millions, pre-tax) |
$ | (1,750 | ) | $ | (1,140 | ) | $ | (560 | ) | $ | 530 | $ | 1,070 | $ | 1,590 | |||||||||||||
| Other comprehensive income attributed to shareholders ($ millions, post-tax)(5) |
$ | (730 | ) | $ | (490 | ) | $ | (240 | ) | $ | 230 | $ | 460 | $ | 680 | |||||||||||||
| Total comprehensive income attributed to shareholders |
$ | (1,920 | ) | $ | (1,290 | ) | $ | (640 | ) | $ | 620 | $ | 1,240 | $ | 1,840 | |||||||||||||
| MLI’s LICAT ratio (change in percentage points) |
(3 | ) | (2 | ) | (1 | ) | 1 | 2 | 2 | |||||||||||||||||||
| As at December 31, 2022, except MLI LICAT, which is as at January 1, 2023(6) |
-30% | -20% | -10% | +10% | +20% | +30% | ||||||||||||||||||||||
| Variable annuity guarantees reported in CSM |
$ | (3,410 | ) | $ | (2,140 | ) | $ | (1,010 | ) | $ | 890 | $ | 1,670 | $ | 2,360 | |||||||||||||
| Impact of risk mitigation — hedging(4) |
1,200 | 740 | 340 | (280 | ) | (510 | ) | (690 | ) | |||||||||||||||||||
| Impact of risk mitigation — reinsurance(4) |
1,480 | 930 | 440 | (390 | ) | (730 | ) | (1,030 | ) | |||||||||||||||||||
| VA net of risk mitigation |
(730 | ) | (470 | ) | (230 | ) | 220 | 430 | 640 | |||||||||||||||||||
| General fund equity |
(520 | ) | (370 | ) | (210 | ) | 240 | 490 | 730 | |||||||||||||||||||
| Contractual service margin ($ millions, pre-tax) |
$ | (1,250 | ) | $ | (840 | ) | $ | (440 | ) | $ | 460 | $ | 920 | $ | 1,370 | |||||||||||||
| Other comprehensive income attributed to shareholders |
$ | (620 | ) | $ | (410 | ) | $ | (210 | ) | $ | 210 | $ | 400 | $ | 600 | |||||||||||||
| Total comprehensive income attributed to shareholders |
$ | (2,080 | ) | $ | (1,330 | ) | $ | (630 | ) | $ | 610 | $ | 1,180 | $ | 1,780 | |||||||||||||
| MLI’s LICAT ratio (change in percentage points)(6) |
(3 | ) | (2 | ) | (1 | ) | 1 | 2 | 3 | |||||||||||||||||||
| (1) See “Caution related to sensitivities” above. (2) This estimate assumes that the performance of the dynamic hedging program would not completely offset the gain/loss from the dynamically hedged variable annuity guarantee liabilities. It assumes that the hedge assets are based on the actual position at the period end, and that equity hedges in the dynamic program offset 95% of the hedged variable annuity liability movement that occur as a result of market changes. (3) The Office of the Superintendent of Financial Institutions (“OSFI”) rules for segregated fund guarantees reflect full capital impacts of shocks over 20 quarters within a prescribed range. As such, the deterioration in equity markets could lead to further increases in capital requirements after the initial shock. (4) For variable annuity contracts measured under VFA the impact of financial risk and changes in interest rates adjusts CSM, unless the risk mitigation option applies. The Company has elected to apply risk mitigation and therefore a portion of the impact is reported in net income attributed to shareholders instead of adjusting the CSM. If the CSM for a group of variable annuity contracts is exhausted the full impact is reported in net income attributed to shareholders. (5) The impact of financial risk and changes to interest rates for variable annuity contracts is not expected to generate sensitivity in Other Comprehensive Income. |
|
|||||||||||||||||||||||||||
| (6) LICAT capital sensitivity is based on the 2023 LICAT guideline that became effective January 1, 2023. |
||||||||||||||||
Interest Rate and Spread Risk Sensitivities and Exposure Measures
| As at December 31, 2023, we estimated the sensitivity of our net income attributed to shareholders to a 50 basis point parallel decline in interest rates to be a benefit of $100 million, and to a 50 basis point parallel increase in interest rates to be a charge of $100 million.
The table below shows the potential impacts from a 50 basis point parallel move in interest rates on CSM, net income attributed to shareholders, other comprehensive income attributed to shareholders, and total comprehensive income attributed to shareholders. This includes a change in current government, swap and corporate rates for all maturities across all markets with no change in credit spreads between government, swap and corporate rates. Also shown separately are the potential impacts from a 50 basis point parallel move in corporate spreads and a 20 basis point parallel move in swap spreads. The impacts reflect the net impact of movements in asset values in liability and surplus segments and movements in the present value of cash flows for insurance contracts including those with cash flows that vary with the returns of underlying items where the present value is measured by stochastic modelling. The method used for deriving sensitivity information and significant assumptions made did not change from the previous period.
The disclosed interest rate sensitivities reflect the accounting designations of our financial assets and corresponding insurance contract liabilities. In most cases these assets and liabilities are designated as fair value through other comprehensive income (“FVOCI”) and as a result, impacts from changes to interest rates are largely in other comprehensive income. There are also changes in interest rates that impact the CSM for VFA contracts that relate to amounts that are not passed through to policyholders. In addition, changes in interest rates impact net income as it relates to derivatives not in hedge accounting relationships and on VFA contracts where the CSM has been exhausted.
The disclosed interest rate sensitivities assume no hedge accounting ineffectiveness, as our hedge accounting programs are optimized for parallel movements in interest rates, leading to immaterial net income impacts under these shocks. However, the actual hedge accounting ineffectiveness is sensitive to non-parallel interest rate movements and will depend on the shape and magnitude of the interest rate movements which could lead to variations in the impact to net income attributed to shareholders. |
68 | 2023 Annual Report | Management’s Discussion and Analysis
|
Our sensitivities vary across all regions in which we operate, and the impacts of yield curve changes will vary depending upon the geography where the change occurs. Furthermore, the impacts from non-parallel movements may be materially different from the estimated impacts of parallel movements.
The interest rate and spread risk sensitivities are determined in isolation of each other and therefore do not reflect the combined impact of changes in government rates and credit spreads between government, swap and corporate rates occurring simultaneously. As a result, the impact of the summation of each individual sensitivity may be materially different from the impact of sensitivities to simultaneous changes in interest rate and spread risk.
The potential impacts also do not take into account other potential effects of changes in interest rate levels, for example, CSM at recognition on the sale of new business or lower interest earned on future fixed income asset purchases.
The impacts do not reflect any potential effect of changing interest rates on the value of our ALDA. Rising interest rates could negatively impact the value of our ALDA (see “Critical Actuarial and Accounting Policies – Fair Value of Invested Assets”, below). More information on ALDA can be found below under “Alternative long-duration asset performance risk sensitivities and exposure measures”. |
| The impact to the LICAT ratio from a change in interest rates reflects the impacts on total comprehensive income, the LICAT adjustments to earnings for the CSM, the surplus allowance and required capital components of the regulatory capital framework. | ||||
Potential impacts on contractual service margin, net income attributed to shareholders, other comprehensive income attributed to shareholders, and total comprehensive income attributed to shareholders of an immediate parallel change in interest rates, corporate spreads or swap spreads relative to current rates(1),(2),(3),(4)
| As at December 31, 2023 ($ millions, post-tax except CSM) |
Interest rates | Corporate spreads | Swap spreads | |||||||||||||||||||||||||
| -50bp | +50bp | -50bp | +50bp | -20bp | +20bp | |||||||||||||||||||||||
| CSM |
$ – | $ | (100 | ) | $ – | $ | (100 | ) | $ | – | $ | – | ||||||||||||||||
| Net income attributed to shareholders |
100 | (100 | ) | – | – | 100 | (100 | ) | ||||||||||||||||||||
| Other comprehensive income attributed to shareholders |
(300 | ) | 300 | (200 | ) | 300 | (100 | ) | 100 | |||||||||||||||||||
| Total comprehensive income attributed to shareholders |
(200 | ) | 200 | (200 | ) | 300 | – | – | ||||||||||||||||||||
| As at December 31, 2022 ($ millions, post-tax except CSM) |
Interest rates | Corporate spreads | Swap spreads | |||||||||||||||||||||||||
| -50bp | +50bp | -50bp | +50bp | -20bp | +20bp | |||||||||||||||||||||||
| CSM |
$ (100 | ) | $ | – | $ (100 | ) | $ | – | $ | – | $ | – | ||||||||||||||||
| Net income attributed to shareholders |
1,700 | (1,500 | ) | – | – | |
– |
|
|
– |
|
|||||||||||||||||
| Other comprehensive income attributed to shareholders |
(1,900 | ) | 1,600 | – | – | |
– |
|
|
– |
|
|||||||||||||||||
| Total comprehensive income attributed to shareholders |
(200 | ) | 100 | – | – | – | – | |||||||||||||||||||||
| (1) See “Caution related to sensitivities” above. (2) Estimates include changes to the net actuarial gains/losses with respect to the Company’s pension obligations as a result of changes in interest rates. (3) Includes guaranteed insurance and annuity products, including variable annuity contracts as well as adjustable benefit products where benefits are generally adjusted as interest rates and investment returns change, a portion of which have minimum credited rate guarantees. For adjustable benefit products subject to minimum rate guarantees, the sensitivities are based on the assumption that credited rates will be floored at the minimum. (4) The Company adopted IFRS 9 hedge accounting prospectively from January 1, 2023, as such the sensitivity results for 2023 and 2022 are based on different accounting basis in which 2023 includes the impacts of hedge accounting and 2022 does not. |
|
|||||||||||||||||||||||||||
Swap spreads remain at low levels, and if they were to rise, this could generate material changes to net income attributed to shareholders.
Potential impact on MLI’s LICAT ratio of an immediate parallel change in interest rates, corporate spreads or swap spreads relative to current rates(1),(2),(3),(4),(5)
| As at December 31, 2023 (change in percentage points) |
Interest rates | Corporate spreads | Swap spreads | |||||||||||||||||||||
| -50bp | +50bp | -50bp | +50bp | -20bp | +20bp | |||||||||||||||||||
| MLI’s LICAT ratio |
– | – | (4 | ) | 4 | – | – | |||||||||||||||||
| As at January 1, 2023(6) (change in percentage points) |
Interest rates | Corporate spreads | Swap spreads | |||||||||||||||||||||
| -50bp | +50bp | -50bp | +50bp | -20bp | +20bp | |||||||||||||||||||
| MLI’s LICAT ratio |
(1 | ) | 1 | (3 | ) | 3 | – | – | ||||||||||||||||
| (1) | See “Caution related to sensitivities” above. |
| (2) | In addition, estimates include changes to the net actuarial gains/losses with respect to the Company’s pension obligations as a result of changes in interest rates. |
| (3) | Includes guaranteed insurance and annuity products, including variable annuity contracts as well as adjustable benefit products where benefits are generally adjusted as interest rates and investment returns change, a portion of which have minimum credited rate guarantees. For adjustable benefit products subject to minimum rate guarantees, the sensitivities are based on the assumption that credited rates will be floored at the minimum. |
| (4) | LICAT impacts reflect the impact of anticipated scenario switches. |
| (5) | Under LICAT, spread movements are determined from a selection of investment grade bond indices with BBB and better bonds for each jurisdiction. For LICAT, we use the following indices: FTSE TMX Canada All Corporate Bond Index, Barclays USD Liquid Investment Grade Corporate Index, and Nomura-BPI (Japan). LICAT impacts presented for corporate spreads reflect the impact of anticipated scenario switches. |
| (6) | LICAT capital sensitivity is based on the 2023 LICAT guideline that became effective January 1, 2023. |
|
|
69 |
LICAT Scenario Switch
When interest rates change past a certain threshold, reflecting the combined movement in risk-free rates and corporate spreads, a different prescribed interest rate stress scenario needs to be taken into account in the LICAT ratio calculation in accordance with OSFI’s LICAT guideline.
The LICAT guideline specifies four stress scenarios for interest rates and prescribes the methodology to determine the most adverse scenario to apply for each LICAT geographic region1 based on current market inputs and the Company’s balance sheet.
With the current level of interest rates in 2023, the probability of a scenario switch that could materially impact our LICAT ratio is low2. Should a scenario switch be triggered in a LICAT geographic region, the full impact would be reflected immediately for non-participating products while the impact for participating products would be reflected over six quarters using a rolling average of interest rate risk capital, in line with the smoothing approach prescribed in the LICAT guideline. The LICAT interest rate, corporate spread and swap spread sensitivities presented above reflect the impact of scenario switches, if any, for each disclosed sensitivity.
The level of interest rates and corporate spreads that would trigger a switch in the scenarios is dependent on market conditions and movements in the Company’s asset and liability position. The scenario switch, if triggered, could reverse in response to subsequent changes in interest rates and/or corporate spreads.
Alternative Long-Duration Asset Performance Risk Sensitivities and Exposure Measures
| The following table shows the potential impact on CSM, net income attributed to shareholders, other comprehensive income attributed to shareholders, and total comprehensive income attributed to shareholders resulting from an immediate 10% change in market values of ALDA. The method used for deriving sensitivity information and significant assumptions made did not change from the previous period.
ALDA includes commercial real estate, timber and farmland real estate, infrastructure, and private equities, some of which relate to energy3.
The impacts do not reflect any future potential changes to non-fixed income return volatility. Refer to “Publicly traded equity performance risk sensitivities and exposure measures” above for more details. |
Potential immediate impacts on contractual service margin, net income attributed to shareholders, other comprehensive income attributed to shareholders, and total comprehensive income attributed to shareholders from changes in ALDA market values(1)
| As at ($ millions, post-tax except CSM) |
December 31, 2023 | December 31, 2022 | ||||||||||||||||||||||
| -10% | +10% | -10% | +10% | |||||||||||||||||||||
| CSM excluding NCI | $ | (100 | ) | $ | 100 | $ | (100 | ) | $ | 100 | ||||||||||||||
| Net income attributed to shareholders(2) | (2,400 | ) | 2,400 | (2,500 | ) | 2,500 | ||||||||||||||||||
| Other comprehensive income attributed to shareholders | (200 | ) | 200 | (100 | ) | 100 | ||||||||||||||||||
| Total comprehensive income attributed to shareholders | (2,600 | ) | 2,600 | (2,600 | ) | 2,600 | ||||||||||||||||||
| (1) See “Caution related to sensitivities” above. (2) Net income attributed to shareholders includes core earnings and the amounts excluded from core earnings. |
|
|||||||||||||||||||||||
Potential immediate impact on MLI LICAT ratio arising from changes in ALDA market values(1)
| December 31, 2023 | January 1, 2023(2) | |||||||||||||||||||
| (change in percentage points) | -10% | +10% | -10% | +10% | ||||||||||||||||
| MLI’s LICAT ratio |
(2) | 2 | (3) | 3 | ||||||||||||||||
| (1) | See “Caution Related to Sensitivities” above. |
| (2) | LICAT capital sensitivity is based on the 2023 LICAT guideline that became effective January 1, 2023. |
Foreign Exchange Risk Sensitivities and Exposure Measures
| We generally match the currency of our assets with the currency of the insurance and investment contract liabilities they support, with the objective of mitigating risk of loss arising from foreign currency exchange rate changes. As at December 31, 2023, we did not have a material unmatched currency exposure. |
The following table shows the potential impact on core earnings of a 10% change in the value of the Canadian dollar relative to our other key operating currencies. Note that the impact of foreign currency exchange rates on items excluded from core earnings does not provide relevant information given the nature of these items.
| 1 | LICAT geographic locations to determine the most adverse scenario include North America, the United Kingdom, Europe, Japan and Other Region. |
| 2 | See “Caution regarding forward-looking statements” above. |
| 3 | Energy includes legacy oil and gas equity interests related to upstream and midstream assets that are in runoff, and Energy Transition private equity interests in areas supportive of the transition to lower carbon forms of energy, such as wind, solar, batteries, and magnets. |
70 | 2023 Annual Report | Management’s Discussion and Analysis
Potential impact on core earnings of changes in foreign exchange rates(1),(2)
| 2023 | 2022 | |||||||||||||||||||
| As at December 31, ($ millions) |
+10% strengthening |
-10% weakening |
+10% strengthening |
-10% weakening |
||||||||||||||||
| 10% change in the Canadian dollar relative to the U.S. dollar and the Hong Kong dollar |
$ (390 | ) | $ | 390 | $ | (320 | ) | $ | 320 | |||||||||||
| 10% change in the Canadian dollar relative to the Japanese yen |
(40 | ) | 40 | (40 | ) | 40 | ||||||||||||||
| (1) | This item is a non-GAAP financial measure. See “Non-GAAP and Other Financial Measures” below for more information. |
| (2) | See “Caution Related to Sensitivities” above. |
LICAT regulatory ratios are also sensitive to the fluctuations in the Canadian dollar relative to our other key operating currencies. The direction and materiality of this sensitivity varies across various capital metrics.
Liquidity Risk Exposure Strategy
| We manage liquidity levels of the consolidated group and key subsidiaries against established thresholds. These thresholds are based on liquidity stress scenarios over varying time horizons.
Increased use of derivatives for hedging purposes has necessitated greater emphasis on measurement and management of contingent liquidity risk related to these instruments, in particular the movement of “over-the-counter” derivatives to central clearing in the U.S. and Japan places an emphasis on cash as the primary source of liquidity as opposed to security holdings. The market value of our derivative portfolio is therefore regularly stress tested to assess the potential collateral and cash settlement requirements under various market conditions. |
Manulife Bank (the “Bank”) has a standalone liquidity risk management framework. The framework includes stress testing, cash flow modeling, a funding plan and a contingency plan. The Bank has an established securitization infrastructure which enables the Bank to access a range of funding and liquidity sources. The Bank models extreme but plausible stress scenarios that demonstrate that the Bank has a sufficient pool of highly liquid marketable securities, which when combined with the Bank’s capacity to securitize residential mortgage assets provides sufficient liquidity to meet potential requirements under these stress scenarios.
Similarly, Global WAM has a standalone liquidity risk management framework for the businesses managing assets or manufacturing investment products for third-party clients. We maintain fiduciary standards to ensure that client and regulatory expectations are met in relation to the liquidity risks taken within each investment. Additionally, we regularly monitor and review the liquidity of our investment products as part of our ongoing risk management practices.
Market Risk Factors
Our most significant source of publicly traded equity risk arises from equity-linked products with guarantees, where the guarantees are linked to the performance of the underlying funds.
| • | Publicly traded equity performance risk arises from a variety of sources, including guarantees associated with equity-linked investments such as variable annuity and segregated fund products, general fund investments in publicly traded equities and mutual funds backing general fund product liabilities. |
| • | Market conditions resulting in reductions in the asset value we manage have an adverse effect on the revenues and profitability of our investment management business, which depends on fees related primarily to the values of assets under management and administration. |
| • | Guaranteed benefits of variable annuity and segregated funds are contingent and payable upon death, maturity, permitted withdrawal or annuitization. If equity markets decline or even if they increase by an amount lower than the risk-free rate plus an adjustment for product illiquidity assumed in our actuarial valuation, additional liabilities may need to be established to cover the contingent liabilities, resulting in reductions that could impact net income attributed to shareholders, the contractual service margin, and regulatory capital ratios. Further, if equity markets do not recover to the amount of the guarantees, by the dates the liabilities are due, the accrued liabilities will need to be paid out in cash. In addition, sustained flat or declining public equity markets would likely reduce asset-based fee revenues related to variable annuities and segregated funds with guarantees, unit linked products, and other wealth and insurance products. |
| • | Where publicly traded equity investments are used to support general fund product liabilities, adverse public equity returns and associated impacts to insurance contract liabilities from certain product features such as universal life minimum crediting rate guarantees, or participating product zero dividend floor implicit guarantees, could result in a reduction to the contractual services margin or total comprehensive income. |
We experience interest rate and spread risk within the general fund primarily due to differences in how our assets and liabilities respond to changes in these variables.
| • | Interest rate and spread risk arises from differences in the movements of our assets and liabilities due to changes in these variables. For our assets, changes in value from movements in interest rates and spreads would vary by asset and would be impacted by factors such as duration and credit rating. For insurance contract liabilities, which are discounted using risk-free yields adjusted by an illiquidity premium, changes in the value would be impacted by factors such as the duration of the liability, and the spread exposure through the |
|
|
71 |
| illiquidity premium. To the extent that there are mismatches between the assets and liabilities such as through differences in duration, or differences in spread exposure, interest rate or spread movements could result in a reduction in the contractual service margin or total comprehensive income. |
| • | The Company’s disclosed estimated impact from interest rate movements reflects a parallel increase and decrease in interest rates of specific amounts. The impact from non-parallel movements may be different from the estimated impact of parallel movements. For further information on interest rate scenarios refer to “Interest Rate and Spread Risk Sensitivities and Exposure Measures”. |
We experience ALDA performance risk from the risk of low returns, including lower valuations.
| • | ALDA performance risk arises from general fund investments in directly-owned real estate, timber properties, farmland properties, infrastructure, private equities, and oil and gas and energy transition assets. |
| • | Difficult economic conditions could result in higher vacancy, lower rental rates, and lower demand for real estate investments, all of which would adversely impact the value of our diversified real estate investments. Continual advances in the digitization of work and the transformation of physical retail may have further negative impact to our commercial real estate investments. Difficult economic conditions could also prevent companies in which we have made private equity investments from achieving their business plans and could cause the value of these investments to fall, or even cause the companies to fail. Sustained declines in valuation multiples in the public equity market would also likely cause values to decline in our private equity portfolio. The timing and amount of investment income from private equity investments is difficult to predict, and investment income from these investments can vary from quarter to quarter. |
| • | Our timberland and farmland holdings are exposed to natural risks, such as prolonged drought, wildfires, insects, windstorms, flooding, and climate change. We are generally not insured for these types of risks but seek to proactively mitigate their impact through portfolio diversification and prudent operating practices. |
| • | The value of oil and gas and energy transition assets could be adversely affected by declines in energy prices as well as by a number of other factors including production declines, uncertainties associated with estimating oil and natural gas reserves, difficult economic conditions, changes in consumer preferences to transition to a low-carbon economy, competition from renewable energy providers and geopolitical events. Changes in government regulation of the oil and gas industry, including environmental regulation, carbon taxes and changes in the royalty rates resulting from provincial royalty reviews, could also adversely affect the value of our oil and gas investments. |
| • | Higher interest rates, in combination with uncertain economic environments, could precipitate higher ALDA discount rates as buyers begin to demand higher current returns to invest in ALDA. Since ALDA cash flows may, to some degree, be fixed in the near to medium term, some ALDA values may initially decline in order for the asset returns to meet the desired higher discount rates in future periods, resulting in lowered current portfolio returns. |
| • | The negative impact of changes in market or economic factors can take time to be fully reflected in the valuations of private investments, including ALDA, especially if the change is large and rapid, as market participants endeavor to adjust their forecasts and better understand the potential medium to long-term impact of such changes. As a result, valuation changes in any given period may reflect the delayed impact of events that occurred in prior periods. Our real estate valuations are based on external appraisals, and these appraisals may lag behind current market transactions. |
| • | We rely on a diversified portfolio of ALDA to generate relatively stable investment returns. Diversification benefits may be reduced at times, especially during a period of economic stress, which would adversely affect portfolio returns. |
We experience foreign exchange risk as a substantial portion of our business is transacted in currencies other than Canadian dollars.
| • | Our financial results are reported in Canadian dollars. A substantial portion of our business is transacted in currencies other than Canadian dollars, mainly U.S. dollars, Hong Kong dollars and Japanese yen. If the Canadian dollar strengthens relative to these currencies, net income attributed to shareholders would decline and our reported shareholders’ equity would decline. A weakening of the Canadian dollar against the foreign currencies in which we do business would have the opposite effect and would increase net income attributed to shareholders and shareholders’ equity. |
The Company’s hedging strategies will not fully reduce the market risks related to the product guarantees and fees being hedged, hedging costs may increase and the hedging strategies expose the Company to additional risks.
| • | Our hedging strategies rely on the execution of derivative transactions in a timely manner. Market conditions can limit availability of hedging instruments, requiring us to post additional collateral, and can further increase the costs of executing derivative transactions. Therefore, hedging costs and the effectiveness of the strategy may be negatively impacted if markets for these instruments become illiquid. The Company is subject to the risk of increased funding and collateral demands which may become significant as equity markets and interest rates increase. |
| • | The Company is also subject to counterparty risks arising from the derivative instruments and to the risk of increased funding and collateral demands which may become significant as equity markets and interest rates increase. The strategies are highly dependent on complex systems and mathematical models that are subject to error and rely on forward-looking long-term assumptions that may prove inaccurate, and which rely on sophisticated infrastructure and personnel which may fail or be unavailable at critical times. Due to the complexity of the strategies, there may be additional unidentified risks that may negatively impact our business and future financial results. In addition, rising equity markets and interest rates that would otherwise result in profits on variable annuities and segregated funds will be offset by losses from our hedging positions. For further information pertaining to counterparty risks, refer to the risk factor “If a counterparty fails to fulfill its obligations, we may be exposed to risks we had sought to mitigate”. |
72 | 2023 Annual Report | Management’s Discussion and Analysis
| • | Under certain market conditions, which include a sustained increase in realized equity and interest rate volatilities, a decline in interest rates, or an increase in the correlation between equity returns and interest rate declines, the costs of hedging the benefit guarantees provided in variable annuities and segregated funds may increase or become uneconomic. In addition, there can be no assurance that our dynamic hedging strategy will fully offset the risks arising from the variable annuities and segregated funds being hedged. |
| • | The level of guarantee claims returns or other benefits ultimately paid will be impacted by policyholder longevity and policyholder behaviour including the timing and amount of withdrawals, lapses, fund transfers, and contributions. The sensitivity of liability values to equity market and interest rate movements that we hedge are based on long-term expectations for longevity and policyholder behaviour since the impact of actual policyholder longevity and policyholder behaviour variances cannot be hedged using capital markets instruments. The efficiency of our market risk hedging is directly affected by accuracy of the assumptions related to policyholder longevity and policyholder behaviour. |
Prolonged changes in market interest rates may impact our net income attributed to shareholders and capital ratios.
| • | A prolonged low or negative (nominal or real) interest rate environment may result in lower net investment results and a decrease in new business CSM until products are repositioned for the lower rate environment. Other potential consequences of low interest rates include: |
| ¡ | Negative impact on sales and reduced new business profitability; |
| ¡ | Increased cost of hedging and as a result, the offering of guarantees could become uneconomic; |
| ¡ | Reinvestment of cash flows into low yielding bonds could result in lower future earnings due to lower returns on surplus and general fund assets supporting in-force liabilities, and due to guarantees embedded in products including minimum guaranteed rates in participating and adjustable products; |
| ¡ | Negative impacts to other macroeconomic factors including unfavourable economic growth and lower returns on other asset classes; |
| ¡ | Potential impairments of goodwill; |
| ¡ | Lower expected earnings on in-force policies; |
| ¡ | Potential risk of lowering the ultimate spot rate within our discount rates that would increase our liabilities; |
| ¡ | A switch in the prescribed interest stress scenario that impacts LICAT capital. See “LICAT Scenario Switch” above; and |
| ¡ | Reduced ability of MFC’s insurance subsidiaries to pay dividends to MFC. |
| • | While higher interest rates are generally good for our business, there are some associated risks. A rapid rise in interest rate or a prolonged high-rate environment may result in material changes in policyholder behavior such as higher surrenders, withdrawals, changes in fund contributions or fund transfers. Other potential consequences of rapid rise in or prolonged high interest rates include: |
| ¡ | Decrease in value of existing fixed income assets supporting general account surplus and liabilities, including the employee benefit plans; |
| ¡ | Losses attributable to early liquidation of fixed income instruments supporting contractual surrender benefits; |
| ¡ | Decline in value of some of our ALDA investments, particularly those with fixed contractual cash flows such as long-leased real estate and certain infrastructure investments; |
| ¡ | Increase in collateral demands, especially for our interest rate hedging book which incurs market-to-market losses in a rising rate environment; |
| ¡ | Adverse effect on the local solvency ratio for some countries in which we operate; |
| ¡ | A switch in the prescribed interest stress scenario that impacts LICAT capital. See “LICAT Scenario Switch” above; |
| ¡ | Shift in new sales mix from competitive pressure on wealth products that are less attractive on a yield basis; |
| ¡ | Increase in funding costs on repurchase agreements (i.e., repo transactions); and |
| ¡ | Increase in borrowing costs as we refinance our debt. |
The global interest rate benchmark reform, leading to the transition away from IBORs to alternative reference rates based on risk-free rates, may impact the value of our IBOR-based financial instruments.
| • | Various interest rate benchmarks, including Interbank Offered Rates (IBORs) such as London Interbank Offered Rate (LIBOR) and Canadian Dollar Offered Rate (CDOR), are the subject of international regulatory guidance and proposals for reform. Regulators in various jurisdictions have pushed for the transition of IBORs to alternative reference rates based on risk-free rates. Manulife holds different types of instruments, including derivatives, bonds, loans, and other floating rate instruments that reference IBORs. Changes from IBORs to alternative reference rates that have different characteristics compared to IBORs may adversely affect the valuation of our existing interest rate linked and derivatives securities we hold, the effectiveness of those derivatives in mitigating our risks, securities we have issued, or other assets, liabilities and other contractual rights, and obligations whose value is tied to IBORs or to IBOR alternatives. There can be no assurance that alternative reference rates will perform in the same way as IBORs as a result of interest rate changes, market volatility, or global or regional economic, financial, political, regulatory, judicial, or other events. Furthermore, depending on the nature of the alternative reference rate, we may become exposed to additional risks such as legal settlement risk associated with instruments having inadequate fallback language. To ensure a timely transition to alternative reference rates, Manulife has established an enterprise-wide program and governance structure across functions to identify, measure, monitor, and manage financial and non-financial risks of transition. Manulife’s enterprise-wide program focuses on quantifying our exposures to various IBORs, evaluating contract fallback language, contract remediation, risk management, assessing accounting and tax implications, and ensuring operational readiness for IT systems, models, processes, and controls. |
|
|
73 |
| • | Further to previous announcements by various regulators, the publication of GBP, EUR, CHF and JPY LIBOR settings, as well as one-week and two-month USD LIBOR settings was discontinued on December 31, 2021. The publication of the remaining USD LIBOR tenors (overnight and one, three, six and twelve-month USD LIBOR) was discontinued on June 30, 2023. We have successfully transitioned our exposures to the LIBOR rates that decommissioned on December 31, 2021 and June 30, 2023. |
| • | In December 2021, the Canadian Alternative Reference Rate (CARR) working group recommended that the administrator of CDOR, Refinitiv Benchmark Services (UK) Limited (RBSL), cease publication of CDOR after the end of June 2024. On May 16, 2022, RBSL announced that the calculation and publication of all tenors of CDOR will permanently cease immediately following a final publication on June 28, 2024. Further to the confirmation of CDOR’s cessation date, OSFI expects all new derivative contracts and securities to transition to alternative reference rates by June 30, 2023, with no new CDOR exposure being booked after that date, with limited exceptions. OSFI also expects Federally Regulated Financial Institutions (FRFIs) to transition all loan agreements referencing CDOR by June 28, 2024, including prioritizing system and model updates to accommodate the use of Canadian Overnight Repo Rate Average (CORRA), the alternative reference rate to which CDOR is expected to transition, or any alternative reference rates, as necessary. In July 2023, CARR announced that there should be no new CDOR or Banker’s Acceptance (BA) loans after November 1, 2023 to facilitate a tapered transition for the loan market. Manulife has incorporated these developments in its project plan to align with updated timelines and ensure an orderly transition. We continue to monitor market developments, changes, and guidance from regulators on the interest rate benchmark reform. |
Liquidity risk is impacted by various factors, including but not limited to, capital and credit market conditions, repricing risk on letters of credit, collateral pledging obligations, and reliance on deposits sensitive to confidence or broad macroeconomic factors.
| • | Adverse market conditions may significantly affect our liquidity risk. |
| ¡ | Reduced asset liquidity may restrict our ability to sell certain types of assets for cash without taking significant losses. If providers of credit preserve their capital, our access to borrowing from banks and others or access to other types of credit, such as letters of credit, may be reduced. If investors have a negative perception of our creditworthiness, this may reduce access to the debt capital markets or increase borrowing costs. |
| ¡ | Liquid assets are required to pledge as collateral to support activities such as the use of derivatives for hedging purposes and to cover cash settlement associated with such derivatives. |
| ¡ | The principal sources of our liquidity are cash, insurance and annuity premiums, fee income earned on AUM, cash flow from our investment portfolios, and our assets that are readily convertible into cash, including money market securities. The issuance of long-term debt, common and preferred shares, and other capital securities may also increase our available liquid assets or be required to replace certain maturing or callable liabilities. In the event we seek additional financing, the availability and terms of such financing will depend on a variety of factors including market conditions, the availability of credit to the financial services industry, our credit ratings and credit capacity, as well as the possibility that customers, lenders, or investors could develop a negative perception of our long-term or short-term financial prospects if we incur large financial losses or if the level of our business activity decreases due to a significant market downturn. |
| • | Increased cleared derivative transactions, combined with margin rules on non-cleared derivatives, could adversely impact our liquidity risk. |
| ¡ | Over time our existing over-the-counter derivatives will migrate to clearing houses, or the Company and its counterparties may have the right to cancel derivative contracts after specific dates or in certain situations such as a ratings downgrade, which could accelerate the transition to clearing houses. Cleared derivatives are subject to both initial and variation margin requirements, and a more restrictive set of eligible collateral than non-cleared derivatives. |
| ¡ | In addition, initial margin rules for new non-cleared derivatives further increase our liquidity needs. |
| • | We are exposed to repricing risk on letters of credit. |
| ¡ | In the normal course of business, third-party banks issue letters of credit on our behalf. In lieu of posting collateral, our businesses utilize letters of credit for which third parties are the beneficiaries, as well as for affiliate reinsurance transactions between subsidiaries of MFC. Letters of credit and letters of credit facilities must be renewed periodically. At time of renewal, the Company is exposed to repricing risk and under adverse conditions increases in costs may be realized. In the most extreme scenarios, letters of credit capacity could become constrained due to non-renewals which would restrict our flexibility to manage capital. This could negatively impact our ability to meet local capital requirements or our sales of products in jurisdictions in which our operating companies have been affected. As at December 31, 2023, letters of credit for which third parties are beneficiaries, in the amount of $466 million, were outstanding. There were no assets pledged against these outstanding letters of credit as at December 31, 2023. |
| • | Our obligations to pledge collateral or make payments related to declines in value of specified assets may adversely affect our liquidity. |
| ¡ | In the normal course of business, we are obligated to pledge assets to comply with jurisdictional regulatory and other requirements including collateral pledged in relation to derivative contracts and assets held as collateral for repurchase funding agreements. The amount of collateral we may be required to post under these agreements, and the payments we are required to make to our counterparties, may increase under certain circumstances, including a sustained or continued decline in the value of our derivative contracts. Such additional collateral requirements and payments could have an adverse effect on our liquidity. As at December 31, 2023, total pledged assets were $13,840 million, compared with $16,221 million as at December 31, 2022. |
74 | 2023 Annual Report | Management’s Discussion and Analysis
| • | Our bank subsidiary relies on deposits sensitive to confidence as well as macroeconomic conditions. |
| ¡ | Manulife Bank is a wholly owned subsidiary of our Canadian life insurance operating company, MLI. Retail deposits are a significant part of the funding base of Manulife Bank. A real or perceived problem with the Bank or its parent company could result in a loss of confidence in the Bank’s ability to meet its obligations, which in turn may trigger a significant withdrawal of deposit funds. A substantial portion of the Bank’s deposits are demand deposits that can be withdrawn at any time, while the majority of the Bank’s assets are first residential mortgages and home equity lines of credit, which represent long-term funding obligations. Manulife Bank is a member of the Canadian Deposit Insurance Corporation (CDIC) which insures demand deposits up to $100,000 per eligible depositor. Insured demand deposits are less susceptible to runoff and a significant proportion of Manulife Bank’s deposits are CDIC insured. If deposit withdrawal speeds exceed our extreme stress test assumptions, mitigation strategies outlined in the Bank’s liquidity contingency plan will be executed and the Bank may choose to sell or securitize assets with third parties. There is no guarantee that the Bank will be able to sell or securitize the assets or that its customers will be able to repay their indebtedness. In such circumstances, Manulife Bank may consider the use of Bank of Canada facilities to generate liquidity to pay depositors; however, access to these facilities is at the sole discretion of the Bank of Canada and they provide only short-term liquidity. |
The declaration and payment of dividends and the amount thereof is subject to change.
| • | The holders of common shares are entitled to receive dividends as and when declared by the Board, subject to the preference of the holders of Class A Shares, Class 1 Shares, Class B Shares (collectively, the “Preferred Shares”) and any other shares ranking senior to the common shares with respect to priority in payment of dividends. The declaration and payment of dividends and the amount thereof is subject to the discretion of the Board of MFC and is dependent upon the results of operations, financial condition, cash requirements and future prospects of, and regulatory and contractual restrictions on the payment of dividends by MFC and other factors deemed relevant by the Board of MFC. Although MFC has historically declared quarterly cash dividends on the common shares, MFC is not required to do so and the Board of MFC may reduce, defer, or eliminate MFC’s common share dividend in the future. |
| • | The foregoing risk disclosure in respect of the declaration and payment of dividends on the common shares applies equally in respect of the declaration and payment of dividends on the Preferred Shares, notwithstanding that the Preferred Shares have a fixed rate of dividend. |
| • | See “Government Regulation” and “Dividends” in MFC’s Annual Information Form dated February 14, 2024 for a summary of additional statutory and contractual restrictions concerning the declaration of dividends by MFC. |
Credit Risk
Credit risk is the risk of loss due to the inability or unwillingness of a borrower or counterparty to fulfill its payment obligations.
Credit Risk Management Strategy
Credit risk is governed by the Credit Committee which oversees the overall credit risk management program. The Company has established objectives for overall quality and diversification of our general fund investment portfolio and criteria for the selection of counterparties, including derivative counterparties, reinsurers, and insurance providers. Our policies establish exposure limits by borrower, corporate connection, quality rating, industry, and geographic region, and govern the usage of credit derivatives. Corporate connection limits vary according to risk rating. Our general fund fixed income investments are primarily public and private investment grade bonds and commercial mortgages. We have a program for selling Credit Default Swaps (“CDS”) that employs a highly selective, diversified and conservative approach. CDS decisions follow the same underwriting standards as our cash bond portfolio. Our credit granting units follow a defined evaluation process that provides an objective assessment of credit proposals. We assign a risk rating, based on a standardized 22-point scale consistent with those of external rating agencies, following a detailed examination of the borrower that includes a review of business strategy, market competitiveness, industry trends, financial strength, access to funds, and other risks facing the counterparty. We assess and update risk ratings regularly. For additional input to the process, we also assess credit risks using a variety of industry standard market-based tools and metrics. We map our risk ratings to pre-established probabilities of default and loss given defaults, based on historical industry and Company experience, and to resulting default costs.
We establish delegated credit approval authorities and make credit decisions on a case-by-case basis at a management level appropriate to the size and risk level of the transaction, based on the delegated authorities that vary according to risk rating. Major credit decisions are approved by the Credit Committee and the largest decisions are approved by the CEO and, in certain cases, by the Board.
We limit the types of authorized derivatives and applications and require pre-approval of all derivative application strategies and regular monitoring of the effectiveness of derivative strategies. Derivative counterparty exposure limits are established based on a minimum acceptable counterparty credit rating (generally A- from internationally recognized rating agencies). We measure both bilateral and exchange-traded derivative counterparty exposure as net potential credit exposure, which takes into consideration the replacement cost, which reflects mark-to-market values of the exposure adjusted for the effects of net collateral, and the potential future exposure, which reflects the potential increase in exposure until the closure or replacement of the transactions. Reinsurance counterparty exposure is measured reflecting the level of ceded liabilities on a best estimate basis net of collateral held. The creditworthiness of all reinsurance counterparties is reviewed internally on a regular basis.
Regular reviews of the credits within the various portfolios are undertaken with the goal of prompt identification of changes to credit quality and, where appropriate, taking corrective action.
|
|
75 |
We establish Expected Credit Loss (“ECL”) allowances for investments in debt instruments which are measured at FVOCI or amortized cost. On an ongoing basis, ECL allowances are monitored for changes in credit quality and adjusted accordingly. Credit risk which arises from reinsurance counterparties is included in the valuation models of reinsurance contract assets. There is no assurance that the ECL allowances or valuation results will be adequate to cover future potential losses.
Our credit policies, procedures and investment strategies are established under a strong governance framework and are designed to ensure that risks are identified, measured, and monitored consistent with our risk appetite. We seek to actively manage credit exposure in our investment portfolio to reduce risk and minimize losses, and derivative counterparty exposure is managed proactively. However, we could experience volatility on a quarterly basis and losses could potentially rise as a result.
Credit Risk Exposure Measures
We use the ECL impairment allowance model in accordance with IFRS to establish and maintain allowances on our invested assets which are debt instruments measured at FVOCI or amortized cost. ECL allowances are measured on a probability-weighted basis, based on four macroeconomic scenarios, and incorporate consideration of past events, current market conditions, and reasonable supportable information about future economic conditions.
We measure ECL allowances using a three-stage approach. We recognize ECL on performing financial instruments that have not experienced significant increases in credit risk since acquisition to the extent of losses expected to result from defaults occurring within 12 months of the reporting date (Stage 1). Full lifetime ECLs are recognized for financial instruments experiencing significant increase in credit risk since acquisition or having become 30 days in arrears in principal or interest payments (Stage 2). Full lifetime ECLs are also recognized for financial instruments which have become credit-impaired (Stage 3), with a probability of default set at 100%. Interest income on Stage 3 financial instruments is determined based on the carrying amount of the asset, net of any credit loss allowance.
For more information on our ECL allowances, refer to notes 1 and 9 of the 2023 Annual Consolidated Financial Statements.
Credit Risk Factors
Borrower or counterparty defaults or downgrades could adversely impact our earnings.
Worsening regional and global economic conditions could result in borrower or counterparty defaults or downgrades and could lead to increased allowances or impairments related to our general fund invested assets and derivative financial instruments, and an increase in the credit risk factored into modeling of our reinsurance contract assets and insurance contract liabilities.
Our invested assets subject to credit risk primarily include investment grade bonds, private placements, commercial mortgages, asset-backed securities, and consumer loans. These assets are generally carried at FVOCI, and as a result of ECL modeling changes in various elements used in ECL calculations would be recorded as a charge against income. The return cash inflow assumptions incorporated in actuarial liabilities include an expected level of future asset impairments. There is a risk that actual impairments will exceed the assumed level of impairments in the future and earnings could be adversely impacted.
Volatility may arise from defaults and downgrade charges on our invested assets and as a result, losses could potentially rise above long-term expected levels. The ECL impairment allowance was $929 million, representing 0.22% of total general fund invested assets as at December 31, 2023, compared with $724 million, representing 0.18% of total general fund invested assets on implementation of IFRS 9, effective January 1, 2023.
If a counterparty fails to fulfill its obligations, we may be exposed to risks we had sought to mitigate.
| • | The Company uses derivative financial instruments to mitigate exposures to public equity, foreign currency, interest rate and other market risks arising from on-balance sheet financial instruments, guarantees related to variable annuity products, selected anticipated transactions and certain other guarantees. The Company may be exposed to counterparty risk if a counterparty fails to pay amounts owed to us or otherwise perform its obligations to us. Counterparty risk increases during economic downturns because the probability of default increases for most counterparties. If any of these counterparties default, we may not be able to recover the amounts due from that counterparty. As at December 31, 2023, the largest single counterparty exposure, without taking into account the impact of master netting agreements or the benefit of collateral held, was $1,357 million (2022 – $1,582 million). The net exposure to this counterparty, after taking into account master netting agreements and the fair value of collateral held, was $nil (2022 – $nil). As at December 31, 2023, the total maximum credit exposure related to derivatives across all counterparties, without taking into account the impact of master netting agreements and the benefit of collateral held, was $9,044 million (2022 – $9,072 million) compared with $154 million after taking into account master netting agreements and the benefit of fair value of collateral held (2022 – $215 million). The exposure to any counterparty would grow if, upon the counterparty’s default, markets moved such that our derivatives with that counterparty gain in value. Until we are able to replace those derivatives with another counterparty, the gain on the derivatives subsequent to the counterparty’s default would not be backed by collateral. |
| • | The Company reinsures a portion of the business we enter into; however, we remain legally liable for contracts that we had reinsured. In the event that any of our reinsurance providers were unable or unwilling to fulfill their contractual obligations related to the liabilities we cede to them, we would need to decrease reinsurance contract held assets, adversely impacting our net income attributed to shareholders and capital position. In addition, the Company has over time sold certain blocks of business to third-party purchasers using reinsurance. To the extent that the reinsured contracts are not subsequently novated to the purchasers, we remain legally liable |
76 | 2023 Annual Report | Management’s Discussion and Analysis
| to the insureds. Should the purchasers be unable or unwilling to fulfill their contractual obligations under the reinsurance agreement, we would need to decrease reinsurance contract held assets resulting in a charge to net income attributed to shareholders. To reduce credit risk, the Company may require purchasers to provide collateral for their reinsurance liabilities. |
| • | We participate in a securities lending program whereby blocks of securities are loaned to third parties, primarily major brokerage firms and commercial banks. Collateral, which exceeds the market value of the loaned securities, is retained by the Company until the underlying security has been returned. If any of our securities lending counterparties default and the value of the collateral is insufficient, we would incur losses. As at December 31, 2023, the Company had loaned securities (which are included in invested assets) valued at approximately $626 million, compared with $723 million as at December 31, 2022. |
The determination of loss allowances and impairments on our investments is subjective and changes could materially impact our results of operations or financial position.
| • | The determination of impairment losses on debt investments measured at FVOCI or amortized cost is based upon the expected credit loss (“ECL”) model which is applied quarterly. ECL allowances are measured under four probability-weighted macroeconomic scenarios and are estimated as the differences between all contractual cash flows that are due in accordance with the contract and all the cash flows that we expect to receive, discounted at the original effective interest rates of the contracts. This process includes consideration of past events, current market conditions, and reasonable supportable information about future economic conditions. Forward-looking macroeconomic variables used within the estimation models represent variables that are the most closely related with credit loss expectations for the relevant issuance. |
| • | The estimation and measurement of ECL impairment losses requires significant judgment. These estimates are driven by many elements, changes in which can result in different levels of allowances. Elements include the estimation of the amount and timing of future cash flows, our criteria for assessing if there has been a significant increase in credit risk (“SICR”), the selection of forward-looking macroeconomic scenarios and their probability weights, the application of expert credit judgment in the development of the models, inputs and, when applicable, overlay adjustments. It is our process to regularly review our models in the context of actual loss experience and adjust when necessary. We have implemented formal policies, procedures, and controls over all significant impairment processes. |
| • | Such evaluations and assessments are revised as conditions change and new information becomes available. We update our evaluations regularly and reflect changes in allowances and impairments as such evaluations warrant. The evaluations are inherently subjective and incorporate only those risk factors known to us at the time the evaluation is made. There can be no assurance that management has accurately assessed the level of impairments that have occurred. Additional impairments will likely need to be taken or allowances provided for in the future as conditions evolve. Historical trends may not be indicative of future impairments or allowances. |
Product Risk
We make a variety of assumptions related to the expected future level of claims, policyholder behaviour, expenses, reinsurance costs and sales levels when we design and price products, and when we establish insurance and investment contract liabilities. Product risk is the risk of failure to design, implement and maintain a product or service to achieve these expected outcomes, and the risk of loss due to actual experience emerging differently than assumed when a product was designed and priced. Assumptions for future claims are generally based on both Company and industry experience, and assumptions for future policyholder behaviour and expenses are generally based on Company experience. Assumptions for future policyholder behaviour include assumptions related to the retention rates for insurance and wealth products. Assumptions for expenses include assumptions related to future maintenance expense levels and volume of the business.
Product Risk Management Strategy
Product risk is governed by the Product Oversight Committee for the insurance business. Global WAM product risk is managed by first line product management working groups and the Global Investment Product Committee. Notable products which could introduce new and material risks are reviewed and approved by the Global WAM Risk Committee prior to launch.
Product Oversight Committee
The Product Oversight Committee oversees the overall insurance risk management program. The Product Oversight Committee has established a broad framework for managing insurance risk under a set of policies, standards and guidelines, to ensure that our product offerings align with our risk taking philosophy and risk limits, and achieve acceptable profit margins. These cover:
| • | product design features |
| • | use of reinsurance |
| • | pricing models and software |
| • | internal risk based capital allocations |
| • | target profit objectives |
| • | pricing methods and assumption setting |
| • | stochastic and stress scenario testing |
| • | required documentation |
| • | review and approval processes |
| • | experience monitoring programs |
In each business unit that sells insurance, we designate individual pricing officers who are accountable for pricing activities, chief underwriters who are accountable for underwriting activities, and chief claims risk managers who are accountable for claims activities. Both the pricing officer and the general manager of each business unit approve the design and pricing of each product, including key
|
|
77 |
claims, policyholder behaviour, investment return and expense assumptions, in accordance with global policies and standards. Risk management functions provide additional oversight, review and approval of material product and pricing initiatives, as well as material underwriting initiatives. Actuarial functions provide oversight review and approval of insurance and investment contract liability valuation methods and assumptions. In addition, both risk and actuarial functions review and approve new reinsurance arrangements. We perform annual risk and compliance self-assessments of the product development, pricing, underwriting and claims activities of all insurance businesses. To leverage best practices, we facilitate knowledge transfer between staff working with similar businesses in different geographies.
We utilize a global underwriting manual intended to ensure insurance underwriting practices for direct written life business are consistent across the organization while reflecting local conditions. Each business unit establishes underwriting policies and procedures, including criteria for approval of risks and claims adjudication policies and procedures.
We apply retention limits per insured life that are intended to reduce our exposure to individual large claims which are monitored in each business unit. These retention limits vary by market and jurisdiction. We reinsure exposure in excess of these limits with other companies (see “Risk Management and Risk Factors – Product Risk Factors – External market conditions determine the availability, terms and cost of reinsurance protection” below). Our current global life retention limit is US$30 million for individual policies (US$35 million for survivorship life policies) and is shared across businesses. We apply lower limits in some markets and jurisdictions. We aim to further reduce exposure to claims concentrations by applying geographical aggregate retention limits for certain covers. Enterprise-wide, we aim to reduce the likelihood of high aggregate claims by operating globally, insuring a wide range of unrelated risk events, and reinsuring some risks. We seek to actively manage the Company’s aggregate exposure to each of policyholder behaviour risk and claims risk against enterprise-wide economic capital limits. Policyholder behaviour risk limits cover the combined risk arising from policy lapses and surrenders, withdrawals and other policyholder driven activity. The claims risk limits cover the combined risk arising from mortality, longevity and morbidity.
Internal experience studies, as well as trends in our experience and that of the industry, are monitored to update current and projected claims and policyholder behaviour assumptions, resulting in updates to insurance contract liabilities as appropriate.
Global WAM Risk Management Committee
Global WAM product risk is managed by first line product management working groups and the Global Investment Product Committee. The Global WAM Risk Management Committee reviews and approves notable new products prior to launch. The Global WAM Risk Management Committee has established a framework for managing risk to ensure that notable product offerings align with Global WAM risk taking philosophy and risk appetite.
Product Risk Factors
Losses may result should actual experience be materially different than that assumed in the valuation of insurance contract liabilities.
| • | Such losses could have a significant adverse effect on our results of operations and financial condition. In addition, we periodically review the assumptions we make in determining our insurance contract liabilities and the review may result in an increase in insurance contract liabilities and a decrease in net income attributed to shareholders. Such assumptions require significant professional judgment, and actual experience may be materially different than the assumptions we make. (See “Critical Actuarial and Accounting Policies” below). |
| • | Policyholder behaviour including premium payment patterns, policy renewals, lapse rates and withdrawal, and surrender activity are influenced by many factors including market and general economic conditions, and the availability and relative attractiveness of other products in the marketplace. For example, a weak or declining economic environment could increase the value of guarantees associated with variable annuities or other embedded guarantees and contribute to adverse policyholder behaviour experience, or a rapid rise in interest rates could increase the attractiveness of alternatives for customers holding products that offer contractual surrender benefits that are not market value adjusted, which could also contribute to adverse policyholder behaviour experience. If premium persistency or lapse rates are significantly different from our expectations, it could have a material adverse effect on our business, financial condition, results of operations, and cash flows. |
We may be unable to implement necessary price increases on our in-force businesses or may face delays in implementation.
| • | We continue to seek state regulatory approvals for price increases on existing long-term care business in the United States. We cannot be certain whether or when each approval will be granted. For some in-force business, regulatory approval for price increases may not be required. However, regulators or policyholders may nonetheless seek to challenge our authority to implement such increases. Our insurance contract liabilities reflect our estimates of the impact of these price increases, but should we be less successful than anticipated in obtaining them, then insurance contract liabilities could increase accordingly and reduce net income attributed to shareholders. |
78 | 2023 Annual Report | Management’s Discussion and Analysis
Evolving legislation related to genetic testing could adversely impact our underwriting abilities.
| • | Current or future legislation in jurisdictions where Manulife operates may restrict its right to underwrite based on access to genetic test results. Without the obligation of disclosure, the asymmetry of information shared between applicant and insurer could increase anti-selection in both new business and in-force policyholder behaviour. The impact of restricting insurers’ access to this information and the associated problems of anti-selection becomes more acute where genetic technology leads to advancements in diagnosis of life-threatening conditions that are not matched by improvements in treatment. We cannot predict the potential financial impact that this would have on the Company or the industry as a whole. In addition, there may be further unforeseen implications as genetic testing continues to evolve and becomes more established in mainstream medical practice. |
Life and health insurance claims may be impacted unexpectedly by changes in the prevalence of diseases or illnesses, medical and technology advances, widespread lifestyle changes, natural disasters, large-scale human-made disasters and acts of terrorism.
| • | Claims resulting from catastrophic events could cause substantial volatility in our financial results in any period and could materially reduce our profitability or harm our financial condition. Large-scale catastrophic events may also reduce the overall level of economic activity, which could hurt our business and our ability to write new business. It is possible that geographic concentration of insured individuals could increase the severity of claims we receive from future catastrophic events. The effectiveness of external parties, including governmental and non-governmental organizations, in combating the severity of such an event is outside of our control and could have a material impact on the losses we experience. |
| • | The cost of health insurance benefits may be impacted by unforeseen trends in the incidence, termination and severity rates of claims. The ultimate level of lifetime benefits paid to policyholders may be increased by an unexpected increase in life expectancy. For example, advances in technology could lead to longer lives through better medical treatment or better disease prevention. As well, adverse claims experience could result from systematic anti-selection, which could arise from anti-selective lapse behaviour, underwriting process failures, anti-selective policyholder behaviour due to greater consumer accessibility to home-based medical screening, or other factors. |
| • | For information on the implications of COVID-19 on our product risk, please refer to “Pandemic risk and potential implications of COVID-19” below. |
External market conditions determine the availability, terms and cost of reinsurance protection which could impact our financial position and our ability to write new policies.
| • | As part of our overall risk and capital management strategy, we purchase reinsurance protection on certain risks underwritten or assumed by our various insurance businesses. As the global reinsurance industry continues to review and optimize their business models, certain of our reinsurers have attempted to increase rates on our existing reinsurance contracts. The ability of our reinsurers to increase rates depends upon the terms of each reinsurance contract. Typically, the reinsurer’s ability to raise rates is restricted by a number of terms in our reinsurance contracts, which we seek to enforce. We believe our reinsurance provisions are appropriate; however, there can be no assurance regarding the impact of future rate increase actions taken by our reinsurers. Accordingly, future rate increase actions by our reinsurers could result in financial impacts including charges to earnings and/or CSM, an increase in the cost of reinsurance and the assumption of more risk on business already reinsured. |
| • | In addition, an increase in the cost of reinsurance could also adversely affect our ability to write future new business or result in the assumption of more risk with respect to policies we issue. Premium rates charged on new policies we write are based, in part, on the assumption that reinsurance will be available at a certain cost. Certain reinsurers may attempt to increase the rates they charge us for new policies we write, and for competitive reasons, we may not be able to raise the premium rates we charge for newly written policies to offset the increase in reinsurance rates. If the cost of reinsurance were to increase, or if reinsurance were to become unavailable and if alternatives to reinsurance were not available, our ability to write new policies at competitive premium rates could be adversely affected. |
Operational Risk
Operational risk is naturally present in all of our business activities and encompasses a broad range of risks, including regulatory compliance failures, legal disputes, technology failures, business interruption, information security and privacy breaches, human resource management failures, processing errors, modelling errors, business integration, theft and fraud, and damage to physical assets. Exposures can take the form of financial losses, regulatory sanctions, loss of competitive positioning, or damage to our reputation. Operational risk is also embedded in all the practices we use to manage other risks; therefore, if not managed effectively, operational risk can impact our ability to manage other key risks such as credit risk, market risk, liquidity risk and product risk.
Operational Risk Management Strategy
Our corporate governance practices, corporate values, and integrated enterprise-wide approach to managing risk set the foundation for mitigating operational risks. This base is further strengthened by internal controls and systems, compensation programs, and talent management throughout the organization. We align compensation programs with business strategy, long-term shareholder value and good governance practices, and we benchmark these compensation practices against peer companies.
We have an enterprise operational risk management framework that sets out the processes we use to identify, assess, manage, mitigate and report on significant operational risk exposures. Execution of our operational risk management strategy supports the drive towards a
|
|
79 |
focus on the effective management of our key global operational risks. An Operational Risk Committee oversees all operational risk matters, including operational risk strategy, management and governance. We have enterprise-wide risk management programs for specific operational risks that could materially impact our ability to do business or impact our reputation.
Legal and Regulatory Risk Management Strategy
Global Compliance oversees our regulatory compliance program and function, supported by designated Chief Compliance Officers in every segment. The program is designed to promote compliance with regulatory obligations worldwide and to assist in making the Company’s employees aware of the laws and regulations that affect it, and the risks associated with failing to comply. Segment Compliance groups monitor emerging legal and regulatory issues and changes and prepare us to address new requirements. Global Compliance also independently assesses and monitors the effectiveness of a broad range of regulatory compliance processes and business practices against potential legal, regulatory, fraud and reputation risks, and allows significant issues to be escalated and proactively mitigated. Among these processes and business practices are: privacy (i.e. handling of personal and other confidential information), sales and marketing practices, sales compensation practices, asset management practices, fiduciary responsibilities, employment practices, product design, the Ethics Hotline, and regulatory filings. In addition, we have policies, processes and controls in place to help protect the Company, our customers and other related third parties from acts of fraud and from risks associated with money laundering and terrorist financing. Audit Services, Global Compliance and Segment Compliance personnel periodically assess the effectiveness of the system of internal controls. For further discussion of government regulation and legal proceedings, refer to “Government Regulation” in MFC’s Annual Information Form dated February 14, 2024 and note 19 of the 2023 Annual Consolidated Financial Statements.
Business Continuity Risk Management Strategy
Our enterprise-wide business continuity and disaster recovery program includes policies, plans and procedures that seek to minimize the impact of disruptions resulting from internal or external factors (including natural or human-made disasters), and is designed to ensure that key business services and functions can continue normal operations in the event of a major disruption. Each business unit is accountable for preparing and maintaining detailed business continuity plans and processes which through regular monitoring and assessment, are recalibrated to meet evolving environment conditions and business requirements. The global program incorporates periodic scenario analysis designed to validate the assessment of both critical and non-critical units, as well as the establishment and testing of appropriate business continuity plans for all critical functions. The business continuity team establishes and regularly tests crisis management plans and global crisis communications protocols. We maintain off-site data backup facilities and/or failover capabilities as required to manage the risk of downtime and to accelerate system recovery when needed.
Technology & Information Security Risk Management Strategy
Our Technology Risk Management function provides strategy, direction, and oversight and facilitates governance for all technology risk domain activities across the Company. The scope of this function includes: reducing information risk exposures by introducing a robust enterprise information risk management framework and supporting infrastructure for proactively identifying, managing, monitoring and reporting on critical information risk exposures; promoting transparency and informed decision-making by building and maintaining information risk profiles and risk dashboards for Enterprise Technology & Services and segments aligned with enterprise and operational risk reporting; providing advisory services to Global Technology and the segments around current and evolving technology risks and their impact to the Company’s information risk profile; and reducing vendor information risk exposures by incorporating sound information risk management practices into sourcing, outsourcing and offshoring initiatives and programs.
The enterprise-wide information security program, which is overseen by the Chief Information Risk Officer, seeks to mitigate information security risks. This program establishes the information and cyber security framework for the Company, including governance, policies and standards, and appropriate controls to protect information and computer systems. We also have ongoing security awareness training sessions for all employees. The Board’s Risk Committee regularly reviews the Company’s information security program, including cyber security risks, mitigation and resilience, and engages in discussions regarding the effectiveness of the program for identifying and addressing relevant risks.
Many jurisdictions in which we operate are implementing more stringent privacy legislation. Our global privacy program, overseen by our Chief Privacy Officer, seeks to manage the risk associated with the handling of personal information, including the risk of privacy breaches. It includes policies and standards, ongoing monitoring of emerging privacy legislation, and a network of privacy officers. Processes have been established to provide guidance on handling personal information and for reporting privacy incidents and issues to appropriate management for response and resolution. As a global company, Manulife is subject to a wide variety of laws and regulations throughout its operations, including those related to privacy and information security. In many jurisdictions, privacy and information security requirements are becoming more onerous, including stringent incident reporting requirements, and may increase our compliance costs as well as the risks associated with any compliance failure.
In addition, the Chief Information Risk Officer, the Chief Privacy Officer, and their teams work closely on information security and privacy matters.
Human Resource Risk Management Strategy
We have multiple human resource policies, practices and programs in place that seek to manage the risks associated with attracting and retaining top talent. These include recruiting programs at every level of the organization, training and development programs for our
80 | 2023 Annual Report | Management’s Discussion and Analysis
individual contributors and people leaders, initiatives to help increase diversity, equity and inclusion, employee engagement surveys, and competitive compensation programs that are designed to attract, motivate and retain high performing and high potential employees.
Model Risk Management Strategy
We have designated model risk management teams working closely with model owners and users that seek to manage model risk. Our model risk oversight program includes processes intended to ensure that our critical business models are conceptually sound and used as intended, and to assess the appropriateness of the calculations and outputs.
Third-Party Risk Management Strategy
Our governance framework to address third-party risk includes appropriate policies, standards and procedures, and monitoring of ongoing results and contractual compliance of third-party arrangements.
Initiatives Risk Management Strategy
To seek to ensure that key initiatives are successfully implemented and monitored by management, we have a global Transformation and Delivery Team, which is responsible for establishing policies and standards for initiative management. Our policies, standards and practices are benchmarked against leading practices.
Operational Risk Factors
Competition for the best people is intense and an inability to recruit qualified individuals may negatively impact our ability to execute on business strategies or to conduct our operations.
| • | Market fluctuations aside, the competition for top talent and key capabilities continues to be fierce. Our ability to attract external talent while developing our own internal capabilities is core to our high performing team ambitions. Our industry continues to require specific core capabilities and in meeting those talent needs we compete against other insurance companies, financial institutions, and wealth management organizations to attract talent. We also compete against organizations across many industries for digital talent, functional experts, leaders, and sales talent. To find the talent we need to deliver on our strategic objectives and maintain our competitive advantage, our core approach is focused on building enhanced talent networks to entice top candidates in the market. The risk of other organizations both inside and outside of our geographic footprint targeting our employees is heightened as companies maintain flexible remote working arrangements. Additionally, we are in an environment where pay levels have been increasing more quickly than in recent years due to the competitive talent market, inflation, and other factors. We help ensure that our value proposition remains competitive and current through offerings such as flexible work arrangements, learning investments, wellbeing, recognition & incentive programs, and a culture that strives to be recognized as a top employer within the markets we operate. |
If we are not able to attract, motivate and retain agency leaders and individual agents, our competitive position, growth and profitability will suffer.
| • | The attraction and motivation of productive and engaged sales representatives (agents) is critical to achieving our financial targets and a positive customer experience and brand. We compete with other financial services companies for sales representatives primarily based on the opportunity available, our brand and culture, support services, compensation and product features. Negative changes to any of these factors, or falling below market competitive levels, could impact our ability to attract, retain and engage sufficient sales representatives which could pose a risk to our business objectives and ambitions and could have a material adverse effect on our business, results of operations and financial condition. |
If we are unable to complete key projects on time, on budget, and capture planned benefits, our business strategies and plans, and operations may be impaired.
| • | We must successfully deliver several key projects in order to implement our business strategies and successfully achieve plans. If we are unable to complete these projects in accordance with planned schedules, and to capture projected benefits, there could be a material adverse effect on our business and financial condition. |
Key business processes may fail, causing material loss events and impacting our customers and reputation.
| • | A large number of complex transactions are processed by the organization and third parties, there is risk that errors may have significant impact on our customers or result in a loss to the organization. Controls are in place that seek to ensure processing accuracy for our most significant business processes, and the necessary monitoring, escalation and reporting processes have been established for when errors do occur. |
The interconnectedness of our operations and risk management strategies could expose us to risk if all factors are not appropriately considered and communicated.
| • | Our business operations, including strategies and operations related to risk management, asset liability management and liquidity management, are interconnected and complex. Changes in one area may have a secondary impact in another area of our operations. For example, risk management actions, such as the increased use of interest rate swaps, could have implications for liquidity risk management, as this strategy could result in the need to post additional amounts of collateral. Failure to appropriately consider these inter-relationships, or effectively communicate changes in strategies or activities across our operations, could have a negative impact on the strategic objectives or operations of another group. |
|
|
81 |
Our risk management policies, procedures and strategies may leave us exposed to unidentified or unanticipated risks, which could negatively affect our business, results of operations and financial condition.
| • | We devote significant resources to develop our risk management policies, procedures, and strategies. Nonetheless, there is a risk that our policies, procedures, and strategies may not be comprehensive. Many of our methods for measuring and managing risk exposures are based upon the use of observed historical market behaviour or statistics based on historical models. Future behaviour may differ from past behaviour. Furthermore, data or models we use may not always be accurate, complete, up-to-date, or properly evaluated or reported. |
We are subject to tax audits, tax litigation or similar proceedings, and as a result we may owe additional taxes, interest and penalties in amounts that may be material.
| • | We are subject to income and other taxes in the jurisdictions in which we do business. In determining our provisions for income taxes and our accounting for tax related matters in general, we are required to exercise judgment. We regularly make estimates where the ultimate tax determination is uncertain. There can be no assurance that the final determination of any tax audit, appeal of the decision of a taxing authority, tax litigation or similar proceedings will not be materially different from that reflected in our historical financial statements. The assessment of additional taxes, interest and penalties could be materially adverse to our current and future results of operations and financial condition. |
Our operations face political, legal, operational and other risks that could negatively affect those operations or our results of operations and financial condition.
| • | Our operations face the risk of discriminatory regulation, political and economic instability, the imposition of economic or trade sanctions, isolationist foreign policies, armed conflicts, civil unrest or disobedience, government policies or regulations adopted in response to political or social pressures and rising populism and/or nationalism, limited protection for, or increased costs to protect intellectual property rights, inability to protect and/or enforce contractual or legal rights, nationalization or expropriation of assets, price controls and exchange controls or other restrictions that prevent us from transferring funds out of the countries in which we operate and disruptions in global supply chains. In addition, as political tensions and populism and/or nationalism rise in a number of locations, compliance with laws and regulations by global financial institutions may become challenging as complying with the requirements in one jurisdiction may be contrary to the requirements of another. |
| • | A substantial portion of our revenue and net income attributed to shareholders is derived from our operations outside of North America, primarily in Asian markets. Some of these markets are developing and are rapidly growing countries where these risks may be heightened. |
| • | In particular, tensions remain elevated between mainland China and Canada, the U.S. and their allies over a number of issues, including trade, technology and human rights resulting in the imposition of sanctions and trade restrictions on companies and individuals. Mainland China and the Hong Kong SAR are important markets for Manulife and tensions may create a more challenging operating environment for Manulife. In addition, the military conflicts in the Middle East and in Ukraine may negatively impact regional and global financial markets and economies. |
| • | These risks could result in disruptions to our operations, unanticipated costs, increased market volatility and inflation, a contraction of business activity and recession, diminished investor and consumer confidence, lower investment growth, insurance sales and fees earned on managed assets, the loss of assets or a reduction in their value and reduced remittances. Failure to manage these risks could have a significant negative impact on our operations and profitability globally. |
We are regularly involved in litigation.
| • | We are regularly involved in litigation, either as a plaintiff or defendant. These cases could result in an unfavourable resolution and could have a material adverse effect on our results of operations and financial condition. For further discussion of legal proceedings refer to note 19 of the 2023 Annual Consolidated Financial Statements. |
We are exposed to investors trying to profit from short positions in our stock.
| • | Short-sellers seek to profit from a decline in the price of our common shares. Through their actions and public statements, they may encourage the decline in price from which they profit and may encourage others to take short positions in our shares. The existence of such short positions and the related publicity may lead to continued volatility in our common share price. |
System failures or events that impact our facilities may disrupt business operations.
| • | Technology is used in virtually all aspects of our business and operations; in addition, part of our strategy involves the expansion of technology to directly serve our customers. An interruption in the service of our technology resulting from system failure, cyber-attack, human error, natural disaster, human-made disaster, pandemic, or other unpredictable events beyond reasonable control could prevent us from effectively operating our business. We rely on the internet in order to conduct business and may be adversely impacted by outages in critical infrastructure such as electric grids, undersea cables, satellites or other communications used by us or our third parties. |
| • | While our facilities and operations are distributed across the globe, we can experience extreme weather, natural disasters, civil unrest, human-made disasters, power outages, pandemic, and other events which can prevent access to, and operations within, the facilities for our employees, partners, and other parties that support our business operations. |
82 | 2023 Annual Report | Management’s Discussion and Analysis
| • | We take measures to plan, structure and protect against routine events that may impact our operations, and maintain plans to recover from unpredictable events. An interruption to our operations may subject us to regulatory sanctions and legal claims, lead to a loss of customers, assets and revenues, or otherwise adversely affect us from a financial, operational and reputational perspective. |
An information security or privacy breach of our operations or of a related third party could adversely impact our business, results of operations, financial condition, and reputation.
| • | It is possible that the Company may not be able to anticipate or to implement effective preventive measures against all disruptions or privacy and security breaches, especially because the techniques used change frequently, generally increase in sophistication, often are not recognized until launched, and because cyber-attacks can originate from a wide variety of sources, including organized crime, hackers, terrorists, activists, and other parties, including parties sponsored by hostile foreign governments. Those parties may also attempt to fraudulently induce employees, customers, and other users of the Company’s systems or third-party service providers to disclose sensitive information in order to gain access to the Company’s data or that of its customers or clients. We, our customers, regulators and other third parties have been subject to, and are likely to continue to be the target of, cyber-attacks, including computer viruses, malicious or destructive code, phishing attacks, denial of service and other security incidents, that could result in the unauthorized release, gathering, monitoring, misuse, loss or destruction of personal, confidential, proprietary and other information of the Company, our employees, our customers or of third parties, or otherwise materially disrupt our or our customers’ or other third parties’ network access or business operations. These attacks could adversely impact us from a financial, operational and reputational perspective. |
| • | The Company maintains an Information Risk Management Program, which includes information and cyber security defenses, to protect our networks and systems from attacks; however, there can be no assurance that these counter measures will be successful in every instance in protecting our networks against advanced attacks. In addition to protection, detection and response mechanisms, the Company maintains cyber risk insurance, but this insurance may not cover all costs associated with the financial, operational and reputational consequences of personal, confidential or proprietary information being compromised. |
Model risk may arise from the inappropriate use or interpretation of models or their output, or the use of deficient models, data or assumptions.
| • | We rely on highly complex models for pricing, valuation and risk measurement, and for input on decision making. Consequently, the risk of inappropriate use or interpretation of our models or their output, or the use of deficient models, could have a material adverse effect on our business. |
Fraud risks may arise from incidents related to many external threats.
| • | Fraud incidents could adversely impact our business, results of operations, financial condition, and reputation. Anti-Fraud policies and standards are in place to guide our organization in the implementation of controls to protect against, detect and recover from ever-evolving fraud risks, such as distributor, underwriting, disbursement, account take-over, claims, bank, and others. The Global Anti-Fraud Office with Global Compliance is responsible for governance and oversight of external fraud risks. |
Contracted third parties may fail to deliver against contracted activities.
| • | We rely on third parties to perform a variety of activities on our behalf, and failure of our most significant third parties to meet their contracted obligations may impact our ability to meet our strategic objectives or may directly impact our customers. Vendor governance processes are in place that seek to ensure that appropriate due diligence is conducted at time of vendor contracting, and ongoing vendor monitoring activities are in place that seek to ensure that the contracted services are being fulfilled to satisfaction, but we may nevertheless not be able to mitigate all possible failures. |
Damage to the natural environment may arise related to our business operations, owned property or commercial mortgage loan portfolio.
| • | Environmental risk may originate from investment properties that are subject to natural or human-made environmental risk. Real estate assets may be owned, leased and/or managed, as well as mortgaged by Manulife and we might enter into the chain of liability due to foreclosure ownership when in default. |
| • | Liability under environmental protection laws resulting from our commercial mortgage loan portfolio and owned property (including commercial real estate, timberland and farmland properties) may adversely impact our reputation, results of operations and financial condition. Under applicable laws, contamination of a property with hazardous materials or substances may give rise to a lien on the property to secure recovery of the costs of cleanup. In some instances, this lien has priority over the lien of an existing mortgage encumbering the property. The environmental risk may result from on-site or off-site (adjacent) due to migration of regulated pollutants or contaminants with financial or reputational environmental risk and liability consequences by virtue of strict liability. Environmental risk could also arise from natural disasters (e.g., climate change, weather, fire, earthquake, floods, and pests) or human activities (use of chemicals or pesticides) conducted within the site or when impacted from adjacent sites. |
| • | Additionally, as lender, we may incur environmental liability (including without limitation liability for cleanup, remediation and damages incurred by third parties) similar to that of an owner or operator of the property, if we or our agents exercise sufficient control over the operations at the property. We may also have liability as the owner and/or operator of real estate for environmental conditions or contamination that exist or occur on the property or affecting other property. |
|
|
83 |
Pandemic risk and potential implications of COVID-19
Governments and businesses continue to navigate the longer-term implications from COVID-19, including economic, legal, regulatory, tax, and other responses that could have a significant adverse impact on our global business operations and financial results. The pace of recovery, or any resurgence of COVID-19, may continue to differ across geographies in which we operate, which could impact the execution of our business strategies.
| • | We purchase reinsurance protection on certain risks underwritten or assumed by our various insurance businesses. As either a direct or indirect result of COVID-19, we may find reinsurance more difficult or costly to obtain. |
| • | In pricing or repricing of new business, the impact of any COVID-19 related changes may be compounded with or offset by other pricing inputs. These inputs include assumption changes (e.g., reinsurance, interest rates, morbidity, mortality, expense, and lapse and surrender changes), business considerations related to retaining specific market share or client business and regulatory restrictions impacting the approval process for price changes. |
| • | The implementation of widespread remote or hybrid work arrangements continues to heighten operational risks, including, but not limited to, cyber, fraud, money laundering, information security, privacy, and third-party risks. We rely on our risk management strategies to monitor and mitigate these and other operational risks. |
| • | Market volatility and stressed conditions resulting from possible longer-term impacts of COVID-19 could result in additional cash and collateral demands primarily from changes to policyholder termination or renewal rates, withdrawals of customer deposit balances, borrowers renewing or extending their loans when they mature, derivative settlements or collateral demands, reinsurance settlements or collateral demands, and our willingness to support the local solvency position of our subsidiaries. Such an environment could also limit our access to capital markets. Sustained global economic uncertainty could also result in adverse credit ratings changes which in turn could result in more costly or limited access to funding sources. While we currently have a variety of sources of liquidity including cash balances, short-term investments, government and highly rated corporate bonds, and access to contingent liquidity facilities, there can be no assurance that these sources will provide us with sufficient liquidity on commercially reasonable terms in the future. |
Evolving Risks
The identification and assessment of our external environment for evolving risks is an important aspect of our ERM Framework, as these risks could have the potential to have a material adverse impact on our operations and/or business strategies.
Our Evolving Risk Framework facilitates the ongoing identification, assessment and monitoring of evolving risks, and includes: maintaining a process for the ongoing discussion and evaluation of such risks with senior leaders; reviewing and validating evolving risks with the ERC; developing and executing on responses to each evolving risk based on materiality and prioritization; and monitoring and reporting on evolving risks on a regular basis to the Board’s Risk Committee.
Additional Risk Factors That May Affect Future Results
Other factors that may affect future results include changes in government trade policy; monetary policy or fiscal policy, including interest rates policy from central banks; political conditions and developments in or affecting the countries in which we operate; technological changes; public infrastructure disruptions; changes in consumer spending and saving habits; the possible impact on local, national or global economies from public health or natural disaster emergencies; and international conflicts and other developments including those relating to terrorist activities. Although we take steps to anticipate and minimize risks in general, unforeseen future events may have a negative impact on our business, financial condition and results of operations.
We caution that the preceding discussion of risks that may affect future results is not exhaustive. When relying on our forward-looking statements to make decisions with respect to our Company, investors and others should carefully consider the foregoing risks, as well as other uncertainties and potential events, and other external and Company specific risks that may adversely affect the future business, financial condition or results of operations of our Company.
84 | 2023 Annual Report | Management’s Discussion and Analysis
10. Capital Management Framework
Manulife seeks to manage its capital with the objectives of:
| • | Operating with sufficient capital to be able to honour all commitments to its policyholders and creditors with a high degree of confidence; |
| • | Retaining the ongoing confidence of regulators, policyholders, rating agencies, investors and other creditors in order to ensure access to capital markets; and |
| • | Optimizing return on capital to meet shareholders’ expectations subject to constraints and considerations of adequate levels of capital established to meet the first two objectives. |
Capital is managed and monitored in accordance with the Capital Management Policy. The Policy is reviewed and approved by the Board annually and is integrated with the Company’s risk and financial management frameworks. It establishes guidelines regarding the quantity and quality of capital, internal capital mobility, and proactive management of ongoing and future capital requirements.
Our capital management framework takes into account the requirements of the Company as a whole, as well as the needs of each of our subsidiaries. Internal capital targets are set above regulatory requirements, and consider a number of factors, including results of sensitivity and stress testing and our own risk assessments, as well as business needs. We monitor against these internal targets and initiate actions appropriate to achieving our business objectives.
We periodically assess the strength of our capital position under various stress scenarios. The annual Financial Condition Testing (“FCT”) typically quantifies the financial impact of economic events arising from shocks in public equity and other markets, interest rates and credit, amongst others. Our 2023 FCT results demonstrate that we would have sufficient assets, under the various adverse scenarios tested, to discharge our insurance and investment contract liabilities. This conclusion was also supported by a variety of other stress tests conducted by the Company.
We use an Economic Capital (“EC”) framework to inform our internal view of the level of required capital and available capital. The EC framework is a key component of the Own Risk and Solvency Assessment (“ORSA”) process, which is an internal assessment of an insurer’s risks, capital needs and solvency position, and is used for setting Internal Capital Targets.
Capital management is also integrated into our product planning and performance management practices.
The composition of capital between equity and other capital instruments impacts the financial leverage ratio which is an important consideration in determining the Company’s financial strength and credit ratings. The Company monitors and rebalances its capital mix through capital issuances and redemptions.
Financing Activities
Securities Transactions
During 2023, we raised a total of $1.2 billion of subordinated debt in Canada, and $0.6 billion of subordinated debt was redeemed at par.
| ($ millions) | Par value | Issued(1) | Redeemed/ Matured(1) |
|||||||||
| 5.409% MFC Subordinated debentures, issued on Mar 10, 2023 |
$ | 1,200 | $ | 1,195 | $ | – | ||||||
| 3.317% MFC Subordinated debentures, redeemed on May 9, 2023 |
$ |
600 |
|
– |
|
600 |
|
|||||
| Total |
$ |
1,195 |
|
$ |
600 |
|
||||||
| (1) | Represents carrying value, net of issuance costs. |
Normal Course Issuer Bid
We announced on February 21, 2023, that the Toronto Stock Exchange (“TSX”) approved a normal course issuer bid (the “2023 NCIB”) permitting the purchase for cancellation of up to 55.7 million common shares, representing approximately 3% of our issued and outstanding common shares. Purchases under the 2023 NCIB commenced on February 23, 2023 and were completed in December 2023. As of December 31, 2023, MFC purchased for cancellation under the 2023 NCIB 55.7 million of its common shares at an average price of $25.48 per common share for a total cost of $1.4 billion.
Our previous NCIB (the “2022 NCIB”) that was announced on February 1, 2022, expired on February 2, 2023. Under the 2022 NCIB, MFC purchased for cancellation 85.8 million of its common shares at an average price of $23.99 per share for a total cost of $2.1 billion, which represented approximately 4.4% of our issued and outstanding common shares.
During 2023, MFC purchased for cancellation 62.6 million of its common shares at an average price of $25.47 per common share for a total cost of $1.6 billion, including 6.9 million shares for a total cost of $0.2 billion that were purchased under the 2022 NCIB.
|
|
85 |
We have received approval from OSFI to launch an NCIB (the “2024 NCIB”) that permits the purchase for cancellation of up to 50 million common shares, representing approximately 2.8% of our issued and outstanding common shares, commencing in February 2024. The 2024 NCIB remains subject to the approval of the TSX.
Consolidated Capital
| As at December 31, ($ millions) |
2023 | 2022 | ||||||
| Non-controlling interests |
$ |
1,431 |
|
$ |
1,427 |
|
||
| Participating policyholders’ equity |
|
257 |
|
|
(77 |
) |
||
| Preferred shares and other equity |
|
6,660 |
|
|
6,660 |
|
||
| Common shareholders’ equity(1) |
|
40,379 |
|
|
40,216 |
|
||
| Total equity |
|
48,727 |
|
|
48,226 |
|
||
| Exclude the accumulated other comprehensive gain/(loss) on cash flow hedges |
|
26 |
|
|
8 |
|
||
| Total equity excluding accumulated other comprehensive gain/(loss) on cash flow hedges |
|
48,701 |
|
|
48,218 |
|
||
| Post-tax CSM |
|
18,503 |
|
|
15,251 |
|
||
| Qualifying capital instruments |
|
6,667 |
|
|
6,122 |
|
||
| Consolidated capital(2) |
$ |
73,871 |
|
$ |
69,591 |
|
||
| (1) | Common shareholders’ equity is equal to total shareholders’ equity less preferred shares and other equity. |
| (2) | Consolidated capital does not include $6.1 billion (2022 – $6.2 billion) of MFC senior debt as this form of financing does not meet OSFI’s definition of regulatory capital at the MFC level. The Company has down-streamed the proceeds from this financing into operating entities in a form that qualifies as regulatory capital at the subsidiary level. |
MFC’s consolidated capital was $73.9 billion as at December 31, 2023, an increase of $4.3 billion compared with $69.6 billion as at December 31, 2022. The increase was driven by higher post-tax CSM, an increase in total equity, and the net issuance of subordinated debt. The increase in total equity was due to growth in retained earnings, partially offset by common share buybacks.
Remittance of Capital
As part of its capital management, Manulife promotes internal capital mobility so that MFC has access to funds to meet its obligations and to optimize capital deployment. Remittances is defined as the cash remitted or made available for distribution to MFC from its subsidiaries. It is a key metric used by management to evaluate our financial flexibility. In 2023, MFC subsidiaries delivered $5.5 billion in remittances of which Asia and U.S. operations delivered $1.7 billion and $1.5 billion, respectively. This result was driven by underlying cash generation and some benefits from the impact of markets, particularly on our Canadian surplus bonds, due to the decline in interest rates over the year. Remittances were $1.4 billion lower than 2022 as prior year remittances benefited from the U.S. variable annuity transaction.
Financial Leverage Ratio
MFC’s financial leverage ratio as at December 31, 2023 was 24.3%, a decrease of 0.8 percentage points from 25.1% as at December 31, 2022. The decrease in the ratio was driven by higher post-tax CSM and an increase in total equity, partially offset by the net issuance of subordinated debt.
Common Shareholder Dividends
The declaration and payment of shareholder dividends and the amount thereof are at the discretion of the Board and depend upon various factors, including the results of operations, financial conditions, future prospects of the Company, dividend payout ratio and taking into account regulatory restrictions on the payment of shareholder dividends.
Common Shareholder Dividends Paid
| For the years ended December 31, $ per share |
2023 | 2022 | ||||||
| Dividends paid |
$ |
1.46 |
|
$ |
1.32 |
|
||
The Company offers a Dividend Reinvestment Program (“DRIP”) whereby shareholders may elect to automatically reinvest dividends in the form of MFC common shares instead of receiving cash. The offering of the program and its terms of execution are subject to the Board’s discretion.
During 2023, the required common shares in connection with the DRIP were purchased on the open market with no applicable discount.
Regulatory Capital Position
MFC and MLI are regulated by OSFI and are subject to consolidated risk based capital requirements. Manulife monitors and manages its consolidated capital in compliance with the OSFI LICAT guideline. Under this regime, our available capital and other eligible capital resources are measured against a required amount of risk capital determined in accordance with the guideline. For regulatory reporting purposes under the LICAT framework, consolidated capital is adjusted for various additions or deductions to capital as mandated by the guidelines defined by OSFI.
86 | 2023 Annual Report | Management’s Discussion and Analysis
Manulife’s operating activities are conducted within MLI and its subsidiaries. MLI’s LICAT ratio was 137% as at December 31, 2023, compared with 131% as at December 31, 2022. The six percentage point increase from December 31, 2022 was primarily driven by the transition to the IFRS 17 accounting basis. Other positive movements included earnings and capital initiatives, partially offset by the capital impacts of market movements, capital market actions, and shareholder dividends.
MFC’s LICAT ratio was 124% as at December 31, 2023, compared with 119% as at December 31, 2022, with the increase driven by similar factors that impacted the movement in MLI’s LICAT ratio. The difference between the MLI and MFC ratios is largely due to the $6.1 billion (2022 – $6.2 billion) of MFC senior debt outstanding that does not qualify as available capital at the MFC level, but based on the form it was down-streamed to MLI, it qualifies as regulatory capital at the MLI level.
The LICAT ratios as at December 31, 2023, resulted in excess capital of $22.3 billion over OSFI’s supervisory target ratio of 100% for MLI, and $20.7 billion over OSFI’s regulatory minimum target ratio of 90% for MFC (no supervisory target is applicable to MFC). In addition, all MLI’s subsidiaries maintain capital levels in excess of local requirements.
Credit Ratings
Manulife’s operating companies have strong financial strength ratings from credit rating agencies. These ratings are important factors in establishing the competitive position of insurance companies and maintaining public confidence in products being offered. Maintaining strong ratings on debt and capital instruments issued by MFC and its subsidiaries allows us to access capital markets at competitive pricing levels. Should these credit ratings decrease materially, our cost of financing may increase and our access to funding and capital through capital markets could be reduced.
During 2023, S&P, Moody’s, Morningstar DBRS, Fitch and AM Best Company (“AM Best”) maintained their assigned ratings of MFC and its primary insurance operating companies.
The following table summarizes the financial strength ratings of MLI and certain of its subsidiaries as at January 31, 2024.
Financial Strength Ratings
| Subsidiary | Jurisdiction |
S&P |
Moody’s |
Morningstar DBRS |
Fitch |
AM Best |
||||||
|
The Manufacturers Life Insurance Company |
Canada |
AA- |
A1 |
AA |
AA- |
A+ (Superior) |
||||||
|
John Hancock Life Insurance Company (U.S.A.) |
United States |
AA- |
A1 |
Not Rated |
AA- |
A+ (Superior) |
||||||
|
Manulife (International) Limited |
Hong Kong |
AA- |
Not Rated |
Not Rated |
Not Rated |
Not Rated |
||||||
|
Manulife Life Insurance Company |
Japan |
A+ |
Not Rated |
Not Rated |
Not Rated |
Not Rated |
||||||
|
Manulife (Singapore) Pte. Ltd. |
Singapore |
AA- |
Not Rated |
Not Rated |
Not Rated |
Not Rated |
On October 23, 2023, Fitch revised Manulife’s outlook to positive from stable; the positive outlook remained unchanged as of January 31, 2024.
As of January 31, 2024, S&P, Moody’s, Morningstar DBRS, and AM Best had a stable outlook on these ratings. The S&P rating and outlook for Manulife Life Insurance Company are constrained by the sovereign rating on Japan (A+/Stable).
|
|
87 |
11. Critical Actuarial and Accounting Policies
The preparation of Consolidated Financial Statements in conformity with IFRS requires management to make judgments, estimates and assumptions that affect the application of accounting policies and the reported amounts of assets and liabilities, and the disclosure of contingent assets and liabilities as at the date of the Consolidated Financial Statements, and the reported amounts of insurance service, investment result, and other revenues and expenses during the reporting periods. Actual results may differ from these estimates. The most significant estimation processes relate to evaluating assumptions used in measuring insurance and investment contract liabilities and reinsurance contract held liabilities, assessing assets for impairment, determining of pension and other post-employment benefit obligation and expense assumptions, determining income taxes and uncertain tax positions, and estimating fair values of certain invested assets. Estimates and underlying assumptions are reviewed on an ongoing basis. Revisions to accounting estimates are recognized in the year in which the estimates are revised and in any future years affected. Although some variability is inherent in these estimates, management believes that the amounts recorded are appropriate. The material accounting policies used and the most significant judgments made by management in applying these accounting policies in the preparation of the 2023 Annual Consolidated Financial Statements are described in note 1 to the Consolidated Financial Statements.
Critical Actuarial Policies – Insurance and Investment Contract Liabilities
Insurance contract liabilities are determined in Canada under IFRS 17 “Insurance Contracts”, which was issued by the International Accounting Standards Board (“IASB”) in May 2017 to be effective for years beginning on January 1, 2021. Amendments to IFRS 17 were issued in June 2020 and included a two-year deferral of the effective date. IFRS 17, as amended, was effective for years beginning on January 1, 2023, and applies to insurance contracts, reinsurance contracts issued, reinsurance contracts held, and investment contracts with discretionary participation features.
IFRS 17 establishes principles for the recognition, measurement, presentation and disclosure of insurance contracts within the scope of the Standard. The objective of IFRS 17 is to ensure that an entity provides relevant information that faithfully represents those contracts. This information provides a basis for users of financial statements to assess the effect that insurance contracts have on the entity’s financial position, financial performance, and cash flows.
Insurance contract liabilities include the fulfilment cash flows and the contractual service margin. The fulfilment cash flows comprise:
| • | An estimate of future cash flows |
| • | An adjustment to reflect the time value of money and the financial risk related to the future cash flows if not included in the estimate of future cash flows |
| • | A risk adjustment for non-financial risk |
Estimates of future cash flows including any adjustments to reflect the time value of money and financial risk represent the estimated value of future policyholder benefits and settlement obligations to be paid over the term remaining on in-force policies, including costs of servicing the policies, reduced by any future amounts paid by policyholders to the Company for their policies. The determination of estimates of future cash flows involves the use of estimates and assumptions. To determine the best estimate amount, assumptions must be made for several key factors, including future mortality and morbidity rates, rates of policy termination and premium persistency, operating expenses, and certain taxes (other than income taxes). Further information on best estimate assumptions is provided in the “Best Estimate Assumptions” section below.
To reflect the time value of money and financial risk, estimates of future cash flows are generally discounted using risk-free yield curves adjusted by an illiquidity premium to reflect the liquidity characteristics of the liabilities. The Company primarily uses a deterministic projection using best estimate assumptions to determine the present value of future cash flows. However, where there are financial guarantees such as universal life minimum crediting rates guarantees, participating life zero dividend floor implicit guarantees and variable annuities guarantees, a stochastic approach to capture the asymmetry of the risk is used. For the stochastic approach the cash flows are both projected and discounted at scenario specific rates calibrated on average to be the risk-free yield curves adjusted for illiquidity. The Company disaggregates insurance finance income or expenses on insurance contracts issued for most of its group of insurance contracts between profit or loss and other comprehensive income (“OCI”). The impact of changes in market interest rates on the value of the life insurance and related reinsurance assets and liabilities are reflected in OCI to minimize accounting mismatches between the accounting for insurance assets and liabilities and supporting financial assets.
Risk adjustments for non-financial risk represent the compensation an entity requires for bearing the uncertainty about the amount and timing of the cash flows that arises from non-financial risk as the entity fulfills insurance contracts. The risk adjustment considers insurance, lapse and expense risks, includes both favourable and unfavourable outcomes, and reflects diversification benefits from the insurance contracts issued. The Company has estimated the risk adjustment using a margin approach. This approach applies a margin for adverse deviation, typically in terms of a percentage of best estimate assumptions, where future cash flows are uncertain. The resulting cash flows are discounted at rates consistent with the best estimate cash flows to arrive at the total risk adjustment. The ranges of these margins are set by the Company and reviewed periodically. The risk adjustment for non-financial risk for insurance contracts correspond to a 90 - 95% confidence level for all segments. The risk adjustment for non-financial risk leads to higher insurance contract liabilities, but increases the income recognized in later periods as the risk adjustment releases as the non-financial risk on policies decreases.
88 | 2023 Annual Report | Management’s Discussion and Analysis
The contractual service margin represents the present value of unearned profits the entity will recognize as services are provided in the future.
Total net insurance contract liabilities were $482.0 billion as at December 31, 2023 (December 31, 2022 – $464.4 billion), reflecting business growth and foreign exchange impacts.
Best Estimate Assumptions
We follow established processes to determine the assumptions used in the determination of insurance contract liabilities. The nature of each risk factor and the process for setting the assumptions used in the determination are discussed below.
Mortality
Mortality relates to the occurrence of death. Mortality assumptions are based on our internal as well as industry past and emerging experience and are differentiated by sex, underwriting class, policy type and geographic market. We make assumptions about future mortality improvements using historical experience derived from population data. Reinsurance is used to offset some of our direct mortality exposure on in-force life insurance policies with the impact of the reinsurance separately accounted for in our reinsurance contract assets or liabilities. Actual mortality experience is monitored against these assumptions separately for each business. The results are favourable where mortality rates are lower than assumed for life insurance and where mortality rates are higher than assumed for payout annuities and long-term care. Overall 2023 experience was favourable (2022 – unfavourable) when compared with our assumptions.
Morbidity
Morbidity relates to the occurrence of accidents and sickness for the insured risks. Morbidity assumptions are based on our internal as well as industry past and emerging experience and are established for each type of morbidity risk and geographic market. For our JH Long Term Care business we make assumptions about future morbidity changes. Actual morbidity experience is monitored against these assumptions separately for each business. Our morbidity risk exposure relates to future expected claims costs for long-term care insurance, as well as for group benefits and certain individual health insurance products we offer. Overall 2023 experience was favourable (2022 – favourable) when compared with our assumptions.
Policy Termination and Premium Persistency
Policy termination includes lapses and surrenders, where lapses represent the termination of policies due to non-payment of premiums and surrenders represent the voluntary termination of policies by policyholders. Premium persistency represents the level of ongoing deposits on contracts where there is policyholder discretion as to the amount and timing of deposits. Policy termination and premium persistency assumptions are primarily based on our recent experience adjusted for expected future conditions. Assumptions reflect differences by type of contract within each geographic market and actual experience is monitored against these assumptions separately for each business. Overall 2023 experience was unfavourable (2022 – unfavourable) when compared with our assumptions.
Directly Attributable Expenses and Taxes
Directly attributable operating expense assumptions reflect the projected costs of maintaining and servicing in-force policies, including associated directly attributable overhead expenses. The expenses are derived from internal cost studies and are projected into the future with an allowance for inflation. For some developing businesses, there is an expectation that unit costs will decline as these businesses mature. Actual expenses are monitored against assumptions separately for each business. Overall maintenance expenses for 2023 were unfavourable (2022 – unfavourable) when compared with our assumptions. Taxes reflect assumptions for future premium taxes and other non-income related taxes.
Experience Adjusted Products
Where policies have features that allow the impact of changes in experience to be passed on to policyholders through policy dividends, experience rating refunds, credited rates or other adjustable features, the projected policyholder benefits are adjusted to reflect the projected experience. Minimum contractual guarantees and other market considerations are considered in determining the policy adjustments.
Sensitivity of Earnings to Changes in Assumptions
The following tables present information on how reasonably possible changes in assumptions made by the Company on insurance contracts’ non-economic risk variables and certain economic risk variables impact contractual service margin, net income attributed to shareholders, other comprehensive income attributed to shareholders, and total comprehensive income attributed to shareholders. For non-economic risk variables, the impacts are shown separately gross and net of the impacts of reinsurance contracts held. The method used for deriving sensitivity information and significant assumptions made did not change from the previous period.
The analysis is based on a simultaneous change in assumptions across all businesses and holds all other assumptions constant. In practice, experience for each assumption will frequently vary by geographic market and business, and assumption updates are specifically made on a business and geographic basis. Actual results can differ materially from these estimates for a variety of reasons including the interaction among these factors when more than one changes, actual experience differing from the assumptions, changes in business mix, effective tax rates, and the general limitations of our internal models.
|
|
89 |
Potential impact on contractual service margin, net income attributed to shareholders, other comprehensive income attributed to shareholders, and total comprehensive income attributed to shareholders arising from changes to non-economic assumptions(1)
| As at December 31, 2023 ($ millions, post-tax except CSM) |
CSM net of NCI | Net income attributed to shareholders |
Other comprehensive income attributed to shareholders |
Total comprehensive income attributed to shareholders |
||||||||||||||||||||||||||||||||
| Gross | Net | Gross | Net | Gross | Net | Gross | Net | |||||||||||||||||||||||||||||
| Policy related assumptions |
||||||||||||||||||||||||||||||||||||
| 2% adverse change in future mortality rates(2),(3),(5) |
||||||||||||||||||||||||||||||||||||
| Portfolios where an increase in rates increases insurance contract liabilities |
$ | (800 | ) | $ | (200 | ) | $ | (400 | ) | $ | (200 | ) | $ | – | $ | – | $ | (400 | ) | $ | (200 | ) | ||||||||||||||
| Portfolios where a decrease in rates increases insurance contract liabilities |
– | (500 | ) | – | – | 100 | 100 | – | 100 | |||||||||||||||||||||||||||
| 5% adverse change in future morbidity rates(4),(5),(6) (incidence and termination) |
(1,500 | ) | (1,300 | ) | (3,300 | ) | (3,300 | ) | 500 | 400 | (2,800 | ) | (2,900 | ) | ||||||||||||||||||||||
| 10% change in future policy termination rates(3),(5) |
||||||||||||||||||||||||||||||||||||
| Portfolios where an increase in rates increases insurance contract liabilities |
(600 | ) | (500 | ) | (100 | ) | (100 | ) | (100 | ) | (100 | ) | (200 | ) | (200 | ) | ||||||||||||||||||||
| Portfolios where a decrease in rates increases insurance contract liabilities |
(1,200 | ) | (800 | ) | (400 | ) | (300 | ) | 300 | 200 | (100 | ) | (100 | ) | ||||||||||||||||||||||
| 5% increase in future expense levels |
(600 | ) | (600 | ) | – | – | – | – | – | – | ||||||||||||||||||||||||||
| As at December 31, 2022 ($ millions, post-tax except CSM) |
CSM net of NCI | Net income attributed to shareholders |
Other comprehensive income attributed to shareholders |
Total comprehensive income attributed to shareholders |
||||||||||||||||||||||||||||||||
| Gross | Net | Gross | Net | Gross | Net | Gross | Net | |||||||||||||||||||||||||||||
| Policy related assumptions |
||||||||||||||||||||||||||||||||||||
| 2% adverse change in future mortality rates(2),(3),(5) |
||||||||||||||||||||||||||||||||||||
| Portfolios where an increase in rates increases insurance contract liabilities |
$ | (1,400 | ) | $ | (600 | ) | $ | 100 | $ | – | $ | 100 | $ | – | $ | 200 | $ | – | ||||||||||||||||||
| Portfolios where a decrease in rates increases insurance contract liabilities |
– | (500 | ) | (100 | ) | – | 100 | 100 | – | 100 | ||||||||||||||||||||||||||
| 5% adverse change in future morbidity rates(4),(5),(6) (incidence and termination) |
(1,100 | ) | (1,000 | ) | (3,600 | ) | (3,600 | ) | 600 | 600 | (3,000 | ) | (3,000 | ) | ||||||||||||||||||||||
| 10% change in future policy termination rates(3),(5) |
||||||||||||||||||||||||||||||||||||
| Portfolios where an increase in rates increases insurance contract liabilities |
(500 | ) | (400 | ) | (100 | ) | (100 | ) | (100 | ) | (100 | ) | (200 | ) | (200 | ) | ||||||||||||||||||||
| Portfolios where a decrease in rates increases insurance contract liabilities |
(1,800 | ) | (1,200 | ) | – | (100 | ) | 400 | 300 | 400 | 200 | |||||||||||||||||||||||||
| 5% increase in future expense levels |
(800 | ) | (700 | ) | – | – | – | – | – | – | ||||||||||||||||||||||||||
|
(1) The participating policy funds are largely self-supporting and experience gains or losses would generally result in changes to future dividends reducing the direct impact to the CSM and shareholder income. (2) An increase in mortality rates will generally increase insurance contract liabilities for life insurance contracts, whereas a decrease in mortality rates will generally increase insurance contract liabilities for policies with longevity risk such as payout annuities. (3) The sensitivity is measured for each direct insurance portfolio net of the impacts of any reinsurance held on the policies within that portfolio to determine if the overall insurance contract liabilities increased. (4) No amounts related to morbidity risk are included for policies where the insurance contract liability provides only for claims costs expected over a short period, generally less than one year, such as Group Life and Health. (5) The impacts of the sensitivities on LTC for morbidity, mortality and lapse do not assume any offsets from the Company’s ability to contractually raise premium rates in such events, subject to state regulatory approval. In practice, we would plan to file for rate increases equal to the amount of deterioration resulting from the sensitivity. (6) This includes a 5% deterioration in incidence rates and 5% deterioration in claim termination rates. |
|
|||||||||||||||||||||||||||||||||||
90 | 2023 Annual Report | Management’s Discussion and Analysis
Potential impact on contractual service margin, net income attributed to shareholders, other comprehensive income attributed to shareholders, and total comprehensive income attributed to shareholders arising from changes to non-economic assumptions on Long Term Care(1)
| As at December 31, 2023 ($ millions, post-tax except CSM) |
CSM net of NCI | Net income attributed to shareholders |
Other comprehensive |
Total comprehensive income attributed to shareholders |
||||||||||||||||||||||||||||||||
| Gross | Net | Gross | Net | Gross | Net | Gross | Net | |||||||||||||||||||||||||||||
| Policy related assumptions |
||||||||||||||||||||||||||||||||||||
| 2% adverse change in future mortality rates(2),(3) |
$ | (300 | ) | $ | (300 | ) | $ | – | $ | – | $ | – | $ | – | $ | – | $ | – | ||||||||||||||||||
| 5% adverse change in future morbidity incidence rates(2),(3) |
(900 | ) | (900 | ) | (800 | ) | (800 | ) | 100 | 100 | (700 | ) | (700 | ) | ||||||||||||||||||||||
| 5% adverse change in future morbidity claims termination rates(2),(3) |
(900 | ) | (900 | ) | (1,600 | ) | (1,600 | ) | 300 | 300 | (1,400 | ) | (1,400 | ) | ||||||||||||||||||||||
| 10% adverse change in future policy termination rates(2),(3) |
(400 | ) | (400 | ) | – | – | – | – | – | – | ||||||||||||||||||||||||||
| 5% increase in future expense levels(3) |
(100 | ) | (100 | ) | – | – | – | – | – | – | ||||||||||||||||||||||||||
| As at December 31, 2022 ($ millions, post-tax except CSM) |
CSM net of NCI | Net income attributed to shareholders |
Other comprehensive income attributed to shareholders |
Total comprehensive income attributed to shareholders |
||||||||||||||||||||||||||||||||
| Gross | Net | Gross | Net | Gross | Net | Gross | Net | |||||||||||||||||||||||||||||
| Policy related assumptions |
||||||||||||||||||||||||||||||||||||
| 2% adverse change in future mortality rates(2),(3) |
$ | (400 | ) | $ | (400 | ) | $ | – | $ | – | $ | – | $ | – | $ | – | $ | – | ||||||||||||||||||
| 5% adverse change in future morbidity incidence rates(2),(3) |
(700 | ) | (700 | ) | (1,100 | ) | (1,100 | ) | 200 | 200 | (900 | ) | (900 | ) | ||||||||||||||||||||||
| 5% adverse change in future morbidity claims termination rates(2),(3) |
(700 | ) | (700 | ) | (1,800 | ) | (1,800 | ) | 300 | 300 | (1,500 | ) | (1,500 | ) | ||||||||||||||||||||||
| 10% adverse change in future policy termination rates(2),(3) |
(400 | ) | (400 | ) | – | – | 100 | 100 | 100 | 100 | ||||||||||||||||||||||||||
| 5% increase in future expense levels(3) |
(100 | ) | (100 | ) | – | – | – | – | – | – | ||||||||||||||||||||||||||
|
(1) Translated from US$ at 1.3186 for 2023 and US$ at 1.3549 for 2022. (2) The impacts of the sensitivities on LTC for morbidity, mortality and lapse do not assume any offsets from the Company’s ability to contractually raise premium rates in such events, subject to state regulatory approval. In practice, we would plan to file for rate increases equal to the amount of deterioration resulting from the sensitivities. (3) The impact of favourable changes to all the sensitivities is relatively symmetrical. |
|
|||||||||||||||||||||||||||||||||||
Potential impact on contractual service margin, net income attributed to shareholders, other comprehensive income attributed to shareholders, and total comprehensive income attributed to shareholders arising from changes to certain economic financial assumptions used in the determination of insurance contract liabilities(1)
| As at December 31, 2023 ($ millions, post-tax except CSM) |
CSM net of NCI | Net income attributed to shareholders |
Other comprehensive income attributed to shareholders |
Total comprehensive income attributed to shareholders |
||||||||||||||||
| Financial assumptions |
||||||||||||||||||||
| 10 basis point reduction in ultimate spot rate |
$ | (200 | ) | $ | – | $ | (300 | ) | $ | (300 | ) | |||||||||
| 50 basis point increase in interest rate volatility(2) |
– | – | – | – | ||||||||||||||||
| 50 basis point increase in non-fixed income return volatility(2) |
(100 | ) | – | – | – | |||||||||||||||
| As at December 31, 2022 ($ millions, post-tax except CSM) |
CSM net of NCI | Net income attributed to shareholders |
Other comprehensive income attributed to shareholders |
Total comprehensive income attributed to shareholders |
||||||||||||||||
| Financial assumptions |
||||||||||||||||||||
| 10 basis point reduction in ultimate spot rate |
$ | (300 | ) | $ | – | $ | (300 | ) | $ | (300 | ) | |||||||||
| 50 basis point increase in interest rate volatility(2) |
(100 | ) | – | – | – | |||||||||||||||
| 50 basis point increase in non-fixed income return volatility(2) |
(100 | ) | – | – | – | |||||||||||||||
|
(1) Note that the impact of these assumptions are not linear. (2) Used in the determination of insurance contract liabilities with financial guarantees. This includes universal life minimum crediting rate guarantees, participating life zero dividend floor implicit guarantees, and variable annuities guarantees, where a stochastic approach is used to capture the asymmetry of the risk. |
|
|||||||||||||||||||
|
|
91 |
Review of Actuarial Methods and Assumptions
The Company performs a comprehensive review of actuarial methods and assumptions annually. The review is designed to reduce the Company’s exposure to uncertainty by ensuring assumptions for liability risks remain appropriate. This is accomplished by monitoring experience and updating assumptions that represent a best estimate of expected future experience, and margins that are appropriate for the risks assumed. While the assumptions selected represent the Company’s best estimates and assessment of risk, the ongoing monitoring of experience and changes in the economic environment are likely to result in future changes to the actuarial assumptions, which could materially impact the insurance contract liabilities. The changes implemented from the review are generally implemented in the third quarter of each year, though updates may be made outside the third quarter in certain circumstances.
2023 Review of Actuarial Methods and Assumptions
On a full year basis, the 2023 review of actuarial methods and assumptions resulted in a decrease in pre-tax fulfilment cash flows of $3,197 million.1 These changes resulted in an increase in pre-tax net income attributed to shareholders of $171 million ($105 million post-tax), an increase in pre-tax net income attributed to participating policyholders of $173 million ($165 million post-tax), an increase in CSM of $2,754 million, and an increase in pre-tax other comprehensive income of $99 million ($73 million post-tax).
In 3Q23, the completion of the 2023 annual review of actuarial methods and assumptions resulted in a decrease in pre-tax fulfilment cash flows of $347 million. These changes resulted in an increase in pre-tax net income attributed to shareholders of $27 million (a decrease of $14 million post-tax), an increase in pre-tax net income attributed to participating policyholders of $58 million ($74 million post-tax), an increase in CSM of $116 million, and an increase in pre-tax other comprehensive income of $146 million ($110 million post-tax).
In 4Q23, we also updated our actuarial methods and assumptions which decreased the overall level of the risk adjustment for non-financial risk. This change moves the risk adjustment to approximately the middle of our existing 90 - 95% confidence level range. The risk adjustment would have exceeded the 95% confidence level in 4Q23 without making the change. This change led to a decrease in pre-tax fulfilment cash flows of $2,850 million, an increase in pre-tax net income attributed to shareholders of $144 million ($119 million post-tax), an increase in pre-tax net income attributed to participating policyholders of $115 million ($91 million post-tax), an increase in CSM of $2,638 million, and a decrease in pre-tax other comprehensive income of $47 million ($37 million post-tax).
Since the beginning of 2020, some lines of business have seen impacts to mortality and policyholder behaviour driven by the COVID-19 pandemic. Given the long-term nature of our assumptions, our 2023 experience studies have excluded experience that was materially impacted by COVID-19 as this is not seen to be indicative of the levels of actual future claims or lapses.
Impact of changes in actuarial methods and assumptions on pre-tax fulfilment cash flows(1)
| ($ millions) | For the three and nine months ended September 30, 2023 |
For the three months ended December 31, 2023 |
For the year ended December 31, 2023 |
|||||||||
| Canada variable annuity product review |
$ | (133 | ) | $ | – | $ | (133 | ) | ||||
| Mortality and morbidity updates |
265 | – | 265 | |||||||||
| Lapse and policyholder behaviour updates |
98 | – | 98 | |||||||||
| Methodology and other updates |
(577 | ) | (2,850 | ) | (3,427 | ) | ||||||
| Impact of changes in actuarial methods and assumptions, pre-tax |
$ | (347 | ) | $ | (2,850 | ) | $ | (3,197 | ) | |||
| (1) | Excludes the portion related to non-controlling interests of $103 million for the three and nine months ended September 30, 2023, and $97 million for the three months ended December 31, 2023, respectively. |
| 1 | Fulfilment cash flows include an estimate of future cash flows; an adjustment to reflect the time value of money and the financial risk related to future cash flows if not included in the estimate of future cash flows; and a risk adjustment for non-financial risk. Additional information on fulfilment cash flows can be found in note 7 of our 2023 Annual Consolidated Financial Statements. |
92 | 2023 Annual Report | Management’s Discussion and Analysis
Impact of changes in actuarial methods and assumptions on pre-tax net income attributed to shareholders, pre-tax net income attributed to participating policyholders, OCI and CSM(1)
| ($ millions) | For the three and nine months ended September 30, 2023 |
For the three months ended December 31, 2023 |
For the year ended December 31, 2023 |
|||||||||
| Portion recognized in net income (loss) attributed to: |
||||||||||||
| Participating policyholders |
$ | 58 | $ | 115 | $ | 173 | ||||||
| Shareholders |
27 | 144 | 171 | |||||||||
| 85 | 259 | 344 | ||||||||||
| Portion recognized in OCI attributed to: |
||||||||||||
| Participating policyholders |
– | (21 | ) | (21 | ) | |||||||
| Shareholders |
146 | (26 | ) | 120 | ||||||||
| 146 | (47 | ) | 99 | |||||||||
| Portion recognized in CSM |
116 | 2,638 | 2,754 | |||||||||
| Impact of changes in actuarial methods and assumptions, pre-tax |
$ | 347 | $ | 2,850 | $ | 3,197 | ||||||
| (1) | Excludes the portion related to non-controlling interests, of which $72 million is related to CSM for the three and nine months ended September 30, 2023, and $87 million is related to CSM for the three months ended December 31, 2023. |
Canada variable annuity product review
The review of our variable annuity products in Canada resulted in a decrease in pre-tax fulfilment cash flows of $133 million.
The decrease was driven by a reduction in investment management fees, partially offset by updates to product assumptions, including surrenders, incidence, and utilization, to reflect emerging experience.
Mortality and morbidity updates
Mortality and morbidity updates resulted in an increase in pre-tax fulfilment cash flows of $265 million.
The increase was driven by a strengthening of incidence rates for certain products in Vietnam to align with emerging experience and updates to mortality assumptions in our U.S. life insurance business to reflect industry trends, as well as emerging experience. This was partially offset by updates to morbidity assumptions for certain products in Japan to reflect actual experience.
Lapse and policyholder behaviour updates
Updates to lapses and policyholder behaviour assumptions resulted in an increase in pre-tax fulfilment cash flows of $98 million.
The increase was primarily driven by a detailed review of lapse assumptions for our universal life level cost of insurance products in Canada, which resulted in a reduction to the lapse rates to align with emerging trends.
Methodology and other updates
Methodology and other updates resulted in a decrease in pre-tax fulfilment cash flows of $3,427 million.
In 3Q23, methodology and other updates resulted in a decrease in pre-tax fulfilment cash flows of $577 million. The decrease was driven by the impact of cost-of-guarantees for participating policyholders across all segments from annual updates related to parameters, dividend recalibration, and market movements during the year, as well as modelling refinements for certain products in Asia. This was partially offset by a modelling methodology update to project future premiums on our U.S. life insurance business.
In 4Q23, methodology and other updates resulted in a decrease in pre-tax fulfilment cash flows of $2,850 million. The decrease was driven by a decrease in the overall level of the risk adjustment for non-financial risk. This change moves the risk adjustment to approximately the middle of our existing 90-95% confidence level range.
|
|
93 |
Impact of changes in actuarial methods and assumptions on pre-tax fulfilment cash flows, net income attributed to shareholders, CSM and OCI by segment1
For the three and nine months ended September 30, 2023
The impact of changes in actuarial methods and assumptions in Canada resulted in a decrease in pre-tax fulfilment cash flows of $159 million. The decrease was driven by updates to our variable annuity product assumptions, as well as by updates to our valuation models for participating products, driven by the annual dividend recalibration, partially offset by a reduction in lapse rates on our universal life level cost of insurance products to reflect emerging trends. These changes resulted in an increase in pre-tax net income attributed to shareholders of $52 million ($37 million post-tax), an increase in CSM of $142 million, and an increase in pre-tax other comprehensive income of $2 million ($1 million post-tax).
The impact of changes in actuarial methods and assumptions in the U.S. resulted in an increase in pre-tax fulfilment cash flows of $270 million. The increase was related to our life insurance business and primarily driven by a modelling methodology update to project future premiums, as well as updates to mortality assumptions. These changes resulted in an increase in pre-tax net income attributed to shareholders of $134 million ($106 million post-tax), a decrease in CSM of $600 million, and an increase in pre-tax other comprehensive income of $196 million ($155 million post-tax).
The impact of changes in actuarial methods and assumptions in Asia resulted in a decrease in pre-tax fulfilment cash flows of $457 million. The decrease largely relates to participating products, primarily driven by model refinements, dividend recalibration updates, as well as annual updates to reflect market movements during the year. This, and the updates to morbidity assumptions on certain products in Japan, were partially offset by updates to incidence rates on certain products in Vietnam. These changes resulted in a decrease in pre-tax net income attributed to shareholders of $159 million ($157 million post-tax), an increase in CSM of $574 million, and a decrease in pre-tax other comprehensive income of $53 million ($47 million post-tax).
The impact of changes in actuarial methods and assumptions in Corporate and Other (which includes our Reinsurance businesses) resulted in a decrease in pre-tax fulfilment cash flows of $1 million. These changes resulted in no impacts to pre-tax net income attributed to shareholders or CSM, and an increase in pre-tax other comprehensive income of $1 million ($1 million post-tax).
For the three months ended December 31, 2023
The reduction in the risk adjustment level resulted in the following impacts by segment:
The impact of changes in actuarial methods and assumptions in Canada resulted in a decrease in pre-tax fulfilment cash flows of $246 million. These changes resulted in an increase in pre-tax net income attributed to shareholders of $4 million ($3 million post-tax), an increase in pre-tax net income attributed to policyholder of $40 million ($29 million post-tax), an increase in CSM of $213 million, and a decrease in pre-tax other comprehensive income of $11 million ($8 million post-tax).
The impact of changes in actuarial methods and assumptions in the U.S. resulted in a decrease in pre-tax fulfilment cash flows of $91 million. These changes resulted in an increase in pre-tax net income attributed to shareholders of $33 million ($26 million post-tax), an increase in CSM of $78 million, and a decrease in pre-tax other comprehensive income of $20 million ($15 million post-tax).
The impact of changes in actuarial methods and assumptions in Asia resulted in a decrease in pre-tax fulfilment cash flows of $2,513 million. These changes resulted in an increase in pre-tax net income attributed to shareholders of $107 million ($90 million post-tax), an increase in pre-tax net income attributed to policyholders of $75 million ($62 million post-tax), an increase in CSM of $2,348 million, and a decrease in pre-tax other comprehensive income of $17 million ($14 million post-tax).
2022 Review of Actuarial Methods and Assumptions
The completion of the 2022 annual review of actuarial methods and assumptions resulted in an increase in pre-tax fulfilment cash flows of $192 million. These changes resulted in an increase in pre-tax net income attributed to shareholders of $23 million ($26 million post-tax), a decrease in pre-tax net income attributed to participating policyholders of $26 million ($18 million post-tax), a decrease in CSM of $279 million, and an increase in pre-tax other comprehensive income of $90 million ($73 million post-tax).
Since the beginning of 2020, some lines of business have seen impacts to mortality and policyholder behaviour driven by the COVID-19 pandemic. Given the long-term nature of our assumptions, our 2022 experience studies have excluded experience that was materially impacted by COVID-19 as this is not seen to be indicative of the levels of actual future claims or lapses.
| 1 | Our review of actuarial methods and assumptions also impacts net income attributed to participating policyholders. The total company impact can be found in the above table. |
94 | 2023 Annual Report | Management’s Discussion and Analysis
Impact of changes in actuarial methods and assumptions on pre-tax fulfilment cash flows(1)
| For the year ended December 31, 2022 ($ millions) |
Total | |||
| Long-term care triennial review |
$ | 118 | ||
| Mortality and morbidity updates |
83 | |||
| Lapse and policyholder behaviour updates |
234 | |||
| Methodology and other updates |
(243 | ) | ||
| Impact of changes in actuarial methods and assumptions, pre-tax |
$ | 192 | ||
| (1) | Excludes the portion related to non-controlling interests of $8 million. |
Impact of changes in actuarial methods and assumptions on pre-tax net income attributed to shareholders, pre-tax net income attributed to participating policyholders, OCI and CSM(1)
| For the year ended December 31, 2022 ($ millions) |
Total | |||
| Portion recognized in net income (loss) attributed to: |
||||
| Participating policyholders |
$ | (26 | ) | |
| Shareholders |
23 | |||
| (3 | ) | |||
| Portion recognized in OCI attributed to: |
||||
| Participating policyholders |
– | |||
| Shareholders |
90 | |||
| 90 | ||||
| Portion recognized in CSM |
(279 | ) | ||
| Impact of changes in actuarial methods and assumptions, pre-tax |
$ | (192 | ) | |
| (1) | Excludes the portion related to non-controlling interests, of which $nil million is related to CSM. |
Long-term care triennial review
U.S. Insurance completed a comprehensive long-term care (“LTC”) experience study. The review included all aspects of claim assumptions, as well as the progress on future premium rate increases. The impact of the LTC review was an increase in pre-tax fulfilment cash flows of $118 million.
The experience study showed that claim costs established in our last triennial review remain appropriate in aggregate for our older blocks of business1 supported by robust claims data on this mature block. Pre-tax fulfilment cash flows were increased for claim costs on our newer block of business2. This was driven by lower active life mortality3 supported by Company experience and a recent industry study, as well as higher utilization of benefits, which included the impact of reflecting higher inflation in the cost-of-care up to 2022. We also reviewed and updated incidence and claim termination assumptions which, on a net basis, provided a partial offset to the increase in pre-tax fulfilment cash flows on active life mortality and utilization. In addition, some policyholders are electing to reduce their benefits in lieu of paying increased premiums which resulted in a reduction in pre-tax fulfilment cash flows.
Experience continues to support the assumptions of both future morbidity and mortality improvement, resulting in no changes to these assumptions.
As of September 30, 2022, we had received actual premium increase approvals of $2.5 billion pre-tax (US$1.9 billion pre-tax) on a present value basis since the last triennial review in 2019. This aligns with the full amount assumed in our pre-tax fulfilment cash flows at that time and demonstrates our continued strong track record of securing premium rate increases4. In 2022, the review of future premium increases assumed in fulfilment cash flows resulted in a net $2.5 billion (US$1.9 billion) decrease in pre-tax fulfilment cash flows. This reflects expected future premium increases that are due to our 2022 review of morbidity, mortality, and lapse assumptions, as well as outstanding amounts from prior state filings. Premium increases averaging approximately 30% will be sought on about one-half of the business, excluding the carryover of 2019 amounts requested. Our assumptions reflect the estimated timing and amount of state approved premium increases.
Mortality and morbidity updates
Mortality and morbidity updates resulted in an increase in pre-tax fulfilment cash flows of $83 million, driven by updates to morbidity assumptions in Vietnam to align with experience, partially offset by a detailed review of the mortality assumptions for our Canada insurance business.
Lapse and policyholder behaviour updates
Updates to lapses and policyholder behaviour assumptions resulted in an increase in pre-tax fulfilment cash flows of $234 million.
| 1 | First generation policies issued prior to 2002. |
| 2 | Second generation policies with an average issue date of 2007 and Group policies with an average issue date of 2003. |
| 3 | The mortality rate of LTC policyholders who are currently not on claim. |
| 4 | Actual experience obtaining premium increases could be materially different than what the Company has assumed, resulting in further increases or decreases in insurance contract liabilities, which could be material. See “Caution regarding forward-looking statements” above. |
|
|
95 |
We completed a detailed review of lapse assumptions for Singapore, and increased lapse rates to align with experience on our index-linked products, which reduced projected future fee income to be received on these products.
We also increased lapse rates on Canada’s term insurance products for policies approaching their renewal date, reflecting emerging experience in our study.
Methodology and other updates
Other updates resulted in a decrease in pre-tax fulfilment cash flows of $243 million, which included updates to discount rates and policyholder dividends on participating products, as well as various other modelling and projection updates.
Impact of changes in actuarial methods and assumptions on pre-tax fulfilment cash flows, net income attributed to shareholders, CSM and OCI by segment
The impact of changes in actuarial methods and assumptions in Canada resulted in an increase in pre-tax fulfilment cash flows of $22 million. The increase was driven by updates to the lapse assumptions for certain term insurance products, largely offset by updates to discount rates and policyholder dividends on participating products, as well as updates to mortality assumptions for our insurance business. These changes resulted in an increase in pre-tax net income attributed to shareholders of $64 million ($47 million post-tax), an increase in CSM of $43 million, and a decrease in pre-tax other comprehensive income of $96 million ($71 million post-tax).
The impact of changes in actuarial methods and assumptions in the U.S. resulted in an increase in pre-tax fulfilment cash flows of $108 million, driven by the triennial review of long-term care. These changes resulted in a decrease in pre-tax net income attributed to shareholders of $16 million ($12 million post-tax), a decrease in CSM of $202 million, and an increase in pre-tax other comprehensive income of $110 million ($86 million post-tax).
The impact of changes in actuarial methods and assumptions in Asia resulted in an increase in pre-tax fulfilment cash flows of $62 million. The increase was driven by updates to lapse assumptions in Singapore and morbidity updates in Vietnam, partially offset by various other modelling and projection updates. These changes resulted in a decrease in pre-tax net income attributed to shareholders of $25 million ($9 million post-tax), a decrease in CSM of $120 million, and an increase in pre-tax other comprehensive income of $76 million ($58 million post-tax).
Critical Accounting Policies
Consolidation
The Company is required to consolidate the financial position and results of entities it controls. Control exists when the Company:
| • | Has the power to govern the financial and operating policies of the entity; |
| • | Is exposed to a significant portion of the entity’s variable returns; and |
| • | Is able to use its power to influence variable returns from the entity. |
The Company uses the same principles to assess control over any entity it is involved with. In evaluating control, potential factors assessed include the effects of:
| • | Substantive voting rights that are potentially or currently exercisable; |
| • | Contractual management relationships with the entity; |
| • | Rights and obligations resulting from policyholders to manage investments on their behalf; |
| • | The extent of other parties’ involvement in the entity, if any, the possibility for de facto control being present; and |
| • | The effect of any legal or contractual restraints on the Company from using its power to affect its variable returns from the entity. |
An assessment of control is based on arrangements in place and the assessed risk exposures at inception of the relationship. Initial evaluations are reconsidered at a later date if:
| • | The contractual arrangements of the entity are amended such that the Company’s involvement with the entity changes; |
| • | The Company acquires or loses power over the financial and operating policies of the entity; |
| • | The Company acquires additional interests in the entity or its interests in an entity are diluted; or |
| • | The Company’s ability to use its power to affect its variable returns from the entity changes. |
Subsidiaries are consolidated from the date on which control is obtained by the Company and cease to be consolidated from the date that control ceases. A change in control may lead to gains or losses on derecognition of a subsidiary when losing control, or on derecognition of previous interests in a subsidiary when gaining control.
Fair Value of Invested Assets
A large portion of the Company’s invested assets are recorded at fair value. Refer to note 1 of the 2023 Annual Consolidated Financial Statements for a description of the methods used in determining fair values. When quoted prices in active markets are not available for a particular investment, significant judgment is required to determine an estimated fair value based on market standard valuation methodologies
96 | 2023 Annual Report | Management’s Discussion and Analysis
including discounted cash flow methodologies, matrix pricing, consensus pricing services, or other similar techniques. The inputs to these standard valuation methodologies include: current interest rates or yields for similar instruments, credit rating of the issuer or counterparty, industry sector of the issuer, coupon rate, call provisions, sinking fund requirements, tenor (or expected tenor) of the instrument, management’s assumptions regarding liquidity, volatilities and estimated future cash flows. Accordingly, the estimated fair values are based on available market information and management’s judgments about the key market factors impacting these financial instruments. Financial markets are susceptible to severe events evidenced by rapid depreciation in asset values accompanied by a reduction in asset liquidity. The Company’s ability to sell assets, or the price ultimately realized for these assets, depends upon the demand and liquidity in the market which increases the use of judgment in determining the estimated fair value of certain assets.
Evaluation of Invested Asset Impairment
FVOCI debt investments are carried at fair market value, with changes in fair value recorded in other comprehensive income (“OCI”) with the exception of unrealized gains and losses on foreign currency translation of foreign currency denominated FVOCI debt investments which are included in net income.
Debt investments classified as FVOCI or amortized cost are reviewed on a regular basis for expected credit loss (“ECL”) impairment allowances. ECL allowances are measured as the difference between amounts due according to the contractual terms of the debt security and the discounted value of cash flows that the Company expects to receive. Changes in ECL impairment allowances are recorded in the provision for credit losses included in net income.
Significant judgment is required in assessing ECL impairment allowances and fair values and recoverable values. Key matters considered include macroeconomic factors, industry specific developments, and specific issues with respect to single issuers and borrowers.
Changes in circumstances may cause future assessments of invested asset ECL impairment allowances to be materially different from current assessments, which could require additional provisions for impairment. Additional information on the process and methodology for determining the allowance for expected credit losses is included in the discussion of credit risk in notes 1 and 9 to the 2023 Annual Consolidated Financial Statements.
Derivative Financial Instruments
The Company uses derivative financial instruments (“derivatives”) including swaps, forwards and futures agreements, and options to help manage current and anticipated exposures to changes in interest rates, foreign exchange rates, commodity prices and equity market prices, and to replicate permissible investments. Refer to note 5 to the 2023 Annual Consolidated Financial Statements for a description of the methods used to determine the fair value of derivatives.
The accounting for derivatives is complex and interpretations of the primary accounting guidance continue to evolve in practice. Judgment is applied in determining the availability and application of hedge accounting designations and the appropriate accounting treatment under such accounting guidance. Differences in judgment as to the availability and application of hedge accounting designations and the appropriate accounting treatment may result in a differing impact on the Consolidated Financial Statements of the Company from previous periods. Assessments of hedge effectiveness and measurements of ineffectiveness of hedging relationships are also subject to interpretations and estimations.
Hedge Accounting
The Company applies hedge accounting principles under IFRS 9 to certain economic hedge transactions that qualify for hedge accounting. The Company evaluates the economic relationship between the hedged item and the hedging instrument, assesses the effect of credit risk on the economic relationship and determines the hedge ratio between the hedged item and hedging instrument to identify qualifying hedge accounting relationships.
The Company designates fair value hedges to hedge interest rate exposure on fixed rate assets and liabilities. In certain instances, the Company hedges fair value exposure due to both foreign exchange and interest rate risk using cross currency swaps.
The Company designates interest rate derivatives under cash flow hedges to hedge interest rate exposure in variable rate financial instruments. In addition, the Company may use non-functional currency denominated long-term debt, forward currency contracts and cross currency swaps to mitigate the foreign exchange translation risk of net investments in foreign operations.
The Company applies the cost of hedging option for certain hedge accounting relationships, as such changes in forward points and foreign currency basis spreads are excluded from the hedge accounting relationships and are accounted for as a separate component in equity.
Employee Future Benefits
The Company maintains defined contribution and defined benefit pension plans and other post-employment plans for employees and agents, including registered (tax qualified) pension plans that are typically funded, as well as supplemental non-registered (non-qualified) pension plans for executives, retiree welfare plans and disability welfare plans that are typically not funded. The largest defined benefit pension and retiree welfare plans in the U.S. and Canada are the material plans that are discussed herein and in note 16 to the 2023 Annual Consolidated Financial Statements.
|
|
97 |
Due to the long-term nature of defined benefit pension and retiree welfare plans, the calculation of the defined benefit obligation and net benefit cost depends on various assumptions such as discount rates, salary increase rates, cash balance interest crediting rates, health care cost trend rates and rates of mortality. These assumptions are determined by management and are reviewed annually. The key assumptions, as well as the sensitivity of the defined benefit obligation to changes in these assumptions, are presented in note 16 to the 2023 Annual Consolidated Financial Statements.
Changes in assumptions and differences between actual and expected experience give rise to actuarial gains and losses that affect the amount of the defined benefit obligation and OCI. For 2023, the amount recorded in OCI was a loss of $5 million (2022 – loss of $49 million) for the defined benefit pension plans and a gain of $10 million (2022 – gain of $34 million) for the retiree welfare plans.
Contributions to the registered (tax qualified) defined benefit pension plans are made in accordance with the applicable U.S. and Canadian regulations. During 2023, the Company contributed $3 million (2022 – $3 million) to these plans. As at December 31, 2023, the difference between the fair value of assets and the defined benefit obligation for these plans was a surplus of $422 million (2022 – surplus of $441 million). For 2024, the contributions to the plans are expected to be approximately $2 million.
The Company’s supplemental pension plans for executives are not funded; benefits under these plans are paid as they become due. During 2023, the Company paid benefits of $56 million (2022 – $56 million) under these plans. As at December 31, 2023, the defined benefit obligation for these plans, which is reflected as a liability in the balance sheet, amounted to $546 million (2022 – $561 million).
The Company’s retiree welfare plans are partially funded, although there are no regulations or laws governing or requiring the funding of these plans. As at December 31, 2023, the difference between the fair value of plan assets and the defined benefit obligation for these plans was a surplus of $76 million (2022 – surplus of $57 million).
Income Taxes
The Company is subject to income tax laws in various jurisdictions. Tax laws are complex and potentially subject to different interpretations by the taxpayer and the relevant tax authority. The provision for income taxes represents management’s interpretation of the relevant tax laws and its estimate of current and future income tax implications of the transactions and events during the period. A deferred tax asset or liability results from temporary differences between carrying values of assets and liabilities and their respective tax basis. Deferred tax assets and liabilities are recorded based on expected future tax rates and management’s assumptions regarding the expected timing of the reversal of such temporary differences. The realization of deferred tax assets depends upon the existence of sufficient taxable income within the carryback or carryforward periods under the tax law in the applicable tax jurisdiction. A deferred tax asset is recognized to the extent that future realization of the tax benefit is probable. Deferred tax assets are reviewed at each reporting date and are reduced to the extent that it is no longer probable that the tax benefit will be realized. At December 31, 2023, we had $6,739 million of deferred tax assets (December 31, 2022 – $6,708 million). Factors in management’s determination include, among others, the following:
| • | Future taxable income exclusive of reversing temporary differences and carryforwards; |
| • | Future reversals of existing taxable temporary differences; |
| • | Taxable income in prior carryback years; and |
| • | Tax planning strategies. |
The Company may be required to change its provision for income taxes if the ultimate deductibility of certain items is successfully challenged by taxing authorities or if estimates used in determining the amount of deferred tax assets to recognize change significantly, or when receipt of new information indicates the need for adjustment in the recognition of deferred tax assets. Additionally, future events, such as changes in tax laws, tax regulations, or interpretations of such laws or regulations, could have an impact on the provision for income tax, deferred tax balances, actuarial liabilities (see Critical Actuarial and Accounting Policies – Expenses and Taxes above) and the effective tax rate. Any such changes could significantly affect the amounts reported in the Consolidated Financial Statements in the year these changes occur.
Goodwill and Intangible Assets
At December 31, 2023, under IFRS we had $5,919 million of goodwill (December 31, 2022 – $6,014 million) and $4,391 million of intangible assets ($1,825 million of which are intangible assets with indefinite lives) (December 31, 2022 – $4,505 million and $1,861 million, respectively). Goodwill and intangible assets with indefinite lives are tested for impairment at the cash generating unit level (“CGU”) or group of CGUs level. A CGU comprises the smallest group of assets that are capable of generating largely independent cash flows and is either a business segment or a level below. The tests performed in 2023 demonstrated that there was no impairment of goodwill or intangible assets with indefinite lives (2022 – $nil). Changes in discount rates and cash flow projections used in the determination of recoverable values or reductions in market-based earnings multiples may result in impairment charges in the future, which could be material.
Impairment charges could occur in the future as a result of changes in economic conditions. The goodwill testing for 2024 will be updated based on the conditions that exist in 2024 and may result in impairment charges, which could be material.
98 | 2023 Annual Report | Management’s Discussion and Analysis
Disclosure Controls and Procedures
Our disclosure controls and procedures are designed to provide reasonable assurance that information required to be disclosed by us is recorded, processed, summarized, and reported accurately and completely and within the time periods specified under Canadian and U.S. securities laws. Our process includes controls and procedures that are designed to ensure that information is accumulated and communicated to management, including the CEO and CFO, to allow timely decisions regarding required disclosure.
As of December 31, 2023, management evaluated the effectiveness of its disclosure controls and procedures as defined under the rules adopted by the U.S. Securities and Exchange Commission and the Canadian securities regulatory authorities. This evaluation was performed under the supervision of the Audit Committee, the CEO and CFO. Based on that evaluation, the CEO and CFO concluded that our disclosure controls and procedures were effective as of December 31, 2023.
MFC’s Audit Committee has reviewed this MD&A and the 2023 Consolidated Financial Statements and MFC’s Board approved these reports prior to their release.
Management’s Report on Internal Control over Financial Reporting
Management is responsible for establishing and maintaining adequate internal control over financial reporting. The Company’s internal control system was designed to provide reasonable assurance to management and the Board regarding the preparation and fair presentation of published financial statements in accordance with generally accepted accounting principles. All internal control systems, no matter how well designed, have inherent limitations. Therefore, even those systems determined to be effective can provide only reasonable assurance with respect to financial statement preparation and presentation.
Management maintains a comprehensive system of controls intended to ensure that transactions are executed in accordance with management’s authorization, assets are safeguarded, and financial records are reliable. Management also takes steps to ensure that information and communication flows are effective and to monitor performance, including performance of internal control procedures.
Management assessed the effectiveness of the Company’s internal control over financial reporting as of December 31, 2023 based on the criteria set forth by the Committee of Sponsoring Organizations of the Treadway Commission 2013 framework in Internal Control – Integrated Framework. Based on this assessment, management believes that, as of December 31, 2023, the Company’s internal control over financial reporting is effective.
The effectiveness of the Company’s internal control over financial reporting as of December 31, 2023 has been audited by Ernst & Young LLP, the Company’s independent registered public accounting firm that also audited the Consolidated Financial Statements of the Company for the year ended December 31, 2023. Their report expressed an unqualified opinion on the effectiveness of the Company’s internal control over financial reporting as of December 31, 2023.
Changes in Internal Control over Financial Reporting
No changes were made in our internal control over financial reporting during the year ended December 31, 2023 that have materially affected, or are reasonably likely to materially affect, our internal control over financial reporting except that, in connection with the adoption of IFRS 17 and IFRS 9, the Company made significant updates and modifications to existing internal controls and implemented a number of new internal controls. These changes include controls over new and existing systems, including technological systems, and controls that were implemented or modified in our actuarial and accounting processes to address the risks associated with the newly adopted accounting standards.
|
|
99 |
13. Non-GAAP and Other Financial Measures
The Company prepares its Consolidated Financial Statements in accordance with International Financial Reporting Standards (“IFRS”) as issued by the International Accounting Standards Board. We use a number of non-GAAP and other financial measures to evaluate overall performance and to assess each of our businesses. This section includes information required by National Instrument 52-112 –Non-GAAP and Other Financial Measures Disclosure in respect of “specified financial measures” (as defined therein).
Non-GAAP financial measures include core earnings (loss); pre-tax core earnings; core earnings available to common shareholders; core earnings before income taxes, depreciation and amortization (“core EBITDA”); total expenses; core expenses; total expenditures; core expenditures; transitional net income (loss) attributed to shareholders; transitional net income (loss) attributed to shareholders (before tax); transitional net income (loss) before income taxes; transitional net income (loss); common shareholders’ transitional net income; Drivers of Earnings (“DOE”) line items for net investment result, other, income tax (expenses) recoveries and transitional net income attributed to participating policyholders and NCI; core DOE line items for core net insurance service result, core net investment result, other core earnings, and core income tax (expenses) recoveries; post-tax contractual service margin (“post-tax CSM”); post-tax contractual service margin net of NCI (“post-tax CSM net of NCI”); Manulife Bank net lending assets; Manulife Bank average net lending assets; assets under management (“AUM”); assets under management and administration (“AUMA”); Global WAM managed AUMA; core revenue; adjusted book value; and net annualized fee income. In addition, non-GAAP financial measures include the following stated on a constant exchange rate (“CER”) basis: any of the foregoing non-GAAP financial measures; net income attributed to shareholders; and common shareholders’ net income.
Non-GAAP ratios include core return on shareholders’ equity (“core ROE”); diluted core earnings per common share (“core EPS”); transitional return on common shareholders’ equity (“transitional ROE”); transitional basic earnings per common share (“transitional basic EPS”); transitional diluted earnings per common share (“transitional diluted EPS”); financial leverage ratio; adjusted book value per common share; common share core dividend payout ratio (“dividend payout ratio”); expense efficiency ratio; expenditure efficiency ratio; core EBITDA margin; effective tax rate on core earnings; effective tax rate on transitional net income attributed to shareholders; and net annualized fee income yield on average AUMA. In addition, non-GAAP ratios include the percentage growth/decline on a CER basis in any of the above non-GAAP financial measures and non-GAAP ratios; net income attributed to shareholders; common shareholders’ net income; pre-tax net income attributed to shareholders; general expenses; DOE line item for net insurance service result; CSM; CSM net of NCI; impact of new insurance business; new business CSM net of NCI; basic earnings per common share (“basic EPS”); and diluted earnings per common share (“diluted EPS”).
Other specified financial measures include assets under administration (“AUA”); consolidated capital; embedded value (“EV”); new business value (“NBV”); new business value margin (“NBV margin”); sales; annualized premium equivalent (“APE”) sales; gross flows; net flows; average assets under management and administration (“average AUMA”); Global WAM average managed AUMA; average assets under administration; remittances; any of the foregoing specified financial measures stated on a CER basis; and percentage growth/decline in any of the foregoing specified financial measures on a CER basis. In addition, we provide an explanation below of the components of core DOE line items other than the change in expected credit loss, the items that comprise certain items excluded from core earnings, and the components of CSM movement other than the new business CSM.
Our reporting currency for the Company is Canadian dollars and U.S. dollars is the functional currency for Asia and U.S. segment results. Financial measures presented in U.S. dollars are calculated in the same manner as the Canadian dollar measures. These amounts are translated to U.S. dollars using the period end rate of exchange for financial measures such as AUMA and the CSM balance and the average rates of exchange for the respective quarter for periodic financial measures such as our income statement, core earnings and items excluded from core earnings, transitional net income measures, and line items in our CSM movement schedule and DOE. Year-to-date or full year periodic financial measures presented in U.S. dollars are calculated as the sum of the quarterly results translated to U.S. dollars. See section 1 “Impact of Foreign Currency Exchange Rates” of the MD&A above for the Canadian to U.S. dollar quarterly and full year rates of exchange.
Non-GAAP financial measures and non-GAAP ratios are not standardized financial measures under GAAP and, therefore, might not be comparable to similar financial measures disclosed by other issuers. Therefore, they should not be considered in isolation or as a substitute for any other financial information prepared in accordance with GAAP.
Core earnings (loss) is a financial measure which we believe aids investors in better understanding the long-term earnings capacity and valuation of the business. Core earnings allows investors to focus on the Company’s operating performance by excluding the impact of market related gains or losses, changes in actuarial methods and assumptions that flow directly through income as well as a number of other items, outlined below, that we believe are material, but do not reflect the underlying earnings capacity of the business. For example, due to the long-term nature of our business, the mark-to-market movements in equity markets, interest rates including impacts on hedge accounting ineffectiveness, foreign currency exchange rates and commodity prices as well as the change in the fair value of ALDA from period-to-period can, and frequently do, have a substantial impact on the reported amounts of our assets, insurance contract liabilities and net income attributed to shareholders. These reported amounts may not be realized if markets move in the opposite direction in a subsequent period. This makes it very difficult for investors to evaluate how our businesses are performing from period-to-period and to compare our performance with other issuers.
100 | 2023 Annual Report | Management’s Discussion and Analysis
We believe that core earnings better reflect the underlying earnings capacity and valuation of our business. We use core earnings and core EPS as key metrics in our short-term incentive plans at the total Company and operating segment level. We also base our mid- and long-term strategic priorities on core earnings.
We have updated our definition of core earnings to reflect the change in the recognition, measurement and presentation of insurance contract liabilities and financial assets and liabilities under IFRS 17 and IFRS 9, respectively, and have also replaced the nomenclature of the items included in core earnings and the net income items excluded from core earnings to conform with the nomenclature under IFRS 17 and IFRS 9.
Core earnings includes the expected return on our invested assets and any other gains (charges) from market experience are included in net income but excluded from core earnings. The expected return for fixed income assets is based on the related book yields. For ALDA and public equities, the expected return reflects our long-term view of asset class performance. These returns for ALDA and public equities vary by asset class and range from 3.25% to 11.5%, leading to an average return of between 9.0% to 9.5% on these assets as of December 31, 2023.
While core earnings is relevant to how we manage our business and offers a consistent methodology, it is not insulated from macroeconomic factors which can have a significant impact. See below for reconciliation of core earnings to net income attributed to shareholders and income before income taxes. Net income attributed to shareholders excludes net income attributed to participating policyholders and non-controlling interests.
Any future changes to the core earnings definition referred to below, will be disclosed.
Items included in core earnings:
| 1. | Expected insurance service result on in-force policies, including expected release of the risk adjustment, CSM recognized for service provided, and expected earnings from short-term products measured under the premium allocation approach (“PAA”). |
| 2. | Impacts from the initial recognition of new contracts (onerous contracts, including the impact of the associated reinsurance contracts). |
| 3. | Insurance experience gains or losses that flow directly through net income. |
| 4. | Operating and investment expenses compared with expense assumptions used in the measurement of insurance and investment contract liabilities. |
| 5. | Expected investment earnings, which is the difference between expected return on our invested assets and the associated finance income or expense from the insurance contract liabilities. |
| 6. | Net provision for ECL on FVOCI and amortized cost debt instruments. |
| 7. | Expected asset returns on surplus investments. |
| 8. | All earnings for the Global WAM segment, except for applicable net income items excluded from core earnings as noted below. |
| 9. | All earnings for the Manulife Bank business, except for applicable net income items excluded from core earnings as noted below. |
| 10. | Routine or non-material legal settlements. |
| 11. | All other items not specifically excluded. |
| 12. | Tax on the above items. |
| 13. | All tax related items except the impact of enacted or substantively enacted income tax rate changes and taxes on items excluded from core earnings. |
Net income items excluded from core earnings:
| 1. | Market experience gains (losses) including the items listed below: |
| • | Gains (charges) on general fund public equity and ALDA investments from returns being different than expected. |
| • | Gains (charges) on derivatives not in hedging relationships, or gains (charges) resulting from hedge accounting ineffectiveness. |
| • | Realized gains (charges) from the sale of FVOCI debt instruments. |
| • | Market related gains (charges) on onerous contracts measured using the variable fee approach (e.g. variable annuities, unit linked, participating insurance) net of the performance on any related hedging instruments. |
| • | Gains (charges) related to certain changes in foreign exchange rates. |
| 2. | Changes in actuarial methods and assumptions used in the measurement of insurance contract liabilities that flow directly through income. |
| • | The Company reviews actuarial methods and assumptions annually, and this process is designed to reduce the Company’s exposure to uncertainty by ensuring assumptions remain appropriate. This is accomplished by monitoring experience and selecting assumptions which represent a current view of expected future experience and ensuring that the risk adjustment is appropriate for the risks assumed. |
| • | Changes related to the ultimate spot rate within the discount curves are included in the market experience gains (losses). |
| 3. | The impact on the measurement of insurance and investment contract assets and liabilities and reinsurance contract held assets and liabilities from changes in product features and new or changes to in-force reinsurance contracts, if material. |
|
|
101 |
| 4. | The fair value changes in long-term investment plan (“LTIP”) obligations for Global WAM investment management. |
| 5. | Goodwill impairment charges. |
| 6. | Gains or losses on acquisition and disposition of a business. |
| 7. | Material one-time only adjustments, including highly unusual/extraordinary and material legal settlements and restructuring charges, or other items that are material and exceptional in nature. |
| 8. | Tax on the above items. |
| 9. | Net income (loss) attributed to participating shareholders and non-controlling interests. |
| 10. | Impact of enacted or substantially enacted income tax rate changes. |
As noted in section 1 “Implementation of IFRS 17 and IFRS 9” above, our 2022 quarterly and full year results are not directly comparable with 2023 results because IFRS 9 hedge accounting and expected credit loss (“ECL”) principles are applied prospectively effective January 1, 2023. Accordingly, we have presented comparative quarterly and full year 2022 core earnings and our transitional net income metrics (see “Transitional net income to shareholders” paragraph below) inclusive of IFRS 9 hedge accounting and expected credit loss principles as if IFRS had allowed such principles to be implemented for 2022 (the “IFRS 9 transitional impacts”).
Transitional net income (loss) attributed to shareholders is a financial measure where our 2022 net income attributed to shareholders includes the effects of the IFRS 9 transitional impacts which we believe will assist investors in evaluating our operational performance because the associated adjustments are reported in our 2023 net income attributed to shareholders. Transitional net income (loss) before income taxes, Transitional net income (loss), Transitional net income (loss) attributed to shareholders before income taxes and Common shareholders’ transitional net income (loss) similarly include the effect of the IFRS 9 transitional impacts on our income (loss) before income taxes, net income (loss), net income (loss) attributed to shareholders before income taxes and common shareholders’ net income (loss), respectively. Transitional financial measures are temporary and will only be reported for 2022 comparative periods in our annual 2023 MD&A.
102 | 2023 Annual Report | Management’s Discussion and Analysis
Reconciliation of core earnings to net income attributed to shareholders
| 2023 | ||||||||||||||||||||||||
| ($ millions, post-tax and based on actual foreign exchange rates in effect in the applicable reporting period, unless otherwise stated) |
Asia | Canada | U.S. | Global WAM | Corporate and Other |
Total | ||||||||||||||||||
| Income (loss) before income taxes |
$ | 2,244 | $ | 1,609 | $ | 751 | $ | 1,497 | $ | 351 | $ | 6,452 | ||||||||||||
| Income tax (expenses) recoveries |
||||||||||||||||||||||||
| Core earnings |
(279 | ) | (378 | ) | (402 | ) | (204 | ) | 99 | (1,164 | ) | |||||||||||||
| Items excluded from core earnings |
(161 | ) | 5 | 290 | 6 | 179 | 319 | |||||||||||||||||
| Income tax (expenses) recoveries |
(440 | ) | (373 | ) | (112 | ) | (198 | ) | 278 | (845 | ) | |||||||||||||
| Net income (post-tax) |
1,804 | 1,236 | 639 | 1,299 | 629 | 5,607 | ||||||||||||||||||
| Less: Net income (post-tax) attributed to |
||||||||||||||||||||||||
| Non-controlling interests (“NCI”) |
141 | – | – | 2 | 1 | 144 | ||||||||||||||||||
| Participating policyholders |
315 | 45 | – | – | – | 360 | ||||||||||||||||||
| Net income (loss) attributed to shareholders (post-tax) |
1,348 | 1,191 | 639 | 1,297 | 628 | 5,103 | ||||||||||||||||||
| Less: Items excluded from core earnings (post-tax) |
||||||||||||||||||||||||
| Market experience gains (losses) |
(553 | ) | (341 | ) | (1,196 | ) | 10 | 290 | (1,790 | ) | ||||||||||||||
| Changes in actuarial methods and assumptions that flow directly through income |
(68 | ) | 41 | 132 | – | – | 105 | |||||||||||||||||
| Restructuring charge |
– | – | – | (36 | ) | – | (36 | ) | ||||||||||||||||
| Reinsurance transactions, tax related items and other |
(79 | ) | 4 | (56 | ) | 2 | 269 | 140 | ||||||||||||||||
| Core earnings (post-tax) |
$ | 2,048 | $ | 1,487 | $ | 1,759 | $ | 1,321 | $ | 69 | $ | 6,684 | ||||||||||||
| Income tax on core earnings (see above) |
279 | 378 | 402 | 204 | (99 | ) | 1,164 | |||||||||||||||||
| Core earnings (pre-tax) |
$ | 2,327 | $ | 1,865 | $ | 2,161 | $ | 1,525 | $ | (30 | ) | $ | 7,848 | |||||||||||
Core earnings, CER basis and U.S. dollars
| 2023 | ||||||||||||||||||||||||
| (Canadian $ millions, post-tax and based on actual foreign exchange rates in effect in the applicable reporting period, unless otherwise stated) |
Asia | Canada | U.S. | Global WAM | Corporate and Other |
Total | ||||||||||||||||||
| Core earnings (post-tax) |
$ | 2,048 | $ | 1,487 | $ | 1,759 | $ | 1,321 | $ | 69 | $ | 6,684 | ||||||||||||
| CER adjustment(1) |
(10 | ) | – | 15 | 7 | 2 | 14 | |||||||||||||||||
| Core earnings, CER basis (post-tax) |
$ | 2,038 | $ | 1,487 | $ | 1,774 | $ | 1,328 | $ | 71 | $ | 6,698 | ||||||||||||
| Income tax on core earnings, CER basis(2) |
277 | 378 | 405 | 204 | (99 | ) | 1,165 | |||||||||||||||||
| Core earnings, CER basis (pre-tax) |
$ | 2,315 | $ | 1,865 | $ | 2,179 | $ | 1,532 | $ | (28 | ) | $ | 7,863 | |||||||||||
|
Core earnings (U.S. dollars) – Asia and U.S. segments |
||||||||||||||||||||||||
| Core earnings (post-tax)(3), US $ |
$ | 1,518 | $ | 1,304 | ||||||||||||||||||||
| CER adjustment US $(1) |
(21 | ) | – | |||||||||||||||||||||
| Core earnings, CER basis (post-tax), US $ |
$ | 1,497 | $ | 1,304 | ||||||||||||||||||||
| (1) | The impact of updating foreign exchange rates to that which was used in 4Q23. |
| (2) | Income tax on core earnings adjusted to reflect the foreign exchange rates for the Statement of Income in effect for 4Q23. |
| (3) | Core earnings (post-tax) in Canadian $ is translated to US $ using the US $ Statement of Income exchange rate for the four respective quarters that make up 2023 core earnings. |
|
|
103 |
Reconciliation of core earnings and transitional net income attributed to shareholders to net income attributed to shareholders
| 2022 | ||||||||||||||||||||||||
| ($ millions, post-tax and based on actual foreign exchange rates in effect in the applicable reporting period, unless otherwise stated) |
Asia | Canada | U.S. | Global WAM | Corporate and Other |
Total | ||||||||||||||||||
| Income (loss) before income taxes |
$ | 910 | $ | (969 | ) | $ | (3,011 | ) | $ | 1,291 | $ | (1,359 | ) | $ | (3,138 | ) | ||||||||
| Income tax (expenses) recoveries |
||||||||||||||||||||||||
| Core earnings |
(264 | ) | (335 | ) | (341 | ) | (222 | ) | 116 | (1,046 | ) | |||||||||||||
| Items excluded from core earnings |
(54 | ) | 845 | 1,036 | 52 | 326 | 2,205 | |||||||||||||||||
| Income tax (expenses) recoveries |
(318 | ) | 510 | 695 | (170 | ) | 442 | 1,159 | ||||||||||||||||
| Net income (post-tax) |
592 | (459 | ) | (2,316 | ) | 1,121 | (917 | ) | (1,979 | ) | ||||||||||||||
| Less: Net income (post-tax) attributed to |
||||||||||||||||||||||||
| Non-controlling interests |
120 | – | – | – | 1 | 121 | ||||||||||||||||||
| Participating policyholders |
(211 | ) | 44 | – | – | – | (167 | ) | ||||||||||||||||
| Net income (loss) attributed to shareholders (post-tax) |
683 | (503 | ) | (2,316 | ) | 1,121 | (918 | ) | (1,933 | ) | ||||||||||||||
| IFRS 9 transitional impacts (post-tax) |
(36 | ) | 1,701 | 3,764 | – | 2 | 5,431 | |||||||||||||||||
| Transitional net income (loss) attributed to shareholders (post-tax) |
647 | 1,198 | 1,448 | 1,121 | (916 | ) | 3,498 | |||||||||||||||||
| Less: Items excluded from core earnings (post-tax) |
||||||||||||||||||||||||
| Market experience gains (losses) |
(1,141 | ) | (196 | ) | (93 | ) | (260 | ) | (895 | ) | (2,585 | ) | ||||||||||||
| Changes in actuarial methods and assumptions that flow directly through income |
(9 | ) | 47 | (12 | ) | – | – | 26 | ||||||||||||||||
| Restructuring charge |
– | – | – | – | – | – | ||||||||||||||||||
| Reinsurance transactions, tax related items and other |
(15 | ) | (40 | ) | (13 | ) | 82 | 242 | 256 | |||||||||||||||
| Core earnings (post-tax) |
$ | 1,812 | $ | 1,387 | $ | 1,566 | $ | 1,299 | $ | (263 | ) | $ | 5,801 | |||||||||||
| Income tax on core earnings (see above) |
263 | 335 | 341 | 222 | (116 | ) | 1,045 | |||||||||||||||||
| Core earnings (pre-tax) |
$ | 2,075 | $ | 1,722 | $ | 1,907 | $ | 1,521 | $ | (379 | ) | $ | 6,846 | |||||||||||
Core earnings, CER basis and U.S. dollars
| 2022 | ||||||||||||||||||||||||
| (Canadian $ millions, post-tax and based on actual foreign exchange rates in effect in the applicable reporting period, unless otherwise stated) |
Asia | Canada | U.S. | Global WAM | Corporate and Other |
Total | ||||||||||||||||||
| Core earnings (post-tax) |
$ | 1,812 | $ | 1,387 | $ | 1,566 | $ | 1,299 | $ | (263 | ) | $ | 5,801 | |||||||||||
| CER adjustment(1) |
30 | – | 69 | 40 | (5 | ) | 134 | |||||||||||||||||
| Core earnings, CER basis (post-tax) |
$ | 1,842 | $ | 1,387 | $ | 1,635 | $ | 1,339 | $ | (268 | ) | $ | 5,935 | |||||||||||
| Income tax on core earnings, CER basis(2) |
267 | 335 | 356 | 226 | (116 | ) | 1,068 | |||||||||||||||||
| Core earnings, CER basis (pre-tax) |
$ | 2,109 | $ | 1,722 | $ | 1,991 | $ | 1,565 | $ | (384 | ) | $ | 7,003 | |||||||||||
|
Core earnings (U.S. dollars) – Asia and U.S. segments |
||||||||||||||||||||||||
| Core earnings (post-tax)(3), US $ |
$ | 1,392 | $ | 1,202 | ||||||||||||||||||||
| CER adjustment US $(1) |
(39 | ) | – | |||||||||||||||||||||
| Core earnings, CER basis (post-tax), US $ |
$ | 1,353 | $ | 1,202 | ||||||||||||||||||||
| (1) | The impact of updating foreign exchange rates to that which was used in 4Q23. |
| (2) | Income tax on core earnings adjusted to reflect the foreign exchange rates for the Statement of Income in effect for 4Q23. |
| (3) | Core earnings (post-tax) in Canadian $ is translated to US $ using the US $ Statement of Income exchange rate for the four respective quarters that make up 2022 core earnings. |
104 | 2023 Annual Report | Management’s Discussion and Analysis
Reconciliation of core earnings to net income attributed to shareholders
| 4Q23 | ||||||||||||||||||||||||
| ($ millions, post-tax and based on actual foreign exchange rates in effect in the applicable reporting period, unless otherwise stated) |
Asia | Canada | U.S. | Global WAM | Corporate and Other |
Total | ||||||||||||||||||
| Income (loss) before income taxes |
$ | 847 | $ | 498 | $ | 244 | $ | 424 | $ | 110 | $ | 2,123 | ||||||||||||
| Income tax (expenses) recoveries |
||||||||||||||||||||||||
| Core earnings |
(76 | ) | (87 | ) | (113 | ) | (55 | ) | 37 | (294 | ) | |||||||||||||
| Items excluded from core earnings |
(33 | ) | (29 | ) | 67 | (3 | ) | (30 | ) | (28 | ) | |||||||||||||
| Income tax (expenses) recoveries |
(109 | ) | (116 | ) | (46 | ) | (58 | ) | 7 | (322 | ) | |||||||||||||
| Net income (post-tax) |
738 | 382 | 198 | 366 | 117 | 1,801 | ||||||||||||||||||
| Less: Net income (post-tax) attributed to |
||||||||||||||||||||||||
| Non-controlling interests (“NCI”) |
37 | – | – | 1 | 1 | 39 | ||||||||||||||||||
| Participating policyholders |
86 | 17 | – | – | – | 103 | ||||||||||||||||||
| Net income (loss) attributed to shareholders (post-tax) |
615 | 365 | 198 | 365 | 116 | 1,659 | ||||||||||||||||||
| Less: Items excluded from core earnings (post-tax) |
||||||||||||||||||||||||
| Market experience gains (losses) |
– | 9 | (279 | ) | 51 | 86 | (133 | ) | ||||||||||||||||
| Changes in actuarial methods and assumptions that flow directly through income |
89 | 4 | 26 | – | – | 119 | ||||||||||||||||||
| Restructuring charge |
– | – | – | (36 | ) | – | (36 | ) | ||||||||||||||||
| Reinsurance transactions, tax related items and other |
(38 | ) | – | (23 | ) | (3 | ) | – | (64 | ) | ||||||||||||||
| Core earnings (post-tax) |
$ | 564 | $ | 352 | $ | 474 | $ | 353 | $ | 30 | $ | 1,773 | ||||||||||||
| Income tax on core earnings (see above) |
76 | 87 | 113 | 55 | (37 | ) | 294 | |||||||||||||||||
| Core earnings (pre-tax) |
$ | 640 | $ | 439 | $ | 587 | $ | 408 | $ | (7 | ) | $ | 2,067 | |||||||||||
Core earnings, CER basis and U.S. dollars
| 4Q23 | ||||||||||||||||||||||||
| (Canadian $ millions, post-tax and based on actual foreign exchange rates in effect in the applicable reporting period, unless otherwise stated) |
Asia | Canada | U.S. | Global WAM | Corporate and Other |
Total | ||||||||||||||||||
| Core earnings (post-tax) |
$ | 564 | $ | 352 | $ | 474 | $ | 353 | $ | 30 | $ | 1,773 | ||||||||||||
| CER adjustment(1) |
– | – | – | – | – | – | ||||||||||||||||||
| Core earnings, CER basis (post-tax) |
$ | 564 | $ | 352 | $ | 474 | $ | 353 | $ | 30 | $ | 1,773 | ||||||||||||
| Income tax on core earnings, CER basis(2) |
76 | 87 | 113 | 55 | (37 | ) | 294 | |||||||||||||||||
| Core earnings, CER basis (pre-tax) |
$ | 640 | $ | 439 | $ | 587 | $ | 408 | $ | (7 | ) | $ | 2,067 | |||||||||||
|
Core earnings (U.S. dollars) – Asia and U.S. segments |
||||||||||||||||||||||||
| Core earnings (post-tax)(3), US $ |
$ | 414 | $ | 349 | ||||||||||||||||||||
| CER adjustment US $(1) |
– | – | ||||||||||||||||||||||
| Core earnings, CER basis (post-tax), US $ |
$ | 414 | $ | 349 | ||||||||||||||||||||
| (1) | The impact of updating foreign exchange rates to that which was used in 4Q23. |
| (2) | Income tax on core earnings adjusted to reflect the foreign exchange rates for the Statement of Income in effect for 4Q23. |
| (3) | Core earnings (post-tax) in Canadian $ is translated to US $ using the US $ Statement of Income exchange rate for 4Q23. |
|
|
105 |
Reconciliation of core earnings to net income attributed to shareholders
| 3Q23 | ||||||||||||||||||||||||
| ($ millions, post-tax and based on actual foreign exchange rates in effect in the applicable reporting period, unless otherwise stated) |
Asia | Canada | U.S. | Global WAM | Corporate and Other |
Total | ||||||||||||||||||
| Income (loss) before income taxes |
$ | 439 | $ | 376 | $ | 68 | $ | 366 | $ | (75 | ) | $ | 1,174 | |||||||||||
| Income tax (expenses) recoveries |
||||||||||||||||||||||||
| Core earnings |
(62 | ) | (109 | ) | (93 | ) | (59 | ) | 30 | (293 | ) | |||||||||||||
| Items excluded from core earnings |
(73 | ) | 15 | 97 | 11 | 294 | 344 | |||||||||||||||||
| Income tax (expenses) recoveries |
(135 | ) | (94 | ) | 4 | (48 | ) | 324 | 51 | |||||||||||||||
| Net income (post-tax) |
304 | 282 | 72 | 318 | 249 | 1,225 | ||||||||||||||||||
| Less: Net income (post-tax) attributed to |
||||||||||||||||||||||||
| Non-controlling interests (“NCI”) |
25 | – | – | – | – | 25 | ||||||||||||||||||
| Participating policyholders |
195 | (8 | ) | – | – | – | 187 | |||||||||||||||||
| Net income (loss) attributed to shareholders (post-tax) |
84 | 290 | 72 | 318 | 249 | 1,013 | ||||||||||||||||||
| Less: Items excluded from core earnings (post-tax) |
||||||||||||||||||||||||
| Market experience gains (losses) |
(286 | ) | (159 | ) | (476 | ) | (43 | ) | (58 | ) | (1,022 | ) | ||||||||||||
| Changes in actuarial methods and assumptions that flow directly through income |
(157 | ) | 37 | 106 | – | – | (14 | ) | ||||||||||||||||
| Restructuring charge |
– | – | – | – | – | – | ||||||||||||||||||
| Reinsurance transactions, tax related items and other |
5 | 4 | – | – | 297 | 306 | ||||||||||||||||||
| Core earnings (post-tax) |
$ | 522 | $ | 408 | $ | 442 | $ | 361 | $ | 10 | $ | 1,743 | ||||||||||||
| Income tax on core earnings (see above) |
62 | 109 | 93 | 59 | (30 | ) | 293 | |||||||||||||||||
| Core earnings (pre-tax) |
$ | 584 | $ | 517 | $ | 535 | $ | 420 | $ | (20 | ) | $ | 2,036 | |||||||||||
Core earnings, CER basis and U.S. dollars
| 3Q23 | ||||||||||||||||||||||||
| (Canadian $ millions, post-tax and based on actual foreign exchange rates in effect in the applicable reporting period, unless otherwise stated) |
Asia | Canada | U.S. | Global WAM | Corporate and Other |
Total | ||||||||||||||||||
| Core earnings (post-tax) |
$ | 522 | $ | 408 | $ | 442 | $ | 361 | $ | 10 | $ | 1,743 | ||||||||||||
| CER adjustment(1) |
5 | – | 6 | 4 | – | 15 | ||||||||||||||||||
| Core earnings, CER basis (post-tax) |
$ | 527 | $ | 408 | $ | 448 | $ | 365 | $ | 10 | $ | 1,758 | ||||||||||||
| Income tax on core earnings, CER basis(2) |
62 | 109 | 95 | 59 | (30 | ) | 295 | |||||||||||||||||
| Core earnings, CER basis (pre-tax) |
$ | 589 | $ | 517 | $ | 543 | $ | 424 | $ | (20 | ) | $ | 2,053 | |||||||||||
| Core earnings (U.S. dollars) – Asia and U.S. segments |
||||||||||||||||||||||||
| Core earnings (post-tax)(3), US $ |
$ | 390 | $ | 329 | ||||||||||||||||||||
| CER adjustment US $(1) |
(3 | ) | – | |||||||||||||||||||||
| Core earnings, CER basis (post-tax), US $ |
$ | 387 | $ | 329 | ||||||||||||||||||||
| (1) | The impact of updating foreign exchange rates to that which was used in 4Q23. |
| (2) | Income tax on core earnings adjusted to reflect the foreign exchange rates for the Statement of Income in effect for 4Q23. |
| (3) | Core earnings (post-tax) in Canadian $ is translated to US $ using the US $ Statement of Income exchange rate for 3Q23. |
106 | 2023 Annual Report | Management’s Discussion and Analysis
Reconciliation of core earnings to net income attributed to shareholders
| 2Q23 | ||||||||||||||||||||||||
| ($ millions, post-tax and based on actual foreign exchange rates in effect in the applicable reporting period, unless otherwise stated) |
Asia | Canada | U.S. | Global WAM | Corporate and Other |
Total | ||||||||||||||||||
| Income (loss) before income taxes |
$ | 345 | $ | 312 | $ | 220 | $ | 362 | $ | 197 | $ | 1,436 | ||||||||||||
| Income tax (expenses) recoveries |
||||||||||||||||||||||||
| Core earnings |
(73 | ) | (97 | ) | (110 | ) | (45 | ) | 18 | (307 | ) | |||||||||||||
| Items excluded from core earnings |
(18 | ) | 33 | 73 | 1 | (47 | ) | 42 | ||||||||||||||||
| Income tax (expenses) recoveries |
(91 | ) | (64 | ) | (37 | ) | (44 | ) | (29 | ) | (265 | ) | ||||||||||||
| Net income (post-tax) |
254 | 248 | 183 | 318 | 168 | 1,171 | ||||||||||||||||||
| Less: Net income (post-tax) attributed to |
||||||||||||||||||||||||
| Non-controlling interests (“NCI”) |
25 | – | – | 1 | – | 26 | ||||||||||||||||||
| Participating policyholders |
99 | 21 | – | – | – | 120 | ||||||||||||||||||
| Net income (loss) attributed to shareholders (post-tax) |
130 | 227 | 183 | 317 | 168 | 1,025 | ||||||||||||||||||
| Less: Items excluded from core earnings (post-tax) |
||||||||||||||||||||||||
| Market experience gains (losses) |
(297 | ) | (147 | ) | (275 | ) | (7 | ) | 156 | (570 | ) | |||||||||||||
| Changes in actuarial methods and assumptions that flow directly through income |
– | – | – | – | – | – | ||||||||||||||||||
| Restructuring charge |
– | – | – | – | – | – | ||||||||||||||||||
| Reinsurance transactions, tax related items and other |
(46 | ) | – | – | 4 | – | (42 | ) | ||||||||||||||||
| Core earnings (post-tax) |
$ | 473 | $ | 374 | $ | 458 | $ | 320 | $ | 12 | $ | 1,637 | ||||||||||||
| Income tax on core earnings (see above) |
73 | 97 | 110 | 45 | (18 | ) | 307 | |||||||||||||||||
| Core earnings (pre-tax) |
$ | 546 | $ | 471 | $ | 568 | $ | 365 | $ | (6 | ) | $ | 1,944 | |||||||||||
Core earnings, CER basis and U.S. dollars
| 2Q23 | ||||||||||||||||||||||||
| (Canadian $ millions, post-tax and based on actual foreign exchange rates in effect in the applicable reporting period, unless otherwise stated) |
Asia | Canada | U.S. | Global WAM | Corporate and Other |
Total | ||||||||||||||||||
| Core earnings (post-tax) |
$ | 473 | $ | 374 | $ | 458 | $ | 320 | $ | 12 | $ | 1,637 | ||||||||||||
| CER adjustment(1) |
(5 | ) | – | 8 | 2 | – | 5 | |||||||||||||||||
| Core earnings, CER basis (post-tax) |
$ | 468 | $ | 374 | $ | 466 | $ | 322 | $ | 12 | $ | 1,642 | ||||||||||||
| Income tax on core earnings, CER basis(2) |
71 | 97 | 111 | 45 | (17 | ) | 307 | |||||||||||||||||
| Core earnings, CER basis (pre-tax) |
$ | 539 | $ | 471 | $ | 577 | $ | 367 | $ | (5 | ) | $ | 1,949 | |||||||||||
| Core earnings (U.S. dollars) – Asia and U.S. segments |
||||||||||||||||||||||||
| Core earnings (post-tax)(3), US $ |
$ | 353 | $ | 341 | ||||||||||||||||||||
| CER adjustment US $(1) |
(9 | ) | – | |||||||||||||||||||||
| Core earnings, CER basis (post-tax), US $ |
$ | 344 | $ | 341 | ||||||||||||||||||||
| (1) | The impact of updating foreign exchange rates to that which was used in 4Q23. |
| (2) | Income tax on core earnings adjusted to reflect the foreign exchange rates for the Statement of Income in effect for 4Q23. |
| (3) | Core earnings (post-tax) in Canadian $ is translated to US $ using the US $ Statement of Income exchange rate for 2Q23. |
|
|
107 |
Reconciliation of core earnings to net income attributed to shareholders
| 1Q23 | ||||||||||||||||||||||||
| ($ millions, post-tax and based on actual foreign exchange rates in effect in the applicable reporting period, unless otherwise stated) |
Asia | Canada | U.S. | Global WAM | Corporate and Other |
Total | ||||||||||||||||||
| Income (loss) before income taxes |
$ | 613 | $ | 423 | $ | 219 | $ | 345 | $ | 119 | $ | 1,719 | ||||||||||||
| Income tax (expenses) recoveries |
||||||||||||||||||||||||
| Core earnings |
(68 | ) | (85 | ) | (86 | ) | (45 | ) | 14 | (270 | ) | |||||||||||||
| Items excluded from core earnings |
(37 | ) | (14 | ) | 53 | (3 | ) | (38 | ) | (39 | ) | |||||||||||||
| Income tax (expenses) recoveries |
(105 | ) | (99 | ) | (33 | ) | (48 | ) | (24 | ) | (309 | ) | ||||||||||||
| Net income (post-tax) |
508 | 324 | 186 | 297 | 95 | 1,410 | ||||||||||||||||||
| Less: Net income (post-tax) attributed to |
||||||||||||||||||||||||
| Non-controlling interests (“NCI”) |
54 | – | – | – | – | 54 | ||||||||||||||||||
| Participating policyholders |
(65 | ) | 15 | – | – | – | (50 | ) | ||||||||||||||||
| Net income (loss) attributed to shareholders (post-tax) |
519 | 309 | 186 | 297 | 95 | 1,406 | ||||||||||||||||||
| Less: Items excluded from core earnings (post-tax) |
||||||||||||||||||||||||
| Market experience gains (losses) |
30 | (44 | ) | (166 | ) | 9 | 106 | (65 | ) | |||||||||||||||
| Changes in actuarial methods and assumptions that flow directly through income |
– | – | – | – | – | – | ||||||||||||||||||
| Restructuring charge |
– | – | – | – | – | – | ||||||||||||||||||
| Reinsurance transactions, tax related items and other |
– | – | (33 | ) | 1 | (28 | ) | (60 | ) | |||||||||||||||
| Core earnings (post-tax) |
$ | 489 | $ | 353 | $ | 385 | $ | 287 | $ | 17 | $ | 1,531 | ||||||||||||
| Income tax on core earnings (see above) |
68 | 85 | 86 | 45 | (14 | ) | 270 | |||||||||||||||||
| Core earnings (pre-tax) |
$ | 557 | $ | 438 | $ | 471 | $ | 332 | $ | 3 | $ | 1,801 | ||||||||||||
Core earnings, CER basis and U.S. dollars
| 1Q23 | ||||||||||||||||||||||||
| (Canadian $ millions, post-tax and based on actual foreign exchange rates in effect in the applicable reporting period, unless otherwise stated) |
Asia | Canada | U.S. | Global WAM | Corporate and Other |
Total | ||||||||||||||||||
| Core earnings (post-tax) |
$ | 489 | $ | 353 | $ | 385 | $ | 287 | $ | 17 | $ | 1,531 | ||||||||||||
| CER adjustment(1) |
(10 | ) | – | 3 | 1 | – | (6 | ) | ||||||||||||||||
| Core earnings, CER basis (post-tax) |
$ | 479 | $ | 353 | $ | 388 | $ | 288 | $ | 17 | $ | 1,525 | ||||||||||||
| Income tax on core earnings, CER basis(2) |
67 | 85 | 86 | 45 | (14 | ) | 269 | |||||||||||||||||
| Core earnings, CER basis (pre-tax) |
$ | 546 | $ | 438 | $ | 474 | $ | 333 | $ | 3 | $ | 1,794 | ||||||||||||
| Core earnings (U.S. dollars) – Asia and U.S. segments |
||||||||||||||||||||||||
| Core earnings (post-tax)(3), US $ |
$ | 361 | $ | 285 | ||||||||||||||||||||
| CER adjustment US $(1) |
(9 | ) | – | |||||||||||||||||||||
| Core earnings, CER basis (post-tax), US $ |
$ | 352 | $ | 285 | ||||||||||||||||||||
| (1) | The impact of updating foreign exchange rates to that which was used in 4Q23. |
| (2) | Income tax on core earnings adjusted to reflect the foreign exchange rates for the Statement of Income in effect for 4Q23. |
| (3) | Core earnings (post-tax) in Canadian $ is translated to US $ using the US $ Statement of Income exchange rate for 1Q23. |
108 | 2023 Annual Report | Management’s Discussion and Analysis
Reconciliation of core earnings and transitional net income attributed to shareholders to net income attributed to shareholders
| 4Q22 | ||||||||||||||||||||||||
| ($ millions, post-tax and based on actual foreign exchange rates in effect in the applicable reporting period, unless otherwise stated) |
Asia | Canada | U.S. | Global WAM | Corporate and Other |
Total | ||||||||||||||||||
| Income (loss) before income taxes |
$ | 403 | $ | (37 | ) | $ | (68 | ) | $ | 461 | $ | (62 | ) | $ | 697 | |||||||||
| Income tax (expenses) recoveries |
||||||||||||||||||||||||
| Core earnings |
(82 | ) | (81 | ) | (96 | ) | (47 | ) | 71 | (235 | ) | |||||||||||||
| Items excluded from core earnings |
(21 | ) | 67 | 120 | (13 | ) | 308 | 461 | ||||||||||||||||
| Income tax (expenses) recoveries |
(103 | ) | (14 | ) | 24 | (60 | ) | 379 | 226 | |||||||||||||||
| Net income (post-tax) |
300 | (51 | ) | (44 | ) | 401 | 317 | 923 | ||||||||||||||||
| Less: Net income (post-tax) attributed to |
||||||||||||||||||||||||
| Non-controlling interests |
32 | – | – | – | 1 | 33 | ||||||||||||||||||
| Participating policyholders |
(47 | ) | 22 | – | – | – | (25 | ) | ||||||||||||||||
| Net income (loss) attributed to shareholders (post-tax) |
315 | (73 | ) | (44 | ) | 401 | 316 | 915 | ||||||||||||||||
| IFRS 9 transitional impacts (post-tax) |
178 | 193 | (62 | ) | – | 4 | 313 | |||||||||||||||||
| Transitional net income (loss) attributed to shareholders (post-tax) |
493 | 120 | (106 | ) | 401 | 320 | 1,228 | |||||||||||||||||
| Less: Items excluded from core earnings (post-tax) |
||||||||||||||||||||||||
| Market experience gains (losses) |
12 | (136 | ) | (514 | ) | 45 | (62 | ) | (655 | ) | ||||||||||||||
| Changes in actuarial methods and assumptions that flow directly through income |
– | – | – | – | – | – | ||||||||||||||||||
| Restructuring charge |
– | – | – | – | – | – | ||||||||||||||||||
| Reinsurance transactions, tax related items and other |
(15 | ) | (40 | ) | – | 82 | 313 | 340 | ||||||||||||||||
| Core earnings (post-tax) |
$ | 496 | $ | 296 | $ | 408 | $ | 274 | $ | 69 | $ | 1,543 | ||||||||||||
| Income tax on core earnings (see above) |
82 | 81 | 96 | 47 | (71 | ) | 235 | |||||||||||||||||
| Core earnings (pre-tax) |
$ | 578 | $ | 377 | $ | 504 | $ | 321 | $ | (2 | ) | $ | 1,778 | |||||||||||
Core earnings, CER basis and U.S. dollars
| 4Q22 | ||||||||||||||||||||||||
| (Canadian $ millions, post-tax and based on actual foreign exchange rates in effect in the applicable reporting period, unless otherwise stated) |
Asia | Canada | U.S. | Global WAM | Corporate and Other |
Total | ||||||||||||||||||
| Core earnings (post-tax) |
$ | 496 | $ | 296 | $ | 408 | $ | 274 | $ | 69 | $ | 1,543 | ||||||||||||
| CER adjustment(1) |
(1 | ) | – | 1 | – | – | – | |||||||||||||||||
| Core earnings, CER basis (post-tax) |
$ | 495 | $ | 296 | $ | 409 | $ | 274 | $ | 69 | $ | 1,543 | ||||||||||||
| Income tax on core earnings, CER basis(2) |
81 | 82 | 95 | 48 | (71 | ) | 235 | |||||||||||||||||
| Core earnings, CER basis (pre-tax) |
$ | 576 | $ | 378 | $ | 504 | $ | 322 | $ | (2 | ) | $ | 1,778 | |||||||||||
| Core earnings (U.S. dollars) – Asia and U.S. segments |
||||||||||||||||||||||||
| Core earnings (post-tax)(3), US $ |
$ | 365 | $ | 301 | ||||||||||||||||||||
| CER adjustment US $(1) |
(1 | ) | – | |||||||||||||||||||||
| Core earnings, CER basis (post-tax), US $ |
$ | 364 | $ | 301 | ||||||||||||||||||||
| (1) | The impact of updating foreign exchange rates to that which was used in 4Q23. |
| (2) | Income tax on core earnings adjusted to reflect the foreign exchange rates for the Statement of Income in effect for 4Q23. |
| (3) | Core earnings (post-tax) in Canadian $ is translated to US $ using the US $ Statement of Income exchange rate for 4Q22. |
|
|
109 |
Segment core earnings by business line or geographic source
($ millions, post-tax and based on actual foreign exchange rates in effect in the applicable reporting period, unless otherwise stated)
Asia
| Quarterly Results | Full Year Results | |||||||||||||||||||||||||||
| (US $ millions) | 4Q23 | 3Q23 | 2Q23 | 1Q23 | 4Q22 | 2023 | 2022 | |||||||||||||||||||||
| Hong Kong |
$ | 218 | $ | 190 | $ | 161 | $ | 159 | $ | 153 | $ | 728 | $ | 668 | ||||||||||||||
| Japan |
79 | 87 | 81 | 62 | 76 | 309 | 308 | |||||||||||||||||||||
| Asia Other(1) |
119 | 119 | 119 | 137 | 126 | 494 | 419 | |||||||||||||||||||||
| International High Net Worth |
72 | 75 | ||||||||||||||||||||||||||
| Mainland China |
49 | 29 | ||||||||||||||||||||||||||
| Singapore |
161 | 136 | ||||||||||||||||||||||||||
| Vietnam |
133 | 109 | ||||||||||||||||||||||||||
| Other Emerging Markets(2) |
79 | 70 | ||||||||||||||||||||||||||
| Regional Office |
(2 | ) | (6 | ) | (8 | ) | 3 | 10 | (13 | ) | (3 | ) | ||||||||||||||||
| Total Asia core earnings |
$ | 414 | $ | 390 | $ | 353 | $ | 361 | $ | 365 | $ | 1,518 | $ | 1,392 | ||||||||||||||
| (1) | Core earnings for Asia Other is reported by country annually, on a full year basis. |
| (2) | Other Emerging Markets includes Indonesia, the Philippines, Malaysia, Thailand, Cambodia and Myanmar. |
| Quarterly Results | Full Year Results | |||||||||||||||||||||||||||
| (US $ millions), CER basis(1) | 4Q23 | 3Q23 | 2Q23 | 1Q23 | 4Q22 | 2023 | 2022 | |||||||||||||||||||||
| Hong Kong |
$ | 218 | $ | 190 | $ | 161 | $ | 159 | $ | 152 | $ | 728 | $ | 668 | ||||||||||||||
| Japan |
79 | 85 | 76 | 56 | 74 | 296 | 274 | |||||||||||||||||||||
| Asia Other(2) |
119 | 118 | 115 | 134 | 128 | 486 | 414 | |||||||||||||||||||||
| International High Net Worth |
72 | 75 | ||||||||||||||||||||||||||
| Mainland China |
47 | 27 | ||||||||||||||||||||||||||
| Singapore |
160 | 140 | ||||||||||||||||||||||||||
| Vietnam |
129 | 105 | ||||||||||||||||||||||||||
| Other Emerging Markets(3) |
78 | 67 | ||||||||||||||||||||||||||
| Regional Office |
(2 | ) | (6 | ) | (8 | ) | 3 | 10 | (13 | ) | (3 | ) | ||||||||||||||||
| Total Asia core earnings, CER basis |
$ | 414 | $ | 387 | $ | 344 | $ | 352 | $ | 364 | $ | 1,497 | $ | 1,353 | ||||||||||||||
| (1) | Core earnings adjusted to reflect the foreign exchange rates for the Statement of Income in effect for 4Q23. |
| (2) | Core earnings for Asia Other is reported by country annually, on a full year basis. |
| (3) | Other Emerging Markets includes Indonesia, the Philippines, Malaysia, Thailand, Cambodia and Myanmar. |
Canada
| (Canadian $ in millions) |
Quarterly Results | Full Year Results | ||||||||||||||||||||||||||
| 4Q23 | 3Q23 | 2Q23 | 1Q23 | 4Q22 | 2023 | 2022 | ||||||||||||||||||||||
| Insurance |
$ | 258 | $ | 310 | $ | 276 | $ | 257 | $ | 206 | $ | 1,101 | $ | 984 | ||||||||||||||
| Annuities |
48 | 48 | 55 | 53 | 45 | 204 | 238 | |||||||||||||||||||||
| Manulife Bank |
46 | 50 | 43 | 43 | 45 | 182 | 165 | |||||||||||||||||||||
| Total Canada core earnings |
$ | 352 | $ | 408 | $ | 374 | $ | 353 | $ | 296 | $ | 1,487 | $ | 1,387 | ||||||||||||||
U.S.
| (US $ in millions) |
Quarterly Results | Full Year Results | ||||||||||||||||||||||||||
| 4Q23 | 3Q23 | 2Q23 | 1Q23 | 4Q22 | 2023 | 2022 | ||||||||||||||||||||||
| U.S. Insurance |
$ | 300 | $ | 283 | $ | 293 | $ | 257 | $ | 259 | $ | 1,133 | $ | 1,016 | ||||||||||||||
| U.S. Annuities |
49 | 46 | 48 | 28 | 42 | 171 | 186 | |||||||||||||||||||||
| Total U.S. core earnings |
$ | 349 | $ | 329 | $ | 341 | $ | 285 | $ | 301 | $ | 1,304 | $ | 1,202 | ||||||||||||||
110 | 2023 Annual Report | Management’s Discussion and Analysis
Global WAM by business line
| Quarterly Results | Full Year Results | |||||||||||||||||||||||||||
| (Canadian $ in millions) | 4Q23 | 3Q23 | 2Q23 | 1Q23 | 4Q22 | 2023 | 2022 | |||||||||||||||||||||
| Retirement |
$ | 203 | $ | 192 | $ | 186 | $ | 164 | $ | 156 | $ | 745 | $ | 673 | ||||||||||||||
| Retail |
127 | 135 | 119 | 121 | 130 | 502 | 571 | |||||||||||||||||||||
| Institutional asset management |
23 | 34 | 15 | 2 | (12 | ) | 74 | 55 | ||||||||||||||||||||
| Total Global WAM core earnings |
$ | 353 | $ | 361 | $ | 320 | $ | 287 | $ | 274 | $ | 1,321 | $ | 1,299 | ||||||||||||||
| Quarterly Results | Full Year Results | |||||||||||||||||||||||||||
| (Canadian $ in millions), CER basis(1) | 4Q23 | 3Q23 | 2Q23 | 1Q23 | 4Q22 | 2023 | 2022 | |||||||||||||||||||||
| Retirement |
$ | 203 | $ | 195 | $ | 187 | $ | 165 | $ | 155 | $ | 750 | $ | 697 | ||||||||||||||
| Retail |
127 | 136 | 120 | 121 | 130 | 504 | 583 | |||||||||||||||||||||
| Institutional asset management |
23 | 34 | 15 | 2 | (11 | ) | 74 | 59 | ||||||||||||||||||||
| Total Global WAM core earnings, CER basis |
$ | 353 | $ | 365 | $ | 322 | $ | 288 | $ | 274 | $ | 1,328 | $ | 1,339 | ||||||||||||||
| (1) | Core earnings adjusted to reflect the foreign exchange rates for the Statement of Income in effect for 4Q23. |
Global WAM by geographic source
| Quarterly Results | Full Year Results | |||||||||||||||||||||||||||
| (Canadian $ in millions) | 4Q23 | 3Q23 | 2Q23 | 1Q23 | 4Q22 | 2023 | 2022 | |||||||||||||||||||||
| Asia |
$ | 109 | $ | 108 | $ | 103 | $ | 84 | $ | 79 | $ | 404 | $ | 336 | ||||||||||||||
| Canada |
100 | 94 | 96 | 88 | 78 | 378 | 401 | |||||||||||||||||||||
| U.S. |
144 | 159 | 121 | 115 | 117 | 539 | 562 | |||||||||||||||||||||
| Total Global WAM core earnings |
$ | 353 | $ | 361 | $ | 320 | $ | 287 | $ | 274 | $ | 1,321 | $ | 1,299 | ||||||||||||||
| Quarterly Results | Full Year Results | |||||||||||||||||||||||||||
| (Canadian $ in millions), CER basis(1) | 4Q23 | 3Q23 | 2Q23 | 1Q23 | 4Q22 | 2023 | 2022 | |||||||||||||||||||||
| Asia |
$ | 109 | $ | 110 | $ | 104 | $ | 84 | $ | 80 | $ | 407 | $ | 350 | ||||||||||||||
| Canada |
100 | 94 | 96 | 88 | 78 | 378 | 401 | |||||||||||||||||||||
| U.S. |
144 | 161 | 122 | 116 | 116 | 543 | 588 | |||||||||||||||||||||
| Total Global WAM core earnings, CER basis |
$ | 353 | $ | 365 | $ | 322 | $ | 288 | $ | 274 | $ | 1,328 | $ | 1,339 | ||||||||||||||
| (1) | Core earnings adjusted to reflect the foreign exchange rates for the Statement of Income in effect for 4Q23. |
Core earnings available to common shareholders is a financial measure that is used in the calculation of core ROE and core EPS. It is calculated as core earnings (post-tax) less preferred share dividends.
| Quarterly Results | Full Year Results | |||||||||||||||||||||||||||
| ($ millions, post-tax and based on actual foreign exchange rates in effect in the applicable reporting period, unless otherwise stated) |
4Q23 | 3Q23 | 2Q23 | 1Q23 | 4Q22 | 2023 | 2022 | |||||||||||||||||||||
| Core earnings |
$ | 1,773 | $ | 1,743 | $ | 1,637 | $ | 1,531 | $ | 1,543 | $ | 6,684 | $ | 5,801 | ||||||||||||||
| Less: Preferred share dividends |
(99 | ) | (54 | ) | (98 | ) | (52 | ) | (97 | ) | (303 | ) | (260 | ) | ||||||||||||||
| Core earnings available to common shareholders |
1,674 | 1,689 | 1,539 | 1,479 | 1,446 | 6,381 | 5,541 | |||||||||||||||||||||
| CER adjustment(1) |
– | 15 | 5 | (6 | ) | – | 14 | 134 | ||||||||||||||||||||
| Core earnings available to common shareholders, CER basis |
$ | 1,674 | $ | 1,704 | $ | 1,544 | $ | 1,473 | $ | 1,446 | $ | 6,395 | $ | 5,675 | ||||||||||||||
| (1) | The impact of updating foreign exchange rates to that which was used in 4Q23. |
|
|
111 |
Core ROE measures profitability using core earnings available to common shareholders as a percentage of the capital deployed to earn the core earnings. The Company calculates core ROE using average common shareholders’ equity quarterly, as the average of common shareholders’ equity at the start and end of the quarter, and annually, as the average of the quarterly average common shareholders’ equity for the year.
| Quarterly Results | Full Year Results | |||||||||||||||||||||||||||
| ($ millions, unless otherwise stated) | 4Q23 | 3Q23 | 2Q23 | 1Q23 | 4Q22 | 2023 | 2022 | |||||||||||||||||||||
| Core earnings available to common shareholders |
$ | 1,674 | $ | 1,689 | $ | 1,539 | $ | 1,479 | $ | 1,446 | $ | 6,381 | $ | 5,541 | ||||||||||||||
| Annualized core earnings available to common shareholders (post-tax) |
$ | 6,641 | $ | 6,701 | $ | 6,173 | $ | 5,998 | $ | 5,737 | $ | 6,381 | $ | 5,541 | ||||||||||||||
| Average common shareholders’ equity (see below) |
$ | 40,563 | $ | 39,897 | $ | 39,881 | $ | 40,465 | $ | 40,667 | $ | 40,201 | $ | 39,726 | ||||||||||||||
| Core ROE (annualized) (%) |
16.4% | 16.8% | 15.5% | 14.8% | 14.1% | 15.9% | 14.0% | |||||||||||||||||||||
| Average common shareholders’ equity |
||||||||||||||||||||||||||||
| Total shareholders’ and other equity |
$ | 47,039 | $ | 47,407 | $ | 45,707 | $ | 47,375 | $ | 46,876 | $ | 47,039 | $ | 46,876 | ||||||||||||||
| Less: Preferred shares and other equity |
6,660 | 6,660 | 6,660 | 6,660 | 6,660 | 6,660 | 6,660 | |||||||||||||||||||||
| Common shareholders’ equity |
$ | 40,379 | $ | 40,747 | $ | 39,047 | $ | 40,715 | $ | 40,216 | $ | 40,379 | $ | 40,216 | ||||||||||||||
| Average common shareholders’ equity |
$ | 40,563 | $ | 39,897 | $ | 39,881 | $ | 40,465 | $ | 40,667 | $ | 40,201 | $ | 39,726 | ||||||||||||||
Core EPS is equal to core earnings available to common shareholders divided by diluted weighted average common shares outstanding.
Core earnings related to strategic priorities
The Company measures its progress on certain strategic priorities using core earnings. These strategic priorities include core earnings from highest potential businesses, core earnings from Asia region, and core earnings from long-term care insurance (“LTC”) and variable annuities (“VA”) businesses. The core earnings for these businesses is calculated consistent with our definition of core earnings.
| Highest potential businesses | ||||||||||||
| For the years ended December 31, | ||||||||||||
| ($ millions and post-tax, unless otherwise stated) | 2023 | 2022 | ||||||||||
| Core earnings highest potential businesses(1) |
$ | 4,039 | $ | 3,556 | ||||||||
| Core earnings – All other businesses |
2,645 | 2,245 | ||||||||||
| Core earnings | 6,684 | 5,801 | ||||||||||
| Items excluded from core earnings | (1,581 | ) | (2,303 | ) | ||||||||
| Net income (loss) attributed to shareholders / Transitional | $ | 5,103 | $ | 3,498 | ||||||||
| Less: IFRS 9 transitional impacts (post-tax) | – | 5,431 | ||||||||||
| Net income (loss) attributed to shareholders | $ | 5,103 | $ | (1,933 | ) | |||||||
| Highest potential businesses core earnings contribution | 60% | 61% | ||||||||||
| (1) | Includes core earnings from Asia and Global WAM segments, Canada Group Benefits, and behavioural insurance products. |
| Asia region | ||||||||||||
| For the years ended December 31, | ||||||||||||
| ($ millions and post-tax, unless otherwise stated) | 2023 | 2022 | ||||||||||
| Core earnings of Asia region(1) |
$ | 2,452 | $ | 2,147 | ||||||||
| Core earnings – All other businesses |
4,232 | 3,654 | ||||||||||
| Core earnings | 6,684 | 5,801 | ||||||||||
| Items excluded from core earnings | (1,581 | ) | (2,303 | ) | ||||||||
| Net income (loss) attributed to shareholders / Transitional | $ | 5,103 | $ | 3,498 | ||||||||
| Less: IFRS 9 transitional impacts (post-tax) | – | 5,431 | ||||||||||
| Net income (loss) attributed to shareholders | $ | 5,103 | $ | (1,933 | ) | |||||||
| Asia region core earnings contribution | 37% | 37% | ||||||||||
| (1) | Includes core earnings from Asia segment and Global WAM’s business in Asia. |
112 | 2023 Annual Report | Management’s Discussion and Analysis
| LTC and VA businesses | ||||||||||||
| For the years ended December 31, | ||||||||||||
| ($ millions and post-tax, unless otherwise stated) | 2023 | 2022 | ||||||||||
| Core earnings of LTC & VA businesses(1) |
$ | 821 | $ | 932 | ||||||||
| Core earnings – All other businesses |
5,863 | 4,869 | ||||||||||
| Core earnings | 6,684 | 5,801 | ||||||||||
| Items excluded from core earnings | (1,581 | ) | (2,303 | ) | ||||||||
| Net income (loss) attributed to shareholders / Transitional | $ | 5,103 | $ | 3,498 | ||||||||
| Less: IFRS 9 transitional impacts (post-tax) | – | 5,431 | ||||||||||
| Net income (loss) attributed to shareholders | $ | 5,103 | $ | (1,933 | ) | |||||||
| LTC and VA core earnings contribution | 12% | 16% | ||||||||||
| (1) | Includes core earnings from U.S. long-term care and Asia, Canada and U.S. variable annuities businesses. |
The effective tax rate on core earnings is equal to income tax on core earnings divided by pre-tax core earnings. The effective tax rate on transitional net income attributed to shareholders is equal to income tax on transitional net income attributed to shareholders divided by pre-tax transitional net income attributed to shareholders.
Common share core dividend payout ratio is a ratio that measures the percentage of core earnings paid to common shareholders as dividends. It is calculated as dividends per common share divided by core EPS.
| Quarterly Results | Full Year Results | |||||||||||||||||||||||||||
| 4Q23 | 3Q23 | 2Q23 | 1Q23 | 4Q22 | 2023 | 2022 | ||||||||||||||||||||||
| Per share dividend |
$ | 0.37 | $ | 0.37 | $ | 0.37 | $ | 0.37 | $ | 0.33 | $ | 1.46 | $ | 1.32 | ||||||||||||||
| Core EPS |
$ | 0.92 | $ | 0.92 | $ | 0.83 | $ | 0.79 | $ | 0.77 | $ | 3.47 | $ | 2.90 | ||||||||||||||
| Common share core dividend payout ratio |
40% | 40% | 44% | 46% | 43% | 42% | 46% | |||||||||||||||||||||
Drivers of Earnings (“DOE”) is used to identify the primary sources of gains or losses in each reporting period. It is one of the key tools we use to understand and manage our business. The DOE has replaced the Source of Earnings that was disclosed under OSFI’s Source of Earnings Disclosure (Life Insurance Companies) guideline. The DOE line items are comprised of amounts that have been included in our financial statements. The DOE shows the sources of net income (loss) attributed to shareholders and the core DOE shows the sources of core earnings and the items excluded from core earnings, reconciled to net income attributed to shareholders. We have included transitional non-GAAP financial measures for our 2022 comparative quarterly results. The elements of the core earnings view are described below:
Net Insurance Service Result represents the net income attributed to shareholders associated with providing insurance service to policyholders within the period. This includes lines attributed to core earnings including:
| • | Expected earnings on insurance contracts which includes the release of risk adjustment for expired non-financial risk, the CSM recognized for service provided and expected earnings on short-term PAA insurance business. |
| • | Impact of new insurance business relates to income at initial recognition from new insurance contracts. Losses would occur if the group of new insurance contracts was onerous at initial recognition. If reinsurance contracts provide coverage for the direct insurance contracts, then the loss is offset by a corresponding gain on reinsurance contracts held. |
| • | Insurance experience gains (losses) arise from items such as claims, persistency, and expenses, where the actual experience in the current period differs from the expected results assumed in the insurance and investment contract liabilities. Generally, this line would be driven by claims and expenses, as persistency experience relates to future service and would be offset by changes to the carrying amount of the contractual service margin unless the group is onerous, in which case the impact of persistency experience would be included in core earnings. |
| • | Other represents pre-tax net income on residual items in the insurance result section. |
Net Investment Result represents the net income attributed to shareholders associated with investment results within the period. Note that results associated with Global WAM and Manulife Bank are shown on separate DOE lines. However within the income statement, the results associated with these businesses would impact the total investment result. This section includes lines attributed to core earnings including:
| • | Expected investment earnings, which is the difference between expected asset returns and the associated finance income or expense from insurance contract liabilities, net of investment expenses. |
| • | Change in expected credit loss, which is the gain or charge to net income attributed to shareholders for credit losses to bring the allowance for credit losses to a level management considers adequate for expected credit-related losses on its portfolio. |
| • | Expected earnings on surplus reflects the expected investment return on surplus assets. |
| • | Other represents pre-tax net income on residual items in the investment result section. |
|
|
113 |
Global WAM is the pre-tax net income from the Global Wealth and Asset Management segment, adjusted for applicable items excluded from core earnings as noted in the core earnings (loss) section above.
Manulife Bank is the pre-tax net income from Manulife Bank, adjusted for applicable items excluded from core earnings as noted in the core earnings (loss) section above.
Other represents net income associated with items outside of the net insurance service result, net investment result, Global WAM and Manulife Bank. Other includes lines attributed to core earnings such as:
| • | Non-directly attributable expenses are expenses incurred by the Company which are not directly attributable to fulfilling insurance contracts. Non-directly attributable expenses excludes non-directly attributable investment expenses as they are included in the net investment result. |
| • | Other represents pre-tax net income on residual items in the Other section. Most notably this would include the cost of financing debt issued by Manulife. |
Net income attributed to shareholders includes the following items excluded from core earnings:
| • | Market experience gains (losses) related to items excluded from core earnings that relate to changes in market variables. |
| • | Changes in actuarial methods and assumptions that flow directly through income related to updates in the methods and assumptions used to value insurance contract liabilities. |
| • | Restructuring charges includes a charge taken to reorganize operations. |
| • | Reinsurance transactions, tax-related items and other include the impacts of new or changes to in-force reinsurance contracts, the impact of enacted or substantially enacted income tax rate changes and other amounts defined as items excluded from core earnings not specifically captured in the lines above. |
All of the above items are discussed in more detail in our definition of items excluded from core earnings.
114 | 2023 Annual Report | Management’s Discussion and Analysis
Drivers of Earnings (“DOE”) – 2023
($ millions, pre-tax and based on actual foreign exchange rates in effect in the applicable reporting period, unless otherwise stated)
| 2023 | ||||||||||||||||||||||||
| Asia | Canada | U.S. | Global WAM |
Corporate and Other |
Total | |||||||||||||||||||
| Net insurance service result |
$ | 1,941 | $ | 1,193 | $ | 607 | $ | – | $ | 236 | $ | 3,977 | ||||||||||||
| Net investment result |
478 | 252 | 233 | – | 919 | 1,882 | ||||||||||||||||||
| Global WAM |
– | – | – | 1,497 | – | 1,497 | ||||||||||||||||||
| Manulife Bank |
– | 251 | – | – | – | 251 | ||||||||||||||||||
| Other |
(175 | ) | (87 | ) | (89 | ) | – | (804 | ) | (1,155 | ) | |||||||||||||
| Net income (loss) before income taxes |
2,244 | 1,609 | 751 | 1,497 | 351 | 6,452 | ||||||||||||||||||
| Income tax (expenses) recoveries |
(440 | ) | (373 | ) | (112 | ) | (198 | ) | 278 | (845 | ) | |||||||||||||
| Net income (loss) |
1,804 | 1,236 | 639 | 1,299 | 629 | 5,607 | ||||||||||||||||||
| Less: Net income (loss) attributed to NCI |
(141 | ) | – | – | (2 | ) | (1 | ) | (144 | ) | ||||||||||||||
| Less: Net income (loss) attributed to participating policyholders |
(315 | ) | (45 | ) | – | – | – | (360 | ) | |||||||||||||||
| Net income (loss) attributed to shareholders (post-tax) |
$ | 1,348 | $ | 1,191 | $ | 639 | $ | 1,297 | $ | 628 | $ | 5,103 | ||||||||||||
Reconciliations of DOE line items to the consolidated financial statements and DOE presentation
| 2023 | ||||||||||||||||||||||||
| Asia | Canada | U.S. | Global WAM |
Corporate and Other |
Total | |||||||||||||||||||
| Net insurance service result reconciliation |
||||||||||||||||||||||||
| Total insurance service result—financial statements |
$ | 1,941 | $ | 1,193 | $ | 607 | $ | – | $ | 236 | $ | 3,977 | ||||||||||||
| Less: Insurance service result attributed to: |
||||||||||||||||||||||||
| Items excluded from core earnings |
– | 19 | (55 | ) | – | (3 | ) | (39 | ) | |||||||||||||||
| NCI |
87 | – | – | – | 1 | 88 | ||||||||||||||||||
| Participating policyholders |
308 | 107 | – | – | – | 415 | ||||||||||||||||||
| Core net insurance result |
$ | 1,546 | $ | 1,067 | $ | 662 | $ | – | $ | 238 | $ | 3,513 | ||||||||||||
| Core net insurance result, CER adjustment(1) |
(3 | ) | – | 6 | – | 2 | 5 | |||||||||||||||||
| Core net insurance result, CER basis |
$ | 1,543 | $ | 1,067 | $ | 668 | $ | – | $ | 240 | $ | 3,518 | ||||||||||||
| Total investment result reconciliation |
||||||||||||||||||||||||
| Total investment result per financial statements |
$ | 478 | $ | 1,717 | $ | 233 | $ | (946 | ) | $ | 1,476 | $ | 2,958 | |||||||||||
| Less: Reclassify net investment result in each of Manulife Bank in Canada and Global WAM to its own line of the DOE |
– | (1,445 | ) | – | 946 | – | (499 | ) | ||||||||||||||||
| Less: Consolidation adjustments(2) |
– | – | – | – | (557 | ) | (557 | ) | ||||||||||||||||
| Less: Other |
– | (20 | ) | – | – | – | (20 | ) | ||||||||||||||||
| Net investment result |
478 | 252 | 233 | – | 919 | 1,882 | ||||||||||||||||||
| Less: Net investment result attributed to: |
||||||||||||||||||||||||
| Items excluded from core earnings |
(605 | ) | (345 | ) | (1,296 | ) | – | 298 | (1,948 | ) | ||||||||||||||
| NCI |
92 | – | – | – | – | 92 | ||||||||||||||||||
| Participating policyholders |
74 | (17 | ) | – | – | – | 57 | |||||||||||||||||
| Core net investment result |
917 | 614 | 1,529 | – | 621 | 3,681 | ||||||||||||||||||
| Core net investment result, CER adjustment(1) |
(11 | ) | – | 13 | – | – | 2 | |||||||||||||||||
| Core net investment result, CER basis |
$ | 906 | $ | 614 | $ | 1,542 | $ | – | $ | 621 | $ | 3,683 | ||||||||||||
| Manulife Bank and Global WAM by DOE line reconciliation |
||||||||||||||||||||||||
| Manulife Bank and Global WAM net income attributed to shareholders |
– | 251 | – | 1,496 | – | 1,747 | ||||||||||||||||||
| Less: Manulife Bank and Global WAM attributed to: |
||||||||||||||||||||||||
| Items excluded from core earnings |
– | 2 | – | (29 | ) | – | (27 | ) | ||||||||||||||||
| Core earnings in Manulife Bank and Global WAM |
– | 249 | – | 1,525 | – | 1,774 | ||||||||||||||||||
| Core earnings in Manulife Bank and Global WAM, CER adjustment(1) |
– | – | – | 7 | – | 7 | ||||||||||||||||||
| Core earnings in Manulife Bank and Global WAM, CER basis |
$ | – | $ | 249 | $ | – | $ | 1,532 | $ | – | $ | 1,781 | ||||||||||||
| (1) | The impact of updating foreign exchange rates to that which was used in 4Q23. |
| (2) | Consolidation adjustments in Other DOE line reclassified to net investment result DOE line. |
|
|
115 |
Drivers of Earnings (“DOE”) – 2023 (continued)
| 2023 | ||||||||||||||||||||||||
| Asia | Canada | U.S. | Global WAM |
Corporate and Other |
Total | |||||||||||||||||||
| Other reconciliation |
||||||||||||||||||||||||
| Other revenue per financial statements |
$ | 67 | $ | 272 | $ | 79 | $ | 6,709 | $ | (381 | ) | $ | 6,746 | |||||||||||
| General expenses per financial statements |
(220 | ) | (514 | ) | (156 | ) | (2,931 | ) | (509 | ) | (4,330 | ) | ||||||||||||
| Commission related to non-insurance contracts |
(10 | ) | (55 | ) | 3 | (1,322 | ) | 39 | (1,345 | ) | ||||||||||||||
| Interest expense per financial statements |
(12 | ) | (1,004 | ) | (15 | ) | (13 | ) | (510 | ) | (1,554 | ) | ||||||||||||
| Total financial statements values included in Other |
(175 | ) | (1,301 | ) | (89 | ) | 2,443 | (1,361 | ) | (483 | ) | |||||||||||||
| Less: Reclassify Other in each of Manulife Bank in Canada and Global WAM to its own line of the DOE |
– | 1,194 | – | (2,443 | ) | – | (1,249 | ) | ||||||||||||||||
| Less: Consolidation adjustments(1) |
– | – | – | – | 557 | 557 | ||||||||||||||||||
| Other |
– | 20 | – | – | – | 20 | ||||||||||||||||||
| Other |
(175 | ) | (87 | ) | (89 | ) | – | (804 | ) | (1,155 | ) | |||||||||||||
| Less: Other attributed to: |
||||||||||||||||||||||||
| Items excluded from core earnings |
(7 | ) | (2 | ) | (59 | ) | (2 | ) | 85 | 15 | ||||||||||||||
| NCI |
4 | – | – | 2 | – | 6 | ||||||||||||||||||
| Participating policyholders |
(2 | ) | (12 | ) | – | – | – | (14 | ) | |||||||||||||||
| Add: Par earnings transfer to shareholders |
34 | 8 | – | – | – | 42 | ||||||||||||||||||
| Core Other |
(136 | ) | (65 | ) | (30 | ) | – | (889) | (1,120 | ) | ||||||||||||||
| Core Other, CER adjustment(2) |
2 | – | (1 | ) | – | – | 1 | |||||||||||||||||
| Core Other, CER basis |
$ | (134 | ) | $ | (65 | ) | $ | (31 | ) | $ | – | $ | (889) | $ | (1,119 | ) | ||||||||
| Income tax recoveries (expenses) reconciliation |
||||||||||||||||||||||||
| Income tax recoveries (expenses) per financial statements |
$ | (440 | ) | $ | (373 | ) | $ | (112 | ) | $ | (198 | ) | $ | 278 | $ | (845 | ) | |||||||
| Less: Income tax recoveries (expenses) attributed to: |
||||||||||||||||||||||||
| Items excluded from core earnings |
(89 | ) | 30 | 290 | 7 | 179 | 417 | |||||||||||||||||
| NCI |
(42 | ) | – | – | (1 | ) | – | (43 | ) | |||||||||||||||
| Participating policyholders |
(30 | ) | (25 | ) | – | – | – | (55 | ) | |||||||||||||||
| Core income tax recoveries (expenses) |
(279 | ) | (378 | ) | (402 | ) | (204 | ) | 99 | (1,164 | ) | |||||||||||||
| Core income tax recoveries (expenses), CER adjustment(2) |
2 | – | (3 | ) | – | – | (1 | ) | ||||||||||||||||
| Core income tax recoveries (expenses), CER basis |
$ | (277 | ) | $ | (378 | ) | $ | (405 | ) | $ | (204 | ) | $ | 99 | $ | (1,165 | ) | |||||||
| Net income (loss) before income taxes, CER basis(3) |
||||||||||||||||||||||||
| Net insurance service result |
$ | 1,940 | $ | 1,194 | $ | 611 | $ | – | $ | 239 | $ | 3,984 | ||||||||||||
| Net investment result |
484 | 252 | 235 | – | 919 | 1,890 | ||||||||||||||||||
| Global WAM |
– | – | – | 1,502 | – | 1,502 | ||||||||||||||||||
| Manulife Bank |
– | 251 | – | – | – | 251 | ||||||||||||||||||
| Other |
(174 | ) | (87 | ) | (90 | ) | 2 | (805 | ) | (1,154 | ) | |||||||||||||
| Net income (loss) before income taxes, CER basis |
$ | 2,250 | $ | 1,610 | $ | 756 | $ | 1,504 | $ | 353 | $ | 6,473 | ||||||||||||
| (1) | Consolidation adjustments in Other DOE line reclassified to net investment result DOE line. |
| (2) | The impact of updating foreign exchange rates to that which was used in 4Q23. |
| (3) | DOE on a CER basis adjusted to reflect the foreign exchange rates for the Statement of Income in effect for 4Q23. |
116 | 2023 Annual Report | Management’s Discussion and Analysis
Drivers of Earnings (“DOE”) – 2022
($ millions, pre-tax and based on actual foreign exchange rates in effect in the applicable reporting period, unless otherwise stated)
| 2022 | ||||||||||||||||||||||||
| Asia | Canada | U.S. | Global WAM | Corporate and Other |
Total | |||||||||||||||||||
| Net insurance service result |
$ | 1,554 | $ | 1,190 | $ | 533 | $ | – | $ | (117 | ) | $ | 3,160 | |||||||||||
| Transitional net investment result |
(484 | ) | 380 | 1,272 | – | (392 | ) | 776 | ||||||||||||||||
| Global WAM |
– | – | – | 1,291 | – | 1,291 | ||||||||||||||||||
| Manulife Bank |
– | 215 | – | – | – | 215 | ||||||||||||||||||
| Other |
(275 | ) | (85 | ) | (52 | ) | – | (847 | ) | (1,259 | ) | |||||||||||||
| Transitional net income (loss) before income taxes |
795 | 1,700 | 1,753 | 1,291 | (1,356 | ) | 4,183 | |||||||||||||||||
| Transitional income tax (expenses) recoveries |
(237 | ) | (458 | ) | (305 | ) | (170 | ) | 441 | (729 | ) | |||||||||||||
| Transitional net income (loss) |
558 | 1,242 | 1,448 | 1,121 | (915 | ) | 3,454 | |||||||||||||||||
| Less: Transitional net income (loss) attributed to NCI |
(114 | ) | – | – | – | (1 | ) | (115 | ) | |||||||||||||||
| Less: Transitional net income (loss) attributed to participating policyholders |
203 | (44 | ) | – | – | – | 159 | |||||||||||||||||
| Transitional net income (loss) attributed to shareholders (post-tax) |
$ | 647 | $ | 1,198 | $ | 1,448 | $ | 1,121 | $ | (916 | ) | $ | 3,498 | |||||||||||
Reconciliations of DOE line items to the consolidated financial statements and DOE presentation
| 2022 | ||||||||||||||||||||||||
| Asia | Canada | U.S. | Global WAM | Corporate and Other |
Total | |||||||||||||||||||
| Net insurance service result reconciliation |
||||||||||||||||||||||||
| Total insurance service result—financial statements |
$ | 1,554 | $ | 1,190 | $ | 533 | $ | – | $ | (117 | ) | $ | 3,160 | |||||||||||
| Less: Insurance service result attributed to: |
||||||||||||||||||||||||
| Items excluded from core earnings |
(34 | ) | 28 | 179 | – | (2 | ) | 171 | ||||||||||||||||
| NCI |
70 | – | – | – | – | 70 | ||||||||||||||||||
| Participating policyholders |
(73 | ) | 132 | – | – | – | 59 | |||||||||||||||||
| Core net insurance result |
$ | 1,591 | $ | 1,030 | $ | 354 | $ | – | $ | (115 | ) | $ | 2,860 | |||||||||||
| Core net insurance result, CER adjustment(1) |
34 | – | 14 | – | (6 | ) | 42 | |||||||||||||||||
| Core net insurance result, CER basis |
$ | 1,625 | $ | 1,030 | $ | 368 | $ | – | $ | (121 | ) | $ | 2,902 | |||||||||||
| Transitional net investment result reconciliation |
||||||||||||||||||||||||
| Total investment result per financial statements |
$ | (370 | ) | $ | (1,300 | ) | $ | (3,493 | ) | $ | (1,200 | ) | $ | (6 | ) | $ | (6,369 | ) | ||||||
| IFRS 9 transitional impacts |
(114 | ) | 2,667 | 4,765 | – | 4 | 7,322 | |||||||||||||||||
| Total including transitional impacts |
(484 | ) | 1,367 | 1,272 | (1,200 | ) | (2 | ) | 953 | |||||||||||||||
| Less: Reclassify net investment result in each of Manulife Bank in Canada and Global WAM to its own line of the DOE |
– | (977 | ) | – | 1,200 | – | 223 | |||||||||||||||||
| Less: Consolidation adjustments(2) |
– | – | – | – | (390 | ) | (390 | ) | ||||||||||||||||
| Less: Other |
– | (10 | ) | – | – | – | (10 | ) | ||||||||||||||||
| Transitional net investment result |
$ | (484 | ) | $ | 380 | $ | 1,272 | $ | – | $ | (392 | ) | $ | 776 | ||||||||||
| Less: Transitional net investment result attributed to: |
||||||||||||||||||||||||
| Items excluded from core earnings |
(1,158 | ) | (131 | ) | (316 | ) | – | (717 | ) | (2,322 | ) | |||||||||||||
| NCI |
51 | – | – | – | – | 51 | ||||||||||||||||||
| Participating policyholders |
(54 | ) | (31 | ) | – | – | – | (85 | ) | |||||||||||||||
| Core net investment result |
677 | 542 | 1,588 | – | 325 | 3,132 | ||||||||||||||||||
| Core net investment result, CER adjustment(1) |
3 | – | 72 | – | – | 75 | ||||||||||||||||||
| Core net investment result, CER basis |
$ | 680 | $ | 542 | $ | 1,660 | $ | – | $ | 325 | $ | 3,207 | ||||||||||||
| Manulife Bank and Global WAM by DOE line reconciliation |
||||||||||||||||||||||||
| Manulife Bank and Global WAM net income attributed to shareholders |
$ | – | $ | 215 | $ | – | $ | 1,291 | $ | – | $ | 1,506 | ||||||||||||
| Less: Manulife Bank and Global WAM attributed to: |
||||||||||||||||||||||||
| Items excluded from core earnings |
– | (15 | ) | – | (230 | ) | – | (245 | ) | |||||||||||||||
| Core earnings in Manulife Bank and Global WAM |
$ | – | $ | 230 | $ | – | $ | 1,521 | $ | – | $ | 1,751 | ||||||||||||
| Core earnings in Manulife Bank and Global WAM, CER adjustment(1) |
– | – | – | 44 | – | 44 | ||||||||||||||||||
| Core earnings in Manulife Bank and Global WAM, CER basis |
$ | – | $ | 230 | $ | – | $ | 1,565 | $ | – | $ | 1,795 | ||||||||||||
| (1) | The impact of updating foreign exchange rates to that which was used in 4Q23. |
| (2) | Consolidation adjustments in Other DOE line reclassified to net investment result DOE line. |
|
|
117 |
Drivers of Earnings (“DOE”) – 2022 (continued)
| 2022 | ||||||||||||||||||||||||
| Asia | Canada | U.S. | Global WAM | Corporate and Other |
Total | |||||||||||||||||||
| Other reconciliation |
||||||||||||||||||||||||
| Other revenue per financial statements |
$ | 56 | $ | 262 | $ | 101 | $ | 6,391 | $ | (624 | ) | $ | 6,186 | |||||||||||
| General expenses per financial statements |
(303 | ) | (518 | ) | (140 | ) | (2,583 | ) | (187 | ) | (3,731 | ) | ||||||||||||
| Commission related to non-insurance contracts |
(15 | ) | (55 | ) | 4 | (1,310 | ) | 43 | (1,333 | ) | ||||||||||||||
| Interest expense per financial statements |
(12 | ) | (548 | ) | (16 | ) | (7 | ) | (468 | ) | (1,051 | ) | ||||||||||||
| Total financial statements values included in Other |
(274 | ) | (859 | ) | (51 | ) | 2,491 | (1,236 | ) | 71 | ||||||||||||||
| Less: Reclassify Other in each of Manulife Bank in Canada and Global WAM to its own line of the DOE |
– | 762 | – | (2,491 | ) | – | (1,729 | ) | ||||||||||||||||
| Less: Consolidation adjustments(1) |
– | – | – | – | 389 | 389 | ||||||||||||||||||
| Other |
(1 | ) | 12 | (1 | ) | – | – | 10 | ||||||||||||||||
| Other |
(275 | ) | (85 | ) | (52 | ) | – | (847 | ) | (1,259 | ) | |||||||||||||
| Less: Other attributed to: |
||||||||||||||||||||||||
| Items excluded from core earnings |
(29 | ) | – | (17 | ) | – | (258 | ) | (304 | ) | ||||||||||||||
| NCI |
7 | – | – | – | – | 7 | ||||||||||||||||||
| Participating policyholders |
(14 | ) | (1 | ) | – | – | – | (15 | ) | |||||||||||||||
| Add: Par earnings transfer to shareholders |
46 | 4 | – | – | – | 50 | ||||||||||||||||||
| Core Other |
(193 | ) | (80 | ) | (35 | ) | – | (589 | ) | (897 | ) | |||||||||||||
| Core Other, CER adjustment(2) |
(3 | ) | – | (2 | ) | – | 1 | (4 | ) | |||||||||||||||
| Core Other, CER basis |
$ | (196 | ) | $ | (80 | ) | $ | (37 | ) | $ | – | $ | (588 | ) | $ | (901 | ) | |||||||
| Income tax recoveries (expenses) reconciliation |
||||||||||||||||||||||||
| Income tax recoveries (expenses) per financial statements |
$ | (318 | ) | $ | 510 | $ | 695 | $ | (170 | ) | $ | 442 | $ | 1,159 | ||||||||||
| IFRS 9 transitional impacts |
81 | (968 | ) | (1,000 | ) | – | (1 | ) | (1,888 | ) | ||||||||||||||
| Transitional income tax recoveries (expenses) |
(237 | ) | (458 | ) | (305 | ) | (170 | ) | 441 | (729 | ) | |||||||||||||
| Less: Transitional income tax recoveries (expenses) attributed to: |
||||||||||||||||||||||||
| Items excluded from core earnings |
54 | (71 | ) | 36 | 52 | 325 | 396 | |||||||||||||||||
| NCI |
(12 | ) | – | – | – | – | (12 | ) | ||||||||||||||||
| Participating policyholders |
(16 | ) | (52 | ) | – | – | – | (68 | ) | |||||||||||||||
| Core income tax recoveries (expenses) |
(263 | ) | (335 | ) | (341 | ) | (222 | ) | 116 | (1,045 | ) | |||||||||||||
| Core income tax recoveries (expenses), CER adjustment(2) |
(4 | ) | – | (15 | ) | (4 | ) | – | (23 | ) | ||||||||||||||
| Core income tax recoveries (expenses), CER basis |
$ | (267 | ) | $ | (335 | ) | $ | (356 | ) | $ | (226 | ) | $ | 116 | $ | (1,068 | ) | |||||||
| Net income (loss) attributed to NCI |
$ | 120 | $ | – | $ | – | $ | – | $ | 1 | $ | 121 | ||||||||||||
| IFRS 9 transitional impacts |
(6 | ) | – | – | – | – | (6 | ) | ||||||||||||||||
| Transitional net income (loss) to NCI |
$ | 114 | $ | – | $ | – | $ | – | $ | 1 | $ | 115 | ||||||||||||
| Net income (loss) attributed to participating policyholders |
$ | (211 | ) | $ | 44 | $ | – | $ | – | $ | – | $ | (167 | ) | ||||||||||
| IFRS 9 transitional impacts |
8 | – | – | – | – | 8 | ||||||||||||||||||
| Transitional net income (loss) to participating policyholders |
$ | (203 | ) | $ | 44 | $ | – | $ | – | $ | – | $ | (159 | ) | ||||||||||
| Transitional net income (loss) before income taxes, CER basis(3) |
||||||||||||||||||||||||
| Net insurance service result |
$ | 1,572 | $ | 1,190 | $ | 560 | $ | – | $ | (122 | ) | $ | 3,200 | |||||||||||
| Net investment result |
(466 | ) | 380 | 1,375 | – | (391 | ) | 898 | ||||||||||||||||
| Global WAM |
– | – | – | 1,332 | – | 1,332 | ||||||||||||||||||
| Manulife Bank |
– | 215 | – | – | – | 215 | ||||||||||||||||||
| Other |
(280 | ) | (85 | ) | (56 | ) | – | (847 | ) | (1,268 | ) | |||||||||||||
| Transitional net income (loss) before income taxes, CER basis |
$ | 826 | $ | 1,700 | $ | 1,879 | $ | 1,332 | $ | (1,360 | ) | $ | 4,377 | |||||||||||
| (1) | Consolidation adjustments in Other DOE line reclassified to net investment result DOE line. |
| (2) | The impact of updating foreign exchange rates to that which was used in 4Q23. |
| (3) | DOE on a CER basis adjusted to reflect the foreign exchange rates for the Statement of Income in effect for 4Q23. |
118 | 2023 Annual Report | Management’s Discussion and Analysis
Drivers of Earnings (“DOE”) – 4Q23
($ millions, pre-tax and based on actual foreign exchange rates in effect in the applicable reporting period, unless otherwise stated)
| 4Q23 | ||||||||||||||||||||||||
| Asia | Canada | U.S. | Global WAM | Corporate and Other |
Total | |||||||||||||||||||
| Net insurance service result |
$ | 644 | $ | 306 | $ | 195 | $ | – | $ | 91 | $ | 1,236 | ||||||||||||
| Net investment result |
285 | 137 | 72 | – | 182 | 676 | ||||||||||||||||||
| Global WAM |
– | – | – | 425 | – | 425 | ||||||||||||||||||
| Manulife Bank |
– | 72 | – | – | – | 72 | ||||||||||||||||||
| Other |
(82 | ) | (17 | ) | (23 | ) | (1 | ) | (163 | ) | (286 | ) | ||||||||||||
| Net income (loss) before income taxes |
847 | 498 | 244 | 424 | 110 | 2,123 | ||||||||||||||||||
| Income tax (expenses) recoveries |
(109 | ) | (116 | ) | (46 | ) | (58 | ) | 7 | (322 | ) | |||||||||||||
| Net income (loss) |
738 | 382 | 198 | 366 | 117 | 1,801 | ||||||||||||||||||
| Less: Net income (loss) attributed to NCI |
(37 | ) | – | – | (1 | ) | (1 | ) | (39 | ) | ||||||||||||||
| Less: Net income (loss) attributed to participating policyholders |
(86) | (17 | ) | – | – | – | (103 | ) | ||||||||||||||||
| Net income (loss) attributed to shareholders (post-tax) |
$ | 615 | $ | 365 | $ | 198 | $ | 365 | $ | 116 | $ | 1,659 | ||||||||||||
Reconciliations of DOE line items to the consolidated financial statements and DOE presentation
| 4Q23 | ||||||||||||||||||||||||
| Asia | Canada | U.S. | Global WAM | Corporate and Other |
Total | |||||||||||||||||||
| Net insurance service result reconciliation |
||||||||||||||||||||||||
| Total insurance service result—financial statements |
$ | 644 | $ | 306 | $ | 195 | $ | – | $ | 91 | $ | 1,236 | ||||||||||||
| Less: Insurance service result attributed to: |
||||||||||||||||||||||||
| Items excluded from core earnings |
130 | 12 | 21 | – | (2 | ) | 161 | |||||||||||||||||
| NCI |
19 | – | – | – | 1 | 20 | ||||||||||||||||||
| Participating policyholders |
60 | 39 | – | – | – | 99 | ||||||||||||||||||
| Core net insurance result |
435 | 255 | 174 | – | 92 | 956 | ||||||||||||||||||
| Core net insurance result, CER adjustment(1) |
– | – | – | – | – | – | ||||||||||||||||||
| Core net insurance result, CER basis |
$ | 435 | $ | 255 | $ | 174 | $ | – | $ | 92 | $ | 956 | ||||||||||||
| Total investment result reconciliation |
||||||||||||||||||||||||
| Total investment result per financial statements |
$ | 285 | $ | 511 | $ | 72 | $ | (139 | ) | $ | 344 | $ | 1,073 | |||||||||||
| Less: Reclassify net investment result in each of Manulife Bank in Canada and Global WAM to its own line of the DOE |
– | (377 | ) | – | 139 | – | (238 | ) | ||||||||||||||||
| Less: Consolidation adjustments(2) |
– | – | – | – | (162 | ) | (162 | ) | ||||||||||||||||
| Less: Other |
– | 3 | – | – | – | 3 | ||||||||||||||||||
| Net investment result |
285 | 137 | 72 | – | 182 | 676 | ||||||||||||||||||
| Less: Net investment result attributed to: |
||||||||||||||||||||||||
| Items excluded from core earnings |
(47 | ) | 9 | (359 | ) | – | 39 | (358 | ) | |||||||||||||||
| NCI |
37 | – | – | – | – | 37 | ||||||||||||||||||
| Participating policyholders |
50 | (10 | ) | – | – | – | 40 | |||||||||||||||||
| Core net investment result |
245 | 138 | 431 | – | 143 | 957 | ||||||||||||||||||
| Core net investment result, CER adjustment(1) |
– | – | – | – | – | – | ||||||||||||||||||
| Core net investment result, CER basis |
$ | 245 | $ | 138 | $ | 431 | $ | – | $ | 143 | $ | 957 | ||||||||||||
| Manulife Bank and Global WAM by DOE line reconciliation |
||||||||||||||||||||||||
| Manulife Bank and Global WAM net income attributed to shareholders |
$ | – | $ | 72 | $ | – | $ | 424 | $ | – | $ | 496 | ||||||||||||
| Less: Manulife Bank and Global WAM attributed to: |
||||||||||||||||||||||||
| Items excluded from core earnings |
– | 8 | – | 16 | – | 24 | ||||||||||||||||||
| Core earnings in Manulife Bank and Global WAM |
– | 64 | – | 408 | – | 472 | ||||||||||||||||||
| Core earnings in Manulife Bank and Global WAM, CER adjustment(1) |
– | – | – | – | – | – | ||||||||||||||||||
| Core earnings in Manulife Bank and Global WAM, CER basis |
$ | – | $ | 64 | $ | – | $ | 408 | $ | – | $ | 472 | ||||||||||||
| (1) | The impact of updating foreign exchange rates to that which was used in 4Q23. |
| (2) | Consolidation adjustments in Other DOE line reclassified to net investment result DOE line. |
|
|
119 |
Drivers of Earnings (“DOE”) – 4Q23 (continued)
| 4Q23 | ||||||||||||||||||||||||
| Asia | Canada | U.S. | Global WAM | Corporate and Other |
Total | |||||||||||||||||||
| Other reconciliation |
||||||||||||||||||||||||
| Other revenue per financial statements |
$ | (16 | ) | $ | 75 | $ | 8 | $ | 1,688 | $ | (36 | ) | $ | 1,719 | ||||||||||
| General expenses per financial statements |
(59 | ) | (136 | ) | (28 | ) | (793 | ) | (164 | ) | (1,180 | ) | ||||||||||||
| Commission related to non-insurance contracts |
(3 | ) | (12 | ) | 1 | (330 | ) | 9 | (335 | ) | ||||||||||||||
| Interest expense per financial statements |
(4 | ) | (246 | ) | (4 | ) | (2 | ) | (134 | ) | (390 | ) | ||||||||||||
| Total financial statements values included in Other |
(82 | ) | (319 | ) | (23 | ) | 563 | (325 | ) | (186 | ) | |||||||||||||
| Less: Reclassify Other in each of Manulife Bank in Canada and Global WAM to its own line of the DOE |
– | 305 | – | (564 | ) | – | (259 | ) | ||||||||||||||||
| Less: Consolidation adjustments(1) |
– | – | – | – | 162 | 162 | ||||||||||||||||||
| Other |
– | (3 | ) | – | – | – | (3 | ) | ||||||||||||||||
| Other |
(82 | ) | (17 | ) | (23 | ) | (1 | ) | (163 | ) | (286 | ) | ||||||||||||
| Less: Other attributed to: |
||||||||||||||||||||||||
| Items excluded from core earnings |
(26 | ) | 4 | (5 | ) | (2 | ) | 79 | 50 | |||||||||||||||
| NCI |
(2 | ) | – | – | 1 | – | (1 | ) | ||||||||||||||||
| Participating policyholders |
(4 | ) | (1 | ) | – | – | – | (5 | ) | |||||||||||||||
| Add: Par earnings transfer to shareholders |
10 | 2 | – | – | – | 12 | ||||||||||||||||||
| Core Other |
(40 | ) | (18 | ) | (18 | ) | – | (242 | ) | (318 | ) | |||||||||||||
| Core Other, CER adjustment(2) |
– | – | – | – | – | – | ||||||||||||||||||
| Core Other, CER basis |
$ | (40 | ) | $ | (18 | ) | $ | (18 | ) | $ | – | $ | (242 | ) | $ | (318 | ) | |||||||
| Income tax recoveries (expenses) reconciliation |
||||||||||||||||||||||||
| Income tax recoveries (expenses) per financial statements |
$ | (109 | ) | $ | (116 | ) | $ | (46 | ) | $ | (58 | ) | $ | 7 | $ | (322 | ) | |||||||
| Less: Income tax recoveries (expenses) attributed to: |
||||||||||||||||||||||||
| Items excluded from core earnings |
(6 | ) | (20 | ) | 67 | (3 | ) | (30 | ) | 8 | ||||||||||||||
| NCI |
(17 | ) | – | – | – | – | (17 | ) | ||||||||||||||||
| Participating policyholders |
(10 | ) | (9 | ) | – | – | – | (19 | ) | |||||||||||||||
| Core income tax recoveries (expenses) |
(76 | ) | (87 | ) | (113 | ) | (55 | ) | 37 | (294 | ) | |||||||||||||
| Core income tax recoveries (expenses), CER adjustment(2) |
– | – | – | – | – | – | ||||||||||||||||||
| Core income tax recoveries (expenses), CER basis |
$ | (76 | ) | $ | (87 | ) | $ | (113 | ) | $ | (55 | ) | $ | 37 | $ | (294 | ) | |||||||
| Net income (loss) before income taxes, CER basis(3) |
||||||||||||||||||||||||
| Net insurance service result |
$ | 644 | $ | 306 | $ | 195 | $ | – | $ | 91 | $ | 1,236 | ||||||||||||
| Net investment result |
285 | 137 | 72 | – | 182 | 676 | ||||||||||||||||||
| Global WAM |
– | – | – | 425 | – | 425 | ||||||||||||||||||
| Manulife Bank |
– | 72 | – | – | – | 72 | ||||||||||||||||||
| Other |
(82 | ) | (17 | ) | (23 | ) | (1 | ) | (163 | ) | (286 | ) | ||||||||||||
| Net income (loss) before income taxes, CER basis |
$ | 847 | $ | 498 | $ | 244 | $ | 424 | $ | 110 | $ | 2,123 | ||||||||||||
| (1) | Consolidation adjustments in Other DOE line reclassified to net investment result DOE line. |
| (2) | The impact of updating foreign exchange rates to that which was used in 4Q23. |
| (3) | DOE on a CER basis adjusted to reflect the foreign exchange rates for the Statement of Income in effect for 4Q23. |
120 | 2023 Annual Report | Management’s Discussion and Analysis
Drivers of Earnings (“DOE”) – 3Q23
($ millions, pre-tax and based on actual foreign exchange rates in effect in the applicable reporting period, unless otherwise stated)
| 3Q23 | ||||||||||||||||||||||||
| Asia | Canada | U.S. | Global WAM | Corporate and Other |
Total | |||||||||||||||||||
| Net insurance service result |
$ | 467 | $ | 366 | $ | 108 | $ | – | $ | 64 | $ | 1,005 | ||||||||||||
| Net investment result |
4 | (14 | ) | (45 | ) | – | 142 | 87 | ||||||||||||||||
| Global WAM |
– | – | – | 365 | – | 365 | ||||||||||||||||||
| Manulife Bank |
– | 55 | – | – | – | 55 | ||||||||||||||||||
| Other |
(32 | ) | (31 | ) | 5 | 1 | (281 | ) | (338 | ) | ||||||||||||||
| Net income (loss) before income taxes |
439 | 376 | 68 | 366 | (75 | ) | 1,174 | |||||||||||||||||
| Income tax (expenses) recoveries |
(135 | ) | (94 | ) | 4 | (48 | ) | 324 | 51 | |||||||||||||||
| Net income (loss) |
304 | 282 | 72 | 318 | 249 | 1,225 | ||||||||||||||||||
| Less: Net income (loss) attributed to NCI |
(25 | ) | – | – | – | – | (25 | ) | ||||||||||||||||
| Less: Net income (loss) attributed to participating policyholders |
(195 | ) | 8 | – | – | – | (187 | ) | ||||||||||||||||
| Net income (loss) attributed to shareholders (post-tax) |
$ | 84 | $ | 290 | $ | 72 | $ | 318 | $ | 249 | $ | 1,013 | ||||||||||||
Reconciliations of DOE line items to the consolidated financial statements and DOE presentation
| 3Q23 | ||||||||||||||||||||||||
| Asia | Canada | U.S. | Global WAM | Corporate and Other |
Total | |||||||||||||||||||
| Net insurance service result reconciliation |
||||||||||||||||||||||||
| Total insurance service result - financial statements |
$ | 467 | $ | 366 | $ | 108 | $ | – | $ | 64 | $ | 1,005 | ||||||||||||
| Less: Insurance service result attributed to: |
||||||||||||||||||||||||
| Items excluded from core earnings |
(112 | ) | 11 | (51 | ) | – | (1 | ) | (153 | ) | ||||||||||||||
| NCI |
15 | – | – | – | – | 15 | ||||||||||||||||||
| Participating policyholders |
177 | 21 | – | – | – | 198 | ||||||||||||||||||
| Core net insurance result |
387 | 334 | 159 | – | 65 | 945 | ||||||||||||||||||
| Core net insurance result, CER adjustment(1) |
4 | – | 2 | – | 1 | 7 | ||||||||||||||||||
| Core net insurance result, CER basis |
$ | 391 | $ | 334 | $ | 161 | $ | – | $ | 66 | $ | 952 | ||||||||||||
| Total investment result reconciliation |
||||||||||||||||||||||||
| Total investment result per financial statements |
$ | 4 | $ | 389 | $ | (45 | ) | $ | (303 | ) | $ | 273 | $ | 318 | ||||||||||
| Less: Reclassify net investment result in each of Manulife Bank in Canada and Global WAM to its own line of the DOE |
– | (380 | ) | – | 303 | – | (77 | ) | ||||||||||||||||
| Less: Consolidation adjustments(2) |
– | – | – | – | (131 | ) | (131 | ) | ||||||||||||||||
| Less: Other |
– | (23 | ) | – | – | – | (23 | ) | ||||||||||||||||
| Net investment result |
4 | (14 | ) | (45 | ) | – | 142 | 87 | ||||||||||||||||
| Less: Net investment result attributed to: |
||||||||||||||||||||||||
| Items excluded from core earnings |
(274 | ) | (130 | ) | (418 | ) | – | (5 | ) | (827 | ) | |||||||||||||
| NCI |
17 | – | – | – | – | 17 | ||||||||||||||||||
| Participating policyholders |
28 | (21 | ) | – | – | – | 7 | |||||||||||||||||
| Core net investment result |
233 | 137 | 373 | – | 147 | 890 | ||||||||||||||||||
| Core net investment result, CER adjustment(1) |
1 | (1 | ) | 6 | – | – | 6 | |||||||||||||||||
| Core net investment result, CER basis |
$ | 234 | $ | 136 | $ | 379 | $ | – | $ | 147 | $ | 896 | ||||||||||||
| Manulife Bank and Global WAM by DOE line reconciliation |
||||||||||||||||||||||||
| Manulife Bank and Global WAM net income attributed to shareholders |
$ | – | $ | 55 | $ | – | $ | 365 | $ | – | $ | 420 | ||||||||||||
| Less: Manulife Bank and Global WAM attributed to: |
||||||||||||||||||||||||
| Items excluded from core earnings |
– | (11 | ) | – | (55 | ) | – | (66 | ) | |||||||||||||||
| Core earnings in Manulife Bank and Global WAM |
– | 66 | – | 420 | – | 486 | ||||||||||||||||||
| Core earnings in Manulife Bank and Global WAM, CER adjustment(1) |
– | – | – | 4 | – | 4 | ||||||||||||||||||
| Core earnings in Manulife Bank and Global WAM, CER basis |
$ | – | $ | 66 | $ | – | $ | 424 | $ | – | $ | 490 | ||||||||||||
| (1) | The impact of updating foreign exchange rates to that which was used in 4Q23. |
| (2) | Consolidation adjustments in Other DOE line reclassified to net investment result DOE line. |
|
|
121 |
Drivers of Earnings (“DOE”) – 3Q23 (continued)
| 3Q23 | ||||||||||||||||||||||||
| Asia | Canada | U.S. | Global WAM | Corporate and Other |
Total | |||||||||||||||||||
| Other reconciliation |
||||||||||||||||||||||||
| Other revenue per financial statements |
$ | 26 | $ | 53 | $ | 31 | $ | 1,709 | $ | (174 | ) | $ | 1,645 | |||||||||||
| General expenses per financial statements |
(52 | ) | (128 | ) | (29 | ) | (703 | ) | (129 | ) | (1,041 | ) | ||||||||||||
| Commission related to non-insurance contracts |
(3 | ) | (14 | ) | 6 | (334 | ) | 9 | (336 | ) | ||||||||||||||
| Interest expense per financial statements |
(3 | ) | (290 | ) | (3 | ) | (1 | ) | (119 | ) | (416 | ) | ||||||||||||
| Total financial statements values included in Other |
(32 | ) | (379 | ) | 5 | 671 | (413 | ) | (148 | ) | ||||||||||||||
| Less: Reclassify Other in each of Manulife Bank in Canada and Global WAM to its own line of the DOE |
– | 325 | – | (670 | ) | – | (345 | ) | ||||||||||||||||
| Less: Consolidation adjustments(1) |
– | – | – | – | 132 | 132 | ||||||||||||||||||
| Other |
– | 23 | – | – | – | 23 | ||||||||||||||||||
| Other |
(32 | ) | (31 | ) | 5 | 1 | (281 | ) | (338 | ) | ||||||||||||||
| Less: Other attributed to: |
||||||||||||||||||||||||
| Items excluded from core earnings |
5 | (4 | ) | 2 | – | (49 | ) | (46 | ) | |||||||||||||||
| NCI |
2 | – | – | 1 | – | 3 | ||||||||||||||||||
| Participating policyholders |
3 | (5 | ) | – | – | – | (2 | ) | ||||||||||||||||
| Add: Par earnings transfer to shareholders |
6 | 2 | – | – | – | 8 | ||||||||||||||||||
| Core Other |
(36 | ) | (20 | ) | 3 | – | (232 | ) | (285 | ) | ||||||||||||||
| Core Other, CER adjustment(2) |
– | 1 | – | – | (1 | ) | – | |||||||||||||||||
| Core Other, CER basis |
$ | (36 | ) | $ | (19 | ) | $ | 3 | $ | – | $ | (233 | ) | $ | (285 | ) | ||||||||
| Income tax recoveries (expenses) reconciliation |
||||||||||||||||||||||||
| Income tax recoveries (expenses) per financial statements |
$ | (135 | ) | $ | (94 | ) | $ | 4 | $ | (48 | ) | $ | 324 | $ | 51 | |||||||||
| Less: Income tax recoveries (expenses) attributed to: |
||||||||||||||||||||||||
| Items excluded from core earnings |
(58 | ) | 16 | 97 | 12 | 294 | 361 | |||||||||||||||||
| NCI |
(9 | ) | – | – | (1 | ) | – | (10 | ) | |||||||||||||||
| Participating policyholders |
(6 | ) | (1 | ) | – | – | – | (7 | ) | |||||||||||||||
| Core income tax recoveries (expenses) |
(62 | ) | (109 | ) | (93 | ) | (59 | ) | 30 | (293 | ) | |||||||||||||
| Core income tax recoveries (expenses), CER adjustment(2) |
– | – | (2 | ) | – | – | (2 | ) | ||||||||||||||||
| Core income tax recoveries (expenses), CER basis |
$ | (62 | ) | $ | (109 | ) | $ | (95 | ) | $ | (59 | ) | $ | 30 | $ | (295 | ) | |||||||
| Net income (loss) before income taxes, CER basis(3) |
||||||||||||||||||||||||
| Net insurance service result |
$ | 473 | $ | 366 | $ | 109 | $ | – | $ | 66 | $ | 1,014 | ||||||||||||
| Net investment result |
3 | (14 | ) | (45 | ) | – | 141 | 85 | ||||||||||||||||
| Global WAM |
– | – | – | 369 | – | 369 | ||||||||||||||||||
| Manulife Bank |
– | 55 | – | – | – | 55 | ||||||||||||||||||
| Other |
(33 | ) | (31 | ) | 6 | – | (281 | ) | (339 | ) | ||||||||||||||
| Net income (loss) before income taxes, CER basis |
$ | 443 | $ | 376 | $ | 70 | $ | 369 | $ | (74 | ) | $ | 1,184 | |||||||||||
| (1) | Consolidation adjustments in Other DOE line reclassified to net investment result DOE line. |
| (2) | The impact of updating foreign exchange rates to that which was used in 4Q23. |
| (3) | DOE on a CER basis adjusted to reflect the foreign exchange rates for the Statement of Income in effect for 4Q23. |
122 | 2023 Annual Report | Management’s Discussion and Analysis
Drivers of Earnings (“DOE”) – 2Q23
($ millions, pre-tax and based on actual foreign exchange rates in effect in the applicable reporting period, unless otherwise stated)
| 2Q23 | ||||||||||||||||||||||||
| Asia | Canada | U.S. | Global WAM | Corporate and Other |
Total | |||||||||||||||||||
| Net insurance service result |
$ | 460 | $ | 262 | $ | 131 | $ | – | $ | 34 | $ | 887 | ||||||||||||
| Net investment result |
(96 | ) | 12 | 105 | – | 351 | 372 | |||||||||||||||||
| Global WAM |
– | – | – | 362 | – | 362 | ||||||||||||||||||
| Manulife Bank |
– | 59 | – | – | – | 59 | ||||||||||||||||||
| Other |
(19 | ) | (21 | ) | (16 | ) | – | (188 | ) | (244 | ) | |||||||||||||
| Net income (loss) before income taxes |
345 | 312 | 220 | 362 | 197 | 1,436 | ||||||||||||||||||
| Income tax (expenses) recoveries |
(91 | ) | (64 | ) | (37 | ) | (44 | ) | (29 | ) | (265 | ) | ||||||||||||
| Net income (loss) |
254 | 248 | 183 | 318 | 168 | 1,171 | ||||||||||||||||||
| Less: Net income (loss) attributed to NCI |
(25 | ) | – | – | (1 | ) | – | (26 | ) | |||||||||||||||
| Less: Net income (loss) attributed to participating policyholders |
(99 | ) | (21 | ) | – | – | – | (120 | ) | |||||||||||||||
| Net income (loss) attributed to shareholders (post-tax) |
$ | 130 | $ | 227 | $ | 183 | $ | 317 | $ | 168 | $ | 1,025 | ||||||||||||
Reconciliations of DOE line items to the consolidated financial statements and DOE presentation
| 2Q23 | ||||||||||||||||||||||||
| Asia | Canada | U.S. | Global WAM | Corporate and Other |
Total | |||||||||||||||||||
| Net insurance service result reconciliation |
||||||||||||||||||||||||
| Total insurance service result - financial statements |
$ | 460 | $ | 262 | $ | 131 | $ | – | $ | 34 | $ | 887 | ||||||||||||
| Less: Insurance service result attributed to: |
||||||||||||||||||||||||
| Items excluded from core earnings |
(44 | ) | (4 | ) | (26 | ) | – | 1 | (73 | ) | ||||||||||||||
| NCI |
13 | – | – | – | – | 13 | ||||||||||||||||||
| Participating policyholders |
122 | 21 | – | – | – | 143 | ||||||||||||||||||
| Core net insurance result |
369 | 245 | 157 | – | 33 | 804 | ||||||||||||||||||
| Core net insurance result, CER adjustment(1) |
(3 | ) | (1 | ) | 4 | – | 1 | 1 | ||||||||||||||||
| Core net insurance result, CER basis |
$ | 366 | $ | 244 | $ | 161 | $ | – | $ | 34 | $ | 805 | ||||||||||||
| Total investment result reconciliation |
||||||||||||||||||||||||
| Total investment result per financial statements |
$ | (96 | ) | $ | 354 | $ | 105 | $ | (244 | ) | $ | 478 | $ | 597 | ||||||||||
| Less: Reclassify net investment result in each of Manulife Bank in Canada and Global WAM to its own line of the DOE |
– | (342 | ) | – | 244 | – | (98 | ) | ||||||||||||||||
| Less: Consolidation adjustments(2) |
– | – | – | – | (127 | ) | (127 | ) | ||||||||||||||||
| Less: Other |
– | – | – | – | – | – | ||||||||||||||||||
| Net investment result |
(96 | ) | 12 | 105 | – | 351 | 372 | |||||||||||||||||
| Less: Net investment result attributed to: |
||||||||||||||||||||||||
| Items excluded from core earnings |
(318 | ) | (184 | ) | (319 | ) | – | 183 | (638 | ) | ||||||||||||||
| NCI |
14 | – | – | – | – | 14 | ||||||||||||||||||
| Participating policyholders |
(7 | ) | 14 | – | – | – | 7 | |||||||||||||||||
| Core net investment result |
215 | 182 | 424 | – | 168 | 989 | ||||||||||||||||||
| Core net investment result, CER adjustment(1) |
(5 | ) | 1 | 5 | – | – | 1 | |||||||||||||||||
| Core net investment result, CER basis |
$ | 210 | $ | 183 | $ | 429 | $ | – | $ | 168 | $ | 990 | ||||||||||||
| Manulife Bank and Global WAM by DOE line reconciliation |
||||||||||||||||||||||||
| Manulife Bank and Global WAM net income attributed to shareholders |
$ | – | $ | 59 | $ | – | $ | 362 | $ | – | $ | 421 | ||||||||||||
| Less: Manulife Bank and Global WAM attributed to: |
||||||||||||||||||||||||
| Items excluded from core earnings |
– | – | – | (3 | ) | – | (3 | ) | ||||||||||||||||
| Core earnings in Manulife Bank and Global WAM |
– | 59 | – | 365 | – | 424 | ||||||||||||||||||
| Core earnings in Manulife Bank and Global WAM, CER adjustment(1) |
– | – | – | 2 | – | 2 | ||||||||||||||||||
| Core earnings in Manulife Bank and Global WAM, CER basis |
$ | – | $ | 59 | $ | – | $ | 367 | $ | – | $ | 426 | ||||||||||||
| (1) | The impact of updating foreign exchange rates to that which was used in 4Q23. |
| (2) | Consolidation adjustments in Other DOE line reclassified to net investment result DOE line. |
|
|
123 |
Drivers of Earnings (“DOE”) – 2Q23 (continued)
| 2Q23 | ||||||||||||||||||||||||
| Asia | Canada | U.S. | Global WAM | Corporate and Other |
Total | |||||||||||||||||||
| Other reconciliation |
||||||||||||||||||||||||
| Other revenue per financial statements |
$ | 47 | $ | 72 | $ | 16 | $ | 1,647 | $ | (91 | ) | $ | 1,691 | |||||||||||
| General expenses per financial statements |
(61 | ) | (127 | ) | (25 | ) | (709 | ) | (101 | ) | (1,023 | ) | ||||||||||||
| Commission related to non-insurance contracts |
(2 | ) | (13 | ) | (3 | ) | (329 | ) | 11 | (336 | ) | |||||||||||||
| Interest expense per financial statements |
(3 | ) | (236 | ) | (4 | ) | (5 | ) | (133 | ) | (381 | ) | ||||||||||||
| Total financial statements values included in Other |
(19 | ) | (304 | ) | (16 | ) | 604 | (314 | ) | (49 | ) | |||||||||||||
| Less: Reclassify Other in each of Manulife Bank in Canada and Global WAM to its own line of the DOE |
– | 283 | – | (604 | ) | – | (321 | ) | ||||||||||||||||
| Less: Consolidation adjustments(1) |
– | – | – | – | 126 | 126 | ||||||||||||||||||
| Other |
– | – | – | – | – | – | ||||||||||||||||||
| Other |
(19 | ) | (21 | ) | (16 | ) | – | (188 | ) | (244 | ) | |||||||||||||
| Less: Other attributed to: |
||||||||||||||||||||||||
| Items excluded from core earnings |
23 | (1 | ) | (3 | ) | – | 19 | 38 | ||||||||||||||||
| NCI |
4 | – | – | – | – | 4 | ||||||||||||||||||
| Participating policyholders |
1 | (3 | ) | – | – | – | (2 | ) | ||||||||||||||||
| Add: Par earnings transfer to shareholders |
9 | 2 | – | – | – | 11 | ||||||||||||||||||
| Core Other |
(38 | ) | (15 | ) | (13 | ) | – | (207 | ) | (273 | ) | |||||||||||||
| Core Other, CER adjustment(2) |
1 | – | – | – | – | 1 | ||||||||||||||||||
| Core Other, CER basis |
$ | (37 | ) | $ | (15 | ) | $ | (13 | ) | $ | – | $ | (207 | ) | $ | (272 | ) | |||||||
| Income tax recoveries (expenses) reconciliation |
||||||||||||||||||||||||
| Income tax recoveries (expenses) per financial statements |
$ | (91 | ) | $ | (64 | ) | $ | (37 | ) | $ | (44 | ) | $ | (29 | ) | $ | (265 | ) | ||||||
| Less: Income tax recoveries (expenses) attributed to: |
||||||||||||||||||||||||
| Items excluded from core earnings |
(4 | ) | 42 | 73 | 1 | (47 | ) | 65 | ||||||||||||||||
| NCI |
(6 | ) | – | – | – | – | (6 | ) | ||||||||||||||||
| Participating policyholders |
(8 | ) | (9 | ) | – | – | – | (17 | ) | |||||||||||||||
| Core income tax recoveries (expenses) |
(73 | ) | (97 | ) | (110 | ) | (45 | ) | 18 | (307 | ) | |||||||||||||
| Core income tax recoveries (expenses), CER adjustment(2) |
2 | – | (1 | ) | – | (1 | ) | – | ||||||||||||||||
| Core income tax recoveries (expenses), CER basis |
$ | (71 | ) | $ | (97 | ) | $ | (111 | ) | $ | (45 | ) | $ | 17 | $ | (307 | ) | |||||||
| Net income (loss) before income taxes, CER basis (3) |
||||||||||||||||||||||||
| Net insurance service result |
$ | 457 | $ | 262 | $ | 134 | $ | – | $ | 34 | $ | 887 | ||||||||||||
| Net investment result |
(81 | ) | 12 | 106 | – | 352 | 389 | |||||||||||||||||
| Global WAM |
– | – | – | 364 | – | 364 | ||||||||||||||||||
| Manulife Bank |
– | 59 | – | – | – | 59 | ||||||||||||||||||
| Other |
(19 | ) | (21 | ) | (17 | ) | – | (188 | ) | (245 | ) | |||||||||||||
| Net income (loss) before income taxes, CER basis |
$ | 357 | $ | 312 | $ | 223 | $ | 364 | $ | 198 | $ | 1,454 | ||||||||||||
| (1) | Consolidation adjustments in Other DOE line reclassified to net investment result DOE line. |
| (2) | The impact of updating foreign exchange rates to that which was used in 4Q23. |
| (3) | DOE on a CER basis adjusted to reflect the foreign exchange rates for the Statement of Income in effect for 4Q23. |
124 | 2023 Annual Report | Management’s Discussion and Analysis
Drivers of Earnings (“DOE”) – 1Q23
($ millions, pre-tax and based on actual foreign exchange rates in effect in the applicable reporting period, unless otherwise stated)
| 1Q23 | ||||||||||||||||||||||||
| Asia | Canada | U.S. | Global WAM | Corporate and Other |
Total | |||||||||||||||||||
| Net insurance service result |
$ | 370 | $ | 259 | $ | 173 | $ | – | $ | 47 | $ | 849 | ||||||||||||
| Net investment result |
285 | 117 | 101 | – | 244 | 747 | ||||||||||||||||||
| Global WAM |
– | – | – | 345 | – | 345 | ||||||||||||||||||
| Manulife Bank |
– | 65 | – | – | – | 65 | ||||||||||||||||||
| Other |
(42 | ) | (18 | ) | (55 | ) | – | (172 | ) | (287 | ) | |||||||||||||
| Net income (loss) before income taxes |
613 | 423 | 219 | 345 | 119 | 1,719 | ||||||||||||||||||
| Income tax (expenses) recoveries |
(105 | ) | (99 | ) | (33 | ) | (48 | ) | (24 | ) | (309 | ) | ||||||||||||
| Net income (loss) |
508 | 324 | 186 | 297 | 95 | 1,410 | ||||||||||||||||||
| Less: Net income (loss) attributed to NCI |
(54 | ) | – | – | – | – | (54 | ) | ||||||||||||||||
| Less: Net income (loss) attributed to participating policyholders |
65 | (15 | ) | – | – | – | 50 | |||||||||||||||||
| Net income (loss) attributed to shareholders (post-tax) |
$ | 519 | $ | 309 | $ | 186 | $ | 297 | $ | 95 | $ | 1,406 | ||||||||||||
Reconciliations of DOE line items to the consolidated financial statements and DOE presentation
| 1Q23 | ||||||||||||||||||||||||
| Asia | Canada | U.S. | Global WAM | Corporate and Other |
Total | |||||||||||||||||||
| Net insurance service result reconciliation |
||||||||||||||||||||||||
| Total insurance service result - financial statements |
$ | 370 | $ | 259 | $ | 173 | $ | – | $ | 47 | $ | 849 | ||||||||||||
| Less: Insurance service result attributed to: |
||||||||||||||||||||||||
| Items excluded from core earnings |
26 | – | 1 | – | (1 | ) | 26 | |||||||||||||||||
| NCI |
40 | – | – | – | – | 40 | ||||||||||||||||||
| Participating policyholders |
(51 | ) | 26 | – | – | – | (25 | ) | ||||||||||||||||
| Core net insurance result |
355 | 233 | 172 | – | 48 | 808 | ||||||||||||||||||
| Core net insurance result, CER adjustment(1) |
(5 | ) | 1 | – | – | – | (4 | ) | ||||||||||||||||
| Core net insurance result, CER basis |
$ | 350 | $ | 234 | $ | 172 | $ | – | $ | 48 | $ | 804 | ||||||||||||
| Total investment result reconciliation |
||||||||||||||||||||||||
| Total investment result per financial statements |
$ | 285 | $ | 463 | $ | 101 | $ | (260 | ) | $ | 381 | $ | 970 | |||||||||||
| Less: Reclassify net investment result in each of Manulife Bank in Canada and Global WAM to its own line of the DOE |
– | (346 | ) | – | 260 | – | (86 | ) | ||||||||||||||||
| Less: Consolidation adjustments(2) |
– | – | – | – | (137 | ) | (137 | ) | ||||||||||||||||
| Less: Other |
– | – | – | – | – | – | ||||||||||||||||||
| Net investment result |
285 | 117 | 101 | – | 244 | 747 | ||||||||||||||||||
| Less: Net investment result attributed to: |
||||||||||||||||||||||||
| Items excluded from core earnings |
34 | (40 | ) | (200 | ) | – | 81 | (125 | ) | |||||||||||||||
| NCI |
24 | – | – | – | – | 24 | ||||||||||||||||||
| Participating policyholders |
3 | – | – | – | – | 3 | ||||||||||||||||||
| Core net investment result |
224 | 157 | 301 | – | 163 | 845 | ||||||||||||||||||
| Core net investment result, CER adjustment(1) |
(8 | ) | – | 2 | – | 1 | (5 | ) | ||||||||||||||||
| Core net investment result, CER basis |
$ | 216 | $ | 157 | $ | 303 | $ | – | $ | 164 | $ | 840 | ||||||||||||
| Manulife Bank and Global WAM by DOE line reconciliation |
||||||||||||||||||||||||
| Manulife Bank and Global WAM net income attributed to shareholders |
$ | – | $ | 65 | $ | – | $ | 345 | $ | – | $ | 410 | ||||||||||||
| Less: Manulife Bank and Global WAM attributed to: |
||||||||||||||||||||||||
| Items excluded from core earnings |
– | 5 | – | 13 | – | 18 | ||||||||||||||||||
| Core earnings in Manulife Bank and Global WAM |
– | 60 | – | 332 | – | 392 | ||||||||||||||||||
| Core earnings in Manulife Bank and Global WAM, CER adjustment(1) |
– | – | – | 1 | – | 1 | ||||||||||||||||||
| Core earnings in Manulife Bank and Global WAM, CER basis |
$ | – | $ | 60 | $ | – | $ | 333 | $ | – | $ | 393 | ||||||||||||
| (1) | The impact of updating foreign exchange rates to that which was used in 4Q23. |
| (2) | Consolidation adjustments in Other DOE line reclassified to net investment result DOE line. |
|
|
125 |
Drivers of Earnings (“DOE”) – 1Q23 (continued)
| 1Q23 | ||||||||||||||||||||||||
| Asia | Canada | U.S. | Global WAM | Corporate and Other |
Total | |||||||||||||||||||
| Other reconciliation |
||||||||||||||||||||||||
| Other revenue per financial statements |
$ | 10 | $ | 72 | $ | 24 | $ | 1,665 | $ | (80 | ) | $ | 1,691 | |||||||||||
| General expenses per financial statements |
(48 | ) | (123 | ) | (74 | ) | (726 | ) | (115 | ) | (1,086 | ) | ||||||||||||
| Commission related to non-insurance contracts |
(2 | ) | (16 | ) | (1 | ) | (329 | ) | 10 | (338 | ) | |||||||||||||
| Interest expense per financial statements |
(2 | ) | (232 | ) | (4 | ) | (5 | ) | (124 | ) | (367 | ) | ||||||||||||
| Total financial statements values included in Other |
(42 | ) | (299 | ) | (55 | ) | 605 | (309 | ) | (100 | ) | |||||||||||||
| Less: Reclassify Other in each of Manulife Bank in Canada and Global WAM to its own line of the DOE |
– | 281 | – | (605 | ) | – | (324 | ) | ||||||||||||||||
| Less: Consolidation adjustments(1) |
– | – | – | – | 137 | 137 | ||||||||||||||||||
| Other |
– | – | – | – | – | – | ||||||||||||||||||
| Other |
(42 | ) | (18 | ) | (55 | ) | – | (172 | ) | (287 | ) | |||||||||||||
| Less: Other attributed to: |
||||||||||||||||||||||||
| Items excluded from core earnings |
(9 | ) | (1 | ) | (53 | ) | – | 36 | (27 | ) | ||||||||||||||
| NCI |
– | – | – | – | – | – | ||||||||||||||||||
| Participating policyholders |
(2 | ) | (3 | ) | – | – | – | (5 | ) | |||||||||||||||
| Add: Par earnings transfer to shareholders |
9 | 2 | – | – | – | 11 | ||||||||||||||||||
| Core Other |
(22 | ) | (12 | ) | (2 | ) | – | (208 | ) | (244 | ) | |||||||||||||
| Core Other, CER adjustment(2) |
2 | (1 | ) | 1 | – | (1 | ) | 1 | ||||||||||||||||
| Core Other, CER basis |
$ | (20 | ) | $ | (13 | ) | $ | (1 | ) | $ | – | $ | (209 | ) | $ | (243 | ) | |||||||
| Income tax recoveries (expenses) reconciliation |
||||||||||||||||||||||||
| Income tax recoveries (expenses) per financial statements |
$ | (105 | ) | $ | (99 | ) | $ | (33 | ) | $ | (48 | ) | $ | (24 | ) | $ | (309 | ) | ||||||
| Less: Income tax recoveries (expenses) attributed to: |
||||||||||||||||||||||||
| Items excluded from core earnings |
(21 | ) | (8 | ) | 53 | (3 | ) | (38 | ) | (17 | ) | |||||||||||||
| NCI |
(10 | ) | – | – | – | – | (10 | ) | ||||||||||||||||
| Participating policyholders |
(6 | ) | (6 | ) | – | – | – | (12 | ) | |||||||||||||||
| Core income tax recoveries (expenses) |
(68 | ) | (85 | ) | (86 | ) | (45 | ) | 14 | (270 | ) | |||||||||||||
| Core income tax recoveries (expenses), CER adjustment(2) |
1 | – | – | – | – | 1 | ||||||||||||||||||
| Core income tax recoveries (expenses), CER basis |
$ | (67 | ) | $ | (85 | ) | $ | (86 | ) | $ | (45 | ) | $ | 14 | $ | (269 | ) | |||||||
| Net income (loss) before income taxes, CER basis(3) |
||||||||||||||||||||||||
| Net insurance service result |
$ | 365 | $ | 259 | $ | 174 | $ | – | $ | 48 | $ | 846 | ||||||||||||
| Net investment result |
278 | 117 | 101 | – | 244 | 740 | ||||||||||||||||||
| Global WAM |
– | – | – | 345 | – | 345 | ||||||||||||||||||
| Manulife Bank |
– | 65 | – | – | – | 65 | ||||||||||||||||||
| Other |
(41 | ) | (18 | ) | (54 | ) | – | (173 | ) | (286 | ) | |||||||||||||
| Net income (loss) before income taxes, CER basis |
$ | 602 | $ | 423 | $ | 221 | $ | 345 | $ | 119 | $ | 1,710 | ||||||||||||
| (1) | Consolidation adjustments in Other DOE line reclassified to net investment result DOE line. |
| (2) | The impact of updating foreign exchange rates to that which was used in 4Q23. |
| (3) | DOE on a CER basis adjusted to reflect the foreign exchange rates for the Statement of Income in effect for 4Q23. |
126 | 2023 Annual Report | Management’s Discussion and Analysis
Drivers of Earnings (“DOE”) – 4Q22
($ millions, pre-tax and based on actual foreign exchange rates in effect in the applicable reporting period, unless otherwise stated)
| 4Q22 | ||||||||||||||||||||||||
| Asia | Canada | U.S. | Global WAM |
Corporate and Other |
Total | |||||||||||||||||||
| Net insurance service result |
$ | 485 | $ | 301 | $ | 126 | $ | – | $ | 49 | $ | 961 | ||||||||||||
| Transitional net investment result |
169 | (69 | ) | (259 | ) | – | 62 | (97 | ) | |||||||||||||||
| Global WAM |
– | – | – | 461 | – | 461 | ||||||||||||||||||
| Manulife Bank |
– | 72 | – | – | – | 72 | ||||||||||||||||||
| Other |
(39 | ) | (27 | ) | (15 | ) | – | (167 | ) | (248 | ) | |||||||||||||
| Transitional net income (loss) before income taxes |
615 | 277 | (148 | ) | 461 | (56 | ) | 1,149 | ||||||||||||||||
| Transitional income tax (expenses) recoveries |
(122 | ) | (135 | ) | 42 | (60 | ) | 377 | 102 | |||||||||||||||
| Transitional net income (loss) |
493 | 142 | (106 | ) | 401 | 321 | 1,251 | |||||||||||||||||
| Less: Transitional net income (loss) attributed to NCI |
(34 | ) | – | – | – | (1 | ) | (35 | ) | |||||||||||||||
| Less: Transitional net income (loss) attributed to participating policyholders |
34 | (22 | ) | – | – | – | 12 | |||||||||||||||||
| Transitional net income (loss) attributed to shareholders (post-tax) |
$ | 493 | $ | 120 | $ | (106 | ) | $ | 401 | $ | 320 | $ | 1,228 | |||||||||||
Reconciliations of DOE line items to the consolidated financial statements and DOE presentation
| 4Q22 | ||||||||||||||||||||||||
| Asia | Canada | U.S. | Global WAM |
Corporate and Other |
Total | |||||||||||||||||||
| Net insurance service result reconciliation |
||||||||||||||||||||||||
| Total insurance service result—financial statements |
$ | 485 | $ | 301 | $ | 126 | $ | – | $ | 49 | $ | 961 | ||||||||||||
| Less: Insurance service result attributed to: |
||||||||||||||||||||||||
| Items excluded from core earnings |
69 | 1 | 10 | – | (1 | ) | 79 | |||||||||||||||||
| NCI |
18 | – | – | – | – | 18 | ||||||||||||||||||
| Participating policyholders |
15 | 84 | – | – | – | 99 | ||||||||||||||||||
| Core net insurance result |
383 | 216 | 116 | – | 50 | 765 | ||||||||||||||||||
| Core net insurance result, CER adjustment(1) |
1 | – | – | – | (1 | ) | – | |||||||||||||||||
| Core net insurance result, CER basis |
$ | 384 | $ | 216 | $ | 116 | $ | – | $ | 49 | $ | 765 | ||||||||||||
| Transitional net investment result reconciliation |
||||||||||||||||||||||||
| Total investment result per financial statements |
$ | (45 | ) | $ | (60 | ) | $ | (179 | ) | $ | (149 | ) | $ | 157 | $ | (276 | ) | |||||||
| IFRS 9 transitional impacts |
214 | 312 | (80 | ) | – | 7 | 453 | |||||||||||||||||
| Total including transitional impacts |
169 | 252 | (259 | ) | (149 | ) | 164 | 177 | ||||||||||||||||
| Less: Reclassify net investment result in each of Manulife Bank in Canada and Global WAM to its own line of the DOE |
– | (324 | ) | – | 149 | – | (175 | ) | ||||||||||||||||
| Less: Consolidation adjustments(2) |
– | – | – | – | (102 | ) | (102 | ) | ||||||||||||||||
| Less: Other |
– | 3 | – | – | – | 3 | ||||||||||||||||||
| Transitional net investment result |
169 | (69 | ) | (259 | ) | – | 62 | (97 | ) | |||||||||||||||
| Less: Transitional net investment result attributed to: |
||||||||||||||||||||||||
| Items excluded from core earnings |
(54 | ) | (189 | ) | (662 | ) | – | (75 | ) | (980 | ) | |||||||||||||
| NCI |
31 | – | – | – | – | 31 | ||||||||||||||||||
| Participating policyholders |
(15 | ) | (2 | ) | – | – | – | (17 | ) | |||||||||||||||
| Core net investment result |
207 | 122 | 403 | – | 137 | 869 | ||||||||||||||||||
| Core net investment result, CER adjustment(1) |
(2 | ) | 1 | 1 | – | – | – | |||||||||||||||||
| Core net investment result, CER basis |
$ | 205 | $ | 123 | $ | 404 | $ | – | $ | 137 | $ | 869 | ||||||||||||
| Manulife Bank and Global WAM by DOE line reconciliation |
||||||||||||||||||||||||
| Manulife Bank and Global WAM net income attributed to shareholders |
$ | – | $ | 72 | $ | – | $ | 461 | $ | – | $ | 533 | ||||||||||||
| Less: Manulife Bank and Global WAM attributed to: |
||||||||||||||||||||||||
| Items excluded from core earnings |
– | 5 | – | 140 | – | 145 | ||||||||||||||||||
| Core earnings in Manulife Bank and Global WAM |
– | 67 | – | 321 | – | 388 | ||||||||||||||||||
| Core earnings in Manulife Bank and Global WAM, CER adjustment(1) |
– | – | – | 1 | – | 1 | ||||||||||||||||||
| Core earnings in Manulife Bank and Global WAM, CER basis |
$ | – | $ | 67 | $ | – | $ | 322 | $ | – | $ | 389 | ||||||||||||
| (1) | The impact of updating foreign exchange rates to that which was used in 4Q23. |
| (2) | Consolidation adjustments in Other DOE line reclassified to net investment result DOE line. |
|
|
127 |
| Drivers of Earnings (“DOE”) – 4Q22 (continued) | 4Q22 | |||||||||||||||||||||||
| Asia | Canada | U.S. | Global WAM |
Corporate and Other |
Total | |||||||||||||||||||
| Other reconciliation |
||||||||||||||||||||||||
| Other revenue per financial statements |
$ | 15 | $ | 67 | $ | 17 | $ | 1,646 | $ | (74 | ) | $ | 1,671 | |||||||||||
| General expenses per financial statements |
(42 | ) | (135 | ) | (29 | ) | (715 | ) | (81 | ) | (1,002 | ) | ||||||||||||
| Commission related to non-insurance contracts |
(3 | ) | (14 | ) | 2 | (316 | ) | 11 | (320 | ) | ||||||||||||||
| Interest expense per financial statements |
(8 | ) | (196 | ) | (4 | ) | (5 | ) | (124 | ) | (337 | ) | ||||||||||||
| Total financial statements values included in Other |
(38 | ) | (278 | ) | (14 | ) | 610 | (268 | ) | 12 | ||||||||||||||
| Less: Reclassify Other in each of Manulife Bank in Canada and Global WAM to its own line of the DOE |
– | 252 | – | (610 | ) | – | (358 | ) | ||||||||||||||||
| Less: Consolidation adjustments(1) |
– | – | – | – | 101 | 101 | ||||||||||||||||||
| Other |
(1 | ) | (1 | ) | (1 | ) | – | – | (3 | ) | ||||||||||||||
| Other |
(39 | ) | (27 | ) | (15 | ) | – | (167 | ) | (248 | ) | |||||||||||||
| Less: Other attributed to: |
||||||||||||||||||||||||
| Items excluded from core earnings |
– | – | – | – | 22 | 22 | ||||||||||||||||||
| NCI |
– | – | – | – | – | – | ||||||||||||||||||
| Participating policyholders |
(7 | ) | (1 | ) | – | – | – | (8 | ) | |||||||||||||||
| Add: Par earnings transfer to shareholders |
20 | (2 | ) | – | – | – | 18 | |||||||||||||||||
| Core Other |
(12 | ) | (28 | ) | (15 | ) | – | (189 | ) | (244 | ) | |||||||||||||
| Core Other, CER adjustment(2) |
(1 | ) | – | (1 | ) | – | 1 | (1 | ) | |||||||||||||||
| Core Other, CER basis |
$ | (13 | ) | $ | (28 | ) | $ | (16 | ) | $ | – | $ | (188 | ) | $ | (245 | ) | |||||||
| Income tax recoveries (expenses) reconciliation |
||||||||||||||||||||||||
| Income tax recoveries (expenses) per financial statements |
$ | (102 | ) | $ | (14 | ) | $ | 23 | $ | (60 | ) | $ | 379 | $ | 226 | |||||||||
| IFRS 9 transitional impacts |
(20 | ) | (121 | ) | 19 | – | (2 | ) | (124 | ) | ||||||||||||||
| Transitional income tax recoveries (expenses) |
(122 | ) | (135 | ) | 42 | (60 | ) | 377 | 102 | |||||||||||||||
| Less: Transitional income tax recoveries (expenses) attributed to: |
||||||||||||||||||||||||
| Items excluded from core earnings |
(18 | ) | 6 | 138 | (13 | ) | 306 | 419 | ||||||||||||||||
| NCI |
(13 | ) | – | – | – | – | (13 | ) | ||||||||||||||||
| Participating policyholders |
(9 | ) | (60 | ) | – | – | – | (69 | ) | |||||||||||||||
| Core income tax recoveries (expenses) |
(82 | ) | (81 | ) | (96 | ) | (47 | ) | 71 | (235 | ) | |||||||||||||
| Core income tax recoveries (expenses), CER adjustment(2) |
1 | (1 | ) | 1 | (1 | ) | – | – | ||||||||||||||||
| Core income tax recoveries (expenses), CER basis |
$ | (81 | ) | $ | (82 | ) | $ | (95 | ) | $ | (48 | ) | $ | 71 | $ | (235 | ) | |||||||
| Net income (loss) attributed to NCI |
$ | 32 | $ | – | $ | – | $ | – | $ | 1 | $ | 33 | ||||||||||||
| IFRS 9 transitional impacts |
2 | – | – | – | – | 2 | ||||||||||||||||||
| Transitional net income (loss) to NCI |
$ | 34 | $ | – | $ | – | $ | – | $ | 1 | $ | 35 | ||||||||||||
| Net income (loss) attributed to participating policyholders |
$ | (47 | ) | $ | 22 | $ | – | $ | – | $ | – | $ | (25 | ) | ||||||||||
| IFRS 9 transitional impacts |
13 | – | – | – | – | 13 | ||||||||||||||||||
| Transitional net income (loss) to participating policyholders |
$ | (34 | ) | $ | 22 | $ | – | $ | – | $ | – | $ | (12 | ) | ||||||||||
| Transitional net income (loss) before income taxes, CER basis(3) |
||||||||||||||||||||||||
| Net insurance service result |
$ | 487 | $ | 301 | $ | 127 | $ | – | $ | 49 | $ | 964 | ||||||||||||
| Net investment result |
166 | (69 | ) | (260 | ) | – | 62 | (101 | ) | |||||||||||||||
| Global WAM |
– | – | – | 458 | – | 458 | ||||||||||||||||||
| Manulife Bank |
– | 72 | – | – | – | 72 | ||||||||||||||||||
| Other |
(41 | ) | (27 | ) | (16 | ) | – | (167 | ) | (251 | ) | |||||||||||||
| Transitional net income (loss) before income taxes, CER basis |
$ | 612 | $ | 277 | $ | (149 | ) | $ | 458 | $ | (56 | ) | $ | 1,142 | ||||||||||
| (1) | Consolidation adjustments in Other DOE line reclassified to net investment result DOE line. |
| (2) | The impact of updating foreign exchange rates to that which was used in 4Q23. |
| (3) | DOE on a CER basis adjusted to reflect the foreign exchange rates for the Statement of Income in effect for 4Q23. |
128 | 2023 Annual Report | Management’s Discussion and Analysis
The contractual service margin (“CSM”) is a liability that represents future unearned profits on insurance contracts written. It is a component of our insurance and reinsurance contract liabilities on our Statement of Financial Position. Organic and inorganic changes in CSM include amounts attributed to participating shareholders and non-controlling interests. CSM growth is the percentage change in the CSM net of NCI compared with a prior period on a constant exchange rate basis.
Changes in CSM that are classified as organic include the following impacts:
| • | Impact of new business is the impact on CSM from insurance contracts initially recognized in the period and includes acquisition expense related gains (losses) which impact the CSM in the period. It excludes the impact on CSM from entering into new in-force reinsurance contracts which would generally be considered a management action; |
| • | Expected movement related to finance income or expenses includes interest accreted on the CSM during the period and the expected change in the CSM on VFA contracts if returns are as expected; |
| • | CSM recognized for service provided is the portion of the CSM that is recognized in net income for service provided in the period; and |
| • | Insurance experience gains (losses) and other is primarily the change in the CSM balance from experience variances that relate to future periods. This includes persistency experience and changes in future period cash flows caused by other current period experience. |
Changes in CSM that are classified as inorganic include:
| • | Changes in actuarial methods and assumptions that adjust the CSM; |
| • | Effect of movement in exchange rates over the reporting period; |
| • | Impact of markets; and |
| • | Reinsurance transactions, tax-related and other items that reflects the impact related to future cash flows from items such as gains or losses on disposition of a business, the impact of enacted or substantially enacted income tax rate changes, material one-time only adjustments that are exceptional in nature and other amounts not specifically captured in the previous inorganic items. |
Post-tax CSM is used in the definition of financial leverage ratio and consolidated capital and is calculated as the CSM adjusted for the marginal income tax rate in the jurisdictions that report a CSM balance. Post-tax CSM net of NCI is used in the adjusted book value per share calculation and is calculated as the CSM excluding non-controlling interests adjusted for the marginal income tax rate in the jurisdictions that report this balance.
New business CSM is the impact of new business defined above, excluding CSM attributed to non-controlling interests. New business CSM growth is the percentage change in the New business CSM net of NCI compared with a prior period on a constant exchange rate basis.
|
|
129 |
CSM and post-tax CSM information
($ millions and based on actual foreign exchange rates in effect in the applicable reporting period, unless otherwise stated)
| As at |
Dec 31, 2023 |
Sept 30, 2023 |
June 30, 2023 |
Mar 31, 2023 |
Dec 31, 2022 |
|||||||||||||||
| CSM |
$ | 21,301 | $ | 18,149 | $ | 18,103 | $ | 18,200 | $ | 17,977 | ||||||||||
| Less: CSM for NCI |
(861 | ) | (780 | ) | (680 | ) | (733 | ) | (694 | ) | ||||||||||
| CSM, net of NCI |
$ | 20,440 | $ | 17,369 | $ | 17,423 | $ | 17,467 | $ | 17,283 | ||||||||||
| CER adjustment(1) |
380 | 116 | 324 | (171 | ) | (138 | ) | |||||||||||||
| CSM, net of NCI, CER basis |
$ | 20,820 | $ | 17,485 | $ | 17,747 | $ | 17,296 | $ | 17,145 | ||||||||||
| CSM by segment |
||||||||||||||||||||
| Asia |
$ | 12,617 | $ | 10,030 | $ | 9,630 | $ | 9,678 | $ | 9,420 | ||||||||||
| Asia NCI |
861 | 780 | 680 | 733 | 694 | |||||||||||||||
| Canada |
4,060 | 3,662 | 3,656 | 3,659 | 3,675 | |||||||||||||||
| U.S. |
3,738 | 3,651 | 4,106 | 4,080 | 4,136 | |||||||||||||||
| Corporate and Other |
25 | 26 | 31 | 50 | 52 | |||||||||||||||
| CSM |
$ | 21,301 | $ | 18,149 | $ | 18,103 | $ | 18,200 | $ | 17,977 | ||||||||||
| CSM, CER adjustment(1) |
||||||||||||||||||||
| Asia |
$ | 269 | $ | 100 | $ | 207 | $ | (195 | ) | $ | (157 | ) | ||||||||
| Asia NCI |
12 | 12 | 22 | (33 | ) | (23 | ) | |||||||||||||
| Canada |
– | – | – | – | – | |||||||||||||||
| U.S. |
110 | 16 | 117 | 24 | 19 | |||||||||||||||
| Corporate and Other |
– | – | – | – | – | |||||||||||||||
| Total |
$ | 391 | $ | 128 | $ | 346 | $ | (204 | ) | $ | (161 | ) | ||||||||
| CSM, CER basis |
||||||||||||||||||||
| Asia |
$ | 12,886 | $ | 10,130 | $ | 9,837 | $ | 9,483 | $ | 9,263 | ||||||||||
| Asia NCI |
873 | 792 | 702 | 700 | 671 | |||||||||||||||
| Canada |
4,060 | 3,662 | 3,656 | 3,659 | 3,675 | |||||||||||||||
| U.S. |
3,848 | 3,667 | 4,223 | 4,104 | 4,155 | |||||||||||||||
| Corporate and Other |
25 | 26 | 31 | 50 | 52 | |||||||||||||||
| Total CSM, CER basis |
$ | 21,692 | $ | 18,277 | $ | 18,449 | $ | 17,996 | $ | 17,816 | ||||||||||
| Post-tax CSM |
||||||||||||||||||||
| CSM |
$ | 21,301 | $ | 18,149 | $ | 18,103 | $ | 18,200 | $ | 17,977 | ||||||||||
| Marginal tax rate on CSM |
(2,798 | ) | (2,474 | ) | (2,645 | ) | (2,724 | ) | (2,726 | ) | ||||||||||
| Post-tax CSM |
$ | 18,503 | $ | 15,675 | $ | 15,458 | $ | 15,476 | $ | 15,251 | ||||||||||
| CSM, net of NCI |
$ | 20,440 | $ | 17,369 | $ | 17,423 | $ | 17,467 | $ | 17,283 | ||||||||||
| Marginal tax rate on CSM net of NCI |
(2,692 | ) | (2,377 | ) | (2,546 | ) | (2,617 | ) | (2,624 | ) | ||||||||||
| Post-tax CSM net of NCI |
$ | 17,748 | $ | 14,992 | $ | 14,877 | $ | 14,850 | $ | 14,659 | ||||||||||
| (1) | The impact of reflecting CSM and CSM net of NCI using the foreign exchange rates for the Statement of Financial Position in effect for 4Q23. |
130 | 2023 Annual Report | Management’s Discussion and Analysis
New business CSM detail, CER basis
($ millions pre-tax, and based on actual foreign exchange rates in effect in the applicable reporting period, unless otherwise stated)
| Quarterly Results |
Full Year Results |
|||||||||||||||||||||||||||
| 4Q23 | 3Q23 | 2Q23 | 1Q23 | 4Q22 | 2023 | 2022 | ||||||||||||||||||||||
| New business CSM, net of NCI |
||||||||||||||||||||||||||||
| Hong Kong |
$ | 199 | $ | 167 | $ | 191 | $ | 119 | $ | 110 | $ | 676 | $ | 437 | ||||||||||||||
| Japan |
42 | 29 | 19 | 36 | 28 | 126 | 140 | |||||||||||||||||||||
| Asia Other |
173 | 206 | 222 | 146 | 186 | 747 | 732 | |||||||||||||||||||||
| International High Net Worth |
231 | 197 | ||||||||||||||||||||||||||
| Mainland China |
138 | 12 | ||||||||||||||||||||||||||
| Singapore |
244 | 189 | ||||||||||||||||||||||||||
| Vietnam |
87 | 305 | ||||||||||||||||||||||||||
| Other Emerging Markets |
47 | 29 | ||||||||||||||||||||||||||
| Asia |
414 | 402 | 432 | 301 | 324 | 1,549 | 1,309 | |||||||||||||||||||||
| Canada |
70 | 51 | 57 | 46 | 47 | 224 | 199 | |||||||||||||||||||||
| U.S. |
142 | 54 | 103 | 95 | 71 | 394 | 387 | |||||||||||||||||||||
| Total new business CSM net of NCI |
626 | 507 | 592 | 442 | 442 | 2,167 | 1,895 | |||||||||||||||||||||
| Asia NCI |
39 | 46 | 38 | 19 | – | 142 | 20 | |||||||||||||||||||||
| Total impact of new insurance business in CSM |
$ | 665 | $ | 553 | $ | 630 | $ | 461 | $ | 442 | $ | 2,309 | $ | 1,915 | ||||||||||||||
| New business CSM, net of NCI, CER adjustment(1),(2) |
||||||||||||||||||||||||||||
| Hong Kong |
$ | – | $ | 3 | $ | 3 | $ | 1 | $ | – | $ | 7 | $ | 20 | ||||||||||||||
| Japan |
– | (1 | ) | (1 | ) | (3 | ) | (1 | ) | (5 | ) | (10 | ) | |||||||||||||||
| Asia Other |
– | 5 | (1 | ) | (3 | ) | 2 | 1 | 22 | |||||||||||||||||||
| International High Net Worth |
3 | 7 | ||||||||||||||||||||||||||
| Mainland China |
– | – | ||||||||||||||||||||||||||
| Singapore |
2 | 13 | ||||||||||||||||||||||||||
| Vietnam |
(2 | ) | 3 | |||||||||||||||||||||||||
| Other Emerging Markets |
(2 | ) | (1 | ) | ||||||||||||||||||||||||
| Asia |
– | 7 | 1 | (5 | ) | 1 | 3 | 32 | ||||||||||||||||||||
| Canada |
– | – | – | – | – | – | – | |||||||||||||||||||||
| U.S. |
– | 1 | 1 | 1 | – | 3 | 20 | |||||||||||||||||||||
| Total new business CSM net of NCI |
– | 8 | 2 | (4 | ) | 1 | 6 | 52 | ||||||||||||||||||||
| Asia NCI |
– | – | – | (1 | ) | (1 | ) | (1 | ) | (1 | ) | |||||||||||||||||
| Total impact of new insurance business in CSM |
$ | – | $ | 8 | $ | 2 | $ | (5 | ) | $ | – | $ | 5 | $ | 51 | |||||||||||||
| New business CSM net of NCI, CER basis |
||||||||||||||||||||||||||||
| Hong Kong |
$ | 199 | $ | 170 | $ | 194 | $ | 120 | $ | 110 | $ | 683 | $ | 457 | ||||||||||||||
| Japan |
42 | 28 | 18 | 33 | 27 | 121 | 130 | |||||||||||||||||||||
| Asia Other |
173 | 211 | 221 | 143 | 188 | 748 | 754 | |||||||||||||||||||||
| International High Net Worth |
234 | 204 | ||||||||||||||||||||||||||
| Mainland China |
138 | 12 | ||||||||||||||||||||||||||
| Singapore |
246 | 202 | ||||||||||||||||||||||||||
| Vietnam |
85 | 308 | ||||||||||||||||||||||||||
| Other Emerging Markets |
45 | 28 | ||||||||||||||||||||||||||
| Asia |
414 | 409 | 433 | 296 | 325 | 1,552 | 1,341 | |||||||||||||||||||||
| Canada |
70 | 51 | 57 | 46 | 47 | 224 | 199 | |||||||||||||||||||||
| U.S. |
142 | 55 | 104 | 96 | 71 | 397 | 407 | |||||||||||||||||||||
| Total new business CSM net of NCI, CER basis |
626 | 515 | 594 | 438 | 443 | 2,173 | 1,947 | |||||||||||||||||||||
| Asia NCI, CER basis |
39 | 46 | 38 | 18 | (1 | ) | 141 | 19 | ||||||||||||||||||||
| Total impact of new insurance business in CSM, CER basis |
$ | 665 | $ | 561 | $ | 632 | $ | 456 | $ | 442 | $ | 2,314 | $ | 1,966 | ||||||||||||||
| (1) | The impact of updating foreign exchange rates to that which was used in 4Q23. |
| (2) | New business CSM for Asia Other is reported by country annually, on a full year basis. Other Emerging Markets within Asia Other include Indonesia, the Philippines, Malaysia, Thailand, Cambodia and Myanmar. |
|
|
131 |
The Company also uses financial performance measures that are prepared on a constant exchange rate basis, which exclude the impact of currency fluctuations (from local currency to Canadian dollars at a total Company level and from local currency to U.S. dollars in Asia). Such financial measures may be stated on a constant exchange rate basis or the percentage growth/decline in the financial measure on a constant exchange rate basis, using the income statement and balance sheet exchange rates effective for the fourth quarter of 2023.
Information supporting constant exchange rate basis for GAAP and non-GAAP financial measures is presented below and throughout this section.
Basic EPS and diluted EPS, CER basis is equal to common shareholders’ net income on a CER basis divided by the weighted average common shares outstanding and diluted weighted common shares outstanding, respectively.
General expenses, CER basis
($ millions, and based on actual foreign exchange rates in effect in the applicable reporting period, unless otherwise stated)
| Quarterly Results | Full Year Results | |||||||||||||||||||||||||||
| 4Q23 | 3Q23 | 2Q23 | 1Q23 | 4Q22 | 2023 | 2022 | ||||||||||||||||||||||
| General expenses |
$ | 1,180 | $ | 1,042 | $ | 1,022 | $ | 1,086 | $ | 1,002 | $ | 4,330 | $ | 3,731 | ||||||||||||||
| CER adjustment(1) |
– | 9 | 8 | 3 | 4 | 20 | 100 | |||||||||||||||||||||
| General expenses, CER basis |
$ | 1,180 | $ | 1,051 | $ | 1,030 | $ | 1,089 | $ | 1,006 | $ | 4,350 | $ | 3,831 | ||||||||||||||
| (1) | The impact of updating foreign exchange rates to that which was used in 4Q23. |
132 | 2023 Annual Report | Management’s Discussion and Analysis
Net income financial measures on a CER basis
($ Canadian millions, post-tax and based on actual foreign exchange rates in effect in the applicable reporting period, unless otherwise stated)
| Quarterly Results | Full Year Results | |||||||||||||||||||||||||||
| 4Q23 | 3Q23 | 2Q23 | 1Q23 | 4Q22 | 2023 | 2022 | ||||||||||||||||||||||
| Net income (loss) attributed to shareholders: |
||||||||||||||||||||||||||||
| Asia |
$ | 615 | $ | 84 | $ | 130 | $ | 519 | $ | 315 | $ | 1,348 | $ | 683 | ||||||||||||||
| Canada |
365 | 290 | 227 | 309 | (73 | ) | 1,191 | (503 | ) | |||||||||||||||||||
| U.S. |
198 | 72 | 183 | 186 | (44 | ) | 639 | (2,316 | ) | |||||||||||||||||||
| Global WAM |
365 | 318 | 317 | 297 | 401 | 1,297 | 1,121 | |||||||||||||||||||||
| Corporate and Other |
116 | 249 | 168 | 95 | 316 | 628 | (918 | ) | ||||||||||||||||||||
| Total net income (loss) attributed to shareholders |
1,659 | 1,013 | 1,025 | 1,406 | 915 | 5,103 | (1,933 | ) | ||||||||||||||||||||
| Preferred share dividends and other equity distributions |
(99 | ) | (54 | ) | (98 | ) | (52 | ) | (97 | ) | (303 | ) | (260 | ) | ||||||||||||||
| Common shareholders’ net income (loss) |
$ | 1,560 | $ | 959 | $ | 927 | $ | 1,354 | $ | 818 | $ | 4,800 | $ | (2,193 | ) | |||||||||||||
| CER adjustment(1) |
||||||||||||||||||||||||||||
| Asia |
$ | – | $ | 2 | $ | 13 | $ | 1 | $ | 19 | $ | 16 | $ | 274 | ||||||||||||||
| Canada |
– | 1 | 1 | (2 | ) | (2 | ) | – | 78 | |||||||||||||||||||
| U.S. |
– | – | 11 | 1 | (2 | ) | 12 | (160 | ) | |||||||||||||||||||
| Global WAM |
– | 4 | 4 | – | (1 | ) | 8 | 16 | ||||||||||||||||||||
| Corporate and Other |
– | (7 | ) | (9 | ) | (1 | ) | (11 | ) | (17 | ) | (86 | ) | |||||||||||||||
| Total net income (loss) attributed to shareholders |
– | – | 20 | (1 | ) | 3 | 19 | 122 | ||||||||||||||||||||
| Preferred share dividends and other equity distributions |
– | – | – | – | – | – | – | |||||||||||||||||||||
| Common shareholders’ net income (loss) |
$ | – | $ | – | $ | 20 | $ | (1 | ) | $ | 3 | $ | 19 | $ | 122 | |||||||||||||
| Net income (loss) attributed to shareholders, CER basis |
||||||||||||||||||||||||||||
| Asia |
$ | 615 | $ | 86 | $ | 143 | $ | 520 | $ | 334 | $ | 1,364 | $ | 957 | ||||||||||||||
| Canada |
365 | 291 | 228 | 307 | (75 | ) | 1,191 | (425 | ) | |||||||||||||||||||
| U.S. |
198 | 72 | 194 | 187 | (46 | ) | 651 | (2,476 | ) | |||||||||||||||||||
| Global WAM |
365 | 322 | 321 | 297 | 400 | 1,305 | 1,137 | |||||||||||||||||||||
| Corporate and Other |
116 | 242 | 159 | 94 | 305 | 611 | (1,004 | ) | ||||||||||||||||||||
| Total net income (loss) attributed to shareholders, CER basis |
1,659 | 1,013 | 1,045 | 1,405 | 918 | 5,122 | (1,811 | ) | ||||||||||||||||||||
| Preferred share dividends and other equity distributions, CER basis |
(99 | ) | (54 | ) | (98 | ) | (52 | ) | (97 | ) | (303 | ) | (260 | ) | ||||||||||||||
| Common shareholders’ net income (loss), CER basis |
$ | 1,560 | $ | 959 | $ | 947 | $ | 1,353 | $ | 821 | $ | 4,819 | $ | (2,071 | ) | |||||||||||||
| Asia net income attributed to shareholders, U.S. dollars |
||||||||||||||||||||||||||||
| Asia net income (loss) attributed to shareholders, US $(2) |
$ | 452 | $ | 63 | $ | 96 | $ | 384 | $ | 231 | $ | 995 | $ | 516 | ||||||||||||||
| CER adjustment, US $(1) |
– | – | 9 | (2 | ) | 14 | 7 | 186 | ||||||||||||||||||||
| Asia net income (loss) attributed to shareholders, U.S. $, CER basis(1) |
$ | 452 | $ | 63 | $ | 105 | $ | 382 | $ | 245 | $ | 1,002 | $ | 702 | ||||||||||||||
| Net income (loss) attributed to shareholders (pre-tax) |
||||||||||||||||||||||||||||
| Net income (loss) attributed to shareholders (post-tax) |
$ | 1,659 | $ | 1,013 | $ | 1,025 | $ | 1,406 | $ | 915 | $ | 5,103 | $ (1,933 | ) | ||||||||||||||
| Tax on net income attributed to shareholders |
288 | (67 | ) | 242 | 287 | (307 | ) | 750 | (1,241 | ) | ||||||||||||||||||
| Net income (loss) attributed to shareholders (pre-tax) |
1,947 | 946 | 1,267 | 1,693 | 608 | 5,853 | (3,174 | ) | ||||||||||||||||||||
| CER adjustment(1) |
– | 7 | 21 | (9 | ) | 4 | 19 | (110 | ) | |||||||||||||||||||
| Net income (loss) attributed to shareholders (pre-tax), CER basis |
$ | 1,947 | $ | 953 | $ | 1,288 | $ | 1,684 | $ | 612 | $ | 5,872 | $ | (3,284 | ) | |||||||||||||
| (1) | The impact of updating foreign exchange rates to that which was used in 4Q23. |
| (2) | Asia net income attributed to shareholders (post-tax) in Canadian dollars is translated to U.S. dollars using the U.S. dollar Statement of Income rate for the reporting period. |
|
|
133 |
Transitional net income financial measures on a CER basis
($ Canadian millions, post-tax and based on actual foreign exchange rates in effect in the applicable reporting period, unless otherwise stated)
| Quarterly Results | Full Year Results |
|||||||||||||||||||
| 4Q22 | 3Q22 | 2Q22 | 1Q22 | 2022 | ||||||||||||||||
| Transitional net income (loss) attributed to shareholders: |
||||||||||||||||||||
| Asia |
$ | 493 | $ | 176 | $ | (227 | ) | $ | 205 | $ | 647 | |||||||||
| Canada |
120 | 481 | 271 | 326 | 1,198 | |||||||||||||||
| U.S. |
(106 | ) | 314 | 355 | 885 | 1,448 | ||||||||||||||
| Global WAM |
401 | 287 | 150 | 283 | 1,121 | |||||||||||||||
| Corporate and Other |
320 | (481 | ) | (381 | ) | (374 | ) | (916 | ) | |||||||||||
| Total transitional net income (loss) attributed to shareholders |
1,228 | 777 | 168 | 1,325 | 3,498 | |||||||||||||||
| Preferred share dividends and other equity distributions |
(97 | ) | (51 | ) | (60 | ) | (52 | ) | (260 | ) | ||||||||||
| Common shareholders’ transitional net income (loss) |
$ | 1,131 | $ | 726 | $ | 108 | $ | 1,273 | $ | 3,238 | ||||||||||
| CER adjustment(1) |
||||||||||||||||||||
| Asia |
$ | 14 | $ | 32 | $ | 34 | $ | 62 | $ | 142 | ||||||||||
| Canada |
(3 | ) | 13 | 7 | 12 | 29 | ||||||||||||||
| U.S. |
(2 | ) | 16 | (4 | ) | 58 | 68 | |||||||||||||
| Global WAM |
(1 | ) | 8 | 2 | 8 | 17 | ||||||||||||||
| Corporate and Other |
(10 | ) | (23 | ) | (22 | ) | (31 | ) | (86 | ) | ||||||||||
| Total CER adjustment–transitional net income attributed to shareholders |
(2 | ) | 46 | 17 | 109 | 170 | ||||||||||||||
| Preferred share dividends and other equity distributions |
– | – | – | – | – | |||||||||||||||
| Common shareholders’ transitional net income (loss) |
$ | (2 | ) | $ | 46 | $ | 17 | $ | 109 | $ | 170 | |||||||||
| Transitional net income (loss) attributed to shareholders, CER basis |
||||||||||||||||||||
| Asia |
$ | 507 | $ | 208 | $ | (193 | ) | $ | 267 | $ | 789 | |||||||||
| Canada |
117 | 494 | 278 | 338 | 1,227 | |||||||||||||||
| U.S. |
(108 | ) | 330 | 351 | 943 | 1,516 | ||||||||||||||
| Global WAM |
400 | 295 | 152 | 291 | 1,138 | |||||||||||||||
| Corporate and Other |
310 | (504 | ) | (403 | ) | (405 | ) | (1,002 | ) | |||||||||||
| Total transitional net income (loss) attributed to shareholders, CER basis |
1,226 | 823 | 185 | 1,434 | 3,668 | |||||||||||||||
| Preferred share dividends and other equity distributions, CER basis |
(97 | ) | (51 | ) | (60 | ) | (52 | ) | (260 | ) | ||||||||||
| Common shareholders’ net income (loss), CER basis |
$ | 1,129 | $ | 772 | $ | 125 | $ | 1,382 | $ | 3,408 | ||||||||||
| Asia transitional net income attributed to shareholders, U.S. dollars |
||||||||||||||||||||
| Asia transitional net income (loss) attributed to shareholders, US $(2) |
$ | 363 | $ | 134 | $ | (177 | ) | $ | 161 | $ | 481 | |||||||||
| CER adjustment, US $(1) |
9 | 19 | 35 | 35 | 98 | |||||||||||||||
| Asia transitional net income (loss) attributed to shareholders, U.S. $, CER basis(1) |
$ | 372 | $ | 153 | $ | (142 | ) | $ | 196 | $ | 579 | |||||||||
| Transitional net income (loss) attributed to shareholders (pre-tax) |
||||||||||||||||||||
| Transitional net income (loss) attributed to shareholders (post-tax) |
$ | 1,228 | $ | 777 | $ | 168 | $ | 1,325 | $ | 3,498 | ||||||||||
| Tax on transitional net income attributed to shareholders |
(184 | ) | 200 | 230 | 403 | 649 | ||||||||||||||
| Transitional net income (loss) attributed to shareholders (pre-tax) |
1,044 | 977 | 398 | 1,728 | 4,147 | |||||||||||||||
| CER adjustment(1) |
(6 | ) | 29 | 62 | 121 | 206 | ||||||||||||||
| Transitional net income (loss) attributed to shareholders (pre-tax), CER basis |
$ | 1,038 | $ | 1,006 | $ | 460 | $ | 1,849 | $ | 4,353 | ||||||||||
| (1) | The impact of updating foreign exchange rates to that which was used in 4Q23. |
| (2) | Asia transitional net income attributed to shareholders (post-tax) in Canadian dollars is translated to U.S. dollars using the U.S. dollar Statement of Income rate for the reporting period. |
134 | 2023 Annual Report | Management’s Discussion and Analysis
Transitional ROE measures profitability in 2022 using common shareholders’ transitional net income (loss) as a percentage of capital deployed to earn that income. The Company calculates transitional ROE using average common shareholders’ equity quarterly, as the average of common shareholders’ equity at the start and end of the quarter, and annually, as the average of the quarterly average common shareholders’ equity for the year. Transitional ROE is a temporary measure and will only be reported for 2022 comparative periods in our annual 2023 MD&A.
| Quarterly Results | Full Year Results |
|||||||||||||||||||
| ($ millions, unless otherwise stated) | 4Q22 | 3Q22 | 2Q22 | 1Q22 | 2022 | |||||||||||||||
| Total transitional net income (loss) attributed to shareholders |
$ | 1,228 | $ | 777 | $ | 168 | $ | 1,325 | $ | 3,498 | ||||||||||
| Preferred share dividends and other equity distributions |
(97 | ) | (51 | ) | (60 | ) | (52 | ) | (260 | ) | ||||||||||
| Common shareholders transitional net income (loss) |
$ | 1,131 | $ | 726 | $ | 108 | $ | 1,273 | $ | 3,238 | ||||||||||
| Annualized common shareholders transitional net income (loss) |
$ | 4,487 | $ | 2,876 | $ | 437 | $ | 5,163 | $ | 3,238 | ||||||||||
| Average common shareholders’ equity |
$ | 40,667 | $ | 40,260 | $ | 39,095 | $ | 38,881 | $ | 39,726 | ||||||||||
| Transitional ROE (annualized) (%) |
11.0% | 7.1% | 1.1% | 13.3% | 8.2% | |||||||||||||||
Transitional basic EPS and transitional diluted EPS is equal to transitional common shareholders’ net income divided by the weighted average common shares outstanding and diluted weighted common shares outstanding, respectively. Transitional basic EPS and transitional diluted EPS, CER basis is equal to transitional common shareholders’ net income on a CER basis divided by the weighted average common shares outstanding and diluted weighted common shares outstanding, respectively. Each of these EPS measures are temporary and will only be reported for 2022 comparative periods in our annual 2023 MD&A.
AUMA is a financial measure of the size of the Company. It is comprised of AUM and AUA. AUM includes assets of the General Account, consisting of total invested assets and segregated funds net assets, and external client assets for which we provide investment management services, consisting of mutual fund, institutional asset management and other fund net assets. AUA are assets for which we provide administrative services only. Assets under management and administration is a common industry metric for wealth and asset management businesses.
Our Global WAM business also manages assets on behalf of other segments of the Company. Global WAM-managed AUMA is a financial measure equal to the sum of Global WAM’s AUMA and assets managed by Global WAM on behalf of other segments. It is an important measure of the assets managed by Global WAM.
|
|
135 |
AUM and AUMA reconciliations
(Canadian $ in millions, and based on actual foreign exchange rates in effect in the applicable reporting period, unless otherwise stated)
| CAD $ | US $(4) | |||||||||||||||||||||||||||||||||||||||
| December 31, 2023 | December 31, 2023 | |||||||||||||||||||||||||||||||||||||||
| As at | Asia | Canada | U.S. | Global WAM |
Corporate and Other |
Total | Asia | U.S. | ||||||||||||||||||||||||||||||||
| Total invested assets |
||||||||||||||||||||||||||||||||||||||||
| Manulife Bank net lending assets |
$ | – | $ | 25,321 | $ | – | $ | – | $ | – | $ | 25,321 | $ | – | $ | – | ||||||||||||||||||||||||
| Derivative reclassification(1) |
– | – | – | – | 3,201 | 3,201 | – | – | ||||||||||||||||||||||||||||||||
| Invested assets excluding above items |
144,433 | 86,135 | 133,959 | 7,090 | 17,071 | 388,688 | 109,533 | 101,592 | ||||||||||||||||||||||||||||||||
| Total |
144,433 | 111,456 | 133,959 | 7,090 | 20,272 | 417,210 | 109,533 | 101,592 | ||||||||||||||||||||||||||||||||
| Segregated funds net assets |
||||||||||||||||||||||||||||||||||||||||
| Segregated funds net assets – Institutional |
– | – | – | 3,328 | – | 3,328 | – | – | ||||||||||||||||||||||||||||||||
| Segregated funds net assets – Other(2) |
24,854 | 36,085 | 68,585 | 244,738 | (46 | ) | 374,216 | 18,846 | 52,014 | |||||||||||||||||||||||||||||||
| Total |
24,854 | 36,085 | 68,585 | 248,066 | (46 | ) | 377,544 | 18,846 | 52,014 | |||||||||||||||||||||||||||||||
| AUM per financial statements |
169,287 | 147,541 | 202,544 | 255,156 | 20,226 | 794,754 | 128,379 | 153,606 | ||||||||||||||||||||||||||||||||
| Mutual funds |
– | – | – | 277,365 | – | 277,365 | – | – | ||||||||||||||||||||||||||||||||
| Institutional asset management(3) |
– | – | – | 119,161 | – | 119,161 | – | – | ||||||||||||||||||||||||||||||||
| Other funds |
– | – | – | 15,435 | – | 15,435 | – | – | ||||||||||||||||||||||||||||||||
| Total AUM |
169,287 | 147,541 | 202,544 | 667,117 | 20,226 | 1,206,715 | 128,379 | 153,606 | ||||||||||||||||||||||||||||||||
| Assets under administration |
– | – | – | 182,046 | – | 182,046 | – | – | ||||||||||||||||||||||||||||||||
| Total AUMA |
$ | 169,287 | $ | 147,541 | $ | 202,544 | $ | 849,163 | $ | 20,226 | $ | 1,388,761 | $ | 128,379 | $ | 153,606 | ||||||||||||||||||||||||
| Total AUMA, US $(4) |
$ | 1,053,209 | ||||||||||||||||||||||||||||||||||||||
| Total AUMA |
$ | 169,287 | $ | 147,541 | $ | 202,544 | $ | 849,163 | $ | 20,226 | $ | 1,388,761 | ||||||||||||||||||||||||||||
| CER adjustment(5) |
– | – | – | – | – | – | ||||||||||||||||||||||||||||||||||
| Total AUMA, CER basis |
$ | 169,287 | $ | 147,541 | $ | 202,544 | $ | 849,163 | $ | 20,226 | $ | 1,388,761 | ||||||||||||||||||||||||||||
| Global WAM Managed AUMA |
||||||||||||||||||||||||||||||||||||||||
| Global WAM AUMA |
$ | 849,163 | ||||||||||||||||||||||||||||||||||||||
| AUM managed by Global WAM for Manulife’s other segments |
205,814 | |||||||||||||||||||||||||||||||||||||||
| Total |
$ | 1,054,977 | ||||||||||||||||||||||||||||||||||||||
| (1) | Corporate and Other consolidation adjustment related to net derivative assets reclassified from total invested assets to other lines on the Statement of Financial Position. |
| (2) | Corporate and Other segregated funds net asset represents elimination of amounts held by the Company. |
| (3) | Institutional asset management excludes Institutional segregated funds net assets. |
| (4) | US $ AUMA is calculated as total AUMA in Canadian $ divided by the US $ exchange rate in effect at the end of the quarter. |
| (5) | The impact of updating foreign exchange rates to that which was used in 4Q23. |
136 | 2023 Annual Report | Management’s Discussion and Analysis
| CAD $ | US $(4) | |||||||||||||||||||||||||||||||||||
| September 30, 2023 | September 30, 2023 | |||||||||||||||||||||||||||||||||||
| As at | Asia | Canada | U.S. | Global WAM |
Corporate and Other |
Total | Asia | U.S. | ||||||||||||||||||||||||||||
| Total invested assets |
||||||||||||||||||||||||||||||||||||
| Manulife Bank net lending assets |
$ | – | $ | 25,123 | $ | – | $ | – | $ | – | $ | 25,123 | $ | – | $ | – | ||||||||||||||||||||
| Derivative reclassification(1) |
– | – | – | – | 8,141 | 8,141 | – | – | ||||||||||||||||||||||||||||
| Invested assets excluding above items |
135,820 | 78,377 | 128,790 | 6,723 | 15,762 | 365,472 | 100,438 | 95,259 | ||||||||||||||||||||||||||||
| Total |
135,820 | 103,500 | 128,790 | 6,723 | 23,903 | 398,736 | 100,438 | 95,259 | ||||||||||||||||||||||||||||
| Segregated funds net assets |
||||||||||||||||||||||||||||||||||||
| Segregated funds net assets – Institutional |
– | – | – | 3,477 | – | 3,477 | – | – | ||||||||||||||||||||||||||||
| Segregated funds net assets – Other(2) |
23,769 | 34,448 | 64,796 | 230,469 | (47 | ) | 353,435 | 17,587 | 47,926 | |||||||||||||||||||||||||||
| Total |
23,769 | 34,448 | 64,796 | 233,946 | (47 | ) | 356,912 | 17,587 | 47,926 | |||||||||||||||||||||||||||
| AUM per financial statements |
159,589 | 137,948 | 193,586 | 240,669 | 23,856 | 755,648 | 118,025 | 143,185 | ||||||||||||||||||||||||||||
| Mutual funds |
– | – | – | 266,069 | – | 266,069 | – | – | ||||||||||||||||||||||||||||
| Institutional asset management(3) |
– | – | – | 111,754 | – | 111,754 | – | – | ||||||||||||||||||||||||||||
| Other funds |
– | – | – | 14,359 | – | 14,359 | – | – | ||||||||||||||||||||||||||||
| Total AUM |
159,589 | 137,948 | 193,586 | 632,851 | 23,856 | 1,147,830 | 118,025 | 143,185 | ||||||||||||||||||||||||||||
| Assets under administration |
– | – | – | 173,897 | – | 173,897 | – | – | ||||||||||||||||||||||||||||
| Total AUMA |
$ | 159,589 | $ | 137,948 | $ | 193,586 | $ | 806,748 | $ | 23,856 | $ | 1,321,727 | $ | 118,025 | $ | 143,185 | ||||||||||||||||||||
| Total AUMA, US $(4) |
$ | 977,609 | ||||||||||||||||||||||||||||||||||
| Total AUMA |
$ | 159,589 | $ | 137,948 | $ | 193,586 | $ | 806,748 | $ | 23,856 | $ | 1,321,727 | ||||||||||||||||||||||||
| CER adjustment(5) |
(1,150 | ) | – | (4,758 | ) | (12,683 | ) | – | (18,591 | ) | ||||||||||||||||||||||||||
| Total AUMA, CER basis |
$ | 158,439 | $ | 137,948 | $ | 188,828 | $ | 794,065 | $ | 23,856 | $ | 1,303,136 | ||||||||||||||||||||||||
| Global WAM Managed AUMA |
||||||||||||||||||||||||||||||||||||
| Global WAM AUMA |
$ | 806,748 | ||||||||||||||||||||||||||||||||||
| AUM managed by Global WAM for Manulife’s other segments |
201,407 | |||||||||||||||||||||||||||||||||||
| Total |
$ | 1,008,155 | ||||||||||||||||||||||||||||||||||
Note: For footnotes (1) to (5), refer to the “AUM and AUMA reconciliation” table as at December 31, 2023 above.
|
|
137 |
| CAD $ | US $(4) | |||||||||||||||||||||||||||||||||||
| June 30, 2023 | June 30, 2023 | |||||||||||||||||||||||||||||||||||
| As at | Asia | Canada | U.S. | Global WAM |
Corporate and Other |
Total | Asia | U.S. | ||||||||||||||||||||||||||||
| Total invested assets |
||||||||||||||||||||||||||||||||||||
| Manulife Bank net lending assets |
$ | – | $ | 25,003 | $ | – | $ | – | $ | – | $ | 25,003 | $ | – | $ | – | ||||||||||||||||||||
| Derivative reclassification(1) |
– | – | – | – | 3,895 | 3,895 | – | – | ||||||||||||||||||||||||||||
| Invested assets excluding above items |
135,208 | 83,026 | 132,133 | 5,464 | 18,699 | 374,530 | 102,166 | 99,855 | ||||||||||||||||||||||||||||
| Total |
135,208 | 108,029 | 132,133 | 5,464 | 22,594 | 403,428 | 102,166 | 99,855 | ||||||||||||||||||||||||||||
| Segregated funds net assets |
||||||||||||||||||||||||||||||||||||
| Segregated funds net assets – Institutional |
– | – | – | 3,564 | – | 3,564 | – | – | ||||||||||||||||||||||||||||
| Segregated funds net assets – Other(2) |
24,052 | 35,993 | 67,303 | 235,113 | (44 | ) | 362,417 | 18,182 | 50,862 | |||||||||||||||||||||||||||
| Total |
24,052 | 35,993 | 67,303 | 238,677 | (44 | ) | 365,981 | 18,182 | 50,862 | |||||||||||||||||||||||||||
| AUM per financial statements |
159,260 | 144,022 | 199,436 | 244,141 | 22,550 | 769,409 | 120,348 | 150,717 | ||||||||||||||||||||||||||||
| Mutual funds |
– | – | – | 267,835 | – | 267,835 | – | – | ||||||||||||||||||||||||||||
| Institutional asset management(3) |
– | – | – | 112,491 | – | 112,491 | – | – | ||||||||||||||||||||||||||||
| Other funds |
– | – | – | 14,674 | – | 14,674 | – | – | ||||||||||||||||||||||||||||
| Total AUM |
159,260 | 144,022 | 199,436 | 639,141 | 22,550 | 1,164,409 | 120,348 | 150,717 | ||||||||||||||||||||||||||||
| Assets under administration |
– | – | – | 180,430 | – | 180,430 | – | – | ||||||||||||||||||||||||||||
| Total AUMA |
$ | 159,260 | $ | 144,022 | $ | 199,436 | $ | 819,571 | $ | 22,550 | $ | 1,344,839 | $ | 120,348 | $ | 150,717 | ||||||||||||||||||||
| Total AUMA, US $(4) |
$ | 1,016,277 | ||||||||||||||||||||||||||||||||||
| Total AUMA |
$ | 159,260 | $ | 144,022 | $ | 199,436 | $ | 819,571 | $ | 22,550 | $ | 1,344,839 | ||||||||||||||||||||||||
| CER adjustment(5) |
844 | – | (691 | ) | (1,189 | ) | – | (1,036 | ) | |||||||||||||||||||||||||||
| Total AUMA, CER basis |
$ | 160,104 | $ | 144,022 | $ | 198,745 | $ | 818,382 | $ | 22,550 | $ | 1,343,803 | ||||||||||||||||||||||||
| Global WAM Managed AUMA |
||||||||||||||||||||||||||||||||||||
| Global WAM AUMA |
$ | 819,571 | ||||||||||||||||||||||||||||||||||
| AUM managed by Global WAM for Manulife’s other segments |
203,825 | |||||||||||||||||||||||||||||||||||
| Total |
$ | 1,023,396 | ||||||||||||||||||||||||||||||||||
Note: For footnotes (1) to (5), refer to the “AUM and AUMA reconciliation” table as at December 31, 2023 above.
138 | 2023 Annual Report | Management’s Discussion and Analysis
| CAD $ | US $(4) | |||||||||||||||||||||||||||||||||||
| March 31, 2023 | March 31, 2023 | |||||||||||||||||||||||||||||||||||
| As at | Asia | Canada | U.S. | Global WAM |
Corporate and Other |
Total | Asia | U.S. | ||||||||||||||||||||||||||||
| Total invested assets |
||||||||||||||||||||||||||||||||||||
| Manulife Bank net lending assets |
$ | – | $ | 24,747 | $ | – | $ | – | $ | – | $ | 24,747 | $ | – | $ | – | ||||||||||||||||||||
| Derivative reclassification(1) |
– | – | – | – | 3,488 | 3,488 | – | – | ||||||||||||||||||||||||||||
| Invested assets excluding above items |
138,029 | 82,733 | 136,454 | 5,565 | 21,460 | 384,241 | 102,014 | 100,827 | ||||||||||||||||||||||||||||
| Total |
138,029 | 107,480 | 136,454 | 5,565 | 24,948 | 412,476 | 102,014 | 100,827 | ||||||||||||||||||||||||||||
| Segregated funds net assets |
||||||||||||||||||||||||||||||||||||
| Segregated funds net assets – Institutional |
– | – | – | 3,718 | – | 3,718 | – | – | ||||||||||||||||||||||||||||
| Segregated funds net assets – Other(2) |
24,203 | 36,374 | 67,935 | 231,860 | (46 | ) | 360,326 | 17,893 | 50,197 | |||||||||||||||||||||||||||
| Total |
24,203 | 36,374 | 67,935 | 235,578 | (46 | ) | 364,044 | 17,893 | 50,197 | |||||||||||||||||||||||||||
| AUM per financial statements |
162,232 | 143,854 | 204,389 | 241,143 | 24,902 | 776,520 | 119,907 | 151,024 | ||||||||||||||||||||||||||||
| Mutual funds |
– | – | – | 267,767 | – | 267,767 | – | – | ||||||||||||||||||||||||||||
| Institutional asset management(3) |
– | – | – | 113,781 | – | 113,781 | – | – | ||||||||||||||||||||||||||||
| Other funds |
– | – | – | 14,302 | – | 14,302 | – | – | ||||||||||||||||||||||||||||
| Total AUM |
162,232 | 143,854 | 204,389 | 636,993 | 24,902 | 1,172,370 | 119,907 | 151,024 | ||||||||||||||||||||||||||||
| Assets under administration |
– | – | – | 177,510 | – | 177,510 | – | – | ||||||||||||||||||||||||||||
| Total AUMA |
$ | 162,232 | $ | 143,854 | $ | 204,389 | $ | 814,503 | $ | 24,902 | $ | 1,349,880 | $ | 119,907 | $ | 151,024 | ||||||||||||||||||||
| Total AUMA, US $(4) |
$ | 997,399 | ||||||||||||||||||||||||||||||||||
| Total AUMA |
$ | 162,232 | $ | 143,854 | $ | 204,389 | $ | 814,503 | $ | 24,902 | $ | 1,349,880 | ||||||||||||||||||||||||
| CER adjustment(5) |
(5,870 | ) | – | (5,241 | ) | (16,714 | ) | – | (27,825 | ) | ||||||||||||||||||||||||||
| Total AUMA, CER basis |
$ | 156,362 | $ | 143,854 | $ | 199,148 | $ | 797,789 | $ | 24,902 | $ | 1,322,055 | ||||||||||||||||||||||||
| Global WAM Managed AUMA |
||||||||||||||||||||||||||||||||||||
| Global WAM AUMA |
$ | 814,503 | ||||||||||||||||||||||||||||||||||
| AUM managed by Global WAM for Manulife’s other segments |
208,013 | |||||||||||||||||||||||||||||||||||
| Total |
$ | 1,022,516 | ||||||||||||||||||||||||||||||||||
Note: For footnotes (1) to (5), refer to the “AUM and AUMA reconciliation” table as at December 31, 2023 above.
|
|
139 |
| CAD $ | US $(4) | |||||||||||||||||||||||||||||||||||
| December 31, 2022 | December 31, 2022 | |||||||||||||||||||||||||||||||||||
| As at | Asia | Canada | U.S. | Global WAM |
Corporate and Other |
Total | Asia | U.S. | ||||||||||||||||||||||||||||
| Total invested assets |
||||||||||||||||||||||||||||||||||||
| Manulife Bank net lending assets |
$ | – | $ | 24,779 | $ | – | $ | – | $ | – | $ | 24,779 | $ | – | $ | – | ||||||||||||||||||||
| Derivative reclassification(1) |
– | – | – | – | 5,701 | 5,701 | – | – | ||||||||||||||||||||||||||||
| Invested assets excluding above items |
132,808 | 82,150 | 133,635 | 5,752 | 15,317 | 369,662 | 98,007 | 98,628 | ||||||||||||||||||||||||||||
| Total |
132,808 | 106,929 | 133,635 | 5,752 | 21,018 | 400,142 | 98,007 | 98,628 | ||||||||||||||||||||||||||||
| Segregated funds net assets |
||||||||||||||||||||||||||||||||||||
| Segregated funds net assets – Institutional |
– | – | – | 3,719 | – | 3,719 | – | – | ||||||||||||||||||||||||||||
| Segregated funds net assets – Other(2) |
23,227 | 35,695 | 65,490 | 220,471 | (40 | ) | 344,843 | 17,138 | 48,333 | |||||||||||||||||||||||||||
| Total |
23,227 | 35,695 | 65,490 | 224,190 | (40 | ) | 348,562 | 17,138 | 48,333 | |||||||||||||||||||||||||||
| AUM per financial statements |
156,035 | 142,624 | 199,125 | 229,942 | 20,978 | 748,704 | 115,145 | 146,961 | ||||||||||||||||||||||||||||
| Mutual funds |
– | – | – | 258,273 | – | 258,273 | – | – | ||||||||||||||||||||||||||||
| Institutional asset management(3) |
– | – | – | 109,740 | – | 109,740 | – | – | ||||||||||||||||||||||||||||
| Other funds |
– | – | – | 13,617 | – | 13,617 | – | – | ||||||||||||||||||||||||||||
| Total AUM |
156,035 | 142,624 | 199,125 | 611,572 | 20,978 | 1,130,334 | 115,145 | 146,961 | ||||||||||||||||||||||||||||
| Assets under administration |
– | – | – | 170,768 | – | 170,768 | – | – | ||||||||||||||||||||||||||||
| Total AUMA |
$ | 156,035 | $ | 142,624 | $ | 199,125 | $ | 782,340 | $ | 20,978 | $ | 1,301,102 | $ | 115,145 | $ | 146,961 | ||||||||||||||||||||
| Total AUMA, US $(4) |
$ | 960,259 | ||||||||||||||||||||||||||||||||||
| Total AUMA |
$ | 156,035 | $ | 142,624 | $ | 199,125 | $ | 782,340 | $ | 20,978 | $ | 1,301,102 | ||||||||||||||||||||||||
| CER adjustment(5) |
(5,632 | ) | – | (5,343 | ) | (16,437 | ) | – | (27,412 | ) | ||||||||||||||||||||||||||
| Total AUMA, CER basis |
$ | 150,403 | $ | 142,624 | $ | 193,782 | $ | 765,903 | $ | 20,978 | $ | 1,273,690 | ||||||||||||||||||||||||
| Global WAM Managed AUMA |
||||||||||||||||||||||||||||||||||||
| Global WAM AUMA |
$ | 782,340 | ||||||||||||||||||||||||||||||||||
| AUM managed by Global WAM for Manulife’s other segments |
201,920 | |||||||||||||||||||||||||||||||||||
| Total |
$ | 984,260 | ||||||||||||||||||||||||||||||||||
Note: For footnotes (1) to (5), refer to the “AUM and AUMA reconciliation” table as at December 31, 2023 above.
140 | 2023 Annual Report | Management’s Discussion and Analysis
Global WAM AUMA and Managed AUMA by business line and geographic source
($ millions, and based on actual foreign exchange rates in effect in the applicable reporting period, unless otherwise stated)
| As at | Dec 31, 2023 |
Sept 30, 2023 |
June 30, 2023 |
Mar 31, 2023 |
Dec 31, 2022 |
|||||||||||||||
| Global WAM AUMA by business line |
||||||||||||||||||||
| Retirement |
$ | 431,601 | $ | 410,433 | $ | 419,380 | $ | 413,769 | $ | 395,108 | ||||||||||
| Retail |
292,629 | 278,372 | 281,814 | 281,198 | 271,351 | |||||||||||||||
| Institutional asset management |
124,933 | 117,943 | 118,377 | 119,536 | 115,881 | |||||||||||||||
| Total |
$ | 849,163 | $ | 806,748 | $ | 819,571 | $ | 814,503 | $ | 782,340 | ||||||||||
| Global WAM AUMA by business line, CER basis(1) |
||||||||||||||||||||
| Retirement |
$ | 431,601 | $ | 402,570 | $ | 418,219 | $ | 405,460 | $ | 386,836 | ||||||||||
| Retail |
292,629 | 274,485 | 281,457 | 275,827 | 266,039 | |||||||||||||||
| Institutional asset management |
124,933 | 117,010 | 118,706 | 116,502 | 113,028 | |||||||||||||||
| Total |
$ | 849,163 | $ | 794,065 | $ | 818,382 | $ | 797,789 | $ | 765,903 | ||||||||||
| Global WAM AUMA by geographic source |
||||||||||||||||||||
| Asia |
$ | 115,523 | $ | 113,642 | $ | 112,283 | $ | 115,819 | $ | 110,724 | ||||||||||
| Canada |
233,351 | 219,518 | 226,087 | 223,045 | 213,802 | |||||||||||||||
| U.S. |
500,289 | 473,588 | 481,201 | 475,639 | 457,814 | |||||||||||||||
| Total |
$ | 849,163 | $ | 806,748 | $ | 819,571 | $ | 814,503 | $ | 782,340 | ||||||||||
| Global WAM AUMA by geographic source, CER basis(1) |
||||||||||||||||||||
| Asia |
$ | 115,523 | $ | 112,655 | $ | 112,784 | $ | 111,316 | $ | 106,562 | ||||||||||
| Canada |
233,351 | 219,518 | 226,087 | 223,045 | 213,802 | |||||||||||||||
| U.S. |
500,289 | 461,892 | 479,511 | 463,428 | 445,539 | |||||||||||||||
| Total |
$ | 849,163 | $ | 794,065 | $ | 818,382 | $ | 797,789 | $ | 765,903 | ||||||||||
| Global WAM Managed AUMA by business line |
||||||||||||||||||||
| Retirement |
$ | 431,601 | $ | 410,433 | $ | 419,380 | $ | 413,769 | $ | 395,108 | ||||||||||
| Retail |
368,843 | 351,384 | 357,539 | 358,098 | 346,200 | |||||||||||||||
| Institutional asset management |
254,533 | 246,338 | 246,477 | 250,649 | 242,952 | |||||||||||||||
| Total |
$ | 1,054,977 | $ | 1,008,155 | $ | 1,023,396 | $ | 1,022,516 | $ | 984,260 | ||||||||||
| Global WAM Managed AUMA by business line, CER basis(1) |
||||||||||||||||||||
| Retirement |
$ | 431,601 | $ | 402,570 | $ | 418,219 | $ | 405,460 | $ | 386,836 | ||||||||||
| Retail |
368,843 | 346,349 | 357,003 | 351,516 | 339,646 | |||||||||||||||
| Institutional asset management |
254,533 | 242,718 | 246,427 | 244,753 | 237,206 | |||||||||||||||
| Total |
$ | 1,054,977 | $ | 991,637 | $ | 1,021,649 | $ | 1,001,729 | $ | 963,688 | ||||||||||
| Global WAM Managed AUMA by geographic source |
||||||||||||||||||||
| Asia |
$ | 191,238 | $ | 188,098 | $ | 185,198 | $ | 191,720 | $ | 183,893 | ||||||||||
| Canada |
282,487 | 266,935 | 274,957 | 272,101 | 261,756 | |||||||||||||||
| U.S. |
581,252 | 553,122 | 563,241 | 558,695 | 538,611 | |||||||||||||||
| Total |
$ | 1,054,977 | $ | 1,008,155 | $ | 1,023,396 | $ | 1,022,516 | $ | 984,260 | ||||||||||
| Global WAM Managed AUMA by geographic source, CER basis(1) |
||||||||||||||||||||
| Asia |
$ | 191,238 | $ | 185,278 | $ | 185,448 | $ | 185,276 | $ | 177,764 | ||||||||||
| Canada |
282,487 | 266,935 | 274,957 | 272,101 | 261,756 | |||||||||||||||
| U.S. |
581,252 | 539,424 | 561,244 | 544,352 | 524,168 | |||||||||||||||
| Total |
$ | 1,054,977 | $ | 991,637 | $ | 1,021,649 | $ | 1,001,729 | $ | 963,688 | ||||||||||
| (1) | AUMA adjusted to reflect the foreign exchange rates for the Statement of Financial Position in effect for 4Q23. |
Average assets under management and administration (“average AUMA”) is the average of Global WAM’s AUMA during the reporting period. It is a measure used in analyzing and explaining fee income and earnings of our Global WAM segment. It is calculated as the average of the opening balance of AUMA and the ending balance of AUMA using daily balances where available and month-end or quarter-end averages when daily averages are unavailable. Similarly, Global WAM average managed AUMA and average AUA are the average of Global WAM’s managed AUMA and AUA, respectively, and are calculated in a manner consistent with average AUMA.
|
|
141 |
Manulife Bank net lending assets is a financial measure equal to the sum of Manulife Bank’s loans and mortgages, net of allowances. Manulife Bank average net lending assets is a financial measure which is calculated as the quarter-end average of the opening and the ending balance of net lending assets. Both of these financial measures are a measure of the size of Manulife Bank’s portfolio of loans and mortgages and are used to analyze and explain its earnings.
| As at
($ millions) |
Dec 31, 2023 |
Sept 30, 2023 |
June 30, 2023 |
Mar 31, 2023 |
Dec 31, 2022 |
|||||||||||||||
| Mortgages |
$ | 52,421 | $ | 51,012 | $ | 51,459 | $ | 52,128 | $ | 51,765 | ||||||||||
| Less: mortgages not held by Manulife Bank |
29,536 | 28,402 | 29,088 | 30,087 | 29,767 | |||||||||||||||
| Total mortgages held by Manulife Bank |
22,885 | 22,610 | 22,371 | 22,041 | 21,998 | |||||||||||||||
| Loans to Bank clients |
2,436 | 2,513 | 2,632 | 2,706 | 2,781 | |||||||||||||||
| Manulife Bank net lending assets |
$ | 25,321 | $ | 25,123 | $ | 25,003 | $ | 24,747 | $ | 24,779 | ||||||||||
| Manulife Bank average net lending assets |
||||||||||||||||||||
| Beginning of period |
$ | 25,123 | $ | 25,003 | $ | 24,747 | $ | 24,779 | $ | 24,637 | ||||||||||
| End of period |
25,321 | 25,123 | 25,003 | 24,747 | 24,779 | |||||||||||||||
| Manulife Bank average net lending assets by quarter |
$ | 25,222 | $ | 25,063 | $ | 24,875 | $ | 24,763 | $ | 24,708 | ||||||||||
| Manulife Bank average net lending assets – full year |
$ | 25,050 | $ | 24,113 | ||||||||||||||||
Financial leverage ratio is a debt-to-equity ratio. With the adoption of IFRS 17 on January 1, 2023, the calculation of financial leverage ratio was updated to include the CSM on a post-tax basis, and prior period comparatives were updated. The ratio is calculated as the sum of long-term debt, capital instruments and preferred shares and other equity instruments divided by the sum of long-term debt, capital instruments, equity and post-tax CSM.
Adjusted book value is the sum of common shareholders’ equity and post-tax CSM net of NCI. It is an important measure for monitoring growth and measuring insurance businesses’ value. Adjusted book value per common share is calculated by dividing adjusted book value by the number of common shares outstanding at the end of the period.
| As at
($ millions) |
Dec 31, 2023 |
Sept 30, 2023 |
June 30, 2023 |
Mar 31, 2023 |
Dec 31, 2022 |
|||||||||||||||
| Common shareholders’ equity |
$ | 40,379 | $ | 40,747 | $ | 39,047 | $ | 40,715 | $ | 40,216 | ||||||||||
| Post-tax CSM, net of NCI |
17,748 | 14,992 | 14,877 | 14,850 | 14,659 | |||||||||||||||
| Adjusted book value |
$ | 58,127 | $ | 55,739 | $ | 53,924 | $ | 55,565 | $ | 54,875 | ||||||||||
Consolidated capital serves as a foundation of our capital management activities at the MFC level. Consolidated capital is calculated as the sum of: (i) total equity excluding accumulated other comprehensive income (“AOCI”) on cash flow hedges; (ii) post-tax CSM; and (iii) certain other capital instruments that qualify as regulatory capital. For regulatory reporting purposes under the LICAT framework, the numbers are further adjusted for various additions or deductions to capital as mandated by the guidelines defined by OSFI.
| As at
($ millions) |
Dec 31, 2023 |
Sept 30, 2023 |
June 30, 2023 |
Mar 31, 2023 |
Dec 31, 2022 |
|||||||||||||||
| Total equity |
$ | 48,727 | $ | 49,035 | $ | 47,156 | $ | 48,751 | $ | 48,226 | ||||||||||
| Less: AOCI gain/(loss) on cash flow hedges |
26 | 47 | – | (38 | ) | 8 | ||||||||||||||
| Total equity excluding AOCI on cash flow hedges |
48,701 | 48,988 | 47,156 | 48,789 | 48,218 | |||||||||||||||
| Post-tax CSM |
18,503 | 15,675 | 15,458 | 15,476 | 15,251 | |||||||||||||||
| Qualifying capital instruments |
6,667 | 6,702 | 6,662 | 7,317 | 6,122 | |||||||||||||||
| Consolidated capital |
$ | 73,871 | $ | 71,365 | $ | 69,276 | $ | 71,582 | $ | 69,591 | ||||||||||
Core EBITDA is a financial measure which Manulife uses to better understand the long-term earnings capacity and valuation of our Global WAM business on a basis more comparable to how the profitability of global asset managers is generally measured. Core EBITDA presents core earnings before the impact of interest, taxes, depreciation, and amortization. Core EBITDA excludes certain acquisition expenses related to insurance contracts in our retirement businesses which are deferred and amortized over the expected lifetime of the customer relationship. Core EBITDA was selected as a key performance indicator for our Global WAM business, as EBITDA is widely used among asset management peers, and core earnings is a primary profitability metric for the Company overall.
142 | 2023 Annual Report | Management’s Discussion and Analysis
Reconciliation of Global WAM core earnings to core EBITDA and Global WAM core EBITDA by business line and geographic source
| ($ millions, pre-tax and based on actual foreign exchange rates in |
Quarterly Results | Full Year Results | ||||||||||||||||||||||||||
| 4Q23 | 3Q23 | 2Q23 | 1Q23 | 4Q22 | 2023 | 2022 | ||||||||||||||||||||||
| Global WAM core earnings (post-tax) |
$ | 353 | $ | 361 | $ | 320 | $ | 287 | $ | 274 | $ | 1,321 | $ | 1,299 | ||||||||||||||
| Add back taxes, acquisition costs, other expenses and deferred sales commissions |
||||||||||||||||||||||||||||
| Core income tax (expenses) recoveries (see above) |
55 | 59 | 45 | 45 | 47 | 204 | 222 | |||||||||||||||||||||
| Amortization of deferred acquisition costs and other depreciation |
45 | 41 | 40 | 40 | 43 | 166 | 154 | |||||||||||||||||||||
| Amortization of deferred sales commissions |
21 | 19 | 19 | 21 | 25 | 80 | 98 | |||||||||||||||||||||
| Core EBITDA |
$ | 474 | $ | 480 | $ | 424 | $ | 393 | $ | 389 | $ | 1,771 | $ | 1,773 | ||||||||||||||
| CER adjustment(1) |
– | 4 | 3 | 1 | 1 | 8 | 51 | |||||||||||||||||||||
| Core EBITDA, CER basis |
$ | 474 | $ | 484 | $ | 427 | $ | 394 | $ | 390 | $ | 1,779 | $ | 1,824 | ||||||||||||||
| Core EBITDA by business line |
||||||||||||||||||||||||||||
| Retirement |
$ | 265 | $ | 242 | $ | 233 | $ | 217 | $ | 211 | $ | 957 | $ | 883 | ||||||||||||||
| Retail |
175 | 190 | 168 | 171 | 181 | 704 | 796 | |||||||||||||||||||||
| Institutional asset management |
34 | 48 | 23 | 5 | (3 | ) | 110 | 94 | ||||||||||||||||||||
| Total |
$ | 474 | $ | 480 | $ | 424 | $ | 393 | $ | 389 | $ | 1,771 | $ | 1,773 | ||||||||||||||
| Core EBITDA by geographic source |
||||||||||||||||||||||||||||
| Asia |
$ | 135 | $ | 132 | $ | 125 | $ | 113 | $ | 108 | $ | 505 | $ | 455 | ||||||||||||||
| Canada |
152 | 146 | 148 | 136 | 129 | 582 | 617 | |||||||||||||||||||||
| U.S. |
187 | 202 | 151 | 144 | 152 | 684 | 701 | |||||||||||||||||||||
| Total |
$ | 474 | $ | 480 | $ | 424 | $ | 393 | $ | 389 | $ | 1,771 | $ | 1,773 | ||||||||||||||
| Core EBITDA by business line, CER basis(2) |
||||||||||||||||||||||||||||
| Retirement |
$ | 265 | $ | 244 | $ | 235 | $ | 218 | $ | 211 | $ | 962 | $ | 912 | ||||||||||||||
| Retail |
175 | 191 | 168 | 171 | 183 | 705 | 813 | |||||||||||||||||||||
| Institutional asset management |
34 | 49 | 24 | 5 | (4 | ) | 112 | 99 | ||||||||||||||||||||
| Total, CER basis |
$ | 474 | $ | 484 | $ | 427 | $ | 394 | $ | 390 | $ | 1,779 | $ | 1,824 | ||||||||||||||
| Core EBITDA by geographic source, CER basis(2) |
||||||||||||||||||||||||||||
| Asia |
$ | 135 | $ | 133 | $ | 127 | $ | 112 | $ | 108 | $ | 507 | $ | 472 | ||||||||||||||
| Canada |
152 | 146 | 148 | 136 | 129 | 582 | 617 | |||||||||||||||||||||
| U.S. |
187 | 205 | 152 | 146 | 153 | 690 | 735 | |||||||||||||||||||||
| Total, CER basis |
$ | 474 | $ | 484 | $ | 427 | $ | 394 | $ | 390 | $ | 1,779 | $ | 1,824 | ||||||||||||||
| (1) | The impact of updating foreign exchange rates to that which was used in 4Q23. |
| (2) | Core EBITDA adjusted to reflect the foreign exchange rates for the Statement of Income in effect for 4Q23. |
|
|
143 |
Core EBITDA margin is a financial measure which Manulife uses to better understand the long-term profitability of our Global WAM business on a more comparable basis to how profitability of global asset managers are measured. Core EBITDA margin presents core earnings before the impact of interest, taxes, depreciation, and amortization divided by core revenue from these businesses. Core revenue is used to calculate our core EBITDA margin, and is equal to the sum of pre-tax other revenue and investment income in Global WAM included in core EBITDA, and it excludes such items as revenue related to integration and acquisitions and market experience gains (losses). Core EBITDA margin was selected as a key performance indicator for our Global WAM business, as EBITDA margin is widely used among asset management peers, and core earnings is a primary profitability metric for the Company overall.
| Quarterly Results | Full Year Results | |||||||||||||||||||||||||||
| ($ millions, unless otherwise stated) | 4Q23 | 3Q23 | 2Q23 | 1Q23 | 4Q22 | 2023 | 2022 | |||||||||||||||||||||
| Core EBITDA margin |
||||||||||||||||||||||||||||
| Core EBITDA |
$ | 474 | $ | 480 | $ | 424 | $ | 393 | $ | 389 | $ | 1,771 | $ | 1,773 | ||||||||||||||
| Core revenue |
$ | 1,842 | $ | 1,783 | $ | 1,722 | $ | 1,756 | $ | 1,646 | $ | 7,103 | $ | 6,516 | ||||||||||||||
| Core EBITDA margin |
25.7% | 26.9% | 24.6% | 22.4% | 23.6% | 24.9% | 27.2% | |||||||||||||||||||||
| Global WAM core revenue |
||||||||||||||||||||||||||||
| Other revenue per financial statements |
$ | 1,719 | $ | 1,645 | $ | 1,691 | $ | 1,691 | $ | 1,671 | $ | 6,746 | $ | 6,186 | ||||||||||||||
| Less: Other revenue in segments other than Global WAM |
31 | (64 | ) | 44 | 26 | 26 | 37 | (205 | ) | |||||||||||||||||||
| Other revenue in Global WAM (fee income) |
$ | 1,688 | $ | 1,709 | $ | 1,647 | $ | 1,665 | $ | 1,645 | $ | 6,709 | $ | 6,391 | ||||||||||||||
| Investment income per financial statements |
$ | 4,497 | $ | 4,028 | $ | 4,135 | $ | 3,520 | $ | 4,271 | $ | 16,180 | $ | 15,204 | ||||||||||||||
| Realized and unrealized gains (losses) on assets supporting insurance and investment contract liabilities per financial statements |
2,674 | (2,430 | ) | 950 | 1,944 | (2,453 | ) | 3,138 | (13,646 | ) | ||||||||||||||||||
| Total investment income |
7,171 | 1,598 | 5,085 | 5,464 | 1,818 | 19,318 | 1,558 | |||||||||||||||||||||
| Less: Investment income in segments other than Global WAM |
6,941 | 1,578 | 5,010 | 5,357 | 1,672 | 18,886 | 1,659 | |||||||||||||||||||||
| Investment income in Global WAM |
$ | 230 | $ | 20 | $ | 75 | $ | 107 | $ | 146 | $ | 432 | $ | (101 | ) | |||||||||||||
| Total other revenue and investment income in Global WAM |
$ | 1,918 | $ | 1,729 | $ | 1,722 | $ | 1,772 | $ | 1,791 | $ | 7,141 | $ | 6,290 | ||||||||||||||
| Less: Total revenue reported in items excluded from core earnings |
||||||||||||||||||||||||||||
| Market experience gains (losses) |
63 | (54 | ) | 7 | 12 | 55 | 28 | (316 | ) | |||||||||||||||||||
| Revenue related to integration and acquisitions |
13 | – | (7 | ) | 4 | 90 | 10 | 90 | ||||||||||||||||||||
| Global WAM core revenue |
$ | 1,842 | $ | 1,783 | $ | 1,722 | $ | 1,756 | $ | 1,646 | $ | 7,103 | $ | 6,516 | ||||||||||||||
Expense measures
With the adoption of IFRS 17, we have replaced core general expenses with two new measures: core expenses and core expenditures. Under IFRS 17, expenses previously reported in general expenses are now reported as:
| 1. | General expenses that flow directly through income; |
| 2. | Directly attributable maintenance expenses, which are reported in insurance service expenses and flow directly through income; |
| 3. | Directly attributable acquisition expenses for contracts measured using the PAA method which are reported in insurance service expenses, and flow directly through income; and |
| 4. | Directly attributable acquisition expenses that are capitalized into the CSM. |
144 | 2023 Annual Report | Management’s Discussion and Analysis
Total expenses include items 1 to 3 above and total expenditures include items 1 to 4 above.
Core expenses is used to calculate our expense efficiency ratio and is equal to total expenses that are included in core earnings and excludes such items as material legal provisions for settlements, restructuring charges and expenses related to integration and acquisitions.
| ($ millions, and based on actual foreign exchange rates in effect in the applicable reporting period, unless otherwise stated) |
Quarterly Results | Full Year Results | ||||||||||||||||||||||||||
| 4Q23 | 3Q23 | 2Q23 | 1Q23 | 4Q22 | 2023 | 2022 | ||||||||||||||||||||||
| Core expenses |
||||||||||||||||||||||||||||
| General expenses – Statements of Income |
$ | 1,180 | $ | 1,042 | $ | 1,022 | $ | 1,086 | $ | 1,002 | $ | 4,330 | $ | 3,731 | ||||||||||||||
| Directly attributable acquisition expense for contracts measured using the PAA method(1) |
42 | 37 | 35 | 33 | 15 | 147 | 58 | |||||||||||||||||||||
| Directly attributable maintenance expense(1) |
565 | 544 | 550 | 546 | 577 | 2,205 | 2,039 | |||||||||||||||||||||
| Total expenses |
1,787 | 1,623 | 1,607 | 1,665 | 1,594 | 6,682 | 5,828 | |||||||||||||||||||||
| Less: General expenses included in items excluded from core earnings |
||||||||||||||||||||||||||||
| Restructuring charge |
46 | – | – | – | – | 46 | – | |||||||||||||||||||||
| Integration and acquisition |
8 | – | – | – | 18 | 8 | 26 | |||||||||||||||||||||
| Legal provisions and Other expenses |
8 | 1 | 9 | 60 | – | 78 | 40 | |||||||||||||||||||||
| Total |
62 | 1 | 9 | 60 | 18 | 132 | 66 | |||||||||||||||||||||
| Core expenses |
$ | 1,725 | $ | 1,622 | $ | 1,598 | $ | 1,605 | $ | 1,576 | $ | 6,550 | $ | 5,762 | ||||||||||||||
| CER adjustment(2) |
– | 12 | 8 | (4 | ) | 3 | 16 | 119 | ||||||||||||||||||||
| Core expenses, CER basis |
$ | 1,725 | $ | 1,634 | $ | 1,606 | $ | 1,601 | $ | 1,579 | $ | 6,566 | $ | 5,881 | ||||||||||||||
| Total expenses |
$ | 1,787 | $ | 1,623 | $ | 1,607 | $ | 1,665 | $ | 1,594 | $ | 6,682 | $ | 5,828 | ||||||||||||||
| CER adjustment(2) |
– | 12 | 7 | (3 | ) | 3 | 16 | 121 | ||||||||||||||||||||
| Total expenses, CER basis |
$ | 1,787 | $ | 1,635 | $ | 1,614 | $ | 1,662 | $ | 1,597 | $ | 6,698 | $ | 5,949 | ||||||||||||||
| (1) | Expenses are components of insurance service expenses on the Statements of Income that flow directly through income. |
| (2) | The impact of updating foreign exchange rates to that which was used in 4Q23. |
Core expenditures is used to calculate our expenditure efficiency ratio and is equal to total expenditures excluding such items as material legal provisions for settlements, restructuring charges and expenses related to integration and acquisitions. Total expenditures is equal to the sum of total expenses and costs that are directly attributable to the acquisition of new business that are capitalized into the CSM.
| ($ millions, and based on actual foreign exchange rates in effect in the applicable reporting period, unless otherwise stated) |
Quarterly Results | Full Year Results | ||||||||||||||||||||||||||
| 4Q23 | 3Q23 | 2Q23 | 1Q23 | 4Q22 | 2023 | 2022 | ||||||||||||||||||||||
| Core expenditures |
||||||||||||||||||||||||||||
| Total expenses |
$ | 1,787 | $ | 1,623 | $ | 1,607 | $ | 1,665 | $ | 1,594 | $ | 6,682 | $ | 5,828 | ||||||||||||||
| Directly attributable acquisition expenses capitalized through the CSM(1) |
524 | 489 | 501 | 507 | 532 | 2,021 | 1,909 | |||||||||||||||||||||
| Total expenditures |
2,311 | 2,112 | 2,108 | 2,172 | 2,126 | 8,703 | 7,737 | |||||||||||||||||||||
| Less: General expenses included in items excluded from core earnings (see core expenses reconciliation above) |
62 | 1 | 9 | 60 | 18 | 132 | 66 | |||||||||||||||||||||
| Core expenditures |
$ | 2,249 | $ | 2,111 | $ | 2,099 | $ | 2,112 | $ | 2,108 | $ | 8,571 | $ | 7,671 | ||||||||||||||
| CER adjustment(2) |
– | 16 | 5 | (12 | ) | 1 | 9 | 136 | ||||||||||||||||||||
| Core expenditures, CER basis |
$ | 2,249 | $ | 2,127 | $ | 2,104 | $ | 2,100 | $ | 2,109 | $ | 8,580 | $ | 7,807 | ||||||||||||||
| Total expenditures |
$ | 2,311 | $ | 2,112 | $ | 2,108 | $ | 2,172 | $ | 2,126 | $ | 8,703 | $ | 7,737 | ||||||||||||||
| CER adjustment(2) |
– | 15 | 3 | (10 | ) | 1 | 8 | 138 | ||||||||||||||||||||
| Total expenditures, CER basis |
$ | 2,311 | $ | 2,127 | $ | 2,111 | $ | 2,162 | $ | 2,127 | $ | 8,711 | $ | 7,875 | ||||||||||||||
| (1) | Expenses are components of insurance service expenses on the Statements of Income and are then capitalized to CSM. |
| (2) | The impact of updating foreign exchange rates to that which was used in 4Q23. |
|
|
145 |
Expense efficiency ratio is a financial measure which Manulife uses to measure progress towards our target to be more efficient. It is defined as core expenses divided by the sum of core earnings before income taxes (“pre-tax core earnings”) and core expenses.
Expenditure efficiency ratio is a financial measure which Manulife uses to measure progress towards our target to be more efficient. It is defined as core expenditures divided by the sum of core earnings before income taxes (“pre-tax core earnings”) and core expenditures.
Embedded value (“EV”) is a measure of the present value of shareholders’ interests in the expected future distributable earnings on in-force business reflected in the Consolidated Statements of Financial Position of Manulife, excluding any value associated with future new business. EV is calculated as the sum of the adjusted net worth and the value of in-force business calculated as at December 31. The adjusted net worth is the IFRS shareholders’ equity adjusted for goodwill and intangible assets, fair value of surplus assets, the fair value of debt, preferred shares, and other equity, and local statutory balance sheet, regulatory reserve, and capital for our Asian businesses. The value of in-force business in Canada and the U.S. is the present value of expected future IFRS earnings, on an IFRS 4 basis, on in-force business less the present value of the cost of holding capital to support the in-force business under the LICAT framework. The value of in-force business in Asia reflects local statutory earnings and capital requirements. The value of in-force business excludes Global WAM, Bank or P&C Reinsurance businesses.
Net annualized fee income yield on average AUMA (“Net fee income yield”) is a financial measure that represents the net annualized fee income from Global WAM channels over average AUMA. This measure provides information on Global WAM’s adjusted return generated from managing AUMA.
Net annualized fee income is a financial measure that represents Global WAM income before income taxes, adjusted to exclude items unrelated to net fee income, including general expenses, investment income, non-AUMA related net benefits and claims, and net premium taxes. It also excludes the components of Global WAM net fee income from managing assets on behalf of other segments. This measure is annualized based on the number of days in the year divided by the number of days in the reporting period.
Reconciliation of income before income taxes to net fee income yield
| Quarterly Results | Full Year Results | |||||||||||||||||||||||||||
| ($ millions, unless otherwise stated) | 4Q23 | 3Q23 | 2Q23 | 1Q23 | 4Q22 | 2023 | 2022 | |||||||||||||||||||||
| Income before income taxes |
$ | 2,123 | $ | 1,174 | $ | 1,436 | $ | 1,719 | $ | 697 | $ | 6,452 | $ | (3,138 | ) | |||||||||||||
| Less: Income before income taxes for segments other than Global WAM |
1,699 | 808 | 1,074 | 1,374 | 236 | 4,955 | (4,429 | ) | ||||||||||||||||||||
| Global WAM income before income taxes |
424 | 366 | 362 | 345 | 461 | 1,497 | 1,291 | |||||||||||||||||||||
| Items unrelated to net fee income |
648 | 717 | 674 | 676 | 527 | 2,715 | 2,653 | |||||||||||||||||||||
| Global WAM net fee income |
1,072 | 1,083 | 1,036 | 1,021 | 988 | 4,212 | 3,944 | |||||||||||||||||||||
| Less: Net fee income from other segments |
174 | 171 | 142 | 136 | 134 | 623 | 547 | |||||||||||||||||||||
| Global WAM net fee income excluding net fee income from other segments |
898 | 912 | 894 | 885 | 854 | 3,589 | 3,397 | |||||||||||||||||||||
| Net annualized fee income |
$ | 3,563 | $ | 3,618 | $ | 3,584 | $ | 3,589 | $ | 3,388 | $ | 3,589 | $ | 3,397 | ||||||||||||||
| Average Assets under Management and Administration |
$ | 816,706 | $ | 813,157 | $ | 814,945 | $ | 804,455 | $ | 779,642 | $ | 812,662 | $ | 790,268 | ||||||||||||||
| Net fee income yield (bps) |
43.6 | 44.5 | 44.0 | 44.6 | 43.5 | 44.2 | 43.0 | |||||||||||||||||||||
New business value (“NBV”) is the change in embedded value as a result of sales in the reporting period. The definition of NBV has changed for periods beginning after 2022 as follows:
| • | adopting IFRS 17 in the calculation of expected future distributable earnings in Canada, and international high net worth business, which was reclassified to the Asia segment in 2023; and |
| • | changing the basis for calculating expected future distributable earnings in the U.S. from IFRS to local capital requirements. |
146 | 2023 Annual Report | Management’s Discussion and Analysis
NBV for periods beginning after December 31, 2022 is calculated as the present value of shareholders’ interests in expected future distributable earnings in accordance with IFRS 17, after the cost of capital calculated under the LICAT framework in Canada and the local capital requirements in the U.S. and Asia, on actual new business sold in the period using assumptions that are consistent with the assumptions used in the calculation of embedded value.
NBV for periods prior to January 1, 2023 is calculated as the present value of shareholders’ interests in expected future distributable earnings in accordance with IFRS 4 “Insurance Contracts”, after the cost of capital calculated under the LICAT framework in Canada and the U.S. and the local capital requirements in Asia, on actual new business sold in the period using assumptions that are consistent with the assumptions used in the calculation of embedded value.
NBV excludes businesses with immaterial insurance risks, such as the Company’s Global WAM, Manulife Bank and the P&C Reinsurance businesses. NBV is a useful metric to evaluate the value created by the Company’s new business franchise.
New business value margin (“NBV margin”) is calculated as NBV divided by APE sales excluding non-controlling interests. APE sales are calculated as 100% of regular premiums and deposits sales and 10% of single premiums and deposits sales. NBV margin is a useful metric to help understand the profitability of our new business.
Sales are measured according to product type:
For individual insurance, sales include 100% of new annualized premiums and 10% of both excess and single premiums. For individual insurance, new annualized premiums reflect the annualized premium expected in the first year of a policy that requires premium payments for more than one year. Single premium is the lump sum premium from the sale of a single premium product, e.g. travel insurance. Sales are reported gross before the impact of reinsurance.
For group insurance, sales include new annualized premiums and administrative services only premium equivalents on new cases, as well as the addition of new coverages and amendments to contracts, excluding rate increases.
Insurance-based wealth accumulation product sales include all new deposits into variable and fixed annuity contracts. As we discontinued sales of new variable annuity contracts in the U.S. in the first quarter of 2013, subsequent deposits into existing U.S. variable annuity contracts are not reported as sales. Asia variable annuity deposits are included in APE sales.
APE sales are comprised of 100% of regular premiums and deposits and 10% of excess and single premiums and deposits for both insurance and insurance-based wealth accumulation products.
Gross flows is a new business measure presented for our Global WAM business and includes all deposits into mutual funds, group pension/retirement savings products, private wealth and institutional asset management products. Gross flows is a common industry metric for WAM businesses as it provides a measure of how successful the businesses are at attracting assets.
Net flows is presented for our Global WAM business and includes gross flows less redemptions for mutual funds, group pension/retirement savings products, private wealth and institutional asset management products. In addition, net flows include the net flows of exchange traded funds and non-proprietary products sold by Manulife Securities. Net flows is a common industry metric for WAM businesses as it provides a measure of how successful the businesses are at attracting and retaining assets. When net flows are positive, they are referred to as net inflows. Conversely, negative net flows are referred to as net outflows.
Remittances is defined as the cash remitted or made available for distribution to MFC from its subsidiaries. It is a key metric used by management to evaluate our financial flexibility.
Non-GAAP Measures for 2017
Non-GAAP financial measures include 2017 core earnings (loss), pre-tax 2017 core earnings and 2017 core general expenses.
Non-GAAP ratios include the 2017 expense efficiency ratio.
With the implementation of IFRS 17 and IFRS 9 in 2023, we have made revisions to the definition of the above non-GAAP financial measures and non-GAAP ratios. Please refer to Section 1 for an explanation of the implementation of IFRS 17 and IFRS 9 for more information and the above definitions of 2023 core earnings and expense measures for an explanation of the change to the definition of core earnings and the expense efficiency ratio in 2023.
The definitions and reconciliations of the above measures for 2017 are included below.
2017 core earnings (loss) is a financial measure which we believe aids investors in better understanding the long-term earnings capacity and valuation of the business. 2017 core earnings allows investors to focus on the Company’s operating performance by excluding the direct impact of changes in equity markets and interest rates, changes in actuarial methods and assumptions as well as a number of other items, outlined below, that we believe are material, but do not reflect the underlying earnings capacity of the business. For example, due to the long-term nature of our business, the mark-to-market movements of equity markets, interest rates, foreign currency exchange rates and commodity prices from period-to-period can, and frequently do, have a substantial impact on the reported amounts of our assets, liabilities and net income attributed to shareholders. These reported amounts are not actually realized at the time and may never be
|
|
147 |
realized if the markets move in the opposite direction in a subsequent period. This makes it very difficult for investors to evaluate how our businesses are performing from period-to-period and to compare our performance with other issuers.
While core earnings is relevant to how we manage our business and offers a consistent methodology, it is not insulated from macroeconomic factors which can have a significant impact. See below for reconciliation of 2017 core earnings to net income attributed to shareholders and income before income taxes. Net income attributed to shareholders excludes net income attributed to participating policyholders and non-controlling interests.
The items included in 2017 core earnings and items excluded from 2017 core earnings are determined in accordance with the methodology under OSFI’s Source of Earnings Disclosure (Life Insurance Companies) guideline that was in effect at that time, and are listed below.
Items included in 2017 core earnings:
| 1. | Expected earnings on in-force policies, including expected release of provisions for adverse deviation, fee income, margins on group business and spread business such as Manulife Bank and asset fund management. |
| 2. | Macro hedging costs based on expected market returns. |
| 3. | New business strain and gains. |
| 4. | Policyholder experience gains or losses. |
| 5. | Acquisition and operating expenses compared with expense assumptions used in the measurement of policy liabilities. |
| 6. | Up to $400 million of net favourable investment-related experience reported in a single year, which are referred to as “core investment gains”. This means up to $100 million in the first quarter, up to $200 million on a year-to-date basis in the second quarter, up to $300 million on a year-to-date basis in the third quarter and up to $400 million on a full year basis in the fourth quarter. Any investment-related experience losses reported in a quarter will be offset against the net year-to-date investment-related experience gains with the difference being included in 2017 core earnings subject to a maximum of the year-to-date core investment gains and a minimum of zero, which reflects our expectation that investment-related experience will be positive through-the-business cycle. To the extent any investment-related experience losses cannot be fully offset in a quarter, they will be carried forward to be offset against investment-related experience gains in subsequent quarters in the same year, for purposes of determining core investment gains. Investment-related experience relates to fixed income investing, ALDA returns, credit experience and asset mix changes other than those related to a strategic change. An example of a strategic asset mix change is outlined below. |
| ¡ | This favourable and unfavourable investment-related experience is a combination of reported investment experience as well as the impact of investing activities on the measurement of our policy liabilities. We do not attribute specific components of investment-related experience to amounts included or excluded from 2017 core earnings. |
| ¡ | The $400 million threshold represents the estimated average annualized amount of net favourable investment-related experience that the Company reasonably expects to achieve through-the-business cycle based on historical experience. It is not a forecast of expected net favourable investment-related experience for any given fiscal year. |
| ¡ | Our average net annualized investment-related experience, including core investment gains, calculated from the introduction of core earnings in 2012 to the end of 2017 was $475 million (2012 to the end of 2016 was $456 million). |
| ¡ | The decision announced on December 22, 2017 to reduce the allocation to ALDA in the portfolio asset mix supporting our legacy businesses was the first strategic asset mix change since we introduced the core earnings metric in 2012. We refined our description of investment-related experience in 2017 to note that asset mix changes other than those related to a strategic change are taken into consideration in the investment-related experience component of core investment gains. |
| ¡ | While historical investment return time horizons may vary in length based on underlying asset classes generally exceeding 20 years, for purposes of establishing the threshold, we look at a business cycle that is five or more years and includes a recession. We monitor the appropriateness of the threshold as part of our annual five-year planning process and would adjust it, either to a higher or lower amount, in the future if we believed that our threshold was no longer appropriate. |
| ¡ | Specific criteria used for evaluating a potential adjustment to the threshold may include, but are not limited to, the extent to which actual investment-related experience differs materially from actuarial assumptions used in measuring insurance contract liabilities, material market events, material dispositions or acquisitions of assets, and regulatory or accounting changes. |
Core investment gains are reported in the Corporate and Other segment, with an offsetting adjustment to investment-related experience gains and losses in items excluded from 2017 core earnings.
| 7. | Earnings on surplus other than mark-to-market items. Gains on available-for-sale (“AFS”) equities and seed money investments in segregated and mutual funds are included in 2017 core earnings. |
| 8. | Routine or non-material legal settlements. |
| 9. | All other items not specifically excluded. |
| 10. | Tax on the above items. |
| 11. | All tax related items except the impact of enacted or substantively enacted income tax rate changes. |
148 | 2023 Annual Report | Management’s Discussion and Analysis
Items excluded from 2017 core earnings:
| 1. | The direct impact of equity markets and interest rates and variable annuity guarantee liabilities includes the items listed below. |
| ¡ | The earnings impact of the difference between the net increase (decrease) in variable annuity liabilities that are dynamically hedged and the performance of the related hedge assets. Our variable annuity dynamic hedging strategy is not designed to completely offset the sensitivity of insurance and investment contract liabilities to all risks or measurements associated with the guarantees embedded in these products for a number of reasons, including: provisions for adverse deviation, fund performance, the portion of the interest rate risk that is not dynamically hedged, realized equity and interest rate volatilities and changes to policyholder behaviour. |
| ¡ | Gains (charges) on variable annuity guarantee liabilities not dynamically hedged. |
| ¡ | Gains (charges) on general fund equity investments supporting policy liabilities and on fee income. |
| ¡ | Gains (charges) on macro equity hedges relative to expected costs. The expected cost of macro hedges is calculated using the equity assumptions used in the valuation of insurance and investment contract liabilities. |
| ¡ | Gains (charges) on higher (lower) fixed income reinvestment rates assumed in the valuation of insurance and investment contract liabilities. |
| ¡ | Gains (charges) on sale of AFS bonds and open derivatives not in hedging relationships in the Corporate and Other segment. |
| 2. | Net favourable investment-related experience in excess of $400 million per annum or net unfavourable investment-related experience on a year-to-date basis. |
| 3. | Mark-to-market gains or losses on assets held in the Corporate and Other segment other than gains on AFS equities and seed money investments in new segregated or mutual funds. |
| 4. | Changes in actuarial methods and assumptions. Policy liabilities for IFRS are valued in Canada under standards established by the Actuarial Standards Board that were in effect at that time. The standards require a comprehensive review of actuarial methods and assumptions to be performed annually. The review is designed to reduce the Company’s exposure to uncertainty by ensuring assumptions for both asset related and liability related risks remain appropriate and is accomplished by monitoring experience and selecting assumptions which represent a current best estimate view of expected future experience, and margins that are appropriate for the risks assumed. Changes related to ultimate reinvestment rates (“URR”) are included in the direct impact of equity markets and interest rates and variable annuity guarantee liabilities. By excluding the results of the annual reviews, 2017 core earnings assist investors in evaluating our operational performance and comparing our operational performance from period to period with other global insurance companies because the associated gain or loss is not reflective of current year performance and not reported in net income in most actuarial standards outside of Canada. |
| 5. | The impact on the measurement of policy liabilities of changes in product features or new reinsurance transactions, if material. |
| 6. | Goodwill impairment charges. |
| 7. | Gains or losses on disposition of a business. |
| 8. | Material one-time only adjustments, including highly unusual/extraordinary and material legal settlements or other items that are material and exceptional in nature. |
| 9. | Tax on the above items. |
| 10. | Net income (loss) attributed to participating policyholders and non-controlling interests. |
| 11. | Impact of enacted or substantially enacted income tax rate changes. |
Reconciliation of income (loss) before income taxes to 2017 core earnings
For the year ended December 31, 2017, our financial statements reported income before income taxes of $2,501 million, income tax expense of $239 million and net income of $2,262 million. Income tax expense was comprised of an income tax expense of $1,137 million on 2017 core earnings and an income tax recovery of $898 million on items excluding 2017 core earnings. Net income of $2,262 million was comprised of net income attributed to shareholders of $2,104 million and net income attributed to NCI of $194 million partially offset by a net loss attributed to participating policyholders of $36 million.
2017 core earnings for the year ended December 31, 2017 of $4,565 million reflected total net income attributed to shareholders of $2,104 million less a charge of $2,461 million from items excluded from 2017 core earnings. Items excluded from 2017 core earnings primarily consisted of a charge from the impact related to U.S. tax reform of $1,777 million, and a charge related to the decision to change portfolio asset mix supporting our legacy businesses of $1,032 million, partially offset by a gain from the direct impact of markets of $209 million, investment-related experience gains outside of 2017 core earnings of $167 million and a number of smaller items. Items excluded from 2017 core earnings were disclosed under OSFI’s Source of Earnings Disclosure (Life Insurance Companies) guideline that was in effect at that time.
Pre-tax 2017 core earnings was $5,702 million, equal to the sum of 2017 core earnings of $4,565 million and tax on 2017 core earnings of $1,137 million.
2017 core earnings related to strategic priorities for the year ended December 31, 2017
The Company measures its progress on certain strategic priorities using 2017 core earnings. These strategic priorities include 2017 core earnings from highest potential businesses, 2017 core earnings from Asia region, and 2017 core earnings from long-term care insurance
|
|
149 |
(“LTC”) and variable annuities (“VA”) businesses. The 2017 core earnings for these businesses is calculated consistent with our definition of 2017 core earnings.
| Highest potential businesses | ||||
| For the year ended December 31, 2017 | ||||
| ($ millions, post-tax and based on actual foreign exchange rates in effect in the applicable reporting period) | ||||
| 2017 core earnings of highest potential businesses(1) |
$ | 2,475 | ||
| 2017 core earnings – All other businesses excl. core investment gains |
1,690 | |||
| Core investment gains(2) | 400 | |||
| 2017 core earnings |
4,565 | |||
| Items excluded from 2017 core earnings |
(2,461 | ) | ||
| Net income (loss) attributed to shareholders |
$ | 2,104 | ||
| Highest potential businesses 2017 core earnings contribution |
54% | |||
| (1) | Includes 2017 core earnings from Asia and Global WAM segments, Canada group benefits, and behavioural insurance products. |
| (2) | This item is disclosed under OSFI’s Source of Earnings guideline in effect at such time. |
| Asia region | ||||
| For the year ended December 31, 2017 | ||||
| ($ millions, post-tax and based on actual foreign exchange rates in effect in the applicable reporting period) | ||||
| 2017 core earnings of Asia region(1) |
$ | 1,663 | ||
| 2017 core earnings – All other businesses excl. core investment gains |
2,502 | |||
| Core investment gains(2) |
400 | |||
| 2017 core earnings |
4,565 | |||
| Items excluded from 2017 core earnings |
(2,461 | ) | ||
| Net income (loss) attributed to shareholders |
$ | 2,104 | ||
| Asia region 2017 core earnings contribution |
36% | |||
| (1) | Includes 2017 core earnings from Asia segment and Global WAM’s business in Asia. |
| (2) | This item is disclosed under OSFI’s Source of Earnings guideline in effect at such time. |
| LTC and VA businesses | ||||
| For the year ended December 31, 2017 | ||||
| ($ millions, post-tax and based on actual foreign exchange rates in effect in the applicable reporting period) | ||||
| 2017 core earnings of LTC and VA businesses(1) |
$ | 1,112 | ||
| 2017 core earnings – All other businesses excl. core investment gains |
3,053 | |||
| Core investment gains(2) |
400 | |||
| 2017 core earnings |
4,565 | |||
| Items excluded from 2017 core earnings |
(2,461 | ) | ||
| Net income (loss) attributed to shareholders |
$ | 2,104 | ||
| LTC and VA businesses 2017 core earnings contribution |
24% | |||
| (1) | Includes 2017 core earnings from U.S. long-term care and Asia, Canada and U.S. variable annuities businesses. |
| (2) | This item is disclosed under OSFI’s Source of Earnings guideline in effect at such time. |
2017 expense efficiency ratio is a financial measure which Manulife uses to measure progress towards our target to be more efficient. It is defined as 2017 core general expenses divided by the sum of 2017 core earnings before income taxes (“pre-tax 2017 core earnings”) and 2017 core general expenses. 2017 core general expenses is used to calculate our 2017 expense efficiency ratio and is equal to pre-tax general expenses included in 2017 core earnings and excludes such items as material legal provisions for settlements, restructuring charges and expenses related to integration and acquisitions.
The 2017 expense efficiency ratio for the year ended December 31, 2017 was 55.4%. 2017 core general expenses were $7,091 million consisting of total general expenses on our financial statements for the year ended December 31, 2017 of $7,233 million less $142 million of general expenses included in items excluded from 2017 core earnings. General expenses included in items excluded from 2017 core earnings include integration and acquisition costs of $81 million and legal provisions and other of $61 million. Pre-tax 2017 core earnings were $5,702 million as noted above.
2017 core earnings available to common shareholders
2017 core earnings available to common shareholders is $4,406 million consisting of 2017 core earnings of $4,565 million less preferred share dividends of $159 million.
150 | 2023 Annual Report | Management’s Discussion and Analysis
Contractual Obligations
In the normal course of business, the Company enters into contracts that give rise to obligations fixed by agreement as to the timing and dollar amount of payment.
As at December 31, 2023, the Company’s contractual obligations and commitments were as follows:
| Payments due by period ($ millions) |
Total | Less than 1 year | 1 to 3 years | 3 to 5 years | Over 5 years | |||||||||||||||
| Long-term debt(1) |
$ | 9,578 | $ | 226 | $ | 2,099 | $ | 1,207 | $ | 6,046 | ||||||||||
| Liabilities for capital instruments(1) |
9,644 | 861 | 597 | 671 | 7,515 | |||||||||||||||
| Investment commitments |
15,117 | 5,408 | 4,570 | 3,953 | 1,186 | |||||||||||||||
| Lease liabilities |
350 | 100 | 133 | 68 | 49 | |||||||||||||||
| Insurance contract liabilities(2) |
1,110,645 | 3,400 | 12,312 | 20,169 | 1,074,764 | |||||||||||||||
| Reinsurance contract held liabilities(2) |
8,448 | 332 | 952 | 1,067 | 6,097 | |||||||||||||||
| Investment contract liabilities(1) |
276,411 | 268,537 | 2,978 | 1,408 | 3,488 | |||||||||||||||
| Deposits from Bank clients |
21,616 | 16,814 | 2,963 | 1,839 | – | |||||||||||||||
| Other |
26,590 | 7,612 | 5,173 | 12,677 | 1,128 | |||||||||||||||
| Total contractual obligations |
$ | 1,478,399 | $ | 303,290 | $ | 31,777 | $ | 43,059 | $ | 1,100,273 | ||||||||||
| (1) | The contractual payments include principal, interest and distributions; and reflect the amounts payable up to and including the final contractual maturity date. The contractual payments reflect the amounts payable from January 1, 2024 up to and including the final contractual maturity date. In the case of floating rate obligations, the floating rate index is based on the interest rates as at December 31, 2023 and is assumed to remain constant to the final contractual maturity date. For the 4.061% MFC Subordinated notes, the reset rate is equal to the Secured Overnight Financing Rate (“SOFR”) Swap Rate as at December 31, 2023, plus a spread adjustment of 0.26161%, plus 1.647%. For the 3.00% MFC Subordinated notes, the reset rate is equal to the Singapore Overnight Rate Average (“SORA”) Swap Rate as at December 31, 2023, plus a spread adjustment of 0.31120%, plus 0.832%. The Company may have the contractual right to redeem or repay obligations prior to maturity and if such right is exercised, total contractual obligations paid and the timing of payment could vary significantly from the amounts and timing included in the table. |
| (2) | Insurance contract liabilities cash flows include estimates related to the timing and payment of death and disability claims, policy surrenders, policy maturities, annuity payments, minimum guarantees on segregated fund products, policyholder dividends, commissions and premium taxes offset by contractual future premiums on in-force contracts and exclude amounts from insurance contract liabilities for account of segregated fund holders. These estimated cash flows are based on the best estimate assumptions used in the determination of insurance contract liabilities. These amounts are undiscounted. Reinsurance contract held liabilities cash flows include estimates related to the timing and payment of future reinsurance premiums offset by recoveries on in-force reinsurance agreements. Due to the use of assumptions, actual cash flows may differ from these estimates (see “Insurance and Investment Contract Liabilities”). Cash flows include embedded derivatives measured separately at fair value. |
Legal and Regulatory Proceedings
We are regularly involved in legal actions, both as a defendant and as a plaintiff. Information on legal and regulatory proceedings can be found in note 19 of the 2023 Annual Consolidated Financial Statements.
|
|
151 |
Quarterly Financial Information
The following table provides summary information related to our eight most recently completed quarters. With the adoption of IFRS 17 and IFRS 9 on January 1, 2023, we have provided quarterly 2023 and restated quarterly 2022 information based on the new standards. See section 1 “Implementation of IFRS 17 and IFRS 9” above for additional information.
| As at and for the three months ended ($ millions, except per share amounts or |
Dec 31, 2023 |
Sept 30, 2023 |
June 30, 2023 |
Mar 31, 2023 |
Dec 31, 2022 |
Sept 30, 2022 |
June 30, 2022 |
Mar 31, 2022 |
||||||||||||||||||||||||
| Revenue |
||||||||||||||||||||||||||||||||
| Insurance revenue |
$ | 6,414 | $ | 6,215 | $ | 5,580 | $ | 5,763 | $ | 6,128 | $ | 5,560 | $ | 5,732 | $ | 5,698 | ||||||||||||||||
| Net investment result |
6,784 | 1,265 | 4,819 | 5,153 | 1,440 | 2,439 | (2,454 | ) | (1,088 | ) | ||||||||||||||||||||||
| Other revenue |
1,719 | 1,645 | 1,691 | 1,691 | 1,671 | 1,547 | 1,446 | 1,522 | ||||||||||||||||||||||||
| Total revenue |
$ | 14,917 | $ | 9,125 | $ | 12,090 | $ | 12,607 | $ | 9,239 | $ | 9,546 | $ | 4,724 | $ | 6,132 | ||||||||||||||||
| Income (loss) before income taxes |
$ | 2,123 | $ | 1,174 | $ | 1,436 | $ | 1,719 | $ | 697 | $ | 484 | $ | (2,656 | ) | $ | (1,663 | ) | ||||||||||||||
| Income tax (expense) recovery |
(322 | ) | 51 | (265 | ) | (309 | ) | 226 | (60 | ) | 553 | 440 | ||||||||||||||||||||
| Net income (loss) |
$ | 1,801 | $ | 1,225 | $ | 1,171 | $ | 1,410 | $ | 923 | $ | 424 | $ | (2,103 | ) | $ | (1,223 | ) | ||||||||||||||
| Net income (loss) attributed to shareholders |
$ | 1,659 | $ | 1,013 | $ | 1,025 | $ | 1,406 | $ | 915 | $ | 491 | $ | (2,119 | ) | $ | (1,220 | ) | ||||||||||||||
| Basic earnings (loss) per common share |
$ | 0.86 | $ | 0.53 | $ | 0.50 | $ | 0.73 | $ | 0.43 | $ | 0.23 | $ | (1.13 | ) | $ | (0.66 | ) | ||||||||||||||
| Diluted earnings (loss) per common share |
$ | 0.86 | $ | 0.52 | $ | 0.50 | $ | 0.73 | $ | 0.43 | $ | 0.23 | $ | (1.13 | ) | $ | (0.66 | ) | ||||||||||||||
| Segregated funds deposits |
$ | 10,361 | $ | 10,172 | $ | 10,147 | $ | 11,479 | $ | 10,165 | $ | 9,841 | $ | 10,094 | $ | 12,328 | ||||||||||||||||
| Total assets (in billions) |
$ | 876 | $ | 836 | $ | 851 | $ | 862 | $ | 834 | $ | 818 | $ | 810 | $ | 865 | ||||||||||||||||
| Weighted average common shares (in millions) |
1,810 | 1,826 | 1,842 | 1,858 | 1,878 | 1,902 | 1,921 | 1,938 | ||||||||||||||||||||||||
| Diluted weighted average common shares (in millions) |
1,814 | 1,829 | 1,846 | 1,862 | 1,881 | 1,904 | 1,924 | 1,942 | ||||||||||||||||||||||||
| Dividends per common share |
$ | 0.365 | $ | 0.365 | $ | 0.365 | $ | 0.365 | $ | 0.330 | $ | 0.330 | $ | 0.330 | $ | 0.330 | ||||||||||||||||
| CDN$ to US$1 – Statement of Financial Position |
1.3186 | 1.3520 | 1.3233 | 1.3534 | 1.3549 | 1.3740 | 1.2900 | 1.2496 | ||||||||||||||||||||||||
| CDN$ to US$1 – Statement of Income |
1.3612 | 1.3411 | 1.3430 | 1.3524 | 1.3575 | 1.3057 | 1.2765 | 1.2663 | ||||||||||||||||||||||||
152 | 2023 Annual Report | Management’s Discussion and Analysis
Selected Annual Financial Information
The following table provides selected annual financial information related to our three most recently completed years. With the adoption of IFRS 17 and IFRS 9 on January 1, 2023, we have provided 2023 and restated 2022 information based on the new standards. See section 1 “Implementation of IFRS 17 and IFRS 9” above for additional information. Information has not been restated prior to January 1, 2022 and as a result, 2021 information is based on what was reported in that year.
| As at and for the years ended December 31, ($ millions, except per share amounts) |
2023 | 2022 | 2021(1) | |||||||||
| Revenue |
||||||||||||
| Asia |
$ | 11,996 | $ | 6,051 | ||||||||
| Canada |
13,793 | 7,299 | ||||||||||
| U.S. |
15,322 | 11,048 | ||||||||||
| Global Wealth and Asset Management |
5,896 | 5,267 | ||||||||||
| Corporate and Other |
1,732 | (24 | ) | |||||||||
| Total revenue |
$ | 48,739 | $ | 29,641 | ||||||||
| Total assets |
$ | 875,574 | $ | 833,689 | ||||||||
| Revenue |
||||||||||||
| Asia |
$ | 29,571 | ||||||||||
| Canada |
12,366 | |||||||||||
| U.S. |
13,256 | |||||||||||
| Global Wealth and Asset Management |
6,541 | |||||||||||
| Corporate and Other |
87 | |||||||||||
| Total revenue |
$ | 61,821 | ||||||||||
| Total assets |
$ | 917,643 | ||||||||||
| Long-term financial liabilities |
||||||||||||
| Long-term debt |
$ | 6,071 | $ | 6,234 | $ | 4,882 | ||||||
| Capital instruments |
6,667 | 6,122 | 6,980 | |||||||||
| Total financial liabilities |
$ | 12,738 | $ | 12,356 | $ | 11,862 | ||||||
| Dividend per common share |
$ | 1.46 | $ | 1.32 | $ | 1.17 | ||||||
| Cash dividend per Class A Share, Series 2 |
1.1625 | 1.1625 | 1.1625 | |||||||||
| Cash dividend per Class A Share, Series 3 |
1.125 | 1.125 | 1.125 | |||||||||
| Cash dividend per Class 1 Share, Series 3 |
0.5870 | 0.5870 | 0.5658 | |||||||||
| Cash dividend per Class 1 Share, Series 4 |
1.4946 | 0.6814 | 0.3814 | |||||||||
| Cash dividend per Class 1 Share, Series 5(2) |
– | – | 0.9728 | |||||||||
| Cash dividend per Class 1 Share, Series 7(4) |
– | 0.2695 | 1.078 | |||||||||
| Cash dividend per Class 1 Share, Series 9 |
1.4945 | 1.1894 | 1.0878 | |||||||||
| Cash dividend per Class 1 Share, Series 11 |
1.4505 | 1.1828 | 1.1828 | |||||||||
| Cash dividend per Class 1 Share, Series 13 |
1.2245 | 1.1035 | 1.1035 | |||||||||
| Cash dividend per Class 1 Share, Series 15 |
0.9465 | 0.9465 | 0.9465 | |||||||||
| Cash dividend per Class 1 Share, Series 17 |
0.950 | 0.950 | 0.950 | |||||||||
| Cash dividend per Class 1 Share, Series 19 |
0.9188 | 0.9188 | 0.9188 | |||||||||
| Cash dividend per Class 1 Share, Series 21(3) |
– | – | 0.70 | |||||||||
| Cash dividend per Class 1 Share, Series 23(5) |
– | 0.3031 | 1.2125 | |||||||||
| Cash dividend per Class 1 Share, Series 25 |
1.3303 | 1.175 | 1.175 | |||||||||
| (1) | 2021 total revenue and total assets results are not restated for IFRS 17 and IFRS 9. |
| (2) | MFC redeemed in full the Class 1 Series 5 preferred shares at par, on December 19, 2021, the earliest redemption date. |
| (3) | MFC redeemed in full the Class 1 Series 21 preferred shares at par, on June 19, 2021, the earliest redemption date. |
| (4) | MFC redeemed in full the Class 1 Series 7 preferred shares at par, on March 19, 2022, the earliest redemption date. |
| (5) | MFC redeemed in full the Class 1 Series 23 preferred shares at par, on March 19, 2022, the earliest redemption date. |
Revenue
Total revenue in 4Q23 was $14.9 billion compared with $9.2 billion in 4Q22. The increase in total revenue of $5.7 billion was primarily due to an increase in net investment income due to net realized and unrealized gains in 4Q23 compared with losses in 4Q22. Results by segment include:
| • | Asia total revenue increased $2.6 billion in 4Q23 compared with 4Q22, due to higher net investment income driven by higher net realized and unrealized gains on invested assets and higher investment income. |
| • | Canada total revenue increased $2.0 billion in 4Q23 compared with 4Q22, driven by higher net investment income due to net realized and unrealized gains on invested assets in 4Q23 compared with losses in 4Q22. |
|
|
153 |
| • | U.S. total revenue increased $0.8 billion in 4Q23 compared with 4Q22, driven by higher net investment income due to net realized and unrealized losses on invested assets in 4Q22, partially offset by lower investment income. |
| • | Global WAM total revenue increased $0.1 billion in 4Q23 compared with 4Q22, primarily due to higher fee income from growth in average AUMA and an increase in fee spreads, partially offset by the non-recurrence of a gain on our acquisition of the remaining equity interest in MFM in 2022. |
| • | Corporate and Other total revenue increased $0.2 billion in 4Q23 compared with 4Q22, primarily driven by an increase in net investment income from lower realized losses on the sale of FVOCI debt instruments in 4Q23 compared with 4Q22, a more favourable impact of markets on derivatives and other assets, and higher yields on debt instruments. |
On a full year basis, total revenue in 2023 was $48.7 billion compared with $29.6 billion in 2022. The increase in total revenue of $19.1 billion was due to higher net investment income mainly from net realized and unrealized gains in 2023 compared with losses in 2022, along with higher insurance revenue and other revenue. Results by segment include:
| • | Asia total revenue increased $5.9 billion in 2023 compared with 2022 due to similar reasons as noted above. |
| • | Canada total revenue increased $6.5 billion in 2023 compared with 2022, driven by higher net investment income, due to net realized and unrealized gains on invested assets in 2023 compared with losses in 2022 and higher investment income, as well as higher insurance revenue. |
| • | U.S. total revenue increased $4.3 billion in 2023 compared with 2022, driven by higher net investment income due to similar reasons as noted above. |
| • | Global WAM total revenue increased $0.6 billion in 2023 compared with 2022, primarily driven by higher fee income, from an increase in fee spreads, growth in average AUMA and higher performance fees in Institutional Asset Management, as well as the favourable impact of a weaker Canadian dollar compared with the U.S. dollar, and gains on seed money investments in 2023 compared with losses in 2022. This was partially offset by the non-recurrence of a gain on our acquisition of the remaining equity interest in MFM in 2022. |
| • | Corporate and Other total revenue increased $1.8 billion in 2023 compared with 2022, primarily driven by similar reasons noted above and a more favourable impact of markets on equities. |
Revenue
| Revenue ($ millions) |
Quarterly Results | Full Year Results | ||||||||||||||
| 4Q23 | 4Q22 | 2023 | 2022 | |||||||||||||
| Insurance revenue |
$ | 6,414 | $ | 6,128 | $ | 23,972 | $ | 23,118 | ||||||||
| Net investment income |
6,784 | 1,440 | 18,021 | 337 | ||||||||||||
| Other revenue |
1,719 | 1,671 | 6,746 | 6,186 | ||||||||||||
| Total revenue |
$ | 14,917 | $ | 9,239 | $ | 48,739 | $ | 29,641 | ||||||||
| Asia |
$ | 3,572 | $ | 990 | $ | 11,996 | $ | 6,051 | ||||||||
| Canada |
4,663 | 2,648 | 13,793 | 7,299 | ||||||||||||
| U.S. |
4,566 | 3,814 | 15,322 | 11,048 | ||||||||||||
| Global Wealth and Asset Management |
1,632 | 1,530 | 5,896 | 5,267 | ||||||||||||
| Corporate and Other |
484 | 257 | 1,732 | (24 | ) | |||||||||||
| Total revenue |
$ | 14,917 | $ | 9,239 | $ | 48,739 | $ | 29,641 | ||||||||
Differences between IFRS and Hong Kong Financial Reporting Standards
Manulife’s Consolidated Financial Statements are presented in accordance with IFRS. Upon issuance of IFRS 17 “Insurance Contracts” effective January 1, 2023, there is no longer any material difference between IFRS and Hong Kong Financial Reporting Standards.
IFRS and Hong Kong Regulatory Requirements
Insurers in Hong Kong are required by the Insurance Authority to meet minimum solvency requirements. As at December 31, 2023, the Company’s business that falls within the scope of these requirements has sufficient assets to meet the minimum solvency requirements under both Hong Kong regulatory requirements and IFRS.
Outstanding Common Shares
As at January 31, 2024, MFC had 1,806,118,020 common shares outstanding.
Additional Information Available
Additional information relating to Manulife, including MFC’s Annual Information Form, is available on the Company’s website at www.manulife.com and on the SEDAR+ website at www.sedarplus.ca.
154 | 2023 Annual Report | Management’s Discussion and Analysis
Exhibit 99.3

MANULIFE FINANCIAL CORPORATION
Annual Information Form
February 14, 2024
P a g e | 2
Table of Contents
| TABLE OF CONTENTS | Annual Information Form
|
Management’s Discussion & Analysis Reference
|
||
|
CORPORATE STRUCTURE
|
4 | |||
|
GENERAL DEVELOPMENT OF THE BUSINESS
|
4 | 18-24 | ||
|
BUSINESS OPERATIONS
|
5 | 10-43 | ||
|
RISK MANAGEMENT
|
8 | 48-84 | ||
|
GOVERNMENT REGULATION
|
8 | |||
|
GENERAL DESCRIPTION OF CAPITAL STRUCTURE
|
15 | |||
|
DIVIDENDS
|
19 | |||
|
CONSTRAINTS ON OWNERSHIP OF SHARES
|
20 | |||
|
RATINGS
|
20 | |||
|
MARKET FOR SECURITIES
|
23 | |||
|
ESCROWED SECURITIES AND SECURITIES SUBJECT TO CONTRACTUAL RESTRICTION ON TRANSFER
|
26 | |||
|
DIRECTORS AND EXECUTIVE OFFICERS
|
26 | |||
|
LEGAL PROCEEDINGS AND REGULATORY ACTIONS
|
29 | |||
|
TRANSFER AGENT AND REGISTRAR
|
29 | |||
|
INTERESTS OF EXPERTS
|
30 | |||
|
AUDIT COMMITTEE
|
30 | |||
|
ADDITIONAL INFORMATION
|
31 | |||
|
SCHEDULE 1 – AUDIT COMMITTEE CHARTER
|
32 |
P a g e | 3
Presentation of Information
In this annual information form (“AIF”), unless otherwise indicated or unless the context otherwise requires:
| • | all references to “MFC” and “MLI” refer to Manulife Financial Corporation and The Manufacturers Life Insurance Company, respectively, not including their subsidiaries; |
| • | MFC and its subsidiaries, including MLI, are collectively referred to as “Manulife”; |
| • | references to “Company”, “we”, “us” and “our” refer to Manulife; |
| • | references to “$” or “C$” are to Canadian dollars; and |
| • | information is as at December 31, 2023. |
Documents Incorporated by Reference
The following documents are incorporated by reference in and form part of this AIF:
| • | MFC’s Management’s Discussion and Analysis for the year ended December 31, 2023 (our “2023 MD&A”); and |
| • | MFC’s audited annual consolidated financial statements and accompanying notes as at and for the year ended December 31, 2023 (our “2023 Consolidated Financial Statements”). |
These documents have been filed with securities regulators in Canada and may be accessed at the System for Electronic Document Analysis and Retrieval + (“SEDAR+”), found at www.sedarplus.ca. They have also been filed with the U.S. Securities and Exchange Commission (the “SEC”) and may be found at www.sec.gov.
Any website address included in this AIF is an inactive textual reference only and information appearing on such website is not part of, and is not incorporated by reference in, this AIF.
Caution Regarding Forward-Looking Statements
From time to time, the Company makes written and/or oral forward-looking statements, including in this document and the documents incorporated by reference in this document. In addition, the Company’s representatives may make forward-looking statements orally to analysts, investors, the media and others. All such statements are made pursuant to the “safe harbour” provisions of Canadian provincial securities laws and the U.S. Private Securities Litigation Reform Act of 1995.
The forward-looking statements in this document and the documents incorporated by reference in this document include, but are not limited to, statements with respect to possible share buybacks under our normal course issuer bid, the Company’s possible or assumed future results set out under “General Development of the Business”, “Business Operations” and “Government Regulation”, the Company’s strategic priorities and targets for its highest potential businesses, net promoter score, straight-through processing, ongoing expense efficiency, portfolio optimization, employee engagement, its medium-term financial and operating targets, its ability to achieve our financed emissions and absolute scope 1 and 2 emissions targets, the estimated timing and amount of state approved future premium increases on our U.S. LTC business, the closing of the reinsurance transaction in respect of certain legacy blocks and the associated capital release, the closing of the acquisition of CQS, the impact of changes in tax laws, the probability and impact of LICAT scenario switches, and our journey to net zero, and also relate to, among other things, our objectives, goals, strategies, intentions, plans, beliefs, expectations and estimates, and can generally be identified by the use of words such as “may”, “will”, “could”, “should”, “would”, “likely”, “suspect”, “outlook”, “expect”, “intend”, “estimate”, “anticipate”, “believe”, “plan”, “forecast”, “objective”, “seek”, “aim”, “continue”, “goal”, “restore”, “embark” and “endeavour” (or the negative thereof) and words and expressions of similar import, and include statements concerning possible or assumed future results. Although we believe that the expectations reflected in such forward-looking statements are reasonable, such statements involve risks and uncertainties, and undue reliance should not be placed on such statements and they should not be interpreted as confirming market or analysts’ expectations in any way.
Certain material factors or assumptions are applied in making forward-looking statements, and actual results may differ materially from those expressed or implied in such statements. Important factors that could cause actual results P a g e | 4
to differ materially from expectations include, but are not limited to, the factors identified under “Caution regarding forward-looking statements” in our 2023 MD&A. Additional information about material risk factors that could cause actual results to differ materially from expectations and about material factors or assumptions applied in making forward-looking statements may be found under “Risk Management and Risk Factors” and “Critical Actuarial and Accounting Policies” in our 2023 MD&A, in the “Risk Management” note to our 2023 Consolidated Financial Statements and elsewhere in MFC’s filings with Canadian and U.S. securities regulators. The forward-looking statements in this document or in the documents incorporated by reference in this document are, unless otherwise indicated, stated as of the date hereof or the date of the document incorporated by reference, as the case may be, and are presented for the purpose of assisting investors and others in understanding the Company’s financial position and results of operations, our future operations, as well as the Company’s objectives and strategic priorities, and may not be appropriate for other purposes. The Company does not undertake to update any forward-looking statements, except as required by law.
CORPORATE STRUCTURE
Name, Address and Incorporation
Manulife Financial Corporation is a life insurance company incorporated under the Insurance Companies Act (Canada) (the “ICA”) on April 26, 1999 for the purpose of becoming the holding company of MLI following its demutualization. MLI was incorporated on June 23, 1887, by a Special Act of Parliament of the Dominion of Canada and was converted into a mutual life insurance company in 1968. Pursuant to Letters Patent of Conversion, effective September 23, 1999, MLI implemented a plan of demutualization under the ICA and converted to a life insurance company with common shares and became the wholly owned subsidiary of MFC.
MFC’s head office and registered office is located at 200 Bloor Street East, Toronto, Canada, M4W 1E5.
Intercorporate Relationships
The major operating subsidiaries of MFC, including direct and indirect subsidiaries, and MFC’s direct and indirect voting interest therein, are listed in Note 22 (Subsidiaries) to our 2023 Consolidated Financial Statements. These companies are incorporated in the jurisdiction in which their head office or registered office is located.
GENERAL DEVELOPMENT OF THE BUSINESS
Three Year History
In 2023, despite a challenging operating environment with persistent macroeconomic and geopolitical uncertainty, our business proved resilient, and we stayed committed to our strategic priorities. We have successfully closed a milestone reinsurance transaction, reported our first full year of financial results prepared under IFRS 17, gained momentum on our post-pandemic recovery in Asia and are tracking well on our digital transformation journey. Further highlights with respect to our five strategic priorities are outlined in our 2023 MD&A. The following changes were made in 2023 to the executive leadership team: Colin Simpson was appointed Chief Financial Officer succeeding Phil Witherington who was appointed CEO, Asia Segment, Halina von dem Hagen was appointed Chief Risk Officer, Rahim Hirji was appointed Chief Auditor and Head of Advisory Services, and Brooks Tingle was appointed CEO, US Segment.
In 2022, we navigated an increasingly complex macroeconomic and geopolitical environment. Our all-weather strategy allowed us to capitalize on opportunities rooted in longer-term trends and deliver against our strategic priorities amidst short-term headwinds. We remain committed to executing against our strategic priorities to fulfill our commitments to customers and unlock value for our shareholders. Further highlights with respect to our five strategic priorities are outlined in our 2022 MD&A. We have successfully delivered on our global Return-to-Office mandate after over two years of remote work, welcoming back our colleagues in a hybrid work environment. The following changes were made in 2022 to the executive leadership team: Naveed Irshad was appointed CEO, Canada Segment, succeeding Mike Doughty after his retirement, Marc Costantini joined as Global Head of Inforce Management, and Damien Green was appointed CEO, Asia Segment.
In 2021, we continued to navigate COVID-19 while executing against our five strategic priorities. At Manulife’s Investor Day on June 29, 2021, we announced that we have entered a new phase of our strategy, with a greater focus on P a g e | 5
accelerating growth of our highest potential businesses and a commitment to meaningful metrics to measure our progress through to 2025. Our five strategic priorities remained the right areas of focus to achieve our ambition of being the most digital, customer-centric global company in our industry. No changes were made to the executive leadership team in 2021.
Additional information about our business can be found in the “Business Operations” section below, and in MFC’s 2023 MD&A, on pages 10 to 43 inclusive.
BUSINESS OPERATIONS
Information about our business and operating segments, our strategy, products, and investment activities, is included in MFC’s 2023 MD&A, on pages 10 to 43 inclusive.
DISTRIBUTION METHODS
The Company has a multi-channel distribution network in all the segments in which it operates, with different emphasis depending on the product line and geography. Our four operating segments are: Asia, Canada, U.S., and Global Wealth and Asset Management.
Asia We have insurance operations in 11 markets across Asia. We are a leading provider of insurance products and insurance-based wealth accumulation products, driven by a customer-centric strategy, leveraging the asset management expertise and products managed by our Global Wealth and Asset Management segment. Our portfolio includes a broad array of health, protection, savings, medical, term and whole life products.
Our diversified multi-channel distribution network in Asia includes contracted agents, bank partnerships and independent agents, financial advisors, and brokers. We have exclusive bancassurance partnerships, including a long-term, regional partnership with DBS Bank Ltd. in Singapore, Hong Kong, mainland China and Indonesia, and Alliance Bank in Malaysia, that give us access to over 35 million bank customers.
In Hong Kong and Macau, our insurance products are marketed and sold through the Company’s agency, bancassurance partnerships, and independent broker channels. In Japan, product offerings are marketed through proprietary sales agents, independent agencies or managing general agents and bancassurance partners. In Singapore, mainland China, Vietnam, Indonesia, the Philippines, Malaysia, Cambodia and Myanmar, products are primarily marketed and sold through agents, bank channels (including exclusive partnerships), brokerages, and independent financial advisors.
Canada We are a leading financial services provider, offering insurance products, insurance-based wealth accumulation products and banking services, have a variable annuity business, and we leverage the asset management expertise and products managed by our Global Wealth and Asset Management segment.
We offer financial protection solutions to individuals, families, and business owners through a combination of competitive products, professional advice and quality customer service. We provide life, health, disability and specialty products, such as mortgage creditor and travel insurance, through advisors, sponsor groups and associations, as well as direct-to-customer.
We provide group life, health and disability insurance solutions to Canadian sponsors (these include traditional employers as well as other forms of groups such as government programs, unions, and associations) and these products are distributed through various distribution channels, including a national network of regional offices that provide support to plan sponsors.
Manulife Bank offers flexible debt and cash flow management solutions as part of a customer’s overall financial plan. Products include savings and chequing accounts, guaranteed interest certificates, lines of credit, investment loans, mortgages and other specialized lending programs, offered through financial advisors supported by a broad distribution network.
P a g e | 6
U.S. Our U.S. segment provides a range of life insurance products and insurance-based wealth accumulation products and has an in-force long-term care insurance business and an in-force annuity business.
The insurance products we offer are designed to provide estate, business and income-protection solutions for affluent markets and the middle market, and to leverage the asset management expertise and products managed by our Global Wealth and Asset Management business. The primary distribution channel of our products is licensed financial advisors. We aim to establish lifelong customer relationships that benefit from our holistic protection and wealth product offerings in the future.
As a life insurer, we believe we can and should help our customers live longer, healthier, better lives, and are a leader in making behavioural insurance features standard on all our new insurance product offerings. Those features are generally available through the John Hancock Vitality program, which rewards customers for the everyday steps they take toward better long-term health. The program is underpinned by a network of like-minded companies, including Amazon, Apple, GRAIL, and ŌURA, who share our commitment to helping people gain a better understanding of their personal health and achieve better outcomes.
On the inforce side, our long-term care insurance policies provide coverage for the cost of long-term services and support, and our annuity business includes fixed deferred, variable deferred, and payout products.
Global Wealth and Asset Management Our Global Wealth and Asset Management segment, branded as Manulife Investment Management, provides investment advice and innovative solutions to retirement, retail and institutional clients. Our leading capabilities in public and private markets are strengthened by an investment footprint that spans 19 geographies1, including 10 in Asia, with over 120 years of on-the-ground experience.
In retirement, we provide financial guidance, advice, and investment solutions and recordkeeping services to over 9 million plan participants and rollover individuals in North America and Asia while they are in the accumulation phase with their employer, and increasingly as they prepare for their retirement outside their employer’s plan. In North America, our Canadian retirement business focuses on providing retirement solutions through defined contribution plans, and also to group plan members when they retire or leave their plan; and in the United States, we provide solutions to employer sponsored retirement plans as well as personal retirement accounts to individuals when they leave their plan. In Asia, we provide retirement offerings to employers and individuals, including Mandatory Provident Fund (“MPF”) schemes and administration in Hong Kong. Additionally, we provide retirement solutions in several emerging retirement markets in Asia, including the Philippines, Indonesia and Malaysia.
In retail, we distribute investment funds to clients through our proprietary advice channels in Canada and Asia as well as through intermediaries and banks in North America and Asia, and offer investment strategies across the world, through affiliated and select unaffiliated asset managers. In Canada, we also provide holistic personal advice to individual clients and investment management, private banking and wealth and estate solutions to high-net-worth clients. In addition, we provide wealth management expertise for insurance-based wealth accumulation products that are distributed through Manulife’s insurance segments, as well as through our own proprietary advice channels.
Our institutional asset management business provides comprehensive asset management solutions for pension plans, foundations, endowments, financial institutions, and other institutional investors worldwide. Our solutions span all major asset classes including equities, fixed income, and alternative assets (including real estate, timberland, farmland, private equity/debt, infrastructure, and liquid alternatives). In addition, we offer multi-asset investment solutions covering a broad range of clients’ investment needs.
Sustainable asset management is integral to our investment approach. Through the lens of financial materiality, we focus our sustainability expertise on helping clients identify and manage systemic risks and take advantage of related opportunities. We endeavor to enhance the resiliency of our clients’ assets through our robust program of
| 1 | United States, Canada, Japan, Hong Kong, Singapore, Taiwan, Indonesia, Vietnam, Malaysia, India, the Philippines, England, Ireland, Switzerland, Germany, and mainland China. In addition, we have timberland/farmland operations in Australia, New Zealand, and Chile. |
P a g e | 7
stewardship, which includes one-on-one company engagement, responsible asset operations, the development of global sustainability standards, and efforts to encourage positive change through a wide range of regulatory and industry engagements.
COMPETITION
We operate in highly competitive markets and compete for customers with other insurance companies, banks, wealth management companies, and mutual fund companies. We also compete with emerging fintechs, as well as non-traditional technology players entering the financial services industry. Customer loyalty and retention, and access to distributors, are important to the Company’s success and are influenced by many factors, including our distribution practices and regulations, product features, service levels, prices, and our financial strength ratings and reputation.
Key trends that are increasing competitive pressures in all our markets include (i) digital solutions to enhance the customer experience and (ii) simplified and innovative product offerings. Both traditional and non-traditional competitors are beginning to evolve their strategies to respond to these trends.
Asia With over 125 years of continuous operations in Asia, we are one of the few foreign insurance companies with scale, diversified distribution and a broad Asian footprint across developed and emerging insurance markets. We believe that the Company is well positioned to benefit from the potential of the region.
Canada The financial protection market remains dominated by three large Canadian insurance providers, of which we are one, while certain regional or smaller carriers focused on specialty products or niche segments are extremely competitive in some markets.
U.S. Competition in the U.S. is primarily with other large insurance firms, as well as mutual insurance companies, that distribute comparable products through similar channels.
Global Wealth and Asset Management In North America, the wealth and asset management market continues to be led by large wealth management companies that are consolidating. Across our Asian markets, we operate in very competitive markets comprised of global, pan-Asian, and regional wealth and asset managers. Our institutional asset management competitors are made up of a disparate group of global and regional institutional asset management companies, each of whom competes with us in distinct asset classes.
ENVIRONMENTAL, SOCIAL AND GOVERNANCE REPORT AND PUBLIC ACCOUNTABILITY STATEMENT
We report on the environmental, social and governance dimensions of our products and services, as well as our operations and community activities in Manulife’s annual Environmental, Social and Governance Report and Public Accountability Statement. These two reports provide information on priorities and performance and can be found on the Sustainability section of the Company’s website at www.manulife.com/sustainability.
In 2022, we launched an Impact Agenda which outlines our key focus areas to drive sustained social and environmental impact through our business and our interactions with customers, communities and the environments in which we operate. There are three key areas of focus: empowering sustained health and well-being, driving inclusive economic opportunity and accelerating a sustainable future.
In order to ensure our sustainability efforts make an impact beyond our business, we actively engage with various internationally recognized initiatives and frameworks to help drive progress across industries and geographies. Since 2017, Manulife has been a supporter of the Task Force on Climate-related Financial Disclosures (“TCFD”) recommendations, now the responsibility of the International Financial Reporting Standards (IFRS) Foundation. Our 2023 MD&A includes disclosures in the “Strategic Risk – Environmental, Social and Governance Risks” section on our ESG framework, including Manulife’s climate change approach. Please also refer to our Environmental, Social and P a g e | 8
Governance Report, published in the second quarter of each year, for detailed disclosure on our alignment with the TCFD recommendations and our sustainability performance.
RISK MANAGEMENT
A categorization and explanation of the broad risks facing the Company, Manulife’s risk management strategies for each category, and a discussion of the specific risks and uncertainties to which our business operations and financial condition are subject can be found in the section entitled “Risk Management and Risk Factors” in our 2023 MD&A.
As noted under “Caution Regarding Forward-Looking Statements”, forward-looking statements involve risks and uncertainties and actual results may differ materially from those expressed or implied in such statements. Strategic risk, market risk, credit risk, product risk and operational risk are the five principal categories of risk described in our 2023 MD&A. These risk factors should be considered in conjunction with the other information in this AIF and the documents incorporated by reference herein.
GOVERNMENT REGULATION
As an insurance company, Manulife is subject to regulation and supervision by governmental authorities in the jurisdictions in which it does business. In Canada, the Company is subject to both federal and provincial regulation. In the United States, the Company is primarily regulated by each of the states in which it conducts business and by federal securities laws. The Company’s Asia operations are similarly subject to a variety of regulatory and supervisory regimes in each of the Asian jurisdictions in which the Company operates, which vary in degree of regulation and supervision.
CANADA
Manulife is governed by the ICA. The ICA is administered by, and activities of the Company are supervised by, the Office of the Superintendent of Financial Institutions (Canada) (“OSFI”), the primary regulator of federal financial institutions. The ICA permits insurance companies to offer, directly or through subsidiaries or through networking arrangements, a broad range of financial services, including banking, investment counseling and portfolio management, mutual funds, trust services, real property brokerage and appraisal, information processing and merchant banking services.
The ICA requires the filing of annual and other reports on the financial condition of the Company, provides for periodic examinations of the Company’s affairs, imposes restrictions on transactions with related parties, and sets forth requirements governing reserves for actuarial liabilities and the safekeeping of assets and other matters. OSFI supervises Manulife on a consolidated basis (including capital adequacy) to ensure that OSFI has an overview of the group’s activities. This includes the ability to review both insurance and non-insurance activities conducted by subsidiaries of Manulife with supervisory power to bring about corrective action.
Capital Requirements
The ICA requires Canadian insurance companies to maintain adequate levels of capital at all times.
Capital requirements for MFC and MLI are governed by the Life Insurance Capital Adequacy Test (“LICAT”) guideline, with LICAT ratios prepared on a consolidated basis. LICAT uses a risk-based approach to measure and aggregate specified risks to calculate the amount of regulatory capital required to support these risks. It measures the capital adequacy of a life insurer and is one of several indicators used by OSFI to assess a life insurer’s financial condition. The LICAT ratio compares capital resources to the Base Solvency Buffer, the latter being the risk-based capital requirement determined in accordance with the guideline. The LICAT guideline for 2023 makes calibration adjustments to adapt to the IFRS 17 accounting change including an increase to adjusted retained earnings to recognize the IFRS 17 Contractual Service Margin (CSM) as available capital, and the reduction of required capital through the reduction of the scalar on Base Solvency Buffer from 1.05 to 1.0. These changes took effect in the LICAT ratio reported as of March 31, 2023. Our capital position continues to be strong under IFRS 17.
P a g e | 9
Capital resources include Available Capital, as well as a Surplus Allowance (equal to the net risk adjustment reported in the financial statements in respect of all insurance contracts other than risk adjustments arising from segregated fund contracts with guarantee risks) and Eligible Deposits (collateral and letters of credit from unregistered reinsurers). Available Capital includes common equity, qualifying preferred shares, qualifying innovative tier 1 instruments, limited recourse capital notes, subordinated debt, contributed surplus, adjusted retained earnings, adjusted Accumulated Other Comprehensive Income (“AOCI”) and the participating account. Under LICAT, certain deductions are made from Available Capital, including, but not limited to, goodwill, intangible assets, a portion of deferred tax assets, and controlling interests in non-life financial corporations.
The Base Solvency Buffer is equal to the aggregated capital requirements, net of credits for diversification and qualifying participating and adjustable products. The capital requirements cover the following five risk components: market risk, credit risk, insurance risk, operational risk and segregated funds guarantee risk.
The minimum regulatory LICAT ratio is 90% for MFC and MLI; in addition, MLI is subject to an industry-wide supervisory target of 100%. OSFI expects each insurance company to establish an internal target capital level that provides a cushion above the regulatory requirements. This cushion allows for coping with volatility in markets and economic conditions, and enhances flexibility in capital management to consider aspects such as innovations in the industry, consolidation trends and international developments. OSFI may require that a higher amount of capital be available, taking into account such factors as operating experience and diversification of asset or insurance portfolios. MFC endeavours to manage its business such that LICAT ratios for both MFC and MLI are above their internal targets. See the section entitled “Capital Management Framework – Regulatory Capital Position” in our 2023 MD&A for our LICAT ratios.
OSFI may intervene and assume control of a Canadian life insurance company if it deems the amount of available capital insufficient. Capital requirements may be adjusted by OSFI as experience develops, the risk profile of Canadian life insurers changes, or to reflect other risks.
See the section entitled “Risk Management and Risk Factors” in our 2023 MD&A for information about regulatory initiatives and other developments that could impact MFC’s capital position.
Regulated subsidiaries of MFC must maintain minimum levels of capital, which are based on the local capital regime and the statutory accounting basis in each jurisdiction. The Company seeks to maintain capital in excess of the minimum required in all foreign jurisdictions in which the Company does business.
Investment Powers
Under the ICA, Manulife must maintain a prudent portfolio of investments and loans, subject to certain overall limitations on the amount it may invest in certain classes of investments, such as commercial loans. Additional restrictions (and in some cases, the need for regulatory approvals) limit the types of investments that the Company can make in excess of 10% of the voting rights or 25% of the equity of any entity.
Restrictions on Shareholder Dividends and Capital Transactions
The ICA prohibits the declaration or payment of any dividend on shares of an insurance company if there are reasonable grounds for believing an insurance company does not have adequate capital and adequate and appropriate forms of liquidity, or the declaration or the payment of the dividend would cause the insurance company to be in contravention of any regulation made under the ICA respecting the maintenance of adequate capital and adequate and appropriate forms of liquidity, or any direction made to the company by the Superintendent of Financial Institutions (Canada) (the “Superintendent”). The ICA also requires an insurance company to notify the Superintendent of the declaration of a dividend at least 15 days prior to the date fixed for its payment. Similarly, the ICA prohibits the purchase for cancellation of any shares issued by an insurance company, or the redemption of any redeemable shares or other similar capital transactions, if there are reasonable grounds for believing that the company does not have adequate capital and adequate and appropriate forms of liquidity, or the purchase or the payment would cause the company to be, in contravention of any regulation made under the ICA respecting the maintenance of adequate capital and adequate and appropriate forms of liquidity, or any direction made to the P a g e | 10
company by the Superintendent. These latter transactions would require the prior approval of the Superintendent. There is currently no direction against MFC or MLI paying a dividend or redeeming or purchasing their shares for cancellation.
Chief Actuary
In accordance with the ICA, the Board of Directors of MFC (the “Board”) has appointed the Chief Actuary who must be a Fellow of the Canadian Institute of Actuaries. The Chief Actuary is required to value the policy liabilities of Manulife as at the end of each financial year in accordance with accepted actuarial practices1 with such changes as may be determined by the Superintendent and any direction that may be made by the Superintendent, including selection of appropriate assumptions and methods. The Chief Actuary must make a report in the prescribed form on the valuation including providing an opinion as to whether the consolidated financial statements fairly present the results of the valuation. At least once in each financial year, the Chief Actuary must meet with the Board, or the Audit Committee, to report, in accordance with accepted actuarial practice and any direction that may be made by the Superintendent, on the current and expected future financial condition of the Company. The Chief Actuary is also required to report to the President and Chief Executive Officer and the Chief Financial Officer of the Company if the Chief Actuary identifies any matters that, in the Chief Actuary’s opinion, have material adverse effects on the financial condition of the Company and require rectification.
Prescribed Supervisory Information
The Supervisory Information (Insurance Companies) Regulations made under the ICA prohibit regulated insurance companies, such as MFC and MLI, from disclosing, directly or indirectly, “prescribed supervisory information”, as defined in those regulations. Prescribed supervisory information includes assessments, recommendations, ratings and reports concerning the Company made by or at the request of the Superintendent, orders of the Superintendent with respect to capital and liquidity, certain regulatory actions taken with respect to the Company, prudential agreements between the Company and the Superintendent, and directions of the Superintendent that we cease or refrain from committing, or remedy, unsafe or unsound practices in conducting our business.
Provincial Insurance Regulation
The Company is also subject to provincial regulation and supervision in each province and territory of Canada in which it carries on business. While mainly subject to direct governance by provincial insurance regulation, which is concerned primarily with the form of insurance contracts and the sale and marketing of insurance and annuity products, including the licensing and supervision of insurance agents, the Company is also subject to other provincial regulatory regimes governing general commercial conduct, such as consumer protection and privacy. Insurance sales and agent compensation are also subject to guidelines established by the Canadian Insurance Services Regulatory Organization, which have been incorporated into the criteria by which provincial insurance regulators undertake supervision. Individual variable insurance contracts and the underlying segregated funds to which they relate are also subject to guidelines established by the Canadian Life and Health Insurance Association Inc. which have been incorporated into regulation in Ontario, are consistent with guidelines in Quebec adopted under the authority of Québec insurance legislation, and are generally followed by the regulators of all other provinces. These guidelines govern a number of matters relating to the sale of these products and the administration of the underlying segregated funds. MLI is licensed to transact business in all provinces and territories of Canada.
Provincial/Territorial Securities Laws
The Company’s Canadian investment fund, dealer and asset management businesses are subject to Canadian provincial and territorial securities laws. Manulife Investment Management Limited (“MIML”) is registered as a portfolio manager with the securities commissions in all Canadian provinces and territories, as an investment fund manager in the provinces of Ontario, Newfoundland and Labrador and Québec, as a commodity trading manager in Ontario, and as a derivatives portfolio manager in Québec. Manulife Investment Management Distributors Inc. (“MIMDI”) is registered as an exempt market dealer with the securities commissions in all Canadian provinces and territories.
| 1 | Accepted actuarial practices means Canadian accepted actuarial practices as established by the Actuarial Standards Board. |
P a g e | 11
MIML and MIMDI are subject to regulation by the applicable provincial securities regulators. Manulife Wealth Inc. (“MWI”) is registered under provincial and territorial securities laws to sell investments across Canada and is subject to regulation by the applicable provincial and territorial securities regulators. MWI is regulated by the Canadian Investment Regulatory Organization. MWI is also registered as a derivatives dealer in Québec.
Consumer Protection for Financial Institution Failure
Assuris was created by the life and health insurance industry in Canada in 1990 to provide Canadian policyholders with protection in the event of the insolvency of their insurance company. Assuris is funded by its member insurance companies, including MLI and Manulife Assurance Company of Canada. Member companies of Assuris are assessed to build and maintain a liquidity fund at a minimum level of $100 million. Members are then primarily subject to assessment on an “as needed” basis. The assessment base for member companies is calculated using each member’s solvency buffer, subject to adjustments where the member operates in foreign jurisdictions.
The Canadian Investor Protection Fund (“CIPF”) has been created to provide clients with protection, within defined limits, in the event of the insolvency of their investment dealer or their mutual fund dealer. The CIPF is funded by its member investment dealers and mutual fund dealers, including MWI.
The Canada Deposit Insurance Corporation (“CDIC”) is a federal crown corporation created by parliament in 1967 to protect deposits made with member financial institutions in case of their failure. CDIC member institutions, including Manulife Bank and its subsidiary Manulife Trust Company, fund deposit insurance through premiums paid on the insured deposits that they hold.
UNITED STATES
General Regulation at the State Level
The various states in the United States have laws regulating transactions between insurers and other members of insurance holding company systems. Transactions between the Company’s U.S. domiciled insurance subsidiaries and their affiliates are subject to regulation by the states in which such insurance subsidiaries are domiciled and, for certain limited matters, states in which they transact business. Most states have enacted legislation that requires each insurance holding company and each insurance subsidiary in an insurance holding company system to register with, and be subject to regulation by, the insurance regulatory authority of the insurance subsidiary’s state of domicile. The Company’s principal U.S. life insurance subsidiaries are John Hancock Life Insurance Company (U.S.A.) (“JHUSA”), John Hancock Life Insurance Company of New York (“JHNY”) and John Hancock Life & Health Insurance Company (“JHLH”). They are domiciled in Michigan, New York and Massachusetts, respectively. Under such laws, the insurance subsidiaries are required to annually furnish financial and related information concerning the operations of companies within the holding company system that may materially affect the operations, management or financial condition of insurers within the system. These reports are also filed with other insurance departments on request. In addition, such laws provide that all transactions within an insurance holding company system must be fair and equitable, and following any such transactions, each insurer’s policyholder surplus must be both reasonable in relation to its outstanding liabilities and adequate for its needs.
The laws of the various states also establish regulatory agencies with broad administrative powers, such as the power to approve policy forms, grant and revoke licenses to transact business, regulate trade practices, license agents, require financial statements and prescribe the type and amount of investment permitted. State insurance regulatory authorities regularly make inquiries, hold investigations and administer market conduct examinations with respect to an insurer’s compliance with applicable insurance laws and regulations.
Insurance companies are required to file detailed annual statements with state insurance regulators in each of the states in which they do business and their business and accounts are subject to examination by such regulators at any time. Quarterly statements must also be filed with the state insurance regulator in the insurer’s state of domicile and with the insurance departments of many of the states in which the insurer does business. Insurance regulators may periodically examine an insurer’s financial condition, adherence to statutory accounting practices and compliance with insurance department rules and regulations.
P a g e | 12
State insurance departments, as part of their routine oversight process, conduct detailed examinations of the books, records and accounts of insurance companies domiciled in their states. These examinations are generally conducted in accordance with the examining state’s laws and the guidelines promulgated by the National Association of Insurance Commissioners (the “NAIC”), an association of the chief insurance supervisory officials of each state, territory or possession of the United States. Each of the Company’s principal U.S. domiciled insurance subsidiaries is subject to periodic examinations by its respective domiciliary state insurance regulators. The latest published examination reports issued by each such insurance department did not raise any material issues or adjustments.
Investment Powers
The Company’s U.S. domiciled insurance subsidiaries are subject to laws and regulations that require diversification of their investment portfolios and limit the amount of investments in certain investment categories such as below investment grade bonds and real estate. Failure to comply with these laws and regulations may cause investments exceeding regulatory limitations to be treated as non-admitted assets for the purposes of measuring statutory surplus and in some circumstances would require divestiture of the non-qualifying assets.
Minimum Statutory Surplus and Capital
The Company’s U.S. domiciled life insurance subsidiaries are required to have minimum statutory surplus and capital of various amounts depending on the state in which they are licensed and the types of business they transact.
NAIC IRIS Ratios
The NAIC uses a set of financial relationships or “tests,” known as the Insurance Regulatory Information System (“IRIS”), which are designed for the early identification of insurance companies which might warrant special attention by insurance regulatory authorities. Insurance companies submit data annually to the NAIC, which in turn analyzes the data utilizing 12 ratios, each with defined “usual ranges.” Having ratios that fall outside the usual range does not necessarily indicate that a company experienced unfavourable results. An insurance company may fall out of the usual range for one or more ratios because of transactions that are favourable (such as large increases in surplus) or are immaterial or eliminated at the consolidated level. Each company’s ratios are reviewed annually and are assigned a ranking by a team of examiners and financial analysts at the NAIC for the purpose of identifying companies that require immediate regulatory attention. The rankings are not reported to the companies and are only available to regulators.
Risk-Based Capital Requirements
In order to enhance the regulation of insurer solvency, state regulators have adopted the NAIC model law implementing Risk-Based Capital (“RBC”) requirements for life insurance companies. The requirements are designed to monitor capital adequacy and to raise the level of protection that statutory surplus provides for policyholders. The model law measures four major areas of risk facing life insurers: (i) the risk of loss from asset defaults and asset fluctuation; (ii) the risk of loss from adverse mortality and morbidity experience; (iii) the risk of loss from mismatching of asset and liability cash flows due to changing interest rates; and (iv) general business risk. Insurers having less statutory surplus than required by the RBC model formula are subject to varying degrees of regulatory action depending on the level of capital inadequacy. Based on the formula adopted by the NAIC, each of the Company’s U.S. domiciled insurance company subsidiaries exceeded the RBC capital requirements as at December 31, 2023.
Regulation of Shareholder Dividends and Other Payments from Insurance Subsidiaries
Manulife’s ability to meet debt service obligations and pay operating expenses and shareholder dividends depends on the receipt of sufficient funds from its operating subsidiaries. Our U.S. operating subsidiaries are indirectly owned by MLI. The payment of dividends by JHUSA is subject to restrictions set forth in the insurance laws of Michigan, its domiciliary state. Similarly, the payment of dividends by JHNY and JHLH is regulated by New York and Massachusetts insurance laws, respectively. In all three states, regulatory approval is required if proposed shareholder dividend distributions exceed certain thresholds. In addition, general regulations relating to an insurer’s P a g e | 13
financial condition and solvency may also preclude or restrict the amount of dividends that may be paid by the Company’s U.S. domiciled insurance subsidiaries.
Federal Securities and Commodity Laws
Certain of the Company’s subsidiaries and certain investment funds, policies and contracts offered by them are subject to regulation under federal securities laws administered by the SEC and under certain state securities laws. Certain segregated funds of the Company’s insurance subsidiaries are registered as investment companies under the Investment Company Act of 1940, as are certain other funds managed by subsidiaries of the Company. Interests in segregated funds under certain variable annuity contracts and variable insurance policies issued by the Company’s insurance subsidiaries are also registered under the U.S. Securities Act of 1933. Each of John Hancock Distributors LLC and John Hancock Investment Management Distributors LLC is registered as a broker-dealer under the U.S. Securities Exchange Act of 1934 and each is a member of, and subject to regulation by, the Financial Industry Regulatory Authority.
Each of John Hancock Investment Management LLC, Manulife Investment Management (US) LLC, Manulife Investment Management Timberland and Agriculture Inc., Manulife Investment Management Private Markets (US) LLC, John Hancock Variable Trust Advisers LLC, Manulife Investment Management (North America) Limited and John Hancock Personal Financial Services, LLC is an investment adviser registered under the U.S. Investment Advisers Act of 1940. Certain investment companies advised or managed by these subsidiaries are registered with the SEC under the Investment Company Act of 1940 and the shares of certain of these entities are qualified for sale in certain states in the United States and the District of Columbia. All aspects of the investment advisory activities of the Company’s subsidiaries are subject to various federal and state laws and regulations in jurisdictions in which they conduct business. These laws and regulations are primarily intended to benefit investment advisory clients and investment company shareholders and generally grant supervisory agencies broad administrative powers, including the power to limit or restrict the carrying on of business for failure to comply with such laws and regulations. In such event, the possible sanctions that may be imposed include the suspension of individual employees, limitations on the activities in which the investment advisor may engage, suspension or revocation of the investment advisor’s registration as an advisor, censure and fines.
The Commodity Exchange Act may regulate certain of the Company’s segregated funds and registered funds as a “commodity pool”, and certain of the Company’s registered advisers as a “commodity pool operator” or a “commodity trading advisor”.
State Guaranty Funds
All states of the United States have insurance guaranty fund laws requiring life insurance companies doing business in the state to participate in a guaranty association which, like Assuris in Canada, is organized to protect policyholders against loss of benefits in the event of an insolvency or wind-up of a member insurer. These associations levy assessments (up to prescribed limits) on the basis of the proportionate share of premiums written by member insurers in the lines of business in which the impaired or insolvent insurer is engaged. Assessments levied against the Company in each of the past five years have not been material.
Employee Retirement Income Security Act of 1974 (“ERISA”) Considerations
Employee benefit plans are governed by ERISA and are subject to regulation by the U.S. Department of Labor. As service providers to employee benefit plans, the Company and its subsidiaries may be “parties in interest”, as such term is defined in ERISA and the Internal Revenue Code of 1986, as amended (the “Code”), with respect to such plans. Certain transactions between parties in interest and those plans are prohibited by ERISA and the Code. If it is determined that the Company or subsidiary is not in compliance with an applicable statutory or administrative exemption, severe penalties and excise taxes could be imposed under ERISA and the Code.
In addition, ERISA imposes duties on fiduciaries to employee benefit plans covered by that law. The Company’s subsidiaries that provide investment management or investment advisory services with respect to plan assets may be deemed to be fiduciaries under ERISA. Accordingly, the applicable subsidiary must comply with both the fiduciary P a g e | 14
duty and prohibited transaction rules of ERISA and the Code. If it is determined that the Company subsidiary has breached its fiduciary duties in providing investment management or advice to a plan, then the Company subsidiary could be liable for restoring any losses to the applicable plan(s).
ASIA
In Asia, local insurance authorities supervise and monitor the Company’s business and financial condition in each of the markets in which the Company operates. The Company is also required to meet specific minimum working and regulatory capital requirements and is subject to regulations governing the investment of such capital in each of these jurisdictions. Hong Kong Special Administrative Region (“Hong Kong”) and Japan are the regulatory jurisdictions governing Manulife’s most significant operations in Asia.
Hong Kong
In Hong Kong, the authority and responsibility for supervision of the insurance industry is vested in the Insurance Authority (“IA”) under the Insurance Ordinance, Cap. 41 (the “Insurance Ordinance”).
The Chief Executive of the Government of Hong Kong appoints the members of the IA pursuant to the Insurance Ordinance. The Insurance Ordinance provides that no person shall carry on any insurance business in or from Hong Kong except a company authorized to do so by the IA, Lloyd’s of the United Kingdom or an association of underwriters approved by the IA. The Insurance Ordinance stipulates certain requirements for authorized insurers, including robust corporate governance, enhanced “fit and proper person” requirements for directors, controllers and several key persons in control functions such as financial control, compliance, risk management, intermediary management, actuary and internal audit, minimum capital and solvency margin requirements, adequate reinsurance arrangement requirements and statutory reporting requirements. The Insurance Ordinance also confers powers of inspection, investigation and intervention on the IA for the protection of policyholders and potential policyholders.
The IA has residual power to appoint an advisor or a manager to any authorized insurer if the IA considers such appointment to be desirable for the protection of policyholders or potential policyholders against the risk that the insurer may be unable to meet its liabilities or to fulfill the reasonable expectations of policyholders or potential policyholders and that, in the IA’s opinion, the exercise of other interventionary powers conferred by the Insurance Ordinance would not be appropriate to safeguard the interests of policyholders or potential policyholders. In such circumstances, the advisor or manager appointed by the IA will have management control of the insurer.
In Hong Kong, the Company’s life insurance business is conducted through a branch of a wholly owned Bermuda subsidiary, Manulife (International) Limited, which is licensed to carry on the business of “long-term” insurance by the IA and the Bermuda Monetary Authority.
Long-term insurance companies are required under the Insurance Ordinance to maintain certain solvency margins. The required solvency margin is the aggregate of two components: (i) a percentage of the mathematical reserves; and (ii) a percentage of the capital at risk as prescribed under the Insurance (Margin of Solvency) Rules (Cap.41F), enacted pursuant to the Insurance Ordinance. For a long-term insurance company, the value of its assets must not be less than the amount of its liabilities by the required solvency margin, subject to a minimum of Hong Kong $2 million. Compliance with the solvency margin requirements is reported annually to the IA. Currently, all solvency margin requirements are being met.
Investment managers and distributors in Hong Kong, including Manulife Investment Management (Hong Kong) Limited (entity and staff)(“MIMHK”), and the sale of mutual funds and the issuance of advertisements, invitations or documents in relation to collective investment schemes which contain an invitation to acquire an interest (products and selling) are highly regulated and are subject to Hong Kong securities laws as administered by the Securities and Futures Commission (“SFC”). The promotion and sale of pension schemes fund products is undertaken by Manulife (International) Limited as the scheme sponsor, with Manulife Provident Funds Trust Company Limited as the MPF approved trustee, and all such activities are subject to the supervision of the Mandatory Provident Fund Schemes Authority (“MPFA”) and the IA. Management of the relevant pension funds is undertaken by MIMHK as investment manager, which is subject to the supervision of the MPFA and the SFC. The sales of long term insurance policies, investment-linked assurance, group life and health products and P a g e | 15
Qualifying Deferred Annuity Products are subject to the supervision of the IA. Investment-linked assurance is also subject to supervision by the SFC. The sale of Voluntary Health Insurance Scheme products is subject to the regulatory scrutiny of the Food and Health Bureau of the Hong Kong Government. Manulife (International) Limited also conducts long term insurance business in the Macau Special Administrative Region and is regulated by the Monetary Authority of Macau.
Japan
Life insurance companies in Japan, including Manulife Life Insurance Company (“Manulife Japan”), are governed by the Insurance Business Law and the regulations issued thereunder (the “IB Law”). The IB Law sets out a comprehensive regulatory regime for Japanese life insurers, including such matters as capital and solvency requirements, powers of regulatory intervention, new insurance products and restrictions on shareholder dividends and distributions. The administration and application of the IB Law is supervised by the Financial Services Agency (“FSA”). The IB Law provides for certain rules with respect to the approval of new insurance products and the setting of premium levels.
The IB Law includes obligations relating to sales of insurance products such as understanding customers’ intentions and provision of relevant information to customers, as well as agencies’ obligation to develop their own control frameworks including the non-exclusive agencies’ obligation to recommend a product based on a comparison with similar products.
The FSA published Principles for Customer-Oriented Business Operations that recommend financial institutions, including insurers, among others, take the following actions:
(i) develop and make public a policy for a customer-oriented business; (ii) provide thorough disclosure of detailed fees and expenses of financial products to customers; (iii) provide important information in an easy to understand manner; and (iv) provide services suited to each customer. Manulife Japan established a policy known as a “Customer Promise” and made it public on its website.
Investment managers in Japan, including Manulife Investment Management (Japan) Limited, are governed by the Financial Instruments and Exchange Act (Japan), and the regulations issued thereunder (the “FIEA”). The FIEA sets out a comprehensive regulatory regime for investment managers that do business in Japan, including the registration requirement for investment managers, filing requirements for public offerings of investment trusts, behaviour regulations and other matters. Persons who conduct investment management business in Japan (management of investment trusts and/or discretionary investment management business) must be registered with the FSA under the FIEA. The registered investment managers are supervised by the FSA or local financial bureaus. The Investment Trust and Investment Corporation Act (Japan) provides structural requirements for investment trust funds organized within Japan and also governs managers of such domestic investment trusts.
Restrictions on Shareholder Dividends
In Asia, insurance and company laws in the jurisdictions in which the Company operates provide for specific restrictions on the payment of shareholder dividends and other distributions by the Company’s subsidiaries, or impose solvency or other financial tests, which could affect the ability of these subsidiaries to pay dividends in certain circumstances.
GENERAL DESCRIPTION OF CAPITAL STRUCTURE
The following summarizes certain provisions of MFC’s common shares, preferred shares and limited recourse capital notes. This summary is qualified in its entirety by MFC’s by-laws and the actual terms and conditions of such securities.
MFC has authorized share capital consisting of an unlimited number of common shares (“Common Shares”), an unlimited number of Class A Shares (“Class A Shares”), an unlimited number of Class B Shares (“Class B Shares”) and an unlimited number of Class 1 Shares (“Class 1 Shares”) (collectively, the Class A Shares, Class B Shares and Class 1 Shares are “Preferred Shares”).
P a g e | 16
As of December 31, 2023, MFC had the following Common Shares, Class A Shares and Class 1 Shares issued:
| Common Shares |
1,806,039,020 | |||
| Class A Shares Series 2 |
14,000,000 | |||
| Class A Shares Series 3 |
12,000,000 | |||
| Class 1 Shares Series 3 |
6,537,903 | |||
| Class 1 Shares Series 4 |
1,462,097 | |||
| Class 1 Shares Series 9 |
10,000,000 | |||
| Class 1 Shares Series 11 |
8,000,000 | |||
| Class 1 Shares Series 13 |
8,000,000 | |||
| Class 1 Shares Series 15 |
8,000,000 | |||
| Class 1 Shares Series 17 |
14,000,000 | |||
| Class 1 Shares Series 19 |
10,000,000 | |||
| Class 1 Shares Series 25 |
10,000,000 | |||
| Class 1 Shares Series 271 |
2,000,000 | |||
| Class 1 Shares Series 282 |
1,200,000 | |||
| Class 1 Shares Series 293 |
1,000,000 |
MFC has authorized but not issued Class 1 Shares Series 10, Class 1 Shares Series 12, Class 1 Shares Series 14, Class 1 Shares Series 16, Class 1 Shares Series 18, Class 1 Shares Series 20, and Class 1 Shares Series 26.
Certain Provisions of the Class A Shares as a Class
The following is a summary of certain provisions attaching to the Class A Shares as a class.
Priority
Each series of Class A Shares ranks on a parity with every other series of Class A Shares and every series of Class 1 Shares with respect to dividends and return of capital. The Class A Shares shall be entitled to a preference over the Class B Shares, the Common Shares and any other shares ranking junior to the Class A Shares with respect to priority in payment of dividends and in the distribution of assets in the event of the liquidation, dissolution or winding-up of MFC, whether voluntary or involuntary, or any other distribution of the assets of MFC among its shareholders for the specific purpose of winding up its affairs.
Certain Provisions of the Class B Shares as a Class
The following is a summary of certain provisions attaching to the Class B Shares as a class.
Priority
Each series of Class B Shares ranks on a parity with every other series of Class B Shares with respect to dividends and return of capital. The Class B Shares shall rank junior to the Class A Shares and the Class 1 Shares with respect to priority in payment of dividends and in the distribution of assets in the event of the liquidation, dissolution or winding-up of MFC, whether voluntary or involuntary, or any other distribution of the assets of MFC among its shareholders for the specific purpose of winding up its affairs, but the Class B Shares shall be entitled to a preference over the Common Shares and any other shares ranking junior to the Class B Shares with respect to priority in
| 1 | On February 17, 2021, 2,000,000 Non-Cumulative Fixed Rate Reset Class 1 Shares Series 27 were issued to the Limited Recourse Trustee, Computershare Trust Company of Canada, in connection with MFC’s Limited Recourse Capital Notes Series 1. These shares are not listed on the Toronto Stock Exchange (the “TSX”). |
| 2 | On November 10, 2021, 1,200,000 Non-Cumulative Fixed Rate Reset Class 1 Shares Series 28 were issued to the Limited Recourse Trustee, Computershare Trust Company of Canada, in connection with MFC’s Limited Recourse Capital Notes Series 2. These shares are not listed on the TSX. |
| 3 | On June 14, 2022, 1,000,000 Non-Cumulative Fixed Rate Reset Class 1 Shares Series 29 were issued to the Limited Recourse Trustee, Computershare Trust Company of Canada, in connection with MFC’s Limited Recourse Capital Notes Series 3. These shares are not listed on the TSX. |
P a g e | 17
payment of dividends and the distribution of assets in the event of the liquidation, dissolution or winding-up of MFC, whether voluntary or involuntary, or any other distribution of the assets of MFC among its shareholders for the specific purpose of winding up its affairs.
Certain Provisions of the Class 1 Shares as a Class
The following is a summary of certain provisions attaching to the Class 1 Shares as a class.
Priority
Each series of Class 1 Shares ranks on a parity with every other series of Class 1 Shares and every series of Class A Shares with respect to dividends and return of capital. The Class 1 Shares shall be entitled to a preference over the Class B Shares, the Common Shares and any other shares ranking junior to the Class 1 Shares with respect to priority in payment of dividends and in the distribution of assets in the event of the liquidation, dissolution or winding-up of MFC, whether voluntary or involuntary, or any other distribution of the assets of MFC among its shareholders for the specific purpose of winding up its affairs.
Certain Provisions Common to the Class A Shares, Class B Shares and Class 1 Shares
The following is a summary of certain provisions attaching to the Class A Shares as a class, to the Class B Shares as a class and to the Class 1 Shares as a class.
Directors’ Right to Issue in One or More Series
The Class A Shares, Class B Shares and Class 1 Shares may be issued at any time and from time to time in one or more series. Before any shares of a series are issued, the Board shall fix the number of shares that will form such series, if any, and shall, subject to any limitations set out in the by-laws of MFC or in the ICA, determine the designation, rights, privileges, restrictions and conditions to be attached to the Class A Shares, Class B Shares or Class 1 Shares as the case may be, of such series, the whole subject to the filing with OSFI of the particulars of such series, including the rights, privileges, restrictions and conditions determined by the Board.
Summaries of the terms for each series of the Class A Shares and Class 1 Shares that have been issued or authorized for issuance are contained in the prospectuses relating to such shares, which are available on SEDAR+.
Voting Rights of Preferred Shares
Except as hereinafter referred to or as required by law or as specified in the rights, privileges, restrictions and conditions attached from time to time to any series of Class A Shares, Class B Shares or Class 1 Shares, the holders of such Class A Shares, Class B Shares or Class 1 Shares as a class shall not be entitled as such to receive notice of, to attend or to vote at any meeting of the shareholders of MFC.
Amendment with Approval of Holders of Preferred Shares
The rights, privileges, restrictions and conditions attached to each of the Class A Shares, Class B Shares and Class 1 Shares as a class may be added to, changed or removed but only with the approval of the holders of such class of Preferred Shares given as hereinafter specified.
Approval of Holders of Preferred Shares
The approval of the holders of a class of Preferred Shares to add to, change or remove any right, privilege, restriction or condition attaching to such class of Preferred Shares as a class or in respect of any other matter requiring the consent of the holders of such class of Preferred Shares may be given in such manner as may then be required by law, subject to a minimum requirement that such approval be given by resolution signed by all the holders of such class of Preferred Shares or passed by the affirmative vote of at least two-thirds (2/3) of the votes cast at a meeting of the holders of such class of Preferred Shares duly called for that purpose. Notwithstanding any other condition or P a g e | 18
provision of any class of Preferred Shares, the approval of the holders of any class, voting separately as a class or series, is not required on a proposal to amend the by-laws of MFC to:
| (i) | increase or decrease the maximum number of authorized Class A Shares, Class B Shares or Class 1 Shares, as the case may be, or increase the maximum number of authorized shares of a class of shares having rights or privileges equal or superior to such class of Preferred Shares; |
| (ii) | effect the exchange, reclassification or cancellation of all or any part of the Class A Shares, Class B Shares or Class 1 Shares, as the case may be; or |
| (iii) | create a new class of shares equal to or superior to the Class A Shares, the Class B Shares or the Class 1 Shares, as the case may be. |
The formalities to be observed with respect to the giving of notice of any such meeting or any adjourned meeting, the quorum required therefor and the conduct thereof shall be those from time to time required by the ICA as in force at the time of the meeting and those, if any, prescribed by the by-laws or the administrative resolutions of MFC with respect to meetings of shareholders. On every poll taken at every meeting of the holders of a class of Preferred Shares as a class, or at any joint meeting of the holders of two or more series of a class of Preferred Shares, each holder of such class of Preferred Shares entitled to vote thereat shall have one vote in respect of each relevant Preferred Share held.
Certain Provisions of the Common Shares as a Class
The authorized common share capital of MFC consists of an unlimited number of Common Shares without nominal or par value. Each holder of Common Shares is entitled to receive notice of and to attend all meetings of the shareholders of MFC and is entitled to one vote for each share held except for meetings at which only holders of another specified class or series of shares of MFC are entitled to vote separately as a class or series. The holders of Common Shares are entitled to receive dividends as and when declared by the Board, subject to the preference of the holders of Class A Shares, Class B Shares, Class 1 Shares and any other shares ranking senior to the Common Shares with respect to priority in payment of dividends. After payment to the holders of Class A Shares, Class B Shares, Class 1 Shares and any other shares ranking senior to Common Shares with respect to priority in the distribution of assets in the event of the liquidation, dissolution or winding-up of MFC, the holders of Common Shares shall be entitled to receive prorated the net assets of MFC remaining, after the payment of all creditors and liquidation preferences, if any, that pertain to shareholders.
Description of the Limited Recourse Capital Notes
MFC has outstanding $2,000,000,000 of 3.375% Limited Recourse Capital Notes Series 1 (Subordinated Indebtedness) due June 19, 2081 (the “Series 1 Notes”); $1,200,000,000 of 4.10% Limited Recourse Capital Notes Series 2 (Subordinated Indebtedness) due March 19, 2082 (the “Series 2 Notes”); and $1,000,000,000 of 7.117% Limited Recourse Capital Notes Series 3 (Subordinated Indebtedness) due June 19, 2082 (the “Series 3 Notes” and collectively with the Series 1 Notes and the Series 2 Notes, the “Notes”) which are classified as equity in our 2023 Consolidated Financial Statements.
Certain Provisions of the Limited Recourse Capital Notes
The following is a summary of certain provisions attaching to the Notes as a class.
Priority
The Notes are direct, subordinated, unsecured indebtedness of MFC and will rank subordinate to all of MFC’s policy liabilities and all other indebtedness (including all of MFC’s other unsecured and subordinated indebtedness) from time to time issued and outstanding, except for such indebtedness which by its terms ranks equally in right of payment with, or is subordinate to, the Notes.
P a g e | 19
Limited Recourse
In the event of non-payment by MFC of the principal amount of, interest on, or redemption price for, the Notes when due, the sole recourse of each holder of the Notes shall be limited to the assets held in respect of the Notes by Computershare Trust Company of Canada, as trustee (the “Limited Recourse Trustee”) of Manulife LRCN Limited Recourse Trust (the “Limited Recourse Trust”) from time to time (“Corresponding Trust Assets”). As of the date hereof, the Corresponding Trust Assets in respect of the Series 1 Notes consist of 2,000,000 Class 1 Shares Series 27, the Corresponding Trust Assets in respect of the Series 2 Notes consist of 1,200,000 Class 1 Shares Series 28 and the Corresponding Trust Assets in respect of the Series 3 Notes consist of 1,000,000 Class 1 Shares Series 29.
DIVIDENDS
The declaration and payment of dividends and the amount thereof is subject to the discretion of the Board and is dependent upon the results of operations, financial condition, cash requirements and future prospects of, and regulatory restrictions on the payment of dividends by, the Company and other factors deemed relevant by the Board.
Since MFC is a holding company that conducts all of its operations through regulated insurance subsidiaries (or companies owned directly or indirectly by these subsidiaries), its ability to pay future dividends will depend on the receipt of sufficient funds from its regulated insurance subsidiaries. These subsidiaries are also subject to certain regulatory restrictions under laws in Canada, the United States and certain other countries that may limit their ability to pay dividends or make other upstream distributions. MFC has paid the following cash dividends in the period from January 1, 2021 to December 31, 2023:
|
Type of Shares |
2023 |
2022 |
2021 |
|||
|
Common Shares |
$1.4600 |
$1.3200 |
$1.1700 |
|||
|
Preferred Shares |
||||||
|
Class A Shares Series 2 |
$1.1625 |
$1.1625 |
$1.1625 |
|||
|
Class A Shares Series 3 |
$1.1250 |
$1.1250 |
$1.1250 |
|||
|
Class 1 Shares Series 3 |
$0.5870 |
$0.5870 |
$0.5658 |
|||
|
Class 1 Shares Series 4 |
$1.4946 |
$0.6814 |
$0.3814 |
|||
|
Class 1 Shares Series 5 |
- |
- |
$0.9728 |
|||
|
Class 1 Shares Series 7 |
- |
$0.2695 |
$1.0780 |
|||
|
Class 1 Shares Series 9 |
$1.4945 |
$1.1894 |
$1.0878 |
|||
|
Class 1 Shares Series 11 |
$1.4505 |
$1.1828 |
$1.1828 |
|||
|
Class 1 Shares Series 13 |
$1.2245 |
$1.1035 |
$1.1035 |
|||
|
Class 1 Shares Series 15 |
$0.9465 |
$0.9465 |
$0.9465 |
|||
|
Class 1 Shares Series 17 |
$0.9500 |
$0.9500 |
$0.9500 |
|||
|
Class 1 Shares Series 19 |
$0.9188 |
$0.9188 |
$0.9188 |
|||
|
Class 1 Shares Series 21 |
- |
- |
$0.7000 |
|||
|
Class 1 Shares Series 23 |
- |
$0.3031 |
$1.2125 |
|||
|
Class 1 Shares Series 25 |
$1.3303 |
$1.1750 |
$1.1750 |
|||
|
Class 1 Shares Series 27 |
- |
- |
- |
|||
|
Class 1 Shares Series 28 |
- |
- |
- |
|||
|
Class 1 Shares Series 29 |
- |
- |
- |
|||
With reference to the information in the table above:
Class 1 Shares Series 5 were redeemed and delisted from the Toronto Stock Exchange (the “TSX”), effective December 19, 2021. Class 1 Shares Series 7 and Series 23 were redeemed and delisted from the TSX, effective March 19, 2022. Class 1 Shares Series 21 were redeemed and delisted from the TSX, effective June 19, 2021.
P a g e | 20
Until revoked, the Limited Recourse Trustee of the Limited Recourse Trust has waived its right to receive any and all dividends on the Class 1 Shares Series 27, the Class 1 Shares Series 28, and the Class 1 Shares Series 29. Until such waiver is revoked by the Limited Recourse Trustee of the Limited Recourse Trust, no dividends are expected to be declared or paid on the Class 1 Shares Series 27, the Class 1 Shares Series 28 or the Class 1 Shares Series 29.
The 2023, 2022 and 2021 dividends on the Common Shares, the Class A Shares and the Class 1 Shares were paid quarterly in March, June, September and December.
CONSTRAINTS ON OWNERSHIP OF SHARES
The ICA contains restrictions on the purchase or other acquisition, issue, transfer and voting of the shares of MFC. Pursuant to these restrictions, no person is permitted to acquire any shares of MFC if the acquisition would cause the person to have a “significant interest” in any class of shares of MFC, unless the prior approval of the Minister of Finance (Canada) is obtained. The restrictions also prohibit any person from becoming a “major shareholder” of MFC. In addition, MFC is not permitted to record in its securities register any transfer or issue of shares if the transfer or issue would cause the person to breach the ownership restrictions. For these purposes, a person has a significant interest in a class of shares of MFC where the aggregate of any shares of that class beneficially owned by that person, any entity controlled by that person and by any person associated or acting jointly or in concert with that person exceeds 10% of all the outstanding shares of that class of shares of MFC. A person is a major shareholder if the aggregate of any shares in a class of voting shares held by that person and by any entity controlled by that person exceeds 20% of the outstanding shares of that class, or, for a class of non-voting shares, a holding exceeds 30% of that class. If a person contravenes any of these restrictions, the Minister of Finance (Canada) may, by order, direct such person to dispose of all or any portion of those shares. In addition, the ICA prohibits life insurance companies, including MFC, from recording in their securities register a transfer or issue of any share to His Majesty in right of Canada or of a province, an agent or agency of His Majesty, a foreign government or an agent or agency of a foreign government and provides further that no person may exercise the voting rights attached to those shares of an insurance company. The ICA exempts from such constraints certain foreign financial institutions which are controlled by foreign governments and eligible agents provided certain conditions are satisfied.
Under applicable insurance laws and regulations in Michigan, New York and Massachusetts, no person may acquire control of any of the Company’s insurance company subsidiaries domiciled in any such state without obtaining prior approval of such state’s insurance regulatory authority. Under applicable laws and regulations, any person acquiring, directly or indirectly, 10% or more of the voting securities of any other person is presumed to have acquired “control” of such person. Thus, any person seeking to acquire 10% or more of the voting securities of MFC must obtain the prior approval of the insurance regulatory authorities in certain states including Michigan, Massachusetts and New York, or must demonstrate to the relevant insurance regulator’s satisfaction that the acquisition of such securities will not give them control of MFC. Under state law, the failure to obtain such prior approval would entitle MFC or the insurance regulatory authorities to seek judicial injunctive relief, including enjoining the proposed acquisition or the voting of the acquired securities at any meeting of shareholders.
RATINGS
Credit rating agencies publish credit ratings, which are indicators of an issuer’s ability to meet the terms of its obligations in a timely manner and are important factors in a company’s overall funding profile and ability to access external capital.
Ratings are important factors in establishing the competitive position of insurance companies, maintaining public confidence in products being offered, and determining the cost of capital. A ratings downgrade, or the potential for such a downgrade, could adversely affect our operations and financial condition. Some effects of a downgrade include an increase in our cost of capital and limit in our access to the capital markets, causing some of our existing liabilities to be subject to acceleration, additional collateral support, changes in terms or additional financial obligations, the termination of our relationships with broker-dealers, banks, agents, wholesalers and other distributors of our products and services, an unfavourable impact on our ability to execute on our hedging strategy, a material increase in the number of surrenders, for all or a portion of the net cash values, by the owners of policies and P a g e | 21
contracts we have issued, and a material increase in the number of withdrawals by policyholders of cash values from their policies, and a reduction in new sales.
The following table summarizes, by type of securities, the ratings and ranking that MFC has received from select independent rating organizations as at February 9, 2024. Note that some of the rating organizations may not have assigned ratings to all classes or series of instruments under each security type.
| AM Best Company (“AM Best”) |
DBRS Limited & (“Morningstar DBRS”) |
Fitch Ratings Inc. (“Fitch”) |
S&P Global Ratings (“S&P”) |
|||||||||||||
|
Securities |
Rating | Rank | Rating | Rank | Rating/ | Rank | Rating | Rank | ||||||||
|
Preferred Shares |
bbb | 9 of 21 | Pfd-2 (high) | 4 of 16 | BBB- | 10 of 21 |
P-2 (high), BBB+ | 4 of 18, 6 of 20 |
||||||||
|
Medium Term Notes and Senior Debt |
a- | 7 of 21 | A (high) | 5 of 26 | A- | 7 of 21 | A | 6 of 22 | ||||||||
|
Subordinated Debt |
bbb+ | 8 of 21 | A | 6 of 26 | BBB+ | 8 of 21 | A- | 7 of 22 | ||||||||
|
Limited Recourse Capital Notes |
bbb+ | 8 of 21 | A (low) | 7 of 26 | BBB- | 10 of 21 |
BBB+ | 8 of 22 | ||||||||
The security ratings accorded by the rating organizations are not a recommendation to purchase, hold or sell these securities and may be subject to revision or withdrawal at any time by the rating organizations. Security ratings are intended to provide investors with an independent measure of the credit quality of an issue of securities. The Company provides certain rating agencies with confidential, in-depth information in support of the rating process.
The Company has paid customary rating fees to Morningstar DBRS, Fitch and S&P in connection with some or all of the above-mentioned ratings. In addition, the Company has made customary payments in respect of certain other services provided to the Company by each of AM Best, Morningstar DBRS, Fitch, and S&P during the last two years.
The descriptions of the ratings below are sourced from public information as disclosed by each rating agency.
AM Best Ratings
AM Best assigns ratings for preferred shares and debt in a range from “aaa” to “c”. These ratings provide an opinion of an entity’s ability to meet ongoing financial obligations to security holders when due, and reflects the risk that an issuer may not meet its contractual obligations. The modifiers plus (+) or minus (-) may be appended to a rating to denote a gradation within the category to indicate whether credit quality is near the top or bottom of a particular rating category. The company’s rating outlooks may be positive, stable, or negative, indicating the potential future direction a rating may move over a 36-month period. The Company’s current rating outlook is stable.
MFC’s Class A Shares and Class 1 Shares have been assigned a “bbb” rating, which denotes a good ability to meet the terms of the obligation; however, the issue is more susceptible to changes in economic or other conditions.
MFC’s Medium Term Notes and Senior Debt have been assigned an “a-” rating, which denotes an excellent ability to meet the terms of the obligation.
MFC’s Subordinated Debt and Limited Recourse Capital Notes have been assigned a “bbb+” rating, which denotes a good ability to meet the terms of the obligation; however, the issue is more susceptible to changes in economic or other conditions.
Morningstar DBRS Ratings
P a g e | 22
Morningstar DBRS assigns ratings for preferred shares in a range from “Pfd-1” to “D”. The Morningstar DBRS preferred share rating scale is used in the Canadian securities market and is meant to give an indication of the risk that a borrower will not fulfill its full obligations in a timely manner with respect to both dividend and principal commitments. Morningstar DBRS assigns ratings for long-term obligations in a range from “AAA” to “D”. The scale provides an opinion on the risk that an issuer will fail to satisfy its financial obligations in accordance with the terms under which an obligation has been issued. Every Morningstar DBRS rating is based on quantitative and qualitative considerations relevant to the borrowing entity. Some rating categories are denoted by the subcategories “high” and “low”. The absence of either a “high” or “low” designation indicates the rating is in the middle of the category. The company’s rating is appended with one of three rating trends: “Positive”, “Stable”, or “Negative”. The Company’s current rating trend is stable.
MFC’s Class A Shares and Class 1 Shares have been assigned a “Pfd-2 (high)” rating as they are considered to be of good credit quality. Protection of dividends and principal is still substantial, but earnings, the balance sheet and coverage ratios are not as strong as “Pfd-1” rated companies.
MFC’s Medium Term Notes and Senior Debt have been assigned an “A (high)” rating, while MFC’s Subordinated Debt has been assigned an “A” rating and MFC’s Limited Recourse Capital Notes have been assigned an “A (low)” rating. An obligation rated “A (high)”, “A” or “A (low)” is of good credit quality, where the capacity for the payment of financial obligations is substantial, but of lesser credit quality than “AA”. The Company may be vulnerable to future events, but qualifying negative factors are considered manageable.
Fitch Ratings
Fitch assigns ratings for preferred shares and debt in a range from “AAA” to “C” and these ratings provide an opinion on the relative ability of an entity to meet financial commitments, such as interest, preferred dividends, repayment of principal, insurance claims or counterparty obligations. These ratings are used by investors as indications of the likelihood of receiving the money owed to them in accordance with the terms on which they invested. These ratings do not directly address any risk other than credit risk. In particular, ratings do not deal with the risk of a market value loss on a rated security due to changes in interest rates, liquidity and other market considerations. The modifiers “+” or “-” may be appended to a rating to denote relative status within major rating categories. The company’s rating outlook indicates the direction a rating is likely to move over a one- to two-year period. Rating outlooks may be positive, stable, negative or evolving. The Company’s current rating outlook is positive.
MFC’s Class A Shares and Class 1 Shares have been assigned a “BBB-” rating. This rating indicates that expectations of credit risk are currently low. The capacity for payment of financial commitments is considered adequate but adverse business or economic conditions are more likely to impair this capacity.
MFC’s Medium Term Notes and Senior Debt have been assigned an “A-” rating. This rating denotes expectations of low credit risk. The capacity for payment of financial commitments is considered strong. This capacity may, nevertheless, be more vulnerable to adverse business or economic conditions than is the case for higher ratings.
MFC’s Subordinated Debt have been assigned a “BBB+” rating, while MFC’s Limited Recourse Capital Notes have been assigned a “BBB-” rating. These ratings indicate that expectations of credit risk are currently low. The capacity for payment of financial commitments is considered adequate but adverse business or economic conditions are more likely to impair this capacity.
S&P Ratings
S&P assigns ratings for Canadian preferred shares in a range from “P-1” to “D” and these ratings are a forward-looking opinion about the creditworthiness of an obligor with respect to a specific preferred share obligation issued in the Canadian market, relative to preferred shares issued by other issuers in the Canadian market. There is a direct correspondence between the specific ratings assigned on the Canadian preferred share scale and the various rating levels on the global debt rating scale of S&P. It is the practice of S&P to present an issuer’s preferred share ratings on both the global ratings scale and the Canadian national scale when listing the ratings for a particular issuer. S&P’s Canadian scale preferred share ratings may be modified by the addition of “High” or “Low” to show relative standing P a g e | 23
within the major rating categories. S&P’s global scale preferred share ratings may be modified by the addition of a plus (+) or minus (-) sign to show relative standing within the major rating categories.
S&P assigns ratings for long-term obligations in a range from “AAA” to “D”. These ratings provide a forward-looking opinion about the creditworthiness of an obligor with respect to a specific financial obligation, a specific class of financial obligations, or a specific financial program (including ratings on medium-term note programs and commercial paper programs). S&P’s long-term issue credit ratings may be modified by the addition of a plus (+) or minus (-) sign to show relative standing within the major rating categories.
The company’s rating outlook may be positive, negative, stable, developing or not meaningful. The Company’s current rating outlook is stable.
MFC’s Class A Shares and Class 1 Shares have been assigned a “P-2 (High)” rating on the Canadian scale (which corresponds to a “BBB+” rating on the global scale), while MFC’s Limited Recourse Capital Notes have been assigned a “BBB+” rating. Obligations rated “P-2 (High)” or “BBB+” exhibit adequate protection parameters; however, adverse economic conditions or changing circumstances are more likely to lead to a weakened capacity of the obligor to meet its financial commitment on the obligation.
MFC’s Medium Term Notes and Senior Debt have been assigned an “A” rating, while its Subordinated Debt has been assigned an “A-” rating. An obligation rated “A” or “A-” is somewhat more susceptible to the adverse effects of changes in circumstances and economic conditions than obligations in higher-rated categories, however, the obligor’s capacity to meet its financial commitment on the obligation is still strong.
MARKET FOR SECURITIES
MFC’s Common Shares are listed for trading under the symbol “MFC” on the Toronto Stock Exchange (“TSX”), the New York Stock Exchange (“NYSE”), and the Philippine Stock Exchange and under “0945” on The Stock Exchange of Hong Kong Limited. The Class A Shares Series 2 and Class A Shares Series 3 preferred shares are listed for trading on the TSX under the symbols “MFC.PR.B” and “MFC.PR.C”, respectively. The Class 1 Shares Series 3, Class 1 Shares Series 4, Class 1 Shares Series 9, Class 1 Shares Series 11, Class 1 Shares Series 13, Class 1 Shares Series 15, Class 1 Shares Series 17, Class 1 Shares Series 19 and Class 1 Shares Series 25 preferred shares are listed for trading on the TSX under the symbols “MFC.PR.F”, “MFC.PR.P”, “MFC.PR.I”, “MFC.PR.J”, “MFC.PR.K”, “MFC.PR.L”, “MFC.PR.M”, “MFC.PR.N” and “MFC.PR.Q”, respectively.
Trading Price and Volume
The following table sets out the intra-day price range and trading volume of the Common Shares on the TSX and the NYSE for the period indicated.
| 2023 | TSX | NYSE | ||||||||||
|
High (C$) |
Low (C$) |
Volume (000s) |
High (U.S.$) |
Low (U.S.$) |
Volume (000s) |
|||||||
| January |
26.55 | 24.27 | 137,018 | 19.93 | 17.78 | 9,089 | ||||||
| February |
27.40 | 25.71 | 218,186 | 20.40 | 19.10 | 12,268 | ||||||
| March |
27.50 | 23.92 | 201,203 | 20.24 | 17.39 | 19,681 | ||||||
| April |
26.85 | 24.62 | 94,271 | 19.79 | 18.31 | 8,314 | ||||||
| May |
26.93 | 24.86 | 202,991 | 20.02 | 18.24 | 17,074 | ||||||
| June |
26.13 | 23.96 | 120,935 | 19.63 | 18.16 | 15,887 | ||||||
| July |
26.55 | 24.33 | 107,541 | 20.13 | 18.32 | 11,950 | ||||||
| August |
26.48 | 23.70 | 160,642 | 19.94 | 17.49 | 22,937 | ||||||
|
September |
26.41 | 24.51 | 115,422 | 19.68 | 18.14 | 20,790 | ||||||
| October |
25.59 | 23.69 | 85,808 | 18.81 | 17.08 | 19,435 | ||||||
| November |
26.61 | 24.10 | 193,593 | 19.61 | 17.37 | 20,974 | ||||||
| December |
29.45 | 26.38 | 129,250 | 22.32 | 19.50 | 13,005 | ||||||
P a g e | 24
The following tables set out the intra-day price range and trading volume of the Class A Shares Series 2 and Series 3 preferred shares and the Class 1 Shares Series 3, Series 4, Series 9, Series 11, Series 13, Series 15, Series 17, Series 19, and Series 25 preferred shares on the TSX for the period indicated.
| 2023 | TSX – Class A Shares Series 2 | TSX – Class A Shares Series 3 | ||||||||||
| High (C$) |
Low (C$) |
Volume (000s) |
High (C$) |
Low (C$) |
Volume (000s) |
|||||||
| January |
21.05 | 18.63 | 236 | 20.48 | 18.14 | 142 | ||||||
| February |
20.89 | 19.39 | 121 | 20.40 | 18.91 | 49 | ||||||
| March |
19.70 | 19.01 | 66 | 19.09 | 18.43 | 105 | ||||||
| April |
19.71 | 19.17 | 68 | 19.26 | 18.61 | 107 | ||||||
| May |
19.49 | 18.22 | 77 | 18.96 | 17.71 | 84 | ||||||
| June |
18.72 | 17.73 | 126 | 18.22 | 17.26 | 69 | ||||||
| July |
18.18 | 17.52 | 174 | 17.91 | 17.22 | 124 | ||||||
| August |
18.18 | 16.63 | 174 | 17.68 | 16.10 | 179 | ||||||
| September |
17.51 | 16.96 | 154 | 17.20 | 16.50 | 97 | ||||||
| October |
17.22 | 16.69 | 234 | 16.77 | 16.36 | 200 | ||||||
| November |
19.00 | 16.98 | 401 | 18.26 | 16.79 | 128 | ||||||
| December |
19.45 | 17.81 | 173 | 18.60 | 17.06 | 169 | ||||||
| 2023 | TSX – Class 1 Shares Series 3 | TSX – Class 1 Shares Series 4 | ||||||||||
| High (C$) |
Low (C$) |
Volume (000s) |
High (C$) |
Low (C$) |
Volume (000s) |
|||||||
| January |
13.30 | 12.88 | 275 | 15.82 | 14.75 | 11 | ||||||
| February |
13.66 | 13.03 | 102 | 16.00 | 15.50 | 10 | ||||||
| March |
13.30 | 12.14 | 43 | 15.80 | 15.00 | 19 | ||||||
| April |
12.54 | 12.13 | 15 | 15.10 | 14.50 | 9 | ||||||
| May |
12.89 | 11.70 | 54 | 14.90 | 14.22 | 23 | ||||||
| June |
12.69 | 11.84 | 103 | 16.24 | 14.48 | 10 | ||||||
| July |
12.75 | 12.55 | 38 | 17.00 | 15.90 | 20 | ||||||
| August |
13.23 | 12.43 | 137 | 16.80 | 15.30 | 8 | ||||||
| September |
13.29 | 11.80 | 91 | 16.12 | 14.69 | 12 | ||||||
| October |
13.66 | 12.11 | 537 | 16.80 | 14.91 | 8 | ||||||
| November |
14.37 | 12.35 | 309 | 16.35 | 14.76 | 12 | ||||||
| December |
14.65 | 13.66 | 302 | 15.80 | 15.25 | 22 | ||||||
| 2023 | TSX – Class 1 Shares Series 9 | TSX – Class 1 Shares Series 11 | ||||||||||
| High (C$) |
Low (C$) |
Volume (000s) |
High (C$) |
Low (C$) |
Volume (000s) |
|||||||
| January |
23.49 | 22.26 | 231 | 21.88 | 20.00 | 102 | ||||||
| February |
24.05 | 23.00 | 150 | 23.15 | 21.25 | 185 | ||||||
| March |
23.95 | 22.18 | 315 | 22.86 | 21.05 | 334 | ||||||
| April |
23.07 | 22.55 | 129 | 22.45 | 21.64 | 339 | ||||||
| May |
23.00 | 20.66 | 106 | 22.33 | 21.08 | 391 | ||||||
| June |
21.82 | 20.90 | 50 | 21.60 | 20.41 | 170 | ||||||
| July |
21.13 | 19.99 | 162 | 20.90 | 20.38 | 133 | ||||||
| August |
21.15 | 20.21 | 261 | 21.04 | 19.86 | 282 | ||||||
| September |
20.39 | 19.98 | 122 | 20.15 | 19.66 | 117 | ||||||
| October |
20.01 | 18.85 | 133 | 20.23 | 19.00 | 206 | ||||||
| November |
21.88 | 18.98 | 154 | 22.23 | 19.20 | 111 | ||||||
| December |
22.51 | 21.32 | 125 | 22.97 | 21.98 | 115 | ||||||
P a g e | 25
| 2023 | TSX – Class 1 Shares Series 13 | TSX – Class 1 Shares Series 15 | ||||||||||
| High (C$) |
Low (C$) |
Volume (000s) |
High (C$) |
Low (C$) |
Volume (000s) |
|||||||
| January |
19.16 | 17.05 | 57 | 17.70 | 16.40 | 36 | ||||||
| February |
19.95 | 18.20 | 42 | 18.07 | 16.84 | 140 | ||||||
| March |
19.90 | 18.21 | 58 | 17.75 | 16.32 | 57 | ||||||
| April |
18.34 | 17.66 | 469 | 16.85 | 16.13 | 13 | ||||||
| May |
18.25 | 17.50 | 148 | 16.85 | 15.52 | 25 | ||||||
| June |
19.34 | 17.95 | 90 | 17.71 | 16.10 | 134 | ||||||
| July |
19.98 | 19.00 | 116 | 17.65 | 17.12 | 131 | ||||||
| August |
20.30 | 19.67 | 311 | 17.66 | 16.46 | 278 | ||||||
| September |
20.13 | 19.51 | 192 | 18.00 | 16.64 | 80 | ||||||
| October |
20.07 | 18.56 | 168 | 18.24 | 16.62 | 539 | ||||||
| November |
21.98 | 18.79 | 220 | 18.95 | 16.70 | 84 | ||||||
| December |
22.35 | 21.21 | 138 | 19.59 | 18.40 | 61 | ||||||
| 2023 | TSX – Class 1 Shares Series 17 | TSX – Class 1 Shares Series 19 | ||||||||||
| High (C$) |
Low (C$) |
Volume (000s) |
High (C$) |
Low (C$) |
Volume (000s) |
|||||||
| January |
18.81 | 17.17 | 55 | 18.42 | 16.43 | 34 | ||||||
| February |
18.97 | 17.32 | 102 | 18.23 | 17.17 | 325 | ||||||
| March |
17.97 | 16.60 | 104 | 17.70 | 16.25 | 91 | ||||||
| April |
17.08 | 16.47 | 44 | 16.84 | 16.03 | 46 | ||||||
| May |
17.09 | 15.55 | 158 | 16.82 | 15.21 | 113 | ||||||
| June |
16.95 | 15.80 | 211 | 16.49 | 15.65 | 178 | ||||||
| July |
17.42 | 16.80 | 88 | 16.83 | 16.21 | 56 | ||||||
| August |
17.10 | 16.50 | 205 | 16.78 | 16.16 | 355 | ||||||
| September |
17.24 | 16.44 | 132 | 16.94 | 16.10 | 196 | ||||||
| October |
17.54 | 15.95 | 250 | 17.23 | 16.10 | 98 | ||||||
| November |
19.00 | 16.74 | 115 | 18.69 | 16.36 | 43 | ||||||
| December |
19.24 | 18.29 | 84 | 18.82 | 17.76 | 123 | ||||||
| 2023 | TSX – Class 1 Shares Series 25 | |||||||||||
|
High (C$) |
Low (C$) |
Volume (000s) |
||||||||||
| January |
21.38 | 18.72 | 173 | |||||||||
| February |
21.86 | 20.25 | 218 | |||||||||
| March |
22.51 | 18.60 | 165 | |||||||||
| April |
20.00 | 18.40 | 198 | |||||||||
| May |
20.99 | 19.55 | 162 | |||||||||
| June |
20.83 | 19.67 | 91 | |||||||||
| July |
20.79 | 19.60 | 150 | |||||||||
| August |
20.40 | 19.42 | 149 | |||||||||
| September |
19.70 | 19.41 | 86 | |||||||||
| October |
19.63 | 18.58 | 91 | |||||||||
| November |
22.00 | 18.86 | 159 | |||||||||
| December |
22.20 | 21.45 | 164 | |||||||||
P a g e | 26
ESCROWED SECURITIES AND SECURITIES SUBJECT TO CONTRACTUAL RESTRICTION ON TRANSFER
In connection with the issuances of the Series 1 Notes, Series 2 Notes and the Series 3 Notes, the Class 1 Shares Series 27, Class 1 Shares Series 28 and the Class 1 Shares Series 29, respectively, were issued to and are held in the Limited Recourse Trust and are restricted from being transferred, except to holders of the Series 1 Notes, the Series 2 Notes or the Series 3 Notes, respectively, in respect of certain events. See “General Description of Capital Structure – Certain Provisions of the Limited Recourse Capital Notes” above.
| DESIGNATION OF CLASS |
NUMBER OF SECURITIES HELD IN ESCROW OR THAT ARE SUBJECT TO A CONTRACTUAL RESTRICTION ON TRANSFER |
PERCENTAGE OF CLASS | ||
|
Class 1 Shares Series 27 |
2,000,000 | 2.49% | ||
| Class 1 Shares Series 28 |
1,200,000 | 1.50% | ||
| Class 1 Shares Series 29 |
1,000,000 | 1.25% |
DIRECTORS AND EXECUTIVE OFFICERS
DIRECTORS
The by-laws of MFC provide that the Board shall consist of a minimum of seven and a maximum of 30 Directors, with the exact number of Directors to be elected at any annual meeting of MFC to be fixed by the Directors prior to such annual meeting.
The following table sets forth the Directors of MFC, as of the date of this AIF, and for each Director, their place of residence, principal occupation, years as a director and membership on Board committees.
Each Director is elected for a term of one year, expiring at the close of the next annual meeting of the Company. The next annual meeting will occur on May 9, 2024.
P a g e | 27
|
Name and Residence |
Principal Occupation | Director Since |
Board Committee Membership (1) |
|||
|
Donald R. Lindsay British Columbia, Canada |
Chair of the Board, MFC and MLI (2) | August 2010 | CGNC (Chair)(3) | |||
|
Roy Gori Ontario, Canada |
President and Chief Executive Officer, MFC and MLI (4) |
October 2017 | N/A (4) | |||
|
Nicole S. Arnaboldi Connecticut, United States |
Partner, Oak Hill Capital Management, LLC (private equity company) (5) | June 2020 | MRCC (Chair) Risk |
|||
|
Guy L.T. Bainbridge Edinburgh, UK |
Corporate Director | August 2019 | Audit (Chair) CGNC |
|||
|
Susan F. Dabarno Ontario, Canada |
Corporate Director | March 2013 | MRCC Risk |
|||
|
Julie E. Dickson Ontario, Canada |
Corporate Director (6) | August 2019 | MRCC Risk |
|||
| Tsun-yan Hsieh Singapore |
Chair, LinHart Group Pte Ltd. (consulting firm) | October 2011 | Audit CGNC |
|||
|
Vanessa Kanu Ontario, Canada |
Chief Financial Officer, Telus International (Cda) Inc. (technology company) (7) | February 2022 | Audit CGNC |
|||
|
C. James Prieur Illinois, United States |
Corporate Director | January 2013 | MRCC Risk (Chair) |
|||
|
Andrea S. Rosen Ontario, Canada |
Corporate Director | August 2011 | Audit CGNC |
|||
|
May Tan Hong Kong, People’s Republic of China |
Corporate Director | December 2021 | Audit CGNC |
|||
|
Leagh E. Turner Ontario, Canada |
CEO, Coupa Software Inc. (software company) (8) | November 2020 | MRCC Risk |
|||
Notes
| (1) | In this table, Audit means Audit Committee, CGNC means Corporate Governance and Nominating Committee, MRCC means Management Resources and Compensation Committee, and Risk means Risk Committee. |
| (2) | Don Lindsay was appointed Chair of the Board effective February 15, 2023. Mr. Lindsay held the position of Vice-Chair of the Board from November 9, 2022 to February 15, 2023. Prior to October 2022, Mr. Lindsay was President and Chief Executive Officer, Teck Resources Limited. |
| (3) | Mr. Lindsay is a member of the CGNC; however, in his capacity as Chair, Mr. Lindsay attends the meetings of all committees whenever possible. |
| (4) | Roy Gori is not a member of any committee but attends committee meetings at the invitation of the Chair. |
| (5) | From June 2020 to May 2021, Nicole Arnaboldi was a corporate director and from February 2019 to June 2020 she was Senior Advisor at Credit Suisse (USA). Prior to February 2019 she was Vice Chair at Credit Suisse (USA). |
| (6) | Prior to August 2019, Julie Dickson was a Member of the Supervisory Board for the Single Supervisory Mechanism at the European Central Bank. |
| (7) | Prior to September 2020, Vanessa Kanu was Chief Financial Officer at Mitel Networks Corporation. |
| (8) | From February 2022 to November 2023, Leagh Turner was Co-Chief Executive Officer, Ceridian HCM, Inc. From August 2018 to February 2022, Ms.Turner was President and Chief Operating Officer at Ceridian HCM, Inc. |
P a g e | 28
EXECUTIVE OFFICERS
The name, place of residence, and position of each of the executive officers of Manulife are set forth in the following table as of January 1, 2024.
| Name and Residence | Position with Manulife | |
|
Roy Gori Ontario, Canada |
President and Chief Executive Officer | |
|
Marc M. Costantini Massachusetts, United States |
Global Head of Inforce Management (1) | |
|
Steven A. Finch Massachusetts, United States |
Chief Actuary | |
|
James D. Gallagher Massachusetts, United States |
General Counsel | |
|
Scott S. Hartz Massachusetts, United States |
Chief Investment Officer(2) | |
|
Rahim Hirji Ontario, Canada |
Chief Auditor and Head of Advisory Services(3) | |
|
Naveed Irshad Ontario, Canada |
President and Chief Executive Officer, Manulife Canada(4) | |
|
Rahul M. Joshi Texas, United States |
Chief Operations Officer(5) | |
|
Pamela O. Kimmet Florida, United States |
Chief Human Resources Officer | |
|
Karen A. Leggett Ontario, Canada |
Chief Marketing Officer(6) | |
|
Paul R. Lorentz Ontario, Canada |
President and Chief Executive Officer, Global Wealth and Asset Management(7) | |
|
Colin L. Simpson Ontario, Canada |
Chief Financial Officer(8) | |
|
Brooks E. Tingle Massachusetts, United States |
President and Chief Executive Officer, John Hancock(9) | |
|
Halina K. von dem Hagen Ontario, Canada |
Chief Risk Officer(10) | |
|
Shamus E. Weiland New York, United States |
Chief Information Officer (11) | |
|
Philip J. Witherington Hong Kong, People’s Republic of China |
President & Chief Executive Officer, Asia(12) | |
Notes
| (1) | From April 2020 to June 2022, Marc Costantini was President and Chief Executive Officer, Corporate Development Strategy and Digital Solutions at Munich Re, North America Life and Health. From January 2020 to April 2020, Mr. Costantini was a consultant at Munich Re, North America Life and Health. Prior to January 2020, Mr. Costantini was Executive Vice President Commercial and Government Markets at Guardian Life Insurance Company. |
| (2) | Prior to March 1, 2019, Scott Hartz was Global Head of General Account Investments. |
| (3) | Prior to June 2023, Rahim Hirji was Chief Risk Officer. |
| (4) | From November 3, 2021 to June 1, 2022, Naveed Irshad was Global Head of Inforce Management. From January 1, 2018 to November 3, 2021, Mr. Irshad was Head of North American Legacy Business. |
| (5) | Prior to June 2019, Rahul Joshi was Senior Vice President of Customer Care, Walmart Ecommerce/Jet.com. |
| (6) | From July 2019 to February 17, 2020, Karen Leggett was a Partner at Ernst & Young Global Consulting Services. Prior to July 2019, she was the Chief Marketing Officer and Executive Vice President of Corporate Development at National Bank of Canada. |
| (7) | Prior to March 1, 2019, Paul Lorentz was Head, Global Wealth and Asset Management. |
| (8) | From November 2022 to July 2023, Colin Simpson was Chief Financial Officer, US Segment. Prior to November 2022, Mr. Simpson was Chief Financial Officer, Aviva Canada. |
| (9) | Prior to April 2023, Brooks Tingle was President and Chief Executive Officer, John Hancock Insurance. |
| (10) | Prior to June 2023, Halina von dem Hagen was Global Treasurer and Head of Capital Management. |
P a g e | 29
| (11) | Prior to April 2019, Shamus Weiland was Managing Director, North America Technology Head at CitiGroup. |
| (12) | From June 2017 to July 2023 Philip Witherington was Chief Financial Officer. |
SHARE OWNERSHIP
The number of Common Shares held by the Directors and executive officers of MFC as at December 31, 2023 was 1,407,808, which represented less than 1% of the outstanding Common Shares.
LEGAL PROCEEDINGS AND REGULATORY ACTIONS
A description of certain legal proceedings to which the Company is a party can be found in the section entitled “Legal proceedings” in Note 19 to our 2023 Consolidated Financial Statements.
Since January 1, 2023, (i) there have been no penalties or sanctions imposed against us by a Canadian securities regulatory authority, other than nominal late filing fees, or by a court relating to Canadian securities legislation, (ii) there have been no other penalties or sanctions imposed by a court or regulatory body against us that would likely be considered important to a reasonable investor in making an investment decision, and (iii) we have not entered into any settlement agreements before a court relating to Canadian securities legislation or with a Canadian securities regulatory authority.
TRANSFER AGENT AND REGISTRAR
TSX Trust Company is the principal transfer agent and registrar for MFC’s Common and Preferred shares. MFC’s transfer agents and co-transfer agents are as follows (opposite their applicable jurisdictions):
| Transfer Agent |
||
| Canada: |
TSX Trust Company P.O. Box 700, Station B Montreal, Québec, Canada, H3B 3K3 Toll Free: 1-800-783-9495 www.tsxtrust.com www.tsxtrust.com/fr |
|
| Co-Transfer Agents |
||
| United States: |
Equiniti Trust Company, LLC P.O. Box 27756 Newark, NJ 07103 Toll Free: 1-800-249-7702
http://equiniti.com/us/ast-access/ |
|
| Philippines: |
Rizal Commercial Banking Corporation Ground Floor, West Wing
Telephone: 632 5318 8567 or 632 8894 9909 www.rcbc.com/stocktransfer |
|
| Hong Kong: |
Tricor Investor Services Limited 17/F, Far East Finance Centre 16 Harcourt Road Hong Kong Telephone: 852 2980-1333 www.tricoris.com |
|
P a g e | 30
INTERESTS OF EXPERTS
Ernst & Young LLP, Chartered Professional Accountants, Licensed Public Accountants, Toronto, Canada, is the external auditor who prepared the Reports of Independent Registered Public Accounting Firm to the Shareholders and Board of Directors on the audited consolidated financial statements of the Company, and the Report of Independent Registered Public Accounting Firm to the Shareholders and Board of Directors on Internal Control over Financial Reporting under Standards of the Public Company Accounting Oversight Board (United States). Ernst & Young LLP is independent with respect to the Company within the meaning of the CPA Code of Professional Conduct of the Chartered Professional Accountants of Ontario, United States federal securities laws and the rules and regulations thereunder, including the independence rules adopted by the SEC pursuant to the Sarbanes-Oxley Act of 2002 (“SOX”) and is in compliance with Rule 3520 of the Public Company Accounting Oversight Board (United States). Under Hong Kong’s Financial Reporting Council Ordinance, Ernst & Young LLP is a Recognised Public Interest Entity Auditor.
Steven Finch is the Appointed Actuary of the Company who prepared the Appointed Actuary’s Report to the Shareholders of the Company. The number of Common Shares of MFC held by Steven Finch as at December 31, 2023 represented less than 1% of the outstanding Common Shares.
AUDIT COMMITTEE
Audit Committee Charter
The Audit Committee has adopted a formal Charter that describes the Audit Committee’s role and responsibilities. The Charter is set out in the attached Schedule 1.
The Audit Committee is responsible for assisting the Board in its oversight role with respect to the quality and integrity of financial information, the effectiveness of the Company’s internal control over financial reporting, the effectiveness of the Company’s risk management and compliance practices, the performance, qualifications and independence of the independent auditor, the Company’s compliance with legal and regulatory requirements, the performance of the Company’s finance, actuarial, internal audit and global compliance functions, and the procedures relating to conflicts of interest, confidential information, related party transactions, and customer complaints.
Composition of the Audit Committee
MFC’s Audit Committee was composed of the following members as at December 31, 2023: Guy Bainbridge (Chair of the Audit Committee), Tsun-yan Hsieh, Vanessa Kanu, Andrea Rosen and May Tan. The Board has reviewed the committee membership and determined that all members are financially literate as required by the NYSE Listed Company Manual and the applicable instruments of the Canadian Securities Administrators. All committee members are independent, pursuant to applicable regulatory and stock exchange requirements. The Board has also determined that Guy Bainbridge, Tsun-yan Hsieh, Vanessa Kanu, Andrea Rosen and May Tan have the necessary qualifications to be designated as audit committee financial experts under SOX.
Relevant Education and Experience
In addition to the general business experience of each member of MFC’s Audit Committee, each member of the Audit Committee in 2023 had relevant education and experience. Guy Bainbridge is a member of the Institute of Chartered Accountants in England and Wales and holds an MA from the University of Cambridge. Mr. Bainbridge is a former partner of KPMG LLP. Tsun-yan Hsieh holds an MBA from Harvard University and a B.Sc. Mechanical Engineering from the University of Alberta. Vanessa Kanu holds a B.Sc in International and Financial Economics from the University of Hull, is a Chartered Accountant in Canada, a Certified Public Accountant in the United States, and a member of the Institute of Chartered Accountants of England and Wales. Ms. Kanu currently serves as the Chief Financial Officer of Telus International (Cda) Inc. Andrea Rosen holds a BA from Yale University, an LLB from Osgoode Hall Law School and an MBA from the Schulich School of Business at York University. Ms. Rosen previously served as Vice Chair of TD Bank Financial Group and as President of TD Canada Trust. May Tan holds a P a g e | 31
B.A. in Economics and Accounting from the University of Sheffield, is a member of the Institute of Chartered Accountants of England and Wales and is a Certified Public Accountant in Hong Kong.
Pre-Approval Policies and Procedures
Our auditor independence policy requires the Audit Committee to pre-approve all audit and permitted non-audit services (including the fees and conditions) the external auditor provides. If a new service is proposed during the year that is outside the pre-approved categories or budget, it must be pre-approved by the Audit Committee Chair.
All audit and permitted non-audit services provided by Ernst & Young LLP have been pre-approved by the Audit Committee.
External Auditor Service Fees
The table below lists the services Ernst & Young LLP provided to Manulife and its subsidiaries in the last two fiscal years and the fees they charged each year.
| Fees | 2023
($ in millions) |
2022
($ in millions) |
||
|
Audit Fees: |
51.4 | 44.5 | ||
| Includes the audit of our financial statements as well as the financial statements of our subsidiaries, segregated funds, audits of statutory filings, prospectus services, report on internal controls, reviews of quarterly reports and regulatory filings. | ||||
|
Audit-Related Fees: |
4.0 | 3.6 | ||
| Includes consultation concerning financial accounting and reporting standards not classified as audit, due diligence in connection with proposed or consummated transactions and assurance services to report on internal controls for third parties. | ||||
|
Tax Fees: |
0.4 | 0.1 | ||
| Includes tax compliance, tax planning and tax advice services. | ||||
|
All Other Fees: |
0.2 | 0.2 | ||
| Includes other advisory services. | ||||
|
Total |
56.0 | 48.4 | ||
Note: Total fees above exclude fees of $13.1 million in 2023 and $10.5 million in 2022 for professional services provided by Ernst & Young LLP to certain investment funds managed by subsidiaries of MFC. For certain funds, these fees are paid directly by the funds. For other funds, in addition to other administrative costs, the subsidiaries are responsible for the auditor’s fees for professional services, in return for a fixed administration fee. Audit fees for 2023 and 2022 above also include one-time fees for special projects related to the implementation of IFRS17 and 9 of $12.8M and $10.9M, respectively.
ADDITIONAL INFORMATION
Additional information with respect to the Company, including directors’ and officers’ remuneration and indebtedness, principal holders of MFC’s securities, and securities authorized for issuance under MFC’s equity compensation plans, where applicable, is contained in MFC’s Management Information Circular for its most recent annual meeting of security holders that involved the election of directors. Additional financial information is provided in our 2023 Consolidated Financial Statements and our 2023 MD&A. Copies of these documents and additional information relating to the Company may be found on SEDAR+ at www.sedarplus.ca and is accessible at the Company’s website, www.manulife.com.
P a g e | 32
Schedule 1
Manulife Financial Corporation (the “Company”)
Audit Committee Charter
| 1. | Overall Role and Responsibility |
| 1.1 | The Audit Committee (“Committee”) shall: |
| (a) | assist the Board of Directors in its oversight role with respect to: |
| (i) | the quality and integrity of financial information; |
| (ii) | the effectiveness of the Company’s internal control over financial reporting; |
| (iii) | the effectiveness of the Company’s risk management and compliance practices; |
| (iv) | the independent auditor’s performance, qualifications and independence; |
| (v) | the Company’s compliance with legal and regulatory requirements; |
| (vi) | the Finance, Actuarial, Internal Audit and Global Compliance functions; |
| (vii) | conflicts of interest and confidential information; |
| (viii) | related party transactions; and |
| (ix) | complaints of customers relating to obligations under the Insurance Companies Act (Canada) (the “Act”), and accounting, internal accounting controls and audit matters. |
| (b) | prepare such reports of the Committee required to be included in the Proxy Circular in accordance with applicable laws or the rules of applicable securities regulatory authorities. |
| 1.2 | The Committee will also act as the conduct review committee of the Company. |
| 2. | Structure and Composition |
| 2.1 | The Committee shall consist of five or more Directors appointed by the Board of Directors on the recommendation of the Corporate Governance and Nominating Committee. |
| 2.2 | No member of the Committee shall be an officer or employee of the Company, its subsidiaries or affiliates. Members of the Committee will not be affiliated with the Company as such term is defined in the Act. |
| 2.3 | Each member of the Committee shall satisfy the applicable independence and experience requirements of the laws governing the Company, the applicable stock exchanges on which the Company’s securities are listed and applicable securities regulatory authorities. |
| 2.4 | The Board of Directors shall designate one member of the Committee as the Committee Chair. |
| 2.5 | Members of the Committee shall serve at the pleasure of the Board of Directors for such term or terms as the Board of Directors may determine. |
P a g e | 33
| 2.6 | Each member of the Committee shall be financially literate as such qualification is defined by applicable law and interpreted by the Board of Directors in its business judgment. |
| 2.7 | The Board of Directors shall determine whether and how many members of the Committee qualify as a financial expert as defined by applicable law. At least one member must be an audit committee financial expert, as defined in applicable laws and regulations. |
| 2.8 | The Committee shall annually determine whether any of its members serve on the audit committee of more than three public companies (including the Committee). If any of the Committee members fall into this category, the Committee shall consider the ability of such members to effectively serve on the Committee and, if it is determined that such members are able to continue serving, the Committee shall record the reasons for such a decision. |
| 3. | Structure, Operations and Assessment |
| 3.1 | The Committee shall meet quarterly or more frequently as the Committee may determine. The Committee shall report to the Board of Directors on its activities after each of its meetings. |
| 3.2 | The affirmative vote of a majority of the members of the Committee participating in any meeting of the Committee is necessary for the adoption of any resolution. |
| 3.3 | The Committee may create one or more subcommittees and may delegate, in its discretion, all or a portion of its duties and responsibilities to such subcommittees. |
| 3.4 | The Committee shall, on an annual basis: |
| (a) | review and assess the adequacy of this Charter and, where necessary, recommend changes to the Board of Directors for its approval; |
| (b) | undertake a performance evaluation of the Committee comparing the performance of the Committee with the requirements of this Charter; and |
| (c) | report the results of the performance evaluation to the Board of Directors. |
The performance evaluation by the Committee shall be conducted in such manner as the Committee deems appropriate. The report to the Board of Directors may take the form of an oral report by the chair of the Committee or any other member of the Committee designated by the Committee to make this report.
| 3.5 | The Committee is expected to establish and maintain free and open communication with management, the independent auditor, the Chief Auditor and the Chief Actuary and shall periodically meet separately with each of them. |
| 4. | Specific Duties |
The Committee will carry out the following specific duties:
| 4.1 | Oversight of the Independent Auditor |
| (a) | Recommend to the Board for approval the appointment and, when considered appropriate, the dismissal or removal of the independent auditor for the purpose of preparing or issuing an auditor’s report or performing other audit, review or attest services for the Company (subject to shareholder ratification). |
| (b) | Review and approve the scope and terms of all audit engagements and recommend to the Board the compensation of the independent auditor. |
P a g e | 34
| (c) | Oversee the work of the independent auditor engaged for the purpose of preparing or issuing an audit report or performing other audit, review or attest services (including resolution of disagreements between management and the independent auditor regarding financial reporting). The independent auditor shall report directly to the Committee. |
| (d) | Pre-approve all audit services and permitted non-audit services (including the fees, terms and conditions for the performance of such services) to be provided by the independent auditor. |
| (e) | When appropriate, the Committee may delegate to one or more members the authority to grant preapprovals of audit and permitted non-audit services and the full Committee shall be informed of each non-audit service. |
| (f) | Review the decisions of such delegates under subsection (e) above, which shall be presented to the full Committee at its next scheduled meeting. |
| (g) | Evaluate the qualifications, performance and independence of the independent auditor, including: |
| (i) | reviewing and evaluating the lead partner on the independent auditor’s engagement with the Company; |
| (ii) | considering whether the auditor’s quality controls are adequate and the provision of permitted non-audit services are compatible with maintaining the auditor’s independence; and |
| (iii) | addressing any concerns raised by regulatory authorities or other stakeholders regarding the auditor’s independence. |
| (h) | Present its conclusions with respect to the independent auditor to the Board of Directors and, if so determined by the Committee, recommend that the Board of Directors take additional action to satisfy itself of the qualifications, performance and independence of the independent auditor. |
| (i) | Obtain and review a report from the independent auditor at least annually regarding: |
| (i) | the independent auditor’s internal quality-control procedures; |
| (ii) | any material issues raised by the most recent internal quality-control review, or peer review, of the firm, or by any inquiry or investigation by governmental or professional authorities within the preceding five years respecting one or more independent audits carried out by the firm; |
| (iii) | any steps taken to deal with any such issues; and |
| (iv) | all relationships between the independent auditor and the Company. |
| (j) | At least annually, review and approve the audit plan (including any significant changes to the audit plan) and, as part of this review, satisfy itself that the audit plan is risk-based and addresses all the relevant activities over a measurable cycle and that the work of the independent auditor and Internal Audit is coordinated. |
| (k) | Ensure the rotation of the lead (or coordinating) audit partner having primary responsibility for the audit and the audit partner responsible for reviewing the audit as required by law. |
| (l) | Review and approve policies for the Company’s hiring of partners and employees or former partners and employees of the independent auditor. |
P a g e | 35
| 4.2 | Financial Reporting |
| (a) | Review and discuss with management and the independent auditor the annual audited financial statements, the results of the audit, any changes to the audit scope or strategy, the annual report of the auditors on the statements and any other returns or transactions required to be reviewed by the Committee and report to the Board of Directors prior to approval by the Board of Directors and the publication of earnings. |
| (b) | Review such returns of the Company as the Superintendent of Financial Institutions (Canada) (the “Superintendent”) may specify. |
| (c) | Review and discuss with the independent auditor and with management the Company’s annual and quarterly financial disclosures, including management’s discussion and analysis. The Committee shall approve any reports for inclusion in the Company’s Annual Report, as required by applicable legislation and make a recommendation thereon to the Board. |
| (d) | Review the Company’s disclosure policy, which governs the release of information about the Company and requires timely, accurate and fair disclosure of such information in compliance with all legal and regulatory requirements, and periodically assess the adequacy of procedures regarding disclosure of financial information. |
| (e) | Require management to implement and maintain appropriate internal control procedures. |
| (f) | Oversee systems of internal control and meet with the heads of the oversight functions, management and the independent auditors to assess the adequacy and effectiveness of these systems and to obtain reasonable assurance that the controls are effective. |
| (g) | Review and discuss with management and the independent auditor management’s report on its assessment of internal controls over financial reporting and the independent auditor’s attestation report on management’s assessment. |
| (h) | Review, evaluate and approve the procedures established under s. 4.2(e). |
| (i) | Review such investments and transactions that could adversely affect the well-being of the Company as the auditor or any officer of the Company may bring to the attention of the Committee. |
| (j) | Review and discuss with management and the independent auditor the Company’s quarterly financial statements prior to the publication of earnings, including: |
| (i) | the results of the independent auditor’s review of the quarterly financial statements; and |
| (ii) | any matters required to be communicated by the independent auditor under applicable review standards. |
| (k) | Review and discuss with management and the independent auditor at least annually significant financial reporting issues and judgments made in connection with the preparation of the Company’s financial statements, including: |
| (i) | key areas of risk for material misstatement of the financial statements, including critical accounting estimates or areas of measurement uncertainty; |
| (ii) | whether the auditor considers estimates to be within an acceptable range and the rationale for the final valuation decision and whether it is consistent with industry practice; |
P a g e | 36
| (iii) | any significant changes in the Company’s selection or application of accounting or actuarial principles; |
| (iv) | any major issues as to the adequacy of the Company’s internal controls; |
| (v) | any special steps adopted in light of material control deficiencies, if any; and |
| (vi) | the role of any other audit firms. |
| (l) | Review and discuss with management and the independent auditor at least annually reports from the independent auditor on: |
| (i) | critical accounting policies and practices to be used; |
| (ii) | significant financial reporting issues, estimates and judgments made in connection with the preparation of the financial statements; |
| (iii) | alternative treatments of financial information within generally accepted accounting principles that have been discussed with management, ramifications of the use of such alternative disclosures and treatments, and the treatment preferred by the independent auditor; and |
| (iv) | other material written communications between the independent auditor and management, such as any management letter or schedule of unadjusted differences. |
| (m) | Meet with the independent auditor to discuss the annual financial statements and any investments or transactions that may adversely affect the well-being of the Company. |
| (n) | Discuss with the independent auditor at least annually any “management” or “internal control” letters issued or proposed to be issued by the independent auditor to the Company and review all material correspondence between the independent auditor and management related to audit findings. |
| (o) | Review and discuss with management and the independent auditor at least annually any significant changes to the Company’s accounting and actuarial principles and practices suggested by the independent auditor, internal audit personnel or management and assess whether the Company’s accounting and actuarial practices are appropriate and within the boundaries of acceptable practice. |
| (p) | Discuss with management and approve the Company’s earnings press releases, the release of earnings projections, forecast or guidance and the use of non-GAAP financial measures (if any), and the financial information provided to analysts and rating agencies. |
| (q) | Review and discuss with management and the independent auditor at least annually the effect of regulatory and accounting initiatives as well as off-balance-sheet structures on the Company’s financial statements. |
| (r) | Discuss with the independent auditor matters required to be discussed by American Institute of Certified Public Accountants Statement on Auditing Standards No. 61 relating to the conduct of the audit, including any difficulties encountered in the course of the audit work, any restrictions on the scope of activities or access to requested information and any significant disagreements with management. |
| (s) | Review and discuss with the Chief Executive Officer and the Chief Financial Officer the procedures undertaken in connection with the Chief Executive Officer and Chief Financial Officer certifications for the annual and interim filings with applicable securities regulatory authorities. |
P a g e | 37
| (t) | Review disclosures made by the Company’s Chief Executive Officer and Chief Financial Officer during their certification process for the annual and interim filing with applicable securities regulatory authorities about any significant deficiencies in the design or operation of internal controls which could adversely affect the Company’s ability to record, process, summarize and report financial data or any material weaknesses in the internal controls, and any fraud involving management or other employees who have a significant role in the Company’s internal controls. |
| (u) | Meet with the Chief Actuary of the Company at least annually to receive and review reports, opinions and recommendations prepared by the Chief Actuary in accordance with the Act, including the parts of the annual financial statement and the annual return filed under s. 665 of the Act, prepared by the Chief Actuary, and such other matters as the Committee may direct, including the report on the Financial Condition Testing (formerly the Dynamic Capital Adequacy Testing), which is also reviewed by the Risk Committee. |
| (v) | Receive reports from the Chief Actuary regarding material capital model modifications and new capital model applications. |
| (w) | Discuss with the Company’s General Counsel at least annually any legal matters that may have a material impact on the financial statements, operations, assets or compliance policies and any material reports or inquiries received by the Company or any of its subsidiaries from regulators or governmental agencies. |
| (x) | Meet with the Chief Auditor and with management to discuss the effectiveness of the internal control procedure established pursuant to s. 4.2(e). |
| 4.3 | Oversight of the Finance Function |
| (a) | At least annually review and approve the mandate of the Chief Financial Officer and the Finance function. |
| (b) | At least annually, review and approve the budget, structure, skills and resources of the Finance function. |
| (c) | At least annually, review the performance evaluation of the Chief Financial Officer, with the input of the Management Resources and Compensation Committee, and assess the effectiveness of the Chief Financial Officer and the Finance function. |
| (d) | Recommend to the Board for approval the appointment and, when considered appropriate, the dismissal of the Chief Financial Officer, who shall have direct access to the Committee. |
| (e) | Review the results of periodic independent reviews of the Finance function. |
| 4.4 | Oversight of the Actuarial Function |
| (a) | At least annually, review and approve the mandate for the Chief Actuary and the Actuarial function. |
| (b) | At least annually, review and approve the budget, structure, skills and resources of the Actuarial function. |
| (c) | At least annually, review the performance evaluation of the Chief Actuary, with the input of the Management Resources and Compensation Committee, and assess the effectiveness of the Chief Actuary and the Actuarial function. |
| (d) | Recommend to the Board for approval the appointment and, when considered appropriate, the dismissal of the Chief Actuary, who shall have direct access to the Committee. |
P a g e | 38
| (e) | Review the results of periodic independent reviews of the Actuarial function. |
| 4.5 | Oversight of the Internal Audit Function |
| (a) | At least annually, review and approve the mandate of the Chief Auditor and the Internal Audit function. |
| (b) | At least annually, review and approve the budget, structure, skills, resources, independence and qualifications of the Internal Audit function. |
| (c) | At least annually, review and approve the audit plan of the Internal Audit function (including any significant changes to the audit plan) and, as part of this review, satisfy itself that the audit plan is risk-based and addresses all the relevant activities over a measurable cycle and that the work of the independent auditor and Internal Audit is coordinated. |
| (d) | Review the periodic reports of the internal audit department on internal audit activities, including audit findings, recommendations and progress in meeting the annual audit plan (including the impact of any resource limitations). |
| (e) | At least annually, review the performance evaluation and compensation of the Chief Auditor, with the input of the Management Resources and Compensation Committee, and assess the effectiveness of the Chief Auditor and the Internal Audit function. |
| (f) | Recommend to the Board for approval the appointment and, when considered appropriate, the dismissal of the Chief Auditor, who shall have direct access to the Committee. |
| (g) | Review the results of periodic independent reviews and self-assessments of the Internal Audit function’s conformance with the International Standards for the Professional Practice of Internal Auditing and Code of Ethics, and action plans to address any significant conformance issues. |
| 4.6 | Risk Management Oversight |
| (a) | Review reports from the Risk Committee respecting the Company’s processes for assessing and managing risk. |
| (b) | The Committee will receive reports that highlight key areas of disclosure judgement considered by the Disclosure Committee. |
| 4.7 | Oversight of Regulatory Compliance and Complaint Handling |
| (a) | Establish procedures for the receipt, retention and treatment of complaints received by the Company regarding accounting, internal accounting controls or auditing matters, and the confidential, anonymous submission by employees of concerns regarding questionable accounting or auditing matters. |
| (b) | Discuss with management and the independent auditor at least annually any correspondence with regulators or governmental agencies and any published reports which raise material issues regarding the Company’s financial statements or accounting. |
| (c) | Review at least annually with the Global Compliance Chief the Company’s compliance with applicable laws and regulations, and correspondence from regulators. |
P a g e | 39
| 4.8 | Oversight of the Global Compliance Function |
| (a) | At least annually, review and approve the mandate for the Global Compliance Chief and the Global Compliance function. |
| (b) | At least annually, review and approve the budget, structure, skills and resources of the Global Compliance function. |
| (c) | At least annually, review the performance evaluation of the Global Compliance Chief, with the input of the Management Resources and Compensation Committee, and assess the effectiveness of the Global Compliance Chief and the Global Compliance function. |
| (d) | Recommend to the Board for approval, the appointment and, when considered appropriate, the dismissal of the Global Compliance Chief, who shall have direct access to the Committee. |
| (e) | Review the results of periodic independent reviews of the Global Compliance function. |
| 4.9 | Oversight of the Anti-Money Laundering and Anti-Terrorist Financing Program |
| (a) | The Committee shall review the Company’s Anti-Money Laundering and Anti-Terrorist Financing Policy. |
| (b) | The Committee shall meet with the Chief Anti-Money Laundering Officer as necessary to review the AML/ATF Program. |
| (c) | The Committee shall meet with the Chief Auditor as necessary to review results of testing of the effectiveness of the AML/ATF Program. |
| 4.10 | Review of Ethical Standards |
| (a) | Annual review of the Company’s Code of Business Conduct and Ethics. |
| (b) | Establish procedures to receive and process any request from executive officer(s) and Director(s) for waiver of the Company’s Code of Business Conduct and Ethics. |
| (c) | Grant any waiver of the Company’s Code of Business Conduct and Ethics to executive officer(s) and Director(s) as the Committee may in its sole discretion deem appropriate and arrange for any such waiver to be promptly disclosed to the shareholders in accordance with applicable laws or the rules of applicable securities regulatory authorities. |
| (d) | Annual review and assessment of procedures established by the Board of Directors to resolve conflicts of interest, including techniques for identification of potential conflict situations. |
| (e) | Review and assessment of procedures established by the Board of Directors for restricting the use of confidential information. |
| 4.11 | Self Dealing and Disclosure Requirements |
| (a) | Require management to establish procedures for complying with Part XI (Self-Dealing) of the Act (the “Related Party Standards”). |
| (b) | Establish criteria for the determination of materiality of a transaction with a related party. |
P a g e | 40
| (c) | Annual review of the Related Party Standards and their effectiveness in ensuring that the Company is complying with Part XI of the Act and the Sarbanes-Oxley Act. |
| (d) | Review the practices of the Company to ensure that any transactions with related parties of the Company that may have a material effect on the stability or solvency of the Company are identified. |
| (e) | Ensure that, within 90 days after the end of each financial year of the Company, the Committee will report to the Superintendent on its activities of the previous year respecting conduct review, undertaken in carrying out its responsibilities under the Act (and, in particular, in respect of (a), (c), and (d) above). |
| (f) | The Committee shall report to the Superintendent on its mandate respecting conduct review and responsibilities of the Committee and the procedures referred to in (a) above. |
| (g) | Review and assessment of the procedures established by the Board of Directors to disclose information to customers of the Company under the Act, if applicable, and of the procedures for dealing with complaints of customers of the Company to satisfy itself that the applicable procedures are being followed. |
| 4.12 | Proxy Circular |
| (a) | The Committee shall prepare a report on its activities on an annual basis to be included in the Proxy Circular, as may be required by applicable laws or rules of applicable securities regulatory authorities. |
| 4.13 | Duties and Responsibilities Delegated by the Board |
| (a) | Exercise such other powers and perform such other duties and responsibilities as are incidental to the purposes, duties and responsibilities specified herein and as may from time to time be delegated to the Committee by the Board of Directors. |
| 5. | Funding for the Independent Auditor and Retention of External Advisors |
The Company shall provide for appropriate funding, as determined by the Committee, for payment of compensation to the independent auditor for the purpose of issuing an audit report and to any advisors retained by the Committee. The Committee shall have the authority to retain such external advisors as it may from time to time deem necessary or advisable for its purposes and to set the terms of the retainer. The expenses related to any such engagement shall also be funded by the Company.
Exhibit 99.4
Certification of Annual Filings
Manulife Financial Corporation
I, Roy Gori, certify that:
| 1. | I have reviewed this annual report on Form 40-F of Manulife Financial Corporation; |
| 2. | Based on my knowledge, this report does not contain any untrue statement of a material fact or omit to state a material fact necessary to make the statements made, in light of the circumstances under which such statements were made, not misleading with respect to the period covered by this report; |
| 3. | Based on my knowledge, the financial statements, and other financial information included in this report, fairly present in all material respects the financial condition, results of operations and cash flows of the issuer as of, and for, the periods presented in this report; |
| 4. | The issuer’s other certifying officer(s) and I are responsible for establishing and maintaining disclosure controls and procedures (as defined in Exchange Act Rules 13a-15(e) and 15d-15(e)) and internal control over financial reporting (as defined in Exchange Act Rules 13a-15(f) and 15d-15(f)) for the issuer and have: |
| (a) | Designed such disclosure controls and procedures, or caused such disclosure controls and procedures to be designed under our supervision, to ensure that material information relating to the issuer, including its consolidated subsidiaries, is made known to us by others within those entities, particularly during the period in which this report is being prepared; |
| (b) | Designed such internal control over financial reporting, or caused such internal control over financial reporting to be designed under our supervision, to provide reasonable assurance regarding the reliability of financial reporting and the preparation of financial statements for external purposes in accordance with generally accepted accounting principles; |
| (c) | Evaluated the effectiveness of the issuer’s disclosure controls and procedures and presented in this report our conclusions about the effectiveness of the disclosure controls and procedures, as of the end of the period covered by this report based on such evaluation; and |
| (d) | Disclosed in this report any change in the issuer’s internal control over financial reporting that occurred during the period covered by the annual report that has materially affected, or is reasonably likely to materially affect, the issuer’s internal control over financial reporting; and |
| 5. | The issuer’s other certifying officer(s) and I have disclosed, based on our most recent evaluation of internal control over financial reporting, to the issuer’s auditors and the audit committee of the issuer’s board of directors (or persons performing the equivalent functions): |
| (a) | All significant deficiencies and material weaknesses in the design or operation of internal control over financial reporting which are reasonably likely to adversely affect the issuer’s ability to record, process, summarize and report financial information; and |
| (b) | Any fraud, whether or not material, that involves management or other employees who have a significant role in the issuer’s internal control over financial reporting. |
Date: February 14, 2024
| /s/ Roy Gori |
| Roy Gori |
| President and Chief Executive Officer |
Exhibit 99.5
Certification of Annual Filings
Manulife Financial Corporation
I, Colin Simpson, certify that:
| 1. | I have reviewed this annual report on Form 40-F of Manulife Financial Corporation; |
| 2. | Based on my knowledge, this report does not contain any untrue statement of a material fact or omit to state a material fact necessary to make the statements made, in light of the circumstances under which such statements were made, not misleading with respect to the period covered by this report; |
| 3. | Based on my knowledge, the financial statements, and other financial information included in this report, fairly present in all material respects the financial condition, results of operations and cash flows of the issuer as of, and for, the periods presented in this report; |
| 4. | The issuer’s other certifying officer(s) and I are responsible for establishing and maintaining disclosure controls and procedures (as defined in Exchange Act Rules 13a-15(e) and 15d-15(e)) and internal control over financial reporting (as defined in Exchange Act Rules 13a-15(f) and 15d-15(f)) for the issuer and have: |
| (a) | Designed such disclosure controls and procedures, or caused such disclosure controls and procedures to be designed under our supervision, to ensure that material information relating to the issuer, including its consolidated subsidiaries, is made known to us by others within those entities, particularly during the period in which this report is being prepared; |
| (b) | Designed such internal control over financial reporting, or caused such internal control over financial reporting to be designed under our supervision, to provide reasonable assurance regarding the reliability of financial reporting and the preparation of financial statements for external purposes in accordance with generally accepted accounting principles; |
| (c) | Evaluated the effectiveness of the issuer’s disclosure controls and procedures and presented in this report our conclusions about the effectiveness of the disclosure controls and procedures, as of the end of the period covered by this report based on such evaluation; and |
| (d) | Disclosed in this report any change in the issuer’s internal control over financial reporting that occurred during the period covered by the annual report that has materially affected, or is reasonably likely to materially affect, the issuer’s internal control over financial reporting; and |
| 5. | The issuer’s other certifying officer(s) and I have disclosed, based on our most recent evaluation of internal control over financial reporting, to the issuer’s auditors and the audit committee of the issuer’s board of directors (or persons performing the equivalent functions): |
| (a) | All significant deficiencies and material weaknesses in the design or operation of internal control over financial reporting which are reasonably likely to adversely affect the issuer’s ability to record, process, summarize and report financial information; and |
| (b) | Any fraud, whether or not material, that involves management or other employees who have a significant role in the issuer’s internal control over financial reporting. |
Date: February 14, 2024
| /s/ Colin Simpson |
| Colin Simpson |
| Chief Financial Officer |
Exhibit 99.6
CERTIFICATION
Pursuant to 18 United States Code s. 1350
As adopted pursuant to
Section 906 of the Sarbanes–Oxley Act of 2002
In connection with the Annual Report on Form 40-F of Manulife Financial Corporation (the “Company”) for the year ended December 31, 2023, as filed with the Securities and Exchange Commission on the date hereof (the “Report”), the undersigned officer of the Company certifies pursuant to 18 U.S.C. Section 1350, as adopted pursuant to Section 906 of the Sarbanes-Oxley Act of 2002, that to his knowledge:
| 1. | The Report fully complies with the requirements of section 13(a) or 15(d) of the Securities Exchange Act of 1934, as amended; and |
| 2. | The information contained in the Report fairly presents, in all material respects, the financial condition and results of operations of the Company. |
Date: February 14, 2024
| /s/ Roy Gori |
||
| Name: | Roy Gori | |
| Title: | President and Chief Executive Officer | |
Exhibit 99.7
CERTIFICATION
Pursuant to 18 United States Code s. 1350
As adopted pursuant to
Section 906 of the Sarbanes–Oxley Act of 2002
In connection with the Annual Report on Form 40-F of Manulife Financial Corporation (the “Company”) for the year ended December 31, 2022, as filed with the Securities and Exchange Commission on the date hereof (the “Report”), the undersigned officer of the Company certifies pursuant to 18 U.S.C. Section 1350, as adopted pursuant to Section 906 of the Sarbanes-Oxley Act of 2002, that to his knowledge:
| 1. | The Report fully complies with the requirements of section 13(a) or 15(d) of the Securities Exchange Act of 1934, as amended; and |
| 2. | The information contained in the Report fairly presents, in all material respects, the financial condition and results of operations of the Company. |
Date: February 14, 2024
| /s/ Colin Simpson |
| Colin Simpson |
| Chief Financial Officer |
Exhibit 99.8
CONSENT OF INDEPENDENT REGISTERED PUBLIC ACCOUNTING FIRM
We consent to the reference to our firm under the caption “Interests of Experts” and to the incorporation by reference in the following Registration Statements:
•Registration Statement (Form S-8 No. 333-12610) of Manulife Financial Corporation pertaining to the Manulife Financial Corporation Stock Plan for Non-Employee Directors and Executive Stock Option Plan;
•Registration Statement (Form S-8 No. 333-13072) of Manulife Financial Corporation pertaining to the Manulife Financial Corporation Global Share Ownership Plan;
•Registration Statement (Form S-8 No. 333-157326) of Manulife Financial Corporation pertaining to the Stock Plan for Non-Employee Directors, Executive Stock Option Plan and Global Share Ownership Plan;
•Registration Statement (Form S-8 No. 333-114951) of Manulife Financial Corporation pertaining to the John Hancock Financial Services, Inc. 1999 Long-Term Stock Incentive Plan, as amended and the John Hancock Financial Services, Inc. Non-Employee Directors’ Long-Term Stock Incentive Plan;
•Registration Statement (Form S-8 No. 333-129430) of Manulife Financial Corporation pertaining to the Deferred Compensation Plan for Certain Employees of John Hancock and the Deferred Compensation Plan of the John Hancock Financial Network;
•Registration Statement (Form S-8 No. 333-211366) of Manulife Financial Corporation pertaining to the Deferred Compensation Plan for Certain Employees of John Hancock and the Deferred Compensation Plan for the John Hancock Financial Network;
• Registration Statement (Form S-8 No. 333-272672) of Manulife Financial Corporation pertaining to the Deferred Compensation Plan for Certain Employees of John Hancock and the Deferred Compensation Plan for the John Hancock Financial Network;
• Registration Statement (Form F-10 No. 333-259543) of Manulife Financial Corporation pertaining to Manulife Financial Corporation’s shelf prospectus offering Debt Securities, Preferred Shares, Common Shares, Subscription Receipts, Warrants, Share Purchase Contracts and Units;
•Registration Statement (Form F-10 No. 333-2274698) of Manulife Financial Corporation pertaining to Manulife Financial Corporation’s shelf prospectus offering Debt Securities, Preferred Shares, Common Shares, Subscription Receipts, Warrants, Share Purchase Contracts and Units;
•Registration Statement (Form F-3D No. 333-159176) of Manulife Financial Corporation pertaining to the Manulife Financial Corporation Dividend Reinvestment and Share Purchase Plan for U.S. Shareholder of Manulife Financial Corporation (the “Company”) and the use herein of our reports dated February 14, 2024, with respect to the consolidated statements of financial position as at December 31, 2023 and December 31, 2022 and the consolidated statements of income, comprehensive income, changes in equity and cash flows for each of the years in the two-year period ended December 31, 2023, and the effectiveness of internal control over financial reporting of the Company as of December 31, 2023, included in this Annual Report on Form 40-F.
| /s/ “Ernst & Young LLP” | ||
| Toronto, Canada | Chartered Professional Accountants | |
| February 14, 2024 | Licensed Public Accountants | |
Exhibit 99.9
CONSENT OF APPOINTED ACTUARY
I hereby consent to the use and incorporation by reference in this Annual Report on Form 40-F of Manulife Financial Corporation (the “Company”) for the year ended December 31, 2023 of my Appointed Actuary’s Report to the Shareholders dated February 14, 2024 (the “Report”), relating to the valuation of the policy liabilities of the Company for its Consolidated Statements of Financial Position as at December 31, 2023 and 2022 and their change in the Consolidated Statements of Income for the years then ended.
| /s/ Steven A. Finch |
| Steven A. Finch |
| Chief Actuary |
| Fellow, Canadian Institute of Actuaries |
| Toronto, Canada |
Date: February 14, 2024