FORM 6-K
U.S. SECURITIES AND EXCHANGE COMMISSION
Washington, D.C. 20549
Report of Foreign Private Issuer
Pursuant to Rule 13a-16 or 15d-16 of
the Securities Exchange Act of 1934
Commission File Number: 1-15270
For the month of February 2024
NOMURA HOLDINGS, INC.
(Translation of registrant’s name into English)
13-1, Nihonbashi 1-chome
Chuo-ku, Tokyo 103-8645
Japan
(Address of principal executive offices)
Indicate by check mark whether the registrant files or will file annual reports under cover Form 20-F or Form 40-F.
Form 20-F X Form 40-F
Indicate by check mark if the registrant is submitting the Form 6-K in paper as permitted by Regulation S-T Rule 101(b)(1):
Indicate by check mark if the registrant is submitting the Form 6-K in paper as permitted by Regulation S-T Rule 101(b)(7): Information furnished on this form:
SIGNATURES
Pursuant to the requirements of the Securities Exchange Act of 1934, the registrant has duly caused this report to be signed on its behalf by the undersigned, thereunto duly authorized.
| NOMURA HOLDINGS, INC. | ||||
| Date: February 5, 2024 |
By: | /s/ Yoshifumi Kishida |
||
| Yoshifumi Kishida | ||||
| Senior Managing Director | ||||
|
Connecting Markets East & West Consolidated Results of Operations Third quarter, year ending March 2024 (US GAAP) Nomura Holdings, Inc. January 2024 Nomura
|
Outline Presentation Financial Supplement Executive summary (p. 2-3) Consolidated balance sheet (p. 17) Overview of results (p. 4) Value at risk (p. 18) Business segment results (p. 5) Consolidated financial highlights (p. 19) Retail (p. 6-8) Consolidated income (p. 20) Investment Management (p. 9-10) Main revenue items (p. 21) Wholesale (p. 11-13) Consolidated results: Income (loss) before income taxes by segment and region (p. 22) Non-interest expenses (p. 14) Segment Other (p. 23) Robust financial position (p. 15) Retail related data (p. 24-27) Investment Management related data (p. 28-29) Wholesale related data (p. 30) Number of employees (p. 31)
|
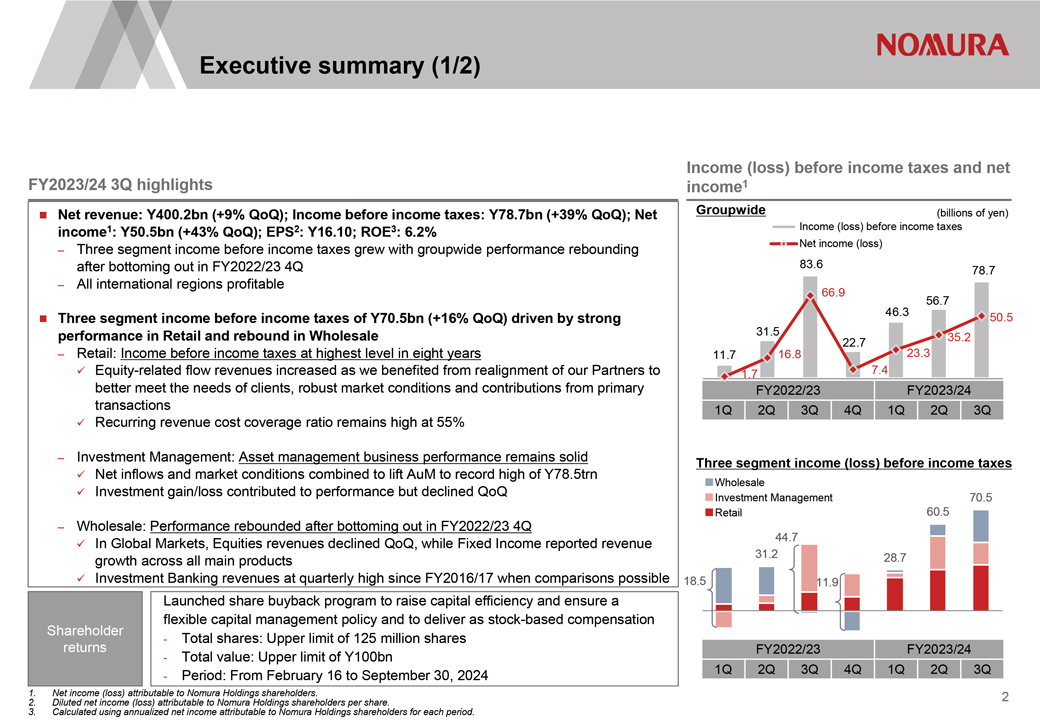
Executive summary (1/2) FY2023/24 3Q highlights Net revenue: Y400.2bn (+9% QoQ); Income before income taxes: Y78.7bn (+39% QoQ); Net income1: Y50.5bn (+43% QoQ); EPS2: Y16.10; ROE3: 6.2% Three segment income before income taxes grew with groupwide performance rebounding after bottoming out in FY2022/23 4Q All international regions profitable Three segment income before income taxes of Y70.5bn (+16% QoQ) driven by strong performance in Retail and rebound in Wholesale Retail: Income before income taxes at highest level in eight years Equity-related flow revenues increased as we benefited from realignment of our Partners to better meet the needs of clients, robust market conditions and contributions from primary transactions Recurring revenue cost coverage ratio remains high at 55% Investment Management: Asset management business performance remains solid Net inflows and market conditions combined to lift AuM to record high of Y78.5trn Investment gain/loss contributed to performance but declined QoQ Wholesale: Performance rebounded after bottoming out in FY2022/23 4Q In Global Markets, Equities revenues declined QoQ, while Fixed Income reported revenue growth across all main products Investment Banking revenues at quarterly high since FY2016/17 when comparisons possible Launched share buyback program to raise capital efficiency and ensure a flexible capital management policy and to deliver as stock-based compensation Shareholder—Total shares: Upper limit of 125 million shares returns—Total value: Upper limit of Y100bn —Period: From February 16 to September 30, 2024 Net income (loss) attributable to Nomura Holdings shareholders. Diluted net income (loss) attributable to Nomura Holdings shareholders per share. Calculated using annualized net income attributable to Nomura Holdings shareholders for each period. Income (loss) before income taxes and net income1 Groupwide (billions of yen) Income (loss) before income taxes Net income (loss) 83.6 78.7 66.9 56.7 46.3 50.5 31.5 35.2 22.7 11.7 16.8 23.3 1.7 7.4 FY2022/23 FY2023/24 1Q 2Q 3Q 4Q 1Q 2Q 3Q Three segment income (loss) before income taxes Wholesale Investment Management 70.5 Retail 60.5 44.7 31.2 28.7 18.5 11.9 FY2022/23 FY2023/24 1Q 2Q 3Q 4Q 1Q 2Q 3Q2
|
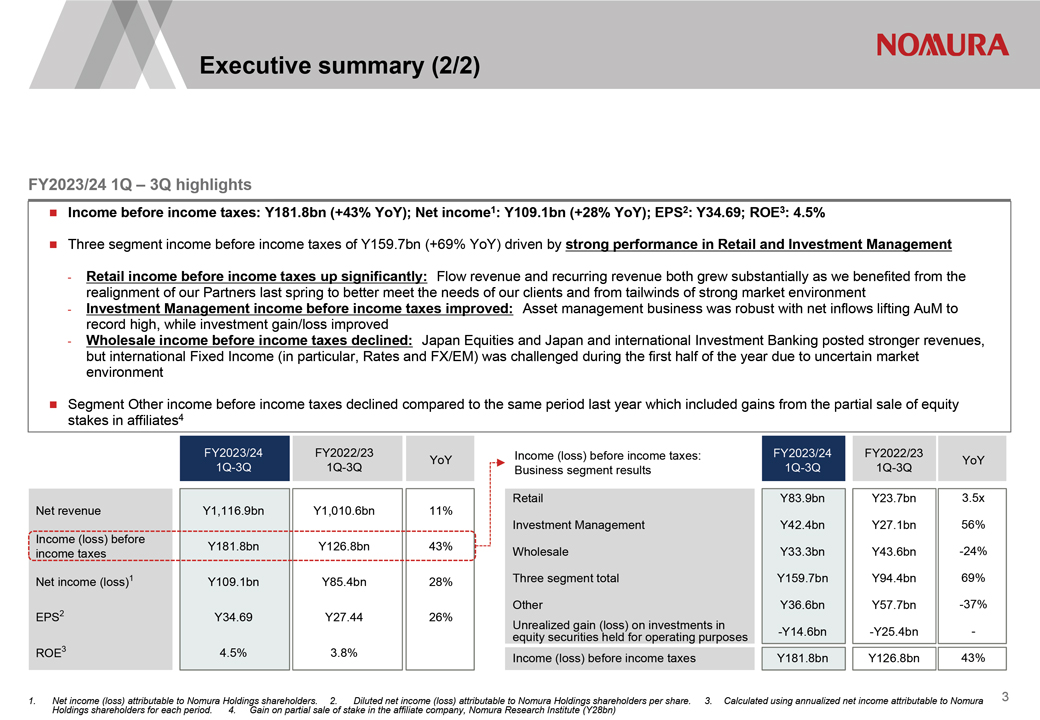
Executive summary (2/2) FY2023/24 1Q 3Q highlights Income before income taxes: Y181.8bn (+43% YoY); Net income1: Y109.1bn (+28% YoY); EPS2: Y34.69; ROE3: 4.5% Three segment income before income taxes of Y159.7bn (+69% YoY) driven by strong performance in Retail and Investment Management —Retail income before income taxes up significantly: Flow revenue and recurring revenue both grew substantially as we benefited from the realignment of our Partners last spring to better meet the needs of our clients and from tailwinds of strong market environment—Investment Management income before income taxes improved: Asset management business was robust with net inflows lifting AuM to record high, while investment gain/loss improved—Wholesale income before income taxes declined: Japan Equities and Japan and international Investment Banking posted stronger revenues, but international Fixed Income (in particular, Rates and FX/EM) was challenged during the first half of the year due to uncertain market environment Segment Other income before income taxes declined compared to the same period last year which included gains from the partial sale of equity stakes in affiliates4 FY2023/24 FY2022/23 YoY Income (loss) before income taxes: FY2023/24 FY2022/23 YoY 1Q-3Q 1Q-3Q Business segment results 1Q-3Q 1Q-3Q Retail Y83.9bn Y23.7bn 3.5x Net revenue Y1,116.9bn Y1,010.6bn 11% Investment Management Y42.4bn Y27.1bn 56% Income (loss) before Y181.8bn Y126.8bn 43% income taxes Wholesale Y33.3bn Y43.6bn -24% Net income (loss)1 Y109.1bn Y85.4bn 28% Three segment total Y159.7bn Y94.4bn 69% Other Y36.6bn Y57.7bn -37% EPS2 Y34.69 Y27.44 26% equity Unrealized securities gain (loss) held foron operating investments purposes in -Y14.6bn -Y25.4bn—ROE3 4.5% 3.8% Income (loss) before income taxes Y181.8bn Y126.8bn 43% 1. Net income (loss) attributable to Nomura Holdings shareholders. 2. Diluted net income (loss) attributable to Nomura Holdings shareholders per share. 3. Calculated using annualized net income attributable to Nomura Holdings shareholders for each period. 4. Gain on partial sale of stake in the affiliate company, Nomura Research Institute (Y28bn)3
|
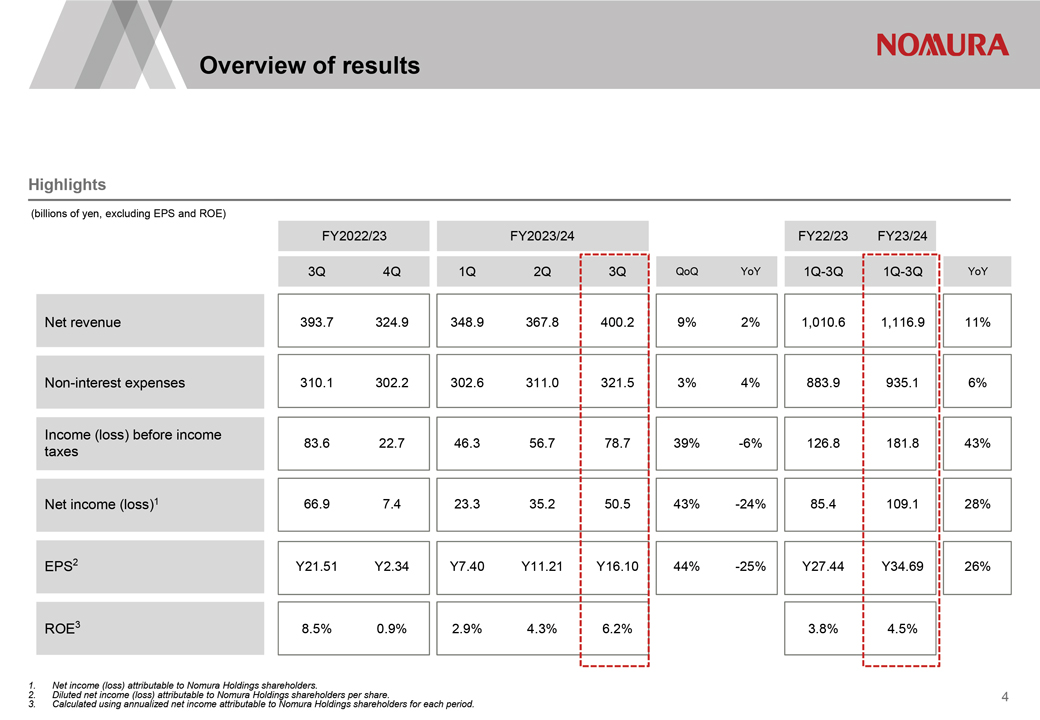
Overview of results Highlights (billions of yen, excluding EPS and ROE) FY2022/23 FY2023/24 FY22/23 FY23/24 3Q 4Q 1Q 2Q 3Q QoQ YoY 1Q-3Q 1Q-3Q YoY Net revenue 393.7 324.9 348.9 367.8 400.2 9% 2% 1,010.6 1,116.9 11% Non-interest expenses 310.1 302.2 302.6 311.0 321.5 3% 4% 883.9 935.1 6% Income (loss) before income taxes 83.6 22.7 46.3 56.7 78.7 39% -6% 126.8 181.8 43% Net income (loss)1 66.9 7.4 23.3 35.2 50.5 43% -24% 85.4 109.1 28% EPS2 Y21.51 Y2.34 Y7.40 Y11.21 Y16.10 44% -25% Y27.44 Y34.69 26% ROE3 8.5% 0.9% 2.9% 4.3% 6.2% 3.8% 4.5% Net income (loss) attributable to Nomura Holdings shareholders. Diluted net income (loss) attributable to Nomura Holdings shareholders per share. Calculated using annualized net income attributable to Nomura Holdings shareholders for each period.4
|
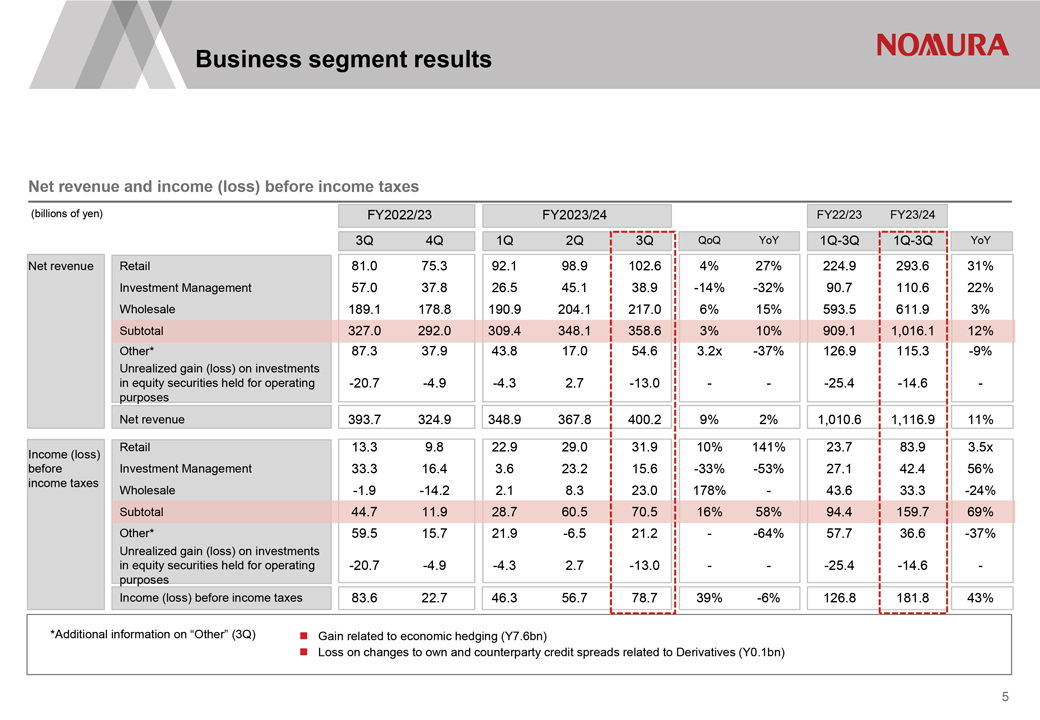
Business segment results Net revenue and income (loss) before income taxes (billions of yen) FY2022/23 FY2023/24 FY22/23 FY23/24 3Q 4Q 1Q 2Q 3Q QoQ YoY 1Q-3Q 1Q-3Q YoY Net revenue Retail 81.0 75.3 92.1 98.9 102.6 4% 27% 224.9 293.6 31% Investment Management 57.0 37.8 26.5 45.1 38.9 -14% -32% 90.7 110.6 22% Wholesale 189.1 178.8 190.9 204.1 217.0 6% 15% 593.5 611.9 3% Subtotal 327.0 292.0 309.4 348.1 358.6 3% 10% 909.1 1,016.1 12% Other* 87.3 37.9 43.8 17.0 54.6 3.2x -37% 126.9 115.3 -9% Unrealized gain (loss) on investments in equity securities held for operating -20.7 -4.9 -4.3 2.7 -13.0 — -25.4 -14.6— purposes Net revenue 393.7 324.9 348.9 367.8 400.2 9% 2% 1,010.6 1,116.9 11% Income (loss) Retail 13.3 9.8 22.9 29.0 31.9 10% 141% 23.7 83.9 3.5x before Investment Management 33.3 16.4 3.6 23.2 15.6 -33% -53% 27.1 42.4 56% income taxes Wholesale -1.9 -14.2 2.1 8.3 23.0 178%—43.6 33.3 -24% Subtotal 44.7 11.9 28.7 60.5 70.5 16% 58% 94.4 159.7 69% Other* 59.5 15.7 21.9 -6.5 21.2 —64% 57.7 36.6 -37% Unrealized gain (loss) on investments in equity securities held for operating -20.7 -4.9 -4.3 2.7 -13.0 — -25.4 -14.6— purposes Income (loss) before income taxes 83.6 22.7 46.3 56.7 78.7 39% -6% 126.8 181.8 43% *Additional information on Other (3Q) Gain related to economic hedging (Y7.6bn) Loss on changes to own and counterparty credit spreads related to Derivatives (Y0.1bn) 5
|
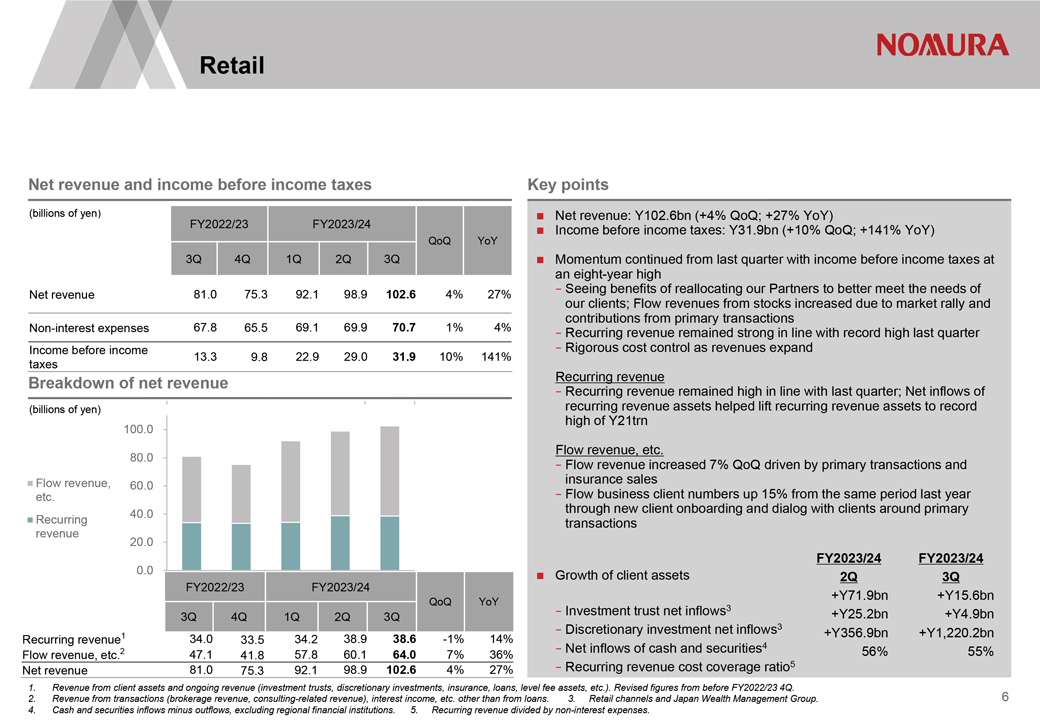
Retail Net revenue and income before income taxes (billions of yen) FY2022/23 FY2023/24 QoQ YoY 3Q 4Q 1Q 2Q 3Q Net revenue 81.0 75.3 92.1 98.9 102.6 4% 27% Non-interest expenses 67.8 65.5 69.1 69.9 70.7 1% 4% Income before income 13.3 9.8 22.9 29.0 31.9 10% 141% taxes Breakdown of net revenue (billions of yen) 100.0 80.0 Flow revenue, 60.0 etc. Recurring 40.0 revenue 20.0 0.0 FY2022/23 FY2023/24 QoQ YoY 3Q 4Q 1Q 2Q 3Q Recurring revenue1 34.0 33.5 34.2 38.9 38.6 -1% 14% Flow revenue, etc.2 47.1 41.8 57.8 60.1 64.0 7% 36% Net revenue 81.0 75.3 92.1 98.9 102.6 4% 27% Key points Net revenue: Y102.6bn (+4% QoQ; +27% YoY) Income before income taxes: Y31.9bn (+10% QoQ; +141% YoY) Momentum continued from last quarter with income before income taxes at an eight-year high Seeing benefits of reallocating our Partners to better meet the needs of our clients; Flow revenues from stocks increased due to market rally and contributions from primary transactions Recurring revenue remained strong in line with record high last quarter Rigorous cost control as revenues expand Recurring revenue Recurring revenue remained high in line with last quarter; Net inflows of recurring revenue assets helped lift recurring revenue assets to record high of Y21trn Flow revenue, etc. Flow revenue increased 7% QoQ driven by primary transactions and insurance sales Flow business client numbers up 15% from the same period last year through new client onboarding and dialog with clients around primary transactions FY2023/24 FY2023/24 Growth of client assets 2Q 3Q +Y71.9bn +Y15.6bn —Investment trust net inflows3 +Y25.2bn +Y4.9bn —Discretionary investment net inflows3 +Y356.9bn +Y1,220.2bn —Net inflows of cash and securities4 56% 55% —Recurring revenue cost coverage ratio5 1. Revenue from client assets and ongoing revenue (investment trusts, discretionary investments, insurance, loans, level fee assets, etc.). Revised figures from before FY2022/23 4Q. 2. Revenue from transactions (brokerage revenue, consulting-related revenue), interest income, etc. other than from loans. 3. Retail channels and Japan Wealth Management Group. 4. Cash and securities inflows minus outflows, excluding regional financial institutions. 5. Recurring revenue divided by non-interest expenses.6
|
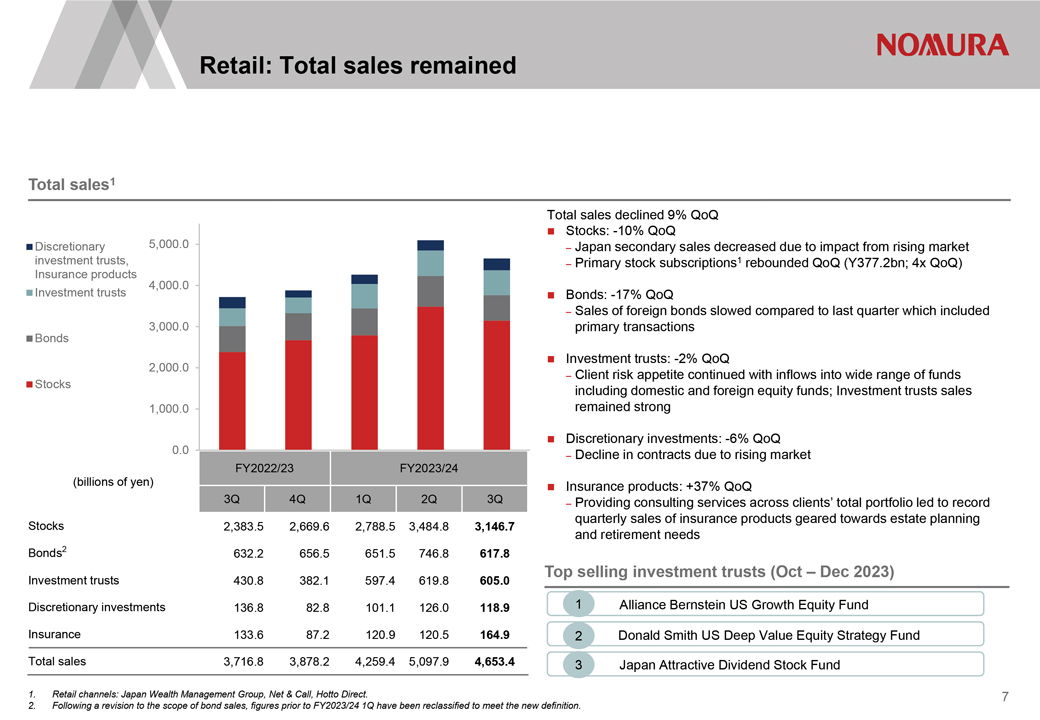
Retail: Total sales remained Total sales1 Discretionary 5,000.0 investment trusts, Insurance products 4,000.0 Investment trusts Bonds 3,000.0 2,000.0 Stocks 1,000.0 0.0 FY2022/23 FY2023/24 (billions of yen) 3Q 4Q 1Q 2Q 3Q Stocks 2,383.5 2,669.6 2,788.5 3,484.8 3,146.7 Bonds2 632.2 656.5 651.5 746.8 617.8 Investment trusts 430.8 382.1 597.4 619.8 605.0 Discretionary investments 136.8 82.8 101.1 126.0 118.9 Insurance 133.6 87.2 120.9 120.5 164.9 Total sales 3,716.8 3,878.2 4,259.4 5,097.9 4,653.4 Total sales declined 9% QoQ Stocks: -10% QoQ Japan secondary sales decreased due to impact from rising market Primary stock subscriptions1 rebounded QoQ (Y377.2bn; 4x QoQ) Bonds: -17% QoQ Sales of foreign bonds slowed compared to last quarter which included primary transactions Investment trusts: -2% QoQ Client risk appetite continued with inflows into wide range of funds including domestic and foreign equity funds; Investment trusts sales remained strong Discretionary investments: -6% QoQ Decline in contracts due to rising market Insurance products: +37% QoQ Providing consulting services across clients total portfolio led to record quarterly sales of insurance products geared towards estate planning and retirement needs Top selling investment trusts (Oct Dec 2023) Alliance Bernstein US Growth Equity Fund Donald Smith US Deep Value Equity Strategy Fund Japan Attractive Dividend Stock Fund Retail channels: Japan Wealth Management Group, Net & Call, Hotto Direct. Following a revision to the scope of bond sales, figures prior to FY2023/24 1Q have been reclassified to meet the new definition.7
|
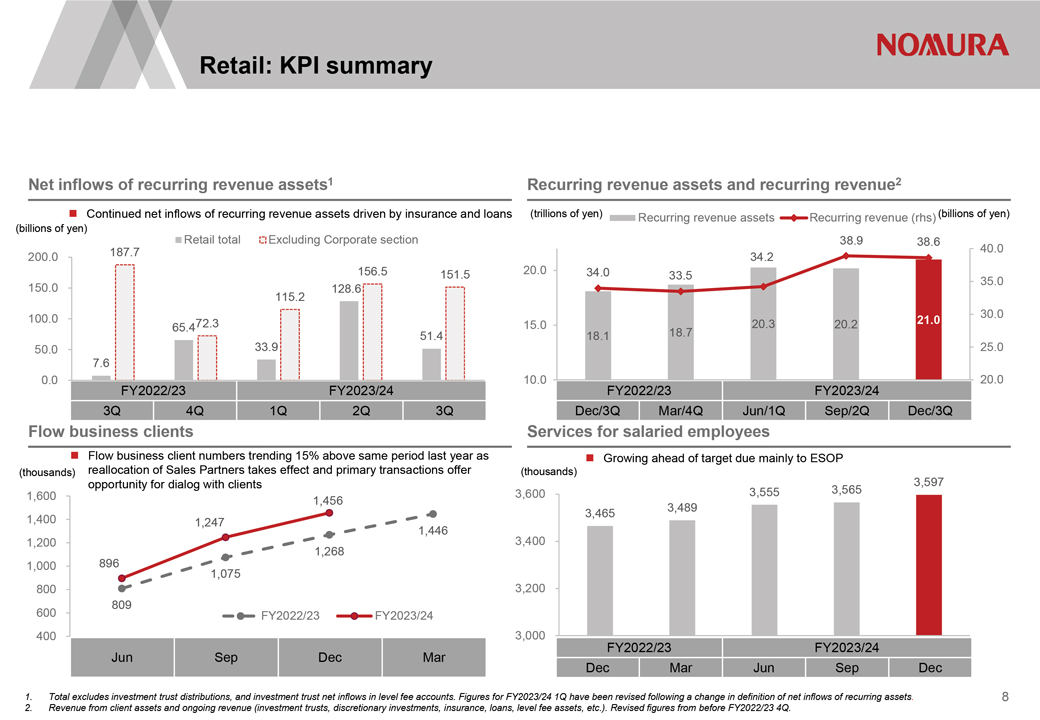
Retail: KPI summary Net inflows of recurring revenue assets1 Continued net inflows of recurring revenue assets driven by insurance and loans (billions of yen) Retail total Excluding Corporate section 200.0 187.7 156.5 151.5 150.0 128.6 115.2 100.0 72.3 65.4 51.4 50.0 33.9 7.6 0.0 FY2022/23 FY2023/24 3Q 4Q 1Q 2Q 3Q Flow business clients Flow business client numbers trending 15% above same period last year as (thousands) reallocation of Sales Partners takes effect and primary transactions offer opportunity for dialog with clients 1,600 1,456 1,400 1,247 1,200 1,446 896 1,268 1,000 1,075 800 809 600 FY2022/23 FY2023/24 400 Jun Sep Dec Mar Recurring revenue assets and recurring revenue2 (trillions of yen) Recurring revenue assets Recurring revenue (rhs) (billions of yen) 38.9 38.6 40.0 34.2 20.0 34.0 33.5 35.0 30.0 15.0 18.7 20.3 20.2 21.0 18.1 25.0 10.0 20.0 FY2022/23 FY2023/24 Dec/3Q Mar/4Q Jun/1Q Sep/2Q Dec/3Q Services for salaried employees Growing ahead of target due mainly to ESOP (thousands) 3,597 3,600 3,555 3,565 3,465 3,489 3,400 3,200 3,000 FY2022/23 FY2023/24 Dec Mar Jun Sep Dec Total excludes investment trust distributions, and investment trust net inflows in level fee accounts. Figures for FY2023/24 1Q have been revised following a change in definition of net inflows of recurring assets. Revenue from client assets and ongoing revenue (investment trusts, discretionary investments, insurance, loans, level fee assets, etc.). Revised figures from before FY2022/23 4Q.8
|
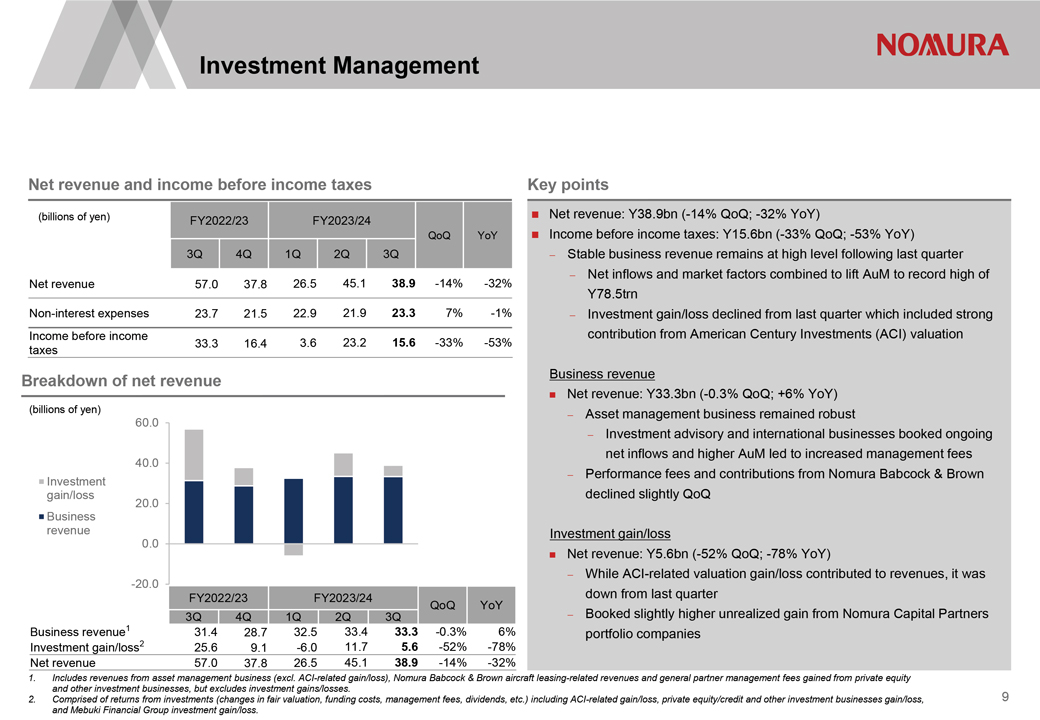
Investment Management Net revenue and income before income taxes (billions of yen) FY2022/23 FY2023/24 QoQ YoY 3Q 4Q 1Q 2Q 3Q Net revenue 57.0 37.8 26.5 45.1 38.9 -14% -32% Non-interest expenses 23.7 21.5 22.9 21.9 23.3 7% -1% Income before income 33.3 16.4 3.6 23.2 15.6 -33% -53% taxes Breakdown of net revenue (billions of yen) 60.0 40.0 Investment gain/loss 20.0 Business revenue 0.0 -20.0 FY2022/23 FY2023/24 3Q 4Q 1Q 2Q 3Q QoQ YoY Business revenue1 31.4 28.7 32.5 33.4 33.3 -0.3% 6% Investment gain/loss2 25.6 9.1 -6.0 11.7 5.6 -52% -78% Net revenue 57.0 37.8 26.5 45.1 38.9 -14% -32% Key points Net revenue: Y38.9bn (-14% QoQ; -32% YoY) Income before income taxes: Y15.6bn (-33% QoQ; -53% YoY) Stable business revenue remains at high level following last quarter Net inflows and market factors combined to lift AuM to record high of Y78.5trn Investment gain/loss declined from last quarter which included strong contribution from American Century Investments (ACI) valuation Business revenue Net revenue: Y33.3bn (-0.3% QoQ; +6% YoY) Asset management business remained robust Investment advisory and international businesses booked ongoing net inflows and higher AuM led to increased management fees Performance fees and contributions from Nomura Babcock & Brown declined slightly QoQ Investment gain/loss Net revenue: Y5.6bn (-52% QoQ; -78% YoY) While ACI-related valuation gain/loss contributed to revenues, it was down from last quarter Booked slightly higher unrealized gain from Nomura Capital Partners portfolio companies Includes revenues from asset management business (excl. ACI-related gain/loss), Nomura Babcock & Brown aircraft leasing-related revenues and general partner management fees gained from private equity and other investment businesses, but excludes investment gains/losses. Comprised of returns from investments (changes in fair valuation, funding costs, management fees, dividends, etc.) including ACI-related gain/loss, private equity/credit and other investment businesses gain/loss, and Mebuki Financial Group investment gain/loss.9
|
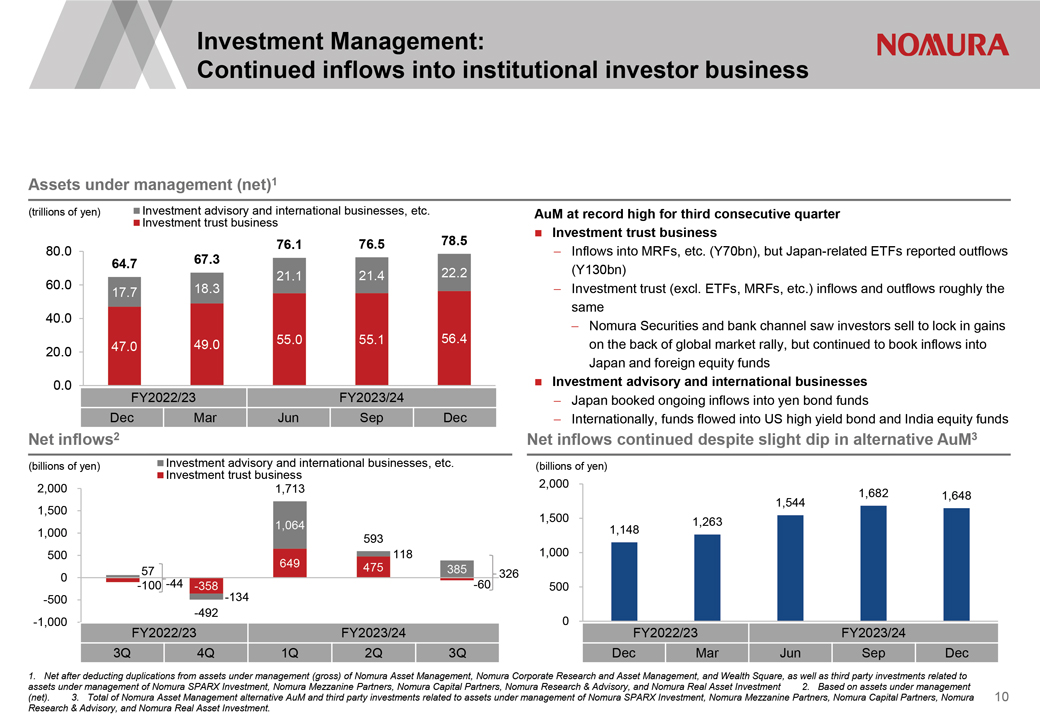
Investment Management: Continued inflows into institutional investor business Assets under management (net)1 (trillions of yen) Investment Investment advisory trust business and international businesses, etc. 76.1 76.5 78.5 80.0 64.7 67.3 22.2 21.1 21.4 60.0 18.3 17.7 40.0 49.0 55.0 55.1 56.4 20.0 47.0 0.0 FY2022/23 FY2023/24 Dec Mar Jun Sep Dec Net inflows2 AuM at record high for third consecutive quarter Investment trust business Inflows into MRFs, etc. (Y70bn), but Japan-related ETFs reported outflows (Y130bn) Investment trust (excl. ETFs, MRFs, etc.) inflows and outflows roughly the same Nomura Securities and bank channel saw investors sell to lock in gains on the back of global market rally, but continued to book inflows into Japan and foreign equity funds Investment advisory and international businesses Japan booked ongoing inflows into yen bond funds Internationally, funds flowed into US high yield bond and India equity funds Net inflows continued despite slight dip in alternative AuM3 (billions of yen) Investment Investment trust advisory business and international businesses, etc. (billions of yen) 2,000 1,713 2,000 1,682 1,648 1,544 1,500 1,500 1,263 1,064 1,148 1,000 593 500 118 1,000 649 475 385 0 57 -44 326 -100 -358 -134 -60 500 -500 -492 -1,000 0 FY2022/23 FY2023/24 FY2022/23 FY2023/24 3Q 4Q 1Q 2Q 3Q Dec Mar Jun Sep Dec 1. Net after deducting duplications from assets under management (gross) of Nomura Asset Management, Nomura Corporate Research and Asset Management, and Wealth Square, as well as third party investments related to assets under management of Nomura SPARX Investment, Nomura Mezzanine Partners, Nomura Capital Partners, Nomura Research & Advisory, and Nomura Real Asset Investment 2. Based on assets under management (net). 3. Total of Nomura Asset Management alternative AuM and third party investments related to assets under management of Nomura SPARX Investment, Nomura Mezzanine Partners, Nomura Capital Partners, Nomura Research & Advisory, and Nomura Real Asset Investment.10
|
|
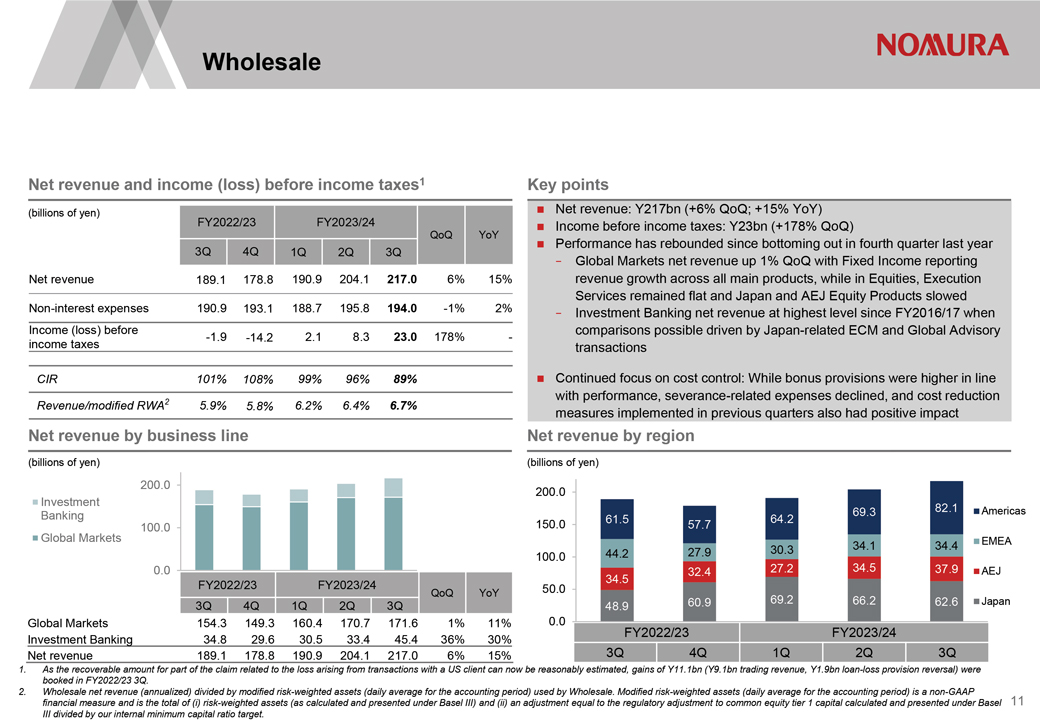
Wholesale Net revenue and income (loss) before income taxes1 (billions of yen) FY2022/23 FY2023/24 QoQ YoY 3Q 4Q 1Q 2Q 3Q Net revenue 189.1 178.8 190.9 204.1 217.0 6% 15% Non-interest expenses 190.9 193.1 188.7 195.8 194.0 -1% 2% Income (loss) before income taxes -1.9 -14.2 2.1 8.3 23.0 178%—CIR 101% 108% 99% 96% 89% Revenue/modified RWA2 5.9% 5.8% 6.2% 6.4% 6.7% Net revenue by business line (billions of yen) 200.0 Investment Banking 100.0 Global Markets 0.0 FY2022/23 FY2023/24 QoQ YoY 3Q 4Q 1Q 2Q 3Q Global Markets 154.3 149.3 160.4 170.7 171.6 1% 11% Investment Banking 34.8 29.6 30.5 33.4 45.4 36% 30% Net revenue 189.1 178.8 190.9 204.1 217.0 6% 15% Key points Net revenue: Y217bn (+6% QoQ; +15% YoY) Income before income taxes: Y23bn (+178% QoQ) Performance has rebounded since bottoming out in fourth quarter last year Global Markets net revenue up 1% QoQ with Fixed Income reporting revenue growth across all main products, while in Equities, Execution Services remained flat and Japan and AEJ Equity Products slowed Investment Banking net revenue at highest level since FY2016/17 when comparisons possible driven by Japan-related ECM and Global Advisory transactions Continued focus on cost control: While bonus provisions were higher in line with performance, severance-related expenses declined, and cost reduction measures implemented in previous quarters also had positive impact Net revenue by region (billions of yen) 200.0 69.3 82.1 Americas 150.0 61.5 57.7 64.2 34.1 34.4 EMEA 44.2 27.9 30.3 100.0 32.4 27.2 34.5 37.9 AEJ 34.5 50.0 60.9 69.2 66.2 62.6 Japan 48.9 0.0 FY2022/23 FY2023/24 3Q 4Q 1Q 2Q 3Q As the recoverable amount for part of the claim related to the loss arising from transactions with a US client can now be reasonably estimated, gains of Y11.1bn (Y9.1bn trading revenue, Y1.9bn loan-loss provision reversal) were booked in FY2022/23 3Q. Wholesale net revenue (annualized) divided by modified risk-weighted assets (daily average for the accounting period) used by Wholesale. Modified risk-weighted assets (daily average for the accounting period) is a non-GAAP financial measure and is the total of (i) risk-weighted assets (as calculated and presented under Basel III) and (ii) an adjustment equal to the regulatory adjustment to common equity tier 1 capital calculated and presented under Basel III divided by our internal minimum capital ratio target.11
|
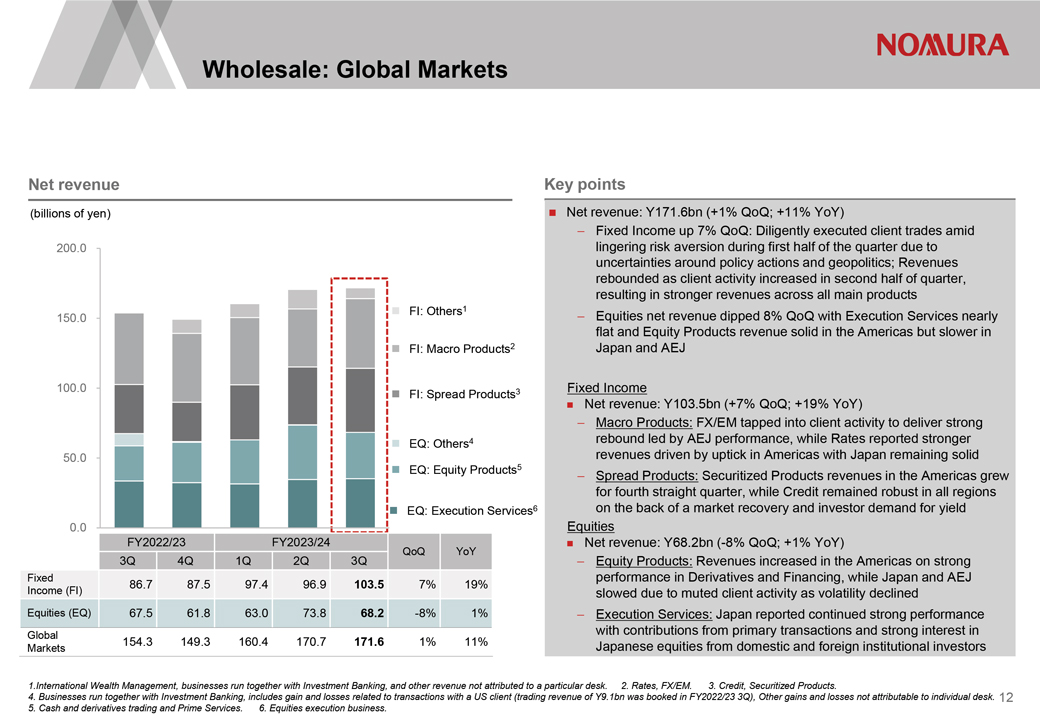
Wholesale: Global Markets Net revenue (billions of yen) 200.0 FI: Others1 150.0 FI: Macro Products2 100.0 3 FI: Spread Products EQ: Others4 50.0 EQ: 5 Equity Products EQ: Execution Services6 0.0 FY2022/23 FY2023/24 QoQ YoY 3Q 4Q 1Q 2Q 3Q Fixed 86.7 87.5 97.4 96.9 103.5 7% 19% Income (FI) Equities (EQ) 67.5 61.8 63.0 73.8 68.2 -8% 1% Global 154.3 149.3 160.4 170.7 171.6 1% 11% Markets Key points Net revenue: Y171.6bn (+1% QoQ; +11% YoY) Fixed Income up 7% QoQ: Diligently executed client trades amid lingering risk aversion during first half of the quarter due to uncertainties around policy actions and geopolitics; Revenues rebounded as client activity increased in second half of quarter, resulting in stronger revenues across all main products Equities net revenue dipped 8% QoQ with Execution Services nearly flat and Equity Products revenue solid in the Americas but slower in Japan and AEJ Fixed Income Net revenue: Y103.5bn (+7% QoQ; +19% YoY) Macro Products: FX/EM tapped into client activity to deliver strong rebound led by AEJ performance, while Rates reported stronger revenues driven by uptick in Americas with Japan remaining solid Spread Products: Securitized Products revenues in the Americas grew for fourth straight quarter, while Credit remained robust in all regions on the back of a market recovery and investor demand for yield Equities Net revenue: Y68.2bn (-8% QoQ; +1% YoY) Equity Products: Revenues increased in the Americas on strong performance in Derivatives and Financing, while Japan and AEJ slowed due to muted client activity as volatility declined Execution Services: Japan reported continued strong performance with contributions from primary transactions and strong interest in Japanese equities from domestic and foreign institutional investors 1.International Wealth Management, businesses run together with Investment Banking, and other revenue not attributed to a particular desk. 2. Rates, FX/EM. 3. Credit, Securitized Products. 4. Businesses run together with Investment Banking, includes gain and losses related to transactions with a US client (trading revenue of Y9.1bn was booked in FY2022/23 3Q), Other gains and losses not attributable to individual desk. 5. Cash and derivatives trading and Prime Services. 6. Equities execution business. 12
|
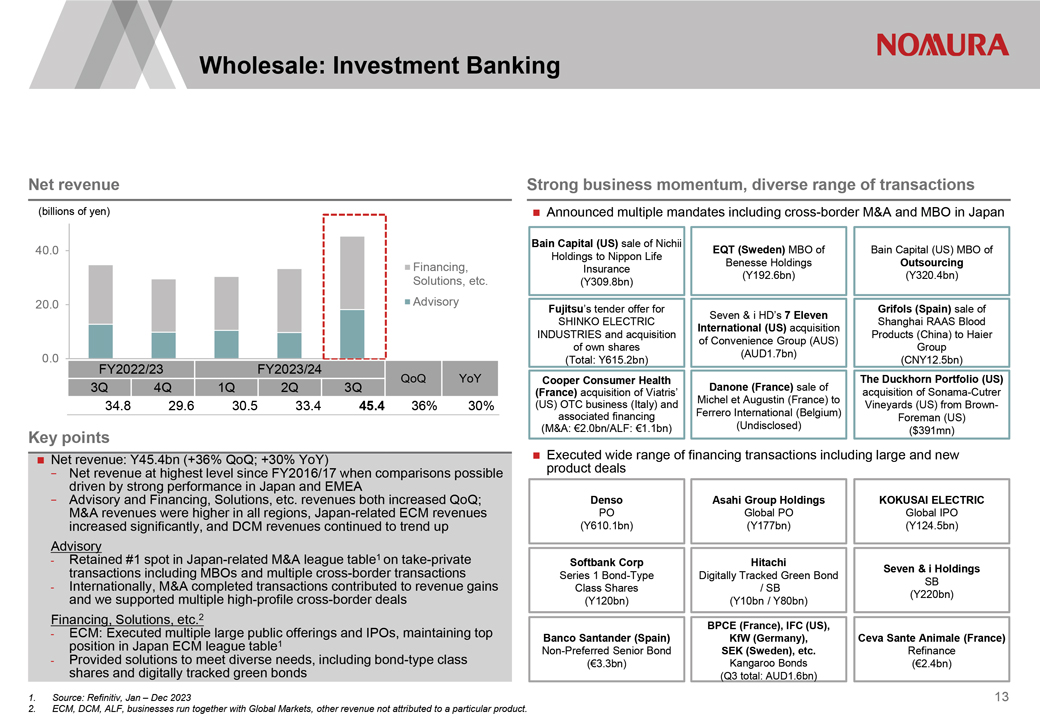
Wholesale: Investment Banking Key points Net revenue: Y45.4bn (+36% QoQ; +30% YoY)—Net driven revenue by strong at highest performance level since in Japan FY2016/17 and EMEA when comparisons possible —Advisory M&A revenues and Financing, were higher Solutions, in all regions, etc. revenues Japan-related both increased ECM revenues QoQ; increased significantly, and DCM revenues continued to trend up Advisory Retained #1 spot in 1—transactions including Japan-related MBOs and multiple M&A league cross-border table on transactions take-private —Internationally, and we supported M&A multiple completed high-profile transactions cross-border contributed deals to revenue gains Financing, Solutions, etc.2—ECM: position Executed in Japan multiple ECM league large public table1 offerings and IPOs, maintaining top—shares Provided and solutions digitally to tracked meet diverse green bonds needs, including bond-type class Source: Refinitiv, Jan Dec 2023 ECM, DCM, ALF, businesses run together with Global Markets, other revenue not attributed to a particular product. Net revenue (billions of yen) 40.0 Financing, Solutions, etc. 20.0 Advisory 0.0 FY2022/23 FY2023/24 QoQ YoY 3Q 4Q 1Q 2Q 3Q 34.8 29.6 30.5 33.4 45.4 36% 30% Strong business momentum, diverse range of transactions Announced multiple mandates including cross-border M&A and MBO in Japan Bain Capital (US) sale of Nichii Holdings to Nippon Life EQT (Sweden) MBO of Bain Capital (US) MBO of Insurance Benesse Holdings Outsourcing (Y309.8bn) (Y192.6bn) (Y320.4bn) Fujitsu s tender offer for Grifols (Spain) sale of Seven & i HD s 7 Eleven SHINKO ELECTRIC Shanghai RAAS Blood International (US) acquisition INDUSTRIES and acquisition Products (China) to Haier of Convenience Group (AUS) of own shares Group (AUD1.7bn) (Total: Y615.2bn) (CNY12.5bn) Cooper Consumer Health The Duckhorn Portfolio (US) (France) acquisition of Viatris Danone (France) sale of acquisition of Sonama-Cutrer (US) OTC business (Italy) and Michel et Augustin (France) to Vineyards (US) from Brown- associated financing Ferrero International (Belgium) Foreman (US) (M&A: 2.0bn/ALF: 1.1bn) (Undisclosed) ($391mn) Executed wide range of financing transactions including large and new product deals Denso Asahi Group Holdings KOKUSAI ELECTRIC PO Global PO Global IPO (Y610.1bn) (Y177bn) (Y124.5bn) Softbank Corp Hitachi Series 1 Bond-Type Digitally Tracked Green Bond Seven & i Holdings Class Shares / SB SB (Y120bn) (Y10bn / Y80bn) (Y220bn) BPCE (France), IFC (US), Banco Santander (Spain) KfW (Germany), Ceva Sante Animale (France) Non-Preferred Senior Bond SEK (Sweden), etc. Refinance (3.3bn) Kangaroo Bonds (2.4bn) (Q3 total: AUD1.6bn) 13
|
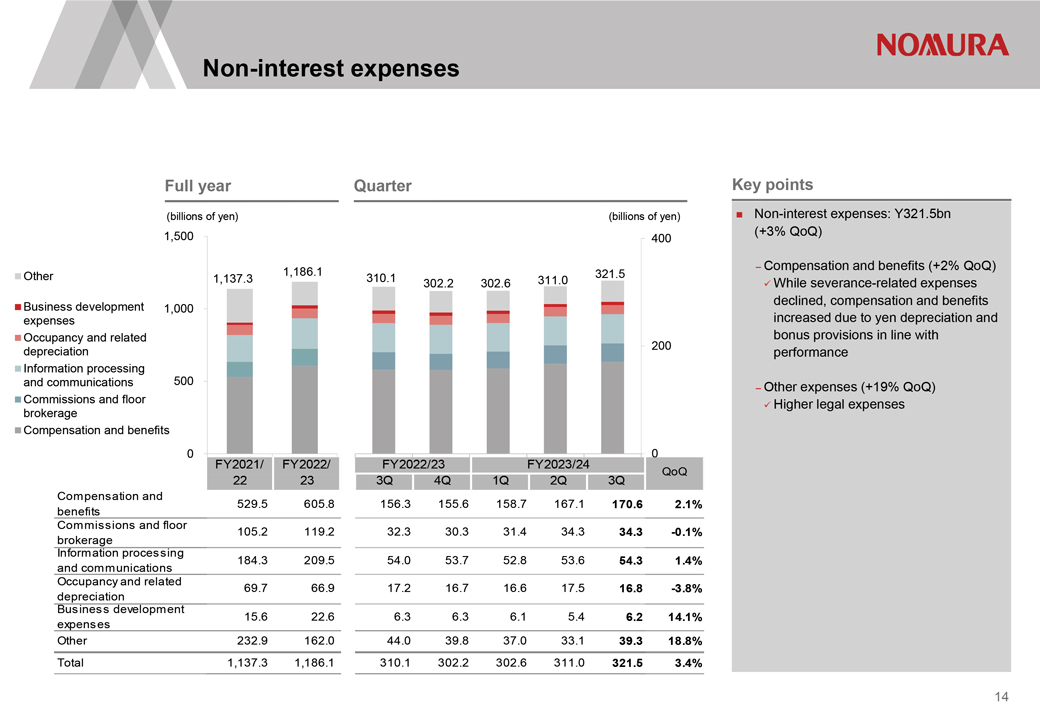
Non-interest expenses Full year Quarter (billions of yen) (billions of yen) 1,500 400 Other 1,186.1 321.5 1,137.3 310.1 302.2 302.6 311.0 Business development 1,000 expenses Occupancy and related depreciation 200 Information processing 500 and communications Commissions and floor brokerage Compensation and benefits 0 0 FY2021/ FY2022/ FY2022/23 FY2023/24 QoQ 22 23 3Q 4Q 1Q 2Q 3Q Compensation and 529.5 605.8 156.3 155.6 158.7 167.1 170.6 2.1% benefits Commissions and floor 105.2 119.2 32.3 30.3 31.4 34.3 34.3 -0.1% Information brokerage processing 184.3 209.5 54.0 53.7 52.8 53.6 54.3 1.4% and communications Occupancy and related 69.7 66.9 17.2 16.7 16.6 17.5 16.8 -3.8% Business depreciation development 15.6 22.6 6.3 6.3 6.1 5.4 6.2 14.1% expenses Other 232.9 162.0 44.0 39.8 37.0 33.1 39.3 18.8% Total 1,137.3 1,186.1 310.1 302.2 302.6 311.0 321.5 3.4% Key points Non-interest expenses: Y321.5bn (+3% QoQ) Compensation and benefits (+2% QoQ) While severance-related expenses declined, compensation and benefits increased due to yen depreciation and bonus provisions in line with performance Other expenses (+19% QoQ) Higher legal expenses 14
|
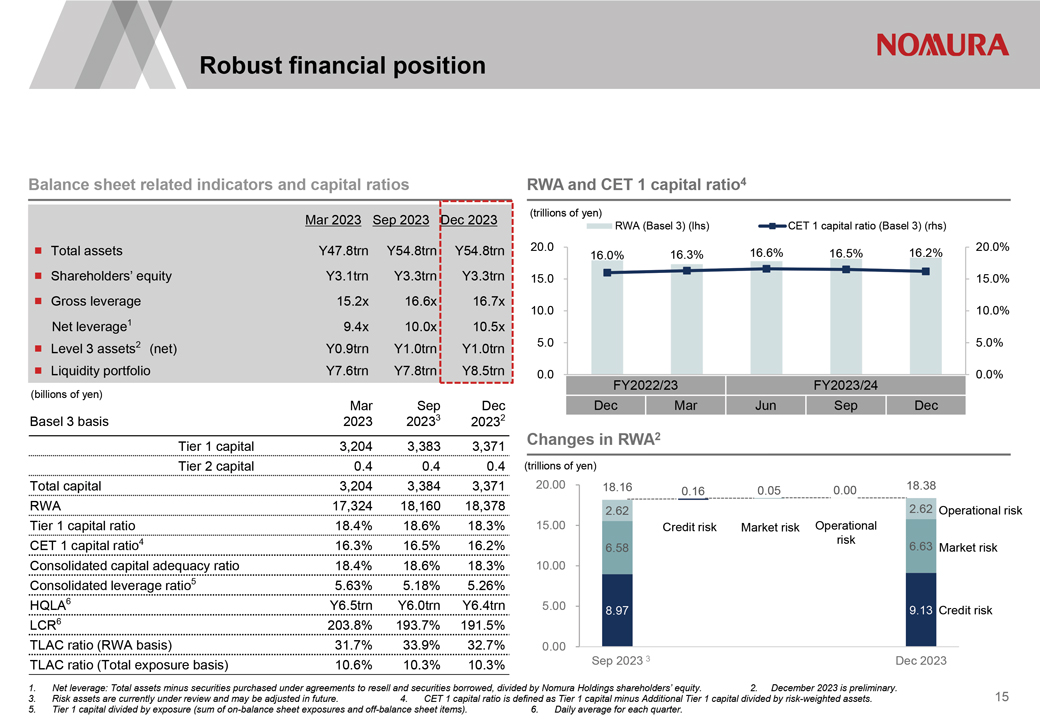
Robust financial position Balance sheet related indicators and capital ratios Mar 2023 Sep 2023 Dec 2023 Total assets Y47.8trn Y54.8trn Y54.8trn Shareholders equity Y3.1trn Y3.3trn Y3.3trn Gross leverage 15.2x 16.6x 16.7x Net leverage1 9.4x 10.0x 10.5x Level 3 assets2 (net) Y0.9trn Y1.0trn Y1.0trn Liquidity portfolio Y7.6trn Y7.8trn Y8.5trn (billions of yen) Mar Sep Dec Basel 3 basis 2023 20233 20232 Tier 1 capital 3,204 3,383 3,371 Tier 2 capital 0.4 0.4 0.4 Total capital 3,204 3,384 3,371 RWA 17,324 18,160 18,378 Tier 1 capital ratio 18.4% 18.6% 18.3% CET 1 capital ratio4 16.3% 16.5% 16.2% Consolidated capital adequacy ratio 18.4% 18.6% 18.3% Consolidated leverage ratio5 5.63% 5.18% 5.26% HQLA6 Y6.5trn Y6.0trn Y6.4trn LCR6 203.8% 193.7% 191.5% TLAC ratio (RWA basis) 31.7% 33.9% 32.7% TLAC ratio (Total exposure basis) 10.6% 10.3% 10.3% RWA and CET 1 capital ratio4 (trillions of yen) RWA (Basel 3) (lhs) CET 1 capital ratio (Basel 3) (rhs) 20.0 16.6% 16.2% 20.0% 16.0% 16.3% 16.5% 15.0 15.0% 10.0 10.0% 5.0 5.0% 0.0 0.0% FY2022/23 FY2023/24 Dec Mar Jun Sep Dec Changes in RWA2 (trillions of yen) 20.00 18.16 0.05 0.00 18.38 0.16 2.62 2.62 Operational risk 15.00 Credit risk Market risk Operational risk 6.58 6.63 Market risk 10.00 5.00 8.97 9.13 Credit risk 0.00 Sep 2023 3 Dec 2023 1. Net leverage: Total assets minus securities purchased under agreements to resell and securities borrowed, divided by Nomura Holdings shareholders equity. 2. December 2023 is preliminary. 3. Risk assets are currently under review and may be adjusted in future. 4. CET 1 capital ratio is defined as Tier 1 capital minus Additional Tier 1 capital divided by risk-weighted assets. 5. Tier 1 capital divided by exposure (sum of on-balance sheet exposures and off-balance sheet items). 6. Daily average for each quarter. 15

|
Financial Supplement
|
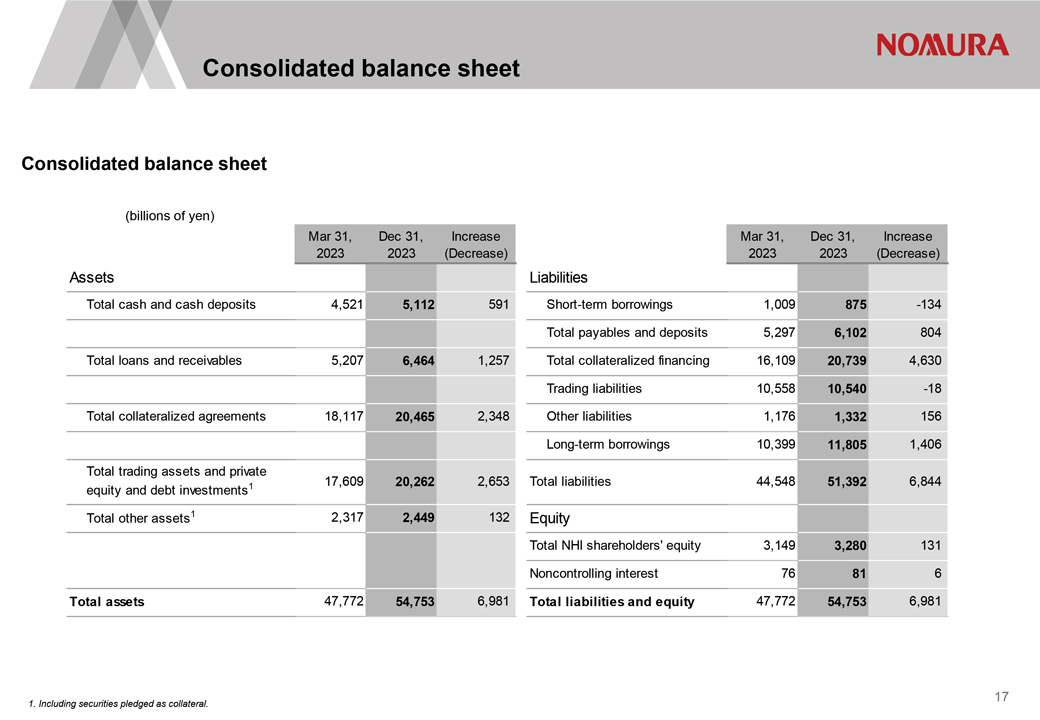
Consolidated balance sheet Consolidated balance sheet (billions of yen) Mar 31, Dec 31, Increase Mar 31, Dec 31, Increase 2023 2023 (Decrease) 2023 2023 (Decrease) Assets Liabilities Total cash and cash deposits 4,521 5,112 591 Short-term borrowings 1,009 875 -134 Total payables and deposits 5,297 6,102 804 Total loans and receivables 5,207 6,464 1,257 Total collateralized financing 16,109 20,739 4,630 Trading liabilities 10,558 10,540 -18 Total collateralized agreements 18,117 20,465 2,348 Other liabilities 1,176 1,332 156 Long-term borrowings 10,399 11,805 1,406 Total trading assets and private equity and debt investments 1 17,609 20,262 2,653 Total liabilities 44,548 51,392 6,844 Total other assets1 2,317 2,449 132 Equity Total NHI shareholders’ equity 3,149 3,280 131 Noncontrolling interest 76 81 6 Total assets 47,772 54,753 6,981 Total liabilities and equity 47,772 54,753 6,981 1. Including securities pledged as collateral. 17
|
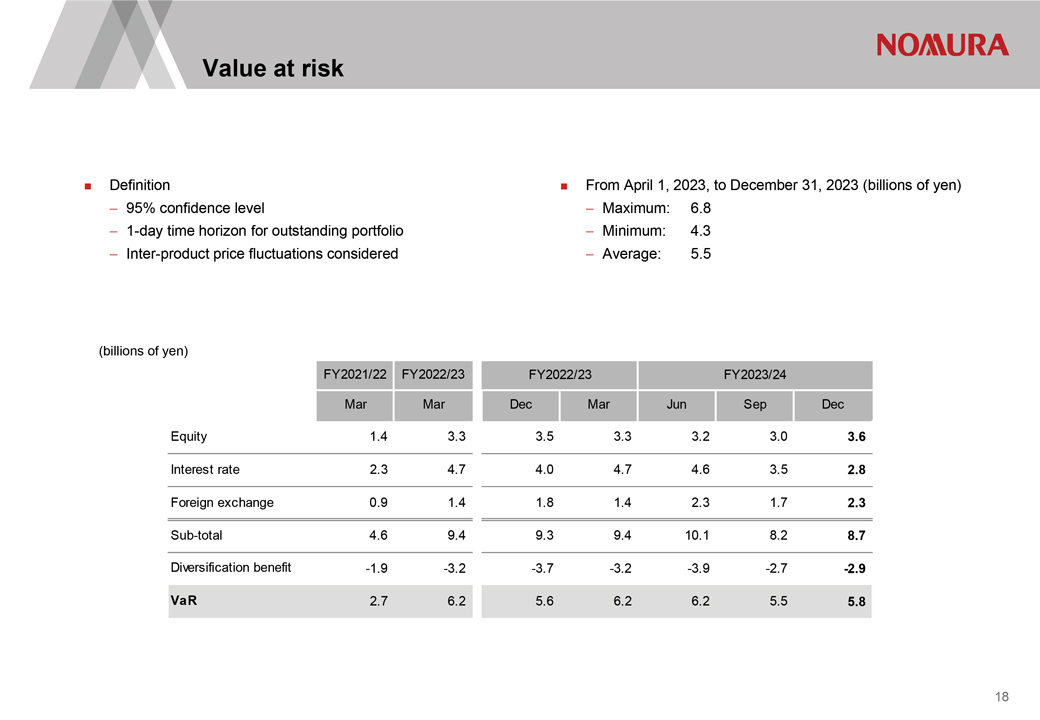
Value at risk Definition From April 1, 2023, to December 31, 2023 (billions of yen) 95% confidence level Maximum: 6.8 1-day time horizon for outstanding portfolio Minimum: 4.3 Inter-product price fluctuations considered Average: 5.5 (billions of yen) FY2021/22 FY2022/23 FY2022/23 FY2023/24 Mar Mar Dec Mar Jun Sep Dec Equity 1.4 3.3 3.5 3.3 3.2 3.0 3.6 Interest rate 2.3 4.7 4.0 4.7 4.6 3.5 2.8 Foreign exchange 0.9 1.4 1.8 1.4 2.3 1.7 2.3 Sub-total 4.6 9.4 9.3 9.4 10.1 8.2 8.7 Diversification benefit -1.9 -3.2 -3.7 -3.2 -3.9 -2.7 -2.9 VaR 2.7 6.2 5.6 6.2 6.2 5.5 5.8 18
|
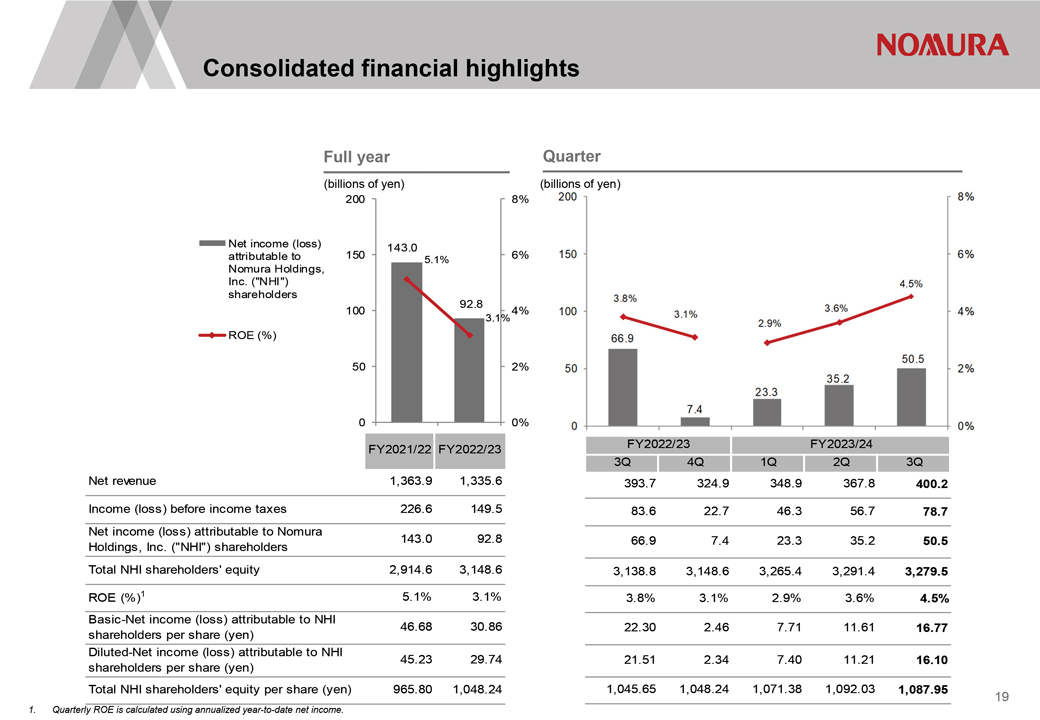
Consolidated financial highlights Full year (billions of yen) 200 8% Net income (loss) 150 143.0 6% attributable to 5.1% Nomura Holdings, Inc. (“NHI”) shareholders 92.8 100 4% 3.1% ROE (%) 50 2% 0 0% FY2021/22 FY2022/23 Net revenue 1,363.9 1,335.6 Income (loss) before income taxes 226.6 149.5 Net income (loss) attributable to Nomura 143.0 92.8 Holdings, Inc. (“NHI”) shareholders Total NHI shareholders’ equity 2,914.6 3,148.6 ROE (%)1 5.1% 3.1% Basic-Net income (loss) attributable to NHI 46.68 30.86 shareholders per share (yen) Diluted-Net income (loss) attributable to NHI 45.23 29.74 shareholders per share (yen) Total NHI shareholders’ equity per share (yen) 965.80 1,048.24 Quarter (billions of yen) 200 8% 150 6% 4.5% 3.8% 100 3.6% 4% 3.1% 2.9% 66.9 50.5 50 2% 35.2 23.3 7.4 0 0% FY2022/23 FY2023/24 3Q 4Q 1Q 2Q 3Q 393.7 324.9 348.9 367.8 400.2 83.6 22.7 46.3 56.7 78.7 66.9 7.4 23.3 35.2 50.5 3,138.8 3,148.6 3,265.4 3,291.4 3,279.5 3.8% 3.1% 2.9% 3.6% 4.5% 22.30 2.46 7.71 11.61 16.77 21.51 2.34 7.40 11.21 16.10 1,045.65 1,048.24 1,071.38 1,092.03 1,087.95 1. Quarterly ROE is calculated using annualized year-to-date net income. [Graphic Appears Here] 19
|
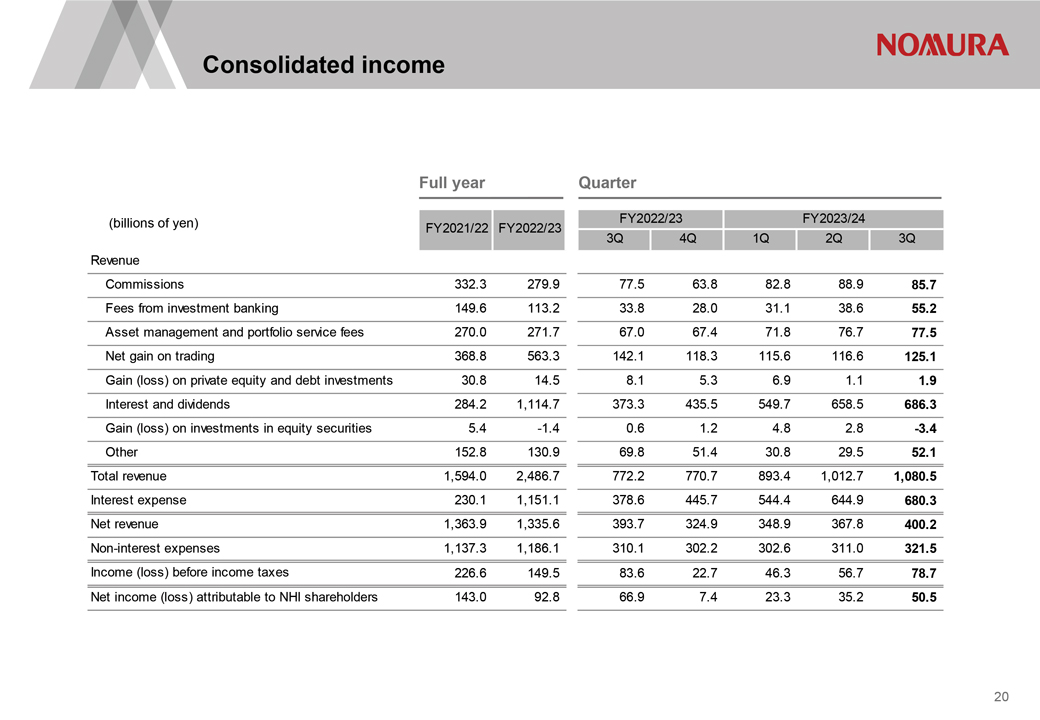
Consolidated income Full year Quarter (billions of yen) FY2021/22 FY2022/23 FY2022/23 FY2023/24 3Q 4Q 1Q 2Q 3Q Revenue Commissions 332.3 279.9 77.5 63.8 82.8 88.9 85.7 Fees from investment banking 149.6 113.2 33.8 28.0 31.1 38.6 55.2 Asset management and portfolio service fees 270.0 271.7 67.0 67.4 71.8 76.7 77.5 Net gain on trading 368.8 563.3 142.1 118.3 115.6 116.6 125.1 Gain (loss) on private equity and debt investments 30.8 14.5 8.1 5.3 6.9 1.1 1.9 Interest and dividends 284.2 1,114.7 373.3 435.5 549.7 658.5 686.3 Gain (loss) on investments in equity securities 5.4 -1.4 0.6 1.2 4.8 2.8 -3.4 Other 152.8 130.9 69.8 51.4 30.8 29.5 52.1 Total revenue 1,594.0 2,486.7 772.2 770.7 893.4 1,012.7 1,080.5 Interest expense 230.1 1,151.1 378.6 445.7 544.4 644.9 680.3 Net revenue 1,363.9 1,335.6 393.7 324.9 348.9 367.8 400.2 Non-interest expenses 1,137.3 1,186.1 310.1 302.2 302.6 311.0 321.5 Income (loss) before income taxes 226.6 149.5 83.6 22.7 46.3 56.7 78.7 Net income (loss) attributable to NHI shareholders 143.0 92.8 66.9 7.4 23.3 35.2 50.5 20
|
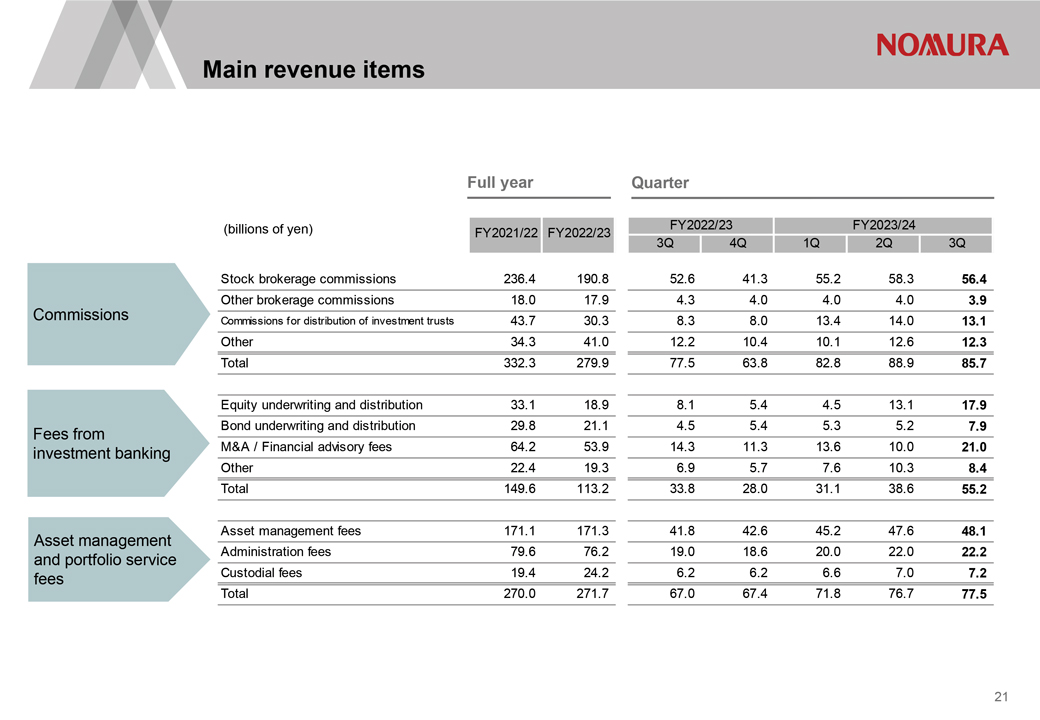
Main revenue items Full year Quarter (billions of yen) FY2021/22 FY2022/23 FY2022/23 FY2023/24 3Q 4Q 1Q 2Q 3Q Stock brokerage commissions 236.4 190.8 52.6 41.3 55.2 58.3 56.4 Other brokerage commissions 18.0 17.9 4.3 4.0 4.0 4.0 3.9 Commissions Commissions for distribution of investment trusts 43.7 30.3 8.3 8.0 13.4 14.0 13.1 Other 34.3 41.0 12.2 10.4 10.1 12.6 12.3 Total 332.3 279.9 77.5 63.8 82.8 88.9 85.7 Equity underwriting and distribution 33.1 18.9 8.1 5.4 4.5 13.1 17.9 Fees from Bond underwriting and distribution 29.8 21.1 4.5 5.4 5.3 5.2 7.9 investment banking M&A / Financial advisory fees 64.2 53.9 14.3 11.3 13.6 10.0 21.0 Other 22.4 19.3 6.9 5.7 7.6 10.3 8.4 Total 149.6 113.2 33.8 28.0 31.1 38.6 55.2 Asset management Asset management fees 171.1 171.3 41.8 42.6 45.2 47.6 48.1 and portfolio service Administration fees 79.6 76.2 19.0 18.6 20.0 22.0 22.2 fees Custodial fees 19.4 24.2 6.2 6.2 6.6 7.0 7.2 Total 270.0 271.7 67.0 67.4 71.8 76.7 77.5 21
|
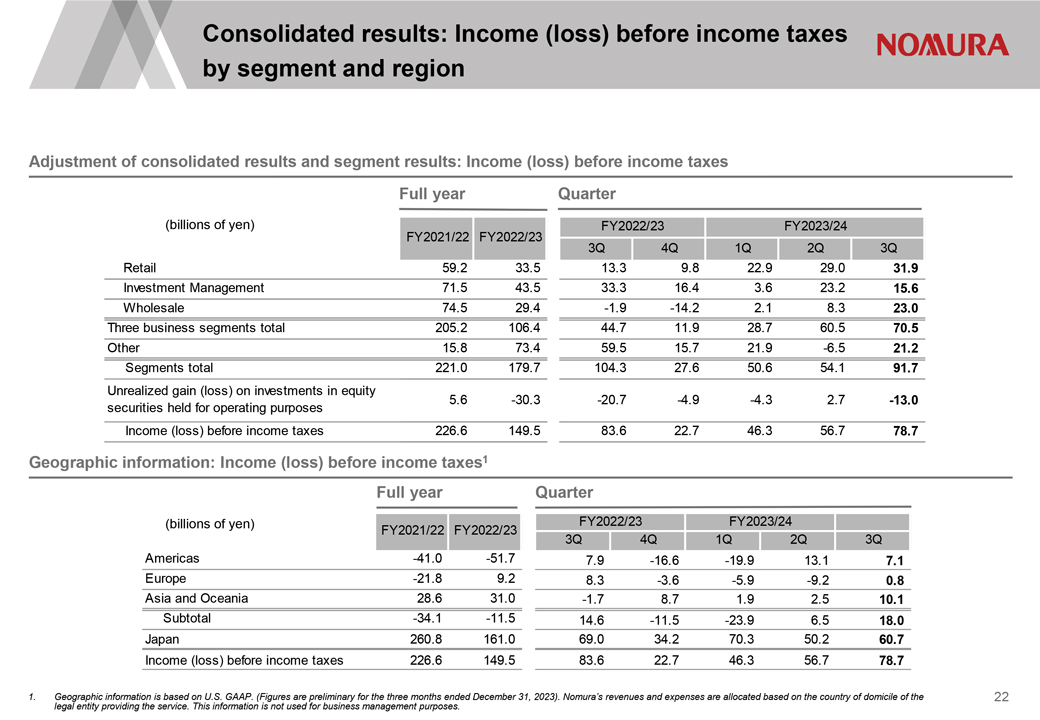
Consolidated results: Income (loss) before income taxes by segment and region [Graphic Appears Here] Adjustment of consolidated results and segment results: Income (loss) before income taxes Full year Quarter (billions of yen) FY2022/23 FY2023/24 FY2021/22 FY2022/23 3Q 4Q 1Q 2Q 3Q Retail 59.2 33.5 13.3 9.8 22.9 29.0 31.9 Investment Management 71.5 43.5 33.3 16.4 3.6 23.2 15.6 Wholesale 74.5 29.4 -1.9 -14.2 2.1 8.3 23.0 Three business segments total 205.2 106.4 44.7 11.9 28.7 60.5 70.5 Other 15.8 73.4 59.5 15.7 21.9 -6.5 21.2 Segments total 221.0 179.7 104.3 27.6 50.6 54.1 91.7 Unrealized gain (loss) on investments in equity securities held for operating purposes 5.6 -30.3 -20.7 -4.9 -4.3 2.7 -13.0 Income (loss) before income taxes 226.6 149.5 83.6 22.7 46.3 56.7 78.7 Geographic information: Income (loss) before income taxes1 Full year Quarter (billions of yen) FY2022/23 FY2023/24 FY2021/22 FY2022/23 3Q 4Q 1Q 2Q 3Q Americas -41.0 -51.7 7.9 -16.6 -19.9 13.1 7.1 Europe -21.8 9.2 8.3 -3.6 -5.9 -9.2 0.8 Asia and Oceania 28.6 31.0 -1.7 8.7 1.9 2.5 10.1 Subtotal -34.1 -11.5 14.6 -11.5 -23.9 6.5 18.0 Japan 260.8 161.0 69.0 34.2 70.3 50.2 60.7 Income (loss) before income taxes 226.6 149.5 83.6 22.7 46.3 56.7 78.7 Geographic information is based on U.S. GAAP. (Figures are preliminary for the three months ended December 31, 2023). Nomura s revenues and expenses are allocated based on the country of domicile of the legal entity providing the service. This information is not used for business management purposes. 22
|
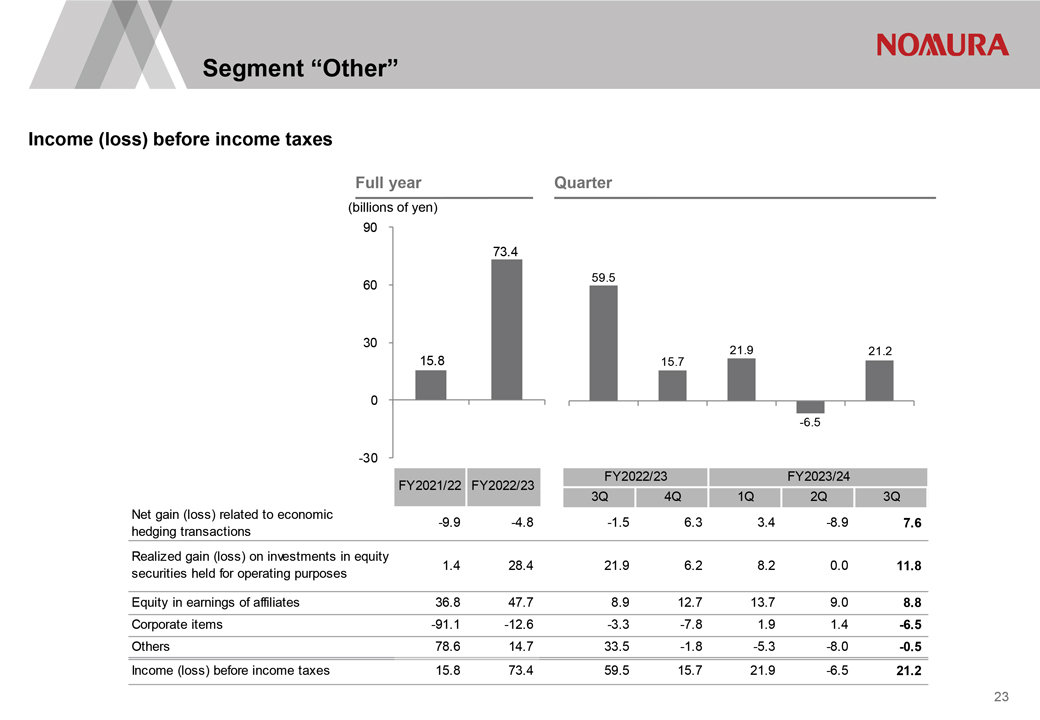
Segment Other Income (loss) before income taxes Full year Quarter (billions of yen) 90 73.4 60 59.5 30 21.9 21.2 15.8 15.7 0 1 2 3 -6.45 5 -30 FY2021/22 FY2022/23 FY2022/23 FY2023/24 3Q 4Q 1Q 2Q 3Q Net gain (loss) related to economic -9.9 -4.8 -1.5 6.3 3.4 -8.9 7.6 hedging transactions Realized gain (loss) on investments in equity securities held for operating purposes 1.4 28.4 21.9 6.2 8.2 0.0 11.8 Equity in earnings of affiliates 36.8 47.7 8.9 12.7 13.7 9.0 8.8 Corporate items -91.1 -12.6 -3.3 -7.8 1.9 1.4 -6.5 Others 78.6 14.7 33.5 -1.8 -5.3 -8.0 -0.5 Income (loss) before income taxes 15.8 73.4 59.5 15.7 21.9 -6.5 21.2 23
|
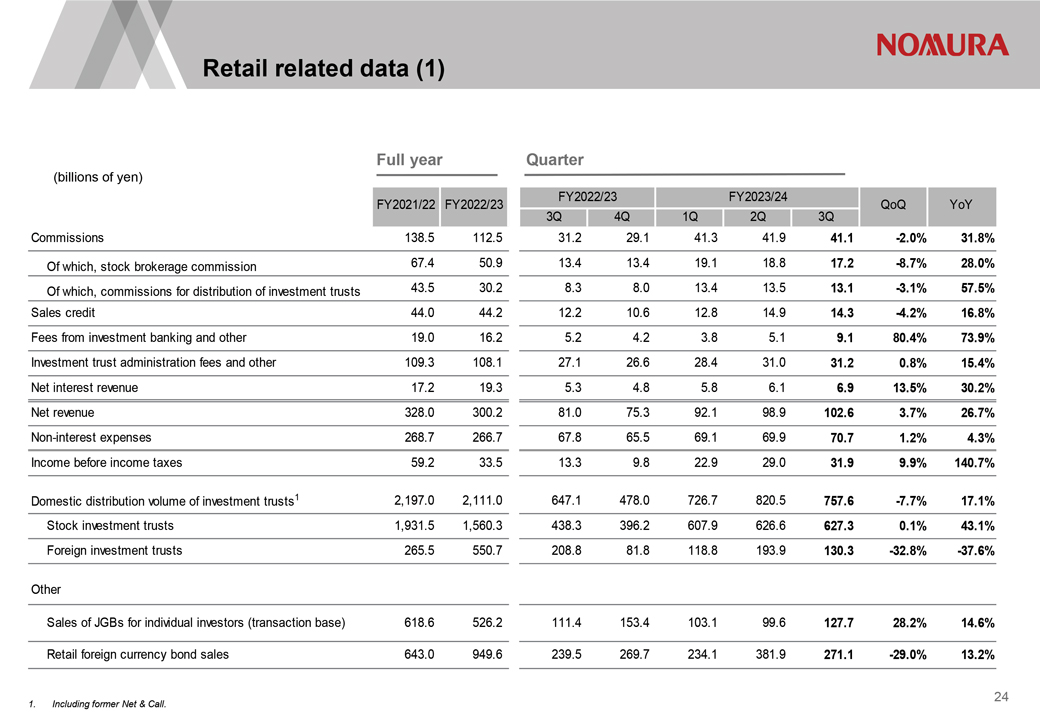
Retail related data (1) Full year Quarter (billions of yen) FY2022/23 FY2023/24 FY2021/22 FY2022/23 QoQ YoY 3Q 4Q 1Q 2Q 3Q Commissions 138.5 112.5 31.2 29.1 41.3 41.9 41.1 -2.0% 31.8% Of which, stock brokerage commission 67.4 50.9 13.4 13.4 19.1 18.8 17.2 -8.7% 28.0% Of which, commissions for distribution of investment trusts 43.5 30.2 8.3 8.0 13.4 13.5 13.1 -3.1% 57.5% Sales credit 44.0 44.2 12.2 10.6 12.8 14.9 14.3 -4.2% 16.8% Fees from investment banking and other 19.0 16.2 5.2 4.2 3.8 5.1 9.1 80.4% 73.9% Investment trust administration fees and other 109.3 108.1 27.1 26.6 28.4 31.0 31.2 0.8% 15.4% Net interest revenue 17.2 19.3 5.3 4.8 5.8 6.1 6.9 13.5% 30.2% Net revenue 328.0 300.2 81.0 75.3 92.1 98.9 102.6 3.7% 26.7% Non-interest expenses 268.7 266.7 67.8 65.5 69.1 69.9 70.7 1.2% 4.3% Income before income taxes 59.2 33.5 13.3 9.8 22.9 29.0 31.9 9.9% 140.7% Domestic distribution volume of investment trusts 1 2,197.0 2,111.0 647.1 478.0 726.7 820.5 757.6 -7.7% 17.1% Stock investment trusts 1,931.5 1,560.3 438.3 396.2 607.9 626.6 627.3 0.1% 43.1% Foreign investment trusts 265.5 550.7 208.8 81.8 118.8 193.9 130.3 -32.8% -37.6% Other Sales of JGBs for individual investors (transaction base) 618.6 526.2 111.4 153.4 103.1 99.6 127.7 28.2% 14.6% Retail foreign currency bond sales 643.0 949.6 239.5 269.7 234.1 381.9 271.1 -29.0% 13.2% 1. Including former Net & Call. 24
|
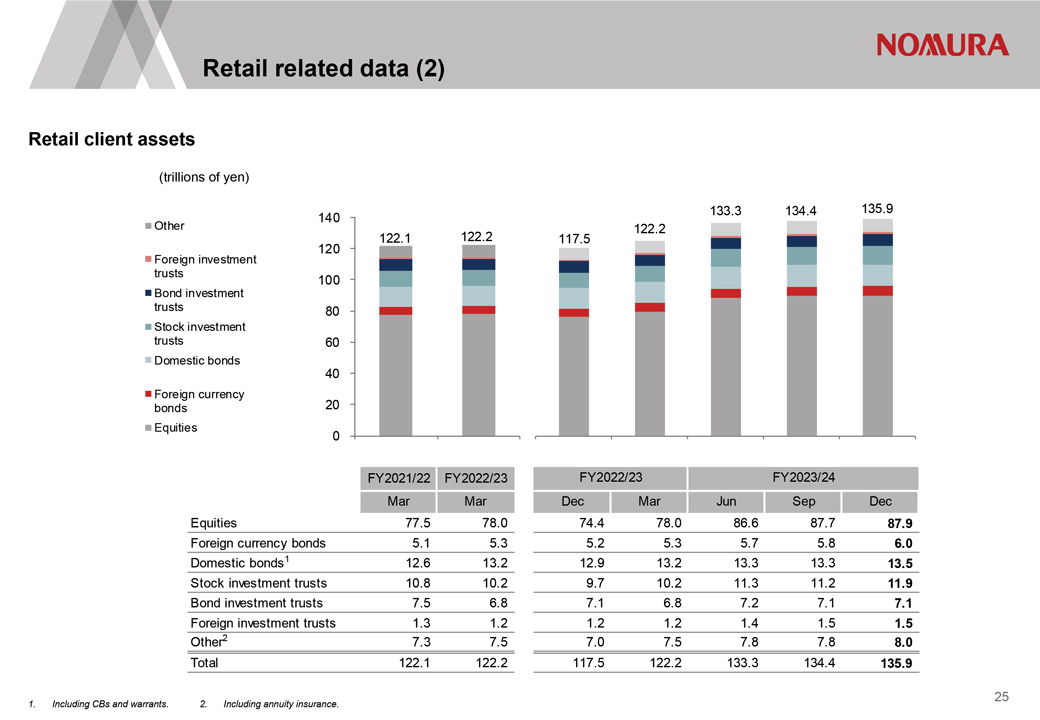
Retail related data (2) Retail client assets (trillions of yen) 133.3 134.4 135.9 140 Other 122.2 122.1 122.2 117.5 120 Foreign investment trusts 100 Bond investment trusts 80 Stock investment trusts 60 Domestic bonds 40 Foreign currency bonds 20 Equities 0 FY2021/22 FY2022/23 FY2022/23 FY2023/24 Mar Mar Dec Mar Jun Sep Dec Equities 77.5 78.0 74.4 78.0 86.6 87.7 87.9 Foreign currency bonds 5.1 5.3 5.2 5.3 5.7 5.8 6.0 Domestic bonds1 12.6 13.2 12.9 13.2 13.3 13.3 13.5 Stock investment trusts 10.8 10.2 9.7 10.2 11.3 11.2 11.9 Bond investment trusts 7.5 6.8 7.1 6.8 7.2 7.1 7.1 Foreign investment trusts 1.3 1.2 1.2 1.2 1.4 1.5 1.5 Other2 7.3 7.5 7.0 7.5 7.8 7.8 8.0 Total 122.1 122.2 117.5 122.2 133.3 134.4 135.9 1. Including CBs and warrants. 2. Including annuity insurance. 25
|
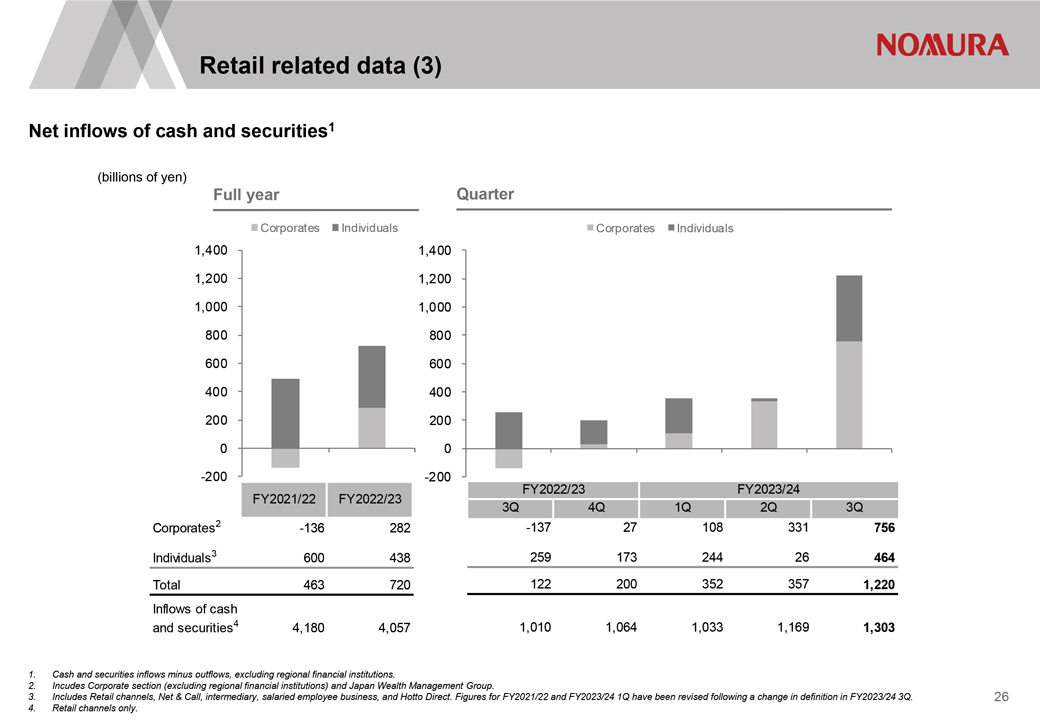
Retail related data (3) Net inflows of cash and securities1 (billions of yen) Full year Quarter Corporates Individuals Corporates Individuals 1,400 1,400 1,200 1,200 1,000 1,000 800 800 600 600 400 400 200 200 0 0 -200 -200 FY2022/23 FY2023/24 FY2021/22 FY2022/23 3Q 4Q 1Q 2Q 3Q Corporates2 -136 282 -137 27 108 331 756 Individuals3 600 438 259 173 244 26 464 Total 463 720 122 200 352 357 1,220 Inflows of cash and securities4 4,180 4,057 1,010 1,064 1,033 1,169 1,303 Cash and securities inflows minus outflows, excluding regional financial institutions. Incudes Corporate section (excluding regional financial institutions) and Japan Wealth Management Group. Includes Retail channels, Net & Call, intermediary, salaried employee business, and Hotto Direct. Figures for FY2021/22 and FY2023/24 1Q have been revised following a change in definition in FY2023/24 3Q. Retail channels only. 26
|
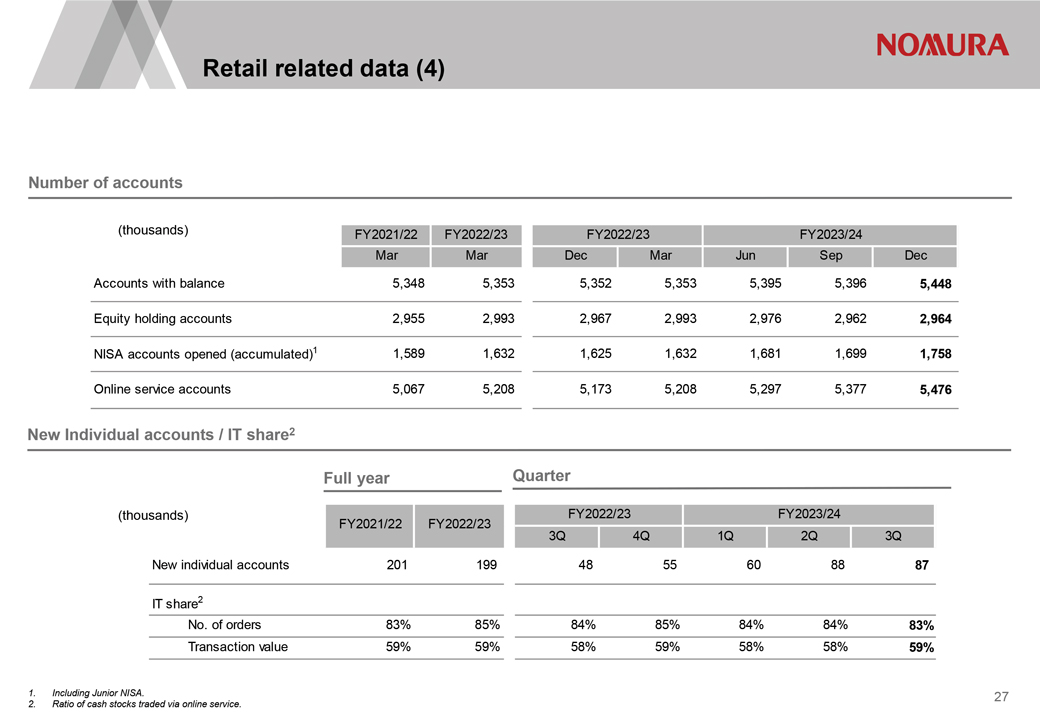
Retail related data (4) Number of accounts (thousands) FY2021/22 FY2022/23 FY2022/23 FY2023/24 Mar Mar Dec Mar Jun Sep Dec Accounts with balance 5,348 5,353 5,352 5,353 5,395 5,396 5,448 Equity holding accounts 2,955 2,993 2,967 2,993 2,976 2,962 2,964 NISA accounts opened (accumulated)1 1,589 1,632 1,625 1,632 1,681 1,699 1,758 Online service accounts 5,067 5,208 5,173 5,208 5,297 5,377 5,476 New Individual accounts / IT share2 Full year Quarter (thousands) FY2022/23 FY2023/24 FY2021/22 FY2022/23 3Q 4Q 1Q 2Q 3Q New individual accounts 201 199 48 55 60 88 87 IT share2 No. of orders 83% 85% 84% 85% 84% 84% 83% Transaction value 59% 59% 58% 59% 58% 58% 59% Including Junior NISA. Ratio of cash stocks traded via online service. 27
|
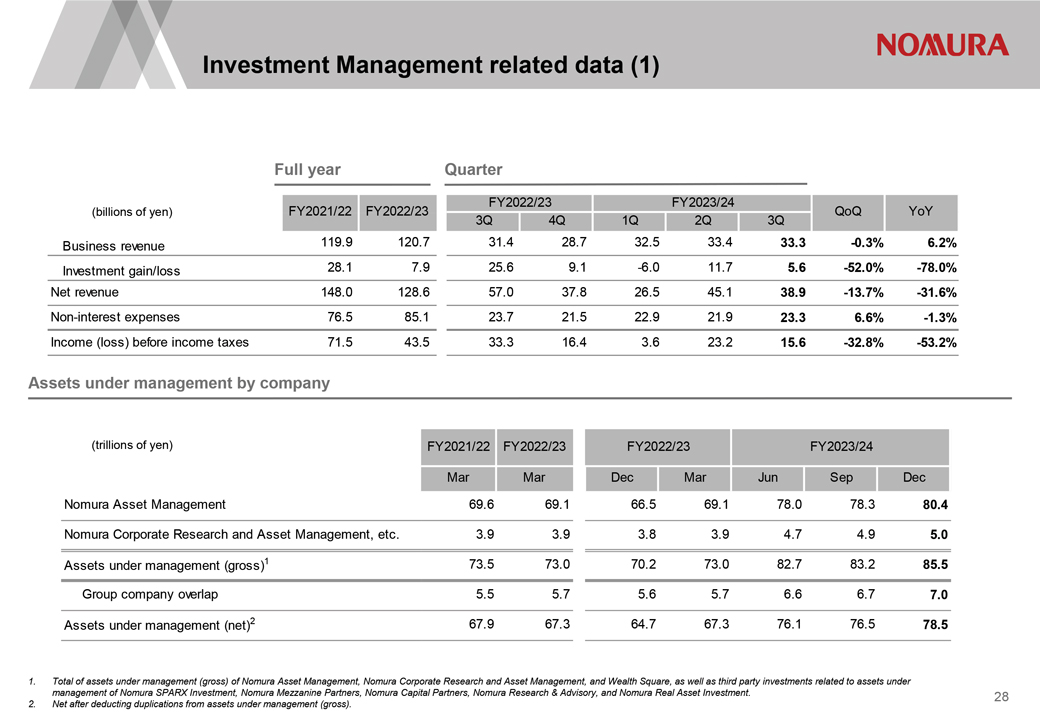
Investment Management related data (1) Full year Quarter FY2022/23 FY2023/24 (billions of yen) FY2021/22 FY2022/23 QoQ YoY 3Q 4Q 1Q 2Q 3Q Business revenue 119.9 120.7 31.4 28.7 32.5 33.4 33.3 -0.3% 6.2% Investment gain/loss 28.1 7.9 25.6 9.1 -6.0 11.7 5.6 -52.0% -78.0% Net revenue 148.0 128.6 57.0 37.8 26.5 45.1 38.9 -13.7% -31.6% Non-interest expenses 76.5 85.1 23.7 21.5 22.9 21.9 23.3 6.6% -1.3% Income (loss) before income taxes 71.5 43.5 33.3 16.4 3.6 23.2 15.6 -32.8% -53.2% Assets under management by company (trillions of yen) FY2021/22 FY2022/23 FY2022/23 FY2023/24 Mar Mar Dec Mar Jun Sep Dec Nomura Asset Management 69.6 69.1 66.5 69.1 78.0 78.3 80.4 Nomura Corporate Research and Asset Management, etc. 3.9 3.9 3.8 3.9 4.7 4.9 5.0 Assets under management (gross)1 73.5 73.0 70.2 73.0 82.7 83.2 85.5 Group company overlap 5.5 5.7 5.6 5.7 6.6 6.7 7.0 Assets under management (net)2 67.9 67.3 64.7 67.3 76.1 76.5 78.5 Total of assets under management (gross) of Nomura Asset Management, Nomura Corporate Research and Asset Management, and Wealth Square, as well as third party investments related to assets under management of Nomura SPARX Investment, Nomura Mezzanine Partners, Nomura Capital Partners, Nomura Research & Advisory, and Nomura Real Asset Investment. Net after deducting duplications from assets under management (gross). 28
|
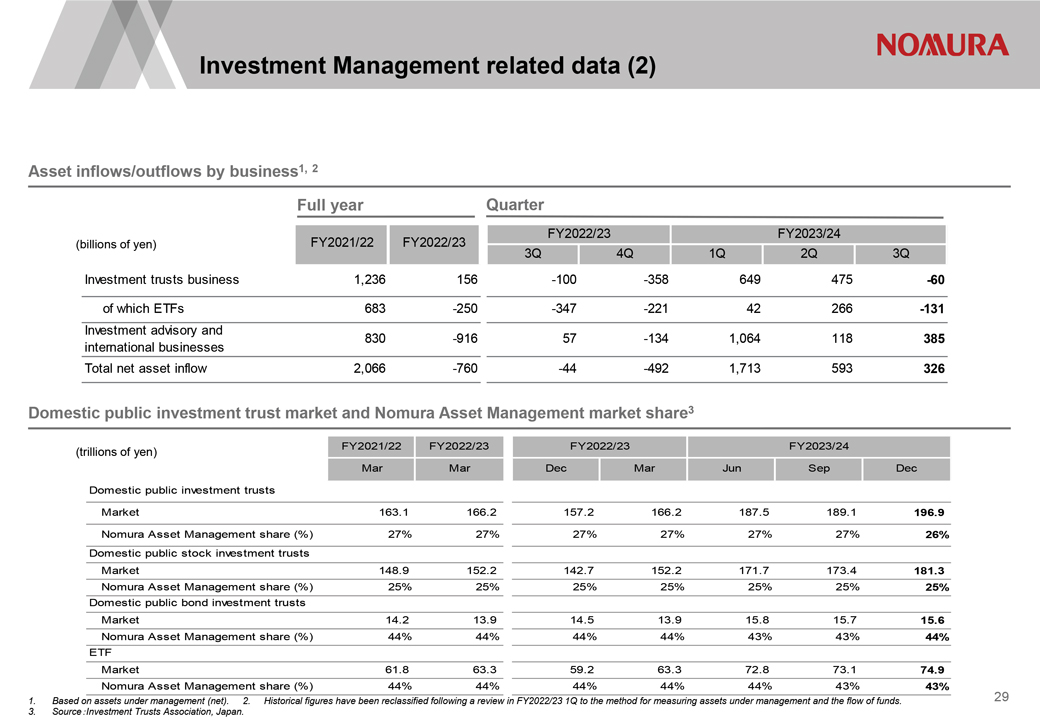
Investment Management related data (2) Asset inflows/outflows by business1, 2 Full year Quarter (billions of yen) FY2021/22 FY2022/23 FY2022/23 FY2023/24 3Q 4Q 1Q 2Q 3Q Investment trusts business 1,236 156 -100 -358 649 475 -60 of which ETFs 683 -250 -347 -221 42 266 -131 Investment advisory and 830 -916 57 -134 1,064 118 385 international businesses Total net asset inflow 2,066 -760 -44 -492 1,713 593 326 Domestic public investment trust market and Nomura Asset Management market share3 (trillions of yen) FY2021/22 FY2022/23 FY2022/23 FY2023/24 Mar Mar Dec Mar Jun Sep Dec Domestic public investment trusts Market 163.1 166.2 157.2 166.2 187.5 189.1 196.9 Nomura Asset Management share (%) 27% 27% 27% 27% 27% 27% 26% Domestic public stock investment trusts Market 148.9 152.2 142.7 152.2 171.7 173.4 181.3 Nomura Asset Management share (%) 25% 25% 25% 25% 25% 25% 25% Domestic public bond investment trusts Market 14.2 13.9 14.5 13.9 15.8 15.7 15.6 Nomura Asset Management share (%) 44% 44% 44% 44% 43% 43% 44% ETF Market 61.8 63.3 59.2 63.3 72.8 73.1 74.9 Nomura Asset Management share (%) 44% 44% 44% 44% 44% 43% 43% 1. Based on assets under management (net). 2. Historical figures have been reclassified following a review in FY2022/23 1Q to the method for measuring assets under management and the 739401 flow of funds. 3. Source Investment Trusts Association, Japan. 29
|
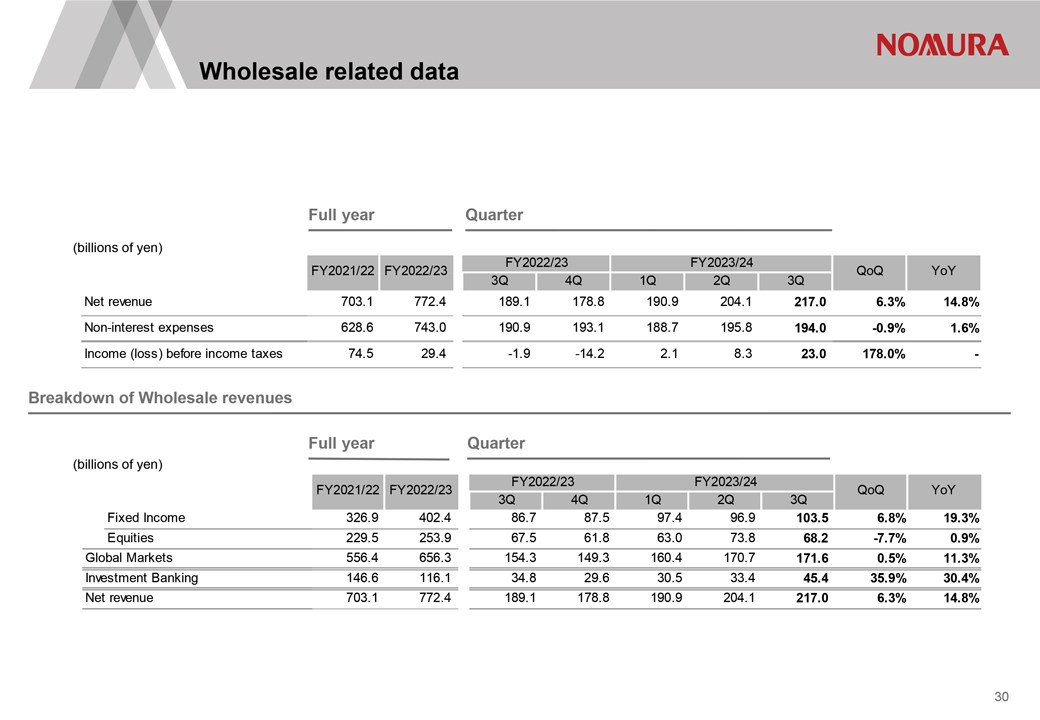
Wholesale related data Full year Quarter (billions of yen) FY2022/23 FY2023/24 FY2021/22 FY2022/23 QoQ YoY 3Q 4Q 1Q 2Q 3Q Net revenue 703.1 772.4 189.1 178.8 190.9 204.1 217.0 6.3% 14.8% Non-interest expenses 628.6 743.0 190.9 193.1 188.7 195.8 194.0 -0.9% 1.6% Income (loss) before income taxes 74.5 29.4 -1.9 -14.2 2.1 8.3 23.0 178.0%—Breakdown of Wholesale revenues Full year Quarter (billions of yen) FY2022/23 FY2023/24 FY2021/22 FY2022/23 QoQ YoY 3Q 4Q 1Q 2Q 3Q Fixed Income 326.9 402.4 86.7 87.5 97.4 96.9 103.5 6.8% 19.3% Equities 229.5 253.9 67.5 61.8 63.0 73.8 68.2 -7.7% 0.9% Global Markets 556.4 656.3 154.3 149.3 160.4 170.7 171.6 0.5% 11.3% Investment Banking 146.6 116.1 34.8 29.6 30.5 33.4 45.4 35.9% 30.4% Net revenue 703.1 772.4 189.1 178.8 190.9 204.1 217.0 6.3% 14.8% 30
|
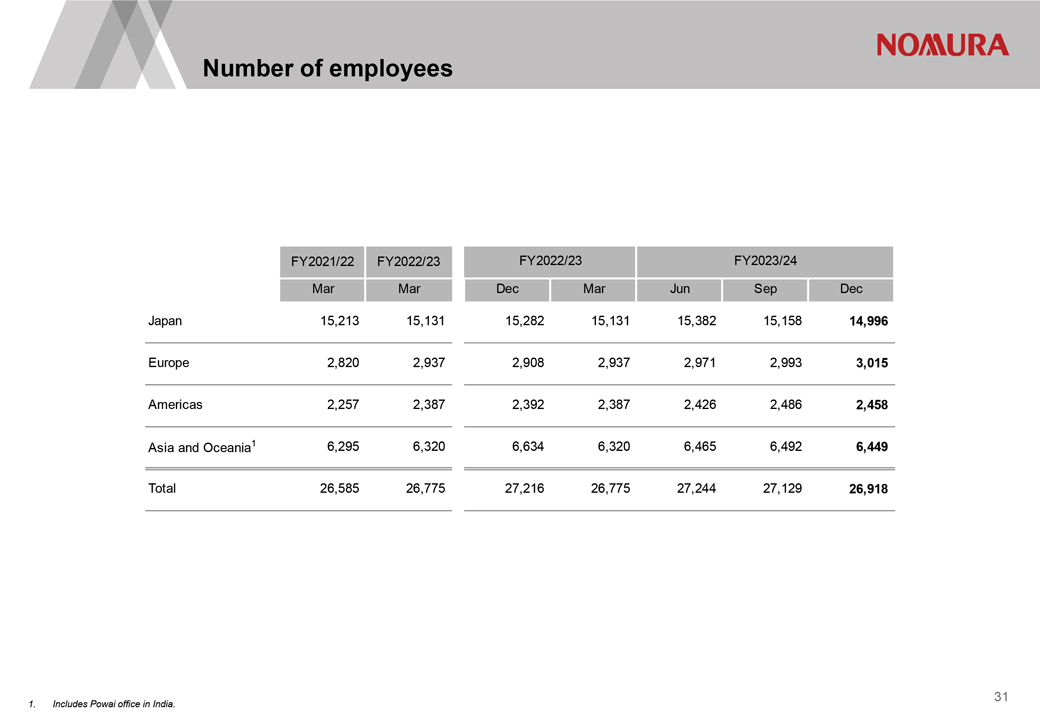
Number of employees FY2021/22 FY2022/23 FY2022/23 FY2023/24 Mar Mar Dec Mar Jun Sep Dec Japan 15,213 15,131 15,282 15,131 15,382 15,158 14,996 Europe 2,820 2,937 2,908 2,937 2,971 2,993 3,015 Americas 2,257 2,387 2,392 2,387 2,426 2,486 2,458 Asia and Oceania1 6,295 6,320 6,634 6,320 6,465 6,492 6,449 Total 26,585 26,775 27,216 26,775 27,244 27,129 26,918 1. Includes Powai office in India. 31
|
Disclaimer This document is produced by Nomura Holdings, Inc. ( Nomura ). Nothing in this document shall be considered as an offer to sell or solicitation of an offer to buy any security, commodity or other instrument, including securities issued by Nomura or any affiliate thereof. Offers to sell, sales, solicitations to buy, or purchases of any securities issued by Nomura or any affiliate thereof may only be made or entered into pursuant to appropriate offering materials or a prospectus prepared and distributed according to the laws, regulations, rules and market practices of the jurisdictions in which such offers or sales may be made. The information and opinions contained in this document have been obtained from sources believed to be reliable, but no representations or warranty, express or implied, are made that such information is accurate or complete and no responsibility or liability can be accepted by Nomura for errors or omissions or for any losses arising from the use of this information. All rights regarding this document are reserved by Nomura unless otherwise indicated. No part of this document shall be reproduced, stored in a retrieval system or transmitted in any form or by any means, electronic, mechanical, photocopying, recording or otherwise, without the prior written permission of Nomura. This document contains statements that may constitute, and from time to time our management may make forward-looking statements within the meaning of the safe harbor provisions of The Private Securities Litigation Reform Act of 1995. Any such statements must be read in the context of the offering materials pursuant to which any securities may be offered or sold in the United States. These forward-looking statements are not historical facts but instead represent only our belief regarding future events, many of which, by their nature, are inherently uncertain and outside our control. Actual results and financial condition may differ, possibly materially, from what is indicated in those forward-looking statements. You should not place undue reliance on any forward-looking statement and should consider all of the following uncertainties and risk factors, as well as those more fully discussed under Nomura s most recent Annual Report on Form 20-F and other reports filed with the U.S. Securities and Exchange Commission ( SEC ) that are available on Nomura s website (https://www.nomura.com) and on the SEC s website (https://www.sec.gov); Important risk factors that could cause actual results to differ from those in specific forward-looking statements include, without limitation, economic and market conditions, political events and investor sentiments, liquidity of secondary markets, level and volatility of interest rates, currency exchange rates, security valuations, competitive conditions and size, and the number and timing of transactions. Forward-looking statements speak only as of the date they are made, and Nomura undertakes no obligation to update any forward-looking statement to reflect the impact of circumstances or events that arise after the date the forward-looking statement was made. The consolidated financial information in this document is unaudited.

|
Nomura Holdings, Inc. www.nomura.com