UNITED STATES
SECURITIES AND EXCHANGE COMMISSION
Washington, D.C. 20549
FORM 8-K
CURRENT REPORT
Pursuant to Section 13 or 15(d)
of the Securities Exchange Act of 1934
January 19, 2024
(Date of report; date of earliest event reported)
Commission file number: 1-3754
ALLY FINANCIAL INC.
(Exact name of registrant as specified in its charter)
| Delaware | 38-0572512 | |
|
(State or other jurisdiction of incorporation or organization) |
(I.R.S. Employer Identification No.) |
Ally Detroit Center
500 Woodward Ave.
Floor 10, Detroit, Michigan
48226
(Address of principal executive offices)
(Zip Code)
(866) 710-4623
(Registrant’s telephone number, including area code)
Check the appropriate box below if the Form 8-K filing is intended to simultaneously satisfy the filing obligation of the registrant under any of the following provisions (see General Instruction A.2. below):
| ☐ | Written communications pursuant to Rule 425 under the Securities Act (17 CFR 230.425) |
| ☐ | Soliciting material pursuant to Rule 14a-12 under the Exchange Act (17 CFR 240.14a-12) |
| ☐ | Pre-commencement communications pursuant to Rule 14d-2(b) under the Exchange Act (17 CFR 240.14d-2(b)) |
| ☐ | Pre-commencement communications pursuant to Rule 13e-4(c) under the Exchange Act (17 CFR 240.13e-4(c)) |
Securities registered pursuant to Section 12(b) of the Act (listed on the New York Stock Exchange):
Title of each class |
Trading symbols |
|
| Common Stock, par value $0.01 per share | ALLY |
Indicate by check mark whether the registrant is an emerging growth company as defined in Rule 405 of the Securities Act of 1933 (§230.405 of this chapter) or Rule 12b-2 of the Securities Exchange Act of 1934 (§240.12b-2 of this chapter).
Emerging growth company ☐
If an emerging growth company, indicate by check mark if the registrant has elected not to use the extended transition period for complying with any new or revised financial accounting standards provided pursuant to Section 13(a) of the Exchange Act. ☐
| Item 2.02 | Results of Operation and Financial Condition. |
On January 19, 2024, Ally Financial Inc. issued a press release announcing preliminary operating results for the fourth quarter and full year ended December 31, 2023. The press release is attached hereto and incorporated by reference as Exhibit 99.1. Charts furnished to securities analysts are attached hereto and incorporated by reference as Exhibit 99.2. In addition, supplemental financial data furnished to securities analysts is attached hereto and incorporated by reference as Exhibit 99.3.
| Item 9.01 | Financial Statements and Exhibits. |
Exhibit No. |
Description |
|
| 99.1 | Press Release, Dated January 19, 2024 | |
| 99.2 | Charts Furnished to Securities Analysts | |
| 99.3 | Supplemental Financial Data Furnished to Securities Analysts | |
| 104 | The cover page from this Current Report on Form 8-K, formatted in Inline XBRL | |
SIGNATURES
Pursuant to the requirements of the Securities Exchange Act of 1934, the registrant has duly caused this report to be signed on its behalf by the undersigned hereunto duly authorized.
| ALLY FINANCIAL INC. | ||||||
| (Registrant) | ||||||
| Dated: January 19, 2024 | /s/ David J. DeBrunner |
|||||
| David J. DeBrunner | ||||||
| Vice President, Controller, and Chief Accounting Officer | ||||||
Exhibit 99.1
News release: IMMEDIATE RELEASE

Ally Financial Reports Fourth Quarter and Full-Year 2023 Financial Results
Full-Year 2023 Net Income of $1.0 billion, $2.98 EPS, $3.05 Adjusted EPS1
Fourth Quarter Net Income of $76 million, $0.16 EPS, $0.45 Adjusted EPS1
|
Full-Year 2023 Results
|
||||||||
| PRE-TAX INCOME | TOTAL NET REVENUE | RETURN ON COMMON EQUITY | CORE ROTCE1 | |||
| $1.1 billion | $8.2 billion | 8.3% | 11.5% | |||
|
|
Fourth Quarter 2023 Results |
|
||||
| PRE-TAX INCOME | RETURN ON COMMON EQUITY | COMMON SHAREHOLDER EQUITY | ||
| $64 million | 1.8% | $37.83/share | ||
| CORE PRE-TAX INCOME1 | CORE ROTCE1 | ADJUSTED TANGIBLE BOOK VALUE1 | ||
| $174 million | 6.9% | $33.34/share | ||

|
• Reached agreement to sell Ally Lending; CET1 benefit of ~15 bps at closing in 1Q ‘24, and accretive to EPS and tangible book value |
|
| • Deconsolidated $1.7 billion of seasoned retail auto loans generating 9 bps of CET1 benefit |
||
| • Headcount actions announced in 3Q have been realized, driving $80 million of annualized expense savings |
||
| • FDIC special assessment fee of $38 million, among the lowest in the industry given the composition of the deposit base |

|
• EPS of $2.98; Adjusted EPS1 of $3.05 |
|
| • Total Net Revenue of $8.2 billion; Adjusted Total Net Revenue1 of $8.2 billion |
||
| • Pre-Provision Net Revenue1 of $3.1 billion; Core Pre-Provision Net Revenue1 of $3.2 billion |
||
| • Established leader in dealer financial services offering comprehensive suite of auto finance and insurance products |
||
| – 13.8 million consumer auto applications driving $40.0 billion origination volume |
||
| – Retail auto originated yield1 of 10.7% with nearly 40% of originated volume within highest credit quality tier |
||
| – 177 bps full-year retail auto net charge-offs, in-line with full-year guidance |
||
| – Insurance earned premiums of $1.3 billion, highest since IPO |
||
| • Leading, digital-first Ally Bank platform generated strong growth across consumer and commercial product suite |
||
| – Retail deposits of $142.3 billion from 3.0 million retail deposit customers | $155 billion total deposits |
||
| – 1.2 million active credit cardholders; balanced approach to growth with compelling return profile |
||
| – Corporate Finance HFI loan portfolio of $10.9 billion | 25% ROE in 2023, with less than 1% of loans in nonaccrual status |

|
• Earnings per share (EPS) of $0.16; Adjusted EPS1 of $0.45 |
|
| • Total Net Revenue of $2.1 billion; Adjusted Total Net Revenue1 of $2.0 billion |
||
| • Pre-Provision Net Revenue1 of $0.7 billion; Core Pre-Provision Net Revenue1 of $0.8 billion |
||
| • Consumer auto originations of $9.6 billion | Estimated retail auto originated yield1 of 10.81%, h124 bps YoY |
||
| • Retail deposit growth of $2.2 billion QoQ | Retail deposit net customer growth of 52 thousand |
||
1 The following are non-GAAP financial measures which Ally believes are important to the reader of the Consolidated Financial Statements, but which are supplemental to and not a substitute for GAAP measures: Accelerated issuance expense (Accelerated OID), Adjusted earnings per share (Adjusted EPS), Adjusted efficiency ratio, Adjusted noninterest expense, Adjusted other revenue, Adjusted tangible book value per share (Adjusted TBVPS), Adjusted total net revenue, Core net income attributable to common shareholders, Core original issue discount (Core OID) amortization expense, Core outstanding original issue discount balance (Core OID balance), Core pre-provision net revenue (Core PPNR), Core pre-tax income, Core return on tangible common equity (Core ROTCE), Investment income and other (adjusted), Net financing revenue (excluding Core OID), Net interest margin (excluding Core OID), Pre-provision net revenue (PPNR), and Tangible Common Equity. These measures are used by management, and we believe are useful to investors in assessing the company’s operating performance and capital. Refer to the definitions of non-GAAP financial measures and other key terms along with reconciliations to GAAP later in this document.

| Chief Executive Officer Comments | ||||
|
“In 2023, a year filled with unique challenges for the financial services industry, Ally demonstrated the strength and resolve that has made us an industry leading financial institution,” said Chief Executive Officer Jeffrey J. Brown. “While cognizant of the highly dynamic environment, we remain focused on building businesses that are resilient through all environments. We ended 2023 with growing momentum and remain positioned for long-term success.”
|
|
“At Ally Bank, we recognized our 15th consecutive year of retail deposit growth, now serving over three million deposit customers following record customer growth in 2023. Integration of Credit Card within OneAlly further enhanced the seamless experience we aim to provide our customers. Corporate Finance delivered another year of solid performance, including $307 million of pre-tax income, the highest since our IPO.”
|
|
“Dealer financial services continues to capitalize on its competitive advantage, decisioning a record 13.8 million consumer applications which enabled $40 billion of consumer auto originations. Nearly 40% of our retail auto originations were made up of the highest credit quality tier at an estimated originated yield of 10.7%, demonstrating our ability to quickly adapt to changing origination environments while prioritizing risk-adjusted returns. Within Insurance, earned premiums of $1.3 billion were the highest since our IPO and we see opportunities for continued growth as we leverage synergies with Auto Finance.”
|
|
“Disciplined capital management remains paramount in navigating the current operating environment and we executed several strategic capital management actions in the fourth quarter. We recently reached an agreement to sell Ally Lending which upon closing is expected to be an approximately 15 basis point benefit to CET1 and modestly accretive to earnings per share and tangible book value. These actions are a continuation of our strategic priorities to invest resources in growing scale businesses and strengthening relationships with consumer and dealer customers.”
|
|
“Looking forward to 2024, I know that Ally will remain true to the “Do It Right” culture that we have built. As my time at Ally comes to a close, I must reiterate my pride in our achievements over the past 15 years and am excited to see what the future holds for this outstanding organization. I have the utmost confidence in this board, team, and their ability to execute against the strategic priorities that have served us well for many years and that will continue driving long-term value to all stakeholders in the years ahead.”
|
|
Fourth Quarter and Full-Year 2023 Financial Results |
||||
| Increase/(Decrease) vs. | ||||||||||||||||||||||||||||||||
| ($ millions except per share data) | 4Q 23 | 3Q 23 | 4Q 22 | 2023 | 2022 | 3Q 23 | 4Q 22 | 2022 | ||||||||||||||||||||||||
| (a) Net Financing Revenue |
$ | 1,493 | $ | 1,533 | $ | 1,674 | $ | 6,201 | $ | 6,850 | $ | (40 | ) | $ | (181 | ) | $ | (649 | ) | |||||||||||||
| Core OID1 |
13 | 12 | 11 | 48 | 42 | — | 2 | 7 | ||||||||||||||||||||||||
| Net Financing Revenue (excluding Core OID)1 |
1,506 | 1,545 | 1,685 | 6,249 | 6,892 | (40 | ) | (179 | ) | (642 | ) | |||||||||||||||||||||
| (b) Other Revenue |
574 | 435 | 527 | 2,013 | 1,578 | 139 | 47 | 435 | ||||||||||||||||||||||||
| Change in Fair Value of Equity Securities2 |
(74 | ) | 56 | (49 | ) | (107 | ) | 215 | (130 | ) | (25 | ) | (322 | ) | ||||||||||||||||||
| Adjusted Other Revenue1 |
500 | 491 | 478 | 1,906 | 1,793 | 9 | 22 | 113 | ||||||||||||||||||||||||
| (c) Provision for Credit Losses |
587 | 508 | 490 | 1,968 | 1,399 | 79 | 97 | 569 | ||||||||||||||||||||||||
| Repositioning3 |
(16 | ) | — | — | (16 | ) | — | (16 | ) | (16 | ) | (16 | ) | |||||||||||||||||||
| Adjusted Provision for Credit Losses1 |
603 | 508 | 490 | 1,984 | 1,399 | 95 | 113 | 585 | ||||||||||||||||||||||||
| (d) Noninterest Expense |
1,416 | 1,232 | 1,266 | 5,163 | 4,687 | 184 | 150 | 476 | ||||||||||||||||||||||||
| Repositioning3 |
187 | 30 | 57 | 217 | 77 | 157 | 130 | 140 | ||||||||||||||||||||||||
| Noninterest Expense (excluding Repositioning)1 |
1,229 | 1,202 | 1,209 | 4,946 | 4,610 | 27 | 20 | 336 | ||||||||||||||||||||||||
| Pre-Tax Income (a+b-c-d) |
$ | 64 | $ | 228 | $ | 445 | $ | 1,083 | $ | 2,342 | $ | (164 | ) | $ | (381 | ) | $ | (1,259 | ) | |||||||||||||
| Income Tax Expense |
(13 | ) | (68 | ) | 167 | 61 | 627 | 55 | (180 | ) | (566 | ) | ||||||||||||||||||||
| Net Loss from Discontinued Operations |
(1 | ) | — | — | (2 | ) | (1 | ) | (1 | ) | (1 | ) | (1 | ) | ||||||||||||||||||
| Net Income |
$ | 76 | $ | 296 | $ | 278 | $ | 1,020 | $ | 1,714 | $ | (220 | ) | $ | (202 | ) | $ | (694 | ) | |||||||||||||
| Preferred Dividends |
27 | 27 | 27 | 110 | 110 | — | — | — | ||||||||||||||||||||||||
| Net Income Attributable to Common Shareholders |
$ | 49 | $ | 269 | $ | 251 | $ | 910 | $ | 1,604 | $ | (220 | ) | $ | (202 | ) | $ | (694 | ) | |||||||||||||
| GAAP EPS (diluted) |
$ | 0.16 | $ | 0.88 | $ | 0.83 | $ | 2.98 | $ | 5.03 | $ | (0.72 | ) | $ | (0.67 | ) | $ | (2.05 | ) | |||||||||||||
| Core OID, Net of Tax1 |
0.03 | 0.03 | 0.03 | 0.13 | 0.10 | 0.00 | 0.00 | 0.02 | ||||||||||||||||||||||||
| Change in Fair Value of Equity Securities, Net of Tax3 |
(0.19 | ) | 0.14 | (0.13 | ) | (0.28 | ) | 0.53 | (0.34 | ) | (0.06 | ) | (0.81 | ) | ||||||||||||||||||
| Repositioning, Discontinued Ops., and Other, Net of Tax3 |
0.45 | 0.08 | 0.15 | 0.53 | 0.19 | 0.37 | 0.30 | 0.33 | ||||||||||||||||||||||||
| Significant Discrete Tax Items |
— | (0.31 | ) | 0.20 | (0.31 | ) | 0.19 | 0.31 | (0.20 | ) | (0.50 | ) | ||||||||||||||||||||
| Adjusted EPS1 |
$ | 0.45 | $ | 0.83 | $ | 1.08 | $ | 3.05 | $ | 6.06 | $ | (0.38 | ) | $ | (0.63 | ) | $ | (3.01 | ) | |||||||||||||
| (1) | Represents a non-GAAP financial measure. Refer to the Definitions of Non-GAAP Financial Measures and Other Key Terms and Reconciliation to GAAP later in this press release. |
| (2) | Impacts the Insurance, Corporate Finance and Corporate and Other segments. The change reflects fair value adjustments to equity securities that are reported at fair value. Management believes the change in fair value of equity securities should be removed from select financial measures because it enables the reader to better understand the business’ ongoing ability to generate revenue and income. |
| (3) | Contains non-GAAP financial measures and other financial measures. See pages 6 and 7 for definitions. |
Note: Repositioning items include restructuring costs, costs related to the pending sale of Ally Lending, FDIC Special Assessment in 2023, and cost related to termination of legacy qualified pension plan in 2022.
2
| Discussion of Results | ||||||
|
Fourth Quarter
Net income attributable to common shareholders decreased $202 million versus the prior-year quarter to $49 million due to higher provision expense from continued credit normalization and higher noninterest expense caused in part by a write down of goodwill related to the pending sale of Ally Lending and the FDIC special assessment incurred during the quarter.
Net financing revenue decreased $181 million versus the prior-year quarter as a result of higher funding costs partially offset by continued expansion of earning asset yields and balance sheet optimization.
Other revenue increased $47 million versus the prior-year quarter, including a $74 million increase in the fair value of equity securities in the quarter, compared to a $49 million increase in the fair value of equity securities in the prior-year quarter. Other revenue, excluding the change in fair value of equity securitiesA, increased $22 million YoY primarily driven by continued momentum across our diversified portfolio of products.
Fourth quarter NIM of 3.17%, including Core OIDB of 3 bps, decreased 48 bps YoY. Excluding Core OIDB, NIM 3.20%, was also down 48 bps YoY given higher funding costs due to the elevated rate environment, which was offset in part by higher retail auto and floating rate asset yields.
Provision for credit losses increased $97 million to $587 million compared to the prior-year quarter due to continued normalization in credit, partially offset by a release due to the pending sale of Ally Lending.
Noninterest expense increased $150 million YoY primarily due to the write-down of goodwill associated with the pending sale of Ally Lending and the special assessment from the FDIC.
Full-Year 2023
Net income attributable to common shareholders was $910 million in 2023, compared to $1.6 billion in 2022, due to lower net financing revenue, higher noninterest expense, and increased provision expense from credit normalization.
Net financing revenue declined to $6.2 billion, down $649 million from the prior year, driven by higher funding costs, partially offset by expanding earning asset yields.
Full year NIM was 3.32%, including Core OIDB of 3 bps, down 53 bps YoY. Excluding Core OIDB, NIM was 3.35%, down 53 bps YoY.
Other revenue was up $435 million YoY, including a $107 million increase in the fair value of equity securities in the year, compared to a $215 million decrease in the fair value of equity securities in 2022. Other revenue, excluding the impact of the change in fair value of equity securitiesA, was up $113 million to $1.9 billion, reflecting continued momentum across our diverse portfolio of products.
Provision for credit losses increased $569 million from the prior year, due to higher net charge-offs driven by credit normalization, partially offset by lower asset growth across our portfolio as compared to the year prior.
Noninterest expense increased $476 million from the prior year, largely due to factors previously mentioned.
|
||||||
AAdjusted other revenue is a non-GAAP financial measure. Equity fair value adjustments related to ASU 2016-01 requires change in the fair value of equity securities to be recognized in current period net income as compared to periods prior to 1/1/18 in which such adjustments were recognized through other comprehensive income, a component of equity.
BRepresents a non-GAAP financial measure. Refer to definitions of Non-GAAP Financial Measures and Other Key Terms and Reconciliation to GAAP later in this press release.
|
Pre-Tax Income by Segment |
||||||||||||||||
| Increase/(Decrease) vs. | ||||||||||||||||||||||||||||||||
| ($ millions) |
4Q 23 | 3Q 23 | 4Q 22 | 2023 | 2022 | 3Q 23 | 4Q 22 | 2022 | ||||||||||||||||||||||||
| Automotive Finance |
$ | 294 | $ | 377 | $ | 437 | $ | 1,614 | $ | 2,250 | $ | (83 | ) | $ | (143 | ) | $ | (636 | ) | |||||||||||||
| Insurance |
129 | (16 | ) | 101 | 213 | (38 | ) | 145 | 28 | 251 | ||||||||||||||||||||||
| Dealer Financial Services |
$ | 423 | $ | 361 | $ | 538 | $ | 1,827 | $ | 2,212 | $ | 62 | $ | (115 | ) | $ | (385 | ) | ||||||||||||||
| Corporate Finance |
79 | 84 | 67 | 307 | 282 | (5 | ) | 12 | 25 | |||||||||||||||||||||||
| Mortgage Finance |
24 | 26 | 19 | 92 | 55 | (2 | ) | 5 | 37 | |||||||||||||||||||||||
| Corporate and Other |
(462 | ) | (243 | ) | (179 | ) | (1,143 | ) | (207 | ) | (219 | ) | (283 | ) | (936 | ) | ||||||||||||||||
| Pre-Tax Income from Continuing Operations |
$ | 64 | $ | 228 | $ | 445 | $ | 1,083 | $ | 2,342 | $ | (164 | ) | $ | (381 | ) | $ | (1,259 | ) | |||||||||||||
| Core OID1 |
13 | 12 | 11 | 48 | 42 | — | 2 | 7 | ||||||||||||||||||||||||
| Change in Fair Value of Equity Securities2 |
(74 | ) | 56 | (49 | ) | (107 | ) | 215 | (130 | ) | (25 | ) | (322 | ) | ||||||||||||||||||
| Repositioning3 |
172 | 30 | 57 | 201 | 77 | 142 | 115 | 124 | ||||||||||||||||||||||||
| Core Pre-Tax Income1 |
$ | 174 | $ | 326 | $ | 464 | $ | 1,226 | $ | 2,676 | $ | (152 | ) | $ | (290 | ) | $ | (1,450 | ) | |||||||||||||
| (1) | Represents a non-GAAP financial measure. Refer to the Definitions of Non-GAAP Financial Measures and Other Key Terms and Reconciliation to GAAP later in this press release. |
| (2) | Change in fair value of equity securities primarily impacts the Insurance, Corporate Finance, and Corporate and Other segments. Reflects equity fair value adjustments which requires change in the fair value of equity securities to be recognized in current period net income. |
| (3) | Contains non-GAAP financial measures and other financial measures. See pages 6 and 7 for definitions. |
Note: Repositioning items include restructuring costs, costs related to the pending sale of Ally Lending, FDIC Special Assessment in 2023, and cost related to termination of legacy qualified pension plan in 2022.
3
| Discussion of Segment Results | ||||
|
Auto Finance
Pre-tax income in the fourth quarter of $294 million was down $143 million versus the prior-year quarter primarily driven by higher provision expense.
Net financing revenue of $1.3 billion was up $5 million YoY as higher portfolio yield more than offset higher funding costs. Ally’s retail auto portfolio yield, excluding the impact of hedges, increased 106 bps YoY to 8.43% in the fourth quarter as the portfolio continues to turn over and benefit from higher yielding originations.
Provision for credit losses totaled $492 million, up $116 million YoY, due to higher retail auto net charge-offs as credit normalizes. The fourth quarter retail auto net charge-off rate of 2.21% increased 55 bps YoY, with the pace of increase moderating in each quarter of 2023 as front-book vintages season.
Consumer auto originations in the fourth quarter increased to $9.6 billion from $9.2 billion in the prior-year period, which included $6.2 billion of used retail volume, or 65% of total originations, $2.7 billion of new retail volume, and $0.6 billion of leases. Estimated retail auto originated yieldC in the quarter was 10.81%.
Full-year 2023 pre-tax income of $1.6 billion was down $0.6 billion due to higher provision for credit losses and higher noninterest expense, partially offset by higher net financing revenue.
Consumer originations decreased $6.4 billion in 2023 to $40.0 billion, with used volume of $25.8 billion, or 65% of total 2023 originations, $11.3 billion of new retail volume and $2.9 billion of leases. Estimated retail auto originated yieldC was 10.69% in 2023 compared to 8.24% in 2022 as benchmark rates increased and record application flow enabled strong pricing and selective underwriting.
End-of-period auto earning assets increased $3.8 billion YoY from $113.1 billion to $116.9 billion primarily due to an increase in commercial auto earning assets as well as a modest increase in retail assets, partially offset by a decline in lease assets and retail loan deconsolidation. End-of-period consumer auto earning assets were down $0.8 billion YoY, driven by lower lease assets. End-of-period commercial earning assets of $23.3 billion were up $4.6 billion YoY due to industry-wide new vehicle inventory supply and higher dealer loans, partially offset by a decrease in used vehicle supply.
Insurance
Pre-tax income in the fourth quarter of $129 million increased $28 million versus the prior-year period. Results reflect a $67 million increase in the fair value of equity securitiesD during the fourth quarter compared to a $49 million increase in the fair value of equity securitiesD in the prior year period. Core pre-tax incomeE was $62 million in the quarter, up $10 million YoY primarily driven by elevated earned premiums, partially offset by higher losses driven by P&C portfolio growth and higher insured values, higher weather losses, and GAP loss normalization from lower vehicle values.
Quarterly written premiums were $333 million, up $48 million YoY, driven by P&C premiums from growing dealer inventory levels, growth in other dealer products, as well as F&I growth driven by higher volume in Canada and other U.S. ancillary products. Total investment income was $44 million, up $11 million YoY, excluding a $67 million increase in the fair value of equity securitiesD during the quarter, driven by an increase in realized investment gains during the period.
The full-year 2023 pre-tax income of $213 million was up $251 million versus the prior year primarily due to the increase in the fair value of equity securities during the year. Core pre-tax incomeE for 2023 was $103 million, down $68 million from 2022 as higher earned premiums were more than offset by higher losses driven by P&C portfolio growth and higher insured values, higher weather losses, and GAP loss normalization from lower vehicle values.
|
CEstimated Retail Auto Originated Yield is a forward-looking non-GAAP financial measure determined by calculating the estimated average annualized yield for loans originated during the period. Refer to the Definitions of Non-GAAP Financial Measures and Other Key Terms and Reconciliation to GAAP later in this press release.
DASU 2016-01 requires change in the fair value of equity securities to be recognized in current period net income as compared to periods prior to 1/1/2018 in which such adjustments were recognized through other comprehensive income, a component of equity.
ERepresents a non-GAAP financial measure. Excludes equity fair value adjustments related to ASU 2016-01 which requires change in the fair value of equity securities to be recognized in current period net income as compared to periods prior to 1/1/2018 in which such adjustments were recognized through other comprehensive income, a component of equity. Refer to the definitions of Non-GAAP Financial Measures and Other Key Terms and Reconciliation to GAAP later in this press release.
4
| Discussion of Segment Results | ||||
|
Corporate Finance
Pre-tax income was $79 million in the quarter, up $12 million YoY, primarily driven by higher net financing revenue and lower noninterest expense.
Net financing revenue increased $11 million YoY to $105 million, primarily due to higher loan balances. Interest revenue benefited from increased yields on the entirely floating rate asset portfolio. Other revenue of $23 million was down $2 million year over year. The HFI loan portfolio increased 7% YoY from $10.1 billion to $10.9 billion. Non-accrual loans comprise less than 1% of the portfolio while criticized assets make up approximately 10%.
Provision for credit losses remained relatively flat to the prior year period at $17 million.
Full-year 2023 pre-tax income of $307 million was the highest since our IPO, up $25 million YoY as higher revenues were partially offset by increased provision and noninterest expense in line with higher asset balances.
Mortgage Finance
Fourth quarter pre-tax income was $24 million, up $5 million YoY driven by lower noninterest expense reflecting the benefit of the variable cost direct-to-consumer partnership model.
Net financing revenue in the quarter was down $4 million YoY to $51 million, reflecting lower asset balances combined with higher cost of funds. Other revenue remained relatively flat YoY increasing from $1 million to $3 million.
Full-year 2023 pre-tax income was $92 million, up $37 million from 2022, driven primarily by lower noninterest expense due to the previously mentioned variable cost structure.
DTC originations totaled $1.0 billion in 2023, down $2.3 billion YoY, reflective of industry contraction along with Ally’s continued focus on customer experience and operational efficiency.
|
||||
|
Capital, Liquidity & Funding, and Deposits |
||||||||||
|
Capital
During 2023, Ally paid four quarterly common dividends totaling $1.20 per share, which was unchanged YoY. Ally’s Board of Directors approved another $0.30 per share common dividend for the first quarter of 2024. Ally did not repurchase any shares on the open market during 2023.
Ally’s Common Equity Tier 1 capital ratio increased slightly year over year, ending the year at 9.4%. Risk weighted assets increased from $157 billion to $162 billion, reflective of our commitment to prudent capital management while continuing to invest in our highest returning businesses.
Liquidity & Funding
Liquid cash and cash equivalents F totaled $6.5 billion at quarter-end, down $1.5 billion compared to the end of the third quarter. Highly liquid securities were $20.6 billion and unused pledged borrowing capacity at the FHLB and FRB was $10.3 billion and $26 billion, respectively, at quarter-end. Total current available liquidityG was $63.5 billion at year-end, equal to 5.5x uninsured deposit balances.
Deposits represented 88% of Ally’s funding portfolio at year-end, which is unchanged from the year prior.
Deposits
Retail deposits increased to $142.3 billion at quarter-end, up $4.6 billion YoY and up $2.2 billion for the quarter. Total deposits increased to $154.7 billion at year-end, up $2.4 billion YoY, and Ally maintained industry-leading customer retention at 97%.
The average retail portfolio deposit rate was 4.15% for the quarter, up 170 bps YoY and up 15 bps QoQ.
Ally experienced the best retail deposit customer growth in our history with 359 thousand net new customers during the year, exceeding 3 million customers, and up 13% YoY. Millennials and younger generations continue to comprise the largest segment of new customers, accounting for nearly three-quarters of new customers in the fourth quarter. At the end of the fourth quarter, 10% of Ally’s deposit customers utilized multiple Ally products.
|
||||||||||
FCash & cash equivalents may include the restricted cash accumulation for retained notes maturing within the following 30 days and returned to Ally on the distribution date. See page 18 of the Financial Supplement for more details.
GTotal liquidity includes cash & cash equivalents, highly liquid securities and current unused borrowing capacity at the FHLB, and FRB Discount Window. See page 18 of the Financial Supplement for more details.
5
|
Definitions of Non-GAAP Financial Measures and Other Key Terms |
||||||||||||||
Ally believes the non-GAAP financial measures defined here are important to the reader of the Consolidated Financial Statements, but these are supplemental to and not a substitute for GAAP measures. See Reconciliation to GAAP below for calculation methodology and details regarding each measure.
Adjusted earnings per share (Adjusted EPS) is a non-GAAP financial measure that adjusts GAAP EPS for revenue and expense items that are typically strategic in nature or that management otherwise does not view as reflecting the operating performance of the company. Management believes Adjusted EPS can help the reader better understand the operating performance of the core businesses and their ability to generate earnings. In the numerator of Adjusted EPS, GAAP net income attributable to common shareholders is adjusted for the following items: (1) excludes discontinued operations, net of tax, as Ally is primarily a domestic company and sales of international businesses and other discontinued operations in the past have significantly impacted GAAP EPS, (2) adds back the tax-effected non-cash Core OID, (3) adjusts for tax-effected repositioning and other which are primarily related to the extinguishment of high cost legacy debt, strategic activities and significant other one-time items, (4) change in fair value of equity securities, (5) excludes significant discrete tax items that do not relate to the operating performance of the core businesses, and adjusts for preferred stock capital actions that have been taken by the company to normalize its capital structure, as applicable for respective periods. See page 7 for calculation methodology and details.
Core Return on Tangible Common Equity (Core ROTCE) is a non-GAAP financial measure that management believes is helpful for readers to better understand the ongoing ability of the company to generate returns on its equity base that supports core operations. For purposes of this calculation, tangible common equity is adjusted for Core OID balance and net DTA. Ally’s Core net income attributable to common shareholders for purposes of calculating Core ROTCE is based on the actual effective tax rate for the period adjusted for significant discrete tax items including tax reserve releases, which aligns with the methodology used in calculating adjusted earnings per share.
| (1) | In the numerator of Core ROTCE, GAAP net income attributable to common shareholders is adjusted for discontinued operations net of tax, tax-effected Core OID, tax-effected repositioning and other which are primarily related to the extinguishment of high-cost legacy debt, strategic activities and significant other one-time items, change in fair value of equity securities, significant discrete tax items, and preferred stock capital actions, as applicable for respective periods. |
| (2) | In the denominator, GAAP shareholder’s equity is adjusted for goodwill and identifiable intangibles net of DTL, Core OID balance, and net DTA. |
Adjusted Efficiency Ratio is a non-GAAP financial measure that management believes is helpful to readers in comparing the efficiency of its core banking and lending businesses with those of its peers. In the numerator of Adjusted Efficiency Ratio, total noninterest expense is adjusted for Rep and warrant expense, Insurance segment expense, and repositioning and other which are primarily related to the extinguishment of high cost legacy debt, strategic activities and significant other one-time items, as applicable for respective periods. In the denominator, total net revenue is adjusted for Core OID and Insurance segment revenue. See Reconciliation to GAAP on page 8 for calculation methodology and details.
Adjusted Tangible Book Value per Share (Adjusted TBVPS) is a non-GAAP financial measure that reflects the book value of equity attributable to shareholders even if Core OID balance were accelerated immediately through the financial statements. As a result, management believes Adjusted TBVPS provides the reader with an assessment of value that is more conservative than GAAP common shareholder’s equity per share. Adjusted TBVPS generally adjusts common equity for: (1) goodwill and identifiable intangibles, net of DTLs, and (2) tax-effected Core OID balance to reduce tangible common equity in the event the corresponding discounted bonds are redeemed/tendered, as applicable for respective periods.
Core Net Income Attributable to Common Shareholders is a non-GAAP financial measure that serves as the numerator in the calculations of Adjusted EPS and Core ROTCE and that, like those measures, is believed by management to help the reader better understand the operating performance of the core businesses and their ability to generate earnings. Core Net Income Attributable to Common Shareholders adjusts GAAP net income attributable to common shareholders for discontinued operations net of tax, tax-effected Core OID expense, tax-effected repositioning and other primarily related to the extinguishment of high-cost legacy debt and strategic activities and significant other, preferred stock capital actions, significant discrete tax items and tax-effected changes in equity investments measured at fair value, as applicable for respective periods. See Reconciliation to GAAP on page 7 for calculation methodology and details.
Core Original Issue Discount (Core OID) Amortization Expense is a non-GAAP financial measure for OID, and is believed by management to help the reader better understand the activity removed from: Core pre-tax income (loss), Core net income (loss) attributable to common shareholders, Adjusted EPS, Core ROTCE, Adjusted efficiency ratio, Adjusted total net revenue, and Net financing revenue (excluding Core OID). Core OID is primarily related to bond exchange OID which excludes international operations and future issuances. See page 8 for calculation methodology and details.
Core Outstanding Original Issue Discount Balance (Core OID balance) is a non-GAAP financial measure for outstanding OID and is believed by management to help the reader better understand the balance removed from Core ROTCE and Adjusted TBVPS. Core OID balance is primarily related to bond exchange OID which excludes international operations and future issuances. See page 8 for calculation methodology and details.
Core Pre-Tax Income is a non-GAAP financial measure that adjusts pre-tax income from continuing operations by excluding (1) Core OID, and (2) change in fair value of equity securities (change in fair value of equity securities impacts the Insurance and Corporate Finance segments), and (3) Repositioning and other which are primarily related to the extinguishment of high cost legacy debt, strategic activities and significant other one-time items, as applicable for respective periods or businesses. Management believes core pre-tax income can help the reader better understand the operating performance of the core businesses and their ability to generate earnings. See the Pre-Tax Income by Segment Table on page 3 for calculation methodology and details.
Pre-provision net revenue (PPNR) is a non-GAAP financial measure calculated by adding GAAP Net Financing Revenue and GAAP Other Revenue then subtracting GAAP Noninterest expense, excluding Provision for credit losses. Management believes that PPNR is a helpful financial metric because it enables the reader to assess the business’ ability to generate earnings to cover credit losses and as it is utilized by Federal Reserve’s approach to modeling within the Supervisory Stress Test Framework that generally follows U.S. generally accepted accounting principles (GAAP) and includes a calculation of PPNR as a component of projected pre-tax net income.
Core pre-provision net revenue (Core PPNR) is a non-GAAP financial measure calculated by adding GAAP Net Financing Revenue and GAAP Other Revenue and subtracting GAAP Noninterest expense then adding Core OID and repositioning expenses, excluding Provision for credit losses. Management believes that Core PPNR is a helpful financial metric because it enables the reader to assess the core business’ ability to generate earnings to cover credit losses.
Tangible Common Equity is a non-GAAP financial measure that is defined as common stockholders’ equity less goodwill and identifiable intangible assets, net of deferred tax liabilities. Ally considers various measures when evaluating capital adequacy, including Tangible Common Equity. Ally believes that Tangible Common Equity is important because we believe readers may assess our capital adequacy using this measure. Additionally, presentation of this measure allows readers to compare certain aspects of our capital adequacy on the same basis to other companies in the industry. For purposes of calculating Core Return on Tangible Common Equity (Core ROTCE), Tangible Common Equity is further adjusted for Core OID balance and net deferred tax asset. See page 7 for calculation methodology & details.
Net Interest Margin (excluding Core OID) is calculated using a non-GAAP measure that adjusts net interest margin by excluding Core OID. The Core OID balance is primarily related to bond exchange OID which excludes international operations and future issuances. Management believes net interest margin ex. Core OID is a helpful financial metric because it enables the reader to better understand the business’s profitability and margins.
Net Financing Revenue (excluding Core OID) is calculated using a non-GAAP measure that adjusts net financing revenue by excluding Core OID. The Core OID balance is primarily related to bond exchange OID which excludes international operations and future issuances. Management believes net financing revenue ex. Core OID is a helpful financial metric because it enables the reader to better understand the business’s ability to generate revenue.
Adjusted Other Revenue is a non-GAAP financial measure that adjusts GAAP other revenue for OID expenses, repositioning, and change in fair value of equity securities. Management believes adjusted other revenue is a helpful financial metric because it enables the reader better understand the business’s ability to generate other revenue.
Adjusted Total Net Revenue is a non-GAAP financial measure that management believes is helpful for readers to understand the ongoing ability of the company to generate revenue. For purposes of this calculation, GAAP net financing revenue is adjusted by excluding Core OID to calculate net financing revenue ex. core OID. GAAP other revenue is adjusted for OID expenses, repositioning, and change in fair value of equity securities to calculate adjusted other revenue. Adjusted total net revenue is calculated by adding net financing revenue ex. core OID to adjusted other revenue.
Adjusted Noninterest Expense is a non-GAAP financial measure that adjusts GAAP noninterest expense for repositioning items. Management believes adjusted noninterest expense is a helpful financial metric because it enables the reader better understand the business’s expenses excluding nonrecurring items.
Adjusted Provision for Credit Losses is a non-GAAP financial measure that adjusts GAAP provision for credit losses for repositioning items. Management believes adjusted provision for credit losses is a helpful financial metric because it enables the reader better understand the business’s expenses excluding nonrecurring items.
Estimated Retail Auto Originated Yield is a financial measure determined by calculating the estimated average annualized yield for loans originated during the period. At this time there currently is no comparable GAAP financial measure for Estimated Retail Auto Originated Yield and therefore this forecasted estimate of yield at the time of origination cannot be quantitatively reconciled to comparable GAAP information.
Net Charge-Off Ratios are annualized net charge-offs divided by average outstanding finance receivables and loans excluding loans measured at fair value and loans held-for-sale.
Accelerated issuance expense (Accelerated OID) is the recognition of issuance expenses related to calls of redeemable debt.
Customer retention rate is the annualized 3-month rolling average of 1 minus the monthly attrition rate; excludes escheatment.
6
Repositioning is primarily related to the extinguishment of high-cost legacy debt, strategic activities, restructuring, amounts related to nonrecurring business transactions or pending transactions, and significant other one-time items. Corporate and Other primarily consists of activity related to centralized corporate treasury activities such as management of the cash and corporate investment securities and loan portfolios, short- and long-term debt, retail and brokered deposit liabilities, derivative instruments, the amortization of the discount associated with new debt issuances and bond exchanges, and the residual impacts of our corporate FTP and treasury ALM activities. Corporate and Other also includes certain equity investments, the management of our legacy mortgage portfolio, and reclassifications and eliminations between the reportable operating segments. Subsequent to June 1, 2016, the revenue and expense activity associated with Ally Invest was included within the Corporate and Other segment. Subsequent to October 1, 2019, the revenue and expense activity associated with Ally Lending was included within the Corporate and Other segment. Subsequent to December 1, 2021, the revenue and expense activity associated with Fair Square was included within the Corporate and Other segment.
Change in fair value of equity securities impacts the Insurance, Corporate Finance and Corporate and Other segments. Reflects equity fair value adjustments related to ASU 2016-01 which requires change in the fair value of equity securities to be recognized in current period net income as compared to periods prior to 1/1/18 in which such adjustments were recognized through other comprehensive income, a component of equity.
Estimated impact of CECL on regulatory capital per final rule issued by U.S. banking agencies—In December 2018, the FRB and other U.S. banking agencies approved a final rule to address the impact of CECL on regulatory capital by allowing BHCs and banks, including Ally, the option to phase in the day-one impact of CECL over a three-year period. In March 2020, the FRB and other U.S. banking agencies issued an interim final rule that became effective on March 31, 2020 and provided an alternative option for banks to temporarily delay the impacts of CECL, relative to the incurred loss methodology for estimating the allowance for loan losses, on regulatory capital. A final rule that was largely unchanged from the March 2020 interim final rule was issued by the FRB and other U.S. banking agencies in August 2020, and became effective in September 2020. For regulatory capital purposes, these rules permitted us to delay recognizing the estimated impact of CECL on regulatory capital until after a two-year deferral period, which for us extended through December 31, 2021. Beginning on January 1, 2022, we are required to phase in 25% of the previously deferred estimated capital impact of CECL, with an additional 25% to be phased in at the beginning of each subsequent year until fully phased in by the first quarter of 2025. Under these rules, firms that adopt CECL and elect the five-year transition will calculate the estimated impact of CECL on regulatory capital as the day-one impact of adoption plus 25% of the subsequent change in allowance during the two-year deferral period, which according to the final rule approximates the impact of CECL relative to an incurred loss model. We adopted this transition option during the first quarter of 2020, and beginning January 1, 2022, are phasing in the regulatory capital impacts of CECL based on this five-year transition period.
|
Reconciliation to GAAP |
||||||||||||||
| Adjusted Earnings per Share |
||||||||||||||||||||||
| Numerator ($ millions) | FY 2023 | FY 2022 | 4Q 23 | 3Q 23 | 4Q 22 | |||||||||||||||||
| GAAP Net Income Attributable to Common Shareholders |
$ | 910 | $ | 1,604 | $ | 49 | $ | 269 | $ | 251 | ||||||||||||
| Discontinued Operations, Net of Tax |
2 | 1 | 1 | — | — | |||||||||||||||||
| Core OID |
48 | 42 | 13 | 12 | 11 | |||||||||||||||||
| Repositioning and Other |
201 | 77 | 172 | 30 | 57 | |||||||||||||||||
| Change in the Fair Value of Equity Securities |
(107 | ) | 215 | (74 | ) | 56 | (49 | ) | ||||||||||||||
| Tax on: Core OID & Change in Fair Value of Equity Securities (21% tax rate) |
(30 | ) | (70 | ) | (23 | ) | (21 | ) | (4 | ) | ||||||||||||
| Significant Discrete Tax Items |
(94 | ) | 61 | — | (94 | ) | 61 | |||||||||||||||
| Core Net Income Attributable to Common Shareholders |
[a] | $ | 930 | $ | 1,929 | $ | 137 | $ | 252 | $ | 327 | |||||||||||
| Denominator |
||||||||||||||||||||||
| Weighted-Average Common Shares Outstanding - (Diluted, thousands) |
[b] | 305,135 | 318,629 | 306,730 | 305,693 | 303,062 | ||||||||||||||||
| Adjusted EPS |
[a] ÷ [b] | $ | 3.05 | $ | 6.06 | $ | 0.45 | $ | 0.83 | $ | 1.08 | |||||||||||
| Core Return on Tangible Common Equity (ROTCE) |
||||||||||||||||||||||
| Numerator ($ millions) | FY 2023 | FY 2022 | 4Q 23 | 3Q 23 | 4Q 22 | |||||||||||||||||
| GAAP Net Income Attributable to Common Shareholders |
$ | 910 | $ | 1,604 | $ | 49 | $ | 269 | $ | 251 | ||||||||||||
| Discontinued Operations, Net of Tax |
2 | 1 | 1 | — | — | |||||||||||||||||
| Core OID |
48 | 42 | 13 | 12 | 11 | |||||||||||||||||
| Repositioning and Other |
201 | 77 | 172 | 30 | 57 | |||||||||||||||||
| Change in Fair Value of Equity Securities |
(107 | ) | 215 | (74 | ) | 56 | (49 | ) | ||||||||||||||
| Tax on: Core OID & Change in Fair Value of Equity Securities (21% tax rate) |
(30 | ) | (70 | ) | (23 | ) | (21 | ) | (4 | ) | ||||||||||||
| Significant Discrete Tax Items |
(94 | ) | 61 | — | (94 | ) | 61 | |||||||||||||||
| Core Net Income Attributable to Common Shareholders |
[a] | $ | 930 | $ | 1,929 | $ | 137 | $ | 252 | $ | 327 | |||||||||||
| Denominator (Average, $ millions) |
||||||||||||||||||||||
| GAAP Shareholder’s Equity |
$ | 13,272 | $ | 14,348 | $ | 13,296 | $ | 13,179 | $ | 12,647 | ||||||||||||
| Preferred Equity |
(2,324 | ) | (2,324 | ) | (2,324 | ) | (2,324 | ) | (2,324 | ) | ||||||||||||
| GAAP Common Shareholder’s Equity |
$ | 10,948 | $ | 12,024 | $ | 10,972 | $ | 10,855 | $ | 10,323 | ||||||||||||
| Goodwill & Identifiable Intangibles, Net of Deferred Tax Liabilities (DTLs) |
(859 | ) | (921 | ) | (805 | ) | (883 | ) | (906 | ) | ||||||||||||
| Tangible Common Equity |
$ | 10,089 | $ | 11,103 | $ | 10,167 | $ | 9,972 | $ | 9,417 | ||||||||||||
| Core OID Balance |
(817 | ) | (862 | ) | (799 | ) | (812 | ) | (847 | ) | ||||||||||||
| Net Deferred Tax Asset (DTA) |
(1,193 | ) | (820 | ) | (1,378 | ) | (1,310 | ) | (1,165 | ) | ||||||||||||
| Normalized Common Equity |
[b] | $ | 8,079 | $ | 9,421 | $ | 7,989 | $ | 7,850 | $ | 7,405 | |||||||||||
| Core Return on Tangible Common Equity |
[a] ÷ [b] | 11.5 | % | 20.5 | % | 6.9 | % | 12.9 | % | 17.6 | % | |||||||||||
7
| Adjusted Tangible Book Value per Share |
||||||||||||||||||||||||
| Numerator ($ billions) | FY 2023 | FY 2022 | 4Q 23 | 3Q 23 | 4Q 22 | |||||||||||||||||||
| GAAP Shareholder’s Equity |
$ | 13,766 | $ | 12,859 | $ | 13,766 | $ | 12,825 | $ | 12,859 | ||||||||||||||
| Preferred Equity |
(2,324 | ) | (2,324 | ) | (2,324 | ) | (2,324 | ) | (2,324 | ) | ||||||||||||||
| GAAP Common Shareholder’s Equity |
$ | 11,442 | $ | 10,535 | $ | 11,442 | $ | 10,501 | $ | 10,535 | ||||||||||||||
| Goodwill and Identifiable Intangible Assets, Net of DTLs |
(731 | ) | (902 | ) | (731 | ) | (879 | ) | (902 | ) | ||||||||||||||
| Tangible Common Equity |
10,711 | 9,633 | 10,711 | 9,622 | 9,633 | |||||||||||||||||||
| Tax-effected Core OID Balance (21% tax rate) |
(626 | ) | (665 | ) | (626 | ) | (636 | ) | (665 | ) | ||||||||||||||
| Adjusted Tangible Book Value |
[a] | $ | 10,084 | $ | 8,968 | $ | 10,084 | $ | 8,986 | $ | 8,968 | |||||||||||||
| Denominator |
||||||||||||||||||||||||
| Issued Shares Outstanding (period-end, thousands) |
[b] | 302,459 | 299,324 | 302,459 | 301,630 | 299,324 | ||||||||||||||||||
| Metric |
||||||||||||||||||||||||
| GAAP Shareholder’s Equity per Share |
$ | 45.51 | $ | 42.96 | $ | 45.51 | $ | 42.52 | $ | 42.96 | ||||||||||||||
| Preferred Equity per Share |
(7.68 | ) | (7.76 | ) | (7.68 | ) | (7.70 | ) | (7.76 | ) | ||||||||||||||
| GAAP Common Shareholder’s Equity per Share |
$ | 37.83 | $ | 35.20 | $ | 37.83 | $ | 34.81 | $ | 35.20 | ||||||||||||||
| Goodwill and Identifiable Intangible Assets, Net of DTLs per Share |
(2.42 | ) | (3.01 | ) | (2.42 | ) | (2.91 | ) | (3.01 | ) | ||||||||||||||
| Tangible Common Equity per Share |
$ | 35.41 | $ | 32.18 | $ | 35.41 | $ | 31.90 | $ | 32.18 | ||||||||||||||
| Tax-effected Core OID Balance (21% tax rate) per Share |
(2.07 | ) | (2.22 | ) | (2.07 | ) | (2.11 | ) | (2.22 | ) | ||||||||||||||
| Adjusted Tangible Book Value per Share |
[a] ÷ [b] | $ | 33.34 | $ | 29.96 | $ | 33.34 | $ | 29.79 | $ | 29.96 | |||||||||||||
| Adjusted Efficiency Ratio |
||||||||||||||||||||||||
| Numerator ($ millions) | FY 2023 | FY 2022 | 4Q 23 | 3Q 23 | 4Q 22 | |||||||||||||||||||
| GAAP Noninterest Expense |
$ | 5,163 | $ | 4,687 | $ | 1,416 | $ | 1,232 | $ | 1,266 | ||||||||||||||
| Insurance Expense |
(1,332 | ) | (1,150 | ) | (321 | ) | (338 | ) | (286 | ) | ||||||||||||||
| Repositioning and Other |
(217 | ) | (77 | ) | (187 | ) | (30 | ) | (57 | ) | ||||||||||||||
| Adjusted Noninterest Expense for Adjusted Efficiency Ratio |
[a] | $ | 3,614 | $ | 3,460 | $ | 908 | $ | 864 | $ | 923 | |||||||||||||
| Denominator ($ millions) |
||||||||||||||||||||||||
| Total Net Revenue |
$ | 8,214 | $ | 8,428 | $ | 2,067 | $ | 1,968 | $ | 2,201 | ||||||||||||||
| Core OID |
48 | 42 | 13 | 12 | 11 | |||||||||||||||||||
| Insurance Revenue |
(1,545 | ) | (1,112 | ) | (450 | ) | (322 | ) | (387 | ) | ||||||||||||||
| Adjusted Net Revenue for Adjusted Efficiency Ratio |
[b] | $ | 6,717 | $ | 7,358 | $ | 1,630 | $ | 1,658 | $ | 1,825 | |||||||||||||
| Adjusted Efficiency Ratio |
[a] ÷ [b] | 53.8 | % | 47.0 | % | 55.7 | % | 52.1 | % | 50.6 | % | |||||||||||||
| Original Issue Discount Amortization Expense ($ millions) |
||||||||||||||||||||||||
| FY 2023 | FY 2022 | 4Q 23 | 3Q 23 | 4Q 22 | ||||||||||||||||||||
| GAAP Original Issue Discount Amortization Expense |
$ | 61 | $ | 53 | $ | 16 | $ | 15 | $ | 14 | ||||||||||||||
| Other OID |
(13 | ) | (11 | ) | (3 | ) | (3 | ) | (3 | ) | ||||||||||||||
| Core Original Issue Discount (Core OID) Amortization Expense (excl. accelerated OID) |
$ | 48 | $ | 42 | $ | 13 | $ | 12 | $ | 11 | ||||||||||||||
| Outstanding Original Issue Discount Balance ($ millions) |
||||||||||||||||||||||||
| FY 2023 | FY 2022 | 4Q 23 | 3Q 23 | 4Q 22 | ||||||||||||||||||||
| GAAP Outstanding Original Issue Discount Balance |
$ | (831 | ) | $ | (882 | ) | $ | (831 | ) | $ | (847 | ) | $ | (882 | ) | |||||||||
| Other Outstanding OID Balance |
39 | 40 | 39 | 42 | 40 | |||||||||||||||||||
| Core Outstanding Original Issue Discount Balance (Core OID Balance) |
$ | (793 | ) | $ | (841 | ) | $ | (793 | ) | $ | (806 | ) | $ | (841 | ) | |||||||||
8
| ($ millions) | ||||||||||||||||||||||||
| Net Financing Revenue (ex. Core OID) | FY 2023 | FY 2022 | 4Q 23 | 3Q 23 | 4Q 22 | |||||||||||||||||||
| GAAP Net Financing Revenue |
[w] | $ | 6,201 | $ | 6,850 | $ | 1,493 | $ | 1,533 | $ | 1,674 | |||||||||||||
| Core OID |
48 | 42 | 13 | 12 | 11 | |||||||||||||||||||
| Net Financing Revenue (ex. Core OID) |
[a] | $ | 6,249 | $ | 6,892 | $ | 1,506 | $ | 1,545 | $ | 1,685 | |||||||||||||
| Adjusted Other Revenue | FY 2023 | FY 2022 | 4Q 23 | 3Q 23 | 4Q 22 | |||||||||||||||||||
| GAAP Other Revenue |
[x] | $ | 2,013 | $ | 1,578 | $ | 574 | $ | 435 | $ | 527 | |||||||||||||
| Change in Fair Value of Equity Securities |
(107 | ) | 215 | (74 | ) | 56 | (49 | ) | ||||||||||||||||
| Adjusted Other Revenue |
[b] | $ | 1,906 | $ | 1,793 | $ | 500 | $ | 491 | $ | 478 | |||||||||||||
| Adjusted Total Net Revenue | FY 2023 | FY 2022 | 4Q 23 | 3Q 23 | 4Q 22 | |||||||||||||||||||
| Adjusted Total Net Revenue |
[a]+[b] | $ | 8,155 | $ | 8,685 | $ | 2,006 | $ | 2,036 | $ | 2,163 | |||||||||||||
| Adjusted Provision for Credit Losses | FY 2023 | FY 2022 | 4Q 23 | 3Q 23 | 4Q 22 | |||||||||||||||||||
| GAAP Provision for Credit Losses |
[y] | $ | 1,968 | $ | 1,399 | $ | 587 | $ | 508 | $ | 490 | |||||||||||||
| Repositioning |
(16 | ) | — | (16 | ) | — | — | |||||||||||||||||
| Adjusted Provision for Credit Losses |
[c] | $ | 1,984 | $ | 1,399 | $ | 603 | $ | 508 | $ | 490 | |||||||||||||
| Adjusted NIE (Excluding Repositioning) | FY 2023 | FY 2022 | 4Q 23 | 3Q 23 | 4Q 22 | |||||||||||||||||||
| GAAP Noninterest Expense |
[z] | $ | 5,163 | $ | 4,687 | $ | 1,416 | $ | 1,232 | $ | 1,266 | |||||||||||||
| Repositioning |
217 | 77 | 187 | 30 | 57 | |||||||||||||||||||
| Adjusted NIE (Excluding Repositioning) |
[d] | $ | 4,946 | $ | 4,610 | $ | 1,229 | $ | 1,202 | $ | 1,209 | |||||||||||||
| Core Pre-Tax Income | FY 2023 | FY 2022 | 4Q 23 | 3Q 23 | 4Q 22 | |||||||||||||||||||
| Pre-Tax Income |
[w]+[x]-[y]-[z] | $ | 1,083 | $ | 2,342 | $ | 64 | $ | 228 | $ | 445 | |||||||||||||
| Core Pre-Tax Income |
[a]+[b]-[c]-[d] | $ | 1,226 | $ | 2,676 | $ | 174 | $ | 326 | $ | 464 | |||||||||||||
| Core Pre-Provision Net Revenue (Core PPNR) | FY 2023 | FY 2022 | 4Q 23 | 3Q 23 | 4Q 22 | |||||||||||||||||||
| Pre-Provision Net Revenue |
[w]+[x]-[z] | $ | 3,051 | $ | 3,741 | $ | 651 | $ | 736 | $ | 935 | |||||||||||||
| Core Pre-Provision Net Revenue |
[a]+[b]-[d] | $ | 3,209 | $ | 4,075 | $ | 777 | $ | 834 | $ | 954 | |||||||||||||
|
|
||||||||||||||||||||||||
| Insurance Non-GAAP Walk to Core Pre-Tax Income (Quarterly) |
|
|||||||||||||||||||||||
| ($ millions) | 4Q 2023 | 4Q 2022 | ||||||||||||||||||||||
| Change in the | Change in the | |||||||||||||||||||||||
| GAAP | fair value of | Non-GAAP1 | GAAP | fair value of | Non-GAAP1 | |||||||||||||||||||
| equity securities |
equity securities |
|||||||||||||||||||||||
| Insurance |
||||||||||||||||||||||||
| Premiums, Service Revenue Earned and Other |
$ | 339 | $ | — | $ | 339 | $ | 305 | $ | — | $ | 305 | ||||||||||||
| Losses and Loss Adjustment Expenses |
93 | — | 93 | 63 | — | 63 | ||||||||||||||||||
| Acquisition and Underwriting Expenses |
228 | — | 228 | 223 | — | 223 | ||||||||||||||||||
| Investment Income and Other |
111 | (67 | ) | 44 | 82 | (49 | ) | 33 | ||||||||||||||||
| Pre-Tax Income from Continuing Operations |
$ | 129 | $ | (67 | ) | $ | 62 | $ | 101 | $ | (49 | ) | $ | 52 | ||||||||||
| Insurance Non-GAAP Walk to Core Pre-Tax Income (Annual) |
|
|||||||||||||||||||||||
| ($ millions) | FY 2023 | FY 2022 | ||||||||||||||||||||||
| Change in the | Change in the | |||||||||||||||||||||||
| GAAP | fair value of | Non-GAAP1 | GAAP | fair value of | Non-GAAP1 | |||||||||||||||||||
| equity securities |
equity securities |
|||||||||||||||||||||||
| Insurance |
||||||||||||||||||||||||
| Premiums, Service Revenue Earned and Other |
$ | 1,284 | $ | — | $ | 1,284 | $ | 1,166 | $ | — | $ | 1,166 | ||||||||||||
| Losses and Loss Adjustment Expenses |
422 | — | 422 | 280 | — | 280 | ||||||||||||||||||
| Acquisition and Underwriting Expenses |
910 | — | 910 | 870 | — | 870 | ||||||||||||||||||
| Investment Income and Other |
261 | (110 | ) | 151 | (54 | ) | 210 | 156 | ||||||||||||||||
| Pre-Tax Income from Continuing Operations |
$ | 213 | $ | (110 | ) | $ | 103 | $ | (38 | ) | $ | 210 | $ | 172 | ||||||||||
1Non-GAAP line items walk to Core Pre-Tax Income, a non-GAAP financial measure that adjusts Pre-Tax Income.
9
|
Additional Financial Information |
||||||||||||||
For additional financial information, the fourth quarter and full-year 2023 earnings presentation and financial supplement are available in the Events & Presentations section of Ally’s Investor Relations Website at http://www.ally.com/about/investor/events-presentations/.
About Ally Financial Inc.
Ally Financial Inc. (NYSE: ALLY) is a financial services company with the nation’s largest all-digital bank and an industry-leading auto financing business, driven by a mission to “Do It Right” and be a relentless ally for customers and communities. The company serves more than 11 million customers through a full range of online banking services (including deposits, mortgage, point-of-sale personal lending and credit card products) and securities brokerage and investment advisory services. The company also includes a robust corporate finance business that offers capital for equity sponsors and middle-market companies, as well as auto financing and insurance offerings. For more information, please visit www.ally.com and follow @allyfinancial.
For more information and disclosures about Ally, visit https://www.ally.com/#disclosures.
For further images and news on Ally, please visit https://media.ally.com.
Forward-Looking Statements
This earnings release and related communications should be read in conjunction with the financial statements, notes, and other information contained in our Annual Reports on Form 10-K, Quarterly Reports on Form 10-Q, and Current Reports on Form 8-K. This information is preliminary and based on company and third-party data available at the time of the release or related communication.
This earnings release and related communications contain forward-looking statements within the meaning of the Private Securities Litigation Reform Act of 1995. These statements can be identified by the fact that they do not relate strictly to historical or current facts — such as statements about the outlook for financial and operating metrics and performance and future capital allocation and actions. Forward-looking statements often use words such as “believe,” “expect,” “anticipate,” “intend,” “pursue,” “seek,” “continue,” “estimate,” “project,” “outlook,” “forecast,” “potential,” “target,” “objective,” “trend,” “plan,” “goal,” “initiative,” “priorities,” or other words of comparable meaning or future-tense or conditional verbs such as “may,” “will,” “should,” “would,” or “could.” Forward-looking statements convey our expectations, intentions, or forecasts about future events, circumstances, or results. All forward-looking statements, by their nature, are subject to assumptions, risks, and uncertainties, which may change over time and many of which are beyond our control. You should not rely on any forward-looking statement as a prediction or guarantee about the future.
Actual future objectives, strategies, plans, prospects, performance, conditions, or results may differ materially from those set forth in any forward looking statement. Some of the factors that may cause actual results or other future events or circumstances to differ from those in forward looking statements are described in our Annual Report on Form 10-K for the year ended December 31, 2022, our subsequent Quarterly Reports on Form 10-Q or Current Reports on Form 8-K, or other applicable documents that are filed or furnished with the U.S. Securities and Exchange Commission (collectively, our “SEC filings”). Any forward-looking statement made by us or on our behalf speaks only as of the date that it was made. We do not undertake to update any forward-looking statement to reflect the impact of events, circumstances, or results that arise after the date that the statement was made, except as required by applicable securities laws. You, however, should consult further disclosures (including disclosures of a forward-looking nature) that we may make in any subsequent SEC filings.
This earnings release and related communications contain specifically identified non-GAAP financial measures, which supplement the results that are reported according to generally accepted accounting principles (“GAAP”). These non-GAAP financial measures may be useful to investors but should not be viewed in isolation from, or as a substitute for, GAAP results. Differences between non-GAAP financial measures and comparable GAAP financial measures are reconciled in the release.
Unless the context otherwise requires, the following definitions apply. The term “loans” means the following consumer and commercial products associated with our direct and indirect financing activities: loans, retail installment sales contracts, lines of credit, and other financing products excluding operating leases. The term “operating leases” means consumer- and commercial-vehicle lease agreements where Ally is the lessor and the lessee is generally not obligated to acquire ownership of the vehicle at lease-end or compensate Ally for the vehicle’s residual value. The terms “lend,” “finance,” and “originate” mean our direct extension or origination of loans, our purchase or acquisition of loans, or our purchase of operating leases as applicable. The term “consumer” means all consumer products associated with our loan and operating-lease activities and all commercial retail installment sales contracts. The term “commercial” means all commercial products associated with our loan activities, other than commercial retail installment sales contracts. The term “partnerships” means business arrangements rather than partnerships as defined by law.
| Contacts: |
||
| Sean Leary | Peter Gilchrist | |
| Ally Investor Relations | Ally Communications (Media) | |
| 704-444-4830 | 704-644-6299 | |
| sean.leary@ally.com | peter.gilchrist@ally.com |
10

4Q 2023 Preliminary Results Exhibit 99.2 Ally Financial Inc. 4Q 2023 Earnings Review January 19, 2024 Contact Ally Investor Relations at (866) 710-4623 or investor.relations@ally.com 1

4Q 2023 Preliminary Results Forward-Looking Statements and Additional Information This presentation and related communications should be read in conjunction with the financial statements, notes, and other information contained in our Annual Reports on Form 10-K, Quarterly Reports on Form 10-Q, and Current Reports on Form 8-K. This information is preliminary and based on company and third-party data available at the time of the presentation or related communication. This presentation and related communications contain forward-looking statements within the meaning of the Private Securities Litigation Reform Act of 1995. These statements can be identified by the fact that they do not relate strictly to historical or current facts—such as statements about the outlook for financial and operating metrics and performance and future capital allocation and actions. Forward-looking statements often use words such as “believe,” “expect,” “anticipate,” “intend,” “pursue,” “seek,” “continue,” “estimate,” “project,” “outlook,” “forecast,” “potential,” “target,” “objective,” “trend,” “plan,” “goal,” “initiative,” “priorities,” or other words of comparable meaning or future-tense or conditional verbs such as “may,” “will,” “should,” “would,” or “could.” Forward-looking statements convey our expectations, intentions, or forecasts about future events, circumstances, or results. All forward-looking statements, by their nature, are subject to assumptions, risks, and uncertainties, which may change over time and many of which are beyond our control. You should not rely on any forward-looking statement as a prediction or guarantee about the future. Actual future objectives, strategies, plans, prospects, performance, conditions, or results may differ materially from those set forth in any forward-looking statement. Some of the factors that may cause actual results or other future events or circumstances to differ from those in forward-looking statements are described in our Annual Report on Form 10-K for the year ended December 31, 2022, our subsequent Quarterly Reports on Form 10-Q or Current Reports on Form 8-K, or other applicable documents that are filed or furnished with the U.S. Securities and Exchange Commission (collectively, our “SEC filings”). Any forward-looking statement made by us or on our behalf speaks only as of the date that it was made. We do not undertake to update any forward-looking statement to reflect the impact of events, circumstances, or results that arise after the date that the statement was made, except as required by applicable securities laws. You, however, should consult further disclosures (including disclosures of a forward-looking nature) that we may make in any subsequent SEC filings. This presentation and related communications contain specifically identified non-GAAP financial measures, which supplement the results that are reported according to U.S. generally accepted accounting principles (“GAAP”). These non-GAAP financial measures may be useful to investors but should not be viewed in isolation from, or as a substitute for, GAAP results. Differences between non-GAAP financial measures and comparable GAAP financial measures are reconciled in the presentation. Unless the context otherwise requires, the following definitions apply. The term “loans” means the following consumer and commercial products associated with our direct and indirect financing activities: loans, retail installment sales contracts, lines of credit, and other financing products excluding operating leases. The term “operating leases” means consumer- and commercial-vehicle lease agreements where Ally is the lessor and the lessee is generally not obligated to acquire ownership of the vehicle at lease-end or compensate Ally for the vehicle’s residual value. The terms “lend,” “finance,” and “originate” mean our direct extension or origination of loans, our purchase or acquisition of loans, or our purchase of operating leases, as applicable. The term “consumer” means all consumer products associated with our loan and operating-lease activities and all commercial retail installment sales contracts. The term “commercial” means all commercial products associated with our loan activities, other than commercial retail installment sales contracts. The term “partnerships” means business arrangements rather than partnerships as defined by law. 2
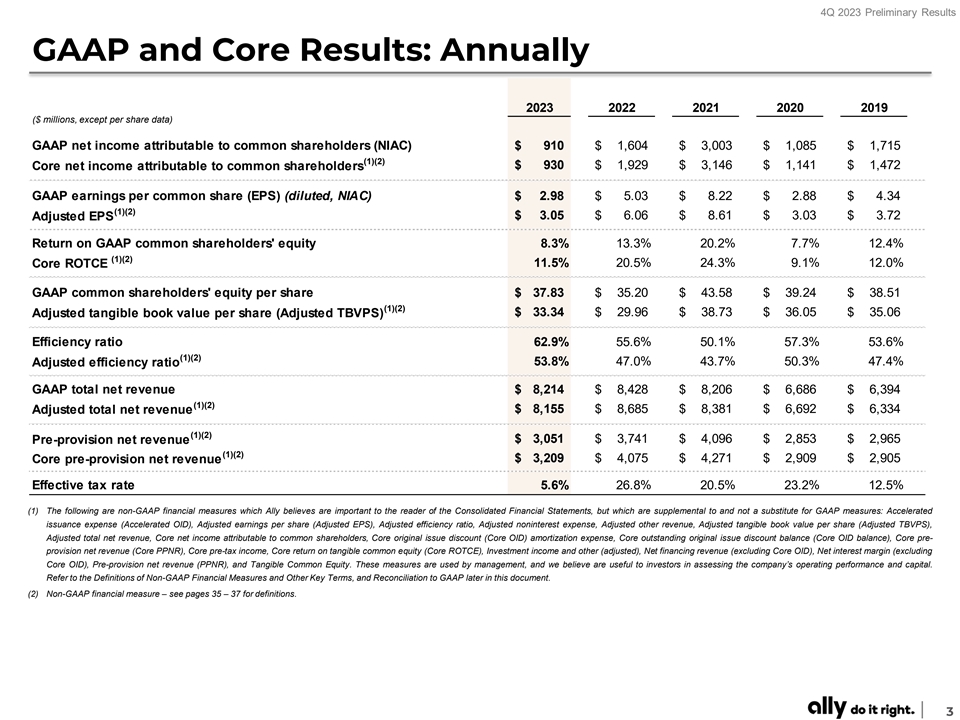
4Q 2023 Preliminary Results GAAP and Core Results: Annually 2023 2022 2021 2020 2019 ($ millions, except per share data) GAAP net income attributable to common shareholders (NIAC) $ 910 $ 1,604 $ 3,003 $ 1,085 $ 1,715 (1)(2) $ 930 $ 1,929 $ 3,146 $ 1,141 $ 1 ,472 Core net income attributable to common shareholders GAAP earnings per common share (EPS) (diluted, NIAC) $ 2.98 $ 5.03 $ 8.22 $ 2.88 $ 4.34 (1)(2) Adjusted EPS $ 3.05 $ 6.06 $ 8.61 $ 3.03 $ 3.72 Return on GAAP common shareholders' equity 8.3% 13.3% 20.2% 7.7% 12.4% (1)(2) 11.5% 20.5% 24.3% 9.1% 12.0% Core ROTCE GAAP common shareholders' equity per share $ 37.83 $ 35.20 $ 4 3.58 $ 39.24 $ 3 8.51 (1)(2) $ 3 3.34 $ 29.96 $ 3 8.73 $ 36.05 $ 3 5.06 Adjusted tangible book value per share (Adjusted TBVPS) Efficiency ratio 62.9% 55.6% 50.1% 57.3% 53.6% (1)(2) 53.8% 47.0% 43.7% 50.3% 47.4% Adjusted efficiency ratio GAAP total net revenue $ 8 ,214 $ 8,428 $ 8,206 $ 6 ,686 $ 6 ,394 (1)(2) $ 8 ,155 $ 8,685 $ 8 ,381 $ 6,692 $ 6 ,334 Adjusted total net revenue (1)(2) $ 3 ,051 $ 3 ,741 $ 4,096 $ 2 ,853 $ 2,965 Pre-provision net revenue (1)(2) $ 3 ,209 $ 4 ,075 $ 4 ,271 $ 2,909 $ 2 ,905 Core pre-provision net revenue Effective tax rate 5.6% 26.8% 20.5% 23.2% 12.5% (1) The following are non-GAAP financial measures which Ally believes are important to the reader of the Consolidated Financial Statements, but which are supplemental to and not a substitute for GAAP measures: Accelerated issuance expense (Accelerated OID), Adjusted earnings per share (Adjusted EPS), Adjusted efficiency ratio, Adjusted noninterest expense, Adjusted other revenue, Adjusted tangible book value per share (Adjusted TBVPS), Adjusted total net revenue, Core net income attributable to common shareholders, Core original issue discount (Core OID) amortization expense, Core outstanding original issue discount balance (Core OID balance), Core pre- provision net revenue (Core PPNR), Core pre-tax income, Core return on tangible common equity (Core ROTCE), Investment income and other (adjusted), Net financing revenue (excluding Core OID), Net interest margin (excluding Core OID), Pre-provision net revenue (PPNR), and Tangible Common Equity. These measures are used by management, and we believe are useful to investors in assessing the company’s operating performance and capital. Refer to the Definitions of Non-GAAP Financial Measures and Other Key Terms, and Reconciliation to GAAP later in this document. (2) Non-GAAP financial measure – see pages 35 – 37 for definitions. 3
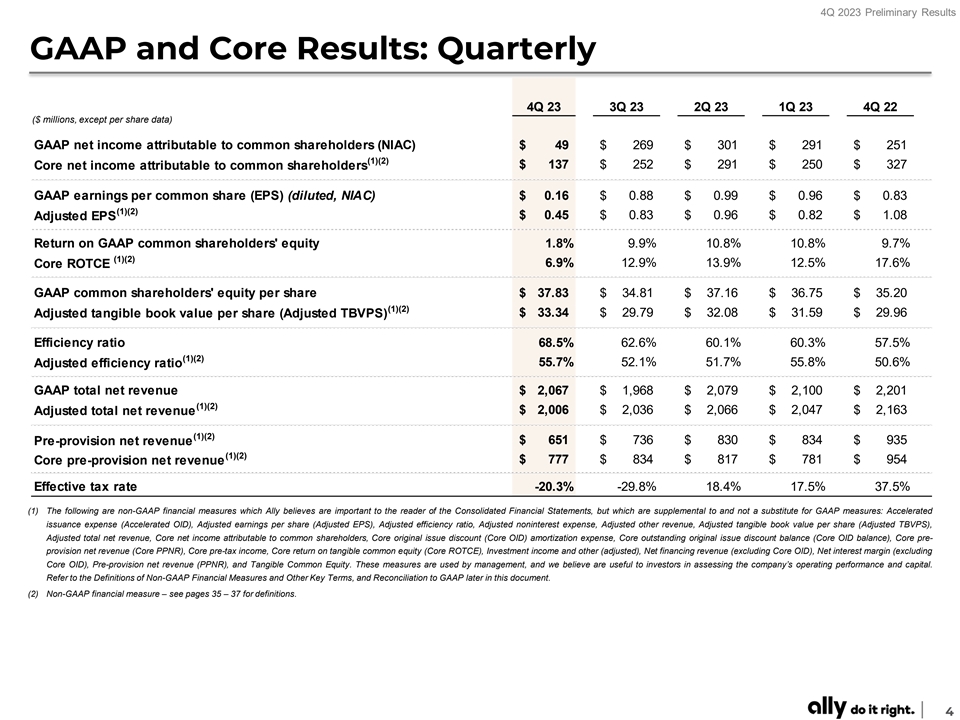
4Q 2023 Preliminary Results GAAP and Core Results: Quarterly 4Q 23 3Q 23 2Q 23 1Q 23 4Q 22 ($ millions, except per share data) GAAP net income attributable to common shareholders (NIAC) $ 49 $ 269 $ 301 $ 291 $ 251 (1)(2) Core net income attributable to common shareholders $ 137 $ 252 $ 291 $ 250 $ 327 GAAP earnings per common share (EPS) (diluted, NIAC) $ 0.16 $ 0.88 $ 0.99 $ 0.96 $ 0.83 (1)(2) Adjusted EPS $ 0.45 $ 0.83 $ 0.96 $ 0.82 $ 1.08 Return on GAAP common shareholders' equity 1.8% 9.9% 10.8% 10.8% 9.7% (1)(2) 6.9% 12.9% 13.9% 12.5% 17.6% Core ROTCE GAAP common shareholders' equity per share $ 3 7.83 $ 3 4.81 $ 37.16 $ 36.75 $ 35.20 (1)(2) Adjusted tangible book value per share (Adjusted TBVPS) $ 3 3.34 $ 2 9.79 $ 3 2.08 $ 3 1.59 $ 2 9.96 Efficiency ratio 68.5% 62.6% 60.1% 60.3% 57.5% (1)(2) 55.7% 52.1% 51.7% 55.8% 50.6% Adjusted efficiency ratio GAAP total net revenue $ 2,067 $ 1,968 $ 2,079 $ 2,100 $ 2 ,201 (1)(2) Adjusted total net revenue $ 2 ,006 $ 2 ,036 $ 2 ,066 $ 2,047 $ 2 ,163 (1)(2) $ 651 $ 736 $ 830 $ 834 $ 935 Pre-provision net revenue (1)(2) $ 777 $ 834 $ 817 $ 781 $ 954 Core pre-provision net revenue Effective tax rate -20.3% -29.8% 18.4% 17.5% 37.5% (1) The following are non-GAAP financial measures which Ally believes are important to the reader of the Consolidated Financial Statements, but which are supplemental to and not a substitute for GAAP measures: Accelerated issuance expense (Accelerated OID), Adjusted earnings per share (Adjusted EPS), Adjusted efficiency ratio, Adjusted noninterest expense, Adjusted other revenue, Adjusted tangible book value per share (Adjusted TBVPS), Adjusted total net revenue, Core net income attributable to common shareholders, Core original issue discount (Core OID) amortization expense, Core outstanding original issue discount balance (Core OID balance), Core pre- provision net revenue (Core PPNR), Core pre-tax income, Core return on tangible common equity (Core ROTCE), Investment income and other (adjusted), Net financing revenue (excluding Core OID), Net interest margin (excluding Core OID), Pre-provision net revenue (PPNR), and Tangible Common Equity. These measures are used by management, and we believe are useful to investors in assessing the company’s operating performance and capital. Refer to the Definitions of Non-GAAP Financial Measures and Other Key Terms, and Reconciliation to GAAP later in this document. (2) Non-GAAP financial measure – see pages 35 – 37 for definitions. 4

4Q 2023 Preliminary Results Purpose-Driven Culture Strong leadership team in place to continue to advance our ‘LEAD’ Core Values and ‘Do It Right’ Culture L E A D Look Execute with Act with Deliver externally excellence professionalism results Strive to meet and exceed the Continuously improve with an Operate with integrity and Lead the charge to win for our needs of our customers intense focus on excellence embrace diversity and customers and company inclusion Customer centric focus and …Driving purpose and a … Delivering long-term investing in our culture… sense of belonging… value for all stakeholders (1) 11M+ Total Customers ➢➢ ‘23 Fortune 100 Best Companies to Work For➢ 60,000+ Volunteer Hours (2) America’s Best Large Employers ‘23 (Forbes) ➢➢➢ 88% Bank Customer Satisfaction 50-50 Media Spend Pledge Best Employers for Women ‘23 (Forbes) (3) th ➢➢➢ 380+ Million Digital Interactions ‘23 Top 50 Companies for Diversity (DiversityInc) 5 Annual Moguls in the Making See page 39 for footnotes. 5
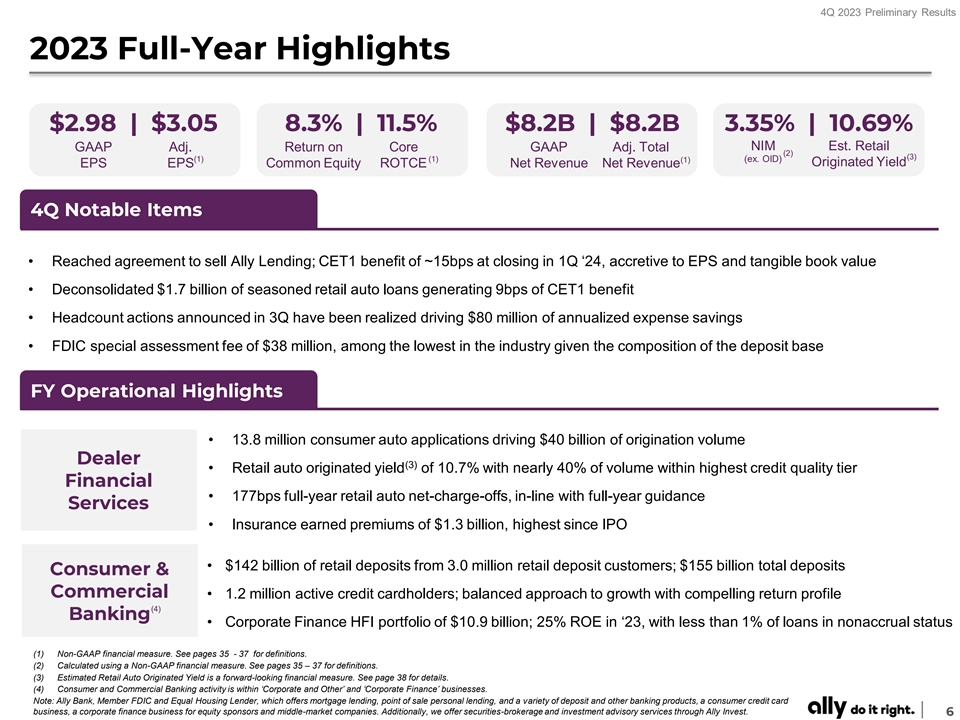
4Q 2023 Preliminary Results 2023 Full-Year Highlights $2.98 | $3.05 8.3% | 11.5% $8.2B | $8.2B 3.35% | 10.69% NIM Est. Retail GAAP Adj. Return on Core GAAP Adj. Total (2) (3) (1) (1) (1) (ex. OID) Originated Yield EPS EPS Common Equity ROTCE Net Revenue Net Revenue 4Q Notable Items • Reached agreement to sell Ally Lending; CET1 benefit of ~15bps at closing in 1Q ‘24, accretive to EPS and tangible book value • Deconsolidated $1.7 billion of seasoned retail auto loans generating 9bps of CET1 benefit • Headcount actions announced in 3Q have been realized driving $80 million of annualized expense savings • FDIC special assessment fee of $38 million, among the lowest in the industry given the composition of the deposit base FY Operational Highlights • 13.8 million consumer auto applications driving $40 billion of origination volume Dealer (3) • Retail auto originated yield of 10.7% with nearly 40% of volume within highest credit quality tier Financial • 177bps full-year retail auto net-charge-offs, in-line with full-year guidance Services • Insurance earned premiums of $1.3 billion, highest since IPO • $142 billion of retail deposits from 3.0 million retail deposit customers; $155 billion total deposits Consumer & Commercial • 1.2 million active credit cardholders; balanced approach to growth with compelling return profile (4) Banking • Corporate Finance HFI portfolio of $10.9 billion; 25% ROE in ‘23, with less than 1% of loans in nonaccrual status (1) Non-GAAP financial measure. See pages 35 - 37 for definitions. (2) Calculated using a Non-GAAP financial measure. See pages 35 – 37 for definitions. (3) Estimated Retail Auto Originated Yield is a forward-looking financial measure. See page 38 for details. (4) Consumer and Commercial Banking activity is within ‘Corporate and Other’ and ‘Corporate Finance’ businesses. Note: Ally Bank, Member FDIC and Equal Housing Lender, which offers mortgage lending, point of sale personal lending, and a variety of deposit and other banking products, a consumer credit card business, a corporate finance business for equity sponsors and middle-market companies. Additionally, we offer securities-brokerage and investment advisory services through Ally Invest. 6
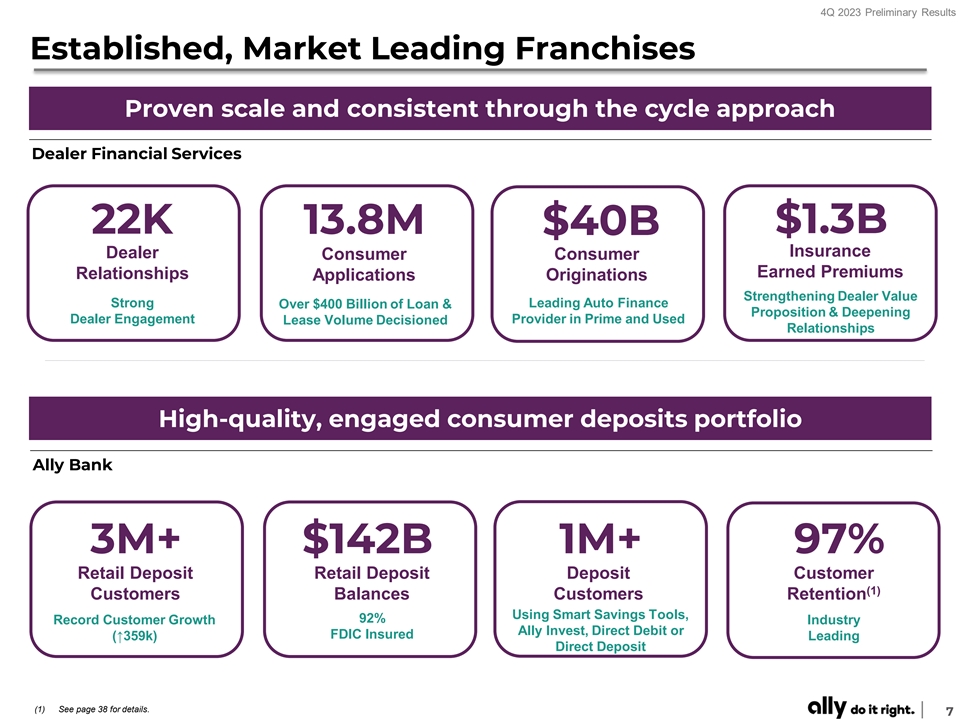
4Q 2023 Preliminary Results Established, Market Leading Franchises Proven scale and consistent through the cycle approach Dealer Financial Services 22K $1.3B 13.8M $40B Insurance Dealer Consumer Consumer Earned Premiums Relationships Applications Originations Strengthening Dealer Value Strong Leading Auto Finance Over $400 Billion of Loan & Proposition & Deepening Dealer Engagement Provider in Prime and Used Lease Volume Decisioned Relationships High-quality, engaged consumer deposits portfolio Ally Bank 3M+ $142B 1M+ 97% Retail Deposit Retail Deposit Deposit Customer (1) Customers Balances Customers Retention Using Smart Savings Tools, 92% Record Customer Growth Industry Ally Invest, Direct Debit or FDIC Insured (↑359k) Leading Direct Deposit (1) See page 38 for details. 7
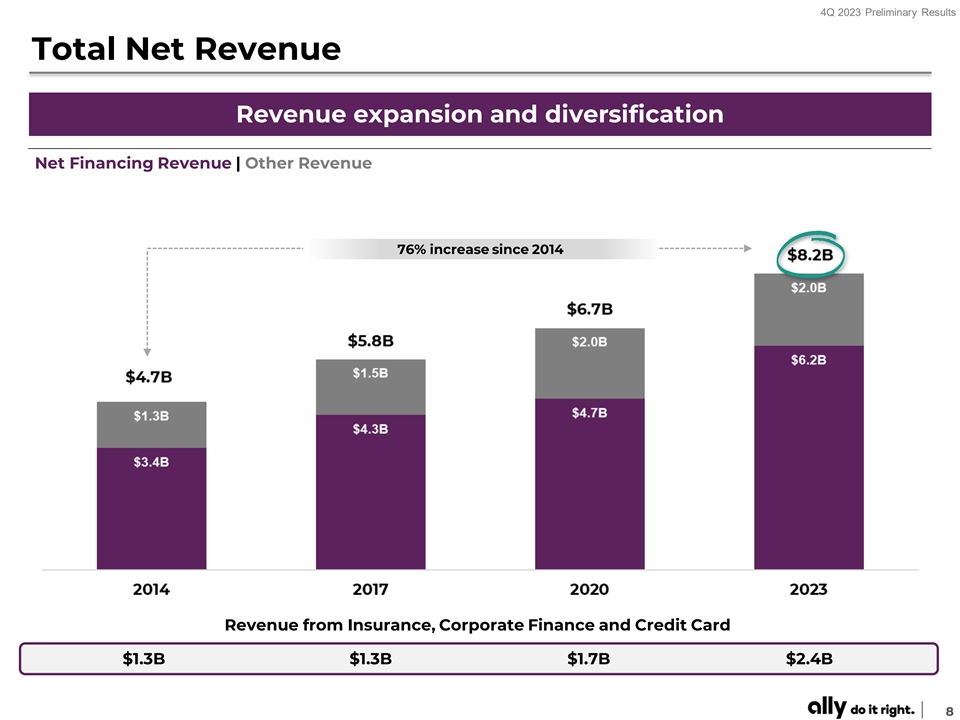
4Q 2023 Preliminary Results Total Net Revenue Revenue expansion and diversification Net Financing Revenue | Other Revenue 76% increase since 2014 Revenue from Insurance, Corporate Finance and Credit Card $1.3B $1.3B $1.7B $2.4B 8
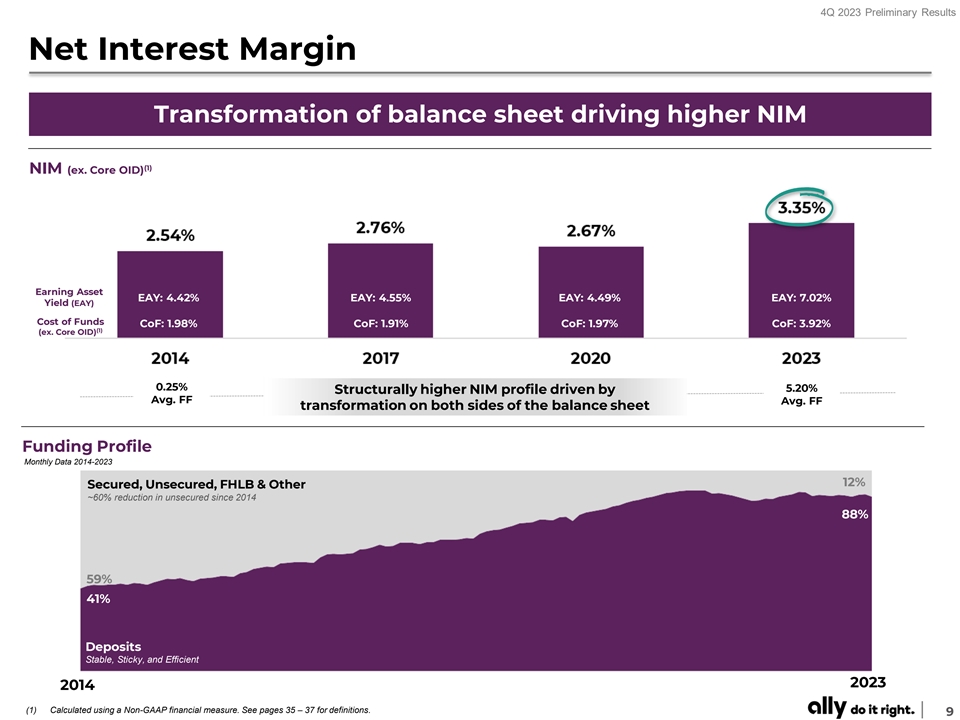
4Q 2023 Preliminary Results Net Interest Margin Transformation of balance sheet driving higher NIM (1) NIM (ex. Core OID) Earning Asset EAY: 4.42% EAY: 4.55% EAY: 4.49% EAY: 5.46% EAY: 7.02% Yield (EAY) Cost of Funds CoF: 1.98% CoF: 1.91% CoF: 1.97% CoF: 1.71% CoF: 3.92% (1) (ex. Core OID) 0.25% 5.20% Structurally higher NIM profile driven by Avg. FF Avg. FF transformation on both sides of the balance sheet Funding Profile Monthly Data 2014-2023 12% Secured, Unsecured, FHLB & Other ~60% reduction in unsecured since 2014 88% 59% 41% Deposits Stable, Sticky, and Efficient 2023 2014 (1) Calculated using a Non-GAAP financial measure. See pages 35 – 37 for definitions. 9

4Q 2023 Preliminary Results Funding and Liquidity Core funded with stable deposits and strong liquidity position Total Available Liquidity Funding Composition ($ billions) (End of Period) Unsecured Debt Cash and Equivalents FHLB / Other FHLB Unused Pledged Borrowing Capacity FRB Discount Window Pledged Capacity Secured Debt Total Deposits Unencumbered Highly Liquid Securities (1) Loan to Deposit Ratio Available Liquidity vs. Uninsured Deposits 5.9x 2.3x 4.1x 5.5x 205% 141% 94% 98% Note: Excludes estimated incremental funding capacity if securities were pledged to Bank Term Funding Program at par (1) Total loans and leases divided by total deposits. relative to market value (~$1.7B). 10

4Q 2023 Preliminary Results Capital Optimization Continuing to optimize capital across all areas of the business • Sale reflects overall strategy to invest resources in growing scale businesses and strengthening relationships with consumer and dealer customers Reached Agreement to • Expected to close in the first quarter of 2024 and generate approximately 15bps of CET1 Sell Ally Lending • Resulted in loss on sale of $101 million after-tax, driven by the write down of goodwill • Deconsolidated $1.7 billion of seasoned retail auto loans in 4Q ‘23 Deconsolidation – Loans primarily made up of 2022 vintage with 7.3% yield of Retail Auto Loans – Transactions drove 9bps CET1 benefit in 4Q ‘23 • Reduced 2023 RWA by $4B through targeted curtailments across retail auto and unsecured • Workforce reduction in 2H ’23 driving $80 million of annual savings Ongoing Capital • Generated $100 million of capital through tax planning strategies Optimization • No reinvestment in investment securities and minimal HFI mortgage volume since 2022 • Transferred $3.6 billion of Non-Agency MBS from AFS to HTM in 4Q ‘23 – Securities do not qualify as contingent liquidity 11

4Q 2023 Preliminary Results 4Q and Full-Year 2023 Financial Results Consolidated Income Statement 4Q 23 3Q 23 4Q 22 2023 2022 ($ millions, except per share data) Net financing revenue $ 1,493 $ 1,533 $ 1,674 $ 6,201 $ 6,850 (1) Core OID 13 12 11 48 42 (1) Net financing revenue (ex. Core OID) 1,506 1,545 1,685 6,249 6,892 Other revenue 574 435 527 2,013 1,578 (2) (74) 56 (49) (107) 215 Repositioning and change in fair value of equity securities (1) 500 491 478 1,906 1,793 Adjusted other revenue Provision for credit losses 587 508 490 1,968 1,399 Memo: Net charge-offs 623 456 390 1,887 952 Memo: Provision build / (release) (36) 52 100 81 447 (3) ( 16) - - ( 16) - Ally Lending Repositioning items (1) 603 508 490 1,984 1,399 Adjusted provision for credit losses Noninterest expense 1,416 1,232 1,266 5,163 4,687 (2) FDIC Special Assessment 38 30 57 68 77 Repositioning items (3) $133M pre-tax impact from 149 - - 149 - Ally Lending Repositioning items provision release and (1) 1,229 1,202 1,209 4,946 4,610 Adjusted noninterest expense write-down of goodwill Pre-tax income $ 64 $ 228 $ 445 $ 1 ,083 $ 2 ,342 Income tax expense / (benefit) ( 13) (68) 167 61 627 Net loss from discontinued operations (1) - - (2) (1) Net income $ 76 $ 296 $ 278 $ 1,020 $ 1,714 Preferred stock dividends 27 27 27 110 110 Net income attributable to common stockholders $ 49 $ 269 $ 251 $ 910 $ 1,604 $ - GAAP EPS (diluted) $ 0.16 $ 0.88 $ 0.83 $ 2 .98 $ 5 .03 (1) Core OID, net of tax 0 .03 0 .03 0.03 0.13 0.10 (2) Change in fair value of equity securities, net of tax (0.19) 0.14 (0.13) (0.28) 0.53 (2) 0 .10 0.08 0.15 0.18 0 .19 Repositioning, discontinued ops., and other, net of tax (3) FDIC Special Assessment 0 .34 - - 0.34 - Repositioning items (Ally Lending) Significant discrete tax items - ( 0.31) 0.20 (0.31) 0 .19 Provision release and (1) write-down of goodwill $ 0 .45 $ 0.83 $ 1.08 $ 3 .05 $ 6 .06 Adjusted EPS (1) Non-GAAP financial measure. See pages 35 – 37 for definitions. (2) Contains Non-GAAP financial measures and other financial measures. See pages 35 – 38 for definitions. (3) Repositioning items related to pending sale of Ally Lending. Contains Non-GAAP financial measures and other financial measures. See pages 35 – 38 for definitions. Note: Repositioning items excluding Ally Lending represent FDIC special assessment fee in 4Q ’23, costs associated with restructuring in 3Q ’23 and cost associated with termination of legacy qualified pension plan in 2022. 12

4Q 2023 Preliminary Results Balance Sheet and Net Interest Margin 4Q 23 3Q 23 4Q 22 2023 2022 Average Average Average Average Average Balance Yield Balance Yield Balance Yield Balance Yield Balance Yield ($ millions) Retail Auto Loans $ 84,711 8.98% $ 85,131 8.90% $ 83,781 7.98% $ 84,393 8.80% $ 81,035 7.19% Memo: Impact from hedges 0.55% 0.74% 0.61% 0.77% 0.18% Auto Leases (net of depreciation) 9,415 6.24% 9,817 7.00% 10,546 6.02% 9,941 6.93% 10,656 6.41% Commercial Auto 21,808 7.14% 20,530 7.11% 17,283 5.91% 20,184 6.96% 16,462 4.45% Corporate Finance 10,787 9.70% 10,309 9.54% 10,181 7.78% 10,486 9.34% 8,974 6.09% (1) 18,788 3.21% 19,028 3.20% 19,876 3.17% 19,188 3.22% 19,218 3.06% Mortgage (2) 2,167 9.86% 2,201 9.94% 1,904 10.37% 2,130 9.94% 1,508 11.31% Consumer Other - Ally Lending Consumer Other - Ally Credit Card 1,925 22.02% 1,826 22.39% 1,486 21.75% 1,769 22.04% 1,216 20.54% Cash and Cash Equivalents 7,571 4.72% 8,308 4.73% 4,129 2.94% 7,261 4.57% 3,886 1.38% (3) 29,784 3.66% 30,769 3.53% 32,513 2.89% 31,264 3.34% 34,778 2.46% Investment Securities & Other Earning Assets $ 186,956 7.22% $ 187,920 7.14% $ 181,698 6.24% $ 186,616 7.02% $ 177,733 5.46% (3) Total Loans and Leases 149,978 8.04% 149,248 8.02% 145,438 7.08% 148,494 7.91% 139,450 6.32% (4) $ 153,672 4.19% $ 153,526 4.04% $ 148,485 2.53% $ 153,087 3.81% $ 143,180 1.39% Deposits Unsecured Debt 9,796 7.10% 10,778 6.40% 9,600 6.03% 10,388 6.49% 9,175 6.00% Secured Debt 2,279 5.15% 3,120 6.81% 1,917 4.73% 2,708 5.96% 1,386 5.77% (5) 8,572 3.79% 7,365 3.23% 9,934 2.80% 7,513 3.23% 10,414 2.29% Other Borrowings Funding Sources $ 174,319 4.35% $ 174,789 4.21% $ 169,936 2.77% $ 173,696 3.97% $ 164,155 1.74% 3.1640% NIM (as reported) 3.17% 3.24% 3.65% 3.32% 3.85% (6) $ 799 6.35% $ 812 6.02% $ 847 5.17% $ 817 5.92% $ 862 4.84% Core OID (6) 3.20% 3.26% 3.68% 3.35% 3.88% NIM (ex. Core OID) (1) Mortgage includes held-for-investment (HFI) loans from the Mortgage Finance segment and the HFI legacy mortgage portfolio in run-off at the Corporate and Other segment. (2) Unsecured lending from point-of-sale financing. Moved to Assets of Operations Held-For-Sale (HFS) on 12/31/23. (3) Includes Community Reinvestment Act and other held-for-sale (HFS) loans. (4) Includes retail, brokered, and other deposits (inclusive of sweep deposits, mortgage escrow and other deposits). (5) Includes FHLB borrowings and Repurchase Agreements. (6) Calculated using a Non-GAAP financial measure. See pages 35 – 37 for definitions. 13

4Q 2023 Preliminary Results Capital (1) • 4Q ‘23 CET1 ratio of 9.4% and TCE / TA ratio of 5.5% Capital Ratios and Risk-Weighted Assets ($ billions) – Closing of Ally Lending sale in early 2024 adds ~15bps of CET1 Total Capital Ratio • $3.8B of CET1 capital above FRB requirement of 7.0% Tier 1 Ratio (Regulatory Minimum + SCB) CET1 Ratio – 9.0% internal operating target Risk • Executed several capital management actions in 4Q ‘23 Weighted Assets – Reached agreement to sell Ally Lending – Deconsolidated $1.7B of retail auto loans from balance sheet – Transferred $3.6B of securities from AFS to HTM • Announced 1Q ’24 common dividend of $0.30 per share Note: For more details on the final rules to address the impact of CECL on regulatory capital by allowing BHCs and banks, including Ally, to delay and subsequently phase-in its impact, see page 38. (1) Adjusted Tangible Book Value Per Share $46 100% increase since 2014 (1) (ex. OCI) (2) OCI Impact End of Period Shares Outstanding: 480M 437M 375M 302M (1) Contains a Non-GAAP financial measure. See pages 35 – 37 for definitions. (2) Prior period OCI impacts are not material to Adjusted Tangible Book Value per Share and therefore not shown. 14

4Q 2023 Preliminary Results Asset Quality: Key Metrics (1) (1) Consolidated Net Charge-Offs (NCOs) Net Charge-Off Activity ($ millions) 4Q 22 1Q 23 2Q 23 3Q 23 4Q 23 Annualized Retail Auto $ 347 $ 351 $ 277 $ 393 $ 470 NCO Rate Commercial Auto - - 4 - 19 Mortgage Finance - - - - - Corporate Finance - - 56 (3) 48 NCOs ($M) Ally Lending 26 30 27 29 36 Ally Credit Card 19 29 36 39 52 (2) Corp/Other (2) (1) (1) (2) (2) Total $ 390 $ 409 $ 399 $ 456 $ 623 (2) Corp/Other includes legacy Mortgage HFI portfolio. Note: Ratios exclude loans measured at fair value and loans held for sale ex. Ally Lending. See page 38 for definition. (1) Retail Auto Net Charge-Offs (NCOs) Retail Auto Delinquencies 4.38% excluding impact from retail auto loan sales 30+ DPD Delinquency Rate Annualized 60+ DPD NCO Rate Delinquency Rate 60+ Delinquent Contracts NCOs ($M) ($M) (1) Excludes write-downs from retail auto loan sales and pending Ally Lending sale. 15 Notes: [1] Includes accruing contracts only [2] Days Past Due (“DPD”).

4Q 2023 Preliminary Results Asset Quality: Coverage and Reserves Consolidated Coverage Retail Auto Coverage QoQ decrease 3.62% ex. ($ billions) ($ billions) driven by change impacts from in portfolio mix, retail auto loan including sale of sales Ally Lending Reserve (%) Reserve (%) Reserve ($) Reserve ($) Note: Coverage rate calculations exclude fair value adjustment for loans in hedge accounting relationships. Note: Coverage rate calculations exclude fair value adjustment for loans in hedge accounting relationships. Consolidated QoQ Reserve Walk ($ millions) Retail Auto ∆ In Portfolio Size Net Charge-off All 4Q ’23 3Q ’23 (ex. Loan Sale + Loan Sale + 1 2 3 4 Activity Other Ally Lending) Ally Lending Reserve Reserve ($623) 4Q ’23 NCOs $ 37 ($215) ($72) $3,837 $3,587 Reduction of allowance Reflects changes in $623 Replenished Loan Growth specific reserves and ($41 related to retail auto loan sales macroeconomic variables and $174 related to pending Ally Lending sale) 16

4Q 2023 Preliminary Results Retail Auto Credit Performance 2023 NCOs in-line with guide (1.8%); seasonally adjusted NCOs to peak in first half of 2024 • Full year 2023 NCO rate of 1.77%; 4Q NCOs at low-end of 2.2% - 2.4% guide driven by stable flow-to-loss rates and strong front book performance, partially offset by softer used vehicle values • 1H ‘24 NCO rates expected to be impacted by ↓ used vehicle values, ↑ unemployment and peak losses on 2H ‘22 vintage (~18 mos. on book), partially offset by strong front book performance – Used vehicle values ↓ ~5% in 1H ‘24; unemployment peaking at 4.4% – Year-over-year change in 30+ day delinquency rates ↓ four quarters in a row – ‘23 vintage 30+ day DQs currently outperforming ‘22 vintage and continues to improve with each additional month on book • Recent originations contain a higher mix of loans from the highest credit tier (2Q ‘23 and forward), supporting lower seasonally adjusted NCOs in 2H ‘24 as 2023 vintages reach peak loss (1) (1) Retail Auto Portfolio Mix by Vintage Change in YoY 30-Day DQ Rates 30+ Day DQs by Vintage 2022 | 2023 0.82% excluding impact from retail auto loan sales MO. 12 2023 2024 2022 2023 MO. 7 2022 ‘21 and ‘21 and Prior Prior 4Q ‘23 4Q ‘24 Months 17 (1) Includes accruing contracts only

4Q 2023 Preliminary Results Used Vehicle Value Outlook Used vehicle values expected to decline through first half of 2024 • Ally Used Vehicle Value Index is ↓ 26% vs. the Dec. ‘21 peak, with an additional ~5% ↓ assumed in 2024 – Expect decline in the first half of 2024, followed by stabilization in 2H 2024 and beyond • Expect used vehicle values to stabilize in 2025 following three years of declines (2022 – 2024) – Lower production in 2020 – 2022 will lead to constrained used supply over the next several years and is expected to provide structural support for used vehicle values over the medium-term Ally Used Vehicle Value Index (AUVI) Used Industry Volume Inflow 3-year-old vehicles, adjusted for seasonality, mix, mileage, and MSRP inflation (# in millions of units) End of Period Used supply ↓ 26% ↓ 16% from peak Source: Manheim, Cox Automotive 18

4Q 2023 Preliminary Results Auto Finance: Agile Market Leader # # # # Leading 1 1 1 1 Prime Auto Bank Floorplan Bank Retail Auto Dealer Satisfaction Insurance Provider (1) (2) (3) (4) Lender Lender Loan Outstandings J.D. Power Award (F&I, P&C Products) Consumer Applications and Approval Rate Auto Balance Sheet Trends ($ billions; EoP, HFI only) Total Consumer Auto Lease Consumer Applications Retail Commercial Approval Rate Auto Consumer Originations Consumer Origination Mix ($ billions; % of $ originations) (% of $ originations) Retail Weighted Avg. FICO Lease New Other Non-OEM (5) Franchised Other OEM Franchised Used Stellantis Nonprime % of Total Retail GM 19 See page 39 for footnotes.
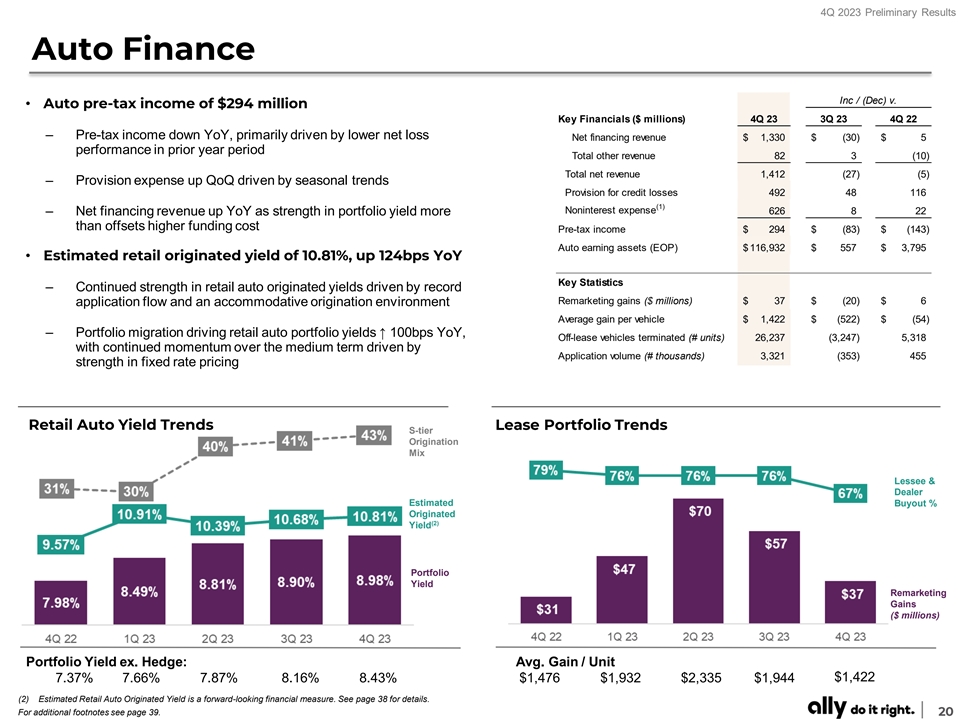
4Q 2023 Preliminary Results Auto Finance Inc / (Dec) v. • Auto pre-tax income of $294 million Key Financials ($ millions) 4Q 23 3Q 23 4Q 22 – Pre-tax income down YoY, primarily driven by lower net loss Net financing revenue $ 1 ,330 $ (30) $ 5 performance in prior year period Total other revenue 82 3 (10) Total net revenue 1,412 (27) ( 5) – Provision expense up QoQ driven by seasonal trends Provision for credit losses 492 48 116 (1) Noninterest expense 626 8 22 – Net financing revenue up YoY as strength in portfolio yield more than offsets higher funding cost Pre-tax income $ 294 $ (83) $ (143) Auto earning assets (EOP) $ 116,932 $ 557 $ 3,795 • Estimated retail originated yield of 10.81%, up 124bps YoY Key Statistics – Continued strength in retail auto originated yields driven by record Remarketing gains ($ millions) $ 37 $ (20) $ 6 application flow and an accommodative origination environment Average gain per vehicle $ 1,422 $ (522) $ (54) – Portfolio migration driving retail auto portfolio yields ↑ 100bps YoY, Off-lease vehicles terminated (# units) 2 6,237 (3,247) 5,318 with continued momentum over the medium term driven by Application volume (# thousands) 3,321 (353) 455 strength in fixed rate pricing Retail Auto Yield Trends Lease Portfolio Trends S-tier Origination Mix Lessee & Dealer Estimated Buyout % Originated (2) Yield Portfolio Yield Remarketing Gains ($ millions) Portfolio Yield ex. Hedge: Avg. Gain / Unit $1,422 7.37% 7.66% 7.87% 8.16% 8.43% $1,476 $1,932 $2,335 $1,944 (2) Estimated Retail Auto Originated Yield is a forward-looking financial measure. See page 38 for details. For additional footnotes see page 39. 20
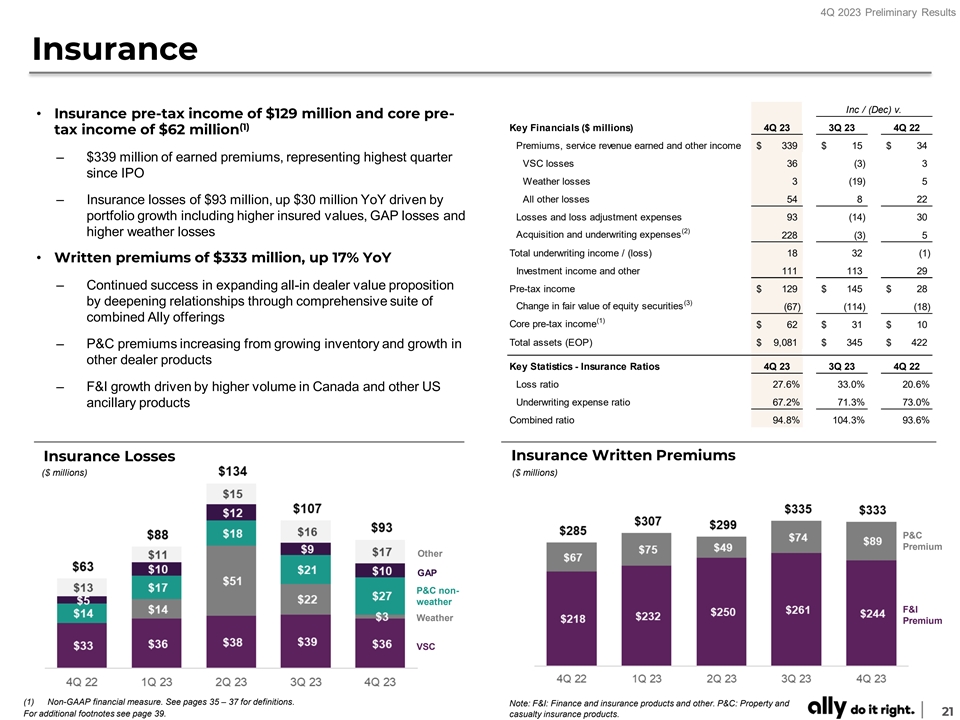
4Q 2023 Preliminary Results Insurance Inc / (Dec) v. • Insurance pre-tax income of $129 million and core pre- (1) Key Financials ($ millions) 4Q 23 3Q 23 4Q 22 tax income of $62 million Premiums, service revenue earned and other income $ 339 $ 15 $ 34 – $339 million of earned premiums, representing highest quarter VSC losses 36 (3) 3 since IPO Weather losses 3 (19) 5 All other losses 54 8 22 – Insurance losses of $93 million, up $30 million YoY driven by portfolio growth including higher insured values, GAP losses and Losses and loss adjustment expenses 93 (14) 30 (2) higher weather losses Acquisition and underwriting expenses 228 ( 3) 5 Total underwriting income / (loss) 18 32 ( 1) • Written premiums of $333 million, up 17% YoY Investment income and other 111 113 29 – Continued success in expanding all-in dealer value proposition Pre-tax income $ 129 $ 145 $ 28 by deepening relationships through comprehensive suite of (3) Change in fair value of equity securities (67) (114) (18) combined Ally offerings (1) Core pre-tax income $ 62 $ 31 $ 10 Total assets (EOP) $ 9 ,081 $ 345 $ 422 – P&C premiums increasing from growing inventory and growth in other dealer products Key Statistics - Insurance Ratios 4Q 23 3Q 23 4Q 22 Loss ratio 27.6% 33.0% 20.6% – F&I growth driven by higher volume in Canada and other US Underwriting expense ratio 67.2% 71.3% 73.0% ancillary products Combined ratio 94.8% 104.3% 93.6% Insurance Written Premiums Insurance Losses ($ millions) ($ millions) P&C Premium Other GAP P&C non- weather F&I Weather Premium VSC (1) Non-GAAP financial measure. See pages 35 – 37 for definitions. Note: F&I: Finance and insurance products and other. P&C: Property and 21 For additional footnotes see page 39. casualty insurance products.

4Q 2023 Preliminary Results Ally Bank: Deposit and Customer Trends $ # 142B 92% $5B 3M 1 97% Largest All-Digital, Retail Deposit FY ‘23 Growth FDIC Ally Bank Customer (1) (2) Direct U.S. Bank Balances (Balances ↑ Every Quarter) Insured Deposit Customers Retention Total Deposits: Retail & Brokered • Total deposits of $154.7 billion, up $2.4 billion YoY ($ billions; EoP) Avg. Retail – Retail deposits of $142.3 billion, up $4.6 billion YoY Portfolio Interest Rate and $2.2 billion QoQ – Total deposits up YoY driven by higher retail balances Brokered / Other • 3 million retail deposit customers, up 13% YoY – Record growth in net retail deposit customers Retail of 359 thousand in 2023 – Nearly 300 thousand multi-product bank customers Note: Brokered / Other includes sweep deposits, mortgage escrow and other deposits. Ally Bank: Multi-product Relationship Customers Net Growth in Retail Deposit Customers (# in thousands) Deposit customers with an Ally Invest, Ally Home or Ally Credit Card relationship (# in thousands) See page 39 for footnotes. Note: Ally Bank, Member FDIC and Equal Housing Lender, which offers mortgage lending, point-of-sale personal lending, and a variety of deposit and other banking products, a consumer credit card business, a corporate finance business for equity sponsors and middle-market companies. Additionally, we offer securities-brokerage and investment advisory services through Ally Invest. 22

4Q 2023 Preliminary Results Ally Credit Card DTC product offering with compelling return profile despite elevated losses • Digital first, customer centric approach with attractive risk-adjusted return profile – Focused on growing and deepening customer relationships responsibly – Legacy offering aligned well with traditional auto finance consumer customers; expanding product offering to meet the needs of deposit customers (1) – Floating rate asset with double digit risk adjusted margins is a strategic fit for Ally’s liability sensitive balance sheet • Credit trends are consistent with broader industry, however more pronounced given portfolio composition – Near-prime portfolio consisting of recent originations with limited benefit from better performing back-book; expect peak NCOs in mid 2024 – Ongoing actions since mid 2022 to limit exposure while pricing for risk to preserve margins; heightened focus on collections staffing and effectiveness Portfolio Composition Credit Tightening Actions Compelling Return Profile as a % of avg. earning assets • Tightened risk scores and credit limits on new accts. 68% of portfolio consists of ‘21 – ’23 Illustrative example • Increased pricing at acquisition originations Near Term Normalized Losses • Pulled back on credit line increase programs 2023 (2) Gross revenue 27% 27% • Restarted credit line decrease program 2022 Annualized NCO % 13% 9% 2021 (1) Risk-adj. margin 14% 10% $300M+ Total Risk Curtailment (FY ‘23) (3) $500M+ in ‘24 Pre-Tax ROA 2% 5% ‘20 and Prior 20% ↓ in new accounts (FY ‘23) 4Q ‘23 ~30% run-rate heading into ‘24 (1) Non-GAAP financial measure. See pages 35 - 37 for definitions. (2) Gross revenue including interest income and fee revenue (3) Net of all operating expenses excluding costs related to the 2021 acquisition of Fair Square including intangible amortization, and corporate allocations. 23 New Existing

4Q 2023 Preliminary Results Ally Home & Invest Deepening customer relationships and adapting to consumer preferences • Ally Home provides a best-in-class mortgage experience that enables Ally to deliver a frictionless, digital end-to-end experience in an innovative way – Strategically positioned with a variable cost structure that allows us to maintain flexibility in different operating environments – Accommodative strategy to meet existing customer needs while balancing growth; 66% of DTC volume from existing depositors in 4Q ‘23 • Ally Invest remains a compelling value proposition for customers who value low minimums and fees, a digital platform, and easy money movement between banking and investing – $13 billion of deposit balances related to Invest customers – 89% of new account volume from existing depositors in 4Q ‘23 Ally Home (Mortgage) Ally Invest (Brokerage & Advisory) Originations ($ in billions) | Launched 1Q’17 Net Customer Assets ($ in billions) | Acquired: 2Q’16 % of DTC originations % of new brokerage accounts from existing depositors from existing depositors More than 80% of 4Q ‘23 originations are conforming and held-for-sale 44% 52% 33% 56% 66% 68% 70% 70% 72% 89% 24

4Q 2023 Preliminary Results Mortgage Finance Inc / (Dec) v. • Mortgage pre-tax income of $24 million Key Financials ($ millions) 4Q 23 3Q 23 4Q 22 Net financing revenue $ 51 $ (2) $ (4) – Noninterest expense down $7 million YoY, reflecting the benefit Total other revenue 3 (1) 1 of variable cost structure Total net revenue $ 54 $ (3) $ (3) • Direct-to-Consumer (DTC) originations of $224 million, Provision for credit losses - 2 (1) (1) reflective of current environment Noninterest expense 30 (3) (7) Pre-tax income $ 24 $ (2) $ 5 – Less than 20% of loans retained on balance sheet Total assets (EOP) $ 18,512 $ (233) $ (1,017) • 4Q ’23 originations primarily from existing depositors, Mortgage Finance HFI Portfolio 4Q 23 3Q 23 4Q 22 Net Carry Value ($ billions) $ 18.4 $ 18.6 $ 19.4 highlighting the strong customer value proposition (2) 52.2% 53.1% 54.6% Wtd. Avg. LTV/CLTV – 66% of DTC originations sourced from existing depositors Refreshed FICO 782 782 781 • Continued focus on customer digital experience and operational efficiency Held-for-Investment Assets Direct-to-Consumer Originations ($ billions) ($ billions) DTC Bulk See page 39 for footnotes. 25

4Q 2023 Preliminary Results Corporate Finance Inc / (Dec) v. • Corporate Finance pre-tax income of $79 million Key Financials ($ millions) 4Q 23 3Q 23 4Q 22 – Pre-tax income of $307 million in full-year 2023, highest since IPO Net financing revenue $ 105 $ 8 $ 11 • Consistently generating strong returns Other revenue 23 ( 1) (2) Total net revenue 128 7 9 – 25% return on equity in 2023 (24% avg. over last five years) Provision for credit losses 17 12 1 • Held-for-investment loans of $10.9B, up 7% YoY (2) Noninterest expense 32 - (4) Pre-tax income $ 79 $ (5) $ 12 – Well diversified, high-quality, 100% first-lien, floating rate loans (3) Change in fair value of equity securities 0 1 ( 0) – Healthcare cashflow represents less than 1.5% of portfolio (1) Core pre-tax income $ 79 $ (4) $ 12 – CRE exposure of $1.3B is limited and performing well (no office CRE) Total assets (EOP) $ 1 1,212 $ 463 $ 668 • Solid credit performance over many years – Criticized assets and non-accrual loans at historically low levels – ~30bps annual NCO rate since IPO; annual NCO rate of 7bps excluding healthcare cash flow business (discontinued in 2020) Net Charge-Off History Asset Quality Summary ~30bps annual NCO rate since 2014 (7bps excluding Healthcare Cashflow exposures) 157% Criticized Nonaccrual Reserves as a % Assets Loans of Nonaccrual Excl. Healthcare Cashflow -0.5% -0.2% 0.6% 0.1% 0.4% 0.0% 0.2% 0.0% 0.2% -0.1% (1) Non-GAAP financial measure. See pages 35 – 37 for definitions. 26 For additional footnotes see page 40.

4Q 2023 Preliminary Results Financial Outlook FY 2024 Net Interest Margin 3.25% - 3.30% | 3.40% - 3.50% (FY | Exit Rate) Incl. ↓ ~5 bps impact from pending sale of Ally Lending and Card curtailments Other Revenue ↑ 5 - 10% Average Earning Assets Flat YoY Net Charge Offs 1.4 - 1.5% | ~1.9% (Consolidated | Retail Auto) (1) Adj. Noninterest Expense ↓ more than 1% | ↑ less than 1% YoY (2) (Controllable | Total OPEX) (3) Tax Rate 18% Remain confident in medium term outlook 4% NIM, $6 EPS, mid-teens RoTCE (1) Non-GAAP financial measures. See pages 35 – 37 for definitions. (2) Defined as total operating expenses excluding FDIC fees and certain insurance expenses (losses and commissions). (3) Assumes statutory U.S. Federal tax rate of 21% 27

4Q 2023 Preliminary Results Strategic Priorities Focused execution on driving long-term value for all stakeholders Ensure culture remains aligned with relentless focus on customers, communities, employees, and shareholders Differentiate as a financial ally for our consumer and commercial customers Continue to grow and diversify by scaling existing businesses Constant evolution to maintain leading digital experiences and brand Driving disciplined risk management and accretive capital deployment Delivering sustainable, enhanced results, and value for ALL stakeholders 28

4Q 2023 Preliminary Results Supplemental 29
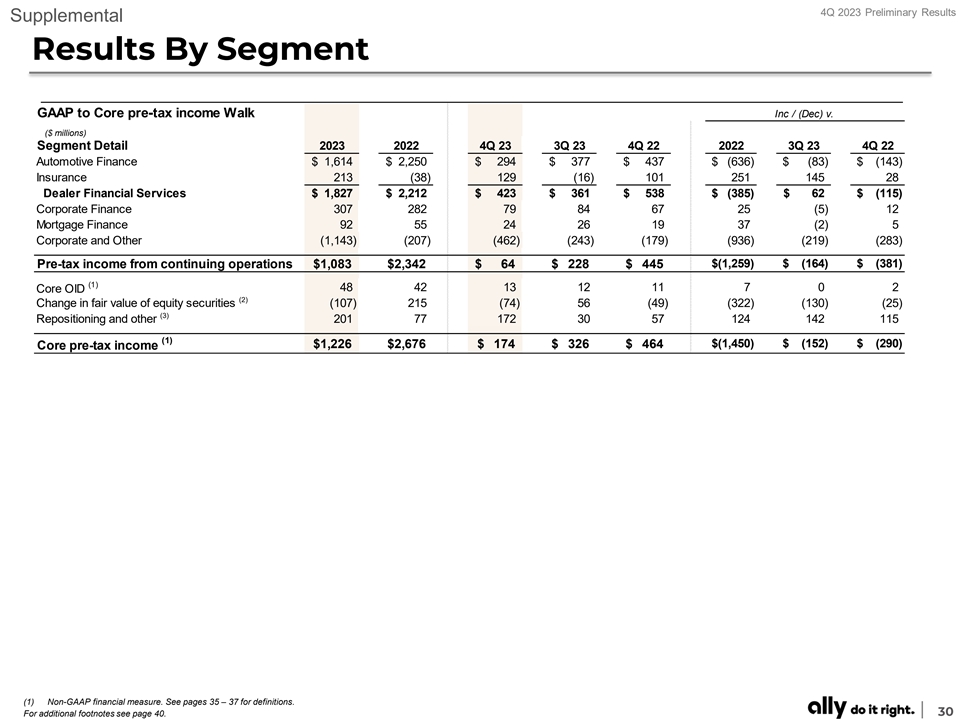
4Q 2023 Preliminary Results Supplemental Results By Segment GAAP to Core pre-tax income Walk Inc / (Dec) v. ($ millions) Segment Detail 2023 2022 4Q 23 3Q 23 4Q 22 2022 3Q 23 4Q 22 Automotive Finance $ 1 ,614 $ 2 ,250 $ 294 $ 377 $ 437 $ (6 36) $ (8 3) $ (143) Insurance 213 (38) 129 (16) 101 251 145 28 Dealer Financial Services $ 1,827 $ 2,212 $ 423 $ 361 $ 538 $ (3 85) $ 62 $ (115) Corporate Finance 307 282 79 84 67 25 (5 ) 12 Mortgage Finance 92 55 24 26 19 37 (2) 5 Corporate and Other (1,143) (207) (4 62) (2 43) (179) (936) (219) (2 83) Pre-tax income from continuing operations $1 ,083 $2 ,342 $ 64 $ 228 $ 445 $(1 ,259) $ (1 64) $ (3 81) (1) 48 42 13 12 11 7 0 2 Core OID (2) Change in fair value of equity securities (107) 215 (7 4) 56 (49) (3 22) (130) (2 5) (3) Repositioning and other 201 77 172 30 57 124 142 115 (1) $1 ,226 $ 2,676 $ 174 $ 326 $ 464 $(1 ,450) $ (152) $ (2 90) Core pre-tax income (1) Non-GAAP financial measure. See pages 35 – 37 for definitions. 30 For additional footnotes see page 40.

4Q 2023 Preliminary Results Supplemental Funding Profile Details Funding Mix Deposit Mix Unsecured FHLB / Other Brokered / Other Secured Retail CD Deposits MMA/OSA/ Spend Note: Totals may not foot due to rounding. Note: Other includes sweep deposits, mortgage escrow and other deposits. Totals may not foot due to rounding. (1) Unsecured Long-Term Debt Maturities Wholesale Funding Issuance ($ billions) ($ billions) Principal Amount Weighted Avg. Maturity Date (2) Coupon Outstanding 2024 4.48% $ 1.45 2025 5.52% $ 2.30 (3) 2026+ $ 6.84 6.56% Term ABS Term Unsecured (1) Excludes retail notes and perpetual preferred equity; as of 12/31/2023. Note: Term ABS shown includes funding amounts (notes sold) at new issue and does not include private (2) Reflects notional value of outstanding bond. Excludes total GAAP OID and capitalized transaction costs. offerings. Excludes $2.35 billion of preferred equity issued in 2021. Totals may not foot due to rounding. (3) Weighted average coupon based on notional value and corresponding coupon for all unsecured bonds as of January 1st of the respective year. Does not reflect weighted average interest expense for the respective year. 31
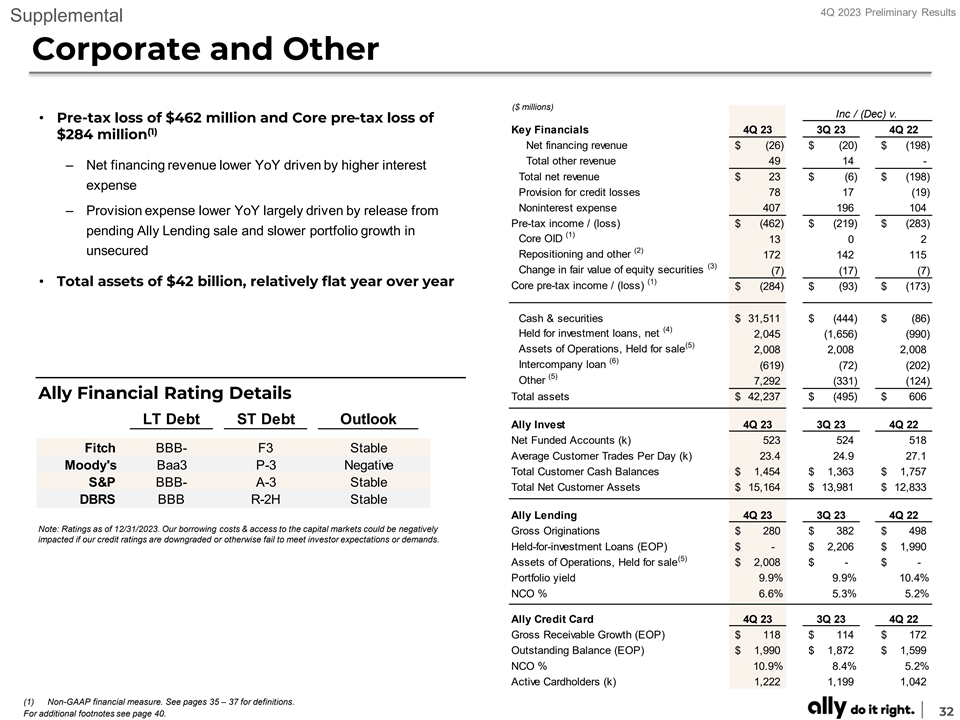
4Q 2023 Preliminary Results Supplemental Corporate and Other ($ millions) Inc / (Dec) v. • Pre-tax loss of $462 million and Core pre-tax loss of Key Financials 4Q 23 3Q 23 4Q 22 (1) $284 million Net financing revenue $ (26) $ (20) $ (198) Total other revenue 49 14 - – Net financing revenue lower YoY driven by higher interest Total net revenue $ 23 $ (6) $ (198) expense Provision for credit losses 78 17 (19) Noninterest expense 407 196 104 – Provision expense lower YoY largely driven by release from Pre-tax income / (loss) $ (462) $ (219) $ (283) pending Ally Lending sale and slower portfolio growth in (1) Core OID 13 0 2 (2) unsecured Repositioning and other 172 142 115 (3) Change in fair value of equity securities (7) (17) (7) (1) • Total assets of $42 billion, relatively flat year over year Core pre-tax income / (loss) $ (284) $ (93) $ (173) Cash & securities $ 31,511 $ (444) $ (86) (4) Held for investment loans, net 2,045 (1,656) (990) (5) Assets of Operations, Held for sale 2,008 2,008 2,008 (6) Intercompany loan (619) (72) (202) (5) Other 7,292 (331) (124) Ally Financial Rating Details Total assets $ 42,237 $ (495) $ 606 LT Debt ST Debt Outlook Ally Invest 4Q 23 3Q 23 4Q 22 Net Funded Accounts (k) 523 524 518 Fitch BBB- F3 Stable Average Customer Trades Per Day (k) 23.4 24.9 27.1 Moody's Baa3 P-3 Negative Total Customer Cash Balances $ 1 ,454 $ 1 ,363 $ 1 ,757 S&P BBB- A-3 Stable Total Net Customer Assets $ 15,164 $ 13,981 $ 12,833 DBRS BBB R-2H Stable Ally Lending 4Q 23 3Q 23 4Q 22 Note: Ratings as of 12/31/2023. Our borrowing costs & access to the capital markets could be negatively Gross Originations $ 280 $ 382 $ 498 impacted if our credit ratings are downgraded or otherwise fail to meet investor expectations or demands. Held-for-investment Loans (EOP) $ - $ 2 ,206 $ 1 ,990 (5) Assets of Operations, Held for sale $ 2,008 $ - $ - Portfolio yield 9.9% 9.9% 10.4% NCO % 6.6% 5.3% 5.2% Ally Credit Card 4Q 23 3Q 23 4Q 22 Gross Receivable Growth (EOP) $ 118 $ 114 $ 172 Outstanding Balance (EOP) $ 1,990 $ 1,872 $ 1,599 NCO % 10.9% 8.4% 5.2% Active Cardholders (k) 1,222 1,199 1,042 (1) Non-GAAP financial measure. See pages 35 – 37 for definitions. 32 For additional footnotes see page 40.

4Q 2023 Preliminary Results Supplemental Interest Rate Risk (1) Net Financing Revenue Sensitivity Analysis ($ millions) 4Q 23 3Q 23 (2) (2) Change in interest rates Gradual Instantaneous Gradual Instantaneous -100 bps $ ( 96) $ ( 107) $ ( 111) $ ( 100) +100 bps $ 88 $ 3 $ 97 $ 101 Stable rate environment n/m $ 16 n/m $ 41 (1) Net financing revenue impacts reflect a rolling 12-month view. See page 38 for additional details. (2) Gradual changes in interest rates are recognized over 12 months. Effective Hedge Notional (EoP) 33

4Q 2023 Preliminary Results Supplemental Deferred Tax Asset (1) Deferred Tax Asset 4Q 23 3Q 23 ($ millions) Gross DTA Valuation Net DTA Net DTA Balance Allowance Balance Balance Net Operating Loss (Federal) $ 8 $ - $ 8 $ 9 Tax Credit Carryforwards 500 (41 ) 459 242 State/Local Tax Carryforwards 287 (135) 152 189 Other Deferred Tax Assets / (Liabilities) 594 - 594 1,066 Net Deferred Tax Asset $ 1,389 $ (176) $ 1,213 $ 1,506 (1) GAAP does not prescribe a method for calculating individual elements of deferred taxes for interim periods; therefore, these balances are estimates. Deferred Tax Asset / (Liability) Balances ($ millions) Net GAAP DTA Balance Disallowed DTA $1,506 $1,213 $1,071 $1,071 $1,009 $4 $4 $5 $5 $10 4Q 22 1Q 23 2Q 23 3Q 23 4Q 23 34

4Q 2023 Preliminary Results Supplemental Notes on Non-GAAP Financial Measures The following are non-GAAP financial measures which Ally believes are important to the reader of the Consolidated Financial Statements, but which are supplemental to and not a substitute for GAAP measures: Accelerated issuance expense (Accelerated OID), Adjusted earnings per share (Adjusted EPS), Adjusted efficiency ratio, Adjusted noninterest expense, Adjusted other revenue, Adjusted tangible book value per share (Adjusted TBVPS), Adjusted total net revenue, Core net income attributable to common shareholders, Core original issue discount (Core OID) amortization expense, Core outstanding original issue discount balance (Core OID balance), Core pre-provision net revenue (Core PPNR), Core pre-tax income, Core return on tangible common equity (Core ROTCE), Investment income and other (adjusted), Net financing revenue (excluding Core OID), Net interest margin (excluding Core OID), Pre-provision net revenue (PPNR), and Tangible Common Equity. These measures are used by management, and we believe are useful to investors in assessing the company’s operating performance and capital. For calculation methodology, refer to the Reconciliation to GAAP later in this document. 1) Accelerated issuance expense (Accelerated OID) is the recognition of issuance expenses related to calls of redeemable debt. 2) Adjusted earnings per share (Adjusted EPS) is a non-GAAP financial measure that adjusts GAAP EPS for revenue and expense items that are typically strategic in nature or that management otherwise does not view as reflecting the operating performance of the company. Management believes Adjusted EPS can help the reader better understand the operating performance of the core businesses and their ability to generate earnings. In the numerator of Adjusted EPS, GAAP net income attributable to common shareholders is adjusted for the following items: (1) excludes discontinued operations, net of tax, as Ally is primarily a domestic company and sales of international businesses and other discontinued operations in the past have significantly impacted GAAP EPS, (2) adds back the tax-effected non-cash Core OID, (3) adjusts for tax-effected repositioning and other which are primarily related to the extinguishment of high cost legacy debt, strategic activities and significant other one-time items, (4) change in fair value of equity securities, (5) excludes significant discrete tax items that do not relate to the operating performance of the core businesses, and adjusts for preferred stock capital actions that have been taken by the company to normalize its capital structure, as applicable for respective periods. See pages 41 - 42 for calculation methodology and details. 3) Adjusted efficiency ratio is a non-GAAP financial measure that management believes is helpful to readers in comparing the efficiency of its core banking and lending businesses with those of its peers. See pages 47 - 48 for calculation details. (1) In the numerator of Adjusted efficiency ratio, total noninterest expense is adjusted for Rep and warrant expense, Insurance segment expense, and repositioning and other which are primarily related to the extinguishment of high-cost legacy debt, strategic activities, restructuring and significant other one- time items, as applicable for respective periods. (2) In the denominator, total net revenue is adjusted for Core OID and Insurance segment revenue. See page 21 for the combined ratio for the Insurance segment which management uses as a primary measure of underwriting profitability for the Insurance segment. 4) Adjusted noninterest expense is a non-GAAP financial measure that adjusts GAAP noninterest expense for repositioning items. Management believes adjusted noninterest expense is a helpful financial metric because it enables the reader better understand the business' expenses excluding nonrecurring items. See pages 47 - 48 for calculation methodology and details. 5) Adjusted other revenue is a non-GAAP financial measure that adjusts GAAP other revenue for OID expenses, repositioning, and change in fair value of equity securities. Management believes adjusted other revenue is a helpful financial metric because it enables the reader to better understand the business' ability to generate other revenue. See pages 49 - 50 for calculation methodology and details. 6) Adjusted provision for credit losses is a non-GAAP financial measure that adjusts GAAP provision for credit losses for repositioning items. Management believes adjusted provision for credit losses is a helpful financial metric because it enables the reader to better understand the business’ expenses excluding nonrecurring items. See pages 49 – 50 for calculation methodology and details. 35
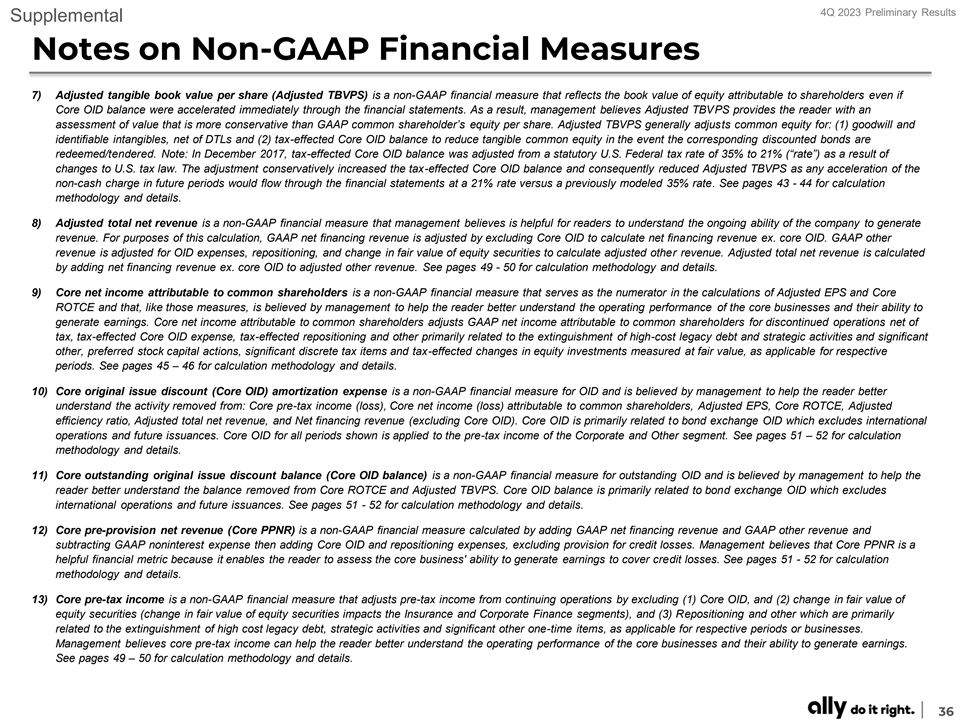
4Q 2023 Preliminary Results Supplemental Notes on Non-GAAP Financial Measures 7) Adjusted tangible book value per share (Adjusted TBVPS) is a non-GAAP financial measure that reflects the book value of equity attributable to shareholders even if Core OID balance were accelerated immediately through the financial statements. As a result, management believes Adjusted TBVPS provides the reader with an assessment of value that is more conservative than GAAP common shareholder’s equity per share. Adjusted TBVPS generally adjusts common equity for: (1) goodwill and identifiable intangibles, net of DTLs and (2) tax-effected Core OID balance to reduce tangible common equity in the event the corresponding discounted bonds are redeemed/tendered. Note: In December 2017, tax-effected Core OID balance was adjusted from a statutory U.S. Federal tax rate of 35% to 21% (“rate”) as a result of changes to U.S. tax law. The adjustment conservatively increased the tax-effected Core OID balance and consequently reduced Adjusted TBVPS as any acceleration of the non-cash charge in future periods would flow through the financial statements at a 21% rate versus a previously modeled 35% rate. See pages 43 - 44 for calculation methodology and details. 8) Adjusted total net revenue is a non-GAAP financial measure that management believes is helpful for readers to understand the ongoing ability of the company to generate revenue. For purposes of this calculation, GAAP net financing revenue is adjusted by excluding Core OID to calculate net financing revenue ex. core OID. GAAP other revenue is adjusted for OID expenses, repositioning, and change in fair value of equity securities to calculate adjusted other revenue. Adjusted total net revenue is calculated by adding net financing revenue ex. core OID to adjusted other revenue. See pages 49 - 50 for calculation methodology and details. 9) Core net income attributable to common shareholders is a non-GAAP financial measure that serves as the numerator in the calculations of Adjusted EPS and Core ROTCE and that, like those measures, is believed by management to help the reader better understand the operating performance of the core businesses and their ability to generate earnings. Core net income attributable to common shareholders adjusts GAAP net income attributable to common shareholders for discontinued operations net of tax, tax-effected Core OID expense, tax-effected repositioning and other primarily related to the extinguishment of high-cost legacy debt and strategic activities and significant other, preferred stock capital actions, significant discrete tax items and tax-effected changes in equity investments measured at fair value, as applicable for respective periods. See pages 45 – 46 for calculation methodology and details. 10) Core original issue discount (Core OID) amortization expense is a non-GAAP financial measure for OID and is believed by management to help the reader better understand the activity removed from: Core pre-tax income (loss), Core net income (loss) attributable to common shareholders, Adjusted EPS, Core ROTCE, Adjusted efficiency ratio, Adjusted total net revenue, and Net financing revenue (excluding Core OID). Core OID is primarily related to bond exchange OID which excludes international operations and future issuances. Core OID for all periods shown is applied to the pre-tax income of the Corporate and Other segment. See pages 51 – 52 for calculation methodology and details. 11) Core outstanding original issue discount balance (Core OID balance) is a non-GAAP financial measure for outstanding OID and is believed by management to help the reader better understand the balance removed from Core ROTCE and Adjusted TBVPS. Core OID balance is primarily related to bond exchange OID which excludes international operations and future issuances. See pages 51 - 52 for calculation methodology and details. 12) Core pre-provision net revenue (Core PPNR) is a non-GAAP financial measure calculated by adding GAAP net financing revenue and GAAP other revenue and subtracting GAAP noninterest expense then adding Core OID and repositioning expenses, excluding provision for credit losses. Management believes that Core PPNR is a helpful financial metric because it enables the reader to assess the core business' ability to generate earnings to cover credit losses. See pages 51 - 52 for calculation methodology and details. 13) Core pre-tax income is a non-GAAP financial measure that adjusts pre-tax income from continuing operations by excluding (1) Core OID, and (2) change in fair value of equity securities (change in fair value of equity securities impacts the Insurance and Corporate Finance segments), and (3) Repositioning and other which are primarily related to the extinguishment of high cost legacy debt, strategic activities and significant other one-time items, as applicable for respective periods or businesses. Management believes core pre-tax income can help the reader better understand the operating performance of the core businesses and their ability to generate earnings. See pages 49 – 50 for calculation methodology and details. 36
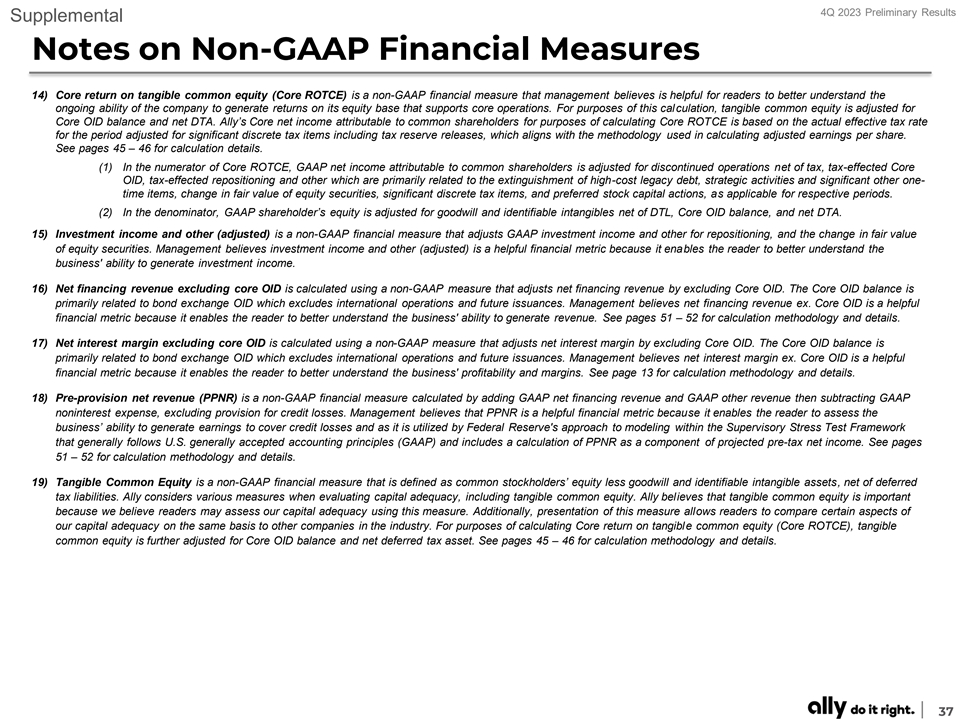
4Q 2023 Preliminary Results Supplemental Notes on Non-GAAP Financial Measures 14) Core return on tangible common equity (Core ROTCE) is a non-GAAP financial measure that management believes is helpful for readers to better understand the ongoing ability of the company to generate returns on its equity base that supports core operations. For purposes of this calculation, tangible common equity is adjusted for Core OID balance and net DTA. Ally’s Core net income attributable to common shareholders for purposes of calculating Core ROTCE is based on the actual effective tax rate for the period adjusted for significant discrete tax items including tax reserve releases, which aligns with the methodology used in calculating adjusted earnings per share. See pages 45 – 46 for calculation details. (1) In the numerator of Core ROTCE, GAAP net income attributable to common shareholders is adjusted for discontinued operations net of tax, tax-effected Core OID, tax-effected repositioning and other which are primarily related to the extinguishment of high-cost legacy debt, strategic activities and significant other one- time items, change in fair value of equity securities, significant discrete tax items, and preferred stock capital actions, as applicable for respective periods. (2) In the denominator, GAAP shareholder’s equity is adjusted for goodwill and identifiable intangibles net of DTL, Core OID balance, and net DTA. 15) Investment income and other (adjusted) is a non-GAAP financial measure that adjusts GAAP investment income and other for repositioning, and the change in fair value of equity securities. Management believes investment income and other (adjusted) is a helpful financial metric because it enables the reader to better understand the business' ability to generate investment income. 16) Net financing revenue excluding core OID is calculated using a non-GAAP measure that adjusts net financing revenue by excluding Core OID. The Core OID balance is primarily related to bond exchange OID which excludes international operations and future issuances. Management believes net financing revenue ex. Core OID is a helpful financial metric because it enables the reader to better understand the business' ability to generate revenue. See pages 51 – 52 for calculation methodology and details. 17) Net interest margin excluding core OID is calculated using a non-GAAP measure that adjusts net interest margin by excluding Core OID. The Core OID balance is primarily related to bond exchange OID which excludes international operations and future issuances. Management believes net interest margin ex. Core OID is a helpful financial metric because it enables the reader to better understand the business' profitability and margins. See page 13 for calculation methodology and details. 18) Pre-provision net revenue (PPNR) is a non-GAAP financial measure calculated by adding GAAP net financing revenue and GAAP other revenue then subtracting GAAP noninterest expense, excluding provision for credit losses. Management believes that PPNR is a helpful financial metric because it enables the reader to assess the business’ ability to generate earnings to cover credit losses and as it is utilized by Federal Reserve's approach to modeling within the Supervisory Stress Test Framework that generally follows U.S. generally accepted accounting principles (GAAP) and includes a calculation of PPNR as a component of projected pre-tax net income. See pages 51 – 52 for calculation methodology and details. 19) Tangible Common Equity is a non-GAAP financial measure that is defined as common stockholders’ equity less goodwill and identifiable intangible assets, net of deferred tax liabilities. Ally considers various measures when evaluating capital adequacy, including tangible common equity. Ally believes that tangible common equity is important because we believe readers may assess our capital adequacy using this measure. Additionally, presentation of this measure allows readers to compare certain aspects of our capital adequacy on the same basis to other companies in the industry. For purposes of calculating Core return on tangible common equity (Core ROTCE), tangible common equity is further adjusted for Core OID balance and net deferred tax asset. See pages 45 – 46 for calculation methodology and details. 37

4Q 2023 Preliminary Results Supplemental Notes on Other Financial Measures 1) Change in fair value of equity securities impacts the Insurance, Corporate Finance and Corporate and Other segments. The change reflects fair value adjustments to equity securities that are reported at fair value. Management believes the change in fair value of equity securities should be removed from select financial measures because it enables the reader to better understand the business’ ongoing ability to generate revenue and income. 2) Customer retention rate is the annualized 3-month rolling average of 1 minus the monthly attrition rate; excludes escheatment. 3) Estimated impact of CECL on regulatory capital per final rule issued by U.S. banking agencies - In December 2018, the FRB and other U.S. banking agencies approved a final rule to address the impact of CECL on regulatory capital by allowing BHCs and banks, including Ally, the option to phase in the day-one impact of CECL over a three-year period. In March 2020, the FRB and other U.S. banking agencies issued an interim final rule that became effective on March 31, 2020 and provided an alternative option for banks to temporarily delay the impacts of CECL, relative to the incurred loss methodology for estimating the allowance for loan losses, on regulatory capital. A final rule that was largely unchanged from the March 2020 interim final rule was issued by the FRB and other U.S. banking agencies in August 2020, and became effective in September 2020. For regulatory capital purposes, these rules permitted us to delay recognizing the estimated impact of CECL on regulatory capital until after a two-year deferral period, which for us extended through December 31, 2021. Beginning on January 1, 2022, we are required to phase in 25% of the previously deferred estimated capital impact of CECL, with an additional 25% to be phased in at the beginning of each subsequent year until fully phased in by the first quarter of 2025. Under these rules, firms that adopt CECL and elect the five-year transition will calculate the estimated impact of CECL on regulatory capital as the day-one impact of adoption plus 25% of the subsequent change in allowance during the two-year deferral period, which according to the final rule approximates the impact of CECL relative to an incurred loss model. We adopted this transition option during the first quarter of 2020, and beginning January 1, 2022 are phasing in the regulatory capital impacts of CECL based on this five-year transition period. 4) Estimated retail auto originated yield is a financial measure determined by calculating the estimated average annualized yield for loans originated during the period. At this time there currently is no comparable GAAP financial measure for Estimated Retail Auto Originated Yield and therefore this forecasted estimate of yield at the time of origination cannot be quantitatively reconciled to comparable GAAP information. 5) Interest rate risk modeling – We prepare our forward-looking baseline forecasts of net financing revenue taking into consideration anticipated future business growth, asset/liability positioning, and interest rates based on the implied forward curve. The analysis is highly dependent upon a variety of assumptions including the repricing characteristics of retail deposits with both contractual and non-contractual maturities. We continually monitor industry and competitive repricing activity along with other market factors when contemplating deposit pricing actions. Please see our SEC filings for more details. 6) Net charge-off ratios are calculated as annualized net charge-offs divided by average outstanding finance receivables and loans excluding loans measured at fair value and loans held-for-sale. 7) Repositioning is primarily related to the extinguishment of high-cost legacy debt, strategic activities, restructuring, amounts related to nonrecurring business transactions or pending transactions, and significant other one-time items. 8) U.S. consumer auto originations ▪ New Retail – standard and subvented rate new vehicle loans; Lease – new vehicle lease originations; Used – used vehicle loans; Growth – total originations from non-GM/Stellantis dealers and direct-to-consumer loans. Note: Stellantis N.V. (“Stellantis”) announced January 17, 2021, following completion of the merger of Peugeot S.A. (“Groupe PSA”) and Fiat Chrysler Automobiles N.V. (“FCA”) on January 16, 2021, the combined company was renamed Stellantis; Nonprime – originations with a FICO® score of less than 620 38

4Q 2023 Preliminary Results Supplemental Additional Notes Page – 5 | Purpose Driven Culture (1) Customers include on-balance sheet Auto, U.S. and Canadian Insurance, active Depositors, on-balance sheet Ally Home DTC Mortgage, Ally Lending, Ally Invest, and Ally Credit Card. (2) Ally Bank Customer Satisfaction Rate as of 4Q ’23. (3) Digital interactions represent the number of online and mobile logins YTD across consumer auto (excluding SmartAuction, Insurance and consumer asset management), Ally Credit Card, Ally Home, Ally Invest, Ally Lending and Deposits. Page – 19 | Auto Finance: Agile Market Leader (1) ‘Prime Auto Lender’ - Source: PIN Navigator Data & Analytics, a business division of J.D. Power. The credit scores provided within these reports have been provided by FICO® Risk Score, Auto 08 FICO® is a registered trademark of Fair Isaac Corporation in the United States and other countries. Ally management defines retail auto market segmentation (unit based) for consumer automotive loans primarily as those loans with a FICO® Score (or an equivalent score) at origination by the following: • Super-prime 720+, Prime 620 – 719, Nonprime less than 620 (2) ‘Bank Floorplan Lender’ - Source: Company filings, including WFC and HBAN. (3) ‘Retail Auto Loan Outstandings’ - Source: Big Wheels Auto Finance Data 2022. (4) ‘#1 Dealer Satisfaction among Non-Captive Lenders with Sub-Prime Credit’ - Source: J.D. Power. (5) Non-OEM Franchised Dealers and Automotive Retailers primarily consist of public and large private, franchise-like, used retail dealer operations including Carvana, CarMax, EchoPark, Westlake, and other similar relationships. Page – 20 | Auto Finance (1) Noninterest expense includes corporate allocations of $288 million in 4Q 2023, $288 million in 3Q 2023, and $290 million in 4Q 2022. Page – 21 | Insurance (2) Acquisition and underwriting expenses includes corporate allocations of $22 million in 4Q 2023, $26 million in 3Q 2023, and $24 million in 4Q 2022. (3) Change in fair value of equity securities impacts the Insurance segment. The change reflects fair value adjustments to equity securities that are reported at fair value. Management believes the change in fair value of equity securities should be removed from select financial measures because it enables the reader to better understand the business’ ongoing ability to generate revenue and income. Page – 22 | Ally Bank: Deposit and Customer Trends (1) Source: FDIC, FFIEC Call Reports and Company filings of branchless banks including Marcus, Discover, American Express, Synchrony. (2) Customer retention rate is the annualized 3-month rolling average of 1 minus the monthly attrition rate; excludes escheatment Page – 25 | Mortgage Finance (1) Noninterest expense includes corporate allocations of $19 million in 4Q 2023, $21 million in 3Q 2023, and $23 million in 4Q 2022. (2) 1st lien only. Updated home values derived using a combination of appraisals, Broker price opinion (BPOs), Automated Valuation Models (AVMs) and Metropolitan Statistical Area (MSA) level house price indices. 39
4Q 2023 Preliminary Results Supplemental Additional Notes Page – 26 | Corporate Finance (2) Noninterest expense includes corporate allocations of $13 million in 4Q 2023, $14 million in 3Q 2023, and $13 million in 4Q 2022. (3) Change in fair value of equity securities impacts the Corporate Finance segment. The change reflects fair value adjustments to equity securities that are reported at fair value. Management believes the change in fair value of equity securities should be removed from select financial measures because it enables the reader to better understand the business’ ongoing ability to generate revenue and income. Page – 30 | Results by Segment (2) Change in fair value of equity securities impacts the Insurance, Corporate Finance and Corporate and Other segments. The change reflects fair value adjustments to equity securities that are reported at fair value. Management believes the change in fair value of equity securities should be removed from select financial measures because it enables the reader to better understand the business’ ongoing ability to generate revenue and income. (3) Repositioning and other which are primarily related to the extinguishment of high-cost legacy debt, strategic activities, restructuring, and significant other one-time items, as applicable for respective periods or businesses. Page – 32 | Corporate and Other (2) Repositioning and other which are primarily related to the extinguishment of high-cost legacy debt, strategic activities, restructuring, and significant other one-time items, as applicable for respective periods or businesses. (3) Change in fair value of equity securities impacts the Corporate and Other segments. The change reflects fair value adjustments to equity securities that are reported at fair value. Management believes the change in fair value of equity securities should be removed from select financial measures because it enables the reader to better understand the business’ ongoing ability to generate revenue and income. (4) HFI legacy mortgage portfolio and HFI Ally Credit Card portfolio 4Q ’23 and includes AFI Ally Lending in prior periods. (5) Amounts related to pending sale of Ally Lending. (6) Intercompany loan related to activity between Insurance and Corporate for liquidity purposes from the wind down of the Demand Notes program. Includes loans held-for-sale. 40
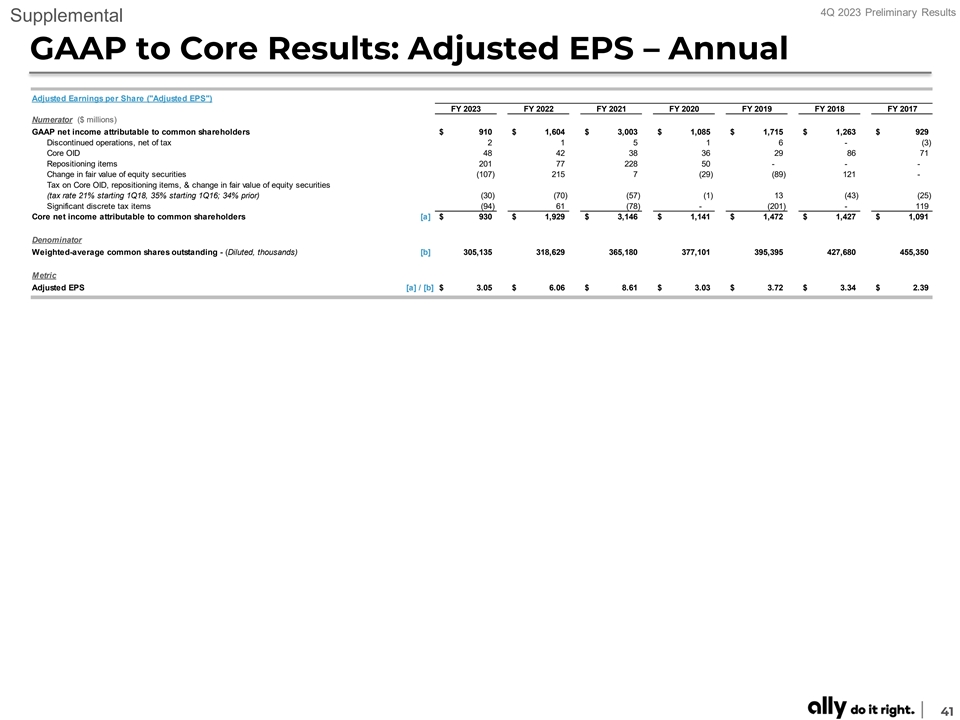
4Q 2023 Preliminary Results Supplemental GAAP to Core Results: Adjusted EPS – Annual Adjusted Earnings per Share ( Adjusted EPS ) FY 2023 FY 2022 FY 2021 FY 2020 FY 2019 FY 2018 FY 2017 Numerator ($ millions) GAAP net income attributable to common shareholders $ 910 $ 1,604 $ 3,003 $ 1,085 $ 1,715 $ 1,263 $ 929 Discontinued operations, net of tax 2 1 5 1 6 - (3) Core OID 48 42 38 36 29 86 71 Repositioning items 201 77 228 50 - - - Change in fair value of equity securities (107) 215 7 (29) (89) 121 - Tax on Core OID, repositioning items, & change in fair value of equity securities (tax rate 21% starting 1Q18, 35% starting 1Q16; 34% prior) (30) (70) (57) (1) 13 (43) (25) Significant discrete tax items (94) 61 (78) - (201) - 119 Core net income attributable to common shareholders [a] $ 930 $ 1,929 $ 3,146 $ 1,141 $ 1,472 $ 1,427 $ 1,091 Denominator Weighted-average common shares outstanding - (Diluted, thousands) [b] 305,135 318,629 365,180 377,101 395,395 427,680 455,350 Metric Adjusted EPS [a] / [b] $ 3.05 $ 6.06 $ 8.61 $ 3.03 $ 3.72 $ 3.34 $ 2.39 41

4Q 2023 Preliminary Results Supplemental GAAP to Core Results: Adjusted EPS – Quarterly Adjusted Earnings per Share ( Adjusted EPS ) QUARTERLY TREND 4Q 23 3Q 23 2Q 23 1Q 23 4Q 22 3Q 22 2Q 22 1Q 22 4Q 21 3Q 21 2Q 21 1Q 21 4Q 20 Numerator ($ millions) GAAP net income attributable to common shareholders $ 49 $ 269 $ 301 $ 291 $ 251 $ 272 $ 454 $ 627 $ 624 $ 683 $ 900 $ 796 $ 687 Discontinued operations, net of tax 1 - - 1 - 1 - - 6 - (1) - - Core OID 13 12 12 11 11 11 10 10 9 9 9 10 9 Repositioning Items 172 30 - - 57 20 - - 107 52 70 - - Change in fair value of equity securities ( 74) 56 (25) (65) ( 49) 62 136 66 (21) 65 ( 19) (17) (111) Tax on Core OID, Repo & change in fair value of equity securities (assumes 21% tax rate) (23) (21) 3 11 (4) (20) ( 31) (16) (20) (26) ( 13) 1 21 Significant discrete tax items - ( 94) - - 61 - - - - - (78) - - Core net income attributable to common shareholders [a] $ 137 $ 252 $ 291 $ 250 $ 327 $ 346 $ 570 $ 687 $ 705 $ 782 $ 868 $ 790 $ 606 Denominator Weighted-average common shares outstanding - (Diluted, thousands) [b] 3 06,730 3 05,693 304,646 3 03,448 3 03,062 310,086 3 24,027 3 37,812 3 48,666 3 61,855 3 73,029 377,529 3 78,424 Metric GAAP EPS $ 0.16 $ 0.88 $ 0.99 $ 0.96 $ 0.83 $ 0.88 $ 1.40 $ 1.86 $ 1.79 $ 1.89 $ 2.41 $ 2.11 $ 1.82 Discontinued operations, net of tax 0.00 - - 0.00 - 0.00 - - 0.02 - (0.00) - - Core OID 0.04 0.04 0.04 0.04 0.04 0.03 0.03 0.03 0.03 0.03 0.02 0.03 0.02 Change in fair value of equity securities (0.24) 0.18 (0.08) (0.21) (0.16) 0.20 0.42 0.19 (0.06) 0.18 (0.05) (0.04) (0.29) Repositioning Items 0.56 0.10 - - 0.19 0.06 - - 0.31 0.14 0.19 - - Tax on Core OID, Repo & change in fair value of equity securities (assumes 21% tax rate) (0.08) (0.07) 0.01 0.04 (0.01) (0.06) (0.09) (0.05) (0.06) (0.07) (0.03) 0.00 0.06 Significant discrete tax items - (0.31) - - 0.20 - - - - - (0.21) - - Adjusted EPS [a] / [b] $ 0.45 $ 0.83 $ 0.96 $ 0.82 $ 1.08 $ 1.12 $ 1.76 $ 2.03 $ 2.02 $ 2.16 $ 2.33 $ 2.09 $ 1.60 42
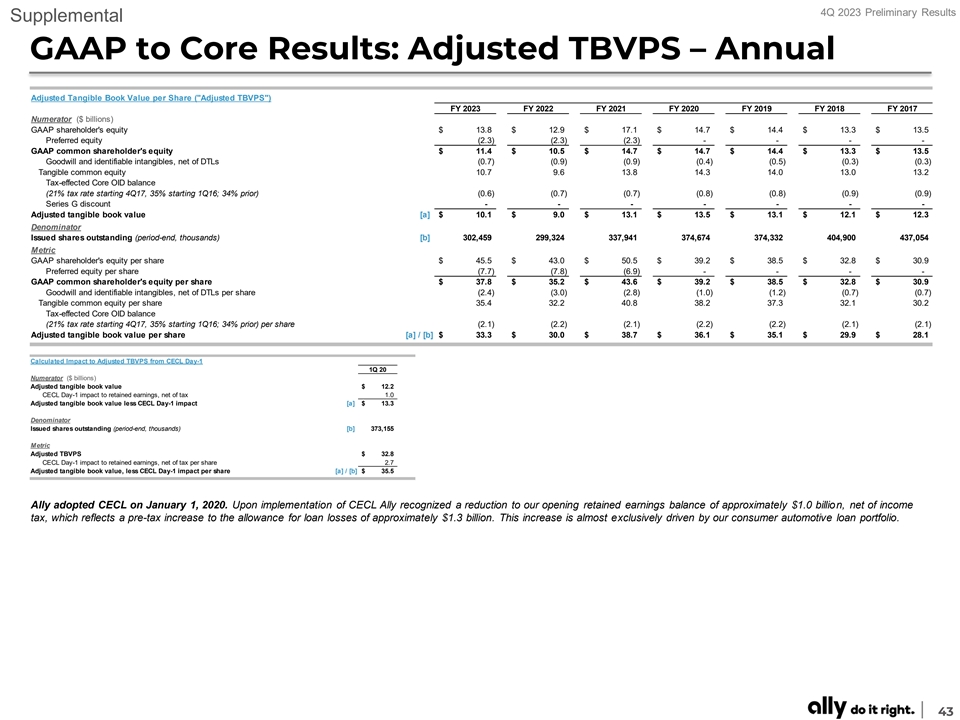
4Q 2023 Preliminary Results Supplemental GAAP to Core Results: Adjusted TBVPS – Annual Adjusted Tangible Book Value per Share ( Adjusted TBVPS ) FY 2023 FY 2022 FY 2021 FY 2020 FY 2019 FY 2018 FY 2017 Numerator ($ billions) GAAP shareholder's equity $ 13.8 $ 12.9 $ 17.1 $ 14.7 $ 14.4 $ 13.3 $ 13.5 Preferred equity (2.3) (2.3) (2.3) - - - - GAAP common shareholder's equity $ 11.4 $ 10.5 $ 14.7 $ 14.7 $ 14.4 $ 13.3 $ 13.5 Goodwill and identifiable intangibles, net of DTLs (0.7) (0.9) (0.9) (0.4) (0.5) (0.3) (0.3) Tangible common equity 10.7 9.6 13.8 14.3 1 4.0 13.0 1 3.2 Tax-effected Core OID balance (21% tax rate starting 4Q17, 35% starting 1Q16; 34% prior) (0.6) (0.7) (0.7) (0.8) (0.8) (0.9) (0.9) Series G discount - - - - - - - Adjusted tangible book value [a] $ 10.1 $ 9.0 $ 13.1 $ 13.5 $ 13.1 $ 12.1 $ 12.3 Denominator Issued shares outstanding (period-end, thousands) [b] 302,459 299,324 337,941 374,674 374,332 404,900 437,054 Metric GAAP shareholder's equity per share $ 45.5 $ 43.0 $ 50.5 $ 39.2 $ 38.5 $ 32.8 $ 30.9 Preferred equity per share (7.7) (7.8) (6.9) - - - - GAAP common shareholder's equity per share $ 37.8 $ 35.2 $ 43.6 $ 39.2 $ 38.5 $ 32.8 $ 30.9 Goodwill and identifiable intangibles, net of DTLs per share (2.4) (3.0) (2.8) (1.0) (1.2) (0.7) (0.7) Tangible common equity per share 35.4 32.2 4 0.8 3 8.2 37.3 3 2.1 3 0.2 Tax-effected Core OID balance (21% tax rate starting 4Q17, 35% starting 1Q16; 34% prior) per share (2.1) (2.2) (2.1) (2.2) (2.2) (2.1) (2.1) Adjusted tangible book value per share [a] / [b] $ 33.3 $ 30.0 $ 38.7 $ 36.1 $ 35.1 $ 29.9 $ 28.1 Calculated Impact to Adjusted TBVPS from CECL Day-1 1Q 20 Numerator ($ billions) Adjusted tangible book value $ 12.2 CECL Day-1 impact to retained earnings, net of tax 1.0 Adjusted tangible book value less CECL Day-1 impact [a] $ 13.3 Denominator Issued shares outstanding (period-end, thousands) [b] 373,155 Metric Adjusted TBVPS $ 32.8 CECL Day-1 impact to retained earnings, net of tax per share 2.7 Adjusted tangible book value, less CECL Day-1 impact per share [a] / [b] $ 35.5 Ally adopted CECL on January 1, 2020. Upon implementation of CECL Ally recognized a reduction to our opening retained earnings balance of approximately $1.0 billion, net of income tax, which reflects a pre-tax increase to the allowance for loan losses of approximately $1.3 billion. This increase is almost exclusively driven by our consumer automotive loan portfolio. 43

4Q 2023 Preliminary Results Supplemental GAAP to Core Results: Adjusted TBVPS – Quarterly Adjusted Tangible Book Value per Share ( Adjusted TBVPS ) QUARTERLY TREND 4Q 23 3Q 23 2Q 23 1Q 23 4Q 22 3Q 22 2Q 22 1Q 22 4Q 21 3Q 21 2Q 21 1Q 21 4Q 20 Numerator ($ billions) GAAP shareholder's equity $ 13.8 $ 12.8 $ 13.5 $ 13.4 $ 12.9 $ 12.4 $ 14.0 $ 15.4 $ 17.1 $ 17.3 $ 17.5 $ 14.6 $ 14.7 less: Preferred equity (2.3) ( 2.3) ( 2.3) ( 2.3) (2.3) (2.3) ( 2.3) (2.3) (2.3) ( 2.3) (2.3) - - GAAP common shareholder's equity $ 11.4 $ 10.5 $ 11.2 $ 11.1 $ 10.5 $ 10.1 $ 11.7 $ 13.1 $ 14.7 $ 15.0 $ 15.2 $ 14.6 $ 14.7 Goodwill and identifiable intangibles, net of DTLs (0.7) (0.9) (0.9) (0.9) (0.9) ( 0.9) (0.9) ( 0.9) (0.9) ( 0.4) (0.4) ( 0.4) (0.4) Tangible common equity 10.7 9.6 10.3 10.2 9.6 9.2 10.7 12.2 13.8 14.6 14.8 14.2 14.3 Tax-effected Core OID balance (assumes 21% tax rate) (0.6) (0.6) (0.6) (0.7) ( 0.7) (0.7) ( 0.7) ( 0.7) (0.7) ( 0.7) (0.8) (0.8) (0.8) Adjusted tangible book value [a] $ 10.1 $ 9.0 $ 9.7 $ 9.5 $ 9.0 $ 8.5 $ 10.1 $ 11.5 $ 13.1 $ 13.9 $ 14.1 $ 13.4 $ 13.5 Denominator Issued shares outstanding (period-end, thousands) [b] 3 02,459 301,630 3 01,619 300,821 2 99,324 300,335 3 12,781 3 27,306 3 37,941 3 49,599 3 62,639 3 71,805 3 74,674 Metric GAAP shareholder's equity per share $ 45.5 $ 42.5 $ 44.9 $ 44.5 $ 43.0 $ 41.4 $ 44.7 $ 47.1 $ 50.5 $ 49.5 $ 48.3 $ 39.3 $ 39.2 less: Preferred equity per share 7 .7 7 .7 7 .7 7 .7 7 .8 7.7 7.4 7 .1 6 .9 6 .6 6 .4 - - GAAP common shareholder's equity per share $ 37.8 $ 34.8 $ 37.2 $ 36.7 $ 35.2 $ 33.7 $ 37.3 $ 40.0 $ 43.6 $ 42.8 $ 41.9 $ 39.3 $ 39.2 Goodwill and identifiable intangibles, net of DTLs per share ( 2.4) (2.9) (2.9) ( 3.0) ( 3.0) ( 3.0) (2.9) ( 2.8) ( 2.8) (1.1) (1.0) ( 1.0) ( 1.0) Tangible common equity per share 35.4 31.9 34.2 33.8 32.2 30.6 34.3 37.1 40.8 41.8 40.9 38.3 38.2 Tax-effected Core OID balance (assumes 21% tax rate) per share ( 2.1) (2.1) ( 2.1) ( 2.2) (2.2) ( 2.2) ( 2.2) (2.1) (2.1) ( 2.0) (2.1) (2.2) (2.2) Adjusted tangible book value per share [a] / [b] $ 33.3 $ 29.8 $ 32.1 $ 31.6 $ 30.0 $ 28.4 $ 32.2 $ 35.0 $ 38.7 $ 39.7 $ 38.8 $ 36.2 $ 36.1 Calculated Impact to Adjusted TBVPS from CECL Day-1 1Q 20 Numerator ($ billions) Adjusted tangible book value $ 12.2 CECL Day-1 impact to retained earnings, net of tax 1.0 Adjusted tangible book value less CECL Day-1 impact [a] $ 13.3 Denominator Issued shares outstanding (period-end, thousands) [b] 373,155 Metric Adjusted TBVPS $ 32.8 CECL Day-1 impact to retained earnings, net of tax per share 2.7 Adjusted tangible book value, less CECL Day-1 impact per share [a] / [b] $ 35.5 Ally adopted CECL on January 1, 2020. Upon implementation of CECL Ally recognized a reduction to our opening retained earnings balance of approximately $1.0 billion, net of income tax, which reflects a pre-tax increase to the allowance for loan losses of approximately $1.3 billion. This increase is almost exclusively driven by our consumer automotive loan portfolio. 44
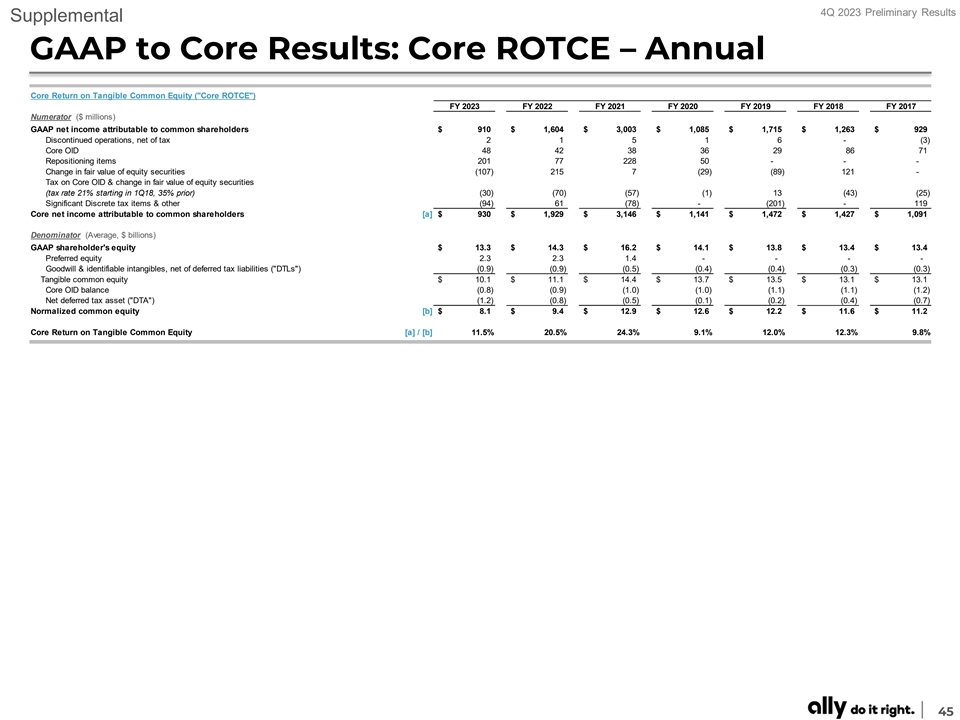
4Q 2023 Preliminary Results Supplemental GAAP to Core Results: Core ROTCE – Annual Core Return on Tangible Common Equity ( Core ROTCE ) FY 2023 FY 2022 FY 2021 FY 2020 FY 2019 FY 2018 FY 2017 Numerator ($ millions) GAAP net income attributable to common shareholders $ 910 $ 1,604 $ 3,003 $ 1,085 $ 1,715 $ 1,263 $ 929 Discontinued operations, net of tax 2 1 5 1 6 - (3) Core OID 48 42 38 36 29 86 71 Repositioning items 201 77 228 50 - - - Change in fair value of equity securities ( 107) 215 7 (29) (89) 121 - Tax on Core OID & change in fair value of equity securities (tax rate 21% starting in 1Q18, 35% prior) (30) (70) (57) (1) 13 (43) (25) Significant Discrete tax items & other (94) 61 (78) - ( 201) - 119 Core net income attributable to common shareholders [a] $ 930 $ 1,929 $ 3,146 $ 1,141 $ 1,472 $ 1,427 $ 1,091 Denominator (Average, $ billions) GAAP shareholder's equity $ 13.3 $ 14.3 $ 16.2 $ 14.1 $ 13.8 $ 13.4 $ 13.4 Preferred equity 2.3 2.3 1.4 - - - - Goodwill & identifiable intangibles, net of deferred tax liabilities ( DTLs ) (0.9) (0.9) (0.5) (0.4) (0.4) (0.3) (0.3) Tangible common equity $ 10.1 $ 11.1 $ 14.4 $ 13.7 $ 13.5 $ 13.1 $ 13.1 Core OID balance (0.8) (0.9) (1.0) (1.0) (1.1) (1.1) (1.2) Net deferred tax asset ( DTA ) (1.2) (0.8) (0.5) (0.1) (0.2) (0.4) (0.7) Normalized common equity [b] $ 8.1 $ 9 .4 $ 12.9 $ 12.6 $ 12.2 $ 11.6 $ 11.2 Core Return on Tangible Common Equity [a] / [b] 11.5% 20.5% 24.3% 9.1% 12.0% 12.3% 9.8% 45

4Q 2023 Preliminary Results Supplemental GAAP to Core Results: Core ROTCE – Quarterly Core Return on Tangible Common Equity ( Core ROTCE ) QUARTERLY TREND 4Q 23 3Q 23 2Q 23 1Q 23 4Q 22 3Q 22 2Q 22 1Q 22 4Q 21 3Q 21 2Q 21 1Q 21 4Q 20 Numerator ($ millions) GAAP net income attributable to common shareholders $ 49 $ 269 $ 301 $ 291 $ 251 $ 272 $ 454 $ 627 $ 624 $ 683 $ 900 $ 796 $ 687 Discontinued operations, net of tax 1 - - 1 - 1 - - 6 - (1) - - Core OID 13 12 12 11 11 11 10 10 9 9 9 10 9 Repositioning Items 172 30 - - 57 20 - - 107 52 70 - - Change in fair value of equity securities (74) 56 (25) ( 65) ( 49) 62 136 66 (21) 65 (19) (17) (111) Tax on Core OID, Repo & change in fair value of equity securities (assumes 21% tax rate) (23) (21) 3 11 (4) ( 20) ( 31) ( 16) (20) ( 26) (13) 1 21 Significant discrete tax items & other - (94) - - 61 - - - - - ( 78) - - Core net income attributable to common shareholders [a] $ 137 $ 252 $ 291 $ 250 $ 327 $ 346 $ 570 $ 687 $ 705 $ 782 $ 868 $ 790 $ 606 Denominator (Average, $ billions) GAAP shareholder's equity $ 13.3 $ 13.2 $ 13.5 $ 13.1 $ 12.6 $ 13.2 $ 14.7 $ 16.2 $ 17.2 $ 17.4 $ 16.1 $ 14.7 $ 14.4 less: Preferred equity (2.3) (2.3) ( 2.3) (2.3) ( 2.3) ( 2.3) ( 2.3) (2.3) (2.3) ( 2.3) ( 1.2) - - GAAP common shareholder's equity $ 11.0 $ 10.9 $ 11.1 $ 10.8 $ 10.3 $ 10.9 $ 12.4 $ 13.9 $ 14.8 $ 15.1 $ 14.9 $ 14.7 $ 14.4 Goodwill & identifiable intangibles, net of deferred tax liabilities ( DTLs ) ( 0.8) ( 0.9) ( 0.9) (0.9) (0.9) (0.9) ( 0.9) ( 0.9) ( 0.7) ( 0.4) (0.4) (0.4) ( 0.4) Tangible common equity $ 10.2 $ 10.0 $ 10.2 $ 9.9 $ 9.4 $ 10.0 $ 11.4 $ 13.0 $ 14.2 $ 14.7 $ 14.5 $ 14.3 $ 14.0 Core OID balance (0.8) (0.8) (0.8) (0.8) (0.8) (0.9) (0.9) ( 0.9) ( 0.9) ( 0.9) ( 1.0) (1.0) ( 1.0) Net deferred tax asset ( DTA ) (1.4) ( 1.3) ( 1.1) (1.1) (1.2) ( 1.1) ( 0.8) ( 0.4) ( 0.6) ( 0.9) ( 0.6) (0.1) ( 0.1) Normalized common equity [b] $ 8.0 $ 7.9 $ 8.4 $ 8.0 $ 7.4 $ 8.0 $ 9.8 $ 11.7 $ 12.7 $ 12.9 $ 13.0 $ 13.1 $ 12.9 Core Return on Tangible Common Equity [a] / [b] 6.9% 12.9% 13.9% 12.5% 17.6% 17.2% 23.2% 23.6% 22.1% 24.2% 26.7% 24.1% 18.7% 46

4Q 2023 Preliminary Results Supplemental GAAP to Core Results: Adjusted Efficiency Ratio – Annual Adjusted Efficiency Ratio FY 2023 FY 2022 FY 2021 FY 2020 FY 2019 FY 2018 FY 2017 Numerator ($ millions) GAAP noninterest expense $ 5,163 $ 4,687 $ 4,110 $ 3,833 $ 3,429 $ 3,264 $ 3,110 Rep and warrant expense - - - 0 (0) 3 0 Insurance expense (1,332) (1,150) (1,061) (1,092) (1,013) (955) ( 950) Repositioning items ( 217) (77) - (50) - - - Adjusted noninterest expense for efficiency ratio [a] $ 3,614 $ 3,460 $ 3,049 $ 2,691 $ 2,416 $ 2,312 $ 2,160 Denominator ($ millions) Total net revenue $ 8,214 $ 8,428 $ 8,206 $ 6,686 $ 6,394 $ 5,804 $ 5,765 Core OID 48 42 38 36 29 86 71 Insurance revenue (1,545) (1,112) (1,404) (1,376) (1,328) (1,035) (1,118) Repositioning items - - 131 - - - - Adjusted net revenue for efficiency ratio [b] $ 6,717 $ 7,358 $ 6,970 $ 5,346 $ 5,095 $ 4,855 $ 4,718 Adjusted Efficiency Ratio [a] / [b] 53.8% 47.0% 43.7% 50.3% 47.4% 47.6% 45.8% 47

4Q 2023 Preliminary Results Supplemental GAAP to Core Results: Adjusted Efficiency Ratio – Quarterly Adjusted Efficiency Ratio QUARTERLY TREND 4Q 23 3Q 23 2Q 23 1Q 23 4Q 22 Numerator ($ millions) GAAP noninterest expense $ 1,416 $ 1,232 $ 1,249 $ 1,266 $ 1,266 Rep and warrant expense - - - - - Insurance expense (321) (338) (358) (315) (286) Repositioning items (187) ( 30) - - (57) Adjusted noninterest expense for efficiency ratio [a] $ 908 $ 864 $ 891 $ 951 $ 923 Denominator ($ millions) Total net revenue $ 2,067 $ 1,968 $ 2,079 $ 2,100 $ 2,201 Core OID 13 12 12 11 11 Repositioning items - - - - - Insurance revenue (450) (322) (366) (407) (387) Adjusted net revenue for the efficiency ratio [b] $ 1,630 $ 1,658 $ 1,725 $ 1,704 $ 1,825 Adjusted Efficiency Ratio [a] / [b] 55.7% 52.1% 51.7% 55.8% 50.6% 48
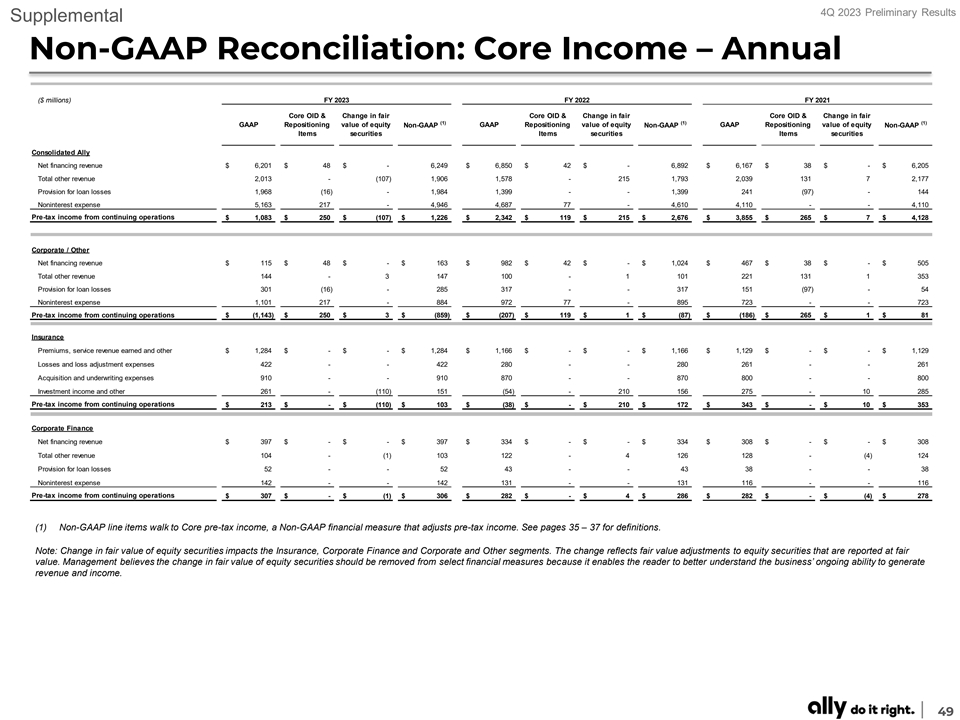
4Q 2023 Preliminary Results Supplemental Non-GAAP Reconciliation: Core Income – Annual ($ millions) FY 2023 FY 2022 FY 2021 Core OID & Change in fair Core OID & Change in fair Core OID & Change in fair (1) (1) (1) GAAP Repositioning value of equity Non-GAAP GAAP Repositioning value of equity Non-GAAP GAAP Repositioning value of equity Non-GAAP Items securities Items securities Items securities Consolidated Ally Net financing revenue $ 6,201 $ 48 $ - 6 ,249 $ 6,850 $ 42 $ - 6,892 $ 6,167 $ 38 $ - $ 6,205 Total other revenue 2,013 - (107) 1,906 1,578 - 215 1,793 2,039 131 7 2,177 Provision for loan losses 1,968 (16) - 1,984 1 ,399 - - 1 ,399 241 (97) - 144 Noninterest expense 5,163 217 - 4,946 4,687 77 - 4,610 4 ,110 - - 4,110 Pre-tax income from continuing operations $ 1,083 $ 250 $ (107) $ 1,226 $ 2,342 $ 119 $ 215 $ 2,676 $ 3,855 $ 265 $ 7 $ 4,128 Corporate / Other Net financing revenue $ 115 $ 48 $ - $ 163 $ 982 $ 42 $ - $ 1,024 $ 467 $ 38 $ - $ 505 Total other revenue 144 - 3 147 100 - 1 101 221 131 1 353 Provision for loan losses 301 (16) - 285 317 - - 317 151 (97) - 54 Noninterest expense 1,101 217 - 884 972 77 - 895 723 - - 723 Pre-tax income from continuing operations $ (1,143) $ 250 $ 3 $ ( 859) $ (207) $ 119 $ 1 $ (87) $ (186) $ 265 $ 1 $ 81 Insurance Premiums, service revenue earned and other $ 1,284 $ - $ - $ 1,284 $ 1,166 $ - $ - $ 1,166 $ 1,129 $ - $ - $ 1,129 Losses and loss adjustment expenses 422 - - 422 280 - - 280 261 - - 261 Acquisition and underwriting expenses 910 - - 910 870 - - 870 800 - - 800 Investment income and other 261 - (110) 151 (54) - 210 156 275 - 10 285 Pre-tax income from continuing operations $ 213 $ - $ ( 110) $ 103 $ (38) $ - $ 210 $ 172 $ 343 $ - $ 10 $ 353 Corporate Finance Net financing revenue $ 397 $ - $ - $ 397 $ 334 $ - $ - $ 334 $ 308 $ - $ - $ 308 Total other revenue 104 - ( 1) 103 122 - 4 126 128 - ( 4) 124 Provision for loan losses 52 - - 52 43 - - 43 38 - - 38 Noninterest expense 142 - - 142 131 - - 131 116 - - 116 Pre-tax income from continuing operations $ 307 $ - $ (1) $ 306 $ 282 $ - $ 4 $ 286 $ 282 $ - $ (4) $ 278 (1) Non-GAAP line items walk to Core pre-tax income, a Non-GAAP financial measure that adjusts pre-tax income. See pages 35 – 37 for definitions. Note: Change in fair value of equity securities impacts the Insurance, Corporate Finance and Corporate and Other segments. The change reflects fair value adjustments to equity securities that are reported at fair value. Management believes the change in fair value of equity securities should be removed from select financial measures because it enables the reader to better understand the business’ ongoing ability to generate revenue and income. 49

4Q 2023 Preliminary Results Supplemental Non-GAAP Reconciliation: Core Income – Quarterly ($ millions) 4Q 23 3Q 23 4Q 22 Change in fair Change in fair Change in fair (1) (1) (1) GAAP Core OID value of equity Repositioning GAAP Core OID value of equity Repositioning GAAP Core OID value of equity Repositioning Non-GAAP Non-GAAP Non-GAAP securities securities securities Consolidated Ally Net financing revenue $ 1,493 $ 13 $ - $ - 1,506 $ 1,533 $ 12 $ - $ - 1 ,545 $ 1,674 $ 11 $ - $ - 1,685 Total other revenue 574 - ( 74) - 500 435 - 56 - 491 527 - (49) - 478 Provision for credit losses 587 - - (16) 603 508 - - - 508 490 - - - 490 Noninterest expense 1,416 - - 187 1 ,229 1,232 - - 30 1 ,202 1,266 - - 57 1,209 Pre-tax income $ 64 $ 13 $ (74) $ 172 $ 174 $ 228 $ 12 $ 56 $ 30 $ 326 $ 445 $ 11 $ (49) $ 57 $ 464 Corporate / Other Net financing revenue $ (26) $ 13 $ - $ - $ (13) $ (6) $ 12 $ - $ - $ 6 $ 172 $ 11 $ - $ - $ 183 Total other revenue 49 - (7) - 42 35 - 10 - 45 49 - (0) - 49 Provision for credit losses 78 - - (16) 94 61 - - - 61 97 - - - 97 Noninterest expense 407 - - 187 220 211 - - 30 181 303 - - 57 246 Pre-tax income $ ( 462) $ 13 $ (7) $ 172 $ ( 284) $ (243) $ 12 $ 10 $ 30 $ (191) $ (179) $ 11 $ (0) $ 57 $ (111) Insurance Premiums, service revenue earned and other $ 339 $ - $ - $ - $ 339 $ 324 $ - $ - $ - $ 324 $ 305 $ - $ - $ - $ 305 Losses and loss adjustment expenses 93 - - - 93 107 - - - 107 63 - - - 63 Acquisition and underwriting expenses 228 - - - 228 231 - - - 231 223 - - - 223 Investment income and other 111 - (67) - 44 (2) - 46 - 44 82 - (49) - 33 Pre-tax income $ 129 $ - $ (67) $ - $ 62 $ (16) $ - $ 46 $ - $ 30 $ 101 $ - $ (49) $ - $ 52 Corporate Finance Net financing revenue $ 105 $ - $ - $ - $ 105 $ 97 $ - $ - $ - $ 97 $ 94 $ - $ - $ - $ 94 Total other revenue 23 - 0 - 23 24 - ( 0) - 24 25 - 0 - 25 Provision for credit losses 17 - - - 17 5 - - - 5 16 - - - 16 Noninterest expense 32 - - - 32 32 - - - 32 36 - - - 36 Pre-tax income $ 79 $ - $ 0 $ - $ 79 $ 84 $ - $ (0) $ - $ 84 $ 67 $ - $ 0 $ - $ 67 (1) Non-GAAP line items walk to Core pre-tax income, a Non-GAAP financial measure that adjusts pre-tax income. See pages 35 – 37 for definitions. Note: Change in fair value of equity securities impacts the Insurance, Corporate Finance and Corporate and Other segments. The change reflects fair value adjustments to equity securities that are reported at fair value. Management believes the change in fair value of equity securities should be removed from select financial measures because it enables the reader to better understand the business’ ongoing ability to generate revenue and income. 50
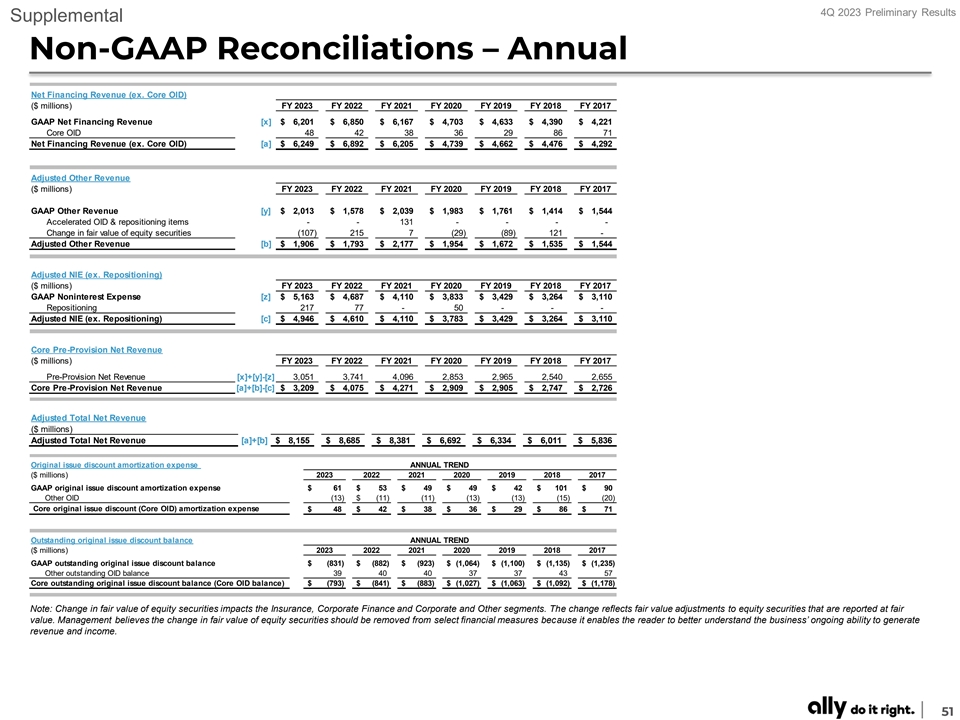
4Q 2023 Preliminary Results Supplemental Non-GAAP Reconciliations – Annual Net Financing Revenue (ex. Core OID) ($ millions) FY 2023 FY 2022 FY 2021 FY 2020 FY 2019 FY 2018 FY 2017 GAAP Net Financing Revenue [x] $ 6,201 $ 6,850 $ 6,167 $ 4,703 $ 4,633 $ 4,390 $ 4,221 Core OID 48 42 38 36 29 86 71 Net Financing Revenue (ex. Core OID) [a] $ 6,249 $ 6,892 $ 6,205 $ 4,739 $ 4,662 $ 4,476 $ 4,292 Adjusted Other Revenue ($ millions) FY 2023 FY 2022 FY 2021 FY 2020 FY 2019 FY 2018 FY 2017 GAAP Other Revenue [y] $ 2,013 $ 1,578 $ 2,039 $ 1,983 $ 1,761 $ 1,414 $ 1,544 Accelerated OID & repositioning items - - 131 - - - - Change in fair value of equity securities (107) 215 7 (29) (89) 121 - Adjusted Other Revenue [b] $ 1,906 $ 1,793 $ 2,177 $ 1,954 $ 1,672 $ 1,535 $ 1,544 Adjusted NIE (ex. Repositioning) ($ millions) FY 2023 FY 2022 FY 2021 FY 2020 FY 2019 FY 2018 FY 2017 GAAP Noninterest Expense [z] $ 5,163 $ 4,687 $ 4,110 $ 3,833 $ 3,429 $ 3,264 $ 3,110 Repositioning 217 77 - 50 - - - Adjusted NIE (ex. Repositioning) [c] $ 4,946 $ 4,610 $ 4,110 $ 3,783 $ 3,429 $ 3,264 $ 3,110 Core Pre-Provision Net Revenue ($ millions) FY 2023 FY 2022 FY 2021 FY 2020 FY 2019 FY 2018 FY 2017 Pre-Provision Net Revenue [x]+[y]-[z] 3,051 3,741 4 ,096 2 ,853 2,965 2,540 2,655 Core Pre-Provision Net Revenue [a]+[b]-[c] $ 3,209 $ 4,075 $ 4,271 $ 2,909 $ 2,905 $ 2,747 $ 2,726 Adjusted Total Net Revenue ($ millions) Adjusted Total Net Revenue [a]+[b] $ 8,155 $ 8,685 $ 8,381 $ 6,692 $ 6,334 $ 6,011 $ 5,836 Original issue discount amortization expense ANNUAL TREND ($ millions) 2023 2022 2021 2020 2019 2018 2017 GAAP original issue discount amortization expense $ 61 $ 53 $ 49 $ 49 $ 42 $ 101 $ 90 Other OID ( 13) $ (11) (11) (13) (13) (15) (20) Core original issue discount (Core OID) amortization expense $ 48 $ 42 $ 38 $ 36 $ 29 $ 86 $ 71 Outstanding original issue discount balance ANNUAL TREND ($ millions) 2023 2022 2021 2020 2019 2018 2017 GAAP outstanding original issue discount balance $ (831) $ (882) $ (923) $ (1,064) $ (1,100) $ (1,135) $ (1,235) Other outstanding OID balance 39 40 40 37 37 43 57 Core outstanding original issue discount balance (Core OID balance) $ (793) $ ( 841) $ ( 883) $ (1,027) $ (1,063) $ (1,092) $ (1,178) Note: Change in fair value of equity securities impacts the Insurance, Corporate Finance and Corporate and Other segments. The change reflects fair value adjustments to equity securities that are reported at fair value. Management believes the change in fair value of equity securities should be removed from select financial measures because it enables the reader to better understand the business’ ongoing ability to generate revenue and income. 51
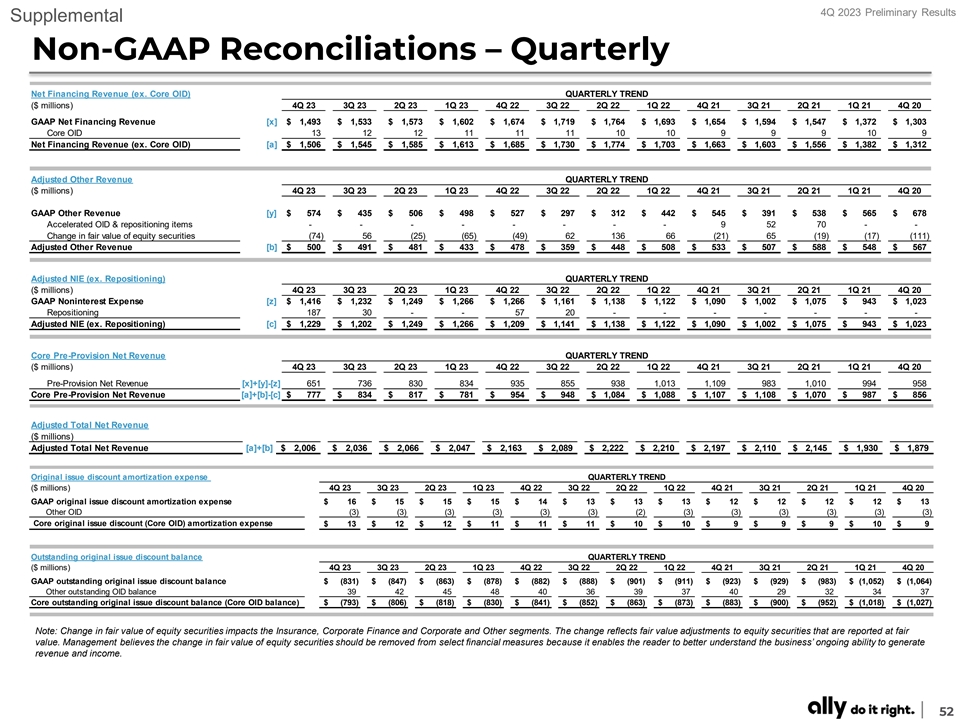
4Q 2023 Preliminary Results Supplemental Non-GAAP Reconciliations – Quarterly Net Financing Revenue (ex. Core OID) QUARTERLY TREND ($ millions) 4Q 23 3Q 23 2Q 23 1Q 23 4Q 22 3Q 22 2Q 22 1Q 22 4Q 21 3Q 21 2Q 21 1Q 21 4Q 20 GAAP Net Financing Revenue [x] $ 1,493 $ 1,533 $ 1,573 $ 1,602 $ 1,674 $ 1,719 $ 1,764 $ 1,693 $ 1,654 $ 1 ,594 $ 1 ,547 $ 1,372 $ 1,303 Core OID 13 12 12 11 11 11 10 10 9 9 9 10 9 Net Financing Revenue (ex. Core OID) [a] $ 1,506 $ 1,545 $ 1,585 $ 1,613 $ 1,685 $ 1 ,730 $ 1,774 $ 1,703 $ 1 ,663 $ 1 ,603 $ 1 ,556 $ 1,382 $ 1 ,312 Adjusted Other Revenue QUARTERLY TREND ($ millions) 4Q 23 3Q 23 2Q 23 1Q 23 4Q 22 3Q 22 2Q 22 1Q 22 4Q 21 3Q 21 2Q 21 1Q 21 4Q 20 GAAP Other Revenue [y] $ 574 $ 435 $ 506 $ 498 $ 527 $ 297 $ 312 $ 442 $ 545 $ 391 $ 538 $ 565 $ 678 Accelerated OID & repositioning items - - - - - - - - 9 52 70 - - Change in fair value of equity securities (74) 56 (25) (65) (49) 62 136 66 (21) 65 (19) (17) (111) Adjusted Other Revenue [b] $ 500 $ 491 $ 481 $ 433 $ 478 $ 359 $ 448 $ 508 $ 533 $ 507 $ 588 $ 548 $ 567 Adjusted NIE (ex. Repositioning) QUARTERLY TREND ($ millions) 4Q 23 3Q 23 2Q 23 1Q 23 4Q 22 3Q 22 2Q 22 1Q 22 4Q 21 3Q 21 2Q 21 1Q 21 4Q 20 GAAP Noninterest Expense [z] $ 1,416 $ 1,232 $ 1,249 $ 1,266 $ 1,266 $ 1,161 $ 1,138 $ 1,122 $ 1,090 $ 1,002 $ 1 ,075 $ 943 $ 1,023 Repositioning 187 30 - - 57 20 - - - - - - - Adjusted NIE (ex. Repositioning) [c] $ 1,229 $ 1,202 $ 1,249 $ 1,266 $ 1,209 $ 1 ,141 $ 1 ,138 $ 1 ,122 $ 1,090 $ 1 ,002 $ 1 ,075 $ 943 $ 1,023 Core Pre-Provision Net Revenue QUARTERLY TREND ($ millions) 4Q 23 3Q 23 2Q 23 1Q 23 4Q 22 3Q 22 2Q 22 1Q 22 4Q 21 3Q 21 2Q 21 1Q 21 4Q 20 Pre-Provision Net Revenue [x]+[y]-[z] 651 736 830 834 935 855 938 1,013 1,109 983 1,010 994 958 Core Pre-Provision Net Revenue [a]+[b]-[c] $ 777 $ 834 $ 817 $ 781 $ 954 $ 948 $ 1,084 $ 1 ,088 $ 1,107 $ 1 ,108 $ 1 ,070 $ 987 $ 856 Adjusted Total Net Revenue ($ millions) Adjusted Total Net Revenue [a]+[b] $ 2,006 $ 2,036 $ 2,066 $ 2,047 $ 2,163 $ 2 ,089 $ 2 ,222 $ 2,210 $ 2 ,197 $ 2 ,110 $ 2 ,145 $ 1 ,930 $ 1,879 Original issue discount amortization expense QUARTERLY TREND ($ millions) 4Q 23 3Q 23 2Q 23 1Q 23 4Q 22 3Q 22 2Q 22 1Q 22 4Q 21 3Q 21 2Q 21 1Q 21 4Q 20 GAAP original issue discount amortization expense $ 16 $ 15 $ 15 $ 15 $ 14 $ 13 $ 13 $ 13 $ 12 $ 12 $ 12 $ 12 $ 13 Other OID (3) (3) (3) (3) (3) (3) (2) (3) (3) (3) (3) (3) (3) Core original issue discount (Core OID) amortization expense $ 13 $ 12 $ 12 $ 11 $ 11 $ 11 $ 10 $ 10 $ 9 $ 9 $ 9 $ 10 $ 9 Outstanding original issue discount balance QUARTERLY TREND ($ millions) 4Q 23 3Q 23 2Q 23 1Q 23 4Q 22 3Q 22 2Q 22 1Q 22 4Q 21 3Q 21 2Q 21 1Q 21 4Q 20 GAAP outstanding original issue discount balance $ ( 831) $ ( 847) $ (863) $ ( 878) $ ( 882) $ ( 888) $ ( 901) $ ( 911) $ ( 923) $ (929) $ ( 983) $ (1,052) $ (1,064) Other outstanding OID balance 39 42 45 48 40 36 39 37 40 29 32 34 37 Core outstanding original issue discount balance (Core OID balance) $ ( 793) $ (806) $ ( 818) $ (830) $ (841) $ ( 852) $ (863) $ (873) $ (883) $ (900) $ (952) $ (1,018) $ (1,027) Note: Change in fair value of equity securities impacts the Insurance, Corporate Finance and Corporate and Other segments. The change reflects fair value adjustments to equity securities that are reported at fair value. Management believes the change in fair value of equity securities should be removed from select financial measures because it enables the reader to better understand the business’ ongoing ability to generate revenue and income. 52
Exhibit 99.3

FOURTH QUARTER 2023
FINANCIAL SUPPLEMENT
| ALLY FINANCIAL INC. FORWARD-LOOKING STATEMENTS AND ADDITIONAL INFORMATION
|

|
This document and related communications should be read in conjunction with the financial statements, notes, and other information contained in our Annual Reports on Form 10-K, Quarterly Reports on Form 10-Q, and Current Reports on Form 8-K. This information is preliminary and based on company and third-party data available at the time of the presentation or related communication.
This document and related communications contain forward-looking statements within the meaning of the Private Securities Litigation Reform Act of 1995. These statements can be identified by the fact that they do not relate strictly to historical or current facts—such as statements about the outlook for financial and operating metrics, and future capital allocation and actions. Forward-looking statements often use words such as “believe,” “expect,” “anticipate,” “intend,” “pursue,” “seek,” “continue,” “estimate,” “project,” “outlook,” “forecast,” “potential,” “target,” “objective,” “trend,” “plan,” “goal,” “initiative,” “priorities,” or other words of comparable meaning or future-tense or conditional verbs such as “may,” “will,” “should,” “would,” or “could.” Forward-looking statements convey our expectations, intentions, or forecasts about future events, circumstances, or results. All forward-looking statements, by their nature, are subject to assumptions, risks, and uncertainties, which may change over time and many of which are beyond our control. You should not rely on any forward-looking statement as a prediction or guarantee about the future. Actual future objectives, strategies, plans, prospects, performance, conditions, or results may differ materially from those set forth in any forward-looking statement. Some of the factors that may cause actual results or other future events or circumstances to differ from those in forward-looking statements are described in our Annual Report on Form 10-K for the year ended December 31, 2022, our subsequent Quarterly Reports on Form 10-Q or Current Reports on Form 8-K, or other applicable documents that are filed or furnished with the U.S. Securities and Exchange Commission (collectively, our “SEC filings”). Any forward-looking statement made by us or on our behalf speaks only as of the date that it was made. We do not undertake to update any forward-looking statement to reflect the impact of events, circumstances, or results that arise after the date that the statement was made, except as required by applicable securities laws. You, however, should consult further disclosures (including disclosures of a forward-looking nature) that we may make in any subsequent SEC filings.
This document and related communications contain specifically identified non-GAAP financial measures, which supplement the results that are reported according to U.S. generally accepted accounting principles (“GAAP”). These non-GAAP financial measures may be useful to investors but should not be viewed in isolation from, or as a substitute for, GAAP results. Differences between non-GAAP financial measures and comparable GAAP financial measures are reconciled in the presentation.
Unless the context otherwise requires, the following definitions apply. The term “loans” means the following consumer and commercial products associated with our direct and indirect financing activities: loans, retail installment sales contracts, lines of credit, and other financing products excluding operating leases. The term “operating leases” means consumer- and commercial-vehicle lease agreements where Ally is the lessor and the lessee is generally not obligated to acquire ownership of the vehicle at lease-end or compensate Ally for the vehicle’s residual value. The terms “lend,” “finance,” and “originate” mean our direct extension or origination of loans, our purchase or acquisition of loans, or our purchase of operating leases, as applicable. The term “consumer” means all consumer products associated with our loan and operating-lease activities and all commercial retail installment sales contracts. The term “commercial” means all commercial products associated with our loan activities, other than commercial retail installment sales contracts. The term “partnerships” means business arrangements rather than partnerships as defined by law.
| 4Q 2023 Preliminary Results | 2 |
| ALLY FINANCIAL INC. TABLE OF CONTENTS
|
|
| Page(s) | ||||
| Consolidated Results | ||||
| Consolidated Financial Highlights | 4 | |||
| Consolidated Income Statement | 5 | |||
| Consolidated Period-End Balance Sheet | 6 | |||
| Consolidated Average Balance Sheet | 7 | |||
| Segment Detail | ||||
| Segment Highlights | 8 | |||
| Automotive Finance | 9-10 | |||
| Insurance | 11 | |||
| Mortgage Finance | 12 | |||
| Corporate Finance | 13 | |||
| Corporate and Other | 14 | |||
| Credit Related Information | 15-16 | |||
| Supplemental Detail | ||||
| Capital | 17 | |||
| Liquidity and Deposits | 18 | |||
| Net Interest Margin | 19 | |||
| Ally Bank Consumer Mortgage HFI Portfolios | 20 | |||
| Earnings Per Share Related Information | 21 | |||
| Adjusted Tangible Book Per Share Related Information | 22 | |||
| Core ROTCE Related Information | 23 | |||
| Adjusted Efficiency Ratio Related Information | 24 | |||
| 4Q 2023 Preliminary Results | 3 |
| ALLY FINANCIAL INC. CONSOLIDATED FINANCIAL HIGHLIGHTS
|
|
| ($ in millions, shares in thousands) | QUARTERLY TRENDS | CHANGE VS. | FULL YEAR | |||||||||||||||||||||||||||||||||||||
| Selected Income Statement Data |
4Q 23 | 3Q 23 | 2Q 23 | 1Q 23 | 4Q 22 | 3Q 23 | 4Q 22 | FY 2023 | FY 2022 | CHANGE | ||||||||||||||||||||||||||||||
| Net financing revenue |
1,493 | 1,533 | 1,573 | 1,602 | 1,674 | (40 | ) | (181 | ) | 6,201 | 6,850 | (649 | ) | |||||||||||||||||||||||||||
| Core OID |
13 | 12 | 12 | 11 | 11 | 0 | 2 | 48 | 42 | 7 | ||||||||||||||||||||||||||||||
| Net financing revenue (excluding Core OID) (1) |
1,506 | 1,545 | 1,585 | 1,613 | 1,685 | (40 | ) | (179 | ) | 6,249 | 6,892 | (642 | ) | |||||||||||||||||||||||||||
| Other revenue |
574 | 435 | 506 | 498 | 527 | 139 | 47 | 2,013 | 1,578 | 435 | ||||||||||||||||||||||||||||||
| Change in fair value of equity securities (2) |
(74 | ) | 56 | (25 | ) | (65 | ) | (49 | ) | (130 | ) | (25 | ) | (107 | ) | 215 | (322 | ) | ||||||||||||||||||||||
| Adjusted other revenue (1) |
500 | 491 | 481 | 433 | 478 | 9 | 22 | 1,906 | 1,793 | 113 | ||||||||||||||||||||||||||||||
| Provision for credit losses |
587 | 508 | 427 | 446 | 490 | 79 | 97 | 1,968 | 1,399 | 569 | ||||||||||||||||||||||||||||||
| Repositioning |
(16 | ) | — | — | — | — | (16 | ) | (16 | ) | (16 | ) | — | (16 | ) | |||||||||||||||||||||||||
| Adjusted Provision for Credit Losses (1) |
603 | 508 | 427 | 446 | 490 | 95 | 113 | 1,984 | 1,399 | 585 | ||||||||||||||||||||||||||||||
| Total noninterest expense (3) |
1,416 | 1,232 | 1,249 | 1,266 | 1,266 | 184 | 150 | 5,163 | 4,687 | 476 | ||||||||||||||||||||||||||||||
| Repositioning |
187 | 30 | — | — | 57 | 157 | 130 | 217 | 77 | 140 | ||||||||||||||||||||||||||||||
| Noninterest Expense (ex. Repositioning) (1) |
1,229 | 1,202 | 1,249 | 1,266 | 1,209 | 27 | 20 | 4,946 | 4,610 | 336 | ||||||||||||||||||||||||||||||
|
|
|
|
|
|
|
|
|
|
|
|
|
|
|
|
|
|
|
|
|
|||||||||||||||||||||
| Pre-tax income from continuing operations |
64 | 228 | 403 | 388 | 445 | (164 | ) | (381 | ) | 1,083 | 2,342 | (1,259 | ) | |||||||||||||||||||||||||||
| Income tax (benefit) expense |
(13 | ) | (68 | ) | 74 | 68 | 167 | 55 | (180 | ) | 61 | 627 | (566 | ) | ||||||||||||||||||||||||||
| (Loss) from discontinued operations, net of tax |
(1 | ) | — | — | (1 | ) | — | (1 | ) | (1 | ) | (2 | ) | (1 | ) | (1 | ) | |||||||||||||||||||||||
|
|
|
|
|
|
|
|
|
|
|
|
|
|
|
|
|
|
|
|
|
|||||||||||||||||||||
| Net Income |
$ | 76 | $ | 296 | $ | 329 | $ | 319 | $ | 278 | $ | (220 | ) | $ | (202 | ) | $ | 1,020 | $ | 1,714 | $ | (694 | ) | |||||||||||||||||
| Preferred Dividends |
27 | 27 | 28 | 28 | 27 | — | — | 110 | 110 | — | ||||||||||||||||||||||||||||||
|
|
|
|
|
|
|
|
|
|
|
|
|
|
|
|
|
|
|
|
|
|||||||||||||||||||||
| Net income attributable to common shareholders |
$ | 49 | $ | 269 | $ | 301 | $ | 291 | $ | 251 | $ | (220 | ) | $ | (202 | ) | $ | 910 | $ | 1,604 | $ | (694 | ) | |||||||||||||||||
|
|
|
|
|
|
|
|
|
|
|
|
|
|
|
|
|
|
|
|
|
|||||||||||||||||||||
| Core Pre-Provision Net Revenue (4) |
$ | 777 | $ | 834 | $ | 817 | $ | 781 | $ | 954 | $ | (57 | ) | $ | (177 | ) | $ | 3,209 | $ | 4,075 | $ | (866 | ) | |||||||||||||||||
| Selected Balance Sheet Data (Period-End) |
||||||||||||||||||||||||||||||||||||||||
| Total assets |
$ | 196,429 | $ | 195,704 | $ | 197,241 | $ | 196,165 | $ | 191,826 | $ | 725 | $ | 4,603 | ||||||||||||||||||||||||||
| Consumer loans |
104,977 | 108,343 | 107,370 | 106,815 | 106,610 | (3,366 | ) | (1,633 | ) | |||||||||||||||||||||||||||||||
| Commercial loans |
34,462 | 31,917 | 31,079 | 29,489 | 29,138 | 2,545 | 5,324 | |||||||||||||||||||||||||||||||||
| Allowance for loan losses |
(3,587 | ) | (3,837 | ) | (3,781 | ) | (3,751 | ) | (3,711 | ) | 250 | 124 | ||||||||||||||||||||||||||||
| Deposits |
154,666 | 152,835 | 154,310 | 154,013 | 152,297 | 1,831 | 2,369 | |||||||||||||||||||||||||||||||||
| Total equity |
13,766 | 12,825 | 13,532 | 13,378 | 12,859 | 941 | 907 | |||||||||||||||||||||||||||||||||
| Common Share Count |
||||||||||||||||||||||||||||||||||||||||
| Weighted average basic |
304,506 | 304,134 | 303,684 | 302,657 | 301,279 | 372 | 3,227 | 303,751 | 316,690 | (12,939 | ) | |||||||||||||||||||||||||||||
| Weighted average diluted |
306,730 | 305,693 | 304,646 | 303,448 | 303,062 | 1,036 | 3,668 | 305,135 | 318,629 | (13,494 | ) | |||||||||||||||||||||||||||||
| Issued shares outstanding (period-end) |
302,459 | 301,630 | 301,619 | 300,821 | 299,324 | 830 | 3,135 | |||||||||||||||||||||||||||||||||
| Per Common Share Data |
||||||||||||||||||||||||||||||||||||||||
| Earnings per share (basic) |
$ | 0.16 | $ | 0.88 | $ | 0.99 | $ | 0.96 | $ | 0.83 | $ | (0.72 | ) | $ | (0.67 | ) | $ | 3.00 | $ | 5.06 | $ | (2.07 | ) | |||||||||||||||||
| Earnings per share (diluted) |
0.16 | 0.88 | 0.99 | 0.96 | 0.83 | (0.72 | ) | (0.67 | ) | 2.98 | 5.03 | (2.05 | ) | |||||||||||||||||||||||||||
| Adjusted earnings per share (1) |
0.45 | 0.83 | 0.96 | 0.82 | 1.08 | (0.38 | ) | (0.63 | ) | 3.05 | 6.06 | (3.01 | ) | |||||||||||||||||||||||||||
| Book value per share |
37.83 | 34.81 | 37.16 | 36.75 | 35.20 | 3.02 | 2.63 | |||||||||||||||||||||||||||||||||
| Tangible book value per share |
35.41 | 31.90 | 34.22 | 33.77 | 32.18 | 3.51 | 3.23 | |||||||||||||||||||||||||||||||||
| Adjusted tangible book value per share (5) |
33.34 | 29.79 | 32.08 | 31.59 | 29.96 | 3.55 | 3.38 | |||||||||||||||||||||||||||||||||
| Select Financial Ratios |
||||||||||||||||||||||||||||||||||||||||
| Net interest margin |
3.17 | % | 3.24 | % | 3.38 | % | 3.51 | % | 3.65 | % | 3.32 | % | 3.85 | % | ||||||||||||||||||||||||||
| Net interest margin (ex. Core OID) (1) |
3.20 | % | 3.26 | % | 3.41 | % | 3.54 | % | 3.68 | % | 3.35 | % | 3.88 | % | ||||||||||||||||||||||||||
| Cost of funds |
4.35 | % | 4.21 | % | 3.89 | % | 3.44 | % | 2.77 | % | 3.97 | % | 1.74 | % | ||||||||||||||||||||||||||
| Cost of funds (ex. Core OID) |
4.29 | % | 4.15 | % | 3.84 | % | 3.39 | % | 2.73 | % | 3.92 | % | 1.71 | % | ||||||||||||||||||||||||||
| Efficiency Ratio |
68.5 | % | 62.6 | % | 60.1 | % | 60.3 | % | 57.5 | % | 62.9 | % | 55.6 | % | ||||||||||||||||||||||||||
| Adjusted efficiency ratio (6) |
55.7 | % | 52.1 | % | 51.7 | % | 55.8 | % | 50.6 | % | 53.8 | % | 47.0 | % | ||||||||||||||||||||||||||
| Return on average assets |
0.1 | % | 0.5 | % | 0.6 | % | 0.6 | % | 0.5 | % | 0.5 | % | 0.9 | % | ||||||||||||||||||||||||||
| Return on average total equity |
1.5 | % | 8.2 | % | 8.9 | % | 8.9 | % | 7.9 | % | 6.9 | % | 11.2 | % | ||||||||||||||||||||||||||
| Return on average tangible common equity |
1.9 | % | 10.8 | % | 11.8 | % | 11.8 | % | 10.7 | % | 9.0 | % | 14.4 | % | ||||||||||||||||||||||||||
| Core ROTCE (7) |
6.9 | % | 12.9 | % | 13.9 | % | 12.5 | % | 17.6 | % | 11.5 | % | 20.5 | % | ||||||||||||||||||||||||||
| Capital Ratios (8) |
||||||||||||||||||||||||||||||||||||||||
| Common Equity Tier 1 (CET1) capital ratio |
9.4 | % | 9.3 | % | 9.3 | % | 9.2 | % | 9.3 | % | ||||||||||||||||||||||||||||||
| Tier 1 capital ratio |
10.8 | % | 10.7 | % | 10.7 | % | 10.7 | % | 10.7 | % | ||||||||||||||||||||||||||||||
| Total capital ratio |
12.4 | % | 12.5 | % | 12.5 | % | 12.5 | % | 12.2 | % | ||||||||||||||||||||||||||||||
| Tier 1 leverage ratio |
8.7 | % | 8.6 | % | 8.6 | % | 8.5 | % | 8.6 | % | ||||||||||||||||||||||||||||||
| (1) | Represents a non-GAAP financial measure. For more details refer to pages 25-27. |
| (2) | For more details refer to pages 25-27. |
| (3) | Including but not limited to employee related expenses, commissions and provision for losses and loss adjustment expense related to the insurance business, information technology expenses, servicing expenses, facilities expenses, marketing expenses, and other professional and legal expenses. |
| (4) | Represents a non-GAAP financial measure. For more details refer to page 25-27. |
| (5) | Represents a non-GAAP financial measure. For more details refer to page 22. |
| (6) | Represents a non-GAAP financial measure. For more details refer to page 24. |
| (7) | Represents a non-GAAP financial measure. For more details refer to page 23. |
| (8) | For more details on the final rules to address the impact of CECL on regulatory capital by allowing BHCs and banks, including Ally, to delay and subsequently phase-in its impact, see page 26. |
| 4Q 2023 Preliminary Results | 4 |
| ALLY FINANCIAL INC. CONSOLIDATED INCOME STATEMENT
|
|
| QUARTERLY TRENDS | CHANGE VS. | FULL YEAR | ||||||||||||||||||||||||||||||||||||||
| ($ in millions) | 4Q 23 | 3Q 23 | 2Q 23 | 1Q 23 | 4Q 22 | 3Q 23 | 4Q 22 | FY 2023 | FY 2022 | CHANGE | ||||||||||||||||||||||||||||||
| Financing revenue and other interest income |
||||||||||||||||||||||||||||||||||||||||
| Interest and fees on finance receivables and loans |
$ | 2,887 | $ | 2,837 | $ | 2,721 | $ | 2,575 | $ | 2,423 | $ | 50 | $ | 464 | $ | 11,020 | $ | 8,099 | $ | 2,921 | ||||||||||||||||||||
| Interest on loans held-for-sale |
5 | 7 | 7 | 15 | 13 | (2 | ) | (8 | ) | 34 | 31 | 3 | ||||||||||||||||||||||||||||
| Total interest and dividends on investment securities |
260 | 256 | 238 | 226 | 220 | 4 | 40 | 980 | 804 | 176 | ||||||||||||||||||||||||||||||
| Interest-bearing cash |
90 | 99 | 87 | 56 | 31 | (9 | ) | 59 | 332 | 54 | 278 | |||||||||||||||||||||||||||||
| Other earning assets |
10 | 11 | 9 | 12 | 12 | (1 | ) | (2 | ) | 42 | 37 | 5 | ||||||||||||||||||||||||||||
| Operating leases |
371 | 385 | 392 | 402 | 400 | (14 | ) | (29 | ) | 1,550 | 1,596 | (46 | ) | |||||||||||||||||||||||||||
|
|
|
|
|
|
|
|
|
|
|
|
|
|
|
|
|
|
|
|
|
|||||||||||||||||||||
| Total financing revenue and other interest income |
3,623 | 3,595 | 3,454 | 3,286 | 3,099 | 28 | 524 | 13,958 | 10,621 | 3,337 | ||||||||||||||||||||||||||||||
| Interest expense |
||||||||||||||||||||||||||||||||||||||||
| Interest on deposits |
1,621 | 1,563 | 1,418 | 1,217 | 946 | 58 | 675 | 5,819 | 1,987 | 3,832 | ||||||||||||||||||||||||||||||
| Interest on short-term borrowings |
37 | 13 | 11 | 12 | 40 | 24 | (3 | ) | 73 | 107 | (34 | ) | ||||||||||||||||||||||||||||
| Interest on long-term debt |
248 | 274 | 252 | 227 | 200 | (26 | ) | 48 | 1,001 | 763 | 238 | |||||||||||||||||||||||||||||
| Interest on other |
2 | — | — | 2 | (1 | ) | 2 | 3 | 4 | — | 4 | |||||||||||||||||||||||||||||
|
|
|
|
|
|
|
|
|
|
|
|
|
|
|
|
|
|
|
|
|
|||||||||||||||||||||
| Total interest expense |
1,908 | 1,850 | 1,681 | 1,458 | 1,185 | 58 | 723 | 6,897 | 2,857 | 4,040 | ||||||||||||||||||||||||||||||
| Depreciation expense on operating lease assets |
222 | 212 | 200 | 226 | 240 | 10 | (18 | ) | 860 | 914 | (54 | ) | ||||||||||||||||||||||||||||
|
|
|
|
|
|
|
|
|
|
|
|
|
|
|
|
|
|
|
|
|
|||||||||||||||||||||
| Net financing revenue |
$ | 1,493 | $ | 1,533 | $ | 1,573 | $ | 1,602 | $ | 1,674 | $ | (40 | ) | $ | (181 | ) | $ | 6,201 | $ | 6,850 | $ | (649 | ) | |||||||||||||||||
| Other revenue |
||||||||||||||||||||||||||||||||||||||||
| Insurance premiums and service revenue earned |
335 | 320 | 310 | 306 | 302 | 15 | 33 | 1,271 | 1,151 | 120 | ||||||||||||||||||||||||||||||
| Gain on mortgage and automotive loans, net |
3 | 4 | 5 | 4 | 24 | (1 | ) | (21 | ) | 16 | 52 | (36 | ) | |||||||||||||||||||||||||||
| Loss on extinguishment of debt |
(0 | ) | — | 0 | (0 | ) | (0 | ) | (0 | ) | 0 | (0 | ) | (0 | ) | 0 | ||||||||||||||||||||||||
| Other gain / (loss) on investments, net |
85 | (41 | ) | 26 | 74 | 53 | 126 | 32 | 144 | (120 | ) | 264 | ||||||||||||||||||||||||||||
| Other income, net of losses |
151 | 152 | 165 | 114 | 148 | (1 | ) | 3 | 582 | 495 | 87 | |||||||||||||||||||||||||||||
|
|
|
|
|
|
|
|
|
|
|
|
|
|
|
|
|
|
|
|
|
|||||||||||||||||||||
| Total other revenue |
574 | 435 | 506 | 498 | 527 | 139 | 47 | 2,013 | 1,578 | 435 | ||||||||||||||||||||||||||||||
| Total net revenue |
2,067 | 1,968 | 2,079 | 2,100 | 2,201 | 99 | (134 | ) | 8,214 | 8,428 | (214 | ) | ||||||||||||||||||||||||||||
| Provision for loan losses |
587 | 508 | 427 | 446 | 490 | 79 | 97 | 1,968 | 1,399 | 569 | ||||||||||||||||||||||||||||||
| Noninterest expense |
||||||||||||||||||||||||||||||||||||||||
| Compensation and benefits expense |
453 | 463 | 448 | 537 | 503 | (10 | ) | (50 | ) | 1,901 | 1,900 | 1 | ||||||||||||||||||||||||||||
| Insurance losses and loss adjustment expenses |
93 | 107 | 134 | 88 | 63 | (14 | ) | 30 | 422 | 280 | 142 | |||||||||||||||||||||||||||||
| Goodwill impairment |
149 | — | — | — | — | 149 | 149 | 149 | — | 149 | ||||||||||||||||||||||||||||||
| Other operating expenses |
721 | 662 | 667 | 641 | 700 | 59 | 21 | 2,691 | 2,507 | 184 | ||||||||||||||||||||||||||||||
|
|
|
|
|
|
|
|
|
|
|
|
|
|
|
|
|
|
|
|
|
|||||||||||||||||||||
| Total noninterest expense |
1,416 | 1,232 | 1,249 | 1,266 | 1,266 | 184 | 150 | 5,163 | 4,687 | 476 | ||||||||||||||||||||||||||||||
| Pre-tax income from continuing operations |
$ | 64 | $ | 228 | $ | 403 | $ | 388 | $ | 445 | $ | (164 | ) | $ | (381 | ) | $ | 1,083 | $ | 2,342 | $ | (1,259 | ) | |||||||||||||||||
| Income tax expense from continuing operations |
(13 | ) | (68 | ) | 74 | 68 | 167 | 55 | (180 | ) | 61 | 627 | (566 | ) | ||||||||||||||||||||||||||
|
|
|
|
|
|
|
|
|
|
|
|
|
|
|
|
|
|
|
|
|
|||||||||||||||||||||
| Net income from continuing operations |
77 | 296 | 329 | 320 | 278 | (219 | ) | (201 | ) | 1,022 | 1,715 | (693 | ) | |||||||||||||||||||||||||||
| Loss from discontinued operations, net of tax |
(1 | ) | — | — | (1 | ) | — | (1 | ) | (1 | ) | (2 | ) | (1 | ) | (1 | ) | |||||||||||||||||||||||
|
|
|
|
|
|
|
|
|
|
|
|
|
|
|
|
|
|
|
|
|
|||||||||||||||||||||
| Net income |
$ | 76 | $ | 296 | $ | 329 | $ | 319 | $ | 278 | $ | (220 | ) | $ | (202 | ) | $ | 1,020 | $ | 1,714 | $ | (694 | ) | |||||||||||||||||
| Preferred Dividends |
27 | 27 | 28 | 28 | 27 | — | — | 110 | 110 | — | ||||||||||||||||||||||||||||||
|
|
|
|
|
|
|
|
|
|
|
|
|
|
|
|
|
|
|
|
|
|||||||||||||||||||||
| Net income available to common shareholders |
$ | 49 | $ | 269 | $ | 301 | $ | 291 | $ | 251 | $ | (220 | ) | $ | (202 | ) | $ | 910 | $ | 1,604 | $ | (694 | ) | |||||||||||||||||
|
|
|
|
|
|
|
|
|
|
|
|
|
|
|
|
|
|
|
|
|
|||||||||||||||||||||
| Core pre-tax Income walk |
||||||||||||||||||||||||||||||||||||||||
| Net financing revenue |
$ | 1,493 | $ | 1,533 | $ | 1,573 | $ | 1,602 | $ | 1,674 | $ | (40 | ) | $ | (181 | ) | $ | 6,201 | $ | 6,850 | $ | (649 | ) | |||||||||||||||||
| Other revenue |
574 | 435 | 506 | 498 | 527 | 139 | 47 | 2,013 | 1,578 | 435 | ||||||||||||||||||||||||||||||
| Provision for credit losses |
587 | 508 | 427 | 446 | 490 | 79 | 97 | 1,968 | 1,399 | 569 | ||||||||||||||||||||||||||||||
| Total noninterest expense |
1,416 | 1,232 | 1,249 | 1,266 | 1,266 | 184 | 150 | 5,163 | 4,687 | 476 | ||||||||||||||||||||||||||||||
|
|
|
|
|
|
|
|
|
|
|
|
|
|
|
|
|
|
|
|
|
|||||||||||||||||||||
| Pre-tax income from continuing operations |
$ | 64 | $ | 228 | $ | 403 | $ | 388 | $ | 445 | $ | (164 | ) | $ | (381 | ) | $ | 1,083 | $ | 2,342 | $ | (1,259 | ) | |||||||||||||||||
| Core OID (2) |
13 | 12 | 12 | 11 | 11 | 0 | 2 | 48 | 42 | 7 | ||||||||||||||||||||||||||||||
| Change in the fair value of equity securities (1) |
(74 | ) | 56 | (25 | ) | (65 | ) | (49 | ) | (130 | ) | (25 | ) | (107 | ) | 215 | (322 | ) | ||||||||||||||||||||||
| Repositioning (1) |
172 | 30 | — | — | 57 | 142 | 115 | 201 | 77 | 124 | ||||||||||||||||||||||||||||||
|
|
|
|
|
|
|
|
|
|
|
|
|
|
|
|
|
|
|
|
|
|||||||||||||||||||||
| Core pre-tax income (2) |
$ | 190 | $ | 326 | $ | 390 | $ | 335 | $ | 464 | $ | (136 | ) | $ | (274 | ) | $ | 1,226 | $ | 2,676 | $ | (1,450 | ) | |||||||||||||||||
|
|
|
|
|
|
|
|
|
|
|
|
|
|
|
|
|
|
|
|
|
|||||||||||||||||||||
| (1) | For more details refer to pages 25-27. |
| (2) | Represents a non-GAAP financial measure. For more details refer to pages 25-27. |
| 4Q 2023 Preliminary Results | 5 |
| ALLY FINANCIAL INC. CONSOLIDATED PERIOD-END BALANCE SHEET
|
|
| ($ in millions) | QUARTERLY TRENDS | CHANGE VS. | ||||||||||||||||||||||||||
| Assets | 4Q 23 | 3Q 23 | 2Q 23 | 1Q 23 | 4Q 22 | 3Q 23 | 4Q 22 | |||||||||||||||||||||
| Cash and cash equivalents |
||||||||||||||||||||||||||||
| Noninterest-bearing |
$ | 638 | $ | 603 | $ | 536 | $ | 554 | $ | 542 | $ | 35 | $ | 96 | ||||||||||||||
| Interest-bearing |
6,307 | 7,912 | 9,436 | 9,226 | 5,029 | (1,605 | ) | 1,278 | ||||||||||||||||||||
|
|
|
|
|
|
|
|
|
|
|
|
|
|
|
|
|
|
|
|
|
|
||||||||
| Total cash and cash equivalents |
6,945 | 8,515 | 9,972 | 9,780 | 5,571 | (1,570 | ) | 1,374 | ||||||||||||||||||||
| Investment securities (1) |
29,905 | 28,532 | 30,453 | 31,215 | 31,284 | 1,373 | (1,379 | ) | ||||||||||||||||||||
| Loans held-for-sale, net |
400 | 289 | 297 | 524 | 654 | 111 | (254 | ) | ||||||||||||||||||||
| Finance receivables and loans, net |
139,439 | 140,260 | 138,449 | 136,304 | 135,748 | (821 | ) | 3,691 | ||||||||||||||||||||
| Allowance for loan losses |
(3,587 | ) | (3,837 | ) | (3,781 | ) | (3,751 | ) | (3,711 | ) | 250 | 124 | ||||||||||||||||
|
|
|
|
|
|
|
|
|
|
|
|
|
|
|
|
|
|
|
|
|
|
||||||||
| Total finance receivables and loans, net |
135,852 | 136,423 | 134,668 | 132,553 | 132,037 | (571 | ) | 3,815 | ||||||||||||||||||||
| Investment in operating leases, net |
9,171 | 9,569 | 9,930 | 10,236 | 10,444 | (398 | ) | (1,273 | ) | |||||||||||||||||||
| Premiums receivables and other insurance assets |
2,749 | 2,775 | 2,768 | 2,713 | 2,698 | (26 | ) | 51 | ||||||||||||||||||||
| Other assets |
9,399 | 9,601 | 9,153 | 9,144 | 9,138 | (202 | ) | 261 | ||||||||||||||||||||
| Assets of operations held-for-sale (2) |
2,008 | — | — | — | — | 2,008 | 2,008 | |||||||||||||||||||||
|
|
|
|
|
|
|
|
|
|
|
|
|
|
|
|
|
|
|
|
|
|
||||||||
| Total assets |
$ | 196,429 | $ | 195,704 | $ | 197,241 | $ | 196,165 | $ | 191,826 | $ | 725 | $ | 4,603 | ||||||||||||||
|
|
|
|
|
|
|
|
|
|
|
|
|
|
|
|
|
|
|
|
|
|
||||||||
| Liabilities |
||||||||||||||||||||||||||||
| Deposit liabilities |
||||||||||||||||||||||||||||
| Noninterest-bearing |
$ | 139 | $ | 188 | $ | 160 | $ | 174 | $ | 185 | $ | (49 | ) | $ | (46 | ) | ||||||||||||
| Interest-bearing |
154,527 | 152,647 | 154,150 | 153,839 | 152,112 | 1,880 | 2,415 | |||||||||||||||||||||
|
|
|
|
|
|
|
|
|
|
|
|
|
|
|
|
|
|
|
|
|
|
||||||||
| Total deposit liabilities |
154,666 | 152,835 | 154,310 | 154,013 | 152,297 | 1,831 | 2,369 | |||||||||||||||||||||
| Short-term borrowings |
3,297 | 2,410 | 2,194 | 1,455 | 2,399 | 887 | 898 | |||||||||||||||||||||
| Long-term debt |
17,570 | 20,096 | 20,141 | 20,480 | 17,762 | (2,526 | ) | (192 | ) | |||||||||||||||||||
| Interest payable |
858 | 1,437 | 955 | 759 | 408 | (579 | ) | 450 | ||||||||||||||||||||
| Unearned insurance premiums and service revenue |
3,492 | 3,494 | 3,478 | 3,455 | 3,453 | (2 | ) | 39 | ||||||||||||||||||||
| Accrued expense and other liabilities |
2,731 | 2,607 | 2,631 | 2,625 | 2,648 | 124 | 83 | |||||||||||||||||||||
| Liabilities of operations held-for-sale |
49 | — | — | — | — | 49 | 49 | |||||||||||||||||||||
|
|
|
|
|
|
|
|
|
|
|
|
|
|
|
|
|
|
|
|
|
|
||||||||
| Total liabilities |
$ | 182,663 | $ | 182,879 | $ | 183,709 | $ | 182,787 | $ | 178,967 | $ | (216 | ) | $ | 3,696 | |||||||||||||
| Equity |
||||||||||||||||||||||||||||
| Common stock and paid-in capital (3) |
$ | 15,104 | $ | 15,069 | $ | 15,048 | $ | 15,015 | $ | 14,978 | $ | 35 | $ | 126 | ||||||||||||||
| Preferred stock |
2,324 | 2,324 | 2,324 | 2,324 | 2,324 | — | — | |||||||||||||||||||||
| Retained earnings / (accumulated deficit) |
154 | 197 | 23 | (185 | ) | (384 | ) | (43 | ) | 538 | ||||||||||||||||||
| Accumulated other comprehensive income / (loss) |
(3,816 | ) | (4,765 | ) | (3,863 | ) | (3,776 | ) | (4,059 | ) | 949 | 243 | ||||||||||||||||
|
|
|
|
|
|
|
|
|
|
|
|
|
|
|
|
|
|
|
|
|
|
||||||||
| Total equity |
13,766 | 12,825 | 13,532 | 13,378 | 12,859 | 941 | 907 | |||||||||||||||||||||
|
|
|
|
|
|
|
|
|
|
|
|
|
|
|
|
|
|
|
|
|
|
||||||||
| Total liabilities and equity |
$ | 196,429 | $ | 195,704 | $ | 197,241 | $ | 196,165 | $ | 191,826 | $ | 725 | $ | 4,603 | ||||||||||||||
|
|
|
|
|
|
|
|
|
|
|
|
|
|
|
|
|
|
|
|
|
|
||||||||
| (1) | Includes Held-to-maturity securities. |
| (2) | Unsecured lending from point-of-sale financing. Moved to Assets of Operations Held-For-Sale (HFS) on 12/31/23. |
| (3) | Includes Treasury stock. |
| 4Q 2023 Preliminary Results | 6 |
| ALLY FINANCIAL INC. CONSOLIDATED AVERAGE BALANCE SHEET (1)
|
|
| ($ in millions) | QUARTERLY TRENDS | CHANGE VS. | FULL YEAR | |||||||||||||||||||||||||||||||||||||
| Assets | 4Q 23 | 3Q 23 | 2Q 23 | 1Q 23 | 4Q 22 | 3Q 23 | 4Q 22 | FY 2023 | FY 2022 | CHANGE | ||||||||||||||||||||||||||||||
| Interest-bearing cash and cash equivalents |
$ | 7,571 | $ | 8,308 | $ | 7,401 | $ | 5,731 | $ | 4,129 | $ | (737 | ) | $ | 3,442 | $ | 7,261 | $ | 3,886 | $ | 3,375 | |||||||||||||||||||
| Investment securities and other earning assets |
29,407 | 30,364 | 31,537 | 32,168 | 32,131 | (957 | ) | (2,724 | ) | 30,861 | 34,397 | (3,536 | ) | |||||||||||||||||||||||||||
| Loans held-for-sale, net |
237 | 278 | 422 | 738 | 722 | (41 | ) | (485 | ) | 417 | 616 | (199 | ) | |||||||||||||||||||||||||||
| Total finance receivables and loans, net (2) (5) |
140,326 | 139,153 | 137,185 | 135,819 | 134,170 | 1,173 | 6,156 | 138,136 | 128,178 | 9,958 | ||||||||||||||||||||||||||||||
| Investment in operating leases, net |
9,415 | 9,817 | 10,110 | 10,435 | 10,546 | (402 | ) | (1,131 | ) | 9,941 | 10,656 | (715 | ) | |||||||||||||||||||||||||||
|
|
|
|
|
|
|
|
|
|
|
|
|
|
|
|
|
|
|
|
|
|
|
|
|
|
|
|
|
|
||||||||||||
| Total interest earning assets |
186,956 | 187,920 | 186,655 | 184,891 | 181,698 | (964 | ) | 5,258 | 186,616 | 177,733 | 8,883 | |||||||||||||||||||||||||||||
| Noninterest-bearing cash and cash equivalents |
257 | 335 | 362 | 333 | 395 | (78 | ) | (138 | ) | 322 | 416 | (94 | ) | |||||||||||||||||||||||||||
| Other assets |
11,644 | 10,925 | 10,781 | 10,817 | 11,082 | 719 | 562 | 11,044 | 10,442 | 602 | ||||||||||||||||||||||||||||||
| Allowance for loan losses |
(3,801 | ) | (3,820 | ) | (3,777 | ) | (3,729 | ) | (3,641 | ) | 19 | (160 | ) | (3,782 | ) | (3,439 | ) | (343 | ) | |||||||||||||||||||||
|
|
|
|
|
|
|
|
|
|
|
|
|
|
|
|
|
|
|
|
|
|
|
|
|
|
|
|
|
|
||||||||||||
| Total assets |
$ | 195,056 | $ | 195,360 | $ | 194,021 | $ | 192,312 | $ | 189,534 | $ | (304 | ) | $ | 5,522 | $ | 194,200 | $ | 185,152 | $ | 9,048 | |||||||||||||||||||
|
|
|
|
|
|
|
|
|
|
|
|
|
|
|
|
|
|
|
|
|
|
|
|
|
|
|
|
|
|
||||||||||||
| Liabilities |
||||||||||||||||||||||||||||||||||||||||
| Interest-bearing deposit liabilities |
||||||||||||||||||||||||||||||||||||||||
| Retail deposit liabilities |
$ | 140,117 | $ | 139,372 | $ | 138,285 | $ | 138,071 | $ | 135,340 | $ | 745 | $ | 4,777 | $ | 138,968 | $ | 133,587 | $ | 5,381 | ||||||||||||||||||||
| Other interest-bearing deposit liabilities (3) |
13,391 | 13,973 | 13,935 | 14,503 | 12,933 | (582 | ) | 458 | 13,947 | 9,400 | 4,547 | |||||||||||||||||||||||||||||
|
|
|
|
|
|
|
|
|
|
|
|
|
|
|
|
|
|
|
|
|
|
|
|
|
|
|
|
|
|
||||||||||||
| Total Interest-bearing deposit liabilities |
153,508 | 153,345 | 152,220 | 152,573 | 148,273 | 163 | 5,235 | 152,915 | 142,987 | 9,928 | ||||||||||||||||||||||||||||||
| Short-term borrowings |
2,714 | 948 | 833 | 1,024 | 4,169 | 1,766 | (1,455 | ) | 1,383 | 4,292 | (2,909 | ) | ||||||||||||||||||||||||||||
| Long-term debt (4) |
17,933 | 20,315 | 20,256 | 18,389 | 17,282 | (2,382 | ) | 651 | 19,226 | 16,683 | 2,543 | |||||||||||||||||||||||||||||
|
|
|
|
|
|
|
|
|
|
|
|
|
|
|
|
|
|
|
|
|
|
|
|
|
|
|
|
|
|
||||||||||||
| Total interest-bearing liabilities (4) |
174,155 | 174,608 | 173,309 | 171,986 | 169,724 | (453 | ) | 4,431 | 173,524 | 163,962 | 9,562 | |||||||||||||||||||||||||||||
| Noninterest-bearing deposit liabilities |
164 | 181 | 162 | 179 | 212 | (17 | ) | (48 | ) | 172 | 193 | (21 | ) | |||||||||||||||||||||||||||
| Other liabilities |
7,826 | 6,503 | 6,760 | 6,662 | 6,809 | 1,323 | 1,017 | 6,940 | 6,606 | 334 | ||||||||||||||||||||||||||||||
|
|
|
|
|
|
|
|
|
|
|
|
|
|
|
|
|
|
|
|
|
|
|
|
|
|
|
|
|
|
||||||||||||
| Total liabilities |
$ | 182,145 | $ | 181,292 | $ | 180,231 | $ | 178,827 | $ | 176,745 | $ | 853 | $ | 5,400 | $ | 180,636 | $ | 170,761 | $ | 9,875 | ||||||||||||||||||||
| Equity |
||||||||||||||||||||||||||||||||||||||||
| Total equity |
$ | 12,911 | $ | 14,068 | $ | 13,790 | $ | 13,485 | $ | 12,789 | $ | (1,157 | ) | $ | 122 | $ | 13,564 | $ | 14,391 | $ | (827 | ) | ||||||||||||||||||
|
|
|
|
|
|
|
|
|
|
|
|
|
|
|
|
|
|
|
|
|
|
|
|
|
|
|
|
|
|
||||||||||||
| Total liabilities and equity |
$ | 195,056 | $ | 195,360 | $ | 194,021 | $ | 192,312 | $ | 189,534 | $ | (304 | ) | $ | 5,522 | $ | 194,200 | $ | 185,152 | $ | 9,048 | |||||||||||||||||||
|
|
|
|
|
|
|
|
|
|
|
|
|
|
|
|
|
|
|
|
|
|
|
|
|
|
|
|
|
|
||||||||||||
| (1) | Average balances are calculated using a combination of monthly and daily average methodologies. |
| (2) | Nonperforming finance receivables and loans are included in the average balances net of unearned income, unamortized premiums and discounts, and deferred fees and costs. |
| (3) | Includes brokered (inclusive of sweep deposits) and other deposits. |
| (4) | Includes average Core OID balance of $799 million in 4Q23, $812 million in 3Q23, $824 million in 2Q23, $835 million in 1Q23, and $847 million in 4Q22. |
| (5) | Includes the effects of finance receivables and loans, net that were transferred to loans held-for-sale, net and subsequently transferred to assets of operations held-for-sale as of December 31, 2023. |
| 4Q 2023 Preliminary Results | 7 |
| ALLY FINANCIAL INC. SEGMENT HIGHLIGHTS
|
|
| ($ in millions) | ||||||||||||||||||||||||||||||||||||||||
| QUARTERLY TRENDS | CHANGE VS. | FULL YEAR | ||||||||||||||||||||||||||||||||||||||
| Pre-tax Income / (Loss) | 4Q 23 | 3Q 23 | 2Q 23 | 1Q 23 | 4Q 22 | 3Q 23 | 4Q 22 | FY 2023 | FY 2022 | CHANGE | ||||||||||||||||||||||||||||||
| Automotive Finance |
$ | 294 | $ | 377 | $ | 501 | $ | 442 | $ | 437 | $ | (83 | ) | $ | (143 | ) | $ | 1,614 | $ | 2,250 | $ | (636 | ) | |||||||||||||||||
| Insurance |
129 | (16 | ) | 8 | 92 | 101 | 145 | 28 | 213 | (38 | ) | 251 | ||||||||||||||||||||||||||||
|
|
|
|
|
|
|
|
|
|
|
|
|
|
|
|
|
|
|
|
|
|
|
|||||||||||||||||||
| Dealer Financial Services |
423 | 361 | 509 | 534 | 538 | 62 | (115 | ) | 1,827 | 2,212 | (385 | ) | ||||||||||||||||||||||||||||
| Corporate Finance |
79 | 84 | 72 | 72 | 67 | (5 | ) | 12 | 307 | 282 | 25 | |||||||||||||||||||||||||||||
| Mortgage Finance |
24 | 26 | 21 | 21 | 19 | (2 | ) | 5 | 92 | 55 | 37 | |||||||||||||||||||||||||||||
| Corporate and Other (1) |
(462 | ) | (243 | ) | (199 | ) | (239 | ) | (179 | ) | (219 | ) | (283 | ) | (1,143 | ) | (207 | ) | (936 | ) | ||||||||||||||||||||
|
|
|
|
|
|
|
|
|
|
|
|
|
|
|
|
|
|
|
|
|
|
|
|||||||||||||||||||
| Pre-tax income from continuing operations |
$ | 64 | $ | 228 | $ | 403 | $ | 388 | $ | 445 | $ | (164 | ) | $ | (381 | ) | $ | 1,083 | $ | 2,342 | $ | (1,259 | ) | |||||||||||||||||
| Core OID (2) (4) |
13 | 12 | 12 | 11 | 11 | 0 | 2 | 48 | 42 | 7 | ||||||||||||||||||||||||||||||
| Change in the fair value of equity securities (3) |
(74 | ) | 56 | (25 | ) | (65 | ) | (49 | ) | (130 | ) | (25 | ) | (107 | ) | 215 | (322 | ) | ||||||||||||||||||||||
| Repositioning (4) |
172 | 30 | — | — | 57 | 142 | 115 | 201 | 77 | 124 | ||||||||||||||||||||||||||||||
|
|
|
|
|
|
|
|
|
|
|
|
|
|
|
|
|
|
|
|
|
|
|
|||||||||||||||||||
| Core pre-tax income (4) |
$ | 174 | $ | 326 | $ | 390 | $ | 335 | $ | 464 | $ | (152 | ) | $ | (290 | ) | $ | 1,226 | $ | 2,676 | $ | (1,450 | ) | |||||||||||||||||
|
|
|
|
|
|
|
|
|
|
|
|
|
|
|
|
|
|
|
|
|
|
|
|||||||||||||||||||
| (1) | Corporate and Other includes the impact of centralized asset and liability management, corporate overhead allocation activities, the legacy mortgage portfolio, Ally Invest activity, Ally Lending activity and the Credit Card portfolio. |
| (2) | Core OID for all periods shown are applied to the pre-tax income of the Corporate and Other segment. |
| (3) | For more details refer to pages 25-27. |
| (4) | Represents a non-GAAP measure. For more details refer to pages 25-27. |
| 4Q 2023 Preliminary Results | 8 |
| ALLY FINANCIAL INC. AUTOMOTIVE FINANCE - CONDENSED FINANCIAL STATEMENTS
|
|
| ($ in millions) | ||||||||||||||||||||||||||||||||||||||||
| QUARTERLY TRENDS | CHANGE VS. | FULL YEAR | ||||||||||||||||||||||||||||||||||||||
| Income Statement |
4Q 23 | 3Q 23 | 2Q 23 | 1Q 23 | 4Q 22 | 3Q 23 | 4Q 22 | FY 2023 | FY 2022 | CHANGE | ||||||||||||||||||||||||||||||
| Net financing revenue |
||||||||||||||||||||||||||||||||||||||||
| Consumer |
$ | 1,799 | $ | 1,748 | $ | 1,649 | $ | 1,576 | $ | 1,555 | $ | 51 | $ | 244 | $ | 6,772 | $ | 5,680 | $ | 1,092 | ||||||||||||||||||||
| Commercial |
394 | 364 | 335 | 299 | 252 | 30 | 142 | 1,392 | 712 | 680 | ||||||||||||||||||||||||||||||
| Loans held-for-sale |
1 | 2 | 1 | 3 | 2 | (1 | ) | (1 | ) | 7 | 2 | 5 | ||||||||||||||||||||||||||||
| Operating leases |
371 | 385 | 392 | 402 | 400 | (14 | ) | (29 | ) | 1,550 | 1,596 | (46 | ) | |||||||||||||||||||||||||||
|
|
|
|
|
|
|
|
|
|
|
|
|
|
|
|
|
|
|
|
|
|
|
|
|
|
|
|
|
|
|
|||||||||||
| Total financing revenue and other interest income |
2,565 | 2,499 | 2,377 | 2,280 | 2,209 | 66 | 356 | 9,721 | 7,990 | 1,731 | ||||||||||||||||||||||||||||||
| Interest expense |
1,013 | 927 | 828 | 732 | 644 | 86 | 369 | 3,500 | 1,852 | 1,648 | ||||||||||||||||||||||||||||||
| Depreciation expense on operating lease assets: |
||||||||||||||||||||||||||||||||||||||||
| Depreciation expense on operating lease assets (ex. remarketing) |
260 | 268 | 271 | 272 | 271 | (8 | ) | (11 | ) | 1,071 | 1,083 | (12 | ) | |||||||||||||||||||||||||||
| Remarketing gains, net of repo valuation |
37 | 57 | 70 | 47 | 31 | (20 | ) | (6) | 211 | 170 | 41 | |||||||||||||||||||||||||||||
|
|
|
|
|
|
|
|
|
|
|
|
|
|
|
|
|
|
|
|
|
|
|
|
|
|
|
|
|
|
|
|||||||||||
| Total depreciation expense on operating lease assets |
222 | 212 | 200 | 226 | 240 | 10 | (18 | ) | 860 | 914 | (54 | ) | ||||||||||||||||||||||||||||
|
|
|
|
|
|
|
|
|
|
|
|
|
|
|
|
|
|
|
|
|
|
|
|
|
|
|
|
|
|
|
|||||||||||
| Net financing revenue |
1,330 | 1,360 | 1,349 | 1,322 | 1,325 | (30 | ) | 5 | 5,361 | 5,224 | 137 | |||||||||||||||||||||||||||||
| Other revenue |
||||||||||||||||||||||||||||||||||||||||
|
|
|
|
|
|
|
|
|
|
|
|
|
|
|
|
|
|
|
|
|
|
|
|
|
|
|
|
|
|
|
|||||||||||
| Total other revenue |
82 | 79 | 83 | 77 | 92 | 3 | (10 | ) | 321 | 306 | 15 | |||||||||||||||||||||||||||||
|
|
|
|
|
|
|
|
|
|
|
|
|
|
|
|
|
|
|
|
|
|
|
|
|
|
|
|
|
|
|
|||||||||||
| Total net revenue |
1,412 | 1,439 | 1,432 | 1,399 | 1,417 | (27 | ) | (5 | ) | 5,682 | 5,530 | 152 | ||||||||||||||||||||||||||||
| Provision for credit losses |
492 | 444 | 331 | 351 | 376 | 48 | 116 | 1,618 | 1,036 | 582 | ||||||||||||||||||||||||||||||
| Noninterest expense |
||||||||||||||||||||||||||||||||||||||||
| Compensation and benefits |
163 | 164 | 160 | 181 | 154 | (1 | ) | 9 | 668 | 629 | 39 | |||||||||||||||||||||||||||||
| Other operating expenses |
463 | 454 | 440 | 425 | 450 | 9 | 13 | 1,782 | 1,615 | 167 | ||||||||||||||||||||||||||||||
|
|
|
|
|
|
|
|
|
|
|
|
|
|
|
|
|
|
|
|
|
|
|
|
|
|
|
|
|
|
|
|||||||||||
| Total noninterest expense |
626 | 618 | 600 | 606 | 604 | 8 | 22 | 2,450 | 2,244 | 206 | ||||||||||||||||||||||||||||||
|
|
|
|
|
|
|
|
|
|
|
|
|
|
|
|
|
|
|
|
|
|
|
|
|
|
|
|
|
|
|
|||||||||||
| Pre-tax Income |
$ | 294 | $ | 377 | $ | 501 | $ | 442 | $ | 437 | $ | (83 | ) | $ | (143 | ) | $ | 1,614 | $ | 2,250 | $ | (636 | ) | |||||||||||||||||
|
|
|
|
|
|
|
|
|
|
|
|
|
|
|
|
|
|
|
|
|
|
|
|
|
|
|
|
|
|
|
|||||||||||
| Memo: Net lease revenue |
||||||||||||||||||||||||||||||||||||||||
| Operating lease revenue |
$ | 371 | $ | 385 | $ | 392 | $ | 402 | $ | 400 | $ | (14 | ) | $ | (29 | ) | $ | 1,550 | $ | 1,596 | $ | (46 | ) | |||||||||||||||||
| Depreciation expense on operating lease assets (ex. remarketing) |
260 | 268 | 271 | 272 | 271 | (8 | ) | (11 | ) | 1,071 | 1,083 | (12 | ) | |||||||||||||||||||||||||||
| Remarketing gains, net of repo valuation |
37 | 57 | 70 | 47 | 31 | (20 | ) | 6 | 211 | 170 | 41 | |||||||||||||||||||||||||||||
|
|
|
|
|
|
|
|
|
|
|
|
|
|
|
|
|
|
|
|
|
|
|
|
|
|
|
|
|
|
|
|||||||||||
| Total depreciation expense on operating lease assets |
222 | 212 | 200 | 226 | 240 | 10 | (18 | ) | 860 | 914 | (54 | ) | ||||||||||||||||||||||||||||
|
|
|
|
|
|
|
|
|
|
|
|
|
|
|
|
|
|
|
|
|
|
|
|
|
|
|
|
|
|
|
|||||||||||
| Net lease revenue |
$ | 149 | $ | 173 | $ | 192 | $ | 176 | $ | 160 | $ | (24 | ) | $ | (11 | ) | $ | 690 | $ | 682 | $ | 8 | ||||||||||||||||||
|
|
|
|
|
|
|
|
|
|
|
|
|
|
|
|
|
|
|
|
|
|
|
|
|
|
|
|
|
|
|
|||||||||||
| Balance Sheet (Period-End) |
||||||||||||||||||||||||||||||||||||||||
| Cash, trading and investment securities |
$ | — | $ | — | $ | — | $ | — | $ | — | $ | — | $ | — | ||||||||||||||||||||||||||
| Loans held-for-sale, net |
13 | 21 | 10 | 19 | 6 | (8 | ) | 7 | ||||||||||||||||||||||||||||||||
| Consumer loans |
84,414 | 85,728 | 84,725 | 84,042 | 83,903 | (1,314 | ) | 511 | ||||||||||||||||||||||||||||||||
| Commercial loans |
23,334 | 21,057 | 20,732 | 19,266 | 18,784 | 2,277 | 4,550 | |||||||||||||||||||||||||||||||||
| Allowance for loan losses |
(3,117 | ) | (3,153 | ) | (3,103 | ) | (3,053 | ) | (3,053 | ) | 36 | (64 | ) | |||||||||||||||||||||||||||
|
|
|
|
|
|
|
|
|
|
|
|
|
|
|
|
|
|
|
|
|
|
||||||||||||||||||||
| Total finance receivables and loans, net |
104,631 | 103,632 | 102,354 | 100,255 | 99,634 | 999 | 4,997 | |||||||||||||||||||||||||||||||||
| Investment in operating leases, net |
9,171 | 9,569 | 9,930 | 10,236 | 10,444 | (398 | ) | (1,273 | ) | |||||||||||||||||||||||||||||||
| Other assets |
1,572 | 1,520 | 1,463 | 1,450 | 1,379 | 52 | 193 | |||||||||||||||||||||||||||||||||
|
|
|
|
|
|
|
|
|
|
|
|
|
|
|
|
|
|
|
|
|
|
||||||||||||||||||||
| Total assets |
$ | 115,387 | $ | 114,742 | $ | 113,757 | $ | 111,960 | $ | 111,463 | $ | 645 | $ | 3,924 | ||||||||||||||||||||||||||
|
|
|
|
|
|
|
|
|
|
|
|
|
|
|
|
|
|
|
|
|
|
||||||||||||||||||||
| 4Q 2023 Preliminary Results | 9 |
| ALLY FINANCIAL INC. AUTOMOTIVE FINANCE - KEY STATISTICS
|
|
| QUARTERLY TRENDS | CHANGE VS. | FULL YEAR | ||||||||||||||||||||||||||||||||||||||
| U.S. Consumer Originations (1) ($ in billions) |
4Q 23 | 3Q 23 | 2Q 23 | 1Q 23 | 4Q 22 | 3Q 23 | 4Q 22 | FY 2023 | FY 2022 | CHANGE | ||||||||||||||||||||||||||||||
| Retail standard - new vehicle GM |
$ | 1.1 | $ | 1.1 | $ | 1.1 | $ | 1.0 | $ | 1.2 | $ | — | $ | (0.1 | ) | $ | 4.3 | $ | 4.4 | $ | (0.1 | ) | ||||||||||||||||||
| Retail standard - new vehicle Stellantis |
0.7 | 0.7 | 0.8 | 0.7 | 0.7 | (0.1 | ) | (0.1 | ) | 2.9 | 3.6 | (0.7 | ) | |||||||||||||||||||||||||||
| Retail standard - new vehicle Other |
1.0 | 1.1 | 1.0 | 1.0 | 1.0 | (0.1 | ) | — | 4.1 | 4.4 | (0.3 | ) | ||||||||||||||||||||||||||||
| Used vehicle |
6.2 | 6.9 | 6.6 | 6.1 | 5.5 | (0.7 | ) | 0.7 | 25.8 | 30.1 | (4.3 | ) | ||||||||||||||||||||||||||||
| Lease |
0.6 | 0.7 | 0.8 | 0.8 | 0.7 | (0.1 | ) | (0.1 | ) | 2.9 | 3.7 | (0.8 | ) | |||||||||||||||||||||||||||
| Retail subvented |
0.0 | 0.0 | 0.0 | 0.0 | 0.0 | 0.0 | 0.0 | 0.0 | 0.2 | (0.2 | ) | |||||||||||||||||||||||||||||
|
|
|
|
|
|
|
|
|
|
|
|
|
|
|
|
|
|
|
|
|
|||||||||||||||||||||
| Total originations |
$ | 9.6 | $ | 10.6 | $ | 10.4 | $ | 9.5 | $ | 9.2 | $ | (1.0 | ) | $ | 0.4 | $ | 40.0 | $ | 46.4 | $ | (6.4 | ) | ||||||||||||||||||
| U.S. Consumer Originations - FICO Score |
||||||||||||||||||||||||||||||||||||||||
| Super prime (760-999) |
$ | 2.4 | $ | 2.5 | $ | 2.4 | $ | 1.8 | $ | 1.8 | $ | (0.1 | ) | $ | 0.6 | $ | 9.0 | $ | 7.6 | $ | 1.4 | |||||||||||||||||||
| High prime (720-759) |
1.4 | 1.5 | 1.4 | 1.2 | 1.3 | (0.1 | ) | 0.1 | 5.5 | 5.9 | (0.4 | ) | ||||||||||||||||||||||||||||
| Prime (660-719) |
2.7 | 3.1 | 3.1 | 2.8 | 2.8 | (0.4 | ) | (0.1 | ) | 11.6 | 14.9 | (3.3 | ) | |||||||||||||||||||||||||||
| Prime/Near (620-659) |
1.5 | 1.8 | 1.8 | 2.0 | 1.8 | (0.3 | ) | (0.3 | ) | 7.1 | 10.2 | (3.1 | ) | |||||||||||||||||||||||||||
| Non-Prime (540-619) |
0.6 | 0.7 | 0.7 | 0.8 | 0.6 | (0.1 | ) | 0.1 | 2.8 | 3.5 | (0.7 | ) | ||||||||||||||||||||||||||||
| Sub-Prime (0-539) |
0.2 | 0.2 | 0.2 | 0.1 | 0.1 | — | 0.1 | 0.7 | 0.6 | 0.1 | ||||||||||||||||||||||||||||||
| No FICO (Primarily CSG) |
0.8 | 0.8 | 0.8 | 0.8 | 0.9 | — | (0.1 | ) | 3.2 | 3.5 | (0.4 | ) | ||||||||||||||||||||||||||||
|
|
|
|
|
|
|
|
|
|
|
|
|
|
|
|
|
|
|
|
|
|||||||||||||||||||||
| Total originations |
$ | 9.6 | $ | 10.6 | $ | 10.4 | $ | 9.5 | $ | 9.2 | $ | (1.0 | ) | $ | 0.4 | $ | 40.0 | $ | 46.4 | $ | (6.4 | ) | ||||||||||||||||||
| U.S. Consumer Retail Originations - Average FICO |
||||||||||||||||||||||||||||||||||||||||
| New vehicle |
718 | 712 | 709 | 700 | 707 | 5 | 11 | 710 | 700 | 10 | ||||||||||||||||||||||||||||||
| Used vehicle |
703 | 701 | 698 | 687 | 693 | 2 | 10 | 697 | 684 | 13 | ||||||||||||||||||||||||||||||
| Total retail originations |
707 | 704 | 701 | 691 | 697 | 3 | 10 | 701 | 688 | 12 | ||||||||||||||||||||||||||||||
| U.S. Market |
||||||||||||||||||||||||||||||||||||||||
| Light vehicle sales (SAAR - units in millions) |
15.5 | 15.7 | 15.8 | 15.0 | 14.2 | (0.1 | ) | 1.4 | 15.5 | 13.7 | 1.7 | |||||||||||||||||||||||||||||
| Light vehicle sales (quarterly - units in millions) |
3.9 | 4.0 | 4.1 | 3.5 | 3.5 | (0.1 | ) | 0.3 | 15.4 | 13.7 | 1.8 | |||||||||||||||||||||||||||||
| Dealer Engagement |
||||||||||||||||||||||||||||||||||||||||
| Total Active DFS Dealers (2) |
21,829 | 22,323 | 22,171 | 22,136 | 21,869 | (494 | ) | (40 | ) | 21,829 | 21,869 | (40 | ) | |||||||||||||||||||||||||||
| Total Application Volume (000s) |
3,321 | 3,674 | 3,517 | 3,319 | 2,866 | (353 | ) | 455 | 13,831 | 12,480 | 1,351 | |||||||||||||||||||||||||||||
| Ally U.S. Commercial Outstandings EOP ($ in billions) |
||||||||||||||||||||||||||||||||||||||||
| Floorplan outstandings |
$ | 17.0 | $ | 14.9 | $ | 14.6 | $ | 13.3 | $ | 13.0 | $ | 2.0 | $ | 3.9 | ||||||||||||||||||||||||||
| Dealer loans and other |
6.3 | 6.1 | 6.1 | 5.9 | 5.7 | 0.2 | 0.6 | |||||||||||||||||||||||||||||||||
|
|
|
|
|
|
|
|
|
|
|
|
|
|
|
|||||||||||||||||||||||||||
| Total Commercial outstandings |
$ | 23.3 | $ | 21.1 | $ | 20.7 | $ | 19.3 | $ | 18.8 | $ | 2.3 | $ | 4.6 | ||||||||||||||||||||||||||
| U.S. Off-Lease Remarketing |
||||||||||||||||||||||||||||||||||||||||
| Off-lease vehicles terminated - on-balance sheet (# in units) |
26,237 | 29,484 | 29,872 | 24,163 | 20,919 | (3,247 | ) | 5,318 | 109,756 | 110,634 | (878 | ) | ||||||||||||||||||||||||||||
| Average gain / (loss) per vehicle |
$ | 1,422 | $ | 1,944 | $ | 2,335 | $ | 1,932 | $ | 1,476 | $ | (522 | ) | $ | (54 | ) | $ | 1,923 | $ | 1,533 | $ | 390 | ||||||||||||||||||
| Total gain ($ in millions) |
$ | 37 | $ | 57 | $ | 70 | $ | 47 | $ | 31 | $ | (20 | ) | 6 | $ | 211 | $ | 170 | $ | 41 | ||||||||||||||||||||
| (1) | Some standard rate loan originations contain manufacturer sponsored cash back rebate incentives. Some lease originations contain rate subvention. While Ally may jointly develop marketing programs for these originations, Ally does not have exclusive rights to such originations under operating agreements with manufacturers. |
| (2) | A dealer is considered to have an active relationship with us if we provided automotive financing, remarketing, or insurance services during three months ended December 31, 2023. |
| 4Q 2023 Preliminary Results | 10 |
| ALLY FINANCIAL INC. INSURANCE - CONDENSED FINANCIAL STATEMENTS AND KEY STATISTICS
|
|
| ($ in millions) | QUARTERLY TRENDS | CHANGE VS. | FULL YEAR | |||||||||||||||||||||||||||||||||||||
| Income Statement (GAAP View) |
4Q 23 | 3Q 23 | 2Q 23 | 1Q 23 | 4Q 22 | 3Q 23 | 4Q 22 | FY 2023 | FY 2022 | CHANGE | ||||||||||||||||||||||||||||||
| Net financing revenue |
||||||||||||||||||||||||||||||||||||||||
| Total interest and fees on finance receivables and loans(1) |
$ | 3 | $ | 2 | $ | 3 | $ | 2 | $ | 2 | $ | 1 | $ | 1 | $ | 10 | $ | 9 | $ | 1 | ||||||||||||||||||||
| Interest and dividends on investment securities |
34 | 32 | 31 | 29 | 32 | 2 | 2 | 126 | 115 | 11 | ||||||||||||||||||||||||||||||
| Interest bearing cash |
5 | 3 | 2 | 3 | 1 | 2 | 4 | 13 | 2 | 11 | ||||||||||||||||||||||||||||||
|
|
|
|
|
|
|
|
|
|
|
|
|
|
|
|
|
|
|
|
|
|||||||||||||||||||||
| Total financing revenue and other interest revenue |
42 | 37 | 36 | 34 | 35 | 5 | 7 | 149 | 126 | 23 | ||||||||||||||||||||||||||||||
| Interest expense |
9 | 8 | 7 | 8 | 7 | 1 | 2 | 32 | 37 | (5 | ) | |||||||||||||||||||||||||||||
|
|
|
|
|
|
|
|
|
|
|
|
|
|
|
|
|
|
|
|
|
|||||||||||||||||||||
| Net financing revenue |
33 | 29 | 29 | 26 | 28 | 4 | 5 | 117 | 89 | 28 | ||||||||||||||||||||||||||||||
| Other revenue |
||||||||||||||||||||||||||||||||||||||||
| Insurance premiums and service revenue earned |
335 | 320 | 310 | 306 | 302 | 15 | 33 | 1,271 | 1,151 | 120 | ||||||||||||||||||||||||||||||
| Other gain / (loss) on investments, net |
78 | (31 | ) | 25 | 72 | 54 | 109 | 24 | 144 | (143 | ) | 287 | ||||||||||||||||||||||||||||
| Other income, net of losses |
4 | 4 | 2 | 3 | 3 | — | 1 | 13 | 15 | (2 | ) | |||||||||||||||||||||||||||||
|
|
|
|
|
|
|
|
|
|
|
|
|
|
|
|
|
|
|
|
|
|||||||||||||||||||||
| Total other revenue |
417 | 293 | 337 | 381 | 359 | 124 | 58 | 1,428 | 1,023 | 405 | ||||||||||||||||||||||||||||||
|
|
|
|
|
|
|
|
|
|
|
|
|
|
|
|
|
|
|
|
|
|||||||||||||||||||||
| Total net revenue |
450 | 322 | 366 | 407 | 387 | 128 | 63 | 1,545 | 1,112 | 433 | ||||||||||||||||||||||||||||||
| Noninterest expense |
||||||||||||||||||||||||||||||||||||||||
| Compensation and benefits expense |
27 | 26 | 27 | 28 | 23 | 1 | 4 | 108 | 101 | 7 | ||||||||||||||||||||||||||||||
| Insurance losses and loss adjustment expenses |
93 | 107 | 134 | 88 | 63 | (14 | ) | 30 | 422 | 280 | 142 | |||||||||||||||||||||||||||||
| Other operating expenses |
201 | 205 | 197 | 199 | 200 | (4 | ) | 1 | 802 | 769 | 33 | |||||||||||||||||||||||||||||
|
|
|
|
|
|
|
|
|
|
|
|
|
|
|
|
|
|
|
|
|
|||||||||||||||||||||
| Total noninterest expense |
321 | 338 | 358 | 315 | 286 | (17 | ) | 35 | 1,332 | 1,150 | 182 | |||||||||||||||||||||||||||||
|
|
|
|
|
|
|
|
|
|
|
|
|
|
|
|
|
|
|
|
|
|||||||||||||||||||||
| Pre-tax (loss) |
$ | 129 | $ | (16 | ) | $ | 8 | $ | 92 | $ | 101 | $ | 145 | $ | 28 | $ | 213 | $ | (38 | ) | $ | 251 | ||||||||||||||||||
|
|
|
|
|
|
|
|
|
|
|
|
|
|
|
|
|
|
|
|
|
|||||||||||||||||||||
| Memo: Income Statement (Managerial View) |
||||||||||||||||||||||||||||||||||||||||
| Insurance premiums and other income |
||||||||||||||||||||||||||||||||||||||||
| Insurance premiums and service revenue earned |
$ | 335 | $ | 320 | $ | 310 | $ | 306 | $ | 302 | $ | 15 | $ | 33 | $ | 1,271 | $ | 1,151 | $ | 120 | ||||||||||||||||||||
| Investment income and other (adjusted) (2) |
44 | 44 | 30 | 33 | 33 | (1 | ) | 11 | 151 | 156 | (4 | ) | ||||||||||||||||||||||||||||
| Other income |
4 | 4 | 2 | 3 | 3 | — | 1 | 13 | 15 | (2 | ) | |||||||||||||||||||||||||||||
|
|
|
|
|
|
|
|
|
|
|
|
|
|
|
|
|
|
|
|
|
|||||||||||||||||||||
| Total insurance premiums and other income |
383 | 368 | 342 | 342 | 338 | 14 | 45 | 1,435 | 1,322 | 114 | ||||||||||||||||||||||||||||||
| Expense |
||||||||||||||||||||||||||||||||||||||||
| Insurance losses and loss adjustment expenses |
93 | 107 | 134 | 88 | 63 | (14 | ) | 30 | 422 | 280 | 142 | |||||||||||||||||||||||||||||
| Acquisition and underwriting expenses |
||||||||||||||||||||||||||||||||||||||||
| Compensation and benefit expense |
27 | 26 | 27 | 28 | 23 | 1 | 4 | 108 | 101 | 7 | ||||||||||||||||||||||||||||||
| Insurance commission expense |
161 | 160 | 158 | 157 | 158 | 1 | 3 | 637 | 611 | 26 | ||||||||||||||||||||||||||||||
| Other expense |
40 | 45 | 39 | 42 | 42 | (5 | ) | (2 | ) | 165 | 158 | 7 | ||||||||||||||||||||||||||||
|
|
|
|
|
|
|
|
|
|
|
|
|
|
|
|
|
|
|
|
|
|||||||||||||||||||||
| Total acquistion and underwriting expense |
228 | 231 | 224 | 227 | 223 | (3 | ) | 5 | 910 | 870 | 40 | |||||||||||||||||||||||||||||
|
|
|
|
|
|
|
|
|
|
|
|
|
|
|
|
|
|
|
|
|
|||||||||||||||||||||
| Total expense |
321 | 338 | 358 | 315 | 286 | (17 | ) | 35 | 1,332 | 1,150 | 182 | |||||||||||||||||||||||||||||
|
|
|
|
|
|
|
|
|
|
|
|
|
|
|
|
|
|
|
|
|
|||||||||||||||||||||
| Core pre-tax (loss) / income (2) |
62 | 30 | (16 | ) | 27 | 52 | 31 | 10 | 103 | 172 | (68 | ) | ||||||||||||||||||||||||||||
| Change in the fair value of equity securities (3) |
67 | (46 | ) | 24 | 65 | 49 | 114 | 18 | 110 | (210 | ) | 319 | ||||||||||||||||||||||||||||
|
|
|
|
|
|
|
|
|
|
|
|
|
|
|
|
|
|
|
|
|
|||||||||||||||||||||
| Income (loss) before income tax expense |
$ | 129 | $ | (16 | ) | $ | 8 | $ | 92 | $ | 101 | $ | 145 | $ | 28 | $ | 213 | $ | (38 | ) | $ | 251 | ||||||||||||||||||
|
|
|
|
|
|
|
|
|
|
|
|
|
|
|
|
|
|
|
|
|
|||||||||||||||||||||
| Balance Sheet (Period-End) |
||||||||||||||||||||||||||||||||||||||||
| Cash and investment securities |
$ | 5,333 | $ | 5,086 | $ | 5,280 | $ | 5,331 | $ | 5,252 | $ | 247 | $ | 81 | ||||||||||||||||||||||||||
| Intercompany loans(1) |
619 | 547 | 510 | 523 | 417 | 72 | 202 | |||||||||||||||||||||||||||||||||
| Premiums receivable and other insurance assets |
2,767 | 2,791 | 2,783 | 2,728 | 2,712 | (24 | ) | 55 | ||||||||||||||||||||||||||||||||
| Other assets |
362 | 312 | 317 | 285 | 278 | 50 | 84 | |||||||||||||||||||||||||||||||||
|
|
|
|
|
|
|
|
|
|
|
|
|
|
|
|||||||||||||||||||||||||||
| Total assets |
$ | 9,081 | $ | 8,736 | $ | 8,890 | $ | 8,867 | $ | 8,659 | $ | 345 | $ | 422 | ||||||||||||||||||||||||||
|
|
|
|
|
|
|
|
|
|
|
|
|
|
|
|||||||||||||||||||||||||||
| Key Statistics |
||||||||||||||||||||||||||||||||||||||||
| Total written premiums and revenue (4) |
$ | 333 | $ | 335 | $ | 299 | $ | 307 | $ | 285 | $ | (2 | ) | $ | 48 | $ | 1,274 | $ | 1,103 | $ | 171 | |||||||||||||||||||
| Loss ratio (5) |
27.6 | % | 33.0 | % | 43.0 | % | 28.3 | % | 20.6 | % | 32.9 | % | 24.0 | % | ||||||||||||||||||||||||||
| Underwriting expense ratio (6) |
67.2 | % | 71.3 | % | 71.5 | % | 73.7 | % | 73.0 | % | 70.8 | % | 74.6 | % | ||||||||||||||||||||||||||
|
|
|
|
|
|
|
|
|
|
|
|
|
|
|
|||||||||||||||||||||||||||
| Combined ratio |
94.8 | % | 104.3 | % | 114.6 | % | 102.0 | % | 93.6 | % | 103.7 | % | 98.6 | % | ||||||||||||||||||||||||||
| (1) | Intercompany activity represents excess liquidity placed with corporate segment. |
| (2) | Represents a non-GAAP financial measure. For more details refer to pages 25-27. |
| (3) | For more details refer to pages 25-27. |
| (4) | Written premiums are net of ceded premium for reinsurance. |
| (5) | Loss Ratio is calculated as Insurance losses and loss adjustment expenses divided by Insurance premiums and service revenue earned and Other Income, net of losses. |
| (6) | Underwriting Expense Ratio is calculated as Compensation and benefits expense and Other operating expenses divided by Insurance premiums and service revenue earned and Other Income, net of losses. |
| 4Q 2023 Preliminary Results | 11 |
| ALLY FINANCIAL INC. MORTGAGE FINANCE - CONDENSED FINANCIAL STATEMENTS
|
|
| ($ in millions) | ||||||||||||||||||||||||||||||||||||||
| QUARTERLY TRENDS | CHANGE VS. | FULL YEAR | ||||||||||||||||||||||||||||||||||||
| Income Statement |
4Q 23 | 3Q 23 | 2Q 23 | 1Q 23 | 4Q 22 | 3Q 23 | 4Q 22 | FY 2023 | FY 2022 | CHANGE |
||||||||||||||||||||||||||||
| Net financing revenue |
||||||||||||||||||||||||||||||||||||||
| Total financing revenue and other interest income |
$ | 147 | $ | 149 | $ | 151 | $ | 153 | $ | 155 | $ | (2 | ) | $ | (8 | ) | $ | 600 | $ | 575 | $ 25 | |||||||||||||||||
| Interest expense |
96 | 96 | 98 | 99 | 100 | — | (4 | ) | 389 | 354 | 35 | |||||||||||||||||||||||||||
|
|
|
|
|
|
|
|
|
|
|
|
|
|
|
|
|
|
|
|
|
|
|
|
|
|
|
|
|
|||||||||||
| Net financing revenue |
51 | 53 | 53 | 54 | 55 | (2 | ) | (4 | ) | 211 | 221 | (10) | ||||||||||||||||||||||||||
| Gain on mortgage loans, net |
3 | 4 | 5 | 4 | 1 | (1 | ) | 2 | 16 | 26 | (10) | |||||||||||||||||||||||||||
| Other income, net of losses |
— | — | — | — | 1 | — | (1 | ) | — | 1 | (1) | |||||||||||||||||||||||||||
|
|
|
|
|
|
|
|
|
|
|
|
|
|
|
|
|
|
|
|
|
|
|
|
|
|
|
|
|
|||||||||||
| Total other revenue |
3 | 4 | 5 | 4 | 2 | (1 | ) | 1 | 16 | 27 | (11) | |||||||||||||||||||||||||||
|
|
|
|
|
|
|
|
|
|
|
|
|
|
|
|
|
|
|
|
|
|
|
|
|
|
|
|
|
|||||||||||
| Total net revenue |
54 | 57 | 58 | 58 | 57 | (3 | ) | (3 | ) | 227 | 248 | (21) | ||||||||||||||||||||||||||
|
|
|
|
|
|
|
|
|
|
|
|
|
|
|
|
|
|
|
|
|
|
|
|
|
|
|
|
|
|||||||||||
| Provision for loan losses |
— | (2 | ) | — | (1 | ) | 1 | 2 | (1 | ) | (3 | ) | 3 | (6) | ||||||||||||||||||||||||
| Noninterest expense |
||||||||||||||||||||||||||||||||||||||
| Compensation and benefits expense |
4 | 5 | 5 | 6 | 6 | (1 | ) | (2 | ) | 20 | 23 | (3) | ||||||||||||||||||||||||||
| Other operating expense |
26 | 28 | 32 | 32 | 31 | (2 | ) | (5 | ) | 118 | 167 | (49) | ||||||||||||||||||||||||||
|
|
|
|
|
|
|
|
|
|
|
|
|
|
|
|
|
|
|
|
|
|
|
|
|
|
|
|
|
|||||||||||
| Total noninterest expense |
30 | 33 | 37 | 38 | 37 | (3 | ) | (7 | ) | 138 | 190 | (52) | ||||||||||||||||||||||||||
|
|
|
|
|
|
|
|
|
|
|
|
|
|
|
|
|
|
|
|
|
|
|
|
|
|
|
|
|
|||||||||||
| Pre-tax Income |
$ | 24 | $ | 26 | $ | 21 | $ | 21 | $ | 19 | $ | (2 | ) | $ | 5 | $ | 92 | $ | 55 | $ 37 | ||||||||||||||||||
|
|
|
|
|
|
|
|
|
|
|
|
|
|
|
|
|
|
|
|
|
|
|
|
|
|
|
|
|
|||||||||||
| Balance Sheet (Period-End) |
||||||||||||||||||||||||||||||||||||||
| Finance receivables and loans, net: |
||||||||||||||||||||||||||||||||||||||
| Consumer loans |
$ | 18,442 | $ | 18,657 | $ | 18,894 | $ | 19,189 | $ | 19,445 | $ | (215 | ) | $ | (1,003 | ) | ||||||||||||||||||||||
| Allowance for loan losses |
(18 | ) | (19 | ) | (20 | ) | (20 | ) | (22 | ) | 1 | 4 | ||||||||||||||||||||||||||
|
|
|
|
|
|
|
|
|
|
|
|
|
|
|
|
|
|
|
|
|
|
||||||||||||||||||
| Total finance receivables and loans, net |
18,424 | 18,638 | 18,874 | 19,169 | 19,423 | (214 | ) | (999 | ) | |||||||||||||||||||||||||||||
| Loans held for sale, net |
25 | 29 | 36 | 24 | 13 | (4 | ) | 12 | ||||||||||||||||||||||||||||||
| Other assets |
63 | 78 | 87 | 97 | 93 | (15 | ) | (30 | ) | |||||||||||||||||||||||||||||
|
|
|
|
|
|
|
|
|
|
|
|
|
|
|
|
|
|
|
|
|
|
||||||||||||||||||
| Total assets |
$ | 18,512 | $ | 18,745 | $ | 18,997 | $ | 19,290 | $ | 19,529 | $ | (233 | ) | $ | (1,017 | ) | ||||||||||||||||||||||
|
|
|
|
|
|
|
|
|
|
|
|
|
|
|
|
|
|
|
|
|
|
||||||||||||||||||
| 4Q 2023 Preliminary Results | 12 |
| ALLY FINANCIAL INC. CORPORATE FINANCE - CONDENSED FINANCIAL STATEMENTS
|
|
| ($ in millions) | ||||||||||||||||||||||||||||||||||||||||
| QUARTERLY TRENDS | CHANGE VS. | FULL YEAR | ||||||||||||||||||||||||||||||||||||||
| Income Statement |
4Q 23 | 3Q 23 | 2Q 23 | 1Q 23 | 4Q 22 | 3Q 23 | 4Q 22 | FY 2023 | FY 2022 | CHANGE | ||||||||||||||||||||||||||||||
| Net financing revenue |
||||||||||||||||||||||||||||||||||||||||
| Total financing revenue and other interest income |
$ | 264 | $ | 248 | $ | 234 | $ | 234 | $ | 199 | $ | 16 | $ | 65 | $ | 980 | $ | 546 | $ | 434 | ||||||||||||||||||||
| Interest expense |
159 | 151 | 142 | 131 | 105 | 8 | 54 | 583 | 212 | 371 | ||||||||||||||||||||||||||||||
|
|
|
|
|
|
|
|
|
|
|
|
|
|
|
|
|
|
|
|
|
|
|
|
|
|
|
|
|
|
|
|||||||||||
| Net financing revenue |
105 | 97 | 92 | 103 | 94 | 8 | 11 | 397 | 334 | 63 | ||||||||||||||||||||||||||||||
| Total other revenue |
23 | 24 | 28 | 29 | 25 | (1 | ) | (2 | ) | 104 | 122 | (18 | ) | |||||||||||||||||||||||||||
|
|
|
|
|
|
|
|
|
|
|
|
|
|
|
|
|
|
|
|
|
|
|
|
|
|
|
|
|
|
|
|||||||||||
| Total net revenue |
128 | 121 | 120 | 132 | 119 | 7 | 9 | 501 | 456 | 45 | ||||||||||||||||||||||||||||||
| Provision for loan losses |
17 | 5 | 15 | 15 | 16 | 12 | 1 | 52 | 43 | 9 | ||||||||||||||||||||||||||||||
| Noninterest expense |
||||||||||||||||||||||||||||||||||||||||
| Compensation and benefits expense |
17 | 16 | 17 | 28 | 20 | 1 | (3 | ) | 78 | 75 | 3 | |||||||||||||||||||||||||||||
| Other operating expense |
15 | 16 | 16 | 17 | 16 | (1 | ) | (1 | ) | 64 | 56 | 8 | ||||||||||||||||||||||||||||
|
|
|
|
|
|
|
|
|
|
|
|
|
|
|
|
|
|
|
|
|
|
|
|
|
|
|
|
|
|
|
|||||||||||
| Total noninterest expense |
32 | 32 | 33 | 45 | 36 | — | (4 | ) | 142 | 131 | 11 | |||||||||||||||||||||||||||||
|
|
|
|
|
|
|
|
|
|
|
|
|
|
|
|
|
|
|
|
|
|
|
|
|
|
|
|
|
|
|
|||||||||||
| Pre-tax income |
$ | 79 | $ | 84 | $ | 72 | $ | 72 | $ | 67 | $ | (5 | ) | $ | 12 | $ | 307 | $ | 282 | $ | 25 | |||||||||||||||||||
|
|
|
|
|
|
|
|
|
|
|
|
|
|
|
|
|
|
|
|
|
|
|
|
|
|
|
|
|
|
|
|||||||||||
| Change in the fair value of equity securities (1) |
0 | (0 | ) | (1 | ) | 0 | 0 | 1 | (0 | ) | (1 | ) | 4 | (5 | ) | |||||||||||||||||||||||||
|
|
|
|
|
|
|
|
|
|
|
|
|
|
|
|
|
|
|
|
|
|
|
|
|
|
|
|
|
|
|
|||||||||||
| Core pre-tax income (2) |
$ | 79 | $ | 84 | $ | 71 | $ | 72 | $ | 67 | $ | (4 | ) | $ | 12 | $ | 306 | $ | 286 | $ | 20 | |||||||||||||||||||
|
|
|
|
|
|
|
|
|
|
|
|
|
|
|
|
|
|
|
|
|
|
|
|
|
|
|
|
|
|
|
|||||||||||
| Balance Sheet (Period-End) |
||||||||||||||||||||||||||||||||||||||||
| Equity securities |
$ | 6 | $ | 6 | $ | 6 | $ | 5 | $ | 6 | $ | — | $ | — | ||||||||||||||||||||||||||
| Loans held for sale, net |
253 | 81 | 48 | 266 | 445 | 172 | (192 | ) | ||||||||||||||||||||||||||||||||
| Commercial loans |
10,905 | 10,637 | 10,132 | 10,003 | 10,147 | 268 | 758 | |||||||||||||||||||||||||||||||||
| Allowance for loan losses |
(153 | ) | (185 | ) | (176 | ) | (217 | ) | (202 | ) | 32 | 49 | ||||||||||||||||||||||||||||
|
|
|
|
|
|
|
|
|
|
|
|
|
|
|
|
|
|
|
|
|
|
||||||||||||||||||||
| Total finance receivables and loans, net |
10,752 | 10,452 | 9,956 | 9,786 | 9,945 | 300 | 807 | |||||||||||||||||||||||||||||||||
| Other assets |
201 | 210 | 180 | 169 | 148 | (9 | ) | 53 | ||||||||||||||||||||||||||||||||
|
|
|
|
|
|
|
|
|
|
|
|
|
|
|
|
|
|
|
|
|
|
||||||||||||||||||||
| Total assets |
$ | 11,212 | $ | 10,749 | $ | 10,190 | $ | 10,226 | $ | 10,544 | $ | 463 | $ | 668 | ||||||||||||||||||||||||||
|
|
|
|
|
|
|
|
|
|
|
|
|
|
|
|
|
|
|
|
|
|
||||||||||||||||||||
| (1) | For more details refer to pages 25-27. |
| (2) | Represents a non-GAAP financial measure. For more details refer to pages 25-27. |
| 4Q 2023 Preliminary Results | 13 |
| ALLY FINANCIAL INC. CORPORATE AND OTHER - CONDENSED FINANCIAL STATEMENTS
|
|
| ($ in millions) | QUARTERLY TRENDS | CHANGE VS. | FULL YEAR | |||||||||||||||||||||||||||||||||||||
| Income Statement |
4Q 23 | 3Q 23 | 2Q 23 | 1Q 23 | 4Q 22 | 3Q 23 | 4Q 22 | FY 2023 | FY 2022 | CHANGE | ||||||||||||||||||||||||||||||
| Net financing revenue |
||||||||||||||||||||||||||||||||||||||||
| Total financing revenue and other interest income |
$ | 605 | $ | 662 | $ | 656 | $ | 585 | $ | 501 | $ | (57 | ) | $ | 104 | $ | 2,508 | $ | 1,384 | $ | 1,124 | |||||||||||||||||||
| Interest expense |
631 | 668 | 606 | 488 | 329 | (37 | ) | 302 | 2,393 | 402 | 1,991 | |||||||||||||||||||||||||||||
|
|
|
|
|
|
|
|
|
|
|
|
|
|
|
|
|
|
|
|
|
|||||||||||||||||||||
| Net financing revenue |
(26 | ) | (6 | ) | 50 | 97 | 172 | (20 | ) | (198 | ) | 115 | 982 | (867 | ) | |||||||||||||||||||||||||
| Other revenue |
||||||||||||||||||||||||||||||||||||||||
| Other gain on investments, net |
8 | (11 | ) | — | 3 | — | 19 | 8 | — | 22 | (22 | ) | ||||||||||||||||||||||||||||
| Other income, net of losses (1) |
41 | 46 | 53 | 4 | 49 | (5 | ) | (8 | ) | 144 | 78 | 66 | ||||||||||||||||||||||||||||
|
|
|
|
|
|
|
|
|
|
|
|
|
|
|
|
|
|
|
|
|
|||||||||||||||||||||
| Total other revenue |
49 | 35 | 53 | 7 | 49 | 14 | — | 144 | 100 | 44 | ||||||||||||||||||||||||||||||
|
|
|
|
|
|
|
|
|
|
|
|
|
|
|
|
|
|
|
|
|
|||||||||||||||||||||
| Total net revenue |
23 | 29 | 103 | 104 | 221 | (6 | ) | (198 | ) | 259 | 1,082 | (823 | ) | |||||||||||||||||||||||||||
| Provision for loan losses |
78 | 61 | 81 | 81 | 97 | 17 | (19 | ) | 301 | 317 | (16 | ) | ||||||||||||||||||||||||||||
| Noninterest expense |
||||||||||||||||||||||||||||||||||||||||
| Compensation and benefits expense |
242 | 252 | 239 | 294 | 300 | (10 | ) | (58 | ) | 1,027 | 1,072 | (45 | ) | |||||||||||||||||||||||||||
| Goodwill impairment |
149 | — | — | — | — | 149 | 149 | 149 | — | 149 | ||||||||||||||||||||||||||||||
| Other operating expense (2) |
16 | (41 | ) | (18 | ) | (32 | ) | 3 | 57 | 13 | (75 | ) | (100 | ) | 25 | |||||||||||||||||||||||||
|
|
|
|
|
|
|
|
|
|
|
|
|
|
|
|
|
|
|
|
|
|||||||||||||||||||||
| Total noninterest expense |
407 | 211 | 221 | 262 | 303 | 196 | 104 | 1,101 | 972 | 129 | ||||||||||||||||||||||||||||||
|
|
|
|
|
|
|
|
|
|
|
|
|
|
|
|
|
|
|
|
|
|||||||||||||||||||||
| Pre-tax (loss) income |
$ | (462 | ) | $ | (243 | ) | $ | (199 | ) | $ | (239 | ) | $ | (179 | ) | $ | (219 | ) | $ | (283 | ) | $ | (1,143 | ) | $ | (207 | ) | $ | (936 | ) | ||||||||||
|
|
|
|
|
|
|
|
|
|
|
|
|
|
|
|
|
|
|
|
|
|||||||||||||||||||||
| Change in the fair value of equity securities (3) |
(7 | ) | 10 | — | — | — | (17 | ) | (7 | ) | 3 | 1 | 3 | |||||||||||||||||||||||||||
| Core OID (4) |
13 | 12 | 12 | 11 | 11 | — | 2 | 48 | 42 | 7 | ||||||||||||||||||||||||||||||
| Repositioning (3) |
172 | 30 | — | — | 57 | 142 | 115 | 201 | 77 | 124 | ||||||||||||||||||||||||||||||
|
|
|
|
|
|
|
|
|
|
|
|
|
|
|
|
|
|
|
|
|
|||||||||||||||||||||
| Core pre-tax (loss) income (4) |
$ | (284 | ) | $ | (191 | ) | $ | (187 | ) | $ | (228 | ) | $ | (111 | ) | $ | (93 | ) | $ | (173 | ) | $ | (890 | ) | $ | (87 | ) | $ | (803 | ) | ||||||||||
|
|
|
|
|
|
|
|
|
|
|
|
|
|
|
|
|
|
|
|
|
|||||||||||||||||||||
| Balance Sheet (Period-End) |
||||||||||||||||||||||||||||||||||||||||
| Cash, trading and investment securities |
$ | 31,511 | $ | 31,955 | $ | 35,139 | $ | 35,659 | $ | 31,597 | $ | (444 | ) | $ | (86 | ) | ||||||||||||||||||||||||
| Loans held-for-sale, net |
109 | 158 | 203 | 215 | 190 | (49 | ) | (81 | ) | |||||||||||||||||||||||||||||||
| Consumer loans |
2,121 | 3,958 | 3,751 | 3,584 | 3,262 | (1,837 | ) | (1,141 | ) | |||||||||||||||||||||||||||||||
| Commercial loans |
223 | 223 | 215 | 220 | 207 | — | 16 | |||||||||||||||||||||||||||||||||
| Intercompany loans (5) |
(619 | ) | (547 | ) | (510 | ) | (523 | ) | (417 | ) | (72 | ) | (202 | ) | ||||||||||||||||||||||||||
| Allowance for loan losses |
(299 | ) | (480 | ) | (482 | ) | (461 | ) | (434 | ) | 181 | 135 | ||||||||||||||||||||||||||||
|
|
|
|
|
|
|
|
|
|
|
|
|
|
|
|||||||||||||||||||||||||||
| Total finance receivables and loans, net |
1,426 | 3,154 | 2,974 | 2,820 | 2,618 | (1,728 | ) | (1,192 | ) | |||||||||||||||||||||||||||||||
| Other assets |
7,183 | 7,465 | 7,091 | 7,128 | 7,226 | (282 | ) | (43 | ) | |||||||||||||||||||||||||||||||
| Assets of operations held-for-sale (6) |
2,008 | — | — | — | — | 2,008 | 2,008 | |||||||||||||||||||||||||||||||||
|
|
|
|
|
|
|
|
|
|
|
|
|
|
|
|||||||||||||||||||||||||||
| Total assets |
$ | 42,237 | $ | 42,732 | $ | 45,407 | $ | 45,822 | $ | 41,631 | $ | (495 | ) | $ | 606 | |||||||||||||||||||||||||
|
|
|
|
|
|
|
|
|
|
|
|
|
|
|
|||||||||||||||||||||||||||
| Core OID Amortization Schedule (4) |
2024 | 2025 | 2026 | 2027 | 2028 & After | |||||||||||||||||||||||||||||||||||
| Remaining Core OID amortization expense |
$ | 56 | $ | 66 | $ | 77 | $ | 89 | Avg = $ | 125/yr | ||||||||||||||||||||||||||||||
(1) Includes the impact of centralized asset and liability management, corporate overhead allocation activities, the legacy mortgage portfolio, Ally Invest activity, and Ally Lending activity.
(2) Other operating expenses includes corporate overhead allocated to the other business segments. Amounts of corporate overhead allocated were $342 million for 4Q23, $348 million for 3Q23, $331 million for 2Q23, $334 million for 1Q23, and $350 million for 4Q22. The receiving business segment records the allocation of corporate overhead expense within other operating expenses.
(3) For more details refer to pages 25-27.
(4) Represents a non-GAAP financial measure. For more details refer to pages 25-27.
(5) Intercompany loans related to activity between Insurance and Corporate and Other for liquidity purposes.
(6) Unsecured lending from point-of-sale financing. Moved to Assets of Operations Held-For-Sale (HFS) on 12/31/23.
| 4Q 2023 Preliminary Results | 14 |
| ALLY FINANCIAL INC. CREDIT RELATED INFORMATION
|
|
| ($ in millions) | ||||||||||||||||||||||||||||||||||||||||
| QUARTERLY TRENDS | CHANGE VS. | FULL YEAR | ||||||||||||||||||||||||||||||||||||||
| Asset Quality - Consolidated (1) |
4Q 23 | 3Q 23 | 2Q 23 | 1Q 23 | 4Q 22 | 3Q 23 | 4Q 22 | FY 2023 | FY 2022 | CHANGE | ||||||||||||||||||||||||||||||
| Ending loan balance |
$ | 139,439 | $ | 140,260 | $ | 138,449 | $ | 136,302 | $ | 135,745 | $ | (821 | ) | $ | 3,694 | |||||||||||||||||||||||||
| 30+ Accruing DPD |
$ | 3,856 | $ | 3,459 | $ | 3,169 | $ | 2,834 | $ | 3,128 | $ | 397 | $ | 728 | ||||||||||||||||||||||||||
| 30+ Accruing DPD % |
2.76 | % | 2.47 | % | 2.29 | % | 2.08 | % | 2.30 | % | ||||||||||||||||||||||||||||||
| 60+ Accruing DPD |
$ | 1,077 | $ | 934 | $ | 841 | $ | 707 | $ | 779 | $ | 143 | $ | 298 | ||||||||||||||||||||||||||
| 60+ Accruing DPD % |
0.77 | % | 0.67 | % | 0.61 | % | 0.52 | % | 0.57 | % | ||||||||||||||||||||||||||||||
| Non-performing loans (NPLs) |
$ | 1,394 | $ | 1,500 | $ | 1,404 | $ | 1,384 | $ | 1,454 | $ | (106 | ) | $ | (60 | ) | ||||||||||||||||||||||||
| Net charge-offs (NCOs) |
$ | 623 | $ | 456 | $ | 399 | $ | 409 | $ | 390 | $ | 167 | $ | 233 | $ | 1,887 | $ | 952 | $ | 935 | ||||||||||||||||||||
| Net charge-off rate (2) |
1.77 | % | 1.31 | % | 1.16 | % | 1.20 | % | 1.16 | % | 1.36 | % | 0.74 | % | ||||||||||||||||||||||||||
| Provision for loan losses |
$ | 587 | $ | 508 | $ | 427 | $ | 446 | $ | 490 | $ | 79 | $ | 97 | $ | 1,968 | $ | 1,399 | $ | 569 | ||||||||||||||||||||
| Allowance for loan losses (ALLL) |
$ | 3,587 | $ | 3,837 | $ | 3,781 | $ | 3,751 | $ | 3,711 | $ | (250 | ) | $ | (124 | ) | ||||||||||||||||||||||||
| ALLL as % of Loans (3) (4) |
2.57 | % | 2.73 | % | 2.72 | % | 2.74 | % | 2.72 | % | ||||||||||||||||||||||||||||||
| ALLL as % of NPLs (3) |
257 | % | 256 | % | 269 | % | 271 | % | 255 | % | ||||||||||||||||||||||||||||||
| ALLL as % of NCOs (3) |
144 | % | 211 | % | 237 | % | 230 | % | 238 | % | ||||||||||||||||||||||||||||||
| US Auto Delinquencies - HFI Retail Contract $‘s |
|
|||||||||||||||||||||||||||||||||||||||
| 30+ Delinquent contract $ |
$ | 3,730 | $ | 3,290 | $ | 3,032 | $ | 2,714 | $ | 2,962 | $ | 440 | $ | 768 | ||||||||||||||||||||||||||
| % of retail contract $ outstanding |
4.42 | % | 3.85 | % | 3.60 | % | 3.24 | % | 3.56 | % | ||||||||||||||||||||||||||||||
| 60+ Delinquent contract $ |
$ | 1,037 | $ | 878 | $ | 796 | $ | 666 | $ | 738 | $ | 159 | $ | 299 | ||||||||||||||||||||||||||
| % of retail contract $ outstanding |
1.23 | % | 1.03 | % | 0.94 | % | 0.80 | % | 0.89 | % | ||||||||||||||||||||||||||||||
| U.S. Auto Annualized Net Charge-Offs - HFI Retail Contract $‘s |
|
|||||||||||||||||||||||||||||||||||||||
| Net charge-offs |
$ | 470 | $ | 393 | $ | 277 | $ | 351 | $ | 347 | $ | 77 | $ | 123 | $ | 1,491 | $ | 785 | $ | 706 | ||||||||||||||||||||
| % of avg. HFI assets (2) |
2.21 | % | 1.85 | % | 1.32 | % | 1.68 | % | 1.66 | % | 1.77 | % | 0.97 | % | ||||||||||||||||||||||||||
| U.S. Auto Annualized Net Charge-Offs - HFI Commercial Contract $‘s |
|
|||||||||||||||||||||||||||||||||||||||
| Net charge-offs |
$ | 19 | $ | (0 | ) | $ | 4 | $ | — | $ | — | $ | 19 | $ | 19 | $ | 23 | $ | (2 | ) | $ | 25 | ||||||||||||||||||
| % of avg. HFI assets (2) |
0.34 | % | — | % | 0.09 | % | — | % | — | % | 0.11 | % | (0.01 | )% | ||||||||||||||||||||||||||
(1) Loans within this table are classified as held-for-investment recorded at amortized cost as these loans are included in our allowance for loan losses.
(2) Net charge-off ratios are calculated as annualized net charge-offs divided by average outstanding finance recievables and loans excluding loans measured at fair value, conditional repurchase loans and loans held-for-sale during the year for each loan category.
(3) Excludes provision for credit losses related to our reserve for unfunded commitments.
(4) ALLL coverage ratios are based on the allowance for loan losses related to loans held-for-investment excluding those loans held at fair value as a percentage of the unpaid principal balance, net of premiums and discounts.
| 4Q 2023 Preliminary Results | 15 |
| ALLY FINANCIAL INC. CREDIT RELATED INFORMATION, CONTINUED
|
|
| ($ in millions) | ||||||||||||||||||||||||||||
| Automotive Finance (1) | QUARTERLY TRENDS | CHANGE VS. | ||||||||||||||||||||||||||
| Consumer | 4Q 23 | 3Q 23 | 2Q 23 | 1Q 23 | 4Q 22 | 3Q 23 | 4Q 22 | |||||||||||||||||||||
| Allowance for loan losses |
$ | 3,083 | $ | 3,104 | $ | 3,064 | $ | 3,022 | $ | 3,020 | $ | (21 | ) | $ | 63 | |||||||||||||
| Total consumer loans (2) |
$ | 84,320 | $ | 85,370 | $ | 84,294 | $ | 83,640 | $ | 83,286 | $ | (1,050 | ) | $ | 1,034 | |||||||||||||
| Coverage ratio (3) |
3.65 | % | 3.62 | % | 3.62 | % | 3.60 | % | 3.60 | % | ||||||||||||||||||
| Commercial |
||||||||||||||||||||||||||||
| Allowance for loan losses |
$ | 34 | $ | 49 | $ | 39 | $ | 31 | $ | 33 | $ | (15 | ) | $ | 1 | |||||||||||||
| Total commercial loans |
$ | 23,334 | $ | 21,057 | $ | 20,732 | $ | 19,266 | $ | 18,784 | $ | 2,277 | $ | 4,550 | ||||||||||||||
| Coverage ratio |
0.15 | % | 0.23 | % | 0.19 | % | 0.16 | % | 0.18 | % | ||||||||||||||||||
| Mortgage (1) |
||||||||||||||||||||||||||||
| Consumer |
||||||||||||||||||||||||||||
| Mortgage Finance |
||||||||||||||||||||||||||||
| Allowance for loan losses |
$ | 18 | $ | 19 | $ | 20 | $ | 20 | $ | 22 | $ | (1 | ) | $ | (4 | ) | ||||||||||||
| Total consumer loans |
$ | 18,442 | $ | 18,657 | $ | 18,894 | $ | 19,189 | $ | 19,445 | $ | (215 | ) | $ | (1,003 | ) | ||||||||||||
| Coverage ratio |
0.10 | % | 0.10 | % | 0.10 | % | 0.11 | % | 0.11 | % | ||||||||||||||||||
| Mortgage - Legacy |
||||||||||||||||||||||||||||
| Allowance for loan losses |
$ | 3 | $ | 3 | $ | 3 | $ | 3 | $ | 5 | $ | — | $ | (2 | ) | |||||||||||||
| Total consumer loans |
$ | 225 | $ | 238 | $ | 255 | $ | 272 | $ | 290 | $ | (13 | ) | $ | (65 | ) | ||||||||||||
| Coverage ratio |
1.32 | % | 1.29 | % | 1.28 | % | 1.11 | % | 1.78 | % | ||||||||||||||||||
| Total Mortgage |
||||||||||||||||||||||||||||
| Allowance for loan losses |
$ | 21 | $ | 22 | $ | 23 | $ | 23 | $ | 27 | $ | (1 | ) | $ | (6 | ) | ||||||||||||
| Total consumer loans |
$ | 18,667 | $ | 18,895 | $ | 19,149 | $ | 19,461 | $ | 19,735 | $ | (228 | ) | $ | (1,068 | ) | ||||||||||||
| Coverage ratio |
0.11 | % | 0.11 | % | 0.12 | % | 0.12 | % | 0.14 | % | ||||||||||||||||||
| Consumer Other - Ally Lending (1) (4) |
||||||||||||||||||||||||||||
| Allowance for loan losses |
$ | — | $ | 202 | $ | 210 | $ | 213 | $ | 194 | $ | (202 | ) | $ | (194 | ) | ||||||||||||
| Total consumer loans |
$ | — | $ | 2,206 | $ | 2,170 | $ | 2,072 | $ | 1,987 | $ | (2,206 | ) | $ | (1,987 | ) | ||||||||||||
| Coverage ratio |
— | % | 9.16 | % | 9.68 | % | 10.29 | % | 9.77 | % | ||||||||||||||||||
| Consumer Other - Ally Credit Card (1) |
||||||||||||||||||||||||||||
| Allowance for loan losses |
$ | 293 | $ | 272 | $ | 266 | $ | 242 | 232 | $ | 21 | $ | 61 | |||||||||||||||
| Total consumer loans |
$ | 1,990 | $ | 1,872 | $ | 1,757 | $ | 1,640 | 1,599 | $ | 118 | $ | 391 | |||||||||||||||
| Coverage ratio |
14.72 | % | 14.55 | % | 15.14 | % | 14.74 | % | 14.51 | % | ||||||||||||||||||
| Corporate Finance (1) |
||||||||||||||||||||||||||||
| Allowance for loan losses |
$ | 153 | $ | 185 | $ | 176 | $ | 217 | $ | 202 | $ | (32 | ) | $ | (49 | ) | ||||||||||||
| Total commercial loans |
$ | 10,905 | $ | 10,636 | $ | 10,132 | $ | 10,003 | $ | 10,147 | $ | 269 | $ | 758 | ||||||||||||||
| Coverage ratio |
1.40 | % | 1.74 | % | 1.74 | % | 2.17 | % | 1.99 | % | ||||||||||||||||||
| Corporate and Other (1) |
||||||||||||||||||||||||||||
| Allowance for loan losses |
$ | 3 | $ | 3 | $ | 3 | $ | 3 | $ | 3 | $ | — | $ | — | ||||||||||||||
| Total commercial loans |
$ | 223 | $ | 224 | $ | 215 | $ | 220 | $ | 207 | $ | (1 | ) | $ | 16 | |||||||||||||
| Coverage ratio |
1.36 | % | 1.36 | % | 1.36 | % | 1.36 | % | 1.36 | % | ||||||||||||||||||
(1) ALLL coverage ratios are based on the domestic allowance as a percentage of finance receivables and loans reported at their gross carrying value, which includes the principal amount outstanding, net of unearned income, unamortized deferred fees reduced by costs on originated loans, unamortized premiums and discounts on purchased loans, unamortized basis adjustments arising from the designation of finance receivables and loans as the hedged item in qualifying fair value hedge relationships, and cumulative principal charge-offs. Excludes loans held at fair value.
(2) Includes ($93M) of fair value adjustment for loans in hedge accounting relationships in 4Q23, ($358M) in 3Q23, ($432M) in 2Q23, ($402M) in 1Q23 and ($617M) in 4Q22.
(3) Excludes ($93M) of fair value adjustment for loans in hedge accounting relationships in 4Q23, ($358M) in 3Q23, ($432M) in 2Q23, ($402M) in 1Q23 and ($617M) in 4Q22.
(4) Unsecured consumer lending from point-of-sale financing.
| 4Q 2023 Preliminary Results | 16 |
| ALLY FINANCIAL INC. CAPITAL
|
|
| ($ in billions) | QUARTERLY TRENDS | CHANGE VS. | ||||||||||||||||||||||||||
| Capital |
4Q 23 | 3Q 23 | 2Q 23 | 1Q 23 | 4Q 22 | 3Q 23 | 4Q 22 | |||||||||||||||||||||
| Risk-weighted assets |
$ | 161.7 | $ | 161.1 | $ | 159.2 | $ | 157.6 | $ | 157.3 | $ | 0.6 | $ | 4.4 | ||||||||||||||
| Common Equity Tier 1 (CET1) capital ratio |
9.4% | 9.3% | 9.3% | 9.2% | 9.3% | |||||||||||||||||||||||
| Tier 1 capital ratio |
10.8% | 10.7% | 10.7% | 10.7% | 10.7% | |||||||||||||||||||||||
| Total capital ratio |
12.4% | 12.5% | 12.5% | 12.5% | 12.2% | |||||||||||||||||||||||
| Tangible common equity / Tangible assets (1)(2) |
5.5% | 4.9% | 5.3% | 5.2% | 5.0% | |||||||||||||||||||||||
| Tangible common equity / Risk-weighted assets (1) |
6.6% | 6.0% | 6.5% | 6.4% | 6.1% | |||||||||||||||||||||||
| Shareholders’ equity |
$ | 13.8 | $ | 12.8 | $ | 13.5 | $ | 13.4 | $ | 12.9 | $ | 1.0 | $ | 0.9 | ||||||||||||||
| add: CECL phase-in adjustment |
0.6 | 0.6 | 0.6 | 0.6 | 0.9 | — | (0.3) | |||||||||||||||||||||
| less: Certain AOCI items and other adjustments |
3.1 | 3.9 | 3.0 | 2.9 | 3.2 | (0.8) | (0.1) | |||||||||||||||||||||
| Preferred equity |
(2.3) | (2.3) | (2.3) | (2.3) | (2.3) | — | — | |||||||||||||||||||||
|
|
|
|
|
|
|
|
|
|
|
|
|
|
|
|||||||||||||||
| Common Equity Tier 1 capital |
$ | 15.1 | $ | 15.0 | $ | 14.8 | $ | 14.5 | $ | 14.6 | $ | 0.1 | $ | 0.5 | ||||||||||||||
|
|
|
|
|
|
|
|
|
|
|
|
|
|
|
|||||||||||||||
| Common Equity Tier 1 capital |
$ | 15.1 | $ | 15.0 | $ | 14.8 | $ | 14.5 | $ | 14.6 | $ | 0.1 | $ | 0.5 | ||||||||||||||
| add: Preferred equity |
2.3 | 2.3 | 2.3 | 2.3 | 2.3 | — | — | |||||||||||||||||||||
| less: Other adjustments |
(0.1) | (0.1) | (0.1) | (0.1) | — | — | (0.1) | |||||||||||||||||||||
|
|
|
|
|
|
|
|
|
|
|
|
|
|
|
|||||||||||||||
| Tier 1 capital |
$ | 17.4 | $ | 17.3 | $ | 17.1 | $ | 16.8 | $ | 16.9 | $ | 0.1 | $ | 0.5 | ||||||||||||||
|
|
|
|
|
|
|
|
|
|
|
|
|
|
|
|||||||||||||||
| Tier 1 capital |
$ | 17.4 | $ | 17.3 | $ | 17.1 | $ | 16.8 | $ | 16.9 | $ | 0.1 | $ | 0.5 | ||||||||||||||
| add: Qualifying subordinated debt |
0.7 | 0.9 | 0.9 | 0.9 | 0.4 | (0.2) | 0.3 | |||||||||||||||||||||
| Allowance for loan and lease losses includible in Tier 2 capital and other adjustments |
2.0 | 2.0 | 1.9 | 1.9 | 1.9 | — | 0.1 | |||||||||||||||||||||
|
|
|
|
|
|
|
|
|
|
|
|
|
|
|
|||||||||||||||
| Total capital |
$ | 20.1 | $ | 20.1 | $ | 19.9 | $ | 19.6 | $ | 19.2 | $ | — | $ | 0.9 | ||||||||||||||
|
|
|
|
|
|
|
|
|
|
|
|
|
|
|
|||||||||||||||
| Total shareholders’ equity |
$ | 13.8 | $ | 12.8 | $ | 13.5 | $ | 13.4 | $ | 12.9 | $ | 1.0 | $ | 0.9 | ||||||||||||||
| less: Preferred equity |
(2.3) | (2.3) | (2.3) | (2.3) | (2.3) | — | — | |||||||||||||||||||||
| Goodwill and intangible assets, net of deferred tax liabilities |
(0.7) | (0.9) | (0.9) | (0.9) | (0.9) | 0.2 | 0.2 | |||||||||||||||||||||
|
|
|
|
|
|
|
|
|
|
|
|
|
|
|
|||||||||||||||
| Tangible common equity (1) |
$ | 10.7 | $ | 9.6 | $ | 10.3 | $ | 10.2 | $ | 9.6 | $ | 1.1 | $ | 1.1 | ||||||||||||||
|
|
|
|
|
|
|
|
|
|
|
|
|
|
|
|||||||||||||||
| Total assets |
$ | 196.4 | $ | 195.7 | $ | 197.2 | $ | 196.2 | $ | 191.8 | $ | 0.7 | $ | 4.6 | ||||||||||||||
| less: Goodwill and intangible assets, net of deferred tax liabilities |
(0.7) | (0.9) | (0.9) | (0.9) | (0.9) | 0.2 | 0.2 | |||||||||||||||||||||
|
|
|
|
|
|
|
|
|
|
|
|
|
|
|
|||||||||||||||
| Tangible assets (2) |
$ | 195.7 | $ | 194.8 | $ | 196.4 | $ | 195.3 | $ | 190.9 | $ | 0.9 | $ | 4.8 | ||||||||||||||
|
|
|
|
|
|
|
|
|
|
|
|
|
|
|
|||||||||||||||
Note: Numbers may not foot due to rounding
(1) Represents a non-GAAP financial measure. For more details refer to pages 25-27.
(2) Ally defines tangible assets as total assets less goodwill and intangible assets, net of deferred tax liabilities.
For more details on the final rules to address the impact of CECL on regulatory capital by allowing BHCs and banks, including Ally, to delay and subsequently phase-in its impact, see page 26.
| 4Q 2023 Preliminary Results | 17 |
| ALLY FINANCIAL INC. LIQUIDITY AND DEPOSITS
|
|
| QUARTERLY TRENDS | CHANGE VS. | |||||||||||||||||||||||||||
| Consolidated Available Liquidity ($ in billions) |
4Q 23 | 3Q 23 | 2Q 23 | 1Q 23 | 4Q 22 | 3Q 23 | 4Q 22 | |||||||||||||||||||||
| Liquid cash and cash equivalents (1) |
$ | 6.5 | $ | 8.0 | $ | 9.5 | $ | 9.3 | $ | 5.1 | $ | (1.5 | ) | $ | 1.4 | |||||||||||||
| Highly liquid securities (2) |
20.6 | 19.6 | 20.7 | 21.5 | 22.2 | 1.1 | (1.5 | ) | ||||||||||||||||||||
|
|
|
|
|
|
|
|
|
|
|
|
|
|
|
|||||||||||||||
| Subtotal |
$ | 27.1 | $ | 27.6 | $ | 30.2 | $ | 30.8 | $ | 27.3 | $ | (0.5 | ) | $ | (0.2 | ) | ||||||||||||
|
|
|
|
|
|
|
|
|
|
|
|
|
|
|
|||||||||||||||
| FHLB Unused Pledged Borrowing Capacity |
10.3 | 11.0 | 12.3 | 12.2 | 11.1 | (0.7 | ) | (0.8 | ) | |||||||||||||||||||
| FRB Discount Window Unused Pledged Capacity |
26.0 | 25.6 | 2.1 | 2.1 | 2.0 | 0.4 | 24.0 | |||||||||||||||||||||
|
|
|
|
|
|
|
|
|
|
|
|
|
|
|
|||||||||||||||
| Total unused pledged capacity |
$ | 36.4 | $ | 36.6 | $ | 14.4 | $ | 14.3 | $ | 13.2 | $ | (0.2 | ) | $ | 23.2 | |||||||||||||
|
|
|
|
|
|
|
|
|
|
|
|
|
|
|
|||||||||||||||
| Total current available liquidity |
$ | 63.5 | $ | 64.1 | $ | 44.6 | $ | 45.0 | $ | 40.5 | $ | (0.7 | ) | $ | 23.0 | |||||||||||||
|
|
|
|
|
|
|
|
|
|
|
|
|
|
|
|||||||||||||||
| Unsecured Long-Term Debt Maturity Profile |
2024 | 2025 | 2026 | 2027 | 2028 | 2029 & After | ||||||||||||||||||||||
| Consolidated remaining maturities (3) |
$ | 1.5 | $ | 2.3 | $ | — | $ | 1.5 | $ | 0.8 | $ | 4.6 | ||||||||||||||||
| Ally Bank Deposits |
||||||||||||||||||||||||||||
| Key Deposit Statistics |
||||||||||||||||||||||||||||
| Average retail CD maturity (months) |
19.0 | 19.1 | 16.2 | 18.7 | 19.4 | (0.1 | ) | (0.4 | ) | |||||||||||||||||||
| Average retail deposit rate |
4.15% | 4.00% | 3.68% | 3.16% | 2.45% | |||||||||||||||||||||||
| End of Period Deposit Levels ($ in millions) |
|
|||||||||||||||||||||||||||
| Retail |
$ | 142,265 | $ | 140,100 | $ | 138,983 | $ | 138,497 | $ | 137,684 | $ | 2,164 | $ | 4,580 | ||||||||||||||
| Brokered & other |
12,402 | 12,735 | 15,327 | 15,516 | 14,613 | (333 | ) | (2,211 | ) | |||||||||||||||||||
|
|
|
|
|
|
|
|
|
|
|
|
|
|
|
|||||||||||||||
| Total deposits |
$ | 154,666 | $ | 152,835 | $ | 154,310 | $ | 154,013 | $ | 152,297 | $ | 1,831 | $ | 2,369 | ||||||||||||||
|
|
|
|
|
|
|
|
|
|
|
|
|
|
|
|||||||||||||||
| Deposit Mix |
||||||||||||||||||||||||||||
| Retail CD |
29% | 28% | 27% | 25% | 20% | |||||||||||||||||||||||
| MMA/OSA/Checking |
63% | 64% | 63% | 65% | 71% | |||||||||||||||||||||||
| Brokered & other |
8% | 8% | 10% | 10% | 9% | |||||||||||||||||||||||
| (1) | May include the restricted cash accumulation for retained notes maturing within the following 30 days and returned to Ally on the distribution date |
| (2) | Includes unencumbered UST, Agency debt, Agency MBS, and highly liquid Corporates |
| (3) | Excludes retail notes; as of 12/31/2023. Reflects notional value of outstanding bond. Excludes total GAAP OID and capitalized transaction costs. |
| 4Q 2023 Preliminary Results | 18 |
| ALLY FINANCIAL INC. NET INTEREST MARGIN
|
|
| ($ in millions) | ||||||||||||||||||||||||||||||||||||||||
| QUARTERLY TRENDS | CHANGE VS. | FULL YEAR | ||||||||||||||||||||||||||||||||||||||
| Average Balance |
4Q 23 | 3Q 23 | 2Q 23 | 1Q 23 | 4Q 22 | 3Q 23 | 4Q 22 | FY 2023 | FY 2022 | CHANGE | ||||||||||||||||||||||||||||||
| Retail Auto Loans |
$ | 84,711 | $ | 85,131 | $ | 84,097 | $ | 83,615 | $ | 83,781 | $ | (420) | $ | 930 | $ | 84,393 | $ | 81,035 | $ | 3,358 | ||||||||||||||||||||
| Auto Lease (net of dep) |
9,415 | 9,817 | 10,110 | 10,435 | 10,546 | (402) | (1,131) | 9,941 | 10,656 | (715) | ||||||||||||||||||||||||||||||
| Dealer Floorplan |
15,693 | 14,507 | 13,764 | 12,893 | 11,822 | 1,186 | 3,871 | 14,223 | 11,418 | 2,805 | ||||||||||||||||||||||||||||||
| Other Dealer Loans |
6,115 | 6,023 | 5,945 | 5,756 | 5,462 | 92 | 653 | 5,961 | 5,044 | 917 | ||||||||||||||||||||||||||||||
| Corporate Finance |
10,787 | 10,309 | 10,240 | 10,606 | 10,181 | 478 | 606 | 10,486 | 8,974 | 1,512 | ||||||||||||||||||||||||||||||
| Mortgage (1) |
18,788 | 19,028 | 19,325 | 19,621 | 19,876 | (240) | (1,088) | 19,188 | 19,218 | (30) | ||||||||||||||||||||||||||||||
| Consumer Other—Ally Lending (2) |
2,167 | 2,201 | 2,114 | 2,037 | 1,904 | (34) | 263 | 2,130 | 1,508 | 622 | ||||||||||||||||||||||||||||||
| Consumer Other—Ally Credit Card |
1,925 | 1,826 | 1,701 | 1,618 | 1,486 | 99 | 439 | 1,769 | 1,216 | 553 | ||||||||||||||||||||||||||||||
| Cash and Cash Equivalents |
7,571 | 8,308 | 7,401 | 5,731 | 4,129 | (737) | 3,442 | 7,261 | 3,886 | 3,375 | ||||||||||||||||||||||||||||||
| Investment Securities and Other |
29,784 | 30,769 | 31,958 | 32,578 | 32,513 | (985) | (2,729) | 31,264 | 34,778 | (3,514) | ||||||||||||||||||||||||||||||
|
|
|
|
|
|
|
|
|
|
|
|
|
|
|
|
|
|
|
|
|
|||||||||||||||||||||
| Total Earning Assets |
$ | 186,956 | $ | 187,920 | $ | 186,655 | $ | 184,891 | $ | 181,698 | $ | (964) | $ | 5,258 | $ | 186,616 | $ | 177,733 | $ | 8,883 | ||||||||||||||||||||
| Interest Revenue |
3,401 | 3,383 | 3,254 | 3,060 | 2,859 | 18 | 542 | 13,098 | 9,707 | 3,391 | ||||||||||||||||||||||||||||||
| Unsecured Debt (ex. Core OID balance) (3) |
$ | 10,595 | $ | 11,590 | $ | 11,442 | $ | 11,193 | $ | 10,447 | $ | (995) | $ | 148 | $ | 11,205 | $ | 10,037 | $ | 1,168 | ||||||||||||||||||||
| Secured Debt |
2,279 | 3,120 | 2,879 | 2,552 | 1,917 | (841) | 362 | 2,708 | 1,386 | 1,322 | ||||||||||||||||||||||||||||||
| Deposits (4) |
153,672 | 153,526 | 152,382 | 152,752 | 148,485 | 146 | 5,187 | 153,087 | 143,180 | 9,907 | ||||||||||||||||||||||||||||||
| Other Borrowings |
8,572 | 7,365 | 7,592 | 6,503 | 9,934 | 1,207 | (1,362) | 7,513 | 10,414 | (2,901) | ||||||||||||||||||||||||||||||
|
|
|
|
|
|
|
|
|
|
|
|
|
|
|
|
|
|
|
|
|
|||||||||||||||||||||
| Total Funding Sources (ex. Core OID balance) (3) |
$ | 175,118 | $ | 175,601 | $ | 174,295 | $ | 173,000 | $ | 170,783 | $ | (483) | $ | 4,335 | $ | 174,513 | $ | 165,017 | $ | 9,496 | ||||||||||||||||||||
| Interest Expense (ex. Core OID) (3) |
1,895 | 1,838 | 1,669 | 1,447 | 1,174 | 57 | 721 | 6,849 | 2,815 | 4,034 | ||||||||||||||||||||||||||||||
| Net Financing Revenue (ex. Core OID) (3) |
$ | 1,506 | $ | 1,545 | $ | 1,585 | $ | 1,613 | $ | 1,685 | $ | (39) | $ | (179) | $ | 6,249 | $ | 6,892 | $ | (643) | ||||||||||||||||||||
| Net Interest Margin (yield details) |
||||||||||||||||||||||||||||||||||||||||
| Retail Auto Loan |
8.98% | 8.90% | 8.81% | 8.49% | 7.98% | 0.08% | 1.00% | 8.80% | 7.19% | 1.61% | ||||||||||||||||||||||||||||||
| Retail Auto Loan (excl. hedge impact) |
8.43% | 8.16% | 7.87% | 7.66% | 7.37% | 0.27% | 1.06% | 8.03% | 7.01% | 1.02% | ||||||||||||||||||||||||||||||
| Auto Lease (net of dep) |
6.24% | 7.00% | 7.60% | 6.84% | 6.02% | (0.76)% | 0.22% | 6.93% | 6.41% | 0.52% | ||||||||||||||||||||||||||||||
| Dealer Floorplan |
7.84% | 7.88% | 7.71% | 7.29% | 6.42% | (0.04)% | 1.42% | 7.70% | 4.49% | 3.21% | ||||||||||||||||||||||||||||||
| Other Dealer Loans |
5.35% | 5.25% | 5.16% | 5.04% | 4.82% | 0.10% | 0.53% | 5.20% | 4.38% | 0.82% | ||||||||||||||||||||||||||||||
| Corporate Finance |
9.70% | 9.54% | 9.15% | 8.96% | 7.78% | 0.16% | 1.92% | 9.34% | 6.09% | 3.25% | ||||||||||||||||||||||||||||||
| Mortgage |
3.21% | 3.20% | 3.22% | 3.25% | 3.17% | 0.01% | 0.04% | 3.22% | 3.06% | 0.16% | ||||||||||||||||||||||||||||||
| Consumer Other—Ally Lending |
9.86% | 9.94% | 9.99% | 9.97% | 10.37% | (0.08)% | (0.51)% | 9.94% | 11.31% | (1.37)% | ||||||||||||||||||||||||||||||
| Consumer Other—Ally Credit Card |
22.02% | 22.39% | 21.88% | 21.84% | 21.75% | (0.37)% | 0.27% | 22.04% | 20.54% | 1.50% | ||||||||||||||||||||||||||||||
| Cash and Cash Equivalents |
4.72% | 4.73% | 4.70% | 3.95% | 2.94% | (0.01)% | 1.78% | 4.57% | 1.38% | 3.19% | ||||||||||||||||||||||||||||||
| Investment Securities and Other |
3.66% | 3.53% | 3.17% | 3.04% | 2.89% | 0.13% | 0.77% | 3.34% | 2.46% | 0.88% | ||||||||||||||||||||||||||||||
|
|
|
|
|
|
|
|
|
|
|
|
|
|
|
|
|
|
|
|
|
|||||||||||||||||||||
| Total Earning Assets |
7.22% | 7.14% | 6.99% | 6.71% | 6.24% | 0.08% | 0.98% | 7.02% | 5.46% | 1.56% | ||||||||||||||||||||||||||||||
| Unsecured Debt (ex. Core OID & Core OID balance) (3) |
6.08% | 5.55% | 5.40% | 5.34% | 5.12% | 0.53% | 0.96% | 5.58% | 5.09% | 0.49% | ||||||||||||||||||||||||||||||
| Secured Debt |
5.15% | 6.81% | 5.61% | 6.04% | 4.73% | (1.66)% | 0.42% | 5.96% | 5.77% | 0.19% | ||||||||||||||||||||||||||||||
| Deposits (4) |
4.19% | 4.04% | 3.74% | 3.23% | 2.53% | 0.15% | 1.66% | 3.81% | 1.39% | 2.42% | ||||||||||||||||||||||||||||||
| Other Borrowings (5) |
3.79% | 3.23% | 3.00% | 2.74% | 2.80% | 0.56% | 0.99% | 3.23% | 2.29% | 0.94% | ||||||||||||||||||||||||||||||
|
|
|
|
|
|
|
|
|
|
|
|
|
|
|
|
|
|
|
|
|
|||||||||||||||||||||
| Total Funding Sources (ex. Core OID & Core OID balance) (3) |
4.29% | 4.15% | 3.84% | 3.39% | 2.73% | 0.14% | 1.56% | 3.92% | 1.71% | 2.21% | ||||||||||||||||||||||||||||||
| NIM (as reported) |
3.17% | 3.24% | 3.38% | 3.51% | 3.65% | (0.07)% | (0.48)% | 3.32% | 3.85% | (0.53)% | ||||||||||||||||||||||||||||||
| NIM (ex. Core OID & Core OID balance) (3) |
3.20% | 3.26% | 3.41% | 3.54% | 3.68% | (0.06)% | (0.48)% | 3.35% | 3.88% | (0.53)% | ||||||||||||||||||||||||||||||
| (1) | Mortgage includes held-for-investment (HFI) loans from the Mortgage Finance segment and the HFI legacy mortgage portfolio in run-off at the Corporate and Other segment. |
| (2) | Unsecured lending from point-of-sale financing. Moved to Assets of Operations Held-For-Sale (HFS) on 12/31/23. |
| (3) | Represents a non-GAAP financial measure. Excludes Core OID from interest expense and Core OID balance from Unsecured Debt. For more details refer to pages 25-27. |
| (4) | Includes retail, brokered, and other deposits. Other includes sweep deposits and other deposits. |
| (5) | Includes FHLB Borrowings, Repurchase Agreements and other. |
| 4Q 2023 Preliminary Results | 19 |
| ALLY FINANCIAL INC. ALLY BANK CONSUMER MORTGAGE HFI PORTFOLIOS (PERIOD-END)
|
|
| ($ in billions) | QUARTERLY TRENDS | |||||||||||||||||||
| Mortgage Finance HFI Portfolio |
4Q 23 | 3Q 23 | 2Q 23 | 1Q 23 | 4Q 22 | |||||||||||||||
| Loan Value |
||||||||||||||||||||
| Gross carry value |
$ | 18.4 | $ | 18.7 | $ | 18.9 | $ | 19.2 | $ | 19.4 | ||||||||||
| Net carry value |
$ | 18.4 | $ | 18.6 | $ | 18.9 | $ | 19.2 | $ | 19.4 | ||||||||||
| Estimated Pool Characteristics |
||||||||||||||||||||
| % Second lien |
0.0 | % | 0.0 | % | 0.0 | % | 0.0 | % | 0.0 | % | ||||||||||
| % Interest only |
0.0 | % | 0.0 | % | 0.0 | % | 0.0 | % | 0.0 | % | ||||||||||
| % 30+ Day delinquent(1)(2) |
0.5 | % | 0.5 | % | 0.4 | % | 0.4 | % | 0.6 | % | ||||||||||
| % Low/No documentation |
0.0 | % | 0.0 | % | 0.0 | % | 0.0 | % | 0.0 | % | ||||||||||
| % Non-primary residence |
4.1 | % | 4.1 | % | 4.1 | % | 4.1 | % | 4.4 | % | ||||||||||
| Refreshed FICO(3) |
782 | 782 | 782 | 781 | 781 | |||||||||||||||
| Wtd. Avg. LTV/CLTV (4) |
52.2 | % | 53.1 | % | 54.5 | % | 55.0 | % | 54.6 | % | ||||||||||
| Corporate Other Legacy Mortgage HFI Portfolio |
||||||||||||||||||||
| Loan Value |
||||||||||||||||||||
| Gross carry value |
$ | 0.2 | $ | 0.2 | $ | 0.3 | $ | 0.3 | $ | 0.3 | ||||||||||
| Net carry value |
$ | 0.2 | $ | 0.2 | $ | 0.3 | $ | 0.3 | $ | 0.3 | ||||||||||
| Estimated Pool Characteristics |
||||||||||||||||||||
| % Second lien |
12.5 | % | 12.4 | % | 12.5 | % | 12.9 | % | 13.0 | % | ||||||||||
| % Interest only |
0.2 | % | 0.2 | % | 0.0 | % | 0.0 | % | 0.1 | % | ||||||||||
| % 30+ Day delinquent(1)(2) |
7.0 | % | 6.7 | % | 6.6 | % | 6.5 | % | 6.4 | % | ||||||||||
| % Low/No documentation |
25.5 | % | 25.2 | % | 24.8 | % | 24.2 | % | 23.6 | % | ||||||||||
| % Non-primary residence |
3.1 | % | 3.2 | % | 3.4 | % | 3.3 | % | 3.3 | % | ||||||||||
| Refreshed FICO(3) |
742 | 743 | 742 | 741 | 742 | |||||||||||||||
| Wtd. Avg. LTV/CLTV (4) |
46.9 | % | 47.3 | % | 48.1 | % | 48.1 | % | 47.4 | % | ||||||||||
| 1) | MBA Delinquency buckets were used for First Lien products and OTS Delinquency buckets were used for all others. |
| 2) | %30+Day Delinquency bucket excludes loans which are current but are in bankruptcy. |
| 3) | Refreshed FICO includes the entire Bank HFI portfolio, inclusive of SBO. Previously, SBO loans had been excluded from our reporting. |
| 4) | 1st lien only. Updated home values derived using a combination of appraisals, BPOs, AVMs and MSA level house price indices. |
| 4Q 2023 Preliminary Results | 20 |
| ALLY FINANCIAL INC. EARNINGS PER SHARE RELATED INFORMATION
|
|
| ($ in millions, shares in thousands) | QUARTERLY TRENDS | CHANGE VS. | FULL YEAR | |||||||||||||||||||||||||||||||||||||||
| Earnings Per Share Data |
4Q 23 | 3Q 23 | 2Q 23 | 1Q 23 | 4Q 22 | 3Q 23 | 4Q 22 | FY 2023 | FY 2022 | CHANGE | ||||||||||||||||||||||||||||||||
| GAAP net income attributable to common shareholders |
$ | 49 | $ | 269 | $ | 301 | $ | 291 | $ | 251 | $ | (220) | $ | (202) | $ | 910 | $ | 1,604 | $ | (694) | ||||||||||||||||||||||
| Weighted-average common shares outstanding - basic |
304,506 | 304,134 | 303,684 | 302,657 | 301,279 | 372 | 3,227 | 303,751 | 316,690 | (12,939) | ||||||||||||||||||||||||||||||||
| Weighted-average common shares outstanding - diluted |
306,730 | 305,693 | 304,646 | 303,448 | 303,062 | 1,036 | 3,668 | 305,135 | 318,629 | (13,494) | ||||||||||||||||||||||||||||||||
| Issued shares outstanding (period-end) |
302,459 | 301,630 | 301,619 | 300,821 | 299,324 | 830 | 3,135 | 302,459 | 299,324 | 3,135 | ||||||||||||||||||||||||||||||||
|
|
|
|
|
|
|
|
|
|
|
|
|
|
|
|
|
|
|
|
|
|||||||||||||||||||||||
| Net income per share - basic |
$ | 0.16 | $ | 0.88 | $ | 0.99 | $ | 0.96 | $ | 0.83 | $ | (0.72) | $ | (0.67) | $ | 3.00 | $ | 5.06 | $ | (2.07) | ||||||||||||||||||||||
|
|
|
|
|
|
|
|
|
|
|
|
|
|
|
|
|
|
|
|
|
|||||||||||||||||||||||
| Net income per share - diluted |
$ | 0.16 | $ | 0.88 | $ | 0.99 | $ | 0.96 | $ | 0.83 | $ | (0.72) | $ | (0.67) | $ | 2.98 | $ | 5.03 | $ | (2.05) | ||||||||||||||||||||||
|
|
|
|
|
|
|
|
|
|
|
|
|
|
|
|
|
|
|
|
|
|||||||||||||||||||||||
| Adjusted Earnings per Share (“Adjusted EPS”) (2) |
||||||||||||||||||||||||||||||||||||||||||
| Numerator |
||||||||||||||||||||||||||||||||||||||||||
| GAAP net income attributable to common shareholders |
$ | 49 | $ | 269 | $ | 301 | $ | 291 | $ | 251 | $ | (220) | $ | (202) | $ | 910 | $ | 1,604 | $ | (694) | ||||||||||||||||||||||
| Discontinued operations, net of tax |
1 | — | — | 1 | — | 1 | 1 | 2 | 1 | 1 | ||||||||||||||||||||||||||||||||
| Core OID |
13 | 12 | 12 | 11 | 11 | 0 | 2 | 48 | 42 | 7 | ||||||||||||||||||||||||||||||||
| Change in the fair value of equity securities (3) |
(74) | 56 | (25) | (65) | (49) | (130) | (25) | (107) | 215 | (322) | ||||||||||||||||||||||||||||||||
| Core OID, repositioning & change in the fair value of equity securities tax (tax rate 21%) |
(23) | (21) | 3 | 11 | (4) | (3) | (19) | (30) | (70) | 40 | ||||||||||||||||||||||||||||||||
| Repositioning (3) |
172 | 30 | — | — | 57 | 142 | 115 | 201 | 77 | 124 | ||||||||||||||||||||||||||||||||
| Significant discrete tax items |
— | (94) | — | — | 61 | 94 | (61) | (94) | 61 | (155) | ||||||||||||||||||||||||||||||||
|
|
|
|
|
|
|
|
|
|
|
|
|
|
|
|
|
|
|
|
|
|||||||||||||||||||||||
| Core net income attributable to common shareholders (1) |
$ | 137 | $ | 252 | $ | 291 | $ | 250 | $ | 327 | $ | (115) | $ | (189) | $ | 930 | $ | 1,929 | $ | (999) | ||||||||||||||||||||||
| Denominator |
||||||||||||||||||||||||||||||||||||||||||
| Weighted-average common shares outstanding - diluted |
306,730 | 305,693 | 304,646 | 303,448 | 303,062 | 1,036 | 3,668 | 305,135 | 318,629 | (13,494) | ||||||||||||||||||||||||||||||||
| Adjusted EPS (2) |
$ | 0.45 | $ | 0.83 | $ | 0.96 | $ | 0.82 | $ | 1.08 | $ | (0.38) | $ | (0.63) | $ | 3.05 | $ | 6.06 | $ | (3.01) | ||||||||||||||||||||||
| GAAP original issue discount amortization expense |
$ | 16 | $ | 15 | $ | 15 | $ | 15 | $ | 14 | $ | 1 | $ | 2 | $ | 61 | $ | 53 | $ | 8 | ||||||||||||||||||||||
| Other OID |
(3) | (3) | (3) | (3) | (3) | — | — | (13) | (11) | (2) | ||||||||||||||||||||||||||||||||
|
|
|
|
|
|
|
|
|
|
|
|
|
|
|
|
|
|
|
|
|
|||||||||||||||||||||||
| Core original issue discount (Core OID) amortization expense (1) |
$ | 13 | $ | 12 | $ | 12 | $ | 11 | $ | 11 | $ | — | $ | 2 | $ | 48 | $ | 42 | $ | 7 | ||||||||||||||||||||||
|
|
|
|
|
|
|
|
|
|
|
|
|
|
|
|
|
|
|
|
|
|||||||||||||||||||||||
| GAAP outstanding original issue discount balance |
$ | (831) | $ | (847) | $ | (863) | $ | (878) | $ | (882) | $ | 16 | $ | 50 | $ | (831) | $ | (882) | $ | 50 | ||||||||||||||||||||||
| Other outstanding OID balance |
39 | 42 | 45 | 48 | 40 | (3) | (2) | 39 | 40 | (2) | ||||||||||||||||||||||||||||||||
|
|
|
|
|
|
|
|
|
|
|
|
|
|
|
|
|
|
|
|
|
|||||||||||||||||||||||
| Core outstanding original issue discount balance (Core OID balance) (1) |
$ | (793) | $ | (806) | $ | (818) | $ | (830) | $ | (841) | $ | 13 | $ | 48 | $ | (793) | $ | (841) | $ | 48 | ||||||||||||||||||||||
|
|
|
|
|
|
|
|
|
|
|
|
|
|
|
|
|
|
|
|
|
|||||||||||||||||||||||
| GAAP Net Financing Revenue |
[A] | $ | 1,493 | $ | 1,533 | $ | 1,573 | $ | 1,602 | $ | 1,674 | $ | (40) | $ | (181) | $ | 6,201 | $ | 6,850 | $ | (649) | |||||||||||||||||||||
| Core OID |
13 | 12 | 12 | 11 | 11 | — | 2 | 48 | 42 | 7 | ||||||||||||||||||||||||||||||||
|
|
|
|
|
|
|
|
|
|
|
|
|
|
|
|
|
|
|
|
|
|||||||||||||||||||||||
| Net Financing Revenue (ex. Core OID) (1) |
[B] | $ | 1,506 | $ | 1,545 | $ | 1,585 | $ | 1,613 | $ | 1,685 | $ | (40) | $ | (179) | $ | 6,249 | $ | 6,892 | $ | (642) | |||||||||||||||||||||
|
|
|
|
|
|
|
|
|
|
|
|
|
|
|
|
|
|
|
|
|
|||||||||||||||||||||||
| GAAP Other Revenue |
[C] | $ | 574 | $ | 435 | $ | 506 | $ | 498 | $ | 527 | $ | 139 | $ | 47 | $ | 2,013 | $ | 1,578 | $ | 435 | |||||||||||||||||||||
| Change in the fair value of equity securities (3) |
(74) | 56 | (25) | (65) | (49) | (130) | (25) | (107) | 215 | (322) | ||||||||||||||||||||||||||||||||
|
|
|
|
|
|
|
|
|
|
|
|
|
|
|
|
|
|
|
|
|
|||||||||||||||||||||||
| Adjusted Other Revenue (1) |
[D] | $ | 500 | $ | 491 | $ | 481 | $ | 433 | $ | 478 | $ | 9 | $ | 22 | $ | 1,906 | $ | 1,793 | $ | 113 | |||||||||||||||||||||
|
|
|
|
|
|
|
|
|
|
|
|
|
|
|
|
|
|
|
|
|
|||||||||||||||||||||||
| GAAP Provision Expense |
$ | 587 | $ | 508 | $ | 427 | $ | 446 | $ | 490 | $ | 79 | $ | 97 | $ | 1,968 | $ | 1,399 | $ | 569 | ||||||||||||||||||||||
| Repositioning |
(16) | — | — | — | — | (16) | (16) | (16) | — | (16) | ||||||||||||||||||||||||||||||||
|
|
|
|
|
|
|
|
|
|
|
|
|
|
|
|
|
|
|
|
|
|||||||||||||||||||||||
| Adjusted Provision (ex. Repositioning) (1) |
$ | 603 | $ | 508 | $ | 427 | $ | 446 | $ | 490 | $ | 95 | $ | 113 | $ | 1,984 | $ | 1,399 | $ | 585 | ||||||||||||||||||||||
|
|
|
|
|
|
|
|
|
|
|
|
|
|
|
|
|
|
|
|
|
|||||||||||||||||||||||
| GAAP Noninterest expense |
[E] | $ | 1,416 | $ | 1,232 | $ | 1,249 | $ | 1,266 | $ | 1,266 | $ | 184 | $ | 150 | $ | 5,163 | $ | 4,687 | $ | 476 | |||||||||||||||||||||
| Repositioning and other |
187 | 30 | — | — | 57 | 157 | 130 | 217 | 77 | 140 | ||||||||||||||||||||||||||||||||
|
|
|
|
|
|
|
|
|
|
|
|
|
|
|
|
|
|
|
|
|
|||||||||||||||||||||||
| Adjusted Noninterest Expense (1) |
[F] | $ | 1,229 | $ | 1,202 | $ | 1,249 | $ | 1,266 | $ | 1,209 | $ | 27 | $ | 20 | $ | 4,946 | $ | 4,610 | $ | 336 | |||||||||||||||||||||
|
|
|
|
|
|
|
|
|
|
|
|
|
|
|
|
|
|
|
|
|
|||||||||||||||||||||||
| Pre-Provision Net Revenue (PPNR) |
[A]+[C]-[E] | $ | 651 | $ | 736 | $ | 830 | $ | 834 | $ | 935 | $ | (85) | $ | (284) | $ | 3,051 | $ | 3,741 | $ | (690) | |||||||||||||||||||||
| Core Pre-Provision Net Revenue (PPNR) (1) |
[B]+[D]-[F] | $ | 777 | $ | 834 | $ | 817 | $ | 781 | $ | 954 | $ | (57) | $ | (177) | $ | 3,209 | $ | 4,075 | $ | (866) | |||||||||||||||||||||
(1) Represents a non-GAAP financial measure. For more details refer to pages 25-27.
(2) Adjusted earnings per share (Adjusted EPS) is a non-GAAP financial measure that adjusts GAAP EPS for revenue and expense items that are typically strategic in nature or that management otherwise does not view as reflecting the operating performance of the company. Management believes Adjusted EPS can help the reader better understand the operating performance of the core businesses and their ability to generate earnings. In the numerator of Adjusted EPS, GAAP net income attributable to common shareholders is adjusted for the following items: (1) excludes discontinued operations, net of tax, as Ally is primarily a domestic company and sales of international businesses and other discontinued operations in the past have significantly impacted GAAP EPS, (2) adds back the tax-effected non-cash Core OID, (3) adjusts for tax-effected repositioning and other which are primarily related to the extinguishment of high cost legacy debt, strategic activities and significant other one-time items, (4) change in fair value of equity securities, (5) excludes significant discrete tax items that do not relate to the operating performance of the core businesses, and adjusts for preferred stock capital actions that have been taken by the company to normalize its capital structure, as applicable for respective periods. See pages 25-27 for details.
(3) For more details refer to pages 25-27.
| 4Q 2023 Preliminary Results | 21 |
| ALLY FINANCIAL INC. ADJUSTED TANGIBLE BOOK PER SHARE RELATED INFORMATION
|
|
| ($ in millions, shares in thousands) | QUARTERLY TRENDS | CHANGE VS. | ||||||||||||||||||||||||||
|
Adjusted Tangible Book Value Per Share (“Adjusted TBVPS”) Information |
4Q 23 | 3Q 23 | 2Q 23 | 1Q 23 | 4Q 22 | 3Q 23 | 4Q 22 | |||||||||||||||||||||
| Numerator |
||||||||||||||||||||||||||||
| GAAP shareholder’s equity |
$ | 13,766 | $ | 12,825 | $ | 13,532 | $ | 13,378 | $ | 12,859 | $ | 941 | $ | 907 | ||||||||||||||
| Preferred equity |
(2,324) | (2,324) | (2,324) | (2,324) | (2,324) | — | — | |||||||||||||||||||||
| GAAP common shareholder’s equity |
$ | 11,442 | $ | 10,501 | $ | 11,208 | $ | 11,054 | $ | 10,535 | $ | 941 | $ | 907 | ||||||||||||||
| Goodwill and identifiable intangibles, net of DTLs |
(731) | (879) | (887) | (895) | (902) | 147 | 171 | |||||||||||||||||||||
|
|
|
|
|
|
|
|
|
|
|
|
|
|
|
|||||||||||||||
| Tangible common equity (1) |
10,711 | 9,622 | 10,321 | 10,159 | 9,633 | 1,088 | 1,078 | |||||||||||||||||||||
| Tax-effected Core OID balance (21% tax rate) (1) |
(626) | (636) | (646) | (656) | (665) | 10 | 38 | |||||||||||||||||||||
| Adjusted tangible book value (2) |
$ | 10,084 | $ | 8,986 | $ | 9,675 | $ | 9,504 | $ | 8,968 | $ | 1,098 | $ | 1,116 | ||||||||||||||
|
|
|
|
|
|
|
|
|
|
|
|
|
|
|
|||||||||||||||
| Denominator |
||||||||||||||||||||||||||||
| Issued shares outstanding (period-end, thousands) |
302,459 | 301,630 | 301,619 | 300,821 | 299,324 | 830 | 3,135 | |||||||||||||||||||||
| GAAP shareholder’s equity per share |
$ | 45.51 | $ | 42.52 | $ | 44.86 | $ | 44.47 | $ | 42.96 | $ | 2.99 | $ | 2.55 | ||||||||||||||
| Preferred equity per share |
(7.68) | (7.70) | (7.71) | (7.73) | (7.76) | 0.02 | 0.08 | |||||||||||||||||||||
| GAAP common shareholder’s equity per share |
$ | 37.83 | $ | 34.81 | $ | 37.16 | $ | 36.75 | $ | 35.20 | $ | 3.02 | $ | 2.63 | ||||||||||||||
| Goodwill and identifiable intangibles, net of DTLs per share |
(2.42) | (2.91) | (2.94) | (2.97) | (3.01) | 0.50 | 0.60 | |||||||||||||||||||||
|
|
|
|
|
|
|
|
|
|
|
|
|
|
|
|||||||||||||||
| Tangible common equity per share (1) |
35.41 | 31.90 | 34.22 | 33.77 | 32.18 | 3.51 | 3.23 | |||||||||||||||||||||
| Tax-effected Core OID balance (21% tax rate) per share (1) |
(2.07) | (2.11) | (2.14) | (2.18) | (2.22) | 0.04 | 0.15 | |||||||||||||||||||||
|
|
|
|
|
|
|
|
|
|
|
|
|
|
|
|||||||||||||||
| Adjusted tangible book value per share (2) |
$ | 33.34 | $ | 29.79 | $ | 32.08 | $ | 31.59 | $ | 29.96 | $ | 3.55 | $ | 3.38 | ||||||||||||||
|
|
|
|
|
|
|
|
|
|
|
|
|
|
|
|||||||||||||||
(1) Represents a non-GAAP financial measure. For more details refer to pages 25-27.
(2) Adjusted tangible book value per share (Adjusted TBVPS) is a non-GAAP financial measure that reflects the book value of equity attributable to shareholders even if Core OID balance were accelerated immediately through the financial statements. As a result, management believes Adjusted TBVPS provides the reader with an assessment of value that is more conservative than GAAP common shareholder’s equity per share. Adjusted TBVPS generally adjusts common equity for (1) goodwill and identifiable intangibles, net of DTLs, and (2) tax-effected Core OID balance to reduce tangible common equity in the event the corresponding discounted bonds are redeemed/tendered and (3) Series G discount which reduces tangible common equity as the company has normalized its capital structure, as applicable for respective periods.
| 4Q 2023 Preliminary Results | 22 |
| ALLY FINANCIAL INC. CORE ROTCE RELATED INFORMATION
|
|
| ($ in millions) unless noted otherwise | QUARTERLY TRENDS | CHANGE VS. | FULL YEAR | |||||||||||||||||||||||||||||||||||||
| Core Return on Tangible Common |
4Q 23 | 3Q 23 | 2Q 23 | 1Q 23 | 4Q 22 | 3Q 23 | 4Q 22 | FY 2023 | FY 2022 | CHANGE | ||||||||||||||||||||||||||||||
| Numerator |
||||||||||||||||||||||||||||||||||||||||
| GAAP net income attributable to common shareholders |
$ | 49 | $ | 269 | $ | 301 | $ | 291 | $ | 251 | $ | (220 | ) | $ | (202 | ) | $ | 910 | $ | 1,604 | $ | (694 | ) | |||||||||||||||||
| Discontinued operations, net of tax |
1 | — | — | 1 | — | 1 | 1 | 2 | 1 | 1 | ||||||||||||||||||||||||||||||
| Core OID (2) |
13 | 12 | 12 | 11 | 11 | — | 2 | 48 | 42 | 7 | ||||||||||||||||||||||||||||||
| Change in the fair value of equity securities |
(74 | ) | 56 | (25 | ) | (65 | ) | (49 | ) | (130 | ) | (25 | ) | (107 | ) | 215 | (322 | ) | ||||||||||||||||||||||
| Core OID, repositioning & change in the fair value of equity securities tax (tax rate 21%) |
(23 | ) | (21 | ) | 3 | 11 | (4 | ) | (3 | ) | (19 | ) | (30 | ) | (70 | ) | 40 | |||||||||||||||||||||||
| Repositioning (2) |
172 | 30 | — | — | 57 | 142 | 115 | 201 | 77 | 124 | ||||||||||||||||||||||||||||||
| Significant discrete tax items |
— | (94 | ) | — | — | 61 | 94 | (61 | ) | (94 | ) | 61 | (155 | ) | ||||||||||||||||||||||||||
|
|
|
|
|
|
|
|
|
|
|
|
|
|
|
|
|
|
|
|
|
|||||||||||||||||||||
| Core net income attributable to common shareholders (1) |
$ | 137 | $ | 252 | $ | 291 | $ | 250 | $ | 327 | $ | (115 | ) | $ | (189 | ) | $ | 930 | $ | 1,929 | $ | (999 | ) | |||||||||||||||||
| Denominator (average, $ millions) |
||||||||||||||||||||||||||||||||||||||||
| GAAP shareholder’s equity |
$ | 13,296 | $ | 13,179 | $ | 13,455 | $ | 13,119 | $ | 12,647 | $ | 117 | $ | 649 | $ | 13,272 | $ | 14,348 | $ | (1,076 | ) | |||||||||||||||||||
| Preferred equity |
(2,324 | ) | (2,324 | ) | (2,324 | ) | (2,324 | ) | (2,324 | ) | — | — | (2,324 | ) | (2,324 | ) | — | |||||||||||||||||||||||
| Goodwill & identifiable intangibles, net of deferred tax liabilities (“DTLs”) |
(805 | ) | (883 | ) | (891 | ) | (898 | ) | (906 | ) | 78 | 101 | (859 | ) | (921 | ) | 62 | |||||||||||||||||||||||
|
|
|
|
|
|
|
|
|
|
|
|
|
|
|
|
|
|
|
|
|
|||||||||||||||||||||
| Tangible common equity (1) |
$ | 10,167 | $ | 9,972 | $ | 10,240 | $ | 9,896 | $ | 9,417 | $ | 195 | $ | 750 | $ | 10,089 | $ | 11,103 | $ | (1,014 | ) | |||||||||||||||||||
| Core OID balance |
(799 | ) | (812 | ) | (824 | ) | (835 | ) | (847 | ) | 13 | 48 | (817 | ) | (862 | ) | 45 | |||||||||||||||||||||||
| Net deferred tax asset (“DTA”) |
(1,378 | ) | (1,310 | ) | (1,060 | ) | (1,059 | ) | (1,165 | ) | (68 | ) | (213 | ) | (1,193 | ) | (820 | ) | (373 | ) | ||||||||||||||||||||
|
|
|
|
|
|
|
|
|
|
|
|
|
|
|
|
|
|
|
|
|
|||||||||||||||||||||
| Normalized common equity |
$ | 7,989 | $ | 7,850 | $ | 8,357 | $ | 8,002 | $ | 7,405 | $ | 139 | $ | 584 | $ | 8,079 | $ | 9,421 | $ | (1,342 | ) | |||||||||||||||||||
| Core Return on Tangible Common Equity (3) |
6.9 | % | 12.9 | % | 13.9 | % | 12.5 | % | 17.6 | % | 11.5 | % | 20.5 | % | ||||||||||||||||||||||||||
(1) Represents a non-GAAP measure. See pages 25-27 for methodology and detail.
(2) For more details see pages 25-27.
(3) Core return on tangible common equity (Core ROTCE) is a non-GAAP financial measure that management believes is helpful for readers to better understand the ongoing ability of the company to generate returns on its equity base that supports core operations. For purposes of this calculation, tangible common equity is adjusted for Core OID balance and net DTA. Ally’s Core net income attributable to common shareholders for purposes of calculating Core ROTCE is based on the actual effective tax rate for the period adjusted for significant discrete tax items including tax reserve releases, which aligns with the methodology used in calculating adjusted earnings per share.
(1) In the numerator of Core ROTCE, GAAP net income attributable to common shareholders is adjusted for discontinued operations net of tax, tax-effected Core OID, tax-effected repositioning and other which are primarily related to the extinguishment of high-cost legacy debt, strategic activities and significant other one-time items, change in fair value of equity securities, significant discrete tax items, and preferred stock capital actions, as applicable for respective periods.
(2) In the denominator, GAAP shareholder’s equity is adjusted for goodwill and identifiable intangibles net of DTL, Core OID balance, and net DTA.
| 4Q 2023 Preliminary Results | 23 |
| ALLY FINANCIAL INC.
ADJUSTED EFFICIENCY RATIO RELATED INFORMATION |
|
| ($ in millions) | QUARTERLY TREND | CHANGE VS. | FULL YEAR | |||||||||||||||||||||||||||||||||||||
| 4Q 23 | 3Q 23 | 2Q 23 | 1Q 23 | 4Q 22 | 3Q 23 | 4Q 22 | FY 2023 | FY 2022 | CHANGE | |||||||||||||||||||||||||||||||
| Numerator |
||||||||||||||||||||||||||||||||||||||||
| GAAP Noninterest expense |
$ | 1,416 | $ | 1,232 | $ | 1,249 | $ | 1,266 | $ | 1,266 | $ | 184 | $ | 150 | $ | 5,163 | $ | 4,687 | $ | 476 | ||||||||||||||||||||
| Rep and warrant expense |
— | — | — | — | — | — | — | — | — | — | ||||||||||||||||||||||||||||||
| Insurance expense |
(321 | ) | (338 | ) | (358 | ) | (315 | ) | (286 | ) | 17 | (35 | ) | (1,332 | ) | (1,150 | ) | (182 | ) | |||||||||||||||||||||
| Repositioning (2) |
(187 | ) | (30 | ) | — | — | (57 | ) | (157 | ) | (130 | ) | (217 | ) | (77 | ) | (140 | ) | ||||||||||||||||||||||
|
|
|
|
|
|
|
|
|
|
|
|
|
|
|
|
|
|
|
|
|
|||||||||||||||||||||
| Adjusted noninterest expense for the efficiency ratio |
$ | 908 | $ | 864 | $ | 891 | $ | 951 | $ | 923 | $ | 44 | $ | (15 | ) | $ | 3,614 | $ | 3,460 | $ | 154 | |||||||||||||||||||
| Denominator |
||||||||||||||||||||||||||||||||||||||||
| Total net revenue |
$ | 2,067 | $ | 1,968 | $ | 2,079 | $ | 2,100 | $ | 2,201 | $ | 99 | $ | (134 | ) | $ | 8,214 | $ | 8,428 | $ | (214 | ) | ||||||||||||||||||
| Core OID (2) |
13 | 12 | 12 | 11 | 11 | 0 | 2 | 48 | 42 | 7 | ||||||||||||||||||||||||||||||
| Insurance revenue |
(450 | ) | (322 | ) | (366 | ) | (407 | ) | (387 | ) | (128 | ) | (63 | ) | (1,545 | ) | (1,112 | ) | (433 | ) | ||||||||||||||||||||
|
|
|
|
|
|
|
|
|
|
|
|
|
|
|
|
|
|
|
|
|
|||||||||||||||||||||
| Adjusted net revenue for the efficiency ratio |
$ | 1,630 | $ | 1,658 | $ | 1,725 | $ | 1,704 | $ | 1,825 | $ | (29 | ) | $ | (195 | ) | $ | 6,717 | $ | 7,358 | $ | (640 | ) | |||||||||||||||||
| Adjusted Efficiency Ratio (1) |
55.7 | % | 52.1 | % | 51.7 | % | 55.8 | % | 50.6 | % | 53.8 | % | 47.0 | % | ||||||||||||||||||||||||||
|
|
|
|
|
|
|
|
|
|
|
|
|
|
|
|||||||||||||||||||||||||||
(1) Adjusted efficiency ratio is a non-GAAP financial measure that management believes is helpful to readers in comparing the efficiency of its core banking and lending businesses with those of its peers. In the numerator of Adjusted efficiency ratio, total noninterest expense is adjusted for Insurance segment expense, Rep and warrant expense, and repositioning and other which is primarily related to the extinguishment of high cost legacy debt, strategic activities and significant one-time items, as applicable for respective periods. In the denominator, total net revenue is adjusted for Insurance segment revenue and Core OID. See page 11 for the combined ratio for the Insurance segment which management uses as a primary measure of underwriting profitability for the Insurance business.
(2) For more details see pages 25-27.
| 4Q 2023 Preliminary Results | 24 |
| ALLY FINANCIAL INC.
|
|
The following are non-GAAP financial measures which Ally believes are important to the reader of the Consolidated Financial Statements, but which are supplemental to and not a substitute for GAAP measures: Accelerated issuance expense (Accelerated OID), Adjusted earnings per share (Adjusted EPS), Adjusted efficiency ratio, Adjusted noninterest expense, Adjusted other revenue, Adjusted tangible book value per share (Adjusted TBVPS), Adjusted total net revenue, Core net income attributable to common shareholders, Core original issue discount (Core OID) amortization expense, Core outstanding original issue discount balance (Core OID balance), Core pre-provision net revenue (Core PPNR), Core pre-tax income, Core return on tangible common equity (Core ROTCE), Investment income and other (adjusted), Net financing revenue (excluding Core OID), Net interest margin (excluding Core OID), Pre-provision net revenue (PPNR), and Tangible Common Equity. These measures are used by management and we believe are useful to investors in assessing the company’s operating performance and capital.
1) Accelerated issuance expense (Accelerated OID) is the recognition of issuance expenses related to calls of redeemable debt.
2) Adjusted earnings per share (Adjusted EPS) is a non-GAAP financial measure that adjusts GAAP EPS for revenue and expense items that are typically strategic in nature or that management otherwise does not view as reflecting the operating performance of the company. Management believes Adjusted EPS can help the reader better understand the operating performance of the core businesses and their ability to generate earnings. In the numerator of Adjusted EPS, GAAP net income attributable to common shareholders is adjusted for the following items: (1) excludes discontinued operations, net of tax, as Ally is primarily a domestic company and sales of international businesses and other discontinued operations in the past have significantly impacted GAAP EPS, (2) adds back the tax-effected non-cash Core OID, (3) adjusts for tax-effected repositioning and other which are primarily related to the extinguishment of high cost legacy debt, strategic activities and significant other onetime items, (4) change in fair value of equity securities, (5) excludes significant discrete tax items that do not relate to the operating performance of the core businesses, and adjusts for preferred stock capital actions that have been taken by the company to normalize its capital structure, as applicable for respective periods.
3) Adjusted efficiency ratio is a non-GAAP financial measure that management believes is helpful to readers in comparing the efficiency of its core banking and lending businesses with those of its peers.
(1) In the numerator of Adjusted efficiency ratio, total noninterest expense is adjusted for Rep and warrant expense, Insurance segment expense, and repositioning and other which are primarily related to the extinguishment of high-cost legacy debt, strategic activities and significant other one-time items, as applicable for respective periods.
(2) In the denominator, total net revenue is adjusted for Core OID and Insurance segment revenue.
4) Adjusted noninterest expense is a non-GAAP financial measure that adjusts GAAP noninterest expense for repositioning items. Management believes adjusted noninterest expense is a helpful financial metric because it enables the reader better understand the business’ expenses excluding nonrecurring items.
5) Adjusted other revenue is a non-GAAP financial measure that adjusts GAAP other revenue for OID expenses, repositioning, and change in fair value of equity securities. Management believes adjusted other revenue is a helpful financial metric because it enables the reader to better understand the business’ ability to generate other revenue.
6) Adjusted Provision for Credit Losses is a non-GAAP financial measure that adjusts GAAP provision for credit losses for repositioning items. Management believes adjusted provision for credit losses is a helpful financial metric because it enables the reader better understand the business’s expenses excluding nonrecurring items.
7) Adjusted tangible book value per share (Adjusted TBVPS) is a non-GAAP financial measure that reflects the book value of equity attributable to shareholders even if Core OID balance were accelerated immediately through the financial statements. As a result, management believes Adjusted TBVPS provides the reader with an assessment of value that is more conservative than GAAP common shareholder’s equity per share. Adjusted TBVPS generally adjusts common equity for: (1) goodwill and identifiable intangibles, net of DTLs, (2) tax-effected Core OID balance to reduce tangible common equity in the event the corresponding discounted bonds are redeemed/tendered, and (3) Series G discount which reduces tangible common equity as the company has normalized its capital structure, as applicable for respective periods. Note: In December 2017, tax-effected Core OID balance was adjusted from a statutory U.S. Federal tax rate of 35% to 21% (“rate”) as a result of changes to U.S. tax law. The adjustment conservatively increased the tax-effected Core OID balance and consequently reduced Adjusted TBVPS as any acceleration of the non-cash charge in future periods would flow through the financial statements at a 21% rate versus a previously modeled 35% rate.
8) Adjusted total net revenue is a non-GAAP financial measure that management believes is helpful for readers to understand the ongoing ability of the company to generate revenue. For purposes of this calculation, GAAP net financing revenue is adjusted by excluding Core OID to calculate net financing revenue ex. core OID. GAAP other revenue is adjusted for OID expenses, repositioning, and change in fair value of equity securities to calculate adjusted other revenue. Adjusted total net revenue is calculated by adding net financing revenue ex. core OID to adjusted other revenue.
9) Change in fair value of equity securities impacts the Insurance, Corporate Finance and Corporate and Other segments. The change reflects fair value adjustments to equity securities that are reported at fair value. Management believes the change in fair value of equity securities should be removed from select financial measures because it enables the reader to better understand the business’ ongoing ability to generate revenue and income.
10) Core net income attributable to common shareholders is a non-GAAP financial measure that serves as the numerator in the calculations of Adjusted EPS and Core ROTCE and that, like those measures, is believed by management to help the reader better understand the operating performance of the core businesses and their ability to generate earnings. Core net income attributable to common shareholders adjusts GAAP net income attributable to common shareholders for discontinued operations net of tax, tax-effected Core OID expense, tax-effected repositioning and other primarily related to the extinguishment of high-cost legacy debt and strategic activities and significant other, preferred stock capital actions, significant discrete tax items and tax-effected changes in equity investments measured at fair value, as applicable for respective periods.
| 4Q 2023 Preliminary Results | 25 |
| ALLY FINANCIAL INC.
|
|
The following are non-GAAP financial measures which Ally believes are important to the reader of the Consolidated Financial Statements, but which are supplemental to and not a substitute for GAAP measures: Accelerated issuance expense (Accelerated OID), Adjusted earnings per share (Adjusted EPS), Adjusted efficiency ratio, Adjusted noninterest expense, Adjusted other revenue, Adjusted tangible book value per share (Adjusted TBVPS), Adjusted total net revenue, Core net income attributable to common shareholders, Core original issue discount (Core OID) amortization expense, Core outstanding original issue discount balance (Core OID balance), Core pre-provision net revenue (Core PPNR), Core pre-tax income, Core return on tangible common equity (Core ROTCE), Investment income and other (adjusted), Net financing revenue (excluding Core OID), Net interest margin (excluding Core OID), Pre-provision net revenue (PPNR), and Tangible Common Equity. These measures are used by management and we believe are useful to investors in assessing the company’s operating performance and capital.
11) Core original issue discount (Core OID) amortization expense is a non-GAAP financial measure for OID and is believed by management to help the reader better understand the activity removed from: Core pre-tax income (loss), Core net income (loss) attributable to common shareholders, Adjusted EPS, Core ROTCE, Adjusted efficiency ratio, Adjusted total net revenue, and Net financing revenue (excluding Core OID). Core OID is primarily related to bond exchange OID which excludes international operations and future issuances. Core OID for all periods shown is applied to the pre-tax income of the Corporate and Other segment.
12) Core outstanding original issue discount balance (Core OID balance) is a non-GAAP financial measure for outstanding OID and is believed by management to help the reader better understand the balance removed from Core ROTCE and Adjusted TBVPS. Core OID balance is primarily related to bond exchange OID which excludes international operations and future issuances.
13) Core pre-provision net revenue (Core PPNR) is a non-GAAP financial measure calculated by adding GAAP net financing revenue and GAAP other revenue and subtracting GAAP noninterest expense then adding Core OID and repositioning expenses, excluding provision for credit losses. Management believes that Core PPNR is a helpful financial metric because it enables the reader to assess the core business’ ability to generate earnings to cover credit losses.
14) Core pre-tax income is a non-GAAP financial measure that adjusts pre-tax income from continuing operations by excluding (1) Core OID, and (2) change in fair value of equity securities (change in fair value of equity securities impacts the Insurance and Corporate Finance segments), and (3) Repositioning and other which are primarily related to the extinguishment of high cost legacy debt, strategic activities and significant other one-time items, as applicable for respective periods or businesses. Management believes core pre-tax income can help the reader better understand the operating performance of the core businesses and their ability to generate earnings.
15) Core return on tangible common equity (Core ROTCE) is a non-GAAP financial measure that management believes is helpful for readers to better understand the ongoing ability of the company to generate returns on its equity base that supports core operations. For purposes of this calculation, tangible common equity is adjusted for Core OID balance and net DTA. Ally’s Core net income attributable to common shareholders for purposes of calculating Core ROTCE is based on the actual effective tax rate for the period adjusted for significant discrete tax items including tax reserve releases, which aligns with the methodology used in calculating adjusted earnings per share.
(1) In the numerator of Core ROTCE, GAAP net income attributable to common shareholders is adjusted for discontinued operations net of tax, tax-effected Core OID, tax-effected repositioning and other which are primarily related to the extinguishment of high-cost legacy debt, strategic activities and significant other onetime items, change in fair value of equity securities, significant discrete tax items, and preferred stock capital actions, as applicable for respective periods.
(2) In the denominator, GAAP shareholder’s equity is adjusted for goodwill and identifiable intangibles net of DTL, Core OID balance, and net DTA.
16) Estimated impact of CECL on regulatory capital per final rule issued by U.S. banking agencies - In December 2018, the FRB and other U.S. banking agencies approved a final rule to address the impact of CECL on regulatory capital by allowing BHCs and banks, including Ally, the option to phase in the day-one impact of CECL over a three-year period. In March 2020, the FRB and other U.S. banking agencies issued an interim final rule that became effective on March 31, 2020 and provided an alternative option for banks to temporarily delay the impacts of CECL, relative to the incurred loss methodology for estimating the allowance for loan losses, on regulatory capital. A final rule that was largely unchanged from the March 2020 interim final rule was issued by the FRB and other U.S. banking agencies in August 2020, and became effective in September 2020. For regulatory capital purposes, these rules permitted us to delay recognizing the estimated impact of CECL on regulatory capital until after a two-year deferral period, which for us extended through December 31, 2021. Beginning on January 1, 2022, we are required to phase in 25% of the previously deferred estimated capital impact of CECL, with an additional 25% to be phased in at the beginning of each subsequent year until fully phased in by the first quarter of 2025. Under these rules, firms that adopt CECL and elect the five-year transition will calculate the estimated impact of CECL on regulatory capital as the day-one impact of adoption plus 25% of the subsequent change in allowance during the two-year deferral period, which according to the final rule approximates the impact of CECL relative to an incurred loss model. We adopted this transition option during the first quarter of 2020, and beginning January 1, 2022, are phasing in the regulatory capital impacts of CECL based on this five-year transition period.
17) Investment income and other (adjusted) is a non-GAAP financial measure that adjusts GAAP investment income and other for repositioning, and the change in fair value of equity securities. Management believes investment income and other (adjusted) is a helpful financial metric because it enables the reader to better understand the business’ ability to generate investment income.
18) Net financing revenue excluding core OID is calculated using a non-GAAP measure that adjusts net financing revenue by excluding Core OID. The Core OID balance is primarily related to bond exchange OID which excludes international operations and future issuances. Management believes net financing revenue ex. Core OID is a helpful financial metric because it enables the reader to better understand the business’ ability to generate revenue.
19) Net interest margin excluding core OID is calculated using a non-GAAP measure that adjusts net interest margin by excluding Core OID. The Core OID balance is primarily related to bond exchange OID which excludes international operations and future issuances. Management believes net interest margin ex. Core OID is a helpful financial metric because it enables the reader to better understand the business’ profitability and margins.
| 4Q 2023 Preliminary Results | 26 |
| ALLY FINANCIAL INC.
|
|
The following are non-GAAP financial measures which Ally believes are important to the reader of the Consolidated Financial Statements, but which are supplemental to and not a substitute for GAAP measures: Accelerated issuance expense (Accelerated OID), Adjusted earnings per share (Adjusted EPS), Adjusted efficiency ratio, Adjusted noninterest expense, Adjusted other revenue, Adjusted tangible book value per share (Adjusted TBVPS), Adjusted total net revenue, Core net income attributable to common shareholders, Core original issue discount (Core OID) amortization expense, Core outstanding original issue discount balance (Core OID balance), Core pre-provision net revenue (Core PPNR), Core pre-tax income, Core return on tangible common equity (Core ROTCE), Investment income and other (adjusted), Net financing revenue (excluding Core OID), Net interest margin (excluding Core OID), Pre-provision net revenue (PPNR), and Tangible Common Equity. These measures are used by management and we believe are useful to investors in assessing the company’s operating performance and capital.
20) Pre-provision net revenue (PPNR) is a non-GAAP financial measure calculated by adding GAAP net financing revenue and GAAP other revenue then subtracting GAAP noninterest expense, excluding provision for credit losses. Management believes that PPNR is a helpful financial metric because it enables the reader to assess the business’ ability to generate earnings to cover credit losses and as it is utilized by Federal Reserve’s approach to modeling within the Supervisory Stress Test Framework that generally follows U.S. generally accepted accounting principles (GAAP) and includes a calculation of PPNR as a component of projected pre-tax net income.
21) Repositioning is primarily related to the extinguishment of high-cost legacy debt, strategic activities, restructuring, amounts related to nonrecurring business transactions or pending transactions, and significant other one-time items.
22) Tangible Common Equity is a non-GAAP financial measure that is defined as common stockholders’ equity less goodwill and identifiable intangible assets, net of deferred tax liabilities. Ally considers various measures when evaluating capital adequacy, including tangible common equity. Ally believes that tangible common equity is important because we believe readers may assess our capital adequacy using this measure. Additionally, presentation of this measure allows readers to compare certain aspects of our capital adequacy on the same basis to other companies in the industry. For purposes of calculating Core return on tangible common equity (Core ROTCE), tangible common equity is further adjusted for Core OID balance and net deferred tax asset.
| 4Q 2023 Preliminary Results | 27 |