UNITED STATES
SECURITIES AND EXCHANGE COMMISSION
Washington, DC 20549
Form 6-K
Report of Foreign Private Issuer
Pursuant to Rule 13a-16 or 15d-16 of
the Securities Exchange Act of 1934
| For the month of: November 2023 | Commission File Number: 002-09048 |
THE BANK OF NOVA SCOTIA
(Name of registrant)
40 Temperance Street,
Toronto, Ontario, M5H 0B4
(416) 933-4103
(Address of Principal Executive Offices)
Indicate by check mark whether the registrant files or will file annual reports under cover of Form 20-F or Form 40-F:
Form 20-F ☐ Form 40-F ☒
This report on Form 6-K shall be deemed to be incorporated by reference in The Bank of Nova Scotia’s registration statements on Form S-8 (File No. 333-199099) and Form F-3 (File No. 333-261476) and to be a part thereof from the date on which this report is filed, to the extent not superseded by documents or reports subsequently filed or furnished.
SIGNATURES
Pursuant to the requirements of the Securities Exchange Act of 1934, the registrant has duly caused this report to be signed on its behalf by the undersigned, thereunto duly authorized.
| THE BANK OF NOVA SCOTIA | ||||||||
| Date: | November 28, 2023 | By: | /s/ Roula Kataras |
|||||
| Name: Roula Kataras | ||||||||
| Title: Senior Vice-President and Chief Accountant | ||||||||
EXHIBIT INDEX
| Exhibit |
Description of Exhibit |
|
| 99.1 | 2023 Annual Financial Statements | |
| 99.2 | 2023 Management’s Discussion and Analysis | |
| Consolidated Financial Statements
|
2023 Scotiabank Annual Report | 139
Consolidated Financial Statements
MANAGEMENT’S RESPONSIBILITY FOR FINANCIAL INFORMATION
The management of The Bank of Nova Scotia (the Bank) is responsible for the integrity and fair presentation of the financial information contained in this Annual Report. The consolidated financial statements have been prepared in accordance with International Financial Reporting Standards (IFRS) as issued by the International Accounting Standards Board (IASB). The consolidated financial statements also comply with the accounting requirements of the Bank Act.
The consolidated financial statements, where necessary, include amounts which are based on the best estimates and judgment of management. Financial information presented elsewhere in this Annual Report is consistent with that shown in the consolidated financial statements.
Management has always recognized the importance of the Bank maintaining and reinforcing the highest possible standards of conduct in all of its actions, including the preparation and dissemination of statements fairly presenting the financial condition of the Bank. In this regard, management has developed and maintains a system of accounting and reporting which provides for the necessary internal controls to ensure that transactions are properly authorized and recorded, assets are safeguarded against unauthorized use or disposition, and liabilities are recognized. The system is augmented by written policies and procedures, the careful selection and training of qualified staff, the establishment of organizational structures providing an appropriate and well-defined division of responsibilities, and the communication of policies and guidelines of Scotiabank’s Code of Conduct throughout the Bank.
Management, under the supervision of and the participation of the President and Chief Executive Officer and the Group Head and Chief Financial Officer, have a process in place to evaluate disclosure controls and procedures and internal control over financial reporting in line with Canadian and U.S. securities regulations.
The system of internal controls is further supported by a professional staff of internal auditors who conduct periodic audits of all aspects of the Bank’s operations. As well, the Bank’s Chief Auditor has full and free access to, and meets periodically with the Audit and Conduct Review Committee of the Board of Directors. In addition, the Bank’s compliance function maintains policies, procedures and programs directed at ensuring compliance with regulatory requirements, including conflict of interest rules.
The Office of the Superintendent of Financial Institutions Canada, which is mandated to protect the rights and interests of the depositors and creditors of the Bank, examines and enquires into the business and affairs of the Bank, as deemed necessary, to determine whether the provisions of the Bank Act are being complied with, and that the Bank is in a sound financial condition.
The Audit and Conduct Review Committee, composed entirely of outside directors, reviews the consolidated financial statements with both management and the independent auditors before such statements are approved by the Board of Directors and submitted to the shareholders of the Bank.
The Audit and Conduct Review Committee reviews and reports its findings to the Board of Directors on all related party transactions that may have a material impact on the Bank.
KPMG LLP, the independent auditors appointed by the shareholders of the Bank, have audited the consolidated financial position of the Bank as at October 31, 2023 and October 31, 2022 and its consolidated financial performance and its consolidated cash flows for each of the years in the two-year period ended October 31, 2023 prepared in accordance with IFRS as issued by the International Accounting Standards Board (IASB) in accordance with Canadian generally accepted auditing standards and the standards of the Public Company Accounting Oversight Board (United States) and the effectiveness of internal control over financial reporting and have expressed their opinions upon completion of such audits in the reports to the shareholders. The Shareholders’ Auditors have full and free access to, and meet periodically with, the Audit and Conduct Review Committee to discuss their audits, including any findings as to the integrity of the Bank’s accounting, financial reporting and related matters.
Scott Thomson
President and Chief Executive Officer
Raj Viswanathan
Group Head and Chief Financial Officer
Toronto, Canada
November 28, 2023
140 | 2023 Scotiabank Annual Report
(This page intentionally left blank)
2023 Scotiabank Annual Report | 141
(This page intentionally left blank)
142 | 2023 Scotiabank Annual Report
(This page intentionally left blank)
2023 Scotiabank Annual Report | 143
Consolidated Financial Statements
REPORT OF INDEPENDENT REGISTERED PUBLIC ACCOUNTING FIRM
To the Shareholders and the Board of Directors of The Bank of Nova Scotia
Opinion on the Consolidated Financial Statements
We have audited the accompanying consolidated statements of financial position of The Bank of Nova Scotia (the Bank) as of October 31, 2023 and 2022, the related consolidated statements of income, comprehensive income, changes in equity and cash flows for the years then ended, and the related notes (collectively, the consolidated financial statements). In our opinion, the consolidated financial statements present fairly, in all material respects, the financial position of the Bank as of October 31, 2023 and 2022, and its financial performance and its cash flows for each of the years then ended, in conformity with International Financial Reporting Standards (IFRS) as issued by the International Accounting Standards Board (IASB).
We also have audited, in accordance with the standards of the Public Company Accounting Oversight Board (United States) (PCAOB), the Bank’s internal control over financial reporting as of October 31, 2023, based on criteria established in Internal Control – Integrated Framework (2013) issued by the Committee of Sponsoring Organizations of the Treadway Commission, and our report dated November 28, 2023 expressed an unqualified opinion on the effectiveness of the Bank’s internal control over financial reporting.
Basis for Opinion
These consolidated financial statements are the responsibility of the Bank’s management. Our responsibility is to express an opinion on these consolidated financial statements based on our audits. We are a public accounting firm registered with the PCAOB and are required to be independent with respect to the Bank in accordance with the U.S. federal securities laws and the applicable rules and regulations of the Securities and Exchange Commission and the PCAOB.
We conducted our audits in accordance with the standards of the PCAOB. Those standards require that we plan and perform the audit to obtain reasonable assurance about whether the consolidated financial statements are free of material misstatement, whether due to error or fraud. Our audits included performing procedures to assess the risks of material misstatement of the consolidated financial statements, whether due to error or fraud, and performing procedures that respond to those risks. Such procedures included examining, on a test basis, evidence regarding the amounts and disclosures in the consolidated financial statements. Our audits also included evaluating the accounting principles used and significant estimates made by management, as well as evaluating the overall presentation of the consolidated financial statements. We believe that our audits provide a reasonable basis for our opinion.
Critical Audit Matters
The critical audit matters communicated below are matters arising from the current period audit of the consolidated financial statements that were communicated or required to be communicated to the Audit and Conduct Review Committee and that: (1) relate to accounts or disclosures that are material to the consolidated financial statements and (2) involved our especially challenging, subjective, or complex judgments. The communication of critical audit matters does not alter in any way our opinion on the consolidated financial statements, taken as a whole, and we are not, by communicating the critical audit matters below, providing separate opinions on the critical audit matters or on the accounts or disclosures to which they relate.
(i) Assessment of Allowance for Credit Losses on Financial Assets (ACL)
Refer to Notes 3 and 13 to the consolidated financial statements.
The Bank’s ACL was $6,372 million as at October 31, 2023. The Bank applies a three-stage approach to measure the ACL, using an expected credit loss (ECL) approach as required under IFRS 9 Financial Instruments. The Bank’s ACL calculations are outputs of a set of complex models. The ACL calculation reflects a probability-weighted outcome that considers multiple scenarios based on the Bank’s view of forecasts of future events and economic conditions. The probability of default (PD), loss given default (LGD) and exposure at default (EAD) inputs used to estimate ACL are modeled based on macroeconomic variables that are closely related with credit losses in the relevant portfolio. The Bank assesses when there has been a significant increase in credit risk subsequent to origination or where the financial asset is in default. If there has been a significant increase in credit risk or the financial asset is in default, lifetime ACL is recorded; otherwise, ACL equal to 12 month expected credit losses is recorded. The estimation of ECL for each stage and the assessment of significant increases in credit risk consider information about past events and current conditions as well as forecasts of future events and economic conditions. The estimation and application of forward-looking information requires significant judgment. Qualitative adjustments or overlays may also be recorded as temporary adjustments using expert credit judgment where the inputs, assumptions and/or models do not capture all relevant risk factors. The use of management overlays requires significant judgment that may impact the amount of ACL recognized.
We identified the assessment of the ACL as a critical audit matter. Significant auditor judgment was required because there was a high degree of measurement uncertainty due to the significant management judgments inherent in certain of the Bank’s key modeled inputs and methodologies. These management judgments impact certain inputs, assumptions, qualitative adjustments or overlays, and the determination of when there has been a significant increase in credit risk. The assessment of the ACL also required significant auditor attention and complex auditor judgment to apply and evaluate the results of audit procedures. Further, specialized skills and knowledge, including experience in the industry, were required to apply audit procedures and evaluate the results of those procedures.
The following are the primary procedures we performed to address this critical audit matter. With the involvement of our credit risk and economics professionals with specialized skills, industry knowledge and relevant experience, we evaluated the design and tested the operating effectiveness of certain internal controls related to the Bank’s ACL process. This included internal controls related to: (1) initial and periodic validation and performance monitoring of models used to derive key modeled inputs into the ACL calculation being PD, LGD and EAD; (2) benchmarking of certain macroeconomic variables, model validation associated with the derivation of the remaining variables and the alternative scenarios and review of probability weights used in the ACL models; (3) the methodology to determine whether there has been a significant increase in credit risk; and (4) the methodology and assumptions used in the determination of qualitative adjustments or overlays. Additionally, for non-retail loans, we tested certain internal controls related to loan reviews over the determination of loan risk grades. We involved credit risk and economics professionals with specialized skills, industry knowledge and relevant experience who assisted in: (1) evaluating the methodology and models used to derive key modeled inputs into the ACL calculation being PD, LGD and EAD and the determination of whether there has been a significant increase in credit risk; (2) assessing the appropriateness of certain underlying macroeconomic variables against external economic data, evaluating the model used to derive other macroeconomic variables and evaluating the assumptions associated with the alternative economic scenarios and the related probabilities; and (3) assessing the qualitative adjustments or overlays by applying our knowledge of the industry and credit judgment
144 | 2023 Scotiabank Annual Report
Consolidated Financial Statements
to evaluate the appropriateness of the Bank’s underlying methodology and assumptions. Additionally, for a selection of non-retail loans, we evaluated the Bank’s assigned loan risk grades against the Bank’s borrower risk rating scale.
(ii) Assessment of the Measurement of Fair Value of Certain Financial Instruments
Refer to Notes 3 and 7 to the consolidated financial statements.
The Bank measures $256,398 million of financial assets and $121,842 million of financial liabilities as at October 31, 2023 at fair value on a recurring basis. Where financial instruments trade in inactive markets or when using internal models where observable parameters do not exist, significant management judgment is required for valuation methodologies and model inputs. The valuation techniques used in determining the fair value of financial instruments include internal models and net asset valuations. The significant unobservable inputs used in the Bank’s valuation techniques include General Partner valuations per financial statements (NAVs), interest rate volatility, equity volatility and correlation.
We identified the assessment of the measurement of fair value for certain financial instruments as a critical audit matter. Significant auditor judgment was required because there was a high degree of measurement uncertainty due to significant judgments inherent in the Bank’s valuation methodologies and significant unobservable inputs used to develop the fair value of certain financial assets and financial liabilities. The assessment of the fair value also required significant auditor attention and complex auditor judgment to apply and evaluate the results of audit procedures. Further, specialized skills and knowledge, including experience in the industry, were required to apply audit procedures and evaluate the results of those procedures.
The following are the primary procedures we performed to address this critical audit matter. We evaluated the design and tested the operating effectiveness of certain internal controls related to the Bank’s processes to determine the fair value of certain financial instruments with the involvement of valuation and information technology professionals with specialized skills, industry knowledge and relevant experience. This included internal controls related to: (1) model validation at inception and periodically; (2) review of NAVs; (3) independent price verification, including assessment of rate sources; and (4) segregation of duties and access controls. With the involvement of valuation professionals with specialized skills, industry knowledge and relevant experience, we tested the fair value of a selection of certain financial instruments. Depending on the nature of the financial instruments, we did this by comparing the NAVs to external information or by developing an independent estimate of fair value and comparing it to the fair value determined by the Bank.
(iii) Assessment of Uncertain Tax Provisions
Refer to Notes 3 and 27 to the consolidated financial statements.
The Bank maintains provisions for uncertain tax positions that it believes appropriately reflect the risk of tax positions under discussion, audit, dispute, or appeal with tax authorities, or which are otherwise considered to involve uncertainty. These provisions are made using the Bank’s best estimate of the amount expected to be paid based on an assessment of all relevant factors, which are reviewed at the end of each reporting period.
We identified the assessment of uncertain tax provisions as a critical audit matter. Significant auditor judgment was required because there was a high degree of measurement uncertainty due to the significant judgments inherent in the Bank’s interpretation of tax law and its best estimate of the ultimate resolution of tax positions. This required significant auditor attention and complex auditor judgment to evaluate the results of audit procedures. Further, specialized skills, industry knowledge, and relevant experience were required to apply audit procedures and evaluate the results of those audit procedures.
The following are the primary procedures we performed to address this critical audit matter. We evaluated the design and tested the operating effectiveness of certain internal controls related to the Bank’s income tax uncertainties process with the involvement of taxation professionals with specialized skills, industry knowledge and relevant experience. This included internal controls related to the (1) identification of tax uncertainties, including the interpretation of tax law and (2) determination of the best estimate of the provision required to settle these tax uncertainties. We involved tax professionals with specialized skills and knowledge, who assisted in (1) evaluating the Bank’s interpretations of tax laws by developing an independent assessment based on our understanding and interpretation of tax laws and considering its impact on the measurement, if applicable, of the uncertain tax provisions; (2) reading and evaluating advice obtained by the Bank from external specialists, and considering its impact on the measurement, if applicable, of the uncertain tax provisions; and (3) inspecting correspondence and settlement documents with applicable taxation authorities, including assessment of the impact of statutes of limitations.

Chartered Professional Accountants, Licensed Public Accountants
We have served as the Bank’s auditor since 2006 and as joint auditor for 14 years prior to that.
Toronto, Canada
November 28, 2023
2023 Scotiabank Annual Report | 145
Consolidated Financial Statements
REPORT OF INDEPENDENT REGISTERED PUBLIC ACCOUNTING FIRM
To the Shareholders and the Board of Directors of The Bank of Nova Scotia
Opinion on Internal Control Over Financial Reporting
We have audited The Bank of Nova Scotia’s internal control over financial reporting as of October 31, 2023, based on the criteria established in Internal Control – Integrated Framework (2013) issued by the Committee of Sponsoring Organizations of the Treadway Commission. In our opinion, The Bank of Nova Scotia (the Bank) maintained, in all material respects, effective internal control over financial reporting as of October 31, 2023, based on the criteria established in Internal Control – Integrated Framework (2013) issued by the Committee of Sponsoring Organizations of the Treadway Commission.
We also have audited, in accordance with the standards of the Public Company Accounting Oversight Board (United States) (PCAOB), the consolidated statements of financial position of the Bank as of October 31, 2023, and 2022, the related consolidated statements of income, comprehensive income, changes in equity and cash flows for the years then ended, and the related notes (collectively, the consolidated financial statements) and our report dated November 28, 2023 expressed an unqualified opinion on those consolidated financial statements.
Basis for Opinion
The Bank’s management is responsible for maintaining effective internal control over financial reporting and for its assessment of the effectiveness of internal control over financial reporting, included in the Controls and Accounting Policies section of Management’s Discussion and Analysis under the heading “Internal Control Over Financial Reporting”. Our responsibility is to express an opinion on the Bank’s internal control over financial reporting based on our audit. We are a public accounting firm registered with the PCAOB and are required to be independent with respect to the Bank in accordance with the U.S. federal securities laws and the applicable rules and regulations of the Securities and Exchange Commission and the PCAOB.
We conducted our audit in accordance with the standards of the PCAOB. Those standards require that we plan and perform the audit to obtain reasonable assurance about whether effective internal control over financial reporting was maintained in all material respects. Our audit of internal control over financial reporting included obtaining an understanding of internal control over financial reporting, assessing the risk that a material weakness exists, and testing and evaluating the design and operating effectiveness of internal control based on the assessed risk. Our audit also included performing such other procedures as we considered necessary in the circumstances. We believe that our audit provides a reasonable basis for our opinion.
Definition and Limitations of Internal Control Over Financial Reporting
A company’s internal control over financial reporting is a process designed to provide reasonable assurance regarding the reliability of financial reporting and the preparation of financial statements for external purposes in accordance with generally accepted accounting principles. A company’s internal control over financial reporting includes those policies and procedures that (1) pertain to the maintenance of records that, in reasonable detail, accurately and fairly reflect the transactions and dispositions of the assets of the company; (2) provide reasonable assurance that transactions are recorded as necessary to permit preparation of financial statements in accordance with generally accepted accounting principles, and that receipts and expenditures of the company are being made only in accordance with authorizations of management and directors of the company; and (3) provide reasonable assurance regarding prevention or timely detection of unauthorized acquisition, use, or disposition of the company’s assets that could have a material effect on the financial statements.
Because of its inherent limitations, internal control over financial reporting may not prevent or detect misstatements. Also, projections of any evaluation of effectiveness to future periods are subject to the risk that controls may become inadequate because of changes in conditions, or that the degree of compliance with the policies or procedures may deteriorate.
Chartered Professional Accountants, Licensed Public Accountants
Toronto, Canada
November 28, 2023
146 | 2023 Scotiabank Annual Report
Consolidated Financial Statements
| Aaron W. Regent | Scott Thomson | |||
| Chairman of the Board | President and Chief Executive Officer |
The accompanying notes are an integral part of these consolidated financial statements.
2023 Scotiabank Annual Report | 147
Consolidated Financial Statements
Consolidated Statement of Income
| For the year ended October 31 ($ millions) | Note | 2023 | 2022 | |||||||||
| Revenue |
||||||||||||
| Interest income(1) |
32 | |||||||||||
| Loans |
$ | 45,043 | $ | 29,390 | ||||||||
| Securities |
6,833 | 2,877 | ||||||||||
| Securities purchased under resale agreements and securities borrowed |
1,478 | 459 | ||||||||||
| Deposits with financial institutions |
3,470 | 832 | ||||||||||
| 56,824 | 33,558 | |||||||||||
| Interest expense |
32 | |||||||||||
| Deposits |
35,650 | 12,794 | ||||||||||
| Subordinated debentures |
471 | 270 | ||||||||||
| Other |
2,416 | 2,379 | ||||||||||
| 38,537 | 15,443 | |||||||||||
| Net interest income |
18,287 | 18,115 | ||||||||||
| Non-interest income |
||||||||||||
| Card revenues |
778 | 779 | ||||||||||
| Banking services fees |
1,879 | 1,770 | ||||||||||
| Credit fees |
1,861 | 1,647 | ||||||||||
| Mutual funds |
2,127 | 2,269 | ||||||||||
| Brokerage fees |
1,117 | 1,125 | ||||||||||
| Investment management and trust |
1,029 | 999 | ||||||||||
| Underwriting and advisory fees |
554 | 543 | ||||||||||
| Non-trading foreign exchange |
911 | 878 | ||||||||||
| Trading revenues |
1,580 | 1,791 | ||||||||||
| Net gain on sale of investment securities |
12 | (e) | 129 | 74 | ||||||||
| Net income from investments in associated corporations |
17 | 153 | 268 | |||||||||
| Insurance underwriting income, net of claims |
482 | 433 | ||||||||||
| Other fees and commissions |
1,072 | 650 | ||||||||||
| Other |
348 | 75 | ||||||||||
| 14,020 | 13,301 | |||||||||||
| Total revenue |
32,307 | 31,416 | ||||||||||
| Provision for credit losses |
13 | (e) | 3,422 | 1,382 | ||||||||
| 28,885 | 30,034 | |||||||||||
| Non-interest expenses |
||||||||||||
| Salaries and employee benefits |
9,596 | 8,836 | ||||||||||
| Premises and technology |
2,659 | 2,424 | ||||||||||
| Depreciation and amortization |
1,820 | 1,531 | ||||||||||
| Communications |
395 | 361 | ||||||||||
| Advertising and business development |
576 | 480 | ||||||||||
| Professional |
780 | 826 | ||||||||||
| Business and capital taxes |
634 | 541 | ||||||||||
| Other |
2,671 | 2,103 | ||||||||||
| 19,131 | 17,102 | |||||||||||
| Income before taxes |
9,754 | 12,932 | ||||||||||
| Income tax expense |
27 | 2,226 | 2,758 | |||||||||
| Net income |
$ | 7,528 | $ | 10,174 | ||||||||
| Net income attributable to non-controlling interests in subsidiaries |
31 | (b) | 118 | 258 | ||||||||
| Net income attributable to equity holders of the Bank |
$ | 7,410 | $ | 9,916 | ||||||||
| Preferred shareholders and other equity instrument holders |
419 | 260 | ||||||||||
| Common shareholders |
$ | 6,991 | $ | 9,656 | ||||||||
| Earnings per common share (in dollars) |
||||||||||||
| Basic |
33 | $ | 5.84 | $ | 8.05 | |||||||
| Diluted |
33 | 5.78 | 8.02 | |||||||||
| Dividends paid per common share (in dollars) |
24 | (a) | 4.18 | 4.06 | ||||||||
| (1) | Includes interest income on financial assets measured at amortized cost and FVOCI, calculated using the effective interest method, of $54,824 for the year ended October 31, 2023 (October 31, 2022 – $32,573). |
The accompanying notes are an integral part of these consolidated financial statements.
148 | 2023 Scotiabank Annual Report
Consolidated Financial Statements
Consolidated Statement of Comprehensive Income
| For the year ended October 31 ($ millions) | 2023 | 2022 | ||||||
| Net income |
$ | 7,528 | $ | 10,174 | ||||
| Other comprehensive income (loss) |
||||||||
| Items that will be reclassified subsequently to net income |
||||||||
| Net change in unrealized foreign currency translation gains (losses): |
||||||||
| Net unrealized foreign currency translation gains (losses) |
1,345 | 3,703 | ||||||
| Net gains (losses) on hedges of net investments in foreign operations |
(577 | ) | (1,655 | ) | ||||
| Income tax expense (benefit): |
||||||||
| Net unrealized foreign currency translation gains (losses) |
2 | 28 | ||||||
| Net gains (losses) on hedges of net investments in foreign operations |
(176 | ) | (434 | ) | ||||
| 942 | 2,454 | |||||||
| Net change in fair value due to change in debt instruments measured at fair value through |
||||||||
| Net gains (losses) in fair value |
176 | (4,333 | ) | |||||
| Reclassification of net (gains) losses to net income |
327 | 2,717 | ||||||
| Income tax expense (benefit): |
||||||||
| Net gains (losses) in fair value |
19 | (1,108 | ) | |||||
| Reclassification of net (gains) losses to net income |
106 | 704 | ||||||
| 378 | (1,212 | ) | ||||||
| Net change in gains (losses) on derivative instruments designated as cash flow hedges: |
||||||||
| Net gains (losses) on derivative instruments designated as cash flow hedges |
3,763 | (10,037 | ) | |||||
| Reclassification of net (gains) losses to net income |
(3,455 | ) | 3,880 | |||||
| Income tax expense (benefit): |
||||||||
| Net gains (losses) on derivative instruments designated as cash flow hedges |
1,034 | (2,709 | ) | |||||
| Reclassification of net (gains) losses to net income |
(971 | ) | 1,089 | |||||
| 245 | (4,537 | ) | ||||||
| Other comprehensive income (loss) from investments in associates |
(16 | ) | (344 | ) | ||||
| Items that will not be reclassified subsequently to net income |
||||||||
| Net change in remeasurement of employee benefit plan asset and liability: |
||||||||
| Actuarial gains (losses) on employee benefit plans |
108 | 955 | ||||||
| Income tax expense (benefit) |
(6 | ) | 277 | |||||
| 114 | 678 | |||||||
| Net change in fair value due to change in equity instruments designated at fair value through |
||||||||
| Net gains (losses) in fair value |
(253 | ) | (106 | ) | ||||
| Income tax expense (benefit) |
(73 | ) | (32 | ) | ||||
| (180 | ) | (74 | ) | |||||
| Net change in fair value due to change in own credit risk on financial liabilities designated |
||||||||
| Change in fair value due to change in own credit risk on financial liabilities designated under the fair value option |
(1,338 | ) | 1,958 | |||||
| Income tax expense (benefit) |
(353 | ) | 514 | |||||
| (985 | ) | 1,444 | ||||||
| Other comprehensive income (loss) from investments in associates |
2 | 2 | ||||||
| Other comprehensive income (loss) |
500 | (1,589 | ) | |||||
| Comprehensive income |
$ | 8,028 | $ | 8,585 | ||||
| Comprehensive income (loss) attributable to non-controlling interests |
327 | 233 | ||||||
| Comprehensive income attributable to equity holders of the Bank |
$ | 7,701 | $ | 8,352 | ||||
| Preferred shareholders and other equity instrument holders |
419 | 260 | ||||||
| Common shareholders |
$ | 7,282 | $ | 8,092 | ||||
The accompanying notes are an integral part of these consolidated financial statements.
2023 Scotiabank Annual Report | 149
Consolidated Financial Statements
Consolidated Statement of Changes in Equity
| Accumulated other comprehensive income (loss) |
||||||||||||||||||||||||||||||||||||||||||||||||||||
| ($ millions) | Common shares (Note 24) |
Retained earnings(1) |
Foreign currency translation |
Debt instruments FVOCI |
Equity instruments FVOCI |
Cash flow hedges |
Other(2) | Other reserves |
Total common equity |
Preferred shares and other equity instruments (Note 24) |
Total attributable to equity holders |
Non- controlling interests in subsidiaries (Note 31(b)) |
Total | |||||||||||||||||||||||||||||||||||||||
| Balance as at October 31, 2022 |
$ | 18,707 | $ | 53,761 | $ | (2,478 | ) | $ | (1,482 | ) | $ | 216 | $ | (4,786 | ) | $ | 1,364 | $ | (152 | ) | $ | 65,150 | $ | 8,075 | $ | 73,225 | $ | 1,524 | $ | 74,749 | ||||||||||||||||||||||
| Net income |
– | 6,991 | – | – | – | – | – | – | 6,991 | 419 | 7,410 | 118 | 7,528 | |||||||||||||||||||||||||||||||||||||||
| Other comprehensive income (loss) |
– | – | 766 | 378 | (201 | ) | 240 | (892 | ) | – | 291 | – | 291 | 209 | 500 | |||||||||||||||||||||||||||||||||||||
| Total comprehensive income |
$ | – | $ | 6,991 | $ | 766 | $ | 378 | $ | (201 | ) | $ | 240 | $ | (892 | ) | $ | – | $ | 7,282 | $ | 419 | $ | 7,701 | $ | 327 | $ | 8,028 | ||||||||||||||||||||||||
| Shares/instruments issued |
1,402 | – | – | – | – | – | – | (3 | ) | 1,399 | – | 1,399 | – | 1,399 | ||||||||||||||||||||||||||||||||||||||
| Shares repurchased/redeemed |
– | – | – | – | – | – | – | – | – | – | – | – | – | |||||||||||||||||||||||||||||||||||||||
| Dividends and distributions paid to equity holders |
– | (5,003 | ) | – | – | – | – | – | – | (5,003 | ) | (419 | ) | (5,422 | ) | (101 | ) | (5,523 | ) | |||||||||||||||||||||||||||||||||
| Share-based payments(3) |
– | – | – | – | – | – | – | 14 | 14 | – | 14 | – | 14 | |||||||||||||||||||||||||||||||||||||||
| Other |
– | (3 | ) | (43 | ) | – | (1 | ) | 1 | – | 57 | 11 | – | 11 | (11 | ) | – | |||||||||||||||||||||||||||||||||||
| Balance as at October 31, 2023 |
$ | 20,109 | $ | 55,746 | $ | (1,755 | ) | $ | (1,104 | ) | $ | 14 | $ | (4,545 | ) | $ | 472 | $ | (84 | ) | $ | 68,853 | $ | 8,075 | $ | 76,928 | $ | 1,739 | $ | 78,667 | ||||||||||||||||||||||
| Balance as at October 31, 2021 |
$ | 18,507 | $ | 51,354 | $ | (4,709 | ) | $ | (270 | ) | $ | 291 | $ | (214 | ) | $ | (431 | ) | $ | 222 | $ | 64,750 | $ | 6,052 | $ | 70,802 | $ | 2,090 | $ | 72,892 | ||||||||||||||||||||||
| Net income |
– | 9,656 | – | – | – | – | – | – | 9,656 | 260 | 9,916 | 258 | 10,174 | |||||||||||||||||||||||||||||||||||||||
| Other comprehensive income (loss) |
– | – | 2,411 | (1,212 | ) | (35 | ) | (4,523 | ) | 1,795 | – | (1,564 | ) | – | (1,564 | ) | (25 | ) | (1,589 | ) | ||||||||||||||||||||||||||||||||
| Total comprehensive income |
$ | – | $ | 9,656 | $ | 2,411 | $ | (1,212 | ) | $ | (35 | ) | $ | (4,523 | ) | $ | 1,795 | $ | – | $ | 8,092 | $ | 260 | $ | 8,352 | $ | 233 | $ | 8,585 | |||||||||||||||||||||||
| Shares/instruments issued |
706 | – | – | – | – | – | – | (18 | ) | 688 | 2,523 | 3,211 | – | 3,211 | ||||||||||||||||||||||||||||||||||||||
| Shares repurchased/redeemed |
(506 | ) | (2,367 | ) | – | – | – | – | – | – | (2,873 | ) | (500 | ) | (3,373 | ) | – | (3,373 | ) | |||||||||||||||||||||||||||||||||
| Dividends and distributions paid to equity holders |
– | (4,858 | ) | – | – | – | – | – | – | (4,858 | ) | (260 | ) | (5,118 | ) | (115 | ) | (5,233 | ) | |||||||||||||||||||||||||||||||||
| Share-based payments(3) |
– | – | – | – | – | – | – | 10 | 10 | – | 10 | – | 10 | |||||||||||||||||||||||||||||||||||||||
| Other |
– | (24 | ) | (180 | ) | – | (40 | ) | (49 | ) | – | (366 | )(4) | (659 | ) | – | (659 | ) | (684 | )(4) | (1,343 | ) | ||||||||||||||||||||||||||||||
| Balance as at October 31, 2022 |
$ | 18,707 | $ | 53,761 | $ | (2,478 | ) | $ | (1,482 | ) | $ | 216 | $ | (4,786 | ) | $ | 1,364 | $ | (152 | ) | $ | 65,150 | $ | 8,075 | $ | 73,225 | $ | 1,524 | $ | 74,749 | ||||||||||||||||||||||
| (1) | Includes undistributed retained earnings of $71 (2022 – $67) related to a foreign associated corporation, which is subject to local regulatory restriction. |
| (2) | Includes Share from associates, Employee benefits and Own credit risk. |
| (3) | Represents amounts on account of share-based payments (refer to Note 26). |
| (4) | Includes changes to non-controlling interests arising from business combinations and related transactions (refer to Note 36). |
The accompanying notes are an integral part of these consolidated financial statements.
150 | 2023 Scotiabank Annual Report
Consolidated Financial Statements
Consolidated Statement of Cash Flows
| Sources (uses) of cash flows for the year ended October 31 ($ millions) | 2023 | 2022 | ||||||
| Cash flows from operating activities |
||||||||
| Net income |
$ | 7,528 | $ | 10,174 | ||||
| Adjustment for: |
||||||||
| Net interest income |
(18,287 | ) | (18,115 | ) | ||||
| Depreciation and amortization |
1,820 | 1,531 | ||||||
| Provision for credit losses |
3,422 | 1,382 | ||||||
| Impairment on investments in associates |
185 | – | ||||||
| Equity-settled share-based payment expense |
14 | 10 | ||||||
| Net gain on sale of investment securities |
(129 | ) | (74 | ) | ||||
| Net (gain)/loss on divestitures |
(367 | ) | 233 | |||||
| Net income from investments in associated corporations |
(153 | ) | (268 | ) | ||||
| Income tax expense |
2,226 | 2,758 | ||||||
| Changes in operating assets and liabilities: |
||||||||
| Trading assets |
(2,689 | ) | 37,501 | |||||
| Securities purchased under resale agreements and securities borrowed |
(18,966 | ) | (41,438 | ) | ||||
| Loans |
4,414 | (97,161 | ) | |||||
| Deposits |
19,478 | 95,905 | ||||||
| Obligations related to securities sold short |
(4,616 | ) | (1,292 | ) | ||||
| Obligations related to securities sold under repurchase agreements and securities lent |
15,937 | 10,838 | ||||||
| Net derivative financial instruments |
2,080 | 115 | ||||||
| Other, net |
(219 | ) | (1,404 | ) | ||||
| Dividends received |
1,299 | 1,156 | ||||||
| Interest received |
55,617 | 31,931 | ||||||
| Interest paid |
(34,731 | ) | (13,336 | ) | ||||
| Income tax paid |
(2,139 | ) | (3,503 | ) | ||||
| Net cash from/(used in) operating activities |
31,724 | 16,943 | ||||||
| Cash flows from investing activities |
||||||||
| Interest-bearing deposits with financial institutions |
(23,538 | ) | 25,783 | |||||
| Purchase of investment securities |
(100,919 | ) | (97,736 | ) | ||||
| Proceeds from sale and maturity of investment securities |
94,875 | 63,130 | ||||||
| Acquisition/divestiture of subsidiaries, associated corporations or business units, net of cash acquired |
895 | (549 | ) | |||||
| Property and equipment, net of disposals |
(442 | ) | (571 | ) | ||||
| Other, net |
(911 | ) | (1,350 | ) | ||||
| Net cash from/(used in) investing activities |
(30,040 | ) | (11,293 | ) | ||||
| Cash flows from financing activities |
||||||||
| Proceeds from issue of subordinated debentures |
1,447 | 3,356 | ||||||
| Redemption of subordinated debentures |
(78 | ) | (1,276 | ) | ||||
| Proceeds from preferred shares and other equity instruments issued |
– | 2,523 | ||||||
| Redemption of preferred shares |
– | (500 | ) | |||||
| Proceeds from common shares issued |
1,402 | 137 | ||||||
| Common shares purchased for cancellation |
– | (2,873 | ) | |||||
| Cash dividends and distributions paid |
(5,422 | ) | (5,118 | ) | ||||
| Distributions to non-controlling interests |
(101 | ) | (115 | ) | ||||
| Payment of lease liabilities |
(325 | ) | (322 | ) | ||||
| Other, net |
311 | (391 | ) | |||||
| Net cash from/(used in) financing activities |
(2,766 | ) | (4,579 | ) | ||||
| Effect of exchange rate changes on cash and cash equivalents |
190 | 301 | ||||||
| Net change in cash and cash equivalents |
(892 | ) | 1,372 | |||||
| Cash and cash equivalents at beginning of year(1) |
11,065 | 9,693 | ||||||
| Cash and cash equivalents at end of year(1) |
$ | 10,173 | $ | 11,065 | ||||
| (1) | Represents cash and non-interest-bearing deposits with financial institutions (refer to Note 6). |
The accompanying notes are an integral part of these consolidated financial statements.
2023 Scotiabank Annual Report | 151
Consolidated Financial Statements
| 2023 Consolidated Financial Statements
|
Table of Contents
| Page | Note | |||
| 205 | 19 | Other assets | ||
| 205 | 20 | Deposits | ||
| 206 | 21 | Subordinated debentures | ||
| 206 | 22 | Other liabilities | ||
| 207 | 23 | Provisions | ||
| 207 | 24 | Common shares, preferred shares and other equity instruments | ||
| 210 | 25 | Capital management | ||
| 211 | 26 | Share-based payments | ||
| 213 | 27 | Corporate income taxes | ||
| 215 | 28 | Employee benefits | ||
| 221 | 29 | Operating segments | ||
| 222 | 30 | Related party transactions | ||
| 224 | 31 | Principal subsidiaries and non-controlling interests in subsidiaries | ||
| 225 | 32 | Interest income and expense | ||
| 225 | 33 | Earnings per share | ||
| 226 | 34 | Guarantees, commitments and pledged assets | ||
| 227 | 35 | Financial instruments – risk management | ||
| 234 | 36 | Acquisitions and divestitures | ||
152 | 2023 Scotiabank Annual Report
Consolidated Financial Statements
| 1 | Reporting Entity |
The Bank of Nova Scotia (the Bank) is a chartered Schedule I bank under the Bank Act (Canada) (the Bank Act) and is regulated by the Office of the Superintendent of Financial Institutions (OSFI). The Bank is a global financial services provider offering a diverse range of products and services, including personal, commercial, corporate and investment banking. The head office of the Bank is located at 1709 Hollis Street, Halifax, Nova Scotia, Canada and its executive offices are at 40 Temperance Street, Toronto, Canada. The common shares of the Bank are listed on the Toronto Stock Exchange (TSX) and the New York Stock Exchange.
| 2 | Basis of Preparation |
Statement of compliance
These consolidated financial statements were prepared in accordance with International Financial Reporting Standards (IFRS) as issued by the International Accounting Standards Board (IASB) and accounting requirements of OSFI in accordance with Section 308 of the Bank Act. Section 308 states that, except as otherwise specified by OSFI, the financial statements are to be prepared in accordance with IFRS.
The consolidated financial statements for the year ended October 31, 2023 have been approved by the Board of Directors for issue on November 28, 2023.
Certain comparative amounts have been restated to conform with the basis of presentation in the current year.
Basis of measurement
The consolidated financial statements have been prepared on the historical cost basis except for the following material items that are measured at fair value in the Consolidated Statement of Financial Position:
| • | Financial assets and liabilities measured at fair value through profit or loss |
| • | Financial assets and liabilities designated at fair value through profit or loss |
| • | Derivative financial instruments |
| • | Equity instruments designated at fair value through other comprehensive income |
| • | Debt instruments measured at fair value through other comprehensive income |
Functional and presentation currency
These consolidated financial statements are presented in Canadian dollars, which is the Bank’s functional currency. All financial information presented in Canadian dollars has been rounded to the nearest million unless otherwise stated.
Management’s use of estimates, assumptions and judgments
The Bank’s accounting policies require estimates, assumptions and judgments that relate to matters that are inherently uncertain. The Bank has established procedures to ensure that accounting policies are applied consistently. Estimates and underlying assumptions are reviewed on an ongoing basis. Revisions to accounting estimates are recognized in the year in which the estimates are revised.
Use of estimates and assumptions
The preparation of these consolidated financial statements, in conformity with IFRS, requires management to make estimates and assumptions that affect the reported amount of assets and liabilities at the date of the consolidated financial statements, and other comprehensive income and income and expenses during the reporting period. Estimates made by management are based on historical experience and other factors and assumptions that are believed to be reasonable. Key areas of estimation uncertainty include those relating to the allowance for credit losses, the fair value of financial instruments (including derivatives), corporate income taxes, employee benefits, goodwill and intangible assets, the fair value of all identifiable assets and liabilities as a result of business combinations, impairment of non-financial assets and provisions. The Bank has utilized estimates, assumptions and judgments that reflect this uncertainty. While management makes its best estimates and assumptions, actual results could differ from these and other estimates.
Significant judgments
In the preparation of these consolidated financial statements, management is required to make significant judgments in the classification and presentation of transactions and instruments and accounting for the Bank’s involvement with other entities.
2023 Scotiabank Annual Report | 153
Consolidated Financial Statements
Significant estimates, assumptions and judgments have been made in the following areas and are discussed as noted in the consolidated financial statements:
| Allowance for credit losses | Note 3 | |
| Note 13(e) | ||
| Fair value of financial instruments | Note 3 | |
| Note 7 | ||
| Corporate income taxes | Note 3 | |
| Note 27 | ||
| Employee benefits | Note 3 | |
| Note 28 | ||
| Goodwill and intangible assets | Note 3 | |
| Note 18 | ||
| Fair value of all identifiable assets and liabilities as a result of business combinations | Note 3 | |
| Note 36 | ||
| Impairment of investment securities | Note 3 | |
| Note 12 | ||
| Impairment of non-financial assets | Note 3 | |
| Note 16 | ||
| Structured entities | Note 3 | |
| Note 15 | ||
| De facto control of other entities | Note 3 | |
| Note 31 | ||
| Derecognition of financial assets and liabilities | Note 3 | |
| Note 14 | ||
| Provisions | Note 3 | |
| Note 23 | ||
| 3 | Significant Accounting Policies |
The significant accounting policies used in the preparation of these consolidated financial statements, including any additional accounting requirements of OSFI, as set out below, have been applied consistently to all periods presented in these consolidated financial statements.
Basis of consolidation
The consolidated financial statements include the assets, liabilities, financial performance and cash flows of the Bank and all of its subsidiaries, after elimination of intercompany transactions and balances. Subsidiaries are defined as entities controlled by the Bank. The Bank’s subsidiaries can be classified as entities controlled through voting interests or structured entities. The Bank consolidates a subsidiary from the date it obtains control. For the Bank to control an entity, all three elements of control should be in existence:
| • | power over the investee; |
| • | exposure, or rights, to variable returns from involvement with the investee; and |
| • | the ability to use power over the investee to affect the amount of the Bank’s returns. |
The Bank does not control an investee when it is acting as an agent. The Bank assesses whether it is an agent by determining whether it is primarily engaged to act on behalf of and for the benefit of another party or parties. The Bank reassesses whether it controls an investee if facts and circumstances indicate that one or more of the elements of control has changed.
Voting-interest subsidiaries
Control is presumed with an ownership interest of more than 50% of the voting rights in an entity unless there are other factors that indicate that the Bank does not control the entity despite having more than 50% of voting rights.
The Bank may consolidate an entity when it owns less than 50% of the voting rights when it has one or more other attributes of power:
| • | by virtue of an agreement, over more than half of the voting rights; |
| • | to govern the financial and operating policies of the entity under a statute or an agreement; |
| • | to appoint or remove the majority of the members of the board of directors or equivalent governing body and control of the entity is by that board or body; or |
| • | to govern the financial and operating policies of the entity through the size of its holding of voting rights relative to the size and dispersion of holding of the other vote holders and voting patterns at shareholder meetings (i.e., de facto control). |
Non-controlling interests are presented within equity in the Consolidated Statement of Financial Position separate from equity attributable to equity holders of the Bank. The net income attributable to non-controlling interests is presented separately in the Consolidated Statement of Income. Partial sales and incremental purchases of interests in subsidiaries that do not result in a change of control are accounted for as equity transactions with non-controlling interest holders. Any difference between the carrying amount of the interest and the transaction amount is recorded as an adjustment to retained earnings.
Structured entities
Structured entities are designed to accomplish certain well-defined objectives and for which voting or similar rights are not the dominant factor in deciding who controls the entity. The Bank controls an entity when it is exposed, or has rights, to variable returns from its involvement with the investee and has the ability to affect those returns through its power over the investee.
The Bank consolidates all structured entities that it controls.
154 | 2023 Scotiabank Annual Report
Consolidated Financial Statements
Investments in associates
An associate is an entity in which the Bank has significant influence, but not control, over the operating and financial policies of the entity.
Investments in associates are recognized initially at cost, which includes the purchase price and other costs directly attributable to the purchase. Associates are accounted for using the equity method which reflects the Bank’s share of the increase or decrease of the post-acquisition earnings and other movements in the associate’s equity.
Investments in associates are evaluated for impairment at the end of each financial reporting period, or more frequently if events or changes in circumstances indicate the existence of objective evidence of impairment.
For purposes of applying the equity method for an investment that has a different reporting period from the Bank, adjustments are made for the effects of any significant events or transactions that occur between the reporting date of the investment and the reporting date of the Bank.
Joint arrangements
The Bank’s investments in joint arrangements over which the Bank has joint control are classified as either joint operations or joint ventures depending on the contractual rights and obligations of each investor, rather than the legal structure of the joint arrangement.
Similar to accounting for investment in associates, for joint ventures, investments are recognized initially at cost and accounted for using the equity method which reflects the Bank’s share of the increase or decrease of the post-acquisition earnings and other movements in the joint venture’s equity. Investments in joint ventures are evaluated for impairment at the end of each financial reporting period, or more frequently if events or changes in circumstances indicate the existence of objective evidence of impairment.
For joint operations, the Bank recognizes its direct rights to, and its share of jointly held assets, liabilities, revenues and expenses. These have been incorporated in the consolidated financial statements under the appropriate headings.
Translation of foreign currencies
The financial statements of each of the Bank’s foreign operations are measured using its functional currency, being the currency of the primary economic environment of the foreign operation.
Translation gains and losses related to the Bank’s monetary items are recognized in non-interest income in the Consolidated Statement of Income. Revenues and expenses denominated in foreign currencies are translated using average exchange rates. Foreign currency non-monetary items that are measured at historical cost are translated into the functional currency at historical rates. Foreign currency non-monetary items measured at fair value are translated into functional currency using the rate of exchange at the date the fair value was determined. Foreign currency gains and losses on non-monetary items are recognized in the Consolidated Statement of Income or Consolidated Statement of Comprehensive Income consistent with the gain or loss on the non-monetary item.
Unrealized gains and losses arising upon translation of foreign operations, together with any gains or losses arising from hedges of those net investment positions to the extent effective, are credited or charged to net change in unrealized foreign currency translation gains/losses in other comprehensive income in the Consolidated Statement of Comprehensive Income. On disposal or meeting the definition of partial disposal of a foreign operation, an appropriate portion of the translation differences previously recognized in other comprehensive income are recognized in the Consolidated Statement of Income.
Financial assets and liabilities
Recognition and initial measurement
The Bank, on the date of origination or purchase, recognizes loans, debt and equity securities, deposits and subordinated debentures at the fair value of the consideration paid or received. Regular-way purchases and sales of financial assets are recognized on the settlement date. All other financial assets and liabilities, including derivatives, are initially recognized on the trade date at which the Bank becomes a party to the contractual provisions of the instrument.
The initial measurement of a financial asset or liability is at fair value plus transaction costs that are directly attributable to its purchase or issuance. For instruments measured at fair value through profit or loss, transaction costs are recognized immediately in profit or loss.
Classification and measurement, derecognition, and impairment of financial instruments
Classification and measurement
Classification and measurement of financial assets
Financial assets include both debt and equity instruments, are classified into one of the following measurement categories:
| • | Amortized cost; |
| • | Fair value through other comprehensive income (FVOCI); |
| • | Fair value through profit or loss (FVTPL); |
| • | Elected at fair value through other comprehensive income (Equities only); or |
| • | Designated at FVTPL |
Debt instruments
Debt instruments, including loans and debt securities, are classified into one of the following measurement categories:
| • | Amortized cost; |
| • | Fair value through other comprehensive income (FVOCI); |
| • | Fair value through profit or loss (FVTPL); or |
| • | Designated at FVTPL |
Classification of debt instruments is determined based on:
| (i) | The business model under which the asset is held; and |
| (ii) | The contractual cash flow characteristics of the instrument. |
2023 Scotiabank Annual Report | 155
Consolidated Financial Statements
Business model assessment
A business model assessment involves determining how financial assets are managed to generate cash flows. The Bank’s business model assessment is based on the following categories:
| • | Held to collect: The objective of this business model is to hold assets and collect contractual cash flows. Any sales of the asset are incidental to the objective of the model. |
| • | Held to collect and for sale: Both collecting contractual cash flows and sales are integral to achieving the objectives of the business model. |
| • | Other business model: The business model is neither held-to-collect nor held-to-collect and for sale. |
The Bank assesses the business model at a portfolio level reflective of how groups of assets are managed together to achieve a particular business objective. For the assessment of a business model, the Bank takes into consideration the following factors:
| • | How the performance of assets in a portfolio is evaluated and reported to group heads and other key decision makers within the Bank’s business lines; |
| • | How compensation is determined for the Bank’s business lines’ management that manages the assets; |
| • | How the business lines’ management is compensated for managing the Bank’s assets based on the fair value or the contractual cash flows collected; |
| • | Whether the assets are held for trading purposes; |
| • | The risks that affect the performance of assets held within a business model and how those risks are managed; and |
| • | The frequency and volume of sales in prior periods and expectations about future sales activity. |
Contractual cash flow characteristics assessment
The contractual cash flow characteristics assessment involves assessing the contractual features of an instrument to determine if they give rise to cash flows that are consistent with a basic lending arrangement. Contractual cash flows are consistent with a basic lending arrangement if they represent cash flows that are solely payments of principal and interest on the principal amount outstanding (SPPI).
Principal is defined as the fair value of the instrument at initial recognition. Principal may change over the life of the instrument due to repayments or amortization of premium/discount.
Interest is defined as the consideration for the time value of money and the credit risk associated with the principal amount outstanding and for other basic lending risks and costs (liquidity risk and administrative costs), and a profit margin.
If the Bank identifies any contractual features that could significantly modify the cash flows of the instrument such that they are no longer consistent with a basic lending arrangement, the related financial asset is classified and measured at FVTPL.
Debt instruments measured at amortized cost
Debt instruments are measured at amortized cost if they are held within a business model whose objective is to hold for collection of contractual cash flows where those cash flows represent solely payments of principal and interest. After initial measurement, debt instruments in this category are carried at amortized cost. Interest income on these instruments is recognized in interest income using the effective interest rate method. The effective interest rate is the rate that discounts estimated future cash payments or receipts through the expected life of the financial asset to the gross carrying amount of a financial asset. Amortized cost is calculated by taking into account any discount or premium on the acquisition, transaction costs and fees that are an integral part of the effective interest rate.
Impairment on debt instruments measured at amortized cost is calculated using the expected credit loss approach. Loans and debt securities measured at amortized cost are presented net of the allowance for credit losses (ACL) in the Statement of Financial Position.
Debt instruments measured at FVOCI
Debt instruments are measured at FVOCI if they are held within a business model whose objective is to hold for collection of contractual cash flows and for selling financial assets, where the assets’ cash flows represent payments that are solely payments of principal and interest. Subsequent to initial recognition, unrealized gains and losses on debt instruments measured at FVOCI are recorded in other comprehensive income (OCI), unless the instrument is designated in a fair value hedge relationship. When designated in a fair value hedge relationship, any changes in fair value due to changes in the hedged risk are recognized in Non-interest income in the Consolidated Statement of Income, along with changes in fair value of the hedging instrument. Upon derecognition, realized gains and losses are reclassified from OCI and recorded in Non-interest income in the Consolidated Statement of Income. Foreign exchange gains and losses that relate to the amortized cost of the debt instrument are recognized in the Consolidated Statement of Income. Premiums, discounts and related transaction costs are amortized over the expected life of the instrument to Interest income in the Consolidated Statement of Income using the effective interest rate method.
Impairment on debt instruments measured at FVOCI is determined using the expected credit loss approach. The ACL on debt instruments measured at FVOCI does not reduce the carrying amount of the asset in the Consolidated Statement of Financial Position, which remains at its fair value. Instead, an amount equal to the allowance that would arise if the assets were measured at amortized cost is recognized in OCI with a corresponding charge to provision for credit losses in the Consolidated Statement of Income. The accumulated allowance recognized in OCI is recycled to the Consolidated Statement of Income upon derecognition of the debt instrument.
Debt instruments measured at FVTPL
Debt instruments are measured at FVTPL if assets:
| (i) | are held for trading purposes; |
| (ii) | are held as part of a portfolio managed on a fair value basis; or |
| (iii) | whose cash flows do not represent payments that are solely payments of principal and interest. |
These instruments are measured at fair value in the Consolidated Statement of Financial Position, with transaction costs recognized immediately in the Consolidated Statement of Income as part of Non-interest income. Realized and unrealized gains and losses are recognized as part of Non-interest income in the Consolidated Statement of Income.
Debt instruments designated at FVTPL
The Bank designates certain debt instruments at FVTPL upon initial recognition, and the designation is irrevocable. The FVTPL designation is available when a fair value is reliably estimated, and doing so eliminates or significantly reduces an accounting mismatch which would otherwise arise.
156 | 2023 Scotiabank Annual Report
Consolidated Financial Statements
Debt instruments designated at FVTPL are recorded in the Consolidated Statement of Financial Position at fair value. Changes in fair value are recognized in Non-interest income in the Consolidated Statement of Income.
Equity instruments
Equity instruments are classified into one of the following measurement categories:
| • | Fair value through profit or loss (FVTPL); or |
| • | Elected at fair value through other comprehensive income (FVOCI). |
Equity instruments measured at FVTPL
Equity instruments are measured at FVTPL, unless an election is made to designate them at FVOCI upon purchase, with transaction costs recognized immediately in the Consolidated Statement of Income as part of Non-interest income. Subsequent to initial recognition, the changes in fair value and dividends received are recognized in the Consolidated Statement of Income.
Equity instruments measured at FVOCI
At initial recognition, the Bank has an option to classify non-trading equity instruments at FVOCI. This election is irrevocable and is made on an instrument-by-instrument basis.
Gains and losses on these instruments, including when derecognized/sold, are recorded in OCI and are not subsequently reclassified to the Consolidated Statement of Income. As such, there is no specific impairment requirement. Dividends received are recorded in Interest income in the Consolidated Statement of Income. Any transaction costs incurred upon purchase of the security are added to the cost basis of the security and are not reclassified to the Consolidated Statement of Income on sale of the security.
Classification and measurement of financial liabilities
Financial liabilities are classified into one of the following measurement categories:
| • | Fair value through profit or loss (FVTPL); |
| • | Amortized cost; or |
| • | Designated at FVTPL. |
Financial liabilities measured at FVTPL
Financial liabilities measured at FVTPL are held principally for the purpose of repurchasing in the near term, or form part of a portfolio of identified financial instruments that are managed together and for which there is evidence of a recent actual pattern of short term profit-taking. Financial liabilities are recognized on a trade date basis and accounted for at fair value, with changes in fair value and any gains or losses recognized in the Consolidated Statement of Income as part of the non-interest income. Transaction costs are expensed as incurred.
Financial liabilities measured at amortized cost
Deposits, subordinated notes and debentures are accounted for at amortized cost. Interest on deposits, calculated using the effective interest rate method, is recognized as interest expense. Interest on subordinated notes and debentures, including capitalized transaction costs, is recognized using the effective interest rate method as interest expense.
Financial liabilities designated at FVTPL
The Bank designates certain financial liabilities at FVTPL upon initial recognition, and the designation is irrevocable. The FVTPL designation is available when a fair value is reliably estimated.
Financial liabilities are designated at FVTPL when it meets one of the following criteria:
| • | The designation eliminates or significantly reduces an accounting mismatch which would otherwise arise; or |
| • | A group of financial liabilities are managed and their performance is evaluated on a fair value basis, in line with a documented risk management strategy; or |
| • | The financial liability contains one or more embedded derivatives which significantly modify the cash flows otherwise required. |
Financial liabilities designated at FVTPL are recorded in the Consolidated Statement of Financial Position at fair value. Any changes in fair value are recognized in Non-interest income in the Consolidated Statement of Income, except for changes in fair value arising from changes in the Bank’s own credit risk which are recognized in OCI. Changes in fair value due to changes in the Bank’s own credit risk are not subsequently reclassified to the Consolidated Statement of Income upon derecognition/extinguishment of the liabilities.
Determination of fair value
The fair value of a financial asset or liability is the price that would be received to sell an asset or paid to transfer a liability in an orderly transaction between market participants in the principal, or in its absence, the most advantageous market to which the Bank has access at the measurement date.
The Bank values instruments carried at fair value using quoted market prices, where available. Fair value based on unadjusted quoted market prices for identical instruments in active markets represents a Level 1 valuation. When quoted market prices are not available, the Bank maximizes the use of observable inputs within valuation models. When a fair value is based on all significant market observable inputs, the valuation is classified as Level 2. Valuations that require the significant use of unobservable inputs are considered Level 3.
Inception gains and losses are only recognized where the valuation is dependent on observable market data; otherwise, they are deferred and amortized over the life of the related contract or until the valuation inputs become observable.
IFRS 13, Fair Value Measurement permits a measurement exception that allows an entity to determine the fair value of a group of financial assets and liabilities with offsetting risks based on the sale or transfer of its net exposure to a particular risk (or risks). The Bank has adopted this exception through an accounting policy choice. Consequently, the fair values of certain portfolios of financial instruments are determined based on the net exposure of those instruments to market, credit or funding risk.
In determining fair value for certain instruments or portfolios of instruments, valuation adjustments or reserves may be required to arrive at a more accurate representation of fair value. These adjustments include those made for credit risk, bid-offer spreads, unobservable parameters, funding costs and constraints on prices in inactive or illiquid markets.
2023 Scotiabank Annual Report | 157
Consolidated Financial Statements
Derecognition of financial assets and liabilities
Derecognition of financial assets
A financial asset is derecognized when the contractual rights to the cash flows from the asset has expired; or the Bank transfers the contractual rights to receive the cash flows from the financial asset; or has assumed an obligation to pay those cash flows to an independent third-party; or the Bank has transferred substantially all the risks and rewards of ownership of that asset to an independent third-party. Management determines whether substantially all the risk and rewards of ownership have been transferred by quantitatively comparing the variability in cash flows before and after the transfer. If the variability in cash flows remains significantly similar subsequent to the transfer, the Bank has retained substantially all of the risks and rewards of ownership.
Where substantially all the risks and rewards of ownership of the financial asset are neither retained nor transferred, the Bank derecognizes the transferred asset only if it has lost control over that asset. Control over the asset is represented by the practical ability to sell the transferred asset. If the Bank retains control over the asset, it will continue to recognize the asset to the extent of its continuing involvement. At times such continuing involvement may be in the form of investment in senior or subordinated tranches of notes issued by non-consolidated structured entities.
On derecognition of a financial asset, the difference between the carrying amount and the sum of (i) the consideration received (including any new asset obtained less any new liability assumed) and (ii) any cumulative gain or loss that had been recognized in other comprehensive income is recognized in the Consolidated Statement of Income.
Transfers of financial assets that do not qualify for derecognition are reported as secured financings in the Consolidated Statement of Financial Position.
The derecognition criteria are applied to the transfer of part of an asset, rather than the asset as a whole, only if such part comprises specifically identified cash flows from the asset, a fully proportionate share of the cash flows from the asset, or a fully proportionate share of specifically identified cash flows from the asset.
Derecognition of financial liabilities
A financial liability is derecognized when the obligation under the liability is discharged, canceled or expires. If an existing financial liability is replaced by another from the same counterparty on substantially different terms, or the terms of the existing liability are substantially modified, such an exchange or modification is treated as a derecognition of the original liability and the recognition of a new liability at fair value. The difference in the respective carrying amount of the existing liability and the new liability is recognized as a gain/loss in the Consolidated Statement of Income.
Impairment
Scope
The Bank applies a three-stage approach to measure allowance for credit losses, using an expected credit loss approach as required under IFRS 9, for the following categories of financial instruments that are not measured at fair value through profit or loss:
| • | Amortized cost financial assets; |
| • | Debt securities classified as at FVOCI; |
| • | Off-balance sheet loan commitments; and |
| • | Financial guarantee contracts. |
Expected credit loss impairment model
The Bank’s allowance for credit losses calculations are outputs of models with a number of underlying assumptions regarding the choice of variable inputs and their interdependencies. The expected credit loss impairment model reflects the present value of all cash shortfalls related to default events either (i) over the following twelve months or (ii) over the expected life of a financial instrument depending on credit deterioration from inception. The allowance for credit losses reflects an unbiased, probability-weighted outcome which considers multiple scenarios based on reasonable and supportable forecasts.
This impairment model measures credit loss allowances using a three-stage approach based on the extent of credit deterioration since origination:
| • | Stage 1 – Where there has not been a significant increase in credit risk (SIR) since initial recognition of a financial instrument, an amount equal to 12 months expected credit loss is recorded. The expected credit loss is computed using a probability of default occurring over the next 12 months. For those instruments with a remaining maturity of less than 12 months, a probability of default corresponding to remaining term to maturity is used. |
| • | Stage 2 – When a financial instrument experiences a SIR subsequent to origination but is not considered to be in default, it is included in Stage 2. This requires the computation of expected credit loss based on the probability of default over the remaining estimated life of the financial instrument. |
| • | Stage 3 – Financial instruments that are considered to be in default are included in this stage. Similar to Stage 2, the allowance for credit losses captures the lifetime expected credit losses. |
Measurement of expected credit loss
The probability of default (PD), exposure at default (EAD), and loss given default (LGD) inputs used to estimate expected credit losses are modelled based on macroeconomic variables that are closely related with credit losses in the relevant portfolio.
Details of these statistical parameters/inputs are as follows:
| • | PD – The probability of default is an estimate of the likelihood of default over a given time horizon. A default may only happen at a certain time over the remaining estimated life if the facility has not been previously derecognized and is still in the portfolio. |
| • | EAD – The exposure at default is an estimate of the exposure at a future default date, considering expected changes in the exposure after the reporting date, including repayments of principal and interest, whether scheduled by contract or otherwise, expected drawdowns on committed facilities, and accrued interest from missed payments. |
| • | LGD – The loss given default is an estimate of the loss arising in the case where a default occurs at a given time. It is based on the difference between the contractual cash flows due and those that the lender would expect to receive, including from the realization of any collateral. It is usually expressed as a percentage of the EAD. |
158 | 2023 Scotiabank Annual Report
Consolidated Financial Statements
Forward-looking information
The estimation of expected credit losses for each stage and the assessment of significant increases in credit risk consider information about past events and current conditions as well as reasonable and supportable forecasts of future events and economic conditions. The estimation and application of forward-looking information may require significant judgment.
Macroeconomic factors
In its models, the Bank relies on a broad range of forward-looking economic information as inputs, such as: GDP growth, unemployment rates, central bank interest rates, and house-price indices. The inputs and models used for calculating expected credit losses may not always capture all characteristics of the market at the date of the financial statements. Qualitative adjustments or overlays may be made as temporary adjustments using expert credit judgment.
Multiple forward-looking scenarios
The Bank determines its allowance for credit losses using four probability-weighted forward-looking scenarios. The Bank considers both internal and external sources of information and data in order to achieve unbiased projections and forecasts. The Bank prepares the scenarios using forecasts generated by Scotiabank Economics (SE). The forecasts are created using internal and external models which are modified by SE as necessary to formulate a ‘base case’ view of the most probable future direction of relevant economic variables as well as a representative range of other possible forecast scenarios. The process involves the development of three additional economic scenarios and consideration of the relative probabilities of each outcome.
The ‘base case’ represents the most likely outcome and is aligned with information used by the Bank for other purposes such as strategic planning and budgeting. The other scenarios represent more optimistic and more pessimistic outcomes. The Bank has identified and documented key drivers of credit risk and credit losses for each portfolio of financial instruments and, using an analysis of historical data, has estimated relationships between macroeconomic variables, credit risk, and credit losses.
Assessment of significant increase in credit risk (SIR)
At each reporting date, the Bank assesses whether there has been a significant increase in credit risk for exposures since initial recognition by comparing the risk of default occurring over the remaining expected life from the reporting date and the date of initial recognition. The assessment considers borrower-specific quantitative and qualitative information without consideration of collateral, and the impact of forward-looking macroeconomic factors.
The common assessments for SIR on retail and non-retail portfolios include macroeconomic outlook, management judgement, and delinquency and monitoring. Forward-looking macroeconomic factors are a key component of the macroeconomic outlook. The importance and relevance of each specific macroeconomic factor depends on the type of product, characteristics of the financial instruments and the borrower and the geographical region. Quantitative models may not always be able to capture all reasonable and supportable information that may indicate a significant increase in credit risk. Qualitative factors may be assessed to supplement the gap. Examples of situations include changes in adjudication criteria for a particular group of borrowers; changes in portfolio composition; and natural disasters impacting certain portfolios. With regards to delinquency and monitoring, there is a rebuttable presumption that the credit risk of the financial instrument has increased since initial recognition when contractual payments are more than 30 days overdue.
Retail portfolio – For retail exposures, a significant increase in credit risk cannot be assessed using forward looking information at an individual account level. Therefore, the assessment must be done at the segment level. Segment migration thresholds exist for each PD model by product which considers the proportionate change in PD as well as the absolute change in PD. The thresholds used for PD migration are reviewed and assessed at least annually unless there is a significant change in credit risk management practices in which case the review is brought forward.
Non-retail portfolio – The Bank uses a risk rating scale (IG codes) for its non-retail exposures. All non-retail exposures have an IG code assigned that reflects the probability of default of the borrower. Both borrower specific and non-borrower specific (i.e. macroeconomic) forward looking information is considered and reflected in the IG rating. Significant increase in credit risk is evaluated based on the migration of the exposures among IG codes.
Expected life
When measuring expected credit loss, the Bank considers the maximum contractual period over which the Bank is exposed to credit risk. All contractual terms are considered when determining the expected life, including prepayment, and extension and rollover options. For certain revolving credit facilities, such as credit cards, the expected life is estimated based on the period over which the Bank is exposed to credit risk and how the credit losses are mitigated by management actions.
Presentation of allowance for credit losses in the Statement of Financial Position
| • | Financial assets measured at amortized cost: as a deduction from the gross carrying amount of the financial assets; |
| • | Debt instruments measured at fair value through other comprehensive income: no allowance is recognized in the Statement of Financial Position because the carrying value of these assets is their fair value. However, the allowance determined is presented in the accumulated other comprehensive income; |
| • | Off-balance sheet credit risks include undrawn lending commitments, letters of credit and letters of guarantee: as a provision in other liabilities. |
Modified financial assets
If the terms of a financial asset are modified or an existing financial asset is replaced with a new one, an assessment is made to determine if the existing financial asset should be derecognized. Where a modification does not result in derecognition, the date of origination continues to be used to determine SIR. Where a modification results in derecognition, the new financial asset is recognized at its fair value on the modification date. The modification date is also the date of origination for this new asset.
The Bank may modify the contractual terms of loans for either commercial or credit reasons. The terms of a loan in good standing may be modified for commercial reasons to provide competitive pricing to borrowers. Loans are also modified for credit reasons where the contractual terms are modified to grant a concession to a borrower that may be experiencing financial difficulty.
2023 Scotiabank Annual Report | 159
Consolidated Financial Statements
For all financial assets modifications of the contractual terms may result in derecognition of the original asset when the changes to the terms of the loans are considered substantial. These terms include interest rate, authorized amount, term, or type of underlying collateral. The original loan is derecognized, and the new loan is recognized at its fair value. The difference between the carrying value of the derecognized asset and the fair value of the new asset is recognized in the Consolidated Statement of Income.
For all loans, performing and credit-impaired, where the modification of terms did not result in the derecognition of the loan, the gross carrying amount of the modified loan is recalculated based on the present value of the modified cash flows discounted at the original effective interest rate and any gain or loss from the modification is recorded in the provision for credit losses line in the Consolidated Statement of Income.
Definition of default
The Bank considers a financial instrument to be in default as a result of one or more loss events that occurred after the date of initial recognition of the instrument and the loss event has a negative impact on the estimated future cash flows of the instrument that can be reliably estimated. This includes events that indicate:
| • | significant financial difficulty of the borrower; |
| • | default or delinquency in interest or principal payments; |
| • | high probability of the borrower entering a phase of bankruptcy or a financial reorganization; |
| • | measurable decrease in the estimated future cash flows from the loan or the underlying assets that back the loan. |
The Bank considers that default has occurred and classifies the financial asset as impaired when it is more than 90 days past due, except for credit card receivables that are treated as defaulted when 180 days past due, unless reasonable and supportable information demonstrates that a more lagging default criterion is appropriate.
Write-off policy
The Bank writes off an impaired financial asset (and the related impairment allowance), either partially or in full, when there is no realistic prospect of recovery. Where financial assets are secured, write-off is generally after receipt of any proceeds from the realization of security. In circumstances where the net realizable value of any collateral has been determined and there is no reasonable expectation of further recovery, write-off may be earlier. Credit card receivables 180 days past due are written-off. In subsequent periods, any recoveries of amounts previously written off are credited to the provision for credit losses in the Consolidated Statement of Income.
Purchased loans
All purchased loans are initially measured at fair value on the date of acquisition. As a result, no allowance for credit losses would be recorded in the Consolidated Statement of Financial Position on the date of acquisition. Purchased loans may fit into either of the two categories: Performing loans or Purchased Credit-Impaired (PCI) loans.
Purchased performing loans follow the same accounting as originated performing loans and are reflected in Stage 1 on the date of the acquisition. They will be subject to a 12-month allowance for credit losses which is recorded as a provision for credit losses in the Consolidated Statement of Income. The fair value adjustment set up for these loans on the date of acquisition is amortized into interest income over the life of these loans.
PCI loans are reflected in Stage 3 and are always subject to lifetime allowance for credit losses. Any changes in the expected cash flows since the date of acquisition are recorded as a charge/recovery in the provision for credit losses in the Consolidated Statement of Income at the end of all reporting periods subsequent to the date of acquisition.
Modification of financial instruments in the context of interest rate benchmark reform – Phase 2 amendments
When the basis for determining the contractual cash flows of a financial asset or financial liability measured at amortized cost is changed as a result of interest rate benchmark reform (IBOR reform), the Bank updates the effective interest rate of the financial asset or financial liability similar to a floating rate financial instrument and does not derecognize or adjust the carrying amount (the practical expedient). The practical expedient is applied only when the modification is required as a direct consequence of IBOR reform, and the new basis for determining the contractual cash flows is economically equivalent to the previous basis. If changes are made to a financial asset or financial liability in addition to changes to the basis for determining the contractual cash flows required by the interest rate benchmark reform, then the Bank sequentially updates the effective interest first to reflect the change required by IBOR reform and then applies its policies on modification or derecognition of financial assets and financial liabilities.
Offsetting of financial instruments
Financial assets and financial liabilities with the same counterparty are offset, with the net amount reported in the Consolidated Statement of Financial Position, only if there is a legally enforceable right to offset the recognized amounts and there is an intention to settle on a net basis, or to realize the assets and settle the liabilities simultaneously. When financial assets and financial liabilities are offset in the Consolidated Statement of Financial Position, the related income and expense items will also be offset in the Consolidated Statement of Income, unless specifically prohibited by an applicable accounting standard.
Cash and deposits with financial institutions
Cash and deposits with financial institutions comprise cash, cash equivalents, demand deposits with banks and other financial institutions, and highly liquid investments that are readily convertible to cash, subject to an insignificant risk of changes in value. These investments are those with less than three months maturity from the date of acquisition.
Precious metals
Precious metals are carried at fair value less costs to sell, and any changes in value are credited or charged to non-interest income – trading revenues in the Consolidated Statement of Income.
Securities purchased and sold under resale agreements
Securities purchased under resale agreements (reverse repurchase agreements) require the purchase of securities by the Bank from a counterparty with an agreement entered to resell the securities at a fixed price at a future date. Since the Bank is reselling the securities at a fixed price at a future date, the risks and rewards have not been transferred to the Bank. The Bank has the right to liquidate the securities purchased in the event of counterparty default.
160 | 2023 Scotiabank Annual Report
Consolidated Financial Statements
Whereas securities sold under agreements to repurchase (repurchase agreements) require the sale of securities by the Bank to a counterparty with an agreement entered simultaneously to purchase the securities back at a fixed price at a future date. Since the Bank is purchasing the securities back at a fixed price at a future date, the risks and rewards have not been transferred from the Bank. The counterparty has the right to use the collateral pledged by the Bank in the event of default.
These agreements are treated as collateralized financing arrangements and are initially recognized at amortized cost. The party disbursing the cash takes possession of the securities serving as collateral for the financing and having a market value equal to, or more than, the principal amount loaned. The securities received under reverse repurchase agreements and securities delivered under repurchase agreements are not recognized on, or derecognized from, the Consolidated Statement of Financial Position, unless the risks and rewards of ownership are obtained or relinquished. The related interest income and interest expense are recorded on an accrual basis using the effective interest rate in the Consolidated Statement of Income.
Obligations related to securities sold short
Obligations related to securities sold short arise in dealing and market-making activities where debt securities and equity shares are sold without possessing such securities.
Similarly, if securities purchased under an agreement to resell are subsequently sold to third parties, the obligation to return the securities is recorded as a short sale within obligations related to securities sold short in the Consolidated Statement of Financial Position. These trading liabilities are measured at fair value with any gains or losses included in non-interest income – trading revenues in the Consolidated Statement of Income. Interest expense accruing on debt securities sold short is recorded in the Consolidated Statement of Income.
Securities lending and borrowing
Securities lending and borrowing transactions are usually collateralized by securities or cash. The transfer of the securities to counterparties is only reflected on the Consolidated Statement of Financial Position if the risks and rewards of ownership are also transferred. For cash collateral advanced or received, the Bank presents these transactions as securities sold under a repurchase agreement or securities purchased under a reverse repurchase agreement, respectively. Interest income on cash collateral paid and interest expense on cash collateral received together with securities lending income and securities borrowing fee are reported in the Consolidated Statement of Income.
Securities borrowed are not recognized on the Consolidated Statement of Financial Position unless they are then sold to third parties, in which case the obligation to return the securities is recorded as a trading liability and measured at fair value with any gains or losses included in non-interest income – trading revenues, in the Consolidated Statement of Income.
Derivative instruments
Derivative instruments are contracts whose value is derived from interest rates, foreign exchange rates, commodity prices, equity prices or other financial variables. Most derivative instruments can be characterized as interest rate contracts, foreign exchange and gold contracts, commodity contracts, equity contracts or credit contracts. Derivative instruments are either exchange-traded contracts or negotiated over-the-counter contracts. Negotiated over-the-counter contracts include swaps, forwards and options.
The Bank enters into these derivative contracts for trading purposes, as well as to manage its risk exposures (i.e., to manage the Bank’s non-trading interest rate, foreign currency and other exposures). Trading activities are undertaken to meet the needs of the Bank’s customers, as well as for the Bank’s own account.
Derivatives embedded in other financial liabilities or host contracts are treated as separate stand-alone derivatives when the following conditions are met:
| • | their economic characteristics and risks are not closely related to those of the host contract; |
| • | a separate instrument with the same terms as the embedded derivative would meet the definition of a derivative; and |
| • | the combined contract is not held for trading or designated at fair value through profit or loss. |
Where an embedded derivative is separable from the host contract but the fair value, as at the acquisition or reporting date, cannot be reliably measured separately, the entire combined contract is measured at fair value. All embedded derivatives are presented on the Consolidated Statement of Financial Position on a combined basis with the host contracts. Changes in fair value of embedded derivatives that are separated from the host contract are recognized in non-interest income in the Consolidated Statement of Income.
All derivatives, including embedded derivatives that must be separately accounted for, are recorded at fair value in the Consolidated Statement of Financial Position. The determination of the fair value of derivatives includes consideration of credit risk, estimated funding costs and ongoing direct costs over the life of the instruments. Inception gains or losses on derivatives are only recognized where the valuation is dependent on observable market data, otherwise, they are deferred and amortized over the life of the related contract, or until the valuation inputs become observable.
The gains and losses resulting from changes in fair values of trading derivatives are included in non-interest income – trading revenues in the Consolidated Statement of Income.
Changes in the fair value of derivatives that do not qualify for hedge accounting are recorded in the Consolidated Statement of Income in non-interest income – other. Where derivative instruments are used to manage the volatility of share-based payment expense, these derivatives are carried at fair value with changes in the fair value in relation to units hedged included in non-interest expenses – salaries and employee benefits in the Consolidated Statement of Income.
Changes in the fair value of derivatives that qualify for hedge accounting are recorded as non-interest income – other in the Consolidated Statement of Income for fair value hedges and other comprehensive income in the Consolidated Statement of Comprehensive Income for cash flow hedges and net investment hedges.
Hedge accounting
The Bank has elected to continue to apply the hedge accounting requirements of IAS 39. Also, the Bank has implemented the additional hedge accounting disclosures that are required by the IFRS 9 related amendments to IFRS 7 Financial Instruments: Disclosures.
The Bank formally documents all hedging relationships and its risk management objective and strategy for undertaking these hedge transactions at inception. The hedge documentation includes identification of the asset, liability, firm commitment or highly probable forecasted transaction being hedged, the nature of the risk being hedged, the hedging instrument used, and the method used to assess the effectiveness of the hedge.
2023 Scotiabank Annual Report | 161
Consolidated Financial Statements
The Bank also formally assesses, both at each hedge’s inception and on an ongoing basis, whether the hedging instruments are highly effective in offsetting changes in fair value or cash flows of the hedged items within an 80-125% range. This assessment incorporates a comparison of critical terms of the hedged and hedging item, and regression analysis, in order to determine (i) whether the hedge relationship is expected to be highly effective going forward (i.e. prospective effectiveness assessment) and (ii) whether the hedge was actually highly effective for the designated period (i.e. retrospective effectiveness assessment). In assessing prospective hedge effectiveness for a hedge relationship directly impacted by the IBOR reform, the Bank will assume that the benchmark interest rate is not altered as a result of the IBOR reform. In instances of assessing retrospective hedge effectiveness where a hedge relationship directly impacted by the IBOR reform falls outside of the 80-125% range solely as a result of the IBOR reform, the Bank will continue hedge accounting as long as other hedge accounting requirements are met.
Hedge ineffectiveness is measured and recorded in non-interest income – other in the Consolidated Statement of Income. When the basis for determining the contractual cash flows of existing hedge relationships changes as a result of the IBOR reform, the Bank updates the hedge documentation without discontinuing the hedging relationship. For cash flow hedges where the interest benchmark changes as a result of the IBOR reform, the Bank deems that the corresponding hedge reserve in OCI is based on the alternative benchmark rate to determine whether the hedged future cash flows are expected to occur. For changes that are in addition to those required by the IBOR reform, the Bank first determines whether the additional changes result in discontinuation of hedge relationships before applying the relief. In addition, when determining the hedged risk, the Bank may designate an alternative benchmark rate risk component that is not currently separately identifiable, as the Bank reasonably expects that the alternative benchmark rate will become separately identifiable within a 24-month period from its first designation.
There are three types of hedges: (i) fair value hedges, (ii) cash flow hedges and (iii) net investment hedges.
Fair value hedges
For fair value hedges, the change in fair value of the hedging instrument is offset in the Consolidated Statement of Income by the change in fair value of the hedged item attributable to the hedged risk. For hedges that are discontinued, the hedged item is no longer adjusted for changes in fair value. The cumulative fair value adjustment of the hedged item is amortized to interest income over its remaining term to maturity or written off to non-interest income directly if the hedged item ceases to exist. The Bank uses fair value hedges primarily to convert fixed rate financial instruments to floating rate financial instruments. Hedged items include debt securities, loans, deposit liabilities and subordinated debentures. Hedging instruments include single-currency interest rate swaps and cross-currency interest rate swaps.
Cash flow hedges
For cash flow hedges, the change in fair value of the hedging instrument, to the extent effective, is recorded in other comprehensive income until the corresponding gains and losses on the hedged item are recognized in income. For hedges that are discontinued, the cumulative unrealized gain or loss recognized in other comprehensive income is reclassified to interest income and/or salaries and employee benefits as the variability in the cash flows of hedged item affects income. However, if the hedged item is derecognized or the forecasted transaction is no longer expected to occur, the unrealized gain or loss is reclassified immediately to non-interest income and/or salaries and employee benefits. The Bank uses cash flow hedges primarily to hedge the variability in cash flows relating to floating rate financial instruments and highly probable forecasted revenues and expenses. Hedged items include debt securities, loans, deposit liabilities, subordinated debentures and highly probable forecasted transactions. Hedging instruments include single-currency interest rate swaps, cross-currency interest rate swaps, total return swaps, foreign currency forwards and foreign currency assets or liabilities.
For the Bank’s cash flow hedges of forecasted transactions that are directly affected by the IBOR Reform, it is assumed that the benchmark interest rate will not be altered as a result of the IBOR Reform for purposes of assessing whether the transactions are highly probable or whether the transactions are still expected to occur.
Net investment hedges
For net investment hedges, the change in fair value of the hedging instrument, to the extent effective, is recorded in other comprehensive income until the corresponding cumulative translation adjustments on the hedged net investment are recognized in income. The Bank designates foreign currency liabilities and foreign currency forwards as hedging instruments to manage the foreign currency exposure and impact on capital ratios arising from foreign operations.
Property and equipment
Land is carried at cost. Buildings (including building fittings), equipment, and leasehold improvements are carried at cost less accumulated depreciation and accumulated impairment losses, if any. Cost includes expenditures that are directly attributable to the acquisition of the asset. Depreciation is calculated using the straight-line method over the estimated useful life of the related asset less any residual value as follows: buildings – up to 40 years, building fittings – up to 15 years, equipment 3 to 10 years, and leasehold improvements – lease term determined by the Bank. Depreciation expense is included in the Consolidated Statement of Income under non-interest expenses – depreciation and amortization. Depreciation methods, useful lives and residual values are reassessed at each financial year-end and adjusted as appropriate.
When major components of building and equipment have different useful lives, they are accounted for separately and depreciated over each component’s estimated useful life.
Net gains and losses on disposal are included in non-interest income – other in the Consolidated Statement of Income in the year of disposal.
Assets held-for-sale
Non-current non-financial assets (and disposal groups) are classified as held-for-sale if their carrying amount will be recovered principally through a sale transaction rather than through continuing use. These assets meet the criteria for classification as held-for-sale if they are available for immediate sale in their present condition and their sale is considered highly probable to occur within one year.
Non-current non-financial assets classified as held-for-sale are measured at the lower of their carrying amount and fair value less costs to sell and are presented within other assets in the Consolidated Statement of Financial Position. Any subsequent write-down to fair value less costs to sell is recognized in the Consolidated Statement of Income, in non-interest income. Any subsequent increase in the fair value less costs to sell, to the extent this does not exceed the cumulative write-down, is also recognized in non-interest income, together with any realized gains or losses on disposal.
Non-financial assets acquired in exchange for loans as part of an orderly realization are recorded as assets held-for-sale or assets held-for-use. If the acquired asset does not meet the requirement to be considered held-for-sale, the asset is considered held-for-use, measured initially at cost which equals the carrying value of the loan and accounted for in the same manner as a similar asset acquired in the normal course of business.
162 | 2023 Scotiabank Annual Report
Consolidated Financial Statements
Business combinations and goodwill
The Bank follows the acquisition method of accounting for the acquisition of a business. The Bank considers the date on which control is obtained and it legally transfers the consideration for the acquired assets and assumed liabilities of the subsidiary to be the date of acquisition. The cost of an acquisition is measured at the fair value of the consideration paid. The fair value of the consideration transferred by the Bank in a business combination is calculated as the sum of the acquisition date fair value of the assets transferred by the Bank, the liabilities incurred by the Bank to former owners of the acquiree, and the equity interests, including any options, issued by the Bank. The Bank recognizes the acquisition date fair values of any previously held investment in the subsidiary and contingent consideration as part of the consideration transferred in exchange for the acquisition. A gain or loss on any previously held investments of an acquiree is recognized in non-interest income – other in the Consolidated Statement of Income.
In general, all identifiable assets acquired (including intangible assets) and liabilities assumed (including any contingent liabilities) are measured at the acquisition date fair value. The Bank records identifiable intangible assets irrespective of whether the assets have been recognized by the acquiree before the business combination. Non-controlling interests, if any, are recognized at their proportionate share of the fair value of identifiable assets and liabilities, unless otherwise indicated. Where the Bank has an obligation to purchase a non-controlling interest for cash or another financial asset, a financial liability is recognized based on management’s best estimate of the present value of the redemption amount. Where the Bank has a corresponding option to settle the purchase of a non-controlling interest by issuing its own common shares, no financial liability is recorded.
Any excess of the cost of acquisition over the Bank’s share of the net fair value of the identifiable assets acquired and liabilities assumed is recorded as goodwill. If the cost of acquisition is less than the fair value of the Bank’s share of the identifiable assets acquired and liabilities assumed, the resulting gain is recognized immediately in non-interest income – other in the Consolidated Statement of Income.
During the measurement period (which is within one year from the acquisition date), the Bank may, on a retrospective basis, adjust the amounts recognized at the acquisition date to reflect new information obtained about facts and circumstances that existed as of the acquisition date.
The Bank accounts for acquisition-related costs as expenses in the periods in which the costs are incurred and the services are received.
Subsequent to acquisition, the Bank accounts for the following assets and liabilities recognized in a business combination as described below:
| • | Contingent liabilities, until resolved, are measured at the higher of the amount that would be recognized as a provision or the amount initially recognized, with any change recognized in the Consolidated Statement of Income. |
| • | Indemnification assets are measured on the same basis as the item to which the indemnification relates. |
| • | Contingent consideration classified as a liability is measured at fair value, with any change recognized in the Consolidated Statement of Income. |
| • | Liabilities to non-controlling interest holders when remeasured at the end of each reporting period, a corresponding change is recorded in equity. |
After initial recognition of goodwill in a business combination, goodwill in aggregate is measured at cost less any accumulated impairment losses. Goodwill is not amortized but tested for impairment annually and when circumstances indicate that the carrying value may be impaired.
Goodwill is reviewed at each reporting date to determine whether there is any indication of impairment. For the purpose of impairment testing, goodwill acquired in a business combination is, on the acquisition date, allocated to each of the Bank’s group of cash-generating units (CGUs) that is expected to benefit from the combination. CGUs to which goodwill has been allocated are aggregated so that the level at which impairment is tested reflects the lowest level at which goodwill is monitored for internal management purposes.
The Bank determines the carrying value of the CGU using a regulatory capital approach based on credit, market, operational risks and leverage, consistent with the Bank’s capital attribution for business line performance measurement. Corporate capital that is not directly attributable is allocated to each CGU on a proportional basis. The recoverable amount is the greater of fair value less costs of disposal and value in use (“VIU”). If either fair value less costs of disposal or VIU exceeds the carrying amount, there is no need to determine the other. VIU is the present value of the future cash flows expected to be derived from a CGU. The determination of VIU involves judgment in estimating cash flow projections, discount rate and terminal growth rate. The future cash flows are based on management approved budgets and plans which factor in market trends, macro-economic conditions, forecasted earnings and business strategy for the CGU. The discount rate is based on the cost of capital while the terminal growth rate is based on the long-term growth expectations in the relevant countries.
The fair value less cost of disposal is the price that would be received from the sale of a CGU in an orderly transaction between market participants, less cost of disposal, at the measurement date. In determining fair value less costs of disposal, an appropriate valuation model is used which considers various factors including normalized net income, control premiums and price earnings multiples. These calculations are corroborated by valuation multiples and quoted share prices for publicly traded subsidiaries or other available fair value indicators. An impairment loss is recognized if the carrying amount of the CGU exceeds the recoverable amount. An impairment loss, in respect of goodwill, is not reversed.
Intangible assets
Intangible assets represent identifiable non-monetary assets and are acquired either separately or through a business combination, or generated internally. The Bank’s intangible assets are mainly comprised of computer software, customer relationships, contract intangibles, core deposit intangibles and fund management contracts.
The cost of a separately acquired intangible asset includes its purchase price and directly attributable costs of preparing the asset for its intended use. Intangibles acquired as part of a business combination are initially recognized at fair value.
In respect of internally generated intangible assets, initial measurement includes all directly attributable costs necessary to create, produce, and prepare the asset to be capable of operating in the manner intended by management.
After initial recognition, an intangible asset is carried at its cost less any accumulated amortization and accumulated impairment losses.
Intangible assets that have finite useful lives are initially measured at cost and are amortized on a straight-line basis over their useful lives as follows: computer software – 5 to 10 years; and other intangible assets – 5 to 20 years. Amortization expense is included in the Consolidated Statement of Income under operating expenses – depreciation and amortization. As intangible assets are non-financial assets, the impairment model for non-financial assets is applied. Intangible assets with indefinite useful lives are not amortized but are tested for impairment annually and when circumstances indicate that the carrying value may be impaired. Intangible assets with finite useful lives are only tested for impairment when events or circumstances indicate that the carrying value may be impaired.
Impairment of non-financial assets
The carrying amount of the Bank’s non-financial assets, other than goodwill and indefinite life intangible assets and deferred tax assets which are separately addressed, is reviewed at each reporting date to determine whether there is any indication of impairment. For the purpose of
2023 Scotiabank Annual Report | 163
Consolidated Financial Statements
impairment testing, non-financial assets that cannot be tested individually are grouped together into the smallest group of assets that generate cash inflows from continuing use that are largely independent from the cash inflows of other assets or groups of assets.
If any indication of impairment exists, then the asset’s recoverable amount is estimated. The recoverable amount of an asset or CGU is the greater of its value in use and its fair value less costs of disposal. The Bank’s corporate assets do not generate separate cash inflows. If there is an indication that a corporate asset may be impaired, then the recoverable amount is determined for the CGU to which the corporate asset belongs.
An impairment loss is recognized if the carrying amount of an asset or a CGU exceeds its recoverable amount. Impairment losses of continuing operations are recognized in the Consolidated Statement of Income in those expense categories consistent with the nature of the impaired asset. Impairment losses recognized in prior periods are reassessed at each reporting date for any indication that the loss had decreased or no longer exists. An impairment loss is reversed if there has been a change in the estimates used to determine the recoverable amount. An impairment loss is reversed only to the extent that the asset’s carrying amount does not exceed the carrying amount that would have been determined, net of depreciation or amortization, if no impairment loss had been recognized. Such reversal is recognized in the Consolidated Statement of Income.
Significant judgment is applied in determining the non-financial asset’s recoverable amount and assessing whether certain events or circumstances constitute objective evidence of impairment.
Corporate income taxes
The Bank follows the balance sheet liability method for corporate income taxes. Under this method, deferred tax assets and liabilities represent the cumulative amount of tax applicable to temporary differences which are the differences between the carrying amount of the assets and liabilities, and their values for tax purposes. Deferred tax assets are recognized only to the extent it is probable that sufficient taxable profits will be available against which the benefit of these deferred tax assets can be utilized.
Deferred tax assets and liabilities are measured using enacted or substantively enacted tax rates expected to apply to taxable income in the years in which those temporary differences are expected to be recovered or settled.
Deferred and current tax assets and liabilities are only offset when they arise in the same tax reporting group and where the Bank has both the legal right and the intention to settle on a net basis or to realize the asset and settle the liability simultaneously.
The Bank maintains provisions for uncertain tax positions that it believes appropriately reflect the risk of tax positions under discussion, audit, dispute or appeal with tax authorities, or which are otherwise considered to involve uncertainty. These provisions are made using the Bank’s best estimate of the amount expected to be paid based on an assessment of all relevant factors, which are reviewed at the end of each reporting period. It is possible that additional liability and income tax expense could arise in the future, depending on the acceptance of the Bank’s tax positions by the relevant tax authorities in the jurisdictions in which the Bank operates.
Income tax is recognized in the Consolidated Statement of Income except where it relates to items recognized in other comprehensive income or directly in equity, in which case income tax is recognized in the same line as the related item.
Leases
At inception of a contract, the Bank assesses whether a contract is, or contains, a lease. A contract is a lease if the contract conveys the right to control the use of an identified asset for a period of time in exchange for consideration. When the Bank is a lessee it recognizes a right-of-use (“ROU”) asset and a lease liability except for short-term leases for assets that have a lease term of 12 months or less and leases of low value items. For short-term leases and low value items the Bank recognizes the lease payment associated with these leases as an expense on a straight-line basis over the lease term.
Asset
A ROU is an asset that represents a lessee’s right to use an underlying asset for the lease term. The ROU asset is initially measured at cost, which is based on the initial amount of the lease liability, any direct costs incurred, any lease payments made at or before the commencement date net of lease incentives received and estimated decommissioning costs.
The ROU asset is subsequently measured at cost less accumulated depreciation and accumulated impairment losses, if any. The ROU asset is depreciated using the straight-line method from the commencement date to the earlier of the end of the useful life of the ROU asset or the end of the lease term. The depreciation is recorded in Depreciation and amortization in the Consolidated Statement of Income. In addition, the ROU asset is adjusted for certain remeasurements of the lease liability.
Liability
At commencement date, the Bank initially measures the lease liability at the present value of the future lease payments, discounted using the Bank’s incremental borrowing rate that takes into account the Bank’s credit risk and economic environment in which the lease is entered. The lease liability is subsequently measured at amortized cost using the effective interest method. It is re-measured if the Bank changes its assessment of whether it will exercise a purchase, extension or termination option. Interest expense is recorded in Interest expense – Other in the Consolidated Statement of Income.
When the lease liability is re-measured in this way, a corresponding adjustment is made to the carrying amount of the ROU asset or is recorded in profit or loss if the carrying amount of the right-of-use asset has been reduced to zero.
Presentation
The Bank presents ROU assets in Property and equipment and lease liabilities in Other liabilities in the Consolidated Statement of Financial Position.
Determining lease term
The Bank’s expectation of exercising the option to renew a lease is determined by assessing if the Bank is “reasonably certain” to exercise that option. The Bank will be reasonably certain to exercise an option when factors create a significant economic incentive to do so. This assessment considers the following criteria: key locations for its branch network, locations on which the Bank has spent significant capital on renovation work, contribution to profit, value of locations based on current economic environment and the remaining term of existing leases.
Provisions
A provision, including for restructuring, is recognized if, as a result of a past event, the Bank has a present legal or constructive obligation that can be estimated reliably, and it is probable that an outflow of economic benefits will be required to settle the obligation.
164 | 2023 Scotiabank Annual Report
Consolidated Financial Statements
The amount recognized as a provision is the Bank’s best estimate of the consideration required to settle the present obligation, taking into account the risks and uncertainties surrounding the obligation. If the effect of the time value of money is considered material, provisions are determined by discounting the expected future cash flows at a pre-tax rate that reflects current market assessments of the time value of money and, where appropriate, the risks specific to the liability. The increase in the provision due to the passage of time is recorded as interest expense – other in the Consolidated Statement of Income.
Insurance contracts
Gross premiums for life insurance contracts are recognized as income when due. Gross premiums for non-life insurance business, primarily property and casualty, are recognized as income over the term of the insurance contracts. Unearned premiums represent the portion of premiums written in the current year that relate to the period of risk after the reporting date. Insurance claims recoveries are accounted as income in the same period as the related claims.
Gross insurance claims for life insurance contracts reflect the cost of all claims arising during the year. Gross insurance claims for property and casualty insurance contracts include paid claims and movements in outstanding claim liabilities. Insurance premiums ceded to reinsurers are accounted as an expense in the same period as the premiums for the direct insurance contracts to which they relate.
Guarantees
A guarantee is a contract that contingently requires the Bank to make specified payments to reimburse the holder for a loss it incurs because a specified debtor failed to make payment when due in accordance with the original or modified terms of a debt instrument. Guarantees include standby letters of credit, letters of guarantee, indemnifications, credit enhancements and other similar contracts. Guarantees that qualify as a derivative are accounted for in accordance with the policy for derivative instruments. For guarantees that do not qualify as a derivative, a liability is recorded for the fair value of the obligation assumed at inception. The fair value of the obligation at inception is generally based on the discounted cash flow of the premium to be received for the guarantee, resulting in a corresponding asset. Subsequent to initial recognition, such guarantees are measured at the higher of the initial amount, less amortization to recognize any fee income earned over the period, and the best estimate of the amount required to settle any financial obligation arising as a result of the guarantee. Any increase in the liability is reported in the Consolidated Statement of Income.
Employee benefits
The Bank provides pension and other benefit plans for eligible employees in Canada and internationally. Pension benefits are offered in the form of defined benefit pension plans (generally based on an employee’s length of service and earnings), and in the form of defined contribution pension plans (where the Bank’s contribution is fixed and there is no legal or constructive obligation to pay further amounts). Other benefits provided include post-retirement health care, dental care and life insurance, along with other long-term employee benefits such as long-term disability benefits.
Defined benefit pension plans and other post-retirement benefit plans
The cost of these employee benefits is actuarially determined each year using the projected unit credit method. The calculation uses management’s best estimate of a number of assumptions – including the discount rate, future compensation, health care costs, mortality, as well as the retirement age of employees. The most significant assumption is the discount rate used to determine the defined benefit obligation, which is set by reference to the yields on high quality corporate bonds that have durations that match the terms of the Bank’s obligations. Separate discount rates are used to determine the annual benefit expense in Canada and the U.S. These rates are determined with reference to the yields on high quality corporate bonds with durations that match the various components of the annual benefit expense. The discount rate used to determine the annual benefit expense for all other plans is the same as the rate used to determine the defined benefit obligation.
The Bank’s net asset or liability in respect of employee benefit plans is calculated separately for each plan as the difference between the present value of future benefits earned in respect of service for prior periods and the fair value of plan assets. The net asset or liability is included in other assets and other liabilities, as appropriate, in the Consolidated Statement of Financial Position. When the net amount in the Consolidated Statement of Financial Position is an asset, the recognized asset is limited to the present value of any economic benefits available in the form of refunds from the plan or reductions in future contributions to the plan.
The current service cost, net interest expense (income), past service cost (credit), settlement gain (loss) and administrative expense are recognized in net income. Net interest expense (income) is calculated by applying the discount rate to the net defined benefit asset or liability. When the benefits of a plan are improved (reduced), a past service cost (credit) is recognized immediately in net income.
Remeasurements comprising of actuarial gains and losses, the effect of the asset ceiling and the return on plan assets in excess of or less than the interest income on the fair value of assets are recognized immediately in the Consolidated Statement of Financial Position with a charge or credit to the Statement of Other Comprehensive Income (OCI) in the period in which they occur. Amounts recorded in OCI are not recycled to the Consolidated Statement of Income.
Other long-term employee benefits
Other long-term employee benefits are accounted for similarly to defined benefit pension plans and other post-retirement benefit plans described above, except that remeasurements are recognized in the Consolidated Statement of Income in the period in which they arise.
Defined contribution plans
The costs of such plans are equal to contributions payable by the Bank to employees’ accounts for service rendered during the period and expensed.
Short-term employee benefits
Short-term employee benefits are expensed as the related service is provided and a liability is measured on an undiscounted basis net of payments made.
Interest and similar income and expenses
For all non-trading interest-bearing financial instruments, interest income or expense is recorded in net interest income using the effective interest rate. This is the rate that exactly discounts estimated future cash payments or receipts through the expected life of the financial instrument or a shorter period, where appropriate, to the gross carrying amount of the financial asset or financial liability. The calculation takes into account all the
2023 Scotiabank Annual Report | 165
Consolidated Financial Statements
contractual terms of the financial instrument (for example, prepayment options) and includes any fees or incremental costs that are directly attributable to the instrument and are an integral part of the effective interest rate, but not future credit losses.
For trading financial instruments, mark-to-market changes including related interest income or expense are recorded in non-interest income – trading revenues.
The carrying amount of interest-bearing financial instruments, measured at amortized cost or classified as FVOCI, is adjusted if the Bank revises its estimates of payments or receipts. The adjusted carrying amount is calculated based on the original effective interest rate and the change in carrying amount is recorded as non-interest income in the Consolidated Statement of Income.
Once the carrying value of a financial asset or a group of similar financial assets has been reduced due to an impairment loss, interest income continues to be recognized based on net effective interest rate inherent in the investment.
Loan origination costs are deferred and amortized into interest income using the effective interest method over the expected term of the loan. Loan fees are recognized in interest income over the appropriate lending or commitment period. Mortgage prepayment fees are recognized in interest income when received, unless they relate to a minor modification to the terms of the mortgage, in which case the fees are deferred and amortized using the effective interest method over the remaining period of the original mortgage.
Loan syndication fees are deferred and amortized in interest income over the term of the loan where the yield the Bank retains is less than that of the comparable lenders in the syndicate.
Loan commitment fees for loans that are likely to be drawn down and other credit related fees are deferred (together with any incremental costs) and recognized as part of the interest income on the loan. When it is unlikely that a loan will be drawn down, the loan commitment fees are recognized in non-interest income.
Fee and commission revenues
Revenue is recognized once the Bank’s customer has obtained control of the service. The transfer of control occurs when the Bank’s customer has the ability to direct the use of and obtain the benefits of the banking services and the contractual performance obligation to the customer has been satisfied. The Bank records revenue gross of expenses where it is the principal in performing a service to the customer and net of expenses where the Bank is an agent for these services. The assessment of principal or agent requires judgement on the basis of whether the Bank controls the services before they are transferred to the customer. From time to time, the Bank may receive variable consideration such as performance fees. These fees are only recognized when it is highly probable that the Bank will not need to reverse a significant amount of revenue.
Card revenues include interchange fees, annual fees and other card related fees. Interchange fees are calculated as a percentage of the transaction and are recognized on the transaction date. Annual fees are recognized in income over 12 months. Other card fees are transaction-based and are recognized on the transaction date.
The Bank operates various loyalty points programs, which allow customers to accumulate points when using the Bank’s products and services. Loyalty point liabilities are subject to periodic remeasurement to reflect the expected cost of redemption. Where the customer has the option to redeem points for statement credits, the cost of the loyalty program is presented net of card fees. Where points can only be redeemed for goods or services, interchange revenue allocated to the loyalty rewards is recognized when the rewards are redeemed. Reward costs are recorded in non-interest expense.
Banking services fees consist of fees earned on personal, business and government deposit activities. Personal deposit-related fees consist of account maintenance and various transaction-based services. Business and government deposit-related fees consist of commercial deposit and treasury management services and other cash management services. These fees are recognized on the transaction date or over time as services are provided to the customer.
Credit fees include fees earned for providing letters of credit and guarantee, loan commitments, bankers’ acceptances, and for arranging loan syndications. These fees are recognized on the transaction date or over time as services are provided based on contractual agreements with the customer.
Mutual funds fees include management and administration fees which are earned in the Bank’s wealth management business. These fees are calculated as a percentage of the fund’s net asset value and recognized as the service is provided. From time to time, the Bank may also recognize performance fees from some funds. These fees are only recognized to the extent that it is highly probable that a significant reversal of revenue will not occur.
Brokerage fees relate to fees earned for providing full-service and discount brokerage services to clients. These fees are contractually agreed and can be asset-based or linked to individual transactions. Such fees are recognized as the service is provided to clients or on the trade date.
Investment management and trust fees include administration, trust services and other investment services provided to clients. These fees are contractually agreed upon and can be linked to portfolio values or individual transactions. Such fees are recognized as the service is provided to clients to the extent that it is highly probable that a significant reversal of revenue will not occur.
Underwriting and other advisory fees relate to fees earned for services provided to clients in relation to the placement of debt and equities. Such fees also include services to clients for mergers, acquisitions, financial restructurings and other corporate finance activities. These fees are recognized when the service has been performed and/or contractual milestones are completed. Performance and completion fees are variable consideration and generally contingent on the successful completion of a transaction.
Other fees and commissions include commissions earned on the sale of third party insurance products to the Bank’s customers. Such fees and commissions are recognized when the performance obligation is completed.
Fee and commission expenses
Fee and commission expenses relate to transaction and service fees which are expensed as the services are received.
Dividend income
Dividend income on equity securities is recognized when the Bank’s right to receive payment is established, which is on the ex-dividend date for listed equity securities.
166 | 2023 Scotiabank Annual Report
Consolidated Financial Statements
Share-based payments
Share-based payments awarded to employees are recognized as compensation expense in the Consolidated Statement of Income over the vesting period based on the number of awards expected to vest including the impact of expected forfeitures. For awards that are delivered in tranches, each tranche is considered a separate award and accounted for separately.
Plain vanilla options and other awards that must be settled for shares are classified as equity awards. Equity-classified awards are expensed based on the grant date fair value with a corresponding increase to equity – other reserves in the Consolidated Statement of Financial Position. If an option is exercised, both the exercise price proceeds together with the amount recorded in other reserves is credited to equity – common shares in the Consolidated Statement of Financial Position.
Stock appreciation rights and other awards that must be settled for cash are classified as liabilities. Liability-classified awards are re-measured to fair value at each reporting date while they remain outstanding, with any changes in fair value recognized in compensation expense in the period. The liability is expensed over the vesting period which incorporates the re-measurement of the fair value and a revised forfeiture rate that anticipates units expected to vest.
For plain vanilla options and stock appreciation rights, the Bank estimates fair value using an option pricing model. The option pricing model requires inputs such as the exercise price of the option, the current share price, the risk free interest rate, expected dividends, expected volatility (calculated using an equal weighting of implied and historical volatility) and specific employee exercise behaviour patterns based on statistical data. For other awards, fair value is the quoted market price of the Bank’s common shares at the reporting date.
Where derivatives are used to economically hedge share-based payment expense, related mark-to-market gains and losses are included in non-interest expenses – salaries and employee benefits in the Consolidated Statement of Income.
Dividends on shares
Dividends on common and preferred shares and other equity instruments are recognized as a liability and deducted from equity when they are declared and no longer at the discretion of the Bank.
Segment reporting
Management’s internal view is the basis for the determination of operating segments. The operating segments are those whose operating results are regularly reviewed by the Bank’s chief operating decision-maker to make decisions about resources to be allocated to the segment and assess its performance. The Bank has four operating segments: Canadian Banking, International Banking, Global Wealth Management and Global Banking and Markets. The Other category represents smaller operating segments, including Group Treasury and other corporate items, which are not allocated to an operating segment. These segments offer different products and services and are managed separately based on the Bank’s management and internal reporting structure.
The results of these business segments are based upon the internal financial reporting systems of the Bank. The accounting policies used in these segments are generally consistent with those followed in the preparation of the consolidated financial statements by the Bank. The only notable accounting measurement difference is the grossing up of revenues which are tax-exempt and income from associate corporations to an equivalent before-tax basis for those affected segments. This change in measurement enables comparison of income arising from taxable and tax-exempt sources.
Given the complexity of the Bank, various estimates and allocation methodologies are used in the preparation of the business segment financial information. The funding value of assets and liabilities is transfer-priced at wholesale market rates, and corporate expenses are allocated to each segment on an equitable basis using various parameters. As well, capital is apportioned to the business segments on a risk-based methodology. Transactions between segments are recorded within segment results as if conducted with a third-party and are eliminated on consolidation.
Earnings per share (EPS)
Basic EPS is computed by dividing net income for the period attributable to the Bank’s common shareholders by the weighted-average number of common shares outstanding during the period.
Diluted EPS is calculated by dividing adjusted net income for the period attributable to common shareholders by the weighted-average number of diluted common shares outstanding for the period. In the calculation of diluted earnings per share, earnings are adjusted for changes in income or expenses that would result from the issuance of dilutive shares. The weighted-average number of diluted common shares outstanding for the period reflects the potential dilution that would occur if options, securities or other contracts that entitle their holders to obtain common shares had been outstanding from the beginning of the period (or a later date) to the end of the period (or an earlier date). Instruments determined to have an antidilutive impact for the period are excluded from the calculation of diluted EPS.
The number of additional shares for inclusion in diluted EPS for share-based payment options is determined using the treasury share method. Under this method, the net number of incremental common shares is determined by assuming that in-the-money stock options are exercised and the proceeds are used to purchase common shares at the average market price during the period.
The number of additional shares associated with capital instruments that potentially result in the issuance of common shares is based on the terms of the contract. On occurrence of contingencies as specified in the Non-Viability Contingent Capital (NVCC) instruments, the number of additional common shares associated with the NVCC subordinated debentures, NVCC subordinated additional Tier 1 capital notes, NVCC limited recourse capital notes and NVCC preferred shares is based on an automatic conversion formula as set out in the respective prospectus supplements.
| 4 | Interest Rate Benchmark Reform |
Overview
The publication of the overnight and 12-month U.S. Dollar London Interbank Offered Rate (USD LIBOR) tenors has ceased, and the one-month, three-month and six-month USD LIBOR tenors became non-representative as of June 30, 2023. These non-representative tenors will be published on a synthetic basis until September 30, 2024, to allow market participants to use such rates in legacy contracts. The Bank has successfully transitioned all of its USD LIBOR contracts to alternative risk-free rates either through amendments in advance of June 30, 2023, or reliance through fallback provisions.
As previously announced by Refinitiv Benchmark Services (UK) Limited, one-month, two-month, and three-month Canadian Dollar Offered Rate (CDOR) tenors will continue to be published until June 28, 2024 (the cessation date). OSFI expects FRFIs to transition CDOR-linked transactions to Canadian Overnight Repo Rate Average (CORRA) before the cessation date.
2023 Scotiabank Annual Report | 167
Consolidated Financial Statements
CanDeal Benchmark Solutions and TMX Datalinx have launched the one-month and three-month Term CORRA benchmark on September 5, 2023. The Canadian Alternative Reference Rate working group (CARR) has announced that after November 1, 2023, all new loan contracts must reference only Overnight CORRA, Term CORRA, or Prime Rate instead of CDOR or a bankers’ acceptance rate.
The move from CDOR to CORRA carries certain transition and market risks. These risks, such as increased volatility, lack of liquidity and slow adoption of industry recommended fallbacks, may impact market participants. In addition to these inherent risks, the Bank is exposed to operational risk arising from the renegotiation of contracts, technology readiness to issue and trade products referencing alternative reference rates as noted above and conduct with clients and counterparties.
The Bank’s Transition Plan aligns with the CDOR transition roadmap and milestones published by CARR. After June 30, 2023, all new derivatives and securities transactions of the Bank must reference CORRA benchmarks with permissible exceptions. With the cessation of CDOR, Bankers Acceptance (BA) based loan facilities will be transitioned to alternative rates such as CORRA or Prime. BA securities, which are produced as a result of BA-based loan facilities, will no longer be issued after the cessation of CDOR and will be replaced by other short-term money market instruments.
The focus of the Transition Program is to address risks by identifying the exposures and contracts referencing CDOR, evaluating the existing contract language in the event CDOR ceases to be published or available, developing the capabilities to issue and trade products referencing CORRA and communicating with clients and counterparties regarding industry developments pertaining to CDOR cessation. The Transition Program provides quarterly updates to the Bank’s Regulatory Oversight Committee and annually to the Risk Committee of the Board of Directors regarding the status of transition plans for migrating the Bank’s CDOR-linked products to CORRA and upgrading systems and processes. Additionally, the Bank provides regular updates on its CDOR transition to OSFI.
Non-derivative financial assets and financial liabilities
The following table reflects the Bank’s CDOR (one-month, two-month and three-month) exposure to non-derivative financial assets and financial liabilities as at October 31, 2023, that has yet to transition to CORRA. These exposures could remain outstanding until CDOR ceases and will therefore transition in the future.
| Carrying Amount | ||||||||
| ($ millions) | As at October 31, 2023 | As at October 31, 2022 | ||||||
| CDOR Maturing after June 28, 2024 |
CDOR Maturing after June 28, 2024 |
|||||||
| Non-derivative financial assets(1) |
$ | 45,512 | $ | 24,146 | ||||
| Non-derivative financial liabilities(2) |
40,644 | 24,256 | ||||||
| (1) | Non derivative financial assets include carrying amounts of debt securities, loans and customer’s liability under acceptances (debt securities, loans and customer’s liability under acceptances measured at amortized cost are gross of allowance for credit losses). |
| (2) | Non-derivative financial liabilities include carrying amounts of deposits, acceptances, obligations related to securities sold short, subordinated debentures and other liabilities. |
Derivatives and undrawn commitments
The following table reflects the Bank’s CDOR (one-month, two-month and three-month) exposure to derivatives and undrawn commitments as at October 31, 2023, that has yet to transition to CORRA. These exposures could remain outstanding until CDOR ceases and will therefore transition in the future.
| Notional Amount | ||||||||
| ($ millions) | As at October 31, 2023 | As at October 31, 2022 | ||||||
| CDOR Maturing after June 28, 2024 |
CDOR Maturing after June 28, 2024 |
|||||||
| Derivatives |
||||||||
| Single currency interest rate swaps(1) |
$ | 1,264,325 | $ | 1,025,373 | ||||
| Cross currency interest rate swaps(1) |
122,729 | 122,718 | ||||||
| Other(2) |
23,811 | 3,574 | ||||||
| Undrawn commitments |
22,265 | 4,787 | ||||||
| (1) | For single currency and/or cross currency interest rate swaps, where both legs are referencing rates directly impacted by the interest rate benchmark reform, the relevant notional amount for both legs are included to reflect the risks relating to the reform for each rate. |
| (2) | Other derivatives include futures, total return swaps and options. |
Hedging derivatives
The following table reflects the Bank’s CDOR (one-month, two-month and three-month) exposure to hedging derivatives as at October 31, 2023, that has yet to transition to CORRA. These exposures will remain outstanding until CDOR ceases and will therefore transition in the future.
| ($ millions) | As at October 31, 2023 | As at October 31, 2022 | ||||||
| CDOR Maturing after June 28, 2024(1) |
CDOR Maturing after June 28, 2024(1) |
|||||||
| Hedging derivatives(2) |
$ | 114,113 | $ | 109,253 | ||||
| (1) | For single currency interest rate swaps, where both legs are referencing rates directly impacted by the interest rate benchmark reform, the relevant notional amount for both legs are included to reflect the risks relating to the reform for each rate. |
| (2) | For cross currency swaps where a CAD float leg is inserted to create two separate hedging instruments, the relevant notional amount for both instruments are included in the table. |
| 5 | Future Accounting Developments |
The Bank actively monitors developments and changes in accounting standards from the IASB, as well as requirements from the other regulatory bodies, including OSFI. The Bank is currently assessing the impact of adoption of new standards issued by the IASB on its consolidated financial statements and also evaluating the alternative elections available on transition.
168 | 2023 Scotiabank Annual Report
Consolidated Financial Statements
Effective November 1, 2023
Insurance Contracts
The International Accounting Standards Board issued IFRS 17 Insurance Contracts to replace IFRS 4 Insurance Contracts. IFRS 17 provides a comprehensive principle-based framework for the recognition, measurement, presentation, and disclosure of insurance contracts, and is effective for the Bank on November 1, 2023. The standard is to be applied on a full retrospective basis unless impractical, where either the modified retrospective or fair value method may be used.
The Bank assessed the data and assumptions required to apply IFRS 17 and determined that the full retrospective approach could be applied for its short duration contracts and the fair value approach was required for its longer duration contracts. Short duration contracts apply the premium allocation approach which requires that the expected premium is recognized into income over the coverage period and a liability is established to the extent that cash inflows are received earlier than the recognition of premiums into insurance revenue. For long duration contracts, the adoption of IFRS 17 will result in recognition of probability-weighted fulfilment cashflows and a risk adjustment for non-financial risk for groups of contracts. To the extent that those groups of contracts are expected to be profitable, a contractual service margin liability is recognized on the Consolidated Statement of Financial Position which represents unearned profits that will be recognized in the Consolidated Statement of Income in the future over the life of the contract. Insurance revenue is earned over the period of expected claims, risk is released as coverage is provided. For all insurance contracts, losses on onerous contracts are recognized in income immediately.
IFRS 17 is effective for the Bank on November 1, 2023, and the Bank plans to adopt the standard by restating the comparative year results from the transition date of November 1, 2022. The expected impact of applying IFRS 17 to opening retained earnings as of transition date is not expected to be material.
| 6 | Cash and Deposits with Financial Institutions |
| As at October 31 ($ millions) | 2023 | 2022 | ||||||
| Cash and non-interest-bearing deposits with financial institutions |
$ | 10,173 | $ | 11,065 | ||||
| Interest-bearing deposits with financial institutions |
80,139 | 54,830 | ||||||
| Total |
$ | 90,312 | (1) | $ | 65,895 | (1) | ||
| (1) | Net of allowances of $7 (2022 – $4). |
The Bank is required to maintain balances with central banks, other regulatory authorities and certain counterparties and these amounted to $5,758 million (2022 – $5,958 million) and are included above.
| 7 | Fair Value of Financial Instruments |
Determination of fair value
The calculation of fair value is based on market conditions at a specific point in time and therefore may not be reflective of future fair values. The Bank has controls and processes in place to ensure that the valuation of financial instruments is appropriately determined.
The Bank discloses the classification of all financial instruments carried at fair value in a hierarchy based on the determination of fair value. The best evidence of fair value for a financial instrument is the quoted price in an active market. Fair value based on unadjusted quoted market prices for identical instruments in active markets represents a Level 1 valuation. Where possible, valuations are based on quoted prices or observable inputs obtained from active markets.
Independent Price Verification (IPV) is undertaken to assess the accuracy of prices and inputs used in the determination of fair value. The IPV process is performed by price verification groups that are independent of the business. The Bank maintains a list of approved pricing sources that are used in the IPV process. These sources include, but are not limited to, brokers, exchanges and pricing services. The valuation policies relating to the IPV process require that all pricing or rate sources used be external to the Bank. At least annually, an independent assessment of pricing or rate sources is performed to determine the market presence and reliability of market levels.
Quoted prices are not always available for over-the-counter (OTC) transactions as well as for transactions in inactive or illiquid markets. OTC transactions are valued using internal models that maximize the use of observable inputs to estimate fair value. The chosen valuation technique incorporates all the factors that market participants would take into account in pricing a transaction. When fair value is based on all significant market observable inputs, the valuation is classified as Level 2. Financial instruments traded in a less active market can be valued using indicative market prices, the present value of cash flows or other valuation techniques. Fair value estimates normally do not consider forced or liquidation sales.
Where financial instruments trade in inactive markets or when using models where observable parameters do not exist, significant management judgment is required for valuation methodologies and model inputs. Valuations that require the significant use of unobservable inputs are considered Level 3.
The specific inputs and valuation techniques used in determining the fair value of financial instruments are noted below. For Level 3 instruments, additional information is disclosed in the Level 3 sensitivity analysis on page 174.
The fair values of cash and deposits with banks, securities purchased under resale agreements and securities borrowed, customers’ liability under acceptances, obligations related to securities sold under repurchase agreements and securities lent, acceptances, and obligations related to securities sold short are assumed to approximate their carrying values, either due to their short-term nature or because they are frequently repriced to current market rates.
Trading loans
Trading loans are comprised of loans for market making, loans that serve as hedges to total return swaps, and purchased mortgages pooled for securitization. Trading loans for market making or that serve as hedges to loan-based credit total return swaps are valued using consensus prices from Bank approved independent pricing services. Purchased mortgages that are held prior to securitization are valued using inputs observed from the MBS market.
2023 Scotiabank Annual Report | 169
Consolidated Financial Statements
Government issued or guaranteed securities
The fair values of government issued or guaranteed debt securities are primarily based on unadjusted quoted prices in active markets, where available. Where quoted prices in active markets are not available, the fair value is determined by utilizing recent transaction prices, reliable broker quotes, or pricing services, which derive fair values using only observable valuation inputs, which are significant to the fair values.
For securities for which quoted prices are not available, the Bank uses a discounted cash flow method, using the effective yield of a similar instrument adjusted for instrument-specific risk factors that are observable inputs such as credit spread and contracted features.
Corporate and other debt
Corporate and other debt securities are valued using unadjusted quoted prices from independent market data providers or third-party broker quotes from an active market. Where direct prices from active markets are not available, the valuation is performed with a yield-based valuation approach. In some instances, interpolated yields of similar bonds are used to price securities. The Bank uses pricing models with observable inputs from market sources such as credit spread, and interest rate curves. These inputs are verified through an IPV process on a monthly basis.
For certain securities where there is no active market, no consensus market pricing and no indicative or executable independent third-party quotes, the Bank uses pricing by third-party providers or internal pricing models and cannot readily observe the significant inputs used to price such instruments.
Mortgage-backed securities
The fair value of residential mortgage-backed securities is primarily determined using broker quotes and independent market data providers. In limited circumstances, an internal price-based model may be used with the unobservable inputs that are significant to the fair value.
Equity securities
The fair value of equity securities is based on unadjusted quoted prices in active markets, where available. Where equity securities are less frequently traded, the most recent exchange-quoted pricing is used to determine fair value.
For private equity securities, where quoted prices in active markets are not readily available, the fair value is determined as a multiple of the underlying earnings or percentage of underlying net asset value obtained from third-party general partner statements.
Derivatives
Fair values of exchange-traded derivatives are based on unadjusted quoted market prices from an active market. Fair values of over-the-counter (OTC) derivatives or inactive exchange-traded derivatives are determined using pricing models, which take into account observable valuation inputs such as current market and contractual prices of the underlying instruments, as well as time value and yield curve or volatility factors underlying the positions. The determination of the fair value of derivatives includes consideration of credit risk, estimated funding costs and ongoing direct costs over the life of the instruments.
Derivative products valued using a valuation technique with market-observable inputs mainly include interest rate swaps and options, currency swaps and forward foreign exchange contracts. The most frequently applied valuation techniques include forward pricing and swap models, using present value calculations. The models incorporate various inputs including foreign exchange spot, forward rates and interest rate curves.
Derivative products valued using a valuation technique with significant unobservable inputs, such as volatility, correlation, and forward curves, may include long dated contracts (interest rate swaps, currency swaps, option contracts, commodity contracts and certain credit default swaps) and other derivative products that reference a basket of assets.
Loans
The estimated fair value of loans carried at amortized cost reflects changes in the general level of interest rates and creditworthiness of borrowers that have occurred since the loans were originated or purchased. The particular valuation methods used are as follows:
| • | Canadian fixed rate residential mortgages are fair valued by discounting the expected future contractual cash flows, taking into account expected prepayments and using management’s best estimate of average market interest rates currently offered for mortgages with similar remaining terms. |
| • | For fixed rate business and government loans, fair value is determined by discounting the expected future contractual cash flows of these loans at interest rates estimated by using the appropriate currency swap curves for the remaining term, adjusted for a credit mark of the expected losses in the portfolio. |
| • | For all other fixed rate loans, fair value is determined by discounting the expected future contractual cash flows of these loans at interest rates estimated by using the appropriate currency swap curves for the remaining term. |
| • | For all floating rate loans fair value is assumed to equal book value. |
The fair value of loans is not adjusted for the value of any credit protection the Bank has purchased to mitigate credit risk.
Deposits
The fair values of deposits payable on demand or after notice or floating rate deposits payable on a fixed date is assumed to equal book value.
The estimated fair values of Canadian personal fixed rate deposits payable on a fixed date are fair valued by discounting the expected future contractual cash outflows, using management’s best estimate of average market interest rates currently offered for deposits with similar remaining terms.
Deposits under the Canada Mortgage Bond (CMB) program are fair valued by discounting expected future contractual cash flows using market observable inputs.
For all other fixed rate deposits, fair value is determined by discounting the expected future contractual cash flows of these deposits at interest rates estimated by using the appropriate currency swap curves for the remaining term.
For structured notes containing embedded features that are bifurcated from plain vanilla notes, the fair value of the embedded derivatives is determined using option pricing models with observable inputs similar to other interest rate or equity derivative contracts.
Certain deposits that are designated at FVTPL are structured notes. Their coupon or repayment terms can be linked to the performance of market parameters such as interest rates, equities, and foreign currencies. The fair value of these structured notes is determined using models which
170 | 2023 Scotiabank Annual Report
Consolidated Financial Statements
incorporate observable market inputs, such as interest rate curves, equity prices, equity volatility and foreign exchange rates. Some structured notes may have significant unobservable inputs to model valuation such as interest rate volatility and equity correlation.
Obligations related to securities sold short
The fair values of these obligations are based on the fair value of the underlying securities, which can include debt or equity securities. The method used to determine fair value is based on the quoted market prices where available in an active market.
Subordinated debentures and other liabilities
The fair values of subordinated debentures, including debentures issued by subsidiaries which are included in other liabilities, are determined by reference to quoted market prices where available or market prices for debt with similar terms and risks. The fair values of other liabilities are determined by the discounted contractual cash flow method with appropriate currency swap curves for the remaining term or market prices for instruments with similar terms and risks.
Fair value of financial instruments
The following table sets out the fair values of financial instruments of the Bank using the valuation methods and assumptions described above. The fair values disclosed do not include non-financial assets, such as property and equipment, investments in associates, precious metals, goodwill and other intangible assets.
| 2023 | 2022 | |||||||||||||||
| As at October 31 ($ millions) | Total fair value |
Total carrying value |
Total fair value |
Total carrying value |
||||||||||||
| Assets: |
||||||||||||||||
| Cash and deposits with financial institutions |
$ | 90,312 | $ | 90,312 | $ | 65,895 | $ | 65,895 | ||||||||
| Trading assets |
117,868 | 117,868 | 113,154 | 113,154 | ||||||||||||
| Securities purchased under resale agreements and securities borrowed |
199,325 | 199,325 | 175,313 | 175,313 | ||||||||||||
| Derivative financial instruments |
51,340 | 51,340 | 55,699 | 55,699 | ||||||||||||
| Investment securities – FVOCI and FVTPL |
86,253 | 86,253 | 86,398 | 86,398 | ||||||||||||
| Investment securities – Amortized cost |
29,816 | 31,984 | 22,443 | 23,610 | ||||||||||||
| Loans |
736,366 | 750,911 | 729,149 | 744,987 | ||||||||||||
| Customers’ liability under acceptances |
18,628 | 18,628 | 19,494 | 19,494 | ||||||||||||
| Other financial assets |
26,677 | 26,677 | 27,394 | 27,394 | ||||||||||||
| Liabilities: |
||||||||||||||||
| Deposits |
942,112 | 952,333 | 904,033 | 916,181 | ||||||||||||
| Financial instruments designated at fair value through profit or loss |
26,779 | 26,779 | 22,421 | 22,421 | ||||||||||||
| Acceptances |
18,718 | 18,718 | 19,525 | 19,525 | ||||||||||||
| Obligations related to securities sold short |
36,403 | 36,403 | 40,449 | 40,449 | ||||||||||||
| Derivative financial instruments |
58,660 | 58,660 | 65,900 | 65,900 | ||||||||||||
| Obligations related to securities sold under repurchase agreements and securities lent |
160,007 | 160,007 | 139,025 | 139,025 | ||||||||||||
| Subordinated debentures |
9,358 | 9,693 | 8,038 | 8,469 | ||||||||||||
| Other financial liabilities |
49,276 | 51,215 | 45,723 | 46,682 | ||||||||||||
2023 Scotiabank Annual Report | 171
Consolidated Financial Statements
Changes in interest rates, credit spreads and liquidity costs are the main cause of changes in the fair value of the Bank’s financial instruments resulting in a favourable or unfavourable variance compared to carrying value. For the Bank’s financial instruments carried at cost or amortized cost, the carrying value is not adjusted to reflect increases or decreases in fair value due to market fluctuations, including those due to interest rate changes. For FVOCI investment securities, derivatives and financial instruments measured at FVTPL or designated as fair value through profit or loss, the carrying value is adjusted regularly to reflect the fair value.
Fair value hierarchy
The following table outlines the fair value hierarchy of instruments carried at fair value on a recurring basis and of instruments not carried at fair value.
| 2023 | 2022 | |||||||||||||||||||||||||||||||
| As at October 31 ($ millions) | Level 1 | Level 2 | Level 3 | Total | Level 1 | Level 2 | Level 3 | Total | ||||||||||||||||||||||||
| Instruments carried at fair value on a recurring basis: |
||||||||||||||||||||||||||||||||
| Assets: |
||||||||||||||||||||||||||||||||
| Precious metals(1) |
$ | – | $ | 937 | $ | – | $ | 937 | $ | – | $ | 543 | $ | – | $ | 543 | ||||||||||||||||
| Trading assets |
||||||||||||||||||||||||||||||||
| Loans |
– | 7,540 | 4 | 7,544 | – | 7,811 | – | 7,811 | ||||||||||||||||||||||||
| Canadian federal government and government guaranteed debt |
13,766 | 3,603 | – | 17,369 | 10,139 | 4,595 | – | 14,734 | ||||||||||||||||||||||||
| Canadian provincial and municipal debt |
5,299 | 4,154 | – | 9,453 | 4,299 | 5,978 | – | 10,277 | ||||||||||||||||||||||||
| U.S. treasury and other U.S. agencies’ debt |
11,218 | – | – | 11,218 | 11,957 | – | – | 11,957 | ||||||||||||||||||||||||
| Other foreign governments’ debt |
19 | 10,626 | – | 10,645 | 15 | 8,287 | – | 8,302 | ||||||||||||||||||||||||
| Corporate and other debt |
3,431 | 7,748 | – | 11,179 | 2,367 | 8,976 | 1 | 11,344 | ||||||||||||||||||||||||
| Equity securities |
47,665 | 67 | 16 | 47,748 | 46,698 | 224 | 11 | 46,933 | ||||||||||||||||||||||||
| Other |
– | 2,712 | – | 2,712 | – | 1,796 | – | 1,796 | ||||||||||||||||||||||||
| $ | 81,398 | $ | 36,450 | $ | 20 | $ | 117,868 | $ | 75,475 | $ | 37,667 | $ | 12 | $ | 113,154 | |||||||||||||||||
| Investment securities(2) |
||||||||||||||||||||||||||||||||
| Canadian federal government and government guaranteed debt |
$ | 7,674 | $ | 4,713 | $ | – | $ | 12,387 | $ | 4,947 | $ | 6,055 | $ | – | $ | 11,002 | ||||||||||||||||
| Canadian provincial and municipal debt |
3,695 | 3,451 | – | 7,146 | 2,029 | 3,400 | – | 5,429 | ||||||||||||||||||||||||
| U.S. treasury and other U.S. agencies’ debt |
25,058 | 3,640 | – | 28,698 | 32,412 | 2,824 | – | 35,236 | ||||||||||||||||||||||||
| Other foreign governments’ debt |
2,527 | 28,891 | – | 31,418 | 3,217 | 24,487 | – | 27,704 | ||||||||||||||||||||||||
| Corporate and other debt |
– | 2,512 | 40 | 2,552 | 40 | 1,874 | 48 | 1,962 | ||||||||||||||||||||||||
| Equity securities |
2,010 | 333 | 1,709 | 4,052 | 3,210 | 215 | 1,640 | 5,065 | ||||||||||||||||||||||||
| $ | 40,964 | $ | 43,540 | $ | 1,749 | $ | 86,253 | $ | 45,855 | $ | 38,855 | $ | 1,688 | $ | 86,398 | |||||||||||||||||
| Derivative financial instruments |
||||||||||||||||||||||||||||||||
| Interest rate contracts |
$ | – | $ | 15,942 | $ | – | $ | 15,942 | $ | – | $ | 15,193 | $ | 17 | $ | 15,210 | ||||||||||||||||
| Foreign exchange and gold contracts |
– | 29,465 | 2 | 29,467 | – | 32,223 | – | 32,223 | ||||||||||||||||||||||||
| Equity contracts |
54 | 3,066 | 27 | 3,147 | 332 | 2,209 | 20 | 2,561 | ||||||||||||||||||||||||
| Credit contracts |
– | 342 | 2 | 344 | – | 780 | – | 780 | ||||||||||||||||||||||||
| Commodity contracts |
– | 2,430 | 10 | 2,440 | – | 4,912 | 13 | 4,925 | ||||||||||||||||||||||||
| $ | 54 | $ | 51,245 | $ | 41 | $ | 51,340 | $ | 332 | $ | 55,317 | $ | 50 | $ | 55,699 | |||||||||||||||||
| Liabilities: |
||||||||||||||||||||||||||||||||
| Deposits(3) |
$ | – | $ | (95 | ) | $ | – | $ | (95 | ) | $ | – | $ | 15 | $ | – | $ | 15 | ||||||||||||||
| Financial liabilities designated at fair value through profit or loss |
– | 26,779 | – | 26,779 | – | 22,421 | – | 22,421 | ||||||||||||||||||||||||
| Obligations related to securities sold short |
29,921 | 6,482 | – | 36,403 | 35,059 | 5,387 | 3 | 40,449 | ||||||||||||||||||||||||
| Derivative financial instruments |
||||||||||||||||||||||||||||||||
| Interest rate contracts |
– | 25,079 | 2 | 25,081 | – | 22,842 | 12 | 22,854 | ||||||||||||||||||||||||
| Foreign exchange and gold contracts |
– | 28,013 | – | 28,013 | – | 35,634 | – | 35,634 | ||||||||||||||||||||||||
| Equity contracts |
135 | 3,106 | 17 | 3,258 | 636 | 3,063 | 21 | 3,720 | ||||||||||||||||||||||||
| Credit contracts |
– | 27 | 1 | 28 | – | 25 | – | 25 | ||||||||||||||||||||||||
| Commodity contracts |
– | 2,274 | 6 | 2,280 | – | 3,660 | 7 | 3,667 | ||||||||||||||||||||||||
| $ | 135 | $ | 58,499 | $ | 26 | $ | 58,660 | $ | 636 | $ | 65,224 | $ | 40 | $ | 65,900 | |||||||||||||||||
| Instruments not carried at fair value(4): |
||||||||||||||||||||||||||||||||
| Assets: |
||||||||||||||||||||||||||||||||
| Investment securities – amortized cost |
$ | 1,627 | $ | 28,189 | $ | – | $ | 29,816 | $ | 2,086 | $ | 20,357 | $ | – | $ | 22,443 | ||||||||||||||||
| Loans(5) |
– | – | 415,738 | 415,738 | – | – | 407,267 | 407,267 | ||||||||||||||||||||||||
| Liabilities: |
||||||||||||||||||||||||||||||||
| Deposits(5) |
– | 425,251 | – | 425,251 | – | 365,134 | – | 365,134 | ||||||||||||||||||||||||
| Subordinated debentures |
– | 9,358 | – | 9,358 | – | 8,038 | – | 8,038 | ||||||||||||||||||||||||
| Other liabilities |
– | 24,651 | – | 24,651 | – | 23,679 | 330 | 24,009 | ||||||||||||||||||||||||
| (1) | The fair value of precious metals is determined based on quoted market prices and forward spot prices, where applicable, less the cost to sell. |
| (2) | Excludes debt investment securities measured at amortized cost of $31,984 (October 31, 2022 – $23,610). |
| (3) | These amounts represent embedded derivatives bifurcated from structured note liabilities measured at amortized cost. |
| (4) | Represents the fair value of financial assets and liabilities where the carrying amount is not a reasonable approximation of fair value. |
| (5) | Represents fixed rate instruments. |
172 | 2023 Scotiabank Annual Report
Consolidated Financial Statements
Level 3 instrument fair value changes
Financial instruments categorized as Level 3 as at October 31, 2023, in the fair value hierarchy comprised of loans, structured corporate bonds, equity securities and complex derivatives.
The following table summarizes the changes in Level 3 instruments carried at fair value for the year ended October 31, 2023.
All positive balances represent assets and negative balances represent liabilities. Consequently, positive amounts indicate purchases of assets or settlements of liabilities and negative amounts indicate sales of assets or issuances of liabilities.
| As at October 31, 2023 | ||||||||||||||||||||||||||||||||
| ($ millions) | Fair value November 1 2022 |
Gains/(losses) recorded in income |
Gains/(losses) recorded in OCI |
Purchases/ Issuances |
Sales/ Settlements |
Transfers into/out of Level 3 |
Fair value October 31 2023 |
Change in unrealized gains/(losses) recorded in income for instruments still held(1) |
||||||||||||||||||||||||
| Trading assets |
||||||||||||||||||||||||||||||||
| Loans |
$ | – | $ | – | $ | – | $ | 5 | $ | – | $ | (1 | ) | $ | 4 | $ | – | |||||||||||||||
| Corporate and other debt |
1 | – | – | – | – | (1 | ) | – | – | |||||||||||||||||||||||
| Equity securities |
11 | – | – | 3 | (33 | ) | 35 | 16 | – | |||||||||||||||||||||||
| 12 | – | – | 8 | (33 | ) | 33 | 20 | – | ||||||||||||||||||||||||
| Investment securities |
||||||||||||||||||||||||||||||||
| Corporate and other debt |
48 | (3 | ) | 3 | – | (8 | ) | – | 40 | (3 | ) | |||||||||||||||||||||
| Equity securities |
1,640 | 59 | 13 | 233 | (135 | ) | (101 | ) | 1,709 | 61 | ||||||||||||||||||||||
| 1,688 | 56 | 16 | 233 | (143 | ) | (101 | ) | 1,749 | 58 | |||||||||||||||||||||||
| Derivative financial instruments – assets |
||||||||||||||||||||||||||||||||
| Interest rate contracts |
17 | (2 | ) | – | 3 | (6 | ) | (12 | ) | – | (2 | ) | ||||||||||||||||||||
| Foreign exchange and gold contracts |
– | – | – | 2 | – | – | 2 | – | ||||||||||||||||||||||||
| Equity contracts |
20 | (3 | ) | – | 6 | (1 | ) | 5 | 27 | (2 | )(2) | |||||||||||||||||||||
| Credit contracts |
– | (2 | ) | – | 4 | – | – | 2 | (2 | ) | ||||||||||||||||||||||
| Commodity contracts |
13 | (3 | ) | – | – | – | – | 10 | (3 | ) | ||||||||||||||||||||||
| Derivative financial instruments – liabilities |
||||||||||||||||||||||||||||||||
| Interest rate contracts |
(12 | ) | – | – | (2 | ) | 3 | 9 | (2 | ) | – | |||||||||||||||||||||
| Equity contracts |
(21 | ) | (3 | ) | – | (18 | ) | 3 | 22 | (17 | ) | (3 | )(2) | |||||||||||||||||||
| Credit contracts |
– | 1 | – | (2 | ) | – | – | (1 | ) | 1 | ||||||||||||||||||||||
| Commodity contracts |
(7 | ) | 1 | – | – | – | – | (6 | ) | 1 | ||||||||||||||||||||||
| 10 | (11 | ) | – | (7 | ) | (1 | ) | 24 | 15 | (10 | ) | |||||||||||||||||||||
| Obligations related to securities sold short |
(3 | ) | – | – | – | 3 | – | – | – | |||||||||||||||||||||||
| Total |
$ | 1,707 | $ | 45 | $ | 16 | $ | 234 | $ | (174 | ) | $ | (44 | ) | $ | 1,784 | $ | 48 | ||||||||||||||
| (1) | These amounts represent the gains and losses from fair value changes of Level 3 instruments still held at the end of the period that are recorded in the Consolidated Statement of Income. |
| (2) | Certain unrealized gains and losses on derivative assets and liabilities are largely offset by mark-to-market changes on other instruments included in trading revenues in the Consolidated Statement of Income, since these instruments act as an economic hedge to certain derivative assets and liabilities. |
The following table summarizes the changes in Level 3 instruments carried at fair value for the year ended October 31, 2022.
| As at October 31, 2022 | ||||||||||||||||||||||||||||
| ($ millions) | Fair value November 1 2021 |
Gains/(losses) recorded in income(1) |
Gains/(losses) recorded in OCI |
Purchases/ Issuances |
Sales/ Settlements |
Transfers into/out of Level 3 |
Fair value October 31 2022 |
|||||||||||||||||||||
| Trading assets |
$ | 41 | $ | (2 | ) | $ | – | $ | 3 | $ | (32 | ) | $ | 2 | $ | 12 | ||||||||||||
| Investment securities |
1,348 | 282 | (1 | ) | 363 | (231 | ) | (73 | ) | 1,688 | ||||||||||||||||||
| Derivative financial instruments |
1 | (8 | ) | – | 4 | – | 13 | 10 | ||||||||||||||||||||
| Financial liabilities designated at fair value through profit or loss |
(139 | ) | 23 | – | (22 | ) | 12 | 126 | – | |||||||||||||||||||
| Obligations related to securities sold short |
– | – | – | (2 | ) | 3 | (4 | ) | (3 | ) | ||||||||||||||||||
| (1) | Gains or losses for items in Level 3 may be offset with losses or gains on related hedges in Level 1 or Level 2. |
Significant transfers
Significant transfers can occur between the fair value hierarchy levels when additional or new information regarding valuation inputs and their refinement and observability becomes available. The Bank recognizes transfers between levels of the fair value hierarchy at the end of the reporting period during which the change has occurred.
The following significant transfers made between Levels 1 and 2 were based on whether the fair value was determined using quoted market prices from an active market.
2023 Scotiabank Annual Report | 173
Consolidated Financial Statements
During the year-ended October 31, 2023:
| • | Trading assets of $1,413 million, investment securities of $1,204 million and obligations related to securities sold short of $114 million were transferred out of Level 2 into Level 1. |
| • | Trading assets of $758 million, investment securities of $752 million and obligations related to securities sold short of $169 million were transferred out of Level 1 into Level 2. |
During the year-ended October 31, 2022:
| • | Trading assets of $705 million, investment securities of $401 million and obligations related to securities sold short of $40 million were transferred out of Level 2 into Level 1. |
| • | Trading assets of $2,099 million, investment securities of $491 million and obligations related to securities sold short of $867 million were transferred out of Level 1 into Level 2. |
The following significant transfers made between Levels 2 and 3 were based on whether the fair value was determined using significant unobservable inputs.
During the year-ended October 31, 2023:
| • | Investment in equity securities of $101 million were transferred out of Level 3 into Level 2. |
During the year-ended October 31, 2022:
| • | Investments in other foreign governments’ debt of $77 million and financial liabilities designated at fair value through profit or loss of $126 million were transferred out of Level 3 into Level 2. |
Level 3 sensitivity analysis
The table below sets out information about significant unobservable inputs used in measuring financial instruments categorized as Level 3 in the fair value hierarchy.
| Valuation technique | Significant unobservable inputs | Range of estimates for unobservable inputs(1) |
Changes in fair value from reasonably possible alternatives ($ millions) |
|||||||||||||||||||
| Investment securities |
||||||||||||||||||||||
| Private equity securities(2) |
Market comparable | General Partner valuations | ||||||||||||||||||||
| per net asset value | 95% - 97% | |||||||||||||||||||||
| |
Price earnings (P/E) multiples |
|
3% - 5% | (65)/65 | ||||||||||||||||||
| Derivative financial instruments |
||||||||||||||||||||||
| Interest rate contracts |
Option pricing | Interest rate | – | |||||||||||||||||||
| model | volatility | 42% - 263% | ||||||||||||||||||||
| Equity contracts |
Option pricing | Equity volatility | 2% - 89% | |||||||||||||||||||
| model | Correlation | (13%) - 96% | (5)/5 | |||||||||||||||||||
| Commodity contracts |
Discounted cash flow | Forward curves | 6% - 15% | (5)/5 | ||||||||||||||||||
| (1) | The range of estimates represents the actual lowest and highest level inputs used to fair value financial instruments within each financial statement category. |
| (2) | The valuation of private equity securities utilizes net asset values as reported by fund managers. Net asset values are not considered observable as the Bank cannot redeem these instruments at such values. The range for net asset values per unit or price per share has not been disclosed for these instruments since the valuations are not model-based. |
The Bank applies judgment in determining unobservable inputs used to calculate the fair value of Level 3 instruments.
The following section discusses the significant unobservable inputs for Level 3 instruments.
General Partner (GP) Valuations per Net Asset Value
Net asset values provided by GPs represent the fair value of investments in private equity securities.
P/E multiples
P/E multiples are used to calculate private equity securities valuation, which is determined based on comparable companies. Higher multiples equate to higher fair values.
Correlation
Correlation becomes an input into equity derivative pricing when the relationship between price movements of two or more of the underlying assets is relevant.
Volatility
Volatility for equity derivatives is a measure of the underlying price fluctuation. Interest rate volatility measures variability of a security yield or interest rate. Historic volatility is often calculated as the annualized standard deviation of daily price or yield variation for a given time period. Implied volatility is such that, when input into an option pricing model, returns a value equal to the current market value of the option.
Forward curves
Monthly forward curves for commodity contracts are required inputs to valuation. A portion of the forward curves are unobservable.
174 | 2023 Scotiabank Annual Report
Consolidated Financial Statements
| 8 | Trading Assets |
| (a) | Trading securities |
An analysis of the carrying value of trading securities is as follows:
| As at October 31, 2023 ($ millions) | Remaining term to maturity | |||||||||||||||||||||||||||
| Within three months |
Three to twelve months |
One to five years |
Five to ten years |
Over ten years |
No specific maturity |
Carrying value |
||||||||||||||||||||||
| Trading securities: |
||||||||||||||||||||||||||||
| Canadian federal government issued or guaranteed debt |
$ | 1,736 | $ | 3,236 | $ | 8,216 | $ | 2,308 | $ | 1,873 | $ | – | $ | 17,369 | ||||||||||||||
| Canadian provincial and municipal debt |
1,938 | 1,376 | 1,379 | 1,128 | 3,632 | – | 9,453 | |||||||||||||||||||||
| U.S. treasury and other U.S. agency debt |
1,337 | 4,392 | 2,873 | 1,973 | 643 | – | 11,218 | |||||||||||||||||||||
| Other foreign government debt |
3,437 | 3,908 | 2,593 | 549 | 158 | – | 10,645 | |||||||||||||||||||||
| Common shares |
– | – | – | – | – | 47,625 | 47,625 | |||||||||||||||||||||
| Other |
274 | 919 | 6,697 | 2,527 | 762 | 123 | 11,302 | |||||||||||||||||||||
| Total |
$ | 8,722 | $ | 13,831 | $ | 21,758 | $ | 8,485 | $ | 7,068 | $ | 47,748 | $ | 107,612 | ||||||||||||||
| Total by currency (in Canadian equivalent): |
||||||||||||||||||||||||||||
| Canadian dollar |
$ | 3,784 | $ | 5,178 | $ | 11,924 | $ | 4,347 | $ | 6,021 | $ | 30,154 | $ | 61,408 | ||||||||||||||
| U.S. dollar |
1,709 | 4,568 | 6,766 | 3,404 | 890 | 12,001 | 29,338 | |||||||||||||||||||||
| Mexican peso |
591 | 2,097 | 2,031 | 134 | 18 | 32 | 4,903 | |||||||||||||||||||||
| Other currencies |
2,638 | 1,988 | 1,037 | 600 | 139 | 5,561 | 11,963 | |||||||||||||||||||||
| Total trading securities |
$ | 8,722 | $ | 13,831 | $ | 21,758 | $ | 8,485 | $ | 7,068 | $ | 47,748 | $ | 107,612 | ||||||||||||||
| As at October 31, 2022 ($ millions) | Remaining term to maturity | |||||||||||||||||||||||||||
| Within three months |
Three to twelve months |
One to five years |
Five to ten years |
Over ten years |
No specific maturity |
Carrying value |
||||||||||||||||||||||
| Trading securities: |
||||||||||||||||||||||||||||
| Canadian federal government issued or guaranteed debt |
$ | 1,072 | $ | 2,581 | $ | 7,089 | $ | 1,934 | $ | 2,057 | $ | 1 | $ | 14,734 | ||||||||||||||
| Canadian provincial and municipal debt |
1,906 | 1,839 | 948 | 1,256 | 4,328 | – | 10,277 | |||||||||||||||||||||
| U.S. treasury and other U.S. agency debt |
1,216 | 5,224 | 3,277 | 2,000 | 240 | – | 11,957 | |||||||||||||||||||||
| Other foreign government debt |
2,610 | 1,643 | 3,545 | 356 | 148 | – | 8,302 | |||||||||||||||||||||
| Common shares |
– | – | – | – | – | 46,753 | 46,753 | |||||||||||||||||||||
| Other |
540 | 1,620 | 5,415 | 2,706 | 1,064 | 179 | 11,524 | |||||||||||||||||||||
| Total |
$ | 7,344 | $ | 12,907 | $ | 20,274 | $ | 8,252 | $ | 7,837 | $ | 46,933 | $ | 103,547 | ||||||||||||||
| Total by currency (in Canadian equivalent): |
||||||||||||||||||||||||||||
| Canadian dollar |
$ | 3,274 | $ | 5,206 | $ | 10,243 | $ | 4,336 | $ | 6,859 | $ | 27,961 | $ | 57,879 | ||||||||||||||
| U.S. dollar |
1,304 | 5,694 | 6,448 | 3,550 | 836 | 12,347 | 30,179 | |||||||||||||||||||||
| Mexican peso |
411 | 1,094 | 2,891 | 77 | 64 | 120 | 4,657 | |||||||||||||||||||||
| Other currencies |
2,355 | 913 | 692 | 289 | 78 | 6,505 | 10,832 | |||||||||||||||||||||
| Total trading securities |
$ | 7,344 | $ | 12,907 | $ | 20,274 | $ | 8,252 | $ | 7,837 | $ | 46,933 | $ | 103,547 | ||||||||||||||
| (b) | Trading loans |
The following table provides the geographic breakdown of trading loans:
| As at October 31 ($ millions) | 2023 | 2022 | ||||||
| Trading loans(1)(2) |
||||||||
| U.S.(3) |
$ | 5,844 | $ | 6,489 | ||||
| Europe(4) |
601 | 708 | ||||||
| Canada(4) |
1,068 | 512 | ||||||
| Other(4) |
31 | 102 | ||||||
| Total |
$ | 7,544 | $ | 7,811 | ||||
| (1) | Geographic segmentation of trading loans is based upon the location of the ultimate risk of the underlying asset. |
| (2) | Loans are primarily denominated in U.S. dollars. |
| (3) | Includes trading loans that serve as a hedge to loan-based credit total return swaps of $5,756 (2022 – $6,414), while the remaining relates to short-term precious metals trading and lending activities. |
| (4) | These loans are primarily related to short-term precious metals trading and lending activities. |
2023 Scotiabank Annual Report | 175
Consolidated Financial Statements
| 9 | Financial Instruments Designated at Fair Value Through Profit or Loss |
In accordance with its risk management strategy, the Bank has elected to designate certain senior note liabilities at fair value through profit or loss to reduce an accounting mismatch between fair value changes in these instruments and fair value changes in related derivatives, and where a hybrid financial liability contains one or more embedded derivatives that are not closely related to the host contract. Changes in fair value of financial liabilities arising from the Bank’s own credit risk are recognized in other comprehensive income, without subsequent reclassification to net income.
The cumulative fair value adjustment due to own credit risk is determined at a point in time by comparing the present value of expected future cash flows over the term of these liabilities discounted at the Bank’s effective funding rate, and the present value of expected future cash flows discounted at a benchmark rate.
The following table presents the fair value of financial liabilities designated at fair value through profit or loss and their changes in fair value.
| Fair value | Change in fair value(1) Gains/(Losses) |
Cumulative change in FV(2) Gains/(Losses) |
||||||||||||||||||||||
| As at | For the year ended | |||||||||||||||||||||||
| October 31 ($ millions) | 2023 | 2022 | 2023 | 2022 | 2023 | 2022 | ||||||||||||||||||
| Liabilities |
||||||||||||||||||||||||
| Senior note liabilities(3) |
$ | 26,779 | $ | 22,421 | $ | 762 | $ | 8,600 | $ | 8,655 | $ | 7,893 | ||||||||||||
| (1) | Change in the difference between the contractual maturity amount and the carrying value. |
| (2) | The cumulative change in fair value is measured from the instruments’ date of initial recognition. |
| (3) | Changes in fair value attributable to changes in the Bank’s own credit risk are recorded in other comprehensive income. Other changes in fair value are recorded in non-interest income – trading revenues. The offsetting fair value changes from associated derivatives is also recorded in non-interest income – trading revenues. |
The following table presents the changes in fair value attributable to changes in the Bank’s own credit risk for financial liabilities designated at fair value through profit or loss as well as their contractual maturity and carrying amounts.
| Senior Note Liabilities | ||||||||||||||||||||
| ($ millions) | Contractual maturity |
Carrying Value |
Difference between contractual maturity amount and carrying value |
Changes in fair value Gains/(Losses) |
Cumulative changes Gains/(Losses) |
|||||||||||||||
| As at October 31, 2023 |
$ | 35,434 | $ | 26,779 | $ | 8,655 | $ | (1,338 | ) | $ | (109 | ) | ||||||||
| As at October 31, 2022 |
$ | 30,314 | $ | 22,421 | $ | 7,893 | $ | 1,958 | $ | 1,229 | ||||||||||
| (1) | The cumulative change in fair value is measured from the instruments’ date of initial recognition. |
176 | 2023 Scotiabank Annual Report
Consolidated Financial Statements
| 10 | Derivative Financial Instruments |
| (a) | Notional amounts(1) |
The following table provides the aggregate notional amounts of derivative financial instruments outstanding by type and segregated between those used by the Bank in its dealer capacity (Trading) and those derivatives designated in hedging relationships. The notional amounts of these contracts represent the derivatives volume outstanding and do not represent the potential gain or loss associated with the market risk or credit risk of such instruments. Credit derivatives within other derivative contracts are comprised primarily of purchased and sold credit default swap transactions. To a lesser extent, this category also includes total return swaps referenced to loans and debt securities. Other derivative contracts – other includes precious metals other than gold, and other commodities including energy and base metal derivatives.
| 2023 | 2022 | |||||||||||||||||||||||
| As at October 31 ($ millions) | Trading | Hedging | Total | Trading | Hedging | Total | ||||||||||||||||||
| Interest rate contracts |
||||||||||||||||||||||||
| Exchange-traded: |
||||||||||||||||||||||||
| Futures |
$ | 445,831 | $ | – | $ | 445,831 | $ | 205,283 | $ | – | $ | 205,283 | ||||||||||||
| Options purchased |
12,829 | – | 12,829 | – | – | – | ||||||||||||||||||
| Options written |
11,787 | – | 11,787 | – | – | – | ||||||||||||||||||
| 470,447 | – | 470,447 | 205,283 | – | 205,283 | |||||||||||||||||||
| Over-the-counter: |
||||||||||||||||||||||||
| Forward rate agreements |
– | – | – | 305 | – | 305 | ||||||||||||||||||
| Swaps |
383,961 | 40,250 | 424,211 | 365,945 | 30,871 | 396,816 | ||||||||||||||||||
| Options purchased |
42,320 | – | 42,320 | 39,321 | – | 39,321 | ||||||||||||||||||
| Options written |
50,717 | – | 50,717 | 44,567 | – | 44,567 | ||||||||||||||||||
| 476,998 | 40,250 | 517,248 | 450,138 | 30,871 | 481,009 | |||||||||||||||||||
| Over-the-counter (settled through central counterparties): |
||||||||||||||||||||||||
| Forward rate agreements |
92,773 | – | 92,773 | 132,691 | – | 132,691 | ||||||||||||||||||
| Swaps |
5,057,948 | 219,390 | 5,277,338 | 5,061,950 | 255,932 | 5,317,882 | ||||||||||||||||||
| Options purchased |
– | – | – | – | – | – | ||||||||||||||||||
| Options written |
– | – | – | – | – | – | ||||||||||||||||||
| 5,150,721 | 219,390 | 5,370,111 | 5,194,641 | 255,932 | 5,450,573 | |||||||||||||||||||
| Total |
$ | 6,098,166 | $ | 259,640 | $ | 6,357,806 | $ | 5,850,062 | $ | 286,803 | $ | 6,136,865 | ||||||||||||
| Foreign exchange and gold contracts |
||||||||||||||||||||||||
| Exchange-traded: |
||||||||||||||||||||||||
| Futures |
$ | 21,336 | $ | – | $ | 21,336 | $ | 14,880 | $ | – | $ | 14,880 | ||||||||||||
| Options purchased |
– | – | – | – | – | – | ||||||||||||||||||
| Options written |
– | – | – | – | – | – | ||||||||||||||||||
| 21,336 | – | 21,336 | 14,880 | – | 14,880 | |||||||||||||||||||
| Over-the-counter: |
||||||||||||||||||||||||
| Spot and forwards |
448,449 | 23,364 | 471,813 | 433,314 | 38,737 | 472,051 | ||||||||||||||||||
| Swaps |
722,095 | 139,184 | 861,279 | 576,564 | 118,890 | 695,454 | ||||||||||||||||||
| Options purchased |
33,155 | – | 33,155 | 25,783 | – | 25,783 | ||||||||||||||||||
| Options written |
37,292 | – | 37,292 | 26,716 | – | 26,716 | ||||||||||||||||||
| 1,240,991 | 162,548 | 1,403,539 | 1,062,377 | 157,627 | 1,220,004 | |||||||||||||||||||
| Over-the-counter (settled through central counterparties): |
||||||||||||||||||||||||
| Spot and forwards |
16,011 | – | 16,011 | 15,662 | – | 15,662 | ||||||||||||||||||
| Swaps |
– | – | – | – | – | – | ||||||||||||||||||
| Options purchased |
– | – | – | – | – | – | ||||||||||||||||||
| Options written |
– | – | – | – | – | – | ||||||||||||||||||
| 16,011 | – | 16,011 | 15,662 | – | 15,662 | |||||||||||||||||||
| Total |
$ | 1,278,338 | $ | 162,548 | $ | 1,440,886 | $ | 1,092,919 | $ | 157,627 | $ | 1,250,546 | ||||||||||||
| Other derivative contracts |
||||||||||||||||||||||||
| Exchange-traded: |
||||||||||||||||||||||||
| Equity |
$ | 54,880 | $ | – | $ | 54,880 | $ | 56,472 | $ | – | $ | 56,472 | ||||||||||||
| Credit |
– | – | – | – | – | – | ||||||||||||||||||
| Commodity and other contracts |
31,321 | – | 31,321 | 30,441 | – | 30,441 | ||||||||||||||||||
| 86,201 | – | 86,201 | 86,913 | – | 86,913 | |||||||||||||||||||
| Over-the-counter: |
||||||||||||||||||||||||
| Equity |
72,005 | 818 | 72,823 | 62,617 | 873 | 63,490 | ||||||||||||||||||
| Credit |
18,408 | – | 18,408 | 19,957 | – | 19,957 | ||||||||||||||||||
| Commodity and other contracts |
28,912 | – | 28,912 | 31,959 | – | 31,959 | ||||||||||||||||||
| 119,325 | 818 | 120,143 | 114,533 | 873 | 115,406 | |||||||||||||||||||
| Over-the-counter (settled through central counterparties): |
||||||||||||||||||||||||
| Equity |
– | – | – | – | – | – | ||||||||||||||||||
| Credit |
9,553 | – | 9,553 | 7,077 | – | 7,077 | ||||||||||||||||||
| Commodity and other contracts |
150 | – | 150 | 388 | – | 388 | ||||||||||||||||||
| 9,703 | – | 9,703 | 7,465 | – | 7,465 | |||||||||||||||||||
| Total |
$ | 215,229 | $ | 818 | $ | 216,047 | $ | 208,911 | $ | 873 | $ | 209,784 | ||||||||||||
| Total notional amounts outstanding |
$ | 7,591,733 | $ | 423,006 | $ | 8,014,739 | $ | 7,151,892 | $ | 445,303 | $ | 7,597,195 | ||||||||||||
| (1) | The notional amounts represent the amount to which a rate or price is applied to determine the amount of cash flows to be exchanged. |
2023 Scotiabank Annual Report | 177
Consolidated Financial Statements
| (b) | Remaining term to maturity |
The following table summarizes the remaining term to maturity of the notional amounts of the Bank’s derivative financial instruments by type:
| As at October 31, 2023 ($ millions) | Within one year | One to five years | Over five years | Total | ||||||||||||
| Interest rate contracts |
||||||||||||||||
| Futures |
$ | 316,054 | $ | 129,359 | $ | 418 | $ | 445,831 | ||||||||
| Forward rate agreements |
91,900 | 873 | – | 92,773 | ||||||||||||
| Swaps |
1,887,305 | 2,452,721 | 1,361,523 | 5,701,549 | ||||||||||||
| Options purchased |
32,854 | 19,765 | 2,530 | 55,149 | ||||||||||||
| Options written |
30,878 | 19,808 | 11,818 | 62,504 | ||||||||||||
| 2,358,991 | 2,622,526 | 1,376,289 | 6,357,806 | |||||||||||||
| Foreign exchange and gold contracts |
||||||||||||||||
| Futures |
14,793 | 6,512 | 31 | 21,336 | ||||||||||||
| Spot and forwards |
447,100 | 32,459 | 8,265 | 487,824 | ||||||||||||
| Swaps |
204,224 | 439,600 | 217,455 | 861,279 | ||||||||||||
| Options purchased |
23,978 | 8,480 | 697 | 33,155 | ||||||||||||
| Options written |
28,148 | 8,392 | 752 | 37,292 | ||||||||||||
| 718,243 | 495,443 | 227,200 | 1,440,886 | |||||||||||||
| Other derivative contracts |
||||||||||||||||
| Equity |
94,113 | 33,062 | 528 | 127,703 | ||||||||||||
| Credit |
13,824 | 7,485 | 6,652 | 27,961 | ||||||||||||
| Commodity and other contracts |
39,421 | 20,372 | 590 | 60,383 | ||||||||||||
| 147,358 | 60,919 | 7,770 | 216,047 | |||||||||||||
| Total |
$ | 3,224,592 | $ | 3,178,888 | $ | 1,611,259 | $ | 8,014,739 | ||||||||
| As at October 31, 2022 ($ millions) | Within one year | One to five years | Over five years | Total | ||||||||||||
| Interest rate contracts |
||||||||||||||||
| Futures |
$ | 144,488 | $ | 60,795 | $ | – | $ | 205,283 | ||||||||
| Forward rate agreements |
109,569 | 23,122 | 305 | 132,996 | ||||||||||||
| Swaps |
2,458,160 | 2,142,509 | 1,114,029 | 5,714,698 | ||||||||||||
| Options purchased |
16,599 | 19,841 | 2,881 | 39,321 | ||||||||||||
| Options written |
13,897 | 18,045 | 12,625 | 44,567 | ||||||||||||
| 2,742,713 | 2,264,312 | 1,129,840 | 6,136,865 | |||||||||||||
| Foreign exchange and gold contracts |
||||||||||||||||
| Futures |
7,334 | 7,342 | 204 | 14,880 | ||||||||||||
| Spot and forwards |
452,733 | 27,323 | 7,657 | 487,713 | ||||||||||||
| Swaps |
175,690 | 331,270 | 188,494 | 695,454 | ||||||||||||
| Options purchased |
18,916 | 6,514 | 353 | 25,783 | ||||||||||||
| Options written |
21,698 | 4,675 | 343 | 26,716 | ||||||||||||
| 676,371 | 377,124 | 197,051 | 1,250,546 | |||||||||||||
| Other derivative contracts |
||||||||||||||||
| Equity |
78,998 | 40,414 | 550 | 119,962 | ||||||||||||
| Credit |
17,124 | 6,602 | 3,308 | 27,034 | ||||||||||||
| Commodity and other contracts |
42,464 | 20,027 | 297 | 62,788 | ||||||||||||
| 138,586 | 67,043 | 4,155 | 209,784 | |||||||||||||
| Total |
$ | 3,557,670 | $ | 2,708,479 | $ | 1,331,046 | $ | 7,597,195 | ||||||||
| (c) | Credit risk |
As with other financial assets, derivative instruments are subject to credit risk. Credit risk arises from the possibility that counterparties may default on their obligations to the Bank. However, whereas the credit risk of other financial assets is represented by the principal amount net of any applicable allowance for credit losses, the credit risk associated with derivatives is normally a small fraction of the notional amount of the derivative instrument.
Derivative contracts generally expose the Bank to credit loss if changes in market rates affect a counterparty’s position unfavourably and the counterparty defaults on payment. Accordingly, exposure to credit risk of derivatives is represented by the positive fair value of the instrument.
Negotiated over-the-counter derivatives generally present greater credit exposure than exchange-traded contracts. The net change in the exchange-traded contracts is normally settled daily in cash with the exchange. Holders of these contracts look to the exchange for performance under the contract.
The Bank strives to limit credit risk by dealing with counterparties that it believes are creditworthy, and investment grade counterparties account for a significant portion of the credit risk exposure arising from the Bank’s derivative transactions as at October 31, 2023. To control credit risk associated with derivatives, the Bank uses similar credit risk management activities and procedures to the approaches used in the lending business in assessing and adjudicating exposure. The Bank utilizes a risk metric, potential future exposure (PFE) for derivatives, to measure utilization
178 | 2023 Scotiabank Annual Report
Consolidated Financial Statements
against established credit limits to the counterparty. PFE measures the effect that changes in the market have on derivative exposures throughout the lifetime of the counterparties’ trades. Additionally, PFE considers risk mitigants such as netting and collateralization. PFE limits and utilization for derivatives counterparties are authorized and monitored by the Bank’s risk management unit.
The Bank obtains the benefit of netting by entering into master netting arrangements with counterparties (typically industry standard International Swaps and Derivatives Association (ISDA) agreements), which allow for a single net settlement of all transactions covered by that agreement in the event of a default or early termination of the transactions. In this manner, the credit risk associated with favourable contracts is eliminated by the master netting arrangement to the extent that unfavourable contracts with the same counterparty are not settled before favourable contracts.
Collateralization is typically documented by way of an ISDA Credit Support Annex (CSA), the terms of which may vary according to each party’s view of the other party’s creditworthiness. CSAs can require one party to post initial margin at the onset of each transaction. CSAs also allow for variation margin to be called if total uncollateralized mark-to-market exposure exceeds an agreed upon threshold. Such variation margin provisions can be one way (only one party will ever post collateral) or bi-lateral (either party may post collateral depending upon which party is in-the-money). The CSA will also detail the types of collateral that are acceptable to each party, and the adjustments that will be applied against each collateral type. The terms of the ISDA master netting agreements and CSAs are taken into consideration in the calculation of counterparty credit risk exposure (see also page 85 of the 2023 Annual Report).
Derivative instruments used by the Bank include credit derivatives in its investment and loan portfolios: credit protection is sold as an alternative to acquiring exposure to bond or loan assets, and bought to manage or mitigate credit exposures.
The following table summarizes the credit exposure of the Bank’s derivative financial instruments. The credit risk amount (CRA) represents the estimated replacement cost, or positive fair value, for all contracts. CRA takes into account master netting or collateral arrangements that have been made1. CRA does not reflect actual or expected losses.
The credit equivalent amount (CEA) is the exposure at default (EAD) prescribed in the Capital Adequacy Requirements (CAR) Guidelines of the Office of the Superintendent of Financial Institutions (OSFI). The risk-weighted asset is calculated by multiplying the CEA by the capital requirement (K) times 12.5, where K is a function of the probability of default (PD), loss given default (LGD), maturity and prescribed correlation factors. Other derivative contracts – other includes precious metals other than gold, and other commodities, including energy and base metal derivatives.
| 2023 | 2022 | |||||||||||||||||||||||||||||||||
| Revised Basel III(1) | Basel III | |||||||||||||||||||||||||||||||||
| As at October 31 ($ millions) | Notional amount | Credit risk amount (CRA)(2) |
Credit equivalent amount (CEA)(2) |
Risk- Weighted Assets |
Notional amount | Credit risk amount (CRA)(2) |
Credit equivalent amount (CEA)(2) |
Risk- Weighted Assets |
||||||||||||||||||||||||||
| Interest rate contracts |
||||||||||||||||||||||||||||||||||
| Futures |
$ | 445,831 | $ | – | $ | 17 | $ | 1 | $ | 205,283 | $ | – | $ | 10 | $ | – | ||||||||||||||||||
| Forward rate agreements |
92,773 | 128 | 59 | 39 | 132,996 | 311 | 93 | 55 | ||||||||||||||||||||||||||
| Swaps |
5,701,549 | 4,678 | 8,322 | 611 | 5,714,698 | 4,331 | 7,655 | 589 | ||||||||||||||||||||||||||
| Options purchased |
55,149 | 41 | 164 | 49 | 39,321 | 183 | 179 | 50 | ||||||||||||||||||||||||||
| Options written |
62,504 | – | 16 | 4 | 44,567 | – | 7 | 1 | ||||||||||||||||||||||||||
| 6,357,806 | 4,847 | 8,578 | 704 | 6,136,865 | 4,825 | 7,944 | 695 | |||||||||||||||||||||||||||
| Foreign exchange and gold contracts |
||||||||||||||||||||||||||||||||||
| Futures |
21,336 | – | 388 | 8 | 14,880 | – | 253 | 5 | ||||||||||||||||||||||||||
| Spot and forwards |
487,824 | 1,544 | 4,458 | 1,168 | 487,713 | 1,784 | 5,834 | 1,425 | ||||||||||||||||||||||||||
| Swaps |
861,279 | 1,289 | 10,665 | 1,993 | 695,454 | 2,147 | 10,330 | 2,273 | ||||||||||||||||||||||||||
| Options purchased |
33,155 | 410 | 693 | 218 | 25,783 | 472 | 638 | 172 | ||||||||||||||||||||||||||
| Options written |
37,292 | – | 26 | 7 | 26,716 | – | 16 | 3 | ||||||||||||||||||||||||||
| 1,440,886 | 3,243 | 16,230 | 3,394 | 1,250,546 | 4,403 | 17,071 | 3,878 | |||||||||||||||||||||||||||
| Other derivative contracts |
||||||||||||||||||||||||||||||||||
| Equity |
127,703 | 1,102 | 7,747 | 1,325 | 119,962 | 636 | 6,534 | 968 | ||||||||||||||||||||||||||
| Credit |
27,961 | 130 | 60 | 14 | 27,034 | 271 | 415 | 136 | ||||||||||||||||||||||||||
| Commodity and other contracts |
60,383 | 1,502 | 3,402 | 348 | 62,788 | 2,636 | 9,057 | 649 | ||||||||||||||||||||||||||
| 216,047 | 2,734 | 11,209 | 1,687 | 209,784 | 3,543 | 16,006 | 1,753 | |||||||||||||||||||||||||||
| Credit Valuation Adjustment |
– | – | – | 4,703 | – | – | – | 6,422 | ||||||||||||||||||||||||||
| Total derivatives |
$ | 8,014,739 | $ | 10,824 | $ | 36,017 | $ | 10,488 | $ | 7,597,195 | $ | 12,771 | $ | 41,021 | $ | 12,748 | ||||||||||||||||||
| Amount settled through central counterparties(3) |
||||||||||||||||||||||||||||||||||
| Exchange-traded |
577,984 | – | 4,078 | 93 | 307,076 | – | 8,110 | 175 | ||||||||||||||||||||||||||
| Over-the-counter |
5,395,825 | – | 4,256 | 85 | 5,473,700 | – | 4,175 | 83 | ||||||||||||||||||||||||||
| $ | 5,973,809 | $ | – | $ | 8,334 | $ | 178 | $ | 5,780,776 | $ | – | $ | 12,285 | $ | 258 | |||||||||||||||||||
| (1) | Regulatory amounts reported in 2023 are under Revised Basel III requirements and are not directly comparable to amounts reported in 2022. |
| (2) | The amounts presented are net of collateral and master netting agreements at the product level. The total amounts relating to netting and collateral were $40,516 (2022 – $42,929) for CRA, and $87,034 (2022 – $84,431) for CEA. |
| (3) | Amounts are included under total derivatives above. Amounts include exposures settled directly through central counterparties and exposures settled through clearing members of central counterparties. |
| 1 | Regulatory haircuts prescribed by the OSFI CAR Guidelines are applied to the collateral balances of the CRA measure. |
2023 Scotiabank Annual Report | 179
Consolidated Financial Statements
| (d) | Fair value |
The following table summarizes the fair value of derivatives segregated by type and segregated between trading and those derivatives designated in hedging relationships.
| As at October 31 ($ millions) | 2023 | 2023 | 2022 | |||||||||||||||||||||||||
| Average fair value | Year-end fair value | Year-end fair value(1) | ||||||||||||||||||||||||||
| Favourable | Unfavourable | Favourable | Unfavourable | Favourable | Unfavourable | |||||||||||||||||||||||
| Trading |
||||||||||||||||||||||||||||
| Interest rate contracts |
||||||||||||||||||||||||||||
| Forward rate agreements |
$ | 199 | $ | 34 | $ | 128 | $ | – | $ | 311 | $ | 48 | ||||||||||||||||
| Swaps |
9,090 | 9,575 | 8,844 | 11,112 | 8,385 | 8,300 | ||||||||||||||||||||||
| Options |
755 | 718 | 1,413 | 586 | 1,384 | 571 | ||||||||||||||||||||||
| 10,044 | 10,327 | 10,385 | 11,698 | 10,080 | 8,919 | |||||||||||||||||||||||
| Foreign exchange and gold contracts |
||||||||||||||||||||||||||||
| Forwards |
6,418 | 6,012 | 7,319 | 5,574 | 8,624 | 7,128 | ||||||||||||||||||||||
| Swaps |
12,129 | 10,888 | 12,251 | 12,663 | 15,672 | 16,722 | ||||||||||||||||||||||
| Options |
590 | 560 | 627 | 601 | 795 | 576 | ||||||||||||||||||||||
| 19,137 | 17,460 | 20,197 | 18,838 | 25,091 | 24,426 | |||||||||||||||||||||||
| Other derivative contracts |
||||||||||||||||||||||||||||
| Equity |
2,607 | 3,125 | 3,146 | 3,174 | 2,560 | 3,648 | ||||||||||||||||||||||
| Credit |
503 | 26 | 344 | 28 | 780 | 25 | ||||||||||||||||||||||
| Commodity and other contracts |
2,920 | 2,476 | 2,440 | 2,280 | 4,925 | 3,667 | ||||||||||||||||||||||
| 6,030 | 5,627 | 5,930 | 5,482 | 8,265 | 7,340 | |||||||||||||||||||||||
| Trading derivatives’ market valuation |
$ | 35,211 | $ | 33,414 | $ | 36,512 | $ | 36,018 | $ | 43,436 | $ | 40,685 | ||||||||||||||||
| Hedging |
||||||||||||||||||||||||||||
| Interest rate contracts |
||||||||||||||||||||||||||||
| Swaps |
$ | 5,557 | $ | 13,383 | $ | 5,130 | $ | 13,935 | ||||||||||||||||||||
| Foreign exchange and gold contracts |
||||||||||||||||||||||||||||
| Forwards |
224 | 667 | 956 | 1,078 | ||||||||||||||||||||||||
| Swaps |
9,046 | 8,508 | 6,176 | 10,130 | ||||||||||||||||||||||||
| $ | 9,270 | $ | 9,175 | $ | 7,132 | $ | 11,208 | |||||||||||||||||||||
| Other derivative contracts |
||||||||||||||||||||||||||||
| Equity |
$ | 1 | $ | 84 | $ | 1 | $ | 72 | ||||||||||||||||||||
| Hedging derivatives’ market valuation |
$ | 14,828 | $ | 22,642 | $ | 12,263 | $ | 25,215 | ||||||||||||||||||||
| Total derivative financial instruments as per Statement of Financial Position |
$ | 51,340 | $ | 58,660 | $ | 55,699 | $ | 65,900 | ||||||||||||||||||||
| Less: impact of master netting and collateral(2) |
40,516 | 40,516 | 42,929 | 42,929 | ||||||||||||||||||||||||
| Net derivative financial instruments(2) |
$ | 10,824 | $ | 18,144 | $ | 12,770 | $ | 22,971 | ||||||||||||||||||||
| (1) | The average fair value of trading derivatives’ market valuation for the year ended October 31, 2022 was: favourable $40,673 and unfavourable $39,481. Average fair value amounts are based on the latest 13 month-end balances. |
| (2) | Master netting agreement amounts are based on the capital adequacy criteria of the Basel Committee on Banking Supervision (BCBS) and OSFI. These criteria allow netting where there are legally enforceable contracts which enable net settlement in the event of a default, bankruptcy, liquidation or similar circumstances. |
| (e) | Hedging activities |
The Bank manages interest rate risk, foreign currency risk and equity risk through hedge accounting transactions.
Interest rate risk
Single-currency interest rate swaps are used to hedge interest rate risk exposure. In fair value hedges of interest rate risk, the interest rate exposure from fixed rate assets and liabilities is converted from fixed to floating rate exposure. In cash flow hedges of interest rate risk, the interest rate exposure from floating rate assets and liabilities is converted from floating to fixed rate exposure. The Bank generally hedges interest rate risk only to the extent of benchmark interest rates.
Foreign currency risk
In fair value hedges, cross-currency swaps and single-currency interest rate swaps are used to manage foreign currency exposure in conjunction with interest rate exposure. Cross-currency interest rate swaps or a combination of cross-currency basis swaps and single-currency interest rate swaps are mainly used to convert a foreign currency fixed rate exposure to a functional currency floating rate exposure. In hedges of both foreign currency and interest rate exposure, the interest rate risk is generally hedged only to the extent of the benchmark interest rate.
In cash flow hedges, cross-currency interest rate swaps, single-currency interest rate swaps, foreign currency forwards and foreign currency assets or liabilities are used to manage foreign currency exposure, or a combined foreign currency and interest rate exposure. Cross-currency interest rate swaps are used to offset the foreign currency exposure by exchanging the interest cash flows in one currency to another currency. Single-currency interest rate swaps may be used in conjunction with cross-currency swaps to convert the foreign currency exposure or resulting functional currency exposure from floating to fixed. Foreign currency forwards and foreign currency denominated assets and liabilities are used to offset the exposure arising from highly probable future cash flows, including purchase considerations for business acquisitions and sale proceeds for business divestitures that are denominated in a foreign currency. In hedges of both foreign currency and interest rate exposure, the interest rate risk is generally hedged only to the extent of the benchmark interest rate.
In net investment hedges, the Bank designates foreign currency liabilities and foreign currency forwards as hedging instruments to manage foreign currency exposure. The designated non-derivative liabilities are denominated in the functional currency of the net investment, such that the foreign currency translation impact from the net investment will be offset by the foreign currency impact from the designated liabilities. The foreign currency forward contracts are structured to sell the functional currency of the net investment in return for the Bank’s functional currency.
Consolidated Financial Statements
Equity risk
180 | 2023 Scotiabank Annual Report Equity risk is created by the Bank’s share-based compensation plans awarded to employees. In cash flow hedges, total return swaps are mainly used to offset the equity exposure by exchanging interest payments for payments based on the returns on the underlying shares.
For all of the risks identified above, the economic relationship and hedge ratio are determined using a qualitative and quantitative assessment. This assessment incorporates comparison of critical terms of the hedged and hedging item, and regression analysis. For regression analysis, a hedging relationship is considered highly effective when all of the following criteria are met: correlation between the variables in the regression is at least 0.8 or greater; slope of the regression is within a 0.8-1.25 range; and confidence level of the slope is at least 95%.The main sources of hedge ineffectiveness include the following:
| • | The use of different discount curves to value the hedged item and the hedging derivative in fair value hedges, in order to reflect the reduced credit risk of collateralized derivatives; |
| • | Differences in key terms such as the underlying reference interest rate tenor, reset/settlement frequency and floating spread between the hedging instruments and the hedged item. |
The Bank has elected to continue to apply the hedge accounting requirements of IAS 39. However, the Bank has implemented the additional hedge accounting disclosures that are required by the IFRS 9 related amendments to IFRS 7 “Financial Instruments: Disclosures”.
The following table summarizes the notional amounts of derivatives and carrying amounts of cash and deposit liabilities designated as hedging instruments.
| 2023 | 2022 | |||||||||||||||||||||||||||||||
| Notional amounts(1) | Notional amounts(1) | |||||||||||||||||||||||||||||||
| Remaining term to maturity | Remaining term to maturity | |||||||||||||||||||||||||||||||
| As at October 31 ($ millions) | Within one year | One to five years | Over five years | Total | Within one year | One to five years | Over five years | Total | ||||||||||||||||||||||||
| Fair value hedges |
||||||||||||||||||||||||||||||||
| Interest rate risk – swaps |
$ | 20,101 | $ | 85,858 | $ | 13,987 | $ | 119,946 | $ | 35,535 | $ | 89,709 | $ | 17,588 | $ | 142,832 | ||||||||||||||||
| Foreign currency/interest rate risk – swaps |
– | – | – | – | – | – | – | – | ||||||||||||||||||||||||
| Cash flow hedges |
||||||||||||||||||||||||||||||||
| Interest rate risk – swaps |
19,356 | 78,159 | 24,809 | 122,324 | 18,267 | 69,933 | 34,180 | 122,380 | ||||||||||||||||||||||||
| Foreign currency/interest rate risk – swaps |
10,921 | 16,826 | 8,175 | 35,922 | 16,886 | 17,628 | 8,527 | 43,041 | ||||||||||||||||||||||||
| Foreign currency risk |
||||||||||||||||||||||||||||||||
| Swaps |
68,514 | 102,582 | 26,521 | 197,617 | 47,525 | 89,863 | 28,745 | 166,133 | ||||||||||||||||||||||||
| Foreign currency forwards |
214 | – | – | 214 | 14,699 | – | – | 14,699 | ||||||||||||||||||||||||
| Cash |
84 | – | – | 84 | 77 | – | – | 77 | ||||||||||||||||||||||||
| Equity risk – total return swaps |
307 | 511 | – | 818 | 270 | 603 | – | 873 | ||||||||||||||||||||||||
| Net investment hedges |
||||||||||||||||||||||||||||||||
| Foreign currency risk |
||||||||||||||||||||||||||||||||
| Foreign currency forwards |
23,150 | – | – | 23,150 | 24,038 | – | – | 24,038 | ||||||||||||||||||||||||
| Deposit liabilities |
6,402 | – | – | 6,402 | 6,289 | – | – | 6,289 | ||||||||||||||||||||||||
| Total |
$ | 149,049 | $ | 283,936 | $ | 73,492 | $ | 506,477 | $ | 163,586 | $ | 267,736 | $ | 89,040 | $ | 520,362 | ||||||||||||||||
| (1) | Notional amounts relating to derivatives that are hedging multiple risks in both assets and liabilities are included in more than one category. |
2023 Scotiabank Annual Report | 181
Consolidated Financial Statements
The following table shows the average rate or price of significant hedging instruments.
| 2023 | 2022 | |||||||||||||||||||||||
| Average rate or price(1) | Average rate or price(1) | |||||||||||||||||||||||
| As at October 31 | Fixed interest rate | FX rate | Price | Fixed interest rate | FX rate | Price | ||||||||||||||||||
| Fair value hedges |
||||||||||||||||||||||||
| Interest rate risk – swaps |
2.51 | % | n/a | n/a | 1.83 | % | n/a | n/a | ||||||||||||||||
| Cash flow hedges |
||||||||||||||||||||||||
| Interest rate risk – swaps |
3.09 | % | n/a | n/a | 2.57 | % | n/a | n/a | ||||||||||||||||
| Foreign currency/interest rate risk – swaps |
||||||||||||||||||||||||
| CAD-USD |
2.15 | % | 1.31 | n/a | 1.70 | % | 1.30 | n/a | ||||||||||||||||
| Foreign currency risk |
||||||||||||||||||||||||
| Swaps |
||||||||||||||||||||||||
| CAD-USD |
n/a | 1.32 | n/a | n/a | 1.27 | n/a | ||||||||||||||||||
| CAD-EUR |
n/a | 1.45 | n/a | n/a | 1.19 | n/a | ||||||||||||||||||
| CAD-GBP |
n/a | 1.69 | n/a | n/a | 1.56 | n/a | ||||||||||||||||||
| Foreign currency forwards |
||||||||||||||||||||||||
| CAD-USD |
n/a | n/a | n/a | n/a | 1.29 | n/a | ||||||||||||||||||
| Equity price risk – total return swaps |
n/a | n/a | $ | 72.25 | n/a | n/a | $ | 75.35 | ||||||||||||||||
| Net investment hedges |
||||||||||||||||||||||||
| Foreign currency risk – foreign currency forwards |
||||||||||||||||||||||||
| CAD-USD |
n/a | 1.34 | n/a | n/a | 1.29 | n/a | ||||||||||||||||||
| MXN-CAD |
n/a | 14.47 | n/a | n/a | 16.91 | n/a | ||||||||||||||||||
| PEN-CAD |
n/a | 2.84 | n/a | n/a | 3.07 | n/a | ||||||||||||||||||
| (1) | The average rate or price is calculated in aggregate for all of the Bank’s hedge relationships, including hedges of assets and liabilities. The majority of the Bank’s hedges have a remaining term to maturity of less than 5 years. |
For fair value hedges, the following table contains information related to items designated as hedging instruments, hedged items and ineffectiveness.
| Carrying amount of the hedging instruments(1) |
Hedge Ineffectiveness(2) |
Accumulated amount of fair item(4) |
||||||||||||||||||||||||||||||||||
| For the year ended October 31, 2023 ($ millions) |
Assets | Liabilities | Gains/(losses) on hedging instrument used to calculate hedge ineffectiveness |
Gains/ (losses) on hedged item used to calculate hedge ineffectiveness |
Ineffectiveness recorded in non-interest income – other |
Carrying amount of the hedged item(3) |
Active hedges |
Discontinued hedges |
||||||||||||||||||||||||||||
| Fair value hedges |
||||||||||||||||||||||||||||||||||||
| Interest rate risk – swaps |
$ | 4,008 | $ | (4,009 | ) | $ | (155 | ) | $ | 140 | $ | (15 | ) | |||||||||||||||||||||||
| Investment securities |
323 | (343 | ) | (20 | ) | $ | 36,367 | $ | (2,380 | ) | $ | 55 | ||||||||||||||||||||||||
| Loans |
(556 | ) | 573 | 17 | 83,899 | (818 | ) | (1,132 | ) | |||||||||||||||||||||||||||
| Deposit liabilities |
113 | (125 | ) | (12 | ) | (65,444 | ) | 3,062 | 770 | |||||||||||||||||||||||||||
| Subordinated debentures |
(35 | ) | 35 | – | (6,185 | ) | 238 | (12 | ) | |||||||||||||||||||||||||||
| Foreign currency/interest |
||||||||||||||||||||||||||||||||||||
| rate risk – swaps |
– | – | – | – | – | |||||||||||||||||||||||||||||||
| Investment securities |
– | – | – | – | – | – | ||||||||||||||||||||||||||||||
| Total |
$ | 4,008 | $ | (4,009 | ) | $ | (155 | ) | $ | 140 | $ | (15 | ) | $ | 48,637 | $ | 102 | $ | (319 | ) | ||||||||||||||||
| (1) | Comprises unrealized gains/losses and are recorded within derivative financial instruments in assets and liabilities, respectively in the Consolidated Statement of Financial Position. |
| (2) | Includes ineffectiveness related to hedges discontinued during the year ended October 31, 2023. |
| (3) | This represents the carrying value on the Consolidated Statement of Financial Position and comprises amortized cost before allowance for credit losses, plus fair value hedge adjustment, except for investment securities which are carried at fair value. |
| (4) | This represents the accumulated fair value hedge adjustment and is a component of the carrying amount of the hedged item. |
182 | 2023 Scotiabank Annual Report
Consolidated Financial Statements
| Carrying amount of the hedging instruments(1) |
Hedge Ineffectiveness(2) | Accumulated amount of
fair item(4) |
||||||||||||||||||||||||||||||||||
| For the year ended October 31, 2022 ($ millions) |
Assets | Liabilities | Gains/(losses) on hedging instrument used to calculate hedge ineffectiveness |
Gains/ (losses) on hedged item used to calculate hedge ineffectiveness |
Ineffectiveness recorded in non-interest income – other |
Carrying amount of the hedged item(3) |
Active hedges |
Discontinued hedges |
||||||||||||||||||||||||||||
| Fair value hedges |
||||||||||||||||||||||||||||||||||||
| Interest rate risk – swaps |
$ | 4,238 | $ | (4,635 | ) | $ | 1,188 | $ | (1,179 | ) | $ | 9 | ||||||||||||||||||||||||
| Investment securities |
2,837 | (2,811 | ) | 26 | $ | 31,325 | $ | (2,500 | ) | $ | 54 | |||||||||||||||||||||||||
| Loans |
2,550 | (2,579 | ) | (29 | ) | 111,469 | (1,552 | ) | (1,926 | ) | ||||||||||||||||||||||||||
| Deposit liabilities |
(3,998 | ) | 4,010 | 12 | (72,004 | ) | 3,997 | 312 | ||||||||||||||||||||||||||||
| Subordinated debentures |
(201 | ) | 201 | – | (5,354 | ) | 202 | (44 | ) | |||||||||||||||||||||||||||
| Foreign currency/interest |
||||||||||||||||||||||||||||||||||||
| rate risk – swaps |
– | – | – | – | – | |||||||||||||||||||||||||||||||
| Investment securities |
– | – | – | 80 | – | (1 | ) | |||||||||||||||||||||||||||||
| Total |
$ | 4,238 | $ | (4,635 | ) | $ | 1,188 | $ | (1,179 | ) | $ | 9 | $ | 65,516 | $ | 147 | $ | (1,605 | ) | |||||||||||||||||
| (1) | Comprises unrealized gains/losses and are recorded within derivative financial instruments in assets and liabilities, respectively in the Consolidated Statement of Financial Position. |
| (2) | Includes ineffectiveness related to hedges discontinued during the year ended October 31, 2022. |
| (3) | This represents the carrying value on the Consolidated Statement of Financial Position and comprises amortized cost before allowance for credit losses, plus fair value hedge adjustment, except for investment securities which are carried at fair value. |
| (4) | This represents the accumulated fair value hedge adjustment and is a component of the carrying amount of the hedged item. |
For cash flow hedges and net investment hedges, the following table contains information related to items designated as hedging instruments, hedged items and ineffectiveness.
| Carrying amount of the hedging instruments(1) |
Hedge Ineffectiveness(2) | |||||||||||||||||||||||
| For the year ended October 31, 2023 ($ millions) | Assets | Liabilities | Gains/(losses) on hedging instrument used to calculate hedge ineffectiveness |
Gains/(losses) on hypothetical derivative used to calculate hedge ineffectiveness(3) |
Ineffectiveness recorded in non-interest income – other(4) |
|||||||||||||||||||
| Cash flow hedges |
||||||||||||||||||||||||
| Interest rate risk – swaps |
$ | 2,690 | $ | (8,217 | ) | $ | (413 | ) | $ | (500 | ) | $ | 91 | |||||||||||
| Foreign currency/interest rate risk – swaps |
319 | (3,818 | ) | (670 | ) | (638 | ) | (15 | ) | |||||||||||||||
| Foreign currency risk |
||||||||||||||||||||||||
| Swaps |
7,586 | (5,847 | ) | 5,125 | 5,130 | (1 | ) | |||||||||||||||||
| Foreign currency forwards |
16 | (4 | ) | (141 | ) | (133 | ) | (11 | ) | |||||||||||||||
| Cash |
84 | – | (7 | ) | (7 | ) | – | |||||||||||||||||
| Equity risk – total return swaps |
1 | (84 | ) | (67 | ) | (67 | ) | – | ||||||||||||||||
| 10,696 | (17,970 | ) | 3,827 | 3,785 | 64 | |||||||||||||||||||
| Net investment hedges |
||||||||||||||||||||||||
| Foreign currency risk |
||||||||||||||||||||||||
| Foreign currency forwards |
208 | (663 | ) | (1,188 | ) | (1,188 | ) | – | ||||||||||||||||
| Deposit liabilities |
n/a | (6,402 | ) | (91 | ) | (91 | ) | – | ||||||||||||||||
| 208 | (7,065 | ) | (1,279 | ) | (1,279 | ) | – | |||||||||||||||||
| Total |
$ | 10,904 | $ | (25,035 | ) | $ | 2,548 | $ | 2,506 | $ | 64 | |||||||||||||
| (1) | Comprises unrealized gains/losses for derivative instruments and are recorded within derivative financial instruments in assets and liabilities, respectively in the Consolidated Statement of Financial Position. |
| (2) | Includes ineffectiveness related to hedges discontinued during the year ended October 31, 2023. |
| (3) | For cash flow hedges, hypothetical derivatives having critical terms which match those of the underlying hedged item are used to assess hedge ineffectiveness. |
| (4) | For cash flow hedges, ineffectiveness is only recognized in the Consolidated Statement of Income when the life-to-date cumulative change in the hedging instrument exceeds the cumulative change in the hypothetical derivative. |
2023 Scotiabank Annual Report | 183
Consolidated Financial Statements
| Carrying amount of the hedging instruments(1) |
Hedge Ineffectiveness(2) | |||||||||||||||||||||||
| For the year ended October 31, 2022 ($ millions) | Assets | Liabilities | Gains/(losses) on hedging instrument used to calculate hedge ineffectiveness |
Gains/(losses) on hypothetical derivative used to calculate hedge ineffectiveness(3) |
Ineffectiveness recorded in non-interest income – other(4) |
|||||||||||||||||||
| Cash flow hedges |
||||||||||||||||||||||||
| Interest rate risk – swaps |
$ | 1,977 | $ | (7,683 | ) | $ | (4,193 | ) | $ | (4,250 | ) | $ | 11 | |||||||||||
| Foreign currency/interest rate risk – swaps |
314 | (3,277 | ) | (4,318 | ) | (4,349 | ) | (24 | ) | |||||||||||||||
| Foreign currency risk |
||||||||||||||||||||||||
| Swaps |
4,777 | (8,470 | ) | (2,592 | ) | (2,589 | ) | (5 | ) | |||||||||||||||
| Foreign currency forwards |
678 | (61 | ) | 1,162 | 1,159 | 2 | ||||||||||||||||||
| Cash |
72 | – | 22 | 22 | – | |||||||||||||||||||
| Equity risk – total return swaps |
1 | (72 | ) | (134 | ) | (134 | ) | – | ||||||||||||||||
| 7,819 | (19,563 | ) | (10,053 | ) | (10,141 | ) | (16 | ) | ||||||||||||||||
| Net investment hedges |
||||||||||||||||||||||||
| Foreign currency risk |
||||||||||||||||||||||||
| Foreign currency forwards |
278 | (1,017 | ) | (1,343 | ) | (1,343 | ) | – | ||||||||||||||||
| Deposit liabilities |
n/a | (6,289 | ) | (574 | ) | (574 | ) | – | ||||||||||||||||
| 278 | (7,306 | ) | (1,917 | ) | (1,917 | ) | – | |||||||||||||||||
| Total |
$ | 8,097 | $ | (26,869 | ) | $ | (11,970 | ) | $ | (12,058 | ) | $ | (16 | ) | ||||||||||
| (1) | Comprises unrealized gains/losses for derivative instruments and are recorded within derivative financial instruments in assets and liabilities, respectively in the Consolidated Statement of Financial Position. |
| (2) | Includes ineffectiveness related to hedges discontinued during the year ended October 31, 2022. |
| (3) | For cash flow hedges, hypothetical derivatives having critical terms which match those of the underlying hedged item are used to assess hedge ineffectiveness. |
| (4) | For cash flow hedges, ineffectiveness is only recognized in the Consolidated Statement of Income when the life-to-date cumulative change in the hedging instrument exceeds the cumulative change in the hypothetical derivative. |
For cash flow hedges and net investment hedges, the following table contains information regarding the impacts on the Consolidated Statement of Other Comprehensive Income on a pre-tax basis.
| AOCI
gains/ November 1, 2022 |
Net gains/ (losses) recognized in OCI |
Amount reclassified to net income as the hedged item affects net income(1) |
AOCI
gains/ October 31, 2023 |
Balance in cash flow hedge reserve/unrealized foreign currency translation account as at October 31, 2023 |
||||||||||||||||||||
| For the year ended October 31, 2023 ($ millions) |
Active hedges |
Discontinued hedges |
||||||||||||||||||||||
| Cash flow hedges |
||||||||||||||||||||||||
| Interest rate risk |
$ | (3,458 | ) | $ | (504 | ) | $ | 482 | $ | (3,480 | ) | $ | (3,227 | ) | $ | (253 | ) | |||||||
| Foreign currency/interest rate risk |
(1,875 | ) | (655 | ) | 523 | (2,007 | ) | (2,096 | ) | 89 | ||||||||||||||
| Foreign currency risk |
(1,181 | ) | 4,989 | (4,511 | ) | (703 | ) | (708 | ) | 5 | ||||||||||||||
| Equity risk |
(4 | ) | (67 | ) | 51 | (20 | ) | (29 | ) | 9 | ||||||||||||||
| (6,518 | ) | 3,763 | (3,455 | ) | (6,210 | ) | (6,060 | ) | (150 | ) | ||||||||||||||
| Net investment hedges |
||||||||||||||||||||||||
| Foreign currency risk |
(3,484 | ) | (1,279 | ) | 702 | (4,061 | ) | (3,966 | ) | (95 | ) | |||||||||||||
| Total |
$ | (10,002 | ) | $ | 2,484 | $ | (2,753 | ) | $ | (10,271 | ) | $ | (10,026 | ) | $ | (245 | ) | |||||||
| (1) | Amounts reclassified from the cash flow hedge and net investment hedge reserves to net income are recorded in non-interest income-other except for amortization, which is recorded in interest income. |
| AOCI gains/ November 1, 2021 |
Net gains/ (losses) recognized in OCI |
Amount reclassified to net income as the hedged item affects net income(1) |
AOCI gains/ October 31, 2022 |
Balance in cash flow hedge reserve/unrealized foreign currency translation account as at October 31, 2022 |
||||||||||||||||||||
| For the year ended October 31, 2022 ($ millions) |
Active hedges |
Discontinued hedges |
||||||||||||||||||||||
| Cash flow hedges |
||||||||||||||||||||||||
| Interest rate risk |
$ | (456 | ) | $ | (4,204 | ) | $ | 1,202 | $ | (3,458 | ) | $ | (3,526 | ) | $ | 68 | ||||||||
| Foreign currency/interest rate risk |
(9 | ) | (4,294 | ) | 2,428 | (1,875 | ) | (2,003 | ) | 128 | ||||||||||||||
| Foreign currency risk |
43 | (1,405 | ) | 181 | (1,181 | ) | (1,179 | ) | (2 | ) | ||||||||||||||
| Equity risk |
61 | (134 | ) | 69 | (4 | ) | (4 | ) | – | |||||||||||||||
| (361 | ) | (10,037 | ) | 3,880 | (6,518 | ) | (6,712 | ) | 194 | |||||||||||||||
| Net investment hedges |
||||||||||||||||||||||||
| Foreign currency risk |
(1,829 | ) | (1,917 | ) | 262 | (3,484 | ) | (3,387 | ) | (97 | ) | |||||||||||||
| Total |
$ | (2,190 | ) | $ | (11,954 | ) | $ | 4,142 | $ | (10,002 | ) | $ | (10,099 | ) | $ | 97 | ||||||||
| (1) | Amounts reclassified from the cash flow hedge and net investment hedge reserves to net income are recorded in non-interest income-other. |
184 | 2023 Scotiabank Annual Report
Consolidated Financial Statements
| 11 | Offsetting Financial Assets and Financial Liabilities |
The Bank is eligible to present certain financial assets and financial liabilities as listed in the table below on a net basis on the Consolidated Statement of Financial Position pursuant to criteria described in Note 3 – Significant accounting policies.
The following tables provide information on the impact of offsetting on the Bank’s Consolidated Statement of Financial Position, as well as the financial impact of netting for instruments that are subject to enforceable master netting arrangements or similar agreements, but do not qualify for offsetting in the Consolidated Statement of Financial Position, as well as available cash and financial instrument collateral.
| As at October 31, 2023 ($ millions) | ||||||||||||||||||||||||
| Types of financial assets | Gross amounts of recognized financial instruments |
Gross amounts of recognized financial instruments offset in the Consolidated Statement of Financial Position |
Net amounts of financial instruments presented in the Consolidated Statement of Financial Position |
Related amounts not offset in the Consolidated Statement of Financial Position |
||||||||||||||||||||
| Impact of master netting arrangements or similar agreements(1) |
Collateral(2)(4) | Net amount(3) | ||||||||||||||||||||||
| Derivative financial instruments |
$ | 51,340 | $ | – | $ | 51,340 | $ | (33,899 | ) | $ | (6,479 | ) | $ | 10,962 | ||||||||||
| Securities purchased under resale agreements and securities borrowed |
272,667 | (73,342 | ) | 199,325 | (17,356 | ) | (179,466 | ) | 2,503 | |||||||||||||||
| Total |
$ | 324,007 | $ | (73,342 | ) | $ | 250,665 | $ | (51,255 | ) | $ | (185,945 | ) | $ | 13,465 | |||||||||
| Types of financial liabilities | ||||||||||||||||||||||||
| Derivative financial instruments |
$ | 58,660 | $ | – | $ | 58,660 | $ | (33,899 | ) | $ | (14,515 | ) | $ | 10,246 | ||||||||||
| Obligations related to securities sold under repurchase agreements and securities lent |
233,349 | (73,342 | ) | 160,007 | (17,356 | ) | (140,215 | ) | 2,436 | |||||||||||||||
| Total |
$ | 292,009 | $ | (73,342 | ) | $ | 218,667 | $ | (51,255 | ) | $ | (154,730 | ) | $ | 12,682 | |||||||||
| As at October 31, 2022 ($ millions) | ||||||||||||||||||||||||
| Types of financial assets |
Gross amounts |
Gross amounts of |
Net amounts of financial instruments |
Related amounts not offset in the Consolidated statement of Financial Position |
Net amount(3) | |||||||||||||||||||
| Impact of master netting arrangements or similar agreements(1) |
Collateral(2)(4) | |||||||||||||||||||||||
| Derivative financial instruments |
$ | 55,775 | $ | (76 | ) | $ | 55,699 | $ | (36,519 | ) | $ | (6,132 | ) | $ | 13,048 | |||||||||
| Securities purchased under resale agreements and securities borrowed |
230,893 | (55,580 | ) | 175,313 | (16,173 | ) | (151,417 | ) | 7,723 | |||||||||||||||
| Total |
$ | 286,668 | $ | (55,656 | ) | $ | 231,012 | $ | (52,692 | ) | $ | (157,549 | ) | $ | 20,771 | |||||||||
| Types of financial liabilities | ||||||||||||||||||||||||
| Derivative financial instruments |
$ | 65,976 | $ | (76 | ) | $ | 65,900 | $ | (36,519 | ) | $ | (17,484 | ) | $ | 11,897 | |||||||||
| Obligations related to securities sold under repurchase agreements and securities lent |
194,605 | (55,580 | ) | 139,025 | (16,173 | ) | (118,559 | ) | 4,293 | |||||||||||||||
| Total |
$ | 260,581 | $ | (55,656 | ) | $ | 204,925 | $ | (52,692 | ) | $ | (136,043 | ) | $ | 16,190 | |||||||||
| (1) | Amounts that are subject to master netting arrangements or similar agreements but were not offset in the Consolidated Statement of Financial Position because they did not meet the net settlement/simultaneous settlement criteria; or because the rights of set off are conditional upon the default of the counterparty only. |
| (2) | Cash and financial instrument collateral amounts received or pledged in relation to the total amounts of financial assets and financial liabilities, including those that were not offset in the Consolidated Statement of Financial Position. These amounts are disclosed at fair value and the rights of set off are conditional upon the default of the counterparty. |
| (3) | Not intended to represent the Bank’s actual exposure to credit risk, as a variety of credit mitigation strategies are employed in addition to offsetting and collateral arrangements. |
| (4) | Derivative financial instruments assets include cash collateral of $4,511 million (2022 - $4,271 million) and non-cash collateral of $1,968 million (2022 - $1,861 million). Derivative financial instruments liabilities include cash collateral of $13,889 million (2022 - $17,215 million) and non-cash collateral of $626 million (2022 - $269 million). |
2023 Scotiabank Annual Report | 185
Consolidated Financial Statements
| 12 | Investment Securities |
The following table presents the carrying amounts of the Bank’s investment securities per measurement category.
| As at October 31 ($ millions) | 2023 | 2022 | ||||||
| Debt investment securities measured at FVOCI |
$ | 82,150 | $ | 81,271 | ||||
| Debt investment securities measured at amortized cost |
31,984 | 23,610 | ||||||
| Equity investment securities designated at FVOCI |
2,164 | 3,439 | ||||||
| Equity investment securities measured at FVTPL |
1,888 | 1,626 | ||||||
| Debt investment securities measured at FVTPL |
51 | 62 | ||||||
| Total investment securities |
$ | 118,237 | $ | 110,008 | ||||
| (a) | Debt investment securities measured at fair value through other comprehensive income (FVOCI) |
| 2023 | 2022 | |||||||||||||||||||||||||||||||
| As at October 31 ($ millions) | Cost | Gross unrealized gains |
Gross unrealized losses |
Fair value | Cost | Gross unrealized gains |
Gross unrealized losses |
Fair value | ||||||||||||||||||||||||
| Canadian federal government issued or guaranteed debt |
$ | 12,794 | $ | 6 | $ | 413 | $ | 12,387 | $ | 11,372 | $ | 4 | $ | 374 | $ | 11,002 | ||||||||||||||||
| Canadian provincial and municipal debt |
7,680 | 2 | 536 | 7,146 | 5,860 | 1 | 432 | 5,429 | ||||||||||||||||||||||||
| U.S. treasury and other U.S. agency debt |
30,741 | 32 | 2,075 | 28,698 | 37,690 | 80 | 2,534 | 35,236 | ||||||||||||||||||||||||
| Other foreign government debt |
32,246 | 91 | 936 | 31,401 | 28,794 | 27 | 1,135 | 27,686 | ||||||||||||||||||||||||
| Other debt |
2,597 | 2 | 81 | 2,518 | 1,989 | 1 | 72 | 1,918 | ||||||||||||||||||||||||
| Total |
$ | 86,058 | $ | 133 | $ | 4,041 | $ | 82,150 | $ | 85,705 | $ | 113 | $ | 4,547 | $ | 81,271 | ||||||||||||||||
| (b) | Debt investment securities measured at amortized cost |
| 2023 | 2022 | |||||||||||||||
| As at October 31 ($ millions) | Fair Value | Carrying value(1) |
Fair Value | Carrying value(1) |
||||||||||||
| Canadian federal and provincial government issued or guaranteed debt |
$ | 9,927 | $ | 10,211 | $ | 8,684 | $ | 9,024 | ||||||||
| U.S. treasury and other U.S. agency debt |
17,912 | 19,788 | 12,212 | 13,042 | ||||||||||||
| Other foreign government debt |
1,860 | 1,871 | 1,459 | 1,470 | ||||||||||||
| Corporate debt |
117 | 114 | 88 | 74 | ||||||||||||
| Total |
$ | 29,816 | $ | 31,984 | $ | 22,443 | $ | 23,610 | ||||||||
| (1) | Balances are net of allowances of $1 (2022 – $1). |
| (c) | Equity investment securities designated at fair value through other comprehensive income (FVOCI) |
The Bank has designated certain equity securities at FVOCI shown in the following table as these investments are held for strategic purposes.
| As at October 31, 2023 ($ millions) | Cost | Gross unrealized gains |
Gross unrealized losses |
Fair value | ||||||||||||
| Preferred equity instruments |
$ | – | $ | – | $ | – | $ | – | ||||||||
| Common shares |
1,947 | 390 | 173 | 2,164 | ||||||||||||
| Total |
$ | 1,947 | $ | 390 | $ | 173 | $ | 2,164 | ||||||||
| As at October 31, 2022 ($ millions) | Cost | Gross unrealized gains |
Gross unrealized losses |
Fair value | ||||||||||||
| Preferred equity instruments |
$ | – | $ | – | $ | – | $ | – | ||||||||
| Common shares |
3,175 | 487 | 223 | 3,439 | ||||||||||||
| Total |
$ | 3,175 | $ | 487 | $ | 223 | $ | 3,439 | ||||||||
Dividend income on equity securities designated at FVOCI of $137 million for the year ended October 31, 2023 (2022 – $167 million) has been recognized in interest income.
During the year ended October 31, 2023, the Bank has disposed of certain equity securities designated at FVOCI with a fair value of $1,738 million (2022 – $958 million). These dispositions have resulted in a cumulative loss of $205 million (2022 – gain of $67 million) that remains in OCI.
186 | 2023 Scotiabank Annual Report
Consolidated Financial Statements
| (d) | An analysis of the carrying value of investment securities is as follows: |
| Remaining term to maturity | ||||||||||||||||||||||||||||
| As at October 31, 2023 ($ millions) | Within three months |
Three to twelve months |
One to five years |
Five to ten years |
Over ten years |
No specific maturity |
Carrying value |
|||||||||||||||||||||
| Fair value through other comprehensive income |
||||||||||||||||||||||||||||
| Debt instruments |
||||||||||||||||||||||||||||
| Canadian federal government issued or guaranteed debt |
$ | 914 | $ | 4,964 | $ | 4,441 | $ | 1,265 | $ | 804 | $ | – | $ | 12,388 | ||||||||||||||
| Yield(1) % |
4.0 | 4.5 | 3.5 | 3.1 | 4.3 | – | 3.9 | |||||||||||||||||||||
| Canadian provincial and municipal debt |
128 | 185 | 3,732 | 3,053 | 48 | – | 7,146 | |||||||||||||||||||||
| Yield(1) % |
3.3 | 1.6 | 2.8 | 3.3 | 4.6 | – | 3.0 | |||||||||||||||||||||
| U.S. treasury and other U.S. agency debt |
714 | 2,848 | 18,782 | 2,723 | 3,631 | – | 28,698 | |||||||||||||||||||||
| Yield(1) % |
4.8 | 2.3 | 2.8 | 4.0 | 3.0 | – | 2.9 | |||||||||||||||||||||
| Other foreign government debt |
7,126 | 8,629 | 11,241 | 4,073 | 331 | – | 31,400 | |||||||||||||||||||||
| Yield(1) % |
2.0 | 3.6 | 4.5 | 5.4 | 3.8 | – | 3.8 | |||||||||||||||||||||
| Other debt |
96 | 193 | 2,160 | 63 | 6 | – | 2,518 | |||||||||||||||||||||
| Yield(1) % |
2.2 | 11.5 | 5.4 | 4.5 | 5.9 | – | 5.7 | |||||||||||||||||||||
| 8,978 | 16,819 | 40,356 | 11,177 | 4,820 | – | 82,150 | ||||||||||||||||||||||
| Equity instruments |
||||||||||||||||||||||||||||
| Preferred equity instruments |
– | – | – | – | – | – | – | |||||||||||||||||||||
| Common shares |
– | – | – | – | – | 2,164 | 2,164 | |||||||||||||||||||||
| 2,164 | 2,164 | |||||||||||||||||||||||||||
| Total FVOCI |
8,978 | 16,819 | 40,356 | 11,177 | 4,820 | 2,164 | 84,314 | |||||||||||||||||||||
| Amortized cost |
||||||||||||||||||||||||||||
| Canadian federal and provincial government issued or guaranteed debt |
700 | 2,147 | 6,959 | 405 | – | – | 10,211 | |||||||||||||||||||||
| Yield(1) % |
3.4 | 3.2 | 3.4 | 4.7 | – | – | 3.4 | |||||||||||||||||||||
| U.S. treasury and other U.S. agency debt |
– | 14 | 163 | 4 | 19,607 | – | 19,788 | |||||||||||||||||||||
| Yield(1) % |
– | 5.5 | 5.0 | 4.5 | 4.5 | – | 4.5 | |||||||||||||||||||||
| Other foreign government debt |
151 | 481 | 1,030 | 185 | 24 | – | 1,871 | |||||||||||||||||||||
| Yield(1) % |
6.0 | 9.2 | 5.6 | 2.6 | 1.5 | – | 6.2 | |||||||||||||||||||||
| Corporate debt |
– | 1 | 2 | 28 | 83 | – | 114 | |||||||||||||||||||||
| Yield(1) % |
– | 5.6 | 3.9 | 3.2 | 5.6 | – | 5.0 | |||||||||||||||||||||
| 851 | 2,643 | 8,154 | 622 | 19,714 | – | 31,984 | ||||||||||||||||||||||
| Fair value through profit or loss |
||||||||||||||||||||||||||||
| Equity instruments |
– | – | – | – | – | 1,888 | 1,888 | |||||||||||||||||||||
| Debt instruments |
– | – | 51 | – | – | – | 51 | |||||||||||||||||||||
| Total investment securities |
$ | 9,829 | $ | 19,462 | $ | 48,561 | $ | 11,799 | $ | 24,534 | $ | 4,052 | $ | 118,237 | ||||||||||||||
| Total by currency (in Canadian equivalent): |
||||||||||||||||||||||||||||
| Canadian dollar |
$ | 1,724 | $ | 7,154 | $ | 13,739 | $ | 3,744 | $ | 941 | $ | 1,648 | $ | 28,950 | ||||||||||||||
| U.S. dollar |
1,028 | 3,853 | 26,261 | 4,944 | 23,245 | 1,965 | 61,296 | |||||||||||||||||||||
| Mexican peso |
737 | 1,447 | 2,468 | 540 | – | 149 | 5,341 | |||||||||||||||||||||
| Other currencies |
6,340 | 7,008 | 6,093 | 2,571 | 348 | 290 | 22,650 | |||||||||||||||||||||
| Total investment securities |
$ | 9,829 | $ | 19,462 | $ | 48,561 | $ | 11,799 | $ | 24,534 | $ | 4,052 | $ | 118,237 | ||||||||||||||
| (1) | Represents the weighted-average yield of fixed income securities. |
2023 Scotiabank Annual Report | 187
Consolidated Financial Statements
| Remaining term to maturity | ||||||||||||||||||||||||||||
| As at October 31, 2022 ($ millions) | Within three months |
Three to twelve months |
One to five years |
Five to ten years |
Over ten years |
No specific maturity |
Carrying value |
|||||||||||||||||||||
| Fair value through other comprehensive income |
||||||||||||||||||||||||||||
| Debt instruments |
||||||||||||||||||||||||||||
| Canadian federal government issued or guaranteed debt |
$ | 2,617 | $ | 2,125 | $ | 4,700 | $ | 675 | $ | 885 | $ | – | $ | 11,002 | ||||||||||||||
| Yield(1) % |
1.0 | 2.7 | 2.2 | 2.1 | 0.2 | – | 1.9 | |||||||||||||||||||||
| Canadian provincial and municipal debt |
372 | 688 | 2,537 | 1,832 | – | – | 5,429 | |||||||||||||||||||||
| Yield(1) % |
1.2 | 1.8 | 2.1 | 2.5 | – | – | 2.1 | |||||||||||||||||||||
| U.S. treasury and other U.S. agency debt |
762 | 8,665 | 19,695 | 3,295 | 2,819 | – | 35,236 | |||||||||||||||||||||
| Yield(1) % |
2.7 | 1.1 | 2.2 | 2.7 | 2.5 | – | 2.0 | |||||||||||||||||||||
| Other foreign government debt |
6,994 | 7,325 | 9,281 | 3,817 | 269 | – | 27,686 | |||||||||||||||||||||
| Yield(1) % |
2.1 | 2.2 | 4.3 | 5.0 | 3.4 | – | 3.3 | |||||||||||||||||||||
| Other debt |
70 | 101 | 1,527 | 214 | 3 | 3 | 1,918 | |||||||||||||||||||||
| Yield(1) % |
9.8 | 2.8 | 4.3 | 3.0 | 5.9 | 4.0 | 4.3 | |||||||||||||||||||||
| 10,815 | 18,904 | 37,740 | 9,833 | 3,976 | 3 | 81,271 | ||||||||||||||||||||||
| Equity instruments |
||||||||||||||||||||||||||||
| Preferred equity instruments |
– | – | – | – | – | – | – | |||||||||||||||||||||
| Common shares |
– | – | – | – | – | 3,439 | 3,439 | |||||||||||||||||||||
| 3,439 | 3,439 | |||||||||||||||||||||||||||
| Total FVOCI |
10,815 | 18,904 | 37,740 | 9,833 | 3,976 | 3,442 | 84,710 | |||||||||||||||||||||
| Amortized cost |
||||||||||||||||||||||||||||
| Canadian federal and provincial government issued or guaranteed debt |
682 | 1,867 | 6,104 | 367 | 4 | – | 9,024 | |||||||||||||||||||||
| Yield(1) % |
1.0 | 3.1 | 2.9 | 7.2 | 0.0 | – | 3.1 | |||||||||||||||||||||
| U.S. treasury and other U.S. agency debt |
– | 812 | 149 | 7 | 12,074 | – | 13,042 | |||||||||||||||||||||
| Yield(1) % |
– | 1.3 | 3.1 | 4.0 | 3.5 | – | 3.4 | |||||||||||||||||||||
| Other foreign government debt |
81 | 382 | 827 | 138 | 43 | – | 1,471 | |||||||||||||||||||||
| Yield(1) % |
2.6 | 7.4 | 4.5 | 2.2 | 1.3 | – | 4.8 | |||||||||||||||||||||
| Corporate debt |
2 | 52 | (10 | ) | 29 | – | – | 73 | ||||||||||||||||||||
| Yield(1) % |
2.7 | 3.0 | 3.9 | 2.6 | – | – | 2.9 | |||||||||||||||||||||
| 765 | 3,113 | 7,070 | 541 | 12,121 | – | 23,610 | ||||||||||||||||||||||
| Fair value through profit or loss |
||||||||||||||||||||||||||||
| Equity instruments |
– | – | – | – | – | 1,626 | 1,626 | |||||||||||||||||||||
| Debt instruments |
– | – | 54 | 8 | – | – | 62 | |||||||||||||||||||||
| Total investment securities |
$ | 11,580 | $ | 22,017 | $ | 44,864 | $ | 10,382 | $ | 16,097 | $ | 5,068 | $ | 110,008 | ||||||||||||||
| Total by currency (in Canadian equivalent): |
||||||||||||||||||||||||||||
| Canadian dollar |
$ | 3,546 | $ | 3,968 | $ | 12,560 | $ | 2,440 | $ | 900 | $ | 2,796 | $ | 26,210 | ||||||||||||||
| U.S. dollar |
1,031 | 11,856 | 24,810 | 4,921 | 14,866 | 1,998 | 59,482 | |||||||||||||||||||||
| Mexican peso |
193 | 496 | 2,695 | 485 | – | 35 | 3,904 | |||||||||||||||||||||
| Other currencies |
6,810 | 5,697 | 4,799 | 2,536 | 331 | 239 | 20,412 | |||||||||||||||||||||
| Total investment securities |
$ | 11,580 | $ | 22,017 | $ | 44,864 | $ | 10,382 | $ | 16,097 | $ | 5,068 | $ | 110,008 | ||||||||||||||
| (1) | Represents the weighted-average yield of fixed income securities. |
| (e) | Net gain on sale of investment securities |
The following table presents the net gain on sale of investment securities:
| For the year ended October 31 ($ millions) | 2023 | 2022 | ||||||
| Debt investment securities measured at amortized cost |
$ | – | $ | – | ||||
| Debt investment securities measured at FVOCI |
129 | 74 | ||||||
| Net gain on sale of investment securities |
$ | 129 | $ | 74 | ||||
188 | 2023 Scotiabank Annual Report
Consolidated Financial Statements
| 13 | Loans, Impaired Loans and Allowance for Credit Losses |
| (a) | Loans at amortized cost |
| 2023 | 2022 | |||||||||||||||||||||||
| As at October 31 ($ millions) | Gross loans |
Allowance for credit losses |
Net carrying amount |
Gross loans |
Allowance for credit losses |
Net carrying amount |
||||||||||||||||||
| Residential mortgages |
$ | 344,182 | $ | 1,084 | $ | 343,098 | $ | 349,279 | $ | 899 | $ | 348,380 | ||||||||||||
| Personal loans |
104,170 | 2,414 | 101,756 | 99,431 | 2,137 | 97,294 | ||||||||||||||||||
| Credit cards |
17,109 | 1,237 | 15,872 | 14,518 | 1,083 | 13,435 | ||||||||||||||||||
| Business and government |
291,822 | 1,637 | 290,185 | 287,107 | 1,229 | 285,878 | ||||||||||||||||||
| Total |
$ | 757,283 | $ | 6,372 | $ | 750,911 | $ | 750,335 | $ | 5,348 | $ | 744,987 | ||||||||||||
| (b) | Loans and acceptances outstanding by geography(1) |
| As at October 31 ($ millions) | 2023 | 2022 | ||||||
| Canada: |
||||||||
| Residential mortgages |
$ | 290,253 | $ | 302,486 | ||||
| Personal loans |
80,732 | 78,427 | ||||||
| Credit cards |
8,216 | 6,970 | ||||||
| Business and government |
114,991 | 105,277 | ||||||
| 494,192 | 493,160 | |||||||
| United States: |
||||||||
| Personal loans |
4,408 | 2,830 | ||||||
| Business and government |
61,342 | 66,680 | ||||||
| 65,750 | 69,510 | |||||||
| Mexico: |
||||||||
| Residential mortgages |
16,556 | 13,080 | ||||||
| Personal loans |
2,200 | 2,556 | ||||||
| Credit cards |
808 | 675 | ||||||
| Business and government |
26,466 | 23,744 | ||||||
| 46,030 | 40,055 | |||||||
| Chile: |
||||||||
| Residential mortgages |
21,499 | 19,441 | ||||||
| Personal loans |
5,081 | 4,766 | ||||||
| Credit cards |
3,654 | 2,921 | ||||||
| Business and government |
22,383 | 24,197 | ||||||
| 52,617 | 51,325 | |||||||
| Peru: |
||||||||
| Residential mortgages |
4,102 | 3,719 | ||||||
| Personal loans |
5,424 | 5,025 | ||||||
| Credit cards |
1,049 | 942 | ||||||
| Business and government |
12,004 | 12,819 | ||||||
| 22,579 | 22,505 | |||||||
| Colombia: |
||||||||
| Residential mortgages |
2,390 | 1,910 | ||||||
| Personal loans |
2,349 | 2,115 | ||||||
| Credit cards |
1,684 | 1,443 | ||||||
| Business and government |
6,327 | 5,541 | ||||||
| 12,750 | 11,009 | |||||||
| Other International: |
||||||||
| Residential mortgages |
9,382 | 8,643 | ||||||
| Personal loans |
3,976 | 3,712 | ||||||
| Credit cards |
1,698 | 1,568 | ||||||
| Business and government |
48,309 | 48,848 | ||||||
| 63,365 | 62,771 | |||||||
| Total loans |
757,283 | 750,335 | ||||||
| Acceptances(2) |
18,628 | 19,494 | ||||||
| Total loans and acceptances(3) |
775,911 | 769,829 | ||||||
| Allowance for credit losses |
(6,462 | ) | (5,379 | ) | ||||
| Total loans and acceptances net of allowance for credit losses |
$ | 769,449 | $ | 764,450 | ||||
| (1) | Geographic segmentation is based on the location of the property for residential mortgages; otherwise, the residence of the borrower. |
| (2) | 0.6% of acceptances reside outside Canada (October 31, 2022 – 0.4%). |
| (3) | Loans and acceptances denominated in U.S. dollars were $151,499 (2022 – $158,715), in Chilean pesos $41,499 (2022 – $39,418), Mexican pesos $34,894 (2022 – $29,194), and in other foreign currencies $55,855 (2022 – $51,445). |
2023 Scotiabank Annual Report | 189
Consolidated Financial Statements
| (c) | Loan maturities |
| As at October 31, 2023 | Remaining term to maturity | Rate sensitivity | ||||||||||||||||||||||||||||||||||||||
| ($ millions) | Within one year |
One to five years |
Five to ten years |
Over ten years |
No specific maturity |
Total | Floating | Fixed rate | Non-rate sensitive |
Total | ||||||||||||||||||||||||||||||
| Residential mortgages |
$ | 47,610 | $ | 254,546 | $ | 15,830 | $ | 23,946 | $ | 2,250 | $ | 344,182 | $ | 98,606 | $ | 242,589 | $ | 2,987 | $ | 344,182 | ||||||||||||||||||||
| Personal loans |
18,279 | 37,875 | 5,593 | 1,189 | 41,234 | 104,170 | 44,913 | 58,002 | 1,255 | 104,170 | ||||||||||||||||||||||||||||||
| Credit cards |
– | – | – | – | 17,109 | 17,109 | – | 17,109 | – | 17,109 | ||||||||||||||||||||||||||||||
| Business and government |
149,625 | 131,039 | 5,493 | 339 | 5,326 | 291,822 | 177,428 | 112,583 | 1,811 | 291,822 | ||||||||||||||||||||||||||||||
| Total |
$ | 215,514 | $ | 423,460 | $ | 26,916 | $ | 25,474 | $ | 65,919 | $ | 757,283 | $ | 320,947 | $ | 430,283 | $ | 6,053 | $ | 757,283 | ||||||||||||||||||||
| Allowance for credit losses |
– | – | – | – | (6,372 | ) | (6,372 | ) | – | – | (6,372 | ) | (6,372 | ) | ||||||||||||||||||||||||||
| Total loans net of allowance for credit losses |
$ | 215,514 | $ | 423,460 | $ | 26,916 | $ | 25,474 | $ | 59,547 | $ | 750,911 | $ | 320,947 | $ | 430,283 | $ | (319 | ) | $ | 750,911 | |||||||||||||||||||
| As at October 31, 2022 | Remaining term to maturity | Rate sensitivity | ||||||||||||||||||||||||||||||||||||||
| ($ millions) | Within one year |
One to five years |
Five to ten years |
Over ten years |
No specific maturity |
Total | Floating | Fixed rate | Non-rate sensitive |
Total | ||||||||||||||||||||||||||||||
| Residential mortgages |
$ | 41,557 | $ | 269,576 | $ | 13,011 | $ | 24,487 | $ | 648 | $ | 349,279 | $ | 114,060 | $ | 232,519 | $ | 2,700 | $ | 349,279 | ||||||||||||||||||||
| Personal loans |
15,772 | 37,279 | 5,328 | 1,282 | 39,770 | 99,431 | 41,883 | 56,707 | 841 | 99,431 | ||||||||||||||||||||||||||||||
| Credit cards |
– | – | – | – | 14,518 | 14,518 | – | 14,518 | – | 14,518 | ||||||||||||||||||||||||||||||
| Business and government |
148,094 | 128,114 | 5,334 | 386 | 5,179 | 287,107 | 166,236 | 119,361 | 1,510 | 287,107 | ||||||||||||||||||||||||||||||
| Total |
$ | 205,423 | $ | 434,969 | $ | 23,673 | $ | 26,155 | $ | 60,115 | $ | 750,335 | $ | 322,179 | $ | 423,105 | $ | 5,051 | $ | 750,335 | ||||||||||||||||||||
| Allowance for credit losses |
– | – | – | – | (5,348 | ) | (5,348 | ) | – | – | (5,348 | ) | (5,348 | ) | ||||||||||||||||||||||||||
| Total loans net of allowance for credit losses |
$ | 205,423 | $ | 434,969 | $ | 23,673 | $ | 26,155 | $ | 54,767 | $ | 744,987 | $ | 322,179 | $ | 423,105 | $ | (297 | ) | $ | 744,987 | |||||||||||||||||||
| (d) | Impaired loans(1) |
| 2023 | 2022 | |||||||||||||||||||||||
| As at October 31 ($ millions) | Gross impaired loans(1) |
Allowance for credit losses |
Net | Gross impaired loans(1) |
Allowance for credit losses |
Net | ||||||||||||||||||
| Residential mortgages |
$ | 1,864 | $ | 498 | $ | 1,366 | $ | 1,386 | $ | 406 | $ | 980 | ||||||||||||
| Personal loans |
1,176 | 664 | 512 | 848 | 551 | 297 | ||||||||||||||||||
| Credit cards |
– | – | – | – | – | – | ||||||||||||||||||
| Business and government |
2,686 | 719 | 1,967 | 2,552 | 678 | 1,874 | ||||||||||||||||||
| Total |
$ | 5,726 | $ | 1,881 | $ | 3,845 | $ | 4,786 | $ | 1,635 | $ | 3,151 | ||||||||||||
| By geography: |
||||||||||||||||||||||||
| Canada |
$ | 1,564 | $ | 514 | $ | 1,050 | $ | 1,054 | $ | 440 | $ | 614 | ||||||||||||
| United States |
– | – | – | – | – | – | ||||||||||||||||||
| Mexico |
1,183 | 372 | 811 | 1,020 | 294 | 726 | ||||||||||||||||||
| Peru |
691 | 372 | 319 | 761 | 352 | 409 | ||||||||||||||||||
| Chile |
1,098 | 264 | 834 | 740 | 202 | 538 | ||||||||||||||||||
| Colombia |
356 | 97 | 259 | 301 | 67 | 234 | ||||||||||||||||||
| Other International |
834 | 262 | 572 | 910 | 280 | 630 | ||||||||||||||||||
| Total |
$ | 5,726 | $ | 1,881 | $ | 3,845 | $ | 4,786 | $ | 1,635 | $ | 3,151 | ||||||||||||
| (1) | Interest income recognized on impaired loans during the year ended October 31, 2023 was $57 (2022 – $44). |
190 | 2023 Scotiabank Annual Report
Consolidated Financial Statements
| (e) | Allowance for credit losses |
| (i) | Key inputs and assumptions |
The Bank’s allowance for credit losses is measured using a three-stage approach based on the extent of credit deterioration since origination. The calculation of the Bank’s allowance for credit losses is an output of a set of complex models with a number of underlying assumptions regarding the choice of variable inputs and their interdependencies. Some of the key drivers include the following:
| • | Changes in risk ratings of the borrower or instrument reflecting changes in their credit quality; |
| • | Changes in the volumes of transactions; |
| • | Changes in the forward-looking macroeconomic environment reflected in the variables used in the models such as GDP growth, unemployment rates, commodity prices, interest rates and house price indices, which are closely related with credit losses in the relevant portfolio; |
| • | Changes in macroeconomic scenarios and the probability weights assigned to each scenario; and |
| • | Borrower migration between the three stages. |
The Bank determines its allowance for credit losses using four probability-weighted forward-looking scenarios (base case, optimistic, pessimistic and very pessimistic).
The Bank considers both internal and external sources of information and data to achieve unbiased projections and forecasts in determining the allowance for credit losses. The Bank prepares the scenarios using forecasts generated by Scotiabank Economics (SE). The forecasts are generated using models whose outputs are modified by SE as necessary to formulate a ‘base case’ view of the most probable future direction of economic developments. The development of the base case and alternative scenarios is overseen by a governance committee that consists of internal stakeholders from across the Bank. The final base case and alternative scenarios reflect significant review and oversight, and incorporate judgment both in the determination of the scenarios’ forecasts and the probability weights that are assigned to them.
| (ii) | Key macroeconomic variables |
The inputs and models used for calculating expected credit losses may not always capture all characteristics of the market at the date of the financial statements. Qualitative adjustments or overlays may be made for certain portfolios or geographies as temporary adjustments in circumstances where, in the Bank’s view, the inputs, assumptions, and/or modelling techniques do not capture all relevant risk factors, including the emergence of economic or geopolitical events up to the date of financial statements.
The Bank has applied expert credit judgement in the determination of the allowance for credit losses to capture, as described above, all relevant risk factors up to the end of the reporting period. The Bank considered both quantitative and qualitative information in the assessment of significant increase in credit risk.
The Bank’s models are calibrated to consider past performance and macroeconomic forward-looking variables as inputs. The Bank has generated a forward-looking base case scenario and three alternate forward-looking scenarios (one optimistic and two pessimistic) as key inputs into the expected credit loss provisioning models.
Over the last year, both the Canadian and U.S. economies proved resilient in the face of monetary tightening, driven largely by resilient labour markets, strong consumption and pent-up demand. This economic resilience and resulting inflationary pressures necessitated more monetary policy tightening than anticipated a year ago. Therefore, while economic growth for both countries in 2023 is now expected to be higher relative to a year ago, growth projections for 2024 have been revised down to reflect the impact of higher policy rates on their economies. This is more evident for Canada given the impacts of wildfires, floods, and strikes, while the U.S. consumer remains relatively more robust. Despite this additional tightening and downward revisions, both economies’ labour markets have remained resilient, supporting a base case forecast of slowing growth into 2024 without a large-scale contraction. In line with recent progress on the inflation front and the expected economic stalling, the base case scenario sees inflation measures in both countries returning to targets by 2025 without additional monetary policy tightening.
The optimistic scenario features somewhat stronger economic activity relative to the base case. The pessimistic scenario is based on the recent banking sector turmoil in the U.S. and Europe, and features deteriorating private sector financial conditions and confidence. These are reducing economic activity and inflation worldwide from the base case scenario, requiring central banks to reduce their monetary policy rates to mitigate the decline in economic activity and prevent inflation from falling below targeted ranges. Lastly, the very pessimistic scenario features a strong stagflationary impulse that leads to a protracted period of financial market uncertainty. This results in higher inflation, requiring central banks to raise their policy rate to higher levels than in the base case in order to bring inflation under control, which is dampening economic activity.
In light of mounting risks in the global economy, including heightened geopolitical tensions, sovereign yield volatility, and weather-related events, the Bank increased the weight of the pessimistic scenarios in calculating the allowance for credit losses on performing loans compared to the prior year, to capture the elevated downside risk to the outlook.
2023 Scotiabank Annual Report | 191
Consolidated Financial Statements
The following tables show certain key macroeconomic variables used to calculate the modelled estimate for the allowance for credit losses. Further changes in these variables up to the date of the financial statements is incorporated through expert credit judgment. For the base case, optimistic and pessimistic scenarios, the projections are provided for the next 12 months and for the remaining forecast period, which represents a medium-term view.
| Base Case Scenario | Alternative Scenario – Optimistic | Alternative Scenario – Pessimistic | Alternative Scenario – Very Pessimistic |
|||||||||||||||||||||||||||||||||||||||||||||||||||||||||
| October 31, 2023 | Next 12 Months |
Remaining Forecast Period |
Next 12 Months |
Remaining Forecast Period |
Next 12 Months |
Remaining Forecast Period |
Next 12 Months |
Remaining Forecast Period |
||||||||||||||||||||||||||||||||||||||||||||||||||||
| Canada |
||||||||||||||||||||||||||||||||||||||||||||||||||||||||||||
| Real GDP growth, y/y % change |
0.7 | 2.9 | 1.3 | 4.2 | -2.2 | 3.5 | -4.3 | 3.9 | ||||||||||||||||||||||||||||||||||||||||||||||||||||
| Consumer price index, y/y % |
2.8 | 2.0 | 2.8 | 2.5 | 1.8 | 1.6 | 6.4 | 2.2 | ||||||||||||||||||||||||||||||||||||||||||||||||||||
| Unemployment rate, average % |
6.0 | 5.7 | 5.7 | 4.2 | 7.6 | 6.3 | 9.7 | 6.6 | ||||||||||||||||||||||||||||||||||||||||||||||||||||
| Bank of Canada overnight rate target, average % |
4.8 | 2.6 | 4.8 | 3.5 | 3.6 | 1.4 | 5.8 | 3.3 | ||||||||||||||||||||||||||||||||||||||||||||||||||||
| HPI – Housing Price Index, y/y % change |
-1.9 | 1.4 | -1.4 | 2.9 | -5.5 | 2.2 | -6.8 | 1.5 | ||||||||||||||||||||||||||||||||||||||||||||||||||||
| USD/CAD exchange rate, average |
1.27 | 1.24 | 1.27 | 1.22 | 1.41 | 1.26 | 1.47 | 1.28 | ||||||||||||||||||||||||||||||||||||||||||||||||||||
| U.S. |
||||||||||||||||||||||||||||||||||||||||||||||||||||||||||||
| Real GDP growth, y/y % change |
1.0 | 1.9 | 1.5 | 2.7 | -2.0 | 2.7 | -3.8 | 3.0 | ||||||||||||||||||||||||||||||||||||||||||||||||||||
| Consumer price index, y/y % |
3.2 | 2.2 | 3.5 | 2.6 | 1.9 | 1.8 | 7.0 | 2.5 | ||||||||||||||||||||||||||||||||||||||||||||||||||||
| Target federal funds rate, upper limit, average % |
5.3 | 2.5 | 5.4 | 3.4 | 4.2 | 0.8 | 6.3 | 3.1 | ||||||||||||||||||||||||||||||||||||||||||||||||||||
| Unemployment rate, average % |
4.1 | 4.5 | 3.9 | 4.1 | 5.6 | 5.0 | 7.2 | 5.2 | ||||||||||||||||||||||||||||||||||||||||||||||||||||
| Mexico |
||||||||||||||||||||||||||||||||||||||||||||||||||||||||||||
| Real GDP growth, y/y % change |
1.7 | 2.2 | 2.6 | 3.3 | -0.2 | 2.7 | -2.8 | 3.2 | ||||||||||||||||||||||||||||||||||||||||||||||||||||
| Unemployment rate, average % |
3.7 | 3.9 | 3.6 | 3.2 | 4.7 | 4.1 | 6.8 | 4.9 | ||||||||||||||||||||||||||||||||||||||||||||||||||||
| Chile |
||||||||||||||||||||||||||||||||||||||||||||||||||||||||||||
| Real GDP growth, y/y % change |
1.3 | 2.9 | 2.8 | 4.6 | -0.9 | 3.5 | -3.1 | 4.1 | ||||||||||||||||||||||||||||||||||||||||||||||||||||
| Unemployment rate, average % |
8.5 | 7.0 | 8.2 | 6.3 | 9.6 | 7.3 | 11.3 | 7.6 | ||||||||||||||||||||||||||||||||||||||||||||||||||||
| Peru |
||||||||||||||||||||||||||||||||||||||||||||||||||||||||||||
| Real GDP growth, y/y % change |
1.9 | 2.7 | 2.7 | 3.9 | 0.8 | 3.1 | -1.4 | 3.6 | ||||||||||||||||||||||||||||||||||||||||||||||||||||
| Unemployment rate, average % |
6.9 | 7.0 | 6.2 | 5.1 | 8.3 | 7.3 | 11.6 | 8.8 | ||||||||||||||||||||||||||||||||||||||||||||||||||||
| Colombia |
||||||||||||||||||||||||||||||||||||||||||||||||||||||||||||
| Real GDP growth, y/y % change |
2.4 | 3.0 | 3.7 | 4.3 | 1.4 | 3.4 | -0.9 | 3.9 | ||||||||||||||||||||||||||||||||||||||||||||||||||||
| Unemployment rate, average % |
9.2 | 9.9 | 8.6 | 7.9 | 11.1 | 10.3 | 15.6 | 12.3 | ||||||||||||||||||||||||||||||||||||||||||||||||||||
| Caribbean |
||||||||||||||||||||||||||||||||||||||||||||||||||||||||||||
| Real GDP growth, y/y % change |
3.8 | 3.8 | 4.5 | 4.9 | 2.8 | 4.2 | 0.5 | 4.7 | ||||||||||||||||||||||||||||||||||||||||||||||||||||
| Global |
||||||||||||||||||||||||||||||||||||||||||||||||||||||||||||
| WTI oil price, average USD/bbl |
78 | 66 | 84 | 82 | 68 | 63 | 62 | 61 | ||||||||||||||||||||||||||||||||||||||||||||||||||||
| Copper price, average USD/lb |
3.97 | 5.01 | 4.11 | 5.65 | 3.70 | 4.89 | 3.56 | 4.83 | ||||||||||||||||||||||||||||||||||||||||||||||||||||
| Global GDP, y/y % change |
2.75 | 2.45 | 3.62 | 3.48 | 0.10 | 3.10 | -1.48 | 3.45 | ||||||||||||||||||||||||||||||||||||||||||||||||||||
192 | 2023 Scotiabank Annual Report
Consolidated Financial Statements
| Base Case Scenario | Alternative Scenario – Optimistic | Alternative Scenario – Pessimistic | Alternative Scenario – Very Pessimistic |
|||||||||||||||||||||||||||||||||||||||||||||||||||||||||
| October 31, 2022 | Next 12 Months |
Remaining Forecast Period |
Next 12 Months |
Remaining Forecast Period |
Next 12 Months |
Remaining Forecast Period |
Next 12 Months |
Remaining Forecast Period |
||||||||||||||||||||||||||||||||||||||||||||||||||||
| Canada |
||||||||||||||||||||||||||||||||||||||||||||||||||||||||||||
| Real GDP growth, y/y % change |
1.2 | 2.1 | 2.4 | 3.1 | -4.8 | 3.7 | -5.9 | 2.6 | ||||||||||||||||||||||||||||||||||||||||||||||||||||
| Consumer price index, y/y % |
4.9 | 2.1 | 5.2 | 2.6 | 9.3 | 2.3 | 12.5 | 9.5 | ||||||||||||||||||||||||||||||||||||||||||||||||||||
| Unemployment rate, average % |
5.7 | 6.0 | 5.1 | 4.7 | 9.7 | 6.9 | 10.2 | 8.6 | ||||||||||||||||||||||||||||||||||||||||||||||||||||
| Bank of Canada overnight rate target, average % |
3.8 | 2.7 | 4.2 | 4.1 | 5.1 | 3.2 | 5.1 | 3.7 | ||||||||||||||||||||||||||||||||||||||||||||||||||||
| HPI – Housing Price Index, y/y % change |
-12.3 | -0.3 | -9.7 | 1.6 | -17.6 | -0.3 | -20.0 | -1.3 | ||||||||||||||||||||||||||||||||||||||||||||||||||||
| USD/CAD exchange rate, average |
1.27 | 1.24 | 1.26 | 1.23 | 1.28 | 1.24 | 1.28 | 1.25 | ||||||||||||||||||||||||||||||||||||||||||||||||||||
| U.S. |
||||||||||||||||||||||||||||||||||||||||||||||||||||||||||||
| Real GDP growth, y/y % change |
0.6 | 2.1 | 1.3 | 3.0 | -5.1 | 3.7 | -6.5 | 3.3 | ||||||||||||||||||||||||||||||||||||||||||||||||||||
| Consumer price index, y/y % |
5.4 | 2.4 | 5.8 | 2.8 | 10.0 | 2.6 | 13.2 | 10.1 | ||||||||||||||||||||||||||||||||||||||||||||||||||||
| Target federal funds rate, upper limit, average % |
3.5 | 2.7 | 4.7 | 4.5 | 4.8 | 3.3 | 4.8 | 3.7 | ||||||||||||||||||||||||||||||||||||||||||||||||||||
| Unemployment rate, average % |
4.3 | 5.0 | 4.2 | 4.6 | 7.9 | 5.7 | 8.3 | 6.7 | ||||||||||||||||||||||||||||||||||||||||||||||||||||
| Mexico |
||||||||||||||||||||||||||||||||||||||||||||||||||||||||||||
| Real GDP growth, y/y % change |
1.4 | 2.6 | 1.9 | 3.5 | -4.0 | 4.0 | -5.1 | 2.5 | ||||||||||||||||||||||||||||||||||||||||||||||||||||
| Unemployment rate, average % |
3.8 | 3.9 | 3.7 | 3.2 | 7.2 | 4.8 | 7.6 | 6.4 | ||||||||||||||||||||||||||||||||||||||||||||||||||||
| Chile |
||||||||||||||||||||||||||||||||||||||||||||||||||||||||||||
| Real GDP growth, y/y % change |
-2.0 | 2.4 | -0.8 | 3.6 | -7.3 | 3.9 | -8.4 | 2.9 | ||||||||||||||||||||||||||||||||||||||||||||||||||||
| Unemployment rate, average % |
8.6 | 7.6 | 8.0 | 6.5 | 12.2 | 8.3 | 12.9 | 9.0 | ||||||||||||||||||||||||||||||||||||||||||||||||||||
| Peru |
||||||||||||||||||||||||||||||||||||||||||||||||||||||||||||
| Real GDP growth, y/y % change |
2.5 | 2.7 | 3.7 | 3.8 | -1.0 | 4.1 | -3.3 | 3.5 | ||||||||||||||||||||||||||||||||||||||||||||||||||||
| Unemployment rate, average % |
7.0 | 6.9 | 6.0 | 4.7 | 10.3 | 7.6 | 11.4 | 9.2 | ||||||||||||||||||||||||||||||||||||||||||||||||||||
| Colombia |
||||||||||||||||||||||||||||||||||||||||||||||||||||||||||||
| Real GDP growth, y/y % change |
3.9 | 2.6 | 6.5 | 3.6 | 0.4 | 4.0 | -2.0 | 3.4 | ||||||||||||||||||||||||||||||||||||||||||||||||||||
| Unemployment rate, average % |
10.7 | 9.9 | 9.0 | 6.7 | 14.0 | 10.7 | 15.1 | 12.3 | ||||||||||||||||||||||||||||||||||||||||||||||||||||
| Caribbean |
||||||||||||||||||||||||||||||||||||||||||||||||||||||||||||
| Real GDP growth, y/y % change |
4.4 | 4.0 | 5.0 | 4.9 | 0.5 | 5.2 | -1.0 | 3.8 | ||||||||||||||||||||||||||||||||||||||||||||||||||||
| Global |
||||||||||||||||||||||||||||||||||||||||||||||||||||||||||||
| WTI oil price, average USD/bbl |
89 | 79 | 95 | 96 | 116 | 83 | 125 | 116 | ||||||||||||||||||||||||||||||||||||||||||||||||||||
| Copper price, average USD/lb |
3.25 | 3.49 | 3.39 | 3.95 | 3.66 | 3.54 | 3.78 | 3.78 | ||||||||||||||||||||||||||||||||||||||||||||||||||||
| Global GDP, y/y % change |
2.02 | 2.83 | 2.96 | 3.83 | -3.05 | 4.23 | -4.14 | 3.79 | ||||||||||||||||||||||||||||||||||||||||||||||||||||
| (iii) | Sensitivity |
Relative to the base case scenario, the weighting of these multiple scenarios increased the reported allowance for credit losses for financial assets in Stage 1 and Stage 2 to $4,719 million (2022 – $3,847 million) from $4,510 million (2022 – $3,609 million).
If the Bank was to only use the very pessimistic scenario for the measurement of allowance for credit losses for such assets, the allowance for credit losses on performing financial instruments would be $786 million (2022 – $1,096 million) higher than the reported allowance for credit losses as at October 31, 2023, excluding the consideration of changes in qualitative overlays or expert credit judgement. Actual results will differ as this does not consider the migration of exposures or incorporate changes that would occur in the portfolio due to risk mitigation actions and other factors.
Under our current probability-weighted scenarios, if all of our performing financial assets were in Stage 1, reflecting a 12 month expected loss period, the allowance for credit losses would be $553 million (2022 – $521 million) lower than the reported allowance for credit losses on performing financial assets.
2023 Scotiabank Annual Report | 193
Consolidated Financial Statements
| (iv) | Allowance for credit losses |
| ($ millions) |
Balance as at November 1, 2022 |
Provision for credit losses(1) |
Net write-offs | Other, including foreign currency adjustment |
Balance as at October 31, 2023 |
|||||||||||||||
| Residential mortgages |
$ | 899 | $ | 212 | $ | (66 | ) | $ | 39 | $ | 1,084 | |||||||||
| Personal loans |
2,137 | 1,377 | (1,180 | ) | 80 | 2,414 | ||||||||||||||
| Credit cards |
1,083 | 1,017 | (916 | ) | 53 | 1,237 | ||||||||||||||
| Business and government |
1,368 | 825 | (290 | ) | (27 | ) | 1,876 | |||||||||||||
| $ | 5,487 | $ | 3,431 | $ | (2,452 | ) | $ | 145 | $ | 6,611 | ||||||||||
| Presented as: |
||||||||||||||||||||
| Allowance for credit losses on loans |
$ | 5,348 | $ | 6,372 | ||||||||||||||||
| Allowance for credit losses on acceptances |
31 | 90 | ||||||||||||||||||
| Allowance for credit losses on off-balance sheet exposures |
108 | 149 | ||||||||||||||||||
| (1) | Excludes amounts associated with other assets of $(9). The provision for credit losses, net of these amounts, is $3,422. |
| ($ millions) | Balance as at November 1, 2021 |
Provision for credit losses |
Net write-offs | Other, including foreign currency adjustment |
Balance as at October 31, 2022 |
|||||||||||||||
| Residential mortgages |
$ | 802 | $ | 85 | $ | (45 | ) | $ | 57 | $ | 899 | |||||||||
| Personal loans |
2,341 | 615 | (863 | ) | 44 | 2,137 | ||||||||||||||
| Credit cards |
1,211 | 469 | (612 | ) | 15 | 1,083 | ||||||||||||||
| Business and government |
1,374 | 213 | (206 | ) | (13 | ) | 1,368 | |||||||||||||
| $ | 5,728 | $ | 1,382 | $ | (1,726 | ) | $ | 103 | $ | 5,487 | ||||||||||
| Presented as: |
||||||||||||||||||||
| Allowance for credit losses on loans |
$ | 5,626 | $ | 5,348 | ||||||||||||||||
| Allowance for credit losses on acceptances |
37 | 31 | ||||||||||||||||||
| Allowance for credit losses on off-balance sheet exposures |
65 | 108 | ||||||||||||||||||
| Allowance | for credit losses on loans |
| As at October 31, 2023 ($ millions) | Stage 1 | Stage 2 | Stage 3 | Total | ||||||||||||
| Residential mortgages |
$ | 265 | $ | 321 | $ | 498 | $ | 1,084 | ||||||||
| Personal loans |
647 | 1,103 | 664 | 2,414 | ||||||||||||
| Credit cards |
414 | 823 | – | 1,237 | ||||||||||||
| Business and government |
535 | 383 | 719 | 1,637 | ||||||||||||
|
Total(1) |
$ | 1,861 | $ | 2,630 | $ | 1,881 | $ | 6,372 | ||||||||
| (1) | Excludes allowance for credit losses for other financial assets including acceptances, investment securities, deposits with banks, off-balance sheet credit risks and reverse repos which amounted to $257. |
| As at October 31, 2022 ($ millions) | Stage 1 | Stage 2 | Stage 3 | Total | ||||||||||||
| Residential mortgages |
$ | 197 | $ | 296 | $ | 406 | $ | 899 | ||||||||
| Personal loans |
665 | 921 | 551 | 2,137 | ||||||||||||
| Credit cards |
436 | 647 | – | 1,083 | ||||||||||||
| Business and government |
255 | 296 | 678 | 1,229 | ||||||||||||
|
Total(1) |
$ | 1,553 | $ | 2,160 | $ | 1,635 | $ | 5,348 | ||||||||
| (1) | Excludes allowance for credit losses for other financial assets including acceptances, investment securities, deposits with banks, off-balance sheet credit risks and reverse repos which amounted to $151. |
194 | 2023 Scotiabank Annual Report
Consolidated Financial Statements
The following table presents the changes to the allowance for credit losses on loans.
| As at October 31, 2023 | As at October 31, 2022 | |||||||||||||||||||||||||||||||
| ($ millions) | Stage 1 | Stage 2 | Stage 3 | Total | Stage 1 | Stage 2 | Stage 3 | Total | ||||||||||||||||||||||||
| Residential mortgages |
||||||||||||||||||||||||||||||||
| Balance at beginning of the year |
$ | 197 | $ | 296 | $ | 406 | $ | 899 | $ | 152 | $ | 276 | $ | 374 | $ | 802 | ||||||||||||||||
| Provision for credit losses |
||||||||||||||||||||||||||||||||
| Remeasurement(1) |
(125 | ) | 74 | 253 | 202 | (54 | ) | 43 | 80 | 69 | ||||||||||||||||||||||
| Newly originated or purchased financial assets |
35 | – | – | 35 | 34 | – | – | 34 | ||||||||||||||||||||||||
| Derecognition of financial assets and maturities |
(9 | ) | (16 | ) | – | (25 | ) | (5 | ) | (13 | ) | – | (18 | ) | ||||||||||||||||||
| Changes in models and methodologies |
– | – | – | – | – | – | – | – | ||||||||||||||||||||||||
| Transfer to (from): |
||||||||||||||||||||||||||||||||
| Stage 1 |
183 | (138 | ) | (45 | ) | – | 65 | (52 | ) | (13 | ) | – | ||||||||||||||||||||
| Stage 2 |
(35 | ) | 149 | (114 | ) | – | (9 | ) | 46 | (37 | ) | – | ||||||||||||||||||||
| Stage 3 |
– | (62 | ) | 62 | – | – | (19 | ) | 19 | – | ||||||||||||||||||||||
| Gross write-offs | – | – | (97 | ) | (97 | ) | – | – | (73 | ) | (73 | ) | ||||||||||||||||||||
| Recoveries | – | – | 31 | 31 | – | – | 28 | 28 | ||||||||||||||||||||||||
| Foreign exchange and other movements(6) |
19 | 18 | 2 | 39 | 14 | 15 | 28 | 57 | ||||||||||||||||||||||||
| Balance at end of year(2) |
$ | 265 | $ | 321 | $ | 498 | $ | 1,084 | $ | 197 | $ | 296 | $ | 406 | $ | 899 | ||||||||||||||||
| Personal loans |
||||||||||||||||||||||||||||||||
| Balance at beginning of the year |
$ | 665 | $ | 921 | $ | 551 | $ | 2,137 | $ | 644 | $ | 1,071 | $ | 626 | $ | 2,341 | ||||||||||||||||
| Provision for credit losses |
||||||||||||||||||||||||||||||||
| Remeasurement(1) |
(727 | ) | 1,027 | 964 | 1,264 | (579 | ) | 441 | 609 | 471 | ||||||||||||||||||||||
| Newly originated or purchased financial assets |
376 | – | – | 376 | 338 | – | – | 338 | ||||||||||||||||||||||||
| Derecognition of financial assets and maturities |
(91 | ) | (172 | ) | – | (263 | ) | (76 | ) | (118 | ) | – | (194 | ) | ||||||||||||||||||
| Changes in models and methodologies |
– | – | – | – | – | – | – | – | ||||||||||||||||||||||||
| Transfer to (from): |
||||||||||||||||||||||||||||||||
| Stage 1 |
618 | (603 | ) | (15 | ) | – | 467 | (457 | ) | (10 | ) | – | ||||||||||||||||||||
| Stage 2 |
(212 | ) | 297 | (85 | ) | – | (133 | ) | 192 | (59 | ) | – | ||||||||||||||||||||
| Stage 3 |
(10 | ) | (392 | ) | 402 | – | (5 | ) | (221 | ) | 226 | – | ||||||||||||||||||||
| Gross write-offs | – | – | (1,417 | ) | (1,417 | ) | – | – | (1,116 | ) | (1,116 | ) | ||||||||||||||||||||
| Recoveries | – | – | 237 | 237 | – | – | 253 | 253 | ||||||||||||||||||||||||
| Foreign exchange and other movements(6) |
28 | 25 | 27 | 80 | 9 | 13 | 22 | 44 | ||||||||||||||||||||||||
| Balance at end of year(2) |
$ | 647 | $ | 1,103 | $ | 664 | $ | 2,414 | $ | 665 | $ | 921 | $ | 551 | $ | 2,137 | ||||||||||||||||
| Credit cards |
||||||||||||||||||||||||||||||||
| Balance at beginning of the year |
$ | 436 | $ | 647 | $ | – | $ | 1,083 | $ | 352 | $ | 859 | $ | – | $ | 1,211 | ||||||||||||||||
| Provision for credit losses |
||||||||||||||||||||||||||||||||
| Remeasurement(1) |
(300 | ) | 614 | 653 | 967 | (176 | ) | 141 | 449 | 414 | ||||||||||||||||||||||
| Newly originated or purchased financial assets |
188 | – | – | 188 | 146 | – | – | 146 | ||||||||||||||||||||||||
| Derecognition of financial assets and maturities |
(65 | ) | (73 | ) | – | (138 | ) | (51 | ) | (40 | ) | – | (91 | ) | ||||||||||||||||||
| Changes in models and methodologies |
– | – | – | – | – | – | – | – | ||||||||||||||||||||||||
| Transfer to (from): |
||||||||||||||||||||||||||||||||
| Stage 1 |
273 | (273 | ) | – | – | 240 | (240 | ) | – | – | ||||||||||||||||||||||
| Stage 2 |
(140 | ) | 140 | – | – | (77 | ) | 77 | – | – | ||||||||||||||||||||||
| Stage 3 |
– | (255 | ) | 255 | – | – | (152 | ) | 152 | – | ||||||||||||||||||||||
| Gross write-offs |
– | – | (1,113 | ) | (1,113 | ) | – | – | (791 | ) | (791 | ) | ||||||||||||||||||||
| Recoveries |
– | – | 197 | 197 | – | – | 179 | 179 | ||||||||||||||||||||||||
| Foreign exchange and other movements(6) |
22 | 23 | 8 | 53 | 2 | 2 | 11 | 15 | ||||||||||||||||||||||||
| Balance at end of year(2) |
$ | 414 | $ | 823 | $ | – | $ | 1,237 | $ | 436 | $ | 647 | $ | – | $ | 1,083 | ||||||||||||||||
| Total retail loans |
||||||||||||||||||||||||||||||||
| Balance at beginning of the year |
$ | 1,298 | $ | 1,864 | $ | 957 | $ | 4,119 | $ | 1,148 | $ | 2,206 | $ | 1,000 | $ | 4,354 | ||||||||||||||||
| Provision for credit losses |
– | – | – | – | – | – | – | – | ||||||||||||||||||||||||
| Remeasurement(1) |
(1,152 | ) | 1,715 | 1,870 | 2,433 | (809 | ) | 625 | 1,138 | 954 | ||||||||||||||||||||||
| Newly originated or purchased financial assets |
599 | – | – | 599 | 518 | – | – | 518 | ||||||||||||||||||||||||
| Derecognition of financial assets and maturities |
(165 | ) | (261 | ) | – | (426 | ) | (132 | ) | (171 | ) | – | (303 | ) | ||||||||||||||||||
| Changes in models and methodologies |
– | – | – | – | – | – | – | – | ||||||||||||||||||||||||
| Transfer to (from): |
– | – | – | – | – | – | – | – | ||||||||||||||||||||||||
| Stage 1 |
1,074 | (1,014 | ) | (60 | ) | – | 772 | (749 | ) | (23 | ) | – | ||||||||||||||||||||
| Stage 2 |
(387 | ) | 586 | (199 | ) | – | (219 | ) | 315 | (96 | ) | – | ||||||||||||||||||||
| Stage 3 |
(10 | ) | (709 | ) | 719 | – | (5 | ) | (392 | ) | 397 | – | ||||||||||||||||||||
| Gross write-offs |
– | – | (2,627 | ) | (2,627 | ) | – | – | (1,980 | ) | (1,980 | ) | ||||||||||||||||||||
| Recoveries |
– | – | 465 | 465 | – | – | 460 | 460 | ||||||||||||||||||||||||
| Foreign exchange and other movements(6) |
69 | 66 | 37 | 172 | 25 | 30 | 61 | 116 | ||||||||||||||||||||||||
| Balance at end of year(2) |
$ | 1,326 | $ | 2,247 | $ | 1,162 | $ | 4,735 | $ | 1,298 | $ | 1,864 | $ | 957 | $ | 4,119 | ||||||||||||||||
| Business and government |
||||||||||||||||||||||||||||||||
| Balance at beginning of the year |
$ | 322 | $ | 320 | $ | 695 | $ | 1,337 | $ | 212 | $ | 470 | $ | 655 | $ | 1,337 | ||||||||||||||||
| Provision for credit losses |
||||||||||||||||||||||||||||||||
| Remeasurement(1) |
168 | 172 | 427 | 767 | (79 | ) | (36 | ) | 302 | 187 | ||||||||||||||||||||||
| Newly originated or purchased financial assets |
467 | – | – | 467 | 310 | – | – | 310 | ||||||||||||||||||||||||
| Derecognition of financial assets and maturities |
(391 | ) | (50 | ) | (31 | ) | (472 | ) | (255 | ) | (89 | ) | (30 | ) | (374 | ) | ||||||||||||||||
| Changes in models and methodologies |
– | – | – | – | 30 | 57 | – | 87 | ||||||||||||||||||||||||
| Transfer to (from): |
||||||||||||||||||||||||||||||||
| Stage 1 |
108 | (108 | ) | – | – | 118 | (118 | ) | – | – | ||||||||||||||||||||||
| Stage 2 |
(52 | ) | 63 | (11 | ) | – | (27 | ) | 29 | (2 | ) | – | ||||||||||||||||||||
| Stage 3 |
– | (8 | ) | 8 | – | – | (8 | ) | 8 | – | ||||||||||||||||||||||
| Gross write-offs |
– | – | (355 | ) | (355 | ) | – | – | (318 | ) | (318 | ) | ||||||||||||||||||||
| Recoveries |
– | – | 65 | 65 | – | – | 112 | 112 | ||||||||||||||||||||||||
| Foreign exchange and other movements |
13 | 14 | (50 | ) | (23 | ) | 13 | 15 | (32 | ) | (4 | ) | ||||||||||||||||||||
| Balance at end of period including off-balance sheet exposures(2) |
$ | 635 | $ | 403 | $ | 748 | $ | 1,786 | $ | 322 | $ | 320 | $ | 695 | $ | 1,337 | ||||||||||||||||
| Less: Allowance for credits losses on off-balance sheet exposures(2)(3) |
100 | 20 | 29 | 149 | 67 | 24 | 17 | 108 | ||||||||||||||||||||||||
| Balance at end of year(2) |
$ | 535 | $ | 383 | $ | 719 | $ | 1,637 | $ | 255 | $ | 296 | $ | 678 | $ | 1,229 | ||||||||||||||||
| (1) | Includes credit risk changes as a result of significant increases in credit risk, changes in credit risk that did not result in a transfer between stages, changes in model inputs and assumptions and changes due to drawdowns of undrawn commitments. |
| (2) | Interest income on impaired loans for residential mortgages, personal loans, credit cards, and business and government loans totaled $378 (2022 – $274). |
| (3) | Allowance for credit losses on off-balance sheet exposures is recorded in other liabilities in the Consolidated Statement of Financial Position. |
| (4) | Allowance for credit losses on acceptances are recorded against the financial asset in the Consolidated Statement of Financial Position. |
| (5) | During the year ended October 31, 2023, the contractual terms of certain financial assets were modified where the modification did not result in derecognition. The carrying value of such loans that were modified in Stage 2 and Stage 3 was $2,096 and $798 respectively, before the modification. |
| (6) | Divestitures are included in the foreign exchange and other movements. |
2023 Scotiabank Annual Report | 195
Consolidated Financial Statements
| (f) | Carrying value of exposures by risk rating |
| Residential mortgages | As at October 31, 2023 | As at October 31, 2022 | ||||||||||||||||||||||||||||||
| Category of PD grades ($ millions) | Stage 1 | Stage 2 | Stage 3(1) | Total | Stage 1 | Stage 2 | Stage 3(1) | Total | ||||||||||||||||||||||||
| Very low |
$ | 202,322 | $ | 957 | $ | – | $ | 203,279 | $ | 208,526 | $ | 635 | $ | – | $ | 209,161 | ||||||||||||||||
| Low |
88,909 | 877 | – | 89,786 | 90,745 | 1,172 | – | 91,917 | ||||||||||||||||||||||||
| Medium |
19,758 | 1,385 | – | 21,143 | 18,399 | 1,032 | – | 19,431 | ||||||||||||||||||||||||
| High |
3,424 | 3,428 | – | 6,852 | 2,759 | 2,680 | – | 5,439 | ||||||||||||||||||||||||
| Very high |
63 | 2,242 | – | 2,305 | 53 | 1,429 | – | 1,482 | ||||||||||||||||||||||||
| Loans not graded(2) |
17,792 | 1,161 | – | 18,953 | 19,276 | 1,187 | – | 20,463 | ||||||||||||||||||||||||
| Default |
– | – | 1,864 | 1,864 | – | – | 1,386 | 1,386 | ||||||||||||||||||||||||
| Total |
332,268 | 10,050 | 1,864 | 344,182 | 339,758 | 8,135 | 1,386 | 349,279 | ||||||||||||||||||||||||
| Allowance for credit losses |
265 | 321 | 498 | 1,084 | 197 | 296 | 406 | 899 | ||||||||||||||||||||||||
| Carrying value |
$ | 332,003 | $ | 9,729 | $ | 1,366 | $ | 343,098 | $ | 339,561 | $ | 7,839 | $ | 980 | $ | 348,380 | ||||||||||||||||
| (1) | Stage 3 includes purchased or originated credit-impaired loans. |
| (2) | Portfolios where the customer account level ‘Probability of Default’ has not been determined have been included in the ‘Loans not graded’ category. |
| Personal loans | As at October 31, 2023 | As at October 31, 2022 | ||||||||||||||||||||||||||||||
| Category of PD grades ($ millions) | Stage 1 | Stage 2 | Stage 3(1) | Total | Stage 1 | Stage 2 | Stage 3(1) | Total | ||||||||||||||||||||||||
| Very low |
$ | 29,849 | $ | 211 | $ | – | $ | 30,060 | $ | 30,098 | $ | 285 | $ | – | $ | 30,383 | ||||||||||||||||
| Low |
27,594 | 558 | – | 28,152 | 27,284 | 685 | – | 27,969 | ||||||||||||||||||||||||
| Medium |
8,725 | 599 | – | 9,324 | 8,789 | 1,464 | – | 10,253 | ||||||||||||||||||||||||
| High |
8,369 | 3,529 | – | 11,898 | 7,059 | 2,275 | – | 9,334 | ||||||||||||||||||||||||
| Very high |
125 | 2,177 | – | 2,302 | 81 | 1,655 | – | 1,736 | ||||||||||||||||||||||||
| Loans not graded(2) |
19,427 | 1,831 | – | 21,258 | 17,371 | 1,537 | – | 18,908 | ||||||||||||||||||||||||
| Default |
– | – | 1,176 | 1,176 | – | – | 848 | 848 | ||||||||||||||||||||||||
| Total |
94,089 | 8,905 | 1,176 | 104,170 | 90,682 | 7,901 | 848 | 99,431 | ||||||||||||||||||||||||
| Allowance for credit losses |
647 | 1,103 | 664 | 2,414 | 665 | 921 | 551 | 2,137 | ||||||||||||||||||||||||
| Carrying value |
$ | 93,442 | $ | 7,802 | $ | 512 | $ | 101,756 | $ | 90,017 | $ | 6,980 | $ | 297 | $ | 97,294 | ||||||||||||||||
| (1) | Stage 3 includes purchased or originated credit-impaired loans. |
| (2) | Portfolios where the customer account level ‘Probability of Default’ has not been determined have been included in the ‘Loans not graded’ category. |
| Credit cards | As at October 31, 2023 | As at October 31, 2022 | ||||||||||||||||||||||||||||||
| Category of PD grades ($ millions) | Stage 1 | Stage 2 | Stage 3 | Total | Stage 1 | Stage 2 | Stage 3 | Total | ||||||||||||||||||||||||
| Very low |
$ | 1,989 | $ | 42 | $ | – | $ | 2,031 | $ | 1,813 | $ | 47 | $ | – | $ | 1,860 | ||||||||||||||||
| Low |
3,329 | 89 | – | 3,418 | 2,756 | 159 | – | 2,915 | ||||||||||||||||||||||||
| Medium |
4,262 | 116 | – | 4,378 | 3,434 | 190 | – | 3,624 | ||||||||||||||||||||||||
| High |
3,239 | 1,310 | – | 4,549 | 3,042 | 998 | – | 4,040 | ||||||||||||||||||||||||
| Very high |
38 | 820 | – | 858 | 36 | 587 | – | 623 | ||||||||||||||||||||||||
| Loans not graded(1) |
1,290 | 585 | – | 1,875 | 997 | 459 | – | 1,456 | ||||||||||||||||||||||||
| Default |
– | – | – | – | – | – | – | – | ||||||||||||||||||||||||
| Total |
14,147 | 2,962 | – | 17,109 | 12,078 | 2,440 | – | 14,518 | ||||||||||||||||||||||||
| Allowance for credit losses |
414 | 823 | – | 1,237 | 436 | 647 | – | 1,083 | ||||||||||||||||||||||||
| Carrying value |
$ | 13,733 | $ | 2,139 | $ | – | $ | 15,872 | $ | 11,642 | $ | 1,793 | $ | – | $ | 13,435 | ||||||||||||||||
| (1) | Portfolios where the customer account level ‘Probability of Default’ has not been determined have been included in the ‘Loans not graded’ category. |
| Undrawn loan commitments – Retail |
As at October 31, 2023 | As at October 31, 2022 | ||||||||||||||||||||||||||||||
| Category of PD grades ($ millions) | Stage 1 | Stage 2 | Stage 3 | Total | Stage 1 | Stage 2 | Stage 3 | Total | ||||||||||||||||||||||||
| Very low |
$ | 104,488 | $ | 3 | $ | – | $ | 104,491 | $ | 98,973 | $ | 6 | $ | – | $ | 98,979 | ||||||||||||||||
| Low |
20,037 | 1 | – | 20,038 | 19,196 | 9 | – | 19,205 | ||||||||||||||||||||||||
| Medium |
8,518 | 11 | – | 8,529 | 7,880 | 44 | – | 7,924 | ||||||||||||||||||||||||
| High |
3,814 | 421 | – | 4,235 | 3,700 | 307 | – | 4,007 | ||||||||||||||||||||||||
| Very high |
68 | 296 | – | 364 | 34 | 354 | – | 388 | ||||||||||||||||||||||||
| Loans not graded(1) |
9,522 | 1,894 | – | 11,416 | 8,316 | 1,667 | – | 9,983 | ||||||||||||||||||||||||
| Default |
– | – | – | – | – | – | – | – | ||||||||||||||||||||||||
| Carrying value |
$ | 146,447 | $ | 2,626 | $ | – | $ | 149,073 | $ | 138,099 | $ | 2,387 | $ | – | $ | 140,486 | ||||||||||||||||
| (1) | Portfolios where the customer account level ‘Probability of Default’ has not been determined have been included in the ‘Loans not graded’ category. |
196 | 2023 Scotiabank Annual Report
Consolidated Financial Statements
| Total retail loans | As at October 31, 2023 | As at October 31, 2022 | ||||||||||||||||||||||||||||||
| Category of PD grades ($ millions) | Stage 1 | Stage 2 | Stage 3(1) | Total | Stage 1 | Stage 2 | Stage 3(1) | Total | ||||||||||||||||||||||||
| Very low |
$ | 338,648 | $ | 1,213 | $ | – | $ | 339,861 | $ | 339,410 | $ | 973 | $ | – | $ | 340,383 | ||||||||||||||||
| Low |
139,869 | 1,525 | – | 141,394 | 139,981 | 2,025 | – | 142,006 | ||||||||||||||||||||||||
| Medium |
41,263 | 2,111 | – | 43,374 | 38,502 | 2,730 | – | 41,232 | ||||||||||||||||||||||||
| High |
18,846 | 8,688 | – | 27,534 | 16,560 | 6,260 | – | 22,820 | ||||||||||||||||||||||||
| Very high |
294 | 5,535 | – | 5,829 | 204 | 4,025 | – | 4,229 | ||||||||||||||||||||||||
| Loans not graded(2) |
48,031 | 5,471 | – | 53,502 | 45,960 | 4,850 | – | 50,810 | ||||||||||||||||||||||||
| Default |
– | – | 3,040 | 3,040 | – | – | 2,234 | 2,234 | ||||||||||||||||||||||||
| Total |
586,951 | 24,543 | 3,040 | 614,534 | 580,617 | 20,863 | 2,234 | 603,714 | ||||||||||||||||||||||||
| Allowance for credit losses |
1,326 | 2,247 | 1,162 | 4,735 | 1,298 | 1,864 | 957 | 4,119 | ||||||||||||||||||||||||
| Carrying value |
$ | 585,625 | $ | 22,296 | $ | 1,878 | $ | 609,799 | $ | 579,319 | $ | 18,999 | $ | 1,277 | $ | 599,595 | ||||||||||||||||
| (1) | Stage 3 includes purchased or originated credit-impaired loans. |
| (2) | Portfolios where the customer account level ‘Probability of Default’ has not been determined have been included in the ‘Loans not graded’ category. |
| Business and government loans | As at October 31, 2023 | As at October 31, 2022 | ||||||||||||||||||||||||||||||
| Category of PD grades ($ millions) | Stage 1 | Stage 2 | Stage 3(1) | Total | Stage 1 | Stage 2 | Stage 3(1) | Total | ||||||||||||||||||||||||
| Investment grade |
$ | 160,148 | $ | 1,205 | $ | – | $ | 161,353 | $ | 162,696 | $ | 1,775 | $ | – | $ | 164,471 | ||||||||||||||||
| Non-Investment grade |
114,192 | 7,705 | – | 121,897 | 105,251 | 9,563 | – | 114,814 | ||||||||||||||||||||||||
| Watch list |
28 | 3,340 | – | 3,368 | 22 | 2,890 | – | 2,912 | ||||||||||||||||||||||||
| Loans not graded(2) |
2,500 | 18 | – | 2,518 | 2,346 | 12 | – | 2,358 | ||||||||||||||||||||||||
| Default |
– | – | 2,686 | 2,686 | – | – | 2,552 | 2,552 | ||||||||||||||||||||||||
| Total |
276,868 | 12,268 | 2,686 | 291,822 | 270,315 | 14,240 | 2,552 | 287,107 | ||||||||||||||||||||||||
| Allowance for credit losses |
535 | 383 | 719 | 1,637 | 255 | 296 | 678 | 1,229 | ||||||||||||||||||||||||
| Carrying value |
$ | 276,333 | $ | 11,885 | $ | 1,967 | $ | 290,185 | $ | 270,060 | $ | 13,944 | $ | 1,874 | $ | 285,878 | ||||||||||||||||
| (1) | Stage 3 includes purchased or originated credit-impaired loans. |
| (2) | Portfolios where the customer account level ‘Probability of Default’ has not been determined have been included in the ‘Loans not graded’ category. |
| Undrawn loan commitments – Business and government |
As at October 31, 2023 | As at October 31, 2022 | ||||||||||||||||||||||||||||||
| Category of PD grades ($ millions) | Stage 1 | Stage 2 | Stage 3(1) | Total | Stage 1 | Stage 2 | Stage 3(1) | Total | ||||||||||||||||||||||||
| Investment grade |
$ | 240,044 | $ | 1,673 | $ | – | $ | 241,717 | $ | 222,734 | $ | 1,502 | $ | – | $ | 224,236 | ||||||||||||||||
| Non-investment grade |
62,634 | 5,288 | – | 67,922 | 62,827 | 4,534 | – | 67,361 | ||||||||||||||||||||||||
| Watch list |
1 | 1,103 | – | 1,104 | 4 | 604 | – | 608 | ||||||||||||||||||||||||
| Loans not graded(2) |
5,205 | – | – | 5,205 | 4,573 | – | – | 4,573 | ||||||||||||||||||||||||
| Default |
– | – | 109 | 109 | – | – | 139 | 139 | ||||||||||||||||||||||||
| Total |
307,884 | 8,064 | 109 | 316,057 | 290,138 | 6,640 | 139 | 296,917 | ||||||||||||||||||||||||
| Allowance for credit losses |
100 | 20 | 29 | 149 | 67 | 24 | 17 | 108 | ||||||||||||||||||||||||
| Carrying value |
$ | 307,784 | $ | 8,044 | $ | 80 | $ | 315,908 | $ | 290,071 | $ | 6,616 | $ | 122 | $ | 296,809 | ||||||||||||||||
| (1) | Stage 3 includes purchased or originated credit-impaired loans. |
| (2) | Portfolios where the customer account level ‘Probability of Default’ has not been determined have been included in the ‘Loans not graded’ category. |
| Total non-retail loans | As at October 31, 2023 | As at October 31, 2022 | ||||||||||||||||||||||||||||||
| Category of PD grades ($ millions) | Stage 1 | Stage 2 | Stage 3(1) | Total | Stage 1 | Stage 2 | Stage 3(1) | Total | ||||||||||||||||||||||||
| Investment grade |
$ | 400,192 | $ | 2,878 | $ | – | $ | 403,070 | $ | 385,430 | $ | 3,277 | $ | – | $ | 388,707 | ||||||||||||||||
| Non-investment grade |
176,826 | 12,993 | – | 189,819 | 168,078 | 14,097 | – | 182,175 | ||||||||||||||||||||||||
| Watch list |
29 | 4,443 | – | 4,472 | 26 | 3,494 | – | 3,520 | ||||||||||||||||||||||||
| Loans not graded(2) |
7,705 | 18 | – | 7,723 | 6,919 | 12 | – | 6,931 | ||||||||||||||||||||||||
| Default |
– | – | 2,795 | 2,795 | – | – | 2,691 | 2,691 | ||||||||||||||||||||||||
| Total |
584,752 | 20,332 | 2,795 | 607,879 | 560,453 | 20,880 | 2,691 | 584,024 | ||||||||||||||||||||||||
| Allowance for credit losses |
635 | 403 | 748 | 1,786 | 322 | 320 | 695 | 1,337 | ||||||||||||||||||||||||
| Carrying value |
$ | 584,117 | $ | 19,929 | $ | 2,047 | $ | 606,093 | $ | 560,131 | $ | 20,560 | $ | 1,996 | $ | 582,687 | ||||||||||||||||
| (1) | Stage 3 includes purchased or originated credit-impaired loans. |
| (2) | Portfolios where the customer account level ‘Probability of Default’ has not been determined have been included in the ‘Loans not graded’ category. |
2023 Scotiabank Annual Report | 197
Consolidated Financial Statements
| (g) | Loans past due but not impaired(1) |
A loan is considered past due when a counterparty has not made a payment by the contractual due date. The following table presents the carrying value of loans that are contractually past due but not classified as impaired because they are either less than 90 days past due or fully secured and collection efforts are reasonably expected to result in repayment or restoring it to a current status in accordance with the Bank’s policy. In cases where borrowers have opted to participate in payment deferral programs, deferral of payments is not considered past due and such loans are not aged further during the deferral period.
| 2023(2) | 2022(2) | |||||||||||||||||||||||||||||||
| As at October 31 ($ millions) | 31 – 60 days |
61 – 90 days |
91 days and greater(3) |
Total | 31 – 60 days |
61 – 90 days |
91 days and greater(3) |
Total | ||||||||||||||||||||||||
| Residential mortgages |
$ | 1,329 | $ | 617 | $ | – | $ | 1,946 | $ | 1,015 | $ | 482 | $ | – | $ | 1,497 | ||||||||||||||||
| Personal loans |
648 | 360 | – | 1,008 | 505 | 254 | – | 759 | ||||||||||||||||||||||||
| Credit cards |
238 | 157 | 345 | 740 | 173 | 113 | 249 | 535 | ||||||||||||||||||||||||
| Business and government |
159 | 57 | – | 216 | 122 | 47 | – | 169 | ||||||||||||||||||||||||
| Total |
$ | 2,374 | $ | 1,191 | $ | 345 | $ | 3,910 | $ | 1,815 | $ | 896 | $ | 249 | $ | 2,960 | ||||||||||||||||
| (1) | Loans past due 30 days or less are not presented in this analysis as they are not administratively considered past due. |
| (2) | For loans where payment deferrals were granted, deferred payments are not considered past due and such loans are not aged further during the deferral period. Regular aging of the loans resumes, after the end of the deferral period. |
| (3) | All loans that are over 90 days past due are considered impaired with the exception of credit card receivables which are considered impaired when 180 days past due. |
| (h) | Purchased credit-impaired loans |
Certain financial assets including loans are credit-impaired on initial recognition either through acquisition or origination. The following table provides details of such assets:
| As at October 31 ($ millions) | 2023 | 2022 | ||||||
| Unpaid principal balance(1) |
$ | 307 | $ | 309 | ||||
| Credit related fair value adjustments |
(87 | ) | (70 | ) | ||||
| Carrying value |
220 | 239 | ||||||
| Stage 3 allowance |
(1 | ) | (2 | ) | ||||
| Carrying value net of related allowance |
$ | 219 | $ | 237 | ||||
| (1) | Represents principal amount owed net of write-offs. |
| 14 | Derecognition of Financial Assets |
Securitization of residential mortgage loans
The Bank securitizes fully insured residential mortgage loans, Bank originated and others, through the creation of mortgage-backed securities (MBS) under the National Housing Act (NHA) MBS program, sponsored by Canada Mortgage and Housing Corporation (CMHC). MBS created under the program are primarily sold to Canada Housing Trust (the Trust), a government sponsored entity, under the Canada Mortgage Bond (CMB) program, and/or third-party investors. The Trust issues securities to third-party investors. The CMHC also previously purchased insured mortgage pools from the Bank under the Insured Mortgage Purchase Program (IMPP).
Sale of mortgages under the above programs does not meet the derecognition requirements, where the Bank retains the pre-payment and interest rate risk associated with the mortgages, which represent substantially all the risks and rewards associated with the transferred assets.
The transferred mortgages continue to be recognized on the Consolidated Statement of Financial Position as residential mortgage loans. Cash proceeds from the transfer are treated as secured borrowings and included in Deposits – Business and government on the Consolidated Statement of Financial Position.
The following table provides the carrying amount of transferred assets that do not qualify for derecognition and the associated liabilities:
| As at October 31 ($ millions) | 2023(1) | 2022(1) | ||||||
| Assets |
||||||||
| Carrying value of residential mortgage loans |
$ | 13,508 | $ | 15,032 | ||||
| Other related assets(2) |
8,600 | 9,854 | ||||||
| Liabilities |
||||||||
| Carrying value of associated liabilities |
20,222 | 24,173 | ||||||
| (1) | The fair value of the transferred assets is $20,264 (2022 – $23,379) and the fair value of the associated liabilities is $19,265 (2022 – $23,254), for a net position of $999 (2022 – $125). |
| (2) | These include cash held in trust and trust permitted investment assets, including repurchase style transactions of mortgage-backed securities, acquired as part of principal reinvestment account that the Bank is required to maintain in order to participate in the programs. |
Securitization of personal lines of credit, credit cards and auto loans
The Bank securitizes a portion of its credit card and auto loan receivables through consolidated structured entities. These receivables continue to be recognized on the Consolidated Statement of Financial Position as personal loans and credit card loans. For further details, refer to Note 15.
Securities sold under repurchase agreements and securities lent
The Bank enters into transactions, such as repurchase agreements and securities lending agreements, where the Bank transfers assets under agreements to repurchase them on a future date and retains all the substantial risks and rewards associated with the assets. The transferred assets remain on the Consolidated Statement of Financial Position.
198 | 2023 Scotiabank Annual Report
Consolidated Financial Statements
The following table provides the carrying amount of the transferred assets and the associated liabilities:
| As at October 31 ($ millions) | 2023(1) | 2022(1) | ||||||
| Carrying value of assets associated with: |
||||||||
| Repurchase agreements(2) |
$ | 140,296 | $ | 122,552 | ||||
| Securities lending agreements |
56,174 | 52,178 | ||||||
| Total |
196,470 | 174,730 | ||||||
| Carrying value of associated liabilities(3) |
$ | 160,007 | $ | 139,025 | ||||
| (1) | The fair value of transferred assets is $196,470 (2022 – $174,730) and the fair value of the associated liabilities is $160,007 (2022 – $139,025), for a net position of $36,463 (2022 – $35,705). |
| (2) | Does not include over-collateralization of assets pledged. |
| (3) | Liabilities for securities lending arrangements only include amounts related to cash collateral received. For securities received as collateral, refer to Note 35(a)(iv) – Financial Instruments – Risk Management. |
Continuing involvement in transferred financial assets
The Bank issued loans under the Canada Emergency Business Account (CEBA) program. These loans are not recognized in the Consolidated Statement of Financial Position as the program meets the pass-through criteria of financial assets under IFRS 9.
As at October 31, 2023, the Bank has issued $3.4 billion of CEBA loans (October 31, 2022 – $3.9 billion). The Bank retains a continuing involvement through its servicing of these loans on behalf of Export Development Canada. The appropriate level of administration fees for servicing the loans has been recognized.
| 15 | Structured Entities |
| (a) | Consolidated structured entities |
U.S. multi-seller conduit
The Bank-sponsored U.S. multi-seller conduit purchases high-quality financial assets from independent third parties (the sellers) funded by the issuance of highly rated asset-backed commercial paper. The sellers continue to service the financial assets and provide credit enhancements through overcollateralization protection and cash reserves.
Each asset purchased by the conduit has a deal-specific liquidity facility provided by the Bank in the form of a Liquidity Asset Purchase Agreement (LAPA). The primary purpose of the LAPA is to provide an alternative source of financing in the event the conduit is unable to access the asset-backed commercial paper market. The administration agent can require the Bank in its capacity as liquidity provider to purchase an interest in the related assets owned by the conduit. The Bank is not obligated to perform under the LAPA agreements in the event the conduit itself is insolvent.
The Bank’s liquidity agreements with the conduit call for the Bank to fund full par value of the assets, including defaulted assets, if any, of the conduit. This facility is available to absorb the losses on defaulted assets, if any, in excess of losses absorbed by deal-specific seller credit enhancements. Further, the Bank holds the subordinated note issued by the conduit.
The Bank’s exposure from the U.S. conduit through the LAPA, including the obligation to purchase defaulted assets and investment in the conduit’s subordinated note, give the Bank the obligation to absorb losses that could potentially be significant to the conduit, which in conjunction with power to direct the conduit’s activities, result in the Bank consolidating the U.S. multi-seller conduit.
The conduit’s assets of $13 billion (2022 – $10 billion) are primarily included in Business and government loans on the Bank’s Consolidated Statement of Financial Position.
There are contractual restrictions on the ability of the Bank’s consolidated U.S. multi-seller conduit to transfer funds to the Bank. The Bank is restricted from accessing the conduit’s assets under the relevant arrangements. The Bank has no rights to the assets owned by the conduit. In the normal course of business, the assets of the conduit can only be used to settle the obligations of the conduit.
Bank funding vehicles and capital vehicles
The Bank uses funding and capital vehicles to facilitate cost-efficient financing of its own operations, including the issuance of covered bonds and notes. Activities of funding structured entities are generally limited to holding an interest in a pool of assets or receivables generated by the Bank. Capital vehicles include Scotiabank LRCN Trust which was established in connection with the Bank’s issuance of qualifying regulatory capital instruments. These structured entities are consolidated due to the Bank’s decision-making power and ability to use that power to affect the returns.
Covered bonds
The Bank has a registered covered bond program through which it issues debt that is guaranteed by Scotiabank Covered Bond Guarantor Limited Partnership (the “LP”). Under this program, the LP purchases uninsured residential mortgages from the Bank, which it acquires with funding provided by the Bank.
As at October 31, 2023, $50.0 billion (2022 – $45.9 billion) covered bonds were outstanding and included in Deposits – Business and government on the Consolidated Statement of Financial Position. The Bank’s outstanding covered bonds are denominated in U.S. dollars, Australian dollars, British pounds, Swiss francs, Euros, Canadian Dollars, and Norwegian Kroner. As at October 31, 2023, assets pledged in relation to these covered bonds were uninsured residential mortgages denominated in Canadian dollars of $51.5 billion (2022 – $51.4 billion). These figures exclude activities in connection with covered bonds held by the Bank and that are eliminated upon consolidation.
Credit card receivables securitization trust
The Bank securitizes a portion of its Canadian credit card receivables through a Bank-sponsored structured entity. This entity issues senior and subordinated notes to third-party investors and the proceeds of such issuance are used to purchase co-ownership interests in credit card receivables originated by the Bank. Recourse of the note holders is limited to the purchased interest.
The Bank is responsible for servicing the transferred credit card receivables as well as performing administrative functions for this entity. As at October 31, 2023, U.S.$2.0 billion ($2.8 billion Canadian dollar equivalent) (2022 – U.S.$0.8 billion, $1.1 billion Canadian dollar equivalent) Class A notes; and U.S.$174 million ($241 million Canadian dollar equivalent) (2022 – U.S.$70 million, $95 million Canadian dollar equivalent) subordinated Class B and Class C notes were outstanding and included in Deposits – Business and government on the Consolidated Statement of Financial
2023 Scotiabank Annual Report | 199
Consolidated Financial Statements
Position. As at October 31, 2023 assets pledged in relation to these notes were credit card receivables, denominated in Canadian dollars, of $3.2 billion (2022 – $1.2 billion).
Auto loan receivables securitization trusts
The Bank previously securitized a portion of its Canadian auto loan receivables through Bank-sponsored structured entities. The entities issued senior and subordinated notes to the Bank and/or third-party investors, and the proceeds of such issuances were used to purchase discrete pools of retail indirect auto loan receivables from the Bank. Recourse of the note holders was limited to the auto loan receivables.
The Bank was responsible for servicing the transferred auto loan receivables as well as performing administrative functions for the entities. As at October 31, 2023, the aggregate senior and subordinated notes issued to third parties outstanding and included in Deposits – Business and government on the Consolidated Statement of Financial Position were nil (2022 – U.S.$15.7 million, $21.4 million Canadian dollar equivalent), and assets pledged in relation to these notes were nil (2022 – $216.4 million).
Scotiabank LRCN Trust
The Bank sponsors the Scotiabank LRCN Trust established in connection with the issuance of limited recourse capital notes. As at October 31, 2023, $4.5 billion (2022 – $4.5 billion) of externally-issued limited recourse capital notes were outstanding and included in Preferred shares and other equity instruments on the Consolidated Statement of Financial Position. Refer to Note 24(b) – Preferred shares and other equity instruments for further information.
Other
Assets of other consolidated structured entities are comprised of securities, deposits with banks and other assets to meet the Bank’s and customer needs.
| (b) | Unconsolidated structured entities |
The following table provides information about other structured entities which the Bank does not control and therefore does not consolidate.
| As at October 31, 2023 | ||||||||||||||||
| ($ millions) | Canadian multi-seller conduits that the Bank administers |
Structured finance entities |
Other funding vehicles |
Total | ||||||||||||
| Total assets on structured entity’s financial statements |
$ | 5,291 | $ | 3,683 | $ | 1,872 | $ | 10,846 | ||||||||
| Assets recognized on the Bank’s financial statements |
||||||||||||||||
| Trading assets |
8 | 18 | – | 26 | ||||||||||||
| Investment securities |
– | 804 | 10 | 814 | ||||||||||||
| Loans(1) |
– | 1,182 | 61 | 1,243 | ||||||||||||
| Other |
– | 2 | 9 | 11 | ||||||||||||
| 8 | 2,006 | 80 | 2,094 | |||||||||||||
| Liabilities recognized on the Bank’s financial statements |
||||||||||||||||
| Deposits – Business and government |
– | – | 1,834 | 1,834 | ||||||||||||
| Other |
– | – | 38 | 38 | ||||||||||||
| – | – | 1,872 | 1,872 | |||||||||||||
| Bank’s maximum exposure to loss |
$ | 5,299 | $ | 3,296 | $ | 71 | $ | 8,666 | ||||||||
| As at October 31, 2022 | ||||||||||||||||
| ($ millions) | Canadian multi-seller conduits that the Bank administers |
Structured finance entities |
Other funding vehicles |
Total | ||||||||||||
| Total assets (on structured entity’s financial statements) |
$ | 3,773 | $ | 2,304 | $ | 833 | $ | 6,910 | ||||||||
| Assets recognized on the Bank’s financial statements |
||||||||||||||||
| Trading assets |
35 | 2 | – | 37 | ||||||||||||
| Investment securities |
– | 885 | 10 | 895 | ||||||||||||
| Loans(1) |
– | 704 | 59 | 763 | ||||||||||||
| 35 | 1,591 | 69 | 1,695 | |||||||||||||
| Liabilities recognized on the Bank’s financial statements |
||||||||||||||||
| Deposits – Business and government |
– | – | 833 | 833 | ||||||||||||
| – | – | 833 | 833 | |||||||||||||
| Bank’s maximum exposure to loss |
$ | 3,808 | $ | 1,591 | $ | 69 | $ | 5,468 | ||||||||
| (1) | Loan balances are presented net of allowance for credit losses. |
The Bank’s maximum exposure to loss represents the notional amounts of guarantees, liquidity facilities, and other credit support relationships with the structured entities, the credit risk amount for certain derivative contracts with the entities and the amount invested where the Bank holds an ownership interest in the structured entities. Of the aggregate amount of maximum exposure to loss as at October 31, 2023, the Bank has recorded $2.1 billion (2022 – $1.7 billion), primarily its interest in the structured entities, on the Consolidated Statement of Financial Position.
Canadian multi-seller conduits that the Bank administers
The Bank sponsors two Canadian multi-seller conduits. The conduits purchase assets from independent third parties (the sellers) funded by the issuance of asset-backed commercial paper. The sellers continue to service the assets and provide credit enhancements through overcollateralization protection and cash reserves. The Bank has no rights to these assets as they are available to support the obligations of the
200 | 2023 Scotiabank Annual Report
Consolidated Financial Statements
respective programs but manages for a fee the commercial paper selling programs. To ensure timely repayment of the commercial paper, each asset pool financed by the multi-seller conduits has a deal-specific LAPA with the Bank. Pursuant to the terms of the LAPA, the Bank as the liquidity provider is obligated to purchase non-defaulted assets, transferred by the conduit at the conduit’s original cost as reflected in the table above. In most cases, the liquidity agreements do not require the Bank to purchase defaulted assets. Additionally, the Bank has not provided any program-wide credit enhancement to these conduits. The Bank provides additional liquidity facilities to these multi-seller conduits to a maximum amount of $1.8 billion (2022 – $2.6 billion) based on future asset purchases by these conduits.
Although the Bank has power over the relevant activities of the conduits, it has limited exposure to variability in returns, which results in the Bank not consolidating the two Canadian conduits.
Structured finance entities
The Bank has interests in structured entities used to assist corporate clients in accessing cost-efficient financing through their securitization structures. The Bank may act as an administrator, an investor or a combination of both in these types of structures.
The Bank provides senior credit facilities to unaffiliated structured entities that are established by third parties to acquire and/or originate loans for the purposes of issuing collateralized loan obligations (CLOs). These credit facilities benefit from subordinated capital provided by either the collateral manager or third-party investors via subordinated financing, capital injection or asset contribution. Subordinated capital represents the first loss tranche which absorbs losses prior to the Bank’s senior exposure. The Bank’s broker-dealer affiliate acts as the arranger and placement agent for the CLOs. Proceeds from the sale of the CLOs are used to repay the senior credit facilities. The Bank does not consolidate these entities as it does not have decision making power over their relevant activities, which include the acquisition and/or origination of loans and overall management of the underlying portfolio. As at October 31, 2023, the Bank has funded $220 million of the credit facilities provided to these structured entities (October 31, 2022 – $nil).
Other funding vehicles
These entities are designed to pass the Bank’s credit risk to the holders of the securities. Therefore, the Bank does not have exposure or rights to variable returns from these unconsolidated entities.
The Bank uses a funding vehicle to transfer credit exposure on certain loan assets and purchases credit protection against eligible credit events from this vehicle. The vehicle collateralizes its obligation using cash proceeds received through the issuance of guarantee-linked notes. Loan assets are not sold or assigned to the vehicle and remain on the Bank’s Consolidated Statement of Financial Position. During the year, $998 million of guarantee-linked notes (October 31, 2022 – $nil) were issued by this vehicle and included in Deposits – Business and government on the Bank’s Consolidated Statement of Financial Position.
Although the Bank has power over the relevant activities of these vehicles, it has limited exposure to variability in returns, which results in the Bank not consolidating these vehicles.
| (c) | Other unconsolidated Bank-sponsored entities |
The Bank sponsors unconsolidated structured entities including mutual funds, in which it has insignificant or no interest at the reporting date. The Bank is a sponsor when it is significantly involved in the design and formation at inception of the structured entities, and the Bank’s name is used by the structured entities to create an awareness of the instruments being backed by the Bank’s reputation and obligation. The Bank also considers other factors, such as its continuing involvement and obligations to determine if, in substance, the Bank is a sponsor.
As at October 31, 2023, the Bank earned $2,369 million (2022 – $2,486 million) in revenue from unconsolidated Bank-sponsored mutual fund entities.
| 16 | Property and Equipment |
| ($ millions) | Land & Building |
Equipment | Technology Assets |
Leasehold Improvements |
Right-of-use Assets |
Total | ||||||||||||||||||
| Cost |
||||||||||||||||||||||||
| Balance as at October 31, 2021 |
$ | 1,569 | $ | 1,906 | $ | 2,410 | $ | 1,649 | $ | 4,003 | $ | 11,537 | ||||||||||||
| Additions |
102 | 110 | 169 | 160 | 215 | 756 | ||||||||||||||||||
| Disposals/Retirements |
(56 | ) | (59 | ) | (20 | ) | (47 | ) | (98 | ) | (280 | ) | ||||||||||||
| Foreign currency adjustments and other |
62 | 405 | (354 | ) | 33 | 77 | 223 | |||||||||||||||||
| Balance as at October 31, 2022 |
$ | 1,677 | $ | 2,362 | $ | 2,205 | $ | 1,795 | $ | 4,197 | $ | 12,236 | ||||||||||||
| Additions |
97 | 161 | 130 | 129 | 143 | 660 | ||||||||||||||||||
| Disposals/Retirements |
(64 | ) | (781 | ) | (1,657 | ) | (118 | ) | (118 | ) | (2,738 | ) | ||||||||||||
| Foreign currency adjustments and other |
103 | 67 | 27 | 48 | 114 | 359 | ||||||||||||||||||
| Balance as at October 31, 2023 |
$ | 1,813 | $ | 1,809 | $ | 705 | $ | 1,854 | $ | 4,336 | $ | 10,517 | ||||||||||||
| Accumulated depreciation |
||||||||||||||||||||||||
| Balance as at October 31, 2021 |
$ | 597 | $ | 1,464 | $ | 2,060 | $ | 1,059 | $ | 736 | $ | 5,916 | ||||||||||||
| Depreciation |
37 | 83 | 153 | 98 | 378 | 749 | ||||||||||||||||||
| Disposals/Retirements |
(24 | ) | (59 | ) | (16 | ) | (51 | ) | (59 | ) | (209 | ) | ||||||||||||
| Foreign currency adjustments and other |
27 | 289 | (264 | ) | 11 | 17 | 80 | |||||||||||||||||
| Balance as at October 31, 2022 |
$ | 637 | $ | 1,777 | $ | 1,933 | $ | 1,117 | $ | 1,072 | $ | 6,536 | ||||||||||||
| Depreciation |
44 | 104 | 161 | 113 | 379 | 801 | ||||||||||||||||||
| Disposals/Retirements |
(4 | ) | (748 | ) | (1,655 | ) | (92 | ) | (106 | ) | (2,605 | ) | ||||||||||||
| Foreign currency adjustments and other |
9 | 135 | (58 | ) | 14 | 43 | 143 | |||||||||||||||||
| Balance as at October 31, 2023 |
$ | 686 | $ | 1,268 | $ | 381 | $ | 1,152 | $ | 1,388 | $ | 4,875 | ||||||||||||
| Net book value |
||||||||||||||||||||||||
| Balance as at October 31, 2022 |
$ | 1,040 | $ | 585 | $ | 272 | $ | 678 | $ | 3,125 | $ | 5,700 | (1) | |||||||||||
| Balance as at October 31, 2023 |
$ | 1,127 | $ | 541 | $ | 324 | $ | 702 | $ | 2,948 | $ | 5,642 | (1) | |||||||||||
| (1) | Includes $38 (2022 – $36) of investment property. |
2023 Scotiabank Annual Report | 201
Consolidated Financial Statements
| 17 | Investments in Associates |
The Bank had significant investments in the following associates:
| 2023 | 2022 | |||||||||||||||||||||||
| As at October 31 ($ millions) | Country of incorporation |
Nature of business | Ownership percentage |
Date of financial statements(1) |
Carrying value |
Carrying value |
||||||||||||||||||
| Canadian Tire’s Financial Services business (CTFS)(2) |
Canada | Financial Services | – | $ | – | $ | 579 | |||||||||||||||||
| Bank of Xi’an Co. Ltd.(3) |
China | Banking | 18.11 | % | September 30, 2023 | 895 | 1,007 | |||||||||||||||||
| Maduro & Curiel’s Bank N.V.(4) |
Curacao | Banking | 48.10 | % | September 30, 2023 | 489 | 438 | |||||||||||||||||
| (1) | Represents the date of the most recent financial statements. Where available, financial statements prepared by the associates’ management or other published information is used to estimate the change in the Bank’s interest since the most recent financial statements. |
| (2) | On October 31, 2023, the Bank closed the sale of its 20% interest in CTFS to Canadian Tire Corporation. Refer to Note 36 – Acquisitions and Divestitures. |
| (3) | Based on the quoted price on the Shanghai Stock Exchange, the Bank’s investment in Bank of Xi’an Co. Ltd was $529 as at October 31, 2023 (October 31, 2022 – $489). |
| (4) | The local regulator requires financial institutions to set aside reserves for general banking risks. These reserves are not required under IFRS, and represent undistributed retained earnings related to a foreign associated corporation, which are subject to local regulatory restrictions. As of October 31, 2023 these reserves amounted to $71 (2022 – $67). |
Impairment testing of Bank of Xi’an Co. Ltd.
As at October 31, 2023, the market value of the Bank’s investment in Bank of Xi’an Co. Ltd. based on the quoted price on the Shanghai Stock Exchange continues to be below its carrying value. The Bank has been performing quarterly impairment testing on this investment due to the prolonged period in which its market value has remained below the carrying amount. The impairment test involves comparing the carrying value of the investment to its recoverable amount based on value in use (“VIU”). In estimating VIU, the Bank uses a discounted cash flows valuation model which incorporates key assumptions, including a 5-year forecast of after-tax cash flows for the underlying entity, the estimated terminal growth rate beyond 5 years, and the applicable discount rate. As at October 31, 2023, the estimate of VIU was determined using a terminal growth rate of 3% (2022 - 3%) and a discount rate of 12% (2022 - 12%).
The VIU methodology resulted in an impairment charge of $185 million ($159 million after-tax) recorded in non-interest expenses - other, driven primarily by the economic outlook in China.
Summarized financial information
Summarized financial information of the Bank’s significant associates are as follows.
| For the twelve months ended(1) | As at October 31, 2023 | |||||||||||||||
| ($ millions) | Revenue | Net income |
Total assets | Total liabilities | ||||||||||||
| Canadian Tire’s Financial Services business (CTFS) |
$ | 1,347 | $ | 368 | $ | n/a | $ | n/a | ||||||||
| Bank of Xi’an Co. Ltd. |
1,277 | 487 | 80,803 | 75,027 | ||||||||||||
| Maduro & Curiel’s Bank N.V. |
416 | 165 | 7,636 | 6,616 | ||||||||||||
| For the twelve months ended(1) | As at October 31, 2022 | |||||||||||||||
| ($ millions) | Revenue | Net income |
Total assets | Total liabilities | ||||||||||||
| Canadian Tire’s Financial Services business (CTFS) |
$ | 1,260 | $ | 399 | $ | 6,870 | $ | 5,629 | ||||||||
| Bank of Xi’an Co. Ltd. |
1,306 | 497 | 67,864 | 62,489 | ||||||||||||
| Maduro & Curiel’s Bank N.V. |
324 | 99 | 7,181 | 6,288 | ||||||||||||
| (1) | Based on the most recent available financial statements. |
| 18 | Goodwill and Other Intangible Assets |
Goodwill
The changes in the carrying amounts of goodwill by groups of cash-generating units (CGU) are as follows:
| ($ millions) | Canadian Banking |
Global Wealth Management |
Global Banking and Markets |
Latin America |
Caribbean and Central America |
Total | ||||||||||||||||||
| Balance as at October 31, 2021 |
$ | 1,690 | $ | 3,580 | $ | 231 | $ | 2,517 | $ | 830 | $ | 8,848 | ||||||||||||
| Acquisitions |
– | – | – | – | – | – | ||||||||||||||||||
| Dispositions |
– | – | – | – | – | – | ||||||||||||||||||
| Foreign currency adjustments and other |
– | 19 | 12 | (116 | ) | 111 | 26 | |||||||||||||||||
| Balance as at October 31, 2022 |
1,690 | 3,599 | 243 | 2,401 | 941 | 8,874 | ||||||||||||||||||
| Acquisitions |
– | – | – | – | – | – | ||||||||||||||||||
| Dispositions |
– | – | – | – | – | – | ||||||||||||||||||
| Foreign currency adjustments and other |
– | 11 | 3 | 229 | 64 | 307 | ||||||||||||||||||
| Balance as at October 31, 2023 |
$ | 1,690 | $ | 3,610 | $ | 246 | $ | 2,630 | $ | 1,005 | $ | 9,181 | ||||||||||||
202 | 2023 Scotiabank Annual Report
Consolidated Financial Statements
Impairment testing of goodwill
Goodwill acquired in business combinations is allocated to each of the Bank’s groups of CGUs that are expected to benefit from the synergies of the particular acquisition. Goodwill is assessed for impairment annually or more frequently if events or circumstances occur that may indicate impairment.
The Bank determines the carrying values of its CGUs using a regulatory capital approach based on credit, market, operational risks and leverage, consistent with the Bank’s capital attribution for business line performance measurement. Corporate capital that is not directly attributable is allocated to each CGU on a proportional basis. The resulting carrying amount determined for the CGU is then compared to its respective recoverable amount to identify any impairment.
Annual impairment testing for goodwill was performed as at July 31, 2023 and 2022, and no impairment was determined to exist. As of October 31, 2023 and 2022, there were no significant changes to this assessment.
Fair value less costs of disposal
For all CGUs other than Latin America, the recoverable amount was determined using the fair value less costs of disposal (FVLCD) method. In arriving at FVLCD, the Bank estimates the fair value of the CGU using price earnings (P/E) multiples applied to normalized net income for the last four quarters as of the test date, applies a control premium based on a weighted average of acquisition premiums paid globally in the banking industry over the past five years for comparable companies, and deducts the estimated costs of disposal. The fair value measurement is categorized as Level 3 due to significant inputs being unobservable. For the 2023 annual impairment test, P/E multiples ranging from 9 to 10 times (2022 – 9 to 12 times) were used.
The Bank has performed sensitivity analysis on the key assumptions used in estimating FVLCD. The estimate of reasonably possible changes to the key assumptions are based on available evidence in respect of each input, such as risks associated with the normalized net income projections, and range of P/E multiples observed externally. Reasonable negative changes in the net income outlook (decrease of 5%) or P/E multiples (decrease of 1x), each in isolation, holding other factors constant, would not result in impairment for the Canadian Banking, Global Wealth Management and Caribbean and Central America CGUs. For the Global Banking and Markets CGU, a 5% decrease in its net income outlook, holding other factors constant, would not result in impairment. However, a 0.8x decrease in the P/E multiple, holding other factors constant, will result in FVLCD approximating carrying value. FVLCD was 109% of the carrying amount with a P/E multiple of 9.5x as at July 31, 2023.
Value in use
For the 2023 annual impairment test, the Latin America CGU’s FVLCD fell below its carrying amount. As such, further testing was required to measure its recoverable amount under the value in use (VIU) method (2022 – FVLCD method). In estimating VIU, the Bank uses a discounted cash flow valuation model based on a 5-year forecast of after-tax cash flows, the estimated terminal growth rate beyond 5 years, and the applicable discount rate. The 5-year cash flow forecast is based on management approved budgets and plans which consider market trends, macro-economic conditions, forecasted earnings and the business strategy for the CGU. The terminal growth rate is based on long-term growth expectations in Latin America, and the discount rate is based on the cost of capital of comparable companies. For the 2023 annual impairment test, a terminal growth rate of 3% and a discount rate of 13% was used.
The Bank has performed sensitivity analysis on the key assumptions used in estimating the Latin America CGU’s VIU. The estimate of reasonably possible changes to the key assumptions is based on available evidence in respect of each input such as historical performance against forecasts, risks associated with the underlying cash flow projections, and range of discount rates observed externally. Reasonable negative changes in any one key assumption, holding other factors constant, would not result in impairment for the Latin America CGU.
2023 Scotiabank Annual Report | 203
Consolidated Financial Statements
Intangible assets
Intangible assets consist of assets with indefinite and finite useful lives. Indefinite life intangible assets consist substantially of fund management contracts. The fund management contracts are for the management of open-ended funds. Finite life intangible assets include assets such as computer software, customer relationships and core deposit intangibles.
| Finite life | Indefinite life | |||||||||||||||||||||
| ($ millions) | Computer software |
Other intangibles |
Fund management contracts(1) |
Other intangibles |
Total | |||||||||||||||||
| Cost |
||||||||||||||||||||||
| Balance as at October 31, 2021 |
$ | 5,698 | $ | 1,867 | $ | 4,415 | $ | 166 | $ | 12,146 | ||||||||||||
| Acquisitions |
– | – | – | – | – | |||||||||||||||||
| Additions |
987 | – | – | – | 987 | |||||||||||||||||
| Disposals/Retirements |
(2 | ) | – | – | – | (2 | ) | |||||||||||||||
| Foreign currency adjustments and other |
4 | 8 | – | – | 12 | |||||||||||||||||
| Balance as at October 31, 2022 |
$ | 6,687 | $ | 1,875 | $ | 4,415 | $ | 166 | $ | 13,143 | ||||||||||||
| Acquisitions |
– | – | – | – | – | |||||||||||||||||
| Additions |
1,125 | – | – | – | 1,125 | |||||||||||||||||
| Impairment(3) |
(184 | ) | (110 | ) | – | (3 | ) | (297 | ) | |||||||||||||
| Disposals/Retirements |
(2,141 | ) | (2 | ) | – | – | (2,143 | ) | ||||||||||||||
| Foreign currency adjustments and other |
152 | 52 | – | – | 204 | |||||||||||||||||
| Balance as at October 31, 2023 |
$ | 5,639 | $ | 1,815 | $ | 4,415 | $ | 163 | $ | 12,032 | ||||||||||||
| Accumulated amortization |
||||||||||||||||||||||
| Balance as at October 31, 2021 |
$ | 3,117 | $ | 1,273 | $ | – | $ | – | $ | 4,390 | ||||||||||||
| Amortization |
685 | 97 | – | – | 782 | |||||||||||||||||
| Disposals/Retirements |
(1 | ) | – | – | – | (1 | ) | |||||||||||||||
| Foreign currency adjustments and other |
8 | 5 | – | – | 13 | |||||||||||||||||
| Balance as at October 31, 2022 |
$ | 3,809 | $ | 1,375 | $ | – | $ | – | $ | 5,184 | ||||||||||||
| Amortization |
862 | 157 | – | – | 1,019 | |||||||||||||||||
| Impairment(3) |
(134 | ) | (34 | ) | – | – | (168 | ) | ||||||||||||||
| Disposals/Retirements |
(1,996 | ) | (2 | ) | – | – | (1,998 | ) | ||||||||||||||
| Foreign currency adjustments and other |
25 | (42 | ) | – | – | (17 | ) | |||||||||||||||
| Balance as at October 31, 2023 |
$ | 2,566 | $ | 1,454 | $ | – | $ | – | $ | 4,020 | ||||||||||||
| Net book value |
||||||||||||||||||||||
| As at October 31, 2022 |
$ | 2,878 | (2) | $ | 500 | $ | 4,415 | $ | 166 | $ | 7,959 | |||||||||||
| As at October 31, 2023 |
$ | 3,073 | (2) | $ | 361 | $ | 4,415 | $ | 163 | $ | 8,012 | |||||||||||
| (1) | Fund management contracts are attributable to the previously acquired Dynamic Funds business (formerly DundeeWealth Inc.), MD Financial Management Inc., and Jarislowsky Fraser Limited. |
| (2) | Computer software comprises of purchased software of $429 (2022 – $337), internally generated software of $1,711 (2022 – $1,555), and in process software not subject to amortization of $933 (2022 – $986). |
| (3) | Impairment charges taken against finite life intangible assets primarily relate to the full write-off of a contract-based intangible asset in Peru, and software assets which were decommissioned in Q4 2023. |
Impairment testing of intangible assets
Indefinite life intangible assets are not amortized and are assessed for impairment annually or more frequently if events or changes in circumstances indicate that the asset may be impaired. Impairment is assessed by comparing the carrying value of the indefinite life intangible asset to its recoverable amount. The recoverable amount of the fund management contracts is based on a value in use approach using the multi-period excess earnings method. This approach uses cash flow projections from management-approved financial budgets which include key assumptions related to market appreciation, net sales of funds, and operating margins, taking into consideration past experience and market expectations. The forecast cash flows cover a 5-year period, with a terminal growth rate of 4.5% (2022 – 4.5%) applied thereafter. These cash flows have been discounted at 10% (2022 – 10%). Fund management contracts were assessed for annual impairment as at July 31, 2023 and 2022 and no impairment was determined to exist. As of October 31, 2023 and 2022, there were no significant changes to this assessment. In addition, reasonable negative changes in any one key assumption, holding other factors constant, would not result in impairment.
Finite life intangible assets are only assessed for impairment if events or circumstances indicate that the asset may be impaired. When required, impairment is assessed by comparing the carrying value of the finite life intangible asset to its recoverable amount, which is generally determined using a value in use approach.
204 | 2023 Scotiabank Annual Report
Consolidated Financial Statements
| 19 | Other Assets |
| As at October 31 ($ millions) | 2023 | 2022 | ||||||
| Accrued interest |
$ | 4,907 | $ | 3,710 | ||||
| Accounts receivable and prepaids |
2,218 | 1,715 | ||||||
| Current tax assets |
2,743 | 3,349 | ||||||
| Margin deposits on derivatives |
12,254 | 15,656 | ||||||
| Segregated fund assets |
1,463 | 1,795 | ||||||
| Pension assets (Note 28) |
936 | 1,052 | ||||||
| Receivable from brokers, dealers and clients |
4,142 | 4,608 | ||||||
| Other |
6,278 | 5,371 | ||||||
| Total |
$ | 34,941 | $ | 37,256 | ||||
| 20 | Deposits |
| 2023 | 2022 | |||||||||||||||||||||||
| Payable on demand(1) | ||||||||||||||||||||||||
| As at October 31 ($ millions) | Interest- bearing |
Non-interest- bearing |
Payable after notice(2) |
Payable on a fixed date(3) |
Total | |||||||||||||||||||
| Personal |
$ | 4,989 | $ | 10,289 | $ | 148,027 | $ | 125,312 | $ | 288,617 | $ | 265,892 | ||||||||||||
| Business and government |
161,121 | 32,421 | 46,431 | 372,294 | 612,267 | 597,617 | ||||||||||||||||||
| Financial institutions |
12,871 | 851 | 1,876 | 35,851 | 51,449 | 52,672 | ||||||||||||||||||
| Total |
$ | 178,981 | $ | 43,561 | $ | 196,334 | (4) | $ | 533,457 | $ | 952,333 | $ | 916,181 | |||||||||||
| Recorded in: |
||||||||||||||||||||||||
| Canada |
$ | 128,274 | $ | 23,256 | $ | 160,728 | $ | 366,938 | $ | 679,196 | $ | 642,977 | ||||||||||||
| United States |
41,207 | 42 | 4 | 55,554 | 96,807 | 104,984 | ||||||||||||||||||
| United Kingdom |
– | – | 422 | 21,140 | 21,562 | 24,243 | ||||||||||||||||||
| Mexico |
– | 7,321 | 13,252 | 20,851 | 41,424 | 31,841 | ||||||||||||||||||
| Peru |
4,586 | 456 | 4,782 | 6,036 | 15,860 | 16,439 | ||||||||||||||||||
| Chile |
1,389 | 4,783 | 156 | 17,396 | 23,724 | 22,105 | ||||||||||||||||||
| Colombia |
32 | 531 | 4,261 | 4,756 | 9,580 | 8,211 | ||||||||||||||||||
| Other International |
3,493 | 7,172 | 12,729 | 40,786 | 64,180 | 65,381 | ||||||||||||||||||
|
Total(5) |
$ | 178,981 | $ | 43,561 | $ | 196,334 | $ | 533,457 | $ | 952,333 | $ | 916,181 | ||||||||||||
| (1) | Deposits payable on demand include all deposits for which we do not have the right to notice of withdrawal, generally chequing accounts. |
| (2) | Deposits payable after notice include all deposits for which we require notice of withdrawal, generally savings accounts. |
| (3) | All deposits that mature on a specified date, generally term deposits, guaranteed investments certificates and similar instruments. |
| (4) | Includes $123 (2022 – $156) of non-interest bearing deposits. |
| (5) | Deposits denominated in U.S. dollars amount to $320,088 (2022 – $326,041), deposits denominated in Chilean pesos amount to $20,200 (2022 – $18,740), deposits denominated in Mexican pesos amount to $38,127 (2022 – $29,269) and deposits denominated in other foreign currencies amount to $116,926 (2022 – $106,817). |
The following table presents the maturity schedule for term deposits in Canada greater than $100,000(1).
| ($ millions) | Within three months |
Three to six months |
Six to twelve months |
One to five years |
Over five years |
Total | ||||||||||||||||||
| As at October 31, 2023 |
$ | 66,726 | $ | 39,525 | $ | 62,675 | $ | 130,384 | $ | 19,021 | $ | 318,331 | ||||||||||||
| As at October 31, 2022 |
$ | 53,656 | $ | 36,035 | $ | 62,891 | $ | 110,015 | $ | 21,440 | $ | 284,037 | ||||||||||||
| (1) | The majority of foreign term deposits are in excess of $100,000. |
2023 Scotiabank Annual Report | 205
Consolidated Financial Statements
| 21 | Subordinated Debentures |
These debentures are direct, unsecured obligations of the Bank and are subordinate to the claims of the Bank’s depositors and other creditors. The Bank, where appropriate, enters into interest rate and cross-currency swaps to hedge the related risks.
| As at October 31 ($ millions) | 2023 | 2022 | ||||||||||||
| Maturity date | Interest rate (%) |
Terms(1) | Carrying value(2) |
Carrying value(2) |
||||||||||
| June 2025 |
8.90 | Redeemable at any time. | $ | 252 | $ | 253 | ||||||||
| December 2025(3) |
4.50 | U.S.$1,250 million. | 1,714 | 1,690 | ||||||||||
| January 2029(3) |
3.89 | Redeemable on or after January 18, 2024. After January 18, 2024, interest will be payable at an annual rate equal to the three-month bankers’ acceptance rate plus 1.58%. | 1,752 | 1,770 | ||||||||||
| July 2029(3) |
2.836 | Redeemable on or after July 3, 2024. After July 3, 2024, interest will be payable at an annual rate equal to the three-month bankers’ acceptance rate plus 1.18% or the applicable alternative rate, including adjustments, as specified in the terms of the instrument. | 1,339 | 1,459 | ||||||||||
| August 2085 |
Floating | On August 31, 2023, the Bank redeemed these notes at 100% of their principal amount plus accrued interest to the redemption date. | – | 78 | ||||||||||
| May 2037(3) |
4.588 | U.S.$1,250 million. Redeemable between April 12, 2027, and May 4, 2032. On May 4, 2032, interest will reset at the then prevailing 5-year U.S. treasury rate plus 2.050%. | 1,676 | 1,644 | ||||||||||
| May 2032(3) |
3.934 | Redeemable on or after May 3, 2027. After May 3, 2027, interest will be payable quarterly at the then prevailing three-month bankers’ acceptance rate plus 1.52%. | 1,587 | 1,575 | ||||||||||
| December 2032(3) |
1.800 | JPY 33,000 million. Redeemable on December 20, 2027. After December 20, 2027, interest will be payable semi-annually at the reference Japanese Government Bond rate plus 1.681% on the reset date. | 301 | – | ||||||||||
| August 2033(3) |
5.679 | Redeemable on or after August 2, 2028. After August 2, 2028, interest will be payable at an annual rate equal to Daily Compounded CORRA plus 2.100%. | 962 | – | ||||||||||
| December 2033(3) |
1.830 | JPY 12,000 million. Redeemable on December 1, 2028. After December 1, 2028, interest rate on the debentures will be reset to the prevailing yield of Japanese Government Bond rate plus 1.477% on the reset date. | 110 | – | ||||||||||
| $ | 9,693 | $ | 8,469 | |||||||||||
| (1) | In accordance with the provisions of the Capital Adequacy Guideline of the Superintendent, all redemptions are subject to regulatory approval and subject to the terms in the relevant prospectus. |
| (2) | The carrying value of subordinated debentures may differ from par value due to the impact of fair value hedges used for managing interest rate risk and subordinated debentures held for market-making purposes. |
| (3) | These debentures contain non-viability contingent capital (NVCC) provisions. Under such NVCC provisions, outstanding debentures are convertible into a variable number of common shares if OSFI announces that the Bank has ceased, or is about to cease, to be viable, or if a federal or provincial government in Canada publicly announces that the Bank has accepted or agreed to accept a capital injection, or equivalent support, from the federal government or any provincial government or political subdivision or agent thereof without which the Bank would have been determined by OSFI to be non-viable. If such a conversion were to occur, the debentures would be converted into common shares pursuant to an automatic conversion formula defined as 150% of the par value plus accrued and unpaid interest divided by the conversion price and, where applicable, subject to translation at foreign exchange rates in effect at the time of conversion. The conversion price is based on the greater of: (i) a floor price of $5.00 (subject to adjustments in certain events as set out in the respective prospectus supplements), and (ii) the current market price of the Bank’s common shares at the time of the trigger event (10-day weighted average). |
| 22 | Other Liabilities |
| As at October 31 ($ millions) | 2023 | 2022 | ||||||
| Accrued interest |
$ | 7,594 | $ | 3,612 | ||||
| Lease liabilities(1) |
3,202 | 3,323 | ||||||
| Accounts payable and accrued expenses |
7,819 | 6,995 | ||||||
| Current tax liabilities |
728 | 464 | ||||||
| Deferred tax liabilities (Note 27) |
1,446 | 1,100 | ||||||
| Gold and silver certificates and bullion |
439 | 372 | ||||||
| Margin and collateral accounts |
8,531 | 9,029 | ||||||
| Segregated fund liabilities |
1,463 | 1,795 | ||||||
| Payables to brokers, dealers and clients |
1,565 | 1,957 | ||||||
| Provisions (Note 23) |
573 | 287 | ||||||
| Allowance for credit losses on off-balance sheet exposures (Note 13) |
149 | 108 | ||||||
| Pension liabilities (Note 28) |
521 | 549 | ||||||
| Other liabilities of subsidiaries and structured entities |
26,836 | 25,010 | ||||||
| Other |
8,663 | 8,098 | ||||||
| Total |
$ | 69,529 | $ | 62,699 | ||||
| (1) | Represents discounted value of lease liabilities. |
The table below sets out a maturity analysis of undiscounted lease liabilities showing the lease payments to be made after the reporting date:
| As at October 31 ($ millions) | 2023 | 2022 | ||||||
| Within 1 year |
$ | 428 | $ | 425 | ||||
| 1 to 2 years |
410 | 414 | ||||||
| 2 to 3 years |
405 | 404 | ||||||
| 3 to 4 years |
398 | 387 | ||||||
| 4 to 5 years |
371 | 373 | ||||||
| After 5 years |
1,852 | 1,962 | ||||||
| Total |
$ | 3,864 | $ | 3,965 | ||||
206 | 2023 Scotiabank Annual Report
Consolidated Financial Statements
| 23 | Provisions |
| ($ millions) | ||||
| As at November 1, 2021 |
$ | 296 | ||
| Provisions made during the year |
149 | |||
| Provisions utilized / released during the year |
(158 | ) | ||
| Balance as at October 31, 2022 |
$ | 287 | ||
| Provisions made during the year |
470 | |||
| Provisions utilized / released during the year |
(184 | ) | ||
| Balance as at October 31, 2023 |
$ | 573 | ||
Restructuring Charge
In Q4 2023, the Bank recorded a restructuring charge and severance provisions of $354 million related to workforce reductions as a result of the Bank’s end-to-end digitization, automation, changes in customers’ day-to-day banking preferences, as well as the ongoing efforts to streamline operational processes and optimize distribution channels. Of these amounts, which were all recorded in the Other operating segment, $316 million was the restructuring charge included in other liabilities - provisions.
Prior Year
In the prior year, the Bank recorded a restructuring charge of $85 million, primarily related to the strategic decision to realign the Bank’s Global Banking and Markets businesses in Asia Pacific to focus on select banking and capital markets activities in the region. The charge also included the cost of reducing Canadian and international full-time technology employees, driven by our ongoing technology modernization and digital transformation. These changes are a result of the Bank’s commitment to simplify processes and optimize distribution channels to run businesses more effectively while meeting changing customer needs and our evolving geographical focus. This charge was recorded in the Other operating segment.
Legal
In the ordinary course of business, the Bank and its subsidiaries are and have been subject to a variety of pending and threatened legal proceedings, including civil claims and lawsuits, regulatory examinations, investigations, audits, and requests for information by various governmental regulatory agencies and law enforcement authorities in various jurisdictions. Some of these matters may involve novel legal theories and interpretations and may be advanced under criminal as well as civil statutes, and some proceedings could result in the imposition of civil, regulatory enforcement or criminal penalties. The Bank reviews the status of all proceedings on an ongoing basis and will exercise judgment in resolving them in such manner as the Bank believes to be in its best interest. In view of the inherent difficulty of predicting the outcome of such matters, the Bank cannot state what the eventual outcome of such matters will be. However, based on current knowledge, management does not believe that liabilities, if any, arising from pending litigation or regulatory proceedings will have a material adverse effect on the Consolidated Statement of Financial Position or results of operations of the Bank.
Legal provisions are established when it becomes probable that the Bank will incur an expense related to a legal action or regulatory proceeding and the amount can be reliably estimated. Such provisions are recorded at the best estimate of the amount required to settle any obligation related to these legal actions as at the balance sheet date, taking into account the risks and uncertainties surrounding the obligation. Management and internal and external experts are involved in estimating any amounts that may be required. The actual costs of resolving these claims may vary significantly from the amount of the legal provisions. The Bank’s estimate involves significant judgement, given the varying stages of the proceedings, the fact that the Bank’s liability, if any, has yet to be determined and the fact that the underlying matters will change from time to time. As such, there is a possibility that the ultimate resolution of those legal actions may be material to the Bank’s consolidated results of operations for any particular reporting period.
Prior Years
In 2021, the Bank recorded settlement and litigation provisions in the amount of $62 million in connection with the Bank’s former metals business. These provisions were recorded in the Other operating segment.
The Bank, through its Peruvian subsidiary, is engaged in legal actions related to certain value-added tax assessed amounts and associated interest totaling $165 million, which arose from certain client transactions which occurred prior to the Bank’s acquisition of the subsidiary. The legal action in Peru relating to the original assessed amount was heard by the Peruvian Constitutional Court in June 2023 and a decision is pending. In November 2021, the Peruvian Constitutional Court dismissed the matter relating to the accrued interest for procedural reasons. With respect to this interest component, in October 2022, the Bank filed a request for arbitration against the Republic of Peru before the International Centre for the Settlement of Investment Disputes, pursuant to the provisions of the Canada-Peru Free Trade Agreement and the matter is proceeding through the arbitration process. The claim arises out of the Constitutional Court of Peru’s inequitable treatment of Scotiabank Peru’s rights in breach of the Canada-Peru Free Trade Agreement. The Bank is confident that it will be successful in these matters and intends to continue to defend its position. Accordingly, no amounts have been accrued in the consolidated financial statements.
| 24 | Common shares, preferred shares and other equity instruments |
| (a) | Common shares |
Authorized:
An unlimited number of common shares without nominal or par value.
Issued and fully paid:
| 2023 | 2022 | |||||||||||||||
| As at October 31 ($ millions) | Number of shares | Amount | Number of shares | Amount | ||||||||||||
| Outstanding at beginning of year |
1,191,375,095 | $ | 18,707 | 1,215,337,523 | $ | 18,507 | ||||||||||
| Issued in relation to share-based payments, net (Note 26) |
415,247 | 28 | 1,951,372 | 136 | ||||||||||||
| Issued in relation to the acquisition of a subsidiary or associated corporation |
– | – | 7,000,000 | 570 | ||||||||||||
| Issued in relation to the Shareholder Dividend and Share Purchase Plan(1) |
22,254,078 | 1,374 | – | – | ||||||||||||
| Repurchased for cancellation under the Normal Course Issuer Bid |
– | – | (32,913,800 | ) | (506 | ) | ||||||||||
| Outstanding at end of year |
1,214,044,420 | (2) | $ | 20,109 | 1,191,375,095 | (2) | $ | 18,707 | ||||||||
| (1) | Commencing with the dividend declared on February 28, 2023 and paid on April 26, 2023, the Bank issued to participants of the Shareholder Dividend and Share Purchase Plan (the “Plan”), common shares from treasury with a discount of 2% to the average market price (as defined in the Plan). Prior to the dividend paid on April 26, 2023, common shares received by participants under the Plan were shares purchased from the open market at prevailing market prices. |
| (2) | In the normal course of business, the Bank’s regulated Dealer subsidiary purchases and sells the Bank’s common shares to facilitate trading/institutional client activity. During fiscal 2023, the number of such shares bought was 19,133,834 and sold was 19,132,702 (2022 – 17,757,599 bought and 17,757,599 sold). |
2023 Scotiabank Annual Report | 207
Consolidated Financial Statements
Dividend
The dividends paid on common shares in fiscal 2023 and 2022 were $5,003 million ($4.18 per share) and $4,858 million ($4.06 per share), respectively. The Board of Directors approved a quarterly dividend of $1.06 per common share at its meeting on November 27, 2023. This quarterly dividend applies to shareholders of record at the close of business on January 3, 2024, and is payable January 29, 2024. Refer to Note 24(c) – Restriction on payment of dividends and retirement of shares.
Normal Course Issuer Bid
The Bank currently does not have an active normal course issuer bid and did not repurchase any common shares during the year ended October 31, 2023. The Bank’s previous normal course issuer bid terminated on December 1, 2022. Under this program, the Bank repurchased and cancelled approximately 32.9 million common shares at a volume weighted average price of $87.28 per share for a total amount of $2,873 million. These repurchases were carried out prior to October 31, 2022.
Non-viability Contingent Capital
The maximum number of common shares issuable on conversion of NVCC subordinated debentures, NVCC subordinated additional tier 1 capital notes, including those issued to Scotiabank LRCN Trust as recourse assets in respect of NVCC limited recourse capital notes, and NVCC preferred shares as at October 31, 2023 would be 5,046 million common shares (2022 – 4,580 million common shares) based on the floor price and excluding the impact of any accrued and unpaid interest and any declared but unpaid dividends (refer to Note 21 – Subordinated debentures and Note 24(b) – Preferred shares and other equity instruments for further details).
| (b) | Preferred shares and other equity instruments |
Preferred shares
Authorized:
An unlimited number of preferred shares without nominal or par value.
Issued and fully paid:
| 2023 | 2022 | |||||||||||||||||||||||||||||||
| As at October 31 ($ millions) | Number of shares |
Amount | Dividends declared per share(1) |
Conversion feature |
Number of shares |
Amount | Dividends declared per share |
Conversion feature |
||||||||||||||||||||||||
| NVCC Preferred shares:(a) |
||||||||||||||||||||||||||||||||
| Series 38(b) |
– | – | – | – | – | – | 0.303125 | Series 39 | ||||||||||||||||||||||||
| Series 40(c) |
12,000,000 | 300 | 1.212500 | Series 41 | 12,000,000 | 300 | 1.212500 | Series 41 | ||||||||||||||||||||||||
| Total preferred shares |
12,000,000 | $ | 300 | 12,000,000 | $ | 300 | ||||||||||||||||||||||||||
| (1) | Dividends declared from November 1, 2022 to October 31, 2023. |
Terms of NVCC preferred shares
| First issue date | Issue price |
Initial dividend |
Initial dividend payment date |
Rate reset spread |
Redemption date | Redemption price |
||||||||||||||||||||||
| NVCC Preferred shares(a): |
||||||||||||||||||||||||||||
| Series 40(c) |
October 12, 2018 | 25.00 | 0.362100 | January 29, 2019 | 2.43 | % | January 27, 2024 | 25.00 | ||||||||||||||||||||
| (a) | Non-cumulative preferential cash dividends on all series are payable quarterly, as and when declared by the Board. Dividends on the Non-cumulative 5-Year Rate Reset Preferred Shares Non Viability Contingent Capital (NVCC) (Series 40) are payable at the applicable rate for the initial five-year fixed rate period ending one day prior to the redemption date. Subsequent to the initial five-year fixed rate period, and resetting every five years thereafter, the dividend on such Rate Reset Preferred Shares will be determined by the sum of the 5-year Government of Canada Yield plus the indicated rate reset spread, multiplied by $25.00. If outstanding, non-cumulative preferential cash dividends on the Series 41 are payable quarterly, as and when declared by the Board. Dividends on the Non-cumulative 5-Year Rate Reset Preferred Shares NVCC (Series 41) are payable, at a rate equal to the sum of the three month Government of Canada Treasury Bill rate plus the rate reset spread of the converted preferred shares, multiplied by $25.00. For each of the years presented, the Bank paid all of the non-cumulative preferred share dividends. |
| (b) | On January 27, 2022 the Bank redeemed all outstanding Non-cumulative Preferred Shares Series 38 at a price equal to $25.00 per share plus dividends declared on November 30, 2021 of $0.3031250 per Series 38 share. |
| (c) | Holders of Non-cumulative 5-Year Rate Reset Preferred Shares Series 40 (NVCC) will have the option to convert shares into an equal number of Non-cumulative Floating Rate Preferred Shares Series 41 (NVCC) on January 27, 2024, and on January 27 every five years thereafter. If outstanding, holders of Non-cumulative Floating Rate Reset Preferred Shares Series 41 (NVCC) will have the option to convert shares into an equal number of Non-cumulative 5-Year Rate Reset Preferred Shares Series 40 (NVCC) on January 27, 2029, and on January 27 every five years thereafter. With respect to Series 40 and 41, if the Bank determines that, after giving effect to any Election Notices received, there would be less than 1,000,000 preferred shares of such Series issued and outstanding on an applicable conversion date, then all of the issued and outstanding preferred shares of such Series will automatically be converted into an equal number of the preferred shares of the other relevant Series. With regulatory approval, Series 40 preferred shares may be redeemed by the Bank on January 27, 2024 and every five years thereafter, and for Series 41 preferred shares, if outstanding, on January 27, 2029 and every five years thereafter, at $25.00 per share, together with declared and unpaid dividends. |
Under NVCC provisions, NVCC preferred shares Series 40 and 41, if outstanding, are convertible into a variable number of common shares if OSFI announces that the Bank has ceased, or is about to cease, to be viable, or if a federal or provincial government in Canada publicly announces that the Bank has accepted or agreed to accept a capital injection, or equivalent support, from the federal government or any provincial government or political subdivision or agent thereof without which the Bank would have been determined by OSFI to be non-viable. If such a conversion were to occur, NVCC preferred shares Series 40 and 41, if outstanding, would be converted into common shares pursuant to an automatic conversion formula defined as 100% times the share value of $25.00 plus declared and unpaid dividends divided by the conversion price. The conversion price is based on the greater of: (i) a floor price of $5.00 or (subject to adjustments in certain events as set out in their respective prospectus supplements), and (ii) the current market price of the Bank’s common shares at the time of the trigger event (10-day weighted average).
208 | 2023 Scotiabank Annual Report
Consolidated Financial Statements
Other equity instruments
Other equity instruments are comprised of NVCC additional Tier 1 qualifying regulatory capital notes:
| 2023 | 2022 | |||||||||||||||||||||||||||||||||||||||
| First issue date/ Series number |
Notional Amount (millions) |
Next reset date |
Interest rate |
Interest rate after reset |
Next redemption date |
Redemption frequency after reset(1) |
Amount | Distributions paid per Note(2) |
Amount | Distributions paid per Note(2) |
||||||||||||||||||||||||||||||
| Subordinated Additional Tier 1 Capital Notes(3)(4) |
||||||||||||||||||||||||||||||||||||||||
| October 12, 2017(5) |
U.S.$ | 1,250 | |
January 12, 2024 |
|
8.33538 | % | |
SOFR +2.90961 |
(5) % |
|
January 12, 2024 |
|
Quarterly | $ | 1,560 | U.S.$ | 76.23 | $ | 1,560 | U.S.$ | 46.50 | ||||||||||||||||||
| June 4, 2020 |
U.S.$ | 1,250 | |
June 4, 2025 |
|
4.900 | % | |
UST +4.551 |
(6) % |
|
June 4, 2025 |
|
|
Every five years |
|
$ | 1,689 | U.S.$ | 49.00 | $ | 1,689 | U.S.$ | 49.00 | ||||||||||||||||
| Limited Recourse Capital |
||||||||||||||||||||||||||||||||||||||||
| Series 1(8) |
$ | 1,250 | |
July 27, 2026 |
|
3.700 | % | |
GOC +2.761 |
(9) % |
|
June 27, 2026 |
|
|
Every five years |
|
$ | 1,250 | $ | 37.00 | $ | 1,250 | $ | 37.00 | ||||||||||||||||
| Series 2(10) | U.S.$ | 600 | |
October 27, 2026 |
|
3.625 | % | |
UST +2.613 |
(6) % |
|
October 27, 2026 |
|
Quarterly | $ | 753 | U.S.$ | 36.25 | $ | 753 | U.S.$ | 38 | ||||||||||||||||||
| Series 3(11) | $ | 1,500 | |
July 27, 2027 |
|
7.023 | % | |
GOC +3.95 |
(9) % |
|
June 27, 2027 |
|
|
Every five years |
|
$ | 1,500 | $ | 70.23 | $ | 1,500 | $ | 25 | ||||||||||||||||
| Series 4(12) | U.S.$ | 750 | |
October 27, 2027 |
|
8.625 | % | |
UST +4.389 |
(6) % |
|
October 27, 2027 |
|
Quarterly | $ | 1,023 | U.S.$ | 86.73 | $ | 1,023 | U.S.$ | – | ||||||||||||||||||
| Total other equity instruments |
$ | 7,775 | $ | 7,775 | ||||||||||||||||||||||||||||||||||||
| (1) | Each security is redeemable at the sole discretion of the Bank on the first reset date and every quarter or five years, as applicable, thereafter. Limited Recourse Capital Notes (LRCN) Series 1 and Series 3 are also redeemable in the one month period preceding each reset date. The securities are also redeemable following a regulatory or tax event, as described in the offering documents. All redemptions are subject to regulatory consent and occur at a redemption price of par plus accrued and unpaid interest (unless canceled, where applicable). |
| (2) | Distributions paid from November 1 to October 31 in the relevant fiscal year per face amount of $1,000 or U.S.$1,000, as applicable. |
| (3) | The securities rank pari passu to each other and are the Bank’s direct unsecured obligations, ranking subordinate to Bank’s other subordinated indebtedness. |
| (4) | While interest is payable on the securities when it becomes due, the Bank may, at its sole discretion and with notice, cancel interest payments. Refer to Note 24(c) – Restriction on payment of dividends and retirement of shares. |
| (5) | CME 3-month Term SOFR. In respect of these securities, on June 28, 2023, the Bank announced the interest rate transition from three-month USD LIBOR to three-month Term SOFR, plus a spread adjustment of 26.161 bps, for interest periods commencing on or after July 12, 2023. |
| (6) | The then-prevailing five-year U.S. Treasury Rate. |
| (7) | Interest on LRCN is non-deferrable, however, non-payment of interest that is not cured within five business days results in a Recourse Event. A Recourse Event of the respective Series occurs if (a) there is non-payment in cash by the Bank of the principal amount, together with any accrued and unpaid interest, on the maturity date, (b) there is non-payment in cash of interest which is not cured within 5 business days, (c) there is non-payment in cash of the redemption price in connection with the redemption of the LRCNs, (d) an event of default occurs (i.e. bankruptcy, insolvency, or liquidation of the Bank), or (e) there is an NVCC Trigger Event. Upon the occurrence of a Recourse Event, the noteholder’s sole recourse will be limited to their proportionate share of the Series’ respective assets held in Scotiabank LRCN Trust, a consolidated entity, which consist initially of the respective AT1 Notes or, following an NVCC Trigger Event, common shares. Refer to Note 24(c) – Restriction on payment of dividends and retirement of shares. |
| (8) | On June 15, 2021, the Bank issued $1,250 million 3.70% Fixed Rate Resetting Limited Recourse Capital Notes Series 1 (NVCC) (“LRCN Series 1”). In connection with the issuance of LRCN Series 1, the Bank issued $1,250 million of Fixed Rate Resetting Perpetual Subordinated Additional Tier 1 Capital Notes (NVCC) (“the Series 1 AT1 Notes”) to Scotiabank LRCN Trust to be held as trust assets in connection with the LRCN structure. |
| (9) | The then-prevailing five-year Government of Canada yield. |
| (10) | On October 7, 2021, the Bank issued U.S.$600 million 3.625% Fixed Rate Resetting Limited Recourse Capital Notes Series 2 (NVCC) (“LRCN Series 2”). In connection with the issuance of LRCN Series 2, the Bank issued U.S.$600 million of Fixed Rate Resetting Perpetual Subordinated Additional Tier 1 Capital Notes (NVCC) (“the Series 2 AT1 Notes”) to Scotiabank LRCN Trust to be held as trust assets in connection with the LRCN structure. |
| (11) | On June 16, 2022, the Bank issued $1,500 million 7.023% Fixed Rate Resetting Limited Recourse Capital Notes Series 3 (NVCC) (“LRCN Series 3”). In connection with the issuance of LRCN Series 3, the Bank issued $1,500 million of Fixed Rate Resetting Perpetual Subordinated Additional Tier 1 Capital Notes (NVCC) (“the Series 3 AT1 Notes”) to Scotiabank LRCN Trust to be held as trust assets in connection with the LRCN structure. |
| (12) | On October 25, 2022, the Bank issued U.S.$750 million 8.625% Fixed Rate Resetting Limited Recourse Capital Notes Series 4 (NVCC) (“LRCN Series 4”). In connection with the issuance of LRCN Series 4, the Bank issued U.S.$750 million of Fixed Rate Resetting Perpetual Subordinated Additional Tier 1 Capital Notes (NVCC) (“the Series 4 AT1 Notes”) to Scotiabank LRCN Trust to be held as trust assets in connection with the LRCN structure. |
Contractual NVCC provisions contained in the Bank’s Subordinated Additional Tier 1 Capital Notes, including those issued to Scotiabank LRCN Trust as recourse assets in respect of the LRCNs, trigger conversion of these securities into a variable number of common shares if OSFI announces that the Bank has ceased, or is about to cease, to be viable, or if a federal or provincial government in Canada publicly announces that the Bank has accepted or agreed to accept a capital injection, or equivalent support, from the federal government or any provincial government or political subdivision or agent thereof without which the Bank would have been determined by OSFI to be non-viable. If such a conversion were to occur, outstanding Subordinated Additional Tier 1 Capital Notes (NVCC), would be converted into common shares pursuant to an automatic conversion formula defined as 125% of the par value plus accrued and unpaid interest divided by the conversion price. The conversion price is based on the greater of: (i) $5.00 (subject to adjustments in certain events and converted to U.S. dollar-equivalent, where applicable, each as set out in their respective prospectus supplements), and (ii) the current market price of the Bank’s common shares at the time of the trigger event (10-day weighted average and converted to U.S. dollar-equivalent, where applicable). U.S. dollar equivalents of the floor price and the current market price, where applicable, are based on the CAD/USD exchange rate on the day prior to the trigger event.
The notes above have been determined to be compound instruments that have both equity and liability features. At inception, the fair value of the liability component is initially measured with any residual amount assigned to the equity component. On the respective dates of issuance, the Bank has assigned an insignificant value to each liability component of the notes and, as a result, the proceeds received upon issuance of the notes have been presented as equity. The Bank will continue to monitor events that could impact the value of the liability component.
During the year ended October 31, 2023, the Bank paid aggregate distributions on these notes of $405 million (2022 – $239 million), net of income taxes of $75 million (2022 – $30 million), based on exchange rates in effect on the payment dates, where applicable.
2023 Scotiabank Annual Report | 209
Consolidated Financial Statements
| (c) | Restrictions on payment of dividends and retirement of shares |
Under the Bank Act, the Bank is prohibited from declaring any dividends on its common or preferred shares or redeeming, purchasing or otherwise retiring such shares when the Bank is, or would be placed by such a declaration or retirement, in contravention of the capital adequacy, liquidity or any other regulatory directives issued under the Bank Act.
In the event that applicable cash distributions on any of the Scotiabank Trust Securities are not paid on a regular distribution date, the Bank has undertaken not to declare dividends of any kind on its preferred or common shares until such distributions are made in full or the twelfth month following the non-payment of such distributions. Similarly, should the Bank fail to declare regular dividends on any of its directly issued and outstanding preferred or common shares, cash distributions will also not be made on any of the Scotiabank Trust Securities.
In the event that distributions are not paid in full on the Bank’s Subordinated Additional Tier 1 Capital Notes (NVCC), including those issued as recourse assets in respect of LRCNs to Scotiabank LRCN Trust where the trustee has not waived such distributions or no longer holds the respective AT1 Notes, the Bank has undertaken not to declare dividends on its common or preferred shares or redeem, purchase or otherwise retire such shares until the month commencing after such distributions have been made in full.
In the event that dividends to which preferred shareholders are then entitled have not been paid or sufficient funds have not been set aside to do so, the Bank has undertaken not to declare dividends on its common shares or redeem, purchase or otherwise retire its common shares.
Currently, the above limitations do not restrict the payment of dividends on or retirement of preferred or common shares.
| 25 | Capital Management |
The primary regulator over the Bank’s consolidated capital adequacy is the Office of the Superintendent of Financial Institutions, Canada (OSFI). The capital adequacy regulations in Canada are largely consistent with international standards set by the Basel Committee on Banking Supervision (BCBS). OSFI requires Canadian deposit-taking institutions to fully implement the Basel III reforms and achieve minimums of 7%, 8.5% and 10.5% for CET1, Tier 1 and Total Capital, respectively. OSFI has also designated the Bank as a domestic systemically important bank (D-SIB), increasing its minimum capital ratio requirements by 1% across all tiers of capital effective January 1, 2016, in line with the requirements for global systemically important banks.
In addition, OSFI expects D-SIBs to hold a Domestic Stability Buffer. In December 2022 OSFI announced that the DSB will increase to 3.0% of total risk-weighted assets (RWA), effective February 1, 2023, and has increased the DSB’s range from 0% to 4.0%. OSFI’s minimum regulatory capital ratio requirements, including the D-SIB 1.0% surcharge and its DSB are: 11.0%, 12.5% and 14.5% for CET1, Tier 1 and Total capital ratios, respectively. In addition, in June 2023 OSFI announced an additional 0.5% increase to its DSB, resulting in a DSB of 3.5% of total RWA, effective November 1, 2023.
In addition to risk-based capital requirements, the Basel III reforms introduced a simpler, non risk-based Leverage ratio requirement to act as a supplementary measure to its risk-based capital requirements. Institutions are expected to maintain an operating buffer above the 3.5% minimum, including the D-SIB surcharge of 0.5%, effective Q2 2023.
The Bank’s regulatory capital ratios were as follows:
| As at October 31 ($ millions) | 2023 | 2022 | ||||||
| Revised Basel III |
Basel III | |||||||
| Capital(1)(2) |
||||||||
| Common Equity Tier 1 capital |
$ | 57,041 | $ | 53,081 | ||||
| Net Tier 1 capital |
65,223 | 61,262 | ||||||
| Total regulatory capital |
75,651 | 70,710 | ||||||
| Total loss absorbing capacity (TLAC)(3) |
134,504 | 126,565 | ||||||
| Risk-weighted assets/exposures used in calculation of capital ratios |
||||||||
| Risk-weighted assets(1)(2) |
$ | 440,017 | $ | 462,448 | ||||
| Leverage exposures(4) |
1,562,963 | 1,445,619 | ||||||
| Regulatory ratios(1)(2) |
||||||||
| Common Equity Tier 1 capital ratio |
13.0 | % | 11.5 | % | ||||
| Tier 1 capital ratio |
14.8 | % | 13.2 | % | ||||
| Total capital ratio |
17.2 | % | 15.3 | % | ||||
| Total loss absorbing capacity ratio(3) |
30.6 | % | 27.4 | % | ||||
| Leverage ratio(4) |
4.2 | % | 4.2 | % | ||||
| Total loss absorbing capacity leverage ratio(3) |
8.6 | % | 8.8 | % | ||||
| (1) | Regulatory ratios and amounts reported in 2023 are under Revised Basel III requirements and are not directly comparable to ratios and amounts reported in 2022. |
| (2) | 2023 regulatory capital ratios are based on Revised Basel III requirements as determined in accordance with OSFI Guideline – Capital Adequacy Requirements (February 2023). Prior year regulatory capital ratios were prepared in accordance with OSFI Guideline – Capital Adequacy Requirements (November 2018). |
| (3) | This measure has been disclosed in this document in accordance with OSFI Guideline – Total Loss Absorbing Capacity (September 2018). |
| (4) | 2023 leverage ratios are based on Revised Basel III requirements as determined in accordance with OSFI Guideline – Leverage Requirements (February 2023). Prior year leverage ratios were prepared in accordance with OSFI Guideline – Leverage Requirements (November 2018). |
The Bank exceeded the OSFI regulatory minimum capital ratios as at October 31, 2023.
210 | 2023 Scotiabank Annual Report
Consolidated Financial Statements
| 26 | Share-Based Payments |
| (a) | Stock option plans |
The Bank grants stock options as part of the employee Stock Option Plan as well as stand-alone stock appreciation rights (SARs). Options to purchase common shares and/or to receive an equivalent cash payment, as applicable, may be granted to select employees at an exercise price of the higher of the closing price of the Bank’s common shares on the TSX on the trading day prior to the grant date or the volume weighted average trading price for the five trading days immediately preceding the grant date.
Stock options granted since December 2014 vest 50% at the end of the third year and 50% at the end of the fourth year. This change is prospective and does not impact prior period grants. Stock options are exercisable no later than 10 years after the grant date. In the event that the expiry date falls within an insider trading blackout period, the expiry date will be extended for 10 business days after the end of the blackout period. There is a total of 141 million common shares which have been reserved for issuance under the Bank’s employee Stock Option Plan of which 117 million common shares have been issued as a result of the exercise of options and 12 million common shares are committed under outstanding options, leaving 12 million common shares available for issuance as options. Outstanding options expire on dates ranging from December 9, 2023 to December 8, 2032.
The cost of these options is recognized on a graded vesting basis except where the employee is eligible to retire prior to a tranche’s vesting date, in which case the cost is recognized between the grant date and the date the employee is eligible to retire.
The Stock Option Plan includes:
| • | Stock options |
Employee stock options granted are equity-classified stock options which call for settlement in shares.
The amount recorded in equity – other reserves for vested stock options as at October 31, 2023 was $115 million (2022 – $104 million).
In 2023, an expense of $14 million (2022 – $10 million) was recorded in salaries and employee benefits in the Consolidated Statement of Income. As at October 31, 2023, future unrecognized compensation cost for non-vested stock options was $9 million (2022 – $7 million) which is to be recognized over a weighted-average period of 2.06 years (2022 – 2.07 years).
| • | Stock appreciation rights |
Stand-alone SARs are granted instead of stock options to select employees in countries where local laws may restrict the Bank from issuing shares. When a SAR is exercised, the Bank pays the appreciation amount in cash equal to the rise in the market price of the Bank’s common shares since the grant date.
During fiscal 2023, 111,692 SARs were granted (2022 – 85,136) and as at October 31, 2023, 609,406 SARs were outstanding (2022 – 558,053), of which 604,748 SARs were vested (2022 – 552,272).
The impact to the Bank’s financial statements of vested and outstanding SARs was not material.
Determination of fair values
The share-based payment expense for stock options was quantified using the Black-Scholes option pricing model on the date of grant. The fiscal 2023 and 2022 stock option grants were fair valued using the following weighted-average assumptions and resulting fair value per award:
| 2023 Grant | 2022 Grant | |||||||
| Assumptions |
||||||||
| Risk-free interest rate % |
3.33% | 1.42% | ||||||
| Expected dividend yield |
5.79% | 4.11% | ||||||
| Expected price volatility |
20.58% | 17.67% | ||||||
| Expected life of option |
6.93 Years | 6.7 Years | ||||||
| Fair value |
||||||||
| Weighted-average fair value |
$ | 6.81 | $ | 7.54 | ||||
The risk-free rate is based on Canadian treasury bond rates interpolated for the maturity equal to the expected life until exercise of the options. Expected dividend yield is based on historical dividend payout. Expected price volatility is determined based on the historical volatility for compensation. For accounting purposes, an average of the market consensus implied volatility for traded options on our common shares and the historical volatility is used.
2023 Scotiabank Annual Report | 211
Consolidated Financial Statements
Details of the Bank’s Employee Stock Option Plan are as follows(1):
| 2023 | 2022 | |||||||||||||||
| As at October 31 | Number of stock options (000’s) |
Weighted average exercise price |
Number of stock options (000’s) |
Weighted average exercise price |
||||||||||||
| Outstanding at beginning of year |
9,907 | $ | 73.24 | 10,458 | $ | 69.08 | ||||||||||
| Granted |
2,478 | 68.58 | 1,716 | 85.46 | ||||||||||||
| Exercised as options |
(415 | ) | 59.07 | (1,951 | ) | 62.04 | ||||||||||
| Exercised as SARs |
(7 | ) | 55.63 | (133 | ) | 67.37 | ||||||||||
| Forfeited |
(272 | ) | 74.07 | (183 | ) | 74.30 | ||||||||||
| Expired |
(133 | ) | 72.92 | – | – | |||||||||||
| Outstanding at end of year |
11,558 | $ | 72.74 | 9,907 | $ | 73.24 | ||||||||||
| Exercisable at end of year |
5,088 | $ | 71.90 | 4,304 | $ | 70.24 | ||||||||||
| Available for grant |
12,480 | 14,546 | ||||||||||||||
| Options Outstanding | Options Exercisable | |||||||||||||||||||
| As at October 31, 2023 |
Number of stock options (000’s) |
Weighted average remaining contractual life (years) |
Weighted average exercise price |
Number of stock options (000’s) |
Weighted average exercise price |
|||||||||||||||
| Range of exercise prices |
||||||||||||||||||||
| $55.63 to $68.32 |
1,586 | 1.02 | $ | 64.35 | 1,580 | $ | 64.35 | |||||||||||||
| $68.33 to $74.34 |
7,542 | 6.66 | $ | 70.80 | 2,707 | $ | 73.37 | |||||||||||||
| $74.35 to $85.46 |
2,430 | 6.61 | $ | 84.26 | 801 | $ | 81.81 | |||||||||||||
| 11,558 | 5.88 | $ | 72.74 | 5,088 | $ | 71.90 | ||||||||||||||
| (1) | Excludes SARs. |
| (b) | Employee share ownership plans |
Eligible employees can contribute up to a specified percentage of salary towards the purchase of common shares of the Bank. In general, the Bank matches 50-60% of eligible contributions, depending on the region, up to a maximum dollar amount, which is expensed in salaries and employee benefits. During 2023, the Bank’s contributions totalled $87 million (2022 – $80 million). Contributions, which are used to purchase common shares in the open market, do not result in a subsequent expense to the Bank from share price appreciation.
As at October 31, 2023, an aggregate of 20 million common shares were held under the employee share ownership plans (2022 – 19 million). The shares in the employee share ownership plans are considered outstanding for computing the Bank’s basic and diluted earnings per share.
| (c) | Other share-based payment plans |
Other share-based payment plans use notional units that are valued based on the Bank’s common share price on the TSX. Most grants of units accumulate dividend equivalents in the form of additional units based on the dividends paid on the Bank’s common shares. These plans are settled in cash and, as a result, are liability-classified. Fluctuations in the Bank’s share price change the value of the units, which affects the Bank’s share-based payment expense. As described below, the value of the Performance Share Units also varies based on Bank performance. Upon exercise or redemption, payments are made to the employees with a corresponding reduction in the accrued liability.
In 2023, an aggregate expense of $320 million (2022 – $328 million) was recorded in salaries and employee benefits in the Consolidated Statement of Income for these plans. This expense includes losses from derivatives used to manage the volatility of share-based payments of $131 million (2022 – $120 million losses).
As at October 31, 2023, the share-based payment liability recognized for vested awards under these plans was $741 million (2022 – $763 million).
Details of these other share-based payment plans are as follows:
Deferred Stock Unit Plan (DSU)
Under the DSU Plan, senior executives may elect to receive all or a portion of their cash bonus under the Annual Incentive Plan (which is expensed for the year awarded in salaries and employee benefits in the Consolidated Statement of Income) in the form of deferred stock units which vest immediately. In addition the DSU plan allows for eligible executives of the Bank to participate in grants that are not allocated from the Annual Incentive Plan election. These grants are subject to specific vesting schedules. Units are redeemable in cash only when an executive ceases to be a Bank employee, and must be redeemed by December 31 of the year following that event. As at October 31, 2023, there were 2,243,413 units (2022 – 1,890,117) awarded and outstanding of which 1,579,420 units were vested (2022 – 1,388,033).
Directors’ Deferred Stock Unit Plan (DDSU)
Under the DDSU Plan, non-officer directors of the Bank may elect to receive all or a portion of their fee for that fiscal year (which is expensed by the Bank in other expenses in the Consolidated Statement of Income) in the form of deferred stock units which vest immediately. Units are redeemable in cash, only following resignation or retirement, and must be redeemed by December 31 of the year following that event. As at October 31, 2023, there were 336,929 units outstanding (2022 – 289,646).
Restricted Share Unit Plan (RSU)
Under the RSU Plan, select employees receive an award of restricted share units which, for the majority of grants, vest at the end of three years. There are certain grants that provide for a graduated vesting schedule. Upon vesting, all RSU units are paid in cash to the employee. The share-based payment expense is recognized evenly over the vesting period except where the employee is eligible to retire prior to the vesting date in which case, the expense is recognized between the grant date and the date the employee is eligible to retire. As at October 31, 2023, there were 6,717,498 units (2022 – 5,200,515) awarded and outstanding of which 4,804,239 were vested (2022 – 3,390,197).
212 | 2023 Scotiabank Annual Report
Consolidated Financial Statements
Performance Share Unit Plan (PSU)
Eligible executives receive an award of performance share units which, for the majority of grants, vest at the end of three years. Certain grants provide for a graduated vesting schedule which includes a specific performance factor calculation. PSU awards are subject to performance criteria measured over a three-year period whereby a multiplier factor is applied which impacts the incremental number of units due to employees. The three-year performance measures include return on equity compared to target and total shareholder return relative to a comparator group selected prior to the granting of the award. The Bank uses a probability-weighted-average of potential outcomes to estimate the multiplier impact. The share-based payment expense is recognized over the vesting period except where the employee is eligible to retire prior to the vesting date; in which case, the expense is recognized between the grant date and the date the employee is eligible to retire. This expense varies based on changes in the Bank’s share price and the Bank’s performance compared to the performance measures. Upon vesting, the units are paid in cash to the employee. As at October 31, 2023, there were 7,382,945 units (2022 – 7,525,441) outstanding subject to performance criteria, of which 6,059,966 units were vested (2022 – 5,944,343).
| 27 | Corporate Income Taxes |
Corporate income taxes recorded in the Bank’s consolidated financial statements for the years ended October 31 are as follows:
| (a) | Components of income tax provision |
| For the year ended October 31 ($ millions) | 2023 | 2022 | ||||||
| Provision for income taxes in the Consolidated Statement of Income: |
||||||||
| Current income taxes: |
||||||||
| Domestic: |
||||||||
| Federal |
$ | 736 | $ | 1,779 | ||||
| Provincial |
626 | 1,190 | ||||||
| Adjustments related to prior periods |
715 | (251 | ) | |||||
| Foreign |
1,053 | 897 | ||||||
| Adjustments related to prior periods |
(6 | ) | (86 | ) | ||||
| 3,124 | 3,529 | |||||||
| Deferred income taxes: |
||||||||
| Domestic: |
||||||||
| Federal |
(604 | ) | (543 | ) | ||||
| Provincial |
(274 | ) | (341 | ) | ||||
| Foreign |
(20 | ) | 113 | |||||
| (898 | ) | (771 | ) | |||||
| Total provision for income taxes in the Consolidated Statement of Income |
$ | 2,226 | $ | 2,758 | ||||
| Provision for income taxes in the Consolidated Statement of Changes in Equity: |
||||||||
| Current income taxes |
$ | (168 | ) | $ | (2,651 | ) | ||
| Deferred income taxes |
(325 | ) | 945 | |||||
| (493 | ) | (1,706 | ) | |||||
| Reported in: |
||||||||
| Other Comprehensive Income |
(418 | ) | (1,671 | ) | ||||
| Retained earnings |
(75 | ) | (35 | ) | ||||
| Other reserves |
– | – | ||||||
| Total provision for income taxes in the Consolidated Statement of Changes in Equity |
(493 | ) | (1,706 | ) | ||||
| Total provision for income taxes |
$ | 1,733 | $ | 1,052 | ||||
| Provision for income taxes in the Consolidated Statement of Income includes: |
||||||||
| Deferred tax expense (benefit) relating to origination/reversal of temporary differences |
$ | (828 | ) | $ | (771 | ) | ||
| Deferred tax expense (benefit) of tax rate changes |
(70 | ) | – | |||||
| $ | (898 | ) | $ | (771 | ) | |||
2023 Scotiabank Annual Report | 213
Consolidated Financial Statements
| (b) | Reconciliation to statutory rate |
Income taxes in the Consolidated Statement of Income vary from the amounts that would be computed by applying the composite federal and provincial statutory income tax rate for the following reasons:
| 2023 | 2022 | |||||||||||||||
| For the year ended October 31 ($ millions) | Amount | Percent of pre-tax income |
Amount | Percent of pre-tax income |
||||||||||||
| Income taxes at Canadian statutory rate |
$ | 2,705 | 27.7 | % | $ | 3,394 | 26.2 | % | ||||||||
| Increase (decrease) in income taxes resulting from: |
||||||||||||||||
| Lower average tax rate applicable to subsidiaries and foreign branches |
(710 | ) | (7.3 | ) | (375 | ) | (2.9 | ) | ||||||||
| Tax-exempt income from securities |
(341 | ) | (3.5 | ) | (284 | ) | (2.2 | ) | ||||||||
| Other, net(1) |
572 | 5.9 | 23 | 0.2 | ||||||||||||
| Total income taxes and effective tax rate(2) |
$ | 2,226 | 22.8 | % | $ | 2,758 | 21.3 | % | ||||||||
| (1) | Includes $579 tax expense for the CRD and $48 tax benefit from the non-taxable gain related to the divestiture of the equity interest in CTFS. |
| (2) | The federal statutory income tax rate increased by 1.5% due to the enactment of certain federal budget measures announced in 2022. |
| (c) | Deferred taxes |
Significant components of the Bank’s deferred tax assets and liabilities are as follows:
| Statement of Income | Statement of Financial Position | |||||||||||||||
| For the year ended | As at | |||||||||||||||
| October 31 ($ millions) | 2023 | 2022 | 2023 | 2022 | ||||||||||||
| Deferred tax assets: |
||||||||||||||||
| Loss carryforwards |
$ | (201 | ) | $ | (904 | ) | $ | 1,281 | $ | 1,079 | ||||||
| Allowance for credit losses |
(172 | ) | (17 | ) | 1,155 | 969 | ||||||||||
| Deferred compensation |
(77 | ) | 42 | 274 | 199 | |||||||||||
| Deferred income |
(95 | ) | 192 | 127 | 54 | |||||||||||
| Property and equipment |
(19 | ) | (60 | ) | 339 | 359 | ||||||||||
| Pension and other post-retirement benefits |
(48 | ) | 10 | 321 | 234 | |||||||||||
| Securities |
(15 | ) | (65 | ) | 386 | 433 | ||||||||||
| Lease liabilities |
(1 | ) | (31 | ) | 936 | 946 | ||||||||||
| Cash flow hedges |
– | – | – | – | ||||||||||||
| Other |
(177 | ) | (81 | ) | 573 | 380 | ||||||||||
| Total deferred tax assets |
$ | (805 | ) | $ | (914 | ) | $ | 5,392 | $ | 4,653 | ||||||
| Deferred tax liabilities: |
||||||||||||||||
| Cash flow hedges |
$ | – | $ | – | $ | 127 | $ | 159 | ||||||||
| Deferred compensation |
(19 | ) | (7 | ) | 180 | 148 | ||||||||||
| Deferred income |
(23 | ) | (7 | ) | 36 | 40 | ||||||||||
| Property and equipment |
174 | 135 | 569 | 810 | ||||||||||||
| Pension and other post-retirement benefits |
1 | (12 | ) | 120 | 106 | |||||||||||
| Securities |
(152 | ) | (54 | ) | 385 | 236 | ||||||||||
| Investment in subsidiaries and associates |
43 | (14 | ) | 67 | 126 | |||||||||||
| Intangible assets |
160 | 37 | 1,454 | 1,613 | ||||||||||||
| Other |
(91 | ) | (221 | ) | 370 | 612 | ||||||||||
| Total deferred tax liabilities |
$ | 93 | $ | (143 | ) | $ | 3,308 | $ | 3,850 | |||||||
| Net deferred tax assets (liabilities)(1) |
$ | (898 | ) | $ | (771 | ) | $ | 2,084 | $ | 803 | ||||||
| (1) | For Consolidated Statement of Financial Position presentation, deferred tax assets and liabilities are assessed by legal entity. As a result, the net deferred tax assets of $2,084 (2022 – $803) are represented by deferred tax assets of $3,530 (2022 – $1,903), and deferred tax liabilities of $1,446 (2022 – $1,100) on the Consolidated Statement of Financial Position. |
The major changes to net deferred taxes were as follows:
| For the year ended October 31 ($ millions) | 2023 | 2022 | ||||||
| Balance at beginning of year |
$ | 803 | $ | 902 | ||||
| Deferred tax benefit (expense) for the year recorded in income |
898 | 771 | ||||||
| Deferred tax benefit (expense) for the year recorded in equity |
325 | (945 | ) | |||||
| Disposed in divestitures |
– | – | ||||||
| Other |
58 | 75 | ||||||
| Balance at end of year |
$ | 2,084 | $ | 803 | ||||
214 | 2023 Scotiabank Annual Report
Consolidated Financial Statements
The tax related to temporary differences, unused tax losses and unused tax credits for which no deferred tax asset is recognized in the Consolidated Statement of Financial Position amounts to $10 million (October 31, 2022 – $30 million). The amount related to unrecognized losses is $10 million, which will expire as follows: $4 million between 2023 and 2033 and $6 million has no expiry.
Included in the net deferred tax asset are tax benefits of $2,563 million (2022 – $1,420 million) that relate to tax losses incurred in Canadian or foreign operations in either the current or the preceding year. In determining if it is appropriate to recognize these tax benefits, the Bank relied on projections of future taxable profits.
The amount of taxable temporary differences associated with investments in subsidiaries, associates and interests in joint ventures for which deferred tax liabilities have not been recognized at October 31, 2023 is approximately $50 billion (2022 – $41 billion).
Tax Assessments
The Bank received reassessments totaling $1,555 million of tax and interest as a result of the Canada Revenue Agency (CRA) denying the tax deductibility of certain Canadian dividends received during the 2011–2018 taxation years. The circumstances of the dividends subject to these reassessments are similar to those prospectively addressed by tax rules introduced in 2015 and 2018. The Bank has filed a Notice of Appeal with the Tax Court of Canada against the federal reassessment in respect of its 2011 taxation year. In addition, a subsidiary of the Bank received reassessments on the same matter in respect of its 2018 taxation year totaling $2 million of tax and interest.
A subsidiary of the Bank received withholding tax assessments from the CRA in respect of certain of its securities lending transactions for its 2014 – 2018 taxation years totaling $551 million of tax, penalties, and interest. The subsidiary has filed a Notice of Appeal with the Tax Court of Canada against the federal assessment in respect of its 2014-2018 taxation years.
In respect of both matters the Bank is confident that its tax filing position was appropriate and in accordance with the relevant provisions of the Income Tax Act (Canada) and intends to vigorously defend its position.
Canadian Federal Tax Measures
On December 15, 2022, certain Canadian federal tax measures impacting the Bank were enacted into law including the Canada Recovery Dividend (CRD), a one-time 15% tax on taxable income in excess of $1 billion, as well as an increase of 1.5% to the federal corporate income tax rate on taxable income above $100 million.
The impact of these enacted tax measures was recognized in the Bank’s financial results for the year ended October 31, 2023. The Bank recognized income tax expense of $579 million in the Consolidated Statement of Income for the present value of the total CRD payable of approximately $640 million. The difference will accrete as interest expense over the remaining four-year period. The increase in the Canadian statutory tax rate resulted in a benefit of $39 million related to the 2022 taxation year, recorded in Q1 2023. This included the revaluation of the Bank’s deferred tax assets and liabilities. Of this amount, $13 million was recognized in the Consolidated Statement of Income and the remainder in Other Comprehensive Income.
Global Minimum Tax
The OECD published Pillar Two model rules in December 2021 as part of its efforts toward international tax reform. The rules aim to have large multinational enterprises pay a minimum effective tax rate of 15% in each jurisdiction they operate. OECD member countries are in the process of developing domestic tax legislation to implement the rules.
On May 23, 2023, the IASB issued amendments to IAS 12 Income Taxes introducing a temporary mandatory exception from the recognition and disclosure of deferred taxes related to the implementation of Pillar Two global minimum tax rules. Additional disclosures will be required in future periods for current taxes related to effective rules and impacts from enacted legislation not yet in effect. The Bank has applied the deferred tax exception and will continue monitoring the progress of relevant legislation globally to determine the impact upon substantive enactment.
| 28 | Employee Benefits |
The Bank sponsors a number of employee benefit plans, including pensions (defined benefit and defined contribution) and other benefit plans (post-retirement benefits and other long-term employee benefits) for most of its employees globally. The information presented below relates to the Bank’s principal plans; other plans operated by certain subsidiaries of the Bank are not considered material and are not included in these disclosures.
Global pension plans
The principal pension plans include plans in Canada, U.S., Mexico, UK, Ireland, Jamaica, Trinidad & Tobago and other countries in the Caribbean in which the Bank operates. The Bank has a strong and well-defined governance structure to manage these global obligations. The investment policy for each principal plan is reviewed periodically and all plans are in good standing with respect to legislation and local regulations.
Actuarial valuations for funding purposes for the Bank’s funded pension plans are conducted as required by applicable legislation. The purpose of the actuarial valuation is to determine the funded status of the plans on a going-concern and statutory basis and to determine the required contributions. The plans are funded in accordance with applicable pension legislation and the Bank’s funding policies such that future benefit promises based on plan provisions are well secured. The assumptions used for the funding valuations are set by independent plan actuaries on the basis of the requirements of the local actuarial standards of practice and statutes.
Scotiabank Pension Plan (Canada)
The most significant pension plan is the Scotiabank Pension Plan (SPP) in Canada, which includes a closed defined benefit (DB) component. Employees hired in Canada on or after May 1, 2018, participate in a defined contribution (DC) component only. As the administrator of the SPP, the Bank has established a well-defined governance structure and policies to maintain compliance with legislative and regulatory requirements under OSFI and the Canada Revenue Agency. The Bank appoints a number of committees to oversee and make decisions related to the administration of the SPP. Certain committees are also responsible for the investment of the assets of the SPP Fund and for monitoring the investment managers and performance.
| • | The Human Capital and Compensation Committee (HCOB) of the Board approves the charter of the Pension Administration and Investment Committee (PAIC), reviews reports, and approves the investment policy. The HCOB also reviews and recommends any amendments to the SPP to the Board of Directors. |
| • | PAIC is responsible for recommending the investment policy to the HCOB, for appointing and monitoring investment managers, and for reviewing auditor and actuary reports. PAIC also monitors the administration of member pension benefits. |
2023 Scotiabank Annual Report | 215
Consolidated Financial Statements
| • | The Scotiabank Master Trust Committee (MTC) invests assets in accordance with the investment policy and all applicable legislation. The MTC assigns specific mandates to investment managers. |
| • | The Capital Accumulation Plans (CAP) Committee is responsible for the administration and investment of the DC component of the SPP including the selection and monitoring of investment options available to DC participants. |
Actuarial valuations for funding purposes for the SPP are conducted on an annual basis. The most recent funding valuation was conducted as of November 1, 2022. Contributions are being made to the SPP in accordance with this valuation and are shown in the table in b) below. The assumptions used for the funding valuation are set by independent plan actuaries on the basis of the requirements of the Canadian Institute of Actuaries and applicable regulation.
Other benefit plans
The principal other benefit plans include plans in Canada, U.S., Mexico, Uruguay, UK, Jamaica, Trinidad & Tobago, Colombia and other countries in the Caribbean in which the Bank operates. The most significant other benefit plans provided by the Bank are in Canada.
Key assumptions
The financial information reported below in respect of pension and other benefit plans is based on a number of assumptions. The most significant assumption is the discount rate used to determine the defined benefit obligation, which is set by reference to the yields on high quality corporate bonds that have durations that match the terms of the Bank’s obligations. Separate discount rates are used to determine the annual benefit expense in Canada and the U.S. These rates are determined with reference to the yields on high quality corporate bonds with durations that match the various components of the annual benefit expense. The discount rate used to determine the annual benefit expense for all other plans continues to be the same as the rate used to determine the defined benefit obligation. Other assumptions set by management are determined in reference to market conditions, plan-level experience, best practices and future expectations. The key weighted-average assumptions used by the Bank for the measurement of the benefit obligation and benefit expense for all of the Bank’s principal plans are summarized in the table in f) below.
Risk management
The Bank’s defined benefit pension plans and other benefit plans expose the Bank to a number of risks. Some of the more significant risks include interest rate risk, investment risk, longevity risk and health care cost increases, among others. These risks could result in higher defined benefit expense and a higher defined benefit obligation to the extent that:
| • | there is a decline in discount rates; and/or |
| • | plan assets returns are less than expected; and/or |
| • | plan members live longer than expected; and/or |
| • | health care costs are higher than assumed. |
In addition to the governance structure and policies in place, the Bank manages risks by regularly monitoring market developments and asset investment performance. The Bank also monitors regulatory and legislative changes along with demographic trends and revisits the investment strategy and/or plan design as warranted.
| a) | Relative size of plan obligations and assets |
| Pension plans | Other benefit plans | |||||||||||||||||||
| Canada | ||||||||||||||||||||
| For the year ended October 31, 2023 | SPP | Other | International | Canada | International | |||||||||||||||
| Percentage of total benefit obligations |
71 | % | 15 | % | 14 | % | 48 | % | 52 | % | ||||||||||
| Percentage of total plan assets |
73 | % | 11 | % | 16 | % | 0 | % | 100 | % | ||||||||||
| Percentage of total benefit expense(1) |
71 | % | 26 | % | 3 | % | 42 | % | 58 | % | ||||||||||
| Pension plans | Other benefit plans | |||||||||||||||||||
| Canada | ||||||||||||||||||||
| For the year ended October 31, 2022 | SPP | Other | International | Canada | International | |||||||||||||||
| Percentage of total benefit obligations |
72 | % | 15 | % | 13 | % | 52 | % | 48 | % | ||||||||||
| Percentage of total plan assets |
74 | % | 11 | % | 15 | % | 0 | % | 100 | % | ||||||||||
| Percentage of total benefit expense(1) |
74 | % | 25 | % | 1 | % | 31 | % | 69 | % | ||||||||||
| (1) | Excludes non-routine benefit expense items such as past service costs, curtailment charges and settlement charges. |
| b) | Cash contributions and payments |
The table below shows the cash contributions and payments made by the Bank to its principal plans in 2023, and the prior year.
| Contributions to the principal plans for the year ended October 31 ($ millions) | 2023 | 2022 | ||||||
| Defined benefit pension plans (cash contributions to fund the plans, including paying beneficiaries under the unfunded pension arrangements) |
||||||||
| SPP (excluding DC provision) |
$ | 15 | $ | 184 | ||||
| All other plans |
103 | 80 | ||||||
| Other benefit plans (cash contributions mainly in the form of benefit payments to beneficiaries) |
64 | 59 | ||||||
| Defined contribution pension and other benefit plans (cash contributions) |
159 | 126 | ||||||
| DC pension contributions funded from pension plan surplus |
(59 | ) | – | |||||
| Total contributions(1) |
$ | 282 | $ | 449 | ||||
| (1) | Based on preliminary estimates, the Bank expects to make contributions of $78 to the SPP (excluding the DC provision), $63 to all other defined benefit pension plans, $66 to other benefit plans and $185 to all defined contribution plans (less $63 which is expected to be funded from pension plan surplus) for the year ending October 31, 2024. |
216 | 2023 Scotiabank Annual Report
Consolidated Financial Statements
| c) | Funded and unfunded plans |
The excess (deficit) of the fair value of assets over the benefit obligation at the end of the year includes the following amounts for plans that are wholly unfunded and plans that are wholly or partly funded.
| Pension plans | Other benefit plans | |||||||||||||||
| As at October 31 ($ millions) | 2023 | 2022 | 2023 | 2022 | ||||||||||||
| Benefit obligation |
||||||||||||||||
| Benefit obligation of plans that are wholly unfunded |
$ | 339 | $ | 353 | $ | 873 | $ | 902 | ||||||||
| Benefit obligation of plans that are wholly or partly funded |
7,330 | 7,277 | 241 | 221 | ||||||||||||
| Funded status |
||||||||||||||||
| Benefit obligation of plans that are wholly or partly funded |
$ | 7,330 | $ | 7,277 | $ | 241 | $ | 221 | ||||||||
| Fair value of assets |
8,139 | 8,309 | 113 | 116 | ||||||||||||
| Excess (deficit) of fair value of assets over benefit obligation of wholly or partly funded plans |
$ | 809 | $ | 1,032 | $ | (128 | ) | $ | (105 | ) | ||||||
| Benefit obligation of plans that are wholly unfunded |
339 | 353 | 873 | 902 | ||||||||||||
| Excess (deficit) of fair value of assets over total benefit obligation |
$ | 470 | $ | 679 | $ | (1,001 | ) | $ | (1,007 | ) | ||||||
| Effect of asset limitation and minimum funding requirement |
(55 | ) | (176 | ) | – | – | ||||||||||
| Net asset (liability) at end of year |
$ | 415 | $ | 503 | $ | (1,001 | ) | $ | (1,007 | ) | ||||||
2023 Scotiabank Annual Report | 217
Consolidated Financial Statements
| d) | Financial information |
The following tables present financial information related to the Bank’s principal plans.
| Pension plans | Other benefit plans | |||||||||||||||
| For the year ended October 31 ($ millions) | 2023 | 2022 | 2023 | 2022 | ||||||||||||
| Change in benefit obligation |
||||||||||||||||
| Benefit obligation at beginning of year |
$ | 7,630 | $ | 9,584 | $ | 1,123 | $ | 1,302 | ||||||||
| Current service cost |
218 | 281 | 20 | 22 | ||||||||||||
| Interest cost on benefit obligation |
428 | 335 | 77 | 61 | ||||||||||||
| Employee contributions |
26 | 25 | – | – | ||||||||||||
| Benefits paid |
(406 | ) | (457 | ) | (94 | ) | (89 | ) | ||||||||
| Actuarial loss (gain) |
(278 | ) | (2,234 | ) | (42 | ) | (226 | ) | ||||||||
| Past service cost |
(1 | ) | 34 | (2 | ) | (1 | ) | |||||||||
| Business acquisition |
– | – | (1 | ) | – | |||||||||||
| Settlements |
– | – | – | (2 | ) | |||||||||||
| Foreign exchange |
52 | 62 | 33 | 56 | ||||||||||||
| Benefit obligation at end of year |
$ | 7,669 | $ | 7,630 | $ | 1,114 | $ | 1,123 | ||||||||
| Change in fair value of assets |
||||||||||||||||
| Fair value of assets at beginning of year |
8,309 | 9,464 | 116 | 143 | ||||||||||||
| Interest income on fair value of assets |
480 | 363 | 12 | 13 | ||||||||||||
| Return on plan assets in excess of (less than) interest income on fair value of assets |
(351 | ) | (1,402 | ) | 2 | (24 | ) | |||||||||
| Employer contributions |
59 | 264 | 64 | 59 | ||||||||||||
| Employee contributions |
26 | 25 | – | – | ||||||||||||
| Benefits paid |
(406 | ) | (457 | ) | (94 | ) | (89 | ) | ||||||||
| Administrative expenses |
(12 | ) | (12 | ) | – | – | ||||||||||
| Business acquisition |
– | – | – | – | ||||||||||||
| Settlements |
– | – | – | (2 | ) | |||||||||||
| Foreign exchange |
34 | 64 | 13 | 16 | ||||||||||||
| Fair value of assets at end of year |
$ | 8,139 | $ | 8,309 | $ | 113 | $ | 116 | ||||||||
| Funded status |
||||||||||||||||
| Excess (deficit) of fair value of assets over benefit obligation at end of year |
470 | 679 | (1,001 | ) | (1,007 | ) | ||||||||||
| Effect of asset limitation and minimum funding requirement(1) |
(55 | ) | (176 | ) | – | – | ||||||||||
| Net asset (liability) at end of year |
$ | 415 | $ | 503 | $ | (1,001 | ) | $ | (1,007 | ) | ||||||
| Recorded in: |
||||||||||||||||
| Other assets in the Bank’s Consolidated Statement of Financial Position |
936 | 1,052 | 2 | 1 | ||||||||||||
| Other liabilities in the Bank’s Consolidated Statement of Financial Position |
(521 | ) | (549 | ) | (1,003 | ) | (1,008 | ) | ||||||||
| Net asset (liability) at end of year |
$ | 415 | $ | 503 | $ | (1,001 | ) | $ | (1,007 | ) | ||||||
| Annual benefit expense |
||||||||||||||||
| Current service cost |
218 | 281 | 20 | 22 | ||||||||||||
| Net interest expense (income) |
(33 | ) | (20 | ) | 65 | 48 | ||||||||||
| Administrative expenses |
13 | 15 | – | – | ||||||||||||
| Past service costs |
(1 | ) | 34 | (2 | ) | (1 | ) | |||||||||
| Amount of settlement (gain) loss recognized |
– | – | – | – | ||||||||||||
| Remeasurement of other long-term benefits |
– | – | (2 | ) | (9 | ) | ||||||||||
| Benefit expense (income) recorded in the Consolidated Statement of Income |
$ | 197 | $ | 310 | $ | 81 | $ | 60 | ||||||||
| Defined contribution benefit expense |
$ | 158 | $ | 125 | $ | 1 | $ | 1 | ||||||||
| Remeasurements |
||||||||||||||||
| (Return) on plan assets in excess of interest income on fair value of assets |
351 | 1,402 | (2 | ) | 24 | |||||||||||
| Actuarial loss (gain) on benefit obligation |
(278 | ) | (2,234 | ) | (40 | ) | (217 | ) | ||||||||
| Change in the asset limitation |
(139 | ) | 70 | – | – | |||||||||||
| Remeasurements recorded in OCI |
$ | (66 | ) | $ | (762 | ) | $ | (42 | ) | $ | (193 | ) | ||||
| Total benefit cost |
$ | 289 | $ | (327 | ) | $ | 40 | $ | (132 | ) | ||||||
| Additional details on actual return on assets and actuarial (gains) and losses |
||||||||||||||||
| Actual return on assets (net of administrative expenses) |
$ | 117 | $ | (1,051 | ) | $ | 14 | $ | (11 | ) | ||||||
| Actuarial (gains) and losses from changes in demographic assumptions |
40 | – | (7 | ) | 3 | |||||||||||
| Actuarial (gains) and losses from changes in financial assumptions |
(406 | ) | (2,256 | ) | (28 | ) | (219 | ) | ||||||||
| Actuarial (gains) and losses from changes in experience |
88 | 22 | (7 | ) | (10 | ) | ||||||||||
| Additional details on fair value of pension plan assets invested |
||||||||||||||||
| In Scotiabank securities (stock, bonds) |
57 | 58 | – | – | ||||||||||||
| In property occupied by Scotiabank |
4 | 4 | – | – | ||||||||||||
| Change in asset ceiling/onerous liability |
||||||||||||||||
| Asset ceiling /onerous liability at end of prior year |
176 | 85 | – | – | ||||||||||||
| Interest expense |
19 | 8 | – | – | ||||||||||||
| Remeasurements |
(139 | ) | 70 | – | – | |||||||||||
| Foreign exchange |
(1 | ) | 13 | – | – | |||||||||||
| Asset ceiling /onerous liability at end of year |
$ | 55 | $ | 176 | $ | – | $ | – | ||||||||
| (1) | The recognized asset is limited by the present value of economic benefits available from a reduction in future contributions to a plan and from the ability to pay plan expenses from the fund. |
218 | 2023 Scotiabank Annual Report
Consolidated Financial Statements
| e) | Maturity profile of the defined benefit obligation |
The weighted average duration of the total benefit obligation at October 31, 2023 is 12.9 years (2022 – 12.9 years).
| Pension plans | Other benefit plans | |||||||||||||||
| For the year ended October 31 | 2023 | 2022 | 2023 | 2022 | ||||||||||||
| Disaggregation of the benefit obligation (%) |
||||||||||||||||
| Canada |
||||||||||||||||
| Active members |
48 | % | 49 | % | 3 | % | 3 | % | ||||||||
| Inactive and retired members |
52 | % | 51 | % | 97 | % | 97 | % | ||||||||
| Total |
100 | % | 100 | % | 100 | % | 100 | % | ||||||||
| Mexico |
||||||||||||||||
| Active members |
27 | % | 26 | % | 35 | % | 40 | % | ||||||||
| Inactive and retired members |
73 | % | 74 | % | 65 | % | 60 | % | ||||||||
| Total |
100 | % | 100 | % | 100 | % | 100 | % | ||||||||
| United States |
||||||||||||||||
| Active members |
39 | % | 42 | % | 41 | % | 36 | % | ||||||||
| Inactive and retired members |
61 | % | 58 | % | 59 | % | 64 | % | ||||||||
| Total |
100 | % | 100 | % | 100 | % | 100 | % | ||||||||
| f) | Key assumptions (%) |
The key weighted-average assumptions used by the Bank for the measurement of the benefit obligation and benefit expense for all of the Bank’s principal plans are summarized as follows:
| Pension plans | Other benefit plans | |||||||||||||||
| For the year ended October 31 | 2023 | 2022 | 2023 | 2022 | ||||||||||||
| Benefit obligation at end of year |
||||||||||||||||
| Discount rate – all plans |
6.13 | % | 5.77 | % | 7.36 | % | 7.01 | % | ||||||||
| Discount rate – Canadian plans only |
5.70 | % | 5.41 | % | 5.80 | % | 5.40 | % | ||||||||
| Rate of increase in future compensation(1)(2) |
3.96 | % | 3.90 | % | 4.61 | % | 4.67 | % | ||||||||
| Benefit expense (income) for the year |
||||||||||||||||
| Discount rate – All plans |
||||||||||||||||
| Discount rate for defined benefit obligations |
5.77 | % | 4.24 | % | 7.01 | % | 4.94 | % | ||||||||
| Discount rate for net interest cost |
5.76 | % | 3.81 | % | 6.96 | % | 4.65 | % | ||||||||
| Discount rate for service cost |
5.80 | % | 4.43 | % | 7.09 | % | 5.17 | % | ||||||||
| Discount rate for interest on service cost |
5.71 | % | 3.98 | % | 7.09 | % | 5.07 | % | ||||||||
| Discount rate – Canadian plans only |
||||||||||||||||
| Discount rate for defined benefit obligations |
5.41 | % | 4.08 | % | 5.40 | % | 3.28 | % | ||||||||
| Discount rate for net interest cost |
5.40 | % | 3.59 | % | 5.31 | % | 2.82 | % | ||||||||
| Discount rate for service cost |
5.41 | % | 4.18 | % | 5.49 | % | 3.64 | % | ||||||||
| Discount rate for interest on service cost |
5.30 | % | 3.70 | % | 5.49 | % | 3.46 | % | ||||||||
| Rate of increase in future compensation(1)(2) |
3.90 | % | 2.79 | % | 4.67 | % | 4.30 | % | ||||||||
| Health care cost trend rates at end of year |
||||||||||||||||
| Initial rate |
n/a | n/a | 5.68 | % | 5.67 | % | ||||||||||
| Ultimate rate |
n/a | n/a | 4.93 | % | 4.86 | % | ||||||||||
| Year ultimate rate reached |
n/a | n/a | 2040 | 2040 | ||||||||||||
| Assumed life expectancy in Canada (years) |
||||||||||||||||
| Life expectancy at 65 for current pensioners – male |
23.6 | 23.5 | 23.6 | 23.5 | ||||||||||||
| Life expectancy at 65 for current pensioners – female |
24.7 | 24.6 | 24.7 | 24.6 | ||||||||||||
| Life expectancy at 65, for future pensioners currently aged 45 – male |
24.5 | 24.5 | 24.5 | 24.5 | ||||||||||||
| Life expectancy at 65, for future pensioners currently aged 45 – female |
25.6 | 25.5 | 25.6 | 25.5 | ||||||||||||
| Assumed life expectancy in Mexico (years) |
||||||||||||||||
| Life expectancy at 65 for current pensioners – male |
21.6 | 21.6 | 21.6 | 21.6 | ||||||||||||
| Life expectancy at 65 for current pensioners – female |
23.9 | 23.9 | 23.9 | 23.9 | ||||||||||||
| Life expectancy at 65, for future pensioners currently aged 45 – male |
21.6 | 21.6 | 21.6 | 21.6 | ||||||||||||
| Life expectancy at 65, for future pensioners currently aged 45 – female |
24.0 | 24.0 | 24.0 | 24.0 | ||||||||||||
| Assumed life expectancy in United States (years) |
||||||||||||||||
| Life expectancy at 65 for current pensioners – male |
22.0 | 21.9 | 22.0 | 21.9 | ||||||||||||
| Life expectancy at 65 for current pensioners – female |
23.4 | 23.3 | 23.4 | 23.3 | ||||||||||||
| Life expectancy at 65, for future pensioners currently aged 45 – male |
23.3 | 23.3 | 23.3 | 23.3 | ||||||||||||
| Life expectancy at 65, for future pensioners currently aged 45 – female |
24.8 | 24.7 | 24.8 | 24.7 | ||||||||||||
| (1) | The weighted-average rates of increase in future compensation shown for other benefit plans do not include Canadian flexible post-retirement benefits plans established in fiscal 2005, as they are not impacted by future compensation increases. |
| (2) | The weighted average rates of increase in future compensation shown only consider long-term rates. In some regions, higher rates of increase are assumed in the short term but are not included in the weighted average rates disclosed. |
2023 Scotiabank Annual Report | 219
Consolidated Financial Statements
| g) | Sensitivity analysis |
The sensitivity analysis represents the impact of a change in a single assumption with other assumptions left unchanged. For purposes of the sensitivity analysis, the present value of the defined benefit obligation has been calculated using the projected unit credit method at the end of the reporting period, which is the same as that applied in calculating the defined benefit obligation recognized in the statement of financial position.
| Pension plans | Other benefit plans | |||||||||||||||
| For the year ended October 31, 2023 ($ millions) | Benefit obligation |
Benefit expense |
Benefit obligation |
Benefit expense |
||||||||||||
| Impact of the following changes: |
||||||||||||||||
| 1% decrease in discount rate |
$ | 1,111 | $ | 83 | $ | 130 | $ | 5 | ||||||||
| 0.25% increase in rate of increase in future compensation |
60 | 3 | – | – | ||||||||||||
| 1% increase in health care cost trend rate |
n/a | n/a | 97 | 12 | ||||||||||||
| 1% decrease in health care cost trend rate |
n/a | n/a | (79 | ) | (10 | ) | ||||||||||
| 1 year increase in Canadian life expectancy |
123 | 9 | 12 | 1 | ||||||||||||
| 1 year increase in Mexican life expectancy |
2 | – | 3 | – | ||||||||||||
| 1 year increase in the United States life expectancy |
2 | – | 2 | – | ||||||||||||
| h) | Assets |
The Bank’s principal pension plans’ assets are generally invested with the long-term objective of maximizing overall expected returns, at an acceptable level of risk relative to the benefit obligation. A key factor in managing long-term investment risk is asset mix. Investing the pension assets across different asset classes and geographic regions helps to mitigate risk and to minimize the impact of declines in any single asset class, particular region or type of investment. Investment managers – including related-party managers – are typically hired and assigned specific mandates within each asset class.
Pension plan asset mix guidelines are set for the long term and are documented in each plan’s investment policy. Asset mix policy typically also reflects the nature of the plan’s benefit obligations. Legislation places certain restrictions on asset mix – for example, there are usually limits on concentration in any one investment. Other concentration and quality limits are also set forth in the investment policies. Derivatives constitute a relatively small component of the investment strategy and cannot be used without specific authorization; currently, the main uses of derivatives are for duration management and currency hedging. Asset mix guidelines are reviewed at least once each year, and adjusted, where appropriate, based on market conditions and opportunities. However, large asset class shifts are not common, and typically reflect a change in the pension plan’s situation (e.g. plan amendments) and/or in the investment strategy. Actual asset mix is reviewed regularly and rebalancing back to target asset mix is considered – as needed – generally on a semi-annual basis. The Bank’s other benefit plans are generally not funded, with the exception of certain programs in Mexico.
The tables below show the weighted-average actual and target asset allocations for the Bank’s principal plans at October 31, by asset category.
| Pension plans | Other benefit plans | |||||||||||||||
| Asset category % | Actual 2023 |
Actual 2022 |
Actual 2023 |
Actual 2022 |
||||||||||||
| Cash and cash equivalents |
3 | % | 4 | % | 1 | % | – | % | ||||||||
| Equity investments |
||||||||||||||||
| Quoted in an active market |
39 | % | 38 | % | 34 | % | 37 | % | ||||||||
| Non quoted |
5 | % | 5 | % | – | % | – | % | ||||||||
| 44 | % | 43 | % | 34 | % | 37 | % | |||||||||
| Fixed income investments |
||||||||||||||||
| Quoted in an active market |
5 | % | 4 | % | 61 | % | 58 | % | ||||||||
| Non quoted |
35 | % | 36 | % | – | % | – | % | ||||||||
| 40 | % | 40 | % | 61 | % | 58 | % | |||||||||
| Property |
||||||||||||||||
| Quoted in an active market |
– | % | – | % | 4 | % | 5 | % | ||||||||
| Non quoted |
1 | % | 1 | % | – | % | – | % | ||||||||
| 1 | % | 1 | % | 4 | % | 5 | % | |||||||||
| Other |
||||||||||||||||
| Quoted in an active market |
– | % | – | % | – | % | – | % | ||||||||
| Non quoted |
12 | % | 12 | % | – | % | – | % | ||||||||
| 12 | % | 12 | % | – | % | – | % | |||||||||
| Total |
100 | % | 100 | % | 100 | % | 100 | % | ||||||||
| Target asset allocation at October 31, 2023 Asset category % |
Pension plans | Other benefit plans | ||||||
| Cash and cash equivalents |
– | % | – | % | ||||
| Equity investments |
42 | % | 38 | % | ||||
| Fixed income investments |
44 | % | 57 | % | ||||
| Property |
1 | % | 5 | % | ||||
| Other |
13 | % | – | % | ||||
| Total |
100 | % | 100 | % | ||||
220 | 2023 Scotiabank Annual Report
Consolidated Financial Statements
| 29 | Operating Segments |
Scotiabank is a diversified financial services institution that provides a wide range of financial products and services to retail, commercial and corporate customers around the world. The Bank’s businesses are grouped into four business lines: Canadian Banking, International Banking, Global Banking and Markets and Global Wealth Management. Other smaller business segments are included in the Other segment. The results of these business segments are based upon the internal financial reporting systems of the Bank. The accounting policies used in these segments are generally consistent with those followed in the preparation of the consolidated financial statements as disclosed in Note 3. Notable accounting measurement differences are:
| • | tax normalization adjustments related to the gross-up of income from associated corporations. This adjustment normalizes the effective tax rate in the divisions to better present the contribution of the associated companies to the divisional results. |
| • | the grossing up of tax-exempt net interest income and non-interest income to an equivalent before-tax basis for those affected segments. |
These differences in measurement enable comparison of net interest income and non-interest income arising from taxable and tax-exempt sources.
Scotiabank’s results, and average assets and liabilities, allocated by these operating segments, are as follows:
| For the year ended October 31, 2023 | ||||||||||||||||||||||||
| Taxable equivalent basis ($ millions) | Canadian Banking(1) |
International Banking(1) |
Global Wealth Management(1) |
Global Banking and Markets(1) |
Other(1)(2) | Total | ||||||||||||||||||
| Net interest income(3) |
$ | 9,756 | $ | 8,161 | $ | 842 | $ | 1,572 | $ | (2,044 | ) | $ | 18,287 | |||||||||||
| Non-interest income(4)(5) |
3,087 | 2,937 | 4,449 | 3,980 | (433 | ) | 14,020 | |||||||||||||||||
| Total revenues |
12,843 | 11,098 | 5,291 | 5,552 | (2,477 | ) | 32,307 | |||||||||||||||||
| Provision for credit losses |
1,443 | 1,868 | 10 | 101 | – | 3,422 | ||||||||||||||||||
| Depreciation and amortization(6) |
583 | 563 | 179 | 221 | 274 | 1,820 | ||||||||||||||||||
| Other non-interest expenses |
5,284 | 5,365 | 3,171 | 2,841 | 650 | 17,311 | ||||||||||||||||||
| Income tax expense |
1,514 | 704 | 491 | 621 | (1,104 | ) | 2,226 | |||||||||||||||||
| Net income |
$ | 4,019 | $ | 2,598 | $ | 1,440 | $ | 1,768 | $ | (2,297 | ) | $ | 7,528 | |||||||||||
| Net income attributable to non-controlling interests in subsidiaries |
– | 112 | 9 | – | (3 | ) | 118 | |||||||||||||||||
| Net income attributable to equity holders of the Bank |
$ | 4,019 | $ | 2,486 | $ | 1,431 | $ | 1,768 | $ | (2,294 | ) | $ | 7,410 | |||||||||||
| Average assets ($ billions) |
450 | 237 | 34 | 490 | 185 | 1,396 | ||||||||||||||||||
| Average liabilities ($ billions) |
372 | 179 | 40 | 455 | 273 | 1,319 | ||||||||||||||||||
| (1) | Business line revenues and provision for income taxes are reported on a tax equivalent basis. |
| (2) | Includes all other smaller operating segments and corporate adjustments, such as the elimination of the tax-exempt income gross-up reported in net interest income and non-interest income and provision for income taxes for the year ended October 31, 2023 amounting to $473 to arrive at the amounts reported in the Consolidated Statement of Income, differences in the actual amount of costs incurred and charged to the operating segments. |
| (3) | Interest income is reported net of interest expense as management relies primarily on net interest income as a performance measure. |
| (4) | Card revenues and Banking services fees are mainly earned in Canadian and International Banking. Mutual fund, Brokerage fees and Investment management and trust fees are primarily earned in Global Wealth Management. Underwriting and other advisory fees are predominantly earned in Global Banking and Markets. |
| (5) | Includes net income (on a taxable equivalent basis) from investments in associated corporations for Canadian Banking – $71; International Banking – $251; Global Wealth Management – $18; Global Banking and Markets - $1; and Other – $(188). |
| (6) | Includes impairment charge of software and other intangible assets in the Other segment. |
| For the year ended October 31, 2022 | ||||||||||||||||||||||||
| Taxable equivalent basis ($ millions) | Canadian Banking(1) |
International Banking(1) |
Global Wealth Management(1) |
Global Banking and Markets(1) |
Other(1)(2) | Total | ||||||||||||||||||
| Net interest income(3) |
$ | 9,001 | $ | 6,900 | $ | 764 | $ | 1,630 | $ | (180 | ) | $ | 18,115 | |||||||||||
| Non-interest income(4)(5) |
3,029 | 2,827 | 4,617 | 3,542 | (714 | ) | 13,301 | |||||||||||||||||
| Total revenues |
12,030 | 9,727 | 5,381 | 5,172 | (894 | ) | 31,416 | |||||||||||||||||
| Provision for credit losses |
209 | 1,230 | 6 | (66 | ) | 3 | 1,382 | |||||||||||||||||
| Depreciation and amortization(6) |
601 | 499 | 171 | 162 | 98 | 1,531 | ||||||||||||||||||
| Other non-interest expenses(6) |
4,787 | 4,713 | 3,088 | 2,512 | 471 | 15,571 | ||||||||||||||||||
| Income tax expense |
1,670 | 618 | 551 | 653 | (734 | ) | 2,758 | |||||||||||||||||
| Net income |
$ | 4,763 | $ | 2,667 | $ | 1,565 | $ | 1,911 | $ | (732 | ) | $ | 10,174 | |||||||||||
| Net income attributable to non-controlling interests in subsidiaries |
– | 249 | 9 | – | – | 258 | ||||||||||||||||||
| Net income attributable to equity holders of the Bank |
$ | 4,763 | $ | 2,418 | $ | 1,556 | $ | 1,911 | $ | (732 | ) | $ | 9,916 | |||||||||||
| Average assets ($ billions) |
430 | 207 | 33 | 445 | 167 | 1,282 | ||||||||||||||||||
| Average liabilities ($ billions) |
332 | 152 | 47 | 414 | 263 | 1,208 | ||||||||||||||||||
| (1) | Business line revenues and provision for income taxes are reported on a tax equivalent basis. |
| (2) | Includes all other smaller operating segments and corporate adjustments, such as the elimination of the tax-exempt income gross-up reported in net interest income and non-interest income and provision for income taxes for the year ended October 31, 2022 amounting to $375 to arrive at the amounts reported in the Consolidated Statement of Income, differences in the actual amount of costs incurred and charged to the operating segments. |
| (3) | Interest income is reported net of interest expense as management relies primarily on net interest income as a performance measure. |
| (4) | Card revenues and Banking services fees are mainly earned in Canadian and International Banking. Mutual fund, Brokerage fees and Investment management and trust fees are primarily earned in Global Wealth Management. Underwriting and other advisory fees are predominantly earned in Global Banking and Markets. |
| (5) | Includes net income (on a taxable equivalent basis) from investments in associated corporations for Canadian Banking – $64; International Banking – $250; Global Wealth Management – $14 and Other – $(60). |
| (6) | Prior period amounts have been restated to conform with current period presentation. |
2023 Scotiabank Annual Report | 221
Consolidated Financial Statements
Geographical segmentation
The following table summarizes the Bank’s financial results by geographic region. Revenues and expenses which have not been allocated back to specific operating business lines are reflected in corporate adjustments.
| For the year ended October 31, 2023 ($ millions)(1) |
Canada | United States |
Mexico | Peru | Chile | Colombia | Caribbean and Central America |
Other International |
Total | |||||||||||||||||||||||||||
| Net interest income |
$ | 8,533 | $ | 1,019 | $ | 2,168 | $ | 1,320 | $ | 1,830 | $ | 564 | $ | 1,761 | $ | 1,092 | $ | 18,287 | ||||||||||||||||||
| Non-interest income(1) |
8,598 | 1,351 | 873 | 454 | 593 | 418 | 798 | 935 | 14,020 | |||||||||||||||||||||||||||
| Total revenues(2) |
17,131 | 2,370 | 3,041 | 1,774 | 2,423 | 982 | 2,559 | 2,027 | 32,307 | |||||||||||||||||||||||||||
| Provision for credit losses |
1,492 | 59 | 270 | 404 | 604 | 392 | 123 | 78 | 3,422 | |||||||||||||||||||||||||||
| Non-interest expenses |
10,982 | 1,246 | 1,488 | 727 | 1,014 | 661 | 1,437 | 1,576 | 19,131 | |||||||||||||||||||||||||||
| Income tax expense |
1,041 | 276 | 312 | 162 | 135 | (21 | ) | 197 | 124 | 2,226 | ||||||||||||||||||||||||||
| Subtotal |
3,616 | 789 | 971 | 481 | 670 | (50 | ) | 802 | 249 | 7,528 | ||||||||||||||||||||||||||
| Net income attributable to non-controlling interests in subsidiaries |
(3 | ) | – | 22 | 1 | 18 | (34 | ) | 114 | – | 118 | |||||||||||||||||||||||||
| Net income attributable to equity holders of the Bank |
$ | 3,619 | $ | 789 | $ | 949 | $ | 480 | $ | 652 | $ | (16 | ) | $ | 688 | $ | 249 | $ | 7,410 | |||||||||||||||||
| Total average assets ($ billions) |
$ | 844 | $ | 215 | $ | 58 | $ | 28 | $ | 61 | $ | 14 | $ | 34 | $ | 142 | $ | 1,396 | ||||||||||||||||||
| (1) | Includes net income from investments in associated corporations for Canada – $(115), Peru – $3, Chile – $10, Colombia - $(2), Caribbean and Central America – $117, and Other International – $140. |
| (2) | Revenues are attributed to countries based on where services are performed or assets are recorded. |
| For the year ended October 31, 2022 ($ millions)(1) |
Canada | United States |
Mexico | Peru | Chile | Colombia | Caribbean and Central America |
Other International |
Total | |||||||||||||||||||||||||||
| Net interest income |
$ | 9,827 | $ | 945 | $ | 1,736 | $ | 1,171 | $ | 1,604 | $ | 631 | $ | 1,436 | $ | 765 | $ | 18,115 | ||||||||||||||||||
| Non-interest income(1) |
8,149 | 1,103 | 748 | 422 | 538 | 388 | 719 | 1,234 | 13,301 | |||||||||||||||||||||||||||
| Total revenues(2) |
17,976 | 2,048 | 2,484 | 1,593 | 2,142 | 1,019 | 2,155 | 1,999 | 31,416 | |||||||||||||||||||||||||||
| Provision for credit losses |
180 | (13 | ) | 232 | 342 | 221 | 216 | 175 | 29 | 1,382 | ||||||||||||||||||||||||||
| Non-interest expenses |
9,928 | 1,040 | 1,223 | 628 | 870 | 682 | 1,335 | 1,396 | 17,102 | |||||||||||||||||||||||||||
| Income tax expense |
1,697 | 260 | 196 | 173 | 95 | 39 | 150 | 148 | 2,758 | |||||||||||||||||||||||||||
| Subtotal |
6,171 | 761 | 833 | 450 | 956 | 82 | 495 | 426 | 10,174 | |||||||||||||||||||||||||||
| Net income attributable to non-controlling interests in subsidiaries |
1 | – | 19 | 6 | 104 | 35 | 93 | – | 258 | |||||||||||||||||||||||||||
| Net income attributable to equity holders of the Bank |
$ | 6,170 | $ | 761 | $ | 814 | $ | 444 | $ | 852 | $ | 47 | $ | 402 | $ | 426 | $ | 9,916 | ||||||||||||||||||
| Total average assets ($ billions) |
$ | 765 | $ | 207 | $ | 46 | $ | 27 | $ | 53 | $ | 14 | $ | 32 | $ | 138 | $ | 1,282 | ||||||||||||||||||
| (1) | Includes net income from investments in associated corporations for Canada – $4, Peru – $7, Chile – $9, Caribbean and Central America – $90, and Other International – $158. |
| (2) | Revenues are attributed to countries based on where services are performed or assets are recorded. |
| 30 | Related Party Transactions |
Compensation of key management personnel of the Bank
Key management personnel are those persons having authority and responsibility for planning, directing and controlling the activities of the Bank, directly or indirectly, and comprise the directors of the Bank, the President and Chief Executive Officer, certain direct reports of the President and Chief Executive Officer and Group Heads.
| For the year ended October 31 ($ millions) | 2023 | 2022 | ||||||
| Salaries and cash incentives(1) |
$ | 23 | $ | 24 | ||||
| Equity-based payment(2) |
32 | 36 | ||||||
| Pension and other benefits(1) |
2 | 4 | ||||||
| Total |
$ | 57 | $ | 64 | ||||
| (1) | Expensed during the year. |
| (2) | Awarded during the year. |
Directors can use some or all of their director fees earned to buy common shares of the Bank at market rates through the Director’s Share Purchase Plan. Non-officer directors may elect to receive all or a portion of their fees in the form of deferred stock units which vest immediately. Refer to Note 26 for further details of these plans.
222 | 2023 Scotiabank Annual Report
Consolidated Financial Statements
Loans and deposits of key management personnel
| As at October 31 ($ millions) | 2023 | 2022 | ||||||
| Loans |
$ | 13 | $ | 11 | ||||
| Deposits |
$ | 6 | $ | 5 | ||||
The Bank’s committed credit exposure to companies controlled by directors totaled $266 million as at October 31, 2023 (October 31, 2022 – $264 million), while actual utilized amounts were $165 million (October 31, 2022 – $188.4 million).
Transactions with associates and joint ventures
In the ordinary course of business, the Bank provides normal banking services and enters into transactions with its associated and other related corporations on terms similar to those offered to non-related parties. If these transactions are eliminated on consolidation, they are not disclosed as related party transactions. Transactions between the Bank and its associated companies and joint ventures also qualify as related party transactions and were recorded as follows:
| As at and for the year ended October 31 ($ millions) | 2023 | 2022 | ||||||
| Net income / (loss) |
$ | (22 | ) | $ | (29 | ) | ||
| Loans |
209 | 205 | ||||||
| Deposits |
277 | 286 | ||||||
| Guarantees and commitments |
55 | 96 | ||||||
Scotiabank principal pension plan
The Bank manages assets of $5.2 billion (October 31, 2022 – $4.9 billion) which is a portion of the Scotiabank principal pension plan assets and earned $6.9 million (October 31, 2022 – $6.4 million) in fees.
2023 Scotiabank Annual Report | 223
Consolidated Financial Statements
| 31 | Principal Subsidiaries and Non-Controlling Interests in Subsidiaries |
| (a) | Principal subsidiaries(1) |
The following table presents certain operating subsidiaries the Bank owns, directly or indirectly. All of these subsidiaries are included in the Bank’s consolidated financial statements.
| Carrying value of shares | ||||||||||
| As at October 31 ($ millions) | Principal office | 2023 | 2022 | |||||||
| Canadian |
||||||||||
| Scotia Capital Inc. |
Toronto, Ontario | $ | 3,723 | $ | 3,215 | |||||
| BNS Investments Inc. |
Toronto, Ontario | 22,925 | 15,750 | |||||||
| 1832 Asset Management L.P. |
Toronto, Ontario | |||||||||
| Montreal Trust Company of Canada |
Montreal, Quebec | |||||||||
| MD Financial Management Inc. |
Ottawa, Ontario | 2,711 | 2,781 | |||||||
| Jarislowsky, Fraser Limited |
Montreal, Quebec | 997 | 988 | |||||||
| Scotia Securities Inc. |
Toronto, Ontario | 63 | 63 | |||||||
| Tangerine Bank |
Toronto, Ontario | 4,529 | 3,827 | |||||||
| The Bank of Nova Scotia Trust Company(2) |
Toronto, Ontario | 610 | 214 | |||||||
| Scotia Mortgage Corporation |
Toronto, Ontario | 780 | 810 | |||||||
| National Trust Company |
Stratford, Ontario | 388 | 374 | |||||||
| Roynat Inc. |
Calgary, Alberta | 674 | 594 | |||||||
| Scotia Dealer Advantage Inc. |
Hamilton, Ontario | 912 | 867 | |||||||
| International |
||||||||||
| Scotia Holdings (USA) LLC(3) |
New York, New York | 7,218 | 3,166 | (4) | ||||||
| Scotia Capital (USA) Inc. |
New York, New York | |||||||||
| Scotia Financing (USA) LLC |
New York, New York | |||||||||
| Nova Scotia Inversiones Limitada |
Santiago, Chile | 7,423 | 6,114 | |||||||
| Scotiabank Chile S.A. (99.79%) |
Santiago, Chile | |||||||||
| Grupo Financiero Scotiabank Inverlat, S.A. de C.V. (97.39%) |
Mexico City, Mexico | 6,812 | 5,960 | |||||||
| Scotiabank Inverlat, S.A. |
Mexico City, Mexico | |||||||||
| Scotia Peru Holdings S.A. |
Lima, Peru | 5,700 | 4,961 | |||||||
| Scotiabank Peru S.A.A. (99.31%) |
Lima, Peru | |||||||||
| Multiacciones S.A.S |
Bogota, Colombia | 1,100 | 842 | |||||||
| Scotiabank Colpatria, S.A. (55.98%)(5) |
Bogota, Colombia | |||||||||
| Scotiabank Brasil S.A. Banco Multiplo |
Sao Paulo, Brazil | 914 | 788 | |||||||
| Scotia Uruguay Holdings S.A. |
Montevideo, Uruguay | 585 | 478 | |||||||
| Scotiabank Uruguay S.A. |
Montevideo, Uruguay | |||||||||
| Scotiabank Republica Dominicana, S.A. – Banco Multiple (99.80%) |
Santo Domingo, Dominican Republic | 934 | 906 | |||||||
| Scotiabank Caribbean Holdings Ltd. |
Bridgetown, Barbados | 1,552 | 1,550 | |||||||
| Scotia Group Jamaica Limited (71.78%) |
Kingston, Jamaica | |||||||||
| Scotiabank Trinidad and Tobago Limited (50.90%) |
Port of Spain, Trinidad and Tobago | |||||||||
| Scotiabank (Barbados) Limited |
Bridgetown, Barbados | 307 | 273 | |||||||
| BNS International (Bahamas) Limited |
Nassau, Bahamas | 13,903 | 17,180 | |||||||
| Scotiabank (Bahamas) Limited |
Nassau, Bahamas | |||||||||
| Scotiabank & Trust (Cayman) Ltd. |
Grand Cayman, Cayman Islands | |||||||||
| Grupo BNS de Costa Rica, S.A. |
San Jose, Costa Rica | |||||||||
| Scotiabank (Ireland) Designated Activity Company |
Dublin, Ireland | |||||||||
| (1) | The Bank (or immediate parent of an entity) owns 100% of the outstanding voting shares of each subsidiary unless otherwise noted. |
| (2) | The Bank of Nova Scotia Trust Company & ADS Canadian Bank amalgamated effective November 1, 2022 and continue as The Bank of Nova Scotia Trust Company. |
| (3) | Effective July 1, 2023, Scotia Holdings (U.S.) Inc. converted to a Limited Liability Company and changed its name to Scotia Holdings (USA) LLC. |
| (4) | The 2022 Scotia Capital (USA) Inc. carrying value was part of BNS Investments Inc. |
| (5) | The Bank made a capital contribution to Scotiabank Colpatria S.A. in July 2023 which increased its ownership interest to 55.98% following the subsequent issuance of additional shares. |
Subsidiaries may have a different reporting date from that of the Bank of October 31. Dates may differ for a variety of reasons including local reporting requirements or tax laws. In accordance with the Bank’s accounting policies, for the purpose of inclusion in the consolidated financial statements of the Bank, adjustments are made where significant for subsidiaries with different reporting dates.
224 | 2023 Scotiabank Annual Report
Consolidated Financial Statements
| (b) | Non-controlling interests in subsidiaries |
The Bank’s significant non-controlling interests in subsidiaries are comprised of the following entities:
| As at and for the year ended | ||||||||||||||||||||
| 2023 | 2022 | |||||||||||||||||||
| Non-controlling interest % |
Non-controlling interests in subsidiaries |
Dividends paid to non-controlling interest |
Non-controlling interests in subsidiaries |
Dividends paid to non-controlling interest |
||||||||||||||||
| Scotiabank Chile S.A. |
0.21 | %(1) | $ | 248 | $ | 17 | $ | 227 | $ | 27 | ||||||||||
| Scotiabank Colpatria S.A.(2)(3) |
44.02 | % | 482 | – | 332 | 12 | ||||||||||||||
| Scotia Group Jamaica Limited |
28.22 | % | 336 | 11 | 279 | 10 | ||||||||||||||
| Scotiabank Trinidad and Tobago Limited |
49.10 | % | 450 | 53 | 413 | 52 | ||||||||||||||
| Other |
|
0.01% 49.35% |
– (4) |
223 | 20 | 273 | 14 | |||||||||||||
| Total |
$ | 1,739 | $ | 101 | $ | 1,524 | $ | 115 | ||||||||||||
| (1) | The Bank increased its ownership in Scotiabank Chile S.A. in 2022 by acquiring an additional 16.8% stake from the primary non-controlling shareholders. Refer to Note 36 for details. The remaining non-controlling interest related primarily to non-controlling interests in Scotiabank Chile S.A. subsidiaries. |
| (2) | Non-controlling interest holders for Scotiabank Colpatria S.A. have a right to sell their holding to the Bank after the end of 7th anniversary (January 17, 2019) and at subsequent pre-agreed intervals, into the future, at fair market value that can be settled at the Bank’s discretion, by issuance of common shares or cash. |
| (3) | The Bank made a capital contribution to Scotiabank Colpatria S.A. in July 2023 which increased its ownership interest to 55.98% following the subsequent issuance of additional shares. |
| (4) | Range of non-controlling interest % for other subsidiaries. |
Summarized financial information of the Bank’s subsidiaries with significant non-controlling interests are as follows:
| As at and for the year ended October 31, 2023 | As at and for the year ended October 31, 2022 | |||||||||||||||||||||||||||||||
| ($ millions) | Revenue | Total comprehensive income (loss) |
Total assets | Total liabilities |
Revenue | Total comprehensive income (loss) |
Total assets | Total liabilities |
||||||||||||||||||||||||
| Total |
$ | 4,206 | $ | 1,929 | $ | 102,628 | $ | 91,869 | $ | 3,849 | $ | 880 | $ | 93,880 | $ | 85,754 | ||||||||||||||||
| 32 | Interest Income and Expense |
| For the year ended October 31 ($ millions) | 2023 | 2022 | ||||||||||||||
| Interest income |
Interest expense |
Interest income |
Interest expense |
|||||||||||||
| Measured at amortized cost(1) |
$ | 51,013 | $ | 38,348 | $ | 31,036 | $ | 15,273 | ||||||||
| Measured at FVOCI(1) |
3,811 | – | 1,537 | – | ||||||||||||
| 54,824 | 38,348 | 32,573 | 15,273 | |||||||||||||
| Other |
2,000 | (2) | 189 | (3) | 985 | (2) | 170 | (3) | ||||||||
| Total |
$ | 56,824 | $ | 38,537 | $ | 33,558 | $ | 15,443 | ||||||||
| (1) | The interest income/expense on financial assets/liabilities are calculated using the effective interest method. |
| (2) | Includes dividend income on equity securities. |
| (3) | The interest on lease liabilities was $114 (2022 – $107). |
| 33 | Earnings Per Share |
| For the year ended October 31 ($ millions) | 2023 | 2022 | ||||||
| Basic earnings per common share |
||||||||
| Net income attributable to common shareholders |
$ | 6,991 | $ | 9,656 | ||||
| Weighted average number of common shares outstanding (millions) |
1,197 | 1,199 | ||||||
| Basic earnings per common share(1) (in dollars) |
$ | 5.84 | $ | 8.05 | ||||
| Diluted earnings per common share |
||||||||
| Net income attributable to common shareholders |
$ | 6,991 | $ | 9,656 | ||||
| Dilutive impact of share-based payment options and others(2) |
(36 | ) | 36 | |||||
| Net income attributable to common shareholders (diluted) |
$ | 6,955 | $ | 9,692 | ||||
| Weighted average number of common shares outstanding (millions) |
1,197 | 1,199 | ||||||
| Dilutive impact of share-based payment options and others(2) (millions) |
7 | 9 | ||||||
| Weighted average number of diluted common shares outstanding (millions) |
1,204 | 1,208 | ||||||
| Diluted earnings per common share(1) (in dollars) |
$ | 5.78 | $ | 8.02 | ||||
| (1) | Earnings per share calculations are based on full dollar and share amounts. |
| (2) | Certain options as well as acquisition-related put/call options that the Bank may settle at its own discretion by issuing common shares were not included in the calculation of diluted earnings per share as they were anti-dilutive. |
2023 Scotiabank Annual Report | 225
Consolidated Financial Statements
| 34 | Guarantees, Commitments and Pledged Assets |
| (a) | Guarantees |
The Bank enters into various types of guarantees and indemnifications in the normal course of business. Guarantees represent an undertaking to another party to make a payment to that party when certain specified events occur. The various guarantees and indemnifications that the Bank provides with respect to its customers and other third parties are presented below:
| 2023 | 2022 | |||||||
| As at October 31 ($ millions) | Maximum potential amount of future payments(1) |
Maximum potential amount of future payments(1) |
||||||
| Standby letters of credit and letters of guarantee |
$ | 48,417 | $ | 41,977 | ||||
| Liquidity facilities |
7,060 | 6,361 | ||||||
| Indemnifications |
940 | 926 | ||||||
| (1) | The maximum potential amount of future payments represents those guarantees that can be quantified and excludes other guarantees that cannot be quantified. As many of these guarantees will not be drawn upon and the maximum potential amount of future payments listed above does not consider the possibility of recovery under recourse or collateral provisions, the above amounts are not indicative of future cash requirements, credit risk, or the Bank’s expected losses from these arrangements. |
| (i) | Standby letters of credit and letters of guarantee |
Standby letters of credit and letters of guarantee are irrevocable undertakings by the Bank on behalf of a customer, to make payments to a third party in the event that the customer is unable to meet its obligations to the third party. Generally, the term of these guarantees does not exceed four years. The types and amounts of collateral security held by the Bank for these guarantees is generally the same as for loans.
| (ii) | Liquidity facilities |
The Bank’s backstop liquidity facilities are committed liquidity and provided to asset-backed commercial paper conduits, administered by the Bank. These facilities generally provide an alternative source of financing in the event market disruption prevents the conduit from issuing commercial paper or, in some cases, when certain specified conditions or performance measures are not met. These facilities generally have a term of up to three years.
| (iii) | Indemnifications |
In the ordinary course of business, the Bank enters into many contracts which contain indemnification provisions, such as purchase contracts, service agreements, trademark licensing agreements, director / officer contracts, escrow arrangements, sales of assets or businesses, outsourcing agreements, leasing arrangements, clearing system arrangements, securities lending agency agreements and structured transactions. The Bank cannot estimate the maximum potential future amount that may be payable. The Bank has not made any significant payments under such indemnifications.
| (b) | Other indirect commitments |
In the normal course of business, various other indirect commitments are outstanding which are not reflected on the Consolidated Statement of Financial Position. These may include:
| • | Commercial letters of credit which require the Bank to honour drafts presented by a third-party when specific activities are completed; |
| • | Commitments to extend credit which represent undertakings to make credit available in the form of loans or other financings for specific amounts and maturities, subject to specific conditions; |
| • | Securities lending transactions under which the Bank, acting as principal or agent, agrees to lend securities to a borrower. The borrower must fully collateralize the security loan at all times. The market value of the collateral is monitored relative to the amounts due under the agreements, and where necessary, additional collateral is obtained; and |
| • | Security purchase commitments which require the Bank to fund future investments. |
These financial instruments are subject to normal credit standards, financial controls and monitoring procedures.
The table below provides a detailed breakdown of the Bank’s other indirect commitments expressed in terms of the contractual amounts of the related commitment or contract which are not reflected on the Consolidated Statement of Financial Position.
| As at October 31 ($ millions) | 2023 | 2022 | ||||||
| Commercial letters of credit |
$ | 695 | $ | 1,219 | ||||
| Commitments to extend credit(1) |
||||||||
| Original term to maturity of one year or less |
61,338 | 81,641 | ||||||
| Original term to maturity of more than one year |
222,705 | 186,067 | ||||||
| Securities lending |
56,174 | 52,178 | ||||||
| Securities purchase and other commitments |
736 | 1,105 | ||||||
| Total |
$ | 341,648 | $ | 322,210 | ||||
| (1) | Includes liquidity facilities, and excludes commitments which are unconditionally cancellable at the Bank’s discretion at any time. |
226 | 2023 Scotiabank Annual Report
Consolidated Financial Statements
| (c) | Assets pledged and repurchase agreements |
In the ordinary course of business, securities and other assets are pledged against liabilities. As well, securities are sold under repurchase agreements. The carrying value of pledged assets and details of related activities are shown below.
| As at October 31 ($ millions) | 2023 | 2022 | ||||||
| Assets pledged to: |
||||||||
| Bank of Canada(1) |
$ | 133 | $ | 168 | ||||
| Foreign governments and central banks(1) |
763 | 2,015 | ||||||
| Clearing systems, payment systems and depositories(1) |
1,810 | 1,628 | ||||||
| Assets pledged in relation to exchange-traded derivative transactions |
8,403 | 8,972 | ||||||
| Assets pledged in relation to over-the-counter derivative transactions |
26,871 | 29,658 | ||||||
| Assets pledged as collateral related to securities borrowing and lending |
150,698 | 133,363 | ||||||
| Assets pledged in relation to covered bond program (Note 15)(2) |
51,538 | 51,446 | ||||||
| Assets pledged in relation to other securitization programs (Note 15) |
3,169 | 1,397 | ||||||
| Assets pledged under CMHC programs (Note 14) |
22,108 | 24,886 | ||||||
| Other |
521 | 969 | ||||||
| Total assets pledged |
$ | 266,014 | $ | 254,502 | ||||
| Obligations related to securities sold under repurchase agreements |
140,296 | 122,552 | ||||||
|
Total(3) |
$ | 406,310 | $ | 377,054 | ||||
| (1) | Includes assets pledged in order to participate in clearing and payment systems and depositories, or pledged to have access to the facilities of central banks in foreign jurisdictions. |
| (2) | Excludes mortgages related to covered bonds held by the Bank or used for securities lending transactions. |
| (3) | Includes assets that have been received from counterparties through normal course of business in securities financing and derivative transactions. |
| (d) | Other executory contracts |
Effective July 2018, the Bank has entered into an $800 million contract for naming rights of an arena for 20 years.
The Bank and its subsidiaries have also entered into other long-term executory contracts, relating to outsourced services. The significant outsourcing arrangements have variable pricing based on utilization and are cancellable with notice.
| 35 | Financial Instruments – Risk Management |
The Bank’s principal business activities result in a balance sheet that consists primarily of financial instruments. In addition, the Bank uses derivative financial instruments for both trading and hedging purposes. The principal financial risks that arise from transacting financial instruments include credit risk, liquidity risk and market risk. The Bank’s framework to monitor, evaluate and manage these risks is consistent with that in place as at October 31, 2023:
| • | extensive risk management policies define the Bank’s risk appetite, set the limits and controls within which the Bank and its subsidiaries can operate, and reflect the requirements of regulatory authorities. These policies are approved by the Bank’s Board of Directors, either directly or through the Risk Committee of the Board, (the Board); |
| • | guidelines are developed to clarify risk limits and conditions under which the Bank’s risk policies are implemented; |
| • | processes are implemented to identify, evaluate, document, report and control risk. Standards define the breadth and quality of information required to make a decision; and |
| • | compliance with risk policies, limits and guidelines is measured, monitored and reported to ensure consistency against defined goals. |
Further details on the fair value of financial instruments and how these amounts were determined are provided in Note 7. Note 10 provides details on the terms and conditions of the Bank’s derivative financial instruments including notional amounts, remaining term to maturity, credit risk, and fair values of derivatives used in trading and hedging activities.
| (a) | Credit risk |
Credit risk is the risk of loss resulting from the failure of a borrower or counterparty to honour its financial or contractual obligations to the Bank. The Bank’s Credit Risk Appetite and Credit Risk Policy are developed by its Global Risk Management (GRM) department and limits are reviewed and approved by the Board on an annual and biennial basis, respectively. The Credit Risk Appetite defines target markets and risk tolerances that are developed at an all-Bank level, and then further refined at the business line level. The objectives of the Credit Risk Appetite are to ensure that, for the Bank, including the individual business lines:
| • | target markets and product offerings are well defined; |
| • | the risk parameters for new underwritings and for the portfolios as a whole are clearly specified; and |
| • | transactions, including origination, syndication, loan sales and hedging, are managed in a manner to ensure the goals for the overall portfolio are met. |
The Credit Risk Policy sets out, among other things, the credit risk rating systems and associated parameter estimates, the delegation of authority for granting credit, and the calculation of allowance for credit losses. It forms an integral part of enterprise-wide policies and procedures that encompass governance, risk management and control structure.
The Bank’s credit risk rating systems are designed to support the determination of key credit risk parameter estimates which measure credit and transaction risk. For non-retail exposures, parameters are associated with each credit facility through the assignment of borrower and facility ratings. Borrower risk is evaluated using methodologies that are specific to particular industry sectors and/or business lines. The risk associated with facilities of a given borrower is assessed by considering the facilities’ structural and collateral-related elements. For retail portfolios, product specific models assign accounts into homogeneous segments using internal and external borrower/facility-level credit experience. This process provides for a meaningful differentiation of risk and allows for appropriate and consistent estimation of loss characteristics at the model and segment level. Further details on credit risk relating to derivatives are provided in Note 10(c).
2023 Scotiabank Annual Report | 227
Consolidated Financial Statements
| (i) | Credit risk exposures |
Credit risk exposures disclosed below are presented based on the Basel framework utilized by the Bank i.e., exposures subject to credit risk capital. The Bank uses the Internal Ratings Based approach (IRB) for all material Canadian, U.S., European portfolios, and for a significant portion of all international corporate and commercial portfolios. Under the Advanced Internal Ratings Based (AIRB) approach, the Bank uses internal risk parameter estimates, based on historical experience and appropriate margin of conservatism, for probability of default (PD), loss given default (LGD) and exposure at default (EAD). Under revised Basel III rules, there are new IRB requirements for internally developed model parameters under AIRB, including scope restrictions which limit certain asset classes to only the Foundation Internal Ratings Based (FIRB) approach. For those asset classes (e.g., Large Corporates, Banks, etc.) the FIRB approach utilizes the Bank’s internally modeled PD parameters combined with internationally prescribed LGD and EAD parameters. The remaining portfolios, including other individual portfolios, are treated under the standardized approach.
Under the standardized approach, credit risk is estimated using the risk weights as prescribed by the Basel framework either based on credit assessments by external rating agencies or based on the counterparty type for non-retail exposures and product type for retail exposures. Standardized risk weights also take into account other factors such as specific provisions for defaulted exposures, eligible collateral, and loan-to-value for real estate secured retail exposures.
| As at October 31 ($ millions) | 2023 | 2022 | ||||||||||||||||||
| Revised Basel III(1) | Basel III | |||||||||||||||||||
| Exposure at default(2) | ||||||||||||||||||||
| Category | Drawn(3) | Undrawn commitments |
Other exposures(4) |
Total | Total | |||||||||||||||
| By counterparty type |
||||||||||||||||||||
| Non-retail |
||||||||||||||||||||
| IRB portfolio |
||||||||||||||||||||
| Corporate |
$ | 227,187 | $ | 80,691 | $ | 83,697 | $ | 391,575 | $ | 453,426 | ||||||||||
| Bank |
17,928 | 12,865 | 24,303 | 55,096 | 37,425 | |||||||||||||||
| Sovereign |
239,626 | 2,886 | 10,781 | 253,293 | 234,156 | |||||||||||||||
| 484,741 | 96,442 | 118,781 | 699,964 | 725,007 | ||||||||||||||||
| Standardized portfolio |
||||||||||||||||||||
| Corporate |
45,471 | 7,082 | 5,706 | 58,259 | 59,866 | |||||||||||||||
| Bank |
2,096 | 23 | 776 | 2,895 | 3,788 | |||||||||||||||
| Sovereign |
25,244 | 174 | 104 | 25,522 | 8,983 | |||||||||||||||
| 72,811 | 7,279 | 6,586 | 86,676 | 72,637 | ||||||||||||||||
| Total non-retail |
$ | 557,552 | $ | 103,721 | $ | 125,367 | $ | 786,640 | $ | 797,644 | ||||||||||
| Retail |
||||||||||||||||||||
| IRB portfolio |
||||||||||||||||||||
| Real estate secured |
$ | 236,785 | $ | 51,874 | $ | – | $ | 288,659 | $ | 254,568 | ||||||||||
| Qualifying revolving |
16,187 | 42,492 | – | 58,679 | 46,435 | |||||||||||||||
| Other retail |
34,449 | 4,824 | – | 39,273 | 37,910 | |||||||||||||||
| 287,421 | 99,190 | – | 386,611 | 338,913 | ||||||||||||||||
| Standardized portfolio |
||||||||||||||||||||
| Real estate secured |
64,888 | 108 | – | 64,996 | 63,054 | |||||||||||||||
| Other retail |
51,326 | 9,056 | 58 | 60,440 | 48,089 | |||||||||||||||
| 116,214 | 9,164 | 58 | 125,436 | 111,143 | ||||||||||||||||
| Total retail |
$ | 403,635 | $ | 108,354 | $ | 58 | $ | 512,047 | $ | 450,056 | ||||||||||
| Total |
$ | 961,187 | $ | 212,075 | $ | 125,425 | $ | 1,298,687 | $ | 1,247,700 | ||||||||||
| By geography(5) |
||||||||||||||||||||
| Canada |
$ | 575,320 | $ | 152,872 | $ | 37,813 | $ | 766,005 | $ | 710,049 | ||||||||||
| United States |
137,284 | 35,009 | 51,281 | 223,574 | 247,672 | |||||||||||||||
| Chile |
58,905 | 3,491 | 4,337 | 66,733 | 60,528 | |||||||||||||||
| Mexico |
56,227 | 3,007 | 3,062 | 62,296 | 50,793 | |||||||||||||||
| Peru |
26,642 | 2,358 | 3,467 | 32,467 | 32,176 | |||||||||||||||
| Colombia |
14,212 | 1,505 | 1,116 | 16,833 | 13,291 | |||||||||||||||
| Other International |
||||||||||||||||||||
| Europe |
19,474 | 6,347 | 17,460 | 43,281 | 46,156 | |||||||||||||||
| Caribbean |
30,498 | 2,237 | 1,239 | 33,974 | 32,057 | |||||||||||||||
| Latin America (other) |
18,084 | 1,518 | 2,070 | 21,672 | 20,890 | |||||||||||||||
| All other |
24,541 | 3,731 | 3,580 | 31,852 | 34,088 | |||||||||||||||
| Total |
$ | 961,187 | $ | 212,075 | $ | 125,425 | $ | 1,298,687 | $ | 1,247,700 | ||||||||||
| (1) | Regulatory amounts reported in 2023 are under Revised Basel III requirements and are not directly comparable to amounts reported in 2022. |
| (2) | Exposure at default is presented after credit risk mitigation. Exposures exclude equity securities and other assets. Portfolios under the Standardized Approach are reported net of specific allowances for credit losses and net of collateral amounts treated under the Comprehensive Approach. |
| (3) | Non-retail drawn includes loans, acceptances, deposits with financial institutions and FVOCI debt securities. Retail drawn includes residential mortgages, credit cards, lines of credit, and other personal loans. |
| (4) | Other exposures include off-balance sheet lending instruments such as letters of credit, letters of guarantees, securitizations (2023 excluding first loss of $4 million, and in 2022, including first loss protection of $32.3 million), derivatives and repo-style transactions (reverse repurchase agreements, repurchase agreements, securities lending and securities borrowing), net of related collateral. |
| (5) | Geographic segmentation is based upon the location of the ultimate risk of the credit exposure. |
228 | 2023 Scotiabank Annual Report
Consolidated Financial Statements
Consolidated Statement of Financial Position asset categories cross-referenced to credit risk exposures
The table below provides mapping of on-balance sheet asset categories that are included in the various Basel III exposure categories as presented in the credit risk exposure summary table of these consolidated financial statements. In addition, it also provides other exposures which are subject to market risk and/or other assets which are not subject to market and credit risk with a reconciliation to the Consolidated Statement of Financial Position. The credit risk exposures on certain assets such as cash, precious metals, investment securities (equities) and other assets are not included in the credit risk exposure summary table. Also excluded from the credit risk exposures are certain trading assets and all assets of the Bank’s insurance subsidiaries.
| Credit Risk Exposures | Other Exposures | |||||||||||||||||||||||||||||||||||||||||||||||
| Drawn | Other Exposures | Market Risk Exposures | ||||||||||||||||||||||||||||||||||||||||||||||
| As at October 31, 2023 ($ millions) | Non-retail | Retail | Securitization | Repo-style Transactions |
OTC Derivatives |
Equity | Also subject to Credit Risk |
All Other(1) | Total | |||||||||||||||||||||||||||||||||||||||
| Cash and deposits with financial institutions |
$ | 86,883 | $ | – | $ | – | $ | – | $ | – | $ | – | $ | – | $ | – | $ | 3,429 | $ | 90,312 | ||||||||||||||||||||||||||||
| Precious metals |
– | – | – | – | – | – | – | 937 | – | 937 | ||||||||||||||||||||||||||||||||||||||
| Trading assets |
||||||||||||||||||||||||||||||||||||||||||||||||
| Securities |
– | – | – | – | – | – | – | 107,614 | (2 | ) | 107,612 | |||||||||||||||||||||||||||||||||||||
| Loans |
584 | – | – | – | – | – | 433 | 6,960 | – | 7,544 | ||||||||||||||||||||||||||||||||||||||
| Other |
– | – | – | – | – | – | – | 2,712 | – | 2,712 | ||||||||||||||||||||||||||||||||||||||
| Financial assets designated at fair value through profit or loss |
– | – | – | – | – | – | – | – | – | – | ||||||||||||||||||||||||||||||||||||||
| Securities purchased under resale agreements and securities borrowed |
– | – | – | 199,325 | – | – | – | – | – | 199,325 | ||||||||||||||||||||||||||||||||||||||
| Derivative financial instruments |
– | – | – | – | 51,340 | – | 36,512 | – | – | 51,340 | ||||||||||||||||||||||||||||||||||||||
| Investment securities |
117,172 | – | – | – | – | 4,022 | – | – | (2,957 | ) | 118,237 | |||||||||||||||||||||||||||||||||||||
| Loans: |
||||||||||||||||||||||||||||||||||||||||||||||||
| Residential mortgages(2) |
65,381 | 278,688 | – | – | – | – | – | – | 113 | 344,182 | ||||||||||||||||||||||||||||||||||||||
| Personal loans |
800 | 99,214 | 4,156 | – | – | – | – | – | – | 104,170 | ||||||||||||||||||||||||||||||||||||||
| Credit cards |
– | 14,100 | 251 | – | – | – | – | – | 2,758 | 17,109 | ||||||||||||||||||||||||||||||||||||||
| Business & government |
264,824 | 11,690 | 15,479 | – | – | – | – | – | (171 | ) | 291,822 | |||||||||||||||||||||||||||||||||||||
| Allowances for credit losses(3) |
(474 | ) | (975 | ) | – | – | – | – | – | – | (4,923 | ) | (6,372 | ) | ||||||||||||||||||||||||||||||||||
| Customers’ liability under acceptances |
18,718 | – | – | – | – | – | – | – | (90 | ) | 18,628 | |||||||||||||||||||||||||||||||||||||
| Property and equipment |
– | – | – | – | – | – | – | – | 5,642 | 5,642 | ||||||||||||||||||||||||||||||||||||||
| Investment in associates |
– | – | – | – | – | 59 | – | – | 1,866 | 1,925 | ||||||||||||||||||||||||||||||||||||||
| Goodwill and other intangibles assets |
– | – | – | – | – | – | – | – | 17,193 | 17,193 | ||||||||||||||||||||||||||||||||||||||
| Other (including Deferred tax assets) |
7,129 | 1,170 | – | 237 | – | – | – | – | 29,935 | 38,471 | ||||||||||||||||||||||||||||||||||||||
| Total |
$ | 561,017 | $ | 403,887 | $ | 19,886 | $ | 199,562 | $ | 51,340 | $ | 4,081 | $ | 36,945 | $ | 118,223 | $ | 52,793 | $ | 1,410,789 | ||||||||||||||||||||||||||||
| (1) | Includes the Bank’s insurance subsidiaries’ assets and all other assets which are not subject to credit and market risks. |
| (2) | Includes $60.2 billion in mortgages guaranteed by Canada Mortgage Housing Corporation and federally backed privately insured mortgages. |
| (3) | Amounts for IRB exposures are reported gross of allowances and amounts for standardized exposures are reported net of allowances. |
| Credit Risk Exposures | Other Exposures | |||||||||||||||||||||||||||||||||||||||||||||||
| Drawn | Other Exposures | Market Risk Exposures | ||||||||||||||||||||||||||||||||||||||||||||||
| As at October 31, 2022 ($ millions) | Non-retail | Retail | Securitization | Repo-style Transactions |
OTC Derivatives |
Equity | Also subject to Credit Risk |
All Other(1) | Total | |||||||||||||||||||||||||||||||||||||||
| Cash and deposits with financial institutions |
$ | 62,551 | $ | – | $ | – | $ | – | $ | – | $ | – | $ | – | $ | – | $ | 3,344 | $ | 65,895 | ||||||||||||||||||||||||||||
| Precious metals |
– | – | – | – | – | – | – | 543 | – | 543 | ||||||||||||||||||||||||||||||||||||||
| Trading assets |
||||||||||||||||||||||||||||||||||||||||||||||||
| Securities |
(4 | ) | – | – | – | – | – | – | 103,551 | – | 103,547 | |||||||||||||||||||||||||||||||||||||
| Loans |
408 | – | – | – | – | – | 367 | 7,403 | – | 7,811 | ||||||||||||||||||||||||||||||||||||||
| Other |
– | – | – | – | – | – | – | 1,796 | – | 1,796 | ||||||||||||||||||||||||||||||||||||||
| Financial assets designated at fair value through profit or loss |
– | – | – | – | – | – | – | – | – | – | ||||||||||||||||||||||||||||||||||||||
| Securities purchased under resale agreements and securities borrowed |
– | – | – | 175,313 | – | – | – | – | – | 175,313 | ||||||||||||||||||||||||||||||||||||||
| Derivative financial instruments |
– | – | – | – | 55,699 | – | 43,436 | – | – | 55,699 | ||||||||||||||||||||||||||||||||||||||
| Investment securities |
108,516 | – | – | – | – | 5,081 | – | – | (3,589 | ) | 110,008 | |||||||||||||||||||||||||||||||||||||
| Loans: |
||||||||||||||||||||||||||||||||||||||||||||||||
| Residential mortgages(2) |
76,607 | 272,588 | – | – | – | – | – | – | 84 | 349,279 | ||||||||||||||||||||||||||||||||||||||
| Personal loans |
– | 96,074 | 3,350 | – | – | – | – | – | 7 | 99,431 | ||||||||||||||||||||||||||||||||||||||
| Credit cards |
– | 13,126 | 372 | – | – | – | – | – | 1,020 | 14,518 | ||||||||||||||||||||||||||||||||||||||
| Business & government |
267,921 | 10,395 | 9,675 | – | – | – | – | – | (884 | ) | 287,107 | |||||||||||||||||||||||||||||||||||||
| Allowances for credit losses(3) |
(514 | ) | (817 | ) | – | – | – | – | – | – | (4,017 | ) | (5,348 | ) | ||||||||||||||||||||||||||||||||||
| Customers’ liability under acceptances |
19,525 | – | – | – | – | – | – | – | (31 | ) | 19,494 | |||||||||||||||||||||||||||||||||||||
| Property and equipment |
– | – | – | – | – | – | – | – | 5,700 | 5,700 | ||||||||||||||||||||||||||||||||||||||
| Investment in associates |
– | – | – | – | – | 56 | – | – | 2,577 | 2,633 | ||||||||||||||||||||||||||||||||||||||
| Goodwill and other intangibles assets |
– | – | – | – | – | – | – | – | 16,833 | 16,833 | ||||||||||||||||||||||||||||||||||||||
| Other (including Deferred tax assets) |
2,401 | 991 | – | 106 | – | – | – | – | 35,661 | 39,159 | ||||||||||||||||||||||||||||||||||||||
| Total |
$ | 537,411 | $ | 392,357 | $ | 13,397 | $ | 175,419 | $ | 55,699 | $ | 5,137 | $ | 43,803 | $ | 113,293 | $ | 56,705 | $ | 1,349,418 | ||||||||||||||||||||||||||||
| (1) | Includes the Bank’s insurance subsidiaries’ assets and all other assets which are not subject to credit and market risks. |
| (2) | Includes $75.8 billion in mortgages guaranteed by Canada Mortgage Housing Corporation and federally backed privately insured mortgages. |
| (3) | Amounts for AIRB exposures are reported gross of allowances and amounts for standardized exposures are reported net of allowances. |
2023 Scotiabank Annual Report | 229
Consolidated Financial Statements
| (ii) | Credit quality of non-retail exposures |
Credit decisions are made based upon an assessment of the credit risk of the individual borrower or counterparty. Key factors considered in the assessment include: the borrower’s management; the borrower’s current and projected financial results and credit statistics; the industry in which the borrower operates; economic trends; and geopolitical risk. Banking units and Global Risk Management also review the credit quality of the credit portfolio across the organization on a regular basis to assess whether economic trends or specific events may affect the performance of the portfolio.
The Bank’s non-retail portfolio is well diversified by industry. As at October 31, 2023, and October 31, 2022, a significant portion of the authorized corporate and commercial lending portfolio was internally assessed at a grade that would generally equate to an investment grade rating by external rating agencies. There has not been a significant change in concentrations of credit risk since October 31, 2022.
Internal grades (IG) are used to differentiate the risk of default of a borrower. The following table cross references the Bank’s internal borrower grades with equivalent ratings categories utilized by external rating agencies:
| Cross referencing of internal ratings to external ratings(1) | ||||||||||||
| Equivalent External Rating | ||||||||||||
| S&P | Moody’s | DBRS | Internal Grade | Internal Grade Code | PD Range(2) | |||||||
| AAA to AA+ |
Aaa to Aa1 | AAA to AA (high) | 99 – 98 | 0.0000% – 0.0551% | ||||||||
| AA to A+ |
Aa2 to A1 | AA to A (high) | 95 | 0.0551% – 0.0651% | ||||||||
| A to A- |
A2 to A3 | A to A (low) | Investment grade | 90 | 0.0651% – 0.0748% | |||||||
| BBB+ |
Baa1 | BBB (high) | 87 | 0.0748% – 0.1028% | ||||||||
| BBB |
Baa2 | BBB | 85 | 0.1028% – 0.1552% | ||||||||
| BBB- |
Baa3 | BBB (low) | 83 | 0.1552% – 0.2151% | ||||||||
| BB+ |
Ba1 | BB (high) | 80 | 0.2151% – 0.2983% | ||||||||
| BB |
Ba2 | BB | 77 | 0.2983% – 0.5617% | ||||||||
| BB- |
Ba3 | BB (low) | Non-Investment grade | 75 | 0.5617% – 1.1570% | |||||||
| B+ |
B1 | B (high) | 73 | 1.1570% – 1.9519% | ||||||||
| B to B- |
B2 to B3 | B to B (low) | 70 | 1.9519% – 4.7225% | ||||||||
| CCC+ |
Caa1 | – | 65 | 4.7225% – 12.1859% | ||||||||
| CCC |
Caa2 | – | Watch list | 60 | 12.1859% – 23.8197% | |||||||
| CCC- to CC |
Caa3 to Ca | – | 40 | 23.8197% – 42.1638% | ||||||||
| – |
– | – | 30 | 42.1638% – 100.0000% | ||||||||
| Default |
Default | 21 | 100% | |||||||||
| (1) | Applies to non-retail portfolio. |
| (2) | PD Ranges as at October 31, 2023. The Range does not include the upper boundary for the row. |
Non-retail IRB portfolio
The credit quality of the non-retail IRB portfolio, expressed in terms of risk categories of borrower internal grades is shown in the table below:
| 2023 | 2022 | |||||||||||||||||||||||
| Revised Basel III(1) | Basel III | |||||||||||||||||||||||
| Exposure at Default(2) | ||||||||||||||||||||||||
| As at October 31 ($ millions) Category of internal grades | IG Code | Drawn | Undrawn commitments |
Other exposures(3) |
Total | Total | ||||||||||||||||||
| Investment grade |
99 – 98 | $ | 143,049 | $ | 1,285 | $ | 27,321 | $ | 171,655 | $ | 138,564 | |||||||||||||
| 95 | 35,677 | 10,716 | 21,186 | 67,579 | 70,575 | |||||||||||||||||||
| 90 | 24,561 | 13,302 | 25,381 | 63,244 | 78,215 | |||||||||||||||||||
| 87 | 36,090 | 16,675 | 16,517 | 69,282 | 85,188 | |||||||||||||||||||
| 85 | 34,443 | 14,386 | 9,876 | 58,705 | 73,091 | |||||||||||||||||||
| 83 | 54,334 | 16,342 | 6,967 | 77,643 | 78,869 | |||||||||||||||||||
| Non-Investment grade |
80 | 40,535 | 10,389 | 4,044 | 54,968 | 52,857 | ||||||||||||||||||
| 77 | 27,155 | 6,336 | 3,673 | 37,164 | 36,288 | |||||||||||||||||||
| 75 | 18,824 | 4,769 | 2,698 | 26,291 | 25,712 | |||||||||||||||||||
| 73 | 8,022 | 1,542 | 451 | 10,015 | 7,848 | |||||||||||||||||||
| 70 | 2,481 | 452 | 293 | 3,226 | 2,592 | |||||||||||||||||||
| Watch list |
65 | 775 | 126 | 307 | 1,208 | 395 | ||||||||||||||||||
| 60 | 1,137 | 79 | 9 | 1,225 | 788 | |||||||||||||||||||
| 40 | 165 | 17 | 21 | 203 | 881 | |||||||||||||||||||
| 30 | 100 | 5 | 1 | 106 | 54 | |||||||||||||||||||
| Default |
21 | 952 | 21 | 36 | 1,009 | 1,220 | ||||||||||||||||||
| Total |
$ | 428,300 | $ | 96,442 | $ | 118,781 | $ | 643,523 | $ | 653,137 | ||||||||||||||
| Government guaranteed residential mortgages(4) |
56,441 | – | – | 56,441 | 71,867 | |||||||||||||||||||
| Total |
$ | 484,741 | $ | 96,442 | $ | 118,781 | $ | 699,964 | $ | 725,004 | ||||||||||||||
| (1) | Regulatory amounts reported in 2023 are under Revised Basel III requirements and are not directly comparable to amounts reported in 2022. |
| (2) | After credit risk mitigation. |
| (3) | Includes off-balance sheet lending instruments such as letters of credit, letters of guarantees, securitizations (excluding first loss protection), derivatives and repo-style transactions (reverse repurchase agreements, repurchase agreements and securities lending and borrowing), net of related collateral. |
| (4) | These exposures are classified as sovereign exposures and are included in the non-retail category. |
230 | 2023 Scotiabank Annual Report
Consolidated Financial Statements
Non-retail standardized portfolio
The non-retail standardized portfolio relies on external credit ratings (e.g. S&P, Moody’s, DBRS, etc.) of the borrower, if available, to compute regulatory capital for credit risk. Exposures are risk weighted based on prescribed percentages and a mapping process as defined within OSFI’s Capital Adequacy Requirements Guideline. Non-retail standardized portfolio as at October 31, 2023 comprised of drawn, undrawn and other exposures to corporate, bank and sovereign counterparties amounted to $87 billion (October 31, 2022 – $73 billion). The year over year increase was primarily due to implementation of Basel III Revisions. Within this portfolio, the majority of Corporate/Commercial exposures are to unrated counterparties, mainly in Canada and the Pacific Alliance countries.
| (iii) | Credit quality of retail exposures |
The Bank’s retail portfolios consist of a number of relatively small loans to a large number of borrowers. The portfolios are distributed across Canada and a wide range of countries. As such, the portfolios inherently have a high degree of diversification. In addition, as of October 31, 2023, 26% of the Canadian banking residential mortgage portfolio is insured and the average loan-to-value ratio of the uninsured portion of the portfolio is 49%.
Retail AIRB portfolio
The data in the table below provides a distribution of the retail AIRB exposures within each PD range by asset class:
| As at October 31 ($ millions) | 2023 | 2022 | ||||||||||||||||||||||||||
| Revised Basel III(1) | Basel III | |||||||||||||||||||||||||||
| Exposure at default(2) | ||||||||||||||||||||||||||||
| Real estate secured | ||||||||||||||||||||||||||||
| Category of (PD) grades | PD range | Mortgages | HELOC | Qualifying revolving |
Other retail | Total | Total | |||||||||||||||||||||
| Exceptionally Low(3) |
0.0000% – 0.0499% | $ | – | $ | – | $ | – | $ | – | $ | – | $ | 102,039 | |||||||||||||||
| Very Low |
0.0500% – 0.1999% | 159,633 | 68,050 | 35,140 | 6,586 | 269,409 | 118,374 | |||||||||||||||||||||
| Low |
0.2000% – 0.9999% | 43,171 | 5,154 | 11,724 | 20,421 | 80,470 | 84,843 | |||||||||||||||||||||
| Medium Low |
1.0000% – 2.9999% | 9,284 | – | 7,963 | 6,983 | 24,230 | 22,248 | |||||||||||||||||||||
| Medium |
3.0000% – 9.9999% | 1,073 | 535 | 2,106 | 3,792 | 7,506 | 8,654 | |||||||||||||||||||||
| High |
10.0000% – 19.9999% | 479 | 112 | 1,204 | 87 | 1,882 | 1,123 | |||||||||||||||||||||
| Extremely High |
20.0000% – 99.9999% | 663 | 101 | 451 | 1,148 | 2,363 | 1,163 | |||||||||||||||||||||
| Default |
100% | 316 | 88 | 91 | 256 | 751 | 469 | |||||||||||||||||||||
| Total |
$ | 214,619 | $ | 74,040 | $ | 58,679 | $ | 39,273 | $ | 386,611 | $ | 338,913 | ||||||||||||||||
| (1) | Regulatory amounts reported in 2023 are under Revised Basel III requirements and are not directly comparable to amounts reported in 2022. |
| (2) | After credit risk mitigation. |
| (3) | OSFI has revised the Retail Probablility of Default floor from 0.03% to 0.05% in 2023, under the Revised Basel III framework. |
Retail standardized portfolio
The retail standardized portfolio of $125 billion as at October 31, 2023 (2022 – $111 billion) was comprised of residential mortgages, personal loans, credit cards and lines of credit to individuals, mainly in the Latin American and Caribbean region. Of the total retail standardized exposures, $65 billion (2022 – $63 billion) was represented by mortgages and loans secured by residential real estate, mostly with a loan-to-value ratio of below 80%.
| (iv) | Collateral |
Collateral held
In the normal course of business, to reduce its exposure to counterparty credit risk, the Bank receives collateral for capital markets related activities. The following are examples of the terms and conditions customary to collateral for these types of transactions:
| • | The risks and rewards of the pledged assets reside with the pledgor. |
| • | Additional collateral is required when the market value of the transaction exceeds thresholds agreed upon with the pledgor. |
| • | The Bank is normally permitted to sell or repledge the collateral it receives, although this right is specific to each agreement under which the collateral is pledged. |
| • | Upon satisfaction of the obligation, the Bank must return the pledged assets, unless the Bank has the right to sell or repledge the collateral it receives, in which case the Bank must return comparable collateral to the pledgor. |
As at October 31, 2023, the approximate market value of cash and securities collateral accepted that may be sold or repledged by the Bank was $315 billion (2022 – $259 billion). This collateral is held primarily in connection with reverse repurchase agreements, margin loans, securities lending and derivative transactions. The Bank also borrows securities under standard securities borrowing agreements that it is able to re-pledge. Including these borrowed securities, the approximate market value of securities collateral accepted that may be sold or re-pledged was $313 billion (2022 – $273 billion), of which approximately $75 billion was not sold or re-pledged (2022 – $58 billion).
Collateral pledged
In the normal course of business, securities and other assets are pledged to secure an obligation, participate in clearing or settlement systems, or operate in a foreign jurisdiction. Note 34(c) details the nature and extent of the Bank’s asset pledging activities. Asset pledging transactions are conducted under terms that are common and customary to standard derivative, securities financing, and other borrowing activities. Standard risk management controls are applied with respect to asset pledging.
Assets acquired in exchange for loans
The carrying value of assets acquired in exchange for loans as at October 31, 2023 was $334 million (2022 – $274 million) mainly comprised of real estate and was classified as either held for sale or held for use as appropriate.
2023 Scotiabank Annual Report | 231
Consolidated Financial Statements
| (b) | Liquidity risk |
Liquidity risk is the risk that the Bank is unable to meet its financial obligations in a timely manner at reasonable prices. The Bank’s liquidity risk is subject to extensive risk management controls and is managed within the framework of policies and limits approved by the Board. The Board receives reports on risk exposures and performance against approved limits. The Asset-Liability Committee (ALCO) provides senior management oversight of liquidity risk.
The key elements of the Bank’s liquidity risk management framework include:
| • | liquidity risk measurement and management limits, including limits on maximum net cash outflow by currency over specified short-term horizons; |
| • | prudent diversification of its wholesale funding activities by using a number of different funding programs to access the global financial markets and manage its maturity profile, as appropriate; |
| • | large holdings of liquid assets to support its operations, which can generally be sold or pledged to meet the Bank’s obligations; |
| • | liquidity stress testing, including Bank-specific, global-systemic, and combination systemic/Bank-specific scenarios; and |
| • | liquidity contingency planning. |
The Bank’s foreign operations have liquidity management frameworks that are similar to the Bank’s framework. Local deposits are managed from a liquidity risk perspective based on the local management frameworks and regulatory requirements.
| (i) | Commitments to extend credit |
In the normal course of business, the Bank enters into commitments to extend credit in the form of loans or other financings for specific amounts and maturities, subject to specific conditions. These commitments, which are not reflected on the Consolidated Statement of Financial Position, are subject to normal credit standards, financial controls and monitoring procedures.
| (ii) | Derivative instruments |
The Bank is subject to liquidity risk relating to its use of derivatives to meet customer needs, generate revenues from trading activities, manage market and credit risks arising from its lending, funding and investment activities, and lower its cost of capital. The maturity profile of the notional amounts of the Bank’s derivative instruments is summarized in Note 10(b).
| (c) | Market risk |
Market risk arises from changes in market prices and rates (including interest rates, credit spreads, equity prices, foreign exchange rates and commodity prices), the correlations between them, and their levels of volatility. Market risk is subject to extensive risk management controls, and is managed within the framework of market risk policies and limits approved by the Board. The ALCO and Market Risk Management and Policy Committee oversee the application of the framework set by the Board, and monitor the Bank’s market risk exposures and the activities that give rise to these exposures.
The Bank uses a variety of metrics and models to measure and control market risk exposures. The measurements used are selected based on an assessment of the nature of risks in a particular activity. The principal measurement techniques are Value at Risk (VaR), stress testing, sensitivity analysis and simulation modeling. The Board reviews results from these metrics quarterly. Models are independently validated internally prior to implementation and are subject to formal periodic review.
VaR is a statistical measure that estimates the potential loss in value of the Bank’s trading positions due to adverse market movements over a defined time horizon with a specified confidence level. The quality of the Bank’s VaR is validated by regular back testing analysis, in which the VaR is compared to theoretical and actual profit and loss results. To complement VaR, the Bank also uses stress testing to examine the impact that abnormally large swings in market factors and periods of prolonged inactivity might have on trading portfolios. The stress testing program is designed to identify key risks and ensure that the Bank’s capital can absorb potential losses from abnormal events. The Bank subjects its trading portfolios to a series of stress tests on a daily, weekly and monthly basis.
In trading portfolios, sensitivity analysis is used to measure the effect of changes in risk factors, including prices and volatility, on financial products and portfolios. In non-trading portfolios, sensitivity analysis assesses the effect of changes in interest rates on current earnings and on the economic value of equity. Simulation modeling under various scenarios is particularly important for managing risk in the deposit, lending and investment products the Bank offers to its retail customers.
| (i) | Non-trading interest rate risk |
Interest rate risk is the risk of loss due to the following: changes in the level, slope and curvature of the yield curve; the volatility of interest rates and changes in customer preferences (e.g. mortgage prepayment rates). The Bank actively manages its interest rate exposures with the objective of protecting and enhancing net interest income within established risk tolerances. Interest rate risk arising from the Bank’s funding and investment activities is managed in accordance with Board-approved policies and global limits, which are designed to control the risk to net interest income and economic value of equity. The income limit measures the effect of a specified shift in interest rates on the Bank’s annual net interest income over the next twelve months, while the economic value limit measures the impact of a specified change in interest rates on the present value of the Bank’s net assets. These calculations are based on models that consider a number of inputs and are on a constant balance sheet and make no assumptions for management actions that may mitigate the risk.
Interest rate sensitivity
Based on the Bank’s interest rate positions, the following table shows the pro-forma pre-tax impact on the Bank’s net interest income over the next twelve months and economic value of equity of an immediate and sustained 100 basis points increase and decrease in interest rates across major currencies as defined by the Bank. These calculations are based on models that consider a number of inputs and are on a constant balance sheet and make no assumptions for management actions to mitigate the risk.
| As at October 31 ($ millions) | 2023 | 2022 | ||||||||||||||||||||||||||||||
| Net interest income | Economic value of equity | |||||||||||||||||||||||||||||||
| Canadian dollar |
Other currencies |
Total | Canadian dollar |
Other currencies |
Total | Net interest income |
Economic value of equity |
|||||||||||||||||||||||||
| 100 bp increase |
$ | (206 | ) | $ | 107 | $ | (99 | ) | $ | (532 | ) | $ | (724 | ) | $ | (1,256 | ) | $ | (340 | ) | $ | (2,021 | ) | |||||||||
| 100 bp decrease |
$ | 196 | $ | (128 | ) | $ | 68 | $ | 307 | $ | 517 | $ | 824 | $ | 326 | $ | 1,659 | |||||||||||||||
232 | 2023 Scotiabank Annual Report
Consolidated Financial Statements
| (ii) | Non-trading foreign currency risk |
Foreign currency risk is the risk of loss due to changes in spot and forward rates, and the volatility of currency exchange rates. Non-trading foreign currency risk, also referred to as structural foreign exchange risk, arises primarily from the Bank’s net investments in self-sustaining foreign operations and is controlled by a Board-approved limit. This limit considers potential volatility to shareholders’ equity as well as the potential impact on capital ratios from foreign exchange fluctuations. On a quarterly basis, the Asset-Liability Committee (ALCO) reviews the Bank’s exposures to these net investments. The Bank may fully or partially hedge this exposure by funding the investments in the same currency, or by using other financial instruments, including derivatives.
The Bank is subject to foreign currency risk on the earnings of its foreign operations. To manage this risk, foreign currency revenues and expenses, which are primarily denominated in U.S. dollars, are projected over a number of future fiscal quarters. The ALCO assesses economic data and forecasts to decide on the portion of the estimated future foreign currency revenues and expenses to hedge. Hedging instruments normally include foreign currency spot and forward contracts, as well as foreign currency options and swaps.
As at October 31, 2023, a one percent increase (decrease) in the Canadian dollar against all currencies in which the Bank operates decreases (increases) the Bank’s before-tax annual earnings by approximately $63 million (October 31, 2022 – $55 million) in the absence of hedging activity, primarily from exposure to U.S. dollars. A similar change in the Canadian dollar as at October 31, 2023 would increase (decrease) the unrealized foreign currency translation losses in the accumulated other comprehensive income in equity by approximately $356 million (2022 – $308 million), net of hedging.
| (iii) | Non-trading equity risk |
Equity risk is the risk of loss due to adverse movements in equity prices. Equity price risk is often classified into two categories: general equity risk, which refers to the sensitivity of an instrument or portfolio’s value to changes in the overall level of equity prices, and specific equity risk, which refers to that portion of an individual equity instrument’s price volatility that is determined by entity-specific characteristics.
The Bank is exposed to equity risk through its equity investment portfolios, which are controlled by Board-approved portfolio and VaR limits. Equity investments include common and preferred shares, as well as a diversified portfolio of third-party managed funds.
The majority of the Bank’s equity investment portfolios are managed by Group Treasury under the strategic direction of the ALCO. Group Treasury delegates the management of a portion of equity and equity-related portfolios to other external fund managers to take advantage of these fund managers’ expertise in particular market niches and products.
The fair value of equity securities designated at FVOCI is shown in Note 12.
| (iv) | Trading portfolio risk management |
The Bank’s policies, processes and controls for trading activities are designed to achieve a balance between pursuing profitable trading opportunities and managing earnings volatility within a framework of sound and prudent practices. Trading activities are primarily customer focused.
Market risk arising from the Bank’s trading activities is managed in accordance with Board-approved policies and limits, including aggregate VaR and stress testing limits.
Trading portfolios are marked-to-market in accordance with the Bank’s valuation policies. Positions are marked-to-market daily and valuations are independently reviewed by back office, GRM or finance units on a regular basis. These units also provide profit and loss reporting, as well as VaR and limit compliance reporting to business unit management and executive management for evaluation and action as appropriate. VaR is calculated daily using a 99% confidence level, and a one-day holding period. This means that, once in every 100 days, the trading positions are expected to lose more than the VaR estimate. The Bank calculates general market risk VaR using historical simulation based on 300 days of market data. For debt specific risk VaR, the Bank uses historical resampling. The table below shows the Bank’s VaR by risk factor:
| For the year ended October 31, 2023 | ||||||||||||||||||||
| ($ millions) | As at October 31, 2023 | Average | High | Low | As at October 31, 2022 | |||||||||||||||
| Credit spread plus interest rate |
$ | 12.9 | $ | 14.4 | $ | 24.1 | $ | 9.0 | $ | 9.3 | ||||||||||
| Credit spread |
8.1 | 7.9 | 16.3 | 3.8 | 7.7 | |||||||||||||||
| Interest rate |
11.5 | 12.1 | 21.9 | 7.5 | 8.4 | |||||||||||||||
| Equities |
4.9 | 4.1 | 7.8 | 2.5 | 3.4 | |||||||||||||||
| Foreign exchange |
3.0 | 3.3 | 8.8 | 0.9 | 1.5 | |||||||||||||||
| Commodities |
2.9 | 4.7 | 8.1 | 2.3 | 5.2 | |||||||||||||||
| Debt specific |
3.7 | 3.6 | 4.8 | 2.4 | 4.6 | |||||||||||||||
| Diversification effect |
(13.5 | ) | (14.4 | ) | n/a | n/a | (10.6 | ) | ||||||||||||
| All-Bank VaR |
$ | 13.9 | $ | 15.7 | $ | 25.2 | $ | 11.0 | $ | 13.4 | ||||||||||
| All-Bank stressed VaR |
$ | 44.8 | $ | 39.4 | $ | 87.3 | $ | 13.4 | $ | 27.4 | ||||||||||
Below are the market risk capital requirements as at October 31, 2023.
| ($ millions) | 2023 | 2022 | ||||||
| All-Bank VaR |
$ | 141 | $ | 131 | ||||
| All-Bank stressed VaR |
390 | 324 | ||||||
| Incremental risk charge |
315 | 345 | ||||||
| Standardized approach |
117 | 66 | ||||||
| Total market risk capital |
$ | 963 | $ | 866 | (1) | |||
| (1) | Equates to $12,040 million of risk-weighted assets (October 31, 2022 – $10,820 million). |
2023 Scotiabank Annual Report | 233
Consolidated Financial Statements
| (d) | Operational risk |
Operational risk is the risk of loss resulting from people, inadequate or failed processes and systems, or from external events. Operational risk includes third party risk management and legal risk but excludes strategic risk and reputational risk. It also exists in some form in each of the Bank’s business and support activities, and third parties to whom activities have been outsourced. It can result in financial loss, regulatory sanctions and damage to the Bank’s reputation. The Bank’s Operational Risk Management Framework outlines the Bank’s structured approach for effective management of enterprise-wide operational risk in a manner consistent with best practices and regulatory requirements.
| 36 | Acquisitions and Divestitures |
Acquisitions
Completed acquisition impacting the prior fiscal year
Scotiabank Chile
The Bank completed the acquisition of an additional 16.8% stake in Scotiabank Chile for $1.2 billion from the non-controlling interest shareholders, increasing its ownership to 99.8%. The purchase consideration was comprised of cash of $650 million and the issuance of 7 million common shares valued at $569 million. The increase in ownership was effective February 27, 2022. This transaction was accounted for as a capital transaction through shareholders’ equity and did not result in a change to the carrying value of the assets and liabilities of the subsidiary or the Bank’s associated goodwill.
As at the date of acquisition, the transaction negatively impacted the Bank’s CET1 ratio by 11 basis points. Scotiabank Chile forms part of the International Banking business segment.
Divestitures
Closed divestitures impacting the current fiscal year
Canadian Tire’s Financial Services business (“CTFS”)
On October 31, 2023, the Bank signed and closed the sale of its 20% equity interest in CTFS to Canadian Tire Corporation.
The investment held by the Bank in CTFS was classified as an investment in associate. The carrying value of the Bank’s interest in the investment of $543 million was derecognized on the date of close and a net gain of approximately $367 million ($319 million after-tax) was recorded in non-interest income – other and reported in the Other segment. The transaction increased the Bank’s CET1 ratio by approximately 16 basis points.
Closed divestitures impacting the prior fiscal year
Banco del Caribe, C.A (“BDC”) and Inversiones Americana del Caribe (IAC), B.V. (“IAC”), Venezuela
On October 26, 2022, the Bank completed the sale of its 26.8% interest in BDC and its 23.4% interest in IAC.
The investments held by the Bank in BDC and IAC, were classified as investments in associates. The carrying value of the Bank’s interest in these investments of $73 million was derecognized on the date of close and a net loss of approximately $227 million after-tax was recorded in non-interest income - other and reported in the Other segment. The net loss includes $169 million of cumulative foreign currency translation losses that have been reclassified from accumulated other comprehensive income to the Consolidated Statement of Income. The capital impact of these transactions was not significant.
Thanachart Insurance Public Company Limited (“TNI”) and Thanachart Securities Public Company Limited (“TNS”), Thailand
On October 27, 2022, the Bank completed the sale of its interest in TNI and TNS.
The investments held by the Bank in TNI and TNS were classified as investments in associates. The carrying value of the Bank’s interest in these investments of $134 million was derecognized on the date of close. The financial and capital impacts of this transaction were not significant.
Wind down of operations in India and Malaysia
The Bank has made the decision to wind down its operations in India and Malaysia as part of the realignment of Global Banking and Markets business in the Asia Pacific region. The Bank has recorded a total loss of $102 million after tax in non-interest income – other representing the reclassification of cumulative foreign currency translation losses net of hedges, from accumulated other comprehensive income to the Consolidated Statement of Income. The capital impact of this transaction was not significant.
234 | 2023 Scotiabank Annual Report
Shareholder Information
Annual meeting
Shareholders are invited to attend the 192nd Annual Meeting of Holders of Common Shares, to be held on April 9, 2024, at Scotiabank Centre, Scotia Plaza, 40 King Street West, 2nd Floor, Toronto, Ontario beginning at 9:00 a.m. Eastern. The record date for determining shareholders entitled to receive notice of and to vote at the meeting will be the close of business on February 13, 2024. Please visit our website at https://www.scotiabank.com/annualmeeting for updates concerning the meeting.
Shareholdings and dividends
Information regarding your shareholdings and dividends may be obtained by contacting the transfer agent.
Direct deposit service
Shareholders may have dividends deposited directly into accounts held at financial institutions which are members of the Canadian Payments Association. To arrange direct deposit service, please write to the transfer agent.
Shareholder Dividend and Share Purchase Plan
Scotiabank’s Shareholder Dividend and Share Purchase Plan allows common and preferred shareholders to purchase additional common shares by reinvesting their cash dividend without incurring brokerage or administrative fees. As well, eligible shareholders may invest up to $20,000 each fiscal year to purchase additional common shares of the Bank. All administrative costs of the plan are paid by the Bank. For more information on participation in the plan, please contact the transfer agent.
Listing of shares
Common shares of the Bank are listed for trading on the Toronto and New York stock exchanges.
Series 40 preferred shares of the Bank are listed on the Toronto Stock Exchange.
Stock Symbols
| STOCK |
TICKER SYMBOL | CUSIP NO. | ||
| Common shares |
BNS | 064149 10 7 | ||
| Series 40, Preferred |
BNS.PR.I | 06415E 30 3 |
Dividend Dates for 2024
Record and payment dates for common and preferred shares, subject to approval by the Board of Directors.
| RECORD DATE |
PAYMENT DATE | |
| January 3 |
January 29 | |
| April 2 |
April 26 | |
| July 3 |
July 29 | |
| October 2 |
October 29 |
Valuation day price
For Canadian income tax purposes, The Bank of Nova Scotia’s common stock was quoted at $31.13 per share on Valuation Day, December 22, 1971. This is equivalent to $2.594 after adjusting for the two-for-one stock split in 1976, the three-for-one stock split in 1984, and the two-for-one stock split in 1998. The stock dividend in 2004 did not affect the Valuation Day amount. The stock received as part of the 2004 stock dividend is not included in the pre-1972 pool.
Duplicated communication
Some registered holders of The Bank of Nova Scotia shares might receive more than one copy of shareholder mailings, such as this Annual Report. Every effort is made to avoid duplication; however, if you are registered with different names and/or addresses, multiple mailings may result. If you receive, but do not require, more than one mailing for the same ownership, please contact the transfer agent to combine the accounts.
Credit ratings
| LEGACY SENIOR DEBT/DEPOSITS |
||
| DBRS |
AA | |
| Fitch |
AA | |
| Moody’s |
Aa2 | |
| Standard & Poor’s |
A+ | |
| SENIOR DEBT(1) |
||
| DBRS |
AA(low) | |
| Fitch |
AA- | |
| Moody’s |
A2 | |
| Standard & Poor’s |
A- | |
| SHORT TERM DEPOSITS/COMMERCIAL PAPER |
||
| DBRS |
R-1(high) | |
| Fitch |
F1+ | |
| Moody’s |
P-1 | |
| Standard & Poor’s |
A-1 | |
| SUBORDINATED DEBENTURES(2) |
||
| DBRS |
A(high) | |
| Fitch |
A | |
| Moody’s |
Baa1 | |
| Standard & Poor’s |
A- | |
| SUBORDINATED DEBENTURES (NVCC) |
||
| DBRS |
A(low) | |
| Fitch |
A | |
| Moody’s |
Baa1(hyb) | |
| Standard & Poor’s |
BBB+ | |
| SUBORDINATED ADDITIONAL TIER 1 CAPITAL NOTES (NVCC) |
||
| DBRS |
BBB(high) | |
| Fitch |
BBB+ | |
| Moody’s |
Baa3(hyb) | |
| Standard & Poor’s |
BBB- | |
| LIMITED RECOURSE CAPITAL NOTES (NVCC) |
||
| DBRS |
BBB(high) | |
| Fitch |
BBB+ | |
| Moody’s |
Baa3(hyb) | |
| Standard & Poor’s |
BBB- | |
| NON-CUMULATIVE PREFERRED SHARES (NVCC) |
||
| DBRS |
Pfd-2 | |
| Fitch |
BBB+ | |
| Moody’s |
Baa3(hyb) | |
| Standard & Poor’s |
BBB-/P-2(low)(3) | |
| (1) | Subject to the Canadian Bank Recapitalization (Bail-in) regime |
| (2) | Excluding instruments with Non-Viability Contingent Capital Features |
| (3) | Canadian Scale |
Credit ratings are one of the factors that impact the Bank’s access to capital markets and the terms on which it can conduct derivatives, hedging transactions and borrow funds. The credit ratings and outlook that the rating agencies assign to the Bank are based on their own views and methodologies.
The Bank continues to have strong credit ratings and its deposits and legacy senior debt are rated AA by DBRS, Aa2 by Moody’s, AA by Fitch and A+ by Standard and Poor’s (S&P). The Bank’s bail-inable senior debt is rated AA (low) by DBRS, A2 by Moody’s, AA- by Fitch and A- by S&P. As of October 31, 2023, all such rating agencies have a Stable outlook on the Bank.
Credit ratings are not recommendations to purchase, sell or hold a security and are subject to revision or withdrawal at any time by the rating agency.
2023 Scotiabank Annual Report | 235
Additional information
| CORPORATE HEADQUARTERS | FOR FURTHER INFORMATION | |
| Scotiabank | Customer Service Centre | |
| 40 Temperance Street Toronto, Ontario Canada M5H 0B4 Tel: (416) 866-6161 E-mail: email@scotiabank.com
|
1-800-4-SCOTIA | |
|
Investors Financial Analysts, Portfolio Managers and other Institutional Investors |
||
| Scotiabank | ||
| 40 Temperance Street, Toronto, Ontario | ||
| Canada M5H 0B4 | ||
| Tel: (416) 775-0798
|
||
| E-mail: investor.relations@scotiabank.com | ||
|
Online |
||
| For product, corporate, financial and shareholder information: www.scotiabank.com
|
||
| Global Communications | ||
| Scotiabank | ||
| 40 Temperance Street, Toronto, Ontario | ||
| Canada M5H 0B4
|
||
| E-mail: corporate.communications@scotiabank.com
|
||
| Shareholder Services | ||
| Transfer Agent and Registrar Main Agent | ||
| Computershare Trust Company of Canada | ||
| 100 University Avenue, 8th Floor, Toronto, Ontario Canada M5J 2Y1 |
||
| Tel: 1-877-982-8767
|
||
| E-mail: service@computershare.com | ||
| Co-Transfer Agent (U.S.A.) | ||
| Computershare Trust Company, N.A. Tel: 1-781-575-2000 Fax: 1-781-575-2044
E-mail: service@computershare.com
Street/Courier address: C/O Shareholder Services 150 Royall Street, Canton, MA 02021
Mailing address: PO Box 43078 Providence, RI 02940-3078 |
||
| Corporate Secretary’s Department | ||
| Scotiabank | ||
| 40 Temperance Street, Toronto, Ontario | ||
| Canada M5H 0B4 | ||
| Tel: (416) 866-3672
|
||
| E-mail: corporate.secretary@scotiabank.com | ||
|
|
||
236 | 2023 Scotiabank Annual Report
ENHANCED DISCLOSURE TASK FORCE (EDTF) RECOMMENDATIONS
The Enhanced Disclosure Task Force (EDTF) was established by the Financial Stability Board in May 2012 with the goal of developing fundamental disclosure principles. On October 29, 2012 the EDTF published its report, “Enhancing the Risk Disclosures of Banks,” which sets forth recommendations around improving risk disclosures and identifies existing leading practice risk disclosures.
Below is the index of all these recommendations to facilitate easy reference in the Bank’s annual report and other public disclosure documents available on www.scotiabank.com/investorrelations.
|
Reference Table for EDTF |
||||||||||||||||||||
|
Pages |
||||||||||||||||||||
| Type of risk | Number | Disclosure | MD&A | Financial Statements |
Supplementary Regulatory Capital Disclosures |
|||||||||||||||
| General | 1 | The index of risks to which the business is exposed. | 16 | |||||||||||||||||
| 2 | The Bank’s risk to terminology, measures and key parameters. | 75-79 | ||||||||||||||||||
| 3 | Top and emerging risks, and the changes during the reporting period. | 81-82, 86-93 | ||||||||||||||||||
| 4 | Discussion on the regulatory development and plans to meet new regulatory ratios. | |
56-59, 101-104, 117-119 |
|
||||||||||||||||
| Risk governance, risk management and business model |
5 | The Bank’s Risk Governance structure. | 73-75 | |||||||||||||||||
| 6 | Description of risk culture and procedures applied to support the culture. | 75-79 | ||||||||||||||||||
| 7 | Description of key risks from the Bank’s business model. | 80 | ||||||||||||||||||
| 8 | Stress testing use within the Bank’s risk governance and capital management. | 76-77 | ||||||||||||||||||
| Capital Adequacy and risk-weighted assets |
9 | Pillar 1 capital requirements, and the impact for global systemically important banks. | 56-59 | 210 | 4, 5 | |||||||||||||||
| 10 | a) Regulatory capital components. | 60 | 23-25 | |||||||||||||||||
| b) Reconciliation of the accounting balance sheet to the regulatory balance sheet. | 19-20 | |||||||||||||||||||
| 11 | Flow statement of the movements in regulatory capital since the previous reporting period, including changes in common equity tier 1, additional tier 1 and tier 2 capital. | 61-62 | 98 | |||||||||||||||||
| 12 | Discussion of targeted level of capital, and the plans on how to establish this. | 56-59 | ||||||||||||||||||
| 13 | Analysis of risk-weighted assets by risk type, business, and market risk RWAs. | 64-68, 80, 127 | 179, 233 | |
7, 38-40, 44-61, 74-79, 83, 101, 107 |
|
||||||||||||||
| 14 | Analysis of the capital requirements for each Basel asset class. | 64-68 | |
179, 227-233 |
|
|
17-18, 38-62 72-79, 83, 88-91 |
|
||||||||||||
| 15 | Tabulate credit risk in the Banking Book. | 64-68 | 228 | 17-18, 38-62, 88-91 | ||||||||||||||||
| 16 | Flow statements reconciling the movements in risk-weighted assets for each risk-weighted asset type. | 64-68 | 63, 82, 100 | |||||||||||||||||
| 17 | Discussion of Basel III Back-testing requirement including credit risk model performance and validation. | 65-67 | 64-67, 105 | |||||||||||||||||
| Liquidity Funding | 18 | Analysis of the Bank’s liquid assets. | 98-104 | |||||||||||||||||
| 19 | Encumbered and unencumbered assets analyzed by balance sheet category. | 101 | ||||||||||||||||||
| 20 | Consolidated total assets, liabilities and off-balance sheet commitments analyzed by remaining contractual maturity at the balance sheet date. | 105-107 | ||||||||||||||||||
| 21 | Analysis of the Bank’s sources of funding and a description of the Bank’s funding strategy. | 104-105 | ||||||||||||||||||
| Market Risk | 22 | Linkage of market risk measures for trading and non-trading portfolios and the balance sheet. | 97-98 | |||||||||||||||||
| 23 | Discussion of significant trading and non-trading market risk factors. | 93-98 | 232-233 | |||||||||||||||||
| 24 | Discussion of changes in period on period VaR results as well as VaR assumptions, limitations, backtesting and validation. | 93-98 | 232-233 | |||||||||||||||||
| 25 | Other risk management techniques e.g. stress tests, stressed VaR, tail risk and market liquidity horizon. | 93-98 | 233 | |||||||||||||||||
| Credit Risk | 26 | Analysis of the aggregate credit risk exposures, including details of both personal and wholesale lending. | 86-93, 121-127 | |
189-190, 229-231 |
|
|
7, 38-40, 44-61, 74-79 |
|
|||||||||||
| 27 | Discussion of the policies for identifying impaired loans, defining impairments and renegotiated loans, and explaining loan forbearance policies. | |
158-160, 190 |
|
||||||||||||||||
| 28 | Reconciliations of the opening and closing balances of impaired loans and impairment allowances during the year. | |
89, 121-122, 124-125 |
|
190 | 35-36 | ||||||||||||||
| 29 | Analysis of counterparty credit risk that arises from derivative transactions. | 84-85 | 177-180 | 106 | ||||||||||||||||
| 30 | Discussion of credit risk mitigation, including collateral held for all sources of credit risk. | 84-85, 90 | ||||||||||||||||||
| Other risks | 31 | Quantified measures of the management of operational risk. | 68, 108 | |||||||||||||||||
| 32 | Discussion of publicly known risk items. | 72 | ||||||||||||||||||
16 | 2023 Scotiabank Annual Report
| Management’s Discussion and Analysis
|
Management’s Discussion and Analysis (MD&A) is provided to enable readers to assess the Bank’s financial condition and results of operations as at and for the year ended October 31, 2023. The MD&A should be read in conjunction with the Bank’s 2023 Consolidated Financial Statements, including the Notes. This MD&A is dated November 28, 2023.
Additional information relating to the Bank, including the Bank’s 2023 Annual Report, are available on the Bank’s website at www.scotiabank.com. As well, the Bank’s 2023 Annual Report and Annual Information Form are available on the SEDAR+ website at www.sedarplus.ca and on the EDGAR section of the SEC’s website at www.sec.gov.
2023 Scotiabank Annual Report | 17
Management’s Discussion and Analysis
From time to time, our public communications include oral or written forward-looking statements. Statements of this type are included in this document, and may be included in other filings with Canadian securities regulators or the U.S. Securities and Exchange Commission (SEC), or in other communications. In addition, representatives of the Bank may include forward-looking statements orally to analysts, investors, the media and others. All such statements are made pursuant to the “safe harbor” provisions of the U.S. Private Securities Litigation Reform Act of 1995 and any applicable Canadian securities legislation. Forward-looking statements may include, but are not limited to, statements made in this document, the Management’s Discussion and Analysis in the Bank’s 2023 Annual Report under the headings “Outlook” and in other statements regarding the Bank’s objectives, strategies to achieve those objectives, the regulatory environment in which the Bank operates, anticipated financial results, and the outlook for the Bank’s businesses and for the Canadian, U.S. and global economies. Such statements are typically identified by words or phrases such as “believe,” “expect,” “aim,” “achieve,” “foresee,” “forecast,” “anticipate,” “intend,” “estimate,” “plan,” “goal,” “strive,” “target,” “project,” “commit,” “objective,” and similar expressions of future or conditional verbs, such as “will,” “may,” “should,” “would,” “might,” “can” and “could” and positive and negative variations thereof.
By their very nature, forward-looking statements require us to make assumptions and are subject to inherent risks and uncertainties, which give rise to the possibility that our predictions, forecasts, projections, expectations or conclusions will not prove to be accurate, that our assumptions may not be correct and that our financial performance objectives, vision and strategic goals will not be achieved.
We caution readers not to place undue reliance on these statements as a number of risk factors, many of which are beyond our control and effects of which can be difficult to predict, could cause our actual results to differ materially from the expectations, targets, estimates or intentions expressed in such forward-looking statements.
The future outcomes that relate to forward-looking statements may be influenced by many factors, including but not limited to: general economic and market conditions in the countries in which we operate and globally; changes in currency and interest rates; increased funding costs and market volatility due to market illiquidity and competition for funding; the failure of third parties to comply with their obligations to the Bank and its affiliates; changes in monetary, fiscal, or economic policy and tax legislation and interpretation; changes in laws and regulations or in supervisory expectations or requirements, including capital, interest rate and liquidity requirements and guidance, and the effect of such changes on funding costs; geopolitical risk; changes to our credit ratings; the possible effects on our business of war or terrorist actions and unforeseen consequences arising from such actions; technological changes and technology resiliency; operational and infrastructure risks; reputational risks; the accuracy and completeness of information the Bank receives on customers and counterparties; the timely development and introduction of new products and services, and the extent to which products or services previously sold by the Bank require the Bank to incur liabilities or absorb losses not contemplated at their origination; our ability to execute our strategic plans, including the successful completion of acquisitions and dispositions, including obtaining regulatory approvals; critical accounting estimates and the effect of changes to accounting standards, rules and interpretations on these estimates; global capital markets activity; the Bank’s ability to attract, develop and retain key executives; the evolution of various types of fraud or other criminal behaviour to which the Bank is exposed; anti-money laundering; disruptions or attacks (including cyberattacks) on the Bank’s information technology, internet connectivity, network accessibility, or other voice or data communications systems or services; which may result in data breaches, unauthorized access to sensitive information, and potential incidents of identity theft; increased competition in the geographic and in business areas in which we operate, including through internet and mobile banking and non-traditional competitors; exposure related to significant litigation and regulatory matters; climate change and other environmental and social risks, including sustainability that may arise, including from the Bank’s business activities; the occurrence of natural and unnatural catastrophic events and claims resulting from such events; inflationary pressures; Canadian housing and household indebtedness; the emergence or continuation of widespread health emergencies or pandemics, including their impact on the global economy, financial market conditions and the Bank’s business, results of operations, financial condition and prospects; and the Bank’s anticipation of and success in managing the risks implied by the foregoing. A substantial amount of the Bank’s business involves making loans or otherwise committing resources to specific companies, industries or countries. Unforeseen events affecting such borrowers, industries or countries could have a material adverse effect on the Bank’s financial results, businesses, financial condition or liquidity. These and other factors may cause the Bank’s actual performance to differ materially from that contemplated by forward-looking statements. The Bank cautions that the preceding list is not exhaustive of all possible risk factors and other factors could also adversely affect the Bank’s results, for more information, please see the “Risk Management” section of the Bank’s 2023 Annual Report, as may be updated by quarterly reports.
Material economic assumptions underlying the forward-looking statements contained in this document are set out in the 2023 Annual Report under the headings “Outlook”, as updated by quarterly reports. The “Outlook” and “2024 Priorities” sections are based on the Bank’s views and the actual outcome is uncertain. Readers should consider the above-noted factors when reviewing these sections. When relying on forward-looking statements to make decisions with respect to the Bank and its securities, investors and others should carefully consider the preceding factors, other uncertainties and potential events.
Any forward-looking statements contained in this document represent the views of management only as of the date hereof and are presented for the purpose of assisting the Bank’s shareholders and analysts in understanding the Bank’s financial position, objectives and priorities, and anticipated financial performance as at and for the periods ended on the dates presented, and may not be appropriate for other purposes. Except as required by law, the Bank does not undertake to update any forward-looking statements, whether written or oral, that may be made from time to time by or on its behalf.
Additional information relating to the Bank, including the Bank’s Annual Information Form, can be located on the SEDAR+ website at www.sedarplus.ca and on the EDGAR section of the SEC’s website at www.sec.gov.
November 28, 2023
18 | 2023 Scotiabank Annual Report
T1 Financial highlights
| As at and for the years ended October 31 | 2023 | 2022 | ||||||
| Operating results ($ millions) |
||||||||
| Net interest income |
18,287 | 18,115 | ||||||
| Non-interest income |
14,020 | 13,301 | ||||||
| Total revenue |
32,307 | 31,416 | ||||||
| Provision for credit losses |
3,422 | 1,382 | ||||||
| Non-interest expenses |
19,131 | 17,102 | ||||||
| Income tax expense |
2,226 | 2,758 | ||||||
| Net income |
7,528 | 10,174 | ||||||
| Net income attributable to common shareholders |
6,991 | 9,656 | ||||||
| Operating performance |
||||||||
| Basic earnings per share ($) |
5.84 | 8.05 | ||||||
| Diluted earnings per share ($) |
5.78 | 8.02 | ||||||
| Return on equity (%)(1) |
10.4 | 14.8 | ||||||
| Return on tangible common equity (%)(2) |
13.0 | 18.6 | ||||||
| Productivity ratio (%)(1) |
59.2 | 54.4 | ||||||
| Operating leverage (%)(1) |
(9.0 | ) | (2.4 | ) | ||||
| Net interest margin (%)(2) |
2.12 | 2.20 | ||||||
| Financial position information ($ millions) |
||||||||
| Cash and deposits with financial institutions |
90,312 | 65,895 | ||||||
| Trading assets |
117,868 | 113,154 | ||||||
| Loans |
750,911 | 744,987 | ||||||
| Total assets |
1,410,789 | 1,349,418 | ||||||
| Deposits |
952,333 | 916,181 | ||||||
| Common equity |
68,853 | 65,150 | ||||||
| Preferred shares and other equity instruments |
8,075 | 8,075 | ||||||
| Assets under administration(1) |
673,550 | 641,636 | ||||||
| Assets under management(1) |
316,604 | 311,099 | ||||||
| Capital and liquidity measures |
||||||||
| Common Equity Tier 1 (CET1) capital ratio (%)(3) |
13.0 | 11.5 | ||||||
| Tier 1 capital ratio (%)(3) |
14.8 | 13.2 | ||||||
| Total capital ratio (%)(3) |
17.2 | 15.3 | ||||||
| Total loss absorbing capacity (TLAC) ratio (%)(4) |
30.6 | 27.4 | ||||||
| Leverage ratio (%)(5) |
4.2 | 4.2 | ||||||
| TLAC Leverage ratio (%)(4) |
8.6 | 8.8 | ||||||
| Risk-weighted assets ($ millions)(3) |
440,017 | 462,448 | ||||||
| Liquidity coverage ratio (LCR) (%)(6) |
136 | 119 | ||||||
| Net stable funding ratio (NSFR) (%)(7) |
116 | 111 | ||||||
| Credit quality |
||||||||
| Net impaired loans ($ millions) |
3,845 | 3,151 | ||||||
| Allowance for credit losses ($ millions)(8) |
6,629 | 5,499 | ||||||
| Gross impaired loans as a % of loans and acceptances(1) |
0.74 | 0.62 | ||||||
| Net impaired loans as a % of loans and acceptances(1) |
0.50 | 0.41 | ||||||
| Provision for credit losses as a % of average net loans and acceptances(1)(9) |
0.44 | 0.19 | ||||||
| Provision for credit losses on impaired loans as a % of average net loans and acceptances(1)(9) |
0.35 | 0.24 | ||||||
| Net write-offs as a % of average net loans and acceptances(1) |
0.32 | 0.24 | ||||||
| Adjusted results(2) |
||||||||
| Adjusted net income ($ millions) |
8,441 | 10,749 | ||||||
| Adjusted diluted earnings per share ($) |
6.54 | 8.50 | ||||||
| Adjusted return on equity (%)(10) |
11.7 | 15.7 | ||||||
| Adjusted return on tangible common equity (%)(10) |
14.5 | 19.6 | ||||||
| Adjusted productivity ratio (%) |
57.2 | 52.8 | ||||||
| Adjusted operating leverage (%) |
(8.3 | ) | (1.1 | ) | ||||
| Common share information |
||||||||
| Closing share price ($) (TSX) |
56.15 | 65.85 | ||||||
| Shares outstanding (millions) |
||||||||
| Average – Basic |
1,197 | 1,199 | ||||||
| Average – Diluted |
1,204 | 1,208 | ||||||
| End of period |
1,214 | 1,191 | ||||||
| Dividends paid per share ($) |
4.18 | 4.06 | ||||||
| Dividend yield (%)(1) |
6.5 | 5.1 | ||||||
| Market capitalization ($ millions) (TSX) |
68,169 | 78,452 | ||||||
| Book value per common share ($)(1) |
56.71 | 54.68 | ||||||
| Market value to book value multiple(1) |
1.0 | 1.2 | ||||||
| Price to earnings multiple (trailing 4 quarters)(1) |
9.6 | 8.2 | ||||||
| Other information |
||||||||
| Employees (full-time equivalent) |
89,483 | 90,979 | ||||||
| Branches and offices(11) |
2,379 | 2,439 | ||||||
| (1) | Refer to Glossary on page 136 for the description of the measure. |
| (2) | Refer to Non-GAAP Measures section starting on page 20. |
| (3) | 2023 regulatory capital ratios are based on Revised Basel III requirements as determined in accordance with OSFI Guideline – Capital Adequacy Requirements (February 2023). Prior period regulatory capital ratios were prepared in accordance with OSFI Guideline – Capital Adequacy Requirements (November 2018). |
| (4) | This measure has been disclosed in this document in accordance with OSFI Guideline – Total Loss Absorbing Capacity (September 2018). |
| (5) | 2023 leverage ratios are based on Revised Basel III requirements as determined in accordance with OSFI Guideline – Leverage Requirements (February 2023). Prior period leverage ratios were prepared in accordance with OSFI Guideline – Leverage Requirements (November 2018). |
| (6) | This measure has been disclosed in this document in accordance with OSFI Guideline – Public Disclosure Requirements for Domestic Systemically Important Banks on Liquidity Coverage Ratio (April 2015). |
| (7) | This measure has been disclosed in this document in accordance with OSFI Guideline – Net Stable Funding Ratio Disclosure Requirements (January 2021). |
| (8) | Includes allowance for credit losses on all financial assets – loans, acceptances, off-balance sheet exposures, debt securities, and deposits with financial institutions. |
| (9) | Includes provision for credit losses on certain financial assets – loans, acceptances, and off-balance sheet exposures. |
| (10) | Prior period amounts have been restated to align with current period calculation. |
| (11) | Prior period amounts have been restated to include MD Financial and Jarislowsky Fraser offices. |
2023 Scotiabank Annual Report | 19
Management’s Discussion and Analysis
The Bank uses a number of financial measures and ratios to assess its performance, as well as the performance of its operating segments. Some of these financial measures and ratios are presented on a non-GAAP basis and are not calculated in accordance with Generally Accepted Accounting Principles (GAAP), which are based on International Financial Reporting Standards (IFRS) as issued by the International Accounting Standards Board (IASB), are not defined by GAAP and do not have standardized meanings and therefore might not be comparable to similar financial measures and ratios disclosed by other issuers. The Bank believes that non-GAAP measures and ratios are useful as they provide readers with a better understanding of how management assesses performance. These non-GAAP measures and ratios are used throughout this report and are defined below.
Adjusted results and adjusted diluted earnings per share
The following table presents a reconciliation of GAAP reported financial results to non-GAAP adjusted financial results. Management considers both reported and adjusted results and measures useful in assessing underlying ongoing business performance. Adjusted results and measures remove certain specified items from revenue, non-interest expenses, income taxes and non-controlling interest. Presenting results on both a reported basis and adjusted basis allows readers to assess the impact of certain items on results for the periods presented, and to better assess results and trends excluding those items that may not be reflective of ongoing business performance.
T2 Reconciliation of reported and adjusted results and diluted earnings per share
| As at October 31 ($ millions) | 2023 | 2022 | ||||||
| Reported Results |
||||||||
| Net interest income |
$ | 18,287 | $ | 18,115 | ||||
| Non-interest income |
14,020 | 13,301 | ||||||
| Total revenue |
32,307 | 31,416 | ||||||
| Provision for credit losses |
3,422 | 1,382 | ||||||
| Non-interest expenses |
19,131 | 17,102 | ||||||
| Income before taxes |
9,754 | 12,932 | ||||||
| Income tax expense |
2,226 | 2,758 | ||||||
| Net income |
$ | 7,528 | $ | 10,174 | ||||
| Net income attributable to non-controlling interests in subsidiaries (NCI) |
118 | 258 | ||||||
| Net income attributable to equity holders |
7,410 | 9,916 | ||||||
| Net income attributable to preferred shareholders and other equity instrument holders |
419 | 260 | ||||||
| Net income attributable to common shareholders |
$ | 6,991 | $ | 9,656 | ||||
| Diluted earnings per share (in dollars) |
$ | 5.78 | $ | 8.02 | ||||
| Weighted average number of diluted common shares outstanding (millions) |
1,204 | 1,208 | ||||||
| Adjustments |
||||||||
| Adjusting items impacting non-interest income and total revenue (Pre-tax) |
||||||||
| Divestitures and wind-down of operations |
$ | (367 | ) | $ | 361 | |||
| Adjusting items impacting non-interest expenses (Pre-tax) |
||||||||
| Restructuring charge and severance provisions |
354 | 85 | ||||||
| Consolidation of real estate and contract termination costs |
87 | – | ||||||
| Impairment of non-financial assets |
346 | – | ||||||
| Amortization of acquisition-related intangible assets |
81 | 97 | ||||||
| Support costs for the Scene+ loyalty program |
– | 133 | ||||||
| Total non-interest expense adjusting items (Pre-tax) |
$ | 868 | $ | 315 | ||||
| Total impact of adjusting items on net income before taxes |
501 | 676 | ||||||
| Impact of adjusting items on income tax expense |
||||||||
| Divestitures and wind-down of operations |
48 | (21 | ) | |||||
| Restructuring charge and severance provisions |
(96 | ) | (19 | ) | ||||
| Consolidation of real estate and contract termination costs |
(24 | ) | – | |||||
| Impairment of non-financial assets |
(73 | ) | – | |||||
| Canada recovery dividend |
579 | – | ||||||
| Amortization of acquisition-related intangible assets |
(22 | ) | (26 | ) | ||||
| Support costs for the Scene+ loyalty program |
– | (35 | ) | |||||
| Total impact of adjusting items on income tax expense |
412 | (101 | ) | |||||
| Total impact of adjusting items on net income |
913 | 575 | ||||||
| Impact of adjusting items on NCI |
(3 | ) | (1 | ) | ||||
| Total impact of adjusting items on net income attributable to equity holders and common shareholders |
$ | 910 | $ | 574 | ||||
| Adjusted Results |
||||||||
| Net interest income |
$ | 18,287 | $ | 18,115 | ||||
| Non-interest income |
13,653 | 13,662 | ||||||
| Total revenue |
31,940 | 31,777 | ||||||
| Provision for credit losses |
3,422 | 1,382 | ||||||
| Non-interest expenses |
18,263 | 16,787 | ||||||
| Income before taxes |
10,255 | 13,608 | ||||||
| Income tax expense |
1,814 | 2,859 | ||||||
| Net income |
$ | 8,441 | $ | 10,749 | ||||
| Net income attributable to NCI |
121 | 259 | ||||||
| Net income attributable to equity holders |
8,320 | 10,490 | ||||||
| Net income attributable to preferred shareholders and other equity instrument holders |
419 | 260 | ||||||
| Net income attributable to common shareholders |
$ | 7,901 | $ | 10,230 | ||||
| Diluted earnings per share (in dollars) |
$ | 6.54 | $ | 8.50 | ||||
| Impact of adjustments on diluted earnings per share (in dollars) |
$ | 0.76 | $ | 0.48 | ||||
| Weighted average number of diluted common shares outstanding (millions) |
1,204 | 1,208 | ||||||
20 | 2023 Scotiabank Annual Report
| 1. | The Bank’s Q4 2023 and fiscal 2023 reported results were adjusted for the following items. These amounts were recorded in the Other operating segment. |
| a) | Divestitures and wind-down of operations |
The Bank sold its 20% equity interest in Canadian Tire’s Financial Services business (CTFS) to Canadian Tire Corporation. The sale resulted in a net gain of $367 million ($319 million after-tax). For further details, please refer to Note 36 of the Consolidated Financial Statements.
| b) | Restructuring charge and severance provisions |
The Bank recorded a restructuring charge and severance provisions of $354 million ($258 million after-tax) related to workforce reductions and changes as a result of the Bank’s end-to-end digitization, automation, changes in customers’ day-to-day banking preferences, as well as the ongoing efforts to streamline operational processes and optimize distribution channels.
| c) | Consolidation of real estate and contract termination costs |
The Bank recorded costs of $87 million ($63 million after-tax), related to the consolidation and exit of certain real estate premises, as well as service contract termination costs, as part of the Bank’s optimization strategy.
| d) | Impairment of non-financial assets |
The Bank recorded impairment charges of $185 million ($159 million after-tax) related to its investment in associate, Bank of Xi’an Co. Ltd. in China whose market value has remained below the Bank’s carrying value for a prolonged period. For further details, refer to Note 17 of the Consolidated Financial Statements. Impairment of intangible assets, including software, of $161 million ($114 million after-tax) was also recognized.
| 2. | The Q1 2023 and fiscal 2023 reported results were adjusted for the following items. These amounts were recorded in the Other operating segment. |
| a) | Canada Recovery Dividend |
The Bank recognized an additional income tax expense of $579 million reflecting the present value of the amount payable for the Canada Recovery Dividend (CRD) in Q1 2023. The CRD is a Canadian federal tax measure which requires the Bank to pay a one-time tax of 15% on taxable income in excess of $1 billion, based on the average taxable income for the 2020 and 2021 taxation years. The CRD is payable in equal amounts over five years; however, the present value of these payments was recognized as a liability in the period enacted.
| 3. | All reported periods were adjusted for: |
| a) | Amortization of acquisition-related intangible assets |
These costs relate to the amortization of intangible assets recognized upon the acquisition of businesses, excluding software, and are recorded in the Canadian Banking, International Banking and Global Wealth Management operating segments.
| 4. | Fiscal 2022 reported results were adjusted for the following items. These amounts were recorded in the Other operating segment. |
| a) | Restructuring charge – The Bank recorded a restructuring charge of $85 million ($66 million after-tax) in the prior year related to the realignment of the Global Banking and Markets businesses in Asia Pacific and reductions in technology employees, driven by ongoing technology modernization and digital transformation. |
| b) | Divestitures and wind-down of operations – The Bank sold investments in associates in Venezuela and Thailand. Additionally, the Bank wound down its operations in India and Malaysia in relation to its realignment of the business in the Asia Pacific region. Collectively, the sale and wind-down of these entities resulted in a net loss of $361 million ($340 million after-tax), of which $315 million ($294 million after-tax) related to the reclassification of cumulative foreign currency translation losses net of hedges, from accumulated other comprehensive income to non-interest income in the Consolidated Statement of Income. For further details on these transactions, please refer to Note 36 of the Consolidated Financial Statements. |
| c) | Support costs for the Scene+ loyalty program – In the prior year, the Bank recorded costs of $133 million ($98 million after-tax) to support the expansion of the Scene+ loyalty program to include Empire Company Limited as a partner. |
T3 Impact of adjustments
| For the three months ended October 31, 2023 |
For the year ended | |||||||||||||||||||||||
| 2023 | 2022 | |||||||||||||||||||||||
| ($ millions) | Pre-tax | After-tax | Pre-tax | After-tax | Pre-tax | After-tax | ||||||||||||||||||
| Divestitures and wind-down of operations |
$ | (367 | ) | $ | (319 | ) | $ | (367 | ) | $ | (319 | ) | $ | 361 | $ | 340 | ||||||||
| Restructuring charge and severance provisions |
354 | 258 | 354 | 258 | 85 | 66 | ||||||||||||||||||
| Consolidation of real estate and contract termination costs |
87 | 63 | 87 | 63 | – | – | ||||||||||||||||||
| Impairment of non-financial assets |
||||||||||||||||||||||||
| Investment in associates |
185 | 159 | 185 | 159 | – | – | ||||||||||||||||||
| Intangible assets including software |
161 | 114 | 161 | 114 | – | – | ||||||||||||||||||
| Canada recovery dividend |
– | – | – | 579 | – | – | ||||||||||||||||||
| Amortization of acquisition-related intangible assets |
19 | 14 | 81 | 59 | 97 | 71 | ||||||||||||||||||
| Support costs for the Scene+ loyalty program |
– | – | – | – | 133 | 98 | ||||||||||||||||||
| Total |
$ | 439 | $ | 289 | $ | 501 | $ | 913 | 676 | $ | 575 | |||||||||||||
| Diluted EPS Impact |
$ | 0.24 | $ | 0.76 | $ | 0.48 | ||||||||||||||||||
| CET1 Impact(1) |
6 bps | (6 bps | ) | (2 bps | ) | |||||||||||||||||||
| (1) | Including related impacts on regulatory capital and risk-weighted assets. |
2023 Scotiabank Annual Report | 21
Management’s Discussion and Analysis
T4 Reconciliation of reported and adjusted results by business line
| For the year ended October 31, 2023(1) | ||||||||||||||||||||||||
| ($ millions) | Canadian Banking |
International Banking |
Global Wealth Management |
Global Banking and Markets |
Other | Total | ||||||||||||||||||
| Reported net income (loss) |
$ | 4,019 | $ | 2,598 | $ | 1,440 | $ | 1,768 | $ | (2,297 | ) | $ | 7,528 | |||||||||||
| Net income attributable to non-controlling interests in subsidiaries (NCI) |
– | 112 | 9 | – | (3 | ) | 118 | |||||||||||||||||
| Reported net income attributable to equity holders |
4,019 | 2,486 | 1,431 | 1,768 | (2,294 | ) | $ | 7,410 | ||||||||||||||||
| Reported net income attributable to preferred shareholders and other equity instrument holders |
3 | 5 | 3 | 3 | 405 | $ | 419 | |||||||||||||||||
| Reported net income attributable to common shareholders |
$ | 4,016 | $ | 2,481 | $ | 1,428 | $ | 1,765 | $ | (2,699 | ) | $ | 6,991 | |||||||||||
| Adjustments |
||||||||||||||||||||||||
| Adjusting items impacting non-interest income and total revenue (Pre-tax) |
||||||||||||||||||||||||
| Divestitures and wind-down of operations |
$ | – | $ | – | $ | – | $ | – | $ | (367 | ) | $ | (367 | ) | ||||||||||
| Adjusting items impacting non-interest expenses (Pre-tax) |
||||||||||||||||||||||||
| Restructuting charge and severance provisions |
– | – | – | – | 354 | 354 | ||||||||||||||||||
| Consolidation of real estate and contract termination costs |
– | – | – | – | 87 | 87 | ||||||||||||||||||
| Impairment of non-financial assets |
– | – | – | – | 346 | 346 | ||||||||||||||||||
| Amortization of acquisition-related intangible assets |
4 | 41 | 36 | – | – | 81 | ||||||||||||||||||
| Total non-interest expenses adjustments (Pre-tax) |
4 | 41 | 36 | – | 787 | 868 | ||||||||||||||||||
| Total impact of adjusting items on net income before taxes |
4 | 41 | 36 | – | 420 | 501 | ||||||||||||||||||
| Impact of adjusting items on income tax expense |
||||||||||||||||||||||||
| Canada recovery dividend |
– | – | – | – | 579 | 579 | ||||||||||||||||||
| Impact of other adjusting items on income tax expense |
(1 | ) | (11 | ) | (10 | ) | – | (145 | ) | (167 | ) | |||||||||||||
| Total impact of adjusting items on income tax expense |
(1 | ) | (11 | ) | (10 | ) | – | 434 | 412 | |||||||||||||||
| Total impact of adjusting items on net income |
3 | 30 | 26 | – | 854 | 913 | ||||||||||||||||||
| Impact of adjusting items on NCI |
– | – | – | – | (3 | ) | (3 | ) | ||||||||||||||||
| Total impact of adjusting items on net income attributable to equity holders and common shareholders |
3 | 30 | 26 | – | 851 | 910 | ||||||||||||||||||
| Adjusted net income (loss) |
$ | 4,022 | $ | 2,628 | $ | 1,466 | $ | 1,768 | $ | (1,443 | ) | $ | 8,441 | |||||||||||
| Adjusted net income attributable to equity holders |
$ | 4,022 | $ | 2,516 | $ | 1,457 | $ | 1,768 | $ | (1,443 | ) | $ | 8,320 | |||||||||||
| Adjusted net income attributable to common shareholders |
$ | 4,019 | $ | 2,511 | $ | 1,454 | $ | 1,765 | $ | (1,848 | ) | $ | 7,901 | |||||||||||
|
(1) Refer to Business Line Overview on page 39.
|
||||||||||||||||||||||||
| For the year ended October 31, 2022(1) | ||||||||||||||||||||||||
| ($ millions) | Canadian Banking |
International Banking |
Global Wealth Management |
Global Banking and Markets |
Other | Total | ||||||||||||||||||
| Reported net income (loss) |
$ | 4,763 | $ | 2,667 | $ | 1,565 | $ | 1,911 | $ | (732 | ) | $ | 10,174 | |||||||||||
| Net income attributable to non-controlling interests in subsidiaries (NCI) |
– | 249 | 9 | – | – | 258 | ||||||||||||||||||
| Reported net income attributable to equity holders |
4,763 | 2,418 | 1,556 | 1,911 | (732 | ) | 9,916 | |||||||||||||||||
| Reported net income attributable to preferred shareholders and other equity instrument holders |
6 | 6 | 3 | 4 | 241 | 260 | ||||||||||||||||||
| Reported net income attributable to common shareholders |
$ | 4,757 | $ | 2,412 | $ | 1,553 | $ | 1,907 | $ | (973 | ) | $ | 9,656 | |||||||||||
| Adjustments |
||||||||||||||||||||||||
| Adjusting items impacting non-interest income and total revenue (Pre-tax) |
||||||||||||||||||||||||
| Divestitures and wind-down of operations |
$ | – | $ | – | $ | – | $ | – | $ | 361 | $ | 361 | ||||||||||||
| Adjusting items impacting non-interest expenses (Pre-tax) |
||||||||||||||||||||||||
| Restructuring charge and severance provisions |
– | – | – | – | 85 | 85 | ||||||||||||||||||
| Support costs for the Scene+ loyalty program |
– | – | – | – | 133 | 133 | ||||||||||||||||||
| Amortization of acquisition-related intangible assets |
22 | 39 | 36 | – | – | 97 | ||||||||||||||||||
| Total non-interest expenses adjustments (Pre-tax) |
22 | 39 | 36 | – | 218 | 315 | ||||||||||||||||||
| Total impact of adjusting items on net income before taxes |
22 | 39 | 36 | – | 579 | 676 | ||||||||||||||||||
| Total impact of adjusting items on income tax expense |
(6 | ) | (11 | ) | (9 | ) | – | (75 | ) | (101 | ) | |||||||||||||
| Total impact of adjusting items on net income |
16 | 28 | 27 | – | 504 | 575 | ||||||||||||||||||
| Impact of adjusting items on NCI |
– | – | – | – | (1 | ) | (1 | ) | ||||||||||||||||
| Total impact of adjusting items on net income attributable to equity holders and common shareholders |
16 | 28 | 27 | – | 503 | 574 | ||||||||||||||||||
| Adjusted net income (loss) |
$ | 4,779 | $ | 2,695 | $ | 1,592 | $ | 1,911 | $ | (228 | ) | $ | 10,749 | |||||||||||
| Adjusted net income attributable to equity holders |
$ | 4,779 | $ | 2,446 | $ | 1,583 | $ | 1,911 | $ | (229 | ) | $ | 10,490 | |||||||||||
| Adjusted net income attributable to common shareholders |
$ | 4,773 | $ | 2,440 | $ | 1,580 | $ | 1,907 | $ | (470 | ) | $ | 10,230 | |||||||||||
| (1) | Refer to Business Line Overview on page 39. |
22 | 2023 Scotiabank Annual Report
Constant Dollar
International Banking business segment results are analyzed on a constant dollar basis which is a non-GAAP measure. Under the constant dollar basis, prior period amounts are recalculated using current period average foreign currency rates. The following table presents the reconciliation between reported, adjusted and constant dollar results for International Banking for prior periods. The Bank believes that constant dollar is useful for readers to understand business performance without the impact of foreign currency translation and is used by management to assess the performance of the business segment. The tables below are computed on a basis that is different than the table “Impact of foreign currency translation” in Overview of Performance on page 27.
T5 Reconciliation of International Banking’s reported and adjusted results and constant dollar results
| For the year ended October 31 ($ millions) | 2022 | |||||||||||
| (Taxable equivalent basis) | Reported results |
Foreign exchange |
Constant dollar results |
|||||||||
| Net interest income |
$ | 6,900 | $ | (581 | ) | $ | 7,481 | |||||
| Non-interest income |
2,827 | (80 | ) | 2,907 | ||||||||
| Total revenue |
9,727 | (661 | ) | 10,388 | ||||||||
| Provision for credit losses |
1,230 | (95 | ) | 1,325 | ||||||||
| Non-interest expenses |
5,212 | (372 | ) | 5,584 | ||||||||
| Income tax expense |
618 | (23 | ) | 641 | ||||||||
| Net Income |
$ | 2,667 | $ | (171 | ) | $ | 2,838 | |||||
| Net income attributable to non-controlling interest in subsidiaries |
$ | 249 | $ | (12 | ) | $ | 261 | |||||
| Net income attributable to equity holders of the Bank |
$ | 2,418 | $ | (159 | ) | $ | 2,577 | |||||
| Other measures |
||||||||||||
| Average assets ($ billions) |
$ | 207 | $ | (15 | ) | $ | 222 | |||||
| Average liabilities ($ billions) |
$ | 152 | $ | (12 | ) | $ | 164 | |||||
| For the year ended October 31 ($ millions) | 2022 | |||||||||||
| (Taxable equivalent basis) | Adjusted results |
Foreign exchange |
Constant dollar adjusted results |
|||||||||
| Net interest income |
$ | 6,900 | $ | (581 | ) | $ | 7,481 | |||||
| Non-interest income |
2,827 | (80 | ) | 2,907 | ||||||||
| Total revenue |
9,727 | (661 | ) | 10,388 | ||||||||
| Provision for credit losses |
1,230 | (95 | ) | 1,325 | ||||||||
| Non-interest expenses |
5,173 | (369 | ) | 5,542 | ||||||||
| Income tax expense |
629 | (24 | ) | 653 | ||||||||
| Net Income |
$ | 2,695 | $ | (173 | ) | $ | 2,868 | |||||
| Net income attributable to non-controlling interest in subsidiaries |
$ | 249 | $ | (12 | ) | $ | 261 | |||||
| Net income attributable to equity holders of the Bank |
$ | 2,446 | $ | (161 | ) | $ | 2,607 | |||||
Reconciliation of average total assets, core earning assets and core net interest income
Earning assets
Earning assets are defined as income generating assets which include deposits with financial institutions, trading assets, investment securities, investments in associates, securities borrowed or purchased under resale agreements, loans net of allowances, and customers’ liability under acceptances. This is a non-GAAP measure.
Non-earning assets
Non-earning assets are defined as cash, precious metals, derivative financial instruments, property and equipment, goodwill and other intangible assets, deferred tax assets and other assets. This is a non-GAAP measure.
Core earning assets
Core earning assets are defined as interest-bearing deposits with financial institutions, investment securities and loans net of allowances. This is a non-GAAP measure. The Bank believes that this measure is useful for readers as it presents the main interest-generating assets and eliminates the impact of trading businesses.
Core net interest income
Core net interest income is defined as net interest income earned from core earning assets. This is a non-GAAP measure.
Net interest margin
Net interest margin is calculated as core net interest income for the business line divided by average core earning assets. Net interest margin is a non-GAAP ratio.
2023 Scotiabank Annual Report | 23
Management’s Discussion and Analysis
T6 Reconciliation of average total assets, average earning assets, average core earning assets and net interest margin by business line
Consolidated Bank
| For the year ended October 31 (Unaudited) ($ millions) | 2023 | 2022 | ||||||
| Average total assets - Reported(1) |
$ | 1,395,843 | $ | 1,281,708 | ||||
| Less: Non-earning assets |
114,126 | 107,536 | ||||||
| Average total earning assets(1) |
$ | 1,281,717 | $ | 1,174,172 | ||||
| Less: |
||||||||
| Trading assets |
121,735 | 138,390 | ||||||
| Securities purchased under resale agreements |
||||||||
| and securities borrowed |
187,927 | 140,557 | ||||||
| Other deductions |
73,780 | 62,531 | ||||||
| Average core earning assets(1) |
$ | 898,275 | $ | 832,694 | ||||
| Net Interest Income - Reported |
$ | 18,287 | $ | 18,115 | ||||
| Less: Non-core net interest income |
(798 | ) | (185 | ) | ||||
| Core net interest income |
$ | 19,085 | $ | 18,300 | ||||
| Net interest margin |
2.12 | % | 2.20 | % | ||||
| (1) | Average balances represent the average of daily balances for the period. |
Canadian Banking
| For the year ended October 31 (Unaudited) ($ millions) | 2023 | 2022 | ||||||
| Average total assets - Reported(1) |
$ | 449,555 | $ | 429,528 | ||||
| Less: Non-earning assets |
4,035 | 4,092 | ||||||
| Average total earning assets(1) |
$ | 445,520 | $ | 425,436 | ||||
| Less: |
||||||||
| Other deductions |
29,273 | 23,482 | ||||||
| Average core earning assets(1) |
$ | 416,247 | $ | 401,954 | ||||
| Net Interest Income - Reported |
$ | 9,756 | $ | 9,001 | ||||
| Less: Non-core net interest income |
– | – | ||||||
| Core net interest income |
$ | 9,756 | $ | 9,001 | ||||
| Net interest margin |
2.34 | % | 2.24 | % | ||||
| (1) | Average balances represent the average of daily balances for the period. |
International Banking
| For the year ended October 31 (Unaudited) ($ millions) | 2023 | 2022 | ||||||
| Average total assets - Reported(1) |
$ | 236,688 | $ | 206,550 | ||||
| Less: Non-earning assets |
19,414 | 17,808 | ||||||
| Average total earning assets(1) |
$ | 217,274 | $ | 188,742 | ||||
| Less: |
||||||||
| Trading assets |
6,018 | 4,978 | ||||||
| Securities purchased under resale agreements |
||||||||
| and securities borrowed |
3,218 | 1,265 | ||||||
| Other deductions |
7,684 | 6,781 | ||||||
| Average core earning assets(1) |
$ | 200,354 | $ | 175,718 | ||||
| Net Interest Income - Reported |
$ | 8,161 | $ | 6,900 | ||||
| Less: Non-core net interest income |
(60 | ) | (66 | ) | ||||
| Core net interest income |
$ | 8,221 | $ | 6,966 | ||||
| Net interest margin |
4.10 | % | 3.96 | % | ||||
| (1) | Average balances represent the average of daily balances for the period. |
Return on equity
Return on equity is a profitability measure that presents the net income attributable to common shareholders as a percentage of average common shareholders’ equity.
The Bank attributes capital to its business lines on a basis that approximates 10.5% of Basel III common equity capital requirements which includes credit, market and operational risks and leverage inherent within each business segment.
Return on equity for the business segments is calculated as a ratio of net income attributable to common shareholders of the business segment and the capital attributed.
Adjusted return on equity is a non-GAAP ratio which represents adjusted net income attributable to common shareholders as a percentage of average common shareholders’ equity.
24 | 2023 Scotiabank Annual Report
Return on equity by operating segment
T7 Return on equity by operating segment
| For the year ended October 31, 2023 ($ millions) | Canadian Banking |
International Banking |
Global Wealth Management |
Global Banking and Markets |
Other | Total | ||||||||||||||||||
| Reported |
||||||||||||||||||||||||
| Net income (loss) attributable to common shareholders |
$ | 4,016 | $ | 2,481 | $ | 1,428 | $ | 1,765 | $ | (2,699 | ) | $ | 6,991 | |||||||||||
| Total average common equity(1) |
18,846 | 18,898 | 9,777 | 14,420 | 5,494 | 67,435 | ||||||||||||||||||
| Return on equity |
21.3 | % | 13.1 | % | 14.6 | % | 12.2 | % | nm | (2) | 10.4 | % | ||||||||||||
| Adjusted(3) |
||||||||||||||||||||||||
| Net income (loss) attributable to common shareholders |
4,019 | 2,511 | 1,454 | 1,765 | (1,848 | ) | 7,901 | |||||||||||||||||
| Return on equity |
21.3 | % | 13.3 | % | 14.9 | % | 12.2 | % | nm | (2) | 11.7 | % | ||||||||||||
| (1) | Average amounts calculated using methods intended to approximate the daily average balances for the period. |
| (2) | Not meaningful. |
| (3) | Refer to Tables on pages 20 and 22. |
| For the year ended October 31, 2022 ($ millions) | Canadian Banking |
International Banking |
Global Wealth Management |
Global Banking and Markets |
Other | Total | ||||||||||||||||||
| Reported |
||||||||||||||||||||||||
| Net income (loss) attributable to common shareholders |
$ | 4,757 | $ | 2,412 | $ | 1,553 | $ | 1,907 | $ | (973 | ) | $ | 9,656 | |||||||||||
| Total average common equity(1) |
18,105 | 18,739 | 9,576 | 13,328 | 5,442 | 65,190 | ||||||||||||||||||
| Return on equity |
26.3 | % | 12.9 | % | 16.2 | % | 14.3 | % | nm | (2) | 14.8 | % | ||||||||||||
| Adjusted(3) |
||||||||||||||||||||||||
| Net income (loss) attributable to common shareholders |
4,773 | 2,440 | 1,580 | 1,907 | (470 | ) | 10,230 | |||||||||||||||||
| Return on equity |
26.4 | % | 13.0 | % | 16.5 | % | 14.3 | % | nm | (2) | 15.7 | %(4) | ||||||||||||
| (1) | Average amounts calculated using methods intended to approximate the daily average balances for the period. |
| (2) | Not meaningful. |
| (3) | Refer to Tables on pages 20 and 22. |
| (4) | Prior period has been restated to align with current period calculation. |
Return on tangible common equity
Return on tangible common equity is a profitability measure that is calculated by dividing the net income attributable to common shareholders, adjusted for the amortization of intangibles (excluding software), by average tangible common equity. Tangible common equity is defined as common shareholders’ equity adjusted for goodwill and intangible assets (excluding software), net of deferred taxes. This is a non-GAAP ratio.
Adjusted return on tangible common equity represents adjusted net income attributable to common shareholders as a percentage of average tangible common equity. This is a non-GAAP ratio.
T8 Return on tangible common equity
| For the years ended October 31 ($ millions) | 2023 | 2022 | ||||||
| Reported |
||||||||
| Average common equity – reported(1) |
$ | 67,435 | $ | 65,190 | ||||
| Average goodwill(1)(2) |
(9,376 | ) | (9,197 | ) | ||||
| Average acquisition-related intangibles (net of deferred tax)(1) |
(3,731 | ) | (3,803 | ) | ||||
| Average tangible common equity(1) |
$ | 54,328 | $ | 52,190 | ||||
| Net income attributable to common shareholders – reported |
$ | 6,991 | $ | 9,656 | ||||
| Amortization of acquisition-related intangible assets (after-tax)(3) |
59 | 71 | ||||||
| Net income attributable to common shareholders adjusted for amortization of acquisition-related intangible assets (after-tax) |
$ | 7,050 | $ | 9,727 | ||||
| Return on tangible common equity(4) |
13.0 | % | 18.6 | % | ||||
| Adjusted(3) |
||||||||
| Adjusted net income attributable to common shareholders |
$ | 7,901 | $ | 10,230 | ||||
| Return on tangible common equity – adjusted(4)(5) |
14.5 | % | 19.6 | % | ||||
| (1) | Average amounts calculated using methods intended to approximate the daily average balances for the period. |
| (2) | Includes imputed goodwill from investments in associates. |
| (3) | Refer to Tables on pages 20 and 22. |
| (4) | Calculated on full dollar amounts. |
| (5) | Prior period has been restated to align with current period calculation. |
2023 Scotiabank Annual Report | 25
Management’s Discussion and Analysis
Adjusted productivity ratio
Adjusted productivity ratio represents adjusted non-interest expenses as a percentage of adjusted total revenue. This is a non-GAAP ratio.
Management uses the productivity ratio as a measure of the Bank’s efficiency. A lower ratio indicates improved productivity.
Adjusted operating leverage
This financial metric measures the rate of growth in adjusted total revenue less the rate of growth in adjusted non-interest expenses. This is a non-GAAP ratio.
Management uses operating leverage as a way to assess the degree to which the Bank can increase operating income by increasing revenue.
Trading-related revenue (Taxable equivalent basis)
Trading-related revenue consists of net interest income and non-interest income. Included are unrealized gains and losses on security positions held, realized gains and losses from the purchase and sale of securities, fees and commissions from securities borrowing and lending activities, and gains and losses on trading derivatives. Underwriting and other advisory fees, which are shown separately in the Consolidated Statement of Income, are excluded. Trading related revenue includes certain net interest income and non-interest income items on a taxable equivalent basis (TEB). This methodology grosses up tax-exempt income earned on certain securities to an equivalent before tax basis. This is a non-GAAP measure.
Management believes that this basis for measurement of trading-related revenue provides a uniform comparability of net interest income and non-interest income arising from both taxable and non-taxable sources and facilitates a consistent basis of measurement. While other banks also use TEB, their methodology may not be comparable to the Bank’s methodology.
Adjusted effective tax rate
The adjusted effective tax rate is calculated by dividing adjusted income tax expense by adjusted income before taxes. This is a non-GAAP ratio.
26 | 2023 Scotiabank Annual Report
Management’s Discussion and Analysis | Overview of Performance
Financial Results: 2023 vs 2022
Net income was $7,528 million in 2023, a decrease of 26% from $10,174 million in 2022, due primarily to higher provision for credit losses and non-interest expenses, partly offset by higher revenue and lower provision for income taxes. Diluted earnings per share (EPS) were $5.78 compared to $8.02. Return on equity was 10.4% compared to 14.8%.
Adjusting items impacting net income in the current year were a net charge of $913 million after-tax ($501 million pre-tax). Net impact of the adjusting items on diluted earnings per share was $0.76 and on Basel III Common Equity Tier 1 (CET1) ratio was negative six basis points. In the prior year, adjusting items were a net charge of $575 million after-tax ($676 million pre-tax). Refer to Non-GAAP Measures starting on page 20 for further details.
Adjusted net income was $8,441 million, a decrease of 21% from $10,749 million. The decrease was due primarily to higher provision for credit losses and non-interest expenses, partly offset by lower provision for income taxes. Adjusted diluted EPS were $6.54 compared to $8.50, and adjusted return on equity was 11.7% compared to 15.7%.
Net interest income was $18,287 million, an increase of $172 million or 1%. The increase was driven by loan growth across all business lines, higher margins in International Banking and Canadian Banking, as well as the positive impact of foreign currency translation. These increases were largely offset by a lower contribution from asset/liability management activities related to higher funding costs. Net interest margin was down eight basis points to 2.12%, driven primarily by a lower contribution from asset/liability management activities and higher funding costs in the Other Segment, partly offset by higher margins in International Banking and Canadian Banking.
Non-interest income was $14,020 million, an increase of $719 million or 5%. Adjusted non-interest income was $13,653 million, a decrease of $9 million due to lower trading and wealth management revenues, higher unrealized losses on non-trading derivatives, and lower income from associated corporations. These were largely offset by higher banking revenues, fees and commissions, and the positive impact of foreign currency translation.
The provision for credit losses was $3,422 million compared to $1,382 million last year, an increase of $2,040 million due to higher provision for credit losses on performing and impaired loans, across all business lines. While GDP growth has continued to be resilient in North America, and the Bank’s portfolio remains sound, there is continued uncertainty on what the impact of higher interest rates, resulting from policy tightening to address inflation, will have on consumers and the Bank’s portfolios. This has resulted in higher provisions on performing loans this year. The increase in provision for credit losses on impaired loans was due to lower formations in the prior year. The provision for credit losses ratio increased 25 basis points to 44 basis points.
Non-interest expenses were $19,131 million, an increase of $2,029 million or 12%. Adjusted non-interest expenses increased $1,476 million or 9%. This increase was due to higher personnel costs including inflationary adjustments and annual increases, as well as higher technology-related costs and advertising and business development costs to support business growth. Business and capital taxes and the unfavourable impact of foreign currency translation also contributed to the increase. This increase was partly offset by lower professional fees.
The effective tax rate was 22.8% compared to 21.3% in 2022 due primarily to the impact of the Canada Recovery Dividend (CRD) and the increase in the Canadian statutory tax rate this year, partly offset by higher tax-exempt income and higher income from lower tax rate jurisdictions. On an adjusted basis, the effective rate was 17.7% compared to 21% due to higher tax-exempt income and higher income from lower tax rate jurisdictions, partly offset by the increase in the Canadian statutory tax rate and lower inflationary adjustments.
The Basel III Common Equity Tier 1 (CET1) ratio was 13% as at October 31, 2023, compared to 11.5% last year.
Medium-term financial objectives
The following table provides a summary of our 2023 performance against our medium-term financial objectives(1):
| 2023 Results | ||||||||||||
| Reported | Adjusted(2) | |||||||||||
| Diluted earnings per share growth of 7%+ |
(27.9 | )% | (23.1)% | |||||||||
| Return on equity of 14%+ |
10.4 | % | 11.7% | |||||||||
| Achieve positive operating leverage |
Negative 9.0 | % | Negative 8.3% | |||||||||
| Maintain strong capital ratios |
CET1 capital ratio of 13.0 | % | N/A | |||||||||
| (1) | Refer to the Risk Management section for further discussion on the Bank’s risk management framework. |
| (2) | Refer to Non-GAAP Measures on page 20. |
|
In fiscal 2023, the total shareholder return on the Bank’s shares was (9.1)%, compared to the total return of the S&P/TSX Composite Index of 0.5%. The total compound annual shareholder return on the Bank’s shares over the past five years was 0.9%, and 3.7% over the past 10 years. This is below the total annual return of the S&P/TSX Composite Index over the past five years and ten years of 8.0% and 6.7%, respectively.
Dividends per share totaled $4.18 for the year, increased by 3% from 2022. The Bank’s target payout range is 40-50%. The dividend payout ratio for the year was 71.6%. The Board of Directors approved a quarterly dividend of $1.06 per common share, at its meeting on November 27, 2023. This quarterly dividend applies to shareholders of record at the close of business on January 3, 2024, and is payable January 29, 2024. |
C1 Closing common share price
|
2023 Scotiabank Annual Report | 27
Management’s Discussion and Analysis
T9 Shareholder returns
| For the years ended October 31 | 2023 | 2022 | ||||||
| Closing market price per common share ($) |
56.15 | 65.85 | ||||||
| Dividends paid ($ per share) |
4.18 | 4.06 | ||||||
| Dividend yield (%)(1) |
6.5 | 5.1 | ||||||
| Increase (decrease) in share price (%) |
(14.7 | ) | (18.8 | ) | ||||
| Total annual shareholder return (%)(1) |
(9.1 | ) | (14.5 | ) | ||||
| (1) | Refer to Glossary on page 136 for the description of the measure. |
| C2 | Return to common shareholders Share price appreciation plus dividends reinvested, 2013=100 |
|
|
The cumulative impact of higher policy interest rates around the world is now being felt widely across economies. The slowdown is expected to reinforce downward pressure on inflation in some countries and this will in turn allow central banks to end the tightening cycle. Rate cuts are already underway in some Pacific Alliance Countries, and rate cuts are expected in North America in the second half of 2024. Fears of a major recession appear to be overstated in most economies. We continue to expect the equivalent of an economic stall in most major industrialized economies. A number of major risks cloud the outlook, including uncertainty about the lagged impact of policy tightening, the Israel-Hamas war and the sharp rise in long-term borrowing costs observed in recent weeks.
The tightening cycle is likely over in Canada and the United States, though inflation remains problematically high. Growth is slowing as higher policy rates and the associated uncertainty weigh on household and business spending. Job vacancies are high, balance sheets remain solid by historical standards, and, in Canada, population growth continues to break records. These factors should help the economy avoid a major recession and suggest that a soft-landing or economic stall is more likely. Inflation in both countries is expected to decline gradually to target over the next couple of years allowing central banks to begin cutting rates gradually mid-2024. However, with inflation and wage growth still elevated, central banks have noted that they will have little tolerance for further deviations of inflation from target and stand ready to raise policy rates further if needed. As a consequence, there is a risk that interest rates may not decline until there is substantial evidence that inflation is on the right track.
The economies of the Pacific Alliance are slowing more sharply than those of the United States and Canada owing in large part to a more aggressive policy response by central banks and more damaging impacts of inflation on real wages and spending. Outright economic contractions are expected in Chile and Peru in 2023, though the decline in Peru reflects an additional temporary impact from El Niño. Colombian economic activity is also slowing given high real interest rates but should avoid a recession. Mexico has outperformed most economies this year as investment accelerated after a period of prolonged underperformance. All Pacific Alliance central banks are expected to have cut interest rates significantly by the end of 2024 with some having already started the normalization process.
Strategy
The Bank’s strategy will be focused on delivering profitable and sustainable growth for our shareholders by becoming more responsive to our clients’ evolving needs with a focus on advice and solutions. The Bank will create the capacity to invest in businesses and geographies where we can drive the greatest returns by prudently managing risk and prioritizing growth in markets where we have scale opportunity, while focusing on operational excellence to become more efficient. The Bank will continue to nurture a winning team spirit, building on our position as an employer of choice and investing in developing skills for the future of our people.
Outlook
The Bank’s earnings in 2024 are expected to grow marginally, impacted by slowing economic growth across its markets and increasing regulatory capital requirements. Earnings are expected to benefit from strong net interest income growth, while non-interest revenues are expected to grow modestly, offset by higher tax rate in international countries and an appreciating Canadian dollar. Net interest income is expected to benefit from loans repricing at higher rates, resulting in net interest margin expansion, while loan growth is expected to be modest. The Bank expects moderate expense growth, largely in line with inflation, as investments to strategically grow the Bank are expected to be mostly offset by efficiency savings, to drive positive operating leverage. Provision for credit losses are expected to increase, mainly from sequential growth in non-performing loans throughout 2024 driven by a challenged macroeconomic outlook. Capital and liquidity metrics are expected to remain strong in 2024.
Impact of Foreign Currency Translation
The impact of foreign currency translation on net income is shown in the table below.
T10 Impact of foreign currency translation
| 2023 | 2022 | |||||||||||||||
| For the fiscal years | Average exchange rate |
% Change | Average exchange rate |
% Change | ||||||||||||
| U.S. Dollar/Canadian Dollar |
0.742 | (4.5 | )% | 0.777 | (2.3 | )% | ||||||||||
| Mexican Peso/Canadian Dollar |
13.424 | (15.0 | )% | 15.799 | (1.5 | )% | ||||||||||
| Peruvian Sol/Canadian Dollar |
2.788 | (7.1 | )% | 3.002 | (1.0 | )% | ||||||||||
| Colombian Peso/Canadian Dollar |
3,310 | 3.9 | % | 3,187 | 8.8 | % | ||||||||||
| Chilean Peso/Canadian Dollar |
624.816 | (6.7 | )% | 669.905 | 12.9 | % | ||||||||||
28 | 2023 Scotiabank Annual Report
Management’s Discussion and Analysis | Overview of Performance
T10 Impact of foreign currency translation (Cont’d)
| Impact on net income(1) ($ millions except EPS) | 2023 vs. 2022 |
2022 vs. 2021 |
||||||
| Net interest income |
$ | 665 | $ | (158 | ) | |||
| Non-interest income(2) |
60 | (109 | ) | |||||
| Non-interest expenses |
(517 | ) | 92 | |||||
| Other items (net of tax) |
(158 | ) | 72 | |||||
| Net income |
$ | 50 | $ | (103 | ) | |||
| Earnings per share (diluted) |
$ | 0.04 | $ | (0.09) | ||||
| Impact by business line ($ millions) |
||||||||
| Canadian Banking |
$ | 3 | $ | 3 | ||||
| International Banking(2) |
71 | (97 | ) | |||||
| Global Wealth Management |
23 | – | ||||||
| Global Banking and Markets |
62 | 27 | ||||||
| Other(2) |
(109 | ) | (36 | ) | ||||
| $ | 50 | $ | (103 | ) | ||||
| (1) | Includes impact of all currencies. |
| (2) | Includes the impact of foreign currency hedges. |
2023 Scotiabank Annual Report | 29
Management’s Discussion and Analysis
Net income was $7,528 million in 2023, a decrease of 26% from $10,174 million in 2022, due primarily to higher provision for credit losses and non-interest expenses, partly offset by higher revenue and lower provision for income taxes.
Adjusted net income was $8,441 million, a decrease of 21% from $10,749 million. The decrease was due primarily to higher provision for credit losses and non-interest expenses, partly offset by lower provision for income taxes. Refer to Non-GAAP Measures starting on page 20 for further details.
Net interest income was $18,287 million, an increase of $172 million or 1%. The increase was driven by loan growth across all business lines, higher margins in International Banking and Canadian Banking, as well as the positive impact of foreign currency translation. These increases were largely offset by a lower contribution from asset/liability management activities related to higher funding costs.
In Canadian Banking, net interest income increased $755 million or 8% due primarily to volume growth, as well as margin expansion from the impact of Bank of Canada rate increases on deposit margins, partly offset by lower loan margins. International Banking net interest income increased $1,261 million or 18%, driven by growth in loans, as well as the positive impact of foreign currency translation. Global Banking and Markets net interest income decreased $58 million or 4%, due mainly to lower trading-related interest income, partly offset by corporate loan growth. Net interest income increased $78 million or 10% in Global Wealth Management, driven by strong loan growth and higher margins. In the Other segment net interest income decreased $1,864 million due mainly to higher funding costs resulting from higher interest rates and asset/liability management activities.
Net interest margin was down eight basis points to 2.12%, driven primarily by higher funding costs in the Other Segment resulting from higher interest rates and asset/liability management activities, partly offset by higher margins in International Banking and Canadian Banking.
30 | 2023 Scotiabank Annual Report
Management’s Discussion and Analysis | Group Financial Performance
T11 Average balance sheet(1) and net interest income
| 2023 | 2022 | |||||||||||||||||||||||
| For the fiscal years ($ billions) | Average balance |
Interest | Average rate |
Average balance |
Interest | Average rate |
||||||||||||||||||
| Assets |
||||||||||||||||||||||||
| Deposits with financial institutions |
$ | 77.6 | $ | 3.5 | 4.47 | % | $ | 81.9 | $ | 0.8 | 1.02 | % | ||||||||||||
| Trading assets |
121.7 | 1.8 | 1.52 | % | 138.6 | 0.8 | 0.57 | % | ||||||||||||||||
| Securities purchased under resale agreements and securities borrowed |
187.9 | 1.5 | 0.79 | % | 141.7 | 0.5 | 0.32 | % | ||||||||||||||||
| Investment securities |
117.5 | 5.0 | 4.25 | % | 97.3 | 2.1 | 2.14 | % | ||||||||||||||||
| Loans: |
||||||||||||||||||||||||
| Residential mortgages |
349.6 | 15.3 | 4.37 | % | 337.7 | 11.1 | 3.29 | % | ||||||||||||||||
| Personal loans |
102.9 | 7.9 | 7.68 | % | 95.5 | 5.8 | 6.07 | % | ||||||||||||||||
| Credit cards |
16.0 | 2.9 | 18.42 | % | 13.6 | 2.3 | 16.74 | % | ||||||||||||||||
| Business and government |
293.4 | 18.9 | 6.45 | % | 253.3 | 10.2 | 4.03 | % | ||||||||||||||||
| Allowance for credit losses |
(5.8 | ) | (5.4 | ) | ||||||||||||||||||||
| Total loans |
$ | 756.1 | $ | 45.0 | 5.96 | % | $ | 694.7 | $ | 29.4 | 4.23 | % | ||||||||||||
| Customers’ liability under acceptances |
20.9 | 20.0 | ||||||||||||||||||||||
| Total average earning assets(2) |
$ | 1,281.7 | $ | 56.8 | 4.43 | % | $ | 1,174.2 | $ | 33.6 | 2.86 | % | ||||||||||||
| Other assets |
114.1 | 107.5 | ||||||||||||||||||||||
| Total average assets |
$ | 1,395.8 | $ | 56.8 | 4.07 | % | $ | 1,281.7 | $ | 33.6 | 2.62 | % | ||||||||||||
| Liabilities and equity |
||||||||||||||||||||||||
| Deposits: |
||||||||||||||||||||||||
| Personal |
$ | 279.2 | $ | 7.7 | 2.76 | % | $ | 252.9 | $ | 3.0 | 1.19 | % | ||||||||||||
| Business and government |
621.3 | 26.2 | 4.22 | % | 572.6 | 9.3 | 1.63 | % | ||||||||||||||||
| Financial institutions |
55.3 | 1.7 | 3.06 | % | 51.8 | 0.5 | 0.88 | % | ||||||||||||||||
| Total deposits |
$ | 955.8 | $ | 35.6 | 3.73 | % | $ | 877.3 | $ | 12.8 | 1.46 | % | ||||||||||||
| Obligations related to securities sold under repurchase agreements and securities lent |
141.5 | 0.7 | 0.51 | % | 117.6 | 0.3 | 0.26 | % | ||||||||||||||||
| Subordinated debentures |
9.4 | 0.5 | 5.01 | % | 7.8 | 0.3 | 3.47 | % | ||||||||||||||||
| Other interest-bearing liabilities |
79.5 | 1.7 | 2.13 | % | 81.5 | 2.1 | 2.55 | % | ||||||||||||||||
| Total interest-bearing liabilities |
$ | 1,186.2 | $ | 38.5 | 3.25 | % | $ | 1,084.2 | $ | 15.5 | 1.42 | % | ||||||||||||
| Financial instruments designated at fair value through profit or loss |
25.7 | 22.8 | ||||||||||||||||||||||
| Other liabilities including acceptances |
106.8 | 101.3 | ||||||||||||||||||||||
| Equity(3) |
77.1 | 73.4 | ||||||||||||||||||||||
| Total liabilities and equity |
$ | 1,395.8 | $ | 38.5 | 2.76 | % | $ | 1,281.7 | $ | 15.5 | 1.20 | % | ||||||||||||
| Net interest income |
$ | 18.3 | $ | 18.1 | ||||||||||||||||||||
| (1) | Average of daily balances. |
| (2) | Refer to Non-GAAP Measures on Page 20 for the description of the measure. |
| (3) | Includes non-controlling interest of $1.6 (2022 – $1.7). |
2023 Scotiabank Annual Report | 31
Management’s Discussion and Analysis
T12 Non-interest income
| For the fiscal years ($ millions) | 2023 | 2022 | 2023 versus 2022 |
|||||||||
| Banking |
||||||||||||
| Card revenues |
$ | 778 | $ | 779 | – | % | ||||||
| Banking services fees |
1,879 | 1,770 | 6 | |||||||||
| Credit fees |
1,861 | 1,647 | 13 | |||||||||
| Total banking revenues |
$ | 4,518 | $ | 4,196 | 8 | % | ||||||
| Wealth management |
||||||||||||
| Mutual funds |
$ | 2,127 | $ | 2,269 | (6 | )% | ||||||
| Brokerage fees |
1,117 | 1,125 | (1 | ) | ||||||||
| Investment management and trust |
||||||||||||
| Investment management and custody |
795 | 795 | – | |||||||||
| Personal and corporate trust |
234 | 204 | 15 | |||||||||
| 1,029 | 999 | 3 | ||||||||||
| Total wealth management revenues |
$ | 4,273 | $ | 4,393 | (3 | )% | ||||||
| Underwriting and advisory fees |
554 | 543 | 2 | |||||||||
| Non-trading foreign exchange |
911 | 878 | 4 | |||||||||
| Trading revenues |
1,580 | 1,791 | (12 | ) | ||||||||
| Net gain on sale of investment securities |
129 | 74 | 74 | |||||||||
| Net income from investments in associated corporations |
153 | 268 | (43 | ) | ||||||||
| Insurance underwriting income, net of claims |
482 | 433 | 11 | |||||||||
| Other fees and commissions |
1,072 | 650 | 65 | |||||||||
| Other(2) |
348 | 75 | 364 | |||||||||
| Total non-interest income |
$ | 14,020 | $ | 13,301 | 5 | % | ||||||
| Non-GAAP Adjusting items(1) |
||||||||||||
| Divestitures and wind-down of operations(2) |
(367 | ) | 361 | |||||||||
| Adjusted non-interest income |
$ | 13,653 | $ | 13,662 | – | % | ||||||
| (1) | Refer to Non-GAAP Measures on page 20. |
| (2) | Recorded in Other Non-interest Income. |
| C3 | Sources of non-interest income |
|
|
Non-interest income was $14,020 million, an increase of $719 million or 5%. Adjusted non-interest income was $13,653 million, a decrease of $9 million due to lower trading revenue and wealth management revenues, higher unrealized losses on non-trading derivatives, and lower income from associated corporations. These were largely offset by higher banking revenues, other fees and commissions, and the positive impact of foreign currency translation.
Banking revenues increased $322 million or 8%, due mainly to higher credit fees from banker’s acceptances, and higher deposit and payment services fees.
Wealth management revenues decreased $120 million or 3% due to lower mutual fund revenues and lower brokerage fees. These were partly offset by higher personal and corporate trust revenues.
Underwriting and advisory fees increased by $11 million or 2%, due mainly to higher new issuance activities.
Trading revenues decreased $211 million or 12%, due mainly to lower interest rate and credit trading revenue, as well as lower trading revenue in International Banking.
Other fees and commissions revenue increased by $422 million or 65% due mainly to securities borrowing and lending activities.
Net gain on sale of investment securities increased by $55 million or 74%, due to higher realized gains on bond securities.
Net income from investments in associated corporations decreased $115 million or 43%, due mainly to lower unrealized investment gains from private equity businesses.
Insurance underwriting income increased $49 million or 11%, largely due to lower claims expenses than the prior year.
Other income increased by $273 million. On an adjusted basis, other income decreased by $455 million due primarily to higher unrealized losses on non-trading derivatives as well as lower investment gains.
T13 Trading-related revenues (1)
| For the fiscal years ($ millions) | 2023 | 2022 | ||||||
| Trading-related revenue (TEB)(2) |
||||||||
| Net interest income |
$ | (260 | ) | $ | (112 | ) | ||
| Non-interest income |
||||||||
| Trading revenues |
2,017 | 2,124 | ||||||
| Other fees and commissions |
503 | 158 | ||||||
| Total trading-related revenue (TEB) |
$ | 2,260 | $ | 2,170 | ||||
| Taxable equivalent adjustment |
(437 | ) | (333 | ) | ||||
| Trading-related revenue (Non-TEB) |
$ | 1,823 | $ | 1,837 | ||||
| (1) | Refer to Non-GAAP Measures on page 20. |
| (2) | Trading-related revenue consists of net interest income and non-interest income. Included are unrealized gains and losses on security positions held, realized gains and losses from the purchase and sale of securities, fees and commissions from securities borrowing and lending activities, and gains and losses on trading derivatives. Underwriting and other advisory fees, which are shown separately in the consolidated statement of income, are excluded. |
32 | 2023 Scotiabank Annual Report
Management’s Discussion and Analysis | Group Financial Performance
The provision for credit losses was $3,422 million, compared to $1,382 million, an increase of $2,040 million from last year due to higher provision for credit losses on performing and impaired loans, across all business lines.
Provision for credit losses on performing loans was $699 million, compared to a net reversal of $312 million. Commercial and corporate provisions were $423 million, and retail provisions were $276 million. Higher provisions this year were mainly in Canadian Banking and Global Banking and Markets. The increase was driven primarily by the unfavourable macroeconomic outlook and uncertainty around the impacts of higher interest rates, resulting from policy tightening to address inflation, on certain sectors in the North American non-retail portfolios, and the resulting migration in Canadian retail portfolios. In addition, retail portfolio growth across markets increased the provision for credit losses. Prior year provisions benefitted from reversals driven by improved portfolio credit quality expectations and higher commodity prices. The provision for credit losses ratio on performing loans increased 14 basis points to nine basis points.
Provision for credit losses on impaired loans was $2,723 million compared to $1,694 million, an increase of $1,029 million or 61% due primarily to higher retail formations in the Canadian and International portfolios. The provision for credit losses ratio on impaired loans increased 11 basis points to 35 basis points.
The provision for credit losses ratio increased 25 basis points to 44 basis points.
T14 Provision for credit losses by business line
| 2023 | 2022 | |||||||||||||||||||||||
| For the fiscal years ($ millions) | Performing (Stage 1 and 2) |
Impaired (Stage 3) |
Total | Performing (Stage 1 and 2) |
Impaired (Stage 3) |
Total | ||||||||||||||||||
| Canadian Banking |
||||||||||||||||||||||||
| Retail |
$ | 251 | $ | 848 | $ | 1,099 | $ | (297 | ) | $ | 504 | $ | 207 | |||||||||||
| Commercial |
238 | 106 | 344 | (46 | ) | 48 | 2 | |||||||||||||||||
| Total |
489 | 954 | 1,443 | (343 | ) | 552 | 209 | |||||||||||||||||
| International Banking |
||||||||||||||||||||||||
| Retail |
26 | 1,480 | 1,506 | 51 | 910 | 961 | ||||||||||||||||||
| Commercial |
73 | 285 | 358 | 29 | 236 | 265 | ||||||||||||||||||
| Total |
99 | 1,765 | 1,864 | 80 | 1,146 | 1,226 | ||||||||||||||||||
| Global Wealth Management |
6 | 4 | 10 | 2 | 4 | 6 | ||||||||||||||||||
| Global Banking and Markets |
101 | – | 101 | (59 | ) | (8 | ) | (67 | ) | |||||||||||||||
| Other |
– | – | – | (1 | ) | – | (1 | ) | ||||||||||||||||
| Provision for credit losses on loans, acceptances and off-balance sheet exposures |
$ | 695 | $ | 2,723 | $ | 3,418 | $ | (321) | $ | 1,694 | $ | 1,373 | ||||||||||||
| International Banking |
$ | 4 | $ | – | $ | 4 | $ | 4 | $ | – | $ | 4 | ||||||||||||
| Global Wealth Management |
– | – | – | – | – | – | ||||||||||||||||||
| Global Banking and Markets |
– | – | – | 1 | – | 1 | ||||||||||||||||||
| Other |
– | – | – | 4 | – | 4 | ||||||||||||||||||
| Provision for credit losses on debt securities and deposits with banks |
$ | 4 | $ | – | $ | 4 | $ | 9 | $ | – | $ | 9 | ||||||||||||
| Total provision for credit losses |
$ | 699 | $ | 2,723 | $ | 3,422 | $ | (312 | ) | $ | 1,694 | $ | 1,382 | |||||||||||
T14A Provision for credit losses against impaired financial instruments by business line
| For the fiscal years ($ millions) | 2023 | 2022 | ||||||
| Canadian Banking |
||||||||
| Retail |
$ | 848 | $ | 504 | ||||
| Commercial |
106 | 48 | ||||||
| $ | 954 | $ | 552 | |||||
| International Banking |
||||||||
| Caribbean and Central America |
$ | 161 | $ | 170 | ||||
| Latin America |
||||||||
| Mexico |
315 | 205 | ||||||
| Peru |
393 | 255 | ||||||
| Chile |
479 | 238 | ||||||
| Colombia |
349 | 226 | ||||||
| Other Latin America |
68 | 52 | ||||||
| Total Latin America |
1,604 | 976 | ||||||
| $ | 1,765 | $ | 1,146 | |||||
| Global Wealth Management |
$ | 4 | $ | 4 | ||||
| Global Banking and Markets |
||||||||
| Canada |
$ | (9 | ) | $ | (6 | ) | ||
| U.S. |
14 | 12 | ||||||
| Asia and Europe |
(5 | ) | (14 | ) | ||||
| $ | – | $ | (8 | ) | ||||
| Total |
$ | 2,723 | $ | 1,694 | ||||
2023 Scotiabank Annual Report | 33
Management’s Discussion and Analysis
T15 Provision for credit losses as a percentage of average net loans and acceptances(1)(2)
| For the fiscal years (%) | 2023 | 2022 | ||||||
| Canadian Banking |
||||||||
| Retail |
0.31 | % | 0.06 | % | ||||
| Commercial |
0.40 | – | ||||||
| 0.32 | 0.05 | |||||||
| International Banking |
||||||||
| Retail |
1.96 | 1.48 | ||||||
| Commercial |
0.38 | 0.31 | ||||||
| 1.09 | 0.82 | |||||||
| Global Wealth Management |
0.04 | 0.03 | ||||||
| Global Banking and Markets |
0.07 | (0.06 | ) | |||||
| Provisions against impaired loans |
0.35 | 0.24 | ||||||
| Provisions against performing loans |
0.09 | (0.05 | ) | |||||
| Provision for credit losses as a percentage of average net loans and acceptances |
0.44 | % | 0.19 | % | ||||
| (1) | Includes provision for credit losses on certain financial assets - loans, acceptances, and off-balance sheet exposures. |
| (2) | Refer to Glossary on page 136 for the description of the measure. |
T16 Net write-offs(1) as a percentage of average net loans and acceptances(2)
| For the fiscal years (%) | 2023 | 2022 | ||||||
| Canadian Banking |
||||||||
| Retail |
0.21 | % | 0.16 | % | ||||
| Commercial |
0.12 | 0.04 | ||||||
| 0.19 | 0.13 | |||||||
| International Banking |
||||||||
| Retail |
1.83 | 1.50 | ||||||
| Commercial |
0.20 | 0.23 | ||||||
| 0.93 | 0.79 | |||||||
| Global Wealth Management |
– | 0.03 | ||||||
| Global Banking and Markets |
– | (0.02 | ) | |||||
| Total |
0.32 | % | 0.24 | % | ||||
| (1) | Write-offs net of recoveries. |
| (2) | Refer to Glossary on page 136 for the description of the measure. |
34 | 2023 Scotiabank Annual Report
Management’s Discussion and Analysis | Group Financial Performance
T17 Non-interest expenses and productivity
| For the fiscal years ($ millions) | 2023 | 2022 | 2023 versus 2022 |
|||||||||
| Salaries and employee benefits |
||||||||||||
| Salaries |
$ | 5,607 | $ | 4,989 | 12 | % | ||||||
| Performance-based compensation |
2,083 | 2,004 | 4 | |||||||||
| Share-based payments |
332 | 335 | (1 | ) | ||||||||
| Other employee benefits |
1,574 | 1,508 | 4 | |||||||||
| $ | 9,596 | $ | 8,836 | 9 | % | |||||||
| Premises and technology |
||||||||||||
| Premises |
545 | 516 | 6 | |||||||||
| Technology |
2,114 | 1,908 | 11 | |||||||||
| $ | 2,659 | $ | 2,424 | 10 | % | |||||||
| Depreciation and amortization |
||||||||||||
| Depreciation |
801 | 749 | 7 | |||||||||
| Amortization of intangible assets |
1,019 | 782 | 30 | |||||||||
| $ | 1,820 | $ | 1,531 | 19 | % | |||||||
| Communications |
$ | 395 | $ | 361 | 9 | % | ||||||
| Advertising and business development |
$ | 576 | $ | 480 | 20 | % | ||||||
| Professional |
$ | 780 | $ | 826 | (6 | )% | ||||||
| Business and capital taxes |
||||||||||||
| Business taxes |
567 | 483 | 17 | |||||||||
| Capital taxes |
67 | 58 | 16 | |||||||||
| $ | 634 | $ | 541 | 17 | % | |||||||
| Other |
$ | 2,671 | $ | 2,103 | 27 | % | ||||||
| Total non-interest expenses |
$ | 19,131 | $ | 17,102 | 12 | % | ||||||
| Non-GAAP adjusting items(1): |
||||||||||||
| Restructuring charge and severance provisions |
(354 | ) | (85 | ) | ||||||||
| Consolidation of real estate and contract termination costs |
(87 | ) | – | |||||||||
| Impairment of non-financial assets |
(346 | ) | – | |||||||||
| Amortization of acquisition-related intangible assets |
(81 | ) | (97 | ) | ||||||||
| Support costs for the Scene+ Loyalty Program |
– | (133 | ) | |||||||||
| (868 | ) | (315 | ) | |||||||||
| Recorded in: |
||||||||||||
| Salaries and employee benefits |
(38 | ) | – | |||||||||
| Depreciation and amortization |
(260 | ) | (97 | ) | ||||||||
| Other |
(570 | ) | (218 | ) | ||||||||
| (868 | ) | (315 | ) | |||||||||
| Adjusted non-interest expenses |
$ | 18,263 | $ | 16,787 | 9 | % | ||||||
| Productivity ratio(2) |
59.2 | % | 54.4 | % | ||||||||
| Adjusted productivity ratio(1) |
57.2 | % | 52.8 | % | ||||||||
| (1) | Refer to Non-GAAP Measures starting on page 20. |
| (2) | Refer to Glossary on page 136 for the description of the measure. |
| C4 | Non-interest expenses $ millions |
|
|
| C5 | Direct and indirect taxes $ millions |
|
|
Non-interest expenses were $19,131 million, an increase of $2,029 million or 12%. Adjusted non-interest expenses increased $1,476 million or 9%. This increase was due to higher personnel costs including inflationary adjustments and annual increases, as well as higher technology-related costs and advertising and business development costs to support business growth. Business and capital taxes and the unfavourable impact of foreign currency translation also contributed to the increase. This increase was partly offset by lower professional fees.
The Bank’s total technology cost, consisting of Technology expenses in Table T17 as well as those included within salaries, professional, and amortization of intangible assets and depreciation, was approximately $4.5 billion, an increase of 8% compared to 2022 and represented 14% of revenues, compared to 13% in 2022. This reflects the Bank’s continued investment in modernization, growth and technology initiatives to accelerate digitization and develop new ways to reach customers. There is increased investment in modernizing security tools, and increase staffing for specialized talent in enterprise security, cybersecurity, and security architecture.
The productivity ratio was 59.2% compared to 54.4%. On an adjusted basis, the productivity ratio was 57.2% compared to 52.8%. Operating leverage was negative 9.0%. On an adjusted basis, operating leverage was negative 8.3%.
The effective tax rate was 22.8% compared to 21.3% in 2022, due primarily to the impact of the CRD and the increase in the Canadian statutory tax rate this year, partly offset by higher tax-exempt income and higher income from lower tax rate jurisdictions. On an adjusted basis, the effective rate was 17.7% compared to 21% due to higher tax-exempt income and higher income from lower tax rate jurisdictions, partly offset by the increase in the Canadian statutory tax rate and lower inflationary adjustments.
2023 Scotiabank Annual Report | 35
Management’s Discussion and Analysis
T18 Fourth quarter financial results
| For the three months ended | ||||||||||||
| ($ millions) | October 31 2023 |
July 31 2023 |
October 31 2022 |
|||||||||
| Reported Results |
||||||||||||
| Net interest income |
$ | 4,672 | $ | 4,580 | $ | 4,622 | ||||||
| Non-interest income |
3,636 | 3,510 | 3,004 | |||||||||
| Total revenue |
8,308 | 8,090 | 7,626 | |||||||||
| Provision for credit losses |
1,256 | 819 | 529 | |||||||||
| Non-interest expenses |
5,529 | 4,562 | 4,529 | |||||||||
| Income tax expense |
138 | 497 | 475 | |||||||||
| Net income |
$ | 1,385 | $ | 2,212 | $ | 2,093 | ||||||
| Net income attributable to non-controlling interests in subsidiaries (NCI) |
31 | 21 | 38 | |||||||||
| Net income attributable to equity holders of the Bank |
$ | 1,354 | $ | 2,191 | $ | 2,055 | ||||||
| Preferred shareholders and other equity instrument holders |
109 | 105 | 106 | |||||||||
| Common shareholders |
1,245 | 2,086 | 1,949 | |||||||||
| Adjustments(1) |
||||||||||||
| Adjusting items impacting non-interest income and total revenue (Pre-tax) |
||||||||||||
| Divestitures and wind-down of operations |
$ | (367 | ) | $ | – | $ | 361 | |||||
| Adjusting items impacting non-interest expenses (Pre-tax) |
||||||||||||
| Restructuring charge and severance provisions |
354 | – | 85 | |||||||||
| Consolidation of real estate and contract termination costs |
87 | – | – | |||||||||
| Impairment of non-financial assets |
346 | – | – | |||||||||
| Amortization of acquisition-related intangible assets |
19 | 20 | 24 | |||||||||
| Support costs for the Scene+ loyalty program |
– | – | 133 | |||||||||
| Total non-interest expense adjusting items (Pre-tax) |
806 | 20 | 242 | |||||||||
| Total impact of adjusting items on net income before taxes |
439 | 20 | 603 | |||||||||
| Impact of adjusting items on income tax expense |
||||||||||||
| Divestitures and wind-down of operations |
48 | – | (21 | ) | ||||||||
| Restructuring charge and severance provisions |
(96 | ) | – | (19 | ) | |||||||
| Consolidation of real estate and contract termination costs |
(24 | ) | – | – | ||||||||
| Impairment of non-financial assets |
(73 | ) | – | – | ||||||||
| Amortization of acquisition-related intangible assets |
(5 | ) | (5 | ) | (6 | ) | ||||||
| Support costs for the Scene+ loyalty program |
– | – | (35 | ) | ||||||||
| Total impact of adjusting items on income tax expense |
(150 | ) | (5 | ) | (81 | ) | ||||||
| Total impact of adjusting items on net income |
289 | 15 | 522 | |||||||||
| Impact of adjusting items on NCI |
(3 | ) | – | (1 | ) | |||||||
| Total impact of adjusting items on net income attributable to equity holders and common shareholders |
$ | 286 | $ | 15 | $ | 521 | ||||||
| Adjusted Results |
||||||||||||
| Net interest income |
$ | 4,672 | $ | 4,580 | $ | 4,622 | ||||||
| Non-interest income |
3,269 | 3,510 | 3,365 | |||||||||
| Total revenue |
7,941 | 8,090 | 7,987 | |||||||||
| Provision for credit losses |
1,256 | 819 | 529 | |||||||||
| Non-interest expenses |
4,723 | 4,542 | 4,287 | |||||||||
| Income tax expense |
288 | 502 | 556 | |||||||||
| Net income |
$ | 1,674 | $ | 2,227 | $ | 2,615 | ||||||
| Net income attributable to non-controlling interests in subsidiaries (NCI) |
34 | 21 | 39 | |||||||||
| Net income attributable to equity holders of the Bank |
$ | 1,640 | $ | 2,206 | $ | 2,576 | ||||||
| Preferred shareholders and other equity instrument holders |
109 | 105 | 106 | |||||||||
| Common shareholders |
1,531 | 2,101 | 2,470 | |||||||||
| (1) | Refer to Non-GAAP Measures starting on page 20. |
Net income
Q4 2023 vs Q4 2022
Net income was $1,385 million compared to $2,093 million, a decrease of 34%. This quarter included adjusting items impacting net income of $289 million compared to $522 million in the prior year [refer to Non-GAAP Measures starting on page 20]. Adjusted net income was $1,674 million compared to $2,615 million, a decrease of 36%, due mainly to higher provision for credit losses and non-interest expenses and lower non-interest income, partly offset by lower provision for income taxes.
Q4 2023 vs Q3 2023
Net income was $1,385 million compared to $2,212 million, a decrease of 37%. This quarter included adjusting items impacting net income of $289 million compared to $15 million in the prior quarter [refer to Non-GAAP Measures starting on page 20]. Adjusted net income was $1,674 million compared to $2,227 million, a decrease of 25%. The decrease was due mainly to higher provision for credit losses and non-interest expenses and lower non-interest income, partly offset by lower provision for income taxes.
36 | 2023 Scotiabank Annual Report
Management’s Discussion and Analysis | Group Financial Performance
Total revenue
Q4 2023 vs Q4 2022
Revenues were $8,308 million compared to $7,626 million, an increase of 9%. Adjusted revenues were $7,941 million compared to $7,987 million, a decrease of 1%.
Net interest income was $4,672 million, an increase of $50 million or 1%, due primarily to loan growth across all business lines, and the positive impact of foreign currency translation, largely offset by a lower contribution from asset/liability management activities related to higher funding costs. Net interest margin was down two basis points to 2.16%, driven primarily by a lower contribution from asset/liability management activities related to higher funding costs, and increased levels of high quality, lower-margin liquid assets. The decrease was partly offset by higher margins in International Banking and Canadian Banking.
Non-interest income was $3,636 million, an increase of $632 million or 21%. Adjusted non-interest income was $3,269 million, down $96 million or 3%. The decrease was due mainly to lower trading revenues, investment gains, and income from associated corporations, partly offset by higher fees and commissions, banking revenues, wealth management revenues, and the positive impact of foreign currency translation.
Q4 2023 vs Q3 2023
Revenues were $8,308 million compared to $8,090 million, an increase of 3%. Adjusted revenues were $7,941 million compared to $8,090 million, a decrease of 2%.
Net interest income increased $92 million or 2% driven by a higher net interest margin, partly offset by lower loan volumes. Net interest margin increased by six basis points, driven by higher margins across all business lines, partly offset by lower contribution from asset/liability management activities.
Non-interest income increased by $126 million or 4%. Adjusted non-interest income was down $241 million or 7%. The decrease was due mainly to lower trading revenues, lower unrealized gains on non-trading derivatives and income from associated corporations, partly offset by higher fees and commissions, higher banking revenues, and the positive impact of foreign currency translation.
Provision for credit losses
Q4 2023 vs Q4 2022
The provision for credit losses was $1,256 million, compared to $529 million, an increase of $727 million. The provision for credit losses ratio increased 37 basis points to 65 basis points.
The provision for credit losses on performing loans was $454 million, compared to $35 million. Retail provisions were $224 million and commercial provisions were $230 million this quarter, mostly in Canadian Banking. The increased provision this quarter was driven primarily by the unfavourable macroeconomic outlook and uncertainty around the impacts of higher interest rates, resulting from policy tightening to address inflation, on certain sectors in the North American non-retail portfolios, and the resulting migration in the Canadian retail portfolios. In addition, retail portfolio growth across markets increased the provision for credit losses. Prior year provisions benefitted from improved credit quality expectations mainly in Canadian retail, and improved credit quality in Global Banking and Markets. The provision for credit losses ratio on performing loans increased 21 basis points to 23 basis points.
The provision for credit losses on impaired loans was $802 million, compared to $494 million, an increase of $308 million due primarily to higher formations in Canadian and International Banking retail portfolios. The provision for credit losses ratio on impaired loans was 42 basis points, an increase of 16 basis points.
Q4 2023 vs Q3 2023
The provision for credit losses was $1,256 million, compared to $819 million, an increase of $437 million or 53%. The provision for credit losses ratio increased 23 basis points to 65 basis points.
The provision for credit losses on performing loans was $454 million, compared to $81 million, an increase of $373 million. The higher provision this quarter was driven primarily by the unfavourable macroeconomic outlook and uncertainty around the impacts of higher interest rates, resulting from policy tightening to address inflation, on certain sectors in the North American non-retail portfolios, and the resulting migration in the Canadian retail portfolios. Higher provisions were mainly in Canadian Banking and Global Banking and Markets. The provision for credit losses ratio on performing loans increased 19 basis points to 23 basis points.
The provision for credit losses on impaired loans was $802 million, compared to $738 million, an increase of $64 million or 9% due primarily to higher retail formations, and higher corporate and commercial provisions. The provision for credit losses ratio on impaired loans was 42 basis points, an increase of four basis points.
Non-interest expenses
Q4 2023 vs Q4 2022
Non-interest expenses were $5,529 million, an increase of 22%. Adjusted non-interest expenses were $4,723 million, an increase of $436 million or 10%, driven by higher personnel costs, technology-related costs, performance-based compensation, business and capital taxes, share-based compensation, advertising and the unfavourable impact of foreign currency translation. This was partly offset by lower professional fees.
The productivity ratio was 66.6% compared to 59.4%. The adjusted productivity ratio was 59.5% compared to 53.7%.
Q4 2023 vs Q3 2023
Non-interest expenses increased by $967 million or 21%. Adjusted non-interest expenses increased by $181 million or 4%. The increase was due to higher technology-related costs, performance-based compensation, professional fees and advertising. Partly offsetting were lower other employee benefits.
The productivity ratio was 66.6% compared to 56.4%. The adjusted productivity ratio was 59.5% compared to 56.1%.
Provision for income taxes
Q4 2023 vs Q4 2022
The effective tax rate was 9% compared to 18.5% due primarily to proportionally higher tax savings from higher tax-exempt income and higher income from lower tax rate jurisdictions, as well as the benefit of divestitures. This was partly offset by the increase in the Canadian statutory tax rate and lower inflationary adjustments. On an adjusted basis, the effective rate was 14.7% compared to 17.6% due primarily to proportionally higher tax savings from higher tax-exempt income and higher income from lower tax rate jurisdictions, partly offset by the increase in the Canadian statutory tax rate and lower inflationary adjustments.
2023 Scotiabank Annual Report | 37
Management’s Discussion and Analysis
Q4 2023 vs Q3 2023
The effective tax rate was 9% compared to 18.4% due primarily to proportionally higher tax savings from higher tax-exempt income and higher income from lower tax rate jurisdictions, as well as the benefit of divestitures. This was partly offset by the impairment charge on Bank of Xi’an Co. Ltd. On an adjusted basis, the effective rate was 14.7% compared to 18.4% due primarily to proportionally higher tax savings from higher tax-exempt income and higher income from lower tax rate jurisdictions.
T19 Quarterly financial highlights
| For the three months ended | ||||||||||||||||||||||||||||||||
| ($ millions) | October 31 2023 |
July 31 2023 |
April 30 2023 |
January 31 2023 |
October 31 2022 |
July 31 2022 |
April 30 2022 |
January 31 2022 |
||||||||||||||||||||||||
| Reported results |
||||||||||||||||||||||||||||||||
| Net interest income |
$ | 4,672 | $ | 4,580 | $ | 4,466 | $ | 4,569 | $ | 4,622 | $ | 4,676 | $ | 4,473 | $ | 4,344 | ||||||||||||||||
| Non-interest income |
3,636 | 3,510 | 3,463 | 3,411 | 3,004 | 3,123 | 3,469 | 3,705 | ||||||||||||||||||||||||
| Total revenue |
$ | 8,308 | $ | 8,090 | $ | 7,929 | $ | 7,980 | $ | 7,626 | $ | 7,799 | $ | 7,942 | $ | 8,049 | ||||||||||||||||
| Provision for credit losses |
1,256 | 819 | 709 | 638 | 529 | 412 | 219 | 222 | ||||||||||||||||||||||||
| Non-interest expenses |
5,529 | 4,562 | 4,576 | 4,464 | 4,529 | 4,191 | 4,159 | 4,223 | ||||||||||||||||||||||||
| Income tax expense |
138 | 497 | 485 | 1,106 | 475 | 602 | 817 | 864 | ||||||||||||||||||||||||
| Net income |
$ | 1,385 | $ | 2,212 | $ | 2,159 | $ | 1,772 | $ | 2,093 | $ | 2,594 | $ | 2,747 | $ | 2,740 | ||||||||||||||||
| Basic earnings per share ($) |
1.03 | 1.74 | 1.70 | 1.37 | 1.64 | 2.10 | 2.16 | 2.15 | ||||||||||||||||||||||||
| Diluted earnings per share ($) |
1.02 | 1.72 | 1.69 | 1.36 | 1.63 | 2.09 | 2.16 | 2.14 | ||||||||||||||||||||||||
| Net interest margin (%)(1) |
2.16 | 2.10 | 2.13 | 2.11 | 2.18 | 2.22 | 2.23 | 2.16 | ||||||||||||||||||||||||
| Effective tax rate (%)(2) |
9.0 | 18.4 | 18.4 | 38.4 | 18.5 | 18.8 | 22.9 | 24.0 | ||||||||||||||||||||||||
| Adjusted results(1) |
||||||||||||||||||||||||||||||||
| Adjusting items impacting non-interest income and total revenue (Pre-tax) |
||||||||||||||||||||||||||||||||
| Divestitures and wind-down of operations |
$ | (367 | ) | $ | – | $ | – | $ | – | $ | 361 | $ | – | $ | – | $ | – | |||||||||||||||
| Adjusting items impacting non-interest expenses (Pre-tax) |
||||||||||||||||||||||||||||||||
| Restructuring charge and severance provisions |
354 | – | – | – | 85 | – | – | – | ||||||||||||||||||||||||
| Consolidation of real estate and contract termination costs |
87 | – | – | – | – | – | – | – | ||||||||||||||||||||||||
| Impairment of non-financial assets |
346 | – | – | – | – | – | – | – | ||||||||||||||||||||||||
| Amortization of acquisition-related intangible assets |
19 | 20 | 21 | 21 | 24 | 24 | 24 | 25 | ||||||||||||||||||||||||
| Support costs for the Scene+ loyalty program |
– | – | – | – | 133 | – | – | – | ||||||||||||||||||||||||
| Total non-interest expenses adjustments (Pre-tax) |
806 | 20 | 21 | 21 | 242 | 24 | 24 | 25 | ||||||||||||||||||||||||
| Total impact of adjusting items on net income before taxes |
439 | 20 | 21 | 21 | 603 | 24 | 24 | 25 | ||||||||||||||||||||||||
| Impact of adjusting items on income tax expense: |
||||||||||||||||||||||||||||||||
| Canada recovery dividend |
– | – | – | 579 | – | – | – | – | ||||||||||||||||||||||||
| Impact of other adjusting items on income tax expense |
(150 | ) | (5 | ) | (6 | ) | (6 | ) | (81 | ) | (7 | ) | (6 | ) | (7 | ) | ||||||||||||||||
| Total impact of adjusting items on net income |
289 | 15 | 15 | 594 | 522 | 17 | 18 | 18 | ||||||||||||||||||||||||
| Adjusted net income |
$ | 1,674 | $ | 2,227 | $ | 2,174 | $ | 2,366 | $ | 2,615 | $ | 2,611 | $ | 2,765 | $ | 2,758 | ||||||||||||||||
| Adjusted diluted earnings per share |
$ | 1.26 | $ | 1.73 | $ | 1.70 | $ | 1.85 | $ | 2.06 | $ | 2.10 | $ | 2.18 | $ | 2.15 | ||||||||||||||||
| (1) | Refer to Non-GAAP Measures starting on page 20. |
| (2) | Refer to Glossary on page 136 for the description of the measure. |
Earnings over the period were driven by generally higher net interest income from steady loan and deposit growth and lower effective tax rates, partly offset by higher provision for credit losses and increased term funding costs.
Total revenue
Canadian Banking net interest income over the period has increased driven by volume growth and margin expansion, as recent quarters have benefited from Bank of Canada rate increases. International Banking net interest income has trended upward driven by growth in residential mortgages and business loans and central bank rate increases. Non-interest income for Canadian Banking and International Banking is stable over the period. Global Wealth Management fee-based revenues continue to be impacted by market conditions. Global Banking and Markets revenues are affected by market conditions that impact client activity in the capital markets and business banking businesses. Revenues in the Other segment were impacted by higher term funding costs and other treasury-related activities.
Provision for credit losses
Provision for credit losses have trended higher during the period driven by the unfavourable macroeconomic outlook and the uncertainty around the impact of higher interest rates from policy tightening to address inflation, retail portfolio growth, and higher impaired loan provisions due to higher formations and retail credit migration.
Non-interest expenses
Reported non-interest expenses this quarter was impacted by restructuring and impairment charges taken. During the period, non-interest expenses reflect the Bank’s continued investment in personnel and technology to support business growth as well as the impact of inflation. This was partly offset by expense management and efficiency initiatives. The impact of foreign currency translation has also contributed to fluctuations over the period.
Provision for income taxes
The effective tax rate was 9.0% this quarter. The effective tax rate average was 21.1% over the period and was impacted by the recognition of the CRD in Q1 2023, increased statutory tax rates, divestitures, restructuring charge and net income earned in foreign jurisdictions, as well as the variability of tax-exempt dividend income and inflationary benefits.
38 | 2023 Scotiabank Annual Report
Management’s Discussion and Analysis | Business Line Overview
Business line results are presented on a taxable equivalent basis, adjusting for the following:
| • | The Bank analyzes revenue on a taxable equivalent basis (TEB) for business lines. This methodology grosses up tax-exempt income earned on certain securities reported in either net interest income or non-interest income to an equivalent before tax basis. A corresponding increase is made to the provision for income taxes; hence, there is no impact on net income. Management believes that this basis for measurement provides a uniform comparability of net interest income and non-interest income arising from both taxable and non-taxable sources and facilitates a consistent basis of measurement. While other banks also use TEB, their methodology may not be comparable to the Bank’s methodology. A segment’s revenue and provision for income taxes are grossed up by the taxable equivalent amount. The elimination of the TEB gross up is recorded in the Other segment. |
| • | For business line performance assessment and reporting, net income from associated corporations, which is an after-tax number, is adjusted to normalize for income taxes. The tax normalization adjustment grosses up the amount of net income from associated corporations and normalizes the effective tax rate in the business lines to better present the contribution of the associated corporations to the business line results. |
| • | International Banking business segment results are analyzed on a constant dollar basis. Under constant dollar basis, prior period amounts are recalculated using current period average foreign currency rates thereby eliminating the impact of foreign currency translation. The Bank believes that reporting in constant dollar is useful for readers in assessing ongoing business performance. |
| • | The Other segment includes Group Treasury, smaller operating segments and corporate items which are not allocated to a business line. Group Treasury is primarily responsible for Balance Sheet, Liquidity and Interest Rate Risk management, which includes the Bank’s wholesale funding activities. |
Below are the results of the Bank’s operating segments for 2023.
CANADIAN BANKING
Canadian Banking reported net income attributable to equity holders of $4,019 million, compared to $4,763 million. Adjusted net income attributable to equity holders was $4,022 million, a decrease of $757 million or 16%. The decrease was due primarily to higher provision for credit losses and non-interest expenses, partly offset by higher revenues driven by volume growth and margin expansion. Return on equity was 21.3% compared to 26.3% in the prior year. Adjusted return on equity was 21.3% compared to 26.4% in the prior year.
INTERNATIONAL BANKING
Net income attributable to equity holders was $2,486 million, an increase of $68 million. Adjusted net income attributable to equity holders was $2,516 million, an increase of $70 million. The increase was due largely to higher net interest income and non-interest income, partly offset by higher non-interest expenses, provision for credit losses, and provision for income taxes. Return on equity was 13.1% compared to 12.9% in the prior year. Adjusted return on equity was 13.3% compared to 13.0% in the prior year.
GLOBAL WEALTH MANAGEMENT
Net income attributable to equity holders was $1,431 million, compared to $1,556 million in the prior year. Adjusted net income attributable to equity holders was $1,457 million, down $126 million or 8%. The decline was due primarily to lower mutual fund fees and brokerage revenues, and higher non-interest expenses, partly offset by higher net interest income. Return on equity was 14.6% compared to 16.2% in the prior year. Adjusted return on equity was 14.9% compared to 16.5% in the prior year.
GLOBAL BANKING AND MARKETS
Global Banking and Markets reported net income attributable to equity holders of $1,768 million, a decrease of $143 million or 7%. This decline was due to higher non-interest expenses, higher provision for credit losses, and lower net interest income, partly offset by higher non-interest income and the positive impact of foreign currency translation. Return on equity was 12.2% compared to 14.3% last year.
OTHER
The Other segment reported a net loss attributable to equity holders of $2,294 million. Adjusted net income attributable to equity holders was a loss of $1,443 million compared to net loss of $229 million in the prior year. The decrease of $1,214 million was due to lower revenues resulting primarily from increased funding costs, partly offset by lower provision for income taxes and lower non-interest expenses.
2023 Scotiabank Annual Report | 39
Management’s Discussion and Analysis
|
KEY PERFORMANCE INDICATORS FOR ALL BUSINESS LINES
|
| Management uses a number of key metrics to monitor business line performance: | ||||||||
| • Net income
|
• Return on equity |
• Productivity ratio |
• Provision for credit losses ratio |
|||||
T20 Financial performance – Reported
| For the year ended October 31, 2023 ($ millions) | Canadian Banking |
International Banking |
Global Wealth Management |
Global Banking and Markets |
Other(1) | Total | ||||||||||||||||||
| Net interest income(2) |
$ | 9,756 | $ | 8,161 | $ | 842 | $ | 1,572 | $ | (2,044 | ) | $ | 18,287 | |||||||||||
| Non-interest income(2) |
3,087 | 2,937 | 4,449 | 3,980 | (433 | ) | 14,020 | |||||||||||||||||
| Total revenue(2) |
12,843 | 11,098 | 5,291 | 5,552 | (2,477 | ) | 32,307 | |||||||||||||||||
| Provision for credit losses |
1,443 | 1,868 | 10 | 101 | – | 3,422 | ||||||||||||||||||
| Non-interest expenses |
5,867 | 5,928 | 3,350 | 3,062 | 924 | 19,131 | ||||||||||||||||||
| Provision for income taxes(2) |
1,514 | 704 | 491 | 621 | (1,104 | ) | 2,226 | |||||||||||||||||
| Net income |
$ | 4,019 | $ | 2,598 | $ | 1,440 | $ | 1,768 | $ | (2,297 | ) | $ | 7,528 | |||||||||||
| Net income attributable to non-controlling interests in subsidiaries |
– | 112 | 9 | – | (3 | ) | 118 | |||||||||||||||||
| Net income attributable to equity holders of the Bank |
$ | 4,019 | $ | 2,486 | $ | 1,431 | $ | 1,768 | $ | (2,294 | ) | $ | 7,410 | |||||||||||
| Return on equity(%)(3) |
21.3 | % | 13.1 | % | 14.6 | % | 12.2 | % | – | % | 10.4 | % | ||||||||||||
| Total average assets ($ billions) |
$ | 450 | $ | 237 | $ | 34 | $ | 490 | $ | 185 | $ | 1,396 | ||||||||||||
| Total average liabilities ($ billions) |
$ | 372 | $ | 179 | $ | 40 | $ | 455 | $ | 273 | $ | 1,319 | ||||||||||||
| (1) | The Other category represents smaller operating segments, including Group Treasury, and other corporate adjustments that are not allocated to an operating segment. Corporate adjustments include the net residual in matched maturity transfer pricing, the elimination of the tax-exempt income gross-up reported in net interest income, non-interest income and provision for income taxes, and differences in the actual amount of costs incurred and charged to the operating segments. |
| (2) | Taxable equivalent basis. Refer to Glossary on page 136. |
| (3) | Refer to Non-GAAP Measures on page 20 for the description of the measure. |
| For the year ended October 31, 2022 ($ millions) | Canadian Banking |
International Banking |
Global Wealth Management |
Global Banking and Markets |
Other(1) | Total | ||||||||||||||||||
| Net interest income(2) |
$ | 9,001 | $ | 6,900 | $ | 764 | $ | 1,630 | $ | (180 | ) | $ | 18,115 | |||||||||||
| Non-interest income(2) |
3,029 | 2,827 | 4,617 | 3,542 | (714 | ) | 13,301 | |||||||||||||||||
| Total revenue(2) |
12,030 | 9,727 | 5,381 | 5,172 | (894 | ) | 31,416 | |||||||||||||||||
| Provision for credit losses |
209 | 1,230 | 6 | (66 | ) | 3 | 1,382 | |||||||||||||||||
| Non-interest expenses |
5,388 | 5,212 | 3,259 | 2,674 | 569 | 17,102 | ||||||||||||||||||
| Provision for income taxes(2) |
1,670 | 618 | 551 | 653 | (734 | ) | 2,758 | |||||||||||||||||
| Net income |
$ | 4,763 | $ | 2,667 | $ | 1,565 | $ | 1,911 | $ | (732 | ) | $ | 10,174 | |||||||||||
| Net income attributable to non-controlling interests in subsidiaries |
– | 249 | 9 | – | – | 258 | ||||||||||||||||||
| Net income attributable to equity holders of the Bank |
$ | 4,763 | $ | 2,418 | $ | 1,556 | $ | 1,911 | $ | (732 | ) | $ | 9,916 | |||||||||||
| Return on equity(%)(3) |
26.3 | % | 12.9 | % | 16.2 | % | 14.3 | % | – | % | 14.8 | % | ||||||||||||
| Total average assets ($ billions) |
$ | 430 | $ | 207 | $ | 33 | $ | 445 | $ | 167 | $ | 1,282 | ||||||||||||
| Total average liabilities ($ billions) |
$ | 332 | $ | 152 | $ | 47 | $ | 414 | $ | 263 | $ | 1,208 | ||||||||||||
| (1) | The Other category represents smaller operating segments, including Group Treasury, and other corporate adjustments that are not allocated to an operating segment. Corporate adjustments include the net residual in matched maturity transfer pricing, the elimination of the tax-exempt income gross-up reported in net interest income, non-interest income and provision for income taxes, and differences in the actual amount of costs incurred and charged to the operating segments. |
| (2) | Taxable equivalent basis. Refer to Glossary on page 136. |
| (3) | Refer to Non-GAAP Measures on page 20 for the description of the measure. |
40 | 2023 Scotiabank Annual Report
Management’s Discussion and Analysis | Business Line Overview
T20A Financial performance – Adjusted
| For the year ended October 31, 2023 ($ millions)(1) | Canadian Banking |
International Banking |
Global Wealth Management |
Global Banking and Markets |
Other | Total | ||||||||||||||||||
| Net interest income |
$ | 9,756 | $ | 8,161 | $ | 842 | $ | 1,572 | $ | (2,044 | ) | $ | 18,287 | |||||||||||
| Non-interest income |
3,087 | 2,937 | 4,449 | 3,980 | (800 | ) | 13,653 | |||||||||||||||||
| Total revenue |
12,843 | 11,098 | 5,291 | 5,552 | (2,844 | ) | 31,940 | |||||||||||||||||
| Provision for credit losses |
1,443 | 1,868 | 10 | 101 | – | 3,422 | ||||||||||||||||||
| Non-interest expenses |
5,863 | 5,887 | 3,314 | 3,062 | 137 | 18,263 | ||||||||||||||||||
| Provision for income taxes |
1,515 | 715 | 501 | 621 | (1,538 | ) | 1,814 | |||||||||||||||||
| Net income |
$ | 4,022 | $ | 2,628 | $ | 1,466 | $ | 1,768 | $ | (1,443 | ) | $ | 8,441 | |||||||||||
| Net income attributable to non-controlling interests in subsidiaries |
– | 112 | 9 | – | – | 121 | ||||||||||||||||||
| Net income attributable to equity holders of the Bank |
$ | 4,022 | $ | 2,516 | $ | 1,457 | $ | 1,768 | $ | (1,443 | ) | $ | 8,320 | |||||||||||
| (1) | Refer to Non-GAAP Measures on page 20 for the description of the adjustments. |
| For the year ended October 31, 2022 ($ millions)(1) | Canadian Banking |
International Banking |
Global Wealth Management |
Global Banking and Markets |
Other | Total | ||||||||||||||||||
| Net interest income |
$ | 9,001 | $ | 6,900 | $ | 764 | $ | 1,630 | $ | (180 | ) | $ | 18,115 | |||||||||||
| Non-interest income |
3,029 | 2,827 | 4,617 | 3,542 | (353 | ) | 13,662 | |||||||||||||||||
| Total revenue |
12,030 | 9,727 | 5,381 | 5,172 | (533) | 31,777 | ||||||||||||||||||
| Provision for credit losses |
209 | 1,230 | 6 | (66 | ) | 3 | 1,382 | |||||||||||||||||
| Non-interest expenses |
5,366 | 5,173 | 3,223 | 2,674 | 351 | 16,787 | ||||||||||||||||||
| Provision for income taxes |
1,676 | 629 | 560 | 653 | (659 | ) | 2,859 | |||||||||||||||||
| Net income |
$ | 4,779 | $ | 2,695 | $ | 1,592 | $ | 1,911 | $ | (228 | ) | $ | 10,749 | |||||||||||
| Net income attributable to non-controlling interests in subsidiaries |
– | 249 | 9 | – | 1 | 259 | ||||||||||||||||||
| Net income attributable to equity holders of the Bank |
$ | 4,779 | $ | 2,446 | $ | 1,583 | $ | 1,911 | $ | (229 | ) | $ | 10,490 | |||||||||||
| (1) | Refer to Non-GAAP Measures on page 20 for the description of the adjustments. |
2023 Scotiabank Annual Report | 41
Management’s Discussion and Analysis
| 2023 Achievements | ||||
|
Accelerated business performance
• Further solidified a top-three position in business lending growth within Canada with market share gains.
• Continued progress growing the credit card portfolio with balances reaching $8.4 billion, an all-time high.
• Double-digit growth in deposits, leading to market share gains and a strong improvement to the Bank’s loan to deposit ratio.
• Strong financial results from Tangerine, Canada’s 6th largest personal deposit portfolio.
Winning team culture
• The Scotiabank Women Initiative®, which provides women-owned and women-led businesses with unbiased access to capital, has now deployed $7 billion in capital globally, continuing to progress towards its $10 billion commitment by 2025.
• Ranked as one of the Best Workplaces™ in Canada by Great Place to Work® for the fourth consecutive year.
• Launched Lightspark Engage, a platform that has allowed thousands of homeowners in Calgary and Edmonton to assess their energy use and identify ways to reduce their home’s carbon footprint.
• Deployed almost $10 billion of capital towards the Bank’s climate related finance mobilization commitment to support and finance decarbonization efforts.
Superior customer experience
• Entered into a partnership with Nova Credit, supporting the New to Canada segment by allowing customers to share foreign credit reports when applying for products, an industry-first for Canadian banks.
• Launched Customer Personalization Platform that transforms the Bank’s abilities to drive customer primacy by enabling it to scale personalized offers, supporting customer growth, deepening of relationships and higher engagement.
• Launched Scotia Mortgage+ Program to bundle Day-to-Day accounts and other retail products alongside the mortgage origination process in Home Financing Solutions (HFS) and Broker channels, deepening relationships with mortgage customers.
• Launched a dedicated phone line aimed at providing assistance to customers with hearing and/or speech impairments, who rely on Video Relay Service (VRS) for their remote banking needs.
Digital enablement
• Roll-out of digital capabilities delivered continued progress with a steady increase in digital adoption and active digital, as well as a strong increase in mobile users across both Retail and Tangerine.
• Continued to digitize and streamline our technology solutions within the mid-market segment of commercial banking through nCino to help create capacity and enhance client and employee experience; a full migration will be completed over the next year.
• Further progressed towards digital aspirations, partially supported by Tangerine where over 80% of new deposit flows originated from digitally engaged, multiproduct clients.
Scale our unique partnerships and assets
• Completed the Scene+ rollout of Empire brands, such as Sobeys, Safeway, FreshCo, and IGA, earlier this year and launched our partnership with Home Hardware, with Scene+ now reaching over 14 million members across Canada.
• Tangerine launched a 5-year partnership with Bike Share Toronto elevating brand awareness and supporting numerous Bike Share Toronto initiatives, including the addition of stations and expansion to all of Toronto’s 25 wards and priority neighborhoods.
Select Awards
• Scotiabank ranked highest in J.D. Power 2023 Overall Dealer Satisfaction Prime Credit Non-Captive Automotive Finance Lenders.
• Tangerine Bank ranked highest among midsize banks in the J.D. Power 2023 Canada Retail Banking Satisfaction Study for a 12th consecutive year, the longest running winner for a mid-sized bank in J.D. Power’s history.
• Scotiabank Gold American Express was recognized by Moneysense 2023 as the Best Rewards Card for everyday spending.
|
Business Profile
Canadian Banking provides a full suite of financial advice and banking solutions, supported by an excellent customer experience, to over 11 million customers. Retail, Small Business and Commercial Banking customers are served through its network of 947 branches and 3,703 automated banking machines (ABMs), as well as online, mobile and telephone banking, and specialized sales teams. Canadian Banking also provides an alternative self-directed banking solution to Tangerine customers. Canadian Banking is comprised of the following areas:
| • | Retail banking provides financial advice and solutions along with day-to-day banking products, including debit cards, chequing accounts, credit cards, investments, mortgages, personal loans and related creditor insurance products to retail customers, including automotive dealers and their customers, providing retail automotive financing solutions. Tangerine Bank provides day-to-day banking products, including chequing and saving accounts, credit cards, mortgages, loans and investments to self-directed customers. |
| • | Business banking delivers advice and a full suite of lending, deposit, cash management and trade finance solutions to small, medium, and large businesses, including the Roynat franchise which provides clients with innovative financing alternatives through both public and private markets. |
Strategy
Canadian Banking continued to prioritize providing customer and employee support initiatives throughout 2023. This included focusing on the health and safety of both customers and employees, supporting Retail and Business Banking customers financially, while delivering revenue growth to maintain a top-3 position in Canada across key market share measures.
Canadian Banking will continue to execute its long-term strategy to deliver stable and consistent earnings, including businesses and products that deliver higher returns on equity. Ongoing efforts focus on building stronger relationships with customers to increase engagement and customer primacy and loyalty, investing in digital and analytical capabilities to understand and anticipate customer needs, and developing a high-quality and diverse team of Scotiabank employees.
42 | 2023 Scotiabank Annual Report
Management’s Discussion and Analysis | Canadian Banking
2024 Priorities
| • | Client Primacy: Increase client primacy across Retail, Tangerine, & Commercial banking, with a focus on our priority segments. Deepen relationships across our client base to capture share of wallet and drive non-lending revenue. |
| • | Loyalty & Scene+: Continue to enhance our best in class loyalty program, leveraging it as a strong contributor to grow new primary client relationships and deeper product penetration with existing customers in Canada. |
| • | Operational Efficiency: Simplify, digitize, and streamline our processes to drive operational excellence and efficiency across Canadian Banking. |
| • | Accelerating Tangerine: Leverage Tangerine’s strong brand and market leading digital customer experience to win market share and grow our presence in the Canadian market with a digital-first approach. |
| • | Building Connectivity: Leverage our network and scale to achieve synergies and deliver the entire Bank to our clients, across all segments (e.g. across Retail & Wealth, Commercial & Wealth, leveraging common platforms and technologies where appropriate). |
| • | Accelerate data & analytics, technology, and digital capabilities: Strengthen capabilities across data, technology and digital to support salesforce enablement, customer self-serve and assisted experiences, and insight-driven reporting and decision-making. |
T21 Canadian Banking financial performance
| Taxable equivalent basis ($ millions) | 2023 | 2022 | ||||||
| Reported results |
||||||||
| Net interest income |
$ | 9,756 | $ | 9,001 | ||||
| Non-interest income(1) |
3,087 | 3,029 | ||||||
| Total revenue |
12,843 | 12,030 | ||||||
| Provision for credit losses |
1,443 | 209 | ||||||
| Non-interest expenses |
5,867 | 5,388 | ||||||
| Income tax expense |
1,514 | 1,670 | ||||||
| Net income |
$ | 4,019 | $ | 4,763 | ||||
| Net income attributable to non-controlling interests in subsidiaries |
– | – | ||||||
| Net income attributable to equity holders of the Bank |
$ | 4,019 | $ | 4,763 | ||||
| Key ratios and other financial data |
||||||||
| Return on equity(2) |
21.3 | % | 26.3 | % | ||||
| Productivity(3) |
45.7 | % | 44.8 | % | ||||
| Net interest margin(2) |
2.34 | % | 2.24 | % | ||||
| Provision for credit losses – performing (Stages 1 and 2) |
$ | 489 | $ | (343 | ) | |||
| Provision for credit losses – impaired (Stage 3) |
$ | 954 | $ | 552 | ||||
| Provision for credit losses as a percentage of average net loans and acceptances(3) |
0.32 | % | 0.05 | % | ||||
| Provision for credit losses on impaired loans as a percentage of average net loans and acceptances(3) |
0.21 | % | 0.13 | % | ||||
| Net write-offs as a percentage of average net loans and acceptances(3) |
0.19 | % | 0.13 | % | ||||
| Selected Consolidated Statement of Financial Position data (average balances) |
||||||||
| Earning assets(2) |
$ | 445,520 | $ | 425,436 | ||||
| Total assets |
449,555 | 429,528 | ||||||
| Deposits |
340,345 | 307,985 | ||||||
| Total liabilities |
371,587 | 332,453 | ||||||
| (1) | Includes net income from investments in associated corporations of $71 (2022 – $64). |
| (2) | Refer to Non-GAAP Measures on page 20 for the description of the measure. |
| (3) | Refer to Glossary on page 136 for the description of the measure. |
T21A Adjusted Canadian Banking financial performance(1)
| ($ millions) | 2023 | 2022 | ||||||
| Adjusted results |
||||||||
| Net interest income |
$ | 9,756 | $ | 9,001 | ||||
| Non-interest income |
3,087 | 3,029 | ||||||
| Total revenue |
12,843 | 12,030 | ||||||
| Provision for credit losses |
1,443 | 209 | ||||||
| Non-interest expenses(2) |
5,863 | 5,366 | ||||||
| Income before taxes |
5,537 | 6,455 | ||||||
| Income tax expense |
1,515 | 1,676 | ||||||
| Net income |
$ | 4,022 | $ | 4,779 | ||||
| Net income attributable to non-controlling interests in subsidiaries (NCI) |
– | – | ||||||
| Net income attributable to equity holders |
$ | 4,022 | $ | 4,779 | ||||
| (1) | Refer to Non-GAAP Measures on page 20 for the description of the adjustments. |
| (2) | Includes adjustment for Amortization of acquisition-related intangible assets of $4 (2022 – $22). |
2023 Scotiabank Annual Report | 43
Management’s Discussion and Analysis
Financial Performance
Net income
Canadian Banking reported net income attributable to equity holders of $4,019 million, compared to $4,763 million. Adjusted net income to equity holders was $4,022 million, a decrease of $757 million or 16%. The decrease was due primarily to higher provision for credit losses and non-interest expenses, partly offset by higher revenues driven by volume growth and margin expansion.
Average assets and liabilities
Average assets increased $20 billion or 5% to $450 billion. The growth included $12 billion or 16% in business loans and acceptances, $4 billion or 1% in residential mortgages, $3 billion or 5% in personal loans, and $1 billion or 16% in credit card loans.
Average liabilities increased $40 billion or 12% to $372 billion. The growth included $26 billion or 13% in personal deposits and $7 billion or 6% in non-personal deposits, both primarily in term products.
Revenues
Revenues of $12,843 million increased $813 million or 7%, due to higher net interest income and non-interest income.
Net interest income of $9,756 million increased $755 million or 8%, due primarily to loan and deposit growth and margin expansion. The net interest margin increased 10 basis point to 2.34%, due primarily to the impact of the Bank of Canada rate increases on deposit margins, partly offset by lower loan margins.
Non-interest income of $3,087 million increased $58 million or 2%. The increase was due primarily to elevated private equity gains, higher insurance revenue, foreign exchange fees, and income from associated corporations, partly offset by lower mutual fund distribution fees and banking revenue.
Retail Banking
Total Retail Banking revenues were $9,495 million, an increase of $526 million or 6%. Net interest income increased $531 million or 8%, primarily driven by loan and deposit growth and margin expansion. Non-interest income declined $5 million due mainly to lower mutual fund distribution fees and banking revenue, partly offset by higher insurance revenues.
Business Banking
Total Business Banking revenues were $3,348 million, an increase of $287 million or 9%. Net interest income increased $224 million or 11% due primarily to strong loan and deposit growth, and margin expansion. Non-interest income increased $63 million or 7% due primarily to elevated private equity gains, and higher deposit services and card revenues, partly offset by lower credit fees.
Provision for credit losses
The provision for credit losses was $1,443 million, an increase of $1,234 million. The provision for credit losses ratio was 32 basis points, an increase of 27 basis points.
Provision for credit losses on performing loans was $489 million, compared to a net reversal of $343 million. Retail provisions were $251 million and commercial provisions were $238 million. The provision this year was driven primarily by the unfavourable macroeconomic outlook and uncertainty around the impacts of higher interest rates resulting from policy tightening to address inflation, including the related impacts of migration in the retail portfolios, and on certain sectors in the non-retail portfolios. The previous year benefitted from reversals driven by improved portfolio credit quality expectations. The provision for credit losses ratio on performing loans increased 19 basis points to 11 basis points.
Provision for credit losses on impaired loans was $954 million compared to $552 million, an increase of $402 million due primarily to higher retail formations. The provision for credit losses ratio on impaired loans was 21 basis points, an increase of eight basis points.
Non-interest expenses
Non-interest expenses were $5,867 million compared to $5,388 million, an increase of 9%. Adjusted non-interest expenses were $5,863 million, an increase of $497 million or 9% due primarily to higher personnel costs, including inflationary adjustments, and higher technology, communications, advertising, and business development costs to support business growth.
Provision for income taxes
The effective tax rate was 27.4% compared to 26.0% in the prior year. The increase this year was driven mainly by the higher Canadian statutory tax rate.
Outlook
Revenue in Canadian Banking is expected to be driven further by growth in deposits and loans, although moderating from 2023 levels, and continued improvement in net interest margin. Solid revenue growth in Retail Banking and Tangerine businesses are expected to continue, supported by further volume growth and improving margins. Business Banking revenues are expected to moderate. Maintaining strong expense discipline while balancing investments in strategic growth initiatives to drive future growth will be a primary objective for Canadian Banking. Earnings will be supported by the continued focus on client primacy across Retail, Tangerine and Business Banking, and customer acquisition through our Scene+ loyalty program.
| C6 | Total revenue by sub-segment $ millions |
|
|
| C7 | Average loans and acceptances $ billions |
|
|
| C8 | Average deposits $ billions |
|
|
44 | 2023 Scotiabank Annual Report
Management’s Discussion and Analysis | International Banking
| 2023 Achievements | ||||
|
Acceleration of Growth Drivers
• Improved the Affluent relationship model in the Retail sector through digitally enabled virtual branches, driving client and earnings growth in the segment.
• Launched the Bank’s proprietary digital Credit 360 tool in Chile and Mexico to enhance the Bank’s credit journey in the Commercial sector.
• In GBM, the Bank is well positioned to accelerate growth across its footprint, ranking #1 in the LATAM Loans and #3 in the LATAM ESG bonds league table.
Winning Team
• Recognized as a Great Place to Work® across certain markets in Central America and the Caribbean and ranked 3rd in Colombia and Top 10 in Mexico.
• In Chile, formed the first gender-equitable board of directors of the Chilean private banking sector and ranked Top 10 of the LinkedIn Top Companies in 2023.
• In Mexico, Peru, and Colombia, ranked among the Top 10 in PAR Ranking, recognizing good practices to promote gender equality and diversity within the organization.
• In Dominican Republic, ranked among the Top 5 financial companies with the ‘Best Corporate Reputations’ by Merco.
Focused Customer Strategy
• Maintained positive trend and growth in transactional Net Promoter Score (NPS) across most channels and markets in the Retail sector, with improved competitive market rank in Chile from 5th to 4th.
• Delivered a robust NPS across core markets in the Corporate and Commercial sector, in line with the target and peers, demonstrating strong client coverage and business expertise.
Digital Enablement
• Strong digital progress across Mexico, Chile, Peru, and Colombia through continuous enhancement of digital capabilities. Achieved 73% digital sales, 59% digital adoption, and 93% self-serve transactions; digital users reached 4.4 million, of which ~4 million are mobile users.
• Recognized as the ‘Best Bank for Digital Solutions’ by Euromoney in Chile, with the following achievements:
• Digital Collaboration Tool: Developed in Chile and scaled to Caribbean and Central America, a one-stop, digital ecosystem for Scotia Access clients to access their banking information and advice.
• Scotia Zero: End-to-end digital origination for new-to-bank clients, acquiring ~65K new retail clients during the first 6 months.
Select Awards
• Recognized as the ‘Bank of The Year’ in Chile and Trinidad & Tobago by Latin Finance.
• Won the ‘World’s Best Consumer Digital Banks’ award in Latin America 2023 across certain Caribbean markets by Global Finance.
• Won the ‘Best Bank Award’ and ‘Best Mobile Banking App’ across certain markets in the Caribbean by Global Finance.
• Received the ‘Latin America Loan of the Year’ Award by International Financing Review (IFR) for the largest syndicated transaction in Latin America in 2022 as Sole Lead Arranger and Sole Bookrunner.
• Recognized as the ‘Best Digital Bank in Chile’ and ‘Best Investment Bank in Chile’ by the International Business Magazine.
• Recognized by Environmental Finance with the ‘Sustainability Bond of the Year – Sovereign: Mexico’ Bond Award for 2023.
• Recognized as the ‘Best Bank for ESG’ by Euromoney in Chile.
• Awarded ‘Best Private Bank’ recognitions across two categories in Peru by Global Finance 2023.
|
||||
Business Profile
International Banking is a diverse franchise offering financial advice and solutions to over 12 million Retail, Corporate, and Commercial clients. The geographic footprint encompasses 15+ countries, including Mexico, Chile, Peru, Colombia, Brazil, Uruguay, and certain markets across Central America and the Caribbean. The Bank is well positioned with a unique geographical footprint, providing Digital leadership and connectivity with Canada and the U.S. markets. International Banking countries continue to demonstrate attractive demographics and opportunities to grow banking penetration.
Strategy
International Banking is focused on delivering sustainable earnings growth and selectively capturing business opportunities in higher-return segments and geographies. The focus will be on building stronger relationships with customers to increase engagement and customer primacy, prudently managing credit risk, accelerating deposit growth, prioritizing growth in markets where we have scale opportunity and targeting client segments where we have the product capability and connectivity to be a lead financial services provider. International Banking will continue to focus on expense management while executing our long-term vision of building a strong client franchise across target segments and geographies, supported by a diverse and talented winning team.
2023 Scotiabank Annual Report | 45
Management’s Discussion and Analysis
2024 Priorities
| • | Value creation: Create shareholder value by consolidating a strong client franchise across segments and well-connected footprint to deliver higher return with targeted sustainable profitable growth. |
| • | Strong client franchise: Grow client primacy through target segment-specific value propositions. |
| • | Targeted capital allocation: Drive sustainable profitable growth in higher returning segments and geographies while deemphasizing underperforming businesses. |
| • | Operating Model: Make progress towards standardizing our operating model for deliberate scale and efficiency, maximizing connectivity across our footprint. |
| • | Winning Team: Enhance culture and management process, aligning incentives to drive accountability and execution. |
T22 International Banking financial performance – Reported
| Taxable equivalent basis ($ millions) | 2023 | 2022 | ||||||
| Reported results |
||||||||
| Net interest income |
$ | 8,161 | $ | 6,900 | ||||
| Non-interest income(1) |
2,937 | 2,827 | ||||||
| Total revenue |
11,098 | 9,727 | ||||||
| Provision for credit losses |
1,868 | 1,230 | ||||||
| Non-interest expenses |
5,928 | 5,212 | ||||||
| Income tax expense |
704 | 618 | ||||||
| Net income |
$ | 2,598 | $ | 2,667 | ||||
| Net income attributable to non-controlling interests in subsidiaries |
112 | 249 | ||||||
| Net income attributable to equity holders of the Bank |
$ | 2,486 | $ | 2,418 | ||||
| Key ratios and other financial data |
||||||||
| Return on equity(2) |
13.1 | % | 12.9 | % | ||||
| Productivity(3) |
53.4 | % | 53.6 | % | ||||
| Net interest margin(2) |
4.10 | % | 3.96 | % | ||||
| Provision for credit losses – performing (Stages 1 and 2) |
$ | 103 | $ | 84 | ||||
| Provision for credit losses – impaired (Stage 3) |
$ | 1,765 | $ | 1,146 | ||||
| Provision for credit losses as a percentage of average net loans and acceptances(3) |
1.09 | % | 0.82 | % | ||||
| Provision for credit losses on impaired loans as a percentage of average net loans and acceptances(3) |
1.03 | % | 0.77 | % | ||||
| Net write-offs as a percentage of average net loans and acceptances(3) |
0.93 | % | 0.79 | % | ||||
| Selected Consolidated Statement of Financial Position data (average balances) |
||||||||
| Earning assets(2) |
$ | 217,274 | $ | 188,742 | ||||
| Total assets |
236,688 | 206,550 | ||||||
| Deposits |
126,422 | 107,206 | ||||||
| Total liabilities |
179,316 | 152,140 | ||||||
| (1) | Includes net income from investments in associated corporations of $251 (2022 – $250). |
| (2) | Refer to Non-GAAP Measures on page 20 for the description of the measure. |
| (3) | Refer to Glossary on page 136 for the description of the measure. |
T22A Adjusted International Banking financial performance(1)
| ($ millions) | 2023 | 2022 | ||||||
| Adjusted results |
||||||||
| Net interest income |
$ | 8,161 | $ | 6,900 | ||||
| Non-interest income |
2,937 | 2,827 | ||||||
| Total revenue |
11,098 | 9,727 | ||||||
| Provision for credit losses |
1,868 | 1,230 | ||||||
| Non-interest expenses(2) |
5,887 | 5,173 | ||||||
| Income before taxes |
3,343 | 3,324 | ||||||
| Income tax expense |
715 | 629 | ||||||
| Net income |
$ | 2,628 | $ | 2,695 | ||||
| Net income attributable to non-controlling interests (NCI) |
112 | 249 | ||||||
| Net income attributable to equity holders |
$ | 2,516 | $ | 2,446 | ||||
| (1) | Refer to Non-GAAP Measures on page 20 for the description of the adjustments. |
| (2) | Includes adjustment for Amortization of acquisition-related intangible assets of $41 (2022 – $39). |
46 | 2023 Scotiabank Annual Report
Management’s Discussion and Analysis | International Banking
Financial Performance
Net income
Net income attributable to equity holders was $2,486 million, an increase of $68 million. Adjusted net income attributable to equity holders was $2,516 million, an increase of $70 million. The increase was due largely to higher net interest income and non-interest income, partly offset by higher non-interest expenses, provision for credit losses, and provision for income taxes.
Financial Performance on an Adjusted and Constant Dollar Basis
The discussion below on the results of operations is on an adjusted and constant dollar basis. Under the constant dollar basis, prior period amounts are recalculated using current period average foreign currency rates, which is a non-GAAP financial measure (refer to Non-GAAP Measures on page 20). The Bank believes that constant dollar is useful for readers in assessing ongoing business performance without the impact of foreign currency translation and is used by management to assess the performance of the business segment. Ratios are on a reported basis.
T23 International Banking financial performance on adjusted and constant dollar basis
| Taxable equivalent basis ($ millions) | 2023 | 2022 | ||||||
| Net interest income |
$ | 8,161 | $ | 7,481 | ||||
| Non-interest income(1) |
2,937 | 2,907 | ||||||
| Total revenue |
11,098 | 10,388 | ||||||
| Provision for credit losses |
1,868 | 1,325 | ||||||
| Non-interest expenses |
5,887 | 5,542 | ||||||
| Income tax expense |
715 | 653 | ||||||
| Net income on constant dollar basis |
$ | 2,628 | $ | 2,868 | ||||
| Net income attributable to non-controlling interests in subsidiaries on a constant dollar basis |
112 | 261 | ||||||
| Net income attributable to equity holders of the Bank on a constant dollar basis |
$ | 2,516 | $ | 2,607 | ||||
| Selected Consolidated Statement of Financial Position data (average balances) |
||||||||
| Total assets |
236,688 | 221,719 | ||||||
| Total liabilities |
179,316 | 164,302 | ||||||
| (1) | Includes net income from investments in associated corporations of $251 (2022 – $256). |
| C9 | Total revenue by region $ millions |
|
|
| C10 | Average loans and acceptances $ billions |
|
|
| C11 | Average earning assets by region $ billions |
|
|
| C12 | Average deposits $ billions |
|
|
2023 Scotiabank Annual Report | 47
Management’s Discussion and Analysis
Net income
Net income attributable to equity holders was $2,486 million, a decrease of $91 million or 4%. Adjusted net income attributable to equity holders was $2,516 million, down $91 million or 4%. The decrease was due largely to higher provision for credit losses, partly offset by higher net interest income.
Assets and liabilities
Average assets of $237 billion increased $15 billion or 7%. Total loans increased by 7%, mainly driven by residential mortgages increase of 11%, business loans increase of 6%, and personal and credit card loans increase of 5%.
Average liabilities of $179 billion increased $15 billion or 9%. Total deposits increased by 9% due mainly to higher non-personal deposits increase of 12% and personal deposits increase of 4%.
Revenues
Total revenues were $11,098 million, an increase of $710 million or 7%, due to higher net interest income and non-interest income, driven by margin expansion, capital market revenues and gains on investment securities.
Net interest income was $8,161 million, an increase of 9%. The increase was driven by growth in residential mortgages and commercial loans. Net interest margin increased by 14 basis points to 4.10% due to better business mix and asset repricing, partly offset by higher cost of funds and lower inflation benefits in Chile.
Non-interest income was $2,937 million, an increase of 1%. The increase was driven by net fees and commissions, offset by lower trading revenues.
Latin America
Total revenues were $8,540 million, an increase of $473 million or 6%. Net interest income increased by 8% in line with loan growth. Non-interest income was in line with the prior year, driven by higher capital markets activity, offset by lower treasury gains due to inflation reductions.
Caribbean and Central America
Total revenues were $2,435 million, an increase of $256 million or 12%. Net interest income increased by $211 million or 14%, benefiting from central bank rate increases. Non-interest income increased by $45 million or 7%, mainly driven by higher income from associated corporations, card fees and insurance.
Provision for credit losses
The provision for credit losses was $1,868 million, an increase of $543 million or 41%. The provision for credit losses ratio was 109 basis points, an increase of 27 basis points.
Provision for credit losses on performing loans was $103 million, compared to $93 million, an increase of $10 million. The provision this year was driven primarily by higher commercial provisions due to the less favourable macroeconomic outlook, higher retail provisions in Chile and Colombia, and portfolio growth across markets, partly offset by credit migration to impaired.
Provision for credit losses on impaired loans was $1,765 million, compared to $1,232 million, an increase of $533 million due primarily to higher retail provisions, driven by higher formations across Pacific Alliance markets.
The provision for credit losses ratio on impaired loans was 103 basis points, an increase of 26 basis points.
Non-interest expenses
Non-interest expenses were $5,928 million, an increase of $344 million or 6%. On an adjusted basis, non-interest expenses increased 6%, due primarily to inflationary pressure, partly offset by benefits from prudent expense management and savings initiatives.
Provision for income taxes
The effective tax rate was 21.3% compared to 18.8% last year. On an adjusted basis, the effective tax rate was 21.4%, compared to 18.9% last year due primarily to lower inflationary adjustments in Chile and Mexico and earnings mix across jurisdictions.
Outlook
Revenues in the International Bank are expected to benefit from loan growth and net interest margin expansion, as a result of the expected stabilization of interest rates, and rate reductions in the second half of 2024. Expenses are expected to grow at a lower rate than revenue, reflecting expense saving initiatives, including structure right-sizing to deliver positive operating leverage. Earnings are expected to be impacted by higher provision for credit losses, and a higher tax rate as inflation benefits continue to diminish. The business will continue to invest to drive profitability and sustainable growth in our selected segment and markets across the region.
48 | 2023 Scotiabank Annual Report
Management’s Discussion and Analysis | Global Wealth Management
| 2023 Achievements | ||||
|
Continue growth across asset management and advisory businesses
• Scotia Global Asset Management is ranked #2 by assets in the Canadian investment fund industry. • Further evolved the Total Wealth offering by broadening the Bank’s wealth management advice to include longevity, health, and wellbeing into clients’ financial considerations, and leveraging the unique capabilities of MD Financial Management to help create a differentiated offering. • ScotiaMcLeod Investment Portfolios, the in-house separately managed account program (SMA), continues to demonstrate strong momentum and is the largest and fastest growing in-house SMA program in Canada. • International Wealth Management delivered double-digit earnings growth and made significant progress in expanding Total Wealth internationally, successfully launching a pilot in Colombia, and seamlessly integrating Total Wealth into operations in Chile and Peru.
Focus on Partnerships
• Continued focus on delivering the entire bank to clients and driving partnerships across businesses. Partnerships with Retail and Commercial Banking drove significant referral volumes in the current fiscal year. • Launched Medicus Pension Plan, an innovative multi-employer plan that provides incorporated physicians with a unique opportunity to access predictable lifetime retirement income. The Plan provides a lifetime pension based on a physician’s personal earnings and years of service and pools investments among all Plan participants. • Scotia Smart Investor, a digital hybrid investment tool launched in partnership with Canadian Banking, continues to see strong new asset growth and accounts openings.
Expand international capabilities and offering
• Continued launch of Total Wealth advice model internationally – with a focus in Pacific Alliance countries. • Launched 19 new investment funds in Mexico, Chile, Colombia, and Peru. • Added new asset management capabilities and investment solutions in Chile – launching the new ‘SMART’ robo-advisory platform that delivers a seamless digital investment experience for clients.
Select award highlights
• Scotia Global Asset Management won prestigious awards including 25 FundGrade A+ Awards and 8 individual Lipper Awards across its ScotiaFunds and Dynamic Funds brands for consistent, outstanding, risk-adjusted performance. • Scotia iTRADE ranked #1 among the Big 5 Banks in the 2022 Surviscor Canadian Online Brokerage Ranking for best overall online experience, announced in Fiscal 2023. • Scotia Wealth Management was recognized as the ‘Best Domestic Private Bank in Canada’ by Euromoney’s Global Private Banking Awards 2023. The award recognizes Scotia Wealth Management for its client-focused Total Wealth Planning approach, delivering a seamless, holistic wealth management experience. • Scotia Wealth Management was awarded ‘Best Private Bank for Net Worth Between $1 million and $25 million’ and ‘Best Private Bank for Women Clients’ by Global Finance; Further, they were awarded ‘Best Branding in Private Banking’ (North America) and ‘Best Private Bank for Wealthy Women’ by The Banker (announced in Fiscal 2023).
|
Business Profile
Global Wealth Management is focused on delivering comprehensive wealth management advice and solutions to clients across Scotiabank’s footprint. Global Wealth Management serves over 2 million investment fund and advisory clients across 13 countries – administering over $600 billion in assets.
Global Wealth Management has built a robust client-centric business with comprehensive advice, products, and platforms to meet a broad range of client needs.
Global Wealth Management is comprised of the following businesses:
| • | Wealth Management: Online brokerage (Scotia iTRADE), Mobile investment specialists (Scotiabank), Full-service brokerage (ScotiaMcLeod and MD Financial Management), Trust, Private Banking, Private Investment Counsel (Scotia Wealth Management, Jarislowsky Fraser, and MD Financial Management). |
| • | Asset Management: Retail mutual funds (Scotia & Dynamic Funds), Exchange Traded Funds (Scotia, Dynamic Funds & Tangerine), Liquid Alternatives (Dynamic Funds), Institutional funds (Scotia & Jarislowsky Fraser). |
Scotiatrust, ScotiaMcLeod, Scotia iTRADE, Private Banking, Private Investment Counsel, 1832 Asset Management and Dynamic Funds are top performers in key industry metrics.
Strategy
Global Wealth Management continues to execute on its mission to provide clients with strong risk adjusted investment results and financial planning to deliver wealth solutions that meet their complex needs. The focus continues to be delivering comprehensive advice and planning to best serve clients in the current economic environment and through all market conditions. To maintain our strong momentum towards that focus, Global Wealth Management is continuing to enhance our Total Wealth advice capabilities and innovating our product shelf to deliver purpose-built products for our clients.
In addition, Global Wealth Management is focused on maximizing its international footprint, including leveraging the Bank’s Retail and Commercial Banking infrastructure and network in priority markets across Latin America.
2023 Scotiabank Annual Report | 49
Management’s Discussion and Analysis
2024 Priorities
| • | Deliver plan-based, holistic advice: Deliver the entire bank to new and existing clients with complex wealth and financial needs through the Total Wealth advice model. |
| • | Broaden investment solutions distribution: Leverage our expansive distribution network to increase delivery of investment products and services to clients through Wealth and Retail channels. |
| • | Continue product innovation: Drive innovation in products to deliver industry-leading investment capabilities and performance through purpose-built solutions for customers across Global Wealth Management’s brands and channels. |
| • | Focus on international: Continue to invest and grow the International Wealth business, following the Bank’s retail footprint, by growing the product shelf to support affluent client needs and by enhancing wealth management capabilities to deliver Total Wealth advice. |
| • | Invest in digital: Digitally enable sales and advice to support distribution channels, including proprietary and 3rd party sales. |
| • | Enhance winning team culture: Cultivate a talented, diverse workforce, and foster an environment to keep customers and employees safe, while delivering outstanding results and client experiences. |
T24 Global Wealth Management financial performance
| Taxable equivalent basis ($ millions) | 2023 | 2022 | ||||||
| Reported results |
||||||||
| Net interest income |
$ | 842 | $ | 764 | ||||
| Non-interest income |
4,449 | 4,617 | ||||||
| Total revenue |
5,291 | 5,381 | ||||||
| Provision for credit losses |
10 | 6 | ||||||
| Non-interest expenses |
3,350 | 3,259 | ||||||
| Income tax expense |
491 | 551 | ||||||
| Net income |
$ | 1,440 | $ | 1,565 | ||||
| Net income attributable to non-controlling interests in subsidiaries |
9 | 9 | ||||||
| Net income attributable to equity holders of the Bank |
$ | 1,431 | $ | 1,556 | ||||
| Key ratios and other financial data |
||||||||
| Return on equity(1) |
14.6 | % | 16.2 | % | ||||
| Productivity(2) |
63.3 | % | 60.6 | % | ||||
| Selected Consolidated Statement of Financial Position data (average balances) |
||||||||
| Earning assets(1) |
$ | 24,294 | $ | 22,452 | ||||
| Total assets |
34,127 | 32,721 | ||||||
| Deposits |
33,576 | 38,663 | ||||||
| Total liabilities |
40,481 | 46,906 | ||||||
| Other ($ billions) |
||||||||
| Assets under administration(2) |
$ | 610 | $ | 580 | ||||
| Assets under management(2) |
$ | 317 | $ | 311 | ||||
| (1) | Refer to Non-GAAP Measures on page 20 for the description of the measure. |
| (2) | Refer to Glossary on page 136 for the description of the measure. |
T24A Adjusted Global Wealth Management financial performance(1)
| ($ millions) | 2023 | 2022 | ||||||
| Adjusted results |
||||||||
| Net interest income |
$ | 842 | $ | 764 | ||||
| Non-interest income |
4,449 | 4,617 | ||||||
| Total revenue |
5,291 | 5,381 | ||||||
| Provision for credit losses |
10 | 6 | ||||||
| Non-interest expenses(2) |
3,314 | 3,223 | ||||||
| Income before taxes |
1,967 | 2,152 | ||||||
| Income tax expense |
501 | 560 | ||||||
| Net income |
$ | 1,466 | $ | 1,592 | ||||
| Net income attributable to non-controlling interests in subsidiaries (NCI) |
9 | 9 | ||||||
| Net income attributable to equity holders |
$ | 1,457 | $ | 1,583 | ||||
| (1) | Refer to Non-GAAP Measures on page 20 for the description of the adjustments. |
| (2) | Includes adjustment for Amortization of acquisition-related intangible assets of $36 (2022 – $36). |
50 | 2023 Scotiabank Annual Report
Management’s Discussion and Analysis | Global Wealth Management
Financial Performance
Net income
Net income attributable to equity holders was $1,431 million, compared to $1,556 million in the prior year. Adjusted net income attributable to equity holders was $1,457 million, down $126 million or 8%. The decline was due primarily to lower mutual fund fees and brokerage revenues, and higher non-interest expenses, partly offset by higher net interest income.
Assets under management (AUM) and assets under administration (AUA)
Assets under management of $317 billion increased $6 billion or 2% driven by market appreciation partly offset by net redemptions. Assets under administration of $610 billion increased $30 billion or 5% due primarily to higher net sales and market appreciation.
Revenues
Revenues of $5,291 million decreased $90 million or 2%, due to lower fee income partly offset by higher net interest income.
Net interest income of $842 million increased $78 million or 10%, driven by solid loan growth and improved margins.
Non-interest income was $4,449 million, down $168 million or 4%, due primarily to lower mutual fund fees from lower average AUM, and lower brokerage revenues.
Canada
Revenues of $4,572 million were down $171 million or 4%. Lower mutual fund fees were partly offset by higher net interest income, driven by loan growth and margin expansion.
International
Revenues of $719 million increased by $81 million or 13%. The growth was due primarily to higher net interest income from improved margins, and higher mutual fund fees.
Provision for credit losses
The provision for credit losses was $10 million, an increase of $4 million. The provision for credit losses ratio was four basis points, an increase of one basis point.
Provision for credit losses on performing loans was $6 million, compared $2 million, an increase of $4 million due primarily to the unfavourable macroeconomic outlook.
Provision for credit losses on impaired loans was a $4 million, unchanged from last year. The provision for credit losses ratio on impaired loans was two basis points, an increase of one basis point.
Non-interest expenses
Non-interest expenses of $3,350 million increased by $91 million or 3%, driven largely by the expansion of the revenue-generating salesforce and technology costs to support business growth.
Provision for income taxes
The effective tax rate was 25.4% compared to 26.0% in the prior year.
Outlook
Revenue growth in Global Wealth Management is expected to be driven by retail mutual fund volume growth through active management and multi-brand distribution in Canada; solid growth across our advisory business; and continued expansion across our key international markets. Earnings are expected to grow in 2024 from market appreciation and strong new business volumes. Global Wealth Management will continue to invest in the business through ongoing enhancements to digital client and advisor capabilities, while remaining focused on managing expense growth in line with revenue growth. Global Wealth Management earnings would be expected to improve in line with recovering market conditions.
| C13 | Total revenue by sub-segment $ millions |
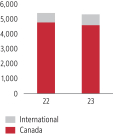
|
| C14 | Wealth management assets under administration (AUA) $ billions, as at October 31 |
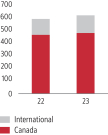
|
| C15 | Wealth management assets under management (AUM) $ billions, as at October 31 |
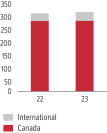
|
2023 Scotiabank Annual Report | 51
Management’s Discussion and Analysis
| 2023 Achievements | ||||
|
Increase relevance to corporate clients and capture more of the non-lending wallet
• Leveraged sector and product expertise to grow origination platform and develop unique, differentiated solutions as demonstrated by top-three Canadian league table rankings in Debt Capital Markets, Loans, and Mergers & Acquisitions. • Invested in client-focused initiatives by modernizing technology infrastructure and platforms across Fixed Income, Foreign Exchange, and Equities businesses to offer best in class execution and widen products and services offerings.
Elevate our product suite to pursue a greater share of wallet
• Established a U.S.-based private credit structuring, syndication, and sales team and continued to build capabilities with a growing product suite for U.S. clients. • Completed SWIFT system migration upgrade, an important payments transformation milestone that lays the foundation for new business services that will streamline the client experience across our global footprint. • Conducted first inaugural synthetic risk transfer trade, providing the Bank with material capital relief at an attractive cost of client capital.
Build presence in the Americas
• Continued progress on multi-year strategy of creating a top-tier local and cross-border wholesale banking business in the Americas. • Broadened distribution of GBM Latam products to regional and international clients through modernized infrastructure, including electronic trading. • Launched new U.S. coverage model to support a larger client footprint including insurance, hedge fund, agency, and regional bank clients.
Select awards and deal highlights
Awards
• Global Finance Sustainable Finance Awards: Best Bank for Sustainable Finance (Canada), Outstanding Leadership in Sustainability Transparency (Global). • The Banker’s Investment Banking Awards 2023: Investment Bank of the Year for Sustainable SSA Financing. • ESG Investing Awards 2023: Best Specialist ESG Research. • Environment Finance Bond Awards 2023: Green Bond of the Year and Sustainability Bond of the Year. • The Banker Deals of the Year 2023: Recognized for Phoenix Tower U.S. $2 billion cross-border syndicate loan.
Deal highlights
• Joint Bookrunner on a number of notable mandates this year, including: • Joint Bookrunner and Sustainable Structuring Agent on Hydro One Inc.’s $1.05 billion Sustainable Bond offering – the issuer’s inaugural offering under its Sustainable Financing Framework and the first Sustainable Bond offering by a Canadian utility. • Rogers Communications’ $3.0 billion offering of senior unsecured notes across 4 tranches, the second largest bond offering on record in the Canadian market. • Canadian National Railway’s $1.75 billion offering of senior unsecured notes across 3 tranches. • Enbridge’s $4.6 billion offering of common shares, representing the largest bought deal in Canadian equity capital markets history. • Brookfield Renewables’ U.S.$500 million offering of L.P. Units / Class A Exchangeable Shares, representing the largest deal from the Power & Utilities sector in F2023. • Rexford Industrial Realty’s U.S.$751 million bought offering, representing the largest bought REIT offering of the year and Scotiabank’s first active role on a bought REIT offering in the U.S. • Vesta’s U.S.$446 million American Depository Receipt (ADR) IPO on the NYSE, representing the first Mexican public company to do a sizable ADR IPO since 2013. • Financial Advisor on a number of marquee transactions this year, including: • Yamana’s sale to Agnico Eagle Mines and Pan American Silver for U.S.$5.2 billion. • Dream Industrial REIT and GIC’s joint acquisition of Summit Industrial Income REIT for $5.9 billion. • Allied Properties REIT’s sale of its urban data centre portfolio to KDDI for $1.35 billion. • Quebecor’s acquisition of Freedom Mobile for $2.85 billion. • GIP’s acquisition of a 40% interest in the Columbia Pipeline System from TC Energy for U.S.$3.9 billion. • Petrobras’s sale of its 90% interest in the Albacora Leste Field to PRIO for U.S.$2.2 billion.
|
||||
52 | 2023 Scotiabank Annual Report
Management’s Discussion and Analysis | Global Banking and Markets
Business Profile
Global Banking and Markets (GBM) provides corporate clients with lending and transaction services, investment banking advice and access to capital markets. GBM is a full-service wholesale bank in the Americas, with operations in 20+ countries, serving clients across Canada, the United States, Latin America, Europe and Asia-Pacific.
Strategy
Global Banking and Markets’ ambition is to deliver sustainable and profitable growth for shareholders, driven by disciplined capital allocation across our footprint. To achieve this vision, GBM is focused on increasing relevance with clients with leading financial advice and solutions and on expanding the Bank’s full-service corporate offering and prioritizing client relationships where we can provide incremental value beyond lending. We are leveraging regional and institutional capabilities to deliver for our clients with focused growth in businesses and markets supported by our strategic framework.
2024 Priorities
| • | Increase relevance to strategic clients: Leverage existing expertise to expand into new and growing areas of opportunity and continue to increase relevance to strategic clients through enhanced analytics. |
| • | Strengthen capital markets offerings and advisory services: Continue to invest in origination services and capital markets product offerings, and further advance digital adoption and electronic execution capabilities. |
| • | Leverage footprint to generate diverse and durable earnings: Maintain leadership position in Canada, deliver U.S. growth strategy, expand in areas of strength and opportunity in Latin America. |
| • | Enable a winning culture: Attract, develop, and retain diverse talent in an inclusive and high-performance environment, while keeping the Bank safe. |
T25 Global Banking and Markets financial performance
| Taxable equivalent basis ($ millions) | 2023(1) | 2022(1) | ||||||
| Reported results |
||||||||
| Net interest income |
$ | 1,572 | $ | 1,630 | ||||
| Non-interest income |
3,980 | 3,542 | ||||||
| Total revenue |
5,552 | 5,172 | ||||||
| Provision for credit losses |
101 | (66 | ) | |||||
| Non-interest expenses |
3,062 | 2,674 | ||||||
| Income tax expense |
621 | 653 | ||||||
| Net income |
$ | 1,768 | $ | 1,911 | ||||
| Net income attributable to non-controlling interests in subsidiaries |
– | – | ||||||
| Net income attributable to equity holders of the Bank |
$ | 1,768 | $ | 1,911 | ||||
| Key ratios and other financial data |
||||||||
| Return on equity(2) |
12.2 | % | 14.3 | % | ||||
| Productivity(3) |
55.2 | % | 51.7 | % | ||||
| Provision for credit losses – performing (Stages 1 and 2) |
$ | 101 | $ | (58 | ) | |||
| Provision for credit losses – impaired (Stage 3) |
$ | – | $ | (8 | ) | |||
| Provision for credit losses as a percentage of average net loans and acceptances(3) |
0.07 | % | (0.06 | )% | ||||
| Provision for credit losses on impaired loans as a percentage of average net loans and acceptances(3) |
– | % | (0.01 | )% | ||||
| Net write-offs as a percentage of average net loans and acceptances(3) |
– | % | (0.02 | )% | ||||
| Selected Consolidated Statement of Financial Position data (average balances) |
||||||||
| Trading assets |
$ | 108,778 | $ | 129,939 | ||||
| Loans and acceptances |
128,276 | 108,722 | ||||||
| Earning assets(2) |
446,426 | 401,109 | ||||||
| Total assets |
490,246 | 444,957 | ||||||
| Deposits |
181,989 | 169,591 | ||||||
| Total liabilities |
455,426 | 414,134 | ||||||
| (1) | Includes the gross-up of tax-exempt income earned on certain securities reported in either net interest income or non-interest income for the year ended October 31, 2023 of $437 (October 31, 2022 – $333). |
| (2) | Refer to Non-GAAP Measures on page 20 for the description of the measure. |
| (3) | Refer to Glossary on page 136 for the description of the measure. |
2023 Scotiabank Annual Report | 53
Management’s Discussion and Analysis
Financial Performance
Net income
Global Banking and Markets reported net income attributable to equity holders of $1,768 million, a decrease of $143 million or 7%. This decline was due to higher non-interest expenses, higher provision for credit losses, and lower net interest income, partly offset by higher non-interest income and the positive impact of foreign currency translation.
Average assets and liabilities
Average assets increased $45 billion or 10% to $490 billion, due mainly to higher securities purchased under resale agreements, higher business loans and the impact of foreign currency translation, partly offset by lower trading securities.
Average liabilities increased $41 billion or 10% to $455 billion, due mainly to growth in securities sold under repurchase agreements, deposits, and the impact of foreign currency translations.
Revenues
Revenues were $5,552 million, an increase of $380 million or 7%. This was due to higher non-interest income and the positive impact of foreign currency translation, partly offset by lower net interest income.
Net interest income of $1,572 million decreased by $58 million or 4%. This was due mainly to higher trading related funding costs and lower corporate lending margins.
Non-interest income of $3,980 million increased by $438 million or 12%. This was due mainly to higher fee and commission revenue, and the positive impact of foreign currency translation.
Provision for credit losses
The provision for credit losses was $101 million compared to a net reversal of $66 million. The provision for credit losses ratio was seven basis points, an increase of 13 basis points.
Provision for credit losses on performing loans was $101 million, compared to a net reversal of $58 million. The provision this period was driven primarily by the unfavourable macroeconomic outlook, and the related impacts on certain sectors of the North American non-retail portfolio.
Provision for credit losses on impaired loans was nil, compared to a net reversal of $8 million, as the prior year benefited from higher recoveries. The provision for credit losses ratio on impaired loans increased by one basis point.
Non-interest expenses
Non-interest expenses increased by $388 million or 15% to $3,062 million, mainly driven by higher personnel and technology costs to support business development and the impact of foreign currency translation.
Provision for income taxes
The effective tax rate was 26.0% compared to 25.5% the prior year. The increase was due mainly to the increase in the Canadian statutory tax rate, partly offset by the impact of the change in earnings mix across jurisdictions.
Outlook
Global Banking and Markets will be focused on priority markets and client primacy to generate increased share of wallet and higher returns. In capital markets, revenue growth will be led by Fixed Income, Currencies & Commodities (FICC), while business banking is expected to deliver higher fee-based revenues with continued focus on targeted sectors such as Healthcare, Technology and Consumer Industrial and Retail. Expense growth will be focused on key investments in priority segments and markets. Global Banking and Markets earnings growth will be supported by focusing on its priority markets in North America to strengthen client relationships and drive profitable and sustainable growth.
| C16 | Total revenue |
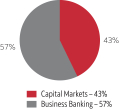
|
| C17 | Business banking revenue $ millions |
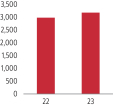
|
| C18 | Capital markets revenue by business line $ millions |
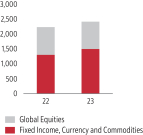
|
| C19 | Composition of average assets $ billions |
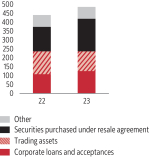
|
| C20 | Trading day losses |
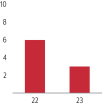
|
54 | 2023 Scotiabank Annual Report
Management’s Discussion and Analysis | Other
The Other segment includes Group Treasury, smaller operating segments and corporate items which are not allocated to a business line. Group Treasury is primarily responsible for Balance Sheet, Liquidity and Interest Rate Risk management, which includes the Bank’s wholesale funding activities.
Net interest income, non-interest income, and the provision for income taxes in each period include the elimination of tax-exempt income gross-up. This amount is included in the operating segments, which are reported on a taxable equivalent basis.
Net income from associated corporations and the provision for income taxes in each period include the tax normalization adjustments related to the gross-up of income from associated companies. This adjustment normalizes the effective tax rate in the divisions to better present the contribution of the associated companies to the divisional results.
Financial Performance
T26 Other financial performance
| ($ millions) | 2023 | 2022 | ||||||
| Reported results |
||||||||
| Net interest income(1) |
$ | (2,044 | ) | $ | (180 | ) | ||
| Non-interest income(1)(2) |
(433 | ) | (714 | ) | ||||
| Total revenue(1) |
(2,477 | ) | (894 | ) | ||||
| Provision for credit losses |
– | 3 | ||||||
| Non-interest expenses |
924 | 569 | ||||||
| Income tax expense(1) |
(1,104 | ) | (734 | ) | ||||
| Net income (loss) |
$ | (2,297 | ) | $ | (732 | ) | ||
| Net income attributable to non-controlling interests in subsidiaries |
(3 | ) | – | |||||
| Net income (loss) attributable to equity holders |
$ | (2,294 | ) | $ | (732 | ) | ||
| (1) | Includes the net residual in matched maturity transfer pricing, and the elimination of the tax-exempt income gross-up reported in net interest income, non-interest income, and provision for income taxes in the business segments, which are reported on a taxable equivalent basis. |
| (2) | Includes net income from investments in associated corporations of $(188) (2022 – $(60)). |
T26A Adjusted Other financial performance(1)
| ($ millions) | 2023 | 2022 | ||||||
| Adjusted results |
||||||||
| Net interest income |
$ | (2,044 | ) | $ | (180 | ) | ||
| Non-interest income(2) |
(800 | ) | (353 | ) | ||||
| Total revenue |
(2,844 | ) | (533 | ) | ||||
| Provision for credit losses |
– | 3 | ||||||
| Non-interest expenses(3) |
137 | 351 | ||||||
| Income before taxes |
(2,981 | ) | (887 | ) | ||||
| Income tax expense(4) |
(1,538 | ) | (659 | ) | ||||
| Net income (loss) |
$ | (1,443 | ) | $ | (228 | ) | ||
| Net income (loss) attributable to non-controlling interests (NCI) |
– | 1 | ||||||
| Net income (loss) attributable to equity holders |
$ | (1,443 | ) | $ | (229 | ) | ||
| (1) | Refer to Non-GAAP Measures on page 20 for the description of the adjustments. |
| (2) | Includes adjustment for net (gain)/loss on divestitures and wind-down of operations of $(367) (October 31, 2022 – $361). |
| (3) | Includes adjustments for restructuring charge and severance provisions of $354, consolidation of real estate and contract termination costs of $87 and impairment of non-financial assets of $346 (October 31, 2022 – Restructuring charge and severance provisions of $85 and Support costs for the Scene+ loyalty program of $133). |
| (4) | Includes adjustment for the Canada Recovery Dividend of $579 (October 31, 2022 – nil). |
Net income
The Other segment reported a net loss attributable to equity holders of $2,294 million. Adjusted net income attributable to equity holders was a loss of $1,443 million compared to net loss of $229 million in the prior year. The decrease of $1,214 million was due to lower revenues resulting primarily from increased funding costs, partly offset by lower provision for income taxes and lower non-interest expenses.
Revenues
Revenues were negative $2,477 million this year. Adjusted revenues were negative $2,844 million, a decrease of $2,311 million from the prior year, due primarily to higher funding costs as a result of central bank rate increases, lower investment gains, and lower income from associated corporations. These were partly offset by higher income from liquid assets.
Non-interest expenses
Non-interest expenses were $924 million, compared to $569 million. Adjusted non-interest expenses were $137 million compared to $351 million in 2022. The decrease of $214 million is due mainly to lower project costs.
2023 Scotiabank Annual Report | 55
Management’s Discussion and Analysis
T27 Condensed statement of financial position
| As at October 31 ($ billions) | 2023 | 2022 | Change | Volume Change |
FX Change |
|||||||||||||||
| Assets |
||||||||||||||||||||
| Cash, deposits with financial institutions and precious metals |
$ | 91.2 | $ | 66.4 | 37 | % | 34 | % | 3 | % | ||||||||||
| Trading assets |
117.9 | 113.2 | 4 | 2 | 2 | |||||||||||||||
| Securities purchased under resale agreements and securities borrowed |
199.3 | 175.3 | 14 | 11 | 3 | |||||||||||||||
| Investment securities |
118.2 | 110.0 | 7 | 5 | 2 | |||||||||||||||
| Loans |
750.9 | 745.0 | 1 | (1 | ) | 2 | ||||||||||||||
| Other |
133.3 | 139.5 | (4 | ) | (10 | ) | 6 | |||||||||||||
| Total assets |
$ | 1,410.8 | $ | 1,349.4 | 5 | % | 2 | % | 3 | % | ||||||||||
| Liabilities |
||||||||||||||||||||
| Deposits |
$ | 952.3 | $ | 916.2 | 4 | % | 2 | % | 2 | % | ||||||||||
| Obligations related to securities sold under repurchase agreements and securities lent |
160.0 | 139.0 | 15 | 11 | 4 | |||||||||||||||
| Other |
210.1 | 211.0 | – | (4 | ) | 4 | ||||||||||||||
| Subordinated debentures |
9.7 | 8.5 | 14 | 14 | – | |||||||||||||||
| Total liabilities |
$ | 1,332.1 | $ | 1,274.7 | 5 | % | 2 | % | 3 | % | ||||||||||
| Equity |
||||||||||||||||||||
| Common equity(1) |
$ | 68.9 | $ | 65.1 | 6 | % | 5 | % | 1 | % | ||||||||||
| Preferred shares and other equity instruments |
8.1 | 8.1 | – | – | – | |||||||||||||||
| Non-controlling interests in subsidiaries |
1.7 | 1.5 | 14 | 13 | 1 | |||||||||||||||
| Total equity |
$ | 78.7 | $ | 74.7 | 5 | % | 4 | % | 1 | % | ||||||||||
| Total liabilities and equity |
$ | 1,410.8 | $ | 1,349.4 | 5 | % | 2 | % | 3 | % | ||||||||||
| (1) | Includes net impact of foreign currency translation, primarily change in spot rates on the translation of assets and liabilities from functional currency to Canadian dollar equivalent. |
| C21 | Loan portfolio loans & acceptances, $ billions, as at October 31 |
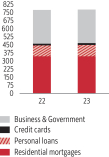
|
| C22 | Deposits $ billions, as at October 31 |
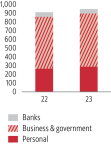
|
Statement of Financial Position
Assets
The Bank’s total assets were $1,411 billion as at October 31, 2023, an increase of $61 billion or 5% from October 31, 2022, including 3% from the impact of foreign currency translation. Cash and deposits with financial institutions increased $24 billion due primarily to higher balances with central banks. Trading securities increased $4 billion due mainly to higher client activity. Loans increased $6 billion. Personal loans and credit cards increased $7 billion reflecting increased consumer spending. Business and government loans increased $5 billion mainly in Canada and Mexico. Residential mortgages decreased $5 billion with lower mortgages in Canada partly offset by growth in Mexico and Chile. Securities purchased under resale agreements and securities borrowed increased $24 billion due to higher client demand. Derivative instrument assets decreased by $4 billion due to changes in foreign exchange rates, interest rates and lower activity. Investment securities increased $8 billion due mainly to higher holdings of U.S. government debt.
Liabilities
Total liabilities were $1,332 billion as at October 31, 2023, an increase of $57 billion or 5% from October 31, 2022, including 3% from the impact of foreign currency translation. Total deposits increased $36 billion. Personal deposits of $289 billion increased $23 billion due primarily to growth in term deposits in Canada. Business and government deposits grew by $15 billion mainly in Canada and Mexico. Financial instruments designated at fair value through profit or loss increased $4 billion due mainly to the issuance of senior note liabilities. Obligations related to securities sold short decreased by $4 billion due to lower client demand. Obligations related to securities sold under repurchase agreements and securities lent increased by $21 billion. Other liabilities increased $7 billion due mainly to accrued interest and debt issuance by subsidiaries. Derivative instrument liabilities decreased $7 billion due to changes in interest rates, foreign exchange rates and lower activity.
Equity
Total shareholders’ equity was $79 billion, an increase of $4 billion from October 31, 2022. Equity was higher due to current year earnings of $7,528 million and net share issuances of $1,399 million primarily related to the Shareholder Dividend and Share Purchase Plan. Partly offsetting these items were dividends paid of $5,422 million.
Overview
Scotiabank is committed to maintaining a strong capital base to support the risks associated with its diversified businesses. Strong capital levels contribute to financial safety for the Bank’s customers, foster investor confidence and support strong credit ratings. It also allows the Bank to take advantage of growth opportunities as they arise and enhance shareholder returns through increased dividends. The Bank’s capital management framework includes a comprehensive internal capital adequacy assessment process (ICAAP), aimed at ensuring that the Bank’s capital is adequate
56 | 2023 Scotiabank Annual Report
Management’s Discussion and Analysis | Group Financial Condition
to meet current and future risks and achieve its strategic objectives. Key components of the Bank’s ICAAP include sound corporate governance; creating a comprehensive risk appetite for the Bank; managing and monitoring capital, both currently and prospectively; and utilizing appropriate financial metrics which relate risk to capital, including internal capital and regulatory capital measures.
Governance and oversight
The Bank has a sound capital management framework to measure, deploy and monitor its available capital and assess its adequacy. Capital is managed in accordance with the Board-approved Capital Management Policy. In addition, the Board reviews and approves the Bank’s annual capital and strategic plans. The Asset-Liability Committee and senior executive management provide governance over the capital management process. The Bank’s Finance, Group Treasury and Global Risk Management groups take a coordinated approach to implementing the Bank’s capital plan.
Risk appetite
The risk appetite framework that establishes enterprise-wide risk tolerances in addition to capital limits are detailed in the Risk Management section “Risk Appetite”. The framework encompasses medium-term targets with respect to regulatory capital thresholds, earnings and other risk-based parameters. These limits drive behaviour to ensure the Bank achieves the following overall objectives: exceed regulatory and internal capital targets, manage capital levels commensurate with the risk profile of the Bank, maintain strong credit ratings and provide the Bank’s shareholders with acceptable returns.
Regulatory capital
Canadian banks are subject to the revised capital adequacy requirements as published by the Basel Committee on Banking Supervision (BCBS) and commonly referred to as Basel III. Under Basel III, there are three primary risk-based regulatory capital ratios used to assess capital adequacy: Common Equity Tier 1 (CET1), Tier 1 and Total capital, which are determined by dividing those capital components by risk-weighted assets. Basel III also provides guidance on non-viability contingent capital (NVCC). The guidance stipulates that in order to qualify as regulatory capital, non-common share capital instruments must be convertible into common equity upon a trigger event as defined within the guidance.
C23 Minimum Regulatory Capital Requirements (as at October 31, 2023)
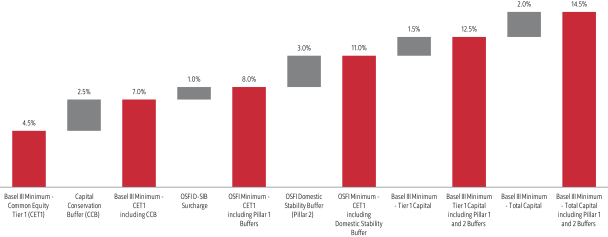
The Office of the Superintendent of Financial Institutions, Canada (OSFI) has issued guidelines, reporting requirements and disclosure guidance which are consistent with the international implementation of Basel III. OSFI requires Canadian deposit-taking institutions to meet minimum requirements related to risk-weighted assets of 7%, 8.5% and 10.5% for CET1, Tier 1 and Total Capital ratios, respectively, which includes the capital conservation buffer of 2.5%. OSFI has also designated the Bank a domestic systemically important bank (D-SIB), increasing its minimum capital ratio requirements by 1% across all tiers of capital, in line with the requirements for global systemically important banks. OSFI’s minimum Pillar 1 capital ratio requirements, are 8.0%, 9.5% and 11.5% for Common Equity Tier 1, Tier 1 and Total capital ratios, respectively.
In June 2018, OSFI implemented the Domestic Stability Buffer, to be held by Domestic Systemically Important Banks (D-SIBs) as an additional Pillar 2 buffer. Breaches of this buffer will not result in banks being subject to automatic constraints on capital distributions. Instead, OSFI will require a remediation plan to address any shortfall to their minimum. Supervisory interventions pursuant to OSFI’s Guide to Intervention would occur in cases where a remediation plan is not produced or executed in a timely manner satisfactory to OSFI. OSFI undertakes a review of the buffer on a semi-annual basis, in June and December, and any changes to the buffer are made public, along with supporting rationale. In exceptional circumstances, OSFI may make and announce adjustments to the buffer in-between scheduled review dates. In addition, OSFI may subsequently vary the minimum requirements for individual D-SIBs or groups of D-SIBs, as a supervisory measure.
In December 2022 OSFI increased the Domestic Stability Buffer (DSB) range from 0% to 4%. It also increased the DSB to 3.0% of total risk-weighted assets (RWA), effective February 1, 2023. Consequently, OSFI’s minimum regulatory capital ratio requirements, including the D-SIB 1.0% surcharge and its DSB are: 11.0%, 12.5% and 14.5% for Common Equity Tier 1 (CET1), Tier 1 and Total capital ratios, respectively. In addition, in June 2023 OSFI announced an additional 0.5% increase to its DSB, resulting in a DSB of 3.5% of total RWA, effective November 1, 2023.
Leverage ratio
In addition to risk-based capital ratio requirements, Basel III introduced a simpler, non risk-based Leverage ratio requirement to act as a supplementary measure to its risk-based capital requirements. The Leverage ratio is defined as a ratio of Basel III Tier 1 capital to a leverage exposure measure which includes on-balance sheet assets and off-balance sheet commitments, derivatives and securities financing transactions, as defined within the requirements. OSFI’s Basel III Leverage Ratio Requirements Guideline and Public Disclosure Requirements outline the
2023 Scotiabank Annual Report | 57
Management’s Discussion and Analysis
application and disclosure of the Basel III Leverage ratio in Canada. Institutions are expected to maintain an operating buffer above the 3.5% minimum, including the D-SIB surcharge of 0.5%, effective Q2 2023.
Total Loss Absorbing Capacity (TLAC)
OSFI has issued its guideline on Total Loss Absorbing Capacity (TLAC), which applies to Canada’s D-SIBs as part of the Federal Government’s bail-in regime. The standards are intended to address the sufficiency of a systemically important bank’s loss absorbing capacity to support its recapitalization in the event of its failure. Effective November 1, 2021, D-SIBs are required to maintain a minimum risk-based Total Loss Absorbing Capacity (TLAC) ratio and a minimum TLAC leverage ratio. TLAC is defined as the aggregate of NVCC Tier 1 capital, NVCC Tier 2 capital, and other TLAC instruments that are subject to conversion in whole or in part into common shares under the CDIC Act and meet all of the eligibility criteria under the guidelines. The Bank’s minimum TLAC ratio requirements consist of 24.5% of risk-weighted assets and 7.25% of leverage ratio exposures. As noted above, OSFI may subsequently vary the minimum TLAC requirements for D-SIBs. Where a D-SIB falls below the minimum TLAC requirements, OSFI may take any measures deemed appropriate, including measures set out in the Bank Act. As at October 31, 2023, the Bank exceeds the OSFI minimum TLAC and TLAC leverage ratios.
Regulatory capital developments
Effective the second quarter of fiscal 2023, the Bank adopted the Revised Basel III reforms in accordance with OSFI’s revised Capital Adequacy Requirements Guideline, Leverage Ratio Requirements Guideline, and Pillar 3 Disclosures Guideline for domestic systematically important banks (D-SIBs). OSFI’s requirements are substantially aligned with the Basel Committee on Banking Supervision’s (BCBS’) Revised Basel III reforms with some differences, primarily in residential real estate and qualifying revolving retail exposures, and with respect to an acceleration of the phase-in period of the aggregate capital output floor to 72.5% by 2026.
Revised Basel III Reforms
The final Basel III reforms implemented in the second quarter of 2023 primarily impact the calculation of risk-weighted assets and include:
| • | a revised standardized approach for credit risk, with increased granularity of prescribed risk weights for credit cards, mortgages and business loans; |
| • | revisions to the internal ratings-based approach for credit risk with new requirements for internally developed model parameters under the Advanced Internal Ratings-Based Approach (AIRB), including scope restrictions which limit certain asset classes to only the Foundation Internal Ratings-Based (FIRB) approach; |
| • | a revised standardized approach for operational risk, which builds on the existing standardized approach including the recognition of an institution’s operational risk loss experience; |
| • | revisions to the measurement of the Leverage ratio and a Leverage ratio buffer, which will take the form of a Tier 1 capital buffer set at 50% of a D-SIB’s 1.0% risk-weighted surcharge capital buffer; and, |
| • | an aggregate output floor, which will ensure that banks’ RWAs generated by internal models are not lower than 72.5% of RWAs as calculated by the Basel III framework’s standardized approaches. There is an international phase-in period for the 72.5% aggregate capital output floor from 2023 until 2028, beginning at 65% for Canadian banks in the second quarter of 2023. |
Internationally, adoption of the revised Basel III reforms is varied across jurisdictions. Current expectations are that many jurisdictions will implement no earlier than 2025. In addition, the revised credit valuation adjustment framework (CVA) and Fundamental Review of the Trading Book (FRTB) market risk requirements will be effective for the Bank in Q1 2024 with an approximate impact of -30 basis points.
The Bank continues to monitor and prepare for developments impacting regulatory capital requirements.
Planning, managing and monitoring capital
Capital is managed and monitored based on planned changes in the Bank’s strategy, identified changes in its operating environment or changes in its risk profile. As part of the Bank’s comprehensive ICAAP, sources and uses of capital are measured and monitored on an ongoing basis through financial metrics, including regulatory thresholds, and internal capital. These results are used in capital planning and strategic decision-making.
The Bank’s assessment of capital adequacy is in the context of its current position and its expected future risk profile and position relative to its internal targets while considering the potential impact of various stress scenarios. Specific scenarios are selected based on the current economic conditions and business events facing the Bank. In addition, the Bank’s forward looking capital adequacy assessment includes a consideration of the results of more severe multi-risk scenarios within its enterprise-wide stress testing. This testing is used to determine the extent to which severe, but plausible events, impact the Bank’s capital.
The Bank sets internal regulatory capital targets to ensure the Bank’s available capital is sufficient within the context of its risk appetite.
The Bank’s internal target includes an adequate buffer over the regulatory minimum ensuring sufficient flexibility for future capital deployment and in consideration of the Bank’s risk appetite, the volatility of planning assumptions, the results from stress testing and contingency planning.
The Bank has a comprehensive risk management framework to ensure that the risks taken while conducting its business activities are consistent with its risk appetite, its impact on capital relative to internal targets, and that there is an appropriate balance between risk and return. Refer to the Risk Management section for further discussion on the Bank’s risk management framework. In managing the Bank’s capital base, close attention is paid to the cost and availability of the various types of capital, desired leverage, changes in the assets and risk-weighted assets, and the opportunities to profitably deploy capital. The amount of capital required for the business risks being assumed, and to meet regulatory requirements, is balanced against the goal of generating an appropriate return for the Bank’s shareholders.
Capital generation
Capital is generated internally through net earnings after dividend payments. As well, capital is generated by the issuance of common shares, preferred shares and other equity instruments, and subordinated debentures, net of redemptions.
Capital deployment
The Bank deploys capital to support sustainable, long-term revenue and net income growth. The growth can be through existing businesses by attracting new customers, increasing cross-selling activities to existing customers, adding new products and enhancing sales productivity, or through acquisitions. All major initiatives to deploy capital are subject to rigorous analysis, validation of business case assumptions and evaluation of expected benefits. Key financial criteria include impact on earnings per share, capital ratios, return on invested capital, expected payback period and internal rate of return based on discounted cash flows.
58 | 2023 Scotiabank Annual Report
Management’s Discussion and Analysis | Group Financial Condition
Regulatory capital and total loss absorbing capacity ratios
The Bank continues to maintain strong, high quality capital levels which position it well for future business growth and opportunities. The CET1 ratio as at October 31, 2023 was 13.0%, an increase of approximately 150 basis points from the prior year. The ratio benefited from the adoption of OSFI’s revised Basel III requirements, internal capital generation during the year including lower risk-weighted assets, net share issuances from the Bank’s Shareholder Dividend and Share Purchase Plan, and the sale of CTFS, partly offset by the Canada Recovery Dividend tax accrual, the restructuring charges, contract terminations costs and other impairments announced during the fourth quarter.
The Bank’s Tier 1 capital ratio was 14.8% as at October 31, 2023, an increase of approximately 160 basis points from the prior year, due primarily to the above noted impacts to the CET1 ratio.
The Bank’s Total capital ratio was 17.2% as at October 31, 2023, an increase of approximately 190 basis points from 2022, due primarily to the above noted impacts to the Tier 1 capital ratio, and issuances of $1 billion, JPY 33 billion and JPY 12 billion of NVCC subordinated debentures, partly offset by $352 million in net amortization of NVCC subordinated debentures and other regulatory adjustments.
The TLAC ratio was 30.6% as at October 31, 2023, an increase of approximately 320 basis points from the prior year, primarily from higher available TLAC and lower risk-weighted assets.
The Leverage ratio was 4.2%, in line with the prior year, due primarily to growth in Tier 1 capital, offset by OSFI’s discontinuance of the temporary exclusion of central bank reserves from its leverage exposures measure and growth in the Bank’s on and off-balance sheet assets.
The TLAC Leverage ratio was 8.6%, a decrease of approximately 20 basis points from 2022, due primarily to OSFI’s discontinuance of the temporary exclusion of central bank reserves from its leverage exposures measure and growth in the Bank’s on and off-balance sheet assets.
The Bank’s capital, leverage and TLAC ratios continue to be in excess of OSFI’s minimum capital ratio requirements for 2023. For 2024, the Bank will continue to prudently manage its capital to address increasing regulatory requirements. The estimated CET1 impact from adoption of the higher capital output floor and the implementation of the new Fundamental Review of the Trading Book and Credit Valuation Adjustment Framework requirements in the first quarter of 2024 is approximately -75 basis points.
C24 Continuity of Common Equity Tier 1 ratio(1)
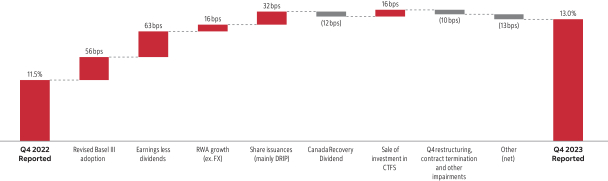
| (1) | For Q4 2023, this measure has been disclosed in this document in accordance with OSFI Guideline – Capital Adequacy Requirements (February 2023). Q4 2022 was prepared in accordance with OSFI Guideline – Capital Adequacy Requirements (November 2018). |
2023 Scotiabank Annual Report | 59
Management’s Discussion and Analysis
T28 Regulatory capital(1)(2) and total loss absorbing capacity (TLAC)(3) ratios
| Revised Basel III | Basel III | |||||||
| As at October 31 ($ millions) | 2023 | 2022 | ||||||
| Common Equity Tier 1 capital |
||||||||
| Total Common Equity(4) |
$ | 68,853 | $ | 65,150 | ||||
| Qualifying non-controlling interest in common equity of subsidiaries |
763 | 694 | ||||||
| ECL transitional adjustment |
– | 75 | ||||||
| Goodwill and intangibles, net of deferred tax liabilities(5) |
(15,738 | ) | (15,546 | ) | ||||
| Threshold related deductions |
– | – | ||||||
| Net deferred tax assets (excluding those arising from temporary differences) |
(231 | ) | (88 | ) | ||||
| Other Common Equity Tier 1 capital deductions(6) |
3,394 | 2,796 | ||||||
| Common Equity Tier 1 |
57,041 | 53,081 | ||||||
| Additional Tier 1 capital |
||||||||
| Preferred shares(7) |
300 | 300 | ||||||
| Subordinated additional Tier 1 capital notes (NVCC) |
3,249 | 3,249 | ||||||
| Limited recourse capital notes (NVCC) |
4,526 | 4,526 | ||||||
| Capital instrument liabilities – trust securities(7) |
– | – | ||||||
| Other Tier 1 capital adjustments(8) |
107 | 106 | ||||||
| Net Tier 1 capital |
65,223 | 61,262 | ||||||
| Tier 2 capital |
||||||||
| Subordinated debentures, net of amortization(7) |
8,412 | 7,461 | ||||||
| Allowance for credit losses eligible for inclusion in Tier 2 and excess allowance (re: IRB approach) |
1,931 | 1,869 | ||||||
| Qualifying non-controlling interest in Tier 2 capital of subsidiaries |
85 | 118 | ||||||
| Other Tier 2 capital adjustments |
– | – | ||||||
| Tier 2 capital |
10,428 | 9,448 | ||||||
| Total regulatory capital |
75,651 | 70,710 | ||||||
| Non-regulatory capital elements of TLAC |
||||||||
| External TLAC instruments |
58,001 | 55,337 | ||||||
| TLAC deductions and other adjustments |
852 | 518 | ||||||
| TLAC available after deductions |
134,504 | 126,565 | ||||||
| Risk-weighted assets ($ billions)(1)(2) |
||||||||
| Credit risk |
378.7 | 401.4 | ||||||
| Market risk |
12.0 | 10.8 | ||||||
| Operational risk |
49.3 | 50.2 | ||||||
| Risk-weighted assets |
$ | 440.0 | $ | 462.4 | ||||
| Regulatory Capital(1)(2) and TLAC(3) ratios |
||||||||
| Common Equity Tier 1 |
13.0 | % | 11.5 | % | ||||
| Tier 1 |
14.8 | % | 13.2 | % | ||||
| Total |
17.2 | % | 15.3 | % | ||||
| Total loss absorbing capacity |
30.6 | % | 27.4 | % | ||||
| Leverage(9) |
||||||||
| Leverage exposures |
$ | 1,562,963 | $ | 1,445,619 | ||||
| Leverage ratio |
4.2 | % | 4.2 | % | ||||
| Total loss absorbing capacity leverage ratio(3) |
8.6 | % | 8.8 | % | ||||
| (1) | Regulatory ratios and amounts reported in 2023 are under Revised Basel III requirements and are not directly comparable to ratios and amounts reported in 2022. |
| (2) | 2023 regulatory capital ratios are based on Revised Basel III requirements as determined in accordance with OSFI Guideline – Capital Adequacy Requirements (February 2023). Prior period regulatory capital ratios were prepared in accordance with OSFI Guideline – Capital Adequacy Requirements (November 2018). |
| (3) | This measure has been disclosed in this document in accordance with OSFI Guideline – Total Loss Absorbing Capacity (September 2018). |
| (4) | Includes Other Reserves adjusted for regulatory capital purposes. |
| (5) | Reported amounts are based on OSFI’s requirements that goodwill relating to investments in associates be classified as goodwill for regulatory reporting purposes. |
| (6) | Other CET1 capital deductions under Basel III include gains/losses due to changes in own credit risk on fair valued liabilities, pension plan assets and other items. |
| (7) | Non-qualifying Tier 1 and Tier 2 capital instruments were subject to a phase-out period until 2022. |
| (8) | Other Tier 1 capital adjustments under Basel III rules include eligible non-controlling interests in subsidiaries. |
| (9) | 2023 leverage ratios are based on Revised Basel III requirements as determined in accordance with OSFI Guideline – Leverage Requirements (February 2023). Prior period leverage ratios were prepared in accordance with OSFI Guideline – Leverage Requirements (November 2018). |
60 | 2023 Scotiabank Annual Report
Management’s Discussion and Analysis | Group Financial Condition
T29 Changes in regulatory capital(1)
| Revised Basel III | Basel III | |||||||
| For the fiscal years ($ millions) | 2023 | 2022 | ||||||
| Total capital, beginning of year |
$ | 70,710 | $ | 66,101 | ||||
| Changes in Common Equity Tier 1 |
||||||||
| Net income attributable to common equity holders of the Bank |
6,991 | 9,656 | ||||||
| Dividends paid to equity holders of the Bank |
(5,003 | ) | (4,858 | ) | ||||
| Shares issued |
1,402 | 706 | ||||||
| Shares repurchased/redeemed |
– | (2,873 | ) | |||||
| Gains/losses due to changes in own credit risk on fair valued liabilities |
1,001 | (1,593 | ) | |||||
| ECL transitional adjustment(2) |
(75 | ) | (160 | ) | ||||
| Movements in accumulated other comprehensive income, excluding cash flow hedges |
7 | 2,739 | ||||||
| Change in non-controlling interest in common equity of subsidiaries |
69 | (628 | ) | |||||
| Change in goodwill and other intangible assets (net of related tax liability)(3) |
(192 | ) | (390 | ) | ||||
| Other changes including regulatory adjustments below: |
(240 | ) | (528 | ) | ||||
| – Deferred tax assets that rely on future profitability (excluding those arising from temporary differences) |
(143 | ) | 86 | |||||
| – Significant investments in the common equity of other financial institutions (amount above 10% threshold) |
– | – | ||||||
| – Other capital deductions |
(162 | ) | (360 | ) | ||||
| – Other |
65 | (254 | ) | |||||
| Changes in Common Equity Tier 1 |
$ | 3,960 | $ | 2,071 | ||||
| Changes in Additional Tier 1 Capital |
||||||||
| Issued |
– | 2,523 | ||||||
| Redeemed |
– | (500 | ) | |||||
| Other changes including regulatory adjustments and phase-out of non-qualifying instruments |
1 | (747 | ) | |||||
| Changes in Additional Tier 1 Capital |
$ | 1 | $ | 1,276 | ||||
| Changes in Tier 2 Capital |
||||||||
| Issued |
1,447 | 3,356 | ||||||
| Redeemed |
– | (1,250 | ) | |||||
| Allowance for credit losses eligible for inclusion in Tier 2 and Excess Allowance under IRB(4) |
62 | (237 | ) | |||||
| Other changes including regulatory adjustments and phase-out of non-qualifying instruments |
(529 | ) | (607 | ) | ||||
| Changes in Tier 2 Capital |
$ | 980 | $ | 1,262 | ||||
| Total capital generated (used) |
$ | 4,941 | $ | 4,609 | ||||
| Total capital, end of year |
$ | 75,651 | $ | 70,710 | ||||
| (1) | Regulatory amounts reported in 2023 are under Revised Basel III requirements and are not directly comparable to amounts reported in 2022. |
| (2) | The ECL transitional adjustment was introduced by OSFI in Q2, 2020. Effective Q1, 2023 the ECL transitional adjustment is no longer applicable. |
| (3) | Reported amounts are based on OSFI’s requirements that goodwill relating to investments in associates be classified as goodwill for regulatory reporting purposes. |
| (4) | Eligible allowances for 2023 and 2022. |
2023 Scotiabank Annual Report | 61
Management’s Discussion and Analysis
Regulatory capital components
The Bank’s regulatory capital is divided into three components – CET1, Additional Tier 1 capital and Tier 2 capital, depending on their degree of permanency and loss absorbency. All components of capital provide support for banking operations and protect depositors.
CET1 consists primarily of common shareholders’ equity, regulatory derived non-controlling interest capital, and prescribed regulatory adjustments or deductions. These regulatory deductions include goodwill, intangible assets (net of deferred tax liabilities), deferred tax assets that rely on future profitability, defined-benefit pension assets, shortfall (if any) of the allowance for credit losses to regulatory parameter-based expected losses and significant investments in the common equity of other financial institutions.
Additional Tier 1 capital consists primarily of qualifying non-cumulative preferred shares, and qualifying other equity instruments (as described in Note 24). Tier 2 capital consists mainly of qualifying subordinated debentures and eligible allowances for credit losses.
The Bank’s CET1 capital was $57.0 billion as at October 31, 2023, an increase of $4.0 billion from the prior year due primarily to:
| • | $2.0 billion growth from internal capital generation, net of dividends paid; |
| • | $1.4 billion from share issuances, mainly from the Bank’s Shareholder Dividend and Share Purchase Plan; |
| • | $1.0 billion increase from movements in Accumulated Other Comprehensive Income, excluding cash flow hedges and own credit risk, primarily from the impact of foreign currency translation net of changes in the fair values of investment securities; and, |
| • | $69 million of higher non-controlling interest regulatory capital. |
Partly offset by:
| • | $432 million from higher regulatory capital deductions, including goodwill, intangibles, etc. |
The Bank’s Tier 1 capital increased by $4.0 billion, primarily due to the above noted impacts to CET1 capital.
Total capital increased by $4.9 billion during the year, mainly due to the above noted impacts to CET1 and Tier 1 capital, and issuances of $1.0 billion, JPY 33 billion and JPY 12 billion of NVCC subordinated debentures, and higher eligible allowances in Tier 2 capital of $62 million, partly offset by $352 million in amortization of NVCC Tier 2 instruments and other regulatory adjustments of $177 million.
| C25 | CET1 capital %, as at October 31 |
|
| C26 | Dividend growth dollars per share |

|
| C27 | Internally generated capital $ billions, for years ended October 31 |
|
Dividends
The annual dividend in 2023 was $4.18, an increase of $0.12 from 2022. The Board of Directors approved a quarterly dividend of $1.06 per common share, at its meeting on November 27, 2023. This quarterly dividend applies to shareholders of record at the close of business on January 3, 2024, and is payable January 29, 2024.
T30 Selected capital management activity
| For the fiscal years ($ millions) | 2023 | 2022 | ||||||
| Dividends |
||||||||
| Common |
$ | 5,003 | $ | 4,858 | ||||
| Preferred and other equity instruments |
419 | 260 | ||||||
| Common shares issued(1) |
1,402 | 706 | ||||||
| Common shares repurchased for cancellation under the Normal Course |
||||||||
| Issuer Bid(2) |
– | 2,873 | ||||||
| Preferred shares and other equity instruments issued(3) |
– | 2,523 | ||||||
| Preferred shares and other equity instruments redeemed(4) |
– | 500 | ||||||
| Maturity, redemption and repurchase of subordinated debentures |
78 | 1,276 | ||||||
| (1) | Represents primarily cash received for stock options exercised during the year and common shares issued pursuant to the Shareholder Dividend and Share Purchase Plan. |
| (2) | No buybacks in fiscal 2023. |
| (3) | No issuance in fiscal 2023. |
| (4) | No redemptions in fiscal 2023. |
Normal Course Issuer Bid
The Bank currently does not have an active normal course issuer bid and did not repurchase any common shares during the year ended October 31, 2023.
The Bank’s previous normal course issuer bid terminated on December 1, 2022. Under this program, the Bank repurchased and cancelled approximately 32.9 million common shares at a volume weighted average price of $87.28 per share for a total amount of $2,873 million. These repurchases were carried out prior to October 31, 2022.
62 | 2023 Scotiabank Annual Report
Management’s Discussion and Analysis | Group Financial Condition
Share data and other capital instruments
The Bank’s common and preferred share data, as well as certain other capital instruments, are shown in T31. Further details, including exchangeability features, are discussed in Note 21 and Note 24 of the consolidated financial statements.
T31 Shares and other instruments
| As at October 31, 2023 | Amount ($ millions) |
Dividends declared per share(1) |
Number outstanding (000s) |
Conversion features |
||||||||||||
| Common shares(2) |
$ | 20,109 | $ | 4.18 | 1,214,044 | n/a | ||||||||||
| NVCC Preferred Shares(3) |
||||||||||||||||
| Preferred shares Series 40(4)(5) |
300 | 1.212500 | 12,000 | Series 41 | ||||||||||||
| NVCC Additional Tier 1 Securities(3)(7) | Amount ($ millions) |
Distribution(6) | Yield (%) | Number outstanding (000s) |
||||||||||||
| Subordinated Additional Tier 1 Capital Notes(8) |
U.S.$ | 1,250 | U.S.$ | 21.3015 | 8.33538 | 1,250 | ||||||||||
| Subordinated Additional Tier 1 Capital Notes(9) |
U.S.$ | 1,250 | U.S.$ | 12.25 | 4.900 | 1,250 | ||||||||||
| Limited Recourse Capital Notes Series 1(10) |
$ | 1,250 | $ | 9.25 | 3.700 | 1,250 | ||||||||||
| Limited Recourse Capital Notes Series 2(11) |
U.S.$ | 600 | U.S.$ | 9.0625 | 3.625 | 600 | ||||||||||
| Limited Recourse Capital Notes Series 3(12) |
$ | 1,500 | $ | 17.5575 | 7.023 | 1,500 | ||||||||||
| Limited Recourse Capital Notes Series 4(13) |
U.S.$ | 750 | U.S.$ | 21.5625 | 8.625 | 750 | ||||||||||
| NVCC Subordinated Debentures(3) | Amount ($ millions) |
Interest Rate (%) |
||||||||||||||
| Subordinated debentures due December 2025 |
U.S.$ | 1,250 | 4.500 | |||||||||||||
| Subordinated debentures due January 2029 |
$ | 1,750 | 3.890 | |||||||||||||
| Subordinated debentures due July 2029 |
$ | 1,500 | 2.836 | |||||||||||||
| Subordinated debentures due May 2032 |
$ | 1,750 | 3.934 | |||||||||||||
| Subordinated debentures due December 2032 |
JPY | 33,000 | 1.800 | |||||||||||||
| Subordinated debentures due August 2033 |
$ | 1,000 | 5.679 | |||||||||||||
| Subordinated debentures due December 2033 |
JPY | 12,000 | 1.830 | |||||||||||||
| Subordinated debentures due May 2037 |
U.S.$ | 1,250 | 4.588 | |||||||||||||
| Other | Amount ($ millions) |
Distribution(6) | Yield (%) | Number outstanding (000s) |
||||||||||||
| Scotiabank Trust Securities – Series 2006-1 issued by Scotiabank Capital Trust(14a,b) |
$ | 750 | 28.25 | 5.650 | 750 | |||||||||||
| Options | Number outstanding (000s) |
|||||||||||||||
| Outstanding options granted under the Stock Option Plans to purchase common shares(2) |
|
11,558 | ||||||||||||||
| (1) | Dividends declared from November 1, 2022 to October 31, 2023. | |
| (2) | Dividends on common shares are paid quarterly, if and when declared. As at November 17, 2023, the number of outstanding common shares and options was 1,214,044 thousand and 11,534 thousand, respectively. | |
| (3) | These securities contain Non-Viability Contingent Capital (NVCC) provisions necessary to qualify as regulatory capital under Basel III. Refer to Notes 21 and 24 of the consolidated financial statements in the Bank’s 2023 Annual Report for further details. | |
| (4) | These shares are entitled to non-cumulative preferential cash dividends payable quarterly. These preferred shares have conversion features. Refer to Note 24 of the consolidated financial statements in the Bank’s 2022 Annual Report for further details. | |
| (5) | Subsequent to the initial five-year fixed rate period ending on January 26, 2024, and resetting every five years thereafter, the dividends, if and when declared, will be determined by the sum of the five-year Government of Canada Yield plus 2.43%, multiplied by $25.00. | |
| (6) | Distributions per face amount of $1,000 or U.S.$1,000 semi-annually or quarterly, as applicable. | |
| (7) | Quarterly distributions are recorded in each fiscal quarter if and when paid. | |
| (8) | In respect of these securities, on June 28, 2023, the Bank announced the interest rate transition from three-month USD LIBOR to three-month Term SOFR, plus a spread adjustment of 26.161 bps, for interest periods commencing on or after July 12, 2023. | |
| (9) | Subsequent to the initial five-year fixed rate period ending on June 4, 2025, and resetting every five years thereafter, the distributions, if and when paid, will be determined by the sum of the five-year U.S. Treasury rate plus 4.551%. | |
| (10) | Subsequent to the initial five-year fixed rate period ending on July 27, 2026, and resetting every five years thereafter, the distributions will be determined by the sum of the five-year Government of Canada Yield plus 2.761%. | |
| (11) | Subsequent to the initial five-year fixed rate period ending on October 27, 2026, and resetting every five years thereafter, the distributions will be determined by the sum of the five-year U.S. Treasury rate plus 2.613%. | |
| (12) | Subsequent to the initial five-year fixed rate period ending on July 27, 2027, and resetting every five years thereafter, the distributions, if and when paid, will be determined by the sum of the five-year Government of Canada Yield plus 3.95%. | |
| (13) | Subsequent to the initial five-year fixed rate period ending on October 27, 2027, and resetting every five years thereafter, the distributions will be determined by the sum of the five-year U.S. Treasury rate plus 4.389%. | |
| (14)(a) | On September 28, 2006, Scotiabank Capital Trust issued 750,000 Scotiabank Trust Securities – Series 2006-1 (Scotia BaTS II Series 2006-1). The holders of Scotia BaTS II Series 2006-1 are entitled to receive non-cumulative fixed cash distributions payable semi-annually in an amount of $28.25 per security. With regulatory approval, these securities may be redeemed in whole upon the occurrence of certain tax or regulatory capital changes, or in whole or in part on December 30, 2011 and on any distribution date thereafter at the option of Scotiabank Capital Trust. The holder has the right at any time to exchange their security into Non-cumulative Preferred Shares Series S of the Bank. The Series S shares will be entitled to cash dividends payable semi-annually in an amount of $0.4875 per $25.00 share. Refer to Note 24(c) – Restrictions on payment of dividends and retirement of shares. The Scotia BaTS II Series 2006-1 may be automatically exchanged, without the consent of the holder, into Non-cumulative Preferred Shares Series T of the Bank in the following circumstances: (i) proceedings are commenced for the winding-up of the Bank; (ii) the Superintendent takes control of the Bank or its assets; (iii) the Bank has a Tier 1 Capital ratio of less than 5% or a Total Capital ratio of less than 8%; or (iv) the Superintendent has directed the Bank to increase its capital or provide additional liquidity and the Bank elects such automatic exchange or the Bank fails to comply with such direction. The Series T shares will be entitled to non-cumulative cash dividends payable semi-annually in an amount of $0.625 per $25.00 share. If there is an automatic exchange of the Scotia BaTS II Series 2006-1 into Preferred Shares Series T of the Bank, then the Bank would become the sole beneficiary of the Trust. | |
| (14)(b) | No cash distributions will be payable on the Scotia BaTS II Series 2006-1 in the event that the regular dividend is not declared on the Bank’s preferred shares and, if no preferred shares are outstanding, the Bank’s common shares. In such a circumstance the net distributable funds of the Trust will be payable to the Bank as the holder of the residual interest in the Trust. Should the Trust fail to pay the semi-annual distributions on the Scotia BaTS II Series 2006-1 in full, the Bank will not declare dividends, of any kind on any of its preferred or common shares for a specified period of time. Refer to Note 24(c) – Restrictions on payment of dividends and retirement of shares. |
2023 Scotiabank Annual Report | 63
Management’s Discussion and Analysis
Credit ratings
Credit ratings are one of the factors that impact the Bank’s access to capital markets and the terms on which it can conduct derivatives, hedging transactions and borrow funds. The credit ratings and outlook that the rating agencies assign to the Bank are based on their own views and methodologies.
The Bank continues to have strong credit ratings and its deposits and legacy senior debt are rated AA by DBRS Morningstar, Aa2 by Moody’s, A+ by Standard and Poor’s (S&P), and AA by Fitch Ratings. The Bank’s bail-inable senior debt is rated AA (low) by DBRS Morningstar, A2 by Moody’s, AA- by Fitch Ratings, and A- by S&P. As of October 31, 2023, all such rating agencies have a Stable outlook on the Bank.
Credit ratings are not recommendations to purchase, sell or hold a security and are subject to revision or withdrawal at any time by the rating agency.
Risk-weighted assets
Regulatory capital requirements are based on OSFI’s target minimum percentage of risk-weighted assets (RWA). RWA represent the Bank’s exposure to credit, market and operational risk and are computed by applying a combination of the OSFI approved Bank’s internal risk models and OSFI prescribed risk weights to on and off-balance sheet exposures. In addition, OSFI has adopted the revised Basel III aggregate output floor, which ensures that the Bank’s total RWAs are not lower than 72.5% of RWAs as calculated by the revised Basel III framework’s standardized approaches. The output floor has been set at 72.5% with an international phase-in period from 2023 to 2028. For Canadian banks, the floor began at 65% as of the second quarter of 2023, increasing by 2.5% in Q1 of each year, until full adoption at 72.5% in the first quarter of 2026.
As at year end, the Bank’s RWA of $440.0 billion, represents a decrease of approximately $22.4 billion, or 4.8%, from 2022, due primarily to the adoption of OSFI’s revised Basel III requirements, partly offset by the impacts from foreign currency translation.
Credit risk-weighted assets
Credit risk measures the risk that a borrower or counterparty will fail to honour its financial or contractual obligations to the Bank.
The credit risk component consists of on and off- balance sheet claims. The Basel III rules are not applied to traditional balance sheet categories but to categories of on and off-balance sheet exposures which represent general classes of assets or exposure types (e.g. Large Corporate, Mid-size Corporate, Small and Medium Enterprise, Sovereign, Bank, Retail Mortgages, Other Retail, Equity, etc.,) based on their different underlying risk characteristics. Generally, while calculating capital requirements, exposure types are analyzed by the following credit risk exposure sub-types: drawn, undrawn, repo-style transactions, over-the-counter (OTC) derivatives, exchange traded derivatives and other off-balance sheet claims.
Credit risk-weighted assets decreased by $22.8 billion to $378.7 billion. The key drivers or components of the change are reflected in Table T32, below.
T32 Flow statement for Basel III credit risk-weighted assets ($ millions)
| 2023 |
2022 |
|||||||||||||||
| Revised Basel III(1) | Basel III | |||||||||||||||
| Credit risk-weighted assets movement by key driver ($ millions) |
Credit risk | Of which counterparty credit risk |
Credit risk | Of which counterparty credit risk |
||||||||||||
| Credit risk-weighted assets as at beginning of year |
$ | 401,434 | $ | 20,217 | $ | 358,782 | $ | 18,046 | ||||||||
| Book size(2) |
(4,121 | ) | (4,081 | ) | 49,412 | 321 | ||||||||||
| Book quality(3) |
2,039 | 529 | (13,393 | ) | (779 | ) | ||||||||||
| Model updates(4) |
– | – | (4,336 | ) | 967 | |||||||||||
| Methodology and policy(5) |
(29,372 | ) | (677 | ) | (1,601 | ) | – | |||||||||
| Acquisitions and disposals |
(560 | ) | – | (1,498 | ) | (23 | ) | |||||||||
| Foreign exchange movements |
9,250 | 288 | 14,242 | 1,685 | ||||||||||||
| Other |
– | – | (174 | ) | – | |||||||||||
| Credit risk-weighted assets as at end of year |
$ | 378,670 | $ | 16,276 | $ | 401,434 | $ | 20,217 | ||||||||
| (1) | Regulatory amounts reported in 2023 are under Revised Basel III requirements and are not directly comparable to the amounts reported in 2022. |
| (2) | Book size is defined as organic changes in book size and composition (including new business and maturing loans). |
| (3) | Book quality is defined as quality of book changes caused by experience such as underlying customer behaviour or demographics, including changes through model calibrations/realignments. |
| (4) | Model updates are defined as model implementation, change in model scope or any change to address model enhancement. |
| (5) | Methodology and policy is defined as methodology changes to the calculations driven by regulatory policy changes, such as new regulation (e.g. Basel III revision). |
64 | 2023 Scotiabank Annual Report
Management’s Discussion and Analysis | Group Financial Condition
T33 Internal rating scale(1) and mapping to external rating agencies
| Equivalent Rating | ||||||||||
| External Rating – S&P | External Rating – Moody’s | External Rating – DBRS | Grade | IG Code | PD Range(2) | |||||
| AAA to AA+ |
Aaa to Aa1 |
AAA to AA (high) |
Investment grade |
99-98 | 0.0000% – 0.0551% | |||||
| AA to A+ |
Aa2 to A1 |
AA to A (high) |
95 | 0.0551% – 0.0651% | ||||||
| A to A- |
A2 to A3 |
A to A (low) |
90 | 0.0651% – 0.0748% | ||||||
| BBB+ |
Baa1 |
BBB (high) |
87 | 0.0748% – 0.1028% | ||||||
| BBB |
Baa2 |
BBB |
85 | 0.1028% – 0.1552% | ||||||
| BBB- |
Baa3 |
BBB (low) |
83 | 0.1552% – 0.2151% | ||||||
| BB+ |
Ba1 |
BB (high) |
Non-Investment grade |
80 | 0.2151% – 0.2983% | |||||
| BB |
Ba2 |
BB |
77 | 0.2983% – 0.5617% | ||||||
| BB- |
Ba3 |
BB (low) |
75 | 0.5617% – 1.1570% | ||||||
| B+ |
B1 |
B (high) |
73 | 1.1570% – 1.9519% | ||||||
| B to B- |
B2 to B3 |
B to B (low) |
70 | 1.9519% – 4.7225% | ||||||
| CCC+ |
Caa1 |
– |
Watch list | 65 | 4.7225% – 12.1859% | |||||
| CCC |
Caa2 |
– |
60 | 12.1859% – 23.8197% | ||||||
| CCC- to CC |
Caa3 to Ca |
– |
40 | 23.8197% – 42.1638% | ||||||
| – |
– |
– |
30 | 42.1638% – 100.0000% | ||||||
| Default |
Default | 21 | 100% |
| (1) | Applies to non-retail portfolio. |
| (2) | PD Ranges as at October 31, 2023. The Range does not include the upper boundary for the row. |
T34 Non-retail IRB portfolio exposure by internal rating grade(1)
| As at October 31 ($ millions) | 2023 | 2022 | ||||||||||||||||||||||||||||||||||||||||
| Revised Basel III(2) | Basel III | |||||||||||||||||||||||||||||||||||||||||
| Grade | IG Code | Exposure at default ($)(4) |
RWA ($)(5) |
PD (%)(6)(9) |
LGD (%)(7)(9) |
RW (%)(8)(9) |
Exposure at default ($)(4) |
RWA ($)(5) |
PD (%)(6)(9) |
LGD (%)(7)(9) |
RW (%)(8)(9) |
|||||||||||||||||||||||||||||||
| Investment grade(3) |
99-98 | 150,660 | 648 | – | 10 | – | 124,743 | 518 | – | 12 | – | |||||||||||||||||||||||||||||||
| 95 | 62,953 | 9,230 | 0.06 | 32 | 15 | 65,476 | 7,375 | 0.06 | 30 | 11 | ||||||||||||||||||||||||||||||||
| 90 | 58,486 | 10,701 | 0.07 | 39 | 18 | 74,135 | 12,333 | 0.07 | 37 | 17 | ||||||||||||||||||||||||||||||||
| 87 | 69,250 | 11,663 | 0.08 | 34 | 17 | 85,132 | 17,978 | 0.08 | 40 | 21 | ||||||||||||||||||||||||||||||||
| 85 | 58,639 | 15,751 | 0.13 | 38 | 27 | 73,039 | 22,940 | 0.13 | 44 | 31 | ||||||||||||||||||||||||||||||||
| 83 | 77,643 | 23,193 | 0.18 | 36 | 30 | 78,869 | 30,225 | 0.18 | 45 | 38 | ||||||||||||||||||||||||||||||||
| Non-Investment grade |
80 | 54,968 | 19,923 | 0.25 | 37 | 36 | 52,666 | 22,474 | 0.25 | 42 | 43 | |||||||||||||||||||||||||||||||
| 77 | 37,165 | 15,282 | 0.35 | 38 | 41 | 36,288 | 17,976 | 0.35 | 43 | 50 | ||||||||||||||||||||||||||||||||
| 75 | 26,291 | 17,142 | 0.90 | 39 | 65 | 25,712 | 17,927 | 0.90 | 41 | 70 | ||||||||||||||||||||||||||||||||
| 73 | 10,015 | 6,547 | 1.49 | 32 | 65 | 7,848 | 5,555 | 1.49 | 34 | 71 | ||||||||||||||||||||||||||||||||
| 70 | 3,226 | 2,988 | 2.56 | 39 | 93 | 2,592 | 2,547 | 2.56 | 41 | 98 | ||||||||||||||||||||||||||||||||
| Watch list |
65 | 1,208 | 1,685 | 8.72 | 38 | 139 | 395 | 525 | 8.73 | 39 | 133 | |||||||||||||||||||||||||||||||
| 60 | 1,225 | 990 | 17.02 | 17 | 81 | 788 | 412 | 17.02 | 12 | 52 | ||||||||||||||||||||||||||||||||
| 40 | 202 | 345 | 33.33 | 34 | 171 | 881 | 2,510 | 33.32 | 55 | 285 | ||||||||||||||||||||||||||||||||
| 30 | 106 | 168 | 53.33 | 37 | 158 | 54 | 105 | 53.06 | 44 | 194 | ||||||||||||||||||||||||||||||||
|
Default(10) |
21 | 1,009 | 1,653 | 100.00 | 35 | 164 | 1,220 | 3,208 | 100.00 | 42 | 263 | |||||||||||||||||||||||||||||||
| Total |
613,046 | 137,909 | 0.41 | 30 | 22 | 629,838 | 164,608 | 0.44 | 34 | 26 | ||||||||||||||||||||||||||||||||
| Government guaranteed residential mortgages |
56,441 | – | – | 23 | – | 71,867 | – | – | 22 | – | ||||||||||||||||||||||||||||||||
| Total |
669,487 | 137,909 | 0.38 | 29 | 21 | 701,705 | 164,608 | 0.39 | 33 | 23 | ||||||||||||||||||||||||||||||||
| (1) | Excludes securitization exposures. |
| (2) | Regulatory amounts reported in 2023 are under Revised Basel III requirements and are not directly comparable to the amounts reported in 2022. |
| (3) | Excludes government guaranteed residential mortgages of $56.4 billion ($71.9 billion in 2022). |
| (4) | After credit risk mitigation. |
| (5) | RWA – Risk-Weighted Assets. Amounts in 2022 are prior to the 6% scaling factor. The scalar is no longer required under the Basel III Revisions framework. |
| (6) | PD – Probability of Default. |
| (7) | LGD – Loss Given Default. |
| (8) | RW – Risk Weight. |
| (9) | Exposure at default used as basis for estimated weightings. |
| (10) | Gross defaulted exposures, before any related allowances. |
Credit risk-weighted assets – non-retail
The Bank uses the Internal Ratings Based (IRB) approach under revised Basel III to determine minimum regulatory capital requirements for credit risk in its Canadian, U.S. and European credit portfolios, and for a significant portion of its international corporate and commercial portfolios. The remaining credit portfolios are subject to the Standardized approach, which relies on the external credit ratings (e.g. S&P, DBRS, Fitch, etc.) of borrowers, if available, or prescribed risk weights for real estate lending to compute regulatory capital for credit risk. For the Bank’s Corporate, Bank and Sovereign IRB portfolios, the key risk measures used in the quantification of regulatory capital for credit risk include probability of default (PD), loss given default (LGD) and exposure at default (EAD).
| • | Probability of default (PD) measures the likelihood that a borrower, with an assigned Internal Grade (IG) rating, will default within a one-year time horizon. IG ratings are a component of the Bank’s risk rating system. Each of the Bank’s internal borrower IG ratings is mapped to a PD estimate. |
2023 Scotiabank Annual Report | 65
Management’s Discussion and Analysis
| • | Loss given default (LGD) measures the severity of loss on a facility in the event of a borrower’s default. LGD segments are determined based on facility characteristics such as seniority, collateral type, collateral coverage and other structural elements. Each LGD segment is assigned a LGD estimate. LGD is based on the concept of economic loss and is calculated using the present value of repayments, recoveries and related direct and indirect expenses. |
| • | Exposure at default (EAD) measures the expected exposure on a facility at the time of default. |
Under the Advanced Internal Ratings Based (AIRB) approach, all three risk measures are estimated using the Bank’s historical data, as well as available external benchmarks, and are updated on a regular basis. The historical data used for estimating these risk measures exceeds the minimum five-year AIRB requirement for PD estimates and the minimum seven-year AIRB requirement for LGD and EAD estimates.
Under revised Basel III there are new IRB requirements for internally developed model parameters under AIRB including scope restrictions which limit certain asset classes to only the Foundation Internal Ratings Based (FIRB) approach. For those asset classes (e.g. Large Corporates, Banks, etc.) the FIRB utilizes the Bank’s internally modeled PD parameters combined with internationally prescribed LGD and EAD parameters.
Further adjustments, as required under the Basel III Framework and OSFI’s requirements set out in its Domestic Implementation Notes, including any input floor requirements, are applied to average estimates obtained from historical data. These adjustments incorporate the regulatory requirements pertaining to:
| • | Long-run estimation of PD, which requires that PD estimates capture average default experience over a reasonable mix of high-default and low-default years of the economic cycle; |
| • | Downturn estimation for internally modeled AIRB LGD, which requires that LGD estimates appropriately reflect conditions observed during periods where credit losses are substantially higher than average; and |
| • | Downturn estimation for internally modeled AIRB EAD, which requires that EAD estimates appropriately reflect conditions observed during periods of economic downturn; and |
| • | The addition of a margin of conservatism, which is related to the likely range of errors based on the identification and quantification of the various sources of uncertainty inherent in historical estimates. |
These risk measures are used in the calculation of regulatory capital requirements based on the Basel framework. The credit quality distribution of the Bank’s IRB non-retail portfolio is shown in Table T34. Portfolio average LGD and RW were generally unchanged year-over-year.
The risk measures are subject to a rigorous back-testing framework which uses the Bank’s historical data to ensure that they are appropriately calibrated. Based on results obtained from the back-testing process, risk measures are reviewed, re-calibrated and independently validated on at least an annual basis in order to reflect the implications of new data, technical advances and other relevant information.
| • | As PD estimates represent long-run parameters, back-testing is performed using historical data spanning at least one full economic cycle. Realized PDs are back-tested using pre-defined confidence intervals, and the results are then aggregated to provide an overall assessment of the appropriateness of each PD estimate; |
| • | The back-testing for AIRB LGD and EAD estimates is conducted from both long-run and downturn perspectives, in order to ensure that these estimates are adequately conservative to reflect both long-run and downturn conditions. |
Portfolio-level back-testing results, based on a comparison of estimated and realized parameters for the four-quarter period ended at July 31, 2023, are shown in Table T35. During this period the actual experiences of PD, LGD and CCF were lower than the estimates as reflected within the risk parameters.
T35 Portfolio-level comparison of estimated and actual non-retail percentages
| Estimated(1) | Actual | |||||||
| Average PD |
0.53 | 0.28 | ||||||
| Average LGD |
39.57 | 18.30 | ||||||
| Average CCF(2) |
49.99 | 9.31 | ||||||
| (1) | Estimated parameters are based on portfolio count-weighted averages at Q3/22, whereas actual parameters are based on count-weighted averages of realized parameters during the subsequent four quarters. |
| (2) | EAD back-testing is performed through Credit Conversion Factor (CCF) back-testing, as EAD is computed using the sum of the drawn exposure and undrawn exposure multiplied by the estimated CCF. |
Credit risk-weighted assets – Canadian retail
The AIRB approach is used to determine minimum regulatory capital requirements for the retail credit portfolio in Canada. The retail portfolio is comprised of the following Basel-based pools:
| • | Residential real estate secured exposures mainly consist of conventional and high ratio residential mortgages and all other products opened under the Scotia Total Equity Plan (STEP), such as loans, credit cards and secured lines of credit; |
| • | Qualifying revolving retail exposures (QRRE) consist of unsecured credit cards and lines of credit, including transactors and revolvers; |
| • | Other retail consists of term loans (secured and unsecured), as well as credit cards and lines of credit which are secured by assets other than real estate or do not meet the QRRE definition. |
For the AIRB portfolios, the following models and parameters are estimated, subject to parameter input floors as required by OSFI:
| • | Probability of default (PD) is the likelihood that the facility will default within the next 12 months. |
| • | Loss Given Default (LGD) measures the economic loss as a proportion of the defaulted balance. |
| • | Exposure at Default (EAD) is the portion of expected exposures at time of default. |
66 | 2023 Scotiabank Annual Report
Management’s Discussion and Analysis | Group Financial Condition
The data observation period used for PD/EAD/LGD estimates meets the five year minimum. Various statistical techniques including predictive modeling and decision trees were used to develop models. The models assign accounts into homogenous segments using internal and external borrower/facility-level credit experience. Every month, exposures are automatically re-rated based on risk and loss characteristics. PD, LGD and EAD estimates are then assigned to each of these segments incorporating the following regulatory requirements:
| • | PD incorporates the average long run default experience over an economic cycle. This long run average includes a mix of high and low default years. |
| • | LGD is adjusted to appropriately reflect economic downturn conditions. |
| • | EAD may also be adjusted to reflect downturn conditions when PD and EAD are highly correlated. |
| • | Sources of uncertainty are reviewed regularly to ensure uncertainties are identified, quantified and included in calculations so that all parameter estimates reflect appropriate levels of conservatism. |
The table below summarizes the credit quality distribution of the Bank’s AIRB retail portfolio as at October 31, 2023.
Year-over-year the Bank’s AIRB retail portfolio parameters and average risk weights remained stable.
T36 Retail AIRB portfolio exposure by PD range(1)
| As at October 31 ($ millions) | 2023 |
2022 |
||||||||||||||||||||||||||||||||||||||||
| Revised Basel III(2) | Basel III | |||||||||||||||||||||||||||||||||||||||||
| Category | PD Range | Exposure at default ($)(1) |
RWA ($)(3) |
PD (%)(4)(7) |
LGD (%)(5)(7) |
RW (%)(6)(7) |
Exposure at default ($)(1) |
RWA ($)(3) |
PD (%)(4)(7) |
LGD (%)(5)(7) |
RW (%)(6)(7) |
|||||||||||||||||||||||||||||||
| Exceptionally low(8) |
0.0000% – 0.0499% | – | – | – | – | – | 102,039 | 2,188 | 0.04 | 25 | 2 | |||||||||||||||||||||||||||||||
| Very low |
0.0500% – 0.1999% | 269,409 | 14,264 | 0.11 | 30 | 5 | 118,374 | 9,134 | 0.17 | 27 | 8 | |||||||||||||||||||||||||||||||
| Low |
0.2000% – 0.9999% | 80,470 | 22,913 | 0.62 | 43 | 28 | 84,843 | 23,009 | 0.63 | 40 | 27 | |||||||||||||||||||||||||||||||
| Medium low |
1.0000% – 2.9999% | 24,230 | 13,951 | 1.79 | 58 | 58 | 22,248 | 12,502 | 1.75 | 54 | 56 | |||||||||||||||||||||||||||||||
| Medium |
3.0000% – 9.9999% | 7,506 | 7,502 | 4.99 | 66 | 100 | 8,654 | 8,657 | 5.11 | 71 | 100 | |||||||||||||||||||||||||||||||
| High |
10.0000% – 19.9999% | 1,882 | 2,890 | 11.08 | 70 | 154 | 1,123 | 1,461 | 15.66 | 53 | 130 | |||||||||||||||||||||||||||||||
| Extremely high |
20.0000% – 99.9999% | 2,363 | 3,683 | 34.27 | 55 | 156 | 1,163 | 1,945 | 37.53 | 56 | 167 | |||||||||||||||||||||||||||||||
|
Default(9) |
100% | 751 | 2,879 | 100.00 | 61 | 384 | 469 | 2,124 | 100.00 | 72 | 453 | |||||||||||||||||||||||||||||||
| Total |
386,611 | 68,082 | 0.87 | 36 | 18 | 338,913 | 61,020 | 0.79 | 33 | 18 | ||||||||||||||||||||||||||||||||
| (1) | After credit risk mitigation. |
| (2) | Regulatory amounts reported in 2023 are under Revised Basel III requirements and are not directly comparable to amounts reported in 2022. |
| (3) | RWA – Risk-Weighted Assets. Amounts in 2022 are prior to the 6% scaling factor. The scalar is no longer required under Basel III Revisions framework. |
| (4) | PD – Probability of Default. |
| (5) | LGD – Loss Given Default. |
| (6) | RW – Risk Weight. |
| (7) | Exposure at default used as basis for estimated weightings. |
| (8) | OSFI has revised the Retail PD floor from 0.03% to 0.05% in 2023, under the Revised Basel III Framework. |
| (9) | Gross defaulted exposures, before any related allowances. |
All AIRB models and parameters are monitored on a quarterly basis and independently validated annually by the Global Risk Management group. These models are tested to ensure rank ordering and back testing of parameters is appropriate. Comparison of estimated and actual loss parameters for the period ended July 31, 2023 is shown in Table T37. During this period the actual experience was more favourable to, or in-line with, the estimates as reflected by the risk parameters. For LGD, retail product actual LGDs were more favourable than their estimates as reflected by the risk parameters.
T37 Estimated and actual loss parameters(1)
| ($ millions) |
Average estimated PD |
Actual default rate |
Average estimated LGD |
Actual LGD |
Estimated EAD |
Actual EAD |
||||||||||||||||||
| Residential real estate secured |
||||||||||||||||||||||||
| Residential mortgages |
||||||||||||||||||||||||
| Insured mortgages(8) |
0.43 | 0.38 | – | – | – | – | ||||||||||||||||||
| Uninsured mortgages |
0.34 | 0.22 | 18.07 | 12.57 | – | – | ||||||||||||||||||
| Secured lines of credit |
0.20 | 0.15 | 26.94 | 17.31 | 80 | 76 | ||||||||||||||||||
| Qualifying revolving retail exposures |
1.42 | 1.00 | 83.24 | 76.54 | 538 | 467 | ||||||||||||||||||
| Other retail |
1.69 | 1.01 | 65.12 | 56.11 | 16 | 16 | ||||||||||||||||||
| (1) | Estimates and actual values are recalculated to align with new models implemented during the period. |
| (2) | Account weighted aggregation. |
| (3) | Default weighted aggregation. |
| (4) | EAD is estimated for revolving products only. |
| (5) | Actual based on accounts not at default as at four quarters prior to reporting date. |
| (6) | Actual LGD calculated based on 24 month recovery period after default and therefore excludes any recoveries received after the 24 month period. |
| (7) | Estimates are based on the four quarters prior to the reporting date. |
| (8) | Actual and estimated LGD for insured mortgages are not shown. Actual LGD includes the insurance benefit, whereas estimated LGD may not. |
Credit risk-weighted assets – International retail
International retail credit portfolios follow the Standardized approach and consist of the following components:
| • | Residential real estate secured lending; and, |
| • | Other regulatory retail, mainly consisting of term loans and credit card and lines of credit transactors and revolvers. |
Under the standardized approach, each of the above components is risk-weighted based on prescribed risk weights, which consider borrower or facility attributes, such as, loan-to-value, transactors vs. revolvers, and drawn vs. undrawn.
2023 Scotiabank Annual Report | 67
Management’s Discussion and Analysis
Market risk
Market risk is the risk of loss from changes in market prices including interest rates, credit spreads, equity prices, foreign exchange rates, and commodity prices, the correlations between them, and their levels of volatility.
For all material trading portfolios, the Bank applies its internal models to calculate the market risk capital charge. OSFI has approved the Bank’s internal VaR, Stressed VaR and Incremental Risk Charge models for the determination of market risk capital. The attributes and parameters of these models are described in the Risk Measurement Summary. In addition, for some non-material trading portfolios, the Bank applies the Standardized Approach for calculating market risk capital. The standardized method uses a “building block” approach, with the capital charge for each risk category calculated separately.
Below are the market risk requirements as at October 31, 2023 and 2022:
T38 Total market risk capital(1)
| ($ millions) | 2023 |
2022 |
||||||
| All-Bank VaR |
$ | 141 | $ | 131 | ||||
| All-Bank stressed VaR |
390 | 324 | ||||||
| Incremental risk charge |
315 | 345 | ||||||
| Standardized approach |
117 | 66 | ||||||
| Total market risk capital |
$ | 963 | $ | 866 | ||||
| (1) | Equates to $12,040 million of market risk-weighted assets (2022 – $10,820 million). |
T39 Risk-weighted assets movement by key drivers
| Market risk | ||||||||
|
2023 |
2022 |
|||||||
| RWA as at beginning of the year |
$ | 10,820 | $ | 8,112 | ||||
| Movement in risk levels(1) |
1,208 | 2,452 | ||||||
| Model updates(2) |
12 | 195 | ||||||
| Methodology and policy(3) |
– | 61 | ||||||
| Acquisitions and divestitures |
– | – | ||||||
| RWA as at end of the year |
$ | 12,040 | $ | 10,820 | ||||
| (1) | Movement in risk levels are defined as changes in risk due to position changes and market movements. Foreign exchange movements are embedded within Movement in risk levels. |
| (2) | Model updates are defined as updates to the model to reflect recent experience, change in model scope. |
| (3) | Methodology and policy is defined as methodology changes to the calculations driven by regulatory policy changes (e.g. Basel III). |
Market risk-weighted assets increased by $1.2 billion to $12.0 billion, as shown in the table above, due primarily to movements in risk levels and higher standardized market risk RWA.
Operational risk
Operational risk is the risk of loss, whether direct or indirect, to which the Bank is exposed due to external events, human error, or the inadequacy or failure of processes, procedures, systems or controls.
Consistent with OSFI’s adoption of the revised Basel III reforms, the Bank applies the new Standardized Measurement Approach (SMA) for calculating operational risk capital requirements. Under the SMA, operational risk capital is determined based on the existing gross income approach further supplemented by a scalar or internal loss multiplier (ILM) that recognizes the Bank’s operational risk loss experience.
Operational risk-weighted assets decreased by $0.9 billion during the year to $49.3 billion due primarily to a benefit of $2.4 billion from the adoption of the SMA in the second quarter of the year, partly offset by growth in the Bank’s gross income and changes in the Bank’s ILM.
Internal capital
The Bank utilizes economic capital methodologies and measures to calculate internal capital. Internal capital is a measure of the unexpected losses inherent in the Bank’s business activities. The calculation of internal capital relies on models that are subject to independent vetting and validation as required by the Bank’s Model Risk Management Policy.
Management assesses its risk profile to determine those risks for which the Bank should attribute internal capital. The major risk categories included in internal capital are:
| • | Credit risk measurement is based on the Bank’s internal credit risk ratings for derivatives, corporate and commercial loans, and credit scoring for retail loans. It is also based on the Bank’s actual experience with recoveries and takes into account differences in term to maturity, probabilities of default, expected severity of loss in the event of default, and the diversification benefits of certain portfolios. |
| • | Market risk for internal capital incorporates models consistent with the regulatory basis, with some exclusions, and calibrated to a higher 99.95% confidence interval, and models of other market risks, mainly structural interest rate and foreign exchange risks. |
| • | Operational risk for internal capital is calculated based on an approach consistent with the Bank’s regulatory capital requirements including a conservative forward-looking view of gross income. |
| • | Other risks include additional risks for which internal capital is attributed, such as business risk, significant investments, insurance risk and real estate risk. |
In addition, the Bank’s measure of internal capital includes a diversification benefit which recognizes that all of the above risks will not occur simultaneously. The Bank also includes the full amount of goodwill and intangible assets in the internal capital amount.
For further discussion on risk management and details on credit, market and operational risks, refer to the Risk Management section.
68 | 2023 Scotiabank Annual Report
Management’s Discussion and Analysis | Group Financial Condition
Off-Balance Sheet Arrangements
In the normal course of business, the Bank enters into contractual arrangements that are either consolidated or not required to be consolidated in its financial statements but could have a current or future impact on the Bank’s financial performance or financial condition. These arrangements can be classified into the following categories: structured entities, securitizations, guarantees and other commitments.
Structured entities
Structured entities are designed to accomplish certain well-defined objectives and for which voting or similar rights are not the dominant factor in deciding who controls the entity. The Bank may become involved with structured entities either at the formation stage or at a later date. The Bank controls an investee when it is exposed, or has rights, to variable returns from its involvement with the investee and has the ability to affect those returns through its power over the investee. The Bank’s arrangements with structured entities include:
| • | Structured entities that are used to provide a wide range of services to customers, such as structured entities established to allow clients to securitize their financial assets while facilitating cost-efficient financing, and to provide certain investment opportunities. |
| • | Structured entities that the Bank sponsors and actively manages. |
The Bank consolidates all structured entities that it controls which includes a U.S. based multi-seller conduit and certain funding and other vehicles. For many of the structured entities that are used to provide services to customers, the Bank does not guarantee the performance of the structured entities’ underlying assets and does not absorb any related losses. For other structured entities, such as securitization and investment vehicles, the Bank may be exposed to credit, market, liquidity, or operational risks. Noteholders of securitizations may also be exposed to these risks. The Bank may earn fees based on the nature of its association with a structured entity.
Unconsolidated structured entities
There are two primary types of association the Bank has with unconsolidated structured entities:
| • | Canadian multi-seller conduits administered by the Bank; and |
| • | Structured finance entities. |
The Bank earned total fees of $51 million in 2023 (October 31, 2022 – $39 million) from certain structured entities in which it had a significant interest at the end of the year but did not consolidate. More information with respect to the Bank’s involvement with these unconsolidated structured entities, including details of liquidity facilities and maximum loss exposure by category is provided below and in Note 15(b) to the consolidated financial statements.
Canadian multi-seller conduits administered by the Bank
The Bank sponsors two Canadian-based multi-seller conduits that are not consolidated. The Bank earned commercial paper issuance fees, program management fees, liquidity fees and other fees from these multi-seller conduits, which totaled $47 million in 2023, compared to $36 million in 2022. These multi-seller conduits purchase high-quality financial assets and finance these assets through the issuance of highly-rated commercial paper.
As further described below, the Bank’s exposure to these off-balance sheet conduits primarily consists of liquidity support and temporary holdings of commercial paper. Although the Bank has power over the relevant activities of the conduits, it has limited exposure to variability in returns, which results in the Bank not consolidating the two Canadian conduits. The Bank has a process to monitor these exposures and significant events impacting the conduits to ensure there is no change in control, which could require the Bank to consolidate the assets and liabilities of the conduits at fair value.
A significant portion of the conduits’ assets have been structured to receive credit enhancements from the sellers, including overcollateralization protection and cash reserve accounts. Each asset purchased by the conduits is supported by a backstop liquidity facility provided by the Bank in the form of a liquidity asset purchase agreement (LAPA). The primary purpose of the backstop liquidity facility is to provide an alternative source of financing in the event the conduits are unable to access the commercial paper market. Under the terms of the LAPA, in most cases, the Bank is not obliged to purchase defaulted assets.
The Bank’s primary exposure to the Canadian-based conduits is the liquidity support provided, with total liquidity facilities of $7.1 billion as at October 31, 2023 (October 31, 2022 – $6.4 billion). The year-over-year increase was due to normal business operations. As at October 31, 2023, total commercial paper outstanding for the Canadian-based conduits was $5.4 billion (October 31, 2022 – $3.8 billion) and the Bank held 0.2% (October 31, 2022 – 0.9%) of the total commercial paper issued by these conduits. Table T40 presents a summary of assets purchased and held by the Bank’s two Canadian multi-seller conduits as at October 31, 2023 and 2022, by underlying exposure.
All of the funded assets have at least an equivalent rating of AA or higher based on the Bank’s internal rating program; and assets held in these conduits were investment grade as at October 31, 2023.
T40 Assets held by Bank-sponsored Canadian-based multi-seller conduits
| 2023 | 2022 | |||||||||||||||||||||||
| As at October 31 ($ millions) | Funded assets(1) |
Unfunded commitments |
Total exposure(2) |
Funded assets(1) |
Unfunded commitments |
Total exposure(2) |
||||||||||||||||||
| Auto loans/leases |
$ | 2,547 | $ | 591 | $ | 3,138 | $ | 2,019 | $ | 369 | $ | 2,388 | ||||||||||||
| Trade receivables |
– | 459 | 459 | – | 528 | 528 | ||||||||||||||||||
| Canadian residential mortgages |
1,966 | 584 | 2,550 | 929 | 1,621 | 2,550 | ||||||||||||||||||
| Equipment leases and rental contracts |
700 | 59 | 759 | 722 | 34 | 756 | ||||||||||||||||||
| Other |
78 | 76 | 154 | 103 | 35 | 138 | ||||||||||||||||||
|
Total(3) |
$ | 5,291 | $ | 1,769 | $ | 7,060 | $ | 3,773 | $ | 2,587 | $ | 6,360 | ||||||||||||
| (1) | Funded assets are reflected at original cost, which approximates estimated fair value. |
| (2) | Exposure to the Bank is through global-style liquidity facilities. |
| (3) | These assets are substantially sourced from Canada. |
2023 Scotiabank Annual Report | 69
Management’s Discussion and Analysis
Structured finance entities
The Bank has interests in structured finance entities used to assist corporate clients in accessing cost-efficient financing through their securitization structures. The Bank’s maximum exposure to loss from structured finance entities was $3,296 million as at October 31, 2023 (October 31, 2022 – $1,591 million). The year-over-year increase was due to normal business operations and new transactions.
The Bank provides senior credit facilities to unaffiliated structured entities that are established by third parties to acquire and/or originate loans for the purposes of issuing collateralized loan obligations (CLOs). These credit facilities benefit from subordinated capital provided by either the collateral manager or third-party investors via subordinated financing, capital injection or asset contribution. Subordinated capital represents the first loss tranche which absorbs losses prior to the Bank’s senior exposure. The Bank’s broker-dealer affiliate acts as the arranger and placement agent for the CLOs. Proceeds from the sale of the CLOs are used to repay the senior credit facilities. The Bank does not consolidate these entities as it does not have decision making power over their relevant activities, which include the acquisition and/or origination of loans and overall management of the underlying portfolio. The Bank’s maximum exposure to loss was $1,511 million as at October 31, 2023 (October 31, 2022 – $nil), relating to credit facilities extended to these entities, of which $220 million was funded (October 31, 2022 – $nil).
Other funding vehicles
These entities are designed to pass the Bank’s credit risk to the holders of the securities. Therefore, the Bank does not have exposure or rights to variable returns from these unconsolidated entities.
The Bank uses a funding vehicle to transfer credit exposure on certain loan assets and purchases credit protection against eligible credit events from this vehicle. The vehicle collateralizes its obligation using cash proceeds received through the issuance of guarantee-linked notes. Loan assets are not sold or assigned to the vehicle and remain on the Bank’s Consolidated Statement of Financial Position. During the year, $998 million of guarantee-linked notes (October 31, 2022 – $nil) were issued by this vehicle and included in Deposits – Business and government on the Bank’s Consolidated Statement of Financial Position.
Other unconsolidated structured entities
The Bank sponsors unconsolidated structured entities including mutual funds, in which it has insignificant or no interest at the reporting date. The Bank is a sponsor when it is significantly involved in the design and formation at inception of the structured entity, and the Bank’s name is used by the structured entity to create an awareness of the instruments being backed by the Bank’s reputation and obligation. The Bank also considers other factors, such as its continuing involvement and obligations to determine if, in substance, the Bank is a sponsor. For the year ended October 31, 2023, the Bank earned $2,369 million income from its involvement with the unconsolidated Bank-sponsored structured entities, all of which is from Bank-sponsored mutual funds (for the year ended October 31, 2022 – $2,486 million).
Securitizations
The Bank securitizes fully insured residential mortgage loans, originated by the Bank and third parties, through the creation of mortgage-backed securities that are sold to Canada Housing Trust (CHT), Canada Mortgage and Housing Corporation (CMHC) or third-party investors, as an efficient source of financing. The sale of such mortgages does not meet the derecognition requirements where the Bank retains substantially all of the risks and rewards of ownership of the securitized mortgages. The transferred mortgages continue to be recognized on the Consolidated Statement of Financial Position, along with the proceeds from sale treated as secured borrowings. More details have been provided in Note 14 of the consolidated financial statements.
Third-party originated mortgages purchased by the Bank and social housing mortgage pools originated by the Bank that are securitized and sold, qualify for derecognition where the Bank transfers substantially all of the risks and rewards of ownership to third parties. As at October 31, 2023, the outstanding amount of off-balance sheet securitized third-party originated mortgages was $19,442 million (October 31, 2022 – $14,137 million) and off-balance sheet securitized social housing pools was $766 million (October 31, 2022 – $646 million).
The Bank securitizes a portion of its Canadian personal and small business credit card receivables (receivables) through Trillium Credit Card Trust II (Trillium), a consolidated Bank-sponsored structured entity. Trillium issues senior and subordinated notes to investors. The proceeds of such issuances are used to purchase co-ownership interests in the receivables originated by the Bank. The sale of such co-ownership interests does not qualify for derecognition and therefore the receivables continue to be recognized on the Bank’s Consolidated Statement of Financial Position. Recourse of the noteholders is limited to the purchased co-ownership interests. During the year, $2,412 million receivables were securitized through Trillium (2022 – $nil).
The Bank previously securitized a portion of its Canadian auto loan receivables (receivables) through Securitized Term Auto Receivables Trust (START entity) 2019-CRT, a consolidated Bank-sponsored structured entity. The START entity issued senior and subordinated notes to the Bank and/or third-party investors, and the proceeds of such issuances were used to purchase discrete pools of retail indirect auto loan receivables from the Bank on a fully serviced basis. The sale of such pools did not qualify for derecognition and therefore the receivables continued to be recognized on the Bank’s Consolidated Statement of Financial Position. Recourse of the note holders was limited to the receivables. During the current and prior year, no receivables were securitized through the START entity, and all remaining outstanding notes matured. As such, as at October 31, 2023, the outstanding senior and subordinated notes issued by the START entity and held by the Bank were nil (2022 – $199 million, eliminated on consolidation).
Guarantees and other commitments
Guarantees and other commitments are fee-based products that the Bank provides to its customers. These products can be categorized as follows:
| • | Standby letters of credit and letters of guarantee. As at October 31, 2023, these amounted to $48 billion, compared to $42 billion last year. These instruments are issued at the request of a Bank customer to secure the customer’s payment or performance obligations to a third party. |
| • | Liquidity facilities. These generally provide an alternate source of funding to asset-backed commercial paper conduits in the event a general market disruption prevents the conduits from issuing commercial paper or, in some cases, when certain specified conditions or performance measures are not met; |
| • | Indemnification contracts. In the ordinary course of business, the Bank enters into many contracts where it may indemnify contract counterparties for certain aspects of its operations that are dependent on other parties’ performance, or if certain events occur. The Bank cannot estimate, in all cases, the maximum potential future amount that may be payable, nor the amount of collateral or assets available under recourse provisions that would mitigate any such payments. Historically, the Bank has not made any significant payments under these indemnities; |
| • | Loan commitments. The Bank has commitments to extend credit, subject to specific conditions, which represent undertakings to make credit available in the form of loans or other financings for specific amounts and maturities. As at October 31, 2023, these commitments amounted to $284 billion, compared to $268 billion last year. The year-over-year increase is primarily due to an increase in business activity and impact from foreign currency translation. |
70 | 2023 Scotiabank Annual Report
Management’s Discussion and Analysis | Group Financial Condition
These guarantees and loan commitments may expose the Bank to credit or liquidity risks, and are subject to the Bank’s standard review and approval processes. For the guaranteed products, the dollar amounts represent the maximum risk of loss in the event of a total default by the guaranteed parties, and are stated before any reduction for recoveries under recourse provisions, insurance policies or collateral held or pledged.
Detailed information on guarantees and loan commitments is disclosed in Note 34 in the consolidated financial statements.
Canadian Government Economic Response Plans
The Bank participated in the following plans as part of the Government of Canada’s COVID-19 Economic Response Plan.
Canada Emergency Business Account (CEBA)
Through the CEBA program, the Bank facilitated loans with eligible small business customers and Export Development Canada (EDC). Eligible small business customers received a loan of up to $60,000. The CEBA loans are not recognized in the Bank’s Consolidated Statement of Financial Position as the program meets the pass-through criteria of financial assets under IFRS 9. As at October 31, 2023, loans issued under the CEBA were approximately $3.4 billion (October 31, 2022 – $3.9 billion).
Business Credit Availability Program (BCAP)
The BCAP provides additional liquidity support to small business and commercial customers through EDC and Business Development Bank of Canada (BDC). As at October 31, 2023, loans issued under the BCAP were $126 million (October 31, 2022 – $163 million).
Under the EDC plan, EDC guarantees an 80% portion of new operating loans made to the export sector as well as domestic companies. Loans guaranteed by EDC continue to be recognized on the Bank’s Consolidated Statement of Financial Position.
Under the BCAP, BDC entered into a co-lending facility with the Bank in which BDC purchases an 80% participation in term loans made to eligible small business and commercial customers. The portion of loans sold to BDC are derecognized from the Bank’s Consolidated Statement of Financial Position as the program meets the derecognition criteria for a transfer under IFRS 9.
Under the BDC HASCAP, BDC guarantees 100% of new term loans made to eligible small business and commercial customers. Loans guaranteed by BDC continue to be recognized on the Bank’s Consolidated Statement of Financial Position. As at October 31, 2023, loans issued under the HASCAP were $238 million (October 31, 2022 – $277 million).
Given the nature of the Bank’s main business activities, financial instruments make up a substantial portion of the Bank’s financial position and are integral to the Bank’s business. Assets that are financial instruments include cash resources, securities, securities purchased under resale agreements, loans and customers’ liability under acceptances. Financial instrument liabilities include deposits, acceptances, obligations related to securities sold under repurchase agreements, obligations related to securities sold short, subordinated debentures and capital instrument liabilities. In addition, the Bank uses derivative financial instruments for both trading and hedging purposes.
Financial instruments are generally carried at fair value, except for non-trading loans and receivables, certain securities and most financial liabilities, which are carried at amortized cost unless designated as fair value through profit and loss at inception.
Unrealized gains and losses on the following items are recorded in other comprehensive income (OCI):
| • | debt instruments measured at fair value through OCI, |
| • | equity instruments measured at fair value through OCI, |
| • | derivatives designated as cash flow hedges, and |
| • | financial instruments designated as net investment hedges. |
Gains and losses on derecognition of debt instruments at FVOCI are reclassified from OCI to the Consolidated Statement of Income under non-interest income. Gains and losses on derecognition of equity instruments designated at FVOCI are not reclassified from OCI to the Consolidated Statement of Income. Gains and losses on cash flow hedges and net investment hedges are recorded in the Consolidated Statement of Income when the hedged item affects income.
The Bank’s accounting policies for derivatives and hedging activities are further described in Note 3 to the consolidated financial statements.
Interest income and expense on non-trading interest-bearing financial instruments are recorded in the Consolidated Statement of Income as part of net interest income. Credit losses related to loans are recorded in the provision for credit losses in the Consolidated Statement of Income. Interest income and expense, as well as gains and losses, on trading securities and trading loans are recorded in non-interest income – trading revenues.
Several risks arise from transacting financial instruments, including credit risk, liquidity risk, operational risk and market risk. The Bank manages these risks using extensive risk management policies and practices, including various Board-approved risk management limits.
A discussion of the Bank’s risk management policies and practices can be found in the Risk Management section on pages 73 to 112. In addition, Note 35 to the consolidated financial statements presents the Bank’s exposure to credit risk, liquidity risk and market risks arising from financial instruments as well as the Bank’s corresponding risk management policies and procedures.
There are various measures that reflect the level of risk associated with the Bank’s portfolio of financial instruments. For example, the interest rate risk arising from the Bank’s financial instruments can be estimated by calculating the impact of a 100 basis point increase or decrease in interest rates on annual income, and the economic value of shareholders’ equity, as described on page 95. For trading activities, Table T50 discloses the average one-day Value at Risk by risk factor. For derivatives, based on the maturity profile of the notional amount of the Bank’s derivative financial instruments, only 20% (2022 – 18%) had a term to maturity greater than five years.
Note 10 to the consolidated financial statements provides details about derivatives used in trading and hedging activities, including notional amounts, remaining term to maturity, credit risk and fair values.
The fair value of the Bank’s financial instruments is provided in Note 7 to the consolidated financial statements along with a description of how these amounts were determined.
The fair value of the Bank’s financial instruments was unfavourable when compared to their carrying value by $4.2 billion as at October 31, 2023 (October 31, 2022 – unfavourable $3.5 billion). This difference relates mainly to loan assets, debt investment securities measured at amortized cost, deposit liabilities, subordinated debentures and other liabilities. These changes are primarily driven by movements in interest rates and by volume changes. Fair value estimates are based on market conditions as at October 31, 2023, and may not be reflective of future fair values. Further information on how fair values are estimated is contained in the section on critical accounting policies and estimates.
Disclosures specific to certain financial instruments designated at fair value through profit and loss can be found in Note 9 to the consolidated financial statements. These designations were made primarily to significantly reduce accounting mismatches.
2023 Scotiabank Annual Report | 71
Management’s Discussion and Analysis
Selected Credit Instruments – Publicly Known Risk Items
Mortgage-backed securities
Total mortgage-backed securities held in the Non-trading and Trading portfolios are shown in Table T41.
T41 Mortgage-backed securities
| 2023 | 2022 | |||||||||||||||
| As at October 31 Carrying value ($ millions) | Non-trading portfolio(1) |
Trading portfolio |
Non-trading portfolio |
Trading portfolio |
||||||||||||
| Canadian NHA mortgage-backed securities(2) |
$ | 7,103 | $ | 2,671 | $ | 5,410 | $ | 2,149 | ||||||||
| Canadian residential mortgage-backed securities |
– | 4 | – | 7 | ||||||||||||
| U.S. Agency mortgage-backed securities(3) |
23,751 | – | 11,435 | – | ||||||||||||
| Total |
$ | 30,854 | $ | 2,675 | $ | 16,845 | $ | 2,156 | ||||||||
| (1) | The balances are comprised of securities under the amortized cost and FVOCI measurement categories. |
| (2) | Canada Mortgage and Housing Corporation is a corporation of the Government of Canada that provides a guarantee of timely payment to NHA mortgage-backed security investors. |
| (3) | The Government National Mortgage Association (Ginnie Mae) is a U.S. Government corporation that provides a guarantee of timely payment to U.S. Agency mortgage-backed security investors. |
Other
As at October 31, 2023, the Bank has insignificant exposure to highly leveraged loans awaiting syndication, auction-rate securities, Alt-A type loans, monoline insurance and investments in structured investment vehicles.
72 | 2023 Scotiabank Annual Report
Management’s Discussion and Analysis | Risk Management
Effective risk management is fundamental to the success and resilience of the Bank and is recognized as key in the Bank’s overall approach to strategy management. Scotiabank has a strong, disciplined risk culture where managing risk is a responsibility shared by all of the Bank’s employees.
The primary goals of risk management are to ensure that the outcomes of risk-taking activities are consistent with the Bank’s strategies and risk appetite, and that there is an appropriate balance between risk and reward to maximize shareholder value. Scotiabank’s Enterprise-Wide Risk Management Framework articulates the foundation for achieving these goals.
The Enterprise-Wide Risk Management Framework is subject to constant evaluation in order for it to meet the challenges and requirements of the global markets in which the Bank operates, including regulatory standards and industry best practices. The risk management programs of the Bank’s subsidiaries align in all material respects to the Bank’s risk management framework, although the actual execution of their programs may be different. They are designed to identify, assess, and mitigate threats and vulnerabilities to which the Bank is exposed and serve to enhance its overall resilience.
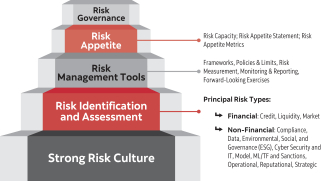
The Bank’s risk management framework is applied on an enterprise-wide basis and consists of five key elements:
| • | Risk Governance |
| • | Risk Appetite |
| • | Risk Management Tools |
| • | Risk Identification and Assessment |
| • | Risk Culture |
Risk Management Principles
Risk-taking and risk management activities across the enterprise are guided by the following principles:
Balancing Risk and Reward – business and risk decisions are consistent with strategies and risk appetite.
Understand the Risks – all material risks to which the Bank is exposed, including both financial and non-financial, are identified and managed.
Forward Thinking – emerging risks and potential vulnerabilities are proactively identified and managed.
Shared Accountability – every employee is responsible for managing risk.
Customer Focus – understanding our customers and their needs is essential to all business and risk decision-making.
Protect our Brand – all risk-taking activities must be in line with the Bank’s risk appetite, Scotiabank Code of Conduct, values and policy principles.
Controls – maintaining a robust and resilient control environment to protect our stakeholders.
Resilience – being prepared operationally and financially to respond to adverse events.
Compensation – performance and compensation structures reinforce the Bank’s values and promote sound risk taking behaviour taking into account the compensation-related regulatory environment.
Risk Governance
Effective risk management begins with effective risk governance.
The Bank has a well-established risk governance structure, with an active and engaged Board of Directors supported by an experienced executive management team. Decision-making is highly centralized through several executive and senior risk management committees.
The Bank’s risk management framework is predicated on the three lines of defence model. Within this model:
| • | The First Line of Defence (typically comprised of the business lines and most corporate functions) |
| o | Incurs and owns the risks |
| o | Designs and executes internal controls |
| o | Ensures that the risks generated are identified, assessed, managed, monitored, reported on, within risk appetite, and are in compliance with relevant policies, guidelines and limits |
| • | The Second Line of Defence (typically comprised of control functions such as Global Risk Management, Global Compliance and Global Finance) |
| o | Provides independent oversight and effective challenge of the First Line of Defence |
| o | Establishes risk appetite, risk limits, policies, and frameworks, in accordance with best practice and regulatory requirements |
| o | Measures, monitors, controls and reports on risks taken in relation to risk appetite, and on emerging risks |
| • | The Third Line of Defence (Audit Department) provides enterprise-wide independent, objective and reasonable assurance over the design and operating effectiveness of the Bank’s internal control, risk management and governance processes |
All employees are, for some of their activities, risk owners, as all employees are capable of generating reputational and operational risks in their day-to-day activities and are held accountable for owning and managing these risks.
2023 Scotiabank Annual Report | 73
Management’s Discussion and Analysis
Governance Structure
The Bank’s Board of Directors and its Committees provide oversight and governance over the Bank’s Risk Management program which is supported by the President and Chief Executive Officer and Chief Risk Officer.
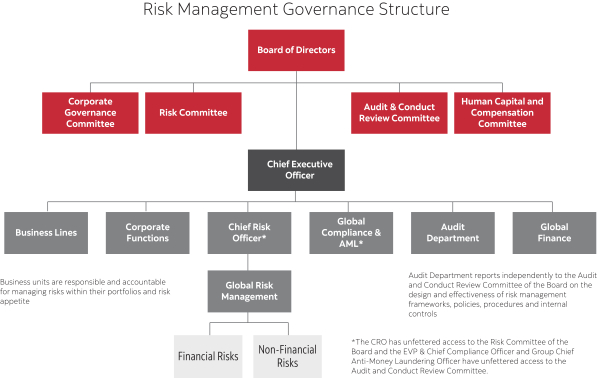
Board of Directors: as the top of the Bank’s risk management governance structure, provides oversight, either directly or through its committees, to satisfy itself that decision making is aligned with the Bank’s strategies and risk appetite. The Board receives regular updates on the key risks of the Bank – including a quarterly comprehensive summary of the Bank’s risk profile and performance of the portfolio against defined limits – and approves key risk policies, frameworks, and limits.
Risk Committee of the Board: assists the Board in fulfilling its responsibilities for the review of the Bank’s risk appetite and identifying and monitoring key financial and non-financial risks and the oversight of the promotion and maintenance of a strong risk culture throughout the Bank. The Committee assists the Board by providing oversight of the risk management functions at the Bank. This includes periodically reviewing and approving the Bank’s key risk management policies, frameworks and limits and satisfying itself that management is operating within the Bank’s Enterprise Risk Appetite Framework. The Committee oversees the Bank’s environmental, social, and governance (ESG) risks, including climate change risk. The Committee also oversees the independence of each of these control functions, including the effectiveness of the heads of these functions, as well as the functions themselves.
Audit and Conduct Review Committee of the Board: assists the Board by providing oversight on the effectiveness of the Bank’s system of internal controls. The Committee oversees the integrity of the Bank’s consolidated financial statements and related quarterly results. This includes oversight of climate-change related disclosure as part of the Bank’s financial reporting of ESG matters as well as the external auditor’s qualifications, independence and performance. This Committee assists the Board in fulfilling its oversight responsibilities for setting standards of conduct and ethical behaviour, the oversight of conduct reviews, risk culture and conduct risk management, and the oversight of compliance with the consumer provisions. The Committee also oversees the Bank’s compliance with legal and regulatory requirements (including anti-money laundering (AML), anti-terrorist financing (ATF) and sanctions), and oversees the Global Finance, Global Compliance and Audit Department functions at the Bank. The Committee also oversees the independence of each of these control functions, including the effectiveness of the heads of these functions, as well as the functions themselves.
Human Capital and Compensation Committee of the Board: in conjunction with the Risk Committee of the Board, satisfies itself that adequate procedures are in place to identify, assess and manage the risks (including Conduct Risk) associated with the Bank’s material compensation programs and that such procedures are consistent with the Bank’s risk management programs. The Committee has further responsibilities relating to leadership, succession planning and total rewards.
Corporate Governance Committee of the Board: acts in an advisory capacity to the Board to enhance the Bank’s corporate governance through a continuing assessment of the Bank’s approach to corporate governance and makes policy recommendations in support of the Bank’s purpose, culture and strategy, including its ESG strategy.
President and Chief Executive Officer (CEO): reports directly to the Board and is responsible for defining, communicating and implementing the strategic direction, goals and core values for Scotiabank that maximize long term shareholder value and returns, and meeting the needs of the Bank’s other key stakeholders. The CEO oversees the establishment of the Bank’s risk appetite, in collaboration with the CRO and CFO, which is consistent with the Bank’s short- and long-term strategy, business and capital plans, as well as compensation programs.
74 | 2023 Scotiabank Annual Report
Management’s Discussion and Analysis | Risk Management
Chief Risk Officer (CRO): reports jointly to the CEO and the Risk Committee of the Board and is responsible for the overall management of Global Risk Management. The CRO has unfettered access to the Risk Committee of the Board to ensure independence of the function. As a senior member of the Bank’s executive management team, the CRO participates in strategic decisions related to where and how the Bank will deploy its various sources of capital to meet the performance targets of the business lines.
Global Risk Management (GRM): supports the Bank’s objectives and is mandated to maintain an ongoing and effective enterprise-wide risk management framework that is understood at all levels of the Bank. GRM is responsible for providing effective challenge and reasonable assurance to executive management, the Board of Directors and shareholders that risks are actively identified, managed and communicated to all key stakeholders. GRM’s mission is to ensure that the outcomes of risk-taking activities optimize and protect long-term value by using insight and partnership to drive business impact and safeguards trust.
Global Compliance & AML: is an independent second line of defence that is responsible for managing compliance risk which includes Regulatory Compliance, Conduct, and Privacy Risks throughout Scotiabank through the Compliance Management Framework (CMF). Global Compliance provides effective challenge and oversight to business lines and corporate functions assessing the adequacy of adherence to and effectiveness of the Bank’s day-to-day regulatory controls, and for opining to the Board on whether, based on the independent monitoring and testing conducted, the controls are sufficiently robust to achieve compliance with the applicable regulatory requirements. The CMF is enabled through effective governance, policies and procedures, a clearly defined risk appetite and embedment of the desired risk culture. This group is responsible for maintaining the AML/ATF and Sanctions program which meets Scotiabank’s needs, industry practice, and legal and regulatory requirements, as well as providing independent oversight of Scotiabank’s compliance with these standards and requirements. The group also develops AML/ATF and Sanctions policies and control standards to effectively manage money laundering, terrorist financing, and sanctions risks. It also provides oversight and effective challenge to the Bank’s management of the risk of bribery and corruption.
Global Finance: leads enterprise-wide financial strategies which support the Bank’s ability to maximize sustainable shareholder value, and actively manages the reliable and timely reporting of financial information to management, the Board of Directors, shareholders, regulators, as well as other stakeholders. This reporting includes the Bank’s consolidated financial statements and related quarterly and annual results, as well as all financial reporting related regulatory filings. Global Finance executes the Bank’s financial, liquidity and capital management strategies with appropriate governance and control, while ensuring its processes are efficient and effective.
Business Lines and Corporate Functions: as the first line of defence in the Three Lines of Defence model, own the risks generated by their activities, are accountable for effective management of the risks within their business lines and functions through identifying, assessing, mitigating, monitoring and reporting the risks. Business lines and corporate functions actively design and implement effective internal controls as well as governance activities to manage risk and maintain activities within risk appetite and policies. Further, business lines have processes to be able to effectively identify, assess, monitor and report against allocated risk appetite limits and are in compliance with relevant policies, standards and guidelines.
Audit Department: reports functionally to the Audit and Conduct Review Committee of the Board on the design and operating effectiveness of the Bank’s risk management processes. The mission of the Audit Department is to provide enterprise-wide independent, objective assurance of the Bank’s internal controls, risk management and governance processes and to provide consulting services to improve the Bank’s operations.
Risk Appetite
Effective risk management requires clear articulation of the Bank’s risk appetite and how the Bank’s risk profile will be managed in relation to that appetite.
The Enterprise Risk Appetite Framework (“Enterprise RAF”) governs the risk activities undertaken by the Bank on an enterprise-wide basis. It articulates the amount and type of risk the Bank is willing to take to achieve its strategic and financial objectives. A clearly articulated and effectively embedded risk appetite supports a strong risk culture and helps to ensure that the Bank stays within the established risk boundaries, while finding an optimal balance between risk and return.
The Enterprise RAF is incorporated into the Bank’s Enterprise-Wide Risk Management Framework (“EWRMF”), strategic, capital, and financial planning processes, and compensation programs. Roles and responsibilities for development and implementation of the Enterprise RAF are well defined and are embedded in executive management mandates.
The Enterprise RAF is reviewed annually by senior management who recommend it to the Board for approval. Business lines, business units, control functions and key subsidiaries develop their own risk appetite frameworks and/or risk appetite statements, which are aligned with the Enterprise RAF.
Risk Appetite Statement
The Bank’s Risk Appetite Statement articulates the aggregate level and type of risk the Bank is willing to accept in order to achieve its business objectives. It includes qualitative statements as well as quantitative measures and considers all the Bank’s Principal Risks.
2023 Scotiabank Annual Report | 75
Management’s Discussion and Analysis
The Bank’s Risk Appetite Statement can be summarized as follows:
| • | The Bank has no appetite for breaches of the Code of Conduct, and consequences applied are commensurate with the severity of the breach. Bank officers and employees are expected to conduct business and interact with others in a legal, compliant, and ethical manner while upholding the Bank’s values. |
| • | The Bank favours businesses that generate sustainable, consistent, and predictable earnings over the business cycle. |
| • | The Bank limits its risk-taking activities to those that are well understood and in line with its risk appetite, risk culture, values, and strategic objectives. |
| • | The Bank strives to maintain a robust and resilient control environment to protect its stakeholders and be prepared operationally and financially to respond to adverse events. |
| • | The Bank has no appetite for reputational, legal, or regulatory risk that would undermine the trust of our stakeholders. |
| • | The Bank aims to maintain a strong capital and liquidity position to maintain its reputation as a safe and secure bank, and to optimally allocate capital to support its strategic and financial objectives. |
Risk Appetite Metrics
Risk appetite metrics help to articulate the Bank’s risk appetite in quantitative terms and are critical to ensuring the Bank stays within its established risk appetite on an on-going basis. Risk appetite metrics are supported by management level limit structures and controls, as applicable.
Other components of Scotiabank’s risk appetite metrics:
| • | Set risk capacity and appetite in relation to regulatory constraints |
| • | Use stress testing to provide forward-looking metrics, as applicable |
| • | Minimize earnings volatility |
| • | Limit exposure to operational events that can have an impact on earnings, including regulatory fines |
| • | Ensure reputational risk is top of mind and strategy is being executed within operating parameters |
Risk Management Tools
Effective risk management includes tools that are guided by the Bank’s Enterprise Risk Appetite Framework and integrated with the Bank’s strategies and business planning processes.
Scotiabank’s risk management framework is supported by a variety of risk management tools that are used individually and/or jointly to manage enterprise-wide risks. Risk management tools are regularly reviewed and updated to ensure consistency with risk-taking activities, and relevance to the business and financial strategies of the Bank.
Frameworks, Policies and Limits
Frameworks and Policies
The Bank develops and implements its key risk frameworks and policies in consultation with the Board. Such frameworks and policies are also subject to the requirements and guidelines of the Office of the Superintendent of Financial Institutions (OSFI), the Bank Act, the requirements and expectations of other regulators in the jurisdictions and activities in which we conduct business, and in consideration of industry best practices. Frameworks and policies apply to specific types of risk or to the activities that are used to measure and control risk exposure. They are developed in consultation with various stakeholders across risk management and other control and corporate functions, business lines and the Audit Department. Their development and implementation are guided by the Bank’s risk appetite, governance standards and set the limits and controls within which the Bank and its subsidiaries can operate. The Bank also provides advice and counsel to its subsidiaries in respect of their risk frameworks and policies to ensure alignment with the Bank, subject to the local regulatory requirements of each subsidiary.
Key risk frameworks and policies may be supported by standards, procedures, guidelines and manuals.
Limits
Limits govern and control risk-taking activities within the appetite and tolerances established by the Board and executive management. Limits also establish accountability for key tasks in the risk-taking process and establish the level or conditions under which transactions may be approved or executed.
Risk Measurement
The Bank’s measurement of risk is a key component of its risk management framework. The measurement methodologies may apply to a group of risks or a single risk type and are supported by an assessment of qualitative risk factors to ensure the level of risks are within the Bank’s risk appetite. The Bank utilizes various risk techniques such as: models; stress testing; scenario and sensitivity analysis; and back testing using data with forward-looking projections based on plausible and worst case economic and financial market events; to support its risk measurement activities.
Models
The use of quantitative risk methodologies and models is subject to effective oversight and a strong governance framework which includes the application of sound and experienced judgment. The development, design, independent review and testing, and approval of models are subject to the Model Risk Management Policy:
| • | regulatory and internal capital |
| • | internal risk management |
| • | valuation/pricing and financial reporting |
| • | meeting initial margin requirements |
| • | business decision-making for risk management |
| • | non-financial risk models, and |
| • | stress testing |
76 | 2023 Scotiabank Annual Report
Management’s Discussion and Analysis | Risk Management
Forward-Looking Exercises
Stress Testing
Stress testing programs at both the enterprise-wide level and individual risk level allow the Bank to estimate the potential impact on the Bank’s performance resulting from significant changes in market conditions, credit environment, liquidity demands, or other risk factors. Enterprise-wide stress testing is also integrated with both the strategic and financial planning processes, as well as financial crisis management planning. The development, approval and on-going review of the Bank’s stress testing programs are subject to policy, and the oversight of the Stress & Scenarios Committee (SSC) or other management committees as appropriate. The SSC is also responsible for reviewing and approving stress test and IFRS 9 related scenarios and models for implementation and use. Each stress testing program is developed with input from a broad base of stakeholders, and results are integrated into management decision making processes for capital adequacy and/or allocation, funding requirements and strategy, risk appetite setting and limit determinations. The stress testing programs are designed to capture a number of stress scenarios with differing severities and time horizons.
Other tests are conducted, as required, at the enterprise-wide level and within specific functional areas to test the decision-making processes of the senior management team and key personnel, by simulating a potential stress scenario. Simulated stress scenarios may include several complexities and disruptions through which senior management are engaged to make certain key decisions. Generally, the objectives of the simulations can include testing (1) the executability of activation protocols, (2) operational readiness, (3) the flexibility of the executive decision-making process, and (4) the process by which actions to be taken are prioritized. The exercises may also be designed to test the applicability and relevance of available data and the timeliness of reporting for decision making under stressed/crisis conditions.
Monitoring and Reporting
The Bank continuously monitors its risk exposures to ensure business activities are operating within approved risk appetite limits, thresholds or guidelines. Risk owners are responsible for identifying and reporting breaches of early warning thresholds and risk appetite limits or any other deteriorating trends in risk profile, as well as highlighting evolving external risk factors, to senior management and/or the Board, as appropriate.
Regular risk reporting to senior management and the Board of Directors provide aggregate measures of risk for all products and business lines, across the Bank’s global footprint, and are used to ensure compliance with risk appetite, policies, limits, and guidelines. They also provide a clear statement on the types, amounts, and sensitivities of the various risks in the portfolio. Senior management and the Board use this information to understand the Bank’s risk profile and the performance of the portfolios. A comprehensive summary of the Bank’s risk profile and performance of the portfolios is presented to the Board of Directors on a quarterly basis.
Risk Identification and Assessment
Effective risk management requires a comprehensive process to identify risks and assess their materiality. We define Risk as the potential impact of deviations from expected outcomes on the Bank’s earnings, capital, liquidity, reputation and resilience caused by internal and external vulnerabilities.
Risk identification and assessment is performed on an ongoing basis through the following:
| • | Transactions – risks, including credit and market exposures, are assessed by the business lines as risk owners with GRM providing review and effective challenge, as applicable |
| • | Monitoring – risks are identified by constantly monitoring and reporting current trends and analysis, top and emerging risks and internal and external significant adverse events impacting the Bank |
| • | New Products and Services – new or significant change to products, services and/or supporting technology are assessed for potential risks through the New Initiatives Risk Assessment Program |
| • | Strategic Investments – investment transactions are thoroughly reviewed for risks and are approved by the Operating Committee with advice and counsel from the Strategic Transactions and Investment Committee who provides direction and guidance on effective allocation and prioritization of resources |
| • | Self Assessments – operational risks through people, processes and systems are periodically self-assessed by the risk owners with the responsible second line of defense providing effective challenge |
On an annual basis, the Bank undergoes a Bank-wide risk assessment that identifies the material risks faced by the Bank for the Internal Capital Adequacy Assessment Process (ICAAP) and the determination of internal capital. This process evaluates the risks and determines the pervasiveness of the risk across multiple business lines, the significance of the risk to a specific business line, the likelihood and potential impact of the risk and whether the risk may cause unexpected losses in income and therefore would be mitigated by internal capital. The process also reviews other evolving and emerging risks and includes qualitative considerations such as strategic, economic and ESG risk factors. The identified risks are ascribed a rating of how probable and impactful they may be and are used as an important input in the ICAAP process and the determination of internal capital.
As part of this annual risk assessment process the Bank’s Principal Risks for the year are identified through consultation with various risk owners and/or stakeholders and approved by the Operational Risk Committee and the Risk Management Committee.
Principal Risk Types
The Bank’s Principal Risk types are reviewed annually as part of the Assessment of Risks process to determine that they adequately reflect the Bank’s risk profile. Principal Risks are defined as:
Those risks which management considers of primary importance: i) having a significant impact or influence on the Bank’s primary business and revenue generating activities (Financial Risks) or ii) inherent in the Bank’s business and can have significant negative strategic, business, financial and/or reputational consequences (Non-Financial Risks).
Principal Risks are assessed on an annual basis considering, amongst other things, the following factors:
| • | Potential impact (direct or indirect) on the Bank’s financial results, operations, management and strategy |
| • | Effect on the Bank’s long-term prospects and ongoing viability |
| • | Regulatory focus and/or social concern |
2023 Scotiabank Annual Report | 77
Management’s Discussion and Analysis
| • | Short to mid-term macroeconomic and market environment |
| • | Financial and human resources required to manage and monitor the risk |
| • | Establishment of key risk indicators, performance indicators or management limits to monitor and control the risk |
| • | Peer identification and global best practices |
| • | Regular monitoring and reporting to the Board on the risk is warranted |
Once a Principal Risk has been identified, governance structures and mechanisms must be in place for that risk:
| • | Committee governance structures have been established to manage the risk |
| • | Dedicated 2nd line resources are in place providing effective challenge |
| • | Frameworks and supporting policies, procedures and guidelines have been developed and implemented to manage the risk as appropriate |
| • | Risk appetite limits have been established supported by management limits, early warning thresholds and key risk indicators as appropriate for the risk |
| • | Adequate and effective monitoring and reporting has been established to the Board, executive and senior management, including from subsidiaries |
| • | Board and executive management have clear roles and responsibilities in relation to risk identification, assessment, measurement, monitoring and reporting to support effective governance and oversight |
Principal Risks are categorized into two main groups:
Financial Risks:
Credit, Liquidity, Market
These are risks that are directly associated with the Bank’s primary business and revenue generating activities. The Bank understands these risks well and takes them on to generate sustainable, consistent and predictable earnings. Financial risks are generally quantifiable and are relatively predictable. The Bank has a higher risk appetite for financial risks which are a fundamental part of doing business; but only when they are well understood, within established limits, and meet the desired risk and return profile.
Non-Financial Risks:
Compliance, Cyber Security & Information Technology (IT), Data, Environmental, Social & Governance (ESG), Model, Money Laundering / Terrorist Financing and Sanctions, Operational, Reputational, Strategic
These are risks that are inherent in our business and can have significant negative strategic, business, financial and/or reputational consequences if not managed properly. In comparison to financial risks, non-financial risks are less predictable and more difficult to define and measure. The Bank has low risk appetite for non-financial risks and mitigates these accordingly.
Significant Adverse Events
The Bank defines a Significant Adverse Event (SAE) as an internally or externally occurring event that has resulted, or may result in, a significant impact on the Bank’s financial performance, reputation, risk appetite, regulatory compliance, or operations. Significant is defined as the relative importance of a matter within the context in which it is being considered, including quantitative and qualitative factors, such as magnitude, nature, effect, relevance, and impact.
Risk Culture
Effective risk management requires a strong, robust, and pervasive risk culture where every Bank employee understands and recognizes their role as a risk manager and is responsible for identifying and managing risks.
| The Bank’s risk culture is influenced by numerous factors including the interdependent relationship amongst the Bank’s risk governance structure, risk appetite, strategy, organizational culture, and risk management tools.
A strong risk culture is a key driver of conduct. It promotes behaviours that align to the Bank’s values and enables employees to identify risk taking activities that are beyond the established risk appetite.
The Bank’s Risk Culture program is based on four indicators of a strong risk culture:
1. Tone from the Top – Leading by example including clear and consistent communication on risk behaviour expectations, the importance of the Bank’s values, and fostering an environment where everyone has ownership and responsibility for “doing the right thing”.
|
|
|
| 2. Accountability – All employees are accountable for risk management. There is an environment of open communication where employees feel safe to speak-up and raise concerns without fear of retaliation and consequences for not adhering to the desired behaviours.
3. Risk Management – Risk taking activities are consistent with the Bank’s strategies and risk appetite. Risk appetite considerations are embedded in key decision-making processes.
4. People Management – Performance and compensation structures encourage desired behaviours and reinforce the Bank’s values and risk culture. |
||
78 | 2023 Scotiabank Annual Report
Management’s Discussion and Analysis | Risk Management
Other elements that influence and support the Bank’s risk culture:
| • | Scotiabank Code of Conduct (our “Code”): describes standards of conduct required of Employees, Contingent Workers, Directors and officers of the Bank. All Scotiabankers are required to receive, read and comply with this Code, and any other applicable Scotiabank policies and affirm their compliance within the required timeline on an annual basis. |
| • | Values: Respect – Value Every Voice; Integrity – Act with Honour; Accountability – Make it Happen; Passion – Be Your Best |
| • | Communication: the Bank actively communicates risk appetite, and how it relates to Scotiabankers, to promote a sound risk culture |
| • | Compensation: programs are structured to comply with compensation-related principles and regulations and discourage behaviours that are not aligned with the Bank’s values and Scotiabank Code of Conduct and ensure that such behaviours are not rewarded |
| • | Training: risk culture is continually reinforced by providing effective and informative mandatory and non-mandatory training modules for all employees on a variety of risk management topics |
| • | Decision-making on risk issues is highly centralized: the flow of information and transactions to senior and executive committees keeps management well informed of the risks the Bank faces and ensures that transactions and risks are aligned with the Bank’s risk appetite |
| • | Employee goals: all employees across the Bank have a risk goal assigned to them annually |
| • | Executive mandates: all Executives across the Bank have risk management responsibilities within their mandates |
2023 Scotiabank Annual Report | 79
Management’s Discussion and Analysis
T42 Exposure to risks arising from the activities of the Bank’s businesses
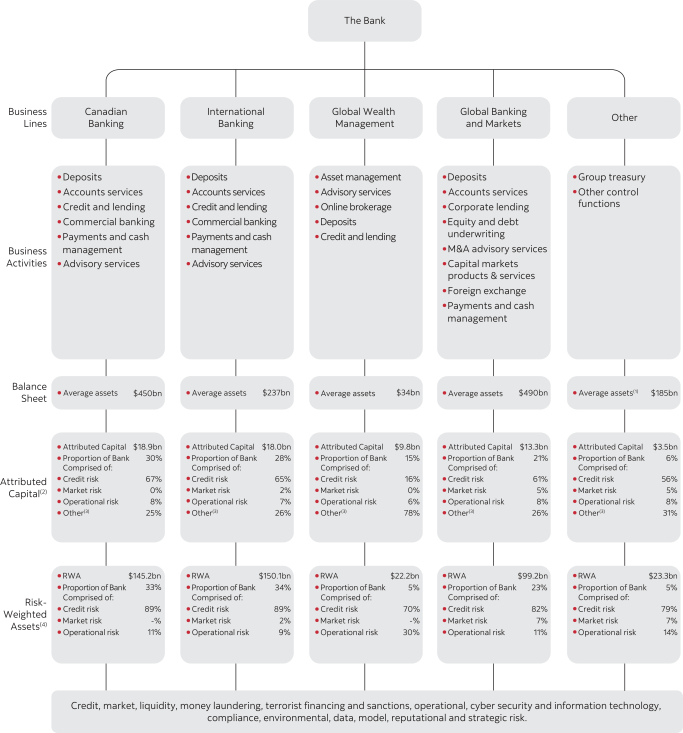
| (1) | Average assets for the Other segment include certain non-earning assets related to the business lines. |
| (2) | Attributed Capital is a combination of regulatory: (i) Risk-based capital and (ii) Leverage capital. Attributed Capital is reported on a quarterly average basis. |
| (3) | Includes Attributed Capital for significant investments, goodwill, intangibles and leverage capital. |
| (4) | Risk-weighted assets (RWA) are as at October 31, 2023 as measured for regulatory purposes in accordance with Revised Basel III. |
80 | 2023 Scotiabank Annual Report
Management’s Discussion and Analysis | Risk Management
Top and emerging risks
The Bank is exposed to a variety of top and emerging risks. These risks can potentially affect the Bank’s business strategies, financial performance, and reputation. As part of our risk management approach, we monitor our operating environment to identify, assess, review, and manage a broad range of top and emerging risks to undertake appropriate risk mitigation strategies.
Risks are identified using a risk identification system whereby information is gathered and consolidated from a variety of internal and external sources including industry research and peer analysis, Senior Management expertise, and risk reporting from our international operations. The results of this research, in conjunction with internal impact assessments across the Bank’s principal risks, help identify top and emerging risks, which, along with mitigation activities, are summarized and reported to Executives and the Board of Directors on a quarterly basis.
The Bank’s top and emerging risks are as follows:
Evolving Cyber Security Threats
Cyber threats against the Bank and/or its third-party service providers continues to be a top concern. These threats manifest as attacks on critical functions that may result in financial loss, data theft, or operational disruption of customer facing systems and critical infrastructure. The inherent risk of Cyber Security Threats continues to increase. Geopolitical conflicts have increased the severity and frequency of cyber threats and state-sanctioned cyber attacks on public-facing services. Advancements in Generative AI and Large Language Models (LLM) create additional attack vectors that enable new forms of fraud or are used to usurp sensitive data and personal identifiable information.
The Bank’s overall cyber security and IT program continues to adapt to the evolving and complex cyber threat landscape and is investing in the cyber security program and improvements to its IT infrastructure which is strengthening the Bank’s operational resilience. More frequent monitoring of critical suppliers helps mitigate the vulnerability to cyber-attacks on third parties. The Bank also maintains cyber insurance coverage to help mitigate potential losses linked to cyber incidents. The insurance coverage limit is regularly reviewed and evaluated to ensure it meets our needs.
Inflation and Recessionary Risks
Central banks in North America and Europe have indicated that prolonged tight monetary policy is required in the face of resilient economies and labour markets, and still elevated inflation. This increases recessionary risks, keeps real estate markets subdued, has the potential to slow consumer spending, and can negatively impact the debt servicing capacity of borrowers. Liquidity and market risk uncertainty can result in stricter credit conditions, which can impact business growth, delinquencies, and collateral valuations.
The Bank’s strategic shift places focus on allocating capital to more mature markets. Frequent monitoring of liquidity, deposit levels, and credit will keep the Bank adept in responding to a changing environment and protect against potential impacts of macroeconomic uncertainty. Portfolios are monitored for delinquency trends, and collections measures are being deployed to mitigate potential impacts to the Bank’s most vulnerable borrowers.
Environmental, Social and Governance (ESG)
Rising ESG considerations (climate, human rights, diversity, equity, and inclusion) and new climate guidelines increase regulatory scrutiny and stakeholder expectations to demonstrate exemplary governance in managing ESG risk. The increased intensity and frequency of severe weather events (e.g., El Niño, hurricanes, flooding, wildfires) highlights the potential impacts of diverse physical risks due to climate change, which include damage to properties and disruptions to operations that can negatively impact profitability. Under current laws and evolving climate regulations, which include management of nature-related risks and their impacts, making exaggerated or misleading sustainability claims or “greenwashing”, either intentionally or due to data collection and reporting challenges, creates legal and reputational risks. However, climate change also creates new opportunities to invest in sustainable finance initiatives. For further details please refer to the ESG Risk section on page 109.
The Bank has several mechanisms to identify, mitigate, and assess Bank losses from physical risks. Disaster recovery planning is focused on ensuring uninterrupted operations for localized disasters and weather-related events. The Bank has a public ESG policy that limits lending to the Oil & Gas industry within the Arctic and for thermal coal mining or coal power generation and continues to support clients as they transition to net-zero and their reduction of emissions by 2030. Social and Governance risks are managed through the implementation of several key policies and commitments, such as the Bank’s code of conduct, corporate governance policies, human rights statements (prescribed by the UN Guiding Principles on Human Rights), antislavery and human trafficking statements (in accordance with Modern Slavery legislation) and diversity, equity, and inclusion goals (e.g., ScotiaRISE, the Scotiabank Women Initiative, and the Black-Led Business Financing Program).
Economic Impacts of Geopolitical Tensions
The potential for political miscalculations and conflict escalations remains a key concern. The shifting global political environment and fracturing global economy, including growing US-China tensions, the ongoing war in Ukraine, recent escalations in the Middle East, and the changing political climate in Latin America, could add complexity to geopolitical uncertainty and pose a fresh threat to the global economy by disrupting supply chains and increasing oil prices. Trade disputes challenge the globalized economy, prompting some governments to promote manufacturing diversification among ‘allies’ for resource, technology, and product security. Though such measures seek to mitigate the economic impacts of geopolitical risk, such policies may raise costs and inefficiencies in capital deployment and allocation.
The Bank seeks to do business in countries that have a track record of economic growth and institutional stability. The Bank monitors geopolitical developments through various pillars and threat intelligence coordination, and monitors regions with geopolitical conflicts to ensure sanctions related controls continue to be fully compliant with evolving laws. The Bank’s stress testing programs help evaluate the potential impacts of severe economic scenarios, and the Bank can draw from its extensive experience operating in emerging markets across the globe to manage volatility, and right scaling exposure when necessary.
Increased Regulatory Change and Government Policy
As a global financial institution, the Bank operates under various legal and regulatory frameworks that affect its businesses. The increasing volume, complexity, and pace of regulatory and government policy changes across the Bank’s footprint is competing for limited resources and is a challenge when balancing compliance with innovation amidst growing competition in the non-regulated financial industry. The Bank strives to monitor and evaluate the emerging regulatory developments and to implement the necessary changes to ensure compliance. However, any inadvertent non-compliance may expose the Bank to fines, penalties, litigation, regulatory sanctions, enforcement actions and restrictions or prohibitions on its business activities. These consequences may adversely affect the Bank’s financial performance, its business strategy execution and its reputation.
2023 Scotiabank Annual Report | 81
Management’s Discussion and Analysis
The Bank continues to monitor changes in regulatory guidance from regulators and to assess the impact of new regulations across its operating footprint and the credit life cycle, and it continues to work with peers to promote consistent guidance and requirements across jurisdictions. For additional information on some of the key regulatory developments that potentially impact the Bank’s operations, see “Regulatory Developments” on page 117.
Resilience Vulnerabilities to Third Parties
The Bank continues to rely on third parties for the delivery of some critical services. The growing concentration of dominant third and nth parties for the delivery of these critical services, combined with attempts to keep up with technological advancements in a volatile macroeconomic and geopolitical environment, requires oversight and monitoring of complex third- and nth-party arrangements, and increases regulatory, operational, data and cyber risk for service providers. Resiliency and preparedness for third party disruptions is an area of increasing focus as individual banks are expected to coordinate and manage the systemic risks associated with critical third parties notwithstanding disparate regulations.
The Bank aims to be “Resilient by Design” and has established an operational resilience framework to support engagements with third party service providers. The Bank continues to invest in enhancing its governance of third parties, resourcing capabilities, and technology to ensure it manages third party risk prudently.
Generative AI (GenAI) Adoption Risk
Maintaining competitiveness through adoption of GenAI including Large Language Models (LLM) is vital for the Bank. Initiatives across business lines look to leverage the technology for improved decision-making and process optimisation, while keeping pace with the risks it poses, including malicious use in criminal activity, potential data vulnerabilities, and unintended consequences of using GenAI on consumer trust and confidence. Rapid adoption and ease of use of GenAI technologies also leads to increased competitive pressures from non-regulated FinTech companies. Compliance headwinds exists as regulators are in various stages of preparing for the rapid adoption of AI technologies and the Bank can attract increased regulatory risk and scrutiny if it adopts these technologies without adequate governance and risk management frameworks.
The Bank has established AI Risk Guidelines and has existing data and model governance frameworks for the ethical and sound adoption of AI technologies, which includes cross-functional governance of access to, and usage of, tools within the enterprise.
Increased Reliance on Data and Models
The increasing role of data in decision making processes and operations, potential for bias, and increasing sensitivities and concerns on appropriate use of data in the decision-making process, can all result in reputational risk. Poor data quality and timeliness can hinder the Bank’s assessment and disclosure of key risk data needed to meet regulatory disclosure requirements, which could raise the Bank’s compliance and operational costs. Adoption of new technology (i.e., GenAI) in financial services can create new risks, such as potential copyrights and intellectual property infringement, spread of misinformation, and inaccuracy of model output stability in model performance impacting reliability for decision making.
The Bank has policies which outline guiding principles on how to manage the risks of using models and data, in alignment to the latest regulations on data and AI, while incorporating data ethics into its code of conduct and training. The Bank continues to invest in better modeling tools and stress testing capabilities.
Failure to Adapt to Technological Change
Risks and impacts emanating from digitalization of money, consumer directed finance (e.g., open banking), and digital innovations (e.g., cloud computing, digital wallets), combined with the complexity of operational/technological change, increases strategic risk and requires investments to adapt to new technologies to respond to changing customer needs, regulatory expectations, and cyber threats. Rapid digitalization has created greater dependency on technology to carry out critical business processes and as digital service usage continues to increase, stakeholder tolerance for downtime has reduced.
Technology is a focus for the Bank and is a key enabler for the Bank’s clients to do business easily, for automating processes, and for driving innovation, including better risk analytics. IT change management is an increasing risk focus as adoption of new technologies requires increasing execution speed to stay competitive.
82 | 2023 Scotiabank Annual Report
Management’s Discussion and Analysis | Risk Management
Principal Risks – Financial
Credit risk is the risk of loss resulting from the failure of a borrower or counterparty to honour its financial or contractual obligations to the Bank. Credit risk arises in the Bank’s direct lending operations, and in its funding, investment and trading activities where counterparties have repayment or other obligations to the Bank.
Credit risk summary
| • | The Bank’s overall loan book as of October 31, 2023 increased to $776 billion versus $770 billion as of October 31, 2022, with growth reflected in Personal, and Business and Government lending. Residential mortgages were $344 billion as of October 31, 2023, with 84% in Canada. The corporate loan book, which accounts for 40% of the total loan book, is composed of 55% of loans with an investment grade rating as of October 31, 2023, compared to 40% of the total loan book in October 31, 2022. |
| • | Loans and acceptances (Personal, and Business and Government lending) remained diversified by region, industry and customer. Regional exposure is spread across our key markets (Canada 66%, United States 8%, Chile 7%, Mexico 6% and Other 13%). Financial Services constitutes 4% of overall gross exposures (before consideration of collateral) and was $31 billion, a decrease of $8 billion from October 31, 2022. These exposures are predominately to highly rated counterparties and are generally collateralized. |
The effective management of credit risk requires the establishment of an appropriate risk culture. Key credit risk policies and appetite statements are important elements used to create this culture.
The Board of Directors, either directly or through the Risk Committee (the Board), reviews and approves the Bank’s Credit Risk Appetite limits annually and Credit Risk Policy limits and thresholds biennially.
| • | The objectives of the Credit Risk Appetite are to ensure that: |
| – | target markets and product offerings are well defined at both the enterprise-wide and business line levels; |
| – | the risk parameters for new underwritings and for the portfolios as a whole are clearly specified; and |
| – | transactions, including origination, syndication, loan sales and hedging, are managed in a manner that is consistent with the Bank’s risk appetite. |
| • | The Credit Risk Policy articulates the credit risk management framework, including: |
| – | credit risk management policies; |
| – | delegation of authority; |
| – | the credit risk management program; |
| – | credit risk management for trading and investment activities; and |
| – | Single Name and Aggregate limits, beyond which credit applications must be escalated to the Board for approval. |
GRM develops the credit risk management framework and policies that detail, among other things, the credit risk rating systems and associated parameter estimates; the delegation of authority for granting credit; the methodology and calculation of the allowance for credit losses; and the authorization of write-offs.
Corporate and commercial credit exposures are segmented by various business lines and/or by major industry type. Aggregate credit risk limits for each of these segments are also reviewed and approved biennially by the Board. Portfolio management objectives and risk diversification are key factors in setting these limits.
Consistent with the Board-approved limits, borrower limits are set within the context of established lending criteria and guidelines for individual borrowers, particular industries, countries and certain types of lending, to ensure the Bank does not have excessive concentration to any single borrower, or related group of borrowers, particular industry sector or geographic region. Through the portfolio management process, loans may be syndicated to reduce overall exposure to a single name. For certain segments of the portfolio, credit derivative contracts are also used to mitigate the risk of loss due to borrower default. Risk is also mitigated through the selective sale of loans.
Banking units and GRM regularly review the various segments of the credit portfolio on an enterprise-wide basis to assess the impact of economic trends or specific events on the performance of the portfolio, and to determine whether corrective action is required. These reviews include the examination of the risk factors for particular products, industries and countries. The results of these reviews are reported to the Risk Management Committee and, when significant, to the Board.
Risk measures
The Bank’s credit risk rating systems support the determination of key credit risk parameter estimates (Probability of Default (PD), Loss-Given-Default (LGD) and Exposure at Default (EAD)) that are applicable to both Retail and Business Banking portfolios and are designed to measure customer credit and transaction risk. The parameters are an integral part of enterprise-wide policies and procedures encompassing governance, risk management, and control structure, and are used in various internal and regulatory credit risk quantification calculations.
The Bank’s credit risk rating system is subject to a comprehensive validation, governance and oversight framework. The objectives of this framework are to ensure that:
| • | Credit risk rating methodologies and parameters are appropriately designed and developed, independently validated, and regularly reviewed, and that the results of each process are adequately documented; and |
| • | The validation process represents an effective challenge to the design and development process including an assessment of risk measures. |
The Bank’s credit risk rating methodologies and parameters are reviewed and validated at least annually. Units within GRM are responsible for design, and development of credit risk rating methodologies and parameters. Separate units within GRM are responsible for validation and review. The operation of these separate units are functionally independent from the business units responsible for originating exposures. Within GRM, these units are also independent from the units involved in risk rating approval and credit adjudication.
Business Banking credit risk ratings and associated risk parameters affect lending decisions, and loan pricing. Both Business Banking and Retail Banking’s credit risk rating systems affect the computation of the allowance for credit losses, and regulatory capital.
2023 Scotiabank Annual Report | 83
Management’s Discussion and Analysis
Corporate and commercial
Corporate and commercial credit exposure arises in the Bank’s business lines.
Risk ratings
The Bank’s risk rating system utilizes internal grade (IG) ratings – a 17 point scale used to differentiate the risk of default of borrowers, and the risk of loss on facilities. The general relationship between the Bank’s IG ratings and external agency ratings is shown in table T33.
IG ratings are also used to define credit adjudication authority levels appropriate to the size and risk of each credit application. Lower-rated credits require increasingly more senior management involvement depending upon the aggregate exposure. Where a credit exceeds the authority delegated to a credit unit, credit units will refer the request – with its recommendation – to a senior credit committee for adjudication. In certain cases, these must be referred to the Risk Committee of the Board of Directors.
Adjudication
Credit adjudication units within GRM analyze and evaluate all significant credit requests for corporate and commercial credit exposures, to ensure that risks are adequately assessed, properly approved, continually monitored and actively managed. The decision-making process begins with an assessment of the credit risk of the individual borrower or counterparty. Key factors considered in the assessment include:
| • | The borrower’s management; |
| • | The borrower’s current and projected financial results and credit statistics; |
| • | The industry in which the borrower operates; |
| • | Environmental and Climate Change risks (including regulatory or reputational impacts); |
| • | Economic trends; and |
| • | Geopolitical risk. |
Based on this assessment, a risk rating is assigned to the individual borrower or counterparty, using the Bank’s risk rating systems.
A separate risk rating is also assigned at the facility level, taking into consideration additional factors, such as security, seniority of claim, structure, term and any other forms of credit risk mitigation that affect the amount of potential loss in the event of a default of the facility. Security typically takes the form of charges over inventory, receivables, real estate, and operating assets when lending to corporate and commercial borrowers; and cash or treasuries for trading lines such as securities lending, repurchase transactions, and derivatives. The types of acceptable collateral, and related valuation processes are documented in risk management policies and manuals.
Other forms of credit risk mitigation include third party guarantees and, in the case of derivatives facilities, master netting agreements.
Internal borrower and facility risk ratings are assigned when a facility is first authorized, and are promptly re-evaluated and adjusted, if necessary, as a result of changes to the customer’s financial condition or business prospects. Re-evaluation is an ongoing process, and is done in the context of general economic changes, specific industry prospects, and event risks, such as revised financial projections, interim financial results and extraordinary announcements.
The internal credit risk ratings are also considered as part of the Bank’s adjudication limits. Single borrower limits are much lower for higher risk borrowers than low risk borrowers.
The credit adjudication process also uses a risk-adjusted return on equity profitability model to ensure that the client and transaction structure offers an appropriate return for a given level of risk. For the corporate portfolio, and the large borrowers in International, the Loan Portfolio Management Group reviews the profitability model results, together with external benchmarks, and provides an opinion on the relative return and pricing of each transaction above a minimum threshold.
Individual credit exposures are regularly monitored by both the business line units and GRM for any signs of deterioration. In addition, the business line units and GRM conduct a review and risk analysis of each borrower annually, or more frequently for higher-risk borrowers. If, in the judgement of management, an account requires the expertise of specialists in workouts and restructurings, it will be transferred to a special accounts management group for monitoring and resolution.
Credit Risk Mitigation – Collateral/Security
Traditional Non-Retail Products (e.g. Operating lines of Credit, Term Loans)
Collateral values are accurately identified at the outset and throughout the tenure of a transaction by using standard evaluation methodologies. Collateral valuation estimates are conducted at a frequency that is appropriate to the frequency by which the market value fluctuates, using the collateral type and the borrower risk profile.
In addition, when it is not cost effective to monitor highly volatile collateral (e.g. accounts receivable, inventory), appropriate lending margins are applied to compensate (e.g. accounts receivable are capped at 80% of value, inventory at 50%). The frequency of collateral valuations is also increased when early warning signals of a borrower’s deteriorating financial condition are identified.
Borrowers are required to confirm adherence to covenants including confirmation of collateral values on a periodic basis, which are used by the Bank to provide early warning signals of collateral value deterioration. Periodic inspections of physical collateral are performed where appropriate and where reasonable means of doing so are available.
Bank procedures require verification including certification by banking officers during initial, annual, and periodic reviews, that collateral values/margins/etc. have been assessed and, where necessary, steps have been taken to mitigate any decreased collateral values.
The Bank does not use automated valuation models (AVMs) for valuation purposes for traditional non-retail products. GRM performs its own valuations of companies based on various factors such as book value, discounted book value, enterprise value etc.
Commercial/Corporate Real Estate
New or updated appraisals are generally obtained at inception of a new facility, as well as during loan modifications, loan workouts and troubled debt restructure. The primary reason for requiring a new appraisal is if, in the reasonable opinion of the banking execution unit, or GRM, there has been a material change in value. Additionally, none of the appraisal guidelines contained within the policies should dissuade the Bank from requesting an appraisal more frequently if an adverse change in market conditions, sponsorship, credit worthiness, or other underwriting assumptions is realized or expected.
84 | 2023 Scotiabank Annual Report
Management’s Discussion and Analysis | Risk Management
Appraisals must be in writing and must contain sufficient information and analysis to support the Bank’s decision to make the loan. Moreover, in rendering an opinion of the property’s market value, third party appraisers are responsible for establishing the scope of work necessary to develop credible assignment results. The appraisal must meet the regulatory and industry requirements which, depending on the type of property being appraised, contain any or all of the following three approaches to value:
| i. | comparable sales approach |
| ii. | replacement cost approach |
| iii. | income approach |
The appraiser must disclose the rationale for the omission of any valuation approach. Furthermore, the appraiser must disclose whether the subject property was physically inspected and whether anyone provided significant assistance to the person signing the appraisal report. The report must contain a presentation and explanation of the assumptions used in determining value under each of the above mentioned approaches.
Review of every appraisal is conducted by the banking units and GRM to confirm that the appraisal identifies all of the relevant issues for the specific asset class, location and economic environment and incorporates all appropriate valuation methodologies and assumptions. In most cases, the banking units also include comparable properties in addition to what is included in the appraisal to further justify value.
When third party assessors are used, they must be accredited and satisfactory to the Bank. In addition, GRM validates any third party valuations via internal desktop estimates either based on comparables or discounted income valuations.
Traded products
Traded products are transactions such as OTC derivatives (including foreign exchange and commodity based transactions), and Securities Financing Transactions (including repurchase/reverse repurchase agreements, and securities lending/borrowing). Credit risks arising from traded products cannot be determined with certainty at the outset, because during the tenure of a transaction the dollar value of the counterparty’s obligation to the Bank will be affected by changes in the capital markets (such as changes in stock prices, interest rates, and exchange rates). The Bank adjudicates credit exposures arising from transacting in traded products by considering their current fair value plus an additional component to reflect potential future changes in their mark-to-market value. The credit adjudication process also includes an evaluation of potential wrong-way risk, which arises when the exposure to a counterparty is positively correlated to the probability of default of that counterparty.
Credit risk associated with traded products is managed within the same credit adjudication process as the lending business. The Bank considers the credit risk arising from lending activities, as well as the potential credit risk arising from transacting in traded products with that counterparty.
Credit risk mitigation – collateral/security
Derivatives are generally transacted under industry standard International Swaps and Derivatives Association (ISDA) master netting agreements, which allow for a single net settlement of all transactions covered by that agreement in the event of a default or early termination of the transactions. ISDA agreements are frequently accompanied by an ISDA Credit Support Annex (CSA), the terms of which may vary according to each party’s view of the other party’s creditworthiness. CSAs and regulation in some jurisdictions can require both parties to post initial margin (regulatory and non-regulatory). CSAs also allow for variation margin to be called if total uncollateralized mark-to-market exposure exceeds an agreed upon threshold. Such variation margin provisions can be one-way (only one party will ever post collateral) or bilateral (either party may post depending upon which party is in-the-money). The CSA will also detail the types of collateral that are acceptable to each party, and the haircuts that will be applied against each collateral type. The terms of the ISDA master netting agreements and CSAs are taken into consideration in the calculation of counterparty credit risk exposure.
For derivative transactions, investment grade counterparties account for approximately 90% of the credit risk. Approximately 42% of the Bank’s derivative counterparty exposures are to bank counterparties, as defined under Basel III revision. After taking into consideration, where applicable, netting and collateral arrangements, no net credit risk amount arising from traded products transactions with any single counterparty was considered material to the financial position of the Bank as at October 31, 2023. No individual exposure to an investment grade bilateral counterparty exceeded $2,188 million and no individual exposure to a corporate counterparty exceeded $477 million.
Retail
Retail credit exposures arise in the Canadian Banking and International Banking business lines.
Adjudication
The decision-making process for retail loans ensures that credit risks are adequately assessed, properly approved, continually monitored and actively managed. Generally, credit decisions on consumer loans are processed by proprietary adjudication software and are based on risk ratings and customer segmentation, which are generated using predictive credit scoring models.
The Bank’s credit adjudication and portfolio management methodologies are designed to ensure consistent underwriting and early identification of problem loans in line with our risk appetite. The Bank’s rigorous credit underwriting and retail risk modeling methodologies are more customer focused than product focused. The Bank’s view is that a customer-centric approach provides better risk assessment than product-based approaches, a more consistent experience to the customer, and should result in lower loan losses over time.
All credit scoring and policy changes are initiated by units within GRM that are functionally independent from the business units responsible for retail portfolios. Risk models and parameters are also subject to independent validation and review from the units involved in the design and development of models. The review process includes referral to the appropriate Senior Credit Committee for approval, where required. Consumer credit portfolios are reviewed at least monthly to identify emerging trends in loan quality and to assess whether corrective action is required.
Risk ratings
The Bank’s consumer risk rating systems are oriented to borrower or transaction risk. Each retail exposure is assigned a risk grade based on the customer’s credit history and/or internal credit score. The Bank’s automated risk rating systems assess the ongoing credit-worthiness of individual customers on a monthly basis. This process provides for meaningful and timely identification and management of problem loans.
The risk rating system under the AIRB approach is subject to regular review and ongoing performance monitoring of key components. Risk model validations are conducted independently from the areas responsible for rating system development and implementation, to ensure effective independence in design and performance review.
2023 Scotiabank Annual Report | 85
Management’s Discussion and Analysis
Customer behavior characteristics which are used as inputs within the Bank’s Basel III AIRB models are consistent with those used by the Bank’s Canadian consumer risk rating systems. The International portfolios are subject to the Standardized approach at this time.
Credit risk mitigation – collateral/security
The property values for residential real estate secured exposures are confirmed at origination through a variety of validation methodologies, including AVM and full appraisals (in-person inspection). The appraisal is completed by a third party, Bank approved appraiser. For monitoring of material portfolios, property values are indexed quarterly to house prices. For loan impairment within material portfolios, residential property values are re-confirmed using third party AVM’s.
Where AVM values are used, these AVM values are subject to routine validation through a continuous random sampling process that back-tests AVM values against available property appraisals (primarily third party AVMs). Where third party appraisals are obtained, the Bank relies on the professional industry accreditation of the appraiser. Samples of approved appraisal reports are reviewed by the Bank’s senior appraisers to ensure consistent appraisal quality and satisfactory appraisal values. The third party appraisers are selected from a pre-approved list of Bank-vetted appraisers.
Credit Quality
IFRS 9 Financial Instruments requires the consideration of past events, current conditions and reasonable and supportable forward-looking information over the life of the exposure to measure expected credit losses. Furthermore, to assess significant increases in credit risk, IFRS 9 requires that entities assess changes in the risk of a default occurring over the expected life of a financial instrument when determining staging. Consistent with the requirements of IFRS 9, the Bank considers both quantitative and qualitative information in the assessment of a significant increase in credit risk.
The Bank’s models are calibrated to consider past performance and macroeconomic forward-looking variables as inputs, as further described below. Expert credit judgement may be applied in circumstances where, in the Bank’s view, the inputs, assumptions, and/or modelling techniques do not capture all relevant risk factors, including the emergence of economic or political events of the market up to the date of the financial statements. Expert credit judgement is applied in the assessment of underlying credit deterioration and migration of balances to progressive stages.
The Bank has generated a forward-looking base case scenario and three alternate forward-looking scenarios (one optimistic and two pessimistic) as key inputs into the expected credit loss provisioning models.
Over the last year, both the Canadian and U.S. economies proved resilient in the face of monetary tightening, driven largely by resilient labour markets, strong consumption and pent-up demand. This economic resilience and resulting inflationary pressures necessitated more monetary policy tightening than anticipated a year ago. Therefore, while economic growth for both countries in 2023 is now expected to be higher relative to a year ago, growth projections for 2024 have been revised down to reflect the impact of higher policy rates on their economies. This is more evident for Canada given the impacts of wildfires, floods, and strikes, while the U.S. consumer remains relatively more robust. Despite this additional tightening and downward revisions, both economies’ labour markets have remained resilient, supporting a base case forecast of slowing growth into 2024 without a large-scale contraction. In line with recent progress on the inflation front and the expected economic stalling, the base case scenario sees inflation measures in both countries returning to targets by 2025 without additional monetary policy tightening.
The optimistic scenario features somewhat stronger economic activity relative to the base case. The pessimistic scenario is based on the recent banking sector turmoil in the U.S. and Europe, and features deteriorating private sector financial conditions and confidence. These are reducing economic activity and inflation worldwide from the base case scenario, requiring central banks to reduce their monetary policy rates to mitigate the decline in economic activity and prevent inflation from falling below targeted ranges. Lastly, the very pessimistic scenario features a strong stagflationary impulse that leads to a protracted period of financial market uncertainty. This results in higher inflation, requiring central banks to raise their policy rate to higher levels than in the base case in order to bring inflation under control, which is dampening economic activity.
In light of mounting risks in the global economy, including heightened geopolitical tensions, sovereign yield volatility, and weather-related events, the Bank increased the weight of the pessimistic scenarios in calculating the allowance for credit losses on performing loans compared to the prior year, to capture the elevated downside risk to the outlook.
86 | 2023 Scotiabank Annual Report
Management’s Discussion and Analysis | Risk Management
The following section provides additional detail on certain key macroeconomic variables used to calculate the modelled estimate for the allowance for credit losses (see page 191 for all key variables). Further changes in these variables up to the date of the financial statements are incorporated through expert credit judgement.
| • | Gross Domestic Product (GDP): The base case scenario assumes a slowdown in economic activity into 2024 in Canada and the U.S., owing to the impacts of monetary tightening on both economies. In Canada, we expect the economy will grow by about 1.2% in 2023 before slowing to 0.7% in 2024 and picking up pace again in 2025. This is similar to the outlook for the U.S., where we expect an economic expansion of about 2.1% in 2023 before slowing to 0.6% in 2024. Relative to last year, this profile reflects more economic resiliency in 2022 and 2023 than previously expected. |
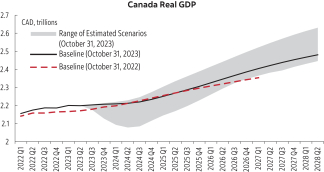
|
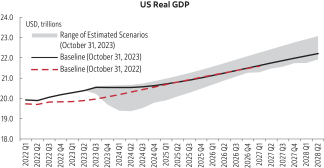
|
| • | Unemployment Rate: The base case scenario assumes a modest increase in the unemployment rate in both Canada and the U.S. through 2025. The employment response to the economic slowdown predicted next year is expected to be muted relative to previous cycles owing to tight labour market conditions. Unemployment rate projections for both countries are lower than they were last year, particularly in the U.S., owing to much more resilient labour markets than previously assessed. |
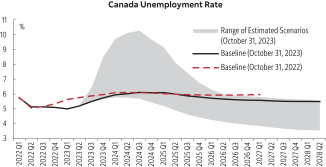
|
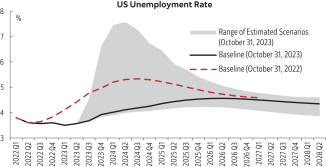
|
2023 Scotiabank Annual Report | 87
Management’s Discussion and Analysis
T43 Allowance for credit losses by business line
| As at October 31 ($ millions) | 2023 | 2022 | ||||||
| Canadian Banking |
||||||||
| Retail |
$ | 1,865 | $ | 1,528 | ||||
| Commercial |
507 | 328 | ||||||
| $ | 2,372 | $ | 1,856 | |||||
| International Banking |
||||||||
| Retail |
||||||||
| Caribbean and Central America |
$ | 481 | $ | 547 | ||||
| Mexico |
622 | 576 | ||||||
| Peru |
667 | 631 | ||||||
| Chile |
635 | 490 | ||||||
| Colombia |
350 | 247 | ||||||
| Other |
99 | 84 | ||||||
| Commercial |
941 | 780 | ||||||
| $ | 3,795 | $ | 3,355 | |||||
| Global Wealth Management |
$ | 27 | $ | 20 | ||||
| Global Banking and Markets |
$ | 176 | $ | 115 | ||||
| Other |
$ | 2 | $ | 2 | ||||
| Allowance for credit losses on loans |
$ | 6,372 | $ | 5,348 | ||||
| Allowance for credit losses on: |
||||||||
| Acceptances |
$ | 90 | $ | 31 | ||||
| Off-balance sheet exposures |
149 | 108 | ||||||
| Debt securities and deposits with financial institutions |
18 | 12 | ||||||
| Total Allowance for credit losses |
$ | 6,629 | $ | 5,499 | ||||
Allowance for credit losses
The total allowance for credit losses as at October 31, 2023 was $6,629 million compared to $5,499 million in the prior year. The allowance for credit losses ratio was 85 basis points, an increase of 14 basis points. The allowance for credit losses for loans was $6,372 million, an increase of $1,024 million from October 31, 2022. The increase was due to the unfavourable macroeconomic outlook and the uncertainty around the impacts of higher interest rates, on certain sectors in the North American non-retail portfolios and the resulting migration in the retail portfolios, as well as the impact of foreign currency translation.
The allowance for credit losses on performing loans was higher at $4,491 million compared to $3,713 million as at October 31, 2022. The allowance for performing loans ratio was 61 basis points, an increase of 11 basis points from the prior year. The increase was due to the unfavourable macroeconomic outlook and the uncertainty around the impacts of higher interest rates, on certain sectors in the North American non-retail portfolios and the resulting migration in the retail portfolios, as well as the impact of foreign currency translation.
The allowance on impaired loans increased by $246 million to $1,881 million from $1,635 million last year (refer to T44). The allowance for impaired loans ratio was 24 basis points, an increase of three basis points. The increase was due primarily to higher retail provisions and the impact of foreign currency translation.
The allowance for credit losses on impaired loans in Canadian Banking increased by $76 million to $491 million, due primarily to higher retail formations. In International Banking, the allowance for credit losses on impaired loans increased by $179 million to $1,364 million, due primarily to higher retail provisions across the Pacific Alliance and the impact of foreign currency translation. In Global Banking and Markets, the allowance for credit loss on impaired loans was $16 million, a decrease of $12 million from last year. In Global Wealth Management, the allowance for credit loss on impaired loans increased by $3 million to $10 million.
88 | 2023 Scotiabank Annual Report
Management’s Discussion and Analysis | Risk Management
T44 Impaired loans by business line
| 2023 | 2022 | |||||||||||||||||||||||
| As at October 31 ($ millions) | Gross impaired loans |
Allowance for credit |
Net impaired loans |
Gross impaired loans |
Allowance for credit |
Net impaired loans |
||||||||||||||||||
| Canadian Banking |
||||||||||||||||||||||||
| Retail |
$ | 965 | $ | 353 | $ | 612 | $ | 603 | $ | 266 | $ | 337 | ||||||||||||
| Commercial |
475 | 138 | 337 | 314 | 149 | 165 | ||||||||||||||||||
| $ | 1,440 | $ | 491 | $ | 949 | $ | 917 | $ | 415 | $ | 502 | |||||||||||||
| International Banking |
||||||||||||||||||||||||
| Caribbean and Central America |
$ | 662 | $ | 160 | $ | 502 | $ | 718 | $ | 185 | $ | 533 | ||||||||||||
| Latin America |
||||||||||||||||||||||||
| Mexico |
1,183 | 372 | 811 | 1,020 | 294 | 726 | ||||||||||||||||||
| Peru |
691 | 372 | 319 | 761 | 352 | 409 | ||||||||||||||||||
| Chile |
1,098 | 264 | 834 | 740 | 202 | 538 | ||||||||||||||||||
| Colombia |
356 | 97 | 259 | 301 | 67 | 234 | ||||||||||||||||||
| Other Latin America |
167 | 99 | 68 | 155 | 85 | 70 | ||||||||||||||||||
| Total Latin America |
3,495 | 1,204 | 2,291 | 2,977 | 1,000 | 1,977 | ||||||||||||||||||
| $ | 4,157 | $ | 1,364 | $ | 2,793 | $ | 3,695 | $ | 1,185 | $ | 2,510 | |||||||||||||
| Global Wealth Management |
$ | 32 | $ | 10 | $ | 22 | $ | 18 | $ | 7 | $ | 11 | ||||||||||||
| Global Banking and Markets |
||||||||||||||||||||||||
| Canada |
$ | 96 | $ | 15 | $ | 81 | $ | 128 | $ | 21 | $ | 107 | ||||||||||||
| U.S. |
– | – | – | – | – | – | ||||||||||||||||||
| Asia and Europe |
1 | 1 | – | 28 | 7 | 21 | ||||||||||||||||||
| $ | 97 | $ | 16 | $ | 81 | $ | 156 | $ | 28 | $ | 128 | |||||||||||||
| Totals |
$ | 5,726 | $ | 1,881 | $ | 3,845 | $ | 4,786 | $ | 1,635 | $ | 3,151 | ||||||||||||
Impaired loan metrics
| Net impaired loans | ||||||||
| As at October 31 ($ millions) | 2023 | 2022 | ||||||
| Net impaired loans as a % of loans and acceptances(1) |
0.50 | % | 0.41 | % | ||||
| Allowance against impaired loans as a % of gross impaired loans(1) |
33 | % | 34 | % | ||||
| (1) | Refer to Glossary on page 136 for the description of the measure. |
Impaired loans
Gross impaired loans increased to $5,726 million as at October 31, 2023, from $4,786 million last year (refer to T69). The increase was due primarily to higher formations in Canadian Banking and International retail portfolios, and the impact of foreign currency translation.
Impaired loans in Canadian Banking increased by $523 million, due primarily to higher formations in the retail and commercial portfolios. In International Banking, impaired loans increased by $462 million, due primarily to higher retail formations and the impact of foreign currency translation, partly offset by lower commercial formations. Impaired loans in Global Banking and Markets decreased by $59 million, due primarily to repayments. Impaired loans in Global Wealth Management increased by $14 million. The gross impaired loan ratio was 74 basis points as at October 31, 2023, an increase of 12 basis points.
Net impaired loans, after deducting the allowance for credit losses, were $3,845 million as at October 31, 2023, an increase of $694 million from the prior year. Net impaired loans as a percentage of loans and acceptances were 0.50% as at October 31, 2023, an increase of nine basis points from 0.41% last year.
2023 Scotiabank Annual Report | 89
Management’s Discussion and Analysis
Portfolio review
Canadian Banking
Gross impaired loans in the retail portfolio increased by $362 million or 60% from last year, due primarily to higher formations. The allowance for credit losses on impaired loans in the retail portfolio was $353 million, an increase of $87 million or 33% from last year due to higher formations.
In the commercial loan portfolio, gross impaired loans increased by $161 million to $475 million due primarily to higher formations. The allowance for credit losses on impaired loans was $138 million, down $11 million or 7% from last year.
International Banking
In the retail portfolio, gross impaired loans increased by $432 million to $2,055 million, due primarily to higher formations, mainly Pacific Alliance, and the impact of foreign currency translation. The allowance for credit losses on impaired loans in the retail portfolio was $802 million, an increase of $116 million or 17% from last year, due primarily to higher formations and the impact of foreign currency translation.
In the commercial portfolio, gross impaired loans were $2,102 million, an increase of $30 million from last year, due primarily to the impact of foreign currency translation, partly offset by lower formations. The allowance for credit losses on impaired loans was $562 million, an increase of $63 million or 13% from last year, due primarily to the impact of foreign currency translation.
Global Wealth Management
Gross impaired loans in Global Wealth Management were $32 million, an increase of $14 million from last year due primarily to higher formations. The allowance for credit losses on impaired loans was $10 million, an increase of $3 million from last year.
Global Banking and Markets
Gross impaired loans in Global Banking and Markets decreased by $59 million to $97 million, due primarily to repayments. The allowance for credit losses on impaired loans was $16 million, a decrease of $12 million from last year.
Risk diversification
The Bank’s exposure to various countries and types of borrowers are well diversified (see T63 and T67). Chart C28 shows loans and acceptances by geography. Ontario represents the largest Canadian exposure at 36% of the total. Latin America was 19% of the total exposure and the U.S. was 8%.
Chart C29 shows loans and acceptances by type of borrower (see T67). Excluding loans to households, the largest industry exposures were real estate and construction (9%), financial services (4% including banks and non-banks) and utilities (4%).
Risk mitigation
To mitigate exposures in its performing corporate portfolios, the Bank uses diversification by company, industry, and country, with loan sales and credit derivatives used sparingly. In 2023, loan sales totaled $192 million, compared to $309 million in 2022. As at October 31, 2023, no credit derivatives were used to mitigate loan exposures in the portfolios (October 31, 2022 – nil). The Bank actively monitors industry and country concentrations. As in the case with all industry exposures, the Bank continues to closely follow developing trends and takes additional steps to mitigate risk as warranted.
Overview of loan portfolio
The Bank has a well-diversified portfolio by product, business and geography. Details of certain portfolios of current focus are highlighted below.
| C28 | Well diversified in Canada and internationally... loans and acceptances, October 2023 |
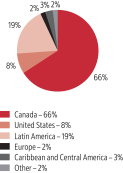
| C29 | ... and in household and business lending loans and acceptances, October 2023 |
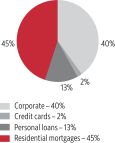
90 | 2023 Scotiabank Annual Report
Management’s Discussion and Analysis | Risk Management
Real estate secured lending
A large portion of the Bank’s lending portfolio is comprised of residential mortgages and consumer loans, which are well diversified by borrower. As at October 31, 2023, these loans accounted for $466 billion or 60% of the Bank’s total loans and acceptances outstanding (October 31, 2022 – $463 billion or 60%). Of these, $367 billion or 79% are real estate secured loans (October 31, 2022 – $371 billion or 80%). The tables below provide more details by portfolios.
Insured and uninsured residential mortgages and home equity lines of credit
The following table presents amounts of insured and uninsured residential mortgages and home equity lines of credit (HELOCs), by geographic area.
T45 Insured and uninsured residential mortgages and HELOCs, by geographic areas(1)
| 2023 | ||||||||||||||||||||||||||||||||||||||||||||||||
| Residential mortgages | Home equity lines of credit | |||||||||||||||||||||||||||||||||||||||||||||||
| As at October 31 | Insured(2) | Uninsured | Total | Insured(2) | Uninsured | Total | ||||||||||||||||||||||||||||||||||||||||||
| ($ millions) | Amount | % | Amount | % | Amount | % | Amount | % | Amount | % | Amount | % | ||||||||||||||||||||||||||||||||||||
| Canada:(3) |
||||||||||||||||||||||||||||||||||||||||||||||||
| Atlantic provinces |
$ | 4,859 | 1.7 | $ | 6,458 | 2.2 | $ | 11,317 | 3.9 | $ | – | – | $ | 1,059 | 4.7 | $ | 1,059 | 4.7 | ||||||||||||||||||||||||||||||
| Quebec |
7,679 | 2.6 | 11,842 | 4.1 | 19,521 | 6.7 | – | – | 1,138 | 5.0 | 1,138 | 5.0 | ||||||||||||||||||||||||||||||||||||
| Ontario |
31,023 | 10.7 | 130,580 | 45.0 | 161,603 | 55.7 | – | – | 13,228 | 58.9 | 13,228 | 58.9 | ||||||||||||||||||||||||||||||||||||
| Manitoba & Saskatchewan |
5,247 | 1.8 | 4,400 | 1.5 | 9,647 | 3.3 | – | – | 611 | 2.7 | 611 | 2.7 | ||||||||||||||||||||||||||||||||||||
| Alberta |
15,972 | 5.5 | 14,793 | 5.1 | 30,765 | 10.6 | – | – | 2,221 | 9.9 | 2,221 | 9.9 | ||||||||||||||||||||||||||||||||||||
| British Columbia & Territories |
10,758 | 3.7 | 46,642 | 16.1 | 57,400 | 19.8 | – | – | 4,215 | 18.8 | 4,215 | 18.8 | ||||||||||||||||||||||||||||||||||||
| Canada(4)(5) |
$ | 75,538 | 26.0 | % | $ | 214,715 | 74.0 | % | $ | 290,253 | 100 | % | $ | – | – | % | $ | 22,472 | 100 | % | $ | 22,472 | 100 | % | ||||||||||||||||||||||||
| International |
– | – | 53,929 | 100 | 53,929 | 100 | – | – | – | – | – | – | ||||||||||||||||||||||||||||||||||||
| Total |
$ | 75,538 | 21.9 | % | $ | 268,644 | 78.1 | % | $ | 344,182 | 100 | % | $ | – | – | % | $ | 22,472 | 100 | % | $ | 22,472 | 100 | % | ||||||||||||||||||||||||
| 2022 | ||||||||||||||||||||||||||||||||||||||||||||||||
| Canada(4)(5) |
$ | 83,514 | 27.6 | % | $ | 218,972 | 72.4 | % | $ | 302,486 | 100 | % | $ | – | – | % | $ | 22,178 | 100 | % | $ | 22,178 | 100 | % | ||||||||||||||||||||||||
| International |
– | – | 46,793 | 100 | 46,793 | 100 | – | – | – | – | – | – | ||||||||||||||||||||||||||||||||||||
| Total |
$ | 83,514 | 23.9 | % | $ | 265,765 | 76.1 | % | $ | 349,279 | 100 | % | $ | – | – | % | $ | 22,178 | 100 | % | $ | 22,178 | 100 | % | ||||||||||||||||||||||||
| (1) | The measures in this section have been disclosed in this document in accordance with OSFI Guideline – B20 - Residential Mortgage Underwriting Practices and Procedures (January 2018). |
| (2) | Default insurance is contractual coverage for the life of eligible facilities whereby the Bank’s exposure to real estate secured lending is protected against potential shortfalls caused by borrower default. This insurance is provided by either government-backed entities or private mortgage insurers. |
| (3) | The province represents the location of the property in Canada. |
| (4) | Includes multi-residential dwellings (4+ units) of $3,710 (October 31, 2022 – $3,782) of which $2,458 are insured (October 31, 2022 – $2,524). |
| (5) | Variable rate mortgages account for 33% (October 31, 2022 – $37%) of the Bank’s total Canadian residential mortgage portfolio. |
Amortization period ranges for residential mortgages
The following table presents the distribution of residential mortgages by remaining amortization periods, and by geographic areas.
T46 Distribution of residential mortgages by remaining amortization periods, and by geographic areas(1)
| 2023 | ||||||||||||||||||||||||
| Residential mortgages by remaining amortization periods | ||||||||||||||||||||||||
| As at October 31 | Less than 20 years |
20-24 years |
25-29 years |
30-34 years |
35 years and greater |
Total residential mortgage |
||||||||||||||||||
| Canada |
34.2 | % | 37.4 | % | 27.7 | % | 0.5 | % | 0.2 | % | 100 | % | ||||||||||||
| International |
64.5 | % | 17.2 | % | 17.2 | % | 1.1 | % | – | % | 100 | % | ||||||||||||
| 2022 | ||||||||||||||||||||||||
| Canada |
29.2 | % | 40.5 | % | 28.5 | % | 1.6 | % | 0.2 | % | 100 | % | ||||||||||||
| International |
62.8 | % | 16.9 | % | 17.5 | % | 2.8 | % | – | % | 100 | % | ||||||||||||
| (1) | The measures in this section have been disclosed in this document in accordance with OSFI Guideline – B20 – Residential Mortgage Underwriting Practices and Procedures (January 2018). |
Loan to value ratios
The Canadian residential mortgage portfolio is 74% uninsured (October 31, 2022 – 72%). The average loan-to-value (LTV) ratio of the uninsured portfolio is 49% (October 31, 2022 – 49%).
The following table presents the weighted average LTV ratio for total newly originated uninsured residential mortgages and home equity lines of credit during the year, which include mortgages for purchases, refinances with a request for additional funds and transfers from other financial institutions, by geographic areas.
2023 Scotiabank Annual Report | 91
Management’s Discussion and Analysis
T47 Loan to value ratios(1)
| Uninsured LTV ratios(2) | ||||||||||
| For the year ended October 31, 2023 | ||||||||||
| Residential mortgages LTV% |
Home equity lines of credit(3) LTV% |
|||||||||
| Canada: |
||||||||||
| Atlantic provinces |
58.5 | % | 62.8 | % | ||||||
| Quebec |
60.1 | 67.4 | ||||||||
| Ontario |
60.4 | 62.4 | ||||||||
| Manitoba & Saskatchewan |
61.7 | 62.3 | ||||||||
| Alberta |
62.1 | 68.1 | ||||||||
| British Columbia & Territories |
59.0 | 61.7 | ||||||||
| Canada |
60.2 | % | 62.9 | % | ||||||
| International |
71.7 | % | n/a | |||||||
| For the year ended October 31, 2022 | ||||||||||
| Canada |
63.4 | % | 63.0 | % | ||||||
| International |
72.7 | % | n/a | |||||||
| (1) | The measures in this section have been disclosed in this document in accordance with OSFI Guideline – B20 – Residential Mortgage Underwriting Practices and Procedures (January 2018). |
| (2) | The province represents the location of the property in Canada. |
| (3) | Includes all HELOCs. For Scotia Total Equity Plan HELOC’s, LTV is calculated based on the sum of residential mortgages and the authorized limit for related HELOCs, divided by the value of the related residential property, and presented on a weighted average basis for newly originated mortgages and HELOCs. |
Potential impact on residential mortgages and real estate home equity lines of credit in the event of an economic downturn
As part of its stress testing program, the Bank analyzes the impact of various combinations of home price declines and unemployment increases on the Bank’s residential mortgage portfolios. Those results continue to show that credit losses and impacts on capital ratios are within a level the Bank considers manageable. In addition, the Bank has undertaken extensive all-Bank scenario analyses to assess the impact to the enterprise of different scenarios and is confident that it has the financial resources to withstand even a very negative outlook.
Loans to Canadian condominium developers
The Bank had loans outstanding to Canadian condominium developers of $3,259 million as at October 31, 2023 (October 31, 2022 – $2,134 million). This is a high quality portfolio with well-known developers who have long-term relationships with the Bank.
Commercial real estate exposures
The Bank’s commercial real estate portfolio was $67.4 billion, or 8.7% of the Bank’s total loans and acceptances outstanding as at October 31, 2023 (October 31, 2022 – $60.9 billion or 7.9%). This portfolio is largely comprised of loans to the residential and industrial sectors (73%), both with relatively stable fundamentals. Total exposure to the Office subsector represents approximately 9% of the commercial real estate portfolio, of which 60% are investment grade facilities.
Regional non-retail exposures
The Bank’s exposures outside Canada and the U.S. are diversified by region and product and are sized appropriately relative to the credit worthiness of the counterparties (65% of the exposures are to investment grade counterparties based on a combination of internal and external ratings). The Bank’s exposures are carried at amortized cost or fair value using observable inputs, with negligible amounts valued using models with unobservable inputs (Level 3). There were no significant events during the year that materially impacted the Bank’s exposures.
The Bank has no direct exposure to Russia or Ukraine. While some customers may be negatively impacted by the conflict in the region and by trade restrictions as a result of sanctions, the impact to the Bank, to date, is immaterial and appropriately mitigated.
The Bank’s exposure to sovereigns was $66.2 billion as at October 31, 2023 (October 31, 2022 – $60.5 billion), $16.7 billion to banks (October 31, 2022 – $16.3 billion) and $129.2 billion to corporates (October 31, 2022 – $128.2 billion).
In addition to exposures detailed in the table below, the Bank had indirect exposures consisting of securities exposures to non-European entities whose parent company is domiciled in Europe of $0.3 billion as at October 31, 2023 (October 31, 2022 – $0.4 billion).
92 | 2023 Scotiabank Annual Report
Management’s Discussion and Analysis | Risk Management
The Bank’s regional credit exposures are distributed as follows:
T48 Bank’s regional credit exposures distribution
| As at October 31 | 2023 | 2022 | ||||||||||||||||||||||||||||||
| ($ millions) | Loans and loan equivalents(1) |
Deposits with financial institutions |
Securities(2) | SFT and derivatives(3) |
Funded Total |
Undrawn Commitments(4) |
Total | Total | ||||||||||||||||||||||||
| Latin America(5) |
$ | 91,148 | $ | 11,559 | $ | 24,395 | $ | 2,533 | $ | 129,635 | $ | 8,080 | $ | 137,715 | $ | 130,858 | ||||||||||||||||
| Caribbean and Central America |
12,269 | 3,930 | 3,733 | 29 | 19,961 | 3,341 | 23,302 | 24,186 | ||||||||||||||||||||||||
| Europe, excluding U.K. |
7,969 | 3,525 | 1,025 | 3,295 | 15,814 | 10,601 | 26,415 | 24,298 | ||||||||||||||||||||||||
| U.K. |
8,809 | 1,974 | 644 | 5,695 | 17,122 | 8,423 | 25,545 | 24,370 | ||||||||||||||||||||||||
| Asia |
12,858 | 1,151 | 15,146 | 259 | 29,414 | 8,957 | 38,371 | 37,210 | ||||||||||||||||||||||||
| Other(6) |
61 | – | 45 | 71 | 177 | 421 | 598 | 1,499 | ||||||||||||||||||||||||
| Total |
$ | 133,114 | $ | 22,139 | $ | 44,988 | $ | 11,882 | $ | 212,123 | $ | 39,823 | $ | 251,946 | $ | 242,421 | ||||||||||||||||
| (1) | Individual allowances for credit losses are $563. Letters of credit and guarantees are included as funded exposure as they have been issued. Included in loans and loans equivalent are letters of credit and guarantees which total $16,297 as at October 31, 2023 (October 31, 2022 – $15,462). |
| (2) | Exposures for securities are calculated taking into account derivative positions where the security is the underlying reference asset and short trading positions, with net short positions in brackets. |
| (3) | SFT comprise of securities purchased under resale agreements, obligations related to securities sold under repurchase agreements and securities lending and borrowing transactions. Gross and net funded exposures represent all net positive positions after taking into account collateral. Collateral held against derivatives was $5,867 and collateral held against SFT was $126,120. |
| (4) | Undrawn commitments represent an estimate of the contractual amount that may be drawn upon by the obligor and include commitments to issue letters of credit on behalf of other banks in a syndicated bank lending arrangement. |
| (5) | Includes countries in the Pacific Alliance plus Brazil, Uruguay, Venezuela, Ecuador and Argentina. |
| (6) | Includes Middle East and Africa. |
Market risk is the risk of loss from changes in market prices and rates (including interest rates, credit spreads, equity prices, foreign exchange rates and commodity prices), the correlations between them, and their levels of volatility. Market risk includes trading risk, investment risk, structural interest rate risk and structural foreign exchange risk. Below is an index of market risk disclosures:
Market risk factors
Interest rate risk
The risk of loss due to changes in the level and/or the volatility of interest rates. This risk affects instruments such as, but not limited to, debt securities, loans, mortgages, deposits and derivatives.
Interest rate risks are managed through sensitivity analysis (including economic value of equity and net interest income), stress testing, and VaR limits and mitigated through portfolio diversification and hedges using interest rate derivatives and debt securities.
Credit spread risk
The risk of loss due to changes in the market price and volatility of credit, or the creditworthiness of issuers. This risk is mainly concentrated in loan and debt securities portfolios. Risk is managed through sensitivity, jump-to-default, stress testing and VaR limits and mitigated through hedges using credit derivatives.
Foreign currency risk
The risk of loss resulting from changes in currency exchange rates and exchange rate volatility. Foreign currency denominated debt and other securities as well as future cash flows in foreign currencies are exposed to this type of risk. Risk is managed through sensitivity, stress testing and VaR limits and mitigated through hedges using foreign exchange positions and derivatives.
Equity risk
The risk of loss due to changes in prices, volatility or any other equity related risk factor of individual equity or equity linked securities. This risk affects instruments such as, but not limited to, equities, exchange traded funds, mutual funds, derivatives and other equity linked products. Risk is managed through sensitivity, stress testing and VaR limits and mitigated through hedges using physical equity and derivatives instruments.
Commodity risk
The risk of loss due to changes in prices or volatility of metal, energy and agriculture products. Risk is managed through sensitivity, stress testing and VaR limits and mitigated through derivative hedges.
The following maps risk factors to trading and non-trading activities:
| Non-trading Funding | Investments | Trading | ||
| Interest rate risk Foreign currency risk |
Interest rate risk Credit spread risk Foreign currency risk Equity risk |
Interest rate risk Credit spread risk Foreign currency risk Equity risk Commodity risk |
||
2023 Scotiabank Annual Report | 93
Management’s Discussion and Analysis
Market risk governance
Overview
The Board of Directors reviews and approves market risk policies and limits annually. The Bank’s Asset-Liability Committee (ALCO) and Market Risk Management and Policy Committee (MRMPC) oversee the application of the framework set by the Board, and monitor the Bank’s market risk exposures and the activities that give rise to these exposures. The MRMPC establishes specific operating policies and sets limits at the product, portfolio, business unit and business line levels, and for the Bank in total. Limits are reviewed at least annually.
Global Risk Management provides independent oversight of all significant market risks, supporting the MRMPC and ALCO with analysis, risk measurement, monitoring, reporting, proposals for standards and support for new product development. To ensure compliance with policies and limits, market risk exposures are independently monitored on a continuing basis, either by Global Risk Management, the back offices, or Finance. They provide senior management, business units, the ALCO, and the MRMPC with a series of daily, weekly and monthly reports of market risk exposures by business line and risk type.
The Bank uses a variety of metrics and models to measure and control market risk exposures. These measurements are selected based on an assessment of the nature of risks in a particular activity. The principal measurement techniques are Value at Risk (VaR), Incremental Risk Charge, stress testing, and sensitivity analysis. The use and attributes of each of these techniques are noted in the Risk Measurement Summary.
Risk measurement summary
Value at risk (VaR)
VaR is a statistical method of measuring potential loss due to market risk based upon a common confidence interval and time horizon. The Bank calculates VaR daily using a 99% confidence level, and a one-day holding period for its trading portfolios. This means that once in every 100 days, the trading positions are expected to lose more than the VaR estimate. VaR has two components: general market risk and debt specific risk. The Bank calculates general market risk VaR using historical simulation based on 300 days of market data. Obligor specific risk on debt instruments and credit derivatives not captured in general market risk VaR is calculated through the debt specific risk VaR, which uses historical resampling. In addition, the Bank calculates a Stressed VaR measure which follows the same basic methodology as VaR but is calibrated to a one year stressed period. The stressed period is determined based on analysis of the trading book’s risk profile against historical market data. Stressed VaR complements VaR in that it evaluates the impact of market volatility that is outside the VaR’s historical set.
All material risk factors are captured in VaR. Where historical data is not available, proxies are used to establish the relevant volatility for VaR and Stressed VaR until sufficient data is available. Changes in VaR between reporting periods are generally due to changes in positions, volatilities and/or correlations between asset classes. VaR is also used to evaluate risks arising in certain funding and investment portfolios. Backtesting is also an important and necessary part of the VaR process. The Bank backtests the actual trading profit and loss against the VaR result to validate the quality and accuracy of the Bank’s VaR model. The Board reviews VaR results quarterly.
Incremental Risk Charge (IRC)
Basel market risk capital requirements includes IRC which captures the following:
Default risk: This is the potential for direct losses due to an obligor’s (bond issuer or counterparty) default.
Credit migration risk: This is the potential for direct losses due to a credit rating downgrade or upgrade.
A Monte Carlo model is used to perform default and migration simulations for the obligors underlying credit derivative and bond portfolios. IRC is calculated at the 99.9th percentile with a one year liquidity horizon.
Stress testing
A limitation of VaR and Stressed VaR is that they only reflect the recent history of market volatility and a specific one year stressed period, respectively. To complement these measures, stress testing examines the impact that abnormally large changes in market factors and periods of prolonged inactivity might have on trading portfolios. Stress testing scenarios are designed to include large shifts in risk factors as well as historical and theoretical multi risk market events. Historical scenarios capture severe movements over periods that are significantly longer than the one-day holding period captured in VaR, such as the 2008 Credit Crisis or the 1998 Russian Financial Crisis. Similar to Stressed VaR, stress testing provides management with information on potential losses due to tail events. In addition, the results from the stress testing program are used to verify that the Bank’s market risk capital is sufficient to absorb these potential losses.
The Bank subjects its trading portfolios to a series of daily, weekly and monthly stress tests. The Bank also evaluates risk in its investment portfolios monthly, using stress tests based on risk factor sensitivities and specific market events. The stress testing program is an essential component of the Bank’s comprehensive risk management framework which complements the VaR methodology and other risk measures and controls employed by the Bank.
Sensitivity analysis
In trading portfolios, sensitivity analysis is used to measure the effect of changes in risk factors, including prices and volatility, on financial products and portfolios. These measures apply across product types and geographies and are used for limit monitoring and management reporting.
In non-trading portfolios, sensitivity analysis assesses the effect of changes in interest rates on current earnings and on the economic value of equity. It is applied globally to each of the major currencies within the Bank’s operations. The Bank’s sensitivity analysis for limit and disclosure purposes is measured through positive and negative parallel shifts in the underlying interest rate curves. These calculations are based on models that consider a number of inputs and are on a constant balance sheet and make no assumptions for management actions that may mitigate the risks. The Bank also performs sensitivity analysis using various non-parallel interest rate curve shifts, for example: curve steepeners, curve flatteners and curve twists.
94 | 2023 Scotiabank Annual Report
Management’s Discussion and Analysis | Risk Management
Validation of market risk models
Prior to the implementation of new market risk models, rigorous validation and testing is conducted. Validation is conducted when the model is initially developed and when any significant changes are made to the model. The models are also subject to ongoing validation, the frequency of which is determined by model risk ratings. Models may also be triggered for earlier revalidation when there have been significant structural changes in the market or changes to the composition of the portfolio. Model validation includes backtesting, and additional analysis such as:
| • | Theoretical review or tests to demonstrate whether assumptions made within the internal model are appropriate; and |
| • | Impact tests including stress testing that would occur under historical and hypothetical market conditions. |
The validation process is governed by the Bank’s Model Risk Management Policy.
Non-trading market risk
Funding and investment activities
Market risk arising from the Bank’s funding and investment activities is identified, managed and controlled through the Bank’s asset-liability management processes. The Asset-Liability Committee meets monthly to review risks and opportunities, and evaluate performance including the effectiveness of hedging strategies.
Interest rate risk
Interest rate risk arising from the Bank’s lending, funding and investment activities is managed in accordance with Board-approved policies and global limits, which are designed to control the risk to net interest income and economic value of equity. The net interest income (NII) sensitivity measures the effect of a specified change in interest rates on the Bank’s annual net interest income over the next twelve months, while the economic value of equity (EVE) sensitivity measures the impact of a specified change in interest rates on the present value of the Bank’s net assets. Limits for both measurements are set according to the documented risk appetite of the Bank. Board-level limit utilization is reported to both the Asset-Liability Committee and the Board on a regular basis. Any limit exceptions are reported according to the Limit Monitoring and Compliance Policy of the Bank.
The net interest income and the economic value of equity result from the differences between yields earned on the Bank’s non-trading assets and interest expense paid on its liabilities. Net interest income and economic value of equity sensitivities measure the risk to the Bank’s earnings and capital arising from adverse movements in interest rates that affect the Bank’s banking book position. The Bank’s banking book position reflects the mismatch of the maturity and re-pricing characteristics between the assets and liabilities and optional elements embedded in the Bank’s structural balance sheet (e.g. mortgage prepayment). The mismatch and embedded optional elements are inherent in the non-trading operations of the Bank and exposes it to changes of interest rates. The Asset-Liability Committee provides strategic direction for the management of structural interest rate risk within the risk appetite framework authorized by the Board of Directors. The asset/liability management strategy is executed by Group Treasury with the objective of protecting and enhancing net interest income within established risk tolerances.
Simulation modeling, sensitivity analysis and stress testing are used to assess exposures and for limit monitoring of the Bank’s interest rate risk in the banking book. The Bank’s interest rate risk exposure is estimated by simulating the banking book position under a range of rate shocks. The simulations incorporate maturities, renewal, and repricing characteristics of the banking book along with prepayment and redemption behaviour of loans and cashable investment products. Calculations are generally based on the earlier of contractual re-pricing or maturity of on-balance sheet and off-balance sheet assets and liabilities, although certain assets and liabilities such as credit cards and deposits without a fixed maturity are assigned a maturity profile based on the longevity of the exposure. Expected prepayments from loans and cashable investment products are also incorporated into the exposure calculations.
Table T49 shows the pro-forma pre-tax impact on the Bank’s net interest income over the next twelve months and economic value of equity of an immediate and sustained 100 basis points increase and decrease in interest rate across major currencies as defined by the Bank. The interest rate sensitivities tabulated are based on models that consider a number of inputs and are on a constant balance sheet. There are no assumptions made for management actions that may mitigate risk. Based on the Bank’s interest rate positions at year-end 2023, an immediate and sustained 100 basis point increase in interest rates across all major currencies and maturities would decrease pre-tax net interest income by approximately $99 million over the next 12 months, assuming no further management actions. During fiscal 2023, this measure ranged between decrease of $28 million and decrease of $304 million.
This same increase in interest rates would result in an pre-tax decrease in the present value of the Bank’s net assets of approximately $1,256 million. During fiscal 2023, this measure ranged between $1,029 million and $1,689 million. The directional sensitivity of these two key metrics is largely determined by the difference in time horizons (net interest income captures the impact over the next twelve months only, whereas economic value considers the potential impact of interest rate changes on the present value of all future cash flows). The net interest income and economic value results are compared to the authorized Board limits. Both interest rate sensitivities remained within the Bank’s approved consolidated limits in the reporting period.
T49 Structural interest sensitivity
| 2023 | 2022 | |||||||||||||||
| As at October 31 ($ millions) | Economic Value of Equity |
Net Interest Income |
Economic Value of Equity |
Net Interest Income |
||||||||||||
| Pre-tax impact of |
||||||||||||||||
| 100bp increase in rates |
||||||||||||||||
| Non-trading risk |
$ | (1,256 | ) | $ | (99 | ) | $ | (2,021 | ) | $ | (340 | ) | ||||
| 100bp decrease in rates |
||||||||||||||||
| Non-trading risk |
$ | 824 | $ | 68 | $ | 1,659 | $ | 326 | ||||||||
2023 Scotiabank Annual Report | 95
Management’s Discussion and Analysis
Foreign currency risk
Foreign currency risk in the Bank’s unhedged funding and investment activities arises primarily from the Bank’s net investments in foreign operations as well as foreign currency earnings in its domestic and remitting foreign branch operations.
The Bank’s foreign currency exposure to its net investments in foreign operations is controlled by a Board-approved limit. This limit considers factors such as potential volatility to shareholders’ equity as well as the potential impact on capital ratios from foreign exchange fluctuations. On a monthly basis, the Asset-Liability Committee reviews the Bank’s foreign currency net investment exposures and determines the appropriate hedging strategies. These may include funding the investments in the same currency or using other financial instruments, including derivatives.
Foreign currency translation gains and losses from net investments in foreign operations, net of related hedging activities and tax effects, are recorded in accumulated other comprehensive income within shareholders’ equity. However, the Bank’s regulatory capital ratios are not materially affected by these foreign exchange fluctuations because the risk-weighted assets of the foreign operations tend to move in a similar direction.
The Bank is also subject to foreign currency translation risk on the earnings of its domestic and remitting foreign branch operations. The Bank forecasts foreign currency revenues and expenses, over a number of future fiscal quarters. The Asset-Liability Committee also assesses economic data trends and forecasts to determine if some or all of the estimated future foreign currency revenues and expenses should be hedged. Hedging instruments normally include foreign currency spot and forward contracts, as well as foreign currency options and swaps. Certain of these economic hedges may not qualify for hedge accounting resulting in a potential for a mismatch in the timing of the recognition of economic hedge gains/losses and the underlying foreign earnings translation gains/losses. In accordance with IFRS, foreign currency translation gains and losses relating to monetary and non-monetary items are recorded directly in earnings.
As at October 31, 2023, a one percent increase (decrease) in the Canadian dollar against all currencies in which the Bank operates decreases (increases) the Bank’s before-tax annual earnings by approximately $63 million (October 31, 2022 – $55 million) in the absence of hedging activity, due primarily from exposure to U.S. dollars.
Investment portfolio risks
The Bank holds investment portfolios to meet liquidity and statutory reserve requirements and for investment purposes. These portfolios expose the Bank to interest rate, foreign currency, credit spread and equity risks. Debt investments primarily consist of government, agency, and corporate bonds. Equity investments include common and preferred shares, as well as a diversified portfolio of third-party managed funds. The majority of these securities are valued using prices obtained from external sources. These portfolios are controlled by a Board-approved policy and limits.
Trading market risk
The Bank’s policies, processes and controls for trading activities are designed to achieve a balance between pursuing profitable trading opportunities and managing earnings volatility within a framework of sound and prudent practices. Trading activities are primarily customer focused.
Market risk arising from the Bank’s trading activities is managed in accordance with Board-approved policies, and aggregate VaR and stress testing limits. The quality of the Bank’s VaR is validated by regular backtesting analysis, in which the VaR is compared to both theoretical profit and loss results based on fixed end of day positions and actual reported profit and loss. A VaR at the 99% confidence interval is an indication of a 1% probability that losses will exceed the VaR if positions remain unchanged during the next business day. Trading positions are however managed dynamically and, as a result, actual profit/loss backtesting exceptions are uncommon.
In fiscal 2023, the total one-day VaR for trading activities averaged $15.7 million, compared to $13.5 million in 2022. The increase was largely driven by increased interest rate and credit spread risk.
T50 Market risk measures
| 2023 | 2022 | |||||||||||||||||||||||||||||||||||
| ($ millions) | Year end | Avg | High | Low | Year end | Avg | High | Low | ||||||||||||||||||||||||||||
| Credit Spread plus Interest Rate |
$ | 12.9 | $ | 14.4 | $ | 24.1 | $ | 9.0 | $ | 9.3 | $ | 12.0 | $ | 19.0 | $ | 7.2 | ||||||||||||||||||||
| Credit Spread |
8.1 | 7.9 | 16.3 | 3.8 | 7.7 | 5.3 | 9.6 | 2.0 | ||||||||||||||||||||||||||||
| Interest Rate |
11.5 | 12.1 | 21.9 | 7.5 | 8.4 | 11.4 | 19.6 | 5.7 | ||||||||||||||||||||||||||||
| Equities |
4.9 | 4.1 | 7.8 | 2.5 | 3.4 | 4.0 | 6.8 | 1.7 | ||||||||||||||||||||||||||||
| Foreign Exchange |
3.0 | 3.3 | 8.8 | 0.9 | 1.5 | 2.1 | 5.3 | 0.8 | ||||||||||||||||||||||||||||
| Commodities |
2.9 | 4.7 | 8.1 | 2.3 | 5.2 | 3.1 | 5.8 | 1.0 | ||||||||||||||||||||||||||||
| Debt Specific |
3.7 | 3.6 | 4.8 | 2.4 | 4.6 | 2.3 | 4.6 | 1.6 | ||||||||||||||||||||||||||||
| Diversification Effect |
(13.5 | ) | (14.4 | ) | n/a | n/a | (10.6 | ) | (10.0 | ) | n/a | n/a | ||||||||||||||||||||||||
| All-Bank VaR |
$ | 13.9 | $ | 15.7 | $ | 25.2 | $ | 11.0 | $ | 13.4 | $ | 13.5 | $ | 20.4 | $ | 7.8 | ||||||||||||||||||||
| All-Bank Stressed VaR |
$ | 44.8 | $ | 39.4 | $ | 87.3 | $ | 13.4 | $ | 27.4 | $ | 30.9 | $ | 58.4 | $ | 16.8 | ||||||||||||||||||||
| Incremental Risk Charge |
$ | 271.5 | $ | 280.6 | $ | 488.0 | $ | 182.4 | $ | 285.4 | $ | 233.8 | $ | 373.5 | $ | 148.6 | ||||||||||||||||||||
The Bank also calculates a Stressed VaR which uses the same basic methodology as the VaR. However, Stressed VaR is calculated using market volatility from a one-year time period identified as stressful, given the risk profile of the trading portfolio. Throughout fiscal 2023, the Stressed VaR was calculated using the 2019/2020 COVID period, while in 2022 it was calculated using the 2008/2009 credit crisis period. In fiscal 2023, the average total one-day Stressed VaR for trading activities was $39.4 million, compared to $30.9 million in 2022. The Stressed VaR increase was mainly due to higher equity and interest rate exposure in the first two quarters of the year.
In fiscal 2023, the average IRC increased to $280.6 million from $233.8 million in 2022. The IRC utilization, which measures fixed income default and rating migration risk, increased due to larger bond holdings in the trading portfolio.
96 | 2023 Scotiabank Annual Report
Management’s Discussion and Analysis | Risk Management
Description of trading revenue components and graphical comparison of VaR to daily P&L
Chart C30 shows the distribution of daily trading revenue for fiscal 2023 and Chart C31 compares that distribution to daily VaR results. Trading revenue includes changes in portfolio value as well as the impact of new trades, commissions, fees and reserves. Some components of revenue which are calculated less frequently are pro-rated. Trading revenue averaged $13.2 million per day, increased from $12.3 million in 2022. Revenue was positive on 99% of trading days during the year, which was better than the level in 2022. During the year, the largest single day trading loss was $27 million which occurred on March 13, 2023, and was larger than the total VaR of $22 million on the same day.
| C30 | Trading revenue distribution Year ended October 31, 2023 |
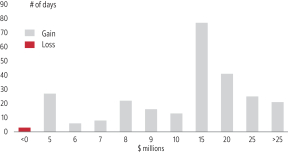
|
| C31 | Daily trading revenue vs. VaR $ millions, November 1, 2022 to October 31, 2023 |
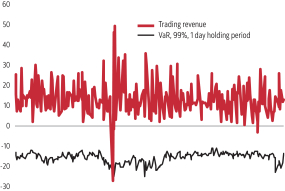
|
Market risk linkage to Consolidated Statement of Financial Position
Trading assets and liabilities are marked to market daily and included in trading risk measures such as VaR. Derivatives captured under trading risk measures are largely related to the activities of Global Banking and Markets, while derivatives captured under non-trading risk measures include those used in asset/liability management and designated in a hedge relationship. A comparison of Consolidated Statement of Financial Position items which are covered under the trading and non-trading risk measures is provided in the table below.
T51 Market risk linkage to Consolidated Statement of Financial Position of the Bank
| Market Risk Measure | ||||||||||||||||||||
| As at October 31, 2023 ($ millions) | Consolidated Statement of Financial Position |
Trading Risk | Non-trading risk |
Not subject to market risk |
Primary risk sensitivity of non-trading risk |
|||||||||||||||
| Precious metals |
$ | 937 | $ | 937 | $ | – | $ | – | n/a | |||||||||||
| Trading assets |
117,868 | 117,719 | 149 | – | Interest rate, FX | |||||||||||||||
| Derivative financial instruments |
51,340 | 36,512 | 14,828 | – | Interest rate, FX, equity | |||||||||||||||
| Investment securities |
118,237 | – | 118,237 | – | Interest rate, FX, equity | |||||||||||||||
| Loans |
750,911 | – | 750,911 | – | Interest rate, FX | |||||||||||||||
| Assets not subject to market risk (1) |
371,496 | – | – | 371,496 | n/a | |||||||||||||||
| Total assets |
$ | 1,410,789 | $ | 155,168 | $ | 884,125 | $ | 371,496 | ||||||||||||
| Deposits |
$ | 952,333 | $ | – | $ | 908,649 | $ | 43,684 | Interest rate, FX, equity | |||||||||||
| Financial instruments designated at fair value through profit or loss |
26,779 | – | 26,779 | – | Interest rate, equity | |||||||||||||||
| Obligations related to securities sold short |
36,403 | 36,403 | – | – | n/a | |||||||||||||||
| Derivative financial instruments |
58,660 | 36,018 | 22,642 | – | Interest rate, FX, equity | |||||||||||||||
| Trading liabilities(2) |
439 | 439 | – | – | n/a | |||||||||||||||
| Retirement and other benefit liabilities |
1,524 | – | 1,524 | – | Interest rate, credit spread, equity | |||||||||||||||
| Liabilities not subject to market risk (3) |
255,984 | – | – | 255,984 | n/a | |||||||||||||||
| Total liabilities |
$ | 1,332,122 | $ | 72,860 | $ | 959,594 | $ | 299,668 | ||||||||||||
| (1) | Includes goodwill, intangibles, other assets and securities purchased under resale agreements and securities borrowed. |
| (2) | Gold and silver certificates and bullion included in other liabilities. |
| (3) | Includes obligations related to securities sold under repurchase agreements and securities lent and other liabilities. |
2023 Scotiabank Annual Report | 97
Management’s Discussion and Analysis
| Market Risk Measure | ||||||||||||||||||||
| As at October 31, 2022 ($ millions) | Consolidated Statement of Financial Position |
Trading Risk | Non-trading risk |
Not subject to market risk |
Primary risk sensitivity of non-trading risk |
|||||||||||||||
| Precious metals |
$ | 543 | $ | 543 | $ | – | $ | – | n/a | |||||||||||
| Trading assets |
113,154 | 113,117 | 37 | – | Interest rate, FX | |||||||||||||||
| Derivative financial instruments |
55,699 | 43,436 | 12,263 | – | Interest rate, FX, equity | |||||||||||||||
| Investment securities |
110,008 | – | 110,008 | – | Interest rate, FX, equity | |||||||||||||||
| Loans |
744,987 | – | 744,987 | – | Interest rate, FX | |||||||||||||||
| Assets not subject to market risk (1) |
325,027 | – | – | 325,027 | n/a | |||||||||||||||
| Total assets |
$ | 1,349,418 | $ | 157,096 | $ | 867,295 | $ | 325,027 | ||||||||||||
| Deposits |
$ | 916,181 | $ | – | $ | 869,219 | $ | 46,962 | Interest rate, FX, equity | |||||||||||
| Financial instruments designated at fair value through profit or loss |
22,421 | – | 22,421 | – | Interest rate, equity | |||||||||||||||
| Obligations related to securities sold short |
40,449 | 40,449 | – | – | n/a | |||||||||||||||
| Derivative financial instruments |
65,900 | 40,685 | 25,215 | – | Interest rate, FX, equity | |||||||||||||||
| Trading liabilities(2) |
372 | 372 | – | – | n/a | |||||||||||||||
| Retirement and other benefit liabilities |
1,557 | – | 1,557 | – | Interest rate, credit spread, equity | |||||||||||||||
| Liabilities not subject to market risk (3) |
227,789 | – | – | 227,789 | n/a | |||||||||||||||
| Total liabilities |
$ | 1,274,669 | $ | 81,506 | $ | 918,412 | $ | 274,751 | ||||||||||||
| (1) | Includes goodwill, intangibles, other assets and securities purchased under resale agreements and securities borrowed. |
| (2) | Gold and silver certificates and bullion included in other liabilities. |
| (3) | Includes obligations related to securities sold under repurchase agreements and securities lent and other liabilities. |
Derivative instruments and structured transactions
Derivatives
The Bank uses derivatives to meet customer needs, generate revenues from trading activities, manage market and credit risks arising from its lending, and for funding and investment activities. The Bank uses several types of derivative products, including interest rate swaps, futures and options, to hedge interest rate risk exposure. Forward contracts, swaps and options are used to manage foreign currency risk exposures. Credit exposures in its lending and investment books may be managed using credit default swaps. As a dealer, the Bank markets a range of derivatives to its customers, including interest rate, foreign exchange, equity, commodity and credit derivatives.
Market risk arising from derivatives transactions is subject to the control, reporting and analytical techniques noted above. Additional controls and analytical techniques are applied to address certain market-related risks that are unique to derivative products.
Structured transactions
Structured transactions are specialized transactions that may involve combinations of cash, other financial assets and derivatives designed to meet the specific risk management or financial requirements of customers. These transactions are carefully evaluated by the Bank to identify and address the credit, market, legal, tax, reputational and other risks, and are subject to a cross-functional review and sign-off by Trading Management, Global Risk Management, Taxation, Finance and Legal departments. Large structured transactions are also subject to review by senior risk management committees and evaluated in accordance with the procedures described below in Reputational Risk.
The market risk in these transactions is usually minimal, and returns are earned by providing structuring expertise and by taking credit risk. Once executed, structured transactions are subject to the same ongoing credit reviews and market risk analysis as other types of derivatives transactions. This review and analysis includes careful monitoring of the quality of the reference assets, and ongoing valuation of the derivatives and reference assets.
Liquidity risk is the risk that the Bank is unable to meet its financial obligations in a timely manner at reasonable prices. Financial obligations include liabilities to depositors, payments due under derivative contracts, settlement of securities borrowing and repurchase transactions, and lending and investment commitments.
Effective liquidity risk management is essential to maintain the confidence of depositors and counterparties, manage the Bank’s cost of funds and to support core business activities, even under adverse circumstances.
Liquidity risk is managed within the framework of policies and limits that are approved by the Board of Directors. The Board receives reports on risk exposures and performance against approved limits. The Asset-Liability Committee (ALCO) provides senior management oversight of liquidity risk.
The key elements of the liquidity risk framework are:
| • | Measurement and modeling – the Bank’s liquidity model measures and forecasts cash inflows and outflows, including off-balance sheet cash flows on a daily basis. Risk is managed by a set of key limits over the maximum net cash outflow by currency over specified short-term horizons (cash gaps), a minimum level of core liquidity, and liquidity stress tests. |
| • | Reporting – Global Risk Management provides independent oversight of all significant liquidity risks, supporting the ALCO with analysis, risk measurement, stress testing, monitoring and reporting. |
98 | 2023 Scotiabank Annual Report
Management’s Discussion and Analysis | Risk Management
| • | Stress testing – the Bank performs liquidity stress testing on a regular basis, to evaluate the effect of both industry-wide and Bank-specific disruptions on the Bank’s liquidity position. Liquidity stress testing has many purposes including: |
| – | Helping the Bank understand the potential behavior of various on-balance sheet and off-balance sheet positions in circumstances of stress; and |
| – | Based on this knowledge, facilitating the development of risk mitigation and contingency plans. |
The Bank’s liquidity stress tests consider the effect of changes in funding assumptions, depositor behavior and the market value of liquid assets. The Bank performs industry standard stress tests, the results of which are reviewed at senior levels of the organization and are considered in making liquidity management decisions.
| • | Contingency planning – the Bank maintains a liquidity contingency plan that specifies an approach for analyzing and responding to actual and potential liquidity events. The plan outlines an appropriate governance structure for the management and monitoring of liquidity events, processes for effective internal and external communication, and identifies potential counter measures to be considered at various stages of an event. A contingency plan is maintained both at the parent-level as well as for major subsidiaries. |
| • | Funding diversification – the Bank actively manages the diversification of its deposit liabilities by source, type of depositor, instrument, term and geography. |
| • | Core liquidity – the Bank maintains a pool of highly liquid, unencumbered assets that can be readily sold or pledged to secure borrowings under stressed market conditions or due to Bank-specific events. The Bank also maintains liquid assets to support its intra-day settlement obligations in payment, depository and clearing systems. |
Liquid assets
Liquid assets are a key component of liquidity management and the Bank holds these types of assets in sufficient quantity to meet potential needs for liquidity management.
Liquid assets can be used to generate cash either through sale, repurchase transactions or other transactions where these assets can be used as collateral to generate cash, or by allowing the asset to mature. Liquid assets include deposits at central banks, deposits with financial institutions, call and other short-term loans, marketable securities, precious metals and securities received as collateral from securities financing and derivative transactions. Liquid assets do not include borrowing capacity from central bank facilities.
Marketable securities are securities traded in active markets, which can be converted to cash within a timeframe that is in accordance with the Bank’s liquidity management framework. Assets are assessed considering a number of factors, including the expected time it would take to convert them to cash.
Marketable securities included in liquid assets are comprised of securities specifically held as a liquidity buffer or for asset liability management purposes; trading securities, which are primarily held by Global Banking and Markets; and collateral received for securities financing and derivative transactions.
The Bank maintains large holdings of unencumbered liquid assets to support its operations. These assets generally can be sold or pledged to meet the Bank’s obligations. As at October 31, 2023 unencumbered liquid assets were $319 billion (October 31, 2022 – $260 billion). Securities including National Housing Act (NHA) mortgage-backed securities, comprised 73% of liquid assets (October 31, 2022 – 77%). Other unencumbered liquid assets, comprising cash and deposits with central banks, deposits with financial institutions and precious metals were 27% (October 31, 2022 – 23%). The increase in total unencumbered liquid assets to support enterprise liquidity metrics was primarily attributable to an increase in Canadian and foreign government securities, cash and deposits with central banks and NHA mortgage-backed securities, partly offset by a decrease in other liquid securities.
The carrying values outlined in the liquid asset table are consistent with the carrying values in the Bank’s Consolidated Statement of Financial Position as at October 31, 2023. The liquidity value of the portfolio will vary under different stress events as different assumptions are used for the stress scenarios.
2023 Scotiabank Annual Report | 99
Management’s Discussion and Analysis
The Bank’s liquid asset pool is summarized in the following table:
T52 Liquid asset pool
| Encumbered liquid assets |
Unencumbered liquid assets |
|||||||||||||||||||||||||||||||
| As at October 31, 2023 ($ millions) |
Bank-owned liquid assets |
Securities received as collateral from securities financing and derivative transactions |
Total liquid assets |
Pledged as collateral |
Other(1) | Available as collateral |
Other | |||||||||||||||||||||||||
| Cash and deposits with central banks |
$ | 82,050 | $ | – | $ | 82,050 | $ | – | $ | 6,115 | $ | 75,935 | $ | – | ||||||||||||||||||
| Deposits with financial institutions |
8,262 | – | 8,262 | – | 47 | 8,215 | – | |||||||||||||||||||||||||
| Precious metals |
937 | – | 937 | – | – | 937 | – | |||||||||||||||||||||||||
| Securities: |
||||||||||||||||||||||||||||||||
| Canadian government obligations |
57,007 | 42,922 | 99,929 | 34,342 | – | 65,587 | – | |||||||||||||||||||||||||
| Foreign government obligations |
104,123 | 129,814 | 233,937 | 110,941 | – | 122,996 | – | |||||||||||||||||||||||||
| Other securities |
60,961 | 103,437 | 164,398 | 144,627 | – | 19,771 | – | |||||||||||||||||||||||||
| NHA mortgage-backed securities |
33,503 | – | 33,503 | 7,548 | – | 25,955 | – | |||||||||||||||||||||||||
| Total |
$ | 346,843 | $ | 276,173 | $ | 623,016 | $ | 297,458 | $ | 6,162 | $ | 319,396 | $ | – | ||||||||||||||||||
| Encumbered liquid assets |
Unencumbered liquid assets |
|||||||||||||||||||||||||||||||
| As at October 31, 2022 ($ millions) |
Bank-owned liquid assets |
Securities received as collateral from securities financing and derivative transactions |
Total liquid assets |
Pledged as collateral |
Other(1) | Available as collateral |
Other | |||||||||||||||||||||||||
| Cash and deposits with central banks |
$ | 56,720 | $ | – | $ | 56,720 | $ | – | $ | 5,254 | $ | 51,466 | $ | – | ||||||||||||||||||
| Deposits with financial institutions |
9,175 | – | 9,175 | – | 400 | 8,775 | – | |||||||||||||||||||||||||
| Precious metals |
543 | – | 543 | – | – | 543 | – | |||||||||||||||||||||||||
| Securities: |
||||||||||||||||||||||||||||||||
| Canadian government obligations |
51,114 | 29,484 | 80,598 | 40,290 | – | 40,308 | – | |||||||||||||||||||||||||
| Foreign government obligations |
98,673 | 108,134 | 206,807 | 104,052 | – | 102,755 | – | |||||||||||||||||||||||||
| Other securities |
60,783 | 90,675 | 151,458 | 115,995 | – | 35,463 | – | |||||||||||||||||||||||||
| NHA mortgage-backed securities |
29,409 | – | 29,409 | 8,571 | – | 20,838 | – | |||||||||||||||||||||||||
| Total |
$ | 306,417 | $ | 228,293 | $ | 534,710 | $ | 268,908 | $ | 5,654 | $ | 260,148 | $ | – | ||||||||||||||||||
| (1) | Assets which are restricted from being used to secure funding for legal or other reasons. |
A summary of total unencumbered liquid assets held by the parent bank and its branches, and domestic and foreign subsidiaries, is presented below:
T53 Total unencumbered liquid assets held by the parent bank and its branches, and domestic and foreign subsidiaries
| As at October 31 ($ millions) |
2023 | 2022 | ||||||
| The Bank of Nova Scotia (Parent) |
$ | 237,501 | $ | 184,848 | ||||
| Bank domestic subsidiaries |
39,988 | 26,912 | ||||||
| Bank foreign subsidiaries |
41,907 | 48,388 | ||||||
| Total |
$ | 319,396 | $ | 260,148 | ||||
The Bank’s liquidity pool is held across major currencies, mostly comprised of Canadian and U.S. dollar holdings. As shown above, the vast majority (87%) of liquid assets are held by the Bank’s corporate office, branches of the Bank, and Canadian subsidiaries of the Bank. To the extent a liquidity reserve held in a foreign subsidiary of the Bank is required for regulatory purposes, it is assumed to be unavailable to the rest of the Group. Other liquid assets held by a foreign subsidiary are assumed to be available only in limited circumstances. The Bank monitors and ensures compliance in relation to minimum levels of liquidity required and assets held within each entity, and/or jurisdiction.
100 | 2023 Scotiabank Annual Report
Management’s Discussion and Analysis | Risk Management
Encumbered assets
In the course of the Bank’s day-to-day activities, securities and other assets are pledged to secure an obligation, participate in clearing or settlement systems, or operate in a foreign jurisdiction. Securities are also pledged under repurchase agreements. A summary of encumbered and unencumbered assets is presented below:
T54 Asset encumbrance
| Encumbered assets | Unencumbered assets | |||||||||||||||||||||||||||||||
| As at October 31, 2023 ($ millions) |
Bank-owned assets |
Securities received as collateral from securities financing and derivative |
Total assets | Pledged as collateral |
Other(1) | Available as collateral(2) |
Other(3) | |||||||||||||||||||||||||
| Cash and deposits with central banks |
$ | 82,050 | $ | – | $ | 82,050 | $ | – | $ | 6,115 | $ | 75,935 | $ | – | ||||||||||||||||||
| Deposits with financial institutions |
8,262 | – | 8,262 | – | 47 | 8,215 | – | |||||||||||||||||||||||||
| Precious metals |
937 | – | 937 | – | – | 937 | – | |||||||||||||||||||||||||
| Liquid securities: |
||||||||||||||||||||||||||||||||
| Canadian government obligations |
57,007 | 42,922 | 99,929 | 34,342 | – | 65,587 | – | |||||||||||||||||||||||||
| Foreign government obligations |
104,123 | 129,814 | 233,937 | 110,941 | – | 122,996 | – | |||||||||||||||||||||||||
| Other liquid securities |
60,961 | 103,437 | 164,398 | 144,627 | – | 19,771 | – | |||||||||||||||||||||||||
| Other securities |
3,758 | 7,714 | 11,472 | 4,941 | – | – | 6,531 | |||||||||||||||||||||||||
| Loans classified as liquid assets: |
||||||||||||||||||||||||||||||||
| NHA mortgage-backed securities |
33,503 | – | 33,503 | 7,548 | – | 25,955 | – | |||||||||||||||||||||||||
| Other loans |
724,952 | – | 724,952 | 4,693 | 88,682 | 13,064 | 618,513 | |||||||||||||||||||||||||
| Other financial assets(4) |
273,930 | (185,713 | ) | 88,217 | 15,287 | – | – | 72,930 | ||||||||||||||||||||||||
| Non-financial assets |
61,306 | – | 61,306 | – | – | – | 61,306 | |||||||||||||||||||||||||
| Total |
$ | 1,410,789 | $ | 98,174 | $ | 1,508,963 | $ | 322,379 | $ | 94,844 | $ | 332,460 | $ | 759,280 | ||||||||||||||||||
| Encumbered assets | Unencumbered assets | |||||||||||||||||||||||||||||||
| As at October 31, 2022 ($ millions) |
Bank-owned assets |
Securities received as collateral from securities financing and derivative |
Total assets | Pledged as collateral |
Other(1) | Available as collateral(2) |
Other(3) | |||||||||||||||||||||||||
| Cash and deposits with central banks |
$ | 56,720 | $ | – | $ | 56,720 | $ | – | $ | 5,254 | $ | 51,466 | $ | – | ||||||||||||||||||
| Deposits with financial institutions |
9,175 | – | 9,175 | – | 400 | 8,775 | – | |||||||||||||||||||||||||
| Precious metals |
543 | – | 543 | – | – | 543 | – | |||||||||||||||||||||||||
| Liquid securities: |
||||||||||||||||||||||||||||||||
| Canadian government obligations |
51,114 | 29,484 | 80,598 | 40,290 | – | 40,308 | – | |||||||||||||||||||||||||
| Foreign government obligations |
98,673 | 108,134 | 206,807 | 104,052 | – | 102,755 | – | |||||||||||||||||||||||||
| Other liquid securities |
60,783 | 90,675 | 151,458 | 115,995 | – | 35,463 | – | |||||||||||||||||||||||||
| Other securities |
2,985 | 11,376 | 14,361 | 3,611 | – | – | 10,750 | |||||||||||||||||||||||||
| Loans classified as liquid assets: |
||||||||||||||||||||||||||||||||
| NHA mortgage-backed securities |
29,409 | – | 29,409 | 8,571 | – | 20,838 | – | |||||||||||||||||||||||||
| Other loans |
723,389 | – | 723,389 | 3,658 | 77,122 | 11,657 | 630,952 | |||||||||||||||||||||||||
| Other financial assets(4) |
254,935 | (160,410 | ) | 94,525 | 18,450 | – | – | 76,075 | ||||||||||||||||||||||||
| Non-financial assets |
61,692 | – | 61,692 | – | – | – | 61,692 | |||||||||||||||||||||||||
| Total |
$ | 1,349,418 | $ | 79,259 | $ | 1,428,677 | $ | 294,627 | $ | 82,776 | $ | 271,805 | $ | 779,469 | ||||||||||||||||||
| (1) | Assets which are restricted from being used to secure funding for legal or other reasons. |
| (2) | Assets that are readily available in the normal course of business to secure funding or meet collateral needs including central bank borrowing immediately available. |
| (3) | Other unencumbered assets are not subject to any restrictions on their use to secure funding or as collateral but the Bank would not consider them to be readily available. These include loans, a portion of which may be used to access central bank facilities outside of the normal course or to raise secured funding through the Bank’s secured funding programs. |
| (4) | Securities received as collateral against other financial assets are included within liquid securities and other securities. |
As of October 31, 2023 total encumbered assets of the Bank were $417 billion (October 31, 2022 – $377 billion). Of the remaining $1,092 billion (October 31, 2022 – $1,051 billion) of unencumbered assets, $332 billion (October 31, 2022 – $272 billion) are considered readily available in the normal course of business to secure funding or meet collateral needs as detailed above.
In some over-the-counter derivative contracts, the Bank would be required to post additional collateral or receive less collateral in the event its credit rating was downgraded. The Bank maintains access to sufficient collateral to meet these obligations in the event of a downgrade of its ratings by one or more of the rating agencies. As at October 31, 2023 the potential adverse impact on derivatives collateral that would result from a one-notch or two-notch downgrade of the Bank’s rating below its lowest current rating was $26 million or $977 million, respectively.
Encumbered liquid assets are not considered to be available for liquidity management purposes. Liquid assets which are used to hedge derivative positions in trading books or for hedging purposes are considered to be available for liquidity management provided they meet the criteria discussed in liquid assets above.
Liquidity coverage ratio
The Liquidity Coverage Ratio measure (LCR) is based on a 30-day liquidity stress scenario, with assumptions defined in the OSFI Liquidity Adequacy Requirements (LAR) Guideline. The LCR is calculated as the ratio of high quality liquid assets (HQLA) to net cash outflows. The Bank is subject to a regulatory minimum LCR of 100%.
2023 Scotiabank Annual Report | 101
Management’s Discussion and Analysis
The LAR Guideline stipulates that banks must maintain an adequate level of unencumbered HQLA that can be converted into cash to meet liquidity needs over a 30 calendar day horizon under a pre-defined significantly severe liquidity stress scenario. The LCR-prescribed liquidity stress scenario includes assumptions for asset haircuts, deposit run-off, wholesale rollover rates, and outflow rates for commitments.
HQLA are grouped into three categories: Level 1, Level 2A and Level 2B, as defined in the LAR Guideline. Level 1 HQLA receive no haircuts, and includes cash, deposits with central banks, central bank reserves available to the Bank in times of stress, and securities with a 0% risk weight. Level 2A and 2B include HQLA of lesser quality and attracts haircuts ranging from 15%-50%.
The total weighted values for net cash outflows for the next 30 days are derived by applying the assumptions specified in the LAR Guideline to specific items, including loans, deposits, maturing debt, derivative transactions and commitments to extend credit.
The following table presents the Bank’s average LCR for the quarter ended October 31, 2023 based on the average daily position in the quarter.
T55 Bank’s average LCR(1)
| For the quarter ended October 31, 2023 ($ millions)(2) | Total unweighted value (Average)(3) |
Total weighted value |
||||||
| High-quality liquid assets |
||||||||
| Total high-quality liquid assets (HQLA) |
* | $ | 272,637 | |||||
| Cash outflows |
||||||||
| Retail deposits and deposits from small business customers, of which: |
$ | 242,430 | $ | 22,974 | ||||
| Stable deposits |
98,628 | 3,160 | ||||||
| Less stable deposits |
143,802 | 19,814 | ||||||
| Unsecured wholesale funding, of which: |
299,363 | 137,055 | ||||||
| Operational deposits (all counterparties) and deposits in networks of cooperative banks |
102,475 | 24,731 | ||||||
| Non-operational deposits (all counterparties) |
166,084 | 81,520 | ||||||
| Unsecured debt |
30,804 | 30,804 | ||||||
| Secured wholesale funding |
* | 58,074 | ||||||
| Additional requirements, of which: |
271,811 | 60,448 | ||||||
| Outflows related to derivative exposures and other collateral requirements |
41,928 | 20,899 | ||||||
| Outflows related to loss of funding on debt products |
6,918 | 6,918 | ||||||
| Credit and liquidity facilities |
222,965 | 32,631 | ||||||
| Other contractual funding obligations |
1,370 | 1,342 | ||||||
| Other contingent funding obligations(5) |
573,560 | 7,394 | ||||||
| Total cash outflows |
* | $ | 287,287 | |||||
| Cash inflows |
||||||||
| Secured lending (e.g. reverse repos) |
$ | 273,864 | $ | 43,630 | ||||
| Inflows from fully performing exposures |
33,262 | 20,686 | ||||||
| Other cash inflows |
21,816 | 21,816 | ||||||
| Total cash inflows |
$ | 328,942 | $ | 86,132 | ||||
| Total adjusted value(6) |
||||||||
| Total HQLA |
* | $ | 272,637 | |||||
| Total net cash outflows |
* | $ | 201,155 | |||||
| Liquidity coverage ratio (%) |
* | 136 | % | |||||
| For the quarter ended October 31, 2022 ($ millions) | Total adjusted value(6) |
|||||||
| Total HQLA |
* | $ | 213,156 | |||||
| Total net cash outflows |
* | $ | 179,274 | |||||
| Liquidity coverage ratio (%) |
* | 119 | % | |||||
| * | Disclosure is not required under regulatory guideline. |
| (1) | This measure has been disclosed in this document in accordance with OSFI Guideline – Public Disclosure Requirements for Domestic Systemically Important Banks on Liquidity Coverage Ratio (April 2015). |
| (2) | Based on the average daily positions of the 62 business days in the quarter. |
| (3) | Unweighted values represent outstanding balances maturing or callable within the next 30 days. |
| (4) | Weighted values represent balances calculated after the application of HQLA haircuts or inflow and outflow rates, as prescribed by the LAR Guideline. |
| (5) | Total unweighted value includes uncommitted credit and liquidity facilities, guarantees and letters of credit, outstanding debt securities with remaining maturity greater than 30 days, and other contractual cash outflows. |
| (6) | Total adjusted value represents balances calculated after the application of both haircuts and inflow and outflow rates and any applicable caps. |
HQLA is substantially comprised of Level 1 assets (as defined in the LAR Guideline), such as cash, deposits with central banks available to the Bank in times of stress, and highly rated securities issued or guaranteed by governments, central banks and supranational entities.
The increase in the Bank’s average LCR for the quarter ended October 31, 2023 versus the quarter ended October 31, 2022 was attributable to growth in deposits and wholesale funding, partly offset by growth in loans and securities. The Bank monitors its significant currency exposures, Canadian and U.S. dollars, in accordance with its liquidity risk management framework and risk appetite.
102 | 2023 Scotiabank Annual Report
Management’s Discussion and Analysis | Risk Management
Net stable funding ratio
The Net Stable Funding Ratio (NSFR) requires institutions to maintain a stable funding profile in relation to the composition of their assets and off-balance sheet exposures. It is calculated as the ratio of available stable funding (ASF) to required stable funding (RSF), with assumptions defined in the LAR Guideline. The Bank is subject to a regulatory minimum NSFR of 100%.
ASF is defined as the portion of capital and liabilities expected to be reliable over the time horizons considered by the NSFR. RSF is a function of the liquidity characteristics and residual maturities of the various assets held by the Bank as well as those of its off-balance sheet exposures.
The total weighted values for ASF and RSF included in the table that follows are derived by applying the assumptions specified in the LAR Guideline to balance sheet items, including capital instruments, wholesale funding, deposits, loans and mortgages, securities, derivatives and off-balance sheet items such as commitments to extend credit.
The following table presents the Bank’s NSFR as at October 31, 2023.
T56 Bank’s NSFR(1)
| Unweighted Value by Residual Maturity | Weighted value(3) |
|||||||||||||||||||
| As at October 31, 2023 ($ millions) | No maturity(2) | < 6 months | 6-12 months | ≥ 1 year | ||||||||||||||||
| Available Stable Funding (ASF) Item |
|
|||||||||||||||||||
| Capital: | $ | 89,589 | $ | – | $ | – | $ | – | $ | 89,589 | ||||||||||
| Regulatory capital |
89,589 | – | – | – | 89,589 | |||||||||||||||
| Other capital instruments |
– | – | – | – | – | |||||||||||||||
| Retail deposits and deposits from small business customers: | 190,046 | 86,049 | 29,923 | 53,810 | 329,620 | |||||||||||||||
| Stable deposits |
90,836 | 24,310 | 10,893 | 15,396 | 135,133 | |||||||||||||||
| Less stable deposits |
99,210 | 61,739 | 19,030 | 38,414 | 194,487 | |||||||||||||||
| Wholesale funding: | 188,847 | 315,295 | 58,923 | 134,632 | 333,595 | |||||||||||||||
| Operational deposits |
101,283 | – | – | – | 50,642 | |||||||||||||||
| Other wholesale funding |
87,564 | 315,295 | 58,923 | 134,632 | 282,953 | |||||||||||||||
| Liabilities with matching interdependent assets | – | 1,501 | 2,559 | 16,224 | – | |||||||||||||||
| Other liabilities: | 70,371 | 131,257 | 19,511 | |||||||||||||||||
| NSFR derivative liabilities |
10,695 | |||||||||||||||||||
| All other liabilities and equity not included in the above categories |
70,371 | 99,703 | 2,695 | 18,164 | 19,511 | |||||||||||||||
| Total ASF | $ | 772,315 | ||||||||||||||||||
| Required Stable Funding (RSF) Item |
|
|||||||||||||||||||
| Total NSFR high-quality liquid assets (HQLA) | $ | 17,300 | ||||||||||||||||||
| Deposits held at other financial institutions for operational purposes | $ | 116 | $ | 950 | $ | – | $ | – | $ | 533 | ||||||||||
| Performing loans and securities: | 105,066 | 196,253 | 66,045 | 511,065 | 570,563 | |||||||||||||||
| Performing loans to financial institutions secured by Level 1 HQLA |
35 | 40,617 | 4,694 | – | 4,538 | |||||||||||||||
| Performing loans to financial institutions secured by non-Level 1 HQLA and unsecured performing loans to financial institutions |
3,577 | 80,002 | 11,035 | 12,167 | 30,593 | |||||||||||||||
| Performing loans to non-financial corporate clients, loans to retail and small business customers, and loans to sovereigns, central banks and PSEs, of which: |
60,622 | 62,798 | 32,866 | 228,138 | 292,298 | |||||||||||||||
| With a risk weight of less than or equal to 35% under the Basel II standardised approach for credit risk |
– | 236 | 395 | 2,101 | 1,681 | |||||||||||||||
| Performing residential mortgages, of which: |
21,926 | 12,040 | 17,265 | 263,127 | 220,085 | |||||||||||||||
| With a risk weight of less than or equal to 35% under the Basel II standardised approach for credit risk |
21,926 | 11,940 | 17,083 | 248,441 | 207,460 | |||||||||||||||
| Securities that are not in default and do not qualify as HQLA, including exchange-traded equities |
18,906 | 796 | 185 | 7,633 | 23,049 | |||||||||||||||
| Assets with matching interdependent liabilities(4) | – | 1,501 | 2,559 | 16,224 | – | |||||||||||||||
| Other assets: | 3,649 | 190,249 | 57,469 | |||||||||||||||||
| Physical traded commodities, including gold |
3,649 | 3,102 | ||||||||||||||||||
| Assets posted as initial margin for derivative contracts and contributions to default funds of CCPs |
9,136 | 7,766 | ||||||||||||||||||
| NSFR derivative assets |
6,262 | – | ||||||||||||||||||
| NSFR derivative liabilities before deduction of variation margin posted |
29,816 | 1,491 | ||||||||||||||||||
| All other assets not included in the above categories |
– | 100,279 | – | 44,756 | 45,110 | |||||||||||||||
| Off-balance sheet items | 499,710 | 19,279 | ||||||||||||||||||
| Total RSF | $ | 665,144 | ||||||||||||||||||
| Net Stable Funding Ratio (%) | 116 | % | ||||||||||||||||||
| (1) | This measure has been disclosed in this document in accordance with the LAR Guideline-Net Stable Funding Ratio Disclosure Requirements (January 2021). |
| (2) | Items in the “no maturity” time bucket do not have a stated maturity. These may include, but are not limited to, items such as capital with perpetual maturity, non-maturity deposits, short positions, open maturity positions, non-HQLA equities, and physical traded commodities. |
| (3) | Weighted values represent balances calculated after the application of ASF and RSF rates, as prescribed by the LAR Guideline. |
| (4) | Interdependent assets and liabilities are primarily comprised of transactions related to the Canada Mortgage Bond program. |
2023 Scotiabank Annual Report | 103
Management’s Discussion and Analysis
| Weighted value |
||||
| As at October 31, 2022 ($ millions) | ||||
| Total ASF | $ | 720,082 | ||
| Total RSF | 649,927 | |||
| Net stable funding ratio (%) | 111 | % | ||
Available stable funding is primarily provided by the Bank’s large pool of retail, small business and corporate customer deposits; secured and unsecured wholesale funding and capital. Required stable funding primarily originates from the Bank’s loan and mortgage portfolio, securities holdings, off-balance sheet items and other assets.
The Bank’s NSFR as at October 31, 2023 was higher compared to the previous year end primarily due to higher ASF from retail deposits and deposits from small business customers and secured funding and lower RSF from mortgages, partly offset by higher RSF from securities and loans.
Funding
The Bank ensures that its funding sources are well diversified. Funding concentrations are regularly monitored and analyzed by type. The sources of funding are capital, deposits from retail and commercial clients sourced through the Canadian and international branch network, deposits from financial institutions as well as wholesale debt issuances.
Capital and personal deposits are key components of the Bank’s funding and these amounted to $385 billion as at October 31, 2023 (October 31, 2022 – $357 billion(1)). The increase since October 31, 2022 is due primarily to growth in personal deposits and common equity. The Bank’s funding is also comprised of commercial deposits, particularly those of an operating or relationship nature. Capital and customer deposit based funding is augmented by wholesale debt issuances, the longer term (original maturity over 1 year) portion of which amounts to $216 billion (October 31, 2022 – $204 billion). Longer term wholesale debt issuances include senior notes, mortgage securitizations, asset-backed securities and covered bonds.
The Bank operates in many different currencies and countries. From a funding perspective, the most significant currencies are Canadian and U.S. dollars. With respect to the Bank’s operations outside Canada, there are different funding strategies depending on the nature of the activities in each country. For those countries where the Bank operates a branch banking subsidiary, the strategy is for the subsidiary to be substantially self-funding in its local market. For other subsidiaries or branches outside Canada where local deposit gathering capability is not sufficient, funding is provided through the wholesale funding activities of the Bank.
From an overall funding perspective, the Bank’s objective is to achieve an appropriate balance between the cost and the stability of funding. Diversification of funding sources is a key element of the funding strategy.
The Bank’s wholesale debt diversification strategy is primarily executed via the Bank’s main wholesale funding centres, located in Toronto, New York, London and Singapore. The majority of these funds are sourced in Canadian and U.S. dollars. Where required, these funds are swapped to fund assets in different currencies. The funding strategy deployed by wholesale funding centres and the management of associated risks, such as geographic and currency risk, are managed centrally within the framework of policies and limits that are approved by the Board of Directors.
In the normal course, the Bank uses a mix of unsecured and secured wholesale funding instruments across a variety of markets. The choice of instruments and markets is based on a number of factors, including relative cost, market capacity and diversification of funding. Market conditions can change over time, impacting cost and capacity in particular markets or instruments. Changing market conditions can include periods of stress where the availability of funding in particular markets or instruments is constrained. In these circumstances the Bank would increase its focus on sources of funding in functioning markets and secured funding instruments. Should a period of extreme stress exist such that all wholesale funding sources are constrained, the Bank maintains a pool of liquid assets to mitigate its liquidity risk. This pool includes cash, deposits with central banks and securities.
In Canada, the Bank raises short and longer-term wholesale debt through the issuance of senior unsecured notes. Additional longer-term wholesale debt may be generated through the Bank’s Canadian Debt and Equity Shelf, the securitization of Canadian insured residential mortgages through CMHC programs (such as Canada Mortgage Bonds), uninsured residential mortgages through the Bank’s Covered Bond Program, retail credit card receivables through the Trillium Credit Card Trust II program, retail indirect auto loan receivables through the Securitized Term Auto Receivables Trust program and unsecured personal lines of credit through the Halifax Receivables Trust program. CMHC securitization programs, while included in the Bank’s view of wholesale debt issuance, do not entail the run-off risk that can be experienced in funding raised from capital markets.
Outside of Canada, short-term wholesale debt may be raised through the issuance of negotiable certificates of deposit in the United States, Hong Kong, the United Kingdom, and Australia and the issuance of commercial paper in the United States. The Bank operates longer-term wholesale debt issuance registered programs in the United States, such as its SEC Registered Debt and Equity Shelf, and non-registered programs, such as the securitization of retail indirect auto loan receivables through the Securitized Term Auto Receivables Trust program and retail credit card receivables through the Trillium Credit Card Trust II program. The Bank may issue its Covered Bond Program (listed with the U.K. Listing Authority and the Swiss Stock Exchange), in Europe, the United Kingdom, the United States, Australia and Switzerland. The Bank also raises longer-term funding across a variety of currencies through its Australian Medium Term Note Programme, European Medium Term Note Programme (listed with the U.K. Listing Authority and the Swiss Stock Exchange) and Singapore Medium Term Note Programme (listed with the Singapore Exchange and the Taiwan Exchange).
The Department of Finance’s bail-in regulations under the Canada Deposit Insurance Corporation (CDIC) Act and the Bank Act, became effective September 23, 2018. Senior long-term debt issued by the Bank on or after September 23, 2018, that has an original term greater than 400 days and is marketable, subject to certain exceptions, is subject to the Canadian Bank Recapitalization (Bail-in) regime. Under the Bail-in regime, in circumstances when the Superintendent of Financial Institutions has determined that a bank may no longer be viable, the Governor in Council may, upon a recommendation of the Minister of Finance that they are of the opinion that it is in the public interest to do so, grant an order directing the CDIC to convert all or a portion of certain shares and liabilities of that bank into common shares. As at October 31, 2023, issued and outstanding liabilities of $76 billion (October 31, 2022 – $73 billion) were subject to conversion under the bail-in regime.
| (1) | Prior period amount has been restated to conform with current period presentation. |
104 | 2023 Scotiabank Annual Report
Management’s Discussion and Analysis | Risk Management
The table below provides the remaining contractual maturities of funding raised through wholesale funding. In the Consolidated Statement of Financial Position, these liabilities are primarily included in Business & Government Deposits.
T57 Wholesale funding(1)
| As at October 31, 2023 ($ millions) |
Less than 1 month |
1-3 months |
3-6 months |
6-9 months |
9-12 months |
Sub-Total < 1 Year |
1-2 years | 2-5 years | >5 years | Total | ||||||||||||||||||||||||||||||
| Deposits from banks(2) |
$ | 2,363 | $ | 1,197 | $ | 129 | $ | 693 | $ | 450 | $ | 4,832 | $ | 415 | $ | – | $ | – | $ | 5,247 | ||||||||||||||||||||
| Bearer deposit notes, commercial paper and short-term certificate of deposits |
12,026 | 15,304 | 20,407 | 17,064 | 7,060 | 71,861 | 1,739 | 268 | 79 | 73,947 | ||||||||||||||||||||||||||||||
| Asset-backed commercial paper(3) |
4,532 | 3,998 | 2,655 | 1,397 | – | 12,582 | – | – | – | 12,582 | ||||||||||||||||||||||||||||||
| Senior notes(4)(5) |
176 | 3,034 | 4,047 | 7,740 | 1,392 | 16,389 | 2,250 | 8,651 | 11,593 | 38,883 | ||||||||||||||||||||||||||||||
| Bail-inable notes(5) |
– | 613 | 9,450 | 2,288 | 1,889 | 14,240 | 20,462 | 26,063 | 15,204 | 75,969 | ||||||||||||||||||||||||||||||
| Asset-backed securities |
– | 1 | – | – | – | 1 | 910 | 1,387 | 851 | 3,149 | ||||||||||||||||||||||||||||||
| Covered bonds |
– | 1,834 | – | – | 2,935 | 4,769 | 9,163 | 29,892 | 5,976 | 49,800 | ||||||||||||||||||||||||||||||
| Mortgage securitization(6) |
– | 953 | 548 | 1,751 | 811 | 4,063 | 3,627 | 7,851 | 4,268 | 19,809 | ||||||||||||||||||||||||||||||
| Subordinated debentures(7) |
– | – | 2 | – | – | 2 | 336 | 1,976 | 9,322 | 11,636 | ||||||||||||||||||||||||||||||
| Total wholesale funding sources |
$ | 19,097 | $ | 26,934 | $ | 37,238 | $ | 30,933 | $ | 14,537 | $ | 128,739 | $ | 38,902 | $ | 76,088 | $ | 47,293 | $ | 291,022 | ||||||||||||||||||||
| Of Which: |
||||||||||||||||||||||||||||||||||||||||
| Unsecured funding |
$ | 14,566 | $ | 20,148 | $ | 34,034 | $ | 27,784 | $ | 10,792 | $ | 107,324 | $ | 25,201 | $ | 36,959 | $ | 36,198 | $ | 205,682 | ||||||||||||||||||||
| Secured funding |
4,531 | 6,786 | 3,204 | 3,149 | 3,745 | 21,415 | 13,701 | 39,129 | 11,095 | 85,340 | ||||||||||||||||||||||||||||||
| As at October 31, 2022 ($ millions) |
Less than 1 month |
1-3 months |
3-6 months |
6-9 months |
9-12 months |
Sub-Total < 1 Year |
1-2 years | 2-5 years | >5 years | Total | ||||||||||||||||||||||||||||||
| Deposits from banks(2) |
$ | 2,182 | $ | 799 | $ | 319 | $ | 600 | $ | 298 | $ | 4,198 | $ | 128 | $ | 12 | $ | – | $ | 4,338 | ||||||||||||||||||||
| Bearer deposit notes, commercial paper and short-term certificate of deposits |
8,739 | 18,053 | 29,042 | 17,568 | 9,958 | 83,360 | 824 | 416 | 50 | 84,650 | ||||||||||||||||||||||||||||||
| Asset-backed commercial paper(3) |
1,767 | 5,418 | 2,337 | 68 | – | 9,590 | – | – | – | 9,590 | ||||||||||||||||||||||||||||||
| Senior notes(4)(5) |
1,998 | 1,605 | 8,335 | 1,925 | 5,161 | 19,024 | 2,720 | 6,048 | 11,003 | 38,795 | ||||||||||||||||||||||||||||||
| Bail-inable notes(5) |
1,311 | 682 | 1,420 | 5,500 | 5,408 | 14,321 | 13,678 | 29,887 | 14,630 | 72,516 | ||||||||||||||||||||||||||||||
| Asset-backed securities |
– | 1 | – | 1 | 592 | 594 | 3 | 648 | 103 | 1,348 | ||||||||||||||||||||||||||||||
| Covered bonds |
– | 859 | 3,919 | – | 2,356 | 7,134 | 4,375 | 26,973 | 7,423 | 45,905 | ||||||||||||||||||||||||||||||
| Mortgage securitization(6) |
– | 1,721 | 806 | 1,048 | 2,562 | 6,137 | 4,069 | 8,854 | 4,778 | 23,838 | ||||||||||||||||||||||||||||||
| Subordinated debentures(7) |
– | – | – | – | – | – | 3 | 2,108 | 8,566 | 10,677 | ||||||||||||||||||||||||||||||
| Total wholesale funding sources |
$ | 15,997 | $ | 29,138 | $ | 46,178 | $ | 26,710 | $ | 26,335 | $ | 144,358 | $ | 25,800 | $ | 74,946 | $ | 46,553 | $ | 291,657 | ||||||||||||||||||||
| Of Which: |
||||||||||||||||||||||||||||||||||||||||
| Unsecured funding |
$ | 14,231 | $ | 21,138 | $ | 39,117 | $ | 25,592 | $ | 20,825 | $ | 120,903 | $ | 17,353 | $ | 38,471 | $ | 34,248 | $ | 210,975 | ||||||||||||||||||||
| Secured funding |
1,766 | 8,000 | 7,061 | 1,118 | 5,510 | 23,455 | 8,447 | 36,475 | 12,305 | 80,682 | ||||||||||||||||||||||||||||||
| (1) | Wholesale funding sources exclude obligations related to securities sold under repurchase agreements and bankers’ acceptances, which are disclosed in the contractual maturities table below. Amounts are based on remaining term to maturity. |
| (2) | Only includes commercial bank deposits. |
| (3) | Wholesale funding sources also exclude asset-backed commercial paper (ABCP) issued by certain ABCP conduits that are not consolidated for financial reporting purposes. |
| (4) | Not subject to bail-in. |
| (5) | Includes structured notes issued to institutional investors. |
| (6) | Represents residential mortgages funded through Canadian Federal Government agency sponsored programs. Funding accessed through such programs does not impact the funding capacity of the Bank in its own name. |
| (7) | Although subordinated debentures are a component of regulatory capital, they are included in this table in accordance with EDTF recommended disclosures. |
Wholesale funding generally bears a higher risk of run-off in a stressed environment than other sources of funding. The Bank mitigates this risk through funding diversification, ongoing engagement with investors and by maintaining a large holding of unencumbered liquid assets. Unencumbered liquid assets of $319 billion as at October 31, 2023 (October 31, 2022 – $260 billion) were well in excess of wholesale funding sources that mature in the next twelve months.
Contractual maturities and obligations
The table below provides the maturity of assets and liabilities as well as the off-balance sheet commitments as at October 31, 2023, based on the contractual maturity date.
From a liquidity risk perspective the Bank considers factors other than contractual maturity in the assessment of liquid assets or in determining expected future cash flows. In particular, for securities with a fixed maturity date, the ability and time horizon to raise cash from these securities is more relevant to liquidity management than contractual maturity. For other assets and deposits the Bank uses assumptions about rollover rates to assess liquidity risk for normal course and stress scenarios. Similarly, the Bank uses assumptions to assess the potential drawdown of credit commitments in various scenarios.
The Bank’s contractual obligations include contracts and purchase obligations, including agreements to purchase goods and services that are enforceable, legally binding on the Bank and affect the Bank’s liquidity and capital resource needs. The Bank leases a large number of its branches, offices and other locations. The majority of these leases are for a term of five years, with options to renew.
2023 Scotiabank Annual Report | 105
Management’s Discussion and Analysis
T58 Contractual maturities
| As at October 31, 2023 | ||||||||||||||||||||||||||||||||||||||||
| ($ millions) | Less than one month |
One to three months |
Three to six months |
Six to nine months |
Nine to twelve months |
One to two years |
Two to five years |
Over five years |
No specific maturity |
Total | ||||||||||||||||||||||||||||||
| Assets |
||||||||||||||||||||||||||||||||||||||||
| Cash and deposits with financial institutions and precious metals |
$ | 85,337 | $ | 383 | $ | 50 | $ | 45 | $ | 47 | $ | 132 | $ | 246 | $ | 199 | $ | 4,810 | $ | 91,249 | ||||||||||||||||||||
| Trading assets |
2,822 | 6,336 | 7,434 | 2,798 | 3,687 | 8,878 | 18,512 | 16,942 | 50,459 | 117,868 | ||||||||||||||||||||||||||||||
| Securities purchased under resale agreements and securities borrowed |
174,243 | 11,632 | 8,185 | 3,247 | 2,018 | – | – | – | – | 199,325 | ||||||||||||||||||||||||||||||
| Derivative financial instruments |
3,403 | 5,590 | 3,641 | 2,772 | 2,238 | 7,917 | 12,495 | 13,284 | – | 51,340 | ||||||||||||||||||||||||||||||
| Investment securities – FVOCI |
2,679 | 6,299 | 8,095 | 4,006 | 4,718 | 9,754 | 30,602 | 15,997 | 2,164 | 84,314 | ||||||||||||||||||||||||||||||
| Investment securities – amortized cost |
291 | 560 | 754 | 1,063 | 826 | 2,937 | 5,217 | 20,336 | – | 31,984 | ||||||||||||||||||||||||||||||
| Investment securities – FVTPL |
– | – | – | – | – | – | 51 | – | 1,888 | 1,939 | ||||||||||||||||||||||||||||||
| Loans |
61,791 | 38,905 | 39,256 | 39,951 | 35,611 | 132,128 | 291,332 | 52,390 | 59,547 | 750,911 | ||||||||||||||||||||||||||||||
| Residential mortgages |
3,722 | 6,362 | 10,961 | 12,478 | 14,087 | 70,902 | 183,644 | 39,776 | 2,250 | (1) | 344,182 | |||||||||||||||||||||||||||||
| Personal loans |
3,594 | 2,538 | 4,168 | 4,398 | 3,581 | 13,419 | 24,456 | 6,782 | 41,234 | 104,170 | ||||||||||||||||||||||||||||||
| Credit cards |
– | – | – | – | – | – | – | – | 17,109 | 17,109 | ||||||||||||||||||||||||||||||
| Business and government |
54,475 | 30,005 | 24,127 | 23,075 | 17,943 | 47,807 | 83,232 | 5,832 | 5,326 | (2) | 291,822 | |||||||||||||||||||||||||||||
| Allowance for credit losses |
– | – | – | – | – | – | – | – | (6,372 | ) | (6,372 | ) | ||||||||||||||||||||||||||||
| Customers’ liabilities under acceptances |
15,243 | 3,307 | 73 | 5 | – | – | – | – | – | 18,628 | ||||||||||||||||||||||||||||||
| Other assets |
– | – | – | – | – | – | – | – | 63,231 | 63,231 | ||||||||||||||||||||||||||||||
| Total assets |
345,809 | 73,012 | 67,488 | 53,887 | 49,145 | 161,746 | 358,455 | 119,148 | 182,099 | 1,410,789 | ||||||||||||||||||||||||||||||
| Liabilities and equity |
||||||||||||||||||||||||||||||||||||||||
| Deposits |
$ | 109,973 | $ | 65,320 | $ | 70,697 | $ | 58,361 | $ | 46,318 | $ | 68,912 | $ | 86,716 | $ | 27,160 | $ | 418,876 | $ | 952,333 | ||||||||||||||||||||
| Personal |
18,320 | 16,379 | 18,241 | 13,690 | 16,668 | 25,987 | 15,199 | 828 | 163,305 | 288,617 | ||||||||||||||||||||||||||||||
| Non-personal |
91,653 | 48,941 | 52,456 | 44,671 | 29,650 | 42,925 | 71,517 | 26,332 | 255,571 | 663,716 | ||||||||||||||||||||||||||||||
| Financial instruments designated at fair value through profit or loss |
385 | 696 | 1,333 | 1,084 | 1,361 | 6,979 | 4,045 | 10,896 | – | 26,779 | ||||||||||||||||||||||||||||||
| Acceptances |
15,333 | 3,307 | 73 | 5 | – | – | – | – | – | 18,718 | ||||||||||||||||||||||||||||||
| Obligations related to securities sold short |
312 | 2,039 | 2,216 | 1,016 | 2,032 | 2,915 | 6,827 | 7,503 | 11,543 | 36,403 | ||||||||||||||||||||||||||||||
| Derivative financial instruments |
2,542 | 4,561 | 2,866 | 2,328 | 1,983 | 8,440 | 14,489 | 21,451 | – | 58,660 | ||||||||||||||||||||||||||||||
| Obligations related to securities sold under repurchase agreements and securities lent |
157,525 | 821 | 1,661 | – | – | – | – | – | – | 160,007 | ||||||||||||||||||||||||||||||
| Subordinated debentures |
– | – | – | – | – | 252 | 1,714 | 7,727 | – | 9,693 | ||||||||||||||||||||||||||||||
| Other liabilities |
530 | 1,809 | 1,309 | 1,248 | 1,556 | 7,642 | 6,021 | 8,021 | 41,393 | 69,529 | ||||||||||||||||||||||||||||||
| Total equity |
– | – | – | – | – | – | – | – | 78,667 | 78,667 | ||||||||||||||||||||||||||||||
| Total liabilities and equity |
286,600 | 78,553 | 80,155 | 64,042 | 53,250 | 95,140 | 119,812 | 82,758 | 550,479 | 1,410,789 | ||||||||||||||||||||||||||||||
| Off-Balance sheet commitments |
||||||||||||||||||||||||||||||||||||||||
| Credit commitments(3) |
$ | 7,709 | $ | 8,558 | $ | 22,634 | $ | 17,905 | $ | 19,784 | $ | 47,035 | $ | 150,573 | $ | 11,571 | $ | – | $ | 285,769 | ||||||||||||||||||||
| Guarantees and letters of credit(4) |
– | – | – | – | – | – | – | – | 49,112 | 49,112 | ||||||||||||||||||||||||||||||
| Outsourcing obligations(5) |
18 | 35 | 52 | 52 | 52 | 39 | 33 | 24 | – | 305 | ||||||||||||||||||||||||||||||
| (1) | Includes primarily impaired mortgages. |
| (2) | Includes primarily overdrafts and impaired loans. |
| (3) | Includes the undrawn component of committed credit and liquidity facilities. |
| (4) | Includes outstanding balances of guarantees, standby letters of credit and commercial letters of credit which may expire undrawn. |
| (5) | The Bank relies on outsourcing arrangements for certain support and/or business functions, including, but not limited to, computer operations and cheque and bill payment processing. |
106 | 2023 Scotiabank Annual Report
Management’s Discussion and Analysis | Risk Management
T58 Contractual maturities
| As at October 31, 2022 | ||||||||||||||||||||||||||||||||||||||||
| ($ millions) | Less than one month |
One to three months |
Three to six months |
Six to nine months |
Nine to twelve months |
One to two years |
Two to five years |
Over five years |
No specific maturity |
Total | ||||||||||||||||||||||||||||||
| Assets |
||||||||||||||||||||||||||||||||||||||||
| Cash and deposits with financial institutions and precious metals |
$ | 57,217 | $ | 481 | $ | 171 | $ | 94 | $ | 89 | $ | 298 | $ | 464 | $ | 390 | $ | 7,234 | $ | 66,438 | ||||||||||||||||||||
| Trading assets |
2,228 | 5,501 | 6,338 | 4,073 | 2,519 | 8,652 | 15,791 | 19,323 | 48,729 | 113,154 | ||||||||||||||||||||||||||||||
| Securities purchased under resale agreements and securities borrowed |
132,383 | 28,000 | 13,781 | 997 | 152 | – | – | – | – | 175,313 | ||||||||||||||||||||||||||||||
| Derivative financial instruments |
5,227 | 5,797 | 4,166 | 2,749 | 2,653 | 7,386 | 14,538 | 13,183 | – | 55,699 | ||||||||||||||||||||||||||||||
| Investment securities – FVOCI |
3,886 | 6,929 | 4,983 | 3,574 | 10,347 | 8,466 | 29,274 | 13,809 | 3,442 | 84,710 | ||||||||||||||||||||||||||||||
| Investment securities – amortized cost |
19 | 746 | 314 | 1,945 | 854 | 2,113 | 4,957 | 12,662 | – | 23,610 | ||||||||||||||||||||||||||||||
| Investment securities – FVTPL |
– | – | – | – | – | – | 54 | 8 | 1,626 | 1,688 | ||||||||||||||||||||||||||||||
| Loans |
61,748 | 39,627 | 33,765 | 37,342 | 32,941 | 95,758 | 339,211 | 49,828 | 54,767 | 744,987 | ||||||||||||||||||||||||||||||
| Residential mortgages |
2,523 | 5,132 | 8,614 | 14,293 | 10,995 | 42,088 | 227,488 | 37,498 | 648 | (1) | 349,279 | |||||||||||||||||||||||||||||
| Personal loans |
3,909 | 2,023 | 3,287 | 3,415 | 3,138 | 13,008 | 24,271 | 6,610 | 39,770 | 99,431 | ||||||||||||||||||||||||||||||
| Credit cards |
– | – | – | – | – | – | – | – | 14,518 | 14,518 | ||||||||||||||||||||||||||||||
| Business and government |
55,316 | 32,472 | 21,864 | 19,634 | 18,808 | 40,662 | 87,452 | 5,720 | 5,179 | (2) | 287,107 | |||||||||||||||||||||||||||||
| Allowance for credit losses |
– | – | – | – | – | – | – | – | (5,348 | ) | (5,348 | ) | ||||||||||||||||||||||||||||
| Customers’ liabilities under acceptances |
15,418 | 3,812 | 191 | 55 | 18 | – | – | – | – | 19,494 | ||||||||||||||||||||||||||||||
| Other assets |
– | – | – | – | – | – | – | – | 64,325 | 64,325 | ||||||||||||||||||||||||||||||
| Total assets |
278,126 | 90,893 | 63,709 | 50,829 | 49,573 | 122,673 | 404,289 | 109,203 | 180,123 | 1,349,418 | ||||||||||||||||||||||||||||||
| Liabilities and equity |
||||||||||||||||||||||||||||||||||||||||
| Deposits |
$ | 97,418 | $ | 63,589 | $ | 67,249 | $ | 48,001 | $ | 53,602 | $ | 43,075 | $ | 83,647 | $ | 28,645 | $ | 430,955 | $ | 916,181 | ||||||||||||||||||||
| Personal |
12,910 | 12,478 | 14,358 | 12,931 | 12,872 | 13,870 | 13,361 | 639 | 172,473 | 265,892 | ||||||||||||||||||||||||||||||
| Non-personal |
84,508 | 51,111 | 52,891 | 35,070 | 40,730 | 29,205 | 70,286 | 28,006 | 258,482 | 650,289 | ||||||||||||||||||||||||||||||
| Financial instruments designated at fair value through profit or loss |
337 | 658 | 727 | 900 | 1,189 | 5,989 | 2,190 | 10,431 | – | 22,421 | ||||||||||||||||||||||||||||||
| Acceptances |
15,449 | 3,812 | 191 | 55 | 18 | – | – | – | – | 19,525 | ||||||||||||||||||||||||||||||
| Obligations related to securities sold short |
539 | 1,507 | 890 | 1,817 | 2,404 | 3,959 | 5,437 | 7,426 | 16,470 | 40,449 | ||||||||||||||||||||||||||||||
| Derivative financial instruments |
3,386 | 4,968 | 4,876 | 3,032 | 3,181 | 8,721 | 17,231 | 20,505 | – | 65,900 | ||||||||||||||||||||||||||||||
| Obligations related to securities sold under repurchase agreements and securities lent |
128,128 | 8,596 | 2,153 | 72 | – | 76 | – | – | – | 139,025 | ||||||||||||||||||||||||||||||
| Subordinated debentures |
– | – | – | – | – | – | 1,943 | 6,526 | – | 8,469 | ||||||||||||||||||||||||||||||
| Other liabilities |
3,914 | 1,342 | 2,331 | 1,713 | 695 | 7,526 | 5,404 | 7,150 | 32,624 | 62,699 | ||||||||||||||||||||||||||||||
| Total equity |
– | – | – | – | – | – | – | – | 74,749 | 74,749 | ||||||||||||||||||||||||||||||
| Total liabilities and equity |
249,171 | 84,472 | 78,417 | 55,590 | 61,089 | 69,346 | 115,852 | 80,683 | 554,798 | 1,349,418 | ||||||||||||||||||||||||||||||
| Off-Balance sheet commitments |
||||||||||||||||||||||||||||||||||||||||
| Credit commitments(3) |
$ | 8,531 | $ | 9,272 | $ | 19,662 | $ | 23,795 | $ | 20,971 | $ | 35,498 | $ | 126,074 | $ | 23,164 | $ | – | $ | 266,967 | ||||||||||||||||||||
| Guarantees and letters of credit(4) |
– | – | – | – | – | – | – | – | 41,977 | 41,977 | ||||||||||||||||||||||||||||||
| Outsourcing obligations(5) |
18 | 36 | 53 | 53 | 53 | 208 | 61 | 35 | – | 517 | ||||||||||||||||||||||||||||||
| (1) | Includes primarily impaired mortgages. |
| (2) | Includes primarily overdrafts and impaired loans. |
| (3) | Includes the undrawn component of committed credit and liquidity facilities. |
| (4) | Includes outstanding balances of guarantees, standby letters of credit and commercial letters of credit which may expire undrawn. |
| (5) | The Bank relies on outsourcing arrangements for certain support and/or business functions, including, but not limited to, computer operations and cheque and bill payment processing. |
2023 Scotiabank Annual Report | 107
Management’s Discussion and Analysis
Principal Risks – Non-Financial
Money Laundering, Terrorist Financing and Sanctions Risk
Money Laundering / Terrorist Financing (ML/TF) and Sanctions risks are the susceptibility of Scotiabank to be used by individuals or organizations to launder the proceeds of crime, finance terrorism, or violate economic sanctions. It also includes the risk that Scotiabank does not comply with applicable Anti-Money Laundering (AML)/Anti-Terrorist Financing (ATF) or Sanctions legislation or does not apply adequate controls reasonably designed to deter and detect ML/TF and sanctions violations or to file required regulatory reports.
Money laundering, terrorist financing and sanctions risks are managed throughout the Bank via the operation of the Bank’s AML/ATF and Sanctions Program (“the AML/ATF Program”). The Group Chief Anti-Money Laundering Officer is responsible for the AML/ATF Program, which includes the development and application of compliance policies, procedures, the assessment of money laundering, terrorist-financing and sanctions risks, and the maintenance of an ongoing training program. The effectiveness of the AML/ATF and Sanctions Program is subject to regular review and independent assessment conducted by the Audit Department. Global Compliance & AML establishes enterprise standards to assess customers for money laundering, terrorist financing and sanctions risk.
The Bank conducts an enterprise-wide annual self-assessment of the ML/TF and sanctions risks inherent in its business units, as well as an assessment of the control measures in place to manage those risks. The process is led by the Bank’s AML unit, the results of which are shared with the Bank’s senior management. All active employees are provided with mandatory AML/ATF and Sanctions training on an annual basis. The Bank performs Customer Due Diligence sufficient to form a reasonable belief that it knows the true identity of its customers, including in the case of an entity, its material ultimate beneficial owners.
The Bank will not maintain anonymous accounts, nor will it maintain accounts for shell banks. Consistent with a risk-based approach, the Bank assesses the risks of its customers and, where appropriate, conducts enhanced due diligence on those who are considered higher risk. The Bank also conducts ongoing risk tailored monitoring of its customers to detect and report suspicious transactions and activity, and conducts customer and transaction screening against terrorist, sanctions, and other designated watch-lists.
Operational Risk
Operational risk is the risk of loss resulting from people, inadequate or failed processes and systems, or from external events. Operational risk includes third party risk, fraud risk and legal risk. It exists in some form in each of the Bank’s business and support activities, and third parties with whom the Bank has entered a relationship with for outsourcing activities or the provision of products or services. It can result in financial loss, regulatory sanctions and damage to the Bank’s reputation. Operational risk management refers to the discipline of systematic identification, assessment, measurement, mitigation, monitoring, and reporting of operational risk.
The Bank’s Operational Risk Management Framework (ORMF) outlines a structured approach for the effective management of enterprise-wide operational risk in a manner consistent with best practices and regulatory requirements, including those issued by OSFI in their Operational Risk Management Guideline (OSFI E21). The ORMF is supplemented by additional policies, processes, standards and methodologies. The ORMF supports the governance and management of all other non-financial risks. The Framework is approved by the Bank’s Operational Risk Committee and addresses program governance, risk culture and risk appetite along with the following key program components:
Risk Identification and Assessment
Risk identification and assessment is a critical part of effectively managing operational risk. Risks are identified, classified and assessed. Their potential impact is evaluated and reported to management and the Board. Operational risk management tools and programs are in place to support the identification and assessment of operational risk with each having their defined methodology and/or standards. The key tools include Risk and Control Self-Assessments (RCSA), Scenario Analysis, and New Initiatives Risk Assessment.
Risk Measurement
A key component of risk management is quantifying the size and scope of the Bank’s operational risk exposure. The collection and analysis of internal and external operational risk event data and operational risk capital values provide meaningful information to measure operational risk. The data captured provides meaningful information for assessing and mitigating operational risk exposure at the Bank as a result of event root cause analysis and evaluation of internal controls. Timely, accurate and complete reporting of Operational Risk Event data assists the Bank in maintaining a strong risk culture and promotes transparency of the financial impact of Operational Risk Events by aggregating losses and monitoring performance to indicate whether the Bank is operating within its risk appetite.
Operational Risk Capital refers to regulatory and internal capital which is quantified as a reserve for unexpected losses resulting from operational risk. Operational risk capital is a component of the total amount of risk capital that the Bank holds. Loss data from OREs are collected in the Bank’s Operational Risk Management System and used for reporting purposes. When combined with Business Indicator Component (BIC) data, the loss data captured from OREs is a critical input for the calculation of the Bank’s Internal Loss Multiplier (ILM), which is included in the operational risk regulatory capital calculation.
Risk Mitigation
Controls are identified and assessed through the various Operational Risk Management tools. In cases where controls are deemed deficient a response will be required. Operational risk response decisions include mitigation, transfer, acceptance, and avoidance of operational risks. The appropriate response will be determined based on consideration of the nature of the risks, their potential impacts and the consideration of the Bank’s Code of Conduct and risk appetite thresholds.
Risk Monitoring, Analytics, and Reporting
The Bank has processes in place for the ongoing monitoring of operational risk. These monitoring activities can provide an early warning of emerging issues, triggering timely management response. In addition, these activities allow for review and analysis of the risk profile in relation to risk appetite or other key indicators to identify when events may be approaching or exceeding thresholds, requiring action and/or escalation. Operational risk data is collected in risk systems and used for reporting. Operational risk reporting facilitates distribution and escalation of operational risk information to the relevant parties, including the Operational Risk Committee, as well as senior management and the Board via the Enterprise Risk Management report. It provides stakeholders involved in operational risk management activities access to reliable data in a consistent and timely manner to support risk-based decision making.
108 | 2023 Scotiabank Annual Report
Management’s Discussion and Analysis | Risk Management
Cyber Security and Information Technology (IT) Risk
Cyber Security Risk is the risk of loss of confidentiality, integrity, or availability of information, data, or information systems and reflect the potential adverse impacts to organizational operations (i.e., mission, functions, image, or reputation) and assets, customers, and other stakeholders. Information Technology Risk is the risk of financial loss, disruption or damage to reputation from a failure of information technology systems.
The Cyber Security and IT risk landscape continues to evolve across the financial industry. The increasing use of digital delivery channels to deliver financial services exposes the Bank to various vectors of attack. Threat actors (individuals, organized crime rings and nation state sponsored) continue to target financial institutions to steal data, money or to disrupt operations. These events may negatively impact the Bank’s operational environment, our customers and other third parties.
The Board of Directors approves the Information Technology and Information Security Risk Summary Framework, which along with its respective policies and other frameworks are focused on safeguarding the Bank and its customers’ information, ensuring the Bank’s IT environment is secure and resilient in support of our business objectives. The Bank continues to expand its cyber security capabilities to defend against potential threats and minimize impact to the business.
Compliance Risk
Compliance Risk is the risk of an activity not being conducted in conformity with applicable laws, rules, regulations, and prescribed practices (“regulatory requirements”), and compliance-related internal policies and procedures and ethical standards expected by regulators, customers, investors, employees and other stakeholders. Compliance Risk includes Regulatory Compliance Risk, Conduct Risk, and Privacy Risk.
Regulatory compliance risk: the risk that business activity may not be conducted in conformity with all applicable regulatory requirements wherever the Bank does business.
Conduct Risk: is an aggregation of risks arising from actions or behaviours of the Bank’s officers, directors, employees, or the conduct of the Bank’s business (directly or indirectly), not in conformity with the Bank’s values or principles for ethical conduct and which has, or has the potential to have, an adverse impact on the Bank, the Bank’s customers or employees, or integrity of the financial markets in which the Bank operates.
Privacy Risk: the risk that arises from contraventions of applicable privacy laws, regulations, standards, and regulatory expectations; ethical or operational standards set out in the Scotiabank Code of Conduct (our ‘Code’), or other Bank policies, procedures, manuals, guidelines; and/or employees’ responsibility to respectfully treat the Personally Identifiable Information (PII) of the Bank’s customers, employees, and other stakeholders.
The Board approves the Compliance Risk Summary Framework which provides an overview of the key governance components, responsibilities and programs which support the Bank in effectively managing Compliance Risk as a part of the Bank’s Compliance Program. The Bank is required to comply with E-13 guidelines as set out by the Office of the Superintendent of Financial Institution (OSFI) with respect to the management of regulatory compliance risk. Regulatory compliance management at the Bank is governed by the Compliance Management Framework (CMF). The primary objective of the Bank’s CMF is to provide assurance that the Bank’s business activities are being conducted in a manner compliant with all applicable regulations in the Bank’s countries of operations and in line with the Bank’s risk appetite.
Environmental, Social and Governance Risk
ESG Risk is the risk that an environmental (including climate risk), social, or governance event, or condition, which if occurs could cause an actual or potential negative impact to the Bank.
The Bank is exposed to ESG risks due to both its internal operations and its business activities. The Bank considers Environmental Risk to be the potential adverse impacts to the Bank as a result of climate change and/or damage to the natural environment or biodiversity, such as land, water, plants, natural resources, ecosystems, and the atmosphere. The Bank considers the physical and transition risks associated with climate change to be a component of Environmental Risk. Scotiabank’s Environmental Risk Management Policy outlines the key principles and commitments that guide the Bank in how it manages environmental risks as part of its day-to-day operations, lending and investment practices, supplier agreements, management of real estate holdings, and internal and external reporting protocols. This policy is supplemented by specific processes and guidelines relating to individual business lines.
Social Risk is the risk of potential adverse impacts to the Bank that can arise due to the mismanagement of social considerations that can cause actual or perceived negative impacts on people and communities. Social considerations include, but are not limited to, human rights (including human trafficking and modern slavery); Indigenous rights; labour standards and working conditions; diversity, equity, and inclusion; accessibility; community health, safety, and security; disadvantaged and vulnerable groups; cultural property and heritage; and land acquisition and involuntary resettlement. Scotiabank’s high-level approach to respecting and promoting human rights are communicated in the Scotiabank Code of Conduct and in the Global Human Rights Statement.
Corporate governance refers to the oversight mechanisms and the way in which the Bank is governed. It encompasses the Bank’s policies and processes, how decisions are made, and how it deals with the various interests of, and relationships with, its many stakeholders, including shareholders, customers, employees, regulators, and the broader community. Governance Risk is the risk of potential adverse impacts to the Bank stemming from poor or ineffective corporate governance mechanisms and controls. The Bank’s Corporate Governance Policies are designed to ensure the independence of the Board and its ability to effectively supervise management’s operation of the Bank.
Scotiabank’s ESG Risk department is responsible for establishing frameworks, policies, processes, tools, training and standards to effectively manage and mitigate the Bank’s exposure to ESG risk. Scotiabank has established clear governance structures and risk management elements that identify, assess, measure, monitor, manage, mitigate, and report ESG risks. These various components are described in the Bank’s ESG Risk Management Framework and Policy. This framework, in conjunction with its supporting policies, processes, and guidelines, assist the Bank in managing ESG risks in a manner that is consistent with regulatory requirements, industry standards, best practices, and its risk appetite.
In the area of project financing, Scotiabank has been a signatory to the internationally recognized Equator Principles (EPs) framework since 2006. This framework enables financial institutions, in partnership with its clients, to identify, assess, manage, mitigate and report environmental and social risks and impacts associated with the large-scale infrastructure and industrial development projects. It applies globally and to all industry sectors when financing a new project using the following financial products: to project finance loans and advisory assignments where total capital
2023 Scotiabank Annual Report | 109
Management’s Discussion and Analysis
costs of the project exceeds U.S.$10 million, and to certain project-related corporate loans, bridge loans, and project-related refinance and project-related acquisition finance loans. The Bank applies the EPs to in-scope transactions to ensure that the projects that we finance and advise on are developed in an environmentally and socially responsible manner. Specifically, the framework provides safeguards for protecting the natural environment, biodiversity, workers, and communities, including respecting the rights of vulnerable and/or disadvantage populations such as children and indigenous peoples. The Bank’s application of the EPs is summarized in the annual EP Implementation Report which is published on the Bank’s website under Responsibility & Social Impact, ESG Publications and Policies.
In 2023, various regulators, including OSFI, published climate-related disclosure guidelines that are aligned to the Task Force on Climate-related Financial Disclosures (TCFD) recommendations. In addition, standard setting bodies such as the International Sustainability Standards Board (ISSB) published climate and sustainability-related disclosures. The Bank has put in place a dedicated project team with executive oversight to implement OSFI’s climate risk management requirements. The Bank actively monitors policy and legislative requirements through ongoing dialogue with government, industry, and stakeholders in the countries where it operates. Scotiabank has been meeting with environmental organizations, industry associations and socially responsible investment organizations with respect to the role that banks can play to help address issues such as climate change, protection of biodiversity, and promotion of sustainable forestry practices.
ESG Reporting
Scotiabank is a signatory to and a participant in key global initiatives that advance transparency and disclosures in sustainability. The Bank’s ESG reporting is informed by several global sustainability disclosure standards, frameworks, and initiatives including, but not limited to, the TCFD, CDP, the Partnership for Carbon Accounting Financials (PCAF), the Sustainability Accounting Standards Board (SASB), the Global Reporting Initiative (GRI), the UN Global Compact (UNGC), and the Sustainable Development Goals (SDGs). ESG reporting and disclosures can be found on the Bank’s website under Responsibility & Social Impact, ESG Publications and Policies.
Task Force on Climate-related Financial Disclosures (TCFD)
Beginning in 2024, the ISSB will assume responsibility of monitoring climate-related disclosures and reporting to the Financial Stability Board.
Governance
Board Oversight
As ESG topics require a multidisciplinary approach, the risks, and opportunities it poses to the Bank are addressed by the Board of Directors and its committees. The following Board committees provide ongoing oversight, at minimum, annually, but are engaged as important matters arise:
| • | Risk Committee: Retains oversight of ESG Risks, including climate-related risks, and periodically reviews and approves the Bank’s key risk management policies, frameworks, and limits to ensure that management is operating within the Bank’s Enterprise Risk Appetite Framework. |
| • | Corporate Governance Committee: Evaluates the Bank’s environmental and social performance and assesses best practices for ESG disclosure; examines current and emerging ESG topics, considers their implications on the Bank’s strategy and reviews the Bank’s annual ESG Report; and acts in an advisory capacity through a continuing assessment of the Bank’s approach to corporate governance and makes policy recommendations, including on topics such as human rights. |
| • | Audit & Conduct Review Committee: Oversees climate-related disclosure as part of the Bank’s financial reporting, sets standards of conduct for ethical behaviour and oversees conduct risk management, and consumer protection. |
| • | Human Capital & Compensation Committee: Oversees human capital and compensation strategies related to diversity, equity and inclusion, employee health, safety, and well-being and other ESG policies and practices. |
Management’s Role
The Board of Directors is supported by the President and Chief Executive Officer (CEO) and Chief Risk Officer (CRO). The CRO has delegated their authority over the oversight of ESG risk to the Operational Risk Committee (ORC). The ORC provides effective oversight and challenge of the Bank’s management of environmental and social risks. Its responsibilities include monitoring of the ESG risk profile, reviews and approves ESG Risk frameworks, policies, risk appetite statements and limits to the ORC.
Furthermore, a dedicated Corporate ESG Committee assists the Bank in achieving its ESG objectives by providing strategic guidance and advice on the Bank’s ESG priorities and commitments. It recommends approval of corporate ESG, climate change and human rights related strategies and disclosures to the Operating Committee.
Strategy
In October 2021, Scotiabank joined the Net Zero Banking Alliance (NZBA), re-enforcing the Bank’s commitment in playing a significant role to finance the climate transition and support collaborative approaches between the public and private sectors to reach the goal of net-zero by 2050. Scotiabank’s 2022 Net Zero Pathways Report sets out interim emissions intensity reduction targets for the Oil and Gas and the Power and Utilities sectors. In October 2023, Scotiabank introduced a third emissions intensity reduction target for the Automotive Sector. The Bank will continue to report annually on its plans and progress towards establishing additional sector targets and achieving these targets. As part of this program, Scotiabank’s $10 million Net-Zero Research Fund, established in 2021, has awarded $3 million in funding to date to stimulate pioneering research to support the decarbonization of the economy.
In addition, the Bank has committed to mobilize $350 billion by 2030 in climate-related finance to address climate change. This includes incentivizing innovation intended to help mitigate the impact of climate change. The financial products and services we offer in support of these objectives, outlined in the Climate-Related Finance Framework, contribute to Scotiabank’s goal of becoming net zero by 2050. The Sustainable Finance and Clean Tech Energy Groups within Global Banking and Markets and Canadian Business Banking continues to grow and works closely with Scotiabank partner teams to provide financial solutions and ESG advice across sustainable finance products to corporate, financial, public sector and institutional clients across our global footprint.
The Bank has also committed to securing 100% non-emitting electricity(1) in Canada by 2025 and globally by 2030 and reducing Scope 1 and 2 GHG emissions (against 2016 baseline) by 35% globally by 2030. In 2022, the Bank has secured 67% of electricity from non-emitting sources and achieved 29% absolute operational emission reduction.
| (1) | Either physically or virtually. Non-emitting sources includes renewable (hydro, solar, wind, geothermal, tidal) and nuclear sources, and may include the use of RECs. |
110 | 2023 Scotiabank Annual Report
Management’s Discussion and Analysis | Risk Management
Risk Management
Climate change risk is the risk of potential adverse impacts to the Bank as a result of the direct or indirect impacts of a changing climate. Climate change risks could be in the form of physical or transition risk. Examples of physical risk considerations include severe weather (e.g., floods, hurricanes, extreme cold or heat). Examples of transition risk considerations include policy/regulatory actions such as subsidies, taxes, or increased fuel costs, as well as changing market conditions.
The Bank utilizes a comprehensive environmental risk management process where the identification, assessment and management of climate change risk is done through due diligence as part of the overall existing environmental risk assessment and credit adjudication processes. We continue to advance our capabilities and approach to climate risk management:
| • | The Bank has a Climate Change Risk Assessment (CCRA) process that evaluates both the physical and transition risks a client may face, and their level of awareness to such risks. The Bank assessed its exposure to the sectors with the highest vulnerability to physical and transition climate risk drivers. The CCRA compliments the sector sensitivity analysis by capturing borrower level mitigation factors such as geography, location of assets, and climate-specific management strategies. The CCRA and climate sector vulnerability results have been included within credit industry reviews to assess climate risk drivers and determine their potential materiality. |
| • | A module on climate change risk is delivered in the annual mandatory environmental risk training for all banking officers and credit adjudicators. |
| • | The Bank commenced a pilot project within our underwriting process to assess the alignment between the Bank’s emissions targets and the targets of select Global Banking and Markets lending clients in the oil and gas and power and utilities sectors. The initial lessons from the pilot and portfolio evaluation are being used to inform the Bank’s interim net zero target. |
| • | A procedure document was created to assess the sustainability features of credit transactions to reduce greenwashing risk. |
| • | The Bank is establishing an enterprise ESG data and analytics strategy. It’s aimed at improving ESG data management and centralizing ESG-related infrastructure. |
| • | The Bank is developing methods to integrate transition and physical risks arising from climate change into our enterprise stress testing framework. Climate scenario analysis is being applied to predict credit risk to our non-retail lending portfolio in near-term (2025 and 2030) and long-term horizons (2050) enterprise-wide, using four scenarios from the Network for Greening the Financial System (NGFS): Current Policies, Nationally Determined Contributions (NDCs), Delayed Transition, and Net Zero 2050, which vary in levels of physical and transition risk. Current Policies and NDCs are considered ‘hot house world’ scenarios with high physical and low transition risk. Delayed Transition assumes a disorderly transition with delayed policy implementation leading to a low-moderate physical risk, high transition risk scenario. In contrast, Net Zero 2050 assumes strict policies will be implemented immediately leading to an orderly, low physical risk, low transition risk scenario. Scenario analysis is also being applied in our retail lending portfolio to predict physical risks. |
| • | The Bank is a participant in industry groups to develop consistent methodologies and metrics for TCFD reporting. |
| • | The Bank is a participant in the United National Environment Program – Finance Initiative (UNEP FI) TCFD and Climate Risk Program. The program is meant to assist the financial sector in developing sound practices regarding climate risk. |
| • | The Bank collaborates extensively with sector and non-governmental organizations such as the Institute of International Finance’s (IIF) Sustainable Finance Working Group, Canadian Business for Social Responsibility (CBSR) Net-Zero Working Group, and Canadian Sustainable Finance Action Council (SFAC), associated Taxonomy Technical Expert Group and various workstreams of the Glasgow Financial Alliance for Net Zero (GFANZ), such as the Mainstream Transition Finance and the Policy workstreams. |
Metrics and Targets
Scotiabank states, monitors, and reports on ESG related performance and targets annually in Scotiabank’s ESG Report. As part of the Climate Commitments, the Bank is tracking the initiatives that underlie its commitment through the metrics and targets it has adopted pursuant to these Commitments, including a target to reduce operational GHG emissions and to mobilize $350 billion to reduce the impacts of climate change.
Additionally, the Bank has an ESG Performance Metric (ESGPM) that is included in the Enterprise Risk Appetite Framework as a risk appetite metric. The ESGPM is a composite measure of ESG risk based on environmental, social and governance sub-metrics which inform on reputational, credit, and operational categories. The metric is internally reported quarterly, in accordance with other risk appetite metrics.
The process to calculate the Bank’s gross credit risk exposures to carbon-related sectors can be found in the ESG report.
Data Risk
Data risk is the risk of exposure to the adverse financial and non-financial consequences (e.g., revenue loss, reputational risk, regulatory risk, sub-optimal management decisions) caused by mismanagement, misunderstanding or misuse of the Bank’s data assets. This risk may arise from a lack of data risk awareness; insufficient data risk oversight, governance and controls; inadequate data management and poor data quality; inferior data security and protection; and/or inappropriate, unintended or unethical data usage.
The Data Risk Management Framework (DRMF) outlines the overarching guiding principles for data risk management and defines the governance structure of the enterprise data risk management program, recognizing the collaborative nature of data risk management and oversight. The Data Risk Management Policy (DRMP) categorizes and explains risks associated with data throughout the data lifecycle; and outlines the interaction model and roles and responsibilities for key stakeholders involved in managing the data risk across the organization.
Model Risk
Model risk is the risk of adverse financial (e.g., capital, losses, revenue) and reputational consequences arising from the design, development, implementation and/or use of a model. It can originate from, among other things, inappropriate specifications; incorrect parameter estimates; flawed hypotheses and/or assumptions; mathematical computation errors; inaccurate, inappropriate or incomplete data; inappropriate, improper or unintended usage; and inadequate monitoring and/or controls.
The Model Risk Management Framework outlines the Bank’s approach for effective governance and oversight of model risk consistent with the policies and processes outlined in the Bank’s Model Risk Management Policy (MRMP). The MRMP describes the overarching principles, policies, and procedures that provide the framework for managing model risk. All models, whether developed by the Bank or vendor-supplied, that meet the Bank’s model definition are covered by this Policy. The MRMP also clearly defines roles and responsibilities for key stakeholders involved in the model risk management cycle.
2023 Scotiabank Annual Report | 111
Management’s Discussion and Analysis
Reputational Risk
Reputational risk is the risk that negative publicity or stakeholder sentiment regarding Scotiabank’s conduct, business practices or associations, whether true or not, will adversely affect its revenues, operations or customer base, or require costly litigation or other defensive measures.
The Bank has an Enterprise Reputational Risk Policy, as well as other policies and procedures for managing suitability risk, and reputational and legal risk related to various transactions, relationships or other Bank activities. Reputational risk is managed and controlled by the Scotiabank Code of Conduct, governance practices and risk management programs, policies, procedures, and training. All directors, officers and employees have a responsibility to conduct their activities in accordance with the Scotiabank Code of Conduct, and in a manner that minimizes reputational risk. The activities of the Legal; Global Tax; Corporate Secretary; Global Communications; Global Compliance & AML, and Global Risk Management departments, as well as the Reputational Risk Committee, are particularly oriented to the management of reputational risk.
Strategic Risk
Strategic risk is the risk that the enterprise, business lines or corporate functions will make strategic choices that are inappropriate or insufficiently resilient to changes in the business environment, or ineffectively execute such strategies.
The Board is ultimately responsible for oversight of strategic risk, by ensuring a robust strategic planning process and approving, on an annual basis, the strategic plan for the Bank. Changes in our business strategy can impact our risk appetite and therefore the Annual Strategy Report to the Board of Directors considers linkages between the Bank’s Enterprise Risk Appetite Framework and the enterprise strategy, business line strategies and how the corporate functions support the business lines in the execution of their strategic plans. The Board reviews this material, along with other relevant strategic and financial presentations by management throughout the year in order to provide the appropriate governance.
The strategic planning process is managed by Enterprise Strategy which supports the management of strategic risk throughout the planning process by ensuring alignment across our business, financial, capital and risk planning. Global Risk Management also provides oversight of strategic risk by providing independent reviews throughout the strategic planning process, establishing enterprise risk frameworks, and independently monitoring and reporting on the level of risk established against our risk appetite metrics.
The development, evaluation and execution of the Bank’s strategic plans is owned by the Management team of the Bank. They participate actively in the annual planning process and on an ongoing basis, Heads of Business Lines and Corporate Functions identify, manage, and assess the internal and external risks that could impede achievement of, or progress of, strategic objectives. The executive management team regularly meets to evaluate the effectiveness of the Bank’s strategic plan, and consider what amendments, if any, are required.
112 | 2023 Scotiabank Annual Report
Management’s Discussion and Analysis | Controls and Accounting Policies
Controls and Accounting Policies
Management’s responsibility for financial information contained in this annual report is described on page 140.
Disclosure controls and procedures
The Bank’s disclosure controls and procedures are designed to provide reasonable assurance that information is accumulated and communicated to the Bank’s management, including the President and Chief Executive Officer and the Group Head and Chief Financial Officer, as appropriate, to allow timely decisions regarding required disclosure.
As of October 31, 2023, the Bank’s management, with the participation of the President and Chief Executive Officer and the Group Head and Chief Financial Officer, evaluated the effectiveness of its disclosure controls and procedures, as defined under the rules adopted by the U.S. Securities and Exchange Commission (SEC) and the Canadian securities regulatory authorities, and have concluded that the Bank’s disclosure controls and procedures are effective.
Internal control over financial reporting
Management of the Bank is responsible for establishing and maintaining adequate internal control over financial reporting. These controls include policies and procedures that:
| • | pertain to the maintenance of records that, in reasonable detail, accurately and fairly reflect the transactions and dispositions of the assets of the Bank; |
| • | provide reasonable assurance that transactions are recorded as necessary to permit preparation of financial statements in accordance with International Financial Reporting Standards (IFRS) as issued by the International Accounting Standards Board (IASB), and that receipts and expenditures are being made only in accordance with authorizations of management and directors of the Bank; and |
| • | provide reasonable assurance regarding prevention or timely detection of unauthorized acquisition, use or disposition of the Bank’s assets that could have a material effect on the financial statements. |
All control systems contain inherent limitations, no matter how well designed. As a result, the Bank’s management acknowledges that its internal control over financial reporting will not prevent or detect all misstatements due to error or fraud. In addition, management’s evaluation of controls can provide only reasonable, not absolute, assurance that all control issues that may result in material misstatements, if any, have been detected.
Management assessed the effectiveness of internal control over financial reporting, using the Internal Control-Integrated Framework 2013 issued by the Committee of Sponsoring Organizations of the Treadway Commission (COSO), and based on that assessment concluded that internal control over financial reporting was effective as of October 31, 2023. There are no material weaknesses that have been identified by management in this regard. KPMG LLP, the independent auditors appointed by the shareholders of the Bank, who have audited the consolidated financial statements, have also audited internal control over financial reporting as of October 31, 2023.
Changes in internal control over financial reporting
During the year ended October 31, 2023, there have been no changes in the Bank’s internal control over financial reporting that have materially affected, or are reasonably likely to materially affect, the Bank’s internal control over financial reporting.
Critical Accounting Policies and Estimates
The Bank’s accounting policies are integral to understanding and interpreting the financial results reported in this annual report. Note 3 to the consolidated financial statements summarizes the significant accounting policies used in preparing the Bank’s consolidated financial statements. Certain of these policies require management to make estimates, assumptions and subjective judgments that are difficult, complex, and often relate to matters that are inherently uncertain. The policies discussed below are particularly important to the presentation of the Bank’s financial position and results of operations, as changes in the estimates, assumptions and judgments could have a material impact on the Bank’s consolidated financial statements. These estimates, assumptions and judgments are adjusted in the normal course of business to reflect changing underlying circumstances.
Allowance for credit losses
The allowance for credit losses, using an expected credit loss approach as required under IFRS 9, is estimated using valuation models and incorporates inputs, assumptions and techniques that involve a high degree of management judgment. Under IFRS 9 expected credit loss methodology, an allowance is recorded for expected credit losses on financial assets regardless of whether there has been an actual loss event. The Bank recognizes an allowance at an amount equal to 12 month expected credit losses if the credit risk at the reporting date has not increased significantly since initial recognition (Stage 1). When a financial asset experiences a significant increase in credit risk after origination but is not considered to be in default, it is included in Stage 2 and subject to lifetime expected credit losses. Financial assets that are in default are included in Stage 3. Similar to Stage 2, the allowance for credit losses for Stage 3 financial assets captures the lifetime expected credit losses.
The main drivers in allowance for credit loss changes that are subject to significant judgment include the following:
| • | Determination of point-in-time parameters such as probability of default (PD), loss given default (LGD) and exposure at default (EAD). |
| • | Forecast of macroeconomic variables for multiple scenarios and probability weighting of the scenarios. |
| • | Assessment of significant increase in credit risk. |
Qualitative adjustments or overlays may also be made as temporary adjustments using expert credit judgment in circumstances where, in the Bank’s view, the existing regulatory guidance, inputs, assumptions, and/or modelling techniques do not capture all relevant risk factors. The use of management overlays requires significant judgment that may impact the amount of allowance recognized.
Measurement of expected credit losses
The probability of default (PD), exposure at default (EAD), and loss given default (LGD) inputs used to estimate expected credit losses are modelled based on historical default and loss experience, and macroeconomic variables that are closely related with credit losses in the relevant portfolio.
2023 Scotiabank Annual Report | 113
Management’s Discussion and Analysis
Details of these statistical parameters/inputs are as follows:
| • | PD – The probability of default is an estimate of the likelihood of default over a given time horizon. A default may only happen at a certain time over the remaining estimated life, if the facility has not been previously derecognized and is still in the portfolio. |
| • | EAD – The exposure at default is an estimate of the exposure at a future default date, considering expected changes in the exposure after the reporting date, including repayments of principal and interest, whether scheduled by contract or otherwise, expected drawdowns on committed facilities, and accrued interest from missed payments. |
| • | LGD – The loss given default is an estimate of the loss arising in the case where a default occurs at a given time. It is based on the difference between the contractual cash flows due and those that the lender would expect to receive, including from the realization of any collateral. It is usually expressed as a percentage of the EAD. |
Forward-looking macroeconomic scenarios
The Bank uses a broad range of forward-looking economic information as inputs to its models of expected credit losses and the related allowance. These include real GDP, unemployment rates, consumer price index, central bank interest rates, and house-price indices, amongst others. The allowance is determined using four probability-weighted, forward-looking scenarios. The Bank considers both internal and external sources of information and data in order to create unbiased projections and forecasts. The Bank prepares the scenarios using forecasts generated by Scotiabank Economics (SE). The forecasts are generated using both internally and externally developed models whose outputs are modified by SE as necessary to formulate a ‘base case’ view of the most probable future direction of economic developments; SE also develops a representative range of other alternative possible forecast scenarios. More specifically, the process involves the development of three additional economic scenarios to which relative probabilities are assigned. The development of the baseline and alternative scenarios is overseen by a governance committee that consists of internal stakeholders from across the Bank. The final baseline and alternative scenarios reflect significant review and oversight and incorporate judgment both in the determination of the scenarios’ forecasts and the probability weights that are assigned to them.
Significant Increase in credit risk (SIR)
The assessment of SIR since origination of a financial asset considers borrower-specific quantitative and qualitative information without consideration of collateral, and the impact of forward-looking information. Quantitative models may not always be able to capture all reasonable and supportable information that may indicate a significant increase in credit risk. Qualitative factors may be assessed to supplement the gap. Examples of situations include changes in adjudication criteria for a particular group of borrowers; changes in portfolio composition and natural disaster events impacting certain portfolios.
For retail exposures, a significant increase in credit risk cannot be assessed using forward-looking information at an individual account level. Therefore, the assessment must be done at the segment level. Segment migration thresholds exist for each PD model by product which considers the proportionate change in PD as well as the absolute change in PD. The thresholds used for PD migration are reviewed and assessed at least annually unless there is a significant change in credit risk management practices in which case the review is brought forward.
For Non-retail exposures the Bank uses an internal risk rating scale (IG codes). All non-retail exposures have an IG code assigned that reflects the probability of default of the borrower. Both borrower specific and non-borrower specific (i.e. macroeconomic) forward-looking information is considered and reflected in the IG rating. Significant increase in credit risk is evaluated based on the migration of the exposures among IG codes.
Fair value of financial instruments
All financial instruments are measured at fair value on initial recognition. Subsequent measurement of a financial instrument depends on its classification. The contractual cash flow characteristics of a financial instrument and the business model under which it is held determine such classification. Non-trading loans and receivables, certain securities and most financial liabilities are carried at amortized cost unless classified or designated as fair value through profit and loss or fair value through other comprehensive income at inception.
The fair value of a financial asset or liability is the price that would be received to sell an asset or paid to transfer a liability in an orderly transaction between market participants in the principal, or in its absence, the most advantageous market to which the Bank has access at the measurement date.
The Bank discloses the classification of all financial instruments carried at fair value in a hierarchy based on the determination of fair value. The best evidence of fair value for a financial instrument is the quoted price in an active market. Fair value based on unadjusted quoted market prices for identical instruments in active markets represents a Level 1 valuation. Quoted prices are not always available for over-the-counter (OTC) transactions, as well as transactions in inactive or illiquid markets. OTC transactions are valued using internal models that maximize the use of observable inputs to estimate fair value. The chosen valuation technique incorporates all the factors that market participants would consider in pricing a transaction. When fair value is based on all significant market observable inputs, the valuation is classified as Level 2. Financial instruments traded in a less active market can be valued using indicative market prices, the present value of cash flows or other valuation techniques. Fair value estimates normally do not consider forced or liquidation sales. Where financial instruments trade in inactive markets or when using models where observable parameters do not exist, significant management judgement is required for valuation methodologies and model inputs. Valuations that require the significant use of unobservable inputs are considered Level 3. The calculation of estimated fair value is based on market conditions at a specific point in time and therefore may not be reflective of future fair values.
The Bank has controls and processes in place to ensure that the valuation of financial instruments is appropriately determined. Global Risk Management (GRM) is responsible for the design and application of the Bank’s risk management framework. GRM is independent of the Bank’s business units and is overseen by Executive Management and the Board of Directors. Senior management committees within GRM oversee and establish standards that are critical in ensuring that appropriate valuation methodologies and policies are in place for determining fair value.
Where possible, valuations are based on quoted prices or observable inputs obtained from active markets. GRM oversees a monthly Independent Price Verification (IPV) process to ensure the reliability and accuracy of prices and inputs used in the determination of fair value. The IPV process is performed by price verification groups that are independent of the business. The Bank maintains an approved list of pricing sources that are used in the IPV process. These sources include, but are not limited to, brokers, dealers and consensus pricing services. The valuation policies relating to the IPV process require that all pricing or rate sources be external to the Bank. At least annually, an independent assessment of pricing or rate sources is performed by GRM to determine the market presence or market representative levels.
Where quoted prices are not readily available, such as for transactions in over-the-counter markets, internal models that maximize the use of observable inputs are used to estimate fair value. An independent second-line model risk management function within GRM oversees the initial
114 | 2023 Scotiabank Annual Report
Management’s Discussion and Analysis | Controls and Accounting Policies
model validation, approval and ongoing validation and the performance monitoring of valuation models used in determining fair value. Model development and validation processes are governed by the Bank’s Model Risk Management Policy.
In determining fair value for certain instruments or portfolios of instruments, valuation adjustments or reserves may be required to arrive at a more accurate representation of fair value. The Bank’s policy of applying valuation reserves to a portfolio of instruments is approved by a senior management committee. These reserves can include adjustments for credit risk, bid-offer spreads, unobservable parameters, funding costs and constraints on prices in inactive or illiquid markets. The methodology for the calculation of valuation reserves is reviewed at least annually by senior management.
Valuation adjustments recorded against the fair value of financial assets and financial liabilities totaled $153 million as at October 31, 2023 (2022 – $357 million), net of any write-offs. The majority of the year-over-year change is due to tightening of counterparty credit spreads during the year.
As at October 31, 2023, a net funding valuation adjustment (FVA) representing an excess of funding benefit adjustment over funding cost adjustment of $271 million (2022 – $127 million), pre-tax, was recorded for uncollateralized derivative instruments.
Employee benefits
The Bank provides pension and other benefit plans for eligible employees in Canada and internationally. Pension benefits are offered in the form of defined benefit pension plans (generally based on an employee’s length of service and earnings), and in the form of defined contribution pension plans (where the Bank’s contribution is fixed and there is no legal or constructive obligation to pay further amounts). Other benefits include post-retirement health care, dental care and life insurance, along with other long-term employee benefits such as long-term disability benefits.
The employee benefit expenses and the related benefit obligation are calculated using actuarial methods and certain actuarial assumptions. These assumptions are based on management’s best estimate and are reviewed and approved annually. The most significant assumption is the discount rate used to determine the defined benefit obligation, which is set by reference to the yields on high quality corporate bonds that have durations that match the terms of the Bank’s obligations. Separate discount rates are used to determine the annual benefit expense in Canada and the U.S. These rates are determined with reference to the yields on high quality corporate bonds with durations that match the various components of the annual benefit expense. The discount rate used to determine the annual benefit expense for all other plans is the same as the rate used to determine the defined benefit obligation. Other key assumptions include future compensation, health care costs, employee turnover, retirement age and mortality. When making these estimates, management considers expectations of future economic trends and business conditions, including inflation rates as well as other factors, such as plan specific experience and best practices.
Actual experience that differs from assumptions made by management will result in a net actuarial gain or loss recognized immediately in other comprehensive income, except for other long-term employee benefits where they are recognized in the Consolidated Statement of Income.
Note 28 of the consolidated financial statements contains details of the Bank’s employee benefit plans, such as the disclosure of pension and other benefit amounts, management’s key assumptions, and a sensitivity analysis of changes in these assumptions on the employee benefit obligation and expense.
Corporate income taxes
Management exercises judgment in determining the provision for income taxes and deferred income tax assets and liabilities. The provision is based on management’s expectations regarding the income tax consequences of transactions and events during the period. Management interprets the tax legislation for each jurisdiction in which the Bank operates and makes assumptions about the expected timing of the reversal of deferred income tax assets and liabilities. If management’s interpretations of the legislation differ from those of the tax authorities, or if the actual timing of the reversals of the deferred income tax assets and liabilities is not as anticipated, the provision for income taxes could increase or decrease in future periods.
The Bank maintains provisions for uncertain tax positions that it believes appropriately reflect the risk of tax positions under discussion, audit, dispute or appeal with tax authorities, or which are otherwise considered to involve uncertainty. These provisions are made using the Bank’s best estimate of the amount expected to be paid based on an assessment of all relevant factors, which are reviewed at the end of each reporting period. It is possible that additional liability and income tax expense could arise in the future, depending on the acceptance of the Bank’s tax positions by the relevant tax authorities in the jurisdictions in which the Bank operates.
Note 27 of the consolidated financial statements contains further details with respect to the Bank’s provisions for income taxes.
Structured entities
In the normal course of business, the Bank enters arrangements with structured entities on behalf of its customers and for its own purposes. These structured entities can be generally categorized as multi-seller commercial paper conduits, Bank funding vehicles and structured finance entities. Further details are provided in the Off-balance sheet arrangements section on page 69.
Management is required to exercise judgement to determine whether a structured entity should be consolidated. This evaluation involves understanding the arrangements, determining whether decisions about the relevant activities are made by means of voting rights or other contractual arrangements, and determining whether the Bank controls the structured entity.
The Bank controls an investee when it is exposed, or has rights, to variable returns from its involvement with the investee and has the ability to affect those returns through its power over the investee. The three elements of control are:
| • | power over the investee; |
| • | exposure, or rights, to variable returns from involvement with the investee; and |
| • | the ability to use power over the investee to affect the amount of the Bank’s returns. |
This definition of control applies to circumstances:
| • | when voting rights or similar rights give the Bank power, including situations where the Bank holds less than a majority of voting rights or involving potential voting rights; |
| • | when an investee is designed so that voting rights are not the dominant factor in deciding who controls the investee (i.e., relevant activities are directed by contractual arrangements); |
| • | involving agency relationships; and |
| • | when the Bank has control over specified assets of an investee. |
2023 Scotiabank Annual Report | 115
Management’s Discussion and Analysis
The Bank does not control an investee when it is acting in an agent’s capacity. The Bank assesses whether it is an agent by determining whether it is primarily engaged to act on behalf and for the benefit of another party or parties. Factors that the Bank considers in this assessment include the scope of its decision-making authority over the investee, the rights held by other parties, the remuneration to which it is entitled, and the Bank’s exposure to variability of returns from other interests that it holds in the investee. The analysis uses both qualitative and quantitative analytical techniques and involves the use of a number of assumptions about the business environment in which the structured entity operates and the amount and timing of future cash flows. The Bank reassesses whether it controls an investee if facts and circumstances indicate that one or more of the three elements of control change. Management is required to exercise judgement to determine if a change in control event has occurred. During 2023, there were no change in control events that caused the Bank to change its control conclusion of its multi-seller conduits or other structured entities.
As described in Note 15 to the consolidated financial statements and in the discussion of off-balance sheet arrangements, the Bank does not control the two Canadian-based multi-seller conduits that it sponsors and they are not required to be consolidated on the Bank’s Consolidated Statement of Financial Position. The Bank controls its U.S.-based multi-seller conduit and consolidates it on the Bank’s Consolidated Statement of Financial Position.
Goodwill
For impairment testing, goodwill acquired in a business combination is, on the acquisition date, allocated to each of the Bank’s group of cash-generating units (CGU) that are expected to benefit from the particular acquisition. Goodwill is not amortized but tested for impairment annually and when circumstances indicate that the carrying value may be impaired. At each reporting date, goodwill is reviewed to determine whether there is any indication of impairment. Each CGU to which goodwill is allocated for impairment testing reflects the lowest level at which goodwill is monitored for internal management purposes.
The Bank determines the carrying value of the CGU using a regulatory capital approach based on credit, market, operational risks and leverage, consistent with the Bank’s capital attribution for business line performance measurement. Corporate capital that is not directly attributable is allocated to each CGU on a proportional basis. The recoverable amount is the greater of fair value less costs of disposal (“FVLCD”) and value in use (“VIU”). If either FVLCD or VIU exceeds the carrying amount, there is no need to determine the other. An impairment loss is recognized if the carrying amount of the CGU exceeds the recoverable amount. An impairment loss, in respect of goodwill, is not reversed.
FVLCD is the price that would be received from the sale of a CGU in an orderly transaction between market participants, less costs of disposal, at the measurement date. In determining FVLCD, an appropriate valuation model is used which considers various factors including normalized net income, price earnings multiples, and control premiums. These calculations are corroborated by valuation multiples and quoted share prices for publicly traded subsidiaries or other available fair value indicators.
VIU is the present value of the future cash flows expected to be derived from a CGU. The determination of VIU involves judgment in estimating future cash flows, terminal growth rate and discount rate. The future cash flows are based on management approved budgets and plans which factor in market trends, macro-economic conditions, forecasted earning and business strategy for the CGU. The terminal growth rate is based on the long-term growth expectations in the relevant countries, while the discount rate is based on the cost of capital.
Significant judgment is applied in determining the recoverable amounts of the CGU and assessing whether certain events or circumstances constitute objective evidence of impairment.
Goodwill was assessed for annual impairment based on the methodology described above as at July 31, 2023, and no impairment was determined to exist. As of October 31, 2023, there were no significant changes to this assessment. For additional information, see Note 18 of the consolidated financial statements.
Intangible assets
Intangible assets with indefinite useful lives are not amortized but tested for impairment annually and when circumstances indicate that the carrying value may be impaired. Intangible assets with finite useful lives are amortized over the estimated useful life of the asset, and are tested for impairment only when events and circumstances indicate impairment. Indefinite life and finite life intangible assets are reviewed at each reporting date to determine whether there is any indication of impairment.
The recoverable amount is the greater of fair value less costs of disposal (“FVLCD”) and value in use (“VIU”). If either FVLCD or VIU exceeds the carrying amount, there is no need to determine the other. The VIU method is used by the Bank to determine the recoverable amount of intangible assets. In determining VIU, a discounted cash flows valuation model is used which incorporates key assumptions such as management-approved cash flow projections, terminal growth rate, and the applicable discount rate. An impairment loss is recognized if the carrying amount of the intangible asset exceeds its recoverable amount. Impairment losses recognized in prior periods are reassessed at each reporting period for any indication that the loss has decreased or no longer exists. An impairment loss recognized in a prior period shall be reversed only if there has been a change in the estimates used to determine the asset’s recoverable amount since the last impairment was recognized. The reversal of an impairment loss reflects an increase in the estimated service potential of an asset, either from use or from sale, and does not only result from the passage of time. An impairment loss is reversed only to the extent that the intangible asset’s carrying amount does not exceed the carrying amount that would have been determined if no impairment loss had been recognized.
The recoverable amount is significantly impacted by the discount rate and the terminal value. Significant judgment is applied in determining the intangible asset’s recoverable amount and assessing whether certain events or circumstances constitute objective evidence of impairment.
Indefinite life intangible assets were assessed for annual impairment based on the methodology described above as at July 31, 2023, and no impairment was determined to exist. As of October 31, 2023, there were no significant changes to this assessment. For additional information on both indefinite life and finite life intangible assets, see Note 18 of the consolidated financial statements.
Derecognition of financial assets
Financial assets are derecognized when the contractual rights to the cash flows from the asset have expired, which occurs with repayment by the borrower or upon substantial modification of the asset terms. Assets are also derecognized when the Bank transfers the contractual rights to receive the cash flows from the financial asset or has assumed an obligation to pay those cash flows to an independent third-party, and the Bank has transferred substantially all the risks and rewards of ownership of that asset to an independent third-party.
Management must apply judgement in determining whether a modification of the terms of the financial asset is substantial. For loans, this includes the nature of the modification and the extent of changes to terms including interest rate, authorized amount, term, or type of underlying collateral.
Management must also apply judgement in determining, based on specific facts and circumstances, whether the Bank has retained or transferred substantially all the risks and rewards of ownership of the financial asset. Where substantially all the risks and rewards of ownership of the financial asset are neither retained nor transferred, the Bank derecognizes the transferred asset only if it has lost control over that asset. If the Bank retains control over the asset, it will continue to recognize the asset to the extent of its continuing involvement.
116 | 2023 Scotiabank Annual Report
Management’s Discussion and Analysis | Controls and Accounting Policies
Most assets transferred under repurchase agreements, securities lending agreements, securitizations of fully insured Canadian residential mortgages, and securitizations of personal lines of credit, credit cards and auto loans do not qualify for derecognition. The Bank continues to record the transferred assets on the Consolidated Statement of Financial Position as secured financings.
Further information on derecognition of financial assets can be found in Note 14 of the consolidated financial statements.
Provisions
The Bank recognizes a provision if, because of a past event, the Bank has a present legal or constructive obligation that can be estimated reliably, and it is probable that an outflow of economic benefits will be required to settle the obligation. Probable in this context means more likely than not. Significant judgement is required in determining whether a present obligation exists and in estimating the probability, timing, and amount of any future outflows.
In the ordinary course of business, the Bank and its subsidiaries are routinely defendants in, or parties to a number of pending and threatened legal actions and regulatory proceedings, including actions brought on behalf of various classes of claimants. In view of the inherent difficulty of predicting the outcome of such matters, the Bank cannot state what the eventual outcome of such matters will be.
Legal provisions are established when it becomes probable that the Bank will incur an expense related to a legal action and the amount can be reliably estimated. Such provisions are recorded at the best estimate of the amount required to settle any obligation related to these legal actions as at the balance sheet date, considering the risks and uncertainties surrounding the obligation. Management and internal and external experts are involved in estimating any amounts that may be required. The actual costs of resolving these claims may vary significantly from the amount of the legal provisions. The Bank’s estimate involves significant judgement, given the varying stages of the proceedings, the fact that the Bank’s liability, if any, has yet to be determined and the fact that the underlying matters will change from time to time. As such, there is a possibility that the ultimate resolution of those legal actions may be material to the Bank’s consolidated results of operations for any reporting period.
Future Accounting Developments
The Bank actively monitors developments and changes in accounting standards from the IASB, as well as requirements from the other regulatory bodies, including OSFI. The Bank is currently assessing the impact of adoption of new standards issued by the IASB on its consolidated financial statements and also evaluating the alternative elections available on transition.
Effective November 1, 2023
Insurance contracts
The International Accounting Standards Board issued IFRS 17 Insurance Contracts to replace IFRS 4 Insurance Contracts. IFRS 17 provides a comprehensive principle-based framework for the recognition, measurement, presentation, and disclosure of insurance contracts and is effective for the Bank on November 1, 2023. The standard is to be applied on a full retrospective basis unless impractical, where either the modified retrospective or fair value method may be used.
The Bank assessed the data and assumptions required to apply IFRS 17 and determined that the full retrospective approach could be applied for its short duration contracts and the fair value approach was required for its longer duration contracts. Short duration contracts apply the premium allocation approach which requires that the expected premium is recognized into income over the coverage period and a liability is established to the extent that cash inflows are received earlier than the recognition of premiums into insurance revenue. For long duration contracts, the adoption of IFRS 17 will result in recognition of probability-weighted fulfilment cashflows and a risk adjustment for non-financial risk for groups of contracts. To the extent that those groups of contracts are expected to be profitable, a contractual service margin liability is recognized on the Consolidated Statement of Financial Position which represents unearned profits that will be recognized in the Consolidated Statement of Income in the future over the life of the contract. Insurance revenue is earned over the period of expected claims, risk is released as coverage is provided. For all insurance contracts, losses on onerous contracts are recognized in income immediately.
IFRS 17 is effective for the Bank on November 1, 2023, and the Bank plans to adopt the standard by restating the comparative year results from the transition date of November 1, 2022. The expected impact of applying IFRS 17 to opening retained earnings as of transition date is not expected to be material.
The Bank continues to monitor and respond to global regulatory developments relating to a broad spectrum of topics, in order to ensure that control functions and business lines are responsive on a timely basis and business impacts, if any, are minimized. A high-level summary of some of the key regulatory developments that have the potential of impacting the Bank’s operations is included in the Legal and compliance risk section of this MD&A and below, as may be updated by quarterly reports.
Act to Modernize Legislation Provisions Respecting the Protection of Personal Information
On June 12, 2020, Law 25 (previously Bill 64) was introduced in Quebec to modernize its private and public sector privacy laws. Called An Act to Modernize Legislation Provisions Respecting the Protection of Personal Information (Quebec), the Law introduces stricter requirements for privacy, including enhanced transparency, protections and consent, for Quebec businesses with significant fines and increased authorities for the Commission d’accès à l’information. The original Bill 64 was adopted by the National Assembly on September 21, 2021, and the second series of amendments came into force on September 22, 2023, with the remainder coming into force on September 22, 2024. The Bill is now referred to as Law 25. On October 31, 2023, the Commission d’accès à l’information published its guidelines. The Bank is working on the implementation of Law 25 requirements.
New Derivative Business Conduct Rules
The Canadian Securities Administrators (CSA) published Multilateral Instrument 93-101 Derivatives: Business Conduct on September 28, 2023. This instrument, which becomes effective in participating jurisdictions on September 28, 2024, regulates the Bank’s conduct as a derivatives dealer and provides protections to over-the-counter derivatives market participants. The Bank is working to implement any required changes to ensure the Bank’s compliance by the effective date.
2023 Scotiabank Annual Report | 117
Management’s Discussion and Analysis
OSFI Guideline B-15: Disclosure of Climate-Related Matters
OSFI published its final Guideline B-15 – Climate Risk Management on March 7, 2023, which sets out its expectations for the management of climate-related risks for FRFIs and includes disclosure expectations beginning on October 31, 2024. The Bank contributed with the Canadian Bankers Association (CBA) to respond to a draft Climate Risk Regulatory Data Return consultation which was due on September 30th, 2023. On October 16th, the Office of the Superintendent of Financial Institutions (OSFI) launched a consultation on Standardized Climate Scenario Exercise with responses due by December 16th, 2023. The Bank is working on the timely implementation of OSFI B-15 requirements.
OSFI Draft Integrity and Security Guideline
On October 13, 2023, in response to Bill C-47 (an Act to implement certain provisions of the budget tabled in Parliament on March 28, 2023) and OSFI’s expanded integrity and security mandate, OSFI published a draft Integrity and Security Guideline for consultation. Comments on the draft guideline were due November 24, 2023 and OSFI intends to issue a final guideline by end of January 2024. This draft guideline requires federally regulated financial institutions (FRFIs), such as the Bank, to ensure that they have adequate policies and procedures in place to protect against threats to their integrity and security, follow all relevant existing OSFI guidelines, and meet specific new expectations in the draft guideline, such as the expectation that any suspicion of foreign interference, undue influence and malicious activity be promptly reported to law enforcement. The Bank is currently reviewing the draft guideline and its potential impact on the Bank.
OSFI Draft Revised Guideline E-21: Operational Risk
On October 13, 2023, OSFI launched a public consultation of revised Guideline E-21: Operational Resilience and Operational Risk Management (Guideline E-21). The revised Guideline E-21 (i) establishes a more explicit linkage between Operational Risk and Operational Resilience practices, (ii) sets new expectations for operational resilience to strengthen FRFIs ability to prepare for and recover from severe disruptive events; (iii) modernizes OSFI’s expectations for operational risk management by recognizing that operational resilience is built on a foundation of effective operational risk management and setting out new expectations for business continuity management, crisis management, change management and data risk management; and (iv) contributes to FRFIs’ integrity and security.
OSFI Guideline B-20: Residential Mortgage Underwriting Practices and Procedures
OSFI launched a public consultation of Guideline B-20 on Residential Mortgage Underwriting Practices and Procedures (Guideline B-20) in January 2023. The consultation was focusing on a set of proposed complementary debt serviceability measures designed to better control prudential risks arising from high consumer indebtedness. The proposed debt serviceability measures include loan-to-income (LTI) and debt-to-income (DTI) restrictions, debt service coverage restrictions, and interest rate affordability stress tests. In October 2023, OSFI confirmed that it would no longer pursue two of its proposals at this time: debt-to-income (DTI) restrictions (while keeping LTI restrictions on the table) and debt service loan coverage restrictions. The Bank is monitoring this proposed regulatory development.
OSFI finalizes its Solo Total Loss Absorbing Capacity (TLAC) framework
In September 2023, OSFI finalized changes to its Solo TLAC Framework, effective the first quarter of 2024. Under this framework, OSFI has established a risk-based Solo TLAC ratio, which builds on the risk-based TLAC ratio set out in OSFI’s TLAC Guideline and the risk-based capital ratios described within OSFI’s Capital Adequacy Requirements Guideline. The risk-based Solo TLAC ratio will be the primary basis used by OSFI to assess the sufficiency of TLAC that is readily available to the domestic Parent Bank and to assess the Parent’s ability to act as a source of strength for its subsidiaries and/or other affiliates. Based on the Solo TLAC requirements within finalized guideline, the Bank expects to be compliant with the new requirements.
Interest rate benchmark reform
The publication of the overnight and 12-month U.S. Dollar London Interbank Offered Rate (USD LIBOR) tenors has ceased, and the one-month, three-month and six-month USD LIBOR tenors became non-representative as of June 30, 2023. These non-representative tenors will be published on a synthetic basis until September 30, 2024, to allow market participants to use such rates in legacy contracts. The Bank has successfully transitioned all of its USD LIBOR contracts to alternative risk-free rates either through amendments in advance as of June 30, 2023, or reliance through fallback provisions.
As previously announced by Refinitiv Benchmark Services (UK) Limited, one-month, two-month, and three-month Canadian Dollar Offered Rate (CDOR) tenors will continue to be published until June 28, 2024 (the cessation date). OSFI expects FRFIs to transition CDOR-linked transactions to Canadian Overnight Repo Rate Average (CORRA) before the cessation date.
CanDeal Benchmark Solutions and TMX Datalinx have launched the one-month and three-month Term CORRA benchmark on September 5, 2023. The Canadian Alternative Reference Rate working group (CARR) has announced that after November 1, 2023, all new loan contracts must reference only Overnight CORRA, Term CORRA, or Prime Rate instead of CDOR or a bankers’ acceptance rate.
The Bank’s Transition Plan aligns with the CDOR transition roadmap and milestones published by CARR. After June 30, 2023, all new derivatives and securities transactions of the Bank must reference CORRA benchmarks with permissible exceptions. With the cessation of CDOR, Bankers Acceptance (BA) based loan facilities will be transitioned to alternative rates such as CORRA or Prime. BA securities, which are produced as a result of BA-based loan facilities, will no longer be issued after the cessation of CDOR and will be replaced by other short-term money market instruments.
Canadian Federal Tax Measures
The Federal Budget released on March 28, 2023 included certain tax measures affecting the Bank. Of particular note were proposals to eliminate the deduction for dividends received on shares of Canadian corporations that are categorized as mark-to-market property for tax purposes; to impose a 2% tax on the net value of share repurchases; and to impose GST/HST on payment card clearing services with the potential to reassess prior years for GST/HST amounts owing. The Federal Budget also reconfirmed the Government of Canada’s commitment to implement the Organisation for Economic Co-operation and Development’s (OECD) Pillar Two model rules, which will impose a 15% minimum tax on global operations.
On June 22, 2023, Bill C-47 (an Act to implement certain provisions of the budget tabled in Parliament on March 28, 2023) containing the proposed Federal Budget tax measure relating to GST/HST on payment card clearing services passed all readings in Parliament and received royal assent to become law.
The impact of the enacted legislation on payment card clearing service fees paid by the Bank up to March 31, 2021 has been recognized in the Bank’s financial results as of October 31, 2023 and is not material for the Bank. The remaining impact of the enacted legislation and Federal Budget
118 | 2023 Scotiabank Annual Report
Management’s Discussion and Analysis | Controls and Accounting Policies
proposals, if enacted, would result in increased tax expense for the Bank; however, their impact cannot be accurately assessed at this time due to uncertainties around the final rules and their application by the Canada Revenue Agency.
On August 4, 2023, the Department of Finance Canada released draft legislation, which includes, among other things, the Pillar Two global minimum tax rules and 2% tax on the net value of all types of share repurchases by public corporations in Canada.
The Fall Economic Statement released on November 21, 2023 reaffirms the government’s intention to proceed with the previously announced tax measures, including the denial of the Dividend Received Deduction.
Global Minimum Tax
The OECD published Pillar Two model rules in December 2021 as part of its efforts toward international tax reform. The rules aim to have large multinational enterprises pay a minimum effective tax of 15% in each jurisdiction they operate. OECD member countries are in the process of developing domestic tax legislation to implement the rules.
On May 23, 2023, the IASB issued amendments to IAS 12 Income Taxes introducing a temporary mandatory exception from the recognition and disclosure of deferred taxes related to the implementation of Pillar Two global minimum tax rules. Additional disclosures will be required in future periods for current taxes related to effective rules and impacts from enacted legislation not yet in effect. The Bank has applied the deferred tax exception and will continue monitoring the progress of relevant legislation globally to determine the impact upon substantive enactment.
Quebec’s Consumer Protection Act
On October 5, 2023, the Province of Quebec’s National Assembly adopted “An Act to protect consumers from planned obsolescence and to promote the durability, repairability and maintenance of goods”. In addition to the planned obsolescence prohibitions, this act introduces in the existing Consumer Protection Act (Quebec) a more robust set of administrative penalties for organizations and their directors found in breach of its provisions, with potential maximum fines reaching up to 5% of the organization’s worldwide turnover for the preceding year. The Bank is monitoring this proposed regulatory development.
Financial Institutions Statues Review and Non-Sufficient Fund Fees
On October 5, 2023, the Department of Finance launched a public consultation as part of its periodic review of the key statutes governing FRFIs: the Bank Act, the Insurance Companies Act, and the Trust and Loan Companies Act. This is being done in anticipation of the upcoming sunset date for these statutes, of June 30, 2025. Specifically, the Department of Finance is seeking views on how these statutes, and related legislation, regulations, and policies, should respond to emerging financial sector trends, and whether technical changes are needed. In particular, how emerging trends in the financial sector will impact consumers, national security, fair competition, and the safety and integrity of the financial system, and whether any changes are needed to the framework. The Bank is closely monitoring this proposed regulatory development.
On October 17, 2023, the Deputy Prime Minister and Minister of Finance, announced a direction to lower non-sufficient fund fees charged by banks. Further, the Minister has directed the Financial Consumer Agency of Canada to work with financial institutions to improve the features of low-cost accounts, such as providing additional debit transactions, online bill payments, and e-transfers with no extra fees and to make more Canadians eligible for no-cost account. The Bank is monitoring this proposed regulatory development.
Compensation of key management personnel
Key management personnel are those persons having authority and responsibility for planning, directing and controlling the activities of the Bank, directly or indirectly, and comprise the directors of the Bank, the President and Chief Executive Officer, certain direct reports of the President and Chief Executive Officer and Group Heads.
T59 Compensation of key management personnel of the Bank
| For the year ended October 31 ($ millions) | 2023 | 2022 | ||||||
| Salaries and cash incentives(1) |
$ | 23 | $ | 24 | ||||
| Equity-based payment(2) |
32 | 36 | ||||||
| Pension and other benefits(1) |
2 | 4 | ||||||
| Total |
$ | 57 | $ | 64 | ||||
| (1) | Expensed during the year. |
| (2) | Awarded during the year. |
Directors can use some or all of their director fees earned to buy common shares of the Bank at market rates through the Director’s Share Purchase Plan. Non-officer directors may elect to receive all or a portion of their fees in the form of deferred stock units which vest immediately. Refer to Note 26 – Share-based payments for further details of these plans.
T60 Loans and deposits of key management personnel
Loans are currently granted to key management personnel at market terms and conditions.
| As at October 31 ($ millions) | 2023 | 2022 | ||||||
| Loans |
$ | 13 | $ | 11 | ||||
| Deposits |
$ | 6 | $ | 5 | ||||
The Bank’s committed credit exposure to companies controlled by directors totaled $266 million as at October 31, 2023 (October 31, 2022 – $264 million) while actual utilized accounts were $165 million (October 31, 2022 – $188.4 million).
2023 Scotiabank Annual Report | 119
Management’s Discussion and Analysis
Transactions with associates and joint ventures
In the ordinary course of business, the Bank provides normal banking services and enters into transactions with its associated and other related corporations on terms similar to those offered to non-related parties. If these transactions are eliminated on consolidation, they are not disclosed as related party transactions. Transactions between the Bank and its associated companies and joint ventures also qualify as related party transactions and are as follows:
T61 Transactions with associates and joint ventures
| As at and for the year ended October 31 ($ millions) | 2023 | 2022 | ||||||
| Net income / (loss) |
$ | (22 | ) | $ | (29 | ) | ||
| Loans |
209 | 205 | ||||||
| Deposits |
277 | 286 | ||||||
| Guarantees and commitments |
$ | 55 | $ | 96 | ||||
Scotiabank principal pension plan
The Bank manages assets of $5.2 billion (October 31, 2022 – $4.9 billion) which is a portion of the Scotiabank principal pension plan assets and earned $6.9 million (October 31, 2022 – $6.4 million) in fees.
Oversight and governance
The oversight responsibilities of the Audit and Conduct Review Committee (ACRC) with respect to related party transactions include reviewing policies and practices for identifying transactions with related parties that may materially affect the Bank, and reviewing the procedures for ensuring compliance with the Bank Act for related party transactions. The Bank Act requirements encompass a broader definition of related party transactions than is set out in IFRS. The Bank has various procedures in place to ensure that related party information is identified and reported to the ACRC on a semi-annual basis. The ACRC is provided with detailed reports that reflect the Bank’s compliance with its established procedures.
The Bank’s Internal Audit department carries out audit procedures as necessary to provide the ACRC with reasonable assurance that the Bank’s policies and procedures to identify, authorize and report related party transactions are appropriately designed and operating effectively.
120 | 2023 Scotiabank Annual Report
Management’s Discussion and Analysis | Supplementary Data
T62 Net income by geographic segment
| 2023 | 2022 | |||||||||||||||||||||||||||||||||||||||||||||||||||||||||||||||||||||||||||||
| For the fiscal year ($ millions) | Canada | U.S. | Mexico | Peru | Chile | Colombia | Caribbean and Central America |
Other Inter- national |
Total | Canada | U.S. | Mexico | Peru | Chile | Colombia | Caribbean and Central America |
Other Inter- national |
Total | ||||||||||||||||||||||||||||||||||||||||||||||||||||||||||||
| Net interest income |
|
$ | 8,533 | $ | 1,019 | $ | 2,168 | $ | 1,320 | $ | 1,830 | $ | 564 | $ | 1,761 | $ | 1,092 | $ | 18,287 | $ | 9,827 | $ | 945 | $ | 1,736 | $ | 1,171 | $ | 1,604 | $ | 631 | $ | 1,436 | $ | 765 | $ | 18,115 | |||||||||||||||||||||||||||||||||||||||||
| Non-interest income |
8,598 | 1,351 | 873 | 454 | 593 | 418 | 798 | 935 | 14,020 | 8,149 | 1,103 | 748 | 422 | 538 | 388 | 719 | 1,234 | 13,301 | ||||||||||||||||||||||||||||||||||||||||||||||||||||||||||||
| Provision for credit losses |
1,492 | 59 | 270 | 404 | 604 | 392 | 123 | 78 | 3,422 | 180 | (13 | ) | 232 | 342 | 221 | 216 | 175 | 29 | 1,382 | |||||||||||||||||||||||||||||||||||||||||||||||||||||||||||
| Non-interest expenses |
10,982 | 1,246 | 1,488 | 727 | 1,014 | 661 | 1,437 | 1,576 | 19,131 | 9,928 | 1,040 | 1,223 | 628 | 870 | 682 | 1,335 | 1,396 | 17,102 | ||||||||||||||||||||||||||||||||||||||||||||||||||||||||||||
| Income tax expense |
1,041 | 276 | 312 | 162 | 135 | (21 | ) | 197 | 124 | 2,226 | 1,697 | 260 | 196 | 173 | 95 | 39 | 150 | 148 | 2,758 | |||||||||||||||||||||||||||||||||||||||||||||||||||||||||||
| Net income |
3,616 | 789 | 971 | 481 | 670 | (50 | ) | 802 | 249 | 7,528 | 6,171 | 761 | 833 | 450 | 956 | 82 | 495 | 426 | 10,174 | |||||||||||||||||||||||||||||||||||||||||||||||||||||||||||
| Net income attributable to non-controlling interests in subsidiaries |
(3 | ) | – | 22 | 1 | 18 | (34 | ) | 114 | – | 118 | 1 | – | 19 | 6 | 104 | 35 | 93 | – | 258 | ||||||||||||||||||||||||||||||||||||||||||||||||||||||||||
| Net income attributable to equity holders of the Bank |
$ | 3,619 | $ | 789 | $ | 949 | $ | 480 | $ | 652 | $ | (16 | ) | $ | 688 | $ | 249 | $ | 7,410 | $ | 6,170 | $ | 761 | $ | 814 | $ | 444 | $ | 852 | $ | 47 | $ | 402 | $ | 426 | $ | 9,916 | |||||||||||||||||||||||||||||||||||||||||
| Adjustments(1) |
876 | – | – | 5 | 20 | – | 4 | 5 | 910 | 511 | – | 1 | 6 | 20 | 1 | 4 | 31 | 574 | ||||||||||||||||||||||||||||||||||||||||||||||||||||||||||||
| Adjusted net income (loss) attributable to equity holders of the Bank(1) |
$ | 4,495 | $ | 789 | $ | 949 | $ | 485 | $ | 672 | $ | (16 | ) | $ | 692 | $ | 254 | $ | 8,320 | $ | 6,681 | $ | 761 | $ | 815 | $ | 450 | $ | 872 | $ | 48 | $ | 406 | $ | 457 | $ | 10,490 | |||||||||||||||||||||||||||||||||||||||||
| (1) | Refer to Non-GAAP Measures starting on page 20. |
T63 Loans and acceptances by geography
| As at October 31 ($ billions) | 2023 | 2022 | ||||||
| Canada |
||||||||
| Atlantic provinces |
$ | 24.8 | $ | 24.4 | ||||
| Quebec |
41.5 | 38.8 | ||||||
| Ontario |
278.4 | 277.5 | ||||||
| Manitoba and Saskatchewan |
20.1 | 22.2 | ||||||
| Alberta |
55.2 | 56.4 | ||||||
| British Columbia |
92.7 | 93.3 | ||||||
| 512.7 | 512.6 | |||||||
| U.S. |
65.8 | 69.5 | ||||||
| Mexico |
46.1 | 40.1 | ||||||
| Peru |
22.6 | 22.5 | ||||||
| Chile |
52.6 | 51.3 | ||||||
| Colombia |
12.8 | 11.0 | ||||||
| Other International |
||||||||
| Latin America |
16.1 | 15.8 | ||||||
| Europe |
10.9 | 10.9 | ||||||
| Caribbean and Central America |
24.5 | 23.9 | ||||||
| Asia and Other |
11.8 | 12.2 | ||||||
| 63.3 | 62.8 | |||||||
| $ | 775.9 | $ | 769.8 | |||||
| Total allowance for credit losses |
(6.5 | ) | (5.3 | ) | ||||
| Total loans and acceptances net of allowance for credit losses |
$ | 769.4 | $ | 764.5 | ||||
T64 Gross impaired loans by geographic segment
| As at October 31 ($ millions) | 2023 | 2022 | ||||||
| Canada |
$ | 1,564 | $ | 1,054 | ||||
| U.S. |
– | – | ||||||
| Mexico |
1,183 | 1,020 | ||||||
| Peru |
691 | 761 | ||||||
| Chile |
1,098 | 740 | ||||||
| Colombia |
356 | 301 | ||||||
| Other International |
834 | 910 | ||||||
| Total |
$ | 5,726 | $ | 4,786 | ||||
2023 Scotiabank Annual Report | 121
Management’s Discussion and Analysis
T65 Provision against impaired financial instruments by geographic segment
| For the fiscal years ($ millions) | 2023 | 2022 | ||||||
| Canada |
$ | 949 | $ | 548 | ||||
| U.S. |
14 | 12 | ||||||
| Mexico |
315 | 205 | ||||||
| Peru |
393 | 255 | ||||||
| Chile |
479 | 237 | ||||||
| Colombia |
349 | 227 | ||||||
| Other International |
224 | 210 | ||||||
| Total |
$ | 2,723 | $ | 1,694 | ||||
T66 Cross-border exposure to select countries(1)
| As at October 31 ($ millions) | Loans | Trade | Interbank deposits |
Government and other securities |
Investment in subsidiaries and affiliates |
Other | 2023 Total |
2022 Total |
||||||||||||||||||||||||
| Asia |
||||||||||||||||||||||||||||||||
| China |
$ | 1,344 | $ | 108 | $ | 366 | $ | 914 | $ | 93 | $ | 2 | $ | 2,827 | $ | 3,298 | ||||||||||||||||
| India |
733 | 8 | – | – | – | – | 741 | 891 | ||||||||||||||||||||||||
| Singapore |
4,523 | 205 | 39 | – | – | 4 | 4,771 | 4,273 | ||||||||||||||||||||||||
| Hong Kong |
1,241 | 1 | 14 | 42 | – | 31 | 1,329 | 1,611 | ||||||||||||||||||||||||
| Japan |
226 | 262 | 3 | 6,420 | – | 19 | 6,930 | 4,991 | ||||||||||||||||||||||||
| Others(2) |
365 | 15 | 49 | – | 131 | 4 | 564 | 709 | ||||||||||||||||||||||||
| Total |
$ | 8,432 | $ | 599 | $ | 471 | $ | 7,376 | $ | 224 | $ | 60 | $ | 17,162 | $ | 15,773 | ||||||||||||||||
| Latin America |
||||||||||||||||||||||||||||||||
| Chile |
$ | 3,275 | $ | 760 | $ | 3,828 | $ | 217 | $ | 7,423 | $ | 56 | $ | 15,559 | $ | 14,825 | ||||||||||||||||
| Mexico |
6,269 | 170 | – | 699 | 6,812 | 37 | 13,987 | 13,423 | ||||||||||||||||||||||||
| Brazil |
14,151 | 655 | – | – | 897 | – | 15,703 | 15,655 | ||||||||||||||||||||||||
| Peru |
3,859 | 7 | – | 119 | 5,661 | 2 | 9,648 | 9,102 | ||||||||||||||||||||||||
| Colombia |
2,989 | 58 | – | 240 | 1,161 | 13 | 4,461 | 4,125 | ||||||||||||||||||||||||
| Others(3) |
191 | 2 | – | – | 585 | – | 778 | 608 | ||||||||||||||||||||||||
| Total |
$ | 30,734 | $ | 1,652 | $ | 3,828 | $ | 1,275 | $ | 22,539 | $ | 108 | $ | 60,136 | $ | 57,738 | ||||||||||||||||
| Caribbean and Central America |
||||||||||||||||||||||||||||||||
| Panama |
$ | 4,907 | $ | – | $ | 62 | $ | 200 | $ | 184 | $ | – | $ | 5,353 | $ | 5,625 | ||||||||||||||||
| Costa Rica |
578 | – | – | – | 1,356 | 3 | 1,937 | 2,239 | ||||||||||||||||||||||||
| Dominican Republic |
1,384 | 234 | – | – | 934 | – | 2,552 | 2,270 | ||||||||||||||||||||||||
| Others(4) |
382 | 109 | – | – | 2,604 | 1 | 3,096 | 2,448 | ||||||||||||||||||||||||
| Total |
$ | 7,251 | $ | 343 | $ | 62 | $ | 200 | $ | 5,078 | $ | 4 | $ | 12,938 | $ | 12,582 | ||||||||||||||||
| As at October 31, 2023 |
$ | 46,417 | $ | 2,594 | $ | 4,361 | $ | 8,851 | $ | 27,841 | $ | 172 | $ | 90,236 | ||||||||||||||||||
| As at October 31, 2022 |
$ | 46,282 | $ | 4,932 | $ | 4,507 | $ | 6,931 | $ | 23,134 | $ | 307 | $ | 86,093 | ||||||||||||||||||
| (1) | Cross-border exposure represents a claim, denominated in a currency other than the local one, against a borrower in a foreign country on the basis of ultimate risk. |
| (2) | Includes Indonesia, Macau, Malaysia, South Korea, Thailand and Taiwan. |
| (3) | Includes Uruguay. Prior period amounts include Uruguay and Venezuela. |
| (4) | Includes other Caribbean countries, such as Bahamas, Barbados, Jamaica, Trinidad & Tobago, and Turks & Caicos. |
122 | 2023 Scotiabank Annual Report
Management’s Discussion and Analysis | Supplementary Data
T67 Loans and acceptances by type of borrower
| As at October 31 ($ billions) | 2023 | 2022 | ||||||
| Residential mortgages |
$ | 344.2 | $ | 349.3 | ||||
| Personal loans |
104.2 | 99.4 | ||||||
| Credit cards |
17.1 | 14.5 | ||||||
| Personal |
$ | 465.5 | $ | 463.2 | ||||
| Financial services |
||||||||
| Non-bank |
$ | 29.9 | $ | 35.2 | ||||
| Bank(1) |
0.8 | 4.2 | ||||||
| Wholesale and retail |
34.3 | 34.3 | ||||||
| Real estate and contractor |
67.4 | 60.9 | ||||||
| Energy |
9.1 | 9.2 | ||||||
| Transportation |
9.7 | 9.3 | ||||||
| Automotive |
18.9 | 14.6 | ||||||
| Agriculture |
17.6 | 19.8 | ||||||
| Hospitality and leisure |
3.7 | 4.0 | ||||||
| Mining |
6.6 | 6.2 | ||||||
| Metals |
2.3 | 2.8 | ||||||
| Utilities |
29.5 | 27.1 | ||||||
| Health care |
8.2 | 7.2 | ||||||
| Technology and media |
25.1 | 25.3 | ||||||
| Chemicals |
2.3 | 2.4 | ||||||
| Food and beverage |
11.8 | 11.8 | ||||||
| Forest products |
2.9 | 2.5 | ||||||
| Other(2) |
23.8 | 23.6 | ||||||
| Sovereign(3) |
6.5 | 6.2 | ||||||
| Business and government |
$ | 310.4 | $ | 306.6 | ||||
| $ | 775.9 | $ | 769.8 | |||||
| Total allowance for credit losses |
(6.5 | ) | (5.3 | ) | ||||
| Total loans and acceptances net of allowance for credit losses |
$ | 769.4 | $ | 764.5 | ||||
| (1) | Deposit taking institutions and securities firms. |
| (2) | Other includes $7.2 in wealth management, $3.4 in services and $1.8 in financing products (2022 – $6.4, $2.5, and $1.0 respectively). |
| (3) | Includes central banks, regional and local governments, supra-national agencies. |
T68 Off-balance sheet credit instruments
| As at October 31 ($ billions) | 2023 | 2022 | ||||||
| Commitments to extend credit(1) |
$ | 284.0 | $ | 267.7 | ||||
| Standby letters of credit and letters of guarantee |
48.4 | 42.0 | ||||||
| Securities lending, securities purchase commitments and other |
57.7 | 54.5 | ||||||
| Total |
$ | 390.1 | $ | 364.2 | ||||
| (1) | Includes liquidity facilities, and excludes commitments which are unconditionally cancellable at the Bank’s discretion at any time. |
2023 Scotiabank Annual Report | 123
Management’s Discussion and Analysis
T69 Changes in net impaired loans
| For the fiscal years ($ millions) | 2023 | 2022 | ||||||
| Gross impaired loans |
||||||||
| Balance at beginning of year |
$ | 4,786 | $ | 4,456 | ||||
| Net additions |
||||||||
| New additions |
7,067 | 5,277 | ||||||
| Acquisition-related |
– | – | ||||||
| Declassifications |
(1,940 | ) | (1,353 | ) | ||||
| Payments |
(1,406 | ) | (1,445 | ) | ||||
| Sales |
(49 | ) | (53 | ) | ||||
| 3,672 | 2,426 | |||||||
| Write-offs |
||||||||
| Residential mortgages |
(97 | ) | (73 | ) | ||||
| Personal loans |
(1,417 | ) | (1,116 | ) | ||||
| Credit cards |
(1,113 | ) | (791 | ) | ||||
| Business and government |
(355 | ) | (318 | ) | ||||
| (2,982 | ) | (2,298 | ) | |||||
| Foreign exchange and other |
250 | 202 | ||||||
| Balance at end of year |
$ | 5,726 | $ | 4,786 | ||||
| Allowance for credit losses on financial instruments |
||||||||
| Balance at beginning of year |
$ | 1,635 | $ | 1,655 | ||||
| Provision for credit losses |
2,723 | 1,678 | ||||||
| Write-offs |
(2,982 | ) | (2,298 | ) | ||||
| Recoveries |
||||||||
| Residential mortgages |
31 | 28 | ||||||
| Personal loans |
237 | 253 | ||||||
| Credit cards |
197 | 179 | ||||||
| Business and government |
65 | 112 | ||||||
| 530 | 572 | |||||||
| Foreign exchange and other |
(25 | ) | 28 | |||||
| Balance at end of year |
$ | 1,881 | $ | 1,635 | ||||
| Net impaired loans |
||||||||
| Balance at beginning of year |
$ | 3,151 | $ | 2,801 | ||||
| Net change in gross impaired loans |
940 | 330 | ||||||
| Net change in allowance for credit losses on impaired financial instruments |
(246 | ) | 20 | |||||
| Balance at end of year |
$ | 3,845 | $ | 3,151 | ||||
T70 Provision for credit losses
| For the fiscal years ($ millions) | 2023 | 2022 | ||||||
| New provisions |
$ | 3,357 | $ | 2,361 | ||||
| Reversals |
(104 | ) | (95 | ) | ||||
| Recoveries |
(530 | ) | (572 | ) | ||||
| Provision for credit losses on impaired financial instruments |
2,723 | 1,694 | ||||||
| Provision for credit losses – performing financial instruments |
699 | (312 | ) | |||||
| Total Provision for credit losses |
$ | 3,422 | $ | 1,382 | ||||
124 | 2023 Scotiabank Annual Report
Management’s Discussion and Analysis | Supplementary Data
T71 Provision for credit losses against impaired financial instruments by type of borrower
| For the fiscal years ($ millions) | 2023 | 2022 | ||||||
| Residential mortgages |
$ | 156 | $ | 49 | ||||
| Personal loans |
1,266 | 766 | ||||||
| Credit cards |
908 | 601 | ||||||
| Personal |
2,330 | 1,416 | ||||||
| Financial services |
||||||||
| Non-bank |
70 | 20 | ||||||
| Bank |
– | – | ||||||
| Wholesale and retail |
72 | 22 | ||||||
| Real estate and construction |
118 | 84 | ||||||
| Energy |
(2 | ) | (29 | ) | ||||
| Transportation |
(2 | ) | 23 | |||||
| Automotive |
5 | (3 | ) | |||||
| Agriculture |
50 | 37 | ||||||
| Hospitality and leisure |
4 | 13 | ||||||
| Mining |
(9 | ) | 12 | |||||
| Metals |
17 | (6 | ) | |||||
| Utilities |
(4 | ) | 34 | |||||
| Health care |
5 | 7 | ||||||
| Technology and media |
7 | 15 | ||||||
| Chemicals |
15 | 10 | ||||||
| Food and beverage |
22 | 13 | ||||||
| Forest products |
3 | 14 | ||||||
| Other |
21 | 8 | ||||||
| Sovereign |
1 | 4 | ||||||
| Business and government |
393 | 278 | ||||||
| Provision for credit losses on impaired financial instruments |
$ | 2,723 | $ | 1,694 | ||||
T72 Impaired loans by type of borrower
| 2023 | 2022 | |||||||||||||||||||||||||||
| As at October 31 ($ millions) | Gross | Allowance for credit losses |
Net | Gross | Allowance for credit losses |
Net | ||||||||||||||||||||||
| Residential mortgages |
$ | 1,864 | $ | 498 | $ | 1,366 | $ | 1,386 | $ | 406 | $ | 980 | ||||||||||||||||
| Personal loans |
1,176 | 664 | 512 | 848 | 551 | 297 | ||||||||||||||||||||||
| Credit cards |
– | – | – | – | – | – | ||||||||||||||||||||||
| Personal |
$ | 3,040 | $ | 1,162 | $ | 1,878 | $ | 2,234 | $ | 957 | $ | 1,277 | ||||||||||||||||
| Financial services |
||||||||||||||||||||||||||||
| Non-bank |
118 | 48 | 70 | 142 | 22 | 120 | ||||||||||||||||||||||
| Bank |
– | – | – | 1 | – | 1 | ||||||||||||||||||||||
| Wholesale and retail |
456 | 202 | 254 | 484 | 215 | 269 | ||||||||||||||||||||||
| Real estate and construction |
773 | 150 | 623 | 491 | 98 | 393 | ||||||||||||||||||||||
| Energy |
33 | 7 | 26 | 59 | 12 | 47 | ||||||||||||||||||||||
| Transportation |
82 | 29 | 53 | 89 | 38 | 51 | ||||||||||||||||||||||
| Automotive |
27 | 9 | 18 | 18 | 9 | 9 | ||||||||||||||||||||||
| Agriculture |
272 | 73 | 199 | 196 | 72 | 124 | ||||||||||||||||||||||
| Hospitality and leisure |
95 | 14 | 81 | 87 | 15 | 72 | ||||||||||||||||||||||
| Mining |
6 | 3 | 3 | 39 | 9 | 30 | ||||||||||||||||||||||
| Metals |
57 | 21 | 36 | 70 | 17 | 53 | ||||||||||||||||||||||
| Utilities |
4 | 2 | 2 | 93 | 9 | 84 | ||||||||||||||||||||||
| Health care |
68 | 18 | 50 | 53 | 26 | 27 | ||||||||||||||||||||||
| Technology and media |
27 | 12 | 15 | 37 | 13 | 24 | ||||||||||||||||||||||
| Chemicals |
82 | 16 | 66 | 88 | 12 | 76 | ||||||||||||||||||||||
| Food and beverage |
133 | 42 | 91 | 97 | 30 | 67 | ||||||||||||||||||||||
| Forest products |
80 | 11 | 69 | 79 | 13 | 66 | ||||||||||||||||||||||
| Other |
135 | 59 | 76 | 182 | 63 | 119 | ||||||||||||||||||||||
| Sovereign |
238 | 3 | 235 | 247 | 5 | 242 | ||||||||||||||||||||||
| Business and government |
$ | 2,686 | $ | 719 | $ | 1,967 | $ | 2,552 | $ | 678 | $ | 1,874 | ||||||||||||||||
| Total |
$ | 5,726 | $ | 1,881 | $ | 3,845 | $ | 4,786 | $ | 1,635 | $ | 3,151 | ||||||||||||||||
2023 Scotiabank Annual Report | 125
Management’s Discussion and Analysis
T73 Total credit risk exposures by geography(1)(2)
| 2023 | 2022 | |||||||||||||||||||||||||||
| Revised Basel III(3) | Basel III | |||||||||||||||||||||||||||
| Non-Retail | ||||||||||||||||||||||||||||
| As at October 31 ($ millions) | Drawn | Undrawn | Other exposures(4) |
Retail | Total | Total | ||||||||||||||||||||||
| Canada |
$ | 253,003 | $ | 49,641 | $ | 37,785 | $ | 425,576 | $ | 766,005 | $ | 710,049 | ||||||||||||||||
| U.S. |
137,284 | 35,009 | 51,281 | – | 223,574 | 247,672 | ||||||||||||||||||||||
| Chile |
28,645 | 1,825 | 4,336 | 31,927 | 66,733 | 60,528 | ||||||||||||||||||||||
| Mexico |
36,863 | 2,372 | 3,061 | 20,000 | 62,296 | 50,793 | ||||||||||||||||||||||
| Peru |
15,902 | 1,474 | 3,444 | 11,647 | 32,467 | 32,176 | ||||||||||||||||||||||
| Colombia |
7,886 | 400 | 1,116 | 7,431 | 16,833 | 13,291 | ||||||||||||||||||||||
| Other International |
||||||||||||||||||||||||||||
| Europe |
19,474 | 6,347 | 17,460 | – | 43,281 | 46,156 | ||||||||||||||||||||||
| Caribbean and Central America |
16,836 | 1,545 | 1,234 | 14,359 | 33,974 | 32,057 | ||||||||||||||||||||||
| Latin America (other) |
17,118 | 1,377 | 2,070 | 1,107 | 21,672 | 20,890 | ||||||||||||||||||||||
| Other |
24,541 | 3,731 | 3,580 | – | 31,852 | 34,088 | ||||||||||||||||||||||
| Total |
$ | 557,552 | $ | 103,721 | $ | 125,367 | $ | 512,047 | $ | 1,298,687 | $ | 1,247,700 | ||||||||||||||||
| As at October 31, 2022 |
$ | 462,153 | $ | 132,195 | $ | 130,471 | $ | 522,881 | $ | 1,247,700 | ||||||||||||||||||
| (1) | Geographic segmentation is based upon the location of the ultimate risk of the credit exposure. Includes all credit risk portfolios and excludes equities and other assets. |
| (2) | Amounts represent exposure at default. |
| (3) | Regulatory amounts reported in 2023 are under Revised Basel III requirements and are not directly comparable to amounts reported in 2022. |
| (4) | Includes off-balance sheet lending instruments such as letters of credit, letters of guarantee, derivatives, securitization and repo-style transactions after collateral. |
T74 IRB credit risk exposures by maturity(1)(2)
| 2023 | 2022 | |||||||||||||||||||||||
| Revised Basel III(3) | Basel III | |||||||||||||||||||||||
| Residual maturity as at October 31 ($ millions) | Drawn | Undrawn | Other exposures(4) |
Total | Total | |||||||||||||||||||
| Non-retail |
||||||||||||||||||||||||
| Less than 1 year |
$ | 201,930 | $ | 30,922 | $ | 70,999 | $ | 303,851 | $ | 315,321 | ||||||||||||||
| One to 5 years |
183,665 | 61,548 | 39,786 | 284,999 | 291,225 | |||||||||||||||||||
| Over 5 years |
41,460 | 3,972 | 7,996 | 53,428 | 45,636 | |||||||||||||||||||
| Total non-retail |
$ | 427,055 | $ | 96,442 | $ | 118,781 | $ | 642,278 | $ | 652,182 | ||||||||||||||
| Retail |
||||||||||||||||||||||||
| Less than 1 year |
$ | 34,440 | $ | 56,698 | $ | – | $ | 91,138 | $ | 56,047 | ||||||||||||||
| One to 5 years |
253,126 | – | – | 253,126 | 267,711 | |||||||||||||||||||
| Over 5 years |
16,457 | – | – | 16,457 | 16,917 | |||||||||||||||||||
| Revolving credits(5) |
41,084 | 42,492 | – | 83,576 | 71,063 | |||||||||||||||||||
| Total retail |
$ | 345,107 | $ | 99,190 | $ | – | $ | 444,297 | $ | 411,738 | ||||||||||||||
| Total |
$ | 772,162 | $ | 195,632 | $ | 118,781 | $ | 1,086,575 | $ | 1,063,920 | ||||||||||||||
| As at October 31, 2022 |
$ | 755,551 | $ | 186,322 | $ | 122,047 | $ | 1,063,920 | ||||||||||||||||
| (1) | Remaining term to maturity of the credit exposure. Includes all credit risk portfolios and excludes equity securities and other assets. |
| (2) | Exposure at default, before credit risk mitigation. |
| (3) | Regulatory amounts reported in 2023 are under Revised Basel III requirements and are not directly comparable to amounts reported in 2022. |
| (4) | Off-balance sheet lending instruments, such as letters of credit, letters of guarantee, securitization, derivatives and repo-style transactions after collateral. |
| (5) | Credit cards and lines of credit with unspecified maturity. |
126 | 2023 Scotiabank Annual Report
Management’s Discussion and Analysis | Supplementary Data
T75 Total credit risk exposures and risk-weighted assets
| 2023 | 2022 | |||||||||||||||||||||||||||||||||||
| Revised Basel III(1) | Basel III | |||||||||||||||||||||||||||||||||||
| IRB | Standardized(2) | Total | Total | |||||||||||||||||||||||||||||||||
| As at October 31 ($ millions) | Exposure at Default(3) |
Risk- weighted assets |
Exposure at Default(3) |
Risk- weighted assets |
Exposure at Default(3) |
Risk- weighted assets |
Exposure at Default(3) |
Risk- weighted assets |
||||||||||||||||||||||||||||
| Non-retail |
||||||||||||||||||||||||||||||||||||
| Corporate |
||||||||||||||||||||||||||||||||||||
| Drawn |
$ | 227,187 | $ | 78,417 | $ | 45,471 | $ | 45,030 | $ | 272,658 | $ | 123,447 | $ | 281,060 | $ | 140,485 | ||||||||||||||||||||
| Undrawn |
80,691 | 26,170 | 7,082 | 7,093 | 87,773 | 33,263 | 126,226 | 45,819 | ||||||||||||||||||||||||||||
| Other(4) |
43,462 | 9,312 | 2,530 | 2,532 | 45,992 | 11,844 | 63,238 | 15,615 | ||||||||||||||||||||||||||||
| 351,340 | 113,899 | 55,083 | 54,655 | 406,423 | 168,554 | 470,524 | 201,919 | |||||||||||||||||||||||||||||
| Bank |
||||||||||||||||||||||||||||||||||||
| Drawn |
17,928 | 4,339 | 2,096 | 917 | 20,024 | 5,256 | 20,564 | 6,050 | ||||||||||||||||||||||||||||
| Undrawn |
12,865 | 5,763 | 23 | 11 | 12,888 | 5,774 | 4,765 | 1,179 | ||||||||||||||||||||||||||||
| Other(4) |
14,566 | 3,600 | 718 | 288 | 15,284 | 3,888 | 8,411 | 958 | ||||||||||||||||||||||||||||
| 45,359 | 13,702 | 2,837 | 1,216 | 48,196 | 14,918 | 33,740 | 8,187 | |||||||||||||||||||||||||||||
| Sovereign |
||||||||||||||||||||||||||||||||||||
| Drawn |
239,626 | 4,927 | 25,244 | 3,667 | 264,870 | 8,594 | 160,529 | 4,811 | ||||||||||||||||||||||||||||
| Undrawn |
2,886 | 323 | 174 | 148 | 3,060 | 471 | 1,204 | 101 | ||||||||||||||||||||||||||||
| Other(4) |
4,756 | 401 | 60 | 60 | 4,816 | 461 | 3,774 | 348 | ||||||||||||||||||||||||||||
| 247,268 | 5,651 | 25,478 | 3,875 | 272,746 | 9,526 | 165,507 | 5,260 | |||||||||||||||||||||||||||||
| Total Non-retail |
||||||||||||||||||||||||||||||||||||
| Drawn |
484,741 | 87,683 | 72,811 | 49,614 | 557,552 | 137,297 | 462,153 | 151,346 | ||||||||||||||||||||||||||||
| Undrawn |
96,442 | 32,256 | 7,279 | 7,252 | 103,721 | 39,508 | 132,195 | 47,099 | ||||||||||||||||||||||||||||
| Other(4) |
62,784 | 13,313 | 3,308 | 2,880 | 66,092 | 16,193 | 75,423 | 16,921 | ||||||||||||||||||||||||||||
| $ | 643,967 | $ | 133,252 | $ | 83,398 | $ | 59,746 | $ | 727,365 | $ | 192,998 | $ | 669,771 | $ | 215,366 | |||||||||||||||||||||
| Retail |
||||||||||||||||||||||||||||||||||||
| Retail residential mortgages |
||||||||||||||||||||||||||||||||||||
| Drawn |
$ | 214,619 | $ | 23,952 | $ | 64,402 | $ | 20,744 | $ | 279,021 | $ | 44,696 | $ | 346,133 | $ | 48,265 | ||||||||||||||||||||
| 214,619 | 23,952 | 64,402 | 20,744 | 279,021 | 44,696 | 346,133 | 48,265 | |||||||||||||||||||||||||||||
| Secured lines of credit |
||||||||||||||||||||||||||||||||||||
| Drawn |
22,166 | 3,972 | 486 | 170 | 22,652 | 4,142 | 21,879 | 3,278 | ||||||||||||||||||||||||||||
| Undrawn |
51,874 | 2,024 | 108 | 38 | 51,982 | 2,062 | 22,435 | 879 | ||||||||||||||||||||||||||||
| 74,040 | 5,996 | 594 | 208 | 74,634 | 6,204 | 44,314 | 4,157 | |||||||||||||||||||||||||||||
| Qualifying retail revolving exposures |
||||||||||||||||||||||||||||||||||||
| Drawn |
16,187 | 10,026 | 12,089 | 7,929 | 28,276 | 17,955 | 16,018 | 9,166 | ||||||||||||||||||||||||||||
| Undrawn |
42,492 | 4,373 | 7,760 | 4,072 | 50,252 | 8,445 | 30,417 | 3,247 | ||||||||||||||||||||||||||||
| 58,679 | 14,399 | 19,849 | 12,001 | 78,528 | 26,400 | 46,435 | 12,413 | |||||||||||||||||||||||||||||
| Other retail |
||||||||||||||||||||||||||||||||||||
| Drawn |
34,449 | 21,490 | 39,237 | 29,550 | 73,686 | 51,040 | 80,938 | 54,546 | ||||||||||||||||||||||||||||
| Undrawn/Other |
4,824 | 2,245 | 1,354 | 1,024 | 6,178 | 3,269 | 5,061 | 2,594 | ||||||||||||||||||||||||||||
| 39,273 | 23,735 | 40,591 | 30,574 | 79,864 | 54,309 | 85,999 | 57,140 | |||||||||||||||||||||||||||||
| Total retail |
||||||||||||||||||||||||||||||||||||
| Drawn |
287,421 | 59,440 | 116,214 | 58,393 | 403,635 | 117,833 | 464,968 | 115,255 | ||||||||||||||||||||||||||||
| Undrawn/Other |
99,190 | 8,642 | 9,222 | 5,134 | 108,412 | 13,776 | 57,913 | 6,720 | ||||||||||||||||||||||||||||
| $ | 386,611 | $ | 68,082 | $ | 125,436 | $ | 63,527 | $ | 512,047 | $ | 131,609 | $ | 522,881 | $ | 121,975 | |||||||||||||||||||||
| Securitization exposures |
30,477 | 5,268 | 2,570 | 914 | 33,047 | 6,182 | 27,535 | 5,409 | ||||||||||||||||||||||||||||
| Trading derivatives |
25,520 | 4,657 | 708 | 674 | 26,228 | 5,331 | 27,513 | 5,891 | ||||||||||||||||||||||||||||
| CVA derivatives |
– | – | – | 4,703 | – | 4,703 | – | 6,422 | ||||||||||||||||||||||||||||
| Subtotal |
$ | 1,086,575 | $ | 211,259 | $ | 212,112 | $ | 129,564 | $ | 1,298,687 | $ | 340,823 | $ | 1,247,700 | $ | 355,063 | ||||||||||||||||||||
| Equities |
– | – | 6,749 | 16,000 | 6,749 | 16,000 | 5,292 | 5,209 | ||||||||||||||||||||||||||||
| Other assets(5) |
– | – | 48,912 | 21,847 | 48,912 | 21,847 | 81,111 | 27,312 | ||||||||||||||||||||||||||||
| Total credit risk, before |
$ | 1,086,575 | $ | 211,259 | $ | 267,773 | $ | 167,411 | $ | 1,354,348 | $ | 378,670 | $ | 1,334,103 | $ | 387,584 | ||||||||||||||||||||
| Add-on for 6% scaling |
– | – | – | – | – | – | – | 13,850 | ||||||||||||||||||||||||||||
| Total credit risk |
$ | 1,086,575 | $ | 211,259 | $ | 267,773 | $ | 167,411 | $ | 1,354,348 | $ | 378,670 | $ | 1,334,103 | $ | 401,434 | ||||||||||||||||||||
| (1) | Regulatory amounts reported in 2023 are under Revised Basel III requirements and are not directly comparable to amounts reported in 2022. |
| (2) | Portfolios under the Standardized Approach are reported net of specific allowances for credit losses and net of collateral amounts treated under the Comprehensive Approach. |
| (3) | Outstanding amount for on-balance sheet exposures and loan equivalent amount for off-balance sheet exposures. Prior to 2023, before credit risk mitigation. |
| (4) | Other exposures include off-balance sheet lending instruments, such as letters of credit, letters of guarantee, non-trading derivatives and repo-style exposures, after collateral. |
| (5) | Other assets include amounts related to central counterparties. Prior to 2023, gross of capital deductions. |
| (6) | Prior to 2023, the Basel Committee imposed a scaling factor (6%) on risk-weighted assets for Internal Ratings-Based credit risk portfolios. |
2023 Scotiabank Annual Report | 127
Management’s Discussion and Analysis
T76 Volume/rate analysis of change in net interest income
| Increase (decrease) due to change in: 2023 versus 2022 |
Increase (decrease) due to change in: 2022 versus 2021 |
|||||||||||||||||||||||
| ($ millions) | Average volume |
Average rate |
Net change |
Average volume |
Average rate |
Net change |
||||||||||||||||||
| Net interest income |
||||||||||||||||||||||||
| Total earning assets |
$ | 3,293 | $ | 19,973 | $ | 23,266 | $ | 2,607 | $ | 5,965 | $ | 8,572 | ||||||||||||
| Total interest-bearing liabilities |
1,205 | 21,889 | 23,094 | 902 | 6,516 | 7,418 | ||||||||||||||||||
| Change in net interest income |
$ | 2,088 | $ | (1,916 | ) | $ | 172 | $ | 1,705 | $ | (551 | ) | $ | 1,154 | ||||||||||
| Assets |
||||||||||||||||||||||||
| Deposits with banks |
$ | (43 | ) | $ | 2,681 | $ | 2,638 | $ | 15 | $ | 635 | $ | 650 | |||||||||||
| Trading assets |
(97 | ) | 1,148 | 1,051 | (9 | ) | 490 | 481 | ||||||||||||||||
| Securities purchased under resale agreements |
149 | 870 | 1,019 | 33 | 248 | 281 | ||||||||||||||||||
| Investment securities |
432 | 2,473 | 2,905 | 64 | 865 | 929 | ||||||||||||||||||
| Loans: |
||||||||||||||||||||||||
| Residential mortgages |
393 | 3,776 | 4,169 | 1,173 | 663 | 1,836 | ||||||||||||||||||
| Personal loans |
450 | 1,658 | 2,108 | 195 | 490 | 685 | ||||||||||||||||||
| Credit cards |
396 | 269 | 665 | 55 | (50 | ) | 5 | |||||||||||||||||
| Business and government |
1,613 | 7,098 | 8,711 | 1,081 | 2,624 | 3,705 | ||||||||||||||||||
| Total loans |
2,852 | 12,801 | 15,653 | 2,504 | 3,727 | 6,231 | ||||||||||||||||||
| Total earning assets |
$ | 3,293 | $ | 19,973 | $ | 23,266 | $ | 2,607 | $ | 5,965 | $ | 8,572 | ||||||||||||
| Liabilities |
||||||||||||||||||||||||
| Deposits: |
||||||||||||||||||||||||
| Personal |
$ | 312 | $ | 4,404 | $ | 4,716 | $ | 61 | $ | 953 | $ | 1,014 | ||||||||||||
| Business and government |
793 | 16,112 | 16,905 | 705 | 4,472 | 5,177 | ||||||||||||||||||
| Banks |
31 | 1,204 | 1,235 | 53 | 85 | 138 | ||||||||||||||||||
| Total deposits |
1,136 | 21,720 | 22,856 | 819 | 5,510 | 6,329 | ||||||||||||||||||
| Obligations related to securities sold under repurchase agreements |
62 | 356 | 418 | 1 | 166 | 167 | ||||||||||||||||||
| Subordinated debentures |
56 | 145 | 201 | 33 | 57 | 90 | ||||||||||||||||||
| Other interest-bearing liabilities |
(49 | ) | (332 | ) | (381 | ) | 49 | 783 | 832 | |||||||||||||||
| Total interest-bearing liabilities |
$ | 1,205 | $ | 21,889 | $ | 23,094 | $ | 902 | $ | 6,516 | $ | 7,418 | ||||||||||||
T77 Provision for income and other taxes
| For the fiscal years ($ millions) | 2023 | 2022 | 2023 versus 2022 |
|||||||||
| Income taxes |
||||||||||||
| Income tax expense |
$ | 2,226 | $ | 2,758 | (19.3 | )% | ||||||
| Other taxes |
||||||||||||
| Payroll taxes |
500 | 458 | 9.2 | |||||||||
| Business and capital taxes |
634 | 541 | 17.2 | |||||||||
| Harmonized sales tax and other |
484 | 479 | 1.0 | |||||||||
| Total other taxes |
1,618 | 1,478 | 9.5 | |||||||||
| Total income and other taxes(1) |
$ | 3,844 | $ | 4,236 | (9.3 | )% | ||||||
| Net income before income taxes |
$ | 9,754 | $ | 12,932 | (24.6 | )% | ||||||
| Effective income tax rate (%)(2) |
22.8 | 21.3 | 1.5 | |||||||||
| Total tax rate (%)(3) |
33.8 | 29.4 | 4.4 | |||||||||
| (1) | Comprising $2,188 of Canadian taxes (2022 – $2,782) and $1,656 of foreign taxes (2022 – $1,454). |
| (2) | Refer to Glossary on page 136 for the description of the measure. |
| (3) | Total income and other taxes as a percentage of net income before income and other taxes. |
128 | 2023 Scotiabank Annual Report
Management’s Discussion and Analysis | Supplementary Data
T78 Assets under administration and management(1)
| ($ billions) | 2023 | 2022 | ||||||
| Assets under administration |
||||||||
| Personal |
||||||||
| Retail brokerage |
$ | 198.3 | $ | 192.4 | ||||
| Investment management and trust |
180.5 | 162.7 | ||||||
| 378.8 | 355.1 | |||||||
| Mutual funds |
201.5 | 198.8 | ||||||
| Institutional |
93.3 | 87.7 | ||||||
| Total |
$ | 673.6 | $ | 641.6 | ||||
| Assets under management |
||||||||
| Personal |
$ | 79.8 | $ | 76.7 | ||||
| Mutual funds |
186.2 | 184.1 | ||||||
| Institutional |
50.6 | 50.3 | ||||||
| Total |
$ | 316.6 | $ | 311.1 | ||||
| (1) | Refer to Glossary on page 136 for the description of the measure. |
T79 Changes in assets under administration and management(1)
| As at October 31 ($ billions) | 2023 | 2022 | ||||||
| Assets under administration |
||||||||
| Balance at beginning of year |
$ | 641.6 | $ | 652.9 | ||||
| Net inflows (outflows) |
12.3 | 20.0 | ||||||
| Impact of market changes, including foreign currency translation |
19.7 | (31.3 | ) | |||||
| Balance at end of year |
$ | 673.6 | $ | 641.6 | ||||
| (1) | Refer to Glossary on page 136 for the description of the measure. |
| As at October 31 ($ billions) | 2023 | 2022 | ||||||
| Assets under management |
||||||||
| Balance at beginning of year |
$ | 311.1 | $ | 345.8 | ||||
| Net inflows (outflows) |
(7.5 | ) | (4.3 | ) | ||||
| Impact of market changes, including foreign currency translation |
13.0 | (30.4 | ) | |||||
| Balance at end of year |
$ | 316.6 | $ | 311.1 | ||||
T80 Fees paid to the shareholders’ auditors
| For the fiscal years ($ millions) | 2023 | 2022 | ||||||
| Audit services |
$ | 33.0 | $ | 30.4 | ||||
| Audit-related services |
1.0 | 2.6 | ||||||
| Tax services outside of the audit scope |
0.4 | – | ||||||
| Other non-audit services |
0.9 | 0.4 | ||||||
| Total Bank and Subsidiaries |
$ | 35.3 | $ | 33.4 | ||||
| Mutual funds |
3.2 | 1.2 | ||||||
| Total Fees |
$ | 38.5 | $ | 34.6 | ||||
2023 Scotiabank Annual Report | 129
Management’s Discussion and Analysis
Selected Quarterly Information
T81 Selected quarterly information
| 2023 | 2022 | |||||||||||||||||||||||||||||||
| As at and for the quarter ended | Q4 | Q3 | Q2 | Q1 | Q4 | Q3 | Q2 | Q1 | ||||||||||||||||||||||||
| Operating results ($ millions) |
||||||||||||||||||||||||||||||||
| Net interest income |
4,672 | 4,580 | 4,466 | 4,569 | 4,622 | 4,676 | 4,473 | 4,344 | ||||||||||||||||||||||||
| Non-interest income |
3,636 | 3,510 | 3,463 | 3,411 | 3,004 | 3,123 | 3,469 | 3,705 | ||||||||||||||||||||||||
| Total revenue |
8,308 | 8,090 | 7,929 | 7,980 | 7,626 | 7,799 | 7,942 | 8,049 | ||||||||||||||||||||||||
| Provision for credit losses |
1,256 | 819 | 709 | 638 | 529 | 412 | 219 | 222 | ||||||||||||||||||||||||
| Non-interest expenses |
5,529 | 4,562 | 4,576 | 4,464 | 4,529 | 4,191 | 4,159 | 4,223 | ||||||||||||||||||||||||
| Income tax expense |
138 | 497 | 485 | 1,106 | 475 | 602 | 817 | 864 | ||||||||||||||||||||||||
| Net income |
1,385 | 2,212 | 2,159 | 1,772 | 2,093 | 2,594 | 2,747 | 2,740 | ||||||||||||||||||||||||
| Net income attributable to common shareholders |
1,245 | 2,086 | 2,029 | 1,631 | 1,949 | 2,504 | 2,595 | 2,608 | ||||||||||||||||||||||||
| Operating performance |
||||||||||||||||||||||||||||||||
| Basic earnings per share ($) |
1.03 | 1.74 | 1.70 | 1.37 | 1.64 | 2.10 | 2.16 | 2.15 | ||||||||||||||||||||||||
| Diluted earnings per share ($) |
1.02 | 1.72 | 1.69 | 1.36 | 1.63 | 2.09 | 2.16 | 2.14 | ||||||||||||||||||||||||
| Return on equity (%)(1) |
7.2 | 12.1 | 12.3 | 9.9 | 11.9 | 15.3 | 16.2 | 15.8 | ||||||||||||||||||||||||
| Return on tangible common equity (%)(2) |
9.0 | 15.1 | 15.4 | 12.4 | 15.0 | 19.2 | 20.4 | 19.9 | ||||||||||||||||||||||||
| Productivity ratio (%)(1) |
66.5 | 56.4 | 57.7 | 55.9 | 59.4 | 53.7 | 52.4 | 52.5 | ||||||||||||||||||||||||
| Net interest margin (%)(2) |
2.16 | 2.10 | 2.13 | 2.11 | 2.18 | 2.22 | 2.23 | 2.16 | ||||||||||||||||||||||||
| Financial position information ($ billions) |
||||||||||||||||||||||||||||||||
| Cash and deposits with financial institutions |
90.3 | 90.3 | 63.9 | 81.4 | 65.9 | 67.7 | 85.9 | 99.1 | ||||||||||||||||||||||||
| Trading assets |
117.9 | 119.3 | 114.7 | 116.3 | 113.2 | 118.6 | 133.6 | 152.9 | ||||||||||||||||||||||||
| Loans |
750.9 | 752.2 | 764.1 | 755.2 | 745.0 | 713.4 | 689.7 | 667.3 | ||||||||||||||||||||||||
| Total assets |
1,410.8 | 1,396.1 | 1,373.2 | 1,374.4 | 1,349.4 | 1,292.1 | 1,288.5 | 1,245.5 | ||||||||||||||||||||||||
| Deposits |
952.3 | 957.2 | 945.5 | 949.9 | 916.2 | 879.6 | 876.6 | 851.0 | ||||||||||||||||||||||||
| Common equity |
68.9 | 68.0 | 69.1 | 66.1 | 65.1 | 65.0 | 64.8 | 66.2 | ||||||||||||||||||||||||
| Preferred shares and other equity instruments |
8.1 | 8.1 | 8.1 | 8.1 | 8.1 | 7.1 | 5.6 | 5.6 | ||||||||||||||||||||||||
| Assets under administration(1) |
673.6 | 690.8 | 684.2 | 664.7 | 641.6 | 630.1 | 640.2 | 651.2 | ||||||||||||||||||||||||
| Assets under management(1) |
316.6 | 331.3 | 329.5 | 322.4 | 311.1 | 319.6 | 326.2 | 345.3 | ||||||||||||||||||||||||
| Capital and liquidity measures |
||||||||||||||||||||||||||||||||
| Common Equity Tier 1 (CET1) capital ratio (%)(3) |
13.0 | 12.7 | 12.3 | 11.5 | 11.5 | 11.4 | 11.6 | 12.0 | ||||||||||||||||||||||||
| Tier 1 capital ratio (%)(3) |
14.8 | 14.6 | 14.1 | 13.2 | 13.2 | 13.0 | 12.8 | 13.4 | ||||||||||||||||||||||||
| Total capital ratio (%)(3) |
17.2 | 16.9 | 16.2 | 15.2 | 15.3 | 15.0 | 15.0 | 15.1 | ||||||||||||||||||||||||
| Total loss absorbing capacity (TLAC) ratio (%)(4) |
30.6 | 30.5 | 28.3 | 27.9 | 27.4 | 28.4 | 30.1 | 28.3 | ||||||||||||||||||||||||
| Leverage ratio (%)(5) |
4.2 | 4.1 | 4.2 | 4.2 | 4.2 | 4.2 | 4.2 | 4.4 | ||||||||||||||||||||||||
| TLAC Leverage ratio (%)(4) |
8.6 | 8.7 | 8.4 | 8.9 | 8.8 | 9.3 | 9.8 | 9.4 | ||||||||||||||||||||||||
| Risk-weighted assets ($ billions)(3) |
440.0 | 439.8 | 451.1 | 471.5 | 462.4 | 452.8 | 445.3 | 433.7 | ||||||||||||||||||||||||
| Liquidity coverage ratio (LCR) (%)(6) |
136 | 133 | 131 | 122 | 119 | 122 | 125 | 123 | ||||||||||||||||||||||||
| Net stable funding ratio (NSFR) (%)(7) |
116 | 114 | 111 | 109 | 111 | 109 | 109 | 108 | ||||||||||||||||||||||||
| Credit quality |
||||||||||||||||||||||||||||||||
| Net impaired loans ($ millions) |
3,845 | 3,667 | 3,554 | 3,450 | 3,151 | 2,695 | 2,660 | 2,812 | ||||||||||||||||||||||||
| Allowance for credit losses ($ millions)(8) |
6,629 | 6,094 | 5,931 | 5,668 | 5,499 | 5,295 | 5,375 | 5,583 | ||||||||||||||||||||||||
| Gross impaired loans as a % of loans and acceptances(1) |
0.74 | 0.70 | 0.67 | 0.65 | 0.62 | 0.58 | 0.60 | 0.64 | ||||||||||||||||||||||||
| Net impaired loans as a % of loans and acceptances(1) |
0.50 | 0.47 | 0.45 | 0.44 | 0.41 | 0.36 | 0.37 | 0.41 | ||||||||||||||||||||||||
| Provision for credit losses as a % of average net loans and acceptances (annualized)(1)(9) |
0.65 | 0.42 | 0.37 | 0.33 | 0.28 | 0.22 | 0.13 | 0.13 | ||||||||||||||||||||||||
| Provision for credit losses on impaired loans as a % of average net loans and acceptances (annualized)(1)(9) |
0.42 | 0.38 | 0.33 | 0.29 | 0.26 | 0.21 | 0.24 | 0.24 | ||||||||||||||||||||||||
| Net write-offs as a % of average net loans and acceptances (annualized)(1) |
0.35 | 0.34 | 0.29 | 0.29 | 0.24 | 0.21 | 0.25 | 0.27 | ||||||||||||||||||||||||
| Adjusted results(2) |
||||||||||||||||||||||||||||||||
| Adjusted net income ($ millions) |
1,674 | 2,227 | 2,174 | 2,366 | 2,615 | 2,611 | 2,765 | 2,758 | ||||||||||||||||||||||||
| Adjusted diluted earnings per share ($) |
1.26 | 1.73 | 1.70 | 1.85 | 2.06 | 2.10 | 2.18 | 2.15 | ||||||||||||||||||||||||
| Adjusted return on equity (%) |
8.9 | 12.2 | 12.4 | 13.4 | 15.0 | 15.4 | 16.4 | 15.9 | ||||||||||||||||||||||||
| Adjusted return on tangible common equity (%)(10) |
11.0 | 15.1 | 15.4 | 16.8 | 18.8 | 19.2 | 20.4 | 19.9 | ||||||||||||||||||||||||
| Adjusted productivity ratio (%) |
59.5 | 56.1 | 57.5 | 55.7 | 53.7 | 53.4 | 52.1 | 52.2 | ||||||||||||||||||||||||
| Common share information |
||||||||||||||||||||||||||||||||
| Closing share price ($) (TSX) |
56.15 | 66.40 | 67.63 | 72.03 | 65.85 | 78.01 | 81.35 | 91.56 | ||||||||||||||||||||||||
| Shares outstanding (millions) |
||||||||||||||||||||||||||||||||
| Average – Basic |
1,206 | 1,199 | 1,192 | 1,192 | 1,192 | 1,195 | 1,199 | 1,211 | ||||||||||||||||||||||||
| Average – Diluted |
1,211 | 1,214 | 1,197 | 1,199 | 1,199 | 1,203 | 1,201 | 1,230 | ||||||||||||||||||||||||
| End of period |
1,214 | 1,205 | 1,198 | 1,192 | 1,191 | 1,193 | 1,198 | 1,204 | ||||||||||||||||||||||||
| Dividends paid per share ($) |
1.06 | 1.06 | 1.03 | 1.03 | 1.03 | 1.03 | 1.00 | 1.00 | ||||||||||||||||||||||||
| Dividend yield (%)(1) |
7.0 | 6.5 | 6.0 | 6.1 | 5.7 | 5.2 | 4.5 | 4.6 | ||||||||||||||||||||||||
| Market capitalization ($ billions) (TSX) |
68.2 | 80.0 | 81.0 | 85.8 | 78.5 | 93.1 | 97.4 | 110.3 | ||||||||||||||||||||||||
| Book value per common share ($)(1) |
56.71 | 56.40 | 57.65 | 55.47 | 54.68 | 54.52 | 54.13 | 54.94 | ||||||||||||||||||||||||
| Market value to book value multiple(1) |
1.0 | 1.2 | 1.2 | 1.3 | 1.2 | 1.4 | 1.5 | 1.7 | ||||||||||||||||||||||||
| Price to earnings multiple (trailing 4 quarters)(1) |
9.6 | 10.3 | 9.9 | 9.9 | 8.2 | 9.3 | 9.8 | 11.4 | ||||||||||||||||||||||||
| (1) | Refer to Glossary on page 136 for the description of the measure. |
| (2) | Refer to page 20 for a discussion of non-GAAP measures. |
| (3) | Effective Q2, 2023, regulatory capital ratios are based on Revised Basel III requirements as determined in accordance with OSFI Guideline – Capital Adequacy Requirements (February 2023). Prior period regulatory capital ratios were prepared in accordance with OSFI Guideline – Capital Adequacy Requirements (November 2018). |
| (4) | This measure has been disclosed in this document in accordance with OSFI Guideline – Total Loss Absorbing Capacity (September 2018). |
| (5) | Effective Q2, 2023, leverage ratios are based on Revised Basel III requirements as determined in accordance with OSFI Guideline – Leverage Requirements (February 2023). Prior period leverage ratios were prepared in accordance with OSFI Guideline – Leverage Requirements (November 2018). |
| (6) | This measure has been disclosed in this document in accordance with OSFI Guideline – Public Disclosure Requirements for Domestic Systemically Important Banks on Liquidity Coverage Ratio (April 2015). |
| (7) | This measure has been disclosed in this document in accordance with OSFI Guideline – Net Stable Funding Ratio Disclosure Requirements (January 2021). |
| (8) | Includes allowance for credit losses on all financial assets – loans, acceptances, off-balance sheet exposures, debt securities, and deposits with financial institutions. |
| (9) | Includes provision for credit losses on certain financial assets – loans, acceptances and off-balance sheet exposures. |
| (10) | The amounts for Q1, 2022 and Q4, 2022 have been restated to align with current period calculation. |
130 | 2023 Scotiabank Annual Report
Management’s Discussion and Analysis | Supplementary Data
T82 Selected annual information
| ($ millions) | 2023 | 2022 | 2021 | |||||||||
| Total revenue |
$ | 32,307 | $ | 31,416 | $ | 31,252 | ||||||
| Net income attributable to: |
||||||||||||
| Equity holders of the Bank |
7,410 | 9,916 | 9,624 | |||||||||
| Non-controlling interests in subsidiaries |
118 | 258 | 331 | |||||||||
| $ | 7,528 | $ | 10,174 | $ | 9,955 | |||||||
| Basic earnings per share (in dollars) |
$ | 5.84 | $ | 8.05 | $ | 7.74 | ||||||
| Diluted earnings per share (in dollars) |
5.78 | 8.02 | 7.70 | |||||||||
| Dividend paid per common share (in dollars) |
4.18 | 4.06 | 3.60 | |||||||||
| Total assets |
1,410,789 | 1,349,418 | 1,184,844 | |||||||||
| Deposits |
952,333 | 916,181 | 797,259 | |||||||||
T83 Condensed Consolidated Statement of Financial Position
| As at October 31 ($ millions) | 2023(1) | 2022(1) | 2021(1) | 2020(1) | 2019(1) | 2018(1) | 2017 | 2016 | 2015 | 2014 | ||||||||||||||||||||||||||||||
| Assets |
||||||||||||||||||||||||||||||||||||||||
| Cash, deposits with financial institutions and Precious metals |
$ | 91,249 | $ | 66,438 | $ | 87,078 | $ | 77,641 | $ | 50,429 | $ | 65,460 | $ | 65,380 | $ | 54,786 | $ | 84,477 | $ | 64,016 | ||||||||||||||||||||
| Trading assets |
117,868 | 113,154 | 146,312 | 117,839 | 127,488 | 100,262 | 98,464 | 108,561 | 99,140 | 113,248 | ||||||||||||||||||||||||||||||
| Securities purchased under resale agreements and securities borrowed |
199,325 | 175,313 | 127,739 | 119,747 | 131,178 | 104,018 | 95,319 | 92,129 | 87,312 | 93,866 | ||||||||||||||||||||||||||||||
| Investment securities |
118,237 | 110,008 | 75,199 | 111,389 | 82,359 | 78,396 | 69,269 | 72,919 | 43,216 | 38,662 | ||||||||||||||||||||||||||||||
| Loans, net of allowance |
750,911 | 744,987 | 636,986 | 603,263 | 592,483 | 551,834 | 504,369 | 480,164 | 458,628 | 424,309 | ||||||||||||||||||||||||||||||
| Other(2) |
133,199 | 139,518 | 111,530 | 106,587 | 102,224 | 98,523 | 82,472 | 87,707 | 83,724 | 71,565 | ||||||||||||||||||||||||||||||
| $ | 1,410,789 | $ | 1,349,418 | $ | 1,184,844 | $ | 1,136,466 | $ | 1,086,161 | $ | 998,493 | $ | 915,273 | $ | 896,266 | $ | 856,497 | $ | 805,666 | |||||||||||||||||||||
| Liabilities |
||||||||||||||||||||||||||||||||||||||||
| Deposits |
$ | 952,333 | $ | 916,181 | $ | 797,259 | $ | 750,838 | $ | 733,390 | $ | 676,534 | $ | 625,367 | $ | 611,877 | $ | 600,919 | $ | 554,017 | ||||||||||||||||||||
| Obligations related to securities sold under repurchase agreements and securities lent |
160,007 | 139,025 | 123,469 | 137,763 | 124,083 | 101,257 | 95,843 | 97,083 | 77,015 | 88,953 | ||||||||||||||||||||||||||||||
| Subordinated debentures |
9,693 | 8,469 | 6,334 | 7,405 | 7,252 | 5,698 | 5,935 | 7,633 | 6,182 | 4,871 | ||||||||||||||||||||||||||||||
| Other(2) |
210,089 | 210,994 | 184,890 | 169,957 | 151,244 | 147,324 | 126,503 | 121,852 | 118,902 | 108,614 | ||||||||||||||||||||||||||||||
| 1,332,122 | 1,274,669 | 1,111,952 | 1,065,963 | 1,015,969 | 930,813 | 853,648 | 838,445 | 803,018 | 756,455 | |||||||||||||||||||||||||||||||
| Common equity |
68,853 | 65,150 | 64,750 | 62,819 | 63,638 | 61,044 | 55,454 | 52,657 | 49,085 | 44,965 | ||||||||||||||||||||||||||||||
| Preferred shares and other equity instruments |
8,075 | 8,075 | 6,052 | 5,308 | 3,884 | 4,184 | 4,579 | 3,594 | 2,934 | 2,934 | ||||||||||||||||||||||||||||||
| Non-controlling interests in subsidiaries |
1,739 | 1,524 | 2,090 | 2,376 | 2,670 | 2,452 | 1,592 | 1,570 | 1,460 | 1,312 | ||||||||||||||||||||||||||||||
| Total equity |
78,667 | 74,749 | 72,892 | 70,503 | 70,192 | 67,680 | 61,625 | 57,821 | 53,479 | 49,211 | ||||||||||||||||||||||||||||||
| $ | 1,410,789 | $ | 1,349,418 | $ | 1,184,844 | $ | 1,136,466 | $ | 1,086,161 | $ | 998,493 | $ | 915,273 | $ | 896,266 | $ | 856,497 | $ | 805,666 | |||||||||||||||||||||
| (1) | The amounts for the years ended October 31, 2018 to October 31, 2023 have been prepared in accordance with IFRS 9; prior period amounts have not been restated. |
| (2) | The amounts for the years ended October 31, 2020 to October 31, 2023 have been prepared in accordance with IFRS 16; prior year amounts have not been restated. |
T84 Condensed Consolidated Statement of Income
| For the year ended October 31 ($ millions) |
2023 | 2022 | 2021 | 2020 | 2019 | 2018 | 2017 | 2016 | 2015 | 2014 | ||||||||||||||||||||||||||||||
| Revenue |
||||||||||||||||||||||||||||||||||||||||
| Net interest income(1)(2) |
$ | 18,287 | $ | 18,115 | $ | 16,961 | $ | 17,320 | $ | 17,177 | $ | 16,191 | $ | 15,035 | $ | 14,292 | $ | 13,092 | $ | 12,305 | ||||||||||||||||||||
| Non-interest income(1)(3) |
14,020 | 13,301 | 14,291 | 14,016 | 13,857 | 12,584 | 12,120 | 12,058 | 10,957 | 11,299 | ||||||||||||||||||||||||||||||
| Total revenue |
32,307 | 31,416 | 31,252 | 31,336 | 31,034 | 28,775 | 27,155 | 26,350 | 24,049 | 23,604 | ||||||||||||||||||||||||||||||
| Provision for credit losses(1) |
3,422 | 1,382 | 1,808 | 6,084 | 3,027 | 2,611 | 2,249 | 2,412 | 1,942 | 1,703 | ||||||||||||||||||||||||||||||
| Non-interest expenses(2)(3) |
19,131 | 17,102 | 16,618 | 16,856 | 16,737 | 15,058 | 14,630 | 14,540 | 13,041 | 12,601 | ||||||||||||||||||||||||||||||
| Income before taxes |
9,754 | 12,932 | 12,826 | 8,396 | 11,270 | 11,106 | 10,276 | 9,398 | 9,066 | 9,300 | ||||||||||||||||||||||||||||||
| Income tax expense |
2,226 | 2,758 | 2,871 | 1,543 | 2,472 | 2,382 | 2,033 | 2,030 | 1,853 | 2,002 | ||||||||||||||||||||||||||||||
| Net income |
$ | 7,528 | $ | 10,174 | $ | 9,955 | $ | 6,853 | $ | 8,798 | $ | 8,724 | $ | 8,243 | $ | 7,368 | $ | 7,213 | $ | 7,298 | ||||||||||||||||||||
| Net income attributable to non-controlling interests in subsidiaries |
118 | 258 | 331 | 75 | 408 | 176 | 238 | 251 | 199 | 227 | ||||||||||||||||||||||||||||||
| Net income attributable to equity holders of the Bank |
$ | 7,410 | $ | 9,916 | $ | 9,624 | $ | 6,778 | $ | 8,390 | $ | 8,548 | $ | 8,005 | $ | 7,117 | $ | 7,014 | $ | 7,071 | ||||||||||||||||||||
| Preferred shareholders and other equity instrument holders |
419 | 260 | 233 | 196 | 182 | 187 | 129 | 130 | 117 | 155 | ||||||||||||||||||||||||||||||
| Common shareholders |
$ | 6,991 | $ | 9,656 | $ | 9,391 | $ | 6,582 | $ | 8,208 | $ | 8,361 | $ | 7,876 | $ | 6,987 | $ | 6,897 | $ | 6,916 | ||||||||||||||||||||
| (1) | The amounts for the years ended October 31, 2018 to October 31, 2023 have been prepared in accordance with IFRS 9; prior year amounts have not been restated. |
| (2) | The amounts for the years ended October 31, 2020 to October 31, 2023 have been prepared in accordance with IFRS 16; prior year amounts have not been restated. |
| (3) | The amounts for the years ended October 31, 2019 to October 31, 2023 have been prepared in accordance with IFRS 15; prior year amounts have not been restated. |
2023 Scotiabank Annual Report | 131
Management’s Discussion and Analysis
T85 Consolidated Statement of Changes in Equity
| For the year ended October 31 ($ millions) | 2023 | 2022 | 2021 | 2020 | 2019 | 2018 | 2017 | |||||||||||||||||||||
| Common shares |
||||||||||||||||||||||||||||
| Balance at beginning of year |
$ | 18,707 | $ | 18,507 | $ | 18,239 | $ | 18,264 | $ | 18,234 | $ | 15,644 | $ | 15,513 | ||||||||||||||
| Issued |
1,402 | 706 | 268 | 59 | 255 | 2,708 | 313 | |||||||||||||||||||||
| Purchased for cancellation |
– | (506 | ) | – | (84 | ) | (225 | ) | (118 | ) | (182 | ) | ||||||||||||||||
| Balance at end of year |
$ | 20,109 | $ | 18,707 | $ | 18,507 | $ | 18,239 | $ | 18,264 | $ | 18,234 | $ | 15,644 | ||||||||||||||
| Retained earnings |
||||||||||||||||||||||||||||
| Balance at beginning of year |
53,761 | 51,354 | 46,345 | 44,439 | 41,414 | 38,117 | 34,752 | |||||||||||||||||||||
| IFRS adjustment |
– | – | – | – | (58 | ) | (564 | ) | – | |||||||||||||||||||
| Restated balances |
53,761 | 51,354 | 46,345 | 44,439 | 41,356 | 37,553 | 34,752 | |||||||||||||||||||||
| Net income attributable to common shareholders of the Bank |
6,991 | 9,656 | 9,391 | 6,582 | 8,208 | 8,361 | 7,876 | |||||||||||||||||||||
| Common dividends |
(5,003 | ) | (4,858 | ) | (4,371 | ) | (4,363 | ) | (4,260 | ) | (3,985 | ) | (3,668 | ) | ||||||||||||||
| Purchase of shares for cancellation and premium on redemption |
– | (2,367 | ) | – | (330 | ) | (850 | ) | (514 | ) | (827 | ) | ||||||||||||||||
| Other |
(3 | ) | (24 | ) | (11 | ) | 17 | (15 | ) | (1 | ) | (16 | ) | |||||||||||||||
| Balance at end of year |
$ | 55,746 | $ | 53,761 | $ | 51,354 | $ | 46,345 | $ | 44,439 | $ | 41,414 | $ | 38,117 | ||||||||||||||
| Accumulated other comprehensive income (loss) |
||||||||||||||||||||||||||||
| Balance at beginning of year |
(7,166 | ) | (5,333 | ) | (2,125 | ) | 570 | 992 | 1,577 | 2,240 | ||||||||||||||||||
| IFRS adjustment |
– | – | – | – | – | 51 | – | |||||||||||||||||||||
| Restated balances |
(7,166 | ) | (5,333 | ) | (2,125 | ) | 570 | 992 | 1,628 | 2,240 | ||||||||||||||||||
| Cumulative effect of adopting new accounting policies |
– | – | – | – | – | – | – | |||||||||||||||||||||
| Other comprehensive income (loss) |
291 | (1,564 | ) | (3,134 | ) | (2,668 | ) | (422 | ) | (693 | ) | (663 | ) | |||||||||||||||
| Other |
(43 | ) | (269 | ) | (74 | ) | (27 | ) | – | 57 | – | |||||||||||||||||
| Balance at end of year |
$ | (6,918 | ) | $ | (7,166 | ) | $ | (5,333 | ) | $ | (2,125 | ) | $ | 570 | $ | 992 | $ | 1,577 | ||||||||||
| Other reserves |
||||||||||||||||||||||||||||
| Balance at beginning of year |
(152 | ) | 222 | 360 | 365 | 404 | 116 | 152 | ||||||||||||||||||||
| Share-based payments(3) |
14 | 10 | 7 | 5 | 7 | 6 | 8 | |||||||||||||||||||||
| Other |
54 | (384 | ) | (145 | ) | (10 | ) | (46 | ) | 282 | (44 | ) | ||||||||||||||||
| Balance at end of year |
$ | (84 | ) | $ | (152 | ) | $ | 222 | $ | 360 | $ | 365 | $ | 404 | $ | 116 | ||||||||||||
| Total common equity |
$ | 68,853 | $ | 65,150 | $ | 64,750 | $ | 62,819 | $ | 63,638 | $ | 61,044 | $ | 55,454 | ||||||||||||||
| Preferred shares and other equity instruments |
||||||||||||||||||||||||||||
| Balance at beginning of year |
8,075 | 6,052 | 5,308 | 3,884 | 4,184 | 4,579 | 3,594 | |||||||||||||||||||||
| Net income attributable to preferred shareholders and other equity instrument holders of the Bank |
419 | 260 | 233 | 196 | 182 | 187 | 129 | |||||||||||||||||||||
| Preferred and other equity instrument dividends |
(419 | ) | (260 | ) | (233 | ) | (196 | ) | (182 | ) | (187 | ) | (129 | ) | ||||||||||||||
| Issued |
– | 2,523 | 2,003 | 1,689 | – | 300 | 1,560 | |||||||||||||||||||||
| Redeemed |
– | (500 | ) | (1,259 | ) | (265 | ) | (300 | ) | (695 | ) | (575 | ) | |||||||||||||||
| Balance at end of year |
$ | 8,075 | $ | 8,075 | $ | 6,052 | $ | 5,308 | $ | 3,884 | $ | 4,184 | $ | 4,579 | ||||||||||||||
| Non-controlling interests |
||||||||||||||||||||||||||||
| Balance at beginning of year |
1,524 | 2,090 | 2,376 | 2,670 | 2,452 | 1,592 | 1,570 | |||||||||||||||||||||
| IFRS adjustment |
– | – | – | – | – | (97 | ) | – | ||||||||||||||||||||
| Restated balances |
1,524 | 2,090 | 2,376 | 2,670 | 2,452 | 1,495 | 1,570 | |||||||||||||||||||||
| Net income attributable to non-controlling interests |
118 | 258 | 331 | 75 | 408 | 176 | 238 | |||||||||||||||||||||
| Distributions to non-controlling interests |
(101 | ) | (115 | ) | (123 | ) | (148 | ) | (150 | ) | (199 | ) | (133 | ) | ||||||||||||||
| Effect of foreign exchange and others |
198 | (709 | ) | (494 | ) | (221 | ) | (40 | ) | 980 | (83 | ) | ||||||||||||||||
| Balance at end of year |
$ | 1,739 | $ | 1,524 | $ | 2,090 | $ | 2,376 | $ | 2,670 | $ | 2,452 | $ | 1,592 | ||||||||||||||
| Total equity at end of year |
$ | 78,667 | $ | 74,749 | $ | 72,892 | $ | 70,503 | $ | 70,192 | $ | 67,680 | $ | 61,625 | ||||||||||||||
| (1) | Includes retrospective adjustments primarily related to foreign currency translation on Allowance for Credit Losses with respect to periods prior to 2013 ($152). |
| (2) | To reflect the adoption of the own credit risk provisions of IFRS 9 pertaining to financial liabilities designated at fair value through profit or loss. |
| (3) | Represents amounts on account of share-based payments (refer to Note 26 in the consolidated financial statements). |
T86 Consolidated Statement of Comprehensive Income
| For the year ended October 31 ($ millions) | 2023 | 2022 | 2021 | 2020 | 2019 | 2018 | 2017 | |||||||||||||||||||||
| Net income |
$ | 7,528 | $ | 10,174 | $ | 9,955 | $ | 6,853 | $ | 8,798 | $ | 8,724 | $ | 8,243 | ||||||||||||||
| Other comprehensive income (loss), net of income taxes: |
||||||||||||||||||||||||||||
| Items that will be reclassified subsequently to net income |
||||||||||||||||||||||||||||
| Net change in unrealized foreign currency translation gains (losses) |
942 | 2,454 | (3,520 | ) | (2,239 | ) | (819 | ) | (606 | ) | (1,259 | ) | ||||||||||||||||
| Net change in unrealized gains (losses) on available-for-sale securities (debt and equity)(1) |
n/a | n/a | n/a | n/a | n/a | n/a | (55 | ) | ||||||||||||||||||||
| Net change in fair value due to change in debt instruments measured at fair value through other comprehensive income(1) |
378 | (1,212 | ) | (600 | ) | 293 | 105 | (252 | ) | n/a | ||||||||||||||||||
| Net change in gains (losses) on derivative instruments designated as cash flow hedges |
245 | (4,537 | ) | (806 | ) | (32 | ) | 708 | (361 | ) | (28 | ) | ||||||||||||||||
| Other comprehensive income (loss) from investments in associates |
(16 | ) | (344 | ) | 37 | (2 | ) | 103 | 66 | 56 | ||||||||||||||||||
| Items that will not be reclassified subsequently to net income |
||||||||||||||||||||||||||||
| Net change in remeasurement of employee benefit plan asset and liability |
114 | 678 | 1,335 | (465 | ) | (815 | ) | 318 | 592 | |||||||||||||||||||
| Net change in fair value due to change in equity instruments designated at fair value through other comprehensive income(1) |
(180 | ) | (74 | ) | 408 | (85 | ) | 95 | 60 | n/a | ||||||||||||||||||
| Net change in fair value due to change in own credit risk on financial liabilities designated under the fair value option(2) |
(985 | ) | 1,444 | (199 | ) | (298 | ) | 8 | (22 | ) | (21 | ) | ||||||||||||||||
| Other comprehensive income (loss) from investments in associates |
2 | 2 | 5 | (8 | ) | (10 | ) | (7 | ) | 6 | ||||||||||||||||||
| Other comprehensive income (loss) |
500 | (1,589 | ) | (3,340 | ) | (2,836 | ) | (625 | ) | (804 | ) | (709 | ) | |||||||||||||||
| Comprehensive income |
$ | 8,028 | $ | 8,585 | $ | 6,615 | $ | 4,017 | $ | 8,173 | $ | 7,920 | $ | 7,534 | ||||||||||||||
| Comprehensive income (loss) attributable to: |
||||||||||||||||||||||||||||
| Common shareholders of the Bank |
$ | 7,282 | $ | 8,092 | $ | 6,257 | $ | 3,914 | $ | 7,786 | $ | 7,668 | $ | 7,213 | ||||||||||||||
| Preferred shareholders and other equity instrument holders of the Bank |
419 | 260 | 233 | 196 | 182 | 187 | 129 | |||||||||||||||||||||
| Non-controlling interests in subsidiaries |
327 | 233 | 125 | (93 | ) | 205 | 65 | 192 | ||||||||||||||||||||
| $ | 8,028 | $ | 8,585 | $ | 6,615 | $ | 4,017 | $ | 8,173 | $ | 7,920 | $ | 7,534 | |||||||||||||||
| (1) | The amounts for the years ended October 31, 2018 to October 31, 2023 have been prepared in accordance with IFRS 9; prior period amounts have not been restated. |
| (2) | In accordance with the transition requirements for the own credit risk provisions of IFRS 9, prior year comparatives have not been restated for the adoption of this standard in 2015. |
132 | 2023 Scotiabank Annual Report
Management’s Discussion and Analysis | Supplementary Data
| 2016 | 2015 | 2014 | ||||||||||||
| $ | 15,141 | $ | 15,231 | $ | 14,516 | |||||||||
| 391 | 104 | 771 | ||||||||||||
| (19 | ) | (194 | ) | (56 | ) | |||||||||
| $ | 15,513 | $ | 15,141 | $ | 15,231 | |||||||||
| 31,316 | 28,609 | 25,315 | ||||||||||||
| – | – | (247 | ) | |||||||||||
| 31,316 | 28,609 | 25,068 | ||||||||||||
| 6,987 | 6,897 | 6,916 | ||||||||||||
| (3,468 | ) | (3,289 | ) | (3,110 | ) | |||||||||
| (61 | ) | (761 | ) | (264 | ) | |||||||||
| (22 | ) | (140 | )(1) | (1 | ) | |||||||||
| $ | 34,752 | $ | 31,316 | $ | 28,609 | |||||||||
| 2,455 | 949 | 545 | ||||||||||||
| – | – | (157 | ) | |||||||||||
| 2,455 | 949 | 388 | ||||||||||||
| – | (5 | )(2) | – | |||||||||||
| (215 | ) | 1,511 | 561 | |||||||||||
| – | – | – | ||||||||||||
| $ | 2,240 | $ | 2,455 | $ | 949 | |||||||||
| 173 | 176 | 193 | ||||||||||||
| 7 | 14 | 30 | ||||||||||||
| (28 | ) | (17 | ) | (47 | ) | |||||||||
| $ | 152 | $ | 173 | $ | 176 | |||||||||
| $ | 52,657 | $ | 49,085 | $ | 44,965 | |||||||||
| 2,934 | 2,934 | 4,084 | ||||||||||||
|
|
130 |
|
117 | 155 | ||||||||||
| (130 | ) | (117 | ) | (155 | ) | |||||||||
| 1,350 | – | – | ||||||||||||
| (690 | ) | – | (1,150 | ) | ||||||||||
| $ | 3,594 | $ | 2,934 | $ | 2,934 | |||||||||
| 1,460 | 1,312 | 1,155 | ||||||||||||
| – | – | (17 | ) | |||||||||||
| 1,460 | 1,312 | 1,138 | ||||||||||||
| 251 | 199 | 227 | ||||||||||||
| (116 | ) | (86 | ) | (76 | ) | |||||||||
| (25 | ) | 35 | 23 | |||||||||||
| $ | 1,570 | $ | 1,460 | $ | 1,312 | |||||||||
| $ | 57,821 | $ | 53,479 | $ | 49,211 | |||||||||
| 2016 | 2015 | 2014 | ||||||||||||
| $ | 7,368 | $ | 7,213 | $ | 7,298 | |||||||||
| 396 | 1,855 | 889 | ||||||||||||
|
|
(172 |
) |
(480 | ) | (38 | ) | ||||||||
|
|
n/a |
|
n/a | n/a | ||||||||||
|
|
258 |
|
55 | (6 | ) | |||||||||
| 31 | (9 | ) | 60 | |||||||||||
| (716 | ) | (1 | ) | (320 | ) | |||||||||
|
|
n/a |
|
n/a | n/a | ||||||||||
|
|
(16 |
) |
15 | n/a | ||||||||||
| (10 | ) | 1 | (2 | ) | ||||||||||
| (229 | ) | 1,436 | 583 | |||||||||||
| $ | 7,139 | $ | 8,649 | $ | 7,881 | |||||||||
| $ | 6,772 | $ | 8,408 | $ | 7,477 | |||||||||
| 130 | 117 | 155 | ||||||||||||
| 237 | 124 | 249 | ||||||||||||
| $ | 7,139 | $ | 8,649 | $ | 7,881 | |||||||||
2023 Scotiabank Annual Report | 133
Management’s Discussion and Analysis
T87 Other statistics
| For the year ended October 31 | 2023 | 2022 | 2021 | 2020 | 2019 | 2018 | 2017 | |||||||||||||||||||||
| Operating performance |
||||||||||||||||||||||||||||
| Basic earnings per share ($) |
5.84 | 8.05 | 7.74 | 5.43 | 6.72 | 6.90 | 6.55 | |||||||||||||||||||||
| Diluted earnings per share ($) |
5.78 | 8.02 | 7.70 | 5.30 | 6.68 | 6.82 | 6.49 | |||||||||||||||||||||
| Return on equity (%)(1) |
10.4 | 14.8 | 14.7 | 10.4 | 13.1 | 14.5 | 14.6 | |||||||||||||||||||||
| Productivity ratio (%)(1) |
59.2 | 54.4 | 53.2 | 53.8 | 53.9 | 52.3 | 53.9 | |||||||||||||||||||||
| Return on assets (%)(1) |
0.54 | 0.79 | 0.86 | 0.59 | 0.83 | 0.92 | 0.90 | |||||||||||||||||||||
| Net interest margin (%)(2) |
2.12 | 2.20 | 2.23 | 2.27 | 2.44 | 2.46 | 2.46 | |||||||||||||||||||||
| Capital measures(1) |
||||||||||||||||||||||||||||
| Common Equity Tier 1 (CET1) capital ratio (%)(3) |
13.0 | 11.5 | 12.3 | 11.8 | 11.1 | 11.1 | 11.5 | |||||||||||||||||||||
| Tier 1 capital ratio (%)(3) |
14.8 | 13.2 | 13.9 | 13.3 | 12.2 | 12.5 | 13.1 | |||||||||||||||||||||
| Total capital ratio (%)(3) |
17.2 | 15.3 | 15.9 | 15.5 | 14.2 | 14.3 | 14.9 | |||||||||||||||||||||
| Leverage ratio (%)(4) |
4.2 | 4.2 | 4.8 | 4.7 | 4.2 | 4.5 | 4.7 | |||||||||||||||||||||
| Common share information |
||||||||||||||||||||||||||||
| Closing share price ($) (TSX) |
56.15 | 65.85 | 81.14 | 55.35 | 75.54 | 70.65 | 83.28 | |||||||||||||||||||||
| Number of shares outstanding (millions) |
1,214 | 1,191 | 1,215 | 1,211 | 1,216 | 1,227 | 1,199 | |||||||||||||||||||||
| Dividends paid per share ($) |
4.18 | 4.06 | 3.60 | 3.60 | 3.49 | 3.28 | 3.05 | |||||||||||||||||||||
| Dividend yield (%)(1)(5) |
6.5 | 5.1 | 5.2 | 5.8 | 4.9 | 4.2 | 4.0 | |||||||||||||||||||||
| Price to earnings multiple (trailing 4 quarters)(1) |
9.6 | 8.2 | 10.5 | 10.2 | 11.2 | 10.2 | 12.7 | |||||||||||||||||||||
| Book value per common share ($)(1) |
56.71 | 54.68 | 53.28 | 51.85 | 52.33 | 49.75 | 46.24 | |||||||||||||||||||||
| Other information |
||||||||||||||||||||||||||||
| Average total assets ($ millions) |
1,395,843 | 1,281,708 | 1,157,213 | 1,160,584 | 1,056,063 | 945,683 | 912,619 | |||||||||||||||||||||
| Number of branches and offices |
2,379 | 2,439 | (6) | 2,573 | (6) | 2,618 | 3,109 | 3,095 | 3,003 | |||||||||||||||||||
| Number of employees |
89,483 | 90,979 | 89,488 | 91,447 | 101,380 | 97,021 | 87,761 | |||||||||||||||||||||
| Number of automated banking machines |
8,679 | 8,610 | 8,610 | 8,791 | 9,391 | 9,029 | 8,140 | |||||||||||||||||||||
| (1) | Refer to Glossary on page 136 for the description of the measure. |
| (2) | Refer to page 20 for a discussion of non-GAAP measures. |
| (3) | 2023 regulatory capital ratios are based on Revised Basel III requirements as determined in accordance with OSFI Guideline – Capital Adequacy Requirements (February 2023). Prior period regulatory capital ratios were prepared in accordance with OSFI Guideline – Capital Adequacy Requirements (November 2018). |
| (4) | The 2023 leverage ratio is based on Revised Basel III requirements as determined in accordance with OSFI Guideline – Leverage Requirements (February 2023). Prior period leverage ratios were prepared in accordance with OSFI Guideline – Leverage Requirements (November 2018). |
| (5) | Based on the average of the high and low common share price for the year. |
| (6) | Prior period amounts have been restated to include MD Financial and Jarislowsky Fraser offices. |
134 | 2023 Scotiabank Annual Report
Management’s Discussion and Analysis | Supplementary Data
| 2016 | 2015 | 2014 | ||||||||||||
| 5.80 | 5.70 | 5.69 | ||||||||||||
| 5.77 | 5.67 | 5.66 | ||||||||||||
| 13.8 | 14.6 | 16.1 | ||||||||||||
| 55.2 | 54.2 | 53.4 | ||||||||||||
| 0.81 | 0.84 | 0.92 | ||||||||||||
| 2.38 | 2.39 | 2.39 | ||||||||||||
| 11.0 | 10.3 | 10.8 | ||||||||||||
| 12.4 | 11.5 | 12.2 | ||||||||||||
| 14.6 | 13.4 | 13.9 | ||||||||||||
| 4.5 | 4.2 | n/a | ||||||||||||
| 72.08 | 61.49 | 69.02 | ||||||||||||
| 1,208 | 1,203 | 1,217 | ||||||||||||
| 2.88 | 2.72 | 2.56 | ||||||||||||
| 4.7 | 4.4 | 3.8 | ||||||||||||
| 12.4 | 10.8 | 12.1 | ||||||||||||
| 43.59 | 40.80 | 36.96 | ||||||||||||
| 913,844 | 860,607 | 795,641 | ||||||||||||
| 3,113 | 3,177 | 3,288 | ||||||||||||
| 88,901 | 89,214 | 86,932 | ||||||||||||
| 8,144 | 8,191 | 8,732 | ||||||||||||
2023 Scotiabank Annual Report | 135
Allowance for Credit Losses: An allowance set aside which, in management’s opinion, is adequate to absorb credit-related losses on all financial assets and off-balance sheet exposures subject to impairment assessment. It includes allowances for performing financial assets and impaired financial assets.
Allowance for Credit Losses Ratio: The ratio of period end total allowance for credit losses (excluding debt securities and deposits with financial institutions) divided by gross loans and acceptances.
Allowance for Impaired Loans Ratio: The ratio of period end impaired allowance for credit losses (excluding debt securities and deposits with financial institutions) divided by gross loans and acceptances.
Allowance for Performing Loans Ratio: The ratio of period end performing allowance for credit losses (excluding debt securities and deposits with financial institutions) divided by gross loans and acceptances.
Allowance against Impaired Loans as a % of Gross Impaired Loans: The ratio of allowance against impaired loans to gross impaired loans.
Assets Under Administration (AUA): Assets administered by the Bank which are beneficially owned by clients and therefore not reported on the Bank’s Consolidated Statement of Financial Position. Services provided for AUA are of an administrative nature, such as trusteeship, custodial, safekeeping, income collection and distribution, securities trade settlements, customer reporting, and other similar services.
Assets Under Management (AUM): Assets managed by the Bank on a discretionary basis and in respect of which the Bank earns investment management fees. AUM are beneficially owned by clients and are therefore not reported on the Bank’s Consolidated Statement of Financial Position. Some AUM are also administered assets and are therefore included in assets under administration.
Bankers’ Acceptances (BAs): Negotiable, short-term debt securities, guaranteed for a fee by the issuer’s bank.
Basis Point: A unit of measure defined as one-hundredth of one per cent.
Book Value per Common Share: Common shareholders’ equity divided by the number of outstanding common shares at the end of the period.
Canadian Overnight Repo Rate Average (CORRA): CORRA measures the cost of overnight general collateral funding in Canadian dollars using Government of Canada treasury bills and bonds as collateral for repurchase transactions.
Common Equity Tier 1 (CET1), Tier 1 and Total Capital Ratios: Under Revised Basel III, there are three primary regulatory capital ratios used to assess capital adequacy, CET1, Tier 1 and Total capital ratios, which are determined by dividing those capital components by their respective risk-weighted assets.
CET1 consists primarily of common shareholders’ equity net of regulatory adjustments. These regulatory adjustments include goodwill, intangible assets net of deferred tax liabilities, deferred tax assets that rely on future profitability, defined-benefit pension fund net assets, shortfall of credit provision to expected losses and significant investments in common equity of other financial institutions.
Tier 1 includes CET1 and additional Tier 1 capital which consists primarily of qualifying non-cumulative preferred shares, non-cumulative subordinated additional Tier 1 capital notes and limited recourse capital notes. Tier 2 capital consists mainly of qualifying subordinated debentures and the eligible allowance for credit losses.
Total capital is comprised of CET1 capital, Tier 1 capital and Tier 2 capital.
Covered Bonds: Debt obligations of the Bank for which the payment of all amounts of interest and principal are unconditionally and irrevocably guaranteed by a limited partnership and secured by a pledge of the covered bond portfolio. The assets in the covered bond portfolio held by the limited partnership consist of first lien Canadian uninsured residential mortgages or first lien Canadian residential mortgages insured under CMHC mortgage insurance, respectively, and their related security interest.
Derivative Products: Financial contracts whose value is derived from an underlying price, interest rate, exchange rate or price index. Forwards, options and swaps are all derivative instruments.
Dividend Yield: Dividends per common share divided by the average of the high and low share price in the relevant period.
Effective Tax Rate: The effective tax rate is the overall tax rate paid by the Bank on its earned income. The effective tax rate is calculated by dividing the Bank’s income tax expense by income before taxes.
Fair Value: The price that would be received to sell an asset or paid to transfer a liability in an orderly transaction between market participants in the principal, or in its absence, the most advantageous market to which the Bank has access at the measurement date.
Foreign Exchange Contracts: Commitments to buy or sell a specified amount of foreign currency on a set date and at a predetermined rate of exchange.
Forward Rate Agreement (FRA): A contract between two parties, whereby a designated interest rate, applied to a notional principal amount, is locked in for a specified period of time. The difference between the contracted rate and prevailing market rate is paid in cash on the settlement date. These agreements are used to protect against, or take advantage of, future interest rate movements.
Futures: Commitments to buy or sell designated amounts of commodities, securities or currencies on a specified date at a predetermined price. Futures are traded on recognized exchanges. Gains and losses on these contracts are settled daily, based on closing market prices.
Gross Impaired Loans as a % of Loans and Acceptances: The ratio of gross impaired loans, debt investments and off-balance sheet exposures expressed as a percentage of loans and acceptances.
Hedging: Protecting against price, interest rate or foreign exchange exposures by taking positions that are expected to react to market conditions in an offsetting manner.
Impaired Loans: Loans on which the Bank no longer has reasonable assurance as to the timely collection of interest and principal, or where a contractual payment is past due for a prescribed period or the customer is declared to be bankrupt.
Leverage Ratio: The ratio of Basel III Tier 1 capital to a leverage exposure measure which includes on-balance sheet assets and off-balance sheet commitments, derivatives and securities financing transactions, as defined within the OSFI Leverage Requirements Guideline.
Liquidity Coverage Ratio (LCR): The ratio of high quality liquid assets to stressed net cash outflows over a 30 calendar day time horizon, as defined within the OSFI Liquidity Adequacy Requirements Guideline.
Marked-To-Market: The valuation of certain financial instruments at fair value as of the Consolidated Statement of Financial Position date.
Market Value to Book Value Multiple: This financial valuation metric is calculated by dividing the current closing share price of the period by the book value per common share.
136 | 2023 Scotiabank Annual Report
Net Impaired Loans as a % of Loans and Acceptances: The ratio of net impaired loans, debt investments and off-balance sheet exposures expressed as a percentage of loans and acceptances.
Net Interest Margin: Net interest margin is calculated as core net interest income for the business line divided by average core earning assets.
Net Stable Funding Ratio (NSFR): The ratio of available stable funding to required stable funding, as defined within the OSFI Liquidity Adequacy Requirements Guideline.
Net Write-offs as a % of Average Net Loans and Acceptances: The ratio of net write-offs expressed as a percentage of average net loans and acceptances.
Notional Principal Amounts: The contract or principal amounts used to determine payments for certain off-balance sheet instruments and derivatives, such as FRAs, interest rate swaps and cross-currency swaps. The amounts are termed “notional” because they are not usually exchanged themselves, serving only as the basis for calculating amounts that do change hands.
Off-Balance Sheet Instruments: These are indirect credit commitments, including undrawn commitments to extend credit and derivative instruments, which are not recorded on the Bank’s balance sheet under IFRS.
Operating Leverage: This financial metric measures the rate of growth in total revenue less the rate of growth in non-interest expenses.
Options: Contracts between buyer and seller giving the buyer of the option the right, but not the obligation, to buy (call) or sell (put) a specified commodity, financial instrument or currency at a set price or rate on or before a specified future date.
OSFI: The Office of the Superintendent of Financial Institutions Canada, the regulator of Canadian banks.
Pacific Alliance: Comprises the countries of Chile, Colombia, Mexico and Peru.
Price to Earnings Multiple (Trailing 4 Quarters): Closing share price at period end divided by cumulative basic earnings per common share (EPS) of the past 4 quarters.
Productivity Ratio: Management uses the productivity ratio as a measure of the Bank’s efficiency. This ratio represents non-interest expenses as a percentage of total revenue.
Provision for Credit Losses (PCL) as a % of Average Net Loans and Acceptances: The ratio of PCL on loans, acceptances and off-balance sheet exposures expressed as a percentage of average net loans and acceptances.
Provision for Credit Losses (PCL) on Impaired Loans as a % of Average Net Loans and Acceptances: PCL on impaired loans ratio under IFRS 9 is calculated using PCL on impaired loans, acceptances and off-balance sheet exposures as a percentage of average net loans and acceptances.
Repos: Repos is short for “obligations related to securities sold under repurchase agreements” – a short-term transaction where the Bank sells assets, normally government bonds, to a client and simultaneously agrees to repurchase them on a specified date and at a specified price. It is a form of short-term funding.
Return on Assets (ROA): Net income expressed as a percentage of total average assets.
Return on Equity (ROE): Net income attributable to common shareholders, expressed as a percentage of average common shareholders’ equity. The Bank attributes capital to its business lines on a basis that approximates 10.5% of Basel III common equity capital requirements which includes credit, market and operational risks and leverage inherent in each business segment. Return on equity for the business segments is calculated as a ratio of net income attributable to common shareholders of the business segment and the capital attributed.
Return on Tangible Common Equity (ROTCE): Return on Tangible Common Equity is calculated by dividing the net income attributable to common shareholders, adjusted for the amortization of intangibles (excluding software), by average tangible common equity. Tangible common equity is defined as common shareholders’ equity adjusted for goodwill and acquisition-related intangible assets (excluding software), net of deferred taxes.
Reverse Repos: Reverse repos is short for “securities purchased under resale agreements” – a short-term transaction where the Bank purchases assets, normally government bonds, from a client and simultaneously agrees to resell them on a specified date and at a specified price. It is a form of short-term collateralized lending.
Risk-Weighted Assets: Comprised of three broad categories including credit risk, market risk and operational risk, which are computed under the Revised Basel III Framework in accordance with OSFI Guideline – Capital Adequacy Requirements (February 2023). Risk-weighted assets for credit risk are calculated using modelled parameters, formulas and risk-weight requirements as specified by the Revised Basel III Framework. In addition, the Bank uses both internal models and standardized approaches to calculate market risk capital and standardized approaches for operational risk capital which are converted to risk-weighted assets.
Securitization: The process by which financial assets (typically loans) are transferred to a trust, which normally issues a series of different classes of asset-backed securities to investors to fund the purchase of loans.
Structured Entities: A structured entity is defined as an entity created to accomplish a narrow and well-defined objective. A structured entity may take the form of a corporation, trust, partnership or unincorporated entity. Structured entities are often created with legal arrangements that impose strict and sometimes permanent limits on the decision-making powers of their governing board, trustee or management over the operations of the entity.
Standby Letters of Credit and Letters of Guarantee: Written undertakings by the Bank, at the request of the customer, to provide assurance of payment to a third-party regarding the customer’s obligations and liabilities to that third-party.
Structured Credit Instruments: A wide range of financial products which includes Collateralized Debt Obligations, Collateralized Loan Obligations, Structured Investment Vehicles, and Asset-Backed Securities. These instruments represent investments in pools of credit-related assets, whose values are primarily dependent on the performance of the underlying pools.
Swaps: Interest rate swaps are agreements to exchange streams of interest payments, typically one at a floating rate, the other at a fixed rate, over a specified period of time, based on notional principal amounts. Cross-currency swaps are agreements to exchange payments in different currencies over predetermined periods of time.
2023 Scotiabank Annual Report | 137
Taxable Equivalent Basis (TEB): The Bank analyzes net interest income, non-interest income, and total revenue on a taxable equivalent basis (TEB). This methodology grosses up tax-exempt income earned on certain securities reported in either net interest income or non-interest income to an equivalent before tax basis. A corresponding increase is made to the provision for income taxes; hence, there is no impact on net income. Management believes that this basis for measurement provides a uniform comparability of net interest income and non-interest income arising from both taxable and non-taxable sources and facilitates a consistent basis of measurement. While other banks also use TEB, their methodology may not be comparable to the Bank’s methodology. For purposes of segmented reporting, a segment’s revenue and provision for income taxes are grossed up by the taxable equivalent amount. The elimination of the TEB gross up is recorded in the Other segment.
Total Annual Shareholder Return (TSR): Total annual shareholder return is calculated as the overall appreciation in share price, plus any dividends paid during the year; this sum is then divided by the share price at the beginning of the year to arrive at the TSR. Total annual shareholder return assumes reinvestment of quarterly dividends.
Total Loss Absorbing Capacity (TLAC): The aggregate of NVCC Tier 1 capital, NVCC Tier 2 capital, and other TLAC instruments that are subject to conversion in whole or in part into common shares under the CDIC Act and meet all of the eligibility criteria under the OSFI guideline – Total Loss Absorbing Capacity (September 2018).
Other TLAC Instruments include prescribed shares and liabilities that are subject to conversion into common shares pursuant to the CDIC Act and which meet all of the eligibility criteria set out in the Total Loss Absorbing Capacity (TLAC) Guidelines.
Value At Risk (VaR): An estimate of the potential loss that might result from holding a position for a specified period of time, with a given level of statistical confidence.
Yield Curve: A graph showing the term structure of interest rates, plotting the yields of similar quality bonds by term to maturity.
Basel III Glossary
Credit Risk Parameters
Exposure at Default (EAD): Generally represents the expected gross exposure – outstanding amount for on-balance sheet exposure and loan equivalent amount for off-balance sheet exposure at default.
Probability of Default (PD): Measures the likelihood that a borrower will default within a one-year time horizon, expressed as a percentage.
Loss Given Default (LGD): Measures the severity of loss on a facility in the event of a borrower’s default, expressed as a percentage of exposure at default.
Exposure Types
Non-retail
Corporate: Defined as a debt obligation of a corporation, partnership, or proprietorship.
Bank: Defined as a debt obligation of a bank or bank equivalent (including certain public sector entities (PSEs) treated as bank equivalent exposures).
Sovereign: Defined as a debt obligation of a sovereign, central bank, certain multi development banks and certain PSEs treated as sovereign.
Securitization: On-balance sheet investments in asset-backed securities, mortgage-backed securities, collateralized loan obligations and collateralized debt obligations, off-balance sheet liquidity lines to the Bank’s own sponsored and third-party conduits and credit enhancements.
Retail
Residential Mortgage: Loans to individuals against residential property (four units or less).
Secured Lines Of Credit: Revolving personal lines of credit secured by residential real estate.
Qualifying Revolving Retail Exposures: Credit cards and unsecured lines of credit for individuals.
Other Retail: All other personal loans.
Exposure Sub-types
Drawn: Outstanding amounts for loans, leases, acceptances, deposits with banks and FVOCI debt securities.
Undrawn: Unutilized portion of authorized committed credit lines.
Other Exposures
Repo-Style Transactions: Reverse repurchase agreements (reverse repos) and repurchase agreements (repos), securities lending and borrowing.
OTC Derivatives: Over-the-counter derivatives contracts refers to financial instruments which are traded through a dealer network rather than through an exchange.
Other Off-balance Sheet: Direct credit substitutes, such as standby letters of credit and guarantees, trade letters of credit, and performance letters of credit and guarantees.
Exchange-Traded Derivative Contracts: Exchange-traded derivative contracts are derivative contracts (e.g., futures contracts and options) that are transacted on an organized futures exchange. These include futures contracts (both long and short positions), purchased options and written options.
Qualifying Central Counterparty (QCCP): A licensed central counterparty is considered “qualifying” when it is compliant with the International Organization of Securities Commissions (IOSCO) standards and is able to assist clearing member banks in properly capitalizing for CCP exposures.
Asset Value Correlation Multiplier (AVC): Basel III has increased the risk-weights on exposures to certain Financial Institutions (FIs) relative to the non-financial corporate sector by introducing an AVC. The correlation factor in the risk-weight formula is multiplied by this AVC factor of 1.25 for all exposures to regulated FIs whose total assets are greater than or equal to U.S. $100 billion and all exposures to unregulated FIs.
Specific Wrong-Way Risk (WWR): Specific Wrong-Way Risk arises when the exposure to a particular counterparty is positively correlated with the probability of default of the counterparty due to the nature of the transactions with the counterparty.
Basel III Regulatory Capital Floor: Since the introduction of Basel II in 2008, OSFI has prescribed a minimum regulatory capital floor for institutions that use the advanced internal ratings-based approach for credit risk. Effective Q2 2023, the capital floor add-on is determined under the Revised Basel III Framework by comparing RWA generated for IRB and standardized portfolios to RWA calculated under a standardized approach at the required capital floor calibration. A shortfall to the capital floor RWA requirement is added to the Bank’s RWA.
138 | 2023 Scotiabank Annual Report