UNITED STATES
SECURITIES AND EXCHANGE COMMISSION
Washington, D.C. 20549
FORM 8-K
CURRENT REPORT
Pursuant to Section 13 or Section 15(d)
of the Securities Exchange Act of 1934
Date of Report (Date of earliest event reported): November 15, 2023
The Greenbrier Companies, Inc.
(Exact name of registrant as specified in its charter)
| Oregon | 001-13146 | 93-0816972 | ||
| (State or other jurisdiction of incorporation or organization) |
(Commission File Number) |
(I.R.S. Employer Identification Number) |
| One Centerpointe Drive, Suite 200 Lake Oswego, OR |
97035 | |
| (Address of principal executive offices) | (Zip Code) |
(503) 684-7000
(Registrant’s telephone number, including area code)
Not Applicable
(Former name or former address, if changed since last report)
Check the appropriate box below if the Form 8-K filing is intended to simultaneously satisfy the filing obligation of the registrant under any of the following provisions:
| ☐ | Written communications pursuant to Rule 425 under the Securities Act (17 CFR 230.425) |
| ☐ | Soliciting material pursuant to Rule 14a-12 under the Exchange Act (17 CFR 240.14a-12) |
| ☐ | Pre-commencement communications pursuant to Rule 14d-2(b) under the Exchange Act (17 CFR 240.14d-2(b)) |
| ☐ | Pre-commencement communications pursuant to Rule 13e-4(c) under the Exchange Act (17 CFR 240.13e-4(c)) |
Securities registered pursuant to Section 12(b) of the Act:
| Title of each class |
Trading |
Name of each exchange on which registered |
||
| Common Stock without par value | GBX | New York Stock Exchange |
Indicate by check mark whether the registrant is an emerging growth company as defined in Rule 405 of the Securities Act of 1933 or Rule 12b-2 of the Securities Exchange Act of 1934.
Emerging growth company ☐
If an emerging growth company, indicate by check mark if the registrant has elected not to use the extended transition period for complying with any new or revised financial accounting standards provided pursuant to Section 13(a) of the Exchange Act. ☐
| Item 7.01 | Regulation FD Disclosure |
On November 15, 2023, The Greenbrier Companies, Inc. (the “Company”) posted an updated investor presentation on the Company’s website, which has been updated to reflect the results of the Company’s most recently completed quarter. The Company is hereby furnishing a copy of the updated investor presentation as Exhibit 99.1 to this Current Report on Form 8-K.
The information contained and referenced in this Item 7.01 is being “furnished” and shall not be deemed “filed” for purposes of Section 18 of the Securities Exchange Act of 1934, as amended (the “Exchange Act”), or otherwise subject to the liabilities of Section 18 of the Exchange Act. The information in this Item 7.01 shall not be incorporated by reference into any registration statement or other document pursuant to the Securities Act of 1933, as amended, or into any filing or other document pursuant to the Exchange Act, except as otherwise expressly stated in any such filing. The furnishing of the information under Item 7.01 in this Current Report on Form 8-K is not intended to, and does not, constitute a determination or admission by the Company that the information under Item 7.01 in this Current Report on Form 8-K is material or complete, or that investors should consider this information before making an investment decision with respect to any security of the Company.
| Item 9.01 | Financial Statements and Exhibits |
(d) Exhibits
| Exhibit No. |
Description | |
| 99.1 | Investor Presentation of The Greenbrier Companies, Inc. | |
| 104 | Cover Page Interactive Data File (embedded within the Inline XBRL document). | |
SIGNATURE
Pursuant to the requirements of the Securities Exchange Act of 1934, the registrant has duly caused this report to be signed on its behalf by the undersigned hereunto duly authorized.
| THE GREENBRIER COMPANIES, INC. | ||||||
| Dated: November 15, 2023 | By: | /s/ Martin R. Baker |
||||
| Martin R. Baker Senior Vice President, Chief Legal and Compliance Officer |
||||||
Exhibit 99.1
NYSE: GBX Stephens Annual Investment Conference November 2023
Forward Looking Statements & Non-GAAP Financial Measures This presentation and the accompanying oral presentation contain forward-looking statements, including statements that are not purely statements of historical fact. The Greenbrier Companies, Inc. (the “Company,” “we,” “us” or “our”) uses words, and variations of words, such as “approach,” “believe,” “capacity,” “commit,” “continue,” “demand,” “drive,” “expect,” “focus,” “goal,” “growth,” “help,” “improve,” “increase,” “invest,” “leverage,” “long-term,” “maintain,” “meet,” “next,” “objective,” “provide,” “position,” “reduce,” “return,” “require,” “strategic,” “strive,” “target,” “trend,” “will,” and similar expressions to identify forward-looking statements. These forward-looking statements include, without limitation, statements about backlog and other orders, production capacity, railcar deliveries, leasing and syndication operations and performance, expectations for operating segments, environmental, social and governance commitments, financing, future liquidity, revenue, cash flow, strategic initiatives, tax treatment, and other information regarding future performance and strategies and appear throughout this presentation. These forward-looking statements are not guarantees of future performance and are subject to certain risks, uncertainties and important factors that could cause actual results to differ materially from the results contemplated by the forward-looking statements. Such risks, uncertainties and important factors that might cause such a difference include, but are not limited to, the following: an economic downturn and economic uncertainty; inflation (including rising energy prices, interest rates, wages and other escalators) and policy reactions thereto (including actions by central banks); disruptions in the supply of materials and components used in the production of our products; the war in Ukraine and related events, and the COVID-19 pandemic, variants thereof, governmental reaction thereto, and related economic disruptions (including, among other factors, operations and supply disruptions and labor shortages). Our backlog of railcar units and other orders not included in backlog are not necessarily indicative of future results of operations. Certain orders in backlog are subject to customary documentation which may not occur. There may be other factors that may cause our actual results to differ materially from the forward-looking statements, including the risks, uncertainties and factors described in more detail in the Company’s filings with the SEC, including in the “Risk Factors” and “Management’s Discussion and Analysis of Financial Condition and Results of Operations” sections of the Company’s most recently filed Annual Report on Form 10-K. Except as otherwise required by law, the Company assumes no obligation to update any forward-looking statements or information, which speak as of their respective dates. Readers are cautioned not to place undue reliance on these forward-looking statements, which reflect management’s opinions only as of the date hereof. 2
An Established Industry Leader Proven history of delivering strong performance Strategically positioned for growth
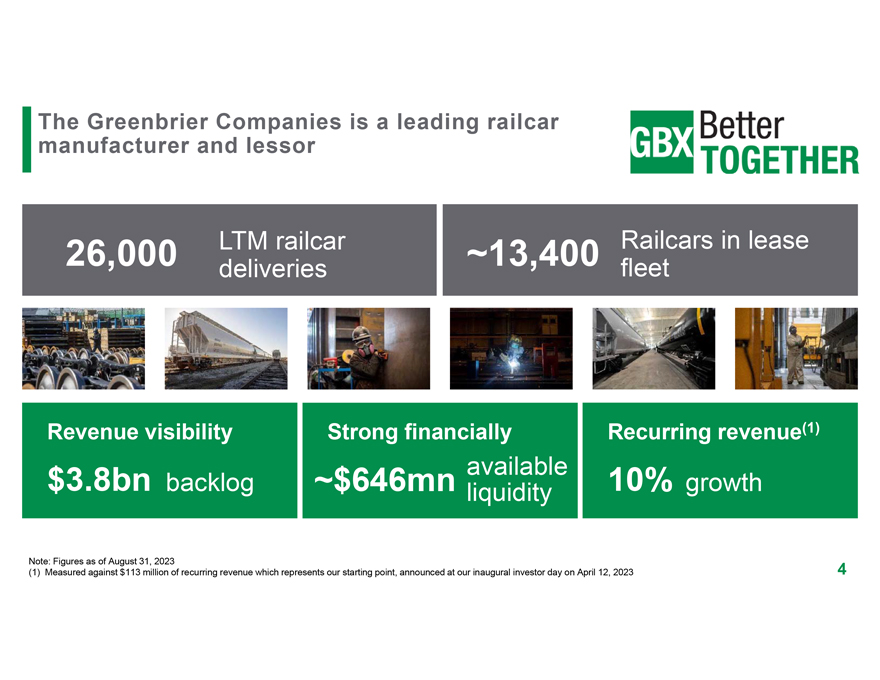
The Greenbrier Companies is a leading railcar manufacturer and lessor 26,000 LTM railcar ~13,400 Railcars in lease deliveries fleet Revenue visibility Strong financially Recurring revenue(1) $3.8bn available 10% backlog ~$646mn liquidity growth Note: Figures as of August 31, 2023 4 (1) Measured against $113 million of recurring revenue which represents our starting point, announced at our inaugural investor day on April 12, 2023
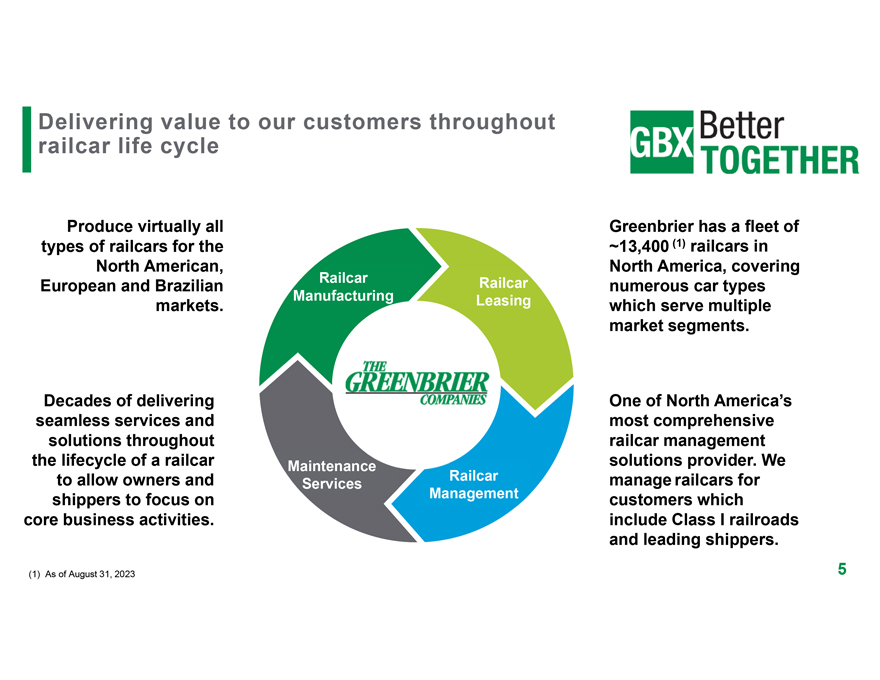
Delivering value to our customers throughout railcar life cycle Produce virtually all Greenbrier has a fleet of types of railcars for the ~13,400 (1) railcars in North American, North America, covering Railcar Railcar European and Brazilian numerous car types Manufacturing Leasing markets. which serve multiple market segments. Decades of delivering One of North America’s seamless services and most comprehensive solutions throughout railcar management the lifecycle of a railcar Maintenance solutions provider. We to allow owners and Railcar manage railcars for Services shippers to focus on Management customers which core business activities. include Class I railroads and leading shippers. (1) As of August 31, 2023 5
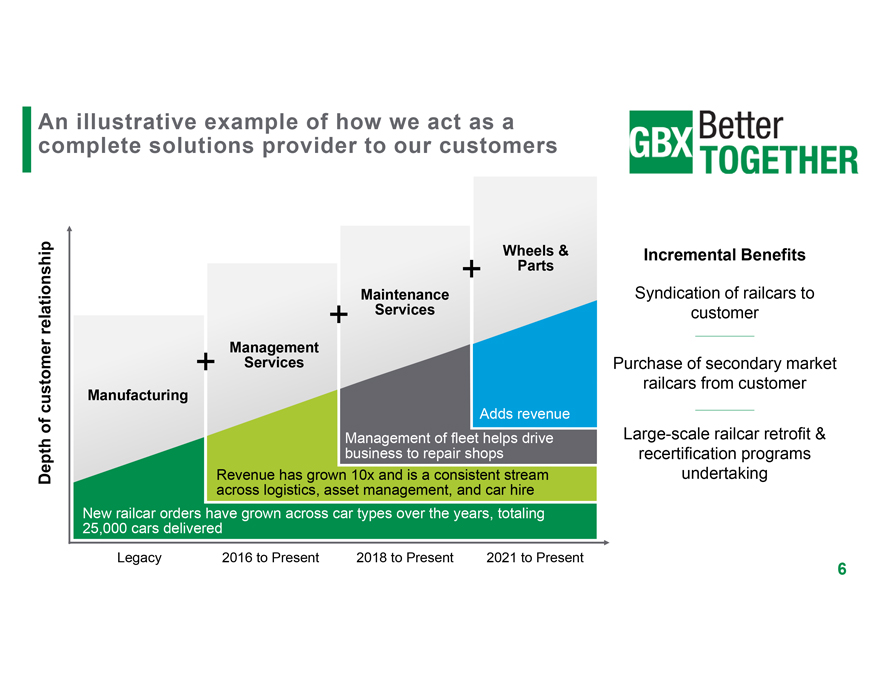
An illustrative example of how we act as a complete solutions provider to our customers Wheels & Incremental Benefits + Parts Maintenance Syndication of railcars to relationship + Services customer Management + Services Purchase of secondary market railcars from customer customer Manufacturing of Adds revenue Management of fleet helps drive Large-scale railcar retrofit & business to repair shops recertification programs Depth Revenue has grown 10x and is a consistent stream undertaking across logistics, asset management, and car hire New railcar orders have grown across car types over the years, totaling 25,000 cars delivered Legacy 2016 to Present 2018 to Present 2021 to Present 6
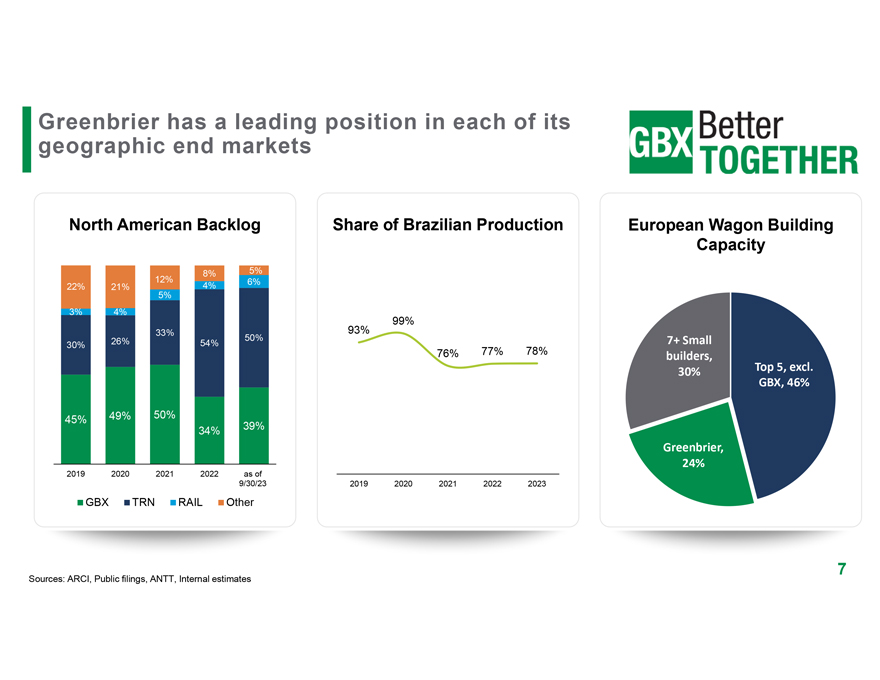
Greenbrier has a leading position in each of its geographic end markets North American Backlog Share of Brazilian Production European Wagon Building Capacity 8% 5% 12% 6% 22% 21% 4% 5% 3% 4% 99% 33% 93% 26% 50% 7+ Small 30% 54% 76% 77% 78% builders, 30% Top 5, excl. GBX, 46% 45% 49% 50% 34% 39% Greenbrier, 24% 2019 2020 2021 2022 as of 9/30/23 2019 2020 2021 2022 2023 GBX TRN RAIL Other 7 Sources: ARCI, Public filings, ANTT, Internal estimates
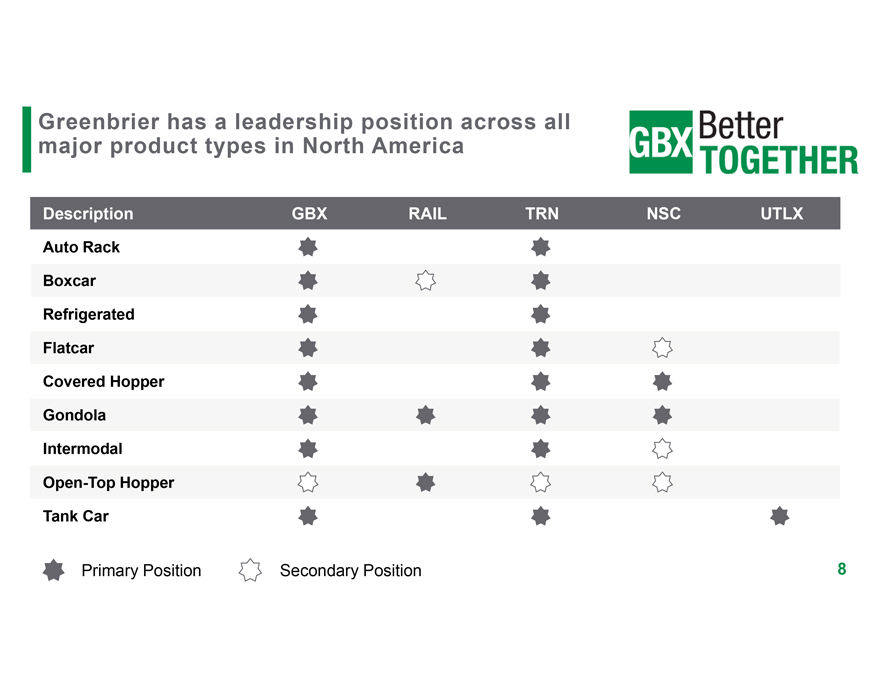
Greenbrier has a leadership position across all major product types in North America Description GBX RAIL TRN NSC UTLX Auto Rack Boxcar Refrigerated Flatcar Covered Hopper Gondola Intermodal Open-Top Hopper Tank Car Primary Position Secondary Position 8
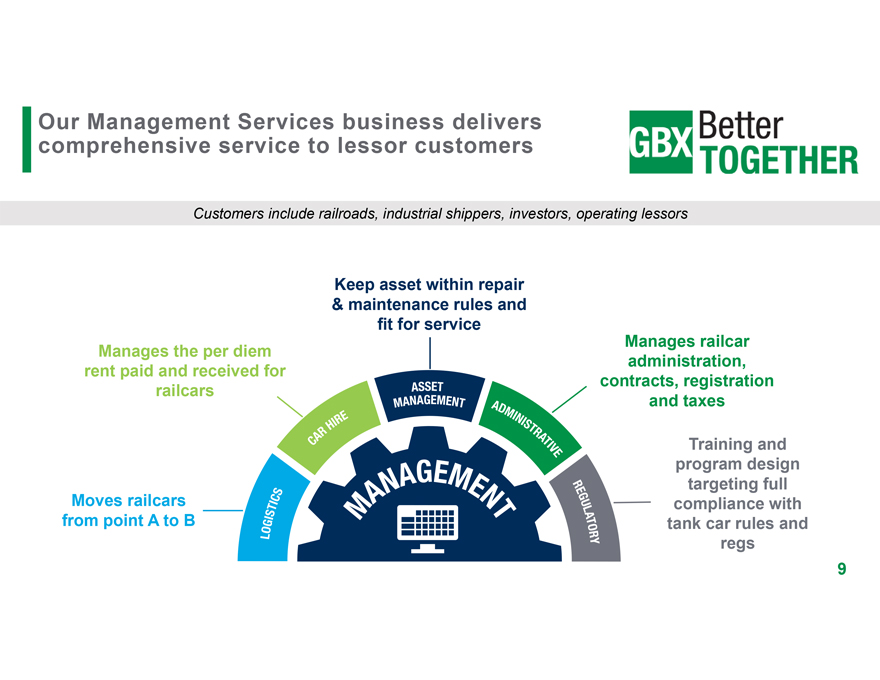
Our Management Services business delivers comprehensive service to lessor customers Customers include railroads, industrial shippers, investors, operating lessors Keep asset within repair & maintenance rules and fit for service Manages railcar Manages the per diem administration, rent paid and received for contracts, registration railcars and taxes Training and program design targeting full Moves railcars compliance with from point A to B tank car rules and regs 9
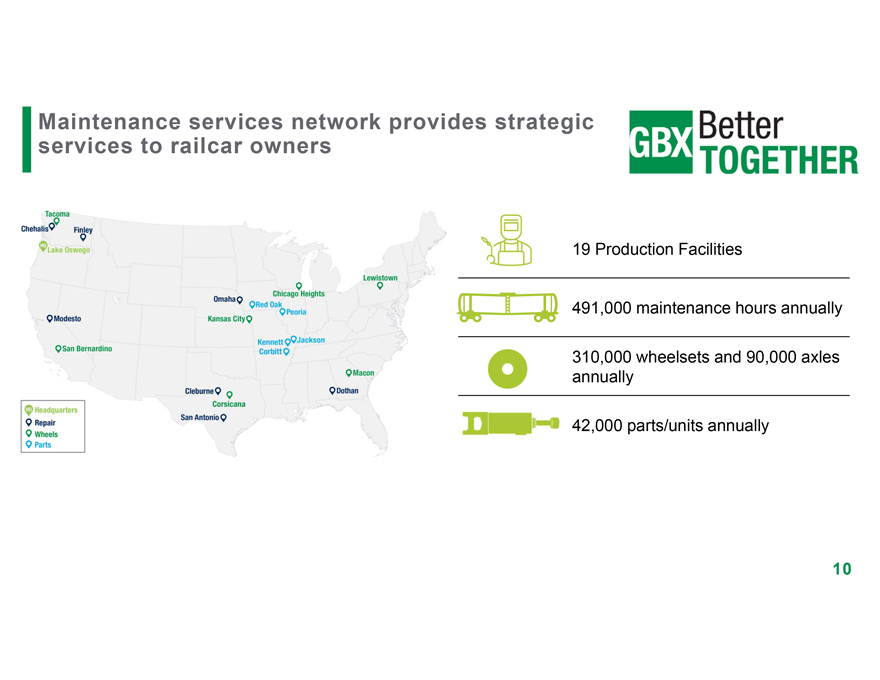
Maintenance services network provides strategic services to railcar owners 19 Production Facilities 491,000 maintenance hours annually 310,000 wheelsets and 90,000 axles annually 42,000 parts/units annually 10
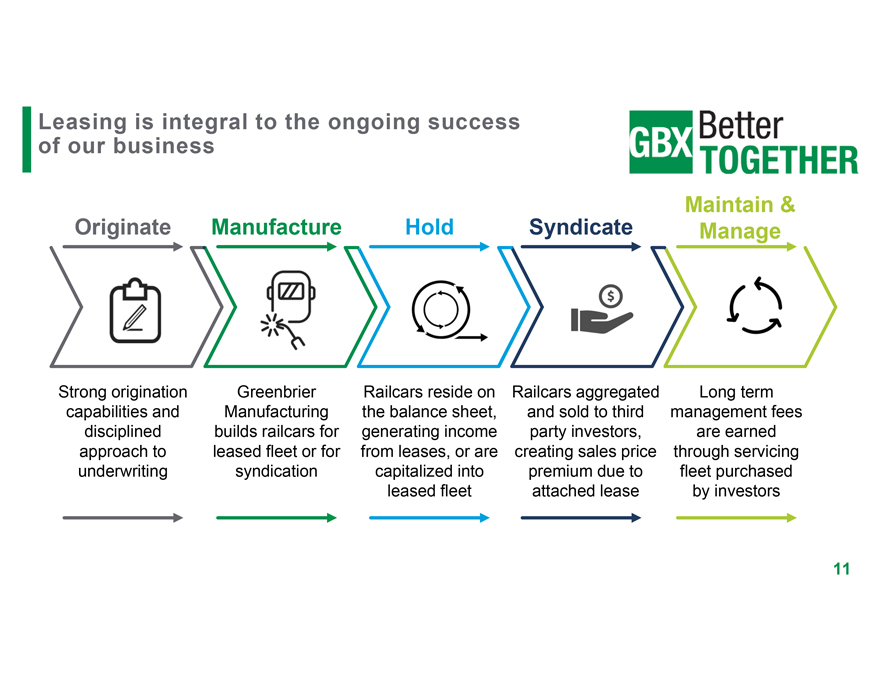
Leasing is integral to the ongoing success of our business Maintain & Originate Manufacture Hold Syndicate Manage Strong origination Greenbrier Railcars reside on Railcars aggregated Long term capabilities and Manufacturing the balance sheet, and sold to third management fees disciplined builds railcars for generating income party investors, are earned approach to leased fleet or for from leases, or are creating sales price through servicing underwriting syndication capitalized into premium due to fleet purchased leased fleet attached lease by investors 11
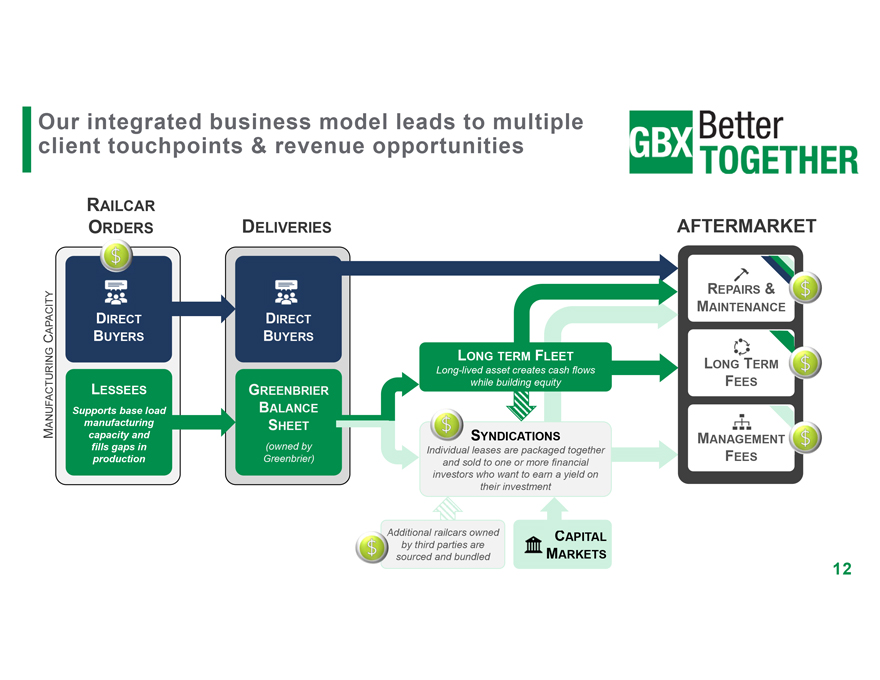
Our integrated business model leads to multiple client touchpoints & revenue opportunities RAILCAR ORDERS DELIVERIES AFTERMARKET REPAIRS & MAINTENANCE APACITY DIRECT DIRECT C BUYERS BUYERS LONG TERM FLEET LONG TERM Long-lived asset creates cash flows while building equity FEES LESSEES GREENBRIER Supports base load BALANCE ANUFACTURING manufacturing SHEET M capacity and SYNDICATIONS MANAGEMENT fills gaps in (owned by Individual leases are packaged together production Greenbrier) FEES and sold to one or more financial investors who want to earn a yield on their investment Additional railcars owned CAPITAL by third parties are ARKETS sourced and bundled M 12
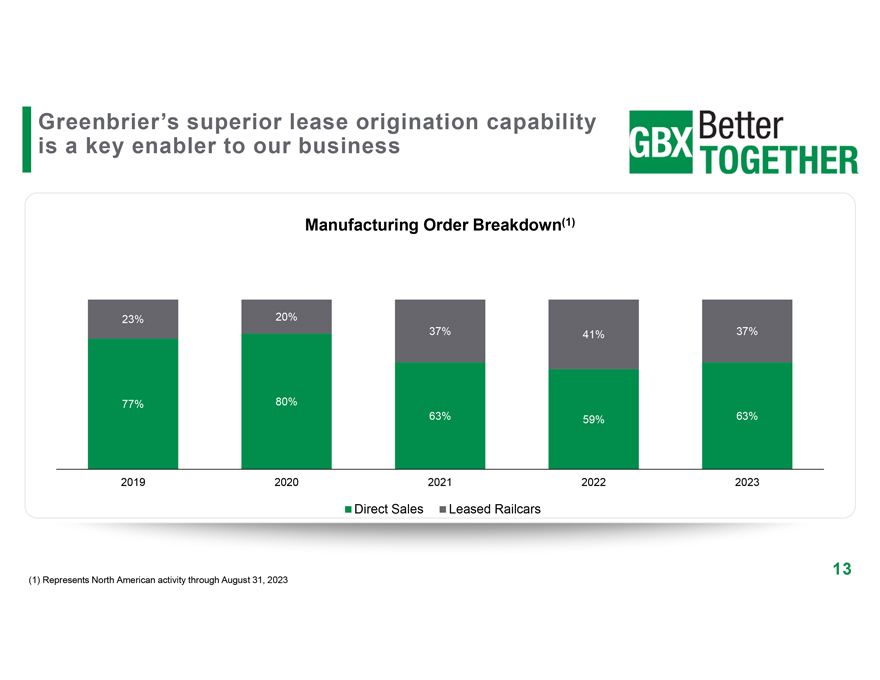
Greenbrier’s superior lease origination capability is a key enabler to our business Manufacturing Order Breakdown(1) 23% 20% 37% 41% 37% 77% 80% 63% 59% 63% 2019 2020 2021 2022 2023 Direct Sales Leased Railcars (1) Represents North American activity through August 31, 2023 13
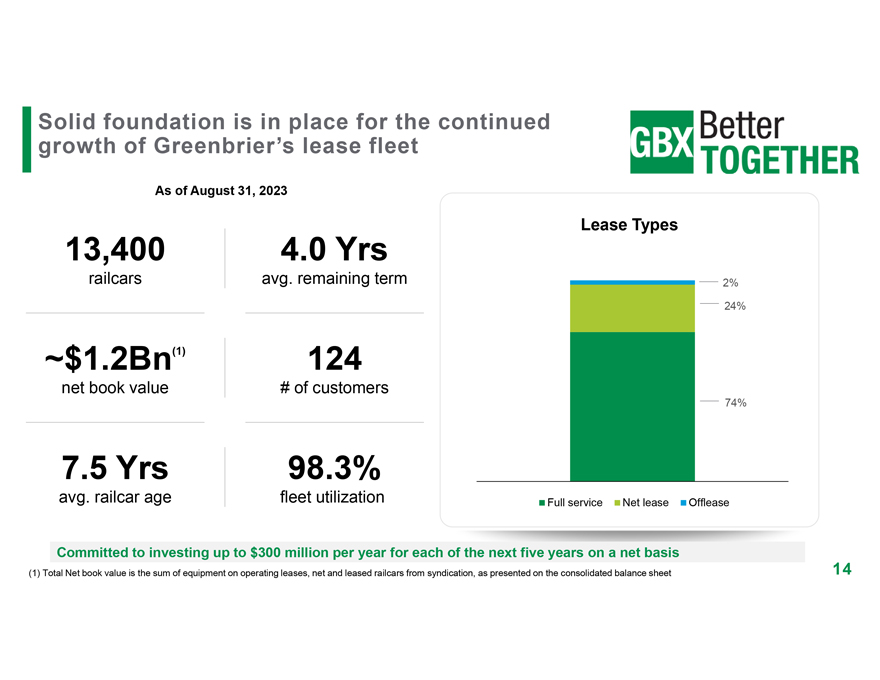
Solid foundation is in place for the continued growth of Greenbrier’s lease fleet As of August 31, 2023 13,400 4.0 Yrs Lease Types railcars avg. remaining term 2% 24% ~$1.2Bn(1) 124 net book value # of customers 74% 7.5 Yrs 98.3% avg. railcar age fleet utilization Full service Net lease Offlease Committed to investing up to $300 million per year for each of the next five years on a net basis (1) Total Net book value is the sum of equipment on operating leases, net and leased railcars from syndication, as presented on the consolidated balance sheet 14
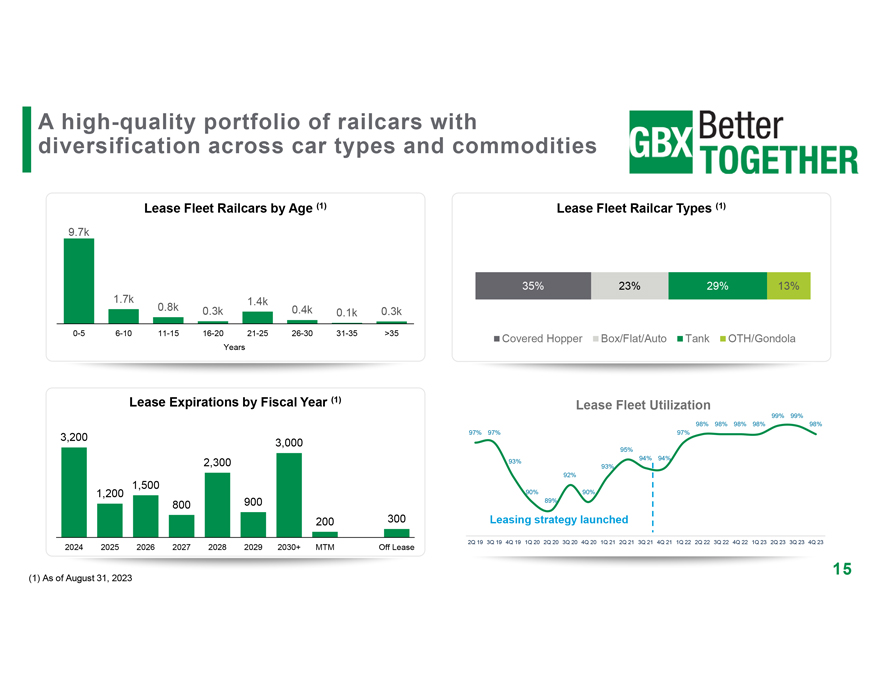
A high-quality portfolio of railcars with diversification across car types and commodities Lease Fleet Railcars by Age (1) Lease Fleet Railcar Types (1) 9.7k 35% 23% 29% 13% 1.7k 1.4k 0.8k 0.3k 0.4k 0.3k 0.1k 0-5 6-10 11-15 16-20 21-25 26-30 31-35 >35 Covered Hopper Box/Flat/Auto Tank OTH/Gondola Years Lease Expirations by Fiscal Year (1) Lease Fleet Utilization 99% 99% 98% 98% 98% 98% 98% 3,200 97% 97% 97% 3,000 95% 94% 94% 2,300 93% 93% 92% 1,500 90% 90% 1,200 89% 800 900 200 300 Leasing strategy launched 2Q 19 3Q 19 4Q 19 1Q 20 2Q 20 3Q 20 4Q 20 1Q 21 2Q 21 3Q 21 4Q 21 1Q 22 2Q 22 3Q 22 4Q 22 1Q 23 2Q 23 3Q 23 4Q 23 2024 2025 2026 2027 2028 2029 2030+ MTM Off Lease 15 (1) As of August 31, 2023
An Established Industry Leader Proven history of delivering strong performance Strategically positioned for growth
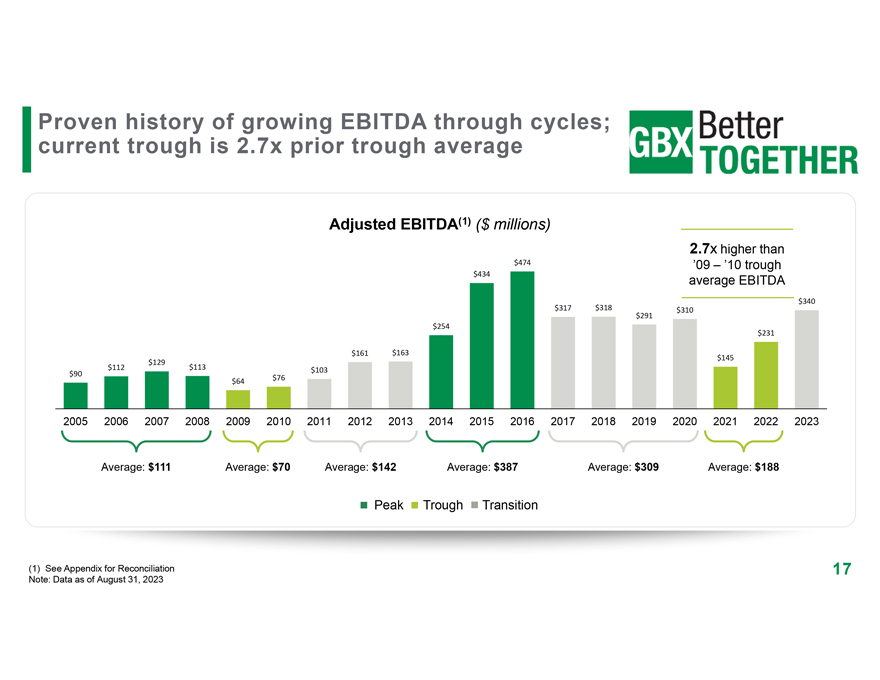
Proven history of growing EBITDA through cycles; current trough is 2.7x prior trough average Adjusted EBITDA(1) ($ millions) 2.7x higher than $474 ’09 – ’10 trough $434 average EBITDA $317 $318 $340 $310 $291 $254 $231 $161 $163 $145 $129 $90 $112 $113 $103 $76 $64 2005 2006 2007 2008 2009 2010 2011 2012 2013 2014 2015 2016 2017 2018 2019 2020 2021 2022 2023 Average: $111 Average: $70 Average: $142 Average: $387 Average: $309 Average: $188 Peak Trough Transition (1) See Appendix for Reconciliation 17 Note: Data as of August 31, 2023
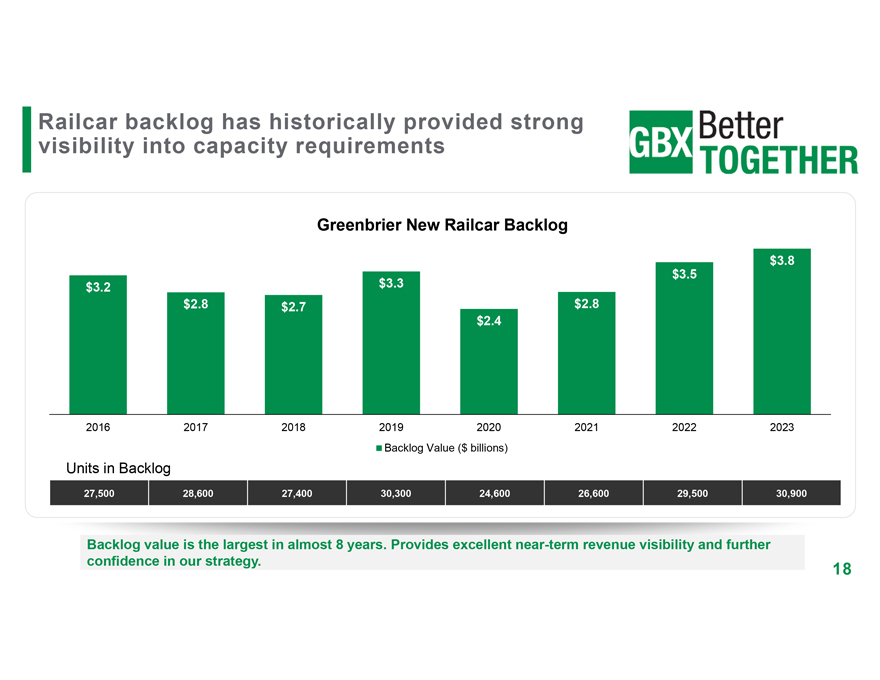
Railcar backlog has historically provided strong visibility into capacity requirements Greenbrier New Railcar Backlog $3.8 $3.5 $3.2 $3.3 $2.8 $2.7 $2.8 $2.4 2016 2017 2018 2019 2020 2021 2022 2023 Backlog Value ($ billions) Units in Backlog 27,500 28,600 27,400 30,300 24,600 26,600 29,500 30,900 Backlog value is the largest in almost 8 years. Provides excellent near-term revenue visibility and further confidence in our strategy. 18
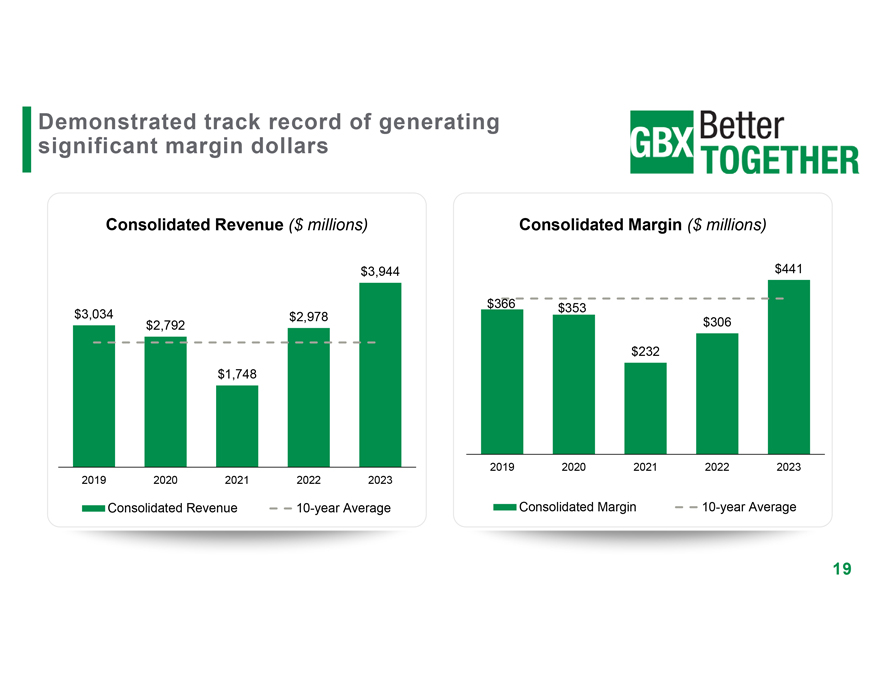
Demonstrated track record of generating significant margin dollars Consolidated Revenue ($ millions) Consolidated Margin ($ millions) $3,944 $441 $366 $353 $3,034 $2,978 $2,792 $306 $232 $1,748 2019 2020 2021 2022 2023 2019 2020 2021 2022 2023 Consolidated Revenue 10-year Average Consolidated Margin 10-year Average 19
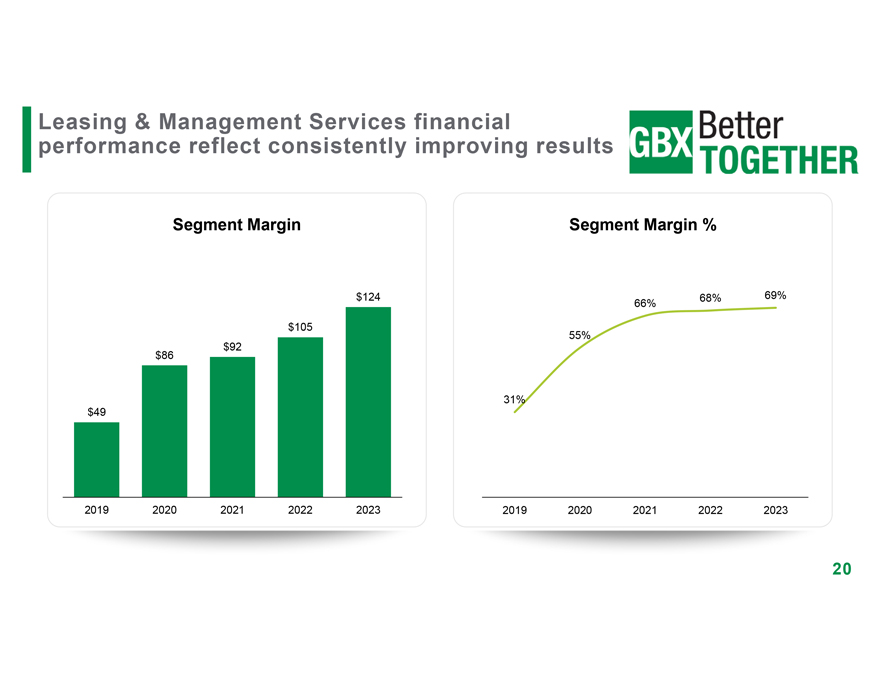
Leasing & Management Services financial performance reflect consistently improving results Segment Margin Segment Margin % $124 68% 69% 66% $105 55% $92 $86 31% $49 2019 2020 2021 2022 2023 2019 2020 2021 2022 2023 20
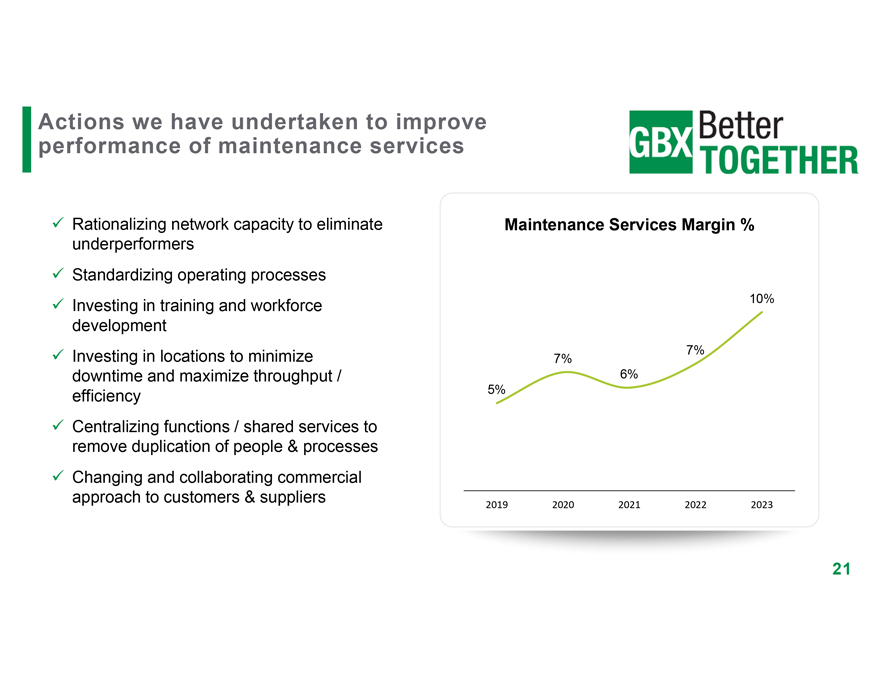
Actions we have undertaken to improve performance of maintenance services ? Rationalizing network capacity to eliminate Maintenance Services Margin % underperformers? Standardizing operating processes? Investing in training and workforce 10% development? Investing in locations to minimize 7% 7% downtime and maximize throughput / 6% efficiency 5%? Centralizing functions / shared services to remove duplication of people & processes? Changing and collaborating commercial approach to customers & suppliers 2019 2020 2021 2022 2023 21
An Established Industry Leader Proven history of delivering strong performance Strategically positioned for growth
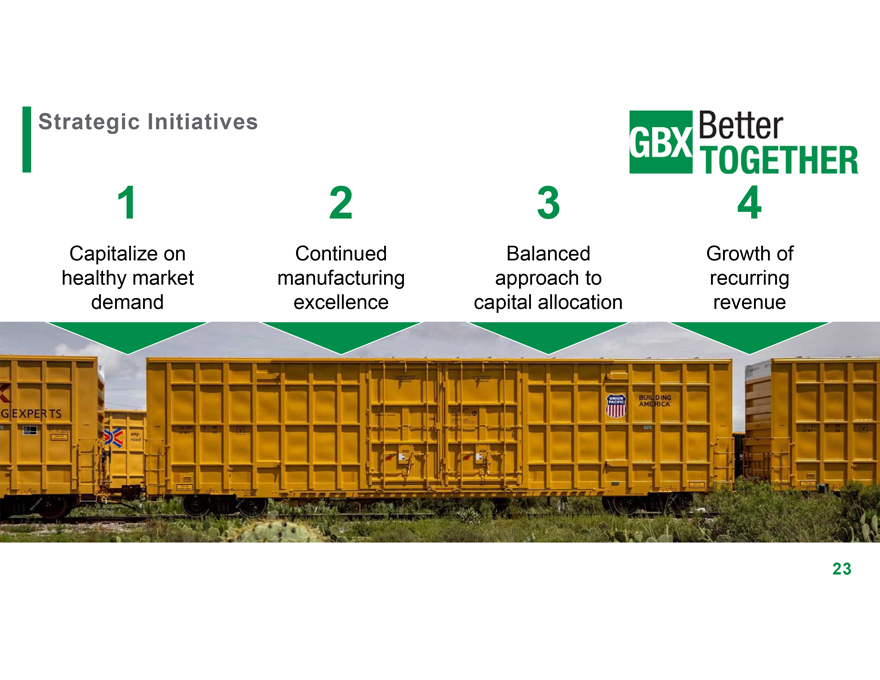
Strategic Initiatives 1 2 3 4 Capitalize on Continued Balanced Growth of healthy market manufacturing approach to recurring demand excellence capital allocation revenue 23
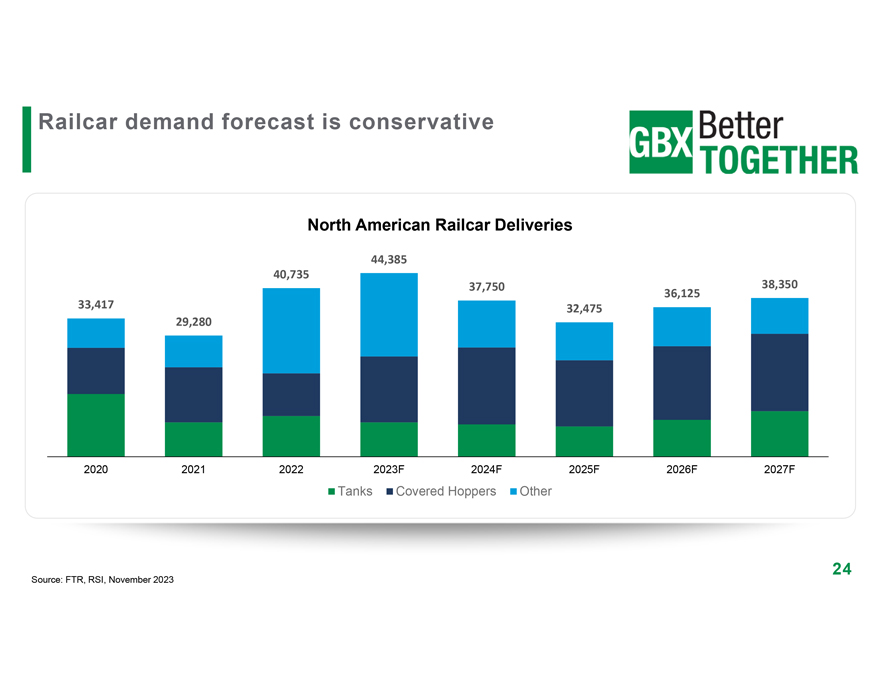
Railcar demand forecast is conservative North American Railcar Deliveries 44,385 40,735 38,350 37,750 36,125 33,417 32,475 29,280 2020 2021 2022 2023F 2024F 2025F 2026F 2027F Tanks Covered Hoppers Other Source: FTR, RSI, November 2023 24
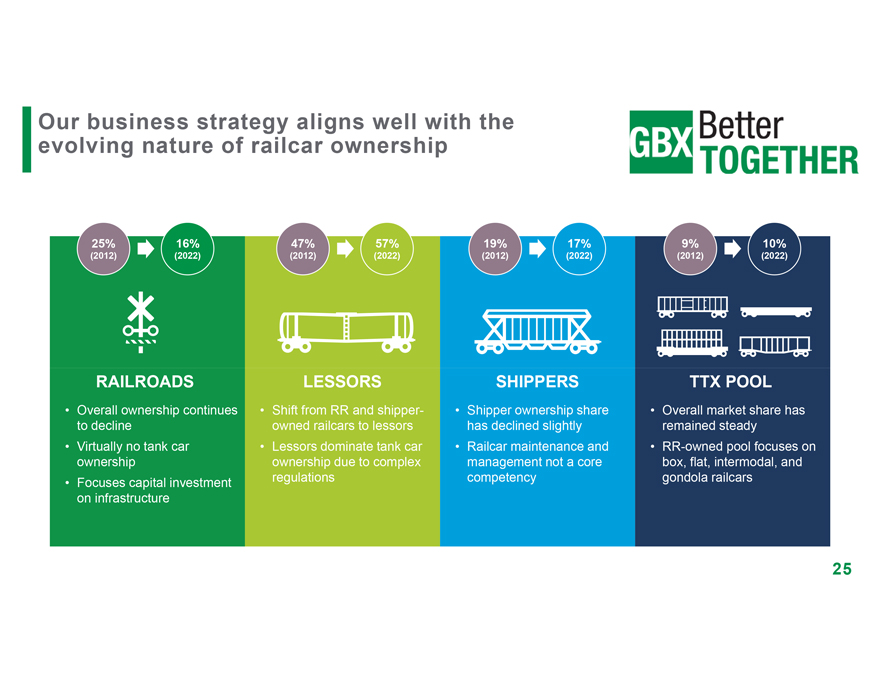
Our business strategy aligns well with the evolving nature of railcar ownership 25% 16% 47% 57% 19% 17% 9% 10% (2012) (2022) (2012) (2022) (2012) (2022) (2012) (2022) RAILROADS LESSORS SHIPPERS TTX POOL • Overall ownership continues • Shift from RR and shipper- • Shipper ownership share • Overall market share has to decline owned railcars to lessors has declined slightly remained steady • Virtually no tank car • Lessors dominate tank car • Railcar maintenance and • RR-owned pool focuses on ownership ownership due to complex management not a core box, flat, intermodal, and • Focuses capital investment regulations competency gondola railcars on infrastructure 25
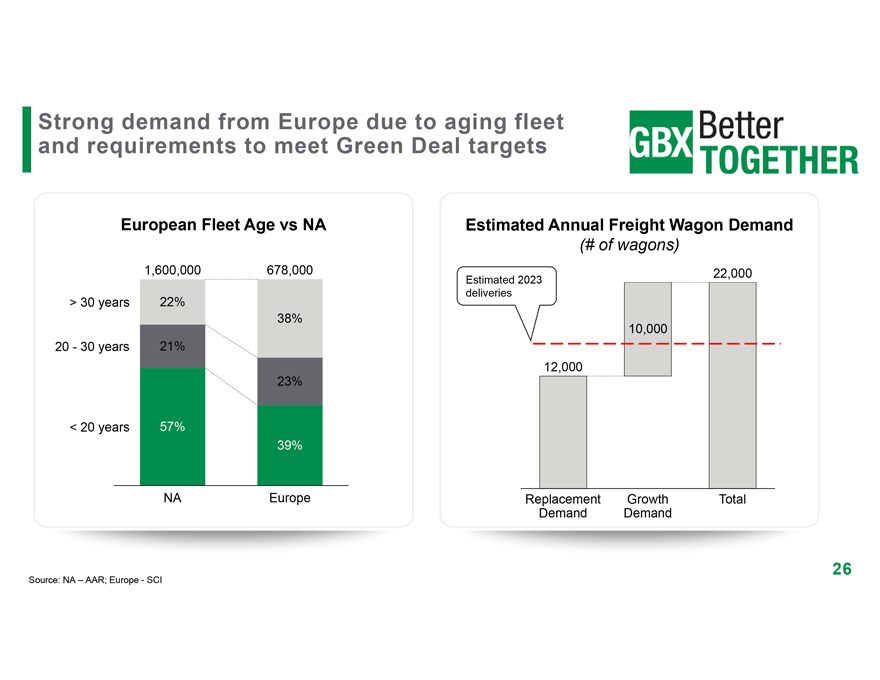
Strong demand from Europe due to aging fleet and requirements to meet Green Deal targets European Fleet Age vs NA 1,600,000 678,000 > 30 years 22% 38% 20—30 years 21% 23% < 20 years 57% 39% NA Europe Estimated Annual Freight Wagon Demand (# of wagons) 22,000 Estimated 2023 deliveries 10,000 12,000 Replacement Growth Total Demand Demand Source: NA – AAR; Europe—SCI
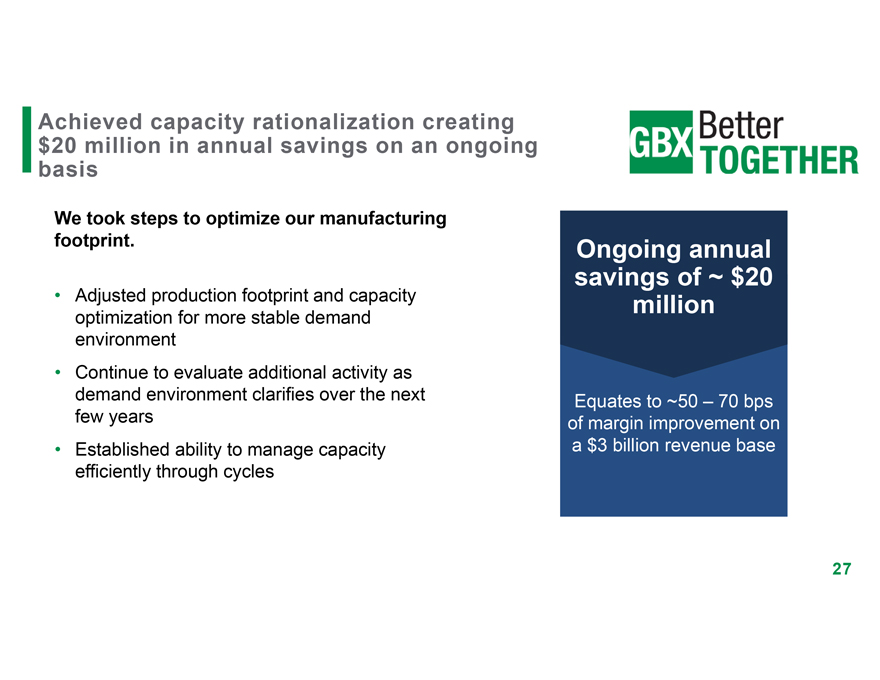
Achieved capacity rationalization creating $20 million in annual savings on an ongoing basis We took steps to optimize our manufacturing footprint. Ongoing annual • Adjusted production footprint and capacity savings of ~ $20 million optimization for more stable demand environment • Continue to evaluate additional activity as demand environment clarifies over the next Equates to ~50 – 70 bps few years of margin improvement on • Established ability to manage capacity a $3 billion revenue base efficiently through cycles
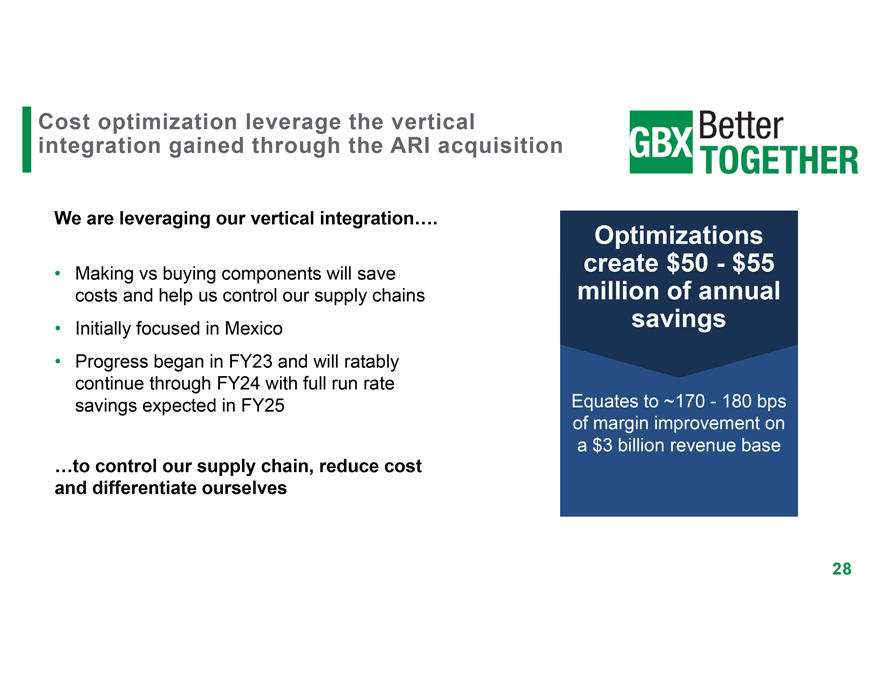
Cost optimization leverage the vertical integration gained through the ARI acquisition We are leveraging our vertical integration…. Optimizations • Making vs buying components will save create $50—$55 costs and help us control our supply chains million of annual • Initially focused in Mexico savings • Progress began in FY23 and will ratably continue through FY24 with full run rate savings expected in FY25 Equates to ~170—180 bps of margin improvement on a $3 billion revenue base …to control our supply chain, reduce cost and differentiate ourselves
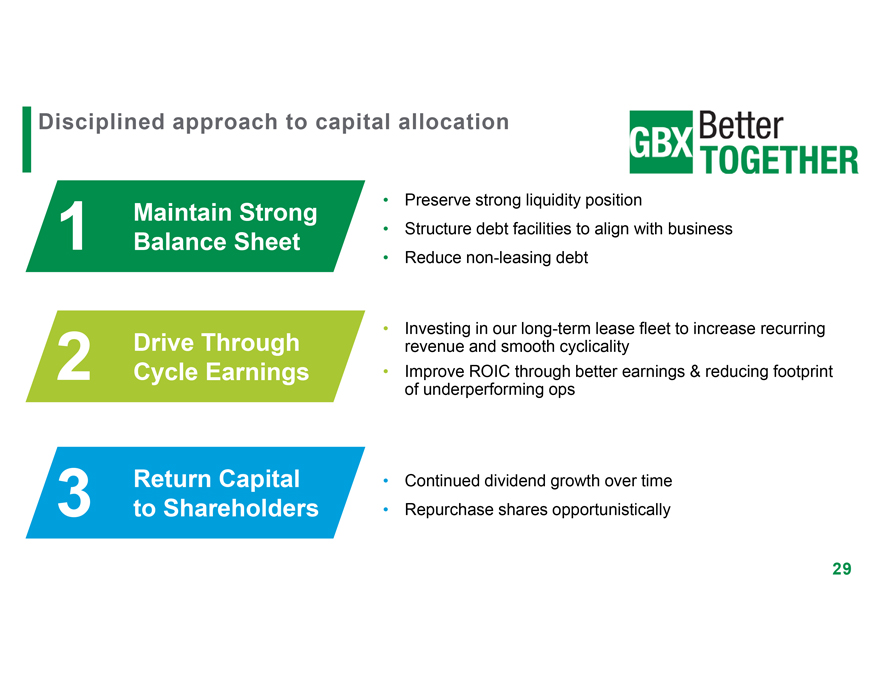
Disciplined approach to capital allocation • Preserve strong liquidity position Maintain Strong 1 • Structure debt facilities to align with business Balance Sheet • Reduce non-leasing debt • Investing in our long-term lease fleet to increase recurring Drive Through revenue and smooth cyclicality 2 Cycle Earnings • Improve ROIC through better earnings & reducing footprint of underperforming ops Return Capital • Continued dividend growth over time 3 to Shareholders • Repurchase shares opportunistically
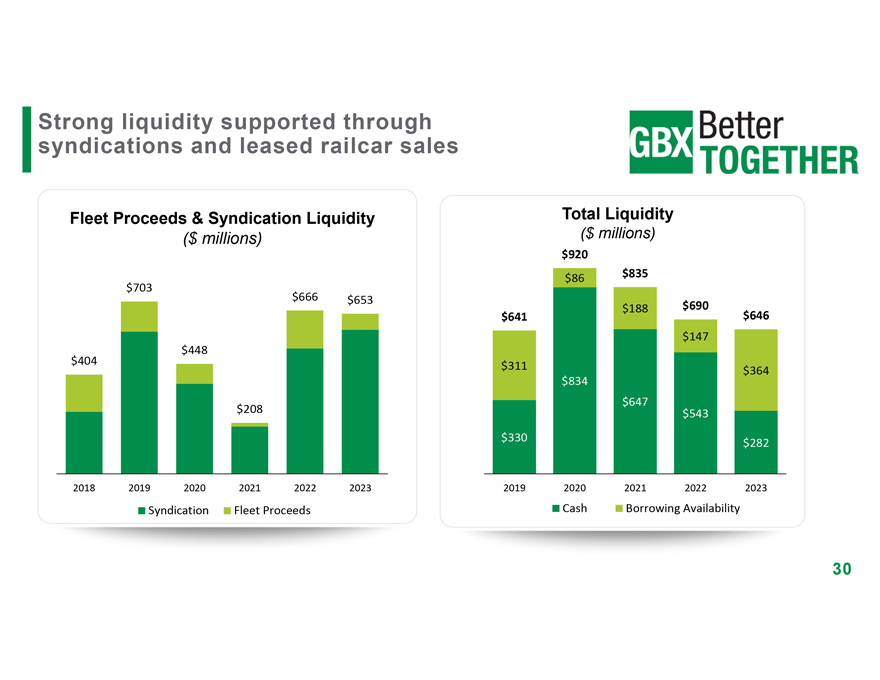
Strong liquidity supported through syndications and leased railcar sales Fleet Proceeds & Syndication Liquidity ($ millions) $703 $666 $653 $448 $404 $208 2018 2019 2020 2021 2022 2023 Syndication Fleet Proceeds Total Liquidity ($ millions) $920 $835 $86 $188 $690 $646 $641 $147 $311 $364 $834 $647 $543 $330 $282 2019 2020 2021 2022 2023 Cash Borrowing Availability
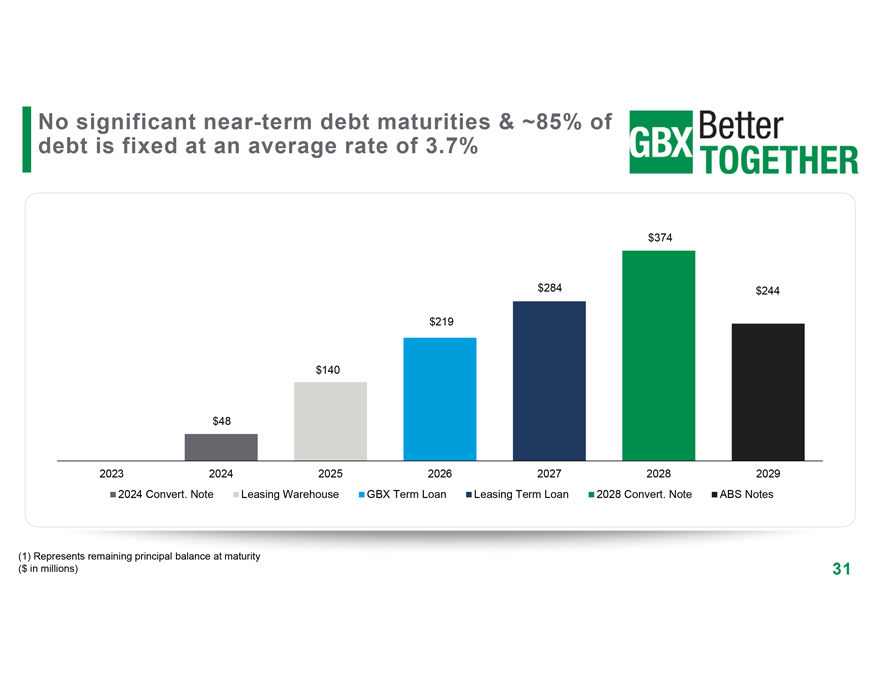
No significant near-term debt maturities & ~85% of debt is fixed at an average rate of 3.7% $374 $284 $244 $219 $140 $48 2023 2024 2025 2026 2027 2028 2029 2024 Convert. Note Leasing Warehouse GBX Term Loan Leasing Term Loan 2028 Convert. Note ABS Notes (1) Represents remaining principal balance at maturity ($ in millions)
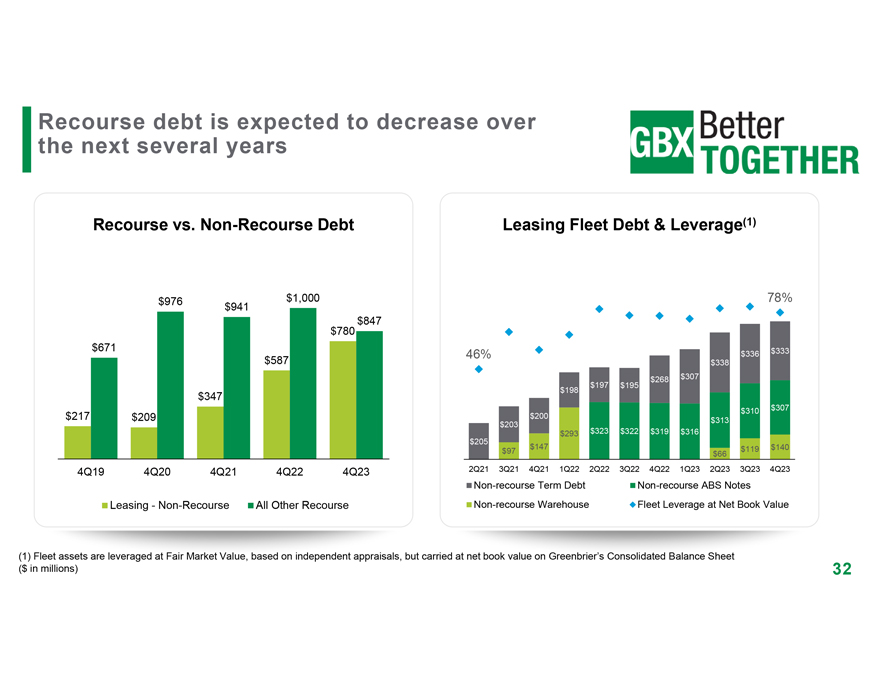
Recourse debt is expected to decrease over the next several years Recourse vs. Non-Recourse Debt Leasing Fleet Debt & Leverage(1) $976 $1,000 78% $941 $780 $847 $671 $333 46% $336 $587 $338 $268 $307 $197 $195 $198 $347 $310 $307 $217 $209 $200 $313 $203 $293 $323 $322 $319 $316 $205 $147 $119 $140 $97 $66 4Q19 4Q20 4Q21 4Q22 4Q23 2Q21 3Q21 4Q21 1Q22 2Q22 3Q22 4Q22 1Q23 2Q23 3Q23 4Q23 Non-recourse Term Debt Non-recourse ABS Notes Leasing—Non-Recourse All Other Recourse Non-recourse Warehouse Fleet Leverage at Net Book Value (1) Fleet assets are leveraged at Fair Market Value, based on independent appraisals, but carried at net book value on Greenbrier’s Consolidated Balance Sheet ($ in millions)
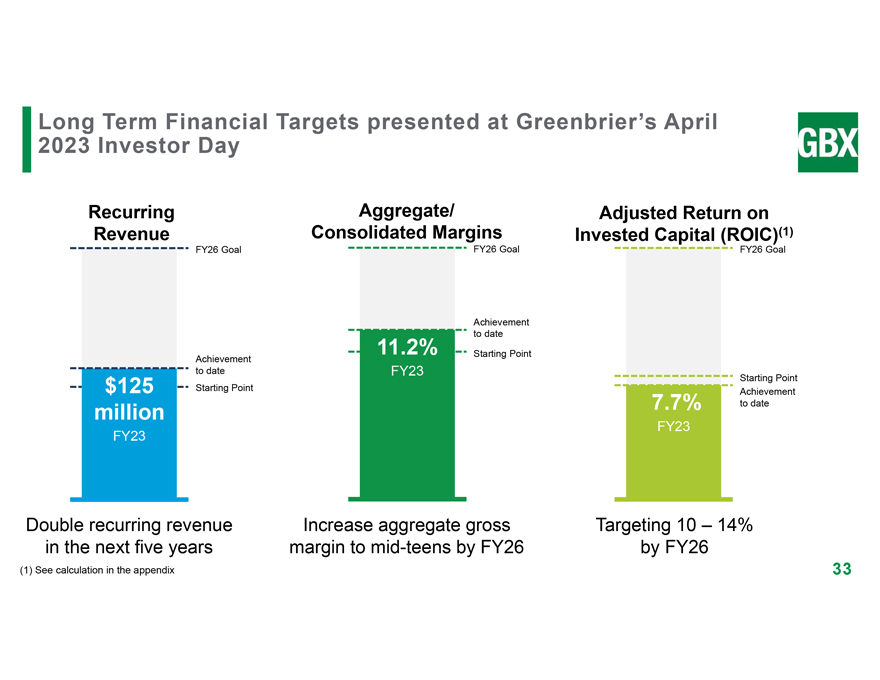
Long Term Financial Targets presented at Greenbrier’s April 2023 Investor Day Recurring Aggregate/ Adjusted Return on Revenue Consolidated Margins Invested Capital (ROIC)(1) FY26 Goal FY26 Goal FY26 Goal Achievement to date 11.2% Starting Point Achievement to date FY23 Starting Point $125 Starting Point Achievement million 7.7% to date FY23 FY23 Double recurring revenue Increase aggregate gross Targeting 10 – 14% in the next five years margin to mid-teens by FY26 by FY26 (1) See calculation in the appendix 33
APPENDIX SLIDES
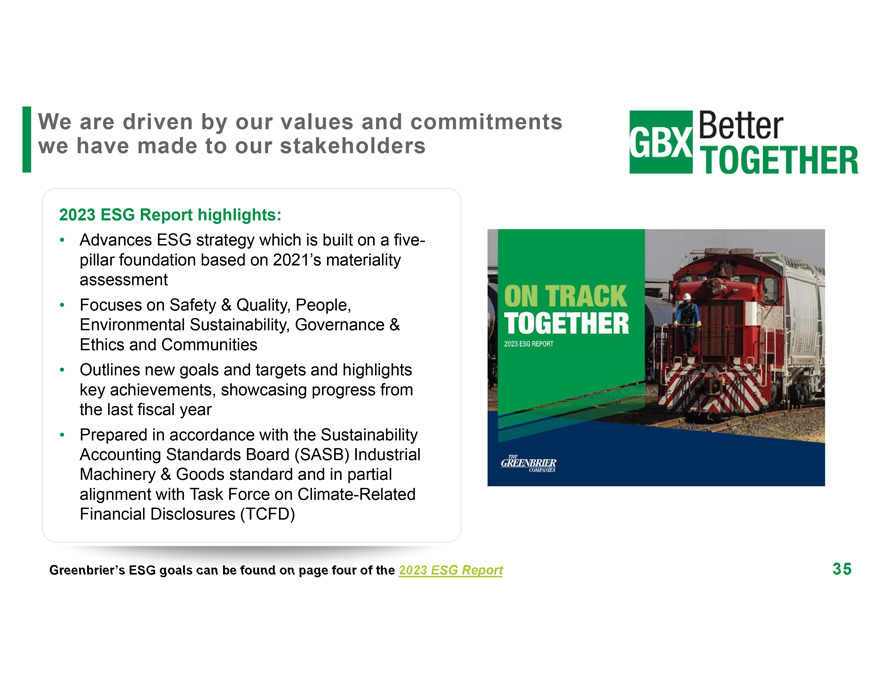
We are driven by our values and commitments we have made to our stakeholders 2023 ESG Report highlights: • Advances ESG strategy which is built on a five-pillar foundation based on 2021’s materiality assessment • Focuses on Safety & Quality, People, Environmental Sustainability, Governance & Ethics and Communities • Outlines new goals and targets and highlights key achievements, showcasing progress from the last fiscal year • Prepared in accordance with the Sustainability Accounting Standards Board (SASB) Industrial Machinery & Goods standard and in partial alignment with Task Force on Climate-Related Financial Disclosures (TCFD) ESG Report 35
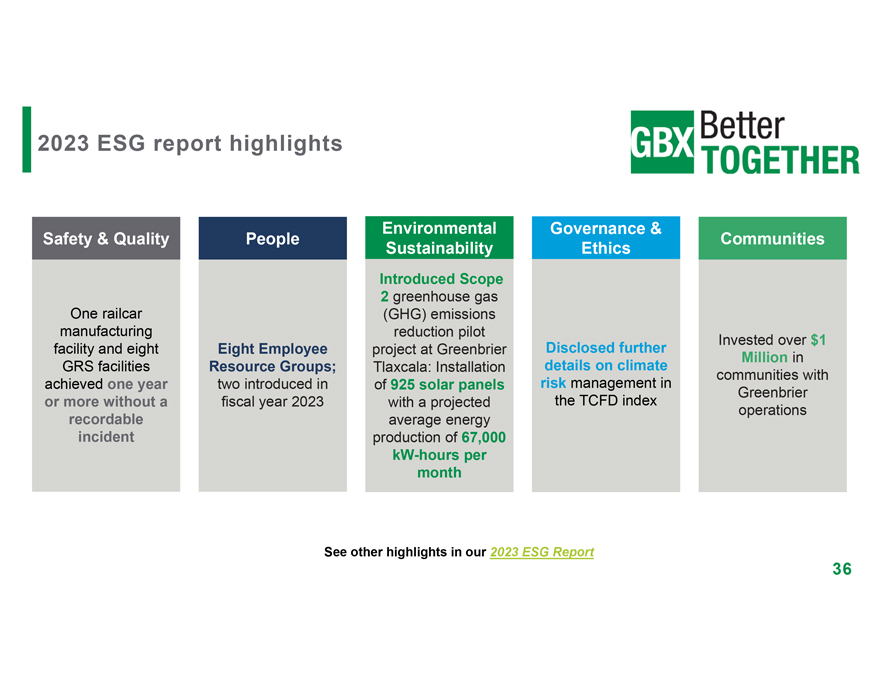
2023 ESG report highlights Environmental Governance & Safety & Quality People Communities Sustainability Ethics Introduced Scope 2 greenhouse gas One railcar (GHG) emissions manufacturing reduction pilot Invested over $1 facility and eight Eight Employee project at Greenbrier Disclosed further Million in GRS facilities Resource Groups; Tlaxcala: Installation details on climate communities with achieved one year two introduced in of 925 solar panels risk management in Greenbrier or more without a fiscal year 2023 with a projected the TCFD index operations recordable average energy incident production of 67,000 kW-hours per month See other highlights in our 2023 ESG Report 36
We strive to be the standard setter in the freight transportation industry 37
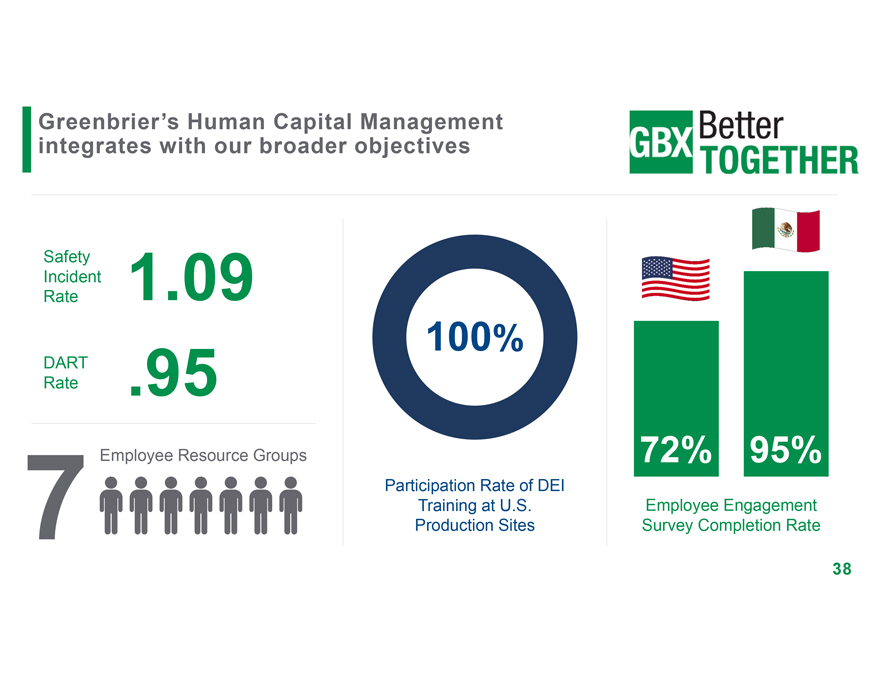
Greenbrier’s Human Capital Management integrates with our broader objectives Safety Incident 1.09 Rate 100% DART Rate .95 Employee Resource Groups 72% 95% Participation Rate of DEI Training at U.S. Employee Engagement 7 Production Sites Survey Completion Rate * Source: Association of American Railroads 38 * Source: Association of American Railroads
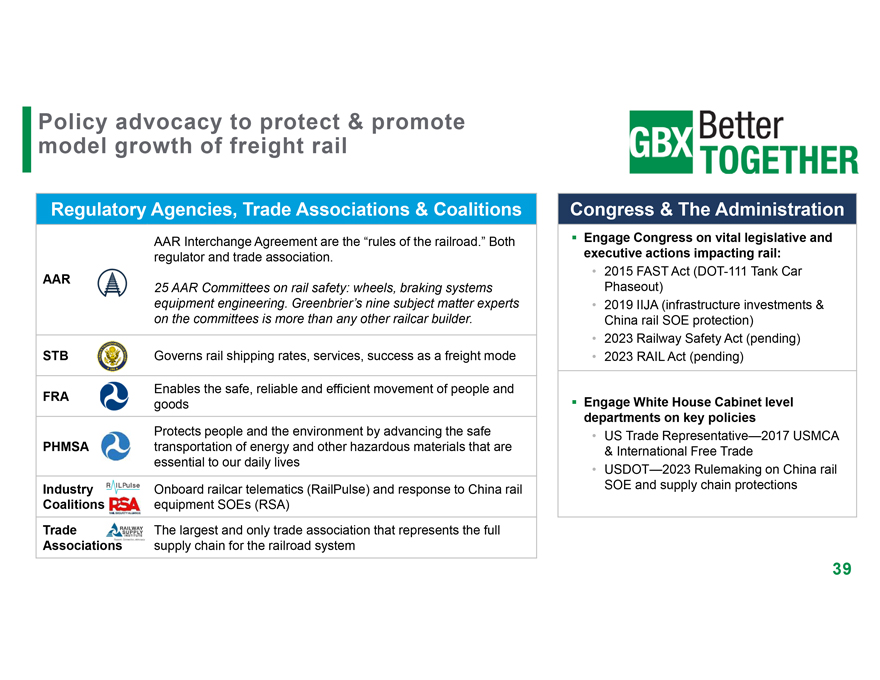
Policy advocacy to protect & promote model growth of freight rail Regulatory Agencies, Trade Associations & Coalitions AAR Interchange Agreement are the “rules of the railroad.” Both regulator and trade association. AAR 25 AAR Committees on rail safety: wheels, braking systems equipment engineering. Greenbrier’s nine subject matter experts on the committees is more than any other railcar builder. STB Governs rail shipping rates, services, success as a freight mode Enables the safe, reliable and efficient movement of people and FRA goods Protects people and the environment by advancing the safe PHMSA transportation of energy and other hazardous materials that are essential to our daily lives Industry Onboard railcar telematics (RailPulse) and response to China rail Coalitions equipment SOEs (RSA) Trade The largest and only trade association that represents the full Associations supply chain for the railroad system Congress & The Administration ï,§ Engage Congress on vital legislative and executive actions impacting rail: • 2015 FAST Act (DOT-111 Tank Car Phaseout) • 2019 IIJA (infrastructure investments & China rail SOE protection) • 2023 Railway Safety Act (pending) • 2023 RAIL Act (pending) ï,§ Engage White House Cabinet level departments on key policies • US Trade Representative—2017 USMCA & International Free Trade • USDOT—2023 Rulemaking on China rail SOE and supply chain protections 39
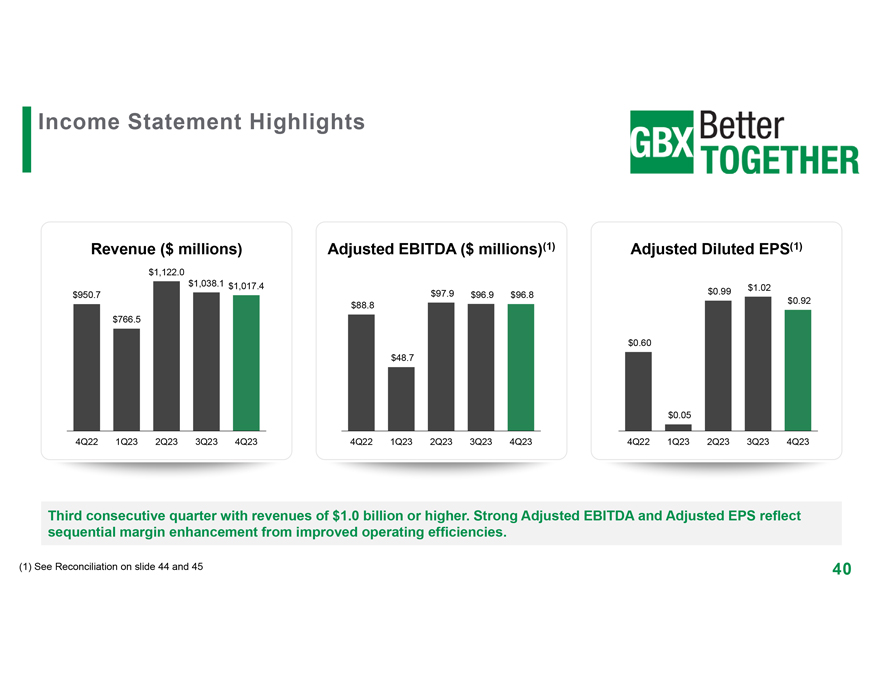
Income Statement Highlights Revenue ($ millions) Adjusted EBITDA ($ millions)(1) Adjusted Diluted EPS(1) $1,122.0 $1,038.1 $1,017.4 $0.99 $1.02 $950.7 $97.9 $96.9 $96.8 $0.92 $88.8 $766.5 $0.60 $48.7 $0.05 4Q22 1Q23 2Q23 3Q23 4Q23 4Q22 1Q23 2Q23 3Q23 4Q23 4Q22 1Q23 2Q23 3Q23 4Q23 Third consecutive quarter with revenues of $1.0 billion or higher. Strong Adjusted EBITDA and Adjusted EPS reflect sequential margin enhancement from improved operating efficiencies. (1) See Reconciliation on slide 44 and 45 40
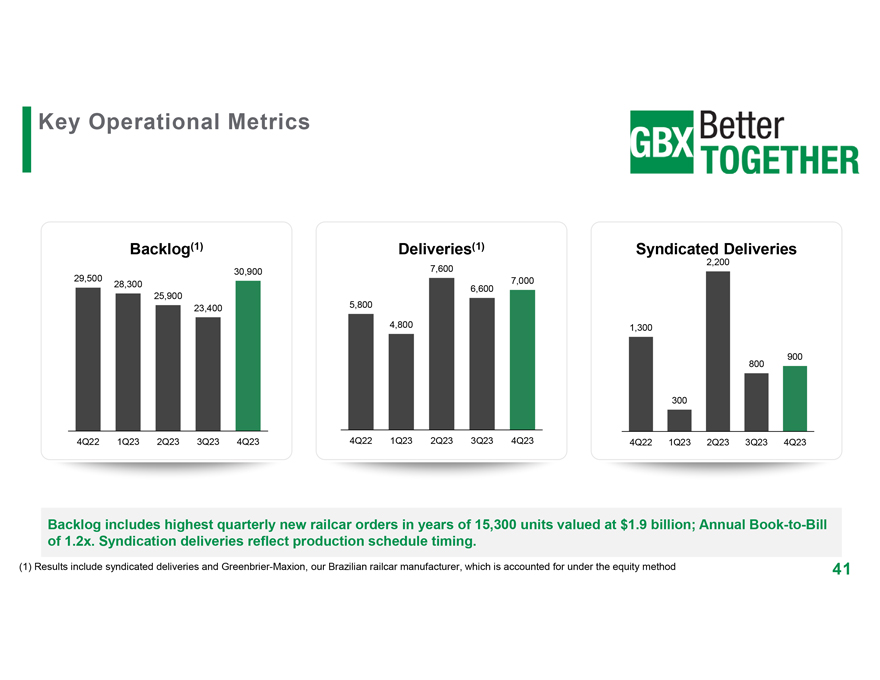
Key Operational Metrics Backlog(1) Deliveries(1) Syndicated Deliveries 2,200 30,900 7,600 29,500 7,000 28,300 6,600 25,900 5,800 23,400 4,800 1,300 900 800 300 4Q22 1Q23 2Q23 3Q23 4Q23 4Q22 1Q23 2Q23 3Q23 4Q23 4Q22 1Q23 2Q23 3Q23 4Q23 Backlog includes highest quarterly new railcar orders in years of 15,300 units valued at $1.9 billion; Annual Book-to-Bill of 1.2x. Syndication deliveries reflect production schedule timing. (1) Results include syndicated deliveries and Greenbrier-Maxion, our Brazilian railcar manufacturer, which is accounted for under the equity method 41
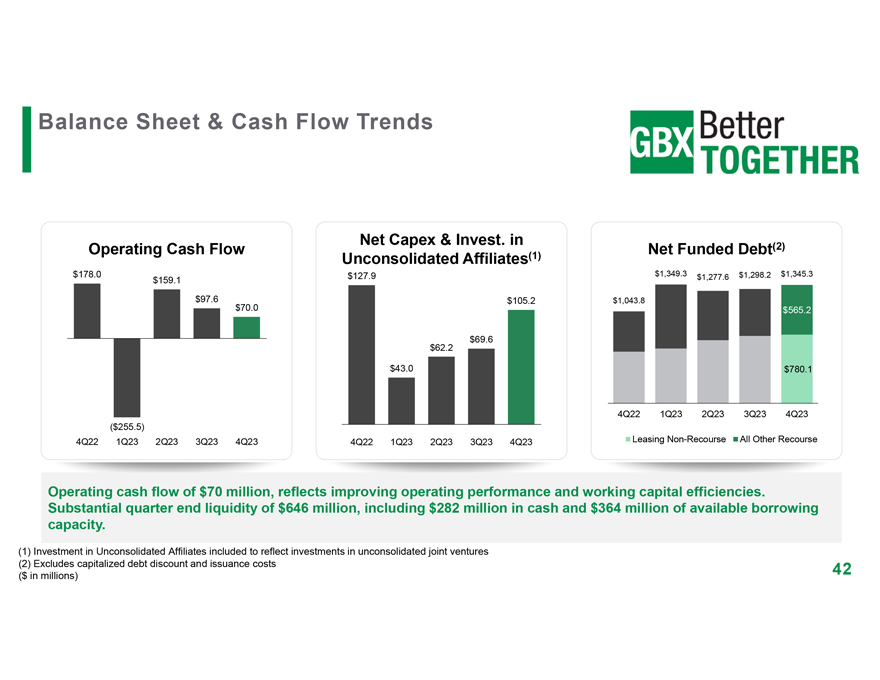
Balance Sheet & Cash Flow Trends Net Capex & Invest. in (2) Operating Cash Flow Net Funded Debt Unconsolidated Affiliates(1) $178.0 $127.9 $1,349.3 $1,277.6 $1,298.2 $1,345.3 $159.1 $97.6 $70.0 $105.2 $1,043.8 $565.2 $62.2 $69.6 $43.0 $780.1 4Q22 1Q23 2Q23 3Q23 4Q23 ($255.5) 4Q22 1Q23 2Q23 3Q23 4Q23 4Q22 1Q23 2Q23 3Q23 4Q23 Leasing Non-Recourse All Other Recourse Operating cash flow of $70 million, reflects improving operating performance and working capital efficiencies. Substantial quarter end liquidity of $646 million, including $282 million in cash and $364 million of available borrowing capacity. (1) Investment in Unconsolidated Affiliates included to reflect investments in unconsolidated joint ventures (2) Excludes capitalized debt discount and issuance costs 42 ($ in millions)
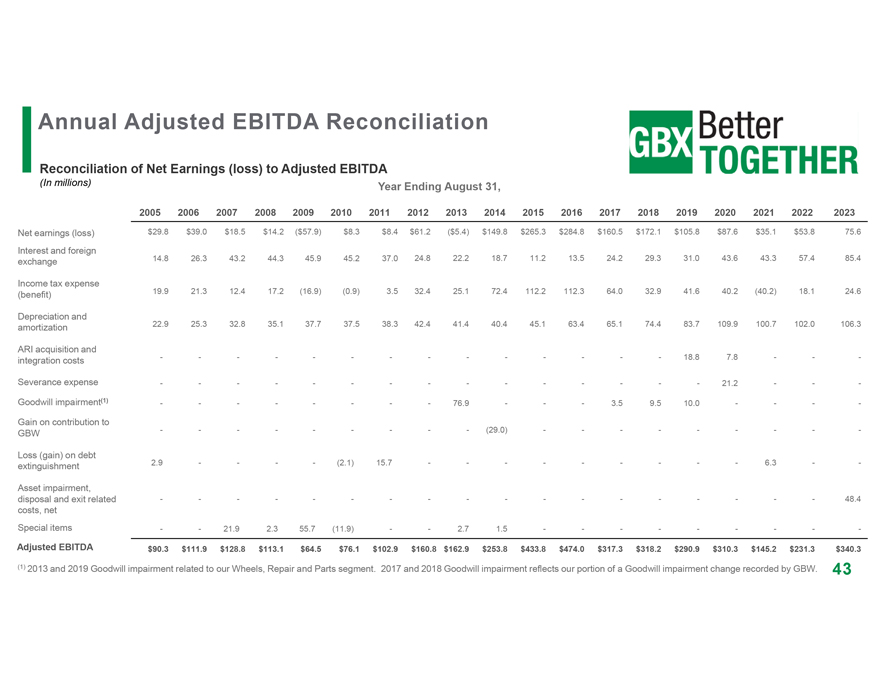
Annual Adjusted EBITDA Reconciliation Reconciliation of Net Earnings (loss) to Adjusted EBITDA (In millions) Year Ending August 31, 2005 2006 2007 2008 2009 2010 2011 2012 2013 2014 2015 2016 2017 2018 2019 2020 2021 2022 2023 Net earnings (loss) $29.8 $39.0 $18.5 $14.2 ($57.9) $8.3 $8.4 $61.2 ($5.4) $149.8 $265.3 $284.8 $160.5 $172.1 $105.8 $87.6 $35.1 $53.8 75.6 Interest and foreign 14.8 26.3 43.2 44.3 45.9 45.2 37.0 24.8 22.2 18.7 11.2 13.5 24.2 29.3 31.0 43.6 43.3 57.4 85.4 exchange Income tax expense 19.9 21.3 12.4 17.2 (16.9) (0.9) 3.5 32.4 25.1 72.4 112.2 112.3 64.0 32.9 41.6 40.2 (40.2) 18.1 24.6 (benefit) Depreciation and 22.9 25.3 32.8 35.1 37.7 37.5 38.3 42.4 41.4 40.4 45.1 63.4 65.1 74.4 83.7 109.9 100.7 102.0 106.3 amortization ARI acquisition and — — —-—-— — 18.8 7.8 -—integration costs Severance expense — — —-—-— ——21.2 — -Goodwill impairment(1) — — —— 76.9-— 3.5 9.5 10.0- -—Gain on contribution to — — —-— (29.0) — — -—— GBW Loss (gain) on debt 2.9 — — (2.1) 15.7 — — — ——6.3 —extinguishment Asset impairment, disposal and exit related — — —-—-— — -—- 48.4 costs, net Special items — 21.9 2.3 55.7 (11.9) — 2.7 1.5 — — — ——Adjusted EBITDA $90.3 $111.9 $128.8 $113.1 $64.5 $76.1 $102.9 $160.8 $162.9 $253.8 $433.8 $474.0 $317.3 $318.2 $290.9 $310.3 $145.2 $231.3 $340.3 (1) 2013 and 2019 Goodwill impairment related to our Wheels, Repair and Parts segment. 2017 and 2018 Goodwill impairment reflects our portion of a Goodwill impairment change recorded by GBW. 43
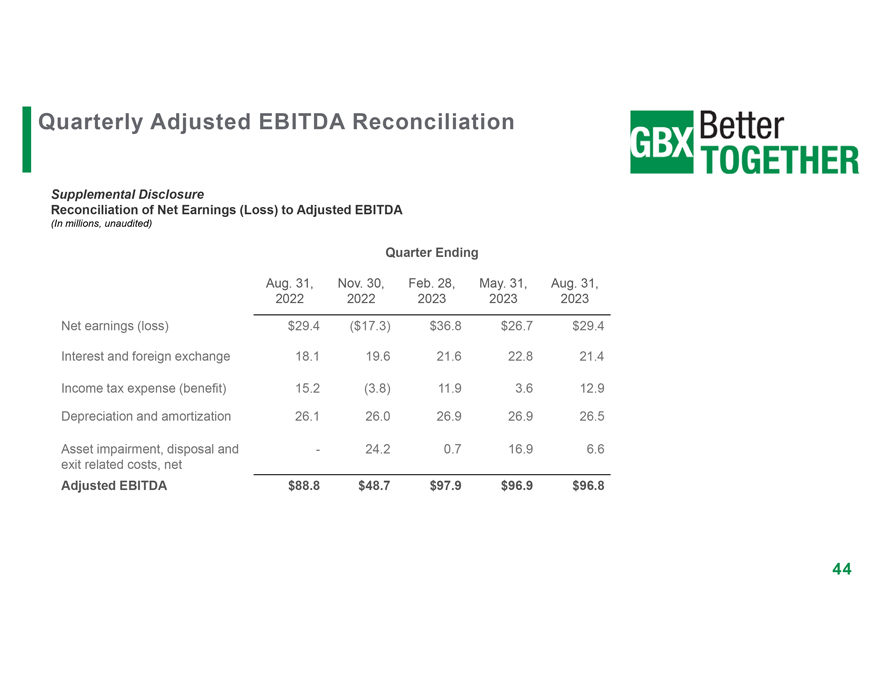
Quarterly Adjusted EBITDA Reconciliation Supplemental Disclosure Reconciliation of Net Earnings (Loss) to Adjusted EBITDA (In millions, unaudited) Quarter Ending Aug. 31, Nov. 30, Feb. 28, May. 31, Aug. 31, 2022 2022 2023 2023 2023 Net earnings (loss) $29.4 ($17.3) $36.8 $26.7 $29.4 Interest and foreign exchange 18.1 19.6 21.6 22.8 21.4 Income tax expense (benefit) 15.2 (3.8) 11.9 3.6 12.9 Depreciation and amortization 26.1 26.0 26.9 26.9 26.5 Asset impairment, disposal and—24.2 0.7 16.9 6.6 exit related costs, net Adjusted EBITDA $88.8 $48.7 $97.9 $96.9 $96.8 44
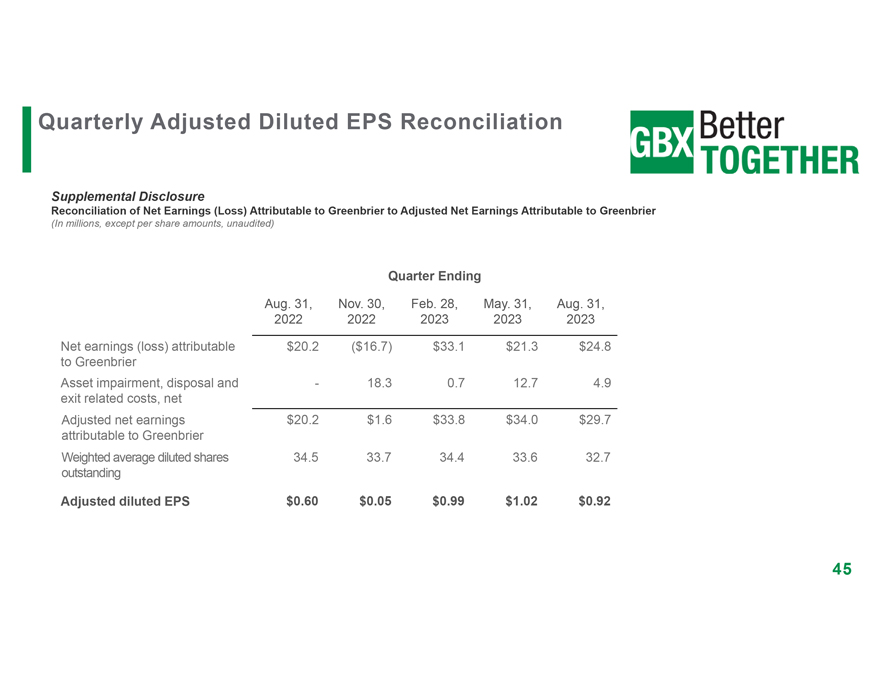
Quarterly Adjusted Diluted EPS Reconciliation Supplemental Disclosure Reconciliation of Net Earnings (Loss) Attributable to Greenbrier to Adjusted Net Earnings Attributable to Greenbrier (In millions, except per share amounts, unaudited) Quarter Ending Aug. 31, Nov. 30, Feb. 28, May. 31, Aug. 31, 2022 2022 2023 2023 2023 Net earnings (loss) attributable $20.2 ($16.7) $33.1 $21.3 $24.8 to Greenbrier Asset impairment, disposal and—18.3 0.7 12.7 4.9 exit related costs, net Adjusted net earnings $20.2 $1.6 $33.8 $34.0 $29.7 attributable to Greenbrier Weighted average diluted shares 34.5 33.7 34.4 33.6 32.7 outstanding Adjusted diluted EPS $0.60 $0.05 $0.99 $1.02 $0.92 45
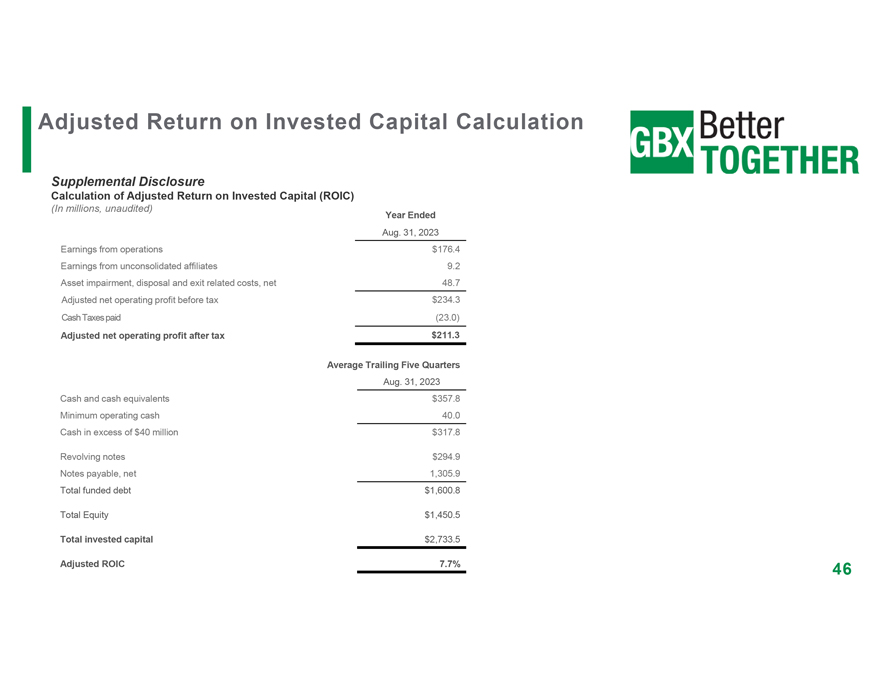
Adjusted Return on Invested Capital Calculation Supplemental Disclosure Calculation of Adjusted Return on Invested Capital (ROIC) (In millions, unaudited) Year Ended Aug. 31, 2023 Earnings from operations $176.4 Earnings from unconsolidated affiliates 9.2 Asset impairment, disposal and exit related costs, net 48.7 Adjusted net operating profit before tax $234.3 Cash Taxes paid (23.0) Adjusted net operating profit after tax $211.3 Average Trailing Five Quarters Aug. 31, 2023 Cash and cash equivalents $357.8 Minimum operating cash 40.0 Cash in excess of $40 million $317.8 Revolving notes $294.9 Notes payable, net 1,305.9 Total funded debt $1,600.8 Total Equity $1,450.5 Total invested capital $2,733.5 Adjusted ROIC 7.7% 46
Non-GAAP Financial Measures This presentation includes certain financial measures that were not prepared in accordance with generally accepted accounting principles (GAAP) because we believe they help investors understand our performance. Adjusted EBITDA, Adjusted diluted earnings per share (EPS) and Adjusted Return on invested capital (ROIC) are not financial measures under GAAP. These metrics are performance measurement tools used by rail supply companies and Greenbrier. You should not consider these metrics in isolation or as a substitute for other financial statement data determined in accordance with GAAP. In addition, because these metrics are not a measure of financial performance under GAAP and are susceptible to varying calculations, the measures presented may differ from and may not be comparable to similarly titled measures used by other companies. We define Adjusted EBITDA as Net earnings (loss) before Interest and foreign exchange, Income tax benefit (expense), Depreciation and amortization and the impact associated with items we do not believe are indicative of our core business or which affect comparability. We believe the presentation of Adjusted EBITDA provides useful information as it excludes the impact of financing, foreign exchange, income taxes and the accounting effects of capital spending and other items. These items may vary for different companies for reasons unrelated to the overall operating performance of a company’s core business. We believe this assists in comparing our performance across reporting periods. Reconciliations of GAAP financial measures to Non-GAAP financial measures are contained in this presentation and on our website under at gbrx.com under “Investors.” Adjusted ROIC is calculated by dividing the trailing four quarters of Adjusted net operating profit after tax by the average trailing five quarters of invested capital. Adjusted net operating profit after tax is defined as Earnings from operations, plus Earnings from unconsolidated affiliates, excluding the impact associated with items we do not believe are indicative of our core business or which affect comparability, less cash paid for income taxes, net. Total invested capital is defined as Revolving notes, plus Notes payable, plus Total equity, less cash in excess of $40 million. We believe Adjusted ROIC is useful to investors as it quantifies how efficiently we generated operating income relative to the capital we have invested in the business. Adjusted net earnings attributable to Greenbrier and Adjusted diluted EPS excludes the impact associated with items we do not believe are indicative of our core business or which affect comparability. We believe this assists in comparing our performance across reporting periods. These items may vary for different companies for reasons unrelated to the overall operating performance of a company’s core business. We believe this assists in comparing our performance across reporting periods. 47

NYSE: GBX Stephens Annual Investment Conference November 2023