UNITED STATES
SECURITIES AND EXCHANGE COMMISSION
WASHINGTON, D.C. 20549
Form 6-K
REPORT OF FOREIGN PRIVATE ISSUER
PURSUANT TO RULE 13a-16 OR 15d-16
UNDER THE SECURITIES EXCHANGE ACT OF 1934
For the month of November 2023
Commission File Number: 1-9059
BARRICK GOLD CORPORATION
(Registrant’s name)
Brookfield Place, TD Canada Trust Tower, Suite 3700
161 Bay Street, P.O. Box 212
Toronto, Ontario M5J 2S1 Canada
(Address of principal executive offices)
Indicate by check mark whether the registrant files or will file annual reports under cover of Form 20-F or Form 40-F.
Form 20-F ☐ Form 40-F ☒
INCORPORATION BY REFERENCE
Exhibit 99.1 to this report on Form 6-K is furnished, not filed, and will not be incorporated by reference into any registration statement.
Exhibit 99.2 to this report on Form 6-K is hereby incorporated by reference into the Registration Statements on Form F-3 (File No. 333-206417), Form S-8 (File Nos. 333-121500, 333-131715, 333-135769, 333-224560) and Form F-10 (File No. 333-271603).
SIGNATURES
Pursuant to the requirements of the Securities Exchange Act of 1934, the registrant has duly caused this report to be signed on its behalf by the undersigned, thereunto duly authorized.
| BARRICK GOLD CORPORATION | ||||||
| Date: November 2, 2023 | By: /s/ Poupak Bahamin | |||||
| Name: Poupak Bahamin | ||||||
| Title: General Counsel | ||||||
EXHIBIT INDEX
| Exhibits |
Description |
|
| 99.1 | 2023 Q3 Report Press Release dated November 2, 2023 | |
| 99.2 | Barrick Gold Corporation’s Comparative Unaudited Financial Statements prepared in accordance with International Financial Reporting Standards and the notes thereto for the three and nine months ended September 30, 2023 and Management’s Discussion and Analysis for the same periods | |
Exhibit 99.1

BARRICK KEEPS KEY PROJECTS ON TRACK
AND DELIVERS ANOTHER QUARTER OF
IMPROVED PRODUCTION AND COSTS
ALL AMOUNTS EXPRESSED IN U.S. DOLLARS
LONDON, November 2, 2023 — Barrick Gold Corporation (NYSE:GOLD)(TSX:ABX) — Barrick’s Q3 results showed improved production at lower costs and confirmed its long term growth forecast. President and chief executive Mark Bristow said the Q3 performance was an improvement on the previous quarter’s and Q4 is expected to be better. Despite the projected second half improvement, gold production is forecast to be marginally below the low end of our annual guidance range. Copper is comfortably on track to meet its guidance for production and costs.
Gold production in Q3 was higher than Q2 driven by improved performances at Cortez, Turquoise Ridge and Kibali. As previously disclosed, the ramp up at Pueblo Viejo is slower than planned. Barrick is engaged with original equipment suppliers to develop permanent solutions for their equipment failures. The 2024 Pueblo Viejo production forecast still exceeds 800,000 ounces (100% basis).1 The company also confirmed that the Notice of Availability for the Final Environmental Impact Statement for Goldrush was published on October 27.
“Mining is a long game and we don’t manage Barrick by the quarter—our projection for a 30% increase in the production of gold-equivalent ounces by the end of this decade remains intact,” he said.2
CONTINUED ON PAGE 3
Key Performance Indicators
Financial and Operating Highlights
| Financial Results |
Q3 2023 | Q2 2023 | Q3 2022 | |||||||||
| Realized gold price4,5 ($ per ounce) |
1,928 | 1,972 | 1,722 | |||||||||
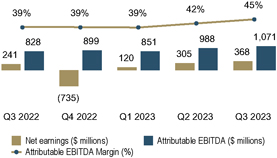
| Net earnings ($ millions) |
368 | 305 | 241 | |||||||||
| Adjusted net earnings6 ($ millions) |
418 | 336 | 224 | |||||||||
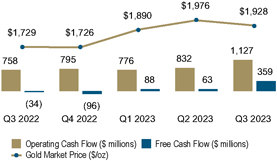
| Net cash provided by operating activities ($ millions) |
1,127 | 832 | 758 | |||||||||
| Free cash flow3 ($ millions) |
359 | 63 | (34 | ) | ||||||||
| Net earnings per share ($) |
0.21 | 0.17 | 0.14 | |||||||||
| Adjusted net earnings per share6 ($) |
0.24 | 0.19 | 0.13 | |||||||||
| Attributable capital expenditures7 ($ millions) |
589 | 588 | 609 | |||||||||
| Operating Results |
Q3 2023 | Q2 2023 | Q3 2022 | |||||||||
| Gold |
||||||||||||
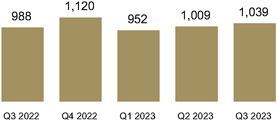
| Production4 (000s of ounces) |
1,039 | 1,009 | 988 | |||||||||
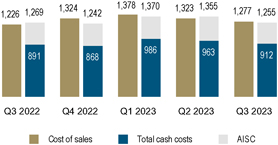
| Cost of sales4,8 ($ per ounce) |
1,277 | 1,323 | 1,226 | |||||||||
| Total cash costs4,9 ($ per ounce) |
912 | 963 | 891 | |||||||||
| All-in sustaining costs4,9 ($ per ounce) |
1,255 | 1,355 | 1,269 | |||||||||
| Copper |
||||||||||||
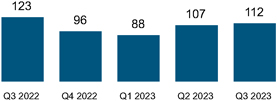
| Production4 (millions of pounds) |
112 | 107 | 123 | |||||||||
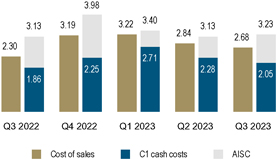
| Cost of sales4,8 ($ per pound) |
2.68 | 2.84 | 2.30 | |||||||||
| C1 cash costs4,10 ($ per pound) |
2.05 | 2.28 | 1.86 | |||||||||
| All-in sustaining costs4,10 ($ per pound) |
3.23 | 3.13 | 3.13 | |||||||||
| Financial Position |
|
As at 9/30/23 |
|
|
As at 6/30/23 |
|
|
As at 9/30/22 |
|
|||
| Debt (current and long-term) ($ millions) |
4,775 | 4,774 | 5,095 | |||||||||
| Cash and equivalents ($ millions) |
4,261 | 4,157 | 5,240 | |||||||||
| Debt, net of cash ($ millions) |
514 | 617 | (145 | ) | ||||||||
Best Assets
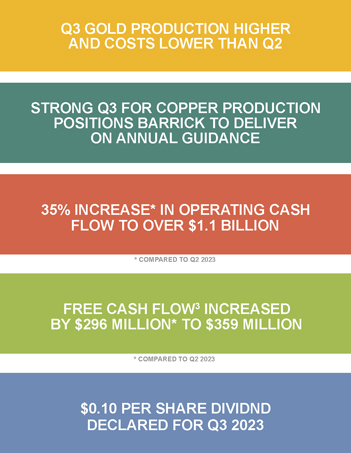
| ∎ | Q3 gold production higher and costs lower than Q2; increased production from Cortez, Turquoise Ridge and Kibali |
| ∎ | Stronger Q4 expected with 2023 gold production marginally below the low end of guidance |
| ∎ | Pueblo Viejo equipment issues impact plant expansion project commissioning and ramp-up |
| ∎ | Strong Q3 for copper production positions Barrick to deliver on annual guidance |
| ∎ | Lumwana feasibility study on track for completion by end 2024, paving the way for near doubling of capacity |
| ∎ | Signing of Special Mining Lease and Mining Development Contract keeps Porgera on track for year end restart11 |
| ∎ | Veladero Phase 7B leach pad expansion scheduled for completion in 2024 |
| ∎ | Reko Diq feasibility study update on track for completion by end of 2024 |
| ∎ | Strong brownfields drilling results at AME & LATAM Asia Pacific Tier One12 mines support expected replacement of 2023 reserve depletion |
| ∎ | Mineral resource definition at NGM support future three year reserve/resource replacement strategy |
| ∎ | Expanded exploration portfolio across South, Central and North America |
Leader in Sustainability
| ∎ | Scope 3 emissions reduction and engagement targets set |
| ∎ | Barrick complies with GISTM requirements for Extreme and Very High Consequence facilities in line with guidance |
| ∎ | Barrick continues to exceed its water re-use and recycling targets |
| ∎ | Malaria Incidence Rate13 26% below the comparable period from 2022 |
| ∎ | Barrick pioneers mining industry in Pakistan hosting first-ever Minerals Summit |
| ∎ | Barrick establishes schools, clinics and water plants in Balochistan |
| ∎ | Winnemucca Child Care and Early Learning Centre opened |
Delivering Value
| ∎ | 35% quarter on quarter increase in operating cash flow to over $1.1 billion |
| ∎ | Free cash flow3 increased by $296 million over Q2 to $359 million |
| ∎ | Debt, net of cash decreased to $514 million; net leverage near zero |
| ∎ | 24% increase in net earnings per share and 26% increase in adjusted net earnings per share6 to $0.24 for the quarter |
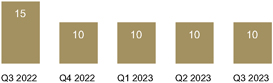
| ∎ | $0.10 per share dividend declared |
| BARRICK THIRD QUARTER 2023 | 2 | PRESS RELEASE |
CONTINUED FROM PAGE 1
Barrick’s other key growth projects—the development of the Reko Diq copper and gold mine in Pakistan, and the expansion of the Lumwana copper mine in Zambia—are making steady progress. Construction of Reko Diq is scheduled to start in 2025 targeting first production in 2028, and Lumwana’s expansion is scheduled on the same timetable. Reko Diq will rank among the world’s top 10 copper producers when it reaches full production, while the expanded Lumwana mine is forecast to produce at an annual production rate of 240,000 tonnes of contained copper.14,15
“Growing the copper portfolio is one of our strategic priorities, and when these two mines are in full production, they will promote Barrick to the premier league of copper producers alongside its peerless gold portfolio. In the meantime, we’re using our very successful Jabal Sayid copper mine in Saudi Arabia as a springboard for the discovery of new opportunities within the Kingdom and around the Red Sea to Egypt, where we believe the Arabian-Nubian Shield is poised to become a major new mining destination,” Bristow said.
Barrick has aggressive exploration across its global portfolio, aiming both to sustain the company’s peerless record of reserves replacement, and to find its next million-ounce discovery. Since the merger with Randgold Resources in 2019, Barrick has replaced 125% of its depleted reserves (exclusive of divestments and acquisitions on a gold equivalent basis).16
Strong drill results at Nevada Gold Mines support its three-year resource and replacement plan and, brownfields exploration is highlighting the potential in the Africa and Middle East region, and the exploration portfolios of South, Central and North America are being expanded.
Bristow described Barrick’s financial performance for the quarter as strong, noting that operating cash flows grew by 35% to more than $1 billion, free cash flow3 was up significantly to $359 million, net earnings per share increased 24% to $0.21 per share and adjusted net earnings per share6 rose 26% to $0.24 per share. The quarterly dividend was maintained at 10 cents per share.
“Our robust balance sheet secures Barrick’s capacity to continue to invest in growth projects, both new and existing. These projects are not required to maintain our existing production profile; they’re exceptional opportunities to drive real long-term value creation, and our team has shown that they’re more than capable of fully delivering on them,” Bristow said.
Q3 2023 Results Presentation
Webinar and Conference Call
Mark Bristow will host a live presentation of the results today at 11:00 AM ET, with an interactive webinar linked to a conference call. Participants will be able to ask questions.
Go to the webinar
US and Canada (toll-free), 1 800 319 4610
UK (toll-free), 0808 101 2791
International (toll), +1 416 915 3239
The Q3 2023 presentation materials will be available on Barrick’s website at www.barrick.com and the webinar will remain on the website for later viewing.

BARRICK DECLARES Q3 DIVIDEND
Barrick today announced the declaration of a dividend of $0.10 per share for the third quarter of 2023. The dividend is consistent with the company’s Performance Dividend Policy announced at the start of 2022.
The Q3 2023 dividend will be paid on December 15, 2023 to shareholders of record at the close of business on November 30, 2023.
“The continuing strength of our business and our balance sheet allows us to maintain the distribution of a robust
dividend to our shareholders, whilst still ensuring adequate liquidity to invest in our significant growth projects,” said senior executive vice-president and chief financial officer Graham Shuttleworth.
| BARRICK THIRD QUARTER 2023 | 3 | PRESS RELEASE |
BARRICK SETS SCOPE 3 EMISSIONS TARGETS
IN LINE WITH SUSTAINABILITY STRATEGY
Barrick has set Scope 3 emissions reduction targets to advance its responsible energy transitioning program in line with its integrated and holistic approach to sustainability management.
Scope 3 emissions are those generated outside the company’s operational control, associated with upstream and downstream activities. Barrick has already established a Scope 1 and 2 reduction target of 30% by 2030 against a 2018 baseline for its own operations while maintaining a steady production profile, with the ultimate vision of achieving net zero by 2050.
Group sustainability executive Grant Beringer says effective Scope 3 action requires the combined efforts of producers, suppliers and customers and must be backed by short-, medium- and long-term implementation plans.
“As with Scope 1 and 2, we’ve set a clear Scope 3 roadmap, with targets that are achievable, measurable and based on science rather than wishful thinking. After extensive supplier engagement and data collection, we’ve developed category-level targets for emissions hotspots that have the greatest potential for action. These targets are both quantitative and qualitative. Qualitative targets, and the engagement that goes with them, are fundamental to progressing collective action and the evolution of data quality. As we improve our data quality, we will review and refine our targets and the actions being taken to achieve them. In line with our partnership model, we are also helping suppliers to build the necessary management capacity,” he says.
Barrick president and chief executive Mark Bristow says the company’s climate strategy was a key component of its sustainability strategy, which is linked to the objectives of the United Nations Sustainable Development Goals (SDGs).
“Mining is integral to the achievement of the SDGs and Barrick has long shown the way by making sustainability foundational to all our activities. This has included the early creation of detailed and demonstrable emissions reduction roadmaps, with allocated capital, designed to deliver tangible progress towards our targets,” he says.
These targets are both quantitative and qualitative and are focused on high emission areas in our value chain as outlined below:
Goods and Suppliers (Category 1):17
| • | Quantitative Target: 30% emissions reduction of “Tier 1” suppliers (those suppliers that collectively account for 5% of Barrick’s total spend in this category) by 2030 against a 2022 Scope 3 base year; |
| • | Qualitative Target: Incorporate 130 of our largest suppliers by spend into our annual outreach (this includes our Tier 1 suppliers as well as chemical and metal fabricator suppliers) and engagement; |
| • | 2025 Target: Collect high-quality data for 50% of Tier 1 and chemical and metal fabricator suppliers through engagement, and refine emissions reduction targets by 2025. |
Fuels and Energy (Category 3):17
| • | Quantitative Target: 20% reduction against a 2022 Scope 3 base year by 2030; |
| • | Qualitative Targets: |
| ○ | Collaborate towards new technologies to reduce fleet emissions; and |
| ○ | Engage with host governments where we consume power from national grids for continued renewable energy incorporation. |
Downstream Copper Processing (Category 10):17
| • | Qualitative Target: Outreach and engagement of all downstream customers and smelters; |
| • | 2025 Target: Set emissions reduction target, covering 75% of copper processing, by 2025. |
| BARRICK THIRD QUARTER 2023 | 4 | PRESS RELEASE |
TURQUOISE RIDGE TURNAROUND
DELIVERS 14% PRODUCTION INCREASE
Turquoise Ridge, one of Nevada Gold Mines’ Tier One12 mines, has increased production by 14% year on year against the same period in 2022, despite a planned shutdown, on the back of improved throughput and recovery at the Sage autoclave and a better underground performance. The mine is now well on track to achieve its annual guidance.
Nevada Gold Mines (NGM) managing director Peter Richardson says a new and rejuvenated leadership team had implemented a move from reactive to planned maintenance, achieving a substantial improvement in maintenance compliance. The stabilization of the carbon-in-leach circuit has delivered a 6% improvement in the recovery rate year on year.
“The now fully operational third shaft has increased the mine’s hoisting capacity, shortened hauling distances and
provided additional ventilation. These improvements will increase production and significantly reduce mining unit costs.”
Richardson says the lessons learned from the Turquoise Ridge performance achievements will be applied across the Nevada mines. A similar maintenance intervention is already under way at Carlin’s process facilities, with the first focus on the Goldstrike autoclave.
REKO DIQ DEVELOPMENT CONTINUES TO
PREPARE FOR EARLY WORK START
The feasibility study update for the Reko Diq project, which hosts the giant copper-gold deposit in Pakistan’s Balochistan province, continues to make good progress towards its scheduled completion by the end of next year.
During the past quarter there was a strong focus on delineating water supply for the mine from surrounding aquifers. A seismic survey of aquifers in the surrounding area has indicated significant potential for aquifer water to meet the immediate water supply needs of the mine. Drilling has commenced to confirm the potential of these aquifers to meet the long-term water supply needs of the mine. Reko Diq also is working with Fleet Space Technologies, whose passive seismic geodes are purpose-built to perform in extreme conditions, to map the basin geometry of the groundwater systems.
An investigation of the region’s existing rail network has shown there are no capacity problems on the rail lines planned to be used by the mine during operation. The rail option is an efficient, environmentally friendly, and cost-effective way to transport copper concentrate from the mine to the port in Qasim and consumables and equipment back to the mine. Port Gwadar, in Balochistan, is being studied in parallel with Qasim and is expected to be used in the future once required infrastructure is developed by the Government of Pakistan to connect this port and the Government completes necessary port improvements.
Last quarter Barrick launched its International Graduate Program in Pakistan, designed to cultivate a cadre of future experts and leaders for the country’s fledgling mining industry. Nine young graduates—four of them women—have been selected through a merit-driven process in Balochistan.
Their disciplines are electrical engineering, civil engineering, renewable energy and geology. Barrick is also working with other partners to develop vocational and technical training centres to ensure that as the project ramps up, people from the surrounding area will be equipped to participate. Reko Diq’s workforce, which will number more than 4,500 when the mine is fully operational, will be assembled, with priority given to Balochistan locals and Pakistan nationals. Currently the project workforce comprises 120 people with 70% from Balochistan.
In line with its commitment to sharing Reko Diq’s benefits with the people of Balochistan from an early stage, Barrick has already commissioned three primary schools and supplied them with qualified teachers and educational material. The schools have introduced young people, about half of them girls, to formal education. Similarly, it has partnered with the Indus Hospital and Healthcare Network (IHHN) to establish a community health centre in Reko Diq’s nearest neighbouring village. IHHN has donated a state-of-the-art mobile clinic, operationally funded by Reko Diq, to serve the community while the Reko Diq funded Indus hospital is being set up.
In the meantime, Barrick is progressing project financing discussions with potential lenders, with positive responses. The financing process is expected to be formally launched before the end of the year and will run in tandem with the updated feasibility study, which will form the basis of the funding.
| BARRICK THIRD QUARTER 2023 | 5 | PRESS RELEASE |
SPECIAL MINING LEASE SIGNALS PORGERA RESTART
Governor General Sir Bob Dabae has granted a special mining lease to New Porgera Limited (NPL), clearing the way for Barrick to restart production at the gold mine, which has been on care and maintenance for three years.11
This follows the signing of a mining development contract and the conclusion of a fiscal stability agreement for New Porgera between the government and NPL. NPL has commenced engagement with the mine property’s landowners to settle compensation agreements.
Barrick president and chief executive Mark Bristow said subject to agreement on compensation, the mine was positioned to restart before the end of this year. Recruitment was being accelerated to employ the full workforce that will be required when the mine starts ramping up operations as soon as the compensation agreements are in place.
“It’s been a long road, but the end is now in sight. Negotiations between Barrick, the government and the other stakeholders required patience and persistence but the spirit of partnership in which they were conducted eventually led to an outcome acceptable to all. Barrick’s commitment to partnership with its host countries is also reflected in NPL’s ownership structure, which ensures the equitable sharing of the value created by Porgera with all stakeholders,” he said.
AS LOULO-GOUNKOTO SUSTAINS A STRONG PERFORMANCE,
BARRICK HUNTS FOR NEW DISCOVERIES IN THE REGION
The Loulo-Gounkoto complex is set to maintain its status as one of the world’s top 10 gold producers as it stays on track to meet this year’s guidance and continues to grow reserves above annual mining depletion, says Barrick president and chief executive Mark Bristow.
Briefing local stakeholders including journalists recently, he noted that in the 26 years Barrick had been in the country, it had worked tirelessly with successive governments and local partners to grow Mali’s mining industry and to promote it as a global investment destination, in the face of many social and political challenges.
Over this time, Barrick has contributed almost $10 billion to the Malian economy in the form of taxes, royalties, salaries and payments to local suppliers. Some 70% of the economic benefit currently generated by the complex goes to its Malian stakeholders. Loulo-Gounkoto has contributed between 5% and 10% to the Malian GDP over the past 10 years.
Barrick has also developed a previously non-existent mining skills base in the region and Loulo-Gounkoto’s entire management team are citizens of Mali. “Mali was the birthplace of Barrick’s philosophy of genuine partnerships
with its host governments. Close relationships can over time be stressed by misconceptions but in the past we have always been able to find solutions through open and transparent dialogue. Mutually acceptable solutions can be achieved if there is a genuine commitment to seek outcomes that deliver real and long-term value for Mali and its people,” he said.
Meanwhile, exploration teams continue to find new growth opportunities in the very prospective Loulo-Gounkoto region. Updated geological models have already identified new high-priority targets with the potential of delivering the next generation of major discoveries.
“We remain committed to Mali and, as we invest in future growth here, we look forward to maintaining a mutually beneficial partnership with the authorities and our in-country stakeholders,” Bristow said.
| BARRICK THIRD QUARTER 2023 | 6 | PRESS RELEASE |
KIBALI DRIVES SUSTAINABLE VALUE CREATION
THROUGH PARTNERSHIPS
The planned third-quarter ramp-up at Kibali, Africa’s largest gold mine, has positioned it strongly to achieve its production guidance for the year, maintaining Barrick’s track record of delivery in the Democratic Republic of Congo.
Speaking to journalists and local stakeholders in Kinshasa, president and chief executive Mark Bristow said Kibali was also well on its way to again replace the ounces mined during the year, with positive results from both KCD underground and Mengu Hill cut-back and good progress with the development of the KCD 11000 lode decline expected to yield further resource to reserve conversions.
Kibali derives most of its energy needs from its three hydropower stations with plans for a 16MW solar farm with a battery energy storage system to augment the hydropower supply during the dry season well under way. Following completion of this project, the mine will run entirely on renewable energy for six months of the year reducing its greenhouse gas emissions by 19.7kt CO2e annually.
Part of the World Gold Council’s new documentary, GOLD: A Journey with Idris Elba, released on YouTube, was filmed at Kibali. Bristow said the mine was driving sustainable value creation through local partnerships, spending over $180 million with Congolese suppliers in the year to date and continuing to invest in community development programs.
“As Barrick has shown, responsible mining has the unique ability to make a transformative impact on the economies of developing and underdeveloped countries. It is a force for good for all its stakeholders, especially host countries and communities, and that force is amplified when there is a genuine partnership between miners and governments,” he said.
These include Cahier des Charge, part of our social development program aligned with the Mining Code, which has launched eleven projects this year with seven nearing completion. Barrick’s investment in this program will total $8.9 million over five years. Additionally, the mine’s community development fund, which contributes 0.3% of revenue to projects, now has 44 projects under its wing.
Kibali also continues to lead the way in biodiversity, with an assessment under way for the transfer of a further 30 white rhinos to the Garamba National Park, where 16 were reintroduced earlier this year by a Barrick-led initiative.
TWIGA PARTNERSHIP SHOWS THE
TRANSFORMATIVE IMPACT OF MINING
Barrick and the Tanzanian government are demonstrating how mining can be an enormous force for good when miners and their host governments work together to create sustainable value for all stakeholders, says president and chief executive Mark Bristow.
Speaking to media and other local stakeholders at Loulo Gold mine recently, Bristow said Barrick’s pioneering Twiga partnership with the government, which equally shares the economic benefits generated by the North Mara and Bulyanhulu mines, should be a model for successful cooperation, notably in developing countries. Not only is Barrick now the largest contributor to the Tanzanian economy through taxes, salaries, dividends, payments to local suppliers, and investment in community projects, but it is also proving the country’s investability to other international mining companies.
Since taking over the two moribund mines in 2019, Barrick has transformed them into a world-class gold mining complex making a substantial contribution to the company’s bottom line. In that time, it has contributed more than $3 billion to the Tanzanian economy, with Twiga this year recognized as the largest dividend payer of all the companies in which the government has an interest. The mines spent 84% of their procurement budgets with local companies, and Tanzanian citizens account for 96% of their workforce.
In the same spirit of partnership, work has begun on the $30 million investment by Barrick in improving the country’s education facilities, and we are finalizing the details for a further $40 million roadbuilding program.
Both mines are well on track to achieve their production guidance for 2023 as well as to replace reserves depleted by mining. In the meantime, exploration across Barrick’s licence areas has highlighted new development opportunities across these areas, including a potential new underground mine at North Mara.
“Our Twiga partnership is not only adding value to the Tanzanian economy but to the quality of the lives of the communities around its mines as they continue to grow. Our continued engagement with these communities and their village leaders, local NGOs and human rights organizations demonstrates Barrick’s partnership philosophy and our commitment to upholding human rights standards in the regions in which we operate,” Bristow said.
| BARRICK THIRD QUARTER 2023 | 7 | PRESS RELEASE |
BARRICK STRENGTHENS ZAMBIA PARTNERSHIP,
INVESTS IN MAJOR EXPANSION OF LUMWANA MINE
Barrick’s transformation of its Lumwana mine into a world-class producer will provide strong impetus for the government’s thrust to revive the country’s copper industry, president and chief executive Mark Bristow said in Lusaka after a recent meeting with Zambian President Hakainde Hichilema.
Barrick is investing almost $2 billion in an expansion project designed to increase Lumwana’s annual production to an estimated 240,000 tonnes of copper from a 50 million tonne per annum process plant over a 36-year life of mine, elevating this once-unprofitable operation into the front rank of copper producers. The project’s accelerated work program is targeting completion of the full feasibility study by the end of 2024, bringing expected expanded process plant production forward to 2028.
Since the merger of Barrick and Randgold in 2019, Lumwana has contributed almost $3 billion to the Zambian economy in the form of taxes, royalties, salaries and the procurement of goods and services. In addition to its local procurement policy, the company is also committed to local employment, and 99.3% of Lumwana’s current workforce are Zambian nationals.
“Barrick believes that its host countries are its key stakeholders and that partnering with them creates sustainable value for both of us. In Zambia as elsewhere in our global network, we seek to share the economic benefits generated by our mines with the countries’ governments and people, notably our neighbouring communities,” Bristow said.
Last year Barrick launched a Business Accelerator Program aimed at building business capacity for the Zambian contractors in Lumwana’s supply chain and to support them in effecting their own growth plans. It is also partnering with the country’s Ministry of Small and Medium Enterprises to support the development of these businesses.
Looking at Lumwana’s current performance, Bristow said it was on track to deliver its production guidance for 2023 and was ramping up mining with both the reopening of the Malundwe pit as well as delivery of the new owner mining pre-stripping fleet.
President Hakainde Hichilema said he was elated by the news of the planned expansion. “This is a show of confidence in our New Dawn government by one of the world’s leading mining companies. Our laser focus is on establishing Zambia as a global mining destination. We have also set ourselves the target of producing 3 million tonnes of copper by 2030. Barrick is a key strategic partner on this journey.”
BARRICK’S EMBEDDED GROWTH PROJECTS TO DRIVE
VALUE WITH 30% RISE IN PRODUCTION
With the potential embedded in its growth project portfolio, Barrick plans to double its copper production by the end of the decade and continue to increase it to an estimated 1 billion pounds or 450,000 tonnes of copper per annum by 2031, says president and chief executive Mark Bristow.2
Speaking to investors on an update call, Bristow said this substantial growth in copper production combined with the output from Barrick’s sector-leading gold portfolio was expected to increase the group’s attributable production by some 30% to 6.8 million gold-equivalent ounces by 2031.2,18
“The value of these projects, and in particular of our substantial and growing copper business, is currently underestimated by the market. If it was properly appreciated, Barrick would be commanding a premium to our peers,” he said.
Mineral resource management and evaluation executive Simon Bottoms said “Reko Diq in Pakistan is positioned to rank as one the world’s top 10 copper mines when it reaches full production, and the pre-feasibility study on the Lumwana Super Pit Expansion is projected to deliver a potential of 240,000 tonnes of copper production per annum from a 50 million tonne process plant expansion over a 36-year life of
mine.14,15 As a result of the progress the accelerated Lumwana work program is now targeting to complete a full feasibility study by the end of 2024, which brings forward our expected production from the Super Pit to 2028. The Reko Diq project also remains on track to deliver an updated feasibility study by the end of 2024. Together, the Reko Diq and Lumwana Super Pit feasibility studies will underpin potential 2024 reserve updates as an indicator of the transition to construction”.
“Within our gold growth portfolio, the wholly-owned Fourmile project is a best-in-class development project located in the world’s most prolific gold district adjacent to existing infrastructure, with ongoing drilling demonstrating significant potential to increase in grade and size. Accordingly, we are assessing options for independent exploration decline access in support of a pre-feasibility study, which would later be reutilised for development and production complementing the current Goldrush development. The results of our preliminary
| BARRICK THIRD QUARTER 2023 | 8 | PRESS RELEASE |
economic assessment indicate that this could support a potential production profile of 300,000-400,000 ounces per annum, over and above the existing Cortez profile of 0.95-1.1 million ounces per year (100% basis) over 10 years,” says Bottoms.2,19
Bristow said Nevada Gold Mines, the world’s largest gold mining complex, was expected to grow its annual production to 3.7 million ounces (100% basis) towards the end of the decade driven by our three Tier One assets and near-mine exploration pointed to the extension of that horizon to 15 years and beyond.2,12
In the Carlin District, the current 10-year production profile is expected to be between 1.4-1.6 million ounces per year (100% basis), and we have identified an exciting potential high-grade opportunity at Horsham, on the northeast side of the known high-grade controlling structures in the Leeville Complex, that we will advance over the next few years, and is expected to extend this profile well past the 10-year window.2
Similarly at Turquoise Ridge, we expect to build on the already significant reserves and resources base with multi-
million ounce potential growth opportunities at Cricket Corridor to the east, BBT Corridor to the south, and Getchell Fault zone to the west. This will potentially further add to the existing 10-year production profile of 550,000-750,000 ounces per year (100% basis).2
In Latin America, the Pueblo Viejo expansion project is transforming a Tier One mine headed for closure into a long-life, low-cost producer.20 While in Papua New Guinea, we are working towards the restart of Porgera by the end of this year, and restarted drilling will target the resource definition of the Wangima Pit, with similar geology to the existing underground and open pit, which has the potential to underpin an approximately 20 year mine life.21
“The Africa and Middle East region, our most consistent production and reserve replacement performer, now also presents us with the exciting growth opportunities as we leverage our partnership model in Tanzania and Saudi Arabia,” Bristow said.
| BARRICK THIRD QUARTER 2023 | 9 | PRESS RELEASE |
2023 Operating and Capital Expenditure Guidance
| GOLD PRODUCTION AND COSTS | ||||||||
| 2023 forecast attributable production (000s oz) |
2023 forecast cost of sales8 ($/oz) |
2023 forecast total cash costs9 ($/oz) |
2023 forecast all-in sustaining costs9 ($/oz) |
|||||
| Carlin (61.5%) |
910 - 1,000 | 1,030 - 1,110 | 820 - 880 | 1,250 - 1,330 | ||||
| Cortez (61.5%)22 |
580 - 650 | 1,080 - 1,160 | 680 - 740 | 930 - 1,010 | ||||
| Turquoise Ridge (61.5%) |
300 - 340 | 1,290 - 1,370 | 900 - 960 | 1,170 - 1,250 | ||||
| Phoenix (61.5%) |
100 - 120 | 1,860 - 1,940 | 880 - 940 | 1,110 - 1,190 | ||||
| Long Canyon (61.5%) |
0 - 10 | 2,120 - 2,200 | 730 - 790 | 1,080 - 1,160 | ||||
| Nevada Gold Mines (61.5%) |
1,900 - 2,100 | 1,140 - 1,220 | 790 - 850 | 1,140 - 1,220 | ||||
| Hemlo |
150 - 170 | 1,400 - 1,480 | 1,210 - 1,270 | 1,590 - 1,670 | ||||
| North America |
2,100 - 2,300 | 1,160 - 1,240 | 820 - 880 | 1,170 - 1,250 | ||||
| Pueblo Viejo (60%) |
470 - 520 | 1,130 - 1,210 | 710 - 770 | 960 - 1,040 | ||||
| Veladero (50%) |
160 - 180 | 1,630 - 1,710 | 1,060 - 1,120 | 1,550 - 1,630 | ||||
| Porgera (47.5%)11 |
— | — | — | — | ||||
| Latin America & Asia Pacific |
630 - 700 | 1,260 - 1,340 | 800 - 860 | 1,110 - 1,190 | ||||
| Loulo-Gounkoto (80%) |
510 - 560 | 1,100 - 1,180 | 750 - 810 | 1,070 - 1,150 | ||||
| Kibali (45%) |
320 - 360 | 1,080 - 1,160 | 710 - 770 | 880 - 960 | ||||
| North Mara (84%) |
230 - 260 | 1,120 - 1,200 | 900 - 960 | 1,240 - 1,320 | ||||
| Bulyanhulu (84%) |
160 - 190 | 1,230 - 1,310 | 880 - 940 | 1,160 - 1,240 | ||||
| Tongon (89.7%) |
180 - 210 | 1,260 - 1,340 | 1,070 - 1,130 | 1,240 - 1,320 | ||||
| Africa & Middle East |
1,450 - 1,600 | 1,130 - 1,210 | 820 - 880 | 1,080 - 1,160 | ||||
| Total Attributable to Barrick23,24,25 |
4,200 - 4,600 | 1,170 - 1,250 | 820 - 880 | 1,170 - 1,250 | ||||
|
COPPER PRODUCTION AND COSTS |
||||||||
| 2023 forecast attributable production (Mlbs) |
2023 forecast cost of sales8 ($/lb) |
2023 forecast C1 cash costs10 ($/lb) |
2023 forecast all-in sustaining costs10 ($/lb) |
|||||
| Lumwana |
260 - 290 | 2.45 - 2.75 | 2.00 - 2.20 | 3.20 - 3.50 | ||||
| Zaldívar (50%) |
100 - 110 | 3.40 - 3.70 | 2.60 - 2.80 | 2.90 - 3.20 | ||||
| Jabal Sayid (50%) |
65 - 75 | 1.80 - 2.10 | 1.50 - 1.70 | 1.60 - 1.90 | ||||
| Total Attributable to Barrick25 |
420 - 470 | 2.60 - 2.90 | 2.05 - 2.25 | 2.95 - 3.25 | ||||
| ATTRIBUTABLE CAPITAL EXPENDITURES | ||||
| ($ millions) | ||||
| Attributable minesite sustaining7 |
1,450 - 1,700 | |||
| Attributable project7 |
750 - 900 | |||
| Total attributable capital expenditures7 |
2,200 - 2,600 | |||
2023 OUTLOOK ASSUMPTIONS AND ECONOMIC SENSITIVITY ANALYSIS
| 2023 Guidance Assumption |
Hypothetical Change | Impact on EBITDA26 (millions) |
Impact on TCC and AISC9,10 |
|||||
| Gold price sensitivity |
$1,650/oz | +/- $100/oz | ‘+/-$590 | ‘+/-$5/oz | ||||
| Copper price sensitivity |
$3.50/lb | +/- $0.25/lb | ‘+/- $110 | ‘+/-$0.01/lb | ||||
Refer to page 13 of Barrick’s Q3 2023 MD&A for the latest full year 2023 outlook.
| BARRICK THIRD QUARTER 2023 | 10 | PRESS RELEASE |
Production and Cost Summary - Gold
| For the three months ended | ||||||||||||||||||||||||
| 9/30/23 | 6/30/23 | % Change | 9/30/22 | % Change | ||||||||||||||||||||
| Nevada Gold Mines LLC (61.5%)a |
||||||||||||||||||||||||
| Gold produced (000s oz attributable basis) |
478 | 458 | 4 % | 425 | 12 % | |||||||||||||||||||
| Gold produced (000s oz 100% basis) |
777 | 744 | 4 % | 691 | 12 % | |||||||||||||||||||
| Cost of sales ($/oz) |
1,273 | 1,357 | (6)% | 1,242 | 2 % | |||||||||||||||||||
| Total cash costs ($/oz)b |
921 | 1,009 | (9)% | 924 | 0 % | |||||||||||||||||||
| All-in sustaining costs ($/oz)b |
1,286 | 1,388 | (7)% | 1,333 | (4)% | |||||||||||||||||||
| Carlin (61.5%)c |
||||||||||||||||||||||||
| Gold produced (000s oz attributable basis) |
230 | 248 | (7)% | 229 | 0 % | |||||||||||||||||||
| Gold produced (000s oz 100% basis) |
374 | 403 | (7)% | 372 | 0 % | |||||||||||||||||||
| Cost of sales ($/oz) |
1,166 | 1,240 | (6)% | 1,137 | 3 % | |||||||||||||||||||
| Total cash costs ($/oz)b |
953 | 1,013 | (6)% | 943 | 1 % | |||||||||||||||||||
| All-in sustaining costs ($/oz)b |
1,409 | 1,407 | 0 % | 1,304 | 8 % | |||||||||||||||||||
| Cortez (61.5%)c |
||||||||||||||||||||||||
| Gold produced (000s oz attributable basis) |
137 | 110 | 25 % | 98 | 40 % | |||||||||||||||||||
| Gold produced (000s oz 100% basis) |
224 | 178 | 25 % | 160 | 40 % | |||||||||||||||||||
| Cost of sales ($/oz) |
1,246 | 1,346 | (7)% | 1,056 | 18 % | |||||||||||||||||||
| Total cash costs ($/oz)b |
840 | 972 | (14)% | 770 | 9 % | |||||||||||||||||||
| All-in sustaining costs ($/oz)b |
1,156 | 1,453 | (20)% | 1,426 | (19)% | |||||||||||||||||||
| Turquoise Ridge (61.5%) |
||||||||||||||||||||||||
| Gold produced (000s oz attributable basis) |
83 | 68 | 22 % | 62 | 34 % | |||||||||||||||||||
| Gold produced (000s oz 100% basis) |
134 | 112 | 22 % | 102 | 34 % | |||||||||||||||||||
| Cost of sales ($/oz) |
1,300 | 1,466 | (11)% | 1,509 | (14)% | |||||||||||||||||||
| Total cash costs ($/oz)b |
938 | 1,088 | (14)% | 1,105 | (15)% | |||||||||||||||||||
| All-in sustaining costs ($/oz)b |
1,106 | 1,302 | (15)% | 1,423 | (22)% | |||||||||||||||||||
| Phoenix (61.5%) |
||||||||||||||||||||||||
| Gold produced (000s oz attributable basis) |
26 | 29 | (10)% | 30 | (13)% | |||||||||||||||||||
| Gold produced (000s oz 100% basis) |
42 | 46 | (10)% | 47 | (13)% | |||||||||||||||||||
| Cost of sales ($/oz) |
2,235 | 2,075 | 8 % | 1,964 | 14 % | |||||||||||||||||||
| Total cash costs ($/oz)b |
1,003 | 948 | 6 % | 953 | 5 % | |||||||||||||||||||
| All-in sustaining costs ($/oz)b |
1,264 | 1,132 | 12 % | 1,084 | 17 % | |||||||||||||||||||
| Long Canyon (61.5%) |
||||||||||||||||||||||||
| Gold produced (000s oz attributable basis) |
2 | 3 | (33)% | 6 | (67)% | |||||||||||||||||||
| Gold produced (000s oz 100% basis) |
3 | 5 | (33)% | 10 | (67)% | |||||||||||||||||||
| Cost of sales ($/oz) |
1,832 | 1,640 | 12 % | 1,769 | 4 % | |||||||||||||||||||
| Total cash costs ($/oz)b |
778 | 637 | 22 % | 662 | 18 % | |||||||||||||||||||
| All-in sustaining costs ($/oz)b |
831 | 677 | 23 % | 684 | 21 % | |||||||||||||||||||
| Pueblo Viejo (60%) |
||||||||||||||||||||||||
| Gold produced (000s oz attributable basis) |
79 | 77 | 3 % | 121 | (35)% | |||||||||||||||||||
| Gold produced (000s oz 100% basis) |
131 | 128 | 3 % | 202 | (35)% | |||||||||||||||||||
| Cost of sales ($/oz) |
1,501 | 1,344 | 12 % | 1,097 | 37 % | |||||||||||||||||||
| Total cash costs ($/oz)b |
935 | 840 | 11 % | 733 | 28 % | |||||||||||||||||||
| All-in sustaining costs ($/oz)b |
1,280 | 1,219 | 5 % | 1,063 | 20 % | |||||||||||||||||||
| BARRICK THIRD QUARTER 2023 | 11 | PRESS RELEASE |
Production and Cost Summary - Gold (continued)
| For the three months ended | ||||||||||||||||||||||||
| 9/30/23 | 6/30/23 | % Change | 9/30/22 | % Change | ||||||||||||||||||||
| Loulo-Gounkoto (80%) |
||||||||||||||||||||||||
| Gold produced (000s oz attributable basis) |
142 | 141 | 1 % | 130 | 9 % | |||||||||||||||||||
| Gold produced (000s oz 100% basis) |
176 | 176 | 1 % | 162 | 9 % | |||||||||||||||||||
| Cost of sales ($/oz) |
1,087 | 1,150 | (5)% | 1,220 | (11)% | |||||||||||||||||||
| Total cash costs ($/oz)b |
773 | 801 | (3)% | 845 | (9)% | |||||||||||||||||||
| All-in sustaining costs ($/oz)b |
1,068 | 1,245 | (14)% | 1,216 | (12)% | |||||||||||||||||||
| Kibali (45%) |
||||||||||||||||||||||||
| Gold produced (000s oz attributable basis) |
99 | 87 | 14 % | 83 | 19 % | |||||||||||||||||||
| Gold produced (000s oz 100% basis) |
221 | 195 | 14 % | 184 | 19 % | |||||||||||||||||||
| Cost of sales ($/oz) |
1,152 | 1,269 | (9)% | 1,047 | 10 % | |||||||||||||||||||
| Total cash costs ($/oz)b |
694 | 797 | (13)% | 731 | (5)% | |||||||||||||||||||
| All-in sustaining costs ($/oz)b |
801 | 955 | (16)% | 876 | (9)% | |||||||||||||||||||
| Veladero (50%) |
||||||||||||||||||||||||
| Gold produced (000s oz attributable basis) |
55 | 54 | 2 % | 41 | 34 % | |||||||||||||||||||
| Gold produced (000s oz 100% basis) |
111 | 108 | 2 % | 83 | 34 % | |||||||||||||||||||
| Cost of sales ($/oz) |
1,376 | 1,424 | (3)% | 1,430 | (4)% | |||||||||||||||||||
| Total cash costs ($/oz)b |
988 | 999 | (1)% | 893 | 11 % | |||||||||||||||||||
| All-in sustaining costs ($/oz)b |
1,314 | 1,599 | (18)% | 1,570 | (16)% | |||||||||||||||||||
| Porgera (47.5%)d |
||||||||||||||||||||||||
| Gold produced (000s oz attributable basis) |
— | — | — % | — | — % | |||||||||||||||||||
| Gold produced (000s oz 100% basis) |
— | — | — % | — | — % | |||||||||||||||||||
| Cost of sales ($/oz) |
— | — | — % | — | — % | |||||||||||||||||||
| Total cash costs ($/oz)b |
— | — | — % | — | — % | |||||||||||||||||||
| All-in sustaining costs ($/oz)b |
— | — | — % | — | — % | |||||||||||||||||||
| Tongon (89.7%) |
||||||||||||||||||||||||
| Gold produced (000s oz attributable basis) |
47 | 44 | 7 % | 41 | 15 % | |||||||||||||||||||
| Gold produced (000s oz 100% basis) |
53 | 49 | 7 % | 46 | 15 % | |||||||||||||||||||
| Cost of sales ($/oz) |
1,423 | 1,514 | (6)% | 1,744 | (18)% | |||||||||||||||||||
| Total cash costs ($/oz)b |
1,217 | 1,380 | (12)% | 1,462 | (17)% | |||||||||||||||||||
| All-in sustaining costs ($/oz)b |
1,331 | 1,465 | (9)% | 1,607 | (17)% | |||||||||||||||||||
| Hemlo |
||||||||||||||||||||||||
| Gold produced (000s oz) |
31 | 35 | (11)% | 28 | 11 % | |||||||||||||||||||
| Cost of sales ($/oz) |
1,721 | 1,562 | 10 % | 1,670 | 3 % | |||||||||||||||||||
| Total cash costs ($/oz)b |
1,502 | 1,356 | 11 % | 1,446 | 4 % | |||||||||||||||||||
| All-in sustaining costs ($/oz)b |
1,799 | 1,634 | 10 % | 1,865 | (4)% | |||||||||||||||||||
| North Mara (84%) |
||||||||||||||||||||||||
| Gold produced (000s oz attributable basis) |
62 | 64 | (3)% | 71 | (13)% | |||||||||||||||||||
| Gold produced (000s oz 100% basis) |
73 | 77 | (3)% | 84 | (13)% | |||||||||||||||||||
| Cost of sales ($/oz) |
1,244 | 1,208 | 3 % | 956 | 30 % | |||||||||||||||||||
| Total cash costs ($/oz)b |
999 | 942 | 6 % | 737 | 36 % | |||||||||||||||||||
| All-in sustaining costs ($/oz)b |
1,429 | 1,355 | 5 % | 951 | 50 % | |||||||||||||||||||
| BARRICK THIRD QUARTER 2023 | 12 | PRESS RELEASE |
Production and Cost Summary - Gold (continued)
| For the three months ended | ||||||||||||||||||||||||
| 9/30/23 | 6/30/23 | % Change | 9/30/22 | % Change | ||||||||||||||||||||
| Bulyanhulu (84%) |
||||||||||||||||||||||||
| Gold produced (000s oz attributable basis) |
46 | 49 | (6)% | 48 | (4)% | |||||||||||||||||||
| Gold produced (000s oz 100% basis) |
55 | 58 | (6)% | 58 | (4)% | |||||||||||||||||||
| Cost of sales ($/oz) |
1,261 | 1,231 | 2 % | 1,229 | 3 % | |||||||||||||||||||
| Total cash costs ($/oz)b |
859 | 850 | 1 % | 898 | (4)% | |||||||||||||||||||
| All-in sustaining costs ($/oz)b |
1,132 | 1,105 | 2 % | 1,170 | (3)% | |||||||||||||||||||
| Total Attributable to Barricke |
||||||||||||||||||||||||
| Gold produced (000s oz) |
1,039 | 1,009 | 3 % | 988 | 5 % | |||||||||||||||||||
| Cost of sales ($/oz)f |
1,277 | 1,323 | (3)% | 1,226 | 4 % | |||||||||||||||||||
| Total cash costs ($/oz)b |
912 | 963 | (5)% | 891 | 2 % | |||||||||||||||||||
| All-in sustaining costs ($/oz)b |
1,255 | 1,355 | (7)% | 1,269 | (1)% | |||||||||||||||||||
| a. | These results represent our 61.5% interest in Carlin, Cortez, Turquoise Ridge, Phoenix and Long Canyon. |
| b. | Further information on these non-GAAP financial performance measures, including detailed reconciliations, is included in the endnotes to this press release. |
| c. | Includes Goldrush. |
| d. | As Porgera was placed on care and maintenance on April 25, 2020, no operating data or per ounce data is provided. |
| e. | Excludes Pierina, which is producing incidental ounces while in closure. |
| f. | Gold cost of sales per ounce is calculated as cost of sales across our gold operations (excluding sites in closure or care and maintenance) divided by ounces sold (both on an attributable basis using Barrick’s ownership share). |
| BARRICK THIRD QUARTER 2023 | 13 | PRESS RELEASE |
Production and Cost Summary - Copper
| For the three months ended | ||||||||||||||||||||||||
| 9/30/23 | 6/30/23 | % Change | 9/30/22 | % Change | ||||||||||||||||||||
| Lumwana |
||||||||||||||||||||||||
| Copper production (Mlbs) |
72 | 67 | 7 % | 82 | (12)% | |||||||||||||||||||
| Cost of sales ($/lb) |
2.48 | 2.80 | (11)% | 2.19 | 13 % | |||||||||||||||||||
| C1 cash costs ($/lb)a |
1.86 | 2.30 | (19)% | 1.78 | 4 % | |||||||||||||||||||
| All-in sustaining costs ($/lb)a |
3.41 | 3.29 | 4 % | 3.50 | (3)% | |||||||||||||||||||
| Zaldívar (50%) |
||||||||||||||||||||||||
| Copper production (Mlbs attributable basis) |
22 | 22 | 0 % | 23 | (4)% | |||||||||||||||||||
| Copper production (Mlbs 100% basis) |
46 | 43 | 0 % | 45 | (4)% | |||||||||||||||||||
| Cost of sales ($/lb) |
3.86 | 3.89 | (1)% | 3.20 | 21 % | |||||||||||||||||||
| C1 cash costs ($/lb)a |
2.99 | 3.02 | (1)% | 2.45 | 22 % | |||||||||||||||||||
| All-in sustaining costs ($/lb)a |
3.39 | 3.73 | (9)% | 2.94 | 15 % | |||||||||||||||||||
| Jabal Sayid (50%) |
||||||||||||||||||||||||
| Copper production (Mlbs attributable basis) |
18 | 18 | 0 % | 18 | 0 % | |||||||||||||||||||
| Copper production (Mlbs 100% basis) |
35 | 35 | 0 % | 37 | 0 % | |||||||||||||||||||
| Cost of sales ($/lb) |
1.72 | 1.61 | 7 % | 1.58 | 9 % | |||||||||||||||||||
| C1 cash costs ($/lb)a |
1.45 | 1.26 | 15 % | 1.41 | 3 % | |||||||||||||||||||
| All-in sustaining costs ($/lb)a |
1.64 | 1.42 | 15 % | 1.52 | 8 % | |||||||||||||||||||
| Total Attributable to Barrick |
||||||||||||||||||||||||
| Copper production (Mlbs) |
112 | 107 | 5 % | 123 | (9)% | |||||||||||||||||||
| Cost of sales ($/lb)b |
2.68 | 2.84 | (6)% | 2.30 | 17 % | |||||||||||||||||||
| C1 cash costs ($/lb)a |
2.05 | 2.28 | (10)% | 1.86 | 10 % | |||||||||||||||||||
| All-in sustaining costs ($/lb)a |
3.23 | 3.13 | 3 % | 3.13 | 3 % | |||||||||||||||||||
| a. | Further information on these non-GAAP financial performance measures, including detailed reconciliations, is included in the endnotes to this press release. |
| b. | Copper cost of sales per pound is calculated as cost of sales across our copper operations divided by pounds sold (both on an attributable basis using Barrick’s ownership share). |
| BARRICK THIRD QUARTER 2023 | 14 | PRESS RELEASE |
Financial and Operating Highlights
| For the three months ended | For the nine months ended | |||||||||||||||||||||||||||||
| 9/30/23 | 6/30/23 | % Change | 9/30/22 | % Change | 9/30/23 | 9/30/22 | % Change | |||||||||||||||||||||||
| Financial Results ($ millions) |
||||||||||||||||||||||||||||||
| Revenues |
2,862 | 2,833 | 1 % | 2,527 | 13 % | 8,338 | 8,239 | 1 % | ||||||||||||||||||||||
| Cost of sales |
1,915 | 1,937 | (1)% | 1,815 | 6 % | 5,793 | 5,404 | 7 % | ||||||||||||||||||||||
| Net earningsa |
368 | 305 | 21 % | 241 | 53 % | 793 | 1,167 | (32)% | ||||||||||||||||||||||
| Adjusted net earningsb |
418 | 336 | 24 % | 224 | 87 % | 1,001 | 1,106 | (9)% | ||||||||||||||||||||||
| Adjusted EBITDAb |
1,464 | 1,368 | 7 % | 1,155 | 27 % | 4,015 | 4,327 | (7)% | ||||||||||||||||||||||
| Adjusted EBITDA marginc |
51 % | 48 % | 6 % | 46 % | 11 % | 48 % | 53 % | (9)% | ||||||||||||||||||||||
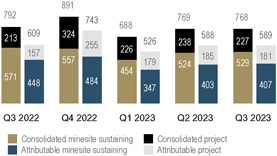
| Minesite sustaining capital expendituresb,d |
529 | 524 | 1 % | 571 | (7)% | 1,507 | 1,514 | 0 % | ||||||||||||||||||||||
| Project capital expendituresb,d |
227 | 238 | (5)% | 213 | 7 % | 691 | 625 | 11 % | ||||||||||||||||||||||
| Total consolidated capital expendituresd,e |
768 | 769 | 0 % | 792 | (3)% | 2,225 | 2,158 | 3 % | ||||||||||||||||||||||
| Net cash provided by operating activities |
1,127 | 832 | 35 % | 758 | 49 % | 2,735 | 2,686 | 2 % | ||||||||||||||||||||||
| Net cash provided by operating activities marginf |
39 % | 29 % | 34 % | 30 % | 30 % | 33 % | 33 % | 0 % | ||||||||||||||||||||||
| Free cash flowb |
359 | 63 | 470 % | (34) | 1,156 % | 510 | 528 | (3)% | ||||||||||||||||||||||
| Net earnings per share (basic and diluted) |
0.21 | 0.17 | 24 % | 0.14 | 50 % | 0.45 | 0.66 | (32)% | ||||||||||||||||||||||
| Adjusted net earnings (basic)b per share |
0.24 | 0.19 | 26 % | 0.13 | 85 % | 0.57 | 0.62 | (8)% | ||||||||||||||||||||||
| Weighted average diluted common shares |
1,755 | 1,755 | 0 % | 1,768 | (1)% | 1,755 | 1,775 | (1)% | ||||||||||||||||||||||
| Operating Results |
||||||||||||||||||||||||||||||
| Gold production (thousands of ounces)g |
1,039 | 1,009 | 3 % | 988 | 5 % | 3,000 | 3,021 | (1)% | ||||||||||||||||||||||
| Gold sold (thousands of ounces)g |
1,027 | 1,001 | 3 % | 997 | 3 % | 2,982 | 3,030 | (2)% | ||||||||||||||||||||||
| Market gold price ($/oz) |
1,928 | 1,976 | (2)% | 1,729 | 12 % | 1,930 | 1,824 | 6 % | ||||||||||||||||||||||
| Realized gold priceb,g ($/oz) |
1,928 | 1,972 | (2)% | 1,722 | 12 % | 1,934 | 1,820 | 6 % | ||||||||||||||||||||||
| Gold cost of sales (Barrick’s share)g,h ($/oz) |
1,277 | 1,323 | (3)% | 1,226 | 4 % | 1,325 | 1,211 | 9 % | ||||||||||||||||||||||
| Gold total cash costsb,g ($/oz) |
912 | 963 | (5)% | 891 | 2 % | 953 | 859 | 11 % | ||||||||||||||||||||||
| Gold all-in sustaining costsb,g ($/oz) |
1,255 | 1,355 | (7)% | 1,269 | (1)% | 1,325 | 1,215 | 9 % | ||||||||||||||||||||||
| Copper production (millions of pounds)g |
112 | 107 | 5 % | 123 | (9)% | 307 | 344 | (11)% | ||||||||||||||||||||||
| Copper sold (millions of pounds)g |
101 | 101 | 0 % | 120 | (16)% | 291 | 346 | (16)% | ||||||||||||||||||||||
| Market copper price ($/lb) |
3.79 | 3.84 | (1)% | 3.51 | 8 % | 3.89 | 4.11 | (5)% | ||||||||||||||||||||||
| Realized copper priceb,g ($/lb) |
3.78 | 3.70 | 2 % | 3.24 | 17 % | 3.88 | 3.86 | 1 % | ||||||||||||||||||||||
| Copper cost of sales (Barrick’s share)g,i ($/lb) |
2.68 | 2.84 | (6)% | 2.30 | 17 % | 2.90 | 2.21 | 31 % | ||||||||||||||||||||||
| Copper C1 cash costsb,g ($/lb) |
2.05 | 2.28 | (10)% | 1.86 | 10 % | 2.33 | 1.79 | 30 % | ||||||||||||||||||||||
| Copper all-in sustaining costsb,g ($/lb) |
3.23 | 3.13 | 3 % | 3.13 | 3 % | 3.25 | 2.96 | 10 % | ||||||||||||||||||||||
| As at 9/30/23 |
As at 6/30/23 |
% Change | As at 9/30/22 |
% Change | ||||||||||||||||||||||||||
| Financial Position ($ millions) |
||||||||||||||||||||||||||||||
| Debt (current and long-term) |
4,775 | 4,774 | 0 % | 5,095 | (6)% | |||||||||||||||||||||||||
| Cash and equivalents |
4,261 | 4,157 | 3 % | 5,240 | (19)% | |||||||||||||||||||||||||
| Debt, net of cash |
514 | 617 | (17)% | (145) | 454 % | |||||||||||||||||||||||||
| a. | Net earnings represents net earnings attributable to the equity holders of the Company. |
| b. | Further information on these non-GAAP financial performance measures, including detailed reconciliations, is included in the endnotes to this press release. |
| c. | Represents adjusted EBITDA divided by revenue. |
| d. | Amounts presented on a consolidated cash basis. Project capital expenditures are included in our calculation of all-in costs, but not included in our calculation of all-in sustaining costs. |
| e. | Total consolidated capital expenditures also includes capitalized interest of $12 million and $27 million, respectively, for the three and nine month periods ended September 30, 2023 (June 30, 2023: $7 million and September 30, 2022: $8 million and $19 million, respectively). |
| f. | Represents net cash provided by operating activities divided by revenue. |
| g. | On an attributable basis. |
| h. | Gold cost of sales per ounce is calculated as cost of sales across our gold operations (excluding sites in closure or care and maintenance) divided by ounces sold (both on an attributable basis using Barrick’s ownership share). |
| i. | Copper cost of sales per pound is calculated as cost of sales across our copper operations divided by pounds sold (both on an attributable basis using Barrick’s ownership share). |
| BARRICK THIRD QUARTER 2023 | 15 | PRESS RELEASE |
Consolidated Statements of Income
| Barrick Gold Corporation (in millions of United States dollars, except per share data) (Unaudited) |
Three months ended September 30, |
Nine months ended September 30, |
||||||||||||||
| 2023 | 2022 | 2023 | 2022 | |||||||||||||
| Revenue (notes 4 and 5) |
$2,862 | $2,527 | $8,338 | $8,239 | ||||||||||||
| Costs and expenses (income) |
||||||||||||||||
| Cost of sales (notes 4 and 6) |
1,915 | 1,815 | 5,793 | 5,404 | ||||||||||||
| General and administrative expenses |
30 | 26 | 97 | 110 | ||||||||||||
| Exploration, evaluation and project expenses |
86 | 77 | 258 | 244 | ||||||||||||
| Impairment charges (notes 8b and 12) |
— | 24 | 23 | 29 | ||||||||||||
| Loss on currency translation |
30 | 3 | 56 | 12 | ||||||||||||
| Closed mine rehabilitation |
(44 | ) | (55 | ) | (35 | ) | (180 | ) | ||||||||
| Income from equity investees (note 11) |
(68 | ) | (52 | ) | (179 | ) | (240 | ) | ||||||||
| Other expense (income) (note 8a) |
58 | (9 | ) | 128 | (18 | ) | ||||||||||
| Income before finance costs and income taxes |
$855 | $698 | $2,197 | $2,878 | ||||||||||||
| Finance costs, net |
(52 | ) | (73 | ) | (154 | ) | (250 | ) | ||||||||
| Income before income taxes |
$803 | $625 | $2,043 | $2,628 | ||||||||||||
| Income tax expense (note 9) |
(218 | ) | (215 | ) | (687 | ) | (795 | ) | ||||||||
| Net income |
$585 | $410 | $1,356 | $1,833 | ||||||||||||
| Attributable to: |
||||||||||||||||
| Equity holders of Barrick Gold Corporation |
$368 | $241 | $793 | $1,167 | ||||||||||||
| Non-controlling interests (note 15) |
$217 | $169 | $563 | $666 | ||||||||||||
| Earnings per share data attributable to the equity holders of Barrick Gold Corporation (note 7) |
||||||||||||||||
| Net income |
||||||||||||||||
| Basic |
$0.21 | $0.14 | $0.45 | $0.66 | ||||||||||||
| Diluted |
$0.21 | $0.14 | $0.45 | $0.66 | ||||||||||||
The notes to these unaudited condensed interim financial statements, which are contained in the Third Quarter Report 2023 available on our website, are an integral part of these consolidated financial statements.
| BARRICK THIRD QUARTER 2023 | 16 | PRESS RELEASE |
Consolidated Statements of Comprehensive Income
| Barrick Gold Corporation (in millions of United States dollars) (Unaudited) |
Three months ended September 30, |
Nine months ended September 30, |
||||||||||||||
| 2023 | 2022 | 2023 | 2022 | |||||||||||||
| Net income |
$585 | $410 | $1,356 | $1,833 | ||||||||||||
| Other comprehensive income (loss), net of taxes |
||||||||||||||||
| Items that may be reclassified subsequently to profit or loss: |
||||||||||||||||
| Realized losses on derivatives designated as cash flow hedges, net of tax $nil, $nil, $nil and $nil |
— | 1 | — | 1 | ||||||||||||
| Currency translation adjustments, net of tax $nil, $nil, $nil and $nil |
— | 1 | (3 | ) | 2 | |||||||||||
| Items that will not be reclassified to profit or loss: |
||||||||||||||||
| Actuarial loss on post employment benefit obligations, net of tax $nil, $nil, $nil and $nil |
— | (1 | ) | — | (2 | ) | ||||||||||
| Net change on equity investments, net of tax $1, $nil, $nil and $(6) |
(12 | ) | 3 | (17 | ) | 35 | ||||||||||
| Total other comprehensive (loss) income |
(12 | ) | 4 | (20 | ) | 36 | ||||||||||
| Total comprehensive income |
$573 | $414 | $1,336 | $1,869 | ||||||||||||
| Attributable to: |
||||||||||||||||
| Equity holders of Barrick Gold Corporation |
$356 | $245 | $773 | $1,203 | ||||||||||||
| Non-controlling interests |
$217 | $169 | $563 | $666 | ||||||||||||
The notes to these unaudited condensed interim financial statements, which are contained in the Third Quarter Report 2023 available on our website, are an integral part of these consolidated financial statements.
| BARRICK THIRD QUARTER 2023 | 17 | PRESS RELEASE |
Consolidated Statements of Cash Flow
| Barrick Gold Corporation (in millions of United States dollars) (Unaudited) |
Three months ended September 30, |
Nine months ended September 30, |
||||||||||||||
| 2023 | 2022 | 2023 | 2022 | |||||||||||||
| OPERATING ACTIVITIES |
||||||||||||||||
| Net income |
$585 | $410 | $1,356 | $1,833 | ||||||||||||
| Adjustments for the following items: |
||||||||||||||||
| Depreciation |
504 | 457 | 1,479 | 1,393 | ||||||||||||
| Finance costs, net1 |
52 | 73 | 154 | 250 | ||||||||||||
| Impairment charges (notes 8b and 12) |
— | 24 | 23 | 29 | ||||||||||||
| Income tax expense (note 9) |
218 | 215 | 687 | 795 | ||||||||||||
| Income from equity investees (note 11) |
(68 | ) | (52 | ) | (179 | ) | (240 | ) | ||||||||
| Gain on sale of non-current assets |
(4 | ) | (64 | ) | (10 | ) | (86 | ) | ||||||||
| Loss on currency translation |
30 | 3 | 56 | 12 | ||||||||||||
| Change in working capital (note 10) |
(47 | ) | (52 | ) | (298 | ) | (217 | ) | ||||||||
| Other operating activities (note 10) |
(74 | ) | (91 | ) | (73 | ) | (294 | ) | ||||||||
| Operating cash flows before interest and income taxes |
1,196 | 923 | 3,195 | 3,475 | ||||||||||||
| Interest paid |
(31 | ) | (23 | ) | (184 | ) | (175 | ) | ||||||||
| Interest received1 |
57 | 30 | 157 | 52 | ||||||||||||
| Income taxes paid2 |
(95 | ) | (172 | ) | (433 | ) | (666 | ) | ||||||||
| Net cash provided by operating activities |
1,127 | 758 | 2,735 | 2,686 | ||||||||||||
| INVESTING ACTIVITIES |
||||||||||||||||
| Property, plant and equipment |
||||||||||||||||
| Capital expenditures (note 4) |
(768 | ) | (792 | ) | (2,225 | ) | (2,158 | ) | ||||||||
| Sales proceeds |
2 | 52 | 8 | 75 | ||||||||||||
| Investment sales |
3 | — | 3 | 382 | ||||||||||||
| Dividends received from equity method investments (note 11) |
74 | 101 | 159 | 770 | ||||||||||||
| Shareholder loan repayments from equity method investments (note 11) |
— | — | 5 | — | ||||||||||||
| Net cash used in investing activities |
(689 | ) | (639 | ) | (2,050 | ) | (931 | ) | ||||||||
| FINANCING ACTIVITIES |
||||||||||||||||
| Lease repayments |
(3 | ) | (6 | ) | (11 | ) | (16 | ) | ||||||||
| Debt repayments |
— | (56 | ) | — | (56 | ) | ||||||||||
| Dividends |
(175 | ) | (351 | ) | (524 | ) | (882 | ) | ||||||||
| Share buyback program |
— | (141 | ) | — | (314 | ) | ||||||||||
| Funding from non-controlling interests (note 15) |
13 | — | 23 | — | ||||||||||||
| Disbursements to non-controlling interests (note 15) |
(175 | ) | (162 | ) | (399 | ) | (661 | ) | ||||||||
| Other financing activities (note 10) |
7 | 60 | 48 | 140 | ||||||||||||
| Net cash used in financing activities |
(333 | ) | (656 | ) | (863 | ) | (1,789 | ) | ||||||||
| Effect of exchange rate changes on cash and equivalents |
(1 | ) | (3 | ) | (1 | ) | (6 | ) | ||||||||
| Net increase (decrease) in cash and equivalents |
104 | (540 | ) | (179 | ) | (40 | ) | |||||||||
| Cash and equivalents at the beginning of period |
4,157 | 5,780 | 4,440 | 5,280 | ||||||||||||
| Cash and equivalents at the end of period |
$4,261 | $5,240 | $4,261 | $5,240 | ||||||||||||
| 1 | 2022 figures have been restated to reflect the change in presentation to present interest received ($30 million for the three months ended and $52 million for the nine months ended September 30, 2022) separately from finance costs. |
| 2 | Income taxes paid excludes $68 million (2022: $59 million) for the three months ended September 30, 2023 and $124 million (2022: $95 million) for the nine months ended September 30, 2023 of income taxes payable that were settled against offsetting value added tax (“VAT”) receivables. |
The notes to these unaudited condensed interim financial statements, which are contained in the Third Quarter Report 2023 available on our website, are an integral part of these consolidated financial statements.
| BARRICK THIRD QUARTER 2023 | 18 | PRESS RELEASE |
Consolidated Balance Sheets
| Barrick Gold Corporation (in millions of United States dollars) (Unaudited) |
As at September 30, 2023 |
As at December 31, 2022 |
||||||
| ASSETS |
||||||||
| Current assets |
||||||||
| Cash and equivalents |
$4,261 | $4,440 | ||||||
| Accounts receivable |
561 | 554 | ||||||
| Inventories |
1,913 | 1,781 | ||||||
| Other current assets (note 13b) |
684 | 1,690 | ||||||
| Total current assets |
$7,419 | $8,465 | ||||||
| Non-current assets |
||||||||
| Equity in investees (note 11) |
3,998 | 3,983 | ||||||
| Property, plant and equipment |
26,621 | 25,821 | ||||||
| Goodwill |
3,581 | 3,581 | ||||||
| Intangible assets |
149 | 149 | ||||||
| Deferred income tax assets |
27 | 19 | ||||||
| Non-current portion of inventory |
2,774 | 2,819 | ||||||
| Other assets |
1,026 | 1,128 | ||||||
| Total assets |
$45,595 | $45,965 | ||||||
| LIABILITIES AND EQUITY |
||||||||
| Current liabilities |
||||||||
| Accounts payable |
$1,584 | $1,556 | ||||||
| Debt |
8 | 13 | ||||||
| Current income tax liabilities |
313 | 163 | ||||||
| Other current liabilities (note 13b) |
513 | 1,388 | ||||||
| Total current liabilities |
$2,418 | $3,120 | ||||||
| Non-current liabilities |
||||||||
| Debt |
4,767 | 4,769 | ||||||
| Provisions |
2,112 | 2,211 | ||||||
| Deferred income tax liabilities |
3,367 | 3,247 | ||||||
| Other liabilities |
1,233 | 1,329 | ||||||
| Total liabilities |
$13,897 | $14,676 | ||||||
| Equity |
||||||||
| Capital stock (note 14) |
$28,117 | $28,114 | ||||||
| Deficit |
(7,016 | ) | (7,282 | ) | ||||
| Accumulated other comprehensive income (loss) |
6 | 26 | ||||||
| Other |
1,913 | 1,913 | ||||||
| Total equity attributable to Barrick Gold Corporation shareholders |
$23,020 | $22,771 | ||||||
| Non-controlling interests (note 15) |
8,678 | 8,518 | ||||||
| Total equity |
$31,698 | $31,289 | ||||||
| Contingencies and commitments (notes 4 and 16) |
||||||||
| Total liabilities and equity |
$45,595 | $45,965 | ||||||
The notes to these unaudited condensed interim financial statements, which are contained in the Third Quarter Report 2023 available on our website, are an integral part of these consolidated financial statements.
| BARRICK THIRD QUARTER 2023 | 19 | PRESS RELEASE |
Consolidated Statements of Changes in Equity
| Barrick Gold Corporation | Attributable to equity holders of the company | |||||||||||||||||||||||||||||||
| (in millions of United States dollars) (Unaudited) |
Common Shares (in thousands) |
Capital stock |
Retained earnings (deficit) |
Accumulated other comprehensive income (loss)1 |
Other2 | Total equity attributable to shareholders |
Non- controlling interests |
Total equity |
||||||||||||||||||||||||
| At January 1, 2023 |
1,755,350 | $28,114 | ($7,282 | ) | $26 | $1,913 | $22,771 | $8,518 | $31,289 | |||||||||||||||||||||||
| Net income |
— | — | 793 | — | — | 793 | 563 | 1,356 | ||||||||||||||||||||||||
| Total other comprehensive loss |
— | — | — | (20 | ) | — | (20 | ) | — | (20 | ) | |||||||||||||||||||||
| Total comprehensive income (loss) |
— | — | 793 | (20 | ) | — | 773 | 563 | 1,336 | |||||||||||||||||||||||
| Transactions with owners |
||||||||||||||||||||||||||||||||
| Dividends |
— | — | (524 | ) | — | — | (524 | ) | — | (524 | ) | |||||||||||||||||||||
| Funding from non-controlling interests (note 15) |
— | — | — | — | — | — | 23 | 23 | ||||||||||||||||||||||||
| Disbursements to non-controlling interests (note 15) |
— | — | — | — | — | — | (426 | ) | (426 | ) | ||||||||||||||||||||||
| Dividend reinvestment plan (note 14) |
173 | 3 | (3 | ) | — | — | — | — | — | |||||||||||||||||||||||
| Total transactions with owners |
173 | 3 | (527 | ) | — | — | (524 | ) | (403 | ) | (927 | ) | ||||||||||||||||||||
| At September 30, 2023 |
1,755,523 | $28,117 | ($7,016 | ) | $6 | $1,913 | $23,020 | $8,678 | $31,698 | |||||||||||||||||||||||
| At January 1, 2022 |
1,779,331 | $28,497 | ($6,566 | ) | ($23 | ) | $1,949 | $23,857 | $8,450 | $32,307 | ||||||||||||||||||||||
| Net income |
— | — | 1,167 | — | — | 1,167 | 666 | 1,833 | ||||||||||||||||||||||||
| Total other comprehensive income |
— | — | — | 36 | — | 36 | — | 36 | ||||||||||||||||||||||||
| Total comprehensive income |
— | — | 1,167 | 36 | — | 1,203 | 666 | 1,869 | ||||||||||||||||||||||||
| Transactions with owners |
||||||||||||||||||||||||||||||||
| Dividends |
— | — | (882 | ) | — | — | (882 | ) | — | (882 | ) | |||||||||||||||||||||
| Disbursements to non-controlling interests |
— | — | — | — | — | — | (673 | ) | (673 | ) | ||||||||||||||||||||||
| Dividend reinvestment plan |
204 | 3 | (3 | ) | — | — | — | — | — | |||||||||||||||||||||||
| Share buyback program |
(17,500 | ) | (280 | ) | — | — | (34 | ) | (314 | ) | — | (314 | ) | |||||||||||||||||||
| Total transactions with owners |
(17,296 | ) | (277 | ) | (885 | ) | — | (34 | ) | (1,196 | ) | (673 | ) | (1,869 | ) | |||||||||||||||||
| At September 30, 2022 |
1,762,035 | $28,220 | ($6,284 | ) | $13 | $1,915 | $23,864 | $8,443 | $32,307 | |||||||||||||||||||||||
| 1 | Includes cumulative translation losses at September 30, 2023: $95 million (December 31, 2022: $93 million; September 30, 2022: $92 million). |
| 2 | Includes additional paid-in capital as at September 30, 2023: $1,875 million (December 31, 2022: $1,875 million; September 30, 2022: $1,877 million). |
The notes to these unaudited condensed interim financial statements, which are contained in the Third Quarter Report 2023 available on our website, are an integral part of these consolidated financial statements.
| BARRICK THIRD QUARTER 2023 | 20 | PRESS RELEASE |
Technical Information
The scientific and technical information contained in this press release has been reviewed and approved by Craig Fiddes, SME-RM, Lead, Resource Modeling, Nevada Gold Mines; Chad Yuhasz, P.Geo, Mineral Resource Manager, Latin America & Asia Pacific; Richard Peattie, MPhil, FAusIMM, Mineral Resources Manager: Africa and Middle East; Simon Bottoms, CGeol, MGeol, FGS, FAusIMM, Mineral Resource Management and Evaluation Executive; John Steele, CIM, Metallurgy, Engineering and Capital Projects Executive; and Joel Holliday, FAusIMM, Executive Vice-President, Exploration — each a “Qualified Person” as defined in National Instrument 43-101 - Standards of Disclosure for Mineral Projects.
All mineral reserve and mineral resource estimates are estimated in accordance with National Instrument 43-101 - Standards of Disclosure for Mineral Projects. Unless otherwise noted, such mineral reserve and mineral resource estimates are as of December 31, 2022.
Endnotes
Endnote 1
On a 100% basis. Refer to the Technical Report on the Pueblo Viejo Mine, Dominican Republic, dated March 17, 2023 and filed on SEDAR at www.sedar.com and EDGAR at www.sec.gov on March 17, 2023. See Appendix B – Outlook Assumptions.
Endnote 2
See Appendix B - Outlook Assumptions. Gold Equivalent Ounces from copper assets are calculated using a gold price of $1,300/ oz and a copper price of $3.00/lb.
Endnote 3
“Free cash flow” is a non-GAAP financial measure that deducts capital expenditures from net cash provided by operating activities. Management believes this to be a useful indicator of our ability to operate without reliance on additional borrowing or usage of existing cash. Free cash flow is intended to provide additional information only and does not have any standardized definition under IFRS, and should not be considered in isolation or as a substitute for measures of performance prepared in accordance with IFRS. The measure is not necessarily indicative of operating profit or cash flow from operations as determined under IFRS. Other companies may calculate this measure differently. Further details on this non-GAAP financial performance measure are provided in the MD&A accompanying Barrick’s financial statements filed from time to time on SEDAR at www.sedar.com and on EDGAR at www.sec.gov. The following table reconciles this non-GAAP financial measure to the most directly comparable IFRS measure.
Reconciliation of Net Cash Provided by Operating Activities to Free Cash Flow
| ($ millions) | For the three months ended | For the nine months ended | ||||||||||||||||||
| 9/30/23 | 6/30/23 | 9/30/22 | 9/30/23 | 9/30/22 | ||||||||||||||||
| Net cash provided by operating activities |
1,127 | 832 | 758 | 2,735 | 2,686 | |||||||||||||||
| Capital expenditures |
(768 | ) | (769 | ) | (792 | ) | (2,225 | ) | (2,158 | ) | ||||||||||
| Free cash flow |
359 | 63 | (34 | ) | 510 | 528 | ||||||||||||||
Endnote 4
On an attributable basis.
Endnote 5
“Realized price” is a non-GAAP financial performance measure which excludes from sales: treatment and refining charges; and cumulative catch-up adjustment to revenue relating to our streaming arrangements. We believe this provides investors and analysts with a more accurate measure with which to compare to market gold and copper prices and to assess our gold and copper sales performance. For those reasons, management believes that this measure provides a more accurate reflection of our company’s past performance and is a better indicator of its expected performance in future periods. The realized price measure is intended to provide additional information, and does not have any standardized definition under IFRS and should not be considered in isolation or as a substitute for measures of performance prepared in accordance with IFRS. The measure is not necessarily indicative of sales as determined under IFRS. Other companies may calculate this measure differently. The following table reconciles realized prices to the most directly comparable IFRS measure. Further details on these non-GAAP financial performance measures are provided in the MD&A accompanying Barrick’s financial statements filed from time to time on SEDAR at www.sedar.com and on EDGAR at www.sec.gov.
| BARRICK THIRD QUARTER 2023 | 21 | PRESS RELEASE |
Reconciliation of Sales to Realized Price per ounce/pound
| ($ millions, except per ounce/pound information in dollars) |
Gold | Copper | Gold | Copper | ||||||||||||||||||||||||||||||||||||
| For the three months ended | For the nine months ended | |||||||||||||||||||||||||||||||||||||||
| 9/30/23 | 6/30/23 | 9/30/22 | 9/30/23 | 6/30/23 | 9/30/22 | 9/30/23 | 9/30/22 | 9/30/23 | 9/30/22 | |||||||||||||||||||||||||||||||
| Sales |
2,588 | 2,584 | 2,277 | 209 | 189 | 200 | 7,583 | 7,385 | 569 | 698 | ||||||||||||||||||||||||||||||
| Sales applicable to non-controlling interests |
(797 | ) | (787 | ) | (700 | ) | 0 | 0 | 0 | (2,307 | ) | (2,266 | ) | 0 | 0 | |||||||||||||||||||||||||
| Sales applicable to equity method investmentsa,b |
187 | 171 | 152 | 126 | 133 | 134 | 484 | 433 | 419 | 486 | ||||||||||||||||||||||||||||||
| Sales applicable to sites in closure or care and maintenancec |
(4 | ) | (2 | ) | (14 | ) | 0 | 0 | 0 | (13 | ) | (44 | ) | 0 | 0 | |||||||||||||||||||||||||
| Treatment and refinement charges |
7 | 8 | 3 | 47 | 50 | 54 | 22 | 8 | 140 | 152 | ||||||||||||||||||||||||||||||
| Revenues – as adjusted |
1,981 | 1,974 | 1,718 | 382 | 372 | 388 | 5,769 | 5,516 | 1,128 | 1,336 | ||||||||||||||||||||||||||||||
| Ounces/pounds sold (000s ounces/millions pounds)c |
1,027 | 1,001 | 997 | 101 | 101 | 120 | 2,982 | 3,030 | 291 | 346 | ||||||||||||||||||||||||||||||
| Realized gold/copper price per ounce/poundd |
1,928 | 1,972 | 1,722 | 3.78 | 3.70 | 3.24 | 1,934 | 1,820 | 3.88 | 3.86 | ||||||||||||||||||||||||||||||
| a. | Represents sales of $187 million and $484 million, respectively, for the three and nine month periods ended September 30, 2023 (June 30, 2023: $171 million and September 30, 2022: $152 million and $433 million, respectively) applicable to our 45% equity method investment in Kibali for gold. Represents sales of $82 million and $261 million, respectively, for the three and nine month periods ended September 30, 2023 (June 30, 2023: $81 million and September 30, 2022: $82 million and $299 million, respectively) applicable to our 50% equity method investment in Zaldívar and $49 million and $176 million, respectively (June 30, 2023: $58 million and September 30, 2022: $57 million and $201 million, respectively), applicable to our 50% equity method investment in Jabal Sayid for copper. |
| b. | Sales applicable to equity method investments are net of treatment and refinement charges. |
| c. | On an attributable basis. Excludes Pierina, which is producing incidental ounces while in closure. |
| d. | Realized price per ounce/pound may not calculate based on amounts presented in this table due to rounding. |
Endnote 6
“Adjusted net earnings” and “adjusted net earnings per share” are non-GAAP financial performance measures. Adjusted net earnings excludes the following from net earnings: impairment charges (reversals) related to intangibles, goodwill, property, plant and equipment, and investments; acquisition/disposition gains/losses; foreign currency translation gains/losses; significant tax adjustments; other items that are not indicative of the underlying operating performance of our core mining business; and tax effect and non-controlling interest of the above items. Management uses this measure internally to evaluate our underlying operating performance for the reporting periods presented and to assist with the planning and forecasting of future operating results. Management believes that adjusted net earnings is a useful measure of our performance because impairment charges, acquisition/disposition gains/losses and significant tax adjustments do not reflect the underlying operating performance of our core mining business and are not necessarily indicative of future operating results. Adjusted net earnings and adjusted net earnings per share are intended to provide additional information only and does not have any standardized definition under IFRS and should not be considered in isolation or as a substitute for measures of performance prepared in accordance with IFRS. The measures are not necessarily indicative of operating profit or cash flow from operations as determined under IFRS. Other companies may calculate these measures differently. The following table reconciles these non-GAAP financial measures to the most directly comparable IFRS measure. Further details on these non-GAAP financial performance measures are provided in the MD&A accompanying Barrick’s financial statements filed from time to time on SEDAR at www.sedar.com and on EDGAR at www.sec.gov.
Reconciliation of Net Earnings to Net Earnings per Share, Adjusted Net Earnings and Adjusted Net Earnings per Share
| ($ millions, except per share amounts in dollars) | For the three months ended | For the nine months ended | ||||||||||||||||||
| 9/30/23 | 6/30/23 | 9/30/22 | 9/30/23 | 9/30/22 | ||||||||||||||||
| Net earnings attributable to equity holders of the Company |
368 | 305 | 241 | 793 | 1,167 | |||||||||||||||
| Impairment charges (reversals) related to intangibles, goodwill, property, plant and equipment, and investmentsa |
0 | 22 | 24 | 23 | 29 | |||||||||||||||
| Acquisition/disposition gainsb |
(4 | ) | (3 | ) | (64 | ) | (10 | ) | (86 | ) | ||||||||||
| Loss (gain) on currency translation |
30 | (12 | ) | 3 | 56 | 12 | ||||||||||||||
| Significant tax adjustmentsc |
19 | 33 | 44 | 100 | 99 | |||||||||||||||
| Other (income) expense adjustmentsd |
(5 | ) | (3 | ) | (27 | ) | 55 | (109 | ) | |||||||||||
| Non-controlling intereste |
4 | (7 | ) | 4 | (9 | ) | (3 | ) | ||||||||||||
| Tax effecte |
6 | 1 | (1 | ) | (7 | ) | (3 | ) | ||||||||||||
| Adjusted net earnings |
418 | 336 | 224 | 1,001 | 1,106 | |||||||||||||||
| Net earnings per sharef |
0.21 | 0.17 | 0.14 | 0.45 | 0.66 | |||||||||||||||
| Adjusted net earnings per sharef |
0.24 | 0.19 | 0.13 | 0.57 | 0.62 | |||||||||||||||
| a. | For the three month period ended June 30, 2023, net impairment charges were mainly related to miscellaneous assets. For the three and nine month periods ended September 30, 2022, net impairment charges mainly relate to an inventory write-off at Lumwana. |
| b. | For the three and nine month periods ended September 30, 2022, acquisition/disposition gains mainly related to the sale of a portfolio of royalties to Maverix Metals Inc. and the sale of a portfolio of royalties by Nevada Gold Mines to Gold Royalty Corp. |
| c. | For the three month period ended September 30, 2023, significant tax adjustments were mainly related to the de-recognition of deferred tax assets, adjustments in respect of prior years and the re-measurement of deferred tax balances. For the nine month period ended September 30, 2023, significant tax adjustments were mainly related to the settlement agreement to resolve the tax dispute at Porgera, the de-recognition of deferred tax assets, adjustments in respect of prior years and the re-measurement of deferred tax balances. |
| BARRICK THIRD QUARTER 2023 | 22 | PRESS RELEASE |
| d. | For the nine month period ended September 30, 2023, other (income) expense adjustments mainly relate to the $30 million commitment we made towards the expansion of education infrastructure in Tanzania, per our community investment obligations under the Twiga partnership. Other (income) expense adjustments for all periods were also impacted by changes in the discount rate assumptions on our closed mine rehabilitation provision and care and maintenance expenses at Porgera. |
| e. | Non-controlling interest and tax effect for the three and nine month periods ended September 30, 2023 primarily relates to loss (gain) on currency translation. |
| f. | Calculated using weighted average number of shares outstanding under the basic method of earnings per share. |
Endnote 7
These amounts are presented on the same basis as our guidance. Minesite sustaining capital expenditures and project capital expenditures are non-GAAP financial measures. Capital expenditures are classified into minesite sustaining capital expenditures or project capital expenditures depending on the nature of the expenditure. Minesite sustaining capital expenditures is the capital spending required to support current production levels. Project capital expenditures represent the capital spending at new projects and major, discrete projects at existing operations intended to increase net present value through higher production or longer mine life. Management believes this to be a useful indicator of the purpose of capital expenditures and this distinction is an input into the calculation of all-in sustaining costs per ounce and all-in costs per ounce. Classifying capital expenditures is intended to provide additional information only and does not have any standardized definition under IFRS, and should not be considered in isolation or as a substitute for measures of performance prepared in accordance with IFRS. Other companies may calculate these measures differently. The following table reconciles these non-GAAP financial performance measures to the most directly comparable IFRS measure.
Reconciliation of the Classification of Capital Expenditures
| ($ millions) | For the three months ended | For the nine months ended | ||||||||||||||||||
| 9/30/23 | 6/30/23 | 9/30/22 | 9/30/23 | 9/30/22 | ||||||||||||||||
| Minesite sustaining capital expenditures |
529 | 524 | 571 | 1,507 | 1,514 | |||||||||||||||
| Project capital expenditures |
227 | 238 | 213 | 691 | 625 | |||||||||||||||
| Capitalized interest |
12 | 7 | 8 | 27 | 19 | |||||||||||||||
| Total consolidated capital expenditures |
768 | 769 | 792 | 2,225 | 2,158 | |||||||||||||||
Endnote 8
Gold cost of sales per ounce is calculated as cost of sales across our gold operations (excluding sites in closure or care and maintenance) divided by ounces sold (both on an attributable basis using Barrick’s ownership share). Copper cost of sales per pound is calculated as cost of sales across our copper operations divided by pounds sold (both on an attributable basis using Barrick’s ownership share). References to attributable basis means our 100% share of Hemlo and Lumwana, our 61.5% share of NGM, our 60% share of Pueblo Viejo, our 80% share of Loulo-Gounkoto, our 89.7% share of Tongon, our 84% share of North Mara, and Bulyanhulu, our 50% share of Veladero, Zaldívar and Jabal Sayid, our 47.5% share of Porgera and our 45% share of Kibali.
Endnote 9
“Total cash costs” per ounce, “All-in sustaining costs” per ounce and “All-in costs” per ounce are non-GAAP financial performance measures which are calculated based on the definition published by the World Gold Council (a market development organization for the gold industry comprised of and funded by gold mining companies from around the world, including Barrick, the “WGC”). The WGC is not a regulatory organization. Management uses these measures to monitor the performance of our gold mining operations and its ability to generate positive cash flow, both on an individual site basis and an overall company basis. “Total cash costs” per ounce start with our cost of sales related to gold production and removes depreciation, the non-controlling interest of cost of sales and includes by-product credits. “All-in sustaining costs” per ounce start with “Total cash costs” per ounce and includes sustaining capital expenditures, sustaining leases, general and administrative costs, minesite exploration and evaluation costs and reclamation cost accretion and amortization. These additional costs reflect the expenditures made to maintain current production levels. “All-in costs” per ounce start with “All-in sustaining costs” and adds additional costs that reflect the varying costs of producing gold over the life-cycle of a mine, including: project capital expenditures (capital spending at new projects and major, discrete projects at existing operations intended to increase net present value through higher production or longer mine life) and other non-sustaining costs (primarily non-sustaining leases, exploration and evaluation costs, community relations costs and general and administrative costs that are not associated with current operations). These definitions recognize that there are different costs associated with the life-cycle of a mine, and that it is therefore appropriate to distinguish between sustaining and non-sustaining costs. Barrick believes that the use of “Total cash costs” per ounce, “All-in sustaining costs” per ounce and “All-in costs” per ounce will assist analysts, investors and other stakeholders of Barrick in understanding the costs associated with producing gold, understanding the economics of gold mining, assessing our operating performance and also our ability to generate free cash flow from current operations and to generate free cash flow on an overall company basis. “Total cash costs” per ounce, “All-in sustaining costs” per ounce and “All-in costs” per ounce are intended to provide additional information only and do not have standardized definitions under IFRS and should not be considered in isolation or as a substitute for measures of performance prepared in accordance with IFRS. These measures are not equivalent to net income or cash flow from operations as determined under IFRS. Although the WGC has published a standardized definition, other companies may calculate these measures differently. Further details on these non-GAAP financial performance measures are provided in the MD&A accompanying Barrick’s financial statements filed from time to time on SEDAR at www.sedar.com and on EDGAR at www.sec.gov.
| BARRICK THIRD QUARTER 2023 | 23 | PRESS RELEASE |
Reconciliation of Gold Cost of Sales to Total cash costs, All-in sustaining costs and All-in costs, including on a per ounce basis
| ($ millions, except per ounce information in dollars) | For the three months ended | For the nine months ended | ||||||||||||||||||||
| Footnote | 9/30/23 | 6/30/23 | 9/30/22 | 9/30/23 | 9/30/22 | |||||||||||||||||
| Cost of sales applicable to gold production |
1,736 | 1,753 | 1,638 | 5,250 | 4,923 | |||||||||||||||||
| Depreciation |
(427 | ) | (413 | ) | (393 | ) | (1,285 | ) | (1,250 | ) | ||||||||||||
| Cash cost of sales applicable to equity method investments |
65 | 67 | 61 | 195 | 166 | |||||||||||||||||
| By-product credits |
(65 | ) | (60 | ) | (50 | ) | (186 | ) | (156 | ) | ||||||||||||
| Non-recurring items |
a | 0 | 0 | 0 | 0 | 0 | ||||||||||||||||
| Other |
b | 7 | 5 | (7 | ) | 12 | (30 | ) | ||||||||||||||
| Non-controlling interests |
c | (380 | ) | (388 | ) | (360 | ) | (1,146 | ) | (1,049 | ) | |||||||||||
| Total cash costs |
936 | 964 | 889 | 2,840 | 2,604 | |||||||||||||||||
| General & administrative costs |
30 | 28 | 26 | 97 | 110 | |||||||||||||||||
| Minesite exploration and evaluation costs |
d | 11 | 14 | 22 | 36 | 52 | ||||||||||||||||
| Minesite sustaining capital expenditures |
e | 529 | 524 | 571 | 1,507 | 1,514 | ||||||||||||||||
| Sustaining leases |
7 | 9 | 12 | 23 | 27 | |||||||||||||||||
| Rehabilitation - accretion and amortization (operating sites) |
f | 14 | 15 | 12 | 43 | 36 | ||||||||||||||||
| Non-controlling interest, copper operations and other |
g | (238 | ) | (197 | ) | (264 | ) | (594 | ) | (661 | ) | |||||||||||
| All-in sustaining costs |
1,289 | 1,357 | 1,268 | 3,952 | 3,682 | |||||||||||||||||
| Global exploration and evaluation and project expense |
d | 75 | 87 | 55 | 222 | 192 | ||||||||||||||||
| Community relations costs not related to current operations |
0 | 1 | 0 | 1 | 0 | |||||||||||||||||
| Project capital expenditures |
e | 227 | 238 | 213 | 691 | 625 | ||||||||||||||||
| Non-sustaining leases |
0 | 0 | 0 | 0 | 0 | |||||||||||||||||
| Rehabilitation - accretion and amortization (non-operating sites) |
f | 6 | 6 | 5 | 18 | 13 | ||||||||||||||||
| Non-controlling interest and copper operations and other |
g | (101 | ) | (122 | ) | (71 | ) | (311 | ) | (197 | ) | |||||||||||
| All-in costs |
1,496 | 1,567 | 1,470 | 4,573 | 4,315 | |||||||||||||||||
| Ounces sold - attributable basis (000s ounces) |
h | 1,027 | 1,001 | 997 | 2,982 | 3,030 | ||||||||||||||||
| Cost of sales per ounce |
i,j | 1,277 | 1,323 | 1,226 | 1,325 | 1,211 | ||||||||||||||||
| Total cash costs per ounce |
j | 912 | 963 | 891 | 953 | 859 | ||||||||||||||||
| Total cash costs per ounce (on a co-product basis) |
j,k | 954 | 1,003 | 925 | 995 | 893 | ||||||||||||||||
| All-in sustaining costs per ounce |
j | 1,255 | 1,355 | 1,269 | 1,325 | 1,215 | ||||||||||||||||
| All-in sustaining costs per ounce (on a co-product basis) |
j,k | 1,297 | 1,395 | 1,303 | 1,367 | 1,249 | ||||||||||||||||
| All-in costs per ounce |
j | 1,457 | 1,566 | 1,474 | 1,534 | 1,424 | ||||||||||||||||
| All-in costs per ounce (on a co-product basis) |
j,k | 1,499 | 1,606 | 1,508 | 1,576 | 1,458 | ||||||||||||||||
| a. | Non-recurring items |
| These costs are not indicative of our cost of production and have been excluded from the calculation of total cash costs. |
| b. | Other |
| Other adjustments for the three and nine month periods ended September 30, 2023 include the removal of total cash costs and by-product credits associated with Pierina, which is producing incidental ounces, of $nil and $3 million, respectively (June 30, 2023: $nil; September 30, 2022: $7 million and $17 million, respectively). |
| c. | Non-controlling interests |
| Non-controlling interests include non-controlling interests related to gold production of $536 million and $1,598 million, respectively, for the three and nine month periods ended September 30, 2023 (June 30, 2023: $533 million and September 30, 2022: $491 million and $1,472 million, respectively). Non-controlling interests include NGM, Pueblo Viejo, Loulo-Gounkoto, Tongon, North Mara and Bulyanhulu. Refer to Note 4 to the Financial Statements for further information. |
| d. | Exploration and evaluation costs |
| Exploration, evaluation and project expenses are presented as minesite sustaining if it supports current mine operations and project if it relates to future projects. Refer to page 51 of Barrick’s Q3 2023 MD&A. |
| e. | Capital expenditures |
| Capital expenditures are related to our gold sites only and are split between minesite sustaining and project capital expenditures. Project capital expenditures are capital spending at new projects and major, discrete projects at existing operations intended to increase net present value through higher production or longer mine life. Significant projects in the current year are the plant expansion project at Pueblo Viejo and the solar projects at NGM and Loulo-Gounkoto. Refer to page 50 of Barrick’s Q3 2023 MD&A. |
| f. | Rehabilitation—accretion and amortization |
| Includes depreciation on the assets related to rehabilitation provisions of our gold operations and accretion on the rehabilitation provision of our gold operations, split between operating and non-operating sites. |
| g. | Non-controlling interest and copper operations |
| Removes general & administrative costs related to non-controlling interests and copper based on a percentage allocation of revenue. Also removes exploration, evaluation and project expenses, rehabilitation costs and capital expenditures incurred by our copper sites and the non-controlling interest of NGM, Pueblo Viejo, Loulo-Gounkoto, Tongon, North Mara and Bulyanhulu operating segments. It also includes capital expenditures applicable to our equity method investment in Kibali. Figures remove the impact of Pierina. The impact is summarized as the following: |
| BARRICK THIRD QUARTER 2023 | 24 | PRESS RELEASE |
| ($ millions) | For the three months ended | For the nine months ended | ||||||||||||||||||||||
| Non-controlling interest, copper operations and other | 9/30/23 | 6/30/23 | 9/30/22 | 9/30/23 | 9/30/22 | |||||||||||||||||||
| General & administrative costs |
(5 | ) | (5 | ) | (5 | ) | (16 | ) | (23 | ) | ||||||||||||||
| Minesite exploration and evaluation expenses |
(4 | ) | (4 | ) | (9 | ) | (12 | ) | (19 | ) | ||||||||||||||
| Rehabilitation - accretion and amortization (operating sites) |
(5 | ) | (5 | ) | (3 | ) | (15 | ) | (10 | ) | ||||||||||||||
| Minesite sustaining capital expenditures |
(224 | ) | (183 | ) | (247 | ) | (551 | ) | (609 | ) | ||||||||||||||
| All-in sustaining costs total |
(238 | ) | (197 | ) | (264 | ) | (594 | ) | (661 | ) | ||||||||||||||
| Global exploration and evaluation and project expense |
(29 | ) | (37 | ) | (9 | ) | (78 | ) | (24 | ) | ||||||||||||||
| Project capital expenditures |
(72 | ) | (85 | ) | (62 | ) | (233 | ) | (173 | ) | ||||||||||||||
| All-in costs total |
(101 | ) | (122 | ) | (71 | ) | (311 | ) | (197 | ) | ||||||||||||||
| h. | Ounces sold - attributable basis |
| Excludes Pierina, which is producing incidental ounces while in closure. |
| i. | Cost of sales per ounce |
| Figures remove the cost of sales impact of: Pierina of $nil and $3 million, respectively, for the three and nine month periods ended September 30, 2023 (June 30, 2023: $nil and September 30, 2022: $6 million and $17 million, respectively), which is producing incidental ounces. Gold cost of sales per ounce is calculated as cost of sales across our gold operations (excluding sites in closure or care and maintenance) divided by ounces sold (both on an attributable basis using Barrick’s ownership share). |
| j. | Per ounce figures |
| Cost of sales per ounce, total cash costs per ounce, all-in sustaining costs per ounce and all-in costs per ounce may not calculate based on amounts presented in this table due to rounding. |
| k. | Co-product costs per ounce |
| Total cash costs per ounce, all-in sustaining costs per ounce and all-in costs per ounce presented on a co-product basis removes the impact of by-product credits of our gold production (net of non-controlling interest) calculated as: |
| ($ millions) | For the three months ended | For the nine months ended | ||||||||||||||||||||||
| 9/30/23 | 6/30/23 | 9/30/22 | 9/30/23 | 9/30/22 | ||||||||||||||||||||
| By-product credits |
65 | 60 | 50 | 186 | 156 | |||||||||||||||||||
| Non-controlling interest |
(22 | ) | (20 | ) | (16 | ) | (61 | ) | (53 | ) | ||||||||||||||
| By-product credits (net of non-controlling interest) |
43 | 40 | 34 | 125 | 103 | |||||||||||||||||||
Endnote 10
“C1 cash costs” per pound and “All-in sustaining costs” per pound are non-GAAP financial performance measures related to our copper mine operations. We believe that “C1 cash costs” per pound enables investors to better understand the performance of our copper operations in comparison to other copper producers who present results on a similar basis. “C1 cash costs” per pound excludes royalties and production taxes and non-routine charges as they are not direct production costs. “All-in sustaining costs” per pound is similar to the gold all-in sustaining costs metric and management uses this to better evaluate the costs of copper production. We believe this measure enables investors to better understand the operating performance of our copper mines as this measure reflects all of the sustaining expenditures incurred in order to produce copper. “All-in sustaining costs” per pound includes C1 cash costs, sustaining capital expenditures, sustaining leases, general and administrative costs, minesite exploration and evaluation costs, royalties and production taxes, reclamation cost accretion and amortization and writedowns taken on inventory to net realizable value. Further details on these non-GAAP financial performance measures are provided in the MD&A accompanying Barrick’s financial statements filed from time to time on SEDAR at www.sedar.com and on EDGAR at www.sec.gov.
| BARRICK THIRD QUARTER 2023 | 25 | PRESS RELEASE |
Reconciliation of Copper Cost of Sales to C1 cash costs and All-in sustaining costs, including on a per pound basis
| ($ millions, except per pound information in dollars) | For the three months ended | For the nine months ended | ||||||||||||||||||||||
| 9/30/23 | 6/30/23 | 9/30/22 | 9/30/23 | 9/30/22 | ||||||||||||||||||||
| Cost of sales |
167 | 176 | 172 | 517 | 469 | |||||||||||||||||||
| Depreciation/amortization |
(70 | ) | (59 | ) | (59 | ) | (173 | ) | (131 | ) | ||||||||||||||
| Treatment and refinement charges |
47 | 50 | 54 | 140 | 152 | |||||||||||||||||||
| Cash cost of sales applicable to equity method investments |
82 | 84 | 81 | 253 | 227 | |||||||||||||||||||
| Less: royalties |
(15 | ) | (16 | ) | (23 | ) | (46 | ) | (87 | ) | ||||||||||||||
| By-product credits |
(4 | ) | (6 | ) | (2 | ) | (14 | ) | (11 | ) | ||||||||||||||
| Other |
0 | 0 | 0 | 0 | 0 | |||||||||||||||||||
| C1 cash costs |
207 | 229 | 223 | 677 | 619 | |||||||||||||||||||
| General & administrative costs |
6 | 4 | 4 | 16 | 22 | |||||||||||||||||||
| Rehabilitation - accretion and amortization |
3 | 2 | 0 | 7 | 2 | |||||||||||||||||||
| Royalties |
15 | 16 | 23 | 46 | 87 | |||||||||||||||||||
| Minesite exploration and evaluation costs |
3 | 2 | 8 | 7 | 16 | |||||||||||||||||||
| Minesite sustaining capital expenditures |
91 | 58 | 115 | 182 | 271 | |||||||||||||||||||
| Sustaining leases |
2 | 4 | 1 | 9 | 4 | |||||||||||||||||||
| All-in sustaining costs |
327 | 315 | 374 | 944 | 1,021 | |||||||||||||||||||
| Pounds sold - attributable basis (millions pounds) |
101 | 101 | 120 | 291 | 346 | |||||||||||||||||||
| Cost of sales per pounda,b |
2.68 | 2.84 | 2.30 | 2.90 | 2.21 | |||||||||||||||||||
| C1 cash costs per pounda |
2.05 | 2.28 | 1.86 | 2.33 | 1.79 | |||||||||||||||||||
| All-in sustaining costs per pounda |
3.23 | 3.13 | 3.13 | 3.25 | 2.96 | |||||||||||||||||||
| a. | Cost of sales per pound, C1 cash costs per pound and all-in sustaining costs per pound may not calculate based on amounts presented in this table due to rounding. |
| b. | Copper cost of sales per pound is calculated as cost of sales across our copper operations divided by pounds sold (both on an attributable basis using Barrick’s ownership share). |
Endnote 11
Porgera was placed on temporary care and maintenance on April 25, 2020 and remains excluded from our 2023 guidance. We expect to update our guidance to include Porgera following both the execution of landowner compensation agreements and the finalization of a timeline for the resumption of full mine operations. The granting of the new SML to New Porgera Limited reduced Barrick’s interest in the future production of the Porgera mine from 47.5% to 24.5%.
Endnote 12
A Tier One Gold Asset is an asset with a $1,300/oz reserve potential to deliver a minimum 10-year life, annual production of at least 500,000 ounces of gold and with all in sustaining costs per ounce in the lower half of the industry cost curve. A Tier One Copper Asset is an asset with a $3.00/lb reserve with potential for +5Mt contained copper in support of at least 20 years life, annual production of at least 200ktpa, with all in sustaining costs per pound in the lower half of the industry cost curve. A Tier Two Gold Asset is an asset with a reserve potential to deliver a minimum 10-year life, annual production of at least 250,000 ounces of gold and total cash costs per ounce over the mine life that are in the lower half of the industry cost curve. A Strategic Asset is an asset which in the opinion of Barrick, has the potential to deliver significant unrealized value in the future.
Endnote 13
Malaria Incidence Rate is calculated as number of new positive cases of malaria X 100 / Total employees during the reporting period.
Endnote 14
Barrick holds a 50% ownership interest in the Reko Diq project following the completion of the transaction allowing for the reconstitution of the project on December 15, 2022. This completed the process that began earlier in 2022 following the conclusion of a framework agreement among the Governments of Pakistan and Balochistan province, Barrick and Antofagasta plc, which provided a path for the development of the project under a reconstituted structure. The remaining 50% of the reconstituted project is held by Pakistani stakeholders. Barrick is the operator of the project.
Reko Diq mineral resources are estimated in accordance with National Instrument 43-101 - Standards of Disclosure for Mineral Projects as required by Canadian securities regulatory authorities. Estimates are as of December 31, 2022, unless otherwise noted. Attributable Indicated resources of 1,800 tonnes grading 0.26 g/t, representing 15 million ounces of gold, and 1,900 million tonnes grading 0.44%, representing 18,000 million pounds of copper. Inferred resources of 570 tonnes grading 0.2 g/t, representing 3.7 million ounces of gold, and 590 million tonnes grading 0.4%, representing 4,600 million pounds of copper. Complete mineral reserve and mineral resource data for all mines and projects referenced in this presentation, including tonnes, grades, pounds, and ounces, can be found on pages 33-46 of Barrick’s 2022 Annual Information Form / Form 40-F on file with the Canadian provincial securities regulators on SEDAR at www.sedar.com and the Securities and Exchange Commission on EDGAR at www.sec.gov.
| BARRICK THIRD QUARTER 2023 | 26 | PRESS RELEASE |
Endnote 15
Lumwana financial metrics and production metrics are based upon a preliminary economic assessment which is preliminary in nature because it includes inferred mineral resources that are considered too speculative geologically to have the economic considerations applied to them that would enable them to be categorized as mineral reserves, and there is no certainty that the preliminary economic assessment will be realized. The preliminary economic assessment for Lumwana Super Pit is based upon a $3.00/lb whittle pit shell. The assumptions outlined within the preliminary economic assessment have formed the basis for the ongoing pre-feasibility study and are made by the qualified person.
Lumwana mineral resources are estimated in accordance with National Instrument 43-101 - Standards of Disclosure for Mineral Projects as required by Canadian securities regulatory authorities. Estimates are as of December 31, 2022, unless otherwise noted. Attributable Measured resources of 140 million tonnes grading 0.48%, representing 1,500 million pounds of copper, Indicated resources of 960 million tonnes grading 0.55%, representing 12,000 million pounds of copper, Measured and Indicated resources of 1,100 million tonnes grading 0.54%, representing 13,000 million pounds of copper and Inferred resources of 820 million tonnes grading 0.5%,representing 8,700 million pounds of copper. Complete mineral reserve and mineral resource data for all mines and projects referenced in this presentation, including tonnes, grades, pounds, and ounces, can be found on pages 33-46 of Barrick’s 2022 Annual Information Form / Form 40-F on file with the Canadian provincial securities regulators on SEDAR at www.sedar.com and the Securities and Exchange Commission on EDGAR at www.sec.gov.
Endnote 16
Gold Equivalent Ounces from copper assets are calculated using a gold price of $1300/oz and a copper price of $3.00/lb. Estimated in accordance with National Instrument 43-101 - Standards of Disclosure for Mineral Projects as required by Canadian securities regulatory authorities:
| • | Estimates as of December 31, 2022: Proven mineral reserves of 260 million tonnes grading 2.26g/t, representing 19 million ounces of gold, and 390 million tonnes grading 0.40%, representing 3,500 million pounds of copper. Probable reserves of 1,200 million tonnes grading 1.53g/t, representing 57 million ounces of gold, and 1,100 million tonnes grading 0.37%, representing 8,800 million pounds of copper. |
| • | Estimates as of December 31, 2021: Proven mineral reserves of 240 million tonnes grading 2.20 g/t, representing 17 million ounces of gold, and 380 million tonnes grading 0.41%, representing 3,400 million pounds of copper. Probable reserves of 1,000 million tonnes grading 1.60 g/t, representing 53 million ounces of gold, and 1,100 million tonnes grading 0.37%, representing 8,800 million pounds of copper. |
| • | Estimates as of December 31, 2020: Proven reserves of 280 million tonnes grading 2.37 g/t, representing 21 million ounces of gold, and 350 million tonnes grading 0.39%, representing 3,000 million pounds of copper. Probable reserves of 990 million tonnes grading 1.46 g/t, representing 47 million ounces of gold, and 1,100 million tonnes grading 0.39%, representing 9,700 million pounds of copper. Estimates as of December 31, 2019: Proven reserves of 280 million tonnes grading 2.42 g/t, representing 22 million ounces of gold, and 420 million tonnes grading 0.4%, representing 3,700 million pounds of copper. Probable reserves of 1,000 million tonnes grading 1.48 g/t, representing 49 million ounces of gold, and 1,200 million tonnes grading 0.38%, representing 9,800 million pounds of copper. |
| • | Estimates as of December 31, 2019 reflect Barrick’s acquisition of all of the shares of Acacia Mining plc that it did not already own as of September 17, 2019. |
Acquisitions and divestments includes the following: a decrease of 2.2 Moz in proven and probable gold reserves from December 31, 2019 to December 31, 2020, as a result of the divestiture of Barrick’s Massawa gold project effective March 4, 2020; and a decrease of 0.90 Moz in proven and probable gold reserves from December 31, 2020 to December 31, 2021, as a result of the change in Barrick’s equity interest in Porgera from 47.5% to 24.5% and the net impact of the asset exchange of Lone Tree to i-80 Gold for the remaining 50% of South Arturo that Nevada Gold Mines did not already own.
Endnote 17
Categories as defined in the Greenhouse Gas Protocol’s Technical Guidance for Calculating Scope 3 Emissions. Achievement of Barrick’s Scope 3 targets will require collaboration with suppliers and customers in our value chain, which are outside of Barrick’s direct control.
Endnote 18
Gold Equivalent Ounces from copper assets are calculated using a gold price of $1,300/oz and a copper price of $3.00/lb.
Endnote 19
Fourmile financial metrics and production metrics are based upon preliminary economic assessment which is preliminary in nature because it includes inferred mineral resources that are considered too speculative geologically to have the economic considerations applied to them that would enable them to be categorized as mineral reserves, and there is no certainty that the preliminary economic assessment will be realized. The preliminary economic assessment for Fourmile is based upon $1,300/oz mineable stope optimizer. The assumptions outlined within the preliminary economic assessment have formed the basis for the ongoing study and are made by the qualified person. Fourmile is currently 100% owned by Barrick. As previously disclosed,
| BARRICK THIRD QUARTER 2023 | 27 | PRESS RELEASE |
Barrick anticipates Fourmile being contributed to the Nevada Gold Mines joint venture if certain criteria are met following the completion of drilling and the requisite feasibility work.
Fourmile mineral resources are estimated in accordance with National Instrument 43-101 - Standards of Disclosure for Mineral Projects as required by Canadian securities regulatory authorities. Estimates are as of December 31, 2022, unless otherwise noted. Indicated resources of 1.5 million tonnes grading 10.01 g/t, representing 0.49 million ounces of gold, and Inferred resources of 7.8 million tonnes grading 10.5 g/t, representing 2.7 million ounces of gold, Complete mineral reserve and mineral resource data for all mines and projects referenced in this presentation, including tonnes, grades, pounds, and ounces, can be found on pages 33-46 of Barrick’s 2022 Annual Information Form / Form 40-F on file with the Canadian provincial securities regulators on SEDAR at www.sedar.com and the Securities and Exchange Commission on EDGAR at www.sec.gov.
Endnote 20
Refer to the Technical Report on the Pueblo Viejo Mine, Dominican Republic, dated March 17, 2023 and filed on SEDAR at www.sedar.com and EDGAR at www.sec.gov on March 17, 2023.
Endnote 21
Porgera financial metrics and production metrics are based upon a preliminary economic assessment which is preliminary in nature because it includes inferred mineral resources that are considered too speculative geologically to have the economic considerations applied to them that would enable them to be categorized as mineral reserves, and there is no certainty that the preliminary economic assessment will be realized. The preliminary economic assessment for Porgera is based upon a $1,300/oz Au whittle pit shell. The assumptions outlined within the preliminary economic assessment have formed the basis for the ongoing pre-feasibility study and are made by the qualified person.
Porgera mineral resources are estimated in accordance with National Instrument 43-101 - Standards of Disclosure for Mineral Projects as required by Canadian securities regulatory authorities. Estimates are as of December 31, 2022, unless otherwise noted. Attributable Measured resources of 1.4 million tonnes grading 5.55g/t, representing 0.25 million ounces of gold, Indicated resources of 19 million tonnes grading 3.62g/t, representing 2.3 million ounces of gold. Inferred resources of 8.0 million tonnes grading 3.2g/t, representing 0.82 million ounces of gold. Complete mineral reserve and mineral resource data for all mines and projects referenced in this presentation, including tonnes, grades, pounds, and ounces, can be found on pages 33-46 of Barrick’s 2022 Annual Information Form / Form 40-F on file with the Canadian provincial securities regulators on SEDAR at www.sedar.com and the Securities and Exchange Commission on EDGAR at www.sec.gov.
Endnote 22
Includes Goldrush.
Endnote 23
Total cash costs and all-in sustaining costs per ounce include costs allocated to non-operating sites.
Endnote 24
Operating division guidance ranges reflect expectations at each individual operating division and may not add up to the company-wide guidance range total. Guidance ranges exclude Pierina which is producing incidental ounces while in closure.
Endnote 25
Includes corporate administration costs.
Endnote 26
EBITDA is a non-GAAP financial performance measure, which excludes the following from net earnings: income tax expense; finance costs; finance income; and depreciation. Management believes that EBITDA is a valuable indicator of our ability to generate liquidity by producing operating cash flow to fund working capital needs, service debt obligations, and fund capital expenditures. Management uses EBITDA for this purpose. Adjusted EBITDA removes the effect of impairment charges; acquisition/disposition gains/losses; foreign currency translation gains/losses; and other expense adjustments. We also remove the impact of the income tax expense, finance costs, finance income and depreciation incurred in our equity method accounted investments. We believe these items provide a greater level of consistency with the adjusting items included in our adjusted net earnings reconciliation, with the exception that these amounts are adjusted to remove any impact on finance costs/income, income tax expense and/or depreciation as they do not affect EBITDA. We believe this additional information will assist analysts, investors and other stakeholders of Barrick in better understanding our ability to generate liquidity from our full business, including equity method investments, by excluding these amounts from the calculation as they are not indicative of the performance of our core mining business and not necessarily reflective of the underlying operating results for the periods presented. Starting with the accompanying MD&A, we are presenting attributable EBITDA, which removes the non-controlling interest portion from our adjusted EBITDA measure. Prior periods have been presented to allow for comparability. We believe this additional information will assist analysts, investors and other stakeholders of Barrick in better understanding our ability to generate liquidity from our attributable business and which is aligned with how we present our forward looking guidance on gold ounces and copper pounds produced. EBITDA, adjusted EBITDA, and attributable EBITDA are intended to provide additional information only and do not have any standardized definition under IFRS and should not be considered in isolation or as a
| BARRICK THIRD QUARTER 2023 | 28 | PRESS RELEASE |
substitute for measures of performance prepared in accordance with IFRS. Other companies may calculate EBITDA, adjusted EBITDA, and attributable EBITDA differently. Further details on these nonGAAP financial performance measures are provided in the MD&A accompanying Barrick’s financial statements filed from time to time on SEDAR at www.sedar.com and on EDGAR at www.sec.gov.
Reconciliation of Net Earnings to EBITDA, Adjusted EBITDA and Attributable EBITDA
| ($ millions) | For the three months ended | For the nine months ended | ||||||||||||||||||
| 9/30/23 | 6/30/23 | 9/30/22 | 9/30/23 | 9/30/22 | ||||||||||||||||
| Net earnings | 585 | 502 | 410 | 1,356 | 1,833 | |||||||||||||||
| Income tax expense |
218 | 264 | 215 | 687 | 795 | |||||||||||||||
| Finance costs, neta |
30 | 23 | 55 | 90 | 204 | |||||||||||||||
| Depreciation |
504 | 480 | 457 | 1,479 | 1,393 | |||||||||||||||
| EBITDA | 1,337 | 1,269 | 1,137 | 3,612 | 4,225 | |||||||||||||||
| Impairment charges (reversals) of non-current assetsb | 0 | 22 | 24 | 23 | 29 | |||||||||||||||
| Acquisition/disposition gainsc | (4 | ) | (3 | ) | (64 | ) | (10 | ) | (86 | ) | ||||||||||
| Loss (gain) on currency translation | 30 | (12 | ) | 3 | 56 | 12 | ||||||||||||||
| Other (income) expense adjustmentsd | (5 | ) | (3 | ) | (27 | ) | 55 | (109 | ) | |||||||||||
| Income tax expense, net finance costsa, and depreciation from equity investees | 106 | 95 | 82 | 279 | 256 | |||||||||||||||
| Adjusted EBITDA | 1,464 | 1,368 | 1,155 | 4,015 | 4,327 | |||||||||||||||
| Non-controlling Interests | (393 | ) | (380 | ) | (327 | ) | (1,096 | ) | (1,196 | ) | ||||||||||
| Attributable EBITDA | 1,071 | 988 | 828 | 2,919 | 3,131 | |||||||||||||||
| Revenues - as adjustede | 2,363 | 2,346 | 2,106 | 6,897 | 6,852 | |||||||||||||||
| Attributable EBITDA marginf | 45 | % | 42 | % | 39 | % | 42 | % | 46 | % | ||||||||||
| a. | Finance costs exclude accretion. |
| b. | For the three month period ended June 30, 2023, net impairment charges were mainly related to miscellaneous assets. For the three and nine month periods ended September 30, 2022, net impairment charges mainly relate to an inventory write-off at Lumwana. |
| c. | For the three and nine month periods ended September 30, 2022, acquisition/disposition gains mainly related to the sale of a portfolio of royalties to Maverix Metals Inc. and the sale of a portfolio of royalties by Nevada Gold Mines to Gold Royalty Corp. |
| d. | For the nine month period ended September 30, 2023, other (income) expense adjustments mainly relate to the $30 million commitment we made towards the expansion of education infrastructure in Tanzania, per our community investment obligations under the Twiga partnership. Other (income) expense adjustments for all periods were also impacted by changes in the discount rate assumptions on our closed mine rehabilitation provision and care and maintenance expenses at Porgera. |
| e. | Refer to Reconciliation of Sales to Realized Price per ounce/pound on page 76 of Barrick’s Q3 2023 MD&A. |
| f. | Represents attributable EBITDA divided by revenues - as adjusted. |
Endnote 27
Reko Diq “Cost of Sales” per pound Cu “C1 cash costs” per pound Cu and “All-in sustaining costs” per pound Cu are reported inclusive of by-product credit for gold production based upon long term reserve prices of $1,300/oz Au and $3.00/lb Cu.
| BARRICK THIRD QUARTER 2023 | 29 | PRESS RELEASE |
Appendix A
|
Reko Diq Study Snapshot (100%)14 |
||||
| Mine Life (yrs) | 42 | |||
|
Mineral Resource14
(100% basis) |
M&I: 3.8Bt @ 0.44% Cu for 17Mt Cu | |||
| INF: 1.2Bt @ 0.4% Cu for 4.2Mt Cu | ||||
| Phase 1 | Phase 2 | |||
| Throughput (Mtpa) | 40 (2028 – 2033) | 80 (2034 onwards) | ||
| Average Annual Production | ||||
| Copper (kt)i | 250ii | 400ii | ||
| Gold (koz)i | 300ii | 500ii | ||
| Average Annual Total Tonnes Mined (TTM) (Mt) | 100ii | 200ii | ||
| Strip Ratio | 0.4ii | 1.0ii | ||
| Construction Capital ($bn)7 | Approx. 5.0 – 5.5 | Approx. 3.2 – 3.5 | ||
| Cost of Sales ($/lb)27 | Approx.1.2 – 1.3 | Approx.1.1 – 1.2 | ||
| AISC ($/lb)10,27 | Approx.1.2 – 1.3 | Approx.1.1 – 1.2 | ||
| C1 Costs ($/lb)10,27 | Approx. 0.8 – 0.9 | Approx. 0.7 – 0.8 | ||
| i. | 96.5% of Annual Copper production and 94% of Annual Gold production from the concentrate is assumed to be payable under industry standard smelting and refining terms. |
| ii. | Indicative gold and copper recovered production profile from Reko Diq, which is conceptual in nature. Subject to change following an updated feasibility study. |
|
Lumwana Study Snapshot15 |
||||
|
Mineral Resource15 (100% attrib.)
|
M&I: 1.1Bt @ 0.54% Cu for 6.0Mt Cu | |||
| INF: 0.8Bt @ 0.5% Cu for 4.0Mt Cu | ||||
| Current | Super Pit | |||
| Mine Life (yrs) | 19 | 36ii | ||
| Throughput (Mtpa) | 26-28 | 50 | ||
| Avg Annual Cu Produced (kt) 100% basisi | 150 | 240ii | ||
| Average Annual TTM (Mt) | 110 | 250ii | ||
| Life of Mine Strip Ratio | 3.4 | 4.3ii | ||
| Construction Capital ($bn)7 | N/A | Approx. 1.6-1.9 (2024 – 2028) |
||
| Cost of Sales ($/lb) | 2.2 | Approx. 2.1 – 2.4 | ||
| LOM AISC ($/lb)10 | 2.3 | Approx.1.9 – 2.2 | ||
| LOM C1 Costs ($/lb)10 | 1.9 | Approx. 1.8 – 2.1 | ||
| i. | 96.5% of Annual Copper production from the concentrate is assumed to be payable under industry standard smelting and refining terms. |
| ii. | Indicative copper production profile from Lumwana, which is conceptual in nature. Subject to change following completion of the pre-feasibility study. |
| BARRICK THIRD QUARTER 2023 | 30 | PRESS RELEASE |
|
Fourmile Conceptual PEA Study Snapshot19 |
||
|
Mineral Resource19 (100% attrib.) |
M&I: 0.49Moz @ 10g/t INF: 2.7Moz @ 10.5g/t |
|
| Exploration Upsidei | 13 – 20Mt @ 13.3 – 20.0g/t | |
| Mine Life (yrs) | +15ii | |
| Ore tonnes (ktpa) | 600 – 1,500ii | |
| Average annual gold production (Koz) | 300 – 400ii | |
| Construction Capital ($bn)7 | Approx. 0.8 – 1.1 | |
| Cost of Sales ($/oz) | Approx. 700 – 900 | |
| AISC ($/oz)9 | Approx. 700 – 900 | |
| i. | Potential quantities and grades in these preliminary results are conceptual in nature and there has been insufficient exploration to define a mineral resource at this time and it is uncertain that further exploration will result in the target being delineated as a mineral resource. |
| ii. | Indicative gold production profile from Fourmile which is conceptual in nature. Subject to change following completion of the pre-feasibility study. |
|
Porgera Conceptual PEA Study Snapshot (100%)21 |
||
| Mineral Resource21 (100% basis) |
M&I: 10.2Moz Au @ 3.8g/t INF: 3.4Moz Au @ 3.2g/t |
|
| Exploration Upsidei | 30 – 50Mt @ 2.5 – 3.3g/t | |
| Mine Life (yrs) | 20ii | |
| Ore tonnes (ktpa) | 5,650 – 6,200ii | |
| Average annual gold production (Koz) | 650 – 750ii | |
| Expansion Capital ($bn)7 | Approx. 0.9 – 1.1iii | |
| Cost of Sales ($/oz) | Approx. 800 – 1,000 | |
| AISC ($/oz)9 | Approx. 700 – 900 | |
| i. | Potential quantities and grades in these preliminary results are conceptual in nature and there has been insufficient exploration to define a mineral resource at this time and it is uncertain that further exploration will result in the target being delineated as a mineral resource. |
| ii. | Indicative gold production profile from Porgera (100% basis) which is conceptual in nature and is subject to change following completion of a pre-feasibility study. |
| iii. | 65% of expansion capital is planned during 2024-2028 and 25% during 2029-2033. |
| BARRICK THIRD QUARTER 2023 | 31 | PRESS RELEASE |
Appendix B – Outlook Assumptions
| Key assumptions | 2023 | 2024 | 2025+ | |||
| Gold Price ($/oz) | 1,900 | 1,300 | 1,300 | |||
| Copper Price ($/lb) | 3.50 | 3.00 | 3.00 | |||
| Oil Price (WTI) ($/barrel) | 90 | 70 | 70 | |||
| AUD Exchange Rate (AUD:USD) | 0.75 | 0.75 | 0.75 | |||
| ARS Exchange Rate (USD:ARS) | 230 | 230 | 230 | |||
| CAD Exchange Rate (USD:CAD) | 1.30 | 1.30 | 1.30 | |||
| CLP Exchange Rate (USD:CLP) | 800 | 900 | 900 | |||
| EUR Exchange Rate (EUR:USD) | 1.10 | 1.20 | 1.20 | |||
| • | Barrick’s five-year indicative base case outlook is based on our current operating asset portfolio, sustaining projects in progress and exploration/mineral resource management initiatives in execution. Our outlook is based on our current reserves and resources as disclosed in our Q4 2022 report and assumes that we will continue to be able to convert resources into reserves. Additional asset optimization, further exploration growth, new project initiatives and divestitures are not included. For the group gold and copper segments, and where applicable for a specific region, our indicative outlook is subject to change and assumes the following: |
| ○ | New open pit production permitted and commencing at Hemlo in the second half of 2025, allowing three years for permitting and two years for pre-stripping prior to first ore production in 2027. |
| ○ | Production from the proposed Pueblo Viejo plant expansion and tailings facility project starting in 2023. |
| ○ | Tongon will enter care and maintenance by 2026. |
| ○ | Production attributable to Porgera is based on the assumption that the mine’s current care and maintenance status will be temporary, and that the suspension of operations will not have a significant impact on Barrick’s future production. |
| • | Our five-year indicative base case outlook excludes: |
| ○ | Production from Fourmile. |
| ○ | Production from Pierina and Golden Sunlight, which are currently in care and maintenance. |
| ○ | Production from long-term greenfield optionality from Donlin, Pascua-Lama, Norte Abierto or Alturas. |
| • | Barrick’s ten-year base case production profile is subject to change and are based on the same assumptions as the current five-year outlook detailed above, except that the next five years of the ten-year outlook assume attributable production from exploration and mineral resource management projects in execution at Nevada Gold Mines and Hemlo. |
| • | Barrick’s five-year and ten-year production profile in this presentation also assumes the re-start of Porgera, as well as an indicative gold and copper production profile for Reko Diq and an indicative copper production profile for the Lumwana Super Pit expansion, both of which are conceptual in nature. |
| • | Barrick’s 15-year production profile for Nevada Gold Mines is based on the same assumptions as the ten-year base case production profile detailed above. |
| BARRICK THIRD QUARTER 2023 | 32 | PRESS RELEASE |
Corporate Office
Barrick Gold Corporation
161 Bay Street, Suite 3700
Toronto, Ontario M5J 2S1
Canada
Telephone: +1 416 861-9911
Email: investor@barrick.com
Website: www.barrick.com
Shares Listed
| GOLD | The New York Stock Exchange |
| ABX | The Toronto Stock Exchange |
Transfer Agents and Registrars
TSX Trust Company
301 – 100 Adelaide Street West
Toronto, Ontario M5H 4H1
or
Equiniti Trust Company, LLC
6201 – 15 Avenue
Brooklyn, New York 11219
Telephone: 1-800-387-0825
Fax: 1-888-249-6189
Email: shareholderinquiries@tmx.com
Website: www.tsxtrust.com
Enquiries
President and Chief Executive Officer
Mark Bristow
+1 647 205 7694
+44 788 071 1386
Senior Executive Vice-President and
Chief Financial Officer
Graham Shuttleworth
+1 647 262 2095
+44 779 771 1338
Investor and Media Relations
Kathy du Plessis
+44 20 7557 7738
Email: barrick@dpapr.com
Cautionary Statement on Forward-Looking Information
Certain information contained or incorporated by reference in this press release, including any information as to our strategy, projects, plans or future financial or operating performance, constitutes “forward-looking statements”. All statements, other than statements of historical fact, are forward-looking statements. The words “believe”, “expect”, “strategy”, “target”, “plan”, “focus”, “scheduled”, “commitment” “opportunities”, “guidance”, “project”, “expand”, “invest”, “continue”, “progress”, “develop”, “on track”, “estimate”, “growth”, “potential”, “future”, “extend”, “will”, “could”, “would”, “should”, “may” and similar expressions identify forward-looking statements. In particular, this press release contains forward-looking statements including, without limitation, with respect to: Barrick’s forward-looking production guidance, including anticipated gold production for the fourth quarter of 2023 and our expectation of a shortfall (and the magnitude of the expected shortfall) in 2023 annual gold production relative to Barrick’s previously announced 2023 guidance and our five, ten and fifteen-year production profiles for gold and copper; projected capital, operating and exploration expenditures; our ability to convert resources into reserves and replace reserves net of depletion from production; mine life and production rates, including expected mineral reserve replacement in 2023 and 2024, annual production expectations from Reko Diq and Lumwana and anticipated production growth from Barrick’s organic project pipeline and reserve replacement; Barrick’s global exploration strategy and planned exploration activities, including the expected benefits of drill results at Nevada Gold Mines; our ability to identify new Tier One assets and the potential for existing assets to attain Tier One status; Barrick’s copper
strategy; our plans and expected completion and benefits of our growth projects, including the Pueblo Viejo plant expansion and mine life extension project, Fourmile, Reko Diq project, Porgera mine, Lumwana Super Pit and growth opportunities at Nevada Gold Mines; potential mineralization and metal or mineral recoveries; expected timing for the feasibility study, construction and targeted first production for the Reko Diq project; our expectations for a project financing process for Reko Diq; the duration of the temporary suspension of operations at Porgera, the conditions for the reopening of the mine, including the execution of compensation agreements with local landowners, and the timeline to recommence operations; potential mine life of Porgera; our pipeline of high confidence projects at or near existing operations; the potential to extend Veladero’s life of mine; Barrick’s global exploration strategy and planned exploration activities; Barrick’s partnership with the Government of Tanzania under the framework agreement; Lumwana’s ability to further extend the life of mine through the development of a Super Pit and targeted timing for construction and first production; Barrick’s strategy, plans, targets and goals in respect of environmental and social governance issues, including local community relations, economic contributions and education, infrastructure and procurement initiatives, climate change (including our Scope 3 emissions targets and our reliance on our value chain to help us achieve these targets within the specified time frames), biodiversity initiatives and tailings storage facilities management, including Barrick’s conformance with the Global Industry Standard on Tailings Management; Barrick’s talent management strategy; and expectations regarding future price
| BARRICK THIRD QUARTER 2023 | 33 | PRESS RELEASE |
assumptions, financial performance and other outlook or guidance.
Forward-looking statements are necessarily based upon a number of estimates and assumptions including material estimates and assumptions related to the factors set forth below that, while considered reasonable by the Company as at the date of this press release in light of management’s experience and perception of current conditions and expected developments, are inherently subject to significant business, economic and competitive uncertainties and contingencies. Known and unknown factors could cause actual results to differ materially from those projected in the forward-looking statements and undue reliance should not be placed on such statements and information. Such factors include, but are not limited to: fluctuations in the spot and forward price of gold, copper or certain other commodities (such as silver, diesel fuel, natural gas and electricity); risks associated with projects in the early stages of evaluation and for which additional engineering and other analysis is required; risks related to the possibility that future exploration results will not be consistent with the Company’s expectations, that quantities or grades of reserves will be diminished, and that resources may not be converted to reserves; risks associated with the fact that certain of the initiatives described in this press release are still in the early stages and may not materialize; changes in mineral production performance, exploitation and exploration successes; risks that exploration data may be incomplete and considerable additional work may be required to complete further evaluation, including but not limited to drilling, engineering and socioeconomic studies and investment; the speculative nature of mineral exploration and development; lack of certainty with respect to foreign legal systems, corruption and other factors that are inconsistent with the rule of law; changes in national and local government legislation, taxation, controls or regulations and/or changes in the administration of laws, policies and practices; the potential impact of proposed changes to Chilean law on the status of value added tax refunds received in Chile in connection with the development of the Pascua-Lama project; expropriation or nationalization of property and political or economic developments in Canada, the United States or other countries in which Barrick does or may carry on business in the future; risks relating to political instability in certain of the jurisdictions in which Barrick operates; timing of receipt of, or failure to comply with, necessary permits and approvals, including the issuance of a Record of Decision for the Goldrush Project and/or whether the Goldrush Project will be permitted to advance as currently designed under its Feasibility Study, and the environmental license for the construction and operation of the El Naranjo tailings storage facility for Pueblo Viejo; non-renewal of key licenses by governmental authorities; failure to comply with environmental and health and safety laws and regulations; increased costs and physical and transition risks related to climate change, including extreme weather events, resource shortages, emerging policies and increased regulations relating to greenhouse gas emission levels, energy efficiency and reporting of risks; contests over title to properties, particularly title to undeveloped properties, or over access to water, power and other required infrastructure; the liability associated with risks and hazards in the mining industry, and the ability to maintain insurance to cover such losses; damage to the Company’s reputation due to the actual or perceived occurrence of any number of events, including negative publicity with respect to the Company’s handling of environmental matters or dealings with community groups, whether true or not; risks related to operations near communities that may regard Barrick’s operations as being detrimental to them; litigation and legal and administrative proceedings; operating or technical difficulties in connection with mining or development activities, including geotechnical challenges, tailings dam and storage facilities
failures, and disruptions in the maintenance or provision of required infrastructure and information technology systems; increased costs, delays, suspensions and technical challenges associated with the construction of capital projects; risks associated with working with partners in jointly controlled assets; risks related to disruption of supply routes which may cause delays in construction and mining activities, including disruptions in the supply of key mining inputs due to the invasion of Ukraine by Russia; risk of loss due to acts of war, terrorism, sabotage and civil disturbances; risks associated with artisanal and illegal mining; risks associated with Barrick’s infrastructure, information technology systems and the implementation of Barrick’s technological initiatives, including risks related to cyber-attacks, cybersecurity breaches, or similar network or system disruptions; the impact of global liquidity and credit availability on the timing of cash flows and the values of assets and liabilities based on projected future cash flows; the impact of inflation, including global inflationary pressures driven by supply chain disruptions caused by the ongoing Covid-19 pandemic, global energy cost increases following the invasion of Ukraine by Russia and country-specific political and economic factors in Argentina; adverse changes in our credit ratings; fluctuations in the currency markets; changes in U.S. dollar interest rates; risks arising from holding derivative instruments (such as credit risk, market liquidity risk and mark-to-market risk); risks related to the demands placed on the Company’s management, the ability of management to implement its business strategy and enhanced political risk in certain jurisdictions; uncertainty whether some or all of Barrick’s targeted investments and projects will meet the Company’s capital allocation objectives and internal hurdle rate; whether benefits expected from recent transactions are realized; business opportunities that may be presented to, or pursued by, the Company; our ability to successfully integrate acquisitions or complete divestitures; risks related to competition in the mining industry; employee relations including loss of key employees; availability and increased costs associated with mining inputs and labor; risks associated with diseases, epidemics and pandemics, including the effects and potential effects of the global Covid-19 pandemic; risks related to the failure of internal controls; and risks related to the impairment of the Company’s goodwill and assets. Barrick also cautions that its 2023 guidance, as well as its five, ten and fifteen-year production profiles for gold and copper, may be impacted by the ongoing business and social disruption caused by the spread of Covid-19.
In addition, there are risks and hazards associated with the business of mineral exploration, development and mining, including environmental hazards, industrial accidents, unusual or unexpected formations, pressures, cave-ins, flooding and gold bullion, copper cathode or gold or copper concentrate losses (and the risk of inadequate insurance, or inability to obtain insurance, to cover these risks).
Many of these uncertainties and contingencies can affect our actual results and could cause actual results to differ materially from those expressed or implied in any forward-looking statements made by, or on behalf of, us. Readers are cautioned that forward-looking statements are not guarantees of future performance. All of the forward-looking statements made in this press release are qualified by these cautionary statements. Specific reference is made to the most recent Form 40-F/Annual Information Form on file with the SEC and Canadian provincial securities regulatory authorities for a more detailed discussion of some of the factors underlying forward-looking statements and the risks that may affect Barrick’s ability to achieve the expectations set forth in the forward-looking statements contained in this press release. We disclaim any intention or obligation to update or revise any forward-looking statements whether as a result of new information, future events or otherwise, except as required by applicable law.
| BARRICK THIRD QUARTER 2023 | 34 | PRESS RELEASE |
Exhibit 99.2

Management’s Discussion and Analysis (“MD&A”)
Quarterly Report on the Third Quarter of 2023
This portion of the Quarterly Report provides management’s discussion and analysis (“MD&A”) of the financial condition and results of operations, to enable a reader to assess material changes in financial condition and results of operations as at, and for the three and nine month periods ended September 30, 2023, in comparison to the corresponding prior-year periods. The MD&A is intended to help the reader understand Barrick Gold Corporation (“Barrick”, “we”, “our”, the “Company” or the “Group”), our operations, financial performance as well as our present and future business environment. This MD&A, which has been prepared as of November 1, 2023, is intended to supplement and complement the condensed unaudited interim consolidated financial statements and notes thereto, prepared in accordance with International Financial Reporting Standards (“IFRS”) as issued by the International Accounting Standards Board (“IASB”), including International Accounting Standard 34 Interim Financial Reporting (“IAS 34”), for the three and nine month periods ended September 30, 2023 (collectively, the “Financial Statements”), which are included in this Quarterly Report on pages 84 to 88. You are encouraged to review the Financial Statements in conjunction with your review of this MD&A. This MD&A should be read in conjunction with both the
annual audited consolidated financial statements for the two years ended December 31, 2022, the related annual MD&A included in the 2022 Annual Report, and the most recent Form 40–F/Annual Information Form on file with the U.S. Securities and Exchange Commission (“SEC”) and Canadian provincial securities regulatory authorities. These documents and additional information relating to the Company are available on SEDAR at www.sedar.com and EDGAR at www.sec.gov. Certain notes to the Financial Statements are specifically referred to in this MD&A and such notes are incorporated by reference herein. All dollar amounts in this MD&A are in millions of United States dollars (“$” or “US$”), unless otherwise specified.
For the purposes of preparing our MD&A, we consider the materiality of information. Information is considered material if: (i) such information results in, or would reasonably be expected to result in, a significant change in the market price or value of our shares; (ii) there is a substantial likelihood that a reasonable investor would consider it important in making an investment decision; or (iii) it would significantly alter the total mix of information available to investors. We evaluate materiality with reference to all relevant circumstances, including potential market sensitivity.
Abbreviations
| BAP | Biodiversity Action Plans | |
| BLM | Bureau of Land Management | |
| BNL | Barrick Niugini Limited | |
| CDCs | Community Development Committees | |
| CHUG | Cortez Hills Underground | |
| CIL | Carbon-in-leach | |
| Commencement Agreement | Detailed Porgera Project Commencement Agreement between PNG and BNL | |
| DRC | Democratic Republic of Congo | |
| E&S Committee | Environmental and Social Oversight Committee | |
| ESG | Environmental, Social and Governance | |
| ESG & Nominating Committee | Environmental, Social, Governance & Nominating Committee | |
| ESIA | Environmental and Social Impact Assessment | |
| FEIS | Final Environmental Impact Statement | |
| GHG | Greenhouse Gas | |
| GISTM | Global Industry Standard for Tailings Management | |
| GoT | Government of Tanzania | |
| IASB | International Accounting Standards Board | |
| ICMM | International Council on Mining and Metals | |
| IFRS | International Financial Reporting Standards | |
| IRC | Internal Revenue Commission | |
| ISSB | International Sustainability Standards Board | |
| KCD | Karagba, Chauffeur and Durba | |
| Kumul Minerals | Kumul Minerals Holdings Limited | |
| LTI | Lost Time Injury |
| LTIFR | Lost Time Injury Frequency Rate | |
| MAA | Multiple Accounts Analysis | |
| MRE | Mineral Resources Enga Limited | |
| MVA | Megavolt-amperes | |
| MW | Megawatt | |
| NOA | Notice of Availability | |
| NGM | Nevada Gold Mines | |
| NSR | Net Smelter Return | |
| OECD | Organisation for Economic Co-operation and Development | |
| PFS | Prefeasibility Study | |
| PNG | Papua New Guinea | |
| Randgold | Randgold Resources Limited | |
| RC | Reverse Circulation | |
| RIL | Resin-in-leach | |
| ROD | Record of Decision | |
| Roundtable | Environmental, Social and Governance Raters Roundtable | |
| SDG | Sustainable Development Goals | |
| SML | Special Mining Lease | |
| TCFD | Task Force for Climate-related Financial Disclosures | |
| TRIFR | Total Recordable Injury Frequency Rate | |
| TSF | Tailings Storage Facilities | |
| TW | True Width | |
| WGC | World Gold Council | |
| WTI | West Texas Intermediate |
| BARRICK THIRD QUARTER 2023 | 1 | MANAGEMENT’S DISCUSSION AND ANALYSIS |
Cautionary Statement on Forward-Looking Information
Certain information contained or incorporated by reference in this MD&A, including any information as to our strategy, projects, plans or future financial or operating performance, constitutes “forward-looking statements”. All statements, other than statements of historical fact, are forward-looking statements. The words “believe”, “expect”, “anticipated”, “vision”, “aim”, “strategy”, “target”, “plan”, “opportunities”, “guidance”, “forecast”, “outlook”, “objective”, “intend”, “project”, “pursue”, “develop”, “progress”, “continue”, “committed”, “budget”, “estimate”, “potential”, “prospective”, “future”, “focus”, “during”, “ongoing”, “following”, “subject to”, “scheduled”, “may”, “will”, “can”, “could”, “would”, “should” and similar expressions identify forward-looking statements. In particular, this MD&A contains forward-looking statements including, without limitation, with respect to: Barrick’s forward-looking production guidance, including anticipated gold production for the fourth quarter of 2023 and our expectation of a shortfall (and the magnitude of the expected shortfall) in 2023 annual gold production relative to Barrick’s previously announced 2023 guidance; estimates of future cost of sales per ounce for gold and per pound for copper, total cash costs per ounce and C1 cash costs per pound, and all-in-sustaining costs per ounce/ pound; cash flow forecasts; projected capital, operating and exploration expenditures; the share buyback program and performance dividend policy, including the criteria for dividend payments; mine life and production rates; projected capital estimates and anticipated permitting timelines related to the Goldrush Project; our plans and expected completion and benefits of our growth and capital projects, including the Goldrush Project and expected timing for commercial production, Fourmile, Pueblo Viejo plant expansion and mine life extension project, including estimated capital costs, expected timing for completion of commissioning of the plant expansion and the completion of the feasibility study for the El Naranjo tailings storage facility, the Veladero Phase 7 leach pad project, the Reko Diq project, solar power projects at NGM and Loulo-Gounkoto, the Jabal Sayid Lode 1 project and new mobile equipment fleet at Lumwana; the planned updating of the historical Reko Diq feasibility study and targeted first production; the potential for Lumwana to extend its life of mine through the development of a Super Pit and expected timing of the feasibility study and targeted first production; the potential for an underground option at Long Canyon; capital expenditures related to upgrades and ongoing management initiatives; our ability to identify new Tier One assets and the potential for existing assets to attain Tier One status; Barrick’s global exploration strategy and planned exploration activities; the timeline for the implementation of the definitive agreements in accordance with the Commencement Agreement between PNG and BNL; the duration of the temporary suspension of operations at Porgera, the conditions for the reopening of the mine including the execution of compensation agreements with local landowners and the timeline to recommence operations; our pipeline of high confidence projects at or near existing operations; potential mineralization and metal or mineral recoveries; our ability to convert resources into reserves; asset sales, joint ventures and partnerships; Barrick’s strategy, plans and targets in respect of environmental and social governance issues,
including climate change, GHG emissions reduction targets (including with respect to our Scope 3 emissions and our reliance on our value chain to help us achieve these targets within the specified time frames), safety performance, responsible water use, TSF management, including Barrick’s conformance with the Global Industry Standard on Tailings Management, community development, biodiversity and human rights initiatives; and expectations regarding future price assumptions, financial performance and other outlook or guidance.
Forward-looking statements are necessarily based upon a number of estimates and assumptions including material estimates and assumptions related to the factors set forth below that, while considered reasonable by the Company as at the date of this MD&A in light of management’s experience and perception of current conditions and expected developments, are inherently subject to significant business, economic and competitive uncertainties and contingencies. Known and unknown factors could cause actual results to differ materially from those projected in the forward-looking statements and undue reliance should not be placed on such statements and information. Such factors include, but are not limited to: fluctuations in the spot and forward price of gold, copper or certain other commodities (such as silver, diesel fuel, natural gas and electricity); risks associated with projects in the early stages of evaluation and for which additional engineering and other analysis is required; risks related to the possibility that future exploration results will not be consistent with the Company’s expectations, that quantities or grades of reserves will be diminished, and that resources may not be converted to reserves; risks associated with the fact that certain of the initiatives described in this MD&A are still in the early stages and may not materialize; changes in mineral production performance, exploitation and exploration successes; risks that exploration data may be incomplete and considerable additional work may be required to complete further evaluation, including but not limited to drilling, engineering and socioeconomic studies and investment; the speculative nature of mineral exploration and development; lack of certainty with respect to foreign legal systems, corruption and other factors that are inconsistent with the rule of law; changes in national and local government legislation, taxation, controls or regulations and/or changes in the administration of laws, policies and practices; the potential impact of proposed changes to Chilean law on the status of value added tax refunds received in Chile in connection with the development of the Pascua-Lama project; expropriation or nationalization of property and political or economic developments in Canada, the United States or other countries in which Barrick does or may carry on business in the future; risks relating to political instability in certain of the jurisdictions in which Barrick operates; timing of receipt of, or failure to comply with, necessary permits and approvals, including the issuance of a ROD for the Goldrush Project and/or whether the Goldrush Project will be permitted to advance as currently designed under its Feasibility Study, the environmental license for the construction and operation of the El Naranjo tailings storage facility for Pueblo Viejo, and assessments required to optimize Long Canyon’s life of mine; non-renewal of key licenses by governmental authorities; failure to comply with environmental and health and safety laws and regulations;
| BARRICK THIRD QUARTER 2023 | 2 | MANAGEMENT’S DISCUSSION AND ANALYSIS |
increased costs and physical and transition risks related to climate change, including extreme weather events, resource shortages, emerging policies and increased regulations relating to related to greenhouse gas emission levels, energy efficiency and reporting of risks; contests over title to properties, particularly title to undeveloped properties, or over access to water, power and other required infrastructure; the liability associated with risks and hazards in the mining industry, and the ability to maintain insurance to cover such losses; damage to the Company’s reputation due to the actual or perceived occurrence of any number of events, including negative publicity with respect to the Company’s handling of environmental matters or dealings with community groups, whether true or not; risks related to operations near communities that may regard Barrick’s operations as being detrimental to them; litigation and legal and administrative proceedings; operating or technical difficulties in connection with mining or development activities, including geotechnical challenges, tailings dam and storage facilities failures, and disruptions in the maintenance or provision of required infrastructure and information technology systems; increased costs, delays, suspensions and technical challenges associated with the construction of capital projects; risks associated with working with partners in jointly controlled assets; risks related to disruption of supply routes which may cause delays in construction and mining activities, including disruptions in the supply of key mining inputs due to the invasion of Ukraine by Russia; risk of loss due to acts of war, terrorism, sabotage and civil disturbances; risks associated with artisanal and illegal mining; risks associated with Barrick’s infrastructure, information technology systems and the implementation of Barrick’s technological initiatives, including risks related to cyber-attacks, cybersecurity breaches, or similar network or system disruptions; the impact of global liquidity and credit availability on the timing of cash flows and the values of assets and liabilities based on projected future cash flows; the impact of inflation, including global inflationary pressures driven by supply chain disruptions caused by the ongoing Covid-19 pandemic, global energy cost increases following the invasion of Ukraine by Russia and country-specific political and economic factors in Argentina; adverse changes in our credit ratings; fluctuations in the currency markets; changes in U.S. dollar interest rates; risks arising from holding derivative instruments (such as credit risk, market liquidity risk and mark-to-market risk); risks related
to the demands placed on the Company’s management, the ability of management to implement its business strategy and enhanced political risk in certain jurisdictions; uncertainty whether some or all of Barrick’s targeted investments and projects will meet the Company’s capital allocation objectives and internal hurdle rate; whether benefits expected from recent transactions are realized; business opportunities that may be presented to, or pursued by, the Company; our ability to successfully integrate acquisitions or complete divestitures; risks related to competition in the mining industry; employee relations including loss of key employees; availability and increased costs associated with mining inputs and labor; risks associated with diseases, epidemics and pandemics, including the effects and potential effects of the global Covid-19 pandemic; risks related to the failure of internal controls; and risks related to the impairment of the Company’s goodwill and assets. Barrick also cautions that its 2023 guidance may be impacted by the ongoing business and social disruption caused by the spread of Covid-19.
In addition, there are risks and hazards associated with the business of mineral exploration, development and mining, including environmental hazards, industrial accidents, unusual or unexpected formations, pressures, cave-ins, flooding and gold bullion, copper cathode or gold or copper concentrate losses (and the risk of inadequate insurance, or inability to obtain insurance, to cover these risks).
Many of these uncertainties and contingencies can affect our actual results and could cause actual results to differ materially from those expressed or implied in any forward-looking statements made by, or on behalf of, us. Readers are cautioned that forward-looking statements are not guarantees of future performance. All of the forward-looking statements made in this MD&A are qualified by these cautionary statements. Specific reference is made to the most recent Form 40-F/Annual Information Form on file with the SEC and Canadian provincial securities regulatory authorities for a more detailed discussion of some of the factors underlying forward-looking statements and the risks that may affect Barrick’s ability to achieve the expectations set forth in the forward-looking statements contained in this MD&A. We disclaim any intention or obligation to update or revise any forward-looking statements whether as a result of new information, future events or otherwise, except as required by applicable law.
| BARRICK THIRD QUARTER 2023 | 3 | MANAGEMENT’S DISCUSSION AND ANALYSIS |
Use of Non-GAAP Financial Measures
We use the following non-GAAP financial measures in our MD&A:
| ∎ | “adjusted net earnings” |
| ∎ | “free cash flow” |
| ∎ | “EBITDA” |
| ∎ | “adjusted EBITDA” |
| ∎ | “attributable EBITDA” |
| ∎ | “minesite sustaining capital expenditures” |
| ∎ | “project capital expenditures” |
| ∎ | “total cash costs per ounce” |
| ∎ | “C1 cash costs per pound” |
| ∎ | “all-in sustaining costs per ounce/pound” |
| ∎ | “all-in costs per ounce” and |
| ∎ | “realized price” |
For a detailed description of each of the non-GAAP financial measures used in this MD&A and a detailed reconciliation to the most directly comparable measure under IFRS, please refer to the Non-GAAP Financial Measures section of this MD&A on pages 59 to 76. Each non-GAAP financial measure has been annotated with a reference to an endnote on page 77. The non-GAAP financial measures set out in this MD&A are intended to provide additional information to investors and do not have any standardized meaning under IFRS, and therefore may not be comparable to other issuers, and should not be considered in isolation or as a substitute for measures of performance prepared in accordance with IFRS.
Changes in Presentation of Non-GAAP Financial Performance Measures
Attributable EBITDA
Starting with this MD&A, we are presenting attributable EBITDA, which removes the non-controlling interest portion from our adjusted EBITDA measure. Prior periods have been presented to allow for comparability. We believe this additional information will assist analysts, investors and other stakeholders of Barrick in better understanding our ability to generate liquidity from our attributable business and which is aligned with how we present our forward looking guidance on gold ounces and copper pounds produced.
Index
|
5 Overview |
|
5 Financial and Operating Highlights |
|
9 Key Business Developments |
|
10 Environmental, Social and Governance |
|
13 Outlook |
|
15 Production and Cost Summary |
|
17 Operating Performance |
|
18 Nevada Gold Mines |
|
19 Carlin |
|
21 Cortez |
|
23 Turquoise Ridge |
|
25 Other Mines - Nevada Gold Mines |
|
26 Pueblo Viejo |
|
28 Loulo-Gounkoto |
|
30 Kibali |
|
32 North Mara |
|
34 Bulyanhulu |
|
36 Other Mines - Gold |
|
37 Lumwana |
|
39 Other Mines - Copper |
|
40 Growth Projects |
|
43 Exploration and Mineral Resource Management |
|
47 Review of Financial Results |
|
47 Revenue |
|
48 Production Costs |
|
50 Capital Expenditures |
|
50 General and Administrative Expenses |
|
51 Exploration, Evaluation and Project Expenses |
|
51 Finance Costs, Net |
|
51 Additional Significant Statement of Income Items |
|
52 Income Tax Expense |
|
54 Financial Condition Review |
|
54 Balance Sheet Review |
|
54 Shareholders’ Equity |
|
54 Financial Position and Liquidity |
|
55 Summary of Cash Inflow (Outflow) |
|
57 Commitments and Contingencies |
|
58 Review of Quarterly Results |
|
58 Internal Control over Financial Reporting and Disclosure Controls and Procedures |
|
59 IFRS Critical Accounting Policies and Accounting Estimates |
|
59 Non-GAAP Financial Measures |
|
77 Technical Information |
|
77 Endnotes |
|
84 Financial Statements |
|
89 Notes to Consolidated Financial Statements |
| BARRICK THIRD QUARTER 2023 | 4 | MANAGEMENT’S DISCUSSION AND ANALYSIS |
| OVERVIEW | OPERATING PERFORMANCE
|
GROWTH PROJECTS & EXPLORATION
|
REVIEW OF FINANCIAL RESULTS
|
OTHER INFORMATION & NON-GAAP RECONCILIATIONS |
FINANCIAL STATEMENTS |
|||||
Overview
Financial and Operating Highlights
| For the three months ended | For the nine months ended | |||||||||||||||||||||||||||||||
| 9/30/23 | 6/30/23 | % Change | 9/30/22 | % Change | 9/30/23 | 9/30/22 | % Change | |||||||||||||||||||||||||
| Financial Results ($ millions) |
||||||||||||||||||||||||||||||||
| Revenues |
2,862 | 2,833 | 1 % | 2,527 | 13 % | 8,338 | 8,239 | 1 % | ||||||||||||||||||||||||
| Cost of sales |
1,915 | 1,937 | (1)% | 1,815 | 6 % | 5,793 | 5,404 | 7 % | ||||||||||||||||||||||||
| Net earningsa |
368 | 305 | 21 % | 241 | 53 % | 793 | 1,167 | (32)% | ||||||||||||||||||||||||
| Adjusted net earningsb |
418 | 336 | 24 % | 224 | 87 % | 1,001 | 1,106 | (9)% | ||||||||||||||||||||||||
| Adjusted EBITDAb |
1,464 | 1,368 | 7 % | 1,155 | 27 % | 4,015 | 4,327 | (7)% | ||||||||||||||||||||||||
| Adjusted EBITDA marginc |
51 % | 48 % | 6 % | 46 % | 11 % | 48 % | 53 % | (9)% | ||||||||||||||||||||||||
| Minesite sustaining capital expendituresb,d |
529 | 524 | 1 % | 571 | (7)% | 1,507 | 1,514 | 0 % | ||||||||||||||||||||||||
| Project capital expendituresb,d |
227 | 238 | (5)% | 213 | 7 % | 691 | 625 | 11 % | ||||||||||||||||||||||||
| Total consolidated capital expendituresd,e |
768 | 769 | 0 % | 792 | (3)% | 2,225 | 2,158 | 3 % | ||||||||||||||||||||||||
| Net cash provided by operating activities |
1,127 | 832 | 35 % | 758 | 49 % | 2,735 | 2,686 | 2 % | ||||||||||||||||||||||||
| Net cash provided by operating activities marginf |
39 % | 29 % | 34 % | 30 % | 30 % | 33 % | 33 % | 0 % | ||||||||||||||||||||||||
| Free cash flowb |
359 | 63 | 470 % | (34) | 1,156 % | 510 | 528 | (3)% | ||||||||||||||||||||||||
| Net earnings per share (basic and diluted) |
0.21 | 0.17 | 24 % | 0.14 | 50 % | 0.45 | 0.66 | (32)% | ||||||||||||||||||||||||
| Adjusted net earnings (basic)b per share |
0.24 | 0.19 | 26 % | 0.13 | 85 % | 0.57 | 0.62 | (8)% | ||||||||||||||||||||||||
| Weighted average diluted common shares |
1,755 | 1,755 | 0 % | 1,768 | (1)% | 1,755 | 1,775 | (1)% | ||||||||||||||||||||||||
| Operating Results |
||||||||||||||||||||||||||||||||
| Gold production (thousands of ounces)g |
1,039 | 1,009 | 3 % | 988 | 5 % | 3,000 | 3,021 | (1)% | ||||||||||||||||||||||||
| Gold sold (thousands of ounces)g |
1,027 | 1,001 | 3 % | 997 | 3 % | 2,982 | 3,030 | (2)% | ||||||||||||||||||||||||
| Market gold price ($/oz) |
1,928 | 1,976 | (2)% | 1,729 | 12 % | 1,930 | 1,824 | 6 % | ||||||||||||||||||||||||
| Realized gold priceb,g ($/oz) |
1,928 | 1,972 | (2)% | 1,722 | 12 % | 1,934 | 1,820 | 6 % | ||||||||||||||||||||||||
| Gold cost of sales (Barrick’s share)g,h ($/oz) |
1,277 | 1,323 | (3)% | 1,226 | 4 % | 1,325 | 1,211 | 9 % | ||||||||||||||||||||||||
| Gold total cash costsb,g ($/oz) |
912 | 963 | (5)% | 891 | 2 % | 953 | 859 | 11 % | ||||||||||||||||||||||||
| Gold all-in sustaining costsb,g ($/oz) |
1,255 | 1,355 | (7)% | 1,269 | (1)% | 1,325 | 1,215 | 9 % | ||||||||||||||||||||||||
| Copper production (millions of pounds)g |
112 | 107 | 5 % | 123 | (9)% | 307 | 344 | (11)% | ||||||||||||||||||||||||
| Copper sold (millions of pounds)g |
101 | 101 | 0 % | 120 | (16)% | 291 | 346 | (16)% | ||||||||||||||||||||||||
| Market copper price ($/lb) |
3.79 | 3.84 | (1)% | 3.51 | 8 % | 3.89 | 4.11 | (5)% | ||||||||||||||||||||||||
| Realized copper priceb,g ($/lb) |
3.78 | 3.70 | 2 % | 3.24 | 17 % | 3.88 | 3.86 | 1 % | ||||||||||||||||||||||||
| Copper cost of sales (Barrick’s share)g,i ($/lb) |
2.68 | 2.84 | (6)% | 2.30 | 17 % | 2.90 | 2.21 | 31 % | ||||||||||||||||||||||||
| Copper C1 cash costsb,g ($/lb) |
2.05 | 2.28 | (10)% | 1.86 | 10 % | 2.33 | 1.79 | 30 % | ||||||||||||||||||||||||
| Copper all-in sustaining costsb,g ($/lb) |
3.23 | 3.13 | 3 % | 3.13 | 3 % | 3.25 | 2.96 | 10 % | ||||||||||||||||||||||||
| As at 9/30/23 |
As at 6/30/23 |
% Change | As at 9/30/22 |
% Change | ||||||||||||||||||||||||||||
| Financial Position ($ millions) |
||||||||||||||||||||||||||||||||
| Debt (current and long-term) |
4,775 | 4,774 | 0 % | 5,095 | (6)% | |||||||||||||||||||||||||||
| Cash and equivalents |
4,261 | 4,157 | 3 % | 5,240 | (19)% | |||||||||||||||||||||||||||
| Debt, net of cash |
514 | 617 | (17)% | (145) | 454 % | |||||||||||||||||||||||||||
| a. | Net earnings represents net earnings attributable to the equity holders of the Company. |
| b. | Further information on these non-GAAP financial measures, including detailed reconciliations, is included on pages 59 to 76 of this MD&A. |
| c. | Represents adjusted EBITDA divided by revenue. |
| d. | Amounts presented on a consolidated cash basis. Project capital expenditures are included in our calculation of all-in costs, but not included in our calculation of all-in sustaining costs. |
| e. | Total consolidated capital expenditures also includes capitalized interest of $12 million and $27 million, respectively, for the three and nine month periods ended September 30, 2023 (June 30, 2023: $7 million and September 30, 2022: $8 million and $19 million, respectively). |
| f. | Represents net cash provided by operating activities divided by revenue. |
| g. | On an attributable basis. |
| h. | Gold cost of sales per ounce is calculated as cost of sales across our gold operations (excluding sites in closure or care and maintenance) divided by ounces sold (both on an attributable basis using Barrick’s ownership share). |
| i. | Copper cost of sales per pound is calculated as cost of sales across our copper operations divided by pounds sold (both on an attributable basis using Barrick’s ownership share). |
| BARRICK THIRD QUARTER 2023 | 5 | MANAGEMENT’S DISCUSSION AND ANALYSIS |
| OVERVIEW | OPERATING PERFORMANCE
|
GROWTH PROJECTS & EXPLORATION
|
REVIEW OF FINANCIAL RESULTS
|
OTHER INFORMATION & NON-GAAP RECONCILIATIONS |
FINANCIAL STATEMENTS |
|||||
| GOLD PRODUCTIONa (thousands of ounces) | COPPER PRODUCTIONa (millions of pounds) | |
|
|
|
|
| GOLD COST OF SALESb, TOTAL CASH COSTSc, AND ALL-IN SUSTAINING COSTSc ($ per ounce) |
COPPER COST OF SALESb, C1 CASH COSTSc, AND ALL-IN SUSTAINING COSTSc ($ per pound) |
|
|
|
|
|
| NET EARNINGS, ATTRIBUTABLE EBITDAc AND ATTRIBUTABLE EBITDA MARGINc |
CAPITAL EXPENDITURESc,d ($ millions) |
|
|
|
|
|
| OPERATING CASH FLOW AND FREE CASH FLOWc | DIVIDENDSe (cents per share) | |
|
|
|
|
| a. | On an attributable basis. |
| b. | Gold cost of sales per ounce is calculated as cost of sales across our gold operations (excluding sites in closure or care and maintenance) divided by ounces sold (both on an attributable basis using Barrick’s ownership share). Copper cost of sales per pound is calculated as cost of sales across our copper operations divided by pounds sold (both on an attributable basis using Barrick’s ownership share). |
| c. | Further information on these non-GAAP financial measures, including detailed reconciliations, is included on pages 59 to 76 of this MD&A. |
| d. | Capital expenditures also includes capitalized interest. |
| e. | Dividend per share declared in respect of the stated period, inclusive of the performance dividend. |
| BARRICK THIRD QUARTER 2023 | 6 | MANAGEMENT’S DISCUSSION AND ANALYSIS |
| OVERVIEW | OPERATING PERFORMANCE
|
GROWTH PROJECTS & EXPLORATION
|
REVIEW OF FINANCIAL RESULTS
|
OTHER INFORMATION & NON-GAAP RECONCILIATIONS |
FINANCIAL STATEMENTS |
|||||
Factors affecting net earnings and adjusted net earnings1 - three months ended September 30, 2023 versus June 30, 2023
Net earnings attributable to equity holders of Barrick (“net earnings”) for the three months ended September 30, 2023 were $368 million compared to $305 million in the prior quarter. This increase was mainly due to lower gold and copper cost of sales per ounce/pound2, higher gold sales volume and an increase in realized copper prices1, partially offset by lower realized gold prices1. Net earnings were also favorably affected by lower income tax expense. This was partially offset by losses on currency translation of $30 million, compared to a gain of $12 million in the previous quarter.
After adjusting for items that are not indicative of future operating earnings, adjusted net earnings1 of $418 million for the three months ended September 30, 2023 was $82 million higher than the prior quarter. The increase was primarily due to lower gold and copper cost of sales per ounce2. The decrease in gold cost of sales per ounce2 was mainly due to the impact of sales mix across the portfolio, with a higher contribution of ounces at a lower cost per ounce from Cortez, Turquoise Ridge and Kibali, combined with lower unit costs at Carlin. The lower copper cost of sales per pound2 was primarily due to the improved mining efficiencies at Lumwana. This was combined with higher gold sales volume, primarily due to higher oxide production from the Crossroads open pit and Cortez Hills underground at Cortez. In addition, production was higher at Turquoise Ridge due to planned autoclave maintenance in the previous quarter and at Kibali driven by improved grades. This was offset by lower production at Carlin due to lower open pit ore tonnes mined at a lower average grade as mining in the Goldstar open pit was substantially completed early in the third quarter, leading to a higher proportion of lower grade stockpile tonnes processed at the roasters. Adjusted net earnings1 was also impacted by a lower realized gold price1, partially offset by a higher realized copper price1. The realized gold and copper prices1 were $1,928 per ounce and $3.78 per pound, respectively, in the three months ended September 30, 2023, compared to $1,972 per ounce and $3.70 per pound, respectively, in the prior quarter.
Factors affecting net earnings and adjusted net earnings1 - three months ended September 30, 2023 versus September 30, 2022
Net earnings for the third quarter of 2023 were $368 million compared to $241 million in the same prior year period. This increase was mainly due to higher realized gold and copper prices1, combined with higher gold sales volumes. This was partially offset by higher gold and copper cost of sales per ounce/pound2 and a combined $63 million gain on the sale of a portfolio of royalties to Maverix Metals Inc. and a portfolio of royalties by NGM to Gold Royalty Corp in the same prior year period.
After adjusting for items that are not indicative of future operating earnings, adjusted net earnings1 of $418 million in the third quarter of 2023 were $194 million higher than the same prior year period. One of the primary drivers of the increase was higher realized gold and copper prices1. The realized gold and copper prices1 were $1,928 per ounce and $3.78 per pound, respectively, in the three months ended September 30, 2023 compared to $1,722 per ounce and $3.24 per pound, respectively, in the same prior year period. This was combined with higher gold
sales volumes. The increase in gold sales volume was primarily due to higher oxide production from the Crossroads open pit and Cortez Hills underground at Cortez, combined with higher grades processed, recoveries and throughput at both Turquoise Ridge and Kibali. This was partially offset by lower production at Pueblo Viejo, driven by lower recoveries and lower throughput from premature mechanical failures of the newly installed equipment during the commissioning and ramp-up of the plant expansion. Adjusted net earnings1 were further impacted by higher gold cost of sales per ounce2, mainly due to lower grades processed, partially offset by a lower contribution at higher unit costs from Pueblo Viejo; higher depreciation at Kibali; and higher copper cost of sales per pound2, primarily due to lower grades processed and lower recoveries at Lumwana.
The significant adjusting items in the three months ended September 30, 2023 include:
| ∎ | $34 million ($30 million before tax or non-controlling interests) in losses on currency translation, primarily due to the devaluation of the Chilean peso, the Argentine peso and the West African CFA franc; and |
| ∎ | $19 million in significant tax adjustments, mainly related to the de-recognition of deferred tax assets, adjustments in respect of prior years and the remeasurement of deferred tax balances. |
Refer to page 59 for a full list of reconciling items between net earnings and adjusted net earnings1 for the current and previous periods.
Factors affecting net earnings and adjusted net earnings1 - nine months ended September 30, 2023 versus September 30, 2022
Net earnings for the nine months ended September 30, 2023 were $793 million compared to $1,167 million in the same prior year period. Among the drivers of the decrease were a higher gold and copper cost of sales per ounce/pound2 and lower gold and copper sales volumes, partially offset by a higher realized gold price1. Net earnings were also impacted by a closed mine rehabilitation gain of $35 million in the current period compared to $180 million in the same prior year period resulting from a smaller increase in the market real risk-free rate used to discount the closure provision in the current period, compared to the same prior year period.
After adjusting for items that are not indicative of future operating earnings, adjusted net earnings1 of $1,001 million for the nine months ended September 30, 2023 were $105 million lower than the same prior year period. The decrease in adjusted net earnings was primarily due to a higher gold and copper cost of sales per ounce/pound2 and lower gold and copper sales volumes, partially offset by a higher realized gold price1. The increase in gold cost of sales per ounce2 compared to the same prior year period was primarily due to lower grades processed, and higher contractor and maintenance costs, while the increase in copper cost of sales per pound2 was mainly due to higher operating unit costs resulting from lower grades processed, lower recoveries and lower capitalized waste stripping at Lumwana. The lower gold sales volume was primarily at Pueblo Viejo resulting from lower grades processed in line with the planned mining and stockpile feed sequence, and lower throughput due to tie-in and commissioning work related to the plant expansion; at Carlin mainly due to the closure of the Gold Quarry concentrator at the beginning of the second quarter of 2023
Numerical annotations throughout the text of this document refer to the endnotes found starting on page 77.
| BARRICK THIRD QUARTER 2023 | 7 | MANAGEMENT’S DISCUSSION AND ANALYSIS |
| OVERVIEW | OPERATING PERFORMANCE
|
GROWTH PROJECTS & EXPLORATION
|
REVIEW OF FINANCIAL RESULTS
|
OTHER INFORMATION & NON-GAAP RECONCILIATIONS |
FINANCIAL STATEMENTS |
|||||
and the conversion of the Goldstrike autoclave to a conventional CIL process in the first quarter of 2023; and at Long Canyon as Phase 1 mining was completed in May 2022. These impacts were partially offset by higher oxide ore tonnes mined from Crossroads and CHUG, combined with higher heap leach production at Cortez. The decrease in copper sales volume was mainly at Lumwana due to lower grades processed and lower recoveries, partially offset by higher throughput. These unfavourable impacts were partially offset by an increase in the realized gold price1, while the realized copper price1 was in line with the same prior year period. The realized gold and copper prices1 were $1,934 per ounce and $3.88 per pound, respectively, in the nine months ended September 30, 2023, compared to $1,820 per ounce and $3.86 per pound, respectively, in the same prior year period.
The significant adjusting items in the nine months ended September 30, 2023 include:
| ∎ | $100 million in significant tax adjustments, mainly related to the settlement agreement to resolve the tax dispute at Porgera, the de-recognition of deferred tax assets, adjustments in respect of prior years and the re-measurement of deferred tax balances; |
| ∎ | $55 million ($55 million before tax and non-controlling interests) in other expense (income) adjustments in the current year, primarily related to changes in our closed mine rehabilitation as a result of lower discount rate assumptions and care and maintenance expenses at Porgera, and the $30 million commitment made towards the expansion of education infrastructure in Tanzania per our community investment obligations under the Twiga partnership; and |
| ∎ | $47 million ($56 million before tax and non-controlling interests) in losses on currency translation, mainly due to fluctuations of the Zambian kwacha during the relevant periods. |
Refer to page 59 for a full list of reconciling items between net earnings and adjusted net earnings1 for the current and previous periods.
Factors affecting Operating Cash Flow and Free Cash Flow1 - three months ended September 30, 2023 versus June 30, 2023
In the three months ended September 30, 2023, we generated $1,127 million in operating cash flow, compared to $832 million in the prior quarter. The increase of $295 million was primarily due to a decrease in cash taxes paid and lower interest paid as a result of the timing of semi-annual interest payments on our bonds, which occur in Q2 and Q4. Operating cash flow was further impacted by lower total cash costs/C1 cash costs per ounce/pound1, higher gold sales volume and an increase in the realized copper price1, partially offset by a lower realized gold price1.
For the three months ended September 30, 2023, we recorded free cash flow1 of $359 million, compared to $63 million in the prior quarter, mainly reflecting higher operating cash flows as explained above, while capital expenditures remained in line with the prior quarter. In the third quarter of 2023, capital expenditures on a cash basis were $768 million compared to $769 million in the prior quarter, as a slight decrease in project capital expenditures1, was largely offset by a slight increase in minesite sustaining capital expenditures1. The decrease in project capital expenditures1 was mainly at Pueblo Viejo as the plant expansion nears completion and at Lumwana due to the timing of deliveries of the remaining new owner mining truck fleet to replace the contract mining. This was
partially offset by higher project capital expenditures1 at Loulo-Gounkoto due to the Yalea South project. Minesite sustaining capital expenditures1 increased primarily driven by increased capitalized waste stripping at Lumwana and Carlin, partially offset by lower capitalized waste stripping at Loulo-Gounkoto.
Factors affecting Operating Cash Flow and Free Cash Flow1 - three months ended September 30, 2023 versus September 30, 2022
In the third quarter of 2023, we generated $1,127 million in operating cash flow, compared to $758 million in the same prior year period. The increase of $369 million was primarily due to higher realized gold and copper prices1, combined with higher gold sales volumes. This was partially offset by higher gold and copper total cash costs/C1 cash costs per ounce/pound1. Operating cash flow was also positively impacted by lower cash taxes paid and higher interest income received as a result of an increase in market interest rates.
In the third quarter of 2023, we generated free cash flow1 of $359 million compared to negative free cash flow1 of $34 million in the same prior year period. The increase primarily reflects higher operating cash flows as explained above and to a lesser extent slightly lower capital expenditures. In the third quarter of 2023, capital expenditures on a cash basis were $768 million compared to $792 million in the third quarter of 2022. The decrease in capital expenditures of $24 million was due to a decrease in minesite sustaining capital expenditures1, partially offset by an increase in project capital expenditures1. Minesite sustaining capital expenditures1 decreased compared to the same prior year period, mainly due to lower capitalized waste stripping at Cortez and an improvement in mining unit rates at Lumwana, partially offset by higher capitalized waste stripping and underground development at Carlin. The increase in project capital expenditures1 is primarily due to higher expenditures at the TS Solar project at NGM as construction began in the fourth quarter of 2022, combined with the investment in the new owner mining truck fleet at Lumwana. This was partially offset by lower project spend at Pueblo Viejo as the plant expansion nears completion.
Factors affecting Operating Cash Flow and Free Cash Flow1 - nine months ended September 30, 2023 versus September 30, 2022
For the nine months ended September 30, 2023, we generated $2,735 million in operating cash flow, compared to $2,686 million in the same prior year period. The increase of $49 million was primarily due to lower cash taxes paid and an increase in interest income received as a result of higher market interest rates. Operating cash flow was negatively impacted by higher total cash costs/C1 cash costs per ounce/pound1 and lower gold and copper sales volumes, partially offset by a higher realized gold price1. This was combined with an unfavorable movement in working capital, mainly in accounts receivable and accounts payable, partially offset by a favorable movement in other current assets.
For the nine months ended September 30, 2023, we generated free cash flow1 of $510 million compared to $528 million in the same prior year period. The decrease of $18 million primarily reflects higher capital expenditures, partially offset by higher operating cash flows as explained above. In the nine months ended September 30, 2023, capital expenditures on a cash basis were $2,225 million
| BARRICK THIRD QUARTER 2023 | 8 | MANAGEMENT’S DISCUSSION AND ANALYSIS |
| OVERVIEW | OPERATING PERFORMANCE
|
GROWTH PROJECTS & EXPLORATION
|
REVIEW OF FINANCIAL RESULTS
|
OTHER INFORMATION & NON-GAAP RECONCILIATIONS |
FINANCIAL STATEMENTS |
|||||
compared to $2,158 million in the same prior year period resulting from an increase in project capital expenditures1, partially offset by a decrease in minesite sustaining capital expenditures1. The increase in project capital expenditures1 was primarily the result of the investment in the new owner mining truck fleet at Lumwana, combined with higher expenditures at the TS Solar project at NGM as construction began in the fourth quarter of 2022. This was partially offset by lower project spend incurred on the plant expansion at Pueblo Viejo. Lower minesite sustaining capital expenditures1 is mainly due to lower capitalized waste stripping at Cortez and Lumwana was largely offset by an increase in project spend on processing facilities and underground development at Carlin, higher capitalized waste stripping at North Mara, and increased expenditures on the tailings buttress project and new equipment purchases in the underground at Loulo-Gounkoto.
Key Business Developments
Share Buyback Program
At the February 14, 2023 meeting, the Board of Directors authorized a new share buyback program for the purchase of up to $1 billion of Barrick’s outstanding shares over the next 12 months. As at September 30, 2023, we have not purchased any shares under this program in 2023.
The actual number of common shares that may be purchased, and the timing of any such purchases, will be determined by Barrick based on a number of factors, including the Company’s financial performance, the availability of cash flows, and the consideration of other uses of cash, including capital investment opportunities, returns to shareholders, and debt reduction.
The repurchase program does not obligate the Company to acquire any particular number of common shares, and the repurchase program may be suspended or discontinued at any time at the Company’s discretion.
Porgera Special Mining Lease
On April 9, 2021, BNL signed a binding Framework Agreement with the Independent State of PNG and Kumul Minerals, a state-owned mining company, setting out the terms and conditions for the reopening of the Porgera mine. On February 3, 2022, the Framework Agreement was replaced by the Commencement Agreement signed by PNG, Kumul Minerals, BNL, Porgera (Jersey) Limited, an affiliate of BNL, and MRE, the holder of the remaining 5% of the original Porgera joint venture. The Commencement Agreement reflects the commercial terms previously agreed to under the Framework Agreement, namely that PNG stakeholders will receive a 51% equity stake in the Porgera mine, with the remaining 49% to be held by BNL or an affiliate. BNL is jointly owned on a 50/50 basis by Barrick and Zijin Mining Group. The Commencement Agreement also provides that PNG stakeholders and BNL and its affiliates will share the economic benefits derived from the reopened Porgera mine on a 53% and 47% basis over the remaining life of mine, respectively, and that the Government of PNG will retain the option to acquire BNL’s or its affiliate’s 49% equity participation at fair market value after 10 years.
On April 21, 2022, the PNG National Parliament passed legislation to provide, among other things, certain agreed tax exemptions and tax stability for the new Porgera joint venture. This legislation was certified on May 30, 2022. Six out of the seven pieces of legislation took effect as of
April 11 and 14, 2023, respectively, when they were published in the National Gazette, as required under PNG Law. The remaining act awaits publication to take effect.
On September 13, 2022, the Shareholders’ Agreement for the new Porgera joint venture company was executed by Porgera (Jersey) Limited, the state-owned Kumul Minerals (Porgera) Limited and MRE. New Porgera Limited, the new Porgera joint venture company, was incorporated on September 22, 2022 and became a party to the Commencement Agreement and the Shareholders’ Agreement on October 13, 2023.
On March 31, 2023, BNL, the Independent State of PNG and New Porgera Limited signed the New Porgera Progress Agreement whereby the parties reiterated their commitment to reopening the Porgera mine in line with the terms of the Commencement Agreement and the Shareholders’ Agreement. The provisions of the Commencement Agreement will be fully implemented, and work to recommence full mine operations at Porgera will begin, following the satisfaction of a number of conditions. Under the terms of the Commencement Agreement, BNL will remain in possession of the site and maintain the mine on care and maintenance.
New Porgera Limited lodged an application with the Mineral Resources Authority for a new SML on June 13, 2023, in accordance with the Commencement Agreement.
On June 20, 2023, the PNG IRC, the Commissioner General, Barrick and BNL entered into a settlement agreement to resolve a dispute regarding tax assessments issued by the IRC against BNL. The resolution of this tax dispute satisfied one of the conditions to the reopening of the Porgera mine under the Commencement Agreement.
On October 13, 2023, the Independent State of PNG granted the new SML, Special Mining Lease 13, to New Porgera Limited, following the execution of the Mining Development Contract by the Independent State of PNG and New Porgera Limited. The granting of the new SML to New Porgera Limited reduced Barrick’s interest in the future production of the Porgera mine from 47.5% to 24.5%. Also on October 13, 2023, the Independent State of PNG and New Porgera Limited executed the Fiscal Stability Agreement for the Porgera mine and New Porgera Limited and BNL executed the Project Operatorship Agreement, pursuant to which BNL was appointed as operator of the Porgera mine.
The parties to the Commencement Agreement are continuing to progress the remaining conditions for the reopening of the mine. The key remaining condition to restart is the execution of new compensation agreements with local landowners.
Our 2023 gold guidance continues to exclude Porgera, pending the execution of landowner compensation agreements and the finalization of a timeline for the resumption of full mine operations. Refer to notes 12 and 16 to the Financial Statements for more information.
| BARRICK THIRD QUARTER 2023 | 9 | MANAGEMENT’S DISCUSSION AND ANALYSIS |
| OVERVIEW | OPERATING PERFORMANCE
|
GROWTH PROJECTS & EXPLORATION
|
REVIEW OF FINANCIAL RESULTS
|
OTHER INFORMATION & NON-GAAP RECONCILIATIONS |
FINANCIAL STATEMENTS |
|||||
Environmental, Social and Governance (“ESG”)
Sustainability is entrenched in our DNA: our sustainability strategy is our business plan.
Barrick’s vision to sustainability is underpinned by the knowledge that sustainability aspects are interconnected and must be tackled in conjunction with, and reference to, each other. We call this approach Holistic and Integrated Sustainability Management. Although we integrate our sustainability management, we discuss our sustainability strategy within four overarching pillars: (1) respecting human rights; (2) protecting the health and safety of our people and local communities; (3) sharing the benefits of our operations; and (4) managing our impacts on the environment.
We implement this strategy by blending top-down accountability with bottom-up responsibility. This means we place the day-to-day ownership of sustainability, and the associated risks and opportunities, in the hands of individual sites. In the same way that each site must manage its geological, operational and technical capabilities to meet business objectives, it must also manage and identify programs, metrics, and targets that measure progress and deliver real value for the business and our stakeholders, including our host countries and local communities. The Group Sustainability Executive, supported by regional sustainability leads, provides oversight and direction over this site-level ownership, to ensure alignment with the strategic priorities of the overall business.
Governance
The bedrock of our sustainability strategy is strong governance. Our most senior management-level body dedicated to sustainability is the E&S Committee, which connects site-level ownership of our sustainability strategy with the leadership of the Group. It is chaired by the President and Chief Executive Officer and includes: (1) regional Chief Operating Officers; (2) minesite General Managers; (3) Health, Safety, Environment and Closure Leads; (4) the Group Sustainability Executive; (5) in-house legal counsel; and (6) an independent sustainability consultant in an advisory role. The E&S Committee meets on a quarterly basis to review our performance across a range of key performance indicators, and to provide independent oversight and review of sustainability management.
The President and Chief Executive Officer reviews the reports of the E&S Committee at every quarterly meeting of the Board’s ESG & Nominating Committee. The reports are reviewed to ensure the implementation of our sustainability policies and to drive performance of our environmental, health and safety, community relations and development, and human rights programs.
This is supplemented by weekly meetings, at a minimum, between the Regional Sustainability Leads and the Group Sustainability Executive. These meetings examine the sustainability-related risks and opportunities facing the business in real time, as well as the progress and issues integrated into weekly Executive Committee review meetings.
Our industry-first Sustainability Scorecard accounts for 25% of the long-term incentive awards for senior leaders as part of the Barrick Partnership Plan. As we strive for ongoing strong performance, the Sustainability Scorecard targets and metrics are updated annually. The results of the 2022 Sustainability Scorecard, and updated metrics and targets for 2023, were disclosed in our 2022
Sustainability Report, published in April 2023. The E&S Committee tracks our progress against all metrics.
Human rights
Our commitment to respect human rights is codified in our standalone Human Rights Policy and informed by the expectations of the United Nations Guiding Principles on Business and Human Rights, the Voluntary Principles on Security and Human Rights and the OECD Guidelines for Multinational Enterprises. This commitment is fulfilled on the ground via our Human Rights Program, the fundamental principles of which include: monitoring and reporting, due diligence, training, as well as disciplinary action and remedy.
We continue to assess and manage security and human rights risks at all our operations and provide security and human rights training to private and public security forces across our sites.
Safety
We are committed to the safety, health and well-being of our people, their families and the communities in which we operate. Our safety vision is “Everyone to go home safe and healthy every day.”
Regrettably, in September 2023 we had two unfortunate incidents: one at Loulo-Gounkoto in Mali, which resulted in the fatality of an employee; and a second fatal incident of an exploration contractor at NGM.
Our focus and priority continues to be on the roll out of our “Journey to Zero” initiative, which was developed in the first quarter of 2023. This last quarter has seen the update of our 10 Fatal Risks Standards, as well as the roll out of the Field Level Risk Assessment.
We report our safety performance quarterly as part of both our E&S Committee meetings and our reports to the ESG & Nominating Committee. Our safety performance is a regular standing agenda item on our weekly Executive Committee review meeting.
In terms of other key performance indicators, for the third quarter of 2023, our LTIFR3 was 0.29, an 11% increase quarter on quarter, and our TRIFR3 was 1.28, an increase of 27% from the second quarter.
Social
We regard our host communities and countries as important partners in our business. Our sustainability policies commit us to transparency in our relationships with host communities, government authorities, the public and other key stakeholders. Through these policies, we commit to conducting our business with integrity and with absolute opposition to corruption. We require our suppliers to operate ethically and responsibly as a condition of doing business with us.
Community and economic development
Our commitment to social and economic development is set out in our overarching Sustainable Development and Social Performance policies. Mining has been identified as vital for the achievement of the United Nations SDGs, not only for its role in providing the minerals needed to enable the transition to a lower carbon intensive economy, but more importantly because of its ability to drive socio-economic development and build resilience. Creating long-term value and sharing economic benefits is at the heart of our approach to sustainability, as well as community development. This approach is encapsulated in three concepts:
| BARRICK THIRD QUARTER 2023 | 10 | MANAGEMENT’S DISCUSSION AND ANALYSIS |
| OVERVIEW | OPERATING PERFORMANCE
|
GROWTH PROJECTS & EXPLORATION
|
REVIEW OF FINANCIAL RESULTS
|
OTHER INFORMATION & NON-GAAP RECONCILIATIONS |
FINANCIAL STATEMENTS |
|||||
The primacy of partnership: this means that we invest in real partnerships with mutual responsibility. Partnerships include local communities, suppliers, government, and organizations, and this approach is epitomized through our CDCs with development initiatives and investments.
Sharing the benefits: We hire and buy local wherever possible as this injects money into and keeps it in our local communities and host countries. By doing this, we build capacity, community resilience and create opportunity. We also invest in community development through our CDCs. Sharing the benefits also means paying our fair share of taxes, royalties and dividends and doing so transparently, primarily through the reporting mechanism of the Canadian Extractive Sector Transparency Measures Act. Our annual Tax Contribution Report sets out, in detail, our economic contributions to host governments.
Engaging and listening to stakeholders: We develop tailored stakeholder engagement plans for every operation and the business as a whole. These plans guide and document how often we engage with various stakeholder groups and allow us to proactively deal with issues before they escalate into significant risks.
Our community development spend during the third quarter was $10 million, and $27 million in the year to date.
Environment
We know the environment in which we work and our host communities are inextricably linked, and we apply a holistic and integrated approach to sustainability management. Being responsible stewards of the environment by applying the highest standards of environmental management, using natural resources and energy efficiently, recycling and reducing waste as well as working to protect biodiversity, we can deliver significant cost savings to our business, reduce future liabilities and help build stronger stakeholder relationships. Environmental matters such as how we use water, prevent incidents, manage tailings, respond to changing climate, and protect biodiversity are key areas of focus.
We maintained our strong track record of stewardship and did not record any Class 14 environmental incidents during the quarter or for 2023 year to date.
Climate Change
The ESG & Nominating Committee is responsible for overseeing Barrick’s policies, programs and performance relating to sustainability and the environment, including climate change. The Audit & Risk Committee assists the Board in overseeing the Group’s management of enterprise risks as well as the implementation of policies and standards for monitoring and mitigating such risks. Climate change is built into our formal risk management process, outputs of which are regularly reviewed by the Audit & Risk Committee.
Barrick’s climate change strategy has three pillars: (1) identify, understand and mitigate the risks associated with climate change; (2) measure and reduce our GHG emissions across our operations and value chain; and (3) improve our disclosure on climate change. The three pillars of our climate change strategy do not focus solely on the development of emissions reduction targets, rather, we integrate and consider aspects of biodiversity protection, water management and community resilience in our approach.
We are acutely aware of the impacts that climate change and extreme weather events have on our host
communities and countries, particularly developing nations which are often the most vulnerable. As the world economy transitions to renewable power, it is imperative that developing nations are not left behind. As a responsible business, we have focused our efforts on building resilience in our host communities and countries, just as we do for our business. Our climate disclosure is based on the recommendations of the TCFD.
Identify, understand and mitigate the risks associated with climate change
We identify and manage risks, build resilience to a changing climate and extreme weather events, as well as position ourselves for new opportunities. These factors continue to be incorporated into our formal risk assessment process. We have identified several risks and opportunities for our business including: physical impacts of extreme weather events; an increase in regulations that seek to address climate change; and an increase in global investment in innovation and low-carbon technologies.
The risk assessment process includes scenario analysis, which is being rolled out to all sites with an initial focus on our Tier One Gold Assets5, to assess site-specific climate related risks and opportunities. The key findings and a summary of this asset-level physical and transitional risk assessment at Loulo-Gounkoto and Kibali were disclosed as part of our CDP (formerly known as the Carbon Disclosure Project) Climate Change and Water Security questionnaires, submitted to CDP in July 2023.
In addition, climate scenario analysis and risk assessments were completed for Carlin (physical risks) and NGM (transitional risks). These disclosures will be included in the 2023 Sustainability Report to be published in 2024.
Measure and reduce the Group’s impact on climate change
Mining is an energy-intensive business, and we understand the important link between energy use and GHG emissions. By measuring and effectively managing our energy use, we can reduce our GHG emissions, achieve more efficient production, and reduce our costs.
We have climate champions at each site who are tasked with identifying roadmaps and assessing feasibility for our GHG emissions reductions and carbon offsets for hard-to-abate emissions. Any carbon offsets that we pursue must have appropriate socio-economic and/or biodiversity benefits. We have published an achievable emissions reduction roadmap and continue to assess further reduction opportunities across our operations. The detailed roadmap was first published in our 2021 Sustainability Report and includes committed-capital projects and projects under investigation that rely on technological advances, with a progress summary contained in the 2022 Sustainability Report.
We continue to progress our extensive work across our value chain in understanding our Scope 3 (indirect emissions associated with the value chain) emissions and implementing our engagement roadmap to enable our key suppliers to set meaningful and measurable reduction targets, in line with the commitments made through the ICMM Climate Position Paper.
In November 2023, Barrick announced its Scope 3 emissions targets which it developed to promote awareness and action in its value chain and empower those actors to set their own net zero commitments, with short and medium-term targets. These targets are both quantitative and qualitative and are focused on high emission areas in our value chain as outlined below:
| BARRICK THIRD QUARTER 2023 | 11 | MANAGEMENT’S DISCUSSION AND ANALYSIS |
| OVERVIEW | OPERATING PERFORMANCE
|
GROWTH PROJECTS & EXPLORATION
|
REVIEW OF FINANCIAL RESULTS
|
OTHER INFORMATION & NON-GAAP RECONCILIATIONS |
FINANCIAL STATEMENTS |
|||||
Goods and Suppliers (Category 16):
| ∎ | Quantitative Target: 30% emissions reduction of “Tier 1” suppliers (those suppliers that collectively account for 5% of Barrick’s total spend in this category) by 2030 against a 2022 Scope 3 base year; |
| ∎ | Qualitative Target: Incorporate 130 of our largest suppliers by spend into our annual outreach (this includes our Tier 1 suppliers as well as chemical and metal fabricator suppliers) and engagement; |
| ∎ | 2025 Target: Collect high-quality data for 50% of Tier 1 and chemical and metal fabricator suppliers through engagement, and refine emissions reduction targets by 2025. |
Fuels and Energy (Category 36):
| ∎ | Quantitative Target: 20% reduction against a 2022 Scope 3 base year by 2030; |
| ∎ | Qualitative Targets: |
| ∎ | Collaborate towards new technologies to reduce fleet emissions; and |
| ∎ | Engage with host governments where we consume power from national grids for continued renewable energy incorporation. |
Downstream Copper Processing (Category 106):
| ∎ | Qualitative Target: Outreach and engagement of all downstream customers and smelters; |
| ∎ | 2025 Target: Set emissions reduction target, covering 75% of copper processing, by 2025. |
Improve our disclosure on climate change
Our disclosure on climate change, including in our Sustainability Report and on our website, is developed in line with the TCFD recommendations. Barrick continues to monitor the various regulatory climate disclosure standards being developed around the world, including the ISSB’s recently issued S2 Climate-related Disclosures. In addition, we complete the annual CDP Climate Change and Water Security questionnaires. This ensures our investor-relevant water use, emissions and climate data is widely available.
Emissions
Barrick’s interim GHG emissions reduction target is for a minimum 30% reduction by 2030 against our 2018 baseline, while maintaining a steady production profile. The basis of this reduction is against a 2018 baseline of 7,541 kt CO2-e.
Our GHG emissions reduction target is grounded in science and has a detailed pathway for achievement. Our target is not static and will be updated as we continue to identify and implement new GHG reduction opportunities.
Ultimately, our vision is net zero GHG emissions by 2050, achieved primarily through GHG reductions, with some offsets for hard-to-abate emissions. Site-level plans to improve energy efficiency, integrate clean and renewable energy sources and reduce GHG emissions will also be strengthened. We plan to supplement our corporate emissions reduction target with context-based site-specific emissions reduction targets.
During the third quarter of 2023, the Group’s total Scope 1 and 2 (location-based) GHG emissions were 1,789 kt CO2-e. Year to date emissions are approximately 6% less than the GHG emissions for the same period year to date in 2022.
Water
Water is a vital and increasingly scarce global resource. Managing and using water responsibly is one of the most critical parts of our sustainability strategy. Our commitment to responsible water use is codified in our Environmental Policy. Steady, reliable access to water is critical to the effective operation of our mines. Access to water is also a fundamental human right.
Understanding the water stress in the regions we operate enables us to better understand the risks and manage our water resources through site-specific water balances, based on the ICMM Water Accounting Framework, aimed at minimizing our water withdrawal and maximizing water reuse and recycling within our operations.
We include each mine’s water risks in its operational risk register. These risks are then aggregated and incorporated into the corporate risk register. Our identified water-related risks include: (1) managing excess water in regions with high rainfall; (2) maintaining access to water in arid areas and regions prone to water scarcity; and (3) regulatory risks related to permitting limits as well as municipal and national regulations for water use.
We set an annual water recycling and reuse target of 80%. Our water recycling and reuse rate for the third quarter of 2023 was approximately 85%. The increase was due to refinement of the Pueblo Viejo water balance accounting and thus the performance for the same period in 2022 is not directly comparable.
Tailings
We are committed to having our TSFs meet global best practices for safety. Our TSFs are carefully engineered and regularly inspected, particularly those in regions with high rainfall and seismic events.
We disclosed our conformance to the GISTM for all Extreme and Very High consequence facilities on the Barrick website on August 4, 2023, within the committed disclosure timeframe. All of our sites that are classified as Very High or Extreme consequence are in conformance with the GISTM. We continue to progress with our conformance for lower consequence facilities in accordance with the GISTM. Disclosures for lower consequence facilities will be completed by August 2025, also in accordance with the GISTM.
Biodiversity
Biodiversity underpins many of the ecosystem services on which our mines and their surrounding communities depend. If improperly managed, mining and exploration activities have the potential to negatively affect biodiversity and ecosystem services. Protecting biodiversity and preventing nature loss is also critical and inextricably linked to the fight against climate change. We work to proactively manage our impact on biodiversity and strive to protect the ecosystems in which we operate. Wherever possible, we aim to achieve a net neutral biodiversity impact, particularly for ecologically sensitive environments.
We continue to work to implement our BAPs. The BAPs outline our strategy to achieve net-neutral impacts for all key biodiversity features and their associated management plans.
| BARRICK THIRD QUARTER 2023 | 12 | MANAGEMENT’S DISCUSSION AND ANALYSIS |
| OVERVIEW | OPERATING PERFORMANCE
|
GROWTH PROJECTS & EXPLORATION
|
REVIEW OF FINANCIAL RESULTS
|
OTHER INFORMATION & NON-GAAP RECONCILIATIONS |
FINANCIAL STATEMENTS |
|||||
Full Year 2023 Outlook
We expect our 2023 gold production to be marginally below the low end of the 4.2 to 4.6 million ounce guidance range that we announced at the start of 2023. We continue to hold ourselves accountable to deliver to the initial commitment and are exploring short-term options to narrow the gap. The deviation from plan was primarily due to equipment issues hindering the ramp-up at Pueblo Viejo. Additionally, Cortez and Carlin are now anticipated to be slightly below their production guidance for the year. We continue to expect a significant increase in the Group’s fourth quarter production volume, with the full year expected to be within 3% of the low end of the range.
At Pueblo Viejo, the plant expansion ramp-up during the third quarter was impacted by equipment failures primarily at the newly installed flotation circuit. Together with the original equipment manufacturer, we have identified the root cause of these failures and the rectification work is underway. We also experienced a further setback early in the fourth quarter with the structural failure of the crusher conveyor. We now expect to reach nameplate capacity for the expanded plant during the first quarter of 2024.
At Nevada Gold Mines, Cortez’s production was primarily impacted by lower than forecasted oxide grades out of Crossroads and a slower than expected ramp-up at Goldrush. At Carlin, production was impacted by slower mining rates in the Gold Quarry pit as well as unplanned downtime at the Goldstrike autoclave in the third quarter, which is also expected to impact the fourth quarter.
Aside from the three aforementioned sites, all other sites are expected to deliver within guidance. Notably, Veladero is now expected to exceed the top end of its 2023 production guidance range.
Our 2023 gold guidance continues to exclude Porgera, pending the execution of landowner compensation agreements and the finalization of a timeline for the resumption of full mine operations which is expected by the end of 2023.
Our 2023 gold cost guidance has been impacted by lower production volumes and we now expect to be slightly above the initial ranges we provided after allowing for the higher gold price impact. These cost guidance ranges were based on a gold price assumption of $1,650 per ounce. We have previously disclosed a sensitivity of approximately $5 per ounce on our 2023 gold cost guidance metrics for every $100 per ounce change in the gold price and based on the realized gold price for the nine months to September 30, 2023, the impact of the higher gold price flowing into higher royalty costs has been approximately $15/oz.
We continue to expect 2023 copper production to be in the range of 420 to 470 million pounds. Production in the final quarter of 2023 is expected to be stronger than the previous three quarters, mainly due to steadily increasing throughput at Lumwana as we execute on our owner-miner strategy and continue to see the benefit of ramping up the new mining fleet. We expect that we will deliver on our group copper cost guidance metrics for 2023 which are based on a copper price assumption of $3.50 per pound.
With respect to our attributable capital expenditures, we expect the full year outcome to be around the midpoint of the guidance range of $2.2-2.6 billion.
Further detail on our 2023 company guidance is provided below, inclusive of the key assumptions that were used as the basis for this guidance as released on February 15, 2023 and as qualified by the risks and uncertainties discussed above.
| Company Guidance |
2023 | |||
| ($ millions, except per ounce/pound data) |
Estimate | |||
| Gold production (millions of ounces) |
4.20 - 4.60 | |||
| Gold cost metrics |
||||
| Cost of sales - gold ($/oz) |
1,170 - 1,250 | |||
| Total cash costs ($/oz)a |
820 - 880 | |||
| Depreciation ($/oz) |
320 - 350 | |||
| All-in sustaining costs ($/oz)a |
1,170 - 1,250 | |||
| Copper production (millions of pounds) |
420 - 470 | |||
| Copper cost metrics |
||||
| Cost of sales - copper ($/lb) |
2.60 - 2.90 | |||
| C1 cash costs ($/lb)a |
2.05 - 2.25 | |||
| Depreciation ($/lb) |
0.80 - 0.90 | |||
| All-in sustaining costs ($/lb)a |
2.95 - 3.25 | |||
| Exploration and project expenses |
400 - 440 | |||
| Exploration and evaluation |
180 - 200 | |||
| Project expenses |
220 - 240 | |||
| General and administrative expenses |
~180 | |||
| Corporate administration |
~130 | |||
| Share-based compensationb |
~50 | |||
| Other expense |
70 - 90 | |||
| Finance costs, net |
280 - 320 | |||
| Attributable capital expenditures: |
||||
| Attributable minesite sustaininga |
1,450 - 1,700 | |||
| Attributable projecta |
750 - 900 | |||
| Total attributable capital expenditures |
2,200 - 2,600 | |||
| Effective income tax ratec |
27% - 32% | |||
| Key assumptions (used for guidance) |
||||
| Gold Price ($/oz) |
1,650 | |||
| Copper Price ($/lb) |
3.50 | |||
| Oil Price (WTI) ($/barrel) |
90 | |||
| AUD Exchange Rate (AUD:USD) |
0.75 | |||
| ARS Exchange Rate (USD:ARS) |
170 | |||
| CAD Exchange Rate (USD:CAD) |
1.30 | |||
| CLP Exchange Rate (USD:CLP) |
900 | |||
| EUR Exchange Rate (EUR:USD) |
1.20 | |||
| a. | Further information on these non-GAAP financial measures, including detailed reconciliations, is included on pages 59 to 76 of this MD&A. |
| b. | Based on a one-month trailing average ending December 31, 2022 of US$17.04 per share. |
| c. | Based on key assumptions included in this table. |
| BARRICK THIRD QUARTER 2023 | 13 | MANAGEMENT’S DISCUSSION AND ANALYSIS |
| OVERVIEW | OPERATING PERFORMANCE
|
GROWTH PROJECTS & EXPLORATION
|
REVIEW OF FINANCIAL RESULTS
|
OTHER INFORMATION & NON-GAAP RECONCILIATIONS |
FINANCIAL STATEMENTS |
|||||
Operating Division Guidance
Our 2023 forecast gold and copper production, cost of salesa, total cash costsb, all-in sustaining costsb, and C1 cash costsb ranges by operating division are as follows:
| Operating Division | 2023 forecast attributable production (000s ozs) |
2023 forecast cost of salesa ($/oz) |
2023 forecast total cash costsb ($/oz) |
2023 forecast
all-in sustaining costsb ($/oz) |
||||||||||||
| Gold | ||||||||||||||||
| Carlin (61.5%) |
910 - 1,000 | 1,030 - 1,110 | 820 - 880 | 1,250 - 1,330 | ||||||||||||
| Cortez (61.5%)c |
580 - 650 | 1,080 - 1,160 | 680 - 740 | 930 - 1,010 | ||||||||||||
| Turquoise Ridge (61.5%) |
300 - 340 | 1,290 - 1,370 | 900 - 960 | 1,170 - 1,250 | ||||||||||||
| Phoenix (61.5%) |
100 - 120 | 1,860 - 1,940 | 880 - 940 | 1,110 - 1,190 | ||||||||||||
| Long Canyon (61.5%) |
0 - 10 | 2,120 - 2,200 | 730 - 790 | 1,080 - 1,160 | ||||||||||||
| Nevada Gold Mines (61.5%) |
1,900 - 2,100 | 1,140 - 1,220 | 790 - 850 | 1,140 - 1,220 | ||||||||||||
| Hemlo |
150 - 170 | 1,400 - 1,480 | 1,210 - 1,270 | 1,590 - 1,670 | ||||||||||||
| North America |
2,100 - 2,300 | 1,160 - 1,240 | 820 - 880 | 1,170 - 1,250 | ||||||||||||
| Pueblo Viejo (60%) |
470 - 520 | 1,130 - 1,210 | 710 - 770 | 960 - 1,040 | ||||||||||||
| Veladero (50%) |
160 - 180 | 1,630 - 1,710 | 1,060 - 1,120 | 1,550 - 1,630 | ||||||||||||
| Porgera (47.5%)d |
— | — | — | — | ||||||||||||
| Latin America & Asia Pacific |
630 - 700 | 1,260 - 1,340 | 800 - 860 | 1,110 - 1,190 | ||||||||||||
| Loulo-Gounkoto (80%) |
510 - 560 | 1,100 - 1,180 | 750 - 810 | 1,070 - 1,150 | ||||||||||||
| Kibali (45%) |
320 - 360 | 1,080 - 1,160 | 710 - 770 | 880 - 960 | ||||||||||||
| North Mara (84%) |
230 - 260 | 1,120 - 1,200 | 900 - 960 | 1,240 - 1,320 | ||||||||||||
| Bulyanhulu (84%) |
160 - 190 | 1,230 - 1,310 | 880 - 940 | 1,160 - 1,240 | ||||||||||||
| Tongon (89.7%) |
180 - 210 | 1,260 - 1,340 | 1,070 - 1,130 | 1,240 - 1,320 | ||||||||||||
| Africa & Middle East |
1,450 - 1,600 | 1,130 - 1,210 | 820 - 880 | 1,080 - 1,160 | ||||||||||||
|
|
||||||||||||||||
| Total Attributable to Barricke,f,g | 4,200 - 4,600 | 1,170 - 1,250 | 820 - 880 | 1,170 - 1,250 | ||||||||||||
| 2023 forecast attributable production (M lbs) |
2023 forecast cost of salesa ($/lb) |
2023 forecast C1 cash costsb ($/lb) |
2023 forecast
all-in sustaining costsb ($/lb) |
|||||||||||||
| Copper | ||||||||||||||||
| Lumwana |
260 - 290 | 2.45 - 2.75 | 2.00 - 2.20 | 3.20 - 3.50 | ||||||||||||
| Zaldívar (50%) |
100 - 110 | 3.40 - 3.70 | 2.60 - 2.80 | 2.90 - 3.20 | ||||||||||||
| Jabal Sayid (50%) |
65 - 75 | 1.80 - 2.10 | 1.50 - 1.70 | 1.60 - 1.90 | ||||||||||||
| Total Copperg | 420 - 470 | 2.60 - 2.90 | 2.05 - 2.25 | 2.95 - 3.25 | ||||||||||||
| a. | Gold cost of sales per ounce is calculated as cost of sales across our gold operations (excluding sites in closure or care and maintenance) divided by ounces sold (both on an attributable basis using Barrick’s ownership share). Copper cost of sales per pound is calculated as cost of sales across our copper operations divided by pounds sold (both on an attributable basis using Barrick’s ownership share). |
| b. | Further information on these non-GAAP financial measures, including detailed reconciliations, is included on pages 59 to 76 of this MD&A. |
| c. | Includes Goldrush. |
| d. | Porgera was placed on temporary care and maintenance on April 25, 2020 and remains excluded from our 2023 guidance. We expect to update our guidance to include Porgera following both the execution of landowner compensation agreements and the finalization of a timeline for the resumption of full mine operations. The granting of the new SML to New Porgera Limited reduced Barrick’s interest in the future production of the Porgera mine from 47.5% to 24.5%. Refer to page 9 for further details. |
| e. | Total cash costs and all-in sustaining costs per ounce include costs allocated to non-operating sites. |
| f. | Operating division guidance ranges reflect expectations at each individual operating division and may not add up to the company-wide guidance range total. Guidance ranges exclude Pierina which is producing incidental ounces while in closure. |
| g. | Includes corporate administration costs. |
| BARRICK THIRD QUARTER 2023 | 14 | MANAGEMENT’S DISCUSSION AND ANALYSIS |
| OVERVIEW | OPERATING PERFORMANCE
|
GROWTH PROJECTS & EXPLORATION
|
REVIEW OF FINANCIAL RESULTS
|
OTHER INFORMATION & NON-GAAP RECONCILIATIONS |
FINANCIAL STATEMENTS |
|||||
Production and Cost Summary - Gold
|
For the three months ended |
||||||||||||||||
| 9/30/23 | 6/30/23 | % Change | 9/30/22 | % Change | ||||||||||||
| Nevada Gold Mines LLC (61.5%)a |
||||||||||||||||
| Gold produced (000s oz) |
478 | 458 | 4 % | 425 | 12 % | |||||||||||
| Cost of sales ($/oz) |
1,273 | 1,357 | (6)% | 1,242 | 2 % | |||||||||||
| Total cash costs ($/oz)b |
921 | 1,009 | (9)% | 924 | 0 % | |||||||||||
| All-in sustaining costs ($/oz)b |
1,286 | 1,388 | (7)% | 1,333 | (4)% | |||||||||||
| Carlin (61.5%) |
||||||||||||||||
| Gold produced (000s oz) |
230 | 248 | (7)% | 229 | 0 % | |||||||||||
| Cost of sales ($/oz) |
1,166 | 1,240 | (6)% | 1,137 | 3 % | |||||||||||
| Total cash costs ($/oz)b |
953 | 1,013 | (6)% | 943 | 1 % | |||||||||||
| All-in sustaining costs ($/oz)b |
1,409 | 1,407 | 0 % | 1,304 | 8 % | |||||||||||
| Cortez (61.5%)c |
||||||||||||||||
| Gold produced (000s oz) |
137 | 110 | 25 % | 98 | 40 % | |||||||||||
| Cost of sales ($/oz) |
1,246 | 1,346 | (7)% | 1,056 | 18 % | |||||||||||
| Total cash costs ($/oz)b |
840 | 972 | (14)% | 770 | 9 % | |||||||||||
| All-in sustaining costs ($/oz)b |
1,156 | 1,453 | (20)% | 1,426 | (19)% | |||||||||||
| Turquoise Ridge (61.5%) |
||||||||||||||||
| Gold produced (000s oz) |
83 | 68 | 22 % | 62 | 34 % | |||||||||||
| Cost of sales ($/oz) |
1,300 | 1,466 | (11)% | 1,509 | (14)% | |||||||||||
| Total cash costs ($/oz)b |
938 | 1,088 | (14)% | 1,105 | (15)% | |||||||||||
| All-in sustaining costs ($/oz)b |
1,106 | 1,302 | (15)% | 1,423 | (22)% | |||||||||||
| Phoenix (61.5%) |
||||||||||||||||
| Gold produced (000s oz) |
26 | 29 | (10)% | 30 | (13)% | |||||||||||
| Cost of sales ($/oz) |
2,235 | 2,075 | 8 % | 1,964 | 14 % | |||||||||||
| Total cash costs ($/oz)b |
1,003 | 948 | 6 % | 953 | 5 % | |||||||||||
| All-in sustaining costs ($/oz)b |
1,264 | 1,132 | 12 % | 1,084 | 17 % | |||||||||||
| Long Canyon (61.5%) |
||||||||||||||||
| Gold produced (000s oz) |
2 | 3 | (33)% | 6 | (67)% | |||||||||||
| Cost of sales ($/oz) |
1,832 | 1,640 | 12 % | 1,769 | 4 % | |||||||||||
| Total cash costs ($/oz)b |
778 | 637 | 22 % | 662 | 18 % | |||||||||||
| All-in sustaining costs ($/oz)b |
831 | 677 | 23 % | 684 | 21 % | |||||||||||
| Pueblo Viejo (60%) |
||||||||||||||||
| Gold produced (000s oz) |
79 | 77 | 3 % | 121 | (35)% | |||||||||||
| Cost of sales ($/oz) |
1,501 | 1,344 | 12 % | 1,097 | 37 % | |||||||||||
| Total cash costs ($/oz)b |
935 | 840 | 11 % | 733 | 28 % | |||||||||||
| All-in sustaining costs ($/oz)b |
1,280 | 1,219 | 5 % | 1,063 | 20 % | |||||||||||
| Loulo-Gounkoto (80%) |
||||||||||||||||
| Gold produced (000s oz) |
142 | 141 | 1 % | 130 | 9 % | |||||||||||
| Cost of sales ($/oz) |
1,087 | 1,150 | (5)% | 1,220 | (11)% | |||||||||||
| Total cash costs ($/oz)b |
773 | 801 | (3)% | 845 | (9)% | |||||||||||
| All-in sustaining costs ($/oz)b |
1,068 | 1,245 | (14)% | 1,216 | (12)% | |||||||||||
| Kibali (45%) |
||||||||||||||||
| Gold produced (000s oz) |
99 | 87 | 14 % | 83 | 19 % | |||||||||||
| Cost of sales ($/oz) |
1,152 | 1,269 | (9)% | 1,047 | 10 % | |||||||||||
| Total cash costs ($/oz)b |
694 | 797 | (13)% | 731 | (5)% | |||||||||||
| All-in sustaining costs ($/oz)b |
801 | 955 | (16)% | 876 | (9)% | |||||||||||
| Veladero (50%) |
||||||||||||||||
| Gold produced (000s oz) |
55 | 54 | 2 % | 41 | 34 % | |||||||||||
| Cost of sales ($/oz) |
1,376 | 1,424 | (3)% | 1,430 | (4)% | |||||||||||
| Total cash costs ($/oz)b |
988 | 999 | (1)% | 893 | 11% | |||||||||||
| All-in sustaining costs ($/oz)b |
1,314 | 1,599 | (18)% | 1,570 | (16)% | |||||||||||
| Porgera (47.5%)d |
||||||||||||||||
| Gold produced (000s oz) |
— | — | — % | — | — % | |||||||||||
| Cost of sales ($/oz) |
— | — | — % | — | — % | |||||||||||
| Total cash costs ($/oz)b |
— | — | — % | — | — % | |||||||||||
| All-in sustaining costs ($/oz)b |
— | — | — % | — | — % | |||||||||||
| BARRICK THIRD QUARTER 2023 | 15 | MANAGEMENT’S DISCUSSION AND ANALYSIS |
| OVERVIEW | OPERATING PERFORMANCE
|
GROWTH PROJECTS & EXPLORATION
|
REVIEW OF FINANCIAL RESULTS
|
OTHER INFORMATION & NON-GAAP RECONCILIATIONS |
FINANCIAL STATEMENTS |
|||||
Production and Cost Summary - Gold (continued)
|
For the three months ended |
||||||||||||||||
| 9/30/23 | 6/30/23 | % Change | 9/30/22 | % Change | ||||||||||||
| Tongon (89.7%) |
||||||||||||||||
| Gold produced (000s oz) |
47 | 44 | 7 % | 41 | 15 % | |||||||||||
| Cost of sales ($/oz) |
1,423 | 1,514 | (6)% | 1,744 | (18)% | |||||||||||
| Total cash costs ($/oz)b |
1,217 | 1,380 | (12)% | 1,462 | (17)% | |||||||||||
| All-in sustaining costs ($/oz)b |
1,331 | 1,465 | (9)% | 1,607 | (17)% | |||||||||||
| Hemlo |
||||||||||||||||
| Gold produced (000s oz) |
31 | 35 | (11)% | 28 | 11 % | |||||||||||
| Cost of sales ($/oz) |
1,721 | 1,562 | 10 % | 1,670 | 3 % | |||||||||||
| Total cash costs ($/oz)b |
1,502 | 1,356 | 11 % | 1,446 | 4 % | |||||||||||
| All-in sustaining costs ($/oz)b |
1,799 | 1,634 | 10 % | 1,865 | (4)% | |||||||||||
| North Mara (84%) |
||||||||||||||||
| Gold produced (000s oz) |
62 | 64 | (3)% | 71 | (13)% | |||||||||||
| Cost of sales ($/oz) |
1,244 | 1,208 | 3 % | 956 | 30 % | |||||||||||
| Total cash costs ($/oz)b |
999 | 942 | 6 % | 737 | 36 % | |||||||||||
| All-in sustaining costs ($/oz)b |
1,429 | 1,355 | 5 % | 951 | 50 % | |||||||||||
| Bulyanhulu (84%) |
||||||||||||||||
| Gold produced (000s oz) |
46 | 49 | (6)% | 48 | (4)% | |||||||||||
| Cost of sales ($/oz) |
1,261 | 1,231 | 2 % | 1,229 | 3 % | |||||||||||
| Total cash costs ($/oz)b |
859 | 850 | 1 % | 898 | (4)% | |||||||||||
| All-in sustaining costs ($/oz)b |
1,132 | 1,105 | 2 % | 1,170 | (3)% | |||||||||||
| Total Attributable to Barricke |
||||||||||||||||
| Gold produced (000s oz) |
1,039 | 1,009 | 3 % | 988 | 5 % | |||||||||||
| Cost of sales ($/oz)f |
1,277 | 1,323 | (3)% | 1,226 | 4 % | |||||||||||
| Total cash costs ($/oz)b |
912 | 963 | (5)% | 891 | 2 % | |||||||||||
| All-in sustaining costs ($/oz)b |
1,255 | 1,355 | (7)% | 1,269 | (1)% | |||||||||||
| a. | These results represent our 61.5% interest in Carlin, Cortez, Turquoise Ridge, Phoenix and Long Canyon. |
| b. | Further information on these non-GAAP financial measures, including detailed reconciliations, is included on pages 59 to 76 of this MD&A. |
| c. | Includes Goldrush. |
| d. | As Porgera was placed on care and maintenance on April 25, 2020, no operating data or per ounce data is provided. |
| e. | Excludes Pierina, which is producing incidental ounces while in closure. |
| f. | Gold cost of sales per ounce is calculated as cost of sales across our gold operations (excluding sites in closure or care and maintenance) divided by ounces sold (both on an attributable basis using Barrick’s ownership share). |
| BARRICK THIRD QUARTER 2023 | 16 | MANAGEMENT’S DISCUSSION AND ANALYSIS |
| OVERVIEW | OPERATING PERFORMANCE
|
GROWTH PROJECTS & EXPLORATION
|
REVIEW OF FINANCIAL RESULTS
|
OTHER INFORMATION & NON-GAAP RECONCILIATIONS |
FINANCIAL STATEMENTS |
|||||
Production and Cost Summary - Copper
| For the three months ended
|
||||||||||||||||
| 9/30/23 | 6/30/23 | % Change | 9/30/22 | % Change | ||||||||||||
| Lumwana |
||||||||||||||||
| Copper production (millions lbs) |
72 | 67 | 7 % | 82 | (12)% | |||||||||||
| Cost of sales ($/lb) |
2.48 | 2.80 | (11)% | 2.19 | 13 % | |||||||||||
| C1 cash costs ($/lb)a |
1.86 | 2.30 | (19)% | 1.78 | 4 % | |||||||||||
| All-in sustaining costs ($/lb)a |
3.41 | 3.29 | 4 % | 3.50 | (3)% | |||||||||||
| Zaldívar (50%) |
||||||||||||||||
| Copper production (millions lbs) |
22 | 22 | 0 % | 23 | (4)% | |||||||||||
| Cost of sales ($/lb) |
3.86 | 3.89 | (1)% | 3.20 | 21 % | |||||||||||
| C1 cash costs ($/lb)a |
2.99 | 3.02 | (1)% | 2.45 | 22 % | |||||||||||
| All-in sustaining costs ($/lb)a |
3.39 | 3.73 | (9)% | 2.94 | 15 % | |||||||||||
| Jabal Sayid (50%) |
||||||||||||||||
| Copper production (millions lbs) |
18 | 18 | 0 % | 18 | 0 % | |||||||||||
| Cost of sales ($/lb) |
1.72 | 1.61 | 7 % | 1.58 | 9 % | |||||||||||
| C1 cash costs ($/lb)a |
1.45 | 1.26 | 15 % | 1.41 | 3 % | |||||||||||
| All-in sustaining costs ($/lb)a |
1.64 | 1.42 | 15 % | 1.52 | 8 % | |||||||||||
| Total Copper |
||||||||||||||||
| Copper production (millions lbs) |
112 | 107 | 5 % | 123 | (9)% | |||||||||||
| Cost of sales ($/lb)b |
2.68 | 2.84 | (6)% | 2.30 | 17 % | |||||||||||
| C1 cash costs ($/lb)a |
2.05 | 2.28 | (10)% | 1.86 | 10 % | |||||||||||
| All-in sustaining costs ($/lb)a |
3.23 | 3.13 | 3 % | 3.13 | 3 % | |||||||||||
| a. | Further information on these non-GAAP financial measures, including detailed reconciliations, is included on pages 59 to 76 of this MD&A. |
| b. | Copper cost of sales per pound is calculated as cost of sales across our copper operations divided by pounds sold (both on an attributable basis using Barrick’s ownership share). |
Operating Performance
In the first quarter of 2023, we re-evaluated our reportable operating segments and started detailed reporting on our interest in Lumwana and no longer provide detailed reporting on our interest in Veladero. As a result, our presentation of reportable operating segments consists of eight gold mines (Carlin, Cortez, Turquoise Ridge, Pueblo Viejo, Loulo-Gounkoto, Kibali, North Mara and Bulyanhulu) and one copper mine (Lumwana). The remaining operating
segments, including our remaining gold and copper mines, have been grouped into an “Other Mines” category and will not be reported on individually. Segment performance is evaluated based on a number of measures including operating income before tax, production levels and unit production costs. Certain costs are managed on a consolidated basis and are therefore not reflected in segment income.
| BARRICK THIRD QUARTER 2023 | 17 | MANAGEMENT’S DISCUSSION AND ANALYSIS |
| OVERVIEW | OPERATING PERFORMANCE
|
GROWTH PROJECTS & EXPLORATION
|
REVIEW OF FINANCIAL RESULTS
|
OTHER INFORMATION & NON-GAAP RECONCILIATIONS |
FINANCIAL STATEMENTS |
|||||
Nevada Gold Mines (61.5%)a, Nevada, USA
Summary of Operating and Financial Data
| For the three months ended | For the nine months ended | |||||||||||||||||||||||||||
| 9/30/23 | 6/30/23 | % Change | 9/30/22 | % Change | 9/30/23 | 9/30/22 | % Change | |||||||||||||||||||||
| Total tonnes mined (000s) |
42,953 | 45,386 | (5)% | 43,388 | (1)% | 124,840 | 134,093 | (7)% | ||||||||||||||||||||
| Open pit ore |
8,374 | 8,311 | 1 % | 5,307 | 58 % | 22,367 | 16,290 | 37 % | ||||||||||||||||||||
| Open pit waste |
33,171 | 35,741 | (7)% | 36,701 | (10)% | 98,484 | 113,673 | (13)% | ||||||||||||||||||||
| Underground |
1,408 | 1,334 | 6 % | 1,380 | 2 % | 3,989 | 4,130 | (3)% | ||||||||||||||||||||
| Average grade (grams/tonne) |
||||||||||||||||||||||||||||
| Open pit mined |
0.80 | 1.20 | (33)% | 1.47 | (46)% | 1.04 | 1.12 | (7)% | ||||||||||||||||||||
| Underground mined |
9.28 | 8.75 | 6 % | 8.61 | 8 % | 8.88 | 8.86 | 0 % | ||||||||||||||||||||
| Processed |
1.99 | 2.17 | (8)% | 2.69 | (26)% | 2.14 | 2.49 | (14)% | ||||||||||||||||||||
| Ore tonnes processed (000s) |
10,014 | 9,054 | 11 % | 7,594 | 32 % | 26,435 | 24,821 | 7 % | ||||||||||||||||||||
| Oxide mill |
2,299 | 2,385 | (4)% | 3,037 | (24)% | 7,409 | 9,018 | (18)% | ||||||||||||||||||||
| Roaster |
1,364 | 1,199 | 14 % | 1,408 | (3)% | 3,568 | 4,141 | (14)% | ||||||||||||||||||||
| Autoclave |
959 | 808 | 19 % | 1,172 | (18)% | 2,483 | 3,346 | (26)% | ||||||||||||||||||||
| Heap leach |
5,392 | 4,662 | 16 % | 1,977 | 173 % | 12,975 | 8,316 | 56 % | ||||||||||||||||||||
| Recovery rateb |
85 % | 83 % | 2 % | 78 % | 9 % | 83 % | 77 % | 8 % | ||||||||||||||||||||
| Oxide Millb |
82 % | 77 % | 6 % | 71 % | 15 % | 78 % | 71 % | 10 % | ||||||||||||||||||||
| Roaster |
86 % | 86 % | 0 % | 86 % | 0 % | 86 % | 85 % | 1 % | ||||||||||||||||||||
| Autoclave |
84 % | 81 % | 4 % | 66 % | 27 % | 82 % | 65 % | 26 % | ||||||||||||||||||||
| Gold produced (000s oz) |
478 | 458 | 4 % | 425 | 12 % | 1,352 | 1,346 | 0 % | ||||||||||||||||||||
| Oxide mill |
96 | 86 | 12 % | 79 | 22 % | 285 | 223 | 28 % | ||||||||||||||||||||
| Roaster |
228 | 247 | (8)% | 236 | (3)% | 657 | 707 | (7)% | ||||||||||||||||||||
| Autoclave |
106 | 90 | 18 % | 83 | 28 % | 278 | 263 | 6 % | ||||||||||||||||||||
| Heap leach |
48 | 35 | 37 % | 27 | 78 % | 132 | 153 | (14)% | ||||||||||||||||||||
| Gold sold (000s oz) |
480 | 458 | 5 % | 424 | 13 % | 1,349 | 1,345 | 0 % | ||||||||||||||||||||
| Revenue ($ millions) |
945 | 922 | 2 % | 744 | 27 % | 2,674 | 2,510 | 7 % | ||||||||||||||||||||
| Cost of sales ($ millions) |
614 | 624 | (2)% | 531 | 16 % | 1,844 | 1,630 | 13 % | ||||||||||||||||||||
| Income ($ millions) |
314 | 287 | 9 % | 215 | 46 % | 790 | 880 | (10)% | ||||||||||||||||||||
| EBITDA ($ millions)c |
460 | 425 | 8 % | 332 | 39 % | 1,214 | 1,269 | (4)% | ||||||||||||||||||||
| EBITDA margind |
49 % | 46 % | 7 % | 45 % | 9 % | 45 % | 51 % | (12)% | ||||||||||||||||||||
| Capital expenditures ($ millions) |
213 | 208 | 2 % | 191 | 12 % | 590 | 538 | 10 % | ||||||||||||||||||||
| Minesite sustainingc |
162 | 162 | 0 % | 163 | (1)% | 461 | 456 | 1 % | ||||||||||||||||||||
| Projectc |
51 | 46 | 11 % | 28 | 82 % | 129 | 82 | 57 % | ||||||||||||||||||||
| Cost of sales ($/oz) |
1,273 | 1,357 | (6)% | 1,242 | 2 % | 1,359 | 1,193 | 14 % | ||||||||||||||||||||
| Total cash costs ($/oz)c |
921 | 1,009 | (9)% | 924 | 0 % | 998 | 865 | 15 % | ||||||||||||||||||||
| All-in sustaining costs ($/oz)c |
1,286 | 1,388 | (7)% | 1,333 | (4)% | 1,366 | 1,227 | 11 % | ||||||||||||||||||||
| All-in costs ($/oz)c |
1,389 | 1,489 | (7)% | 1,398 | (1)% | 1,461 | 1,288 | 13 % | ||||||||||||||||||||
| a. | Barrick is the operator of NGM and owns 61.5%, with Newmont Corporation owning the remaining 38.5%. NGM is accounted for as a subsidiary with a 38.5% non-controlling interest. These results represent our 61.5% interest in Carlin, Cortez, Turquoise Ridge, Phoenix and Long Canyon. |
| b. | Excludes the Gold Quarry (Mill 5) concentrator. |
| c. | Further information on these non-GAAP financial measures, including detailed reconciliations, is included on pages 59 to 76 of this MD&A. |
| d. | Represents EBITDA divided by revenue. |
NGM includes Carlin, Cortez, Turquoise Ridge, Phoenix and Long Canyon. Barrick is the operator of the joint venture and owns 61.5%, with Newmont owning the remaining 38.5%. Refer to the following pages for a detailed discussion of each minesite’s results.
| BARRICK THIRD QUARTER 2023 | 18 | MANAGEMENT’S DISCUSSION AND ANALYSIS |
| OVERVIEW | OPERATING PERFORMANCE
|
GROWTH PROJECTS & EXPLORATION
|
REVIEW OF FINANCIAL RESULTS
|
OTHER INFORMATION & NON-GAAP RECONCILIATIONS |
FINANCIAL STATEMENTS |
|||||
Carlin (61.5%), Nevada, USA
Summary of Operating and Financial Data
| For the three months ended | For the nine months ended | |||||||||||||||||||||||||||
| 9/30/23 | 6/30/23 | % Change | 9/30/22 | % Change | 9/30/23 | 9/30/22 | % Change | |||||||||||||||||||||
| Total tonnes mined (000s) |
19,674 | 18,690 | 5 % |
17,574 | 12 % |
52,721 | 56,125 | (6)% |
||||||||||||||||||||
| Open pit ore |
600 | 1,641 | (63)% | 2,274 | (74)% | 3,328 | 4,738 | (30)% | ||||||||||||||||||||
| Open pit waste |
18,271 | 16,290 | 12 % | 14,524 | 26 % | 47,115 | 48,900 | (4)% | ||||||||||||||||||||
| Underground |
803 | 759 | 6 % | 776 | 3 % | 2,278 | 2,487 | (8)% | ||||||||||||||||||||
| Average grade (grams/tonne) |
||||||||||||||||||||||||||||
| Open pit mined |
1.50 | 2.80 | (46)% | 2.34 | (36)% | 2.46 | 1.77 | 39 % | ||||||||||||||||||||
| Underground mined |
7.98 | 7.76 | 3 % | 7.98 | 0 % | 7.82 | 8.07 | (3)% | ||||||||||||||||||||
| Processed |
4.74 | 4.55 | 4 % | 3.42 | 39 % | 4.48 | 3.41 | 31 % | ||||||||||||||||||||
| Ore tonnes processed (000s) |
1,707 | 2,072 | (18)% |
2,902 | (41)% |
5,416 | 8,988 | (40)% |
||||||||||||||||||||
| Oxide mill |
0 | 0 | 0 % | 618 | (100)% | 377 | 1,831 | (79)% | ||||||||||||||||||||
| Roasters |
1,219 | 1,047 | 16 % | 1,161 | 5 % | 3,118 | 3,402 | (8)% | ||||||||||||||||||||
| Autoclave |
349 | 384 | (9)% | 555 | (37)% | 821 | 1,672 | (51)% | ||||||||||||||||||||
| Heap leach |
139 | 641 | (78)% | 568 | (76)% | 1,100 | 2,083 | (47)% | ||||||||||||||||||||
| Recovery ratea |
85 % | 84 % | 1 % |
78 % | 9 % |
84% | 77 % | 9 % |
||||||||||||||||||||
| Roasters |
86 % | 86 % | 0 % | 85 % | 1 % | 86% | 85 % | 1 % | ||||||||||||||||||||
| Autoclave |
80 % | 69 % | 16 % | 47 % | 70 % | 74% | 44 % | 68% | ||||||||||||||||||||
| Gold produced (000s oz) |
230 | 248 | (7)% |
229 | 0 % |
644 | 701 | (8)% |
||||||||||||||||||||
| Oxide mill |
0 | 0 | 0 % | 10 | (100)% | 4 | 32 | (88)% | ||||||||||||||||||||
| Roasters |
194 | 213 | (9)% | 184 | 5 % | 558 | 559 | 0 % | ||||||||||||||||||||
| Autoclave |
27 | 26 | 4 % | 24 | 13 % | 58 | 72 | (19)% | ||||||||||||||||||||
| Heap leach |
9 | 9 | 0 % | 11 | (18)% | 24 | 38 | (37)% | ||||||||||||||||||||
| Gold sold (000s oz) |
238 | 243 | (2)% | 226 | 5 % | 645 | 702 | (8)% | ||||||||||||||||||||
| Revenue ($ millions) |
461 | 479 | (4)% | 390 | 18 % | 1,254 | 1,285 | (2)% | ||||||||||||||||||||
| Cost of sales ($ millions) |
282 | 304 | (7)% | 261 | 8 % | 828 | 772 | 7 % | ||||||||||||||||||||
| Income ($ millions) |
174 | 169 | 3 % | 123 | 41 % | 409 | 514 | (20)% | ||||||||||||||||||||
| EBITDA ($ millions)b |
225 | 225 | 0 % | 168 | 34 % | 555 | 651 | (15)% | ||||||||||||||||||||
| EBITDA marginc |
49 % | 47 % | 4 % | 43 % | 14 % | 44 % | 51 % | (14)% | ||||||||||||||||||||
| Capital expenditures ($ millions) |
103 | 90 | 14 % | 76 | 36 % | 265 | 221 | 20 % | ||||||||||||||||||||
| Minesite sustainingb |
103 | 90 | 14 % | 76 | 36 % | 265 | 221 | 20 % | ||||||||||||||||||||
| Projectb |
0 | 0 | 0 % | 0 | 0 % | 0 | 0 | 0 % | ||||||||||||||||||||
| Cost of sales ($/oz) |
1,166 | 1,240 | (6)% | 1,137 | 3 % | 1,266 | 1,064 | 19 % | ||||||||||||||||||||
| Total cash costs ($/oz)b |
953 | 1,013 | (6)% | 943 | 1 % | 1,042 | 877 | 19 % | ||||||||||||||||||||
| All-in sustaining costs ($/oz)b |
1,409 | 1,407 | 0 % | 1,304 | 8 % | 1,480 | 1,211 | 22 % | ||||||||||||||||||||
| All-in costs ($/oz)b |
1,409 | 1,407 | 0 % | 1,304 | 8 % | 1,480 | 1,211 | 22 % | ||||||||||||||||||||
| a. | Excludes the Gold Quarry (Mill 5) concentrator. |
| b. | Further information on these non-GAAP financial measures, including detailed reconciliations, is included on pages 59 to 76 of this MD&A. |
| c. | Represents EBITDA divided by revenue. |
Safety and Environment
| For the three months ended | ||||||||
| 9/30/23 | 6/30/23 | |||||||
| LTI |
2 | 1 | ||||||
| LTIFR3 |
1.02 | 1.07 | ||||||
| TRIFR3 |
2.47 | 1.93 | ||||||
| Class 14 environmental incidents |
0 | 0 | ||||||
Financial Results
Q3 2023 compared to Q2 2023
Carlin’s income for the third quarter of 2023 was 3% higher than the prior quarter primarily due to a lower cost of sales per ounce2, partially offset by marginally lower sales volumes and a lower realized gold price1.
Gold production in the third quarter of 2023 was 7% lower compared to the prior quarter primarily due to the lower average grade processed at the roasters. This was mainly driven by lower open pit ore tonnes mined at a lower average grade as mining in the Goldstar open pit was substantially completed early in the third quarter, leading to a higher proportion of lower grade stockpile tonnes processed at the roasters. This was partially offset by an increase in underground ore tonnes mined and processed
| BARRICK THIRD QUARTER 2023 | 19 | MANAGEMENT’S DISCUSSION AND ANALYSIS |
| OVERVIEW | OPERATING PERFORMANCE
|
GROWTH PROJECTS & EXPLORATION
|
REVIEW OF FINANCIAL RESULTS
|
OTHER INFORMATION & NON-GAAP RECONCILIATIONS |
FINANCIAL STATEMENTS |
|||||
and at a higher average grade. In addition, throughput and recovery were also higher compared to the prior quarter.
Total tonnes mined were 5% higher compared to the prior quarter, primarily driven by open pit sequencing per the mine plan. Open pit waste tonnes increased from both the Gold Quarry and the next phase of South Arturo. Open pit ore tonnes and grade mined were 63% and 46% lower, respectively, compared to the prior quarter, driven by a decrease in ore tonnes and grades at both Gold Quarry and South Arturo. At Gold Quarry, mining was slower than planned due to geotechnical impacts on the highwall and working through historic underground workings. This was combined with lower tonnes mined at the Goldstar open pit as mining of phase 4 was substantially completed early in the third quarter, with only small ramp retreats remaining. Underground tonnes mined were 6% higher than the prior quarter, due to mine sequencing and productivity improvements across Carlin’s underground operations while the average grade mined was slightly higher than the prior quarter.
Cost of sales per ounce2 and total cash costs per ounce1 in the third quarter of 2023 were both 6% lower than the prior quarter, largely reflecting reduced operating and maintenance costs, combined with higher capitalized waste stripping. This was partially offset by the lower average grade processed. In the third quarter of 2023, all-in sustaining costs per ounce1 were in line with the prior quarter as lower total cash costs per ounce1 was offset by higher minesite sustaining capital expenditures1.
Capital expenditures in the third quarter of 2023 increased by 14% compared to prior quarter, primarily due to higher capitalized waste stripping and underground development as per the mine plan.
Q3 2023 compared to Q3 2022
Carlin’s income for the three month period ended September 30, 2023 was 41% higher than the same prior year period due to higher sales volumes and a higher realized gold price1, partially offset by a higher cost of sales per ounce2.
Gold production for the three month period ended September 30, 2023 was in line with the same prior year period as increased production at the roasters and autoclave, owing to higher grades and throughput at the roasters and higher recoveries at the autoclave, was offset by the closure of the Gold Quarry concentrator at the end of the first quarter of 2023.
Total tonnes mined were 12% higher than the same prior year period with waste stripping ramping up at the next phase of South Arturo, whereas there was no mining at South Arturo in the same prior year period. This was offset by lower tonnes mined at Goldstar as mining of phase 4 was substantially completed at the beginning of the third quarter and the completion of the Goldstrike 5th NW pit in the fourth quarter of 2022. Average open pit mined grade decreased by 36% compared to the same prior year period, primarily due to completion of mining at the Goldstrike 5th NW pit. Underground tonnes mined were 3% higher while grade was in line with the same prior year period, driven by a change in the mix of ore sources across the different underground operations, as per the mine plan.
Cost of sales per ounce2 and total cash costs per ounce1 for the three month period ended September 30, 2023 were 3% and 1% higher, respectively, than the same prior year period, primarily due to higher maintenance costs related to timing. For the three month period ended September 30, 2023, all-in sustaining costs per ounce1 increased by 8% compared to the same prior year period,
mainly due to higher total cash costs per ounce1, combined with higher minesite sustaining capital expenditures1.
Capital expenditures in the third quarter of 2023 were 36% higher compared with the same prior year period, mainly due to higher capitalized waste stripping and underground development as per the mine plan.
YTD 2023 compared to YTD 2022
Carlin’s income for the nine month period ended September 30, 2023 was 20% lower than the same prior year period, mainly due to lower sales volume and an increase in cost of sales per ounce2. This was partially offset by a higher realized gold price1.
Gold production for the nine month period ended September 30, 2023 was 8% lower than the same prior year period, mainly due to the closure of the Gold Quarry concentrator at the end of the first quarter of 2023, combined with lower leach production driven by the leach cycle. In addition, production was impacted by the autoclave conversion from RIL to CIL in the first quarter of 2023 and the planned maintenance shutdowns at both roasters that occurred earlier in 2023. This was partially offset by a higher average grade processed.
Total tonnes mined decreased by 6% compared to the same prior year period. At the open pit operations, waste tonnes mined were lower, primarily driven by record snowfall levels impacting the first quarter of 2023, as well as open pit sequencing per the mine plan. This was partially offset by an increase in ore tonnes mined from the Goldstar open pit, where mining continued to advance in ore, resulting in lower waste tonnes mined compared to the same prior year period. In addition, waste stripping ramped-up at the next phase of South Arturo whereas there was no mining at South Arturo in the same prior year period. Average open pit mined grade increased by 39% compared to the same prior year period, primarily due to the progression of mining in the Gold Quarry and Goldstar open pits. Underground tonnes and grade mined were 8% and 3% lower, respectively, compared to the same prior year period, driven by a change in the mix of ore sources across the different underground operations, as per the mine plan.
Cost of sales per ounce2 and total cash costs per ounce1 for the nine month period ended September 30, 2023 were both 19% higher than the same prior year period, due to higher maintenance costs driven by the planned shutdowns at both roasters in 2023, higher maintenance costs related to the open pit trucks that are scheduled to be replaced in 2024, combined with the impact of lower sales volumes. For the nine month period ended September 30, 2023, all-in sustaining costs per ounce1 were 22% higher than the same prior year period, mainly due to higher total cash costs per ounce1, combined with higher minesite sustaining capital expenditures1.
Capital expenditures for the nine month period ended September 30, 2023 increased by 20%, primarily due to the continuing advancement of projects related to processing facilities and underground development, along with the timing of open pit and underground mobile equipment deliveries across Carlin’s mining operations.
| BARRICK THIRD QUARTER 2023 | 20 | MANAGEMENT’S DISCUSSION AND ANALYSIS |
| OVERVIEW | OPERATING PERFORMANCE
|
GROWTH PROJECTS & EXPLORATION
|
REVIEW OF FINANCIAL RESULTS
|
OTHER INFORMATION & NON-GAAP RECONCILIATIONS |
FINANCIAL STATEMENTS |
|||||
Cortez (61.5%)a, Nevada, USA
Summary of Operating and Financial Data
| For the three months ended | For the nine months ended | |||||||||||||||||||||||||||
| 9/30/23 | 6/30/23 | % Change | 9/30/22 | % Change | 9/30/23 | 9/30/22 | % Change | |||||||||||||||||||||
| Total tonnes mined (000s) |
16,613 | 20,143 | (18)% | 18,896 | (12)% | 52,082 | 55,124 | (6)% | ||||||||||||||||||||
| Open pit ore |
5,168 | 4,104 | 26 % | 540 | 857% | 11,444 | 3,247 | 252% | ||||||||||||||||||||
| Open pit waste |
11,062 | 15,682 | (29)% | 17,993 | (39)% | 39,600 | 50,898 | (22)% | ||||||||||||||||||||
| Underground |
383 | 357 | 7 % | 363 | 6 % | 1,038 | 979 | 6 % | ||||||||||||||||||||
| Average grade (grams/tonne) |
||||||||||||||||||||||||||||
| Open pit mined |
0.76 | 0.79 | (4)% | 0.44 | 73 % | 0.78 | 0.85 | (8)% | ||||||||||||||||||||
| Underground mined |
9.65 | 9.21 | 5 % | 9.43 | 2 % | 9.41 | 9.58 | (2)% | ||||||||||||||||||||
| Processed |
1.17 | 1.21 | (3)% | 3.21 | (64)% | 1.31 | 2.29 | (43)% | ||||||||||||||||||||
| Ore tonnes processed (000s) |
5,266 | 3,973 | 33 % | 1,092 | 382 % | 11,776 | 4,536 | 160% | ||||||||||||||||||||
| Oxide mill |
627 | 630 | 0 % | 617 | 2 % | 1,821 | 1,899 | (4)% | ||||||||||||||||||||
| Roasters |
145 | 152 | (5)% | 247 | (41) % | 450 | 739 | (39)% | ||||||||||||||||||||
| Heap leach |
4,494 | 3,191 | 41 % | 228 | 1,871 % | 9,505 | 1,898 | 401 % | ||||||||||||||||||||
| Recovery rate |
86 % | 82 % | 5 % | 81 % | 6 % | 84 % | 80 % | 5 % | ||||||||||||||||||||
| Oxide Mill |
85 % | 80 % | 6 % | 72 % | 18 % | 82 % | 71 % | 15 % | ||||||||||||||||||||
| Roasters |
88 % | 87 % | 1 % | 88 % | 0 % | 87 % | 88 % | (1)% | ||||||||||||||||||||
| Gold produced (000s oz) |
137 | 110 | 25 % | 98 | 40 % | 387 | 310 | 25 % | ||||||||||||||||||||
| Oxide Mill |
67 | 55 | 22 % | 38 | 76 % | 191 | 105 | 82 % | ||||||||||||||||||||
| Roasters |
33 | 33 | 0 % | 52 | (37)% | 97 | 148 | (34)% | ||||||||||||||||||||
| Heap leach |
37 | 22 | 68 % | 8 | 363 % | 99 | 57 | 74 % | ||||||||||||||||||||
| Gold sold (000s oz) |
135 | 112 | 21 % | 99 | 36 % | 384 | 312 | 23 % | ||||||||||||||||||||
| Revenue ($ millions) |
259 | 220 | 18 % | 169 | 53 % | 741 | 568 | 30 % | ||||||||||||||||||||
| Cost of sales ($ millions) |
168 | 150 | 12 % | 105 | 60 % | 500 | 347 | 44 % | ||||||||||||||||||||
| Income ($ millions) |
87 | 66 | 32 % | 62 | 40 % | 231 | 214 | 8 % | ||||||||||||||||||||
| EBITDA ($ millions)b |
141 | 107 | 32 % | 90 | 57 % | 382 | 310 | 23 % | ||||||||||||||||||||
| EBITDA marginc |
54 % | 49 % | 10 % | 53 % | 2 % | 52 % | 55 % | (5)% | ||||||||||||||||||||
| Capital expenditures ($ millions) |
56 | 68 | (18)% | 80 | (30)% | 180 | 209 | (14)% | ||||||||||||||||||||
| Minesite sustainingb |
38 | 50 | (24)% | 63 | (40)% | 129 | 165 | (22)% | ||||||||||||||||||||
| Projectb |
18 | 18 | 0 % | 17 | 6 % | 51 | 44 | 16 % | ||||||||||||||||||||
| Cost of sales ($/oz) |
1,246 | 1,346 | (7)% | 1,056 | 18 % | 1,303 | 1,112 | 17 % | ||||||||||||||||||||
| Total cash costs ($/oz)b |
840 | 972 | (14)% | 770 | 9 % | 905 | 800 | 13 % | ||||||||||||||||||||
| All-in sustaining costs ($/oz)b |
1,156 | 1,453 | (20)% | 1,426 | (19)% | 1,270 | 1,355 | (6)% | ||||||||||||||||||||
| All-in costs ($/oz)b |
1,290 | 1,618 | (20)% | 1,602 | (19)% | 1,404 | 1,498 | (6)% | ||||||||||||||||||||
| a. | Includes Goldrush. |
| b. | Further information on these non-GAAP financial measures, including detailed reconciliations, is included on pages 59 to 76 of this MD&A. |
| c. | Represents EBITDA divided by revenue. |
Safety and Environment
| For the three months ended | ||||||||
| 9/30/23 | 6/30/23 | |||||||
| LTI |
0 | 1 | ||||||
| LTIFR3 |
0 | 0.94 | ||||||
| TRIFR3 |
0.93 | 1.88 | ||||||
| Class 14 environmental incidents |
0 | 0 | ||||||
Financial Results
Q3 2023 compared to Q2 2023
Cortez’s income for the third quarter of 2023 was 32% higher than the prior quarter due to higher sales volumes and lower cost of sales per ounce2, partially offset by a lower realized gold price1.
Gold production in the third quarter of 2023 was 25% higher than the prior quarter, resulting from higher production sourced from ore mined at the Crossroads open pit, and processed at both at the oxide mill and the leach pad. Additional oxide mill ounces were also produced from Cortez Hills underground combined with higher refractory production from both CHUG and the Goldrush bulk sample.
Total tonnes mined were 18% lower compared to the prior quarter primarily driven by lower waste tonnes mined at the open pits. Open pit ore tonnes mined were 26% higher than the prior quarter with the average grade mined 4% lower. This was mainly due to mine sequencing
| BARRICK THIRD QUARTER 2023 | 21 | MANAGEMENT’S DISCUSSION AND ANALYSIS |
| OVERVIEW | OPERATING PERFORMANCE
|
GROWTH PROJECTS & EXPLORATION
|
REVIEW OF FINANCIAL RESULTS
|
OTHER INFORMATION & NON-GAAP RECONCILIATIONS |
FINANCIAL STATEMENTS |
|||||
at both Crossroads and Cortez Pits. Underground tonnes mined were 7% higher than the prior quarter, driven by the mine sequence and planned major maintenance performed on the Cortez Hills conveyor, which was completed in the second quarter. Underground grades mined were 5% higher than the prior quarter.
Cost of sales per ounce2 and total cash costs per ounce1 in the third quarter of 2023 were 7% and 14% lower, respectively, than the prior quarter, primarily due to a higher proportion of lower cost oxide ounces in the sales mix, lower operating and maintenance costs on refractory production, partially offset by higher fuel prices. In the third quarter of 2023, all-in sustaining costs per ounce1 were 20% lower than the prior quarter, driven by lower total cash costs per ounce1, combined with decreased minesite sustaining capital expenditures1.
Capital expenditures in the third quarter of 2023 were 18% lower than the prior quarter, primarily due to lower minesite sustaining expenditures1. Minesite sustaining capital expenditures1 were 24% lower compared to the prior quarter, mainly due to lower capitalized waste stripping and a reduction in the number of new haul trucks commissioned.
Q3 2023 compared to Q3 2022
Cortez’s income for the three month period ended September 30, 2023 was 40% higher than the same prior year period, primarily due to a higher sales volume and a higher realized gold price1, partially offset by a higher cost of sales per ounce2.
Gold production for the three month period ended September 30, 2023 was 40% higher than the same prior year period, primarily driven by higher production sourced from ore mined at the Crossroads open pit, and processed at both at the oxide mill and the leach pad. This was combined with higher underground production, slightly offset by lower refractory ore sourced from the Pipeline open pit.
Total tonnes mined were 12% lower compared to the same prior year period, driven by lower open pit waste tonnes mined, partially offset by higher open pit ore tonnes mined and improved underground performance. Open pit ore tonnes and grade mined were almost nine times higher and 73% higher, respectively, compared to the same prior year period, driven by mine plan sequencing at Crossroads and the development of Cortez Pits. Underground tonnes mined increased by 6% over the same prior year period, primarily driven by Cortez Hills underground and increased development activity at Goldrush underground.
Cost of sales per ounce2 and total cash costs per ounce1 for the three month period ended September 30, 2023 were 18% and 9% higher, respectively, than the same prior year period, due to lower grades processed, reflecting a substantially higher proportion of ounces sourced from the open pit operations. For the three month period ended September 30, 2023, all-in sustaining costs per ounce1 decreased by 19% compared to the same prior year period, due to lower minesite sustaining capital expenditures, partially offset by higher total cash costs per ounce1.
Capital expenditures for the three month period ended September 30, 2023 decreased by 30% from the same prior year period, due to lower minesite sustaining capital expenditures1, while project capital expenditures1 were slightly higher than the prior year period. Minesite sustaining capital expenditures1 were 40% lower than the
same prior year period resulting from lower capitalized waste stripping, primarily at Crossroads. Project capital expenditures1 were 6% higher than the same prior year period due to increased activity at Goldrush.
YTD 2023 compared to YTD 2022
Cortez’s income for the nine month period ended September 30, 2023 was 8% higher than the same prior year period, primarily due to higher sales volume and a higher realized gold price1, partially offset by a higher cost of sales per ounce2.
Gold production for the nine month period ended September 30, 2023 was 25% higher than the same prior year period. This was primarily driven by higher oxide ore tonnes mined and processed from Crossroads and Cortez Hills underground (at a higher recovery rate), combined with higher heap leach production. This was partially offset by a decrease in refractory ore shipped and processed at the Carlin roasters.
Total tonnes mined were 6% lower than the same prior year period primarily due to lower open pit waste mined. Open pit ore tonnes mined were 252% higher compared to the same prior year period, primarily driven by the transition from the Pipeline pit, which ceased mining operations in the first quarter of 2022, to the next phases at Crossroads and Cortez Pits which have predominantly been mining in ore this year. Underground tonnes mined increased by 6% over the same prior year period, driven by Cortez Hills underground and increased development activity at Goldrush.
Cost of sales per ounce2 and total cash costs per ounce1 for the nine month period ended September 30, 2023 were 17% and 13% higher, respectively, than the same prior year period due to lower grades processed, reflecting a higher proportion of ounces sourced from the open pit operations, combined with lower capitalized waste stripping. For the nine month period ended September 30, 2023, all-in sustaining costs per ounce1 decreased by 6% compared to the same prior year period, due to lower minesite sustaining capital expenditures1, partially offset by higher total cash costs per ounce1.
Capital expenditures for the nine month period ended September 30, 2023 decreased by 14% from the same prior year period, due to lower minesite sustaining capital expenditures1, partially offset by higher project capital expenditures1. Minesite sustaining capital expenditures1 were 22% lower compared to the same prior year period, primarily due to a decrease in capitalized waste stripping at Crossroads. Project capital expenditures1 were 16% higher due to increased activity at Goldrush.
| BARRICK THIRD QUARTER 2023 | 22 | MANAGEMENT’S DISCUSSION AND ANALYSIS |
| OVERVIEW | OPERATING PERFORMANCE
|
GROWTH PROJECTS & EXPLORATION
|
REVIEW OF FINANCIAL RESULTS
|
OTHER INFORMATION & NON-GAAP RECONCILIATIONS |
FINANCIAL STATEMENTS |
|||||
Turquoise Ridge (61.5%), Nevada, USA
Summary of Operating and Financial Data
| For the three months ended | For the nine months ended | |||||||||||||||||||||||||||||
| 9/30/23 | 6/30/23 | % Change | 9/30/22 | % Change | 9/30/23 | 9/30/22 | % Change | |||||||||||||||||||||||
| Total tonnes mined (000s) |
222 | 218 | 2 % | 241 | (8)% | 673 | 687 | (2)% | ||||||||||||||||||||||
| Open pit ore |
0 | 0 | 0 % | 0 | 0 % | 0 | 24 | (100)% | ||||||||||||||||||||||
| Underground |
222 | 218 | 2 % | 241 | (8)% | 673 | 663 | 2 % | ||||||||||||||||||||||
| Average grade (grams/tonne) |
||||||||||||||||||||||||||||||
| Open pit mined |
n/a | n/a | n/a | n/a | n/a | n/a | 1.52 | n/a | ||||||||||||||||||||||
| Underground mined |
12.73 | 11.22 | 13 % | 9.48 | 34 % | 11.36 | 10.76 | 6 % | ||||||||||||||||||||||
| Processed |
4.37 | 4.85 | (10)% | 3.61 | 21 % | 4.29 | 4.06 | 6 % | ||||||||||||||||||||||
| Ore tonnes processed (000s) |
704 | 504 | 40 % | 699 | 1 % | 1,937 | 1,939 | 0 % | ||||||||||||||||||||||
| Oxide Mill |
94 | 80 | 18 % | 82 | 15 % | 275 | 265 | 4 % | ||||||||||||||||||||||
| Autoclave |
610 | 424 | 44 % | 617 | (1)% | 1,662 | 1,674 | (1)% | ||||||||||||||||||||||
| Recovery rate |
86 % | 87 % | (1)% | 78 % | 10 % | 85 % | 80 % | 6 % | ||||||||||||||||||||||
| Oxide Mill |
87 % | 85 % | 2 % | 89 % | (2)% | 86 % | 83 % | 4 % | ||||||||||||||||||||||
| Autoclave |
86 % | 87 % | (1)% | 78 % | 10 % | 85 % | 79 % | 8 % | ||||||||||||||||||||||
| Gold produced (000s oz) |
83 | 68 | 22 % | 62 | 34 % | 232 | 204 | 14 % | ||||||||||||||||||||||
| Oxide Mill |
4 | 3 | 33 % | 1 | 300 % | 10 | 7 | 43 % | ||||||||||||||||||||||
| Autoclave |
79 | 64 | 23 % | 59 | 34 % | 220 | 191 | 15 % | ||||||||||||||||||||||
| Heap leach |
0 | 1 | (100)% | 2 | (100)% | 2 | 6 | (67)% | ||||||||||||||||||||||
| Gold sold (000s oz) |
78 | 72 | 8 % | 64 | 22 % | 232 | 204 | 14 % | ||||||||||||||||||||||
| Revenue ($ millions) |
150 | 143 | 5 % | 108 | 39 % | 449 | 371 | 21 % | ||||||||||||||||||||||
| Cost of sales ($ millions) |
101 | 106 | (5)% | 95 | 6 % | 323 | 286 | 13 % | ||||||||||||||||||||||
| Income ($ millions) |
49 | 35 | 40 % | 11 | 345 % | 124 | 81 | 53 % | ||||||||||||||||||||||
| EBITDA ($ millions)a |
77 | 61 | 26 % | 36 | 114 % | 209 | 159 | 31 % | ||||||||||||||||||||||
| EBITDA marginb |
51 % | 43 % | 19 % | 33 % | 55 % | 47 % | 43 % | 9 % | ||||||||||||||||||||||
| Capital expenditures ($ millions) |
13 | 15 | (13)% | 28 | (54)% | 49 | 74 | (34)% | ||||||||||||||||||||||
| Minesite sustaininga |
12 | 14 | (14)% | 19 | (37)% | 44 | 52 | (15)% | ||||||||||||||||||||||
| Projecta |
1 | 1 | 0 % | 9 | (89)% | 5 | 22 | (77)% | ||||||||||||||||||||||
| Cost of sales ($/oz) |
1,300 | 1,466 | (11)% | 1,509 | (14)% | 1,391 | 1,403 | (1)% | ||||||||||||||||||||||
| Total cash costs ($/oz)a |
938 | 1,088 | (14)% | 1,105 | (15)% | 1,018 | 1,015 | 0 % | ||||||||||||||||||||||
| All-in sustaining costs ($/oz)a |
1,106 | 1,302 | (15)% | 1,423 | (22)% | 1,225 | 1,292 | (5)% | ||||||||||||||||||||||
| All-in costs ($/oz)a |
1,114 | 1,310 | (15)% | 1,559 | (29)% | 1,242 | 1,398 | (11)% | ||||||||||||||||||||||
| a. | Further information on these non-GAAP financial measures, including detailed reconciliations, is included on pages 59 to 76 of this MD&A. |
| b. | Represents EBITDA divided by revenue. |
Safety and Environment
| For the three months ended | ||||||||
| 9/30/23 | 6/30/23 | |||||||
| LTI |
2 | 1 | ||||||
| LTIFR3 |
3.23 | 1.59 | ||||||
| TRIFR3 |
8.09 | 1.59 | ||||||
|
Class 14 environmental incidents |
0 | 0 | ||||||
Financial Results
Q3 2023 compared to Q2 2023
Turquoise Ridge’s income for the third quarter of 2023 was 40% higher than the prior quarter due to higher sales volume and a lower cost of sales per ounce2, partially offset by a lower realized gold price1.
Gold production in the third quarter of 2023 was 22% higher than the prior quarter, mainly due to the Sage autoclave maintenance shutdown that took place in the second quarter. This allowed more open pit stockpiled tonnes to be processed which was also the driver behind the lower average grade processed.
Total tonnes mined were 2% higher than the prior quarter driven by improved production rates at the Turquoise Ridge underground, partially offset by lower tonnes from Vista underground. Grades mined increased by 13% compared to the prior quarter as per the mine sequence at both underground mines.
Cost of sales per ounce2 and total cash costs per ounce1 in the third quarter of 2023 were 11% and 14% lower, respectively, than the prior quarter, primarily due to the efficiencies of operating at a higher throughput level, combined with reduced autoclave maintenance costs and lower energy costs. All-in sustaining costs per ounce1 were 15% lower than the prior quarter, primarily reflecting lower total cash costs per ounce1 and lower minesite sustaining capital expenditures1.
Capital expenditures in the third quarter of 2023 were 13% lower than the prior quarter mainly due to decreased minesite sustaining capital expenditures1 resulting from lower underground development per the mine plan.
| BARRICK THIRD QUARTER 2023 | 23 | MANAGEMENT’S DISCUSSION AND ANALYSIS |
| OVERVIEW | OPERATING PERFORMANCE
|
GROWTH PROJECTS & EXPLORATION
|
REVIEW OF FINANCIAL RESULTS
|
OTHER INFORMATION & NON-GAAP RECONCILIATIONS |
FINANCIAL STATEMENTS |
|||||
Q3 2023 compared to Q3 2022
Turquoise Ridge’s income for the third quarter of 2023 was 345% higher than the same prior year period due to higher sales volumes, a lower cost of sales per ounce2, and a higher realized gold price1.
Gold production for the three month period ended September 30, 2023 was 34% higher than the same prior year period, primarily due to higher average grades processed, combined with higher recoveries at the Sage autoclave, which was positively impacted by improved carbon management.
Total tonnes mined were 8% lower relative to the same prior year period primarily due to lower Vista underground tonnes mined per the mine plan. Underground grades mined increased 34% compared to the prior quarter as per the mine plan.
Cost of sales per ounce2 and total cash costs per ounce1 for the three month period ended September 30, 2023 were 14% and 15% lower, respectively, than the same prior year period primarily owing to the higher grades processed and higher recoveries. All-in sustaining costs per ounce1 were 22% lower than the same prior year period, reflecting lower total cash costs per ounce1, combined with lower minesite sustaining capital expenditures1.
Capital expenditures for the three month period ended September 30, 2023 were 54% lower than the same prior year period due to lower minesite sustaining capital expenditures1 resulting from lower underground development as per the mine plan. This was combined with lower project capital expenditures1 as the Third Shaft was commissioned and substantially completed in the fourth quarter of 2022.
YTD 2023 compared to YTD 2022
Turquoise Ridge’s income for the nine month period ended September 30, 2023 was 53% higher than the same prior year period on higher sales volumes, a lower cost of sales per ounce2, and a higher realized gold price1.
Gold production for the nine month period ended September 30, 2023 was 14% higher compared to the same prior year period, primarily due to higher autoclave recoveries, which was positively impacted by improved carbon management, combined with higher average grades processed.
Cost of sales per ounce2 for the nine month period ended September 30, 2023 were 1% lower compared to the same prior year period due to higher grades processed and higher recoveries albeit this was largely offset by higher maintenance costs due to timing of plant shutdowns. Total cash costs per ounce1 were in line with the same prior year period. All-in sustaining costs per ounce1 decreased by 5% compared to the same prior year period, primarily due to lower minesite sustaining capital expenditures1.
Capital expenditures for the nine month period ended September 30, 2023 decreased by 34% compared to the same prior year period, mainly due to a decrease in project capital expenditures1 as the Third Shaft Project was largely completed by the end of 2022. This was combined with lower minesite sustaining capital expenditures1 due to lower underground development.
| BARRICK THIRD QUARTER 2023 | 24 | MANAGEMENT’S DISCUSSION AND ANALYSIS |
| OVERVIEW |
OPERATING PERFORMANCE |
GROWTH PROJECTS & EXPLORATION |
REVIEW OF FINANCIAL RESULTS |
OTHER INFORMATION & NON-GAAP RECONCILIATIONS |
FINANCIAL STATEMENTS |
|||||
Other Mines - Nevada Gold Mines
Summary of Operating and Financial Data
| For the three months ended | ||||||||||||||||||||||||||||||||||||||||
| 9/30/23 | 6/30/23 | |||||||||||||||||||||||||||||||||||||||
| Gold produced (000s oz) |
Cost of sales ($/oz) |
Total cash costs ($/oz)a |
All-in sustaining costs ($/oz)a |
Capital ituresb |
Gold produced (000s oz) |
Cost of sales ($/oz) |
Total cash costs ($/oz)a |
All-in sustaining costs ($/oz)a |
Capital ituresb |
|||||||||||||||||||||||||||||||
| Phoenix (61.5%) |
26 | 2,235 | 1,003 | 1,264 | 6 | 29 | 2,075 | 948 | 1,132 | 5 | ||||||||||||||||||||||||||||||
| Long Canyon (61.5%) |
2 | 1,832 | 778 | 831 | 0 | 3 | 1,640 | 637 | 677 | 0 | ||||||||||||||||||||||||||||||
| a. | Further information on these non-GAAP financial measures, including detailed reconciliations, is included on pages 59 to 76 of this MD&A. |
| b. | Includes both minesite sustaining and project capital expenditures1. |
Phoenix (61.5%)
Gold production for Phoenix in the third quarter of 2023 was 10% lower compared to the prior quarter, mainly driven by a planned mill shutdown during the quarter, combined with slightly lower grades mined as per the mine plan. This was partially offset by higher recoveries related to ore chemistry.
Cost of sales per ounce2 and total cash costs per ounce1 in the third quarter of 2023 were 8% and 6% higher, respectively, than the prior quarter mainly due to the impact of lower grades. In the third quarter of 2023, all-in sustaining costs per ounce1 increased by 12% compared to the prior quarter due to higher total cash costs per ounce1, combined with higher minesite sustaining capital expenditures1.
Capital expenditures for the three month period ended September 30, 2023 were 20% higher compared to the prior quarter due to higher minesite sustaining capital expenditures1, partly offset by lower capitalized drilling.
Long Canyon (61.5%)
Mining of Phase 1 was completed in May 2022 and residual leaching commenced thereafter. We continue to work on options for Long Canyon, including a study for a potential underground option.
| BARRICK THIRD QUARTER 2023 | 25 | MANAGEMENT’S DISCUSSION AND ANALYSIS |
| OVERVIEW |
OPERATING PERFORMANCE |
GROWTH PROJECTS & EXPLORATION |
REVIEW OF FINANCIAL RESULTS |
OTHER INFORMATION & NON-GAAP RECONCILIATIONS |
FINANCIAL STATEMENTS |
|||||
Pueblo Viejo (60%)a, Dominican Republic
Summary of Operating and Financial Data
| For the three months ended | For the nine months ended | |||||||||||||||||||||||||||||||
| 9/30/23 | 6/30/23 | % Change | 9/30/22 | % Change | 9/30/23 | 9/30/22 | % Change | |||||||||||||||||||||||||
| Open pit tonnes mined (000s) |
4,489 | 5,115 | (12)% | 5,380 | (17)% | 15,255 | 14,519 | 5 % | ||||||||||||||||||||||||
| Open pit ore |
2,037 | 1,513 | 35 % | 1,853 | 10 % | 5,892 | 4,393 | 34 % | ||||||||||||||||||||||||
| Open pit waste |
2,452 | 3,602 | (32)% | 3,527 | (30)% | 9,363 | 10,126 | (8)% | ||||||||||||||||||||||||
| Average grade (grams/tonne) |
||||||||||||||||||||||||||||||||
| Open pit mined |
2.25 | 1.89 | 19 % | 2.29 | (2)% | 2.00 | 2.46 | (19)% | ||||||||||||||||||||||||
| Processed |
2.40 | 2.31 | 4 % | 2.89 | (17)% | 2.31 | 2.76 | (16)% | ||||||||||||||||||||||||
| Autoclave ore tonnes processed (000s) |
1,404 | 1,206 | 16 % | 1,501 | (6)% | 3,987 | 4,316 | (8)% | ||||||||||||||||||||||||
| Recovery rate |
70 % | 89 % | (21)% | 87 % | (20)% | 82 % | 86 % | (5)% | ||||||||||||||||||||||||
| Gold produced (000s oz) |
79 | 77 | 3 % | 121 | (35)% | 245 | 330 | (26)% | ||||||||||||||||||||||||
| Gold sold (000s oz) |
77 | 79 | (3)% | 124 | (38)% | 246 | 330 | (25)% | ||||||||||||||||||||||||
| Revenue ($ millions) |
152 | 153 | (1)% | 212 | (28)% | 480 | 603 | (20)% | ||||||||||||||||||||||||
| Cost of sales ($ millions) |
117 | 105 | 11 % | 136 | (14)% | 334 | 366 | (9)% | ||||||||||||||||||||||||
| Income ($ millions) |
31 | 46 | (33)% | 70 | (56)% | 138 | 218 | (37)% | ||||||||||||||||||||||||
| EBITDA ($ millions)b |
70 | 82 | (15)% | 109 | (36)% | 252 | 328 | (23)% | ||||||||||||||||||||||||
| EBITDA marginc |
46 % | 54 % | (15)% | 51 % | (10)% | 53 % | 54 % | (2)% | ||||||||||||||||||||||||
| Capital expenditures ($ millions) |
54 | 74 | (27)% | 101 | (47)% | 196 | 256 | (23)% | ||||||||||||||||||||||||
| Minesite sustainingb |
26 | 29 | (10)% | 40 | (35)% | 86 | 96 | (10)% | ||||||||||||||||||||||||
| Projectb |
28 | 45 | (38)% | 61 | (54)% | 110 | 160 | (31)% | ||||||||||||||||||||||||
| Cost of sales ($/oz) |
1,501 | 1,344 | 12 % | 1,097 | 37 % | 1,356 | 1,108 | 22 % | ||||||||||||||||||||||||
| Total cash costs ($/oz)b |
935 | 840 | 11 % | 733 | 28 % | 824 | 714 | 15 % | ||||||||||||||||||||||||
| All-in sustaining costs ($/oz)b |
1,280 | 1,219 | 5 % | 1,063 | 20 % | 1,185 | 1,015 | 17 % | ||||||||||||||||||||||||
| All-in costs ($/oz)b |
1,640 | 1,788 | (8)% | 1,554 | 6 % | 1,630 | 1,500 | 9 % | ||||||||||||||||||||||||
| a. | Barrick is the operator of Pueblo Viejo and owns 60%, with Newmont Corporation owning the remaining 40%. Pueblo Viejo is accounted for as a subsidiary with a 40% non-controlling interest. The results in the table and the discussion that follows are based on our 60% share only. |
| b. | Further information on these non-GAAP financial measures, including detailed reconciliations, is included on pages 59 to 76 of this MD&A. |
| c. | Represents EBITDA divided by revenue. |
Safety and Environment
| For the three months ended | ||||||||
| 9/30/23 | 6/30/23 | |||||||
| LTI | 0 | 0 | ||||||
| LTIFR3 | 0.00 | 0.00 | ||||||
| TRIFR3 | 0.50 | 1.03 | ||||||
| Class 14 environmental incidents | 0 | 0 | ||||||
Financial Results
Q3 2023 compared to Q2 2023
Pueblo Viejo’s income for the third quarter of 2023 was 33% lower than the prior quarter, mainly due to a higher cost of sales per ounce2, slightly lower sales volume and a lower realized gold price1.
Gold production in the third quarter of 2023 was 3% higher than the prior quarter, mainly due to higher throughput as result of the plant expansion ramp-up and higher grades processed, partially offset by lower recovery due to equipment stabilization in the flotation circuit.
Cost of sales per ounce2 and total cash costs per ounce1 for the third quarter of 2023 were 12% and 11% higher, respectively, compared to the prior quarter, mainly driven by higher electricity costs, lower margins achieved from third-party energy sales at the Quisqueya power plant and lower recoveries. This was partially offset by lower plant maintenance costs and higher by-product credits from silver sales. For the third quarter of 2023, all-in sustaining costs per ounce1 were 5% higher than the prior quarter,
mainly due to higher total cash costs per ounce1, partially offset by lower minesite sustaining capital expenditures1.
Capital expenditures for the third quarter of 2023 decreased by 27% compared to the prior quarter, primarily due to lower project capital expenditures1 incurred on the plant expansion as the project nears completion, combined with lower minesite sustaining capital expenditures1.
Q3 2023 compared to Q3 2022
Pueblo Viejo’s income for the third quarter of 2023 was 56% lower than the same prior year period, driven by a higher costs of sales per ounce2 and lower sales volumes, partially offset by a higher realized gold price1.
Gold production for the three month period ended September 30, 2023 was 35% lower than the same prior year period due to lower recoveries due to equipment stabilization in the flotation circuit, lower grades processed (in line with the planned mining and stockpile feed sequence) and lower throughput resulting from tie-ins and equipment failures at the newly installed flotation circuits and SAG mill. We now expect to reach nameplate capacity for the expanded plant during the first quarter of 2024.
Cost of sales per ounce2 and total cash costs per ounce1 for the three month period ended September 30, 2023 were 37% and 28% higher, respectively, compared to the same prior year period. This was mainly due to the impact of lower grades processed and lower recoveries. For the three month period ended September 30, 2023, all-in sustaining costs per ounce1 were 20% higher than the same
| BARRICK THIRD QUARTER 2023 | 26 | MANAGEMENT’S DISCUSSION AND ANALYSIS |
| OVERVIEW |
OPERATING PERFORMANCE |
GROWTH PROJECTS & EXPLORATION |
REVIEW OF FINANCIAL RESULTS |
OTHER INFORMATION & NON-GAAP RECONCILIATIONS |
FINANCIAL STATEMENTS |
|||||
prior year period mainly due to higher total cash costs per ounce1.
Capital expenditures for the three month period ended September 30, 2023 decreased by 47% compared to the same prior year period, primarily due to lower project capital expenditures1 incurred on the plant expansion as the project nears completion, and lower minesite sustaining capital expenditures1 mainly due to the purchase of new mining equipment in the same prior year period.
YTD 2023 compared to YTD 2022
Pueblo Viejo’s income for the nine month period ended September 30, 2023 was 37% lower than the same prior year period, primarily due to lower sales volume and a higher cost of sales per ounce2, partially offset by a higher realized gold price1.
Gold production for the nine month period ended September 30, 2023 was 26% lower than the same prior year period, primarily due to lower grades processed in line with the planned mining and stockpile feed sequence, as well as lower throughput and lower recoveries due to tie-in and commissioning work related to the plant expansion and subsequent equipment failures at the newly installed flotation circuits and SAG mill.
Cost of sales per ounce2 and total cash costs per ounce1 for the nine month period ended September 30, 2023 were 22% and 15% higher, respectively, than the same prior year period, primarily due to the impact of lower grades processed, lower throughput, lower recoveries, and higher input costs. For the nine month period ended September 30, 2023, all-in sustaining costs per ounce1 increased by 17% compared to the same prior year period, primarily reflecting the higher total cash costs per ounce1 and higher minesite sustaining capital expenditures1 on a per ounce basis.
Capital expenditures for the nine month period ended September 30, 2023 decreased by 23% compared to the same prior year period, primarily due to lower project capital expenditures1 incurred on the plant expansion. This was combined with lower minesite sustaining capital expenditures1 as a result of the purchase of new mining equipment in the prior year.
| BARRICK THIRD QUARTER 2023 | 27 | MANAGEMENT’S DISCUSSION AND ANALYSIS |
| OVERVIEW |
OPERATING PERFORMANCE |
GROWTH PROJECTS & EXPLORATION |
REVIEW OF FINANCIAL RESULTS |
OTHER INFORMATION & NON-GAAP RECONCILIATIONS |
FINANCIAL STATEMENTS |
|||||
Loulo-Gounkoto (80%)a, Mali
Summary of Operating and Financial Data
| For the three months ended | For the nine months ended | |||||||||||||||||||||||||||||||
| 9/30/23 | 6/30/23 | % Change | 9/30/22 | % Change | 9/30/23 | 9/30/22 | % Change | |||||||||||||||||||||||||
| Total tonnes mined (000s) |
6,370 | 7,614 | (16)% | 7,271 | (12)% | 22,354 | 24,428 | (8)% | ||||||||||||||||||||||||
| Open pit ore |
575 | 512 | 12 % | 643 | (11)% | 1,212 | 2,062 | (41)% | ||||||||||||||||||||||||
| Open pit waste |
4,893 | 6,189 | (21)% | 5,800 | (16)% | 18,481 | 19,907 | (7)% | ||||||||||||||||||||||||
| Underground |
902 | 913 | (1)% | 828 | 9 % | 2,661 | 2,459 | 8 % | ||||||||||||||||||||||||
| Average grade (grams/tonne) |
||||||||||||||||||||||||||||||||
| Open pit mined |
3.40 | 2.72 | 25 % | 2.59 | 31 % | 2.99 | 2.12 | 41 % | ||||||||||||||||||||||||
| Underground mined |
5.05 | 5.05 | 0 % | 4.55 | 11 % | 5.23 | 4.59 | 14 % | ||||||||||||||||||||||||
| Processed |
4.76 | 4.67 | 2 % | 4.34 | 10 % | 4.71 | 4.60 | 2 % | ||||||||||||||||||||||||
| Ore tonnes processed (000s) |
1,012 | 1,018 | (1)% | 1,015 | 0 % | 3,036 | 3,028 | 0 % | ||||||||||||||||||||||||
| Recovery rate |
91 % | 92 % | (1)% | 92 % | (1)% | 91 % | 91 % | 0 % | ||||||||||||||||||||||||
| Gold produced (000s oz) |
142 | 141 | 1 % | 130 | 9 % | 420 | 408 | 3 % | ||||||||||||||||||||||||
| Gold sold (000s oz) |
145 | 140 | 4 % | 129 | 12 % | 419 | 407 | 3 % | ||||||||||||||||||||||||
| Revenue ($ millions) |
280 | 275 | 2 % | 221 | 27 % | 812 | 744 | 9 % | ||||||||||||||||||||||||
| Cost of sales ($ millions) |
158 | 160 | (1)% | 157 | 1 % | 489 | 461 | 6 % | ||||||||||||||||||||||||
| Income ($ millions) |
111 | 110 | 1 % | 60 | 85 % | 306 | 272 | 13 % | ||||||||||||||||||||||||
| EBITDA ($ millions)b |
156 | 159 | (2)% | 108 | 44 % | 456 | 422 | 8 % | ||||||||||||||||||||||||
| EBITDA marginc |
56 % | 58 % | (3)% | 49 % | 14 % | 56 % | 57 % | (2)% | ||||||||||||||||||||||||
| Capital expenditures ($ millions) |
69 | 73 | (5)% | 65 | 6 % | 225 | 182 | 24 % | ||||||||||||||||||||||||
| Minesite sustainingb |
43 | 61 | (30)% | 44 | (2)% | 147 | 116 | 27 % | ||||||||||||||||||||||||
| Projectb |
26 | 12 | 117 % | 21 | 24 % | 78 | 66 | 18 % | ||||||||||||||||||||||||
| Cost of sales ($/oz) |
1,087 | 1,150 | (5)% | 1,220 | (11)% | 1,168 | 1,132 | 3 % | ||||||||||||||||||||||||
| Total cash costs ($/oz)b |
773 | 801 | (3)% | 845 | (9)% | 809 | 763 | 6 % | ||||||||||||||||||||||||
| All-in sustaining costs ($/oz)b |
1,068 | 1,245 | (14)% | 1,216 | (12)% | 1,166 | 1,067 | 9 % | ||||||||||||||||||||||||
| All-in costs ($/oz)b |
1,249 | 1,335 | (6)% | 1,385 | (10)% | 1,353 | 1,230 | 10 % | ||||||||||||||||||||||||
| a. | Barrick owns 80% of Société des Mines de Loulo SA and Société des Mines de Gounkoto with the Republic of Mali owning 20%. Loulo-Gounkoto is accounted for as a subsidiary with a 20% non-controlling interest on the basis that Barrick controls the asset. The results in the table and the discussion that follows are based on our 80% share, inclusive of the impact of the purchase price allocation resulting from the merger with Randgold. |
| b. | Further information on these non-GAAP financial measures, including detailed reconciliations, is included on pages 59 to 76 of this MD&A. |
| c. | Represents EBITDA divided by revenue. |
Safety and Environment
| For the three months ended | ||||||||
| 9/30/23 | 6/30/23 | |||||||
| LTI | 1 | 0 | ||||||
| LTIFR3 | 0.21 | 0.00 | ||||||
| TRIFR3 | 0.64 | 0.68 | ||||||
| Class 14 environmental incidents | 0 | 0 | ||||||
On September 23, 2023, a tragic incident occurred at Loulo-Gounkoto, which resulted in the fatality of an employee. Please refer to page 10 for further details.
Financial Results
Q3 2023 compared to Q2 2023
Loulo-Gounkoto’s income for the third quarter of 2023 was 1% higher than the prior quarter mainly due to higher sales volumes and a lower cost of sales per ounce2, partially offset by a lower realized gold price1.
Gold production for the third quarter of 2023 was marginally higher than the prior quarter as higher grades processed was largely offset by lower throughput and recovery.
Cost of sales per ounce2 and total cash costs per ounce1 for the third quarter of 2023 were 5% and 3% lower, respectively, than the prior quarter, mainly due to the impact
of higher grades processed and a lower strip ratio in the Gara West open pit. For the third quarter of 2023, all-in sustaining costs per ounce1 were 14% lower than the prior quarter, mainly due to decreased minesite sustaining capital expenditures1 and lower total cash costs per ounce1.
Capital expenditures for the third quarter of 2023 decreased by 5% compared to the prior quarter, mainly driven by lower minesite sustaining capital expenditures1, partially offset by higher project capital expenditures1. The decrease in minesite sustaining capital expenditures1 was primarily due to lower capitalized waste stripping in Gara West. Higher project capital expenditures1 were mainly due to the Yalea South project.
Q3 2023 compared to Q3 2022
Loulo-Gounkoto’s income for the third quarter of 2023 was 85% higher than the same prior year period, primarily due to a higher realized gold price1 and higher sales volumes, and a lower cost of sales per ounce2.
Gold production for the three month period ended September 30, 2023 was 9% higher compared to the same prior year period, mainly due to higher grades processed.
Cost of sales per ounce2 and total cash costs per ounce1 for the third quarter of 2023 were 11% and 9% lower, respectively, than the same prior year period mainly due to the impact of higher grades processed combined
| BARRICK THIRD QUARTER 2023 | 28 | MANAGEMENT’S DISCUSSION AND ANALYSIS |
| OVERVIEW |
OPERATING PERFORMANCE |
GROWTH PROJECTS & EXPLORATION |
REVIEW OF FINANCIAL RESULTS |
OTHER INFORMATION & NON-GAAP RECONCILIATIONS |
FINANCIAL STATEMENTS |
|||||
with lower open pit mining costs and lower power costs. For the third quarter of 2023, all-in sustaining costs per ounce1 decreased by 12% compared to the same prior year period, reflecting the decrease in total cash costs per ounce1 and lower minesite sustaining capital expenditures1 on a per ounce basis.
Capital expenditures for the three month period ended September 30, 2023 increased by 6% compared to the same prior year period, driven by higher project capital expenditures1, while minesite sustaining capital expenditures1 remained relatively consistent with the same prior year period. The increase in project capital expenditures1 was driven by the Yalea South project.
YTD 2023 compared to YTD 2022
Loulo-Gounkoto’s income for the nine month period ended September 30, 2023 was 13% higher than the same prior year period, primarily due to higher sales volumes and a higher realized gold price1, partially offset by a higher cost of sales per ounce2.
Gold production for the nine month period ended September 30, 2023 was 3% higher than the same prior year period, primarily due to higher grades processed.
Cost of sales per ounce2 and total cash costs per ounce1 for the nine month period ended September 30, 2023 were 3% and 6% higher, respectively, than the same prior year period due to the impact of higher royalties resulting from the higher realized gold price1, combined with increased underground mining costs due to an increase in operating development meters partially offset by higher grade processed. For the nine month period ended September 30, 2023, all-in sustaining costs per ounce1 were 9% higher than the same prior year period, due to higher minesite sustaining capital expenditures1 and higher total cash costs per ounce1.
Capital expenditures in the nine month period ended September 30, 2023 increased by 24% compared to the same prior year period, driven by both higher minesite sustaining1 and project capital expenditures1. The higher minesite sustaining capital expenditures1 reflect increased expenditures on the tailings buttress project and new equipment purchases in the underground, partially offset by lower underground development capital reflecting the focus on operating development meters in the current period. The increase in project capital expenditures1 was driven by the Loulo-Gounkoto solar expansion and commencement of the Yalea South project.
Regulatory Matters
In August 2022, the Government of Mali announced that it would conduct an audit of the Malian gold mining industry, including the Loulo-Gounkoto complex. Barrick engaged with the government-appointed auditors and hosted the auditors at Loulo-Gounkoto for a site visit in November 2022. In April 2023, Barrick received a draft report containing the auditors’ preliminary findings. During the second quarter, Barrick responded to the draft report to challenge the auditors’ findings, which Barrick believes are without merit. Barrick has not received a copy of the final report.
In addition, in June 2023, the Government of Mali announced a plan to reform the Malian mining legislation. A new mining code and a law requiring local content in the mining sector were adopted in August 2023 but are not currently in force, pending the adoption of implementing decrees. Under the new mining code, pre-existing mining titles remain subject to the legal and contractual regime under which they were issued for the remainder of their current term.
| BARRICK THIRD QUARTER 2023 | 29 | MANAGEMENT’S DISCUSSION AND ANALYSIS |
| OVERVIEW |
OPERATING PERFORMANCE |
GROWTH PROJECTS & EXPLORATION |
REVIEW OF FINANCIAL RESULTS |
OTHER INFORMATION & NON-GAAP RECONCILIATIONS |
FINANCIAL STATEMENTS |
|||||
Kibali (45%)a, Democratic Republic of Congo
Summary of Operating and Financial Data
| For the three months ended | For the nine months ended | |||||||||||||||||||||||||||||||||||||||
| 9/30/23 | 6/30/23 | % Change | 9/30/22 | % Change | 9/30/23 | 9/30/22 | % Change | |||||||||||||||||||||||||||||||||
| Total tonnes mined (000s) |
4,467 | 4,475 | 0 % | 4,138 | 8 % | 13,844 | 11,828 | 17 % | ||||||||||||||||||||||||||||||||
| Open pit ore |
764 | 698 | 9 % | 561 | 36 % | 2,102 | 1,523 | 38 % | ||||||||||||||||||||||||||||||||
| Open pit waste |
3,188 | 3,317 | (4)% | 3,126 | 2 % | 10,387 | 9,060 | 15 % | ||||||||||||||||||||||||||||||||
| Underground |
515 | 460 | 12 % | 451 | 14 % | 1,355 | 1,245 | 9 % | ||||||||||||||||||||||||||||||||
| Average grade (grams/tonne) |
||||||||||||||||||||||||||||||||||||||||
| Open pit mined |
1.92 | 1.38 | 39 % | 1.44 | 33 % | 1.59 | 1.58 | 1 % | ||||||||||||||||||||||||||||||||
| Underground mined |
5.28 | 5.37 | (2)% | 5.56 | (5)% | 5.05 | 5.59 | (10)% | ||||||||||||||||||||||||||||||||
| Processed |
3.58 | 3.18 | 13 % | 3.26 | 10 % | 3.12 | 3.33 | (6)% | ||||||||||||||||||||||||||||||||
| Ore tonnes processed (000s) |
960 | 949 | 1 % | 898 | 7 % | 2,789 | 2,541 | 10 % | ||||||||||||||||||||||||||||||||
| Recovery rate |
90 % | 90 % | 0 % | 88 % | 2 % | 90 % | 88 % | 2 % | ||||||||||||||||||||||||||||||||
| Gold produced (000s oz) |
99 | 87 | 14 % | 83 | 19 % | 250 | 240 | 4 % | ||||||||||||||||||||||||||||||||
| Gold sold (000s oz) |
97 | 87 | 11 % | 88 | 10 % | 251 | 238 | 5 % | ||||||||||||||||||||||||||||||||
| Revenue ($ millions) |
187 | 172 | 9 % | 152 | 23 % | 486 | 434 | 12 % | ||||||||||||||||||||||||||||||||
| Cost of sales ($ millions) |
112 | 111 | 1 % | 91 | 23 % | 314 | 264 | 19 % | ||||||||||||||||||||||||||||||||
| Income ($ millions) |
72 | 60 | 20 % | 45 | 60 % | 165 | 135 | 22 % | ||||||||||||||||||||||||||||||||
| EBITDA ($ millions)b |
116 | 101 | 15 % | 72 | 61 % | 275 | 223 | 23 % | ||||||||||||||||||||||||||||||||
| EBITDA marginc |
62 % | 59 % | 5 % | 47 % | 32 % | 57 % | 51 % | 12 % | ||||||||||||||||||||||||||||||||
| Capital expenditures ($ millions) |
16 | 18 | (11)% | 18 | (11)% | 53 | 57 | (7) % | ||||||||||||||||||||||||||||||||
| Minesite sustainingb |
8 | 10 | (20)% | 13 | (38)% | 30 | 42 | (29)% | ||||||||||||||||||||||||||||||||
| Projectb |
8 | 8 | 0 % | 5 | 60 % | 23 | 15 | 53 % | ||||||||||||||||||||||||||||||||
| Cost of sales ($/oz) |
1,152 | 1,269 | (9)% | 1,047 | 10 % | 1,250 | 1,113 | 12 % | ||||||||||||||||||||||||||||||||
| Total cash costs ($/oz)b |
694 | 797 | (13)% | 731 | (5)% | 808 | 737 | 10 % | ||||||||||||||||||||||||||||||||
| All-in sustaining costs ($/oz)b |
801 | 955 | (16)% | 876 | (9)% | 954 | 936 | 2 % | ||||||||||||||||||||||||||||||||
| All-in costs ($/oz)b |
881 | 1,043 | (16)% | 940 | (6)% | 1,046 | 1,000 | 5 % | ||||||||||||||||||||||||||||||||
| a. | Barrick owns 45% of Kibali Goldmines SA with the DRC and our joint venture partner, AngloGold Ashanti, owning 10% and 45%, respectively. The figures presented in this table and the discussion that follows are based on our 45% effective interest in Kibali Goldmines SA held through our 50% interest in Kibali (Jersey) Limited and its other subsidiaries (collectively “Kibali”), inclusive of the impact of the purchase price allocation resulting from the merger with Randgold. Kibali is accounted for as an equity method investment on the basis that the joint venture partners that have joint control have rights to the net assets of the joint venture. |
| b. | Further information on these non-GAAP financial measures, including detailed reconciliations, is included on pages 59 to 76 of this MD&A. |
| c. | Represents EBITDA divided by revenue. |
Safety and Environment
| For the three months ended | ||||||||
| 9/30/23 | 6/30/23 | |||||||
| LTI | 2 | 1 | ||||||
| LTIFR3 | 0.46 | 0.23 | ||||||
| TRIFR3 | 1.62 | 0.92 | ||||||
| Class 14 environmental incidents | 0 | 0 | ||||||
Financial Results
Q3 2023 compared to Q2 2023
Kibali’s income for the third quarter of 2023 was 20% higher than the prior quarter, mainly due to higher sales volumes and a lower cost of sales per ounce2, partially offset by a lower realized gold price1.
Gold production in the third quarter of 2023 was 14% higher than the prior quarter, mainly due to mine sequencing delivering higher grades following an improvement in operational flexibility gained with the latest development drives. This was combined with higher throughput.
Cost of sales per ounce2 and total cash costs per ounce1 for the third quarter of 2023 were 9% and 13% lower, respectively, due to the benefit of higher grades processed, efficiency improvements from the underground
operations and lower processing costs mainly due to lower energy costs. For the third quarter of 2023, all-in sustaining costs per ounce1 was 16% lower compared to the prior quarter, mainly due to lower total cash costs per ounce2 and lower minesite sustaining capital expenditures1.
Capital expenditures for the three month period ended September 30, 2023 were 11% lower compared to the prior quarter, due to lower minesite sustaining capital expenditures1 relating to the timing of equipment purchases and lower capitalized waste stripping.
Q3 2023 compared to Q3 2022
Kibali’s income for the three month period ended September 30, 2023 was 60% higher than the same prior year period, driven by higher sales volumes and a higher realized gold price1, partially offset by a higher cost of sales per ounce2.
Gold production for the three month period ended September 30, 2023 was 19% higher than the same prior year period, mainly due to higher throughput, higher recoveries, and higher grades processed.
Cost of sales per ounce2 for the three month period ended September 30, 2023 was 10% higher, due to higher depreciation expense, partially offset by lower total cash costs per ounce1. Total cash costs per ounce1 for the
| BARRICK THIRD QUARTER 2023 | 30 | MANAGEMENT’S DISCUSSION AND ANALYSIS |
| OVERVIEW |
OPERATING PERFORMANCE |
GROWTH PROJECTS & EXPLORATION |
REVIEW OF FINANCIAL RESULTS |
OTHER INFORMATION & NON-GAAP RECONCILIATIONS |
FINANCIAL STATEMENTS |
|||||
three month period ended September 30, 2023 was 5% lower than the same prior year period, due to the benefit of higher grades processed, efficiency improvements from the underground operations, and lower processing costs mainly due to lower energy costs. For the three month period ended September 30, 2023, all-in sustaining costs per ounce1 were 9% lower than the same prior year period, driven by lower total cash costs per ounce1 and lower minesite sustaining capital expenditures1.
Capital expenditures for the three month period ended September 30, 2023 were 11% lower than the same prior year period, mainly due to lower minesite sustaining capital expenditures1 resulting from the timing of equipment deliveries and lower capitalized waste stripping. This was partially offset by an increase in project capital expenditures1 related to the commencement of the solar project, resource conversion drilling and the Oere open pit project, with both the solar project and Oere expenditures forecasted to peak in 2024.
YTD 2023 compared to YTD 2022
Kibali’s income for the nine month period ended September 30, 2023 was 22% higher than the same prior year period, with higher sales volumes and a higher realized gold price1, partially offset by a higher cost of sales per ounce2.
Gold production for the nine month period ended September 30, 2023 was 4% higher compared to the same prior year period, mainly due to higher throughput and recoveries, partially offset by lower grades processed. The lower grade was in line with the plan, as we relied on a higher proportion of open pit ore as we focussed on underground development.
Cost of sales per ounce2 and total cash costs per ounce1 for the nine month period ended September 30, 2023 were 12% and 10% higher, respectively, than the same prior year period, mainly due to the impact of lower grades processed, reflecting a higher proportion of open pit ore feed during the current period and lower underground mined grades. This was partially offset by higher throughput and recoveries. For the nine month period ended September 30, 2023, all-in sustaining costs per ounce1 was 2% higher compared to the same prior year period, mainly due to higher total cash costs per ounce1, partially offset by lower minesite sustaining capital expenditures1.
Capital expenditures in the nine month period ended September 30, 2023 were 7% lower than the same prior year period, mainly due to lower minesite sustaining capital expenditures1 due to lower capitalized waste stripping and lower underground development. This was partially offset by increased project capital expenditures1 due to substantially finalizing the Cyanide Recovery Plant and the Kalimva/Ikamva and Pamao open pit projects, as well as the commencement of the solar project and Oere open pit project, expenditures for both of which are expected to peak in 2024.
| BARRICK THIRD QUARTER 2023 | 31 | MANAGEMENT’S DISCUSSION AND ANALYSIS |
| OVERVIEW |
OPERATING PERFORMANCE |
GROWTH PROJECTS & EXPLORATION |
REVIEW OF FINANCIAL RESULTS |
OTHER INFORMATION & NON-GAAP RECONCILIATIONS |
FINANCIAL STATEMENTS |
|||||
North Mara (84%)a, Tanzania
Summary of Operating and Financial Data
| For the three months ended | For the nine months ended | |||||||||||||||||||||||||||||||||||||||
| 9/30/23 | 6/30/23 | % Change | 9/30/22 | % Change | 9/30/23 | 9/30/22 | % Change | |||||||||||||||||||||||||||||||||
| Total tonnes mined (000s) |
4,529 | 4,252 | 7 % | 2,188 | 107 % | 12,306 | 5,389 | 128 % | ||||||||||||||||||||||||||||||||
| Open pit ore |
439 | 86 | 410 % | 1,445 | (70)% | 994 | 3,262 | (70)% | ||||||||||||||||||||||||||||||||
| Open pit waste |
3,686 | 3,826 | (4)% | 319 | 1,055 % | 10,203 | 1,043 | 878 % | ||||||||||||||||||||||||||||||||
| Underground |
404 | 340 | 19 % | 424 | (5)% | 1,109 | 1,084 | 2 % | ||||||||||||||||||||||||||||||||
| Average grade (grams/tonne) |
||||||||||||||||||||||||||||||||||||||||
| Open pit mined |
1.62 | 1.51 | 7 % | 1.80 | (10)% | 1.82 | 1.92 | (5)% | ||||||||||||||||||||||||||||||||
| Underground mined |
3.32 | 2.96 | 12 % | 3.23 | 3 % | 3.24 | 4.24 | (24)% | ||||||||||||||||||||||||||||||||
| Processed |
2.91 | 3.08 | (6)% | 3.23 | (10)% | 3.08 | 3.29 | (6)% | ||||||||||||||||||||||||||||||||
| Ore tonnes processed (000s) |
715 | 698 | 2 % | 739 | (3)% | 2,129 | 2,013 | 6 % | ||||||||||||||||||||||||||||||||
| Recovery rate |
92 % | 92 % | 0 % | 92 % | 0 % | 92 % | 91 % | 1 % | ||||||||||||||||||||||||||||||||
| Gold produced (000s oz) |
62 | 64 | (3)% | 71 | (13)% | 194 | 193 | 1 % | ||||||||||||||||||||||||||||||||
| Gold sold (000s oz) |
59 | 64 | (8)% | 70 | (16)% | 193 | 195 | (1)% | ||||||||||||||||||||||||||||||||
| Revenue ($ millions) |
115 | 125 | (8)% | 121 | (5)% | 373 | 356 | 5 % | ||||||||||||||||||||||||||||||||
| Cost of sales ($ millions) |
74 | 76 | (3)% | 67 | 10 % | 220 | 187 | 18 % | ||||||||||||||||||||||||||||||||
| Income ($ millions) |
37 | 43 | (14)% | 39 | (5)% | 127 | 152 | (16)% | ||||||||||||||||||||||||||||||||
| EBITDA ($ millions)b |
51 | 59 | (14)% | 54 | (6)% | 173 | 195 | (11)% | ||||||||||||||||||||||||||||||||
| EBITDA marginc |
44 % | 47 % | (6) % | 45 % | (2)% | 46 % | 55 % | (16)% | ||||||||||||||||||||||||||||||||
| Capital expenditures ($ millions) |
47 | 41 | 15 % | 27 | 74 % | 123 | 79 | 56 % | ||||||||||||||||||||||||||||||||
| Minesite sustainingb |
25 | 25 | 0 % | 14 | 79 % | 75 | 32 | 134 % | ||||||||||||||||||||||||||||||||
| Projectb |
22 | 16 | 38 % | 13 | 69 % | 48 | 47 | 2 % | ||||||||||||||||||||||||||||||||
| Cost of sales ($/oz) |
1,244 | 1,208 | 3 % | 956 | 30 % | 1,138 | 960 | 19 % | ||||||||||||||||||||||||||||||||
| Total cash costs ($/oz)b |
999 | 942 | 6 % | 737 | 36 % | 893 | 735 | 21 % | ||||||||||||||||||||||||||||||||
| All-in sustaining costs ($/oz)b |
1,429 | 1,355 | 5 % | 951 | 50 % | 1,298 | 930 | 40 % | ||||||||||||||||||||||||||||||||
| All-in costs ($/oz)b |
1,802 | 1,606 | 12 % | 1,149 | 57 % | 1,547 | 1,173 | 32 % | ||||||||||||||||||||||||||||||||
| a. | Barrick owns 84% of North Mara, with the GoT owning 16%. North Mara is accounted for as a subsidiary with a 16% non-controlling interest on the basis that Barrick controls the asset. The results in the table and the discussion that follows are based on our 84% share. |
| b. | Further information on these non-GAAP financial measures, including detailed reconciliations, is included on pages 59 to 76 of this MD&A. |
| c. | Represents EBITDA divided by revenue. |
Safety and Environment
| For the three months ended | ||||||||
| 9/30/23 | 6/30/23 | |||||||
| LTI | 1 | 1 | ||||||
| LTIFR3 | 0.38 | 0.40 | ||||||
| TRIFR3 | 1.52 | 1.21 | ||||||
| Class 14 environmental incidents | 0 | 0 | ||||||
Financial Results
Q3 2023 compared to Q2 2023
North Mara’s income for the third quarter of 2023 was 14% lower than the prior quarter mainly due to a higher cost of sales per ounce2, lower sales volume and a lower realized gold price1.
In the third quarter of 2023, production was 3% lower than the prior quarter, reflecting the lower grade processed as a result of the blending of stockpiled ore in the current period, in line with the mine plan. This was partially offset by higher throughput.
Cost of sales per ounce2 and total cash costs per ounce1 were 3% and 6% higher, respectively, than the prior quarter due to lower grades processed as a result of the blending of stockpiled ore. All-in sustaining costs per ounce1 in the third quarter of 2023 was 5% higher than the prior quarter, mainly due to higher total cash costs per ounce1.
Capital expenditures in the third quarter of 2023 were 15% higher, which was due to higher project capital expenditures1 mainly related to land acquisitions, conversion drilling at Gokona and the upgraded underground dewatering system. Minesite sustaining capital expenditures1 ended in line with the prior quarter.
Q3 2023 compared to Q3 2022
North Mara’s income for the three month period ending September 30, 2023 was 5% lower than the same prior year period, mainly driven by a higher cost of sales per ounce2 and lower sales volume, partially offset by a higher realized gold price1.
Gold production for the three month period ended September 30, 2023 was 13% lower due to lower throughput and lower grades processed, as we prioritized waste mining in the current quarter in line with our mine plan.
Cost of sales per ounce2 and total cash costs per ounce1 were 30% and 36% higher, respectively, compared to the same prior year period, mainly due to the lower throughput and lower grades processed as a result of the blending of stockpiled ore. This was partially offset by higher capitalized waste stripping at Gena, as we prioritized opening up Gena which was ahead of schedule at the end of the quarter. All-in sustaining costs per ounce1 in the third quarter of 2023 was 50% higher than the same prior year
| BARRICK THIRD QUARTER 2023 | 32 | MANAGEMENT’S DISCUSSION AND ANALYSIS |
| OVERVIEW |
OPERATING PERFORMANCE |
GROWTH PROJECTS & EXPLORATION |
REVIEW OF FINANCIAL RESULTS |
OTHER INFORMATION & NON-GAAP RECONCILIATIONS |
FINANCIAL STATEMENTS |
|||||
period, mainly due to higher minesite sustaining capital expenditures1, combined with higher total cash cost per ounce1.
For the three month period ending September 30, 2023, capital expenditures increased by 74% compared to the same prior year period, mainly due to higher minesite sustaining capital expenditures1 resulting from increased capitalized waste stripping at Gena, the purchase of the underground fleet, underground raising main dewatering station and the TSF extension. Project capital expenditures1 were higher compared to the same prior year period, reflecting land acquisitions and open pit expansion activities at Gena.
YTD 2023 compared to YTD 2022
North Mara’s income for the nine month period ending September 30, 2023 was 16% lower than the same prior year period, mainly due to a higher cost of sales per ounce2 and marginally lower sales volumes, partially offset by a higher realized gold price1.
For the nine month period ending September 30, 2023, gold production was 1% higher than the same prior year period, mainly due to higher throughput resulting from better mining rates offset by lower grades processed.
Cost of sales per ounce2 and total cash costs per ounce1 in the nine month period ending September 30, 2023 were 19% and 21% higher, respectively, due to lower grades processed as a result of the blending of stockpiled ore in the current period, in line with our plan. This was partially offset by increased capitalized waste stripping with mining at Gena open pit tracking ahead of schedule. All-in sustaining costs per ounce1 for the nine month period ending September 30, 2023 was 40% higher than the same prior year period, reflecting the increase in total cash costs per ounce1, combined with higher minesite sustaining capital expenditures1.
For the nine month period ending September 30, 2023, capital expenditures increased by 56% compared to the same prior year period mainly due to higher capitalized waste stripping, reflecting the successful ramp-up of the Gena open pit ahead of plan. This was combined with slightly higher project capital expenditures1, reflecting the construction of the new paste plant and open cast fleet acquired as part of the ongoing ramp-up.
| BARRICK THIRD QUARTER 2023 | 33 | MANAGEMENT’S DISCUSSION AND ANALYSIS |
| OVERVIEW |
OPERATING PERFORMANCE |
GROWTH PROJECTS & EXPLORATION |
REVIEW OF FINANCIAL RESULTS |
OTHER INFORMATION & NON-GAAP RECONCILIATIONS |
FINANCIAL STATEMENTS |
|||||
Bulyanhulu (84%)a, Tanzania
Summary of Operating and Financial Data
| For the three months ended | For the nine months ended | |||||||||||||||||||||||||||||||
| 9/30/23 | 6/30/23 | % Change | 9/30/22 | % Change | 9/30/23 | 9/30/22 | % Change | |||||||||||||||||||||||||
| Underground tonnes mined (000s) |
318 | 314 | 1 % | 262 | 21 % | 917 | 739 | 24 % | ||||||||||||||||||||||||
| Average grade (grams/tonne) |
||||||||||||||||||||||||||||||||
| Underground mined |
6.25 | 7.21 | (13)% | 7.86 | (20)% | 6.80 | 8.18 | (17)% | ||||||||||||||||||||||||
| Processed |
6.33 | 7.07 | (10)% | 7.64 | (17)% | 6.89 | 8.00 | (14)% | ||||||||||||||||||||||||
| Ore tonnes processed (000s) |
241 | 222 | 9 % | 211 | 14 % | 658 | 614 | 7 % | ||||||||||||||||||||||||
| Recovery rate |
95 % | 96 % | (1)% | 94 % | 1 % | 96 % | 93 % | 3 % | ||||||||||||||||||||||||
| Gold produced (000s oz) |
46 | 49 | (6)% | 48 | (4)% | 139 | 147 | (5)% | ||||||||||||||||||||||||
| Gold sold (000s oz) |
45 | 48 | (6)% | 50 | (10)% | 139 | 156 | (11)% | ||||||||||||||||||||||||
| Revenue ($ millions) |
91 | 100 | (9)% | 89 | 2 % | 284 | 298 | (5)% | ||||||||||||||||||||||||
| Cost of sales ($ millions) |
57 | 59 | (3)% | 62 | (8)% | 178 | 188 | (5)% | ||||||||||||||||||||||||
| Income ($ millions) |
33 | 41 | (20)% | 27 | 22 % | 91 | 105 | (13)% | ||||||||||||||||||||||||
| EBITDA ($ millions)b |
46 | 54 | (15)% | 39 | 18 % | 130 | 143 | (9)% | ||||||||||||||||||||||||
| EBITDA marginc |
51 % | 54 % | (6)% | 44 % | 16 % | 46 % | 48 % | (4)% | ||||||||||||||||||||||||
| Capital expenditures ($ millions) |
21 | 20 | 5 % | 18 | 17 % | 61 | 52 | 17 % | ||||||||||||||||||||||||
| Minesite sustainingb |
12 | 12 | 0 % | 13 | (8)% | 40 | 33 | 21 % | ||||||||||||||||||||||||
| Projectb |
9 | 8 | 13 % | 5 | 80 % | 21 | 19 | 11 % | ||||||||||||||||||||||||
| Cost of sales ($/oz) |
1,261 | 1,231 | 2 % | 1,229 | 3 % | 1,282 | 1,203 | 7 % | ||||||||||||||||||||||||
| Total cash costs ($/oz)b |
859 | 850 | 1 % | 898 | (4)% | 896 | 860 | 4 % | ||||||||||||||||||||||||
| All-in sustaining costs ($/oz)b |
1,132 | 1,105 | 2 % | 1,170 | (3)% | 1,188 | 1,080 | 10 % | ||||||||||||||||||||||||
| All-in costs ($/oz)b |
1,335 | 1,273 | 5 % | 1,263 | 6 % | 1,342 | 1,199 | 12 % | ||||||||||||||||||||||||
| a. | Barrick owns 84% of Bulyanhulu, with the GoT owning 16%. Bulyanhulu is accounted for as a subsidiary with a 16% non-controlling interest on the basis that Barrick controls the asset. The results in the table and the discussion that follows are based on our 84% share. |
| b. | Further information on these non-GAAP financial measures, including detailed reconciliations, is included on pages 59 to 76 of this MD&A. |
| c. | Represents EBITDA divided by revenue. |
Safety and Environment
| For the three months ended | ||||||||
| 9/30/23 | 6/30/23 | |||||||
| LTI | 1 | 2 | ||||||
| LTIFR3 | 0.57 | 1.20 | ||||||
| TRIFR3 | 1.72 | 3.60 | ||||||
| Class 14 environmental incidents | 0 | 0 | ||||||
Financial Results
Q3 2023 compared to Q2 2023
Bulyanhulu’s income for the third quarter of 2023 was 20% lower than the prior quarter, due to a higher cost of sales per ounce2, a lower realized gold price1, and lower sales volumes.
In the third quarter of 2023, gold production was 6% lower than the prior quarter, due to lower grades processed as we transitioned into lower grades mined, in line with the mine plan, combined with lower recoveries partially offset by higher throughput.
Cost of sales per ounce2 and total cash costs per ounce1 in the third quarter of 2023 were 2% and 1% higher, respectively, than the prior quarter, reflecting the lower grades processed partially mitigated by improved cost efficiencies. All-in sustaining costs per ounce1 in the third quarter of 2023 were 2% higher than the prior quarter, mainly due to higher total cash costs per ounce1 and slightly higher minesite sustaining capital expenditures1 on a per ounce basis.
Capital expenditures in the third quarter of 2023 were 5% higher compared to the prior quarter, reflecting
slightly higher project capital expenditures1, while minesite sustaining capital expenditures1 were in line with the prior quarter.
Q3 2023 compared to Q3 2022
Bulyanhulu’s income for the three month period ending September 30, 2023 was 22% higher than the same prior year period, mainly due to a higher realized gold price1, partially offset by lower sales volumes and a higher cost of sales per ounce2.
For the three month period ended September 30, 2023, gold production was 4% lower than the same prior year period driven by lower grades processed, in line with the mine sequence, partially offset by higher throughput and recoveries.
Cost of sales per ounce2 for the three month period ending September 30, 2023 were 3% higher than the same prior year period, mainly due to higher depreciation expense, partially offset by lower total cash costs per ounce1. Total cash costs per ounce1 decreased by 4% mainly due to the higher underground development capitalized in the current quarter, as we prioritized underground development to introduce flexibility into our current mine plan, combined with more efficient mining rates. This was partially offset by the lower grades processed. All-in sustaining costs per ounce1 in the third quarter of 2023 was 3% lower than the same prior year period, mainly due to lower total cash costs per ounce1, slightly offset by higher minesite sustaining capital expenditures1 on a per ounce basis.
| BARRICK THIRD QUARTER 2023 | 34 | MANAGEMENT’S DISCUSSION AND ANALYSIS |
| OVERVIEW |
OPERATING PERFORMANCE |
GROWTH PROJECTS & EXPLORATION |
REVIEW OF FINANCIAL RESULTS |
OTHER INFORMATION & NON-GAAP RECONCILIATIONS |
FINANCIAL STATEMENTS |
|||||
For the three month period ending September 30, 2023, capital expenditures were 17% higher than the same prior year period, mainly due to higher project capital expenditures1 resulting from higher conversion drilling and the completion of the third underground tipping point, while minesite sustaining capital expenditures1 remained relatively consistent with the same prior year period.
YTD 2023 compared to YTD 2022
Bulyanhulu’s income for the nine month period ending September 30, 2023 was 13% lower than the same prior year period, mainly due to lower sales volumes and a higher cost of sales per ounce2, partially offset by a higher realized gold price1.
For the nine month period ending September 30, 2023, gold production was 5% lower than the same prior year period, due to the transition to lower grades mined and processed in line with our mine plan. This was partially offset by higher throughput at higher recoveries in the current period as we prioritized underground development as we introduce flexibility into our current mine plan.
Cost of sales per ounce2 and total cash costs per ounce1 in the nine month period ending September 30, 2023 were 7% and 4% higher, respectively, than the same prior year period, reflecting the lower grades processed. All-in sustaining costs per ounce1 for the nine month period ending September 30, 2023 was 10% higher than the same prior year period, mainly due to higher minesite sustaining capital expenditures1 and an increase in total cash costs per ounce1.
For the nine month period ending September 30, 2023, capital expenditures increased by 17% compared to the same prior year period, mainly due to higher minesite sustaining capital expenditures1 from underground development, while project capital expenditures1 remained relatively in line with the same prior year period.
| BARRICK THIRD QUARTER 2023 | 35 | MANAGEMENT’S DISCUSSION AND ANALYSIS |
| OVERVIEW |
OPERATING PERFORMANCE |
GROWTH PROJECTS & EXPLORATION |
REVIEW OF FINANCIAL RESULTS |
OTHER INFORMATION & NON-GAAP RECONCILIATIONS |
FINANCIAL STATEMENTS |
|||||
Other Mines - Gold
Summary of Operating and Financial Data
| For the three months ended | ||||||||||||||||||||||||||||||||||||||||
| 9/30/23 | 6/30/23 | |||||||||||||||||||||||||||||||||||||||
| Gold produced (000s oz) |
Cost of sales ($/oz) |
Total cash costs ($/oz)a |
All-in sustaining costs ($/oz)a |
Capital Expend- ituresb |
Gold produced (000s oz) |
Cost of sales ($/oz) |
Total cash costs ($/oz)a |
All-in sustaining costs ($/oz)a |
Capital Expend- ituresb |
|||||||||||||||||||||||||||||||
| Veladero (50%) |
55 | 1,376 | 988 | 1,314 | 15 | 54 | 1,424 | 999 | 1,599 | 26 | ||||||||||||||||||||||||||||||
| Tongon (89.7%) |
47 | 1,423 | 1,217 | 1,331 | 6 | 44 | 1,514 | 1,380 | 1,465 | 4 | ||||||||||||||||||||||||||||||
| Hemlo |
31 | 1,721 | 1,502 | 1,799 | 12 | 35 | 1,562 | 1,356 | 1,634 | 9 | ||||||||||||||||||||||||||||||
|
Porgerac (47.5%) |
— | — | — | — | — | — | — | — | — | — | ||||||||||||||||||||||||||||||
| a. | Further information on these non-GAAP financial measures, including detailed reconciliations, is included on pages 59 to 76 of this MD&A. |
| b. | Includes both minesite sustaining and project capital expenditures1. |
| c. | As Porgera was placed on care and maintenance on April 25, 2020, no operating data or per ounce data is provided. Refer to page 9 for further information. |
Veladero (50%), Argentina
Gold production for Veladero in the third quarter of 2023 was 2% higher than the prior quarter mainly due to higher recoverable ounces placed. Cost of sales per ounce2 and total cash costs per ounce1 in the third quarter of 2023 decreased by 3% and 1%, respectively, primarily driven by higher production. All-in sustaining costs per ounce1 in the third quarter of 2023 decreased by 18% compared to the prior quarter, driven by lower total cash costs per ounce1 and lower minesite sustaining capital expenditures1.
Tongon (89.7%), Côte d’Ivoire
Gold production for Tongon in the third quarter of 2023 was 7% higher than the prior quarter mainly due to higher grades, in line with the mine plan. Cost of sales per ounce2 and total cash costs per ounce1 in the third quarter of 2023 were 6% and 12% lower, respectively, compared to the prior quarter, primarily driven by the impact of higher grades. All-in sustaining costs per ounce1 in the third quarter of 2023 decreased by 9% compared to the prior quarter, primarily reflecting the lower total cash costs per ounce1, partially offset by higher minesite sustaining capital expenditures1.
Hemlo (100%), Ontario, Canada
Gold production in the third quarter of 2023 was 11% lower than the prior quarter primarily due to lower grades mined and processed as per the mine plan. Cost of sales per ounce2 and total cash costs per ounce1 in the third quarter of 2023 both increased by 10% compared to the prior quarter, primarily due to the impact of the lower grades. In the third quarter of 2023, all-in sustaining costs per ounce1 increased by 10% compared to the prior quarter, primarily reflecting higher total cash costs per ounce1.
| BARRICK THIRD QUARTER 2023 | 36 | MANAGEMENT’S DISCUSSION AND ANALYSIS |
| OVERVIEW | OPERATING PERFORMANCE |
GROWTH PROJECTS & EXPLORATION |
REVIEW OF FINANCIAL RESULTS |
OTHER INFORMATION & NON-GAAP RECONCILIATIONS |
FINANCIAL STATEMENTS |
|||||
Lumwana (100%), Zambia
Summary of Operating and Financial Data
| For the three months ended | For the nine months ended | |||||||||||||||||||||||||||||||
| 9/30/23 | 6/30/23 | % Change | 9/30/22 | % Change | 9/30/23 | 9/30/22 | % Change | |||||||||||||||||||||||||
| Open pit tonnes mined (000s) |
37,455 | 26,919 | 39 % | 29,442 | 27 % | 81,552 | 74,292 | 10 % | ||||||||||||||||||||||||
| Open pit ore |
6,617 | 7,834 | (16)% | 6,013 | 10 % | 19,019 | 16,409 | 16 % | ||||||||||||||||||||||||
| Open pit waste |
30,838 | 19,085 | 62 % | 23,429 | 32 % | 62,533 | 57,883 | 8 % | ||||||||||||||||||||||||
| Average grade |
||||||||||||||||||||||||||||||||
| Open pit mined |
0.56 % | 0.46 % | 22 % | 0.70 % | (20)% | 0.48 % | 0.63 % | (24)% | ||||||||||||||||||||||||
| Processed |
0.55 % | 0.50 % | 10 % | 0.57 % | (4)% | 0.48 % | 0.55 % | (13)% | ||||||||||||||||||||||||
| Tonnes processed (000s) |
6,606 | 6,578 | 0 % | 7,045 | (6)% | 19,707 | 19,002 | 4 % | ||||||||||||||||||||||||
| Recovery rate |
91 % | 93 % | (2)% | 93 % | (2)% | 90 % | 94 % | (4)% | ||||||||||||||||||||||||
| Copper produced (millions of pounds) |
72 | 67 | 7 % | 82 | (12)% | 187 | 214 | (13)% | ||||||||||||||||||||||||
| Copper sold (millions of pounds) |
67 | 63 | 6 % | 79 | (15)% | 179 | 220 | (19)% | ||||||||||||||||||||||||
| Revenue ($ millions) |
209 | 189 | 11 % | 200 | 5 % | 569 | 698 | (18)% | ||||||||||||||||||||||||
| Cost of sales ($ millions) |
166 | 176 | (6)% | 173 | (4)% | 516 | 469 | 10 % | ||||||||||||||||||||||||
| Income ($ millions) |
32 | 0 | 100 % | 21 | 52 % | 20 | 216 | (91)% | ||||||||||||||||||||||||
| EBITDA ($ millions)a |
101 | 59 | 71 % | 81 | 25 % | 192 | 347 | (45)% | ||||||||||||||||||||||||
| EBITDA marginb |
48 % | 31 % | 55 % | 41 % | 17 % | 34 % | 50 % | (32)% | ||||||||||||||||||||||||
| Capital expenditures ($ millions) |
102 | 71 | 44 % | 106 | (4)% | 225 | 242 | (7)% | ||||||||||||||||||||||||
| Minesite sustaininga |
85 | 44 | 93 % | 106 | (20)% | 155 | 242 | (36)% | ||||||||||||||||||||||||
| Projecta |
17 | 27 | (37)% | 0 | 100 % | 70 | 0 | 100 % | ||||||||||||||||||||||||
| Cost of sales ($/lb) |
2.48 | 2.80 | (11)% | 2.19 | 13 % | 2.89 | 2.13 | 36 % | ||||||||||||||||||||||||
| C1 cash costs ($/lb)a |
1.86 | 2.30 | (19)% | 1.78 | 4 % | 2.35 | 1.77 | 33 % | ||||||||||||||||||||||||
| All-in sustaining costs ($/lb)a |
3.41 | 3.29 | 4 % | 3.50 | (3)% | 3.52 | 3.32 | 6 % | ||||||||||||||||||||||||
| All-in costs ($/lb)a |
3.66 | 3.71 | (1)% | 3.50 | 5 % | 3.91 | 3.32 | 18 % | ||||||||||||||||||||||||
| a. | Further information on these non-GAAP financial measures, including detailed reconciliations, is included on pages 59 to 76 of this MD&A. |
| b. | Represents EBITDA divided by revenue. |
Safety and Environment
| For the three months ended | ||||
| 9/30/23 | 6/30/23 | |||||||
| LTI | 1 | 0 | ||||||
| LTIFR3 | 0.30 | 0.00 | ||||||
| TRIFR3 | 0.30 | 0.33 | ||||||
| Class 14 environmental incidents | 0 | 0 | ||||||
Financial Results
Q3 2023 compared to Q2 2023
Lumwana recorded income of $32 million in the third quarter of 2023, compared to breaking even in the prior quarter. This was due to higher sales volumes, a lower cost of sales per pound2 and a higher realized copper price1.
Copper production in the third quarter of 2023 was 7% higher than the prior quarter mainly due to higher grades processed, in line with the mine plan, following a successful ramp-up of waste stripping. This was driven by higher mining unit rates as the new fleet continued to deliver productivity improvements.
Cost of sales per pound2 and C1 cash costs per pound1 were 11% and 19% lower, respectively, than the prior quarter due to improved mining efficiencies, combined with higher grades processed. Cost of sales per pound2 was partially offset by higher depreciation expense. In the third quarter of 2023, all-in sustaining costs per pound1 increased by 4% compared to the prior quarter, primarily driven by an increase in minesite sustaining capital
expenditures1, partially offset by lower C1 cash costs per pound1.
Capital expenditures were 44% higher compared to the prior quarter due to an increase in minesite sustaining capital expenditures1, partially offset by a decrease in project capital expenditures1. Minesite sustaining capital expenditures1 were 93% higher mainly due to increased capitalized waste stripping. Project capital expenditures1 decreased by 37% reflecting the timing of deliveries of the remaining new owner mining fleet to replace the contract mining.
Q3 2023 compared to Q3 2022
Lumwana’s income for the three month period ended September 30, 2023 was 52% higher than the same prior year period, driven by a higher realized copper price1, partially offset by lower sales volumes and a higher cost of sales per pound2.
Copper production for the three month period ended September 30, 2023 was 12% lower than the same prior year period, mainly due to lower grades processed, in line with the mine plan. This was further impacted by lower recoveries and lower throughput.
Cost of sales per pound2 and C1 cash costs per pound1 for the three month period ended September 30, 2023 were 13% and 4% higher, respectively, compared to the same prior year period, mainly as a result of the lower grades processed and lower recoveries. Cost of sales per pound2 was further impacted by higher depreciation expense. For the three month period ended September 30,
| BARRICK THIRD QUARTER 2023 | 37 | MANAGEMENT’S DISCUSSION AND ANALYSIS |
| OVERVIEW |
OPERATING PERFORMANCE |
GROWTH PROJECTS & EXPLORATION |
REVIEW OF FINANCIAL RESULTS |
OTHER INFORMATION & NON-GAAP RECONCILIATIONS |
FINANCIAL STATEMENTS |
|||||
2023, all-in sustaining costs per pound1 was 3% lower than the same prior year period as lower minesite sustaining capital expenditures1 were partially offset by higher C1 cash costs per pound1.
Capital expenditures for the three month period ended September 30, 2023 were 4% lower than the same prior year period, mainly due to lower minesite capital expenditures1 resulting from an improvement in mining unit rates, partially offset by higher waste tonnes. This was partially offset by an increase in project capital expenditures1 relating to the investment in the new owner mining fleet.
YTD 2023 compared to YTD 2022
Lumwana’s income for the nine month period ended September 30, 2023 was 91% lower than the same prior year period, primarily due to lower sales volume and a higher cost of sales per pound2. The realized copper price1 remained in line with the same prior year period.
Copper production for the nine month period ended September 30, 2023 was 13% lower than the same prior year period, primarily due to lower grades processed, in line with the mine plan. This was further impacted by lower recoveries, partially offset by higher throughput.
Cost of sales per pound2 and total C1 cash costs per pound1 for the nine month period ended September 30, 2023 were 36% and 33% higher, respectively, than the same prior year period, mainly due to lower grades processed, lower recoveries and to a lesser extent lower capitalized waste stripping. For the nine month period ended September 30, 2023, all-in sustaining costs per pound1 increased by 6% compared to the same prior year period, mainly due to higher C1 cash costs per pound1, partially offset by lower minesite sustaining capital expenditures1.
Capital expenditures for the nine month period ended September 30, 2023 were 7% lower than the same prior year period due to lower minesite sustaining capital expenditures1 primarily related to lower capitalized waste stripping reflecting the improvement in mining unit costs despite the higher tonnes mined. This was partially offset by higher project capital expenditures1 related to the investment in the new owner mining fleet.
| BARRICK THIRD QUARTER 2023 | 38 | MANAGEMENT’S DISCUSSION AND ANALYSIS |
| OVERVIEW |
OPERATING PERFORMANCE |
GROWTH PROJECTS & EXPLORATION |
REVIEW OF FINANCIAL RESULTS |
OTHER INFORMATION & NON-GAAP RECONCILIATIONS |
FINANCIAL STATEMENTS |
|||||
Other Mines - Copper
Summary of Operating and Financial Data
| For the three months ended | ||||||||||||||||||||||||||||||||||||||||
| 9/30/23 | 6/30/23 | |||||||||||||||||||||||||||||||||||||||
|
Copper pounds) |
Cost of sales ($/lb) |
C1 cash ($/lb)a |
All-in ($/lb)a |
Capital Expend- ituresb |
Copper pounds) |
Cost of sales ($/lb) |
C1 cash ($/lb)a |
All-in ($/lb)a |
Capital Expend- ituresb |
|||||||||||||||||||||||||||||||
| Zaldívar (50%) |
22 | 3.86 | 2.99 | 3.39 | 8 | 22 | 3.89 | 3.02 | 3.73 | 15 | ||||||||||||||||||||||||||||||
| Jabal Sayid (50%) |
18 | 1.72 | 1.45 | 1.64 | 6 | 18 | 1.61 | 1.26 | 1.42 | 5 | ||||||||||||||||||||||||||||||
| a. | Further information on these non-GAAP financial measures, including detailed reconciliations, is included on pages 59 to 76 of this MD&A. |
| b. | Includes both minesite sustaining and project capital expenditures1. |
Zaldívar (50%), Chile
Copper production for Zaldívar in the third quarter of 2023 was in line with the prior quarter. Cost of sales per pound2 and C1 cash costs per pound1 were both 1% lower than the prior quarter, mainly due to lower costs for contractors and materials, as well as the depreciation of the Chilean peso, partially offset by higher labor costs. All-in sustaining costs per pound1 in the third quarter of 2023 was 9% lower compared to the prior quarter, due to lower C1 cash costs per pound1 and lower minesite sustaining capital expenditures1. This investment, of which we are not the operator, continues to be a non-core part of our portfolio.
Jabal Sayid (50%), Saudi Arabia
Jabal Sayid’s copper production in the third quarter of 2023 was in line with the prior quarter. Cost of sales per pound2 and C1 cash costs per pound1 for the third quarter of 2023 increased by 7% and 15%, respectively, compared to the prior quarter, mainly due to lower gold by-product credits. All-in sustaining costs per pound1 in the third quarter of 2023 increased by 15% compared to the prior quarter, due to higher C1 cash costs per pound1, with minesite sustaining capital expenditures1 relatively consistent with the prior quarter.
| BARRICK THIRD QUARTER 2023 | 39 | MANAGEMENT’S DISCUSSION AND ANALYSIS |
| OVERVIEW | OPERATING PERFORMANCE |
GROWTH PROJECTS & EXPLORATION |
REVIEW OF FINANCIAL RESULTS |
OTHER INFORMATION & NON-GAAP RECONCILIATIONS |
FINANCIAL STATEMENTS |
|||||
Growth Project Updates
Goldrush Project, Nevada, USA7
Goldrush, at Cortez, is expected to be a long-life underground mine with anticipated annual production in excess of 400,000 ounces per annum (100% basis) once the project reaches commercial production, currently expected in 2026.
The NOA briefing package on the Goldrush FEIS moved to BLM Headquarters in the third quarter and was published in the Federal Register on October 27, 2023. The official public notice period for the FEIS ends on November 27, 2023. The ROD is still expected towards the end of the fourth quarter of 2023.
While awaiting the ROD, underground exploration and development of the future Goldrush mine continues under the Horse Canyon/Cortez Unified Exploration Project Plan of Operations. Recruitment of experienced miners continues to ramp-up albeit slower than planned. Delivery of production equipment is also on track with more equipment put into service in the third quarter, and more expected by the end of the year.
As at September 30, 2023, project spend was $371 million on a 100% basis (including $11 million in the third quarter of 2023) inclusive of the exploration declines. This capital spent to date, together with the remaining expected pre-production capital, is still anticipated to be near the approximate $1 billion initial capital estimate for the Goldrush project (on a 100% basis).
Fourmile, Nevada, USA
Fourmile is the wholly owned Barrick asset in Nevada and has the potential to form a core component of Cortez, a Tier One Gold Asset5. The current focus is on exploration drilling with promising results to date, highlighted in the Exploration section, which support potential to significantly increase the modeled extents of the declared mineral resource within the two kilometers of prospective Wenban stratigraphy, as well as uplift the grade. A dedicated Barrick project development team and budget are targeting the extension of the existing mineral resources through the Sophia and Dorothy targets, while also assessing options for an independent exploration decline access. One such option that is being assessed is a surface portal from Rangefront North, which would decouple the development of the project from the existing Goldrush operation but ultimately complement the current Goldrush multi-purpose development. Footwall development along the strike of the Fourmile orebodies would initially be used for the prefeasibility drilling and then later be re-used for mine haulage. Barrick anticipates Fourmile being contributed to the NGM joint venture if certain criteria are met following the completion of drilling and the requisite feasibility work.
NGM TS Solar Project, Nevada, USA
The TS Solar project is a 200 MW photovoltaic solar farm located adjacent to NGM’s TS Power Plant and interconnected with the existing plant transmission infrastructure. Upon completion, the project will supply renewable energy to NGM’s operations and is expected to deliver a reduction of 254kt of CO2 equivalent emissions per annum, equating to an 8% decrease from NGM’s 2018 baseline.
Array construction continued on plan throughout the third quarter of 2023 as our labor resource increased to
meet target peak headcount. Site preparations including bulk earthworks, finished grading, stormwater management, and perimeter fencing were completed and civil contractors were demobilized. Mechanical installation continued in sequence, progressing pile installation to 87% complete and tracker installation to 54% complete as at September 30, 2023. Installation of buried electrical cable was completed throughout the array and back to the solar substation. All power conversion skids were received at site and set at their final location for electrical terminations.
Module deliveries continued according to schedule and were staged throughout the array for installation. Module installation rates fell below target early in the quarter due to higher contractor turnover and lower productivity than planned. The electrical contractor addressed these resource and efficiency issues and has stabilized production to recover the original schedule in the fourth quarter. As at September 30, 2023, 39% of modules were installed.
As at September 30, 2023, project spend was $250 million (including $91 million in the third quarter of 2023) out of an estimated capital cost of $290-310 million (100% basis).
Donlin Gold, Alaska, USA
Over the past three years the Donlin Gold team’s focus has centered on building ore body knowledge around the controls on mineralization through detailed mapping and infill grid drilling. The tightly spaced drill grids focused on the deposit’s three main structural domains (ACMA, Lewis and Divide) and supported the classification of inferred and indicated resources in the current Donlin resource estimate. Trade-off studies and analysis on project assumptions, inputs, design components for optimization (mine engineering, metallurgy, hydrology, power, and infrastructure) were also conducted and will continue into 2024.
Donlin Gold, in collaboration with Calista Corporation (“Calista”) and The Kuskokwim Corporation (“TKC”), supported important initiatives in the Yukon-Kuskokwim (Y-K), including education, health, safety, cultural traditions, and environmental programs. Further, Donlin Gold collaborated with Calista and the village of Crooked Creek and engaged state officials, the U.S. Army Corps of Engineers, members of the U.S. congressional delegation, and with senior leadership from the U.S. Department of Interior as part of ongoing outreach to emphasize the thoroughness of the project’s environmental review and permitting procedures, as well as on the strong partnership between Donlin Gold and the Native Alaskans who own the mineral resource and land. The Donlin Gold team also restored the stream and riparian habitat for aquatic life on a nearby historic placer site.
Looking forward to 2024, Barrick proposed continuation of this geological field work to define the measured resource classification within the drilling grid areas, while also testing further brownfield opportunities. The additional geotechnical data gathered during the 2023 field season will support engineering to advance the design, permitting, and approval to construct the water retention dams and the tailings storage facility.
| BARRICK THIRD QUARTER 2023 | 40 | MANAGEMENT’S DISCUSSION AND ANALYSIS |
| OVERVIEW | OPERATING PERFORMANCE |
GROWTH PROJECTS & EXPLORATION |
REVIEW OF FINANCIAL RESULTS |
OTHER INFORMATION & NON-GAAP RECONCILIATIONS |
FINANCIAL STATEMENTS |
|||||
Ongoing metallurgical test work and processing trade-off studies during the year have refined the original feasibility flow sheet, identifying the potential for cost savings through grind size sensitivity and improving the understanding of recoveries by ore type. Metallurgical test work is planned to continue into 2024 with the continued execution of lab pilot plant work utilizing the updated process flow sheet and samples representative of the various ore types and additional samples representing the first three years of mining.
As a key next stage of the project, the optimum mine capacity will be reviewed, whilst also progressing the review of power generation and transmission, including alternative fuel source options, mitigating risk in the logistical strategies for the project and completing a detailed, first principles update of capital and operating costs.
All work streams will concentrate on continuing to move the Donlin Gold project up the value curve. Focus will continue to be on mitigating the technical challenges, defending challenges to the existing permits, advancing the remaining project permitting, and exploring further partnership opportunities to unlock value for our Alaskan partners and communities..
Pueblo Viejo Expansion, Dominican Republic8
The Pueblo Viejo plant expansion and mine life extension project is designed to increase throughput to 14 million tonnes per annum and sustain gold production above 800,000 ounces per year (100% basis) going forward.
The continually diminishing list of construction and commissioning activities for the plant expansion progressed in the third quarter of 2023, with the first of the new oxygen plants, the CIL and the solution cooling towers now operational. Full ramp up has been delayed by equipment failures being resolved by the original equipment manufacturers. Currently temporary fixes are delivering the expected recovery improvements from the new equipment. In addition to resolving the equipment issues, at the start of Q4 we experienced a further setback with the structural failure of the crusher conveyor, which connects the new crusher and the new SAG mill feed stockpile. This is being addressed with an interim solution while the reengineered conveyor structure is completed.
During the fourth quarter of 2023, we expect to complete the second oxygen plant and limestone regrind mill, and ramp-up the flotation circuit mass pull and overall recoveries. With the crusher conveyor structure failure, we now expect to reach nameplate capacity for the expanded plant during the first quarter of 2024.
The technical and social studies for additional tailings storage capacity (El Naranjo) continued to advance as planned. The environmental license for the construction and operation of the El Naranjo facility was received from the Government of the Dominican Republic during the second quarter of 2023, marking an important project milestone. Geotechnical drilling and site investigations are ongoing and continue to support the feasibility study, due for completion in the third quarter of 2024.
As at September 30, 2023, total project spend was $1,011 million (including $47 million in the third quarter of 2023) on a 100% basis. As previously disclosed, the estimated capital cost of the plant expansion and mine life extension project is approximately $2.1 billion (on a 100% basis).
Veladero Phase 7 Leach Pad, Argentina
In November 2021, Minera Andina del Sol approved the Phase 7A leach pad construction project with Phase 7B subsequently approved in the third quarter of 2022. Construction on both phases includes sub-drainage and monitoring, leak collection and recirculation, impermeabilization, as well as pregnant leaching solution collection. Additionally, the north channel will be extended along the leach pad facility.
Construction of Phase 7A was completed on budget at a cost of $81 million (100% basis). As previously disclosed, we deferred Phase 7B construction, since we were ahead on the construction timeline and had sufficient stacking capacity for 2023 and into the second half of 2024. Construction of Phase 7B began during the third quarter of 2023 and is scheduled for completion in 2024.
Overall for Phase 7, as at September 30, 2023, project spend was $104 million (including $3 million in the third quarter of 2023) out of an estimated capital cost of $160 million (100% basis).
Reko Diq Project
On December 15, 2022, Barrick completed the reconstitution of the Reko Diq project in Pakistan’s Balochistan province. The completion of this transaction involved, among other things, the execution of all of the definitive agreements including the mineral agreement stabilizing the fiscal regime applicable to the project, as well as the grant of mining leases, an exploration license, and surface rights. This completed the process that began earlier in 2022 following the conclusion of a framework agreement among the Governments of Pakistan and Balochistan province, Barrick and Antofagasta plc, which provided a path for the development of the project under a reconstituted structure. The project, which was suspended in 2011 due to a dispute over the legality of its licensing process, hosts one of the world’s largest undeveloped open pit copper-gold porphyry deposits.
The reconstituted project is held 50% by Barrick and 50% by Pakistani stakeholders, comprising a 10% free-carried, non-contributing share held by the Provincial Government of Balochistan, an additional 15% held by a special purpose company owned by the Provincial Government of Balochistan and 25% owned by other federal state-owned enterprises. Barrick is the operator of the project. The key fiscal terms for Reko Diq are a 5% NSR payable to the Provincial Government of Balochistan, a 1% NSR final tax regime payable to the Government of Pakistan (subject to a 15-year exemption following commercial production), and a 0.5% NSR export processing zone surcharge.
Barrick has started a full update of the project’s 2010 feasibility and 2011 expansion PFS. The Reko Diq feasibility study update is expected to be completed by the end of 2024, with 2028 targeted for first production.
During 2023, the project team continued to advance the feasibility study, with engineering consultants engaged to advance key areas and commence basic engineering. Personnel continued to be recruited and mobilized for the project with the majority of new hires from Balochistan. The site works were advanced with a focus on early works infrastructure. The refurbished Reko Diq airstrip continues to operate flights with a weekly charter in operation. The advanced social development commitments for the quarter were met with community programs being
| BARRICK THIRD QUARTER 2023 | 41 | MANAGEMENT’S DISCUSSION AND ANALYSIS |
| OVERVIEW | OPERATING PERFORMANCE |
GROWTH PROJECTS & EXPLORATION |
REVIEW OF FINANCIAL RESULTS |
OTHER INFORMATION & NON-GAAP RECONCILIATIONS |
FINANCIAL STATEMENTS |
|||||
advanced at local communities. A health clinic was inaugurated at Humai (the nearest community to Reko Diq site) during the quarter, together with a mobile health clinic which operates out of Nok Khundi.
As at September 30, 2023, year-to-date project spend was $35 million (including $16 million in the third quarter of 2023) (100% basis). This amount is recorded in exploration, evaluation and project expense.
Loulo-Gounkoto Solar Project, Mali
The scope of this project is to design, supply and install a 40 MW (48 MW peak) photovoltaic solar farm with a 36 MVA battery energy storage system. Upon completion, we expect to realize a reduction of 23 million liters of fuel in the power plant, which translates to a saving of approximately 63kt of CO2 equivalent emissions per annum. The project is staged in two phases of solar and battery storage and tracking ahead of schedule. Phase 1 and Phase 2 solar has been completed and 29 of the 30 battery energy storage units are connected to the micro grid. The project schedule status is 98% complete (up from 92% as at June 30, 2023). Phase 1 has been completed with Phase 2 scheduled for completion before the end of 2023.
As at September 30, 2023, project spend was $72 million (including $6 million in the third quarter of 2023) out of an expected capital cost of approximately $90 million (100% basis).
Jabal Sayid Lode 1, Saudi Arabia
The scope of this project is to develop and mine a new orebody, located less than a kilometer from the existing lode at Jabal Sayid, following the completion of a feasibility study that comfortably meets our investment criteria. The project design includes underground capital development as well as ventilation, paste plant and underground mining infrastructure upgrades where stoping commenced during the third quarter of 2023. The up cast ventilation raise bore shaft is fully equipped and surface infrastructure undergoing punch listing. The reagent plant has been commissioned ahead of the scheduled treatment of Lode 1 ore. Civil construction for the new paste pump is progressing well and assembly of the Direct Flow Reactors will commence in the fourth quarter of 2023. The project is 88% complete (up from 81% as at June 30, 2023)
As at September 30, 2023, project spend was $38 million (including $3 million in the third quarter of 2023) out of an estimated capital cost of approximately $40 million (100% basis).
Lumwana Super Pit Expansion, Zambia
During the fourth quarter of 2022, we began a transition to an owner-miner fleet for waste stripping at Lumwana following a study which concluded that this option could result in a 20% cost reduction within the first five years versus contracted services. Separately, this strategy positions the operation well for the Super Pit expansion.
During the quarter, conversion drilling at the Kamisengo resource and the first phase of Chimiwungo Super Pit conversion were both completed. Geometallurgical test work results from Kamisengo confirmed previous comminution requirements and float recoveries. Continued test work of the deep Chimiwungo Super Pit orebody is ongoing, with the aim of identifying any variability in comminution and float characteristics. Geotechnical site investigation drilling of the PFS project layout commenced during the quarter, with test pitting and boreholes being completed at the new plant site and crushed ore stockpile location.
Subsequently, the mine plans were updated with our new geological models which resulted in delaying the start of Kamisengo mining to 2029, thereby deferring conveyor, crusher, and other non-process infrastructure capital until after completion of the main process plant expansion. The mining production profile optimization resulted in a ramp up commencing from 2025, reaching full 250Mtpa capacity by 2032, with a mine life of 36 years9.
ESIA baseline data collection for the project has now been completed for all seasons and compilation of the final ESIA in support of the study is on track to be completed by the end of the first quarter of 2024. Following the completion of the MAA, PFS level design work has commenced and progressed during the quarter on the TSF expansion and the surface water management infrastructure and is scheduled to be completed during the fourth quarter.
The plant expansion PFS was concluded during the quarter, which concluded that the 50Mtpa plant expansion, effectively doubling the existing circuit capable of delivering 240kt Cu per annum provided the best economic returns9. The accelerated feasibility study is scheduled for completion towards the end of next year, with pre-construction expected to start in 2025 and 2028 targeted for first production.
This owner-miner transition is being executed concurrently with the Super Pit PFS, which commenced in the fourth quarter of 2022. The first deliveries of the owner stripping fleet were received at the beginning of 2023 with 37 rigid body dump trucks and eleven excavators in production. Although the delivery schedule has experienced delays, the efficiency of the new fleet has exceeded that of the previous contractor fleet, partially offsetting the shortfall in waste stripping tonnes forecast for the remainder of the year.
As at September 30, 2023, project spend on the new fleet was $102 million (including $17 million in the third quarter of 2023) out of an estimated capital cost of approximately $115 million.
| BARRICK THIRD QUARTER 2023 | 42 | MANAGEMENT’S DISCUSSION AND ANALYSIS |
| OVERVIEW | OPERATING PERFORMANCE |
GROWTH PROJECTS & EXPLORATION |
REVIEW OF FINANCIAL RESULTS |
OTHER INFORMATION & NON-GAAP RECONCILIATIONS |
FINANCIAL STATEMENTS |
|||||
Exploration and Mineral Resource Management
The foundation of our exploration strategy is a deep organizational understanding that discovery through exploration is a long-term investment and the main value driver for our business. Our exploration strategy has multiple elements that all need to be in balance to deliver on Barrick’s business plan for growth and long-term sustainability.
First, we seek to deliver projects of a short to medium-term nature that will drive improvements in mine plans. Second, we seek to make new discoveries that add to Barrick’s Tier One Gold Asset5 portfolio. Third, we work to optimize the value of our major undeveloped projects and finally, we seek to identify emerging opportunities early in their value chain and secure them by an earn-in or outright acquisition, where appropriate.
The following section summarizes the exploration results from the third quarter of 2023.
North America
Carlin, Nevada, USA10
Conversion drilling began from underground platforms within the Fallon footprint (North Leeville) for the first time this quarter. Targeting known mineralization at the southernmost extents of Fallon, holes NLC-23004 and NLC-23006 returned significant intercepts of 7.5 meters TW (True Width) at 16.52 g/t Au and 14.4 meters TW at 12.03 g/t Au respectively. This drilling together with the Miramar drilling represent the start of our efforts to successfully close the 600 meter gap between the Fallon maiden resource to the north and the Miramar resource to the south where drilling along the prospective Veld structure continues to return high-grade intercepts, including 12.8 meters TW at 24.35 g/t Au in NTC-23013 and 13.4 meters TW at 14.46 g/t Au in NTC-23014. All drilling to date confirms the geological model and the controls of the mineralization ultimately supporting the expected upside potential. Reserve conversion drilling will continue within the main footprint of Miramar during the fourth quarter.
Further to the northeast of Fallon, target generation work continues to add additional opportunities. A 40-square kilometer soil survey has identified multiple northeast and northwest oriented trends of multi-kilometer gold anomalism in Upper Plate stratigraphy. These orientations are similar to key ore controlling features within the orebodies of the Greater Leeville deposits, and align with several fault projections from known ore bearing structures. In the fourth quarter, the first framework drill hole will test the anomalous projection of the Basin Bounding fault at an interpreted inflection of the structure which is an analogous structural setting to high-grade mineralization controls on the adjacent Post fault system to the west.
To the west of Goldstrike, results from framework drilling that targeted the East Bounding fault corridor returned pervasive low-grade gold with no significant ore grade intercepts, however the low-grade mineralization is consistently hosted in well developed breccias along the four kilometer zone along its full north-south strike length. The opportunity remains open with multiple vectors pointing south where the final 2023 drill hole intersected significant hanging wall alteration and continuous low-level gold mineralization. Targeted follow up drilling will test the southern vectors and hanging wall alteration and is planned for 2024.
Cortez, Nevada, USA11
Drilling in the third quarter has focused on the conceptual deep target beneath the Goldrush orebody, named Maverick. One hole was completed for 1,523 meters, with the second currently in progress. Drilling is targeting mineralized structures within the Silurian Roberts Mountain stratigraphy, known to host ore at the main Cortez underground mine, in a broad fold similar to the Goldrush orebody that is some 500 meters higher up in elevation. To date, encouraging deformation and alteration has been logged, with assay results still pending.
In the northwest of Robertson, step-out drilling outside of the existing resource pits show continuity of mineralization at depth and near surface at the Distal target. Results including DTL-23010 (7.5 meters TW at 1.28 g/t Au) and DTL-23014 (18.2 meters TW at 1.19 g/t Au) confirm the up-dip continuity of mineralization along the Distal Fault series.
Fourmile, Nevada, USA12
At Fourmile, drilling along the prospective trend between the Sophia and Dorothy zones intersected 28.7 meters at 51.10 g/t Au in drillhole FM23-181D. The targeted corridor along the Sadler Fault remains open along strike north and south of the intercept for a total of 750 meters between the two zones. This result continues to highlight the potential for additional high-grade mineralization north of the existing Fourmile resource. Drilling is planned to continue into the fourth quarter, with additional results expected by quarter end.
Additionally at Fourmile, targets continue to be evaluated on the greater Barrick property through drilling. At the Anna Marie target area, which has many similar geologic characteristics to the Fourmile corridor, 400 meters to the east, drillhole FM23-182DW1 intersected a broad zone of alteration with more than 40 meters of low-level gold and punctuated high-grade samples within a decalcified, strongly sulfidized breccia. The intensity of the alteration in the interval is encouraging, and the system remains open in multiple directions. Work will continue to vector to more continuous zones of high-grade mineralization.
Turquoise Ridge, Nevada, USA13
Reserve conversion drilling at Turquoise Ridge underground continues to infill along the BBT Corridor near mine infrastructure. TUM-23014 intersected 19.8 meters TW at 13.36 g/t Au within an approximately 50 meter gap below the Main Dike and hanging wall to the V Dike within Basal Slope Facies rocks of the Lower Comus, confirming continuity there. Further downhole in TUM-23014, drilling returned 4.6 meters TW at 14.60 g/t Au along a poorly-defined Getchell Fault-parallel structure. Follow-up drilling is planned in the fourth quarter to better understand the lower intercept, which currently remains open down-dip. Inventory conversion drilling targeting the gap between 2022 BBT Corridor drilling and Turquoise Ridge underground proper returned 2.0 meters TW at 6.86 g/t Au and 1.4 meters TW at 13.34 g/t Au in hole TUM-23305. These results follow up from previous drilling in TUM-22416A which returned 7.0 meters TW at 11.08 g/t Au and 3.1 meters TW at 11.61 g/t Au, less than 50 meters along strike. Improvements to the geological model resulted in an update to the previously reported intercept. Mineralization remains open to the
| BARRICK THIRD QUARTER 2023 | 43 | MANAGEMENT’S DISCUSSION AND ANALYSIS |
| OVERVIEW | OPERATING PERFORMANCE |
GROWTH PROJECTS & EXPLORATION |
REVIEW OF FINANCIAL RESULTS |
OTHER INFORMATION & NON-GAAP RECONCILIATIONS |
FINANCIAL STATEMENTS |
|||||
south, where follow-up drilling in 2024 is expected to confirm continuity.
At the Mega Feeder target, results from drilling reported in the second quarter continued to be evaluated, building a more robust understanding of the structural setting below Mega Pit. As previously discussed, the potential for a high-grade, feeder-type target beneath the deposit remains high, and continues to be one of the highest priority target concepts for exploration in the district. While the focus in the first half of the year has been to build an understanding below the Deposit 55 area of the pit, an expanded review of the geology and structural setting to the north and east is defining other potential target areas for the next phase of framework drilling. One additional hole is planned to be executed in the fourth quarter.
Pearl String, Nevada, USA
An initial phase of RC drilling was completed on the Pearl String property during the third quarter. Drilling targeted areas of mapped surface alteration and geochemical anomalism with a high sulphidation epithermal signature both within the optioned portions of the property as well as targets within the Barrick claims to the west. Several holes intersected altered volcanic stratigraphy. Results are pending and when received will be utilized to plan follow up RC drilling in the fourth quarter.
Hemlo, Canada14
Reserve conversion drilling targeting the Lower C-Zone West yielded results in line with expectation, including 9.4 meters TW at 4.83 g/t Au in 1152332, which further validates the updated geological model and the expected reserves conversion. Concurrently, drilling in the C-Zone and Lower B-Zone West are in progress and have yielded the anticipated lithological sequences. Resource drilling began in the D-Zone during the quarter, with the aim of adding resource ounces. Results from this program include 6.6 meters TW at 4.27 g/t Au in 7652311, 3.4 meters TW at 5.84 g/t Au in 7652314, and 3.1 meters TW at 3.11 g/t Au in 7652315, and are in line with expectations.
Pic, Ontario, Canada
Surface geological and geochemical work led to the generation of three targets for framework drilling: a) Porphyry Lake, a 700 meter by 400 meter gold in soil anomaly associated with an area of extensive hornfelsing in basalts cut by porphyry dykes; b) Moses-Beggs Lake, an area defined by a gold in till anomaly associated with shearing in mafic rocks and gold-bearing quartz-carbonate and quartz-tourmaline veins in a Moose Lake Porphyry-aged (i.e. Hemlo-age) intrusive; and c) Roccian Lake, a gold in till anomaly associated with a gold-bearing intrusive at the edge of a covered area with no outcrops. Initial framework drilling to assess the targets was initiated in September 2023.
Sturgeon, Ontario, Canada
A comprehensive till sampling program was completed in the Wabigoon Greenstone Belt identifying a gold in till anomaly at a multi-kilometer scale where regional structures striking NNE and E-W intersect. Surface geological work identified different styles of mineralization within the area of anomalism, including sulfide disseminations in intrusive rock and quartz-carbonate veins of high grade and visible gold. A second significant gold in till anomaly was identified in an area without outcrop, in the vicinity of a mineralized alkalic intrusion, which produced historic gold results.
Patris, Quebec, Canada
Access agreements were established with the vast majority of private landowners in our primary target area at Patris. Following slight delays due to an exceptional forest fire season, surface geological work was initiated and confirmed our target concept by identifying mineralized intrusive rock intruding the sediments southwest of the La Pause fault. An airborne electromagnetic survey was completed to map the thickness of glacial cover across the property and help optimize a drill for till program.
A gradient induced polarization survey is planned for the fourth quarter to help refine targets in the sediments southwest of the La Pause Fault.
Latin America & Asia-Pacific
Pueblo Viejo, Dominican Republic
At Pueblo Viejo, exploration activities defined the following three near-mine targets which will be drill tested in the fourth quarter. In Arroyo del Rey, a drill-ready target has been defined following field mapping, sampling, and integration of the 2022 framework drilling. The target has a 230 meter by 400 meter alteration footprint, with coincident PV-type alteration and chargeability anomalies. Drilling of this target commenced in October 2023.
At Pueblo Grande Norte, located to the west of Pueblo Viejo, drilling is in progress on three porphyry and epithermal targets which had been defined. This framework drilling program is expected to be completed by November 2023.
At Zambrana, to the southeast of the Moore pit, one drill ready target with favorable geology and coincident high chargeability anomalism was defined which will be drill tested during the fourth quarter.
A fourth area of interest to the southeast of Pueblo Viejo, Pueblo Grande Sur, is emerging following field mapping, soil sampling and ground geophysics and framework drilling is planned in H1 2024.
Regional Exploration, Dominican Republic
A full integration and reinterpretation of legacy data on a consolidated Barrick property portfolio located in the west of the Dominican Republic has been initiated. Several areas of interest are emerging and field work to define the geological framework, potential and target areas will be conducted next year.
Veladero District, Argentina
At the Morro Escondido target, a mineral inventory has been defined following the completion of the first diamond drilling campaign. The metallurgical sampling program continues as part of the study to optimize the project economics and the exploration team is now focussing on the geological extensions to mineralization along the Ortiga Trend.
To the north of Morro Escondido, within this trend, several targets have been defined in the Cerro Lila target area which is a large, partly covered, high sulfidation system, of a similar age to Veladero. A Controlled Source Audio Magneto Telluric survey defined several resistivity anomalies coincident with favorable geology. Drilling is scheduled to begin in the fourth quarter.
A fully integrated prospectivity and prioritization assessment was carried out throughout the Veladero District, which resulted in the identification of four new areas with potential to host economic mineralization, increasing the number of priority targets to 10 that will be evaluated by way of geological mapping, sampling, ground geophysics and drilling during this spring-summer season.
| BARRICK THIRD QUARTER 2023 | 44 | MANAGEMENT’S DISCUSSION AND ANALYSIS |
| OVERVIEW | OPERATING PERFORMANCE |
GROWTH PROJECTS & EXPLORATION |
REVIEW OF FINANCIAL RESULTS |
OTHER INFORMATION & NON-GAAP RECONCILIATIONS |
FINANCIAL STATEMENTS |
|||||
As reported previously, the drilling results at the Antenas-Chispas target had reduced the search zone to a 1 kilometer by 2 kilometer area of interest with favourable hydrothermal alteration present. Due to the winter season, there have been no field activities, with plans to return in the fourth quarter of 2023 to test the final zone of interest with two or three more holes.
Drilling of the Lama targets remains suspended due to winter operating conditions. Geological reviews of results remain ongoing to determine a program for the fourth quarter of 2023. As previously reported, those targets with a low potential to pass investment filters have been removed from the portfolio.
Northern Chile
Following the positive early field results at the Guanaqueros project, located in Northern Chile, further geological mapping, sampling, and ground geophysics have identified at least two emerging intermediate sulfidation targets and the ongoing work is expected to deliver drill-ready targets by the second quarter of 2024. Following these positive results, a large district-scale position was consolidated. Several new target areas are emerging in the new district after early-stage field reconnaissance. It is expected that detailed mapping and sampling, as well as geophysical surveys will define the geological framework and potential of the area.
In parallel, generative work is expanding with a focus on securing a strong portfolio of projects that provides exploration optionality.
El Indio Camp (Chile)
In the El Indio district, there have been no field activities due to the winter weather season. Ongoing review work of the target area, based on recent drill results, remains ongoing with the intention to return to the field in the fourth quarter of 2023 for an additional small drilling campaign, targeting the potential for a structurally controlled high-grade feeder zone.
Peru
Field work continues to focus on building a high quality portfolio of district-scale projects across the country. Four areas of interest are advancing in parallel, with projects at different stages, from drill-testing to target delineation to generative.
At Austral, several targets were tested with a drilling campaign executed during the quarter. Results confirmed the geological framework, but intercepted narrow structurally controlled mineralization. Assays results will be integrated to review the potential of the area.
Following the consolidation of the Pataqueña District, further mapping, sampling, and ground geophysical surveys defined four large targets with favorable geology (alteration and host rocks) in a promising structural setting. Pataqueña is an intermediate sulfidation epithermal system. All permits to complete the drilling campaign have been secured, and drilling is planned after the wet season, in the second quarter of 2024.
At a third area of interest, the Libelula District, early-stage work continues to return encouraging results. Detailed field mapping and sampling is ongoing, with ground geophysical surveys planned in early 2024, aiming to have drill-ready targets by the third quarter of 2024.
Reconnaissance field work is planned in a fourth area of interest, where Barrick has consolidated a district-scale position with a favorable license to operate.
Ecuador
During the quarter, Barrick successfully participated in a public tender process conducted by ENAMI EP, the state-owned mining company of Ecuador. The public process preceded the signing of a commercial agreement setting out a framework for the potential exploration and development of four district-scale areas (spanning approximately 398 square kilometers in total) in the prolific Jurassic Belt, which hosts the Mirador and Fruta del Norte deposits. The framework agreement was signed by ENAMI EP and Barrick on September 19, 2023. Following this milestone, Barrick expects to commence reconnaissance field work by year-end and to continue to work with ENAMI EP on implementing the framework agreement.
Porgera, Papua New Guinea
As discussed on page 9, Porgera is currently on temporary care and maintenance and consequently, all exploration activities have ceased.
Japan Gold Strategic Alliance, Japan
In Japan, we have completed the CSAMT geophysical survey at the Aibetsu project, located on Hokkaido Island and the team is progressing with the final interpretation. Looking ahead to the fourth quarter, a second phase of drilling at the Mizobe project on Kyushu island has been scheduled, and a geophysical CSAMT survey is planned for the Togi project situated on Honshu Island.
Asia Pacific
The exploration team is currently focusing on reviewing and evaluating new exploration opportunities across the Asia Pacific region.
Africa and Middle East
Senegal, Exploration15
On the Bambadji joint venture, the framework drilling of the first two prioritized targets along the 26-kilometer prospective corridor of the Bambadji Main Shear Zone (BMSZ) has progressed. At Latifa an encouraging intersection was received from LFDH004: 17.8 meters at 2.59 g/t (including 10 meters at 3.84 g/t) from 419.8 meters, hosted within a 70 meter thick alteration zone, which is open at depth and along strike. At Baqata, results from the three holes drilled on the target demonstrate the exploration potential within a kilometer scale mineralized system with indications of high-grade illustrated by BQDH011: 6.2 meters at 5.82 g/t from 259 meters including 2.7 meters at 12.92 g/t. The Baqata system remains open at depth and will be prioritized against other opportunities in the corridor for the next phases of drilling.
To the west, in the Faleme Domain, additional results from extensive target delineation programs continue to highlight multi-kilometer scale anomalous geochemical trends associated with prospective geological features supporting the exploration potential for major discoveries in this underexplored setting.
Loulo-Gounkoto, Mali16
At Yalea, deep framework drilling is planned to commence in the fourth quarter to test for large scale extensions and/or repetitions of the main high-grade Yalea system, in particular the Purple Patch, at depth. In addition, near surface, under-explored opportunities have been identified along strike both to the north and south of Yalea which will be prioritized for follow up.
| BARRICK THIRD QUARTER 2023 | 45 | MANAGEMENT’S DISCUSSION AND ANALYSIS |
| OVERVIEW | OPERATING PERFORMANCE |
GROWTH PROJECTS & EXPLORATION |
REVIEW OF FINANCIAL RESULTS |
OTHER INFORMATION & NON-GAAP RECONCILIATIONS |
FINANCIAL STATEMENTS |
|||||
At Baboto, a follow-up drilling campaign has confirmed the extension of a large scale mineralized system at depth. Mineralization styles and the geological setting exhibit similarities to major systems such as Yalea with new intersections demonstrating high grade potential within the system, BNRC332: 2 meters at 11.58 g/t , BHD52: 2.15 meters at 8.71 g/t, BDH53: 3.9 meters at 16.83 g/t. A second phase of drilling is in progress to assess the scale of the system and overall potential.
At Gounkoto, geological model reviews at both Gounkoto and Faraba have highlighted untested opportunities for system replications at depth in both targets. Drilling is planned to commence in the fourth quarter.
Tongon, Cote D’Ivoire
At Fonondara, the drilling program designed to assess the potential of the deposit as a satellite for Tongon has returned encouraging initial results with zones of higher grades and widths than those modelled. Additional programs have been designed to test the near surface continuity along strike as well as framework diamond drilling to investigate the overall system potential at depth for a large standalone orebody.
At Korokaha North, initial field validation and data integration, including the layers from a new airborne magnetic survey has highlighted a number of high priority large scale targets, several of which are associated with the eastwards extensions of the fertile structures which control the location of the Tongon deposits. An initial drilling program is scheduled to commence in the fourth quarter to rapidly assess the potential of the targets to become additional satellites to further extend the life of mine at Tongon.
Kibali, Democratic Republic of Congo17
A framework drilling program has been completed in the sparsely tested area between the KCD, Gorumbwa and Kombokolo orebodies. Geological observations provide further support for a parallel corridor northwest of KCD, with similar host rocks and mineralization style. Multiple high impact targets have been generated from the framework program, including a sparsely tested structure linking the KCD and Gorumbwa orebodies and near-surface targets that could support the KCD super pit concept. Follow-up drilling is planned to refine the model and vector toward high grade lodes.
At Agbarabo-Rhino, drilling this quarter successfully intersected the Rhino main mineralization system 250 meters down plunge from the deepest previous holes over a width of 130 meters, and mineralization remains open laterally and down plunge. The results support the potential of Rhino as an ‘anchor lode’ to deliver a significant open pit/underground satellite made up of multiple high-grade shoots less than four kilometers from the Kibali plant demonstrated by ADD030: 22.7 meters at 2.67 g/t Au from 244.4 meters (including. 3.2 meters at 9.24 g/t Au).
Along the KZ-North trend at Oere, a drilling program is in progress to test for a larger, high-grade orebody below the known system. To date, drilling has confirmed the continuity of the mineralized system down to 450 meters vertical depth demonstrated by ORDD0112: 13.9 meters at 2.50 g/t Au from 338.0 meters (including 2.9 meters at 4.86 g/t Au and 3.8 meters at 3.43 g/t Au) and ORDD0113: 9.0 meters at 2.28 g/t Au from 514.3 meters. These results support the exploration potential of the
vertical extension of the system and reinforce the prospectivity of the entire KZ North trend for additional blind high-grade lodes between the Mofu-Oere-Kalimva orebodies.
North Mara and Bulyanhulu, Tanzania18
Framework drilling along the highly prospective Gokona corridor at North Mara has discovered a new gold-bearing hydrothermal system within the Shakta area, eight kilometers northwest of Gokona. Assays from wide-spaced drilling are encouraging, with SKRC019 returning 6 meters at 4.2 g/t Au from 101 meters (including 2 meters at 11.5 g/t Au), within Gokona-style host rocks. The target area is preserved under post-mineralization volcanic cover, with the system open for more than one and a half kilometers along strike, a potential footprint comparable to the Gokona-Gena orebodies. Additional drilling will be completed next quarter to assess the potential of the target.
At Bulyanhulu, shallow geochemical drilling commenced within the northwest tenement holdings, targeting potential repetitions and extensions of the Bulyanhulu-type geology and host structures. The program aims to map the geology and geochemical signatures beneath the post-mineral cover to generate high impact satellite targets close to the Bulyanhulu plant.
An airborne geophysical survey was completed during the quarter across the newly consolidated Siga footprint, and the data will aid in generating the priority initial targets along the interpreted southerly continuation of the Bulyanhulu host structure beneath post-mineral cover.
Lumwana19
All assay results were received for the Kababisa Extension drilling with significant grade and thickness intersected: KAB012 16 meters at 0.67% Cu, KAB13 7 meters at 0.69% Cu and KAB014 7 meters at 0.44% Cu, extending the Kababisa Main mineralization to the north by approximately 850 meters and is still open along strike. Infill drilling of Kababisa main and the northern Extension, including a possible connection to Kamalamba will be the focus for the fourth quarter.
Jabal Sayid, Kingdom of Saudi Arabia
Drilling this quarter at the Janob target, located one-kilometer southwest of Lode 1, has shown continuity of feeder style copper mineralization over a 300 meter strike. Additional surface trenching is being carried out to constrain the surface expression of the copper mineralization and the geological model before deeper drilling is carried out in the fourth quarter to fully assess the potential.
On the Jabal Sayid South project, prospective paleo-surface trends extending from the Jabal Sayid license have been mapped over 1.5 kilometers with coincident copper geochemical anomalies and geophysical responses indicative of massive sulphide mineralization. Targets are being prioritized for scout drill testing in the fourth quarter.
Exploration at Umm ad Damar is progressing rapidly with the delineation of robust targets for initial drill testing planned in the fourth quarter. The targets have been defined based on the integration of geological mapping and sampling, ground geophysics and the relogging of historical drill holes. An airborne geophysical survey is planned for the fourth quarter to support the generation of additional targets.
| BARRICK THIRD QUARTER 2023 | 46 | MANAGEMENT’S DISCUSSION AND ANALYSIS |
| OVERVIEW | OPERATING PERFORMANCE |
GROWTH PROJECTS & EXPLORATION |
REVIEW OF FINANCIAL RESULTS |
OTHER INFORMATION & NON-GAAP RECONCILIATIONS |
FINANCIAL STATEMENTS |
|||||
Review of Financial Results
Revenue
| ($ millions, except per ounce/pound data in dollars) |
For the three months ended |
For the nine months ended |
||||||||||||||||||
| 9/30/23 | 6/30/23 | 9/30/22 | 9/30/23 | 9/30/22 | ||||||||||||||||
| Gold |
||||||||||||||||||||
| 000s oz solda |
1,027 | 1,001 | 997 | 2,982 | 3,030 | |||||||||||||||
| 000s oz produceda |
1,039 | 1,009 | 988 | 3,000 | 3,021 | |||||||||||||||
| Market price ($/oz) |
1,928 | 1,976 | 1,729 | 1,930 | 1,824 | |||||||||||||||
| Realized price ($/oz)b |
1,928 | 1,972 | 1,722 | 1,934 | 1,820 | |||||||||||||||
| Revenue |
2,588 | 2,584 | 2,277 | 7,583 | 7,385 | |||||||||||||||
| Copper |
||||||||||||||||||||
| millions lbs solda |
101 | 101 | 120 | 291 | 346 | |||||||||||||||
| millions lbs produceda |
112 | 107 | 123 | 307 | 344 | |||||||||||||||
| Market price ($/lb) |
3.79 | 3.84 | 3.51 | 3.89 | 4.11 | |||||||||||||||
| Realized price ($/lb)b |
3.78 | 3.70 | 3.24 | 3.88 | 3.86 | |||||||||||||||
| Revenue |
209 | 189 | 200 | 569 | 698 | |||||||||||||||
| Other sales |
65 | 60 | 50 | 186 | 156 | |||||||||||||||
| Total revenue |
2,862 | 2,833 | 2,527 | 8,338 | 8,239 | |||||||||||||||
| a. | On an attributable basis. |
| b. | Further information on these non-GAAP financial measures, including detailed reconciliations, is included on pages 59 to 76 of this MD&A. |
Q3 2023 compared to Q2 2023
In the third quarter of 2023, gold revenues were largely in line with the second quarter of 2023, as higher sales volumes were offset by a lower realized gold price1. The average market price for the three month period ended September 30, 2023 was $1,928 per ounce, representing a 2% decrease versus the all-time high quarterly average of $1,976 per ounce average in the prior quarter. During the third quarter of 2023, the gold price ranged from $1,846 to $1,988 per ounce, and closed the quarter at $1,871 per ounce. Gold prices in the third quarter of 2023 continued to be volatile, impacted by economic and geopolitical concerns, global interest rate policies and outlooks, high levels of inflation, and a strengthening trade-weighted US dollar.
In the third quarter of 2023, gold production on an attributable basis was 30 thousand ounces higher than the prior quarter, primarily due to higher oxide production from the Crossroads open pit and Cortez Hills underground at Cortez. In addition, production was higher at Turquoise Ridge due to planned autoclave maintenance in the previous quarter and at Kibali driven by improved grades. This was offset by lower production at Carlin due to lower open pit ore tonnes mined at a lower average grade as mining in the Goldstar open pit was substantially completed early in the third quarter, leading to a higher proportion of lower grade stockpile tonnes processed at the roasters.
ATTRIBUTABLE GOLD PRODUCTION VARIANCE (000s oz)
Q3 2023 compared to Q2 2023
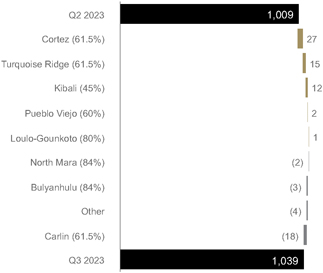
Copper revenues in the third quarter of 2023 increased by 11% compared to the prior quarter, primarily due to a higher realized copper price1, while sales volumes were in line with the prior quarter. The average market price in the third quarter of 2023 was $3.79 per pound, representing a decrease of 1% from the $3.84 per pound average in the prior quarter. The realized copper price1 in the third quarter of 2023 was slightly lower than the market copper price due to the impact of negative provisional pricing adjustments, consistent with the prior quarter. During the third quarter of 2023, the copper price traded in a range of $3.66 to $4.02 per pound, and closed the quarter at $3.73 per pound. Copper prices in the third quarter of 2023 were impacted by a strengthening trade-weighted US dollar, and concerns regarding a slowdown in economic growth, especially in China, which is the world’s largest consumer of copper. Longer term, expectations for increases in copper demand from infrastructure spending and the transition to a low-carbon global economy should continue to have a positive impact on copper demand and consequently, expectations of future prices.
Attributable copper production in the third quarter of 2023 was 5 million pounds higher compared to the prior quarter driven by higher grades processed at Lumwana which was due to improved mining rates resulting from the new truck fleet.
Q3 2023 compared to Q3 2022
For the three month period ended September 30, 2023, gold revenues increased by 14% compared to the same prior year period, primarily due to a higher realized gold price1, combined with higher sales volumes. The average market price for the three month period ended September 30, 2023 was $1,928 per ounce versus $1,729 per ounce for the same prior year period.
| BARRICK THIRD QUARTER 2023 | 47 | MANAGEMENT’S DISCUSSION AND ANALYSIS |
| OVERVIEW | OPERATING PERFORMANCE |
GROWTH PROJECTS & EXPLORATION |
REVIEW OF FINANCIAL RESULTS |
OTHER INFORMATION & NON-GAAP RECONCILIATIONS |
FINANCIAL STATEMENTS |
|||||
ATTRIBUTABLE GOLD PRODUCTION VARIANCE (000s oz)
Q3 2023 compared to Q3 2022
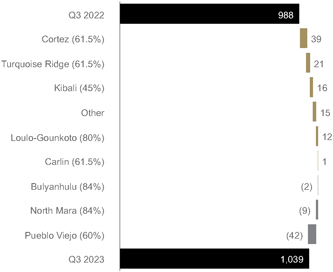
For the three month period ended September 30, 2023, attributable gold production was 51 thousand ounces higher than the same prior year period, primarily due to higher oxide production from the Crossroads open pit and Cortez Hills underground at Cortez, combined with higher grades processed, recoveries and throughput at both Turquoise Ridge and Kibali. This was partially offset by lower production at Pueblo Viejo, driven by lower recoveries and lower throughput from premature mechanical failures of the newly installed equipment during the commissioning and ramp-up of the plant expansion.
Copper revenues for the three month period ended September 30, 2023 increased by 5% compared to the same prior year period, due to a higher realized copper price1, partially offset by lower sales volume. In the third quarter of 2023, the realized copper price1 was lower than the market copper price due to the impact of negative provisional pricing adjustments, consistent with the same prior year period. This reflects the decrease in the copper market price during each of those quarters.
Attributable copper production for the three month period ended September 30, 2023 decreased by 11 million pounds compared to the same prior year period, primarily at Lumwana due to lower grades processed, throughput and recoveries.
YTD 2023 compared to YTD 2022
For the nine month period ended September 30, 2023, gold revenues increased by 3% compared to the same prior year period, primarily due to an increase in the realized gold price1, partially offset by a decrease in sales volumes. The average market price for the nine month period ended September 30, 2023 was $1,930 per ounce versus $1,824 per ounce for the same prior year period.
For the nine month period ended September 30, 2023, attributable gold production was 21 thousand ounces lower than the same prior year period, primarily at Pueblo Viejo resulting from lower grades processed in line with the planned mining and stockpile feed sequence, and lower throughput due to tie-in and commissioning work related to
the plant expansion; at Carlin mainly due to the closure of the Gold Quarry concentrator at the beginning of the second quarter of 2023 and the conversion of the Goldstrike autoclave to a conventional CIL process in the first quarter of 2023; and at Long Canyon as Phase 1 mining was completed in May 2022. These impacts were partially offset by higher oxide ore tonnes mined from Crossroads and CHUG, combined with higher heap leach production at Cortez.
Copper revenues for the nine month period ended September 30, 2023 decreased by 18% compared to the same prior year period, as result of lower sales volume, partially offset by a slightly higher realized copper price1. For the nine month period ended September 30, 2023, the realized copper price1 was slightly lower than the market copper price as a result of the impact of negative provisional pricing adjustments, consistent with the same prior year period, which reflects the decrease in the copper market price during each of those periods.
Attributable copper production for the nine month period ended September 30, 2023, decreased by 37 million pounds compared to the same prior year period, mainly at Lumwana due to lower grades processed and lower recoveries, partially offset by higher throughput.
Production Costs
| ($ millions, except per ounce/pound data in dollars) |
For the three months ended |
For the nine months ended |
||||||||||||||||||
| 9/30/23 | 6/30/23 | 9/30/22 | 9/30/23 | 9/30/22 | ||||||||||||||||
| Gold |
||||||||||||||||||||
| Site operating costs |
1,208 | 1,244 | 1,161 | 3,660 | 3,392 | |||||||||||||||
| Depreciation |
427 | 413 | 393 | 1,285 | 1,250 | |||||||||||||||
| Royalty expense |
90 | 88 | 74 | 279 | 257 | |||||||||||||||
| Community relations |
11 | 8 | 10 | 26 | 24 | |||||||||||||||
| Cost of sales |
1,736 | 1,753 | 1,638 | 5,250 | 4,923 | |||||||||||||||
| Cost of sales ($/oz)a |
1,277 | 1,323 | 1,226 | 1,325 | 1,211 | |||||||||||||||
| Total cash costs ($/oz)b |
912 | 963 | 891 | 953 | 859 | |||||||||||||||
| All-in sustaining costs ($/oz)b |
1,255 | 1,355 | 1,269 | 1,325 | 1,215 | |||||||||||||||
| Copper |
||||||||||||||||||||
| Site operating costs |
81 | 100 | 89 | 296 | 248 | |||||||||||||||
| Depreciation |
70 | 59 | 59 | 173 | 131 | |||||||||||||||
| Royalty expense |
15 | 16 | 23 | 46 | 87 | |||||||||||||||
| Community relations |
1 | 1 | 1 | 2 | 3 | |||||||||||||||
| Cost of sales |
167 | 176 | 172 | 517 | 469 | |||||||||||||||
| Cost of sales ($/lb)a |
2.68 | 2.84 | 2.30 | 2.90 | 2.21 | |||||||||||||||
| C1 cash costs ($/lb)b |
2.05 | 2.28 | 1.86 | 2.33 | 1.79 | |||||||||||||||
| All-in sustaining costs ($/lb)b |
3.23 | 3.13 | 3.13 | 3.25 | 2.96 | |||||||||||||||
| a. | Gold cost of sales per ounce is calculated as cost of sales across our gold operations (excluding sites in closure or care and maintenance) divided by ounces sold (both on an attributable basis using Barrick’s ownership share). Copper cost of sales per pound is calculated as cost of sales across our copper operations divided by pounds sold (both on an attributable basis using Barrick’s ownership share). |
| b. | Further information on these non-GAAP financial measures, including detailed reconciliations, is included on pages 59 to 76 of this MD&A. |
| BARRICK THIRD QUARTER 2023 | 48 | MANAGEMENT’S DISCUSSION AND ANALYSIS |
| OVERVIEW | OPERATING PERFORMANCE |
GROWTH PROJECTS & EXPLORATION |
REVIEW OF FINANCIAL RESULTS |
OTHER INFORMATION & NON-GAAP RECONCILIATIONS |
FINANCIAL STATEMENTS |
|||||
Q3 2023 compared to Q2 2023
In the third quarter of 2023, gold cost of sales on a consolidated basis was almost in line with the second quarter of 2023. Our 45% interest in Kibali is equity accounted, and therefore the mine’s cost of sales is excluded from our consolidated gold cost of sales. Our per ounce metrics, gold cost of sales2 and total cash costs1, includes our proportionate share of cost of sales at our equity method investees, and were 3% and 5% lower, respectively, than the prior quarter, mainly due to the impact of the sales mix across the portfolio, with a higher contribution of ounces at a lower cost per ounce from Cortez, Turquoise Ridge and Kibali, combined with lower unit costs at Carlin.
In the third quarter of 2023, gold all-in sustaining costs per ounce1, which also includes our proportionate share of equity method investees, decreased by 7% compared to the prior quarter. This was primarily due to lower total cash costs per ounce1, as described above, combined with lower minesite sustaining capital expenditures1 on a per ounce basis.
In the third quarter of 2023, copper cost of sales on a consolidated basis was 5% lower than the prior quarter, due to lower site operating costs due to improved mining efficiencies, partially offset by higher depreciation at Lumwana. Our 50% interests in Zaldívar and Jabal Sayid are equity accounted and therefore, we do not include their cost of sales in our consolidated copper cost of sales. Our per pound metrics, copper cost of sales2 and C1 cash costs1, include our proportionate share of cost of sales at our equity method investees. Copper cost of sales per pound2 and C1 cash costs per pound1 were 6% and 10% lower, respectively, compared to the prior period, primarily due to the improved mining efficiencies at Lumwana as mentioned above.
In the third quarter of 2023, copper all-in sustaining costs1 per pound, which also includes our proportionate share of equity method investees, was 3% higher than the prior quarter, primarily due to an increase in minesite sustaining capital expenditures1 related to increased capitalized waste stripping at Lumwana, partially offset by lower C1 cash costs per pound1, as discussed above.
Q3 2023 compared to Q3 2022
For the three month period ended September 30, 2023, gold cost of sales on a consolidated basis was 6% higher than the same prior year period, primarily due to higher sales volumes. Our 45% interest in Kibali is equity accounted and therefore, the mine’s cost of sales is excluded from our consolidated gold cost of sales. Our per ounce metrics, gold cost of sales2 and total cash costs1, include our proportionate share of cost of sales at our equity method investees, and were 4% and 2% higher, respectively, compared to the same prior year period. This was mainly due to lower grades processed, partially offset by a lower contribution at higher unit costs from Pueblo Viejo. Cost of sales per ounce2 was further impacted by higher depreciation at Kibali.
For the three month period ended September 30, 2023, gold all-in sustaining costs per ounce1 was slightly lower than the same prior year period, primarily due to lower minesite sustaining capital expenditures1 on a per ounce basis, partially offset by the increase in total cash costs per ounce1.
For the three month period ended September 30, 2023, copper cost of sales on a consolidated basis was 3% lower than the same prior year period, primarily due to the impact of lower sales volumes. Our 50% interests in Zaldívar and Jabal Sayid are equity accounted and therefore, we do not include their cost of sales in our consolidated copper cost of sales. Our per pound metrics, copper cost of sales2 and C1 cash costs1, includes our proportionate share of cost of sales at our equity method investees. Copper cost of sales per pound2 and C1 cash costs1 were 17% and 10% higher, respectively, compared to the same prior year period, primarily due to lower grades processed and lower recoveries at Lumwana. Cost of sales per pound2 was further impacted by higher depreciation at Lumwana.
For the three month period ended September 30, 2023, copper all-in sustaining costs per pound1 was 3% higher than the same prior year period, primarily reflecting higher C1 cash costs per pound1, as discussed above, partially offset by lower minesite sustaining capital expenditures1 resulting from an improvement in mining unit rates at Lumwana.
YTD 2023 compared to YTD 2022
For the nine month period ended September 30, 2023, cost of sales applicable to gold was 7% higher than the same prior year period, mainly due to lower grades processed, mainly at Cortez, combined with higher contractor and maintenance costs, specifically at NGM. Our 45% interest in Kibali is equity accounted and therefore, we do not include its cost of sales in our consolidated gold cost of sales. On a per ounce basis, gold cost of sales2 and total cash costs1, after including our proportionate share of cost of sales at our equity method investees, were 9% and 11% higher, respectively, than the same prior year period. This was primarily due to lower grades processed, and higher contractor and maintenance costs, as described above.
For the nine month period ended September 30, 2023, gold all-in sustaining costs per ounce1 increased by 9% compared to the same prior year period, primarily due to an increase in total cash costs per ounce1, combined with higher minesite sustaining capital expenditures1 on a per ounce basis.
For the nine month period ended September 30, 2023, copper cost of sales on a consolidated basis was 10% higher than the same prior year period, primarily due to higher site operating costs. This was combined with higher depreciation, partially offset by lower royalty expenses. Our 50% interests in Zaldívar and Jabal Sayid are equity accounted and therefore, we do not include their cost of sales in our consolidated copper cost of sales. Our per pound metrics, copper cost of sales2 and C1 cash costs1, include our proportionate share of cost of sales at our equity method investees. Copper cost of sales per pound2, and C1 cash costs per pound1 were 31% and 30% higher, respectively, compared to the same prior year period, primarily due to higher operating unit costs resulting from lower grades processed, lower recoveries and lower capitalized waste stripping at Lumwana.
For the nine month period ended September 30, 2023, copper all-in sustaining costs per pound1 were 10% higher than the same prior year period, primarily due to increased C1 cash costs per pound1, partially offset by lower minesite sustaining capital expenditures1 which was mainly driven by a decrease in capitalized waste stripping at Lumwana.
| BARRICK THIRD QUARTER 2023 | 49 | MANAGEMENT’S DISCUSSION AND ANALYSIS |
| OVERVIEW | OPERATING PERFORMANCE |
GROWTH PROJECTS & EXPLORATION |
REVIEW OF FINANCIAL RESULTS |
OTHER INFORMATION & NON-GAAP RECONCILIATIONS |
FINANCIAL STATEMENTS |
|||||
Capital Expendituresa
| ($ millions) | For the three months ended |
For the nine months ended |
||||||||||||||||||
| 9/30/23 | 6/30/23 | 9/30/22 | 9/30/23 | 9/30/22 | ||||||||||||||||
| Minesite sustainingb |
529 | 524 | 571 | 1,507 | 1,514 | |||||||||||||||
| Project capital expendituresb,c |
227 | 238 | 213 | 691 | 625 | |||||||||||||||
| Capitalized interest |
12 | 7 | 8 | 27 | 19 | |||||||||||||||
| Total consolidated capital expenditures |
768 | 769 | 792 | 2,225 | 2,158 | |||||||||||||||
| Attributable capital expendituresd |
589 | 588 | 609 | 1,703 | 1,674 | |||||||||||||||
| a. | These amounts are presented on a cash basis. |
| b. | Further information on these non-GAAP financial measures, including detailed reconciliations, is included on pages 59 to 76 of this MD&A. |
| c. | Project capital expenditures1 are included in our calculation of all-in costs, but not included in our calculation of all-in sustaining costs. |
| d. | These amounts are presented on the same basis as our guidance. |
Q3 2023 compared to Q2 2023
In the third quarter of 2023, total consolidated capital expenditures on a cash basis were in line with the second quarter of 2023 as a decrease in project capital expenditures1 was largely offset by an increase in minesite sustaining capital expenditures1. Project capital expenditures1 decreased by 5% compared to the prior quarter, mainly at Pueblo Viejo as the plant expansion nears completion and at Lumwana due to the timing of deliveries of the remaining new owner mining truck fleet to replace the contract mining. This was partially offset by higher project capital expenditures1 at Loulo-Gounkoto due to the Yalea South project. The increase in minesite sustaining capital expenditures1 of 1% was primarily driven by increased capitalized waste stripping at Lumwana and Carlin, partially offset by lower capitalized waste stripping at Loulo-Gounkoto.
Q3 2023 compared to Q3 2022
For the three month period ended September 30, 2023, total consolidated capital expenditures on a cash basis decreased by 3% compared to the same prior year period. This was mainly due to an decrease in minesite sustaining capital expenditures1, partially offset by an increase in project capital expenditures1. Minesite sustaining capital expenditures1 decreased by 7% compared with the same prior year period mainly due to lower capitalized waste stripping at Cortez and an improvement in mining unit rates at Lumwana, partially offset by higher capitalized waste stripping and underground development at Carlin. Project capital expenditures1 increased by 7% compared to the same prior year period, primarily due to higher expenditures at the TS Solar project at NGM as construction began in the fourth quarter of 2022, combined with the investment in the new owner mining truck fleet at Lumwana. This was partially offset by lower project spend at Pueblo Viejo as the plant expansion nears completion.
YTD 2023 compared to YTD 2022
For the nine month period ended September 30, 2023, total consolidated capital expenditures on a cash basis increased by 3% compared to the same prior year period due to an increase in project capital expenditures1, while minesite sustaining capital expenditures1 were relatively consistent with the same prior year. Higher project capital
expenditures1 of 11% were mainly due to the investment in the new owner mining truck fleet at Lumwana, combined with higher expenditures at the TS Solar project at NGM as construction began in the fourth quarter of 2022. This was partially offset by lower project spend incurred on the plant expansion at Pueblo Viejo. Minesite sustaining capital expenditures1 were largely in line with the same prior year period, as lower capitalized waste stripping at Cortez and Lumwana was largely offset by an increase in project spend on processing facilities and underground development at Carlin, higher capitalized waste stripping at North Mara, and increased expenditures on the tailings buttress project and new equipment purchases in the underground at Loulo-Gounkoto.
General and Administrative Expenses
| ($ millions) | For the three months ended |
For the nine months ended |
||||||||||||||||||
| 9/30/23 | 6/30/23 | 9/30/22 | 9/30/23 | 9/30/22 | ||||||||||||||||
| Corporate administration | 23 | 23 | 26 | 74 | 92 | |||||||||||||||
| Share-based compensationa |
7 | 5 | 0 | 23 | 18 | |||||||||||||||
| General & administrative expenses | 30 | 28 | 26 | 97 | 110 | |||||||||||||||
| a. | Based on a US$15.79 share price as at September 30, 2023 (June 30, 2023: US$16.93 and September 30, 2022: US$14.91). |
Q3 2023 compared to Q2 2023
In the third quarter of 2023, general and administrative expenses increased by $2 million compared to the second quarter of 2023, driven by higher share-based compensation expense due to a more modest decrease in our share price during the current quarter as compared to the prior quarter.
Q3 2023 compared to Q3 2022
For the three month period ended September 30, 2023, general and administrative expenses increased by $4 million compared to the same prior year period resulting from higher share-based compensation expense due to a more modest decrease in our share price during the current quarter as compared to the same prior year period.
YTD 2023 compared to YTD 2022
For the nine month period ended September 30, 2023, general and administrative expenses decreased by $13 million compared to the same prior year period. This was due to lower corporate administration expense, partially offset by higher share-based compensation expense attributed to a more modest decrease in our share price during the current period compared to the same prior year period.
| BARRICK THIRD QUARTER 2023 | 50 | MANAGEMENT’S DISCUSSION AND ANALYSIS |
| OVERVIEW | OPERATING PERFORMANCE |
GROWTH PROJECTS & EXPLORATION |
REVIEW OF FINANCIAL RESULTS |
OTHER INFORMATION & NON-GAAP RECONCILIATIONS |
FINANCIAL STATEMENTS |
|||||
Exploration, Evaluation and Project Expenses
| ($ millions) | For the three months ended |
For the nine months ended |
||||||||||||||||||
| 9/30/23 | 6/30/23 | 9/30/22 | 9/30/23 | 9/30/22 | ||||||||||||||||
| Global exploration and evaluation |
35 | 37 | 25 | 99 | 85 | |||||||||||||||
| Project costs: |
||||||||||||||||||||
| Reko Diq |
16 | 14 | 1 | 35 | 3 | |||||||||||||||
| Lumwana |
9 | 10 | 0 | 26 | 0 | |||||||||||||||
| Pascua-Lama |
5 | 7 | 7 | 20 | 36 | |||||||||||||||
| Pueblo Viejo |
1 | 1 | 5 | 3 | 18 | |||||||||||||||
| Other |
8 | 14 | 12 | 33 | 40 | |||||||||||||||
| Corporate development |
1 | 4 | 5 | 6 | 10 | |||||||||||||||
| Global exploration and evaluation and project expense |
75 | 87 | 55 | 222 | 192 | |||||||||||||||
| Minesite exploration and evaluation |
11 | 14 | 22 | 36 | 52 | |||||||||||||||
| Total exploration, evaluation and project expenses |
86 | 101 | 77 | 258 | 244 | |||||||||||||||
Q3 2023 compared to Q2 2023
Exploration, evaluation and project expenses for the third quarter of 2023 decreased by $15 million compared to the second quarter of 2023. This was driven by lower project costs and lower minesite exploration and evaluation costs across various sites.
Q3 2023 compared to Q3 2022
Exploration, evaluation and project expenses for the three month period ended September 30, 2023 increased by $9 million compared to the same prior year period, driven by higher project costs at Reko Diq due to the ramp up of activities at the reconstituted project and PFS work for the Lumwana Super Pit. These were partially offset by lower minesite exploration and evaluation costs, mainly in the Africa & Middle East region.
YTD 2023 compared to YTD 2022
Exploration, evaluation and project expenses for the nine month period ended September 30, 2023 were $14 million higher than the same prior year period, primarily due to higher project costs at Reko Diq due to the ramp up of activities at the reconstituted project and PFS work for the Lumwana Super Pit. This was partially offset by lower project costs at Pascua-Lama as the Chilean side entered closure and at Pueblo Viejo as the technical and social studies for additional tailings storage capacity were completed at the end of 2022, as well as lower minesite exploration and evaluation costs, mainly in the Africa & Middle East region.
Finance Costs, Net
| ($ millions) | For the three months ended |
For the nine months ended |
||||||||||||||||||
| 9/30/23 | 6/30/23 | 9/30/22 | 9/30/23 | 9/30/22 | ||||||||||||||||
| Interest expensea |
100 | 94 | 95 | 299 | 277 | |||||||||||||||
| Accretion |
22 | 21 | 18 | 64 | 46 | |||||||||||||||
| Gain on debt extinguishment |
0 | 0 | (2 | ) | 0 | (2 | ) | |||||||||||||
| Interest capitalized |
(12 | ) | (8 | ) | (8 | ) | (27 | ) | (19 | ) | ||||||||||
| Other finance costs |
2 | 1 | 1 | 4 | 4 | |||||||||||||||
| Finance income |
(60 | ) | (64 | ) | (31 | ) | (186 | ) | (56 | ) | ||||||||||
| Finance costs, net |
52 | 44 | 73 | 154 | 250 | |||||||||||||||
| a. | For the three and nine months ended September 30, 2023, interest expense includes approximately $8 million and $25 million, respectively, of non-cash interest expense relating to the streaming agreements with Royal Gold, Inc. (June 30, 2023: $9 million and September 30, 2022: $8 million and $25 million, respectively). |
Q3 2023 compared to Q2 2023
In the third quarter of 2023, finance costs, net were 18% higher than the prior quarter, mainly due to higher interest expense and slightly lower finance income, partially offset by higher capitalized interest.
Q3 2023 compared to Q3 2022
For the three month period ended September 30, 2023, finance costs, net decreased by 29% compared to the same prior year period, primarily due to higher finance income earned on our cash balance resulting from an increase in market interest rates.
YTD 2023 compared to YTD 2022
For the nine month period ended September 30, 2023, finance costs, net were 38% lower than the same prior year period as a result of higher finance income earned on our cash balance, partially offset by higher accretion, both resulting from an increase in market interest rates. In addition to this, interest expense and finance income were higher versus the same prior year period due to the restricted cash and associated financial liability owed to Antofagasta plc following the reconstitution of the Reko Diq project which occurred on December 15, 2022. A cash payment of $962 million was remitted to Antofagasta plc to extinguish the financial liability during the second quarter of 2023.
Additional Significant Statement of Income Items
| ($ millions) | For the three months ended |
For the nine months ended |
||||||||||||||||||
| 9/30/23 | 6/30/23 | 9/30/22 | 9/30/23 | 9/30/22 | ||||||||||||||||
| Impairment charges |
0 | 22 | 24 | 23 | 29 | |||||||||||||||
| Loss (gain) on currency translation |
30 | (12 | ) | 3 | 56 | 12 | ||||||||||||||
| Closed mine rehabilitation |
(44 | ) | (13 | ) | (55 | ) | (35 | ) | (180 | ) | ||||||||||
| Other expense (income) |
58 | 18 | (9 | ) | 128 | (18 | ) | |||||||||||||
Impairment Charges
Q3 2023 compared to Q2 2023
In the third quarter of 2023, there were no impairment charges, compared to $22 million in the prior period related to miscellaneous assets.
| BARRICK THIRD QUARTER 2023 | 51 | MANAGEMENT’S DISCUSSION AND ANALYSIS |
| OVERVIEW | OPERATING PERFORMANCE |
GROWTH PROJECTS & EXPLORATION |
REVIEW OF FINANCIAL RESULTS |
OTHER INFORMATION & NON-GAAP RECONCILIATIONS |
FINANCIAL STATEMENTS |
|||||
Q3 2023 compared to Q3 2022
For the three month period ended September 30, 2023, there were no impairment charges, compared to $24 million in the same prior year period mainly related to an inventory impairment at Lumwana.
YTD 2023 compared to YTD 2022
For the nine month period ended September 30, 2023, net impairment charges were $23 million, related to miscellaneous assets. This compares to $29 million in the same prior year period, mainly related to an inventory impairment at Lumwana.
For a further breakdown of impairment charges and reversals, refer to note 12 of the Financial Statements.
Loss on Currency Translation (Gain)
Q3 2023 compared to Q2 2023
Loss on currency translation in the third quarter of 2023 was $30 million compared to a gain of $12 million in the prior quarter. The loss in the current quarter mainly related to the devaluation of the Chilean peso, the Argentine peso and the West African CFA franc. The gain in the prior period mainly related to the appreciation of the Zambian kwacha as the country finalized a debt restructuring deal, which represented a reversal of the significant currency weakness that was experienced during the first quarter of 2023. This currency fluctuation resulted in a revaluation of our local currency denominated value-added tax receivable and local currency denominated payable balances.
Q3 2023 compared to Q3 2022
Loss on currency translation in the third quarter of 2023 was $30 million compared to $3 million in the same prior year period. The losses in the current quarter mainly related to the devaluation of the Chilean peso, the Argentine peso and the West African CFA franc. The losses in the same prior year period mainly related to the devaluation of the Argentine peso, partially offset by the appreciation of the Zambian kwacha. These currency fluctuations resulted in a revaluation of our local currency denominated value-added tax receivable and local currency denominated payable balances.
YTD 2023 compared to YTD 2022
Loss on currency translation for the nine month period ended September 30, 2023 increased by $44 million compared to the same prior year period, mainly due to fluctuations of the Zambian kwacha during the relevant periods, combined with the devaluation of the West African CFA franc in the current year. These currency fluctuations resulted in a revaluation of our local currency denominated value-added tax receivable and local currency denominated payable balances.
Closed Mine Rehabilitation
Q3 2023 compared to Q2 2023
Closed mine rehabilitation gain in the third quarter of 2023 was $44 million compared to $13 million in the prior quarter. The increased gain mainly related to a larger increase in the market real risk-free rate used to discount the closure provision in the current period compared to the prior quarter.
Q3 2023 compared to Q3 2022
Closed mine rehabilitation gain in the third quarter of 2023 was $44 million compared to $55 million in the same prior year period. The decreased gain mainly related to a smaller increase in the market real risk-free rate used to discount the closure provision in the current period compared to the same prior year period.
YTD 2023 compared to YTD 2022
Closed mine rehabilitation gain for the nine month period ended September 30, 2023 was $35 million compared to $180 million in the same prior year period. This was mainly related to a smaller increase in the market real risk-free rate used to discount the closure provision in the current period, compared to the same prior year period.
Other Expense (Income)
Q3 2023 compared to Q2 2023
For the three months ended September 30, 2023, other expense was $58 million compared to $18 million in the prior quarter. Other expenses in both the current and prior quarter were mainly related to care and maintenance expenses at Porgera. The current quarter was further impacted by litigation accruals and settlements.
Q3 2023 compared to Q3 2022
For the three months ended September 30, 2023, other expense was $58 million compared to other income $9 million in the same prior year period. Other expense in the current quarter mainly related to care and maintenance expenses at Porgera, combined with litigation accruals and settlements. In the same prior year period, other income mainly related to the gain on the sale of two royalty portfolios, partially offset by care and maintenance expenses at Porgera.
YTD 2023 compared to YTD 2022
For the nine month period ended September 30, 2023, other expense was $128 million compared to other income of $18 million in the same prior year period. The other expense in the current year mainly related to care and maintenance expenses at Porgera, the $30 million commitment we made towards the expansion of education infrastructure in Tanzania per our community investment obligations under the Twiga partnership, combined with litigation accruals and settlements. Other income in the same prior year period mainly related to the gain on the sale of two royalty portfolios, and the insurance claim associated with the mechanical mill failure at the Goldstrike roaster of $22 million, partially offset by care and maintenance expenses at Porgera, litigation costs and miscellaneous write-offs.
Income Tax Expense
Income tax expense was $218 million in the third quarter of 2023. The unadjusted effective income tax rate in the third quarter of 2023 was 27% of income before income taxes.
The underlying effective income tax rate on ordinary income in the third quarter of 2023 was 23% after adjusting for the impact of foreign currency translation losses on deferred tax balances; the impact of the de-recognition of deferred tax assets; the impact of prior year adjustments; the impact of updates to the rehabilitation provision for our non-operating mines; the impact of non-deductible foreign exchange losses; the impact of the
| BARRICK THIRD QUARTER 2023 | 52 | MANAGEMENT’S DISCUSSION AND ANALYSIS |
| OVERVIEW | OPERATING PERFORMANCE |
GROWTH PROJECTS & EXPLORATION |
REVIEW OF FINANCIAL RESULTS |
OTHER INFORMATION & NON-GAAP RECONCILIATIONS |
FINANCIAL STATEMENTS |
|||||
Porgera mine being placed on care and maintenance; and the impact of other expense adjustments.
We record deferred tax charges or credits if changes in facts or circumstances affect the estimated tax basis of assets and therefore, the expectations of our ability to realize deferred tax assets. The interpretation of tax regulations and legislation as well as their application to our business is complex and subject to change. We have significant amounts of deferred tax assets, including tax loss carry forwards, and also deferred tax liabilities. We also have significant amounts of unrecognized deferred tax assets (e.g. for tax losses in Canada). Potential changes in any of these amounts, as well as our ability to realize deferred tax assets, could significantly affect net income or cash flow in future periods. For further details on income tax expense, refer to note 9 of the Financial Statements.
Withholding Taxes
In the third quarter of 2023, we recorded $16 million of dividend withholding taxes related to the undistributed earnings of our subsidiaries in the United States.
Nevada Gold Mines
NGM is a limited liability company treated as a flow through partnership for US tax purposes. The partnership is not subject to federal income tax directly, but each of its partners is liable for tax on its share of the profits of the partnership. As such, Barrick accounts for its current and deferred income tax associated with this investment (61.5% share) following the principles in IAS 12.
OECD Pillar Two model rules
We have applied the exception available under the amendments to IAS 12 published by the IASB in May 2023 and are not recognizing or disclosing information about deferred tax assets and liabilities related to Pillar Two income taxes given relevant information is not known or reasonably estimable at this time. Furthermore, since Pillar Two legislation is not yet enacted or substantively enacted in the main jurisdictions where we operate, we continue working on assessing our exposure to Pillar Two income taxes and will provide an update once further information is available.
| BARRICK THIRD QUARTER 2023 | 53 | MANAGEMENT’S DISCUSSION AND ANALYSIS |
| OVERVIEW | OPERATING PERFORMANCE |
GROWTH PROJECTS & EXPLORATION |
REVIEW OF FINANCIAL RESULTS |
OTHER INFORMATION & NON-GAAP RECONCILIATIONS |
FINANCIAL STATEMENTS |
|||||
Financial Condition Review
Summary Balance Sheet and Key Financial Ratios
| ($ millions, except ratios and share amounts) |
As at 9/30/23 | As at 12/31/22 | ||||||
| Total cash and equivalents |
4,261 | 4,440 | ||||||
| Current assets |
3,158 | 4,025 | ||||||
| Non-current assets |
38,176 | 37,500 | ||||||
| Total Assets |
45,595 | 45,965 | ||||||
| Current liabilities excluding short-term debt |
2,410 | 3,107 | ||||||
| Non-current liabilities excluding long-term debta |
6,712 | 6,787 | ||||||
| Debt (current and long-term) |
4,775 | 4,782 | ||||||
| Total Liabilities |
13,897 | 14,676 | ||||||
| Total shareholders’ equity |
23,020 | 22,771 | ||||||
| Non-controlling interests |
8,678 | 8,518 | ||||||
| Total Equity |
31,698 | 31,289 | ||||||
| Total common shares outstanding (millions of shares) |
1,756 | 1,755 | ||||||
| Debt, net of cash |
514 | 342 | ||||||
| Key Financial Ratios: |
||||||||
| Current ratiob |
3.07:1 | 2.71:1 | ||||||
|
Debt-to-equityc |
0.15:1 | 0.15:1 | ||||||
| a. | Non-current financial liabilities as at September 30, 2023 were $5,265 million (December 31, 2022: $5,314 million). |
| b. | Represents current assets divided by current liabilities (including short-term debt) as at September 30, 2023 and December 31, 2022. |
| c. | Represents debt divided by total shareholders’ equity (including minority interest) as at September 30, 2023 and December 31, 2022. |
Balance Sheet Review
Total assets were $45.6 billion as at September 30, 2023, slightly lower than total assets as at December 31, 2022.
Our asset base is primarily comprised of non-current assets such as property, plant and equipment and goodwill, reflecting the capital-intensive nature of the mining business and our history of growing through acquisitions. Other significant assets include production inventories, indirect taxes recoverable and receivable, concentrate sales receivable, other government and joint venture related receivables, as well as cash and equivalents.
Total liabilities at September 30, 2023 were $13.9 billion, lower than total liabilities at December 31, 2022. Our liabilities are primarily comprised of debt, other non-current liabilities (such as provisions and deferred income tax liabilities), and accounts payable. Both total assets and total liabilities were lower than total assets and liabilities at December 31, 2022 primarily due to the restricted cash and associated financial liability owed to Antofagasta plc following the reconstitution of the Reko Diq project which occurred on December 15, 2022. A cash payment of $962 million was remitted to Antofagasta plc to extinguish the financial liability during the second quarter of 2023.
Shareholders’ Equity
| 10/24/2023 |
Number of shares | |||
| Common shares |
1,755,522,884 | |||
| Stock options |
— | |||
Financial Position and Liquidity
We believe we have sufficient financial resources to meet our business requirements for the foreseeable future, including capital expenditures, working capital requirements, interest payments, environmental rehabilitation, securities buybacks and dividends. During the third quarter of 2023, our cash balance increased as the
cash flow from operating activities and dividends from equity method investments exceeded the cash outflows related to capital expenditures and dividends.
Total cash and cash equivalents as at September 30, 2023 were $4.3 billion. Our capital structure comprises a mix of debt, non-controlling interest (primarily at NGM) and shareholders’ equity. As at September 30, 2023, our total debt was $4.8 billion (debt, net of cash and equivalents was $514 million) and our debt-to-equity ratio was 0.15:1. This compares to total debt as at December 31, 2022 of $4.8 billion (debt, net of cash and equivalents was $342 million), and a debt-to-equity ratio of 0.15:1.
Uses of cash for the remainder of 2023 include capital commitments of $291 million, and we expect to incur attributable minesite sustaining1 and project capital expenditures1 of approximately $600 million during the remainder of the year, based on our guidance range on page 13. For the remainder of 2023, we have contractual obligations and commitments of $475 million for supplies and consumables. In addition, we have $126 million in interest payments and other amounts as detailed in the table on page 57. We expect to fund these commitments through operating cash flow, which is our primary source of liquidity, as well as our existing cash balances as necessary. As discussed on page 9, we have authorized a share buyback program, where we may purchase up to $1 billion of Barrick shares. As at September 30, 2023, we had not purchased any shares under this program in 2023.
We also have a performance dividend policy that will enhance the return to shareholders when the Company’s liquidity is strong. In addition to our base dividend, the amount of the performance dividend on a quarterly basis will be based on the amount of cash, net of debt, on our consolidated balance sheet at the end of each quarter as per the schedule below.
| BARRICK THIRD QUARTER 2023 | 54 | MANAGEMENT’S DISCUSSION AND ANALYSIS |
| OVERVIEW | OPERATING PERFORMANCE |
GROWTH PROJECTS & EXPLORATION |
REVIEW OF FINANCIAL RESULTS |
OTHER INFORMATION & NON-GAAP RECONCILIATIONS |
FINANCIAL STATEMENTS |
|||||
| Performance Dividend Level |
Threshold Level |
Quarterly Base Dividend |
Quarterly Performance Dividend |
Quarterly Total |
||||
| Level I |
Net cash <$0 |
$0.10 per share | $0.00 per share |
$0.10 per share | ||||
| Level II |
Net cash >$0 and <$0.5B |
$0.10 per share | $0.05 per share |
$0.15 per share | ||||
| Level III |
Net cash >$0.5B and <$1B |
$0.10 per share | $0.10 per share |
$0.20 per share | ||||
| Level IV |
Net cash >$1B |
$0.10 per share | $0.15 per share |
$0.25 per share | ||||
The declaration and payment of dividends is at the discretion of the Board of Directors, and will depend on the company’s financial results, cash requirements, future prospects, the number of outstanding common shares, and other factors deemed relevant by the Board.
Our operating cash flow is dependent on the ability of our operations to deliver projected future cash flows. The market price of gold and to a lesser extent, copper, are the primary drivers of our operating cash flow. Other options to enhance liquidity include further portfolio optimization and the creation of new joint ventures and partnerships; issuance of equity securities in the public markets or to private investors, which could be undertaken for liquidity enhancement and/or in connection with establishing a strategic partnership; issuance of long-term debt securities in the public markets or to private investors (Moody’s and S&P currently rate Barrick’s outstanding long-term debt as investment grade, with ratings of A3 and BBB+, respectively); and drawing on the $3.0 billion available under our undrawn Credit Facility (subject to compliance with covenants and the making of certain representations and warranties, this facility is available for drawdown as a source of financing). In May 2023, we completed an amendment of our undrawn $3.0 billion revolving credit facility, including an extension of the termination date by one year to May 2028. The revolving credit facility incorporates sustainability-linked metrics and are made up of annual environmental and social performance targets directly influenced by Barrick’s actions, rather than based on external ratings. The performance targets include Scope 1 and Scope 2 GHG emissions intensity, water use efficiency (reuse and recycling rates), and TRIFR3. Barrick may incur positive or negative pricing adjustments on drawn credit spreads and standby fees based on its sustainability performance versus the targets that have been set. The key financial covenant in our undrawn Credit Facility requires Barrick to maintain a net debt to total capitalization ratio of less than 0.60:1. Barrick’s net debt to total capitalization ratio was 0.02:1 as at September 30, 2023 (0.01:1 as at December 31, 2022).
Summary of Cash Inflow (Outflow)
| ($ millions) |
For the three months ended |
For the nine months ended |
||||||||||||||||||
| 9/30/23 | 6/30/23 | 9/30/22 | 9/30/23 | 9/30/22 | ||||||||||||||||
| Net cash provided by operating activities |
1,127 | 832 | 758 | 2,735 | 2,686 | |||||||||||||||
| Investing activities |
||||||||||||||||||||
| Capital expenditures |
(768 | ) | (769 | ) | (792 | ) | (2,225 | ) | (2,158 | ) | ||||||||||
| Investment sales |
3 | 0 | 0 | 3 | 382 | |||||||||||||||
| Dividends received from equity method investments |
74 | 18 | 101 | 159 | 770 | |||||||||||||||
| Other |
2 | 8 | 52 | 13 | 75 | |||||||||||||||
| Total investing outflows |
(689 | ) | (743 | ) | (639 | ) | (2,050 | ) | (931 | ) | ||||||||||
| Net change in debta |
(3 | ) | (4 | ) | (62 | ) | (11 | ) | (72 | ) | ||||||||||
| Dividendsb |
(175 | ) | (174 | ) | (351 | ) | (524 | ) | (882 | ) | ||||||||||
| Net disbursements to non-controlling interests |
(162 | ) | (152 | ) | (162 | ) | (376 | ) | (661 | ) | ||||||||||
| Share buyback program |
0 | 0 | (141 | ) | 0 | (314 | ) | |||||||||||||
| Other |
7 | 21 | 60 | 48 | 140 | |||||||||||||||
| Total financing outflows |
(333 | ) | (309 | ) | (656 | ) | (863 | ) | (1,789 | ) | ||||||||||
| Effect of exchange rate |
(1 | ) | 0 | (3 | ) | (1 | ) | (6 | ) | |||||||||||
| Decrease in cash and equivalents |
104 | (220 | ) | (540 | ) | (179 | ) | (40 | ) | |||||||||||
| a. | The difference between the net change in debt on a cash basis and the net change on the balance sheet is due to changes in non-cash charges, specifically the unwinding of discounts and amortization of debt issue costs. |
| b. | For the three and nine months ended September 30, 2023, we declared and paid dividends per share in US dollars totaling $0.10 and $0.30, respectively (June 30, 2023: declared and paid $0.10; September 30, 2022: declared and paid $0.20 and $0.50, respectively). |
Q3 2023 compared to Q2 2023
In the third quarter of 2023, we generated $1,127 million in operating cash flow, compared to $832 million in the prior quarter. The increase of $295 million was primarily due to a decrease in cash taxes paid and lower interest paid as a result of the timing of semi-annual interest payments on our bonds, which occur in Q2 and Q4. Operating cash flow was further impacted by lower total cash costs/C1 cash costs per ounce/pound1, higher gold sales volume and an increase in the realized copper price1, partially offset by a lower realized gold price1.
Cash outflows from investing activities in the third quarter of 2023 were $689 million, compared to $743 million in the prior quarter. The decreased outflow of $54 million was primarily due to higher dividends received from equity method investments, in particular Kibali.
Net financing cash outflows for the third quarter of 2023 amounted to $333 million, compared to $309 million in the prior quarter. The increase of $24 million is primarily due to higher net disbursements paid to non-controlling interests, primarily to Newmont in relation to their interests in NGM and Pueblo Viejo.
Q3 2023 compared to Q3 2022
In the third quarter of 2023, we generated $1,127 million in operating cash flow, compared to $758 million in the same prior year period. The increase of $369 million was primarily
| BARRICK THIRD QUARTER 2023 | 55 | MANAGEMENT’S DISCUSSION AND ANALYSIS |
| OVERVIEW | OPERATING PERFORMANCE |
GROWTH PROJECTS & EXPLORATION |
REVIEW OF FINANCIAL RESULTS |
OTHER INFORMATION & NON-GAAP RECONCILIATIONS |
FINANCIAL STATEMENTS |
|||||
due to higher realized gold and copper prices1, combined with higher gold sales volumes. This was partially offset by higher gold and copper total cash costs/C1 cash costs per ounce/pound1. Operating cash flow was also positively impacted by lower cash taxes paid and higher interest income received as a result of an increase in market interest rates.
Cash outflows from investing activities in the third quarter of 2023 were $689 million compared to $639 million in the same prior year period. The increase of $50 million was primarily due to the gain on the sale of two royalty portfolios occurring in the same prior year period, combined with lower dividends received from equity method investments, in particular Kibali. This was partially offset by lower capital expenditures in the current quarter.
Net financing cash outflows for the third quarter of 2023 amounted to $333 million compared to $656 million in the same prior year period. The decrease of $323 million is primarily due to lower dividends paid, and the repurchase of shares under the share buyback program in the same prior year period.
YTD 2023 compared to YTD 2022
For the nine month period ended September 30, 2023, we generated $2,735 million in operating cash flow, compared to $2,686 million in the same prior year period. The increase of $49 million was primarily due to lower cash taxes paid and an increase in interest income received as a result of higher market interest rates. Operating cash flow
was negatively impacted by higher total cash costs/C1 cash costs per ounce/pound1 and lower gold and copper sales volumes, partially offset by a higher realized gold price1. This was combined with an unfavorable movement in working capital, mainly in accounts receivable and accounts payable, partially offset by a favorable movement in other current assets.
Cash outflows from investing activities for the nine month period ended September 30, 2023 were $2,050 million compared to $931 million in the same prior year period. The increase of $1,119 million was primarily due to lower dividends received from equity method investments, in particular Kibali, combined with proceeds received from investment sales in the same prior year period (which included the sale of our interests in Endeavour Mining, Skeena Resources Ltd., i-80 Gold Corp. and Perpetua Resources Corp), and higher capital expenditures.
Net financing cash outflows for the nine month period ended September 30, 2023 amounted to $863 million, compared to $1,789 million in the same prior year period. The decreased outflow of $926 million is primarily due to lower dividends paid, the repurchase of shares under the share buyback program in the same prior year period, and lower net disbursements paid to non-controlling interests, primarily to Newmont in relation to their interest in NGM.
| BARRICK THIRD QUARTER 2023 | 56 | MANAGEMENT’S DISCUSSION AND ANALYSIS |
| OVERVIEW | OPERATING PERFORMANCE |
GROWTH PROJECTS & EXPLORATION |
REVIEW OF FINANCIAL RESULTS |
OTHER INFORMATION & NON-GAAP RECONCILIATIONS |
FINANCIAL STATEMENTS |
|||||
Commitments and Contingencies
Litigation and Claims
We are currently subject to various litigation proceedings as disclosed in note 16 to the Financial Statements, and we may be involved in disputes with other parties in the future that may result in litigation. If we are unable to resolve these disputes favorably, it may have a material adverse impact on our financial condition, cash flow and results of operations.
Contractual Obligations and Commitments
In the normal course of business, we enter into contracts that give rise to commitments for future minimum payments. The following table summarizes the remaining contractual maturities of our financial liabilities and operating and capital commitments shown on an undiscounted basis:
| ($ millions) |
Payments due as at 9/30/23 | |||||||||||||||||||||||||||
| 2023 | 2024 | 2025 | 2026 | 2027 | 2028 and thereafter |
Total | ||||||||||||||||||||||
| Debta |
||||||||||||||||||||||||||||
| Repayment of principal |
0 | 0 | 12 | 47 | 0 | 4,675 | 4,734 | |||||||||||||||||||||
| Capital leases |
3 | 11 | 10 | 10 | 8 | 22 | 64 | |||||||||||||||||||||
| Interest |
126 | 290 | 289 | 286 | 282 | 3,250 | 4,523 | |||||||||||||||||||||
| Provisions for environmental rehabilitationb |
195 | 159 | 124 | 100 | 81 | 2,004 | 2,663 | |||||||||||||||||||||
| Restricted share units |
7 | 18 | 5 | 0 | 0 | 0 | 30 | |||||||||||||||||||||
| Pension benefits and other post-retirement benefits |
1 | 5 | 5 | 5 | 5 | 40 | 61 | |||||||||||||||||||||
| Purchase obligations for supplies and consumablesc |
475 | 352 | 249 | 173 | 167 | 338 | 1,754 | |||||||||||||||||||||
| Capital commitmentsd |
291 | 43 | 1 | 0 | 0 | 0 | 335 | |||||||||||||||||||||
| Social development costse |
11 | 24 | 10 | 8 | 4 | 46 | 103 | |||||||||||||||||||||
| Other obligationsf |
1 | 38 | 48 | 66 | 54 | 549 | 756 | |||||||||||||||||||||
| Total |
1,110 | 940 | 753 | 695 | 601 | 10,924 | 15,023 | |||||||||||||||||||||
| a. | Debt and Interest: Our debt obligations do not include any subjective acceleration clauses or other clauses that enable the holder of the debt to call for early repayment, except in the event that we breach any of the terms and conditions of the debt or for other customary events of default. We are not required to post any collateral under any debt obligations. Projected interest payments on variable rate debt were based on interest rates in effect at September 30, 2023. Interest is calculated on our long-term debt obligations using both fixed and variable rates. |
| b. | Provisions for environmental rehabilitation: Amounts presented in the table represent the undiscounted uninflated future payments for the expected cost of environmental rehabilitation. |
| c. | Purchase obligations for supplies and consumables: Includes commitments related to new purchase obligations to secure a supply of acid, tires and cyanide for our production process. |
| d. | Capital commitments: Purchase obligations for capital expenditures include only those items where binding commitments have been entered into. |
| e. | Social development costs: Includes a commitment of $14 million in 2028 and thereafter, related to the funding of a power transmission line in Argentina. |
| f. | Other obligations includes the Pueblo Viejo joint venture partner shareholder loan, the deposit on the Pascua-Lama silver sale agreement with Wheaton Precious Metals Corp., and minimum royalty payments. |
| BARRICK THIRD QUARTER 2023 | 57 | MANAGEMENT’S DISCUSSION AND ANALYSIS |
| OVERVIEW | OPERATING PERFORMANCE |
GROWTH PROJECTS & EXPLORATION |
REVIEW OF FINANCIAL RESULTS |
OTHER INFORMATION & NON-GAAP RECONCILIATIONS |
FINANCIAL STATEMENTS |
|||||
Review of Quarterly Results
Quarterly Informationa
| ($ millions, except where indicated) |
2023 | 2023 | 2023 | 2022 | 2022 | 2022 | 2022 | 2021 | ||||||||||||||||||||||||
| Q3 | Q2 | Q1 | Q4 | Q3 | Q2 | Q1 | Q4 | |||||||||||||||||||||||||
| Revenues |
2,862 | 2,833 | 2,643 | 2,774 | 2,527 | 2,859 | 2,853 | 3,310 | ||||||||||||||||||||||||
| Realized price per ounce – goldb |
1,928 | 1,972 | 1,902 | 1,728 | 1,722 | 1,861 | 1,876 | 1,793 | ||||||||||||||||||||||||
| Realized price per pound – copperb |
3.78 | 3.70 | 4.20 | 3.81 | 3.24 | 3.72 | 4.68 | 4.63 | ||||||||||||||||||||||||
| Cost of sales |
1,915 | 1,937 | 1,941 | 2,093 | 1,815 | 1,850 | 1,739 | 1,905 | ||||||||||||||||||||||||
| Net earnings |
368 | 305 | 120 | (735) | 241 | 488 | 438 | 726 | ||||||||||||||||||||||||
| Per share (dollars)c |
0.21 | 0.17 | 0.07 | (0.42) | 0.14 | 0.27 | 0.25 | 0.41 | ||||||||||||||||||||||||
| Adjusted net earningsb |
418 | 336 | 247 | 220 | 224 | 419 | 463 | 626 | ||||||||||||||||||||||||
| Per share (dollars)b,c |
0.24 | 0.19 | 0.14 | 0.13 | 0.13 | 0.24 | 0.26 | 0.35 | ||||||||||||||||||||||||
| Operating cash flow |
1,127 | 832 | 776 | 795 | 758 | 924 | 1,004 | 1,387 | ||||||||||||||||||||||||
| Consolidated capital expendituresd |
768 | 769 | 688 | 891 | 792 | 755 | 611 | 669 | ||||||||||||||||||||||||
| Free cash flowb |
359 | 63 | 88 | (96) | (34) | 169 | 393 | 718 | ||||||||||||||||||||||||
| a. | Sum of all the quarters may not add up to the annual total due to rounding. |
| b. | Further information on these non-GAAP financial measures, including detailed reconciliations, is included on pages 59 to 76 of this MD&A. |
| c. | Calculated using weighted average number of shares outstanding under the basic method of earnings per share. |
| d. | Amounts presented on a consolidated cash basis. |
Our recent financial results reflect our emphasis on cost discipline, an agile management structure that empowers our site based leadership teams and a portfolio of Tier One Gold Assets5. This, combined with ongoing strength in gold and copper prices, has resulted in strong operating cash flows over several quarters. The positive free cash flow1 generated, together with the proceeds from various divestitures, have allowed us to continue to reinvest in our business, strengthen our balance sheet and to increase returns to shareholders.
Net earnings has also been impacted by the following items in each quarter, which have been excluded from adjusted net earnings1. In the first quarter of 2023, we recorded a loss on currency translation of $38 million, mainly related to the devaluation of the Zambian kwacha, and a $30 million commitment towards the expansion of
education infrastructure in Tanzania per our community investment obligations under the Twiga partnership. In the fourth quarter of 2022, we recorded a goodwill impairment of $950 million (net of non-controlling interests) related to Loulo-Gounkoto, a non-current asset impairment of $318 million (net of tax) and a net realizable value impairment of leach pad inventory of $27 million (net of tax) at Veladero, and a non-current asset impairment of $42 million (net of tax and non-controlling interests) at Long Canyon. In addition, we recorded an impairment reversal of $120 million and a gain of $300 million following the completion of the transaction allowing for the reconstitution of the Reko Diq project. In the fourth quarter of 2021, we recorded a gain of $118 million (net of tax and non-controlling interest) related to the disposition of Lone Tree.
Internal Control Over Financial Reporting and Disclosure Controls and Procedures
Management is responsible for establishing and maintaining adequate internal control over financial reporting and disclosure controls and procedures as defined in our 2022 annual MD&A.
Together, the internal control frameworks provide internal control over financial reporting and disclosure. Due to its inherent limitations, internal control over financial reporting and disclosure may not prevent or detect all misstatements. Further, the effectiveness of internal control is subject to the risk that controls may become inadequate because of changes in conditions, or that the degree of compliance with policies or procedures may change.
There were no changes in our internal controls over financial reporting during the three months ended September 30, 2023 that have materially affected, or are reasonably likely to materially affect, our internal controls over financial reporting.
Under the supervision and with the participation of management, including the President and Chief Executive Officer and Senior Executive Vice-President and Chief Financial Officer, management will continue to monitor and evaluate the design and effectiveness of its internal control over financial reporting and disclosure controls and procedures, and may make modifications from time to time as considered necessary.
| BARRICK THIRD QUARTER 2023 | 58 | MANAGEMENT’S DISCUSSION AND ANALYSIS |
| OVERVIEW | OPERATING PERFORMANCE |
GROWTH PROJECTS & EXPLORATION |
REVIEW OF FINANCIAL RESULTS |
OTHER INFORMATION & NON-GAAP RECONCILIATIONS |
FINANCIAL STATEMENTS |
|||||
IFRS Critical Accounting Policies and Accounting Estimates
Management has discussed the development and selection of our critical accounting estimates with the Audit & Risk Committee of the Board of Directors, and the Audit & Risk Committee has reviewed the disclosure relating to such estimates in conjunction with its review of this MD&A. The accounting policies and methods we utilize determine how we report our financial condition and results of operations, and they may require management to make estimates or rely on assumptions about matters that are inherently uncertain. The consolidated financial statements have been prepared in accordance with IFRS as issued by the IASB under the historical cost convention, as modified by revaluation of certain financial assets, derivative contracts and post-retirement assets. Our significant accounting policies are disclosed in note 2 of the Financial Statements, including a summary of current and future changes in accounting policies.
Critical Accounting Estimates and Judgments
Certain accounting estimates have been identified as being “critical” to the presentation of our financial condition and results of operations because they require us to make subjective and/or complex judgments about matters that are inherently uncertain; or there is a reasonable likelihood that materially different amounts could be reported under different conditions or using different assumptions and estimates. Our significant accounting judgments, estimates and assumptions are disclosed in note 3 of the accompanying Financial Statements.
Non-GAAP Financial Measures
Adjusted Net Earnings and Adjusted Net Earnings per Share
Adjusted net earnings is a non-GAAP financial measure which excludes the following from net earnings:
| ∎ | Impairment charges (reversals) related to intangibles, goodwill, property, plant and equipment, and investments; |
| ∎ | Acquisition/disposition gains/losses; |
| ∎ | Foreign currency translation gains/losses; |
| ∎ | Significant tax adjustments; |
| ∎ | Other items that are not indicative of the underlying operating performance of our core mining business; and |
| ∎ | Tax effect and non-controlling interest of the above items. |
Management uses this measure internally to evaluate our underlying operating performance for the reporting periods presented and to assist with the planning and forecasting of future operating results. Management believes that adjusted net earnings is a useful measure of our performance because impairment charges, acquisition/ disposition gains/losses and significant tax adjustments do not reflect the underlying operating performance of our core mining business and are not necessarily indicative of future operating results. Furthermore, foreign currency translation gains/losses are not necessarily reflective of the underlying operating results for the reporting periods presented. The tax effect and non-controlling interest of the adjusting items are also excluded to reconcile the amounts to Barrick’s share on a post-tax basis, consistent with net earnings.
As noted, we use this measure for internal purposes. Management’s internal budgets and forecasts and public guidance do not reflect the types of items we adjust for. Consequently, the presentation of adjusted net earnings enables investors and analysts to better understand the underlying operating performance of our core mining business through the eyes of management. Management periodically evaluates the components of adjusted net earnings based on an internal assessment of performance measures that are useful for evaluating the operating performance of our business segments and a review of the non-GAAP financial measures used by mining industry analysts and other mining companies.
Adjusted net earnings is intended to provide additional information only and does not have any standardized definition under IFRS and should not be considered in isolation or as a substitute for measures of performance prepared in accordance with IFRS. The measures are not necessarily indicative of operating profit or cash flow from operations as determined under IFRS. Other companies may calculate these measures differently. The following table reconciles these non-GAAP financial measures to the most directly comparable IFRS measure.
| BARRICK THIRD QUARTER 2023 | 59 | MANAGEMENT’S DISCUSSION AND ANALYSIS |
| OVERVIEW | OPERATING PERFORMANCE |
GROWTH PROJECTS & EXPLORATION |
REVIEW OF FINANCIAL RESULTS |
OTHER INFORMATION & NON-GAAP RECONCILIATIONS |
FINANCIAL STATEMENTS |
|||||
Reconciliation of Net Earnings to Net Earnings per Share, Adjusted Net Earnings and Adjusted Net Earnings per Share
| ($ millions, except per share amounts in dollars) |
For the three months ended | For the nine months ended | ||||||||||||||||||
| 9/30/23 | 6/30/23 | 9/30/22 | 9/30/23 | 9/30/22 | ||||||||||||||||
| Net earnings attributable to equity holders of the Company |
368 | 305 | 241 | 793 | 1,167 | |||||||||||||||
| Impairment charges (reversals) related to intangibles, goodwill, property, plant and equipment, and investmentsa |
0 | 22 | 24 | 23 | 29 | |||||||||||||||
| Acquisition/disposition gainsb |
(4 | ) | (3 | ) | (64 | ) | (10 | ) | (86 | ) | ||||||||||
| Loss (gain) on currency translation |
30 | (12 | ) | 3 | 56 | 12 | ||||||||||||||
| Significant tax adjustmentsc |
19 | 33 | 44 | 100 | 99 | |||||||||||||||
| Other (income) expense adjustmentsd |
(5 | ) | (3 | ) | (27 | ) | 55 | (109 | ) | |||||||||||
| Non-controlling intereste |
4 | (7 | ) | 4 | (9 | ) | (3 | ) | ||||||||||||
| Tax effecte |
6 | 1 | (1 | ) | (7 | ) | (3 | ) | ||||||||||||
| Adjusted net earnings |
418 | 336 | 224 | 1,001 | 1,106 | |||||||||||||||
| Net earnings per sharef |
0.21 | 0.17 | 0.14 | 0.45 | 0.66 | |||||||||||||||
| Adjusted net earnings per sharef |
0.24 | 0.19 | 0.13 | 0.57 | 0.62 | |||||||||||||||
| a. | For the three month period ended June 30, 2023, net impairment charges were mainly related to miscellaneous assets. For the three and nine month periods ended September 30, 2022, net impairment charges mainly relate to an inventory write-off at Lumwana. |
| b. | For the three and nine month periods ended September 30, 2022, acquisition/disposition gains mainly related to the sale of a portfolio of royalties to Maverix Metals Inc. and the sale of a portfolio of royalties by Nevada Gold Mines to Gold Royalty Corp. |
| c. | For the three month period ended September 30, 2023, significant tax adjustments were mainly related to the de-recognition of deferred tax assets, adjustments in respect of prior years and the re-measurement of deferred tax balances. For the nine month period ended September 30, 2023, significant tax adjustments were mainly related to the settlement agreement to resolve the tax dispute at Porgera, the de-recognition of deferred tax assets, adjustments in respect of prior years and the re-measurement of deferred tax balances. |
| d. | For the nine month period ended September 30, 2023, other (income) expense adjustments mainly relate to the $30 million commitment we made towards the expansion of education infrastructure in Tanzania, per our community investment obligations under the Twiga partnership. Other (income) expense adjustments for all periods were also impacted by changes in the discount rate assumptions on our closed mine rehabilitation provision and care and maintenance expenses at Porgera. |
| e. | Non-controlling interest and tax effect for the three and nine month periods ended September 30, 2023 primarily relates to loss (gain) on currency translation. |
| f. | Calculated using weighted average number of shares outstanding under the basic method of earnings per share. |
Free Cash Flow
Free cash flow is a non-GAAP financial measure that deducts capital expenditures from net cash provided by operating activities. Management believes this to be a useful indicator of our ability to operate without reliance on additional borrowing or usage of existing cash.
Free cash flow is intended to provide additional information only and does not have any standardized definition under IFRS and should not be considered in
isolation or as a substitute for measures of performance prepared in accordance with IFRS. The measure is not necessarily indicative of operating profit or cash flow from operations as determined under IFRS. Other companies may calculate this measure differently. The following table reconciles this non-GAAP financial measure to the most directly comparable IFRS measure.
Reconciliation of Net Cash Provided by Operating Activities to Free Cash Flow
| ($ millions) |
For the three months ended | For the nine months ended | ||||||||||||||||||
| 9/30/23 | 6/30/23 | 9/30/22 | 9/30/23 | 9/30/22 | ||||||||||||||||
| Net cash provided by operating activities |
1,127 | 832 | 758 | 2,735 | 2,686 | |||||||||||||||
| Capital expenditures |
(768 | ) | (769 | ) | (792 | ) | (2,225 | ) | (2,158 | ) | ||||||||||
| Free cash flow |
359 | 63 | (34 | ) | 510 | 528 | ||||||||||||||
Capital Expenditures
Capital expenditures are classified into minesite sustaining capital expenditures or project capital expenditures depending on the nature of the expenditure. Minesite sustaining capital expenditures is the capital spending required to support current production levels. Project capital expenditures represent the capital spending at new projects and major, discrete projects at existing operations intended to increase net present value through higher production or longer mine life. Management believes this to be a useful indicator of the purpose of capital expenditures
and this distinction is an input into the calculation of all-in sustaining costs per ounce and all-in costs per ounce.
Classifying capital expenditures is intended to provide additional information only and does not have any standardized definition under IFRS, and should not be considered in isolation or as a substitute for measures of performance prepared in accordance with IFRS. Other companies may calculate these measures differently. The following table reconciles these non-GAAP financial measures to the most directly comparable IFRS measure.
| BARRICK THIRD QUARTER 2023 | 60 | MANAGEMENT’S DISCUSSION AND ANALYSIS |
| OVERVIEW | OPERATING PERFORMANCE |
GROWTH PROJECTS & EXPLORATION |
REVIEW OF FINANCIAL RESULTS |
OTHER INFORMATION & NON-GAAP RECONCILIATIONS |
FINANCIAL STATEMENTS |
|||||
Reconciliation of the Classification of Capital Expenditures
| ($ millions) |
For the three months ended | For the nine months ended | ||||||||||||||||||
| 9/30/23 | 6/30/23 | 9/30/22 | 9/30/23 | 9/30/22 | ||||||||||||||||
| Minesite sustaining capital expenditures |
529 | 524 | 571 | 1,507 | 1,514 | |||||||||||||||
| Project capital expenditures |
227 | 238 | 213 | 691 | 625 | |||||||||||||||
| Capitalized interest |
12 | 7 | 8 | 27 | 19 | |||||||||||||||
| Total consolidated capital expenditures |
768 | 769 | 792 | 2,225 | 2,158 | |||||||||||||||
Total cash costs per ounce, All-in sustaining costs per ounce, All-in costs per ounce, C1 cash costs per pound and All-in sustaining costs per pound
Total cash costs per ounce, all-in sustaining costs per ounce and all-in costs per ounce are non-GAAP financial measures which are calculated based on the definition published by the WGC (a market development organization for the gold industry comprised of and funded by gold mining companies from around the world, including Barrick, the WGC. The WGC is not a regulatory organization. Management uses these measures to monitor the performance of our gold mining operations and its ability to generate positive cash flow, both on an individual site basis and an overall company basis.
Total cash costs start with our cost of sales related to gold production and removes depreciation, the non-controlling interest of cost of sales and includes by-product credits. All-in sustaining costs start with total cash costs and includes sustaining capital expenditures, sustaining leases, general and administrative costs, minesite exploration and evaluation costs and reclamation cost accretion and amortization. These additional costs reflect the expenditures made to maintain current production levels.
All-in costs starts with all-in sustaining costs and adds additional costs that reflect the varying costs of producing gold over the life-cycle of a mine, including: project capital expenditures (capital spending at new projects and major, discrete projects at existing operations intended to increase net present value through higher production or longer mine life) and other non-sustaining costs (primarily non-sustaining leases, exploration and evaluation costs, community relations costs and general and administrative costs that are not associated with current operations). These definitions recognize that there are different costs associated with the life-cycle of a mine, and that it is therefore appropriate to distinguish between sustaining and non-sustaining costs.
We believe that our use of total cash costs, all-in sustaining costs and all-in costs will assist analysts, investors and other stakeholders of Barrick in understanding the costs associated with producing gold, understanding the economics of gold mining, assessing our operating performance and also our ability to generate free cash flow from current operations and to generate free cash flow on an overall company basis. Due to the capital-intensive nature of the industry and the long useful lives over which these items are depreciated, there can be a significant timing difference between net earnings calculated in accordance with IFRS and the amount of free
cash flow that is being generated by a mine and therefore we believe these measures are useful non-GAAP operating metrics and supplement our IFRS disclosures. These measures are not representative of all of our cash expenditures as they do not include income tax payments, interest costs or dividend payments. These measures do not include depreciation or amortization.
Total cash costs per ounce, all-in sustaining costs and all-in costs are intended to provide additional information only and do not have standardized definitions under IFRS and should not be considered in isolation or as a substitute for measures of performance prepared in accordance with IFRS. These measures are not equivalent to net income or cash flow from operations as determined under IFRS. Although the WGC has published a standardized definition, other companies may calculate these measures differently.
In addition to presenting these metrics on a by-product basis, we have calculated these metrics on a co-product basis. Our co-product metrics remove the impact of other metal sales that are produced as a by-product of our gold production from cost per ounce calculations but does not reflect a reduction in costs for costs associated with other metal sales.
C1 cash costs per pound and all-in sustaining costs per pound are non-GAAP financial measures related to our copper mine operations. We believe that C1 cash costs per pound enables investors to better understand the performance of our copper operations in comparison to other copper producers who present results on a similar basis. C1 cash costs per pound excludes royalties and production taxes and non-routine charges as they are not direct production costs. All-in sustaining costs per pound is similar to the gold all-in sustaining costs metric and management uses this to better evaluate the costs of copper production. We believe this measure enables investors to better understand the operating performance of our copper mines as this measure reflects all of the sustaining expenditures incurred in order to produce copper. All-in sustaining costs per pound includes C1 cash costs, sustaining capital expenditures, sustaining leases, general and administrative costs, minesite exploration and evaluation costs, royalties and production taxes, reclamation cost accretion and amortization and write-downs taken on inventory to net realizable value.
| BARRICK THIRD QUARTER 2023 | 61 | MANAGEMENT’S DISCUSSION AND ANALYSIS |
| OVERVIEW | OPERATING PERFORMANCE |
GROWTH PROJECTS & EXPLORATION |
REVIEW OF FINANCIAL RESULTS |
OTHER INFORMATION & NON-GAAP RECONCILIATIONS |
FINANCIAL STATEMENTS |
|||||
Reconciliation of Gold Cost of Sales to Total cash costs, All-in sustaining costs and All-in costs, including on a per ounce basis
| ($ millions, except per ounce information in dollars) |
For the three months ended | For the nine months ended | ||||||||||||||||||||
| Footnote | 9/30/23 | 6/30/23 | 9/30/22 | 9/30/23 | 9/30/22 | |||||||||||||||||
| Cost of sales applicable to gold production |
1,736 | 1,753 | 1,638 | 5,250 | 4,923 | |||||||||||||||||
| Depreciation |
(427 | ) | (413 | ) | (393 | ) | (1,285 | ) | (1,250 | ) | ||||||||||||
| Cash cost of sales applicable to equity method investments |
65 | 67 | 61 | 195 | 166 | |||||||||||||||||
| By-product credits |
(65 | ) | (60 | ) | (50 | ) | (186 | ) | (156 | ) | ||||||||||||
| Non-recurring items |
a | 0 | 0 | 0 | 0 | 0 | ||||||||||||||||
| Other |
b | 7 | 5 | (7 | ) | 12 | (30 | ) | ||||||||||||||
| Non-controlling interests |
c | (380 | ) | (388 | ) | (360 | ) | (1,146 | ) | (1,049 | ) | |||||||||||
| Total cash costs |
936 | 964 | 889 | 2,840 | 2,604 | |||||||||||||||||
| General & administrative costs |
30 | 28 | 26 | 97 | 110 | |||||||||||||||||
| Minesite exploration and evaluation costs |
d | 11 | 14 | 22 | 36 | 52 | ||||||||||||||||
| Minesite sustaining capital expenditures |
e | 529 | 524 | 571 | 1,507 | 1,514 | ||||||||||||||||
| Sustaining leases |
7 | 9 | 12 | 23 | 27 | |||||||||||||||||
| Rehabilitation - accretion and amortization (operating sites) |
f | 14 | 15 | 12 | 43 | 36 | ||||||||||||||||
| Non-controlling interest, copper operations and other |
g | (238 | ) | (197 | ) | (264 | ) | (594 | ) | (661 | ) | |||||||||||
| All-in sustaining costs |
1,289 | 1,357 | 1,268 | 3,952 | 3,682 | |||||||||||||||||
| Global exploration and evaluation and project expense |
d | 75 | 87 | 55 | 222 | 192 | ||||||||||||||||
| Community relations costs not related to current operations |
0 | 1 | 0 | 1 | 0 | |||||||||||||||||
| Project capital expenditures |
e | 227 | 238 | 213 | 691 | 625 | ||||||||||||||||
| Non-sustaining leases |
0 | 0 | 0 | 0 | 0 | |||||||||||||||||
| Rehabilitation - accretion and amortization (non-operating sites) |
f | 6 | 6 | 5 | 18 | 13 | ||||||||||||||||
| Non-controlling interest and copper operations and other |
g | (101 | ) | (122 | ) | (71 | ) | (311 | ) | (197 | ) | |||||||||||
| All-in costs |
1,496 | 1,567 | 1,470 | 4,573 | 4,315 | |||||||||||||||||
| Ounces sold - attributable basis (000s ounces) |
h | 1,027 | 1,001 | 997 | 2,982 | 3,030 | ||||||||||||||||
| Cost of sales per ounce |
i,j | 1,277 | 1,323 | 1,226 | 1,325 | 1,211 | ||||||||||||||||
| Total cash costs per ounce |
j | 912 | 963 | 891 | 953 | 859 | ||||||||||||||||
| Total cash costs per ounce (on a co-product basis) |
j,k | 954 | 1,003 | 925 | 995 | 893 | ||||||||||||||||
| All-in sustaining costs per ounce |
j | 1,255 | 1,355 | 1,269 | 1,325 | 1,215 | ||||||||||||||||
| All-in sustaining costs per ounce (on a co-product basis) |
j,k | 1,297 | 1,395 | 1,303 | 1,367 | 1,249 | ||||||||||||||||
| All-in costs per ounce |
j | 1,457 | 1,566 | 1,474 | 1,534 | 1,424 | ||||||||||||||||
| All-in costs per ounce (on a co-product basis) |
j,k | 1,499 | 1,606 | 1,508 | 1,576 | 1,458 | ||||||||||||||||
| a. | Non-recurring items |
| These costs are not indicative of our cost of production and have been excluded from the calculation of total cash costs. |
| b. | Other |
| Other adjustments for the three and nine month periods ended September 30, 2023 include the removal of total cash costs and by-product credits associated with Pierina, which is producing incidental ounces, of $nil and $3 million, respectively (June 30, 2023: $nil; September 30, 2022: $7 million and $17 million, respectively). |
| c. | Non-controlling interests |
| Non-controlling interests include non-controlling interests related to gold production of $536 million and $1,598 million, respectively, for the three and nine month periods ended September 30, 2023 (June 30, 2023: $533 million and September 30, 2022: $491 million and $1,472 million, respectively). Non-controlling interests include NGM, Pueblo Viejo, Loulo-Gounkoto, Tongon, North Mara and Bulyanhulu. Refer to Note 4 to the Financial Statements for further information. |
| d. | Exploration and evaluation costs |
| Exploration, evaluation and project expenses are presented as minesite sustaining if it supports current mine operations and project if it relates to future projects. Refer to page 51 of this MD&A. |
| e. | Capital expenditures |
| Capital expenditures are related to our gold sites only and are split between minesite sustaining and project capital expenditures. Project capital expenditures are capital spending at new projects and major, discrete projects at existing operations intended to increase net present value through higher production or longer mine life. Significant projects in the current year are the plant expansion project at Pueblo Viejo and the solar projects at NGM and Loulo-Gounkoto. Refer to page 50 of this MD&A. |
| f. | Rehabilitation—accretion and amortization |
| Includes depreciation on the assets related to rehabilitation provisions of our gold operations and accretion on the rehabilitation provision of our gold operations, split between operating and non-operating sites. |
| g. | Non-controlling interest and copper operations |
| Removes general & administrative costs related to non-controlling interests and copper based on a percentage allocation of revenue. Also removes exploration, evaluation and project expenses, rehabilitation costs and capital expenditures incurred by our copper sites and the non-controlling interest of NGM, Pueblo Viejo, Loulo-Gounkoto, Tongon, North Mara and Bulyanhulu operating segments. It also includes capital expenditures applicable to our equity method investment in Kibali. Figures remove the impact of Pierina. The impact is summarized as the following: |
| BARRICK THIRD QUARTER 2023 | 62 | MANAGEMENT’S DISCUSSION AND ANALYSIS |
| OVERVIEW | OPERATING PERFORMANCE |
GROWTH PROJECTS & EXPLORATION |
REVIEW OF FINANCIAL RESULTS |
OTHER INFORMATION & NON-GAAP RECONCILIATIONS |
FINANCIAL STATEMENTS |
|||||
| ($ millions) |
For the three months ended | For the nine months ended | ||||||||||||||||||
| Non-controlling interest, copper operations and other |
9/30/23 | 6/30/23 | 9/30/22 | 9/30/23 | 9/30/22 | |||||||||||||||
| General & administrative costs |
(5 | ) | (5 | ) | (5 | ) | (16 | ) | (23 | ) | ||||||||||
| Minesite exploration and evaluation expenses |
(4 | ) | (4 | ) | (9 | ) | (12 | ) | (19 | ) | ||||||||||
| Rehabilitation - accretion and amortization (operating sites) |
(5 | ) | (5 | ) | (3 | ) | (15 | ) | (10 | ) | ||||||||||
| Minesite sustaining capital expenditures |
(224 | ) | (183 | ) | (247 | ) | (551 | ) | (609 | ) | ||||||||||
| All-in sustaining costs total |
(238 | ) | (197 | ) | (264 | ) | (594 | ) | (661 | ) | ||||||||||
| Global exploration and evaluation and project expense |
(29 | ) | (37 | ) | (9 | ) | (78 | ) | (24 | ) | ||||||||||
| Project capital expenditures |
(72 | ) | (85 | ) | (62 | ) | (233 | ) | (173 | ) | ||||||||||
| All-in costs total |
(101 | ) | (122 | ) | (71 | ) | (311 | ) | (197 | ) | ||||||||||
| h. | Ounces sold - attributable basis |
| Excludes Pierina, which is producing incidental ounces while in closure. |
| i. | Cost of sales per ounce |
| Figures remove the cost of sales impact of: Pierina of $nil and $3 million, respectively, for the three and nine month periods ended September 30, 2023 (June 30, 2023: $nil and September 30, 2022: $6 million and $17 million, respectively), which is producing incidental ounces. Gold cost of sales per ounce is calculated as cost of sales across our gold operations (excluding sites in closure or care and maintenance) divided by ounces sold (both on an attributable basis using Barrick’s ownership share). |
| j. | Per ounce figures |
| Cost of sales per ounce, total cash costs per ounce, all-in sustaining costs per ounce and all-in costs per ounce may not calculate based on amounts presented in this table due to rounding. |
| k. | Co-product costs per ounce |
| Total cash costs per ounce, all-in sustaining costs per ounce and all-in costs per ounce presented on a co-product basis removes the impact of by-product credits of our gold production (net of non-controlling interest) calculated as: |
| ($ millions) |
For the three months ended | For the nine months ended | ||||||||||||||||||
| 9/30/23 | 6/30/23 | 9/30/22 | 9/30/23 | 9/30/22 | ||||||||||||||||
| By-product credits |
65 | 60 | 50 | 186 | 156 | |||||||||||||||
| Non-controlling interest |
(22 | ) | (20 | ) | (16 | ) | (61 | ) | (53 | ) | ||||||||||
| By-product credits (net of non-controlling interest) |
43 | 40 | 34 | 125 | 103 | |||||||||||||||
| BARRICK THIRD QUARTER 2023 | 63 | MANAGEMENT’S DISCUSSION AND ANALYSIS |
| OVERVIEW | OPERATING PERFORMANCE |
GROWTH PROJECTS & EXPLORATION |
REVIEW OF FINANCIAL RESULTS |
OTHER INFORMATION & NON-GAAP RECONCILIATIONS |
FINANCIAL STATEMENTS |
|||||
Reconciliation of Gold Cost of Sales to Total cash costs, All-in sustaining costs and All-in costs, including on a per ounce basis, by operating segment
| ($ millions, except per ounce information in dollars) |
For the three months ended 9/30/23 | |||||||||||||||||||||||||||||||||
| Footnote | Carlin | Corteza | Turquoise Ridge |
Long Canyon |
Phoenix | Nevada Gold Minesb |
Hemlo | North America |
||||||||||||||||||||||||||
| Cost of sales applicable to gold production |
458 | 273 | 164 | 6 | 96 | 997 | 53 | 1,050 | ||||||||||||||||||||||||||
| Depreciation |
(83 | ) | (88 | ) | (45 | ) | (3 | ) | (18 | ) | (237 | ) | (6 | ) | (243 | ) | ||||||||||||||||||
| By-product credits |
(1 | ) | 0 | (1 | ) | 0 | (41 | ) | (43 | ) | (1 | ) | (44 | ) | ||||||||||||||||||||
| Non-recurring items |
c | 0 | 0 | 0 | 0 | 0 | 0 | 0 | 0 | |||||||||||||||||||||||||
| Other |
d | (5 | ) | 0 | 0 | 0 | 6 | 2 | 0 | 2 | ||||||||||||||||||||||||
| Non-controlling interests |
(142 | ) | (72 | ) | (45 | ) | (1 | ) | (17 | ) | (277 | ) | 0 | (277 | ) | |||||||||||||||||||
| Total cash costs |
227 | 113 | 73 | 2 | 26 | 442 | 46 | 488 | ||||||||||||||||||||||||||
| General & administrative costs |
0 | 0 | 0 | 0 | 0 | 0 | 0 | 0 | ||||||||||||||||||||||||||
| Minesite exploration and evaluation costs |
e | 6 | 2 | 1 | 0 | 1 | 10 | 0 | 10 | |||||||||||||||||||||||||
| Minesite sustaining capital expenditures |
f | 169 | 62 | 19 | 0 | 10 | 264 | 9 | 273 | |||||||||||||||||||||||||
| Sustaining capital leases |
0 | 0 | 0 | 0 | 0 | 1 | 1 | 2 | ||||||||||||||||||||||||||
| Rehabilitation - accretion and amortization (operating sites) |
g | 3 | 5 | 1 | 0 | 1 | 10 | 0 | 10 | |||||||||||||||||||||||||
| Non-controlling interests |
(69 | ) | (27 | ) | (8 | ) | 0 | (4 | ) | (110 | ) | 0 | (110 | ) | ||||||||||||||||||||
| All-in sustaining costs |
336 | 155 | 86 | 2 | 34 | 617 | 56 | 673 | ||||||||||||||||||||||||||
| Global exploration and evaluation and project expense |
e | 0 | 0 | 0 | 0 | 0 | 0 | 0 | 0 | |||||||||||||||||||||||||
| Project capital expenditures |
f | 0 | 29 | 2 | 0 | 0 | 82 | 3 | 85 | |||||||||||||||||||||||||
| Non-controlling interests |
0 | (11 | ) | (1 | ) | 0 | 0 | (31 | ) | 0 | (31 | ) | ||||||||||||||||||||||
| All-in costs |
336 | 173 | 87 | 2 | 34 | 668 | 59 | 727 | ||||||||||||||||||||||||||
| Ounces sold - attributable basis (000s ounces) |
238 | 135 | 78 | 2 | 27 | 480 | 31 | 511 | ||||||||||||||||||||||||||
| Cost of sales per ounce |
h,i | 1,166 | 1,246 | 1,300 | 1,832 | 2,235 | 1,273 | 1,721 | 1,300 | |||||||||||||||||||||||||
| Total cash costs per ounce |
i | 953 | 840 | 938 | 778 | 1,003 | 921 | 1,502 | 956 | |||||||||||||||||||||||||
| Total cash costs per ounce (on a co-product basis) |
i,j | 954 | 844 | 944 | 779 | 1,812 | 968 | 1,508 | 1,001 | |||||||||||||||||||||||||
| All-in sustaining costs per ounce |
i | 1,409 | 1,156 | 1,106 | 831 | 1,264 | 1,286 | 1,799 | 1,317 | |||||||||||||||||||||||||
| All-in sustaining costs per ounce (on a co-product basis) |
i,j | 1,410 | 1,160 | 1,112 | 832 | 2,073 | 1,333 | 1,805 | 1,362 | |||||||||||||||||||||||||
| All-in costs per ounce |
i | 1,409 | 1,290 | 1,114 | 831 | 1,264 | 1,389 | 1,912 | 1,421 | |||||||||||||||||||||||||
| All-in costs per ounce (on a co-product basis) |
i,j | 1,410 | 1,294 | 1,120 | 832 | 2,073 | 1,436 | 1,918 | 1,466 | |||||||||||||||||||||||||
| ($ millions, except per ounce information in dollars) |
For the three months ended 9/30/23 | |||||||||||||
| Footnote | Pueblo Viejo | Veladero | Latin America & Asia Pacific | |||||||||||
| Cost of sales applicable to gold production |
195 | 64 | 259 | |||||||||||
| Depreciation |
(65 | ) | (15 | ) | (80 | ) | ||||||||
| By-product credits |
(8 | ) | (3 | ) | (11 | ) | ||||||||
| Non-recurring items |
c | 0 | 0 | 0 | ||||||||||
| Other |
d | 0 | 0 | 0 | ||||||||||
| Non-controlling interests |
(49 | ) | 0 | (49 | ) | |||||||||
| Total cash costs |
73 | 46 | 119 | |||||||||||
| General & administrative costs |
0 | 0 | 0 | |||||||||||
| Minesite exploration and evaluation costs |
e | 0 | 1 | 1 | ||||||||||
| Minesite sustaining capital expenditures |
f | 44 | 13 | 57 | ||||||||||
| Sustaining capital leases |
0 | 0 | 0 | |||||||||||
| Rehabilitation - accretion and amortization (operating sites) |
g | 1 | 0 | 1 | ||||||||||
| Non-controlling interests |
(19 | ) | 0 | (19 | ) | |||||||||
| All-in sustaining costs |
99 | 60 | 159 | |||||||||||
| Global exploration and evaluation and project expense |
e | 0 | 0 | 0 | ||||||||||
| Project capital expenditures |
f | 46 | 2 | 48 | ||||||||||
| Non-controlling interests |
(18 | ) | 0 | (18 | ) | |||||||||
| All-in costs |
127 | 62 | 189 | |||||||||||
| Ounces sold - attributable basis (000s ounces) |
77 | 47 | 124 | |||||||||||
| Cost of sales per ounce |
h,i | 1,501 | 1,376 | 1,468 | ||||||||||
| Total cash costs per ounce |
i | 935 | 988 | 953 | ||||||||||
| Total cash costs per ounce (on a co-product basis) |
i,j | 995 | 1,050 | 1,014 | ||||||||||
| All-in sustaining costs per ounce |
i | 1,280 | 1,314 | 1,304 | ||||||||||
| All-in sustaining costs per ounce (on a co-product basis) |
i,j | 1,340 | 1,376 | 1,365 | ||||||||||
| All-in costs per ounce |
i | 1,640 | 1,349 | 1,584 | ||||||||||
| All-in costs per ounce (on a co-product basis) |
i,j | 1,700 | 1,411 | 1,645 | ||||||||||
| BARRICK THIRD QUARTER 2023 | 64 | MANAGEMENT’S DISCUSSION AND ANALYSIS |
| OVERVIEW | OPERATING PERFORMANCE |
GROWTH PROJECTS & EXPLORATION |
REVIEW OF FINANCIAL RESULTS |
OTHER INFORMATION & NON-GAAP RECONCILIATIONS |
FINANCIAL STATEMENTS |
|||||
| ($ millions, except per ounce information in dollars) |
For the three months ended 9/30/23 | |||||||||||||||||||||||||
| Footnote | Loulo- Gounkoto |
Kibali | North Mara | Tongon | Bulyanhulu |
Africa & Middle East |
||||||||||||||||||||
| Cost of sales applicable to gold production |
198 | 112 | 88 | 74 | 68 | 540 | ||||||||||||||||||||
| Depreciation |
(57 | ) | (44 | ) | (17 | ) | (10 | ) | (16 | ) | (144 | ) | ||||||||||||||
| By-product credits |
0 | (1 | ) | (1 | ) | (1 | ) | (6 | ) | (9 | ) | |||||||||||||||
| Non-recurring items |
c | 0 | 0 | 0 | 0 | 0 | 0 | |||||||||||||||||||
| Other |
d | 0 | 0 | 0 | 0 | 0 | 0 | |||||||||||||||||||
| Non-controlling interests |
(28 | ) | 0 | (11 | ) | (6 | ) | (7 | ) | (52 | ) | |||||||||||||||
| Total cash costs |
113 | 67 | 59 | 57 | 39 | 335 | ||||||||||||||||||||
| General & administrative costs |
0 | 0 | 0 | 0 | 0 | 0 | ||||||||||||||||||||
| Minesite exploration and evaluation costs |
e | 0 | 0 | 0 | 0 | 0 | 0 | |||||||||||||||||||
| Minesite sustaining capital expenditures |
f | 53 | 8 | 29 | 6 | 14 | 110 | |||||||||||||||||||
| Sustaining capital leases |
(1 | ) | 2 | 0 | 0 | 0 | 1 | |||||||||||||||||||
| Rehabilitation - accretion and amortization (operating sites) |
g | 1 | 2 | 1 | (1 | ) | 0 | 3 | ||||||||||||||||||
| Non-controlling interests |
(10 | ) | 0 | (5 | ) | (1 | ) | (2 | ) | (18 | ) | |||||||||||||||
| All-in sustaining costs |
156 | 79 | 84 | 61 | 51 | 431 | ||||||||||||||||||||
| Global exploration and evaluation and project expense |
e | 0 | 0 | 0 | 0 | 0 | 0 | |||||||||||||||||||
| Project capital expenditures |
f | 33 | 8 | 26 | 0 | 11 | 78 | |||||||||||||||||||
| Non-controlling interests |
(7 | ) | 0 | (4 | ) | 0 | (2 | ) | (13 | ) | ||||||||||||||||
| All-in costs |
182 | 87 | 106 | 61 | 60 | 496 | ||||||||||||||||||||
| Ounces sold - attributable basis (000s ounces) |
145 | 97 | 59 | 46 | 45 | 392 | ||||||||||||||||||||
| Cost of sales per ounce |
h,i | 1,087 | 1,152 | 1,244 | 1,423 | 1,261 | 1,186 | |||||||||||||||||||
| Total cash costs per ounce |
i | 773 | 694 | 999 | 1,217 | 859 | 850 | |||||||||||||||||||
| Total cash costs per ounce (on a co-product basis) |
i,j | 774 | 698 | 1,007 | 1,222 | 973 | 866 | |||||||||||||||||||
| All-in sustaining costs per ounce |
i | 1,068 | 801 | 1,429 | 1,331 | 1,132 | 1,095 | |||||||||||||||||||
| All-in sustaining costs per ounce (on a co-product basis) |
i,j | 1,069 | 805 | 1,437 | 1,336 | 1,246 | 1,111 | |||||||||||||||||||
| All-in costs per ounce |
i | 1,249 | 881 | 1,802 | 1,331 | 1,335 | 1,261 | |||||||||||||||||||
| All-in costs per ounce (on a co-product basis) |
i,j | 1,250 | 885 | 1,810 | 1,336 | 1,449 | 1,277 | |||||||||||||||||||
| ($ millions, except per ounce information in dollars) |
For the three months ended 6/30/23 | |||||||||||||||||||||||||||||||||
| Footnote | Carlin | Corteza | Turquoise Ridge |
Long Canyon |
Phoenix | Nevada Gold Minesb |
Hemlo | North America |
||||||||||||||||||||||||||
| Cost of sales applicable to gold production |
495 | 245 | 172 | 8 | 96 | 1,016 | 56 | 1,072 | ||||||||||||||||||||||||||
| Depreciation |
(91) | (67) | (43) | (5) | (18) | (224) | (7) | (231) | ||||||||||||||||||||||||||
| By-product credits |
0 | (1) | (1) | 0 | (40) | (42) | 0 | (42) | ||||||||||||||||||||||||||
| Non-recurring items |
c | 0 | 0 | 0 | 0 | 0 | 0 | 0 | 0 | |||||||||||||||||||||||||
| Other |
d | (3) | 0 | 0 | 0 | 7 | 4 | 0 | 4 | |||||||||||||||||||||||||
| Non-controlling interests |
(155) | (68) | (50) | (1) | (18) | (292) | 0 | (292) | ||||||||||||||||||||||||||
| Total cash costs |
246 | 109 | 78 | 2 | 27 | 462 | 49 | 511 | ||||||||||||||||||||||||||
| General & administrative costs |
0 | 0 | 0 | 0 | 0 | 0 | 0 | 0 | ||||||||||||||||||||||||||
| Minesite exploration and evaluation costs |
e | 7 | 2 | 2 | 0 | 0 | 11 | 0 | 11 | |||||||||||||||||||||||||
| Minesite sustaining capital expenditures |
f | 146 | 81 | 23 | 0 | 6 | 261 | 8 | 269 | |||||||||||||||||||||||||
| Sustaining capital leases |
0 | 0 | 0 | 0 | 1 | 1 | 0 | 1 | ||||||||||||||||||||||||||
| Rehabilitation - accretion and amortization (operating sites) |
g | 3 | 5 | 0 | 0 | 1 | 9 | 1 | 10 | |||||||||||||||||||||||||
| Non-controlling interests |
(60) | (34) | (9) | 0 | (3) | (108) | 0 | (108) | ||||||||||||||||||||||||||
| All-in sustaining costs |
342 | 163 | 94 | 2 | 32 | 636 | 58 | 694 | ||||||||||||||||||||||||||
| Global exploration and evaluation and project expense |
e | 0 | 0 | 0 | 0 | 0 | 0 | 0 | 0 | |||||||||||||||||||||||||
| Project capital expenditures |
f | 0 | 30 | 1 | 0 | 0 | 74 | 1 | 75 | |||||||||||||||||||||||||
| Non-controlling interests |
0 | (12) | 0 | 0 | 0 | (29) | 0 | (29) | ||||||||||||||||||||||||||
| All-in costs |
342 | 181 | 95 | 2 | 32 | 681 | 59 | 740 | ||||||||||||||||||||||||||
| Ounces sold - attributable basis (000s ounces) |
243 | 112 | 72 | 3 | 28 | 458 | 35 | 493 | ||||||||||||||||||||||||||
| Cost of sales per ounce |
h,i | 1,240 | 1,346 | 1,466 | 1,640 | 2,075 | 1,357 | 1,562 | 1,371 | |||||||||||||||||||||||||
| Total cash costs per ounce |
i | 1,013 | 972 | 1,088 | 637 | 948 | 1,009 | 1,356 | 1,034 | |||||||||||||||||||||||||
| Total cash costs per ounce (on a co-product basis) |
i,j | 1,014 | 976 | 1,098 | 640 | 1,676 | 1,057 | 1,361 | 1,079 | |||||||||||||||||||||||||
| All-in sustaining costs per ounce |
i | 1,407 | 1,453 | 1,302 | 677 | 1,132 | 1,388 | 1,634 | 1,406 | |||||||||||||||||||||||||
| All-in sustaining costs per ounce (on a co-product basis) |
i,j | 1,408 | 1,457 | 1,312 | 680 | 1,860 | 1,436 | 1,639 | 1,451 | |||||||||||||||||||||||||
| All-in costs per ounce |
i | 1,407 | 1,618 | 1,310 | 677 | 1,132 | 1,489 | 1,666 | 1,502 | |||||||||||||||||||||||||
| All-in costs per ounce (on a co-product basis) |
i,j | 1,408 | 1,622 | 1,320 | 680 | 1,860 | 1,537 | 1,671 | 1,547 | |||||||||||||||||||||||||
| BARRICK THIRD QUARTER 2023 | 65 | MANAGEMENT’S DISCUSSION AND ANALYSIS |
| OVERVIEW | OPERATING PERFORMANCE |
GROWTH PROJECTS & EXPLORATION |
REVIEW OF FINANCIAL RESULTS |
OTHER INFORMATION & NON-GAAP RECONCILIATIONS |
FINANCIAL STATEMENTS |
|||||
| ($ millions, except per ounce information in dollars) |
For the three months ended 6/30/23 | |||||||||||||
| Footnote | Pueblo Viejo | Veladero | Latin America & Asia Pacific | |||||||||||
| Cost of sales applicable to gold production |
177 | 65 | 242 | |||||||||||
| Depreciation |
(60 | ) | (18 | ) | (78 | ) | ||||||||
| By-product credits |
(6 | ) | (2 | ) | (8 | ) | ||||||||
| Non-recurring items |
c | 0 | 0 | 0 | ||||||||||
| Other |
d | 0 | 0 | 0 | ||||||||||
| Non-controlling interests |
(45 | ) | 0 | (45 | ) | |||||||||
| Total cash costs |
66 | 45 | 111 | |||||||||||
| General & administrative costs |
0 | 0 | 0 | |||||||||||
| Minesite exploration and evaluation costs |
e | 0 | 2 | 2 | ||||||||||
| Minesite sustaining capital expenditures |
f | 48 | 25 | 73 | ||||||||||
| Sustaining capital leases |
0 | 0 | 0 | |||||||||||
| Rehabilitation - accretion and amortization (operating sites) |
g | 2 | 1 | 3 | ||||||||||
| Non-controlling interests |
(19 | ) | 0 | (19 | ) | |||||||||
| All-in sustaining costs |
97 | 73 | 170 | |||||||||||
| Global exploration and evaluation and project expense |
e | 0 | 0 | 0 | ||||||||||
| Project capital expenditures |
f | 75 | 1 | 76 | ||||||||||
| Non-controlling interests |
(30 | ) | 0 | (30 | ) | |||||||||
| All-in costs |
142 | 74 | 216 | |||||||||||
| Ounces sold - attributable basis (000s ounces) |
79 | 45 | 124 | |||||||||||
| Cost of sales per ounce |
h,i | 1,344 | 1,424 | 1,390 | ||||||||||
| Total cash costs per ounce |
i | 840 | 999 | 896 | ||||||||||
| Total cash costs per ounce (on a co-product basis) |
i,j | 886 | 1,048 | 943 | ||||||||||
| All-in sustaining costs per ounce |
i | 1,219 | 1,599 | 1,392 | ||||||||||
| All-in sustaining costs per ounce (on a co-product basis) |
i,j | 1,265 | 1,648 | 1,439 | ||||||||||
| All-in costs per ounce |
i | 1,788 | 1,614 | 1,818 | ||||||||||
| All-in costs per ounce (on a co-product basis) |
i,j | 1,834 | 1,663 | 1,865 | ||||||||||
| ($ millions, except per ounce information in dollars) |
For the three months ended 6/30/23 | |||||||||||||||||||||||||
| Footnote | Loulo- Gounkoto |
Kibali | North Mara | Tongon | Bulyanhulu | Africa & Middle East |
||||||||||||||||||||
| Cost of sales applicable to gold production |
199 | 111 | 91 | 76 | 71 | 548 | ||||||||||||||||||||
| Depreciation |
(60) | (41) | (19) | (7) | (15) | (142) | ||||||||||||||||||||
| By-product credits |
0 | (1) | 0 | 0 | (6) | (7) | ||||||||||||||||||||
| Non-recurring items |
c | 0 | 0 | 0 | 0 | 0 | 0 | |||||||||||||||||||
| Other |
d | 0 | 0 | 0 | 0 | 0 | 0 | |||||||||||||||||||
| Non-controlling interests |
(28) | 0 | (12) | (7) | (9) | (56) | ||||||||||||||||||||
| Total cash costs |
111 | 69 | 60 | 62 | 41 | 343 | ||||||||||||||||||||
| General & administrative costs |
0 | 0 | 0 | 0 | 0 | 0 | ||||||||||||||||||||
| Minesite exploration and evaluation costs |
e | 0 | 0 | 0 | 0 | 0 | 0 | |||||||||||||||||||
| Minesite sustaining capital expenditures |
f | 76 | 10 | 30 | 5 | 14 | 135 | |||||||||||||||||||
| Sustaining capital leases |
1 | 3 | 0 | 1 | 0 | 5 | ||||||||||||||||||||
| Rehabilitation - accretion and amortization (operating sites) |
g | 1 | 0 | 2 | 0 | 1 | 4 | |||||||||||||||||||
| Non-controlling interests |
(16) | 0 | (5) | (1) | (3) | (25) | ||||||||||||||||||||
| All-in sustaining costs |
173 | 82 | 87 | 67 | 53 | 462 | ||||||||||||||||||||
| Global exploration and evaluation and project expense |
e | 0 | 0 | 0 | 0 | 0 | 0 | |||||||||||||||||||
| Project capital expenditures |
f | 16 | 8 | 19 | 0 | 9 | 52 | |||||||||||||||||||
| Non-controlling interests |
(3) | 0 | (3) | 0 | (1) | (7) | ||||||||||||||||||||
| All-in costs |
186 | 90 | 103 | 67 | 61 | 507 | ||||||||||||||||||||
| Ounces sold - attributable basis (000s ounces) |
140 | 87 | 64 | 45 | 48 | 384 | ||||||||||||||||||||
| Cost of sales per ounce |
h,i | 1,150 | 1,269 | 1,208 | 1,514 | 1,231 | 1,239 | |||||||||||||||||||
| Total cash costs per ounce |
i | 801 | 797 | 942 | 1,380 | 850 | 898 | |||||||||||||||||||
| Total cash costs per ounce (on a co-product basis) |
i,j | 801 | 801 | 949 | 1,384 | 960 | 915 | |||||||||||||||||||
| All-in sustaining costs per ounce |
i | 1,245 | 955 | 1,355 | 1,465 | 1,105 | 1,206 | |||||||||||||||||||
| All-in sustaining costs per ounce (on a co-product basis) |
i,j | 1,245 | 959 | 1,362 | 1,469 | 1,215 | 1,223 | |||||||||||||||||||
| All-in costs per ounce |
i | 1,335 | 1,043 | 1,606 | 1,465 | 1,273 | 1,321 | |||||||||||||||||||
| All-in costs per ounce (on a co-product basis) |
i,j | 1,335 | 1,047 | 1,613 | 1,469 | 1,383 | 1,338 | |||||||||||||||||||
| BARRICK THIRD QUARTER 2023 | 66 | MANAGEMENT’S DISCUSSION AND ANALYSIS |
| OVERVIEW | OPERATING PERFORMANCE |
GROWTH PROJECTS & EXPLORATION |
REVIEW OF FINANCIAL RESULTS |
OTHER INFORMATION & NON-GAAP RECONCILIATIONS |
FINANCIAL STATEMENTS |
|||||
| ($ millions, except per ounce information in dollars) |
For the three months ended 9/30/22 | |||||||||||||||||||||||||||||||||||
| Footnote | Carlin | Corteza | Turquoise Ridge |
Long Canyon |
Phoenix | Nevada Gold Minesb |
Hemlo | North America |
||||||||||||||||||||||||||||
| Cost of sales applicable to gold production |
425 | 170 | 155 | 19 | 93 | 862 | 46 | 908 | ||||||||||||||||||||||||||||
| Depreciation |
(74 | ) | (46 | ) | (41 | ) | (12 | ) | (20 | ) | (193 | ) | (6 | ) | (199 | ) | ||||||||||||||||||||
| By-product credits |
(1 | ) | 0 | (1 | ) | 0 | (31 | ) | (33 | ) | 0 | (33 | ) | |||||||||||||||||||||||
| Non-recurring items |
c | 0 | 0 | 0 | 0 | 0 | 0 | 0 | 0 | |||||||||||||||||||||||||||
| Other |
d | (4 | ) | 0 | 0 | 0 | 3 | (1 | ) | 0 | (1 | ) | ||||||||||||||||||||||||
| Non-controlling interests |
(133 | ) | (48 | ) | (43 | ) | (3 | ) | (17 | ) | (244 | ) | 0 | (244 | ) | |||||||||||||||||||||
| Total cash costs |
213 | 76 | 70 | 4 | 28 | 391 | 40 | 431 | ||||||||||||||||||||||||||||
| General & administrative costs |
0 | 0 | 0 | 0 | 0 | 0 | 0 | 0 | ||||||||||||||||||||||||||||
| Minesite exploration and evaluation costs |
e | 7 | 1 | 1 | 0 | 0 | 9 | 1 | 10 | |||||||||||||||||||||||||||
| Minesite sustaining capital expenditures |
f | 124 | 102 | 30 | 0 | 6 | 266 | 9 | 275 | |||||||||||||||||||||||||||
| Sustaining capital leases |
0 | 0 | 0 | 0 | 0 | 0 | 1 | 1 | ||||||||||||||||||||||||||||
| Rehabilitation - accretion and amortization (operating sites) |
g | 3 | 3 | 0 | 0 | 1 | 7 | 0 | 7 | |||||||||||||||||||||||||||
| Non-controlling interests |
(52 | ) | (40 | ) | (12 | ) | 0 | (3 | ) | (108 | ) | 0 | (108 | ) | ||||||||||||||||||||||
| All-in sustaining costs |
295 | 142 | 89 | 4 | 32 | 565 | 51 | 616 | ||||||||||||||||||||||||||||
| Global exploration and evaluation and project expense |
e | 0 | 0 | 0 | 0 | 0 | 0 | 0 | 0 | |||||||||||||||||||||||||||
| Project capital expenditures |
f | 0 | 28 | 14 | 0 | 0 | 45 | 0 | 45 | |||||||||||||||||||||||||||
| Non-controlling interests |
0 | (11 | ) | (5 | ) | 0 | 0 | (17 | ) | 0 | (17 | ) | ||||||||||||||||||||||||
| All-in costs |
295 | 159 | 98 | 4 | 32 | 593 | 51 | 644 | ||||||||||||||||||||||||||||
| Ounces sold - attributable basis (000s ounces) |
226 | 99 | 64 | 6 | 29 | 424 | 27 | 451 | ||||||||||||||||||||||||||||
| Cost of sales per ounce |
h,i | 1,137 | 1,056 | 1,509 | 1,769 | 1,964 | 1,242 | 1,670 | 1,268 | |||||||||||||||||||||||||||
| Total cash costs per ounce |
i | 943 | 770 | 1,105 | 662 | 953 | 924 | 1,446 | 956 | |||||||||||||||||||||||||||
| Total cash costs per ounce (on a co-product basis) |
i,j | 944 | 772 | 1,110 | 662 | 1,548 | 967 | 1,451 | 997 | |||||||||||||||||||||||||||
| All-in sustaining costs per ounce |
i | 1,304 | 1,426 | 1,423 | 684 | 1,084 | 1,333 | 1,865 | 1,365 | |||||||||||||||||||||||||||
| All-in sustaining costs per ounce (on a co-product basis) |
i,j | 1,305 | 1,428 | 1,428 | 684 | 1,679 | 1,376 | 1,870 | 1,406 | |||||||||||||||||||||||||||
| All-in costs per ounce |
i | 1,304 | 1,602 | 1,559 | 684 | 1,084 | 1,398 | 1,866 | 1,427 | |||||||||||||||||||||||||||
| All-in costs per ounce (on a co-product basis) |
i,j | 1,305 | 1,604 | 1,564 | 684 | 1,679 | 1,441 | 1,871 | 1,468 | |||||||||||||||||||||||||||
| ($ millions, except per ounce information in dollars) |
For the three months ended 9/30/22 | |||||||||||||||
| Footnote | Pueblo Viejo | Veladero | Latin America & Asia Pacific | |||||||||||||
| Cost of sales applicable to gold production |
225 | 63 | 288 | |||||||||||||
| Depreciation |
(64 | ) | (23 | ) | (87 | ) | ||||||||||
| By-product credits |
(10 | ) | (1 | ) | (11 | ) | ||||||||||
| Non-recurring items |
c | 0 | 0 | 0 | ||||||||||||
| Other |
d | 0 | 0 | 0 | ||||||||||||
| Non-controlling interests |
(60 | ) | 0 | (60 | ) | |||||||||||
| Total cash costs |
91 | 39 | 130 | |||||||||||||
| General & administrative costs |
0 | 0 | 0 | |||||||||||||
| Minesite exploration and evaluation costs |
e | 0 | 0 | 0 | ||||||||||||
| Minesite sustaining capital expenditures |
f | 67 | 27 | 94 | ||||||||||||
| Sustaining capital leases |
0 | 1 | 1 | |||||||||||||
| Rehabilitation - accretion and amortization (operating sites) |
g | 1 | 1 | 2 | ||||||||||||
| Non-controlling interests |
(27 | ) | 0 | (27 | ) | |||||||||||
| All-in sustaining costs |
132 | 68 | 200 | |||||||||||||
| Global exploration and evaluation and project expense |
e | 0 | 0 | 0 | ||||||||||||
| Project capital expenditures |
f | 101 | 5 | 106 | ||||||||||||
| Non-controlling interests |
(40 | ) | 0 | (40 | ) | |||||||||||
| All-in costs |
193 | 73 | 266 | |||||||||||||
| Ounces sold - attributable basis (000s ounces) |
124 | 44 | 168 | |||||||||||||
| Cost of sales per ounce |
h,i | 1,097 | 1,430 | 1,199 | ||||||||||||
| Total cash costs per ounce |
i | 733 | 893 | 774 | ||||||||||||
| Total cash costs per ounce (on a co-product basis) |
i,j | 784 | 911 | 816 | ||||||||||||
| All-in sustaining costs per ounce |
i | 1,063 | 1,570 | 1,198 | ||||||||||||
| All-in sustaining costs per ounce (on a co-product basis) |
i,j | 1,114 | 1,588 | 1,240 | ||||||||||||
| All-in costs per ounce |
i | 1,554 | 1,659 | 1,625 | ||||||||||||
| All-in costs per ounce (on a co-product basis) |
i,j | 1,605 | 1,677 | 1,667 | ||||||||||||
| BARRICK THIRD QUARTER 2023 | 67 | MANAGEMENT’S DISCUSSION AND ANALYSIS |
| OVERVIEW | OPERATING PERFORMANCE |
GROWTH PROJECTS & EXPLORATION |
REVIEW OF FINANCIAL RESULTS |
OTHER INFORMATION & NON-GAAP RECONCILIATIONS |
FINANCIAL STATEMENTS |
|||||
| ($ millions, except per ounce information in dollars) |
For the three months ended 9/30/22 | |||||||||||||||||||||||||||
| Footnote | Loulo- Gounkoto |
Kibali | North Mara | Tongon | Bulyanhulu | Africa & Middle East |
||||||||||||||||||||||
| Cost of sales applicable to gold production |
196 | 91 | 80 | 79 | 74 | 520 | ||||||||||||||||||||||
| Depreciation |
(60 | ) | (27 | ) | (18 | ) | (13 | ) | (15 | ) | (133 | ) | ||||||||||||||||
| By-product credits |
0 | 0 | 0 | 0 | (5 | ) | (5 | ) | ||||||||||||||||||||
| Non-recurring items |
c | 0 | 0 | 0 | 0 | 0 | 0 | |||||||||||||||||||||
| Other |
d | 0 | 0 | 0 | 0 | 0 | 0 | |||||||||||||||||||||
| Non-controlling interests |
(28 | ) | 0 | (10 | ) | (7 | ) | (9 | ) | (54 | ) | |||||||||||||||||
| Total cash costs |
108 | 64 | 52 | 59 | 45 | 328 | ||||||||||||||||||||||
| General & administrative costs |
0 | 0 | 0 | 0 | 0 | 0 | ||||||||||||||||||||||
| Minesite exploration and evaluation costs |
e | 3 | (4 | ) | 1 | 1 | 0 | 1 | ||||||||||||||||||||
| Minesite sustaining capital expenditures |
f | 55 | 13 | 16 | 5 | 16 | 105 | |||||||||||||||||||||
| Sustaining capital leases |
1 | 4 | 0 | 1 | 0 | 6 | ||||||||||||||||||||||
| Rehabilitation - accretion and amortization (operating sites) |
g | 1 | 0 | 1 | 0 | 0 | 2 | |||||||||||||||||||||
| Non-controlling interests |
(12 | ) | 0 | (3 | ) | 0 | (3 | ) | (18 | ) | ||||||||||||||||||
| All-in sustaining costs |
156 | 77 | 67 | 66 | 58 | 424 | ||||||||||||||||||||||
| Global exploration and evaluation and project expense |
e | 0 | 0 | 0 | 0 | 0 | 0 | |||||||||||||||||||||
| Project capital expenditures |
f | 27 | 5 | 16 | 0 | 6 | 54 | |||||||||||||||||||||
| Non-controlling interests |
(6 | ) | 0 | (3 | ) | 0 | (1 | ) | (10 | ) | ||||||||||||||||||
| All-in costs |
177 | 82 | 80 | 66 | 63 | 468 | ||||||||||||||||||||||
| Ounces sold - attributable basis (000s ounces) |
129 | 88 | 70 | 41 | 50 | 378 | ||||||||||||||||||||||
| Cost of sales per ounce |
h,i | 1,220 | 1,047 | 956 | 1,744 | 1,229 | 1,189 | |||||||||||||||||||||
| Total cash costs per ounce |
i | 845 | 731 | 737 | 1,462 | 898 | 872 | |||||||||||||||||||||
| Total cash costs per ounce (on a co-product basis) |
i,j | 845 | 734 | 742 | 1,465 | 989 | 886 | |||||||||||||||||||||
| All-in sustaining costs per ounce |
i | 1,216 | 876 | 951 | 1,607 | 1,170 | 1,124 | |||||||||||||||||||||
| All-in sustaining costs per ounce (on a co-product basis) |
i,j | 1,216 | 879 | 956 | 1,610 | 1,261 | 1,138 | |||||||||||||||||||||
| All-in costs per ounce |
i | 1,385 | 940 | 1,149 | 1,607 | 1,263 | 1,246 | |||||||||||||||||||||
| All-in costs per ounce (on a co-product basis) |
i,j | 1,385 | 943 | 1,154 | 1,610 | 1,354 | 1,260 | |||||||||||||||||||||
| ($ millions, except per ounce information in dollars) |
For the nine months ended 9/30/23 | |||||||||||||||||||||||||||||||||||
| Footnote | Carlin | Corteza | Turquoise Ridge |
Long Canyon |
Phoenix | Nevada Gold Minesb |
Hemlo | North America |
||||||||||||||||||||||||||||
| Cost of sales applicable to gold production |
1,346 | 813 | 525 | 20 | 291 | 2,995 | 168 | 3,163 | ||||||||||||||||||||||||||||
| Depreciation |
(237 | ) | (246 | ) | (138 | ) | (12 | ) | (55 | ) | (688 | ) | (21 | ) | (709 | ) | ||||||||||||||||||||
| By-product credits |
(2 | ) | (2 | ) | (3 | ) | 0 | (119 | ) | (126 | ) | (1 | ) | (127 | ) | |||||||||||||||||||||
| Non-recurring items |
c | 0 | 0 | 0 | 0 | 0 | 0 | 0 | 0 | |||||||||||||||||||||||||||
| Other |
d | (13 | ) | 0 | 0 | 0 | 20 | 8 | 0 | 8 | ||||||||||||||||||||||||||
| Non-controlling interests |
(422 | ) | (218 | ) | (148 | ) | (3 | ) | (53 | ) | (844 | ) | 0 | (844 | ) | |||||||||||||||||||||
| Total cash costs |
672 | 347 | 236 | 5 | 84 | 1,345 | 146 | 1,491 | ||||||||||||||||||||||||||||
| General & administrative costs |
0 | 0 | 0 | 0 | 0 | 0 | 0 | 0 | ||||||||||||||||||||||||||||
| Minesite exploration and evaluation costs |
e | 21 | 4 | 4 | 0 | 1 | 31 | 0 | 31 | |||||||||||||||||||||||||||
| Minesite sustaining capital expenditures |
f | 431 | 210 | 72 | 0 | 22 | 749 | 29 | 778 | |||||||||||||||||||||||||||
| Sustaining capital leases |
0 | 0 | 0 | 0 | 1 | 2 | 2 | 4 | ||||||||||||||||||||||||||||
| Rehabilitation - accretion and amortization (operating sites) |
g | 9 | 14 | 2 | 0 | 3 | 28 | 1 | 29 | |||||||||||||||||||||||||||
| Non-controlling interests |
(178 | ) | (88 | ) | (30 | ) | 0 | (10 | ) | (312 | ) | 0 | (312 | ) | ||||||||||||||||||||||
| All-in sustaining costs |
955 | 487 | 284 | 5 | 101 | 1,843 | 178 | 2,021 | ||||||||||||||||||||||||||||
| Global exploration and evaluation and project expense |
e | 0 | 0 | 0 | 0 | 0 | 0 | 0 | 0 | |||||||||||||||||||||||||||
| Project capital expenditures |
f | 0 | 83 | 8 | 0 | 0 | 209 | 4 | 213 | |||||||||||||||||||||||||||
| Non-controlling interests |
0 | (32 | ) | (3 | ) | 0 | 0 | (80 | ) | 0 | (80 | ) | ||||||||||||||||||||||||
| All-in costs |
955 | 538 | 289 | 5 | 101 | 1,972 | 182 | 2,154 | ||||||||||||||||||||||||||||
| Ounces sold - attributable basis (000s ounces) |
645 | 384 | 232 | 7 | 81 | 1,349 | 106 | 1,455 | ||||||||||||||||||||||||||||
| Cost of sales per ounce |
h,i | 1,266 | 1,303 | 1,391 | 1,691 | 2,225 | 1,359 | 1,579 | 1,375 | |||||||||||||||||||||||||||
| Total cash costs per ounce |
i | 1,042 | 905 | 1,018 | 660 | 1,047 | 998 | 1,374 | 1,025 | |||||||||||||||||||||||||||
| Total cash costs per ounce (on a co-product basis) |
i,j | 1,044 | 909 | 1,026 | 662 | 1,803 | 1,046 | 1,379 | 1,070 | |||||||||||||||||||||||||||
| All-in sustaining costs per ounce |
i | 1,480 | 1,270 | 1,225 | 707 | 1,250 | 1,366 | 1,672 | 1,389 | |||||||||||||||||||||||||||
| All-in sustaining costs per ounce (on a co-product basis) |
i,j | 1,482 | 1,274 | 1,233 | 709 | 2,006 | 1,414 | 1,677 | 1,434 | |||||||||||||||||||||||||||
| All-in costs per ounce |
i | 1,480 | 1,404 | 1,242 | 707 | 1,250 | 1,461 | 1,716 | 1,480 | |||||||||||||||||||||||||||
| All-in costs per ounce (on a co-product basis) |
i,j | 1,482 | 1,408 | 1,250 | 709 | 2,006 | 1,509 | 1,721 | 1,525 | |||||||||||||||||||||||||||
| BARRICK THIRD QUARTER 2023 | 68 | MANAGEMENT’S DISCUSSION AND ANALYSIS |
| OVERVIEW | OPERATING PERFORMANCE |
GROWTH PROJECTS & EXPLORATION |
REVIEW OF FINANCIAL RESULTS |
OTHER INFORMATION & NON-GAAP RECONCILIATIONS |
FINANCIAL STATEMENTS |
|||||
| ($ millions, except per ounce information in dollars) |
For the nine months ended 9/30/23 | |||||||||||||||
| Footnote | Pueblo Viejo | Veladero | Latin America & Asia Pacific |
|||||||||||||
| Cost of sales applicable to gold production |
556 | 199 | 755 | |||||||||||||
| Depreciation |
(189 | ) | (55 | ) | (244 | ) | ||||||||||
| By-product credits |
(26 | ) | (7 | ) | (33 | ) | ||||||||||
| Non-recurring items |
c | 0 | 0 | 0 | ||||||||||||
| Other |
d | 0 | 0 | 0 | ||||||||||||
| Non-controlling interests |
(138 | ) | 0 | (138 | ) | |||||||||||
| Total cash costs |
203 | 137 | 340 | |||||||||||||
| General & administrative costs |
0 | 0 | 0 | |||||||||||||
| Minesite exploration and evaluation costs |
e | 0 | 4 | 4 | ||||||||||||
| Minesite sustaining capital expenditures |
f | 144 | 68 | 212 | ||||||||||||
| Sustaining capital leases |
0 | 1 | 1 | |||||||||||||
| Rehabilitation - accretion and amortization (operating sites) |
g | 4 | 1 | 5 | ||||||||||||
| Non-controlling interests |
(59 | ) | 0 | (59 | ) | |||||||||||
| All-in sustaining costs |
292 | 211 | 503 | |||||||||||||
| Global exploration and evaluation and project expense |
e | 0 | 0 | 0 | ||||||||||||
| Project capital expenditures |
f | 182 | 9 | 191 | ||||||||||||
| Non-controlling interests |
(72 | ) | 0 | (72 | ) | |||||||||||
| All-in costs |
402 | 220 | 622 | |||||||||||||
| Ounces sold - attributable basis (000s ounces) |
246 | 136 | 382 | |||||||||||||
| Cost of sales per ounce |
h,i | 1,356 | 1,461 | 1,411 | ||||||||||||
| Total cash costs per ounce |
i | 824 | 1,007 | 887 | ||||||||||||
| Total cash costs per ounce (on a co-product basis) |
i,j | 892 | 1,057 | 949 | ||||||||||||
| All-in sustaining costs per ounce |
i | 1,185 | 1,555 | 1,333 | ||||||||||||
| All-in sustaining costs per ounce (on a co-product basis) |
i,j | 1,253 | 1,605 | 1,395 | ||||||||||||
| All-in costs per ounce |
i | 1,630 | 1,620 | 1,687 | ||||||||||||
| All-in costs per ounce (on a co-product basis) |
i,j | 1,698 | 1,670 | 1,749 | ||||||||||||
| ($ millions, except per ounce information in dollars) |
For the nine months ended 9/30/23 | |||||||||||||||||||||||||||
| Footnote | Loulo- Gounkoto |
Kibali | North Mara | Tongon | Bulyanhulu | Africa & Middle East |
||||||||||||||||||||||
| Cost of sales applicable to gold production |
612 | 314 | 262 | 233 | 213 | 1,634 | ||||||||||||||||||||||
| Depreciation |
(188 | ) | (110 | ) | (55 | ) | (32 | ) | (47 | ) | (432 | ) | ||||||||||||||||
| By-product credits |
0 | (2 | ) | (2 | ) | (1 | ) | (17 | ) | (22 | ) | |||||||||||||||||
| Non-recurring items |
c | 0 | 0 | 0 | 0 | 0 | 0 | |||||||||||||||||||||
| Other |
d | 0 | 0 | 0 | 0 | 0 | 0 | |||||||||||||||||||||
| Non-controlling interests |
(85 | ) | 0 | (33 | ) | (20 | ) | (24 | ) | (162 | ) | |||||||||||||||||
| Total cash costs |
339 | 202 | 172 | 180 | 125 | 1,018 | ||||||||||||||||||||||
| General & administrative costs |
0 | 0 | 0 | 0 | 0 | 0 | ||||||||||||||||||||||
| Minesite exploration and evaluation costs |
e | 0 | 0 | 0 | 0 | 0 | 0 | |||||||||||||||||||||
| Minesite sustaining capital expenditures |
f | 184 | 30 | 89 | 15 | 47 | 365 | |||||||||||||||||||||
| Sustaining capital leases |
1 | 5 | 0 | 1 | 0 | 7 | ||||||||||||||||||||||
| Rehabilitation - accretion and amortization (operating sites) |
g | 2 | 2 | 4 | 0 | 1 | 9 | |||||||||||||||||||||
| Non-controlling interests |
(37 | ) | 0 | (15 | ) | (2 | ) | (8 | ) | (62 | ) | |||||||||||||||||
| All-in sustaining costs |
489 | 239 | 250 | 194 | 165 | 1,337 | ||||||||||||||||||||||
| Global exploration and evaluation and project expense |
e | 0 | 0 | 0 | 0 | 0 | 0 | |||||||||||||||||||||
| Project capital expenditures |
f | 98 | 23 | 57 | 0 | 25 | 203 | |||||||||||||||||||||
| Non-controlling interests |
(20 | ) | 0 | (9 | ) | 0 | (4 | ) | (33 | ) | ||||||||||||||||||
| All-in costs |
567 | 262 | 298 | 194 | 186 | 1,507 | ||||||||||||||||||||||
| Ounces sold - attributable basis (000s ounces) |
419 | 251 | 193 | 143 | 139 | 1,145 | ||||||||||||||||||||||
| Cost of sales per ounce |
h,i | 1,168 | 1,250 | 1,138 | 1,462 | 1,282 | 1,232 | |||||||||||||||||||||
| Total cash costs per ounce |
i | 809 | 808 | 893 | 1,256 | 896 | 889 | |||||||||||||||||||||
| Total cash costs per ounce (on a co-product basis) |
i,j | 809 | 813 | 900 | 1,260 | 1,000 | 905 | |||||||||||||||||||||
| All-in sustaining costs per ounce |
i | 1,166 | 954 | 1,298 | 1,356 | 1,188 | 1,169 | |||||||||||||||||||||
| All-in sustaining costs per ounce (on a co-product basis) |
i,j | 1,166 | 959 | 1,305 | 1,360 | 1,292 | 1,185 | |||||||||||||||||||||
| All-in costs per ounce |
i | 1,353 | 1,046 | 1,547 | 1,356 | 1,342 | 1,318 | |||||||||||||||||||||
| All-in costs per ounce (on a co-product basis) |
i,j | 1,353 | 1,051 | 1,554 | 1,360 | 1,446 | 1,334 | |||||||||||||||||||||
| BARRICK THIRD QUARTER 2023 | 69 | MANAGEMENT’S DISCUSSION AND ANALYSIS |
| OVERVIEW | OPERATING PERFORMANCE |
GROWTH PROJECTS & EXPLORATION |
REVIEW OF FINANCIAL RESULTS |
OTHER INFORMATION & NON-GAAP RECONCILIATIONS |
FINANCIAL STATEMENTS |
|||||
| ($ millions, except per ounce information in dollars) |
For the nine months ended 9/30/22 | |||||||||||||||||||||||||||||||||||
| Footnote | Carlin | Corteza | Turquoise Ridge |
Long Canyon |
Phoenix | Nevada Gold Minesb |
Hemlo | North America |
||||||||||||||||||||||||||||
| Cost of sales applicable to gold production |
1,255 | 563 | 465 | 106 | 256 | 2,645 | 160 | 2,805 | ||||||||||||||||||||||||||||
| Depreciation |
(223) | (156) | (127) | (70) | (57) | (633) | (20) | (653) | ||||||||||||||||||||||||||||
| By-product credits |
(1) | (2) | (2) | 0 | (95) | (100) | 0 | (100) | ||||||||||||||||||||||||||||
| Non-recurring items |
c | 0 | 0 | 0 | 0 | 0 | 0 | 0 | 0 | |||||||||||||||||||||||||||
| Other |
d | (28) | 0 | 0 | 0 | 6 | (22) | 0 | (22) | |||||||||||||||||||||||||||
| Non-controlling interests |
(386) | (156) | (129) | (14) | (42) | (727) | 0 | (727) | ||||||||||||||||||||||||||||
| Total cash costs |
617 | 249 | 207 | 22 | 68 | 1,163 | 140 | 1,303 | ||||||||||||||||||||||||||||
| General & administrative costs |
0 | 0 | 0 | 0 | 0 | 0 | 0 | 0 | ||||||||||||||||||||||||||||
| Minesite exploration and evaluation costs |
e | 14 | 7 | 5 | 0 | 0 | 27 | 3 | 30 | |||||||||||||||||||||||||||
| Minesite sustaining capital expenditures |
f | 359 | 268 | 85 | 0 | 19 | 741 | 31 | 772 | |||||||||||||||||||||||||||
| Sustaining capital leases |
1 | 0 | 0 | 0 | 1 | 3 | 2 | 5 | ||||||||||||||||||||||||||||
| Rehabilitation - accretion and amortization (operating sites) |
g | 8 | 7 | 1 | 1 | 3 | 20 | 1 | 21 | |||||||||||||||||||||||||||
| Non-controlling interests |
(148) | (108) | (35) | 0 | (9) | (303) | 0 | (303) | ||||||||||||||||||||||||||||
| All-in sustaining costs |
851 | 423 | 263 | 23 | 82 | 1,651 | 177 | 1,828 | ||||||||||||||||||||||||||||
| Global exploration and evaluation and project expense |
e | 0 | 0 | 0 | 0 | 0 | 0 | 0 | 0 | |||||||||||||||||||||||||||
| Project capital expenditures |
f | 0 | 72 | 35 | 0 | 0 | 133 | 0 | 133 | |||||||||||||||||||||||||||
| Non-controlling interests |
0 | (28) | (13) | 0 | 0 | (51) | 0 | (51) | ||||||||||||||||||||||||||||
| All-in costs |
851 | 467 | 285 | 23 | 82 | 1,733 | 177 | 1,910 | ||||||||||||||||||||||||||||
| Ounces sold - attributable basis (000s ounces) |
702 | 312 | 204 | 52 | 75 | 1,345 | 94 | 1,439 | ||||||||||||||||||||||||||||
| Cost of sales per ounce |
h,i | 1,064 | 1,112 | 1,403 | 1,249 | 2,095 | 1,193 | 1,699 | 1,226 | |||||||||||||||||||||||||||
| Total cash costs per ounce |
i | 877 | 800 | 1,015 | 423 | 901 | 865 | 1,481 | 905 | |||||||||||||||||||||||||||
| Total cash costs per ounce (on a co-product basis) |
i,j | 878 | 804 | 1,020 | 424 | 1,632 | 908 | 1,487 | 946 | |||||||||||||||||||||||||||
| All-in sustaining costs per ounce |
i | 1,211 | 1,355 | 1,292 | 441 | 1,090 | 1,227 | 1,881 | 1,270 | |||||||||||||||||||||||||||
| All-in sustaining costs per ounce (on a co-product basis) |
i,j | 1,212 | 1,359 | 1,297 | 442 | 1,821 | 1,270 | 1,887 | 1,311 | |||||||||||||||||||||||||||
| All-in costs per ounce |
i | 1,211 | 1,498 | 1,398 | 441 | 1,090 | 1,288 | 1,882 | 1,327 | |||||||||||||||||||||||||||
| All-in costs per ounce (on a co-product basis) |
i,j | 1,212 | 1,502 | 1,403 | 442 | 1,821 | 1,331 | 1,888 | 1,368 | |||||||||||||||||||||||||||
| ($ millions, except per ounce information in dollars) |
For the nine months ended 9/30/22 | |||||||||||||||
| Footnote | Pueblo Viejo | Veladero | Latin America & Asia Pacific |
|||||||||||||
| Cost of sales applicable to gold production |
608 | 203 | 811 | |||||||||||||
| Depreciation |
(182 | ) | (73 | ) | (255 | ) | ||||||||||
| By-product credits |
(33 | ) | (3 | ) | (36 | ) | ||||||||||
| Non-recurring items |
c | 0 | 0 | 0 | ||||||||||||
| Other |
d | 0 | 0 | 0 | ||||||||||||
| Non-controlling interests |
(157 | ) | 0 | (157 | ) | |||||||||||
| Total cash costs |
236 | 127 | 363 | |||||||||||||
| General & administrative costs |
0 | 0 | 0 | |||||||||||||
| Minesite exploration and evaluation costs |
e | 0 | 1 | 1 | ||||||||||||
| Minesite sustaining capital expenditures |
f | 160 | 91 | 251 | ||||||||||||
| Sustaining capital leases |
0 | 3 | 3 | |||||||||||||
| Rehabilitation - accretion and amortization (operating sites) |
g | 5 | 2 | 7 | ||||||||||||
| Non-controlling interests |
(66 | ) | 0 | (66 | ) | |||||||||||
| All-in sustaining costs |
335 | 224 | 559 | |||||||||||||
| Global exploration and evaluation and project expense |
e | 1 | 0 | 1 | ||||||||||||
| Project capital expenditures |
f | 267 | 23 | 290 | ||||||||||||
| Non-controlling interests |
(107 | ) | 0 | (107 | ) | |||||||||||
| All-in costs |
496 | 247 | 743 | |||||||||||||
| Ounces sold - attributable basis (000s ounces) |
330 | 146 | 476 | |||||||||||||
| Cost of sales per ounce |
h,i | 1,108 | 1,381 | 1,210 | ||||||||||||
| Total cash costs per ounce |
i | 714 | 867 | 760 | ||||||||||||
| Total cash costs per ounce (on a co-product basis) |
i,j | 775 | 885 | 808 | ||||||||||||
| All-in sustaining costs per ounce |
i | 1,015 | 1,528 | 1,176 | ||||||||||||
| All-in sustaining costs per ounce (on a co-product basis) |
i,j | 1,076 | 1,546 | 1,224 | ||||||||||||
| All-in costs per ounce |
i | 1,500 | 1,682 | 1,577 | ||||||||||||
| All-in costs per ounce (on a co-product basis) |
i,j | 1,561 | 1,700 | 1,625 | ||||||||||||
| BARRICK THIRD QUARTER 2023 | 70 | MANAGEMENT’S DISCUSSION AND ANALYSIS |
| OVERVIEW | OPERATING PERFORMANCE |
GROWTH PROJECTS & EXPLORATION |
REVIEW OF FINANCIAL RESULTS |
OTHER INFORMATION & NON-GAAP RECONCILIATIONS |
FINANCIAL STATEMENTS |
|||||
| ($ millions, except per ounce information in dollars) |
For the nine months ended 9/30/22 | |||||||||||||||||||||||||
| Footnote | Loulo- Gounkoto |
Kibali | North Mara | Tongon | Bulyanhulu | Africa & Middle East |
||||||||||||||||||||
| Cost of sales applicable to gold production |
575 | 264 | 223 | 255 | 224 | 1,541 | ||||||||||||||||||||
| Depreciation |
(187) | (88) | (51) | (49) | (46) | (421) | ||||||||||||||||||||
| By-product credits |
0 | (1) | (1) | 0 | (18) | (20) | ||||||||||||||||||||
| Non-recurring items |
c | 0 | 0 | 0 | 0 | 0 | 0 | |||||||||||||||||||
| Other |
d | 0 | 0 | 0 | 0 | 0 | 0 | |||||||||||||||||||
| Non-controlling interests |
(78) | 0 | (28) | (21) | (26) | (153) | ||||||||||||||||||||
| Total cash costs |
310 | 175 | 143 | 185 | 134 | 947 | ||||||||||||||||||||
| General & administrative costs |
0 | 0 | 0 | 0 | 0 | 0 | ||||||||||||||||||||
| Minesite exploration and evaluation costs |
e | 6 | 2 | 3 | 3 | 0 | 14 | |||||||||||||||||||
| Minesite sustaining capital expenditures |
f | 145 | 42 | 38 | 11 | 40 | 276 | |||||||||||||||||||
| Sustaining capital leases |
1 | 4 | 0 | 2 | 0 | 7 | ||||||||||||||||||||
| Rehabilitation - accretion and amortization (operating sites) |
g | 3 | 0 | 4 | 1 | 1 | 9 | |||||||||||||||||||
| Non-controlling interests |
(31) | 0 | (7) | (2) | (7) | (47) | ||||||||||||||||||||
| All-in sustaining costs |
434 | 223 | 181 | 200 | 168 | 1,206 | ||||||||||||||||||||
| Global exploration and evaluation and project expense |
e | 0 | 0 | 0 | 0 | 0 | 0 | |||||||||||||||||||
| Project capital expenditures |
f | 83 | 15 | 56 | 1 | 22 | 177 | |||||||||||||||||||
| Non-controlling interests |
(17) | 0 | (9) | 0 | (3) | (29) | ||||||||||||||||||||
| All-in costs |
500 | 238 | 228 | 201 | 187 | 1,354 | ||||||||||||||||||||
| Ounces sold - attributable basis (000s ounces) |
407 | 238 | 195 | 119 | 156 | 1,115 | ||||||||||||||||||||
| Cost of sales per ounce |
h,i | 1,132 | 1,113 | 960 | 1,932 | 1,203 | 1,193 | |||||||||||||||||||
| Total cash costs per ounce |
i | 763 | 737 | 735 | 1,560 | 860 | 851 | |||||||||||||||||||
| Total cash costs per ounce (on a co-product basis) |
i,j | 763 | 741 | 740 | 1,563 | 958 | 867 | |||||||||||||||||||
| All-in sustaining costs per ounce |
i | 1,067 | 936 | 930 | 1,686 | 1,080 | 1,083 | |||||||||||||||||||
| All-in sustaining costs per ounce (on a co-product basis) |
i,j | 1,067 | 940 | 935 | 1,689 | 1,178 | 1,099 | |||||||||||||||||||
| All-in costs per ounce |
i | 1,230 | 1,000 | 1,173 | 1,691 | 1,199 | 1,216 | |||||||||||||||||||
| All-in costs per ounce (on a co-product basis) |
i,j | 1,230 | 1,004 | 1,178 | 1,694 | 1,297 | 1,232 | |||||||||||||||||||
| a. |
Includes Goldrush. |
|
| b. |
These results represent our 61.5% interest in Carlin, Cortez, Turquoise Ridge, Phoenix and Long Canyon. |
|
| c. |
Non-recurring items |
|
| These costs are not indicative of our cost of production and have been excluded from the calculation of total cash costs. |
||
| d. |
Other |
|
| Other adjustments at Carlin include the removal of total cash costs and by-product credits associated with Emigrant starting the second quarter of 2022, which is producing incidental ounces. |
||
| e. |
Exploration and evaluation costs |
|
| Exploration, evaluation and project expenses are presented as minesite sustaining if it supports current mine operations and project if it relates to future projects. Refer to page 51 of this MD&A. |
||
| f. |
Capital expenditures |
|
| Capital expenditures are related to our gold sites only and are split between minesite sustaining and project capital expenditures. Project capital expenditures are capital spending at new projects and major, discrete projects at existing operations intended to increase net present value through higher production or longer mine life. Significant projects in the current year are the plant expansion project at Pueblo Viejo and the solar projects at NGM and Loulo-Gounkoto. Refer to page 50 of this MD&A. |
||
| g. |
Rehabilitation - accretion and amortization |
|
| Includes depreciation on the assets related to rehabilitation provisions of our gold operations and accretion on the rehabilitation provision of our gold operations, split between operating and non-operating sites. |
||
| h. |
Cost of sales per ounce |
|
| Gold cost of sales per ounce is calculated as cost of sales across our gold operations (excluding sites in closure or care and maintenance) divided by ounces sold (both on an attributable basis using Barrick’s ownership share). |
||
| i. |
Per ounce figures |
|
| Cost of sales per ounce, total cash costs per ounce, all-in sustaining costs per ounce and all-in costs per ounce may not calculate based on amounts presented in this table due to rounding. |
||
| j. |
Co-product costs per ounce |
|
| Total cash costs per ounce, all-in sustaining costs per ounce and all-in costs per ounce presented on a co-product basis removes the impact of by-product credits of our gold production (net of non-controlling interest) calculated as: |
||
| BARRICK THIRD QUARTER 2023 | 71 | MANAGEMENT’S DISCUSSION AND ANALYSIS |
| OVERVIEW | OPERATING PERFORMANCE |
GROWTH PROJECTS & EXPLORATION |
REVIEW OF FINANCIAL RESULTS |
OTHER INFORMATION & NON-GAAP RECONCILIATIONS |
FINANCIAL STATEMENTS |
|||||
| ($ millions) |
For the three months ended 9/30/23 | |||||||||||||||||||||||||||
| Carlin | Corteza | Turquoise Ridge |
Long Canyon |
Phoenix |
Nevada Gold Minesb |
Hemlo | ||||||||||||||||||||||
| By-product credits |
1 | 0 | 1 | 0 | 41 | 43 | 1 | |||||||||||||||||||||
| Non-controlling interest |
(1 | ) | 0 | 0 | 0 | (16 | ) | (17 | ) | 0 | ||||||||||||||||||
| By-product credits (net of non-controlling interest) |
0 | 0 | 1 | 0 | 25 | 26 | 1 | |||||||||||||||||||||
| ($ millions) |
For the three months ended 9/30/23 | |||||||||||||||||||||||||||
| Pueblo Viejo | Veladero | Loulo- Gounkoto |
Kibali | North Mara | Tongon | Bulyanhulu | ||||||||||||||||||||||
| By-product credits |
8 | 3 | 0 | 1 | 1 | 1 | 6 | |||||||||||||||||||||
| Non-controlling interest |
(4 | ) | 0 | 0 | 0 | 0 | 0 | (1 | ) | |||||||||||||||||||
| By-product credits (net of non-controlling interest) |
4 | 3 | 0 | 1 | 1 | 1 | 5 | |||||||||||||||||||||
| ($ millions) |
For the three months ended 6/30/23 | |||||||||||||||||||||||||||
| Carlin | Corteza | Turquoise Ridge |
Long Canyon |
Phoenix | Nevada Gold Minesb |
Hemlo | ||||||||||||||||||||||
| By-product credits |
0 | 1 | 1 | 0 | 40 | 42 | 0 | |||||||||||||||||||||
| Non-controlling interest |
0 | (1 | ) | (1 | ) | 0 | (16 | ) | (18 | ) | 0 | |||||||||||||||||
| By-product credits (net of non-controlling interest) |
0 | 0 | 0 | 0 | 24 | 24 | 0 | |||||||||||||||||||||
| ($ millions) |
For the three months ended 6/30/23 | |||||||||||||||||||||||||||
| Pueblo Viejo | Veladero | Loulo- Gounkoto |
Kibali | North Mara | Tongon | Bulyanhulu | ||||||||||||||||||||||
| By-product credits |
6 | 2 | 0 | 1 | 0 | 0 | 6 | |||||||||||||||||||||
| Non-controlling interest |
(2 | ) | 0 | 0 | 0 | 0 | 0 | (1 | ) | |||||||||||||||||||
| By-product credits (net of non-controlling interest) |
4 | 2 | 0 | 1 | 0 | 0 | 5 | |||||||||||||||||||||
| ($ millions) |
For the three months ended 9/30/22 | |||||||||||||||||||||||||||
| Carlin | Corteza | Turquoise Ridge |
Long Canyon |
Phoenix | Nevada Gold Minesb |
Hemlo | ||||||||||||||||||||||
| By-product credits |
1 | 0 | 1 | 0 | 31 | 33 | 0 | |||||||||||||||||||||
| Non-controlling interest |
(1 | ) | 0 | (1 | ) | 0 | (12 | ) | (14 | ) | 0 | |||||||||||||||||
| By-product credits (net of non-controlling interest) |
0 | 0 | 0 | 0 | 19 | 19 | 0 | |||||||||||||||||||||
| ($ millions) |
For the three months ended 9/30/22 | |||||||||||||||||||||||||||
| Pueblo Viejo | Veladero | Loulo- Gounkoto |
Kibali | North Mara | Tongon | Bulyanhulu | ||||||||||||||||||||||
| By-product credits |
10 | 1 | 0 | 0 | 0 | 0 | 5 | |||||||||||||||||||||
| Non-controlling interest |
(4 | ) | 0 | 0 | 0 | 0 | 0 | (1 | ) | |||||||||||||||||||
| By-product credits (net of non-controlling interest) |
6 | 1 | 0 | 0 | 0 | 0 | 4 | |||||||||||||||||||||
| ($ millions) |
For the nine months ended 9/30/23 | |||||||||||||||||||||||||||
| Carlin | Corteza | Turquoise Ridge |
Long Canyon |
Phoenix |
Nevada Gold Minesb |
Hemlo | ||||||||||||||||||||||
| By-product credits |
2 | 2 | 3 | 0 | 119 | 126 | 1 | |||||||||||||||||||||
| Non-controlling interest |
(1 | ) | (1 | ) | (1 | ) | 0 | (46 | ) | (49 | ) | 0 | ||||||||||||||||
| By-product credits (net of non-controlling interest) |
1 | 1 | 2 | 0 | 73 | 77 | 1 | |||||||||||||||||||||
| ($ millions) |
For the nine months ended 9/30/23 | |||||||||||||||||||||||||||
| Pueblo Viejo | Veladero | Loulo- Gounkoto |
Kibali | North Mara | Tongon | Bulyanhulu | ||||||||||||||||||||||
| By-product credits |
26 | 7 | 0 | 2 | 2 | 1 | 17 | |||||||||||||||||||||
| Non-controlling interest |
(10 | ) | 0 | 0 | 0 | 0 | 0 | (3 | ) | |||||||||||||||||||
| By-product credits (net of non-controlling interest) |
16 | 7 | 0 | 2 | 2 | 1 | 14 | |||||||||||||||||||||
| ($ millions) |
For the nine months ended 9/30/22 | |||||||||||||||||||||||||||
| Carlin | Corteza | Turquoise Ridge |
Long Canyon |
Phoenix | Nevada Gold Minesb |
Hemlo | ||||||||||||||||||||||
| By-product credits |
1 | 2 | 2 | 0 | 95 | 100 | 0 | |||||||||||||||||||||
| Non-controlling interest |
(1 | ) | (1 | ) | (1 | ) | 0 | (37 | ) | (40 | ) | 0 | ||||||||||||||||
| By-product credits (net of non-controlling interest) |
0 | 1 | 1 | 0 | 58 | 60 | 0 | |||||||||||||||||||||
| BARRICK THIRD QUARTER 2023 | 72 | MANAGEMENT’S DISCUSSION AND ANALYSIS |
| OVERVIEW | OPERATING PERFORMANCE |
GROWTH PROJECTS & EXPLORATION |
REVIEW OF FINANCIAL RESULTS |
OTHER INFORMATION & NON-GAAP RECONCILIATIONS |
FINANCIAL STATEMENTS |
|||||
| ($ millions) |
For the nine months ended 9/30/22 | |||||||||||||||||||||||||||
| Pueblo Viejo | Veladero | Loulo- Gounkoto |
Kibali | North Mara | Tongon | Bulyanhulu | ||||||||||||||||||||||
| By-product credits |
33 | 3 | 0 | 1 | 1 | 0 | 18 | |||||||||||||||||||||
| Non-controlling interest |
(13 | ) | 0 | 0 | 0 | 0 | 0 | (3 | ) | |||||||||||||||||||
| By-product credits (net of non-controlling interest) |
20 | 3 | 0 | 1 | 1 | 0 | 15 | |||||||||||||||||||||
Reconciliation of Copper Cost of Sales to C1 cash costs and All-in sustaining costs, including on a per pound basis
| ($ millions, except per pound information in dollars) |
For the three months ended | For the nine months ended | ||||||||||||||||||
| 9/30/23 | 6/30/23 | 9/30/22 | 9/30/23 | 9/30/22 | ||||||||||||||||
| Cost of sales |
167 | 176 | 172 | 517 | 469 | |||||||||||||||
| Depreciation/amortization |
(70 | ) | (59 | ) | (59 | ) | (173 | ) | (131 | ) | ||||||||||
| Treatment and refinement charges |
47 | 50 | 54 | 140 | 152 | |||||||||||||||
| Cash cost of sales applicable to equity method investments |
82 | 84 | 81 | 253 | 227 | |||||||||||||||
| Less: royalties |
(15 | ) | (16 | ) | (23 | ) | (46 | ) | (87 | ) | ||||||||||
| By-product credits |
(4 | ) | (6 | ) | (2 | ) | (14 | ) | (11 | ) | ||||||||||
| Other |
0 | 0 | 0 | 0 | 0 | |||||||||||||||
| C1 cash costs |
207 | 229 | 223 | 677 | 619 | |||||||||||||||
| General & administrative costs |
6 | 4 | 4 | 16 | 22 | |||||||||||||||
| Rehabilitation - accretion and amortization |
3 | 2 | 0 | 7 | 2 | |||||||||||||||
| Royalties |
15 | 16 | 23 | 46 | 87 | |||||||||||||||
| Minesite exploration and evaluation costs |
3 | 2 | 8 | 7 | 16 | |||||||||||||||
| Minesite sustaining capital expenditures |
91 | 58 | 115 | 182 | 271 | |||||||||||||||
| Sustaining leases |
2 | 4 | 1 | 9 | 4 | |||||||||||||||
| All-in sustaining costs |
327 | 315 | 374 | 944 | 1,021 | |||||||||||||||
| Pounds sold - attributable basis (millions pounds) |
101 | 101 | 120 | 291 | 346 | |||||||||||||||
| Cost of sales per pounda,b |
2.68 | 2.84 | 2.30 | 2.90 | 2.21 | |||||||||||||||
| C1 cash costs per pounda |
2.05 | 2.28 | 1.86 | 2.33 | 1.79 | |||||||||||||||
| All-in sustaining costs per pounda |
3.23 | 3.13 | 3.13 | 3.25 | 2.96 | |||||||||||||||
| a. | Cost of sales per pound, C1 cash costs per pound and all-in sustaining costs per pound may not calculate based on amounts presented in this table due to rounding. |
| b. | Copper cost of sales per pound is calculated as cost of sales across our copper operations divided by pounds sold (both on an attributable basis using Barrick’s ownership share). |
Reconciliation of Copper Cost of Sales to C1 cash costs and All-in sustaining costs, including on a per pound basis, by operating segment
| ($ millions, except per pound information in dollars) |
For the three months ended | |||||||||||||||||||||||||||||||||||
| 9/30/23 | 6/30/23 | 9/30/22 | ||||||||||||||||||||||||||||||||||
| Zaldívar | Lumwana | Jabal Sayid |
Zaldívar | Lumwana | Jabal Sayid |
Zaldívar | Lumwana | Jabal Sayid |
||||||||||||||||||||||||||||
| Cost of sales |
83 | 167 | 22 | 83 | 176 | 25 | 76 | 172 | 28 | |||||||||||||||||||||||||||
| Depreciation/amortization |
(18 | ) | (70 | ) | (5 | ) | (19 | ) | (59 | ) | (5 | ) | (18 | ) | (59 | ) | (5 | ) | ||||||||||||||||||
| Treatment and refinement charges |
0 | 42 | 5 | 0 | 44 | 6 | 0 | 50 | 4 | |||||||||||||||||||||||||||
| Less: royalties |
0 | (15 | ) | 0 | 0 | (16 | ) | 0 | 0 | (23 | ) | 0 | ||||||||||||||||||||||||
| By-product credits |
(1 | ) | 0 | (3 | ) | 0 | 0 | (6 | ) | 0 | 0 | (2 | ) | |||||||||||||||||||||||
| Other |
0 | 0 | 0 | 0 | 0 | 0 | 0 | 0 | 0 | |||||||||||||||||||||||||||
| C1 cash costs |
64 | 124 | 19 | 64 | 145 | 20 | 58 | 140 | 25 | |||||||||||||||||||||||||||
| Rehabilitation - accretion and amortization |
0 | 3 | 0 | 0 | 2 | 0 | 0 | 0 | 0 | |||||||||||||||||||||||||||
| Royalties |
0 | 15 | 0 | 0 | 16 | 0 | 0 | 23 | 0 | |||||||||||||||||||||||||||
| Minesite exploration and evaluation costs |
3 | 0 | 0 | 2 | 0 | 0 | 3 | 5 | 0 | |||||||||||||||||||||||||||
| Minesite sustaining capital expenditures |
4 | 85 | 2 | 12 | 44 | 2 | 8 | 106 | 1 | |||||||||||||||||||||||||||
| Sustaining leases |
1 | 1 | 0 | 3 | 0 | 1 | 1 | 0 | 0 | |||||||||||||||||||||||||||
| All-in sustaining costs |
72 | 228 | 21 | 81 | 207 | 23 | 70 | 274 | 26 | |||||||||||||||||||||||||||
| Pounds sold - attributable basis (millions pounds) |
21 | 67 | 13 | 22 | 63 | 16 | 24 | 79 | 17 | |||||||||||||||||||||||||||
| Cost of sales per pounda,b |
3.86 | 2.48 | 1.72 | 3.89 | 2.80 | 1.61 | 3.20 | 2.19 | 1.58 | |||||||||||||||||||||||||||
| C1 cash costs per pounda |
2.99 | 1.86 | 1.45 | 3.02 | 2.30 | 1.26 | 2.45 | 1.78 | 1.41 | |||||||||||||||||||||||||||
| All-in sustaining costs per pounda |
3.39 | 3.41 | 1.64 | 3.73 | 3.29 | 1.42 | 2.94 | 3.50 | 1.52 | |||||||||||||||||||||||||||
| BARRICK THIRD QUARTER 2023 | 73 | MANAGEMENT’S DISCUSSION AND ANALYSIS |
| OVERVIEW | OPERATING PERFORMANCE |
GROWTH PROJECTS & EXPLORATION |
REVIEW OF FINANCIAL RESULTS |
OTHER INFORMATION & NON-GAAP RECONCILIATIONS |
FINANCIAL STATEMENTS |
|||||
| ($ millions, except per pound information in dollars) |
For the nine months ended | |||||||||||||||||||||||
| 9/30/23 | 9/30/22 | |||||||||||||||||||||||
| Zaldívar | Lumwana | Jabal Sayid | Zaldívar | Lumwana | Jabal Sayid | |||||||||||||||||||
| Cost of sales |
253 | 517 | 73 | 219 | 469 | 76 | ||||||||||||||||||
| Depreciation/amortization |
(57 | ) | (173 | ) | (16 | ) | (53 | ) | (131 | ) | (15 | ) | ||||||||||||
| Treatment and refinement charges |
0 | 122 | 18 | 0 | 139 | 13 | ||||||||||||||||||
| Less: royalties |
0 | (46 | ) | 0 | 0 | (87 | ) | 0 | ||||||||||||||||
| By-product credits |
(1 | ) | 0 | (13 | ) | 0 | 0 | (11 | ) | |||||||||||||||
| Other |
0 | 0 | 0 | 0 | 0 | 0 | ||||||||||||||||||
| C1 cash costs |
195 | 420 | 62 | 166 | 390 | 63 | ||||||||||||||||||
| Rehabilitation - accretion and amortization |
0 | 7 | 0 | 0 | 2 | 0 | ||||||||||||||||||
| Royalties |
0 | 46 | 0 | 0 | 87 | 0 | ||||||||||||||||||
| Minesite exploration and evaluation costs |
7 | 0 | 0 | 9 | 7 | 0 | ||||||||||||||||||
| Minesite sustaining capital expenditures |
21 | 155 | 6 | 25 | 242 | 4 | ||||||||||||||||||
| Sustaining leases |
4 | 2 | 3 | 2 | 2 | 0 | ||||||||||||||||||
| All-in sustaining costs |
227 | 630 | 71 | 202 | 730 | 67 | ||||||||||||||||||
| Pounds sold - attributable basis (millions pounds) |
66 | 179 | 46 | 74 | 220 | 52 | ||||||||||||||||||
| Cost of sales per pounda,b |
3.82 | 2.89 | 1.61 | 2.98 | 2.13 | 1.45 | ||||||||||||||||||
| C1 cash cost per pounda |
2.95 | 2.35 | 1.36 | 2.25 | 1.77 | 1.20 | ||||||||||||||||||
| All-in sustaining costs per pounda |
3.44 | 3.52 | 1.55 | 2.74 | 3.32 | 1.29 | ||||||||||||||||||
| a. | Cost of sales per pound, C1 cash costs per pound and all-in sustaining costs per pound may not calculate based on amounts presented in this table due to rounding. |
| b. | Copper cost of sales per pound is calculated as cost of sales across our copper operations divided by pounds sold (both on an attributable basis using Barrick’s ownership share). |
EBITDA, Adjusted EBITDA and Attributable EBITDA
EBITDA is a non-GAAP financial measure, which excludes the following from net earnings:
| ∎ | Income tax expense; |
| ∎ | Finance costs; |
| ∎ | Finance income; and |
| ∎ | Depreciation. |
Management believes that EBITDA is a valuable indicator of our ability to generate liquidity by producing operating cash flow to fund working capital needs, service debt obligations, and fund capital expenditures. Management uses EBITDA for this purpose. EBITDA is also frequently used by investors and analysts for valuation purposes whereby EBITDA is multiplied by a factor or “EBITDA multiple” that is based on an observed or inferred relationship between EBITDA and market values to determine the approximate total enterprise value of a company.
Adjusted EBITDA removes the effect of impairment charges; acquisition/disposition gains/losses; foreign currency translation gains/losses; and other expense adjustments. We also remove the impact of income tax expense, finance costs, finance income and depreciation incurred in our equity method accounted investments. We believe these items provide a greater level of consistency with the adjusting items included in our adjusted net earnings reconciliation, with the exception that these amounts are adjusted to remove any impact on finance costs/income, income tax expense and/or depreciation as they do not affect EBITDA. We believe this additional information will assist analysts, investors and
other stakeholders of Barrick in better understanding our ability to generate liquidity from our full business, including equity method investments, by excluding these amounts from the calculation as they are not indicative of the performance of our core mining business and do not necessarily reflect the underlying operating results for the periods presented.
Starting with this MD&A, we are presenting attributable EBITDA, which removes the non-controlling interest portion from our adjusted EBITDA measure. Prior periods have been presented to allow for comparability. We believe this additional information will assist analysts, investors and other stakeholders of Barrick in better understanding our ability to generate liquidity from our attributable business and which is aligned with how we present our forward looking guidance on gold ounces and copper pounds produced.
EBITDA, adjusted EBITDA and attributable EBITDA are intended to provide additional information to investors and analysts and do not have any standardized definition under IFRS, and should not be considered in isolation or as a substitute for measures of performance prepared in accordance with IFRS. EBITDA, adjusted EBITDA and attributable EBITDA exclude the impact of cash costs of financing activities and taxes, and the effects of changes in operating working capital balances, and therefore are not necessarily indicative of operating profit or cash flow from operations as determined under IFRS. Other companies may calculate EBITDA, adjusted EBITDA and attributable EBITDA differently.
| BARRICK THIRD QUARTER 2023 | 74 | MANAGEMENT’S DISCUSSION AND ANALYSIS |
| OVERVIEW | OPERATING PERFORMANCE |
GROWTH PROJECTS & EXPLORATION |
REVIEW OF FINANCIAL RESULTS |
OTHER INFORMATION & NON-GAAP RECONCILIATIONS |
FINANCIAL STATEMENTS |
|||||
Reconciliation of Net Earnings to EBITDA, Adjusted EBITDA and Attributable EBITDA
| ($ millions) |
For the three months ended | For the nine months ended | ||||||||||||||||||
| 9/30/23 | 6/30/23 | 9/30/22 | 9/30/23 | 9/30/22 | ||||||||||||||||
| Net earnings |
585 | 502 | 410 | 1,356 | 1,833 | |||||||||||||||
| Income tax expense |
218 | 264 | 215 | 687 | 795 | |||||||||||||||
| Finance costs, neta |
30 | 23 | 55 | 90 | 204 | |||||||||||||||
| Depreciation |
504 | 480 | 457 | 1,479 | 1,393 | |||||||||||||||
| EBITDA |
1,337 | 1,269 | 1,137 | 3,612 | 4,225 | |||||||||||||||
| Impairment charges (reversals) of non-current assetsb |
0 | 22 | 24 | 23 | 29 | |||||||||||||||
| Acquisition/disposition gainsc |
(4 | ) | (3 | ) | (64 | ) | (10 | ) | (86 | ) | ||||||||||
| Loss (gain) on currency translation |
30 | (12 | ) | 3 | 56 | 12 | ||||||||||||||
| Other (income) expense adjustmentsd |
(5 | ) | (3 | ) | (27 | ) | 55 | (109 | ) | |||||||||||
| Income tax expense, net finance costsa, and depreciation from equity investees |
106 | 95 | 82 | 279 | 256 | |||||||||||||||
| Adjusted EBITDA |
1,464 | 1,368 | 1,155 | 4,015 | 4,327 | |||||||||||||||
| Non-controlling Interests |
(393 | ) | (380 | ) | (327 | ) | (1,096 | ) | (1,196 | ) | ||||||||||
| Attributable EBITDA |
1,071 | 988 | 828 | 2,919 | 3,131 | |||||||||||||||
| Revenues - as adjustede |
2,363 | 2,346 | 2,106 | 6,897 | 6,852 | |||||||||||||||
| Attributable EBITDA marginf |
45 | % | 42 | % | 39 | % | 42 | % | 46 | % | ||||||||||
| a. | Finance costs exclude accretion. |
| b. | For the three month period ended June 30, 2023, net impairment charges were mainly related to miscellaneous assets. For the three and nine month periods ended September 30, 2022, net impairment charges mainly relate to an inventory write-off at Lumwana. |
| c. | For the three and nine month periods ended September 30, 2022, acquisition/disposition gains mainly related to the sale of a portfolio of royalties to Maverix Metals Inc. and the sale of a portfolio of royalties by Nevada Gold Mines to Gold Royalty Corp. |
| d. | For the nine month period ended September 30, 2023, other (income) expense adjustments mainly relate to the $30 million commitment we made towards the expansion of education infrastructure in Tanzania, per our community investment obligations under the Twiga partnership. Other (income) expense adjustments for all periods were also impacted by changes in the discount rate assumptions on our closed mine rehabilitation provision and care and maintenance expenses at Porgera. |
| e. | Refer to Reconciliation of Sales to Realized Price per ounce/pound on page 76 of this MD&A. |
| f. | Represents attributable EBITDA divided by revenues - as adjusted. |
Reconciliation of Income to EBITDA by operating site
| ($ millions) |
For the three months ended 9/30/23 | |||||||||||||||||||||||||||||||||||||||
| Carlin (61.5%) |
Corteza (61.5%) |
Turquoise Ridge (61.5%) |
Nevada Gold Minesb (61.5%) |
Pueblo Viejo (60%) |
Loulo- Gounkoto (80%) |
Kibali (45%) |
North Mara (84%) |
Bulyanhulu (84%) |
Lumwana (100%) |
|||||||||||||||||||||||||||||||
| Income |
174 | 87 | 49 | 314 | 31 | 111 | 72 | 37 | 33 | 32 | ||||||||||||||||||||||||||||||
| Depreciation |
51 | 54 | 28 | 146 | 39 | 45 | 44 | 14 | 13 | 69 | ||||||||||||||||||||||||||||||
| EBITDA |
225 | 141 | 77 | 460 | 70 | 156 | 116 | 51 | 46 | 101 | ||||||||||||||||||||||||||||||
| For the three months ended 6/30/23 | ||||||||||||||||||||||||||||||||||||||||
| Carlin (61.5%) |
Corteza (61.5%) |
Turquoise Ridge (61.5%) |
Nevada Gold Minesb (61.5%) |
Pueblo Viejo (60%) |
Loulo- Gounkoto (80%) |
Kibali (45%) |
North Mara (84%) |
Bulyanhulu (84%) |
Lumwana (100%) |
|||||||||||||||||||||||||||||||
| Income |
169 | 66 | 35 | 287 | 46 | 110 | 60 | 43 | 41 | 0 | ||||||||||||||||||||||||||||||
| Depreciation |
56 | 41 | 26 | 138 | 36 | 49 | 41 | 16 | 13 | 59 | ||||||||||||||||||||||||||||||
| EBITDA |
225 | 107 | 61 | 425 | 82 | 159 | 101 | 59 | 54 | 59 | ||||||||||||||||||||||||||||||
| For the three months ended 9/30/22 | ||||||||||||||||||||||||||||||||||||||||
| Carlin (61.5%) |
Corteza (61.5%) |
Turquoise Ridge (61.5%) |
Nevada Gold Minesb (61.5%) |
Pueblo Viejo (60%) |
Loulo- Gounkoto (80%) |
Kibali (45%) |
North Mara (84%) |
Bulyanhulu (84%) |
Lumwana (100%) |
|||||||||||||||||||||||||||||||
| Income |
123 | 62 | 11 | 215 | 70 | 60 | 45 | 39 | 27 | 21 | ||||||||||||||||||||||||||||||
| Depreciation |
45 | 28 | 25 | 117 | 39 | 48 | 27 | 15 | 12 | 60 | ||||||||||||||||||||||||||||||
| EBITDA |
168 | 90 | 36 | 332 | 109 | 108 | 72 | 54 | 39 | 81 | ||||||||||||||||||||||||||||||
| ($ millions) |
For the nine months ended 9/30/2023 | |||||||||||||||||||||||||||||||||||||||
| Carlin (61.5%) |
Corteza (61.5%) |
Turquoise Ridge (61.5%) |
Nevada Gold Minesb (61.5%) |
Pueblo Viejo (60%) |
Loulo- Gounkoto (80%) |
Kibali (45%) |
North Mara (84%) |
Bulyanhulu (84%) |
Lumwana (100%) |
|||||||||||||||||||||||||||||||
| Income |
409 | 231 | 124 | 790 | 138 | 306 | 165 | 127 | 91 | 20 | ||||||||||||||||||||||||||||||
| Depreciation |
146 | 151 | 85 | 424 | 114 | 150 | 110 | 46 | 39 | 172 | ||||||||||||||||||||||||||||||
| EBITDA |
555 | 382 | 209 | 1,214 | 252 | 456 | 275 | 173 | 130 | 192 | ||||||||||||||||||||||||||||||
| BARRICK THIRD QUARTER 2023 | 75 | MANAGEMENT’S DISCUSSION AND ANALYSIS |
| OVERVIEW | OPERATING PERFORMANCE |
GROWTH PROJECTS & EXPLORATION |
REVIEW OF FINANCIAL RESULTS |
OTHER INFORMATION & NON-GAAP RECONCILIATIONS |
FINANCIAL STATEMENTS |
|||||
| ($ millions) |
For the nine months ended 9/30/2022 | |||||||||||||||||||||||||||||||||||||||
| Carlin (61.5%) |
Corteza (61.5%) |
Turquoise Ridge (61.5%) |
Nevada Gold Minesb (61.5%) |
Pueblo Viejo (60%) |
Loulo- Gounkoto (80%) |
Kibali (45%) |
North Mara (84%) |
Bulyanhulu (84%) |
Lumwana (100%) |
|||||||||||||||||||||||||||||||
| Income |
514 | 214 | 81 | 880 | 218 | 272 | 135 | 152 | 105 | 216 | ||||||||||||||||||||||||||||||
| Depreciation |
137 | 96 | 78 | 389 | 110 | 150 | 88 | 43 | 38 | 131 | ||||||||||||||||||||||||||||||
| EBITDA |
651 | 310 | 159 | 1,269 | 328 | 422 | 223 | 195 | 143 | 347 | ||||||||||||||||||||||||||||||
| a. | Includes Goldrush. |
| b. | These results represent our 61.5% interest in Carlin, Cortez, Turquoise Ridge, Phoenix and Long Canyon. |
Realized Price
Realized price is a non-GAAP financial measure which excludes from sales:
| ∎ | Treatment and refining charges; and |
| ∎ | Cumulative catch-up adjustment to revenue relating to our streaming arrangements. |
We believe this provides investors and analysts with a more accurate measure with which to compare to market gold and copper prices and to assess our gold and copper sales performance. For those reasons, management believes that this measure provides a more accurate reflection of our Company’s past performance and is a better indicator of its expected performance in future periods.
The realized price measure is intended to provide additional information, and does not have any standardized definition under IFRS and should not be considered in isolation or as a substitute for measures of performance prepared in accordance with IFRS. The measure is not necessarily indicative of sales as determined under IFRS. Other companies may calculate this measure differently. The following table reconciles realized prices to the most directly comparable IFRS measure.
Reconciliation of Sales to Realized Price per ounce/pound
| ($ millions, except per ounce/pound information |
Gold | Copper | Gold | Copper | ||||||||||||||||||||||||||||||||||||
| in dollars) |
For the three months ended | For the nine months ended | ||||||||||||||||||||||||||||||||||||||
| 9/30/23 | 6/30/23 | 9/30/22 | 9/30/23 | 6/30/23 | 9/30/22 | 9/30/23 | 9/30/22 | 9/30/23 | 9/30/22 | |||||||||||||||||||||||||||||||
| Sales |
2,588 | 2,584 | 2,277 | 209 | 189 | 200 | 7,583 | 7,385 | 569 | 698 | ||||||||||||||||||||||||||||||
| Sales applicable to non-controlling interests |
(797 | ) | (787 | ) | (700 | ) | 0 | 0 | 0 | (2,307 | ) | (2,266 | ) | 0 | 0 | |||||||||||||||||||||||||
| Sales applicable to equity method investmentsa,b |
187 | 171 | 152 | 126 | 133 | 134 | 484 | 433 | 419 | 486 | ||||||||||||||||||||||||||||||
| Sales applicable to sites in closure or care and maintenancec |
(4 | ) | (2 | ) | (14 | ) | 0 | 0 | 0 | (13 | ) | (44 | ) | 0 | 0 | |||||||||||||||||||||||||
| Treatment and refinement charges |
7 | 8 | 3 | 47 | 50 | 54 | 22 | 8 | 140 | 152 | ||||||||||||||||||||||||||||||
| Revenues – as adjusted |
1,981 | 1,974 | 1,718 | 382 | 372 | 388 | 5,769 | 5,516 | 1,128 | 1,336 | ||||||||||||||||||||||||||||||
| Ounces/pounds sold (000s ounces/millions pounds)c |
1,027 | 1,001 | 997 | 101 | 101 | 120 | 2,982 | 3,030 | 291 | 346 | ||||||||||||||||||||||||||||||
| Realized gold/copper price per ounce/poundd |
1,928 | 1,972 | 1,722 | 3.78 | 3.70 | 3.24 | 1,934 | 1,820 | 3.88 | 3.86 | ||||||||||||||||||||||||||||||
| a. | Represents sales of $187 million and $484 million, respectively, for the three and nine month periods ended September 30, 2023 (June 30, 2023: $171 million and September 30, 2022: $152 million and $433 million, respectively) applicable to our 45% equity method investment in Kibali for gold. Represents sales of $82 million and $261 million, respectively, for the three and nine month periods ended September 30, 2023 (June 30, 2023: $81 million and September 30, 2022: $82 million and $299 million, respectively) applicable to our 50% equity method investment in Zaldívar and $49 million and $176 million, respectively (June 30, 2023: $58 million and September 30, 2022: $57 million and $201 million, respectively), applicable to our 50% equity method investment in Jabal Sayid for copper. |
| b. | Sales applicable to equity method investments are net of treatment and refinement charges. |
| c. | On an attributable basis. Excludes Pierina, which is producing incidental ounces while in closure. |
| d. | Realized price per ounce/pound may not calculate based on amounts presented in this table due to rounding. |
| BARRICK THIRD QUARTER 2023 | 76 | MANAGEMENT’S DISCUSSION AND ANALYSIS |
| OVERVIEW | OPERATING PERFORMANCE |
GROWTH PROJECTS & EXPLORATION |
REVIEW OF FINANCIAL RESULTS |
OTHER INFORMATION & NON-GAAP RECONCILIATIONS |
FINANCIAL STATEMENTS |
|||||
Technical Information
The scientific and technical information contained in this MD&A has been reviewed and approved by Craig Fiddes, SME-RM, Lead, Resource Modeling, Nevada Gold Mines; Chad Yuhasz, P.Geo, Mineral Resource Manager, Latin America & Asia Pacific; Richard Peattie, MPhil, FAusIMM, Mineral Resources Manager: Africa and Middle East; Simon Bottoms, CGeol, MGeol, FGS, FAusIMM, Mineral Resource Management and Evaluation Executive; John Steele, CIM, Metallurgy, Engineering and Capital Projects Executive; and Joel Holliday, FAusIMM, Executive Vice-President, Exploration – each a “Qualified Person” as defined in National Instrument 43-101 – Standards of Disclosure for Mineral Projects.
All mineral reserve and mineral resource estimates are estimated in accordance with National Instrument 43-101 – Standards of Disclosure for Mineral Projects. Unless otherwise noted, such mineral reserve and mineral resource estimates are as of December 31, 2022.
Endnotes
| 1 | Further information on these non-GAAP financial measures, including detailed reconciliations, is included on pages 59 to 76 of this MD&A. |
| 2 | Gold cost of sales per ounce is calculated as cost of sales across our gold operations (excluding sites in closure or care and maintenance) divided by ounces sold (both on an attributable basis using Barrick’s ownership share). Copper cost of sales per pound is calculated as cost of sales across our copper operations divided by pounds sold (both on an attributable basis using Barrick’s ownership share). References to attributable basis means our 100% share of Hemlo and Lumwana, our 61.5% share of NGM, our 60% share of Pueblo Viejo, our 80% share of Loulo-Gounkoto, our 89.7% share of Tongon, our 84% share of North Mara, and Bulyanhulu, our 50% share of Veladero, Zaldívar and Jabal Sayid, our 47.5% share of Porgera and our 45% share of Kibali. |
| 3 | Total reportable incident frequency rate (“TRIFR”) is a ratio calculated as follows: number of reportable injuries x 1,000,000 hours divided by the total number of hours worked. Reportable injuries include fatalities, lost time injuries, restricted duty injuries, and medically treated injuries. Lost time injury frequency rate (“LTIFR”) is a ratio calculated as follows: number of lost time injuries x 1,000,000 hours divided by the total number of hours worked. |
| 4 | Class 1 - High Significance is defined as an incident that causes significant negative impacts on human health or the environment or an incident that extends onto publicly accessible land and has the potential to cause significant adverse impact to surrounding communities, livestock or wildlife. |
| 5 | A Tier One Gold Asset is an asset with a $1,300/oz reserve potential to deliver a minimum 10-year life, annual production of at least 500,000 ounces of gold and with all-in sustaining costs per ounce in the lower half of the industry cost curve. A Tier One Copper Asset is an asset with a $3.00/lb reserve with potential for 5Mt or more of contained copper in support of at least 20 years life, annual production of at least 200ktpa, with all-in sustaining costs per pound in the lower half of the industry cost curve. |
| 6 | Categories as defined in the Greenhouse Gas Protocol’s Technical Guidance for Calculating Scope 3 Emissions. Achievement of Barrick’s Scope 3 targets will require collaboration with suppliers and customers in our value chain, which are outside of Barrick’s direct control. |
| 7 | Refer to the Technical Report on the Cortez Complex, Lander and Eureka Counties, State of Nevada, USA, dated December 31, 2021, and filed on SEDAR at www.sedar.com and EDGAR at www.sec.gov on March 18, 2022. |
| 8 | See the Technical Report on the Pueblo Viejo mine, Dominican Republic, dated March 17, 2023, and filed on SEDAR at www.sedar.com and EDGAR at www.sec.gov on March 17, 2023. |
| 9 | Indicative copper production profile from Lumwana, which is conceptual in nature. Subject to change following completion of the pre-feasibility study. |
| 10 | Greater Leeville Significant Interceptsa |
| Drill Results from Q3 2023 |
||||||||||||
| Drill Holeb |
Azimuth | Dip | Interval (m) | Width (m)c | True Width (m)c | Ag (g/t) | ||||||
| HSC-23001 |
129 | (26) | 250.5-283.2 | 32.6 | 32.88 | |||||||
| 263.0-270.6 | 7.6 | 28.49 | ||||||||||
| HSC-23002 |
112 | (28) | 359.1-366.7 | 7.6 | 7.10 | |||||||
| 317.9-329.5 | 11.6 | 13.20 | ||||||||||
| 350.8-354.2 | 3.4 | 5.42 | ||||||||||
| HSC-23003 |
101 | (27) | 363-381.3 | 18.3 | 6.07 | |||||||
| 761.7-771.8 | 10.1 | 1.16 | ||||||||||
| HSX-23001 |
219 | (79) | 857.4-867.8 | 10.4 | 3.24 | |||||||
| BARRICK THIRD QUARTER 2023 | 77 | MANAGEMENT’S DISCUSSION AND ANALYSIS |
| OVERVIEW | OPERATING PERFORMANCE |
GROWTH PROJECTS & EXPLORATION |
REVIEW OF FINANCIAL RESULTS |
OTHER INFORMATION & NON-GAAP RECONCILIATIONS |
FINANCIAL STATEMENTS |
|||||
| 75.3-78.6 | 3.3 | 3.2 | 12.32 | |||||||||
| NLC-23004 |
57 | (52) | 101.2-109.4 | 8.2 | 7.5 | 16.52 | ||||||
| NLC-23006 |
95 | (80) | 50.9-65.8 | 14.9 | 14.4 | 12.03 | ||||||
| 798.7-803.3 | 4.6 | 4.0 | 24.28 | |||||||||
| 866.9-881.0 | 14.2 | 12.3 | 8.67 | |||||||||
| NLX-23017 |
290 | (79) | 900.1-903.0 | 2.9 | 2.5 | 3.93 | ||||||
| NLX-22018 |
250 | (74) | 834.2-842.0 | 7.8 | 6.1 | 10.85 | ||||||
| 807.7-817.0 | 9.8 | 4.25 | ||||||||||
| 842.8-849.5 | 6.7 | 3.87 | ||||||||||
| NLX-22023 |
265 | (74) | 925.4-932.1 | 6.7 | 8.16 | |||||||
| 98.7-110.3 | 11.6 | 11.5 | 8.53 | |||||||||
| NTC-23001 |
300 | (42) | 113.1-121.3 | 8.2 | 8.2 | 44.53 | ||||||
| 15.2-22.6 | 5.0 | 4.6 | 12.10 | |||||||||
| 168.2-188.9 | 20.7 | 13.3 | 5.07 | |||||||||
| 192.1-200.9 | 8.8 | 5.7 | 4.80 | |||||||||
| NTC-23008 |
94 | (22) | 213.1-296.6 | 83.5 | 53.7 | 19.07 | ||||||
| 52.7-87.5 | 4.6 | 4.3 | 6.01 | |||||||||
| 87.5-98.6 | 11.1 | 10.5 | 13.66 | |||||||||
| NTC-23012 |
230 | (53) | 172.5-180.7 | 8.2 | 7.7 | 8.18 | ||||||
| 38.7-49.4 | 10.7 | 10.3 | 27.71 | |||||||||
| 65.8-78.6 | 12.8 | 12.8 | 24.35 | |||||||||
| 157.9-161.2 | 3.3 | 3.3 | 5.50 | |||||||||
| NTC-23013 |
230 | (63) | 170.4-174.8 | 4.4 | 4.4 | 5.59 | ||||||
| 61.3-65.2 | 3.9 | 3.9 | 3.99 | |||||||||
| 70.1-83.5 | 13.4 | 13.4 | 14.46 | |||||||||
| 85.6-93 | 7.4 | 7.3 | 9.00 | |||||||||
| 120.1-127.7 | 7.6 | 6.9 | 7.06 | |||||||||
| NTC-23014 |
277 | (66) | 138.4-141.4 | 3.0 | 2.8 | 8.26 | ||||||
| 34.4-37.8 | 3.4 | 3.3 | 4.08 | |||||||||
| 44.5-56.7 | 12.2 | 12.1 | 8.36 | |||||||||
| 78.8-98.3 | 19.5 | 19.4 | 12.39 | |||||||||
| 255.4-258.5 | 3.1 | 3.0 | 11.42 | |||||||||
| NTC-23022 |
275 | (60) | 269.1-272.8 | 3.7 | 3.6 | 5.06 | ||||||
| NTC-23024 |
275 | (63) | 174.3-186.5 | 12.2 | 10.6 | 5.88 | ||||||
| 138.1-144.2 | 6.1 | 5.5 | 7.60 | |||||||||
| 185.6-193.9 | 8.3 | 6.7 | 6.18 | |||||||||
| NTC-23025 |
250 | (57) | 268.5-273.4 | 4.9 | 4.7 | 4.67 | ||||||
| NTC-23030 |
350 | (76) | 98.5-120.4 | 21.9 | 19.9 | 22.23 | ||||||
| 107.3-115.8 | 8.5 | 8.4 | 17.75 | |||||||||
| NTC-23032 |
53 | (68) | 149.4-152.2 | 2.8 | 2.9 | 5.64 | ||||||
| a. | All intercepts calculated using a 3.4 g/t Au cutoff and are uncapped; minimum downhole intercept width is 2.4 meters; internal dilution is less than 20% total width. |
| b. | Carlin Trend drill hole nomenclature: Project area (CGX - Greater Leeville Exploration, NLX - North Leeville Exploration, NTC - North Turf Core, NLX - North Leeville Growth, LUC - Leeville Underground Core) followed by the year (23 for 2023) then hole number. |
| c. | True width for LUC, NTC and NLX drillholes has been estimated based on the latest geological and ore controls model and it is subject to refinement as additional data becomes available. True width of the intercepts for CGX drillholes is uncertain at this stage. |
The drilling results for Leeville contained in this MD&A have been prepared in accordance with National Instrument 43-101 – Standards of Disclosure for Mineral Projects. All drill hole assay information has been manually reviewed and approved by staff geologists and re-checked by the project manager. Sample preparation and analyses are conducted by an independent laboratory, ALS Minerals. Procedures are employed to ensure security of samples during their delivery from the drill rig to the laboratory. The quality assurance procedures, data verification and assay protocols used in connection with drilling and sampling on the Carlin Trend conform to industry accepted quality control methods.
| BARRICK THIRD QUARTER 2023 | 78 | MANAGEMENT’S DISCUSSION AND ANALYSIS |
| OVERVIEW | OPERATING PERFORMANCE |
GROWTH PROJECTS & EXPLORATION |
REVIEW OF FINANCIAL RESULTS |
OTHER INFORMATION & NON-GAAP RECONCILIATIONS |
FINANCIAL STATEMENTS |
|||||
11 Robertson Significant Interceptsa
| Drill Results from Q3 2023 |
||||||||||||
| Drill Holeb |
Azimuth | Dip | Interval (m) | Width (m)c | True Width (m)c | Au (g/t) | ||||||
| 27.9-31.4 | 3.5 | 0.42 | ||||||||||
| 36.2-39.6 | 3.4 | 0.26 | ||||||||||
| 63.7-82 | 18.3 | 0.28 | ||||||||||
| 85.6-101 | 15.4 | 0.34 | ||||||||||
| AHW-23005A |
355 | (30) | 103.9-107.3 | 3.4 | 3.14 | |||||||
| 119.3-122.8 | 3.5 | 0.31 | ||||||||||
| 127.6-139 | 11.4 | 0.59 | ||||||||||
| 148.1-151.2 | 3.0 | 0.21 | ||||||||||
| 211.2-214.3 | 3.0 | 0.29 | ||||||||||
| 232.7-236.8 | 4.1 | 0.37 | ||||||||||
| 252.8-261.5 | 8.7 | 0.25 | ||||||||||
| 291.7-305.1 | 13.4 | 0.43 | ||||||||||
| 307.2-313 | 5.8 | 0.26 | ||||||||||
| AHW-23003 |
232 | (55) | 370.3-375.5 | 5.2 | 0.68 | |||||||
| 146.7-151.3 | 4.6 | 4.5 | 0.26 | |||||||||
| 163.1-170.7 | 7.6 | 7.5 | 0.51 | |||||||||
| DTL-23010 |
220 | (70) | 173.8-181.4 | 7.6 | 7.5 | 1.28 | ||||||
| 13.7-18.7 | 5.0 | 4.9 | 1.66 | |||||||||
| 100-114.6 | 14.6 | 14.5 | 1.36 | |||||||||
| 128.6-133.8 | 5.2 | 5.2 | 0.45 | |||||||||
| 140.8-150.1 | 9.3 | 9.3 | 0.55 | |||||||||
| 171.9-181 | 9.1 | 9.1 | 0.94 | |||||||||
| DTL-23014 |
310 | (55) | 187.4-205.7 | 18.3 | 18.2 | 1.19 | ||||||
| 152.9-157.6 | 4.7 | 4.56 | ||||||||||
| 218.4-257.7 | 39.3 | 0.68 | ||||||||||
| 264.1-267.5 | 3.4 | 0.41 | ||||||||||
| DTL-23021 |
97 | (60) | 341.7-344.9 | 3.2 | 0.46 | |||||||
| 103.8-109.6 | 5.8 | 0.26 | ||||||||||
| 118.1-122.7 | 4.6 | 0.31 | ||||||||||
| 178.6-183.2 | 4.6 | 0.83 | ||||||||||
| 192.6-225.6 | 32.9 | 0.34 | ||||||||||
| GPC-23002 |
97 | (67) | 245.7-291.7 | 46.0 | 0.41 | |||||||
| 47.2-53.3 | 6.1 | 6.1 | 0.42 | |||||||||
| WPC-23003 |
184 | (72) | 82.9-86.4 | 3.5 | 3.5 | 0.27 | ||||||
| 86.9-90.8 | 4.0 | 3.9 | 0.60 | |||||||||
| 93.9-106.2 | 12.3 | 12.3 | 0.47 | |||||||||
| 115.8-124.2 | 8.4 | 8.4 | 0.41 | |||||||||
| 127.4-136.6 | 9.1 | 9.1 | 1.20 | |||||||||
| 155.9-160.9 | 5.0 | 4.9 | 0.41 | |||||||||
| 207.3-228 | 20.7 | 20.6 | 0.47 | |||||||||
| WPC-23004 |
317 | (66) | 233.9-242.9 | 9.0 | 8.9 | 0.47 | ||||||
| a. | All intercepts calculated using a 0.17 g/t Au cutoff and are uncapped; minimum downhole intercept width is 3.0 meters with 3 metres (consecutive) or less of unmineralized between intercepts; internal dilution is less than 20%. |
| b. | Robertson drill hole nomenclature: Project area: AHC: Altenburg Hill Core, AHW: Altenburg Hill West, DTL: Distal, GPC: Gold Pan Core, and WPC: West Porphyry Core. 23 indicates drill year of 2023. |
| c. | True width of intercepts are uncertain at this stage except where noted. |
The drilling results for Robertson contained in this MD&A have been prepared in accordance with National Instrument 43-101 – Standards of Disclosure for Mineral Projects. All drill hole assay information has been manually reviewed and approved by staff geologists and re-checked by the project manager. Sample preparation and analyses are conducted by an independent laboratory, ALS Minerals and SGS S.A. Procedures are employed to ensure security of samples during their delivery from the drill rig to the laboratory. The quality assurance procedures, data verification and assay protocols used in connection with drilling and sampling on Robertson conform to industry accepted quality control methods.
| BARRICK THIRD QUARTER 2023 | 79 | MANAGEMENT’S DISCUSSION AND ANALYSIS |
| OVERVIEW | OPERATING PERFORMANCE |
GROWTH PROJECTS & EXPLORATION |
REVIEW OF FINANCIAL RESULTS |
OTHER INFORMATION & NON-GAAP RECONCILIATIONS |
FINANCIAL STATEMENTS |
|||||
12 Fourmile Significant Interceptsa
| Drill Results from Q3 2023 | ||||||||||
| Drill Holeb |
Azimuth | Dip | Interval (m) | Width (m)c | Au (g/t) | |||||
| FM23-181D |
194 | (80) | 1270.9-1299.6 | 28.7 | 51.10 | |||||
| FM18-43D (ext) |
155 | (84) | No significant intercept | |||||||
| FM21-174D (ext) |
181 | (69) | No significant intercept | |||||||
| FM22-182D |
337 | (80) | No significant intercept | |||||||
| FM23-186DW1 |
239 | (84) | No significant intercept | |||||||
| a. | All intercepts calculated using a 3.4 g/t Au cutoff and are uncapped; minimum intercept width is 3.0 meters; internal dilution is less than 20% total width. |
| b. | Fourmile drill hole nomenclature: Project area (FM: Fourmile) followed by the year (23 for 2023) then hole number, additionally (ext) notes holes that were re-entered and extended in 2023. |
| c. | True width of intercepts are uncertain at this stage. |
The drilling results for Fourmile contained in this MD&A have been prepared in accordance with National Instrument 43-101 – Standards of Disclosure for Mineral Projects. All drill hole assay information has been manually reviewed and approved by staff geologists and re-checked by the project manager. Sample preparation and analyses are conducted by an independent laboratory, ALS Minerals. Procedures are employed to ensure security of samples during their delivery from the drill rig to the laboratory. The quality assurance procedures, data verification and assay protocols used in connection with drilling and sampling at Fourmile conform to industry accepted quality control methods.
13 Turquoise Ridge Significant Interceptsa
| Drill Results from Q3 2023 |
||||||||||||
| Drill Holeb |
Azimuth | Dip | Interval (m) | Width (m)c | True Width (m)c | Au (g/t) | ||||||
| TUM-23201 |
45 | (73) | 104.3-114.3 | 10.1 | 9.7 | 15.44 | ||||||
| 227.7-232.3 | 4.6 | 3.0 | 6.04 | |||||||||
| 236.4-262.5 | 26.1 | 18.5 | 30.16 | |||||||||
| TUM-23203 |
81 | (31) | 315.7-317.4 | 1.7 | 0.4 | 28.54 | ||||||
| 232.8-259.1 | 26.3 | 17.0 | 19.56 | |||||||||
| 264.5-266.8 | 2.3 | 1.5 | 27.81 | |||||||||
| TUM-23204 |
85 | (28) | 314.0-319.5 | 5.5 | 3.5 | 9.39 | ||||||
| 56.8-64.9 | 8.2 | 7.1 | 8.46 | |||||||||
| 75.6-81.7 | 6.1 | 5.3 | 7.93 | |||||||||
| 129.0-133.5 | 4.6 | 4.0 | 13.59 | |||||||||
| TUM-23207 |
95 | (45) | 153.2-157.9 | 4.8 | 4.2 | 61.01 | ||||||
| 107.6-111.9 | 4.3 | 3.7 | 9.34 | |||||||||
| 186.3-191.2 | 4.9 | 4.2 | 4.68 | |||||||||
| 200.6-202.1 | 1.5 | 1.3 | 4.42 | |||||||||
| 208.2-218.9 | 10.7 | 9.2 | 8.33 | |||||||||
| 251.5-257.0 | 5.5 | 4.8 | 6.74 | |||||||||
| 269.2-282.9 | 13.7 | 11.9 | 9.73 | |||||||||
| TUM-23102 |
180 | (62) | 290.5-296.6 | 6.1 | 5.3 | 10.47 | ||||||
| 136.3-140.4 | 4.1 | 3.3 | 21.92 | |||||||||
| TUM-23216 |
27 | (53) | 205.7-212.8 | 7.1 | 5.7 | 21.87 | ||||||
| TUM-23221 |
7 | (62) | 103.4-106.0 | 2.5 | 2.2 | 43.36 | ||||||
| 67.1-72.2 | 5.2 | 5.0 | 18.58 | |||||||||
| 95.7-116.9 | 21.2 | 19.8 | 13.36 | |||||||||
| 171.0-173.5 | 2.5 | 1.2 | 33.98 | |||||||||
| TUM-23014 |
271 | (73) | 218.6-224.0 | 5.4 | 4.6 | 14.60 | ||||||
| 14.5-19.8 | 5.3 | 2.0 | 6.86 | |||||||||
| TUM-23305 |
190 | (23) | 50.8-53.2 | 2.4 | 1.4 | 13.34 | ||||||
| 59.3-73.2 | 14.0 | 7.0 | 11.08 | |||||||||
| TUM-22416A |
190 | (10) | 83.6-89.3 | 5.7 | 3.1 | 11.61 | ||||||
| a. | All intercepts calculated using a 3.4 g/t Au cutoff and are uncapped; minimum downhole intercept width is 1.0 meters; internal dilution is less than 20% total width. |
| b. | Turquoise Ridge drill hole nomenclature: Project area: TUM: Turquoise Underground Minex. First two numbers indicate year drilled (23 for 2023). |
| c. | True width of intercepts have been estimated based on the current geological model. |
The drilling results for Turquoise Ridge contained in this MD&A have been prepared in accordance with National Instrument 43-101 – Standards of Disclosure for Mineral Projects. All drill hole assay information has been manually reviewed and approved by staff geologists and re-checked by the project manager. Sample preparation and analyses are conducted by an independent laboratory, ALS Minerals. Procedures are employed to ensure security of samples during their delivery from the drill rig to the laboratory. The quality assurance procedures, data verification and assay protocols used in connection with drilling and sampling on Turquoise Ridge conform to industry accepted quality control methods.
| BARRICK THIRD QUARTER 2023 | 80 | MANAGEMENT’S DISCUSSION AND ANALYSIS |
| OVERVIEW | OPERATING PERFORMANCE |
GROWTH PROJECTS & EXPLORATION |
REVIEW OF FINANCIAL RESULTS |
OTHER INFORMATION & NON-GAAP RECONCILIATIONS |
FINANCIAL STATEMENTS |
|||||
14 Hemlo Significant Interceptsa
| Drill Results from Q3 2023 |
||||||||||||
| Drill Holeb |
Azimuth | Dip | Interval (m) | Width (m)c | True Width (m)c | Au (g/t) | ||||||
| 7652311 |
327 | 15 | 70.7-78.2 | 7.6 | 6.6 | 4.27 | ||||||
| 7652314 |
303 | (23) | 158.5-164.4 | 5.9 | 3.4 | 5.84 | ||||||
| 7652315 |
299 | (18) | 155.2-160.5 | 5.3 | 3.1 | 3.11 | ||||||
| 1152332 |
221.3 | (24.2) | 291.2-307.6 | 16.4 | 9.4 | 4.83 | ||||||
| a. | All intercepts calculated using a 2.68 g/t Au cutoff. 765 holes are capped to 40 g/t Au, 115 holes are capped to 30 g/t Au; minimum intercept width is 2.50m; internal dilution is less than 42% total width. |
| b. | Hemlo drill hole nomenclature: Underground hole nomenclature is defined by level (e.g. 765 for the 9765m level) then year (e.g. 23 for 2023) then hole number. |
| c. | True width of intercepts are estimated using the angle to core axis. |
The drilling results for Hemlo contained in this MD&A have been prepared in accordance with National Instrument 43-101 – Standards of Disclosure for Mineral Projects. All drill hole assay information has been manually reviewed and approved by staff geologists and re-checked by the project manager. Sample preparation and analyses are conducted by an independent laboratory, ALS Minerals. Procedures are employed to ensure security of samples during their delivery from the drill rig to the laboratory. The quality assurance procedures, data verification and assay protocols used in connection with drilling and sampling at Hemlo conform to industry accepted quality control methods.
15 Bambadji Significant Interceptsa
| Drill Results from Q3 2023 |
||||||||||||||||
| Drill Holeb |
Azimuth | Dip | Interval (m) | Width (m)c | Au (g/t) | Interval (m) | Including Width (m)c |
Au (g/t) | ||||||||
| BQDH010 |
110 | (50) | 222-226.7 | 4.7 | 1.18 | |||||||||||
| BQDH011 |
110 | (50) | 259-265.2 | 6.2 | 5.82 | 260-262.7 | 2.7 | 12.92 | ||||||||
| BQDH011 |
110 | (50) | 312-322.4 | 10.4 | 0.71 | |||||||||||
| BQDH011 |
110 | (50) | 415.3-427.1 | 11.8 | 1.40 | 415.30-419.10 | 3.8 | 3.01 | ||||||||
| BQDT003 |
110 | (50) | 345.8-358.65 | 12.85 | 1.32 | 63.00-65.00 | 2 | 5.45 | ||||||||
| LFDH004 |
110 | (50) | 419.8-437.6 | 17.8 | 2.59 | 419.8-429.8 | 10 | 3.84 | ||||||||
| a. | All intercepts calculated using a 0.5 g/t Au cutoff and are uncapped; minimum intercept width is 2 meters; internal dilution is equal to or less than 2 meters total width. |
| b. | Drill hole nomenclature: BQ (Baqata), LF (Latifa), followed by type of drilling DH and DT (Diamond Drilling). |
| c. | True widths uncertain at this stage. |
The drilling results for the Dalema property contained in this MD&A have been prepared in accordance with National Instrument 43-101 – Standards of Disclosure for Mineral Projects. All drill hole assay information has been manually reviewed and approved by staff geologists and re-checked by the project manager. Sample preparation and analyses are conducted by SGS Bamako, an independent laboratory. Industry accepted best practices for preparation and fire assaying procedures are utilized to determine gold content. Procedures are employed to ensure security of samples during their delivery from the drill rig to the laboratory. The quality assurance procedures, data verification and assay protocols used in connection with drilling and sampling on the Bambadji property conform to industry accepted quality control methods.
16 Loulo-Gounkoto Significant Interceptsa
| Drill Results from Q3 2023 |
||||||||||||||||
| Includingd | ||||||||||||||||
| Drill Holeb |
Azimuth | Dip | Interval (m) | Width (m)c | Au (g/t) | Interval (m) | Width (m)c | Au (g/t) | ||||||||
| PQ10RC122 |
110 | (50) | 178 - 194 | 16 | 0.65 | |||||||||||
| WAC011 |
270 | (50) | 27 - 29 | 2 | 1.73 | |||||||||||
| WRC013 |
270 | (50) | 110 - 112 | 2 | 0.82 | |||||||||||
| WRC014 |
270 | (50) | 36 - 42 | 6 | 0.68 | |||||||||||
| WRC015 |
270 | (50) | 45274 | 2 | 2.17 | |||||||||||
| WRC016 |
270 | (50) | 170 - 175 | 5 | 0.74 | |||||||||||
| WRC018 |
265 | (50) | 223 - 226 | 3 | 2.50 | |||||||||||
| BNRC332 |
90 | (50) | 158 - 161 | 3 | 0.66 | |||||||||||
| BNRC332 |
90 | (50) | 168 - 172 | 4 | 0.78 | |||||||||||
| BNRC332 |
90 | (50) | 271 - 300 | 29 | 1.46 | 295 - 297 | 2 | 11.58 | ||||||||
| BNRC333 |
90 | (50) | 234 - 243 | 9 | 0.71 | |||||||||||
| BNRC334 |
270 | (50) | 133 - 189 | 56 | 0.65 | |||||||||||
| BDH51 |
90 | (50) | 111.7 - 116.9 | 5.2 | 0.52 | |||||||||||
| BDH51 |
90 | (50) | 236.5 - 239.8 | 3.3 | 0.99 | |||||||||||
| BDH52 |
270.4 | (50) | 121 - 125.75 | 4.75 | 0.57 | |||||||||||
| BDH52 |
270.4 | (50) | 144.95 -161.55 | 16.6 | 1.85 | 159.4 - 161.55 | 2.15 | 8.71 | ||||||||
| BARRICK THIRD QUARTER 2023 | 81 | MANAGEMENT’S DISCUSSION AND ANALYSIS |
| OVERVIEW | OPERATING PERFORMANCE |
GROWTH PROJECTS & EXPLORATION |
REVIEW OF FINANCIAL RESULTS |
OTHER INFORMATION & NON-GAAP RECONCILIATIONS |
FINANCIAL STATEMENTS |
|||||
| BDH53 |
90 | (50) | 216 - 220.3 | 4.3 | 1.99 | |||||||||||
| BDH53 |
90 | (50) | 249.3 -259.15 | 9.85 | 7.02 | 252.4 - 256.3 | 3.9 | 16.83 | ||||||||
| a. | All intercepts calculated using a 0.5 g/t Au cutoff and are uncapped; minimum intercept width is 2 meters; internal dilution is equal to or less than 2 meters total width. |
| b. | Loulo-Gounkoto drill hole nomenclature: prospect initial PQ10 (Point of Quartz 10), W (Waraba), B (Baboto), BN (Baboto North), followed by type of drilling AC (Air Core), RC (Reverse Circulation), DH (Diamond Drilling) |
| c. | True widths uncertain at this stage. |
| d. | All intercepts calculated using a 3.0 g/t Au cutoff and are uncapped; minimum intercept width is 2 meters ; internal dilution is equal to or less than 2 meters total width. |
The drilling results for the Loulo-Gounkoto property contained in this MD&A have been prepared in accordance with National Instrument 43-101 – Standards of Disclosure for Mineral Projects. All drill hole assay information has been manually reviewed and approved by staff geologists and re-checked by the project manager. Sample preparation and analyses are conducted by SGS Laboratories, an independent laboratory. Industry accepted best practices for preparation and fire assaying procedures are utilized to determine gold content. Procedures are employed to ensure security of samples during their delivery from the drill rig to the laboratory. The quality assurance procedures, data verification and assay protocols used in connection with drilling and sampling on the Loulo property conform to industry accepted quality control methods.
17 Kibali Significant Interceptsa
| Drill Results from Q3 2023 |
||||||||||||||||
| Includingd | ||||||||||||||||
| Drill Holeb |
Azimuth | Dip | Interval (m) | Width (m)c | Au (g/t) | Interval (m) | Width (m)c | Au (g/t) | ||||||||
| ADD029 |
127 | (75) | 142.5 - 146.9 | 4.4 | 0.98 | |||||||||||
| 253.1 - 267.8 | 14.7 | 1.58 | ||||||||||||||
| 270.5 - 277.3 | 6.8 | 2.33 | ||||||||||||||
| ADD030 |
127 | (75) | 136.8 - 148.8 | 12.0 | 0.63 | |||||||||||
| 223.3 - 226.2 | 3.0 | 3.33 | ||||||||||||||
| 244.4 - 267.1 | 22.7 | 2.67 | 254.7 -257.9 | 3.2 | 9.24 | |||||||||||
| DDD608 |
200 | (70) | 627.5 - 630.8 | 3.3 | 0.78 | |||||||||||
| 635.6 - 653.8 | 18.2 | 1.13 | 640.1 -643.2 | 3.1 | 2.47 | |||||||||||
| 661.8 - 668.7 | 6.9 | 1.25 | ||||||||||||||
| 719.5 - 725.1 | 5.5 | 1.17 | ||||||||||||||
| 858.5 - 862.0 | 3.5 | 0.74 | ||||||||||||||
| DDD609 |
135 | (70) | 192.8 -195.9 | 3.1 | 2.04 | |||||||||||
| 198.5 - 204.3 | 5.8 | 1.58 | ||||||||||||||
| 216.9 - 223.0 | 6.1 | 0.88 | ||||||||||||||
| ORDD0111 |
301 | (64) | 342.0 - 355.0 | 13 | 0.67 | 349.8 -351.7 | 1.9 | 2.51 | ||||||||
| ORDD0112 |
301 | (63) | 338.0 - 351.9 | 13.9 | 2.50 | 340.0 -343.0 | 2.9 | 4.86 | ||||||||
| 346.0 -350.0 | 3.8 | 3.43 | ||||||||||||||
| 356.0 - 360.6 | 4.6 | 0.68 | ||||||||||||||
| 375.0 - 380.1 | 5.1 | 1.58 | ||||||||||||||
| ORDD0113 |
307 | (63) | 514.3 - 523.3 | 9.0 | 2.28 | |||||||||||
| a. | All intercepts calculated using a 0.5 g/t Au cutoff and are uncapped; minimum intercept width is 2 meters; internal dilution is equal to or less than 25% total width. |
| b. | Kibali drill hole nomenclature: prospect initial (A=Agbarabo; D=Durba; OR=Oere) followed by the type of drilling (RC=Reverse Circulation, DD=Diamond, GC=Grade control) with no designation of the year. KCDU = KCD Underground. |
| c. | True widths of intercepts are uncertain at this stage. |
| d. | Weighted average is calculated by fence using significant intercepts, over the strike length |
| e. | All including intercepts, calculated using a 0.5 g/t Au cutoff and are uncapped; minimum intercept width is 1 meter; no internal dilution, with grade significantly above (> 40%) the overall intercept grade. |
The drilling results for the Kibali property contained in this MD&A have been prepared in accordance with National Instrument 43-101 – Standards of Disclosure for Mineral Projects. All drill hole assay information has been manually reviewed and approved by staff geologists and re-checked by the project manager. Sample preparation and analyses are conducted by SGS Laboratories, an independent laboratory. Industry accepted best practices for preparation and fire assaying procedures are utilized to determine gold content. Procedures are employed to ensure security of samples during their delivery from the drill rig to the laboratory. The quality assurance procedures, data verification and assay protocols used in connection with drilling and sampling on the Kibali property conform to industry accepted quality control methods.
| BARRICK THIRD QUARTER 2023 | 82 | MANAGEMENT’S DISCUSSION AND ANALYSIS |
| OVERVIEW | OPERATING PERFORMANCE |
GROWTH PROJECTS & EXPLORATION |
REVIEW OF FINANCIAL RESULTS |
OTHER INFORMATION & NON-GAAP RECONCILIATIONS |
FINANCIAL STATEMENTS |
|||||
18 North Mara Significant Interceptsa
| Drill Results from Q3 2023 |
||||||||||||||||
| Includingd | ||||||||||||||||
| Drill Holeb |
Azimuth | Dip | Interval (m) | Width (m)c | Au (g/t) | Interval (m) | Width (m)c | Au (g/t) | ||||||||
| SKRC014 |
110-112 | 2 | 0.85 | |||||||||||||
| 21 | (51) | 121-123 | 2 | 0.57 | ||||||||||||
| SKRC019 |
24 | (51) | 101-107 | 6 | 4.2 | 104-106 | 2 | 11.5 | ||||||||
| a. | All intercepts calculated using a 0.5 g/t Au cutoff and are uncapped; minimum intercept width is 1 m; internal dilution is equal to or less than 2 meters total width. |
| b. | North Mara drill hole nomenclature: prospect initial (SK= Shakta) followed by the type of drilling (RC=Reverse Circulation) with no designation of the year. |
| c. | True width of intercepts are uncertain at this stage. |
| d. | All including intercepts, calculated using a 0.5g/t Au cutoff and are uncapped, minimum intercept width is 1m, no internal dilution, with grade significantly above (>40%) the overall intercept grade. |
The drilling results for North Mara contained in this MD&A have been prepared in accordance with National Instrument 43-101 – Standards of Disclosure for Mineral Projects. All drill hole assay information has been manually reviewed and approved by staff geologists and re-checked by the project manager. Sample preparation and analyses are conducted by both the MSA Bulyanhulu and the SGS North Mara laboratory, both of which are independently operated by MSA and SGS respectively. Industry accepted best practices for preparation and fire assaying procedures are utilized to determine gold content. Procedures are employed to ensure security of samples during their delivery from the drill rig to the laboratory. The quality assurance procedures, data verification and assay protocols used in connection with drilling and sampling at North Mara conform to industry accepted quality control methods.
19 Lumwana Significant Interceptsa
| Drill Results from Q3 2023 |
||||||||||
| Drill Holeb |
Azimuth | Dip | Interval (m) | Width (m)c | Cu (%) | |||||
| LBERC008 |
270 | (80) | 34-39 | 5 | 0.20 | |||||
| LBERC012 |
270 | (80) | 101-104 | 3 | 0.36 | |||||
| LBERC013 |
270 | (80) | 11-20 | 9 | 0.25 | |||||
| LBERC013 |
270 | (80) | 40-49 | 9 | 0.26 | |||||
| LBERC014 |
270 | (80) | 107-114 | 7 | 0.51 | |||||
| LBERC014 |
270 | (80) | 116-119 | 3 | 0.42 | |||||
| LBERC015 |
270 | (80) | 17-26 | 9 | 0.26 | |||||
| LBERC015 |
270 | (80) | 28-32 | 4 | 0.39 | |||||
| LBERC015 |
270 | (80) | 103-108 | 5 | 0.28 | |||||
| LBERC016 |
270 | (80) | 40-46 | 6 | 0.31 | |||||
| KAB004 |
90 | (65) | 201-204 | 3 | 0.38 | |||||
| KAB005 |
90 | (65) | 45-50 | 5 | 0.24 | |||||
| KAB006 |
90 | (65) | 185-188 | 3 | 0.32 | |||||
| KAB010 |
90 | (65) | 23-32 | 9 | 0.15 | |||||
| KAB010 |
90 | (65) | 55-60 | 5 | 0.71 | |||||
| KAB011 |
90 | (65) | 82-86 | 4 | 0.23 | |||||
| KAB011 |
90 | (65) | 91-100 | 9 | 0.63 | |||||
| KAB012 |
90 | (65) | 168-184 | 16 | 0.67 | |||||
| KAB013 |
90 | (65) | 108-112 | 4 | 0.18 | |||||
| KAB013 |
90 | (65) | 130-137 | 7 | 0.69 | |||||
| KAB014 |
90 | (65) | 189-196 | 7 | 0.44 | |||||
| a. | All intercepts calculated using a 0.15% TCu cutoff and are uncapped; minimum intercept width is 3 meters; internal dilution is equal to or less than 2 meters total width. |
| b. | Lumwana drill hole nomenclature: prospect initial (LBE = Lubwe Exploration, KAB = Kababisa). LBE is Reverse Circulation (RC) and KAB is Diamond Drililng. |
| c. | True width of intercepts are uncertain at this stage. |
The drilling results for Lumwana contained in this MD&A have been prepared in accordance with National Instrument 43-101 – Standards of Disclosure for Mineral Projects. All drill hole assay information has been manually reviewed and approved by staff geologists and re-checked by the project manager. Sample preparation and analyses are conducted by SGS Laboratories and ALS, independent laboratories. Industry accepted best practices for preparation and fire assaying procedures are utilized to determine gold content. Procedures are employed to ensure security of samples during their delivery from the drill rig to the laboratory. The quality assurance procedures, data verification and assay protocols used in connection with drilling and sampling on Lumwana conform to industry accepted quality control methods.
| BARRICK THIRD QUARTER 2023 | 83 | MANAGEMENT’S DISCUSSION AND ANALYSIS |
| OVERVIEW | OPERATING PERFORMANCE |
GROWTH PROJECTS & EXPLORATION |
REVIEW OF FINANCIAL RESULTS |
OTHER INFORMATION & NON-GAAP RECONCILIATIONS |
FINANCIAL STATEMENTS |
|||||
Consolidated Statements of Income
| Barrick Gold Corporation (in millions of United States dollars, except per share data) (Unaudited) |
Three months ended September 30, |
Nine months ended September 30, |
||||||||||||||
| 2023 | 2022 | 2023 | 2022 | |||||||||||||
| Revenue (notes 4 and 5) |
$2,862 | $2,527 | $8,338 | $8,239 | ||||||||||||
| Costs and expenses (income) |
||||||||||||||||
| Cost of sales (notes 4 and 6) |
1,915 | 1,815 | 5,793 | 5,404 | ||||||||||||
| General and administrative expenses |
30 | 26 | 97 | 110 | ||||||||||||
| Exploration, evaluation and project expenses |
86 | 77 | 258 | 244 | ||||||||||||
| Impairment charges (notes 8b and 12) |
— | 24 | 23 | 29 | ||||||||||||
| Loss on currency translation |
30 | 3 | 56 | 12 | ||||||||||||
| Closed mine rehabilitation |
(44 | ) | (55 | ) | (35 | ) | (180 | ) | ||||||||
| Income from equity investees (note 11) |
(68 | ) | (52 | ) | (179 | ) | (240 | ) | ||||||||
| Other expense (income) (note 8a) |
58 | (9 | ) | 128 | (18 | ) | ||||||||||
| Income before finance costs and income taxes |
$855 | $698 | $2,197 | $2,878 | ||||||||||||
| Finance costs, net |
(52 | ) | (73 | ) | (154 | ) | (250 | ) | ||||||||
| Income before income taxes |
$803 | $625 | $2,043 | $2,628 | ||||||||||||
| Income tax expense (note 9) |
(218 | ) | (215 | ) | (687 | ) | (795 | ) | ||||||||
| Net income |
$585 | $410 | $1,356 | $1,833 | ||||||||||||
| Attributable to: |
||||||||||||||||
| Equity holders of Barrick Gold Corporation |
$368 | $241 | $793 | $1,167 | ||||||||||||
| Non-controlling interests (note 15) |
$217 | $169 | $563 | $666 | ||||||||||||
| Earnings per share data attributable to the equity holders of Barrick Gold Corporation (note 7) |
||||||||||||||||
| Net income |
||||||||||||||||
| Basic |
$0.21 | $0.14 | $0.45 | $0.66 | ||||||||||||
| Diluted |
$0.21 | $0.14 | $0.45 | $0.66 | ||||||||||||
The accompanying notes are an integral part of these condensed interim consolidated financial statements.
| BARRICK THIRD QUARTER 2023 | 84 | FINANCIAL STATEMENTS (UNAUDITED) |
| OVERVIEW | OPERATING PERFORMANCE |
GROWTH PROJECTS & EXPLORATION |
REVIEW OF FINANCIAL RESULTS |
OTHER INFORMATION & NON-GAAP RECONCILIATIONS |
FINANCIAL STATEMENTS |
|||||
Consolidated Statements
of Comprehensive Income
| Barrick Gold Corporation (in millions of United States dollars) (Unaudited) |
Three months ended September 30, |
Nine months ended September 30, |
||||||||||||||
| 2023 | 2022 | 2023 | 2022 | |||||||||||||
| Net income |
$585 | $410 | $1,356 | $1,833 | ||||||||||||
| Other comprehensive income (loss), net of taxes |
||||||||||||||||
| Items that may be reclassified subsequently to profit or loss: |
||||||||||||||||
| Realized losses on derivatives designated as cash flow hedges, net of tax $nil, $nil, $nil and $nil |
— | 1 | — | 1 | ||||||||||||
| Currency translation adjustments, net of tax $nil, $nil, $nil and $nil |
— | 1 | (3 | ) | 2 | |||||||||||
| Items that will not be reclassified to profit or loss: |
||||||||||||||||
| Actuarial loss on post employment benefit obligations, net of tax $nil, $nil, $nil and $nil |
— | (1 | ) | — | (2 | ) | ||||||||||
| Net change on equity investments, net of tax $1, $nil, $nil and $(6) |
(12 | ) | 3 | (17 | ) | 35 | ||||||||||
| Total other comprehensive (loss) income |
(12 | ) | 4 | (20 | ) | 36 | ||||||||||
| Total comprehensive income |
$573 | $414 | $1,336 | $1,869 | ||||||||||||
| Attributable to: |
||||||||||||||||
| Equity holders of Barrick Gold Corporation |
$356 | $245 | $773 | $1,203 | ||||||||||||
| Non-controlling interests |
$217 | $169 | $563 | $666 | ||||||||||||
The accompanying notes are an integral part of these condensed interim consolidated financial statements.
| BARRICK THIRD QUARTER 2023 | 85 | FINANCIAL STATEMENTS (UNAUDITED) |
| OVERVIEW | OPERATING PERFORMANCE |
GROWTH PROJECTS & EXPLORATION |
REVIEW OF FINANCIAL RESULTS |
OTHER INFORMATION & NON-GAAP RECONCILIATIONS |
FINANCIAL STATEMENTS |
|||||
Consolidated Statements of Cash Flow
| Barrick Gold Corporation (in millions of United States dollars) (Unaudited) |
Three months ended September 30, |
Nine months ended September 30, |
||||||||||||||
| 2023 | 2022 | 2023 | 2022 | |||||||||||||
| OPERATING ACTIVITIES |
||||||||||||||||
| Net income |
$585 | $410 | $1,356 | $1,833 | ||||||||||||
| Adjustments for the following items: |
||||||||||||||||
| Depreciation |
504 | 457 | 1,479 | 1,393 | ||||||||||||
| Finance costs, net1 |
52 | 73 | 154 | 250 | ||||||||||||
| Impairment charges (notes 8b and 12) |
— | 24 | 23 | 29 | ||||||||||||
| Income tax expense (note 9) |
218 | 215 | 687 | 795 | ||||||||||||
| Income from equity investees (note 11) |
(68 | ) | (52 | ) | (179 | ) | (240 | ) | ||||||||
| Gain on sale of non-current assets |
(4 | ) | (64 | ) | (10 | ) | (86 | ) | ||||||||
| Loss on currency translation |
30 | 3 | 56 | 12 | ||||||||||||
| Change in working capital (note 10) |
(47 | ) | (52 | ) | (298 | ) | (217 | ) | ||||||||
| Other operating activities (note 10) |
(74 | ) | (91 | ) | (73 | ) | (294 | ) | ||||||||
| Operating cash flows before interest and income taxes |
1,196 | 923 | 3,195 | 3,475 | ||||||||||||
| Interest paid |
(31 | ) | (23 | ) | (184 | ) | (175 | ) | ||||||||
| Interest received1 |
57 | 30 | 157 | 52 | ||||||||||||
| Income taxes paid2 |
(95 | ) | (172 | ) | (433 | ) | (666 | ) | ||||||||
| Net cash provided by operating activities |
1,127 | 758 | 2,735 | 2,686 | ||||||||||||
| INVESTING ACTIVITIES |
||||||||||||||||
| Property, plant and equipment |
||||||||||||||||
| Capital expenditures (note 4) |
(768 | ) | (792 | ) | (2,225 | ) | (2,158 | ) | ||||||||
| Sales proceeds |
2 | 52 | 8 | 75 | ||||||||||||
| Investment sales |
3 | — | 3 | 382 | ||||||||||||
| Dividends received from equity method investments (note 11) |
74 | 101 | 159 | 770 | ||||||||||||
| Shareholder loan repayments from equity method investments (note 11) |
— | — | 5 | — | ||||||||||||
| Net cash used in investing activities |
(689 | ) | (639 | ) | (2,050 | ) | (931 | ) | ||||||||
| FINANCING ACTIVITIES |
||||||||||||||||
| Lease repayments |
(3 | ) | (6 | ) | (11 | ) | (16 | ) | ||||||||
| Debt repayments |
— | (56 | ) | — | (56 | ) | ||||||||||
| Dividends |
(175 | ) | (351 | ) | (524 | ) | (882 | ) | ||||||||
| Share buyback program |
— | (141 | ) | — | (314 | ) | ||||||||||
| Funding from non-controlling interests (note 15) |
13 | — | 23 | — | ||||||||||||
| Disbursements to non-controlling interests (note 15) |
(175 | ) | (162 | ) | (399 | ) | (661 | ) | ||||||||
| Other financing activities (note 10) |
7 | 60 | 48 | 140 | ||||||||||||
| Net cash used in financing activities |
(333 | ) | (656 | ) | (863 | ) | (1,789 | ) | ||||||||
| Effect of exchange rate changes on cash and equivalents |
(1 | ) | (3 | ) | (1 | ) | (6 | ) | ||||||||
| Net increase (decrease) in cash and equivalents |
104 | (540 | ) | (179 | ) | (40 | ) | |||||||||
| Cash and equivalents at the beginning of period |
4,157 | 5,780 | 4,440 | 5,280 | ||||||||||||
| Cash and equivalents at the end of period |
$4,261 | $5,240 | $4,261 | $5,240 | ||||||||||||
| 1 | 2022 figures have been restated to reflect the change in presentation to present interest received ($30 million for the three months ended and $52 million for the nine months ended September 30, 2022) separately from finance costs. |
| 2 | Income taxes paid excludes $68 million (2022: $59 million) for the three months ended September 30, 2023 and $124 million (2022: $95 million) for the nine months ended September 30, 2023 of income taxes payable that were settled against offsetting VAT receivables. |
The accompanying notes are an integral part of these condensed interim consolidated financial statements.
| BARRICK THIRD QUARTER 2023 | 86 | FINANCIAL STATEMENTS (UNAUDITED) |
| OVERVIEW | OPERATING PERFORMANCE |
GROWTH PROJECTS & EXPLORATION |
REVIEW OF FINANCIAL RESULTS |
OTHER INFORMATION & NON-GAAP RECONCILIATIONS |
FINANCIAL STATEMENTS |
|||||
Consolidated Balance Sheets
| Barrick Gold Corporation (in millions of United States dollars) (Unaudited) |
As at September 30, 2023 |
As at December 31, 2022 |
||||||
| ASSETS |
||||||||
| Current assets |
||||||||
| Cash and equivalents |
$4,261 | $4,440 | ||||||
| Accounts receivable |
561 | 554 | ||||||
| Inventories |
1,913 | 1,781 | ||||||
| Other current assets (note 13b) |
684 | 1,690 | ||||||
| Total current assets |
$7,419 | $8,465 | ||||||
| Non-current assets |
||||||||
| Equity in investees (note 11) |
3,998 | 3,983 | ||||||
| Property, plant and equipment |
26,621 | 25,821 | ||||||
| Goodwill |
3,581 | 3,581 | ||||||
| Intangible assets |
149 | 149 | ||||||
| Deferred income tax assets |
27 | 19 | ||||||
| Non-current portion of inventory |
2,774 | 2,819 | ||||||
| Other assets |
1,026 | 1,128 | ||||||
| Total assets |
$45,595 | $45,965 | ||||||
| LIABILITIES AND EQUITY |
||||||||
| Current liabilities |
||||||||
| Accounts payable |
$1,584 | $1,556 | ||||||
| Debt |
8 | 13 | ||||||
| Current income tax liabilities |
313 | 163 | ||||||
| Other current liabilities (note 13b) |
513 | 1,388 | ||||||
| Total current liabilities |
$2,418 | $3,120 | ||||||
| Non-current liabilities |
||||||||
| Debt |
4,767 | 4,769 | ||||||
| Provisions |
2,112 | 2,211 | ||||||
| Deferred income tax liabilities |
3,367 | 3,247 | ||||||
| Other liabilities |
1,233 | 1,329 | ||||||
| Total liabilities |
$13,897 | $14,676 | ||||||
| Equity |
||||||||
| Capital stock (note 14) |
$28,117 | $28,114 | ||||||
| Deficit |
(7,016 | ) | (7,282 | ) | ||||
| Accumulated other comprehensive income (loss) |
6 | 26 | ||||||
| Other |
1,913 | 1,913 | ||||||
| Total equity attributable to Barrick Gold Corporation shareholders |
$23,020 | $22,771 | ||||||
| Non-controlling interests (note 15) |
8,678 | 8,518 | ||||||
| Total equity |
$31,698 | $31,289 | ||||||
| Contingencies and commitments (notes 4 and 16) |
||||||||
| Total liabilities and equity |
$45,595 | $45,965 | ||||||
The accompanying notes are an integral part of these condensed interim consolidated financial statements.
| BARRICK THIRD QUARTER 2023 | 87 | FINANCIAL STATEMENTS (UNAUDITED) |
| OVERVIEW | OPERATING PERFORMANCE |
GROWTH PROJECTS & EXPLORATION |
REVIEW OF FINANCIAL RESULTS |
OTHER INFORMATION & NON-GAAP RECONCILIATIONS |
FINANCIAL STATEMENTS |
|||||
Consolidated Statements of Changes in Equity
| Barrick Gold Corporation |
Attributable to equity holders of the company | |||||||||||||||||||||||||||||||
| (in millions of United States dollars) (Unaudited) |
Common Shares (in thousands) |
Capital stock |
Retained earnings (deficit) |
Accumulated other comprehensive income (loss)1 |
Other2 | Total equity attributable to shareholders |
Non- controlling interests |
Total equity |
||||||||||||||||||||||||
| At January 1, 2023 |
1,755,350 | $28,114 | ($7,282 | ) | $26 | $1,913 | $22,771 | $8,518 | $31,289 | |||||||||||||||||||||||
| Net income |
— | — | 793 | — | — | 793 | 563 | 1,356 | ||||||||||||||||||||||||
| Total other comprehensive loss |
— | — | — | (20 | ) | — | (20 | ) | — | (20 | ) | |||||||||||||||||||||
| Total comprehensive income (loss) |
— | — | 793 | (20 | ) | — | 773 | 563 | 1,336 | |||||||||||||||||||||||
| Transactions with owners |
||||||||||||||||||||||||||||||||
| Dividends |
— | — | (524 | ) | — | — | (524 | ) | — | (524 | ) | |||||||||||||||||||||
| Funding from non-controlling interests (note 15) |
— | — | — | — | — | — | 23 | 23 | ||||||||||||||||||||||||
| Disbursements to non-controlling interests (note 15) |
— | — | — | — | — | — | (426 | ) | (426 | ) | ||||||||||||||||||||||
| Dividend reinvestment plan (note 14) |
173 | 3 | (3 | ) | — | — | — | — | — | |||||||||||||||||||||||
| Total transactions with owners |
173 | 3 | (527 | ) | — | — | (524 | ) | (403 | ) | (927 | ) | ||||||||||||||||||||
| At September 30, 2023 |
1,755,523 | $28,117 | ($7,016 | ) | $6 | $1,913 | $23,020 | $8,678 | $31,698 | |||||||||||||||||||||||
| At January 1, 2022 |
1,779,331 | $28,497 | ($6,566 | ) | ($23 | ) | $1,949 | $23,857 | $8,450 | $32,307 | ||||||||||||||||||||||
| Net income |
— | — | 1,167 | — | — | 1,167 | 666 | 1,833 | ||||||||||||||||||||||||
| Total other comprehensive income |
— | — | — | 36 | — | 36 | — | 36 | ||||||||||||||||||||||||
| Total comprehensive income |
— | — | 1,167 | 36 | — | 1,203 | 666 | 1,869 | ||||||||||||||||||||||||
| Transactions with owners |
||||||||||||||||||||||||||||||||
| Dividends |
— | — | (882 | ) | — | — | (882 | ) | — | (882 | ) | |||||||||||||||||||||
| Disbursements to non-controlling interests |
— | — | — | — | — | — | (673 | ) | (673 | ) | ||||||||||||||||||||||
| Dividend reinvestment plan |
204 | 3 | (3 | ) | — | — | — | — | — | |||||||||||||||||||||||
| Share buyback program |
(17,500 | ) | (280 | ) | — | — | (34 | ) | (314 | ) | — | (314 | ) | |||||||||||||||||||
| Total transactions with owners |
(17,296 | ) | (277 | ) | (885 | ) | — | (34 | ) | (1,196 | ) | (673 | ) | (1,869 | ) | |||||||||||||||||
| At September 30, 2022 |
1,762,035 | $28,220 | ($6,284 | ) | $13 | $1,915 | $23,864 | $8,443 | $32,307 | |||||||||||||||||||||||
| 1 | Includes cumulative translation losses at September 30, 2023: $95 million (December 31, 2022: $93 million; September 30, 2022: $92 million). |
| 2 | Includes additional paid-in capital as at September 30, 2023: $1,875 million (December 31, 2022: $1,875 million; September 30, 2022: $1,877 million). |
The accompanying notes are an integral part of these condensed interim consolidated financial statements.
| BARRICK THIRD QUARTER 2023 | 88 | FINANCIAL STATEMENTS (UNAUDITED) |
| OVERVIEW | OPERATING PERFORMANCE |
GROWTH PROJECTS & EXPLORATION |
REVIEW OF FINANCIAL RESULTS |
OTHER INFORMATION & NON-GAAP RECONCILIATIONS |
FINANCIAL STATEMENTS |
|||||
Notes to Consolidated Financial Statements
Barrick Gold Corporation. Tabular dollar amounts in millions of United States dollars, unless otherwise shown.
1 ∎ Corporate Information
Barrick Gold Corporation (“Barrick”, “we” or the “Company”) is a corporation governed by the Business Corporations Act (British Columbia). The Company’s corporate office is located at Brookfield Place, TD Canada Trust Tower, 161 Bay Street, Suite 3700, Toronto, Ontario, M5J 2S1. The Company’s registered office is 925 West Georgia Street, Suite 1600, Vancouver, British Columbia, V6C 3L2. Barrick shares trade on the New York Stock Exchange under the symbol GOLD and the Toronto Stock Exchange under the symbol ABX. We are principally engaged in the production and sale of gold and copper, as well as related activities such as exploration and mine development. We sell our gold and copper into the world market.
We have ownership interests in producing gold mines that are located in Argentina, Canada, Côte d’Ivoire, the Democratic Republic of the Congo, the Dominican Republic, Mali, Tanzania and the United States. Our mine in Papua New Guinea was placed on care and maintenance in April 2020. We have ownership interests in producing copper mines in Chile, Saudi Arabia and Zambia. We also have various projects located throughout the Americas, Asia and Africa.
2 ∎ Material Accounting Policy Information
a) Statement of Compliance
These condensed interim consolidated financial statements have been prepared in accordance with International Accounting Standard 34 Interim Financial Reporting (“IAS 34”) as issued by the International Accounting Standards Board (“IASB”). These interim financial statements should be read in conjunction with Barrick’s most recently issued Annual Report, which includes information necessary or useful to understanding the Company’s business and financial statement presentation. In particular, the Company’s significant accounting policies were presented in Note 2 of the Annual Consolidated Financial Statements for the year ended December 31, 2022 (“2022 Annual Financial Statements”), and have been consistently applied in the preparation of these interim financial statements, except as otherwise noted in Note 2b. These condensed interim consolidated financial statements were authorized for issuance by the Board of Directors on November 1, 2023.
b) New Accounting Standards Issued But Not Yet Effective
Certain new accounting standards and interpretations have been published that are not mandatory for the current period and have not been early adopted. These standards are not expected to have a material impact on Barrick in the current or future reporting periods.
3 ∎ Critical Judgements, Estimates, Assumptions and Risks
The judgments, estimates, assumptions and risks discussed here reflect updates from the 2022 Annual Financial Statements. For judgments, estimates, assumptions and risks related to other areas not discussed in these interim consolidated financial statements, please refer to Notes 3 and 28 of the 2022 Annual Financial Statements.
a) Provision for Environmental Rehabilitation (“PER”)
Provisions are updated each reporting period for changes to expected cash flows and for the effect of changes in the discount rate and foreign exchange rates. The change in estimate is added or deducted from the related asset and depreciated over the expected economic life of the operation to which it relates. In the case of closed sites, changes in estimates and assumptions are recognized immediately in the consolidated statements of income. We recorded a net decrease of $69 million (2022: $207 million net decrease) to the PER at our minesites for the three months ended September 30, 2023 and a net decrease of $107 million (2022: $646 million net decrease) for the nine months ended September 30, 2023 primarily due to spending incurred during the year and an increase in the discount rate, partially offset by increases in cost estimates mainly driven by our conformance to the Global Industry Standard on Tailings Management, for all Extreme and Very High consequence facilities combined with accretion.
Adjustments to the estimated amount and timing of future closure and rehabilitation cash flows are a normal occurrence in light of the significant judgments and estimates involved. Rehabilitation provisions are adjusted as a result of changes in estimates and assumptions and are accounted for prospectively. In the fourth quarter of each year, our life of mine plans are updated and that typically results in an update to the rehabilitation provision.
b) Pascua-Lama
The Pascua-Lama project received $454 million as at September 30, 2023 (December 31, 2022: $457 million) in value added tax (“VAT”) refunds in Chile relating to the development of the Chilean side of the project. Under the current arrangement, this amount must be repaid if the project does not evidence exports for an amount of $3,538 million within a term that expires on December 31, 2026, unless extended. In 2022, the Chilean government proposed changes to Chilean law on VAT refunds that may affect the timeframe and amount of these refunds. The proposed changes were rejected in a vote by the Lower House of Congress on March 8, 2023, and Barrick will continue to monitor the status of these proposals in the event that they are reintroduced by the Chilean government.
In addition, we have recorded $18 million in VAT recoverable in Argentina as at September 30, 2023 (December 31, 2022: $31 million) relating to the development of the Argentinean side of the project. These amounts may not be fully recoverable if the project does not enter into production and are subject to foreign currency risk as the amounts are recoverable in Argentine pesos.
c) Contingencies
Contingencies can be either possible assets or possible liabilities arising from past events which, by their nature, will be resolved only when one or more future events, not wholly within our control, occur or fail to occur. The assessment of such contingencies inherently involves the exercise of significant judgment and estimates of the outcome of future events. Refer to Note 16 for further details on contingencies.
| BARRICK THIRD QUARTER 2023 | 89 | NOTES TO FINANCIAL STATEMENTS (UNAUDITED) |
| OVERVIEW | OPERATING PERFORMANCE |
GROWTH PROJECTS & EXPLORATION |
REVIEW OF FINANCIAL RESULTS |
OTHER INFORMATION & NON-GAAP RECONCILIATIONS |
FINANCIAL STATEMENTS |
|||||
d) Lagunas Norte
On June 1, 2021, Barrick closed an agreement to sell its 100% interest in the Lagunas Norte gold mine in Peru to Boroo Pte Ltd (“Boroo”). As part of the terms of the transaction, Boroo assumed 50% of the $173 million reclamation bond obligations for Lagunas Norte upon closing.
Boroo was to assume the other 50% within one year of closing; however, this was extended until June 1, 2023. During the second quarter of 2023, Boroo fully assumed this obligation and Barrick has no further obligation related to the closure and reclamation of Lagunas Norte.
4 ∎ Segment Information
Barrick’s business is organized into eighteen minesites. Barrick’s Chief Operating Decision Maker (“CODM”) (Mark Bristow, President and Chief Executive Officer) reviews the operating results, assesses performance and makes capital allocation decisions at the minesite level. In the first quarter of 2023, we re-evaluated our reportable operating segments. Lumwana has been presented as a reportable segment for the current and prior periods. Veladero is no longer a reportable segment. As a result, our presentation of our reportable operating segments consists of eight gold mines (Carlin, Cortez, Turquoise Ridge, Pueblo Viejo, Loulo-Gounkoto, Kibali, North Mara and Bulyanhulu) and one copper mine (Lumwana). The remaining operating segments, including our remaining gold mines, have been grouped into an “Other Mines” category and will not be reported on individually. Prior period figures have been restated to reflect this change and 2022 and 2021 annual information for Lumwana is provided below. Segment performance is evaluated based on a number of measures including operating income before tax, production levels and unit production costs. Certain costs are managed on a consolidated basis and are therefore not reflected in segment income.
Consolidated Statement of Income Information
| Cost of Sales | ||||||||||||||||||||||||
| For the three months ended September 30, 2023 |
Revenue | Site operating costs, royalties and community relations |
Depreciation | Exploration, evaluation and project expenses |
Other expenses (income)1 |
Segment income (loss) |
||||||||||||||||||
| Carlin2 |
$749 | $375 | $83 | $6 | $3 | $282 | ||||||||||||||||||
| Cortez2 |
422 | 185 | 88 | 5 | 2 | 142 | ||||||||||||||||||
| Turquoise Ridge2 |
244 | 119 | 45 | 1 | 1 | 78 | ||||||||||||||||||
| Pueblo Viejo2 |
257 | 130 | 65 | 1 | 2 | 59 | ||||||||||||||||||
| Loulo-Gounkoto2 |
350 | 141 | 57 | (2 | ) | 16 | 138 | |||||||||||||||||
| Kibali |
187 | 68 | 44 | — | 3 | 72 | ||||||||||||||||||
| Lumwana |
209 | 97 | 69 | 9 | 2 | 32 | ||||||||||||||||||
| North Mara2 |
137 | 71 | 17 | — | 4 | 45 | ||||||||||||||||||
| Bulyanhulu2 |
108 | 52 | 16 | — | 1 | 39 | ||||||||||||||||||
| Other Mines2 |
374 | 238 | 56 | 1 | 20 | 59 | ||||||||||||||||||
| Reportable segment total |
$3,037 | $1,476 | $540 | $21 | $54 | $946 | ||||||||||||||||||
| Share of equity investees |
(187 | ) | (68 | ) | (44 | ) | — | (3 | ) | (72 | ) | |||||||||||||
| Segment total |
$2,850 | $1,408 | $496 | $21 | $51 | $874 | ||||||||||||||||||
Consolidated Statement of Income Information
| Cost of Sales | ||||||||||||||||||||||||
| For the three months ended September 30, 2022 |
Revenue | Site operating costs, royalties and community relations |
Depreciation | Exploration, evaluation and project expenses |
Other expenses (income)1 |
Segment income (loss) |
||||||||||||||||||
| Carlin2 |
$635 | $351 | $74 | $7 | $1 | $202 | ||||||||||||||||||
| Cortez2 |
275 | 124 | 46 | 4 | 1 | 100 | ||||||||||||||||||
| Turquoise Ridge2 |
176 | 114 | 41 | 1 | — | 20 | ||||||||||||||||||
| Pueblo Viejo2 |
360 | 161 | 64 | 5 | 3 | 127 | ||||||||||||||||||
| Loulo-Gounkoto2 |
277 | 136 | 60 | 3 | 1 | 77 | ||||||||||||||||||
| Kibali |
152 | 64 | 27 | (2 | ) | 18 | 45 | |||||||||||||||||
| Lumwana |
200 | 113 | 60 | 5 | 1 | 21 | ||||||||||||||||||
| North Mara2 |
144 | 62 | 18 | 1 | 18 | 45 | ||||||||||||||||||
| Bulyanhulu2 |
106 | 59 | 15 | 1 | (1 | ) | 32 | |||||||||||||||||
| Other Mines2 |
325 | 227 | 75 | 2 | 17 | 4 | ||||||||||||||||||
| Reportable segment total |
$2,650 | $1,411 | $480 | $27 | $59 | $673 | ||||||||||||||||||
| Share of equity investees |
(152 | ) | (64 | ) | (27 | ) | 2 | (18 | ) | (45 | ) | |||||||||||||
| Segment total |
$2,498 | $1,347 | $453 | $29 | $41 | $628 | ||||||||||||||||||
| BARRICK THIRD QUARTER 2023 | 90 | NOTES TO FINANCIAL STATEMENTS (UNAUDITED) |
| OVERVIEW | OPERATING PERFORMANCE |
GROWTH PROJECTS & EXPLORATION |
REVIEW OF FINANCIAL RESULTS |
OTHER INFORMATION & NON-GAAP RECONCILIATIONS |
FINANCIAL STATEMENTS |
|||||
Consolidated Statement of Income Information
| Cost of Sales | ||||||||||||||||||||||||
| For the nine months ended September 30, 2023 |
Revenue | Site operating costs, royalties and community relations |
Depreciation | Exploration, evaluation and project expenses |
Other expenses (income)1 |
Segment income (loss) |
||||||||||||||||||
| Carlin2 |
$2,039 | $1,109 | $237 | $21 | $7 | $665 | ||||||||||||||||||
| Cortez2 |
1,206 | 567 | 246 | 12 | 5 | 376 | ||||||||||||||||||
| Turquoise Ridge2 |
730 | 387 | 138 | 4 | 1 | 200 | ||||||||||||||||||
| Pueblo Viejo2 |
806 | 367 | 189 | 3 | 6 | 241 | ||||||||||||||||||
| Loulo-Gounkoto2 |
1,015 | 424 | 188 | — | 21 | 382 | ||||||||||||||||||
| Kibali |
486 | 204 | 110 | — | 7 | 165 | ||||||||||||||||||
| Lumwana |
569 | 344 | 172 | 26 | 7 | 20 | ||||||||||||||||||
| North Mara2 |
444 | 207 | 55 | — | 30 | 152 | ||||||||||||||||||
| Bulyanhulu2 |
338 | 166 | 47 | — | 18 | 107 | ||||||||||||||||||
| Other Mines2 |
1,160 | 734 | 183 | 5 | 56 | 182 | ||||||||||||||||||
| Reportable segment total |
$8,793 | $4,509 | $1,565 | $71 | $158 | $2,490 | ||||||||||||||||||
| Share of equity investees |
(486 | ) | (204 | ) | (110 | ) | — | (7 | ) | (165 | ) | |||||||||||||
| Segment total |
$8,307 | $4,305 | $1,455 | $71 | $151 | $2,325 | ||||||||||||||||||
Consolidated Statement of Income Information
| Cost of Sales | ||||||||||||||||||||||||
| For the nine months ended September 30, 2022 |
Revenue | Site operating costs, royalties and community relations |
Depreciation | Exploration, evaluation and project expenses |
Other expenses (income)1 |
Segment income (loss) |
||||||||||||||||||
| Carlin2 |
$2,090 | $1,032 | $223 | $14 | ($17 | ) | $838 | |||||||||||||||||
| Cortez2 |
923 | 407 | 156 | 10 | 2 | 348 | ||||||||||||||||||
| Turquoise Ridge2 |
603 | 338 | 127 | 5 | 1 | 132 | ||||||||||||||||||
| Pueblo Viejo2 |
1,016 | 426 | 182 | 19 | 8 | 381 | ||||||||||||||||||
| Loulo-Gounkoto2 |
930 | 388 | 187 | 6 | 8 | 341 | ||||||||||||||||||
| Kibali |
434 | 176 | 88 | 2 | 33 | 135 | ||||||||||||||||||
| Lumwana |
698 | 338 | 131 | 7 | 6 | 216 | ||||||||||||||||||
| North Mara2 |
424 | 172 | 51 | 3 | 18 | 180 | ||||||||||||||||||
| Bulyanhulu2 |
355 | 178 | 46 | 1 | 5 | 125 | ||||||||||||||||||
| Other Mines2 |
1,147 | 712 | 277 | 8 | 47 | 103 | ||||||||||||||||||
| Reportable segment total |
$8,620 | $4,167 | $1,468 | $75 | $111 | $2,799 | ||||||||||||||||||
| Share of equity investees |
(434 | ) | (176 | ) | (88 | ) | (2 | ) | (33 | ) | (135 | ) | ||||||||||||
| Segment total |
$8,186 | $3,991 | $1,380 | $73 | $78 | $2,664 | ||||||||||||||||||
| 1 | Includes accretion expense, which is included within finance costs in the consolidated statement of income. For the three months ended September 30, 2023, accretion expense was $12 million (2022: $9 million) and for the nine months ended September 30, 2023, accretion expense was $36 million (2022: $25 million). |
| 2 | Includes non-controlling interest portion of revenues, cost of sales and segment income for the three months ended September 30, 2023 for Nevada Gold Mines $592 million, $384 million, $201 million (2022: $466 million, $331 million, $129 million), Pueblo Viejo $105 million, $79 million, $25 million (2022: $148 million, $89 million, $56 million), Loulo-Gounkoto $70 million, $40 million, $28 million (2022: $55 million, $39 million, $16 million), North Mara and Bulyanhulu $39 million, $25 million, $12 million (2022: $40 million, $24 million, $12 million), and Tongon $10 million, $8 million, $3 million (2022: $8 million, $8 million, $nil) and for the nine months ended September 30, 2023 for Nevada Gold Mines $1,675 million, $1,153 million, $500 million (2022: $1,571 million, $1,018 million, $546 million), Pueblo Viejo $326 million, $222 million, $102 million (2022: $413 million, $242 million, $162 million), Loulo-Gounkoto $203 million, $123 million, $78 million (2022: $186 million, $115 million, $70 million), North Mara and Bulyanhulu $125 million, $76 million, $41 million (2022: $125 million, $71 million, $48 million) and Tongon $32 million, $24 million, $8 million (2022: $25 million, $26 million, $(2) million), respectively. |
| BARRICK THIRD QUARTER 2023 | 91 | NOTES TO FINANCIAL STATEMENTS (UNAUDITED) |
| OVERVIEW | OPERATING PERFORMANCE |
GROWTH PROJECTS & EXPLORATION |
REVIEW OF FINANCIAL RESULTS |
OTHER INFORMATION & NON-GAAP RECONCILIATIONS |
FINANCIAL STATEMENTS |
|||||
Reconciliation of Segment Income to Income Before Income Taxes
| For the three months ended September 30 |
For the nine months ended September 30 |
|||||||||||||||
| 2023 | 2022 | 2023 | 2022 | |||||||||||||
| Segment income |
$874 | $628 | $2,325 | $2,664 | ||||||||||||
| Other revenue |
12 | 29 | 31 | 53 | ||||||||||||
| Other cost of sales/amortization |
(11 | ) | (15 | ) | (33 | ) | (33 | ) | ||||||||
| Exploration, evaluation and project expenses not attributable to segments |
(65 | ) | (48 | ) | (187 | ) | (171 | ) | ||||||||
| General and administrative expenses |
(30 | ) | (26 | ) | (97 | ) | (110 | ) | ||||||||
| Other income (expense) not attributable to segments |
(19 | ) | 44 | (15 | ) | 67 | ||||||||||
| Impairment charges |
— | (24 | ) | (23 | ) | (29 | ) | |||||||||
| Loss on currency translation |
(30 | ) | (3 | ) | (56 | ) | (12 | ) | ||||||||
| Closed mine rehabilitation |
44 | 55 | 35 | 180 | ||||||||||||
| Income from equity investees |
68 | 52 | 179 | 240 | ||||||||||||
| Finance costs, net (includes non-segment accretion) |
(40 | ) | (64 | ) | (118 | ) | (225 | ) | ||||||||
| Gain (loss) on non-hedge derivatives |
— | (3 | ) | 2 | 4 | |||||||||||
| Income before income taxes |
$803 | $625 | $2,043 | $2,628 | ||||||||||||
| Capital Expenditures Information | Segment capital expenditures1 | |||||||||||||||
| For the three months ended September 30 |
For the nine months ended September 30 |
|||||||||||||||
| 2023 | 2022 | 2023 | 2022 | |||||||||||||
| Carlin |
$169 | $121 | $432 | $368 | ||||||||||||
| Cortez |
90 | 133 | 291 | 352 | ||||||||||||
| Turquoise Ridge |
20 | 47 | 70 | 133 | ||||||||||||
| Pueblo Viejo |
113 | 171 | 359 | 465 | ||||||||||||
| Loulo-Gounkoto |
87 | 78 | 282 | 222 | ||||||||||||
| Kibali |
17 | 27 | 61 | 65 | ||||||||||||
| Lumwana |
102 | 105 | 226 | 240 | ||||||||||||
| North Mara |
57 | 29 | 142 | 86 | ||||||||||||
| Bulyanhulu |
27 | 21 | 70 | 56 | ||||||||||||
| Other Mines |
53 | 68 | 168 | 193 | ||||||||||||
| Reportable segment total |
$735 | $800 | $2,101 | $2,180 | ||||||||||||
| Other items not allocated to segments |
109 | 24 | 242 | 87 | ||||||||||||
| Total |
$844 | $824 | $2,343 | $2,267 | ||||||||||||
| Share of equity investees |
(17 | ) | (27 | ) | (61 | ) | (65 | ) | ||||||||
| Total |
$827 | $797 | $2,282 | $2,202 | ||||||||||||
| 1 | Segment capital expenditures are presented for internal management reporting purposes on an accrual basis. Capital expenditures in the Consolidated Statements of Cash Flow are presented on a cash basis. For the three months ended September 30, 2023, cash expenditures were $768 million (2022: $792 million) and the increase in accrued expenditures was $59 million (2022: $5 million increase). For the nine months ended September 30, 2023, cash expenditures were $2,225 million (2022: $2,158 million) and the increase in accrued expenditures was $57 million (2022: $44 million increase). |
| Lumwana | Cost of Sales | |||||||||||||||||||||||||||
| For the year ended |
Revenue | Site operating costs, royalties and community relations |
Depreciation | Exploration, evaluation and project expenses |
Other expenses (income)1 |
Segment income (loss) |
Capital Expenditures |
|||||||||||||||||||||
| December 31, 2022 |
$868 | $443 | $223 | $11 | $11 | $180 | $380 | |||||||||||||||||||||
| December 31, 2021 |
$962 | $373 | $197 | $— | $1 | $391 | $222 | |||||||||||||||||||||
Purchase Commitments
At September 30, 2023, we had purchase obligations for supplies and consumables of $1,754 million (December 31, 2022: $1,753 million).
Capital Commitments
In addition to entering into various operational commitments in the normal course of business, we had capital commitments of $335 million at September 30, 2023 (December 31, 2022: $399 million).
| BARRICK THIRD QUARTER 2023 | 92 | NOTES TO FINANCIAL STATEMENTS (UNAUDITED) |
| OVERVIEW | OPERATING PERFORMANCE |
GROWTH PROJECTS & EXPLORATION |
REVIEW OF FINANCIAL RESULTS |
OTHER INFORMATION & NON-GAAP RECONCILIATIONS |
FINANCIAL STATEMENTS |
|||||
5 ∎ Revenue
| For the three months ended September 30 |
For the nine months ended September 30 |
|||||||||||||||
| 2023 | 2022 | 2023 | 2022 | |||||||||||||
| Gold sales |
||||||||||||||||
| Spot market sales |
$2,509 | $2,191 | $7,325 | $7,141 | ||||||||||||
| Concentrate sales |
80 | 91 | 254 | 249 | ||||||||||||
| Provisional pricing adjustments |
(1 | ) | (5 | ) | 4 | (5 | ) | |||||||||
| $2,588 | $2,277 | $7,583 | $7,385 | |||||||||||||
| Copper sales |
||||||||||||||||
| Concentrate sales |
$211 | $217 | $570 | $751 | ||||||||||||
| Provisional pricing adjustments |
(2 | ) | (17 | ) | (1 | ) | (53 | ) | ||||||||
| $209 | $200 | $569 | $698 | |||||||||||||
| Other sales1 |
65 | 50 | 186 | 156 | ||||||||||||
| Total |
$2,862 | $2,527 | $8,338 | $8,239 | ||||||||||||
| 1 | Revenues include the sale of by-products for our gold and copper mines. |
6 ∎ Cost of Sales
| Gold | Copper | Other3 | Total | |||||||||||||||||||||||||||||
| For the three months ended September 30 |
2023 | 2022 | 2023 | 2022 | 2023 | 2022 | 2023 | 2022 | ||||||||||||||||||||||||
| Site operating costs1,2 |
$1,208 | $1,161 | $81 | $89 | $5 | $— | $1,294 | $1,250 | ||||||||||||||||||||||||
| Depreciation1 |
427 | 393 | 70 | 59 | 7 | 5 | 504 | 457 | ||||||||||||||||||||||||
| Royalty expense |
90 | 74 | 15 | 23 | — | — | 105 | 97 | ||||||||||||||||||||||||
| Community relations |
11 | 10 | 1 | 1 | — | — | 12 | 11 | ||||||||||||||||||||||||
| $1,736 | $1,638 | $167 | $172 | $12 | $5 | $1,915 | $1,815 | |||||||||||||||||||||||||
| Gold | Copper | Other3 | Total | |||||||||||||||||||||||||||||
| For the nine months ended September 30 |
2023 | 2022 | 2023 | 2022 | 2023 | 2022 | 2023 | 2022 | ||||||||||||||||||||||||
| Site operating costs1,2 |
$3,660 | $3,392 | $296 | $248 | $5 | $— | $3,961 | $3,640 | ||||||||||||||||||||||||
| Depreciation1 |
1,285 | 1,250 | 173 | 131 | 21 | 12 | 1,479 | 1,393 | ||||||||||||||||||||||||
| Royalty expense |
279 | 257 | 46 | 87 | — | — | 325 | 344 | ||||||||||||||||||||||||
| Community relations |
26 | 24 | 2 | 3 | — | — | 28 | 27 | ||||||||||||||||||||||||
| $5,250 | $4,923 | $517 | $469 | $26 | $12 | $5,793 | $5,404 | |||||||||||||||||||||||||
| 1 | Site operating costs and depreciation include charges to reduce the cost of inventory to net realizable value as follows: $13 million for the three months ended September 30, 2023 (2022: $22 million) and $27 million for the nine months ended September 30, 2023 (2022: $53 million). |
| 2 | Site operating costs includes the costs of extracting by-products. |
| 3 | Other includes corporate amortization. |
7 ∎ Earnings Per Share
| For the three months ended September 30 |
For the nine months ended September 30 |
|||||||||||||||||||||||||||||||
| 2023 | 2022 | 2023 | 2022 | |||||||||||||||||||||||||||||
| Basic | Diluted | Basic | Diluted | Basic | Diluted | Basic | Diluted | |||||||||||||||||||||||||
| Net income |
$585 | $585 | $410 | $410 | $1,356 | $1,356 | $1,833 | $1,833 | ||||||||||||||||||||||||
| Net income attributable to non-controlling interests |
(217 | ) | (217 | ) | (169 | ) | (169 | ) | (563 | ) | (563 | ) | (666 | ) | (666 | ) | ||||||||||||||||
| Net income attributable to equity holders of Barrick Gold Corporation |
$368 | $368 | $241 | $241 | $793 | $793 | $1,167 | $1,167 | ||||||||||||||||||||||||
| Weighted average shares outstanding |
1,755 | 1,755 | 1,768 | 1,768 | 1,755 | 1,755 | 1,775 | 1,775 | ||||||||||||||||||||||||
| Basic and diluted earnings per share data attributable to the equity holders of Barrick Gold Corporation |
$0.21 | $0.21 | $0.14 | $0.14 | $0.45 | $0.45 | $0.66 | $0.66 | ||||||||||||||||||||||||
| BARRICK THIRD QUARTER 2023 | 93 | NOTES TO FINANCIAL STATEMENTS (UNAUDITED) |
| OVERVIEW | OPERATING PERFORMANCE |
GROWTH PROJECTS & EXPLORATION |
REVIEW OF FINANCIAL RESULTS |
OTHER INFORMATION & NON-GAAP RECONCILIATIONS |
FINANCIAL STATEMENTS |
|||||
8 ∎ Other Expense
a) Other Expense (Income)
| For the three months ended September 30 |
For the nine months ended September 30 |
|||||||||||||||
| 2023 | 2022 | 2023 | 2022 | |||||||||||||
| Other expense: |
||||||||||||||||
| Bank charges |
$1 | $1 | $2 | $3 | ||||||||||||
| Litigation |
1 | 22 | 10 | 29 | ||||||||||||
| Loss (gain) on warrant investments at fair value through profit or loss (“FVPL”) |
1 | 2 | 6 | (2 | ) | |||||||||||
| Porgera care and maintenance costs |
19 | 16 | 49 | 43 | ||||||||||||
| Tanzania supplies obsolescence |
— | 5 | — | 7 | ||||||||||||
| Tanzania education program |
— | — | 30 | — | ||||||||||||
| Litigation accruals and settlements |
20 | — | 20 | — | ||||||||||||
| Other |
26 | 10 | 40 | 28 | ||||||||||||
| Total other expense |
$68 | $56 | $157 | $108 | ||||||||||||
| Other income: |
||||||||||||||||
| Gain on sale of non-current assets1 |
($4 | ) | ($64 | ) | ($10 | ) | ($86 | ) | ||||||||
| Loss (gain) on non-hedge derivatives |
— | 3 | (2 | ) | (4 | ) | ||||||||||
| Insurance proceeds related to NGM |
— | — | — | (22 | ) | |||||||||||
| Interest income on other assets |
(6 | ) | (4 | ) | (17 | ) | (11 | ) | ||||||||
| Other |
— | — | — | (3 | ) | |||||||||||
| Total other income |
($10 | ) | ($65 | ) | ($29 | ) | ($126 | ) | ||||||||
| Total |
$58 | ($9 | ) | $128 | ($18 | ) | ||||||||||
| 1 | 2022 figures include a gain of $63 million from the sale of the royalty portfolios to Maverix Met Inc. and Gold Royalty Corp recorded in the third quarter of 2022. |
b) Impairment Charges
| For the three months ended September 30 |
For the nine months ended September 30 |
|||||||||||||||
| 2023 | 2022 | 2023 | 2022 | |||||||||||||
| Impairment charges of non-current assets1 |
$— | $24 | $23 | $29 | ||||||||||||
| Total |
$— | $24 | $23 | $29 | ||||||||||||
| 1 | Refer to note 12 for further details. |
9 ∎ Income Tax Expense
| For the three months ended September 30 |
For the nine months ended September 30 |
|||||||||||||||
| 2023 | 2022 | 2023 | 2022 | |||||||||||||
| Current |
$147 | $118 | $575 | $601 | ||||||||||||
| Deferred |
71 | 97 | 112 | 194 | ||||||||||||
| Total |
$218 | $215 | $687 | $795 | ||||||||||||
Income tax expense was $687 million for the nine months ended September 30, 2023 (2022: $795 million). The unadjusted effective income tax rate for the nine months ended September 30, 2023 was 34% of income before income taxes.
The underlying effective income tax rate on ordinary income for the nine months ended September 30, 2023 was 27% after adjusting for the impact of foreign currency translation losses on deferred tax balances; the impact of the de-recognition of deferred tax assets; the impact of prior year adjustments; the impact of updates to the rehabilitation provision for our non-operating mines; the impact of non-deductible foreign exchange losses; the impact of the Porgera mine being placed on care and maintenance; the impact of the settlement agreement to resolve the tax dispute at Porgera; the impact of our commitment towards the expansion of education infrastructure in Tanzania; and the impact of other expense adjustments.
Currency Translation
Current and deferred tax balances are subject to remeasurement for changes in foreign currency exchange rates each period. This is required in countries where tax is paid in local currency and the subsidiary has a different functional currency (typically US dollars). The most significant balances relate to Argentine and Malian tax liabilities.
In the nine months ended September 30, 2023, a tax expense of $18 million (2022: $88 million tax expense) arose primarily from translation losses on deferred tax balances in Argentina and Mali due to the weakening of the Argentine peso and the West African CFA franc, respectively, against the US dollar. These net translation losses are included within income tax expense.
Withholding Taxes
For the nine months ended September 30, 2023, we have recorded $47 million (2022: $49 million related to Argentina and the United States) of dividend withholding taxes related to the undistributed earnings of our subsidiaries in the United States.
United States Tax Reform
In August 2022, President Joe Biden signed the Inflation Reduction Act (“the Act”) into law. The Act includes a 15% corporate alternative minimum tax (“CAMT”) that is imposed on applicable financial statement income (“AFSI”) and therefore would be considered in scope for IAS 12 given it is a tax on profits. The CAMT is effective for tax years beginning after December 31, 2022 and CAMT credit carryforwards have an indefinite life. Barrick is subject to CAMT because the Company meets the applicable income thresholds for a foreign-parented multi-national group.
On December 27, 2022, the US Treasury Department and the US Internal Revenue Service issued initial guidance regarding the application of the CAMT. This was followed by a 60-day consultation period, and we have provided comments. We are awaiting the final US Treasury Regulations detailing the application of CAMT.
For the nine months ended September 30, 2023, the deferred tax asset arising from the CAMT credit carryforward has been recognized on the basis we expect that it will be recovered against US Federal Income Tax in the future.
Nevada Gold Mines (“NGM”)
NGM is a limited liability company treated as a flow through partnership for US tax purposes. The partnership is not subject to federal income tax directly, but each of its partners is liable for tax on its share of the profits of the partnership. As such, Barrick accounts for its current and deferred income tax associated with this investment (61.5% share) following the principles in IAS 12.
| BARRICK THIRD QUARTER 2023 | 94 | NOTES TO FINANCIAL STATEMENTS (UNAUDITED) |
| OVERVIEW | OPERATING PERFORMANCE |
GROWTH PROJECTS & EXPLORATION |
REVIEW OF FINANCIAL RESULTS |
OTHER INFORMATION & NON-GAAP RECONCILIATIONS |
FINANCIAL STATEMENTS |
|||||
Organization for Economic Co-operation and Development (“OECD”) Pillar Two model rules
In October 2021, more than 135 jurisdictions agreed to the OECD/G20 Inclusive Framework on Base Erosion and Profit Shifting’s Statement on a Two-Pillar Solution to Address the Tax Challenges Arising from the Digitalization of the Economy. Since then, the OECD has published model rules and other documents related to the second pillar of this solution (the Pillar Two model rules). The Pillar Two model rules provide a template that jurisdictions can translate into domestic tax law and implement as part of an agreed common approach.
In terms of the potential implications for income tax accounting, we have applied the exception available under the amendments to IAS 12 published by the IASB in May 2023 and are not recognizing or disclosing information about deferred tax assets and liabilities related to Pillar Two income taxes given relevant information is not known or reasonably estimable at this time. Furthermore, since Pillar Two legislation is not yet enacted or substantively enacted in the main jurisdictions where we operate, we continue working on assessing our exposure to Pillar Two income taxes and will provide an update once further information is available.
10 ∎ Cash Flow - Other Items
| Operating Cash Flows – Other Items |
For the three months ended September 30 |
For the nine months ended September 30 |
||||||||||||||
| 2023 | 2022 | 2023 | 2022 | |||||||||||||
| Adjustments for non-cash income statement items: |
||||||||||||||||
| Loss (gain) on non-hedge derivatives |
$— | $3 | ($2 | ) | ($4 | ) | ||||||||||
| Loss (gain) on warrant investments at FVPL |
1 | 2 | 6 | (2 | ) | |||||||||||
| Tanzania education program |
(5 | ) | — | 25 | — | |||||||||||
| Share-based compensation expense |
15 | 3 | 40 | 32 | ||||||||||||
| Change in estimate of rehabilitation costs at closed mines |
(44 | ) | (55 | ) | (35 | ) | (180 | ) | ||||||||
| Inventory impairment charges |
7 | 13 | 17 | 37 | ||||||||||||
| Change in other assets and liabilities |
(9 | ) | (15 | ) | 21 | (33 | ) | |||||||||
| Settlement of share-based compensation |
— | — | (29 | ) | (46 | ) | ||||||||||
| Settlement of rehabilitation obligations |
(39 | ) | (42 | ) | (116 | ) | (98 | ) | ||||||||
| Other operating activities |
($74 | ) | ($91 | ) | ($73 | ) | ($294 | ) | ||||||||
| Cash flow arising from changes in: |
||||||||||||||||
| Accounts receivable |
$41 | $76 | $16 | $144 | ||||||||||||
| Inventory |
(48 | ) | (53 | ) | (123 | ) | (133 | ) | ||||||||
| Other current assets |
(69 | ) | (71 | ) | (134 | ) | (243 | ) | ||||||||
| Accounts payable |
16 | (1 | ) | (32 | ) | 16 | ||||||||||
| Other current liabilities |
13 | (3 | ) | (25 | ) | (1 | ) | |||||||||
| Change in working capital |
($47 | ) | ($52 | ) | ($298 | ) | ($217 | ) | ||||||||
| Financing Cash Flows – Other Items |
For the three months ended September 30 |
For the nine months ended September 30 |
||||||||||||||
| 2023 | 2022 | 2023 | 2022 | |||||||||||||
| Pueblo Viejo JV partner shareholder loan |
$7 | $58 | $48 | $138 | ||||||||||||
| Debt extinguishment costs |
— | 2 | — | 2 | ||||||||||||
| Other financing activities |
$7 | $60 | $48 | $140 | ||||||||||||
11 ∎ Equity Accounting Method Investment Continuity
| Kibali | Jabal Sayid | Zaldívar | Other | Total | ||||||||||||||||
| At January 1, 2022 |
$3,267 | $382 | $893 | $52 | $4,594 | |||||||||||||||
| Equity pick-up from equity investees |
86 | 124 | 47 | 1 | 258 | |||||||||||||||
| Dividends received from equity investees |
(694 | ) | (124 | ) | (50 | ) | (1 | ) | (869 | ) | ||||||||||
| At December 31, 2022 |
$2,659 | $382 | $890 | $52 | $3,983 | |||||||||||||||
| Equity pick-up from equity investees |
104 | 70 | 4 | 1 | 179 | |||||||||||||||
| Dividends received from equity investees |
(86 | ) | (73 | ) | — | — | (159 | ) | ||||||||||||
| Shareholder loan repayment |
— | — | — | (5 | ) | (5 | ) | |||||||||||||
| At September 30, 2023 |
$2,677 | $379 | $894 | $48 | $3,998 | |||||||||||||||
| BARRICK THIRD QUARTER 2023 | 95 | NOTES TO FINANCIAL STATEMENTS (UNAUDITED) |
| OVERVIEW | OPERATING PERFORMANCE |
GROWTH PROJECTS & EXPLORATION |
REVIEW OF FINANCIAL RESULTS |
OTHER INFORMATION & NON-GAAP RECONCILIATIONS |
FINANCIAL STATEMENTS |
|||||
12 ∎ Impairment of Goodwill and Other Assets
In accordance with our accounting policy, goodwill is tested for impairment in the fourth quarter and also when there is an indicator of impairment. Non-current assets are tested for impairment or impairment reversals when events or changes in circumstances suggest that the carrying amount may not be recoverable or is understated. Refer to Note 21 of the 2022 Annual Financial Statements for further information.
For the nine months ended September 30, 2023, we recorded net impairment charges of $23 million (2022: $29 million net impairment charges) for non-current assets.
Indicators of impairment and reversals
2023
Porgera
On April 9, 2021, the Papua New Guinea (“PNG”) government and Barrick Niugini Limited (“BNL”, the 95% owner and operator of the Porgera joint venture) agreed on a partnership for the future ownership and operation of the Porgera mine. Porgera has been on care and maintenance since April 2020, when the government declined to renew its special mining lease (“SML”). The financial impact will be determined once all definitive agreements have been implemented. We have determined that as at September 30, 2023, there is no impairment loss to recognize. The ultimate resolution of this dispute may differ from this determination and there is no certainty that the carrying value will remain recoverable. Refer to Note 16 for more information.
13 ∎ Fair Value Measurements
a) Assets and Liabilities Measured at Fair Value on a Recurring Basis
| As at September 30, 2023 |
Quoted prices in active markets for identical assets
(Level 1) |
Significant other observable inputs
(Level 2) |
Significant unobservable inputs
(Level 3) |
Aggregate fair value
|
||||||||||||
| Other investments1 |
$85 | $— | $— | $85 | ||||||||||||
| Receivables from provisional copper and gold sales |
— | 167 | — | 167 | ||||||||||||
| $85 | $167 | $— | $252 | |||||||||||||
| 1 | Includes equity investments in other mining companies. |
b) Fair Values of Financial Assets and Liabilities
| As at September 30, 2023 |
As at December 31, 2022 |
|||||||||||||||
| Carrying amount |
Estimated fair value |
Carrying amount |
Estimated fair value |
|||||||||||||
| Financial assets |
||||||||||||||||
| Other assets1, 5 |
$409 | $409 | $1,358 | $1,358 | ||||||||||||
| Other investments2 |
85 | 85 | 112 | 112 | ||||||||||||
| Derivative assets3 |
— | — | 59 | 59 | ||||||||||||
| $494 | $494 | $1,529 | $1,529 | |||||||||||||
| Financial liabilities |
||||||||||||||||
| Debt4, 6 |
$4,775 | $4,694 | $4,782 | $4,922 | ||||||||||||
| Other liabilities5 |
632 | 632 | 1,562 | 1,562 | ||||||||||||
| $5,407 | $5,326 | $6,344 | $6,484 | |||||||||||||
| 1 | Includes restricted cash and amounts due from our partners. |
| 2 | Includes equity investments in other mining companies. Recorded at fair value. Quoted market prices are used to determine fair value. |
| 3 | 2022 primarily consisted of contingent consideration received as part of the sale of Massawa and Lagunas Norte. During the first quarter of 2023, the final settlement of $46.25 million was received relating to the Massawa contingent consideration. During the second quarter of 2023, $15 million was reclassified to accounts receivable relating to the Lagunas Norte contingent consideration. |
| 4 | Debt is generally recorded at amortized cost. The fair value of debt is primarily determined using quoted market prices. Balance includes both current and long-term portions of debt. |
| 5 | 2022 other assets include a restricted cash balance and other liabilities include a liability to Antofagasta plc. The restricted cash funded Antofagasta plc’s exit from the Reko Diq project, following its reconstitution in the fourth quarter of 2022. This was settled in the second quarter of 2023. |
| 6 | In September 2022, Barrick completed repurchases and cancellations of approximately $56 million of the $750 million outstanding principal on the 5.25% notes due 2042. The settlement resulted in a debt extinguishment gain of $2 million. |
The Company’s valuation techniques were presented in Note 26 of the 2022 Annual Financial Statements and have been consistently applied in these interim financial statements.
| BARRICK THIRD QUARTER 2023 | 96 | NOTES TO FINANCIAL STATEMENTS (UNAUDITED) |
| OVERVIEW | OPERATING PERFORMANCE |
GROWTH PROJECTS & EXPLORATION |
REVIEW OF FINANCIAL RESULTS |
OTHER INFORMATION & NON-GAAP RECONCILIATIONS |
FINANCIAL STATEMENTS |
|||||
14 ∎ Capital Stock
a) Authorized Capital Stock
Our authorized capital stock is composed of an unlimited number of common shares (issued 1,755,522,884 common shares as at September 30, 2023). Our common shares have no par value.
b) Dividends
The Company’s practice has been to declare dividends after a quarter as part of the announcement of the results for the quarter. Dividends declared are paid in the same quarter.
The Company’s dividend reinvestment plan resulted in 173,223 common shares issued to shareholders for the nine months ended September 30, 2023.
c) Share Buyback Program
At the February 14, 2023 meeting, the Board of Directors authorized a new share buyback program for the repurchase of up to $1.0 billion of the Company’s outstanding common shares over the next 12 months. During the nine months ended September 30, 2023, Barrick did not purchase any shares under this program.
The actual number of common shares that may be purchased, and the timing of any such purchases, will be determined by Barrick based on a number of factors, including the Company’s financial performance, the availability of cash flows, and the consideration of other uses of cash, including capital investment opportunities, returns to shareholders, and debt reduction.
The repurchase program does not obligate the Company to acquire any particular number of common shares, and the repurchase program may be suspended or discontinued at any time at the Company’s discretion.
15 ∎ Non-controlling Interests Continuity
| Nevada Gold Mines |
Pueblo Viejo |
Tanzania Mines1 |
Loulo- Gounkoto |
Tongon | Reko Diq | Other | Total | |||||||||||||||||||||||||||||||||
| NCI in subsidiary at September 30, 2023 |
38.5 | % | 40 | % | 16 | % | 20 | % | 10.3 | % | 50 | % | Various | |||||||||||||||||||||||||||
| At January 1, 2022 |
$6,061 | $1,189 | $298 | $953 | $29 | $— | ($80 | ) | $8,450 | |||||||||||||||||||||||||||||||
| Acquisitions |
— | — | — | — | — | 329 | — | 329 | ||||||||||||||||||||||||||||||||
| Share of income (loss) |
633 | 96 | 35 | (179 | ) | — | — | — | 585 | |||||||||||||||||||||||||||||||
| Disbursements |
(626 | ) | (157 | ) | (12 | ) | (35 | ) | (16 | ) | — | — | (846 | ) | ||||||||||||||||||||||||||
| At December 31, 2022 |
$6,068 | $1,128 | $321 | $739 | $13 | $329 | ($80 | ) | $8,518 | |||||||||||||||||||||||||||||||
| Share of income (loss) |
449 | 53 | 22 | 51 | 6 | (18 | ) | — | 563 | |||||||||||||||||||||||||||||||
| Cash contributed |
— | — | — | — | — | 23 | — | 23 | ||||||||||||||||||||||||||||||||
| Disbursements |
(322 | ) | (40 | ) | (23 | ) | (37 | ) | (4 | ) | — | — | (426 | ) | ||||||||||||||||||||||||||
| At September 30, 2023 |
$6,195 | $1,141 | $320 | $753 | $15 | $334 | ($80 | ) | $8,678 | |||||||||||||||||||||||||||||||
| 1 | Tanzania mines consist of the two operating mines, North Mara and Bulyanhulu. |
16 ∎ Contingencies
Certain conditions may exist as of the date the financial statements are issued that may result in a loss to the Company, but which will only be resolved when one or more future events occur or fail to occur. The impact of any resulting loss from such matters affecting these financial statements and noted below may be material.
Except as noted below, no material changes have occurred with respect to the matters disclosed in Note 35 “Contingencies” to the 2022 Annual Financial Statements, and no new contingencies have occurred that are material to the Company since the issuance of the 2022 Annual Financial Statements.
The description set out below should be read in conjunction with Note 35 “Contingencies” to the 2022 Annual Financial Statements.
Litigation and Claims Update
Proposed Canadian Securities Class Actions (Pascua-Lama)
In the Quebec proceeding, the Superior Court issued an Order on March 20, 2023 suspending certain deadlines for a period of three months on consent of the parties. On June 21, 2023, the Court issued an Order extending the suspension until November 15, 2023.
In the Ontario proceeding, the Plaintiffs’ appeal from the dismissal of certain statutory secondary market claims remains pending. The hearing of the appeal has been scheduled for December 13, 2023.
Writ of Kalikasan
This proceeding has been suspended since October 2022 to allow for court-annexed mediation to continue. The parties have jointly requested that the suspension be extended to November 13, 2023. The Court has not yet ruled on that request.
Porgera Special Mining Lease
On March 31, 2023, the State of PNG, BNL and New Porgera Limited, the new Porgera joint venture company, entered into the New Porgera Progress Agreement, which confirmed that all parties are committed to reopening the mine in line with the terms of the Commencement Agreement and the Shareholders’ Agreement, both of which were concluded in 2022.
New Porgera Limited lodged an application with the Mineral Resources Authority for a new SML on June 13, 2023, in accordance with the Commencement Agreement. On October 13, 2023, the new SML, Special Mining Lease 13, was granted by the Independent State of PNG to New Porgera Limited, following the execution of the Mining
| BARRICK THIRD QUARTER 2023 | 97 | NOTES TO FINANCIAL STATEMENTS (UNAUDITED) |
| OVERVIEW | OPERATING PERFORMANCE |
GROWTH PROJECTS & EXPLORATION |
REVIEW OF FINANCIAL RESULTS |
OTHER INFORMATION & NON-GAAP RECONCILIATIONS |
FINANCIAL STATEMENTS |
|||||
Development Contract between the Independent State of PNG and New Porgera Limited. The granting of the new SML to New Porgera Limited reduced Barrick’s interest in the future production of the Porgera mine from 47.5% to 24.5%. Also on October 13, 2023, the Independent State of PNG and New Porgera Limited executed the Fiscal Stability Agreement for the Porgera mine and New Porgera Limited and BNL executed the Project Operatorship Agreement, pursuant to which BNL was appointed as operator of the Porgera mine. The parties to the Commencement Agreement are continuing to progress the other conditions for the reopening of the mine. The key remaining condition to restart is the execution of new compensation agreements with local landowners.
Porgera Tax Audits
On June 20, 2023, the Internal Revenue Commission, the Commissioner General, Barrick and BNL entered into a settlement agreement to resolve the tax dispute. The resolution of this tax dispute satisfied one of the conditions to the reopening of the Porgera mine under the Commencement Agreement.
North Mara - Ontario Litigation
In May 2023, Barrick filed a motion to dismiss or permanently stay the Ontario action on the grounds that the Ontario Superior Court of Justice lacks jurisdiction and that Tanzania is a more appropriate forum in which to litigate this matter. The hearing of the motion has been scheduled for October 2024.
Kibali Customs Dispute
The Company is continuing to engage in discussions with the Customs Authority and Ministry of Finance regarding the customs claims. After having settled, on March 26, 2023, one of the Customs Authority claims concerning historic export duties, on October 2, 2023, the parties agreed to settle a claim relating to the application of the preferential customs regime to the Kibali gold mine. Discussions to resolve the remaining customs claims are ongoing. A formal reassessment notice has not yet been issued by the Customs Authority with respect to these claims.
Zaldívar Water Claims
On April 6, 2023, the Environmental Court of Antofagasta agreed to stay the proceedings through May 6, 2023 to allow for further settlement discussions. The stay expired without a settlement agreement being reached. The Court held an evidentiary hearing during the week of July 24, 2023, and a site inspection took place on August 16 and 17, 2023. Discussions regarding a potential settlement are nevertheless still ongoing, and the Court will hear closing arguments before issuing a decision in this matter.
| BARRICK THIRD QUARTER 2023 | 98 | NOTES TO FINANCIAL STATEMENTS (UNAUDITED) |
Corporate Office
Barrick Gold Corporation
161 Bay Street, Suite 3700
Toronto, Ontario M5J 2S1
Canada
Telephone: +1 416 861-9911
Email: investor@barrick.com
Website: www.barrick.com
Shares Listed
| GOLD | The New York Stock Exchange |
| ABX | The Toronto Stock Exchange |
Transfer Agents and Registrars
TSX Trust Company
301 – 100 Adelaide Street West
Toronto, Ontario M5H 4H1
or
Equiniti Trust Company, LLC
6201 – 15 Avenue
Brooklyn, New York 11219
Telephone: 1-800-387-0825
Fax: 1-888-249-6189
Email: shareholderinquiries@tmx.com
Website: www.tsxtrust.com
Enquiries
President and Chief Executive Officer
Mark Bristow
+1 647 205 7694
+44 788 071 1386
Senior Executive Vice-President and
Chief Financial Officer
Graham Shuttleworth
+1 647 262 2095
+44 779 771 1338
Investor and Media Relations
Kathy du Plessis
+44 20 7557 7738
Email: barrick@dpapr.com
Cautionary Statement on Forward-Looking Information
Certain information contained or incorporated by reference in this press release, including any information as to our strategy, projects, plans or future financial or operating performance, constitutes “forward-looking statements”. All statements, other than statements of historical fact, are forward-looking statements. The words “believe”, “expect”, “strategy”, “target”, “plan”, “focus”, “scheduled”, “commitment” “opportunities”, “guidance”, “project”, “expand”, “invest”, “continue”, “progress”, “develop”, “on track”, “estimate”, “growth”, “potential”, “future”, “extend”, “will”, “could”, “would”, “should”, “may” and similar expressions identify forward-looking statements. In particular, this press release contains forward-looking statements including, without limitation, with respect to: Barrick’s forward-looking production guidance, including anticipated gold production for the fourth quarter of 2023 and our expectation of a shortfall (and the magnitude of the expected shortfall) in 2023 annual gold production relative to Barrick’s previously announced 2023 guidance and our five, ten and fifteen-year production profiles for gold and copper; projected capital, operating and exploration expenditures; our ability to convert resources into reserves and replace reserves net of depletion from production; mine life and production rates, including expected mineral reserve replacement in 2023 and 2024, annual production expectations from Reko Diq and Lumwana and anticipated production growth from Barrick’s organic project pipeline and reserve replacement; Barrick’s global exploration strategy and planned exploration activities, including the expected benefits of drill results at Nevada Gold Mines; our ability to identify new Tier One assets and the
potential for existing assets to attain Tier One status; Barrick’s copper strategy; our plans and expected completion and benefits of our growth projects, including the Pueblo Viejo plant expansion and mine life extension project, Fourmile, Reko Diq project, Porgera mine, Lumwana Super Pit and growth opportunities at Nevada Gold Mines; potential mineralization and metal or mineral recoveries; expected timing for the feasibility study, construction and targeted first production for the Reko Diq project; our expectations for a project financing process for Reko Diq; the duration of the temporary suspension of operations at Porgera, the conditions for the reopening of the mine, including the execution of compensation agreements with local landowners, and the timeline to recommence operations; potential mine life of Porgera; our pipeline of high confidence projects at or near existing operations; the potential to extend Veladero’s life of mine; Barrick’s global exploration strategy and planned exploration activities; Barrick’s partnership with the Government of Tanzania under the framework agreement; Lumwana’s ability to further extend the life of mine through the development of a Super Pit and targeted timing for construction and first production; Barrick’s strategy, plans, targets and goals in respect of environmental and social governance issues, including local community relations, economic contributions and education, infrastructure and procurement initiatives, climate change (including our Scope 3 emissions targets and our reliance on our value chain to help us achieve these targets within the specified time frames), biodiversity initiatives and tailings storage facilities management, including Barrick’s conformance with the Global Industry Standard on Tailings Management; Barrick’s talent management strategy; and expectations regarding future price assumptions, financial performance and other outlook or guidance.
Forward-looking statements are necessarily based upon a number of estimates and assumptions including material estimates and assumptions related to the factors set forth below that, while considered reasonable by the Company as at the date of this press release in light of management’s experience and perception of current conditions and expected developments, are inherently subject to significant business, economic and competitive uncertainties and contingencies. Known and unknown factors could cause actual results to differ materially from those projected in the forward-looking statements and undue reliance should not be placed on such statements and information. Such factors include, but are not limited to: fluctuations in the spot and forward price of gold, copper or certain other commodities (such as silver, diesel fuel, natural gas and electricity); risks associated with projects in the early stages of evaluation and for which additional engineering and other analysis is required; risks related to the possibility that future exploration results will not be consistent with the Company’s expectations, that quantities or grades of reserves will be diminished, and that resources may not be converted to reserves; risks associated with the fact that certain of the initiatives described in this press release are still in the early stages and may not materialize; changes in mineral production performance, exploitation and exploration successes; risks that exploration data may be incomplete and considerable additional work may be required to complete further evaluation, including but not limited to drilling, engineering and socioeconomic studies and investment; the speculative nature of mineral exploration and development; lack of certainty with respect to foreign legal systems, corruption and other factors that are inconsistent with the rule of law; changes in national and local government legislation, taxation, controls or regulations and/or changes in the administration of laws, policies and practices; the potential impact of proposed changes to Chilean law on the status of value added tax refunds received in Chile in connection with the development of the Pascua-Lama project; expropriation or nationalization of property and political or economic developments in Canada, the United States or other countries in which Barrick does or may carry on business in the future; risks relating to political instability in certain of the jurisdictions in which Barrick operates; timing of receipt of, or failure to comply with, necessary permits and approvals, including the issuance of a Record of Decision for the Goldrush Project and/or whether the Goldrush Project will be permitted to advance as currently designed under its Feasibility Study, and the environmental license for the construction and operation of the El Naranjo tailings storage facility for Pueblo Viejo; non-renewal of key licenses by governmental authorities; failure to comply with environmental and health and safety laws and regulations; increased costs and physical and transition risks related to climate change, including extreme weather events, resource shortages, emerging policies and increased regulations relating to greenhouse gas emission levels, energy efficiency and reporting of risks; contests over title to properties, particularly title to undeveloped properties, or over access to water, power and other required infrastructure; the liability associated with risks and hazards in the mining industry, and the ability to maintain insurance to cover such losses; damage to the Company’s reputation due to the actual or perceived occurrence of any number of events, including negative publicity with respect to the Company’s handling of environmental matters or dealings with community groups, whether true or not; risks related to operations near communities that may regard Barrick’s operations as being detrimental to them; litigation and legal and administrative proceedings; operating or technical difficulties in connection with mining or development activities, including geotechnical
challenges, tailings dam and storage facilities failures, and disruptions in the maintenance or provision of required infrastructure and information technology systems; increased costs, delays, suspensions and technical challenges associated with the construction of capital projects; risks associated with working with partners in jointly controlled assets; risks related to disruption of supply routes which may cause delays in construction and mining activities, including disruptions in the supply of key mining inputs due to the invasion of Ukraine by Russia; risk of loss due to acts of war, terrorism, sabotage and civil disturbances; risks associated with artisanal and illegal mining; risks associated with Barrick’s infrastructure, information technology systems and the implementation of Barrick’s technological initiatives, including risks related to cyber-attacks, cybersecurity breaches, or similar network or system disruptions; the impact of global liquidity and credit availability on the timing of cash flows and the values of assets and liabilities based on projected future cash flows; the impact of inflation, including global inflationary pressures driven by supply chain disruptions caused by the ongoing Covid-19 pandemic, global energy cost increases following the invasion of Ukraine by Russia and country-specific political and economic factors in Argentina; adverse changes in our credit ratings; fluctuations in the currency markets; changes in U.S. dollar interest rates; risks arising from holding derivative instruments (such as credit risk, market liquidity risk and mark-to-market risk); risks related to the demands placed on the Company’s management, the ability of management to implement its business strategy and enhanced political risk in certain jurisdictions; uncertainty whether some or all of Barrick’s targeted investments and projects will meet the Company’s capital allocation objectives and internal hurdle rate; whether benefits expected from recent transactions are realized; business opportunities that may be presented to, or pursued by, the Company; our ability to successfully integrate acquisitions or complete divestitures; risks related to competition in the mining industry; employee relations including loss of key employees; availability and increased costs associated with mining inputs and labor; risks associated with diseases, epidemics and pandemics, including the effects and potential effects of the global Covid-19 pandemic; risks related to the failure of internal controls; and risks related to the impairment of the Company’s goodwill and assets. Barrick also cautions that its 2023 guidance, as well as its five, ten and fifteen-year production profiles for gold and copper, may be impacted by the ongoing business and social disruption caused by the spread of Covid-19.
In addition, there are risks and hazards associated with the business of mineral exploration, development and mining, including environmental hazards, industrial accidents, unusual or unexpected formations, pressures, cave-ins, flooding and gold bullion, copper cathode or gold or copper concentrate losses (and the risk of inadequate insurance, or inability to obtain insurance, to cover these risks).
Many of these uncertainties and contingencies can affect our actual results and could cause actual results to differ materially from those expressed or implied in any forward-looking statements made by, or on behalf of, us. Readers are cautioned that forward-looking statements are not guarantees of future performance. All of the forward-looking statements made in this press release are qualified by these cautionary statements. Specific reference is made to the most recent Form 40-F/Annual Information Form on file with the SEC and Canadian provincial securities regulatory authorities for a more detailed discussion of some of the factors underlying forward-looking statements and the risks that may affect Barrick’s ability to achieve the expectations set forth in the forward-looking statements contained in this press release. We disclaim any intention or obligation to update or revise any forward-looking statements whether as a result of new information, future events or otherwise, except as required by applicable law.