UNITED STATES
SECURITIES AND EXCHANGE COMMISSION
Washington, D.C. 20549
FORM 8-K
CURRENT REPORT
Pursuant to Section 13 or 15(d)
of The Securities Exchange Act of 1934
Date of Report (Date of earliest event reported): November 2, 2023
Block, Inc.
(Exact name of registrant as specified in its charter)
| Delaware | 001-37622 | 80-0429876 | ||
| (State or other jurisdiction of incorporation) |
(Commission File Number) |
(IRS Employer Identification No.) |
1955 Broadway, Suite 600
Oakland, CA 946121
(Address of principal executive offices, including zip code)
(415) 375-3176
(Registrant’s telephone number, including area code)
Not Applicable
(Former name or former address, if changed since last report)
Check the appropriate box below if the Form 8-K filing is intended to simultaneously satisfy the filing obligation of the registrant under any of the following provisions (see General Instruction A.2. below):
| ☐ | Written communications pursuant to Rule 425 under the Securities Act (17 CFR 230.425) |
| ☐ | Soliciting material pursuant to Rule 14a-12 under the Exchange Act (17 CFR 240.14a-12) |
| ☐ | Pre-commencement communications pursuant to Rule 14d-2(b) under the Exchange Act (17 CFR 240.14d-2(b)) |
| ☐ | Pre-commencement communications pursuant to Rule 13e-4(c) under the Exchange Act (17 CFR 240.13e-4(c)) |
Securities registered pursuant to Section 12(b) of the Act:
| Title of each class |
Trading |
Name of each exchange |
||
| Class A Common Stock, $0.0000001 par value per share | SQ | New York Stock Exchange |
Indicate by check mark whether the registrant is an emerging growth company as defined in Rule 405 of the Securities Act of 1933 (§230.405 of this chapter) or Rule 12b-2 of the Securities Exchange Act of 1934 (§240.12b-2 of this chapter).
Emerging growth company ☐
If an emerging growth company, indicate by check mark if the registrant has elected not to use the extended transition period for complying with any new or revised financial accounting standards provided pursuant to Section 13(a) of the Exchange Act. ☐
| 1 | We have adopted a distributed work model and, therefore, have no formal headquarters. This address represents our “principal executive office,” which we are required to identify under Securities and Exchange Commission rules. |
| Item 2.02 | Results of Operations and Financial Condition. |
On November 2, 2023, Block, Inc. (the “Company”) issued a Shareholder Letter (the “Letter”) announcing its financial results for the third quarter ended September 30, 2023. In the Letter, the Company also announced that it would be holding a conference call and earnings webcast on November 2, 2023 at 2:00 p.m. Pacific Time to discuss its financial results for the third quarter ended September 30, 2023. The Letter is furnished as Exhibit 99.1 to this Current Report on Form 8-K (this “Report”).
The Company is making reference to non-GAAP financial information in both the Letter and the conference call. A reconciliation of these non-GAAP financial measures to their nearest GAAP equivalents is provided in the Letter.
The information furnished pursuant to Item 2.02 on this Report, including Exhibit 99.1 attached hereto, shall not be deemed “filed” for purposes of Section 18 of the Securities Exchange Act of 1934, as amended (the “Exchange Act”), or otherwise subject to the liabilities of that section, nor shall it be deemed incorporated by reference into any other filing under the Securities Act of 1933, as amended, or the Exchange Act, except as expressly set forth by specific reference in such a filing.
| Item 8.01 | Other Events. |
On November 2, 2023, the Company announced that its board of directors has authorized the repurchase of up to $1.0 billion of the Company’s Class A common stock. Repurchases may be made from time to time through open market purchases or through privately negotiated transactions subject to market conditions, applicable legal requirements and other relevant factors. Open market repurchases may be structured to occur in accordance with the requirements of Rule 10b-18. The Company may also, from time to time, enter into Rule 10b5-1 plans to facilitate repurchases of its shares under this authorization. The repurchase program does not obligate the Company to acquire any particular amount of its Class A common stock and may be suspended at any time at the Company’s discretion. The timing and number of shares repurchased will depend on a variety of factors, including the stock price, business and market conditions, corporate and regulatory requirements, alternative investment opportunities, acquisition opportunities, and other factors. The goal of the program is to offset a portion of the dilution associated with stock-based compensation issued to employees as part of the Company’s overall compensation program.
| Item 9.01 | Financial Statements and Exhibits. |
(d) Exhibits
| Exhibit No. |
Description |
|
| 99.1 | Shareholder Letter, dated November 2, 2023. | |
| 104 | Cover Page Interactive Data File, formatted in inline XBRL. | |
SIGNATURES
Pursuant to the requirements of the Securities Exchange Act of 1934, the registrant has duly caused this report to be signed on its behalf by the undersigned hereunto duly authorized.
| BLOCK, INC. | ||||||
| Date: November 2, 2023 | By: | /s/ Chrysty Esperanza |
||||
| Chrysty Esperanza Chief Legal Officer and Corporate Secretary |
||||||
Exhibit 99.1

| To Our Shareholders: |
||
| November 2, 2023 | We’ve been quiet lately because we’ve been focused. |
|
| When we went public almost 8 years ago, we stated this in our S-1: |
||
| “As a public company our decisions will continue to reflect what we’ve done as a private one—we put our customers first. That means constantly asking the question: how can the financial system better serve people? We’ll measure ourselves by our commitment to take the long view and focus on building a company that creates value over decades and not just a few fiscal quarters out.” |
||
| This commitment over the years resulted in building our Cash App ecosystem beyond the scale of our original Square ecosystem, creating an “ecosystem of ecosystems” model to provide greater growth potential and resiliency across different audience types and use cases, and most recently, an investment framework that takes into account the true cost of our business, including stock based compensation. We shared that investment framework earlier this year: |
||
| Block and each ecosystem must show a believable path to Gross Profit Retention of over 100% and Rule of 40 on Adjusted Operating Income. |
||
| We believe this framework balances creating long term value for customers with the same for our shareholders. We believe we will reach Rule of 40 in 2026, with an initial composition of at least mid-teens gross profit growth and a mid-20% Adjusted Operating Income margin. We will provide annual guidance on these targets until we reach and sustain them, at which point we will reevaluate our guidance principles. |
||
| As we progress towards Rule of 40 in the coming years, we expect our margin profile and free cash flow generation to improve as well, which means we can return more to our shareholders over time. Today, we’re instituting an initial authorization to repurchase $1 billion in shares, which will offset a portion of dilution from share based compensation. This also allows us to act opportunistically when we believe our company is undervalued. |
||
| As we continue to view the business through the lens of our investment framework, we continue to find opportunities for constraints we believe will lead to greater growth. We implemented one of these a year before our IPO: an absolute cap on the number of people we had at the company. It was very effective at driving performance, scoping our work through better prioritization, and looking critically at the number of products we offered against our strategy. We are going to do that again now, by creating an absolute cap on the number of people we have at the company, held firm at 12,000 people until we feel the growth of the business has meaningfully outpaced the growth of the company. We know the inverse is true today. |
||
|
|
BLOCK Q3 2023 2 |
| My focus going forward is threefold: our Square business, our ecosystem of ecosystems model, and our costs. |
||
| I’ll start with the last, costs, noting that as we’ve built out our operating model for our four business units, we’ve created structural duplication and redundancy that would better serve us by being more centralized. We’ve spent a lot of time looking at actual needs of each business and for opportunities to recentralize resources, both on Amrita’s teams and within the business units. We’ve already begun this work. |
||
| Moving on to our ecosystem of ecosystems, our focus is to create a dynamic where we are serving different audiences and use cases to increase our total addressable market and to create overall resilience. We are now serving sellers with Square, individuals with Cash App, developers with TBD, and musicians with TIDAL. We believe we can benefit each audience through connected financial tools, and that each business will positively reinforce each other over time. |
||
| Over the past few months we’ve reset the relationship between Square and Cash App and restructured Afterpay to ensure a stronger connection between each, and most importantly, create an innovative customer experience. We finally have line of sight to seeing more of Square within Cash App, and vice versa. We believe combining the two ecosystems enables us to provide consumer experiences others can’t, specifically for commerce. You’ll be able to see this for yourself early next year. |
||
| Cash App sits at the intersection of three traditionally-distinct use cases: financial services, community based transactions (peer-to-peer payments) and commerce. Our approach for Cash App is to uniquely bring these three areas together to define a new product category and reinvent banking for our customers. With this opportunity in mind we have clarified a focused strategy on earning the primary banking relationship of our existing customer base in the US. We’ll do this through continued focus on reliability, customer service, and security, by enhancing our banking feature set, and revisiting our go-to-market efforts, inclusive of bundling Cash App’s financial services offering. |
||
| Since taking Square back over, I wanted to expand a bit on what I’ve found, and where we’re going. I believe there have been a number of things holding Square back, some structural, some cultural, all of which can be addressed through stronger and more opinionated prioritization and week-on-week fast iteration. We started by resetting our prioritization to focus on four things: a rock solid and flexible multi-vertical platform, providing a “local” experience to sellers of all sizes, growing with AI, and banking on Square. |
||
| We believe our seller platform will prove to be our superpower, with major unlocks arriving in 2024. Our platform serves both our internal teams creating first party products, and our developer and partner ecosystem creating third party solutions, especially for our upmarket sellers. By continuing to focus on increasing reliability and the strength of our development primitives, we will increase our overall agility and development speed. It also enables us to play off the breadth of our ecosystem tools, especially compared to companies who are only focused on single verticals. |
||
|
|
BLOCK Q3 2023 3 |
| As we consider our go-to-market strategy, we’re going to focus on our verticals, with a far greater “local” approach. Upmarket sellers especially want to feel more local and authentic to their customers, and with better technology, they can. And that’s inclusive of how we bring them onto Square, through sales and account management. We’re going to better prioritize our vertical outreach to sellers that are inherently local, such as restaurants and services, both areas we believe we can build a huge amount of strength within. In doing so, we believe we can build significant network effects that benefit both individual customers and sellers of all sizes, from the micro to large. |
||
| While we have exceptional AI talent at the company, we haven’t been using it effectively. We’re putting a huge premium on this work, starting with increasing our engineering productivity not just within Square, but across all of Block. Specific to Square, we are raising our priority to increase productivity and positive outcomes for customer service, sales, and marketing. And we have teams focused on building generative AI features to help sellers grow and help them manage some of the more complex or mundane tasks they perform in order to grow their customer base. |
||
| Finally, we see a growing opportunity for banking with and on Square, and are surfacing it as one of our top priorities. We’ve come a long way since introducing Square Capital. We now have a number of financial tools in the market to help sellers with cash flow and purchasing, including Loans, Debit Card, Credit Card, Checking, Savings, and Bill Pay. We will make these more cohesive as a cash flow home that sellers love because of the fast access to their funds, automatic budgeting, and time-saving tools to spend for their business. |
||
| I’m grateful to get to work closely with the Square team again to focus on our strengths, improve our execution, and reinvigorate growth with new technology and products. We have a cohesive offering like no other, that will only get stronger as we focus back on our original founding principle: if we help a seller grow, we grow. |
||
| We want to thank all of you for your trust and continued belief in our work. We will work to balance that trust with accountability, some of which I hope this letter provides. |
||
| Thank you, |
||
|
Jack Dorsey |
||
|
|
BLOCK Q3 2023 4 |
Q3’23 Highlights
|
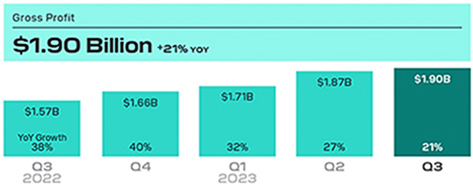
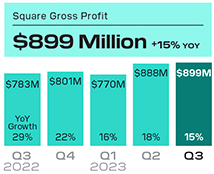
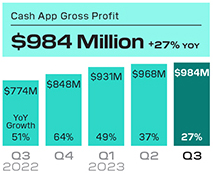
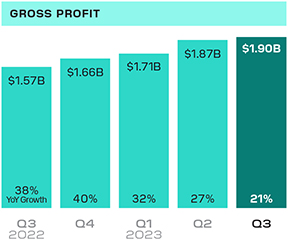
In the third quarter of 2023, we generated gross profit of $1.90 billion, up 21% year over year. Cash App generated gross profit of $984 million, up 27% year over year, and Square generated gross profit of $899 million, up 15% year over year.
We continued to make progress toward our investment framework with an improvement in profitability in the third quarter as we focus on disciplined growth and pursuing cost efficiencies. We are increasing our full-year 2023 guidance for both Adjusted Operating Income and Adjusted EBITDA.¹
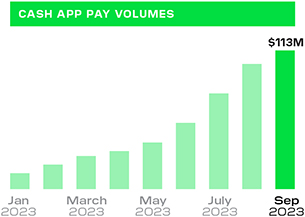
Cash App Pay volumes have experienced rapid growth over the past quarter: As of September, there were more than 2 million Cash App Pay monthly actives, doubling since June.
Prioritizing local sellers and growing upmarket remains a focus: In the third quarter, we launched Square for Franchises to better serve these complex sellers and expand our serviceable market. |
|
|||
|
|
|
|||
|
In the third quarter of 2023, total net revenue was $5.62 billion, up 24% year over year, and, excluding bitcoin revenue, revenue was $3.19 billion, up 16% year over year.
Reconciliations of non-GAAP financial measures used in this letter to their nearest GAAP equivalents are provided at the end of this letter. Please see these reconciliations for a description of certain items that affected operating income (loss) and net income (loss) in the third quarter of 2023.
¹ We have not provided the forward-looking GAAP equivalents for Adjusted EBITDA and Adjusted Operating Income (Loss), or GAAP reconciliations of the aforementioned non-GAAP metrics, as a result of the uncertainty regarding, and the potential variability of, reconciling items such as share-based compensation expense. Accordingly, the Company has relied upon the exception in item 10(e)(1)(i)(B) of Regulation S-K to exclude such reconciliations, as the reconciliations of these non-GAAP guidance metrics to their corresponding GAAP equivalents are not available without unreasonable effort. However, it is important to note that material changes to reconciling items could have a significant effect on future GAAP results. We have provided reconciliations of other historical GAAP to non-GAAP metrics in tables at the end of this letter. |
||||
|
|
BLOCK Q3 2023 5 |
A transacting active is a Cash App account that has at least one financial transaction using any product or service within Cash App during a specified period. A transacting active for a specific Cash App product has at least one financial transaction using that product during the specified period and is referred to as an active. Examples of transactions include sending or receiving a peer-to-peer payment, transferring money into or out of Cash App, making a purchase using Cash App Card, earning a dividend on a stock investment, and paying back a loan, among others. Certain of these accounts may share an alias identifier with one or more other transacting active accounts. This could represent, among other things, one customer with multiple accounts or multiple customers sharing one alias identifier (for example, families).
Inflows per transacting active refers to total inflows in the quarter divided by monthly actives for the last month of the quarter. Inflows refers to funds entering the Cash App ecosystem. Inflows does not include the movement of funds when funds remain in the Cash App ecosystem or when funds leave the Cash App ecosystem, or inflows related to the Afterpay or Verse apps. Inflows from Verse actives were not material to overall inflows.
Cash App Ecosystem
We are building Cash App for customers to be able to use our ecosystem across their financial needs, starting with Cash App Card. We have seen customers adopt the card and then expand usage to other financial services products within Cash App like Savings, ATMs, Borrow, and Direct Deposit. Cash App Card reached 22 million monthly actives as of September, with approximately 30% of those transacting on any given day. To drive further engagement with Cash App Card, we are focused on new card and personalized design launches; marketing that uses a combination of emails, ads, and push notifications; and the convergence of software and hardware through app themes, card effects, and personalization. For instance, in September we launched Pink Card, a custom pink Cash App Card, and we saw the fastest pace of Cash App Card orders ever sold in one week. We have also seen our paid card holders spend more than those using our free cards.
Our customers have found value in gaining access to our short-term credit product, Cash App Borrow, as it provides flexible cash flow optionality. We have been able to reach scale while also maintaining historical loss rates of less than 3% on average: In the third quarter, we originated over $900 million in short-term loans and had more than 2 million Cash App Borrow monthly actives as of September.
We’re working to provide additional utility to banking products like direct deposit, and offer more choice to customers, which in turn drives engagement. In October, we started offering Auto-save paychecks and Paychecks applet, allowing customers to automatically save a percentage of each direct-deposited paycheck across savings, stocks, bitcoin, or their stored balance.

We launched a custom pink Cash App Card in the third quarter that pairs with an in-app pink theme. This is part of our strategy to elevate the card experience, and we have seen paid card holders spend more than those using our free cards.
|
|
BLOCK Q3 2023 6 |
Cash App Pay experienced strong growth and positive unit economics in the third quarter: As of September, we had more than 2 million Cash App Pay monthly actives, doubling since June. Growth has been driven by our recent partnerships, such as DoorDash, Adyen, and Stripe, as well as other large Afterpay merchants. Widening distribution of Cash App Pay allows us to reach customers beyond those whom Cash App Card serves today, and provides increased utility around stored funds.
Cash App Pay volumes are not included in our reported GPV numbers because GPV is related only to transaction-based revenue and not to subscription and services-based revenue. Cash App Pay revenue is included in subscription and services-based revenue.
|
|
BLOCK Q3 2023 7 |
¹ “2023 Franchise Economic Outlook,” International Franchise Association, March 28, 2023.
Square Ecosystem
In August, we launched Square Go, a consumer app that provides a marketplace of local beauty and personal care sellers that use the Square platform, with plans to bring the mobile booking functionality to more verticals in the future. Square Go directly integrates with Square Appointments to provide an end-to-end booking experience so consumers can search, discover, and schedule with highly rated independent service providers in their area. We have connected sellers and buyers to create nearly half a million bookings through Square Go in the third quarter since launch, and week-over-week bookings continued to increase through the same period.
We are focused on refining our go-to-market strategy to win more complex sellers, and in the third quarter we began introducing more formal contracts for large sellers. While smaller sellers enjoy the flexibility of no long-term contracts, we have learned that larger sellers prefer to have set terms for a year or more, allowing them to better manage their cash flow. Enabling multi-year contract terms empowers our sales team to bring sellers into our ecosystem, which allows us to provide competitive up-front discounts and rate guarantees to sellers.
The franchise market in the U.S. drives more than $860 billion of projected revenue across 9,000 brands and a range of verticals.¹ During the third quarter, we introduced Square for Franchises to serve these complex sellers and expand our serviceable market. Franchise and multi-entity sellers are key to our upmarket strategy as they generally use more products and generate greater gross profit than non-franchise sellers. With the Square for Franchises platform, sellers can efficiently manage multiple locations by having a comprehensive view of store performance, offer unique menu options, and coordinate gift card and loyalty programs.

In the third quarter we launched Square Go, a consumer app that provides a marketplace of local beauty and personal care sellers that use the Square platform.
SELLER HIGHLIGHT

Square for Franchises has revolutionized our restaurant group, BIRDCODE, by providing an all-in-one platform for comprehensive reporting across our entire system, seamless payments, and powerful marketing tools. Our mobile app’s Online Ordering feature has been a game-changer for the development of our franchise system and an engaging way to connect with our customers and drive success.”
- BIRDCODE Hot Chicken
|
|
BLOCK Q3 2023 8 |
We believe artificial intelligence (AI) can be a powerful assistant to help sellers further grow their businesses as it can enable greater creativity, efficiency, and productivity. In October, we launched several new AI features dedicated to helping sellers automate operations, speed up workflows, and regain time. For example, approximately 60% of new restaurant sellers have indicated that they don’t have or aren’t ready to upload their menu during onboarding. With Menu Generator, sellers can now create a full menu on Square in minutes, giving them valuable momentum when launching operations on Square.
We’re working to provide sellers in our global markets with innovative tools to account for all forms of payment their customers want to use. During the third quarter, we launched Tap to Pay on Android in Japan and Canada, joining six other countries across Australia, Europe, the UK, and the U.S. As demand for contactless payments continues to scale around the globe, we have seen strong adoption and the ability of Tap to Pay to drive acquisition in our current markets.

In October we launched several new AI features including Copy Generator, which helps sellers save time, level up their websites, and boost search engine optimization (SEO) with AI-assisted short- or long-form website copy.
|
|
BLOCK Q3 2023 9 |
Reconciliations of non-GAAP metrics used in this letter to their nearest GAAP equivalents are provided at the end of this letter.
GPV includes Square GPV and Cash App Business GPV. Square GPV is defined as the total dollar amount of all card payments processed by sellers using Square, net of refunds, and ACH transfers. Cash App Business GPV comprises Cash App activity related to peer-to-peer transactions received by business accounts and peer-to-peer payments sent from a credit card. GPV does not include transactions from our BNPL platform because GPV is related only to transaction-based revenue and not to subscription and services-based revenue.
We acquired our BNPL platform through the acquisition of Afterpay. We recognize revenue from our BNPL platform as subscription and services-based revenue, and have allocated 50% of revenue and gross profit from our BNPL platform to each of Square and Cash App. Revenue from our BNPL platform includes fees generated from consumer receivables, late fees, and certain affiliate and advertising fees from the platform.
Financial Discussion
REVENUE AND GROSS PROFIT
Total net revenue was $5.62 billion in the third quarter of 2023, up 24% year over year. Excluding bitcoin revenue, revenue in the third quarter was $3.19 billion, up 16% year over year. Gross profit was $1.90 billion, up 21% year over year.
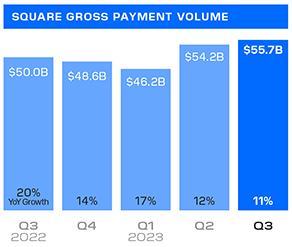
Transaction-based revenue was $1.66 billion in the third quarter of 2023, up 9% year over year, and transaction-based gross profit was $674 million, up 9% year over year. We processed $60.08 billion in GPV in the third quarter of 2023, up 10% year over year. Transaction-based gross profit as a percentage of GPV was 1.12% in the third quarter, down 1 basis point year over year and 4 basis points quarter over quarter.
Subscription and services-based revenue was $1.49 billion in the third quarter of 2023, up 25% year over year, and subscription and services-based gross profit was $1.23 billion, up 28% year over year.
In the third quarter of 2023, gross profit included $18 million of amortization of acquired technology assets, the majority of which was from the acquisition of our BNPL platform.
Bitcoin gross profit was $45 million in the third quarter of 2023. The total sale amount of bitcoin sold to customers, which we recognize as bitcoin revenue, was $2.42 billion. Bitcoin gross profit was 2% of bitcoin revenue.
|
|
BLOCK Q3 2023 10 |
Software and integrated payments gross profit excludes contributions from our BNPL platform.
SQUARE ECOSYSTEM REVENUE
AND GROSS PROFIT
In the third quarter of 2023, Square generated $1.98 billion of revenue and $899 million of gross profit, up 12% and 15% year over year, respectively. Our BNPL platform contributed $129 million of revenue and $94 million of gross profit to Square in the third quarter of 2023.
We continued to drive growth in software and integrated payments, with gross profit from these products up 16% year over year. Gross profit from sidecar payments, or transactions where sellers enter an amount on the keypad and hit charge, grew 2% year over year. Gross profit from our banking products, which primarily include Square Loans, Instant Transfer, and Square Debit Card, was up 20% year over year and 24% year over year excluding gross profit attributable to Paycheck Protection Program (PPP) loan forgiveness.
Square generated $1.54 billion of transaction-based revenue in the third quarter of 2023, up 10% year over year. During the quarter, Square saw more favorable interchange economics, which offset a higher percentage of card-present and credit card transactions on a year-over-year basis, which are less favorable to our economics on a per transaction basis.
In the third quarter of 2023, Square GPV was $55.69 billion, up 11% year over year and 12% year over year on a constant currency basis. We observed the following trends in Square GPV during the third quarter of 2023:
| • | Products: Card-present GPV was up 15% year over year. Card-not-present GPV was up 4% year over year, with card-not-present GPV from software and integrated payments outpacing overall card-not-present GPV. |
| • | Geographies: Square GPV in our U.S. market grew 9% year over year, and growth in our international markets was 28% year over year. On a constant currency basis, Square GPV in our international markets was up 30% year over year. |
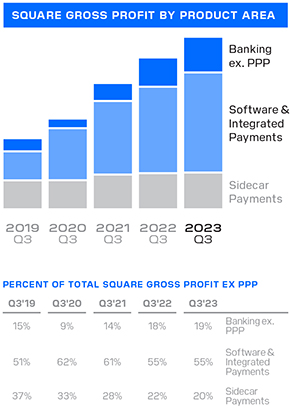
Hardware gross profit losses and gross profit contributions from our BNPL platform are not presented for any period. Percentages are of Square gross profit excluding contributions from PPP loan forgiveness for each period.
Square GPV is defined as the total dollar amount of all card payments processed by sellers using Square, net of refunds, and ACH transfers. Square GPV does not include transactions from our BNPL platform because GPV is related only to transaction-based revenue and not to subscription and services-based revenue.
|
|
BLOCK Q3 2023 11 |
Services verticals include
professional services,
beauty and personal care,
health care and fitness,
and home and repair.
| • | Verticals: On a year-over-year basis, food and drink GPV was up 16%, GPV from services verticals was up 8%, and retail GPV was up 7%. Gross profit from our vertical point-of-sale solutions, including Square Appointments, Square for Restaurants, and Square for Retail, was up 29% year over year. |
| • | Acquisition and Retention: We achieved positive growth in acquisition of new sellers. Retention of existing sellers is a function of churn and GPV per seller. During the quarter, we saw stability in churn of existing sellers compared to historical levels. In the U.S., growth in GPV per seller continued to be affected by consumer demand as year-over-year growth in spend per card and in the number of unique cards decelerated in the third quarter of 2023 compared to the third quarter of 2022. |
Square generated $402 million of subscription and services-based revenue during the third quarter of 2023, up 21% year over year. Square Loans facilitated approximately 120,000 loans totaling $1.17 billion in originations, up 4% year over year.
Hardware revenue in the third quarter of 2023 was $42 million, down 2% year over year, and gross loss was $36 million as we use hardware as an acquisition tool.
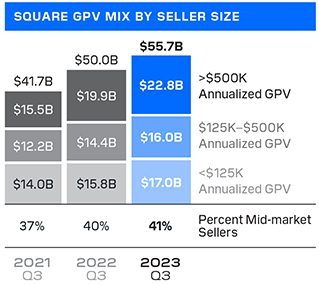
We determine seller size based on annualized GPV during the
applicable quarter. A mid-market seller generates more than
$500,000 in annualized GPV. GPV does not include transactions
from our BNPL platform because GPV is related only to
transaction-based revenue and not to subscription and services-
based revenue. Gross profit from mid-market sellers does not
include gross profit contributions from our BNPL platform.
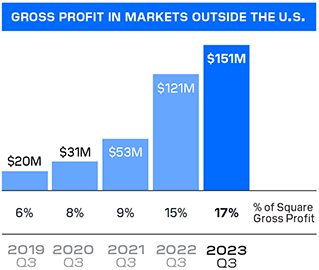
Square gross profit in markets outside the U.S. includes
contributions from our BNPL platform beginning in the second
quarter of 2022. Excluding our BNPL platform, Square gross
profit in markets outside the U.S. was $95 million in the third
quarter of 2023, representing 12% of Square gross profit.
|
|
BLOCK Q3 2023 12 |
Bitcoin revenue is the total
sale amount of bitcoin sold
to customers. Bitcoin costs
are the total amount we pay
to purchase bitcoin in order
to facilitate customers’
access to bitcoin. In future
quarters, bitcoin revenue
and gross profit may
fluctuate as a result of
changes in customer
demand or the market price
of bitcoin.
CASH APP ECOSYSTEM REVENUE
AND GROSS PROFIT
In the third quarter of 2023, Cash App generated $3.58 billion of revenue and $984 million of gross profit, up 34% and 27% year over year, respectively. Excluding bitcoin revenue, Cash App revenue was $1.16 billion, up 26% year over year. Our BNPL platform contributed $129 million of revenue and $94 million of gross profit to Cash App in the third quarter of 2023.
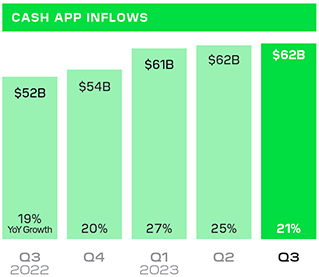
In September, Cash App had 55 million monthly transacting actives, up 11% year over year. Inflows per transacting active in the third quarter were $1,132, up 8% year over year and relatively stable quarter over quarter. Overall inflows were $62 billion, up 21% year over year and 1% quarter over quarter. Monetization rate was 1.43%, up 8 basis points year over year and flat quarter over quarter.
In the third quarter of 2023, Cash App Business GPV was $4.38 billion, up 1% year over year. Cash App Business GPV comprises Cash App activity related to peer-to-peer transactions received by business accounts and peer-to-peer payments sent from a credit card. Cash App generated $121 million of transaction-based revenue during the third quarter of 2023, up 2% year over year.
Cash App generated $1.04 billion of subscription and services-based revenue during the third quarter of 2023, up 29% year over year. Growth was driven by transaction fees from both Cash App Card and Instant Deposit, as well as interest earned on customer funds and revenue from other financial services products.
Cash App generated $45 million of bitcoin gross profit in the third quarter of 2023, up 22% year over year. The total sale amount of bitcoin sold to customers, which we recognize as bitcoin revenue, was $2.42 billion, up 37% year over year. The year-over-year increase in bitcoin revenue and gross profit was driven by an increase in both the average market price of bitcoin and the quantity of bitcoin sold to customers.
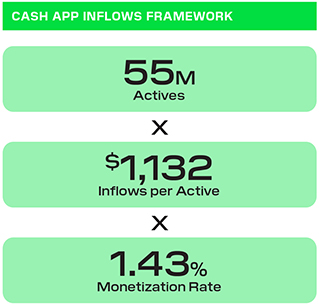
We calculate monetization rate by dividing Cash App gross
profit, excluding contributions from our BNPL platform,
by Cash App inflows.
|
|
BLOCK Q3 2023 13 |
We discuss Cash App
marketing expenses because
a large portion is generated
by our peer-to-peer service,
which we offer free to our
Cash App customers, and we
consider it to be a marketing
tool to encourage the use of
Cash App.
CORPORATE AND OTHER REVENUE
AND GROSS PROFIT
Corporate and Other generated $50 million in revenue and $16 million in gross profit in the third quarter of 2023. Corporate and Other comprised areas outside Square and Cash App, which were primarily TIDAL and intersegment eliminations between Cash App and Square in the third quarter of 2023.
OPERATING EXPENSES
Operating expenses were $1.91 billion on a GAAP basis and $1.44 billion on a non-GAAP basis in the third quarter of 2023, up 18% and 14% year over year, respectively.
Product development expenses were $714 million on a GAAP basis and $430 million on a non-GAAP basis in the third quarter of 2023, each up 30% year over year. The increase was driven primarily by personnel costs related to our engineering team.
Sales and marketing expenses were $479 million on a GAAP basis and $442 million on a non-GAAP basis in the third quarter of 2023, down 1% and 3% year over year, respectively.
| • | Cash App marketing expenses were down 1% year over year, driven by a decrease in advertising costs and partially offset by an increase in peer-to-peer processing costs, related peer-to-peer transaction losses, and card issuance costs. |
| • | Other sales and marketing expenses were down 1% year over year, as growth in Square spend was offset by lower spend for our BNPL platform and TIDAL. Other sales and marketing expenses primarily include expenses related to Square, our BNPL platform, and TIDAL. |
General and administrative expenses were $481 million on a GAAP basis and $379 million on a non-GAAP basis in the third quarter of 2023, up 22% and 21% year over year, respectively. The increase was driven primarily by personnel costs related to our customer support and compliance teams.
|
|
BLOCK Q3 2023 14 |
The accounting rules for bitcoin currently require us to recognize any decreases in market price below carrying value as an impairment charge, with no upward revisions recognized when the market price increases until the sale of that bitcoin. Bitcoin impairment loss is a GAAP expense. Non-GAAP operating expenses exclude bitcoin impairment losses. To determine the impairment charge, Block revalues its bitcoin holdings using the lowest price in the period.
Transaction, loan, and consumer receivables losses were $177 million in the third quarter of 2023, up 20% year over year. The increase was driven primarily by an operational outage as well as growth in Cash App Card transactions and Square GPV. In the third quarter, loss rates for Square GPV, Square Loans, and BNPL consumer receivables remained consistent with historical ranges, and we will continue to monitor trends closely given the dynamic macro environment.
In the third quarter of 2023, operating expenses included $57 million of amortization of customer and other acquired intangible assets, the majority of which was from the acquisition of our BNPL platform. The year-over-year increase in amortization of customer and other acquired intangible assets was driven primarily by the revision of certain intangibles’ useful lives as well as the timing of the acquisition of Afterpay in the first quarter of 2022 and the related intangible assets and measurement period adjustments.
In the fourth quarter of 2020 and first quarter of 2021, we invested $50 million and $170 million, respectively, in bitcoin. As an indefinite-lived intangible asset, bitcoin is subject to impairment losses if the fair value of bitcoin decreases below the carrying value during the assessed period. In the third quarter of 2023, we did not recognize a bitcoin impairment loss. As of September 30, 2023, the carrying value of our investment in bitcoin, after cumulative impairment charges, was $102 million, while the fair value, based on observable market prices, was $216 million, which was $114 million in excess of our carrying value.
|
|
BLOCK Q3 2023 15 |
EARNINGS
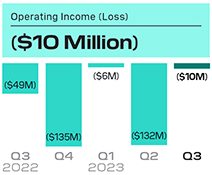
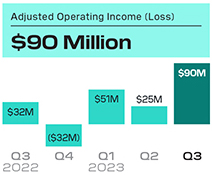
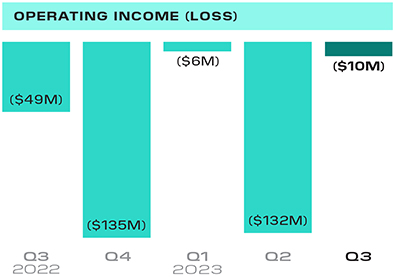
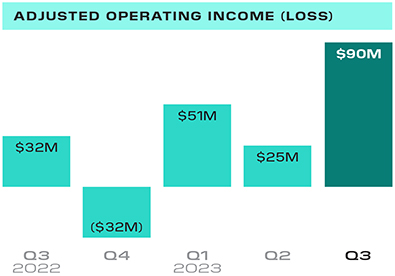
In the third quarter of 2023, operating loss was $10 million and Adjusted Operating Income was $90 million. Adjusted Operating Income (Loss) is a non-GAAP financial measure that excludes certain expenses that we believe are not reflective of our core operating performance, including amortization of intangible assets, bitcoin impairment losses, acquisition-related accelerated share-based compensation expenses, and acquisition-related, integration, and other costs. We present Adjusted Operating Income (Loss) because we use it to evaluate our operating performance, generate future operating plans, and make strategic decisions.
Please see the reconciliations at the end of this letter for a description of certain items that affected operating income (loss) in the second quarter of 2023.
|
|
BLOCK Q3 2023 16 |
EARNINGS
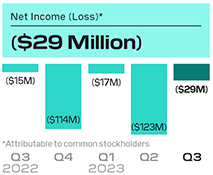
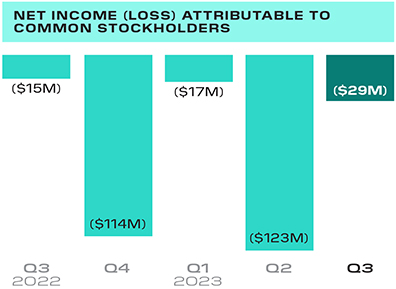
Net loss attributable to common stockholders was $29 million in the third quarter of 2023. Net loss per share attributable to common stockholders was $0.05 on a basic and diluted basis in the third quarter of 2023, based on 611 million weighted-average basic and diluted shares outstanding during the third quarter of 2023, representing a $0.03 decrease year over year.
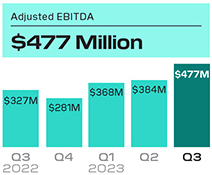
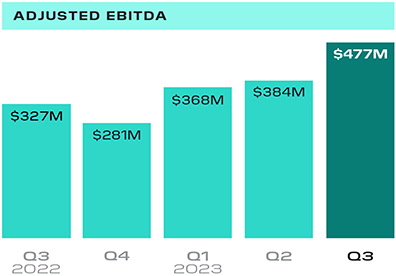
Adjusted EBITDA was $477 million in the third quarter of 2023, compared to $327 million in the third quarter of 2022. The improvement in net income attributable to common stockholders and in Adjusted EBITDA compared to the prior-year period was driven by gross profit growth across our Cash App and Square ecosystems.
In the third quarter of 2023, Adjusted Net Income Per Share (Adjusted EPS) was $0.55 on a diluted basis based on 628 million weighted-average diluted shares outstanding during the third quarter of 2023, representing a $0.13 increase year over year.
Please see the reconciliations at the end of this letter for a description of certain items that affected net income (loss) in the third quarter of 2023.
|
|
BLOCK Q3 2023 17 |
BALANCE SHEET/CASH FLOW
We ended the third quarter of 2023 with $8.1 billion in available liquidity, with $7.3 billion in cash, cash equivalents, restricted cash, and investments in marketable debt securities, as well as $775 million available to be withdrawn from our revolving credit facility. Additionally, we had $1.7 billion available to be withdrawn under our warehouse funding facilities, to support funding of growth in our consumer receivables related to our BNPL platform.
In the third quarter of 2023, Adjusted EBITDA contributed positively to our overall liquidity.
Net cash provided by operating activities was $899 million for the nine months ended September 30, 2023, compared to $131 million for the nine months ended September 30, 2022. Adjusted Free Cash Flow was $1.3 billion for the nine months ended September 30, 2023, compared to negative $17 million for the nine months ended September 30, 2022. We present Adjusted Free Cash Flow because we use it to understand the cash generated by our business, after investments in property and equipment, that can possibly be used for investing in our business and make strategic decisions related to our balance sheet, and because we are focused on growing our Adjusted Free Cash Flow generation over time. This measure is not intended to represent residual cash flows available for discretionary expenditures and may be calculated differently by companies in our industry.
|
|
BLOCK Q3 2023 18 |
Guidance
| 2023 OUTLOOK
|
Q4 2023
|
|
|
|
|
|
| Gross Profit |
$1,960M to $1,980M | |
| YoY growth |
18% to 19% | |
| Adjusted EBITDA1 |
$430M to $450M | |
| Adjusted Operating Income1
|
$40M to $60M
|
|
|
|
|
|
| Current 2023
|
Previous 2023
|
|||
|
|
|
|
||
| Gross profit |
$7,439M to $7,459M | -- | ||
| YoY growth |
24% | -- | ||
| Adjusted EBITDA1 |
$1,660M to $1,680M | $1,500M | ||
| Adjusted Operating Income1
|
$205M to $225M
|
$25M
|
||
|
|
|
|
||
In the fourth quarter of 2023, we expect our share-based compensation expense to remain relatively stable quarter over quarter on a dollar basis.
| 2024 OUTLOOK
|
2024
|
|
|
|
|
|
| Adjusted EBITDA1 |
$2,400M | |
| Adjusted Operating Income1
|
$875M
|
|
|
|
|
|
In 2024 we expect a significant improvement in Adjusted Operating Income margin on a year-over-year basis in 2024 compared to 2023. Our outlook does not assume any additional macroeconomic deterioration, which could impact our results.
We have historically allocated the financial results from our BNPL platform equally to the Cash App and Square segments. In the fourth quarter of 2023, we changed our management reporting structure and moved the business activities and management of our BNPL platform fully under Cash App. Accordingly, beginning in the fourth quarter of 2023, we will update our segment reporting to incorporate the financial results of the BNPL platform within the Cash App segment, rather than allocating 50% of revenue and gross profit from our BNPL platform to each of Square and Cash App. We will also reflect this change for the applicable historical periods we present in our future filings.
On a GAAP basis, we currently expect to recognize approximately $61 million in expenses related to amortization of intangible assets in the fourth quarter of 2023, based on the intangible assets as of September 30, 2023. This quarterly expense includes approximately $18 million recognized in cost of sales and approximately $43 million in operating expenses. On a GAAP basis, we currently expect to recognize approximately $222 million in expenses related to amortization of intangible assets in the full year 2024, based on the intangible assets as of September 30, 2023. This annual expense includes approximately $68 million recognized in cost of sales and approximately $154 million in operating expenses. These amounts may be affected by fluctuations in foreign exchange rates in future periods.
1. We have not provided the forward-looking GAAP equivalents for certain forward-looking non-GAAP metrics, including Adjusted EBITDA, and Adjusted Operating Income (Loss), or GAAP reconciliations of any of the aforementioned, as a result of the uncertainty regarding, and the potential variability of, reconciling items such as share-based compensation expense. Accordingly, the Company has relied upon the exception in item 10(e)(1)(i)(B) of Regulation S-K to exclude such reconciliations, as the reconciliations of these non-GAAP guidance metrics to their corresponding GAAP equivalents are not available without unreasonable effort. However, it is important to note that material changes to reconciling items could have a significant effect on future GAAP results. We have provided reconciliations of other historical GAAP to non-GAAP metrics in tables at the end of this letter.
The 2023 outlook table shows our current outlook for the full year 2023 compared to our prior outlook provided in the second quarter of 2023.
Adjusted Operating Income margin is defined by dividing Adjusted Operating Income over a given period by gross profit over the same period.
|
|
BLOCK Q3 2023 19 |
MEDIA CONTACT
press@block.xyz
INVESTOR RELATIONS CONTACT
ir@block.xyz
Earnings
Webcast
Block (NYSE:SQ) will host a conference call and earnings webcast at 2:00 p.m. Pacific time/5:00 p.m. Eastern time, November 2, to discuss these financial results. To register to participate in the conference call, or to listen to the live audio webcast, please visit the Events & Presentations section of Block’s Investor Relations website at investors.block.xyz. A replay will be available on the same website following the call.
We will release financial results for the fourth quarter and full year 2023 on February 22, 2024, after the market closes, and will also host a conference call and earnings webcast at 2:00 p.m. Pacific time/5:00 p.m. Eastern time on the same day to discuss those financial results.

|

|
|
| Jack Dorsey | Amrita Ahuja | |
|
|
BLOCK Q3 2023 20 |

| “ | Square has allowed us to scale to over 40 locations with the same attention to detail we provided customers at our first store. |
| Working with Square the last six years has been pivotal in allowing us to grow and understand where we need to focus our attention. We can’t be everywhere at once, but we can easily check our phones and track business performance across dozens of locations, understand which products are working and what’s not, and view sales on Square Dashboard. When we need to change the business rapidly, Square can do that with us. As we look at taking Fishbowl to the US, those insights become even more critical.” |

|
|
| Nic Pestalozzi, Nathan Dalah, and Casper Ettelson Co-Owners of Fishbowl |
||
|
|
BLOCK Q3 2023 21 |
|
|
BLOCK Q3 2023 22 |
SAFE HARBOR STATEMENT
This letter contains “forward-looking statements” within the meaning of the Safe Harbor provisions of the U.S. Private Securities Litigation Reform Act of 1995. All statements other than statements of historical fact could be deemed forward-looking, including, but not limited to, statements regarding the future performance of Block, Inc. and its consolidated subsidiaries (the Company); the Company’s strategies, including expected impact of such strategies on our customers, actives, and sellers as well as our business and financial performance, expected financial results, guidance, and general business outlook for current and future periods; the Company’s integration of Afterpay into its Square and Cash App businesses, and its impacts on the Company’s business and financial results; future profitability and growth in the Company’s businesses and products and the Company’s ability to drive such profitability and growth; the Company’s beliefs around artificial intelligence; the Company’s expectations regarding scale, economics, and the demand for or benefits from its products, product features, and services; the Company’s product development plans; the ability of the Company’s products to attract and retain customers, particularly in new or different markets or demographics; trends in the Company’s markets and the continuation of such trends; the Company’s expectations and intentions regarding future expenses, including future transaction and loan losses and the Company’s estimated reserves for such losses; the Company’s bitcoin investments and strategy as well as the potential financial impact and volatility; and management’s statements related to business strategy, plans, investments, opportunities, and objectives for future operations. In some cases, forward-looking statements can be identified by terms such as “may,” “will,” “appears,” “should,” “expects,” “plans,” “anticipates,” “could,” “intends,” “target,” “projects,” “contemplates,” “believes,” “estimates,” “predicts,” “potential,” or “continue,” or the negative of these words or other similar terms or expressions that concern our expectations, strategy, plans, or intentions.
Such statements are subject to a number of known and unknown risks, uncertainties, assumptions, and other factors that may cause the Company’s actual results, performance, or achievements to differ materially from results expressed or implied in this letter. Investors are cautioned not to place undue reliance on these statements, and reported results should not be considered as an indication of future performance.
Risks that contribute to the uncertain nature of the forward-looking statements include, among others, a continued or prolonged economic downturn in the United States and in other countries around the world; the Company’s investments in its business and ability to maintain profitability; the Company’s efforts to expand its product portfolio and market reach; the Company’s ability to develop products and services to address the rapidly evolving market for payments and financial services; the Company’s ability to deal with the substantial and increasingly intense competition in its industry; acquisitions, strategic investments, entries into new businesses, joint ventures, divestitures, and other transactions that the Company may undertake; the integration of Afterpay; the Company’s ability to ensure the integration of its services with a variety of operating systems and the interoperability of its technology with that of third parties; the Company’s ability to retain existing customers, attract new customers, and increase sales to all customers; the Company’s dependence on payment card networks and acquiring processors; our participation in government relief programs set up in response to the COVID-19 pandemic; the effect of extensive regulation and oversight related to the Company’s business in a variety of areas; risks related to the banking ecosystem, including through our bank partnerships, and FDIC and other regulatory obligations; the effect of management changes and business initiatives; the liabilities and loss potential associated with new products, product features, and services; litigation, including intellectual property claims, government investigations or inquiries, and regulatory matters or disputes; adoption of the Company’s products and services in international markets; changes in political, business, and economic conditions; as well as other risks listed or described from time to time in the Company’s filings with the Securities and Exchange Commission (the SEC), including the Company’s Annual Report on Form 10-K for the fiscal year ended December 31, 2022, and subsequent Quarterly Reports on Form 10-Q, which are on file with the SEC and available on the Investor Relations page of the Company’s website. Additional information will also be set forth in the Company’s Quarterly Report on Form 10-Q for the quarter ended September 30, 2023. All forward-looking statements represent management’s current expectations and predictions regarding trends affecting the Company’s business and industry and are based on information and estimates available to the Company at the time of this letter and are not guarantees of future performance. Except as required by law, the Company assumes no obligation to update any of the statements in this letter.
|
|
BLOCK Q3 2023 23 |
KEY OPERATING METRICS AND
NON-GAAP FINANCIAL MEASURES
To supplement our financial information presented in accordance with generally accepted accounting principles in the United States (GAAP), from period to period, we consider and present certain operating and financial measures that we consider key metrics or are not prepared in accordance with GAAP, including Gross Payment Volume (GPV), Adjusted EBITDA, Adjusted Net Income (Loss), Diluted Adjusted Net Income (Loss) Per Share (Adjusted EPS), Adjusted Operating Income (Loss), Adjusted Operating Income (Loss) margin, constant currency, Adjusted Free Cash Flow, and non-GAAP operating expenses as well as other measures defined in this letter such as measures excluding bitcoin revenue, measures excluding gross profit contributions from our BNPL platform, and measures excluding PPP loan forgiveness gross profit.
We believe these metrics and measures are useful to facilitate period-to-period comparisons of our business and to facilitate comparisons of our performance to that of other payments solution providers. We define GPV as the total dollar amount of all card payments processed by sellers using Square, net of refunds, and ACH transfers. Additionally, GPV includes Cash App Business GPV, which comprises Cash App activity related to peer-to-peer transactions received by business accounts, and peer-to-peer payments sent from a credit card. GPV does not include transactions from our BNPL platform.
Adjusted EBITDA, Adjusted Net Income (Loss), and Diluted Adjusted Net Income (Loss) Per Share (Adjusted EPS) are non-GAAP financial measures that represent our net income (loss) and net income (loss) per share, adjusted to eliminate the effect of share-based compensation expenses; amortization of intangible assets; gain or loss on revaluation of equity investments; bitcoin impairment losses; amortization of debt discount and issuance costs; and the gain or loss on the disposal of property and equipment, as applicable. Adjusted Operating Income (Loss) is a non-GAAP financial measure that represents our operating income (loss), adjusted to eliminate the effect of amortization of acquired technology assets; acquisition-related, integration, and other costs; bitcoin impairment losses; amortization of customer and other acquired intangible assets; and acquisition-related share-based acceleration costs. We also exclude from these measures certain acquisition-related and integration costs associated with business combinations, and various other costs that are not reflective of our core operating performance. We exclude amortization of intangible assets arising from business combinations because the amount of such expenses in any specific period may not directly correlate to the underlying performance of our ongoing business operations. Acquisition-related costs include amounts paid to redeem acquirees’ unvested stock-based compensation awards, and legal, accounting, and due diligence costs. Integration costs include advisory and other professional services or consulting fees necessary to integrate acquired businesses. Other costs that are not reflective of our core business operating expenses may include contingent losses, impairment charges, and certain litigation and regulatory charges. We also add back the impact of the acquired deferred revenue and deferred cost adjustment, which was written down to fair value in purchase accounting. Additionally, for purposes of calculating diluted Adjusted EPS, we add back cash interest expense on convertible senior notes, as if converted at the beginning of the period, if the impact is dilutive. In addition to the items above, Adjusted EBITDA is a non-GAAP financial measure that also excludes depreciation and amortization, interest income and expense, other income and expense, and provision or benefit from income taxes, as applicable. Adjusted Operating Income (Loss) margin is calculated as Adjusted Operating Income (Loss) divided by gross profit. To calculate diluted Adjusted EPS, we adjust the weighted-average number of shares of common stock outstanding for the dilutive effect of all potential shares of common stock. In periods when we recorded an Adjusted Net Loss, diluted Adjusted EPS is the same as basic Adjusted EPS because the effects of potentially dilutive items were anti-dilutive given the Adjusted Net Loss position.
|
|
BLOCK Q3 2023 24 |
KEY OPERATING METRICS AND
NON-GAAP FINANCIAL MEASURES
Constant currency growth is calculated by assuming international results in a given period and the comparative prior period are translated from local currencies to the U.S. dollar at rates consistent with the monthly average rates in the comparative prior period. We discuss growth on a constant currency basis because a portion of our business operates in markets outside the U.S. and is subject to changes in foreign exchange rates.
Adjusted Free Cash Flow is a non-GAAP financial measure that represents our net cash provided by operating activities adjusted to include cash flows associated with consumer receivables generated through our BNPL platform, and payments for the purchase of property and equipment as we consider such cash flows to be core part of our normal operations, but are presented as investing activities under GAAP. Adjusted Free Cash Flow however excludes the effects of changes in customers payable, settlements receivables and settlements payable as these amounts, which represent customer transactions, may result in significant fluctuations in Adjusted Free Cash Flow depending on the timing of the end of the reporting period and whether such date is a bank holiday or a weekend. We believe that Adjusted Free Cash Flow provides helpful information in understanding the cash generated by our business, after investments in property and equipment, that can possibly be used for investing in our business, making strategic investments, and strengthening our balance sheet.
Non-GAAP operating expenses is a non-GAAP financial measure that represents operating expenses adjusted to remove the impact of share-based compensation, depreciation and amortization, bitcoin impairment losses, loss on disposal of property and equipment, and acquisition-related integration and other costs.
We have included Adjusted EBITDA, Adjusted Operating Income (Loss), Adjusted Operating Income (Loss) margin, Adjusted Net Income, Adjusted EPS, Adjusted Free Cash Flow, and non-GAAP operating expenses because they are key measures used by our management to evaluate our operating performance, generate future operating plans, and make strategic decisions, including those relating to operating expenses and the allocation of internal resources. Accordingly, we believe that Adjusted EBITDA, Adjusted Operating Income (Loss), Adjusted Operating Income (Loss) margin, Adjusted Net Income, Adjusted EPS, Adjusted Free Cash Flow, and non-GAAP operating expenses provide useful information to investors and others in understanding and evaluating our operating results in the same manner as our management and board of directors. In addition, they provide useful measures for period-to-period comparisons of our business, as certain of these measures remove the effect of certain non-cash items and certain variable charges that do not vary with our operations. We have included measures excluding our BNPL platform because we believe these measures are useful in understanding the ongoing results of our operations. We have included measures excluding bitcoin revenue because our role is to facilitate customers’ access to bitcoin. When customers buy bitcoin through Cash App, we only apply a small margin to the market cost of bitcoin, which tends to be volatile and outside our control. Therefore, we believe deducting bitcoin revenue or gross profit better reflects the economic benefits as well as our performance from these transactions. We have included measures excluding PPP loan forgiveness gross profit because we believe these measures are useful in order to facilitate comparisons of our business without PPP loan forgiveness.
Adjusted EBITDA, Adjusted Net Income, Adjusted Operating Income (Loss), Adjusted Operating Income (Loss) margin, Adjusted EPS, Adjusted Free Cash Flow, and non-GAAP operating expenses, as well as other measures defined in the shareholder letter, such as measures excluding our BNPL platform, bitcoin revenue, and PPP loan forgiveness gross profit, have limitations as financial measures, should be considered as supplemental in nature, and are not meant as substitutes for the related financial information prepared in accordance with GAAP.
We believe that the aforementioned metrics and measures provide useful information about our operating results, enhance the overall understanding of our past performance and future prospects, and provide useful measures for period-to-period comparisons of our business, as they remove the effect of certain variable amounts, or they remove amounts that were not repeated across periods and therefore make comparisons more difficult. Our management uses these measures to evaluate our operating performance, generate future operating plans, and make strategic decisions, including those relating to operating expenses and the allocation of internal resources.
These non-GAAP financial measures should not be considered in isolation from, or as a substitute for, financial information prepared in accordance with GAAP. These non-GAAP financial measures are not based on any standardized methodology prescribed by GAAP. Other companies, including companies in our industry, may calculate these non-GAAP financial measures differently or not at all, which reduces their usefulness as comparative measures.
|
|
BLOCK Q3 2023 25 |
Condensed Consolidated
Statements of Operations
UNAUDITED
In thousands, except per share data
| THREE MONTHS ENDED | NINE MONTHS ENDED | |||||||||||||||
| Sept. 30, 2023 | Sept. 30, 2022 | Sept. 30, 2023 | Sept. 30, 2022 | |||||||||||||
| Revenue: |
||||||||||||||||
| Transaction-based revenue |
$ | 1,658,668 | $ | 1,517,890 | $ | 4,719,027 | $ | 4,226,566 | ||||||||
| Subscription and services-based revenue |
1,492,900 | 1,191,511 | 4,320,621 | 3,245,924 | ||||||||||||
| Hardware revenue |
42,341 | 43,388 | 124,714 | 128,765 | ||||||||||||
| Bitcoin revenue |
2,423,584 | 1,762,752 | 6,978,219 | 5,279,430 | ||||||||||||
|
|
|
|
|
|
|
|
||||||||||
| Total net revenue |
5,617,493 | 4,515,541 | 16,142,581 | 12,880,685 | ||||||||||||
|
|
|
|
|
|
|
|
||||||||||
| Cost of revenue: |
||||||||||||||||
| Transaction-based costs |
984,658 | 901,990 | 2,755,968 | 2,493,988 | ||||||||||||
| Subscription and services-based costs |
259,262 | 225,903 | 802,577 | 622,031 | ||||||||||||
| Hardware costs |
78,338 | 76,002 | 211,208 | 223,160 | ||||||||||||
| Bitcoin costs |
2,378,906 | 1,726,051 | 6,838,914 | 5,157,935 | ||||||||||||
| Amortization of acquired technology assets |
17,880 | 18,506 | 54,780 | 51,874 | ||||||||||||
|
|
|
|
|
|
|
|
||||||||||
| Total cost of revenue |
3,719,044 | 2,948,452 | 10,663,447 | 8,548,988 | ||||||||||||
|
|
|
|
|
|
|
|
||||||||||
| Gross profit |
1,898,449 | 1,567,089 | 5,479,134 | 4,331,697 | ||||||||||||
|
|
|
|
|
|
|
|
||||||||||
| Operating expenses: |
||||||||||||||||
| Product development |
713,788 | 548,037 | 2,035,397 | 1,531,088 | ||||||||||||
| Sales and marketing |
479,381 | 485,838 | 1,512,999 | 1,518,227 | ||||||||||||
| General and administrative |
480,885 | 395,437 | 1,463,003 | 1,235,306 | ||||||||||||
| Transaction, loan, and consumer receivable losses |
177,338 | 147,586 | 485,005 | 395,433 | ||||||||||||
| Bitcoin impairment losses |
— | 1,619 | — | 37,580 | ||||||||||||
| Amortization of customer and other acquired intangible assets |
56,965 | 37,361 | 130,917 | 103,414 | ||||||||||||
|
|
|
|
|
|
|
|
||||||||||
| Total operating expenses |
1,908,357 | 1,615,878 | 5,627,321 | 4,821,048 | ||||||||||||
|
|
|
|
|
|
|
|
||||||||||
| Operating loss |
(9,908) | (48,789) | (148,187) | (489,351) | ||||||||||||
|
|
|
|
|
|
|
|
||||||||||
| Interest expense (income), net |
(21,415) | 6,042 | (28,520) | 34,756 | ||||||||||||
| Other expense (income), net |
(4,262) | (18,798) | 15,488 | (71,036) | ||||||||||||
|
|
|
|
|
|
|
|
||||||||||
| Income (loss) before income tax |
15,769 | (36,033) | (135,155) | (453,071) | ||||||||||||
|
|
|
|
|
|
|
|
||||||||||
| Provision (benefit) for income taxes |
49,529 | (17,289) | 43,773 | (17,687) | ||||||||||||
|
|
|
|
|
|
|
|
||||||||||
| Net loss |
(33,760) | (18,744) | (178,928) | (435,384) | ||||||||||||
| Less: Net loss attributable to noncontrolling interests |
(4,806) | (4,033) | (10,630) | (8,460) | ||||||||||||
|
|
|
|
|
|
|
|
||||||||||
| Net loss attributable to common stockholders |
$ | (28,954) | $ | (14,711) | $ | (168,298) | $ | (426,924) | ||||||||
|
|
|
|
|
|
|
|
||||||||||
| Net loss per share attributable to common stockholders: |
||||||||||||||||
| Basic |
$ | (0.05) | $ | (0.02) | $ | (0.28) | $ | (0.75) | ||||||||
|
|
|
|
|
|
|
|
||||||||||
| Diluted |
$ | (0.05) | $ | (0.02) | $ | (0.28) | $ | (0.75) | ||||||||
|
|
|
|
|
|
|
|
||||||||||
| Weighted-average shares used to compute net loss per share attributable to common stockholders: |
||||||||||||||||
| Basic |
611,276 | 592,672 | 606,767 | 572,234 | ||||||||||||
|
|
|
|
|
|
|
|
||||||||||
| Diluted |
611,276 | 592,672 | 606,767 | 572,234 | ||||||||||||
|
|
|
|
|
|
|
|
||||||||||
|
|
BLOCK Q3 2023 26 |
Condensed Consolidated
Balance Sheets
In thousands, except per share data
| Sept. 30, 2023 | Dec 31, 2022 | |||||||
| Assets | UNAUDITED | |||||||
| Current assets: |
||||||||
| Cash and cash equivalents |
$ | 5,112,293 | $ | 4,544,202 | ||||
| Investments in short-term debt securities |
1,161,144 | 1,081,851 | ||||||
| Settlements receivable |
3,689,046 | 2,416,324 | ||||||
| Customer funds |
2,913,737 | 3,180,324 | ||||||
| Consumer receivables, net |
1,694,949 | 1,871,160 | ||||||
| Loans held for sale |
597,035 | 474,036 | ||||||
| Safeguarding asset related to bitcoin held for other parties |
676,363 | 428,243 | ||||||
| Other current assets |
1,696,033 | 1,627,265 | ||||||
|
|
|
|
||||||
| Total current assets |
17,540,600 | 15,623,405 | ||||||
|
|
|
|
||||||
| Goodwill |
11,749,198 | 11,966,761 | ||||||
| Acquired intangible assets, net |
1,778,951 | 2,014,034 | ||||||
| Investments in long-term debt securities |
426,202 | 573,429 | ||||||
| Operating lease right-of-use assets |
268,418 | 373,172 | ||||||
| Other non-current assets |
791,529 | 813,539 | ||||||
|
|
|
|
||||||
| Total assets |
$ | 32,554,898 | $ | 31,364,340 | ||||
|
|
|
|
||||||
| Liabilities and Stockholders’ Equity |
||||||||
| Current liabilities: |
||||||||
| Customers payable |
$ | 6,672,957 | $ | 5,548,656 | ||||
| Settlements payable |
515,510 | 462,505 | ||||||
| Accrued expenses and other current liabilities |
1,275,427 | 1,073,516 | ||||||
| Current portion of long-term debt (Note 13) |
— | 460,356 | ||||||
| Warehouse funding facilities, current |
51,858 | 461,240 | ||||||
| Safeguarding obligation liability related to bitcoin held for other parties |
676,363 | 428,243 | ||||||
|
|
|
|
||||||
| Total current liabilities |
9,192,115 | 8,434,516 | ||||||
|
|
|
|
||||||
| Warehouse funding facilities, non-current |
858,485 | 877,066 | ||||||
| Long-term debt (Note 13) |
4,117,502 | 4,109,829 | ||||||
| Operating lease liabilities, non-current |
302,779 | 357,419 | ||||||
| Other non-current liabilities |
253,511 | 334,155 | ||||||
|
|
|
|
||||||
| Total liabilities |
14,724,392 | 14,112,985 | ||||||
|
|
|
|
||||||
| Commitments and contingencies (Note 18) |
||||||||
| Stockholders’ equity: |
||||||||
| Preferred stock, $0.0000001 par value: 100,000 shares authorized at September 30, 2023 and December 31, 2022. None issued and outstanding at September 30, 2023 and December 31, 2022. |
— | — | ||||||
| Class A common stock, $0.0000001 par value: 1,000,000 shares authorized at September 30, 2023 and December 31, 2022; 552,215 and 539,408 issued and outstanding at September 30, 2023 and December 31, 2022, respectively. |
— | — | ||||||
| Class B common stock, $0.0000001 par value: 500,000 shares authorized at September 30, 2023 and December 31, 2022; 60,626 and 60,652 issued and outstanding at September 30, 2023 and December 31, 2022, respectively. |
— | — | ||||||
| Additional paid-in capital |
19,352,152 | 18,314,681 | ||||||
| Accumulated other comprehensive loss |
(802,482) | (523,090) | ||||||
| Accumulated deficit |
(737,010) | (568,712) | ||||||
|
|
|
|
||||||
| Total stockholders’ equity attributable to common stockholders |
17,812,660 | 17,222,879 | ||||||
| Noncontrolling interests |
17,846 | 28,476 | ||||||
|
|
|
|
||||||
| Total stockholders’ equity |
17,830,506 | 17,251,355 | ||||||
| Total liabilities and stockholders’ equity |
$ | 32,554,898 | $ | 31,364,340 | ||||
|
|
|
|
||||||
|
|
BLOCK Q3 2023 27 |
Condensed Consolidated
Statements of Cash Flows
UNAUDITED
In thousands
| NINE MONTHS ENDED | ||||||||
| Sept. 30, 2023 | Sept. 30, 2022 | |||||||
| Cash flows from operating activities: |
||||||||
| Net loss |
$ | (178,928) | $ | (435,384) | ||||
| Adjustments to reconcile net loss to net cash provided by operating activities: |
||||||||
| Depreciation and amortization |
303,236 | 249,616 | ||||||
| Amortization of discounts and premiums and other non-cash adjustments |
(368,223) | (371,298) | ||||||
| Non-cash lease expense |
114,067 | 70,958 | ||||||
| Share-based compensation |
944,514 | 794,794 | ||||||
| Loss (gain) on revaluation of equity investments |
16,838 | (43,914) | ||||||
| Transaction, loan, and consumer receivable losses |
485,005 | 395,433 | ||||||
| Bitcoin impairment losses |
— | 37,580 | ||||||
| Change in deferred income taxes |
(86,642) | (47,503) | ||||||
| Changes in operating assets and liabilities: |
||||||||
| Settlements receivable |
(1,518,471) | (793,460) | ||||||
| Purchases and originations of loans |
(5,896,371) | (4,684,598) | ||||||
| Proceeds from payments and forgiveness of loans |
5,575,440 | 4,643,899 | ||||||
| Customers payable |
1,390,888 | 599,886 | ||||||
| Settlements payable |
53,005 | 75,185 | ||||||
| Other assets and liabilities |
64,526 | (360,660) | ||||||
|
|
|
|
||||||
| Net cash provided by operating activities |
898,884 | 130,534 | ||||||
|
|
|
|
||||||
| Cash flows from investing activities: |
||||||||
| Purchases of marketable debt securities |
(934,904) | (521,692) | ||||||
| Proceeds from maturities of marketable debt securities |
994,740 | 769,276 | ||||||
| Proceeds from sale of marketable debt securities |
39,450 | 236,524 | ||||||
| Proceeds from maturities of marketable debt securities from customer funds |
— | 73,000 | ||||||
| Proceeds from sale of marketable debt securities from customer funds |
— | 316,576 | ||||||
| Payments from originations of consumer receivables |
(16,401,673) | (12,286,091) | ||||||
| Proceeds from principal repayments and sales of consumer receivables |
16,814,089 | 12,538,992 | ||||||
| Purchases of property and equipment |
(99,457) | (121,709) | ||||||
| Purchases of other investments |
(7,277) | (39,079) | ||||||
| Business combinations, net of cash acquired |
— | 539,453 | ||||||
|
|
|
|
||||||
| Net cash provided by investing activities |
404,968 | 1,505,250 | ||||||
|
|
|
|
||||||
| Cash flows from financing activities: |
||||||||
| Repayments of Paycheck Protection Program Liquidity Facility advances |
(16,840) | (466,417) | ||||||
| Payments to redeem convertible notes |
(461,761) | (1,071,788) | ||||||
| Proceeds from warehouse facilities borrowings |
564,588 | 711,455 | ||||||
| Repayments of warehouse facilities borrowings |
(967,655) | (310,729) | ||||||
| Proceeds from the exercise of stock options and purchases under the employee stock purchase plan |
70,416 | 49,233 | ||||||
| Payments for tax withholding related to vesting of restricted stock units |
— | (4,734) | ||||||
| Other financing activities |
(19,977) | — | ||||||
| Net increase in interest-bearing deposits |
57,243 | 58,909 | ||||||
| Change in customer funds, restricted from use in the Company’s operations |
(266,587) | 152,663 | ||||||
|
|
|
|
||||||
| Net cash used in financing activities |
(1,040,573) | (881,408) | ||||||
|
|
|
|
||||||
| Effect of foreign exchange rate on cash and cash equivalents |
(28,455) | (94,972) | ||||||
|
|
|
|
||||||
| Net increase in cash, cash equivalents, restricted cash, and customer funds |
234,824 | 659,404 | ||||||
| Cash, cash equivalents, restricted cash, and customer funds, beginning of the period |
8,435,906 | 6,975,090 | ||||||
|
|
|
|
||||||
| Cash, cash equivalents, restricted cash, and customer funds, end of the period |
$ | 8,670,730 | $ | 7,634,494 | ||||
|
|
|
|
||||||
|
|
BLOCK Q3 2023 28 |
Reportable Segment Disclosures
UNAUDITED
Information on the reportable segments revenue and segment operating profit are as
follows (in thousands):
| THREE MONTHS ENDED |
NINE MONTHS ENDED | |||||||||||||||||||||||||||||||
| Sept. 30, 2023 | Sept. 30, 2023 | |||||||||||||||||||||||||||||||
| Cash App | Square | Corporate and Other (i) |
Total | Cash App | Square | Corporate and Other (i) |
Total | |||||||||||||||||||||||||
| Revenue: |
||||||||||||||||||||||||||||||||
| Transaction-based revenue |
$ | 120,783 | $ | 1,537,885 | $ | — | $ | 1,658,668 | $ | 389,186 | $ | 4,329,841 | $ | — | $ 4,719,027 | |||||||||||||||||
| Subscription and services-based revenue |
1,040,591 | 402,126 | 50,183 | 1,492,900 | 3,045,302 | 1,124,465 | 150,854 | 4,320,621 | ||||||||||||||||||||||||
| Hardware revenue |
— | 42,341 | — | 42,341 | — | 124,714 | — | 124,714 | ||||||||||||||||||||||||
| Bitcoin revenue |
2,423,584 | — | — | 2,423,584 | 6,978,219 | — | — | 6,978,219 | ||||||||||||||||||||||||
|
|
|
|
|
|
|
|
|
|
|
|
|
|
|
|
|
|
|
|
|
|
|
|
|
|
||||||||
| Segment revenue |
$ | 3,584,958 | $ | 1,982,352 | $ | 50,183 | $ | 5,617,493 | $ | 10,412,707 | $ | 5,579,020 | $ | 150,854 | $16,142,581 | |||||||||||||||||
|
|
|
|
|
|
|
|
|
|
|
|
|
|
|
|
|
|
|
|
|
|
|
|
|
|
||||||||
| Segment gross profit (ii) | $ | 983,858 | $ | 898,969 | $ | 15,622 | $ | 1,898,449 | $ | 2,883,141 | $ | 2,557,525 | $ | 38,468 | $ 5,479,134 | |||||||||||||||||
|
|
|
|
|
|
|
|
|
|
|
|
|
|
|
|
|
|
|
|
|
|
|
|
|
|
||||||||
| THREE MONTHS ENDED | NINE MONTHS ENDED | |||||||||||||||||||||||||||||||
| Sept. 30, 2022 | Sept. 30, 2022 | |||||||||||||||||||||||||||||||
| Cash App | Square | Corporate and Other (i) |
Total | Cash App | Square | Corporate and Other (i) |
Total | |||||||||||||||||||||||||
| Revenue: |
||||||||||||||||||||||||||||||||
| Transaction-based revenue |
$ | 118,459 | $ | 1,399,431 | $ | — | $ | 1,517,890 | $ | 343,768 | $ | 3,882,798 | $ | — | $ 4,226,566 | |||||||||||||||||
| Subscription and services-based revenue |
803,673 | 331,703 | 56,135 | 1,191,511 | 2,146,163 | 932,188 | 167,573 | 3,245,924 | ||||||||||||||||||||||||
| Hardware revenue |
— | 43,388 | — | 43,388 | — | 128,765 | — | 128,765 | ||||||||||||||||||||||||
| Bitcoin revenue |
1,762,752 | — | — | 1,762,752 | 5,279,430 | — | — | 5,279,430 | ||||||||||||||||||||||||
|
|
|
|
|
|
|
|
|
|
|
|
|
|
|
|
|
|
|
|
|
|
|
|
|
|
||||||||
| Segment revenue |
$ | 2,684,884 | $ | 1,774,522 | $ | 56,135 | $ | 4,515,541 | $ | 7,769,361 | $ | 4,943,751 | $ | 167,573 | $12,880,685 | |||||||||||||||||
|
|
|
|
|
|
|
|
|
|
|
|
|
|
|
|
|
|
|
|
|
|
|
|
|
|
||||||||
| Segment gross profit (ii) | $ | 774,470 | $ | 782,968 | $ | 9,651 | $ | 1,567,089 | $ | 2,103,023 | $ | 2,199,628 | $ | 29,046 | $ 4,331,697 | |||||||||||||||||
|
|
|
|
|
|
|
|
|
|
|
|
|
|
|
|
|
|
|
|
|
|
|
|
|
|
||||||||
Operating Segment Disclosures
UNAUDITED
A reconciliation of total segment gross profit to the Company’s income (loss) before
applicable income taxes is as follows (in thousands):
| THREE MONTHS ENDED | NINE MONTHS ENDED | |||||||||||||||
| Sept. 30, 2023 | Sept. 30, 2022 | Sept. 30, 2023 | Sept. 30, 2022 | |||||||||||||
| Total segment gross profit |
$ | 1,898,449 | $ | 1,567,089 | $ | 5,479,134 | $ | 4,331,697 | ||||||||
| Less: Product development |
713,788 | 548,037 | 2,035,397 | 1,531,088 | ||||||||||||
| Less: Sales and marketing |
479,381 | 485,838 | 1,512,999 | 1,518,227 | ||||||||||||
| Less: General and administrative |
480,885 | 395,437 | 1,463,003 | 1,235,306 | ||||||||||||
| Less: Transaction, loan, and consumer receivable losses |
177,338 | 147,586 | 485,005 | 395,433 | ||||||||||||
| Less: Bitcoin impairment losses |
— | 1,619 | — | 37,580 | ||||||||||||
| Less: Amortization of customer and other intangible assets |
56,965 | 37,361 | 130,917 | 103,414 | ||||||||||||
| Less: Interest expense (income), net |
(21,415) | 6,042 | (28,520 | ) | 34,756 | |||||||||||
| Less: Other expense (income), net |
(4,262) | (18,798 | ) | 15,488 | (71,036 | ) | ||||||||||
|
|
|
|
|
|
|
|
|
|
|
|||||||
| Income (loss) before applicable income taxes |
$ | 15,769 | $ | (36,033 | ) | $ | (135,155 | ) | $ | (453,071 | ) | |||||
|
|
|
|
|
|
|
|
|
|
|
|||||||
(i) Corporate and other represents results related to products and services that are not assigned to a specific reportable segment, and intersegment eliminations between Cash App and Square.
(ii) Segment gross profit for Cash App for the three and nine months ended September 30, 2023 included $8.0 million and $24.9 million of amortization of acquired technology assets expense, respectively. Segment gross profit for Cash App for the three and nine months ended September 30, 2022 included $8.5 million and $23.8 million of amortization of acquired technology assets expense, respectively. Segment gross profit for Square for the three and nine months ended September 30, 2023 included $8.5 million and $25.5 million of amortization of acquired technology assets expense, respectively. Segment gross profit for Square for the three and nine months ended September 30, 2022 included $8.6 million and $23.8 million of amortization of acquired technology assets expense, respectively. Amortization of acquired technology assets expense included in Corporate and Other was immaterial for the three and nine months ended September 30, 2023 and September 30, 2022.
|
|
BLOCK Q3 2023 29 |
Key Operating Metrics and
Non-GAAP Financial Measures
UNAUDITED
| THREE MONTHS ENDED
|
NINE MONTHS ENDED
|
|||||||||||||||||||
| Sept. 30, 2023 | Sept. 30, 2022 | Sept. 30, 2023 | Sept. 30, 2022 | |||||||||||||||||
| Gross Payment Volume (“GPV”) (in millions) |
$ | 60,076 | $ | 54,373 | $ | 170,205 | $ | 150,376 | ||||||||||||
| Adjusted EBITDA (in thousands) |
$ | 477,488 | $ | 327,360 | $ | 1,230,257 | $ | 710,063 | ||||||||||||
| Adjusted Operating Income (Loss) (in thousands) |
$ | 89,749 | $ | 32,167 | $ | 166,222 | $ | (113,544) | ||||||||||||
| Adjusted Net Income Per Share: |
||||||||||||||||||||
| Basic |
$ | 0.57 | $ | 0.44 | $ | 1.39 | $ | 0.83 | ||||||||||||
| Diluted |
$ | 0.55 | $ | 0.42 | $ | 1.35 | $ | 0.78 | ||||||||||||
| THREE MONTHS ENDED
|
NINE MONTHS ENDED
|
|||||||||||||||||||
| Sept. 30, 2023 | Sept. 30, 2022 | Sept. 30, 2023 | Sept. 30, 2022 | |||||||||||||||||
| Square GPV (in millions) |
$ | 55,691 | $ | 50,037 | $ | 156,063 | $ | 137,855 | ||||||||||||
| Cash App GPV (in millions) |
$ | 4,385 | $ | 4,336 | $ | 14,142 | $ | 12,521 | ||||||||||||
|
|
|
|
|
|
|
|
||||||||||||||
| Total GPV |
$ | 60,076 | $ | 54,373 | $ | 170,205 | $ | 150,376 | ||||||||||||
|
|
|
|
|
|
|
|
||||||||||||||
| Adjusted EBITDA UNAUDITED In thousands |
|
|||||||||||||||||||
| THREE MONTHS ENDED | ||||||||||||||||||||
| Sept. 30, 2023 | Sept. 30, 2022 | Dec 31, 2022 | Mar 31, 2023 | June 30, 2023 | ||||||||||||||||
| Net loss attributable to common stockholders |
$ | (28,954) | $ | (14,711) | $ | (113,823) | $ | (16,838) | $ | (122,506) | ||||||||||
| Net loss attributable to noncontrolling interests |
(4,806) | (4,033) | (3,798) | (2,488) | (3,336) | |||||||||||||||
|
|
|
|
|
|
|
|
|
|
||||||||||||
| Net loss |
(33,760) | (18,744) | (117,621) | (19,326) | (125,842) | |||||||||||||||
| Share-based compensation expense |
345,690 | 262,733 | 274,495 | 279,591 | 319,248 | |||||||||||||||
| Depreciation and amortization |
115,518 | 88,721 | 90,907 | 93,173 | 94,545 | |||||||||||||||
| Acquisition-related, integration and other costs |
24,812 | 23,470 | 40,662 | 1,551 | 102,349 | |||||||||||||||
| Interest expense (income), net |
(21,415) | 6,042 | 1,472 | (3,161) | (3,944) | |||||||||||||||
| Other expense (income), net |
(4,262) | (18,798) | (24,407) | 18,371 | 1,379 | |||||||||||||||
| Bitcoin impairment losses |
— | 1,619 | 8,991 | — | — | |||||||||||||||
| Provision (benefit) for income taxes |
49,529 | (17,289) | 5,375 | (2,056) | (3,700) | |||||||||||||||
| Loss (gain) on disposal of property and equipment |
1,355 | (447) | 984 | 191 | 343 | |||||||||||||||
| Acquired deferred revenue and cost adjustment |
21 | 53 | 43 | 33 | 24 | |||||||||||||||
|
|
|
|
|
|
|
|
|
|
||||||||||||
| Adjusted EBITDA |
$ | 477,488 | $ | 327,360 | $ | 280,901 | $ | 368,367 | $ | 384,402 | ||||||||||
|
|
|
|
|
|
|
|
|
|
||||||||||||
| Adjusted Operating Income (Loss) UNAUDITED In thousands |
|
|||||||||||||||||||
| THREE MONTHS ENDED | ||||||||||||||||||||
| Sept. 30, 2023 | Sept. 30, 2022 | Dec 31, 2022 | Mar 31, 2023 | June 30, 2023 | ||||||||||||||||
| Operating loss |
$ | (9,908) | $ | (48,789) | $ | (135,181) | $ | (6,172) | $ | (132,107) | ||||||||||
| Amortization of acquired technology assets |
17,880 | 18,506 | 18,320 | 18,508 | 18,392 | |||||||||||||||
| Acquisition-related, integration and other costs |
24,812 | 23,470 | 40,662 | 1,551 | 102,349 | |||||||||||||||
| Bitcoin impairment losses |
— | 1,619 | 8,991 | — | — | |||||||||||||||
| Amortization of customer and other acquired intangible |
$ | 56,965 | $ | 37,361 | $ | 35,344 | $ | 37,087 | $ | 36,865 | ||||||||||
|
|
|
|
|
|
|
|
|
|
||||||||||||
| Adjusted Operating Income (Loss) |
$ | 89,749 | $ | 32,167 | $ | (31,864) | $ | 50,974 | $ | 25,499 | ||||||||||
|
|
|
|
|
|
|
|
|
|
||||||||||||
|
|
BLOCK Q3 2023 30 |
Adjusted Free Cash Flow
UNAUDITED
In thousands
| NINE MONTHS ENDED | ||||||||
| Sept. 30, 2023 | Sept. 30, 2022 | |||||||
| Net cash provided by operating activities |
$ | 898,884 | $ | 130,534 | ||||
| Consumer receivables cash flows included within investing activities in the GAAP statement of cash flows: |
||||||||
| Payments for originations of consumer receivables |
(16,401,673) | (12,286,091) | ||||||
| Proceeds from principal repayments and sales of consumer receivables |
16,814,089 | 12,538,992 | ||||||
| Less: Purchase of property and equipment |
(99,457) | (121,709) | ||||||
| Reversal of: |
||||||||
| Changes in settlements receivable |
1,518,471 | 793,460 | ||||||
| Changes in customers payable |
(1,390,888) | (599,886) | ||||||
| Changes in settlements payable |
(53,005) | (75,185) | ||||||
| Sales, principal payments and forgiveness of PPP loans |
$ | (12,530) | $ | (397,526) | ||||
|
|
|
|
||||||
| Adjusted Free Cash Flow |
$ | 1,273,891 | $ | (17,411) | ||||
|
|
|
|
||||||
| Net cash provided by investing activities |
$ | 404,968 | $ | 1,505,250 | ||||
| Net cash used in financing activities |
$ | (1,040,573) | $ | (881,408) | ||||
|
|
|
|
||||||
|
|
BLOCK Q3 2023 31 |
Select Financial Results Excluding
Bitcoin, BNPL and PPP
UNAUDITED
In thousands
| THREE MONTHS ENDED | NINE MONTHS ENDED | |||||||||||||||||||
| Sept. 30, 2023 | Sept. 30, 2022 | Sept. 30, 2023 | Sept. 30, 2022 | |||||||||||||||||
| Bitcoin revenue |
$ | 2,423,584 | $ | 1,762,752 | $ | 6,978,219 | $ | 5,279,430 | ||||||||||||
| Bitcoin costs |
2,378,906 | 1,726,051 | 6,838,914 | 5,157,935 | ||||||||||||||||
|
|
|
|
|
|
|
|
||||||||||||||
| Bitcoin gross profit |
$ | 44,678 | $ | 36,701 | $ | 139,305 | $ | 121,495 | ||||||||||||
|
|
|
|
|
|
|
|
||||||||||||||
| THREE MONTHS ENDED | NINE MONTHS ENDED | |||||||||||||||||||
| Sept. 30, 2023 | Sept. 30, 2022 | Sept. 30, 2023 | Sept. 30, 2022 | |||||||||||||||||
| Revenue (GAAP) |
$ | 5,617,493 | $ | 4,515,541 | $ | 16,142,581 | $ | 12,880,685 | ||||||||||||
| Less: Bitcoin revenue |
2,423,584 | 1,762,752 | 6,978,219 | 5,279,430 | ||||||||||||||||
|
|
|
|
|
|
|
|
||||||||||||||
| Total revenue, excluding Bitcoin |
$ | 3,193,909 | $ | 2,752,789 | $ | 9,164,362 | $ | 7,601,255 | ||||||||||||
|
|
|
|
|
|
|
|
||||||||||||||
| THREE MONTHS ENDED | NINE MONTHS ENDED | |||||||||||||||||||
| Sept. 30, 2023 | Sept. 30, 2022 | Sept. 30, 2023 | Sept. 30, 2022 | |||||||||||||||||
| Cash App revenue (GAAP) |
$ | 3,584,958 | $ | 2,684,884 | $ | 10,412,707 | $ | 7,769,361 | ||||||||||||
| Less: Bitcoin contribution to Cash App revenue | 2,423,584 | 1,762,752 | 6,978,219 | 5,279,430 | ||||||||||||||||
|
|
|
|
|
|
|
|
||||||||||||||
| Total Cash App revenue, excluding Bitcoin |
$ | 1,161,374 | $ | 922,132 | $ | 3,434,488 | $ | 2,489,931 | ||||||||||||
|
|
|
|
|
|
|
|
||||||||||||||
| THREE MONTHS ENDED | NINE MONTHS ENDED | |||||||||||||||||||
| Sept. 30, 2023 | Sept. 30, 2022 | Sept. 30, 2023 | Sept. 30, 2022 | |||||||||||||||||
| Square gross profit (GAAP) |
$ | 898,969 | $ | 782,968 | $ | 2,557,525 | $ | 2,199,628 | ||||||||||||
| Less: Square gross profit - U.S. |
747,547 | 662,050 | 2,142,552 | 1,875,958 | ||||||||||||||||
|
|
|
|
|
|
|
|
||||||||||||||
| Total Square gross profit - International |
151,422 | 120,918 | 414,973 | 323,670 | ||||||||||||||||
| Less: BNPL Platform contribution to Square gross profit - International |
|
56,306 | 45,828 | 155,195 | 123,449 | |||||||||||||||
|
|
|
|
|
|
|
|
||||||||||||||
| Total Square gross profit - International, excluding BNPL Platform |
|
$ | 95,116 | $ | 75,090 | $ | 259,778 | $ | 200,221 | |||||||||||
|
|
|
|
|
|
|
|
||||||||||||||
| THREE MONTHS ENDED | ||||||||||||||||||||
| Sept. 30, 2023 | Sept. 30, 2022 | Sept. 30, 2021 | Sept. 30, 2020 | Sept. 30, 2019 | ||||||||||||||||
| Square gross profit (GAAP) |
$ | 898,969 | $ | 782,968 | $ | 606,225 | $ | 409,331 | $ | 363,884 | ||||||||||
| Less: gross profit from Paycheck Protection Program (PPP) loan forgiveness |
317 | 4,900 | 13,284 | — | — | |||||||||||||||
|
|
|
|
|
|
|
|
|
|
||||||||||||
| Square gross profit excluding loan forgiveness from Paycheck Protection Program (PPP) |
$ | 898,652 | $ | 778,068 | $ | 592,941 | $ | 409,331 | $ | 363,884 | ||||||||||
|
|
|
|
|
|
|
|
|
|
||||||||||||
| THREE MONTHS ENDED | ||||||||||||||||||||
| Sept. 30, 2023 | Sept. 30, 2022 | Sept. 30, 2021 | Sept. 30, 2020 | Sept. 30, 2019 | ||||||||||||||||
| Square gross profit from Banking |
$ | 170,228 | $ | 142,245 | $ | 93,619 | $ | 38,305 | $ | 56,083 | ||||||||||
| Less: gross profit from Paycheck Protection Program (PPP) loan forgiveness |
317 | 4,900 | 13,284 | — | — | |||||||||||||||
|
|
|
|
|
|
|
|
|
|
||||||||||||
| Square banking gross profit excluding PPP loan forgiveness |
$ | 169,911 | $ | 137,345 | $ | 80,335 | $ | 38,305 | $ | 56,083 | ||||||||||
|
|
|
|
|
|
|
|
|
|
||||||||||||
|
|
BLOCK Q3 2023 32 |
Adjusted Net Income and
Adjusted EPS
UNAUDITED
In thousands, except per share data
| THREE MONTHS ENDED |
NINE MONTHS ENDED | |||||||||||||||
| Sept. 30, 2023 | Sept. 30, 2022 | Sept. 30, 2023 | Sept. 30, 2022 | |||||||||||||
| Net loss attributable to common stockholders |
$ | (28,954) | $ | (14,711) | $ | (168,298) | $ | (426,924) | ||||||||
| Net loss attributable to noncontrolling interests |
(4,806) | (4,033) | (10,630) | (8,460) | ||||||||||||
|
|
|
|
|
|
|
|
||||||||||
| Net loss |
(33,760) | (18,744) | (178,928) | (435,384) | ||||||||||||
| Share-based compensation expense |
345,690 | 262,733 | 944,529 | 794,794 | ||||||||||||
| Acquisition-related, integration and other costs |
24,812 | 23,470 | 128,712 | 116,602 | ||||||||||||
| Amortization of intangible assets |
74,845 | 55,867 | 185,697 | 155,288 | ||||||||||||
| Amortization of debt discount and issuance costs |
2,973 | 3,851 | 8,807 | 11,307 | ||||||||||||
| Loss (gain) on revaluation of equity investments |
583 | 712 | 16,838 | (43,914) | ||||||||||||
| Bitcoin impairment losses |
— | 1,619 | — | 37,580 | ||||||||||||
| Loss (gain) on disposal of property and equipment |
1,355 | (447) | 1,889 | 635 | ||||||||||||
| Acquired deferred revenue and cost adjustment |
21 | 53 | 78 | 187 | ||||||||||||
| Tax effect of non-GAAP net income adjustments |
(71,050) | (65,940) | (265,304) | (162,000) | ||||||||||||
|
|
|
|
|
|
|
|
||||||||||
| Adjusted Net Income - basic |
$ | 345,469 | $ | 263,174 | $ | 842,318 | $ | 475,095 | ||||||||
|
|
|
|
|
|
|
|
||||||||||
| Cash interest expense on convertible notes |
680 | 1,263 | 2,874 | 3,751 | ||||||||||||
| Adjusted Net Income - diluted |
$ | 346,149 | $ | 264,437 | $ | 845,192 | $ | 478,846 | ||||||||
|
|
|
|
|
|
|
|
||||||||||
| Weighted-average shares used to compute net income per share attributable to common stockholders: |
||||||||||||||||
| Basic |
611,276 | 592,672 | 606,767 | 572,234 | ||||||||||||
|
|
|
|
|
|
|
|
||||||||||
| Diluted |
611,276 | 592,672 | 606,767 | 572,234 | ||||||||||||
|
|
|
|
|
|
|
|
||||||||||
| Net loss per share attributable to common stockholders: |
||||||||||||||||
| Basic |
$ | (0.05) | $ | (0.02) | $ | (0.28) | $ | (0.75) | ||||||||
|
|
|
|
|
|
|
|
||||||||||
| Diluted |
$ | (0.05) | $ | (0.02) | $ | (0.28) | $ | (0.75) | ||||||||
|
|
|
|
|
|
|
|
||||||||||
| Weighted-average shares used to compute Adjusted Net Income Per Share: |
||||||||||||||||
| Basic |
611,276 | 592,672 | 606,767 | 572,234 | ||||||||||||
|
|
|
|
|
|
|
|
||||||||||
| Diluted |
628,059 | 622,974 | 627,784 | 611,227 | ||||||||||||
|
|
|
|
|
|
|
|
||||||||||
| Adjusted Net Income Per Share: |
||||||||||||||||
| Basic |
$ | 0.57 | $ | 0.44 | $ | 1.39 | $ | 0.83 | ||||||||
|
|
|
|
|
|
|
|
||||||||||
| Diluted |
$ | 0.55 | $ | 0.42 | $ | 1.35 | $ | 0.78 | ||||||||
|
|
|
|
|
|
|
|
||||||||||
|
|
BLOCK Q3 2023 33 |
Non-GAAP Operating Expenses
UNAUDITED
In thousands
| THREE MONTHS ENDED |
NINE MONTHS ENDED | |||||||||||||||
| Sept. 30, 2023 | Sept. 30, 2022 | Sept. 30, 2023 | Sept. 30, 2022 | |||||||||||||
| Operating expenses |
$ | (1,908,357) | $ | (1,615,878) | $ | (5,627,321) | $ | (4,821,048) | ||||||||
| Share-based compensation |
345,547 | 262,629 | 944,102 | 794,442 | ||||||||||||
| Depreciation and amortization |
96,446 | 69,500 | 245,358 | 196,802 | ||||||||||||
| Bitcoin impairment losses |
— | 1,619 | — | 37,580 | ||||||||||||
| Loss on disposal of property and equipment |
1,355 | (447) | 1,889 | 635 | ||||||||||||
| Acquisition related, integration and other costs |
24,812 | 23,470 | 128,712 | 116,602 | ||||||||||||
|
|
|
|
|
|
|
|
||||||||||
| Non-GAAP operating expenses |
$ | (1,440,197) | $ | (1,259,107) | $ | (4,307,260) | $ | (3,674,987) | ||||||||
|
|
|
|
|
|
|
|
||||||||||
| THREE MONTHS ENDED | NINE MONTHS ENDED | |||||||||||||||
| Sept. 30, 2023 | Sept. 30, 2022 | Sept. 30, 2023 | Sept. 30, 2022 | |||||||||||||
| Product development |
$ | (713,788) | $ | (548,037) | $ | (2,035,397) | $ | (1,531,088) | ||||||||
| Share-based compensation |
245,244 | 184,569 | 666,512 | 508,781 | ||||||||||||
| Depreciation and amortization |
37,520 | 31,767 | 109,886 | 92,323 | ||||||||||||
| Loss on disposal of property and equipment |
562 | 451 | 874 | 461 | ||||||||||||
|
|
|
|
|
|
|
|
||||||||||
| Non-GAAP product development |
$ | (430,462) | $ | (331,250) | $ | (1,258,125) | $ | (929,523) | ||||||||
|
|
|
|
|
|
|
|
||||||||||
| THREE MONTHS ENDED | NINE MONTHS ENDED | |||||||||||||||
| Sept. 30, 2023 | Sept. 30, 2022 | Sept. 30, 2023 | Sept. 30, 2022 | |||||||||||||
| Sales and marketing |
$ | (479,381) | $ | (485,838) | $ | (1,512,999) | $ | (1,518,227) | ||||||||
| Share-based compensation |
35,703 | 28,744 | 97,858 | 75,133 | ||||||||||||
| Depreciation and amortization |
1,945 | 1,591 | 5,373 | 4,520 | ||||||||||||
| Loss (gain) on disposal of property and equipment |
— | (448) | — | 52 | ||||||||||||
|
|
|
|
|
|
|
|
||||||||||
| Non-GAAP sales and marketing |
$ | (441,733) | $ | (455,951) | $ | (1,409,768) | $ | (1,438,522) | ||||||||
|
|
|
|
|
|
|
|
||||||||||
| THREE MONTHS ENDED | NINE MONTHS ENDED | |||||||||||||||
| Sept. 30, 2023 | Sept. 30, 2022 | Sept. 30, 2023 | Sept. 30, 2022 | |||||||||||||
| General and administrative |
$ | (480,885) | $ | (395,437) | $ | (1,463,003) | $ | (1,235,306) | ||||||||
| Share-based compensation |
64,600 | 49,316 | 179,732 | 210,528 | ||||||||||||
| Depreciation and amortization |
11,719 | 11,129 | 34,826 | 31,517 | ||||||||||||
| Loss on disposal of property and equipment |
793 | (450) | 1,015 | 122 | ||||||||||||
| Acquisition related, integration and other costs |
24,812 | 23,470 | 128,712 | 116,602 | ||||||||||||
|
|
|
|
|
|
|
|
||||||||||
| Non-GAAP general and administrative |
$ | (378,961) | $ | (311,972) | $ | (1,118,718) | $ | (876,537) | ||||||||
|
|
|
|
|
|
|
|
||||||||||
| Depreciation and Amortization by Function UNAUDITED In thousands |
|
|||||||||||||||
| THREE MONTHS ENDED | NINE MONTHS ENDED | |||||||||||||||
| Sept. 30, 2023 | Sept. 30, 2022 | Sept. 30, 2023 | Sept. 30, 2022 | |||||||||||||
| Cost of revenue |
$ | 19,072 | $ | 19,221 | $ | 57,878 | $ | 52,814 | ||||||||
| Product development |
37,520 | 31,767 | 109,886 | 92,323 | ||||||||||||
| Sales and marketing |
1,945 | 1,591 | 5,373 | 4,520 | ||||||||||||
| General and administrative |
11,719 | 11,129 | 34,826 | 31,517 | ||||||||||||
| Amortization of acquired customer assets |
45,262 | 25,013 | 95,273 | 68,442 | ||||||||||||
|
|
|
|
|
|
|
|
||||||||||
| Total depreciation and amortization |
$ | 115,518 | $ | 88,721 | $ | 303,236 | $ | 249,616 | ||||||||
|
|
|
|
|
|
|
|
||||||||||
|
|
BLOCK Q3 2023 34 |