UNITED STATES
SECURITIES AND EXCHANGE COMMISSION
Washington, D.C. 20549
FORM 8-K
CURRENT REPORT
Pursuant to Section 13 or 15(d)
of the Securities Exchange Act of 1934
Date of Report (Date of earliest event reported): October 30, 2023
MIDDLEFIELD BANC CORP.
(Exact name of registrant as specified in its charter)
| Ohio | 001-36613 | 34-1585111 | ||
| (State or other jurisdiction of incorporation) |
(Commission File No.) |
(IRS Employer I.D. No.) |
| 15985 East High Street, Middlefield, Ohio 44062 |
| (Address of principal executive offices) (Zip Code) |
Registrant’s telephone number, including area code: (440) 632-1666
Not Applicable
(Former name or former address, if changed since last report)
Check the appropriate box below if the Form 8-K filing is intended to simultaneously satisfy the filing obligation of the registrant under any of the following provisions (see General Instruction A.2. below):
| ☐ | Written communications pursuant to Rule 425 under the Securities Act (17 CFR 230.425) |
| ☐ | Soliciting material pursuant to Rule 14a-12 under the Exchange Act (17 CFR 240.14a-12) |
| ☐ | Pre-commencement communications pursuant to Rule 14d-2(b) under the Exchange Act (17 CFR 240.14d-2(b)) |
| ☐ | Pre-commencement communications pursuant to Rule 13e-4(c) under the Exchange Act (17 CFR 240.13e-4(c)) |
Securities registered pursuant to Section 12(b) of the Act:
| Title of each class |
Trading |
Name of each exchange |
||
| Common Stock, no par value | MBCN | The NASDAQ Stock Market, LLC (NASDAQ Capital Market) |
Indicate by check mark whether the registrant is an emerging growth company as defined in Rule 405 of the Securities Act of 1933 (§230.405 of this chapter) or Rule 12b-2 of the Securities Exchange Act of 1934 (§240.12b-2 of this chapter).
Emerging growth company ☐
If an emerging growth company, indicate by check mark if the registrant has elected not to use the extended transition period for complying with any new or revised financial accounting standards provided pursuant to Section 13(a) of the Exchange Act. ☐
Item 7.01 Other Events.
Middlefield Banc Corp. (NASDAQ: MBCN) intends to use the materials furnished herewith in one or more meetings with investors/analysts during the fourth quarter of 2023.
The information in this current Report on Form 8-K is being furnished under item 7.01 and shall not be deemed “filed” for the purposes of Section 18 of the Securities Exchange Act of 1934 (the “Exchange Act”), nor shall such information be deemed incorporated by reference in any filing under the Securities Act of 1933 or the Exchange Act, except as shall be expressly set forth by specific reference in such a filing.
Item 9.01(d) Exhibits
The following exhibit is furnished as Regulation FD Disclosure to this Current Report on Form 8-K.
| (a) | Exhibits. |
| 99.1 | 2023 Third Quarter Investor Presentation | |
| 104 | Cover Page Interactive File (embedded within the Inline XBRL document) | |
2
SIGNATURES
Pursuant to the requirements of the Securities Exchange Act of 1934, the Registrant has duly caused this report to be signed on its behalf by the undersigned thereunto duly authorized.
| MIDDLEFIELD BANC CORP. | ||
| By: | /s/ James R. Heslop, II |
|
| James R. Heslop, II | ||
| Chief Executive Officer | ||
| Date: October 30, 2023 | ||
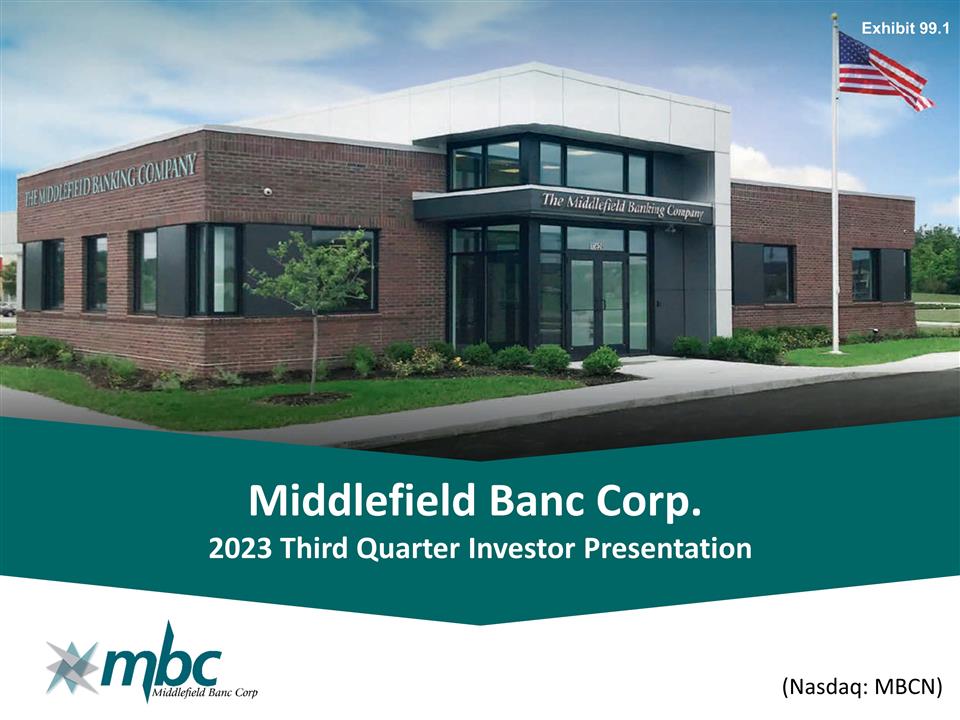
Middlefield Banc Corp. 2023 Third Quarter Investor Presentation (Nasdaq: MBCN) Exhibit 99.1
Forward Looking Statements This presentation contains forward-looking statements within the meaning of the Securities Exchange Act of 1934 and the Private Securities Litigation Reform Act of 1995 concerning Middlefield Banc Corp.’s plans, strategies, objectives, expectations, intentions, financial condition and results of operations. These forward-looking statements reflect management’s current views and intentions and are subject to known and unknown risks, uncertainties, assumptions and other factors that could cause the actual results to differ materially from those contemplated by the statements. The significant risks and uncertainties related to Middlefield Banc Corp. of which management is aware are discussed in detail in the periodic reports that Middlefield Banc Corp. files with the Securities and Exchange Commission (the “SEC”), including in the “Risk Factors” section of its Annual Report on Form 10-K and its Quarterly Report on Form 10-Q. Investors are urged to review Middlefield Banc Corp.’s periodic reports, which are available at no charge through the SEC’s website at www.sec.gov and through Middlefield Banc Corp.’s website at www.middlefieldbank.bank on the “Investor Relations” page. Middlefield Banc Corp. assumes no obligation to update any of these forward-looking statements to reflect a change in its views or events or circumstances that occur after the date of this presentation. www.middlefieldbank.bank
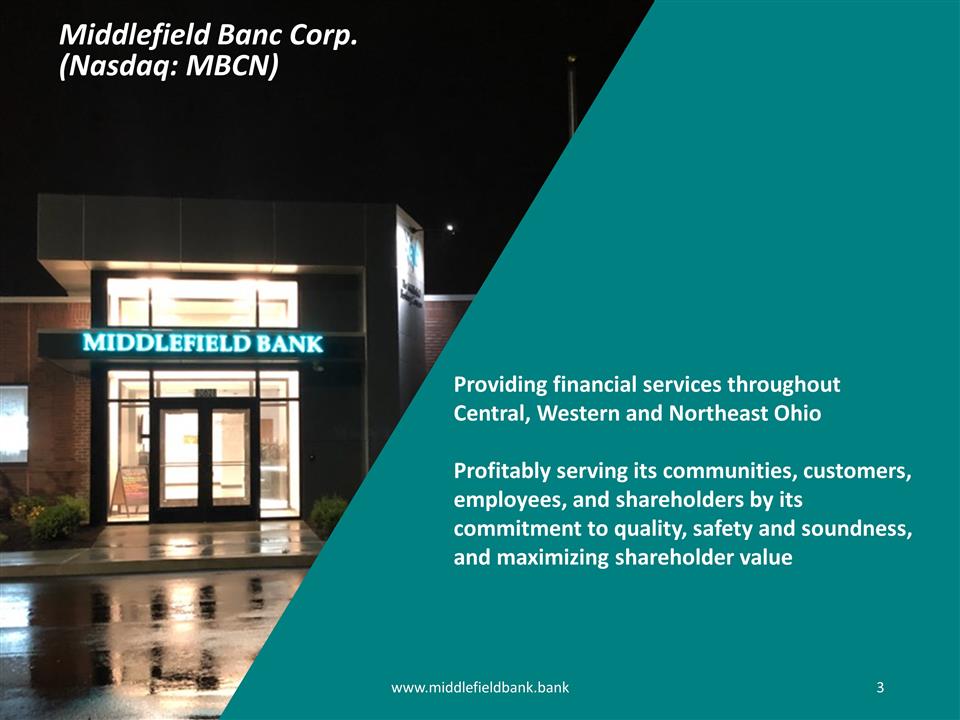
Middlefield Banc Corp. Middlefield Banc Corp. (Nasdaq: MBCN) Providing financial services throughout Central, Western and Northeast Ohio Profitably serving its communities, customers, employees, and shareholders by its commitment to quality, safety and soundness, and maximizing shareholder value www.middlefieldbank.bank
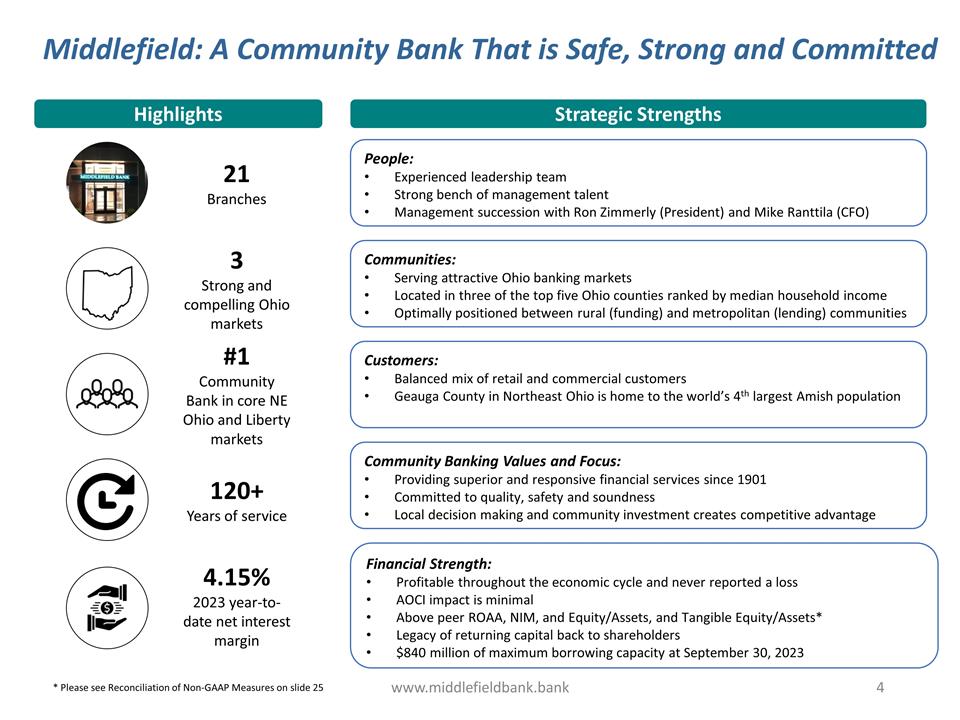
www.middlefieldbank.bank Middlefield: A Community Bank That is Safe, Strong and Committed Highlights Strategic Strengths People: Experienced leadership team Strong bench of management talent Management succession with Ron Zimmerly (President) and Mike Ranttila (CFO) Communities: Serving attractive Ohio banking markets Located in three of the top five Ohio counties ranked by median household income Optimally positioned between rural (funding) and metropolitan (lending) communities Customers: Balanced mix of retail and commercial customers Geauga County in Northeast Ohio is home to the world’s 4th largest Amish population Community Banking Values and Focus: Providing superior and responsive financial services since 1901 Committed to quality, safety and soundness Local decision making and community investment creates competitive advantage Financial Strength: Profitable throughout the economic cycle and never reported a loss AOCI impact is minimal Above peer ROAA, NIM, and Equity/Assets, and Tangible Equity/Assets* Legacy of returning capital back to shareholders $840 million of maximum borrowing capacity at September 30, 2023 21 Branches 120+ Years of service 3 Strong and compelling Ohio markets #1 Community Bank in core NE Ohio and Liberty markets 4.15% 2023 year-to-date net interest margin * Please see Reconciliation of Non-GAAP Measures on slide 25
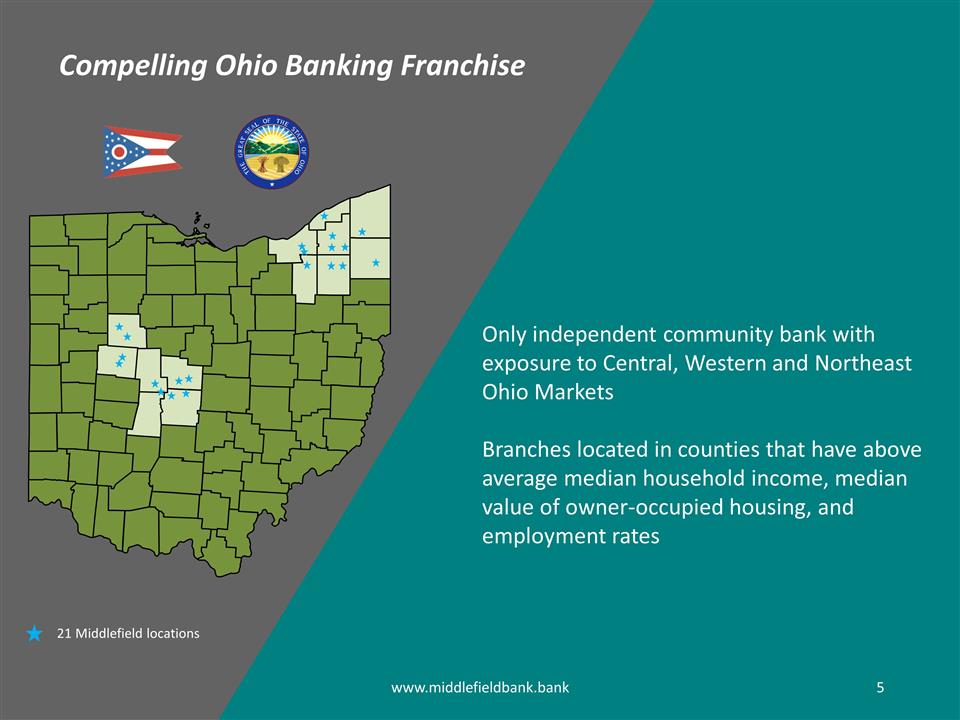
Only independent community bank with exposure to Central, Western and Northeast Ohio Markets Branches located in counties that have above average median household income, median value of owner-occupied housing, and employment rates www.middlefieldbank.bank Compelling Ohio Banking Franchise 21 Middlefield locations
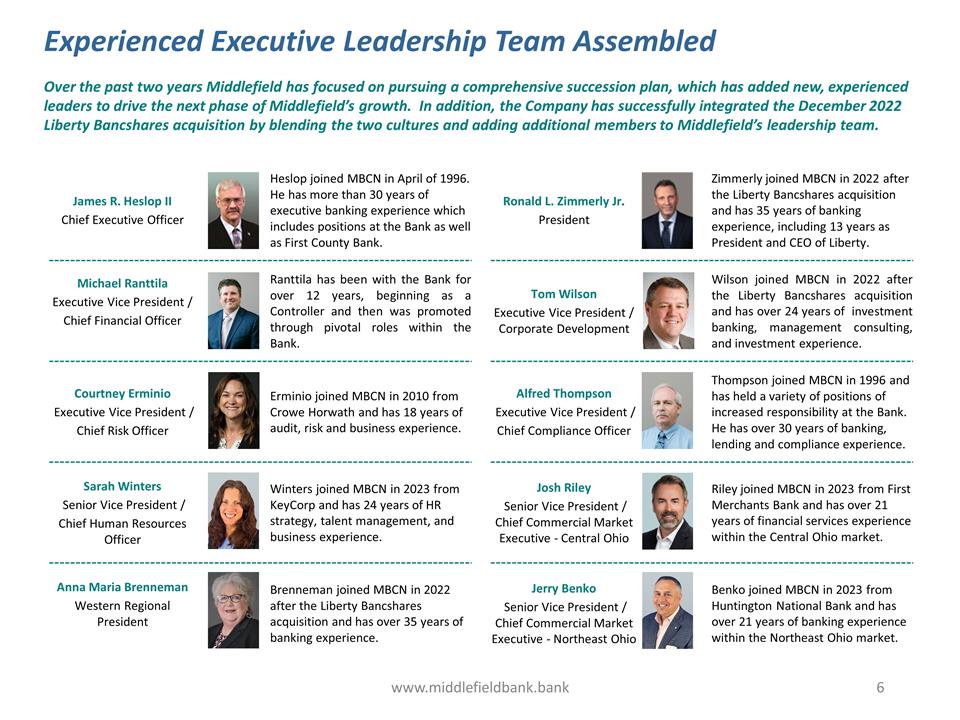
Ronald L. Zimmerly Jr. President Zimmerly joined MBCN in 2022 after the Liberty Bancshares acquisition and has 35 years of banking experience, including 13 years as President and CEO of Liberty. Tom Wilson Executive Vice President / Corporate Development Wilson joined MBCN in 2022 after the Liberty Bancshares acquisition and has over 24 years of investment banking, management consulting, and investment experience. Alfred Thompson Executive Vice President / Chief Compliance Officer Thompson joined MBCN in 1996 and has held a variety of positions of increased responsibility at the Bank. He has over 30 years of banking, lending and compliance experience. Josh Riley Senior Vice President / Chief Commercial Market Executive - Central Ohio Riley joined MBCN in 2023 from First Merchants Bank and has over 21 years of financial services experience within the Central Ohio market. Jerry Benko Senior Vice President / Chief Commercial Market Executive - Northeast Ohio Benko joined MBCN in 2023 from Huntington National Bank and has over 21 years of banking experience within the Northeast Ohio market. Experienced Executive Leadership Team Assembled James R. Heslop II Chief Executive Officer Heslop joined MBCN in April of 1996. He has more than 30 years of executive banking experience which includes positions at the Bank as well as First County Bank. Michael Ranttila Executive Vice President / Chief Financial Officer Ranttila has been with the Bank for over 12 years, beginning as a Controller and then was promoted through pivotal roles within the Bank. Courtney Erminio Executive Vice President / Chief Risk Officer Erminio joined MBCN in 2010 from Crowe Horwath and has 18 years of audit, risk and business experience. Sarah Winters Senior Vice President / Chief Human Resources Officer Winters joined MBCN in 2023 from KeyCorp and has 24 years of HR strategy, talent management, and business experience. Anna Maria Brenneman Western Regional President Brenneman joined MBCN in 2022 after the Liberty Bancshares acquisition and has over 35 years of banking experience. Over the past two years Middlefield has focused on pursuing a comprehensive succession plan, which has added new, experienced leaders to drive the next phase of Middlefield’s growth. In addition, the Company has successfully integrated the December 2022 Liberty Bancshares acquisition by blending the two cultures and adding additional members to Middlefield’s leadership team. www.middlefieldbank.bank
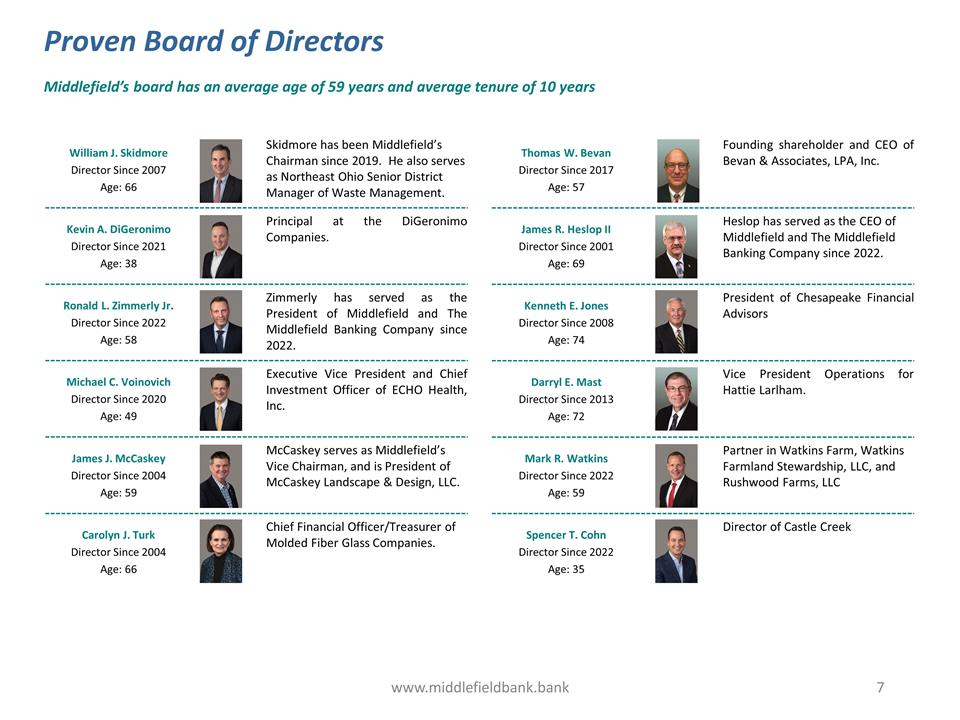
Proven Board of Directors Thomas W. Bevan Director Since 2017 Age: 57 Founding shareholder and CEO of Bevan & Associates, LPA, Inc. James R. Heslop II Director Since 2001 Age: 69 Heslop has served as the CEO of Middlefield and The Middlefield Banking Company since 2022. Kenneth E. Jones Director Since 2008 Age: 74 President of Chesapeake Financial Advisors Darryl E. Mast Director Since 2013 Age: 72 Vice President Operations for Hattie Larlham. Mark R. Watkins Director Since 2022 Age: 59 Partner in Watkins Farm, Watkins Farmland Stewardship, LLC, and Rushwood Farms, LLC Spencer T. Cohn Director Since 2022 Age: 35 Director of Castle Creek William J. Skidmore Director Since 2007 Age: 66 Skidmore has been Middlefield’s Chairman since 2019. He also serves as Northeast Ohio Senior District Manager of Waste Management. Kevin A. DiGeronimo Director Since 2021 Age: 38 Principal at the DiGeronimo Companies. Ronald L. Zimmerly Jr. Director Since 2022 Age: 58 Zimmerly has served as the President of Middlefield and The Middlefield Banking Company since 2022. Michael C. Voinovich Director Since 2020 Age: 49 Executive Vice President and Chief Investment Officer of ECHO Health, Inc. James J. McCaskey Director Since 2004 Age: 59 McCaskey serves as Middlefield’s Vice Chairman, and is President of McCaskey Landscape & Design, LLC. Carolyn J. Turk Director Since 2004 Age: 66 Chief Financial Officer/Treasurer of Molded Fiber Glass Companies. www.middlefieldbank.bank Middlefield’s board has an average age of 59 years and average tenure of 10 years
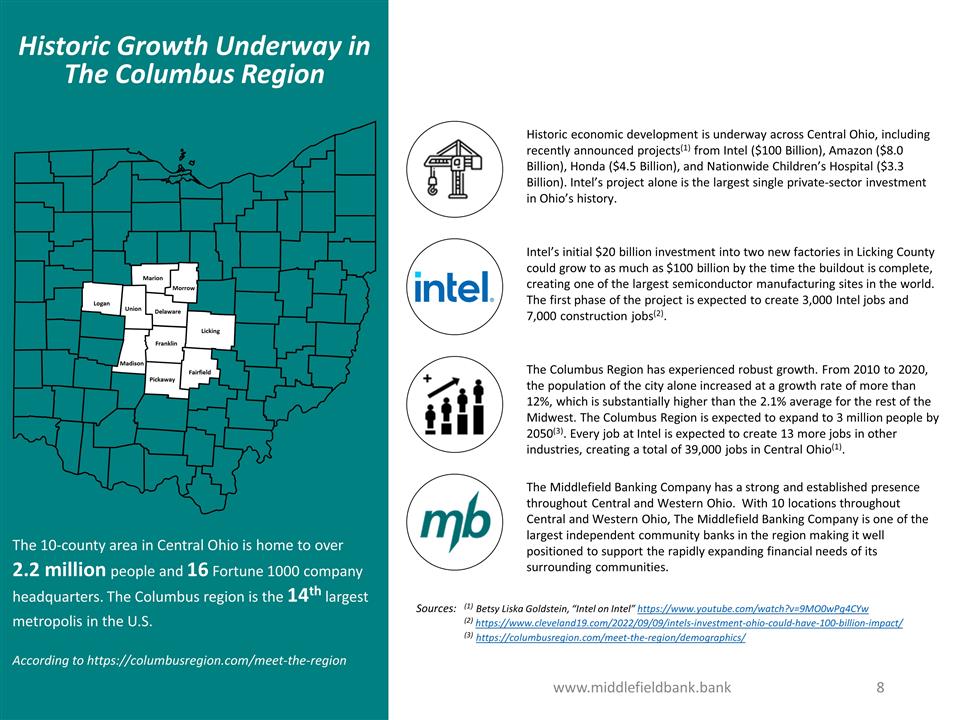
www.middlefieldbank.bank Historic Growth Underway in The Columbus Region Franklin Pickaway Union Madison Delaware Morrow Licking Fairfield Logan Marion The 10-county area in Central Ohio is home to over 2.2 million people and 16 Fortune 1000 company headquarters. The Columbus region is the 14th largest metropolis in the U.S. According to https://columbusregion.com/meet-the-region Sources:(1) Betsy Liska Goldstein, “Intel on Intel” https://www.youtube.com/watch?v=9MO0wPg4CYw (2) https://www.cleveland19.com/2022/09/09/intels-investment-ohio-could-have-100-billion-impact/ (3) https://columbusregion.com/meet-the-region/demographics/ Historic economic development is underway across Central Ohio, including recently announced projects(1) from Intel ($100 Billion), Amazon ($8.0 Billion), Honda ($4.5 Billion), and Nationwide Children’s Hospital ($3.3 Billion). Intel’s project alone is the largest single private-sector investment in Ohio’s history. Intel’s initial $20 billion investment into two new factories in Licking County could grow to as much as $100 billion by the time the buildout is complete, creating one of the largest semiconductor manufacturing sites in the world. The first phase of the project is expected to create 3,000 Intel jobs and 7,000 construction jobs(2). The Columbus Region has experienced robust growth. From 2010 to 2020, the population of the city alone increased at a growth rate of more than 12%, which is substantially higher than the 2.1% average for the rest of the Midwest. The Columbus Region is expected to expand to 3 million people by 2050(3). Every job at Intel is expected to create 13 more jobs in other industries, creating a total of 39,000 jobs in Central Ohio(1). The Middlefield Banking Company has a strong and established presence throughout Central and Western Ohio. With 10 locations throughout Central and Western Ohio, The Middlefield Banking Company is one of the largest independent community banks in the region making it well positioned to support the rapidly expanding financial needs of its surrounding communities.
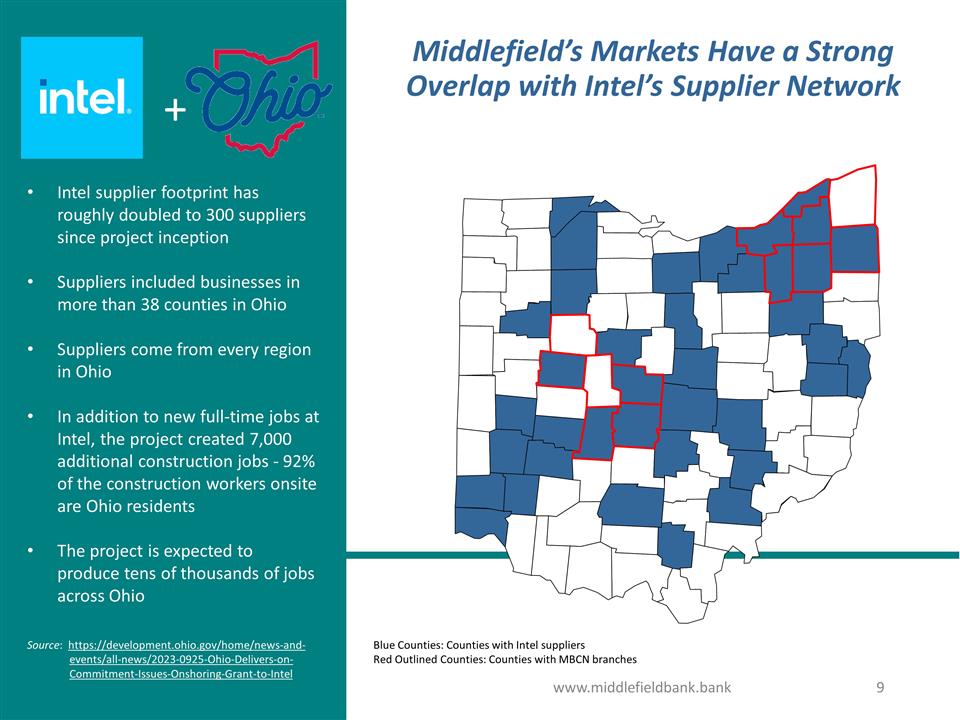
www.middlefieldbank.bank Middlefield’s Markets Have a Strong Overlap with Intel’s Supplier Network Blue Counties: Counties with Intel suppliers Red Outlined Counties: Counties with MBCN branches Intel supplier footprint has roughly doubled to 300 suppliers since project inception Suppliers included businesses in more than 38 counties in Ohio Suppliers come from every region in Ohio In addition to new full-time jobs at Intel, the project created 7,000 additional construction jobs - 92% of the construction workers onsite are Ohio residents The project is expected to produce tens of thousands of jobs across Ohio + Source: https://development.ohio.gov/home/news-and-events/all-news/2023-0925-Ohio-Delivers-on-Commitment-Issues-Onshoring-Grant-to-Intel
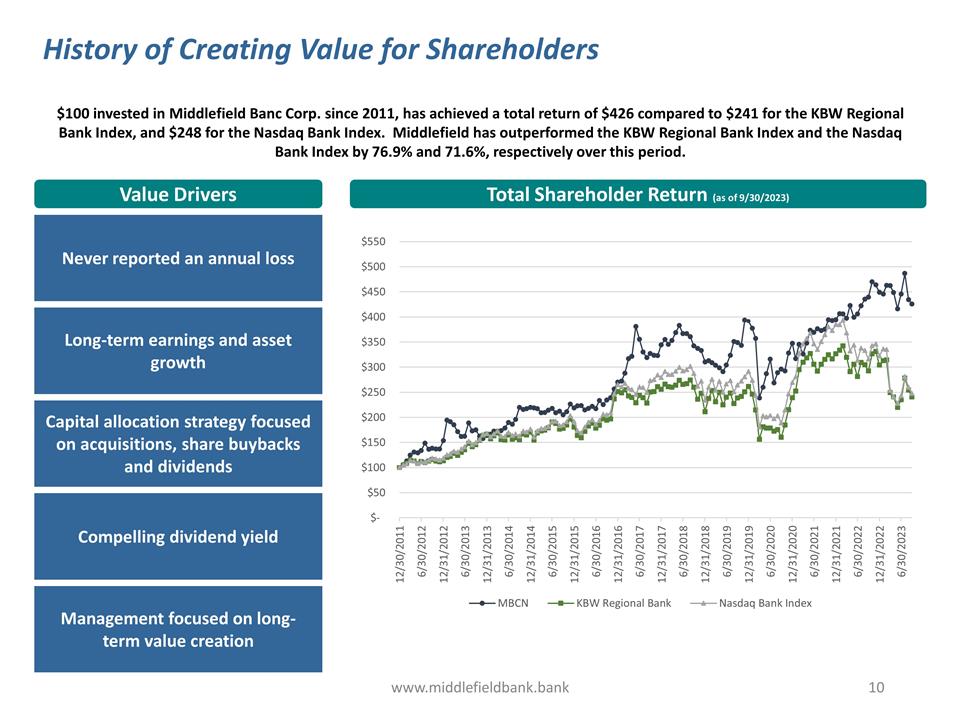
www.middlefieldbank.bank History of Creating Value for Shareholders Total Shareholder Return (as of 9/30/2023) Value Drivers $100 invested in Middlefield Banc Corp. since 2011, has achieved a total return of $426 compared to $241 for the KBW Regional Bank Index, and $248 for the Nasdaq Bank Index. Middlefield has outperformed the KBW Regional Bank Index and the Nasdaq Bank Index by 76.9% and 71.6%, respectively over this period. Never reported an annual loss Compelling dividend yield Capital allocation strategy focused on acquisitions, share buybacks and dividends Long-term earnings and asset growth Management focused on long-term value creation
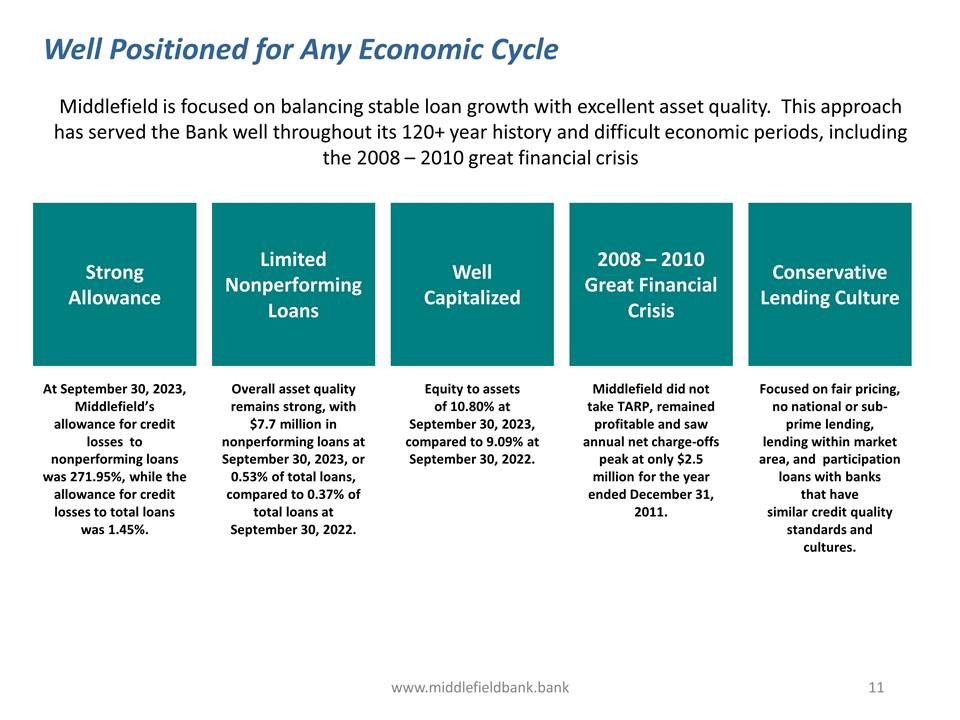
www.middlefieldbank.bank Well Positioned for Any Economic Cycle At September 30, 2023, Middlefield’s allowance for credit losses to nonperforming loans was 271.95%, while the allowance for credit losses to total loans was 1.45%. Strong Allowance Well Capitalized Limited Nonperforming Loans Conservative Lending Culture Focused on fair pricing, no national or sub-prime lending, lending within market area, and participation loans with banks that have similar credit quality standards and cultures. Equity to assets of 10.80% at September 30, 2023, compared to 9.09% at September 30, 2022. Middlefield did not take TARP, remained profitable and saw annual net charge-offs peak at only $2.5 million for the year ended December 31, 2011. Overall asset quality remains strong, with $7.7 million in nonperforming loans at September 30, 2023, or 0.53% of total loans, compared to 0.37% of total loans at September 30, 2022. 2008 – 2010 Great Financial Crisis Middlefield is focused on balancing stable loan growth with excellent asset quality. This approach has served the Bank well throughout its 120+ year history and difficult economic periods, including the 2008 – 2010 great financial crisis
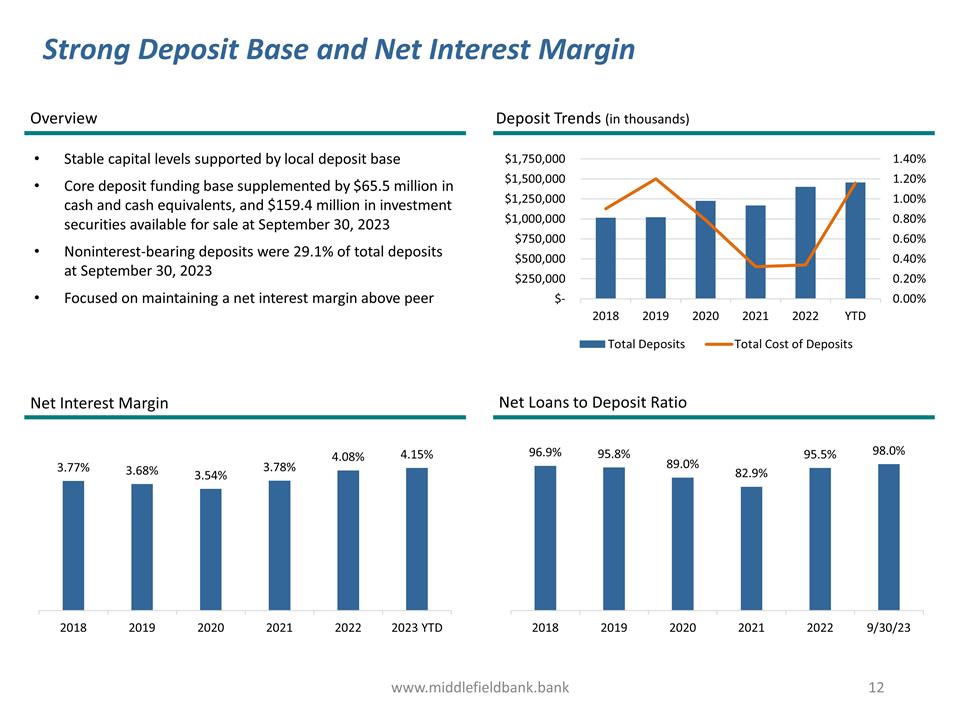
www.middlefieldbank.bank Strong Deposit Base and Net Interest Margin Overview Deposit Trends (in thousands) Net Loans to Deposit Ratio Net Interest Margin Stable capital levels supported by local deposit base Core deposit funding base supplemented by $65.5 million in cash and cash equivalents, and $159.4 million in investment securities available for sale at September 30, 2023 Noninterest-bearing deposits were 29.1% of total deposits at September 30, 2023 Focused on maintaining a net interest margin above peer
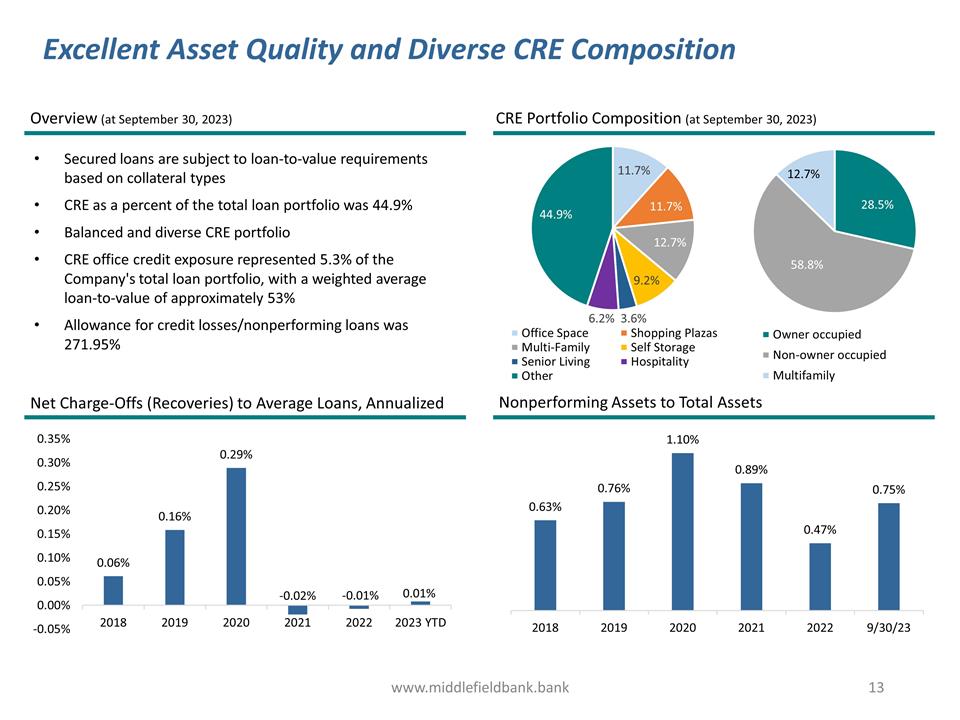
www.middlefieldbank.bank Excellent Asset Quality and Diverse CRE Composition Overview (at September 30, 2023) CRE Portfolio Composition (at September 30, 2023) Nonperforming Assets to Total Assets Net Charge-Offs (Recoveries) to Average Loans, Annualized Secured loans are subject to loan-to-value requirements based on collateral types CRE as a percent of the total loan portfolio was 44.9% Balanced and diverse CRE portfolio CRE office credit exposure represented 5.3% of the Company's total loan portfolio, with a weighted average loan-to-value of approximately 53% Allowance for credit losses/nonperforming loans was 271.95%
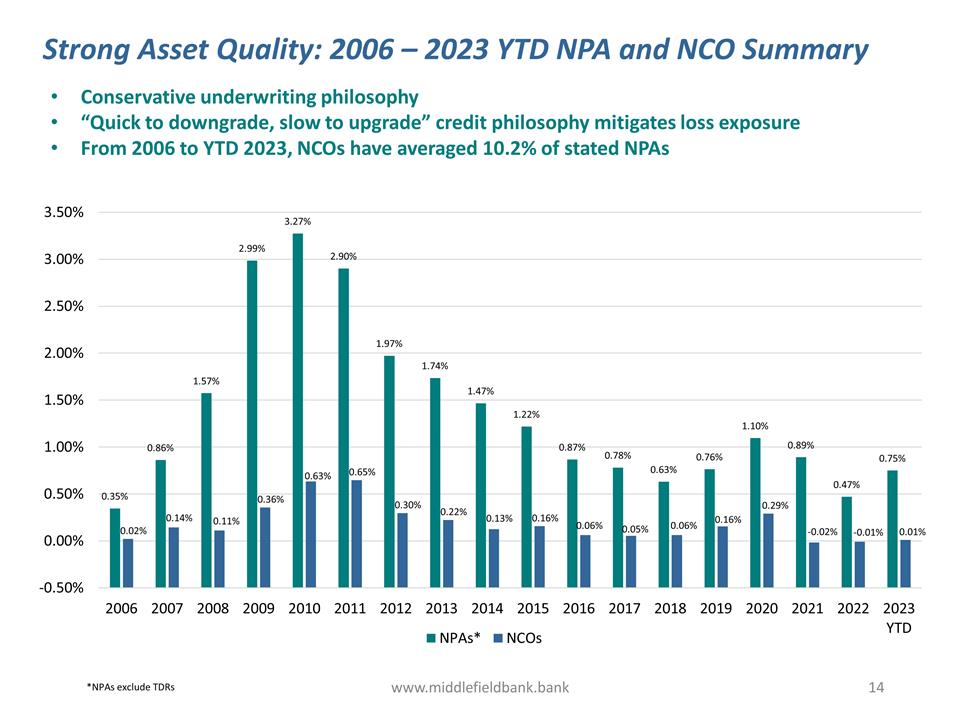
www.middlefieldbank.bank Strong Asset Quality: 2006 – 2023 YTD NPA and NCO Summary Conservative underwriting philosophy “Quick to downgrade, slow to upgrade” credit philosophy mitigates loss exposure From 2006 to YTD 2023, NCOs have averaged 10.2% of stated NPAs *NPAs exclude TDRs
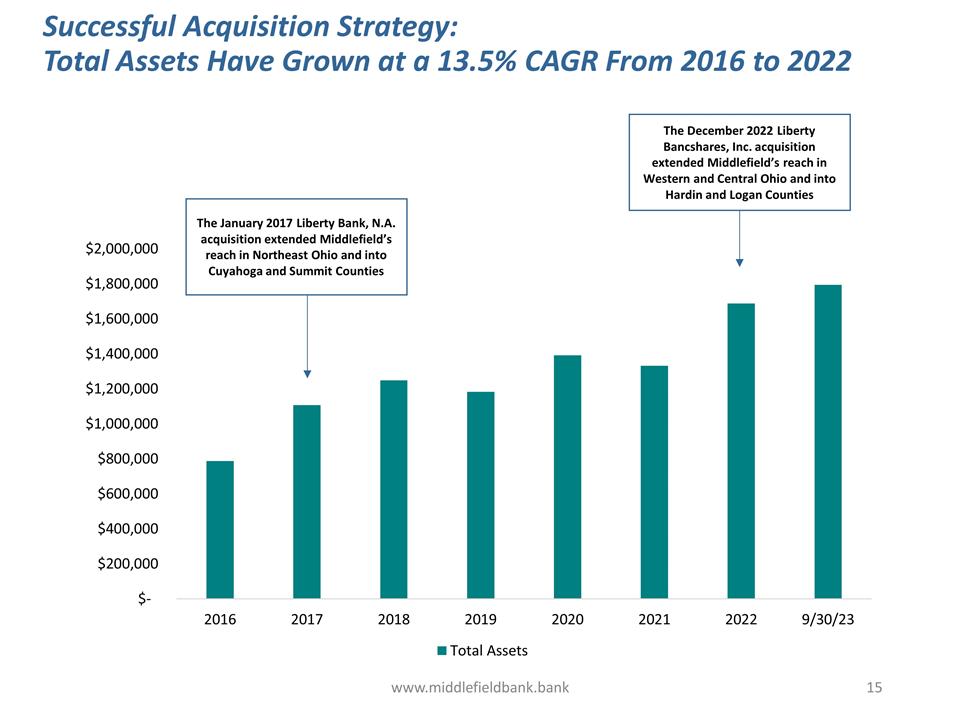
www.middlefieldbank.bank Successful Acquisition Strategy: Total Assets Have Grown at a 13.5% CAGR From 2016 to 2022 The January 2017 Liberty Bank, N.A. acquisition extended Middlefield’s reach in Northeast Ohio and into Cuyahoga and Summit Counties The December 2022 Liberty Bancshares, Inc. acquisition extended Middlefield’s reach in Western and Central Ohio and into Hardin and Logan Counties
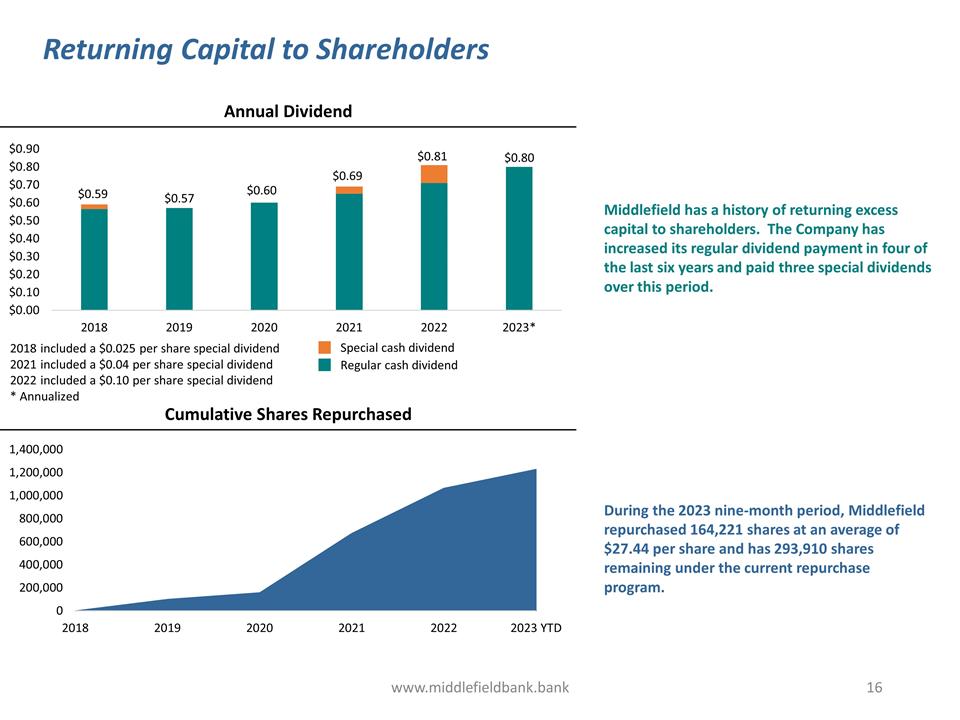
www.middlefieldbank.bank Returning Capital to Shareholders Annual Dividend Cumulative Shares Repurchased Middlefield has a history of returning excess capital to shareholders. The Company has increased its regular dividend payment in four of the last six years and paid three special dividends over this period. During the 2023 nine-month period, Middlefield repurchased 164,221 shares at an average of $27.44 per share and has 293,910 shares remaining under the current repurchase program. 2018 included a $0.025 per share special dividend 2021 included a $0.04 per share special dividend 2022 included a $0.10 per share special dividend * Annualized Special cash dividend Regular cash dividend $0.81
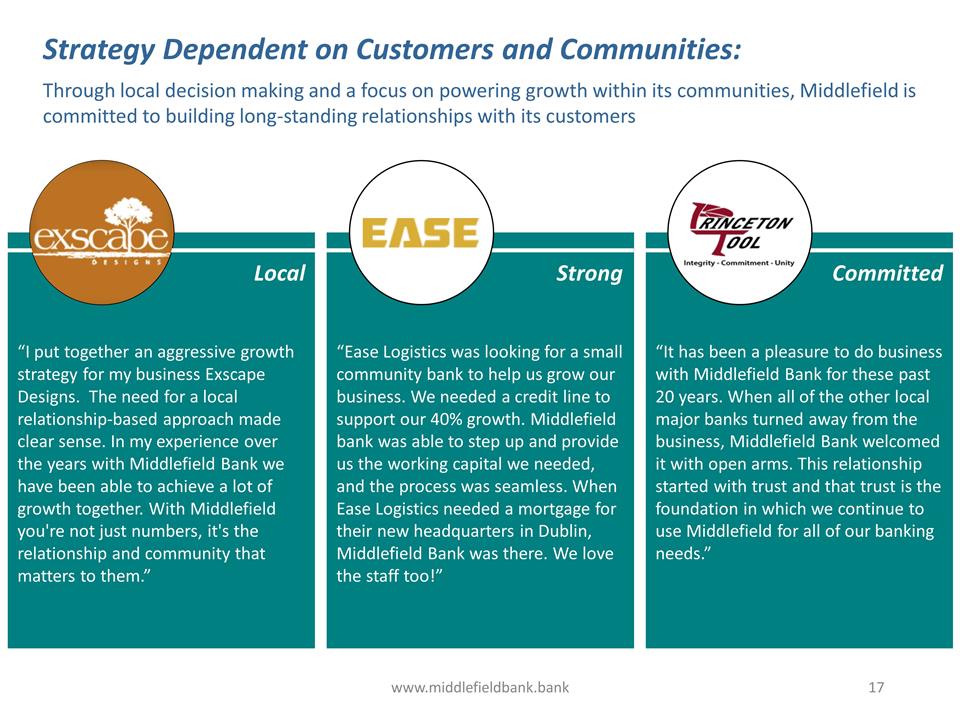
www.middlefieldbank.bank “I put together an aggressive growth strategy for my business Exscape Designs. The need for a local relationship-based approach made clear sense. In my experience over the years with Middlefield Bank we have been able to achieve a lot of growth together. With Middlefield you're not just numbers, it's the relationship and community that matters to them.” “Ease Logistics was looking for a small community bank to help us grow our business. We needed a credit line to support our 40% growth. Middlefield bank was able to step up and provide us the working capital we needed, and the process was seamless. When Ease Logistics needed a mortgage for their new headquarters in Dublin, Middlefield Bank was there. We love the staff too!” “It has been a pleasure to do business with Middlefield Bank for these past 20 years. When all of the other local major banks turned away from the business, Middlefield Bank welcomed it with open arms. This relationship started with trust and that trust is the foundation in which we continue to use Middlefield for all of our banking needs.” Strategy Dependent on Customers and Communities: Local Strong Committed Through local decision making and a focus on powering growth within its communities, Middlefield is committed to building long-standing relationships with its customers
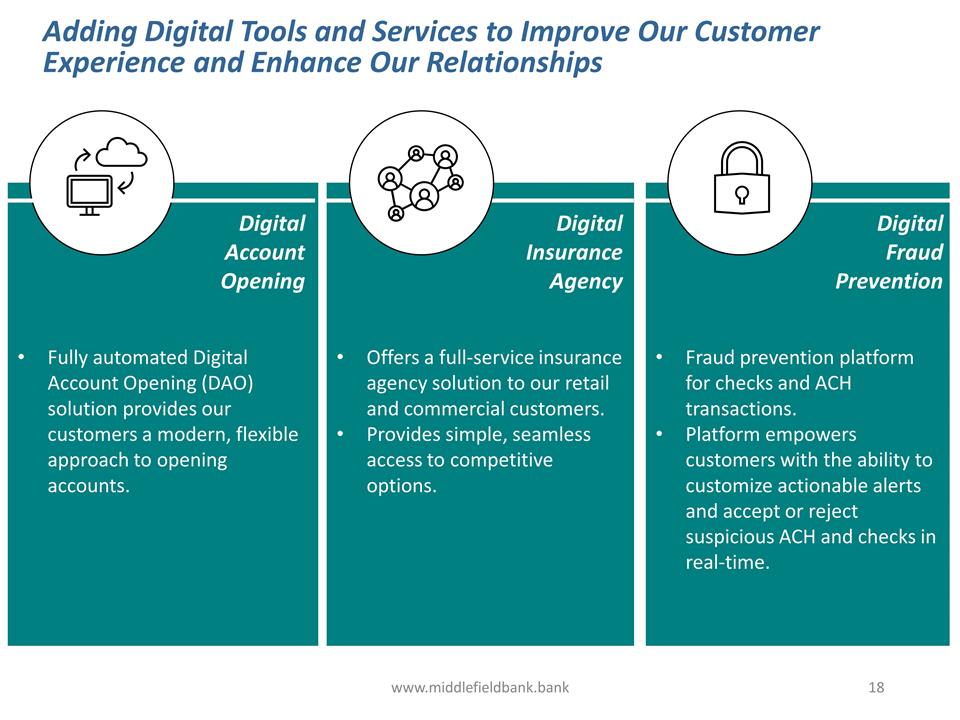
www.middlefieldbank.bank Fully automated Digital Account Opening (DAO) solution provides our customers a modern, flexible approach to opening accounts. Offers a full-service insurance agency solution to our retail and commercial customers. Provides simple, seamless access to competitive options. Fraud prevention platform for checks and ACH transactions. Platform empowers customers with the ability to customize actionable alerts and accept or reject suspicious ACH and checks in real-time. Adding Digital Tools and Services to Improve Our Customer Experience and Enhance Our Relationships Digital Account Opening Digital Insurance Agency Digital Fraud Prevention
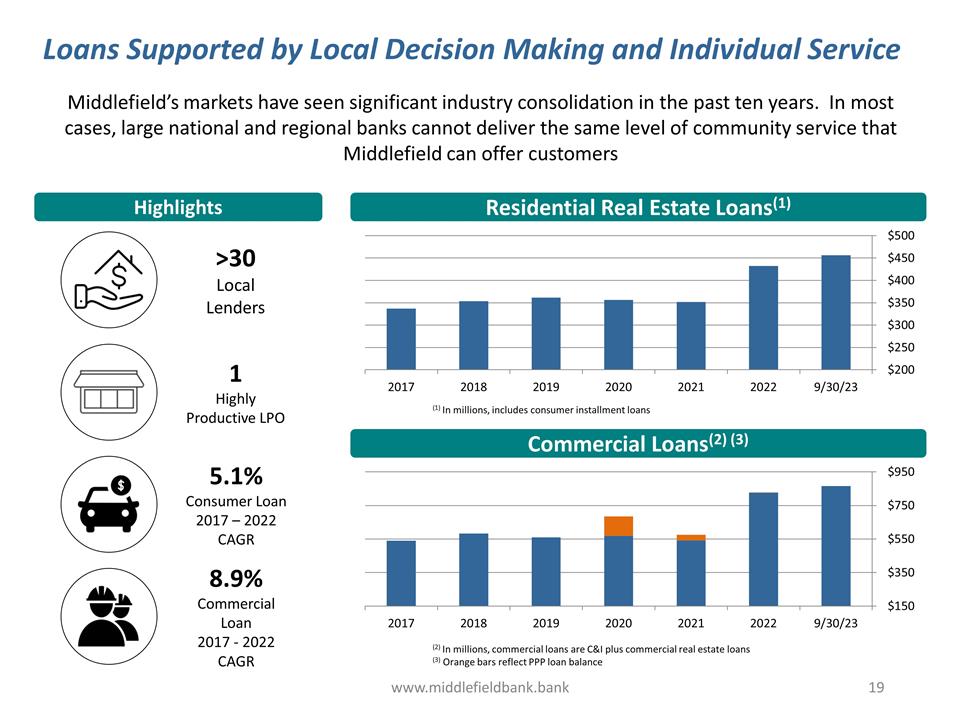
www.middlefieldbank.bank Loans Supported by Local Decision Making and Individual Service Middlefield’s markets have seen significant industry consolidation in the past ten years. In most cases, large national and regional banks cannot deliver the same level of community service that Middlefield can offer customers Highlights Residential Real Estate Loans(1) Commercial Loans(2) (3) (2) In millions, commercial loans are C&I plus commercial real estate loans (3) Orange bars reflect PPP loan balance >30 Local Lenders 1 Highly Productive LPO 8.9% Commercial Loan 2017 - 2022 CAGR 5.1% Consumer Loan 2017 – 2022 CAGR (1) In millions, includes consumer installment loans
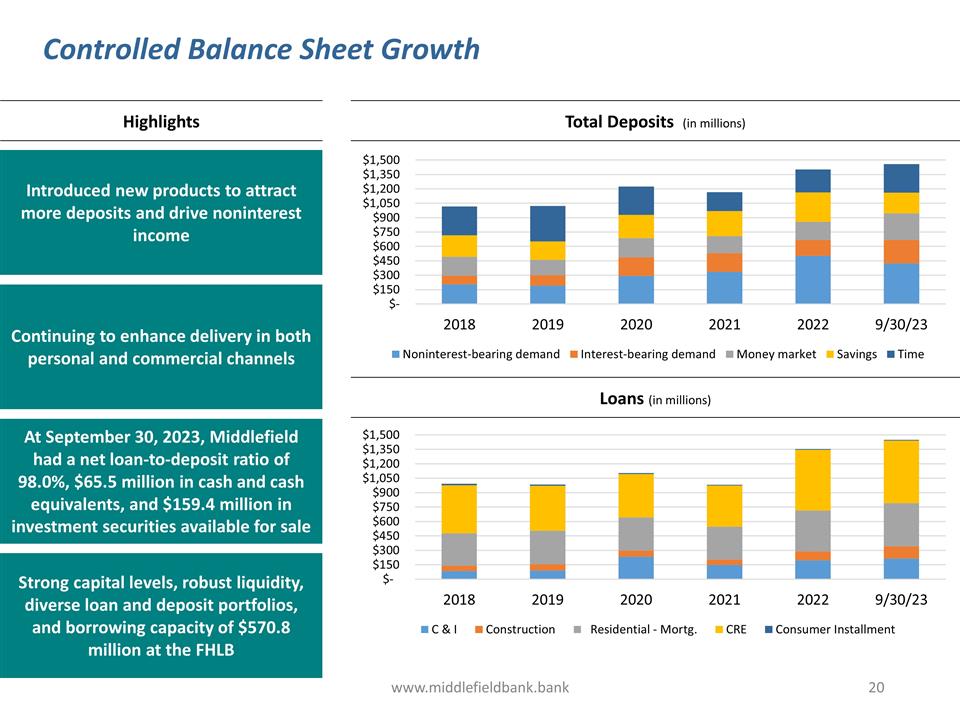
www.middlefieldbank.bank Controlled Balance Sheet Growth Highlights Total Deposits (in millions) Loans (in millions) Introduced new products to attract more deposits and drive noninterest income At September 30, 2023, Middlefield had a net loan-to-deposit ratio of 98.0%, $65.5 million in cash and cash equivalents, and $159.4 million in investment securities available for sale Strong capital levels, robust liquidity, diverse loan and deposit portfolios, and borrowing capacity of $570.8 million at the FHLB Continuing to enhance delivery in both personal and commercial channels
Supplemental Financial Data (Nasdaq: MBCN)
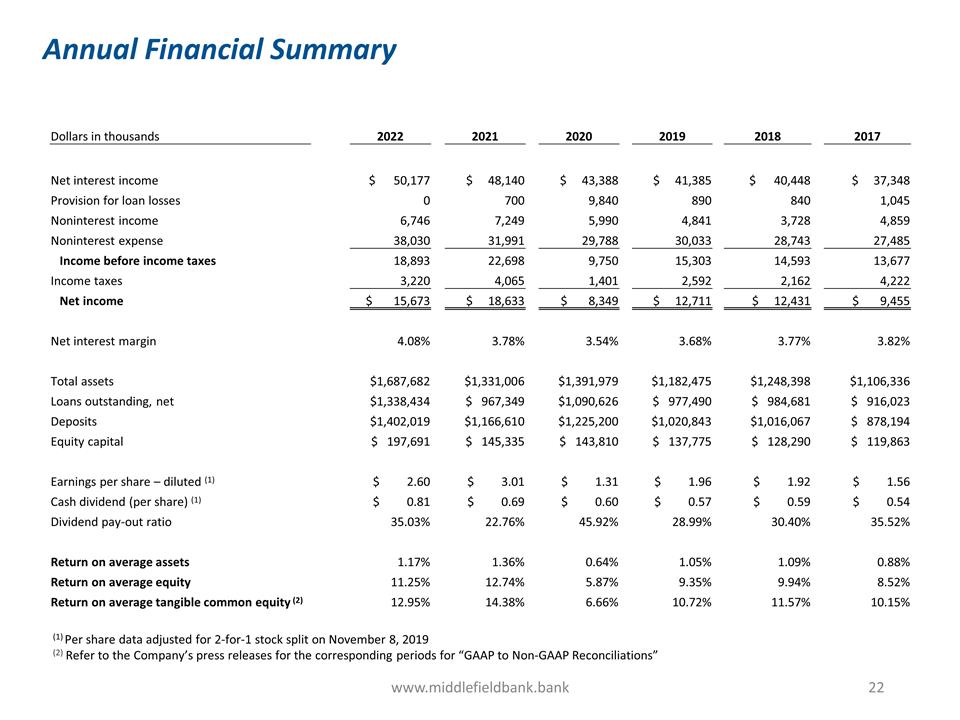
Annual Financial Summary www.middlefieldbank.bank (1) Per share data adjusted for 2-for-1 stock split on November 8, 2019 (2) Refer to the Company’s press releases for the corresponding periods for “GAAP to Non-GAAP Reconciliations” Dollars in thousands 2022 2021 2020 2019 2018 2017 Net interest income $ 50,177 $ 48,140 $ 43,388 $ 41,385 $ 40,448 $ 37,348 Provision for loan losses 0 700 9,840 890 840 1,045 Noninterest income 6,746 7,249 5,990 4,841 3,728 4,859 Noninterest expense 38,030 31,991 29,788 30,033 28,743 27,485 Income before income taxes 18,893 22,698 9,750 15,303 14,593 13,677 Income taxes 3,220 4,065 1,401 2,592 2,162 4,222 Net income $ 15,673 $ 18,633 $ 8,349 $ 12,711 $ 12,431 $ 9,455 Net interest margin 4.08% 3.78% 3.54% 3.68% 3.77% 3.82% Total assets $1,687,682 $1,331,006 $1,391,979 $1,182,475 $1,248,398 $1,106,336 Loans outstanding, net $1,338,434 $ 967,349 $1,090,626 $ 977,490 $ 984,681 $ 916,023 Deposits $1,402,019 $1,166,610 $1,225,200 $1,020,843 $1,016,067 $ 878,194 Equity capital $ 197,691 $ 145,335 $ 143,810 $ 137,775 $ 128,290 $ 119,863 Earnings per share – diluted (1) $ 2.60 $ 3.01 $ 1.31 $ 1.96 $ 1.92 $ 1.56 Cash dividend (per share) (1) $ 0.81 $ 0.69 $ 0.60 $ 0.57 $ 0.59 $ 0.54 Dividend pay-out ratio 35.03% 22.76% 45.92% 28.99% 30.40% 35.52% Return on average assets 1.17% 1.36% 0.64% 1.05% 1.09% 0.88% Return on average equity 11.25% 12.74% 5.87% 9.35% 9.94% 8.52% Return on average tangible common equity (2) 12.95% 14.38% 6.66% 10.72% 11.57% 10.15%
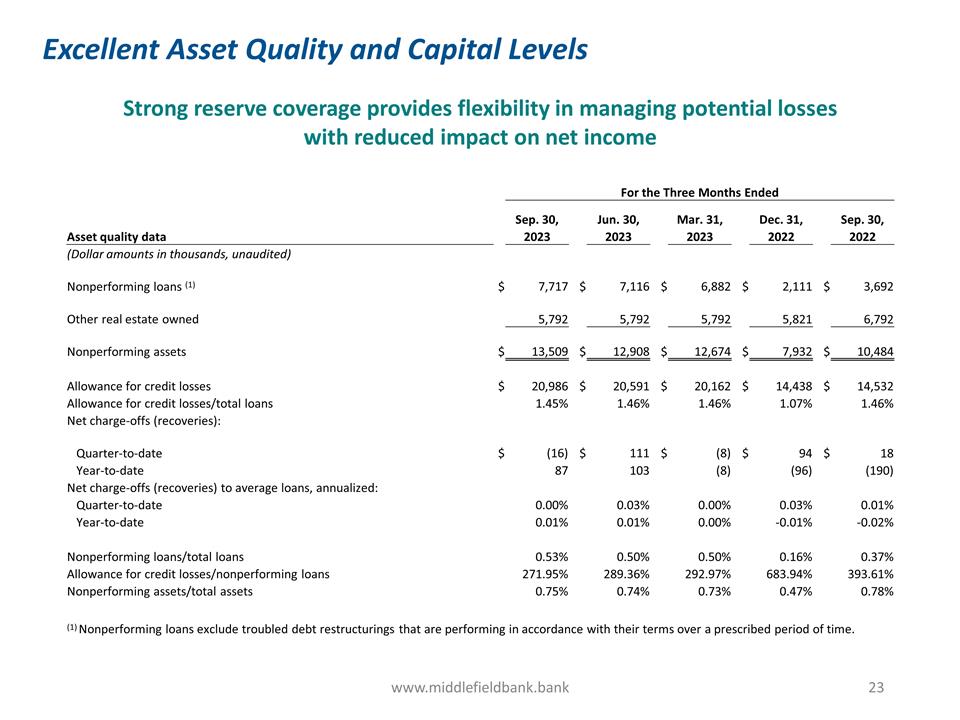
Excellent Asset Quality and Capital Levels www.middlefieldbank.bank Strong reserve coverage provides flexibility in managing potential losses with reduced impact on net income For the Three Months Ended Sep. 30, Jun. 30, Mar. 31, Dec. 31, Sep. 30, Asset quality data 2023 2023 2023 2022 2022 (Dollar amounts in thousands, unaudited) Nonperforming loans (1) $ 7,717 $ 7,116 $ 6,882 $ 2,111 $ 3,692 Other real estate owned 5,792 5,792 5,792 5,821 6,792 Nonperforming assets $ 13,509 $ 12,908 $ 12,674 $ 7,932 $ 10,484 Allowance for credit losses $ 20,986 $ 20,591 $ 20,162 $ 14,438 $ 14,532 Allowance for credit losses/total loans 1.45% 1.46% 1.46% 1.07% 1.46% Net charge-offs (recoveries): Quarter-to-date $ (16) $ 111 $ (8) $ 94 $ 18 Year-to-date 87 103 (8) (96) (190) Net charge-offs (recoveries) to average loans, annualized: Quarter-to-date 0.00% 0.03% 0.00% 0.03% 0.01% Year-to-date 0.01% 0.01% 0.00% -0.01% -0.02% Nonperforming loans/total loans 0.53% 0.50% 0.50% 0.16% 0.37% Allowance for credit losses/nonperforming loans 271.95% 289.36% 292.97% 683.94% 393.61% Nonperforming assets/total assets 0.75% 0.74% 0.73% 0.47% 0.78% (1) Nonperforming loans exclude troubled debt restructurings that are performing in accordance with their terms over a prescribed period of time.
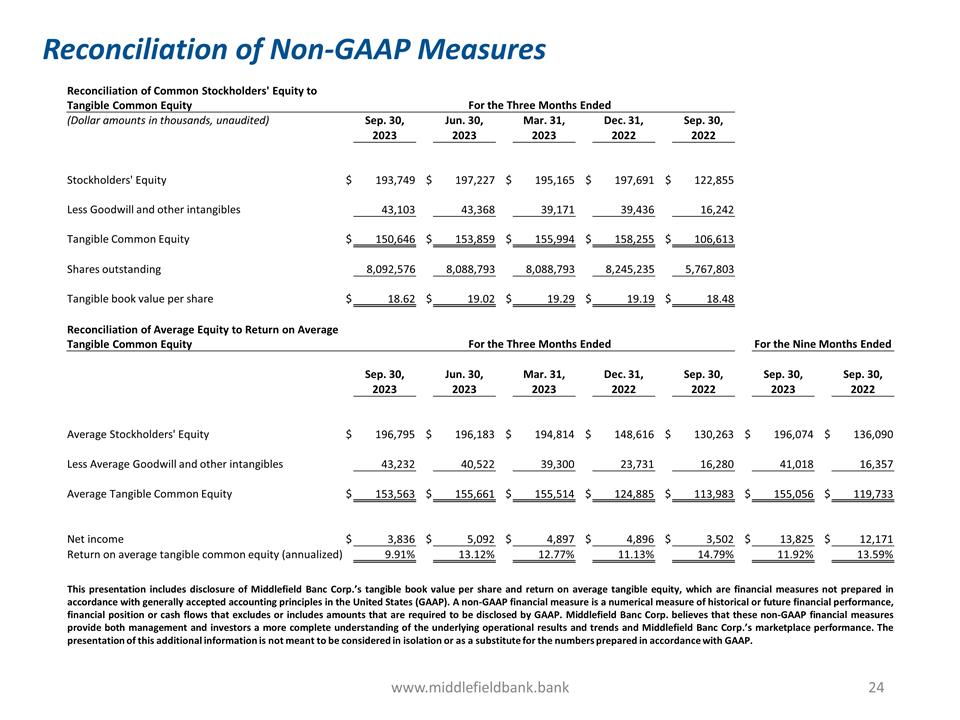
Reconciliation of Non-GAAP Measures www.middlefieldbank.bank This presentation includes disclosure of Middlefield Banc Corp.’s tangible book value per share and return on average tangible equity, which are financial measures not prepared in accordance with generally accepted accounting principles in the United States (GAAP). A non-GAAP financial measure is a numerical measure of historical or future financial performance, financial position or cash flows that excludes or includes amounts that are required to be disclosed by GAAP. Middlefield Banc Corp. believes that these non-GAAP financial measures provide both management and investors a more complete understanding of the underlying operational results and trends and Middlefield Banc Corp.’s marketplace performance. The presentation of this additional information is not meant to be considered in isolation or as a substitute for the numbers prepared in accordance with GAAP. Reconciliation of Common Stockholders' Equity to Tangible Common Equity For the Three Months Ended (Dollar amounts in thousands, unaudited) Sep. 30, Jun. 30, Mar. 31, Dec. 31, Sep. 30, 2023 2023 2023 2022 2022 Stockholders' Equity $ 193,749 $ 197,227 $ 195,165 $ 197,691 $ 122,855 Less Goodwill and other intangibles 43,103 43,368 39,171 39,436 16,242 Tangible Common Equity $ 150,646 $ 153,859 $ 155,994 $ 158,255 $ 106,613 Shares outstanding 8,092,576 8,088,793 8,088,793 8,245,235 5,767,803 Tangible book value per share $ 18.62 $ 19.02 $ 19.29 $ 19.19 $ 18.48 Reconciliation of Average Equity to Return on Average Tangible Common Equity For the Three Months Ended For the Nine Months Ended Sep. 30, Jun. 30, Mar. 31, Dec. 31, Sep. 30, Sep. 30, Sep. 30, 2023 2023 2023 2022 2022 2023 2022 Average Stockholders' Equity $ 196,795 $ 196,183 $ 194,814 $ 148,616 $ 130,263 $ 196,074 $ 136,090 Less Average Goodwill and other intangibles 43,232 40,522 39,300 23,731 16,280 41,018 16,357 Average Tangible Common Equity $ 153,563 $ 155,661 $ 155,514 $ 124,885 $ 113,983 $ 155,056 $ 119,733 Net income $ 3,836 $ 5,092 $ 4,897 $ 4,896 $ 3,502 $ 13,825 $ 12,171 Return on average tangible common equity (annualized) 9.91% 13.12% 12.77% 11.13% 14.79% 11.92% 13.59%