UNITED STATES
SECURITIES AND EXCHANGE COMMISSION
Washington, D.C. 20549
Form 8-K
CURRENT REPORT
Pursuant to Section 13 OR 15(d)
of the Securities Exchange Act of 1934
Date of Report (Date of earliest event reported): October 26, 2023
POPULAR, INC.
(Exact name of registrant as specified in its charter)
| Puerto Rico | 001-34084 | 66-0667416 | ||
| (State or other jurisdiction of incorporation or organization) |
(Commission File Number) | (IRS Employer Identification Number) |
| 209 Muñoz Rivera Avenue | ||
| Hato Rey, Puerto Rico | 00918 | |
| (Address of principal executive offices) | (Zip code) |
(787) 765-9800
(Registrant’s telephone number, including area code)
NOT APPLICABLE
(Former name, former address and former fiscal year, if changed since last report)
Check the appropriate box below if the Form 8-K filing is intended to simultaneously satisfy the filing obligation of the registrant under any of the following provisions (see General Instruction A.2. below):
| ☐ | Written communication pursuant to Rule 425 under the Securities Act (17 CFR 230.425) |
| ☐ | Soliciting material pursuant to Rule 14a-12 under the Exchange Act (17 CFR 240.14a-12) |
| ☐ | Pre-commencement communication pursuant to Rule 14d-2(b) under the Exchange Act (17 CFR 240.14d-2(b)) |
| ☐ | Pre-commencement communication pursuant to Rule 13e-4(c) under the Exchange Act (17 CFR 240.13e-4(c)) |
Securities registered pursuant to Section 12(b) of the Act:
| Title of each class |
Trading |
Name of each exchange |
||
| Common Stock ($0.01 par value) | BPOP | The NASDAQ Stock Market | ||
| 6.125% Cumulative Monthly Income Trust Preferred Securities | BPOPM | The NASDAQ Stock Market |
Indicate by check mark whether the registrant is an emerging growth company as defined in Rule 405 of the Securities Act of 1933 (§230.405 of this chapter) or Rule 12b-2 of the Securities Exchange Act of 1934 (§240.12b-2 of this chapter).
Emerging growth company ☐
If an emerging growth company, indicate by check mark if the registrant has elected not to use the extended transition period for complying with any new or revised financial accounting standards provided pursuant to Section 13(a) of the Exchange Act. ☐
Item 2.02. Results of Operations and Financial Condition.
On October 26, 2023, Popular, Inc. (the “Corporation”) issued a press release announcing its unaudited financial results for the quarter ended September 30, 2023, a copy of which is attached as Exhibit 99.1 to this Current Report on Form 8-K.
The information furnished pursuant to this Item 2.02 of this Current Report on Form 8-K, including Exhibit 99.1, shall not be deemed “filed” for purposes of the Securities Exchange Act of 1934, as amended, nor shall it be incorporated by reference into any of the Corporation’s filings under the Securities Act of 1933, as amended, unless otherwise expressly stated in such filing.
Item 7.01. Regulation FD Disclosure.
The Corporation is furnishing information regarding its conference call to discuss its financial results for the quarter ended September 30, 2023. A copy of the presentation to be used by the Corporation on the conference call is attached hereto as Exhibit 99.2.
The information furnished pursuant to this Item 7.01 of this Current Report on Form 8-K, including Exhibit 99.2, shall not be deemed “filed” for purposes of the Securities Exchange Act of 1934, as amended, nor shall it be incorporated by reference into any of the Corporation’s filings under the Securities Act of 1933, as amended, unless otherwise expressly stated in such filing.
Item 9.01. Financial Statements and Exhibits.
Exhibits 99.1 and 99.2 shall not be deemed to be “filed” for purposes of the Securities Exchange Act of 1934, as amended.
| 99.1 | Press Release dated October 26, 2023 – Third Quarter 2023 Financial Results. | |
| 99.2 | Popular, Inc. Conference Call Presentation – Third Quarter 2023 Financial Results. | |
| 101 | Pursuant to Rule 406 of Regulation S-T, the cover page is formatted in Inline XBRL (Inline eXtensible Business Reporting Language). | |
| 104 | Cover Page Interactive Data File (embedded within the Inline XBRL document and included in Exhibit 101). | |
SIGNATURE
Pursuant to the requirements of the Securities Exchange Act of 1934, as amended, the registrant has duly caused this report to be signed on its behalf by the undersigned hereunto duly authorized.
| POPULAR, INC. (Registrant) |
||||||
| Date: October 26, 2023 | By: | /s/ Jorge J. García |
||||
| Jorge J. García | ||||||
| Senior Vice President and Corporate Comptroller | ||||||
Exhibit 99.1

Popular, Inc. Announces Third Quarter 2023 Financial Results
| • | Net income of $136.6 million in Q3 2023, including an after-tax goodwill impairment charge in our U.S. based equipment leasing subsidiary of $16.4 million, compared to net income of $151.2 million in Q2 2023. |
| • | Net interest income amounted to $534.0 million, an increase of $2.4 million compared to Q2 2023. |
| • | Net interest margin of 3.07% in Q3 2023, compared to 3.14% in Q2 2023; net interest margin on a taxable equivalent basis of 3.24% in Q3 2023, compared to 3.29% in Q2 2023. |
| • | Non-interest income of $159.5 million, or $1.0 million lower than in Q2 2023. |
| • | Operating expenses amounted to $466.0 million, an increase of $5.7 million compared to Q2 2023, including a non-cash goodwill impairment of $23.0 million. |
| • | Credit Quality: |
| • | Non-performing loans held-in-portfolio (“NPLs”) decreased by $24.0 million from Q2 2023; NPLs to loans ratio at 1.1% vs. 1.2% in Q2 2023; |
| • | Net charge-offs (“NCOs”) increased by $8.7 million from Q2 2023; annualized NCOs at 0.39% of average loans held-in-portfolio vs. 0.29% in Q2 2023; |
| • | Allowance for credit losses (“ACL”) to loans held-in-portfolio at 2.09% vs. 2.12% in Q2 2023; and |
| • | ACL to NPLs at 196.7% vs. 181.6% in Q2 2023. |
| • | Loans increased by $998.4 million and by $764.4 million in average quarterly balances, from Q2 2023. |
| • | Ending deposit balances decreased by $667.2 million while average quarterly balances increased by $1.4 billion, from Q2 2023. |
| • | Common Equity Tier 1 ratio of 16.81%, Common Equity per Share of $61.49 and Tangible Book Value per Share of $50.20 at September 30, 2023. |
SAN JUAN, Puerto Rico – (BUSINESS WIRE) – Popular, Inc. (the “Corporation,” “Popular,” “we,” “us,” “our”) (NASDAQ:BPOP) reported net income of $136.6 million for the quarter ended September 30, 2023, including an after-tax goodwill impairment charge in our U.S. based equipment leasing subsidiary of $16.4 million, compared to net income of $151.2 million for the quarter ended June 30, 2023.
Ignacio Alvarez, President and Chief Executive Officer, said: “We are pleased to report another strong quarter. Net income totaled $137 million, which includes a $16 million after-tax goodwill impairment in our U.S. based equipment leasing subsidiary. Excluding this impact, net income would have been $153 million, $2 million higher than the previous quarter.
Our positive results were driven by higher revenues and lower operating expenses, excluding the non-cash goodwill impairment, partially offset by a higher provision for loan losses. We grew our loan portfolio by $1 billion, which contributed to an increase in net interest income despite higher deposit costs. Approximately $600 million of the increase took place in Puerto Rico, reflecting strong economic activity. During the quarter, we crossed a significant milestone, reaching more than 2 million unique customers in Puerto Rico.
Our achievements are made possible by a dedicated team of more than 9,000 colleagues and further strengthen our commitment to our customers, communities and shareholders. Earlier this month we celebrated our 130th anniversary and our team’s energy was palpable. We are proud of our history, which has made us a strong organization with deep-rooted values, and are excited about the opportunities that lie ahead.”
1
Earnings Highlights
| (Unaudited) |
Quarters ended | Nine months ended | ||||||||||||||||||
| (Dollars in thousands, except per share information) |
30-Sep-23 | 30-Jun-23 | 30-Sep-22 | 30-Sep-23 | 30-Sep-22 | |||||||||||||||
| Net interest income |
$ | 534,020 | $ | 531,668 | $ | 579,619 | $ | 1,597,344 | $ | 1,607,793 | ||||||||||
| Provision for credit losses |
45,117 | 37,192 | 39,637 | 129,946 | 33,499 | |||||||||||||||
|
|
|
|
|
|
|
|
|
|
|
|||||||||||
| Net interest income after provision for credit losses |
488,903 | 494,476 | 539,982 | 1,467,398 | 1,574,294 | |||||||||||||||
| Other non-interest income |
159,549 | 160,471 | 426,494 | 481,981 | 738,597 | |||||||||||||||
| Operating expenses |
465,984 | 460,284 | 476,095 | 1,366,955 | 1,284,712 | |||||||||||||||
|
|
|
|
|
|
|
|
|
|
|
|||||||||||
| Income before income tax |
182,468 | 194,663 | 490,381 | 582,424 | 1,028,179 | |||||||||||||||
| Income tax expense |
45,859 | 43,503 | 67,986 | 135,676 | 182,677 | |||||||||||||||
|
|
|
|
|
|
|
|
|
|
|
|||||||||||
| Net income |
$ | 136,609 | $ | 151,160 | $ | 422,395 | $ | 446,748 | $ | 845,502 | ||||||||||
|
|
|
|
|
|
|
|
|
|
|
|||||||||||
| Net income applicable to common stock |
$ | 136,256 | $ | 150,807 | $ | 422,042 | $ | 445,689 | $ | 844,443 | ||||||||||
|
|
|
|
|
|
|
|
|
|
|
|||||||||||
| Net income per common share-basic |
$ | 1.90 | $ | 2.10 | $ | 5.71 | $ | 6.22 | $ | 11.09 | ||||||||||
|
|
|
|
|
|
|
|
|
|
|
|||||||||||
| Net income per common share-diluted |
$ | 1.90 | $ | 2.10 | $ | 5.70 | $ | 6.21 | $ | 11.07 | ||||||||||
|
|
|
|
|
|
|
|
|
|
|
|||||||||||
Net interest income on a taxable equivalent basis – Non-GAAP financial measure
Net interest income, on a taxable equivalent basis, is presented with its different components in Tables D and E for the quarter ended September 30, 2023 and Table F for the nine-month periods ended September 30, 2023 and 2022. Net interest income on a taxable equivalent basis is a non-GAAP financial measure. Management believes that this presentation provides meaningful information since it facilitates the comparison of revenues arising from taxable and tax-exempt sources.
Non-GAAP financial measures used by the Corporation may not be comparable to similarly named non-GAAP financial measures used by other companies.
Net interest income for the quarter ended September 30, 2023 was $534.0 million, an increase of $2.4 million when compared to the previous quarter. Net interest income on a taxable equivalent basis for the third quarter of 2023 was $563.7 million, compared to $558.4 million in the previous quarter, an increase of $5.3 million. The increase in taxable equivalent net interest income results from a higher volume of exempt investments, partially offset by a higher disallowed interest expense in the Puerto Rico tax computation driven by the increase in deposit volume and cost. Refer to the income taxes discussion for further information.
Net interest margin decreased seven basis points to 3.07%. On a taxable equivalent basis, net interest margin for the third quarter of 2023 was 3.24%, compared to 3.29% for the prior quarter, or a five basis points decrease. The lower reduction in the taxable equivalent rate results from a higher benefit of a higher volume of exempt investment securities in Puerto Rico. The main variances in net interest income on a taxable equivalent basis were:
| • | Higher interest income from investment securities, trading and money market investments by $27.4 million driven mainly by higher volume of U.S. Treasury bills, partially offset by a lower volume of money market investments. Both asset classes reflect the effect of the two 25 basis points increases in market rates that occurred at the end of July and at the beginning of May; |
| • | Higher interest income from loans by $26.3 million resulting from an increase in average loans by $770 million, reflecting increases in Banco Popular de Puerto Rico (“BPPR”) by $427 million and an increase in Popular Bank (“PB”) by $343 million. All major loan segments increased in BPPR while at PB the increase was mainly in the commercial and construction portfolios. Loan originations in a higher interest rate environment and the repricing of adjustable-rate loans resulted in a higher yield on loans by nine basis points; most of the categories resulted in a higher yield quarter over quarter; and |
| • | Lower interest expense on other debt upon the previously announced redemption, during the quarter of the $300 million Senior Notes due September 2023; |
partially offset by:
| • | Higher interest expense on deposits by $34.4 million, mainly from the increase in volume and cost of Puerto Rico government deposits and a higher cost in most deposit categories in both BPPR and PB, reflective of the increase in rates. |
2
Net interest income for the BPPR segment amounted to $453.9 million for the third quarter of 2023, flat when compared to $453.1 million in net interest income during the second quarter of 2023. Net interest margin for the BPPR segment decreased by seven basis points to 3.14%. The decrease in net interest margin is related to a higher average volume of deposits, mainly higher cost Puerto Rico government deposits. Earning assets yield improved 17 basis points from the prior quarter to 4.74%. The average volume of earning assets increased by $861 million, while average total deposits increased by $904 million, mainly in P.R. government deposits, which were $1.4 billion higher on average than during Q2 2023, partially offset by a decrease in non-interest-bearing deposits. The cost of interest-bearing deposits increased by 30 basis points to 2.25% from 1.95% the previous quarter. The increase in the cost of deposits mainly resulted from the repricing of public funds and management actions to increase deposit interest rates for certain corporate clients. Total deposit cost in the third quarter of 2023 was 1.68%, compared to 1.44% in the quarter ended June 30, 2023.
Net interest income for PB was $87.4 million for the quarter ended September 30, 2023, unchanged when compared to $87.5 million in net interest income during the previous quarter. Net interest margin decreased by 11 basis points in the quarter to 2.90%, compared to 3.01% in the second quarter of 2023. The decrease in net interest margin was mostly driven by a higher cost of deposits, partially offset by a higher volume of loans and the repricing of adjustable-rate loans in the current interest rates environment. The cost of interest-bearing deposits was 3.31%, compared to 3.02% for the second quarter, or an increase of 29 basis points, while total deposit cost was 2.84% compared to 2.55% in the previous quarter.
Non-interest income
Non-interest income amounted to $159.5 million for the quarter ended September 30, 2023, a decrease of $1.0 million when compared to $160.5 million for the quarter ended June 30, 2023. Fee and transactional-based revenues were slightly lower quarter-over-quarter with the overall results impacted by an unfavorable variance in profit (losses) from equity securities by $2.7 million, mainly related to the fair value of securities held for deferred benefit plans, which have an offsetting effect in personnel costs. The lower fee and transactional-based revenues were partially offset by higher income from mortgage banking activities by $3.1 million, mainly due to a favorable variance of $3.4 million related to the fair value adjustments of mortgage servicing rights (“MSRs”).
Refer to Table B for further details.
Operating expenses
Operating expenses for the third quarter of 2023 totaled $466.0 million, an increase of $5.7 million when compared to the second quarter of 2023. The variance in operating expenses was driven primarily by:
| • | higher personnel cost by $1.7 million mainly due to higher salaries by $2.9 million as a result of the annual merit increase effective during the third quarter of 2023; partially offset by a decrease in other personnel costs by $1.2 million; |
| • | higher credit card processing expenses by $2.2 million mainly due to a volume growth incentive received during the second quarter of 2023 which was recorded as a reduction of expenses; |
| • | higher FDIC deposit insurance expense by $2.1 million mainly due to an accrual adjustment recorded during the second quarter of 2023 related to a decrease in the assessment rate; and |
| • | a non-cash goodwill impairment of $23.0 million in our U.S. based equipment leasing subsidiary due to lower forecasted cash flows and an increase in the rate used to discount cash flows. |
partially offset by:
| • | lower other taxes expense by $7.8 million mainly due to the reversal of an accrual related to regulatory examination fees in BPPR by $8.2 million; |
3
| • | lower professional fees by $11.6 million mainly due to lower advisory expenses by $7.1 million arising from corporate initiatives related to regulatory and compliance efforts, as well as those related to the Corporation’s transformation initiative, incurred during the second quarter of 2023; |
| • | lower business promotion expense by $2.0 million mainly due to lower advertising and credit cards rewards expenses; and |
| • | higher other real estate owned (“OREO”) benefit by $1.9 million mainly due to an increase in the fair value of mortgage properties transferred to OREO. |
Full-time equivalent employees were 9,063 as of September 30, 2023, compared to 9,124 as of June 30, 2023.
For a breakdown of operating expenses by category refer to Table B.
Income taxes
For the quarter ended September 30, 2023, the Corporation recorded an income tax expense of $45.9 million compared to $43.5 million for the previous quarter. The increase in income tax expense was mainly attributable to certain tax benefits recorded in the second quarter, partially offset by lower income before tax. The effective tax rate (“ETR”) for the third quarter of 2023 was 25.1% while the ETR for the second quarter was 22.4%.
The ETR of the Corporation is impacted by the composition and source of its taxable income. The Corporation expects the ETR for the year 2023 to be within a range from 22% to 25%.
Credit Quality
During the third quarter of 2023, the Corporation continued to reflect stable credit quality metrics. Non-performing loans (“NPLs”) and net charge offs (“NCOs”) continued below historical pre-pandemic averages. Consumer portfolios, however, reflected increased delinquencies and NCOs for the quarter primarily due to the expected continued credit normalization. We continue to closely monitor changes in the macroeconomic environment and on borrower performance, especially our unsecured consumer loans, given higher interest rates and inflationary pressures. However, management believes that the improvements over recent years in risk management practices and the risk profile of the Corporation’s loan portfolios positions Popular to continue to operate successfully under the current environment.
The following presents credit quality results for the third quarter of 2023:
| • | At September 30, 2023, total NPLs held-in-portfolio decreased by $24.0 million from June 30, 2023. BPPR’s NPLs decreased by $18.5 million, mostly driven by lower commercial and mortgage NPLs by $16.5 million and $6.8 million, respectively, in part offset by higher consumer NPLs by $5.4 million. The commercial NPLs decrease was mostly driven by loan payoffs. PB’s NPLs decreased by $5.5 million quarter-over-quarter, due to lower commercial and mortgage NPLs by $3.0 million and $2.6 million, respectively. At September 30, 2023, the ratio of NPLs to total loans held-in-portfolio was 1.1%, compared to 1.2% in the second quarter of 2023. |
| • | Inflows of NPLs held-in-portfolio, excluding consumer loans, decreased by $5.9 million quarter-over-quarter. In BPPR, total inflows decreased by $2.6 million due to lower construction inflows by $9.3 million due to a single relationship that entered non-accrual during the second quarter, in part offset by higher mortgage inflows by $7.1 million. PB inflows decreased by $3.3 million, driven by lower commercial inflows. |
| • | NCOs amounted to $32.7 million, increasing by $8.7 million when compared to the second quarter of 2023. BPPR’s NCOs increased by $6.9 million quarter-over-quarter, mainly driven by higher consumer NCOs by $14.1 million, of which $7.2 million and $4.7 million are related to the auto and personal loans portfolios, respectively. This increase was in part offset by a $10.8 million recovery from a commercial loan pay-off, as mentioned above. PB’s NCOs increased by $1.8 million quarter-over-quarter, mainly driven by higher consumer NCOs. During the third quarter of 2023, the Corporation’s ratio of annualized NCOs to average loans held-in-portfolio was 0.39%, compared to 0.29% in the second quarter of 2023. Refer to Table N for further information on NCOs and related ratios. |
4
| • | At September 30, 2023, the allowance for credit losses (“ACL”) increased by $10.9 million from the second quarter of 2023 to $711.1 million. In BPPR, the ACL increased by $28.4 million, primarily driven by higher reserves for the auto and personal loans portfolios attributable to credit normalization, changes in macroeconomic scenarios and loan growth. In PB, the ACL decreased by $17.6 million due to the implementation of a new model for the U.S. commercial real estate portfolio. The new model is based on more granular regional information for the Corporation’s portfolio and accounted for $15 million of PB’s reduction in ACL. |
| • | The ACL incorporated updated macroeconomic scenarios for Puerto Rico and the United States. Given that any one economic outlook is inherently uncertain, the Corporation leverages multiple scenarios to estimate its ACL. The baseline scenario continues to be assigned the highest probability, followed by the pessimistic scenario, and then the optimistic scenario. |
| • | The 2023 annualized GDP growth in the baseline scenario improved to 1.7% and 2.0% for Puerto Rico and the United States, respectively, compared to 1.5% and 1.6% in the previous quarter. The 2023 forecasted average unemployment rate for Puerto Rico improved to 6.1% from 6.3% in the previous forecast, while in the United States unemployment levels remained at 3.6%, stable when compared to the previous forecast. |
| • | GDP growth is expected to slow down during 2024 for both regions, when compared to 2023, as a result of the Fed’s monetary policy. The 2024 GDP growth is expected to be 0.90% for Puerto Rico and 1.25% for the United States. The average 2024 unemployment rate is expected to increase to 6.80% in Puerto Rico and 4.03% in the United States. |
| • | The Corporation’s ratio of the ACL to loans held-in-portfolio was 2.09% in the third quarter of 2023, compared to 2.12% in the previous quarter. The ratio of the ACL to NPLs held-in-portfolio stood at 196.7%, compared to 181.6% in the previous quarter. |
| • | The provision for credit losses for the loan portfolios for the third quarter of 2023 was $43.5 million, compared to $35.7 million in the previous quarter, reflecting the previously mentioned changes in the allowance for credit losses. The provision for the BPPR segment was $54.0 million, compared to $28.4 million in the previous quarter, while the provision for PB was a benefit of $10.5 million, compared to an expense of $7.3 million in the previous quarter. |
| • | The provision for unfunded loan commitments, provision for credit losses on our loan and lease portfolios and provision for credit losses on our investment portfolio are aggregated and presented in the provision for credit losses caption in our Consolidated Statement of Operations. For the third quarter, these combined concepts resulted in a provision expense of $45.1 million, compared to $37.2 million last quarter. |
Non-Performing Assets
| (Unaudited) |
||||||||||||
| (In thousands) |
30-Sep-23 | 30-Jun-23 | 30-Sep-22 | |||||||||
| Non-performing loans held-in-portfolio |
$ | 361,523 | $ | 385,504 | $ | 453,419 | ||||||
| Other real estate owned (“OREO”) |
82,322 | 86,216 | 93,239 | |||||||||
|
|
|
|
|
|
|
|||||||
| Total non-performing assets |
$ | 443,845 | $ | 471,720 | $ | 546,658 | ||||||
|
|
|
|
|
|
|
|||||||
| Net charge-offs (recoveries) for the quarter |
$ | 32,655 | $ | 23,990 | $ | 18,232 | ||||||
|
|
|
|
|
|
|
|||||||
| Ratios: |
||||||||||||
| Loans held-in-portfolio |
$ | 34,029,313 | $ | 33,030,922 | $ | 31,523,188 | ||||||
| Non-performing loans held-in-portfolio to loans held-in-portfolio |
1.06 | % | 1.17 | % | 1.44 | % | ||||||
| Allowance for credit losses to loans held-in-portfolio |
2.09 | 2.12 | 2.23 | |||||||||
| Allowance for credit losses to non-performing loans, excluding loans held-for-sale |
196.69 | 181.63 | 155.07 | |||||||||
|
|
|
|
|
|
|
|||||||
Refer to Table L for additional information.
5
Provision for Credit Losses (Benefit) - Loan Portfolios
| (Unaudited) |
Quarters ended | Nine months ended | ||||||||||||||||||
| (In thousands) |
30-Sep-23 | 30-Jun-23 | 30-Sep-22 | 30-Sep-23 | 30-Sep-22 | |||||||||||||||
| Provision for credit losses (benefit) - loan portfolios: |
||||||||||||||||||||
| BPPR |
$ | 54,017 | $ | 28,379 | $ | 28,694 | $ | 127,599 | $ | 25,161 | ||||||||||
| Popular U.S. |
(10,503 | ) | 7,282 | 10,825 | (1,278 | ) | 9,814 | |||||||||||||
|
|
|
|
|
|
|
|
|
|
|
|||||||||||
| Total provision for credit losses (benefit) - loan portfolios |
$ | 43,514 | $ | 35,661 | $ | 39,519 | $ | 126,321 | $ | 34,975 | ||||||||||
|
|
|
|
|
|
|
|
|
|
|
|||||||||||
Credit Quality by Segment
| (Unaudited) | ||||||||||||
| (In thousands) |
Quarters ended | |||||||||||
| BPPR |
30-Sep-23 | 30-Jun-23 | 30-Sep-22 | |||||||||
| Provision for credit losses - loan portfolios |
$ | 54,017 | $ | 28,379 | $ | 28,694 | ||||||
| Net charge-offs |
25,600 | 18,687 | 18,396 | |||||||||
| Total non-performing loans held-in-portfolio |
333,825 | 352,339 | 410,215 | |||||||||
| Annualized net charge-offs (recoveries) to average loans held-in-portfolio |
0.44 | % | 0.33 | % | 0.34 | % | ||||||
| Allowance / loans held-in-portfolio |
2.63 | % | 2.58 | % | 2.65 | % | ||||||
| Allowance / non-performing loans held-in-portfolio |
187.08 | % | 169.19 | % | 144.05 | % | ||||||
|
|
|
|
|
|
|
|||||||
| Quarters ended | ||||||||||||
| Popular U.S. |
30-Sep-23 | 30-Jun-23 | 30-Sep-22 | |||||||||
| Provision for credit losses - loan portfolios |
$ | (10,503 | ) | $ | 7,282 | $ | 10,825 | |||||
| Net charge-offs |
7,055 | 5,303 | (164 | ) | ||||||||
| Total non-performing loans held-in-portfolio |
27,698 | 33,165 | 43,204 | |||||||||
| Annualized net charge-offs (recoveries) to average loans held-in-portfolio |
0.28 | % | 0.22 | % | (0.01 | ) | ||||||
| Allowance / loans held-in-portfolio |
0.84 | % | 1.05 | % | 1.21 | % | ||||||
| Allowance / non-performing loans held-in-portfolio |
312.42 | % | 313.86 | % | 259.61 | % | ||||||
|
|
|
|
|
|
|
|||||||
Financial Condition Highlights
| (Unaudited) |
||||||||||||
| (In thousands) |
30-Sep-23 | 30-Jun-23 | 30-Sep-22 | |||||||||
| Cash and money market investments |
$ | 6,924,772 | $ | 9,070,118 | $ | 5,992,360 | ||||||
| Investment securities |
25,653,616 | 25,874,316 | 30,434,052 | |||||||||
| Loans |
34,029,313 | 33,030,922 | 31,523,188 | |||||||||
| Total assets |
69,736,936 | 70,838,266 | 70,729,675 | |||||||||
| Deposits |
63,337,600 | 64,004,818 | 64,819,327 | |||||||||
| Borrowings |
1,097,720 | 1,427,254 | 1,300,984 | |||||||||
| Total liabilities |
65,279,328 | 66,273,257 | 67,054,837 | |||||||||
| Stockholders’ equity |
4,457,608 | 4,565,009 | 3,674,838 | |||||||||
|
|
|
|
|
|
|
|||||||
6
Total assets amounted to $69.7 billion at September 30, 2023, a decrease of $1.1 billion from the second quarter of 2023, driven by:
| • | a decrease in money market investments of $2.2 billion due to lower deposits and increased loan balances as discussed below; |
| • | a decrease in securities available-for-sale (“AFS”) of $112.4 million, mainly due to repayments, maturities and unfavorable changes in fair value, offset in part by the purchase of U.S. Treasury securities; and |
| • | a decrease in securities held-to-maturity (“HTM”) of $108.4 million driven by a decrease in U.S. Treasury securities mainly as a result of maturities; |
partially offset by:
| • | an increase in loans held-in-portfolio of $998.4 million reflected across all portfolios in BPPR, except the construction portfolio, and an increase in commercial and construction loans at PB; and |
| • | an increase in other assets of $328.9 million driven by unsettled trade receivables related to proceeds from maturities of U.S. Treasury Notes and interest payments which were received in the fourth quarter. |
Total liabilities decreased by $993.9 million from the second quarter of 2023, driven by:
| • | a decrease of $667.2 million in deposits, mainly in Puerto Rico public sector accounts partially offset by an increase in time deposits and savings accounts at PB; and |
| • | a decrease of $299.4 million in notes payable due to the redemption of $300.0 million in aggregate principal amount of the Senior Notes due September 2023. |
Stockholders’ equity decreased by $107.4 million from the second quarter of 2023, principally due to the after-tax impact of the increase in net unrealized losses in the portfolio of AFS securities of $242.6 million and to common and preferred dividends declared during the quarter, partially offset by the net income for the quarter of $136.6 million and the amortization of unrealized losses from securities previously reclassified to HTM of $35.0 million.
The Corporation is in the process of completing its annual goodwill impairment test, using July 31, 2023 as the evaluation date. During the third quarter, an impairment charge of $23.0 million related to our U.S. based equipment leasing subsidiary was recognized. The Corporation expects to finalize its evaluation prior to the filing of its Form 10-Q for the quarter ended September 30, 2023 with the Securities and Exchange Commission. Any further impairment of goodwill would result in a non-cash expense, net of tax impact. A charge to earnings related to a goodwill impairment would not materially impact regulatory capital and tangible capital calculations.
Common Equity Tier 1 ratio (“CET1”), common equity per share and tangible book value per share were 16.81%, $61.49 and $50.20, respectively, at September 30, 2023, compared to 16.87%, $63.00 and $51.37, respectively, at June 30, 2023. Refer to Table A for capital ratios.
7
Cautionary Note Regarding Forward-Looking Statements
This press release contains “forward-looking statements” within the meaning of the U.S. Private Securities Litigation Reform Act of 1995, including without limitation those regarding Popular’s business, financial condition, results of operations, plans, objectives and future performance. These statements are not guarantees of future performance, are based on management’s current expectations and, by their nature, involve risks, uncertainties, estimates and assumptions. Potential factors, some of which are beyond the Corporation’s control, could cause actual results to differ materially from those expressed in, or implied by, such forward-looking statements. Risks and uncertainties include, without limitation, the effect of competitive and economic factors, and our reaction to those factors, the adequacy of the allowance for loan losses, delinquency trends, market risk and the impact of interest rate changes, capital market conditions, capital adequacy and liquidity, the effect of legal and regulatory proceedings, new accounting standards on the Corporation’s financial condition and results of operations, the scope and duration of the COVID-19 pandemic (including the appearance of new strains of the virus), actions taken by governmental authorities in response thereto, and the direct and indirect impact of the pandemic on Popular, our customers, service providers and third parties. Other potential factors include Popular’s ability to successfully execute its transformation initiative, including, but not limited to, achieving projected earnings, efficiencies and return on tangible common equity and accurately anticipating costs and expenses associated therewith, imposition of FDIC special assessments, changes to regulatory capital, liquidity and resolution-related requirements applicable to financial institutions in response to recent developments affecting the banking sector and the impact of bank failures or adverse developments at other banks and related negative media coverage of the banking industry in general on investor and depositor sentiment regarding the stability and liquidity of banks. All statements contained herein that are not clearly historical in nature, are forward-looking, and the words “anticipate,” “believe,” “continues,” “expect,” “estimate,” “intend,” “project” and similar expressions, and future or conditional verbs such as “will,” “would,” “should,” “could,” “might,” “can,” “may” or similar expressions, are generally intended to identify forward-looking statements.
More information on the risks and important factors that could affect the Corporation’s future results and financial condition is included in our Form 10-K for the year ended December 31, 2022, in our Form 10-Q for the quarters ended March 31, 2023 and June 30, 2023, and in our Form 10-Q for the quarter ended September 30, 2023 to be filed with the Securities and Exchange Commission. Our filings are available on the Corporation’s website (www.popular.com) and on the Securities and Exchange Commission website (www.sec.gov). The Corporation assumes no obligation to update or revise any forward-looking statements or information which speak as of their respective dates.
About Popular, Inc.
Popular, Inc. (NASDAQ: BPOP) is the leading financial institution in Puerto Rico, by both assets and deposits, and ranks among the top 50 U.S. bank holding companies by assets. Founded in 1893, Banco Popular de Puerto Rico, Popular’s principal subsidiary, provides retail, mortgage and commercial banking services in Puerto Rico and the U.S. Virgin Islands. Popular also offers in Puerto Rico auto and equipment leasing and financing, investment banking, broker-dealer and insurance services through specialized subsidiaries. In the mainland United States, Popular provides retail, mortgage and commercial banking services through its New York-chartered banking subsidiary, Popular Bank, which has branches located in New York, New Jersey and Florida.
Conference Call
Popular will hold a conference call to discuss its financial results today, Thursday, October 26, 2023 at 11:00 a.m. Eastern Time. The call will be broadcast live over the Internet and can be accessed through the Investor Relations section of the Corporation’s website: www.popular.com.
Listeners are recommended to go to the website at least 15 minutes prior to the call to download and install any necessary audio software. The call may also be accessed through a dial-in telephone number 1-833-470-1428 (Toll Free) or 1-404-975-4839 (Local). The dial-in access code is 260746.
A replay of the webcast will be archived in Popular’s website. A telephone replay will be available one hour after the end of the conference call through Monday, November 27, 2023. The replay dial in is: 1-866-813-9403 or 1-929-458-6194. The replay passcode is 546020.
An electronic version of this press release can be found at the Corporation’s website: www.popular.com.
8
Popular, Inc.
Financial Supplement to Third Quarter 2023 Earnings Release
Table A - Selected Ratios and Other Information
Table B - Consolidated Statement of Operations
Table C - Consolidated Statement of Financial Condition
Table D - Analysis of Levels and Yields on a Taxable Equivalent Basis (Non-GAAP) - QUARTER
Table E - Analysis of Levels and Yields on a Taxable Equivalent Basis (Non-GAAP) - QUARTER
Table F - Analysis of Levels and Yields on a Taxable Equivalent Basis (Non-GAAP) - YEAR-TO-DATE
Table G - Mortgage Banking Activities and Other Service Fees
Table H - Loans and Deposits
Table I - Loan Delinquency - BPPR Operations
Table J - Loan Delinquency - Popular U.S. Operations
Table K - Loan Delinquency - Consolidated
Table L - Non-Performing Assets
Table M - Activity in Non-Performing Loans
Table N - Allowance for Credit Losses, Net Charge-offs and Related Ratios
Table O - Allowance for Credit Losses ‘‘ACL’’ - Loan Portfolios - Consolidated
Table P - Allowance for Credit Losses ‘‘ACL’’ - Loan Portfolios - BPPR Operations
Table Q - Allowance for Credit Losses ‘‘ACL’’ - Loan Portfolios - Popular U.S. Operations
Table R - Reconciliation to GAAP Financial Measures
9
POPULAR, INC.
Financial Supplement to Third Quarter 2023 Earnings Release
Table A - Selected Ratios and Other Information
(Unaudited)
| Quarters ended | Nine months ended | |||||||||||||||||||
| 30-Sep-23 | 30-Jun-23 | 30-Sep-22 | 30-Sep-23 | 30-Sep-22 | ||||||||||||||||
| Basic EPS |
$ | 1.90 | $ | 2.10 | $ | 5.71 | $ | 6.22 | $ | 11.09 | ||||||||||
| Diluted EPS |
$ | 1.90 | $ | 2.10 | $ | 5.70 | $ | 6.21 | $ | 11.07 | ||||||||||
| Average common shares outstanding |
71,794,934 | 71,690,396 | 73,955,184 | 71,676,630 | 76,173,783 | |||||||||||||||
| Average common shares outstanding - assuming dilution |
71,818,102 | 71,709,203 | 74,057,332 | 71,736,514 | 76,304,219 | |||||||||||||||
| Common shares outstanding at end of period |
72,127,595 | 72,103,969 | 72,673,344 | 72,127,595 | 72,673,344 | |||||||||||||||
| Market value per common share |
$ | 63.01 | $ | 60.52 | $ | 72.06 | $ | 63.01 | $ | 72.06 | ||||||||||
| Market capitalization - (In millions) |
$ | 4,545 | $ | 4,364 | $ | 5,237 | $ | 4,545 | $ | 5,237 | ||||||||||
| Return on average assets |
0.75 | % | 0.85 | % | 2.31 | % | 0.84 | % | 1.54 | % | ||||||||||
| Return on average common equity |
8.17 | % | 9.26 | % | 27.72 | % | 9.13 | % | 19.02 | % | ||||||||||
| Net interest margin (non-taxable equivalent basis) |
3.07 | % | 3.14 | % | 3.32 | % | 3.14 | % | 3.05 | % | ||||||||||
| Net interest margin (taxable equivalent basis) -non-GAAP |
3.24 | % | 3.29 | % | 3.71 | % | 3.32 | % | 3.39 | % | ||||||||||
| Common equity per share |
$ | 61.49 | $ | 63.00 | $ | 50.26 | $ | 61.49 | $ | 50.26 | ||||||||||
| Tangible common book value per common share (non-GAAP) [1] |
$ | 50.20 | $ | 51.37 | $ | 38.69 | $ | 50.20 | $ | 38.69 | ||||||||||
| Tangible common equity to tangible assets (non-GAAP) [1] |
5.25 | % | 5.29 | % | 4.02 | % | 5.25 | % | 4.02 | % | ||||||||||
| Return on average tangible common equity [1] |
9.36 | % | 10.63 | % | 31.86 | % | 10.48 | % | 21.78 | % | ||||||||||
| Tier 1 capital |
16.88 | % | 16.93 | % | 16.10 | % | 16.88 | % | 16.10 | % | ||||||||||
| Total capital |
18.67 | % | 18.74 | % | 17.92 | % | 18.67 | % | 17.92 | % | ||||||||||
| Tier 1 leverage |
8.41 | % | 8.40 | % | 7.65 | % | 8.41 | % | 7.65 | % | ||||||||||
| Common Equity Tier 1 capital |
16.81 | % | 16.87 | % | 16.04 | % | 16.81 | % | 16.04 | % | ||||||||||
| [1] | Refer to Table S for reconciliation to GAAP financial measures. |
10
POPULAR, INC.
Financial Supplement to Third Quarter 2023 Earnings Release
Table B - Consolidated Statement of Operations
(Unaudited)
| Quarters ended |
Variance | Quarter ended | Variance | Nine months ended | ||||||||||||||||||||||||
| Q3 2023 | Q3 2023 | |||||||||||||||||||||||||||
| (In thousands, except per share information) |
30-Sep-23 | 30-Jun-23 | vs. Q2 2023 | 30-Sep-22 | vs. Q3 2022 | 30-Sep-23 | 30-Sep-22 | |||||||||||||||||||||
| Interest income: |
||||||||||||||||||||||||||||
| Loans |
$ | 596,886 | $ | 570,120 | $ | 26,766 | $ | 481,088 | $ | 115,798 | $ | 1,708,216 | $ | 1,354,124 | ||||||||||||||
| Money market investments |
99,286 | 100,775 | (1,489 | ) | 36,966 | 62,320 | 265,785 | 67,172 | ||||||||||||||||||||
| Investment securities |
148,614 | 123,112 | 25,502 | 133,181 | 15,433 | 403,814 | 331,421 | |||||||||||||||||||||
|
|
|
|
|
|
|
|
|
|
|
|
|
|
|
|||||||||||||||
| Total interest income |
844,786 | 794,007 | 50,779 | 651,235 | 193,551 | 2,377,815 | 1,752,717 | |||||||||||||||||||||
|
|
|
|
|
|
|
|
|
|
|
|
|
|
|
|||||||||||||||
| Interest expense: |
||||||||||||||||||||||||||||
| Deposits |
294,121 | 243,488 | 50,633 | 60,897 | 233,224 | 730,824 | 113,507 | |||||||||||||||||||||
| Short-term borrowings |
1,478 | 1,624 | (146 | ) | 921 | 557 | 5,987 | 1,249 | ||||||||||||||||||||
| Long-term debt |
15,167 | 17,227 | (2,060 | ) | 9,798 | 5,369 | 43,660 | 30,168 | ||||||||||||||||||||
|
|
|
|
|
|
|
|
|
|
|
|
|
|
|
|||||||||||||||
| Total interest expense |
310,766 | 262,339 | 48,427 | 71,616 | 239,150 | 780,471 | 144,924 | |||||||||||||||||||||
|
|
|
|
|
|
|
|
|
|
|
|
|
|
|
|||||||||||||||
| Net interest income |
534,020 | 531,668 | 2,352 | 579,619 | (45,599 | ) | 1,597,344 | 1,607,793 | ||||||||||||||||||||
| Provision for credit losses |
45,117 | 37,192 | 7,925 | 39,637 | 5,480 | 129,946 | 33,499 | |||||||||||||||||||||
|
|
|
|
|
|
|
|
|
|
|
|
|
|
|
|||||||||||||||
| Net interest income after provision for credit losses |
488,903 | 494,476 | (5,573 | ) | 539,982 | (51,079 | ) | 1,467,398 | 1,574,294 | |||||||||||||||||||
|
|
|
|
|
|
|
|
|
|
|
|
|
|
|
|||||||||||||||
| Service charges on deposit accounts |
37,318 | 37,781 | (463 | ) | 40,006 | (2,688 | ) | 109,777 | 122,528 | |||||||||||||||||||
| Other service fees |
93,407 | 94,265 | (858 | ) | 86,402 | 7,005 | 277,748 | 244,987 | ||||||||||||||||||||
| Mortgage banking activities |
5,393 | 2,316 | 3,077 | 9,448 | (4,055 | ) | 15,109 | 35,888 | ||||||||||||||||||||
| Net (loss) gain, including impairment, on equity securities |
(1,319 | ) | 1,384 | (2,703 | ) | (1,448 | ) | 129 | 1,165 | (7,651 | ) | |||||||||||||||||
| Net gain (loss) on trading account debt securities |
219 | 35 | 184 | (274 | ) | 493 | 632 | (946 | ) | |||||||||||||||||||
| Net loss on sale of loans, including valuation adjustments on loans held-for-sale |
(44 | ) | — | (44 | ) | — | (44 | ) | (44 | ) | — | |||||||||||||||||
| Adjustments to indemnity reserves on loans sold |
(187 | ) | (456 | ) | 269 | 1,715 | (1,902 | ) | (31 | ) | 1,140 | |||||||||||||||||
| Other operating income |
24,762 | 25,146 | (384 | ) | 290,645 | (265,883 | ) | 77,625 | 342,651 | |||||||||||||||||||
|
|
|
|
|
|
|
|
|
|
|
|
|
|
|
|||||||||||||||
| Total non-interest income |
159,549 | 160,471 | (922 | ) | 426,494 | (266,945 | ) | 481,981 | 738,597 | |||||||||||||||||||
|
|
|
|
|
|
|
|
|
|
|
|
|
|
|
|||||||||||||||
| Operating expenses: |
||||||||||||||||||||||||||||
| Personnel costs |
||||||||||||||||||||||||||||
| Salaries |
127,832 | 124,901 | 2,931 | 115,887 | 11,945 | 378,126 | 316,407 | |||||||||||||||||||||
| Commissions, incentives and other bonuses |
27,670 | 27,193 | 477 | 42,209 | (14,539 | ) | 86,025 | 116,319 | ||||||||||||||||||||
| Pension, postretirement and medical insurance |
16,985 | 17,508 | (523 | ) | 17,120 | (135 | ) | 49,871 | 43,633 | |||||||||||||||||||
| Other personnel costs, including payroll taxes |
20,665 | 21,866 | (1,201 | ) | 18,627 | 2,038 | 69,358 | 53,268 | ||||||||||||||||||||
|
|
|
|
|
|
|
|
|
|
|
|
|
|
|
|||||||||||||||
| Total personnel costs |
193,152 | 191,468 | 1,684 | 193,843 | (691 | ) | 583,380 | 529,627 | ||||||||||||||||||||
| Net occupancy expenses |
28,100 | 27,165 | 935 | 27,420 | 680 | 81,304 | 78,357 | |||||||||||||||||||||
| Equipment expenses |
8,905 | 9,561 | (656 | ) | 8,735 | 170 | 26,878 | 25,798 | ||||||||||||||||||||
| Other taxes |
8,590 | 16,409 | (7,819 | ) | 15,966 | (7,376 | ) | 41,290 | 47,461 | |||||||||||||||||||
| Professional fees |
38,514 | 50,132 | (11,618 | ) | 47,662 | (9,148 | ) | 122,077 | 122,884 | |||||||||||||||||||
| Technology and software expenses |
72,930 | 72,354 | 576 | 68,341 | 4,589 | 213,843 | 213,638 | |||||||||||||||||||||
| Processing and transactional services |
||||||||||||||||||||||||||||
| Credit and debit cards |
13,762 | 11,584 | 2,178 | 13,531 | 231 | 37,896 | 35,177 | |||||||||||||||||||||
| Other processing and transactional services |
24,137 | 25,217 | (1,080 | ) | 18,837 | 5,300 | 70,713 | 59,181 | ||||||||||||||||||||
|
|
|
|
|
|
|
|
|
|
|
|
|
|
|
|||||||||||||||
| Total processing and transactional services |
37,899 | 36,801 | 1,098 | 32,368 | 5,531 | 108,609 | 94,358 | |||||||||||||||||||||
| Communications |
4,220 | 4,175 | 45 | 3,858 | 362 | 12,483 | 11,028 | |||||||||||||||||||||
| Business promotion |
||||||||||||||||||||||||||||
| Rewards and customer loyalty programs |
15,988 | 16,626 | (638 | ) | 14,344 | 1,644 | 44,962 | 38,294 | ||||||||||||||||||||
| Other business promotion |
7,087 | 8,457 | (1,370 | ) | 10,004 | (2,917 | ) | 22,067 | 22,490 | |||||||||||||||||||
|
|
|
|
|
|
|
|
|
|
|
|
|
|
|
|||||||||||||||
| Total business promotion |
23,075 | 25,083 | (2,008 | ) | 24,348 | (1,273 | ) | 67,029 | 60,784 | |||||||||||||||||||
| FDIC deposit insurance |
8,932 | 6,803 | 2,129 | 6,610 | 2,322 | 24,600 | 20,445 | |||||||||||||||||||||
| Other real estate owned (OREO) income |
(5,189 | ) | (3,314 | ) | (1,875 | ) | (2,444 | ) | (2,745 | ) | (10,197 | ) | (12,963 | ) | ||||||||||||||
| Other operating expenses |
||||||||||||||||||||||||||||
11
| Operational losses |
5,504 | 4,280 | 1,224 | 7,145 | (1,641 | ) | 16,584 | 23,031 | ||||||||||||||||||||
| All other |
17,557 | 18,572 | (1,015 | ) | 32,448 | (14,891 | ) | 53,690 | 58,783 | |||||||||||||||||||
|
|
|
|
|
|
|
|
|
|
|
|
|
|
|
|||||||||||||||
| Total other operating expenses |
23,061 | 22,852 | 209 | 39,593 | (16,532 | ) | 70,274 | 81,814 | ||||||||||||||||||||
| Amortization of intangibles |
795 | 795 | — | 795 | — | 2,385 | 2,481 | |||||||||||||||||||||
| Goodwill impairment charge |
23,000 | — | 23,000 | 9,000 | 14,000 | 23,000 | 9,000 | |||||||||||||||||||||
|
|
|
|
|
|
|
|
|
|
|
|
|
|
|
|||||||||||||||
| Total operating expenses |
465,984 | 460,284 | 5,700 | 476,095 | (10,111 | ) | 1,366,955 | 1,284,712 | ||||||||||||||||||||
|
|
|
|
|
|
|
|
|
|
|
|
|
|
|
|||||||||||||||
| Income before income tax |
182,468 | 194,663 | (12,195 | ) | 490,381 | (307,913 | ) | 582,424 | 1,028,179 | |||||||||||||||||||
| Income tax expense |
45,859 | 43,503 | 2,356 | 67,986 | (22,127 | ) | 135,676 | 182,677 | ||||||||||||||||||||
|
|
|
|
|
|
|
|
|
|
|
|
|
|
|
|||||||||||||||
| Net income |
$ | 136,609 | $ | 151,160 | $ | (14,551 | ) | $ | 422,395 | $ | (285,786 | ) | $ | 446,748 | $ | 845,502 | ||||||||||||
|
|
|
|
|
|
|
|
|
|
|
|
|
|
|
|||||||||||||||
| Net income applicable to common stock |
$ | 136,256 | $ | 150,807 | $ | (14,551 | ) | $ | 422,042 | $ | (285,786 | ) | $ | 445,689 | $ | 844,443 | ||||||||||||
|
|
|
|
|
|
|
|
|
|
|
|
|
|
|
|||||||||||||||
| Net income per common share - basic |
$ | 1.90 | $ | 2.10 | $ | (0.20 | ) | $ | 5.71 | $ | (3.81 | ) | $ | 6.22 | $ | 11.09 | ||||||||||||
|
|
|
|
|
|
|
|
|
|
|
|
|
|
|
|||||||||||||||
| Net income per common share - diluted |
$ | 1.90 | $ | 2.10 | $ | (0.20 | ) | $ | 5.70 | $ | (3.80 | ) | $ | 6.21 | $ | 11.07 | ||||||||||||
|
|
|
|
|
|
|
|
|
|
|
|
|
|
|
|||||||||||||||
| Dividends Declared per Common Share |
$ | 0.55 | $ | 0.55 | $ | — | $ | 0.55 | $ | — | $ | 1.65 | $ | 1.65 | ||||||||||||||
|
|
|
|
|
|
|
|
|
|
|
|
|
|
|
12
Popular, Inc.
Financial Supplement to Third Quarter 2023 Earnings Release
Table C - Consolidated Statement of Financial Condition
(Unaudited)
| (In thousands) |
30-Sep-23 | 30-Jun-23 | 30-Sep-22 | Variance Q3 2023 vs. Q2 2023 |
||||||||||||
| Assets: |
||||||||||||||||
| Cash and due from banks |
$ | 535,335 | $ | 476,642 | $ | 2,017,312 | $ | 58,693 | ||||||||
| Money market investments |
6,389,437 | 8,593,476 | 3,975,048 | (2,204,039 | ) | |||||||||||
| Trading account debt securities, at fair value |
30,988 | 29,160 | 30,271 | 1,828 | ||||||||||||
| Debt securities available-for-sale, at fair value |
17,129,858 | 17,242,217 | 28,264,148 | (112,359 | ) | |||||||||||
| Debt securities held-to-maturity, at amortized cost |
8,302,082 | 8,410,566 | 1,953,710 | (108,484 | ) | |||||||||||
| Less: Allowance for credit losses |
6,057 | 6,145 | 7,210 | (88 | ) | |||||||||||
|
|
|
|
|
|
|
|
|
|||||||||
| Total debt securities held-to-maturity, net |
8,296,025 | 8,404,421 | 1,946,500 | (108,396 | ) | |||||||||||
|
|
|
|
|
|
|
|
|
|||||||||
| Equity securities |
190,688 | 192,373 | 185,923 | (1,685 | ) | |||||||||||
| Loans held-for-sale, at lower of cost or fair value |
5,239 | 55,421 | 8,065 | (50,182 | ) | |||||||||||
| Loans held-in-portfolio |
34,369,775 | 33,354,999 | 31,805,921 | 1,014,776 | ||||||||||||
| Less: Unearned income |
340,462 | 324,077 | 282,733 | 16,385 | ||||||||||||
| Allowance for credit losses |
711,068 | 700,200 | 703,096 | 10,868 | ||||||||||||
|
|
|
|
|
|
|
|
|
|||||||||
| Total loans held-in-portfolio, net |
33,318,245 | 32,330,722 | 30,820,092 | 987,523 | ||||||||||||
|
|
|
|
|
|
|
|
|
|||||||||
| Premises and equipment, net |
534,384 | 523,927 | 492,685 | 10,457 | ||||||||||||
| Other real estate |
82,322 | 86,216 | 93,239 | (3,894 | ) | |||||||||||
| Accrued income receivable |
257,833 | 239,998 | 224,307 | 17,835 | ||||||||||||
| Mortgage servicing rights, at fair value |
119,030 | 121,249 | 130,541 | (2,219 | ) | |||||||||||
| Other assets |
2,032,565 | 1,703,662 | 1,700,378 | 328,903 | ||||||||||||
| Goodwill |
804,428 | 827,428 | 827,428 | (23,000 | ) | |||||||||||
| Other intangible assets |
10,559 | 11,354 | 13,738 | (795 | ) | |||||||||||
|
|
|
|
|
|
|
|
|
|||||||||
| Total assets |
$ | 69,736,936 | $ | 70,838,266 | $ | 70,729,675 | $ | (1,101,330 | ) | |||||||
|
|
|
|
|
|
|
|
|
|||||||||
| Liabilities and Stockholders’ Equity: |
||||||||||||||||
| Liabilities: |
||||||||||||||||
| Deposits: |
||||||||||||||||
| Non-interest bearing |
$ | 15,201,374 | $ | 15,316,552 | $ | 17,605,339 | $ | (115,178 | ) | |||||||
| Interest bearing |
48,136,226 | 48,688,266 | 47,213,988 | (552,040 | ) | |||||||||||
|
|
|
|
|
|
|
|
|
|||||||||
| Total deposits |
63,337,600 | 64,004,818 | 64,819,327 | (667,218 | ) | |||||||||||
|
|
|
|
|
|
|
|
|
|||||||||
| Assets sold under agreements to repurchase |
93,071 | 123,205 | 162,450 | (30,134 | ) | |||||||||||
| Other short-term borrowings |
— | — | 250,000 | — | ||||||||||||
| Notes payable |
1,004,649 | 1,304,049 | 888,534 | (299,400 | ) | |||||||||||
| Other liabilities |
844,008 | 841,185 | 934,526 | 2,823 | ||||||||||||
|
|
|
|
|
|
|
|
|
|||||||||
| Total liabilities |
65,279,328 | 66,273,257 | 67,054,837 | (993,929 | ) | |||||||||||
|
|
|
|
|
|
|
|
|
|||||||||
| Stockholders’ equity: |
||||||||||||||||
| Preferred stock |
22,143 | 22,143 | 22,143 | — | ||||||||||||
| Common stock |
1,048 | 1,047 | 1,046 | 1 | ||||||||||||
| Surplus |
4,797,364 | 4,795,581 | 4,652,508 | 1,783 | ||||||||||||
| Retained earnings |
4,189,865 | 4,093,284 | 3,694,020 | 96,581 | ||||||||||||
| Treasury stock |
(2,018,870 | ) | (2,018,611 | ) | (1,970,548 | ) | (259 | ) | ||||||||
| Accumulated other comprehensive loss, net of tax |
(2,533,942 | ) | (2,328,435 | ) | (2,724,331 | ) | (205,507 | ) | ||||||||
|
|
|
|
|
|
|
|
|
|||||||||
| Total stockholders’ equity |
4,457,608 | 4,565,009 | 3,674,838 | (107,401 | ) | |||||||||||
|
|
|
|
|
|
|
|
|
|||||||||
| Total liabilities and stockholders’ equity |
$ | 69,736,936 | $ | 70,838,266 | $ | 70,729,675 | $ | (1,101,330 | ) | |||||||
|
|
|
|
|
|
|
|
|
|||||||||
13
Popular, Inc.
Financial Supplement to Third Quarter 2023 Earnings Release
Table D - Analysis of Levels and Yields on a Taxable Equivalent Basis (Non-GAAP)
For the quarters ended September 30, 2023 and June 30, 2023
(Unaudited)
| Average Volume | Average Yields / Costs | Interest | Variance Attributable to | |||||||||||||||||||||||||||||||||||||||||
| 30-Sep-23 | 30-Jun-23 | Variance | 30-Sep-23 | 30-Jun-23 | Variance | 30-Sep-23 | 30-Jun-23 | Variance | Rate | Volume | ||||||||||||||||||||||||||||||||||
| (In millions) | (In thousands) | |||||||||||||||||||||||||||||||||||||||||||
| $ | 7,292 | $ | 7,851 | $ | (559 | ) | 5.40 | % | 5.15 | % | 0.25 | % | Money market investments |
$ | 99,285 | $ | 100,776 | $ | (1,491 | ) | $ | 5,912 | $ | (7,403 | ) | |||||||||||||||||||
| 28,396 | 27,362 | 1,034 | 2.31 | 2.00 | 0.31 | Investment securities [1] |
165,319 | 136,408 | 28,911 | 23,826 | 5,085 | |||||||||||||||||||||||||||||||||
| 34 | 32 | 2 | 4.43 | 4.65 | (0.22 | ) | Trading securities |
375 | 370 | 5 | (14 | ) | 19 | |||||||||||||||||||||||||||||||
|
|
|
|
|
|
|
|
|
|
|
|
|
|
|
|
|
|
|
|
|
|
|
|||||||||||||||||||||||
| 35,722 | 35,245 | 477 | 2.95 | 2.70 | 0.25 | Total money market, investment and trading securities |
264,979 | 237,554 | 27,425 | 29,724 | (2,299 | ) | ||||||||||||||||||||||||||||||||
|
|
|
|
|
|
|
|
|
|
|
|
|
|
|
|
|
|
|
|
|
|
|
|||||||||||||||||||||||
| Loans: |
||||||||||||||||||||||||||||||||||||||||||||
| 16,611 | 16,237 | 374 | 6.64 | 6.52 | 0.12 | Commercial |
277,977 | 263,934 | 14,043 | 7,951 | 6,092 | |||||||||||||||||||||||||||||||||
| 865 | 737 | 128 | 8.99 | 8.95 | 0.04 | Construction |
19,580 | 16,442 | 3,138 | 244 | 2,894 | |||||||||||||||||||||||||||||||||
| 1,669 | 1,632 | 37 | 6.50 | 6.30 | 0.20 | Leasing |
27,142 | 25,711 | 1,431 | 829 | 602 | |||||||||||||||||||||||||||||||||
| 7,504 | 7,409 | 95 | 5.42 | 5.47 | (0.05 | ) | Mortgage |
101,700 | 101,304 | 396 | (898 | ) | 1,294 | |||||||||||||||||||||||||||||||
| 3,147 | 3,075 | 72 | 13.39 | 13.21 | 0.18 | Consumer |
105,042 | 101,295 | 3,747 | 1,540 | 2,207 | |||||||||||||||||||||||||||||||||
| 3,657 | 3,593 | 64 | 8.47 | 8.31 | 0.16 | Auto |
78,055 | 74,467 | 3,588 | 2,252 | 1,336 | |||||||||||||||||||||||||||||||||
|
|
|
|
|
|
|
|
|
|
|
|
|
|
|
|
|
|
|
|
|
|
|
|||||||||||||||||||||||
| 33,453 | 32,683 | 770 | 7.24 | 7.15 | 0.09 | Total loans |
609,496 | 583,153 | 26,343 | 11,918 | 14,425 | |||||||||||||||||||||||||||||||||
|
|
|
|
|
|
|
|
|
|
|
|
|
|
|
|
|
|
|
|
|
|
|
|||||||||||||||||||||||
| $ | 69,175 | $ | 67,928 | $ | 1,247 | 5.02 | % | 4.84 | % | 0.18 | % | Total earning assets |
$ | 874,475 | $ | 820,707 | $ | 53,768 | $ | 41,642 | $ | 12,126 | ||||||||||||||||||||||
|
|
|
|
|
|
|
|
|
|
|
|
|
|
|
|
|
|
|
|
|
|
|
|||||||||||||||||||||||
| Interest bearing deposits: |
||||||||||||||||||||||||||||||||||||||||||||
| $ | 25,652 | $ | 24,230 | $ | 1,422 | 3.31 | % | 2.91 | % | 0.40 | % | NOW and money market [2] |
$ | 213,957 | $ | 175,640 | $ | 38,317 | $ | 25,174 | $ | 13,143 | ||||||||||||||||||||||
| 14,875 | 14,763 | 112 | 0.73 | 0.66 | 0.07 | Savings |
27,373 | 24,446 | 2,927 | 2,333 | 594 | |||||||||||||||||||||||||||||||||
| 7,986 | 7,715 | 271 | 2.62 | 2.26 | 0.36 | Time deposits |
52,791 | 43,402 | 9,389 | 6,926 | 2,463 | |||||||||||||||||||||||||||||||||
|
|
|
|
|
|
|
|
|
|
|
|
|
|
|
|
|
|
|
|
|
|
|
|||||||||||||||||||||||
| 48,513 | 46,708 | 1,805 | 2.41 | 2.09 | 0.32 | Total interest bearing deposits |
294,121 | 243,488 | 50,633 | 34,433 | 16,200 | |||||||||||||||||||||||||||||||||
|
|
|
|
|
|
|
|
|
|
|
|
|
|
|
|
|
|
|
|
|
|
|
|||||||||||||||||||||||
| 15,038 | 15,480 | (442 | ) | Non-interest bearing demand deposits |
||||||||||||||||||||||||||||||||||||||||
|
|
|
|
|
|
|
|
|
|
|
|
|
|
|
|
|
|
|
|
|
|
|
|||||||||||||||||||||||
| 63,551 | 62,188 | 1,363 | 1.84 | 1.57 | 0.27 | Total deposits |
294,121 | 243,488 | 50,633 | 34,433 | 16,200 | |||||||||||||||||||||||||||||||||
|
|
|
|
|
|
|
|
|
|
|
|
|
|
|
|
|
|
|
|
|
|
|
|||||||||||||||||||||||
| 108 | 125 | (17 | ) | 5.45 | 5.19 | 0.26 | Short-term borrowings |
1,478 | 1,624 | (146 | ) | 91 | (237 | ) | ||||||||||||||||||||||||||||||
| 1,172 | 1,299 | (127 | ) | 5.20 | 5.33 | (0.13 | ) | Other medium and long-term debt |
15,167 | 17,227 | (2,060 | ) | 740 | (2,800 | ) | |||||||||||||||||||||||||||||
|
|
|
|
|
|
|
|
|
|
|
|
|
|
|
|
|
|
|
|
|
|
|
|||||||||||||||||||||||
| 49,793 | 48,132 | 1,661 | 2.48 | 2.19 | 0.29 | Total interest bearing liabilities (excluding demand deposits) |
310,766 | 262,339 | 48,427 | 35,264 | 13,163 | |||||||||||||||||||||||||||||||||
|
|
|
|
|
|
|
|
|
|
|
|
|
|
|
|
|
|
|
|
|
|
|
|||||||||||||||||||||||
| 4,344 | 4,316 | 28 | Other sources of funds |
|||||||||||||||||||||||||||||||||||||||||
|
|
|
|
|
|
|
|
|
|
|
|
|
|
|
|
|
|
|
|
|
|
|
|||||||||||||||||||||||
| $ | 69,175 | $ | 67,928 | $ | 1,247 | 1.78 | % | 1.55 | % | 0.23 | % | Total source of funds |
310,766 | 262,339 | 48,427 | 35,264 | 13,163 | |||||||||||||||||||||||||||
|
|
|
|
|
|
|
|
|
|
|
|
|
|||||||||||||||||||||||||||||||||
| 3.24 | % | 3.29 | % | (0.05 | )% | Net interest margin/ income on a taxable equivalent basis (Non-GAAP) |
563,709 | 558,368 | 5,341 | $ | 6,378 | $ | (1,037 | ) | ||||||||||||||||||||||||||||||
|
|
|
|
|
|
|
|
|
|
|
|
|
|
|
|
|
|||||||||||||||||||||||||||||
| 2.54 | % | 2.65 | % | (0.11 | )% | Net interest spread |
||||||||||||||||||||||||||||||||||||||
|
|
|
|
|
|
|
|||||||||||||||||||||||||||||||||||||||
| Taxable equivalent adjustment |
29,689 | 26,700 | 2,989 | |||||||||||||||||||||||||||||||||||||||||
|
|
|
|
|
|
|
|||||||||||||||||||||||||||||||||||||||
| 3.07 | % | 3.14 | % | (0.07 | )% | Net interest margin/ income non-taxable equivalent basis (GAAP) |
$ | 534,020 | $ | 531,668 | $ | 2,352 | ||||||||||||||||||||||||||||||||
|
|
|
|
|
|
|
|
|
|
|
|
|
|||||||||||||||||||||||||||||||||
Note: The changes that are not due solely to volume or rate are allocated to volume and rate based on the proportion of the change in each category.
| [1] | Average balances exclude unrealized gains or losses on debt securities available-for-sale and the unrealized loss related to certain securities transferred from available-for-sale to held-to-maturity. |
| [2] | Includes interest bearing demand deposits corresponding to certain government entities in Puerto Rico. |
14
Popular, Inc.
Financial Supplement to Third Quarter 2023 Earnings Release
Table E - Analysis of Levels and Yields on a Taxable Equivalent Basis (Non-GAAP)
For the quarters ended September 30, 2023 and September 30, 2022
(Unaudited)
| Average Volume | Average Yields / Costs | Interest | Variance Attributable to | |||||||||||||||||||||||||||||||||||||||||
| 30-Sep-23 | 30-Sep-22 | Variance | 30-Sep-23 | 30-Sep-22 | Variance | 30-Sep-23 | 30-Sep-22 | Variance | Rate | Volume | ||||||||||||||||||||||||||||||||||
| (In millions) | (In thousands) | |||||||||||||||||||||||||||||||||||||||||||
| $ | 7,292 | $ | 6,721 | $ | 571 | 5.40 | % | 2.18 | % | 3.22 | % | Money market investments |
$ | 99,285 | $ | 36,966 | $ | 62,319 | $ | 58,920 | $ | 3,399 | ||||||||||||||||||||||
| 28,396 | 31,859 | (3,463 | ) | 2.31 | 2.33 | (0.02 | ) | Investment securities [1] |
165,319 | 186,847 | (21,528 | ) | (1,510 | ) | (20,018 | ) | ||||||||||||||||||||||||||||
| 34 | 40 | (6 | ) | 4.43 | 6.09 | (1.66 | ) | Trading securities |
375 | 617 | (242 | ) | (150 | ) | (92 | ) | ||||||||||||||||||||||||||||
|
|
|
|
|
|
|
|
|
|
|
|
|
|
|
|
|
|
|
|
|
|
|
|||||||||||||||||||||||
| 35,722 | 38,620 | (2,898 | ) | 2.95 | 2.31 | 0.64 | Total money market, investment and trading securities |
264,979 | 224,430 | 40,549 | 57,260 | (16,711 | ) | |||||||||||||||||||||||||||||||
|
|
|
|
|
|
|
|
|
|
|
|
|
|
|
|
|
|
|
|
|
|
|
|||||||||||||||||||||||
| Loans: |
||||||||||||||||||||||||||||||||||||||||||||
| 16,611 | 14,750 | 1,861 | 6.64 | 5.52 | 1.12 | Commercial |
277,977 | 205,237 | 72,740 | 44,889 | 27,851 | |||||||||||||||||||||||||||||||||
| 865 | 835 | 30 | 8.99 | 6.38 | 2.61 | Construction |
19,580 | 13,431 | 6,149 | 5,667 | 482 | |||||||||||||||||||||||||||||||||
| 1,669 | 1,503 | 166 | 6.50 | 5.90 | 0.60 | Leasing |
27,142 | 22,154 | 4,988 | 2,405 | 2,583 | |||||||||||||||||||||||||||||||||
| 7,504 | 7,264 | 240 | 5.42 | 5.42 | — | Mortgage |
101,700 | 98,348 | 3,352 | 93 | 3,259 | |||||||||||||||||||||||||||||||||
| 3,147 | 2,818 | 329 | 13.39 | 11.74 | 1.65 | Consumer |
105,042 | 83,407 | 21,635 | 11,164 | 10,471 | |||||||||||||||||||||||||||||||||
| 3,657 | 3,562 | 95 | 8.47 | 7.93 | 0.54 | Auto |
78,055 | 71,226 | 6,829 | 4,889 | 1,940 | |||||||||||||||||||||||||||||||||
|
|
|
|
|
|
|
|
|
|
|
|
|
|
|
|
|
|
|
|
|
|
|
|||||||||||||||||||||||
| 33,453 | 30,732 | 2,721 | 7.24 | 6.39 | 0.85 | Total loans |
609,496 | 493,803 | 115,693 | 69,107 | 46,586 | |||||||||||||||||||||||||||||||||
|
|
|
|
|
|
|
|
|
|
|
|
|
|
|
|
|
|
|
|
|
|
|
|||||||||||||||||||||||
| $ | 69,175 | $ | 69,352 | $ | (177 | ) | 5.02 | % | 4.12 | % | 0.90 | % | Total earning assets |
$ | 874,475 | $ | 718,233 | $ | 156,242 | $ | 126,367 | $ | 29,875 | |||||||||||||||||||||
|
|
|
|
|
|
|
|
|
|
|
|
|
|
|
|
|
|
|
|
|
|
|
|||||||||||||||||||||||
| Interest bearing deposits: |
||||||||||||||||||||||||||||||||||||||||||||
| $ | 25,652 | $ | 25,993 | $ | (341 | ) | 3.31 | % | 0.56 | % | 2.75 | % | NOW and money market [2] |
$ | 213,957 | $ | 36,448 | $ | 177,509 | $ | 178,787 | $ | (1,278 | ) | ||||||||||||||||||||
| 14,875 | 15,514 | (639 | ) | 0.73 | 0.20 | 0.53 | Savings |
27,373 | 7,966 | 19,407 | 20,380 | (973 | ) | |||||||||||||||||||||||||||||||
| 7,986 | 6,957 | 1,029 | 2.62 | 0.94 | 1.68 | Time deposits |
52,791 | 16,484 | 36,307 | 29,147 | 7,160 | |||||||||||||||||||||||||||||||||
|
|
|
|
|
|
|
|
|
|
|
|
|
|
|
|
|
|
|
|
|
|
|
|||||||||||||||||||||||
| 48,513 | 48,464 | 49 | 2.41 | 0.50 | 1.91 | Total interest bearing deposits |
294,121 | 60,898 | 233,223 | 228,314 | 4,909 | |||||||||||||||||||||||||||||||||
|
|
|
|
|
|
|
|
|
|
|
|
|
|
|
|
|
|
|
|
|
|
|
|||||||||||||||||||||||
| 15,038 | 15,872 | (834 | ) | Non-interest bearing demand deposits |
||||||||||||||||||||||||||||||||||||||||
|
|
|
|
|
|
|
|
|
|
|
|
|
|
|
|
|
|
|
|
|
|
|
|||||||||||||||||||||||
| 63,551 | 64,336 | (785 | ) | 1.84 | 0.38 | 1.46 | Total deposits |
294,121 | 60,898 | 233,223 | 228,314 | 4,909 | ||||||||||||||||||||||||||||||||
|
|
|
|
|
|
|
|
|
|
|
|
|
|
|
|
|
|
|
|
|
|
|
|||||||||||||||||||||||
| 108 | 155 | (47 | ) | 5.45 | 2.36 | 3.09 | Short-term borrowings |
1,478 | 921 | 557 | 976 | (419 | ) | |||||||||||||||||||||||||||||||
| 1,172 | 913 | 259 | 5.20 | 4.29 | 0.91 | Other medium and long-term debt |
15,167 | 9,798 | 5,369 | 1,050 | 4,319 | |||||||||||||||||||||||||||||||||
|
|
|
|
|
|
|
|
|
|
|
|
|
|
|
|
|
|
|
|
|
|
|
|||||||||||||||||||||||
| 49,793 | 49,532 | 261 | 2.48 | 0.57 | 1.91 | Total interest bearing liabilities (excluding demand deposits) |
310,766 | 71,617 | 239,149 | 230,340 | 8,809 | |||||||||||||||||||||||||||||||||
|
|
|
|
|
|
|
|
|
|
|
|
|
|
|
|
|
|
|
|
|
|
|
|||||||||||||||||||||||
| 4,344 | 3,948 | 396 | Other sources of funds |
|||||||||||||||||||||||||||||||||||||||||
|
|
|
|
|
|
|
|
|
|
|
|
|
|
|
|
|
|
|
|
|
|
|
|||||||||||||||||||||||
| $ | 69,175 | $ | 69,352 | $ | (177 | ) | 1.78 | % | 0.41 | % | 1.37 | % | Total source of funds |
310,766 | 71,617 | 239,149 | 230,340 | 8,809 | ||||||||||||||||||||||||||
|
|
|
|
|
|
|
|
|
|
|
|
|
|||||||||||||||||||||||||||||||||
| 3.24 | % | 3.71 | % | (0.47 | )% | Net interest margin/ income on a taxable equivalent basis (Non-GAAP) |
563,709 | 646,616 | (82,907 | ) | $ | (103,973 | ) | $ | 21,066 | |||||||||||||||||||||||||||||
|
|
|
|
|
|
|
|
|
|
|
|
|
|
|
|
|
|||||||||||||||||||||||||||||
| 2.54 | % | 3.55 | % | (1.01 | )% | Net interest spread |
||||||||||||||||||||||||||||||||||||||
|
|
|
|
|
|
|
|||||||||||||||||||||||||||||||||||||||
| Taxable equivalent adjustment |
29,689 | 66,997 | (37,308 | ) | ||||||||||||||||||||||||||||||||||||||||
|
|
|
|
|
|
|
|||||||||||||||||||||||||||||||||||||||
| 3.07 | % | 3.32 | % | (0.25 | )% | Net interest margin/ income non-taxable equivalent basis (GAAP) |
$ | 534,020 | $ | 579,619 | $ | (45,599 | ) | |||||||||||||||||||||||||||||||
|
|
|
|
|
|
|
|
|
|
|
|
|
|||||||||||||||||||||||||||||||||
Note: The changes that are not due solely to volume or rate are allocated to volume and rate based on the proportion of the change in each category.
| [1] | Average balances exclude unrealized gains or losses on debt securities available-for-sale and the unrealized loss related to certain securities transferred from available-for-sale to held-to-maturity. |
| [2] | Includes interest bearing demand deposits corresponding to certain government entities in Puerto Rico. |
15
Popular, Inc.
Financial Supplement to Third Quarter 2023 Earnings Release
Table F - Analysis of Levels and Yields on a Taxable Equivalent Basis (Non-GAAP) - YEAR-TO-DATE
(Unaudited)
| Average Volume | Average Yields / Costs | Interest | Variance Attributable to | |||||||||||||||||||||||||||||||||||||||||
| 30-Sep-23 | 30-Sep-22 | Variance | 30-Sep-23 | 30-Sep-22 | Variance | 30-Sep-23 | 30-Sep-22 | Variance | Rate | Volume | ||||||||||||||||||||||||||||||||||
| (In millions) | (In thousands) | |||||||||||||||||||||||||||||||||||||||||||
| $ | 6,966 | $ | 10,969 | $ | (4,003 | ) | 5.10 | % | 0.82 | % | 4.28 | % | Money market investments |
$ | 265,785 | $ | 67,172 | $ | 198,613 | $ | 231,496 | $ | (32,883 | ) | ||||||||||||||||||||
| 28,205 | 29,371 | (1,166 | ) | 2.18 | 2.16 | 0.02 | Investment securities [1] |
460,641 | 475,088 | (14,447 | ) | 4,862 | (19,309 | ) | ||||||||||||||||||||||||||||||
| 32 | 59 | (27 | ) | 4.52 | 6.23 | (1.71 | ) | Trading securities |
1,084 | 2,725 | (1,641 | ) | (621 | ) | (1,020 | ) | ||||||||||||||||||||||||||||
|
|
|
|
|
|
|
|
|
|
|
|
|
|
|
|
|
|
|
|
|
|
|
|||||||||||||||||||||||
| 35,203 | 40,399 | (5,196 | ) | 2.76 | 1.80 | 0.96 | Total money market, investment and trading securities |
727,510 | 544,985 | 182,525 | 235,737 | (53,212 | ) | |||||||||||||||||||||||||||||||
|
|
|
|
|
|
|
|
|
|
|
|
|
|
|
|
|
|
|
|
|
|
|
|||||||||||||||||||||||
| Loans: |
||||||||||||||||||||||||||||||||||||||||||||
| 16,206 | 14,245 | 1,961 | 6.50 | 5.26 | 1.24 | Commercial |
787,381 | 560,408 | 226,973 | 143,107 | 83,866 | |||||||||||||||||||||||||||||||||
| 778 | 781 | (3 | ) | 8.79 | 5.87 | 2.92 | Construction |
51,178 | 34,305 | 16,873 | 17,017 | (144 | ) | |||||||||||||||||||||||||||||||
| 1,630 | 1,447 | 183 | 6.31 | 5.92 | 0.39 | Leasing |
77,135 | 64,225 | 12,910 | 4,440 | 8,470 | |||||||||||||||||||||||||||||||||
| 7,434 | 7,315 | 119 | 5.45 | 5.33 | 0.12 | Mortgage |
303,777 | 292,253 | 11,524 | 6,712 | 4,812 | |||||||||||||||||||||||||||||||||
| 3,082 | 2,670 | 412 | 13.10 | 11.44 | 1.66 | Consumer |
302,050 | 228,401 | 73,649 | 35,342 | 38,307 | |||||||||||||||||||||||||||||||||
| 3,603 | 3,507 | 96 | 8.31 | 8.03 | 0.28 | Auto |
223,929 | 210,623 | 13,306 | 7,455 | 5,851 | |||||||||||||||||||||||||||||||||
|
|
|
|
|
|
|
|
|
|
|
|
|
|
|
|
|
|
|
|
|
|
|
|||||||||||||||||||||||
| 32,733 | 29,965 | 2,768 | 7.13 | 6.20 | 0.93 | Total loans |
1,745,450 | 1,390,215 | 355,235 | 214,073 | 141,162 | |||||||||||||||||||||||||||||||||
|
|
|
|
|
|
|
|
|
|
|
|
|
|
|
|
|
|
|
|
|
|
|
|||||||||||||||||||||||
| $ | 67,936 | $ | 70,364 | $ | (2,428 | ) | 4.86 | % | 3.67 | % | 1.19 | % | Total earning assets |
$ | 2,472,960 | $ | 1,935,200 | $ | 537,760 | $ | 449,810 | $ | 87,950 | |||||||||||||||||||||
|
|
|
|
|
|
|
|
|
|
|
|
|
|
|
|
|
|
|
|
|
|
|
|||||||||||||||||||||||
| Interest bearing deposits: |
||||||||||||||||||||||||||||||||||||||||||||
| $ | 24,407 | $ | 26,385 | $ | (1,978 | ) | 2.93 | % | 0.26 | % | 2.67 | % | NOW and money market [2] |
$ | 534,567 | $ | 52,072 | $ | 482,495 | $ | 488,704 | $ | (6,209 | ) | ||||||||||||||||||||
| 14,889 | 16,100 | (1,211 | ) | 0.62 | 0.18 | 0.44 | Savings |
69,262 | 21,430 | 47,832 | 52,158 | (4,326 | ) | |||||||||||||||||||||||||||||||
| 7,603 | 6,913 | 690 | 2.23 | 0.77 | 1.46 | Time deposits |
126,995 | 40,005 | 86,990 | 71,425 | 15,565 | |||||||||||||||||||||||||||||||||
|
|
|
|
|
|
|
|
|
|
|
|
|
|
|
|
|
|
|
|
|
|
|
|||||||||||||||||||||||
| 46,899 | 49,398 | (2,499 | ) | 2.08 | 0.31 | 1.77 | Total interest bearing deposits |
730,824 | 113,507 | 617,317 | 612,287 | 5,030 | ||||||||||||||||||||||||||||||||
|
|
|
|
|
|
|
|
|
|
|
|
|
|
|
|
|
|
|
|
|
|
|
|||||||||||||||||||||||
| 15,405 | 16,088 | (683 | ) | Non-interest bearing demand deposits |
||||||||||||||||||||||||||||||||||||||||
|
|
|
|
|
|
|
|
|
|
|
|
|
|
|
|
|
|
|
|
|
|
|
|||||||||||||||||||||||
| 62,304 | 65,486 | (3,182 | ) | 1.57 | 0.23 | 1.34 | Total deposits |
730,824 | 113,507 | 617,317 | 612,287 | 5,030 | ||||||||||||||||||||||||||||||||
|
|
|
|
|
|
|
|
|
|
|
|
|
|
|
|
|
|
|
|
|
|
|
|||||||||||||||||||||||
| 160 | 124 | 36 | 5.02 | 1.34 | 3.68 | Short-term borrowings |
5,987 | 1,249 | 4,738 | 4,298 | 440 | |||||||||||||||||||||||||||||||||
| 1,140 | 948 | 192 | 5.12 | 4.25 | 0.87 | Other medium and long-term debt |
43,660 | 30,168 | 13,492 | 7,506 | 5,986 | |||||||||||||||||||||||||||||||||
|
|
|
|
|
|
|
|
|
|
|
|
|
|
|
|
|
|
|
|
|
|
|
|||||||||||||||||||||||
| 48,199 | 50,470 | (2,271 | ) | 2.16 | 0.38 | 1.78 | Total interest bearing liabilities (excluding demand deposits) |
780,471 | 144,924 | 635,547 | 624,091 | 11,456 | ||||||||||||||||||||||||||||||||
|
|
|
|
|
|
|
|
|
|
|
|
|
|
|
|
|
|
|
|
|
|
|
|||||||||||||||||||||||
| 4,332 | 3,806 | 526 | Other sources of funds |
|||||||||||||||||||||||||||||||||||||||||
|
|
|
|
|
|
|
|
|
|
|
|
|
|
|
|
|
|
|
|
|
|
|
|||||||||||||||||||||||
| $ | 67,936 | $ | 70,364 | $ | (2,428 | ) | 1.54 | % | 0.28 | % | 1.26 | % | Total source of funds |
780,471 | 144,924 | 635,547 | 624,091 | 11,456 | ||||||||||||||||||||||||||
|
|
|
|
|
|
|
|
|
|
|
|
|
|||||||||||||||||||||||||||||||||
| 3.32 | % | 3.39 | % | (0.07 | )% | Net interest margin/ income on a taxable equivalent basis (Non-GAAP) |
1,692,489 | 1,790,276 | (97,787 | ) | $ | (174,281 | ) | $ | 76,494 | |||||||||||||||||||||||||||||
|
|
|
|
|
|
|
|
|
|
|
|
|
|
|
|
|
|||||||||||||||||||||||||||||
| 2.70 | % | 3.29 | % | (0.59 | )% | Net interest spread |
||||||||||||||||||||||||||||||||||||||
|
|
|
|
|
|
|
|||||||||||||||||||||||||||||||||||||||
| Taxable equivalent adjustment |
95,145 | 182,483 | (87,338 | ) | ||||||||||||||||||||||||||||||||||||||||
|
|
|
|
|
|
|
|||||||||||||||||||||||||||||||||||||||
| 3.14 | % | 3.05 | % | 0.09 | % | Net interest margin/ income non-taxable equivalent basis (GAAP) |
$ | 1,597,344 | $ | 1,607,793 | $ | (10,449 | ) | |||||||||||||||||||||||||||||||
|
|
|
|
|
|
|
|
|
|
|
|
|
|||||||||||||||||||||||||||||||||
Note: The changes that are not due solely to volume or rate are allocated to volume and rate based on the proportion of the change in each category.
| [1] | Average balances exclude unrealized gains or losses on debt securities available-for-sale and the unrealized loss related to certain securities transferred from available-for-sale to held-to-maturity. |
| [2] | Includes interest bearing demand deposits corresponding to certain government entities in Puerto Rico. |
16
Popular, Inc.
Financial Supplement to Third Quarter 2023 Earnings Release
Table G Mortgage Banking Activities and Other Service Fees
(Unaudited)
Mortgage Banking Activities
| Quarters ended | Variance | Nine months ended | Variance | |||||||||||||||||||||||||||||
| (In thousands) |
30-Sep-23 | 30-Jun-23 | 30-Sep-22 | Q3 2023 vs.Q2 2023 |
Q3 2023 vs.Q3 2022 |
30-Sep-23 | 30-Sep-22 | 2023 vs. 2022 |
||||||||||||||||||||||||
| Mortgage servicing fees, net of fair value adjustments: |
||||||||||||||||||||||||||||||||
| Mortgage servicing fees |
$ | 8,025 | $ | 8,369 | $ | 9,126 | $ | (344 | ) | $ | (1,101 | ) | $ | 25,083 | $ | 27,635 | $ | (2,552 | ) | |||||||||||||
| Mortgage servicing rights fair value adjustments |
(2,793 | ) | (6,216 | ) | (499 | ) | 3,423 | (2,294 | ) | (10,385 | ) | 2,846 | (13,231 | ) | ||||||||||||||||||
|
|
|
|
|
|
|
|
|
|
|
|
|
|
|
|
|
|||||||||||||||||
| Total mortgage servicing fees, net of fair value adjustments |
5,232 | 2,153 | 8,627 | 3,079 | (3,395 | ) | 14,698 | 30,481 | (15,783 | ) | ||||||||||||||||||||||
|
|
|
|
|
|
|
|
|
|
|
|
|
|
|
|
|
|||||||||||||||||
| Net (loss) gain on sale of loans, including valuation on loans held-for-sale |
(335 | ) | (61 | ) | 1,124 | (274 | ) | (1,459 | ) | (133 | ) | (374 | ) | 241 | ||||||||||||||||||
|
|
|
|
|
|
|
|
|
|
|
|
|
|
|
|
|
|||||||||||||||||
| Trading account profit (loss): | ||||||||||||||||||||||||||||||||
| Unrealized gains on outstanding derivative positions |
45 | 246 | — | (201 | ) | 45 | 160 | — | 160 | |||||||||||||||||||||||
| Realized gains (losses) on closed derivative positions |
494 | 111 | (240 | ) | 383 | 734 | 661 | 6,325 | (5,664 | ) | ||||||||||||||||||||||
|
|
|
|
|
|
|
|
|
|
|
|
|
|
|
|
|
|||||||||||||||||
| Total trading account profit (loss) |
539 | 357 | (240 | ) | 182 | 779 | 821 | 6,325 | (5,504 | ) | ||||||||||||||||||||||
|
|
|
|
|
|
|
|
|
|
|
|
|
|
|
|
|
|||||||||||||||||
| Losses on repurchased loans, including interest advances |
(43 | ) | (133 | ) | (63 | ) | 90 | 20 | (277 | ) | (544 | ) | 267 | |||||||||||||||||||
|
|
|
|
|
|
|
|
|
|
|
|
|
|
|
|
|
|||||||||||||||||
| Total mortgage banking activities |
$ | 5,393 | $ | 2,316 | $ | 9,448 | $ | 3,077 | $ | (4,055 | ) | $ | 15,109 | $ | 35,888 | $ | (20,779 | ) | ||||||||||||||
|
|
|
|
|
|
|
|
|
|
|
|
|
|
|
|
|
|||||||||||||||||
Other Service Fees
| Quarters ended | Variance | Nine months ended | Variance | |||||||||||||||||||||||||||||
| (In thousands) |
30-Sep-23 | 30-Jun-23 | 30-Sep-22 | Q3 2023 vs.Q2 2023 |
Q3 2023 vs.Q3 2022 |
30-Sep-23 | 30-Sep-22 | 2023 vs. 2022 |
||||||||||||||||||||||||
| Other service fees: | ||||||||||||||||||||||||||||||||
| Debit card fees |
$ | 13,577 | $ | 13,600 | $ | 12,133 | $ | (23 | ) | $ | 1,444 | $ | 40,343 | $ | 36,794 | $ | 3,549 | |||||||||||||||
| Insurance fees |
14,983 | 14,625 | 15,697 | 358 | (714 | ) | 43,481 | 41,870 | 1,611 | |||||||||||||||||||||||
| Credit card fees |
40,804 | 42,644 | 37,829 | (1,840 | ) | 2,975 | 123,946 | 109,626 | 14,320 | |||||||||||||||||||||||
| Sale and administration of investment products |
6,820 | 6,076 | 5,952 | 744 | 868 | 19,454 | 17,760 | 1,694 | ||||||||||||||||||||||||
| Trust fees |
6,381 | 6,600 | 5,506 | (219 | ) | 875 | 18,756 | 17,576 | 1,180 | |||||||||||||||||||||||
| Other fees |
10,842 | 10,720 | 9,285 | 122 | 1,557 | 31,768 | 21,361 | 10,407 | ||||||||||||||||||||||||
|
|
|
|
|
|
|
|
|
|
|
|
|
|
|
|
|
|||||||||||||||||
| Total other service fees |
$ | 93,407 | $ | 94,265 | $ | 86,402 | $ | (858 | ) | $ | 7,005 | $ | 277,748 | $ | 244,987 | $ | 32,761 | |||||||||||||||
|
|
|
|
|
|
|
|
|
|
|
|
|
|
|
|
|
|||||||||||||||||
17
Popular, Inc.
Financial Supplement to Third Quarter 2023 Earnings Release
Table H - Loans and Deposits
(Unaudited)
Loans - Ending Balances
| Variance | ||||||||||||||||||||
| (In thousands) |
30-Sep-23 | 30-Jun-23 | 30-Sep-22 | Q3 2023 vs.Q2 2023 |
Q3 2023 vs.Q3 2022 |
|||||||||||||||
| Loans held-in-portfolio: |
|
|||||||||||||||||||
| Commercial |
||||||||||||||||||||
| Commercial multi-family |
$ | 2,328,433 | $ | 2,331,499 | $ | 2,204,109 | (3,066 | ) | 124,324 | |||||||||||
| Commercial real estate non-owner occupied |
5,035,130 | 4,744,256 | 4,517,475 | 290,874 | 517,655 | |||||||||||||||
| Commercial real estate owner occupied |
3,044,905 | 3,041,398 | 3,066,548 | 3,507 | (21,643 | ) | ||||||||||||||
| Commercial and industrial |
6,527,082 | 6,251,147 | 5,578,727 | 275,935 | 948,355 | |||||||||||||||
| Total Commercial |
16,935,550 | 16,368,300 | 15,366,859 | 567,250 | 1,568,691 | |||||||||||||||
| Construction |
922,112 | 819,903 | 816,290 | 102,209 | 105,822 | |||||||||||||||
| Leasing |
1,698,114 | 1,661,523 | 1,538,504 | 36,591 | 159,610 | |||||||||||||||
| Mortgage |
7,585,111 | 7,449,078 | 7,311,713 | 136,033 | 273,398 | |||||||||||||||
| Consumer |
||||||||||||||||||||
| Credit cards |
1,077,428 | 1,057,389 | 988,550 | 20,039 | 88,878 | |||||||||||||||
| Home equity lines of credit |
67,499 | 68,440 | 72,796 | (941 | ) | (5,297 | ) | |||||||||||||
| Personal |
1,952,168 | 1,896,594 | 1,756,021 | 55,574 | 196,147 | |||||||||||||||
| Auto |
3,633,196 | 3,565,533 | 3,528,904 | 67,663 | 104,292 | |||||||||||||||
| Other |
158,135 | 144,162 | 143,551 | 13,973 | 14,584 | |||||||||||||||
| Total Consumer |
6,888,426 | 6,732,118 | 6,489,822 | 156,308 | 398,604 | |||||||||||||||
|
|
|
|
|
|
|
|
|
|
|
|||||||||||
| Total loans held-in-portfolio |
$ | 34,029,313 | $ | 33,030,922 | $ | 31,523,188 | $ | 998,391 | $ | 2,506,125 | ||||||||||
| Loans held-for-sale: |
||||||||||||||||||||
| Mortgage |
$ | 5,239 | $ | 9,509 | $ | 8,065 | $ | (4,270 | ) | $ | (2,826 | ) | ||||||||
| Credit cards |
— | 45,912 | — | (45,912 | ) | — | ||||||||||||||
|
|
|
|
|
|
|
|
|
|
|
|||||||||||
| Total loans held-for-sale |
$ | 5,239 | $ | 55,421 | $ | 8,065 | $ | (50,182 | ) | $ | (2,826 | ) | ||||||||
|
|
|
|
|
|
|
|
|
|
|
|||||||||||
| Total loans |
$ | 34,034,552 | $ | 33,086,343 | $ | 31,531,253 | $ | 948,209 | $ | 2,503,299 | ||||||||||
|
|
|
|
|
|
|
|
|
|
|
|||||||||||
Deposits - Ending Balances
| Variance | ||||||||||||||||||||
| (In thousands) |
30-Sep-23 | 30-Jun-23 | 30-Sep-22 | Q3 2023 vs. Q2 2023 |
Q3 2023 vs.Q3 2022 |
|||||||||||||||
| Demand deposits [1] |
$ | 27,942,782 | $ | 27,690,840 | $ | 28,773,328 | $ | 251,942 | $ | (830,546 | ) | |||||||||
| Savings, NOW and money market deposits (non-brokered) |
26,452,382 | 27,539,343 | 28,388,057 | (1,086,961 | ) | (1,935,675 | ) | |||||||||||||
| Savings, NOW and money market deposits (brokered) |
734,479 | 772,783 | 728,651 | (38,304 | ) | 5,828 | ||||||||||||||
| Time deposits (non-brokered) |
7,264,156 | 7,231,840 | 6,731,588 | 32,316 | 532,568 | |||||||||||||||
| Time deposits (brokered CDs) |
943,801 | 770,012 | 197,703 | 173,789 | 746,098 | |||||||||||||||
|
|
|
|
|
|
|
|
|
|
|
|||||||||||
| Total deposits |
$ | 63,337,600 | $ | 64,004,818 | $ | 64,819,327 | $ | (667,218 | ) | $ | (1,481,727 | ) | ||||||||
|
|
|
|
|
|
|
|
|
|
|
|||||||||||
| [1] | Includes interest and non-interest bearing demand deposits. |
18
Popular, Inc.
Financial Supplement to Third Quarter 2023 Earnings Release
Table I - Loan Delinquency - BPPR Operations
(Unaudited)
| 30-Sep-23 |
||||||||||||||||||||||||||||||||
| BPPR |
||||||||||||||||||||||||||||||||
| Past due | Past due 90 days or more | |||||||||||||||||||||||||||||||
| (In thousands) |
30-59 days | 60-89 days | 90 days or more |
Total past due |
Current | Loans HIP | Non-accrual loans |
Accruing loans |
||||||||||||||||||||||||
| Commercial multi-family |
$ | 4,407 | $ | 176 | $ | 184 | $ | 4,767 | $ | 290,047 | $ | 294,814 | $ | 184 | $ | — | ||||||||||||||||
| Commercial real estate: |
||||||||||||||||||||||||||||||||
| Non-owner occupied |
1,274 | — | 15,330 | 16,604 | 2,932,277 | 2,948,881 | 15,330 | — | ||||||||||||||||||||||||
| Owner occupied |
817 | 827 | 35,089 | 36,733 | 1,370,820 | 1,407,553 | 35,089 | — | ||||||||||||||||||||||||
| Commercial and industrial |
4,022 | 1,728 | 24,733 | 30,483 | 4,299,335 | 4,329,818 | 21,624 | 3,109 | ||||||||||||||||||||||||
| Construction |
— | — | 6,578 | 6,578 | 163,929 | 170,507 | 6,578 | — | ||||||||||||||||||||||||
| Mortgage |
241,962 | 100,679 | 430,430 | 773,071 | 5,516,197 | 6,289,268 | 187,443 | 242,987 | ||||||||||||||||||||||||
| Leasing |
17,915 | 4,574 | 6,842 | 29,331 | 1,668,783 | 1,698,114 | 6,842 | — | ||||||||||||||||||||||||
| Consumer: |
||||||||||||||||||||||||||||||||
| Credit cards |
11,218 | 8,133 | 17,719 | 37,070 | 1,040,341 | 1,077,411 | — | 17,719 | ||||||||||||||||||||||||
| Home equity lines of credit |
26 | — | — | 26 | 2,448 | 2,474 | — | — | ||||||||||||||||||||||||
| Personal |
19,586 | 12,476 | 18,582 | 50,644 | 1,712,358 | 1,763,002 | 18,582 | — | ||||||||||||||||||||||||
| Auto |
89,453 | 23,019 | 40,268 | 152,740 | 3,480,456 | 3,633,196 | 40,268 | — | ||||||||||||||||||||||||
| Other |
567 | 388 | 2,152 | 3,107 | 144,425 | 147,532 | 1,885 | 267 | ||||||||||||||||||||||||
|
|
|
|
|
|
|
|
|
|
|
|
|
|
|
|
|
|||||||||||||||||
| Total |
$ | 391,247 | $ | 152,000 | $ | 597,907 | $ | 1,141,154 | $ | 22,621,416 | $ | 23,762,570 | $ | 333,825 | $ | 264,082 | ||||||||||||||||
|
|
|
|
|
|
|
|
|
|
|
|
|
|
|
|
|
|||||||||||||||||
| 30-Jun-23 |
||||||||||||||||||||||||||||||||
| BPPR |
||||||||||||||||||||||||||||||||
| Past due | Past due 90 days or more | |||||||||||||||||||||||||||||||
| (In thousands) |
30-59 days | 60-89 days | 90 days or more |
Total past due |
Current | Loans HIP | Non-accrual loans |
Accruing loans |
||||||||||||||||||||||||
| Commercial multi-family |
$ | 3,778 | $ | 179 | $ | 184 | $ | 4,141 | $ | 292,736 | $ | 296,877 | $ | 184 | $ | — | ||||||||||||||||
| Commercial real estate: |
||||||||||||||||||||||||||||||||
| Non-owner occupied |
177 | 512 | 22,942 | 23,631 | 2,882,616 | 2,906,247 | 22,942 | — | ||||||||||||||||||||||||
| Owner occupied |
1,241 | 700 | 35,832 | 37,773 | 1,390,285 | 1,428,058 | 35,832 | — | ||||||||||||||||||||||||
| Commercial and industrial |
2,597 | 728 | 32,846 | 36,171 | 4,002,652 | 4,038,823 | 29,758 | 3,088 | ||||||||||||||||||||||||
| Construction |
— | 970 | 9,284 | 10,254 | 163,481 | 173,735 | 9,284 | — | ||||||||||||||||||||||||
| Mortgage |
221,187 | 88,955 | 449,930 | 760,072 | 5,408,216 | 6,168,288 | 194,219 | 255,711 | ||||||||||||||||||||||||
| Leasing |
13,160 | 3,811 | 4,743 | 21,714 | 1,639,809 | 1,661,523 | 4,743 | — | ||||||||||||||||||||||||
| Consumer: |
||||||||||||||||||||||||||||||||
| Credit cards |
9,506 | 6,311 | 14,185 | 30,002 | 1,027,370 | 1,057,372 | — | 14,185 | ||||||||||||||||||||||||
| Home equity lines of credit |
— | — | — | — | 2,570 | 2,570 | — | — | ||||||||||||||||||||||||
| Personal |
14,865 | 11,660 | 17,438 | 43,963 | 1,642,003 | 1,685,966 | 17,438 | — | ||||||||||||||||||||||||
| Auto |
75,879 | 18,422 | 36,204 | 130,505 | 3,435,028 | 3,565,533 | 36,204 | — | ||||||||||||||||||||||||
| Other |
512 | 274 | 1,901 | 2,687 | 132,605 | 135,292 | 1,735 | 166 | ||||||||||||||||||||||||
|
|
|
|
|
|
|
|
|
|
|
|
|
|
|
|
|
|||||||||||||||||
| Total |
$ | 342,902 | $ | 132,522 | $ | 625,489 | $ | 1,100,913 | $ | 22,019,371 | $ | 23,120,284 | $ | 352,339 | $ | 273,150 | ||||||||||||||||
|
|
|
|
|
|
|
|
|
|
|
|
|
|
|
|
|
|||||||||||||||||
19
| Variance |
||||||||||||||||||||||||||||||||
| Past due | Past due 90 days or more | |||||||||||||||||||||||||||||||
| (In thousands) |
30-59 days |
60-89 days |
90 days or more |
Total past due |
Current | Loans HIP | Non-accrual loans |
Accruing loans |
||||||||||||||||||||||||
| Commercial multi-family |
$ | 629 | $ | (3 | ) | $ | — | $ | 626 | $ | (2,689 | ) | $ | (2,063 | ) | $ | — | $ | — | |||||||||||||
| Commercial real estate: |
||||||||||||||||||||||||||||||||
| Non-owner occupied |
1,097 | (512 | ) | (7,612 | ) | (7,027 | ) | 49,661 | 42,634 | (7,612 | ) | — | ||||||||||||||||||||
| Owner occupied |
(424 | ) | 127 | (743 | ) | (1,040 | ) | (19,465 | ) | (20,505 | ) | (743 | ) | — | ||||||||||||||||||
| Commercial and industrial |
1,425 | 1,000 | (8,113 | ) | (5,688 | ) | 296,683 | 290,995 | (8,134 | ) | 21 | |||||||||||||||||||||
| Construction |
— | (970 | ) | (2,706 | ) | (3,676 | ) | 448 | (3,228 | ) | (2,706 | ) | — | |||||||||||||||||||
| Mortgage |
20,775 | 11,724 | (19,500 | ) | 12,999 | 107,981 | 120,980 | (6,776 | ) | (12,724 | ) | |||||||||||||||||||||
| Leasing |
4,755 | 763 | 2,099 | 7,617 | 28,974 | 36,591 | 2,099 | — | ||||||||||||||||||||||||
| Consumer: |
||||||||||||||||||||||||||||||||
| Credit cards |
1,712 | 1,822 | 3,534 | 7,068 | 12,971 | 20,039 | — | 3,534 | ||||||||||||||||||||||||
| Home equity lines of credit |
26 | — | — | 26 | (122 | ) | (96 | ) | — | — | ||||||||||||||||||||||
| Personal |
4,721 | 816 | 1,144 | 6,681 | 70,355 | 77,036 | 1,144 | — | ||||||||||||||||||||||||
| Auto |
13,574 | 4,597 | 4,064 | 22,235 | 45,428 | 67,663 | 4,064 | — | ||||||||||||||||||||||||
| Other |
55 | 114 | 251 | 420 | 11,820 | 12,240 | 150 | 101 | ||||||||||||||||||||||||
|
|
|
|
|
|
|
|
|
|
|
|
|
|
|
|
|
|||||||||||||||||
| Total |
$ | 48,345 | $ | 19,478 | $ | (27,582 | ) | $ | 40,241 | $ | 602,045 | $ | 642,286 | $ | (18,514 | ) | $ | (9,068 | ) | |||||||||||||
|
|
|
|
|
|
|
|
|
|
|
|
|
|
|
|
|
|||||||||||||||||
20
Popular, Inc.
Financial Supplement to Third Quarter 2023 Earnings Release
Table J - Loan Delinquency - Popular U.S. Operations
(Unaudited)
| 30-Sep-23 |
||||||||||||||||||||||||||||||||
| Popular U.S. |
||||||||||||||||||||||||||||||||
| Past due | Past due 90 days or more |
|||||||||||||||||||||||||||||||
| (In thousands) |
30-59 days |
60-89 days |
90 days or more |
Total past due |
Current | Loans HIP | Non-accrual loans |
Accruing loans |
||||||||||||||||||||||||
| Commercial multi-family |
$ | 1,332 | $ | — | $ | 404 | $ | 1,736 | $ | 2,031,883 | $ | 2,033,619 | $ | 404 | $ | — | ||||||||||||||||
| Commercial real estate: |
||||||||||||||||||||||||||||||||
| Non-owner occupied |
2,628 | — | 734 | 3,362 | 2,082,887 | 2,086,249 | 734 | — | ||||||||||||||||||||||||
| Owner occupied |
1,110 | 923 | 3,877 | 5,910 | 1,631,442 | 1,637,352 | 3,877 | — | ||||||||||||||||||||||||
| Commercial and industrial |
3,000 | 464 | 3,709 | 7,173 | 2,190,091 | 2,197,264 | 3,579 | 130 | ||||||||||||||||||||||||
| Construction |
— | — | — | — | 751,605 | 751,605 | — | — | ||||||||||||||||||||||||
| Mortgage |
946 | 22,313 | 11,980 | 35,239 | 1,260,604 | 1,295,843 | 11,980 | — | ||||||||||||||||||||||||
| Consumer: |
||||||||||||||||||||||||||||||||
| Credit cards |
— | — | — | — | 17 | 17 | — | — | ||||||||||||||||||||||||
| Home equity lines of credit |
1,045 | 335 | 4,085 | 5,465 | 59,560 | 65,025 | 4,085 | — | ||||||||||||||||||||||||
| Personal |
2,581 | 1,716 | 2,637 | 6,934 | 182,232 | 189,166 | 2,637 | — | ||||||||||||||||||||||||
| Other |
113 | — | 402 | 515 | 10,088 | 10,603 | 402 | — | ||||||||||||||||||||||||
|
|
|
|
|
|
|
|
|
|
|
|
|
|
|
|
|
|||||||||||||||||
| Total |
$ | 12,755 | $ | 25,751 | $ | 27,828 | $ | 66,334 | $ | 10,200,409 | $ | 10,266,743 | $ | 27,698 | $ | 130 | ||||||||||||||||
|
|
|
|
|
|
|
|
|
|
|
|
|
|
|
|
|
|||||||||||||||||
| 30-Jun-23 |
||||||||||||||||||||||||||||||||
| Popular U.S. |
||||||||||||||||||||||||||||||||
| Past due | Past due 90 days or more |
|||||||||||||||||||||||||||||||
| (In thousands) |
30-59 days |
60-89 days |
90 days or more |
Total past due |
Current | Loans HIP | Non-accrual loans |
Accruing loans |
||||||||||||||||||||||||
| Commercial multi-family |
$ | 3,137 | $ | — | $ | 418 | $ | 3,555 | $ | 2,031,067 | $ | 2,034,622 | $ | 418 | $ | — | ||||||||||||||||
| Commercial real estate: |
||||||||||||||||||||||||||||||||
| Non-owner occupied |
632 | — | 119 | 751 | 1,837,258 | 1,838,009 | 119 | — | ||||||||||||||||||||||||
| Owner occupied |
1,806 | — | 5,095 | 6,901 | 1,606,439 | 1,613,340 | 5,095 | — | ||||||||||||||||||||||||
| Commercial and industrial |
2,464 | 1,738 | 6,155 | 10,357 | 2,201,967 | 2,212,324 | 5,978 | 177 | ||||||||||||||||||||||||
| Construction |
— | — | — | — | 646,168 | 646,168 | — | — | ||||||||||||||||||||||||
| Mortgage |
1,101 | 5,435 | 14,577 | 21,113 | 1,259,677 | 1,280,790 | 14,577 | — | ||||||||||||||||||||||||
| Consumer: |
||||||||||||||||||||||||||||||||
| Credit cards |
— | — | — | — | 17 | 17 | — | — | ||||||||||||||||||||||||
| Home equity lines of credit |
464 | 49 | 4,252 | 4,765 | 61,105 | 65,870 | 4,252 | — | ||||||||||||||||||||||||
| Personal |
2,766 | 1,725 | 2,726 | 7,217 | 203,411 | 210,628 | 2,726 | — | ||||||||||||||||||||||||
| Other |
— | 154 | — | 154 | 8,716 | 8,870 | — | — | ||||||||||||||||||||||||
|
|
|
|
|
|
|
|
|
|
|
|
|
|
|
|
|
|||||||||||||||||
| Total |
$ | 12,370 | $ | 9,101 | $ | 33,342 | $ | 54,813 | $ | 9,855,825 | $ | 9,910,638 | $ | 33,165 | $ | 177 | ||||||||||||||||
|
|
|
|
|
|
|
|
|
|
|
|
|
|
|
|
|
|||||||||||||||||
21
| Variance |
||||||||||||||||||||||||||||||||
| Past due | Past due 90 days or more |
|||||||||||||||||||||||||||||||
| (In thousands) |
30-59 days |
60-89 days |
90 days or more |
Total past due |
Current | Loans HIP | Non-accrual loans |
Accruing loans |
||||||||||||||||||||||||
| Commercial multi-family |
$ | (1,805 | ) | $ | — | $ | (14 | ) | $ | (1,819 | ) | $ | 816 | $ | (1,003 | ) | $ | (14 | ) | $ | — | |||||||||||
| Commercial real estate: |
||||||||||||||||||||||||||||||||
| Non-owner occupied |
1,996 | — | 615 | 2,611 | 245,629 | 248,240 | 615 | — | ||||||||||||||||||||||||
| Owner occupied |
(696 | ) | 923 | (1,218 | ) | (991 | ) | 25,003 | 24,012 | (1,218 | ) | — | ||||||||||||||||||||
| Commercial and industrial |
536 | (1,274 | ) | (2,446 | ) | (3,184 | ) | (11,876 | ) | (15,060 | ) | (2,399 | ) | (47 | ) | |||||||||||||||||
| Construction |
— | — | — | — | 105,437 | 105,437 | — | — | ||||||||||||||||||||||||
| Mortgage |
(155 | ) | 16,878 | (2,597 | ) | 14,126 | 927 | 15,053 | (2,597 | ) | — | |||||||||||||||||||||
| Consumer: |
||||||||||||||||||||||||||||||||
| Credit cards |
— | — | — | — | — | — | — | — | ||||||||||||||||||||||||
| Home equity lines of credit |
581 | 286 | (167 | ) | 700 | (1,545 | ) | (845 | ) | (167 | ) | — | ||||||||||||||||||||
| Personal |
(185 | ) | (9 | ) | (89 | ) | (283 | ) | (21,179 | ) | (21,462 | ) | (89 | ) | — | |||||||||||||||||
| Other |
113 | (154 | ) | 402 | 361 | 1,372 | 1,733 | 402 | — | |||||||||||||||||||||||
|
|
|
|
|
|
|
|
|
|
|
|
|
|
|
|
|
|||||||||||||||||
| Total |
$ | 385 | $ | 16,650 | $ | (5,514 | ) | $ | 11,521 | $ | 344,584 | $ | 356,105 | $ | (5,467 | ) | $ | (47 | ) | |||||||||||||
|
|
|
|
|
|
|
|
|
|
|
|
|
|
|
|
|
|||||||||||||||||
22
Popular, Inc.
Financial Supplement to Third Quarter 2023 Earnings Release
Table K - Loan Delinquency - Consolidated
(Unaudited)
| 30-Sep-23 |
||||||||||||||||||||||||||||||||
| Popular, Inc. |
||||||||||||||||||||||||||||||||
| Past due | Past due 90 days or more | |||||||||||||||||||||||||||||||
| (In thousands) |
30-59 days | 60-89 days | 90 days or more |
Total past due |
Current | Loans HIP | Non-accrual loans |
Accruing loans |
||||||||||||||||||||||||
| Commercial multi-family |
$ | 5,739 | $ | 176 | $ | 588 | $ | 6,503 | $ | 2,321,930 | $ | 2,328,433 | $ | 588 | $ | — | ||||||||||||||||
| Commercial real estate: |
||||||||||||||||||||||||||||||||
| Non-owner occupied |
3,902 | — | 16,064 | 19,966 | 5,015,164 | 5,035,130 | 16,064 | — | ||||||||||||||||||||||||
| Owner occupied |
1,927 | 1,750 | 38,966 | 42,643 | 3,002,262 | 3,044,905 | 38,966 | — | ||||||||||||||||||||||||
| Commercial and industrial |
7,022 | 2,192 | 28,442 | 37,656 | 6,489,426 | 6,527,082 | 25,203 | 3,239 | ||||||||||||||||||||||||
| Construction |
— | — | 6,578 | 6,578 | 915,534 | 922,112 | 6,578 | — | ||||||||||||||||||||||||
| Mortgage |
242,908 | 122,992 | 442,410 | 808,310 | 6,776,801 | 7,585,111 | 199,423 | 242,987 | ||||||||||||||||||||||||
| Leasing |
17,915 | 4,574 | 6,842 | 29,331 | 1,668,783 | 1,698,114 | 6,842 | — | ||||||||||||||||||||||||
| Consumer: |
||||||||||||||||||||||||||||||||
| Credit cards |
11,218 | 8,133 | 17,719 | 37,070 | 1,040,358 | 1,077,428 | — | 17,719 | ||||||||||||||||||||||||
| Home equity lines of credit |
1,071 | 335 | 4,085 | 5,491 | 62,008 | 67,499 | 4,085 | — | ||||||||||||||||||||||||
| Personal |
22,167 | 14,192 | 21,219 | 57,578 | 1,894,590 | 1,952,168 | 21,219 | — | ||||||||||||||||||||||||
| Auto |
89,453 | 23,019 | 40,268 | 152,740 | 3,480,456 | 3,633,196 | 40,268 | — | ||||||||||||||||||||||||
| Other |
680 | 388 | 2,554 | 3,622 | 154,513 | 158,135 | 2,287 | 267 | ||||||||||||||||||||||||
|
|
|
|
|
|
|
|
|
|
|
|
|
|
|
|
|
|||||||||||||||||
| Total |
$ | 404,002 | $ | 177,751 | $ | 625,735 | $ | 1,207,488 | $ | 32,821,825 | $ | 34,029,313 | $ | 361,523 | $ | 264,212 | ||||||||||||||||
|
|
|
|
|
|
|
|
|
|
|
|
|
|
|
|
|
|||||||||||||||||
| 30-Jun-23 |
||||||||||||||||||||||||||||||||
| Popular, Inc. |
||||||||||||||||||||||||||||||||
| Past due | Past due 90 days or more | |||||||||||||||||||||||||||||||
| (In thousands) |
30-59 days | 60-89 days | 90 days or more |
Total past due |
Current | Loans HIP | Non-accrual loans |
Accruing loans |
||||||||||||||||||||||||
| Commercial multi-family |
$ | 6,915 | $ | 179 | $ | 602 | $ | 7,696 | $ | 2,323,803 | $ | 2,331,499 | $ | 602 | $ | — | ||||||||||||||||
| Commercial real estate: |
||||||||||||||||||||||||||||||||
| Non-owner occupied |
809 | 512 | 23,061 | 24,382 | 4,719,874 | 4,744,256 | 23,061 | — | ||||||||||||||||||||||||
| Owner occupied |
3,047 | 700 | 40,927 | 44,674 | 2,996,724 | 3,041,398 | 40,927 | — | ||||||||||||||||||||||||
| Commercial and industrial |
5,061 | 2,466 | 39,001 | 46,528 | 6,204,619 | 6,251,147 | 35,736 | 3,265 | ||||||||||||||||||||||||
| Construction |
— | 970 | 9,284 | 10,254 | 809,649 | 819,903 | 9,284 | — | ||||||||||||||||||||||||
| Mortgage |
222,288 | 94,390 | 464,507 | 781,185 | 6,667,893 | 7,449,078 | 208,796 | 255,711 | ||||||||||||||||||||||||
| Leasing |
13,160 | 3,811 | 4,743 | 21,714 | 1,639,809 | 1,661,523 | 4,743 | — | ||||||||||||||||||||||||
| Consumer: |
||||||||||||||||||||||||||||||||
| Credit cards |
9,506 | 6,311 | 14,185 | 30,002 | 1,027,387 | 1,057,389 | — | 14,185 | ||||||||||||||||||||||||
| Home equity lines of credit |
464 | 49 | 4,252 | 4,765 | 63,675 | 68,440 | 4,252 | — | ||||||||||||||||||||||||
| Personal |
17,631 | 13,385 | 20,164 | 51,180 | 1,845,414 | 1,896,594 | 20,164 | — | ||||||||||||||||||||||||
| Auto |
75,879 | 18,422 | 36,204 | 130,505 | 3,435,028 | 3,565,533 | 36,204 | — | ||||||||||||||||||||||||
| Other |
512 | 428 | 1,901 | 2,841 | 141,321 | 144,162 | 1,735 | 166 | ||||||||||||||||||||||||
|
|
|
|
|
|
|
|
|
|
|
|
|
|
|
|
|
|||||||||||||||||
| Total |
$ | 355,272 | $ | 141,623 | $ | 658,831 | $ | 1,155,726 | $ | 31,875,196 | $ | 33,030,922 | $ | 385,504 | $ | 273,327 | ||||||||||||||||
|
|
|
|
|
|
|
|
|
|
|
|
|
|
|
|
|
|||||||||||||||||
23
| Variance |
||||||||||||||||||||||||||||||||
| Past due | Past due 90 days or more | |||||||||||||||||||||||||||||||
| (In thousands) |
30-59 days |
60-89 days |
90 days or more |
Total past due |
Current | Loans HIP | Non-accrual loans |
Accruing loans |
||||||||||||||||||||||||
| Commercial multi-family |
$ | (1,176 | ) | $ | (3 | ) | $ | (14 | ) | $ | (1,193 | ) | $ | (1,873 | ) | $ | (3,066 | ) | $ | (14 | ) | $ | — | |||||||||
| Commercial real estate: |
||||||||||||||||||||||||||||||||
| Non-owner occupied |
3,093 | (512 | ) | (6,997 | ) | (4,416 | ) | 295,290 | 290,874 | (6,997 | ) | — | ||||||||||||||||||||
| Owner occupied |
(1,120 | ) | 1,050 | (1,961 | ) | (2,031 | ) | 5,538 | 3,507 | (1,961 | ) | — | ||||||||||||||||||||
| Commercial and industrial |
1,961 | (274 | ) | (10,559 | ) | (8,872 | ) | 284,807 | 275,935 | (10,533 | ) | (26 | ) | |||||||||||||||||||
| Construction |
— | (970 | ) | (2,706 | ) | (3,676 | ) | 105,885 | 102,209 | (2,706 | ) | — | ||||||||||||||||||||
| Mortgage |
20,620 | 28,602 | (22,097 | ) | 27,125 | 108,908 | 136,033 | (9,373 | ) | (12,724 | ) | |||||||||||||||||||||
| Leasing |
4,755 | 763 | 2,099 | 7,617 | 28,974 | 36,591 | 2,099 | — | ||||||||||||||||||||||||
| Consumer: |
||||||||||||||||||||||||||||||||
| Credit cards |
1,712 | 1,822 | 3,534 | 7,068 | 12,971 | 20,039 | — | 3,534 | ||||||||||||||||||||||||
| Home equity lines of credit |
607 | 286 | (167 | ) | 726 | (1,667 | ) | (941 | ) | (167 | ) | — | ||||||||||||||||||||
| Personal |
4,536 | 807 | 1,055 | 6,398 | 49,176 | 55,574 | 1,055 | — | ||||||||||||||||||||||||
| Auto |
13,574 | 4,597 | 4,064 | 22,235 | 45,428 | 67,663 | 4,064 | — | ||||||||||||||||||||||||
| Other |
168 | (40 | ) | 653 | 781 | 13,192 | 13,973 | 552 | 101 | |||||||||||||||||||||||
|
|
|
|
|
|
|
|
|
|
|
|
|
|
|
|
|
|||||||||||||||||
| Total |
$ | 48,730 | $ | 36,128 | $ | (33,096 | ) | $ | 51,762 | $ | 946,629 | $ | 998,391 | $ | (23,981 | ) | $ | (9,115 | ) | |||||||||||||
|
|
|
|
|
|
|
|
|
|
|
|
|
|
|
|
|
|||||||||||||||||
24
Popular, Inc.
Financial Supplement to Third Quarter 2023 Earnings Release
Table L - Non-Performing Assets
(Unaudited)
| Variance | ||||||||||||||||||||||||||||||||
| (In thousands) |
30-Sep-23 | As a % of loans HIP by category |
30-Jun-23 | As a % of loans HIP by category |
30-Sep-22 | As a % of loans HIP by category |
Q3 2023 vs. Q2 2023 |
Q3 2023 vs. Q3 2022 |
||||||||||||||||||||||||
| Non-accrual loans: |
||||||||||||||||||||||||||||||||
| Commercial |
||||||||||||||||||||||||||||||||
| Commercial multi-family |
$ | 588 | — | % | $ | 602 | — | % | $ | 251 | — | % | $ | (14 | ) | $ | 337 | |||||||||||||||
| Commercial real estate non-owner occupied |
16,064 | 0.3 | 23,061 | 0.5 | 32,074 | 0.7 | (6,997 | ) | (16,010 | ) | ||||||||||||||||||||||
| Commercial real estate owner occupied |
38,966 | 1.3 | 40,927 | 1.3 | 28,985 | 0.9 | (1,961 | ) | 9,981 | |||||||||||||||||||||||
| Commercial and industrial |
25,203 | 0.4 | 35,736 | 0.6 | 42,566 | 0.8 | (10,533 | ) | (17,363 | ) | ||||||||||||||||||||||
| Total Commercial |
80,821 | 0.5 | 100,326 | 0.6 | 103,876 | 0.7 | (19,505 | ) | (23,055 | ) | ||||||||||||||||||||||
| Construction |
6,578 | 0.7 | 9,284 | 1.1 | — | — | (2,706 | ) | 6,578 | |||||||||||||||||||||||
| Leasing |
6,842 | 0.4 | 4,743 | 0.3 | 5,697 | 0.4 | 2,099 | 1,145 | ||||||||||||||||||||||||
| Mortgage |
199,423 | 2.6 | 208,796 | 2.8 | 274,306 | 3.8 | (9,373 | ) | (74,883 | ) | ||||||||||||||||||||||
| Consumer |
||||||||||||||||||||||||||||||||
| Home equity lines of credit |
4,085 | 6.1 | 4,252 | 6.2 | 3,970 | 5.5 | (167 | ) | 115 | |||||||||||||||||||||||
| Personal |
21,219 | 1.1 | 20,164 | 1.1 | 19,378 | 1.1 | 1,055 | 1,841 | ||||||||||||||||||||||||
| Auto |
40,268 | 1.1 | 36,204 | 1.0 | 34,432 | 1.0 | 4,064 | 5,836 | ||||||||||||||||||||||||
| Other Consumer |
2,287 | 1.4 | 1,735 | 1.2 | 11,760 | 8.2 | 552 | (9,473 | ) | |||||||||||||||||||||||
| Total Consumer |
67,859 | 1.0 | 62,355 | 0.9 | 69,540 | 1.1 | 5,504 | (1,681 | ) | |||||||||||||||||||||||
|
|
|
|
|
|
|
|
|
|
|
|
|
|
|
|
|
|||||||||||||||||
| Total non-performing loans held-in-portfolio |
361,523 | 1.1 | % | 385,504 | 1.2 | % | 453,419 | 1.4 | % | (23,981 | ) | (91,896 | ) | |||||||||||||||||||
| Other real estate owned (“OREO”) |
82,322 | 86,216 | 93,239 | (3,894 | ) | (10,917 | ) | |||||||||||||||||||||||||
|
|
|
|
|
|
|
|
|
|
|
|||||||||||||||||||||||
| Total non-performing assets [1] |
$ | 443,845 | $ | 471,720 | $ | 546,658 | $ | (27,875 | ) | $ | (102,813 | ) | ||||||||||||||||||||
|
|
|
|
|
|
|
|
|
|
|
|||||||||||||||||||||||
| Accruing loans past due 90 days or more [2] |
$ | 264,212 | $ | 273,327 | $ | 340,503 | $ | (9,115 | ) | $ | (76,291 | ) | ||||||||||||||||||||
|
|
|
|
|
|
|
|
|
|
|
|||||||||||||||||||||||
| Ratios: | ||||||||||||||||||||||||||||||||
| Non-performing assets to total assets |
0.64 | % | 0.67 | % | 0.77 | % | ||||||||||||||||||||||||||
| Non-performing loans held-in-portfolio to loans held-in-portfolio |
1.06 | 1.17 | 1.44 | |||||||||||||||||||||||||||||
| Allowance for credit losses to loans held-in-portfolio |
2.09 | 2.12 | 2.23 | |||||||||||||||||||||||||||||
| Allowance for credit losses to non-performing loans, excluding loans held-for-sale |
196.69 | 181.63 | 155.07 | |||||||||||||||||||||||||||||
|
|
|
|
|
|
|
|||||||||||||||||||||||||||
| [1] | There were no non-performing loans held-for-sale as of September 30, 2023, June 30, 2023 and September 30, 2022. |
| [2] | It is the Corporation’s policy to report delinquent residential mortgage loans insured by FHA or guaranteed by the VA as accruing loans past due 90 days or more as opposed to non-performing since the principal repayment is insured. The balance of these loans includes $8 million at September 30, 2023, related to the rebooking of loans previously pooled into GNMA securities, in which the Corporation had a buy-back option as further described below (June 30, 2023 - $7 million; September 30, 2022 - $9 million). Under the GNMA program, issuers such as BPPR have the option but not the obligation to repurchase loans that are 90 days or more past due. For accounting purposes, these loans subject to the repurchase option are required to be reflected (rebooked) on the financial statements of BPPR with an offsetting liability. These balances include $115 million of residential mortgage loans insured by FHA or guaranteed by the VA that are no longer accruing interest as of September 30, 2023 (June 30, 2023 - $133 million; September 30, 2022 - $198 million). Furthermore, the Corporation has approximately $39 million in reverse mortgage loans which are guaranteed by FHA, but which are currently not accruing interest. Due to the guaranteed nature of the loans, it is the Corporation’s policy to exclude these balances from non-performing assets (June 30, 2023- $39 million; September 30, 2022 - $42 million). |
25
Popular, Inc.
Financial Supplement to Third Quarter 2023 Earnings Release
Table M - Activity in Non-Performing Loans
(Unaudited)
| Commercial loans held-in-portfolio: |
||||||||||||||||||||||||
| Quarter ended | Quarter ended | |||||||||||||||||||||||
| 30-Sep-23 | 30-Jun-23 | |||||||||||||||||||||||
| (In thousands) |
BPPR | Popular U.S. |
Popular, Inc. |
BPPR | Popular U.S. |
Popular, Inc. |
||||||||||||||||||
| Beginning balance NPLs |
$ | 88,716 | $ | 11,610 | $ | 100,326 | $ | 90,952 | $ | 11,048 | $ | 102,000 | ||||||||||||
| Plus: |
||||||||||||||||||||||||
| New non-performing loans |
2,736 | 1,324 | 4,060 | 3,203 | 4,631 | 7,834 | ||||||||||||||||||
| Advances on existing non-performing loans |
— | 7 | 7 | — | 2 | 2 | ||||||||||||||||||
| Less: |
||||||||||||||||||||||||
| Non-performing loans transferred to OREO |
(138 | ) | — | (138 | ) | (21 | ) | — | (21 | ) | ||||||||||||||
| Non-performing loans charged-off |
(969 | ) | (2,446 | ) | (3,415 | ) | (595 | ) | (2,175 | ) | (2,770 | ) | ||||||||||||
| Loans returned to accrual status / loan collections |
(18,118 | ) | (1,901 | ) | (20,019 | ) | (4,823 | ) | (1,896 | ) | (6,719 | ) | ||||||||||||
|
|
|
|
|
|
|
|
|
|
|
|
|
|||||||||||||
| Ending balance NPLs |
$ | 72,227 | $ | 8,594 | $ | 80,821 | $ | 88,716 | $ | 11,610 | $ | 100,326 | ||||||||||||
|
|
|
|
|
|
|
|
|
|
|
|
|
|||||||||||||
| Construction loans held-in-portfolio: |
||||||||||||||||||||||||
| Quarter ended | Quarter ended | |||||||||||||||||||||||
| 30-Sep-23 | 30-Jun-23 | |||||||||||||||||||||||
| (In thousands) |
BPPR | Popular U.S. |
Popular, Inc. |
BPPR | Popular U.S. |
Popular, Inc. |
||||||||||||||||||
| Beginning balance NPLs |
$ | 9,284 | $ | — | $ | 9,284 | $ | — | $ | — | $ | — | ||||||||||||
| Plus: | ||||||||||||||||||||||||
| New non-performing loans |
— | — | — | 9,284 | — | 9,284 | ||||||||||||||||||
| Less: |
||||||||||||||||||||||||
| Non-performing loans charged-off |
(2,537 | ) | — | (2,537 | ) | — | — | — | ||||||||||||||||
| Loans returned to accrual status / loan collections |
(169 | ) | — | (169 | ) | — | — | — | ||||||||||||||||
|
|
|
|
|
|
|
|
|
|
|
|
|
|||||||||||||
| Ending balance NPLs |
$ | 6,578 | $ | — | $ | 6,578 | $ | 9,284 | $ | — | $ | 9,284 | ||||||||||||
|
|
|
|
|
|
|
|
|
|
|
|
|
|||||||||||||
| Mortgage loans held-in-portfolio: |
||||||||||||||||||||||||
| Quarter ended | Quarter ended | |||||||||||||||||||||||
| 30-Sep-23 | 30-Jun-23 | |||||||||||||||||||||||
| (In thousands) |
BPPR | Popular U.S. |
Popular, Inc. |
BPPR | Popular U.S. |
Popular, Inc. |
||||||||||||||||||
| Beginning balance NPLs |
$ | 194,219 | $ | 14,577 | $ | 208,796 | $ | 224,075 | $ | 14,719 | $ | 238,794 | ||||||||||||
| Plus: |
||||||||||||||||||||||||
| New non-performing loans |
34,657 | 4,503 | 39,160 | 27,518 | 4,457 | 31,975 | ||||||||||||||||||
| Advances on existing non-performing loans |
— | 5 | 5 | — | 76 | 76 | ||||||||||||||||||
| Less: |
||||||||||||||||||||||||
| Non-performing loans transferred to OREO |
(5,519 | ) | — | (5,519 | ) | (9,226 | ) | — | (9,226 | ) | ||||||||||||||
| Non-performing loans charged-off |
152 | — | 152 | 271 | — | 271 | ||||||||||||||||||
| Loans returned to accrual status / loan collections |
(36,066 | ) | (7,105 | ) | (43,171 | ) | (48,419 | ) | (4,675 | ) | (53,094 | ) | ||||||||||||
|
|
|
|
|
|
|
|
|
|
|
|
|
|||||||||||||
| Ending balance NPLs |
$ | 187,443 | $ | 11,980 | $ | 199,423 | $ | 194,219 | $ | 14,577 | $ | 208,796 | ||||||||||||
|
|
|
|
|
|
|
|
|
|
|
|
|
|||||||||||||
26
| Total non-performing loans held-in-portfolio (excluding consumer): |
||||||||||||||||||||||||
| Quarter ended | Quarter ended | |||||||||||||||||||||||
| 30-Sep-23 | 30-Jun-23 | |||||||||||||||||||||||
| (In thousands) |
BPPR | Popular U.S. |
Popular, Inc. |
BPPR | Popular U.S. |
Popular, Inc. |
||||||||||||||||||
| Beginning balance NPLs |
$ | 292,219 | $ | 26,187 | $ | 318,406 | $ | 315,027 | $ | 25,767 | $ | 340,794 | ||||||||||||
| Plus: |
||||||||||||||||||||||||
| New non-performing loans |
37,393 | 5,827 | 43,220 | 40,005 | 9,088 | 49,093 | ||||||||||||||||||
| Advances on existing non-performing loans |
— | 12 | 12 | — | 78 | 78 | ||||||||||||||||||
| Less: |
||||||||||||||||||||||||
| Non-performing loans transferred to OREO |
(5,657 | ) | — | (5,657 | ) | (9,247 | ) | — | (9,247 | ) | ||||||||||||||
| Non-performing loans charged-off |
(3,354 | ) | (2,446 | ) | (5,800 | ) | (324 | ) | (2,175 | ) | (2,499 | ) | ||||||||||||
| Loans returned to accrual status / loan collections |
(54,353 | ) | (9,006 | ) | (63,359 | ) | (53,242 | ) | (6,571 | ) | (59,813 | ) | ||||||||||||
|
|
|
|
|
|
|
|
|
|
|
|
|
|||||||||||||
| Ending balance NPLs |
$ | 266,248 | $ | 20,574 | $ | 286,822 | $ | 292,219 | $ | 26,187 | $ | 318,406 | ||||||||||||
|
|
|
|
|
|
|
|
|
|
|
|
|
|||||||||||||
27
Popular, Inc.
Financial Supplement to Third Quarter 2023 Earnings Release
Table N - Allowance for Credit Losses, Net Charge-offs and Related Ratios
(Unaudited)
| Quarters ended | ||||||||||||
| (In thousands) |
30-Sep-23 | 30-Jun-23 | 30-Sep-22 | |||||||||
| Balance at beginning of period - loans held-in-portfolio |
$ | 700,200 | $ | 689,120 | $ | 681,750 | ||||||
| Provision for credit losses (benefit) |
43,514 | 35,661 | 39,519 | |||||||||
| Initial allowance for credit losses - PCD Loans |
9 | 10 | 59 | |||||||||
|
|
|
|
|
|
|
|||||||
| 743,723 | 724,791 | 721,328 | ||||||||||
|
|
|
|
|
|
|
|||||||
| Net loans charge-off (recovered)- BPPR |
||||||||||||
| Commercial: | ||||||||||||
| Commercial multi-family |
— | (1 | ) | — | ||||||||
| Commercial real estate non-owner occupied |
(168 | ) | 430 | (368 | ) | |||||||
| Commercial real estate owner occupied |
166 | (329 | ) | (2,395 | ) | |||||||
| Commercial and industrial |
(10,547 | ) | (1,431 | ) | 1,613 | |||||||
| Total Commercial |
(10,549 | ) | (1,331 | ) | (1,150 | ) | ||||||
| Construction |
2,611 | — | — | |||||||||
| Leasing |
1,442 | 1,593 | 1,338 | |||||||||
| Mortgage |
(3,800 | ) | (3,384 | ) | (2,165 | ) | ||||||
| Consumer: |
||||||||||||
| Credit cards |
8,631 | 6,502 | 4,483 | |||||||||
| Home equity lines of credit |
(30 | ) | (25 | ) | (129 | ) | ||||||
| Personal |
17,303 | 12,641 | 8,227 | |||||||||
| Auto |
9,691 | 2,491 | 7,375 | |||||||||
| Other Consumer |
301 | 200 | 417 | |||||||||
| Total Consumer |
35,896 | 21,809 | 20,373 | |||||||||
|
|
|
|
|
|
|
|||||||
| Total net charged-off (recovered) BPPR |
$ | 25,600 | $ | 18,687 | $ | 18,396 | ||||||
|
|
|
|
|
|
|
|||||||
| Net loans charge-off (recovered) - Popular U.S. |
||||||||||||
| Commercial: | ||||||||||||
| Commercial multi-family |
(1 | ) | (1 | ) | (8 | ) | ||||||
| Commercial real estate non-owner occupied |
(66 | ) | (66 | ) | (2 | ) | ||||||
| Commercial real estate owner occupied |
1,202 | 156 | (26 | ) | ||||||||
| Commercial and industrial |
899 | 1,734 | (475 | ) | ||||||||
| Total Commercial |
2,034 | 1,823 | (511 | ) | ||||||||
| Mortgage |
(62 | ) | (109 | ) | (23 | ) | ||||||
| Consumer: | ||||||||||||
| Home equity lines of credit |
12 | (166 | ) | (907 | ) | |||||||
| Personal |
5,032 | 3,708 | 1,237 | |||||||||
| Other Consumer |
39 | 47 | 40 | |||||||||
| Total Consumer |
5,083 | 3,589 | 370 | |||||||||
|
|
|
|
|
|
|
|||||||
| Total net charged-off (recovered) Popular U.S. |
$ | 7,055 | $ | 5,303 | $ | (164 | ) | |||||
|
|
|
|
|
|
|
|||||||
| Total loans charged-off (recovered) - Popular, Inc. |
$ | 32,655 | $ | 23,990 | $ | 18,232 | ||||||
|
|
|
|
|
|
|
|||||||
| Net write- downs [1] |
$ | — | $ | 601 | $ | — | ||||||
|
|
|
|
|
|
|
|||||||
| Balance at end of period - loans held-in-portfolio |
$ | 711,068 | $ | 700,200 | $ | 703,096 | ||||||
|
|
|
|
|
|
|
|||||||
| Balance at beginning of period - unfunded commitments |
$ | 11,593 | $ | 9,415 | $ | 6,904 | ||||||
| Provision for credit losses (benefit) |
1,691 | 2,178 | 403 | |||||||||
|
|
|
|
|
|
|
|||||||
| Balance at end of period - unfunded commitments [2] |
$ | 13,284 | $ | 11,593 | $ | 7,307 | ||||||
|
|
|
|
|
|
|
|||||||
28
| POPULAR, INC. |
||||||||||||
| Annualized net charge-offs (recoveries) to average loans held-in-portfolio |
0.39 | % | 0.29 | % | 0.24 | % | ||||||
| Provision for credit losses (benefit) - loan portfolios to net charge-offs |
133.25 | % | 148.65 | % | 216.76 | % | ||||||
| BPPR |
||||||||||||
| Annualized net charge-offs (recoveries) to average loans held-in-portfolio |
0.44 | % | 0.33 | % | 0.34 | % | ||||||
| Provision for credit losses (benefit) - loan portfolios to net charge-offs |
211.00 | % | 151.86 | % | 155.98 | % | ||||||
| Popular U.S. |
||||||||||||
| Annualized net charge-offs (recoveries) to average loans held-in-portfolio |
0.28 | % | 0.22 | % | (0.01 | )% | ||||||
| Provision for credit losses (benefit) - loan portfolios to net charge-offs |
(148.87 | )% | 137.32 | % | N.M. | % | ||||||
|
|
|
|
|
|
|
N.M. - Not meaningful.
| [1] | Net write-downs for the quarter ended June 30, 2023 are related to credit cards loans reclassified to held-for-sale. |
| [2] | Allowance for credit losses of unfunded commitments is presented as part of Other Liabilities in the Consolidated Statements of Financial Condition. |
29
Popular, Inc.
Financial Supplement to Third Quarter 2023 Earnings Release
Table O - Allowance for Credit Losses “ACL”- Loan Portfolios - Consolidated
(Unaudited)
| 30-Sep-23 |
||||||||||||
| (In thousands) |
Total ACL | Total loans held-in-portfolio |
ACL to loans held-in-portfolio |
|||||||||
| Commercial: |
||||||||||||
| Commercial multi-family |
$ | 15,223 | $ | 2,328,433 | 0.65 | % | ||||||
| Commercial real estate - non-owner occupied |
67,149 | 5,035,130 | 1.33 | % | ||||||||
| Commercial real estate - owner occupied |
48,109 | 3,044,905 | 1.58 | % | ||||||||
| Commercial and industrial |
103,585 | 6,527,082 | 1.59 | % | ||||||||
|
|
|
|
|
|
|
|||||||
| Total commercial |
$ | 234,066 | $ | 16,935,550 | 1.38 | % | ||||||
|
|
|
|
|
|
|
|||||||
| Construction |
10,971 | 922,112 | 1.19 | % | ||||||||
| Mortgage |
91,904 | 7,585,111 | 1.21 | % | ||||||||
| Leasing |
10,198 | 1,698,114 | 0.60 | % | ||||||||
| Consumer: |
||||||||||||
| Credit cards |
72,550 | 1,077,428 | 6.73 | % | ||||||||
| Home equity lines of credit |
2,387 | 67,499 | 3.54 | % | ||||||||
| Personal |
126,116 | 1,952,168 | 6.46 | % | ||||||||
| Auto |
155,436 | 3,633,196 | 4.28 | % | ||||||||
| Other consumer |
7,440 | 158,135 | 4.70 | % | ||||||||
|
|
|
|
|
|
|
|||||||
| Total consumer |
$ | 363,929 | $ | 6,888,426 | 5.28 | % | ||||||
|
|
|
|
|
|
|
|||||||
| Total |
$ | 711,068 | $ | 34,029,313 | 2.09 | % | ||||||
|
|
|
|
|
|
|
|||||||
30
| 30-Jun-23 |
||||||||||||
| (In thousands) |
Total ACL | Total loans held-in-portfolio |
ACL to loans held-in-portfolio |
|||||||||
| Commercial: |
||||||||||||
| Commercial multi-family |
$ | 26,179 | $ | 2,331,499 | 1.12 | % | ||||||
| Commercial real estate - non-owner occupied |
71,716 | 4,744,256 | 1.51 | % | ||||||||
| Commercial real estate - owner occupied |
51,407 | 3,041,398 | 1.69 | % | ||||||||
| Commercial and industrial |
99,651 | 6,251,147 | 1.59 | % | ||||||||
|
|
|
|
|
|
|
|||||||
| Total commercial |
$ | 248,953 | $ | 16,368,300 | 1.52 | % | ||||||
|
|
|
|
|
|
|
|||||||
| Construction |
11,332 | 819,903 | 1.38 | % | ||||||||
| Mortgage |
96,093 | 7,449,078 | 1.29 | % | ||||||||
| Leasing |
13,927 | 1,661,523 | 0.84 | % | ||||||||
| Consumer: |
||||||||||||
| Credit cards |
71,408 | 1,057,389 | 6.75 | % | ||||||||
| Home equity lines of credit |
2,170 | 68,440 | 3.17 | % | ||||||||
| Personal |
115,828 | 1,896,594 | 6.11 | % | ||||||||
| Auto |
134,247 | 3,565,533 | 3.77 | % | ||||||||
| Other consumer |
6,242 | 144,162 | 4.33 | % | ||||||||
|
|
|
|
|
|
|
|||||||
| Total consumer |
$ | 329,895 | $ | 6,732,118 | 4.90 | % | ||||||
|
|
|
|
|
|
|
|||||||
| Total |
$ | 700,200 | $ | 33,030,922 | 2.12 | % | ||||||
|
|
|
|
|
|
|
|||||||
| Variance |
||||||||||||
| (In thousands) |
Total ACL | Total loans held-in-portfolio |
ACL to loans held-in-portfolio |
|||||||||
| Commercial: |
||||||||||||
| Commercial multi-family |
$ | (10,956 | ) | $ | (3,066 | ) | (0.47 | )% | ||||
| Commercial real estate - non-owner occupied |
(4,567 | ) | 290,874 | (0.18 | )% | |||||||
| Commercial real estate - owner occupied |
(3,298 | ) | 3,507 | (0.11 | )% | |||||||
| Commercial and industrial |
3,934 | 275,935 | — | % | ||||||||
|
|
|
|
|
|
|
|||||||
| Total commercial |
$ | (14,887 | ) | $ | 567,250 | (0.14 | )% | |||||
|
|
|
|
|
|
|
|||||||
| Construction |
(361 | ) | 102,209 | (0.19 | )% | |||||||
| Mortgage |
(4,189 | ) | 136,033 | (0.08 | )% | |||||||
| Leasing |
(3,729 | ) | 36,591 | (0.24 | )% | |||||||
| Consumer: |
||||||||||||
| Credit cards |
1,142 | 20,039 | (0.02 | )% | ||||||||
| Home equity lines of credit |
217 | (941 | ) | 0.37 | % | |||||||
| Personal |
10,288 | 55,574 | 0.35 | % | ||||||||
| Auto |
21,189 | 67,663 | 0.51 | % | ||||||||
| Other consumer |
1,198 | 13,973 | 0.37 | % | ||||||||
|
|
|
|
|
|
|
|||||||
| Total consumer |
$ | 34,034 | $ | 156,308 | 0.38 | % | ||||||
|
|
|
|
|
|
|
|||||||
| Total |
$ | 10,868 | $ | 998,391 | (0.03 | )% | ||||||
|
|
|
|
|
|
|
|||||||
31
Popular, Inc.
Financial Supplement to Third Quarter 2023 Earnings Release
Table P - Allowance for Credit Losses “ACL”- Loan Portfolios - BPPR Operations
(Unaudited)
| 30-Sep-23 |
||||||||||||
| BPPR |
||||||||||||
| (In thousands) |
Total ACL | Total loans held-in-portfolio |
ACL to loans held-in-portfolio |
|||||||||
| Commercial: |
||||||||||||
| Commercial multi-family |
$ | 3,481 | $ | 294,814 | 1.18 | % | ||||||
| Commercial real estate - non-owner occupied |
53,208 | 2,948,881 | 1.80 | % | ||||||||
| Commercial real estate - owner occupied |
41,493 | 1,407,553 | 2.95 | % | ||||||||
| Commercial and industrial |
87,579 | 4,329,818 | 2.02 | % | ||||||||
|
|
|
|
|
|
|
|||||||
| Total commercial |
$ | 185,761 | $ | 8,981,066 | 2.07 | % | ||||||
|
|
|
|
|
|
|
|||||||
| Construction |
5,457 | 170,507 | 3.20 | % | ||||||||
| Mortgage |
79,900 | 6,289,268 | 1.27 | % | ||||||||
| Leasing |
10,198 | 1,698,114 | 0.60 | % | ||||||||
| Consumer: |
||||||||||||
| Credit cards |
72,550 | 1,077,411 | 6.73 | % | ||||||||
| Home equity lines of credit |
87 | 2,474 | 3.52 | % | ||||||||
| Personal |
107,707 | 1,763,002 | 6.11 | % | ||||||||
| Auto |
155,436 | 3,633,196 | 4.28 | % | ||||||||
| Other consumer |
7,438 | 147,532 | 5.04 | % | ||||||||
|
|
|
|
|
|
|
|||||||
| Total consumer |
$ | 343,218 | $ | 6,623,615 | 5.18 | % | ||||||
|
|
|
|
|
|
|
|||||||
| Total |
$ | 624,534 | $ | 23,762,570 | 2.63 | % | ||||||
|
|
|
|
|
|
|
|||||||
32
| 30-Jun-23 |
||||||||||||
| BPPR |
||||||||||||
| (In thousands) |
Total ACL | Total loans held-in-portfolio |
ACL to loans held-in-portfolio |
|||||||||
| Commercial: |
||||||||||||
| Commercial multi-family |
$ | 4,787 | $ | 296,877 | 1.61 | % | ||||||
| Commercial real estate - non-owner occupied |
53,366 | 2,906,247 | 1.84 | % | ||||||||
| Commercial real estate - owner occupied |
41,901 | 1,428,058 | 2.93 | % | ||||||||
| Commercial and industrial |
81,637 | 4,038,823 | 2.02 | % | ||||||||
|
|
|
|
|
|
|
|||||||
| Total commercial |
$ | 181,691 | $ | 8,670,005 | 2.10 | % | ||||||
|
|
|
|
|
|
|
|||||||
| Construction |
9,554 | 173,735 | 5.50 | % | ||||||||
| Mortgage |
82,899 | 6,168,288 | 1.34 | % | ||||||||
| Leasing |
13,927 | 1,661,523 | 0.84 | % | ||||||||
| Consumer: |
||||||||||||
| Credit cards |
71,408 | 1,057,372 | 6.75 | % | ||||||||
| Home equity lines of credit |
96 | 2,570 | 3.74 | % | ||||||||
| Personal |
96,046 | 1,685,966 | 5.70 | % | ||||||||
| Auto |
134,247 | 3,565,533 | 3.77 | % | ||||||||
| Other consumer |
6,240 | 135,292 | 4.61 | % | ||||||||
|
|
|
|
|
|
|
|||||||
| Total consumer |
$ | 308,037 | $ | 6,446,733 | 4.78 | % | ||||||
|
|
|
|
|
|
|
|||||||
| Total |
$ | 596,108 | $ | 23,120,284 | 2.58 | % | ||||||
|
|
|
|
|
|
|
|||||||
| Variance |
||||||||||||
| (In thousands) |
Total ACL | Total loans held-in-portfolio |
ACL to loans held-in-portfolio |
|||||||||
| Commercial: |
||||||||||||
| Commercial multi-family |
(1,306 | ) | (2,063 | ) | (0.43 | )% | ||||||
| Commercial real estate - non-owner occupied |
(158 | ) | 42,634 | (0.04 | )% | |||||||
| Commercial real estate - owner occupied |
(408 | ) | (20,505 | ) | 0.02 | % | ||||||
| Commercial and industrial |
5,942 | 290,995 | — | % | ||||||||
|
|
|
|
|
|
|
|||||||
| Total commercial |
$ | 4,070 | $ | 311,061 | (0.03 | )% | ||||||
|
|
|
|
|
|
|
|||||||
| Construction |
(4,097 | ) | (3,228 | ) | (2.30 | )% | ||||||
| Mortgage |
(2,999 | ) | 120,980 | (0.07 | )% | |||||||
| Leasing |
(3,729 | ) | 36,591 | (0.24 | )% | |||||||
| Consumer: |
||||||||||||
| Credit cards |
1,142 | 20,039 | (0.02 | )% | ||||||||
| Home equity lines of credit |
(9 | ) | (96 | ) | (0.22 | )% | ||||||
| Personal |
11,661 | 77,036 | 0.41 | % | ||||||||
| Auto |
21,189 | 67,663 | 0.51 | % | ||||||||
| Other consumer |
1,198 | 12,240 | 0.43 | % | ||||||||
|
|
|
|
|
|
|
|||||||
| Total consumer |
$ | 35,181 | $ | 176,882 | 0.40 | % | ||||||
|
|
|
|
|
|
|
|||||||
| Total |
$ | 28,426 | $ | 642,286 | 0.05 | % | ||||||
|
|
|
|
|
|
|
|||||||
33
Popular, Inc.
Financial Supplement to Third Quarter 2023 Earnings Release
Table Q - Allowance for Credit Losses “ACL”- Loan Portfolios - POPULAR U.S. Operations
(Unaudited)
| 30-Sep-23 |
||||||||||||
| Popular U.S. |
||||||||||||
| (In thousands) |
Total ACL | Total loans held-in-portfolio |
ACL to loans held-in-portfolio |
|||||||||
| Commercial: |
||||||||||||
| Commercial multi-family |
$ | 11,742 | $ | 2,033,619 | 0.58 | % | ||||||
| Commercial real estate - non-owner occupied |
13,941 | 2,086,249 | 0.67 | % | ||||||||
| Commercial real estate - owner occupied |
6,616 | 1,637,352 | 0.40 | % | ||||||||
| Commercial and industrial |
16,006 | 2,197,264 | 0.73 | % | ||||||||
|
|
|
|
|
|
|
|||||||
| Total commercial |
$ | 48,305 | $ | 7,954,484 | 0.61 | % | ||||||
|
|
|
|
|
|
|
|||||||
| Construction |
5,514 | 751,605 | 0.73 | % | ||||||||
| Mortgage |
12,004 | 1,295,843 | 0.93 | % | ||||||||
| Consumer: |
||||||||||||
| Credit cards |
— | 17 | — | % | ||||||||
| Home equity lines of credit |
2,300 | 65,025 | 3.54 | % | ||||||||
| Personal |
18,409 | 189,166 | 9.73 | % | ||||||||
| Other consumer |
2 | 10,603 | 0.02 | % | ||||||||
|
|
|
|
|
|
|
|||||||
| Total consumer |
$ | 20,711 | $ | 264,811 | 7.82 | % | ||||||
|
|
|
|
|
|
|
|||||||
| Total |
$ | 86,534 | $ | 10,266,743 | 0.84 | % | ||||||
|
|
|
|
|
|
|
|||||||
| 30-Jun-23 |
||||||||||||
| Popular U.S. |
||||||||||||
| (In thousands) |
Total ACL | Total loans held-in-portfolio |
ACL to loans held-in-portfolio |
|||||||||
| Commercial: |
||||||||||||
| Commercial multi-family |
$ | 21,392 | $ | 2,034,622 | 1.05 | % | ||||||
| Commercial real estate - non-owner occupied |
18,350 | 1,838,009 | 1.00 | % | ||||||||
| Commercial real estate - owner occupied |
9,506 | 1,613,340 | 0.59 | % | ||||||||
| Commercial and industrial |
18,014 | 2,212,324 | 0.81 | % | ||||||||
|
|
|
|
|
|
|
|||||||
| Total commercial |
$ | 67,262 | $ | 7,698,295 | 0.87 | % | ||||||
|
|
|
|
|
|
|
|||||||
| Construction |
1,778 | 646,168 | 0.28 | % | ||||||||
| Mortgage |
13,194 | 1,280,790 | 1.03 | % | ||||||||
| Consumer: |
||||||||||||
| Credit cards |
— | 17 | — | % | ||||||||
| Home equity lines of credit |
2,074 | 65,870 | 3.15 | % | ||||||||
| Personal |
19,782 | 210,628 | 9.39 | % | ||||||||
| Other consumer |
2 | 8,870 | 0.02 | % | ||||||||
|
|
|
|
|
|
|
|||||||
| Total consumer |
$ | 21,858 | $ | 285,385 | 7.66 | % | ||||||
|
|
|
|
|
|
|
|||||||
| Total |
$ | 104,092 | $ | 9,910,638 | 1.05 | % | ||||||
|
|
|
|
|
|
|
|||||||
34
| Variance |
||||||||||||
| (In thousands) |
Total ACL | Total loans held-in-portfolio |
ACL to loans held-in-portfolio |
|||||||||
| Commercial: |
||||||||||||
| Commercial multi-family |
$ | (9,650 | ) | $ | (1,003 | ) | (0.47 | )% | ||||
| Commercial real estate - non-owner occupied |
(4,409 | ) | 248,240 | (0.33 | )% | |||||||
| Commercial real estate - owner occupied |
(2,890 | ) | 24,012 | (0.19 | )% | |||||||
| Commercial and industrial |
(2,008 | ) | (15,060 | ) | (0.08 | )% | ||||||
|
|
|
|
|
|
|
|||||||
| Total commercial |
$ | (18,957 | ) | $ | 256,189 | (0.26 | )% | |||||
|
|
|
|
|
|
|
|||||||
| Construction |
3,736 | 105,437 | 0.45 | % | ||||||||
| Mortgage |
(1,190 | ) | 15,053 | (0.10 | )% | |||||||
| Consumer: |
||||||||||||
| Credit cards |
— | — | — | % | ||||||||
| Home equity lines of credit |
226 | (845 | ) | 0.39 | % | |||||||
| Personal |
(1,373 | ) | (21,462 | ) | 0.34 | % | ||||||
| Other consumer |
— | 1,733 | — | % | ||||||||
|
|
|
|
|
|
|
|||||||
| Total consumer |
$ | (1,147 | ) | $ | (20,574 | ) | 0.16 | % | ||||
|
|
|
|
|
|
|
|||||||
| Total |
$ | (17,558 | ) | $ | 356,105 | (0.21 | )% | |||||
|
|
|
|
|
|
|
|||||||
35
Popular, Inc.
Financial Supplement to Third Quarter 2023 Earnings Release
Table R - Reconciliation to GAAP Financial Measures
(Unaudited)
| (In thousands, except share or per share information) |
30-Sep-23 | 30-Jun-23 | 30-Sep-22 | |||||||||
| Total stockholders’ equity |
$ | 4,457,608 | $ | 4,565,009 | $ | 3,674,838 | ||||||
| Less: Preferred stock |
(22,143 | ) | (22,143 | ) | (22,143 | ) | ||||||
| Less: Goodwill |
(804,428 | ) | (827,428 | ) | (827,428 | ) | ||||||
| Less: Other intangibles |
(10,559 | ) | (11,354 | ) | (13,738 | ) | ||||||
|
|
|
|
|
|
|
|||||||
| Total tangible common equity |
$ | 3,620,478 | $ | 3,704,084 | $ | 2,811,529 | ||||||
|
|
|
|
|
|
|
|||||||
| Total assets |
$ | 69,736,936 | $ | 70,838,266 | $ | 70,729,675 | ||||||
| Less: Goodwill |
(804,428 | ) | (827,428 | ) | (827,428 | ) | ||||||
| Less: Other intangibles |
(10,559 | ) | (11,354 | ) | (13,738 | ) | ||||||
|
|
|
|
|
|
|
|||||||
| Total tangible assets |
$ | 68,921,949 | $ | 69,999,484 | $ | 69,888,509 | ||||||
|
|
|
|
|
|
|
|||||||
| Tangible common equity to tangible assets |
5.25 | % | 5.29 | % | 4.02 | % | ||||||
| Common shares outstanding at end of period |
72,127,595 | 72,103,969 | 72,673,344 | |||||||||
| Tangible book value per common share |
$ | 50.20 | $ | 51.37 | $ | 38.69 | ||||||
|
|
|
|
|
|
|
|||||||
| Quarterly average | ||||||||||||
| Total stockholders’ equity [1] |
$ | 6,636,364 | $ | 6,553,488 | $ | 6,061,748 | ||||||
| Less: Preferred Stock |
(22,143 | ) | (22,143 | ) | (22,143 | ) | ||||||
| Less: Goodwill |
(827,177 | ) | (827,427 | ) | (759,318 | ) | ||||||
| Less: Other intangibles |
(11,083 | ) | (11,875 | ) | (24,039 | ) | ||||||
|
|
|
|
|
|
|
|||||||
| Total tangible equity |
$ | 5,775,961 | $ | 5,692,043 | $ | 5,256,248 | ||||||
| Return on average tangible common equity |
9.36 | % | 10.63 | % | 31.86 | % | ||||||
|
|
|
|
|
|
|
|||||||
| [1] | Average balances exclude unrealized gains or losses on debt securities available-for-sale and the unrealized loss related to certain securities transferred from available-for-sale to held-to-maturity. |
CONTACTS:
Popular, Inc.
Investor Relations:
Paul J. Cardillo, 212-417-6721
Senior Vice President and Investor Relations Officer
pcardillo@popular.com
or
Media Relations:
MC González Noguera, 917-804-5253
Executive Vice President and Chief Communications & Public Affairs Officer
mc.gonzalez@popular.com
36

Exhibit 99.2 INVESTOR PRESENTATION Third Quarter 2023
Cautionary Note Regarding Forward-Looking Statements This presentation contains “forward-looking statements” within the meaning of the U.S. Private Securities Litigation Reform Act of 1995. These statements are not guarantees of future performance, are based on the current expectations of Popular, Inc.’s (the “Corporation”) management and, by their nature, involve risks, uncertainties, estimates and assumptions. Potential factors, some of which are beyond the Corporation’s control, could cause actual results to differ materially from those expressed in, or implied by, such forward-looking statements. More information on the risks and important factors that could affect the Corporation’s future results and financial condition is included in our Form 10-K for the year ended December 31, 2022, our Quarterly Reports on Form 10-Q for the quarters ended March 31, 2023, June 30, 2023 and September 30, 2023 as filed with the Securities and Exchange Commission. Our filings are available on the Corporation’s website (www.popular.com) and on the Securities and Exchange Commission website (www.sec.gov). The Corporation assumes no obligation to update or revise any forward-looking statements which speak as of their respective dates.
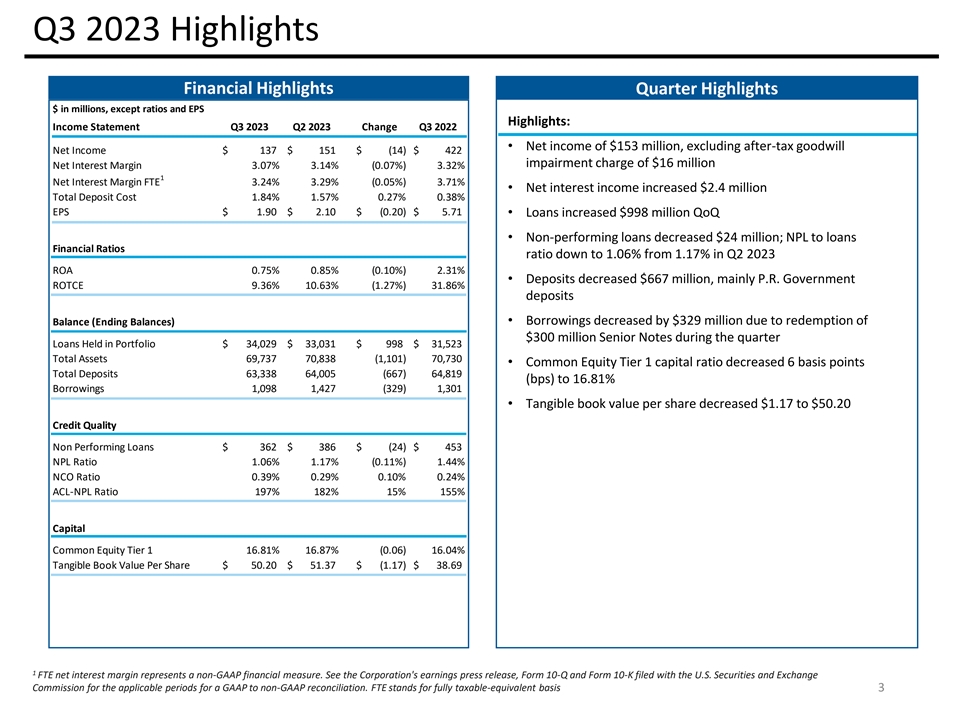
Q3 2023 Highlights Financial Highlights Quarter Highlights $ in millions, except ratios and EPS Highlights: Income Statement Q3 2023 Q2 2023 Change Q3 2022 • Net income of $153 million, excluding after-tax goodwill Net Income $ 137 $ 151 $ (14) $ 422 impairment charge of $16 million Net Interest Margin 3.07% 3.14% (0.07%) 3.32% 1 Net Interest Margin FTE 3.24% 3.29% (0.05%) 3.71% • Net interest income increased $2.4 million Total Deposit Cost 1.84% 1.57% 0.27% 0.38% EPS $ 1.90 $ 2.10 $ (0.20) $ 5.71 • Loans increased $998 million QoQ • Non-performing loans decreased $24 million; NPL to loans Financial Ratios ratio down to 1.06% from 1.17% in Q2 2023 ROA 0.75% 0.85% (0.10%) 2.31% • Deposits decreased $667 million, mainly P.R. Government ROTCE 9.36% 10.63% (1.27%) 31.86% deposits Balance (Ending Balances)• Borrowings decreased by $329 million due to redemption of $300 million Senior Notes during the quarter Loans Held in Portfolio $ 34,029 $ 33,031 $ 998 $ 31,523 Total Assets 69,737 70,838 (1,101) 70,730 • Common Equity Tier 1 capital ratio decreased 6 basis points Total Deposits 63,338 64,005 (667) 64,819 (bps) to 16.81% Borrowings 1,098 1,427 (329) 1,301 • Tangible book value per share decreased $1.17 to $50.20 Credit Quality Non Performing Loans $ 362 $ 386 $ (24) $ 453 NPL Ratio 1.06% 1.17% (0.11%) 1.44% NCO Ratio 0.39% 0.29% 0.10% 0.24% ACL-NPL Ratio 197% 182% 15% 155% Capital Common Equity Tier 1 16.81% 16.87% (0.06) 16.04% Tangible Book Value Per Share $ 50.20 $ 5 1.37 $ (1.17) $ 3 8.69 1 FTE net interest margin represents a non-GAAP financial measure. See the Corporation's earnings press release, Form 10-Q and Form 10-K filed with the U.S. Securities and Exchange Commission for the applicable periods for a GAAP to non-GAAP reconciliation. FTE stands for fully taxable-equivalent basis 3
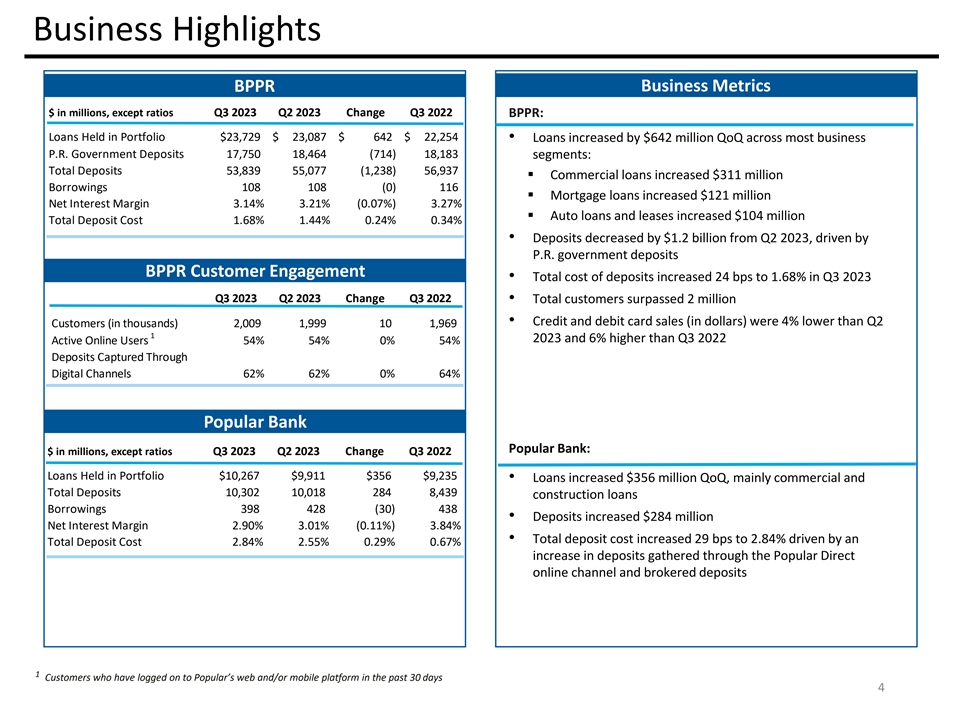
Business Highlights BPPR Business Metrics $ in millions, except ratios Q3 2023 Q2 2023 Change Q3 2022 BPPR: Loans Held in Portfolio $23,729 $ 23,087 $ 642 $ 22,254 • Loans increased by $642 million QoQ across most business P.R. Government Deposits 17,750 18,464 ( 714) 1 8,183 segments: Total Deposits 53,839 5 5,077 (1,238) 5 6,937 ▪ Commercial loans increased $311 million Borrowings 108 108 (0) 116 ▪ Mortgage loans increased $121 million Net Interest Margin 3.14% 3.21% (0.07%) 3.27% ▪ Auto loans and leases increased $104 million Total Deposit Cost 1.68% 1.44% 0.24% 0.34% • Deposits decreased by $1.2 billion from Q2 2023, driven by P.R. government deposits BPPR Customer Engagement • Total cost of deposits increased 24 bps to 1.68% in Q3 2023 Q3 2023 Q2 2023 Change Q3 2022 • Total customers surpassed 2 million • Credit and debit card sales (in dollars) were 4% lower than Q2 Customers (in thousands) 2,009 1,999 10 1,969 1 2023 and 6% higher than Q3 2022 Active Online Users 54% 54% 0% 54% Deposits Captured Through Earnings Digital Channels 62% 62% 0% 64% Popular Bank Popular Bank: $ in millions, except ratios Q3 2023 Q2 2023 Change Q3 2022 Loans Held in Portfolio $10,267 $9,911 $356 $9,235 • Loans increased $356 million QoQ, mainly commercial and Total Deposits 10,302 10,018 284 8,439 construction loans Borrowings 398 428 (30) 438 • Deposits increased $284 million Net Interest Margin 2.90% 3.01% (0.11%) 3.84% • Total deposit cost increased 29 bps to 2.84% driven by an Total Deposit Cost 2.84% 2.55% 0.29% 0.67% increase in deposits gathered through the Popular Direct online channel and brokered deposits 1 Customers who have logged on to Popular’s web and/or mobile platform in the past 30 days 4
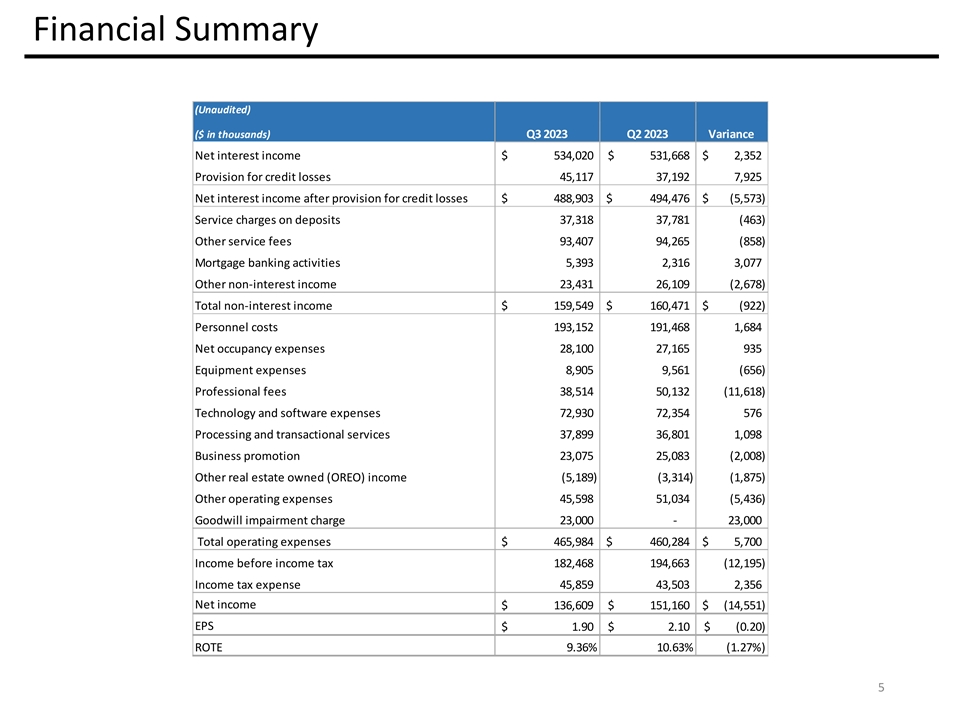
Financial Summary (Unaudited) ($ in thousands) Q3 2023 Q2 2023 Variance Net interest income $ 5 34,020 $ 5 31,668 $ 2 ,352 Provision for credit losses 45,117 37,192 7,925 Net interest income after provision for credit losses $ 4 88,903 $ 494,476 $ (5,573) Service charges on deposits 3 7,318 3 7,781 (463) Other service fees 93,407 9 4,265 (858) Mortgage banking activities 5 ,393 2,316 3,077 Other non-interest income 23,431 26,109 (2,678) Total non-interest income $ 1 59,549 $ 160,471 $ ( 922) Personnel costs 193,152 1 91,468 1,684 Net occupancy expenses 28,100 27,165 935 Equipment expenses 8,905 9,561 (656) Professional fees 38,514 50,132 (11,618) Technology and software expenses 72,930 72,354 576 Processing and transactional services 37,899 36,801 1,098 Business promotion 23,075 25,083 (2,008) Other real estate owned (OREO) income (5,189) ( 3,314) (1,875) Other operating expenses 45,598 51,034 (5,436) Goodwill impairment charge 23,000 - 23,000 Total operating expenses $ 465,984 $ 460,284 $ 5,700 Income before income tax 182,468 1 94,663 (12,195) Income tax expense 45,859 43,503 2,356 Net income $ 1 36,609 $ 1 51,160 $ (14,551) EPS $ 1 .90 $ 2.10 $ ( 0.20) ROTE 9.36% 10.63% (1.27%) 5
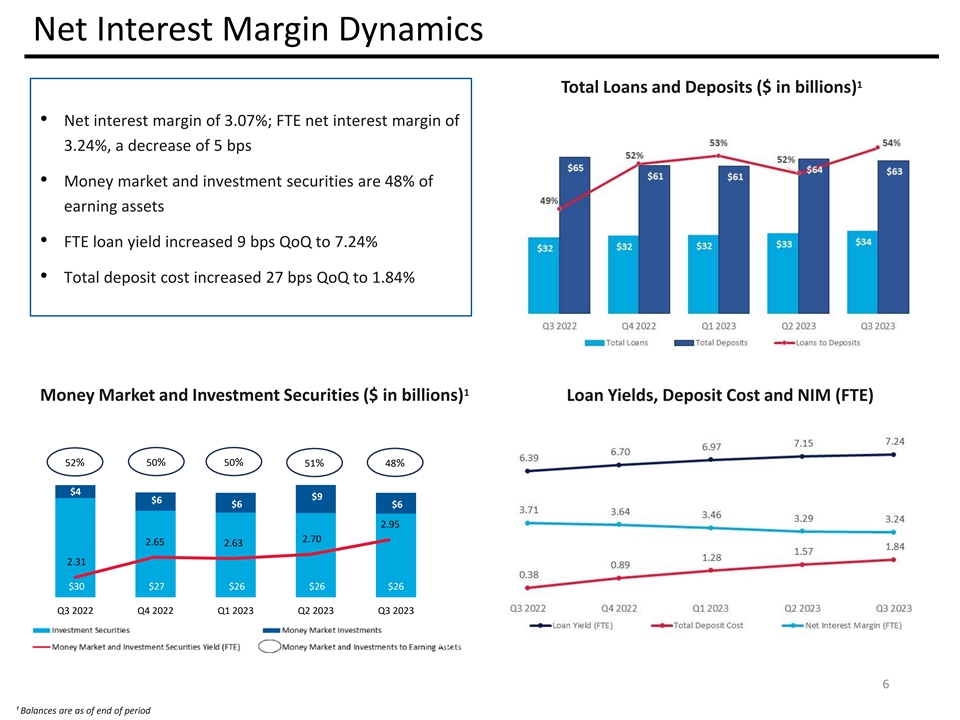
Net Interest Margin Dynamics 1 Total Loans and Deposits ($ in billions) • Net interest margin of 3.07%; FTE net interest margin of 3.24%, a decrease of 5 bps • Money market and investment securities are 48% of earning assets • FTE loan yield increased 9 bps QoQ to 7.24% • Total deposit cost increased 27 bps QoQ to 1.84% 1 Money Market and Investment Securities ($ in billions) Loan Yields, Deposit Cost and NIM (FTE) 52% 50% 50% 51% 48% $4 $9 $6 $6 $6 120% 2.95 2.70 2.65 100% 2.63 2.31 80% $30 $27 $26 $26 $26 60% Q3 2022 Q4 2022 Q1 2023 Q2 2023 Q3 2023 Investment Securities Money Market Investments 40% 20% 6 ¹ Balances are as of end of period 0%
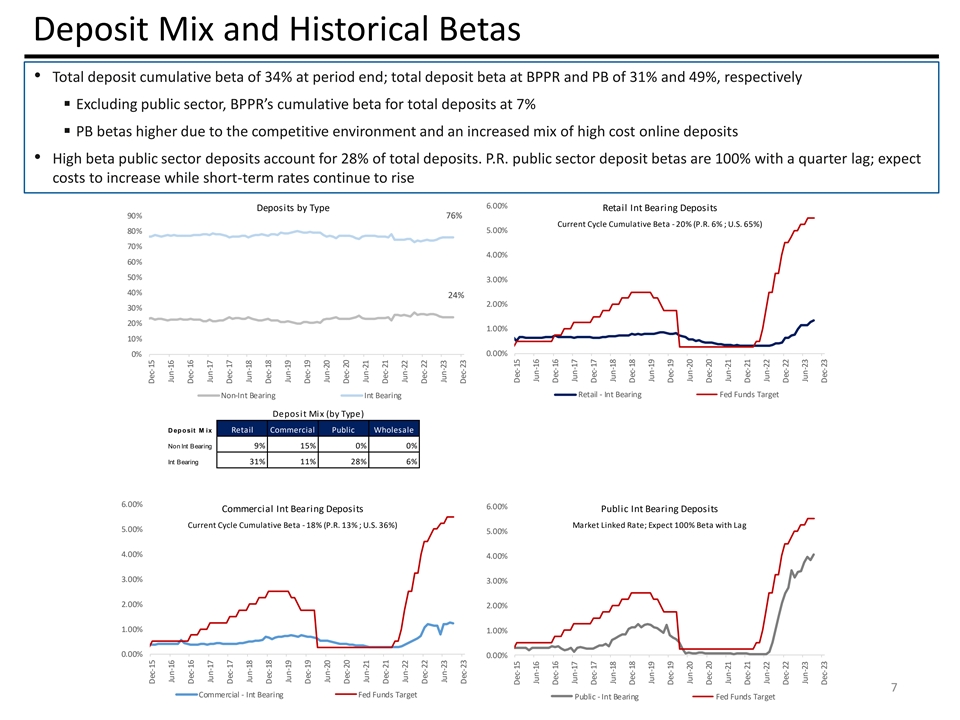
Deposit Mix and Historical Betas • Total deposit cumulative beta of 34% at period end; total deposit beta at BPPR and PB of 31% and 49%, respectively ▪ Excluding public sector, BPPR’s cumulative beta for total deposits at 7% ▪ PB betas higher due to the competitive environment and an increased mix of high cost online deposits • High beta public sector deposits account for 28% of total deposits. P.R. public sector deposit betas are 100% with a quarter lag; expect costs to increase while short-term rates continue to rise 6.00% Deposits by Type Retail Int Bearing Deposits 90% 76% Current Cycle Cumulative Beta - 20% (P.R. 6% ; U.S. 65%) 5.00% 80% 70% 4.00% 60% 50% 3.00% 40% 24% 2.00% 30% 20% 1.00% 10% 0.00% 0% Retail - Int Bearing Fed Funds Target Non-Int Bearing Int Bearing Deposit Mix (by Type) D eposit M ix Retail Commercial Public Wholesale Non Int Bearing 9% 15% 0% 0% Int Bearing 31% 11% 28% 6% 6.00% 6.00% Commercial Int Bearing Deposits Public Int Bearing Deposits Current Cycle Cumulative Beta - 18% (P.R. 13% ; U.S. 36%) Market Linked Rate; Expect 100% Beta with Lag 5.00% 5.00% 4.00% 4.00% 3.00% 3.00% 2.00% 2.00% 1.00% 1.00% 0.00% 0.00% 7 Commercial - Int Bearing Fed Funds Target Public - Int Bearing Fed Funds Target Dec-15 Dec-15 Jun-16 Jun-16 Dec-16 Dec-16 Jun-17 Jun-17 Dec-17 Dec-17 Jun-18 Jun-18 Dec-18 Dec-18 Jun-19 Jun-19 Dec-19 Dec-19 Jun-20 Jun-20 Dec-20 Dec-20 Jun-21 Jun-21 Dec-21 Dec-21 Jun-22 Jun-22 Dec-22 Dec-22 Jun-23 Jun-23 Dec-23 Dec-23 Dec-15 Dec-15 Jun-16 Jun-16 Dec-16 Dec-16 Jun-17 Jun-17 Dec-17 Dec-17 Jun-18 Jun-18 Dec-18 Dec-18 Jun-19 Jun-19 Dec-19 Dec-19 Jun-20 Jun-20 Dec-20 Dec-20 Jun-21 Jun-21 Dec-21 Dec-21 Jun-22 Jun-22 Dec-22 Dec-22 Jun-23 Jun-23 Dec-23 Dec-23
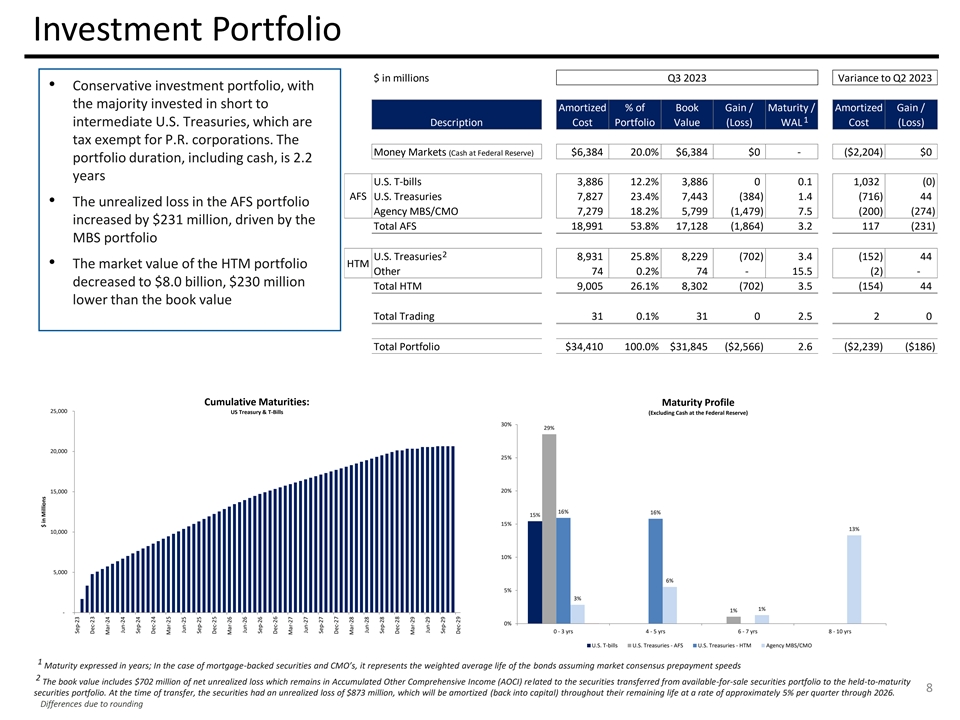
Investment Portfolio $ in millions Q3 2023 Variance to Q2 2023 Q2 2023 • Conservative investment portfolio, with the majority invested in short to Amortized % of Book Gain / Maturity / Amortized Gain / 1 intermediate U.S. Treasuries, which are Description Cost Portfolio Value (Loss) WAL Cost (Loss) tax exempt for P.R. corporations. The Money Markets (Cash at Federal Reserve) $6,384 20.0% $6,384 $0 - ($2,204) $0 portfolio duration, including cash, is 2.2 years U.S. T-bills 3,886 12.2% 3,886 0 0.1 1,032 (0) AFS U.S. Treasuries 7,827 23.4% 7,443 (384) 1.4 (716) 44 • The unrealized E ar loss nings in the AFS portfolio Agency MBS/CMO 7,279 18.2% 5,799 (1,479) 7.5 (200) (274) increased by $231 million, driven by the Total AFS 1 8,991 53.8% 17,128 (1 ,864) 3.2 117 (231) MBS portfolio 2 U.S. Treasuries 8,931 25.8% 8,229 (702) 3.4 (152) 44 • The market value of the HTM portfolio HTM Other 74 0.2% 74 - 15.5 (2) - decreased to $8.0 billion, $230 million Total HTM 9,005 26.1% 8,302 (702) 3.5 (154) 44 lower than the book value Total Trading 31 0.1% 31 0 2.5 2 0 Total Portfolio $34,410 100.0% $31,845 ($2,566) 2.6 ($2,239) ($186) Cumulative Maturities: Maturity Profile 25,000 US Treasury & T-Bills (Excluding Cash at the Federal Reserve) 30% 29% 20,000 25% 15,000 20% 16% 16% 15% 15% 13% 10,000 10% 5,000 6% 5% 3% 1% 1% - 0% 0% 0% 0% 0% 0% 0% 0% 0% 0% 0% 0% 0 - 3 yrs 4 - 5 yrs 6 - 7 yrs 8 - 10 yrs U.S. T-bills U.S. Treasuries - AFS U.S. Treasuries - HTM Agency MBS/CMO 1 Maturity expressed in years; In the case of mortgage-backed securities and CMO’s, it represents the weighted average life of the bonds assuming market consensus prepayment speeds 2 The book value includes $702 million of net unrealized loss which remains in Accumulated Other Comprehensive Income (AOCI) related to the securities transferred from available-for-sale securities portfolio to the held-to-maturity 8 securities portfolio. At the time of transfer, the securities had an unrealized loss of $873 million, which will be amortized (back into capital) throughout their remaining life at a rate of approximately 5% per quarter through 2026. Differences due to rounding $ in Millions Sep-23 Dec-23 Mar-24 Jun-24 Sep-24 Dec-24 Mar-25 Jun-25 Sep-25 Dec-25 Mar-26 Jun-26 Sep-26 Dec-26 Mar-27 Jun-27 Sep-27 Dec-27 Mar-28 Jun-28 Sep-28 Dec-28 Mar-29 Jun-29 Sep-29 Dec-29
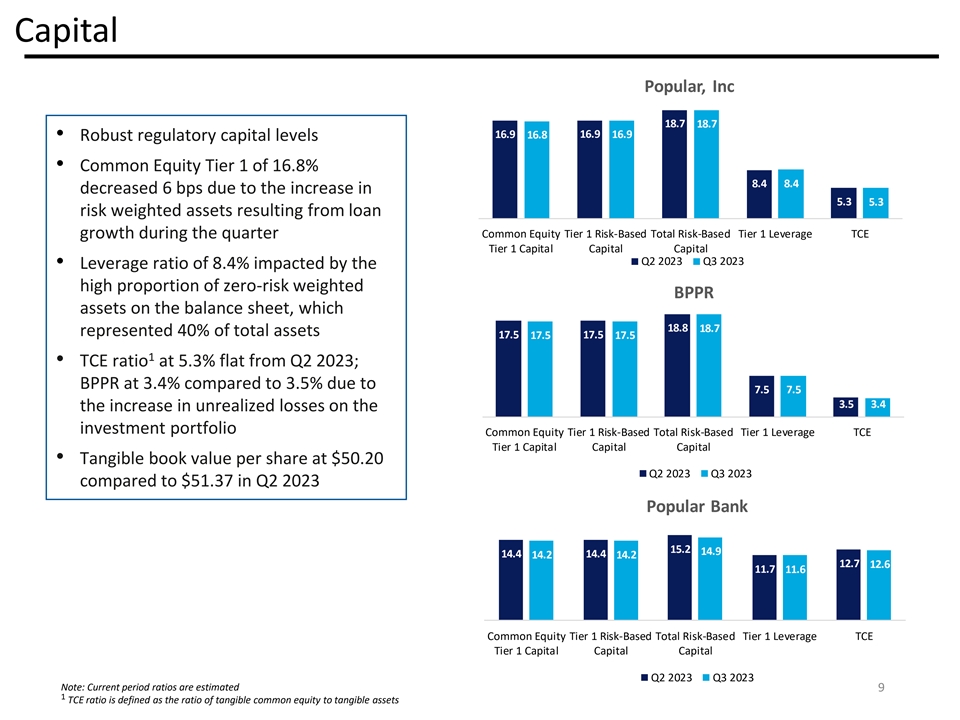
Capital Popular, Inc 18.7 18.7 16.9 16.8 16.9 16.9 • Robust regulatory capital levels • Common Equity Tier 1 of 16.8% 8.4 8.4 decreased 6 bps due to the increase in 5.3 5.3 risk weighted assets resulting from loan Common Equity Tier 1 Risk-Based Total Risk-Based Tier 1 Leverage TCE growth during the quarter Tier 1 Capital Capital Capital Q2 2023 Q3 2023 • Leverage ratio of 8.4% impacted by the high proportion of zero-risk weighted BPPR assets on the balance sheet, which 18.8 18.7 represented 40% of total assets 17.5 17.5 17.5 17.5 1 • TCE ratio at 5.3% flat from Q2 2023; BPPR at 3.4% compared to 3.5% due to 7.5 7.5 3.5 3.4 the increase in unrealized losses on the investment portfolio Common Equity Tier 1 Risk-Based Total Risk-Based Tier 1 Leverage TCE Tier 1 Capital Capital Capital • Tangible book value per share at $50.20 Q2 2023 Q3 2023 compared to $51.37 in Q2 2023 Popular Bank 15.2 14.9 14.4 14.4 14.2 14.2 12.7 12.6 11.7 11.6 Common Equity Tier 1 Risk-Based Total Risk-Based Tier 1 Leverage TCE Tier 1 Capital Capital Capital Q2 2023 Q3 2023 Note: Current period ratios are estimated 9 1 TCE ratio is defined as the ratio of tangible common equity to tangible assets
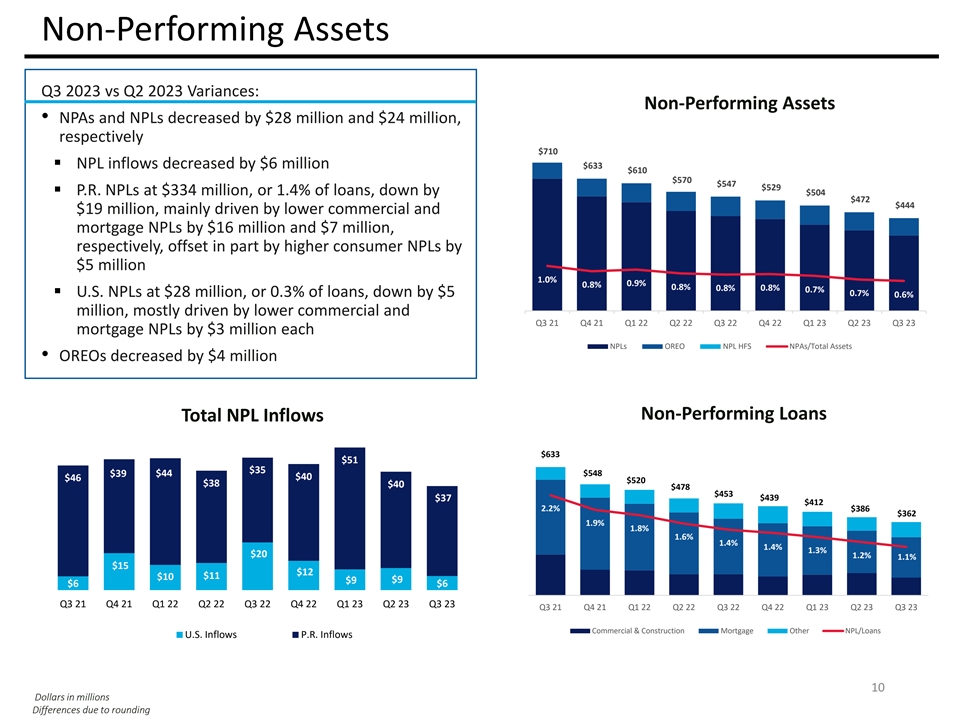
Non-Performing Assets Q3 2023 vs Q2 2023 Variances: Non-Performing Assets • NPAs and NPLs decreased by $28 million and $24 million, $900 4.00% respectively $800 3.50% $710 $700 ▪ NPL inflows decreased by $6 million $633 $610 3.00% $570 $547 $600 $529 ▪ P.R. NPLs at $334 million, or 1.4% of loans, down by $504 2.50% $472 $444 $500 $19 million, mainly driven by lower commercial and 2.00% $400 mortgage NPLs by $16 million and $7 million, 1.50% $300 respectively, offset in part by higher consumer NPLs by 1.00% $5 million $200 1.0% 0.9% 0.8% 0.8% 0.8% 0.8% 0.50% $100 0.7% 0.7% ▪ U.S. NPLs at $28 million, or 0.3% of loans, down by $5 0.6% $- 0.00% million, mostly driven by lower commercial and Q3 21 Q4 21 Q1 22 Q2 22 Q3 22 Q4 22 Q1 23 Q2 23 Q3 23 mortgage NPLs by $3 million each NPLs OREO NPL HFS NPAs/Total Assets • OREOs decreased by $4 million 4.0% Non-Performing Loans Total NPL Inflows 3.5% $633 3.0% $51 $35 $548 $39 $44 $40 $46 $520 2.5% $38 $40 $478 $453 $37 $439 $412 2.0% 2.2% $386 $362 1.9% 1.5% 1.8% 1.6% 1.4% 1.4% 1.3% 1.0% $20 1.2% 1.1% $15 $12 0.5% $11 $10 $9 $9 $6 $6 0.0% Q3 21 Q4 21 Q1 22 Q2 22 Q3 22 Q4 22 Q1 23 Q2 23 Q3 23 Q3 21 Q4 21 Q1 22 Q2 22 Q3 22 Q4 22 Q1 23 Q2 23 Q3 23 Commercial & Construction Mortgage Other NPL/Loans U.S. Inflows P.R. Inflows 10 Dollars in millions Differences due to rounding
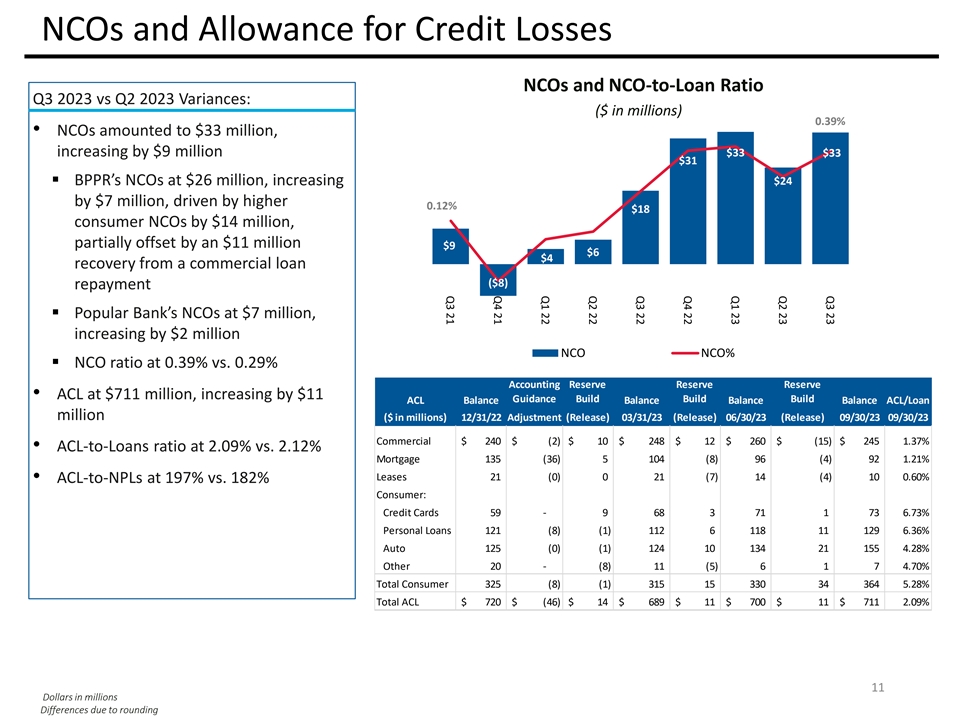
Q3 23 Q2 23 Q1 23 Q4 22 Q3 22 Q2 22 Q1 22 Q4 21 Q3 21 NCOs and Allowance for Credit Losses NCOs and NCO-to-Loan Ratio Q3 2023 vs Q2 2023 Variances: ($ in millions) 0.39% • NCOs amounted to $33 million, increasing by $9 million $33 $33 $31 ▪ BPPR’s NCOs at $26 million, increasing $24 by $7 million, driven by higher 0.12% $18 consumer NCOs by $14 million, partially offset by an $11 million $9 $6 $4 recovery from a commercial loan ($8) repayment ▪ Popular Bank’s NCOs at $7 million, increasing by $2 million NCO NCO% ▪ NCO ratio at 0.39% vs. 0.29% Accounting Reserve Reserve Reserve • ACL at $711 million, increasing by $11 Guidance Build Build Build ACL Balance Balance Balance Balance ACL/Loan million ($ in millions) 12/31/22 Adjustment (Release) 03/31/23 (Release) 06/30/23 (Release) 09/30/23 09/30/23 Commercial $ 240 $ (2) $ 10 $ 248 $ 12 $ 260 $ (15) $ 245 1.37% • ACL-to-Loans ratio at 2.09% vs. 2.12% Mortgage 135 (36) 5 104 (8) 96 (4) 92 1.21% Leases 21 (0) 0 21 (7) 14 (4) 10 0.60% • ACL-to-NPLs at 197% vs. 182% Consumer: Credit Cards 59 - 9 68 3 71 1 73 6.73% Personal Loans 121 (8) (1) 112 6 118 11 129 6.36% Auto 125 (0) (1) 124 10 134 21 155 4.28% Other 20 - (8) 11 (5) 6 1 7 4.70% Total Consumer 325 (8) (1) 315 15 330 34 364 5.28% Total ACL $ 720 $ (46) $ 14 $ 689 $ 11 $ 700 $ 11 $ 711 2.09% 11 Dollars in millions Differences due to rounding
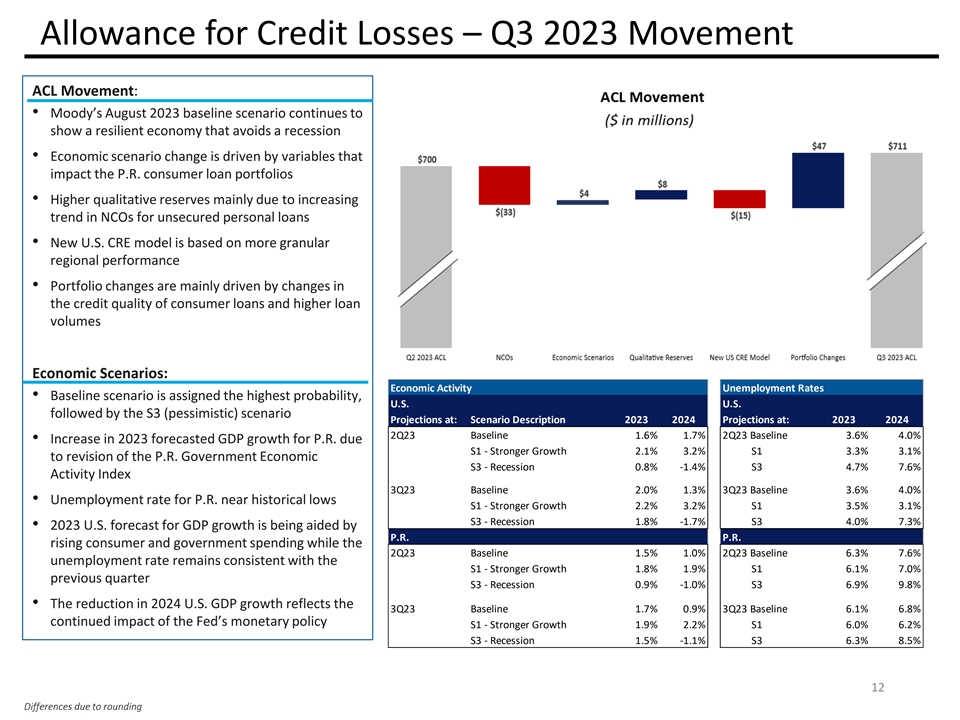
Allowance for Credit Losses – Q3 2023 Movement ACL Movement: • Moody’s August 2023 baseline scenario continues to show a resilient economy that avoids a recession • Economic scenario change is driven by variables that impact the P.R. consumer loan portfolios • Higher qualitative reserves mainly due to increasing trend in NCOs for unsecured personal loans • New U.S. CRE model is based on more granular regional performance • Portfolio changes are mainly driven by changes in the credit quality of consumer loans and higher loan volumes Economic Scenarios: Economic Activity Unemployment Rates • Baseline scenario is assigned the highest probability, U.S. U.S. followed by the S3 (pessimistic) scenario Projections at: Scenario Description 2023 2024 Projections at: 2023 2024 2Q23 Baseline 1.6% 1.7% 2Q23 Baseline 3.6% 4.0% • Increase in 2023 forecasted GDP growth for P.R. due S1 - Stronger Growth 2.1% 3.2% S1 3.3% 3.1% to revision of the P.R. Government Economic S3 - Recession 0.8% -1.4% S3 4.7% 7.6% Activity Index 3Q23 Baseline 2.0% 1.3% 3Q23 Baseline 3.6% 4.0% • Unemployment rate for P.R. near historical lows S1 - Stronger Growth 2.2% 3.2% S1 3.5% 3.1% S3 - Recession 1.8% -1.7% S3 4.0% 7.3% • 2023 U.S. forecast for GDP growth is being aided by P.R. P.R. rising consumer and government spending while the 2Q23 Baseline 1.5% 1.0% 2Q23 Baseline 6.3% 7.6% unemployment rate remains consistent with the S1 - Stronger Growth 1.8% 1.9% S1 6.1% 7.0% previous quarter S3 - Recession 0.9% -1.0% S3 6.9% 9.8% • The reduction in 2024 U.S. GDP growth reflects the 3Q23 Baseline 1.7% 0.9% 3Q23 Baseline 6.1% 6.8% continued impact of the Fed’s monetary policy S1 - Stronger Growth 1.9% 2.2% S1 6.0% 6.2% S3 - Recession 1.5% -1.1% S3 6.3% 8.5% 12 Differences due to rounding
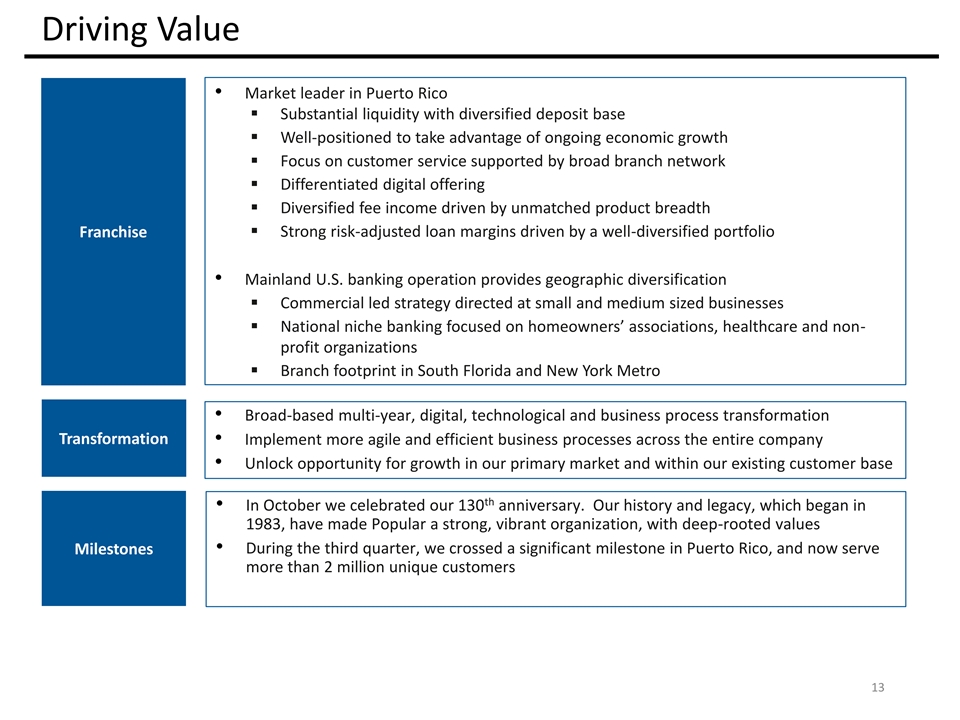
Driving Value • Market leader in Puerto Rico ▪ Substantial liquidity with diversified deposit base ▪ Well-positioned to take advantage of ongoing economic growth ▪ Focus on customer service supported by broad branch network ▪ Differentiated digital offering ▪ Diversified fee income driven by unmatched product breadth Franchise▪ Strong risk-adjusted loan margins driven by a well-diversified portfolio • Mainland U.S. banking operation provides geographic diversification ▪ Commercial led strategy directed at small and medium sized businesses ▪ National niche banking focused on homeowners’ associations, healthcare and non- profit organizations ▪ Branch footprint in South Florida and New York Metro • Broad-based multi-year, digital, technological and business process transformation Transformation • Implement more agile and efficient business processes across the entire company • Unlock opportunity for growth in our primary market and within our existing customer base th • In October we celebrated our 130 anniversary. Our history and legacy, which began in 1983, have made Popular a strong, vibrant organization, with deep-rooted values • During the third quarter, we crossed a significant milestone in Puerto Rico, and now serve Milestones more than 2 million unique customers 13

INVESTOR PRESENTATION Third Quarter 2023 Appendix
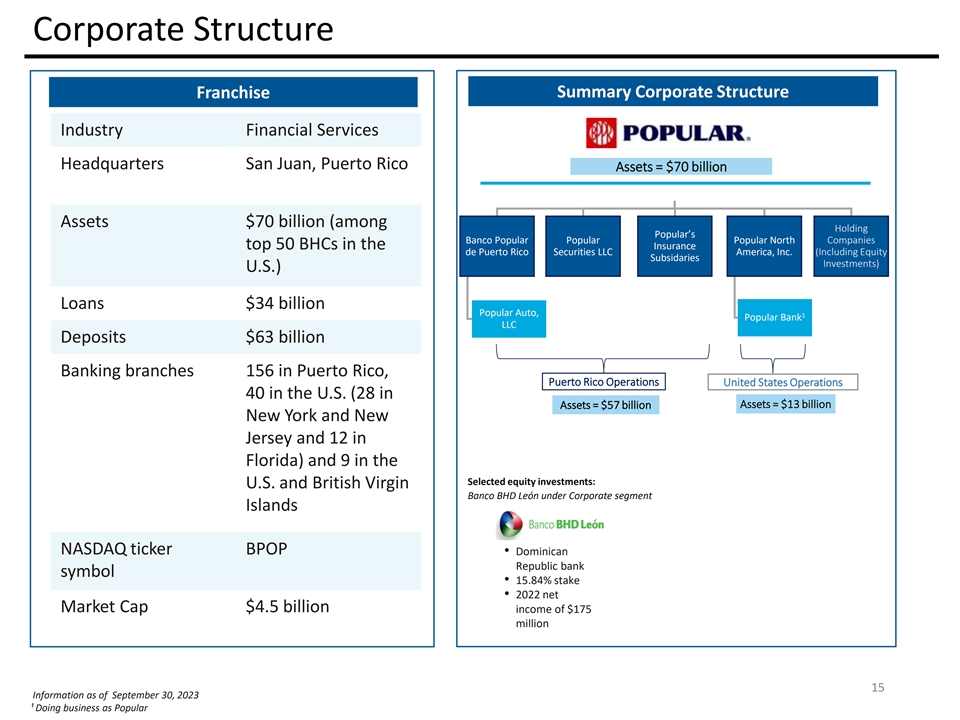
Corporate Structure Summary Corporate Structure Franchise Industry Financial Services Headquarters San Juan, Puerto Rico Assets = $70 billion Assets $70 billion (among Holding Popular’s Banco Popular Popular Popular North Companies top 50 BHCs in the Insurance de Puerto Rico Securities LLC America, Inc. (Including Equity Subsidaries Investments) U.S.) Loans $34 billion Popular Auto, 1 Popular Bank LLC Deposits $63 billion Earnings Earnings Banking branches 156 in Puerto Rico, Puerto Rico Operations United States Operations 40 in the U.S. (28 in Assets = $13 billion Assets = $57 billion New York and New Jersey and 12 in Florida) and 9 in the Selected equity investments: U.S. and British Virgin Banco BHD León under Corporate segment Islands NASDAQ ticker BPOP • Dominican Republic bank symbol • 15.84% stake • 2022 net Market Cap $4.5 billion income of $175 million 15 Information as of September 30, 2023 ¹ Doing business as Popular
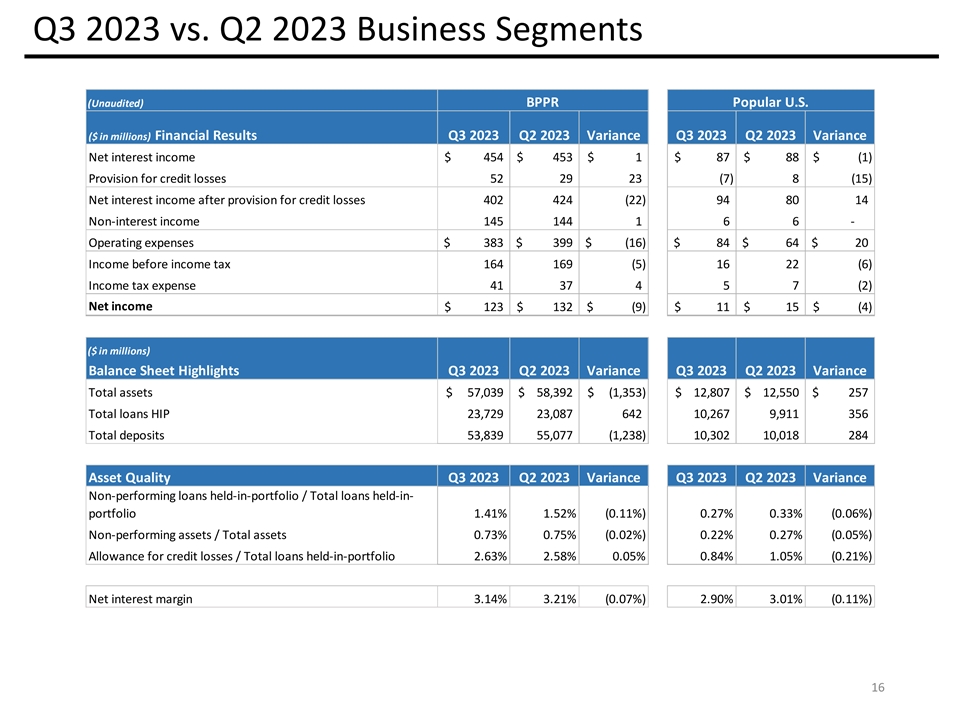
Q3 2023 vs. Q2 2023 Business Segments (Unaudited) BPPR Popular U.S. ($ in millions) Financial Results Q3 2023 Q2 2023 Variance Q3 2023 Q2 2023 Variance Net interest income $ 454 $ 453 $ 1 $ 87 $ 88 $ ( 1) Provision for credit losses 52 29 23 (7) 8 (15) Net interest income after provision for credit losses 402 424 (22) 94 80 14 Non-interest income 145 144 1 6 6 - Operating expenses $ 383 $ 399 $ (16) $ 84 $ 64 $ 20 Income before income tax 164 169 (5) 16 22 (6) Income tax expense 41 37 4 5 7 (2) Net income $ 123 $ 132 $ ( 9) $ 11 $ 15 $ ( 4) ($ in millions) Balance Sheet Highlights Q3 2023 Q2 2023 Variance Q3 2023 Q2 2023 Variance Total assets $ 5 7,039 $ 58,392 $ (1,353) $ 1 2,807 $ 12,550 $ 257 Total loans HIP 23,729 2 3,087 642 10,267 9,911 356 Total deposits 53,839 55,077 ( 1,238) 10,302 1 0,018 284 Asset Quality Q3 2023 Q2 2023 Variance Q3 2023 Q2 2023 Variance Non-performing loans held-in-portfolio / Total loans held-in- portfolio 1.41% 1.52% (0.11%) 0.27% 0.33% (0.06%) Non-performing assets / Total assets 0.73% 0.75% (0.02%) 0.22% 0.27% (0.05%) Allowance for credit losses / Total loans held-in-portfolio 2.63% 2.58% 0.05% 0.84% 1.05% (0.21%) Net interest margin 3.14% 3.21% (0.07%) 2.90% 3.01% (0.11%) 16
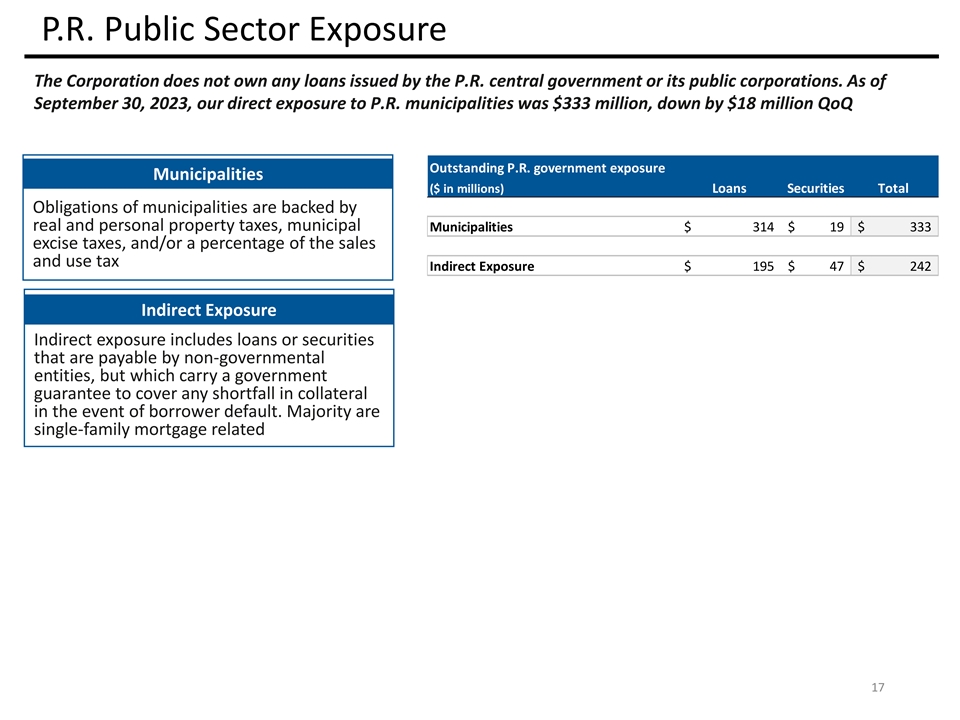
P.R. Public Sector Exposure The Corporation does not own any loans issued by the P.R. central government or its public corporations. As of September 30, 2023, our direct exposure to P.R. municipalities was $333 million, down by $18 million QoQ Outstanding P.R. government exposure Municipalities ($ in millions) Loans Securities Total Obligations of municipalities are backed by real and personal property taxes, municipal Municipalities $ 314 $ 19 $ 333 excise taxes, and/or a percentage of the sales and use tax Indirect Exposure $ 195 $ 47 $ 242 Indirect Exposure Indirect exposure includes loans or securities that are payable by non-governmental entities, but which carry a government guarantee to cover any shortfall in collateral in the event of borrower default. Majority are single-family mortgage related 17
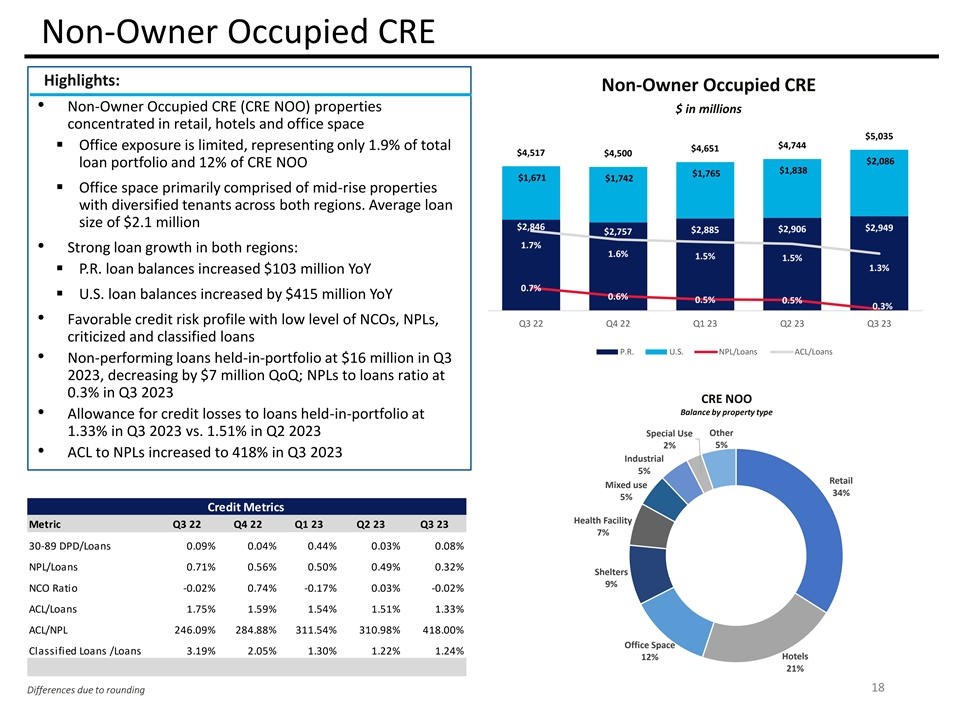
Non-Owner Occupied CRE Highlights: Non-Owner Occupied CRE • Non-Owner Occupied CRE (CRE NOO) properties $ in millions concentrated in retail, hotels and office space 3.5% $5,035 $4,744 ▪ Office exposure is limited, representing only 1.9% of total $4,651 $4,517 $4,500 $2,086 3.0% loan portfolio and 12% of CRE NOO $1,838 $1,765 $1,671 $1,742 ▪ Office space primarily comprised of mid-rise properties 2.5% with diversified tenants across both regions. Average loan 2.0% size of $2.1 million $2,846 $2,949 $2,906 $2,885 $2,757 1.7% 1.5% • Strong loan growth in both regions: 1.6% 1.5% 1.5% 1.3% ▪ P.R. loan balances increased $103 million YoY 1.0% 0.7% ▪ U.S. loan balances increased by $415 million YoY 0.6% 0.5% 0.5% 0.5% 0.3% • Favorable credit risk profile with low level of NCOs, NPLs, Q3 22 Q4 22 Q1 23 Q2 23 Q3 23 0.0% criticized and classified loans P.R. U.S. NPL/Loans ACL/Loans • Non-performing loans held-in-portfolio at $16 million in Q3 2023, decreasing by $7 million QoQ; NPLs to loans ratio at 0.3% in Q3 2023 CRE NOO Balance by property type • Allowance for credit losses to loans held-in-portfolio at 1.33% in Q3 2023 vs. 1.51% in Q2 2023 Special Use Other 5% 2% • ACL to NPLs increased to 418% in Q3 2023 Industrial 5% Retail Mixed use 34% 5% Credit Metrics Health Facility Metric Q3 22 Q4 22 Q1 23 Q2 23 Q3 23 7% 30-89 DPD/Loans 0.09% 0.04% 0.44% 0.03% 0.08% NPL/Loans 0.71% 0.56% 0.50% 0.49% 0.32% Shelters 9% NCO Ratio -0.02% 0.74% -0.17% 0.03% -0.02% ACL/Loans 1.75% 1.59% 1.54% 1.51% 1.33% ACL/NPL 246.09% 284.88% 311.54% 310.98% 418.00% Office Space Classified Loans /Loans 3.19% 2.05% 1.30% 1.22% 1.24% 12% Hotels 21% 18 Differences due to rounding
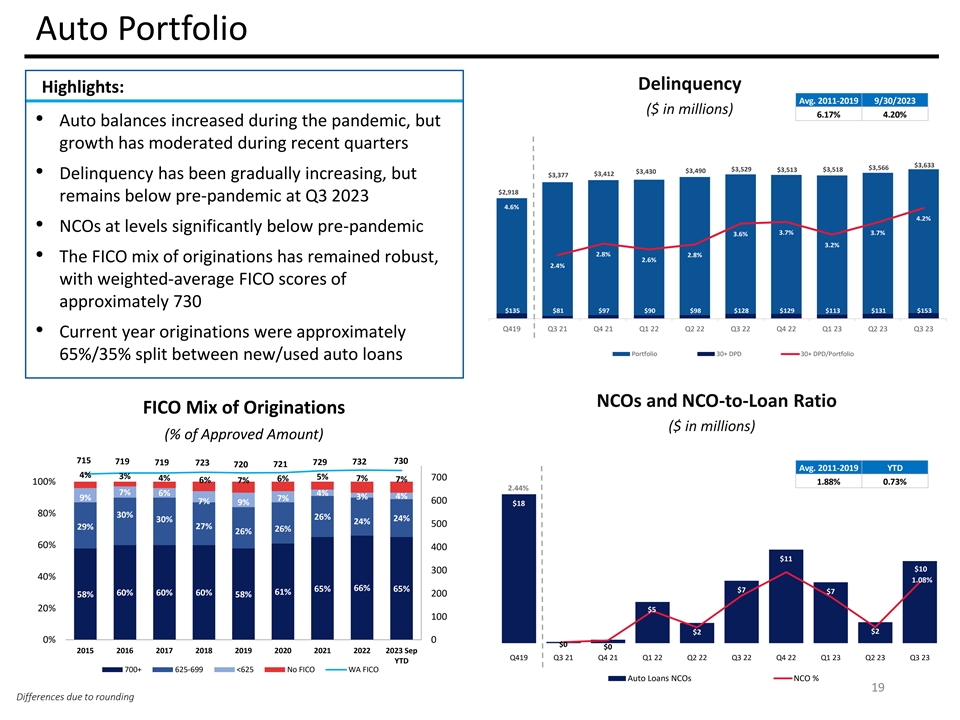
Auto Portfolio Delinquency Highlights: Avg. 2011-2019 9/30/2023 ($ in millions) 6.17% 4.20% • Auto balances increased during the pandemic, but growth has moderated during recent quarters $4,000 6.00% $3,633 $3,566 $3,529 $3,513 $3,518 $3,490 $3,430 $3,412 $3,377 • Delinquency has been gradually increasing, but $3,500 5.00% $2,918 remains below pre-pandemic at Q3 2023 $3,000 4.6% 4.00% 4.2% $2,500 • NCOs at levels significantly below pre-pandemic 3.7% 3.6% 3.7% $2,000 3.00% 3.2% 2.8% 2.8% • The FICO mix of originations has remained robust, $1,500 2.6% 2.4% 2.00% $1,000 with weighted-average FICO scores of 1.00% $500 approximately 730 $135 $81 $97 $90 $98 $128 $129 $113 $131 $153 $- 0.00% Q419 Q3 21 Q4 21 Q1 22 Q2 22 Q3 22 Q4 22 Q1 23 Q2 23 Q3 23 • Current year originations were approximately Portfolio 30+ DPD 30+ DPD/Portfolio 65%/35% split between new/used auto loans NCOs and NCO-to-Loan Ratio FICO Mix of Originations ($ in millions) (% of Approved Amount) 715 719 730 719 723 729 732 721 720 Avg. 2011-2019 YTD 4% 3% 5% 4% 6% 7% 700 6% 7% 7% 100% 1.88% 0.73% 2.44% 7% 6% 4% 3% 4% 9% 7% 7% 600 9% $18 80% 30% 26% 24% 30% 24% 500 29% 27% 26% 26% 60% 400 $11 $10 300 40% 1.08% 66% 65% 65% $7 61% $7 60% 60% 60% 58% 58% 200 20% $5 100 $2 $2 0% 0 $0 $0 2015 2016 2017 2018 2019 2020 2021 2022 2023 Sep Q419 Q3 21 Q4 21 Q1 22 Q2 22 Q3 22 Q4 22 Q1 23 Q2 23 Q3 23 YTD 700+ 625-699 <625 No FICO WA FICO Auto Loans NCOs NCO % 19 Differences due to rounding
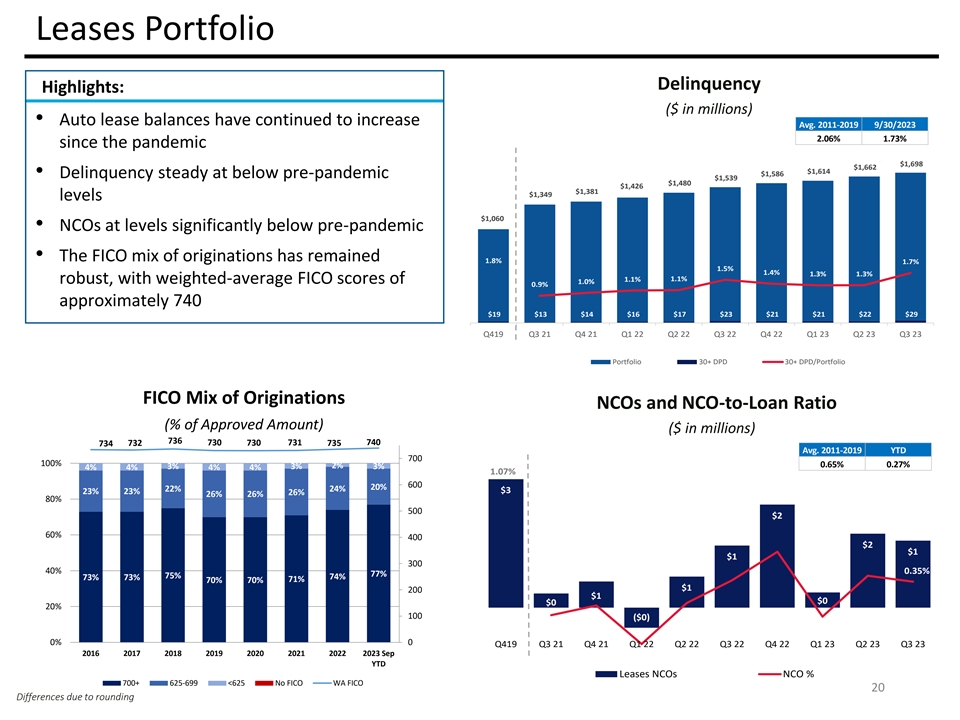
Leases Portfolio Delinquency Highlights: ($ in millions) • Auto lease balances have continued to increase Avg. 2011-2019 9/30/2023 2.06% 1.73% since the pandemic $2,000 6.00% $1,698 $1,800 $1,662 $1,614 $1,586 • Delinquency steady at below pre-pandemic $1,539 5.00% $1,480 $1,600 $1,426 $1,381 $1,349 levels $1,400 4.00% $1,200 $1,060 • NCOs at levels significantly below pre-pandemic $1,000 3.00% $800 • The FICO mix of originations has remained 1.8% 1.7% 2.00% 1.5% $600 1.4% 1.3% 1.3% 1.1% 1.1% robust, with weighted-average FICO scores of 1.0% 0.9% $400 1.00% approximately 740 $200 $19 $13 $14 $16 $17 $23 $21 $21 $22 $29 $- 0.00% Q419 Q3 21 Q4 21 Q1 22 Q2 22 Q3 22 Q4 22 Q1 23 Q2 23 Q3 23 Portfolio 30+ DPD 30+ DPD/Portfolio FICO Mix of Originations NCOs and NCO-to-Loan Ratio (% of Approved Amount) ($ in millions) 736 730 730 731 740 734 732 735 Avg. 2011-2019 YTD 700 100% 2% 0.65% 0.27% 3% 3% 3% 4% 4% 4% 4% 1.07% 600 20% 22% 24% $3 23% 23% 26% 26% 26% 80% 500 $2 60% 400 $2 $1 $1 300 40% 0.35% 77% 75% 73% 73% 74% 70% 70% 71% $1 200 $1 $0 $0 20% 100 ($0) 0% 0 Q419 Q3 21 Q4 21 Q1 22 Q2 22 Q3 22 Q4 22 Q1 23 Q2 23 Q3 23 2016 2017 2018 2019 2020 2021 2022 2023 Sep YTD Leases NCOs NCO % 700+ 625-699 <625 No FICO WA FICO 20 Differences due to rounding
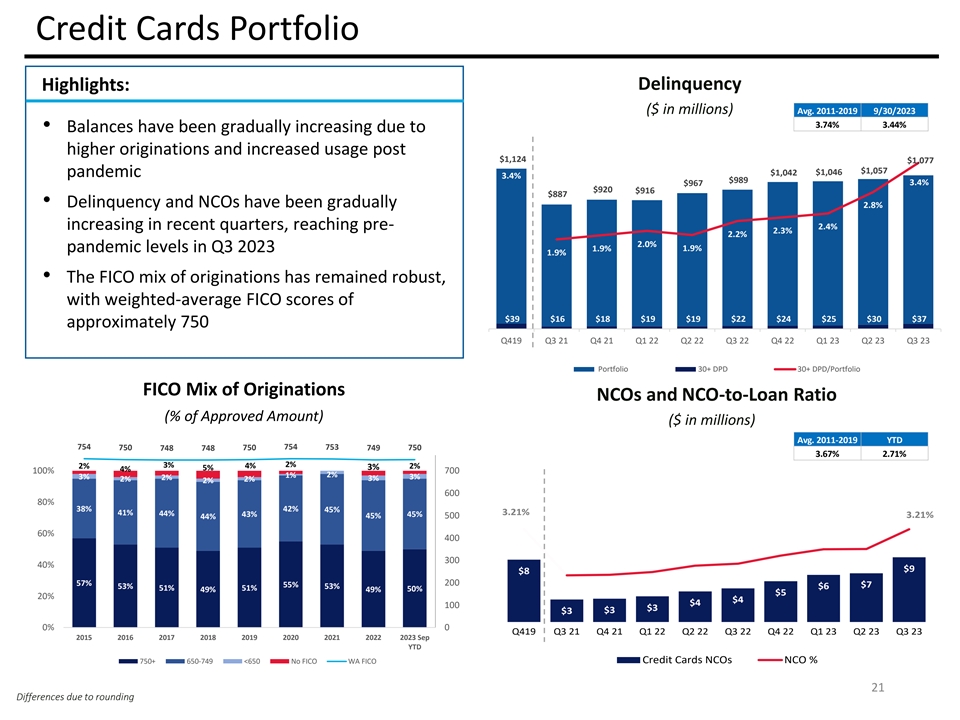
Credit Cards Portfolio Highlights: Delinquency ($ in millions) Avg. 2011-2019 9/30/2023 3.74% 3.44% • Balances have been gradually increasing due to $1,400 4.00% higher originations and increased usage post $1,124 3.50% $1,077 $1,200 $1,057 $1,046 $1,042 pandemic 3.4% $989 3.4% $967 3.00% $920 $916 $1,000 $887 • Delinquency and NCOs have been gradually 2.8% 2.50% $800 2.4% increasing in recent quarters, reaching pre- 2.3% 2.00% 2.2% 2.0% $600 1.9% pandemic levels in Q3 2023 1.9% 1.9% 1.50% $400 • The FICO mix of originations has remained robust, 1.00% $200 with weighted-average FICO scores of 0.50% $39 $16 $18 $19 $19 $22 $24 $25 $30 $37 approximately 750 $- 0.00% Q419 Q3 21 Q4 21 Q1 22 Q2 22 Q3 22 Q4 22 Q1 23 Q2 23 Q3 23 Portfolio 30+ DPD 30+ DPD/Portfolio FICO Mix of Originations NCOs and NCO-to-Loan Ratio (% of Approved Amount) ($ in millions) Avg. 2011-2019 YTD 754 754 753 750 748 748 750 749 750 3.67% 2.71% 3% 4% 2% 2% 2% 5% 3% 4% 100% 700 1% 2% 3% 2% 3% 2% 2% 3% 2% 600 80% 38% 42% 45% 41% 44% 3.21% 43% 45% 45% 500 3.21% 44% 60% 400 300 40% $9 $8 200 57% 55% $7 53% 53% $6 51% 51% 49% 49% 50% $5 20% $4 $4 100 $3 $3 $3 0% 0 Q419 Q3 21 Q4 21 Q1 22 Q2 22 Q3 22 Q4 22 Q1 23 Q2 23 Q3 23 2015 2016 2017 2018 2019 2020 2021 2022 2023 Sep YTD 750+ 650-749 <650 No FICO WA FICO Credit Cards NCOs NCO % 21 Differences due to rounding
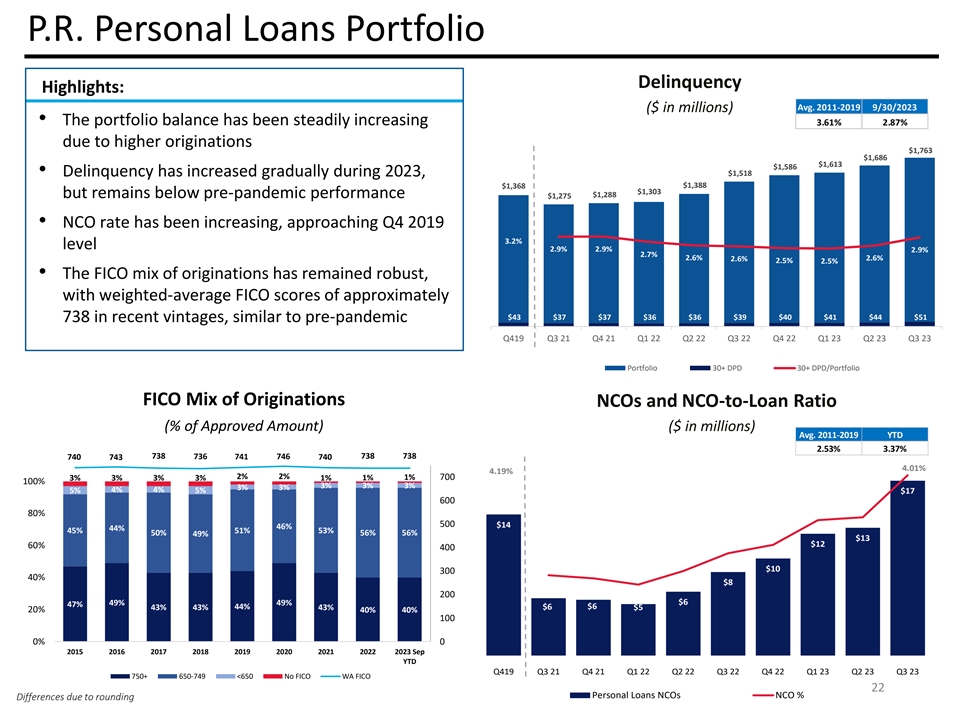
P.R. Personal Loans Portfolio Delinquency Highlights: Avg. 2011-2019 9/30/2023 ($ in millions) • The portfolio balance has been steadily increasing 3.61% 2.87% $2,000 6.00% due to higher originations $1,763 $1,686 $1,800 $1,613 $1,586 5.00% $1,518 • Delinquency has increased gradually during 2023, $1,600 $1,388 $1,368 $1,303 $1,288 but remains below pre-pandemic performance $1,400 $1,275 4.00% $1,200 • NCO rate has been increasing, approaching Q4 2019 $1,000 3.00% 3.2% level 2.9% 2.9% 2.9% $800 2.7% 2.6% 2.6% 2.6% 2.5% 2.5% 2.00% $600 • The FICO mix of originations has remained robust, $400 1.00% with weighted-average FICO scores of approximately $200 $43 $37 $37 $36 $36 $39 $40 $41 $44 $51 738 in recent vintages, similar to pre-pandemic $- 0.00% Q419 Q3 21 Q4 21 Q1 22 Q2 22 Q3 22 Q4 22 Q1 23 Q2 23 Q3 23 Portfolio 30+ DPD 30+ DPD/Portfolio FICO Mix of Originations NCOs and NCO-to-Loan Ratio (% of Approved Amount) ($ in millions) Avg. 2011-2019 YTD 2.53% 3.37% 738 738 738 740 743 736 741 746 740 4.01% 4.19% 2% 2% 1% 1% 700 3% 3% 3% 3% 1% 100% 3% 3% 3% 3% 3% 4% 4% 5% 5% $17 600 80% 500 $14 46% 44% 45% 51% 53% 50% 56% 56% 49% $13 $12 60% 400 $10 300 40% $8 200 49% 49% $6 47% 44% $6 $6 43% 43% 43% $5 20% 40% 40% 100 0% 0 2015 2016 2017 2018 2019 2020 2021 2022 2023 Sep YTD Q419 Q3 21 Q4 21 Q1 22 Q2 22 Q3 22 Q4 22 Q1 23 Q2 23 Q3 23 750+ 650-749 <650 No FICO WA FICO 22 Personal Loans NCOs NCO % Differences due to rounding
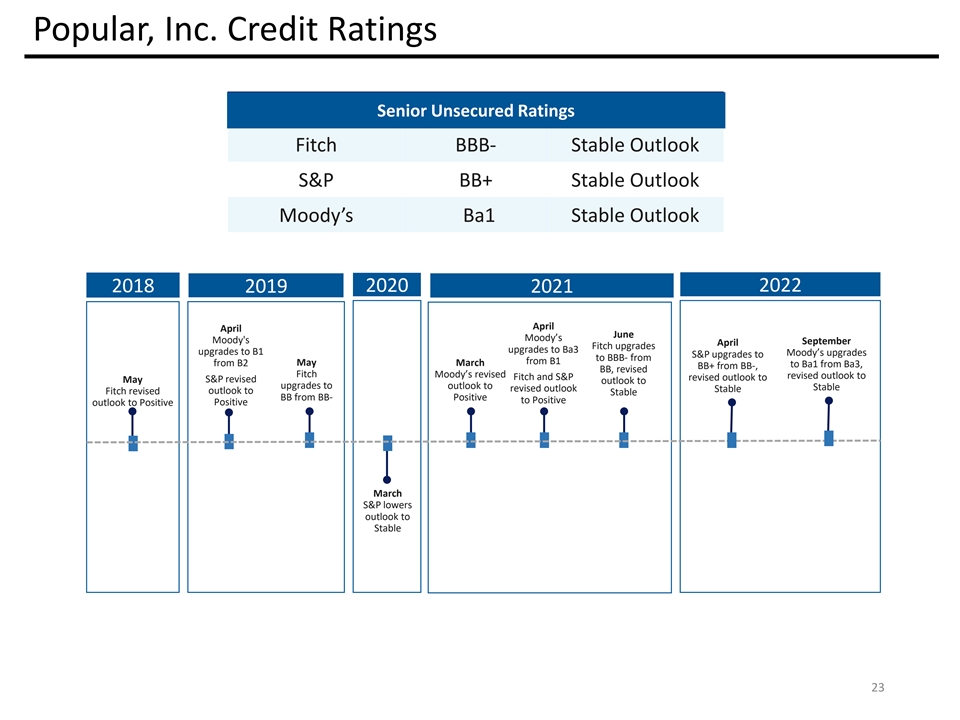
Popular, Inc. Credit Ratings Senior Unsecured Ratings Senior Unsecured Ratings Fitch BBB- Stable Outlook S&P BB+ Stable Outlook Moody’s Ba1 Stable Outlook 2018 2020 2022 2019 2021 April April June Moody’s Moody's September April Fitch upgrades upgrades to Ba3 upgrades to B1 Moody’s upgrades S&P upgrades to to BBB- from from B1 from B2 May March to Ba1 from Ba3, BB+ from BB-, BB, revised Fitch Moody’s revised revised outlook to Fitch and S&P revised outlook to May S&P revised outlook to upgrades to outlook to Stable revised outlook Stable Fitch revised outlook to Stable BB from BB- Positive to Positive Positive outlook to Positive March S&P lowers outlook to Stable 23

INVESTOR PRESENTATION Third Quarter 2023