UNITED STATES
SECURITIES AND EXCHANGE COMMISSION
Washington, D.C. 20549
Form 6-K
Report of Foreign Private Issuer
Pursuant to Rule 13a-16 or 15d-16
under the Securities Exchange Act of 1934
For the month of October 2023
Commission File Number 001-16139
Wipro Limited
(Exact name of Registrant as specified in its charter)
Not Applicable
(Translation of Registrant’s name into English)
Karnataka, India
(Jurisdiction of incorporation or organization)
Doddakannelli
Sarjapur Road
Bangalore, Karnataka 560035, India +91-80-2844-0011
(Address of principal executive offices)
Indicate by check mark whether the registrant files or will file annual reports under cover Form 20-F or Form 40-F:
Form 20-F ☒ Form 40-F ☐
Indicate by check mark if the registrant is submitting the Form 6-K in paper as permitted by Regulation S-T Rule 101(b)(1): Yes ☐ No ☒
Note: Regulation S-T Rule 101(b)(1) only permits the submission in paper of a Form 6-K if submitted solely to provide an attached annual report to security holders.
Indicate by check mark if the registrant is submitting the Form 6-K in paper as permitted by Regulation S-T Rule 101(b)(7): Yes ☐ No ☒
Note: Regulation S-T Rule 101(b)(7) only permits the submission in paper of a Form 6-K if submitted to furnish a report or other document that the registrant foreign private issuer must furnish and make public under the laws of the jurisdiction in which the registrant is incorporated, domiciled or legally organized (the registrant’s “home country”), or under the rules of the home country exchange on which the registrant’s securities are traded, as long as the report or other document is not a press release, is not required to be and has not been distributed to the registrant’s security holders, and, if discussing a material event, has already been the subject of a Form 6-K submission or other Commission filing on EDGAR.
DISCLOSURE OF RESULTS OF OPERATIONS AND FINANCIAL CONDITION
Wipro Limited, a company organized under the laws of the Republic of India (the “Company”), hereby furnishes the Commission with the following information concerning our public disclosures regarding our results of operations for the quarter ended September 30, 2023. The following information shall not be deemed “filed” for purposes of Section 18 of the Securities Exchange Act of 1934, as amended (the “Exchange Act”), or incorporated by reference in any filing under the Securities Act of 1933, as amended, or the Exchange Act, except as shall be expressly set forth by specific reference in such a filing.
On October 18, 2023, we announced our results of operations for the quarter ended September 30, 2023. We issued a press release announcing our results under IFRS, a copy of which is attached to this Form 6-K as Item 99.1.
We placed advertisements in certain Indian newspapers concerning our results of operations for the quarter ended September 30, 2023, under IFRS. A copy of the form of this advertisement is attached to this Form 6-K as Item 99.2.
We made available on our website the Condensed Consolidated Interim Financial Statements as of and for the three months ended September 30, 2023, under IFRS. A copy of such financial statements is attached to this Form 6K as Item 99.3.
We filed with stock exchanges in India a statement of statutorily audited consolidated financial results for the three months ended September 30, 2023, under IFRS. A copy of such financial statements is attached to this Form 6K as Item 99.4.
We filed with stock exchanges in India a datasheet containing operating metrics for the quarter ended September 30, 2023. A copy of such data sheet is attached to this Form 6-K as Item 99.5.
SIGNATURES
Pursuant to the requirements of the Securities Exchange Act of 1934, the registrant has duly caused this report to be signed on its behalf by the undersigned, thereunto duly organized.
| WIPRO LIMITED | ||
| By: | /s/ Aparna Chandrashekar Iyer |
|
| Aparna Chandrashekar Iyer | ||
| Chief Financial Officer | ||
| Dated: October 23, 2023 | ||
INDEX TO EXHIBITS
| Item | ||
| 99.1 | IFRS Press Release | |
| 99.2 | Form of Advertisement Placed in Indian Newspapers | |
| 99.3 | Consolidated Interim Financial Statements under IFRS | |
| 99.4 | Statutorily Audited Consolidated Financial Results filed with stock exchanges in India | |
| 99.5 | Data sheet containing operating metrics filed with stock exchanges in India | |
Exhibit 99.1
FOR IMMEDIATE RELEASE

Wipro Announces Results for the Quarter-Ended September 30, 2023
Large deal bookings reach $1.3 billion, an increase of 79% YoY and 6% QoQ
Total bookings of $3.8 billion, mark a 6% YoY increase
IT services segment EBIT increases 6% YoY. EPS increases 4.1% YoY
Operating cash flows at 145% of net income
EAST BRUNSWICK, N.J. | BANGALORE, India – October 18, 2023: Wipro Limited (NYSE: WIT, BSE: 507685, NSE: WIPRO), a leading technology services and consulting company, announced financial results under International Financial Reporting Standards (IFRS) for the quarter-ended September 30, 2023.
Highlights of the Results
Results for the Quarter ended September 30, 2023:
| 1. | Gross revenue reached ₹225.2 billion ($2.7 billion1), a decrease of 0.1% YoY. |
| 2. | IT services segment revenue was at $2,713.3 million, a decrease of 2.3% QoQ. |
| 3. | Non-GAAP2 constant currency IT Services segment revenue decreased 2.0% QoQ. |
| 4. | Total bookings3 was at $3.8 billion, up by 6% YoY and large deal bookings4 was at $1.3 billion, up by 79.0% YoY. |
| 5. | IT services segment EBIT for the quarter was ₹36.1 billion ($434.0 million1), an increase of 6% YoY. |
| 6. | IT services operating margin5 for the quarter was at 16.1%, up 10 bps QoQ and 100 bps YoY. |
| 7. | Earnings per share for the quarter was at ₹5.06 ($0.061), an increase of 4.1% YoY. |
| 8. | Net income for the quarter was at ₹26.5 billion ($318.5 million1), a decrease of 0.5% YoY. |
| 9. | Operating cash flows at 145% of Net Income for the quarter was at ₹38.6 billion ($465.0 million1). |
| 10. | Voluntary attrition6 has continued to moderate QoQ, coming in at 9-quarter low of 13.4% in Q2’24. |
Outlook for the Quarter ending December 31, 2023
We expect revenue from our IT Services business segment to be in the range of $2,617 million to $2,672 million*. This translates to sequential guidance of -3.5% to -1.5% in constant currency terms.
| * | Outlook for the Quarter ending December 31, 2023, is based on the following exchange rates: GBP/USD at 1.26, Euro/USD at 1.09, AUD/USD at 0.66, USD/INR at 82.70 and CAD/USD at 0.74 |
1
Performance for the Quarter ended September 30, 2023
“We continue to win in the market despite the uncertain macro environment,” said Thierry Delaporte, CEO and Managing Director. “We ended the second quarter with 22 accounts above the $100M range, which is double the number we had in FY’21. Our large deal total contract value reached $1.3 billion—highest in the last nine quarters.”
“Against a challenging environment, we continue to take the bold decisions needed to realize our long-term ambitions. We are investing in our technology infrastructure and streamlining our operations and delivery to drive profitable growth. We are training and reskilling our people so they can be ready for an AI-driven future. The investments we made in our ai360 strategy are helping us realize significant efficiencies across our organization and creating an early leadership position in this fast-evolving space. We are confident that these investments will keep us resilient and competitive in an ever shifting business and economic landscape.”
Aparna C. Iyer, Chief Financial Officer, said, “We remain focused on profitable growth despite a challenging market. Our disciplined approach to improve efficiency, productivity and utilization has led to an increase of 100 bps YoY in our IT services operating margins. Our absolute IT services segment EBIT grew 6% YoY. We generated strong operating cash flow of 145% of net income for the quarter.”
IT Products
| 1. | IT Products segment revenue for the quarter was ₹1.47 billion ($17.7 million1) |
| 2. | IT Products segment results for the quarter was a loss of ₹0.47 billion ($5.6 million1) |
Please refer to the table on page 11 for reconciliation between IFRS IT Services Revenue and IT Services Revenue on a non-GAAP constant currency basis.
| 1. | For the convenience of the readers, the amounts in Indian Rupees in this release have been translated into United States Dollars at the certified foreign exchange rate of US$1 = ₹83.08, as published by the Federal Reserve Board of Governors on September 30, 2023. However, the realized exchange rate in our IT Services business segment for the quarter ended September 30, 2023, was US$1= ₹82.54 |
| 2. | Constant currency for a period is the product of volumes in that period times the average actual exchange rate of the corresponding comparative period. |
| 3. | Total Bookings refers to the total contract value of all orders that were booked during the period including new orders, renewals, and increases to existing contracts. Bookings do not reflect subsequent terminations or reductions related to bookings originally recorded in prior fiscal periods. Bookings are recorded using then-existing foreign currency exchange rates and are not subsequently adjusted for foreign currency exchange rate fluctuations. The revenues from these contracts accrue over the tenure of the contract. For constant currency growth rates, refer note 2. |
| 4. | Large deal bookings consist of deals greater than or equal to $30 million in total contract value. |
| 5. | IT Services Operating Margin refers to Segment Results Total as reflected in IFRS financials. |
| 6. | Voluntary attrition is in IT Services computed on a quarterly annualised basis and excludes DOP. |
| 7. | Effective April 1, 2023, we merged our ISRE segment with our IT Services segment. The YoY growth rates for the quarter ended September 30, 2023 were computed by rebase lining Q2’23 numbers. |
2
Highlights of Strategic Deal Wins
In the second quarter, Wipro continued to win large and strategic deals across industries. Key highlights include:
| 1. | US-based multinational clothing company has selected Wipro to accelerate digital innovation, drive business growth, and enhance long term profitability. Leveraging its expertise in Generative AI, Cloud transformation, and Intelligent Automation, Wipro will help the client optimize current global operations and provide scale for new lines of business. The deal will include a range of services including application support, analytics, cybersecurity, automation, and consulting with the goal of driving improved process maturity, faster incident resolution, and better time to market for the client. |
| 2. | A global leader in technology has selected Wipro for comprehensive silicon engineering services from chip definition to design verification to tapeout. Wipro will provide services for the client’s broad portfolio of products including end point management, observability, and cloud. This strategic partnership will provide the client with increased speed-to-market of their products, improve their reliability, and reduce their total cost of ownership. |
| 3. | An American food service distributor has selected Wipro to undertake a multi-year IT transformation and modernization project. The Wipro team worked with the client to increase cloud usage by up to 80% through native development of several business-critical applications. This included building a cloud enablement platform, creating a transformation blueprint, and setting up a Project Management Office to manage the client’s cloud and IT estate transformation. In addition, Wipro also setup an internal academy to perform a skill gap analysis and provide additional resource training across the business. The client has so far seen a cost reduction of up to 15%, as well as additional savings through marketplace optimization, increased customer satisfaction, and a more scalable operation. |
| 4. | A multinational consumer electronics company selected Wipro to improve their overall customer experience. To achieve this, the Wipro team created a cross-functional customer service transformation program with bespoke analytics and reporting. The project also included automated visualization of performance management, fraud prevention, and gamified learning and training modules for client-facing staff. This program will increase Net Promoter Scores (NPS), improve customer service agent knowledge, and reduce average call times. |
| 5. | Wipro was selected by a global leader in medical technology, services, and solutions to enhance its service desk and improve its employee experience. Wipro developed a bespoke Global IT Service Desk solution, with significant AI-led automation and self-service capabilities including self-help content development and delivery. The solution will be integrated into existing critical systems and will deliver a cost reduction of up to 30%. |
| 6. | One of the largest energy and utilities companies in Brazil has selected Wipro to modernize their billing process. Wipro will implement and support this transformation covering everything from billing to analytics, leveraging cloud infrastructure to streamline the client’s operations. The client can expect a more resilient billing management platform, cost reduction, as well as alignment with their sustainability goals as the process will be paperless. |
3
| 7. | A video hosting platform has selected Wipro to deploy a unique Quality-as-a-Service solution to help improve the client’s overall end-user experience, retention, and revenue. Wipro will build a customised assessment framework to audit and analyse the interactions between employees and end-users. This will provide actionable insights and recommendations that will improve audit completion, internal and customer experience, as well as operational efficiency. |
| 8. | A global technology company has selected Wipro to deliver high-quality digital designs to enhance their manufacturing process. Through the Technology Excellence Center model, Wipro Engineering Edge will implement hardware design verification for multiple business units in a cost-effective, scalable, and efficient manner. This will lead to a 20-25% reduction in total cost, faster time-to-market, high-quality delivery, and the ability to scale. |
| 9. | A leading workplace pension provider in the UK has selected Wipro to provide regulated Pensions Administration and Technology Services to the member of its Defined Contribution (DC) Pensions book. Through this engagement, the client will see enhanced member experience, faster time to market for new products, and significant cost reduction, while supporting 15% year-on-year business growth. |
| 10. | A North American financial institution has selected Wipro to digitize and streamline its loan origination systems and deliver a consistent omni-channel experience to its end-users. NetOxygen, Wipro’s award-winning enterprise loan origination solution, will improve the lending process through automation and cloud technology. This will ensure compliance and information security, as well as fully integrated bilingual support (in French and English). The client will see a reduction in their cost-per-loan of up to 30% and can expect an increase of up to 80% in digital self-generation loan requests. |
Analyst Recognition
| 1. | Wipro was positioned as a Leader in the 2023 Gartner® Magic Quadrant™ for Public Cloud IT Transformation Services |
| 2. | Wipro was rated a Leader in Everest Group’s Digital Twin Services PEAK Matrix® Assessment 2023 |
| 3. | Wipro was recognized as a Leader in ISG Provider Lens™ – Cybersecurity—Solutions and Services 2023—US, UK, France, Nordics (multiple quadrants) |
| 4. | Wipro was rated as a Leader in ISG Provider Lens™ – Google Cloud Partner Ecosystem 2023—US & Europe (all quadrants) |
| 5. | Wipro was rated as a Leader in Avasant’s High-Tech Industry Digital Services RadarView™ 2023—2024 |
| 6. | Wipro was positioned a Leader in Everest Group’s Oracle Cloud Applications Services PEAK Matrix® Assessment 2023 |
| 7. | Wipro was featured as a Leader in ISG Provider Lens™ – Retail & CPG Services 2023—US & Europe (all quadrants) |
| 8. | Wipro was recognized as a Leader in ISG Provider Lens™ – Customer Experience Services 2023—Europe (multiple quadrants) & US (Digital Operations) |
| 9. | Wipro was rated as a Leader in Whitelane’s IT Sourcing Study 2023—Switzerland |
| 10. | Wipro was featured as a Leader in Avasant’s Application Modernization Services RadarView™ 2023 |
| 11. | Wipro was recognized a Leader in Everest Group’s Network Transformation and Managed Services PEAK Matrix® Assessment – System Integrators (SIs) 2023 |
4
| 12. | Wipro was recognized as a Leader in Avasant’s Canada Digital and IT Services RadarView™ 2023—2024 |
Source & Disclaimer: *Gartner, “Magic Quadrant for Public Cloud IT Transformation Services”, Mark Ray, et al, 16 August 2023.
GARTNER is a registered trademark and service mark of Gartner, Inc. and/or its affiliates in the U.S. and internationally, and MAGIC QUADRANT is a registered trademark of Gartner, Inc. and/or its affiliates and are used herein with permission. All rights reserved.
Gartner does not endorse any vendor, product, or service depicted in its research publications, and does not advise technology users to select only those vendors with the highest ratings or other designation. Gartner’s research publications consist of the opinions of Gartner’s research organization and should not be construed as statements of fact. Gartner disclaims all warranties, expressed or implied, with respect to this research, including any warranties of merchantability or fitness for a particular purpose.
The Gartner content described herein (the “Gartner Content”) represents research opinion or viewpoints published, as part of a syndicated subscription service, by Gartner, Inc. (“Gartner”), and is not a representation of fact. Gartner Content speaks as of its original publication date (and not as of the date of this [type of filing]), and the opinions expressed in the Gartner Content are subject to change without notice.
About Key Metrics and Non-GAAP Financial Measures
This press release contains key metrics and non-GAAP financial measures within the meaning of Regulation G and Item 10(e) of Regulation S-K. Such non-GAAP financial measures are measures of our historical or future performance, financial position or cash flows that are adjusted to exclude or include amounts that are excluded or included, as the case may be, from the most directly comparable financial measure calculated and presented in accordance with IFRS.
The table on page 11 provides IT Services Revenue on a constant currency basis, which is a non-GAAP financial measure that is calculated by translating IT Services Revenue from the current reporting period into U.S. dollars based on the currency conversion rate in effect for the prior reporting period. We refer to growth rates in constant currency so that business results may be viewed without the impact of fluctuations in foreign currency exchange rates, thereby facilitating period-to-period comparisons of our business performance. Further, in the normal course of business, we may divest a portion of our business which may not be strategic. We refer to the growth rates in both reported and constant currency adjusting for such divestments in order to represent the comparable growth rates.
Our key metrics and non-GAAP financial measures are not based on any comprehensive set of accounting rules or principles and should not be considered a substitute for, or superior to, the most directly comparable financial measure calculated in accordance with IFRS and may be different from non-GAAP measures used by other companies. Our key metrics and non-GAAP financial measures are not comparable to, nor should be substituted for, an analysis of our revenue over time and involve estimates and judgments. In addition to our non-GAAP measures, the financial statements prepared in accordance with IFRS and the reconciliation of these non-GAAP financial measures with the most directly comparable IFRS financial measure should be carefully evaluated.
Results for the Quarter ended September 30, 2023, prepared under IFRS, along with individual business segment reports, are available in the Investors section of our website www.wipro.com/investors/ We will hold an earnings conference call today at 07:00 p.m. Indian Standard Time (9:30 a.m. U.S. Eastern Time) to discuss our performance for the quarter. The audio from the conference call will be available online through a webcast and can be accessed at the following link- https://links.ccwebcast.com/?EventId=WIP181023
5
Quarterly Conference Call
An audio recording of the management discussions and the question-and-answer session will be available online and will be accessible in the Investor Relations section of our website at www.wipro.com
About Wipro Limited
Wipro Limited (NYSE: WIT, BSE: 507685, NSE: WIPRO) is a leading technology services and consulting company focused on building innovative solutions that address clients’ most complex digital transformation needs. Leveraging our holistic portfolio of capabilities in consulting, design, engineering, and operations, we help clients realize their boldest ambitions and build future-ready, sustainable businesses. With nearly 245,000 employees and business partners across 65 countries, we deliver on the promise of helping our clients, colleagues, and communities thrive in an ever-changing world. For additional information, visit us at www.wipro.com
| Contact for Investor Relations | Contact for Media & Press | |||
| Dipak Kumar Bohra | Abhishek Jain | |||
| Phone: +91-80-6142 7201 | Phone: +91-80-6142 6143 | Phone: +91-80-6142 6450 | ||
| dipak.bohra@wipro.com | abhishek.jain2@wipro.com | media-relations@wipro.com | ||
Forward-Looking Statements
The forward-looking statements contained herein represent Wipro’s beliefs regarding future events, many of which are by their nature, inherently uncertain and outside Wipro’s control. Such statements include, but are not limited to, statements regarding Wipro’s growth prospects, its future financial operating results, the benefits its customers experience and its plans, expectations and intentions. Wipro cautions readers that the forward-looking statements contained herein are subject to risks and uncertainties that could cause actual results to differ materially from the results anticipated by such statements. Such risks and uncertainties include, but are not limited to, risks and uncertainties regarding fluctuations in our earnings, revenue and profits, our ability to generate and manage growth, complete proposed corporate actions, intense competition in IT services, our ability to maintain our cost advantage, wage increases in India, our ability to attract and retain highly skilled professionals, time and cost overruns on fixed-price, fixed-time frame contracts, client concentration, restrictions on immigration, our ability to manage our international operations, reduced demand for technology in our key focus areas, disruptions in telecommunication networks, our ability to successfully complete and integrate potential acquisitions, liability for damages on our service contracts, the success of the companies in which we make strategic investments, withdrawal of fiscal governmental incentives, political instability, war, legal restrictions on raising capital or acquiring companies outside India, unauthorized use of our intellectual property and general economic conditions affecting our business and industry.
Additional risks that could affect our future operating results are more fully described in our filings with the United States Securities and Exchange Commission, including, but not limited to, Annual Reports on Form 20-F. These filings are available at www.sec.gov. We may, from time to time, make additional written and oral forward-looking statements, including statements contained in the company’s filings with the Securities and Exchange Commission and our reports to shareholders. We do not undertake to update any forward-looking statement that may be made from time to time by us or on our behalf.
# # #
(Tables to follow)
6
WIPRO LIMITED AND SUBSIDIARIES
INTERIM CONDENSED CONSOLIDATED STATEMENT OF FINANCIAL POSITION
(₹ in millions, except share and per share data, unless otherwise stated)
| As at March 31, 2023 |
As at September 30, 2023 | |||||||||||
| Convenience translation into US dollar in millions Refer footnote in page 2 |
||||||||||||
| ASSETS |
||||||||||||
| Goodwill |
307,970 | 309,732 | 3,728 | |||||||||
| Intangible assets |
43,045 | 38,109 | 459 | |||||||||
| Property, plant and equipment |
88,659 | 83,086 | 1,000 | |||||||||
| Right-of-Use assets |
18,702 | 17,043 | 205 | |||||||||
| Financial assets |
||||||||||||
| Derivative assets |
29 | 151 | 2 | |||||||||
| Investments |
20,720 | 21,629 | 260 | |||||||||
| Trade receivables |
863 | 872 | 10 | |||||||||
| Other financial assets |
6,330 | 5,973 | 72 | |||||||||
| Investments accounted for using the equity method |
780 | 761 | 9 | |||||||||
| Deferred tax assets |
2,100 | 2,219 | 27 | |||||||||
| Non-current tax assets |
11,922 | 10,878 | 131 | |||||||||
| Other non-current assets |
13,606 | 10,834 | 130 | |||||||||
|
|
|
|
|
|
|
|||||||
| Total non-current assets |
514,726 | 501,287 | 6,033 | |||||||||
|
|
|
|
|
|
|
|||||||
| Inventories |
1,188 | 1,281 | 15 | |||||||||
| Financial assets |
||||||||||||
| Derivative assets |
1,844 | 1,999 | 24 | |||||||||
| Investments |
309,232 | 239,847 | 2,887 | |||||||||
| Cash and cash equivalents |
91,880 | 97,896 | 1,178 | |||||||||
| Trade receivables |
126,350 | 108,146 | 1,302 | |||||||||
| Unbilled receivables |
60,515 | 65,292 | 786 | |||||||||
| Other financial assets |
9,096 | 9,155 | 110 | |||||||||
| Contract assets |
23,001 | 24,464 | 295 | |||||||||
| Current tax assets |
5,091 | 5,017 | 60 | |||||||||
| Other current assets |
32,899 | 31,946 | 385 | |||||||||
|
|
|
|
|
|
|
|||||||
| Total current assets |
661,096 | 585,043 | 7,042 | |||||||||
|
|
|
|
|
|
|
|||||||
| TOTAL ASSETS |
1,175,822 | 1,086,330 | 13,075 | |||||||||
|
|
|
|
|
|
|
|||||||
| EQUITY |
||||||||||||
| Share capital |
10,976 | 10,444 | 126 | |||||||||
| Share premium |
3,689 | 1,732 | 21 | |||||||||
| Retained earnings |
660,964 | 577,487 | 6,951 | |||||||||
| Share-based payment reserve |
5,632 | 6,023 | 72 | |||||||||
| Special Economic Zone re-investment reserve |
46,803 | 44,941 | 541 | |||||||||
| Other components of equity |
53,100 | 58,284 | 702 | |||||||||
|
|
|
|
|
|
|
|||||||
| Equity attributable to the equity holders of the Company |
781,164 | 698,911 | 8,413 | |||||||||
| Non-controlling interests |
589 | 823 | 10 | |||||||||
|
|
|
|
|
|
|
|||||||
| TOTAL EQUITY |
781,753 | 699,734 | 8,423 | |||||||||
|
|
|
|
|
|
|
|||||||
| LIABILITIES |
||||||||||||
| Financial liabilities |
||||||||||||
| Loans and borrowings |
61,272 | 61,971 | 746 | |||||||||
| Lease liabilities |
15,953 | 14,796 | 178 | |||||||||
| Derivative liabilities |
179 | 40 | ^ | |||||||||
| Other financial liabilities |
2,649 | 1,609 | 19 | |||||||||
| Deferred tax liabilities |
15,153 | 15,315 | 184 | |||||||||
| Non-current tax liabilities |
21,777 | 26,048 | 314 | |||||||||
| Other non-current liabilities |
9,333 | 11,025 | 133 | |||||||||
| Provisions |
^ | — | — | |||||||||
|
|
|
|
|
|
|
|||||||
| Total non-current liabilities |
126,316 | 130,804 | 1,574 | |||||||||
|
|
|
|
|
|
|
|||||||
| Financial liabilities |
||||||||||||
| Loans, borrowings and bank overdrafts |
88,821 | 94,060 | 1,132 | |||||||||
| Lease liabilities |
8,620 | 8,348 | 100 | |||||||||
| Derivative liabilities |
2,825 | 1,582 | 19 | |||||||||
| Trade payables and accrued expenses |
89,054 | 78,857 | 949 | |||||||||
| Other financial liabilities |
4,141 | 2,712 | 33 | |||||||||
| Contract liabilities |
22,682 | 16,738 | 201 | |||||||||
| Current tax liabilities |
18,846 | 21,372 | 257 | |||||||||
| Other current liabilities |
30,215 | 29,873 | 360 | |||||||||
| Provisions |
2,549 | 2,250 | 27 | |||||||||
|
|
|
|
|
|
|
|||||||
| Total current liabilities |
267,753 | 255,792 | 3,078 | |||||||||
|
|
|
|
|
|
|
|||||||
| TOTAL LIABILITIES |
394,069 | 386,596 | 4,652 | |||||||||
|
|
|
|
|
|
|
|||||||
| TOTAL EQUITY AND LIABILITIES |
1,175,822 | 1,086,330 | 13,075 | |||||||||
|
|
|
|
|
|
|
|||||||
| ^ | Value is less than 1 |
7
WIPRO LIMITED AND SUBSIDIARIES
INTERIM CONDENSED CONSOLIDATED STATEMENT OF INCOME
(₹ in millions, except share and per share data, unless otherwise stated)
| Three months ended September 30, | Six months ended September 30, | |||||||||||||||||||||||
| 2022 | 2023 | 2023 | 2022 | 2023 | 2023 | |||||||||||||||||||
| Convenience translation into US dollar in millions Refer footnote in page 2 |
Convenience translation into US dollar in millions Refer footnote in page 2 |
|||||||||||||||||||||||
| Revenues |
225,397 | 225,159 | 2,710 | 440,683 | 453,469 | 5,458 | ||||||||||||||||||
| Cost of revenues |
(163,835 | ) | (159,191 | ) | (1,916 | ) | (319,435 | ) | (320,452 | ) | (3,857 | ) | ||||||||||||
|
|
|
|
|
|
|
|
|
|
|
|
|
|||||||||||||
| Gross profit |
61,562 | 65,968 | 794 | 121,248 | 133,017 | 1,601 | ||||||||||||||||||
| Selling and marketing expenses |
(15,140 | ) | (18,767 | ) | (226 | ) | (30,499 | ) | (35,351 | ) | (426 | ) | ||||||||||||
| General and administrative expenses |
(14,976 | ) | (14,124 | ) | (170 | ) | (28,447 | ) | (30,011 | ) | (361 | ) | ||||||||||||
| Foreign exchange gains/(losses), net |
1,057 | 268 | 3 | 2,091 | 206 | 2 | ||||||||||||||||||
|
|
|
|
|
|
|
|
|
|
|
|
|
|||||||||||||
| Results from operating activities |
32,503 | 33,345 | 401 | 64,393 | 67,861 | 816 | ||||||||||||||||||
| Finance expenses |
(2,270 | ) | (3,033 | ) | (37 | ) | (4,315 | ) | (6,119 | ) | (74 | ) | ||||||||||||
| Finance and other income |
4,040 | 4,810 | 58 | 7,730 | 11,352 | 137 | ||||||||||||||||||
| Share of net profit/ (loss) of associates accounted for using the equity method |
(72 | ) | (30 | ) | ^ | (87 | ) | (27 | ) | ^ | ||||||||||||||
|
|
|
|
|
|
|
|
|
|
|
|
|
|||||||||||||
| Profit before tax |
34,201 | 35,092 | 422 | 67,721 | 73,067 | 879 | ||||||||||||||||||
| Income tax expense |
(7,710 | ) | (8,419 | ) | (101 | ) | (15,641 | ) | (17,534 | ) | (211 | ) | ||||||||||||
|
|
|
|
|
|
|
|
|
|
|
|
|
|||||||||||||
| Profit for the period |
26,491 | 26,673 | 321 | 52,080 | 55,533 | 668 | ||||||||||||||||||
|
|
|
|
|
|
|
|
|
|
|
|
|
|||||||||||||
| Profit attributable to: |
||||||||||||||||||||||||
| Equity holders of the Company |
26,590 | 26,463 | 318 | 52,226 | 55,164 | 664 | ||||||||||||||||||
| Non-controlling interests |
(99 | ) | 210 | 3 | (146 | ) | 369 | 4 | ||||||||||||||||
|
|
|
|
|
|
|
|
|
|
|
|
|
|||||||||||||
| Profit for the period |
26,491 | 26,673 | 321 | 52,080 | 55,533 | 668 | ||||||||||||||||||
|
|
|
|
|
|
|
|
|
|
|
|
|
|||||||||||||
| Earnings per equity share: |
||||||||||||||||||||||||
| Attributable to equity holders of the Company |
||||||||||||||||||||||||
| Basic |
4.86 | 5.06 | 0.06 | 9.55 | 10.30 | 0.12 | ||||||||||||||||||
| Diluted |
4.85 | 5.04 | 0.06 | 9.52 | 10.27 | 0.12 | ||||||||||||||||||
| Weighted average number of equity shares used in computing earnings per equity share |
||||||||||||||||||||||||
| Basic |
5,476,167,685 | 5,232,867,366 | 5,232,867,366 | 5,473,962,200 | 5,357,394,940 | 5,357,394,940 | ||||||||||||||||||
| Diluted |
5,484,785,054 | 5,245,641,198 | 5,245,641,198 | 5,486,081,940 | 5,370,078,563 | 5,370,078,563 | ||||||||||||||||||
| ^ | Value is less than 1 |
8
Additional Information:
| Particulars |
Three months ended | Six months ended | Year ended | |||||||||||||||||||||
| September 30, 2023 |
June 30, 2023 |
September 30, 2022 |
September 30, 2023 |
September 30, 2022 |
March 31, 2023 |
|||||||||||||||||||
| Audited | Audited | Audited | Audited | Audited | Audited | |||||||||||||||||||
| Segment revenue |
||||||||||||||||||||||||
| IT Services |
||||||||||||||||||||||||
| Americas 1 |
66,813 | 65,607 | 65,350 | 132,420 | 127,052 | 261,270 | ||||||||||||||||||
| Americas 2 |
66,914 | 68,303 | 70,030 | 135,217 | 136,643 | 278,374 | ||||||||||||||||||
| Europe |
63,976 | 67,134 | 62,684 | 131,110 | 122,960 | 256,845 | ||||||||||||||||||
| APMEA |
26,255 | 26,510 | 27,141 | 52,765 | 52,924 | 106,812 | ||||||||||||||||||
|
|
|
|
|
|
|
|
|
|
|
|
|
|||||||||||||
| Total of IT Services |
223,958 | 227,554 | 225,205 | 451,512 | 439,579 | 903,301 | ||||||||||||||||||
| IT Products |
1,469 | 694 | 1,249 | 2,163 | 3,195 | 6,047 | ||||||||||||||||||
|
|
|
|
|
|
|
|
|
|
|
|
|
|||||||||||||
| Total segment revenue |
225,427 | 228,248 | 226,454 | 453,675 | 442,774 | 909,348 | ||||||||||||||||||
|
|
|
|
|
|
|
|
|
|
|
|
|
|||||||||||||
| Segment result |
||||||||||||||||||||||||
| IT Services |
||||||||||||||||||||||||
| Americas 1 |
15,287 | 13,537 | 12,954 | 28,824 | 24,524 | 51,555 | ||||||||||||||||||
| Americas 2 |
14,023 | 14,169 | 14,959 | 28,192 | 28,183 | 59,689 | ||||||||||||||||||
| Europe |
7,547 | 9,968 | 8,454 | 17,515 | 16,440 | 37,667 | ||||||||||||||||||
| APMEA |
2,985 | 2,800 | 2,670 | 5,785 | 4,739 | 10,681 | ||||||||||||||||||
| Unallocated |
(3,784 | ) | (3,957 | ) | (5,090 | ) | (7,741 | ) | (7,934 | ) | (18,368 | ) | ||||||||||||
|
|
|
|
|
|
|
|
|
|
|
|
|
|||||||||||||
| Total of IT Services |
36,058 | 36,517 | 33,947 | 72,575 | 65,952 | 141,224 | ||||||||||||||||||
| IT Products |
(467 | ) | (161 | ) | (103 | ) | (628 | ) | (158 | ) | (176 | ) | ||||||||||||
| Reconciling Items |
(2,246 | ) | (1,840 | ) | (1,341 | ) | (4,086 | ) | (1,401 | ) | (1,442 | ) | ||||||||||||
|
|
|
|
|
|
|
|
|
|
|
|
|
|||||||||||||
| Total segment result |
33,345 | 34,516 | 32,503 | 67,861 | 64,393 | 139,606 | ||||||||||||||||||
|
|
|
|
|
|
|
|
|
|
|
|
|
|||||||||||||
| Finance expenses |
(3,033 | ) | (3,086 | ) | (2,270 | ) | (6,119 | ) | (4,315 | ) | (10,077 | ) | ||||||||||||
| Finance and other Income |
4,810 | 6,542 | 4,040 | 11,352 | 7,730 | 18,185 | ||||||||||||||||||
| Share of net profit/ (loss) of associates accounted for using the equity method |
(30 | ) | 3 | (72 | ) | (27 | ) | (87 | ) | (57 | ) | |||||||||||||
|
|
|
|
|
|
|
|
|
|
|
|
|
|||||||||||||
| Profit before tax |
35,092 | 37,975 | 34,201 | 73,067 | 67,721 | 147,657 | ||||||||||||||||||
|
|
|
|
|
|
|
|
|
|
|
|
|
|||||||||||||
9
Effective April 1, 2023, we merged our India State Run Enterprise segment (“ISRE”) with our IT Services segment. Currently, the Company is organized into the following operating segments: IT Services and IT Products.
IT Services: As announced on November 12, 2020, effective January 1, 2021, we re-organized our IT Services segment into four Strategic Market Units (“SMUs”)—Americas 1, Americas 2, Europe and Asia Pacific Middle East Africa (“APMEA”).
Americas 1 and Americas 2 are primarily organized by industry sector, while Europe and APMEA are organized by countries.
Americas 1 includes Healthcare and Medical Devices, Consumer Goods and Lifesciences, Retail, Transportation and Services, Communications, Media and Information services, Technology Products and Platforms, in the United States of America and entire business of Latin America (“LATAM”). Americas 2 includes Banking, Financial Services and Insurance, Manufacturing, Hi-tech, Energy and Utilities industry sectors in the United States of America and entire business of Canada. Europe consists of United Kingdom and Ireland, Switzerland, Germany, Benelux, Nordics and Southern Europe. APMEA consists of Australia and New Zealand, India, Middle East, South East Asia, Japan and Africa.
IT Products: The Company is a value-added reseller of desktops, servers, notebooks, storage products, networking solutions and packaged software for leading international brands. In certain total outsourcing contracts of the IT Services segment, the Company delivers hardware, software products and other related deliverables. Revenue relating to the above items is reported as revenue from the sale of IT Products.
10
Reconciliation of selected GAAP measures to Non-GAAP measures
Reconciliation of Non-GAAP Constant Currency IT Services Revenue to IT Services Revenue as per IFRS ($Mn)
Three Months ended September 30, 2023
| IT Services Revenue as per IFRS |
$ | 2,713.3 | ||
| Effect of Foreign currency exchange movement |
$ | 10.0 | ||
|
|
|
|||
| Non-GAAP Constant Currency IT Services Revenue based on previous quarter exchange rates |
$ | 2,723.3 |
Three Months ended September 30, 2023
| IT Services Revenue as per IFRS |
$ | 2,713.3 | ||
| Effect of Foreign currency exchange movement |
$ | (29.7 | ) | |
|
|
|
|||
| Non-GAAP Constant Currency IT Services Revenue based on exchange rates of comparable period in previous year |
$ | 2,683.6 |
Reconciliation of Free Cash Flow for three months and six months ended September 30, 2023
| Amount in INR Mn | ||||||||
| Three months ended September 30, 2023 |
Six months ended September 30, 2023 |
|||||||
| Net Income for the period [A] |
26,673 | 55,533 | ||||||
| Computation of Free Cash Flow |
||||||||
| Net cash generated from operating activities [B] |
38,633 | 76,146 | ||||||
| Add/ (deduct) cash inflow/ (outflow) on: |
||||||||
| Purchase of property, plant and equipment |
(1,975 | ) | (4,184 | ) | ||||
| Proceeds from sale of property, plant and equipment |
3,193 | 4,223 | ||||||
|
|
|
|
|
|||||
| Free Cash Flow [C] |
39,851 | 76,185 | ||||||
|
|
|
|
|
|||||
| Operating Cash Flow as percentage of Net Income [B/A] |
144.8 | % | 137.1 | % | ||||
|
|
|
|
|
|||||
| Free Cash Flow as percentage of Net Income [C/A] |
149.4 | % | 137.2 | % | ||||
|
|
|
|
|
|||||
11
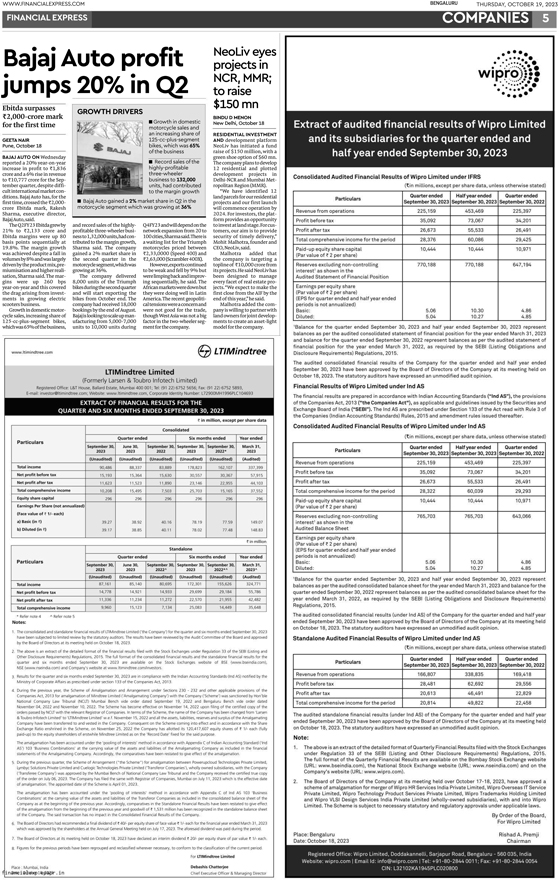
WWW.FINANCIALEXPRESS.COM BENGALURU THURSDAY, OCTOBER 19, 2023 FINANCIAL EXPRESS COMPANIES 5 Bajaj Auto profit jumps 20% in Q2 Ebitda surpasses 2,000-crore mark for the first time GROWTH DRIVERS GEETA NAIR Pune, October 18 BAJAJ AUTO ON Wednesday reported a 20%year-on-year increase in profit to 1,836 crore and a 6% rise in revenue to 10,777 crore for the September quarter, despite difficult international market conditions. Bajaj Auto has, for the first time, crossed the 2,000- crore Ebitda mark, Rakesh Sharma, executive director, BajajAuto,said. The Q2FY23 Ebitda grewby 21% to 2,133 crore and Ebitda margins were up 80 basis points sequentially at 19.8%. The margin growth was achieved despite a fall in volumes by 8% and was largely driven by the product mix,pre- miumisation and higher realisation, Sharma said. The margins were up 260 bps year-on-year and this covered the drag arising from investments in growing electric scooters business. Growth in domestic motorcycle sales, increasing share of 125-cc-plus-segment bikes, which was 65% of the business, Growth in domestic motorcycle sales and an increasing share of 125-cc-plus-segment bikes, which was 65% ofthe business Record sales ofthe highly-profitable three-wheeler business to 132,000 units, had contributed to the margin growth NeoLiv eyes projects in NCR, MMR; to raise $150 mn BINDU D MENON New Delhi, October 18 wiproyj . wvwv. I Li rti i nd tr ee.Co rn Bajaj Auto gained a 2% market share in Q2 in the motorcycle segment which was growing at 36% and record sales of the highly- profitable three-wheeler business to 1,32,000 units,had contributed to the margin growth, Sharma said. The company gained a 2% market share in the second quarter in the motorcycle segment,whichwas growingat36%. The company delivered 8,000 units of the Triumph bikes duringthe second quarter and will start exporting the bikes from October end. The company had received 18,000 bookings bythe end ofAugust. Bajaj is looking to scale up manufacturing from 5,000-7,000 units to 10,000 units during Q4FY2 3 andwill depend on the network expansion from 20 to 100 cities, Sharma said.There is awaiting list for the Triumph motorcycles priced between ^2,33,0000 (Speed 400) and ^2,63,000 (Scrambler400x). However,exports continued to be weak and fell by 9% but were limpingbackand improving sequentially, he said. The African marketswere downbut they were doing well in Latin America.The recent geopolitical tensions were a concern and were not good for the trade, though West Asia was not a big factor in the two-wheeler segment for the company. RESIDENTIAL INVESTMENT AND development platform NeoLiv has initiated a fund raise of $150 million, with a green shoe option of $60 mn. The company plans to develop 12 residential and plotted development projects in Delhi-NCR and Mumbai Metropolitan Region (MMR). “We have identified 12 land parcels for our residential projects and our first launch will commence operation by 2024. For investors, the platform provides an opportunity to invest at land stage. For customers, our aim is to provide security of timely delivery,” Mohit Malhotra, founder and CEO, NeoLiv, said. Malhotra added that the company is targeting a topline of ^10,000 crore from its projects. He said NeoLivhas been designed to manage every facet of real estate pro- jects.”We expect to make the first close from the AIF by the end of this year,” he said. Malhotra added the com- panyiswillingto partnerwith land owners for joint developments to create an asset-light model for the company. Extract of audited financial results of Wipro Limited and its subsidiaries for the quarter ended and half year ended September 30,2023 Consolidated Audited Financial Results of Wipro Limited under IFRS (Tin millions, except per share data, unless otherwise stated) Particulars Quarter ended September 30h 2023 Half ye ar ended September 30,2023 Quarter ended September 30,2022 Revenue from operations 225,15& 453,469 225,397 Profit before tax 35,092 73,067 34,201 Profit after tax 25,673 55,533 26,491 Total comprehensive income for the period 28,376 60,086 29,425 Paid-up equity share capital (Par value of 2 per share) 10.444 10,444 10,971 Reserves excluding non-controlling interest1 as shown in the Audited Statement of Financial Position 770,188 770,188 647,194 Earnings per equity share (Par value of 2 per share) (EPS for quarter ended and half year ended periods is not annualized) Basic: Diluted: 5.06 5.04 10.30 10.27 4.86 4.85 LTIMindtree LTIMindtree Limited (Formerly Larsen & Toubro Infotech Limited) Req stored Office; L£T House. Ballard Estate, Mu mt 3- 400 001; Tel: (91 22) 6752 5656; Fax: (91 22) 6752 5S93P E-mail Tivestor :i mi nd tree, corn; Weuyte www.ltim ndtree com, Corporate Identity Number’ L72900MH1996PLC104693 ‘Balance for the quarter ended September 30, 2023 and half year ended September 30, 2023 represent balances as per the audited consoSi dated statement of financial position for the year ended March 31, 2023 and balance for the quarter ended September 30, 2022 represent balances as per the audited statement of financial position for the year ended March 31, 2022, as required by the SEBI (Listing Obligations and Disclosure Requirements) Regulations, 2015. The audited consolidated financial results of the Company for the quarter ended and half year ended September 30, 2023 have been approved by the Board of Directors of the Company at its meeting held on October 18, 2023. The statutory auditors have expressed art unmodified audit opinion. EXTRACT OF FINANCIAL RESULTS FOR THE QUARTER AND SIX MONTHS ENDED SEPTEMBER 30, 2023 Financial Results of Wipro Limited under Ind AS The financial results are prepared in accordance with Indian Accounting Standards (“Ind AS”), the provisions of the Companies Act, 2013 (“the Companies Act”}, as applicable and guidelines issued by the Securities and Exchange Soard of India (“SEBI”). The Ind AS are prescribed under Section 133 of the Act read with Rule 3 of the Companies (Indian Accounting Standards) Rules, 2015 and amendment rules issued thereafter. Particulars ConsclicFaigd Quarter ended Six months ended Yean ended September 30, 2tK23 Jone 30, 2023 September 30, 2022 September 30, 2023 September 30, 2022* March 31, 2023 (Unaudited) (Unaudited) (Unaudited) (Unaudited) (Unaudited) (Audited) Total income 38,33 7 88,889 178,823 162,107 337,399 Net profit before tax 15,193 15,364 15,690 30,557 30,367 57,915 Net profit after tax 11.G23 11,523 1 1,890 23,146 22,955 44,103 Total comprehensive income 10,208 15.495 7,503 25,703 15,165 37.S52 Equity share capital 296 296 296 296 296 296 Earning per Share (not annualized) (Face value of 1/- each) a) Eaic (in 89.27 48.92 40.16 78 19 77.59 149.07 b) Diluted (in $ 29.17 88.8S 40 11 78 02 //.4B 148.33 in million, except per share data Consolidated Audited Financial Results of Wipro Limited under Ind AS ftin millions, except per share data, unless otherwise stated) Particulars Standalone Quarter ended Six months ended Year ended September 3-Q, 2023 June 30, 2023 September 30, 2022* September 30, 2023 September 30, 2022** March 31. 2023 (Unaudited) (Unaudited) (Unaudited) (Unaudited) (Unaudited) (Audited) Total in Lome 87,161 85,1 40 80,695 172,301 155,626 324.771 Net profit before tax 14,778 14,921 14,933 29,699 29,184 55,786 Net profit after tax 1 1,336 1 1,234 11,272 22,570 21.955 42,482 Total comprehensive income 9,960 15,123 7.134 25,083 14,449 35,648 in miHitjn * Refer note 4 A Refer note 5 Notes: Particulars Quarter ended September 30T 2023 Half year ended September 30,2023 Quarterended September 30,2022 Revenue from operations 225,159 453,469 225,397 Profit before tax 35.092 73,067 34,201 Profit after tax 26,673 55,533 26,491 Total comprehensive income for the period 28.322 60,039 29.293 Paid-up equity share capital (Par value of f 2 per share) 10,444 10,444 10,971 Reserves excluding non-ccntrclting interest1 as shown in the Audited Balance Sheet 765,703 765,703 643,066 Earnings per equity share (Par value of 2 per share) (EPS for quarter ended and half year ended periods is not annualized) Basic: Diluted; 5.06 5.04 10.30 10.27 4.86 4.85 ‘Balance for the quarter ended September 30, 2023 and half year ended September 30, 2023 represent balances as per the audited consolidated balance sheet for the year ended March 31,2023 and balance for the quarter ended September 30, 2022 represent balances as per the audited consolidated balance sheet for the year ended March 31, 2022, as required by the SEBI {Listing Obligations and Disclosure Requirements) Regulations, 2015. The audited consolidated financial results (under Ind AS) of the Company for the quarter ended and half year ended September 30, 2023 have been approved by the Board of Directors of the Company at its meeting held on October 18, 2023, The statutory auditors have expressed an unmodified audit opinion. k ne consolidated and standalone fmanc al results of L-lMmctree Limited (‘the Company) fei the quarter ar.d six months ended September 30, 2023 have been subjected to limited review by the statutory auditors. The results have beer- reviewed by the Audit Committee of the Board and approved bythe Board of Directors at its meeting held on October IS, 2023. 2 Thet adove is an extract of the detailed format of the financial results fifed with the Stodk Exchanges under Regulation 33 of the SEBI (Listing and Other Disclosure Requunnierits: Regulations, 201’j Th ful- format of the cunjci idated financial results and lf’H standalone financial insults ‘or th quarter and six months ended Septembei 30, 2023 a-e availaoe or the Stock Exchanges website of BSE (www.bsemcna.com), NSE (www.nseindia.tpm) and Company’s website at www.ltimindtiM com/iivestors. | Results for the quarter and six months ended September 30. 2023 are in compliance with the Indian Accounting Standards (:rd AS) notilic-d by the Ministry of Corporate Affairs as prescribed Ltnder section 133 ofthe sbrripanieS Act, 201B 4. During the previous year, the Scheme of Amalgamation and Arrangement under Sections 230 - 232 and other applicable provisions of the Companies Ar I, 7D13 fur aria gamatton of Mind! tee l mil nd (‘Amalga mat ng C uinpany’) wfi l fa Company (‘S: iiemej was sanctioned liyHon’iiie National Company Law fi.bunal (NCLT) Murnba Bench vide o*der dared September 19, 2022 and Bengalmu Bench vice cider dated November 04, 2022 and November 10, 2022. The Scheme has become effective on November 14, 2022 upon M ro of the certified copy of the orders passed by NCLT with the relevant Registrar of Companies In terms of the Scheme, the name of the Company nas been changed from ‘Larsen Toi .bro Infr iter i Lim td’ r I.TI Mi nd I re limited’ w e. f Noventip 15, 7022 and all : fie asset s, I abi h ties. eserves and su’ pl JS O’”1 I ie ArralgarT-ai ing Company have been transferred to and vested in the Company. Consequent on the Scheme coming into effect anu in accordance with the Shafe Exchange Ratio enshrined in the Scheme, on November 25, 2022 the Company has allotted its 120,417,607 equity shares of 1/- each (fully paid-up) to the equity shareholders of erstwhi e M^dtree Limited as on the ‘Record Date’ fined for the said purpose The amalgamation has been accounted under the ‘poohrg of interests’ method m accordance with Appendix C of Indiar Accounting Standard {‘Ind AS’) 103 ‘Business Combinations’ al if p carrying va.up of th assets anti liati lities of it Amalgamating Company as included m the financial stafements of the Amalgams ng Company. Accordingly, lhe compa-alives have been restated to give effect of the amalgamation. 5 During the previous quarter, the Scheme of Arrangement (‘the Scheme’) for a malqamation between Poweruadoud ‘echnologies Private Limited, Lymbyc Solutions Private Limited and Cucogic Technologies Private L mited ( Transferor Companies), wholly owned subsidiaries, with the Company (‘Transferee Company’) was approver by the Mumbai Sen ch of National Company Law Tn bun al and the Company received the certified true copy of theord’ on Inly 06, 2023. The Company has filed th same with Registrar of CpinpaiiHs, Mumbai on July 1 I. 2D23 wfirrh i$ the f fet. live riafe of amaiqamation. lhe appointed date of lhe Scheme s April 01, 2029. ‘he amalgamation has been accounted under the ‘pooling of interests method in accordance with Appendix C of Ind AS 102 ‘Business Combinations at the carrying value of the assets and hao lities of the Transferor Companies as included in the consolidatec balance sheet of the Company as at th beginning of the previous year Accordingly, comparatives in the Standalone Finance Results have been restated to g-ve effect of the dmalgarratian ftgrn Ui beginning of lire previous yp^i and goodwill of J 1,531 mil ion has bn rrogni7pd m the standalone balance sf’net of tfie Company. The sa d transact on has no Impact in the Consolidated Financial ResulLs of rhe Company. 6. The Board of U lectors had recommended a final dividend of 40V- per equity share of face value 7 1/ - each- tor the financial year ended March 31 r 2023 which was approved by the shareholders at the Annual General Meeting held on July 17, 2023 “he aforesaid divioenc was paid dur rg the per-txi. 7. The Board; ol Directors al its meeli.ig held on October 13. 2023 have declared a i interim div-dond 20/- pei equity share of par value 1/- each. 8 Figures for the previous periods have been regrouped ar.o recrassihed wherever necessary, to conform to tne classification of me current period For LTIMindtree Limited Standalone Audited Financial Results of Wipro Limited under Ind AS (tin mittions, except per share data, unless otherwise stated) Particulars Quarter ended September 30,2023 Half year ended September 30,2023 Quarter ended September 30,2022 Revenue from operations 166,807 338,835 169,418 Profit before tax 28,481 62,692 29,556 Profit after tax 20.613 46,491 22,829 Total comprehensive income for the period 20,814 49,822 22,458 The audited standalone financial results (under ind AS) of the Company for the quarter ended and half year ended September 30, 2023 have been approved by the Board of Directors of the Company at its meeting held on October 18, 2023. The statutory auditors have expressed an unmodified audit opinion. Note: 1. The above is an extract ofthe detailed format of Quarterly Financial Results filed with the Stock Exchanges under Regulation 33 of the SEBI (Listing and Other Disclosure Requirements) Regulations, 2015. The full format of the Quarterly Financial Results are available on the Bombay Stock Exchange website (URL; www.bseindia.com), the National Stock Exchange website (URL; www.nseindia.com) and on the Company’s website (URL: www.wipro.com). 2. The Board of Directors of the Company at its meeting held over October 17-18, 2023, have approved a scheme of amalgamation for merger of Wipro HR Services India Private Limited, Wipro Overseas IT Service Private Limited, Wipro Technology Product Services Private Limited, Wipro Trademarks Holding Limited and Wipro VLSI Design Services India Private Limited (wholly-owned subsidiaries), with and into Wipro Limited. The Scheme is subject to necessary statutory and regulatory approvals under applicable laws. By Order of the Board, For Wipro Limited Place: Bengaluru Date: October 18, 2023 Rishad A. Premji Chairman Place : Mumbai, lad a f inSnfici^eixpliepeip’r. In Debashis Chatterjee Ch ef Executive Officer Sc Maragmg Director Registered Office; Wipro Limited, Doddakannelli, Sarjapur Road, Bengaluru - 6B0 035, India Website; wipro.com I Email Id: mfo@wipro.com Tel; 4-91 -80-2844 0011; Fax: +91-80-2844 0054 CIN: L32102KA1945PLC020800
Exhibit 99.3
WIPRO LIMITED AND SUBSIDIARIES
INTERIM CONDENSED CONSOLIDATED FINANCIAL STATEMENTS UNDER IFRS
AS AT AND FOR THE THREE AND SIX MONTHS ENDED SEPTEMBER 30, 2023
WIPRO LIMITED AND SUBSIDIARIES
INTERIM CONDENSED CONSOLIDATED STATEMENT OF FINANCIAL POSITION
(₹ in millions, except share and per share data, unless otherwise stated)
| Notes | As at March 31, 2023 |
As at September 30, 2023 | ||||||||||||||
| Convenience translation into US dollar in millions (unaudited) Refer to Note 2(iii) |
||||||||||||||||
| ASSETS |
||||||||||||||||
| Goodwill |
6 | 307,970 | 309,732 | 3,728 | ||||||||||||
| Intangible assets |
6 | 43,045 | 38,109 | 459 | ||||||||||||
| Property, plant and equipment |
4 | 88,659 | 83,086 | 1,000 | ||||||||||||
| Right-of-Use assets |
5 | 18,702 | 17,043 | 205 | ||||||||||||
| Financial assets |
||||||||||||||||
| Derivative assets |
17 | 29 | 151 | 2 | ||||||||||||
| Investments |
8 | 20,720 | 21,629 | 260 | ||||||||||||
| Trade receivables |
863 | 872 | 10 | |||||||||||||
| Other financial assets |
11 | 6,330 | 5,973 | 72 | ||||||||||||
| Investments accounted for using the equity method |
780 | 761 | 9 | |||||||||||||
| Deferred tax assets |
2,100 | 2,219 | 27 | |||||||||||||
| Non-current tax assets |
11,922 | 10,878 | 131 | |||||||||||||
| Other non-current assets |
12 | 13,606 | 10,834 | 130 | ||||||||||||
|
|
|
|
|
|
|
|||||||||||
| Total non-current assets |
514,726 | 501,287 | 6,033 | |||||||||||||
|
|
|
|
|
|
|
|||||||||||
| Inventories |
9 | 1,188 | 1,281 | 15 | ||||||||||||
| Financial assets |
||||||||||||||||
| Derivative assets |
17 | 1,844 | 1,999 | 24 | ||||||||||||
| Investments |
8 | 309,232 | 239,847 | 2,887 | ||||||||||||
| Cash and cash equivalents |
10 | 91,880 | 97,896 | 1,178 | ||||||||||||
| Trade receivables |
126,350 | 108,146 | 1,302 | |||||||||||||
| Unbilled receivables |
60,515 | 65,292 | 786 | |||||||||||||
| Other financial assets |
11 | 9,096 | 9,155 | 110 | ||||||||||||
| Contract assets |
23,001 | 24,464 | 295 | |||||||||||||
| Current tax assets |
5,091 | 5,017 | 60 | |||||||||||||
| Other current assets |
12 | 32,899 | 31,946 | 385 | ||||||||||||
|
|
|
|
|
|
|
|||||||||||
| Total current assets |
661,096 | 585,043 | 7,042 | |||||||||||||
|
|
|
|
|
|
|
|||||||||||
| TOTAL ASSETS |
1,175,822 | 1,086,330 | 13,075 | |||||||||||||
|
|
|
|
|
|
|
|||||||||||
| EQUITY |
||||||||||||||||
| Share capital |
10,976 | 10,444 | 126 | |||||||||||||
| Share premium |
3,689 | 1,732 | 21 | |||||||||||||
| Retained earnings |
660,964 | 577,487 | 6,951 | |||||||||||||
| Share-based payment reserve |
5,632 | 6,023 | 72 | |||||||||||||
| Special Economic Zone re-investment reserve |
46,803 | 44,941 | 541 | |||||||||||||
| Other components of equity |
53,100 | 58,284 | 702 | |||||||||||||
|
|
|
|
|
|
|
|||||||||||
| Equity attributable to the equity holders of the Company |
781,164 | 698,911 | 8,413 | |||||||||||||
| Non-controlling interests |
589 | 823 | 10 | |||||||||||||
|
|
|
|
|
|
|
|||||||||||
| TOTAL EQUITY |
781,753 | 699,734 | 8,423 | |||||||||||||
|
|
|
|
|
|
|
|||||||||||
| LIABILITIES |
||||||||||||||||
| Financial liabilities |
||||||||||||||||
| Loans and borrowings |
13 | 61,272 | 61,971 | 746 | ||||||||||||
| Lease liabilities |
15,953 | 14,796 | 178 | |||||||||||||
| Derivative liabilities |
17 | 179 | 40 | ^ | ||||||||||||
| Other financial liabilities |
14 | 2,649 | 1,609 | 19 | ||||||||||||
| Deferred tax liabilities |
15,153 | 15,315 | 184 | |||||||||||||
| Non-current tax liabilities |
21,777 | 26,048 | 314 | |||||||||||||
| Other non-current liabilities |
15 | 9,333 | 11,025 | 133 | ||||||||||||
| Provisions |
16 | ^ | — | — | ||||||||||||
|
|
|
|
|
|
|
|||||||||||
| Total non-current liabilities |
126,316 | 130,804 | 1,574 | |||||||||||||
|
|
|
|
|
|
|
|||||||||||
| Financial liabilities |
||||||||||||||||
| Loans, borrowings and bank overdrafts |
13 | 88,821 | 94,060 | 1,132 | ||||||||||||
| Lease liabilities |
8,620 | 8,348 | 100 | |||||||||||||
| Derivative liabilities |
17 | 2,825 | 1,582 | 19 | ||||||||||||
| Trade payables and accrued expenses |
89,054 | 78,857 | 949 | |||||||||||||
| Other financial liabilities |
14 | 4,141 | 2,712 | 33 | ||||||||||||
| Contract liabilities |
22,682 | 16,738 | 201 | |||||||||||||
| Current tax liabilities |
18,846 | 21,372 | 257 | |||||||||||||
| Other current liabilities |
15 | 30,215 | 29,873 | 360 | ||||||||||||
| Provisions |
16 | 2,549 | 2,250 | 27 | ||||||||||||
|
|
|
|
|
|
|
|||||||||||
| Total current liabilities |
267,753 | 255,792 | 3,078 | |||||||||||||
|
|
|
|
|
|
|
|||||||||||
| TOTAL LIABILITIES |
394,069 | 386,596 | 4,652 | |||||||||||||
|
|
|
|
|
|
|
|||||||||||
| TOTAL EQUITY AND LIABILITIES |
1,175,822 | 1,086,330 | 13,075 | |||||||||||||
|
|
|
|
|
|
|
|||||||||||
| ^ | Value is less than 1 |
The accompanying notes form an integral part of these interim condensed consolidated financial statements
| As per our report of even date attached | For and on behalf of the Board of Directors | |||||
| for Deloitte Haskins & Sells LLP | Rishad A. Premji | Deepak M. Satwalekar | Thierry Delaporte | |||
| Chartered Accountants | Chairman | Director | Chief Executive Officer and | |||
| Firm’s Registration No: 117366W/W - 100018 | Managing Director | |||||
| Anand Subramanian | Aparna C. Iyer | M. Sanaulla Khan | ||||
| Partner | Chief Financial Officer | Company Secretary | ||||
| Membership No.: 110815 | ||||||
| Bengaluru | ||||||
| October 18, 2023 | ||||||
1
WIPRO LIMITED AND SUBSIDIARIES
INTERIM CONDENSED CONSOLIDATED STATEMENT OF INCOME
(₹ in millions, except share and per share data, unless otherwise stated)
| Three months ended September 30, | Six months ended September 30, | |||||||||||||||||||||||||||
| Notes | 2022 | 2023 | 2023 | 2022 | 2023 | 2023 | ||||||||||||||||||||||
|
|
|
Convenience translation into US dollar in millions (unaudited) Refer to Note 2(iii) |
|
|
Convenience translation into US dollar in millions (unaudited) Refer to Note 2(iii) |
|||||||||||||||||||||||
| Revenues |
20 | 225,397 | 225,159 | 2,710 | 440,683 | 453,469 | 5,458 | |||||||||||||||||||||
| Cost of revenues |
21 | (163,835 | ) | (159,191 | ) | (1,916 | ) | (319,435 | ) | (320,452 | ) | (3,857 | ) | |||||||||||||||
|
|
|
|
|
|
|
|
|
|
|
|
|
|||||||||||||||||
| Gross profit |
61,562 | 65,968 | 794 | 121,248 | 133,017 | 1,601 | ||||||||||||||||||||||
| Selling and marketing expenses |
21 | (15,140 | ) | (18,767 | ) | (226 | ) | (30,499 | ) | (35,351 | ) | (426 | ) | |||||||||||||||
| General and administrative expenses |
21 | (14,976 | ) | (14,124 | ) | (170 | ) | (28,447 | ) | (30,011 | ) | (361 | ) | |||||||||||||||
| Foreign exchange gains/(losses), net |
23 | 1,057 | 268 | 3 | 2,091 | 206 | 2 | |||||||||||||||||||||
|
|
|
|
|
|
|
|
|
|
|
|
|
|||||||||||||||||
| Results from operating activities |
32,503 | 33,345 | 401 | 64,393 | 67,861 | 816 | ||||||||||||||||||||||
| Finance expenses |
22 | (2,270 | ) | (3,033 | ) | (37 | ) | (4,315 | ) | (6,119 | ) | (74 | ) | |||||||||||||||
| Finance and other income |
23 | 4,040 | 4,810 | 58 | 7,730 | 11,352 | 137 | |||||||||||||||||||||
| Share of net profit/ (loss) of associates accounted for using the equity method |
(72 | ) | (30 | ) | ^ | (87 | ) | (27 | ) | ^ | ||||||||||||||||||
|
|
|
|
|
|
|
|
|
|
|
|
|
|||||||||||||||||
| Profit before tax |
34,201 | 35,092 | 422 | 67,721 | 73,067 | 879 | ||||||||||||||||||||||
| Income tax expense |
19 | (7,710 | ) | (8,419 | ) | (101 | ) | (15,641 | ) | (17,534 | ) | (211 | ) | |||||||||||||||
|
|
|
|
|
|
|
|
|
|
|
|
|
|||||||||||||||||
| Profit for the period |
26,491 | 26,673 | 321 | 52,080 | 55,533 | 668 | ||||||||||||||||||||||
|
|
|
|
|
|
|
|
|
|
|
|
|
|||||||||||||||||
| Profit attributable to: |
||||||||||||||||||||||||||||
| Equity holders of the Company |
26,590 | 26,463 | 318 | 52,226 | 55,164 | 664 | ||||||||||||||||||||||
| Non-controlling interests |
(99 | ) | 210 | 3 | (146 | ) | 369 | 4 | ||||||||||||||||||||
|
|
|
|
|
|
|
|
|
|
|
|
|
|||||||||||||||||
| Profit for the period |
26,491 | 26,673 | 321 | 52,080 | 55,533 | 668 | ||||||||||||||||||||||
|
|
|
|
|
|
|
|
|
|
|
|
|
|||||||||||||||||
| Earnings per equity share: |
24 | |||||||||||||||||||||||||||
| Attributable to equity holders of the Company |
||||||||||||||||||||||||||||
| Basic |
4.86 | 5.06 | 0.06 | 9.55 | 10.30 | 0.12 | ||||||||||||||||||||||
| Diluted |
4.85 | 5.04 | 0.06 | 9.52 | 10.27 | 0.12 | ||||||||||||||||||||||
| Weighted average number of equity shares used in computing earnings per equity share |
||||||||||||||||||||||||||||
| Basic |
5,476,167,685 | 5,232,867,366 | 5,232,867,366 | 5,473,962,200 | 5,357,394,940 | 5,357,394,940 | ||||||||||||||||||||||
| Diluted |
5,484,785,054 | 5,245,641,198 | 5,245,641,198 | 5,486,081,940 | 5,370,078,563 | 5,370,078,563 | ||||||||||||||||||||||
| ^ | Value is less than 1 |
The accompanying notes form an integral part of these interim condensed consolidated financial statements
| As per our report of even date attached | For and on behalf of the Board of Directors | |||||
| for Deloitte Haskins & Sells LLP | Rishad A. Premji | Deepak M. Satwalekar | Thierry Delaporte | |||
| Chartered Accountants | Chairman | Director | Chief Executive Officer and | |||
| Firm’s Registration No: 117366W/W - 100018 | Managing Director | |||||
| Anand Subramanian | Aparna C. Iyer | M. Sanaulla Khan | ||||
| Partner | Chief Financial Officer | Company Secretary | ||||
| Membership No.: 110815 | ||||||
| Bengaluru | ||||||
| October 18, 2023 | ||||||
2
WIPRO LIMITED AND SUBSIDIARIES
INTERIM CONDENSED CONSOLIDATED STATEMENT OF COMPREHENSIVE INCOME
(₹ in millions, except share and per share data, unless otherwise stated)
| Three months ended September 30, | Six months ended September 30, | |||||||||||||||||||||||
| 2022 | 2023 | 2023 | 2022 | 2023 | 2023 | |||||||||||||||||||
|
|
|
Convenience translation into US dollar in millions (unaudited) Refer to Note 2(iii) |
|
|
Convenience translation into US dollar in millions (unaudited) Refer to Note 2(iii) |
|||||||||||||||||||
| Profit for the period |
26,491 | 26,673 | 321 | 52,080 | 55,533 | 668 | ||||||||||||||||||
| Other comprehensive income (OCI) |
||||||||||||||||||||||||
| Items that will not be reclassified to profit or loss in subsequent periods |
||||||||||||||||||||||||
| Remeasurements of the defined benefit plans, net |
295 | 51 | ^ | 607 | 6 | ^ | ||||||||||||||||||
| Net change in fair value of investment in equity instruments measured at fair value through OCI |
180 | (124 | ) | (1 | ) | 1,513 | (108 | ) | (1 | ) | ||||||||||||||
|
|
|
|
|
|
|
|
|
|
|
|
|
|||||||||||||
| 475 | (73 | ) | (1 | ) | 2,120 | (102 | ) | (1 | ) | |||||||||||||||
|
|
|
|
|
|
|
|
|
|
|
|
|
|||||||||||||
| Items that will be reclassified to profit or loss in subsequent periods |
||||||||||||||||||||||||
| Foreign currency translation differences |
3,027 | 1,824 | 22 | 8,658 | 1,462 | 18 | ||||||||||||||||||
| Reclassification of foreign currency translation differences on liquidation of subsidiaries to statement of income |
(23 | ) | (183 | ) | (2 | ) | (23 | ) | (181 | ) | (2 | ) | ||||||||||||
| Net change in time value of option contracts designated as cash flow hedges |
(55 | ) | 211 | 3 | (301 | ) | 251 | 3 | ||||||||||||||||
| Net change in intrinsic value of option contracts designated as cash flow hedges |
(121 | ) | (311 | ) | (4 | ) | (327 | ) | 201 | 2 | ||||||||||||||
| Net change in fair value of forward contracts designated as cash flow hedges |
(517 | ) | (62 | ) | (1 | ) | (1,500 | ) | 1,586 | 19 | ||||||||||||||
| Net change in fair value of investment in debt instruments measured at fair value through OCI |
148 | 297 | 4 | (3,954 | ) | 1,336 | 16 | |||||||||||||||||
|
|
|
|
|
|
|
|
|
|
|
|
|
|||||||||||||
| 2,459 | 1,776 | 22 | 2,553 | 4,655 | 56 | |||||||||||||||||||
|
|
|
|
|
|
|
|
|
|
|
|
|
|||||||||||||
| Total other comprehensive income, net of taxes |
2,934 | 1,703 | 21 | 4,673 | 4,553 | 56 | ||||||||||||||||||
|
|
|
|
|
|
|
|
|
|
|
|
|
|||||||||||||
| Total comprehensive income for the period |
29,425 | 28,376 | 342 | 56,753 | 60,086 | 724 | ||||||||||||||||||
|
|
|
|
|
|
|
|
|
|
|
|
|
|||||||||||||
| Total comprehensive income attributable to: |
||||||||||||||||||||||||
| Equity holders of the Company |
29,512 | 28,169 | 340 | 56,863 | 59,809 | 721 | ||||||||||||||||||
| Non-controlling interests |
(87 | ) | 207 | 2 | (110 | ) | 277 | 3 | ||||||||||||||||
|
|
|
|
|
|
|
|
|
|
|
|
|
|||||||||||||
| 29,425 | 28,376 | 342 | 56,753 | 60,086 | 724 | |||||||||||||||||||
|
|
|
|
|
|
|
|
|
|
|
|
|
|||||||||||||
| ^ | Value is less than 1 |
The accompanying notes form an integral part of these interim condensed consolidated financial statements
| As per our report of even date attached | For and on behalf of the Board of Directors | |||||
| for Deloitte Haskins & Sells LLP | Rishad A. Premji | Deepak M. Satwalekar | Thierry Delaporte | |||
| Chartered Accountants | Chairman | Director | Chief Executive Officer and | |||
| Firm’s Registration No: 117366W/W - 100018 | Managing Director | |||||
| Anand Subramanian | Aparna C. Iyer | M. Sanaulla Khan | ||||
| Partner | Chief Financial Officer | Company Secretary | ||||
| Membership No.: 110815 | ||||||
| Bengaluru | ||||||
| October 18, 2023 | ||||||
3
WIPRO LIMITED AND SUBSIDIARIES
INTERIM CONDENSED CONSOLIDATED STATEMENT OF CHANGES IN EQUITY
(₹ in millions, except share and per share data, unless otherwise stated)
| Special Economic Zone re-investment reserve |
Other components of equity | Equity attributable to the equity holders of the Company |
Non- controlling interests |
Total equity | ||||||||||||||||||||||||||||||||||||||||||||
| Particulars |
Number of shares (1) |
Share capital, fully paid-up |
Share premium |
Retained earnings |
Share- based payment reserve |
Foreign currency translation reserve (2) |
Cash flow hedging reserve (3) |
Other reserves (2) |
||||||||||||||||||||||||||||||||||||||||
| As at April 1, 2022 |
5,482,070,115 | 10,964 | 1,566 | 551,252 | 5,258 | 47,061 | 26,850 | 1,477 | 13,730 | 658,158 | 515 | 658,673 | ||||||||||||||||||||||||||||||||||||
| Adjustment on adoption of amendments to IAS 37 |
— | — | — | (51 | ) | — | — | — | — | — | (51 | ) | — | (51 | ) | |||||||||||||||||||||||||||||||||
|
|
|
|
|
|
|
|
|
|
|
|
|
|
|
|
|
|
|
|
|
|
|
|
|
|||||||||||||||||||||||||
| Adjusted balance as at April 1, 2022 |
5,482,070,115 | 10,964 | 1,566 | 551,201 | 5,258 | 47,061 | 26,850 | 1,477 | 13,730 | 658,107 | 515 | 658,622 | ||||||||||||||||||||||||||||||||||||
|
|
|
|
|
|
|
|
|
|
|
|
|
|
|
|
|
|
|
|
|
|
|
|
|
|||||||||||||||||||||||||
| Comprehensive income for the period |
||||||||||||||||||||||||||||||||||||||||||||||||
| Profit for the period |
— | — | 52,226 | — | — | — | — | — | 52,226 | (146 | ) | 52,080 | ||||||||||||||||||||||||||||||||||||
| Other comprehensive income |
— | — | — | — | — | 8,599 | (2,128 | ) | (1,834 | ) | 4,637 | 36 | 4,673 | |||||||||||||||||||||||||||||||||||
|
|
|
|
|
|
|
|
|
|
|
|
|
|
|
|
|
|
|
|
|
|
|
|
|
|||||||||||||||||||||||||
| Total comprehensive income for the period |
— | — | 52,226 | — | — | 8,599 | (2,128 | ) | (1,834 | ) | 56,863 | (110 | ) | 56,753 | ||||||||||||||||||||||||||||||||||
|
|
|
|
|
|
|
|
|
|
|
|
|
|
|
|
|
|
|
|
|
|
|
|
|
|||||||||||||||||||||||||
| Issue of equity shares on exercise of options |
3,471,525 | 7 | 1,101 | — | (1,101 | ) | — | — | — | — | 7 | — | 7 | |||||||||||||||||||||||||||||||||||
| Issue of shares by controlled trust on exercise of options (1) |
— | — | 912 | (912 | ) | — | — | — | — | — | — | — | ||||||||||||||||||||||||||||||||||||
| Compensation cost related to employee share-based payment |
— | — | 6 | 2,574 | — | — | — | — | 2,580 | — | 2,580 | |||||||||||||||||||||||||||||||||||||
| Transferred to Special Economic Zone re-investment reserve |
— | — | (1,343 | ) | — | 1,343 | — | — | — | — | — | — | ||||||||||||||||||||||||||||||||||||
| Others |
— | — | — | — | — | — | — | — | — | (77 | ) | (77 | ) | |||||||||||||||||||||||||||||||||||
|
|
|
|
|
|
|
|
|
|
|
|
|
|
|
|
|
|
|
|
|
|
|
|
|
|||||||||||||||||||||||||
| Other transactions for the period |
3,471,525 | 7 | 1,101 | (425 | ) | 561 | 1,343 | — | — | — | 2,587 | (77 | ) | 2,510 | ||||||||||||||||||||||||||||||||||
|
|
|
|
|
|
|
|
|
|
|
|
|
|
|
|
|
|
|
|
|
|
|
|
|
|||||||||||||||||||||||||
|
|
||||||||||||||||||||||||||||||||||||||||||||||||
|
|
|
|
|
|
|
|
|
|
|
|
|
|
|
|
|
|
|
|
|
|
|
|
|
|||||||||||||||||||||||||
| As at September 30, 2022 |
5,485,541,640 | 10,971 | 2,667 | 603,002 | 5,819 | 48,404 | 35,449 | (651 | ) | 11,896 | 717,557 | 328 | 717,885 | |||||||||||||||||||||||||||||||||||
|
|
|
|
|
|
|
|
|
|
|
|
|
|
|
|
|
|
|
|
|
|
|
|
|
|||||||||||||||||||||||||
| (1) | Includes 11,573,848 treasury shares held as at September 30, 2022 by a controlled trust. 3,115,881 shares have been transferred by the controlled trust to eligible employees on exercise of options during the six months ended September 30, 2022. |
| (2) | Refer to Note 18 |
| (3) | Refer to Note 17 |
4
WIPRO LIMITED AND SUBSIDIARIES
INTERIM CONDENSED CONSOLIDATED STATEMENT OF CHANGES IN EQUITY
(₹ in millions, except share and per share data, unless otherwise stated)
| Special Economic Zone re-investment reserve |
Other components of equity | Equity attributable to the equity holders of the Company |
Non- controlling interests |
Total equity |
||||||||||||||||||||||||||||||||||||||||||||
| Particulars | Number of shares (1) |
Share capital, fully paid-up |
Share premium |
Retained earnings |
Share- based payment reserve |
Foreign currency translation reserve (2) |
Cash flow hedging reserve (3) |
Other reserves (2) |
||||||||||||||||||||||||||||||||||||||||
| As at April 1, 2023 |
5,487,917,741 | 10,976 | 3,689 | 660,964 | 5,632 | 46,803 | 43,255 | (1,403 | ) | 11,248 | 781,164 | 589 | 781,753 | |||||||||||||||||||||||||||||||||||
| Comprehensive income for the period |
||||||||||||||||||||||||||||||||||||||||||||||||
| Profit for the period |
— | — | — | 55,164 | — | — | — | — | — | 55,164 | 369 | 55,533 | ||||||||||||||||||||||||||||||||||||
| Other comprehensive income |
— | — | — | — | — | — | 1,271 | 2,038 | 1,336 | 4,645 | (92 | ) | 4,553 | |||||||||||||||||||||||||||||||||||
|
|
|
|
|
|
|
|
|
|
|
|
|
|
|
|
|
|
|
|
|
|
|
|
|
|||||||||||||||||||||||||
| Total comprehensive income for the period |
— | — | — | 55,164 | — | — | 1,271 | 2,038 | 1,336 | 59,809 | 277 | 60,086 | ||||||||||||||||||||||||||||||||||||
|
|
|
|
|
|
|
|
|
|
|
|
|
|
|
|
|
|
|
|
|
|
|
|
|
|||||||||||||||||||||||||
| Issue of equity shares on exercise of options |
3,545,482 | 7 | 1,811 | — | (1,811 | ) | — | — | — | — | 7 | — | 7 | |||||||||||||||||||||||||||||||||||
| Issue of shares by controlled trust on exercise of options (1) |
— | — | — | 897 | (897 | ) | — | — | — | — | — | — | — | |||||||||||||||||||||||||||||||||||
| Compensation cost related to employee share-based payment |
— | — | — | 5 | 3,099 | — | — | — | — | 3,104 | — | 3,104 | ||||||||||||||||||||||||||||||||||||
| Transferred from Special Economic Zone re-investment reserve |
— | — | — | 1,862 | — | (1,862 | ) | — | — | — | — | — | — | |||||||||||||||||||||||||||||||||||
| Buyback of equity shares, including tax thereon (4) |
(269,662,921 | ) | (539 | ) | (3,768 | ) | (141,015 | ) | — | — | — | — | 539 | (144,783 | ) | — | (144,783 | ) | ||||||||||||||||||||||||||||||
| Transaction cost related to buyback of equity shares (4) |
— | — | — | (390 | ) | — | — | — | — | — | (390 | ) | — | (390 | ) | |||||||||||||||||||||||||||||||||
| Others |
— | — | — | — | — | — | — | — | — | — | (43 | ) | (43 | ) | ||||||||||||||||||||||||||||||||||
|
|
|
|
|
|
|
|
|
|
|
|
|
|
|
|
|
|
|
|
|
|
|
|
|
|||||||||||||||||||||||||
| Other transactions for the period |
(266,117,439 | ) | (532 | ) | (1,957 | ) | (138,641 | ) | 391 | (1,862 | ) | — | — | 539 | (142,062 | ) | (43 | ) | (142,105 | ) | ||||||||||||||||||||||||||||
|
|
|
|
|
|
|
|
|
|
|
|
|
|
|
|
|
|
|
|
|
|
|
|
|
|||||||||||||||||||||||||
| As at September 30, 2023 |
5,221,800,302 | 10,444 | 1,732 | 577,487 | 6,023 | 44,941 | 44,526 | 635 | 13,123 | 698,911 | 823 | 699,734 | ||||||||||||||||||||||||||||||||||||
|
|
|
|
|
|
|
|
|
|
|
|
|
|
|
|
|
|
|
|
|
|
|
|
|
|||||||||||||||||||||||||
| Convenience translation into US dollar in millions (unaudited) Refer to Note 2(iii) |
126 | 21 | 6,951 | 72 | 541 | 536 | 8 | 158 | 8,413 | 10 | 8,423 | |||||||||||||||||||||||||||||||||||||
| (1) | Includes 7,310,222 treasury shares held as at September 30, 2023 by a controlled trust. 2,585,614 shares have been transferred by the controlled trust to eligible employees on exercise of options during the six months ended September 30, 2023. |
| (2) | Refer to Note 18 |
| (3) | Refer to Note 17 |
| (4) | Refer to Note 29 |
The accompanying notes form an integral part of these interim condensed consolidated financial statements
| As per our report of even date attached | For and on behalf of the Board of Directors | |||||
| for Deloitte Haskins & Sells LLP | Rishad A. Premji | Deepak M. Satwalekar | Thierry Delaporte | |||
| Chartered Accountants | Chairman | Director | Chief Executive Officer and | |||
| Firm’s Registration No: 117366W/W - 100018 | Managing Director | |||||
| Anand Subramanian | Aparna C. Iyer | M. Sanaulla Khan | ||||
| Partner | Chief Financial Officer | Company Secretary | ||||
| Membership No.: 110815 | ||||||
| Bengaluru | ||||||
| October 18, 2023 | ||||||
5
WIPRO LIMITED AND SUBSIDIARIES
INTERIM CONDENSED CONSOLIDATED STATEMENT OF CASH FLOWS
(₹ in millions, except share and per share data, unless otherwise stated)
| Six months ended September 30, | ||||||||||||
| 2022 | 2023 | 2023 | ||||||||||
| Convenience translation into US dollar in millions (unaudited) Refer to Note 2(iii) |
||||||||||||
| Cash flows from operating activities |
||||||||||||
| Profit for the period |
52,080 | 55,533 | 668 | |||||||||
| Adjustments to reconcile profit for the period to net cash generated from operating activities: |
||||||||||||
| Gain on sale of property, plant and equipment, net |
(148 | ) | (2,242 | ) | (27 | ) | ||||||
| Depreciation, amortization and impairment expense |
15,707 | 16,350 | 197 | |||||||||
| Unrealized exchange (gain)/loss, net and exchange (gain)/loss on borrowings |
1,406 | 836 | 10 | |||||||||
| Share-based compensation expense |
2,574 | 3,099 | 37 | |||||||||
| Share of net loss of associates accounted for using equity method |
87 | 27 | ^ | |||||||||
| Income tax expense |
15,641 | 17,534 | 211 | |||||||||
| Finance and other income, net of finance expenses |
(3,415 | ) | (5,233 | ) | (63 | ) | ||||||
| Gain on derecognition of contingent consideration payable |
(271 | ) | (506 | ) | (6 | ) | ||||||
| Changes in operating assets and liabilities, net of effects from acquisitions |
||||||||||||
| Trade receivables |
(4,971 | ) | 18,352 | 221 | ||||||||
| Unbilled receivables and contract assets |
(3,861 | ) | (5,937 | ) | (71 | ) | ||||||
| Inventories |
(664 | ) | (92 | ) | (1 | ) | ||||||
| Other assets |
(3,242 | ) | 6,498 | 78 | ||||||||
| Trade payables, accrued expenses, other liabilities and provisions |
(2,783 | ) | (11,260 | ) | (136 | ) | ||||||
| Contract liabilities |
(2,929 | ) | (5,928 | ) | (71 | ) | ||||||
|
|
|
|
|
|
|
|||||||
| Cash generated from operating activities before taxes |
65,211 | 87,031 | 1,047 | |||||||||
| Income taxes paid, net |
(15,418 | ) | (10,885 | ) | (131 | ) | ||||||
|
|
|
|
|
|
|
|||||||
| Net cash generated from operating activities |
49,793 | 76,146 | 916 | |||||||||
|
|
|
|
|
|
|
|||||||
| Cash flows from investing activities: |
||||||||||||
| Payment for purchase of property, plant and equipment |
(8,737 | ) | (4,184 | ) | (50 | ) | ||||||
| Proceeds from disposal of property, plant and equipment |
181 | 4,223 | 51 | |||||||||
| Payment for purchase of investments |
(382,779 | ) | (465,185 | ) | (5,599 | ) | ||||||
| Proceeds from sale of investments |
347,617 | 535,473 | 6,445 | |||||||||
| Proceeds from restricted interim dividend account |
27,410 | — | — | |||||||||
| Payment for business acquisitions including deposits and escrow, net of cash acquired |
(46,341 | ) | — | — | ||||||||
| Interest received |
6,151 | 11,274 | 136 | |||||||||
| Dividend received |
2 | 2 | ^ | |||||||||
|
|
|
|
|
|
|
|||||||
| Net cash generated from/(used in) investing activities |
(56,496 | ) | 81,603 | 983 | ||||||||
|
|
|
|
|
|
|
|||||||
| Cash flows from financing activities: |
||||||||||||
| Proceeds from issuance of equity shares and shares pending allotment |
7 | 7 | ^ | |||||||||
| Repayment of loans and borrowings |
(79,298 | ) | (43,750 | ) | (527 | ) | ||||||
| Proceeds from loans and borrowings |
91,617 | 48,750 | 587 | |||||||||
| Payment of lease liabilities |
(4,927 | ) | (5,172 | ) | (62 | ) | ||||||
| Payment for deferred contingent consideration |
(1,169 | ) | (1,289 | ) | (16 | ) | ||||||
| Interest and finance expenses paid |
(3,458 | ) | (4,850 | ) | (58 | ) | ||||||
| Payment of dividend |
(27,337 | ) | — | — | ||||||||
| Payment for buyback of equity shares, including tax and transaction cost |
— | (145,173 | ) | (1,747 | ) | |||||||
|
|
|
|
|
|
|
|||||||
| Net cash used in financing activities |
(24,565 | ) | (151,477 | ) | (1,823 | ) | ||||||
|
|
|
|
|
|
|
|||||||
| Net increase/(decrease) in cash and cash equivalents during the period |
(31,268 | ) | 6,272 | 75 | ||||||||
| Effect of exchange rate changes on cash and cash equivalents |
456 | (259 | ) | (3 | ) | |||||||
| Cash and cash equivalents at the beginning of the period |
103,833 | 91,861 | 1,106 | |||||||||
|
|
|
|
|
|
|
|||||||
| Cash and cash equivalents at the end of the period (Note 10) |
73,021 | 97,874 | 1,178 | |||||||||
|
|
|
|
|
|
|
|||||||
| ^ | Value is less than 1 |
The accompanying notes form an integral part of these interim condensed consolidated financial statements
| As per our report of even date attached | For and on behalf of the Board of Directors | |||||
| for Deloitte Haskins & Sells LLP | Rishad A. Premji | Deepak M. Satwalekar | Thierry Delaporte | |||
| Chartered Accountants | Chairman | Director | Chief Executive Officer and | |||
| Firm’s Registration No: 117366W/W - 100018 | Managing Director | |||||
| Anand Subramanian | Aparna C. Iyer | M. Sanaulla Khan | ||||
| Partner | Chief Financial Officer | Company Secretary | ||||
| Membership No.: 110815 | ||||||
| Bengaluru | ||||||
| October 18, 2023 | ||||||
6
WIPRO LIMITED AND SUBSIDIARIES
NOTES TO THE INTERIM CONDENSED CONSOLIDATED FINANCIAL STATEMENTS
(₹ in millions, except share and per share data, unless otherwise stated)
1. The Company overview
Wipro Limited (“Wipro” or the “Parent Company”), together with its subsidiaries and controlled trusts (collectively, “we”, “us”, “our”, “the Company” or the “Group”) is a global information technology (“IT”), consulting and business process services (“BPS”) company.
Wipro is a public limited company incorporated and domiciled in India. The address of its registered office is Wipro Limited, Doddakannelli, Sarjapur Road, Bengaluru – 560 035, Karnataka, India. The Company has its primary listing with BSE Ltd. and National Stock Exchange of India Limited. The Company’s American Depository Shares (“ADS”) representing equity shares are also listed on the New York Stock Exchange.
The Company’s Board of Directors authorized these interim condensed consolidated financial statements for issue on October 18, 2023.
2. Basis of preparation of interim condensed consolidated financial statements
(i) Statement of compliance and basis of preparation
These interim condensed consolidated financial statements have been prepared in compliance with IAS 34, “Interim Financial Reporting”, as issued by the International Accounting Standards Board (“IASB”). Selected explanatory notes are included to explain events and transactions that are significant to understand the changes in financial position and performance of the Company since the last annual consolidated financial statements as at and for the year ended March 31, 2023. These interim condensed consolidated financial statements do not include all the information required for full annual financial statements prepared in accordance with International Financial Reporting Standards and its interpretations (“IFRS”).
The interim condensed consolidated financial statements correspond to the classification provisions contained in IAS 1 (revised), “Presentation of Financial Statements”. For clarity, various items are aggregated in the interim condensed consolidated statements of income, interim condensed consolidated statements of comprehensive income and interim condensed consolidated statements of financial position. These items are disaggregated separately in the notes to the interim condensed consolidated financial statements, where applicable. The accounting policies have been consistently applied to all periods presented in these interim condensed consolidated financial statements except for the adoption of new accounting standards, amendments and interpretations effective from April 1, 2023.
All amounts included in the interim condensed consolidated financial statements are reported in millions of Indian rupees (₹ in millions) except share and per share data, unless otherwise stated. Due to rounding off, the numbers presented throughout the document may not add up precisely to the totals and percentages may not precisely reflect the absolute figures. Previous period figures have been regrouped/rearranged, wherever necessary.
(ii) Basis of measurement
These interim condensed consolidated financial statements have been prepared on a historical cost convention and on an accrual basis, except for the following material items which have been measured at fair value as required by relevant IFRS:
| a. | Derivative financial instruments; |
| b. | Financial instruments classified as fair value through other comprehensive income or fair value through profit or loss; |
| c. | The defined benefit liability/(asset) recognized as the present value of defined benefit obligation less fair value of plan assets; and |
| d. | Contingent consideration. |
(iii) Convenience translation (unaudited)
The accompanying interim condensed consolidated financial statements have been prepared and reported in Indian rupees, the functional currency of the Parent Company. Solely for the convenience of the readers, the interim condensed consolidated financial statements as at and for the three and six months ended September 30, 2023, have been translated into United States dollars at the certified foreign exchange rate of US$1 = ₹ 83.08 as published by Federal Reserve Board of Governors on September 30, 2023. No representation is made that the Indian rupee amounts have been, could have been or could be converted into United States dollars at such a rate or any other rate. Due to rounding off, the translated numbers presented throughout the document may not add up precisely to the totals.
(iv) Use of estimates and judgment
The preparation of the interim condensed consolidated financial statements in conformity with IFRS requires the management to make judgments, accounting estimates and assumptions that affect the application of accounting policies and the reported amounts of assets, liabilities, income and expenses. Accounting estimates are monetary amounts in the interim condensed consolidated financial statements that are subject to measurement uncertainty. An accounting policy may require items in the interim condensed consolidated financial statements to be measured at monetary amounts that cannot be observed directly and must instead be estimated. In such a case, management develops an accounting estimate to achieve the objective set out by the accounting policy. Developing accounting estimates involves the use of judgements or assumptions based on the latest available and reliable information. Actual results may differ from those accounting estimates.
7
Accounting estimates and underlying assumptions are reviewed on an ongoing basis. Changes to accounting estimates are recognized in the period in which the estimates are changed and in any future periods affected. In particular, information about material areas of estimation, uncertainty and critical judgments in applying accounting policies that have material effect on the amounts recognized in the interim condensed consolidated financial statements are included in the following notes:
| a) | Revenue recognition: The Company applies judgement to determine whether each product or service promised to a customer is capable of being distinct, and is distinct in the context of the contract, if not, the promised product or service is combined and accounted as a single performance obligation. Revenue is recognized upon transfer of control of promised products or services to customers in an amount that reflects the consideration the Company expects to receive (the “Transaction Price”). The Company allocates the Transaction Price to separately identifiable performance obligation deliverables based on their relative stand-alone selling price. In cases where the Company is unable to determine the stand-alone selling price the Company uses expected cost-plus margin approach in estimating the stand-alone selling price. The Company uses the percentage of completion method using the input (cost expended) method to measure progress towards completion in respect of fixed price contracts. Percentage of completion method accounting relies on estimates of total expected contract revenue and costs. This method is followed when reasonably dependable estimates of the revenues and costs applicable to various elements of the contract can be made. Key factors that are reviewed in estimating the future costs to complete include estimates of future labor costs and productivity efficiencies. Because the financial reporting of these contracts depends on estimates that are assessed continually during the term of these contracts, revenue recognized, profit and timing of revenue for remaining performance obligations are subject to revisions as the contract progresses to completion. When estimates indicate that a loss will be incurred, the loss is provided for in the period in which the loss becomes probable. Volume discounts are recorded as a reduction of revenue. When the amount of discount varies with the levels of revenue, volume discount is recorded based on estimate of future revenue from the customer. |
| b) | Impairment testing: Goodwill recognized on business combination is tested for impairment at least annually and when events occur or changes in circumstances indicate that the recoverable amount of goodwill or a cash generating unit to which goodwill pertains, is less than the carrying value. The Company assesses acquired intangible assets with finite useful life for impairment whenever events or changes in circumstances indicate that the carrying amount may not be recoverable. The recoverable amount of an asset or a cash generating unit is higher of value-in-use and fair value less cost of disposal. The calculation of value in use of an asset or a cash generating unit involves use of significant estimates and assumptions which include turnover, growth rates and net margins used to calculate projected future cash flows, risk-adjusted discount rate, future economic and market conditions. |
| c) | Income taxes: The major tax jurisdictions for the Company are India and the United States of America. |
Significant judgments are involved in determining the provision for income taxes including judgment on whether tax positions are probable of being sustained in tax assessments. A tax assessment can involve complex issues, which can only be resolved over extended time periods.
Deferred tax is recorded on temporary differences between the tax bases of assets and liabilities and their carrying amounts, at the rates that have been enacted or substantively enacted at the reporting date. The ultimate realization of deferred tax assets is dependent upon the generation of future taxable profits during the periods in which those temporary differences and tax loss carry-forwards become deductible. The Company considers expected reversal of deferred tax liabilities and projected future taxable income in making this assessment. The amount of deferred tax assets considered realizable, however, could reduce in the near term if estimates of future taxable income during the carry-forward period are reduced.
| d) | Business combinations: In accounting for business combinations, judgment is required to assess whether an identifiable intangible asset is to be recorded separately from goodwill. Additionally, estimating the acquisition date fair value of the identifiable assets acquired (including useful life estimates), liabilities assumed, and contingent consideration assumed involves management judgment. These measurements are based on information available at the acquisition date and are based on expectations and assumptions that have been deemed reasonable by management. Changes in these judgments, estimates, and assumptions can materially affect the results of operations. |
| e) | Defined benefit plans and compensated absences: The cost of the defined benefit plans, compensated absences and the present value of the defined benefit obligations are based on actuarial valuation using the projected unit credit method. An actuarial valuation involves making various assumptions that may differ from actual developments in the future. These include the determination of the discount rate, future salary increases and mortality rates. Due to the complexities involved in the valuation and its long-term nature, a defined benefit obligation is highly sensitive to changes in these assumptions. All assumptions are reviewed at each reporting date. |
| f) | Expected credit losses on financial assets: The impairment provisions of financial assets are based on assumptions about risk of default and expected timing of collection. The Company uses judgment in making these assumptions and selecting the inputs to the expected credit loss calculation based on the Company’s history of collections, customer’s creditworthiness, existing market conditions as well as forward looking estimates at the end of each reporting period. |
| g) | Useful lives of property, plant and equipment: The Company depreciates property, plant and equipment on a straight-line basis over estimated useful lives of the assets. The charge in respect of periodic depreciation is derived based on an estimate of an asset’s expected useful life and the expected residual value at the end of its life. The lives are based on historical experience with similar assets as well as anticipation of future events, which may impact their life, such as changes in technology. The estimated useful life is reviewed at least annually. |
8
| h) | Useful lives of intangible assets: The Company amortizes intangible assets on a straight-line basis over estimated useful lives of the assets. The useful life is estimated based on a number of factors including the effects of obsolescence, demand, competition and other economic factors such as the stability of the industry and known technological advances and the level of maintenance expenditures required to obtain the expected future cash flows from the assets. The estimated useful life is reviewed at least annually. |
| i) | Provisions and contingent liabilities: The Company estimates the provisions that have present obligations as a result of past events and it is probable that outflow of resources will be required to settle the obligations. These provisions are reviewed at the end of each reporting date and are adjusted to reflect the current best estimates. |
The Company uses significant judgement to disclose contingent liabilities. Contingent liabilities are disclosed when there is a possible obligation arising from past events, the existence of which will be confirmed only by the occurrence or non-occurrence of one or more uncertain future events not wholly within the control of the Company or a present obligation that arises from past events where it is either not probable that an outflow of resources will be required to settle the obligation or a reliable estimate of the amount cannot be made. Contingent assets are neither recognized nor disclosed in the financial statements.
3. Material accounting policy information
Please refer to the Company’s Annual report for the year ended March 31, 2023, for a discussion of the Company’s other material accounting policy information except for the adoption of new accounting standards, amendments and interpretations effective on or after April 1, 2023.
| i. | New amendment adopted by the Company effective from April 1, 2023: |
Amendments to IAS 1 – Presentation of Financial Statements
On January 23, 2020, the IASB issued “Classification of liabilities as Current or Non-Current (Amendments to IAS 1)” providing a more general approach to the classification of liabilities under IAS 1 based on the contractual arrangement in place at the reporting date. The amendments aim to promote consistency in applying the requirements by helping companies to determine whether, in the statement of financial position, debt and other liabilities with an uncertain settlement date should be classified as current (due or potentially due to be settled within one year) or non-current. The amendments also clarified the classification requirements for debt a company might settle by converting it into equity. These amendments are effective for annual reporting periods beginning on or after January 1, 2023, and are to be applied retrospectively, with earlier application permitted. The adoption of amendments to IAS 1 did not have any material impact on the interim condensed consolidated financial statements.
Amendments to IAS 1 – Presentation of Financial Statements
On October 31, 2022, IASB issued ‘Non-current Liabilities with Covenants (Amendments to IAS 1)’. The amendments specify that covenants to be complied with after the reporting date do not affect the classification of debt as current or non-current at the reporting date. Instead, the amendments require a company to disclose information about these covenants in the notes to the financial statements. The amendments are effective for reporting periods beginning on or after January 1, 2024, with earlier application permitted. The adoption of these amendments to IAS 1 did not have any material impact on the interim condensed consolidated financial statements.
Amendments to IAS 12 – Income Taxes
On May 7, 2021, the IASB amended IAS 12 “Income Taxes” and published ‘Deferred Tax related to Assets and Liabilities arising from a Single Transaction (Amendments to IAS 12)’ that clarify how companies account for deferred tax on transactions such as leases and decommissioning obligations. In specified circumstances, companies are exempt from recognizing deferred tax when they recognize assets or liabilities for the first time. The amendments clarify that this exemption does not apply to transactions such as leases and decommissioning obligations and companies are required to recognize deferred tax on such transactions. These amendments are effective for annual reporting periods beginning on or after January 1, 2023 and are to be applied retrospectively, with earlier application permitted. The adoption of these amendments to IAS 12 did not have any material impact on the interim condensed consolidated financial statements.
Amendments to IFRS 16 – Leases
On September 22, 2022, IASB issued ‘Lease Liability in a Sale and Leaseback (Amendments to IFRS 16)’ that specifies the requirements that a seller-lessee uses in measuring the lease liability arising in a sale and leaseback transaction, to ensure the seller-lessee does not recognize any amount of the gain or loss that relates to the right of use it retains. The amendment is intended to improve the requirements for sale and leaseback transactions in IFRS 16 and will not change the accounting for leases unrelated to sale and leaseback transactions. These amendments are effective for annual reporting periods beginning on or after January 1, 2024, and are to be applied retrospectively, with earlier application permitted. The adoption of these amendments to IFRS 16 did not have any material impact on the interim condensed consolidated financial statements.
9
| ii. | New amendments not yet adopted: |
Certain new standards, amendments to standards and interpretations are not yet effective for annual periods beginning after April 1, 2023 and have not been applied in preparing these interim condensed consolidated financial statements. New standards, amendments to standards and interpretations that could have potential impact on the interim condensed consolidated financial statements of the Company are:
Amendments to IAS 12 – Income Taxes
On 23 May 2023, the IASB issued International Tax Reform - Pillar Two Model Rules - Amendments to IAS 12 “Income Taxes” to clarify the application of IAS 12 to income taxes arising from tax law enacted or substantively enacted to implement the Organization for Economic Co-operation and Development (OECD)/G20 Inclusive Framework on Base Erosion and Profit Shifting (BEPS) Pillar Two model rules (Pillar Two income taxes). The Amendments introduced:
| • | a mandatory temporary exception to the accounting for deferred taxes arising from the jurisdictional implementation of the Pillar Two model rules; and |
| • | disclosure requirements for affected entities to help users of the financial statements better understand an entity’s exposure to Pillar Two income taxes arising from that legislation, particularly before its effective date. |
The mandatory temporary exception – the use of which is required to be disclosed – applies immediately. The remaining disclosure requirements apply for annual reporting periods beginning on or after 1 January 2023, but not for any interim periods ending on or before 31 December 2023. The Company is currently evaluating the impact of these amendments on the interim condensed consolidated financial statements.
Amendments to IAS 21 – The Effects of Changes in Foreign Exchange Rates
On August 15, 2023, IASB issued ‘Lack of Exchangeability (Amendments to IAS 21)’ that clarifies how an entity should assess whether a currency is exchangeable and how it should determine a spot exchange rate when exchangeability is lacking, as well as require the disclosure of information that enables users of financial statements to understand the impact of a currency not being exchangeable. These amendments are effective for annual reporting periods beginning on or after January 1, 2025, with earlier application permitted. The adoption of amendments to IAS 21 is not expected to have any material impact on the interim condensed consolidated financial statements.
Amendments to IAS 7 - Statement of Cash Flows and IFRS 7 - Financial Instruments
On 25 May 2023, IASB issued ‘Supplier Finance Arrangements (Amendments to IAS 7 and IFRS 7)’, that require companies to disclose information about its supplier finance arrangements that enables users of financial statements to assess the effects of those arrangements on the companies liabilities and cash flows and on the companies exposure to liquidity risk. These amendments are effective for annual reporting periods beginning on or after January 1, 2024, with earlier application permitted. The Company is currently evaluating the impact of these amendments on the interim condensed consolidated financial statements.
10
4. Property, plant and equipment
| Land | Buildings | Plant and equipment (1) |
Furniture fixtures |
Office equipment |
Vehicles | Total | ||||||||||||||||||||||
| Gross carrying value: |
||||||||||||||||||||||||||||
| As at April 1, 2022 |
₹ | 4,813 | ₹ | 40,686 | ₹ | 123,471 | ₹ | 15,386 | ₹ | 7,259 | ₹ | 317 | ₹ | 191,932 | ||||||||||||||
| Additions |
— | 54 | 6,390 | 674 | 181 | 3 | 7,302 | |||||||||||||||||||||
| Additions through Business combinations |
— | 7 | 357 | 6 | — | 3 | 373 | |||||||||||||||||||||
| Disposals |
(3 | ) | (47 | ) | (1,361 | ) | (71 | ) | (8 | ) | (1 | ) | (1,491 | ) | ||||||||||||||
| Translation adjustment |
(9 | ) | (60 | ) | 307 | (6 | ) | (19 | ) | — | 213 | |||||||||||||||||
|
|
|
|
|
|
|
|
|
|
|
|
|
|
|
|||||||||||||||
| As at September 30, 2022 |
₹ | 4,801 | ₹ | 40,640 | ₹ | 129,164 | ₹ | 15,989 | ₹ | 7,413 | ₹ | 322 | ₹ | 198,329 | ||||||||||||||
| Accumulated depreciation/ impairment: |
|
|||||||||||||||||||||||||||
| As at April 1, 2022 |
₹ | — | ₹ | 10,003 | ₹ | 90,465 | ₹ | 10,814 | ₹ | 5,743 | ₹ | 297 | ₹ | 117,322 | ||||||||||||||
| Depreciation and impairment |
— | 618 | 6,777 | 804 | 293 | 4 | 8,496 | |||||||||||||||||||||
| Disposals |
— | (40 | ) | (1,298 | ) | (70 | ) | (7 | ) | (1 | ) | (1,416 | ) | |||||||||||||||
| Translation adjustment |
— | (9 | ) | 353 | 9 | (13 | ) | — | 340 | |||||||||||||||||||
|
|
|
|
|
|
|
|
|
|
|
|
|
|
|
|||||||||||||||
| As at September 30, 2022 |
₹ | — | ₹ | 10,572 | ₹ | 96,297 | ₹ | 11,557 | ₹ | 6,016 | ₹ | 300 | ₹ | 124,742 | ||||||||||||||
| Capital work-in-progress |
₹ | 17,666 | ||||||||||||||||||||||||||
|
|
|
|||||||||||||||||||||||||||
| Net carrying value including Capital work-in-progress as at September 30, 2022 |
|
₹ | 91,253 | |||||||||||||||||||||||||
|
|
|
|||||||||||||||||||||||||||
| Gross carrying value: |
||||||||||||||||||||||||||||
| As at April 1, 2022 |
₹ | 4,813 | ₹ | 40,686 | ₹ | 123,471 | ₹ | 15,386 | ₹ | 7,259 | ₹ | 317 | ₹ | 191,932 | ||||||||||||||
| Additions |
40 | 7,269 | 12,191 | 3,917 | 964 | 7 | 24,388 | |||||||||||||||||||||
| Additions through Business combinations |
— | 7 | 357 | 6 | — | 3 | 373 | |||||||||||||||||||||
| Disposals |
(3 | ) | (435 | ) | (20,016 | ) | (1,325 | ) | (474 | ) | (168 | ) | (22,421 | ) | ||||||||||||||
| Translation adjustment |
10 | 173 | 1,729 | 102 | 69 | 2 | 2,085 | |||||||||||||||||||||
|
|
|
|
|
|
|
|
|
|
|
|
|
|
|
|||||||||||||||
| As at March 31, 2023 |
₹ | 4,860 | ₹ | 47,700 | ₹ | 117,732 | ₹ | 18,086 | ₹ | 7,818 | ₹ | 161 | ₹ | 196,357 | ||||||||||||||
| Accumulated depreciation/ impairment: |
|
|||||||||||||||||||||||||||
| As at April 1, 2022 |
₹ | — | ₹ | 10,003 | ₹ | 90,465 | ₹ | 10,814 | ₹ | 5,743 | ₹ | 297 | ₹ | 117,322 | ||||||||||||||
| Depreciation and impairment |
— | 1,217 | 13,305 | 1,794 | 600 | 10 | 16,926 | |||||||||||||||||||||
| Disposals |
— | (395 | ) | (19,655 | ) | (1,158 | ) | (463 | ) | (163 | ) | (21,834 | ) | |||||||||||||||
| Translation adjustment |
— | 102 | 1,386 | 70 | 48 | 1 | 1,607 | |||||||||||||||||||||
|
|
|
|
|
|
|
|
|
|
|
|
|
|
|
|||||||||||||||
| As at March 31, 2023 |
₹ | — | ₹ | 10,927 | ₹ | 85,501 | ₹ | 11,520 | ₹ | 5,928 | ₹ | 145 | ₹ | 114,021 | ||||||||||||||
| Capital work-in-progress |
₹ | 6,323 | ||||||||||||||||||||||||||
|
|
|
|||||||||||||||||||||||||||
| Net carrying value including Capital work-in-progress as at March 31, 2023 |
|
₹ | 88,659 | |||||||||||||||||||||||||
|
|
|
|||||||||||||||||||||||||||
| Gross carrying value: |
||||||||||||||||||||||||||||
| As at April 1, 2023 |
₹ | 4,860 | ₹ | 47,700 | ₹ | 117,732 | ₹ | 18,086 | ₹ | 7,818 | ₹ | 161 | ₹ | 196,357 | ||||||||||||||
| Additions |
— | 392 | 2,070 | 705 | 125 | 2 | 3,294 | |||||||||||||||||||||
| Disposals |
(486 | ) | (805 | ) | (5,922 | ) | (886 | ) | (236 | ) | (122 | ) | (8,457 | ) | ||||||||||||||
| Translation adjustment |
(3 | ) | (1 | ) | (38 | ) | (13 | ) | (18 | ) | ^ | (73 | ) | |||||||||||||||
|
|
|
|
|
|
|
|
|
|
|
|
|
|
|
|||||||||||||||
| As at September 30, 2023 |
₹ | 4,371 | ₹ | 47,286 | ₹ | 113,842 | ₹ | 17,892 | ₹ | 7,689 | ₹ | 41 | ₹ | 191,121 | ||||||||||||||
| Accumulated depreciation/ impairment: |
|
|||||||||||||||||||||||||||
| As at April 1, 2023 |
₹ | — | ₹ | 10,927 | ₹ | 85,501 | ₹ | 11,520 | ₹ | 5,928 | ₹ | 145 | ₹ | 114,021 | ||||||||||||||
| Depreciation and impairment |
— | 726 | 5,902 | 1,071 | 322 | 4 | 8,025 | |||||||||||||||||||||
| Disposals |
— | (342 | ) | (5,003 | ) | (852 | ) | (230 | ) | (122 | ) | (6,549 | ) | |||||||||||||||
| Translation adjustment |
— | 1 | (12 | ) | (4 | ) | (12 | ) | ^ | (27 | ) | |||||||||||||||||
|
|
|
|
|
|
|
|
|
|
|
|
|
|
|
|||||||||||||||
| As at September 30, 2023 |
₹ | — | ₹ | 11,312 | ₹ | 86,388 | ₹ | 11,735 | ₹ | 6,008 | ₹ | 27 | ₹ | 115,470 | ||||||||||||||
| Capital work-in-progress |
₹ | 7,435 | ||||||||||||||||||||||||||
|
|
|
|||||||||||||||||||||||||||
| Net carrying value including Capital work-in-progress as at September 30, 2023 |
|
₹ | 83,086 | |||||||||||||||||||||||||
|
|
|
|||||||||||||||||||||||||||
| ^ | Value is less than 1 |
| (1) | Including net carrying value of computer equipment and software amounting to ₹24,873, ₹22,425 and ₹18,177, as at September 30, 2022, March 31, 2023 and September 30, 2023, respectively. |
11
5. Right-of-Use assets
| Category of Right-of-Use asset | ||||||||||||||||||||
| Land | Buildings | Plant and equipment (1) |
Vehicles | Total | ||||||||||||||||
| Gross carrying value: |
||||||||||||||||||||
| As at April 1, 2022 |
₹ | 1,278 | ₹ | 25,993 | ₹ | 2,511 | ₹ | 904 | ₹ | 30,686 | ||||||||||
| Additions |
— | 3,433 | 314 | 88 | 3,835 | |||||||||||||||
| Additions through Business combinations |
— | 201 | — | — | 201 | |||||||||||||||
| Disposals |
— | (1,962 | ) | — | (152 | ) | (2,114 | ) | ||||||||||||
| Translation adjustment |
— | (101 | ) | (35 | ) | (33 | ) | (169 | ) | |||||||||||
|
|
|
|
|
|
|
|
|
|
|
|||||||||||
| As at September 30, 2022 |
₹ | 1,278 | ₹ | 27,564 | ₹ | 2,790 | ₹ | 807 | ₹ | 32,439 | ||||||||||
| Accumulated depreciation: |
||||||||||||||||||||
| As at April 1, 2022 |
₹ | 58 | ₹ | 9,676 | ₹ | 1,512 | ₹ | 570 | ₹ | 11,816 | ||||||||||
| Depreciation |
9 | 2,786 | 273 | 124 | 3,192 | |||||||||||||||
| Disposals |
— | (1,713 | ) | — | (122 | ) | (1,835 | ) | ||||||||||||
| Translation adjustment |
— | (27 | ) | 4 | (19 | ) | (42 | ) | ||||||||||||
|
|
|
|
|
|
|
|
|
|
|
|||||||||||
| As at September 30, 2022 |
₹ | 67 | ₹ | 10,722 | ₹ | 1,789 | ₹ | 553 | ₹ | 13,131 | ||||||||||
|
|
|
|||||||||||||||||||
| Net carrying value as at September 30, 2022 |
₹ | 19,308 | ||||||||||||||||||
|
|
|
|||||||||||||||||||
| Gross carrying value: |
||||||||||||||||||||
| As at April 1, 2022 |
₹ | 1,278 | ₹ | 25,993 | ₹ | 2,511 | ₹ | 904 | ₹ | 30,686 | ||||||||||
| Additions |
— | 6,015 | 1,109 | 236 | 7,360 | |||||||||||||||
| Additions through Business combinations |
— | 201 | — | — | 201 | |||||||||||||||
| Disposals |
— | (5,085 | ) | (1,160 | ) | (317 | ) | (6,562 | ) | |||||||||||
| Translation adjustment |
— | 822 | 120 | 42 | 984 | |||||||||||||||
|
|
|
|
|
|
|
|
|
|
|
|||||||||||
| As at March 31, 2023 |
₹ | 1,278 | ₹ | 27,946 | ₹ | 2,580 | ₹ | 865 | ₹ | 32,669 | ||||||||||
| Accumulated depreciation: |
||||||||||||||||||||
| As at April 1, 2022 |
₹ | 58 | ₹ | 9,676 | ₹ | 1,512 | ₹ | 570 | ₹ | 11,816 | ||||||||||
| Depreciation |
19 | 5,651 | 614 | 238 | 6,522 | |||||||||||||||
| Disposals |
— | (3,564 | ) | (1,003 | ) | (263 | ) | (4,830 | ) | |||||||||||
| Translation adjustment |
— | 364 | 69 | 26 | 459 | |||||||||||||||
|
|
|
|
|
|
|
|
|
|
|
|||||||||||
| As at March 31, 2023 |
₹ | 77 | ₹ | 12,127 | ₹ | 1,192 | ₹ | 571 | ₹ | 13,967 | ||||||||||
|
|
|
|||||||||||||||||||
| Net carrying value as at March 31, 2023 |
₹ | 18,702 | ||||||||||||||||||
|
|
|
|||||||||||||||||||
| Gross carrying value: |
||||||||||||||||||||
| As at April 1, 2023 |
₹ | 1,278 | ₹ | 27,946 | ₹ | 2,580 | ₹ | 865 | ₹ | 32,669 | ||||||||||
| Additions |
— | 2,408 | 233 | 113 | 2,754 | |||||||||||||||
| Disposals |
— | (2,442 | ) | (629 | ) | (158 | ) | (3,229 | ) | |||||||||||
| Translation adjustment |
— | (73 | ) | ^ | (12 | ) | (85 | ) | ||||||||||||
|
|
|
|
|
|
|
|
|
|
|
|||||||||||
| As at September 30, 2023 |
₹ | 1,278 | ₹ | 27,839 | ₹ | 2,184 | ₹ | 808 | ₹ | 32,109 | ||||||||||
| Accumulated depreciation: |
||||||||||||||||||||
| As at April 1, 2023 |
₹ | 77 | ₹ | 12,127 | ₹ | 1,192 | ₹ | 571 | ₹ | 13,967 | ||||||||||
| Depreciation |
9 | 2,708 | 221 | 93 | 3,031 | |||||||||||||||
| Disposals |
— | (1,179 | ) | (554 | ) | (136 | ) | (1,869 | ) | |||||||||||
| Translation adjustment |
— | (49 | ) | (7 | ) | (7 | ) | (63 | ) | |||||||||||
|
|
|
|
|
|
|
|
|
|
|
|||||||||||
| As at September 30, 2023 |
₹ | 86 | ₹ | 13,607 | ₹ | 852 | ₹ | 521 | ₹ | 15,066 | ||||||||||
|
|
|
|||||||||||||||||||
| Net carrying value as at September 30, 2023 |
₹ | 17,043 | ||||||||||||||||||
|
|
|
|||||||||||||||||||
| ^ | Value is less than 1 |
| (1) | Comprised of net carrying value of computer equipment. |
6. Goodwill and intangible assets
The movement in goodwill balance is given below:
| For the period ended | ||||||||
| March 31, 2023 | September 30, 2023 | |||||||
| Balance at the beginning of the period |
₹ | 246,989 | ₹ | 307,970 | ||||
| Translation adjustment |
20,335 | 2,251 | ||||||
| Acquisition through Business combinations(1) |
40,687 | (489 | ) | |||||
| Disposals |
(41 | ) | — | |||||
|
|
|
|
|
|||||
| Balance at the end of the period |
₹ | 307,970 | ₹ | 309,732 | ||||
|
|
|
|
|
|||||
| (1) | Acquisition through business combinations for the year ended March 31, 2023 and six months ended September 30, 2023 is after considering the impact of ₹ 57 and ₹ 489 towards measurement period changes in purchase price allocation of acquisitions made during the year ended March 31, 2022 and 2023, respectively. |
12
The movement in intangible assets is given below:
| Intangible assets | ||||||||||||
| Customer-related | Marketing-related | Total | ||||||||||
| Gross carrying value: |
||||||||||||
| As at April 1, 2022 |
₹ | 43,366 | ₹ | 11,428 | ₹ | 54,794 | ||||||
| Acquisition through Business combinations |
5,480 | 482 | 5,962 | |||||||||
| Deductions/adjustments (1) |
(39 | ) | — | (39 | ) | |||||||
| Translation adjustment |
2,713 | 720 | 3,433 | |||||||||
|
|
|
|
|
|
|
|||||||
| As at September 30, 2022 |
₹ | 51,520 | ₹ | 12,630 | ₹ | 64,150 | ||||||
| Accumulated amortization/ impairment: |
||||||||||||
| As at April 1, 2022 |
₹ | 9,483 | ₹ | 1,756 | ₹ | 11,239 | ||||||
| Amortization and impairment |
3,111 | 908 | 4,019 | |||||||||
| Translation adjustment |
486 | 99 | 585 | |||||||||
|
|
|
|
|
|
|
|||||||
| As at September 30, 2022 |
₹ | 13,080 | ₹ | 2,763 | ₹ | 15,843 | ||||||
|
|
|
|
|
|
|
|||||||
| Net carrying value as at September 30, 2022 |
₹ | 38,440 | ₹ | 9,867 | ₹ | 48,307 | ||||||
|
|
|
|
|
|
|
|||||||
| Gross carrying value: |
||||||||||||
| As at April 1, 2022 |
₹ | 43,366 | ₹ | 11,428 | ₹ | 54,794 | ||||||
| Acquisition through Business combinations |
5,602 | 482 | 6,084 | |||||||||
| Deductions/adjustments (1) |
(2,555 | ) | (862 | ) | (3,417 | ) | ||||||
| Translation adjustment |
3,400 | 876 | 4,276 | |||||||||
|
|
|
|
|
|
|
|||||||
| As at March 31, 2023 |
₹ | 49,813 | ₹ | 11,924 | ₹ | 61,737 | ||||||
| Accumulated amortization/ impairment: |
||||||||||||
| As at April 1, 2022 |
₹ | 9,483 | ₹ | 1,756 | ₹ | 11,239 | ||||||
| Amortization and impairment (2) |
7,718 | 2,236 | 9,954 | |||||||||
| Deductions/adjustments |
(2,519 | ) | (862 | ) | (3,381 | ) | ||||||
| Translation adjustment |
735 | 145 | 880 | |||||||||
|
|
|
|
|
|
|
|||||||
| As at March 31, 2023 |
₹ | 15,417 | ₹ | 3,275 | ₹ | 18,692 | ||||||
|
|
|
|
|
|
|
|||||||
| Net carrying value as at March 31, 2023 |
₹ | 34,396 | ₹ | 8,649 | ₹ | 43,045 | ||||||
|
|
|
|
|
|
|
|||||||
| Gross carrying value: |
||||||||||||
| As at April 1, 2023 |
₹ | 49,813 | ₹ | 11,924 | ₹ | 61,737 | ||||||
| Translation adjustment |
431 | 111 | 542 | |||||||||
|
|
|
|
|
|
|
|||||||
| As at September 30, 2023 |
₹ | 50,244 | ₹ | 12,035 | ₹ | 62,279 | ||||||
| Accumulated amortization/ impairment: |
||||||||||||
| As at April 1, 2023 |
₹ | 15,417 | ₹ | 3,275 | ₹ | 18,692 | ||||||
| Amortization and impairment (2) (3) |
4,393 | 901 | 5,294 | |||||||||
| Translation adjustment |
152 | 32 | 184 | |||||||||
|
|
|
|
|
|
|
|||||||
| As at September 30, 2023 |
₹ | 19,962 | ₹ | 4,208 | ₹ | 24,170 | ||||||
|
|
|
|
|
|
|
|||||||
| Net carrying value as at September 30, 2023 |
₹ | 30,282 | ₹ | 7,827 | ₹ | 38,109 | ||||||
|
|
|
|
|
|
|
|||||||
| (1) | Includes ₹ 39 and ₹ 36 for the period ended September 30, 2022 and March 31, 2023 respectively, towards measurement period adjustment in customer-related intangible in an acquisition completed during the year ended March 31, 2022. |
| (2) | During the year ended March 31, 2023, and six months ended September 30, 2023, decline in the revenue and earnings estimates led to revision of recoverable value of customer-relationship intangible assets and marketing related intangible assets recognized on business combinations. Consequently, the Company has recognized impairment charge of ₹ 1,816 for the year ended March 31, 2023 and ₹ 437 for the three and six months ended September 30, 2023, as part of amortization and impairment. |
| (3) | Due to change in our estimate of useful life of customer-related intangibles in an earlier business combination, the Company has recognized additional amortization charge of ₹ 1,211 for the three and six months ended September 30, 2023, as part of amortization and impairment. |
Amortization expense on intangible assets is included in selling and marketing expenses in the interim condensed consolidated statement of income.
7. Business combinations
Rizing Intermediate Holdings, Inc. and its subsidiaries (“Rizing”), a global SAP consulting firm with industry expertise and consulting capabilities in enterprise asset management, consumer industries, and human experience management. Rizing complements the Company in capabilities (EAM, HCM and S/4HANA), in industries such as Energy and Utilities, Retail and Consumer Products, Manufacturing and Hi Tech in geographies across North America, Europe, Asia, and Australia. The acquisition was consummated on May 20, 2022, for total cash consideration of ₹ 43,845. During the six months ended September 30, 2023, the Company finalized the purchase price allocation as below.
13
| Description | Amount | |||
| Net assets |
₹ | 4,425 | ||
| Fair value of customer-related intangibles |
3,894 | |||
| Fair value of marketing-related intangibles |
482 | |||
| Deferred tax liabilities on intangible assets |
(1,750 | ) | ||
|
|
|
|||
| Total |
₹ | 7,051 | ||
| Goodwill |
36,794 | |||
|
|
|
|||
| Total purchase price |
₹ | 43,845 | ||
|
|
|
|||
| Net Assets include: |
||||
| Cash and cash equivalents |
₹ | 2,114 | ||
| Fair value of acquired trade receivables included in net assets |
₹ | 3,220 | ||
| Gross contractual amount of acquired trade receivables |
₹ | 3,233 | ||
| Less: Allowance for lifetime expected credit loss |
(13 | ) | ||
The goodwill of ₹ 36,794 comprises value of acquired workforce and expected synergies arising from the business combination. Goodwill is allocated to IT Services segment and is not deductible for income tax purposes.
8. Investments
| As at | ||||||||
| March 31, 2023 | September 30, 2023 | |||||||
| Non-current |
||||||||
| Financial instruments at FVTPL |
||||||||
| Equity instruments |
₹ | 3,773 | ₹ | 4,040 | ||||
| Fixed maturity plan mutual funds |
1,300 | 1,342 | ||||||
| Financial instruments at FVTOCI |
||||||||
| Equity instruments |
15,647 | 15,745 | ||||||
| Financial instruments at amortized cost |
||||||||
| Inter corporate and term deposits |
^ | 502 | ||||||
|
|
|
|
|
|||||
| ₹ | 20,720 | ₹ | 21,629 | |||||
| Current |
||||||||
| Financial instruments at FVTPL |
||||||||
| Short-term mutual funds |
₹ | 40,262 | ₹ | 54,790 | ||||
| Financial instruments at FVTOCI |
||||||||
| Non-convertible debentures, government securities, commercial papers, certificate of deposit and bonds |
245,195 | 165,391 | ||||||
| Financial instruments at amortized cost |
||||||||
| Inter corporate and term deposits (1) |
23,775 | 19,666 | ||||||
|
|
|
|
|
|||||
| ₹ | 309,232 | ₹ | 239,847 | |||||
|
|
|
|
|
|||||
| ₹ | 329,952 | ₹ | 261,476 | |||||
|
|
|
|
|
|||||
| ^ | Value is less than 1 |
| (1) | These deposits earn a fixed rate of interest. Term deposits include current deposits in lien with banks primarily on account of term deposits held as margin money deposits against guarantees amounting to ₹ 123 (March 31, 2023: ₹ 653). |
9. Inventories
| As at | ||||||||
| March 31, 2023 | September 30, 2023 | |||||||
| Stores and spare parts |
₹ | 30 | ₹ | 30 | ||||
| Finished and traded goods |
1,158 | 1,251 | ||||||
|
|
|
|
|
|||||
| ₹ | 1,188 | ₹ | 1,281 | |||||
|
|
|
|
|
|||||
10. Cash and cash equivalents
| As at | ||||||||
| March 31, 2023 | September 30, 2023 | |||||||
| Cash and bank balances |
₹ | 60,417 | ₹ | 65,595 | ||||
| Demand deposits with banks (1) |
31,463 | 32,301 | ||||||
|
|
|
|
|
|||||
| ₹ | 91,880 | ₹ | 97,896 | |||||
|
|
|
|
|
|||||
| (1) | These deposits can be withdrawn by the Company at any time without prior notice and without any penalty on the principal. |
14
Cash and cash equivalents consist of the following for the purpose of the statement of cash flows:
| As at | ||||||||
| September 30, 2022 | September 30, 2023 | |||||||
| Cash and cash equivalents |
₹ | 73,023 | ₹ | 97,896 | ||||
| Bank overdrafts |
(2 | ) | (22 | ) | ||||
|
|
|
|
|
|||||
| ₹ | 73,021 | ₹ | 97,874 | |||||
|
|
|
|
|
|||||
11. Other financial assets
| As at | ||||||||
| March 31, 2023 | September 30, 2023 | |||||||
| Non-current |
||||||||
| Security deposits |
₹ | 1,566 | ₹ | 1,170 | ||||
| Finance lease receivables |
4,742 | 4,801 | ||||||
| Others |
22 | 2 | ||||||
|
|
|
|
|
|||||
| ₹ | 6,330 | ₹ | 5,973 | |||||
| Current |
||||||||
| Security deposits |
₹ | 1,549 | ₹ | 1,895 | ||||
| Dues from officers and employees |
735 | 737 | ||||||
| Interest receivables |
386 | 927 | ||||||
| Finance lease receivables |
5,672 | 5,354 | ||||||
| Others |
754 | 242 | ||||||
|
|
|
|
|
|||||
| ₹ | 9,096 | ₹ | 9,155 | |||||
|
|
|
|
|
|||||
| ₹ | 15,426 | ₹ | 15,128 | |||||
|
|
|
|
|
|||||
12. Other assets
| As at | ||||||||
| March 31, 2023 | September 30, 2023 | |||||||
| Non-current |
||||||||
| Prepaid expenses |
₹ | 5,375 | ₹ | 3,590 | ||||
| Costs to obtain contract (1) |
2,936 | 2,667 | ||||||
| Costs to fulfil contract (2) |
261 | 234 | ||||||
| Others |
5,034 | 4,343 | ||||||
|
|
|
|
|
|||||
| ₹ | 13,606 | ₹ | 10,834 | |||||
| Current |
||||||||
| Prepaid expenses |
₹ | 19,164 | ₹ | 21,084 | ||||
| Dues from officers and employees |
799 | 460 | ||||||
| Advance to suppliers |
2,506 | 1,667 | ||||||
| Balance with GST and other authorities |
7,929 | 6,078 | ||||||
| Costs to obtain contract (1) |
978 | 931 | ||||||
| Costs to fulfil contract (2) |
59 | 60 | ||||||
| Others |
1,464 | 1,666 | ||||||
|
|
|
|
|
|||||
| ₹ | 32,899 | ₹ | 31,946 | |||||
|
|
|
|
|
|||||
| ₹ | 46,505 | ₹ | 42,780 | |||||
|
|
|
|
|
|||||
| (1) | Costs to obtain contract amortization of ₹ 226 and ₹ 244 during the three months ended September 30, 2022 and 2023 respectively, ₹ 440 and ₹ 572 during the six months ended September 30, 2022 and 2023 respectively. |
| (2) | Costs to fulfil contract amortization of ₹ 14 and ₹ 15 during the three months ended September 30, 2022 and 2023 respectively, ₹ 28 and ₹ 30 during the six months ended September 30, 2022 and 2023 respectively |
13. Loans, borrowings and bank overdrafts
| As at | ||||||||
| March 31, 2023 | September 30, 2023 | |||||||
| Non-current |
||||||||
| Unsecured Notes 2026 |
₹ | 61,272 | ₹ | 61,971 | ||||
|
|
|
|
|
|||||
| ₹ | 61,272 | ₹ | 61,971 | |||||
| Current |
||||||||
| Borrowings from banks |
₹ | 88,745 | ₹ | 93,981 | ||||
| Loans from institutions other than banks |
57 | 57 | ||||||
| Bank overdrafts |
19 | 22 | ||||||
|
|
|
|
|
|||||
| ₹ | 88,821 | ₹ | 94,060 | |||||
|
|
|
|
|
|||||
| ₹ | 150,093 | ₹ | 156,031 | |||||
|
|
|
|
|
|||||
15
14. Other financial liabilities
| As at | ||||||||
| March 31, 2023 | September 30, 2023 | |||||||
| Non-current |
||||||||
| Contingent consideration (Refer to Note 17) |
₹ | 1,545 | ₹ | 548 | ||||
| Deposits and others |
1,104 | 1,061 | ||||||
|
|
|
|
|
|||||
| ₹ | 2,649 | ₹ | 1,609 | |||||
| Current |
||||||||
| Contingent consideration (Refer to Note 17) |
₹ | 1,508 | ₹ | 719 | ||||
| Advance from customers |
1,373 | 403 | ||||||
| Cash settled ADS RSUs |
6 | 3 | ||||||
| Capital creditors |
215 | 432 | ||||||
| Deposits and others |
1,039 | 1,155 | ||||||
|
|
|
|
|
|||||
| ₹ | 4,141 | ₹ | 2,712 | |||||
|
|
|
|
|
|||||
| ₹ | 6,790 | ₹ | 4,321 | |||||
|
|
|
|
|
|||||
15. Other liabilities
| As at | ||||||||
| March 31, 2023 | September 30, 2023 | |||||||
| Non-current |
||||||||
| Employee benefits obligations |
₹ | 2,947 | ₹ | 3,354 | ||||
| Others |
6,386 | 7,671 | ||||||
|
|
|
|
|
|||||
| ₹ | 9,333 | ₹ | 11,025 | |||||
| Current |
||||||||
| Employee benefits obligations |
₹ | 15,885 | ₹ | 16,632 | ||||
| Statutory and other liabilities |
13,155 | 12,104 | ||||||
| Advance from customers and others |
645 | 461 | ||||||
| Others |
530 | 676 | ||||||
|
|
|
|
|
|||||
| ₹ | 30,215 | ₹ | 29,873 | |||||
|
|
|
|
|
|||||
| ₹ | 39,548 | ₹ | 40,898 | |||||
|
|
|
|
|
|||||
16. Provisions
| As at | ||||||||
| March 31, 2023 | September 30, 2023 | |||||||
| Non-current |
||||||||
| Provision for warranty |
₹ | ^ | ₹ | — | ||||
|
|
|
|
|
|||||
| ₹ | ^ | ₹ | — | |||||
| Current |
||||||||
| Provision for onerous contracts |
₹ | 1,590 | ₹ | 1,663 | ||||
| Provision for warranty |
456 | 228 | ||||||
| Others |
503 | 359 | ||||||
|
|
|
|
|
|||||
| ₹ | 2,549 | ₹ | 2,250 | |||||
|
|
|
|
|
|||||
| ₹ | 2,549 | ₹ | 2,250 | |||||
|
|
|
|
|
|||||
| ^ | Value is less than 1 |
| 17. | Financial instruments: |
Derivative assets and liabilities:
The Company is exposed to currency fluctuations on foreign currency assets / liabilities, forecasted cash flows denominated in foreign currency and net investment in foreign operations. The Company is also exposed to interest rate fluctuations on investments in floating rate financial assets and floating rate borrowings. The Company follows established risk management policies, including the use of derivatives to hedge foreign currency assets / liabilities, interest rates, foreign currency forecasted cash flows and net investment in foreign operations. The counter parties in these derivative instruments are primarily banks and the Company considers the risks of non-performance by the counterparty as immaterial.
16
The following table presents the aggregate contracted principal amounts of the Company’s derivative contracts outstanding:
| (in million) | ||||||||||||||||||||
| As at |
||||||||||||||||||||
| March 31, 2023 |
September 30, 2023 |
|||||||||||||||||||
| Notional |
Fair value | Notional |
Fair value | |||||||||||||||||
| Designated derivative instruments |
||||||||||||||||||||
| Sell: Forward contracts |
USD | 977 | ₹ | (262 | ) | USD | 1,255 | ₹ | 2 | |||||||||||
| € | 94 | ₹ | (497 | ) | € | 47 | ₹ | 154 | ||||||||||||
| £ | 138 | ₹ | (728 | ) | £ | 89 | ₹ | (1 | ) | |||||||||||
| AUD | 89 | ₹ | 9 | AUD | 41 | ₹ | 92 | |||||||||||||
| Range forward option contracts |
USD | 1,157 | ₹ | (19 | ) | USD | 896 | ₹ | 160 | |||||||||||
| € | 49 | ₹ | (112 | ) | € | 131 | ₹ | 162 | ||||||||||||
| £ | 60 | ₹ | (69 | ) | £ | 66 | ₹ | 70 | ||||||||||||
| AUD | 34 | ₹ | 29 | AUD | 68 | ₹ | 28 | |||||||||||||
| Interest rate swaps |
INR | 4,750 | ₹ | (113 | ) | INR | 5,000 | ₹ | (114 | ) | ||||||||||
| USD | — | ₹ | — | USD | 225 | ₹ | 379 | |||||||||||||
| Non-designated derivative instruments |
||||||||||||||||||||
| Sell: Forward contracts (1) |
USD | 1,550 | ₹ | 736 | USD | 1,607 | ₹ | (574 | ) | |||||||||||
| € | 171 | ₹ | (176 | ) | € | 193 | ₹ | 120 | ||||||||||||
| £ | 129 | ₹ | (100 | ) | £ | 129 | ₹ | 109 | ||||||||||||
| AUD | 56 | ₹ | 69 | AUD | 52 | ₹ | 9 | |||||||||||||
| SGD | 14 | ₹ | 1 | SGD | 9 | ₹ | 9 | |||||||||||||
| ZAR | 43 | ₹ | (7 | ) | ZAR | 142 | ₹ | (12 | ) | |||||||||||
| CAD | 69 | ₹ | (25 | ) | CAD | 29 | ₹ | (3 | ) | |||||||||||
| SAR | 147 | ₹ | (6 | ) | SAR | 238 | ₹ | (4 | ) | |||||||||||
| CHF | 9 | ₹ | 5 | CHF | 2 | ₹ | 4 | |||||||||||||
| QAR | 4 | ₹ | (2 | ) | QAR | — | ₹ | — | ||||||||||||
| TRY | 30 | ₹ | (1 | ) | TRY | 86 | ₹ | 1 | ||||||||||||
| NOK | 13 | ₹ | 6 | NOK | — | ₹ | — | |||||||||||||
| OMR | 1 | ₹ | ^ | OMR | 3 | ₹ | (1 | ) | ||||||||||||
| SEK | 3 | ₹ | ^ | SEK | — | ₹ | — | |||||||||||||
| JPY | 784 | ₹ | 6 | JPY | 1,489 | ₹ | 19 | |||||||||||||
| DKK | 33 | ₹ | (4 | ) | DKK | 33 | ₹ | 2 | ||||||||||||
| AED | 20 | ₹ | ^ | AED | 24 | ₹ | ^ | |||||||||||||
| CNH | 1 | ₹ | ^ | CNH | 1 | ₹ | ^ | |||||||||||||
| PLN | — | ₹ | — | PLN | 9 | ₹ | 1 | |||||||||||||
| BDT | — | ₹ | — | BDT | 757 | ₹ | (34 | ) | ||||||||||||
| MXN | — | ₹ | — | MXN | 33 | ₹ | 1 | |||||||||||||
| COP | — | ₹ | — | COP | 10,339 | ₹ | (5 | ) | ||||||||||||
| Buy: Forward contracts |
AED | 5 | ₹ | ^ | AED | — | ₹ | — | ||||||||||||
| NOK | 12 | ₹ | ^ | NOK | 12 | ₹ | 2 | |||||||||||||
| QAR | 4 | ₹ | 2 | QAR | 11 | ₹ | 4 | |||||||||||||
| ZAR | 7 | ₹ | 1 | ZAR | 51 | ₹ | (2 | ) | ||||||||||||
| PLN | 26 | ₹ | 13 | PLN | 30 | ₹ | (34 | ) | ||||||||||||
| SEK | — | ₹ | — | SEK | 39 | ₹ | 5 | |||||||||||||
| JPY | — | ₹ | — | JPY | 261 | ₹ | (3 | ) | ||||||||||||
| USD | — | ₹ | — | USD | 86 | ₹ | 6 | |||||||||||||
| CHF | — | ₹ | — | CHF | 2 | ₹ | (8 | ) | ||||||||||||
| TWD | — | ₹ | — | TWD | 67 | ₹ | (2 | ) | ||||||||||||
| BRL | — | ₹ | — | BRL | 11 | ₹ | (1 | ) | ||||||||||||
| RON | — | ₹ | — | RON | 60 | ₹ | (7 | ) | ||||||||||||
| CAD | — | ₹ | — | CAD | 15 | ₹ | (5 | ) | ||||||||||||
| € | — | ₹ | — | € | 13 | ₹ | (1 | ) | ||||||||||||
| Range forward option contracts |
USD | 30 | ₹ | 31 | USD | — | ₹ | — | ||||||||||||
| Interest rate swaps |
USD | 200 | ₹ | 82 | USD | — | ₹ | — | ||||||||||||
|
|
|
|
|
|||||||||||||||||
| ₹ | (1,131 | ) | ₹ | 528 | ||||||||||||||||
|
|
|
|
|
|||||||||||||||||
| ^ | Value is less than 1 |
| (1) | USD 1,550 and USD 1607 includes USD/PHP sell forward of USD 77 and USD 137 as at March 31, 2023 and September 30, 2023, respectively. |
17
Hedge effectiveness is determined at the inception of the hedge relationship, and through periodic prospective effectiveness assessments to ensure that an economic relationship exists between the hedged item and hedging instrument, including whether the hedging instrument is expected to offset changes in cash flows of hedged items.
The following table summarizes activity in the cash flow hedging reserve within equity related to all derivative instruments classified as cash flow hedges:
| Six months ended September 30, |
||||||||
| 2022 | 2023 | |||||||
| Balance as at the beginning of the period |
₹ | 1,943 | ₹ | (1,762 | ) | |||
| Changes in fair value of effective portion of derivatives |
(1,569 | ) | 1,206 | |||||
| Deferred cancellation gain/(loss), net |
— | 12 | ||||||
| Net (gain)/loss reclassified to consolidated statement of income on occurrence of hedged transactions (1) |
(1,160 | ) | 1,488 | |||||
| Ineffective portion of derivative instruments classified to consolidated statement of income |
— | (86 | ) | |||||
|
|
|
|
|
|||||
| Gain/(loss) on cash flow hedging derivatives, net |
₹ | (2,729 | ) | ₹ | 2,620 | |||
| Translation (gain)/loss |
(6 | ) | (2 | ) | ||||
|
|
|
|
|
|||||
| Balance as at the end of the period |
₹ | (792 | ) | ₹ | 856 | |||
| Deferred tax thereon |
141 | (221 | ) | |||||
|
|
|
|
|
|||||
| Balance as at the end of the period, net of deferred tax |
₹ | (651 | ) | ₹ | 635 | |||
|
|
|
|
|
|||||
| (1) | Includes net (gain)/loss reclassified to revenue of ₹ (640) and ₹ 1291 for the six months ended September 30, 2022, and 2023, respectively and net (gain)/loss reclassified to cost of revenues of ₹ (520) and ₹ 197 for the six months ended September 30, 2022, and 2023, respectively. |
As at September 30, 2022 and 2023, there were no significant gains or losses on derivative transactions or portions thereof that have become ineffective as hedges or associated with an underlying exposure that did not occur.
Fair value:
Financial assets and liabilities include cash and cash equivalents, trade receivables, unbilled receivables, finance lease receivables, employee and other advances, eligible current and non-current assets, loans, borrowings and bank overdrafts, trade payables and accrued expenses, and eligible current liabilities and non-current liabilities.
The fair value of cash and cash equivalents, trade receivables, unbilled receivables, short-term loans, borrowings and bank overdrafts, trade payables and accrued expenses, other current financial assets and liabilities approximate their carrying amount largely due to the short-term nature of these instruments. Finance lease receivables are periodically evaluated based on individual credit worthiness of customers. Based on this evaluation, the Company records allowance for estimated credit losses on these receivables. As at March 31, 2023 and September 30, 2023, the carrying value of such receivables, net of allowances approximates the fair value. The Company’s Unsecured Notes 2026 are contracted at fixed coupon rate of 1.50% and market yield of Unsecured Notes 2026 as of September 30, 2023 is 5.749%.
Investments in short-term mutual funds and fixed maturity plan mutual funds, which are classified as FVTPL are measured using net asset values at the reporting date multiplied by the quantity held. Fair value of investments in non-convertible debentures, government securities, commercial papers, certificate of deposit and bonds classified as FVTOCI is determined based on the indicative quotes of price and yields prevailing in the market at the reporting date. Fair value of investments in equity instruments classified as FVTOCI or FVTPL is determined using market approach primarily based on market multiples method.
The fair value of derivative financial instruments is determined based on observable market inputs including currency spot and forward rates, yield curves and currency volatility.
Fair value hierarchy
The table below analyses financial instruments carried at fair value, by valuation method. The different levels have been defined as follows:
Level 1 – Quoted prices (unadjusted) in active markets for identical assets or liabilities.
Level 2 – Inputs other than quoted prices included within Level 1 that are observable for the asset or liability, either directly (i.e. as prices) or indirectly (i.e. derived from prices).
Level 3 – Inputs for the assets or liabilities that are not based on observable market data (unobservable inputs).
There were no transfer between Level 1, 2 and 3 during the year ended March 31, 2023 and six months ended September 30, 2023.
18
The following table presents fair value hierarchy of assets and liabilities measured at fair value on a recurring basis:
| As at | ||||||||||||||||||||||||||||||||
| March 31, 2023 | September 30, 2023 | |||||||||||||||||||||||||||||||
| Fair value measurements at reporting date | Fair value measurements at reporting date | |||||||||||||||||||||||||||||||
| Total | Level 1 | Level 2 | Level 3 | Total | Level 1 | Level 2 | Level 3 | |||||||||||||||||||||||||
| Assets |
||||||||||||||||||||||||||||||||
| Derivative instruments: |
||||||||||||||||||||||||||||||||
| Cash flow hedges |
₹ | 772 | ₹ | — | ₹ | 772 | ₹ | — | ₹ | 1,439 | ₹ | — | ₹ | 1,439 | ₹ | — | ||||||||||||||||
| Others |
1,101 | — | 1,101 | — | 711 | — | 711 | — | ||||||||||||||||||||||||
| Investments: |
||||||||||||||||||||||||||||||||
| Short-term mutual funds |
40,262 | 40,262 | — | — | 54,790 | 54,790 | — | |||||||||||||||||||||||||
| Fixed maturity plan mutual funds |
1,300 | — | 1,300 | — | 1,342 | — | 1,342 | — | ||||||||||||||||||||||||
| Equity instruments |
19,420 | 99 | — | 19,321 | 19,785 | 83 | — | 19,702 | ||||||||||||||||||||||||
| Non-convertible debentures, government securities, commercial papers, certificate of deposit and bonds |
245,195 | 1,256 | 243,939 | — | 165,391 | 1,263 | 164,128 | — | ||||||||||||||||||||||||
| Liabilities |
||||||||||||||||||||||||||||||||
| Derivative instruments: |
||||||||||||||||||||||||||||||||
| Cash flow hedges |
₹ | (2,534 | ) | ₹ | — | ₹ | (2,534 | ) | ₹ | — | ₹ | (593 | ) | ₹ | — | ₹ | (593 | ) | ₹ | — | ||||||||||||
| Others |
(470 | ) | — | (470 | ) | — | (1,029 | ) | — | (1,029 | ) | — | ||||||||||||||||||||
| Contingent consideration |
(3,053 | ) | — | — | (3,053 | ) | (1,267 | ) | — | — | (1,267 | ) | ||||||||||||||||||||
The following methods and assumptions were used to estimate the fair value of the level 2 financial instruments included in the above table.
Derivative instruments (assets and liabilities): The Company enters into derivative financial instruments with various counterparties, primarily banks with investment grade credit ratings. Derivatives valued using valuation techniques with market observable inputs are mainly interest rate swaps, foreign exchange forward contracts and foreign exchange option contracts. The most frequently applied valuation techniques include forward pricing, swap models and Black Scholes models (for option valuation), using present value calculations. The models incorporate various inputs including the credit quality of counterparties, foreign exchange spot and forward rates, interest rate curves and forward rate curves of the underlying. As at September 30, 2023, the changes in counterparty credit risk had no material effect on the hedge effectiveness assessment for derivatives designated in hedge relationships and other financial instruments recognized at fair value.
Investment in Non-convertible debentures, government securities, commercial papers, certificate of deposit and bonds: Fair value of these instruments is derived based on the indicative quotes of price and yields prevailing in the market as at reporting date.
Investment in fixed maturity plan mutual funds: Fair value of these instruments is derived based on the indicative quotes of price prevailing in the market as at reporting date.
The following methods and assumptions were used to estimate the fair value of the level 3 financial instruments included in the above table.
Investment in equity instruments: Fair value of these instruments is determined using market approach primarily based on market multiples method.
Details of assets and liabilities considered under Level 3 classification
| As at | ||||||||
| Investment in equity instruments | March 31, 2023 | September 30, 2023 | ||||||
| Balance at the beginning of the period |
₹ | 16,324 | ₹ | 19,321 | ||||
| Additions |
2,093 | 592 | ||||||
| Disposals (1) |
(632 | ) | (268 | ) | ||||
| Unrealized gain/(loss) recognized in statement of income |
(2 | ) | (4 | ) | ||||
| Gain/(loss) recognized in other comprehensive income |
291 | (113 | ) | |||||
| Translation adjustment |
1,247 | 174 | ||||||
|
|
|
|
|
|||||
| Balance at the end of the period |
₹ | 19,321 | ₹ | 19,702 | ||||
|
|
|
|
|
|||||
| (1) | During the year ended March 31, 2023, the Company sold its shares in Vicarious FPC, Inc. and Harte Hanks Inc. at a fair value of ₹ 1,150 and recognized a cumulative gain of ₹ 30 in other comprehensive income. |
During the period ended September 30, 2023, the Company sold its shares in Moogsoft (Herd) Inc. at a fair value of ₹ 152 and recognized a cumulative gain of ₹ 8 in other comprehensive income.
19
| As at | ||||||||
| Contingent consideration | March 31, 2023 | September 30, 2023 | ||||||
| Balance at the beginning of the period |
₹ | (4,329 | ) | ₹ | (3,053 | ) | ||
| Additions |
(1,662 | ) | — | |||||
| Reversals (1) |
1,671 | 506 | ||||||
| Payouts |
1,784 | 1,289 | ||||||
| Finance (expense)/writeback recognized in statement of income |
(131 | ) | 9 | |||||
| Translation adjustment |
(386 | ) | (18 | ) | ||||
|
|
|
|
|
|||||
| Balance at the end of the period |
₹ | (3,053 | ) | ₹ | (1,267 | ) | ||
|
|
|
|
|
|||||
| (1) | Towards change in fair value of earn-out liability as a result of changes in estimates of revenue and earnings over the earn-out period. |
18. Foreign currency translation reserve and Other reserves
The movement in foreign currency translation reserve attributable to equity holders of the Company is summarized below:
| Six months ended September 30, | ||||||||
| 2022 | 2023 | |||||||
| Balance at the beginning of the period |
₹ | 26,850 | ₹ | 43,255 | ||||
| Translation difference related to foreign operations, net |
8,622 | 1,452 | ||||||
| Reclassification of foreign currency translation differences on liquidation of subsidiaries to statement of income |
(23 | ) | (181 | ) | ||||
|
|
|
|
|
|||||
| Balance at the end of the period |
₹ | 35,449 | ₹ | 44,526 | ||||
|
|
|
|
|
|||||
The movement in other reserves is summarized below:
| Other Reserves | ||||||||||||||||
| Particulars | Remeasurements of the defined benefit plans |
Investment in debt instruments measured at fair value through OCI |
Investment in equity instruments measured at fair value through OCI |
Capital Redemption Reserve |
||||||||||||
| As at April 1, 2022 |
₹ | (498 | ) | ₹ | 3,018 | ₹ | 10,088 | ₹ | 1,122 | |||||||
| Other comprehensive income |
607 | (3,954 | ) | 1,513 | — | |||||||||||
| As at September 30, 2022 |
₹ | 109 | ₹ | (936 | ) | ₹ | 11,601 | ₹ | 1,122 | |||||||
| As at April 1, 2023 |
₹ | (548 | ) | ₹ | (119 | ) | ₹ | 10,793 | ₹ | 1,122 | ||||||
| Other comprehensive income |
108 | 1,336 | (108 | ) | — | |||||||||||
| Buyback of equity shares |
— | — | — | 539 | ||||||||||||
| As at September 30, 2023 |
₹ | (440 | ) | ₹ | 1,217 | ₹ | 10,685 | ₹ | 1,661 | |||||||
19. Income taxes
| Three months ended September 30, | Six months ended September 30, | |||||||||||||||
| 2022 | 2023 | 2022 | 2023 | |||||||||||||
| Income tax expense as per the interim condensed consolidated statement of income |
₹ | 7,710 | ₹ | 8,419 | ₹ | 15,641 | ₹ | 17,534 | ||||||||
| Income tax included in other comprehensive income on: |
|
|||||||||||||||
| Gains/(losses) on investment securities |
(14 | ) | 34 | (407 | ) | 196 | ||||||||||
| Gains/(losses) on cash flow hedging derivatives |
(154 | ) | (46 | ) | (607 | ) | 580 | |||||||||
| Remeasurements of the defined benefit plans |
54 | 10 | 149 | 43 | ||||||||||||
|
|
|
|
|
|
|
|
|
|||||||||
| ₹ | 7,596 | ₹ | 8,417 | ₹ | 14,776 | ₹ | 18,353 | |||||||||
|
|
|
|
|
|
|
|
|
|||||||||
Income tax expense consists of the following:
| Three months ended September 30, | Six months ended September 30, | |||||||||||||||
| 2022 | 2023 | 2022 | 2023 | |||||||||||||
| Current taxes |
₹ | 8,570 | ₹ | 9,286 | ₹ | 17,599 | ₹ | 18,421 | ||||||||
| Deferred taxes |
(860 | ) | (867 | ) | (1,958 | ) | (887 | ) | ||||||||
|
|
|
|
|
|
|
|
|
|||||||||
| ₹ | 7,710 | ₹ | 8,419 | ₹ | 15,641 | ₹ | 17,534 | |||||||||
|
|
|
|
|
|
|
|
|
|||||||||
Income tax expenses are net of reversal of taxes pertaining to earlier periods, amounting to ₹ 224 and ₹ 109 for the three months ended September 30, 2022 and 2023, and ₹ 292 and ₹ 736 for the six months ended September 30, 2022 and 2023, respectively.
For the three and six months ended September 30, 2023, the Company has applied mandatory temporary exception to the accounting for deferred taxes arising from the jurisdictional implementation of the Pillar Two model rules under International Tax Reform – Pillar Two Model Rules – Amendments to IAS 12.
20
20. Revenues
The tables below present disaggregated revenue from contracts with customers by business segment (Refer to Note 27 “Segment Information”), sector and nature of contract. The Company believes that the below disaggregation best depicts the nature, amount, timing and uncertainty of revenue and cash flows from economic factors.
Effective April 1, 2023, the Company has reorganized its segments by merging India State Run Enterprises (“ISRE”) segment as part of its APMEA SMU within IT Services segment. Comparative period disaggregated revenue information has been restated to give effect to this change.
21
Information on disaggregation of revenues for the three months ended September 30, 2022 is as follows:
| IT Services | IT Products | Total | ||||||||||||||||||||||||||
| Americas 1 | Americas 2 | Europe | APMEA | Total | ||||||||||||||||||||||||
| A. Revenue |
||||||||||||||||||||||||||||
| Rendering of services |
₹ | 65,080 | ₹ | 69,710 | ₹ | 62,358 | ₹ | 27,000 | ₹ | 224,148 | ₹ | — | ₹ | 224,148 | ||||||||||||||
| Sale of products |
— | — | — | — | — | 1,249 | 1,249 | |||||||||||||||||||||
|
|
|
|
|
|
|
|
|
|
|
|
|
|
|
|||||||||||||||
| ₹ | 65,080 | ₹ | 69,710 | ₹ | 62,358 | ₹ | 27,000 | ₹ | 224,148 | ₹ | 1,249 | ₹ | 225,397 | |||||||||||||||
|
|
|
|
|
|
|
|
|
|
|
|
|
|
|
|||||||||||||||
| B. Revenue by sector |
||||||||||||||||||||||||||||
| Banking, Financial Services and Insurance |
₹ | 1,301 | ₹ | 43,158 | ₹ | 25,201 | ₹ | 9,334 | ₹ | 78,994 | ||||||||||||||||||
| Health |
20,004 | 69 | 4,495 | 1,029 | 25,597 | |||||||||||||||||||||||
| Consumer |
27,732 | 996 | 9,158 | 4,676 | 42,562 | |||||||||||||||||||||||
| Communications |
3,481 | 363 | 3,366 | 3,622 | 10,832 | |||||||||||||||||||||||
| Energy, Natural Resources and Utilities |
195 | 9,668 | 9,576 | 5,518 | 24,957 | |||||||||||||||||||||||
| Manufacturing |
50 | 8,500 | 5,975 | 929 | 15,454 | |||||||||||||||||||||||
| Technology |
12,317 | 6,956 | 4,587 | 1,892 | 25,752 | |||||||||||||||||||||||
|
|
|
|
|
|
|
|
|
|
|
|
|
|
|
|||||||||||||||
| ₹ | 65,080 | ₹ | 69,710 | ₹ | 62,358 | ₹ | 27,000 | ₹ | 224,148 | ₹ | 1,249 | ₹ | 225,397 | |||||||||||||||
|
|
|
|
|
|
|
|
|
|
|
|
|
|
|
|||||||||||||||
| C. Revenue by nature of contract |
||||||||||||||||||||||||||||
| Fixed price and volume based |
₹ | 37,312 | ₹ | 35,121 | ₹ | 34,876 | ₹ | 15,908 | ₹ | 123,217 | ₹ | — | ₹ | 123,217 | ||||||||||||||
| Time and materials |
27,768 | 34,589 | 27,482 | 11,092 | 100,931 | — | 100,931 | |||||||||||||||||||||
| Products |
— | — | — | — | — | 1,249 | 1,249 | |||||||||||||||||||||
|
|
|
|
|
|
|
|
|
|
|
|
|
|
|
|||||||||||||||
| ₹ | 65,080 | ₹ | 69,710 | ₹ | 62,358 | ₹ | 27,000 | ₹ | 224,148 | ₹ | 1,249 | ₹ | 225,397 | |||||||||||||||
|
|
|
|
|
|
|
|
|
|
|
|
|
|
|
|||||||||||||||
Information on disaggregation of revenues for the three months ended September 30, 2023 is as follows:
| IT Services | IT Products | Total | ||||||||||||||||||||||||||
| Americas 1 | Americas 2 | Europe | APMEA | Total | ||||||||||||||||||||||||
| A. Revenue |
||||||||||||||||||||||||||||
| Rendering of services |
₹ | 66,735 | ₹ | 66,837 | ₹ | 63,892 | ₹ | 26,226 | ₹ | 223,690 | ₹ | — | ₹ | 223,690 | ||||||||||||||
| Sale of products |
— | — | — | — | — | 1,469 | 1,469 | |||||||||||||||||||||
|
|
|
|
|
|
|
|
|
|
|
|
|
|
|
|||||||||||||||
| ₹ | 66,735 | ₹ | 66,837 | ₹ | 63,892 | ₹ | 26,226 | ₹ | 223,690 | ₹ | 1,469 | ₹ | 225,159 | |||||||||||||||
|
|
|
|
|
|
|
|
|
|
|
|
|
|
|
|||||||||||||||
| B. Revenue by sector |
||||||||||||||||||||||||||||
| Banking, Financial Services and Insurance |
₹ | 676 | ₹ | 41,155 | ₹ | 24,408 | ₹ | 8,886 | ₹ | 75,125 | ||||||||||||||||||
| Health |
22,813 | 26 | 4,281 | 1,347 | 28,467 | |||||||||||||||||||||||
| Consumer |
25,503 | 1,220 | 10,782 | 4,251 | 41,756 | |||||||||||||||||||||||
| Communications |
3,065 | 314 | 2,953 | 3,323 | 9,655 | |||||||||||||||||||||||
| Energy, Natural Resources and Utilities |
193 | 10,232 | 9,993 | 5,466 | 25,884 | |||||||||||||||||||||||
| Manufacturing |
17 | 7,937 | 6,619 | 1,085 | 15,658 | |||||||||||||||||||||||
| Technology |
14,468 | 5,953 | 4,856 | 1,868 | 27,145 | |||||||||||||||||||||||
|
|
|
|
|
|
|
|
|
|
|
|
|
|
|
|||||||||||||||
| ₹ | 66,735 | ₹ | 66,837 | ₹ | 63,892 | ₹ | 26,226 | ₹ | 223,690 | ₹ | 1,469 | ₹ | 225,159 | |||||||||||||||
|
|
|
|
|
|
|
|
|
|
|
|
|
|
|
|||||||||||||||
| C. Revenue by nature of contract |
||||||||||||||||||||||||||||
| Fixed price and volume based |
₹ | 37,936 | ₹ | 34,331 | ₹ | 36,929 | ₹ | 15,770 | ₹ | 124,966 | ₹ | — | ₹ | 124,966 | ||||||||||||||
| Time and materials |
28,799 | 32,506 | 26,963 | 10,456 | 98,724 | — | 98,724 | |||||||||||||||||||||
| Products |
— | — | — | — | — | 1,469 | 1,469 | |||||||||||||||||||||
|
|
|
|
|
|
|
|
|
|
|
|
|
|
|
|||||||||||||||
| ₹ | 66,735 | ₹ | 66,837 | ₹ | 63,892 | ₹ | 26,226 | ₹ | 223,690 | ₹ | 1,469 | ₹ | 225,159 | |||||||||||||||
|
|
|
|
|
|
|
|
|
|
|
|
|
|
|
|||||||||||||||
22
Information on disaggregation of revenues for the six months ended September 30, 2022 is as follows:
| IT Services | IT Products | Total | ||||||||||||||||||||||||||
| Americas 1 | Americas 2 | Europe | APMEA | Total | ||||||||||||||||||||||||
| A. Revenue |
||||||||||||||||||||||||||||
| Rendering of services |
₹ | 126,520 | ₹ | 136,010 | ₹ | 122,315 | ₹ | 52,643 | ₹ | 437,488 | ₹ | — | ₹ | 437,488 | ||||||||||||||
| Sale of products |
— | — | — | — | — | 3,195 | 3,195 | |||||||||||||||||||||
|
|
|
|
|
|
|
|
|
|
|
|
|
|
|
|||||||||||||||
| ₹ | 126,520 | ₹ | 136,010 | ₹ | 122,315 | ₹ | 52,643 | ₹ | 437,488 | ₹ | 3,195 | ₹ | 440,683 | |||||||||||||||
|
|
|
|
|
|
|
|
|
|
|
|
|
|
|
|||||||||||||||
| B. Revenue by sector |
||||||||||||||||||||||||||||
| Banking, Financial Services and Insurance |
₹ | 2,386 | ₹ | 84,146 | ₹ | 49,737 | ₹ | 18,428 | ₹ | 154,697 | ||||||||||||||||||
| Health |
39,448 | 111 | 8,424 | 1,913 | 49,896 | |||||||||||||||||||||||
| Consumer |
53,453 | 1,892 | 17,978 | 8,869 | 82,192 | |||||||||||||||||||||||
| Communications |
6,673 | 704 | 6,500 | 7,505 | 21,382 | |||||||||||||||||||||||
| Energy, Natural Resources and Utilities |
412 | 18,941 | 18,880 | 10,504 | 48,737 | |||||||||||||||||||||||
| Manufacturing |
67 | 16,343 | 11,558 | 1,833 | 29,801 | |||||||||||||||||||||||
| Technology |
24,081 | 13,873 | 9,238 | 3,591 | 50,783 | |||||||||||||||||||||||
|
|
|
|
|
|
|
|
|
|
|
|
|
|
|
|||||||||||||||
| ₹ | 126,520 | ₹ | 136,010 | ₹ | 122,315 | ₹ | 52,643 | ₹ | 437,488 | ₹ | 3,195 | ₹ | 440,683 | |||||||||||||||
|
|
|
|
|
|
|
|
|
|
|
|
|
|
|
|||||||||||||||
| C. Revenue by nature of contract |
||||||||||||||||||||||||||||
| Fixed price and volume based |
₹ | 73,196 | ₹ | 68,980 | ₹ | 68,853 | ₹ | 31,132 | ₹ | 242,161 | ₹ | — | ₹ | 242,161 | ||||||||||||||
| Time and material |
53,324 | 67,030 | 53,462 | 21,511 | 195,327 | — | 195,327 | |||||||||||||||||||||
| Products |
— | — | — | — | — | 3,195 | 3,195 | |||||||||||||||||||||
|
|
|
|
|
|
|
|
|
|
|
|
|
|
|
|||||||||||||||
| ₹ | 126,520 | ₹ | 136,010 | ₹ | 122,315 | ₹ | 52,643 | ₹ | 437,488 | ₹ | 3,195 | ₹ | 440,683 | |||||||||||||||
|
|
|
|
|
|
|
|
|
|
|
|
|
|
|
|||||||||||||||
Information on disaggregation of revenues for the six months ended September 30, 2023 is as follows:
| IT Services | IT Products | Total | ||||||||||||||||||||||||||
| Americas 1 | Americas 2 | Europe | APMEA | Total | ||||||||||||||||||||||||
| A. Revenue |
||||||||||||||||||||||||||||
| Rendering of services |
₹ | 132,357 | ₹ | 135,158 | ₹ | 131,047 | ₹ | 52,744 | ₹ | 451,306 | ₹ | — | ₹ | 451,306 | ||||||||||||||
| Sale of products |
— | — | — | — | — | 2,163 | 2,163 | |||||||||||||||||||||
|
|
|
|
|
|
|
|
|
|
|
|
|
|
|
|||||||||||||||
| ₹ | 132,357 | ₹ | 135,158 | ₹ | 131,047 | ₹ | 52,744 | ₹ | 451,306 | ₹ | 2,163 | ₹ | 453,469 | |||||||||||||||
|
|
|
|
|
|
|
|
|
|
|
|
|
|
|
|||||||||||||||
| B. Revenue by sector |
||||||||||||||||||||||||||||
| Banking, Financial Services and Insurance |
₹ | 1,460 | ₹ | 83,170 | ₹ | 49,930 | ₹ | 17,927 | ₹ | 152,487 | ||||||||||||||||||
| Health |
44,540 | 111 | 9,104 | 2,597 | 56,352 | |||||||||||||||||||||||
| Consumer |
51,858 | 2,334 | 21,581 | 8,520 | 84,293 | |||||||||||||||||||||||
| Communications |
6,551 | 661 | 6,076 | 6,785 | 20,073 | |||||||||||||||||||||||
| Energy, Natural Resources and Utilities |
299 | 20,526 | 21,104 | 11,311 | 53,240 | |||||||||||||||||||||||
| Manufacturing |
64 | 16,421 | 13,512 | 2,123 | 32,120 | |||||||||||||||||||||||
| Technology |
27,585 | 11,935 | 9,740 | 3,481 | 52,741 | |||||||||||||||||||||||
|
|
|
|
|
|
|
|
|
|
|
|
|
|
|
|||||||||||||||
| ₹ | 132,357 | ₹ | 135,158 | ₹ | 131,047 | ₹ | 52,744 | ₹ | 451,306 | ₹ | 2,163 | ₹ | 453,469 | |||||||||||||||
|
|
|
|
|
|
|
|
|
|
|
|
|
|
|
|||||||||||||||
| C. Revenue by nature of contract |
||||||||||||||||||||||||||||
| Fixed price and volume based |
₹ | 75,460 | ₹ | 69,781 | ₹ | 76,652 | ₹ | 31,712 | ₹ | 253,605 | ₹ | — | ₹ | 253,605 | ||||||||||||||
| Time and materials |
56,897 | 65,377 | 54,395 | 21,032 | 197,701 | — | 197,701 | |||||||||||||||||||||
| Products |
— | — | — | — | — | 2,163 | 2,163 | |||||||||||||||||||||
|
|
|
|
|
|
|
|
|
|
|
|
|
|
|
|||||||||||||||
| ₹ | 132,357 | ₹ | 135,158 | ₹ | 131,047 | ₹ | 52,744 | ₹ | 451,306 | ₹ | 2,163 | ₹ | 453,469 | |||||||||||||||
|
|
|
|
|
|
|
|
|
|
|
|
|
|
|
|||||||||||||||
23
21. Expenses by nature
| Three months ended September 30, | Six months ended September 30, | |||||||||||||||
| 2022 | 2023 | 2022 | 2023 | |||||||||||||
| Employee compensation |
₹ | 137,261 | ₹ | 138,536 | ₹ | 263,395 | ₹ | 278,812 | ||||||||
| Sub-contracting and technical fees |
29,131 | 26,547 | 58,585 | 52,932 | ||||||||||||
| Cost of hardware and software |
1,328 | 1,501 | 3,471 | 2,307 | ||||||||||||
| Travel |
3,037 | 4,049 | 6,107 | 8,224 | ||||||||||||
| Facility expenses (1) |
3,300 | 3,815 | 6,599 | 7,267 | ||||||||||||
| Software license expense for internal use (1) |
4,878 | 4,701 | 9,455 | 9,308 | ||||||||||||
| Depreciation, amortization and impairment (5) |
7,969 | 8,970 | 15,707 | 16,350 | ||||||||||||
| Communication |
1,496 | 1,360 | 3,039 | 2,609 | ||||||||||||
| Legal and professional fees (2) |
3,378 | 2,507 | 7,271 | 4,758 | ||||||||||||
| Rates, taxes and insurance |
1,202 | 1,641 | 2,699 | 3,103 | ||||||||||||
| Marketing and brand building |
644 | 880 | 1,544 | 1,857 | ||||||||||||
| Lifetime expected credit loss/ (write-back) |
(79 | ) | 139 | (101 | ) | 439 | ||||||||||
| (Gain)/loss on sale of property, plant and equipment, net(3) |
(26 | ) | (2,320 | ) | (148 | ) | (2,242 | ) | ||||||||
| Miscellaneous expenses (2) (3) (4) |
432 | (244 | ) | 758 | 90 | |||||||||||
|
|
|
|
|
|
|
|
|
|||||||||
| Total cost of revenues, selling and marketing expenses and general and administrative expenses |
₹ | 193,951 | ₹ | 192,082 | ₹ | 378,381 | ₹ | 385,814 | ||||||||
|
|
|
|
|
|
|
|
|
|||||||||
| (1) | Software license expense for internal use has been reclassified from Facility expenses to a separate nature of expense for the three and six months ended September 30, 2022. |
| (2) | Staff recruitment expense has been reclassified from Miscellaneous expenses to Legal and professional fees for the three and six months ended September 30, 2022. |
| (3) | (Gain)/loss on sale of property, plant and equipment, net has been reclassified from Miscellaneous expenses and is presented separately for the three and six months ended September 30, 2023. Previous period figures have been reclassified accordingly. (Gain)/loss on sale of property, plant and equipment, net for the three and six months ended September 30, 2023, includes gain on sale of immovable properties of ₹ (2,368). |
| (4) | Miscellaneous expenses are net of reversals of contingent consideration (Refer to Note 17). |
| (5) | Depreciation, amortization and impairment includes an impairment charge on intangible assets amounting to ₹ 437 for the three and six months ended September 30, 2023 (Refer to Note 6). |
22. Finance expenses
| Three months ended September 30, | Six months ended September 30, | |||||||||||||||
| 2022 | 2023 | 2022 | 2023 | |||||||||||||
| Interest expense |
₹ | 2,270 | ₹ | 3,033 | ₹ | 4,315 | ₹ | 6,119 | ||||||||
|
|
|
|
|
|
|
|
|
|||||||||
| ₹ | 2,270 | ₹ | 3,033 | ₹ | 4,315 | ₹ | 6,119 | |||||||||
|
|
|
|
|
|
|
|
|
|||||||||
23. Finance and other income and Foreign exchange gains/(losses), net
| Three months ended September 30, | Six months ended September 30, | |||||||||||||||
| 2022 | 2023 | 2022 | 2023 | |||||||||||||
| Interest income |
₹ | 3,751 | ₹ | 4,158 | ₹ | 7,330 | ₹ | 9,402 | ||||||||
| Dividend income |
— | 1 | 2 | 2 | ||||||||||||
| Net gain from investments classified as FVTPL |
298 | 737 | 414 | 2,073 | ||||||||||||
| Net loss from investments classified as FVTOCI |
(9 | ) | (86 | ) | (16 | ) | (125 | ) | ||||||||
|
|
|
|
|
|
|
|
|
|||||||||
| Finance and other income |
₹ | 4,040 | ₹ | 4,810 | ₹ | 7,730 | ₹ | 11,352 | ||||||||
|
|
|
|
|
|
|
|
|
|||||||||
| Foreign exchange gains/(losses), net, on financial instruments measured at FVTPL |
₹ | (569 | ) | ₹ | (350 | ) | ₹ | (2,320 | ) | ₹ | 531 | |||||
| Other foreign exchange gains/(losses), net |
1,626 | 618 | 4,411 | (325 | ) | |||||||||||
|
|
|
|
|
|
|
|
|
|||||||||
| Foreign exchange gains/(losses), net |
₹ | 1,057 | ₹ | 268 | ₹ | 2,091 | ₹ | 206 | ||||||||
|
|
|
|
|
|
|
|
|
|||||||||
24
| 24. | Earnings per equity share: |
A reconciliation of profit for the period and equity shares used in the computation of basic and diluted earnings per equity share is set out below:
Basic: Basic earnings per share is calculated by dividing the profit attributable to equity shareholders of the Company by the weighted average number of equity shares outstanding during the period, excluding equity shares purchased by the Company and held as treasury shares.
| Three months ended September 30, | Six months ended September 30, | |||||||||||||||
| 2022 | 2023 | 2022 | 2023 | |||||||||||||
| Profit attributable to equity holders of the Company |
₹ | 26,590 | ₹ | 26,463 | ₹ | 52,226 | ₹ | 55,164 | ||||||||
| Weighted average number of equity shares outstanding |
5,476,167,685 | 5,232,867,366 | 5,473,962,200 | 5,357,394,940 | ||||||||||||
|
|
|
|
|
|
|
|
|
|||||||||
| Basic earnings per equity share |
₹ | 4.86 | ₹ | 5.06 | ₹ | 9.55 | ₹ | 10.30 | ||||||||
|
|
|
|
|
|
|
|
|
|||||||||
Diluted: Diluted earnings per share is calculated by adjusting the weighted average number of equity shares outstanding during the period for assumed conversion of all dilutive potential equity shares. Employee share options are dilutive potential equity shares for the Company.
The calculation is performed in respect of share options to determine the number of shares that could have been acquired at fair value (determined as the average market price of the Company’s shares during the period). The number of shares calculated as above is compared with the number of shares that would have been issued assuming the exercise of the share options.
| Three months ended September 30, | Six months ended September 30, | |||||||||||||||
| 2022 | 2023 | 2022 | 2023 | |||||||||||||
| Profit attributable to equity holders of the Company |
₹ | 26,590 | ₹ | 26,463 | ₹ | 52,226 | ₹ | 55,164 | ||||||||
| Weighted average number of equity shares outstanding |
5,476,167,685 | 5,232,867,366 | 5,473,962,200 | 5,357,394,940 | ||||||||||||
| Effect of dilutive equivalent share options |
8,617,369 | 12,773,832 | 12,119,740 | 12,683,623 | ||||||||||||
|
|
|
|
|
|
|
|
|
|||||||||
| Weighted average number of equity shares for diluted earnings per equity share |
5,484,785,054 | 5,245,641,198 | 5,486,081,940 | 5,370,078,563 | ||||||||||||
|
|
|
|
|
|
|
|
|
|||||||||
| Diluted earnings per equity share |
₹ | 4.85 | ₹ | 5.04 | ₹ | 9.52 | ₹ | 10.27 | ||||||||
|
|
|
|
|
|
|
|
|
|||||||||
Earnings per share for each of the three months ended June 30, 2023 and September 30, 2023 will not add up to earnings per share for the six months ended September 30, 2023, on account of buyback of equity shares.
25. Employee compensation
| Three months ended September 30, | Six months ended September 30, | |||||||||||||||
| 2022 | 2023 | 2022 | 2023 | |||||||||||||
| Salaries and bonus |
₹ | 131,301 | ₹ | 132,179 | ₹ | 251,442 | ₹ | 265,979 | ||||||||
| Employee benefits plans |
4,838 | 4,794 | 9,386 | 9,726 | ||||||||||||
| Share-based compensation (1) |
1,122 | 1,563 | 2,567 | 3,107 | ||||||||||||
|
|
|
|
|
|
|
|
|
|||||||||
| ₹ | 137,261 | ₹ | 138,536 | ₹ | 263,395 | ₹ | 278,812 | |||||||||
|
|
|
|
|
|
|
|
|
|||||||||
| (1) | Includes ₹ (7) and ₹ 8 for the six months ended September 30, 2022, and 2023 respectively, towards cash settled ADS RSUs. |
The employee benefit cost is recognized in the following line items in the interim condensed consolidated statement of income:
| Three months ended September 30, | Six months ended September 30, | |||||||||||||||
| 2022 | 2023 | 2022 | 2023 | |||||||||||||
| Cost of revenues |
₹ | 116,518 | ₹ | 114,844 | ₹ | 224,382 | ₹ | 232,577 | ||||||||
| Selling and marketing expenses |
11,396 | 12,996 | 22,518 | 25,608 | ||||||||||||
| General and administrative expenses |
9,347 | 10,696 | 16,495 | 20,627 | ||||||||||||
|
|
|
|
|
|
|
|
|
|||||||||
| ₹ | 137,261 | ₹ | 138,536 | ₹ | 263,395 | ₹ | 278,812 | |||||||||
|
|
|
|
|
|
|
|
|
|||||||||
The Company has granted 56,015 and 3,273,900 options under RSU option plan during the three and six months ended September 30, 2023 (109,746 and 283,015 for the three and six months ended September 30, 2022); 292,127 and 8,353,252 options under ADS option plan during the three and six months ended September 30, 2023 (529,271 and 1,642,613 for the three and six months ended September 30, 2022).
The Company has also granted Nil and 1,892,498 Performance based stock options (RSU) during the three and six months ended September 30, 2023, respectively (Nil for the three and six months ended September 30, 2022); Nil and 5,648,833 Performance based stock options (ADS) during the three and six months ended September 30, 2023, respectively (Nil for three and six months ended September 30, 2022).
The RSU grants were issued under Wipro Employee Restricted Stock Unit plan 2007 (WSRUP 2007 plan) and the ADS grants were issued under Wipro ADS Restricted Stock Unit Plan (WARSUP 2004 plan). Performance based stock options will vest based on the performance parameters of the Company.
25
26. Commitments and contingencies
Capital commitments: As at March 31, 2023 and September 30, 2023 the Company had committed to spend approximately ₹ 7,675 and ₹ 8,400 respectively, under agreements to purchase/ construct property and equipment. These amounts are net of capital advances paid in respect of these purchases.
Guarantees: As at March 31, 2023 and September 30, 2023, guarantees provided by banks on behalf of the Company to the Indian Government, customers and certain other agencies aggregate to ₹ 16,076 and ₹ 13,717 respectively, as part of the bank line of credit.
Contingencies and lawsuits: The Company is subject to legal proceedings and claims resulting from tax assessment orders/ penalty notices issued under the Income Tax Act, 1961, which have arisen in the ordinary course of its business. Some of the claims involve complex issues and it is not possible to make a reasonable estimate of the expected financial effect, if any, that will result from ultimate resolution of such proceedings. However, the resolution of these legal proceedings is not likely to have a material and adverse effect on the results of operations or the financial position of the Company.
The Company’s assessments are completed for the years up to March 31, 2019. The Company has received demands on multiple tax issues. These claims are primarily arising out of denial of deduction under section 10A of the Income Tax Act, 1961 in respect of profit earned by the Company’s undertaking in Software Technology Park at Bengaluru, the appeals filed against the said demand before the Appellate authorities have been allowed in favor of the Company by the second appellate authority for the years up to March 31, 2008 which either has been or may be contested by the Income tax authorities before the Hon’ble Supreme Court of India. Other claims relate to disallowance of tax benefits on profits earned from Software Technology Park and Special Economic Zone units, capitalization of research and development expenses, transfer pricing adjustments on intercompany / inter unit transactions and other issues.
Income tax claims against the Company amounting to ₹ 91,465 and ₹ 93,484 are not acknowledged as debt as at March 31, 2023 and September 30, 2023, respectively. These matters are pending before various Appellate Authorities and the management expects its position will likely be upheld on ultimate resolution and will not have a material adverse effect on the Company’s financial position and results of operations.
The contingent liability in respect of disputed demands for excise duty, custom duty, sales tax and other matters amounting to ₹ 15,240 and ₹ 17,720 as of March 31, 2023, and September 30, 2023, respectively. However, the resolution of these disputed demands is not likely to have a material and adverse effect on the results of operations or the financial position of the Company.
27. Segment information
Effective April 1, 2023, the Company has reorganized its segments by merging ISRE segment as part of its APMEA SMU within IT Services segment. Comparative period segment information has been restated to give effect to this change.
The Company is now organized into the following operating segments: IT Services and IT Products.
IT Services: The IT Services segment primarily consists of IT services offerings to customers organized by four Strategic Market Units (“SMUs”) - Americas 1, Americas 2, Europe and Asia Pacific Middle East and Africa (“APMEA”). Americas 1 and Americas 2 are primarily organized by industry sector, while Europe and APMEA are organized by countries.
Americas 1 includes the entire business of Latin America (“LATAM”) and the following industry sectors in the United States of America: healthcare and medical devices, consumer goods and life sciences, retail, transportation and services, communications, media and information services, technology products and platforms. Americas 2 includes the entire business in Canada and the following industry sectors in the United States of America: banking, financial services and insurance, manufacturing, hi-tech, energy and utilities. Europe consists of the United Kingdom and Ireland, Switzerland, Germany, Benelux, the Nordics and Southern Europe. APMEA consists of Australia and New Zealand, India, Middle East, South East Asia, Japan and Africa.
Revenue from each customer is attributed to the respective SMUs based on the location of the customer’s primary buying center of such services. With respect to certain strategic global customers, revenue may be generated from multiple countries based on such customer’s buying centers, but the total revenue related to these strategic global customers are attributed to a single SMU based on the geographical location of key decision makers.
Our IT Services segment provides a range of IT and IT enabled services which include digital strategy advisory, customer centric design, technology consulting, IT consulting, custom application design, development, re-engineering and maintenance, systems integration, package implementation, cloud and infrastructure services, business process services, cloud, mobility and analytics services, research and development and hardware and software design.
IT Products: The Company is a value-added reseller of security, packaged and SaaS software for leading international brands. In certain total outsourcing contracts of the IT Services segment, the Company delivers hardware, software products and other related deliverables. Revenue relating to these items is reported as revenue from the sale of IT Products.
The Chief Executive Officer (“CEO”) and Managing Director of the Company has been identified as the Chief Operating Decision Maker as defined by IFRS 8, “Operating Segments”. The CEO of the Company evaluates the segments based on their revenue growth and operating income.
Assets and liabilities used in the Company’s business are not identified to any of the operating segments, as these are used interchangeably between segments. Management believes that it is currently not practicable to provide segment disclosures relating to total assets and liabilities since a meaningful segregation of the available data is onerous.
26
Information on reportable segments for the three months ended September 30, 2022, is as follows:
| IT Services | IT Products | Reconciling Items |
Total | |||||||||||||||||||||||||||||
| Americas 1 | Americas 2 | Europe | APMEA | Total | ||||||||||||||||||||||||||||
| Revenue |
₹ | 65,350 | ₹ | 70,030 | ₹ | 62,684 | ₹ | 27,141 | ₹ | 225,205 | ₹ | 1,249 | ₹ | — | ₹ | 226,454 | ||||||||||||||||
| Segment Result |
12,954 | 14,959 | 8,454 | 2,670 | 39,037 | (103 | ) | (1,341 | ) | 37,593 | ||||||||||||||||||||||
| Unallocated |
(5,090 | ) | — | — | (5,090 | ) | ||||||||||||||||||||||||||
|
|
|
|
|
|
|
|
|
|||||||||||||||||||||||||
| Segment result total |
₹ | 33,947 | ₹ | (103 | ) | ₹ | (1,341 | ) | ₹ | 32,503 | ||||||||||||||||||||||
| Finance expenses |
(2,270 | ) | ||||||||||||||||||||||||||||||
| Finance and other income |
4,040 | |||||||||||||||||||||||||||||||
| Share of net profit/(loss) of associates accounted for using the equity method |
(72 | ) | ||||||||||||||||||||||||||||||
|
|
|
|||||||||||||||||||||||||||||||
| Profit before tax |
₹ | 34,201 | ||||||||||||||||||||||||||||||
| Income tax expense |
(7,710 | ) | ||||||||||||||||||||||||||||||
|
|
|
|||||||||||||||||||||||||||||||
| Profit for the period |
₹ | 26,491 | ||||||||||||||||||||||||||||||
|
|
|
|||||||||||||||||||||||||||||||
| Depreciation, amortization and impairment |
₹ | 7,969 | ||||||||||||||||||||||||||||||
|
|
|
|||||||||||||||||||||||||||||||
Information on reportable segments for the three months ended September 30, 2023, is as follows:
| IT Services | IT Products | Reconciling Items |
Total | |||||||||||||||||||||||||||||
| Americas 1 | Americas 2 | Europe | APMEA | Total | ||||||||||||||||||||||||||||
| Revenue |
₹ | 66,813 | ₹ | 66,914 | ₹ | 63,976 | ₹ | 26,255 | ₹ | 223,958 | ₹ | 1,469 | ₹ | — | ₹ | 225,427 | ||||||||||||||||
| Segment Result |
15,287 | 14,023 | 7,547 | 2,985 | 39,842 | (467 | ) | (2,246 | ) | 37,129 | ||||||||||||||||||||||
| Unallocated |
(3,784 | ) | — | — | (3,784 | ) | ||||||||||||||||||||||||||
|
|
|
|
|
|
|
|
|
|||||||||||||||||||||||||
| Segment result total |
₹ | 36,058 | ₹ | (467 | ) | ₹ | (2,246 | ) | ₹ | 33,345 | ||||||||||||||||||||||
| Finance expenses |
(3,033 | ) | ||||||||||||||||||||||||||||||
| Finance and other income |
4,810 | |||||||||||||||||||||||||||||||
| Share of net profit/(loss) of associates accounted for using the equity method |
(30 | ) | ||||||||||||||||||||||||||||||
|
|
|
|||||||||||||||||||||||||||||||
| Profit before tax |
₹ | 35,092 | ||||||||||||||||||||||||||||||
| Income tax expense |
(8,419 | ) | ||||||||||||||||||||||||||||||
|
|
|
|||||||||||||||||||||||||||||||
| Profit for the period |
₹ | 26,673 | ||||||||||||||||||||||||||||||
|
|
|
|||||||||||||||||||||||||||||||
| Depreciation, amortization and impairment |
₹ | 8,970 | ||||||||||||||||||||||||||||||
|
|
|
|||||||||||||||||||||||||||||||
27
Information on reportable segments for the six months ended September 30, 2022, is as follows:
| IT Services | IT Products | Reconciling Items | Total | |||||||||||||||||||||||||||||
| Americas 1 | Americas 2 | Europe | APMEA | Total | ||||||||||||||||||||||||||||
| Revenue |
₹ | 127,052 | ₹ | 136,643 | ₹ | 122,960 | ₹ | 52,924 | ₹ | 439,579 | ₹ | 3,195 | ₹ | — | ₹ | 442,774 | ||||||||||||||||
| Segment Result |
24,524 | 28,183 | 16,440 | 4,739 | 73,886 | (158 | ) | (1,401 | ) | 72,327 | ||||||||||||||||||||||
| Unallocated |
(7,934 | ) | — | — | (7,934 | ) | ||||||||||||||||||||||||||
|
|
|
|
|
|
|
|
|
|||||||||||||||||||||||||
| Segment Result Total |
₹ | 65,952 | ₹ | (158 | ) | ₹ | (1,401 | ) | ₹ | 64,393 | ||||||||||||||||||||||
| Finance expense |
(4,315 | ) | ||||||||||||||||||||||||||||||
| Finance and other income |
7,730 | |||||||||||||||||||||||||||||||
| Share of net profit/(loss) of associates accounted for using the equity method |
(87 | ) | ||||||||||||||||||||||||||||||
|
|
|
|||||||||||||||||||||||||||||||
| Profit before tax |
₹ | 67,721 | ||||||||||||||||||||||||||||||
| Income tax expense |
(15,641 | ) | ||||||||||||||||||||||||||||||
|
|
|
|||||||||||||||||||||||||||||||
| Profit for the period |
₹ | 52,080 | ||||||||||||||||||||||||||||||
|
|
|
|||||||||||||||||||||||||||||||
| Depreciation, amortization and impairment |
₹ | 15,707 | ||||||||||||||||||||||||||||||
|
|
|
|||||||||||||||||||||||||||||||
Information on reportable segments for the six months ended September 30, 2023, is as follows:
| IT Services | IT Products | Reconciling Items | Total | |||||||||||||||||||||||||||||
| Americas 1 | Americas 2 | Europe | APMEA | Total | ||||||||||||||||||||||||||||
| Revenue |
₹ | 132,420 | ₹ | 135,217 | ₹ | 131,110 | ₹ | 52,765 | ₹ | 451,512 | ₹ | 2,163 | ₹ | — | ₹ | 453,675 | ||||||||||||||||
| Segment Result |
28,824 | 28,192 | 17,515 | 5,785 | 80,316 | (628 | ) | (4,086 | ) | 75,602 | ||||||||||||||||||||||
| Unallocated |
(7,741 | ) | — | — | (7,741 | ) | ||||||||||||||||||||||||||
|
|
|
|
|
|
|
|
|
|||||||||||||||||||||||||
| Segment Result Total |
₹ | 72,575 | ₹ | (628 | ) | ₹ | (4,086 | ) | ₹ | 67,861 | ||||||||||||||||||||||
| Finance expense |
(6,119 | ) | ||||||||||||||||||||||||||||||
| Finance and other income |
11,352 | |||||||||||||||||||||||||||||||
| Share of net profit/(loss) of associates accounted for using the equity method |
(27 | ) | ||||||||||||||||||||||||||||||
|
|
|
|||||||||||||||||||||||||||||||
| Profit before tax |
₹ | 73,067 | ||||||||||||||||||||||||||||||
| Income tax expense |
(17,534 | ) | ||||||||||||||||||||||||||||||
|
|
|
|||||||||||||||||||||||||||||||
| Profit for the period |
₹ | 55,533 | ||||||||||||||||||||||||||||||
|
|
|
|||||||||||||||||||||||||||||||
| Depreciation, amortization and impairment |
₹ | 16,350 | ||||||||||||||||||||||||||||||
|
|
|
|||||||||||||||||||||||||||||||
28
Revenues from India, being Company’s country of domicile, is ₹ 6,162 and ₹ 6,039 for the three months ended September 30, 2022, and 2023, respectively and ₹ 12,669 and ₹ 12,046 for the six months ended September 30, 2022, and 2023, respectively.
Revenues from United States of America and United Kingdom contributed more than 10% of Company’s total revenues as per table below:
| Three months ended September 30, |
Six months ended September 30, |
|||||||||||||||
| 2022 | 2023 | 2022 | 2023 | |||||||||||||
| United States of America |
₹ | 127,308 | ₹ | 128,301 | ₹ | 247,799 | ₹ | 254,798 | ||||||||
| United Kingdom |
27,753 | 27,455 | 54,359 | ₹ | 57,218 | |||||||||||
|
|
|
|
|
|
|
|
|
|||||||||
| ₹ | 155,061 | ₹ | 155,756 | ₹ | 302,158 | ₹ | 312,016 | |||||||||
|
|
|
|
|
|
|
|
|
|||||||||
No customer individually accounted for more than 10% of the revenues during the three and six months ended September 30, 2022, and 2023.
Management believes that it is currently not practicable to provide disclosure of geographical location wise assets, since the meaningful segregation of the available information is onerous.
Notes:
| a) | “Reconciling items” includes elimination of inter-segment transactions and other corporate activities. |
| b) | Revenue from sale of Company owned intellectual properties is reported as part of IT Services revenues. |
| c) | For the purpose of segment reporting, the Company has included the impact of foreign exchange gains/(losses), net in revenues (which is reported as a part of operating profit in the interim condensed consolidated statement of income). |
| d) | Restructuring cost of ₹ 1,360 and ₹ 2,249 for the three months ended September 30, 2022 and 2023, respectively and ₹ 1,360 and ₹ 4,136 for the six months ended September 30, 2022 and 2023 respectively, is included under Reconciling items. |
| e) | Effective April 1, 2023, amortization and impairment of intangibles assets arising from business combination and change in fair value of contingent consideration due to change in estimates is included under “Unallocated” within IT Services segment. Comparative period has been restated to give effect to these changes. |
| Segment results of IT Services segment for the three and six months ended September 30, 2023 are after considering additional amortization due to change in estimate of useful life of the customer-related intangibles in an earlier Business combination. (Refer to Note 6) |
| Accordingly, ₹ 3,484 and ₹ (490) for the three months ended September 30, 2023, ₹ 5,294 and ₹ (506) for the six months ended September 30, 2023, towards amortization and impairment of intangible assets and change in fair value of contingent consideration, respectively, is included under “Unallocated” within IT Services segment (₹ 2,126 and ₹ (185) for the three months ended September 30, 2022 and ₹ 4,019 and ₹ (271) for the six months ended September 30, 2022). |
| f) | Segment results of IT Services segment are after recognition of (gain)/loss on sale of property, plant and equipment of ₹ (26) and ₹ (2,320) for the three months ended September 30, 2022 and 2023, respectively and ₹ (148) and ₹ (2,242) for the six months ended September 30, 2022 and 2023 respectively. |
| g) | Segment results of IT Services segment are after recognition of share-based compensation expense ₹ 1,122 and ₹ 1,563 for the three months ended September 30, 2022 and 2023, respectively and ₹ 2,567 and ₹ 3,107 for the six months ended September 30, 2022 and 2023 respectively. |
28. List of subsidiaries and investments accounted for using equity method as at September 30, 2023 is provided below:
| Subsidiaries |
Subsidiaries |
Subsidiaries |
Country of |
|||
| Attune Consulting India Private Limited | India | |||||
| Capco Technologies Private Limited | India | |||||
| Wipro Technology Product Services Private Limited (formerly known as Encore Theme Technologies Private Limited) | India | |||||
| Wipro Chengdu Limited | China | |||||
| Wipro Holdings (UK) Limited | U.K. | |||||
| Designit A/S | Denmark | |||||
| Designit Denmark A/S | Denmark | |||||
| Designit Germany GmbH | Germany | |||||
| Designit Oslo A/S | Norway | |||||
| Designit Spain Digital, S.L.U | Spain | |||||
| Designit Sweden AB | Sweden | |||||
| Designit T.L.V Ltd. | Israel | |||||
| Wipro Bahrain Limited Co. W.L.L | Bahrain | |||||
29
| Wipro Financial Outsourcing Services Limited | U.K. | |||||
| Wipro UK Limited | U.K. | |||||
| Wipro Gulf LLC | Sultanate of Oman | |||||
| Wipro IT Services S.R.L. | Romania | |||||
| Wipro HR Services India Private Limited | India | |||||
| Wipro IT Services Bangladesh Limited | Bangladesh | |||||
| Wipro IT Services UK Societas | U.K. | |||||
| Wipro 4C NV | Belgium | |||||
| Wipro 4C Consulting France SAS | France | |||||
| Wipro 4C Danmark ApS | Denmark | |||||
| Wipro 4C Nederland B.V | Netherlands | |||||
| Wipro Weare4C UK Limited (1) | U.K. | |||||
| Grove Holdings 2 S.á.r.l | Luxembourg | |||||
| Capco Solution Services GmbH | Germany | |||||
| The Capital Markets Company Italy Srl | Italy | |||||
| Capco Brasil Serviços E Consultoria Ltda (formerly known as Capco Brasil Serviços E Consultoria Em Informática Ltda) | Brazil | |||||
| The Capital Markets Company BV (1) | Belgium | |||||
| PT. WT Indonesia | Indonesia | |||||
| Rainbow Software LLC | Iraq | |||||
| Wipro Arabia Limited (2) | Saudi Arabia | |||||
| Women’s Business Park Technologies Limited (2) | Saudi Arabia | |||||
| Wipro Doha LLC | Qatar | |||||
| Wipro Holdings Hungary Korlátolt Felelősségű Társaság | Hungary | |||||
| Wipro Holdings Investment Korlátolt Felelősségű Társaság | Hungary | |||||
| Wipro Information Technology Netherlands BV. | Netherlands | |||||
| Wipro do Brasil Technologia Ltda (1) | Brazil | |||||
| Wipro Information Technology Kazakhstan LLP | Kazakhstan | |||||
| Wipro Outsourcing Services (Ireland) Limited | Ireland | |||||
| Wipro Portugal S.A. (1) | Portugal | |||||
| Wipro Solutions Canada Limited | Canada | |||||
| Wipro Technologies Limited | Russia | |||||
| Wipro Technologies Peru SAC | Peru | |||||
| Wipro Technologies W.T. Sociedad Anonima | Costa Rica | |||||
| Wipro Technology Chile SPA | Chile | |||||
| Wipro IT Service Ukraine, LLC | Ukaine | |||||
| Wipro IT Services Poland SP Z.O.O | Poland | |||||
| Wipro Technologies Australia Pty Ltd | Australia | |||||
| Wipro Ampion Holdings Pty Ltd (1) | Australia | |||||
| Wipro Technologies SA | Argentina | |||||
| Wipro Technologies SA DE CV | Mexico | |||||
| Wipro Technologies South Africa (Proprietary) Limited | South Africa | |||||
| Wipro Technologies Nigeria Limited | Nigeria | |||||
| Wipro Technologies SRL | Romania | |||||
| Wipro (Thailand) Co. Limited | Thailand | |||||
| Wipro Japan KK | Japan | |||||
| Designit Tokyo Co., Ltd. | Japan | |||||
| Wipro Networks Pte Limited | Singapore | |||||
| Wipro (Dalian) Limited | China | |||||
| Wipro Technologies SDN BHD | Malaysia | |||||
| Wipro Overseas IT Services Private Limited | India | |||||
| Wipro Philippines, Inc. | Philippines | |||||
| Wipro Shanghai Limited | China | |||||
30
| Wipro Trademarks Holding Limited | India | |||||
| Wipro Travel Services Limited | India | |||||
| Wipro VLSI Design Services India Private Limited | India | |||||
| Wipro, LLC | USA | |||||
| Wipro Gallagher Solutions, LLC | USA | |||||
| Wipro Insurance Solutions, LLC | USA | |||||
| Wipro IT Services, LLC | USA | |||||
| Cardinal US Holdings, Inc.(1) | USA | |||||
| Convergence Acceleration Solutions, LLC | USA | |||||
| Designit North America, Inc. | USA | |||||
| Edgile, LLC | USA | |||||
| HealthPlan Services, Inc. (1) | USA | |||||
| Infocrossing, LLC | USA | |||||
| International TechneGroup Incorporated (1) | USA | |||||
| LeanSwift Solutions, Inc.(1) | USA | |||||
| Rizing Intermediate Holdings, Inc. (1) | USA | |||||
| Wipro Appirio, Inc. (1) | USA | |||||
| Wipro Designit Services, Inc. (1) | USA | |||||
| Wipro VLSI Design Services, LLC | USA | |||||
The Company controls ‘The Wipro SA Broad Based Ownership Scheme Trust’, ‘Wipro SA Broad Based Ownership Scheme SPV (RF) (PTY) LTD’ incorporated in South Africa and Wipro Foundation in India.
(2) All the above direct subsidiaries are 100% held by the Company except that the Company holds 66.67% of the equity securities of Wipro Arabia Limited and 55% of the equity securities of Women’s Business Park Technologies Limited are held by Wipro Arabia Limited.
(1) Step Subsidiary details of Cardinal US Holdings, Inc., HealthPlan Services, Inc., International TechneGroup Incorporated, LeanSwift Solutions, Inc., Rizing Intermediate Holdings, Inc., The Capital Markets Company BV, Wipro Ampion Holdings Pty Ltd, Wipro Appirio, Inc., Wipro Designit Services, Inc., Wipro do Brasil Technologia Ltda, Wipro Portugal S.A. and Wipro Weare4C UK Limited are as follows:
| Subsidiaries |
Subsidiaries |
Subsidiaries |
Country of |
|||
| Cardinal US Holdings, Inc. | USA | |||||
| ATOM Solutions LLC | USA | |||||
| Capco Consulting Services LLC | USA | |||||
| Capco RISC Consulting LLC | USA | |||||
| The Capital Markets Company LLC | USA | |||||
| HealthPlan Services, Inc. | USA | |||||
| HealthPlan Services Insurance Agency, LLC | USA | |||||
| International TechneGroup Incorporated | USA | |||||
| International TechneGroup Ltd. | U.K. | |||||
| ITI Proficiency Ltd | Israel | |||||
| MechWorks S.R.L. | Italy | |||||
| LeanSwift Solutions, Inc. | USA | |||||
| LeanSwift AB | Sweden | |||||
| Rizing Intermediate Holdings, Inc. | USA | |||||
| Rizing Lanka (Private) Ltd | Sri Lanka | |||||
| Attune Netherlands B.V. (3) | Netherlands | |||||
| Rizing Solutions Canada Inc. | Canada | |||||
| Rizing LLC | USA | |||||
| Aasonn Philippines Inc. | Philippines | |||||
| Rizing B.V. | Netherlands | |||||
| Rizing Consulting Ireland Limited | Ireland | |||||
| Rizing Consulting Pty Ltd. | Australia | |||||
| Rizing Geospatial LLC | USA | |||||
| Rizing GmbH | Germany | |||||
| Rizing Limited | U.K. | |||||
| Rizing Middle East DMCC | United Arab Emirates | |||||
| Rizing Pte Ltd. (3) | Singapore | |||||
31
| The Capital Markets Company BV | Belgium | |||||
| CapAfric Consulting (Pty) Ltd | South Africa | |||||
| Capco Belgium BV | Belgium | |||||
| Capco Consultancy (Malaysia) Sdn. Bhd | Malaysia | |||||
| Capco Consultancy (Thailand) Ltd | Thailand | |||||
| Capco Consulting Singapore Pte. Ltd | Singapore | |||||
| Capco Greece Single Member P.C | Greece | |||||
| Capco Poland sp. z.o.o | Poland | |||||
| The Capital Markets Company (UK) Ltd | U.K. | |||||
| Capco (UK) 1, Limited | U.K. | |||||
| The Capital Markets Company BV | Netherlands | |||||
| The Capital Markets Company GmbH | Germany | |||||
| Capco Austria GmbH | Austria | |||||
| The Capital Markets Company Limited | Hong Kong | |||||
| Capco Consulting Services (Guangzhou) Company Limited | China | |||||
| The Capital Markets Company Limited | Canada | |||||
| The Capital Markets Company S.á.r.l | Switzerland | |||||
| Andrion AG | Switzerland | |||||
| The Capital Markets Company S.A.S | France | |||||
| The Capital Markets Company s.r.o | Slovakia | |||||
| Wipro Ampion Holdings Pty Ltd | Australia | |||||
| Wipro Ampion Pty Ltd | Australia | |||||
| Wipro Iris Holdco Pty Ltd (3) | Australia | |||||
| Wipro Revolution IT Pty Ltd | Australia | |||||
| Crowdsprint Pty Ltd | Australia | |||||
| Wipro Shelde Australia Pty Ltd | Australia | |||||
| Wipro Appirio, Inc. | USA | |||||
| Wipro Appirio (Ireland) Limited | Ireland | |||||
| Wipro Appirio UK Limited | U.K. | |||||
| Topcoder, LLC. | USA | |||||
| Wipro Designit Services, Inc. | USA | |||||
| Wipro Designit Services Limited | Ireland | |||||
| Wipro do Brasil Technologia Ltda | Brazil | |||||
| Wipro do Brasil Servicos Ltda | Brazil | |||||
| Wipro Do Brasil Sistemas De Informatica Ltda | Brazil | |||||
| Wipro Portugal S.A. | Portugal | |||||
| Wipro Technologies GmbH | Germany | |||||
| Wipro Business Solutions GmbH (3) | Germany | |||||
| Wipro IT Services Austria GmbH | Austria | |||||
| Wipro Weare4C UK Limited | U.K. | |||||
| CloudSocius DMCC | United Arab Emirates | |||||
(3) Step Subsidiary details of Attune Netherlands B.V., Rizing Pte Ltd., Wipro Business Solutions GmbH and Wipro Iris Holdco Pty Ltd are as follows:
| Subsidiaries |
Subsidiaries |
Subsidiaries |
Country of |
|||
| Attune Netherlands B.V. | Netherlands | |||||
| Attune Australia Pty Ltd | Australia | |||||
| Rizing Consulting USA, Inc. | USA | |||||
| Rizing Germany GmbH | Germany | |||||
| Attune Italia S.R.L | Italy | |||||
| Rizing Management LLC | USA | |||||
| Attune UK Ltd. | U.K. | |||||
| Rizing Pte Ltd. | Singapore | |||||
| Rizing New Zealand Ltd. | New Zealand | |||||
| Rizing Philippines Inc. | Philippines | |||||
| Rizing SDN BHD | Malaysia | |||||
| Rizing Solutions Pty Ltd | Australia | |||||
| Synchrony Global SDN BHD | Malaysia | |||||
| Wipro Business Solutions GmbH | Germany | |||||
| Wipro Technology Solutions S.R.L | Romania | |||||
| Wipro Iris Holdco Pty Ltd | Australia | |||||
| Wipro Iris Bidco Pty Ltd | Australia | |||||
32
As at September 30, 2023, the Company held 43.7% interest in Drivestream Inc., accounted for using the equity method.
The list of controlled trusts and firms are:
| Name of the entity |
Country of incorporation |
|
| Wipro Equity Reward Trust | India | |
| Wipro Foundation | India |
29. Buyback of equity shares
During the six months ended September 30, 2023, the Company concluded the buyback of 269,662,921 equity shares (at a price of ₹ 445 per equity share) as approved by the Board of Directors on April 27, 2023. This has resulted in a total cash outflow of ₹ 145,173 (including tax on buyback of ₹ 24,783 and transaction costs related to buyback of ₹ 390). In line with the requirement of the Companies Act, 2013, an amount of ₹ 3,768 and ₹ 141,405 has been utilized from share premium and retained earnings respectively. Further, capital redemption reserve (included in other reserves) of ₹ 539 (representing the nominal value of the shares bought back) has been created as an apportionment from retained earnings. Consequent to such buyback, the paid-up equity share capital has reduced by ₹ 539.
| As per our report of even date attached | For and on behalf of the Board of Directors | |||||
| for Deloitte Haskins & Sells LLP | Rishad A. Premji | Deepak M. Satwalekar | Thierry Delaporte | |||
| Chartered Accountants | Chairman | Director | Chief Executive Officer and | |||
| Firm Registration No: 117366W/W - 100018 | Managing Director | |||||
| Anand Subramanian | Aparna C. Iyer | M. Sanaulla Khan | ||||
| Partner | Chief Financial Officer | Company Secretary | ||||
| Membership No. 110815 | ||||||
| Bengaluru | ||||||
| October 18, 2023 | ||||||
33
Exhibit 99.4
WIPRO LIMITED
CIN: L32102KA1945PLC020800 ; Registered Office : Wipro Limited, Doddakannelli, Sarjapur Road, Bengaluru - 560035, India
Website: www.wipro.com ; Email id – info@wipro.com ; Tel: +91-80-2844 0011 ; Fax: +91-80-2844 0054
STATUTORILY AUDITED CONSOLIDATED FINANCIAL RESULTS FOR THE THREE AND SIX MONTHS ENDED SEPTEMBER 30, 2023
UNDER IFRS (IASB)
(₹ in millions, except share and per share data, unless otherwise stated)
| Particulars |
Three months ended | Six months ended | Year ended | |||||||||||||||||||||||
| September 30, 2023 |
June 30, 2023 |
September 30, 2022 |
September 30, 2023 |
September 30, 2022 |
March 31, 2023 |
|||||||||||||||||||||
| Income |
||||||||||||||||||||||||||
| a) Revenue from operations | 225,159 | 228,310 | 225,397 | 453,469 | 440,683 | 904,876 | ||||||||||||||||||||
| b) Foreign exchange gains/(losses), net |
268 | (62 | ) | 1,057 | 206 | 2,091 | 4,472 | |||||||||||||||||||
| I |
Total income |
225,427 | 228,248 | 226,454 | 453,675 | 442,774 | 909,348 | |||||||||||||||||||
| Expenses |
||||||||||||||||||||||||||
| a) Purchases of stock-in-trade |
576 | 978 | 1,678 | 1,554 | 4,165 | 6,494 | ||||||||||||||||||||
| b) Changes in inventories of finished goods and stock-in-trade |
920 | (182 | ) | (333 | ) | 738 | (679 | ) | 150 | |||||||||||||||||
| c) Employee benefits expense |
138,536 | 140,276 | 137,261 | 278,812 | 263,395 | 537,644 | ||||||||||||||||||||
| d) Depreciation, amortization and impairment expense |
8,970 | 7,380 | 7,969 | 16,350 | 15,707 | 33,402 | ||||||||||||||||||||
| e) Sub-contracting and technical fees |
26,547 | 26,385 | 29,131 | 52,932 | 58,585 | 115,247 | ||||||||||||||||||||
| f) Facility expenses |
3,815 | 3,452 | 3,300 | 7,267 | 6,599 | 13,492 | ||||||||||||||||||||
| g) Travel |
4,049 | 4,175 | 3,037 | 8,224 | 6,107 | 14,445 | ||||||||||||||||||||
| h) Communication |
1,360 | 1,249 | 1,496 | 2,609 | 3,039 | 5,911 | ||||||||||||||||||||
| i) Legal and professional fees |
2,507 | 2,251 | 3,378 | 4,758 | 7,271 | 13,288 | ||||||||||||||||||||
| j) Software license expense for internal use |
4,701 | 4,607 | 4,878 | 9,308 | 9,455 | 18,717 | ||||||||||||||||||||
| k) Marketing and brand building |
880 | 977 | 644 | 1,857 | 1,544 | 2,951 | ||||||||||||||||||||
| l) Lifetime expected credit loss/ (write-back) |
139 | 300 | (79 | ) | 439 | (101 | ) | (604 | ) | |||||||||||||||||
| m) (Gain)/loss on sale of property, plant and equipment, net |
(2,320 | ) | 78 | (26 | ) | (2,242 | ) | (148 | ) | (89 | ) | |||||||||||||||
| n) Other expenses |
1,402 | 1,806 | 1,617 | 3,208 | 3,442 | 8,694 | ||||||||||||||||||||
|
|
|
|
|
|
|
|
|
|
|
|
|
|||||||||||||||
| II |
Total expenses |
192,082 | 193,732 | 193,951 | 385,814 | 378,381 | 769,742 | |||||||||||||||||||
|
|
|
|
|
|
|
|
|
|
|
|
|
|||||||||||||||
| III |
Finance expenses |
3,033 | 3,086 | 2,270 | 6,119 | 4,315 | 10,077 | |||||||||||||||||||
| IV |
Finance and other Income |
4,810 | 6,542 | 4,040 | 11,352 | 7,730 | 18,185 | |||||||||||||||||||
| V |
Share of net profit/ (loss) of associates accounted for using the equity method |
(30 | ) | 3 | (72 | ) | (27 | ) | (87 | ) | (57 | ) | ||||||||||||||
| VI |
Profit before tax [I-II-III+IV+V] |
35,092 | 37,975 | 34,201 | 73,067 | 67,721 | 147,657 | |||||||||||||||||||
| VII |
Tax expense |
8,419 | 9,115 | 7,710 | 17,534 | 15,641 | 33,992 | |||||||||||||||||||
| VIII |
Profit for the period [VI-VII] |
26,673 | 28,860 | 26,491 | 55,533 | 52,080 | 113,665 | |||||||||||||||||||
| Other comprehensive income (OCI) for the period |
||||||||||||||||||||||||||
| Items that will not be reclassified to profit or loss in subsequent periods |
||||||||||||||||||||||||||
| Remeasurements of the defined benefit plans, net |
51 | (45 | ) | 295 | 6 | 607 | (50 | ) | ||||||||||||||||||
| Net change in fair value of investment in equity instruments measured at fair value through OCI |
(124 | ) | 16 | 180 | (108 | ) | 1,513 | 705 | ||||||||||||||||||
| Items that will be reclassified to profit or loss in subsequent periods |
||||||||||||||||||||||||||
| Foreign currency translation differences |
1,824 | (362 | ) | 3,027 | 1,462 | 8,658 | 16,590 | |||||||||||||||||||
| Reclassification of foreign currency translation differences on liquidation of subsidiaries to statement of income |
(183 | ) | 2 | (23 | ) | (181 | ) | (23 | ) | (133 | ) | |||||||||||||||
| Net change in time value of option contracts designated as cash flow hedges |
211 | 40 | (55 | ) | 251 | (301 | ) | (180 | ) | |||||||||||||||||
| Net change in intrinsic value of option contracts designated as cash flow hedges |
(311 | ) | 512 | (121 | ) | 201 | (327 | ) | (212 | ) | ||||||||||||||||
| Net change in fair value of forward contracts designated as cash flow hedges |
(62 | ) | 1,648 | (517 | ) | 1,586 | (1,500 | ) | (2,488 | ) | ||||||||||||||||
1
| Net change in fair value of investment in debt instruments measured at fair value through OCI |
297 | 1,039 | 148 | 1,336 | (3,954 | ) | (3,137 | ) | ||||||||||||||||||
|
|
|
|
|
|
|
|
|
|
|
|
|
|||||||||||||||
| IX |
Total other comprehensive income for the period, net of taxes |
1,703 | 2,850 | 2,934 | 4,553 | 4,673 | 11,095 | |||||||||||||||||||
|
|
|
|
|
|
|
|
|
|
|
|
|
|||||||||||||||
| Total comprehensive income for the period [VIII+IX] |
28,376 | 31,710 | 29,425 | 60,086 | 56,753 | 124,760 | ||||||||||||||||||||
|
|
|
|
|
|
|
|
|
|
|
|
|
|||||||||||||||
| X |
Profit for the period attributable to: |
|||||||||||||||||||||||||
| Equity holders of the Company |
26,463 | 28,701 | 26,590 | 55,164 | 52,226 | 113,500 | ||||||||||||||||||||
| Non-controlling interests |
210 | 159 | (99 | ) | 369 | (146 | ) | 165 | ||||||||||||||||||
|
|
|
|
|
|
|
|
|
|
|
|
|
|||||||||||||||
| 26,673 | 28,860 | 26,491 | 55,533 | 52,080 | 113,665 | |||||||||||||||||||||
|
|
|
|
|
|
|
|
|
|
|
|
|
|||||||||||||||
| Total comprehensive income for the period attributable to: |
||||||||||||||||||||||||||
| Equity holders of the Company |
28,169 | 31,640 | 29,512 | 59,809 | 56,863 | 124,543 | ||||||||||||||||||||
| Non-controlling interests |
207 | 70 | (87 | ) | 277 | (110 | ) | 217 | ||||||||||||||||||
|
|
|
|
|
|
|
|
|
|
|
|
|
|||||||||||||||
| 28,376 | 31,710 | 29,425 | 60,086 | 56,753 | 124,760 | |||||||||||||||||||||
|
|
|
|
|
|
|
|
|
|
|
|
|
|||||||||||||||
| XI |
Paid up equity share capital (Par value ₹ 2 per share) |
10,444 | 10,978 | 10,971 | 10,444 | 10,971 | 10,976 | |||||||||||||||||||
| XII |
Reserves excluding revaluation reserves and Non-controlling interests as per balance sheet |
770,188 | ||||||||||||||||||||||||
| XIII |
Earnings per share (EPS) |
|||||||||||||||||||||||||
| (Equity shares of par value of ₹ 2/- each) | ||||||||||||||||||||||||||
| (EPS for the three and six months ended periods is not annualized) |
||||||||||||||||||||||||||
| Basic (in ₹) |
5.06 | 5.23 | 4.86 | 10.30 | 9.55 | 20.73 | ||||||||||||||||||||
| Diluted (in ₹) |
5.04 | 5.12 | 4.85 | 10.27 | 9.52 | 20.68 |
| 1. | The audited consolidated financial results of the Company for the three and six months ended September 30, 2023, have been approved by the Board of Directors of the Company at its meeting held on October 18, 2023. The Company confirms that its statutory auditors, Deloitte Haskins & Sells LLP have issued an audit report with unmodified opinion on the consolidated financial results. |
| 2. | The above consolidated financial results have been prepared on the basis of the audited interim condensed consolidated financial statements which are prepared in accordance with International Financial Reporting Standards and its interpretations (“IFRS”), as issued by the International Accounting Standards Board (“IASB”). All amounts included in the consolidated financial results (including notes) are reported in millions of Indian rupees (₹ in millions) except share and per share data, unless otherwise stated. |
| 3. | Software license expense for internal use has been reclassified from Facility expenses to a separate nature of expense for the three and six months ended September 30, 2022. Staff recruitment expense has been reclassified from Miscellaneous expenses to Legal and Professional fees for the three and six months ended September 30, 2022. |
| 4. | (Gain)/loss on sale of property, plant and equipment, net has been reclassified from Other expenses and is presented separately for the three months ended September 30, 2023, June 30, 2023 and six months ended September 30, 2023. Previous period figures have been reclassified accordingly. (Gain)/loss on sale of property, plant and equipment, net for the three and six months ended September 30, 2023, includes gain on sale of immovable properties of ₹ (2,368). |
| 5. | List of subsidiaries and investments accounted for using equity method as at September 30, 2023 are provided in the table below: |
| Subsidiaries |
Subsidiaries |
Subsidiaries |
Country of |
|||
| Attune Consulting India Private Limited | India | |||||
| Capco Technologies Private Limited | India | |||||
| Wipro Technology Product Services Private Limited (formerly known as Encore Theme Technologies Private Limited) | India | |||||
| Wipro Chengdu Limited | China | |||||
2
| Wipro Holdings (UK) Limited | U.K. | |||||
| Designit A/S | Denmark | |||||
| Designit Denmark A/S | Denmark | |||||
| Designit Germany GmbH | Germany | |||||
| Designit Oslo A/S | Norway | |||||
| Designit Spain Digital, S.L.U | Spain | |||||
| Designit Sweden AB | Sweden | |||||
| Designit T.L.V Ltd. | Israel | |||||
| Wipro Bahrain Limited Co. W.L.L | Bahrain | |||||
| Wipro Financial Outsourcing Services Limited | U.K. | |||||
| Wipro UK Limited | U.K. | |||||
| Wipro Gulf LLC | Sultanate of Oman | |||||
| Wipro IT Services S.R.L. | Romania | |||||
| Wipro HR Services India Private Limited | India | |||||
| Wipro IT Services Bangladesh Limited | Bangladesh | |||||
| Wipro IT Services UK Societas | U.K. | |||||
| Wipro 4C NV | Belgium | |||||
| Wipro 4C Consulting France SAS | France | |||||
| Wipro 4C Danmark ApS | Denmark | |||||
| Wipro 4C Nederland B.V | Netherlands | |||||
| Wipro Weare4C UK Limited (1) | U.K. | |||||
| Grove Holdings 2 S.á.r.l | Luxembourg | |||||
| Capco Solution Services GmbH | Germany | |||||
| The Capital Markets Company Italy Srl | Italy | |||||
| Capco Brasil Serviços E Consultoria Ltda (formerly known as Capco Brasil Serviços E Consultoria Em Informática Ltda) | Brazil | |||||
| The Capital Markets Company BV (1) | Belgium | |||||
| PT. WT Indonesia | Indonesia | |||||
| Rainbow Software LLC | Iraq | |||||
| Wipro Arabia Limited (2) | Saudi Arabia | |||||
| Women’s Business Park Technologies Limited (2) | Saudi Arabia | |||||
| Wipro Doha LLC | Qatar | |||||
| Wipro Holdings Hungary Korlátolt Felelősségű Társaság | Hungary | |||||
| Wipro Holdings Investment Korlátolt Felelősségű Társaság | Hungary | |||||
| Wipro Information Technology Netherlands BV. | Netherlands | |||||
| Wipro do Brasil Technologia Ltda (1) | Brazil | |||||
| Wipro Information Technology Kazakhstan LLP | Kazakhstan | |||||
| Wipro Outsourcing Services (Ireland) Limited | Ireland | |||||
| Wipro Portugal S.A. (1) | Portugal | |||||
| Wipro Solutions Canada Limited | Canada | |||||
| Wipro Technologies Limited | Russia | |||||
| Wipro Technologies Peru SAC | Peru | |||||
| Wipro Technologies W.T. Sociedad Anonima | Costa Rica | |||||
| Wipro Technology Chile SPA | Chile | |||||
| Wipro IT Service Ukraine, LLC | Ukaine | |||||
| Wipro IT Services Poland SP Z.O.O | Poland | |||||
| Wipro Technologies Australia Pty Ltd | Australia | |||||
| Wipro Ampion Holdings Pty Ltd (1) | Australia | |||||
| Wipro Technologies SA | Argentina | |||||
| Wipro Technologies SA DE CV | Mexico | |||||
| Wipro Technologies South Africa (Proprietary) Limited | South Africa | |||||
| Wipro Technologies Nigeria Limited | Nigeria | |||||
| Wipro Technologies SRL | Romania | |||||
| Wipro (Thailand) Co. Limited | Thailand | |||||
| Wipro Japan KK | Japan | |||||
| Designit Tokyo Co., Ltd. | Japan | |||||
| Wipro Networks Pte Limited | Singapore | |||||
| Wipro (Dalian) Limited | China | |||||
| Wipro Technologies SDN BHD | Malaysia | |||||
3
| Wipro Overseas IT Services Private Limited | India | |||||
| Wipro Philippines, Inc. | Philippines | |||||
| Wipro Shanghai Limited | China | |||||
| Wipro Trademarks Holding Limited | India | |||||
| Wipro Travel Services Limited | India | |||||
| Wipro VLSI Design Services India Private Limited | India | |||||
| Wipro, LLC | USA | |||||
| Wipro Gallagher Solutions, LLC | USA | |||||
| Wipro Insurance Solutions, LLC | USA | |||||
| Wipro IT Services, LLC | USA | |||||
| Cardinal US Holdings, Inc.(1) | USA | |||||
| Convergence Acceleration Solutions, LLC | USA | |||||
| Designit North America, Inc. | USA | |||||
| Edgile, LLC | USA | |||||
| HealthPlan Services, Inc. (1) | USA | |||||
| Infocrossing, LLC | USA | |||||
| International TechneGroup Incorporated (1) | USA | |||||
| LeanSwift Solutions, Inc.(1) | USA | |||||
| Rizing Intermediate Holdings, Inc. (1) | USA | |||||
| Wipro Appirio, Inc. (1) | USA | |||||
| Wipro Designit Services, Inc. (1) | USA | |||||
| Wipro VLSI Design Services, LLC | USA | |||||
The Company controls ‘The Wipro SA Broad Based Ownership Scheme Trust’, ‘Wipro SA Broad Based Ownership Scheme SPV (RF) (PTY) LTD’ incorporated in South Africa and Wipro Foundation in India.
| (2) | All the above direct subsidiaries are 100% held by the Company except that the Company holds 66.67% of the equity securities of Wipro Arabia Limited and 55% of the equity securities of Women’s Business Park Technologies Limited are held by Wipro Arabia Limited. |
| (1) | Step Subsidiary details of Cardinal US Holdings, Inc., HealthPlan Services, Inc., International TechneGroup Incorporated, LeanSwift Solutions, Inc., Rizing Intermediate Holdings, Inc., The Capital Markets Company BV, Wipro Ampion Holdings Pty Ltd, Wipro Appirio, Inc., Wipro Designit Services, Inc., Wipro do Brasil Technologia Ltda, Wipro Portugal S.A. and Wipro Weare4C UK Limited are as follows: |
| Subsidiaries |
Subsidiaries |
Subsidiaries |
Country of |
|||
| Cardinal US Holdings, Inc. | USA | |||||
| ATOM Solutions LLC | USA | |||||
| Capco Consulting Services LLC | USA | |||||
| Capco RISC Consulting LLC | USA | |||||
| The Capital Markets Company LLC | USA | |||||
| HealthPlan Services, Inc. | USA | |||||
| HealthPlan Services Insurance Agency, LLC | USA | |||||
| International TechneGroup Incorporated | USA | |||||
| International TechneGroup Ltd. | U.K. | |||||
| ITI Proficiency Ltd | Israel | |||||
| MechWorks S.R.L. | Italy | |||||
| LeanSwift Solutions, Inc. | USA | |||||
| LeanSwift AB | Sweden | |||||
| Rizing Intermediate Holdings, Inc. | USA | |||||
| Rizing Lanka (Private) Ltd | Sri Lanka | |||||
| Attune Netherlands B.V. (3) | Netherlands | |||||
| Rizing Solutions Canada Inc. | Canada | |||||
| Rizing LLC | USA | |||||
| Aasonn Philippines Inc. | Philippines | |||||
| Rizing B.V. | Netherlands | |||||
| Rizing Consulting Ireland Limited | Ireland | |||||
| Rizing Consulting Pty Ltd. | Australia | |||||
| Rizing Geospatial LLC | USA | |||||
| Rizing GmbH | Germany | |||||
| Rizing Limited | U.K. | |||||
| Rizing Middle East DMCC | United Arab Emirates | |||||
| Rizing Pte Ltd. (3) | Singapore | |||||
4
| The Capital Markets Company BV | Belgium | |||||
| CapAfric Consulting (Pty) Ltd | South Africa | |||||
| Capco Belgium BV | Belgium | |||||
| Capco Consultancy (Malaysia) Sdn. Bhd | Malaysia | |||||
| Capco Consultancy (Thailand) Ltd | Thailand | |||||
| Capco Consulting Singapore Pte. Ltd | Singapore | |||||
| Capco Greece Single Member P.C | Greece | |||||
| Capco Poland sp. z.o.o | Poland | |||||
| The Capital Markets Company (UK) Ltd | U.K. | |||||
| Capco (UK) 1, Limited | U.K. | |||||
| The Capital Markets Company BV | Netherlands | |||||
| The Capital Markets Company GmbH | Germany | |||||
| Capco Austria GmbH | Austria | |||||
| The Capital Markets Company Limited | Hong Kong | |||||
| Capco Consulting Services (Guangzhou) Company Limited | China | |||||
| The Capital Markets Company Limited | Canada | |||||
| The Capital Markets Company S.á.r.l | Switzerland | |||||
| Andrion AG | Switzerland | |||||
| The Capital Markets Company S.A.S | France | |||||
| The Capital Markets Company s.r.o | Slovakia | |||||
| Wipro Ampion Holdings Pty Ltd | Australia | |||||
| Wipro Ampion Pty Ltd | Australia | |||||
| Wipro Iris Holdco Pty Ltd (3) | Australia | |||||
| Wipro Revolution IT Pty Ltd | Australia | |||||
| Crowdsprint Pty Ltd | Australia | |||||
| Wipro Shelde Australia Pty Ltd | Australia | |||||
| Wipro Appirio, Inc. | USA | |||||
| Wipro Appirio (Ireland) Limited | Ireland | |||||
| Wipro Appirio UK Limited | U.K. | |||||
| Topcoder, LLC. | USA | |||||
| Wipro Designit Services, Inc. | USA | |||||
| Wipro Designit Services Limited | Ireland | |||||
| Wipro do Brasil Technologia Ltda | Brazil | |||||
| Wipro do Brasil Servicos Ltda | Brazil | |||||
| Wipro Do Brasil Sistemas De Informatica Ltda | Brazil | |||||
| Wipro Portugal S.A. | Portugal | |||||
| Wipro Technologies GmbH | Germany | |||||
| Wipro Business Solutions GmbH (3) | Germany | |||||
| Wipro IT Services Austria GmbH | Austria | |||||
| Wipro Weare4C UK Limited | U.K. | |||||
| CloudSocius DMCC | United Arab Emirates |
5
| (3) | Step Subsidiary details of Attune Netherlands B.V., Rizing Pte Ltd., Wipro Business Solutions GmbH and Wipro Iris Holdco Pty Ltd are as follows: |
| Subsidiaries |
Subsidiaries |
Subsidiaries |
Country of Incorporation |
|||
| Attune Netherlands B.V. | Netherlands | |||||
| Attune Australia Pty Ltd | Australia | |||||
| Rizing Consulting USA, Inc. | USA | |||||
| Rizing Germany GmbH | Germany | |||||
| Attune Italia S.R.L | Italy | |||||
| Rizing Management LLC | USA | |||||
| Attune UK Ltd. | U.K. | |||||
| Rizing Pte Ltd. | Singapore | |||||
| Rizing New Zealand Ltd. | New Zealand | |||||
| Rizing Philippines Inc. | Philippines | |||||
| Rizing SDN BHD | Malaysia | |||||
| Rizing Solutions Pty Ltd | Australia | |||||
| Synchrony Global SDN BHD | Malaysia | |||||
| Wipro Business Solutions GmbH | Germany | |||||
| Wipro Technology Solutions S.R.L | Romania | |||||
| Wipro Iris Holdco Pty Ltd | Australia | |||||
| Wipro Iris Bidco Pty Ltd | Australia |
As at September 30, 2023, the Company held 43.7% interest in Drivestream Inc., accounted for using the equity method.
The list of controlled trusts and firms are:
| Name of the entity |
Country of incorporation |
|||||
| Wipro Equity Reward Trust | India | |||||
| Wipro Foundation | India | |||||
| 6. | Segment Information |
Effective April 1, 2023, the Company has reorganized its segments by merging India State Run Enterprises (“ISRE”) segment as part of its APMEA SMU within IT Services segment. Comparative period segment information has been restated to give effect to this change.
The Company is now organized into the following operating segments: IT Services and IT Products.
IT Services: The IT services segment primarily consists of IT services offerings to customers organized by four Strategic Market Units (“SMUs”)—Americas 1, Americas 2, Europe and Asia Pacific Middle East and Africa (“APMEA”). Americas 1 and Americas 2 are primarily organized by industry sector, while Europe and APMEA are organized by countries.
Americas 1 includes the entire business of Latin America (“LATAM”) and the following industry sectors in the United States of America: healthcare and medical devices, consumer goods and life sciences, retail, transportation and services, communications, media and information services, technology products and platforms. Americas 2 includes the entire business in Canada and the following industry sectors in the United States of America: banking, financial services and insurance, manufacturing, hi-tech, energy and utilities. Europe consists of the United Kingdom and Ireland, Switzerland, Germany, Benelux, the Nordics and Southern Europe. APMEA consists of Australia and New Zealand, India, Middle East, South East Asia, Japan and Africa.
Revenue from each customer is attributed to the respective SMUs based on the location of the customer’s primary buying center of such services. With respect to certain strategic global customers, revenue may be generated from multiple countries based on such customer’s buying centers, but the total revenue related to these strategic global customers are attributed to a single SMU based on the geographical location of key decision makers.
Our IT Services segment provides a range of IT and IT enabled services which include digital strategy advisory, customer centric design, technology consulting, IT consulting, custom application design, development, re-engineering and maintenance, systems integration, package implementation, cloud and infrastructure services, business process services, cloud, mobility and analytics services, research and development and hardware and software design.
IT Products: The Company is a value-added reseller of security, packaged and SaaS software for leading international brands. In certain total outsourcing contracts of the IT Services segment, the Company delivers hardware, software products and other related deliverables. Revenue relating to these items is reported as revenue from the sale of IT Products.
6
The Chief Executive Officer (“CEO”) and Managing Director of the Company has been identified as the Chief Operating Decision Maker as defined by IFRS 8, “Operating Segments”. The CEO of the Company evaluates the segments based on their revenue growth and operating income.
Assets and liabilities used in the Company’s business are not identified to any of the operating segments, as these are used interchangeably between segments. Management believes that it is currently not practicable to provide segment disclosures relating to total assets and liabilities since a meaningful segregation of the available data is onerous.
Information on reportable segments for the three months ended September 30, 2023, June 30, 2023, September 30, 2022, six months ended September 30, 2023, September 30, 2022 and year ended March 31, 2023 are as follows:
| Particulars |
Three months ended | Six months ended | Year ended | |||||||||||||||||||||
| September 30, 2023 |
June 30, 2023 |
September 30, 2022 |
September 30, 2023 |
September 30, 2022 |
March 31, 2023 |
|||||||||||||||||||
| Audited | Audited | Audited | Audited | Audited | Audited | |||||||||||||||||||
| Segment revenue |
||||||||||||||||||||||||
| IT Services |
||||||||||||||||||||||||
| Americas 1 |
66,813 | 65,607 | 65,350 | 132,420 | 127,052 | 261,270 | ||||||||||||||||||
| Americas 2 |
66,914 | 68,303 | 70,030 | 135,217 | 136,643 | 278,374 | ||||||||||||||||||
| Europe |
63,976 | 67,134 | 62,684 | 131,110 | 122,960 | 256,845 | ||||||||||||||||||
| APMEA |
26,255 | 26,510 | 27,141 | 52,765 | 52,924 | 106,812 | ||||||||||||||||||
|
|
|
|
|
|
|
|
|
|
|
|
|
|||||||||||||
| Total of IT Services |
223,958 | 227,554 | 225,205 | 451,512 | 439,579 | 903,301 | ||||||||||||||||||
| IT Products |
1,469 | 694 | 1,249 | 2,163 | 3,195 | 6,047 | ||||||||||||||||||
|
|
|
|
|
|
|
|
|
|
|
|
|
|||||||||||||
| Total segment revenue |
225,427 | 228,248 | 226,454 | 453,675 | 442,774 | 909,348 | ||||||||||||||||||
|
|
|
|
|
|
|
|
|
|
|
|
|
|||||||||||||
| Segment result |
||||||||||||||||||||||||
| IT Services |
||||||||||||||||||||||||
| Americas 1 |
15,287 | 13,537 | 12,954 | 28,824 | 24,524 | 51,555 | ||||||||||||||||||
| Americas 2 |
14,023 | 14,169 | 14,959 | 28,192 | 28,183 | 59,689 | ||||||||||||||||||
| Europe |
7,547 | 9,968 | 8,454 | 17,515 | 16,440 | 37,667 | ||||||||||||||||||
| APMEA |
2,985 | 2,800 | 2,670 | 5,785 | 4,739 | 10,681 | ||||||||||||||||||
| Unallocated |
(3,784 | ) | (3,957 | ) | (5,090 | ) | (7,741 | ) | (7,934 | ) | (18,368 | ) | ||||||||||||
|
|
|
|
|
|
|
|
|
|
|
|
|
|||||||||||||
| Total of IT Services |
36,058 | 36,517 | 33,947 | 72,575 | 65,952 | 141,224 | ||||||||||||||||||
| IT Products |
(467 | ) | (161 | ) | (103 | ) | (628 | ) | (158 | ) | (176 | ) | ||||||||||||
| Reconciling Items |
(2,246 | ) | (1,840 | ) | (1,341 | ) | (4,086 | ) | (1,401 | ) | (1,442 | ) | ||||||||||||
|
|
|
|
|
|
|
|
|
|
|
|
|
|||||||||||||
| Total segment result |
33,345 | 34,516 | 32,503 | 67,861 | 64,393 | 139,606 | ||||||||||||||||||
|
|
|
|
|
|
|
|
|
|
|
|
|
|||||||||||||
| Finance expenses |
(3,033 | ) | (3,086 | ) | (2,270 | ) | (6,119 | ) | (4,315 | ) | (10,077 | ) | ||||||||||||
| Finance and other Income |
4,810 | 6,542 | 4,040 | 11,352 | 7,730 | 18,185 | ||||||||||||||||||
| Share of net profit/ (loss) of associates accounted for using the equity method |
(30 | ) | 3 | (72 | ) | (27 | ) | (87 | ) | (57 | ) | |||||||||||||
|
|
|
|
|
|
|
|
|
|
|
|
|
|||||||||||||
| Profit before tax |
35,092 | 37,975 | 34,201 | 73,067 | 67,721 | 147,657 | ||||||||||||||||||
|
|
|
|
|
|
|
|
|
|
|
|
|
|||||||||||||
Notes:
| a) | “Reconciling items” includes elimination of inter-segment transactions and other corporate activities. |
| b) | Revenue from sale of Company owned intellectual properties is reported as part of IT Services revenues. |
| c) | For the purpose of segment reporting, the Company has included the net impact of foreign exchange in revenues amounting to ₹ 268, ₹ (62) and ₹ 1,057 for the three months ended September 30, 2023, June 30, 2023, and September 30, 2022 respectively, ₹ 206 and ₹ 2,091 for the six months ended September 30, 2023, September 30, 2022, and ₹ 4,472 for the year ended March 31, 2023, which is reported under foreign exchange gains/(losses), net in the consolidated financial results. |
| d) | Restructuring cost of ₹ 2,249, ₹ 1,887 and ₹ 1,360 is included under Reconciling items for the three months ended September 30, 2023, June 30, 2023 and September 30, 2022, respectively, ₹ 4,136 and ₹ 1,360 for the six months ended September 30, 2023, September 30, 2022, and ₹ 1,355 for the year ended March 31, 2023 respectively. |
| e) | Effective April 1, 2023, amortization and impairment of intangibles assets arising from business combination and change in fair value of contingent consideration is included under “Unallocated” within IT Services segment. Comparative period has been restated to give effect to these changes. |
Segment results of IT Services segment for the three and six months ended September 30, 2023 are after considering additional amortization due to change in estimate of useful life of the customer-related intangibles in an earlier Business combination.
Accordingly, for the three months ended September 30, 2023, June 30, 2023, September 30, 2022, six months ended September 30, 2023, September 30, 2022 and year ended March 31, 2023, ₹ 3,484, ₹ 1,810, ₹ 2,126, ₹ 5,294, ₹ 4,019 and ₹ 9,954 towards amortization and impairment of intangible assets, respectively, and for the three months ended September 30, 2023, June 30, 2023, September 30, 2022, six months ended September 30, 2023, September 30, 2022 and year ended March 31, 2023, ₹ (490), ₹ (16), ₹ (185), ₹ (506), ₹ (271) and ₹ (1,671) towards change in fair value of contingent consideration, respectively, is included under “Unallocated” within IT Services segment.
7
| f) | Segment results of IT Services segment are after recognition of (gain)/loss on sale of property, plant and equipment of ₹ (2,320), ₹ 78 and ₹ (26) for the three months ended September 30, 2023, June 30, 2023 and September 30, 2022, respectively and ₹ (2,242) and ₹ (148) for the six months ended September 30, 2023, September 30, 2022, and ₹ (89) for the year ended March 31, 2023 respectively. (Refer to Note 4) |
| g) | Segment results of IT Services segment are after recognition of share-based compensation expense ₹ 1,563, ₹ 1,544 and ₹ 1,122 for the three months ended September 30, 2023, June 30, 2023 and September 30, 2022, respectively, ₹ 3,107 and ₹ 2,567 for the six months ended September 30, 2023, September 30, 2022, and ₹ 3,958 for the year ended March 31, 2023 respectively. |
| 7. | Buyback of equity shares |
During the six months ended September 30, 2023, the Company concluded the buyback of 269,662,921 equity shares (at a price of ₹ 445 per equity share) as approved by the Board of Directors on April 27, 2023. This has resulted in a total cash outflow of ₹ 145,173 (including tax on buyback of ₹ 24,783 and transaction costs related to buyback of ₹ 390). In line with the requirement of the Companies Act, 2013, an amount of ₹ 3,768 and ₹ 141,405 has been utilized from share premium and retained earnings respectively. Further, capital redemption reserve (included in other reserves) of ₹ 539 (representing the nominal value of the shares bought back) has been created as an apportionment from retained earnings. Consequent to such buyback, the paid-up equity share capital has reduced by ₹ 539.
| 8. | Earnings per share for each of the three months ended September 30, 2023 and June 30, 2023 will not add up to earnings per share for the six months ended September 30, 2023, on account of buyback of equity shares. |
8
| 9. | Audited Consolidated Balance Sheet |
| As at March 31, 2023 | As at September 30, 2023 | |||||||
| ASSETS |
||||||||
| Goodwill |
307,970 | 309,732 | ||||||
| Intangible assets |
43,045 | 38,109 | ||||||
| Property, plant and equipment |
88,659 | 83,086 | ||||||
| Right-of-Use assets |
18,702 | 17,043 | ||||||
| Financial assets |
||||||||
| Derivative assets |
29 | 151 | ||||||
| Investments |
20,720 | 21,629 | ||||||
| Trade receivables |
863 | 872 | ||||||
| Other financial assets |
6,330 | 5,973 | ||||||
| Investments accounted for using the equity method |
780 | 761 | ||||||
| Deferred tax assets |
2,100 | 2,219 | ||||||
| Non-current tax assets |
11,922 | 10,878 | ||||||
| Other non-current assets |
13,606 | 10,834 | ||||||
|
|
|
|
|
|||||
| Total non-current assets |
514,726 | 501,287 | ||||||
|
|
|
|
|
|||||
| Inventories |
1,188 | 1,281 | ||||||
| Financial assets |
||||||||
| Derivative assets |
1,844 | 1,999 | ||||||
| Investments |
309,232 | 239,847 | ||||||
| Cash and cash equivalents |
91,880 | 97,896 | ||||||
| Trade receivables |
126,350 | 108,146 | ||||||
| Unbilled receivables |
60,515 | 65,292 | ||||||
| Other financial assets |
9,096 | 9,155 | ||||||
| Contract assets |
23,001 | 24,464 | ||||||
| Current tax assets |
5,091 | 5,017 | ||||||
| Other current assets |
32,899 | 31,946 | ||||||
|
|
|
|
|
|||||
| Total current assets |
661,096 | 585,043 | ||||||
|
|
|
|
|
|||||
| TOTAL ASSETS |
1,175,822 | 1,086,330 | ||||||
|
|
|
|
|
|||||
| EQUITY |
||||||||
| Share capital |
10,976 | 10,444 | ||||||
| Share premium |
3,689 | 1,732 | ||||||
| Retained earnings |
660,964 | 577,487 | ||||||
| Share-based payment reserve |
5,632 | 6,023 | ||||||
| Special Economic Zone Re-investment reserve |
46,803 | 44,941 | ||||||
| Other components of equity |
53,100 | 58,284 | ||||||
|
|
|
|
|
|||||
| Equity attributable to the equity holders of the Company |
781,164 | 698,911 | ||||||
| Non-controlling interests |
589 | 823 | ||||||
|
|
|
|
|
|||||
| TOTAL EQUITY |
781,753 | 699,734 | ||||||
|
|
|
|
|
|||||
| LIABILITIES |
||||||||
| Financial liabilities |
||||||||
| Loans and borrowings |
61,272 | 61,971 | ||||||
| Lease liabilities |
15,953 | 14,796 | ||||||
| Derivative liabilities |
179 | 40 | ||||||
| Other financial liabilities |
2,649 | 1,609 | ||||||
| Deferred tax liabilities |
15,153 | 15,315 | ||||||
| Non-current tax liabilities |
21,777 | 26,048 | ||||||
| Other non-current liabilities |
9,333 | 11,025 | ||||||
| Provisions |
^ | — | ||||||
|
|
|
|
|
|||||
| Total non-current liabilities |
126,316 | 130,804 | ||||||
|
|
|
|
|
|||||
| Financial liabilities |
||||||||
| Loans, borrowings and bank overdrafts |
88,821 | 94,060 | ||||||
| Lease liabilities |
8,620 | 8,348 | ||||||
| Derivative liabilities |
2,825 | 1,582 | ||||||
| Trade payables and accrued expenses |
89,054 | 78,857 | ||||||
| Other financial liabilities |
4,141 | 2,712 | ||||||
| Contract liabilities |
22,682 | 16,738 | ||||||
| Current tax liabilities |
18,846 | 21,372 | ||||||
| Other current liabilities |
30,215 | 29,873 | ||||||
| Provisions |
2,549 | 2,250 | ||||||
|
|
|
|
|
|||||
| Total current liabilities |
267,753 | 255,792 | ||||||
|
|
|
|
|
|||||
| TOTAL LIABILITIES |
394,069 | 386,596 | ||||||
|
|
|
|
|
|||||
| TOTAL EQUITY AND LIABILITIES |
1,175,822 | 1,086,330 | ||||||
|
|
|
|
|
|||||
| ^ | Value is less than 1 |
9
| 10. | Audited Consolidated Statement of Cash flows |
| Six months ended September 30, | ||||||||
| 2022 | 2023 | |||||||
| Cash flows from operating activities |
||||||||
| Profit for the period |
52,080 | 55,533 | ||||||
| Adjustments to reconcile profit for the period to net cash generated from operating activities: |
||||||||
| Gain on sale of property, plant and equipment, net |
(148 | ) | (2,242 | ) | ||||
| Depreciation, amortization and impairment expense |
15,707 | 16,350 | ||||||
| Unrealized exchange (gain)/loss, net and exchange (gain)/loss on borrowings |
1,406 | 836 | ||||||
| Share-based compensation expense |
2,574 | 3,099 | ||||||
| Share of net loss of associates accounted for using equity method |
87 | 27 | ||||||
| Income tax expense |
15,641 | 17,534 | ||||||
| Finance and other income, net of finance expenses |
(3,415 | ) | (5,233 | ) | ||||
| Gain on derecognition of contingent consideration payable |
(271 | ) | (506 | ) | ||||
| Changes in operating assets and liabilities, net of effects from acquisitions |
||||||||
| Trade receivables |
(4,971 | ) | 18,352 | |||||
| Unbilled receivables and contract assets |
(3,861 | ) | (5,937 | ) | ||||
| Inventories |
(664 | ) | (92 | ) | ||||
| Other assets |
(3,242 | ) | 6,498 | |||||
| Trade payables, accrued expenses, other liabilities and provisions |
(2,783 | ) | (11,260 | ) | ||||
| Contract liabilities |
(2,929 | ) | (5,928 | ) | ||||
|
|
|
|
|
|||||
| Cash generated from operating activities before taxes |
65,211 | 87,031 | ||||||
| Income taxes paid, net |
(15,418 | ) | (10,885 | ) | ||||
|
|
|
|
|
|||||
| Net cash generated from operating activities |
49,793 | 76,146 | ||||||
|
|
|
|
|
|||||
| Cash flows from investing activities: |
||||||||
| Payment for purchase of property, plant and equipment |
(8,737 | ) | (4,184 | ) | ||||
| Proceeds from disposal of property, plant and equipment |
181 | 4,223 | ||||||
| Payment for purchase of investments |
(382,779 | ) | (465,185 | ) | ||||
| Proceeds from sale of investments |
347,617 | 535,473 | ||||||
| Proceeds from restricted interim dividend account |
27,410 | — | ||||||
| Payment for business acquisitions including deposits and escrow, net of cash acquired |
(46,341 | ) | — | |||||
| Interest received |
6,151 | 11,274 | ||||||
| Dividend received |
2 | 2 | ||||||
|
|
|
|
|
|||||
| Net cash generated from/(used in) investing activities |
(56,496 | ) | 81,603 | |||||
|
|
|
|
|
|||||
| Cash flows from financing activities: |
||||||||
| Proceeds from issuance of equity shares and shares pending allotment |
7 | 7 | ||||||
| Repayment of loans and borrowings |
(79,298 | ) | (43,750 | ) | ||||
| Proceeds from loans and borrowings |
91,617 | 48,750 | ||||||
| Payment of lease liabilities |
(4,927 | ) | (5,172 | ) | ||||
| Payment for deferred contingent consideration |
(1,169 | ) | (1,289 | ) | ||||
| Interest and finance expenses paid |
(3,458 | ) | (4,850 | ) | ||||
| Payment of dividend |
(27,337 | ) | — | |||||
| Payment for buyback of equity shares, including tax and transaction cost |
— | (145,173 | ) | |||||
|
|
|
|
|
|||||
| Net cash used in financing activities |
(24,565 | ) | (151,477 | ) | ||||
|
|
|
|
|
|||||
| Net increase/(decrease) in cash and cash equivalents during the period |
(31,268 | ) | 6,272 | |||||
| Effect of exchange rate changes on cash and cash equivalents |
456 | (259 | ) | |||||
| Cash and cash equivalents at the beginning of the period |
103,833 | 91,861 | ||||||
|
|
|
|
|
|||||
| Cash and cash equivalents at the end of the period |
73,021 | 97,874 | ||||||
|
|
|
|
|
|||||
| By order of the Board, | For, Wipro Limited | |
| Place: Bengaluru Date: October 18, 2023 |
Rishad A. Premji Chairman |
|
10
Exhibit 99.5
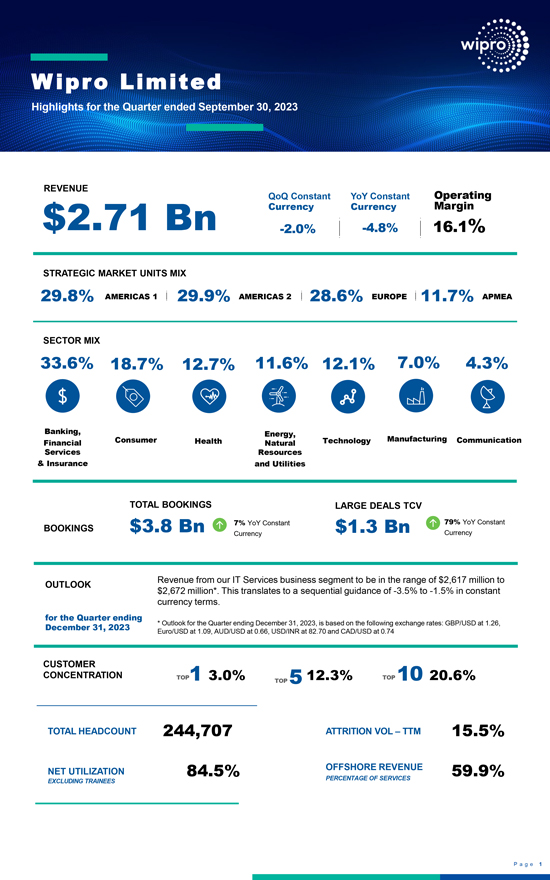
W ipro Limited Highlights for the Quarter ended September 30, 2023 REVENUE QoQ Constant YoY Constant Operating $2.71 Bn Currency Currency Margin -2.0% -4.8% 16.1% STRATEGIC MARKET UNITS MIX 29.8% AMERICAS 1 29.9% AMERICAS 2 28.6% EUROPE 11.7% APMEA SECTOR MIX 33.6% 18.7% 12.7% 11.6% 12.1% 7.0% 4.3% Banking, Energy, Financial Consumer Health Natural Technology Manufacturing Communication Services Resources & Insurance and Utilities TOTAL BOOKINGS LARGE DEALS TCV 7% YoY Constant 79% YoY Constant BOOKINGS $3.8 Bn $1.3 Bn Currency Currency Revenue from our IT Services business segment to be in the range of $2,617 million to OUTLOOK $2,672 million*. This translates to a sequential guidance of -3.5% to -1.5% in constant currency terms. for the Quarter ending December 31, 2023 * Outlook for the Quarter ending December 31, 2023, is based on the following exchange rates: GBP/USD at 1.26, Euro/USD at 1.09, AUD/USD at 0.66, USD/INR at 82.70 and CAD/USD at 0.74 CUSTOMER CONCENTRATION TOP1 3.0% 12.3% TOP 10 20.6% TOP 5 TOTAL HEADCOUNT 244,707 ATTRITION VOL – TTM 15.5% OFFSHORE REVENUE NET UTILIZATION 84.5% 59.9% PERCENTAGE OF SERVICES EXCLUDING TRAINEES P a g e 1
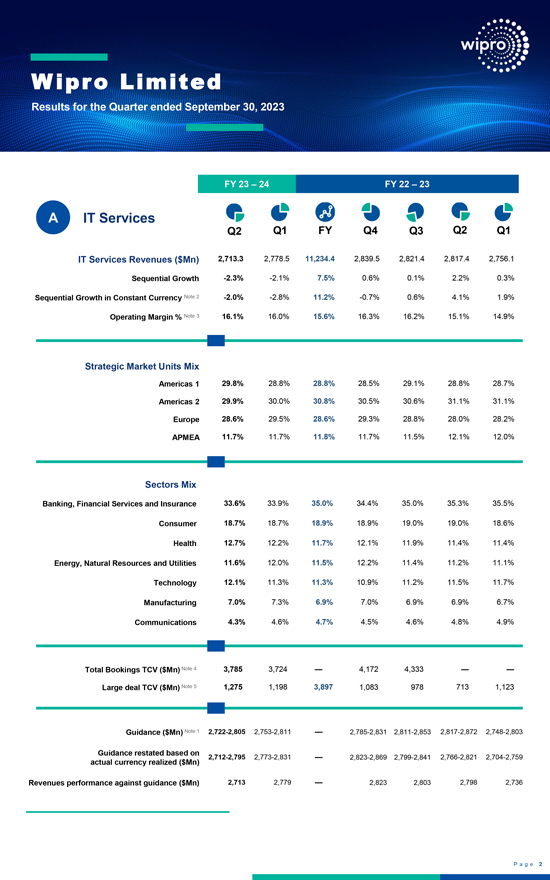
W ipro Limited Results for the Quarter ended September 30, 2023 FY 23 – 24 FY 22 – 23 A IT Services Q2 Q1 FY Q4 Q3 Q2 Q1 IT Services Revenues ($Mn) 2,713.3 2,778.5 11,234.4 2,839.5 2,821.4 2,817.4 2,756.1 Sequential Growth -2.3% -2.1% 7.5% 0.6% 0.1% 2.2% 0.3% Sequential Growth in Constant Currency Note 2 -2.0% -2.8% 11.2% -0.7% 0.6% 4.1% 1.9% Operating Margin % Note 3 16.1% 16.0% 15.6% 16.3% 16.2% 15.1% 14.9% Strategic Market Units Mix Americas 1 29.8% 28.8% 28.8% 28.5% 29.1% 28.8% 28.7% Americas 2 29.9% 30.0% 30.8% 30.5% 30.6% 31.1% 31.1% Europe 28.6% 29.5% 28.6% 29.3% 28.8% 28.0% 28.2% APMEA 11.7% 11.7% 11.8% 11.7% 11.5% 12.1% 12.0% Sectors Mix Banking, Financial Services and Insurance 33.6% 33.9% 35.0% 34.4% 35.0% 35.3% 35.5% Consumer 18.7% 18.7% 18.9% 18.9% 19.0% 19.0% 18.6% Health 12.7% 12.2% 11.7% 12.1% 11.9% 11.4% 11.4% Energy, Natural Resources and Utilities 11.6% 12.0% 11.5% 12.2% 11.4% 11.2% 11.1% Technology 12.1% 11.3% 11.3% 10.9% 11.2% 11.5% 11.7% Manufacturing 7.0% 7.3% 6.9% 7.0% 6.9% 6.9% 6.7% Communications 4.3% 4.6% 4.7% 4.5% 4.6% 4.8% 4.9% Total Bookings TCV ($Mn) Note 4 3,785 3,724 — 4,172 4,333 — — Large deal TCV ($Mn) Note 5 1,275 1,198 3,897 1,083 978 713 1,123 Guidance ($Mn) Note 1 2,722-2,805 2,753-2,811 — 2,785-2,831 2,811-2,853 2,817-2,872 2,748-2,803 Guidance restated based on 2,712-2,795 2,773-2,831 — 2,823-2,869 2,799-2,841 2,766-2,821 2,704-2,759 actual currency realized ($Mn) Revenues performance against guidance ($Mn) 2,713 2,779 — 2,823 2,803 2,798 2,736 P a g e 2
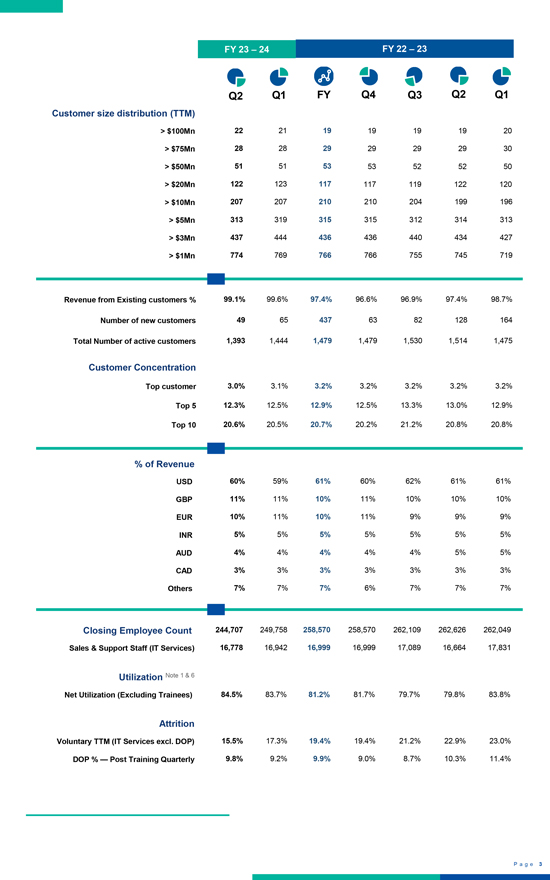
FY 23 – 24 FY 22 – 23 Q2 Q1 FY Q4 Q3 Q2 Q1 Customer size distribution (TTM) > $100Mn 22 21 19 19 19 19 20 > $75Mn 28 28 29 29 29 29 30 > $50Mn 51 51 53 53 52 52 50 > $20Mn 122 123 117 117 119 122 120 > $10Mn 207 207 210 210 204 199 196 > $5Mn 313 319 315 315 312 314 313 > $3Mn 437 444 436 436 440 434 427 > $1Mn 774 769 766 766 755 745 719 Revenue from Existing customers % 99.1% 99.6% 97.4% 96.6% 96.9% 97.4% 98.7% Number of new customers 49 65 437 63 82 128 164 Total Number of active customers 1,393 1,444 1,479 1,479 1,530 1,514 1,475 Customer Concentration Top customer 3.0% 3.1% 3.2% 3.2% 3.2% 3.2% 3.2% Top 5 12.3% 12.5% 12.9% 12.5% 13.3% 13.0% 12.9% Top 10 20.6% 20.5% 20.7% 20.2% 21.2% 20.8% 20.8% % of Revenue USD 60% 59% 61% 60% 62% 61% 61% GBP 11% 11% 10% 11% 10% 10% 10% EUR 10% 11% 10% 11% 9% 9% 9% INR 5% 5% 5% 5% 5% 5% 5% AUD 4% 4% 4% 4% 4% 5% 5% CAD 3% 3% 3% 3% 3% 3% 3% Others 7% 7% 7% 6% 7% 7% 7% Closing Employee Count 244,707 249,758 258,570 258,570 262,109 262,626 262,049 Sales & Support Staff (IT Services) 16,778 16,942 16,999 16,999 17,089 16,664 17,831 Utilization Note 1 & 6 Net Utilization (Excluding Trainees) 84.5% 83.7% 81.2% 81.7% 79.7% 79.8% 83.8% Attrition Voluntary TTM (IT Services excl. DOP) 15.5% 17.3% 19.4% 19.4% 21.2% 22.9% 23.0% DOP % — Post Training Quarterly 9.8% 9.2% 9.9% 9.0% 8.7% 10.3% 11.4% P a g e 3
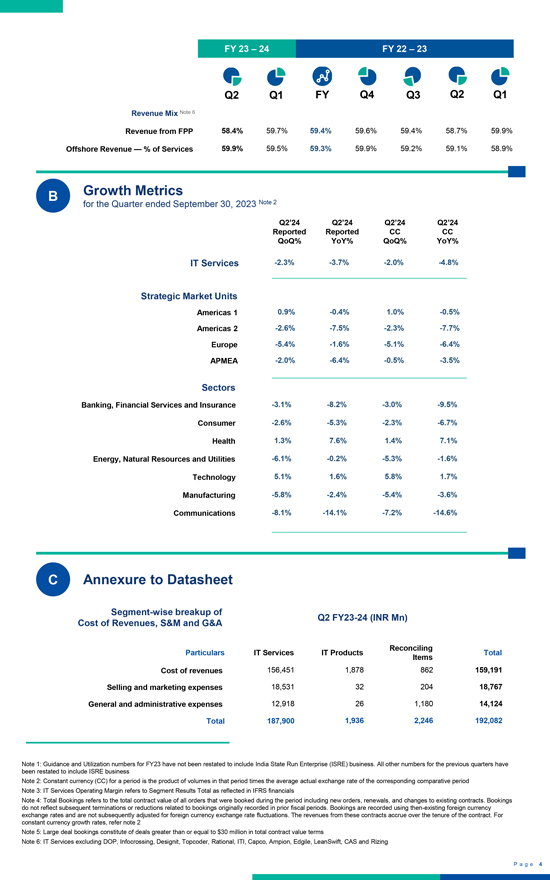
FY 23 – 24 FY 22 – 23 Q2 Q1 FY Q4 Q3 Q2 Q1 Revenue Mix Note 6 Revenue from FPP 58.4% 59.7% 59.4% 59.6% 59.4% 58.7% 59.9% Offshore Revenue — % of Services 59.9% 59.5% 59.3% 59.9% 59.2% 59.1% 58.9% B Growth Metrics for the Quarter ended September 30, 2023 Note 2 Q2’24 Q2’24 Q2’24 Q2’24 Reported Reported CC CC QoQ% YoY% QoQ% YoY% IT Services -2.3% -3.7% -2.0% -4.8% Strategic Market Units Americas 1 0.9% -0.4% 1.0% -0.5% Americas 2 -2.6% -7.5% -2.3% -7.7% Europe -5.4% -1.6% -5.1% -6.4% APMEA -2.0% -6.4% -0.5% -3.5% Sectors Banking, Financial Services and Insurance -3.1% -8.2% -3.0% -9.5% Consumer -2.6% -5.3% -2.3% -6.7% Health 1.3% 7.6% 1.4% 7.1% Energy, Natural Resources and Utilities -6.1% -0.2% -5.3% -1.6% Technology 5.1% 1.6% 5.8% 1.7% Manufacturing -5.8% -2.4% -5.4% -3.6% Communications -8.1% -14.1% -7.2% -14.6% C Annexure to Datasheet Segment-wise breakup of Q2 FY23-24 (INR Mn) Cost of Revenues, S&M and G&A Reconciling Particulars IT Services IT Products Total Items Cost of revenues 156,451 1,878 862 159,191 Selling and marketing expenses 18,531 32 204 18,767 General and administrative expenses 12,918 26 1,180 14,124 Total 187,900 1,936 2,246 192,082 Note 1: Guidance and Utilization numbers for FY23 have not been restated to include India State Run Enterprise (ISRE) business. All other numbers for the previous quarters have been restated to include ISRE business Note 2: Constant currency (CC) for a period is the product of volumes in that period times the average actual exchange rate of the corresponding comparative period Note 3: IT Services Operating Margin refers to Segment Results Total as reflected in IFRS financials Note 4: Total Bookings refers to the total contract value of all orders that were booked during the period including new orders, renewals, and changes to existing contracts. Bookings do not reflect subsequent terminations or reductions related to bookings originally recorded in prior fiscal periods. Bookings are recorded using then-existing foreign currency exchange rates and are not subsequently adjusted for foreign currency exchange rate fluctuations. The revenues from these contracts accrue over the tenure of the contract. For constant currency growth rates, refer note 2 Note 5: Large deal bookings constitute of deals greater than or equal to $30 million in total contract value terms Note 6: IT Services excluding DOP, Infocrossing, Designit, Topcoder, Rational, ITI, Capco, Ampion, Edgile, LeanSwift, CAS and Rizing P a g e 4