UNITED STATES
SECURITIES AND EXCHANGE COMMISSION
Washington, D.C. 20549
FORM 8-K
CURRENT REPORT
Pursuant to Section 13 or 15(d)
of the Securities Exchange Act of 1934
Date of Report (Date of earliest event reported):
October 16, 2023
JEFFERIES FINANCIAL GROUP INC.
(Exact name of registrant as specified in its charter)
| New York | 001-05721 | 13-2615557 | ||
| (State of other jurisdiction of incorporation or organization) |
(Commission File Number) |
(IRS. Employer Identification No.) |
| 520 Madison Ave., New York, New York | 10022 | |
| (Address of principal executive offices) | (Zip Code) |
Registrant’s telephone number, including area code: 212-284-2300
Check the appropriate box below if the Form 8-K filing is intended to simultaneously satisfy the filing obligation of the registrant under any of the following provisions (see General Instruction A.2, below):
| ☐ | Written communications pursuant to Rule 425 under the Securities Act (17 CFR 230.425) |
| ☐ | Soliciting material pursuant to Rule 14a-12 under the Exchange Act (17 CFR 240.14a-12) |
| ☐ | Pre-commencement communications pursuant to Rule 14d-2(b) under the Exchange Act (17 CFR 240.14d-2(b)) |
| ☐ | Pre-commencement communications pursuant to Rule 13e-4(c) under the Exchange Act (17 CFR 240.13e-4(c)) |
Securities registered pursuant to Section 12(b) of the Exchange Act:
| Title of each class |
Trading Symbol(s) |
Name of each exchange on which registered |
||
| Common Stock, par value $1.00 per share | JEF | New York Stock Exchange | ||
| 4.850% Senior Notes Due 2027 | JEF 27A | New York Stock Exchange | ||
| 5.875% Senior Notes Due 2028 | JEF 28 | New York Stock Exchange | ||
| 2.750% Senior Notes Due 2032 | JEF 32A | New York Stock Exchange |
Indicate by check mark whether the registrant is an emerging growth company as defined in Rule 405 of the Securities Act of 1933 (§230.405 of this chapter) or Rule 12b-2 of the Securities Exchange Act of 1934 (§240.12b-2 of this chapter).
Emerging growth company ☐
If an emerging growth company, indicate by check mark if the registrant has elected not to use the extended transition period for complying with any new or revised financial accounting standards provided pursuant to Section 13(a) of the Exchange Act. ☐
| Item 7.01 | Regulation FD Disclosure |
On October 16, 2023, we posted our Investor Presentation to our website, www.jefferies.com, for use at our October 16, 2023 Investor Meeting. A copy of the Investor Presentation is attached hereto as Exhibit 99.1 and is incorporated herein by reference.
The information in Item 7.01 of this Current Report on Form 8-K and Exhibit 99.1 attached hereto shall not be deemed “filed” for purposes of Section 18 of the Securities Exchange Act of 1934, as amended (the “Exchange Act”), or otherwise subject to the liabilities of that section, nor shall it be deemed incorporated by reference in any filing or other document under the Securities Act of 1933, as amended, or the Exchange Act, regardless of any general incorporation language in such filing, except as shall be expressly set forth by specific reference in such filing or document.
| Item 9.01 | Financial Statements and Exhibits |
(d)
| Exhibit |
Description | |
| 99.1 | Investor Presentation | |
| 104 | Cover Page Interactive Data File (embedded within the Inline XBRL document) | |
SIGNATURE
Pursuant to the requirements of the Securities Exchange Act of 1934, the registrant has duly caused this report to be signed on its behalf by the undersigned hereunto duly authorized.
| Date: October 16, 2023 | JEFFERIES FINANCIAL GROUP INC. | |||||
| /s/ Michael J. Sharp |
||||||
| Michael J. Sharp | ||||||
| Executive Vice President and General Counsel | ||||||

Exhibit 99.1 Jefferies Financial Group Inc. 2023 Investor Meeting th Monday, October 16 , 2023
Important Disclosures Forward Looking Statements. Certain statements contained herein may constitute “forward-looking statements, within the meaning of Section 27A of the Securities Act of 1933, Section 21E of the Securities Exchange Act of 1934 and/or the Private Securities Litigation Reform Act of 1995, regarding Jefferies Financial Group Inc., and its subsidiaries. These forward-looking statements reflect our current views relating to, among other things, future revenues, earnings, operations, and other financial results, and may include statements of future performance, plans, and objectives. Forward-looking statements may also include statements pertaining to our strategies for the future development of its business and products. These forward-looking statements are not historical facts and are based on management expectations, estimates, projections, beliefs and certain other assumptions, many of which, by their nature, are inherently uncertain and beyond management’s control. It is possible that the actual results may differ, possibly materially, from the anticipated results indicated in these forward-looking statements. Accordingly, readers are cautioned that any such forward-looking statements are not guarantees of future performance and are subject to certain risks, uncertainties and assumptions that are difficult to predict including, without limitation, the cautionary statements and risks set forth in our Annual and Quarterly Reports and other reports or documents filed with, or furnished to, the SEC from time to time, which are accessible on the SEC website at sec.gov. This information should also be read in conjunction with Jefferies Financial Group Inc. Consolidated Financial Statements and the Notes thereto contained in the Annual, Quarterly and Periodic Reports filed by the such issuer that are also accessible on the SEC website at sec.gov. Readers are cautioned not to place undue reliance on forward-looking statements, which speak only as of the date they are made. We do not undertake to update any forward-looking statements to reflect the impact of circumstances or events that arise after the date of such forward- looking statements. Not an Offer. These materials are provided for shareholders of Jefferies Financial Group Inc. and are for informational purposes only. These materials do not constitute an offer to sell, or a solicitation of an offer to buy, any security or instrument, or a solicitation of interest in any fund, account or strategy described herein. Performance Information. Past performance is not necessarily indicative of future results. 2
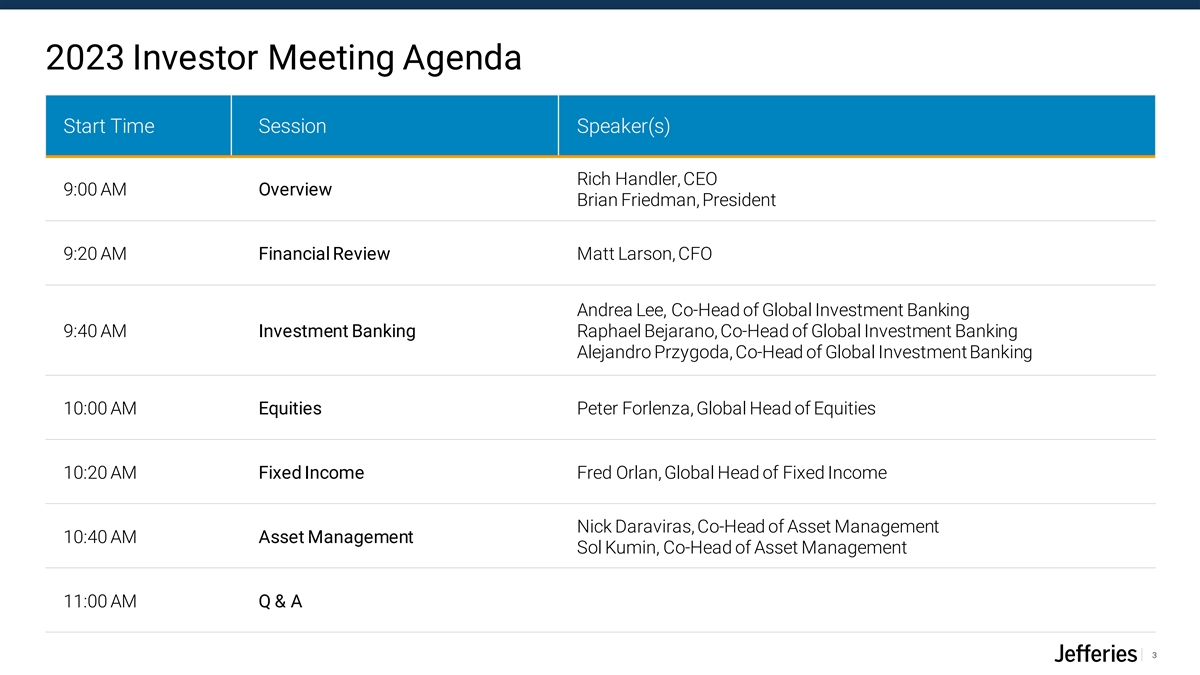
2023 Investor Meeting Agenda Start Time Session Speaker(s) Rich Handler, CEO 9:00 AM Overview Brian Friedman, President 9:20 AM Financial Review Matt Larson, CFO Andrea Lee, Co-Head of Global Investment Banking 9:40 AM Investment Banking Raphael Bejarano, Co-Head of Global Investment Banking Alejandro Przygoda, Co-Head of Global Investment Banking 10:00 AM Equities Peter Forlenza, Global Head of Equities 10:20 AM Fixed Income Fred Orlan, Global Head of Fixed Income Nick Daraviras, Co-Head of Asset Management 10:40 AM Asset Management Sol Kumin, Co-Head of Asset Management 11:00 AM Q & A 3

Overview Rich Handler, CEO Brian Friedman, President
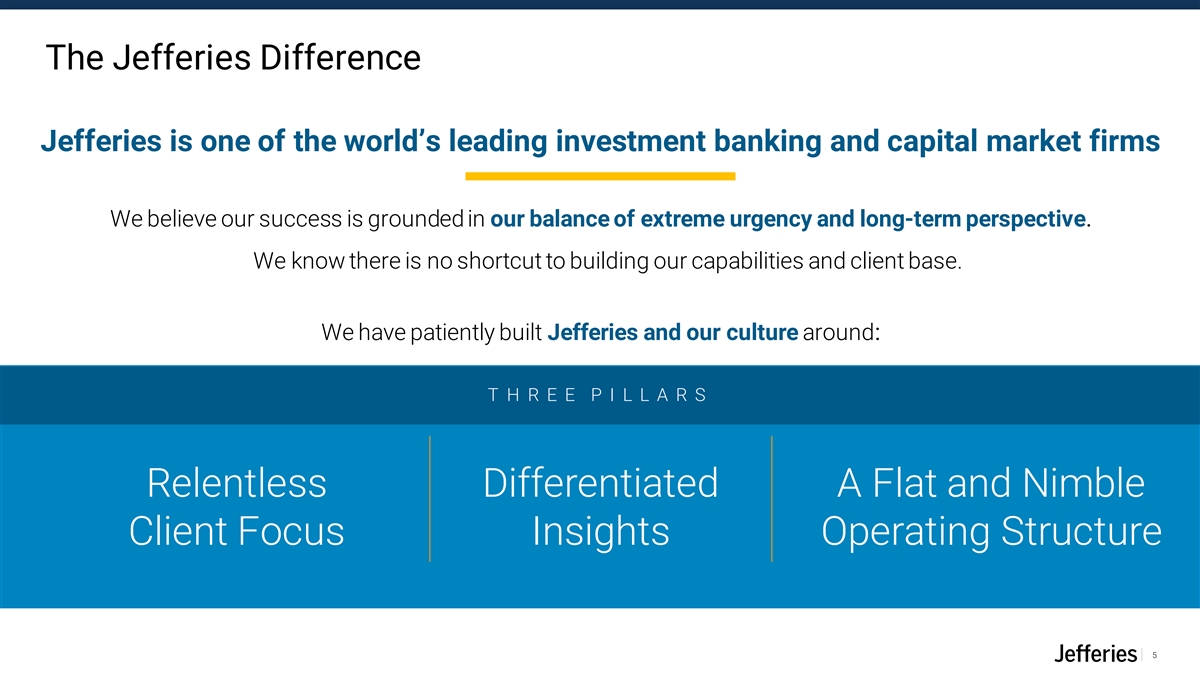
The Jefferies Difference Jefferies is one of the world’s leading investment banking and capital market firms We believe our success is grounded in our balance of extreme urgency and long-term perspective. We know there is no shortcut to building our capabilities and client base. We have patiently built Jefferies and our culture around: T H R E E P I L L A R S T H R E E P I L L A R S Relentless Differentiated A Flat and Nimble Client Focus Insights Operating Structure 5
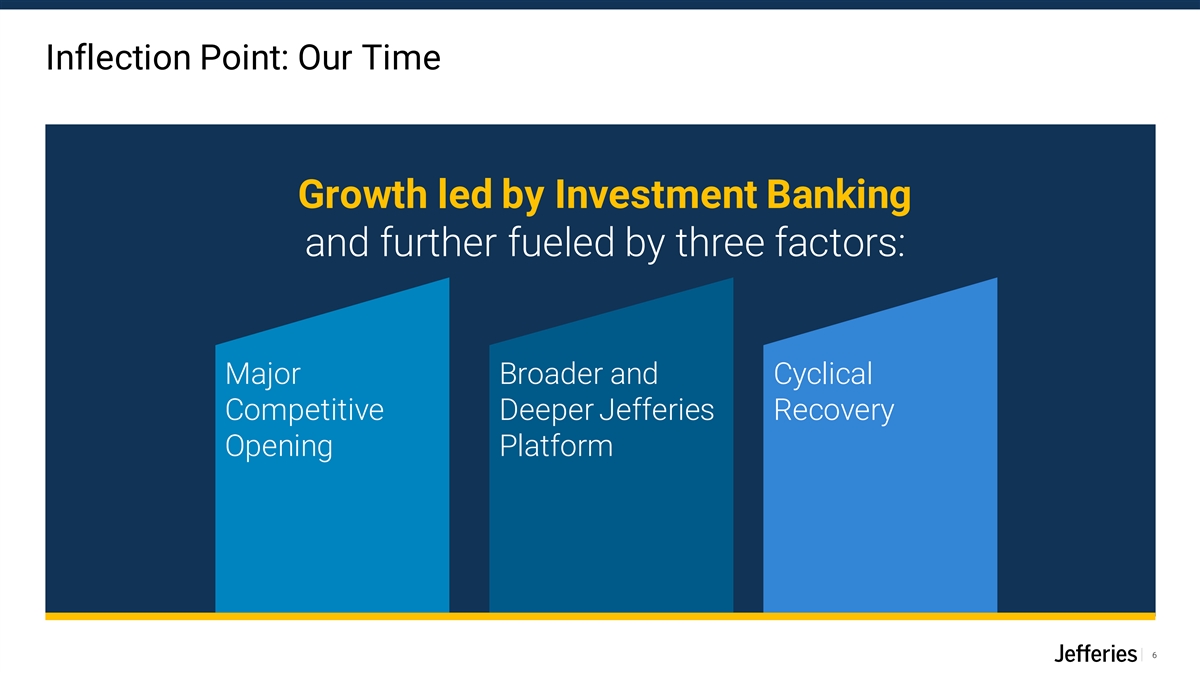
Inflection Point: Our Time Growth led by Investment Banking and further fueled by three factors: Major Broader and Cyclical Competitive Deeper Jefferies Recovery Opening Platform 6
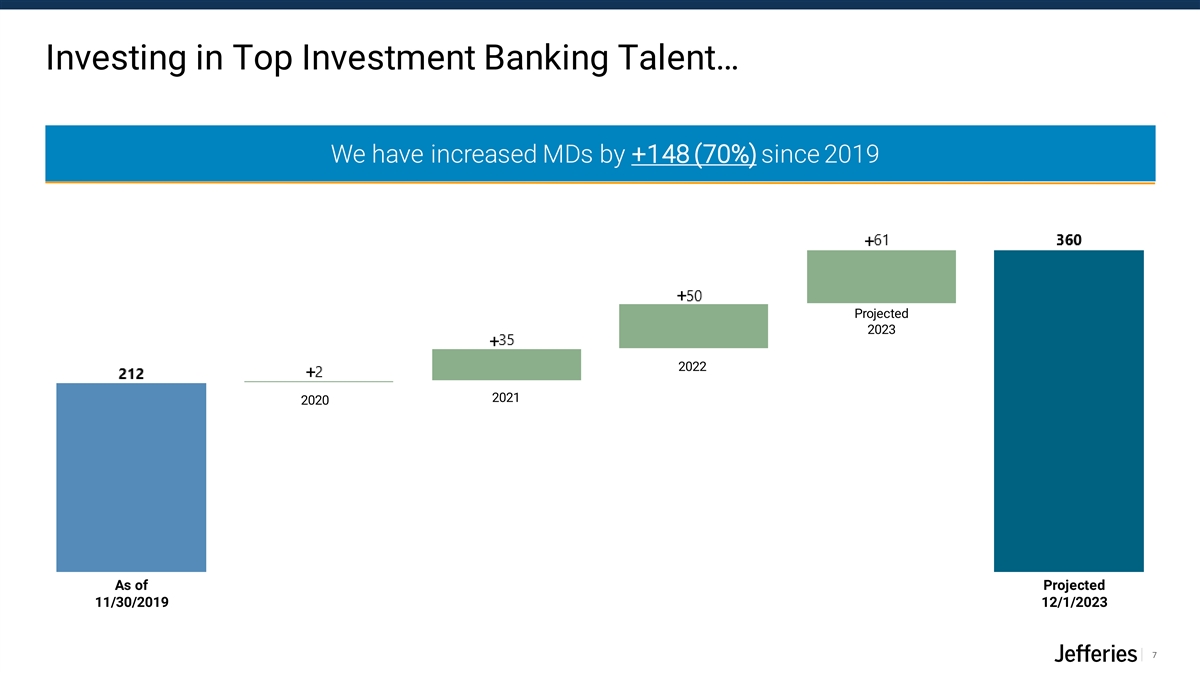
Investing in Top Investment Banking Talent… We have increased MDs by +148 (70%) since 2019 + + Projected 2023 + 2022 + 2021 2020 As of Projected 11/30/2019 12/1/2023 7
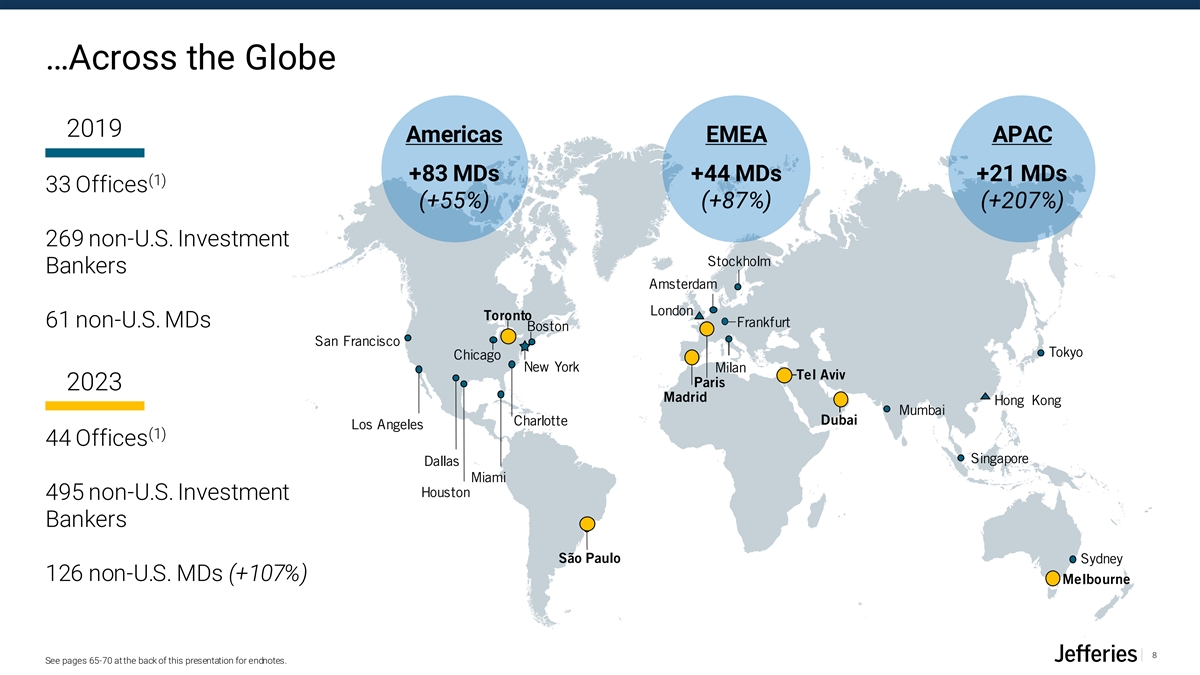
…Across the Globe 2019 Americas EMEA APAC +83 MDs +44 MDs +21 MDs (1) 33 Offices (+55%) (+87%) (+207%) 269 non-U.S. Investment Stockholm Bankers Amsterdam London Toronto 61 non-U.S. MDs Frankfurt Boston San Francisco Tokyo Chicago New York Milan Tel Aviv Paris 2023 Madrid Hong Kong Mumbai Dubai Charlotte Los Angeles (1) 44 Offices Singapore Dallas Miami Houston 495 non-U.S. Investment Bankers São Paulo Sydney 126 non-U.S. MDs (+107%) Melbourne 8 See pages 65-70 at the back of this presentation for endnotes.
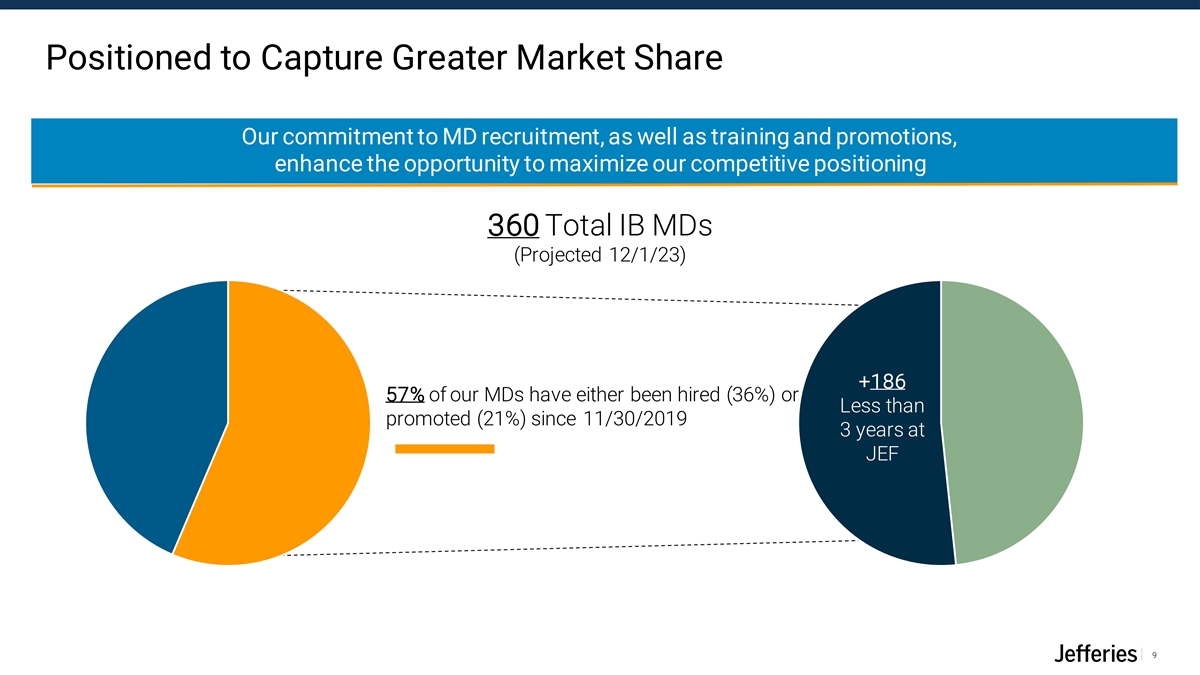
Positioned to Capture Greater Market Share Our commitment to MD recruitment, as well as training and promotions, enhance the opportunity to maximize our competitive positioning 360 Total IB MDs (Projected 12/1/23) +186 57% of our MDs have either been hired (36%) or Less than promoted (21%) since 11/30/2019 3 years at JEF 9
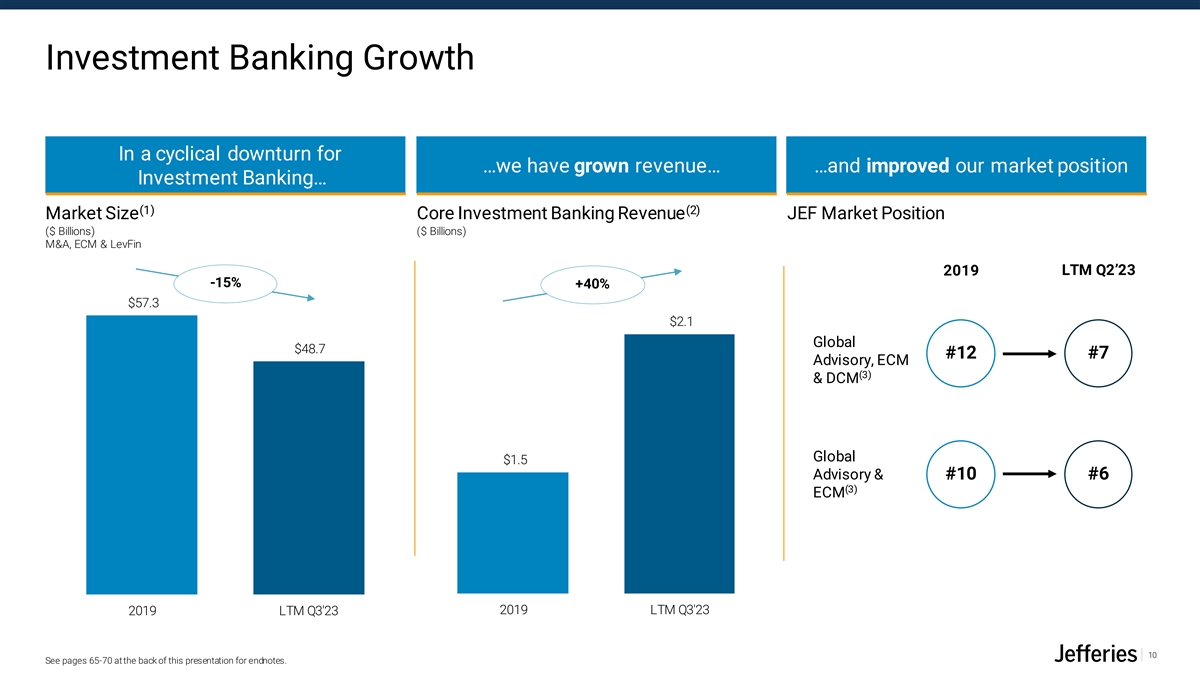
Investment Banking Growth In a cyclical downturn for …we have grown revenue… …and improved our market position Investment Banking… (1) (2) Market Size Core Investment Banking Revenue JEF Market Position ($ Billions) ($ Billions) M&A, ECM & LevFin LTM Q2’23 2019 -15% +40% $57.3 $2.1 Global $48.7 #12 #7 Advisory, ECM (3) & DCM Global $1.5 Advisory & #10 #6 (3) ECM 2019 LTM Q3'23 2019 LTM Q3'23 10 See pages 65-70 at the back of this presentation for endnotes.
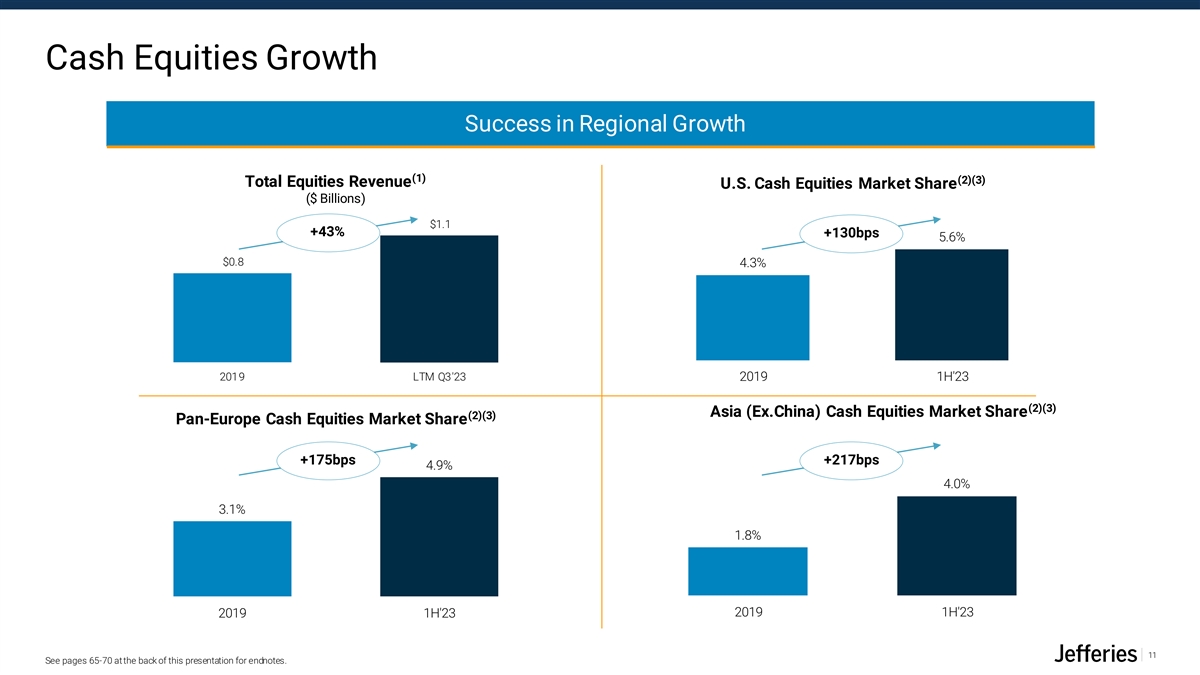
Cash Equities Growth Success in Regional Growth (1) (2)(3) Total Equities Revenue U.S. Cash Equities Market Share ($ Billions) $1.1 +43% +130bps 5.6% $0.8 4.3% 2019 LTM Q3'23 2019 1H'23 (2)(3) Asia (Ex.China) Cash Equities Market Share (2)(3) Pan-Europe Cash Equities Market Share +175bps +217bps 4.9% 4.0% 3.1% 1.8% 2019 1H'23 2019 1H'23 11 See pages 65-70 at the back of this presentation for endnotes.
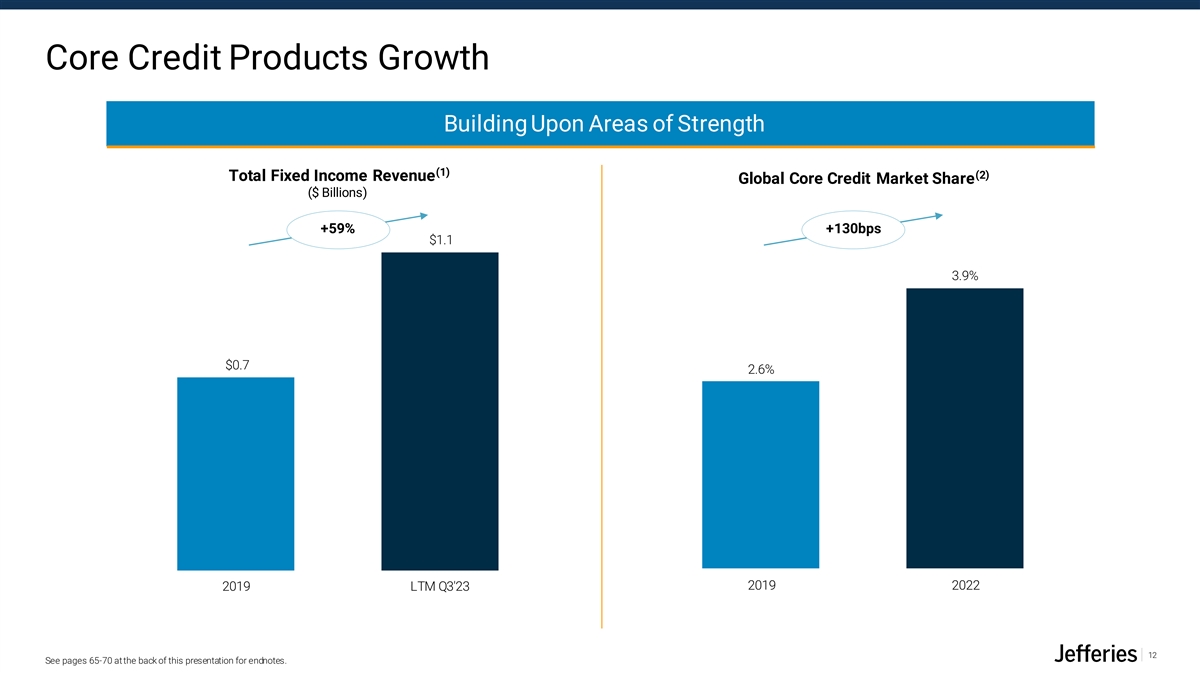
Core Credit Products Growth Building Upon Areas of Strength (1) (2) Total Fixed Income Revenue Global Core Credit Market Share ($ Billions) +59% +130bps $1.1 3.9% $0.7 2.6% 2019 2022 2019 LTM Q3'23 12 See pages 65-70 at the back of this presentation for endnotes.
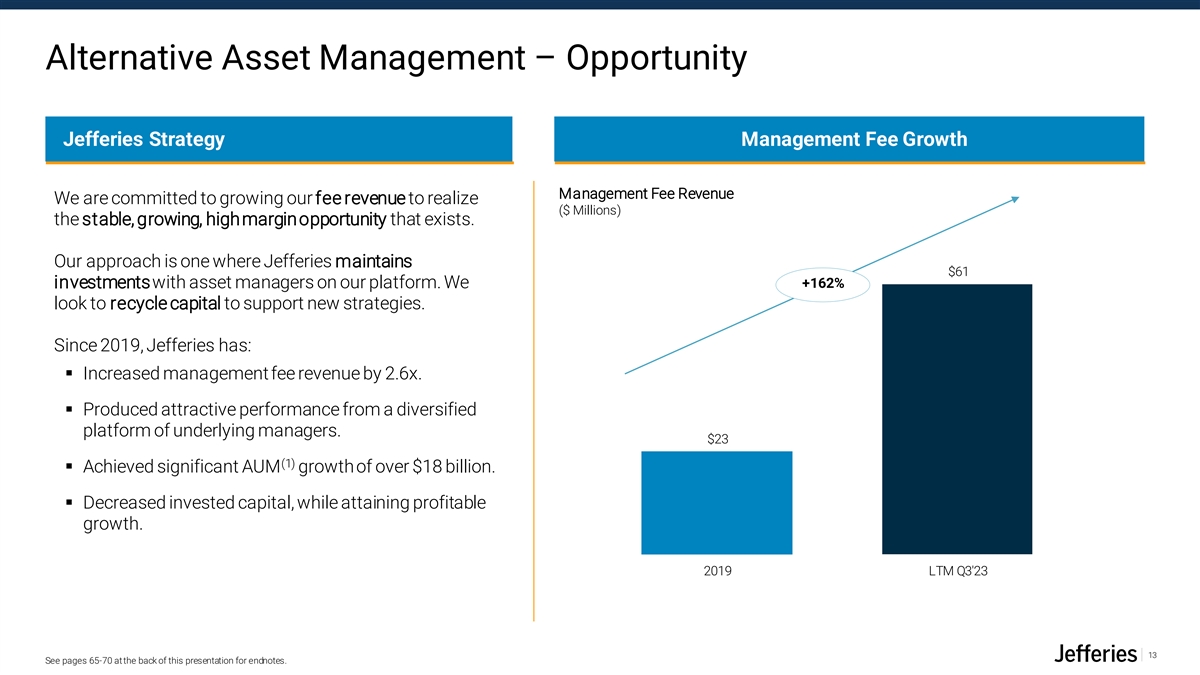
Alternative Asset Management – Opportunity Jefferies Strategy Management Fee Growth Management Fee Revenue We are committed to growing our fee revenue to realize ($ Millions) the stable, growing, high margin opportunity that exists. Our approach is one where Jefferies maintains $61 +162% investments with asset managers on our platform. We look to recycle capital to support new strategies. Since 2019, Jefferies has: ▪ Increased management fee revenue by 2.6x. ▪ Produced attractive performance from a diversified platform of underlying managers. $23 (1) ▪ Achieved significant AUM growth of over $18 billion. ▪ Decreased invested capital, while attaining profitable growth. 2019 LTM Q3'23 13 See pages 65-70 at the back of this presentation for endnotes.
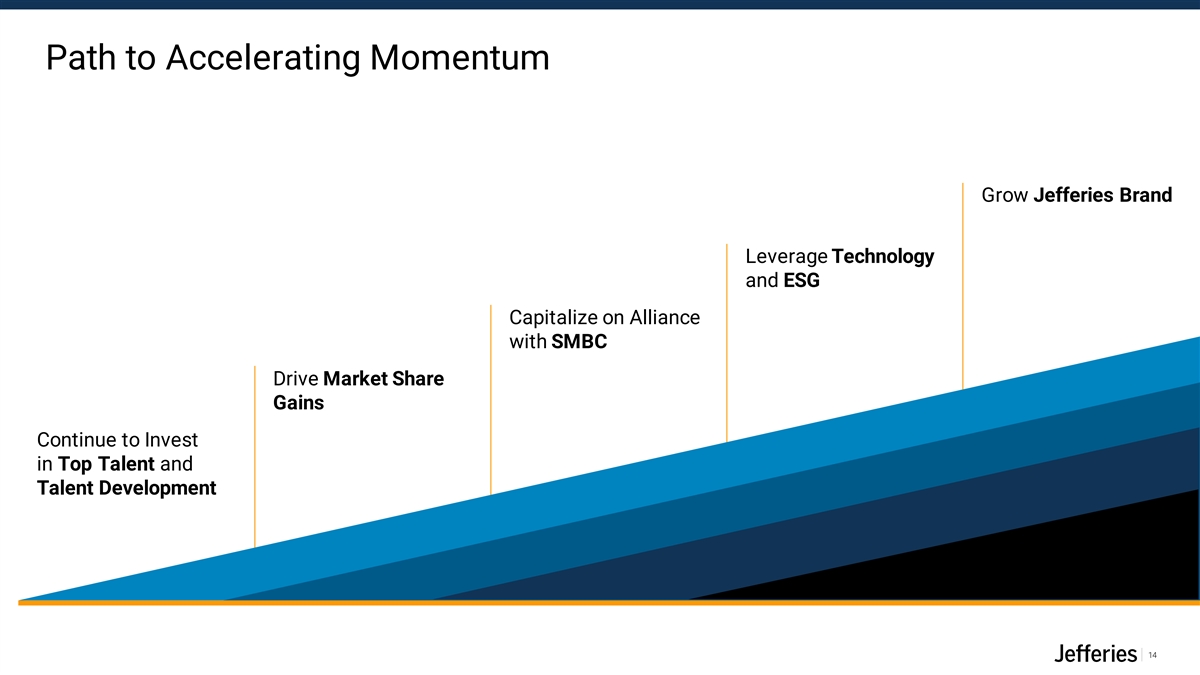
Path to Accelerating Momentum Grow Jefferies Brand Leverage Technology and ESG Capitalize on Alliance with SMBC Drive Market Share Gains Continue to Invest in Top Talent and Talent Development 14
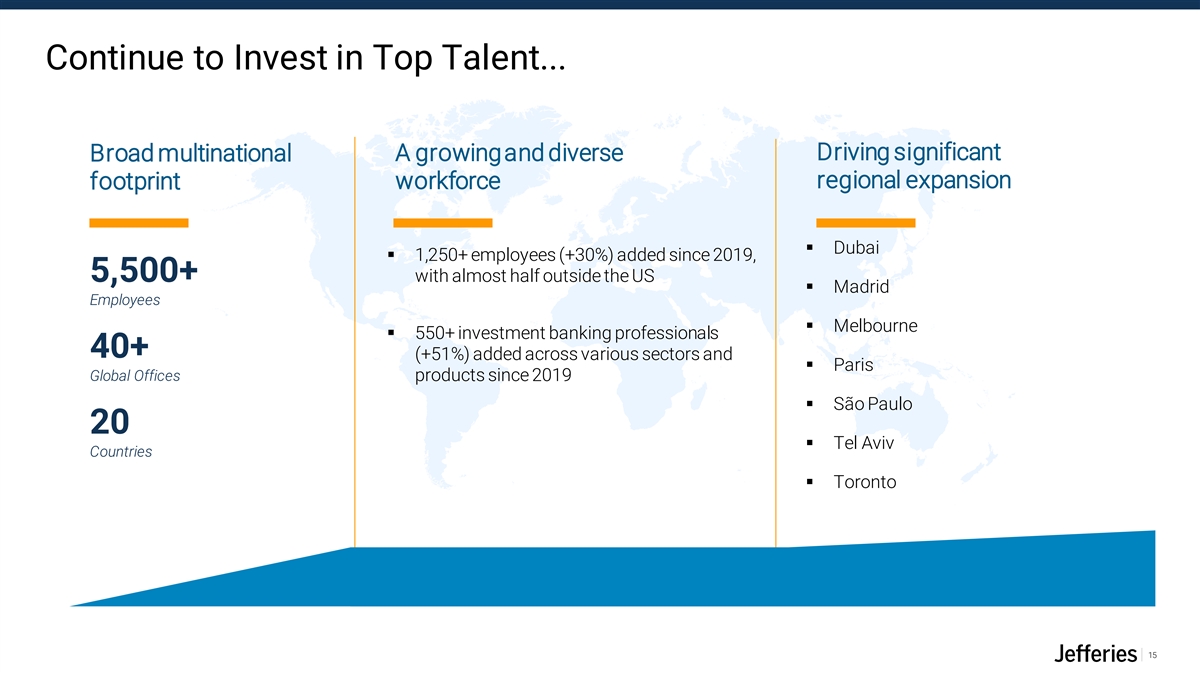
Continue to Invest in Top Talent... Driving significant Broad multinational A growing and diverse workforce regional expansion footprint ▪ Dubai ▪ 1,250+ employees (+30%) added since 2019, 5,500+ with almost half outside the US ▪ Madrid Employees ▪ Melbourne ▪ 550+ investment banking professionals 40+ (+51%) added across various sectors and ▪ Paris Global Offices products since 2019 ▪ São Paulo 20 ▪ Tel Aviv Countries ▪ Toronto 15
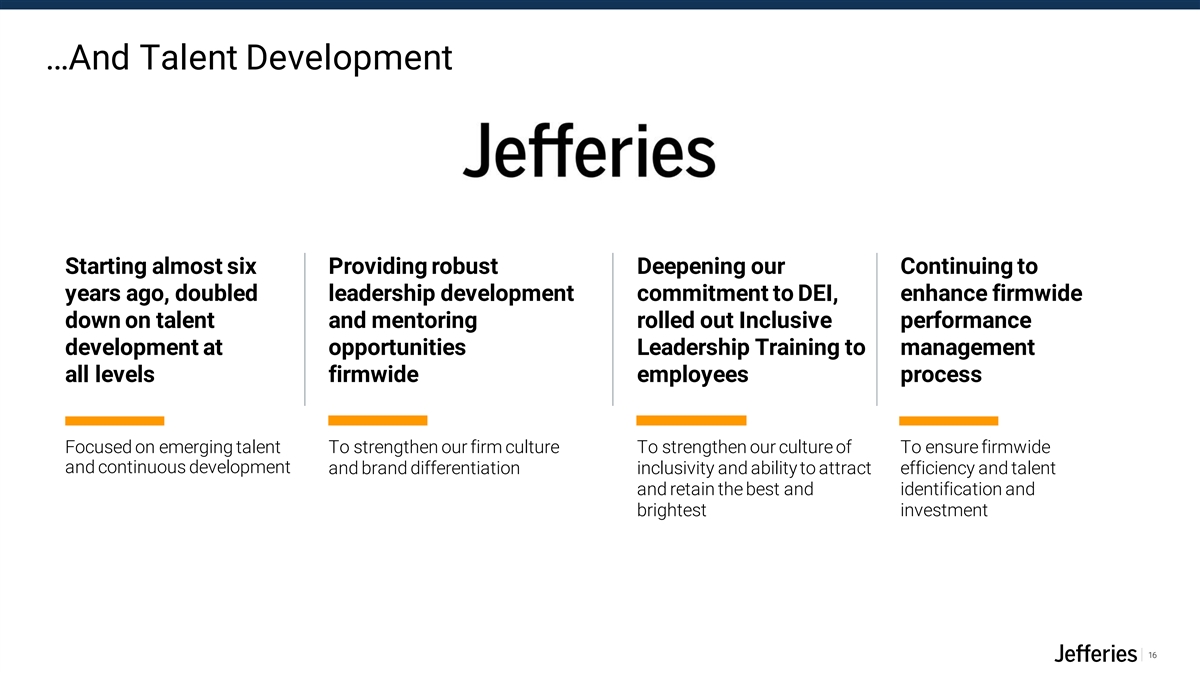
…And Talent Development Starting almost six Providing robust Deepening our Continuing to years ago, doubled leadership development commitment to DEI, enhance firmwide down on talent and mentoring rolled out Inclusive performance development at opportunities Leadership Training to management all levels firmwide employees process Focused on emerging talent To strengthen our firm culture To strengthen our culture of To ensure firmwide and continuous development and brand differentiation inclusivity and ability to attract efficiency and talent and retain the best and identification and brightest investment 16
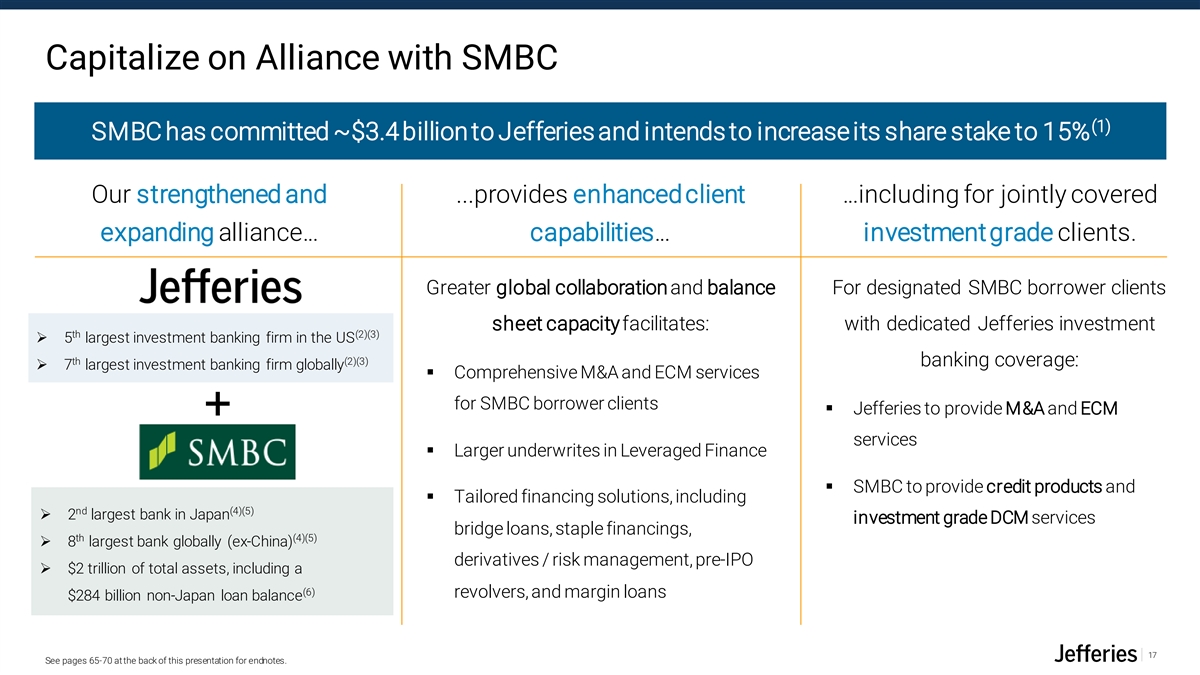
Capitalize on Alliance with SMBC (1) SMBC has committed ~$3.4 billion to Jefferies and intends to increase its share stake to 15% Our strengthened and ...provides enhancedclient …including for jointly covered expanding alliance… capabilities… investment grade clients. Greater global collaboration and balance For designated SMBC borrower clients sheet capacityfacilitates: with dedicated Jefferies investment th (2)(3) ➢ 5 largest investment banking firm in the US th (2)(3) banking coverage: ➢ 7 largest investment banking firm globally ▪ Comprehensive M&A and ECM services for SMBC borrower clients ▪ Jefferies to provide M&A and ECM + services ▪ Larger underwrites in Leveraged Finance ▪ SMBC to provide credit products and ▪ Tailored financing solutions, including nd (4)(5) ➢ 2 largest bank in Japan investment grade DCM services bridge loans, staple financings, th (4)(5) ➢ 8 largest bank globally (ex-China) derivatives / risk management, pre-IPO ➢ $2 trillion of total assets, including a (6) revolvers, and margin loans $284 billion non-Japan loan balance 17 See pages 65-70 at the back of this presentation for endnotes.
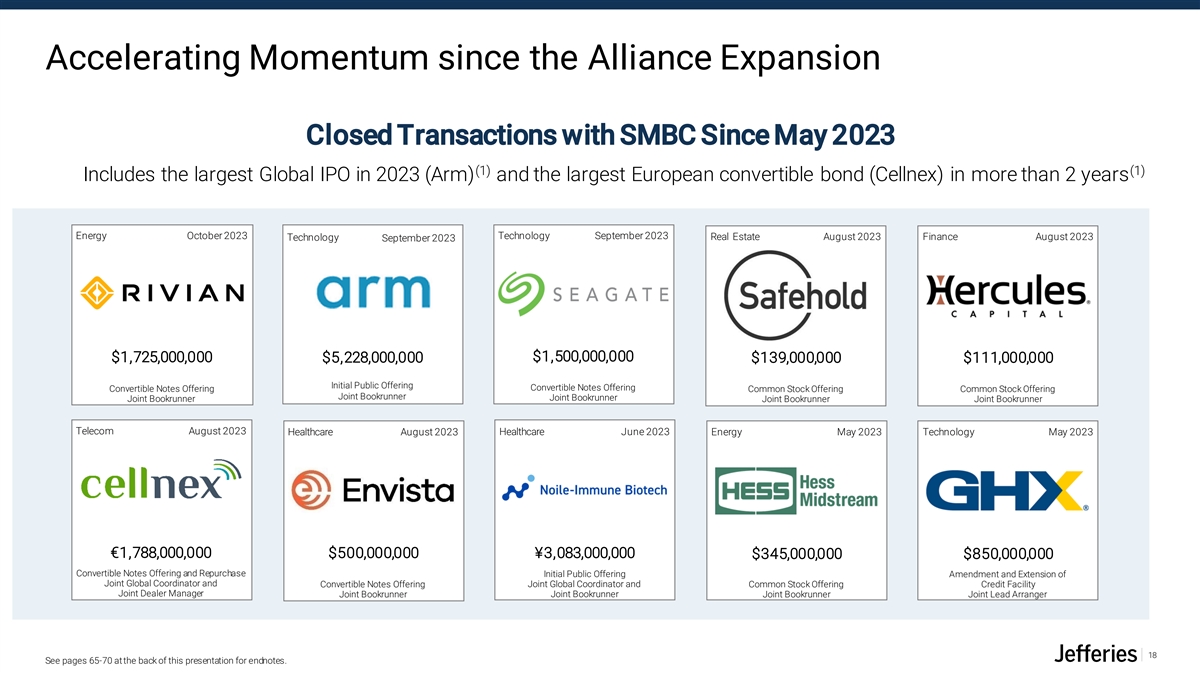
Accelerating Momentum since the Alliance Expansion Closed Transactions with SMBC Since May 2023 (1) (1) Includes the largest Global IPO in 2023 (Arm) and the largest European convertible bond (Cellnex) in more than 2 years Energy October 2023 Technology September 2023 Real Estate August 2023 Finance August 2023 Technology September 2023 $1,500,000,000 $1,725,000,000 $5,228,000,000 $139,000,000 $111,000,000 Initial Public Offering Convertible Notes Offering Convertible Notes Offering Common Stock Offering Common Stock Offering Joint Bookrunner Joint Bookrunner Joint Bookrunner Joint Bookrunner Joint Bookrunner Telecom August 2023 Healthcare August 2023 Healthcare June 2023 Energy May 2023 Technology May 2023 €1,788,000,000 $500,000,000 ¥3,083,000,000 $345,000,000 $850,000,000 Convertible Notes Offering and Repurchase Initial Public Offering Amendment and Extension of Joint Global Coordinator and Convertible Notes Offering Joint Global Coordinator and Common Stock Offering Credit Facility Joint Dealer Manager Joint Bookrunner Joint Bookrunner Joint Bookrunner Joint Lead Arranger 18 See pages 65-70 at the back of this presentation for endnotes.
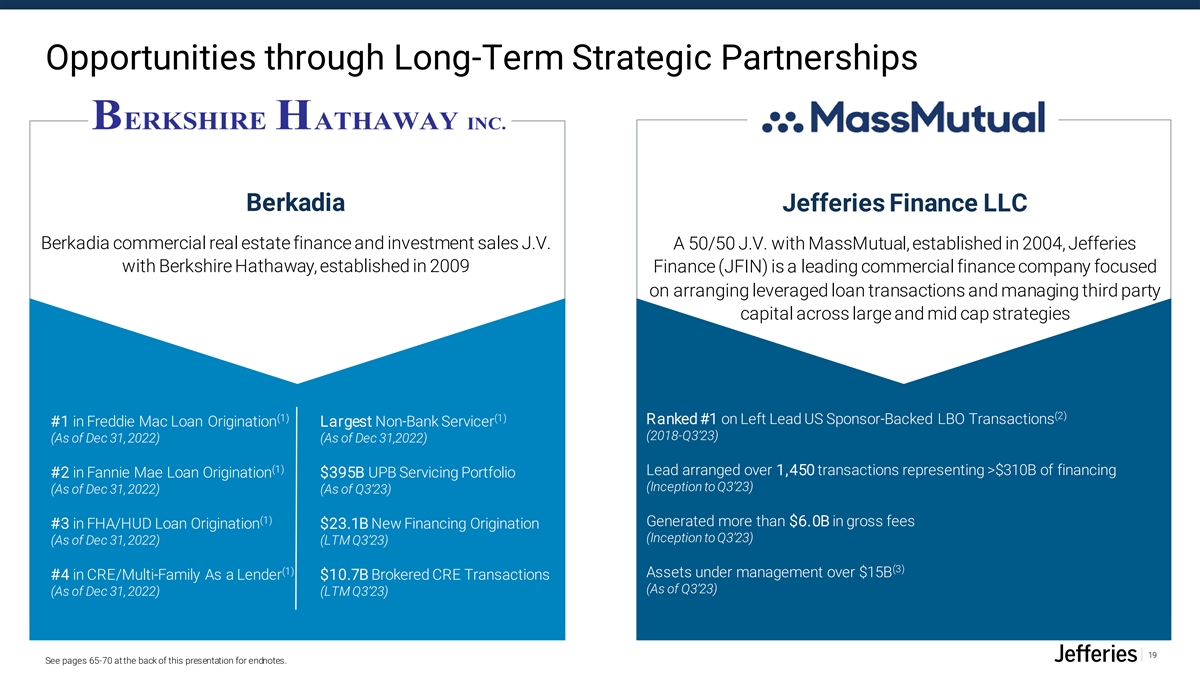
Opportunities through Long-Term Strategic Partnerships Berkadia Jefferies Finance LLC Berkadia commercial real estate finance and investment sales J.V. A 50/50 J.V. with MassMutual, established in 2004, Jefferies with Berkshire Hathaway, established in 2009 Finance (JFIN) is a leading commercial finance company focused on arranging leveraged loan transactions and managing third party capital across large and mid cap strategies (2) (1) (1) Ranked #1 on Left Lead US Sponsor-Backed LBO Transactions #1 in Freddie Mac Loan Origination Largest Non-Bank Servicer (2018-Q3’23) (As of Dec 31, 2022) (As of Dec 31,2022) (1) Lead arranged over 1,450 transactions representing >$310B of financing #2 in Fannie Mae Loan Origination $395B UPB Servicing Portfolio (Inception to Q3’23) (As of Dec 31, 2022) (As of Q3’23) (1) Generated more than $6.0B in gross fees #3 in FHA/HUD Loan Origination $23.1B New Financing Origination (Inception to Q3’23) (As of Dec 31, 2022) (LTM Q3’23) (3) (1) Assets under management over $15B #4 in CRE/Multi-Family As a Lender $10.7B Brokered CRE Transactions (As of Q3’23) (As of Dec 31, 2022) (LTM Q3’23) 19 See pages 65-70 at the back of this presentation for endnotes.
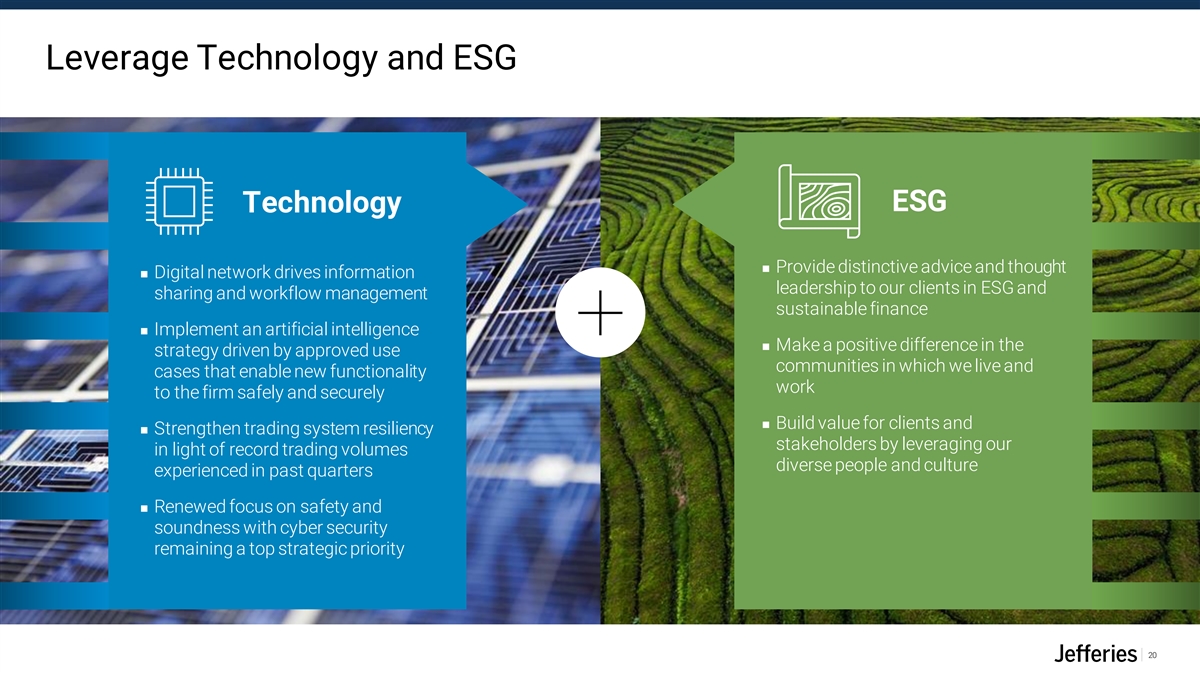
Leverage Technology and ESG ESG Technology ◼ Provide distinctive advice and thought ◼ Digital network drives information leadership to our clients in ESG and sharing and workflow management sustainable finance ◼ Implement an artificial intelligence ◼ Make a positive difference in the strategy driven by approved use communities in which we live and cases that enable new functionality work to the firm safely and securely ◼ Build value for clients and ◼ Strengthen trading system resiliency stakeholders by leveraging our in light of record trading volumes diverse people and culture experienced in past quarters ◼ Renewed focus on safety and soundness with cyber security remaining a top strategic priority 20
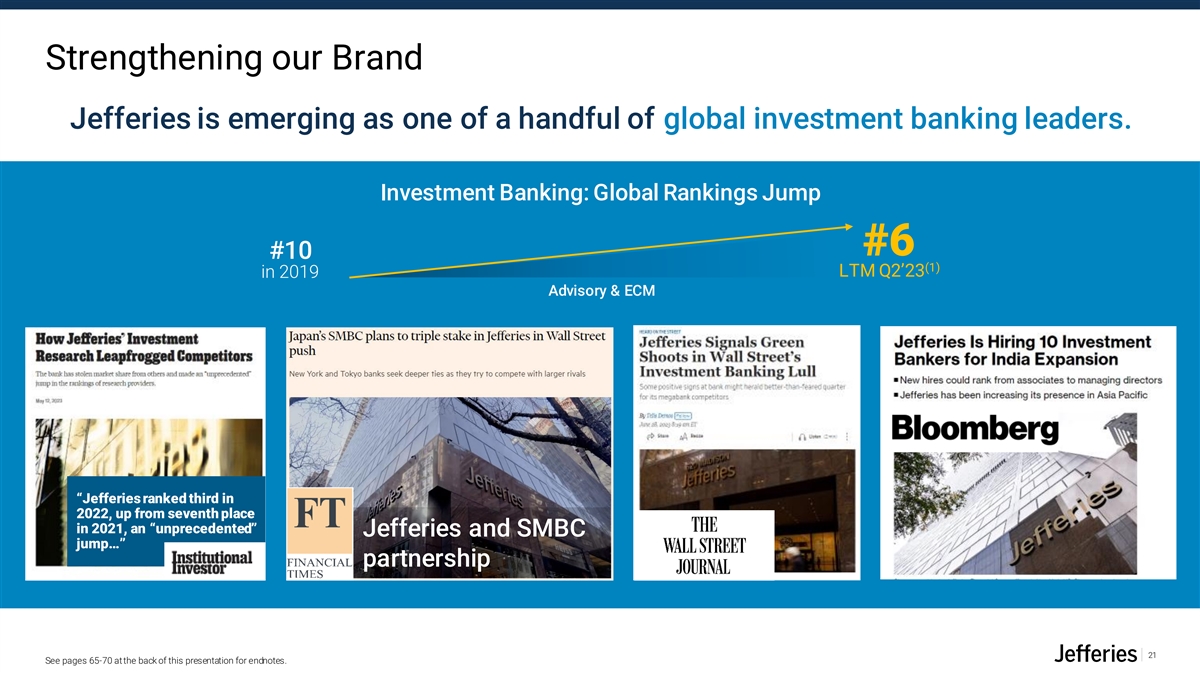
Strengthening our Brand Jefferies is emerging as one of a handful of global investment banking leaders. Investment Banking: Global Rankings Jump #6 #10 (1) LTM Q2’23 in 2019 Advisory & ECM “Jefferies ranked third in 2022, up from seventh place in 2021, an “unprecedented” Jefferies and SMBC jump…” partnership 21 See pages 65-70 at the back of this presentation for endnotes.

Our Process We spoke to more than 500 clients, prospects, intermediaries and internal stakeholders to understand the essence of our brand. 22
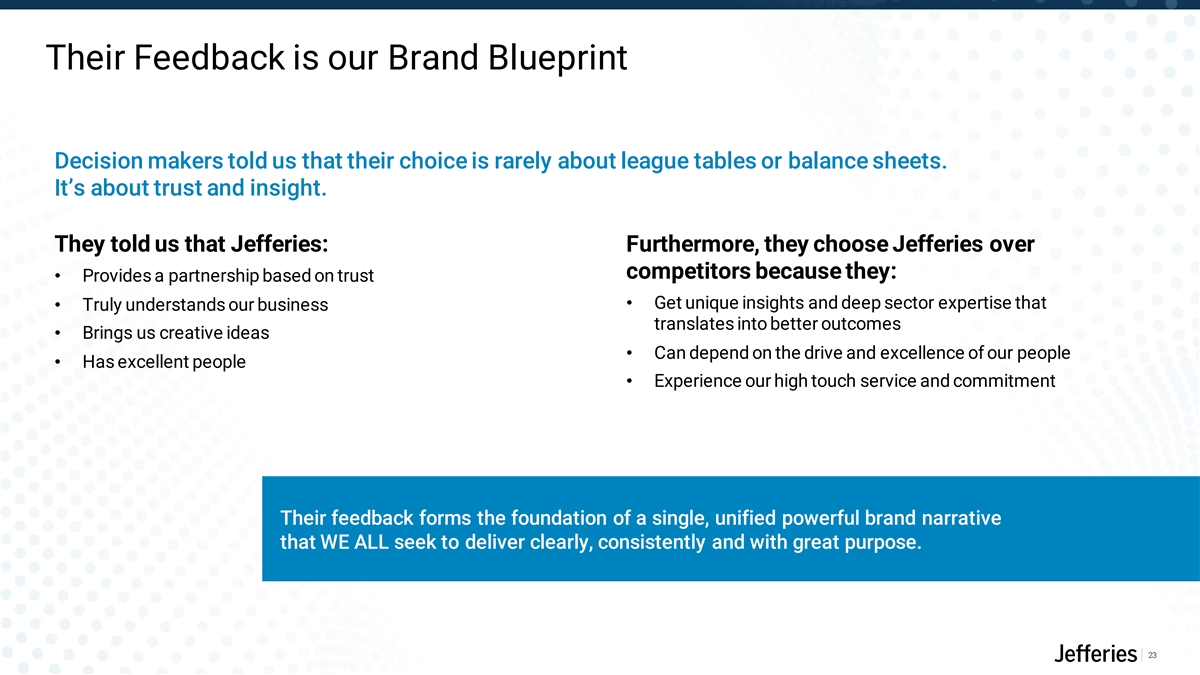
Their Feedback is our Brand Blueprint Decision makers told us that their choice is rarely about league tables or balance sheets. It’s about trust and insight. They told us that Jefferies: Furthermore, they choose Jefferies over competitors because they: • Provides a partnership based on trust • Get unique insights and deep sector expertise that • Truly understands our business translates into better outcomes • Brings us creative ideas • Can depend on the drive and excellence of our people • Has excellent people • Experience our high touch service and commitment Their feedback forms the foundation of a single, unified powerful brand narrative that WE ALL seek to deliver clearly, consistently and with great purpose. 23
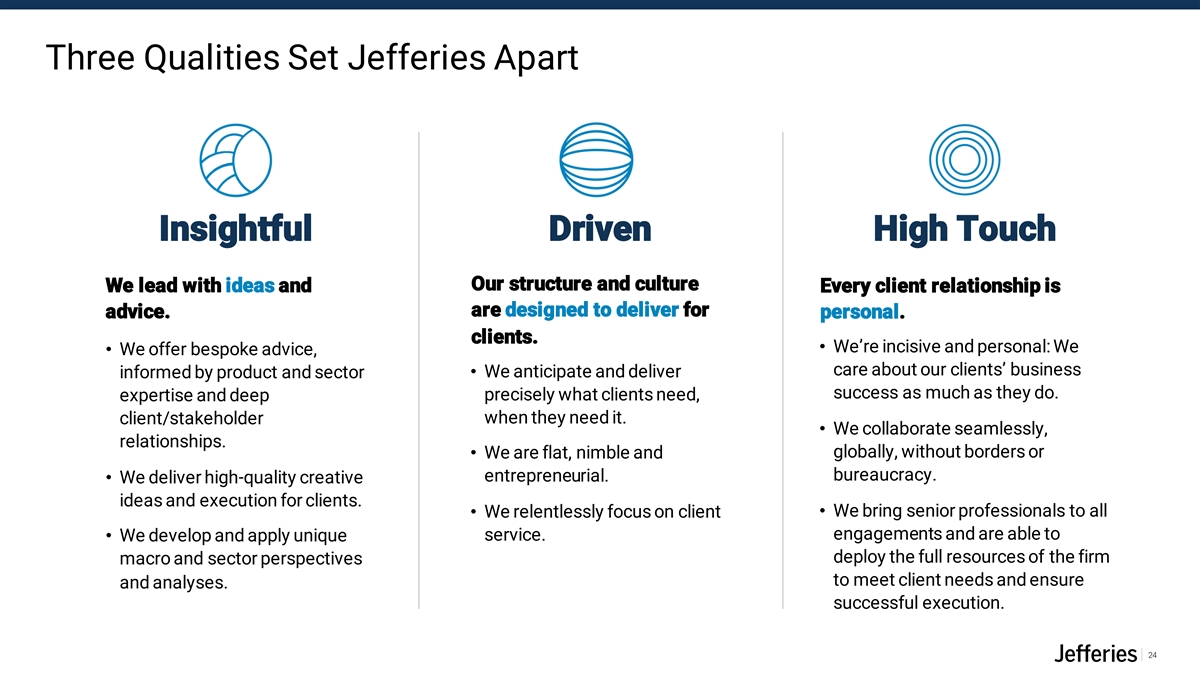
Three Qualities Set Jefferies Apart Insightful Driven High Touch Our structure and culture We lead with ideas and Every client relationship is are designed to deliver for advice. personal. clients. • We’re incisive and personal: We • We offer bespoke advice, care about our clients’ business • We anticipate and deliver informed by product and sector success as much as they do. expertise and deep precisely what clients need, when they need it. client/stakeholder • We collaborate seamlessly, relationships. globally, without borders or • We are flat, nimble and entrepreneurial. bureaucracy. • We deliver high-quality creative ideas and execution for clients. • We bring senior professionals to all • We relentlessly focus on client engagements and are able to • We develop and apply unique service. deploy the full resources of the firm macro and sector perspectives to meet client needs and ensure and analyses. successful execution. 24
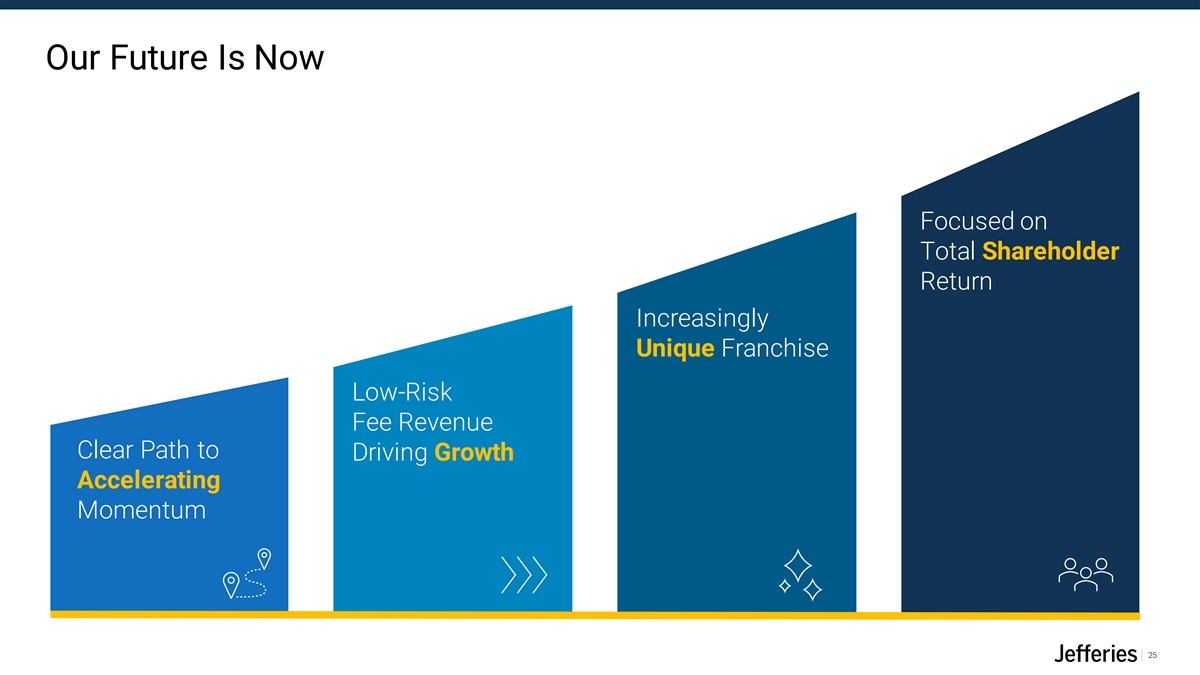
Our Future Is Now Focused on Total Shareholder Return Increasingly Unique Franchise Low-Risk Fee Revenue Clear Path to Driving Growth Accelerating Momentum 25

Financial Review Matt Larson, CFO
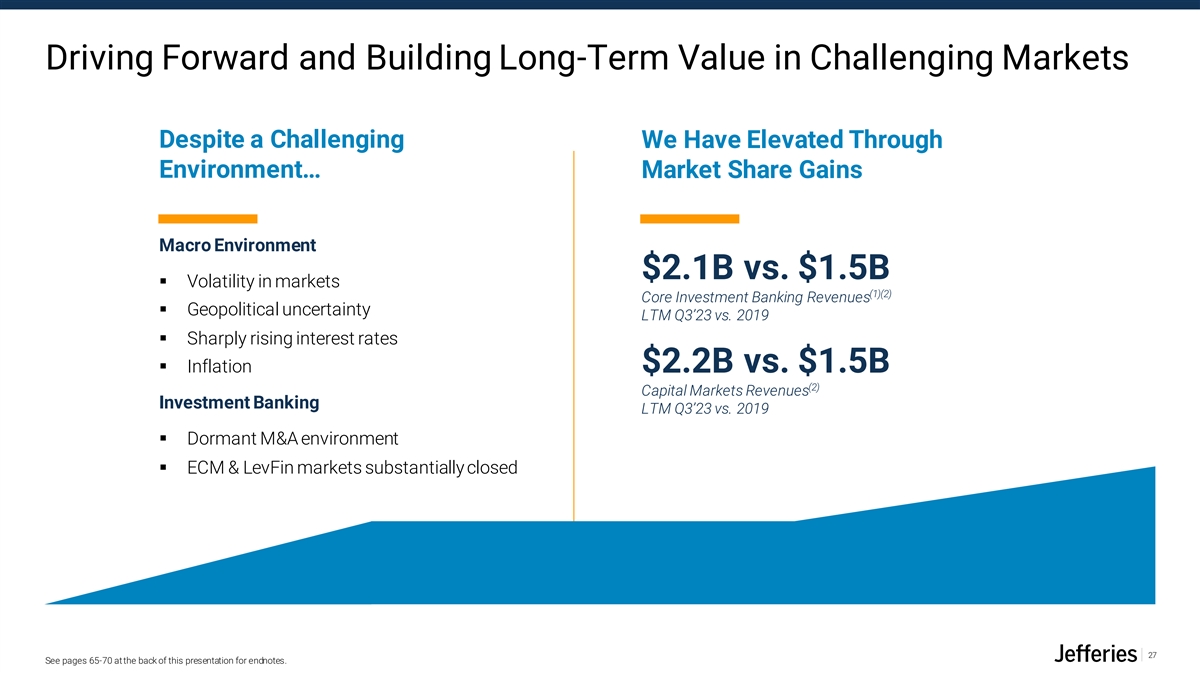
Driving Forward and Building Long-Term Value in Challenging Markets Despite a Challenging We Have Elevated Through Environment… Market Share Gains Macro Environment $2.1B vs. $1.5B ▪ Volatility in markets (1)(2) Core Investment Banking Revenues ▪ Geopolitical uncertainty LTM Q3’23 vs. 2019 ▪ Sharply rising interest rates ▪ Inflation $2.2B vs. $1.5B (2) Capital Markets Revenues Investment Banking LTM Q3’23 vs. 2019 ▪ Dormant M&A environment ▪ ECM & LevFin markets substantially closed 27 See pages 65-70 at the back of this presentation for endnotes.
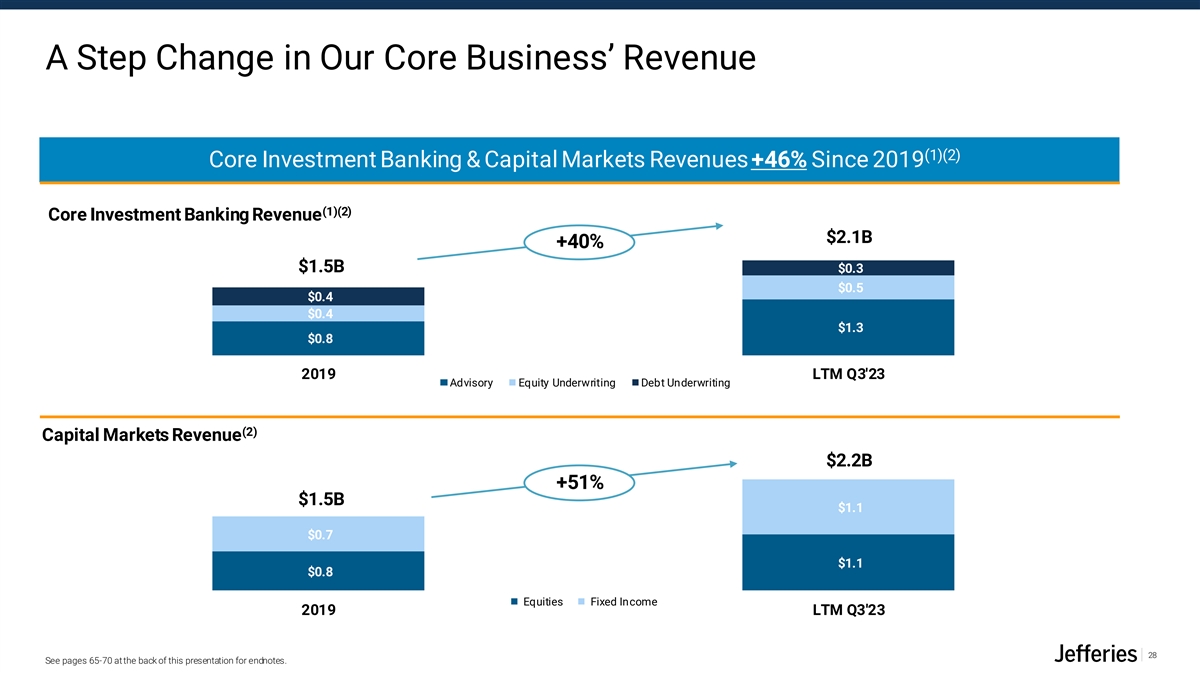
A Step Change in Our Core Business’ Revenue (1)(2) Core Investment Banking & Capital Markets Revenues +46% Since 2019 (1)(2) Core Investment Banking Revenue $2.1B +40% $1.5B $0.3 $0.5 $0.4 $0.4 $1.3 $0.8 2019 LTM Q3'23 Advisory Equity Underwriting Debt Underwriting (2) Capital Markets Revenue $2.2B +51% $1.5B $1.1 $0.7 $1.1 $0.8 Equities Fixed Income 2019 LTM Q3'23 28 See pages 65-70 at the back of this presentation for endnotes.
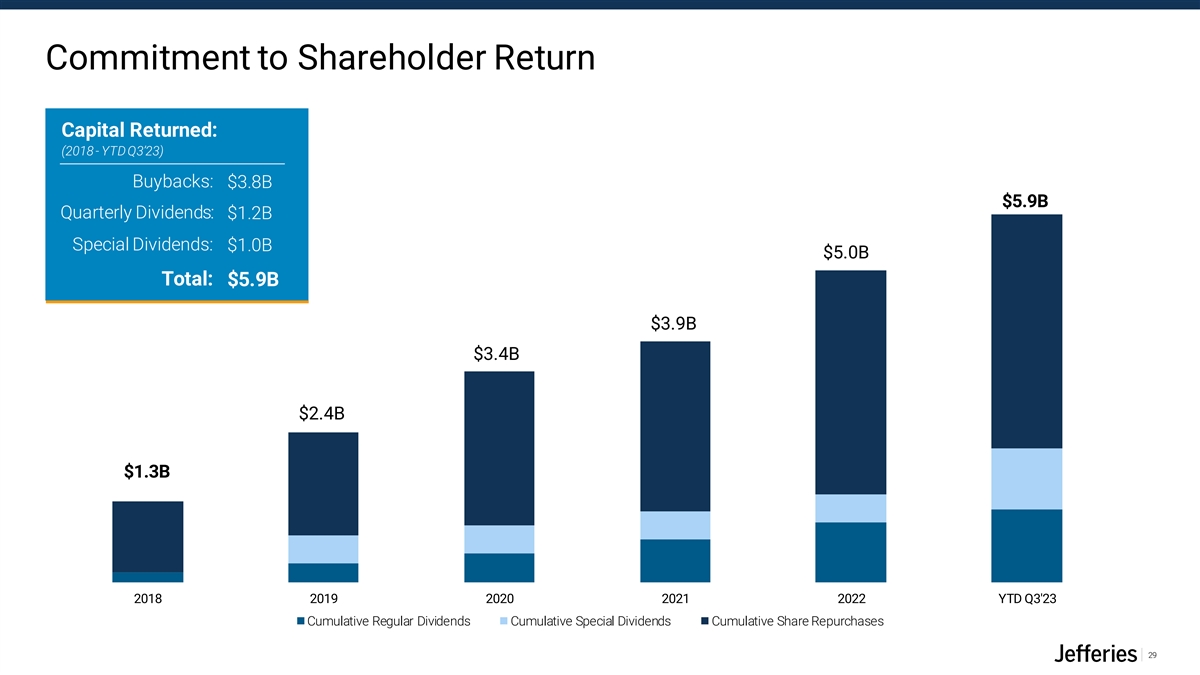
Commitment to Shareholder Return Capital Returned: (2018 - YTD Q3’23) Buybacks: $3.8B $5.9B Quarterly Dividends: $1.2B Special Dividends: $1.0B $5.0B Total: $5.9B $3.9B $3.4B $2.4B $1.3B 2018 2019 2020 2021 2022 YTD Q3'23 Cumulative Regular Dividends Cumulative Special Dividends Cumulative Share Repurchases 29
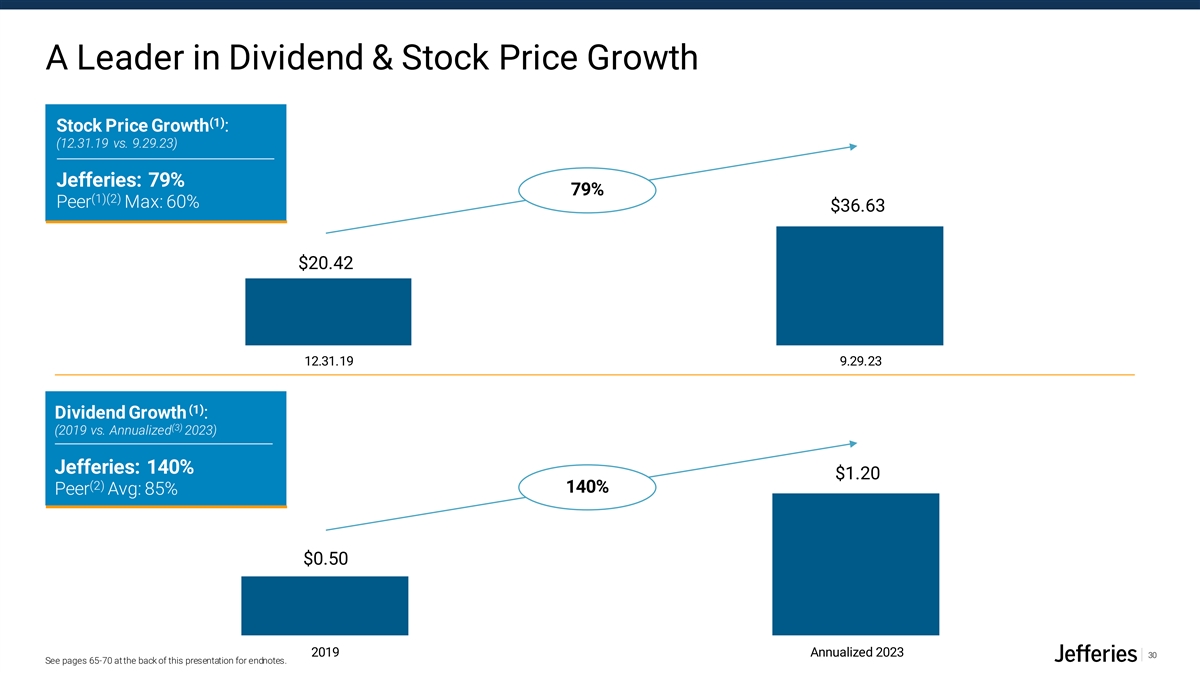
A Leader in Dividend & Stock Price Growth (1) Stock Price Growth : (12.31.19 vs. 9.29.23) Jefferies: 79% 79% (1)(2) Peer Max: 60% $36.63 $20.42 12.31.19 9.29.23 (1) Dividend Growth : (3) (2019 vs. Annualized 2023) Jefferies: 140% $1.20 (2) 140% Peer Avg: 85% $0.50 2019 Annualized 2023 30 See pages 65-70 at the back of this presentation for endnotes.
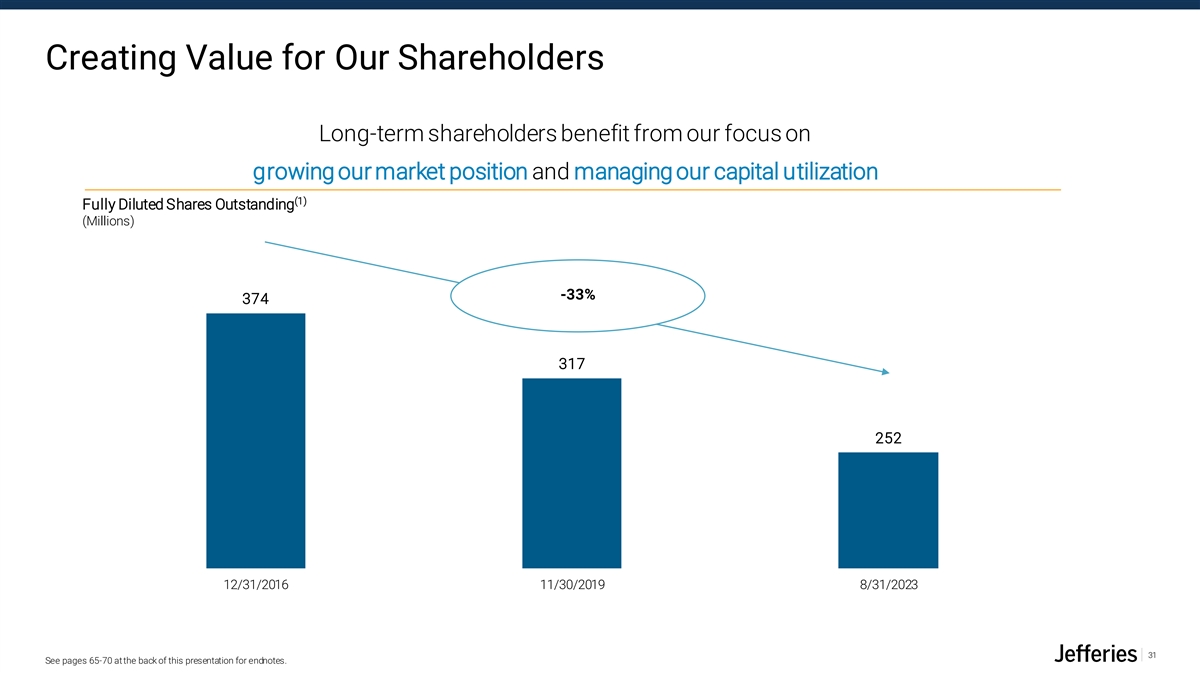
Creating Value for Our Shareholders Long-term shareholders benefit from our focus on growing our market position and managing our capital utilization (1) Fully Diluted Shares Outstanding (Millions) -33% 374 317 252 12/31/2016 11/30/2019 8/31/2023 31 See pages 65-70 at the back of this presentation for endnotes.
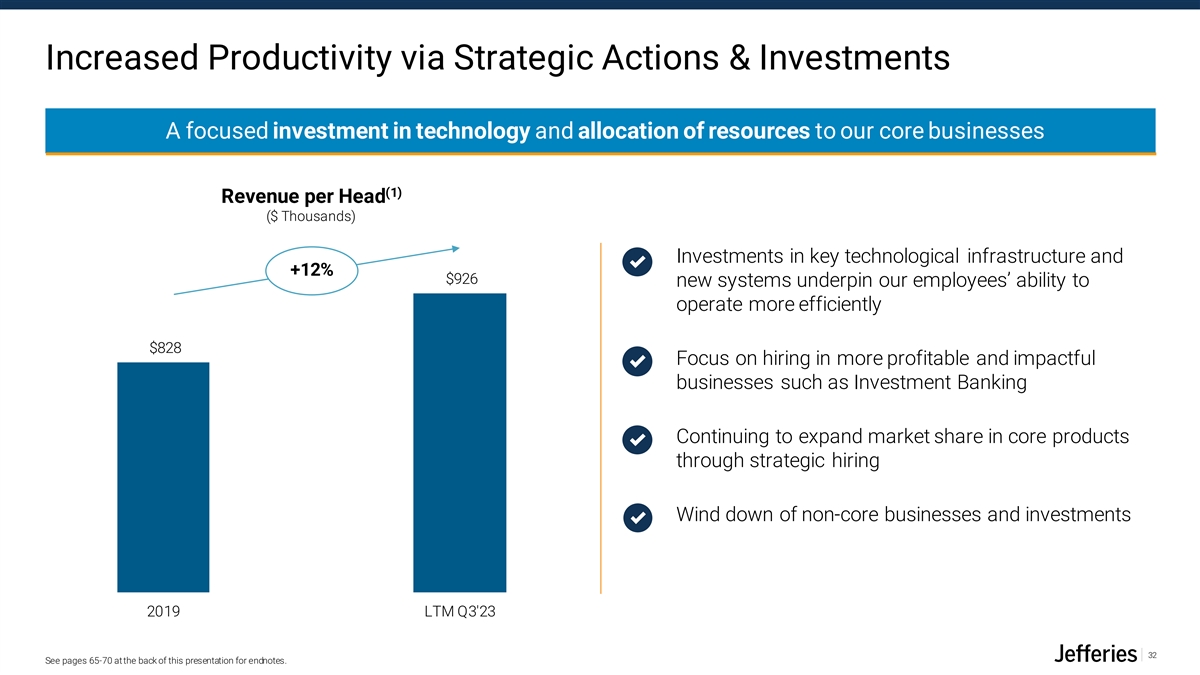
Increased Productivity via Strategic Actions & Investments A focused investment in technology and allocation of resources to our core businesses (1) Revenue per Head ($ Thousands) Investments in key technological infrastructure and +12% $926 new systems underpin our employees’ ability to operate more efficiently $828 Focus on hiring in more profitable and impactful businesses such as Investment Banking Continuing to expand market share in core products through strategic hiring Wind down of non-core businesses and investments 2019 LTM Q3'23 32 See pages 65-70 at the back of this presentation for endnotes.
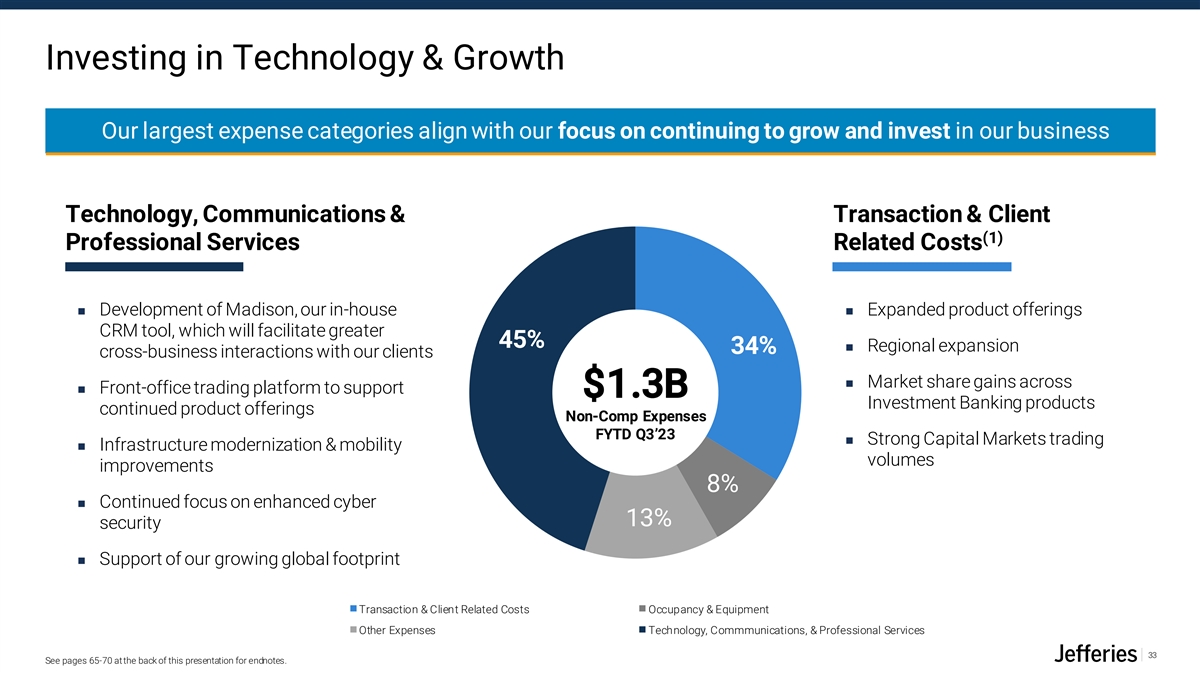
Investing in Technology & Growth Our largest expense categories align with our focus on continuing to grow and invest in our business Technology, Communications & Transaction & Client (1) Professional Services Related Costs ◼ Development of Madison, our in-house ◼ Expanded product offerings CRM tool, which will facilitate greater 45% ◼ Regional expansion 34% cross-business interactions with our clients ◼ Market share gains across ◼ Front-office trading platform to support $1.3B Investment Banking products continued product offerings Non-Comp Expenses FYTD Q3’23 ◼ Strong Capital Markets trading ◼ Infrastructure modernization & mobility volumes improvements 8% ◼ Continued focus on enhanced cyber 13% security ◼ Support of our growing global footprint Transaction & Client Related Costs Occupancy & Equipment Other Expenses Technology, Commmunications, & Professional Services 33 See pages 65-70 at the back of this presentation for endnotes.
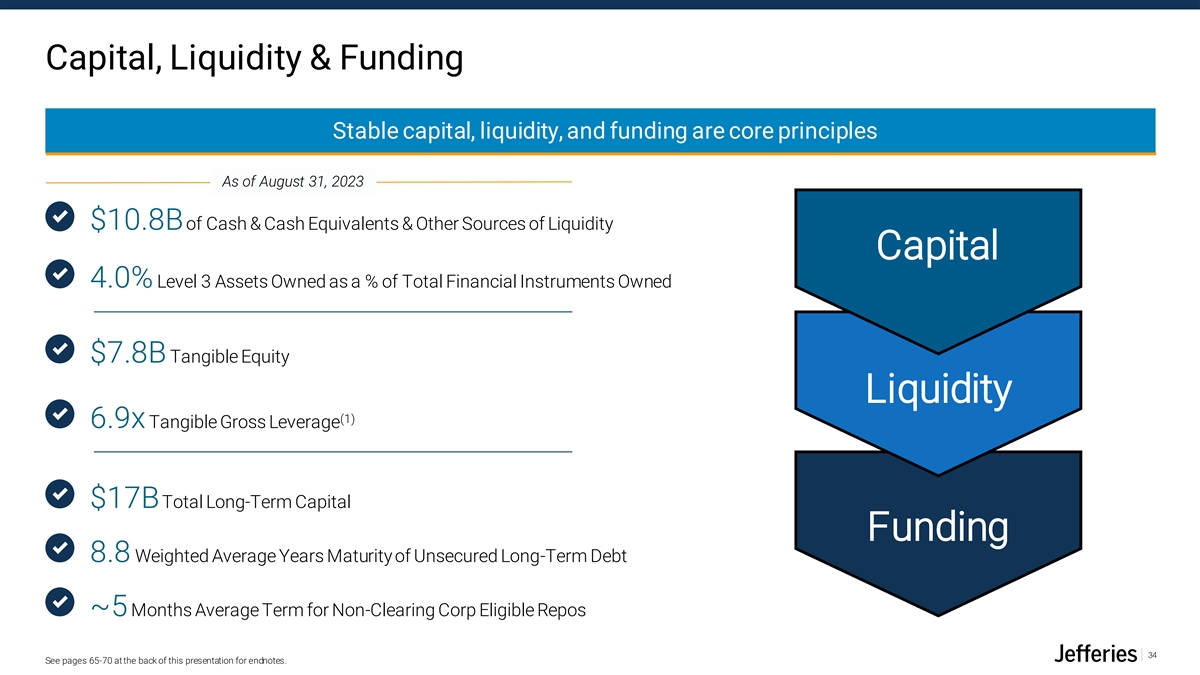
Capital, Liquidity & Funding Stable capital, liquidity, and funding are core principles As of August 31, 2023 $10.8B of Cash & Cash Equivalents & Other Sources of Liquidity Capital 4.0% Level 3 Assets Owned as a % of Total Financial Instruments Owned $7.8B Tangible Equity Liquidity (1) 6.9x Tangible Gross Leverage $17B Total Long-Term Capital Funding 8.8 Weighted Average Years Maturity of Unsecured Long-Term Debt ~5 Months Average Term for Non-Clearing Corp Eligible Repos 34 See pages 65-70 at the back of this presentation for endnotes.

Investment Banking Andrea Lee, Co-Head of Global Investment Banking Raphael Bejarano, Co-Head of Global Investment Banking Alejandro Przygoda, Co-Head of Global Investment Banking
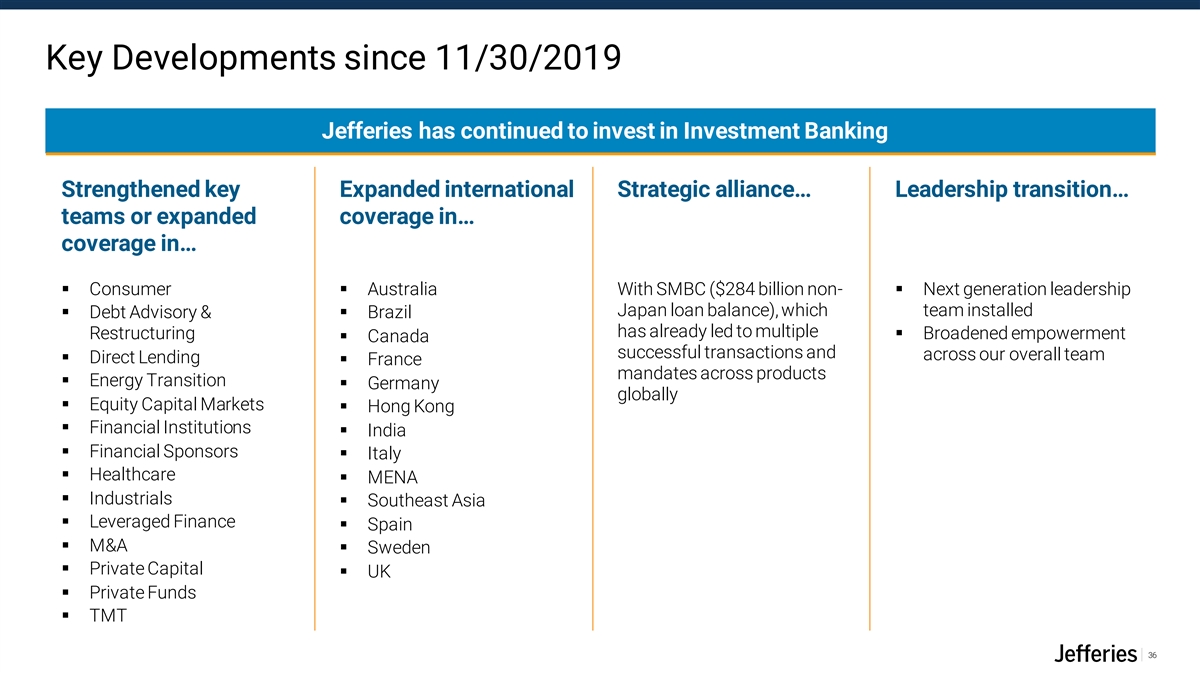
Key Developments since 11/30/2019 Jefferies has continued to invest in Investment Banking Strengthened key Expanded international Strategic alliance… Leadership transition… teams or expanded coverage in… coverage in… ▪ Consumer ▪ Australia With SMBC ($284 billion non-▪ Next generation leadership Japan loan balance), which team installed ▪ Debt Advisory & ▪ Brazil has already led to multiple Restructuring▪ Broadened empowerment ▪ Canada successful transactions and across our overall team ▪ Direct Lending ▪ France mandates across products ▪ Energy Transition ▪ Germany globally ▪ Equity Capital Markets ▪ Hong Kong ▪ Financial Institutions ▪ India ▪ Financial Sponsors ▪ Italy ▪ Healthcare ▪ MENA ▪ Industrials ▪ Southeast Asia ▪ Leveraged Finance ▪ Spain ▪ M&A ▪ Sweden ▪ Private Capital ▪ UK ▪ Private Funds ▪ TMT 36
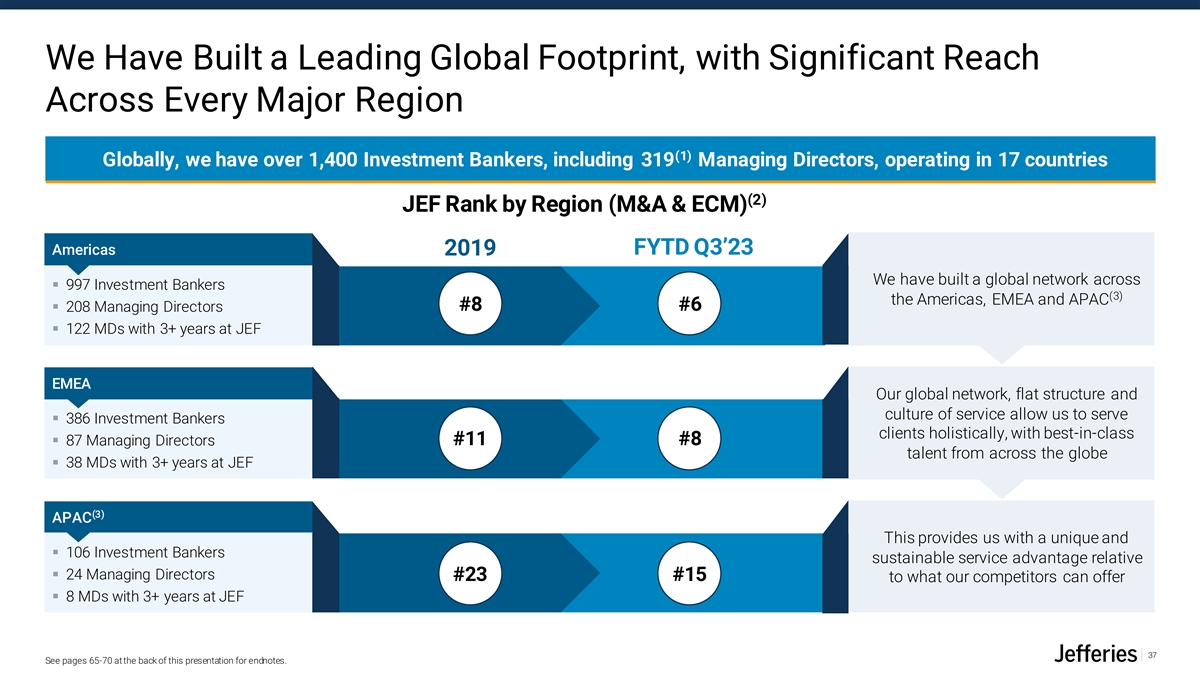
We Have Built a Leading Global Footprint, with Significant Reach Across Every Major Region (1) Globally, we have over 1,400 Investment Bankers, including 319 Managing Directors, operating in 17 countries (2) JEF Rank by Region (M&A & ECM) Americas FYTD Q3’23 2019 We have built a global network across ▪ 997 Investment Bankers (3) the Americas, EMEA and APAC #8 #6 ▪ 208 Managing Directors ▪ 122 MDs with 3+ years at JEF EMEA Our global network, flat structure and culture of service allow us to serve ▪ 386 Investment Bankers clients holistically, with best-in-class #11 #8 ▪ 87 Managing Directors talent from across the globe ▪ 38 MDs with 3+ years at JEF (3) APAC This provides us with a unique and ▪ 106 Investment Bankers sustainable service advantage relative ▪ 24 Managing Directors #23 #15 to what our competitors can offer ▪ 8 MDs with 3+ years at JEF 37 See pages 65-70 at the back of this presentation for endnotes.
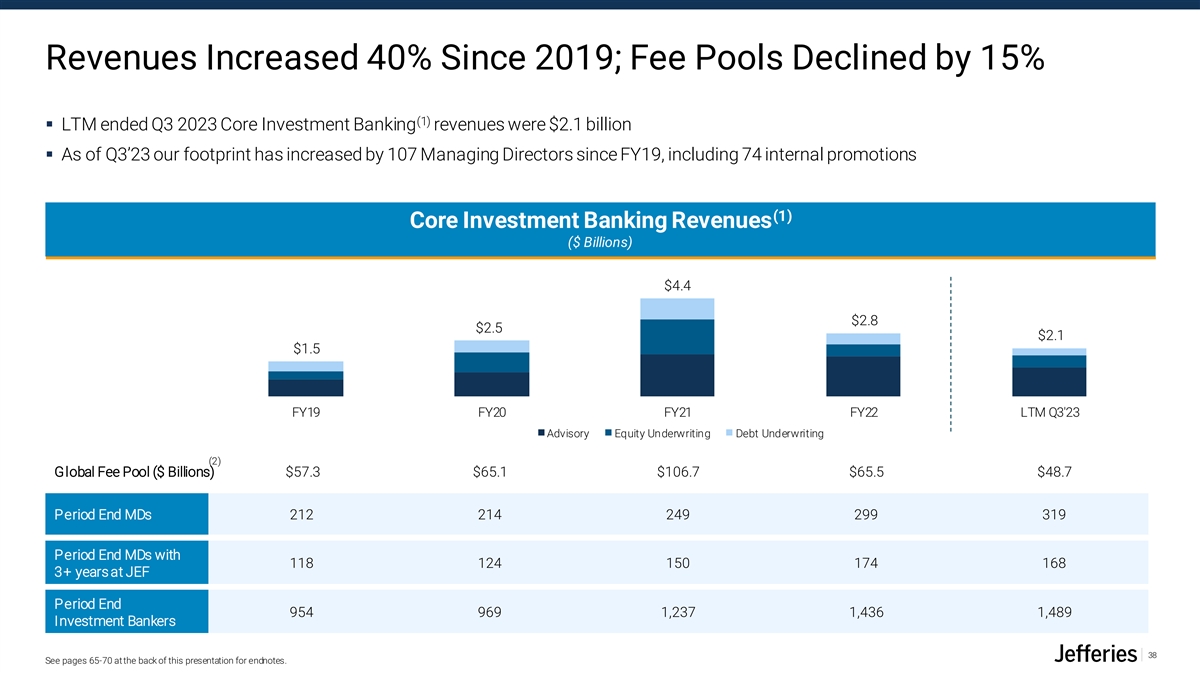
Revenues Increased 40% Since 2019; Fee Pools Declined by 15% (1) ▪ LTM ended Q3 2023 Core Investment Banking revenues were $2.1 billion ▪ As of Q3’23 our footprint has increased by 107 Managing Directors since FY19, including 74 internal promotions (1) Core Investment Banking Revenues ($ Billions) $4.4 $2.8 $2.5 $2.1 $1.5 FY19 FY20 FY21 FY22 LTM Q3'23 Advisory Equity Underwriting Debt Underwriting (2) Global Fee Pool ($ Billions) $57.3 $65.1 $106.7 $65.5 $48.7 Period End MDs 212 214 249 299 319 Period End MDs with 118 124 150 174 168 3+ years at JEF Period End 954 969 1,237 1,436 1,489 Investment Bankers 38 See pages 65-70 at the back of this presentation for endnotes.
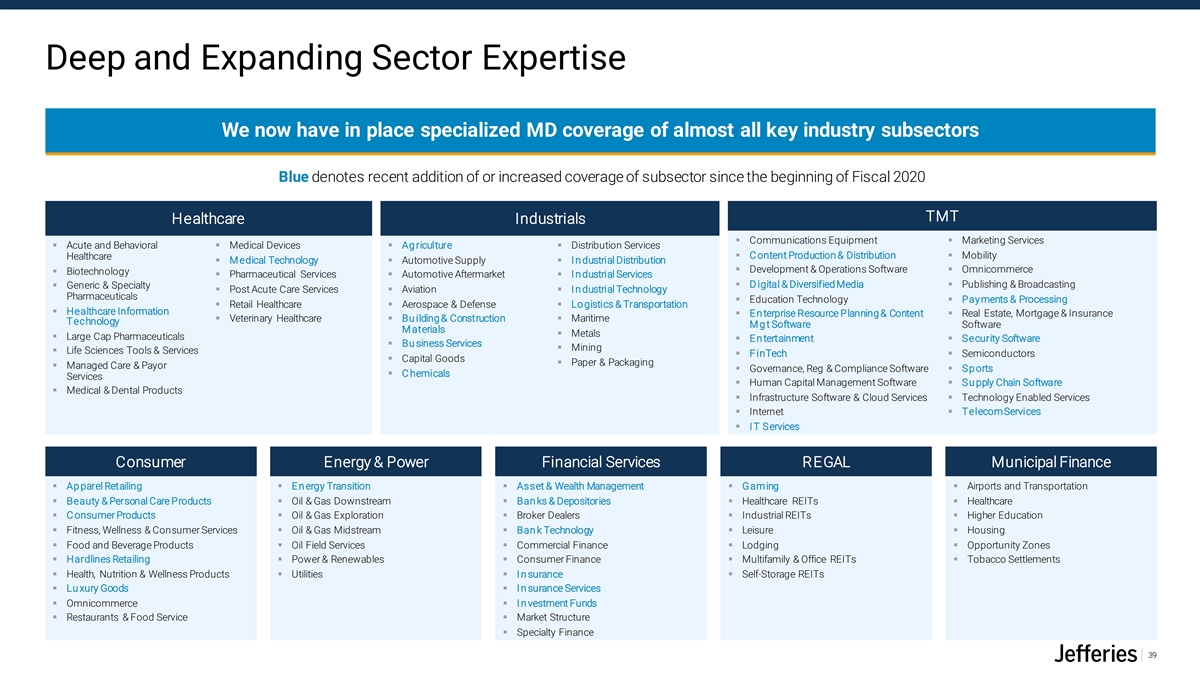
Deep and Expanding Sector Expertise We now have in place specialized MD coverage of almost all key industry subsectors Blue denotes recent addition of or increased coverage of subsector since the beginning of Fiscal 2020 TMT Healthcare Industrials ▪ Communications Equipment▪ Marketing Services ▪ Acute and Behavioral ▪ Medical Devices▪ Ag riculture▪ Distribution Services ▪ C ontent Production & Distribution▪ Mobility Healthcare ▪ M edical Technology▪ Automotive Supply▪ I n dustrial Distribution ▪ Development & Operations Software▪ Omnicommerce ▪ Biotechnology ▪ Pharmaceutical Services▪ Automotive Aftermarket▪ I n dustrial Services ▪ D igital & Diversified Media▪ Publishing & Broadcasting ▪ Generic & Specialty ▪ Post Acute Care Services▪ Aviation▪ I n dustrial Technology Pharmaceuticals ▪ Education Technology▪ Pay ments & Processing ▪ Retail Healthcare▪ Aerospace & Defense▪ Lo gistics & Transportation ▪ Healthcare Information ▪ E n terprise Resource Planning & Content ▪ Real Estate, Mortgage & Insurance ▪ Veterinary Healthcare▪ Bu ilding & Construction ▪ Maritime Technology M g t Software Software M aterials ▪ Metals ▪ Large Cap Pharmaceuticals ▪ E n tertainment▪ Security Software ▪ Bu siness Services ▪ Mining ▪ Life Sciences Tools & Services ▪ F inTech▪ Semiconductors ▪ Capital Goods ▪ Paper & Packaging ▪ Managed Care & Payor ▪ Governance, Reg & Compliance Software▪ Sp orts ▪ C hemicals Services ▪ Human Capital Management Software▪ Su pply Chain Software ▪ Medical & Dental Products ▪ Infrastructure Software & Cloud Services▪ Technology Enabled Services ▪ Internet▪ Telecom Services ▪ I T Services Consumer Energy & Power Financial Services REGAL Municipal Finance ▪ Ap parel Retailing▪ E n ergy Transition▪ Asset & Wealth Management▪ Gaming▪ Airports and Transportation ▪ Beauty & Personal Care Products▪ Oil & Gas Downstream ▪ Ban ks & Depositories▪ Healthcare REITs▪ Healthcare ▪ C onsumer Products▪ Oil & Gas Exploration▪ Broker Dealers ▪ Industrial REITs▪ Higher Education ▪ Fitness, Wellness & Consumer Services▪ Oil & Gas Midstream▪ Ban k Technology▪ Leisure▪ Housing ▪ Food and Beverage Products▪ Oil Field Services▪ Commercial Finance▪ Lodging▪ Opportunity Zones ▪ Hardlines Retailing▪ Power & Renewables▪ Consumer Finance▪ Multifamily & Office REITs▪ Tobacco Settlements ▪ Health, Nutrition & Wellness Products▪ Utilities ▪ I n surance▪ Self-Storage REITs ▪ Lu xury Goods▪ I n surance Services ▪ Omnicommerce▪ I n vestment Funds ▪ Restaurants & Food Service▪ Market Structure ▪ Specialty Finance 39
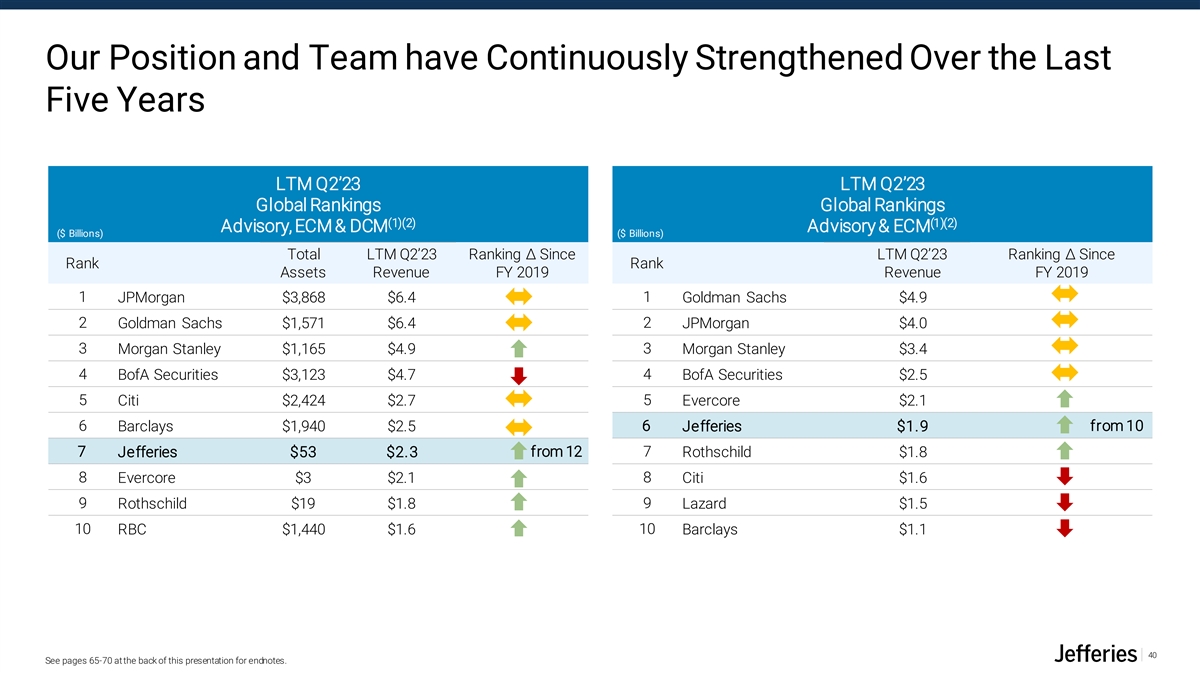
Our Position and Team have Continuously Strengthened Over the Last Five Years LTM Q2’23 LTM Q2’23 Global Rankings Global Rankings (1)(2) (1)(2) Advisory, ECM & DCM Advisory & ECM ($ Billions) ($ Billions) Total LTM Q2’23 Ranking Δ Since LTM Q2’23 Ranking Δ Since Rank Rank Assets Revenue FY 2019 Revenue FY 2019 1 JPMorgan $3,868 $6.4 1 Goldman Sachs $4.9 2 2 Goldman Sachs $1,571 $6.4 JPMorgan $4.0 3 Morgan Stanley $1,165 $4.9 3 Morgan Stanley $3.4 4 BofA Securities $3,123 $4.7 4 BofA Securities $2.5 5 5 Citi $2,424 $2.7 Evercore $2.1 6 Barclays $1,940 $2.5 6 Jefferies $1.9 from 10 7 from 12 7 Jefferies $53 $2.3 Rothschild $1.8 8 Evercore $3 $2.1 8 Citi $1.6 9 Rothschild $19 $1.8 9 Lazard $1.5 10 10 RBC $1,440 $1.6 Barclays $1.1 40 See pages 65-70 at the back of this presentation for endnotes.
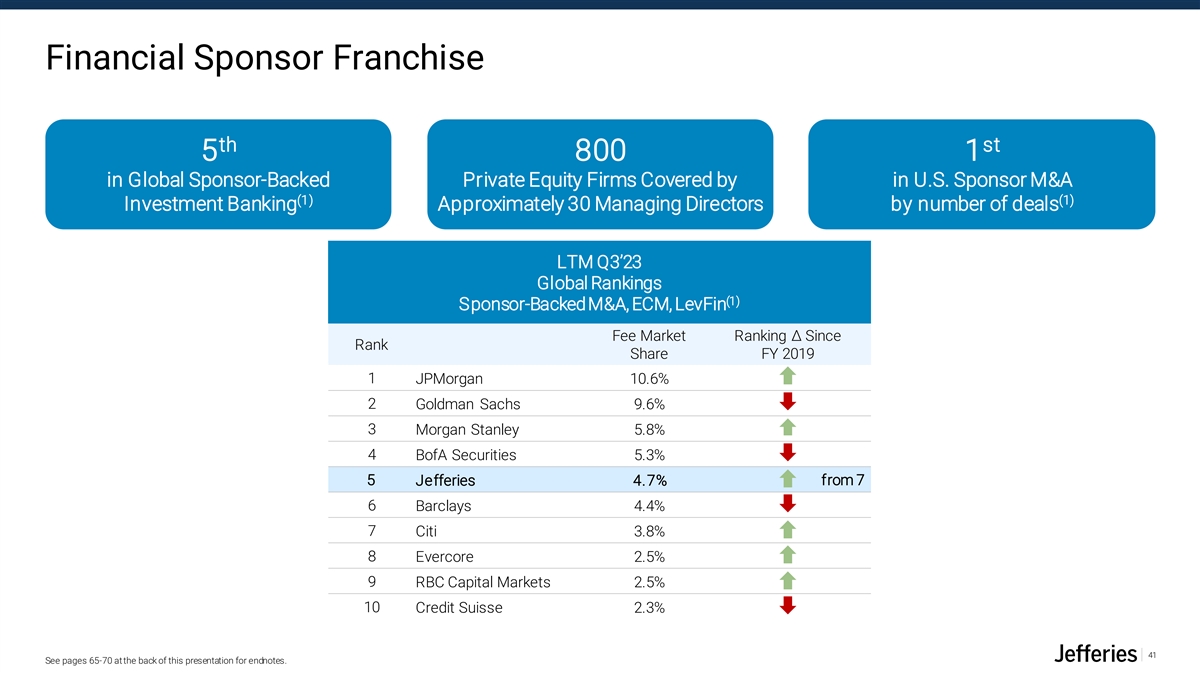
Financial Sponsor Franchise th st 5 800 1 in Global Sponsor-Backed Private Equity Firms Covered by in U.S. Sponsor M&A (1) (1) Investment Banking Approximately 30 Managing Directors by number of deals LTM Q3’23 Global Rankings (1) Sponsor-Backed M&A, ECM, LevFin Fee Market Ranking Δ Since Rank Share FY 2019 1 JPMorgan 10.6% 2 Goldman Sachs 9.6% 3 Morgan Stanley 5.8% 4 BofA Securities 5.3% 5 from 7 Jefferies 4.7% 6 Barclays 4.4% 7 Citi 3.8% 8 Evercore 2.5% 9 RBC Capital Markets 2.5% 10 Credit Suisse 2.3% 41 See pages 65-70 at the back of this presentation for endnotes.
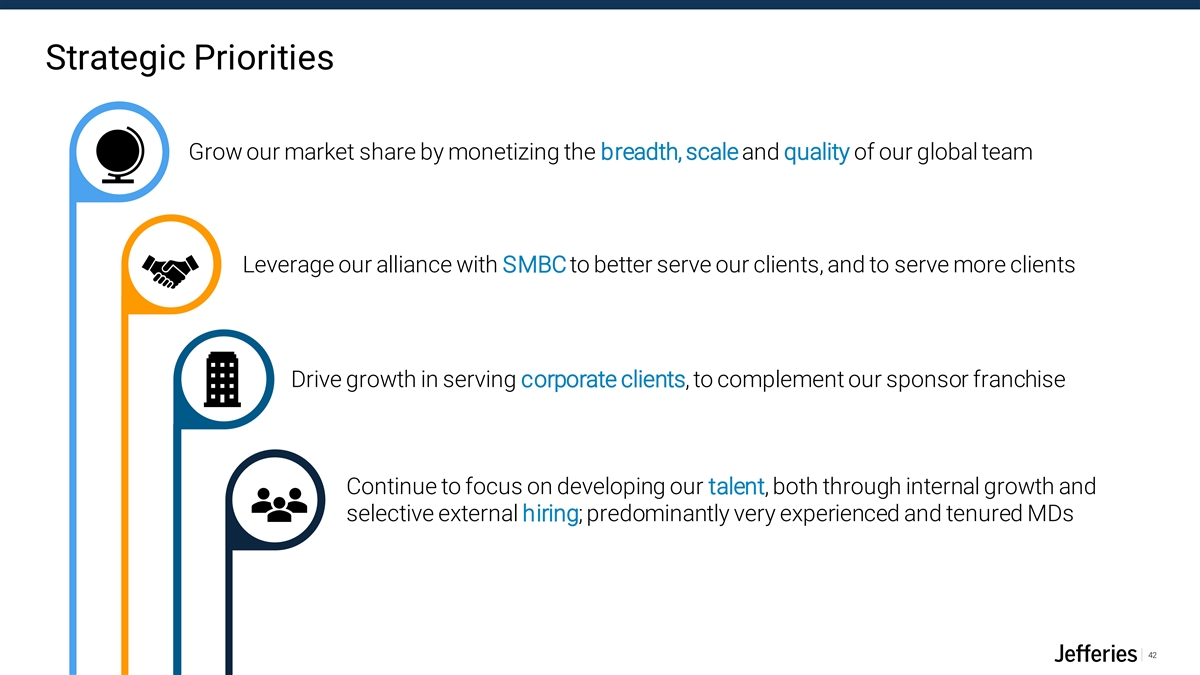
Strategic Priorities Grow our market share by monetizing the breadth, scale and quality of our global team Leverage our alliance with SMBC to better serve our clients, and to serve more clients Drive growth in serving corporate clients, to complement our sponsor franchise Continue to focus on developing our talent, both through internal growth and selective external hiring; predominantly very experienced and tenured MDs 42

Equities Peter Forlenza, Global Head of Equities
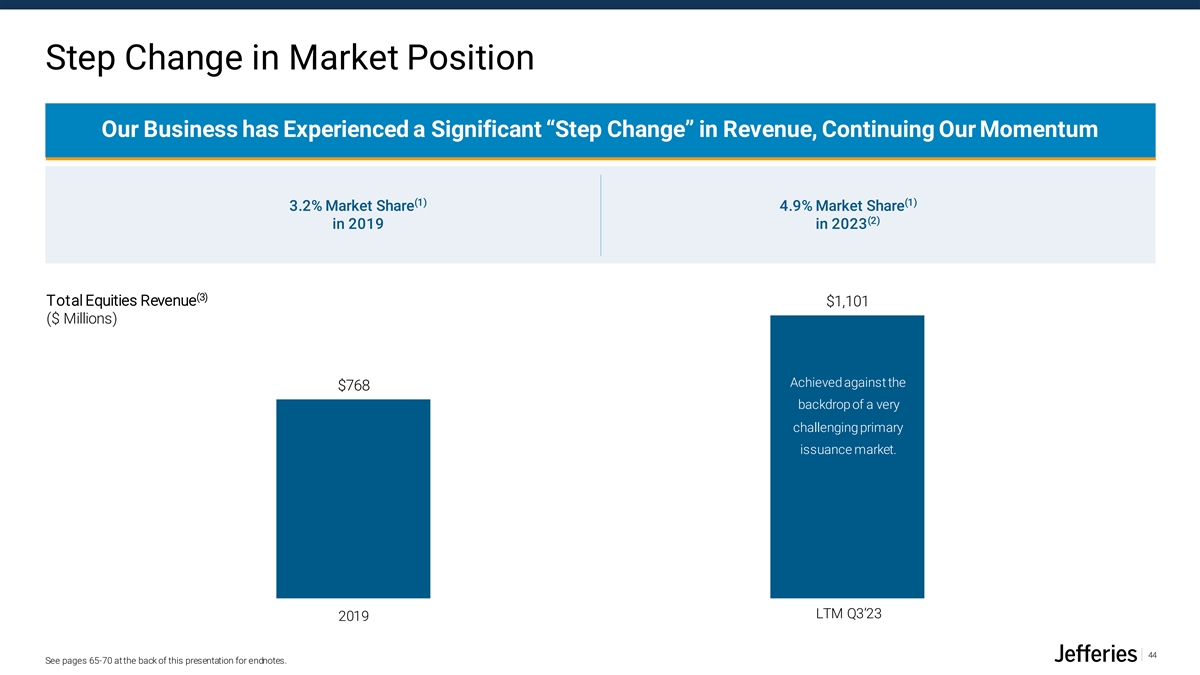
Step Change in Market Position Our Business has Experienced a Significant “Step Change” in Revenue, Continuing Our Momentum (1) (1) 3.2% Market Share 4.9% Market Share (2) in 2019 in 2023 (3) Total Equities Revenue $1,101 ($ Millions) Achieved against the Achieved against the $768 backdrop of a very backdrop of a very LTM results on par with nd our 2 best annual result challenging primary challenging primary ever issuance market. issuance market. LTM Q3’23 2019 2023 LTM 44 See pages 65-70 at the back of this presentation for endnotes.
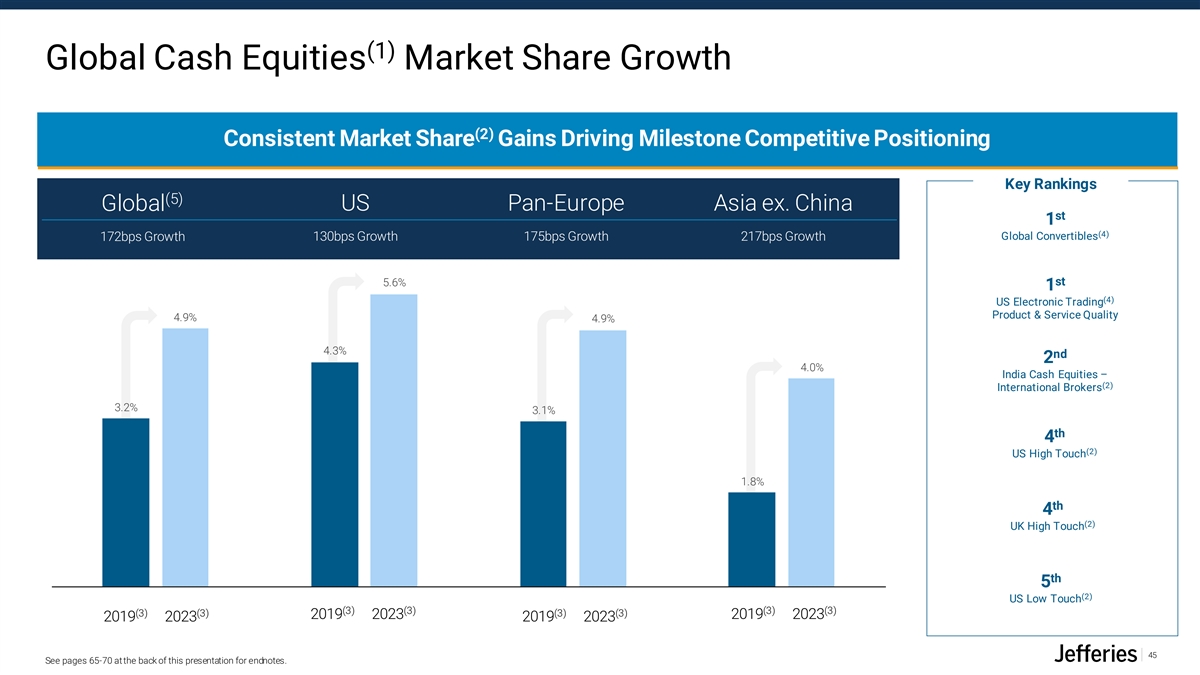
(1) Global Cash Equities Market Share Growth (2) Consistent Market Share Gains Driving Milestone Competitive Positioning Key Rankings (5) Global US Pan-Europe Asia ex. China st 1 (4) Global Convertibles 172bps Growth 130bps Growth 175bps Growth 217bps Growth 5.6% st 1 (4) US Electronic Trading Product & Service Quality 4.9% 4.9% 4.3% nd 2 4.0% India Cash Equities – (2) International Brokers 3.2% 3.1% th 4 (2) US High Touch 1.8% th 4 (2) UK High Touch th 5 (2) US Low Touch (3) (3) (3) (3) (3) (3) (3) (3) 2019 2023 2019 2023 2019 2023 2019 2023 45 See pages 65-70 at the back of this presentation for endnotes.
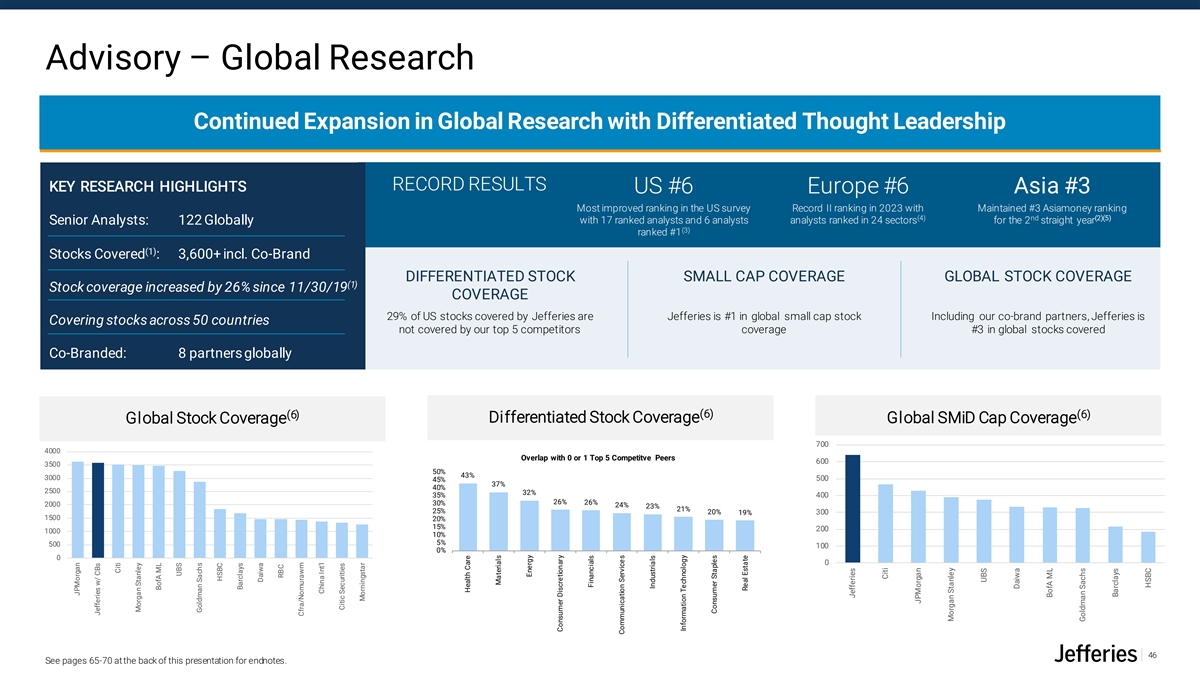
Advisory – Global Research Continued Expansion in Global Research with Differentiated Thought Leadership KEY RESEARCH HIGHLIGHTS RECORD RESULTS US #6 Europe #6 Asia #3 Most improved ranking in the US survey Record II ranking in 2023 with Maintained #3 Asiamoney ranking (4) nd (2)(5) with 17 ranked analysts and 6 analysts analysts ranked in 24 sectors for the 2 straight year Senior Analysts: 122 Globally (3) ranked #1 (1) Stocks Covered : 3,600+ incl. Co-Brand DIFFERENTIATED STOCK SMALL CAP COVERAGE GLOBAL STOCK COVERAGE (1) Stock coverage increased by 26% since 11/30/19 COVERAGE 29% of US stocks covered by Jefferies are Jefferies is #1 in global small cap stock Including our co-brand partners, Jefferies is Covering stocks across 50 countries not covered by our top 5 competitors coverage #3 in global stocks covered Co-Branded: 8 partners globally (6) (6) (6) Differentiated Stock Coverage Global Stock Coverage Global SMiD Cap Coverage 700 4000 Overlap with 0 or 1 Top 5 Competitve Peers 600 3500 50% 43% 3000 500 45% 37% 40% 2500 32% 35% 400 26% 26% 30% 2000 24% 23% 21% 25% 20% 19% 300 1500 20% 15% 200 1000 10% 5% 500 100 0% 0 0 46 See pages 65-70 at the back of this presentation for endnotes. JPMorgan Jefferies w/ CBs Citi Morgan Stanley BofA ML UBS Goldman Sachs HSBC Barclays Daiwa RBC Cfra/Nomurawm China Int'l Citic Securities Morningstar Health Care Materials Energy Consumer Discretionary Financials Communication Services Industrials Information Technology Consumer Staples Real Estate Jefferies Citi JPMorgan Morgan Stanley UBS Daiwa BofA ML Goldman Sachs Barclays HSBC
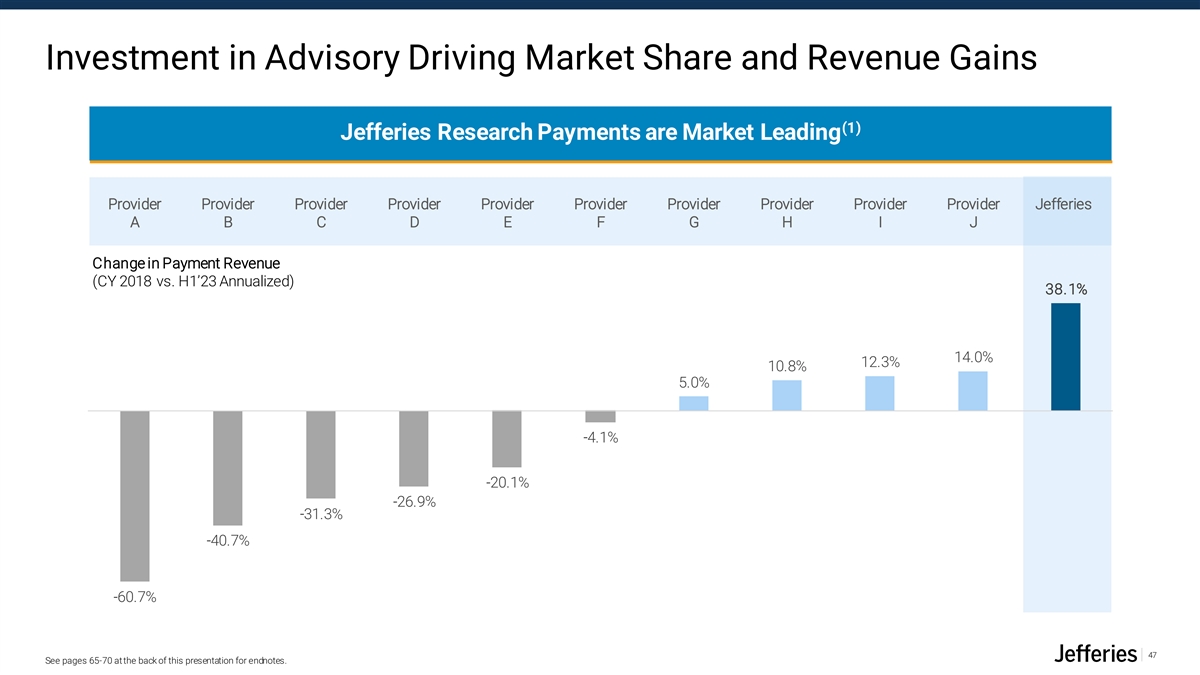
Investment in Advisory Driving Market Share and Revenue Gains (1) Jefferies Research Payments are Market Leading Provider Provider Provider Provider Provider Provider Provider Provider Provider Provider Jefferies A B C D E F G H I J Change in Payment Revenue (CY 2018 vs. H1’23 Annualized) 38.1% 14.0% 12.3% 10.8% 5.0% -4.1% -20.1% -26.9% -31.3% -40.7% -60.7% 47 See pages 65-70 at the back of this presentation for endnotes.
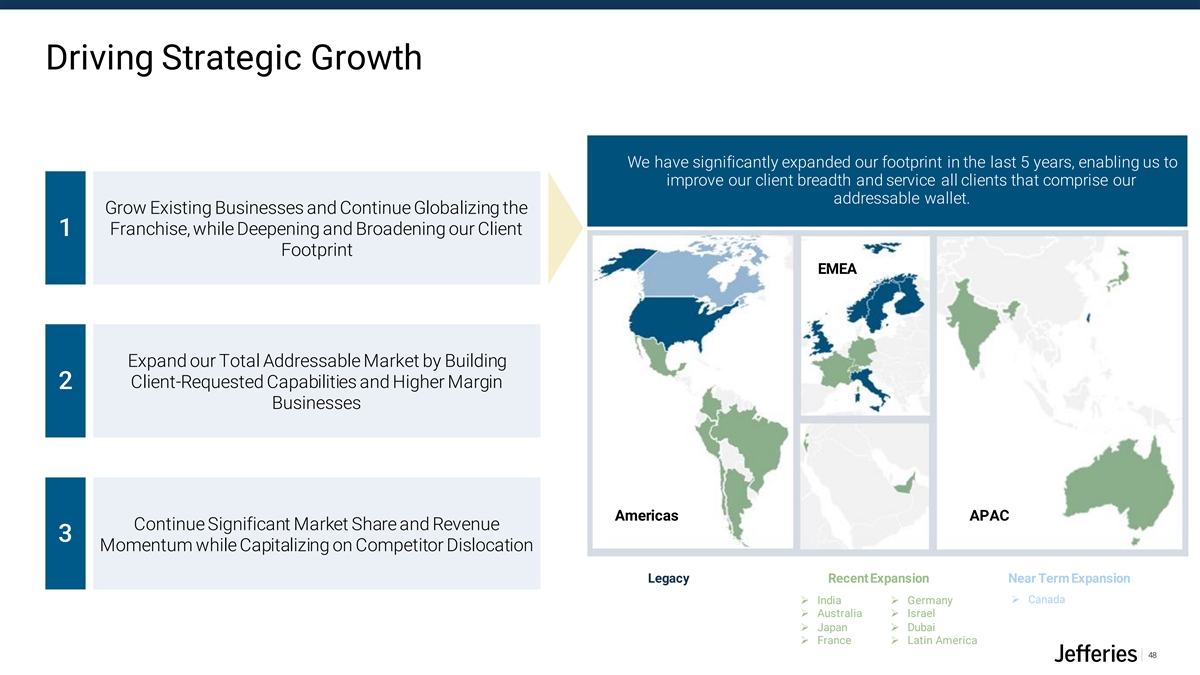
Driving Strategic Growth We have significantly expanded our footprint in the last 5 years, enabling us to improve our client breadth and service all clients that comprise our addressable wallet. Grow Existing Businesses and Continue Globalizing the Franchise, while Deepening and Broadening our Client 1 Footprint EMEA Expand our Total Addressable Market by Building 2 Client-Requested Capabilities and Higher Margin Businesses Americas APAC Continue Significant Market Share and Revenue 3 Momentum while Capitalizing on Competitor Dislocation Legacy Recent Expansion Near Term Expansion ➢ India➢ Germany➢ Canada ➢ Australia➢ Israel ➢ Japan➢ Dubai ➢ France➢ Latin America 48
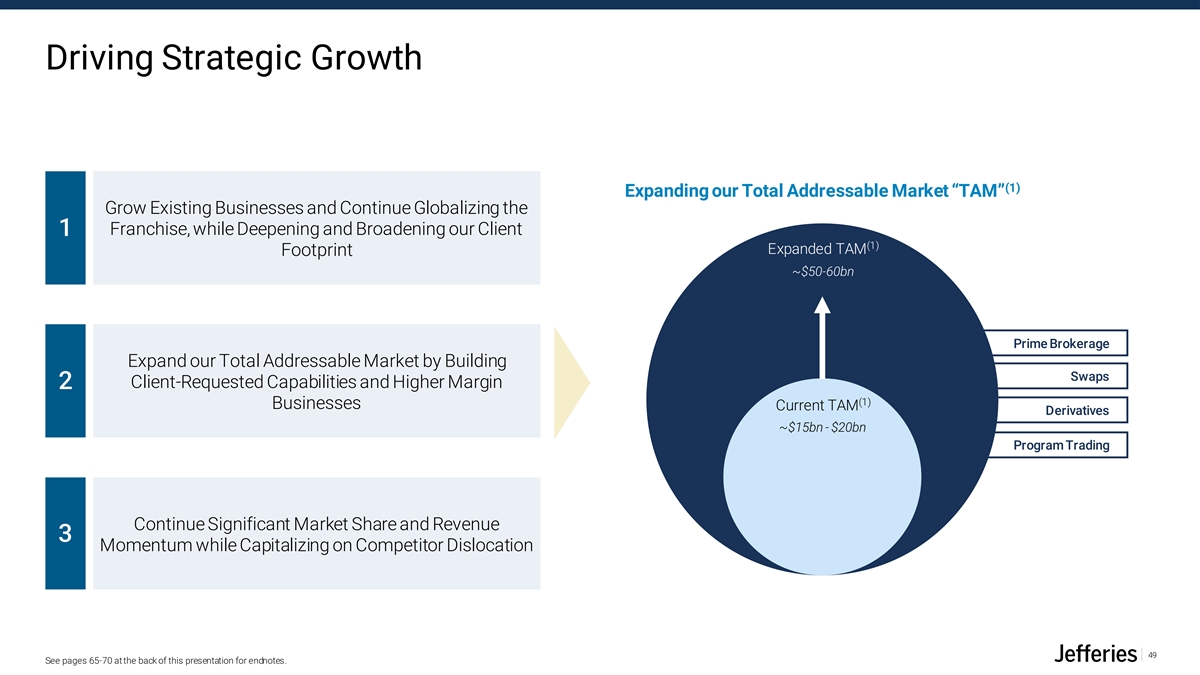
Driving Strategic Growth (1) Expanding our Total Addressable Market “TAM” Grow Existing Businesses and Continue Globalizing the Franchise, while Deepening and Broadening our Client 1 (1) Expanded TAM Footprint ~$50-60bn Prime Brokerage Expand our Total Addressable Market by Building Swaps 2 Client-Requested Capabilities and Higher Margin (1) Businesses Current TAM Derivatives ~$15bn - $20bn Program Trading Continue Significant Market Share and Revenue 3 Momentum while Capitalizing on Competitor Dislocation 49 See pages 65-70 at the back of this presentation for endnotes.
Fixed Income Fred Orlan, Global Head of Fixed Income
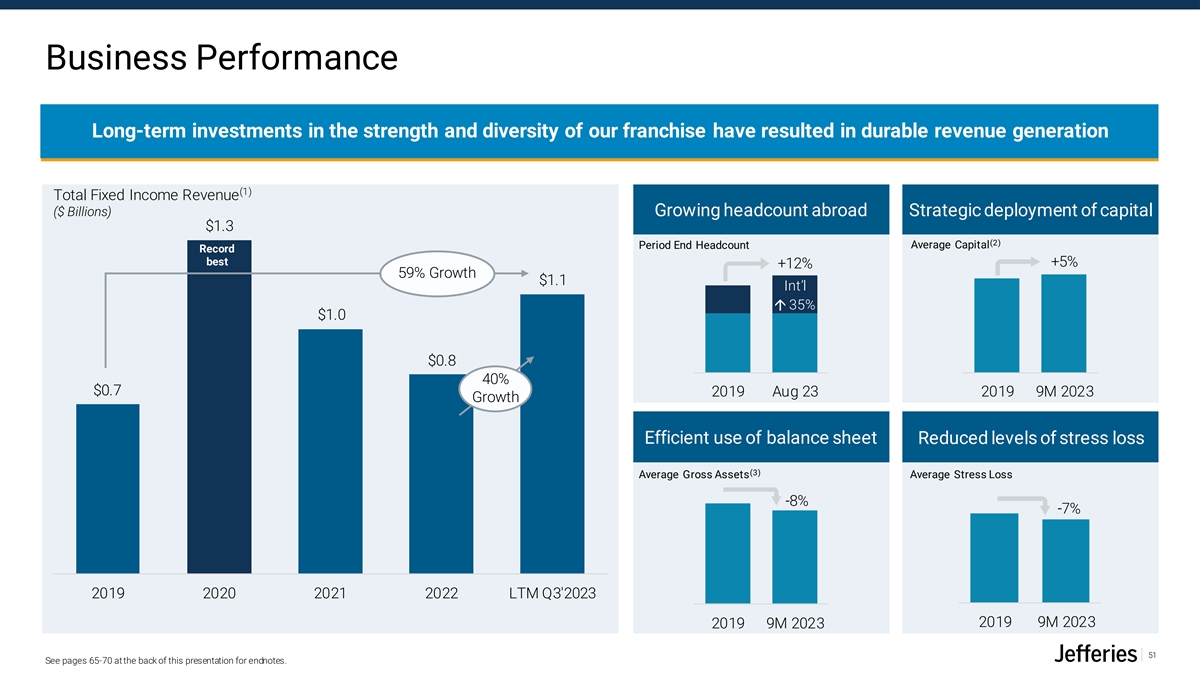
Business Performance Long-term investments in the strength and diversity of our franchise have resulted in durable revenue generation (1) Total Fixed Income Revenue ($ Billions) Growing headcount abroad Strategic deployment of capital $1.3 (2) Period End Headcount Average Capital Record best +5% +12% 59% Growth $1.1 Int’l á 35% $1.0 $0.8 40% $0.7 2019 Aug 23 2019 9M 2023 Growth Efficient use of balance sheet Reduced levels of stress loss (3) Average Gross Assets Average Stress Loss -8% -7% 2019 2020 2021 2022 LTM Q3'2023 2019 9M 2023 2019 9M 2023 51 See pages 65-70 at the back of this presentation for endnotes.
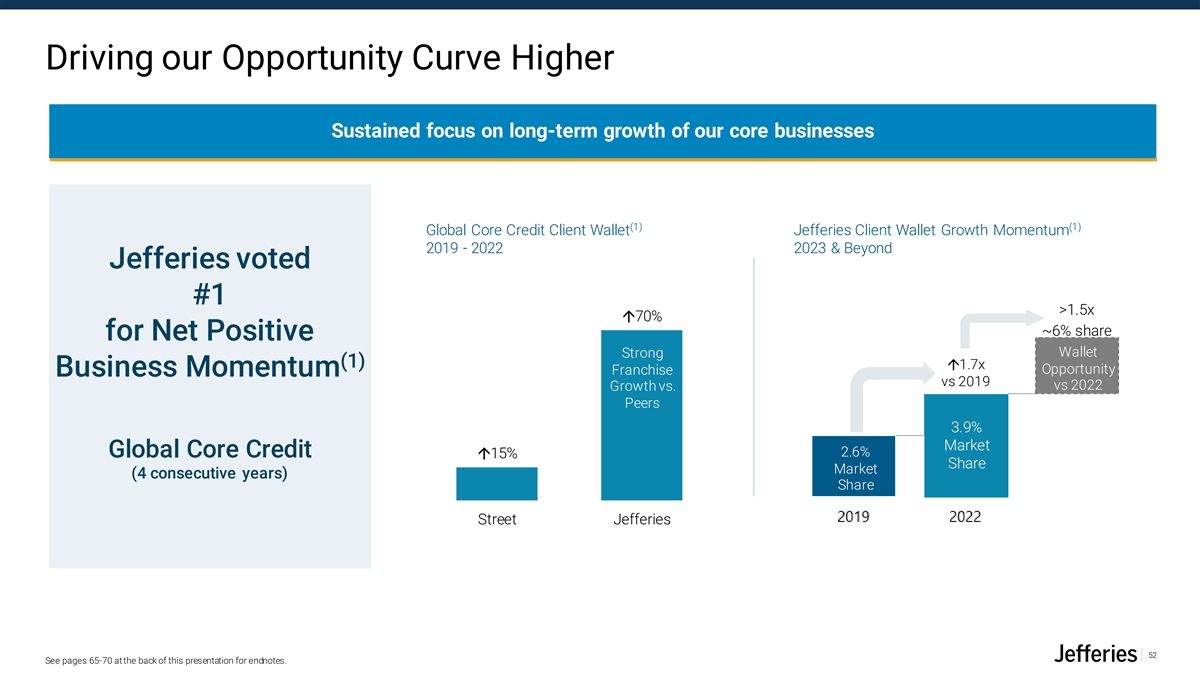
Driving our Opportunity Curve Higher Sustained focus on long-term growth of our core businesses (1) (1) Global Core Credit Client Wallet Jefferies Client Wallet Growth Momentum 2019 - 2022 2023 & Beyond Jefferies voted #1 >1.5x á70% ~6% share for Net Positive Wallet Strong (1) á1.7x Opportunity Franchise Business Momentum vs 2019 vs 2022 Growth vs. Peers 3.9% Market 2.6% Global Core Credit á15% Share Market (4 consecutive years) Share Street Jefferies 52 See pages 65-70 at the back of this presentation for endnotes.
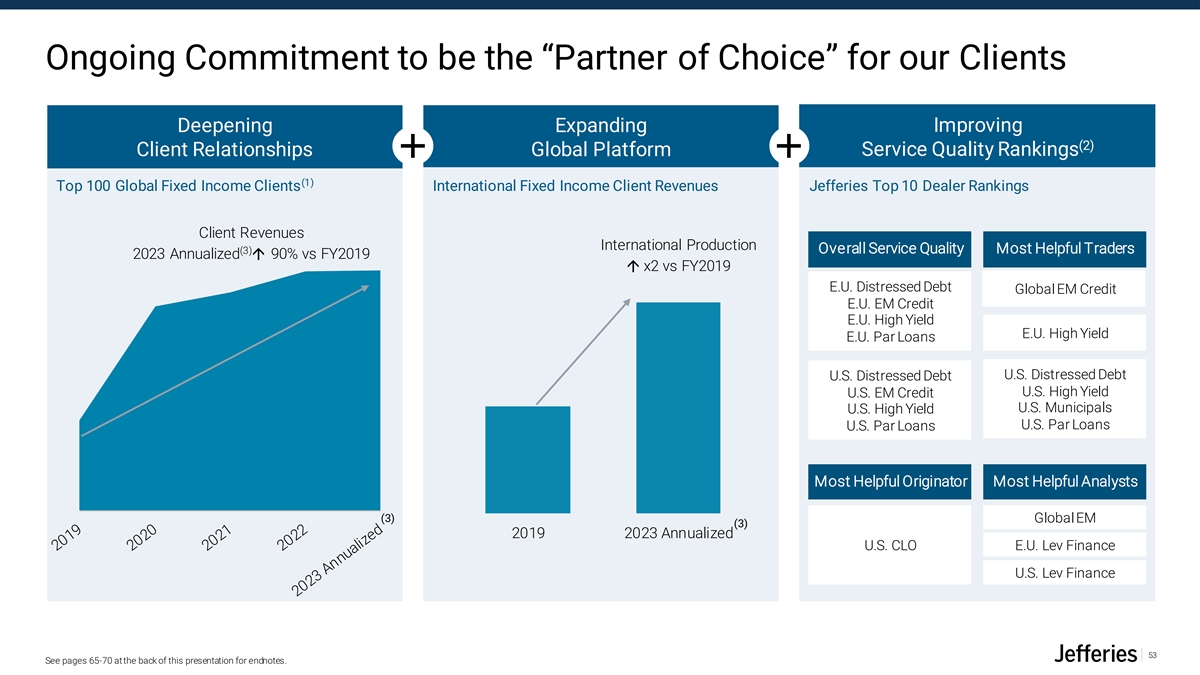
Ongoing Commitment to be the “Partner of Choice” for our Clients Deepening Expanding Improving (2) Client Relationships Global Platform Service Quality Rankings (1) Top 100 Global Fixed Income Clients International Fixed Income Client Revenues Jefferies Top 10 Dealer Rankings Client Revenues International Production (3) Overall Service Quality Most Helpful Traders 2023 Annualizedá 90% vs FY2019 á x2 vs FY2019 E.U. Distressed Debt Global EM Credit E.U. EM Credit E.U. High Yield E.U. High Yield E.U. Par Loans U.S. Distressed Debt U.S. Distressed Debt U.S. High Yield U.S. EM Credit U.S. Municipals U.S. High Yield U.S. Par Loans U.S. Par Loans Most Helpful Originator Most Helpful Analysts (3) Global EM (3) 2019 2023 Annualized U.S. CLO E.U. Lev Finance U.S. Lev Finance 53 See pages 65-70 at the back of this presentation for endnotes.
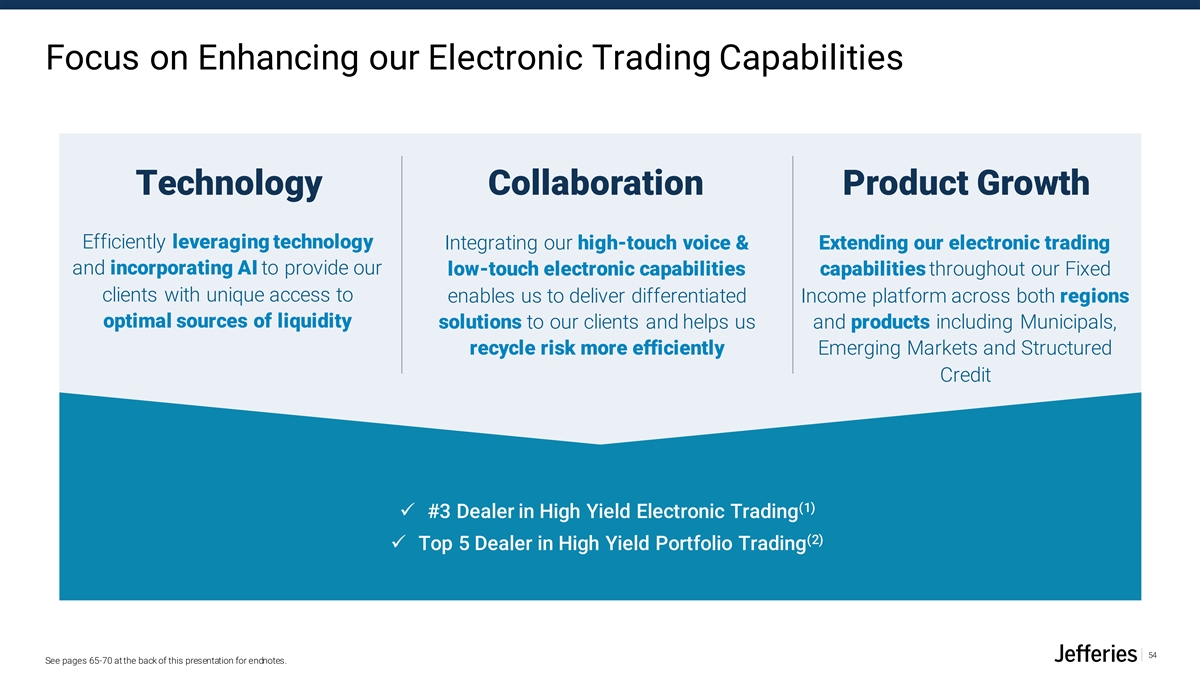
Focus on Enhancing our Electronic Trading Capabilities Technology Collaboration Product Growth Efficiently leveraging technology Integrating our high-touch voice & Extending our electronic trading and incorporating AI to provide our low-touch electronic capabilities capabilities throughout our Fixed clients with unique access to enables us to deliver differentiated Income platform across both regions optimal sources of liquidity solutions to our clients and helps us and products including Municipals, recycle risk more efficiently Emerging Markets and Structured Credit (1) ✓ #3 Dealer in High Yield Electronic Trading (2) ✓ Top 5 Dealer in High Yield Portfolio Trading 54 See pages 65-70 at the back of this presentation for endnotes.
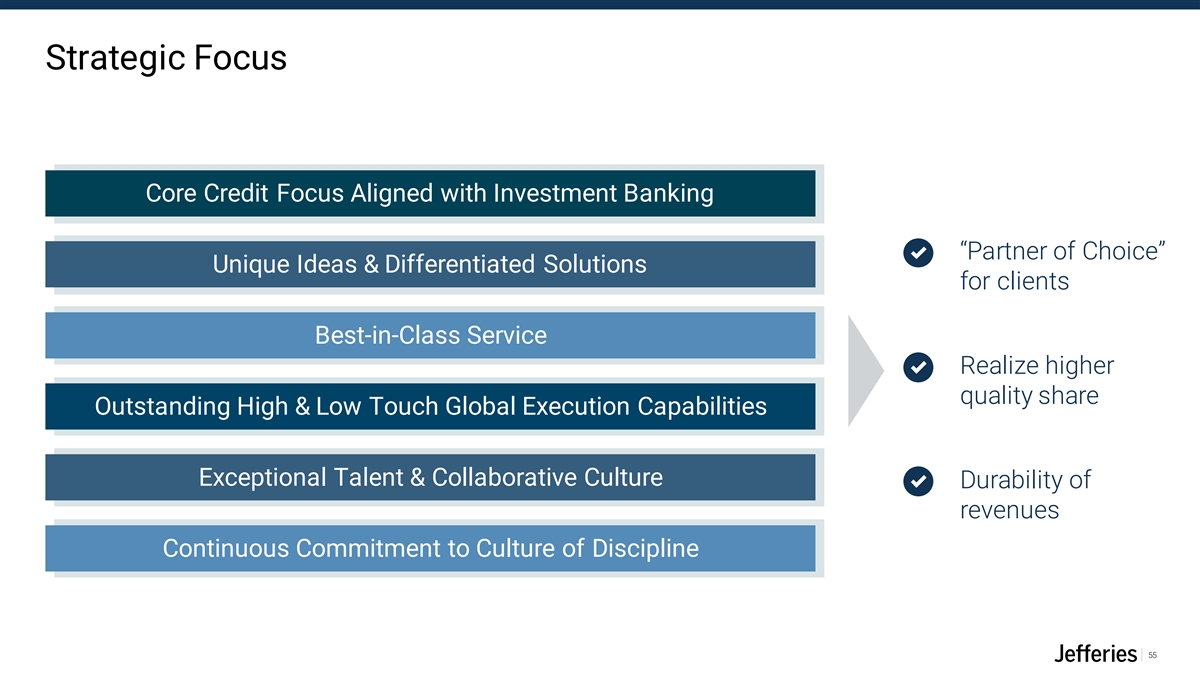
Strategic Focus Core Credit Focus Aligned with Investment Banking “Partner of Choice” Unique Ideas & Differentiated Solutions for clients Globalize Franchise and Best-in-Class Service Expand Client-Requested Capabilities Realize higher Globalize Franchise and quality share Outstanding High & Low Touch Global Execution Capabilities Expand Client-Requested Capabilities Globalize Franchise and Exceptional Talent & Collaborative Culture Durability of Expand Client-Requested Capabilities revenues Globalize Franchise and Continuous Commitment to Culture of Discipline Expand Client-Requested Capabilities 55

Asset Management Nick Daraviras, Co-Head of Asset Management Sol Kumin, Co-Head of Asset Management
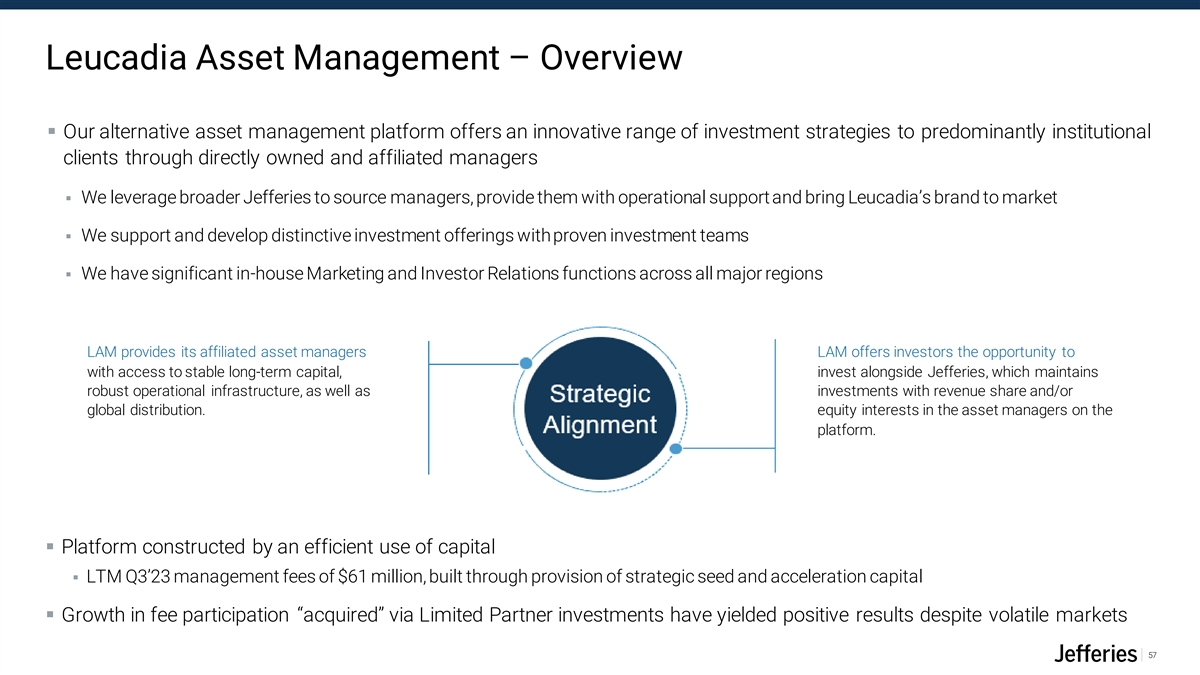
Leucadia Asset Management – Overview ▪ Our alternative asset management platform offers an innovative range of investment strategies to predominantly institutional clients through directly owned and affiliated managers ▪ We leverage broader Jefferies to source managers, provide them with operational support and bring Leucadia’s brand to market ▪ We support and develop distinctive investment offerings with proven investment teams ▪ We have significant in-house Marketing and Investor Relations functions across all major regions LAM provides its affiliated asset managers LAM offers investors the opportunity to with access to stable long-term capital, invest alongside Jefferies, which maintains robust operational infrastructure, as well as investments with revenue share and/or global distribution. equity interests in the asset managers on the platform. ▪ Platform constructed by an efficient use of capital ▪ LTM Q3’23 management fees of $61 million, built through provision of strategic seed and acceleration capital ▪ Growth in fee participation “acquired” via Limited Partner investments have yielded positive results despite volatile markets 57
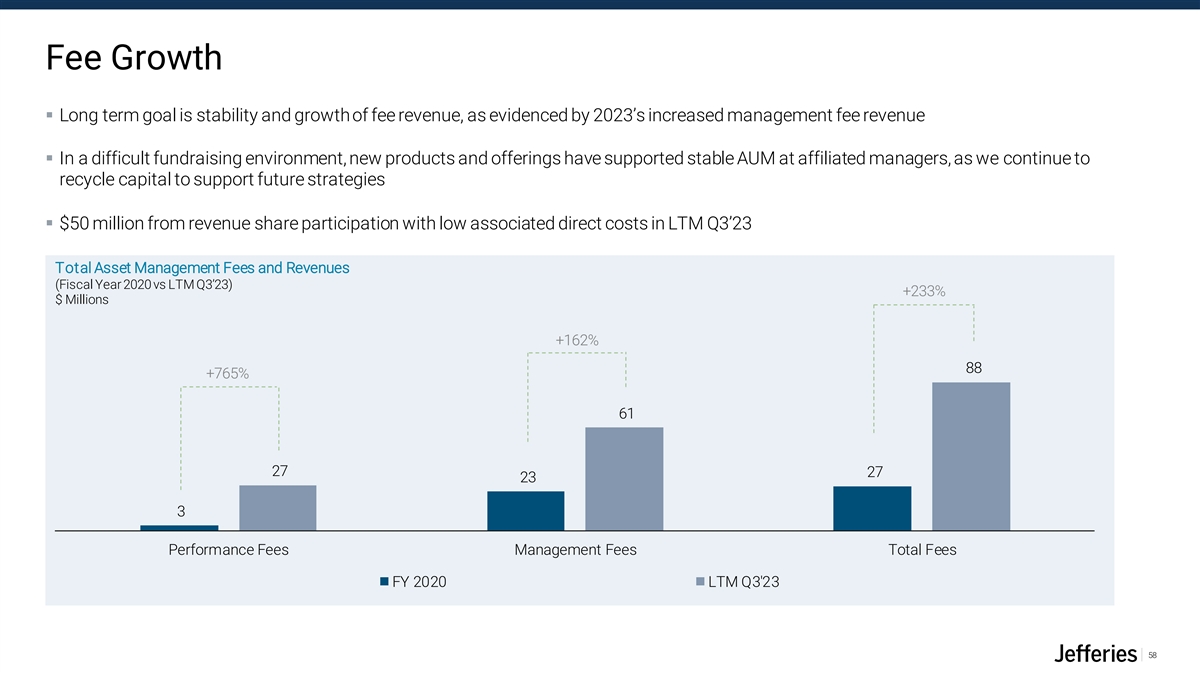
Fee Growth ▪ Long term goal is stability and growth of fee revenue, as evidenced by 2023’s increased management fee revenue ▪ In a difficult fundraising environment, new products and offerings have supported stable AUM at affiliated managers, as we continue to recycle capital to support future strategies ▪ $50 million from revenue share participation with low associated direct costs in LTM Q3’23 Total Asset Management Fees and Revenues (Fiscal Year 2020 vs LTM Q3’23) +233% $ Millions +162% 88 +765% 61 27 27 23 3 Performance Fees Management Fees Total Fees FY 2020 LTM Q3'23 58
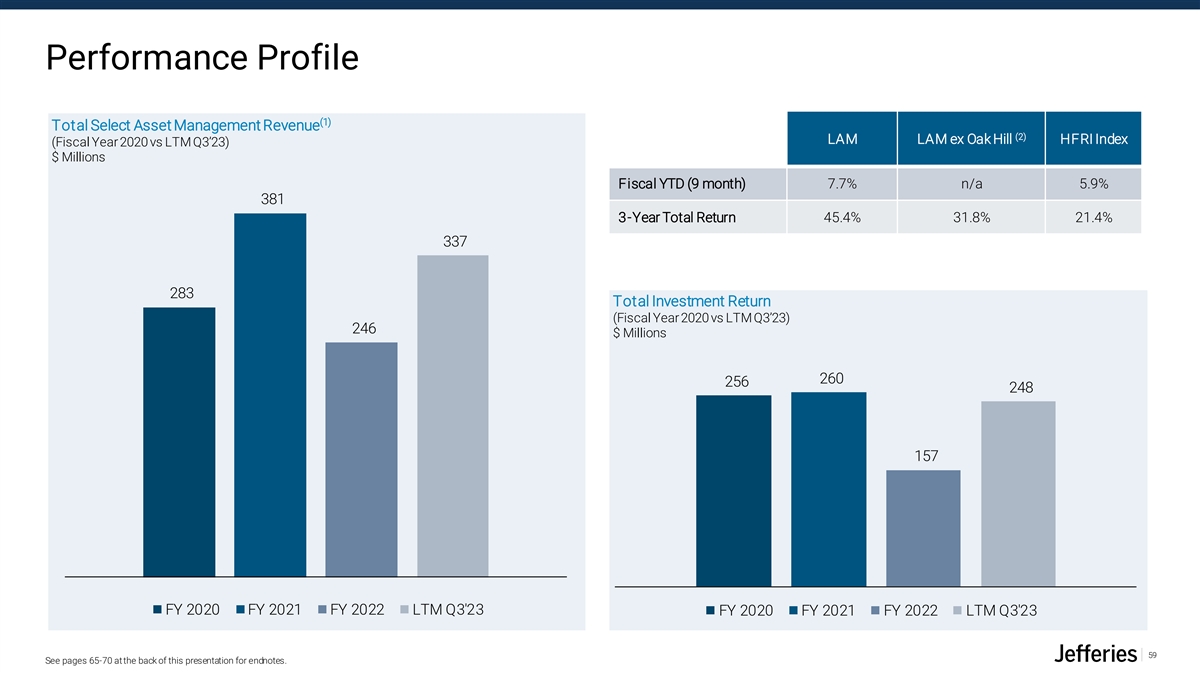
Performance Profile (1) Total Select Asset Management Revenue (2) LAM LAM ex Oak Hill HFRI Index (Fiscal Year 2020 vs LTM Q3’23) $ Millions Fiscal YTD (9 month) 7.7% n/a 5.9% 381 3-Year Total Return 45.4% 31.8% 21.4% 337 283 Total Investment Return (Fiscal Year 2020 vs LTM Q3’23) 246 $ Millions 260 256 248 157 FY 2020 FY 2021 FY 2022 LTM Q3'23 FY 2020 FY 2021 FY 2022 LTM Q3'23 59 See pages 65-70 at the back of this presentation for endnotes.
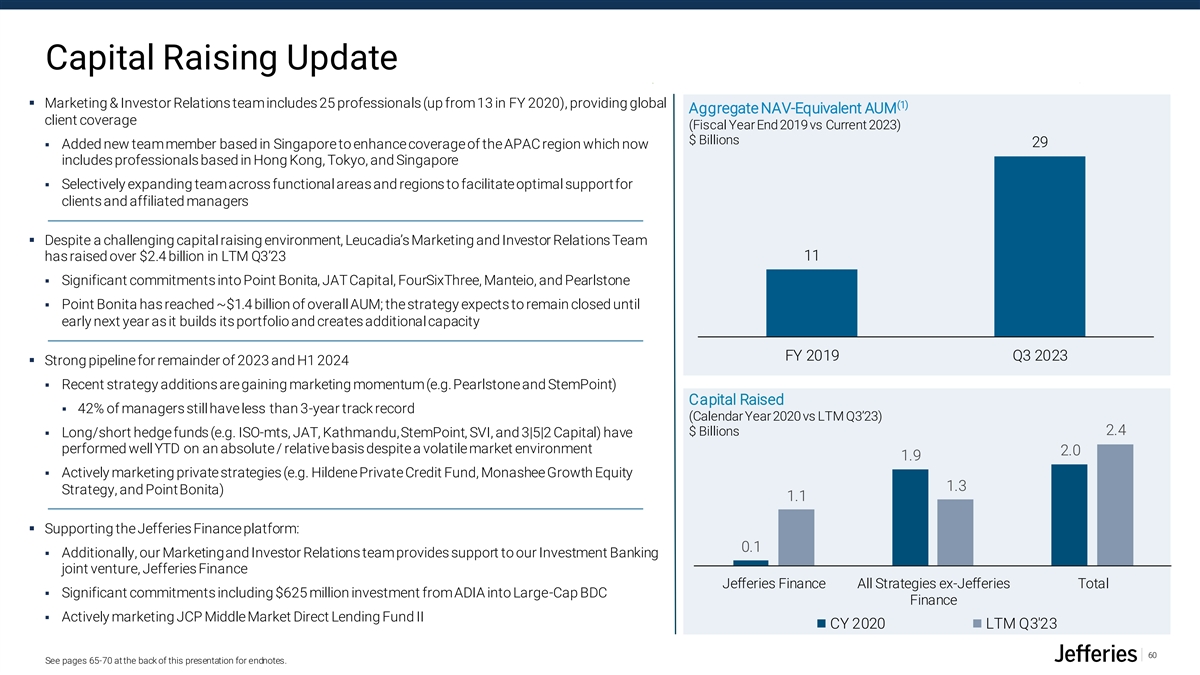
Capital Raising Update ▪ Marketing & Investor Relations team includes 25 professionals (up from 13 in FY 2020), providing global (1) Aggregate NAV-Equivalent AUM client coverage (Fiscal Year End 2019 vs Current 2023) $ Billions 29 ▪ Added new team member based in Singapore to enhance coverage of the APAC region which now includes professionals based in Hong Kong, Tokyo, and Singapore ▪ Selectively expanding team across functional areas and regions to facilitate optimal support for clients and affiliated managers ▪ Despite a challenging capital raising environment, Leucadia’s Marketing and Investor Relations Team has raised over $2.4 billion in LTM Q3’23 11 ▪ Significant commitments into Point Bonita, JAT Capital, FourSixThree, Manteio, and Pearlstone ▪ Point Bonita has reached ~$1.4 billion of overall AUM; the strategy expects to remain closed until early next year as it builds its portfolio and creates additional capacity FY 2019 Q3 2023 ▪ Strong pipeline for remainder of 2023 and H1 2024 ▪ Recent strategy additions are gaining marketing momentum (e.g. Pearlstone and StemPoint) Capital Raised ▪ 42% of managers still have less than 3-year track record (Calendar Year 2020 vs LTM Q3’23) 2.4 $ Billions ▪ Long/short hedge funds (e.g. ISO-mts, JAT, Kathmandu, StemPoint, SVI, and 3|5|2 Capital) have performed well YTD on an absolute / relative basis despite a volatile market environment 2.0 1.9 ▪ Actively marketing private strategies (e.g. Hildene Private Credit Fund, Monashee Growth Equity 1.3 Strategy, and Point Bonita) 1.1 ▪ Supporting the Jefferies Finance platform: 0.1 ▪ Additionally, our Marketing and Investor Relations team provides support to our Investment Banking joint venture, Jefferies Finance Jefferies Finance All Strategies ex-Jefferies Total ▪ Significant commitments including $625 million investment from ADIA into Large-Cap BDC Finance ▪ Actively marketing JCP Middle Market Direct Lending Fund II CY 2020 LTM Q3'23 60 See pages 65-70 at the back of this presentation for endnotes.
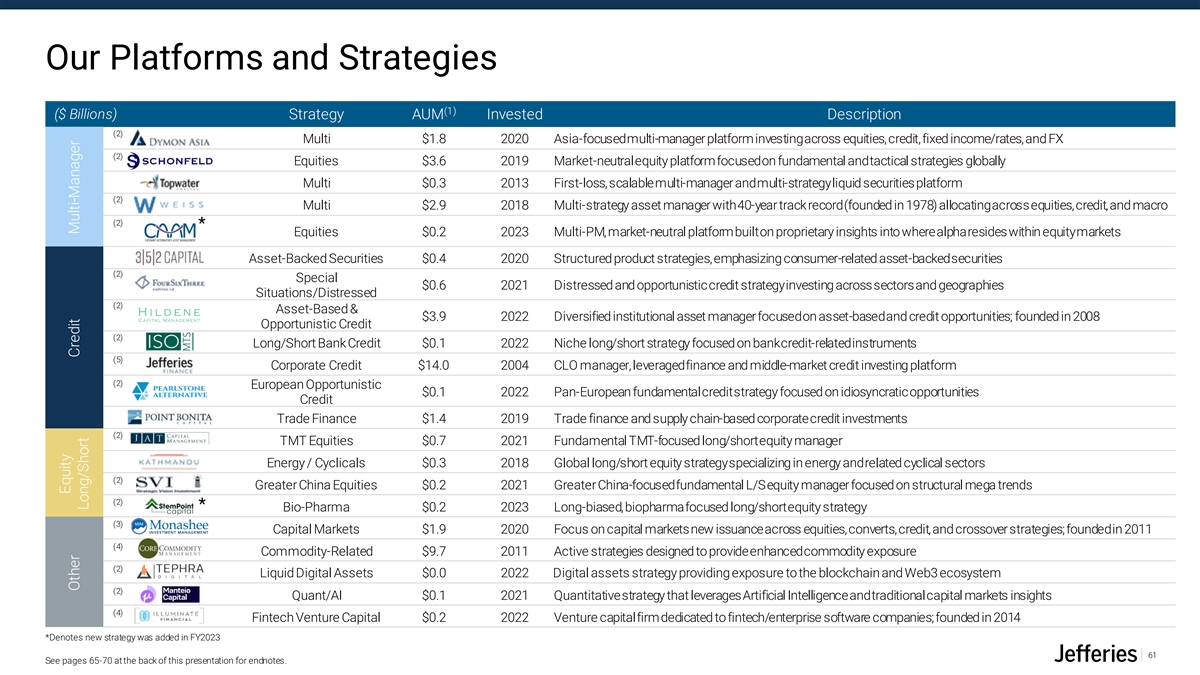
Our Platforms and Strategies (1) ($ Billions) Strategy AUM Invested Description (2) Multi $1.8 2020 Asia-focused multi-manager platform investing across equities, credit, fixed income/rates, and FX (2) Equities $3.6 2019 Market-neutral equity platform focused on fundamental and tactical strategies globally Multi $0.3 2013 First-loss, scalable multi-manager and multi-strategy liquid securities platform (2) Multi $2.9 2018 Multi-strategy asset manager with 40-year track record (founded in 1978) allocating across equities, credit, and macro (2) * Equities $0.2 2023 Multi-PM, market-neutral platform built on proprietary insights into where alpha resides within equity markets Asset-Backed Securities $0.4 2020 Structured product strategies, emphasizing consumer-related asset-backed securities (2) Special $0.6 2021 Distressed and opportunistic credit strategy investing across sectors and geographies Situations/Distressed (2) Asset-Based & $3.9 2022 Diversified institutional asset manager focused on asset-based and credit opportunities; founded in 2008 Opportunistic Credit (2) Long/Short Bank Credit $0.1 2022 Niche long/short strategy focused on bank credit-related instruments (5) Corporate Credit $14.0 2004 CLO manager, leveraged finance and middle-market credit investing platform (2) European Opportunistic $0.1 2022 Pan-European fundamental credit strategy focused on idiosyncratic opportunities Credit Trade Finance $1.4 2019 Trade finance and supply chain-based corporate credit investments (2) TMT Equities $0.7 2021 Fundamental TMT-focused long/short equity manager Energy / Cyclicals $0.3 2018 Global long/short equity strategy specializing in energy and related cyclical sectors (2) Greater China Equities $0.2 2021 Greater China-focused fundamental L/S equity manager focused on structural mega trends (2) * Bio-Pharma $0.2 2023 Long-biased, biopharma focused long/short equity strategy (3) Capital Markets $1.9 2020 Focus on capital markets new issuance across equities, converts, credit, and crossover strategies; founded in 2011 (4) Commodity-Related $9.7 2011 Active strategies designed to provide enhanced commodity exposure (2) Liquid Digital Assets $0.0 2022 Digital assets strategy providing exposure to the blockchain and Web3 ecosystem (2) Quant/AI $0.1 2021 Quantitative strategy that leverages Artificial Intelligence and traditional capital markets insights (4) Fintech Venture Capital $0.2 2022 Venture capital firm dedicated to fintech/enterprise software companies; founded in 2014 *Denotes new strategy was added in FY2023 61 See pages 65-70 at the back of this presentation for endnotes. Equity Other Credit Multi-Manager Long/Short
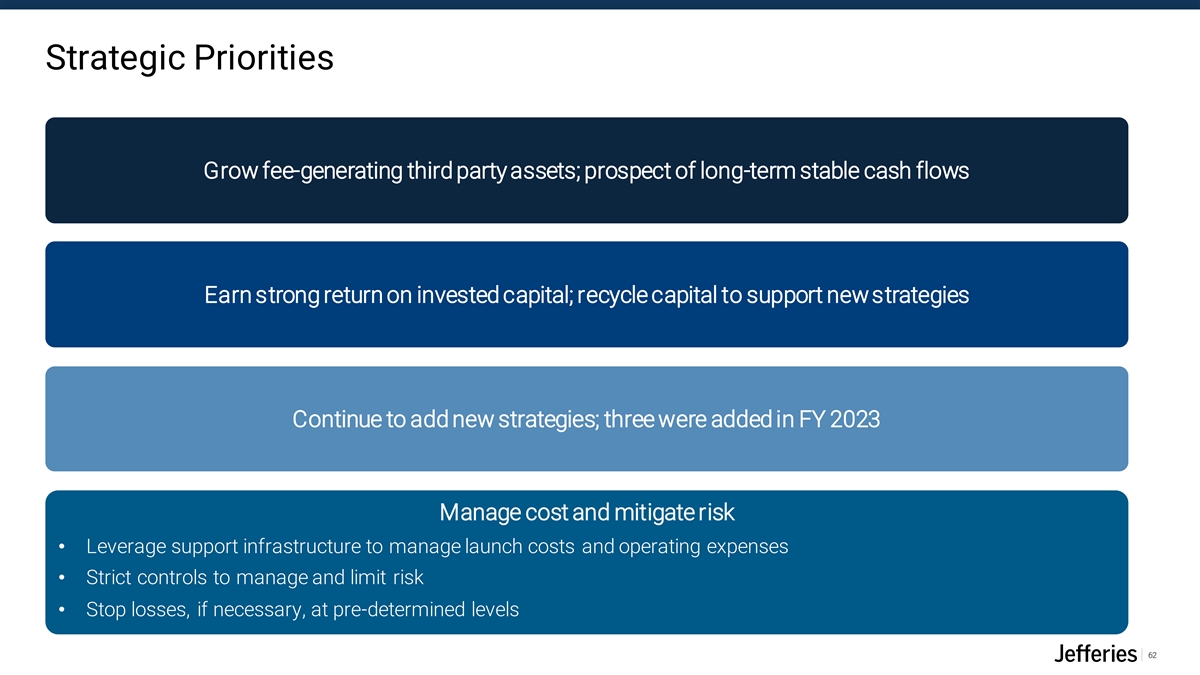
Strategic Priorities Grow fee-generating third party assets; prospect of long-term stable cash flows Earn strong return on invested capital; recycle capital to support new strategies Continue to add new strategies; three were added in FY 2023 Manage cost and mitigate risk • Leverage support infrastructure to manage launch costs and operating expenses • Strict controls to manage and limit risk • Stop losses, if necessary, at pre-determined levels 62

Q&A Session Please submit questions using the webcast question box

Appendix
Endnotes These notes refer to page 8 (1) Map does not show all office locations. These notes refer to page 10 (1) Source of data: Dealogic. (2) Core Investment Banking Revenue is a non-GAAP financial measure. See Appendix for Non-GAAP reconciliation. (3) Source: Investment banking market position based on data compiled by Jefferies and derived from publicly available company filings, including Form 10-Qs and 10-Ks, earnings releases and supplements. These notes refer to page 11 (1) Revenues are presented net of allocations of interest income and interest expense. During the third quarter ended August 31, 2023, we refined our allocated net interest methodology to better reflect net interest expense across our business units based on use of capital. Historical periods have been recast to conform with the revised methodology. (2) Cash Equities market share and ranks sourced from McLagan market survey. (3) Cash includes high touch, low touch, agency program trading and swaps commissions in addition to advisory payments. These notes refer to page 12 (1) Revenues are presented net of allocations of interest income and interest expense. During the third quarter ended August 31, 2023, we refined our allocated net interest methodology to better reflect net interest expense across our business units based on use of capital. Historical periods have been recast to conform with the revised methodology. (2) Core Credit Market Share definition and data provided by Coalition/Greenwich. These notes refer to page 13 (1) AUM includes aggregate NAV and NAV-equivalent Assets Under Management held by us and our affiliated asset managers as of each period end. 65
Endnotes These notes refer to page 17 (1) SMBC’s $2.25 billion financing in 2021 and investments will, at market prices as of 4/27/23, the date of the press release announcing an expansion of the Jefferies and SMBC strategic alliance, result in a financial commitment to Jefferies of approximately $3.4 billion. (2) Source of data: Investment Banking rank defined as M&A, ECM and LevFin per Dealogic. (3) Data as of LTM August 2023. (4) Based on total assets. (5) Source of data: https://www.spglobal.com/marketintelligence/en/news-insights/research/the-world-s-100-largest-banks-2023 as of FYE 2022. (6) Source of data: https://www.smfg.co.jp/english/investor/financial/small/pdf/20230904_bofa_pre01e.pdf . These notes refer to page 18 (1) Source of data: Dealogic. These notes refer to page 19 (1) Source of data: Mortgage Bankers Association annual report. (2) Source of data: Dealogic. (3) Includes both proprietary and third-party AUM. These notes refer to page 21 (1) Source: Investment banking market position based on data compiled by Jefferies and derived from publicly available company filings, including Form 10-Qs and 10-Ks, earnings releases and supplements. These notes refer to page 27 (1) Core Investment Banking Revenue is a non-GAAP measure. See Appendix for Non-GAAP reconciliation. (2) Revenues are presented net of allocations of interest income and interest expense. During the third quarter ended August 31, 2023, Jefferies Financial Group refined our allocated net interest methodology to better reflect net interest expense across our business units based on use of capital. Historical periods have been reclassed to conform with the revised methodology. 66
Endnotes These notes refer to page 28 (1) Core Investment Banking Revenue is a non-GAAP measure. See Appendix for Non-GAAP reconciliation. (2) Revenues are presented net of allocations of interest income and interest expense. During the third quarter ended August 31, 2023, we refined our allocated net interest methodology to better reflect net interest expense across our business units based on use of capital. Historical periods have been recast to conform with the revised methodology. These notes refer to page 30 (1) Source of data: Bloomberg. (2) Peer group defined as: BAC, C, GS, JPM, MS. (3) Annualization calculation: Q1 Dividend + Q2 Dividend + Q3 Dividend + Q3 Dividend = Annualized 2023. These notes refer to page 31 (1) Fully diluted shares outstanding at end of each period. Fully diluted shares outstanding, a non-GAAP measure, is defined as Jefferies Financial Group’s common shares outstanding plus restricted stock units, stock options, conversion of redeemable preferred shares and other shares. See Appendix for non-GAAP reconciliation. These notes refer to page 32 (1) As of November 30, 2022, certain reclassifications were made within the Consolidated Statement of Earnings to present Income from associated companies and Interest expense within Net revenues. Net revenues, for purposes of calculating Revenue per Head, has been recast to conform to this presentation. These notes refer to page 33 (1) Transaction & Client Related Costs include the following expenses: Business Development, Cost of Sales, Brokerage Clearing & Exchange Fees and Underwriting Fees. These notes refer to page 34 (1) See Appendix for reconciliation to GAAP amount. These notes refer to page 37 (1) Headcount as of period end 8/31/23. (2) Source: Dealogic. FYTD as of 8/31/23. (3) APAC excludes China. 67
Endnotes These notes refer to page 38 (1) Core Investment Banking Revenue is a non-GAAP measure. See Appendix for Non-GAAP reconciliation. (2) Source: Dealogic LTM as of 8/31/23. These notes refer to page 40 (1) Source: Investment banking market position based on data compiled by Jefferies and derived from publicly available company filings, including Form 10-Qs and 10-Ks, earnings releases and supplements. (2) FX rates as of 9/29/23. These notes refer to page 41 (1) Source: Dealogic. LTM as of 8/31/23. These notes refer to page 44 (1) Market share sourced from McLagan market survey and reflects Global Cash Equities which represents cumulative share across US, Pan-Europe, and Asia ex. China markets. (2) 2023 market share reflects H1’23 calendar results (latest available). (3) Revenues are presented net of allocations of interest income and interest expense. During the third quarter ended August 31, 2023, we refined our allocated net interest methodology to better reflect net interest expense across our business units based on use of capital. Historical periods have been recast to conform with the revised methodology. These notes refer to page 45 (1) Cash includes high touch, low touch, agency program trading and swaps commissions in addition to advisory payments. (2) Cash Equities market share and ranks sourced from McLagan. (3) Market share reflects full year 2019 versus H1’23 calendar results. (4) Convertibles and Electronic Trading rank sourced from Coalition/Greenwich. (5) Global market share represents cumulative share across US, Pan-Europe, and Asia ex. China markets. 68
Endnotes These notes refer to page 46 (1) Reflects our internal Equity Research coverage from 2019 versus 2023. (2) Asia includes our co-branded coverage. (3) US ranking reflects 2022 Institutional Investor results. (4) Europe ranking reflects 2023 Institutional Investor results. (5) Asia ranking represents 2022 Asiamoney results. (6) SMiD Cap Stock Coverage Breadth information is as of August 2023, sourced from Starmine, and includes our co-branded partners in the survey. These notes refer to page 47 (1) Market data provided by Substantive Research H1’23 Report. These notes refer to page 49 (1) Total addressable market figures are estimated and sourced from Coalition/Greenwich report. These notes refer to page 51 (1) Revenues are presented net of allocations of interest income and interest expense. During the third quarter ended August 31, 2023, we refined our allocated net interest methodology to better reflect net interest expense across our business units based on use of capital. Historical periods have been recast to conform with the revised methodology. (2) Average Capital excludes Intraday Cash. (3) As of November 30, 2022, we changed our accounting for our secondary trading activity related to purchases and sales of corporate loans. Refer to our Annual Report on Form 10-K for the period ended November 30, 2022 for more information. Average gross assets for 2019 have not been restated for the affect of this change, which would have the effect of reducing the difference for average gross assets between 2019 and 9M 2023. These notes refer to page 52 (1) Rankings sourced from Coalition Greenwich 2022 Fixed Income Study. 69
Endnotes These notes refer to page 53 (1) # of Clients based on accounts with >$1m in Annualized Client Revenues. (2) Rankings sourced from Coalition Greenwich 2022 Fixed Income Study. (3) Period reflects Q3’23 YTD annualized metrics. These notes refer to page 54 (1) MarketAxess 9M YTD August 2023. (2) TradeWeb 9M YTD August 2023. These notes refer to page 59 (1) Total Select Asset Management Revenue is a non-GAAP measure. See Appendix for Non-GAAP reconciliation. (2) LAM revenues ex Oak Hill is a non-GAAP measure, which represents $586M of Investment Return less revenues of $175M generated as a result of the sale of Oak Hill in 2022. These notes refer to page 60 (1) AUM includes aggregate NAV and NAV-equivalent Assets Under Management held by us and our affiliated asset managers as of each period end. These notes refer to page 61 (1) AUM includes aggregate NAV and NAV-equivalent Assets Under Management held by us and our affiliated asset managers as of each period end. (2) Represents revenue share agreement. (3) Equity investment made 10/7/19. Not wholly-owned by Jefferies. (4) Not wholly-owned by Jefferies. (5) Jefferies Finance (JFIN) is a 50/50 joint venture between Jefferies and Mass Mutual Life Insurance Company. Leucadia Asset Management’s share of net earnings from JFIN is included in Investment Banking net revenues. 70
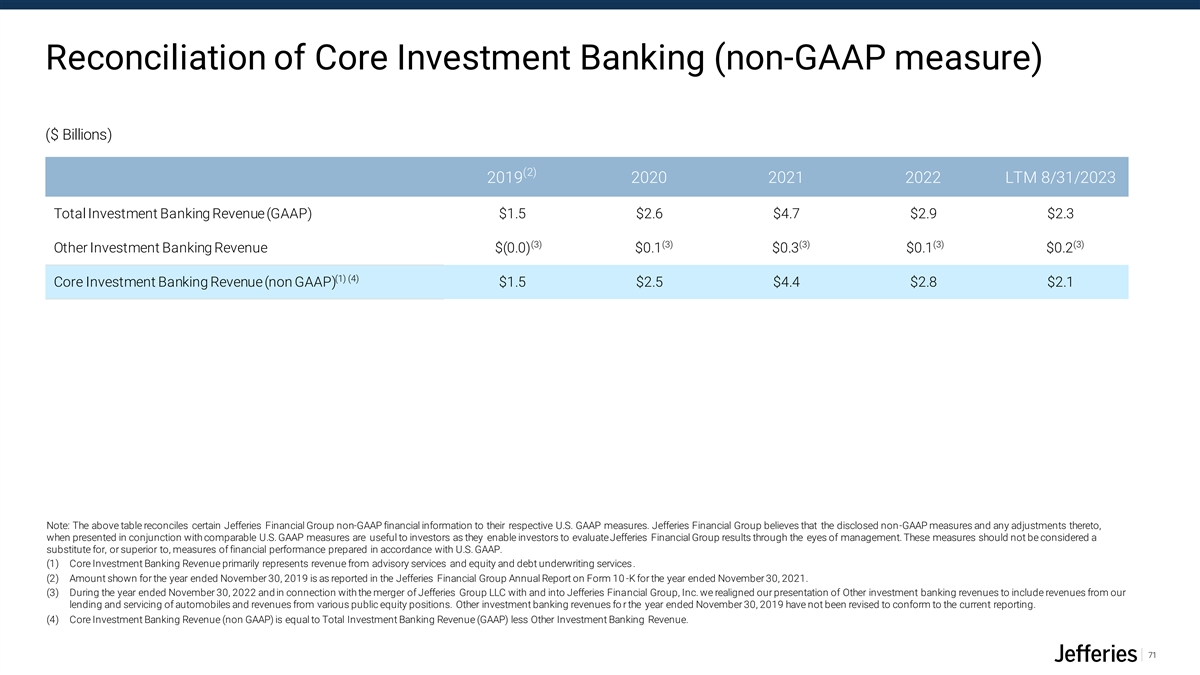
Reconciliation of Core Investment Banking (non-GAAP measure) ($ Billions) (2) 2019 2020 2021 2022 LTM 8/31/2023 Total Investment Banking Revenue (GAAP) $1.5 $2.6 $4.7 $2.9 $2.3 (3) (3) (3) (3) (3) Other Investment Banking Revenue $(0.0) $0.1 $0.3 $0.1 $0.2 (1) (4) Core Investment Banking Revenue (non GAAP) $1.5 $2.5 $4.4 $2.8 $2.1 Note: The above table reconciles certain Jefferies Financial Group non-GAAP financial information to their respective U.S. GAAP measures. Jefferies Financial Group believes that the disclosed non-GAAP measures and any adjustments thereto, when presented in conjunction with comparable U.S. GAAP measures are useful to investors as they enable investors to evaluateJefferies Financial Group results through the eyes of management. These measures should not be considered a substitute for, or superior to, measures of financial performance prepared in accordance with U.S. GAAP. (1) Core Investment Banking Revenue primarily represents revenue from advisory services and equity and debt underwriting services. (2) Amount shown for the year ended November 30, 2019 is as reported in the Jefferies Financial Group Annual Report on Form 10 -K for the year ended November 30, 2021. (3) During the year ended November 30, 2022 and in connection with the merger of Jefferies Group LLC with and into Jefferies Financial Group, Inc. we realigned our presentation of Other investment banking revenues to include revenues from our lending and servicing of automobiles and revenues from various public equity positions. Other investment banking revenues fo r the year ended November 30, 2019 have not been revised to conform to the current reporting. (4) Core Investment Banking Revenue (non GAAP) is equal to Total Investment Banking Revenue (GAAP) less Other Investment Banking Revenue. 71
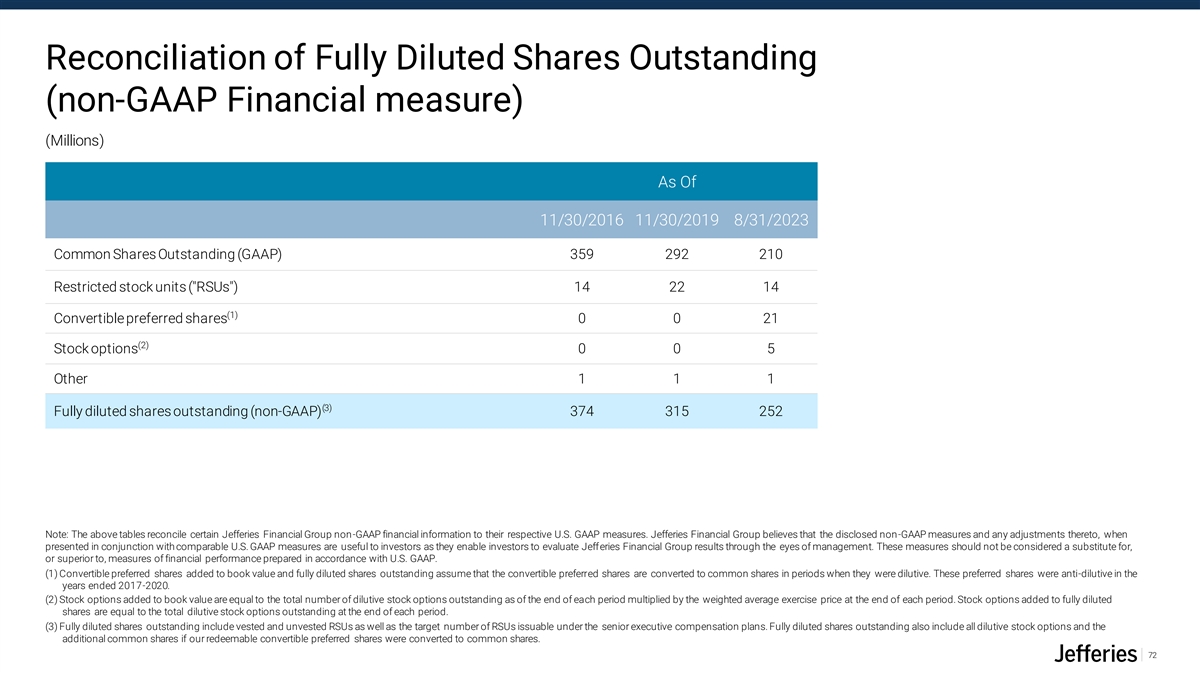
Reconciliation of Fully Diluted Shares Outstanding (non-GAAP Financial measure) ($ Millions except Per Share Amount) (Millions) As Of 11/30/2016 11/30/2019 8/31/2023 Common Shares Outstanding (GAAP) 359 292 210 Restricted stock units ( RSUs ) 14 22 14 (1) Convertible preferred shares 0 0 21 (2) Stock options 0 0 5 Other 1 1 1 Note: The above tables reconcile certain Jefferies Financial Group non-GAAP financial information to their (3) respective U.S. GAAP measures. Jefferies Financial Group believes that the disclosed non-GAAP measures and Fully diluted shares outstanding (non-GAAP) 374 315 252 any adjustments thereto, when presented in conjunction with comparable U.S. GAAP measures are useful to investors as they enable investors to evaluate Jefferies Financial Group results through the eyes of management. These measures should not be considered a substitute for, or superior to, measures of financial performance prepared in accordance with U.S. GAAP. Note: The above tables reconcile certain Jefferies Financial Group non-GAAP financial information to their respective U.S. GAAP measures. Jefferies Financial Group believes that the disclosed non-GAAP measures and any adjustments thereto, when presented in conjunction with comparable U.S. GAAP measures are useful to investors as they enable investors to evaluate Jefferies Financial Group results through the eyes of management. These measures should not be considered a substitute for, or superior to, measures of financial performance prepared in accordance with U.S. GAAP. (1) Convertible preferred shares added to book value and fully diluted shares outstanding assume that the convertible preferred shares are converted to common shares in periods when they were dilutive. These preferred shares were anti-dilutive in the years ended 2017-2020. (2) Stock options added to book value are equal to the total number of dilutive stock options outstanding as of the end of each period multiplied by the weighted average exercise price at the end of each period. Stock options added to fully diluted shares are equal to the total dilutive stock options outstanding at the end of each period. (3) Fully diluted shares outstanding include vested and unvested RSUs as well as the target number of RSUs issuable under the senior executive compensation plans. Fully diluted shares outstanding also include all dilutive stock options and the additional common shares if our redeemable convertible preferred shares were converted to common shares. 72
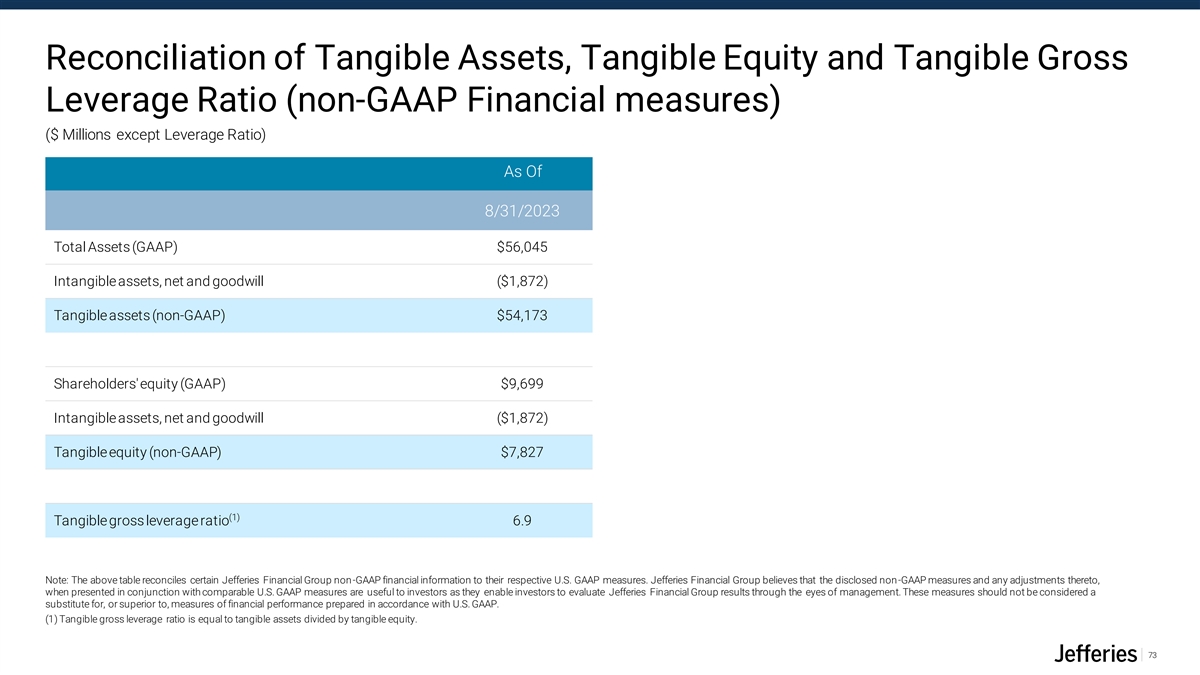
Reconciliation of Tangible Assets, Tangible Equity and Tangible Gross Leverage Ratio (non-GAAP Financial measures) ($ Millions except Leverage Ratio) As Of 8/31/2023 Total Assets (GAAP) $56,045 Intangible assets, net and goodwill ($1,872) Tangible assets (non-GAAP) $54,173 Note: The above tables reconcile certain Jefferies Financial Group non-GAAP financial information Shareholders' equity (GAAP) $9,699 to their respective U.S. GAAP measures. Jefferies Financial Group believes that the disclosed non- Intangible assets, net and goodwill ($1,872) GAAP measures and any adjustments thereto, when presented in conjunction with comparable Tangible equity (non-GAAP) $7,827 U.S. GAAP measures are useful to investors as they enable investors to evaluate Jefferies Financial Group results through the eyes of management. These measures should not be considered a (1) Tangible gross leverage ratio 6.9 substitute for, or superior to, measures of financial performance prepared in accordance with U.S. GAAP. Note: The above table reconciles certain Jefferies Financial Group non-GAAP financial information to their respective U.S. GAAP measures. Jefferies Financial Group believes that the disclosed non-GAAP measures and any adjustments thereto, when presented in conjunction with comparable U.S. GAAP measures are useful to investors as they enable investors to evaluate Jefferies Financial Group results through the eyes of management. These measures should not be considered a substitute for, or superior to, measures of financial performance prepared in accordance with U.S. GAAP. (1) Tangible gross leverage ratio is equal to tangible assets divided by tangible equity. 73
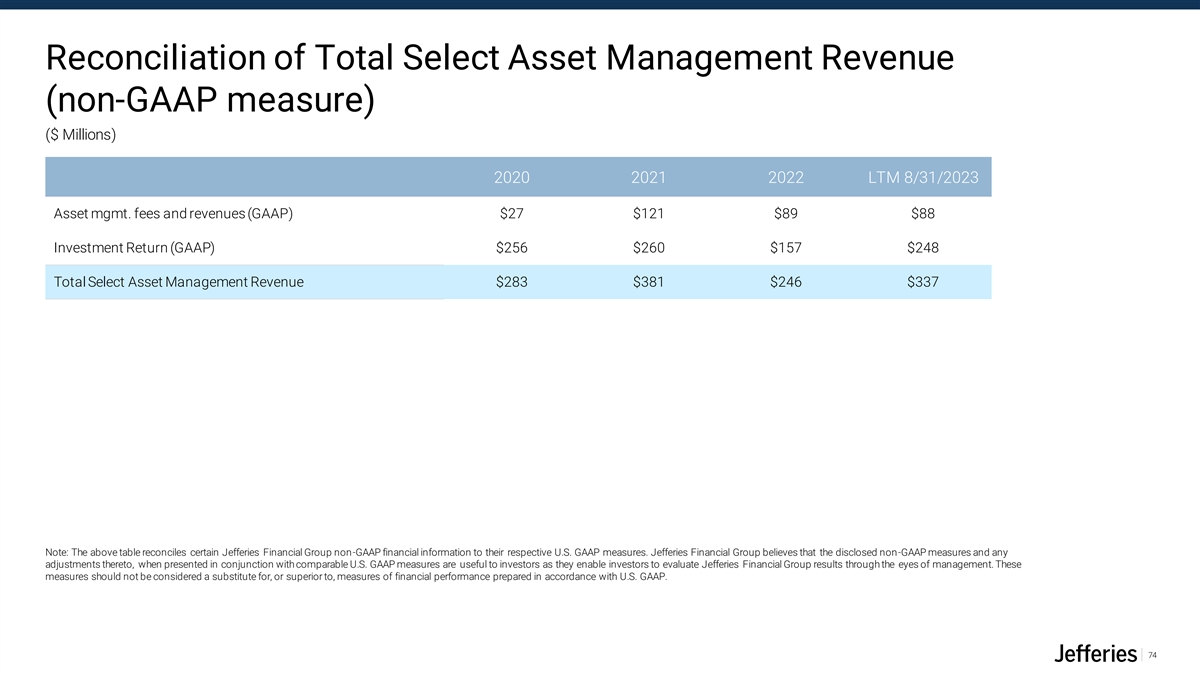
Reconciliation of Total Select Asset Management Revenue (non-GAAP measure) ($ Millions) 2020 2021 2022 LTM 8/31/2023 Asset mgmt. fees and revenues (GAAP) $27 $121 $89 $88 Investment Return (GAAP) $256 $260 $157 $248 Total Select Asset Management Revenue $283 $381 $246 $337 Note: The above table reconciles certain Jefferies Financial Group non-GAAP financial information to their respective U.S. GAAP measures. Jefferies Financial Group believes that the disclosed non-GAAP measures and any adjustments thereto, when presented in conjunction with comparable U.S. GAAP measures are useful to investors as they enable investors to evaluate Jefferies Financial Group results through the eyes of management. These measures should not be considered a substitute for, or superior to, measures of financial performance prepared in accordance with U.S. GAAP. 74