UNITED STATES
SECURITIES AND EXCHANGE COMMISSION
WASHINGTON, D.C. 20549
FORM 8-K
CURRENT REPORT
Pursuant to Section 13 or 15(d)
of the Securities Exchange Act of 1934
Date of Report (Date of earliest event reported): October 11, 2023
WORTHINGTON INDUSTRIES, INC.
(Exact name of Registrant as Specified in Its Charter)
| Ohio | 001-08399 | 31-1189815 | ||
| (State or Other Jurisdiction of Incorporation) |
(Commission File Number) |
(IRS Employer Identification No.) |
| 200 West Old Wilson Bridge Road Columbus, Ohio |
43085 | |
| (Address of Principal Executive Offices) | (Zip Code) |
Registrant’s Telephone Number, Including Area Code: (614) 438-3210
(Former Name or Former Address, if Changed Since Last Report)
Check the appropriate box below if the Form 8-K filing is intended to simultaneously satisfy the filing obligation of the registrant under any of the following provisions:
| ☐ | Written communications pursuant to Rule 425 under the Securities Act (17 CFR 230.425) |
| ☐ | Soliciting material pursuant to Rule 14a-12 under the Exchange Act (17 CFR 240.14a-12) |
| ☐ | Pre-commencement communications pursuant to Rule 14d-2(b) under the Exchange Act (17 CFR 240.14d-2(b)) |
| ☐ | Pre-commencement communications pursuant to Rule 13e-4(c) under the Exchange Act (17 CFR 240.13e-4(c)) |
Securities registered pursuant to Section 12(b) of the Act:
| Title of each class |
Trading |
Name of each exchange on which registered |
||
| Common Shares, Without Par Value | WOR | The New York Stock Exchange |
Indicate by check mark whether the registrant is an emerging growth company as defined in Rule 405 of the Securities Act of 1933 (§ 230.405 of this chapter) or Rule 12b-2 of the Securities Exchange Act of 1934 (§ 240.12b-2 of this chapter).
Emerging growth company ☐
If an emerging growth company, indicate by check mark if the registrant has elected not to use the extended transition period for complying with any new or revised financial accounting standards provided pursuant to Section 13(a) of the Exchange Act. ☐
| Item 7.01 | Regulation FD Disclosure. |
On October 11, 2023, Worthington Industries, Inc. (the “Company”), posted two investor presentations to the Company’s website, both of which relate to the Company’s previously announced plan to separate (the “Planned Separation”) into two independent, publicly traded companies – one company is expected to be comprised of the Company’s Steel Processing business (“Worthington Steel”), and the other company is expected to be comprised of the Company’s Consumer Products, Building Products and Sustainable Energy Solutions businesses (“Worthington Enterprises”). The presentation related to Worthington Steel is included with this Current Report on Form 8-K as Exhibit 99.1 and is incorporated herein by this reference. The presentation related to Worthington Enterprises is included with this Current Report on Form 8-K as Exhibit 99.2 and is incorporated herein by this reference.
These presentations related to the Planned Separation will be shared at the Investor and Analyst Day event the Company is hosting on October 11, 2023 in New York City, and will be available on the Investor Relations section of the Company’s website at https://ir.worthingtonindustries.com. The Worthington Enterprises executive management team will deliver presentations beginning at 9:30 a.m. ET, with the Worthington Steel executive management team presenting at 1:00 p.m. ET.
Completion of the Planned Separation is subject to, among other things, general market conditions, finalization of the capital structure of the two companies, completion of steps necessary to qualify the Planned Separation as a tax-free transaction, receipt of regulatory approvals and final approval by the Company’s Board of Directors. The Company may, at any time and for any reason until the proposed transaction is complete, abandon the Planned Separation or modify or change its terms, including the individual businesses and components of each of the two companies. There can be no assurance regarding the ultimate timing of the Planned Separation or that the Planned Separation will ultimately occur.
The information furnished under Item 7.01 in this Current Report on Form 8-K (including Exhibits 99.1 and 99.2) shall not be deemed “filed” for purposes of Section 18 of the Securities Exchange Act of 1934 (the “Exchange Act”) or otherwise subject to the liabilities of that section and shall not be deemed incorporated by reference in any filing made by the Company under the Securities Act of 1933 or the Exchange Act, except as set forth by specific reference in such filing. This Current Report on Form 8-K shall not be deemed an admission as to the materiality of any information in this Current Report on Form 8-K that is being disclosed pursuant to Regulation FD.
Safe Harbor Statement
Selected statements contained in this Current Report on Form 8-K constitute “forward-looking statements,” as that term is used in the Private Securities Litigation Reform Act of 1995 (the “Act”). The Company wishes to take advantage of the Safe Harbor provisions included in the Act. Forward-looking statements reflect the Company’s current expectations, estimates or projections concerning future results or events. These statements are often identified by the use of forward-looking words or phrases such as “believe,” “expect,” “anticipate,” “may,” “could,” “should,” “would,” “intend,” “plan,” “will,” “likely,” “estimate,” “project,” “position,” “strategy,” “target,” “aim,” “seek,” “foresee,” or other similar words or phrases. These forward-looking statements include, without limitation, statements relating to: future or expected cash positions, liquidity and ability to access financial markets and capital; outlook, strategy or business plans; the intended separation (the “Separation”) of the Company’s Steel Processing business (“Worthington Steel”) from the Company’s other businesses (“New Worthington”); the timing and method of the Separation; the anticipated benefits of the Separation; the expected financial and operational performance of, and future opportunities for, each of the two independent, publicly-traded companies following the Separation; the tax treatment of the Separation transaction; the leadership of each of the two independent, publicly-traded companies following the Separation; the ever-changing effects of the novel coronavirus (“COVID-19”) pandemic and the various responses of governmental and nongovernmental authorities thereto (such as fiscal stimulus packages, quarantines, shut downs and other restrictions on travel and commercial, social or other activities) on economies (local, national and international) and markets, and on our customers, counterparties, employees and third-party service providers; future or expected growth, growth potential, forward momentum, performance, competitive position, sales, volumes, cash flows, earnings, margins, balance sheet strengths, debt, financial condition or other financial measures; pricing trends for raw materials and finished goods and the impact of pricing changes; the ability to improve or maintain margins; expected demand or demand trends for the Company or its markets; additions to product lines and opportunities to participate in new markets; expected benefits from transformation and innovation efforts; the ability to improve performance and competitive position at the Company’s operations; anticipated working capital needs, capital expenditures and asset sales; anticipated improvements and efficiencies in costs, operations, sales, inventory management, sourcing and the supply chain and the results thereof; projected profitability potential; the ability to make acquisitions and the projected timing, results, benefits, costs, charges and expenditures related to acquisitions, joint ventures, headcount reductions and facility dispositions, shutdowns and consolidations; projected capacity and the alignment of operations with demand; the ability to operate profitably and generate cash in down markets; the ability to capture and maintain market share and to develop or take advantage of future opportunities, customer initiatives, new businesses, new products and new markets; expectations for Company and customer inventories, jobs and orders; expectations for the economy and markets or improvements therein; expectations for generating improving and sustainable earnings, earnings potential, margins or shareholder value; effects of judicial rulings; and other non-historical matters.
Because they are based on beliefs, estimates and assumptions, forward-looking statements are inherently subject to risks and uncertainties that could cause actual results to differ materially from those projected. Any number of factors could affect actual results, including, without limitation, those that follow: obtaining final approval of the Separation by the Worthington Industries, Inc. Board of Directors; the uncertainty of obtaining regulatory approvals in connection with the Separation, including rulings from the Internal Revenue Service; the ability to satisfy the necessary closing conditions to complete the Separation on a timely basis, or at all; the Company’s ability to successfully separate the two independent companies and realize the anticipated benefits of the Separation; the risks, uncertainties and impacts, for both the Company’s business and the planned Separation, related to the United Auto Workers strikes against Ford, General Motors and Stellantis North America (the “Detroit Three automakers”), and the associated impact on companies that supply the Detroit Three automakers, the duration and scope of which are impossible to predict; the effect of conditions in national and worldwide financial markets, including inflation, increases in interest rates and economic recession, and with respect to the ability of financial institutions to provide capital; the risks, uncertainties and impacts related to the COVID-19 pandemic – the duration, extent and severity of which are impossible to predict, including the possibility of future resurgence in the spread of COVID-19 or variants thereof – and the availability, effectiveness and acceptance of vaccines, and other actual or potential public health emergencies and actions taken by governmental authorities or others in connection therewith; the effect of national, regional and global economic conditions generally and within major product markets, including significant economic disruptions from COVID-19, the actions taken in connection therewith and the implementation of related fiscal stimulus packages; the impact of tariffs, the adoption of trade restrictions affecting the Company’s products or suppliers, a United States (“U.S.”) withdrawal from or significant renegotiation of trade agreements, the occurrence of trade wars, the closing of border crossings, and other changes in trade regulations or relationships; changing commodity prices and/or supply; product demand and pricing; changes in product mix, product substitution and market acceptance of the Company’s products; volatility or fluctuations in the pricing, quality or availability of raw materials (particularly steel), supplies, transportation, utilities, labor and other items required by operations (especially in light of the COVID-19 pandemic and Russia’s invasion of Ukraine); effects of sourcing and supply chain constraints; the outcome of adverse claims experience with respect to workers’ compensation, product recalls or product liability, casualty events or other matters; effects of facility closures and the consolidation of operations; the effect of financial difficulties, consolidation and other changes within the steel, automotive, construction and other industries in which the Company participates; failure to maintain appropriate levels of inventories; financial difficulties (including bankruptcy filings) of original equipment manufacturers, end-users and customers, suppliers, joint venture partners and others with whom the Company does business; the ability to realize targeted expense reductions from headcount reductions, facility closures and other cost reduction efforts; the ability to realize cost savings and operational, sales and sourcing improvements and efficiencies, and other expected benefits from transformation initiatives, on a timely basis; the overall success of, and the ability to integrate, newly-acquired businesses and joint ventures, maintain and develop their customers, and achieve synergies and other expected benefits and cost savings therefrom; capacity levels and efficiencies, within facilities, within major product markets and within the industries in which the Company participates as a whole; the effect of disruption in the business of suppliers, customers, facilities and shipping operations due to adverse weather, casualty events, equipment breakdowns, labor shortages, interruption in utility services, civil unrest, international conflicts (especially in light of Russia’s invasion of Ukraine), terrorist activities or other causes; changes in customer demand, inventories, spending patterns, product choices, and supplier choices; risks associated with doing business internationally, including economic, political and social instability (especially in light of Russia’s invasion of Ukraine), foreign currency exchange rate exposure and the acceptance of the Company’s products in global markets; the ability to improve and maintain processes and business practices to keep pace with the economic, competitive and technological environment; the effect of inflation, interest rate increases and economic recession, as well as potential adverse impacts as a result of the Inflation Reduction Act of 2022, which may negatively impact the Company’s operations and financial results; deviation of actual results from estimates and/or assumptions used by the Company in the application of its significant accounting policies; the level of imports and import prices in the Company’s markets; the impact of environmental laws and regulations or the actions of the U.S. Environmental Protection Agency or similar regulators which increase costs or limit the Company’s ability to use or sell certain products; the impact of increasing environmental, greenhouse gas emission and sustainability regulations and considerations; the impact of judicial rulings and governmental regulations, both in the U.S. and abroad, including those adopted by the U.S. Securities and Exchange Commission and other governmental agencies as contemplated by the Coronavirus Aid, Relief and Economic Security (CARES) Act, the Consolidated Appropriations Act, 2021, the American Rescue Plan Act of 2021, and the Dodd-Frank Wall Street Reform and Consumer Protection Act of 2010; the effect of healthcare laws in the U.S. and potential changes for such laws, which may increase the Company’s healthcare and other costs and negatively impact the Company’s operations and financial results; the effects of tax laws in the U.S. and potential changes for such laws, which may increase the Company’s costs and negatively impact its operations and financial results; cyber security risks; the effects of privacy and information security laws and standards; and other risks described from time to time in the filings of Worthington Industries, Inc. with the U.S. Securities and Exchange Commission, including those described in “Part I – Item 1A. – Risk Factors” of the Annual Report on Form 10-K of Worthington Industries, Inc. for the fiscal year ended May 31, 2023.
The Company notes these factors for investors as contemplated by the Act. It is impossible to predict or identify all potential risk factors. Consequently, you should not consider the foregoing list to be a complete set of all potential risks and uncertainties. Any forward-looking statements in this Current Report on Form 8-K are based on current information as of the date of this Current Report on Form 8-K, and the Company assumes no obligation to correct or update any such statements in the future, except as required by applicable law.
| Item 9.01 | Financial Statements and Exhibits. |
(a) through (c): Not applicable.
(d) Exhibits:
The following exhibits are included with this Current Report on Form 8-K:
| Exhibit |
Description |
|
| 99.1 | Worthington Steel Investor Presentation posted by Worthington Industries, Inc. on October 11, 2023 (furnished herewith) | |
| 99.2 | Worthington Enterprises Investor Presentation posted by Worthington Industries, Inc. on October 11, 2023 (furnished herewith) | |
| 104 | Cover Page Interactive Data File (embedded within the Inline XBRL document) | |
SIGNATURES
Pursuant to the requirements of the Securities Exchange Act of 1934, the registrant has duly caused this report to be signed on its behalf by the undersigned hereunto duly authorized.
| WORTHINGTON INDUSTRIES, INC. | ||||||
| Date: October 11, 2023 | By: | /s/ Patrick J. Kennedy |
||||
| Patrick J. Kennedy, Vice President - General Counsel and Secretary |
||||||

Exhibit 99.1 Worthington Steel Investor Day 2023 | October 11, 2023 A premier, value-added steel processor with blue-chip customers and expanded opportunities in electrical steel and automotive lightweighting
Notes to Investors FORWARD LOOKING STATEMENTS. Worthington Industries, Inc. (“Worthington”) and Worthington Steel, Inc. (“Worthington Steel” or the “Company) wish to take advantage of the Safe Harbor provisions included in the Private Securities Litigation Reform Act of 1995 (the “Act”). Statements by Worthington and/or the Company relating to the intended separation of Worthington’s Steel Processing business; the timing and method of the separation; the anticipated benefits of the separation; the expected financial and operating performance of, and future opportunities for, each company following the separation; the tax treatment of the transaction; the leadership of each company following the separation; and other non- historical matters constitute “forward-looking statements” within the meaning of the Act. Forward-looking statements may be characterized by terms such as “believe,” “anticipate,” “should,” “would,” “intend,” “plan,” “will,” “expect,” “estimate,” “project,” “positioned,” “strategy,” “targets,” “aims,” “seeks,” “sees” and similar expressions. Because they are based on beliefs, estimates and assumptions, forward-looking statements are inherently subject to risks and uncertainties that could cause actual results to differ materially from those projected. Any number of factors could affect actual results, including, without limitation, the final approval of the separation by our board of directors; the uncertainty of obtaining regulatory approvals in connection with the separation; the ability to satisfy the necessary closing conditions to complete the separation on a timely basis, or at all; our ability to successfully separate the two companies and realize the anticipated benefits of the separation; the risks, uncertainties and impacts, for both Worthington and/or the Company’s business and the planned separation, related to the United Auto Workers strikes against Ford, General Motors and Stellantis North America (the “Detroit Three automakers”), and the associated impact on companies that supply the Detroit Three automakers, the duration and scope of which are impossible to predict; the effect of conditions in national and worldwide financial markets, including inflation, increases in interest rates and economic recession, and with respect to the ability of financial institutions to provide capital; the impact of tariffs, the adoption of trade restrictions affecting Worthington and/or the Company products or suppliers, a United States withdrawal from or significant renegotiation of trade agreements, the occurrence of trade wars, the closing of border crossings, and other changes in trade regulations or relationships; changing oil prices and/or supply; product demand and pricing; changes in product mix, product substitution and market acceptance of Worthington and/or the Company’s products; volatility or fluctuations in the pricing, quality or availability of raw materials (particularly steel), supplies, transportation, utilities, labor and other items required by operations (especially in light of Russia’s invasion of Ukraine); effects of sourcing and supply chain constraints; the outcome of adverse claims experience with respect to workers’ compensation, product recalls or product liability, casualty events or other matters; effects of facility closures and the consolidation of operations; the effect of financial difficulties, consolidation and other changes within the steel, automotive, construction and other industries in which Worthington and/or the Company participates; failure to maintain appropriate levels of inventories; financial difficulties (including bankruptcy filings) of original equipment manufacturers, end-users and customers, suppliers, joint venture partners and others with whom Worthington and/or the Company does business; the ability to realize targeted expense reductions from headcount reductions, facility closures and other cost reduction efforts; the ability to realize cost savings and operational, sales and sourcing improvements and efficiencies, and other expected benefits from transformation initiatives, on a timely basis; the overall success of, and the ability to integrate, newly- acquired businesses and joint ventures, maintain and develop their customers, and achieve synergies and other expected benefits and cost savings therefrom; capacity levels and efficiencies, within facilities, within major product markets and within the industries in which Worthington and/or the Company participates as a whole; the effect of disruption in the business of suppliers, customers, facilities and shipping operations due to adverse weather, casualty events, equipment breakdowns, labor shortages, interruption in utility services, civil unrest, international conflicts (especially in light of Russia’s invasion of Ukraine), terrorist activities or other causes; changes in customer demand, inventories, spending patterns, product choices, and supplier choices; risks associated with doing business internationally, including economic, political and social instability (especially in light of Russia’s invasion of Ukraine), foreign currency exchange rate exposure and the acceptance of Worthington and/or the Company’s products in global markets; the ability to improve and maintain processes and business practices to keep pace with the economic, competitive and technological environment; the effect of inflation, interest rate increases and economic recession, as well as potential adverse impacts as a result of the Inflation Reduction Act of 2022, which may negatively impact Worthington and/or the Company’s operations and financial results; deviation of actual results from estimates and/or assumptions used by Worthington and/or the Company in the application of its significant accounting policies; the level of imports and import prices in Worthington and/or the Company’s markets; 1
Notes to Investors the impact of environmental laws and regulations or the actions of the United States Environmental Protection Agency or similar regulators which increase costs or limit Worthington and/or the Company’s ability to use or sell certain products; the impact of increasing environmental, greenhouse gas emission and sustainability considerations or regulations; the impact of judicial rulings and governmental regulations, both in the United States and abroad, including those adopted by the United States Securities and Exchange Commission (“SEC”) and other governmental agencies as contemplated by the Coronavirus Aid, Relief and Economic Security (CARES) Act, the Consolidated Appropriations Act, 2021, the American Rescue Act of 2021, and the Dodd-Frank Wall Street Reform and the Consumer Protection Act of 2010; the effect of healthcare laws in the United States and potential changes for such laws, especially in light of the COVID-19 pandemic which may increase Worthington and/or the Company’s healthcare and other costs and negatively impact Worthington and/or the Company’s operations and financial results; the effect of tax laws in the U.S. and potential changes for such laws, which may increase Worthington and/or the Company's costs and negatively impact its operations and financial results; cyber security risks; the effects of privacy and information security laws and standards; and other risks described from time to time in the filings of Worthington Industries, Inc. with the SEC, including those described in “Part I — Item 1A. — Risk Factors” of Worthington’s Annual Report on Form 10-K for the fiscal year ended May 31, 2023, and its subsequent filings with the SEC, and in the Registration Statement on Form 10 filed by Worthington Steel (the Form 10 ), including those described in Risk Factors , as may be further amended. Forward-looking statements should be construed in the light of such risks. Readers are cautioned not to place undue reliance on any forward-looking statements, which speak only as of the date made. Worthington and/or Company does not undertake, and hereby disclaim, any obligation to update any forward-looking statements, whether as a result of new information, future developments or otherwise. Market, Industry and Other Data: Unless otherwise indicated, information in this presentation concerning our industry, the industries we serve and the markets in which we operate, including our general expectations, market position, market opportunity and market share, is based on information from third-party sources and management estimates. Management estimates are derived from publicly available information and reports provided to us (including reports from S&P Global Mobility and other industry publications, surveys and forecasts), our knowledge of our industry and assumptions based on such information and knowledge, which we believe to be reasonable. Management estimates have not been verified by any independent source. S&P reports, data and information referenced herein (the “S&P Materials”) are the copyrighted property of S&P Global Inc. and its subsidiaries (“S&P”). The S&P Materials are from sources considered reliable; however, the accuracy and completeness thereof are not warranted, nor are the opinions and analyses published by S&P representations of fact. The S&P Materials speak as of the original publication date thereof and are subject to change without notice. S&P and other trademarks appearing in this S&P Materials are the property of S&P or their respective owners. FINANCIAL INFORMATION. Unless otherwise specified, all financial data and operating metrics included in these materials are presented on a carve-out basis, as presented in the Form 10 of Worthington Steel, Inc., as filed with the Securities and Exchange Commission. The financial information included in this document may not necessarily reflect Worthington Steel’s financial position, results of operations and cash flows in the future, or what Worthington Steel’s financial position, results of operations and cash flows would have been had Worthington Steel been a standalone, independent, publicly-traded company during the periods presented. 2
Notes to Investors NON-GAAP MEASURES. These materials present certain financial measures that are not calculated in accordance with U.S. generally accepted accounting principles, or GAAP. Management believes these non-GAAP measures provide useful supplemental information on the performance of the Company’s ongoing operations and should not be considered as an alternative to the comparable GAAP measure. Additionally, management believes these non-GAAP measures allow for meaningful comparisons and analysis of trends in Worthington and/or the Company’s businesses and enables investors to evaluate operations and future prospects in the same manner as management. A reconciliation of each non-GAAP measure to its most directly comparable GAAP measure is included in the Appendix. The following provides an explanation of each non-GAAP measure presented in these materials: Adjusted EBITDA is defined as Adjusted Earnings Before Interest, Taxes, Depreciation and Amortization, and consists of EBITDA (calculated by adding or subtracting, as appropriate, interest expense, income tax expense and depreciation and amortization to/from net earnings attributable to controlling interest), which is further adjusted to exclude impairment and restructuring charges (gains) as well as other items that management believes are not reflective of, and thus should not be included when evaluating the performance of its ongoing operations, including incremental costs associated with the planned separation. Impairment charges are excluded from adjusted EBITDA because they do not occur in the ordinary course of our ongoing business operations, are inherently unpredictable in timing and amount, and are non-cash, which we believe facilitates the comparison of historical, current and forecasted financial results Restructuring activities, which can result in both discrete gains and/or losses, consist of established programs that are not part of our ongoing operations, such as divestitures, closing or consolidating facilities, employee severance (including rationalizing headcount or other significant changes in personnel), and realignment of existing operations (including changes to management structure in response to underlying performance and/or changing market conditions). Adjusted EBITDA Margin is calculated by dividing Adjusted EBITDA by net sales. Free Cash Flow is defined as operating cash flows less capital expenditures. This communication shall not constitute an offer of any securities for sale, nor shall there be any offer, sale or distribution of securities in any jurisdiction in which such offer, sale or distribution would be unlawful prior to appropriate registration or qualification under the securities laws of such jurisdiction. For additional information with respect to Worthington Steel and the separation, please refer to the Form 10. The consummation of the separation is subject to customary conditions, as further described in the Form 10. 3

Today’s Presenters Tim Adams Geoff Gilmore Jeff Klingler VP & President & EVP & Chief Financial Officer Chief Executive Officer Chief Operating Officer 4
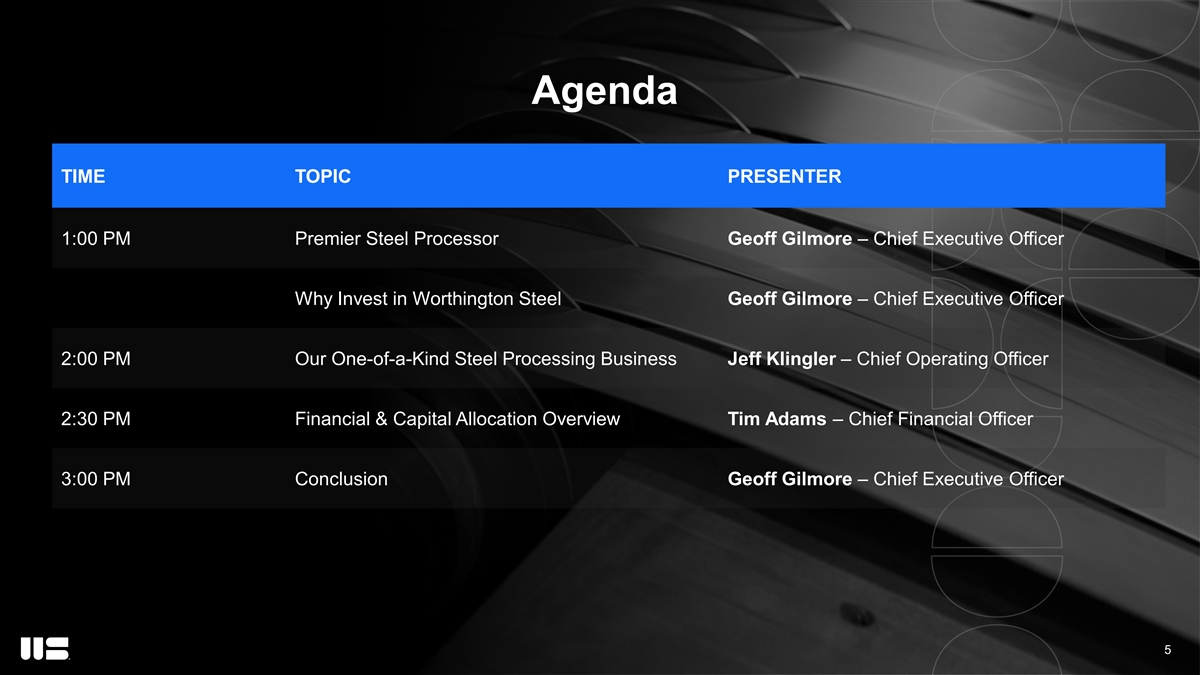
Agenda TIME TOPIC PRESENTER 1:00 PM Premier Steel Processor Geoff Gilmore – Chief Executive Officer Why Invest in Worthington Steel Geoff Gilmore – Chief Executive Officer 2:00 PM Our One-of-a-Kind Steel Processing Business Jeff Klingler – Chief Operating Officer 2:30 PM Financial & Capital Allocation Overview Tim Adams – Chief Financial Officer 3:00 PM Conclusion Geoff Gilmore – Chief Executive Officer 5

PREMIER STEEL PROCESSOR GEOFF GILMORE PRESIDENT & CHIEF EXECUTIVE OFFICER

1 NET SALES 4.0M OUR PHILOSOPHY 1 TONS DELIVERED $3.4B Our people-first philosophy is rooted in the Golden Rule: we treat our employees, customers, suppliers and shareholders as we would like to be treated 3 Net Sales by End-Market 4500 16% PEOPLE OUR VISION 3% 6% To boldly lead the metals industry into a sustainable 53% future by being the most trusted, most innovative and 10% most value-added metals processing partner in North 12% America and beyond 31 Automotive Agriculture Electrical 2 LOCATIONS Construction Heavy Truck Other (Inc. Toll) 1 2 3 TTM ended August 31, 2023; Includes JV people & locations; Sales exclude pro-rata share of unconsolidated JVs. 7
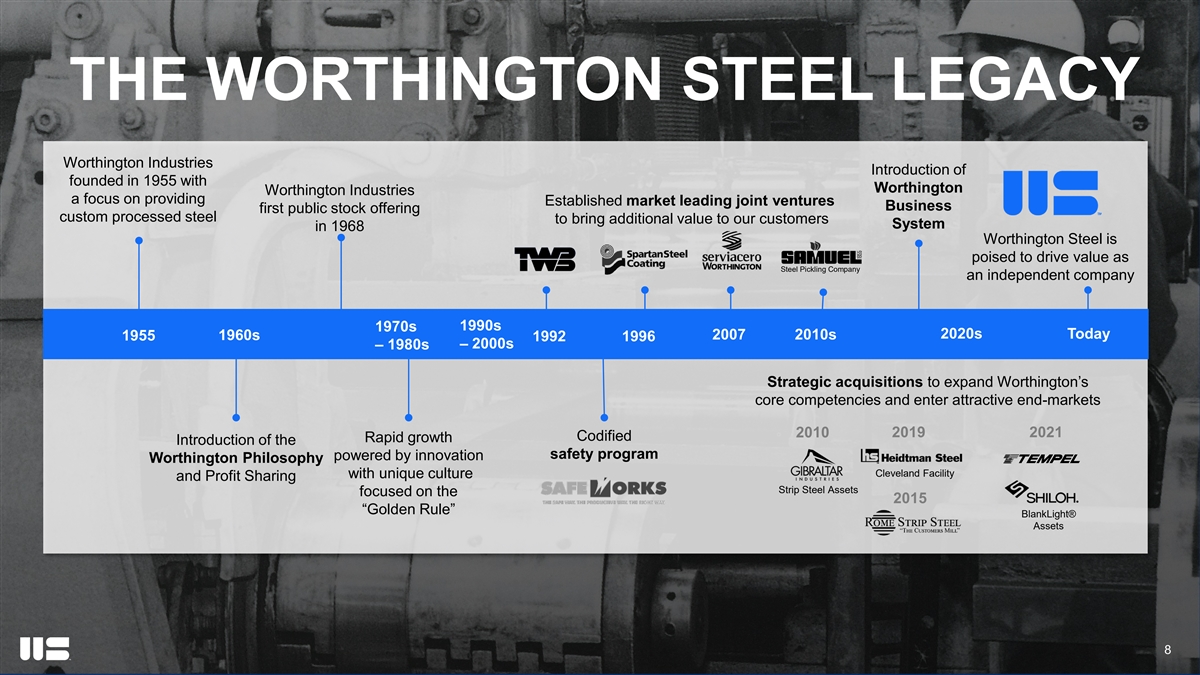
THE WORTHINGTON STEEL LEGACY Worthington Industries Introduction of founded in 1955 with Worthington Worthington Industries a focus on providing Established market leading joint ventures Business first public stock offering custom processed steel to bring additional value to our customers System in 1968 Worthington Steel is poised to drive value as Steel Pickling Company an independent company 1970s 1990s 2020s Today 1960s 2007 2010s 1955 1992 1996 – 2000s – 1980s Strategic acquisitions to expand Worthington’s core competencies and enter attractive end-markets 2010 2019 2021 Codified Rapid growth Introduction of the safety program powered by innovation Worthington Philosophy Cleveland Facility with unique culture and Profit Sharing Strip Steel Assets focused on the 2015 “Golden Rule” BlankLight® Assets 8
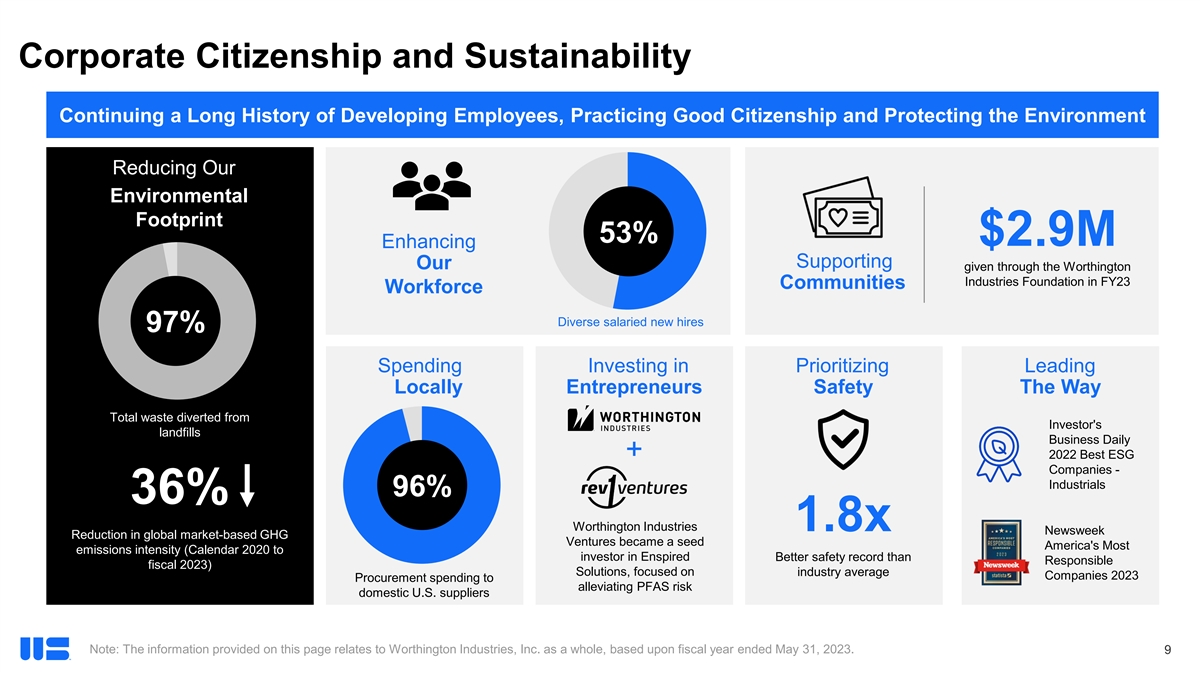
Corporate Citizenship and Sustainability Continuing a Long History of Developing Employees, Practicing Good Citizenship and Protecting the Environment Reducing Our Environmental Footprint 53% $2.9M Enhancing Supporting Our given through the Worthington Industries Foundation in FY23 Communities Workforce Diverse salaried new hires 97% Spending Investing in Prioritizing Leading Locally Entrepreneurs Safety The Way Total waste diverted from Investor's landfills Business Daily 2022 Best ESG + Companies - Industrials 96% 36% Worthington Industries 1.8x Newsweek Reduction in global market-based GHG Ventures became a seed America's Most emissions intensity (Calendar 2020 to investor in Enspired Better safety record than Responsible fiscal 2023) Solutions, focused on industry average Companies 2023 Procurement spending to alleviating PFAS risk domestic U.S. suppliers Note: The information provided on this page relates to Worthington Industries, Inc. as a whole, based upon fiscal year ended May 31, 2023. 9
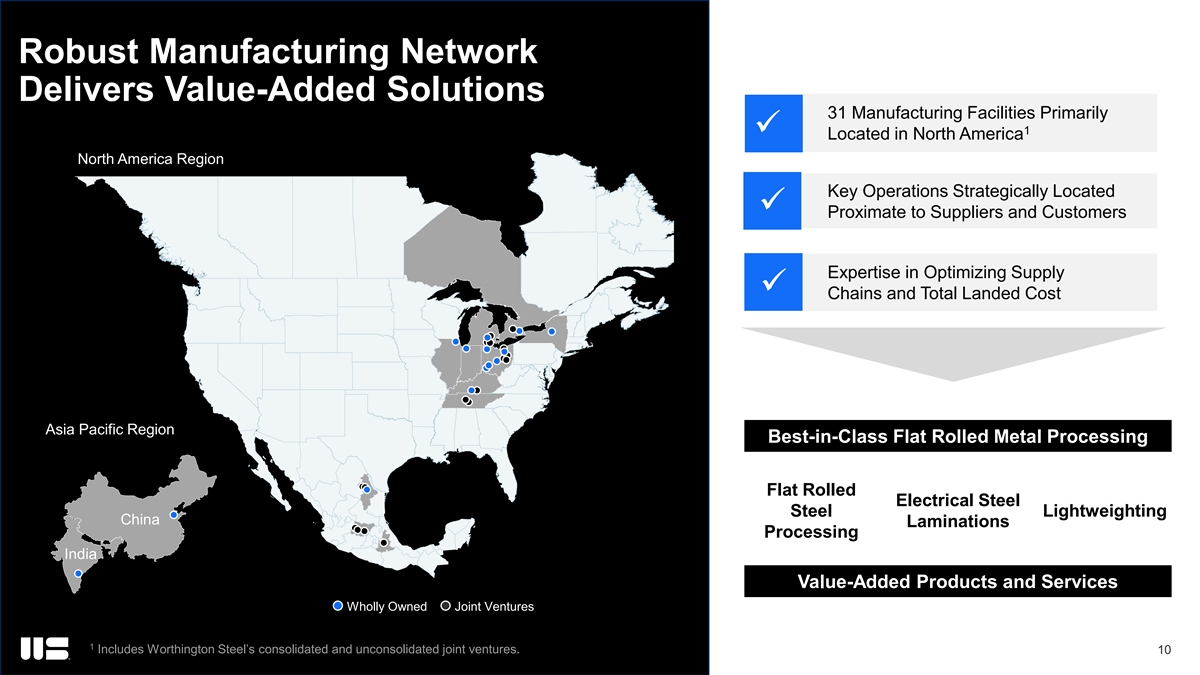
Robust Manufacturing Network Delivers Value-Added Solutions 31 Manufacturing Facilities Primarily 1 ü Located in North America North America Region Key Operations Strategically Located ü Proximate to Suppliers and Customers Expertise in Optimizing Supply ü Chains and Total Landed Cost Asia Pacific Region Best-in-Class Flat Rolled Metal Processing Flat Rolled Electrical Steel Steel Lightweighting China Laminations Processing India Value-Added Products and Services Wholly Owned Facilities Joint Venture Facilities Wholly Owned Joint Ventures 1 Includes Worthington Steel’s consolidated and unconsolidated joint ventures. 10

Critical Supplier to Customers and End Markets Diversified, Blue-Chip Customer Base With Multiple Decades-Long Relationships AUTOMOTIVE CONSTRUCTION ELECTRICAL AGRICULTURE OTHER ~53% OF SALES ~6% OF SALES ~12% OF SALES ~10% OF SALES ~19% OF SALES Note: Sales based on trailing twelve months ended August 31, 2023. 11

PLAY VIDEO 12
WHY INVEST IN WORTHINGTON STEEL GEOFF GILMORE PRESIDENT AND CHIEF EXECUTIVE OFFICER

Unique Steel Processor Well Positioned for Significant Growth 1 WHY Market-Leading Supplier to Attractive End Markets INVEST 2 WORTHINGTON STEEL Strategy Driven by Strong Leadership Team 3 14

Unique Steel Processor Well Positioned for Significant Growth 1 WHY Market-Leading Supplier to Attractive End Markets INVEST 2 WORTHINGTON STEEL Strategy Driven by Strong Leadership Team 3 15
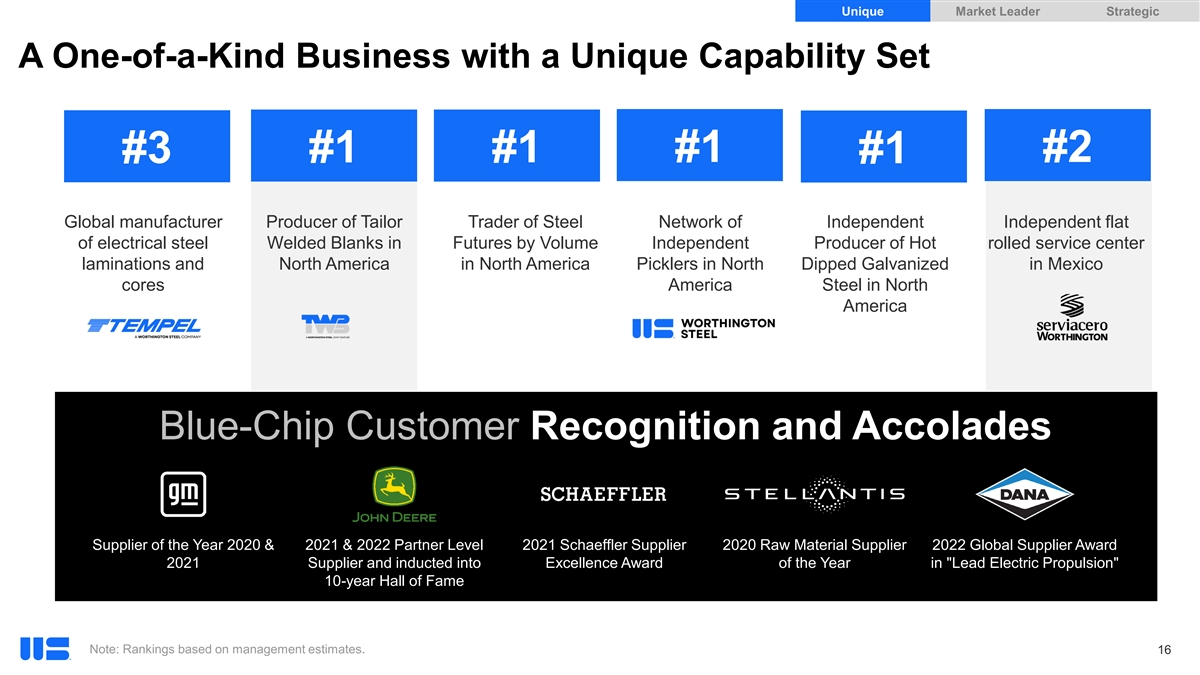
Unique Market Leader Strategic A One-of-a-Kind Business with a Unique Capability Set #1 #1 #1 #2 #3 #1 Global manufacturer Producer of Tailor Trader of Steel Network of Independent Independent flat of electrical steel Welded Blanks in Futures by Volume Independent Producer of Hot rolled service center laminations and North America in North America Picklers in North Dipped Galvanized in Mexico cores America Steel in North America Blue-Chip Customer Recognition and Accolades Supplier of the Year 2020 & 2021 & 2022 Partner Level 2021 Schaeffler Supplier 2020 Raw Material Supplier 2022 Global Supplier Award 2021 Supplier and inducted into Excellence Award of the Year in Lead Electric Propulsion 10-year Hall of Fame Note: Rankings based on management estimates. 16

Unique Market Leader Strategic Worthington Occupies a Unique Position in the Steel Supply Chain WHERE WE OPERATE Mills Service Centers Specialty Hot Roll Dimensional Melt Warehouse Processing Conversion Processing & Distribute Hot Roll Coil (HRC) Specialty cold rolling, Pickling / scale removal Slitting to Width temper pass, annealing, Hot dip galvanizing Cutting to Length heavy gauge blanking Electrical steel lamination manufacturing Tailor welded solutions Supply Chain Management Price Risk Management Why We Win The Breadth of Value-Added Processing Capabilities, End-to-End Supply Chain Management, and Price Risk Management Solutions Differentiates Worthington Steel From Competitors Across the Steel Supply Chain 17

Unique Market Leader Strategic Joint Ventures Expand Our Processing Capabilities and Reach 1 TWB Serviacero Worthington Spartan Steel Coating WSCP (55%) (50%) (52%) (63%) • Partner: BAOSteel Tailored • Partner: Serviacero • Partner: Cleveland-Cliffs • Partner: Samuel, Son & Co. Blanks • Operates 3 steel processing • Single facility in Michigan • Pickling and slitting for the • Tailor welded products for the facilities in Mexico automotive, fabrication and • A cold-rolled, hot-dipped automotive industry appliance markets • Only independent pickler in galvanizing line producing • Operates 11 facilities in US, Mexico galvanized, galvannealed, • Operates 2 pickling facilities Canada, Mexico and aluminized products in Ohio 300k Direct Tons 375k Direct Tons 400k Toll Tons 600k Toll Tons 100k Toll Tons 200k Toll Tons Note: Volumes shown are total tons shipped from the fiscal year ended May 31, 2023 presented on a 100% basis. 18 1 Worthington Samuel Coil Processing.
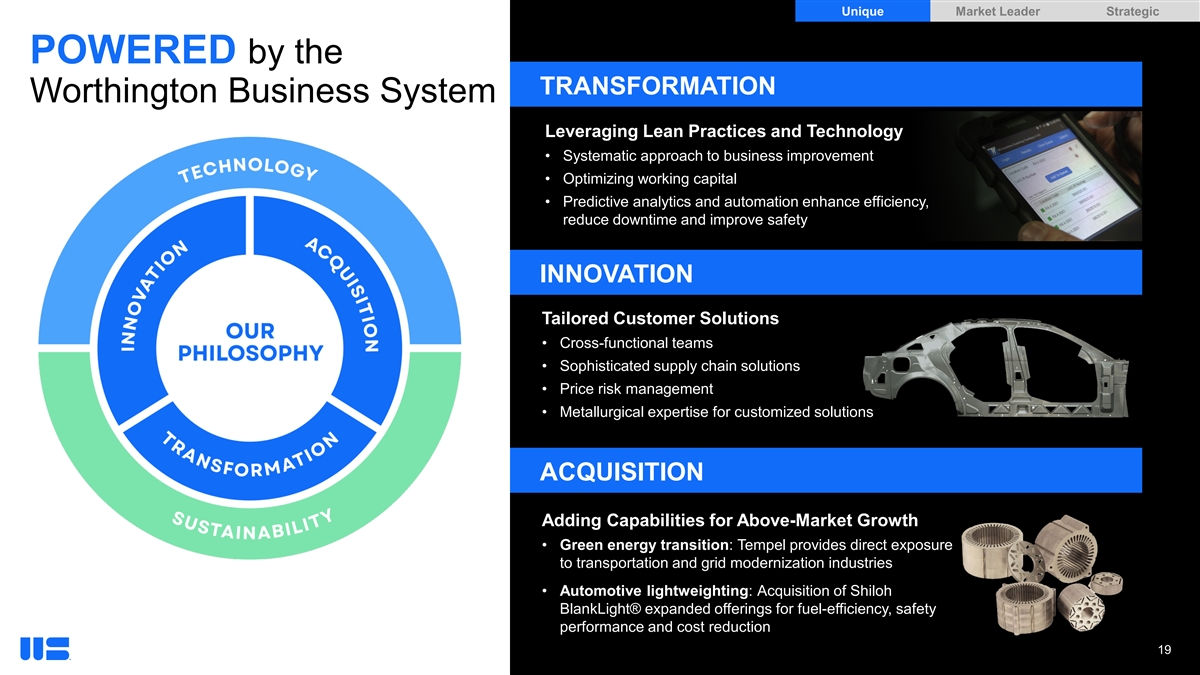
Unique Market Leader Strategic POWERED by the TRANSFORMATION Worthington Business System Leveraging Lean Practices and Technology • Systematic approach to business improvement • Optimizing working capital • Predictive analytics and automation enhance efficiency, reduce downtime and improve safety INNOVATION Tailored Customer Solutions • Cross-functional teams • Sophisticated supply chain solutions • Price risk management • Metallurgical expertise for customized solutions ACQUISITION Adding Capabilities for Above-Market Growth • Green energy transition: Tempel provides direct exposure to transportation and grid modernization industries • Automotive lightweighting: Acquisition of Shiloh BlankLight® expanded offerings for fuel-efficiency, safety performance and cost reduction 19
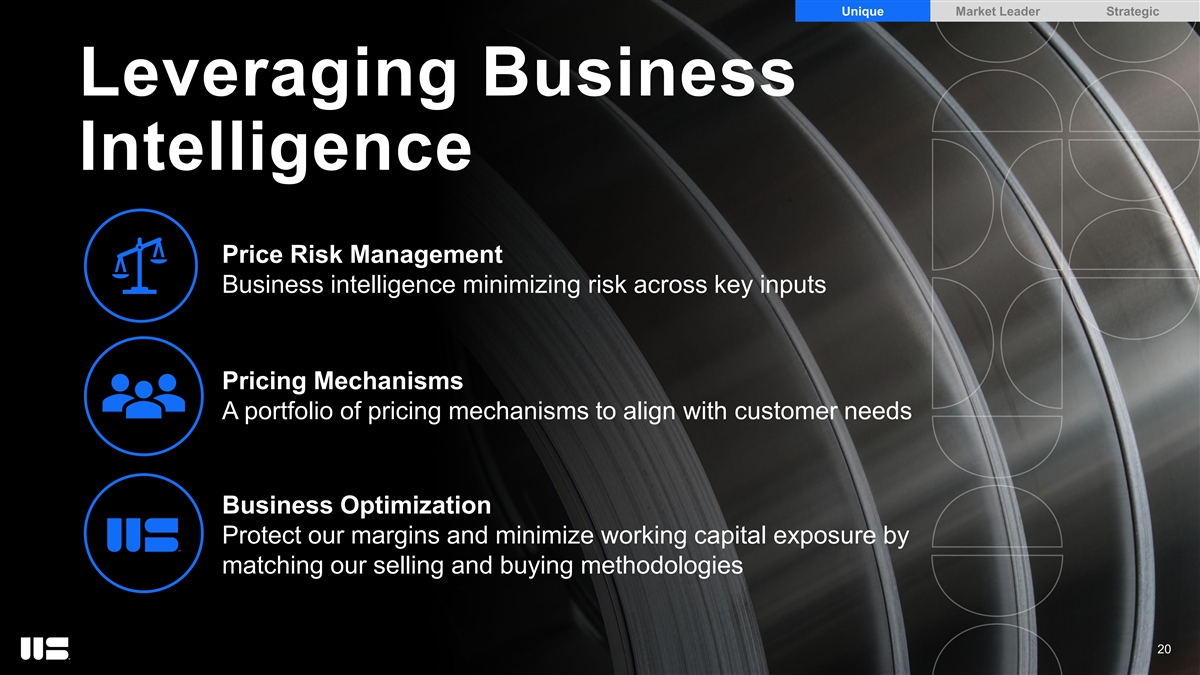
Unique Market Leader Strategic Leveraging Business Intelligence Price Risk Management Business intelligence minimizing risk across key inputs Pricing Mechanisms A portfolio of pricing mechanisms to align with customer needs Business Optimization Protect our margins and minimize working capital exposure by matching our selling and buying methodologies 20
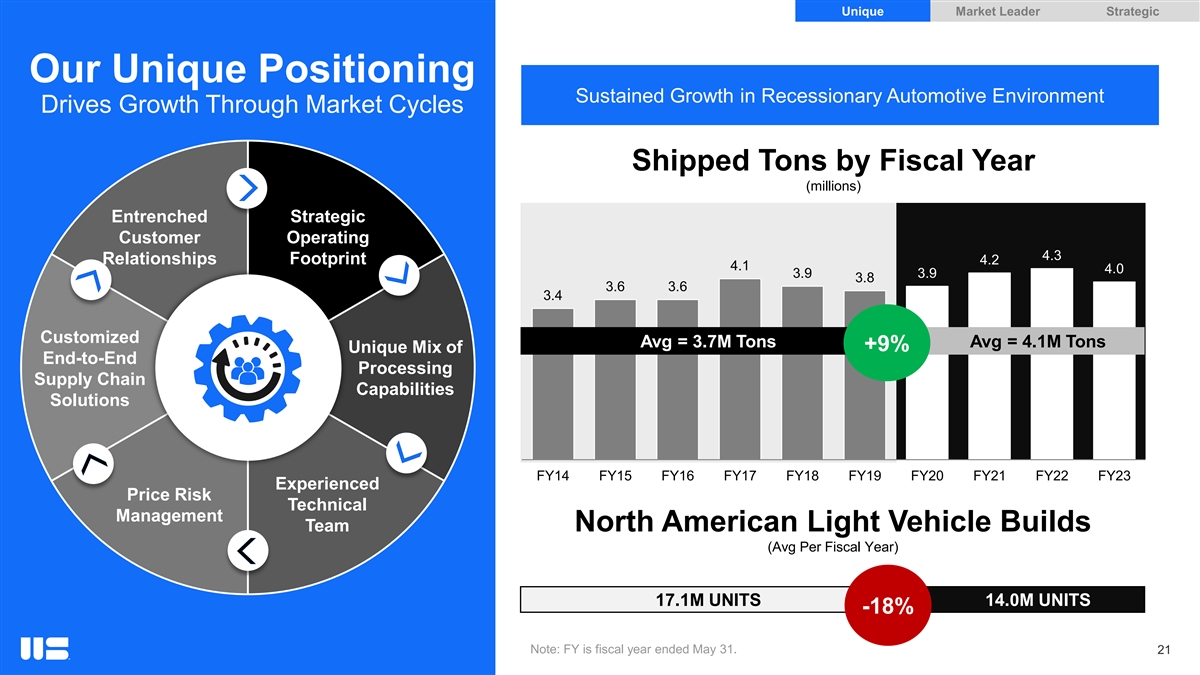
Unique Market Leader Strategic Our Unique Positioning Sustained Growth in Recessionary Automotive Environment Drives Growth Through Market Cycles Shipped Tons by Fiscal Year (millions) Entrenched Strategic Customer Operating 4.3 Relationships Footprint 4.2 4.1 4.0 3.9 3.9 3.8 3.6 3.6 3.4 Customized Avg = 3.7M Tons Avg = 4.1M Tons +9% Unique Mix of End-to-End Processing Supply Chain Capabilities Solutions FY14 FY15 FY16 FY17 FY18 FY19 FY20 FY21 FY22 FY23 Experienced Price Risk Technical Management Team North American Light Vehicle Builds (Avg Per Fiscal Year) 17.1M UNITS 14.0M UNITS -18% Note: FY is fiscal year ended May 31. 21
Unique Steel Processor Well Positioned for Significant Growth 1 WHY Market-Leading Supplier to Attractive End Markets INVEST 2 WORTHINGTON STEEL Strategy Driven by Strong Leadership Team 3 22
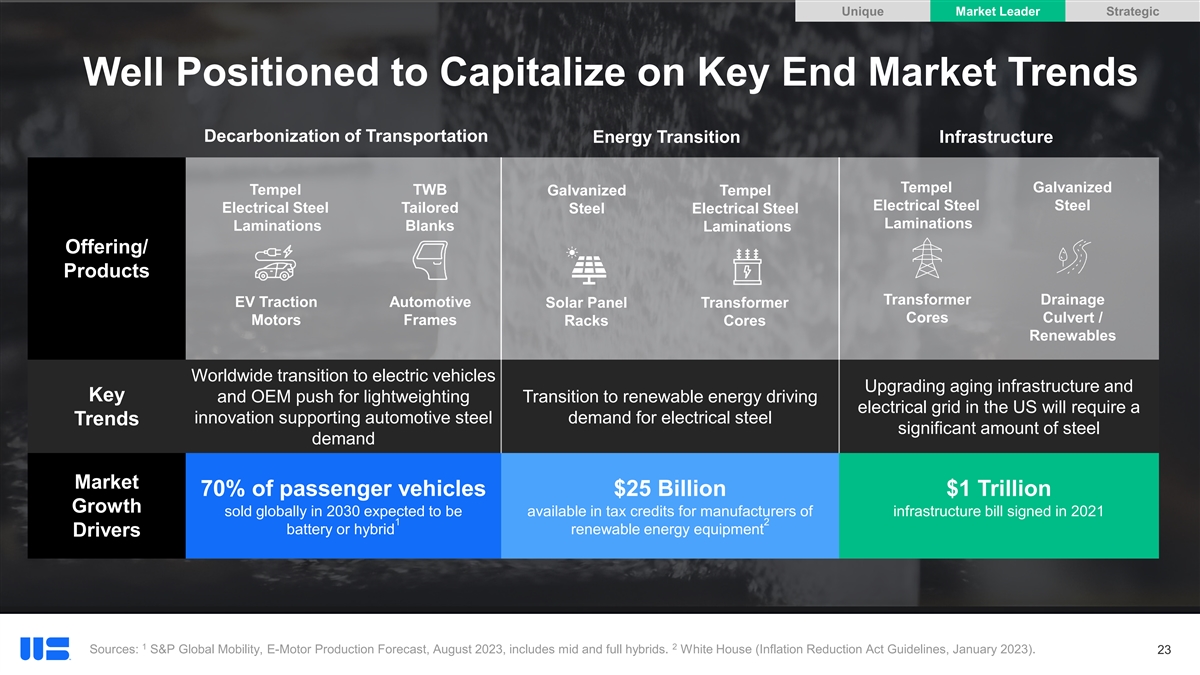
Unique Market Leader Strategic Well Positioned to Capitalize on Key End Market Trends Decarbonization of Transportation Energy Transition Infrastructure Tempel Galvanized Tempel TWB Galvanized Tempel Electrical Steel Steel Electrical Steel Tailored Steel Electrical Steel Laminations Laminations Blanks Laminations Offering/ Products Transformer Drainage EV Traction Automotive Solar Panel Transformer Cores Culvert / Motors Frames Racks Cores Renewables Worldwide transition to electric vehicles Upgrading aging infrastructure and Key and OEM push for lightweighting Transition to renewable energy driving electrical grid in the US will require a innovation supporting automotive steel demand for electrical steel Trends significant amount of steel demand Market 70% of passenger vehicles $25 Billion $1 Trillion Growth sold globally in 2030 expected to be available in tax credits for manufacturers of infrastructure bill signed in 2021 1 2 battery or hybrid renewable energy equipment Drivers 1 2 Sources: S&P Global Mobility, E-Motor Production Forecast, August 2023, includes mid and full hybrids. White House (Inflation Reduction Act Guidelines, January 2023). 23

Unique Market Leader Strategic Automotive Decarbonization Projected Vehicle Production by Propulsion System – 2022 vs. 2030 CY 2022 CY 2030 9% 7% 26% 65% 28% 65% CY 2022 CY 2030 CY 2022 CY 2030 6% 12% 22% 19% 28% Europe 49% 58% 13% 23% 65% 82% 23% North America Greater China Source: S&P Global Mobility, E-Motor Production Forecast, August 2023. 24 Internal Combustion Hybrid Electric Vehicle
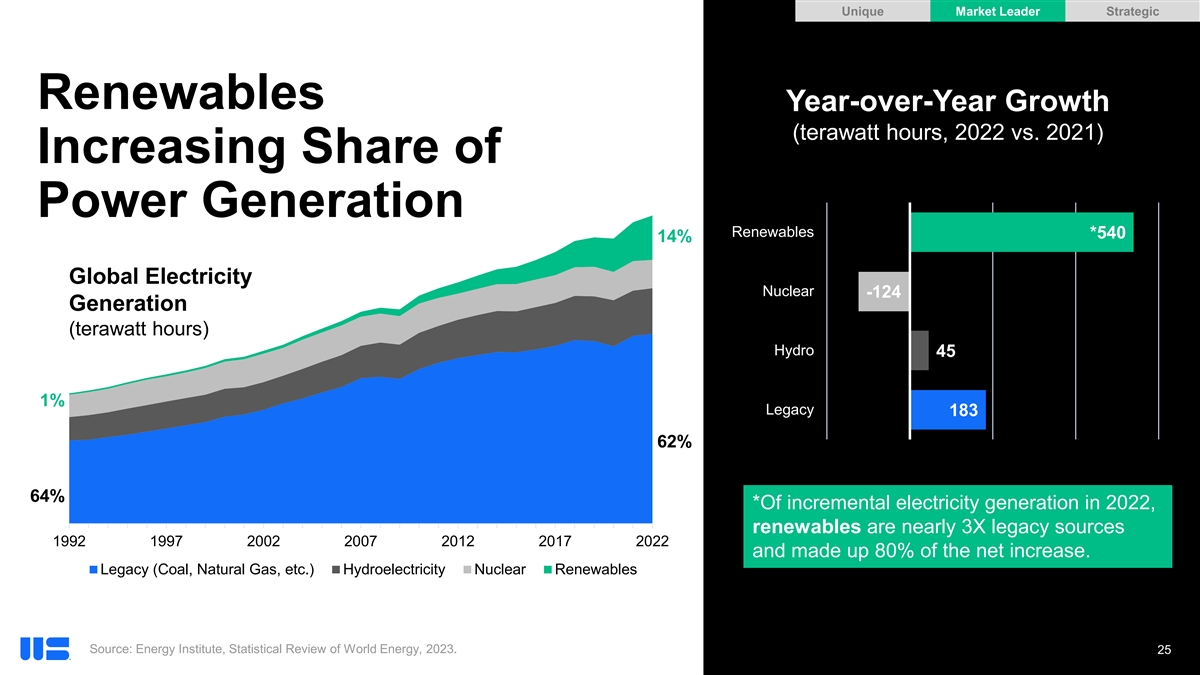
Unique Market Leader Strategic Renewables Year-over-Year Growth (terawatt hours, 2022 vs. 2021) Increasing Share of Power Generation Renewables *540 14% Global Electricity Nuclear -124 Generation (terawatt hours) Hydro 45 1% Legacy 183 62% 64% *Of incremental electricity generation in 2022, renewables are nearly 3X legacy sources 1992 1997 2002 2007 2012 2017 2022 and made up 80% of the net increase. Legacy (Coal, Natural Gas, etc.) Hydroelectricity Nuclear Renewables Source: Energy Institute, Statistical Review of World Energy, 2023. 25
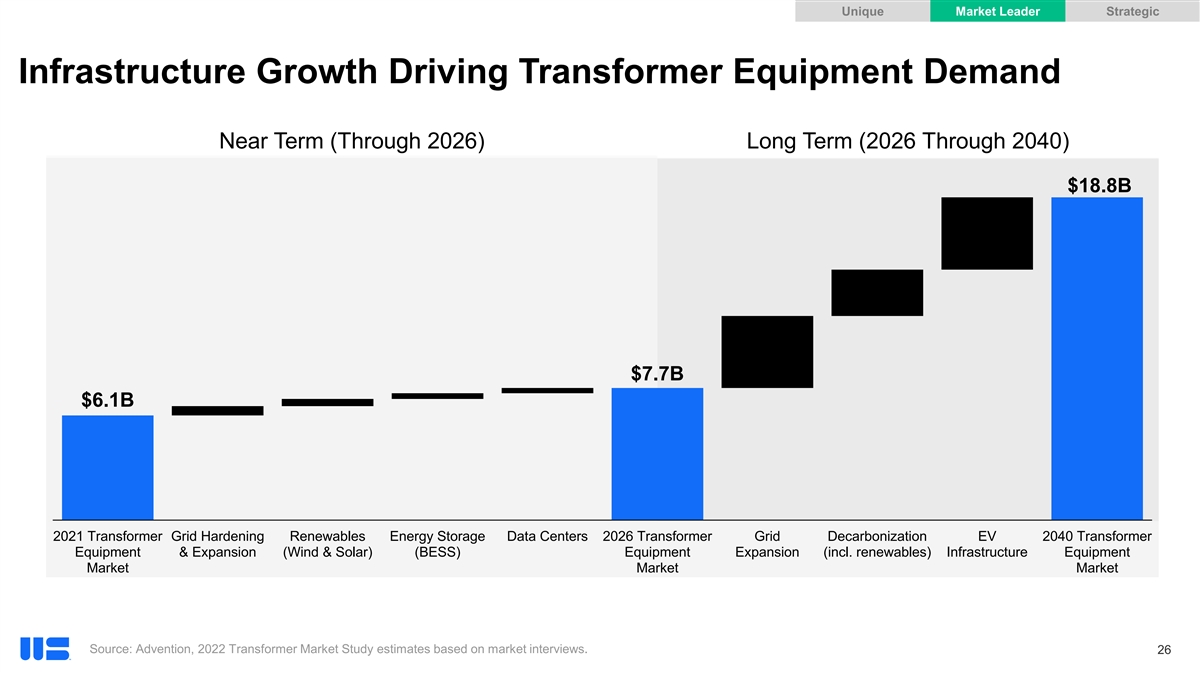
Unique Market Leader Strategic Infrastructure Growth Driving Transformer Equipment Demand Near Term (Through 2026) Long Term (2026 Through 2040) $18.8B $7.7B $6.1B 2021 Transformer Grid Hardening Renewables Energy Storage Data Centers 2026 Transformer Grid Decarbonization EV 2040 Transformer Equipment & Expansion (Wind & Solar) (BESS) Equipment Expansion (incl. renewables) Infrastructure Equipment Market Market Market Source: Advention, 2022 Transformer Market Study estimates based on market interviews. 26
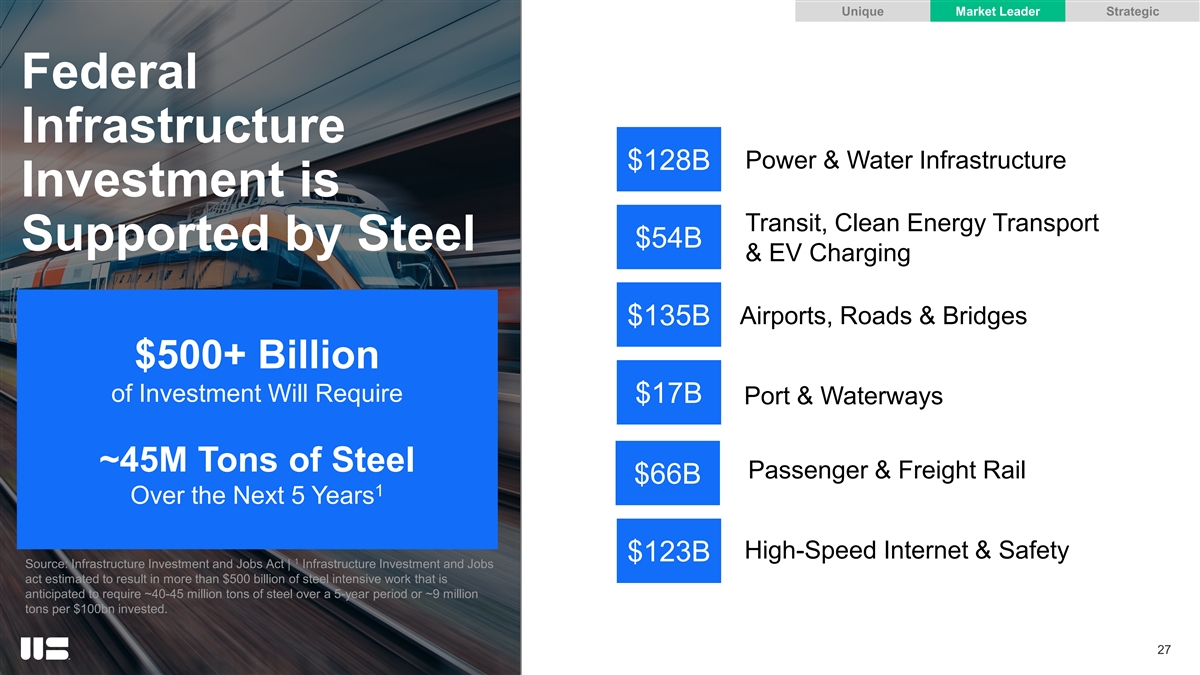
Unique Market Leader Strategic Federal Infrastructure Power & Water Infrastructure $128B Investment is Transit, Clean Energy Transport $54B Supported by Steel & EV Charging $135B Airports, Roads & Bridges $500+ Billion of Investment Will Require $17B Port & Waterways ~45M Tons of Steel Passenger & Freight Rail $66B 1 Over the Next 5 Years High-Speed Internet & Safety $123B 1 Source: Infrastructure Investment and Jobs Act | Infrastructure Investment and Jobs act estimated to result in more than $500 billion of steel intensive work that is anticipated to require ~40-45 million tons of steel over a 5-year period or ~9 million tons per $100bn invested. 27

Unique Steel Processor Well Positioned for Significant Growth 1 WHY Market-Leading Supplier to Attractive End Markets INVEST 2 WORTHINGTON STEEL Strategy Driven by Strong Leadership Team 3 28
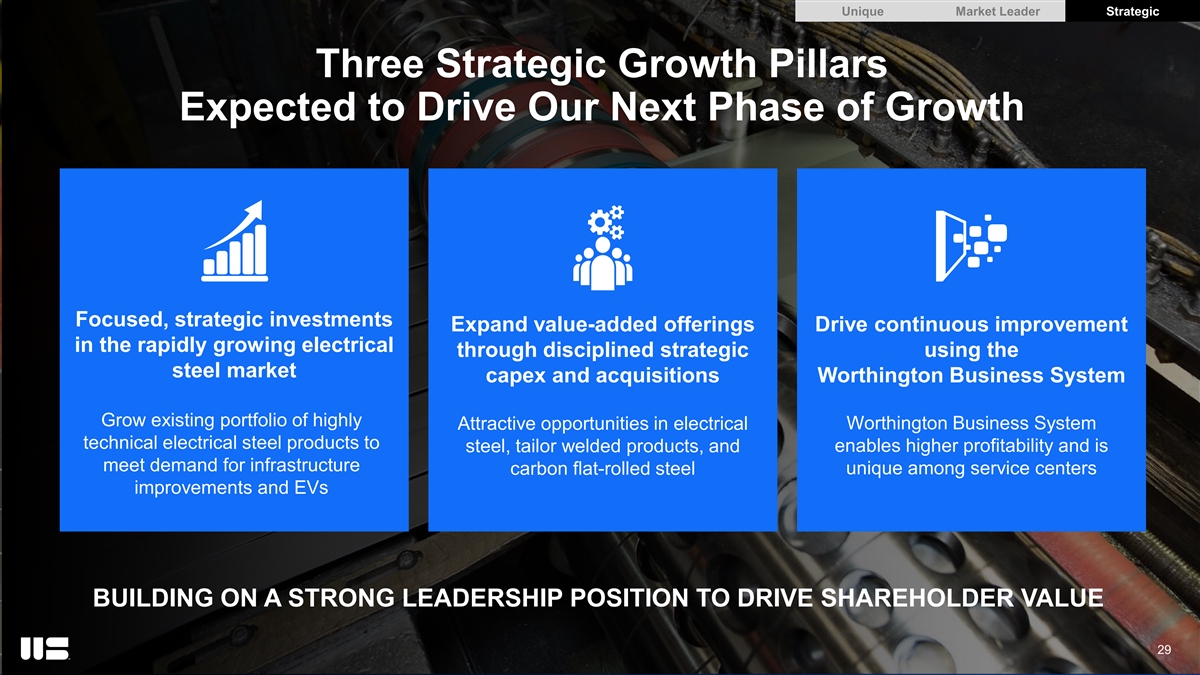
Unique Market Leader Strategic Three Strategic Growth Pillars Expected to Drive Our Next Phase of Growth Focused, strategic investments Expand value-added offerings Drive continuous improvement in the rapidly growing electrical through disciplined strategic using the steel market capex and acquisitions Worthington Business System Grow existing portfolio of highly Attractive opportunities in electrical Worthington Business System technical electrical steel products to steel, tailor welded products, and enables higher profitability and is meet demand for infrastructure carbon flat-rolled steel unique among service centers improvements and EVs BUILDING ON A STRONG LEADERSHIP POSITION TO DRIVE SHAREHOLDER VALUE 29

Unique Market Leader Strategic Proven Management Team Focused on Value Creation Nearly 200 Combined Years of Experience Managing Through Steel Price Cycles and Shifting Macroeconomic Climates with Proven Ability to Execute M&A GEOFF GILMORE JEFF KLINGLER TIM ADAMS MICHAUNE TILLMAN MELISSA DYKSTRA President & Chief VP & Chief VP & General Counsel VP of Corporate Communications Executive VP & Executive Officer Chief Operating Officer Financial Officer 9 Years & Investor Relations 25 Years 25 Years 10 Years 30 Years NIKKI BALLINGER BRAD KERN CLIFF LARIVEY BILL WERTZ VP of Human Resources VP of Operations VP of Commercial, Purchasing VP of Transformation & Price Risk Mgmt & Chief Information Officer 12 Years 33 Years 25 Years 26 Years 30
OUR ONE-OF-A-KIND STEEL PROCESSING BUSINESS JEFF KLINGLER EVP & CHIEF OPERATING OFFICER
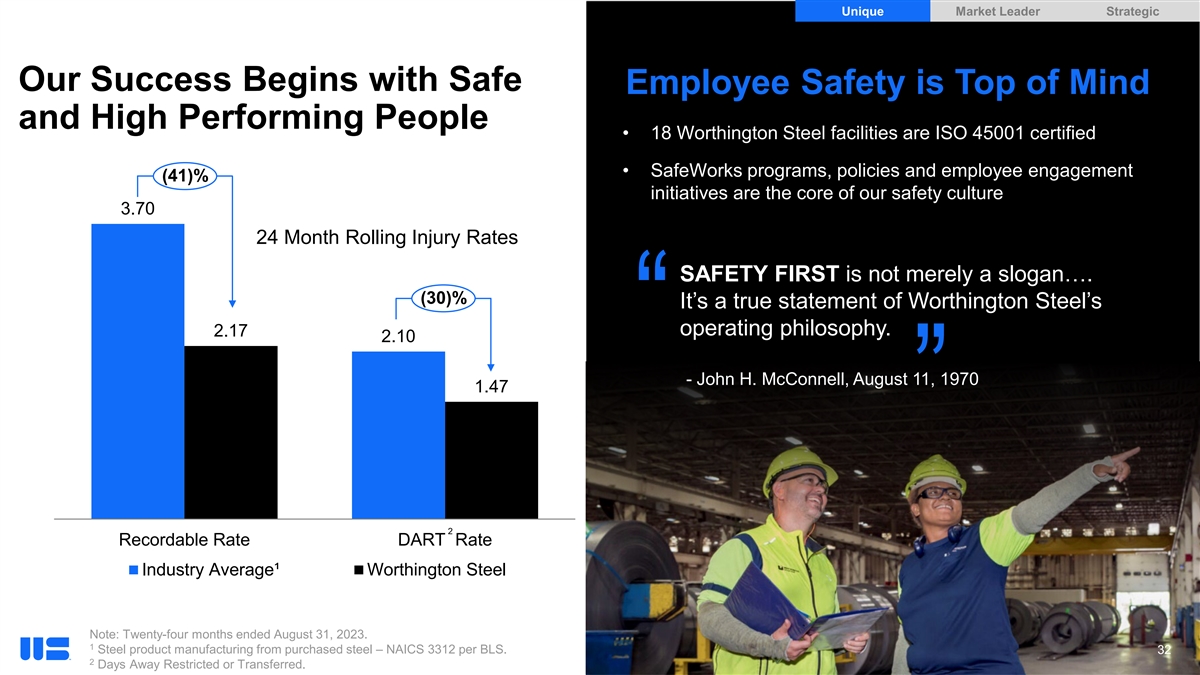
Unique Market Leader Strategic Our Success Begins with Safe Employee Safety is Top of Mind and High Performing People • 18 Worthington Steel facilities are ISO 45001 certified • SafeWorks programs, policies and employee engagement (41)% initiatives are the core of our safety culture 3.70 24 Month Rolling Injury Rates SAFETY FIRST is not merely a slogan…. (30)% It’s a true statement of Worthington Steel’s 2.17 operating philosophy. 2.10 “ - John H. McConnell, August 11, 1970 1.47 ” 2 Recordable Rate DART Rate Industry Average¹ Worthington Steel Note: Twenty-four months ended August 31, 2023. 1 Steel product manufacturing from purchased steel – NAICS 3312 per BLS. 32 2 Days Away Restricted or Transferred.

Unique Market Leader Strategic Our Differentiated Business Model Drives Worthington Steel Forward Beginning with Material Worthington Steel Offers a Wide Range of Value-Added Serving Customers Across from our Mill Partners Processing Capabilities and Services Attractive End Markets Entrenched Strategic Customer Operating Relationships Footprint Automotive Renewable Power Customized Unique Mix of Steel End-to-End Infrastructure Processing Supply Chain Capabilities Solutions Agriculture Mills Construction Experienced Price Risk Heavy Truck Technical Management Team 33

Unique Market Leader Strategic Materials Support and Solutions Team Technical Service Offerings World Class Technical Team Consistent Quality 21 400+ Control & Years of Combined Experience Field & Plant Metallurgists Assurance Knowledge Product Experts Development “Cradle to 6 4 Grave” Material Scientists in the Testing Laboratories Providing Customer and Corporate Materials Laboratory Full Material Characterization Commercial Support State-of-the-Art Data & Analytics Sourcing Operational Process Simulation Driven Decision-Making Development Assistance Equipment Our Technical Services Team Ensures Consistency and Performance Throughout the Sales Process 34

Unique Market Leader Strategic CASE STUDY: Identifying and Solving for Pitted Steel SOLUTION ANALYSIS PROBLEM Defined optimized processing and Customer was paying for buffing and Microstructurally examined the microstructure parameters to maintain the polishing to reduce a rough appearance on steel and determined process surface quality and eliminate buffing and competitive product after forming controls to improve the appearance polishing costs for the customer Over 150,000 shipped tons during fiscal year 2023 tied directly to 35 technical customer development projects completed during the prior five years

Unique Market Leader Strategic The Worthington Business System Drives Continuous Improvement Goal: Margin Expansion Through Operational Excellence Focus: Columbus Tandem Mill Objectives • Improve gauge-reduction performance to reduce scrap and processing time • Leverage insights from various holistic data set and business intelligence tools to identify opportunities for improvement Approximate Savings Achieved $2M $315k Annually Annually Scrap Savings from Improved Performance Reduced / Optimized Footage and Reduced Processing Time 36

Carbon Flat Rolled Steel Processing Market leading provider of carbon flat-rolled steel – a key supplier across the value chain 37

Unique Market Leader Strategic High Quality Steel Processing for Hot Roll Conversion North American Customers 15 Manufacturing Locations Pickling Hot Dip Galvanizing Specialty Processing North America Region Cold Rolling Temper Passing Heavy Gauge Blanking Annealing Asia Pacific Region Dimensional Processing Value-Added Processing Other Processing Locations Slitting to Width Cutting to Length 1 Reflects volumes sold directly to customers in fiscal year ended May 31, 2023. 38 2 Reflects tons of steel customer material toll processed in fiscal year ended May 31, 2023.

Electrical Steel Laminations Tempel is a leading manufacturer of precision magnetic steel laminations for the automotive, transformer, industrial motor, and generator industries • Acquired Tempel Steel on December 1, 2021 39
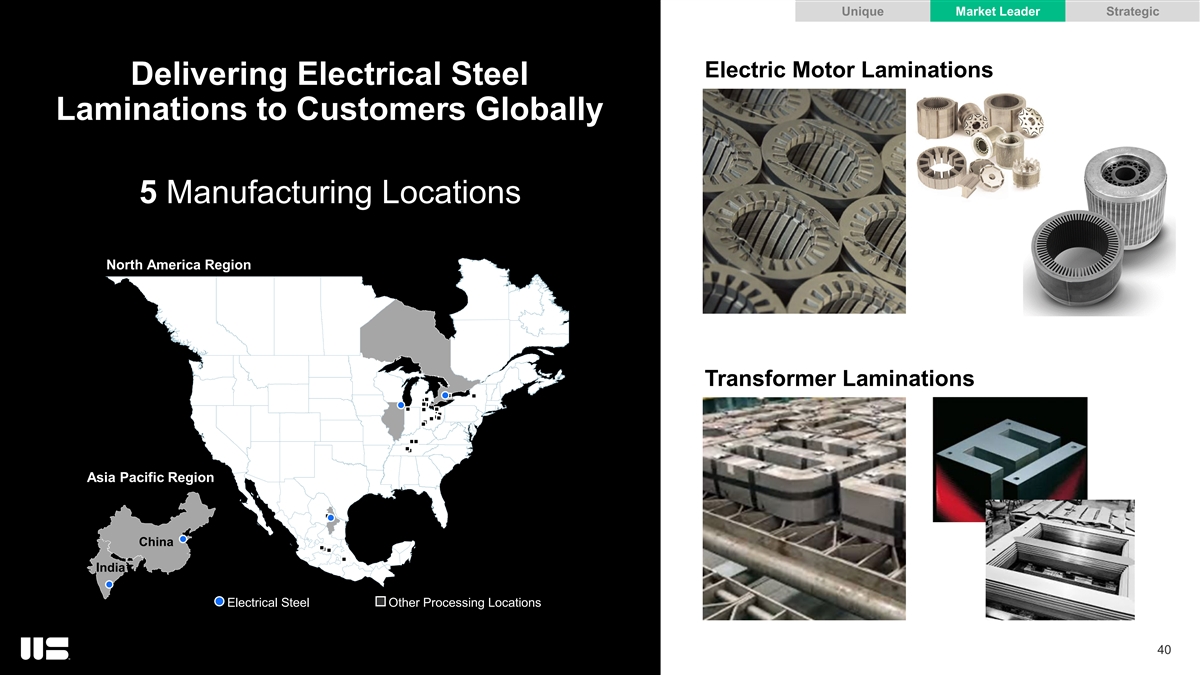
Unique Market Leader Strategic Electric Motor Laminations Delivering Electrical Steel Laminations to Customers Globally 5 Manufacturing Locations North America Region North America Region Transformer Laminations Asia Pacific Region China India Electrical Steel Other Processing Locations 40
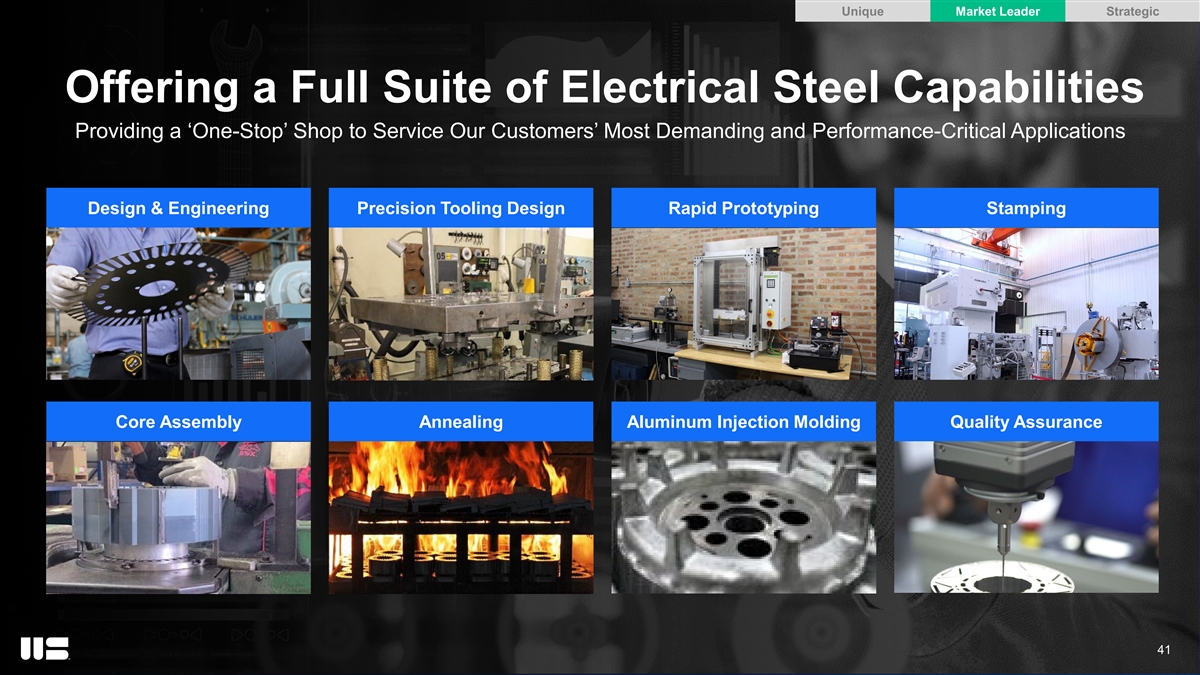
Unique Market Leader Strategic Offering a Full Suite of Electrical Steel Capabilities Providing a ‘One-Stop’ Shop to Service Our Customers’ Most Demanding and Performance-Critical Applications Design & Engineering Precision Tooling Design Rapid Prototyping Stamping Core Assembly Annealing Aluminum Injection Molding Quality Assurance 41
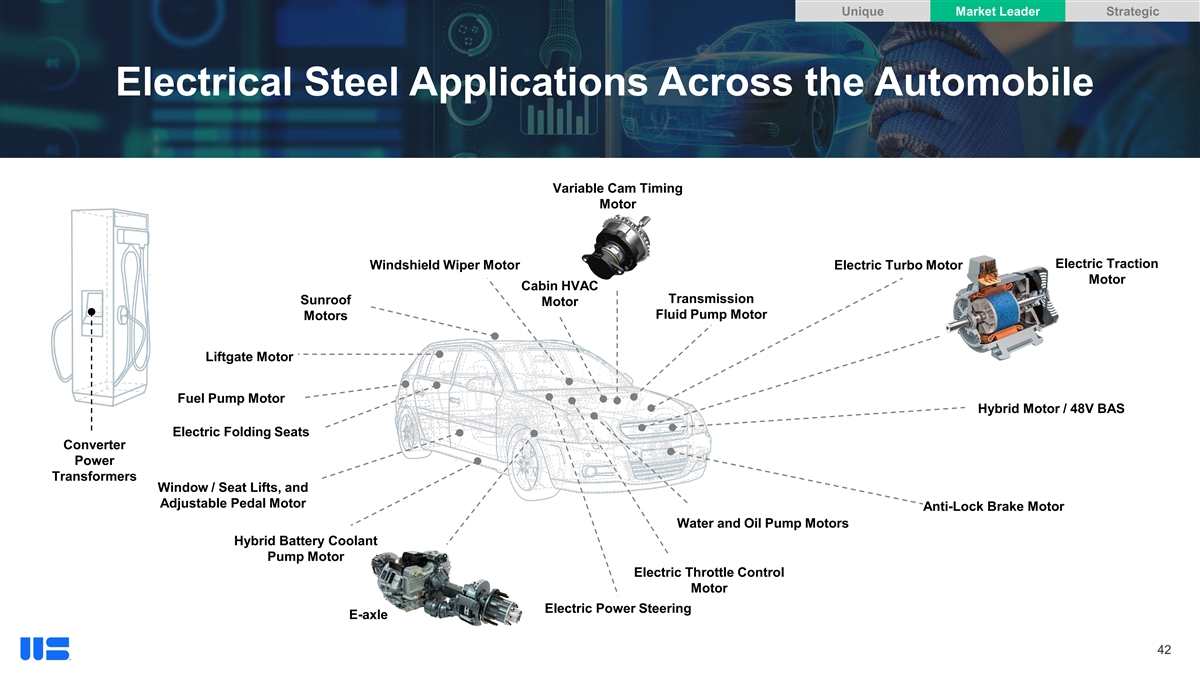
Unique Market Leader Strategic Electrical Steel Applications Across the Automobile Variable Cam Timing Motor Electric Traction Windshield Wiper Motor Electric Turbo Motor Motor Cabin HVAC Transmission Sunroof Motor Fluid Pump Motor Motors Liftgate Motor Fuel Pump Motor Hybrid Motor / 48V BAS Electric Folding Seats Converter Power Transformers Window / Seat Lifts, and Adjustable Pedal Motor Anti-Lock Brake Motor Water and Oil Pump Motors Hybrid Battery Coolant Pump Motor Electric Throttle Control Motor Electric Power Steering E-axle 42
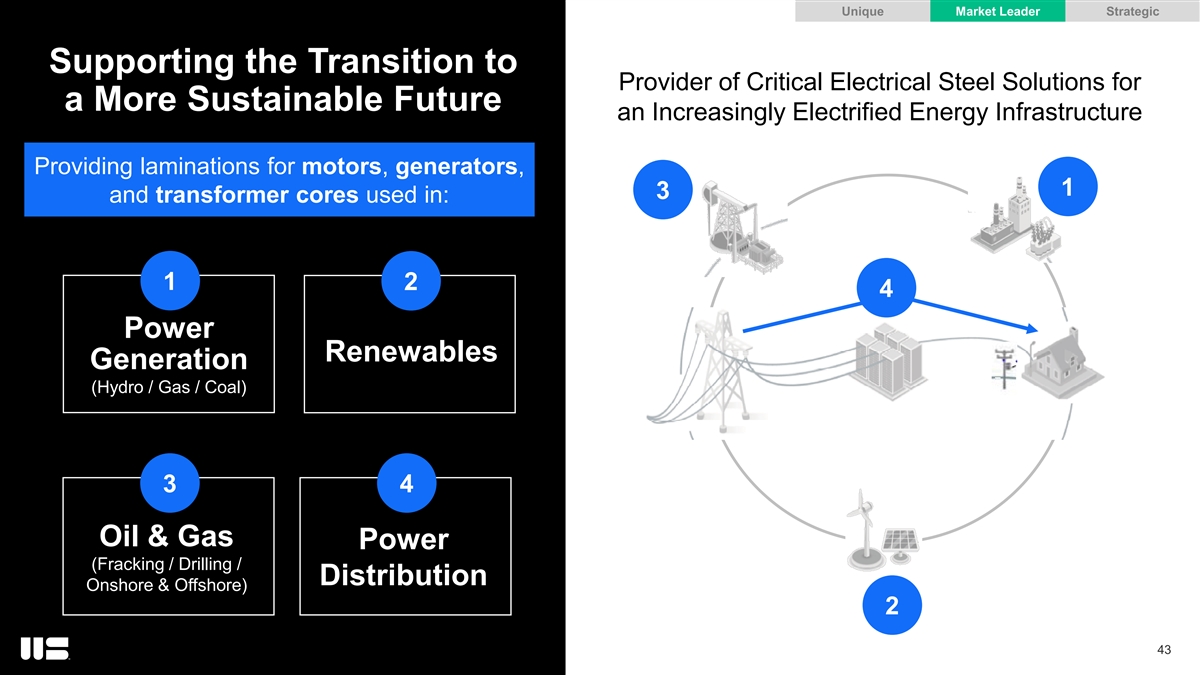
Unique Market Leader Strategic Supporting the Transition to Provider of Critical Electrical Steel Solutions for a More Sustainable Future an Increasingly Electrified Energy Infrastructure Providing laminations for motors, generators, 1 3 and transformer cores used in: 1 2 4 Power Renewables Generation (Hydro / Gas / Coal) 3 4 Oil & Gas Power (Fracking / Drilling / Distribution Onshore & Offshore) 2 43

Lightweighting The TWB Company is a North American leader in Tailor Welded Solutions with products used to reduce weight, lower cost, improve material utilization and consolidate parts • Formed in 1992, the TWB Company is a joint venture between Worthington Steel (55%) and BAOSteel Tailored Blanks (45%) 44

Unique Market Leader Strategic Lightweighting Solutions for We create value for our customers through North American Customers lightweighting, material utilization and cost management 11 Manufacturing Locations Tailor Welded Finished Part Blanks North America Region North America Region Asia Pacific Region Asia Pacific Region Lightweighting Other Processing Locations 45

Unique Market Leader Strategic New Product Development to Meet Evolving Customer Needs Driving Market Share Gains and Customer Intimacy Through a “Voice of Customer” Approach to New Product Development At the Forefront of EV Battery Box Design Continued Enhancements to Core Offerings 3rd Generation Advanced High Upper / Lower Structural Multi-Dimensional Welded Strength Steel Battery Covers Battery Tray Frame Rails Since 2000, we have successfully launched more than 500 production parts 46

A sophisticated business built on a legacy of customer-focused innovation. 47

FINANCIAL & CAPITAL ALLOCATION OVERVIEW TIM ADAMS VP & CHIEF FINANCIAL OFFICER
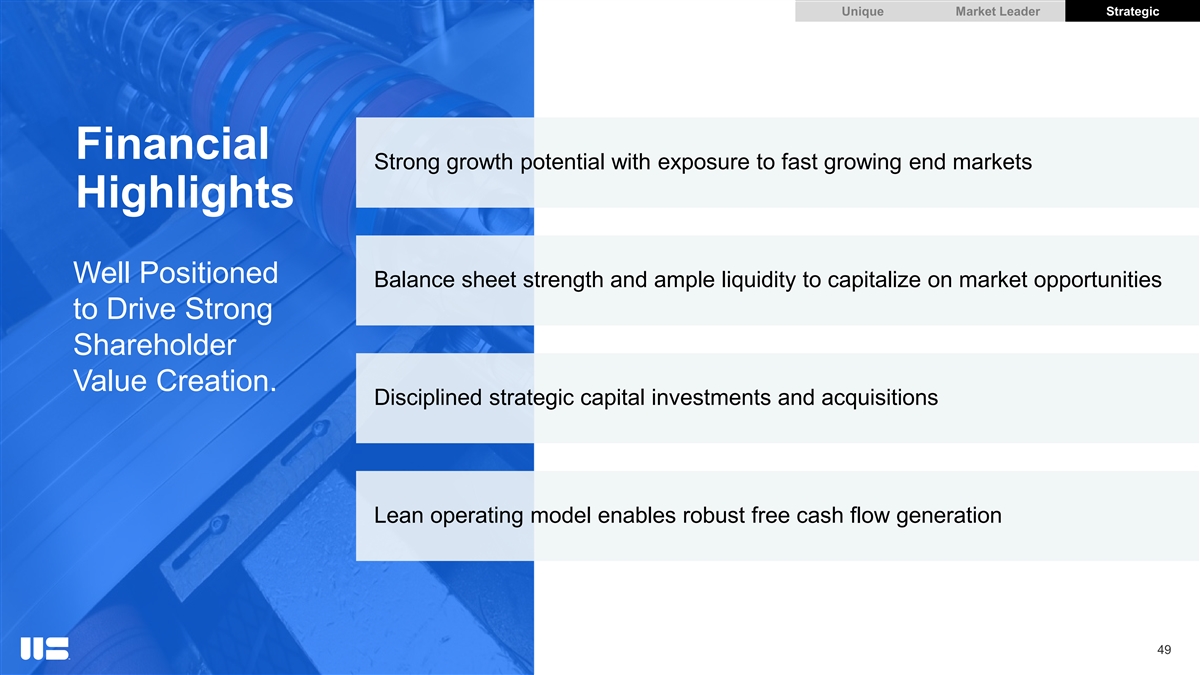
Unique Market Leader Strategic Financial Strong growth potential with exposure to fast growing end markets Highlights Well Positioned Balance sheet strength and ample liquidity to capitalize on market opportunities to Drive Strong Shareholder Value Creation. Disciplined strategic capital investments and acquisitions Lean operating model enables robust free cash flow generation 49

Unique Market Leader Strategic Key Financial Metrics Trailing Twelve Months ended August 31, 2023 Net Sales Volume Adjusted EBITDA $3.4B 4.0M tons $244M (7.1% EBITDA Margin) 1 2 Free Cash Flow Capex Net Debt $228M $52M $120M (1.5% of Net Sales) at separation Note: Metrics are presented as of the trailing twelve months ended August 31, 2023, except net debt, which represents estimates at separation. 50 1 2 Free Cash Flow defined as Operating Cash Flow less Capex. Net debt represents anticipated $150M of debt less $30M of cash at separation.

Unique Market Leader Strategic History of Resilient Performance Net Sales ($M) & Volumes (M Tons) Adjusted EBITDA ($M) | Margin (%) $4,069 $290 $3,608 $266 $3,439 $244 $206 Strategic Acquisitions: 13% $2,127 7% 7% 6% 4.3 4.2 4.0 4.0 FY2021A FY2022A FY2023A TTM (Aug) Adjusted EBITDA ($M) EBITDA Margin FY2021A FY2022A FY2023A TTM (Aug) Estimated Net Sales ($M) Shipped Tons Holding $75 $22 ($49) ($32) G/(L) Note: FY is fiscal year ended May 31, TTM is trailing twelve months ended August 31, 2023. 51

Unique Market Leader Strategic Margin Expansion Opportunities: Levers for Improved Performance Strategy to Target Double-Digit Adj. EBITDA Margins 10%+ 7% TTM (Aug) Adj. Worthington Business Product Mix New Products Acquisitions Long-Term Target EBITDA Margin System Adj. EBITDA Margin Strategy to Worthington Improving product Introduce higher Acquire margin Target 10%+ Business System mix with focus on margin new products accretive businesses drives out waste highest margin and processes Adj. EBITDA products Margin Note: TTM is trailing twelve months ended August 31, 2023. 52

Unique Market Leader Strategic Operating Cash Flow Generation 1 Operating Cash Flow ($M) Operating Working Capital ($M) $850 $1,600 $890 $865 $315 $646 $280 $551 $481 $396 $153 $39 FY2021A FY2022A FY2023A TTM (Aug) FY2021A FY2022A FY2023A TTM (Aug) Capex $29 $36 $45 $52 Steel Price ($/ton) Operating Working Capital ($M) ($M) Note: FY is fiscal year ended May 31. TTM is trailing twelve months ended August 31, 2023. 53 1 Operating Working Capital defined as accounts receivable plus inventory minus accounts payable.
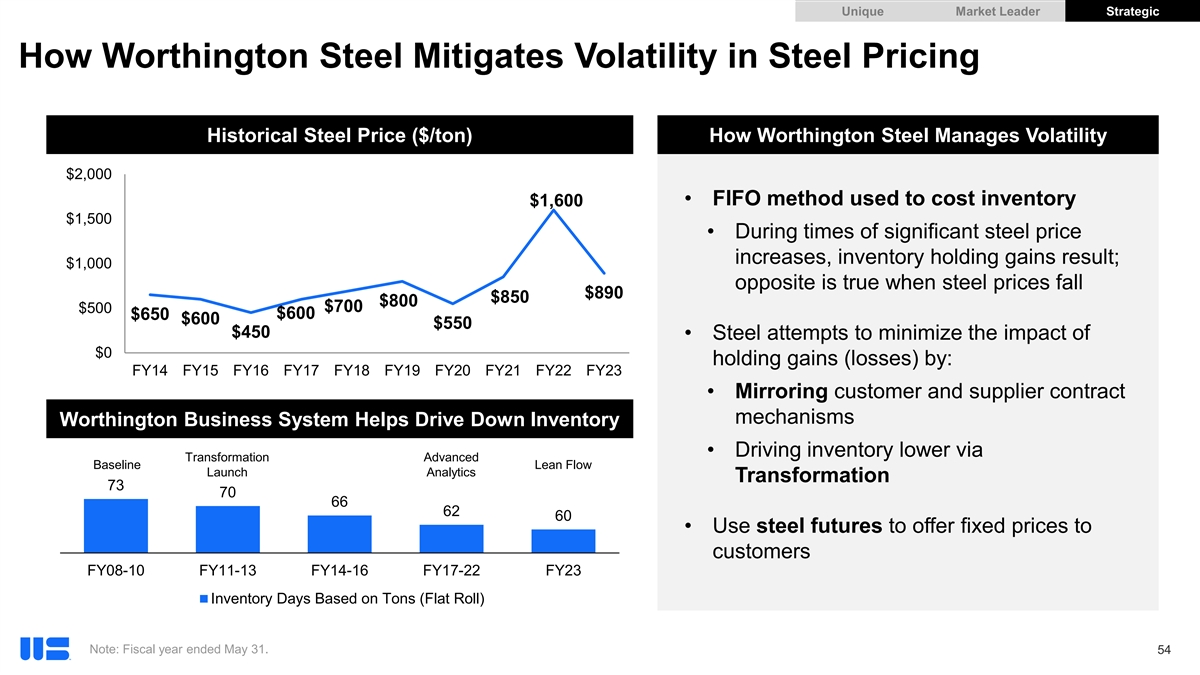
Unique Market Leader Strategic How Worthington Steel Mitigates Volatility in Steel Pricing Historical Steel Price ($/ton) How Worthington Steel Manages Volatility $2,000 • FIFO method used to cost inventory $1,600 $1,500 • During times of significant steel price increases, inventory holding gains result; $1,000 opposite is true when steel prices fall $890 $850 $800 $700 $500 $600 $650 $600 $550 $450 • Steel attempts to minimize the impact of $0 holding gains (losses) by: FY14 FY15 FY16 FY17 FY18 FY19 FY20 FY21 FY22 FY23 • Mirroring customer and supplier contract mechanisms Worthington Business System Helps Drive Down Inventory • Driving inventory lower via Transformation Advanced Baseline Lean Flow Launch Analytics Transformation 73 70 66 62 60 • Use steel futures to offer fixed prices to customers FY08-10 FY11-13 FY14-16 FY17-22 FY23 Inventory Days Based on Tons (Flat Roll) Note: Fiscal year ended May 31. 54

Unique Market Leader Strategic Capital Investments Intended to Strengthen and Grow Market Position Capital Expenditures ($M) ~$35-40M / Year Expected Go Forward Run-Rate Maintenance Capex Spend Strategic Capital Investments $16 • Increasing Lightweighting Capabilities / Capacity $12 • Hot Galvanizing Line: produce Type 1 $8 aluminized steels for the automotive industry $13 • Laser Welding: support lightweighting targets for $36 $33 new Battery EV models $28 $16 • Scaling Global Presence through Strategic Projects FY2021 FY2022 FY2023 TTM • Electrical Steel Lamination Presses: bolster Maintenance Strategic electric vehicle market growth in Mexico, China, and India Capex as 1.4% 0.9% 1.3% 1.5% % of Sales Note: FY is fiscal year ended May 31. TTM is trailing twelve months ended August 31, 2023. 55

Unique Market Leader Strategic Focused Strategic Investments in Electrical Steel Mexico: Increase Capacity to Meet Growing xEV Demand • Expect to invest in a capacity expansion over 24-36 months • Adding ten new presses designed to produce electrical steel laminations used in xEV traction motors • Building expansion underway and placed order for first five presses Canada: Increase Capacity to Meet Transformer Demand • Expect to invest over 24-36 months to double current capacity to produce transformer cores from electrical steel • Significant growth expected in transformers due to age of power grid, increased xEV demand and use of renewable energy • Placed order for long-lead time equipment Expect steady state EBITDA margins to be accretive 56
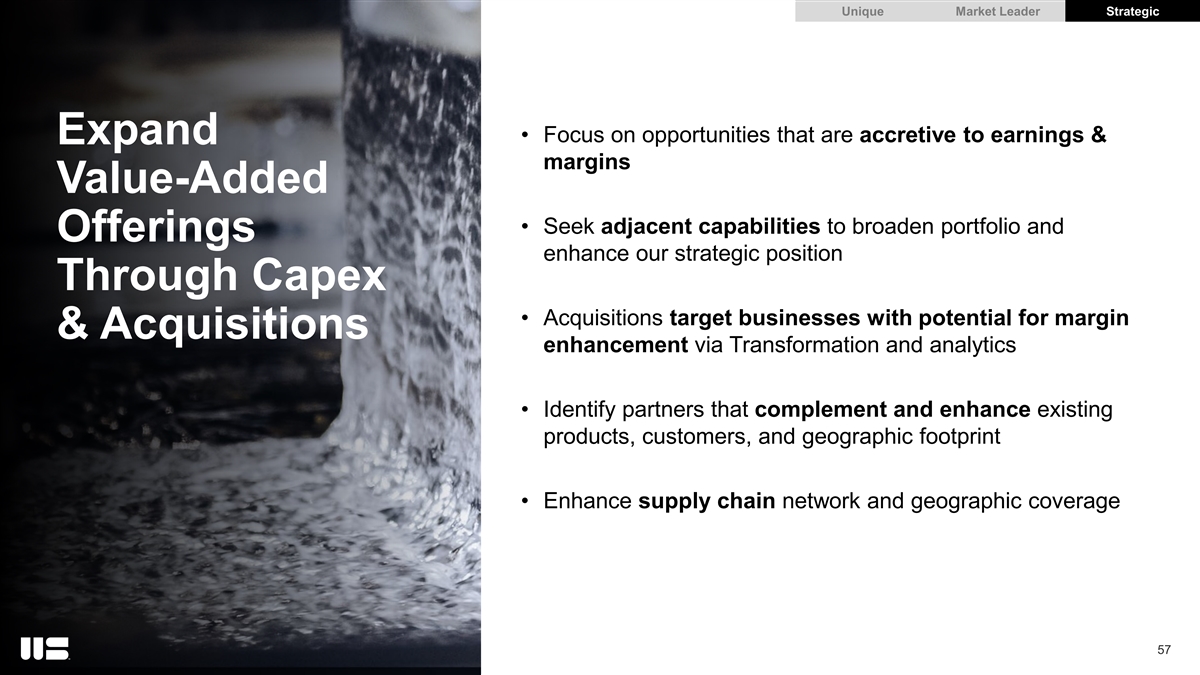
Unique Market Leader Strategic • Focus on opportunities that are accretive to earnings & Expand margins Value-Added • Seek adjacent capabilities to broaden portfolio and Offerings enhance our strategic position Add zinc pot Through Capex shot • Acquisitions target businesses with potential for margin & Acquisitions enhancement via Transformation and analytics • Identify partners that complement and enhance existing products, customers, and geographic footprint • Enhance supply chain network and geographic coverage 57
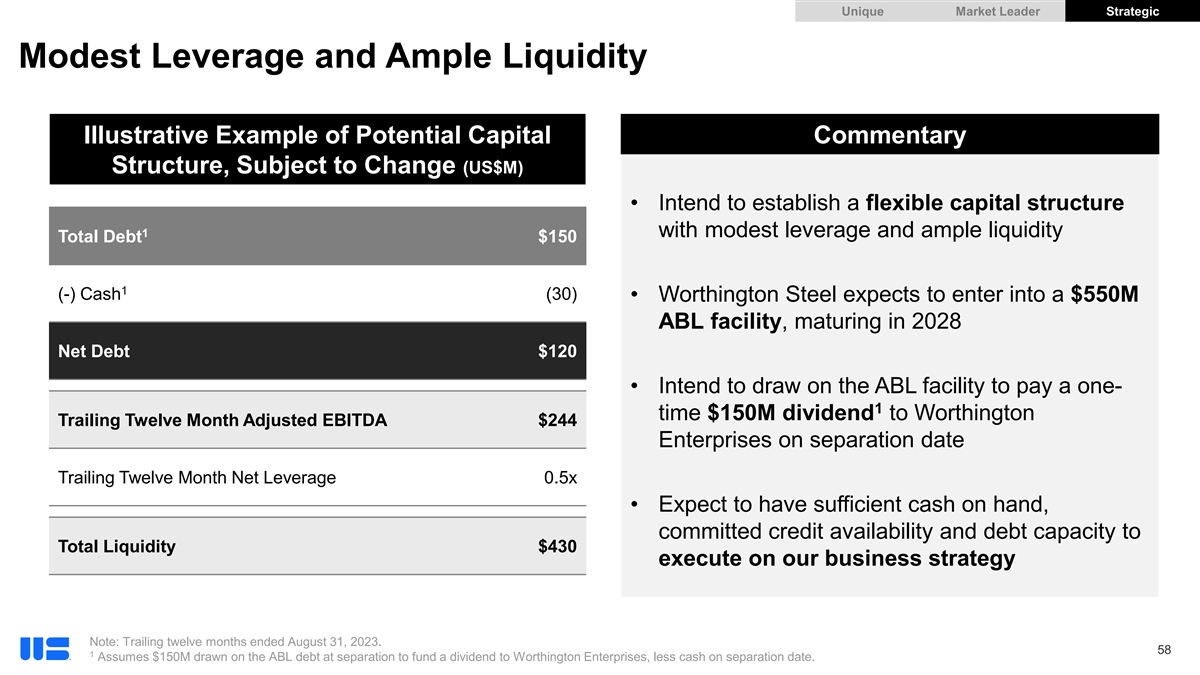
Unique Market Leader Strategic Modest Leverage and Ample Liquidity Illustrative Example of Potential Capital Commentary Structure, Subject to Change (US$M) • Intend to establish a flexible capital structure 1 with modest leverage and ample liquidity Total Debt $150 1 (-) Cash (30) • Worthington Steel expects to enter into a $550M ABL facility, maturing in 2028 Net Debt $120 • Intend to draw on the ABL facility to pay a one- 1 time $150M dividend to Worthington Trailing Twelve Month Adjusted EBITDA $244 Enterprises on separation date Trailing Twelve Month Net Leverage 0.5x • Expect to have sufficient cash on hand, committed credit availability and debt capacity to Total Liquidity $430 execute on our business strategy Note: Trailing twelve months ended August 31, 2023. 58 1 Assumes $150M drawn on the ABL debt at separation to fund a dividend to Worthington Enterprises, less cash on separation date.

Unique Market Leader Strategic Disciplined Framework Designed to Drive Shareholder Value Maintain Ample Liquidity and Financial Flexibility to Support Strategic Initiatives and Resiliency Through the Cycle Organic Strategic Shareholder Growth M&A Return • Maintain operations in • Target acquisition • Focus on maximizing market ready condition shareholder return opportunities that are expected to be immediately accretive to • Grow capacity to meet • Expect to pay a modest earnings electrical steel and dividend lightweighting demand • Leverage track record and skill set to integrate bolt- • Intend to pursue • Pursue high IRR on opportunities and opportunistic share capacity additions realize synergies buybacks 59
CONCLUDING REMARKS GEOFF GILMORE PRESIDENT AND CHIEF EXECUTIVE OFFICER

Unique Steel Processor Well Positioned for Significant Growth 1 REASONS Market-Leading Supplier to Attractive End Markets TO INVEST 2 IN WORTHINGTON STEEL Strategy Driven by Strong Leadership Team 3 61

QUESTIONS
Appendix
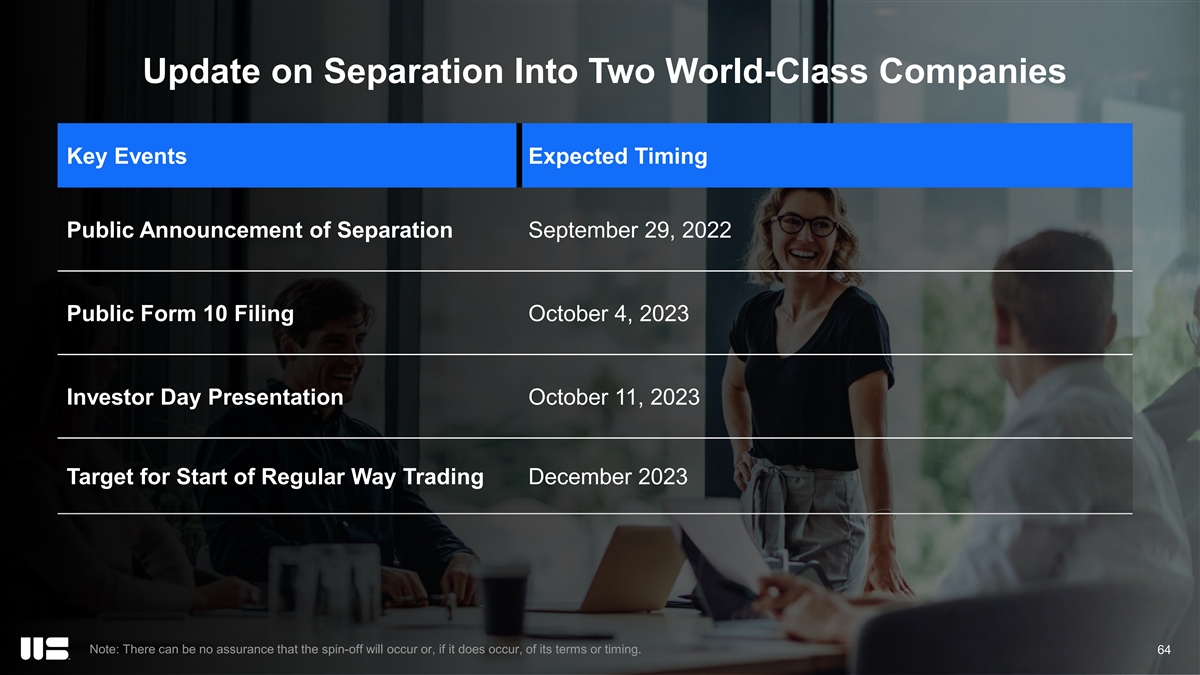
Update on Separation Into Two World-Class Companies Key Events Expected Timing Public Announcement of Separation September 29, 2022 Public Form 10 Filing October 4, 2023 Investor Day Presentation October 11, 2023 Target for Start of Regular Way Trading December 2023 Note: There can be no assurance that the spin-off will occur or, if it does occur, of its terms or timing. 64

Reconciliation of Non-GAAP Financial Measures The steel processing business of Worthington Industries, Inc. Fiscal Year Ended TTM (Worthington Steel) has provided in this presentation certain May 31, August 31, financial information that has not been prepared in accordance with (In millions) 2021 2022 2023 2023 accounting principles generally accepted in the United States of $ 2,127 $ 4,069 $ 3,608 $ 3,439 Net Sales America (“non-GAAP”). Non-GAAP measures should not be considered in isolation from, or as a substitute for, financial $ 171 $ 180 $ 87 $ 115 Net earnings attributable to controlling interest information calculated in accordance with GAAP. Interest expense, net - 3 3 2 Adjusted Earnings Before Interest, Taxes, Depreciation and Income tax expense 48 54 29 36 Amortization (Adjusted EBITDA). Adjusted EBITDA consists of Depreciation and amortization 45 60 70 69 EBITDA (calculated by adding or subtracting, as appropriate, EBITDA $ 264 $ 297 $ 189 $ 222 interest expense, income tax expense and depreciation and (1) Impairment of long-lived assets - 2 2 3 amortization to/from net earnings attributable to controlling (1) Restructuring and other (income) expense, net 2 (9) (2) (2) interest), which is further adjusted to exclude impairment and (2) Separation costs - - 17 21 restructuring expense (income) as well as other items that Adjusted EBITDA $ 266 $ 290 $ 206 $ 244 management believes are not reflective of, and thus should not be included when evaluating the performance of its ongoing Adjusted EBITDA margin 13% 7% 6% 7% operations, including incremental costs associated with the planned separation. (1) Excludes the impact of the noncontrolling interests. Free Cash Flows. Free cash flows is calculated by subtracting (2) Includes direct and incremental costs incurred in connection with the separation of Worthington Steel capital expenditures from operating cash flows. from Worthington Industries, Inc., including audit, legal, and other fees paid to third-party advisors as well as direct and incremental costs associated with the separation of shared corporate functions. TTM August 31 2023 Operating cash flow $ 280 Capital expenditures 52 Free cash flow $ 228 65

OUR PHILOSOPHY adopted in 1961, is the foundation of our culture EARNINGS SUPPLIERS § The first corporate goal for Worthington Industries is to earn money for its § We cannot operate profitably without those who supply the quality materials we shareholders and increase the value of their investment. need. § We believe that the best measurement of the accomplishment of our goal is § We ask that suppliers be competitive in the marketplace with regard to quality, consistent growth in earnings per share. pricing, delivery and volume purchased. § We are a loyal customer to suppliers who meet our quality and service requirements through all market conditions. OUR GOLDEN RULE § We treat our customers, employees, investors and suppliers, as we would like to ORGANIZATION be treated. § We believe in a divisionalized organizational structure with responsibility for performance resting with the head of each operation. PEOPLE § All managers are given the operating latitude and authority to accomplish their § We are dedicated to the belief that people are our most important asset. responsibilities within our corporate goals and objectives. § We believe people respond to recognition, opportunity to grow and fair § In keeping with this philosophy, we do not create excessive corporate compensation. procedures. If procedures are necessary within a particular company operation, § We believe that compensation should be directly related to job performance and that manager creates them. therefore use incentives, profit sharing or otherwise, in every possible situation. § We believe in a small corporate staff and support group to service the needs of § From employees we expect an honest day's work for an honest day's pay our shareholders and operating units as requested. § We believe in the philosophy of § continued employment for all Worthington people. § In filling job openings, every effort is expended to find candidates within COMMUNICATION Worthington, its divisions or subsidiaries.§ We communicate through every possible channel with our customers, employees, shareholders, suppliers and financial community. CUSTOMERS CITIZENSHIP § Without the customer and their need for our products and services we have nothing.§ Worthington Steel practices good citizenship at all levels. We conduct our § We will exert every effort to see that the customer’s quality and service business in a professional and ethical manner. requirements are met.§ We encourage all our people to actively participate in community affairs § Once a commitment is made to a customer, every effort is made to fulfill that § We support worthwhile community causes. obligation. 66

ibdroot\projects\IBD-NY\trillium2020\664375_1\16. Investor Day Presentations\03. WOR Enterprises\2023.09.29 - Exhibit 99.2 Investor Day - WOR Enterprises Shell_v78.pptx INVESTOR DAY OCTOBER 11, 2023 A m ar k et - l ead i ng designer and manufacture r o f i nno v at i v e B u i l d i ng P rod uc t s, C on sum e r P rod uc t s, a n d S u s t ai nab l e E ner g y S o l u t i o ns

Notes to Investors FORWARD LOOKING STATEMENTS. Worthington Industries, Inc. (the “Company” or “Worthington”) wishes to take advantage of the Safe Harbor provisions included in the Private Securities Litigation Reform Act of 1995 (the “Act”). Statements by the Company relating to the intended separation of Worthington’s Steel Processing business; the timing and method of the separation; the anticipated benefits of the separation; the expected financial and operating performance of, and future opportunities for, each company following the separation; the tax treatment of the transaction; the leadership of each company following the separation; and other non-historical matters constitute “forward-looking statements” within the meaning of the Act. Forward-looking statements may be characterized by terms such as “believe,” “anticipate,” “should,” “would,” “intend,” “plan,” “will,” “expect,” “estimate,” “project,” “positioned,” “strategy,” “targets,” “aims,” “seeks,” “sees” and similar expressions. Because they are based on beliefs, estimates and assumptions, forward-looking statements are inherently subject to risks and uncertainties that could cause actual results to differ materially from those projected. Any number of factors could affect actual results, including, without limitation, the final approval of the separation by our board of directors; the uncertainty of obtaining regulatory approvals in connection with the separation; the ability to satisfy the necessary closing conditions to complete the separation on a timely basis, or at all; our ability to successfully separate the two companies and realize the anticipated benefits of the separation; the risks, uncertainties and impacts, for both the Company’s business and the planned separation, related to the United Auto Workers strikes against Ford, General Motors and Stellantis North America (the “Detroit Three automakers”), and the associated impact on companies that supply the Detroit Three automakers, the duration and scope of which are impossible to predict; the effect of conditions in national and worldwide financial markets, including inflation, increases in interest rates and economic recession, and with respect to the ability of financial institutions to provide capital; the impact of tariffs, the adoption of trade restrictions affecting the Company’s products or suppliers, a United States withdrawal from or significant renegotiation of trade agreements, the occurrence of trade wars, the closing of border crossings, and other changes in trade regulations or relationships; changing oil prices and/or supply; product demand and pricing; changes in product mix, product substitution and market acceptance of the Company’s products; volatility or fluctuations in the pricing, quality or availability of raw materials (particularly steel), supplies, transportation, utilities, labor and other items required by operations (especially in light of Russia’s invasion of Ukraine); effects of sourcing and supply chain constraints; the outcome of adverse claims experience with respect to workers’ compensation, product recalls or product liability, casualty events or other matters; effects of facility closures and the consolidation of operations; the effect of financial difficulties, consolidation and other changes within the steel, automotive, construction and other industries in which the Company participates; failure to maintain appropriate levels of inventories; financial difficulties (including bankruptcy filings) of original equipment manufacturers, end-users and customers, suppliers, joint venture partners and others with whom the Company does business; the ability to realize targeted expense reductions from headcount reductions, facility closures and other cost reduction efforts; the ability to realize cost savings and operational, sales and sourcing improvements and efficiencies, and other expected benefits from transformation initiatives, on a timely basis; the overall success of, and the ability to integrate, newly-acquired businesses and joint ventures, maintain and develop their customers, and achieve synergies and other expected benefits and cost savings therefrom; capacity levels and efficiencies, within facilities, within major product markets and within the industries in which the Company participates as a whole; the effect of disruption in the business of suppliers, customers, facilities and shipping operations due to adverse weather, casualty events, equipment breakdowns, labor shortages, interruption in utility services, civil unrest, international conflicts (especially in light of Russia’s invasion of Ukraine), terrorist activities or other causes; changes in customer demand, inventories, spending patterns, product choices, and supplier choices; risks associated with doing business internationally, including economic, political and social instability (especially in light of Russia’s invasion of Ukraine), foreign currency exchange rate exposure and the acceptance of the Company’s products in global markets; the ability to improve and maintain processes and business practices to keep pace with the economic, competitive and technological environment; the effect of inflation, interest rate increases and economic recession, as well as potential adverse impacts as a result of the Inflation Reduction Act of 2022, which may negatively impact the Company’s operations and financial results; deviation of actual results from estimates and/or assumptions used by the Company in the application of its significant accounting policies; the level of imports and import prices in the Company’s markets; the impact of environmental laws and regulations or the actions of the United States Environmental Protection Agency or similar regulators which increase costs or limit the Company’s ability to use or sell certain products; the impact of increasing environmental, greenhouse gas emission and sustainability considerations or regulations; the impact of judicial rulings and governmental regulations, both in the United States and abroad, including those adopted by the United States Securities and Exchange Commission (“SEC”) and other governmental agencies as contemplated by the Coronavirus Aid, Relief and Economic Security (CARES) Act, the Consolidated Appropriations Act, 2021, the American Rescue Act of 2021, and the Dodd-Frank Wall Street Reform and the Consumer Protection Act of 2010; the effect of healthcare laws in the United States and potential changes for such laws, especially in light of the COVID-19 pandemic which may increase the Company’s healthcare and other costs and negatively impact the Company’s operations and financial results; the effect of tax laws in the U.S. and potential changes for such laws, which may increase the Company's costs and negatively impact its operations and financial results; cyber security risks; the effects of privacy and information security laws and standards; and other risks described from time to time in the filings of Worthington Industries, Inc. with the SEC, including those described in “Part I — Item 1A. — Risk Factors” of Worthington’s Annual Report on Form 10-K for the fiscal year ended May 31, 2023, and its subsequent filings with the SEC. Forward-looking statements should be construed in the light of such risks. Readers are cautioned not to place undue reliance on any forward-looking statements, which speak only as of the date made. Worthington does not undertake, and hereby disclaim, any obligation to update any forward-looking statements, whether as a result of new information, future developments or otherwise. 2
Notes to Investors PRO FORMA FINANCIAL INFORMATION. Unless otherwise specified, all financial data and operating metrics included in these materials are presented on a pro forma basis giving effect to the reorganization and the planned separation of the Steel Processing business, as described in the Form 10 filed with the Securities and Exchange Commission, and divested operations historically presented within Other. NON-GAAP MEASURES. These materials include certain financial measures that are not calculated in accordance with U.S. generally accepted accounting principles, or GAAP. Management believes these non-GAAP measures provide useful supplemental information on the performance of the Company’s ongoing operations and should not be considered as an alternative to the comparable GAAP measure. Additionally, management believes these non-GAAP measures allow for meaningful comparisons and analysis of trends in the Company’s businesses and enables investors to evaluate operations and future prospects in the same manner as management. A reconciliation of each non-GAAP measure to its most directly comparable GAAP measure is included in the Appendix. The following provides an explanation of each non-GAAP measure presented in these materials: Adjusted EBITDA is defined as Adjusted Earnings Before Interest, Taxes, Depreciation and Amortization, and consists of EBITDA (calculated by adding or subtracting, as appropriate, interest expense, income tax expense and depreciation and amortization to/from net earnings attributable to controlling interest), which is further adjusted to exclude impairment and restructuring charges (gains) as well as other items that management believes are not reflective of, and thus should not be included when evaluating the performance of its ongoing operations, including incremental costs associated with the planned separation. Adjusted EBITDA also excludes stock-based compensation due to its non-cash nature. In prior periods, Adjusted EBITDA did not exclude stock-based compensation. However, management now believes that further excluding stock-based compensation from Adjusted EBITDA is useful to better understand the financial performance of our business and to facilitate a better comparison of our results to those of our peer companies over multiple periods given that this item may vary between companies for reasons unrelated to overall operating performance. Impairment charges are excluded from adjusted EBITDA because they do not occur in the ordinary course of our ongoing business operations, are inherently unpredictable in timing and amount, and are non- cash, which we believe facilitates the comparison of historical, current and forecasted financial results Restructuring activities, which can result in both discrete gains and/or losses, consist of established programs that are not part of our ongoing operations, such as divestitures, closing or consolidating facilities, employee severance (including rationalizing headcount or other significant changes in personnel), and realignment of existing operations (including changes to management structure in response to underlying performance and/or changing market conditions). Adjusted EBITDA Margin is calculated by dividing Adjusted EBITDA by net sales. Free Cash Flow is defined as Adjusted EBITDA less capital expenditures. Free Cash Flow Conversion is calculated by dividing Free Cash by Adjusted EBITDA. 3

Our Presenter ANDY ROSE President & Chief Executive Officer Worthington Enterprises 4
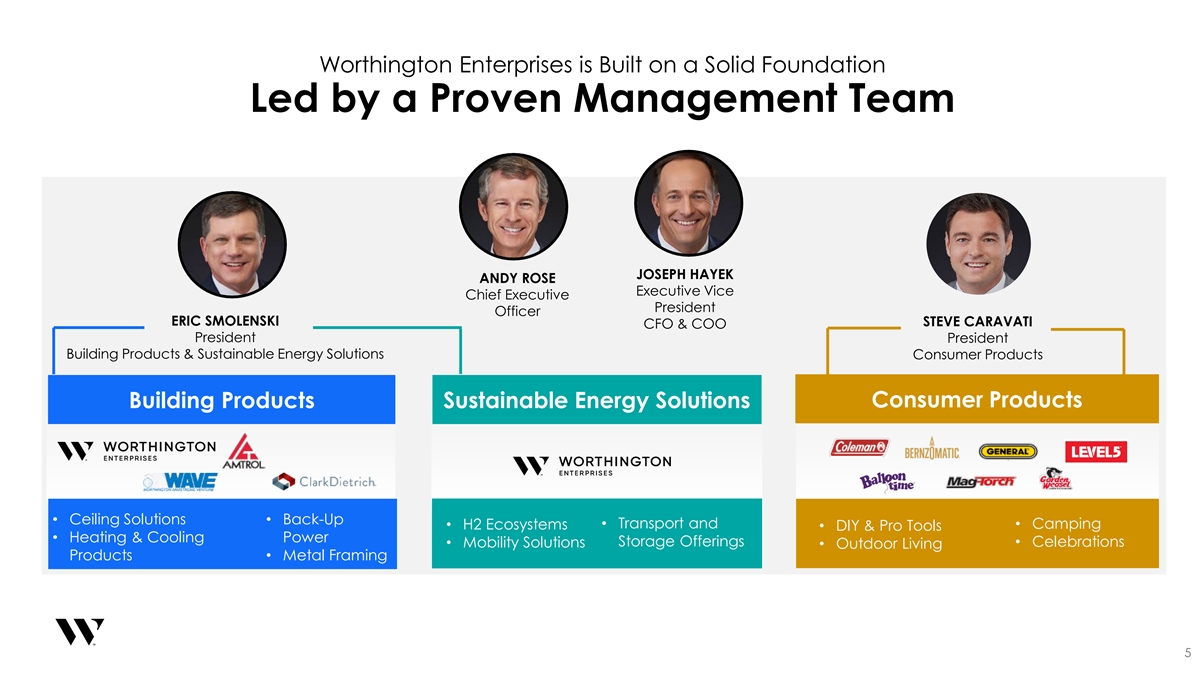
Worthington Enterprises is Built on a Solid Foundation Led by a Proven Management Team JOSEPH HAYEK ANDY ROSE Executive Vice Chief Executive President Officer ERIC SMOLENSKI STEVE CARAVATI CFO & COO President President Building Products & Sustainable Energy Solutions Consumer Products Consumer Products Building Products Sustainable Energy Solutions • Ceiling Solutions • Back-Up • Transport and • Camping • H2 Ecosystems • Transport & Storage • DIY & Pro Tools • Heating & Cooling Power Storage Offerings • Mobility Solutions Off•erC ing elsebrations • Outdoor Living Products • Metal Framing 5
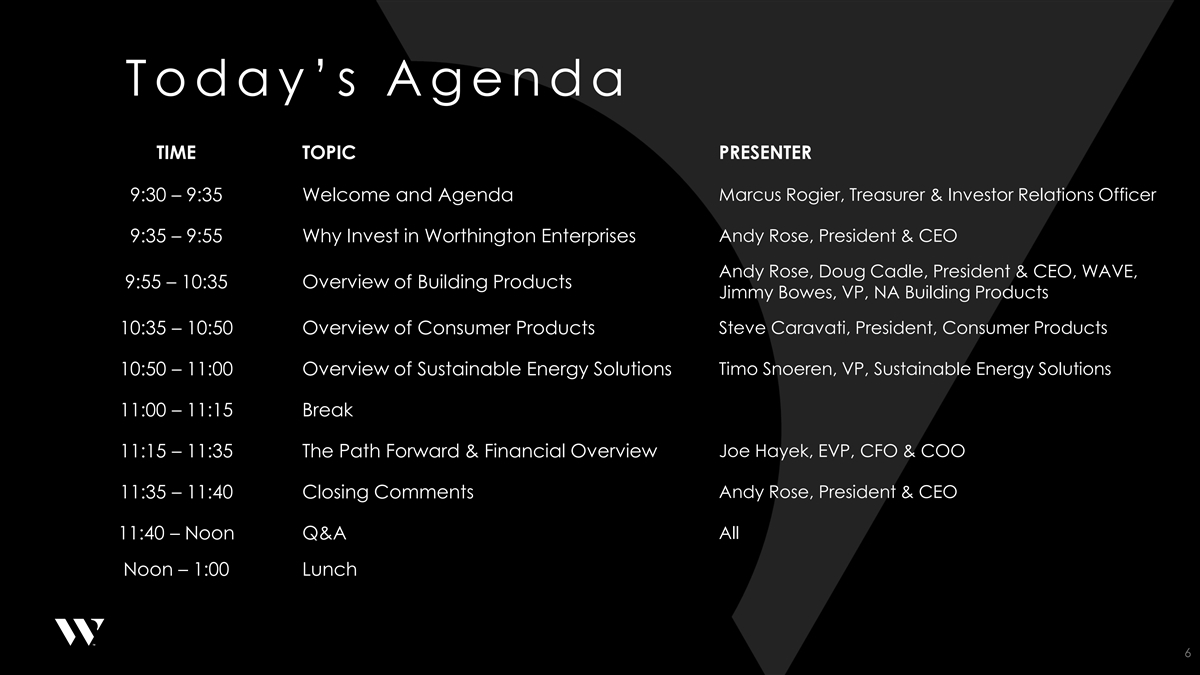
ibdroot\projects\IBD-NY\trillium2020\664375_1\16. Investor Day Presentations\03. WOR Enterprises\2023.09.29 - Investor Day - WOR Enterprises Shell_v78.pptx Today’s Agenda • TIME TOPIC PRESENTER 9:30 – 9:35 Welcome and Agenda Marcus Rogier, Treasurer & Investor Relations Officer 9:35 – 9:55 Why Invest in Worthington Enterprises Andy Rose, President & CEO Andy Rose, Doug Cadle, President & CEO, WAVE, 9:55 – 10:35 Overview of Building Products Jimmy Bowes, VP, NA Building Products Steve Caravati, President, Consumer Products 10:35 – 10:50 Overview of Consumer Products 10:50 – 11:00 Overview of Sustainable Energy Solutions Timo Snoeren, VP, Sustainable Energy Solutions 11:00 – 11:15 Break 11:15 – 11:35 The Path Forward & Financial Overview Joe Hayek, EVP, CFO & COO 11:35 – 11:40 Closing Comments Andy Rose, President & CEO All 11:40 – Noon Q&A Noon – 1:00 Lunch 6

The Planned Separation Will Create Two Market-Leading, Independent Public Companies WORTHINGTON STEEL WORTHINGTON ENTERPRISES Joseph Hayek Tim Adams Andy Rose Geoff Gilmore Chief Financial Officer Chief Executive Officer Chief Financial Officer Chief Executive Officer ü A best-in-class, value-added steel processor with a blue-chip ü ü A market-leader with premier brands in attractive end markets ü customer base in growing end-markets in Consumer Products, Building Products, and Sustainable Energy Solutions ü A market-leader in electrical steel laminations and automotive ü lightweighting solutions capitalizing on electrification, sustainability üü High margins and asset-light business model enable strong cash and infrastructure spending flow generation üü Sophisticated supply chain and pricing solutions to manage ü Growth strategy driven by focus on sustainable, technology- ü complex programs for customers, grow market share and increase enabled solutions disrupting mature markets margins Improved Strategic Focus and Differentiated Investment Theses 7
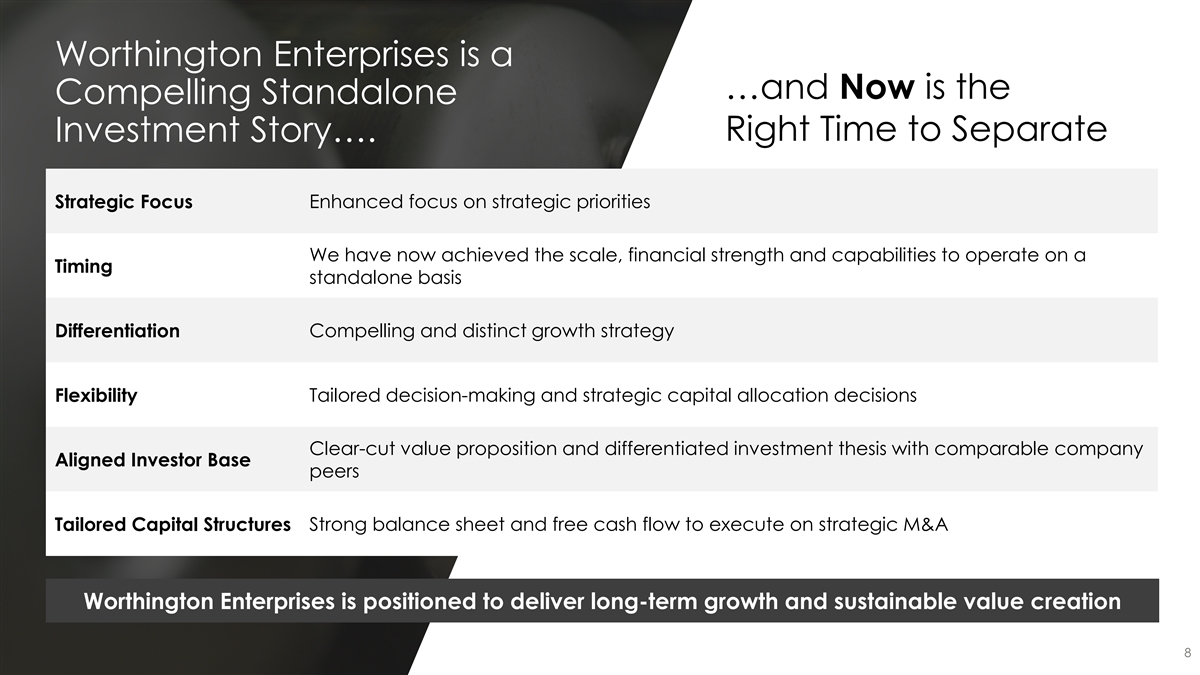
Worthington Enterprises is a …and Now is the Compelling Standalone Right Time to Separate Investment Story…. Strategic Focus Enhanced focus on strategic priorities We have now achieved the scale, financial strength and capabilities to operate on a Timing standalone basis Differentiation Compelling and distinct growth strategy Flexibility Tailored decision-making and strategic capital allocation decisions Clear-cut value proposition and differentiated investment thesis with comparable company Aligned Investor Base peers Tailored Capital Structures Strong balance sheet and free cash flow to execute on strategic M&A Worthington Enterprises is positioned to deliver long-term growth and sustainable value creation 8
ibdroot\projects\IBD-NY\trillium2020\664375_1\16. Investor Day Presentations\03. WOR Enterprises\2023.09.29 - Investor Day - WOR Enterprises Shell_v78.pptx WORTHINGTON ENTERPRISES A market - le ad in g de s i gne r a nd m anuf ac t ure r of innovative Building Products, Consumer Products, and Sustainable Energy Solutions

ibdroot\projects\IBD-NY\trillium2020\664375_1\16. Investor Day Presentations\03. WOR Enterprises\2023.09.29 - Investor Day - WOR Enterprises Shell_v78.pptx PLAY VIDEO 10
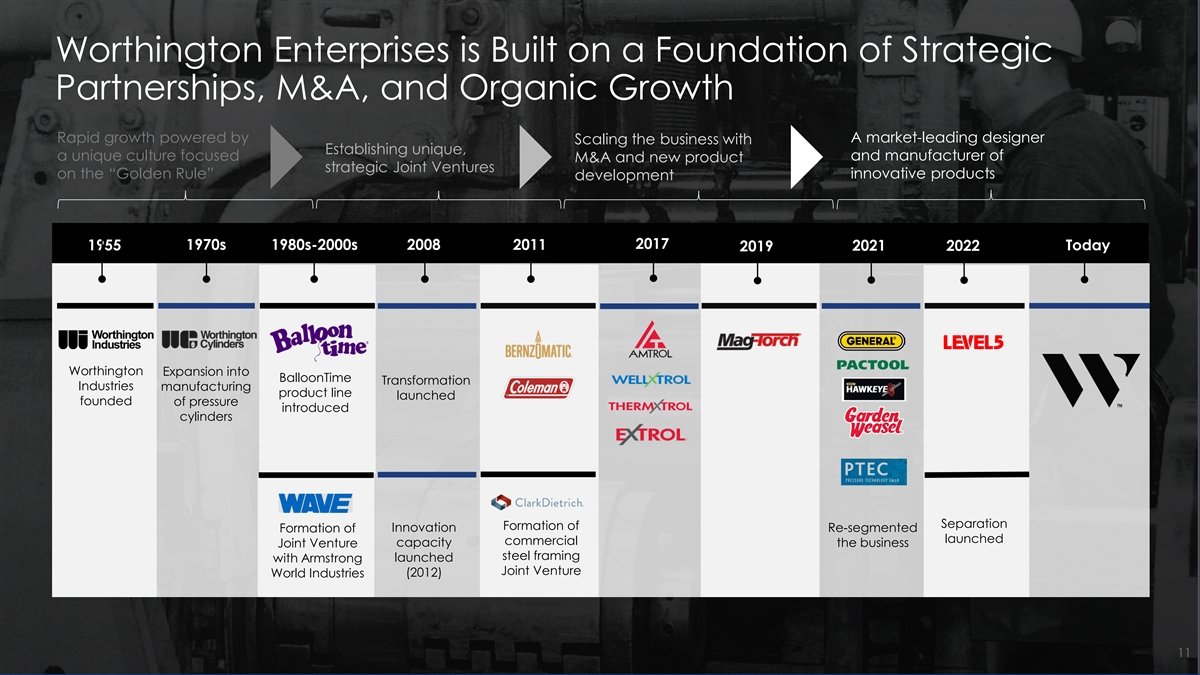
Worthington Enterprises is Built on a Foundation of Strategic Partnerships, M&A, and Organic Growth Rapid growth powered by A market-leading designer Scaling the business with Establishing unique, a unique culture focused and manufacturer of M&A and new product strategic Joint Ventures on the “Golden Rule” innovative products development 2017 1955 1970s 1980s-2000s 2008 2011 Today 2019 2021 2022 Worthington Expansion into BalloonTime Transformation Industries manufacturing product line launched founded of pressure introduced cylinders Separation Formation of Formation of Innovation Re-segmented launched commercial Joint Venture capacity the business steel framing with Armstrong launched Joint Venture World Industries (2012) 11
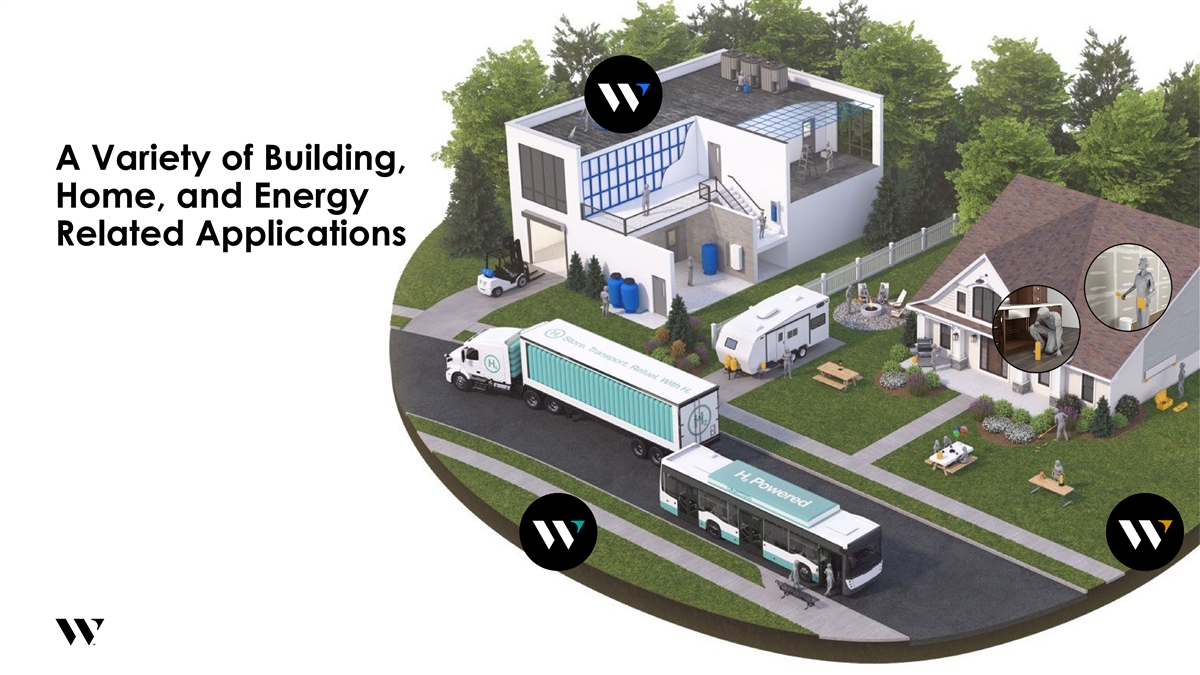
A Variety of Building, Home, and Energy Related Applications 12

CONSUMER PRODUCTS

BUILDING PRODUCTS
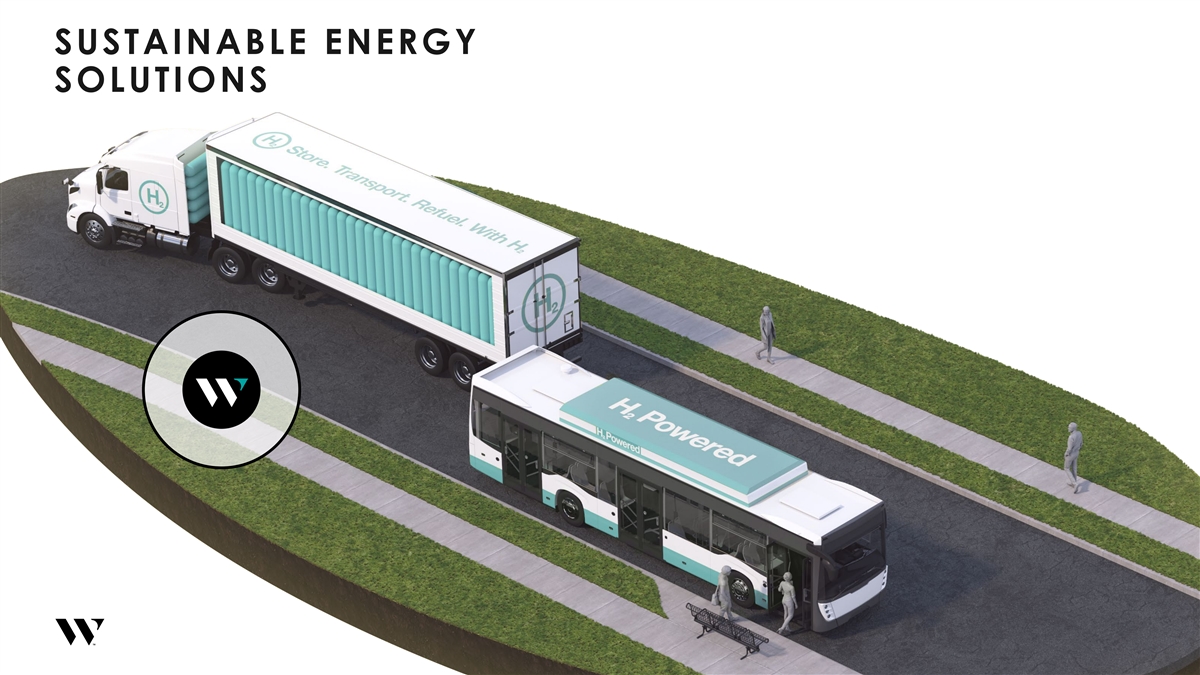
SUSTAINABLE ENERGY SOLUTIONS
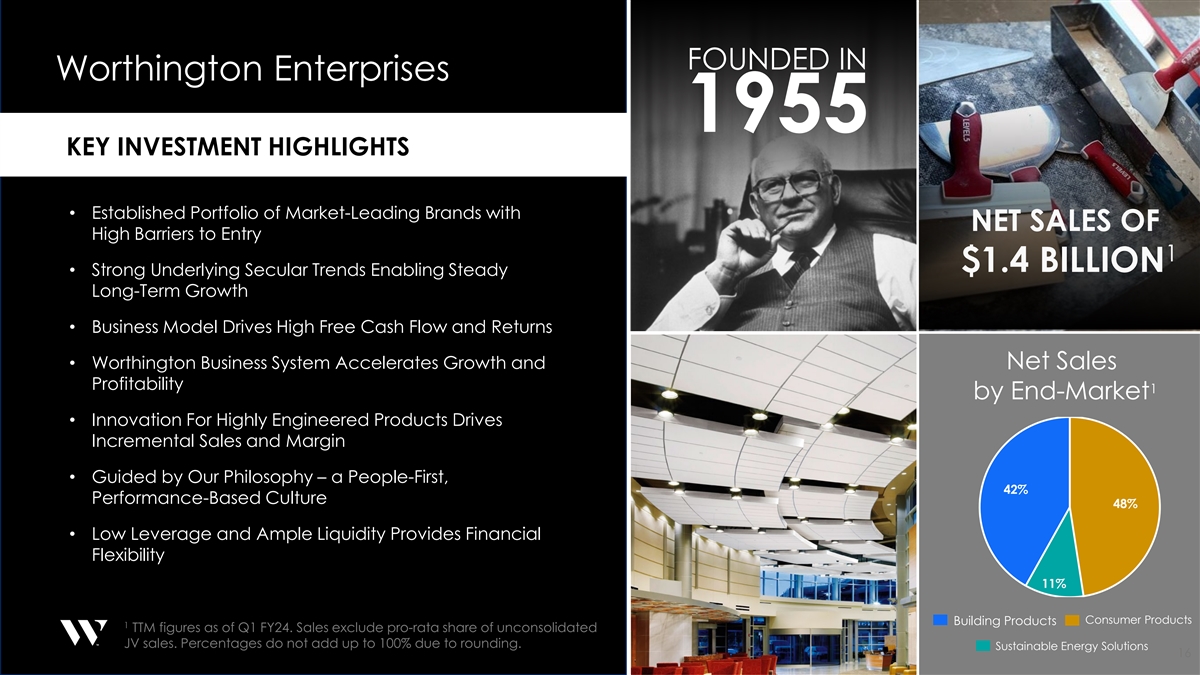
FOUNDED IN Worthington Enterprises 1955 KEY INVESTMENT HIGHLIGHTS • Established Portfolio of Market-Leading Brands with NET SALES OF High Barriers to Entry 1 $1.4 BILLION • Strong Underlying Secular Trends Enabling Steady Long-Term Growth • Business Model Drives High Free Cash Flow and Returns • Worthington Business System Accelerates Growth and Net Sales Profitability 1 by End-Market • Innovation For Highly Engineered Products Drives Incremental Sales and Margin • Guided by Our Philosophy – a People-First, 42% Performance-Based Culture 48% • Low Leverage and Ample Liquidity Provides Financial Flexibility 11% Consumer Products Building Products 1 TTM figures as of Q1 FY24. Sales exclude pro-rata share of unconsolidated JV sales. Percentages do not add up to 100% due to rounding. Sustainable Energy Solutions 16
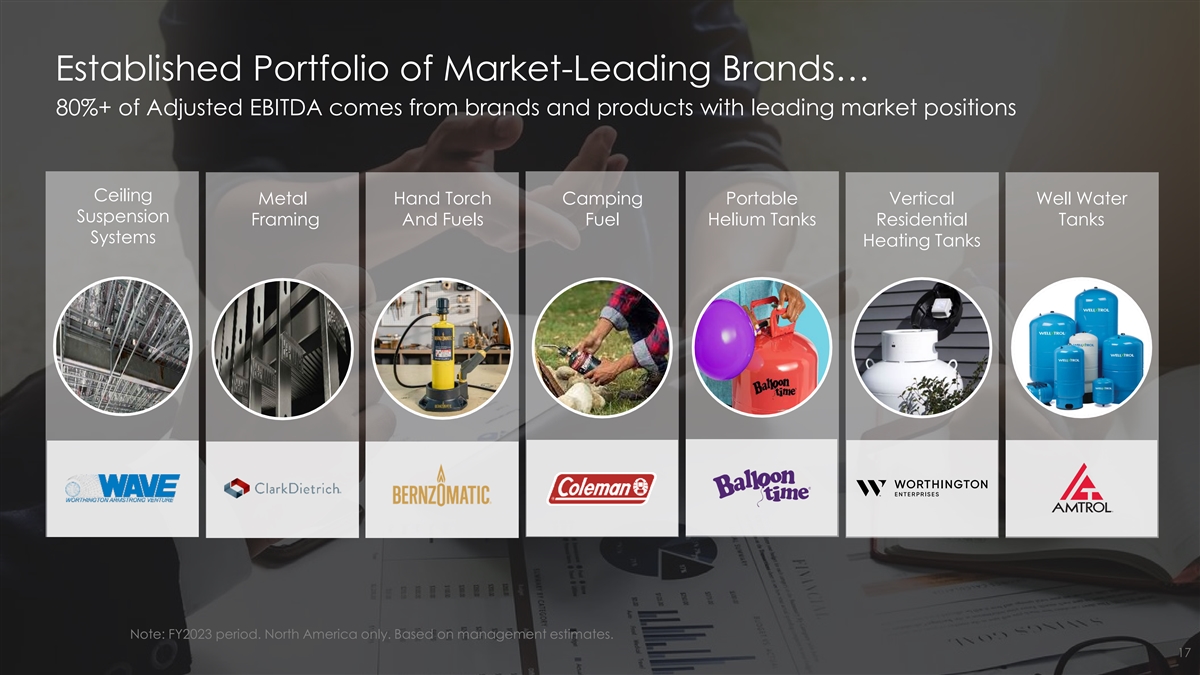
Established Portfolio of Market-Leading Brands… 80%+ of Adjusted EBITDA comes from brands and products with leading market positions Ceiling Metal Hand Torch Camping Portable Vertical Well Water Suspension Framing And Fuels Fuel Helium Tanks Residential Tanks Systems Heating Tanks Note: FY2023 period. North America only. Based on management estimates. 17

High Margin, Asset-Light Business Model, Generating Strong Cash Flow …With High Barriers-to-Entry and Returns Highly Engineered Solutions – Meeting Rigorous Specifications in Highly Regulated Markets Reliability, Speed & Product Quality – Exceptional Quality, Service, and Supply Chain Solutions Robust Industry Knowledge – 68-Year History Providing Specialized, Technical Industry Expertise Innovative Products and Services – Driving Innovation Into Mature Markets Manufacturing at Scale – Automation Enabling Enhanced Efficiency in Production Across Niche Markets 18

Our Products Serve Markets that are Well Positioned to Capitalize on Strong Secular Trends GOVERNMENT STIMULUS ENVIRONMENTAL RE-SHORING AND POPULATION SHIFT AND SUPPORT INVESTMENT NEAR SHORING Propane H2 & CNG Propane Refillable Industrial Metal HVAC Ceiling Metal HVAC Lawn & BBQ / Foam & Tools Systems Systems Systems Solutions Products Framing Products Solutions Framing Products Garden Grill Products Adhesive Increasing investments Multiple Federal Manufacturing Population trends in environmental funding bills support investment in the support increased long-term construction projects at the U.S. in early stages need for new and corporate and and supply chain of multi-year re-modeled homes government level investment resurgence 19
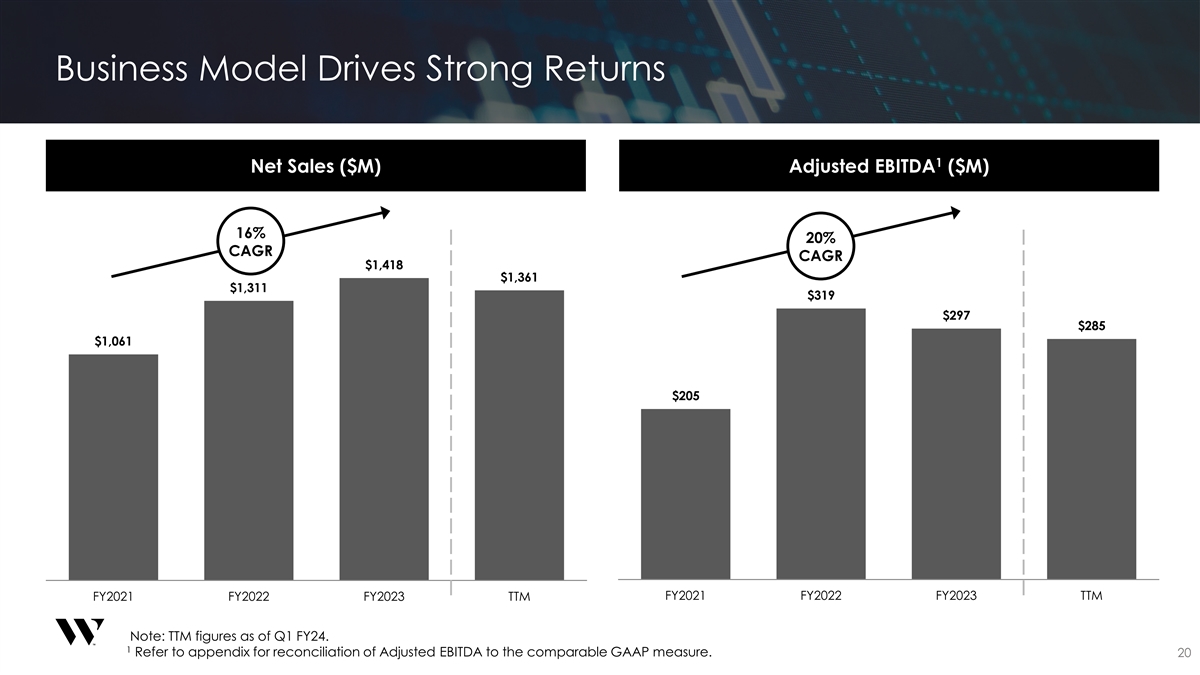
Business Model Drives Strong Returns 1 Net Sales ($M) Adjusted EBITDA ($M) 16% 20% CAGR CAGR $1,418 $1,361 $1,311 $319 $297 $285 $1,061 $205 FY2021 FY2022 FY2023 TTM FY2021 FY2022 FY2023 TTM Note: TTM figures as of Q1 FY24. 1 Refer to appendix for reconciliation of Adjusted EBITDA to the comparable GAAP measure. 20

High Free Cash Flow Generation Accelerating Growth Today Long-Term Targets High Margin and Asset-Light Business Model $1.4B 6-8% Net Sales Net Sales CAGR Powered by the Worthington Business System ~21% 24% 1 1 Adj. EBITDA Margin Adj. EBITDA Margin ~85% 85-90% Driven by Strong Underlying Secular Trends 2 2 Free Cash Flow Conversion Free Cash Flow Conversion Note: TTM figures as of Q1 FY24. 1 Refer to appendix for reconciliation of Adjusted EBITDA to the comparable GAAP measure. 2 21 Free Cash Flow Conversion defined as (Adj. EBITDA – Capex) / Adj. EBITDA.
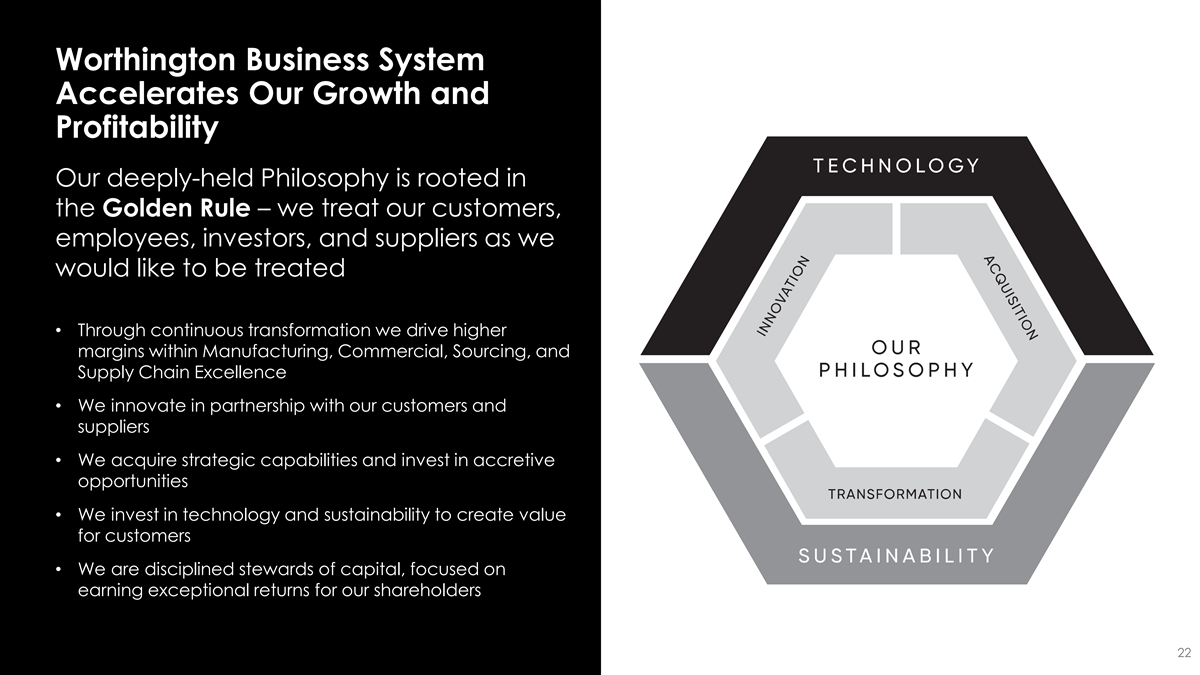
Worthington Business System Accelerates Our Growth and Profitability Our deeply-held Philosophy is rooted in the Golden Rule – we treat our customers, employees, investors, and suppliers as we would like to be treated • Through continuous transformation we drive higher margins within Manufacturing, Commercial, Sourcing, and Supply Chain Excellence • We innovate in partnership with our customers and suppliers • We acquire strategic capabilities and invest in accretive opportunities • We invest in technology and sustainability to create value for customers • We are disciplined stewards of capital, focused on earning exceptional returns for our shareholders 22
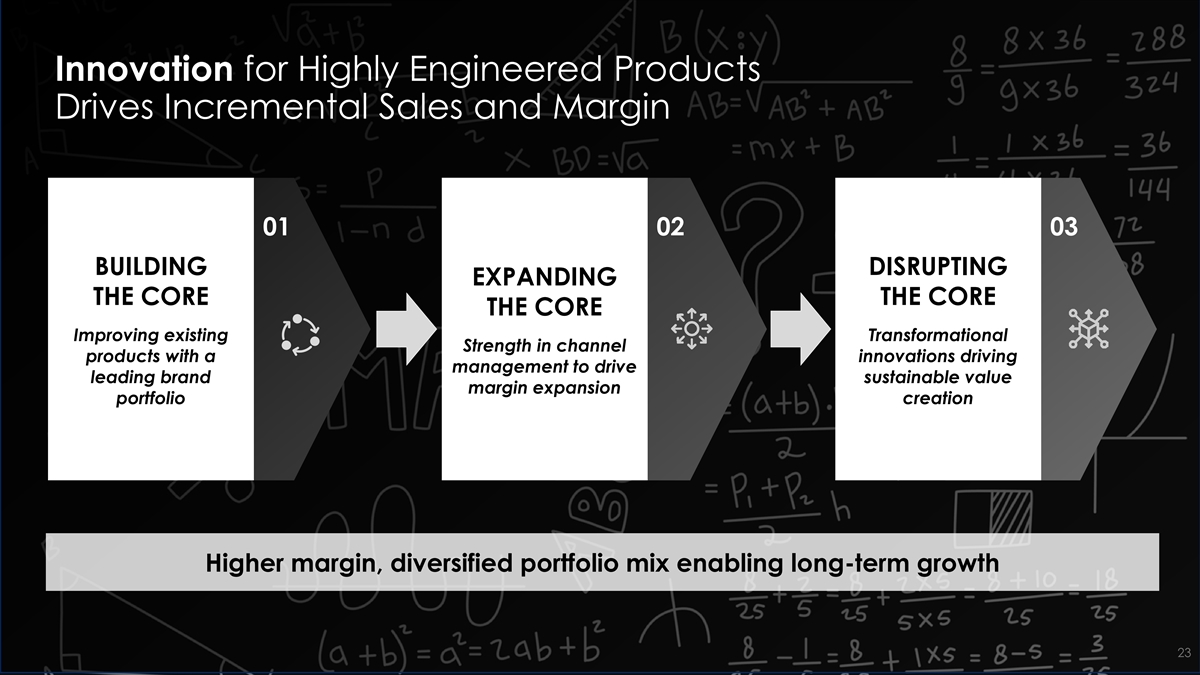
Innovation for Highly Engineered Products Drives Incremental Sales and Margin 01 02 03 BUILDING DISRUPTING EXPANDING THE CORE THE CORE THE CORE Improving existing Transformational Strength in channel products with a innovations driving management to drive leading brand sustainable value margin expansion portfolio creation Higher margin, diversified portfolio mix enabling long-term growth 23
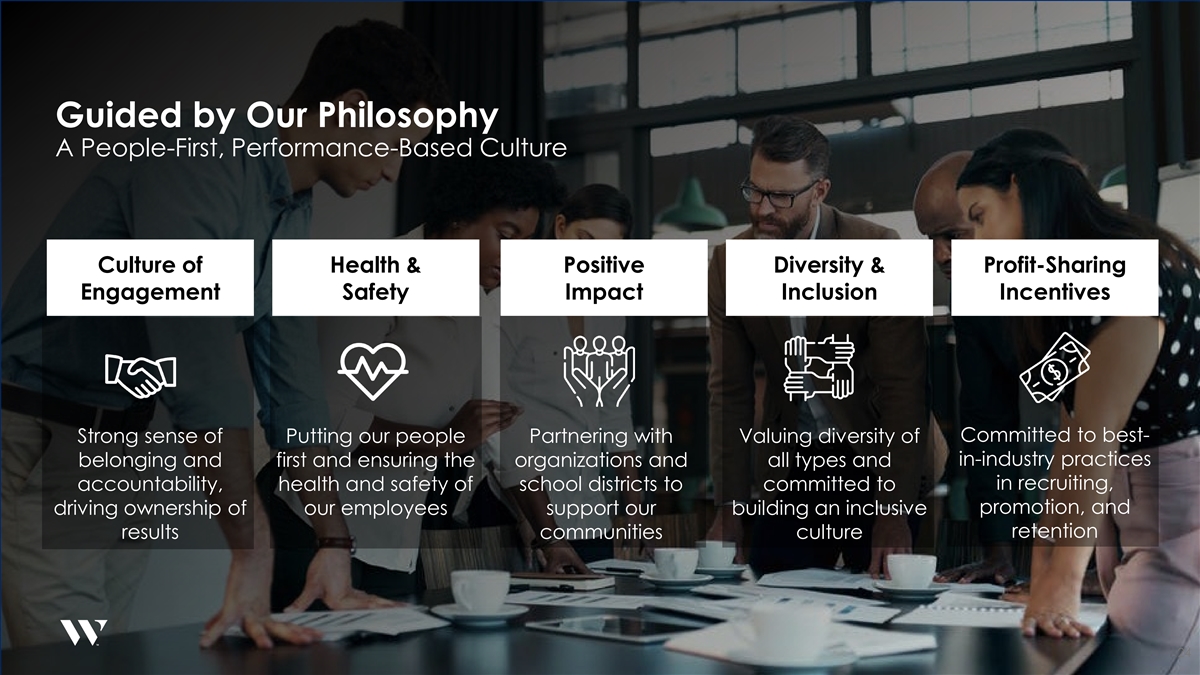
Guided by Our Philosophy A People-First, Performance-Based Culture Culture of Health & Positive Diversity & Profit-Sharing Engagement Safety Impact Inclusion Incentives Strong sense of Putting our people Partnering with Valuing diversity of Committed to best- in-industry practices belonging and first and ensuring the organizations and all types and in recruiting, accountability, health and safety of school districts to committed to promotion, and driving ownership of our employees support our building an inclusive retention results communities culture 24

Low Leverage and Ample Liquidity Provides Financial Flexibility 1 Expected Leverage at Close : Strong 1.0x Balance Sheet Total Debt / TTM Adj. EBITDA Commitment to Maintaining Financial Investment Flexibility Grade Rating Disciplined 2 Expected Liquidity at Close : Capital $701M Allocation Note: TTM figures as of Q1 FY24. 1 Assumes $298M of total debt at close of separation. Based on TTM Adjusted EBITDA of $285M. 25 2 Current liquidity as of 31-Aug-2023. Includes $201M of cash and cash equivalents as of 31-Aug-2023 and $500M of capacity from undrawn revolver.

ibdroot\projects\IBD-NY\trillium2020\664375_1\16. Investor Day Presentations\03. WOR Enterprises\2023.09.29 - Investor Day - WOR Enterprises Shell_v78.pptx OVERVIEW OF BUILDING PRODUCTS 26
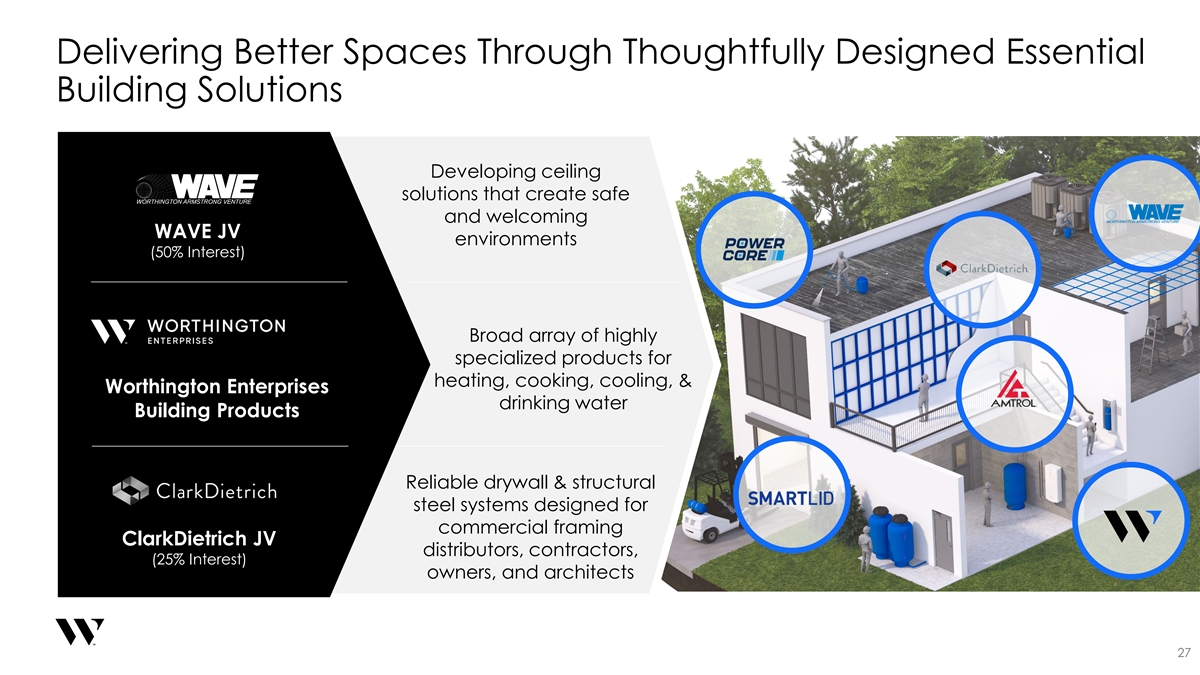
Delivering Better Spaces Through Thoughtfully Designed Essential Building Solutions Developing ceiling solutions that create safe and welcoming WAVE JV environments (50% Interest) Broad array of highly specialized products for B heating, cooking, cooling, & Worthington Enterprises drinking water Building Products Reliable drywall & structural steel systems designed for commercial framing ClarkDietrich JV distributors, contractors, (25% Interest) owners, and architects 27
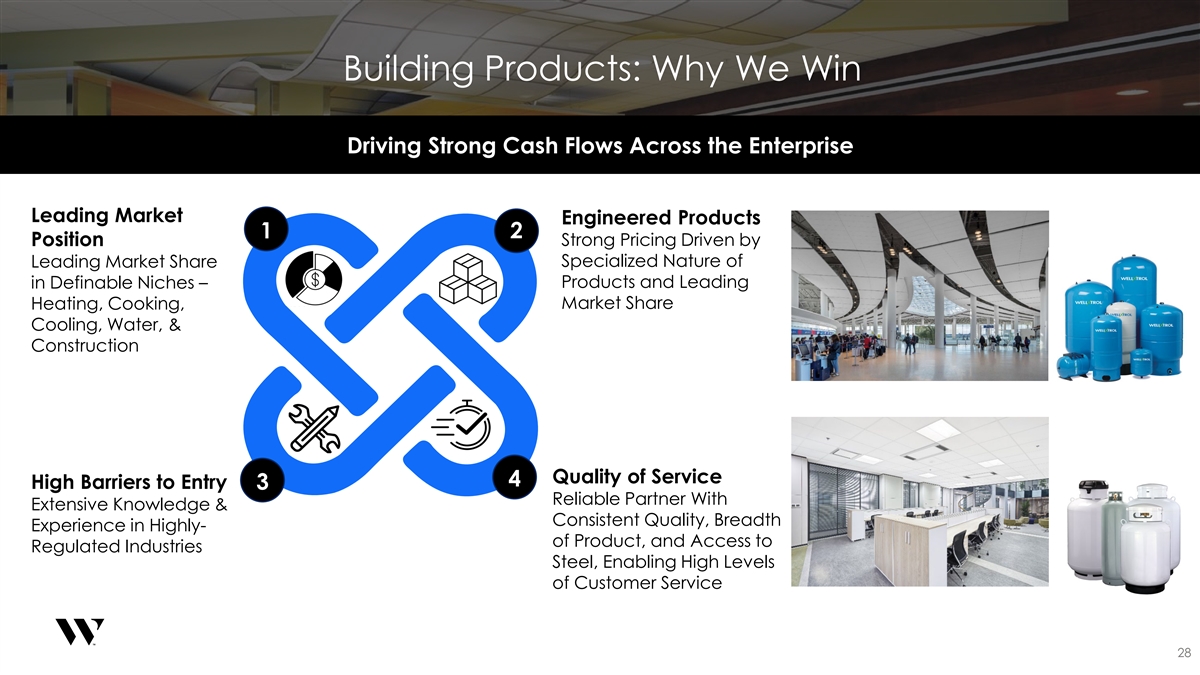
Building Products: Why We Win Driving Strong Cash Flows Across the Enterprise Leading Market Engineered Products 1 2 Position Strong Pricing Driven by Leading Market Share Specialized Nature of Products and Leading in Definable Niches – Market Share Heating, Cooking, Cooling, Water, & Construction Quality of Service 4 High Barriers to Entry 3 Reliable Partner With Extensive Knowledge & Consistent Quality, Breadth Experience in Highly- of Product, and Access to Regulated Industries Steel, Enabling High Levels of Customer Service 28
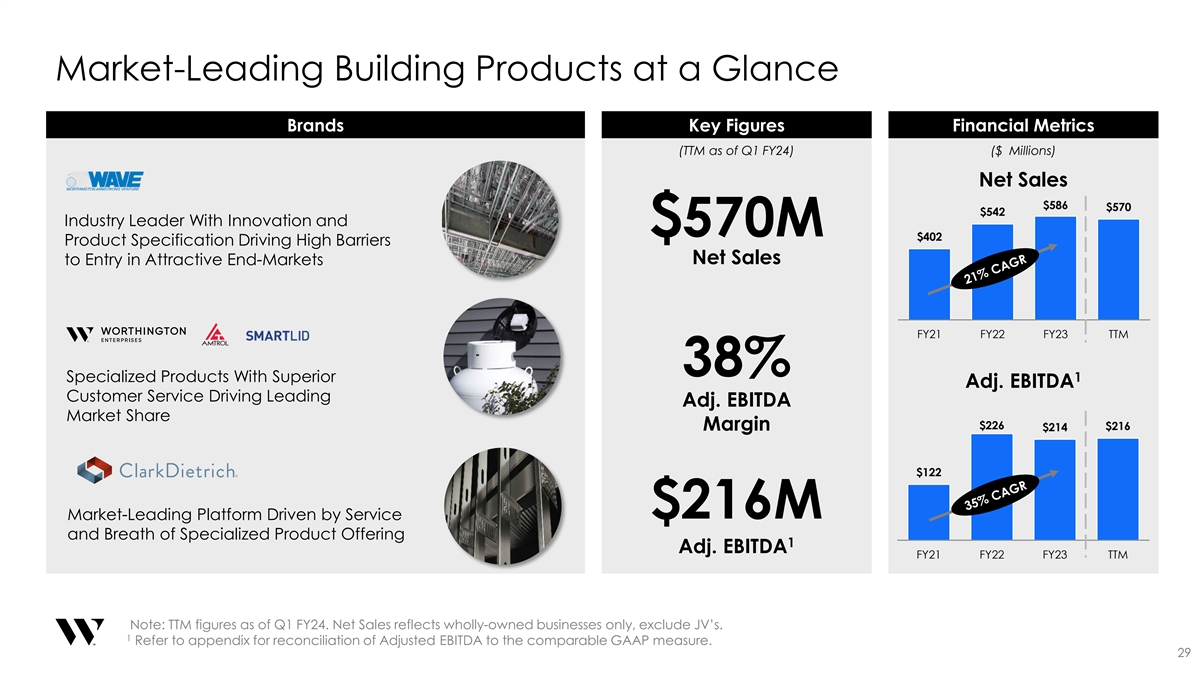
Market-Leading Building Products at a Glance Brands Key Figures Financial Metrics (TTM as of Q1 FY24) ($ Millions) Net Sales $586 $570 $542 Industry Leader With Innovation and $570M $402 Product Specification Driving High Barriers to Entry in Attractive End-Markets Net Sales FY21 FY22 FY23 TTM 38% Specialized Products With Superior 1 Adj. EBITDA Customer Service Driving Leading Adj. EBITDA Market Share $226 $216 Margin $214 $122 $216M Market-Leading Platform Driven by Service and Breath of Specialized Product Offering 1 Adj. EBITDA FY21 FY22 FY23 TTM Note: TTM figures as of Q1 FY24. Net Sales reflects wholly-owned businesses only, exclude JV’s. 1 Refer to appendix for reconciliation of Adjusted EBITDA to the comparable GAAP measure. 29

Our Presenters DOUG CADLE JIMMY BOWES President & CEO Vice President & General Manager WAVE Building Products 30

WAVE: Bringing Together the Best of Both Parents • Established in 1955 • 50/50 JV, established in 1992, leveraging the • Established in 1860 strength of both partners • $1.4B sales in fiscal 2023 • $1.2B in sales in calendar 2022 • $447 million in net sales in our fiscal 2023 • 14 facilities in 5 countries • 16 plants in North America • 7 U.S. plants | 450 employees • 4,000 employees • 3,000 employees • North American market leader in ceiling • A market-leading designer and • Market leader suspension systems and integrated solutions manufacturer of innovative Building • Strong brand Products, Consumer Products, and • Strong exchange of talent with parent Sustainable Energy Solutions companies Steel procurement, supply chain High barriers to entry Go to market expertise management, and innovation driven by specifications 31
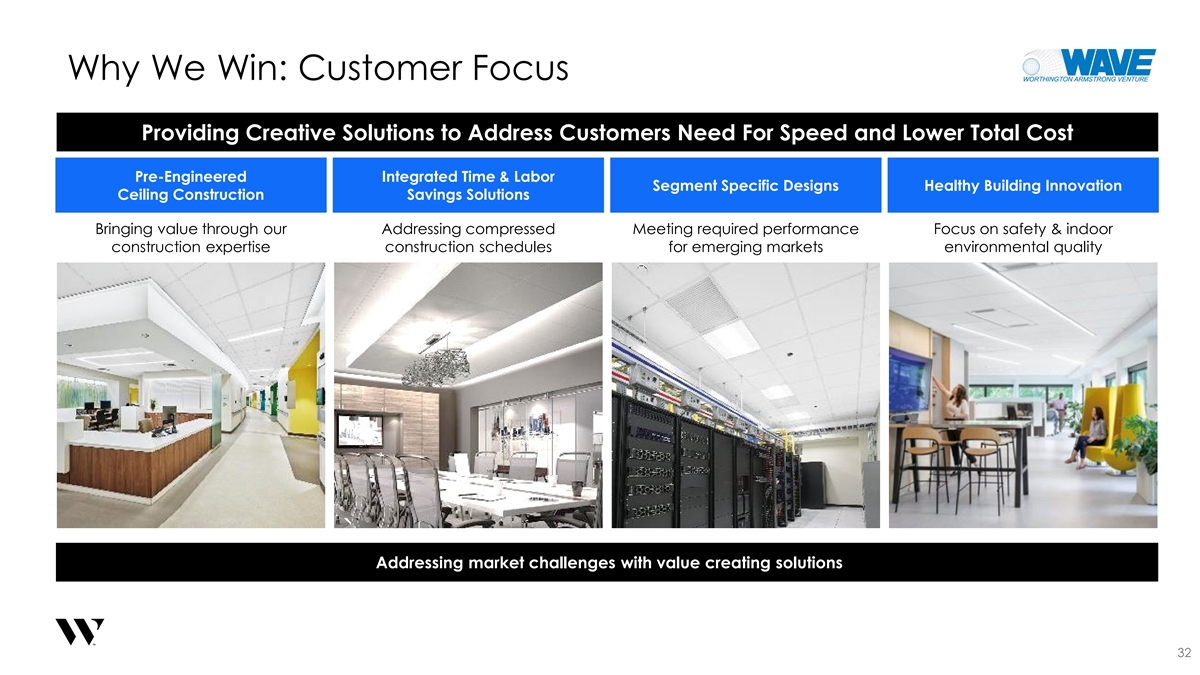
Why We Win: Customer Focus Providing Creative Solutions to Address Customers Need For Speed and Lower Total Cost Pre-Engineered Integrated Time & Labor Segment Specific Designs Healthy Building Innovation Ceiling Construction Savings Solutions Bringing value through our Addressing compressed Meeting required performance Focus on safety & indoor construction expertise construction schedules for emerging markets environmental quality Addressing market challenges with value creating solutions 32
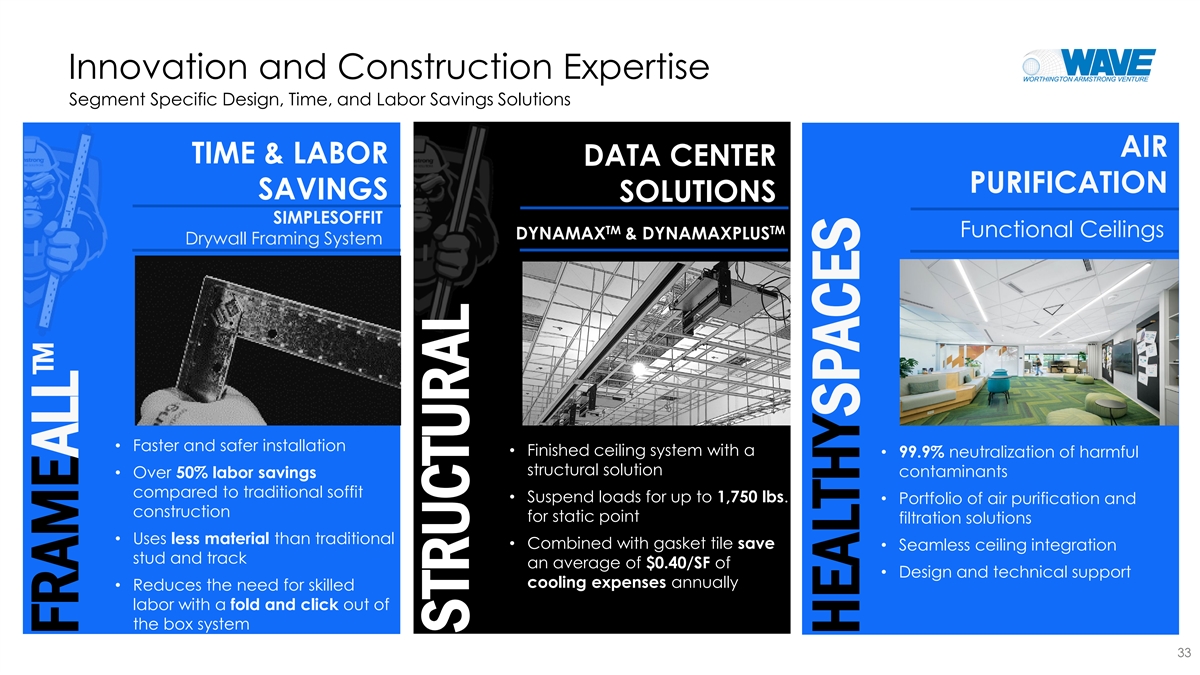
Innovation and Construction Expertise Segment Specific Design, Time, and Labor Savings Solutions AIR TIME & LABOR DATA CENTER PURIFICATION SAVINGS SOLUTIONS SIMPLESOFFIT TM TM Functional Ceilings DYNAMAX & DYNAMAXPLUS Drywall Framing System • Faster and safer installation • Finished ceiling system with a • 99.9% neutralization of harmful structural solution contaminants • Over 50% labor savings compared to traditional soffit • Suspend loads for up to 1,750 lbs. • Portfolio of air purification and construction for static point filtration solutions • Uses less material than traditional • Combined with gasket tile save • Seamless ceiling integration stud and track an average of $0.40/SF of • Design and technical support cooling expenses annually • Reduces the need for skilled labor with a fold and click out of the box system 33 TM FRAMEALL STRUCTURAL HEALTHYSPACES

Consistent Track Record of Delivering Earnings Growth Growth Initiatives Leave WAVE Well Positioned for Future Growth Net Sales ($M) $452 $447 $449 $391 New Containment Solutions allows for more efficient $372 use of power and cooling systems at data centers, resulting is significant cost savings Establishing new MEP and HVAC distribution channels to support rollout of Healthy Spaces products FY2020 FY2021 FY2022 FY2023 TTM Accelerating adjacent products to market, while 1 Contribution to Worthington Adj. EBITDA ($M) staying close to the needs of core customers $ 90 $ 87 $ 86 $ 79 $ 78 40% + $821M 2 EBITDA Margins Cumulative Dividends Paid 1 to WOR Since 2014 FY2020 FY2021 FY2022 FY2023 TTM Note: TTM figures as of Q1 FY24. 1 FY2020 contribution to Adj EBITDA excludes $24.9M gain and associated dividends related to sale of WAVE’s foreign operations. 2 34 Based on FY2023.

Everyday Products Essential for Enjoying Life Established in 1971 Diversified Industry Leading Partnerships Market Leadership in Pressurized Across Numerous with Customers & Suppliers Containment Solutions End Markets Providing Critical Components in Essential End Markets HEATING COOKING COOLING WATER Integral in storing and Key component in Facilitating the transition Delivering safe and transporting refrigerants providing safe and clean away from natural gas and reliable cooking fuel while facilitating transition drinking water in homes oil, as well as providing back- used inside and outside to lower GWP and Ozone and buildings up power solutions the home depleting gases Supported by Strong Installed Base of Homes 143M 23M 50M 90% Homes use propane as an Homes are on well water Homes use Air Conditioning Homes in the US energy source in the US in the US in the US We support 2,000+ customers in these markets by leveraging our 6 facilities and ~2,000 employees 35 Source: US Census Bureau, US Energy Information Administration, US Environmental Protection Agency, National Propane Gas Association.
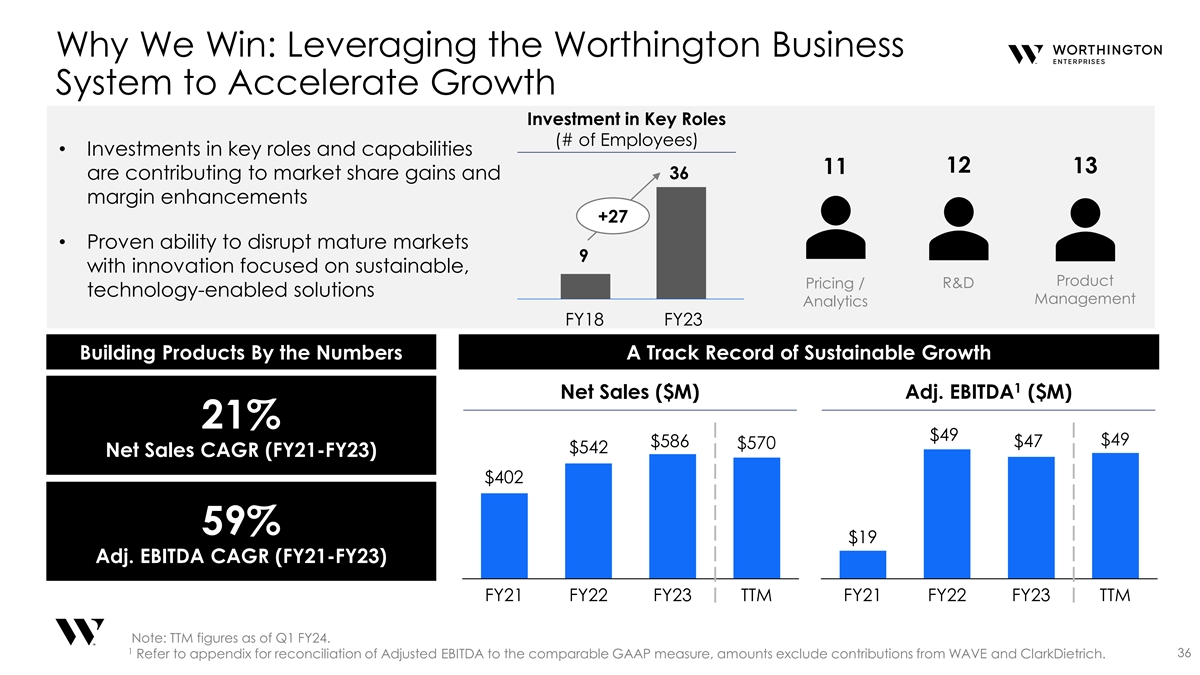
Why We Win: Leveraging the Worthington Business System to Accelerate Growth Investment in Key Roles (# of Employees) • Investments in key roles and capabilities 12 11 13 36 are contributing to market share gains and margin enhancements +27 • Proven ability to disrupt mature markets 9 with innovation focused on sustainable, Product Pricing / R&D technology-enabled solutions Management Analytics FY18 FY23 Building Products By the Numbers A Track Record of Sustainable Growth 1 Net Sales ($M) Adj. EBITDA ($M) 21% $49 $49 $586 $47 $570 $542 Net Sales CAGR (FY21-FY23) $402 $189 59% $19 Adj. EBITDA CAGR (FY21-FY23) FY21 FY22 FY23 TTM FY21 FY22 FY23 TTM Note: TTM figures as of Q1 FY24. 1 36 Refer to appendix for reconciliation of Adjusted EBITDA to the comparable GAAP measure, amounts exclude contributions from WAVE and ClarkDietrich.
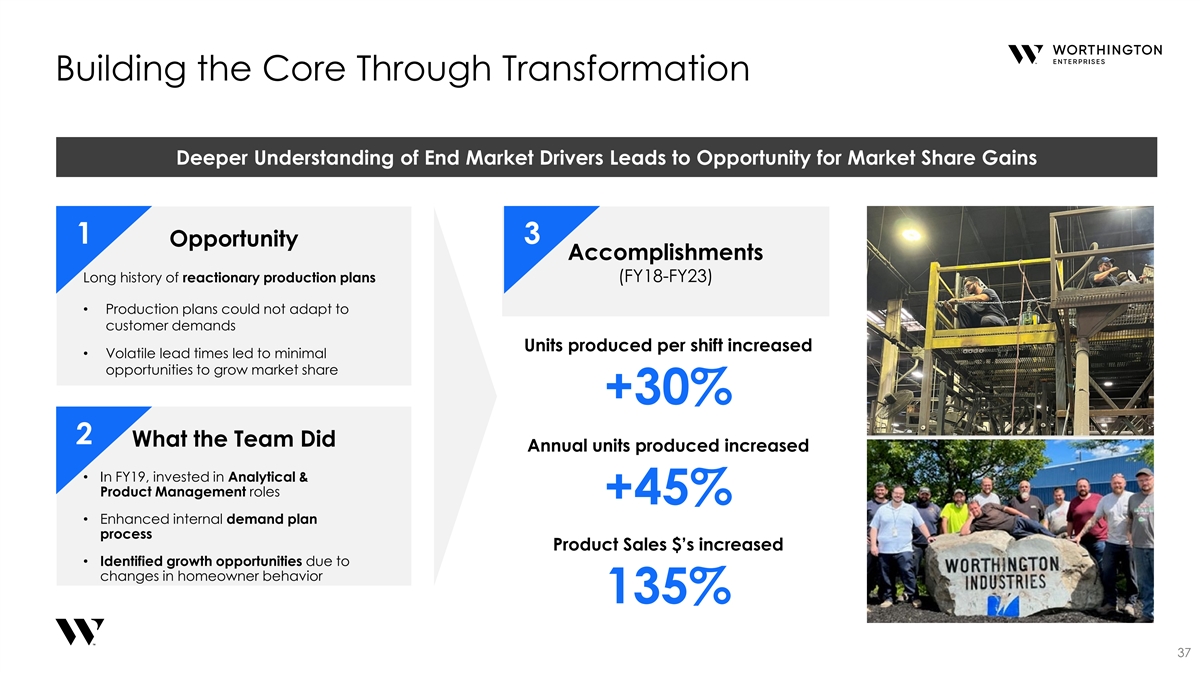
Building the Core Through Transformation Deeper Understanding of End Market Drivers Leads to Opportunity for Market Share Gains 1 3 Opportunity Accomplishments Long history of reactionary production plans (FY18-FY23) • Production plans could not adapt to customer demands Units produced per shift increased • Volatile lead times led to minimal opportunities to grow market share +30% 2 What the Team Did Annual units produced increased • In FY19, invested in Analytical & Product Management roles +45% • Enhanced internal demand plan process Product Sales $’s increased • Identified growth opportunities due to changes in homeowner behavior 135% 37

Expanding the Core Through New Product Development Solving the Propane Industry’s Biggest Problems via Tech-Enabled Solutions Consumers Propane Distributor Propane Distributor How Much Fuel is in My Cylinder? How Can I Optimize My Propane Where are My Cylinders? Delivery Route? Solution: Solution: Solution: NEXI SMARTLID PROGRESSING IN OUR NEW PRODUCT DEVELOPMENT PROCESS 1 • Installed base of 10m cylinders in US • Cylinder-mounted IoT device • Integrated remote monitoring for fuel levels • Provides real time data on fuel use • Provides more efficient fill truck routes & • Not knowing where cylinders are or what condition they are in leads to significant waste • Ultrasound technology reduction in service calls • Solution would provide significant operational • Monitoring, alerts, and ability to order refill all • Industry leading battery life and dual sim tech efficiencies for customers through a mobile app • Monitoring, alerts, & reporting all through app

Disrupting Our Core by Creating New Markets RESULTS HISTORICAL DIP TUBE SOLUTION Spray Foam & Adhesive M A R K E TS SINCE WE INCREASED FOCUS. . . NUMBER OF Ro o f i n g C U ST O M ER S H A VE 4X N ET SA L ES D OUB LE D GROWTH I n sul a t i o n Using Voice of Customer , We’re now solving Spray Foam & Adhesive Market’s Biggest Challenges WATER BASED CHEMICALS A POWERFUL SOLUTION Standard Ergonomic M A R K E TS Cylinder Nightmare Corrodes - Roofing - Insulation - Cabinetry Requires Time - Countertops Skilled Consuming - Flooring Labor - Specialty Chemicals 39

ClarkDietrich A Market Leader in Commercial Steel Framing Contribution to Worthington’s Adj. EBITDA ($M) $ 89 • 25% owned JV formed in 2011 through the combination of ClarkWestern Building Systems and Dietrich Metal Framing $ 80 $ 77 • Building solutions provider for commercial steel framing distributors, contractors, owners & architects • Driven by speed, service, reliability, and broad product offering Cumulative Dividends 1 $201M Paid to WOR Since 2014 $ 25 $ 17 FY2020 FY2021 FY2022 FY2023 TTM Note: TTM figures as of Q1 FY24. 1 As of FY23. 40
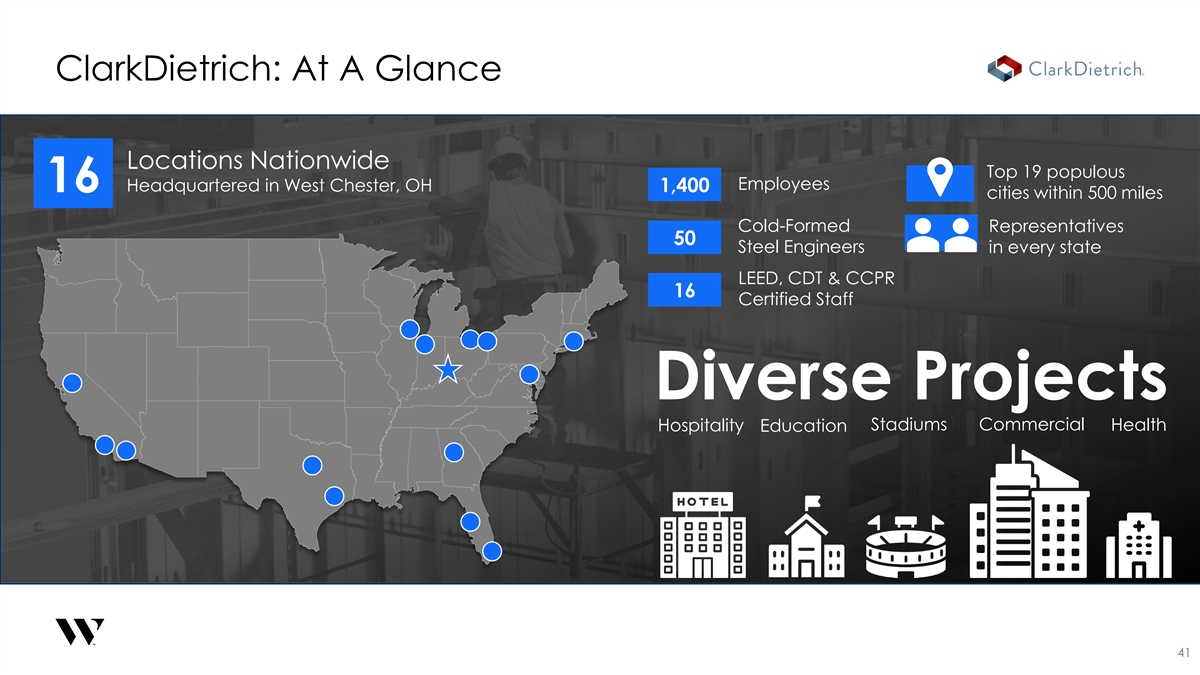
ClarkDietrich: At A Glance Locations Nationwide Top 19 populous Employees Headquartered in West Chester, OH 16 1,400 cities within 500 miles Cold-Formed Representatives 50 Steel Engineers in every state LEED, CDT & CCPR 16 Certified Staff Diverse Projects Commercial Hospitality Stadiums Health Education 41

C Strategic Joint Ventures Drive Consistent, Strong Cash Flow Generation The percentage of dividends received by Worthington relative to JV Equity Income has averaged over 98% over the last ten years $350 Wave & ClarkDietrich Dividends Over Time ($M) $300 137% 133% 130% 107% 100% $250 97% 95% $228 $218 101% Average: 98 % $200 50% 80% 79% $105 $96 $150 $121 $10 $95 $96 $89 $100 $85 $82 $79 $78 $7 $17 $70 $6 $21 $12 $16 $5 $3 $123 $122 $111 $50 $88 $79 $76 $73 $73 $68 $67 $63 $ 0 FY2014 FY2015 FY2016 FY2017 FY2018 FY2019 FY2020¹ FY2021 FY2022 FY2023 TTM WAVE ClarkDietrich Dividends as a % of Equity Earnings Average Dividends as a % of Equity Earnings Note: TTM figures as of Q1 FY24. 1 WAVE FY2020 equity earnings excludes a $24.9M pre-tax gain and associated dividends related to sale of WAVE’s foreign operations. 42

Delivering Essential Building Solutions Poised For Future Growth to Create Better Spaces Market-Leading Positions Consistent, Strong Cash Flow Generation Organic Growth Through New Product Development 43

ibdroot\projects\IBD-NY\trillium2020\664375_1\16. Investor Day Presentations\03. WOR Enterprises\2023.09.29 - Investor Day - WOR Enterprises Shell_v78.pptx OVERVIEW OF CONSUMER PRODUCTS 44

Our Presenter STEVE CARAVATI President CONSUMER PRODUCTS 45
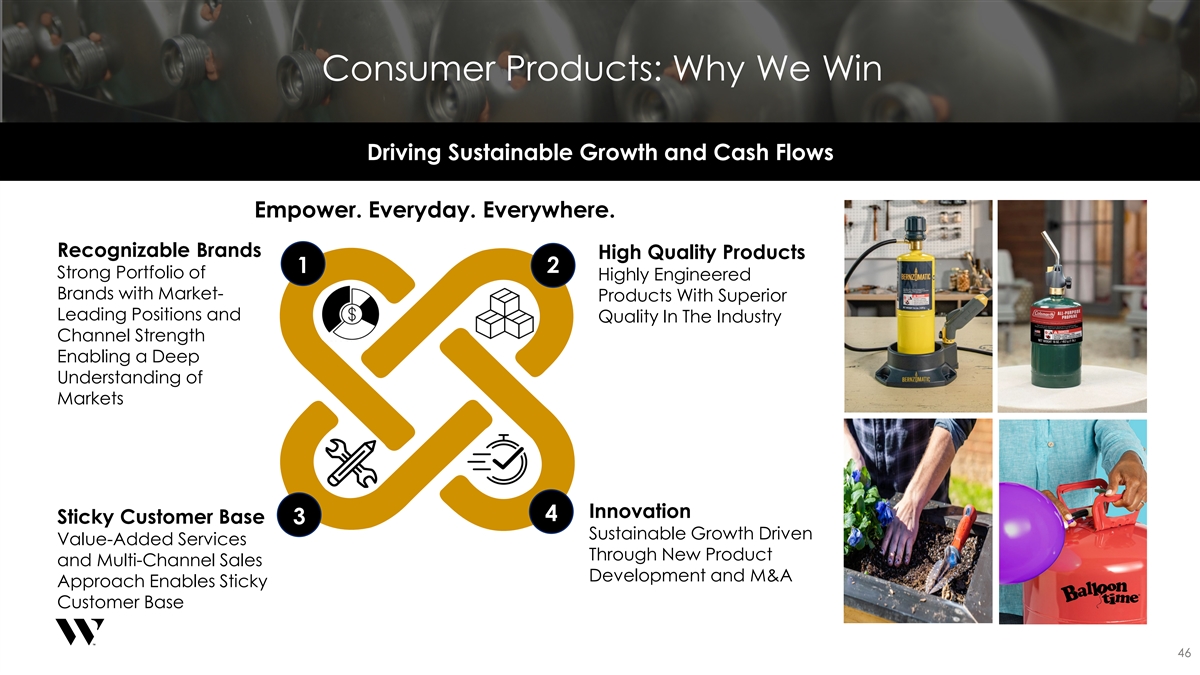
Consumer Products: Why We Win Driving Sustainable Growth and Cash Flows Empower. Everyday. Everywhere. Recognizable Brands High Quality Products 1 2 Strong Portfolio of Highly Engineered Brands with Market- Products With Superior Leading Positions and Quality In The Industry Channel Strength Enabling a Deep Understanding of Markets Innovation 4 Sticky Customer Base 3 Sustainable Growth Driven Value-Added Services Through New Product and Multi-Channel Sales Development and M&A Approach Enables Sticky Customer Base 46

CONSUMER PRODUCTS AT A GLANCE SEGMENT OVERVIEW KEY FIGURES FINANCIAL METRICS (TTM as of Q1 FY24) ($ Millions) Value-added partner to customers, featuring a Net Sales wide variety of highly engineered products across $686 $647 $636 $524 Tools, Outdoor Living, and Celebrations $647M TOOLS OUTDOOR LIVING CELEBRATIONS Net Sales FY21 FY22 FY23 TTM 1 Adj. EBITDA $117 $101 $89 $86 14% Adj. EBITDA Margin FY21 FY22 FY23 TTM Sales by End-Market $89M 18% 28% 1 Adj. EBITDA 54% Tools Outdoor Living Celebrations Note: TTM figures as of Q1 FY2024. 1 Refer to appendix for reconciliation of Adjusted EBITDA to the comparable GAAP measure. 47

PRODUCT PORTFOLIO OVERVIEW Tools Outdoor Living Celebrations 18% 28% 54% OF SALES OF SALES OF SALES Note: TTM figures as of Q1 FY2024. 48

Broad Range of Consumers in Attractive Market Segments with Significant Tailwinds Professionals DIYers Investment in Year-Round Repair & Sustainability & Spaces Remodel Wellness Craftsmen Americans are spending more time Aging U.S. housing stock Growing emphasis and money outside is leading to greater on health and with Outdoor demand for lower-ticket wellness linked to Recreation GDP renovations, upgrades, time spent outdoors outpacing and repairs Outdoor Enthusiasts U.S. GDP Party Planners Source: U.S. Census, 2021 U.S. Bureau of Economic Analysis. 49
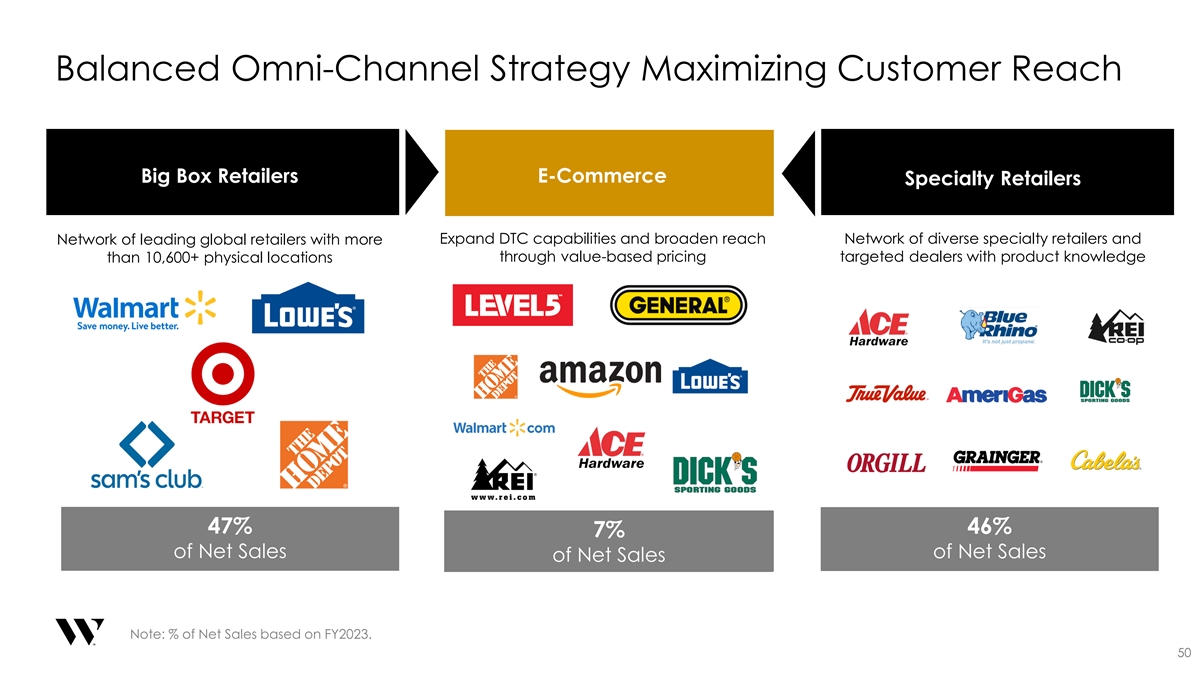
Balanced Omni-Channel Strategy Maximizing Customer Reach Big Box Retailers E-Commerce Specialty Retailers Expand DTC capabilities and broaden reach Network of diverse specialty retailers and Network of leading global retailers with more than 10,600+ physical locations through value-based pricing targeted dealers with product knowledge 47% 46% 7% of Net Sales of Net Sales of Net Sales Note: % of Net Sales based on FY2023. 50

A Roadmap for Our E-Commerce Strategy 4 3 1 2 IDENTIFY GAPS THROUGH EXPAND DTC MODEL TARGETING BRANDS WITH TESTING NEW CONCEPTS CONSUMER INSIGHTS AND PLATFORMS ROOM TO GROW WITH FAST-TO-MARKET TIMELINES 51
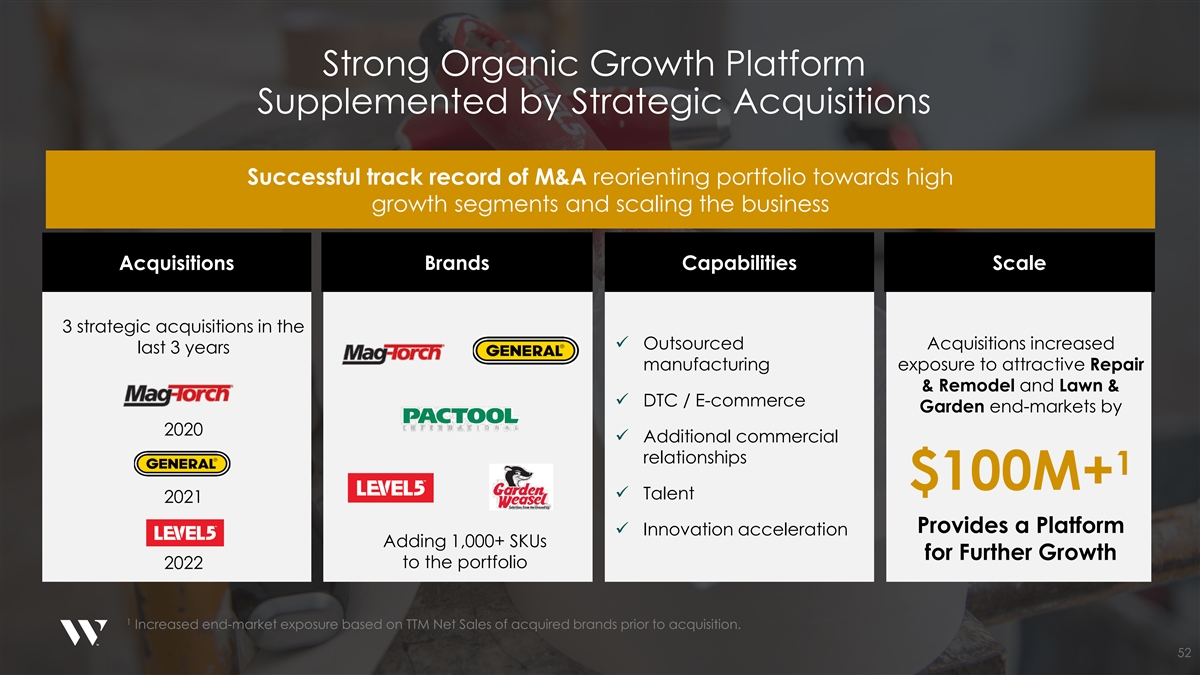
Strong Organic Growth Platform Supplemented by Strategic Acquisitions Successful track record of M&A reorienting portfolio towards high growth segments and scaling the business Acquisitions Brands Capabilities Scale 3 strategic acquisitions in the ü Outsourced Acquisitions increased last 3 years manufacturing exposure to attractive Repair & Remodel and Lawn & ü DTC / E-commerce Garden end-markets by 2020 ü Additional commercial relationships 1 $100M+ ü Talent 2021 Provides a Platform ü Innovation acceleration Adding 1,000+ SKUs for Further Growth 2022 to the portfolio 1 Increased end-market exposure based on TTM Net Sales of acquired brands prior to acquisition. 52
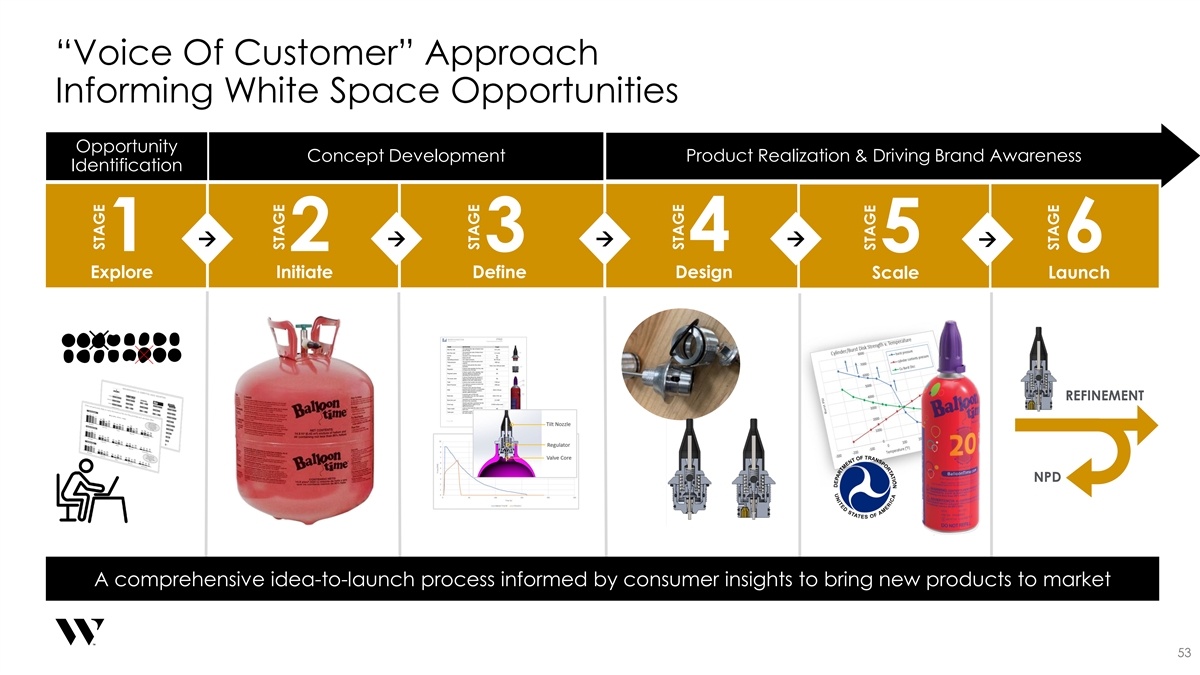
“Voice Of Customer” Approach Informing White Space Opportunities Opportunity Product Realization & Driving Brand Awareness Concept Development Identification à àààà à 1 2 3 4 5 6 Explore Initiate Define Design Scale Launch REFINEMENT NPD A comprehensive idea-to-launch process informed by consumer insights to bring new products to market 53 STAGE STAGE STAGE STAGE STAGE STAGE

Transformation Case Study: Working Capital Reduction Improved Internal Supplier / Customer Relationship and Efficiency Through Transformation 1 3 Opportunity Accomplishments Long history of uncontrolled / uneven supply (Jul-Sep 2023) and demand patterns between Supplier and Customer • Material handling and quality issues • Working capital tied up in inventories Decreased steel inventory by 53% 2 What the Team Did Improved working capital by • Created a Cross Functional Team $500K • Facility visits to assess and understand pain points Controlled and leveled • Used Transformation tools to create ordering & shipping patterns Flow and Pull 54
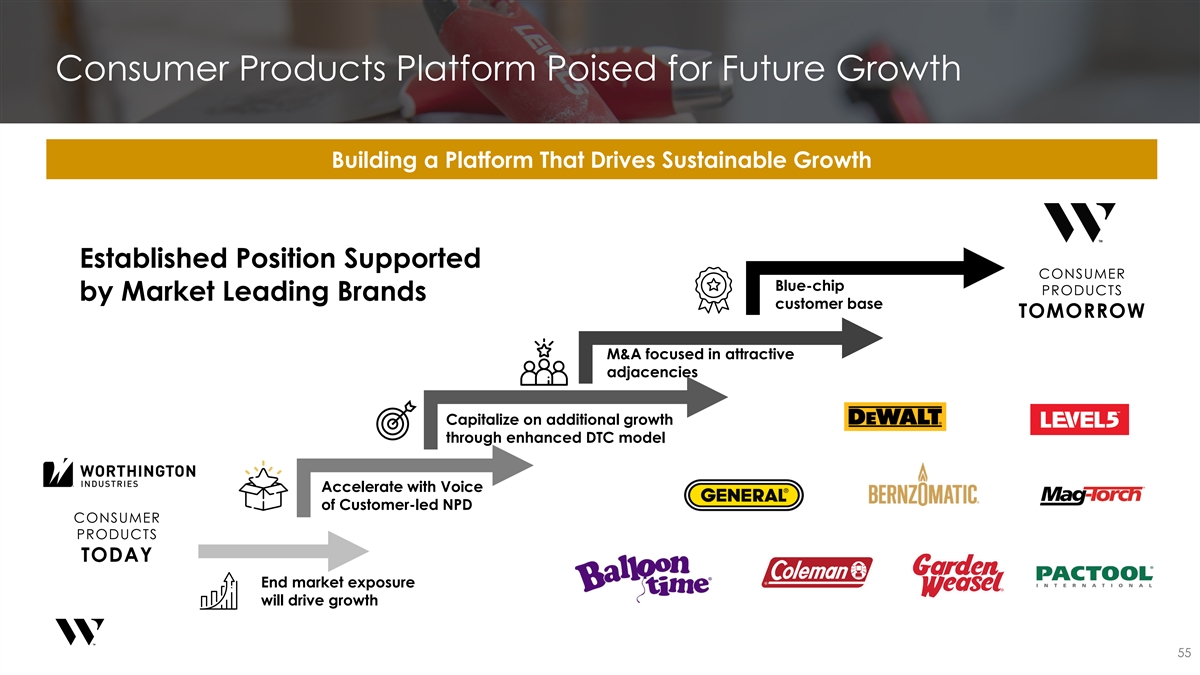
Consumer Products Platform Poised for Future Growth Building a Platform That Drives Sustainable Growth Established Position Supported CONSUMER Blue-chip PRODUCTS by Market Leading Brands customer base TOMORROW M&A focused in attractive adjacencies Capitalize on additional growth through enhanced DTC model Accelerate with Voice of Customer-led NPD CONSUMER PRODUCTS TODAY End market exposure will drive growth 55

ibdroot\projects\IBD-NY\trillium2020\664375_1\16. Investor Day Presentations\03. WOR Enterprises\2023.09.29 - Investor Day - WOR Enterprises Shell_v78.pptx OVERVIEW OF SUSTAINABLE ENERGY SOLUTIONS 56
Our Presenter TIMO SNOEREN Vice President Sustainable Energy Solutions 57

Sustainable Energy Solutions At a Glance Supporting the growing hydrogen ecosystem and adjacent sustainable energies with products including: Slupsk, Poland • On-board fueling systems and services T3 Onboard fueling • Gas containment solutions and services for the systems and Burscheid, cylinders for CNG storage, transport, and distribution of industrial gases Germany and hydrogen applications Valves, One of only 5 global players with the capabilities to create pressure regulators, and deliver these solutions filters, etc. Kienberg, Austria T1 to T4 High-pressure cylinders, bundles Our Goal: and containers for To become the trusted global partner providing system CNG and hydrogen applications solutions for sustainable power and mobility 550 $4M $144M 3 1 EMPLOYEES ADJ. EBITDA NET SALES MANUFACTURING LOCATIONS Note: TTM figures as of Q1 FY2024 1 Refer to appendix for reconciliation of Adjusted EBITDA to the comparable GAAP measure. 58

A Critical Supplier in the Hydrogen & CNG Supply Chain¹ Supply & Generation Transport, Storage, & Distribution Utilization Where Worthington Enterprises Participates End-to-End Solutions for Transport & Storage Industrial Material Supply & Generation Mobility Hydrogen CNG Gas Storage: High Pressure Truck Transport Containers, Bundles, Cylinders Components & Storage Cylinders In the Hydrogen & CNG Worthington Enterprises Offers Transport, Storage, To Customers Across Supply Chain and Distribution Solutions Attractive End Markets 1 Includes LNG and LH2. 59
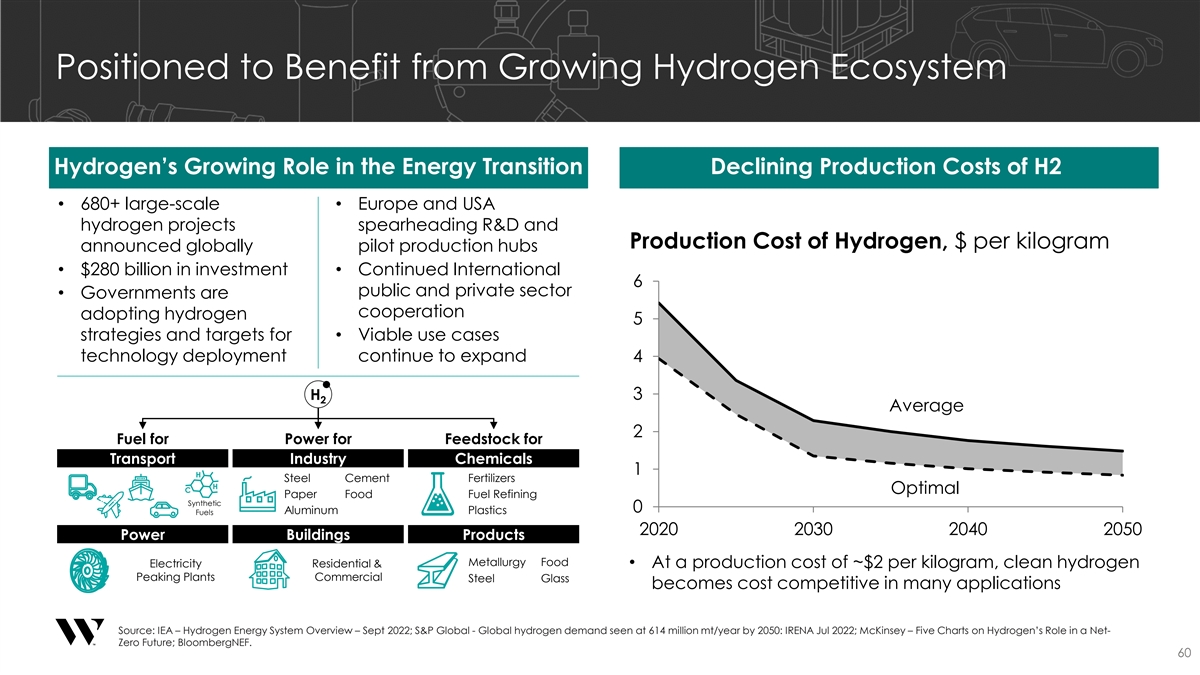
Positioned to Benefit from Growing Hydrogen Ecosystem Positioned to Benefit from Growing Hydrogen Ecosystem Hydrogen’s Growing Role in the Energy Transition Declining Production Costs of H2 • 680+ large-scale • Europe and USA hydrogen projects spearheading R&D and Production Cost of Hydrogen, $ per kilogram announced globally pilot production hubs • $280 billion in investment • Continued International 6 public and private sector • Governments are cooperation adopting hydrogen 5 strategies and targets for • Viable use cases continue to expand technology deployment 4 H 3 2 Average 2 Fuel for Power for Feedstock for Transport Industry Chemicals 1 H Steel Cement Fertilizers H C Optimal Paper Food Fuel Refining Synthetic 0 Fuels Aluminum Plastics 2020 2030 2040 2050 Power Buildings Products Metallurgy Food Electricity Residential & • At a production cost of ~$2 per kilogram, clean hydrogen Peaking Plants Commercial Steel Glass becomes cost competitive in many applications Source: IEA – Hydrogen Energy System Overview – Sept 2022; S&P Global - Global hydrogen demand seen at 614 million mt/year by 2050: IRENA Jul 2022; McKinsey – Five Charts on Hydrogen’s Role in a Net- Zero Future; BloombergNEF. 60

Exciting Recent Launches And Pipeline Show Promising Future Hydrogen Truck Application Hydrogen Transport & Application • 700 BAR H2 Fuel Systems • Container Business • Longer range, less weight • Up to 1,100 Kg of Hydrogen • Green Deal regulations • Initial market demand requiring ~50,000 Hydrogen materializing trucks by 2030 • Strong pipeline of inquiries • Prototyping with key European OEMs SIGMA (IOT) Stationary Hydrogen Storage Hydrogen Bus Application • T1 H2 550 Bar Solutions • 350 BAR H2 Fuel Systems • For use by key Industrial Gas majors • Prototyping with key European OEMS • To be launched Q1 2024 61
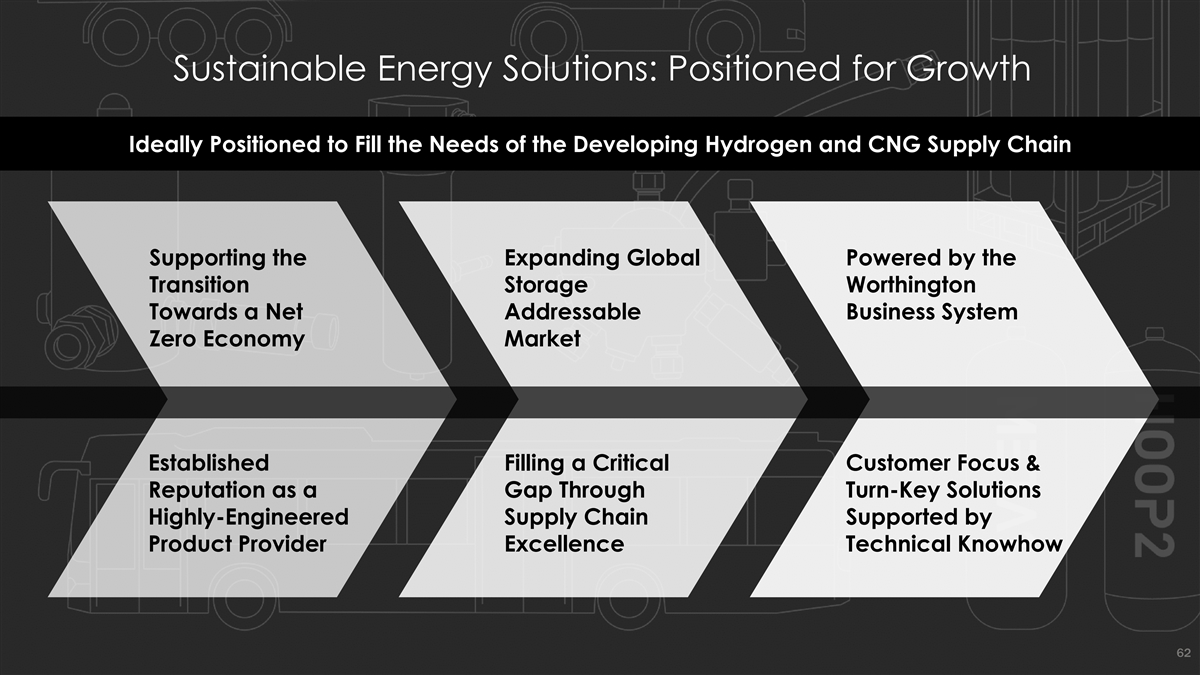
Sustainable Energy Solutions: Positioned for Growth Ideally Positioned to Fill the Needs of the Developing Hydrogen and CNG Supply Chain Supporting the Expanding Global Powered by the Transition Storage Worthington Towards a Net Addressable Business System Zero Economy Market Established Filling a Critical Customer Focus & Reputation as a Gap Through Turn-Key Solutions Highly-Engineered Supply Chain Supported by Product Provider Excellence Technical Knowhow 62

ibdroot\projects\IBD-NY\trillium2020\664375_1\16. Investor Day Presentations\03. WOR Enterprises\2023.09.29 - Investor Day - WOR Enterprises Shell_v78.pptx Break

ibdroot\projects\IBD-NY\trillium2020\664375_1\16. Investor Day Presentations\03. WOR Enterprises\2023.09.29 - Investor Day - WOR Enterprises Shell_v78.pptx The Path Forward
Our Presenter JOE HAYEK Executive VP, CFO & COO Worthington Enterprises 65
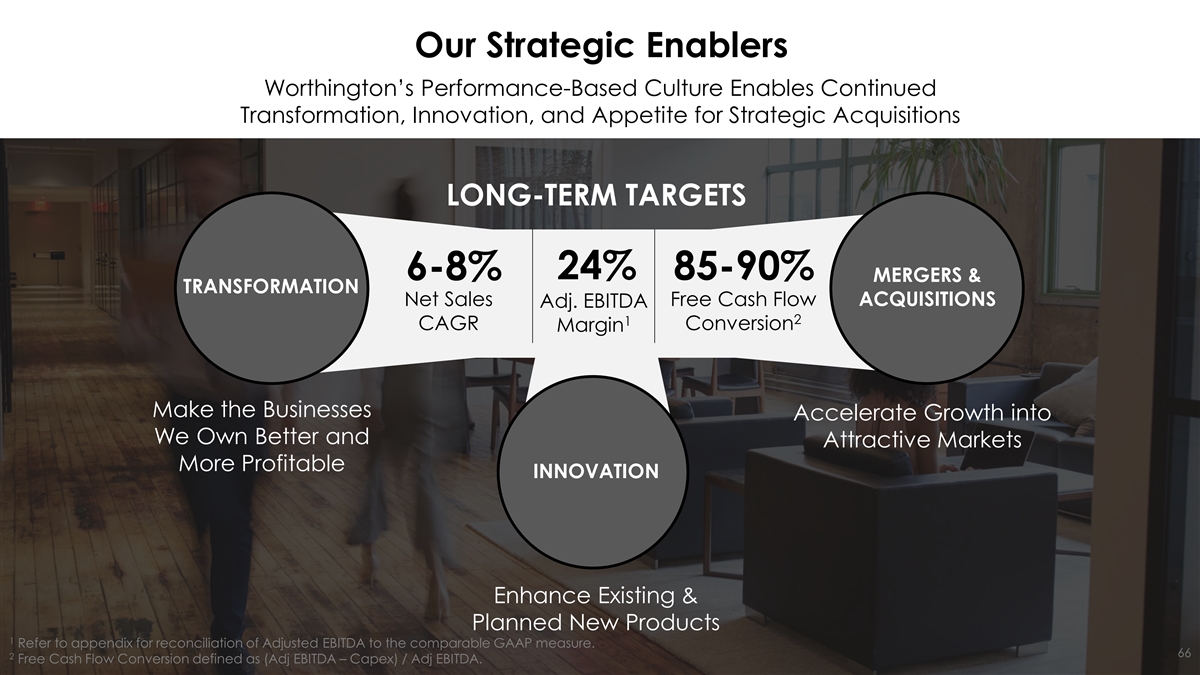
Our Strategic Enablers Worthington’s Performance-Based Culture Enables Continued Transformation, Innovation, and Appetite for Strategic Acquisitions LONG-TERM TARGETS 6-8% 24% 85-90% MERGERS & TRANSFORMATION Net Sales Free Cash Flow ACQUISITIONS Adj. EBITDA 2 1 CAGR Conversion Margin Make the Businesses Accelerate Growth into We Own Better and Attractive Markets More Profitable INNOVATION Enhance Existing & Planned New Products 1 Refer to appendix for reconciliation of Adjusted EBITDA to the comparable GAAP measure. 66 2 Free Cash Flow Conversion defined as (Adj EBITDA – Capex) / Adj EBITDA.

Transformation: Driving Continued Margin Expansion Lean / value stream analysis everywhere Transformation Goals • Margin Enhancement Price desks and margin excellence • Flat Cost-Structure • Operational Efficiencies Optimize sourcing and supply chain capabilities • Increased Service Levels Outsourcing and 3PL models supporting efficient distribution 67

Innovation Creating sustainable, organic growth OUR GOALS Accelerate Speed & Quantity of NPD Drive Use of Technology Asset-Light Mindset Grow % of Sales from New Products Each Year 68

Acquisition: Strategic Acquisitions Expected to Drive Profitable Growth • Predominantly #1 or #2 brand or market position • Higher margin, higher growth brands or products • Asset-light or low capital intensity business model Robust List of M&A Targets in the Pipeline • Exposure to the channels where we have leadership positions • Additive capabilities – must make us better • Demonstrated sustainable competitive advantage 69

Corporate Citizenship and Sustainability Continuing a long history of developing employees, practicing good citizenship, and protecting the environment Reducing Our Environmental Footprint 53% $2.9M Enhancing Supporting Our given through the Worthington 36% Industries Foundation in FY23 Communities Workforce Reduction in global market-based GHG emissions intensity Diverse salaried new hires (CY20 to FY23) Spending Investing in Prioritizing Leading Locally Entrepreneurs Safety The Way Investor's Business Daily 2022 Best ESG + 500/tons Companies - Industrials 96% CO e Reduction 2 Newsweek Combined annual emissions reduction 1.8x Worthington Industries America's Most from energy optimization initiatives at Ventures became a seed Responsible Austria and Portugal facilities Better safety record than investor in Enspired Companies 2023 industry average Procurement spending to Solutions, focused on domestic U.S. suppliers alleviating PFAS risk Note: Figures reported refer to Worthington Industries, Inc as of FY23. 70

ibdroot\projects\IBD-NY\trillium2020\664375_1\16. Investor Day Presentations\03. WOR Enterprises\2023.09.29 - Investor Day - WOR Enterprises Shell_v78.pptx Financial Overview

A Compelling Financial Profile Adj. EBITDA 1 Net Sales Adj. EBITDA Margin $285M $1,361M 21% Net Working 3 4 Fixed Assets FCF Conversion 2 Capital $295M 85% $260M Note: TTM figures as of Q1 FY2024. 1 Refer to appendix for reconciliation of Adjusted EBITDA to the comparable GAAP measure. 2 Net Working Capital is defined as Accounts Receivable ($224M) + Inventory ($193M) – Accounts Payable ($122M). Balances at May 31, 2023 in parentheses. 72 3 4 Figures are as of May 31, 2023. FCF Conversion is defined as (Adj. EBITDA – Capex) / Adj. EBITDA.

Creating a Strong Growth Platform with Scale 1 Net Sales ($M) Adjusted EBITDA ($M) 16% 20% CAGR CAGR $1,418 $1,361 $1,311 $319 $297 $285 $1,061 $205 FY2021 FY2022 FY2023 TTM FY2021 FY2022 FY2023 TTM Long-Term Target: 6-8% Sales CAGR Long-Term Target: 24% Adj. EBITDA Margin Note: TTM figures as of Q1 FY2024. 1 Refer to appendix for reconciliation of Adjusted EBITDA to the comparable GAAP measure. 73
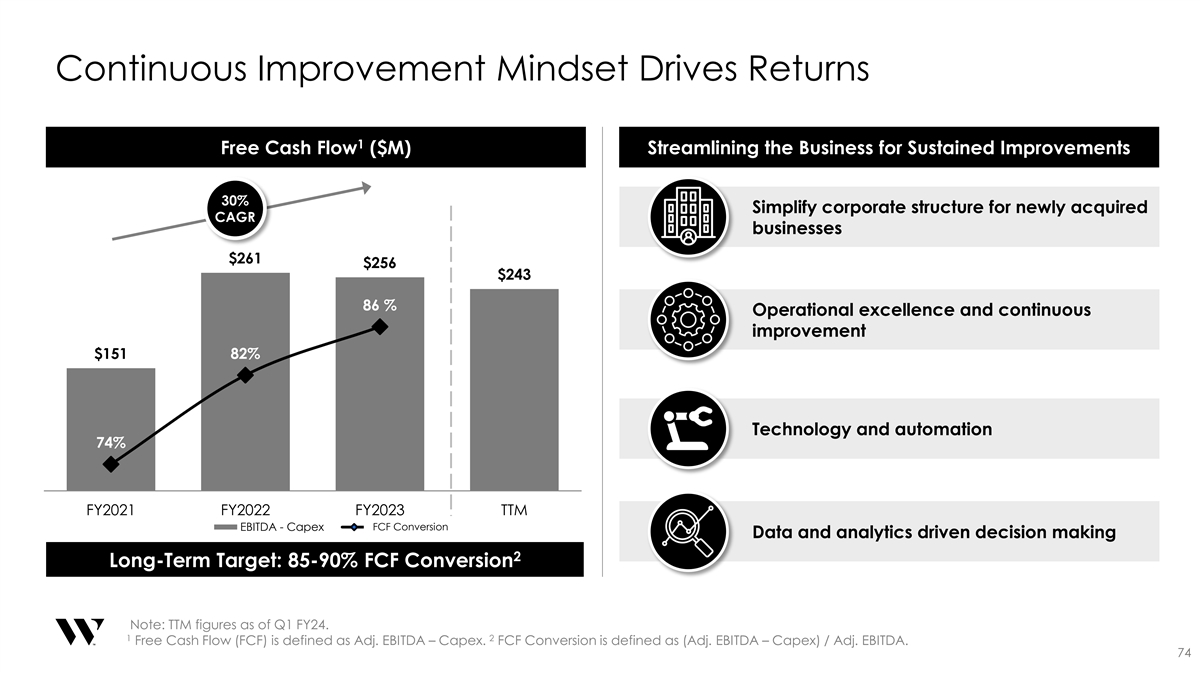
Continuous Improvement Mindset Drives Returns 1 Free Cash Flow ($M) Streamlining the Business for Sustained Improvements 30% Simplify corporate structure for newly acquired CAGR businesses $261 $256 $243 86 % Operational excellence and continuous improvement $151 82% Technology and automation 74% FY2021 FY2022 FY2023 TTM EBITDA - Capex % FCF Co EBITDn Aversion Data and analytics driven decision making 2 Long-Term Target: 85-90% FCF Conversion Note: TTM figures as of Q1 FY24. 1 2 Free Cash Flow (FCF) is defined as Adj. EBITDA – Capex. FCF Conversion is defined as (Adj. EBITDA – Capex) / Adj. EBITDA. 74
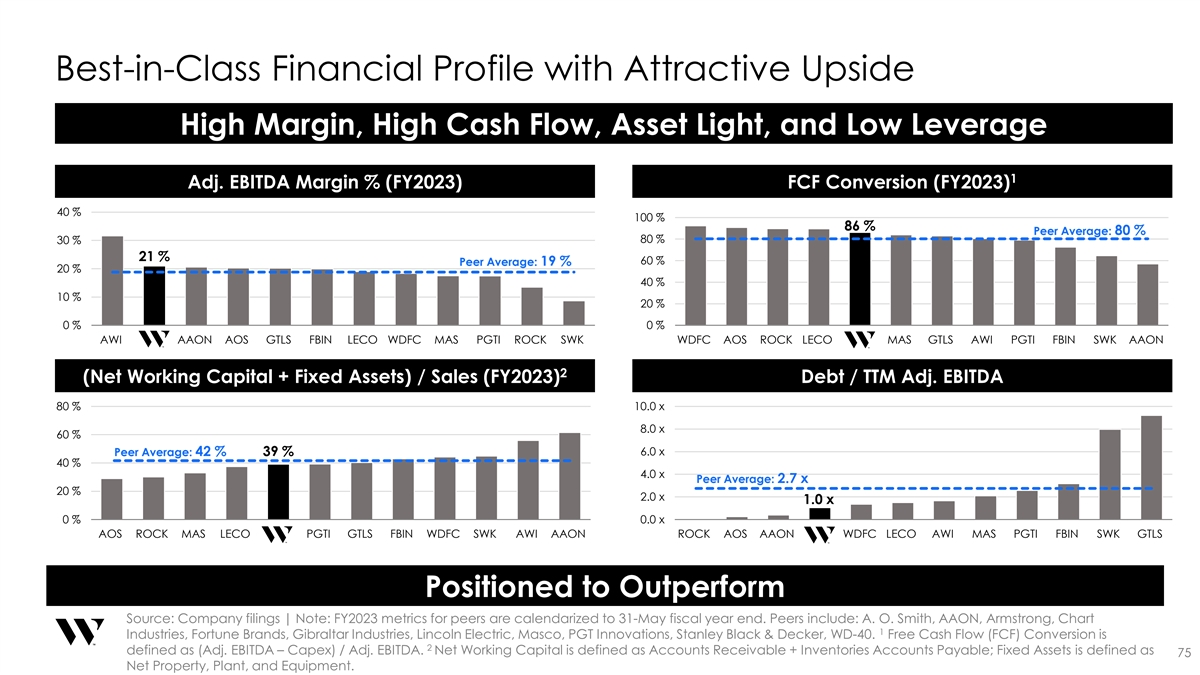
Best-in-Class Financial Profile with Attractive Upside High Margin, High Cash Flow, Asset Light, and Low Leverage 1 Adj. EBITDA Margin % (FY2023) FCF Conversion (FY2023) 40 % 100 % 86 % Peer Average: 80 % 80 % 30 % 21 % 60 % Peer Average: 19 % 20 % 40 % 10 % 20 % 0 % 0 % AWI WE AAON AOS GTLS FBIN LECO WDFC MAS PGTI ROCK SWK WDFC AOS ROCK LECO WE MAS GTLS AWI PGTI FBIN SWK AAON 2 (Net Working Capital + Fixed Assets) / Sales (FY2023) Debt / TTM Adj. EBITDA 80 % 10.0 x 8.0 x 60 % Peer Average: 42 % 39 % 6.0 x 40 % 4.0 x Peer Average: 2.7 x 20 % 2.0 x 1.0 x 0 % 0.0 x AOS ROCK MAS LECO WE PGTI GTLS FBIN WDFC SWK AWI AAON ROCK AOS AAON WE WDFC LECO AWI MAS PGTI FBIN SWK GTLS Positioned to Outperform Source: Company filings | Note: FY2023 metrics for peers are calendarized to 31-May fiscal year end. Peers include: A. O. Smith, AAON, Armstrong, Chart 1 Industries, Fortune Brands, Gibraltar Industries, Lincoln Electric, Masco, PGT Innovations, Stanley Black & Decker, WD-40. Free Cash Flow (FCF) Conversion is 2 defined as (Adj. EBITDA – Capex) / Adj. EBITDA. Net Working Capital is defined as Accounts Receivable + Inventories Accounts Payable; Fixed Assets is defined as 75 Net Property, Plant, and Equipment.
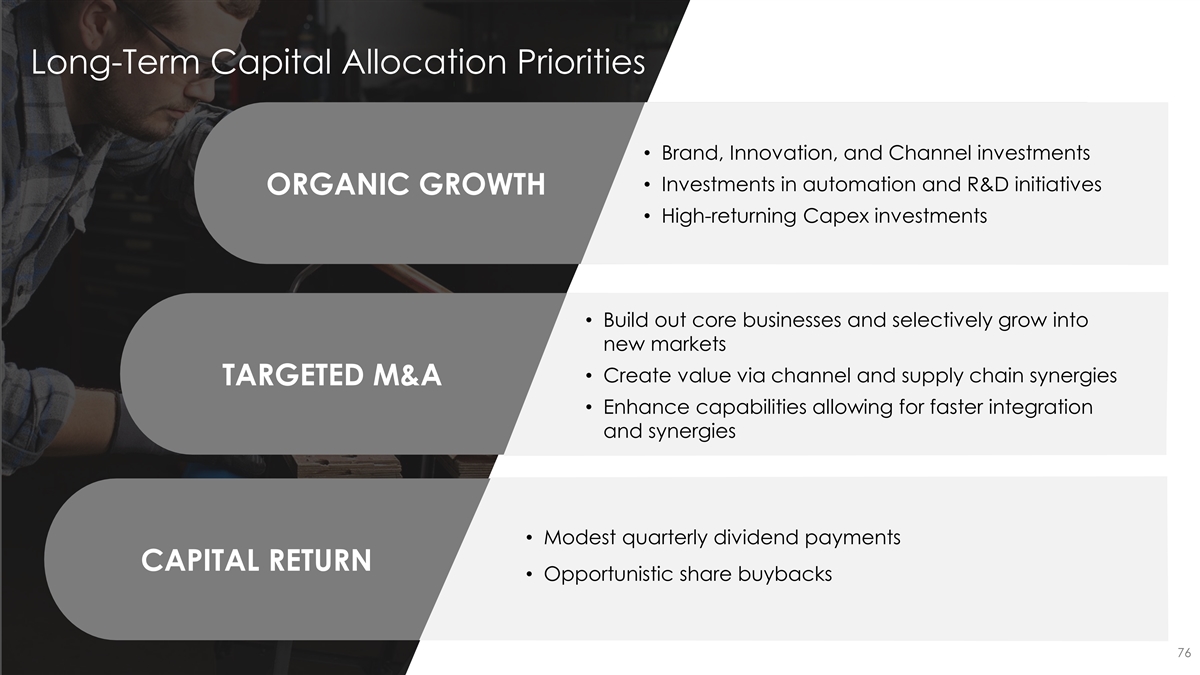
Long-Term Capital Allocation Priorities • Brand, Innovation, and Channel investments • Investments in automation and R&D initiatives ORGANIC GROWTH • High-returning Capex investments • Build out core businesses and selectively grow into new markets • Create value via channel and supply chain synergies TARGETED M&A • Enhance capabilities allowing for faster integration and synergies • Modest quarterly dividend payments CAPITAL RETURN • Opportunistic share buybacks 76
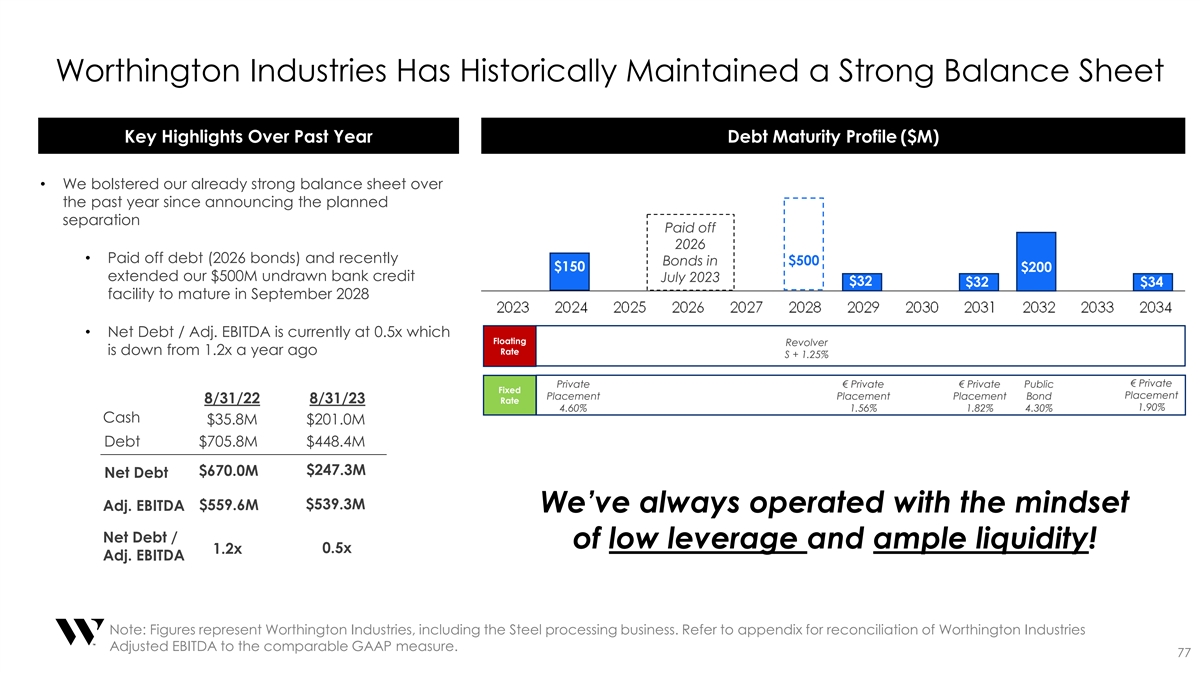
Worthington Industries Has Historically Maintained a Strong Balance Sheet Key Highlights Over Past Year Debt Maturity Profile ($M) • We bolstered our already strong balance sheet over the past year since announcing the planned separation Paid off 2026 • Paid off debt (2026 bonds) and recently $500 Bonds in $150 $200 extended our $500M undrawn bank credit July 2023 $32 $32 $34 facility to mature in September 2028 • Net Debt / Adj. EBITDA is currently at 0.5x which Floating Revolver is down from 1.2x a year ago Rate S + 1.25% Private € Private € Private Public € Private Fixed Placement Placement Placement Placement Bond 8/31/22 8/31/23 Rate 1.90% 4.60% 1.56% 1.82% 4.30% Cash $35.8M $201.0M Debt $705.8M $448.4M $247.3M $670.0M Net Debt $559.6M $539.3M Adj. EBITDA We’ve always operated with the mindset Net Debt / of low leverage and ample liquidity! 1.2x 0.5x Adj. EBITDA Note: Figures represent Worthington Industries, including the Steel processing business. Refer to appendix for reconciliation of Worthington Industries Adjusted EBITDA to the comparable GAAP measure. 77
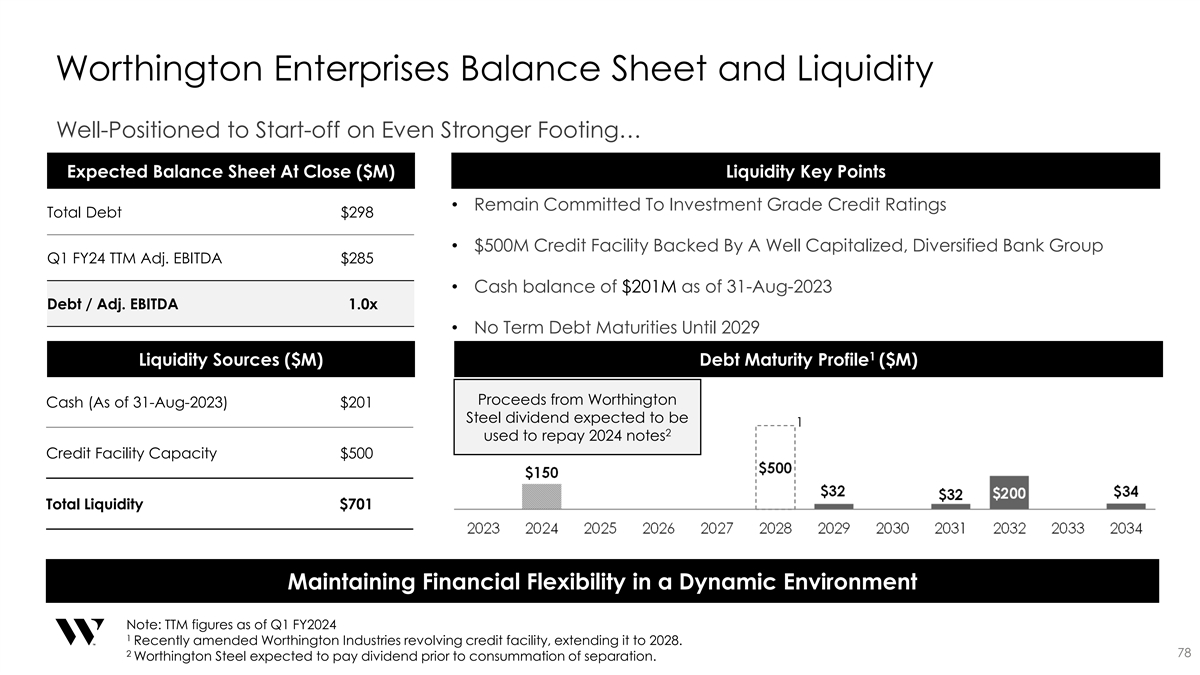
Worthington Enterprises Balance Sheet and Liquidity Well-Positioned to Start-off on Even Stronger Footing… Expected Balance Sheet At Close ($M) Liquidity Key Points • Remain Committed To Investment Grade Credit Ratings Total Debt $298 • $500M Credit Facility Backed By A Well Capitalized, Diversified Bank Group Q1 FY24 TTM Adj. EBITDA $285 • Cash balance of $201M as of 31-Aug-2023 Debt / Adj. EBITDA 1.0x • No Term Debt Maturities Until 2029 1 Liquidity Sources ($M) Debt Maturity Profile ($M) Proceeds from Worthington Cash (As of 31-Aug-2023) $201 Steel dividend expected to be 1 2 used to repay 2024 notes Credit Facility Capacity $500 Total Liquidity $701 Maintaining Financial Flexibility in a Dynamic Environment Note: TTM figures as of Q1 FY2024 1 Recently amended Worthington Industries revolving credit facility, extending it to 2028. 2 78 Worthington Steel expected to pay dividend prior to consummation of separation.

ibdroot\projects\IBD-NY\trillium2020\664375_1\16. Investor Day Presentations\03. WOR Enterprises\2023.09.29 - Investor Day - WOR Enterprises Shell_v78.pptx Closing Remarks

FOUNDED IN Worthington Enterprises 1955 KEY INVESTMENT HIGHLIGHTS • Established Portfolio of Market-Leading Brands with NET SALES OF High Barriers to Entry 1 $1.4 BILLION • Strong Underlying Secular Trends Enabling Steady Long-Term Growth • Business Model Drives High Free Cash Flow and Returns • Worthington Business System Accelerates Growth and Net Sales Profitability 1 by End-Market • Innovation For Highly Engineered Products Drives Incremental Sales and Margin • Guided by Our Philosophy – a People-First, 42% Performance-Based Culture 48% • Low Leverage and Ample Liquidity Provides Financial Flexibility 11% Consumer Products Building Products 1 TTM figures as of Q1 FY24. Sales exclude pro-rata share of unconsolidated JV sales. Percentages do not add up to 100% due to rounding. Sustainable Energy Solutions 80

ibdroot\projects\IBD-NY\trillium2020\664375_1\16. Investor Day Presentations\03. WOR Enterprises\2023.09.29 - Investor Day - WOR Enterprises Shell_v78.pptx Q&A

ibdroot\projects\IBD-NY\trillium2020\664375_1\16. Investor Day Presentations\03. WOR Enterprises\2023.09.29 - Investor Day - WOR Enterprises Shell_v78.pptx Appendix

Update on Separation Into Two World-Class Companies Key Events Expected Timing Public Announcement of Separation September 29, 2022 Amended Worthington Enterprises September 27, 2023 Revolver Credit Facility Effectiveness Public Form 10 Filing October 4, 2023 Investor Day Presentation October 11, 2023 Target for Start of Regular Way Trading December 2023 Note: There can be no assurance that the spin-off will occur or, if it does occur, its terms or timing. 83

OUR PHILOSOPHY adopted in 1961, is the foundation of our culture EARNINGS SUPPLIERS § The first corporate goal for Worthington Industries is to earn money for its § We cannot operate profitably without those who supply the quality materials shareholders and increase the value of their investment. we need. § We believe that the best measurement of the accomplishment of our goal is § We ask that suppliers be competitive in the marketplace with regard to consistent growth in earnings per share. quality, pricing, delivery and volume purchased. § We are a loyal customer to suppliers who meet our quality and service OUR GOLDEN RULE requirements through all market conditions. § We treat our customers, employees, investors and suppliers, as we would like to be treated. ORGANIZATION § We believe in a divisionalized organizational structure with responsibility for performance resting with the head of each operation. PEOPLE § All managers are given the operating latitude and authority to accomplish § We are dedicated to the belief that people are our most important asset. their responsibilities within our corporate goals and objectives. § We believe people respond to recognition, opportunity to grow and fair § In keeping with this philosophy, we do not create excessive corporate compensation. procedures. If procedures are necessary within a particular company § We believe that compensation should be directly related to job operation, that manager creates them. performance and therefore use incentives, profit sharing or otherwise, in § We believe in a small corporate staff and support group to service the needs every possible situation. of our shareholders and operating units as requested. § From employees we expect an honest day's work for an honest day's pay § We believe in the philosophy of COMMUNICATION § continued employment for all Worthington people. § In filling job openings, every effort is expended to find candidates within § We communicate through every possible channel with our customers, Worthington, its divisions or subsidiaries. employees, shareholders, suppliers and financial community. CUSTOMERS CITIZENSHIP § Without the customer and their need for our products and services we have § Worthington Steel practices good citizenship at all levels. We conduct our nothing. business in a professional and ethical manner. § We will exert every effort to see that the customer’s quality and service § We encourage all our people to actively participate in community affairs requirements are met.§ We support worthwhile community causes. § Once a commitment is made to a customer, every effort is made to fulfill that obligation. 84

Worthington Enterprises Reconciliation of Non-GAAP Measures (in thousands) 85

Worthington Enterprises Reconciliation of Non-GAAP Measures (in thousands) Twelve Months Ended May 31, 2023 Worthington Sustainable Enterprises Consumer Building Energy Corporate & Consolidated Products Products Solutions Other Net Sales $ 1,418,496 $ 686,319 $ 586,059 $ 1 46,118 n/a Operating income (loss) $ 88,676 $ 78,039 $ 36,754 $ 7 18 $ ( 26,835) Impairment of long-lived assets 484 - 484 - - Restructuring and other (income) expense ( 367) 213 597 - ( 1,177) (1) Separation costs 24,048 - - - 24,048 Adjusted operating income (loss) $ 112,841 $ 78,252 $ 37,835 $ 718 $ ( 3,964) (2) Miscellaneous income (expense) 277 ( 205) 349 1 99 ( 66) (3) Equity in net income of unconsolidated affiliates 167,258 - 166,427 - 831 Adjusted EBIT $ 280,376 $ 78,047 $ 204,611 $ 917 $ ( 3,199) Depreciation and amortization 46,417 15,734 17,856 6 ,319 6,508 Stock based compensation 11,893 2,141 3,806 - 5,946 Adjusted EBITDA $ 3 38,686 $ 95,922 $ 2 26,273 $ 7,236 $ 9,255 Pro Forma Adjustments: (4) Shared overhead reallocation ( 33,434) 7,405 ( 10,564) $ - ( 30,275) (5) Operational adjustments ( 8,270) ( 2,000) ( 2,000) - ( 4,270) Pro Forma Adjusted EBITDA $ 2 96,983 $ 1 01,326 $ 2 13,709 $ 7,236 $ ( 25,289) Pro Forma Adjusted EBITDA margin 21% 15% 36% 5% NM Pro forma adjusted EBITDA $ 296,983 Less: capital expenditures ( 40,896) Free Cash Flow (FCF) $ 256,087 FCF Conversion 86% Non-GAAP Footnotes: (1) Separation costs reflect direct and incremental costs incurred in connection with the planned separation and are held at the corporate level. (2) Misc. income within Corporate & Other excludes a pre-tax settlement charge of $4,774 related to a pension lift-out transaction completed in August 2022. (3) Equity income within Corporate & Other excludes the following: 1) a pre-tax loss of $16,059 related to the sale of our 50% noncontrolling investment in ArtiFlex Manufacturing, LLC; and 2) a pre-tax gain of $2,063 related to a sale-leaseback transaction at Taxi Workhorse Holdings LLC; Pro Forma Footnotes: (4) Reflects the excess of our estimated post-separation corporate expenses over the amounts historically absorbed by our segments. Additionally, reflects within Corporate & Other certain general overhead expenses that will not be allocated to our segments post-separation, but are included in our historical results. (5) Includes estimated incremental material cost associated with intercompany purchases from the Steel Processing business that will be subject to an arms-length commercial agreement post-separation as well as the removal of certain miscellaneous operating and non-operating items historically held at Corporate but attributed to the Steel Processing business on a pro forma basis. 86
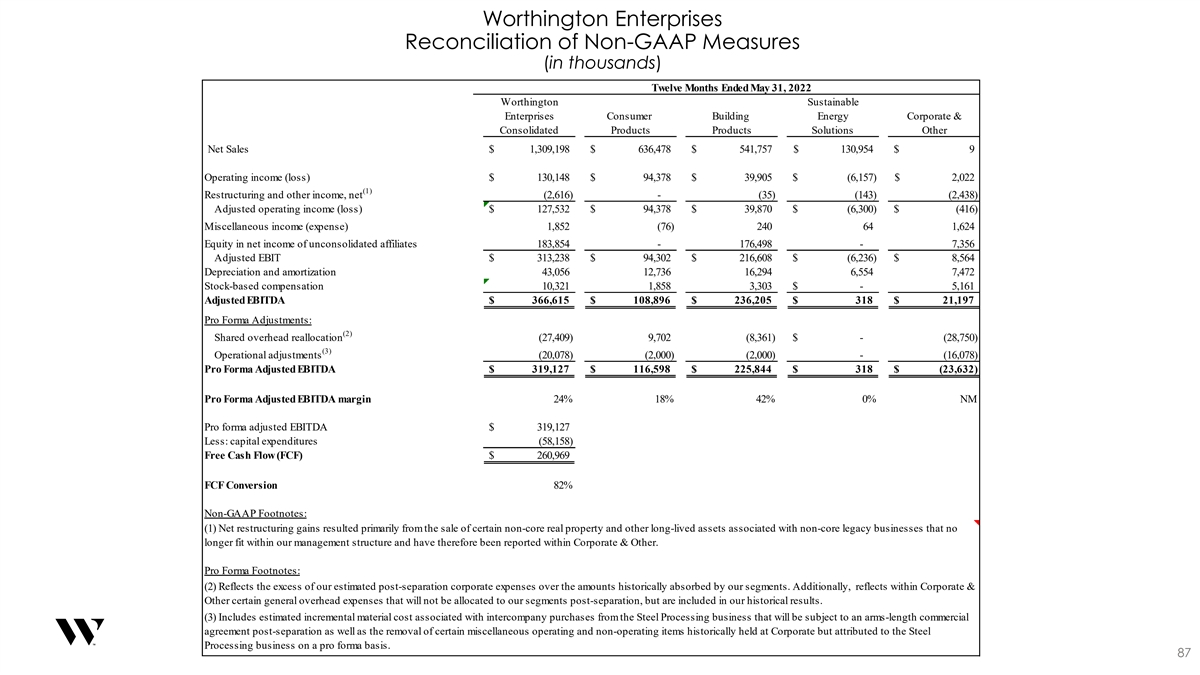
Worthington Enterprises Reconciliation of Non-GAAP Measures (in thousands) Twelve Months Ended May 31, 2022 Worthington Sustainable Enterprises Consumer Building Energy Corporate & Consolidated Products Products Solutions Other Net Sales $ 1,309,198 $ 636,478 $ 541,757 $ 1 30,954 $ 9 Operating income (loss) $ 130,148 $ 94,378 $ 39,905 $ ( 6,157) $ 2,022 (1) Restructuring and other income, net (2,616) - ( 35) ( 143) (2,438) Adjusted operating income (loss) $ 127,532 $ 94,378 $ 39,870 $ (6,300) $ ( 416) Miscellaneous income (expense) 1,852 (76) 240 64 1,624 Equity in net income of unconsolidated affiliates 183,854 - 176,498 - 7,356 Adjusted EBIT $ 313,238 $ 94,302 $ 216,608 $ ( 6,236) $ 8,564 Depreciation and amortization 43,056 12,736 16,294 6,554 7,472 Stock-based compensation 10,321 1,858 3,303 $ - 5,161 Adjusted EBITDA $ 366,615 $ 108,896 $ 236,205 $ 318 $ 21,197 Pro Forma Adjustments: (2) Shared overhead reallocation ( 27,409) 9,702 ( 8,361) $ - (28,750) (3) Operational adjustments (20,078) ( 2,000) (2,000) - (16,078) Pro Forma Adjusted EBITDA $ 3 19,127 $ 1 16,598 $ 2 25,844 $ 318 $ (23,632) Pro Forma Adjusted EBITDA margin 24% 18% 42% 0% NM Pro forma adjusted EBITDA $ 319,127 Less: capital expenditures (58,158) Free Cash Flow (FCF) $ 260,969 FCF Conversion 82% Non-GAAP Footnotes: (1) Net restructuring gains resulted primarily from the sale of certain non-core real property and other long-lived assets associated with non-core legacy businesses that no longer fit within our management structure and have therefore been reported within Corporate & Other. Pro Forma Footnotes: (2) Reflects the excess of our estimated post-separation corporate expenses over the amounts historically absorbed by our segments. Additionally, reflects within Corporate & Other certain general overhead expenses that will not be allocated to our segments post-separation, but are included in our historical results. (3) Includes estimated incremental material cost associated with intercompany purchases from the Steel Processing business that will be subject to an arms-length commercial agreement post-separation as well as the removal of certain miscellaneous operating and non-operating items historically held at Corporate but attributed to the Steel Processing business on a pro forma basis. 87
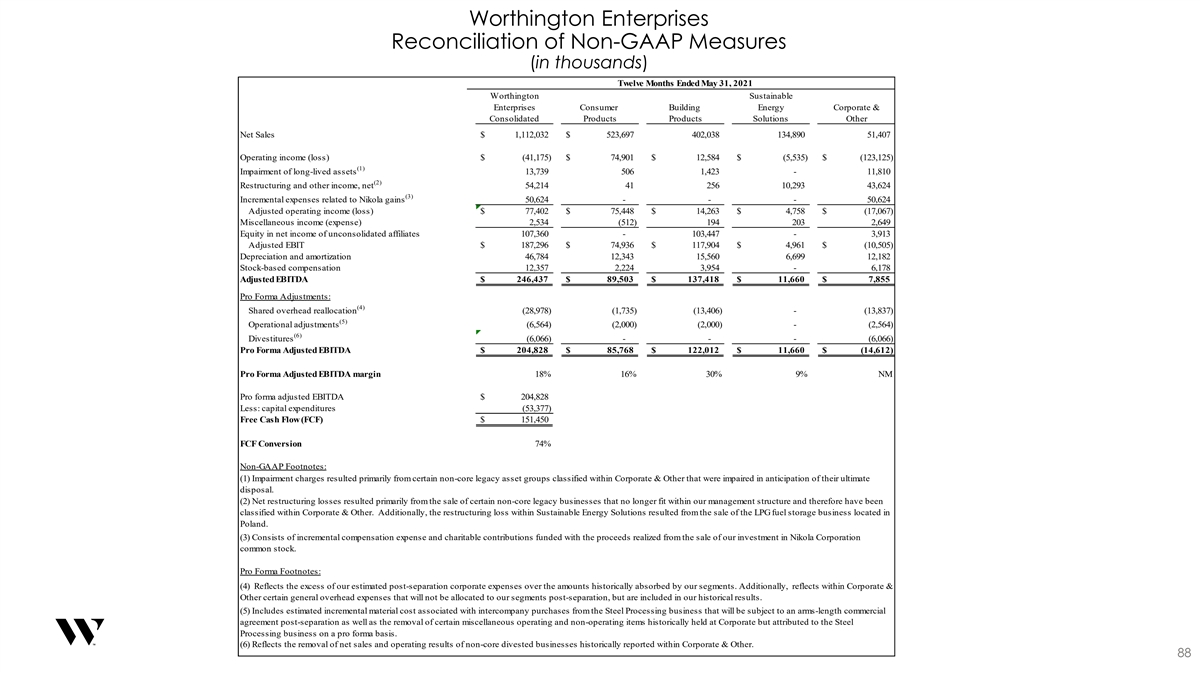
Worthington Enterprises Reconciliation of Non-GAAP Measures (in thousands) Twelve Months Ended May 31, 2021 Worthington Sustainable Enterprises Consumer Building Energy Corporate & Consolidated Products Products Solutions Other Net Sales $ 1,112,032 $ 523,697 402,038 1 34,890 51,407 Operating income (loss) $ ( 41,175) $ 74,901 $ 12,584 $ ( 5,535) $ ( 123,125) (1) Impairment of long-lived assets 13,739 506 1,423 - 11,810 (2) Restructuring and other income, net 54,214 41 256 1 0,293 43,624 (3) Incremental expenses related to Nikola gains 50,624 - - - 50,624 Adjusted operating income (loss) $ 77,402 $ 75,448 $ 14,263 $ 4,758 $ ( 17,067) Miscellaneous income (expense) 2,534 ( 512) 194 2 03 2,649 Equity in net income of unconsolidated affiliates 107,360 - 103,447 - 3,913 Adjusted EBIT $ 187,296 $ 74,936 $ 117,904 $ 4,961 $ ( 10,505) Depreciation and amortization 46,784 12,343 15,560 6 ,699 12,182 Stock-based compensation 12,357 2,224 3,954 - 6,178 Adjusted EBITDA $ 2 46,437 $ 89,503 $ 1 37,418 $ 11,660 $ 7,855 Pro Forma Adjustments: (4) Shared overhead reallocation ( 28,978) ( 1,735) ( 13,406) - ( 13,837) (5) Operational adjustments ( 6,564) ( 2,000) ( 2,000) - ( 2,564) (6) Divestitures ( 6,066) - - - ( 6,066) Pro Forma Adjusted EBITDA $ 2 04,828 $ 85,768 $ 1 22,012 $ 11,660 $ ( 14,612) Pro Forma Adjusted EBITDA margin 18% 16% 30% 9% NM Pro forma adjusted EBITDA $ 204,828 Less: capital expenditures ( 53,377) Free Cash Flow (FCF) $ 151,450 FCF Conversion 74% Non-GAAP Footnotes: (1) Impairment charges resulted primarily from certain non-core legacy asset groups classified within Corporate & Other that were impaired in anticipation of their ultimate disposal. (2) Net restructuring losses resulted primarily from the sale of certain non-core legacy businesses that no longer fit within our management structure and therefore have been classified within Corporate & Other. Additionally, the restructuring loss within Sustainable Energy Solutions resulted from the sale of the LPG fuel storage business located in Poland. (3) Consists of incremental compensation expense and charitable contributions funded with the proceeds realized from the sale of our investment in Nikola Corporation common stock. Pro Forma Footnotes: (4) Reflects the excess of our estimated post-separation corporate expenses over the amounts historically absorbed by our segments. Additionally, reflects within Corporate & Other certain general overhead expenses that will not be allocated to our segments post-separation, but are included in our historical results. (5) Includes estimated incremental material cost associated with intercompany purchases from the Steel Processing business that will be subject to an arms-length commercial agreement post-separation as well as the removal of certain miscellaneous operating and non-operating items historically held at Corporate but attributed to the Steel Processing business on a pro forma basis. (6) Reflects the removal of net sales and operating results of non-core divested businesses historically reported within Corporate & Other. 88
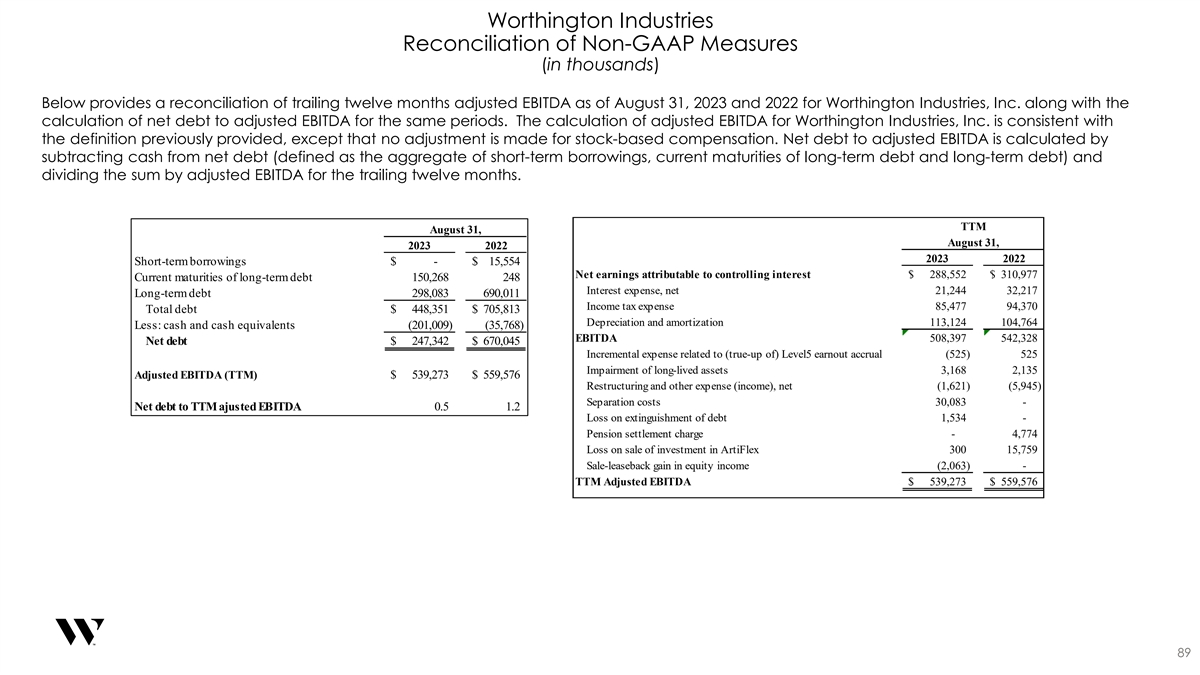
Worthington Industries Reconciliation of Non-GAAP Measures (in thousands) Below provides a reconciliation of trailing twelve months adjusted EBITDA as of August 31, 2023 and 2022 for Worthington Industries, Inc. along with the calculation of net debt to adjusted EBITDA for the same periods. The calculation of adjusted EBITDA for Worthington Industries, Inc. is consistent with the definition previously provided, except that no adjustment is made for stock-based compensation. Net debt to adjusted EBITDA is calculated by subtracting cash from net debt (defined as the aggregate of short-term borrowings, current maturities of long-term debt and long-term debt) and dividing the sum by adjusted EBITDA for the trailing twelve months. TTM August 31, August 31, 2023 2022 2023 2022 Short-term borrowings $ - $ 1 5,554 Net earnings attributable to controlling interest $ 288,552 $ 310,977 Current maturities of long-term debt 150,268 2 48 Interest expense, net 21,244 32,217 Long-term debt 298,083 6 90,011 Income tax expense 85,477 94,370 Total debt $ 448,351 $ 7 05,813 Depreciation and amortization 113,124 104,764 Less: cash and cash equivalents (201,009) (35,768) EBITDA 508,397 542,328 Net debt $ 247,342 $ 6 70,045 Incremental expense related to (true-up of) Level5 earnout accrual (525) 525 Impairment of long-lived assets 3,168 2,135 Adjusted EBITDA (TTM) $ 539,273 $ 5 59,576 Restructuring and other expense (income), net (1,621) (5,945) Separation costs 30,083 - Net debt to TTM ajusted EBITDA 0.5 1 .2 Loss on extinguishment of debt 1,534 - Pension settlement charge - 4,774 Loss on sale of investment in ArtiFlex 300 15,759 Sale-leaseback gain in equity income (2,063) - TTM Adjusted EBITDA $ 539,273 $ 559,576 89