UNITED STATES
SECURITIES AND EXCHANGE COMMISSION
WASHINGTON, D.C. 20549
FORM 8-K
CURRENT REPORT
Pursuant to Section 13 or 15(d)
of the Securities Exchange Act of 1934
Date of Report (Date of earliest event reported): September 20, 2023
Procore Technologies, Inc.
(Exact name of Registrant as Specified in Its Charter)
| Delaware | 001-40396 | 73-1636261 | ||
| (State or Other Jurisdiction of Incorporation) |
(Commission File Number) |
(IRS Employer Identification No.) |
| 6309 Carpinteria Avenue, Carpinteria, CA |
93013 | |
| (Address of Principal Executive Offices) | (Zip Code) |
Registrant’s Telephone Number, Including Area Code: (866) 477-6267
Not Applicable
(Former Name or Former Address, if Changed Since Last Report)
Check the appropriate box below if the Form 8-K filing is intended to simultaneously satisfy the filing obligation of the registrant under any of the following provisions:
| ☐ | Written communications pursuant to Rule 425 under the Securities Act (17 CFR 230.425) |
| ☐ | Soliciting material pursuant to Rule 14a-12 under the Exchange Act (17 CFR 240.14a-12) |
| ☐ | Pre-commencement communications pursuant to Rule 14d-2(b) under the Exchange Act (17 CFR 240.14d-2(b)) |
| ☐ | Pre-commencement communications pursuant to Rule 13e-4(c) under the Exchange Act (17 CFR 240.13e-4(c)) |
Securities registered pursuant to Section 12(b) of the Act:
| Title of each class |
Trading |
Name of each exchange on which registered |
||
| Common stock, $0.0001 par value | PCOR | The New York Stock Exchange |
Indicate by check mark whether the registrant is an emerging growth company as defined in Rule 405 of the Securities Act of 1933 (§ 230.405 of this chapter) or Rule 12b-2 of the Securities Exchange Act of 1934 (§ 240.12b-2 of this chapter).
Emerging growth company ☐
If an emerging growth company, indicate by check mark if the registrant has elected not to use the extended transition period for complying with any new or revised financial accounting standards provided pursuant to Section 13(a) of the Exchange Act. ☐
| Item 7.01 | Regulation FD Disclosure. |
On September 20, 2023, Procore Technologies, Inc. (the “Company”) hosted its 2023 Investor Day, which was held in person and virtually via live webcast. A copy of the Company’s Investor Day presentation is furnished as Exhibit 99.1. A replay of the webcast will be available on the Investor Relations page of the Company’s website at http://investors.procore.com.
The information in each item of this Current Report on Form 8-K and the exhibit attached hereto shall not be deemed “filed” for purposes of Section 18 of the Securities Exchange Act of 1934, as amended (the “Exchange Act”), or otherwise subject to the liabilities of that section, nor shall it be deemed incorporated by reference in any filing under the Securities Act of 1933, as amended, or the Exchange Act, regardless of any general incorporation language in such filing.
| Item 9.01 | Financial Statements and Exhibits. |
(d) Exhibits.
The exhibit listed below is being furnished with this Current Report on Form 8-K.
| Exhibit Number |
Description |
|
| 99.1 | Procore Technologies, Inc. 2023 Investor Day Presentation, dated September 20, 2023 | |
| 104 | Cover Page Interactive Data File (embedded within the Inline XBRL document) | |
1
SIGNATURES
Pursuant to the requirements of the Securities Exchange Act of 1934, as amended, the registrant has duly caused this report to be signed on its behalf by the undersigned thereunto duly authorized.
| Procore Technologies, Inc. | ||||||
| Date: September 20, 2023 | By : | /s/ Benjamin C. Singer |
||||
| Benjamin C. Singer | ||||||
| Chief Legal Officer and Corporate Secretary | ||||||
2

Exhibit 99.1 2023 Investor Day Chicago, IL | September 20, 2023

Agenda Wednesday, September 20 | 9:00am - 12:00pm CST 9:00a - 9:05a Opening Remarks Matthew Puljiz - VP, Finance Vivian Barnett - Senior Manager of Investor Relations 9:05a - 9:25a Deep Dive #1: Construction Industry Dynamics Tooey Courtemanche - Founder, President, & CEO 9:25a - 10:10a Deep Dive #2: Platform & Product Steve Davis - President, Product & Technology Wyatt Jenkins - Chief Product Officer Welcome Geoff Lewis - VP, Product Management 10:10a - 10:30a Deep Dive #3: Fintech Update Paul Lyandres - President of Fintech 10:30a - 10:50a Deep Dive #4: Financial Philosophy Howard Fu - CFO & Treasurer 10:50a - 11:05a Break 11:05a - 12:00p Executive Q&A Tooey Courtemanche - Founder, President, & CEO Howard Fu - CFO & Treasurer Matthew Puljiz - VP, Finance 2 2
Disclaimer Forward-Looking Statements This presentation contains forward-looking statements within the meaning of Section 27A of the Securities Act of 1933, as amended, and Section 21E of the Securities Exchange Act of 1934, as amended, about Procore Technologies, Inc. (“Procore”) and its industry that involve substantial risks and uncertainties. All statements in this presentation, other than statements of historical fact, are forward-looking statements within the meaning of the Private Securities Litigation Reform Act of 1995. Forward-looking statements generally relate to future events or future financial or operating performance, and may be identified by the use of words such as “anticipate,” “believe,” “contemplate,” “continue,” “could,” “estimate,” “expect,” “intend,” “may,” “plan,” “potential,” “predict,” “project,” “should,” “target,” “will,” or “would,” or the negative of these words, or other similar terms or expressions that concern Procore’s expectations, strategy, plans, or intentions. Procore has based the forward-looking statements contained in this presentation primarily on its current expectations and projections about future events and trends that Procore believes may affect its business, financial condition, and operating results. The outcome of the events described in these forward-looking statements is subject to risks, uncertainties, and other factors that could cause results to differ materially from Procore’s current expectations, including, but not limited to, our expectations regarding our financial performance (including revenues, expenses, and margins, and our ability to achieve or maintain future profitability), our ability to effectively manage our growth, anticipated performance, trends, growth rates, and challenges in our business and in the market in which we operate or anticipate entering into, economic and industry trends (in particular, the rate of adoption of construction management software and digitization of the construction industry, inflation, and challenging geopolitical conditions), our ability to attract new customers and retain and increase sales to existing customers, our ability to expand internationally, the effects of increased competition in our markets and our ability to compete effectively, our estimated total addressable market, and as set forth in Procore’s filings with the Securities and Exchange Commission, and further described in the section titled “Risk Factors” in our most recently filed Quarterly Report on Form 10-Q. You should not place undue reliance on Procore’s forward-looking statements. Procore assumes no obligation to update any forward-looking statements to reflect events or circumstances that exist or change after the date on which they were made, except as required by law. Non-GAAP Financial Measures This presentation includes non-GAAP financial measures. These non-GAAP financial measures are not prepared in accordance with U.S. generally accepted accounting principles (“GAAP”), and may not be comparable to similarly-titled measures presented by other companies or to third-party expectations, nor should they be construed as an alternative to other financial measures determined in accordance with GAAP. Refer to the Appendix for a reconciliation of those non-GAAP financial measures to the most directly comparable GAAP measures. The logos and trademarks in this presentation are the property of their respective owners and are used for reference purposes only. 3
— INVESTOR DAY 2023 Deep Dive #1: Construction Industry Dynamics Tooey Courtemanche Founder, President, & CEO

The Construction Industry Is Massive … $11T 13% 7% 2.5Tft² $15T global construction of global GDP of global workforce est. square footage of est. global construction spend in 2020 in 2017 in 2017 new construction in the spend in 2030 next 40 years Source: Oxford Economics: Future of Construction (September 2021) | McKinsey Global Institute: Reinventing Construction (February 2017) | UN Environment: Global Status Report (2017). 5 5

… and Continues to Grow Globally Global Construction Spend (Indexed) Dot-Com Bubble Great Financial Crisis COVID-19 Index: 1995 = 100 (8 months) (18 months) (2 months) Feb 2009: Jun 1998: 1 ~$48B ~$217B Nov 2021: ARRA bill transportation ~$1.2T bill infrastructure bill Global Construction Spend Source: IHS Markit | National Bureau of Economic Research. Note: Global construction spend data as of December 31, 2022. The duration of historical economic recessions is measured from peak 1 to trough by the National Bureau of Economic Research. Amount invested in transportation infrastructure as part of the American Recovery and Reinvestment Act (ARRA). 6

U.S. Construction Growing at 5% CAGR U.S. Construction Spend (Indexed) Dot-Com Bubble Great Financial Crisis COVID-19 Index: 1995 = 100 (8 months) (18 months) (2 months) Feb 2009: Jun 1998: 1 ~$48B ~$217B Nov 2021: ARRA bill transportation ~$1.2T bill infrastructure bill U.S. Construction Spend 1 Source: U.S. Census Bureau | National Bureau of Economic Research. Note: U.S. construction spend data as of June 30, 2023. Amount invested in transportation infrastructure as part of the American Recovery and Reinvestment Act (ARRA). 7

U.S. is Balance of Resi vs. Non-Resi 1 U.S. Construction Value Put in Place (2022) Based on U.S. Census Bureau Data Total: ~$1.8T 1 Source: U.S. Census Bureau. Note: Reflects the total value of construction installed or erected at the site in the U.S. in 2022. 8
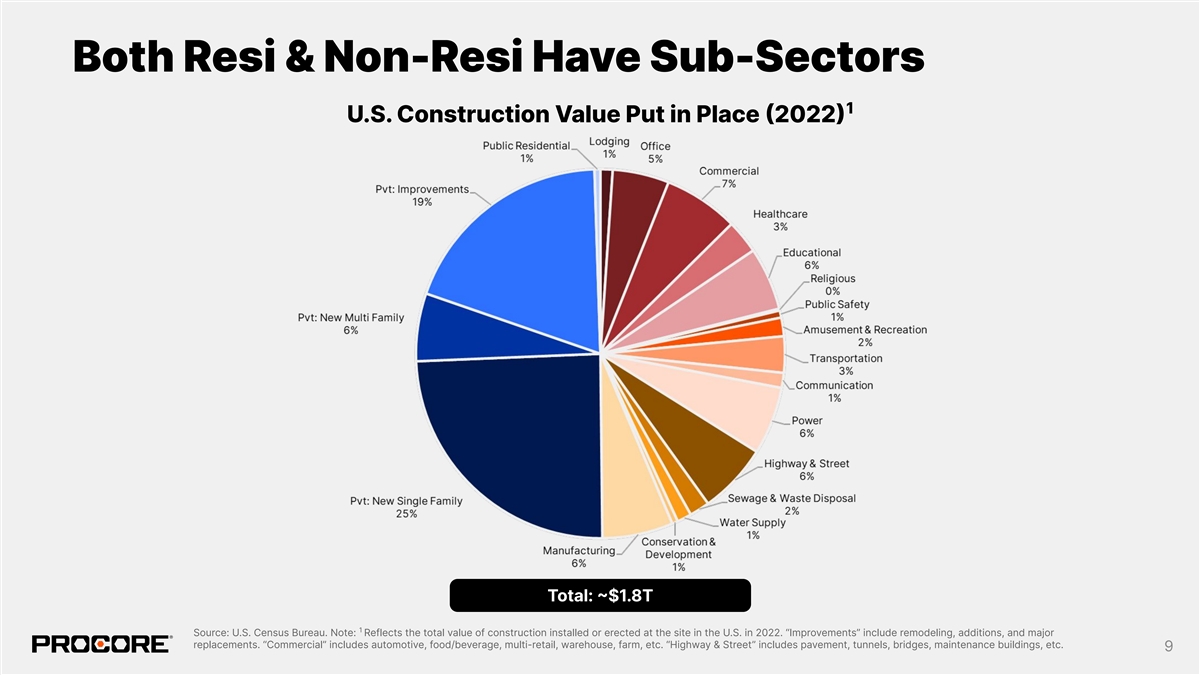
Both Resi & Non-Resi Have Sub-Sectors 1 U.S. Construction Value Put in Place (2022) Total: ~$1.8T 1 Source: U.S. Census Bureau. Note: Reflects the total value of construction installed or erected at the site in the U.S. in 2022. “Improvements” include remodeling, additions, and major replacements. “Commercial” includes automotive, food/beverage, multi-retail, warehouse, farm, etc. “Highway & Street” includes pavement, tunnels, bridges, maintenance buildings, etc. 9
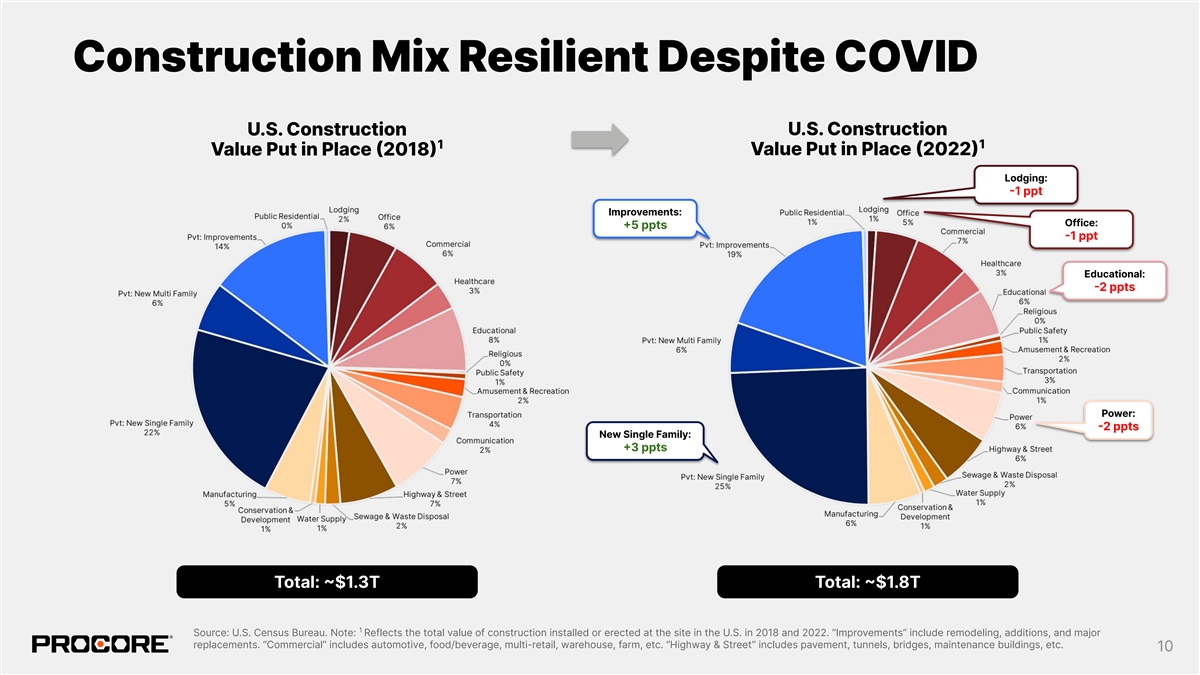
Construction Mix Resilient Despite COVID U.S. Construction U.S. Construction 1 1 Value Put in Place (2022) Value Put in Place (2018) Lodging: -1 ppt Improvements: Office: +5 ppts -1 ppt Educational: -2 ppts Power: -2 ppts New Single Family: +3 ppts Total: ~$1.3T Total: ~$1.8T 1 Source: U.S. Census Bureau. Note: Reflects the total value of construction installed or erected at the site in the U.S. in 2018 and 2022. “Improvements” include remodeling, additions, and major replacements. “Commercial” includes automotive, food/beverage, multi-retail, warehouse, farm, etc. “Highway & Street” includes pavement, tunnels, bridges, maintenance buildings, etc. 10
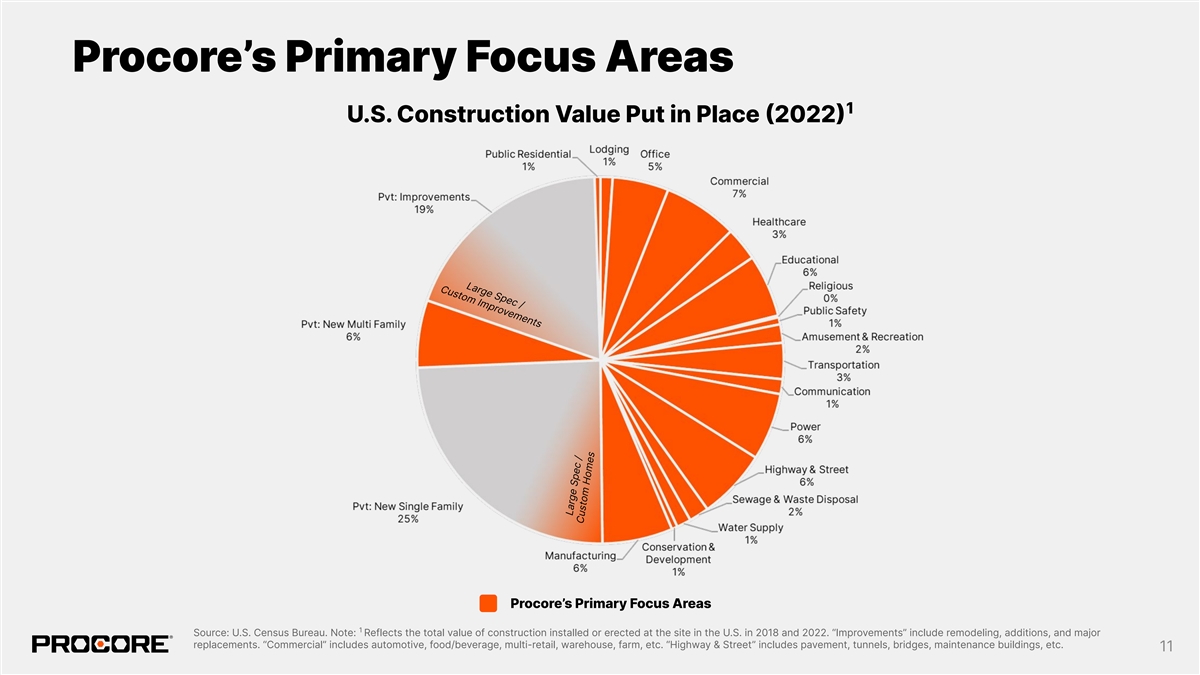
Large Spec / Custom Improvements Procore’s Primary Focus Areas 1 U.S. Construction Value Put in Place (2022) Procore’s Primary Focus Areas 1 Source: U.S. Census Bureau. Note: Reflects the total value of construction installed or erected at the site in the U.S. in 2018 and 2022. “Improvements” include remodeling, additions, and major replacements. “Commercial” includes automotive, food/beverage, multi-retail, warehouse, farm, etc. “Highway & Street” includes pavement, tunnels, bridges, maintenance buildings, etc. 11 Large Spec / Custom Homes

Sectors Behave Differently Over Time Largest Sectors Within Procore’s Primary Focus Areas (Indexed) Great Financial Crisis COVID-19 Index: 2002 = 100 (18 months) (2 months) 800 Source: U.S. Census Bureau | National Bureau of Economic Research | U.S. Bureau of Economic Analysis - FRED, Federal Reserve Bank of St. Louis. Note: U.S. construction spend data by sector as of June 30, 2023. Prior to 2002, U.S. construction spend data by sector only available on an annual basis. U.S. GDP data as of April 2023 (latest available). 12

GCs & SCs Manage Diverse Portfolios U.S. General Contractor Electrical Specialty Contractor Multinational Based in the Northeast in Western Canada Fortune 500 Retail Owner Historic building renovation for a Outdoor university stadium with Ground-up construction of new Healthcare Educational Commercial hospital campus 2,000+ capacity seating retail store location 2 300-unit luxury residential 14k-ft expansion of a private Commercial office tower for new Multi-Family Transportation Office high-rise in Southern CA regional airport headquarters Amusement & Large music concert hall, holding Public 3-story fire hall and emergency Industrial distribution warehouse Commercial Recreation 2,400+ patrons Safety response center facility Renovation and expansion of a Open-air, electrical substation with Expansion of a regional office park Commercial Power Office fully occupied retail center 98k-ft of ground cable/wire with addition of new buildings Data center buildout for one of the 100-unit public affordable housing Full store remodel with larger store Office Multi-Family Commercial largest global cloud providers development size and built-in sustainability 13
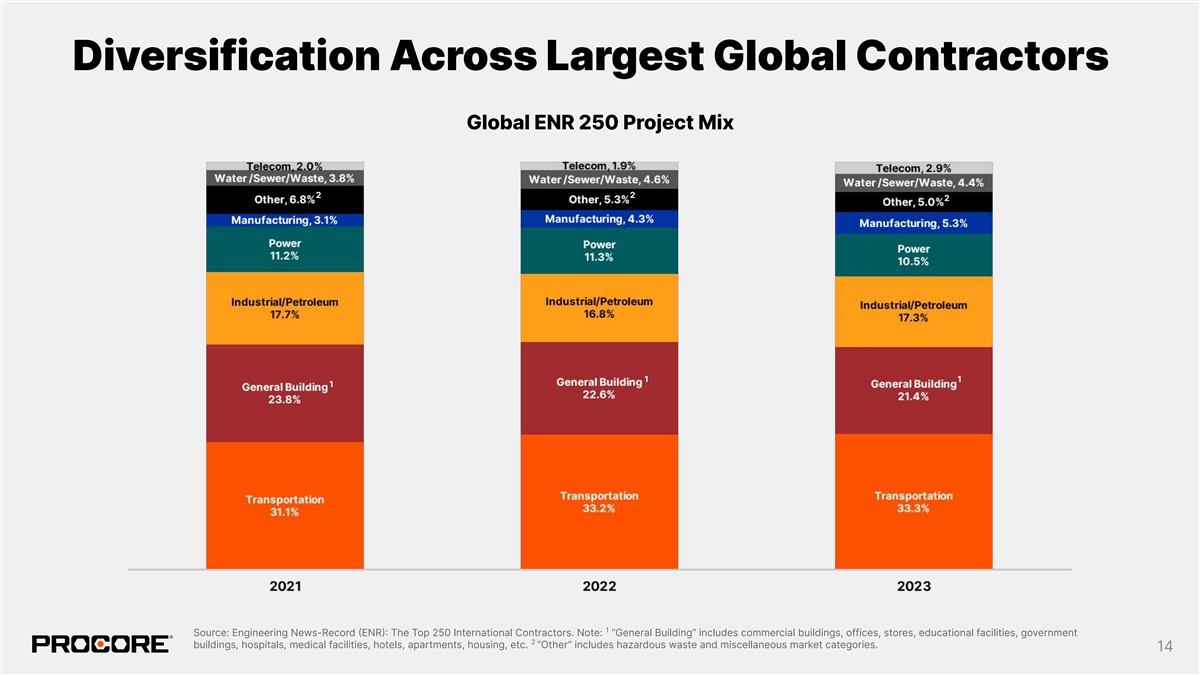
Diversification Across Largest Global Contractors Global ENR 250 Project Mix 2 2 2 1 1 1 1 Source: Engineering News-Record (ENR): The Top 250 International Contractors. Note: “General Building” includes commercial buildings, offices, stores, educational facilities, government 2 buildings, hospitals, medical facilities, hotels, apartments, housing, etc. “Other” includes hazardous waste and miscellaneous market categories. 14
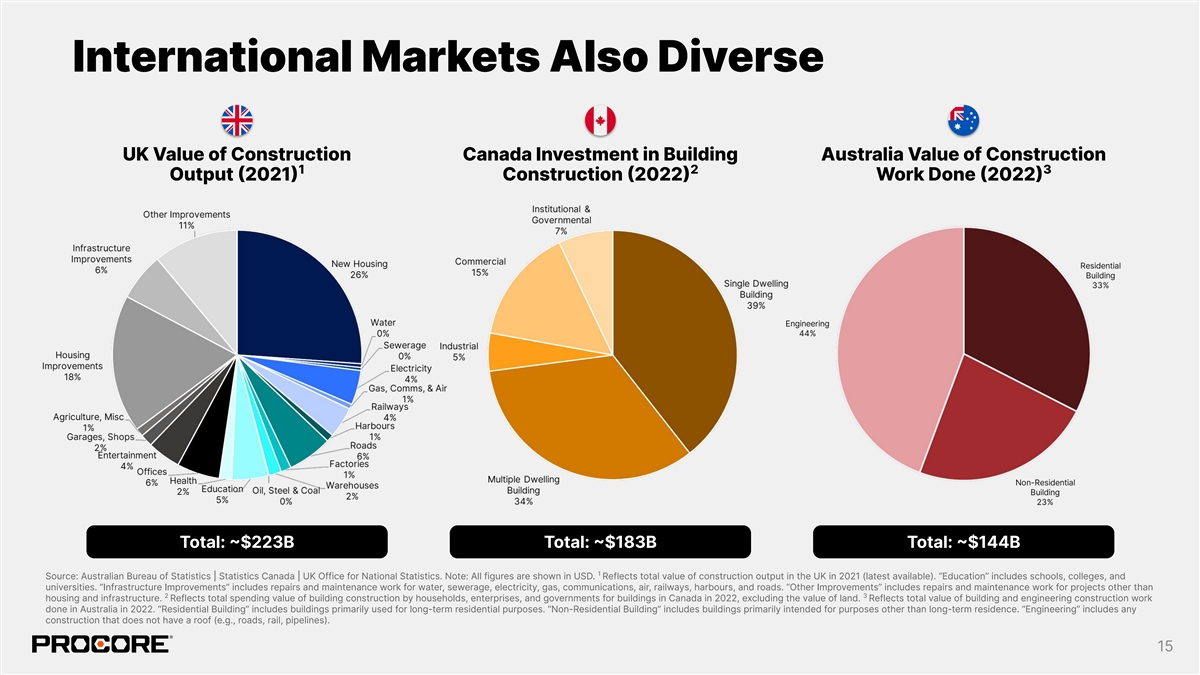
International Markets Also Diverse UK Value of Construction Canada Investment in Building Australia Value of Construction 1 2 3 Output (2021) Construction (2022) Work Done (2022) Total: ~$223B Total: ~$183B Total: ~$144B 1 Source: Australian Bureau of Statistics | Statistics Canada | UK Office for National Statistics. Note: All figures are shown in USD. Reflects total value of construction output in the UK in 2021 (latest available). “Education” includes schools, colleges, and universities. “Infrastructure Improvements” includes repairs and maintenance work for water, sewerage, electricity, gas, communications, air, railways, harbours, and roads. “Other Improvements” includes repairs and maintenance work for projects other than 2 3 housing and infrastructure. Reflects total spending value of building construction by households, enterprises, and governments for buildings in Canada in 2022, excluding the value of land. Reflects total value of building and engineering construction work done in Australia in 2022. “Residential Building” includes buildings primarily used for long-term residential purposes. “Non-Residential Building” includes buildings primarily intended for purposes other than long-term residence. “Engineering” includes any construction that does not have a roof (e.g., roads, rail, pipelines). 15
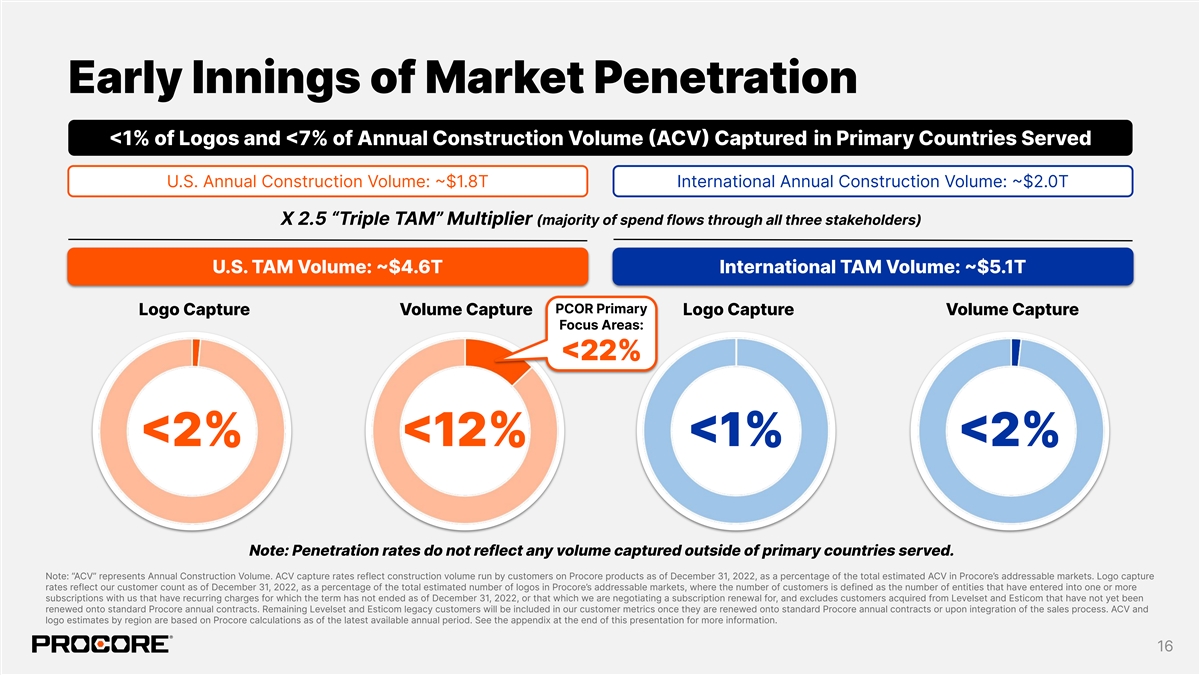
Early Innings of Market Penetration <1% of Logos and <7% of Annual Construction Volume (ACV) Captured in Primary Countries Served U.S. Annual Construction Volume: ~$1.8T International Annual Construction Volume: ~$2.0T X 2.5 “Triple TAM” Multiplier (majority of spend flows through all three stakeholders) U.S. TAM Volume: $4.6T International TAM Volume: $5.1T PCOR Primary Logo Capture Volume Capture Logo Capture Volume Capture Focus Areas: <22% <2% <12% <1% <2% Note: Penetration rates do not reflect any volume captured outside of primary countries served. Note: “ACV” represents Annual Construction Volume. ACV capture rates reflect construction volume run by customers on Procore products as of December 31, 2022, as a percentage of the total estimated ACV in Procore’s addressable markets. Logo capture rates reflect our customer count as of December 31, 2022, as a percentage of the total estimated number of logos in Procore’s addressable markets, where the number of customers is defined as the number of entities that have entered into one or more subscriptions with us that have recurring charges for which the term has not ended as of December 31, 2022, or that which we are negotiating a subscription renewal for, and excludes customers acquired from Levelset and Esticom that have not yet been renewed onto standard Procore annual contracts. Remaining Levelset and Esticom legacy customers will be included in our customer metrics once they are renewed onto standard Procore annual contracts or upon integration of the sales process. ACV and logo estimates by region are based on Procore calculations as of the latest available annual period. See the appendix at the end of this presentation for more information. 16

Key Takeaways Construction is Construction is Procore is in the Construction Massive & Highly Early Innings of Naturally Drives Growing Diversified Penetration Network Effects 17

General Contractors As Gateway to Network Project #1 (WA) Eco Source # of Projects Vertigo Collaborator Active within 2yr Invited Construction Non-Paying 756 Eco Source Trade: Materials 131 Main Character Construction Project #2 (TX) General Contractor 105 RivCloud Healthcare 98 MKM Engineering 89 JD Grading & Excavation 88 Contract Flooring 84 TLD 84 Jackson Electric 75 Lumina Design JD Grading 65 Captain Construction Active within 2yr 64 Flying Airlines Non-Paying Project #1,766 (TX) 63 RivCloud Healthcare Trade: Excavation 57 Midwest Tile & Flooring 47 First Stop MEP 47 SCC Architects 47 D&D Engineers 46 XYZ Instrumentation 44 Frame & Form Construction SC #20,000 Vertigo’s portfolio of projects has Vertigo is a General Vertigo has hundreds of Each Project has a network of recurring collaborators providing Contractor and Procore projects in Procore in all Collaborators, but only some exposure to Owners, SCs, Architects, customer. regions of the country. are Procore customers. Engineers & Suppliers. Note: All characters, companies, and project data are fictional for storytelling purposes. 18

— INVESTOR DAY 2023 Deep Dive #2: Platform & Product Procore’s Platform Steve Davis President, Product & Technology

Procore Was Built in the Cloud for Construction Prequalification Bid Management THE PROCORE PLATFORM Estimating Project Management Architects General Specialty Material Owners Quality & Safety Engineers Contractors Contractors Suppliers Design Coordination PROCORE CONSTRUCTION NETWORK BIM Project Financial Workforce Preconstruction Execution Management Management Field Productivity Workforce Planning 100% PARTNER ECOSYSTEM CONSTRUCTION INTELLIGENCE Cloud-Based Web | Mobile Project Financials Developer API | Data Shared Between Products Invoice Management Search | Collaboration | Documents | Customization | Connectability Accounting Integrations Secure & Trusted Infrastructure Procore Pay Analytics Construction Intelligence Copilot & AI (Coming Soon) 20
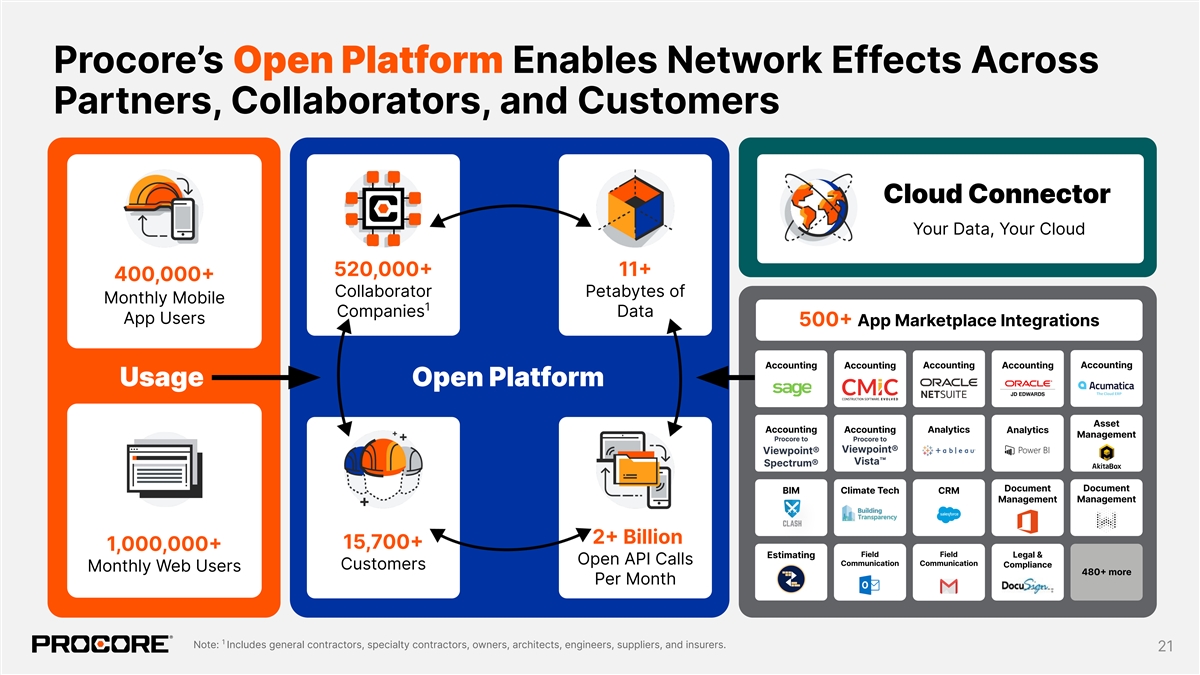
Procore’s Open Platform Enables Network Effects Across Partners, Collaborators, and Customers Cloud Connector Your Data, Your Cloud 520,000+ 11+ 400,000+ Collaborator Petabytes of Monthly Mobile 1 Companies Data App Users 500+ App Marketplace Integrations Accounting Accounting Accounting Accounting Accounting Usage Open Platform Asset Accounting Accounting Analytics Analytics Management Procore to Procore to Viewpoint® Viewpoint® Vista™ Spectrum® Document Document BIM Climate Tech CRM Management Management 2+ Billion 15,700+ 1,000,000+ Field Field Legal & Estimating Open API Calls Communication Communication Compliance Customers Monthly Web Users 480+ more Per Month 1 Note: Includes general contractors, specialty contractors, owners, architects, engineers, suppliers, and insurers. 21
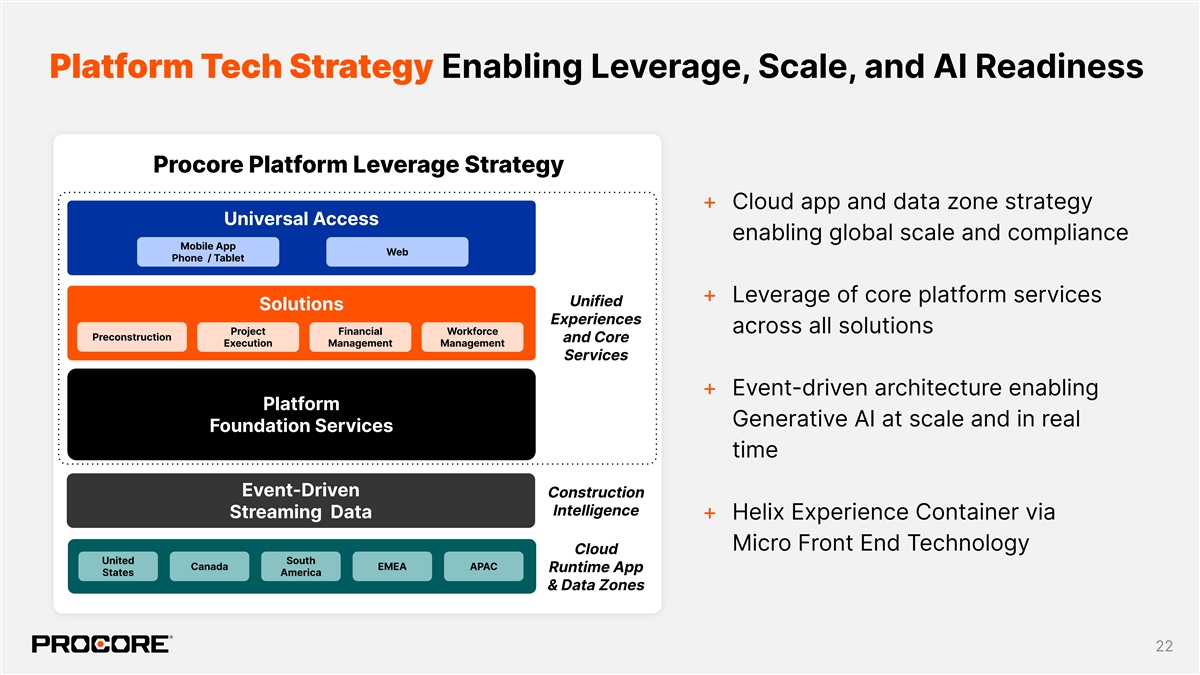
Platform Tech Strategy Enabling Leverage, Scale, and AI Readiness Procore Platform Leverage Strategy + Cloud app and data zone strategy Universal Access enabling global scale and compliance Mobile App Web Phone / Tablet + Leverage of core platform services Unified Solutions Experiences across all solutions Project Financial Workforce Preconstruction and Core Execution Management Management Services + Event-driven architecture enabling Platform Generative AI at scale and in real Foundation Services time Event-Driven Construction Intelligence Streaming Data + Helix Experience Container via Micro Front End Technology Cloud United South Canada EMEA APAC Runtime App States America & Data Zones 22
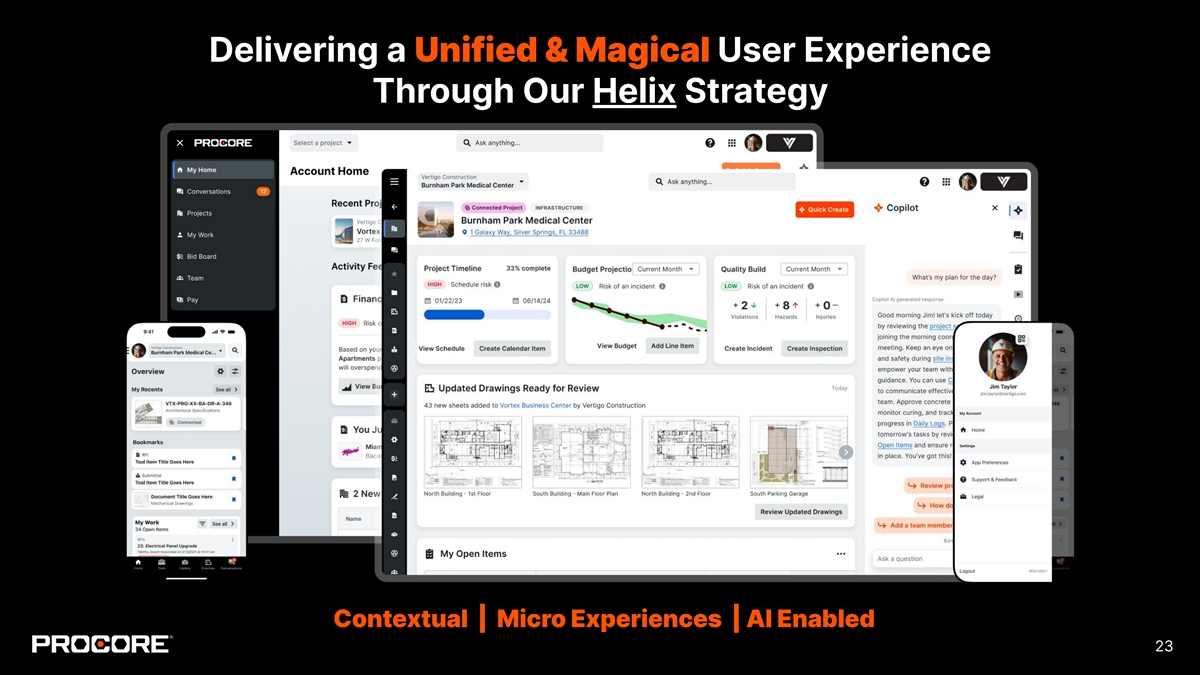
Delivering a Unified & Magical User Experience Through Our Helix Strategy Contextual | Micro Experiences | AI Enabled 23

Copilot AI Intelligence Platform Using Generative AI (Coming Soon) Copilot Intelligence Platform + Intelligent virtual assistant via our Generative AI Services + Common capability across all solutions + Documents, PDF’s, Structured, Unstructured data + Supporting multiple large language models at scale 24
— INVESTOR DAY 2023 Deep Dive #2: Platform & Product Procore’s Products Wyatt Jenkins Chief Product Officer

Construction Lifecycle Connect everyone in construction on a global platform. Preconstruction Project Execution Resource Management Financial Management Operations & Maint Design Design Bidding & Project Quality & Project Invoicing & Estimating Labor Equipment Materials O&M Authoring Mgmt Prequal Mgmt Safety Financials Payments Preconstruction Project Execution Workforce Management Financial Management PARTNER ECOSYSTEM Connected Workflows Through Integrations & Services CONSTRUCTION INTELLIGENCE Full Lifecycle Insights on a Single Platform THE PROCORE PLATFORM Web | Mobile Developer API | Data Shared Between Products Search | Collaboration | Documents | Customization | Connectability Secure & Trusted Infrastructure 26

The Procore Platform Architects & General Specialty Material Owners Engineers Contractors Contractors Suppliers PROCORE CONSTRUCTION NETWORK Project Workforce Financial Preconstruction Execution Management Management PARTNER ECOSYSTEM Connected Workflows Through Integrations & Services CONSTRUCTION INTELLIGENCE Full Lifecycle Insights on a Single Platform THE PROCORE PLATFORM Web | Mobile Developer API | Data Shared Between Products Search | Collaboration | Documents | Customization | Connectability Secure & Trusted Infrastructure 27
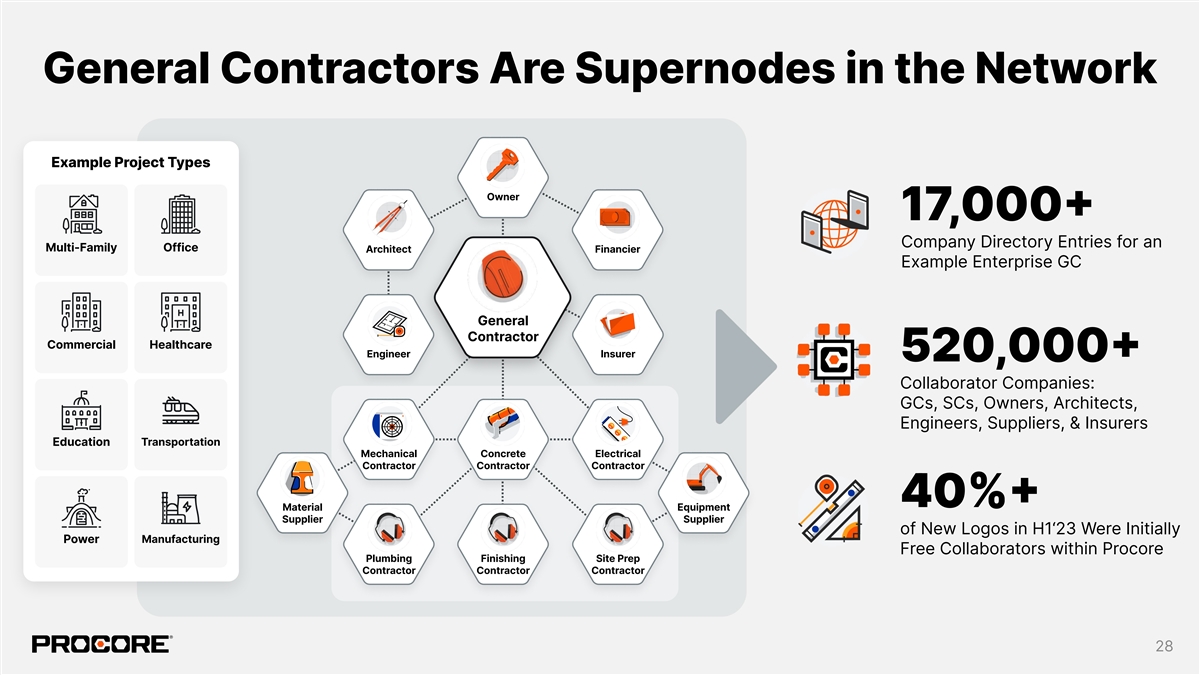
General Contractors Are Supernodes in the Network Example Project Types Owner 17,000+ Company Directory Entries for an Multi-Family Office Architect Financier Example Enterprise GC General Contractor Commercial Healthcare Engineer Insurer 520,000+ Collaborator Companies: GCs, SCs, Owners, Architects, Engineers, Suppliers, & Insurers Education Transportation Mechanical Concrete Electrical Contractor Contractor Contractor 40%+ Material Equipment Supplier Supplier of New Logos in H1‘23 Were Initially Manufacturing Power Free Collaborators within Procore Plumbing Finishing Site Prep Contractor Contractor Contractor 28
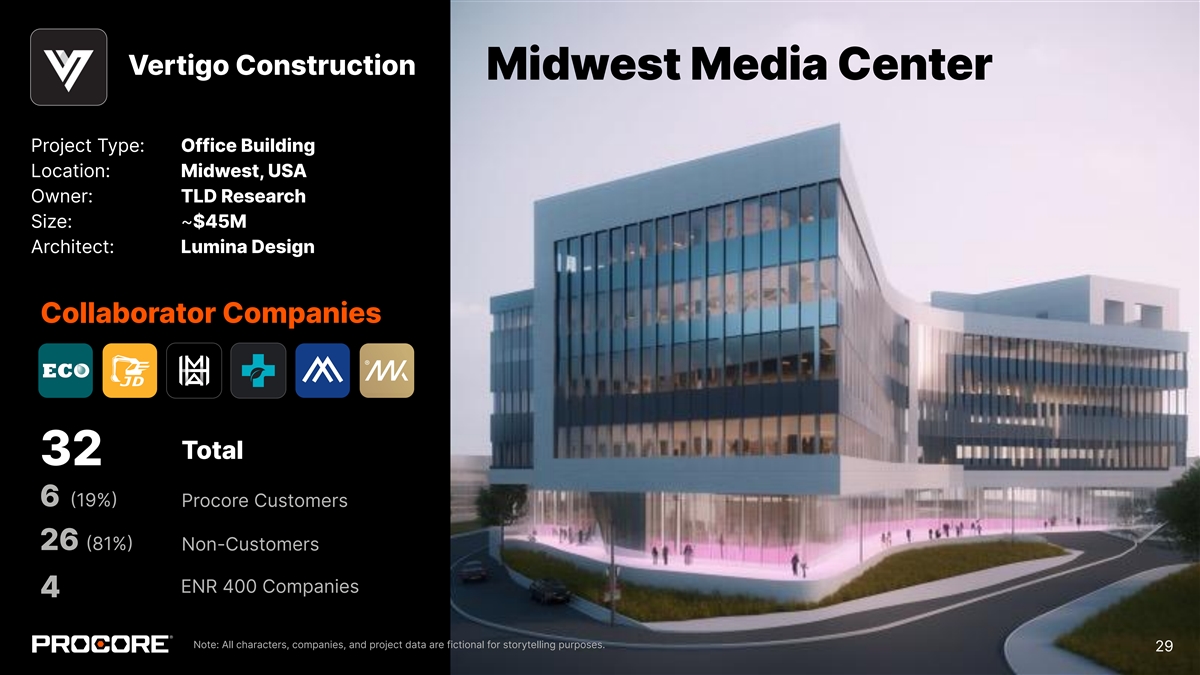
Vertigo Construction Midwest Media Center Project Type: Office Building Location: Midw est, USA Owner: TLD Research Size: ~ $45M Architect: Lumina Design Collaborator Companies Total 32 6 (19%) Procore Customers 26 (81%) Non-Customers ENR 400 Companies 4 Note: All characters, companies, and project data are fictional for storytelling purposes. 29

Procore Connectability Enables Customers to collaborate on Owner projects across accounts. Architect Financier General Contractor Allows Collaborators to easily retain Engineer project data within their own account. Mechanical Concrete Electrical Contractor Contractor Contractor Creates unique value for all participants Material Equipment Supplier Supplier on the network. Plumbing Finishing Site Prep Contractor Contractor Contractor 30
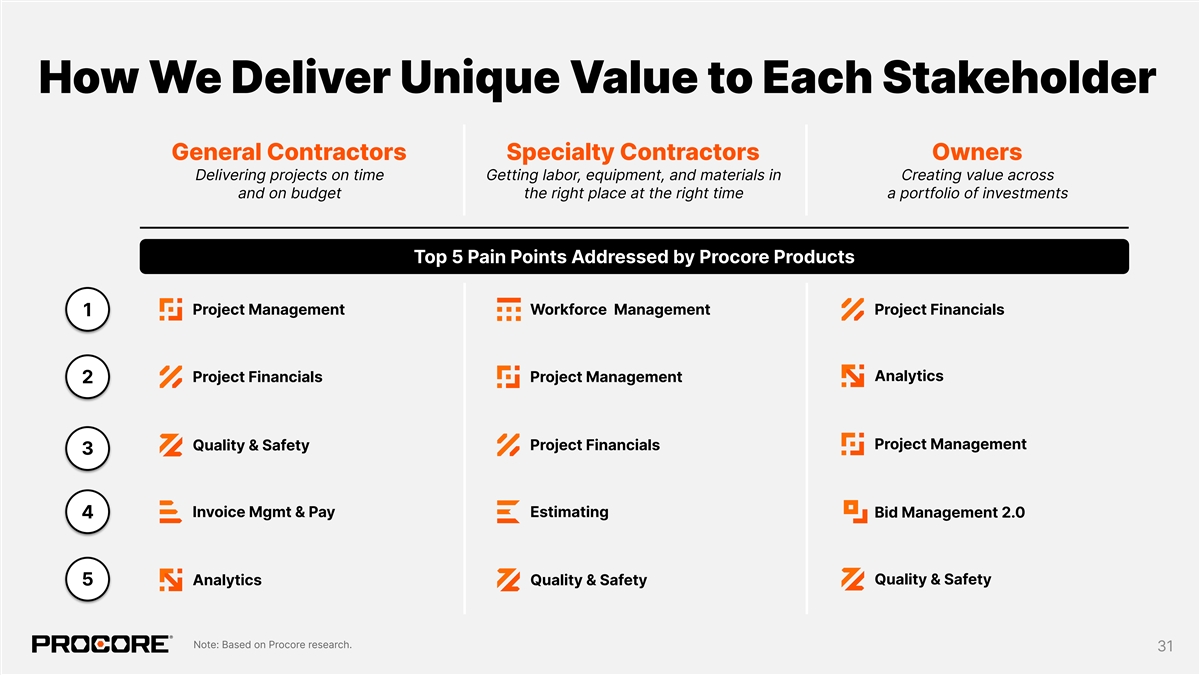
How We Deliver Unique Value to Each Stakeholder General Contractors Specialty Contractors Owners Delivering projects on time Getting labor, equipment, and materials in Creating value across and on budget the right place at the right time a portfolio of investments Top 5 Pain Points Addressed by Procore Products Project Management Workforce Management Project Financials 1 Analytics Project Financials Project Management 2 Project Management Project Financials Quality & Safety 3 Invoice Mgmt & Pay Estimating Bid Management 2.0 4 Quality & Safety Analytics Quality & Safety 5 Note: Based on Procore research. 31
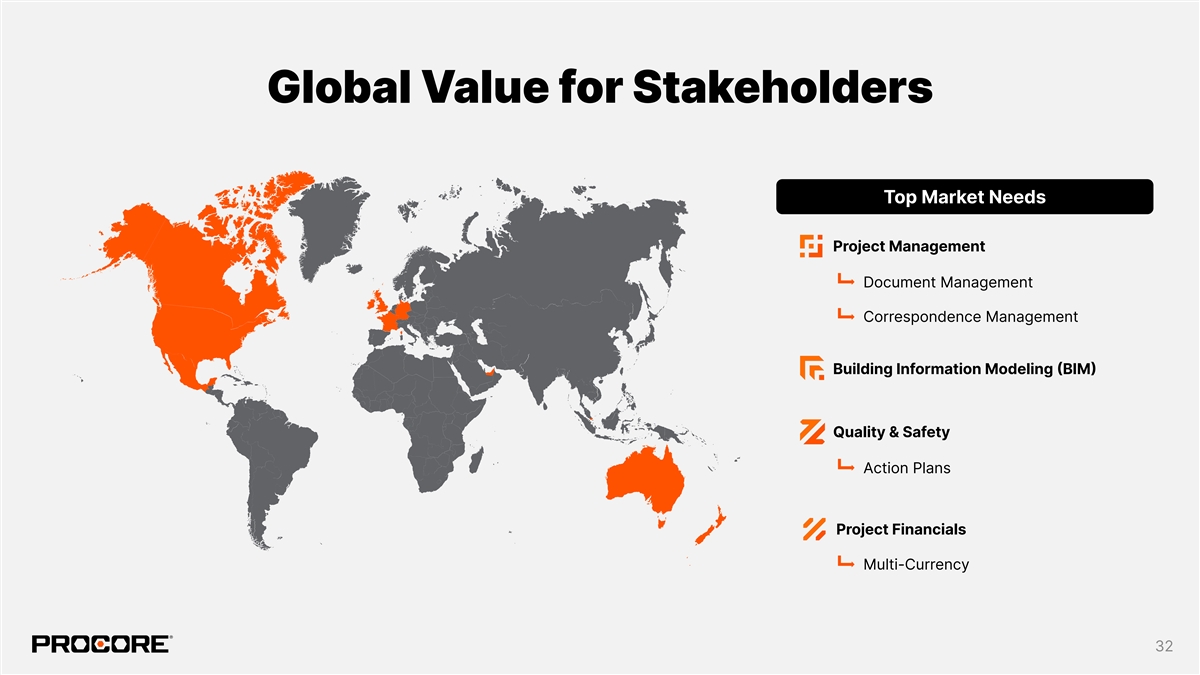
Global Value for Stakeholders Top Market Needs Project Management Document Management Correspondence Management Building Information Modeling (BIM) Quality & Safety Action Plans Project Financials Multi-Currency 32
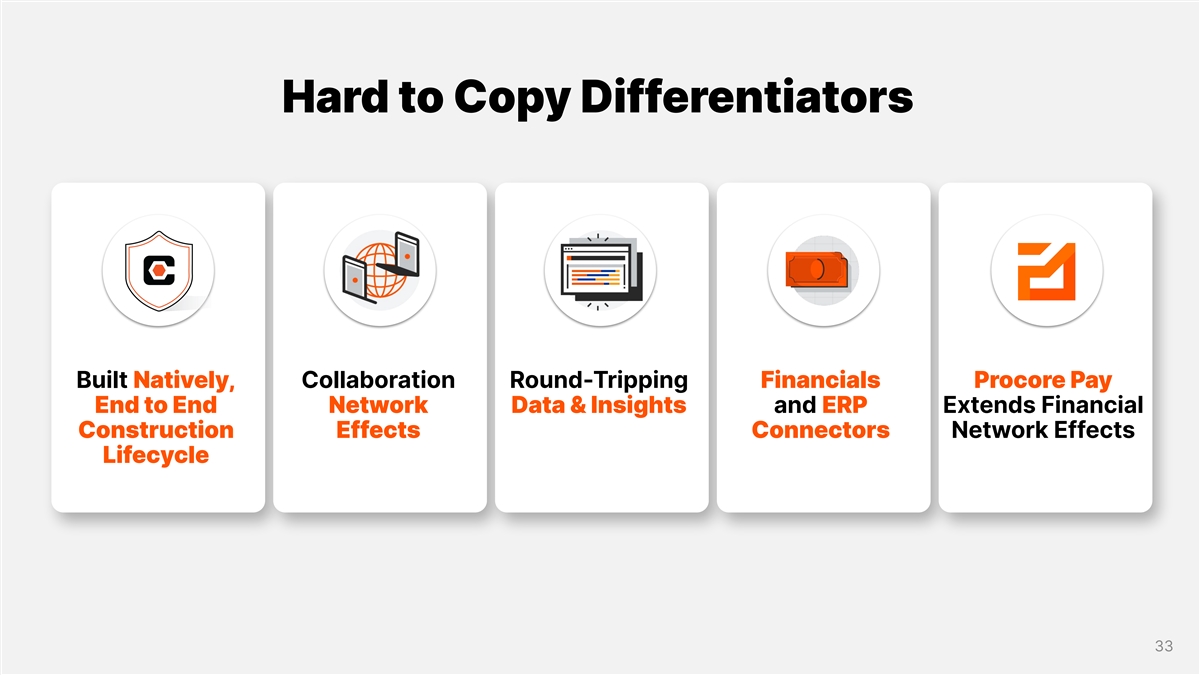
Hard to Copy Differentiators Built Natively, Collaboration Round-Tripping Financials Procore Pay End to End Network Data & Insights and ERP Extends Financial Construction Effects Connectors Network Effects Lifecycle 33
— INVESTOR DAY 2023 Deep Dive #2: Platform & Product Procore Pay Geoff Lewis Vice President, Product Management
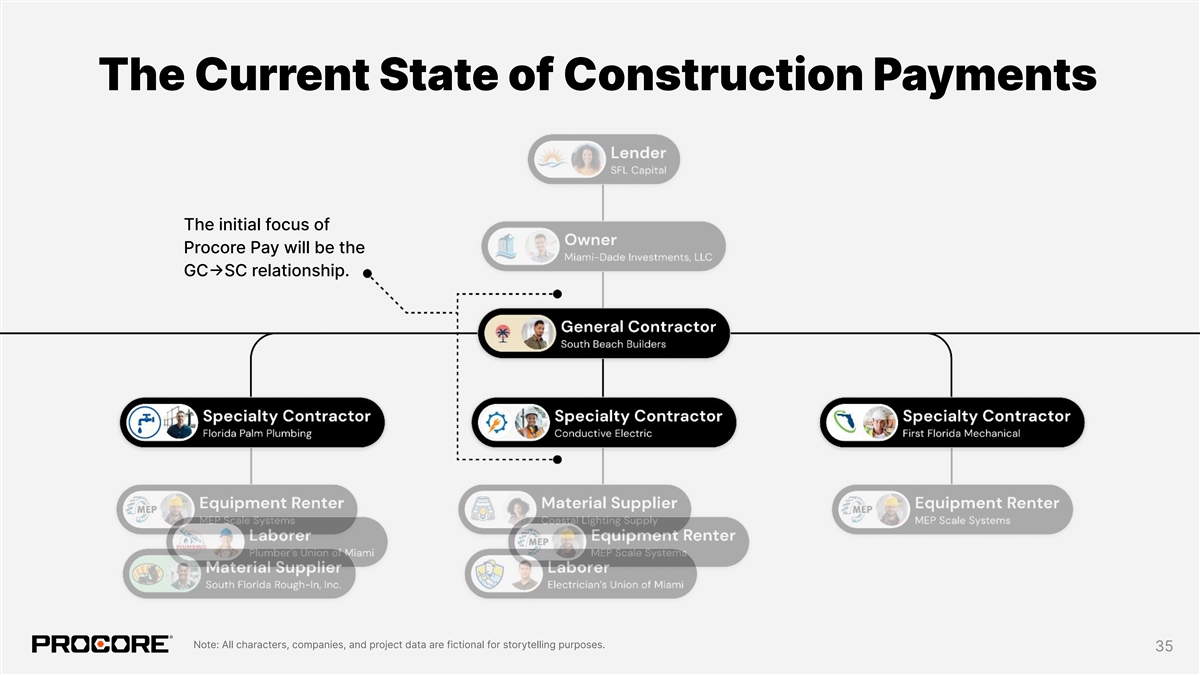
The Current State of Construction Payments The initial focus of Procore Pay will be the GC→SC relationship. Note: All characters, companies, and project data are fictional for storytelling purposes. 35
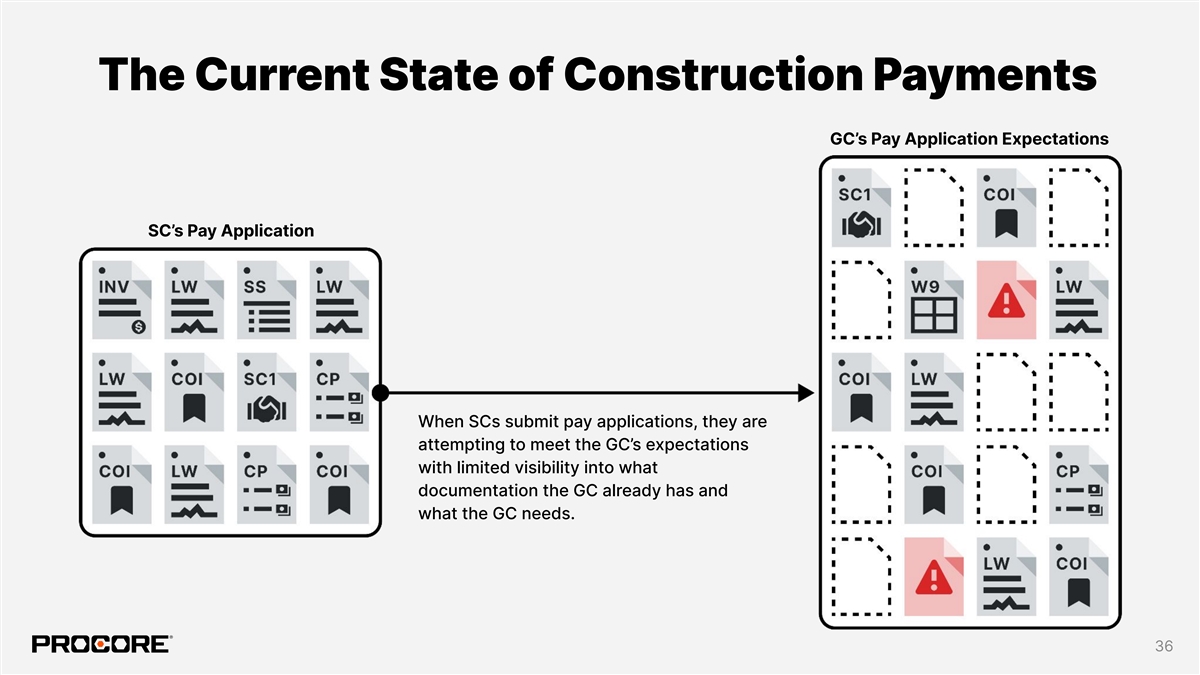
The Current State of Construction Payments GC’s Pay Application Expectations SC’s Pay Application When SCs submit pay applications, they are attempting to meet the GC’s expectations with limited visibility into what documentation the GC already has and what the GC needs. 36
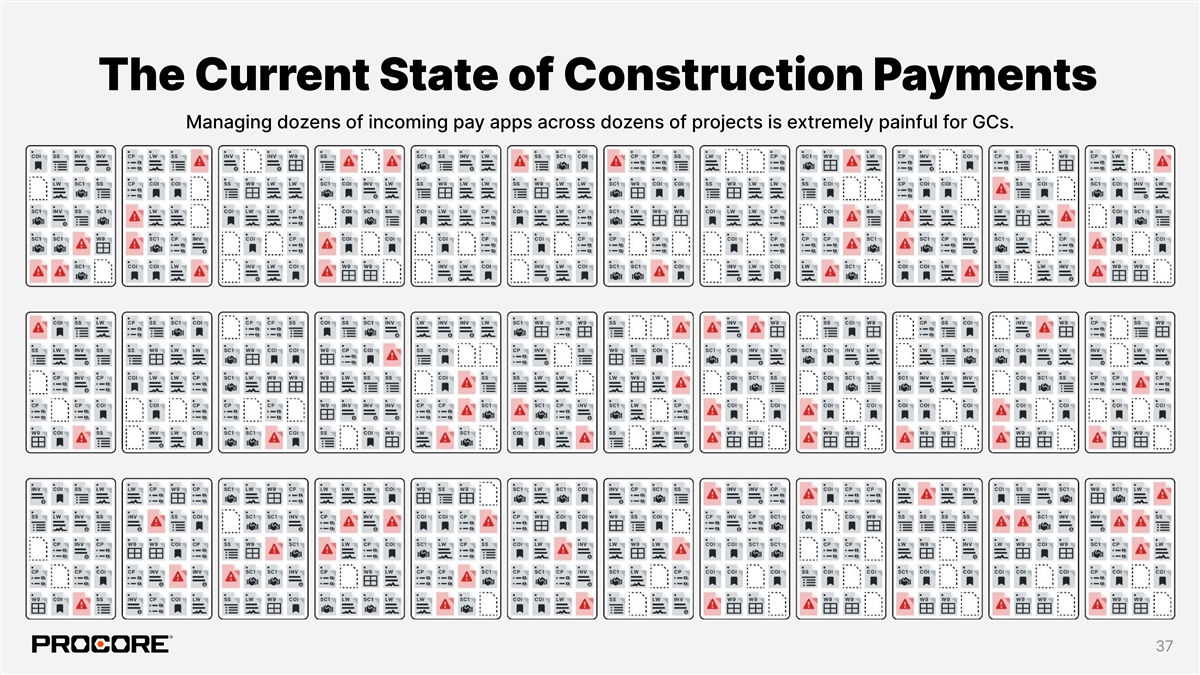
The Current State of Construction Payments Managing dozens of incoming pay apps across dozens of projects is extremely painful for GCs. 37
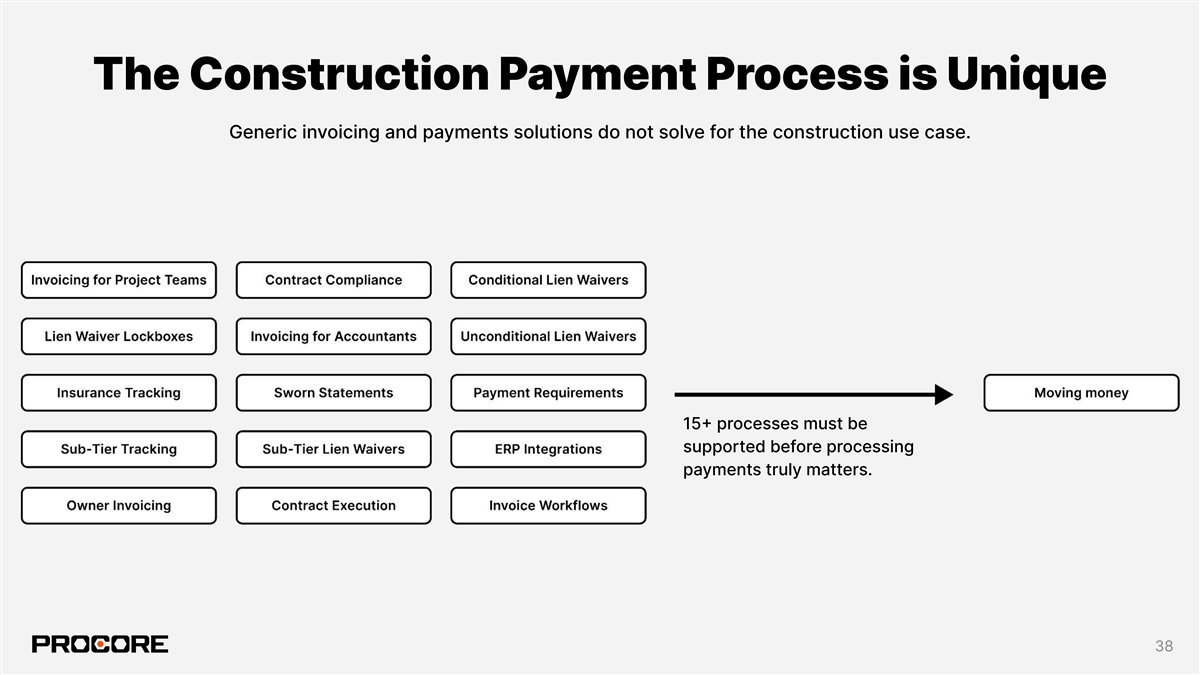
The Construction Payment Process is Unique Generic invoicing and payments solutions do not solve for the construction use case. 15+ processes must be supported before processing payments truly matters. 38
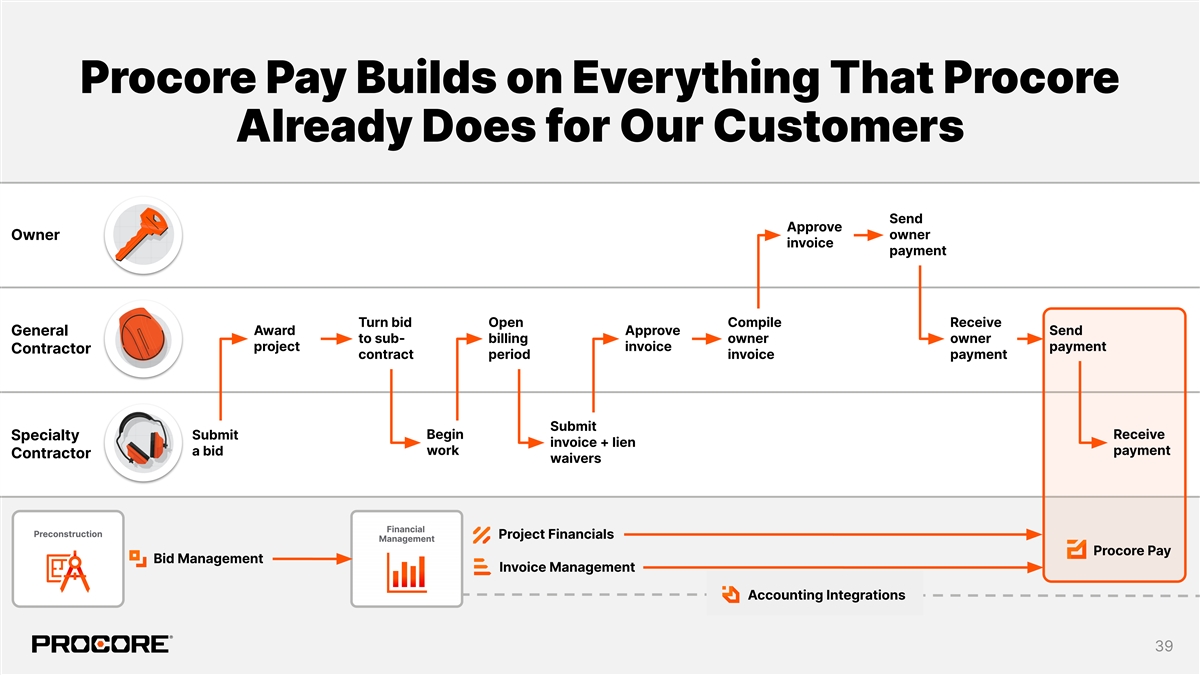
Procore Pay Builds on Everything That Procore Already Does for Our Customers Send Approve owner Owner invoice payment Turn bid Open Compile Receive Award Approve Send General to sub- billing owner owner project invoice payment Contractor contract period invoice payment Submit Submit Begin Receive Specialty invoice + lien work payment a bid Contractor waivers Project Financials Procore Pay Bid Management Invoice Management Accounting Integrations 39

Procore Pay completely reimagines this process and eliminates the pain. Note: All characters, companies, and project data are fictional for storytelling purposes. 40
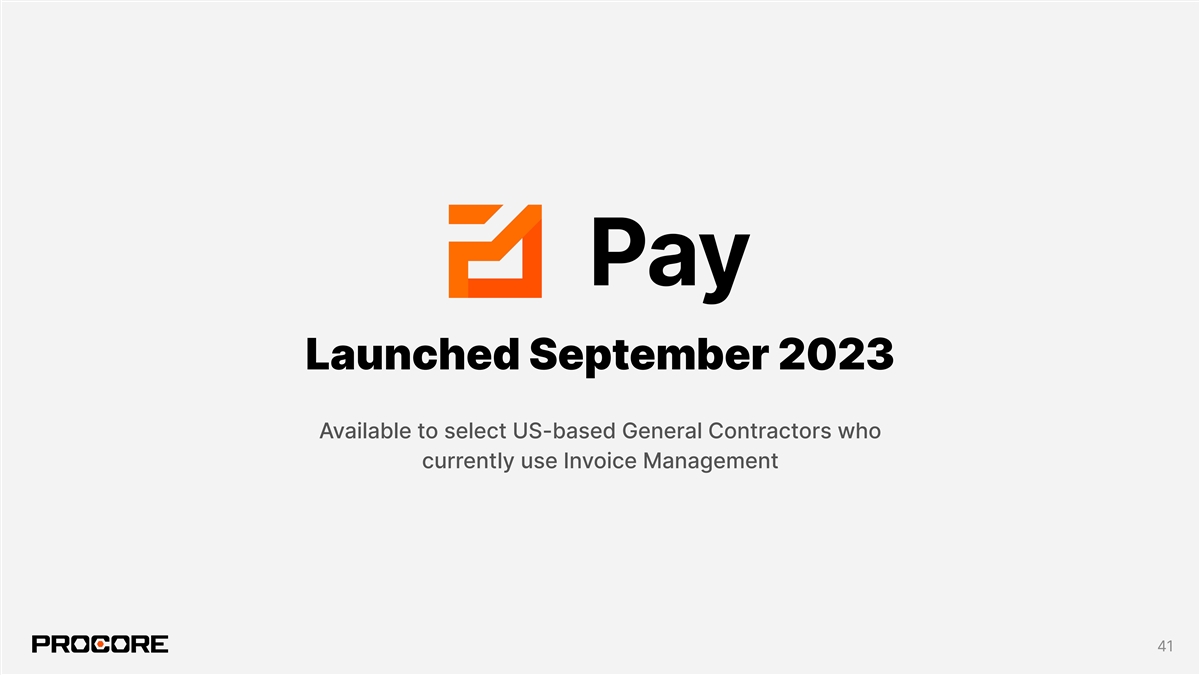
Launched September 2023 Available to select US-based General Contractors who currently use Invoice Management 41
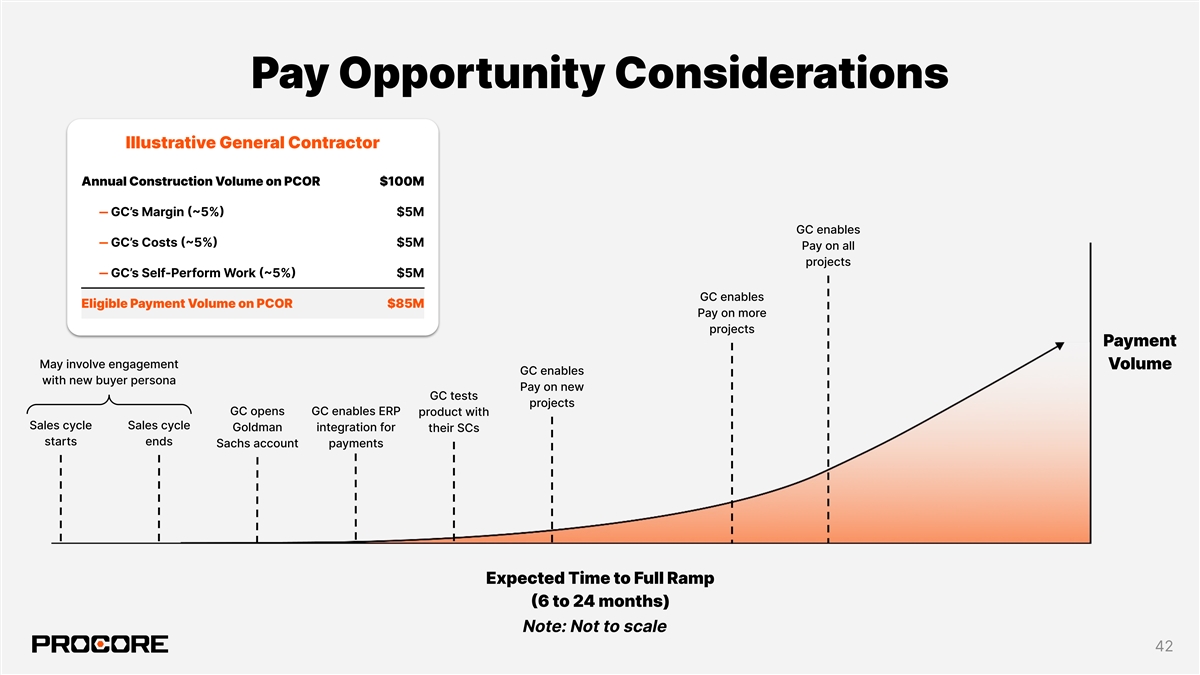
Pay Opportunity Considerations Illustrative General Contractor Annual Construction Volume on PCOR $100M ‒ GC’s Margin (~5%) $5M GC enables ‒ GC’s Costs (~5%) $5M Pay on all projects ‒ GC’s Self-Perform Work (~5%) $5M GC enables Eligible Payment Volume on PCOR $85M Pay on more projects Payment May involve engagement Volume GC enables with new buyer persona Pay on new GC tests projects GC opens GC enables ERP product with Sales cycle Sales cycle Goldman integration for their SCs starts ends Sachs account payments Expected Time to Full Ramp (6 to 24 months) Note: Not to scale 42
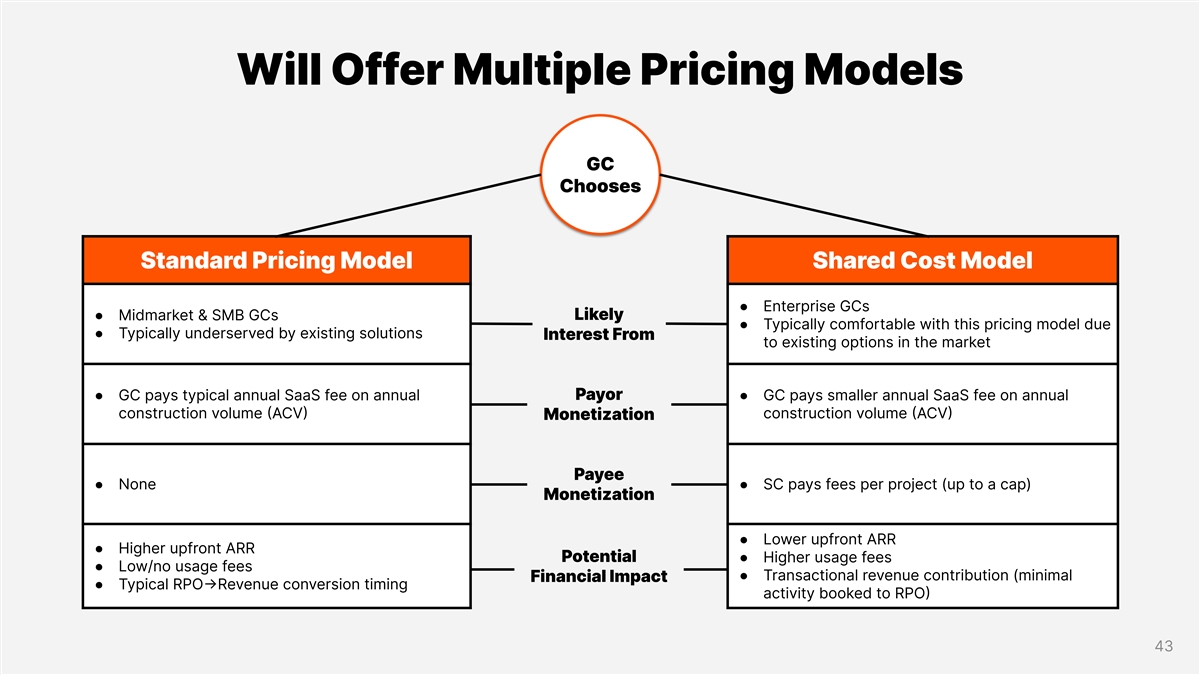
Will Offer Multiple Pricing Models GC Chooses Standard Pricing Model Shared Cost Model ● Enterprise GCs ● Midmarket & SMB GCs Likely ● Typically comfortable with this pricing model due ● Typically underserved by existing solutions Interest From to existing options in the market ● GC pays typical annual SaaS fee on annual Payor● GC pays smaller annual SaaS fee on annual construction volume (ACV) construction volume (ACV) Monetization Payee ● None● SC pays fees per project (up to a cap) Monetization ● Lower upfront ARR ● Higher upfront ARR Potential ● Higher usage fees ● Low/no usage fees ● Transactional revenue contribution (minimal Financial Impact ● Typical RPO→Revenue conversion timing activity booked to RPO) 43
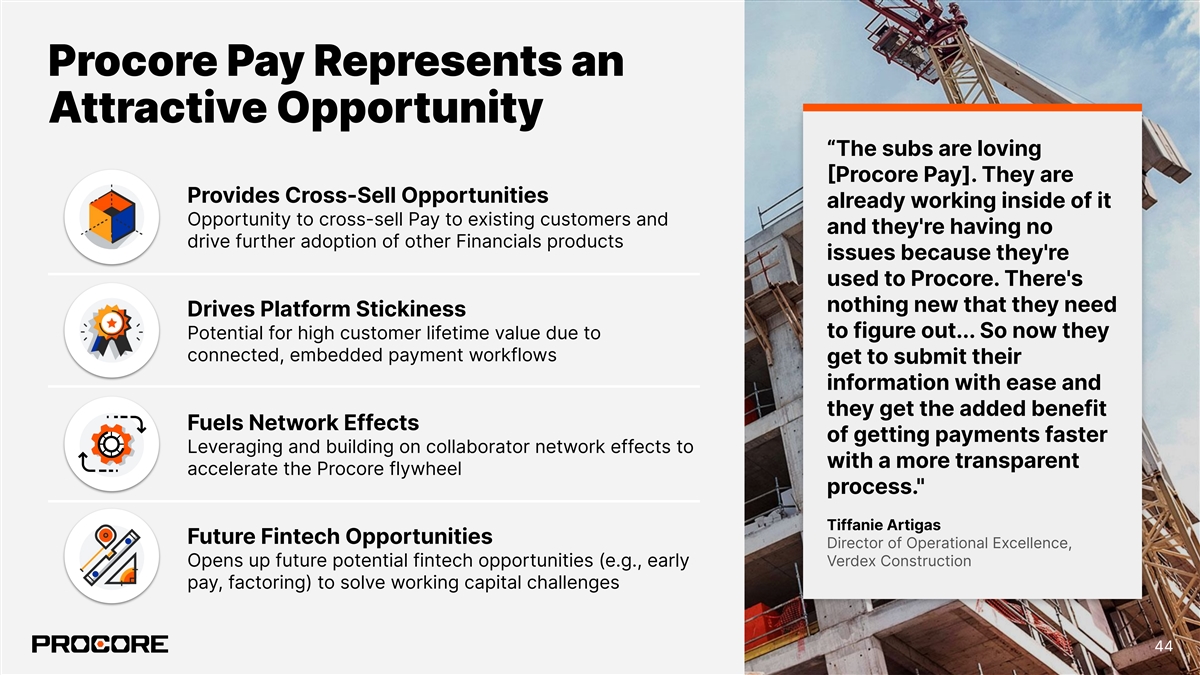
Procore Pay Represents an Attractive Opportunity “The subs are loving Procore Pay]. They are Provides Cross-Sell Opportunities already working inside of it Opportunity to cross-sell Pay to existing customers and and they're having no drive further adoption of other Financials products issues because they're used to Procore. There's nothing new that they need Drives Platform Stickiness to figure out... So now they Potential for high customer lifetime value due to connected, embedded payment workflows get to submit their information with ease and they get the added benefit Fuels Network Effects of getting payments faster Leveraging and building on collaborator network effects to with a more transparent accelerate the Procore flywheel process. Tiffanie Artigas Future Fintech Opportunities Director of Operational Excellence, Verdex Construction Opens up future potential fintech opportunities (e.g., early pay, factoring) to solve working capital challenges 44
— INVESTOR DAY 2023 Deep Dive #3: Fintech Update Paul Lyandres President of Fintech Risk Advisors Capital
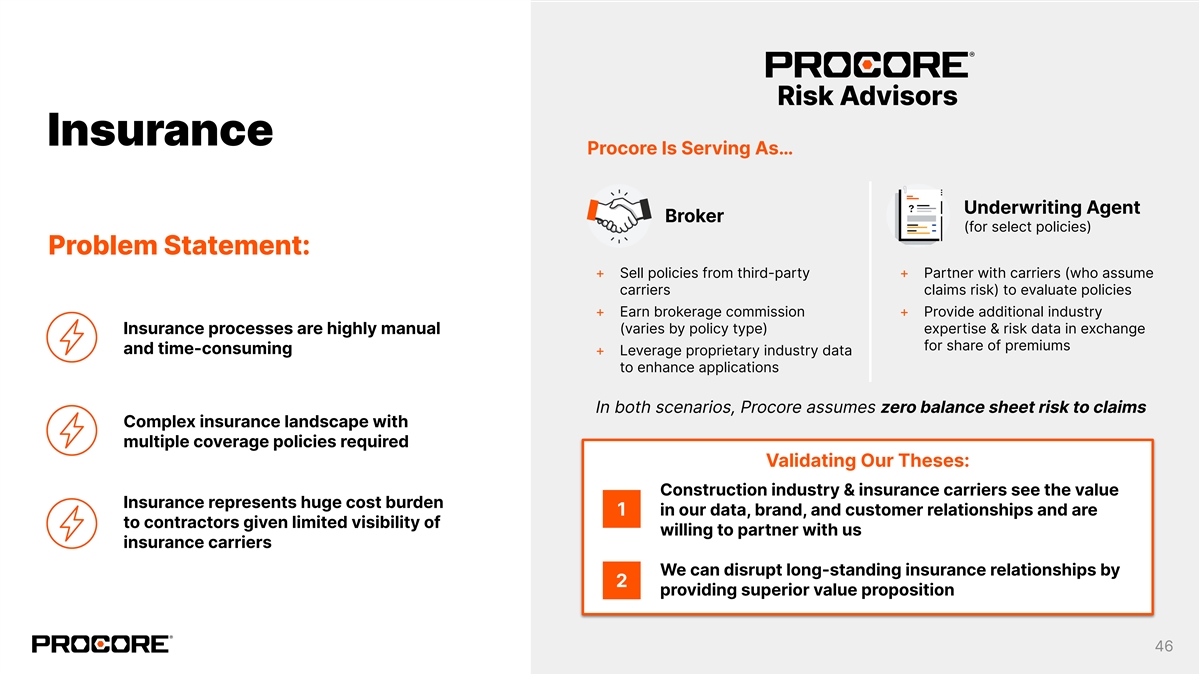
Risk Advisors Insurance Procore Is Serving As… Underwriting Agent Broker (for select policies) Problem Statement: + Sell policies from third-party + Partner with carriers (who assume carriers claims risk) to evaluate policies + Earn brokerage commission + Provide additional industry (varies by policy type) expertise & risk data in exchange Insurance processes are highly manual for share of premiums and time-consuming + Leverage proprietary industry data to enhance applications In both scenarios, Procore assumes zero balance sheet risk to claims Complex insurance landscape with multiple coverage policies required Validating Our Theses: Construction industry & insurance carriers see the value Insurance represents huge cost burden 1 in our data, brand, and customer relationships and are to contractors given limited visibility of willing to partner with us insurance carriers We can disrupt long-standing insurance relationships by 2 providing superior value proposition 46

“I am a construction attorney and have Early Progress & Learnings been following the growth of Procore’s brokerage and risk management initiatives over the past year. 30+ 26-40% I believe that there is often a major 1 Carrier relationships Lower incident rate for Procore customers disconnect between the clients I represent compared to construction industry average and the brokers/agents they use to seek out and purchase insurance products. [...] Your average insurance broker just does 150+ 22-39% not grasp the multitude of interrelated 2 First meetings with customers since Lower lost days rate for Procore risks faced by dynamic, ambitious launch of Procore Risk Advisors customers compared to construction construction firms and others providing industry average services in the constantly changing design/development/construction space.” Getting sufficient coverage at a reasonable price is a clear pain point 1 for customers Construction Attorney Customers understand our vision and recognize why data is 2 important There has been strong early interest in our offering 3 “Now I have to call my broker and break the news. I really like him, but you can’t argue with the results here.” Early sales cycles reflect deep existing broker relationships 4 Surety Customer 1 Source: Procore Risk Advisors, Frost & Sullivan Study: Risk Data Uncovered. Reflects Total Recordable Incident Rate (TRIR), which is an Occupational Safety and Health Administration (OSHA) calculation based on the number of 2 recordable incidents per 100 full-time workers annually. Reduction in TRIR varies by Procore usage score. Reflects Days Away, Restricted, or Transferred (DART) rate, which is an OSHA calculation based on the number of recordable incidents per 100 full-time workers annually that result in time away from work, restricted job roles/tasks, or permanent transfer to a new position. Reduction in DART rate varies by Procore usage score. 47
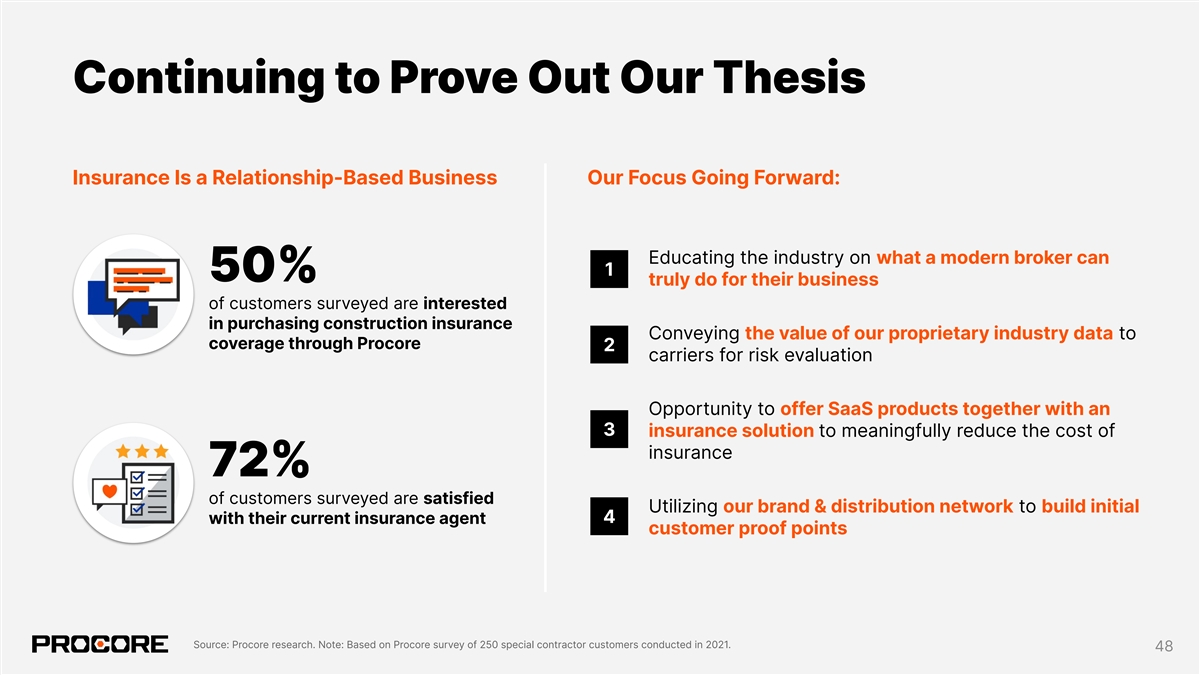
Continuing to Prove Out Our Thesis Insurance Is a Relationship-Based Business Our Focus Going Forward: Educating the industry on what a modern broker can 1 50% truly do for their business of customers surveyed are interested in purchasing construction insurance Conveying the value of our proprietary industry data to coverage through Procore 2 carriers for risk evaluation Opportunity to offer SaaS products together with an 3 insurance solution to meaningfully reduce the cost of insurance 72% of customers surveyed are satisfied Utilizing our brand & distribution network to build initial 4 with their current insurance agent customer proof points Source: Procore research. Note: Based on Procore survey of 250 special contractor customers conducted in 2021. 48 48

Capital We Have Been Experimenting With… And Are Actively Evaluating… Working Capital Materials Financing Early Pay/Factoring 1 + ~$50M lifetime originations + Up to ~90 days on average for SCs to get paid once invoice is approved + Purchase materials from suppliers and sell to Problem Statement: SCs on deferred payment terms + Massive invoice flow already captured on Procore platform + Leverage available proprietary data during underwriting process + Can initially leverage 3rd-party capital partner without incurring balance sheet risk + Secure our financing with lien rights Mismatch in payment timing creates + Procore can pay out approved invoices to working capital constraints + Collect upfront origination fee + weekly SCs early, collect a fee, and recoup payment finance charge once GC is paid + Expect to get paid back in full when SC is paid + Potential to leverage Procore Pay payment + Committing to small amount of capital (<10% flows Limited credit history & difficulty of cash on balance sheet) to build our + Potential for more efficient monetization accessing traditional sources of capital “gametape” Determining the Optimal Approach Lack of capital leads to fewer bids and constricts the specialty contractor’s Long term, our intent is not to scale on our own balance sheet 1 ability to grow We are evaluating the most attractive, efficient approach to solving the 2 working capital problem statement Source: PWC Working Capital Report (2019/2020): Creating Value Through Working Capital. Note: All statistics as of June 30, 2023. 1 Reflects median days sales outstanding (DSO) for the engineering & construction industry. 49
— INVESTOR DAY 2023 Deep Dive #4: Financial Philosophy Howard Fu CFO & Treasurer
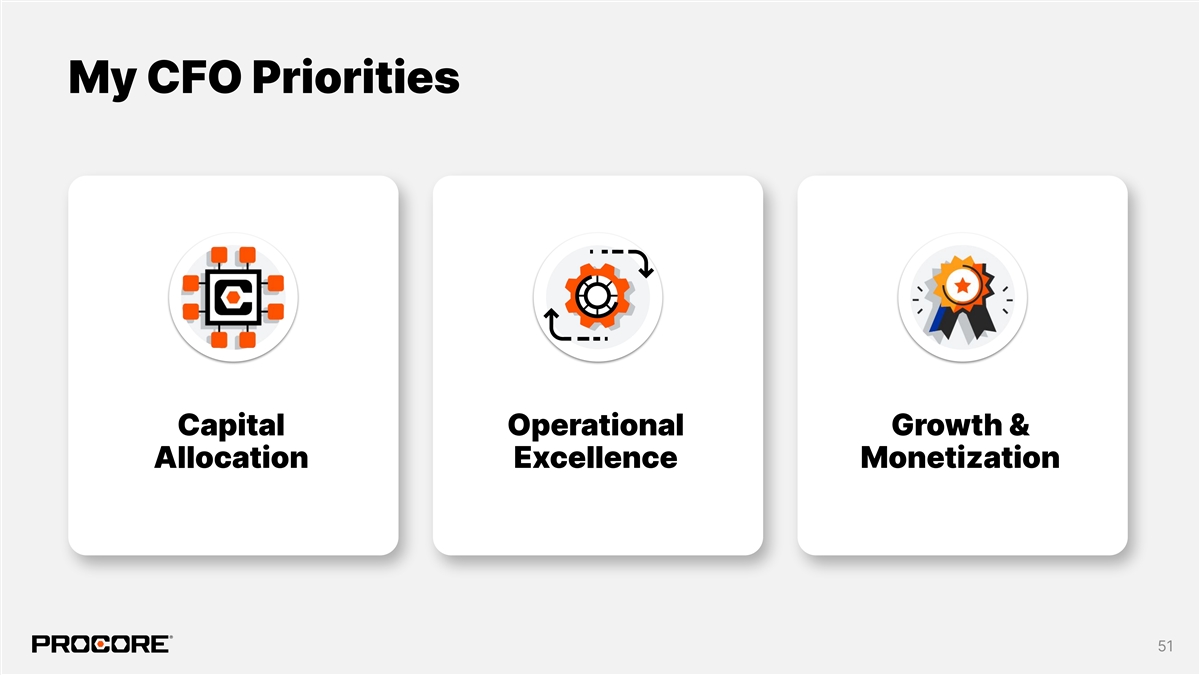
My CFO Priorities Capital Operational Growth & Allocation Excellence Monetization 51
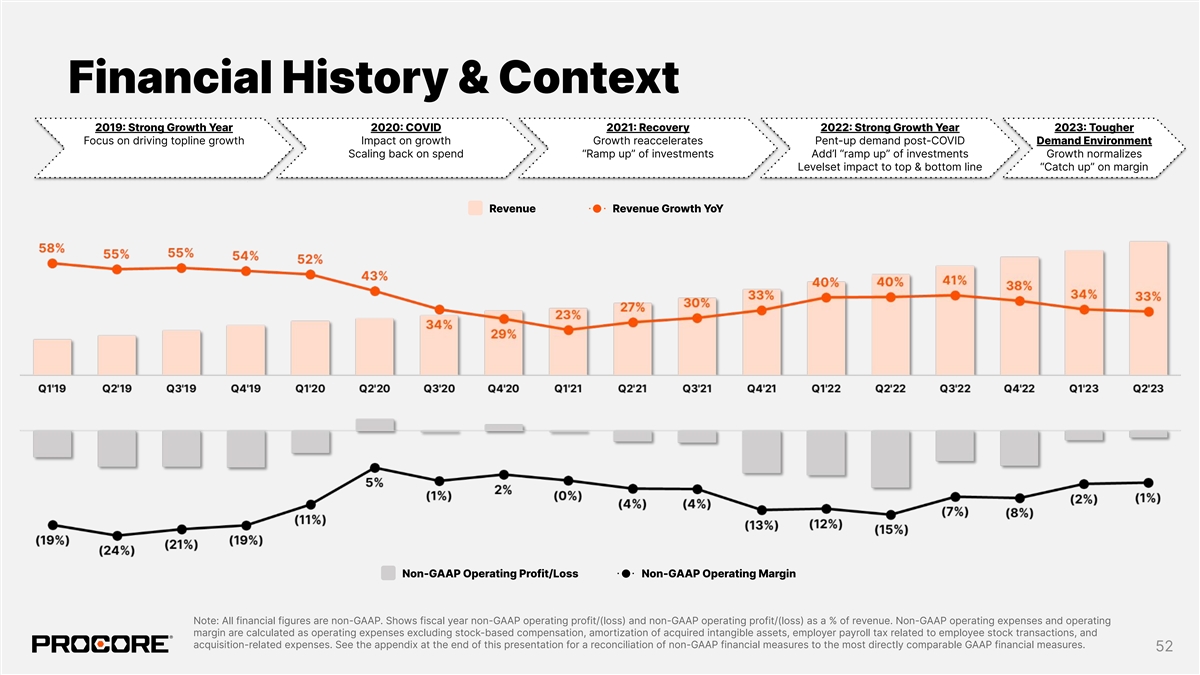
Financial History & Context 2019 Strong Growth Year 2020 COVID 2021 Recovery 2022 Strong Growth Year 2023 Tougher Focus on driving topline growth Impact on growth Growth reaccelerates Pent-up demand post-COVID Demand Environment Scaling back on spend “Ramp up” of investments Add’l “ramp up” of investments Growth normalizes Levelset impact to top & bottom line “Catch up” on margin Revenue Revenue Growth YoY Non-GAAP Operating Profit/Loss Non-GAAP Operating Margin Note: All financial figures are non-GAAP. Shows fiscal year non-GAAP operating profit/(loss) and non-GAAP operating profit/(loss) as a % of revenue. Non-GAAP operating expenses and operating margin are calculated as operating expenses excluding stock-based compensation, amortization of acquired intangible assets, employer payroll tax related to employee stock transactions, and acquisition-related expenses. See the appendix at the end of this presentation for a reconciliation of non-GAAP financial measures to the most directly comparable GAAP financial measures. 52
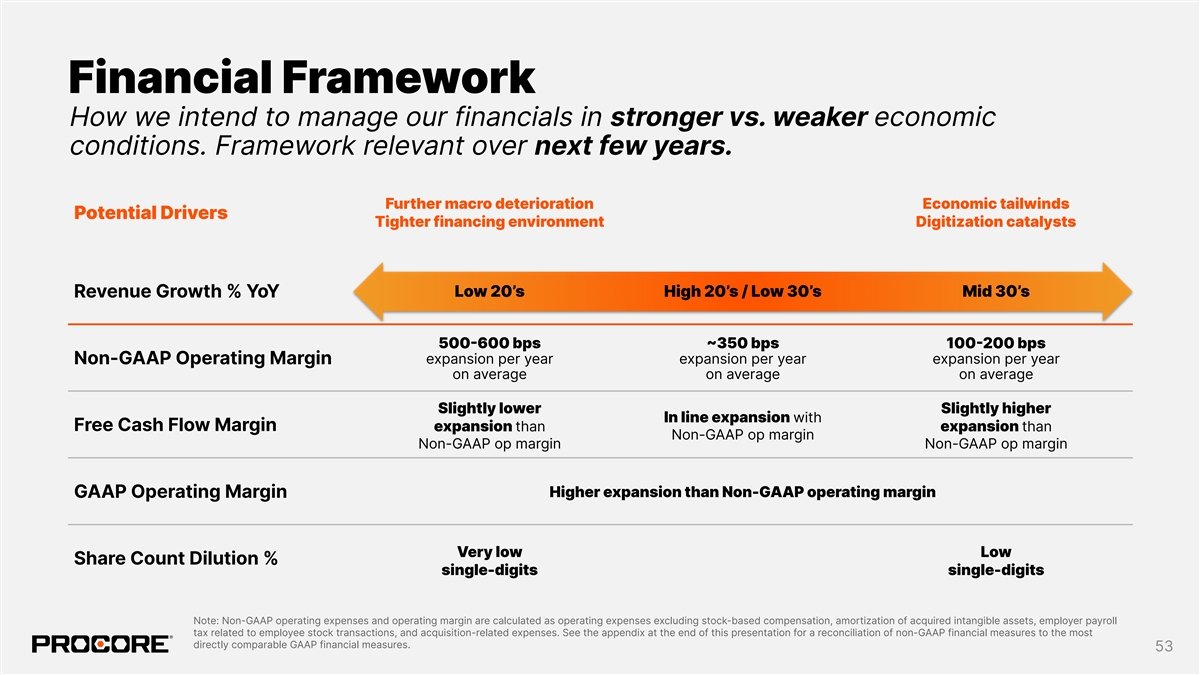
Financial Framework How we intend to manage our financials in stronger vs. weaker economic conditions. Framework relevant over next few years. Further macro deterioration Economic tailwinds Potential Drivers Tighter financing environment Digitization catalysts Low 20’s High 20’s / Low 30’s Mid 30’s Revenue Growth % YoY 500-600 bps ~350 bps 100-200 bps expansion per year expansion per year expansion per year Non-GAAP Operating Margin on average on average on average Slightly lower Slightly higher In line expansion with Free Cash Flow Margin expansion than expansion than Non-GAAP op margin Non-GAAP op margin Non-GAAP op margin GAAP Operating Margin Higher expansion than Non-GAAP operating margin Very low Low Share Count Dilution % single-digits single-digits Note: Non-GAAP operating expenses and operating margin are calculated as operating expenses excluding stock-based compensation, amortization of acquired intangible assets, employer payroll tax related to employee stock transactions, and acquisition-related expenses. See the appendix at the end of this presentation for a reconciliation of non-GAAP financial measures to the most directly comparable GAAP financial measures. 53
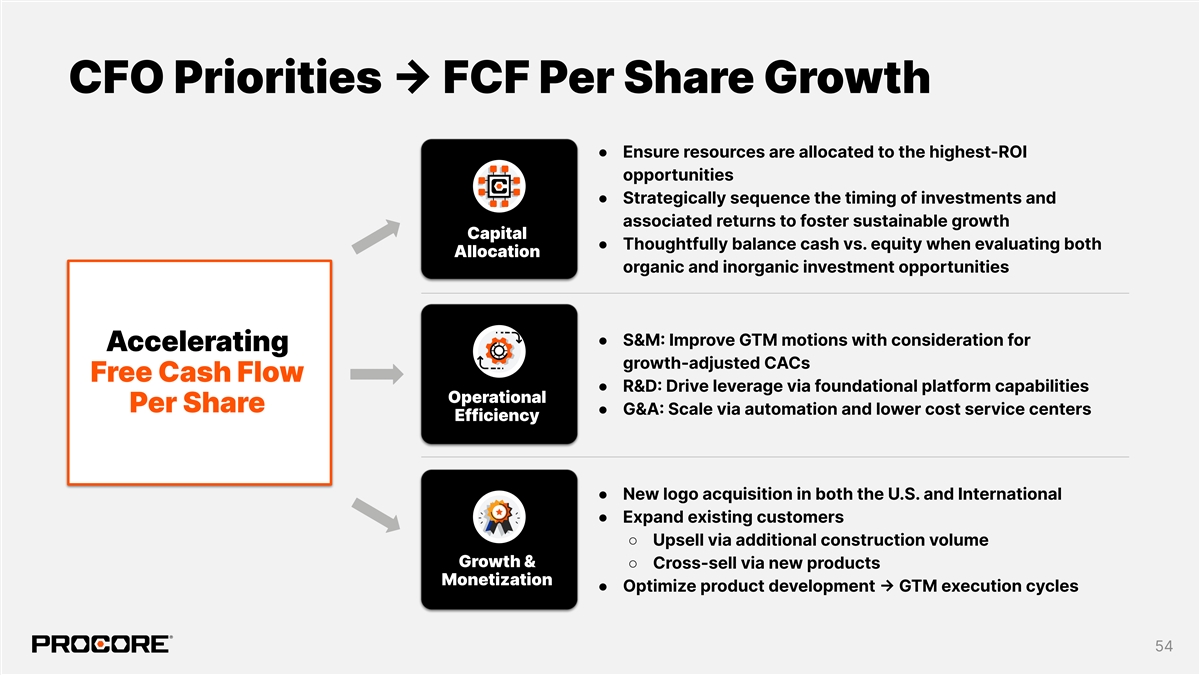
CFO Priorities → FCF Per Share Growth ● Ensure resources are allocated to the highest-ROI opportunities ● Strategically sequence the timing of investments and associated returns to foster sustainable growth Capital ● Thoughtfully balance cash vs. equity when evaluating both Allocation organic and inorganic investment opportunities ● S&M: Improve GTM motions with consideration for Accelerating growth-adjusted CACs Free Cash Flow ● R&D: Drive leverage via foundational platform capabilities Operational Per Share ● G&A: Scale via automation and lower cost service centers Efficiency ● New logo acquisition in both the U.S. and International ● Expand existing customers ○ Upsell via additional construction volume Growth & ○ Cross-sell via new products Monetization ● Optimize product development → GTM execution cycles 54

Break 55

Executive Q&A
Thank You

— INVESTOR DAY 2023 Appendix
References and Definitions CUSTOMERS We define the number of customers at the end of a particular period as the number of entities that have entered into one or more subscriptions with us that have recurring charges for which the term has not ended, or that which we are negotiating a subscription renewal for. An entity with multiple subsidiaries, segments, or divisions, is defined and counted as a single customer, even if there are multiple separate subscriptions. The aforementioned customer count metrics exclude customers acquired from Levelset and Esticom that have not yet been renewed onto standard Procore annual contracts. Remaining Levelset and Esticom legacy customers will be included in our customer metrics once they are renewed onto standard Procore annual contracts or upon integration of the sales process. TOTAL ADDRESSABLE MARKET (TAM) AND CAPTURE RATES ACV and logo estimates by region are calculated by Procore based on data from the U.S. Census Bureau and international government statistics agencies, and D&B Hoovers data. ACV capture rates reflect construction volume run by customers on Procore products as of December 31, 2022, as a percentage of the total estimated ACV in Procore’s addressable markets. Logo capture rates reflect our customer count as of December 31, 2022 as a percentage of the total estimated number of logos in Procore’s addressable markets, where the number of customers is defined as the number of entities that have entered into one or more subscriptions with us that have recurring charges for which the term has not ended as of December 31, 2022, or that which we are negotiating a subscription renewal for. Our estimates are based on latest available annual data and are limited to the following countries: Australia, Canada, France, Germany, Ireland, Italy, New Zealand, Saudi Arabia, Spain, United Arab Emirates, United Kingdom, United States. Please note that more countries are served than represented by our data. 59
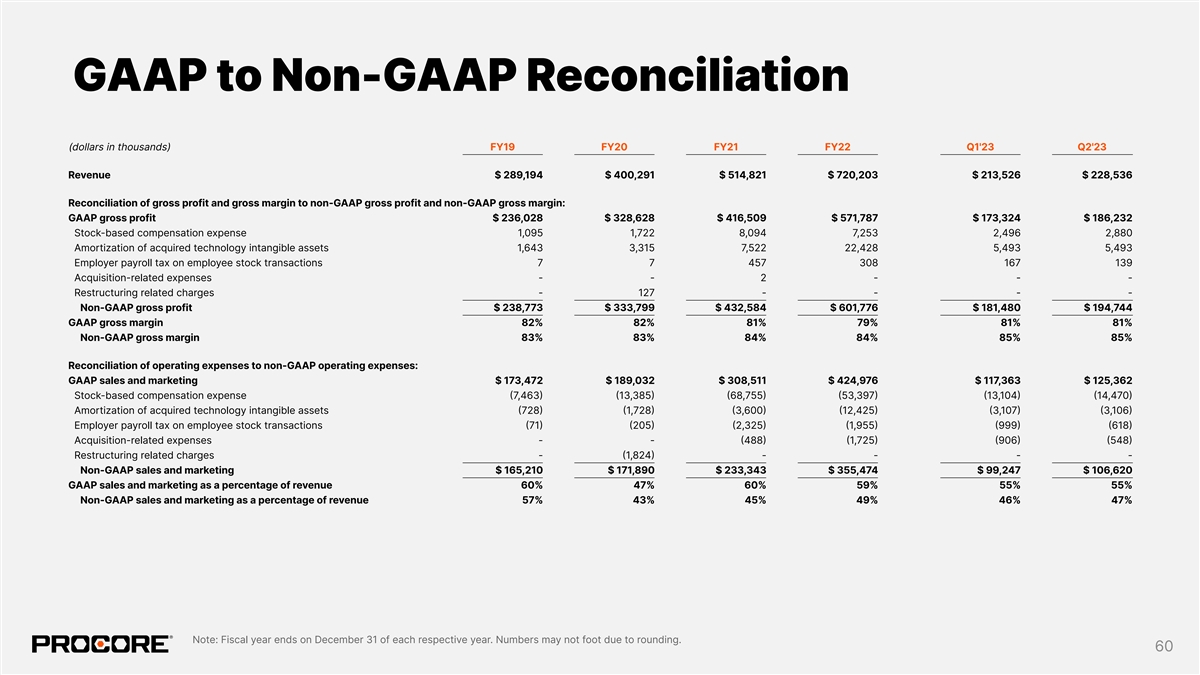
GAAP to Non-GAAP Reconciliation (dollars in thousands) FY19 FY20 FY21 FY22 Q1'23 Q2'23 Revenue $ 289,194 $ 400,291 $ 514,821 $ 720,203 $ 213,526 $ 228,536 Reconciliation of gross profit and gross margin to non-GAAP gross profit and non-GAAP gross margin: GAAP gross profit $ 236,028 $ 328,628 $ 416,509 $ 571,787 $ 173,324 $ 186,232 Stock-based compensation expense 1,095 1,722 8,094 7,253 2,496 2,880 Amortization of acquired technology intangible assets 1,643 3,315 7,522 22,428 5,493 5,493 Employer payroll tax on employee stock transactions 7 7 457 308 167 139 Acquisition-related expenses - - 2 - - - Restructuring related charges - 127 - - - - Non-GAAP gross profit $ 238,773 $ 333,799 $ 432,584 $ 601,776 $ 181,480 $ 194,744 GAAP gross margin 82% 82% 81% 79% 81% 81% Non-GAAP gross margin 83% 83% 84% 84% 85% 85% Reconciliation of operating expenses to non-GAAP operating expenses: GAAP sales and marketing $ 173,472 $ 189,032 $ 308,511 $ 424,976 $ 117,363 $ 125,362 Stock-based compensation expense (7,463) (13,385) (68,755) (53,397) (13,104) (14,470) Amortization of acquired technology intangible assets (728) (1,728) (3,600) (12,425) (3,107) (3,106) Employer payroll tax on employee stock transactions (71) (205) (2,325) (1,955) (999) (618) Acquisition-related expenses - - (488) (1,725) (906) (548) Restructuring related charges - (1,824) - - - - Non-GAAP sales and marketing $ 165,210 $ 171,890 $ 233,343 $ 355,474 $ 99,247 $ 106,620 GAAP sales and marketing as a percentage of revenue 60% 47% 60% 59% 55% 55% Non-GAAP sales and marketing as a percentage of revenue 57% 43% 45% 49% 46% 47% Note: Fiscal year ends on December 31 of each respective year. Numbers may not foot due to rounding. 60
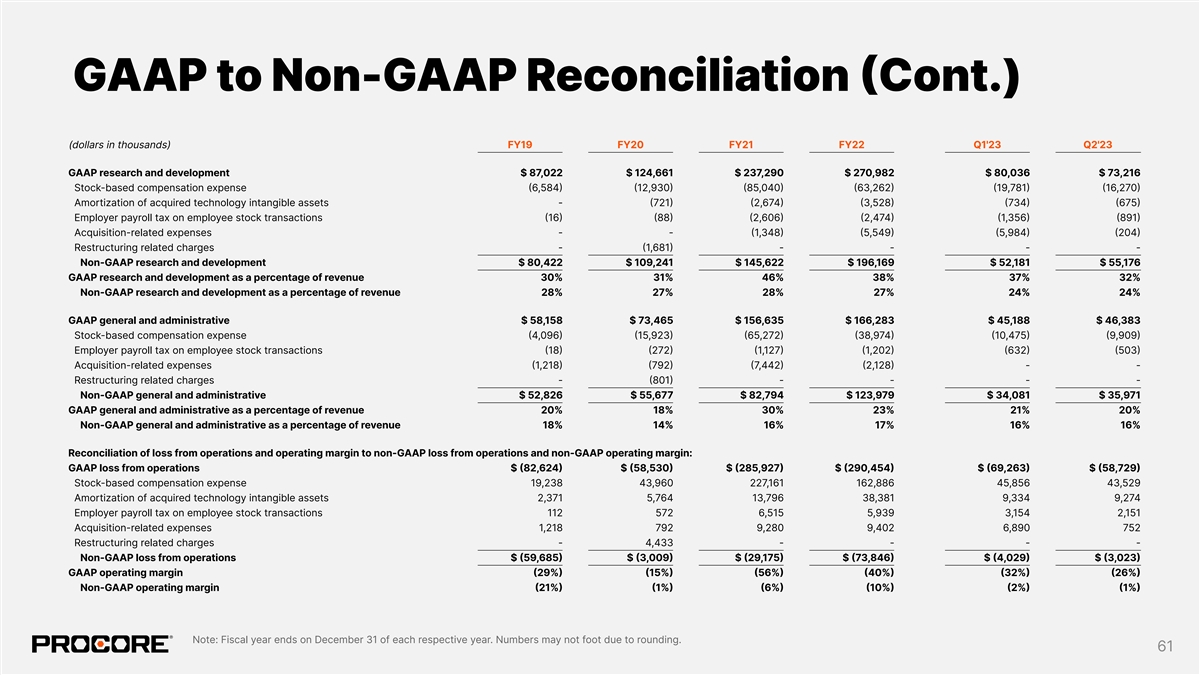
GAAP to Non-GAAP Reconciliation (Cont.) (dollars in thousands) FY19 FY20 FY21 FY22 Q1'23 Q2'23 GAAP research and development $ 87,022 $ 124,661 $ 237,290 $ 270,982 $ 80,036 $ 73,216 Stock-based compensation expense (6,584) (12,930) (85,040) (63,262) (19,781) (16,270) Amortization of acquired technology intangible assets - (721) (2,674) (3,528) (734) (675) Employer payroll tax on employee stock transactions (16) (88) (2,606) (2,474) (1,356) (891) Acquisition-related expenses - - (1,348) (5,549) (5,984) (204) Restructuring related charges - (1,681) - - - - Non-GAAP research and development $ 80,422 $ 109,241 $ 145,622 $ 196,169 $ 52,181 $ 55,176 GAAP research and development as a percentage of revenue 30% 31% 46% 38% 37% 32% Non-GAAP research and development as a percentage of revenue 28% 27% 28% 27% 24% 24% GAAP general and administrative $ 58,158 $ 73,465 $ 156,635 $ 166,283 $ 45,188 $ 46,383 Stock-based compensation expense (4,096) (15,923) (65,272) (38,974) (10,475) (9,909) Employer payroll tax on employee stock transactions (18) (272) (1,127) (1,202) (632) (503) Acquisition-related expenses (1,218) (792) (7,442) (2,128) - - Restructuring related charges - (801) - - - - Non-GAAP general and administrative $ 52,826 $ 55,677 $ 82,794 $ 123,979 $ 34,081 $ 35,971 GAAP general and administrative as a percentage of revenue 20% 18% 30% 23% 21% 20% Non-GAAP general and administrative as a percentage of revenue 18% 14% 16% 17% 16% 16% Reconciliation of loss from operations and operating margin to non-GAAP loss from operations and non-GAAP operating margin: GAAP loss from operations $ (82,624) $ (58,530) $ (285,927) $ (290,454) $ (69,263) $ (58,729) Stock-based compensation expense 19,238 43,960 227,161 162,886 45,856 43,529 Amortization of acquired technology intangible assets 2,371 5,764 13,796 38,381 9,334 9,274 Employer payroll tax on employee stock transactions 112 572 6,515 5,939 3,154 2,151 Acquisition-related expenses 1,218 792 9,280 9,402 6,890 752 Restructuring related charges - 4,433 - - - - Non-GAAP loss from operations $ (59,685) $ (3,009) $ (29,175) $ (73,846) $ (4,029) $ (3,023) GAAP operating margin (29%) (15%) (56%) (40%) (32%) (26%) Non-GAAP operating margin (21%) (1%) (6%) (10%) (2%) (1%) Note: Fiscal year ends on December 31 of each respective year. Numbers may not foot due to rounding. 61

Free Cash Flow Bridge (dollars in thousands) FY19 FY20 FY21 FY22 Q1'23 Q2'23 Revenue $ 289,194 $ 400,291 $ 514,821 $ 720,203 $ 213,526 $ 228,536 Computation of free cash flow and free cash flow margin: Net cash (used in) provided by operating activities $ (7,004) $ 21,853 $ 36,730 $ 12,608 $ 29,275 $ (11,674) Purchases of property and equipment (13,054) (7,202) (12,383) (15,782) (2,173) (2,521) Capitalized software development costs (14,936) (11,764) (15,248) (33,648) (7,951) (9,400) Non-GAAP free cash flow $ (34,994) $ 2,887 $ 9,099 $ (36,822) $ 19,151 $ (23,595) Non-GAAP free cash flow margin (12%) 1% 2% (5%) 9% (10%) Note: Fiscal year ends on December 31 of each respective year. Numbers may not foot due to rounding. 62