UNITED STATES
SECURITIES AND EXCHANGE COMMISSION
WASHINGTON, D.C. 20549
FORM 8-K
CURRENT REPORT
Pursuant to Section 13 or 15(d)
of The Securities Exchange Act of 1934
Date of Report (Date of Earliest Event Reported): September 16, 2023
Pinterest, Inc.
(Exact Name of Registrant as Specified in its Charter)
| Delaware | 001-38872 | 26-3607129 | ||
| (State or Other Jurisdiction of Incorporation) |
(Commission File Number) |
(IRS Employer Identification No.) |
651 Brannan Street
San Francisco, California 94107
(Address of principal executive offices, including zip code)
(415) 762-7100
(Registrant’s telephone number, including area code)
Not Applicable
(Former name or former address, if changed since last report)
Check the appropriate box below if the Form 8-K filing is intended to simultaneously satisfy the filing obligation of the registrant under any of the following provisions (see General Instruction A.2. below):
| ☐ | Written communications pursuant to Rule 425 under the Securities Act (17 CFR 230.425) |
| ☐ | Soliciting material pursuant to Rule 14a-12 under the Exchange Act (17 CFR 240.14a-12) |
| ☐ | Pre-commencement communications pursuant to Rule 14d-2(b) under the Exchange Act (17 CFR 240.14d-2(b)) |
| ☐ | Pre-commencement communications pursuant to Rule 13e-4(c) under the Exchange Act (17 CFR 240.13e-4(c)) |
Securities registered pursuant to Section 12(b) of the Act:
| Title of each class |
Trading Symbol |
Name of each exchange on which registered |
||
| Class A Common Stock, $0.00001 par value | PINS | New York Stock Exchange |
Indicate by check mark whether the registrant is an emerging growth company as defined in Rule 405 of the Securities Act of 1933 (§230.405 of this chapter) or Rule 12b-2 of the Securities Exchange Act of 1934 (§240.12b-2 of this chapter).
Emerging growth company ☐
If an emerging growth company, indicate by check mark if the registrant has elected not to use the extended transition period for complying with any new or revised financial accounting standards provided pursuant to Section 13(a) of the Exchange Act. ☐
| Item 5.02. | Departure of Directors or Certain Officers; Election of Directors; Appointment of Certain Officers; Compensatory Arrangements of Certain Officers. |
On September 17, 2023, Pinterest, Inc. (the “Company”) appointed Scott Schenkel to the Company’s Board of Directors (the “Board”) as a Class II director effective September 15, 2023. The Board has affirmatively determined that Mr. Schenkel is “independent” under the rules of the New York Stock Exchange and the rules and regulations of the U.S. Securities Exchange Act of 1934, as amended (the “Exchange Act”). Mr. Schenkel has also been appointed to the Company’s Audit and Risk Committee effective as of September 15, 2023.
There are no arrangements or understandings between Mr. Schenkel and any other person pursuant to which Mr. Schenkel was appointed as a director. Mr. Schenkel has no direct or indirect material interest in any transaction required to be disclosed pursuant to Item 404(a) of Regulation S-K.
Mr. Schenkel will receive compensation consistent with that received by the Company’s other non-employee directors, as described in the Company’s proxy statement on Schedule 14A for the 2023 annual meeting of stockholders, filed with the U.S. Securities and Exchange Commission on April 12, 2023.
Mr. Schenkel will enter into an indemnification agreement with the Company in the same form as entered into with other directors, which is filed as an exhibit to Amendment No. 2, filed April 8, 2019, to the Company’s Registration Statement on Form S-1 (Registration No, 333-230458).
| Item 7.01 | Regulation FD Disclosure. |
Appointment of New Director
On September 19, 2023, the Company issued a press release relating to Mr. Schenkel’s appointment. This press release is attached as Exhibit 99.1 to this Current Report on Form 8-K.
Investor Day Presentation
On September 19, 2023, the Company presented information regarding the Company’s financial performance and outlook, current Q3 2023 revenue outlook, market opportunity, long range financial model and certain other information to investors, analysts, members of the press and the general public at the Company’s Investor Day event. A copy of the presentation, which includes forward-looking statements and related risks is included with this Form 8-K for convenience and attached hereto as Exhibit 99.2.
Share Repurchase Program
On September 16, 2023, the Board authorized a stock repurchase program of up to $1 billion of its Class A common stock. Under the stock repurchase program, the Company is authorized to repurchase, from time-to-time, shares of its Class A common stock through open market purchases, in privately negotiated transactions or in such other manner as permitted by securities law and as determined by management at such time and in such amounts as management may decide. The program does not obligate the Company to repurchase any specific number of shares and may be modified, suspended or discontinued at any time. The timing, manner, price and amount of any repurchases are determined by the Company in its discretion and depend on a variety of factors, including legal requirements, price and economic and market conditions.
The information in this item 7.01 and the exhibits attached hereto shall not be deemed “filed” for purposes of Section 18 of the Exchange Act or otherwise subject to the liabilities of that section, nor shall it be deemed incorporated by reference in any filing under the Securities Act of 1933, as amended, or the Exchange Act, regardless of any general incorporation language in such filing.
Forward-Looking Statements
This Current Report on Form 8-K may contain forward-looking statements within the meaning of Section 27A of the Securities Act of 1933, as amended, and Section 21E of the Exchange Act of 1934, as amended, about us and our industry that involve substantial risks and uncertainties, including, among other things, statements about our stock repurchase program. Words such as “expects,” “anticipates,” “intends,” “plans,” “estimates,” “assumes,” “may,” “could,” “predicts,” “commitments,” and similar expressions are intended to identify forward-looking statements. These forward-looking statements are only predictions and may differ materially from actual results due to a variety of factors including: changes in macroeconomic conditions, the capital markets, and our business plans or strategies. These and other potential risks and uncertainties that could cause actual results to differ from the results predicted are more fully detailed in our Quarterly Report on Form 10-Q for the quarter year ended June 30, 2023, which is available on our investor relations website at investor.pinterestinc.com and on the Securities Exchange Commission website at www.sec.gov. All information provided in this Current Report is as of September 19, 2023. Undue reliance should not be placed on the forward-looking statements in this Current Report, which are based on information available to us on the date hereof. We undertake no duty to update this information unless required by law.
| Item 9.01 | Financial Statements and Exhibits. |
(d) Exhibits
| Exhibit Number |
Description | |
| 99.1 | Press Release dated September 19, 2023 | |
| 99.2 | Pinterest, Inc. Investor Presentation dated September 19, 2023 | |
| 104 | Cover Page Interactive Data File (embedded within the Inline XBRL document). | |
SIGNATURE
Pursuant to the requirements of the Securities Exchange Act of 1934, the registrant has duly caused this report to be signed on its behalf by the undersigned hereunto duly authorized.
| PINTEREST, INC. | ||||||
| Date: September 19, 2023 | By: | /s/ Julia Brau Donnelly |
||||
| Julia Brau Donnelly | ||||||
| Chief Financial Officer | ||||||
Exhibit 99.1
Pinterest Appoints Scott Schenkel to Board of Directors
San Francisco – September 19th, 2023 – Pinterest, Inc. (NYSE: PINS) Pinterest, Inc., today announced it has appointed Scott Schenkel, former Chief Financial Officer and Interim Chief Executive Officer of eBay, to its Board of Directors.
“Scott is recognized as one of the industry’s top financial and ecommerce experts. He’s widely respected for the operational discipline, business rigor, and financial acumen he’s brought to major global companies, notably at eBay and GE. What’s more, while at eBay, Scott oversaw its advertising investment in Pinterest and therefore brings a first-hand customer perspective to the table. Scott is an ideal fit for our Board of Directors and we’re thrilled to have him join.” – Bill Ready, CEO at Pinterest
Scott spent 13 years at eBay, including serving as Interim Chief Executive Officer, following additional finance leadership roles such as Chief Financial Officer. Prior to eBay, Scott spent nearly two decades as Chief Financial Officer of multiple business lines at General Electric. He currently serves on the Board of Directors at NetApp where he was the Audit Committee Chairman from 2019-2022, and recently transitioned to be the Talent and Compensation Committee Chair in late 2022. He also serves on the Board of Directors of Forter, the Trust Platform for digital commerce, providing accurate, real time decisions about every digital interaction. He holds a B.S. in Finance from Virginia Polytechnic Institute and State University’s Pamplin College of Business.
“Pinterest is uniquely positioned at the intersection of search, social, and commerce. I’ve long admired the high commercial intent of the Pinterest audience. Scaling how users on the platform go from discovery to purchase while increasing conversion for retailers is a tremendous opportunity for Pinterest. I’m thrilled to join the Board of Directors to help with Pinterest’s next phase of growth.” – Scott Schenkel
About Pinterest
Pinterest is the visual inspiration platform where people come to search, save, and shop the best ideas in the world for all of life’s moments. Whether it’s planning an outfit, trying a new beauty ritual, renovating a home, or discovering a new recipe, Pinterest is the best place to confidently go from inspiration to action. Headquartered in San Francisco, Pinterest launched in 2010 and has 465 million monthly active users worldwide. Available on iOS and Android, and at pinterest.com.
###
Exhibit 99.2
Pinterest Investor Day 2023 September 19, 2023
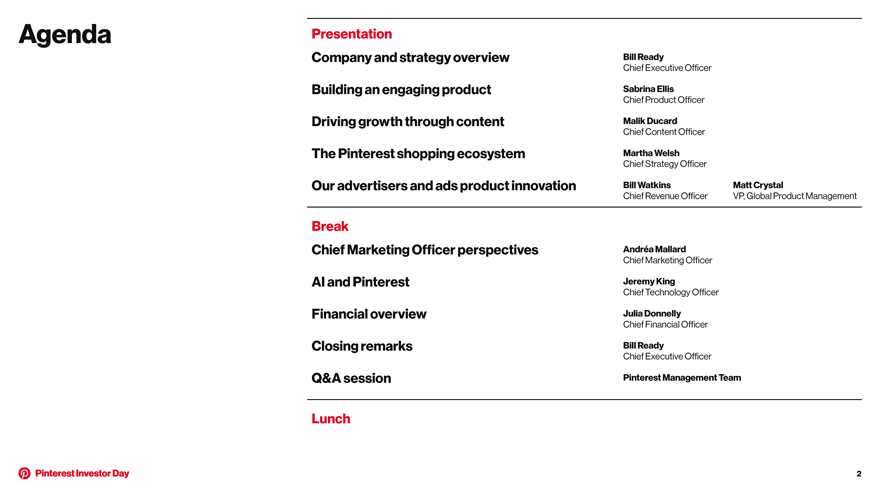
Agenda Presentation Company and strategy overview Bill Ready Chief Executive Officer Building an engaging product Sabrina Ellis Chief Product Officer Driving growth through content Malik Ducard Chief Content Officer The Pinterest shopping ecosystem Martha Welsh Chief Strategy Officer Our advertisers and ads product innovation Bill Watkins Matt Crystal Chief Revenue Officer VP, Global Product Management Break Chief Marketing Officer perspectives Andréa Mallard Chief Marketing Officer AI and Pinterest Jeremy King Chief Technology Officer Financial overview Julia Donnelly Chief Financial Officer Closing remarks Bill Ready Chief Executive Officer Q&A session Pinterest Management Team Lunch 2
Forward Looking Statements This presentation contains forward-looking statements within the meaning of Section 27A of the Securities Act of 1933, as amended, and Section 21E of the Exchange Act of 1934, as amended, about us and our industry that involve substantial risks and uncertainties, including, among other things, statements about trend analyses, future events, future operational performance, financial performance, anticipated growth and industry prospects. Words such as “believe,” “project,” “may,” “will,” “estimate,” “continue,” “anticipate,” “intend,” “expect,” “plan”, “target” and similar expressions are intended to identify forward-looking statements. These forward-looking statements are only predictions and may differ materially from actual results due to a variety of factors including: general economic and political uncertainty in global markets and a worsening of global economic conditions or low levels of economic growth, including inflation, fear of recession, foreign exchange fluctuations and supply-chain issues; our ability to provide useful and relevant content; our ability to attract and retain partners and other content creators that provide relevant and engaging content on our platform; risks associated with new products and changes to existing products as well as other new business initiatives; our ability to maintain and enhance our brand and reputation; compromises in security; our financial performance and fluctuations in operating results; our dependency on online application stores’ and internet search engines’ methodologies and policies; discontinuation, disruptions or outages in authentication by third-party login providers and changes by them that restrict our access or ability to identify users; competition; our ability to scale our business and revenue model; our reliance on advertising revenue and our ability to attract and retain advertisers and effectively measure advertising campaigns; our ability to effectively manage growth and expand and monetize our platform internationally; our lack of operating history and ability to attain and sustain profitability; decisions that reduce short-term revenue or profitability or do not produce expected long-term benefits; risks associated with government actions, laws and regulations that could restrict access to our products or impair our business; litigation and government inquiries; privacy, data and other regulatory concerns; real or perceived inaccuracies in metrics related to our business; disruption, degradation or interference with our hosting services and infrastructure; our ability to attract and retain personnel; the volatility of our stock; and the dual class structure of our common stock and its effect of concentrating voting control with stockholders who held our capital stock prior to the completion of our initial public offering. These and other potential risks and uncertainties that could cause actual results to differ from the results predicted are more fully detailed in our Quarterly Report on Form 10-Q for the fiscal quarter ended June 30, 2023, which is available on our investor relations website at investor.pinterestinc.com and on the SEC website at www.sec.gov. All information provided in this presentation is as of September 19, 2023, unless an earlier date is indicated. Undue reliance should not be placed on the forward-looking statements in this presentation, which are based on information available to us and management’s views as of the date hereof. We undertake no duty to update this information unless required by law. Non-GAAP Financial Measures To supplement our condensed consolidated financial statements, which are prepared and presented in accordance with generally accepted accounting principles in the United States (“GAAP”), we use the following non-GAAP financial measures: Adjusted EBITDA, Adjusted EBITDA margin, Adjusted Gross Margin, Free Cash Flow, and non-GAAP costs and expenses (including non-GAAP cost of revenue, research and development, sales and marketing, and general and administrative). The presentation of these financial measures is not intended to be considered in isolation, or as a substitute for, or superior to, the financial information prepared and presented in accordance with GAAP. Investors are cautioned that there are material limitations associated with the use of non-GAAP financial measures as an analytical tool. In addition, these measures may be different from non-GAAP financial measures used by other companies, limiting their usefulness for comparative purposes. We compensate for these limitations by providing specific information regarding GAAP amounts excluded from these non-GAAP financial measures. We define Adjusted EBITDA as net income (loss) adjusted to exclude depreciation and amortization expense, share-based compensation expense, interest income (expense), net, other income (expense), net, provision for (benefit from) income taxes, non-cash charitable contributions, restructuring charges and for the third quarter of 2020, a one-time payment for the termination of a future lease contract. Adjusted EBITDA margin is calculated by dividing Adjusted EBITDA by revenue. Non-GAAP costs and expenses (including non-GAAP cost of revenue, research and development, sales and marketing, and general and administrative) and non-GAAP net income exclude amortization of acquired intangible assets, share-based compensation expense, non-cash charitable contributions, restructuring charges and for the third quarter of 2020, a one-time payment for the termination of a future lease contract. Adjusted Gross Margin is calculated as revenue less non-GAAP cost of revenue as a percentage of revenue. For a reconciliation of these non-GAAP financial measures to the most directly comparable GAAP financial measures, please see the Appendix. We have not provided the forward-looking GAAP equivalents for forward-looking Adjusted Gross Margin, Adjusted EBITDA Margin and non-GAAP operating expenses or a GAAP reconciliation as a result of the uncertainty regarding, and the potential variability of, reconciling items such as share-based compensation expense, which is impacted by, among other things, employee retention and decisions around future equity grants to employees. Accordingly, a reconciliation of these non-GAAP guidance metrics to their corresponding GAAP equivalents is not available without unreasonable effort. However, it is important to note that material changes to reconciling items could have a significant effect on future GAAP results and, as such, we also believe that any reconciliations provided would imply a degree of precision that could be confusing or misleading to investors. 3
Limitation of Key Metrics The numbers for our key metrics, which include our monthly active users (MAUs) and average revenue per user (ARPU), are calculated using internal company data based on the activity of user accounts. We define a monthly active user as an authenticated Pinterest user who visits our website, opens our mobile application or interacts with Pinterest through one of our browser or site extensions, such as the Save button, at least once during the 30-day period ending on the date of measurement. The number of MAUs do not include Shuffles users unless they would otherwise qualify as MAUs. We measure monetization of our platform through our average revenue per user metric. We define ARPU as our total revenue in a given geography during a period divided by average MAUs in that geography during the period. We calculate average MAUs based on the average of the number of MAUs measured on the last day of the current period and the last day prior to the beginning of the current period. We calculate ARPU by geography based on our estimate of the geography in which revenue-generating activities occur. We use these metrics to assess the growth and health of the overall business and believe that MAUs and ARPU best reflect our ability to attract, retain, engage and monetize our users, and thereby drive revenue. While these numbers are based on what we believe to be reasonable estimates of our user base for the applicable period of measurement, there are inherent challenges in measuring usage of our products across large online and mobile populations around the world. In addition, we are continually seeking to improve our estimates of our user base, and such estimates may change due to improvements or changes in technology or our methodology. All information provided in this presentation is as of September 19, 2023. We undertake no duty to update this information unless required by law. All information provided in this presentation is unaudited. 4

Company and strategy overview
Pinterest’s mission To bring everyone the inspiration to create a life they love
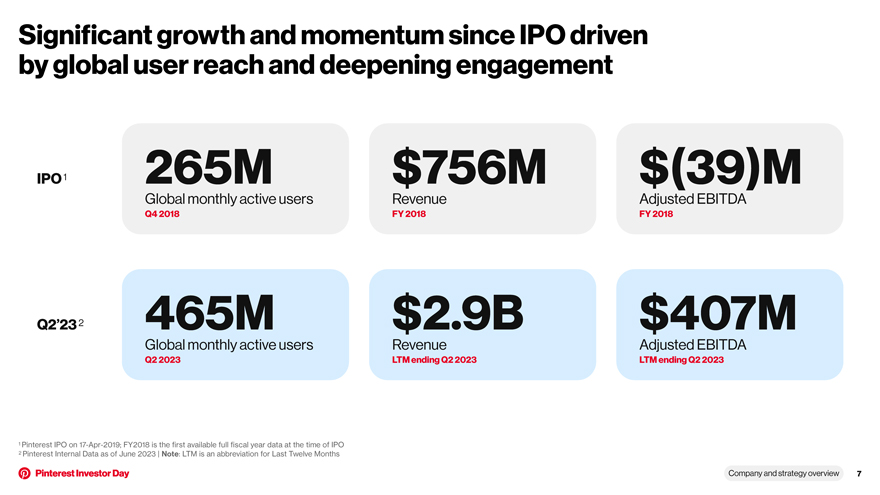
Significant growth and momentum since IPO driven by global user reach and deepening engagement IPO 1 265M $756M $(39)M Global monthly active users Revenue Adjusted EBITDA Q4 2018 FY 2018 FY 2018 Q2’23 2 465M $2.9B $407M Global monthly active users Revenue Adjusted EBITDA Q2 2023 LTM ending Q2 2023 LTM ending Q2 2023 1 Pinterest IPO on 17-Apr-2019; FY2018 is the first available full fiscal year data at the time of IPO 2 Pinterest Internal Data as of June 2023 | Note: LTM is an abbreviation for Last Twelve Months Company and strategy overview 7
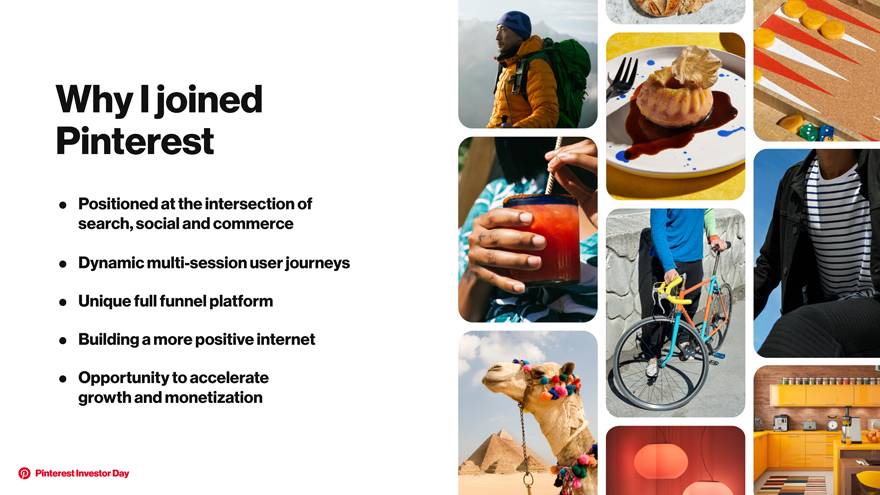
Why I joined Pinterest • Positioned at the intersection of search, social and commerce • Dynamic multi-session user journeys • Unique full funnel platform • Building a more positive internet • Opportunity to accelerate growth and monetization
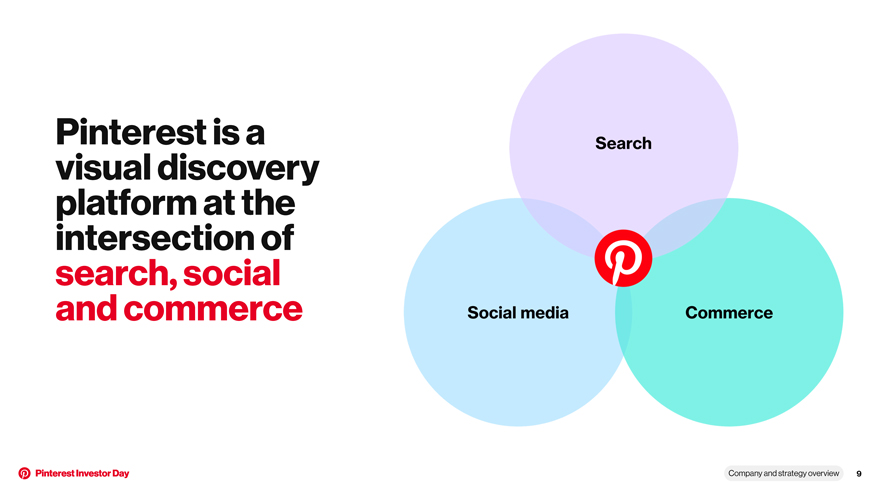
Pinterest is a visual discovery platform at the intersection of search, social and commerce Company and strategy overview 9
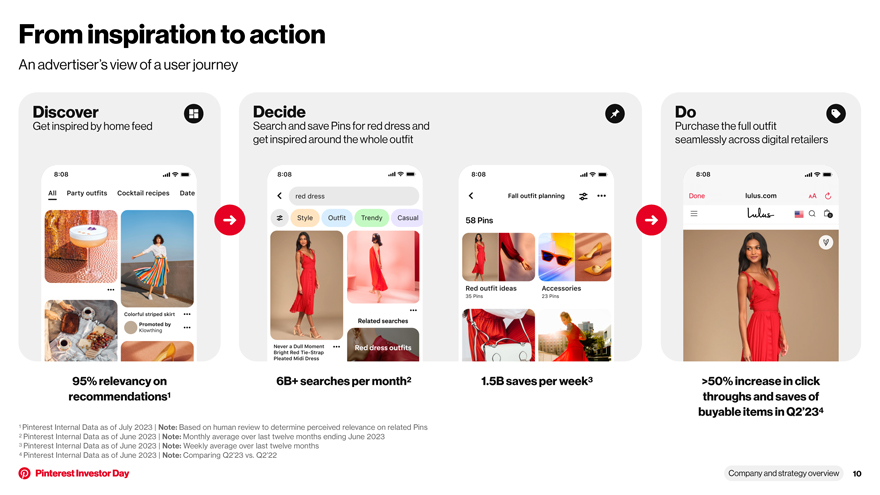
From inspiration to action An advertiser’s view of a user journey Discover Decide Do Get inspired by home feed Search and save Pins for red dress and Purchase the full outfit get inspired around the whole outfit seamlessly across digital retailers 95% relevancy on 6B+ searches per month2 1.5B saves per week3 >50% increase in click recommendations1 throughs and saves of buyable items in Q2’234 1 Pinterest Internal Data as of July 2023 | Note: Based on human review to determine perceived relevance on related Pins 2 Pinterest Internal Data as of June 2023 | Note: Monthly average over last twelve months ending June 2023 3 Pinterest Internal Data as of June 2023 | Note: Weekly average over last twelve months 4 Pinterest Internal Data as of June 2023 | Note: Comparing Q2’23 vs. Q2’22 Company and strategy overview 10
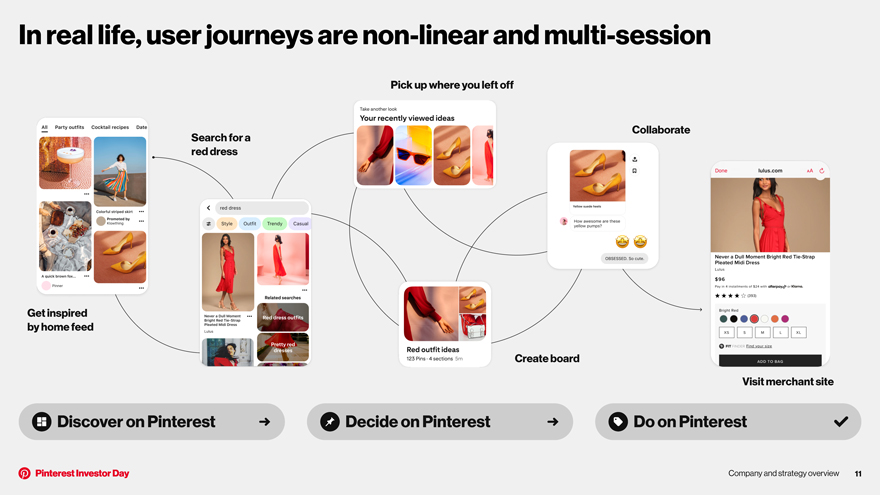
In real life, user journeys are non-linear and multi-session Pick up where you left off Collaborate Search for a red dress Get inspired by home feed Create board Visit merchant site Discover on Pinterest Decide on Pinterest Do on Pinterest Company and strategy overview 11
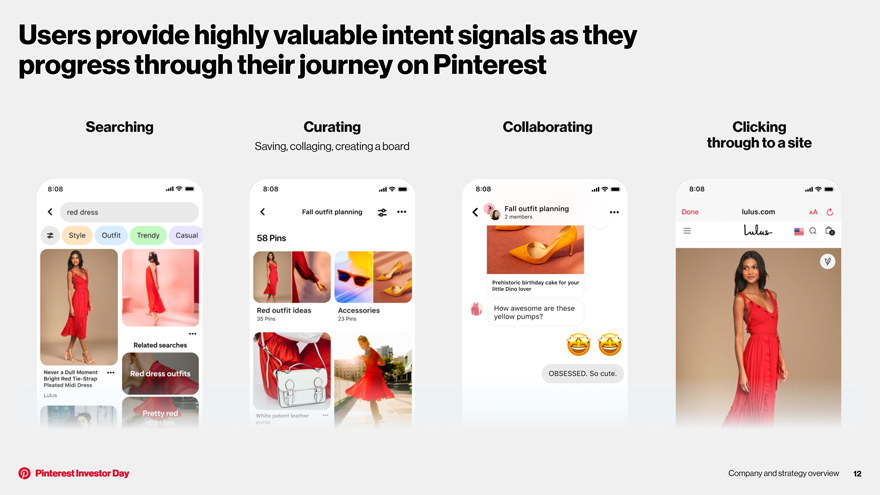
Users provide highly valuable intent signals as they progress through their journey on Pinterest Searching Curating Collaborating Clicking Saving, collaging, creating a board through to a site Company and strategy overview 12
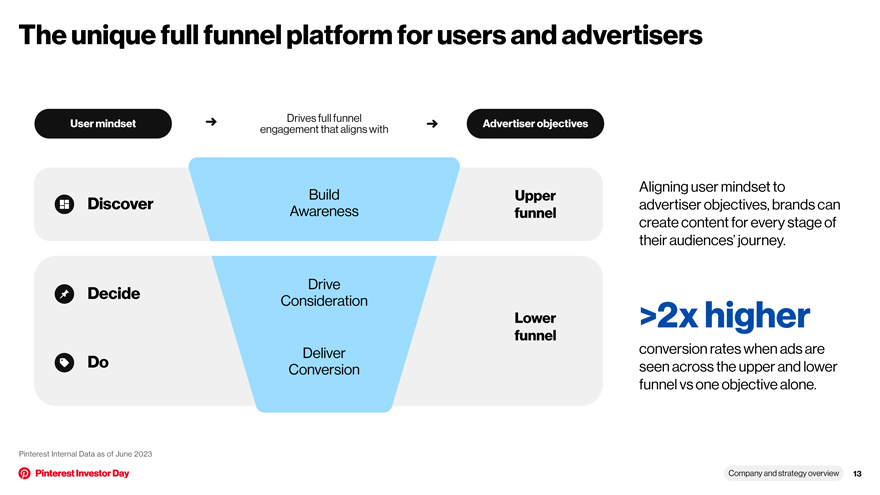
The unique full funnel platform for users and advertisers Drives full funnel User mindset Advertiser objectives engagement that aligns with Aligning user mindset to Build Upper Discover advertiser objectives, brands can Awareness funnel create content for every stage of their audiences’ journey. Drive Decide Consideration Lower >2x higher funnel conversion rates when ads are Deliver Do seen across the upper and lower Conversion funnel vs one objective alone. Pinterest Internal Data as of June 2023 Company and strategy overview 13
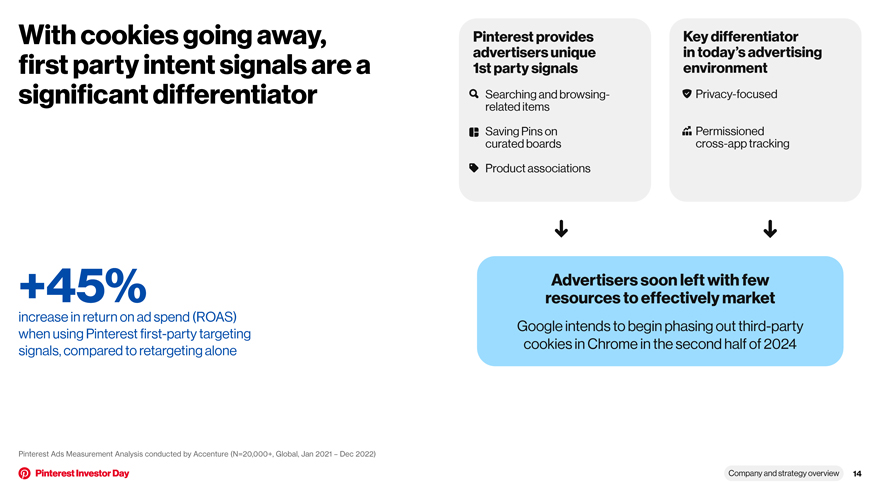
With cookies going away, Pinterest provides Key differentiator advertisers unique in today’s advertising first party intent signals are a 1st party signals environment significant differentiator Searching and browsing- Privacy-focused related items Saving Pins on Permissioned curated boards cross-app tracking Product associations +45% Advertisers soon left with few resources to effectively market increase in return on ad spend (ROAS) Google intends to begin phasing out third-party when using Pinterest first-party targeting cookies in Chrome in the second half of 2024 signals, compared to retargeting alone Pinterest Ads Measurement Analysis conducted by Accenture (N=20,000+, Global, Jan 2021 – Dec 2022) Company and strategy overview 14
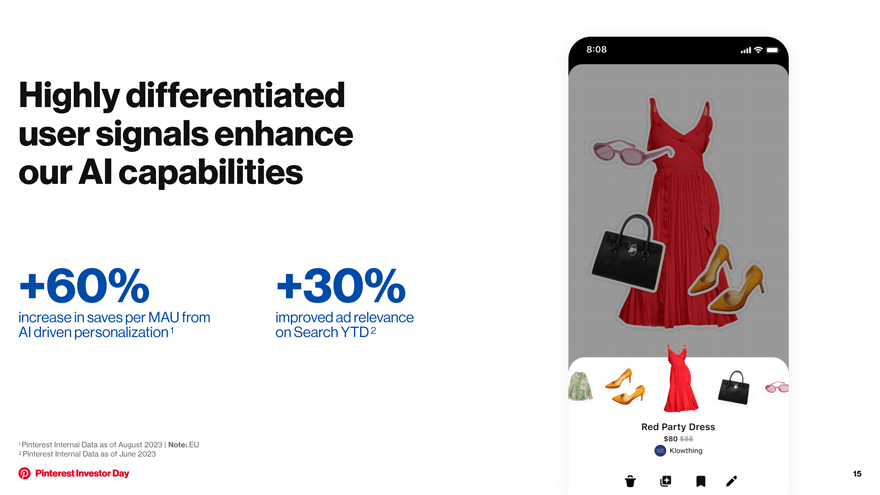
Highly differentiated user signals enhance our AI capabilities +60% +30% increase in saves per MAU from improved ad relevance AI driven personalization 1 on Search YTD 2 1 Pinterest Internal Data as of August 2023 | Note: EU 2 Pinterest Internal Data as of June 2023
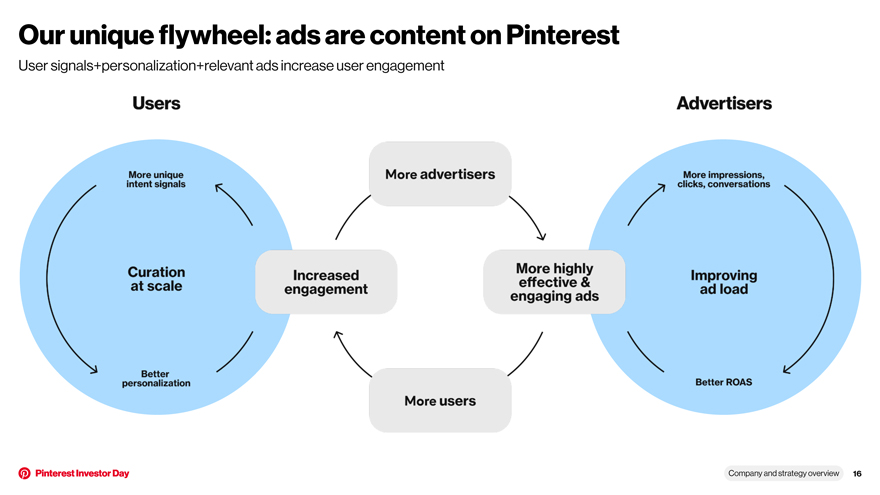
Our unique flywheel: ads are content on Pinterest User signals+personalization+relevant ads increase user engagement Company and strategy overview 16
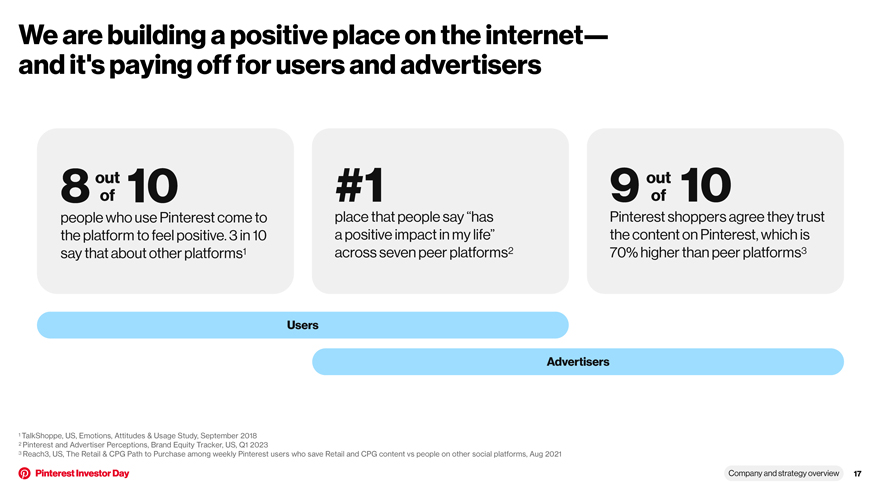
We are building a positive place on the internet— and it’s paying off for users and advertisers out out 8 of 10 #1 9 of 10 people who use Pinterest come to place that people say “has Pinterest shoppers agree they trust the platform to feel positive. 3 in 10 a positive impact in my life” the content on Pinterest, which is say that about other platforms1 across seven peer platforms2 70% higher than peer platforms3 Users Advertisers 1 TalkShoppe, US, Emotions, Attitudes & Usage Study, September 2018 2 Pinterest and Advertiser Perceptions, Brand Equity Tracker, US, Q1 2023 3 Reach3, US, The Retail & CPG Path to Purchase among weekly Pinterest users who save Retail and CPG content vs people on other social platforms, Aug 2021 Company and strategy overview 17
Our business priorities 1 Growing users and deepening engagement 2 Improving monetization per user (ARPU) 3 Driving profitable growth
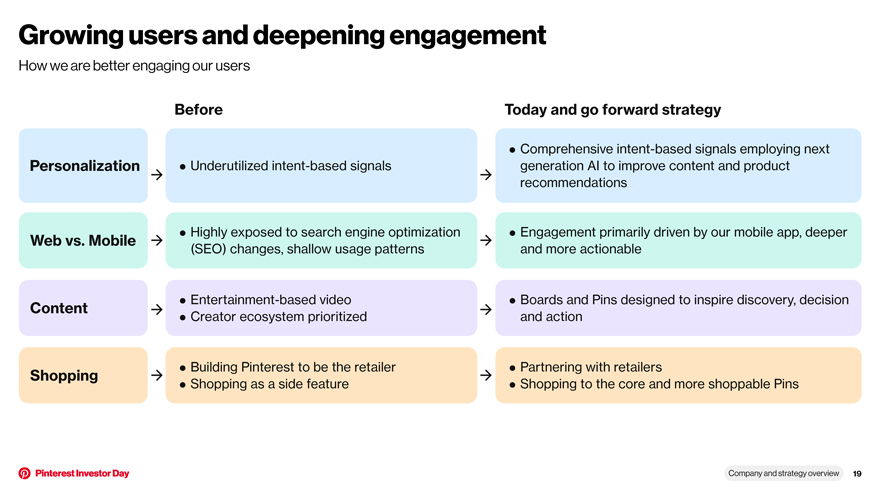
Growing users and deepening engagement How we are better engaging our users Before Today and go forward strategy • Comprehensive intent-based signals employing next Personalization • Underutilized intent-based signals generation AI to improve content and product recommendations • Highly exposed to search engine optimization • Engagement primarily driven by our mobile app, deeper Web vs. Mobile (SEO) changes, shallow usage patterns and more actionable • Entertainment-based video • Boards and Pins designed to inspire discovery, decision Content • Creator ecosystem prioritized and action • Building Pinterest to be the retailer • Partnering with retailers Shopping • Shopping as a side feature • Shopping to the core and more shoppable Pins Company and strategy overview 19
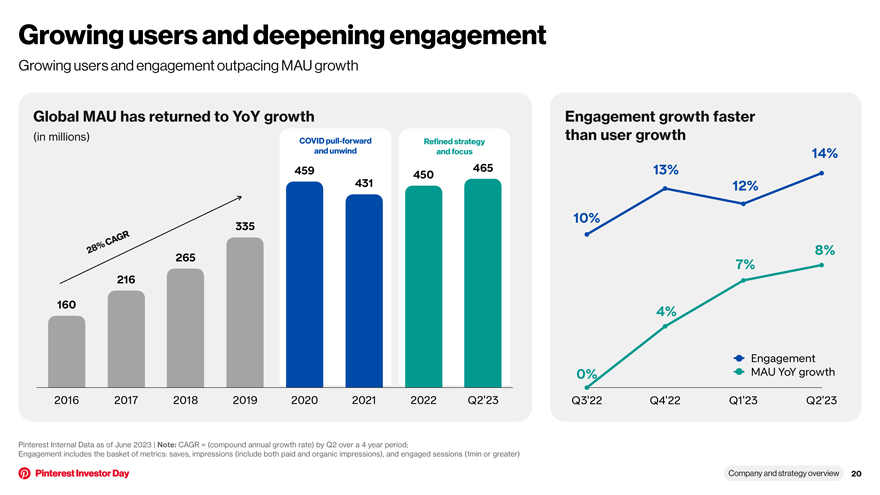
Growing users and deepening engagement Growing users and engagement outpacing MAU growth Global MAU has returned to YoY growth Engagement growth faster (in millions) COVID pull-forward than user growth Refined strategy and unwind and focus 14% 459 465 13% 450 431 12% 10% 335 A GR 28% C 8% 265 7% 216 160 4% Engagement 0% MAU YoY growth 2016 2017 2018 2019 2020 2021 2022 Q2’23 Q3’22 Q4’22 Q1’23 Q2’23 Pinterest Internal Data as of June 2023 | Note: CAGR = (compound annual growth rate) by Q2 over a 4 year period; Engagement includes the basket of metrics: saves, impressions (include both paid and organic impressions), and engaged sessions (1min or greater) Company and strategy overview 20
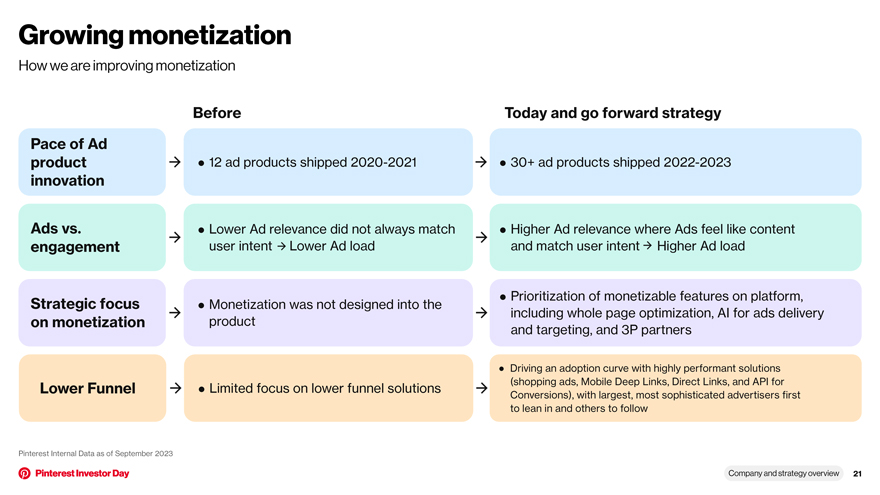
Growing monetization How we are improving monetization Before Today and go forward strategy Pace of Ad product • 12 ad products shipped 2020-2021 • 30+ ad products shipped 2022-2023 innovation Ads vs. • Lower Ad relevance did not always match • Higher Ad relevance where Ads feel like content engagement user intent Lower Ad load and match user intent Higher Ad load Strategic focus • Prioritization of monetizable features on platform, • Monetization was not designed into the including whole page optimization, AI for ads delivery on monetization product and targeting, and 3P partners • Driving an adoption curve with highly performant solutions Limited focus on lower funnel solutions (shopping ads, Mobile Deep Links, Direct Links, and API for Lower Funnel • Conversions), with largest, most sophisticated advertisers first to lean in and others to follow Pinterest Internal Data as of September 2023 Company and strategy overview 21
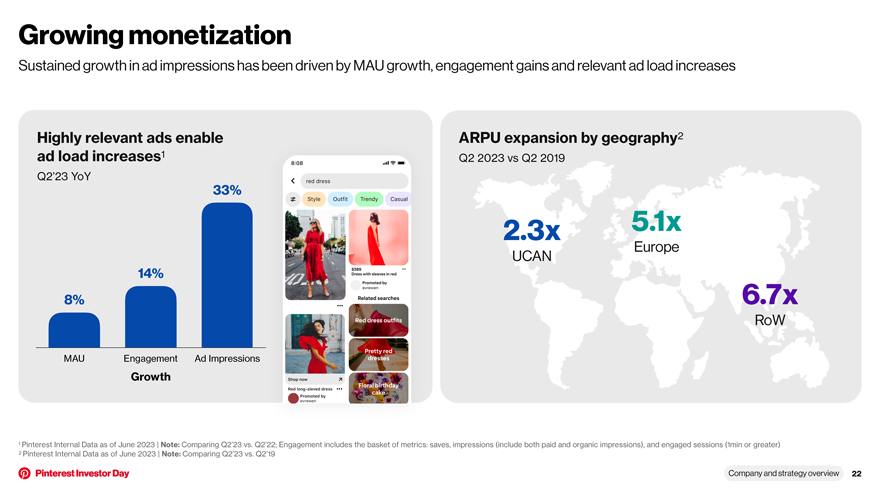
Growing monetization Sustained growth in ad impressions has been driven by MAU growth, engagement gains and relevant ad load increases Highly relevant ads enable ARPU expansion by geography2 ad load increases1 Q2 2023 vs Q2 2019 Q2’23 YoY 33% 2.3x 5.1x Europe UCAN 14% 8% 6.7x RoW MAU Engagement Ad Impressions Growth 1 Pinterest Internal Data as of June 2023 | Note: Comparing Q2’23 vs. Q2’22; Engagement includes the basket of metrics: saves, impressions (include both paid and organic impressions), and engaged sessions (1min or greater) 2 Pinterest Internal Data as of June 2023 | Note: Comparing Q2’23 vs. Q2’19 Company and strategy overview 22
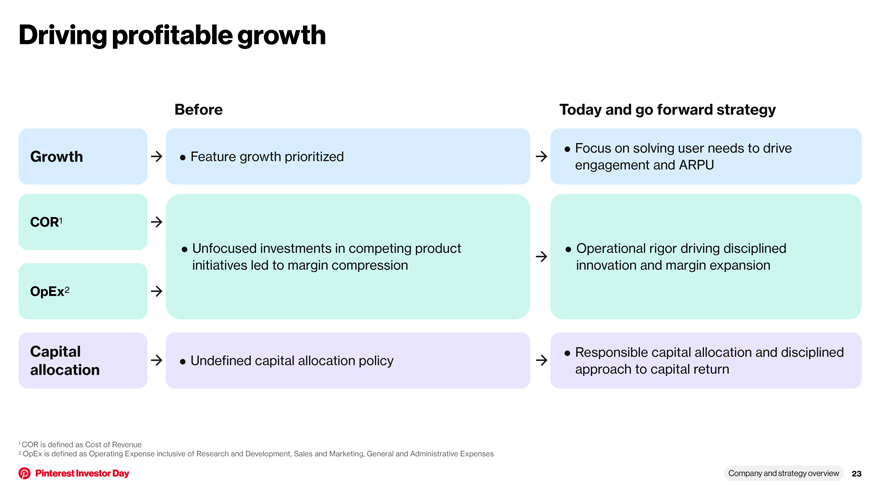
Driving profitable growth Before Today and go forward strategy • Focus on solving user needs to drive Growth • Feature growth prioritized engagement and ARPU COR1 • Unfocused investments in competing product • Operational rigor driving disciplined initiatives led to margin compression innovation and margin expansion OpEx2 Capital • Responsible capital allocation and disciplined • Undefined capital allocation policy allocation approach to capital return 1 COR is defined as Cost of Revenue 2 OpEx is defined as Operating Expense inclusive of Research and Development, Sales and Marketing, General and Administrative Expenses Company and strategy overview 23

Executing against a massive opportunity Pinterest market share (Based on 2022 revenue) $550B US & Canada: $255B UCAN Europe Europe: $111B 0.9% 0.4% Digital RoW: $183B advertising spend1 RoW Global 0.1% 0.5% $2.8B Pinterest FY2022 revenue US & Canada: $2.3B Europe: $0.4B RoW: $0.1B 1 Insider Intelligence | eMarketer | Note: Worldwide Global Digital Advertising Spend Forecast as of Q1 2023; RoW is defined as Rest of World Company and strategy overview 24
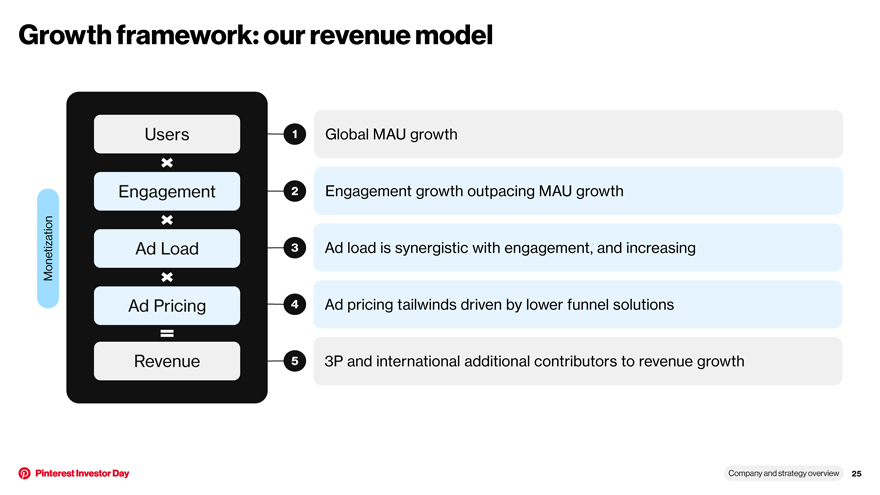
Growth framework: our revenue model Users 1 Global MAU growth Engagement 2 Engagement growth outpacing MAU growth Monetization Ad Load 3 Ad load is synergistic with engagement, and increasing Ad Pricing 4 Ad pricing tailwinds driven by lower funnel solutions Revenue 5 3P and international additional contributors to revenue growth Company and strategy overview 25
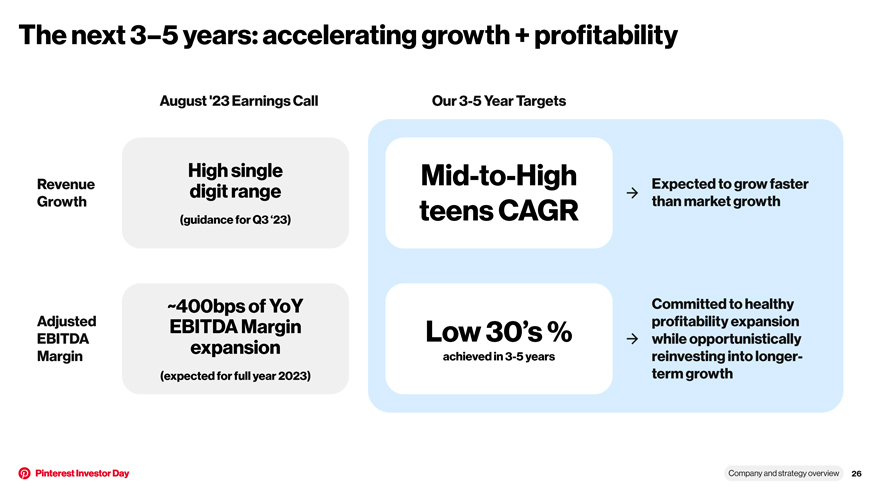
The next 3–5 years: accelerating growth + profitability August ‘23 Earnings Call Our 3-5 Year Targets High single Mid-to-High Revenue digit range Expected to grow faster Growth teens CAGR than market growth (guidance for Q3 ‘23) ~400bps of YoY Committed to healthy Adjusted EBITDA Margin Low 30’s % profitability expansion EBITDA expansion while opportunistically Margin achieved in 3-5 years reinvesting into longer- (expected for full year 2023) term growth Company and strategy overview 26
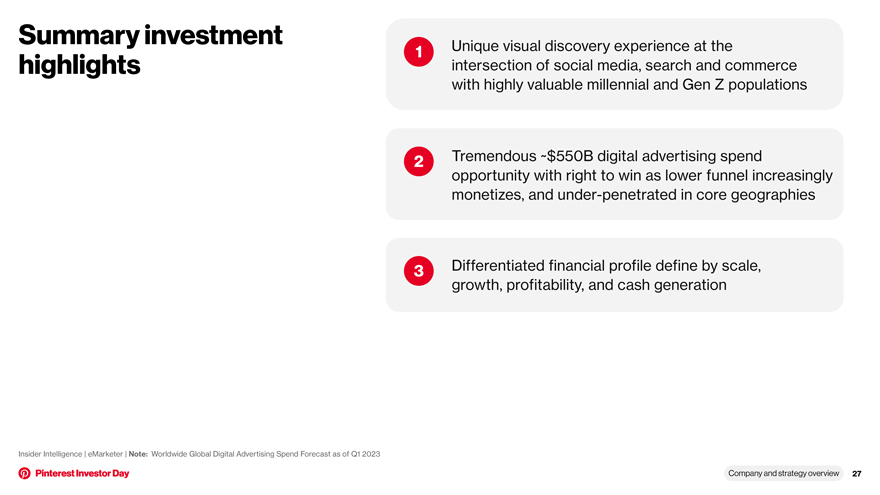
Summary investment Unique visual discovery experience at the 1 highlights intersection of social media, search and commerce with highly valuable millennial and Gen Z populations 2 Tremendous ~$550B digital advertising spend opportunity with right to win as lower funnel increasingly monetizes, and under-penetrated in core geographies 3 Differentiated financial profile define by scale, growth, profitability, and cash generation Insider Intelligence | eMarketer | Note: Worldwide Global Digital Advertising Spend Forecast as of Q1 2023 Company and strategy overview 27
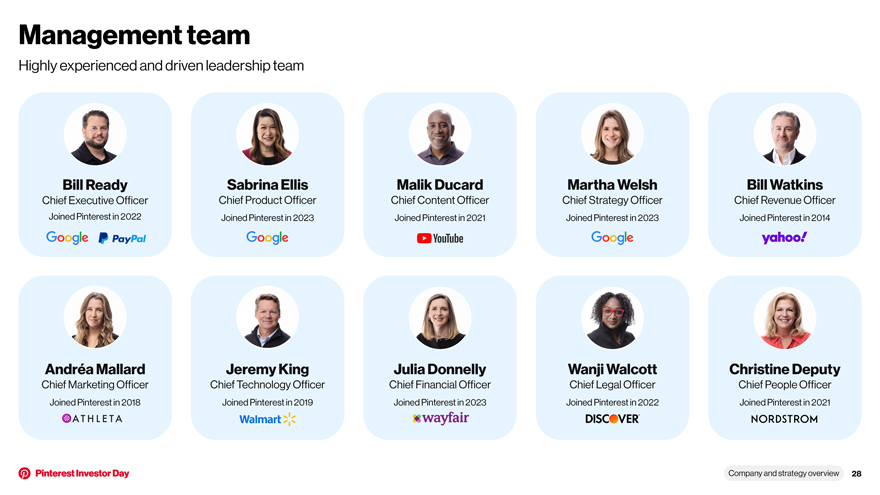
Management team Highly experienced and driven leadership team Bill Ready Sabrina Ellis Malik Ducard Martha Welsh Bill Watkins Chief Executive Officer Chief Product Officer Chief Content Officer Chief Strategy Officer Chief Revenue Officer Joined Pinterest in 2022 Joined Pinterest in 2023 Joined Pinterest in 2021 Joined Pinterest in 2023 Joined Pinterest in 2014 Andréa Mallard Jeremy King Julia Donnelly Wanji Walcott Christine Deputy Chief Marketing Officer Chief Technology Officer Chief Financial Officer Chief Legal Officer Chief People Officer Joined Pinterest in 2018 Joined Pinterest in 2019 Joined Pinterest in 2023 Joined Pinterest in 2022 Joined Pinterest in 2021 Company and strategy overview 28

Building an engaging product
Agenda 1 Meet our audience 2 Product investments driving growth Building an engaging product 30
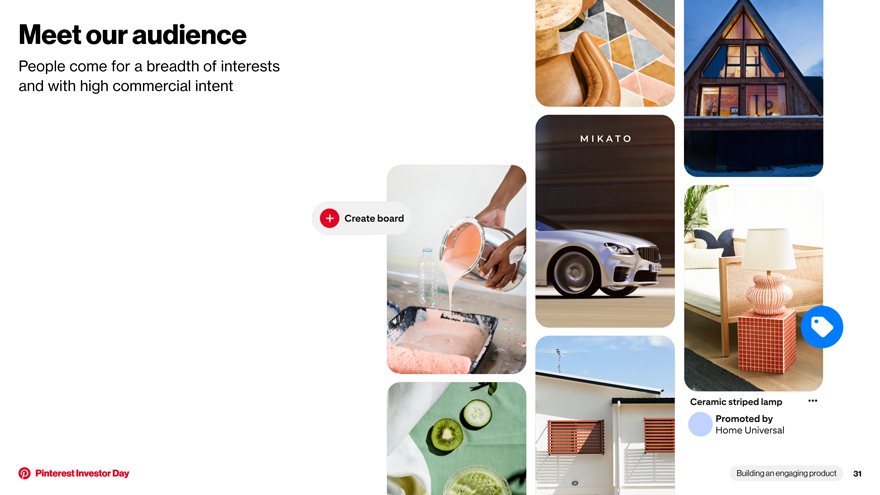
Meet our audience People come for a breadth of interests and with high commercial intent Building an engaging product 31
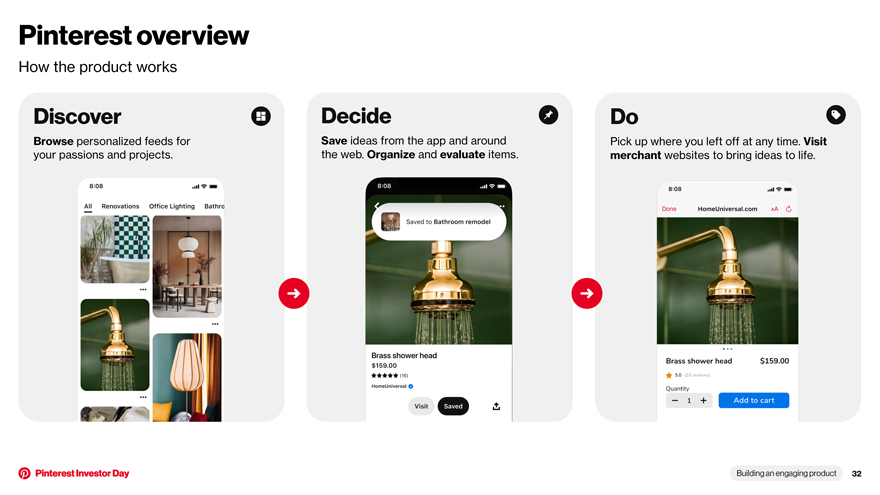
Pinterest overview How the product works Discover Decide Do Browse personalized feeds for Save ideas from the app and around Pick up where you left off at any time. Visit your passions and projects. the web. Organize and evaluate items. merchant websites to bring ideas to life. Building an engaging product 32
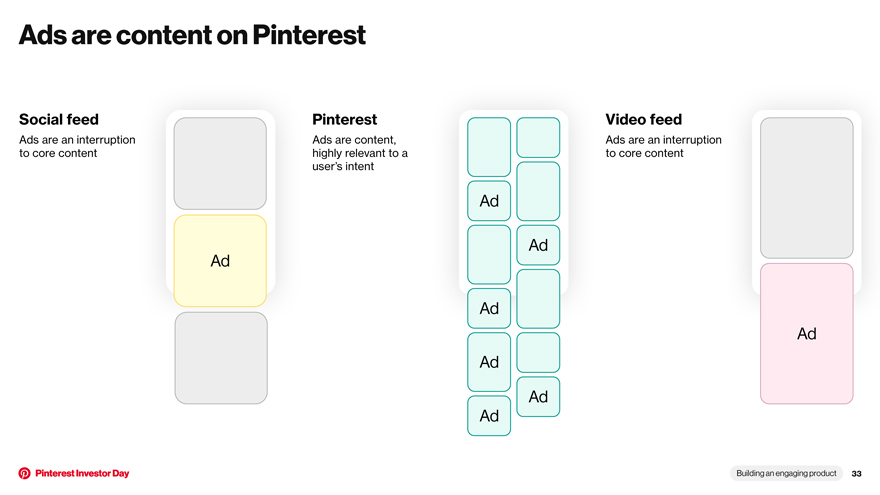
Ads are content on Pinterest Social feed Pinterest Video feed Ads are an interruption Ads are content, Ads are an interruption to core content highly relevant to a to core content user’s intent Ad Ad Ad Ad Ad Ad Ad Ad 520674-002-Part-2 18Sep23 20:25 Page 198 Building an engaging product 33
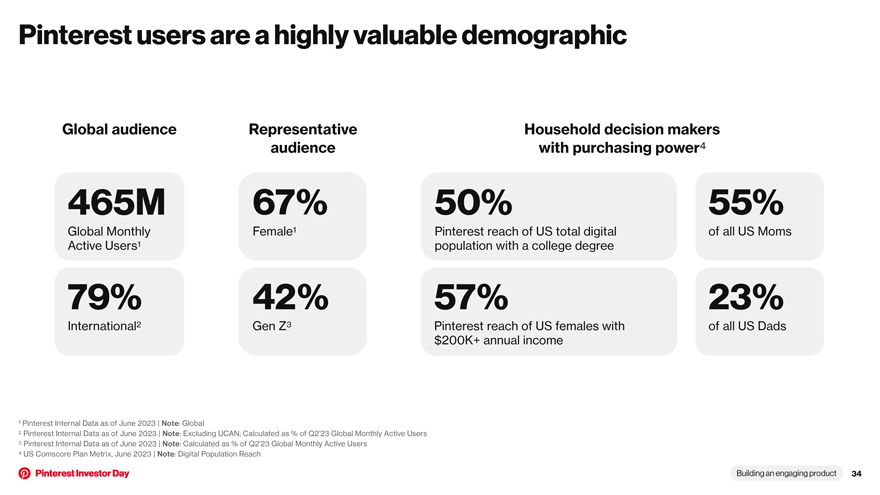
Pinterest users are a highly valuable demographic Global audience Representative Household decision makers audience with purchasing power4 465M 67% 50% 55% Global Monthly Female1 Pinterest reach of US total digital of all US Moms Active Users1 population with a college degree 79% 42% 57% 23% International2 Gen Z3 Pinterest reach of US females with of all US Dads $200K+ annual income ¹ Pinterest Internal Data as of June 2023 | Note: Global 2 Pinterest Internal Data as of June 2023 | Note: Excluding UCAN; Calculated as % of Q2’23 Global Monthly Active Users 3 Pinterest Internal Data as of June 2023 | Note: Calculated as % of Q2’23 Global Monthly Active Users 4 US Comscore Plan Metrix, June 2023 | Note: Digital Population Reach Building an engaging product 34
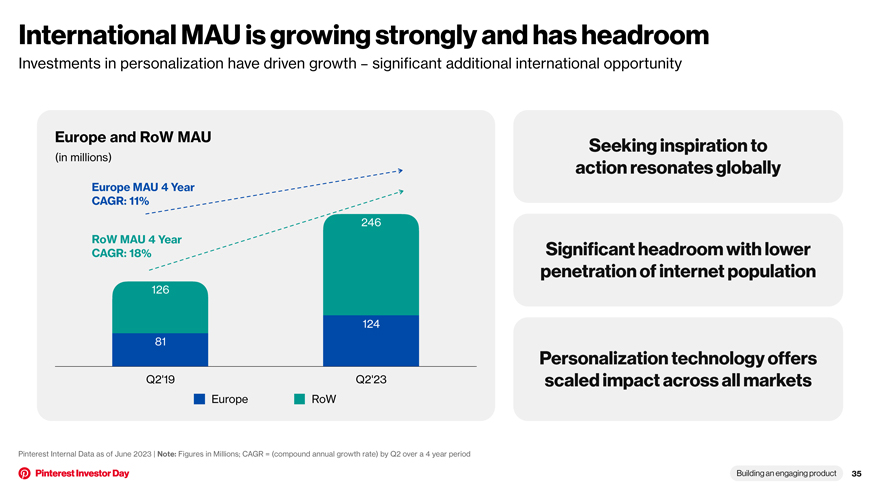
International MAU is growing strongly and has headroom Investments in personalization have driven growth – significant additional international opportunity Europe and RoW MAU Seeking inspiration to (in millions) action resonates globally Europe MAU 4 Year CAGR: 11% 246 RoW MAU 4 Year CAGR: 18% Significant headroom with lower penetration of internet population 126 124 81 Personalization technology offers Q2’19 Q2’23 scaled impact across all markets Europe RoW Pinterest Internal Data as of June 2023 | Note: Figures in Millions; CAGR = (compound annual growth rate) by Q2 over a 4 year period Building an engaging product 35
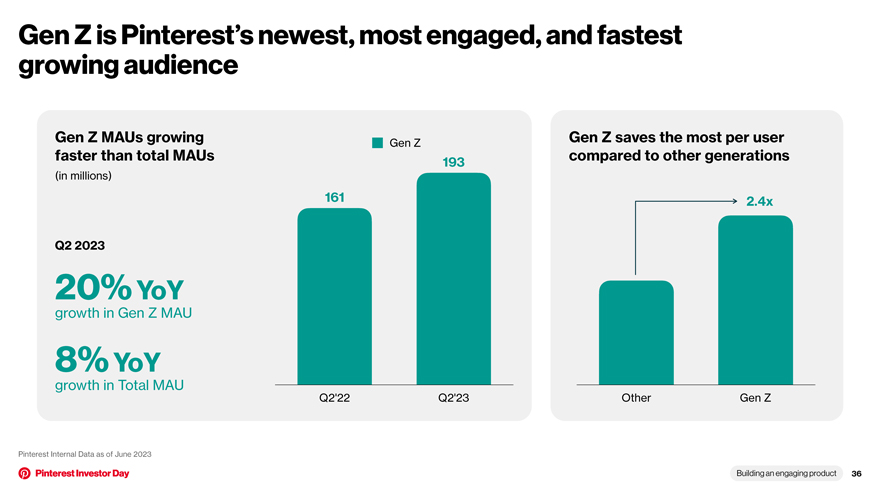
Gen Z is Pinterest’s newest, most engaged, and fastest growing audience Gen Z MAUs growing Gen Z Gen Z saves the most per user faster than total MAUs 193 compared to other generations (in millions) 161 2.4x Q2 2023 20% YoY growth in Gen Z MAU 8% YoY growth in Total MAU Q2’22 Q2’23 Other Gen Z Pinterest Internal Data as of June 2023 Building an engaging product 36
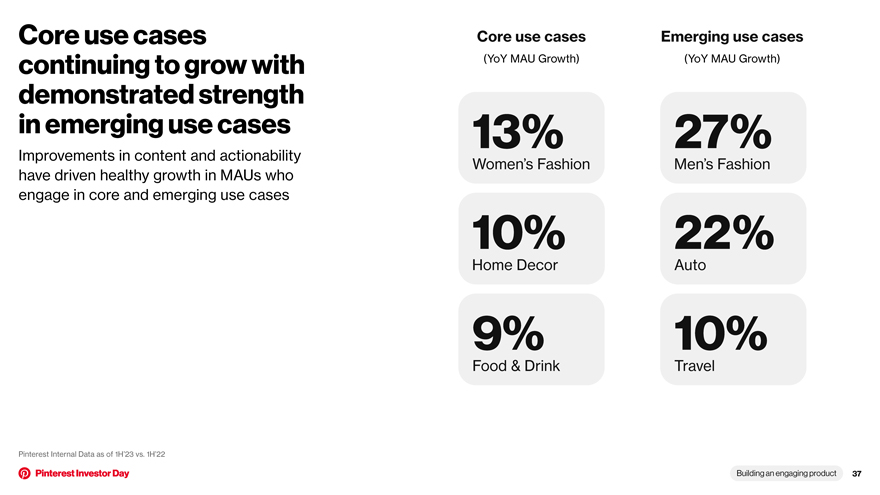
Core use cases Core use cases Emerging use cases continuing to grow with (YoY MAU Growth) (YoY MAU Growth) demonstrated strength in emerging use cases 13% 27% Improvements in content and actionability Women’s Fashion Men’s Fashion have driven healthy growth in MAUs who engage in core and emerging use cases 10% 22% Home Decor Auto 9% 10% Food & Drink Travel Pinterest Internal Data as of 1H’23 vs. 1H’22 Building an engaging product 37
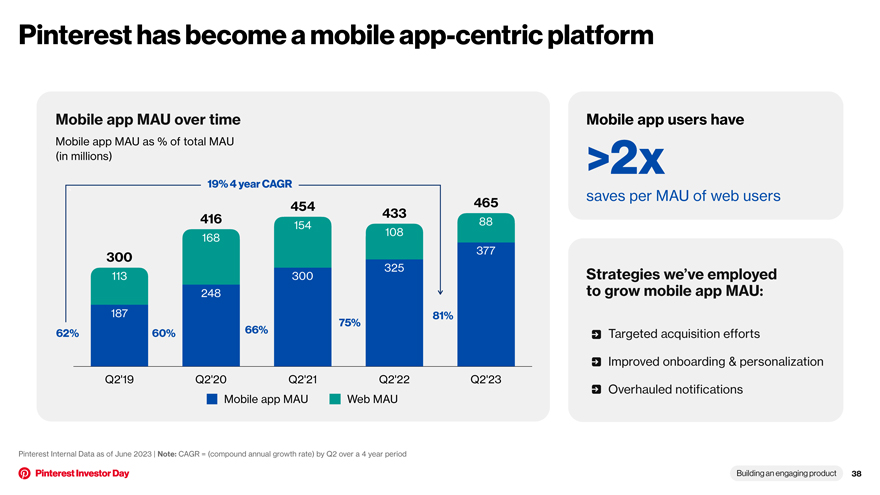
Pinterest has become a mobile app-centric platform Mobile app MAU over time Mobile app users have Mobile app MAU as % of total MAU (in millions) >2x 19% 4 year CAGR ` saves per MAU of web users 454 465 416 433 154 108 88 168 300 377 325 Strategies we’ve employed 113 300 248 to grow mobile app MAU: 187 81% 75% 62% 60% 66% Targeted acquisition efforts Improved onboarding & personalization Q2’19 Q2’20 Q2’21 Q2’22 Q2’23 Overhauled notifications Mobile app MAU Web MAU Pinterest Internal Data as of June 2023 | Note: CAGR = (compound annual growth rate) by Q2 over a 4 year period Building an engaging product 38
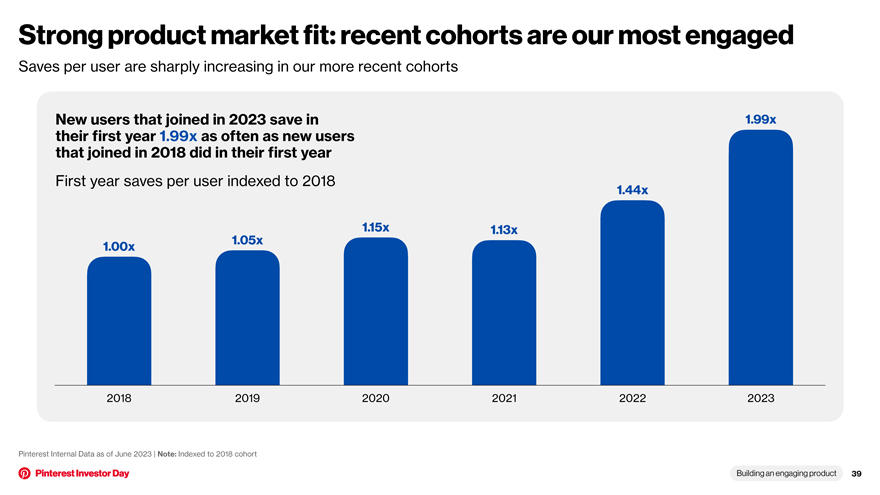
Strong product market fit: recent cohorts are our most engaged Saves per user are sharply increasing in our more recent cohorts New users that joined in 2023 save in 1.99x their first year 1.99x as often as new users that joined in 2018 did in their first year First year saves per user indexed to 2018 1.44x 1.15x 1.13x 1.05x 1.00x 2018 2019 2020 2021 2022 2023 Pinterest Internal Data as of June 2023 | Note: Indexed to 2018 cohort Building an engaging product 39
Product investments to drive growth Re-investing in Doubling down Atomization personalization on saving and Collages Building an engaging product 40
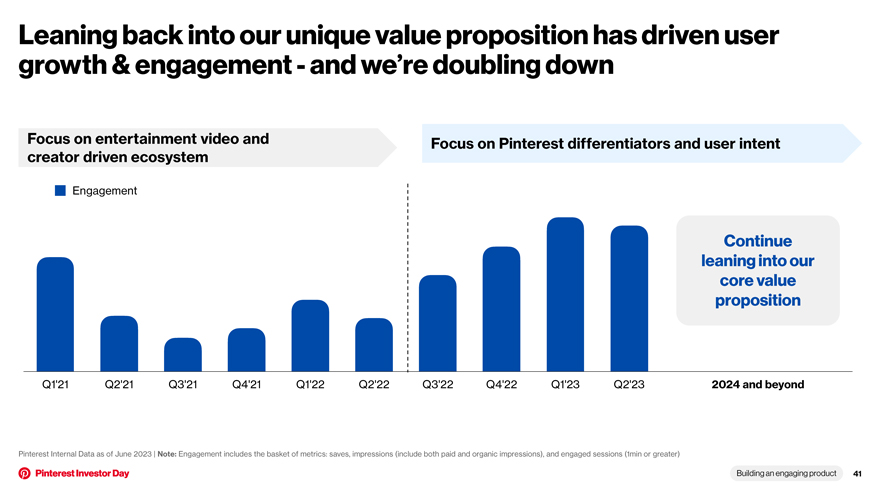
Leaning back into our unique value proposition has driven user growth & engagement—and we’re doubling down Focus on entertainment video and Focus on Pinterest differentiators and user intent creator driven ecosystem Engagement Continue leaning into our core value proposition Q1’21 Q2’21 Q3’21 Q4’21 Q1’22 Q2’22 Q3’22 Q4’22 Q1’23 Q2’23 2024 and beyond Pinterest Internal Data as of June 2023 | Note: Engagement includes the basket of metrics: saves, impressions (include both paid and organic impressions), and engaged sessions (1min or greater) Building an engaging product 41
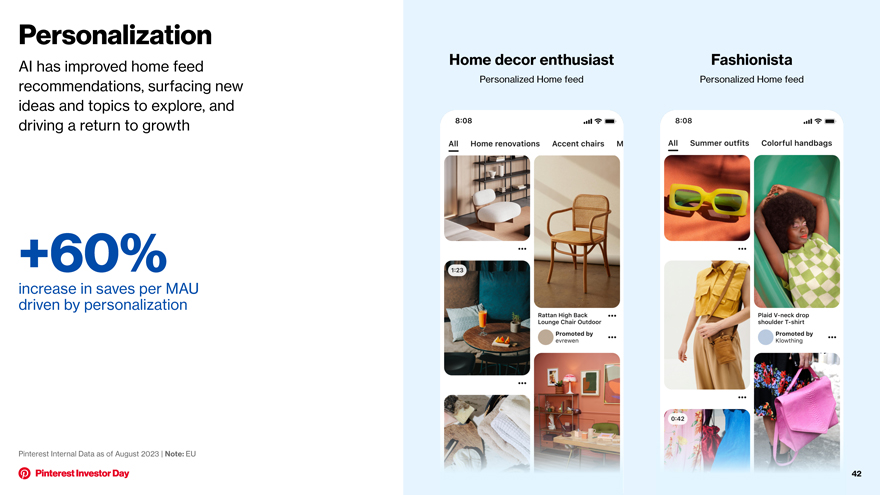
Personalization AI has improved home feed Home decor enthusiast Fashionista recommendations, surfacing new Personalized Home feed Personalized Home feed ideas and topics to explore, and driving a return to growth +60% increase in saves per MAU driven by personalization Pinterest Internal Data as of August 2023 | Note: EU 42
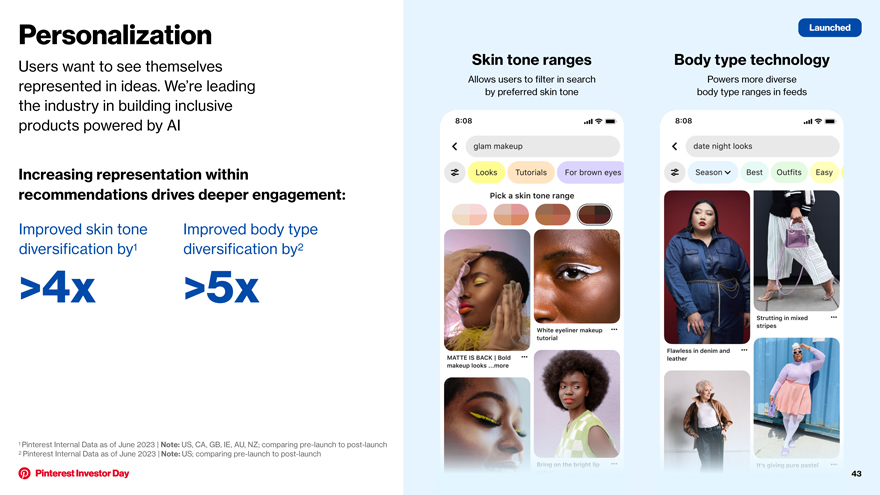
Personalization Launched Users want to see themselves Skin tone ranges Body type technology represented in ideas. We’re leading Allows users to filter in search Powers more diverse by preferred skin tone body type ranges in feeds the industry in building inclusive products powered by AI Increasing representation within recommendations drives deeper engagement: Improved skin tone Improved body type diversification by1 diversification by2 >4x >5x 1 Pinterest Internal Data as of June 2023 | Note: US, CA, GB, IE, AU, NZ; comparing pre-launch to post-launch 2 Pinterest Internal Data as of June 2023 | Note: US; comparing pre-launch to post-launch 43
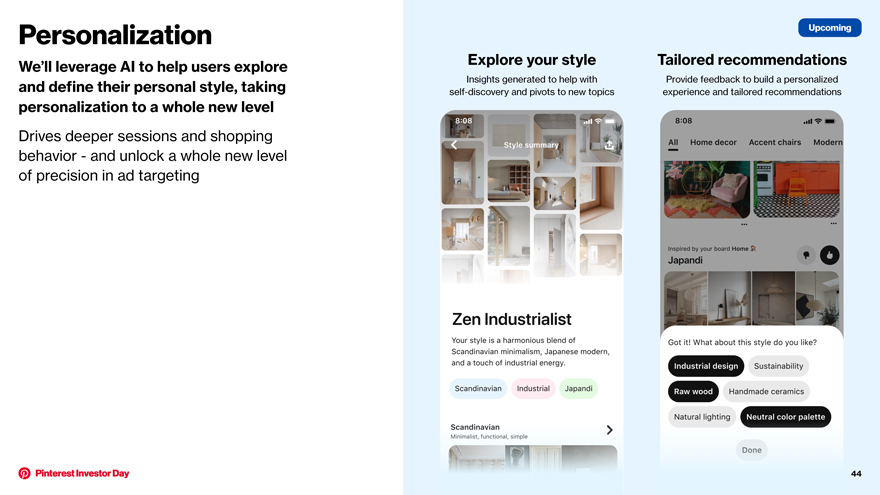
Personalization Upcoming We’ll leverage AI to help users explore Explore your style Tailored recommendations and define their personal style, taking Insights generated to help with Provide feedback to build a personalized self-discovery and pivots to new topics experience and tailored recommendations personalization to a whole new level Drives deeper sessions and shopping behavior—and unlock a whole new level of precision in ad targeting 44
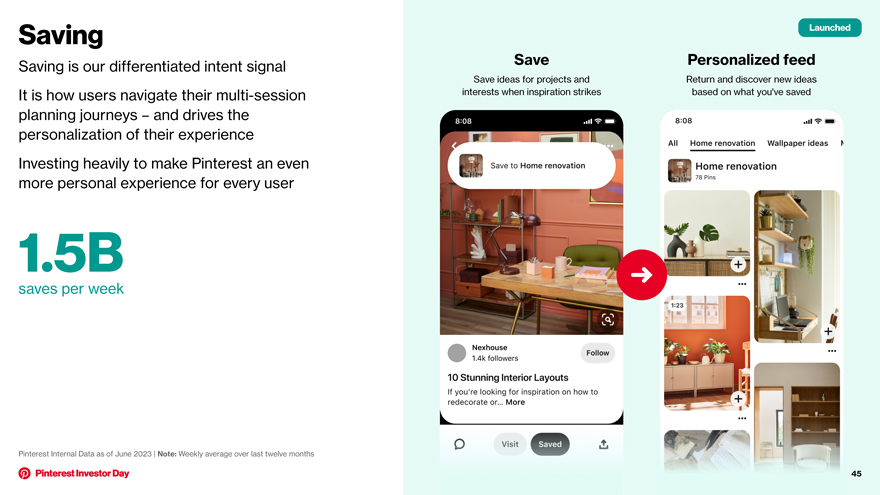
Saving Launched Saving is our differentiated intent signal Save Personalized feed Save ideas for projects and Return and discover new ideas It is how users navigate their multi-session interests when inspiration strikes based on what you’ve saved planning journeys – and drives the personalization of their experience Investing heavily to make Pinterest an even more personal experience for every user 1.5B saves per week Pinterest Internal Data as of June 2023 | Note: Weekly average over last twelve months 45
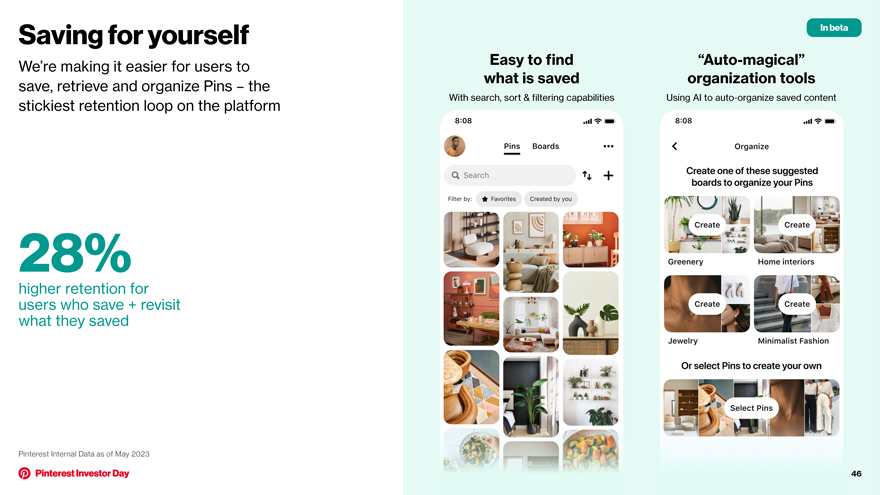
Saving for yourself In beta We’re making it easier for users to Easy to find “Auto-magical” what is saved organization tools save, retrieve and organize Pins – the With search, sort & filtering capabilities Using AI to auto-organize saved content stickiest retention loop on the platform 28% higher retention for users who save + revisit what they saved Pinterest Internal Data as of May 2023 46
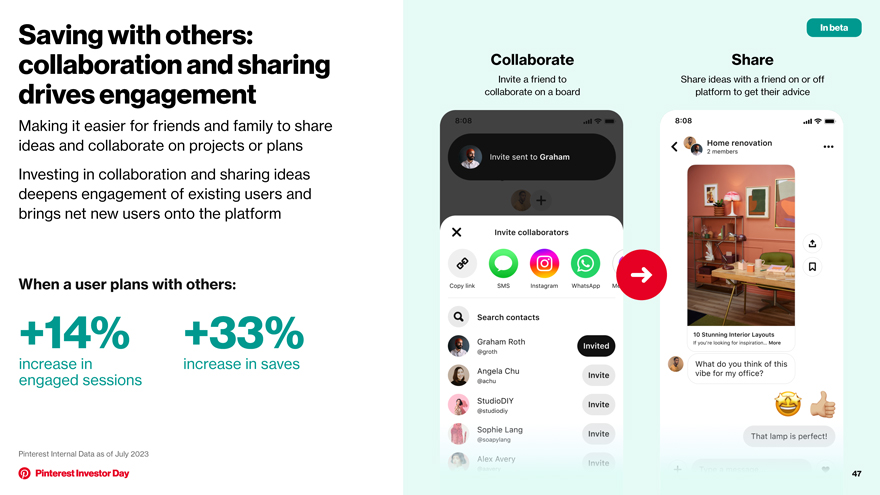
Saving with others: In beta collaboration and sharing Collaborate Share Invite a friend to Share ideas with a friend on or off drives engagement collaborate on a board platform to get their advice Making it easier for friends and family to share ideas and collaborate on projects or plans Investing in collaboration and sharing ideas deepens engagement of existing users and brings net new users onto the platform When a user plans with others: +14% +33% increase in increase in saves engaged sessions Pinterest Internal Data as of July 2023 47
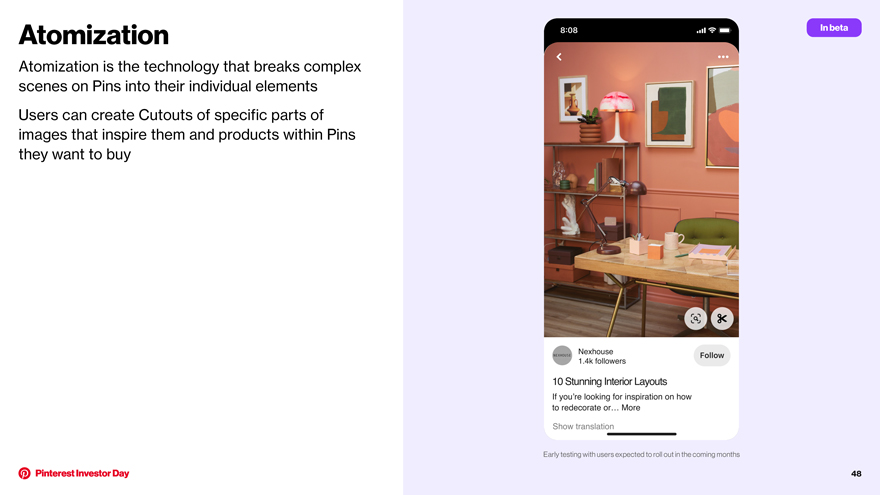
Atomization In beta Atomization is the technology that breaks complex scenes on Pins into their individual elements Users can create Cutouts of specific parts of images that inspire them and products within Pins they want to buy Early testing with users expected to roll out in the coming months 48
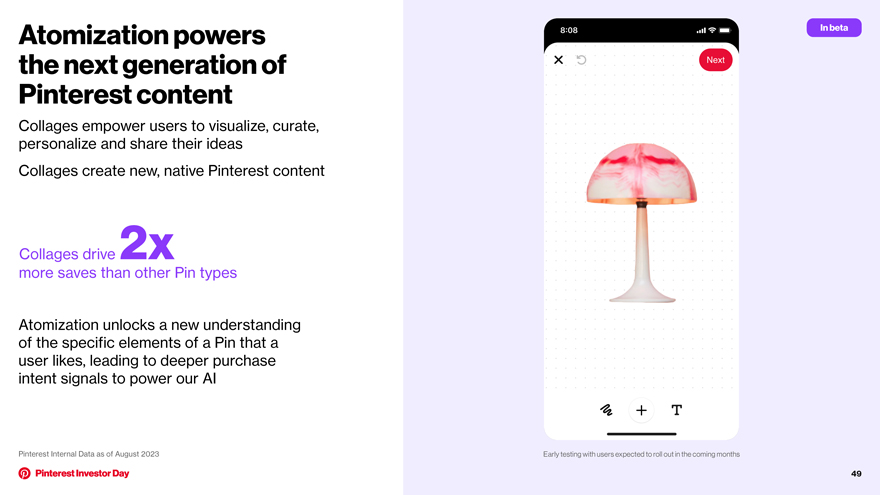
Atomization powers In beta the next generation of Pinterest content Collages empower users to visualize, curate, personalize and share their ideas Collages create new, native Pinterest content Collages drive 2x more saves than other Pin types Atomization unlocks a new understanding of the specific elements of a Pin that a user likes, leading to deeper purchase intent signals to power our AI Pinterest Internal Data as of August 2023 Early testing with users expected to roll out in the coming months 49
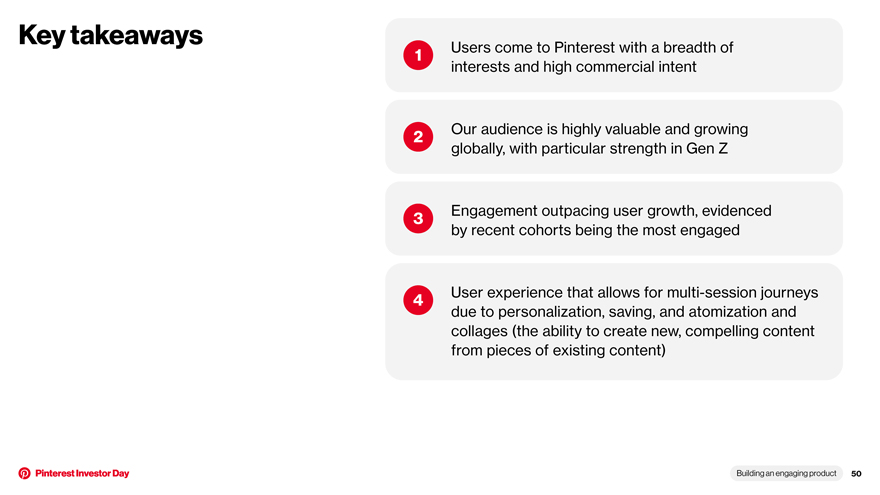
Key takeaways 1 Users come to Pinterest with a breadth of interests and high commercial intent 2 Our audience is highly valuable and growing globally, with particular strength in Gen Z 3 Engagement outpacing user growth, evidenced by recent cohorts being the most engaged 4 User experience that allows for multi-session journeys due to personalization, saving, and atomization and collages (the ability to create new, compelling content from pieces of existing content) Building an engaging product 50

Driving growth through content
Agenda 1 Diverse content across verticals and formats 2 Highly scalable content strategy 1 Content drives engagement Driving growth through content 52
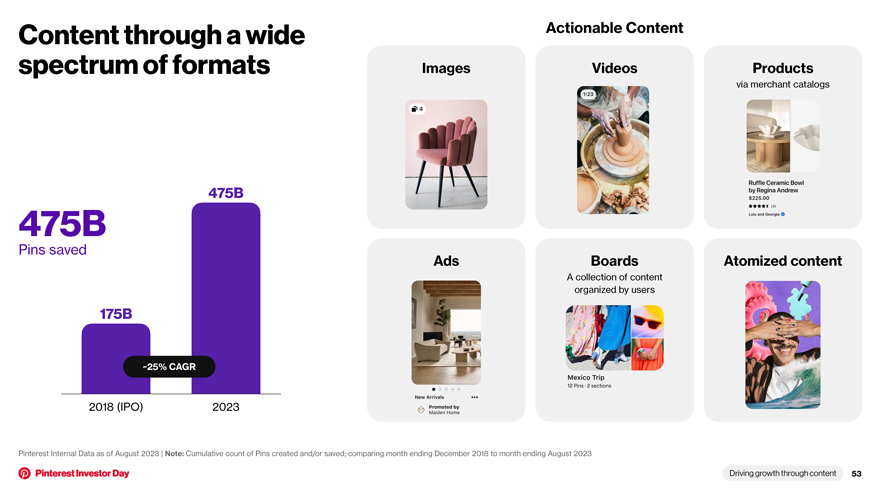
Content through a wide Actionable Content spectrum of formats Images Videos Products via merchant catalogs 475B 475B Pins saved Ads Boards Atomized content A collection of content organized by users 175B ~25% CAGR 2018 (IPO) 2023 Pinterest Internal Data as of August 2023 | Note: Cumulative count of Pins created and/or saved; comparing month ending December 2018 to month ending August 2023 Driving growth through content 53
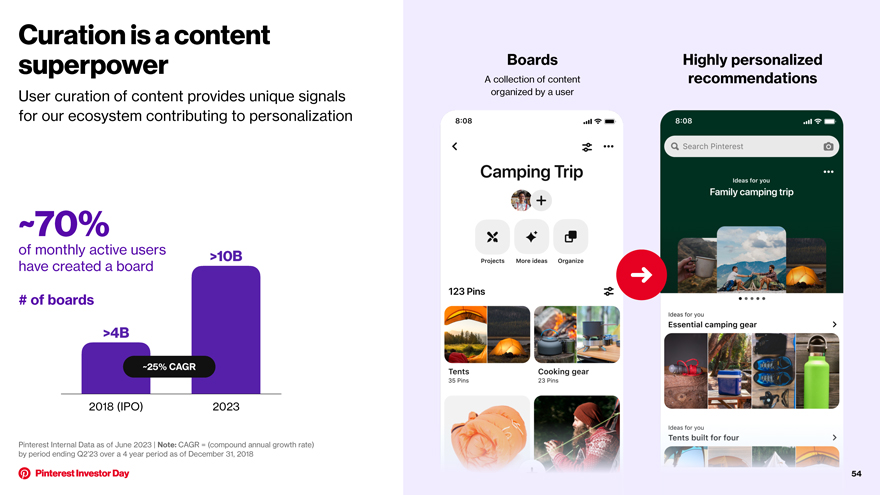
Curation is a content superpower Boards Highly personalized A collection of content recommendations User curation of content provides unique signals organized by a user for our ecosystem contributing to personalization ~70% of monthly active users >10B have created a board # of boards >4B ~25% CAGR 2018 (IPO) 2023 Pinterest Internal Data as of June 2023 | Note: CAGR = (compound annual growth rate) by period ending Q2’23 over a 4 year period as of December 31, 2018 54
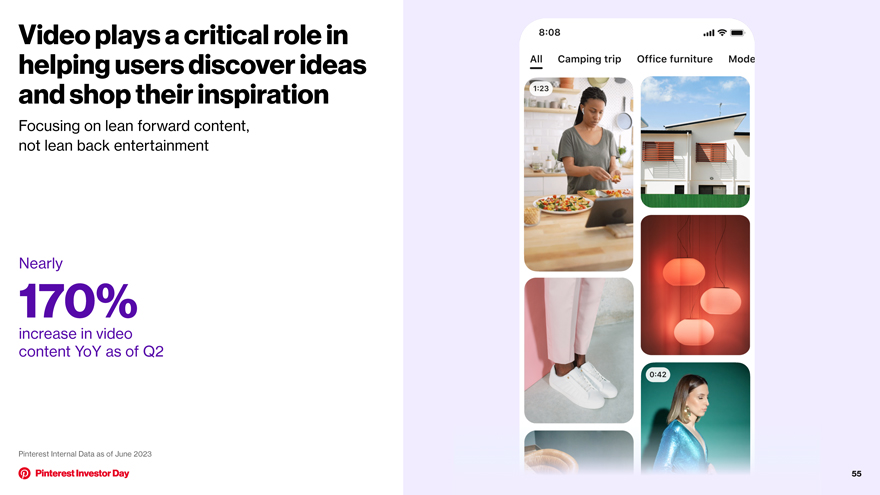
Video plays a critical role in helping users discover ideas and shop their inspiration Focusing on lean forward content, not lean back entertainment Nearly 170% increase in video content YoY as of Q2 Pinterest Internal Data as of June 2023 55
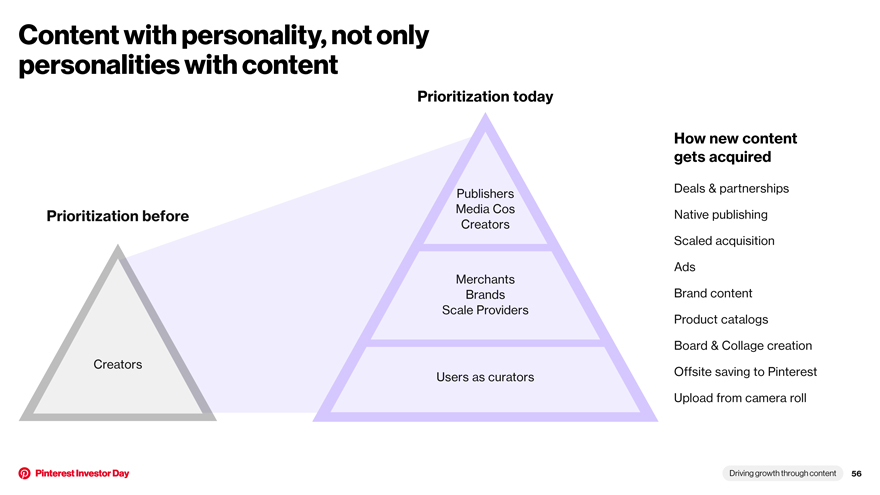
Content with personality, not only personalities with content Prioritization today How new content gets acquired Publishers Deals & partnerships Prioritization before Media Cos Native publishing Creators Scaled acquisition Ads Merchants Brands Brand content Scale Providers Product catalogs Board & Collage creation Creators Users as curators Offsite saving to Pinterest Upload from camera roll Driving growth through content 56
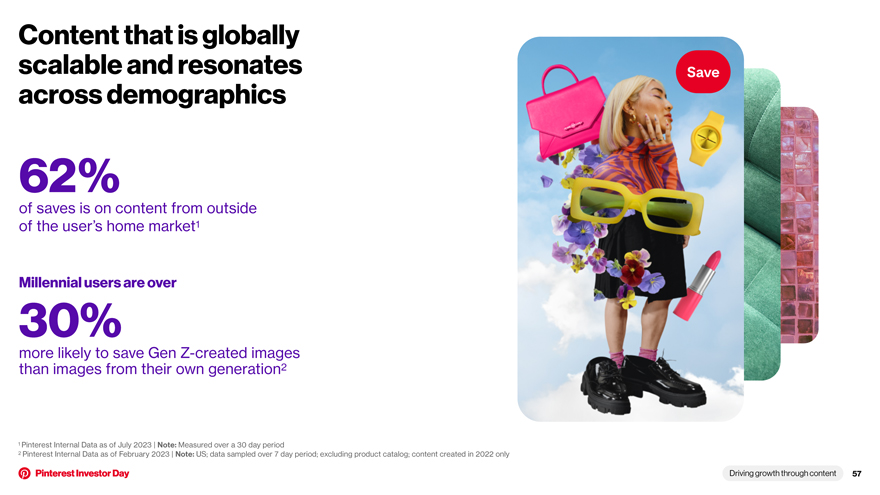
Content that is globally scalable and resonates across demographics 62% of saves is on content from outside of the user’s home market1 Millennial users are over 30% more likely to save Gen Z-created images than images from their own generation2 1 Pinterest Internal Data as of July 2023 | Note: Measured over a 30 day period 2 Pinterest Internal Data as of February 2023 | Note: US; data sampled over 7 day period; excluding product catalog; content created in 2022 only Driving growth through content 57
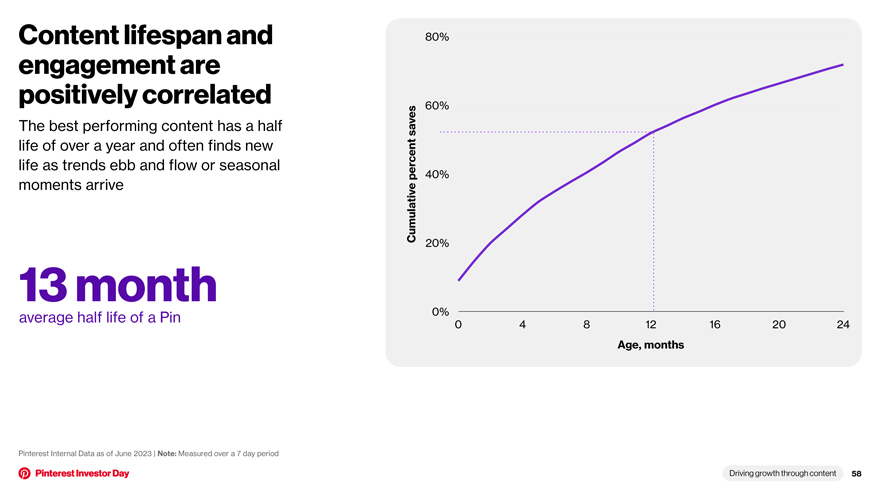
Content lifespan and 80% engagement are positively correlated 60% The best performing content has a half saves life of over a year and often finds new life as trends ebb and flow or seasonal percent 40% moments arrive Cumulative 20% 13 month average half life of a Pin 0% 0 4 8 12 16 20 24 Age, months Pinterest Internal Data as of June 2023 | Note: Measured over a 7 day period Driving growth through content 58
Key takeaways 1 Content Users come across t Pinteres a wide spectrum with a breadth of formats f is vital to interests our engagement and high commercial proposition, intent including curation which creates a completely unique form of content on Pinterest 2 We are growing globally scalable and evergreen content through an increasingly diverse set of suppliers 3 Content strategy success leads to greater engagement across Pinterest Driving growth through content 59
The Pinterest shopping ecosystem
Agenda 1 Introduction to our shopping experience 2 Our shopping strategy: historical and future 3 Shopping and ads are highly synergistic The Pinterest shopping ecosystem 61

Users come to Pinterest active shopping intent +50% of users think of Pinterest as a place to shop today1 96% of searches are unbranded2 1 Pinterest Internal Data as of June 2023 | Note: In-app survey results 2 Pinterest Internal Data as of June 2023 | Note: US; calculated as % of the top 1000 mos 62
Integrated shopping into core experiences We fundamentally shifted our shopping strategy a year ago From being the retailer to partnering with retailers The Pinterest shopping ecosystem 63
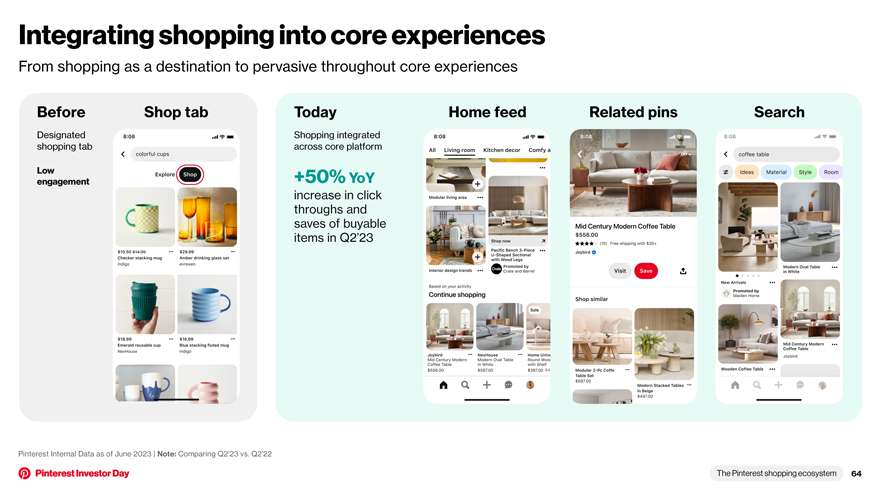
Integrating shopping into core experiences From shopping as a destination to pervasive throughout core experiences Before Shop tab Today Home feed Related pins Search Designated Shopping integrated shopping tab across core platform Low +50% YoY engagement increase in click throughs and saves of buyable items in Q2’23 Pinterest Internal Data as of June 2023 | Note: Comparing Q2’23 vs. Q2’22 The Pinterest shopping ecosystem 64
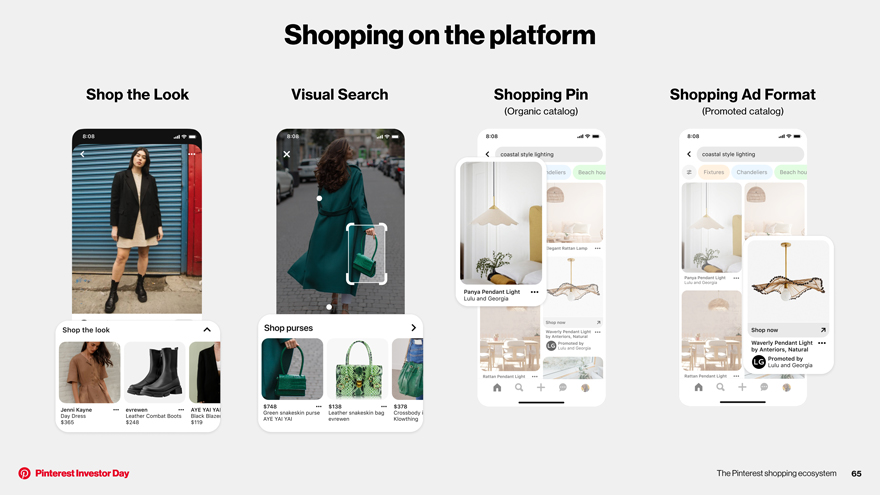
Shopping on the platform Shop the Look Visual Search Shopping Pin Shopping Ad Format (Organic catalog) (Promoted catalog) The Pinterest shopping ecosystem 65
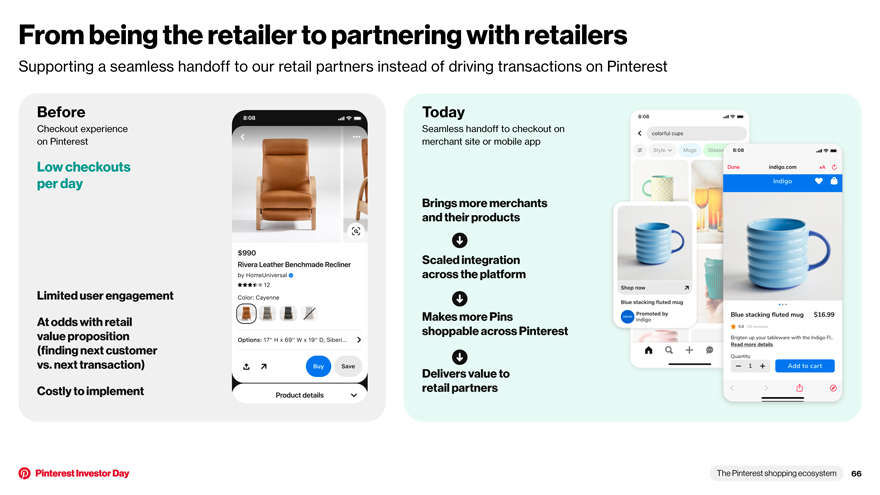
From being the retailer to partnering with retailers Supporting a seamless handoff to our retail partners instead of driving transactions on Pinterest Before Today Checkout experience Seamless handoff to checkout on on Pinterest merchant site or mobile app Low checkouts per day Brings more merchants and their products Scaled integration across the platform Limited user engagement At odds with retail Makes more Pins value proposition shoppable across Pinterest (finding next customer vs. next transaction) Delivers value to Costly to implement retail partners The Pinterest shopping ecosystem 66
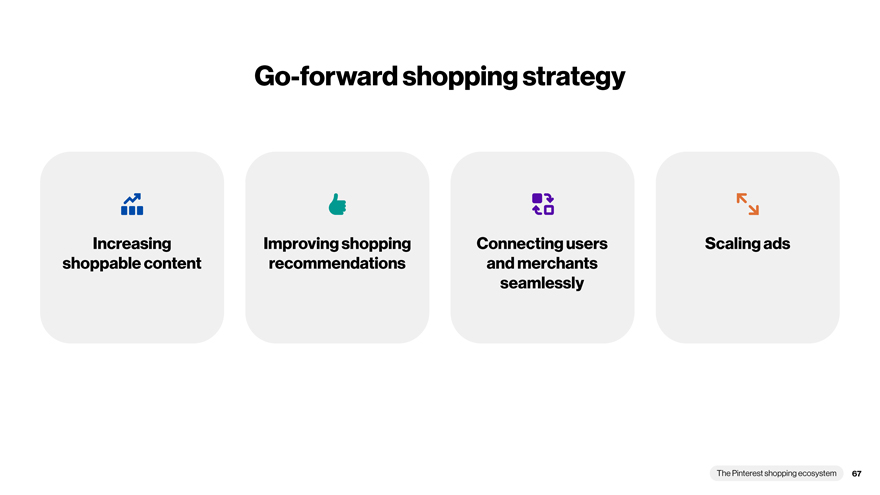
Go-forward shopping strategy Increasing Improving shopping Connecting users Scaling ads shoppable content recommendations and merchants seamlessly The Pinterest shopping ecosystem 67
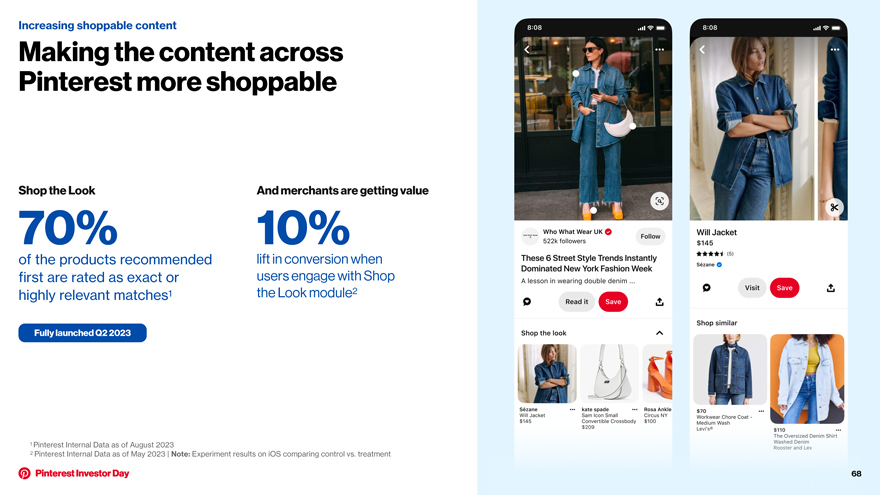
Increasing shoppable content Making the content across Pinterest more shoppable Shop the Look And merchants are getting value 70% 10% of the products recommended lift in conversion when first are rated as exact or users engage with Shop highly relevant matches1 the Look module2 Fully launched Q2 2023 1 Pinterest Internal Data as of August 2023 2 Pinterest Internal Data as of May 2023 | Note: Experiment results on iOS comparing control vs. treatment 68
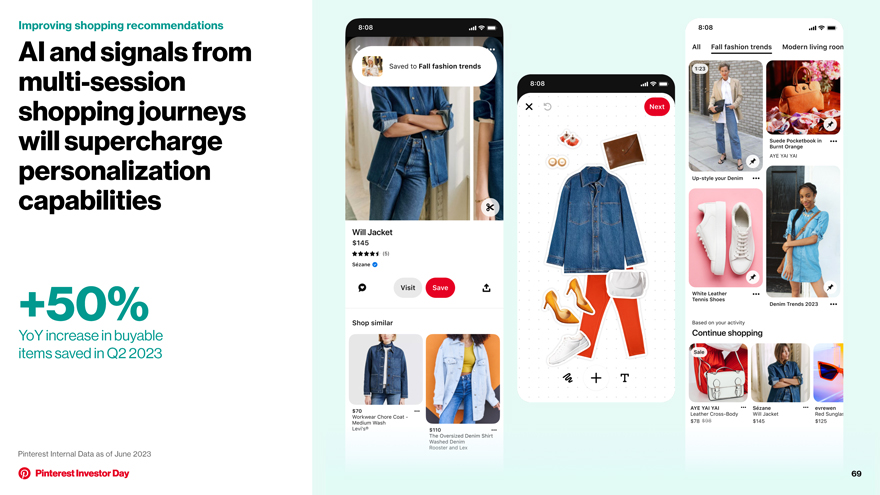
Improving shopping recommendations AI and signals from multi-session shopping journeys will supercharge personalization capabilities +50% YoY increase in buyable items saved in Q2 2023 Pinterest Internal Data as of June 2023 69
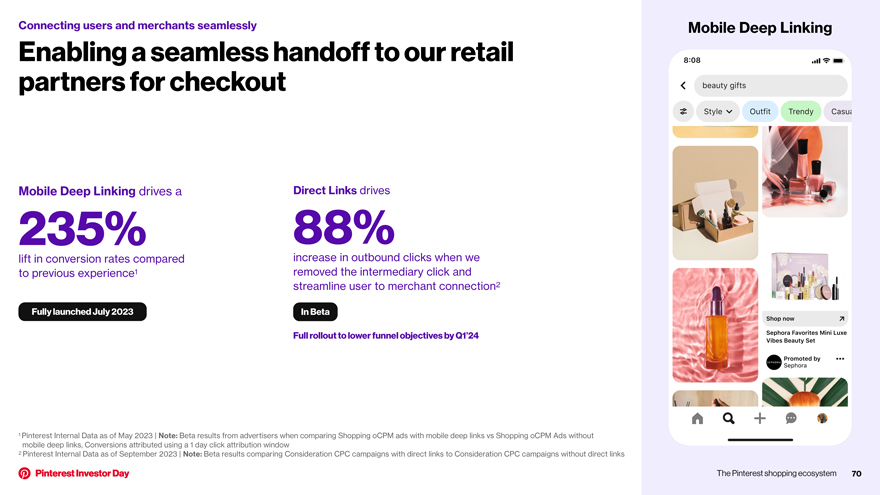
Connecting users and merchants seamlessly Mobile Deep Linking Enabling a seamless handoff to our retail partners for checkout Mobile Deep Linking drives a Direct Links drives 235% 88% lift in conversion rates compared increase in outbound clicks when we to previous experience1 removed the intermediary click and streamline user to merchant connection2 Fully launched July 2023 In Beta Full rollout to lower funnel objectives by Q1’24 1 Pinterest Internal Data as of May 2023 | Note: Beta results from advertisers when comparing Shopping oCPM ads with mobile deep links vs Shopping oCPM Ads without mobile deep links, Conversions attributed using a 1 day click attribution window 2 Pinterest Internal Data as of September 2023 | Note: Beta results comparing Consideration CPC campaigns with direct links to Consideration CPC campaigns without direct links The Pinterest shopping ecosystem 70
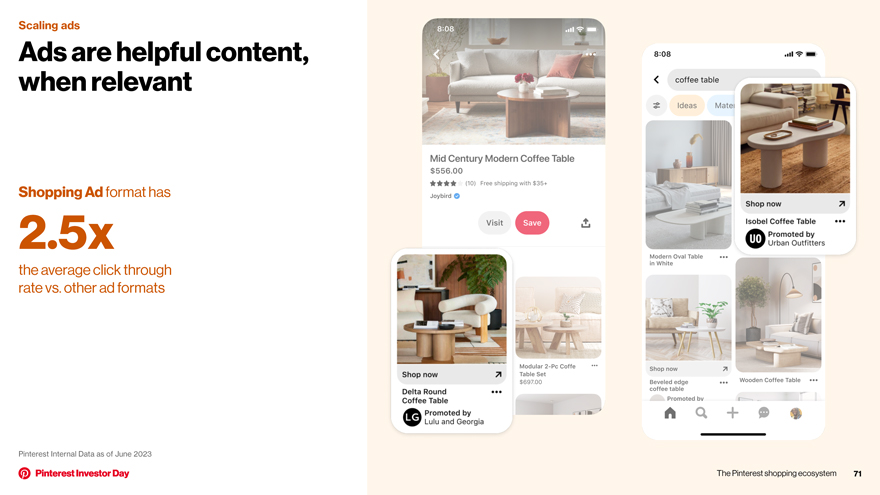
Scaling ads Ads are helpful content, when relevant Shopping Ad format has 2.5x the average click through rate vs. other ad formats Pinterest Internal Data as of June 2023 The Pinterest shopping ecosystem 71
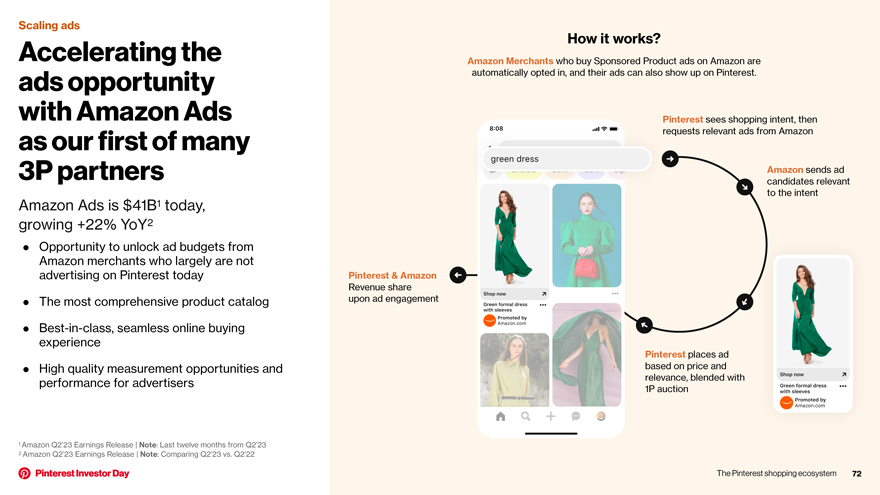
Scaling ads Accelerating the How it works? Amazon Merchants who buy Sponsored Product ads on Amazon are ads opportunity automatically opted in, and their ads can also show up on Pinterest. with Amazon Ads Pinterest sees shopping intent, then as our first of many equests relevant ads from Amazon 3P partners Amazon sends ad candidates relevant to the intent Amazon Ads is $41B1 today, growing +22% YoY2 • Opportunity to unlock ad budgets from Amazon merchants who largely are not advertising on Pinterest today Pinterest & Amazon Revenue share • The most comprehensive product catalog upon ad engagement • Best-in-class, seamless online buying experience Pinterest places ad • High quality measurement opportunities and based on price and performance for advertisers relevance, blended with 1P auction 1 Amazon Q2’23 Earnings Release | Note: Last twelve months from Q2’23 2 Amazon Q2’23 Earnings Release | Note: Comparing Q2’23 vs. Q2’22 The Pinterest shopping ecosystem 72
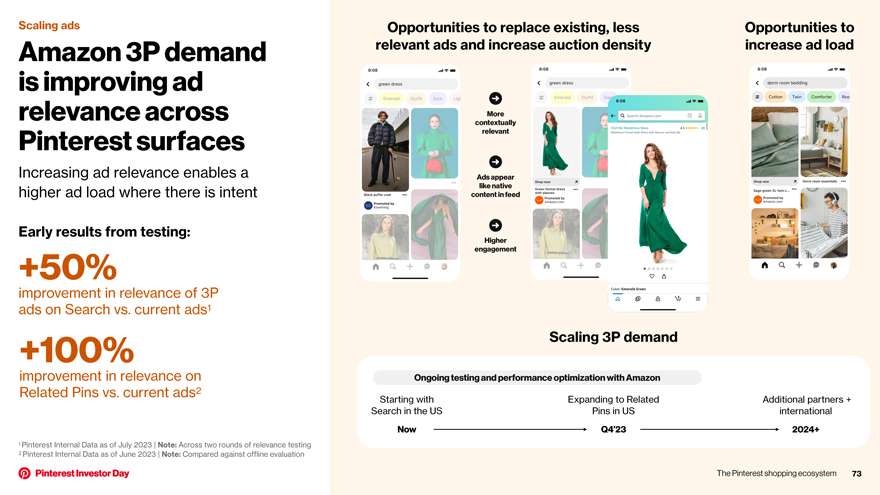
Scaling ads Opportunities to replace existing, less Opportunities to Amazon 3P demand relevant ads and increase auction density increase ad load is improving ad relevance across More contextually Pinterest surfaces relevant Increasing ad relevance enables a Ads appear like native higher ad load where there is intent content in feed Early results from testing: Higher +50% engagement improvement in relevance of 3P ads on Search vs. current ads1 +100% Scaling 3P demand improvement in relevance on Ongoing testing and performance optimization with Amazon Related Pins vs. current ads2 Starting with Expanding to Related Additional partners + Search in the US Pins in US international Now Q4’23 2024+ 1 Pinterest Internal Data as of July 2023 | Note: Across two rounds of relevance testing 2 Pinterest Internal Data as of June 2023 | Note: Compared against offline evaluation The Pinterest shopping ecosystem 73
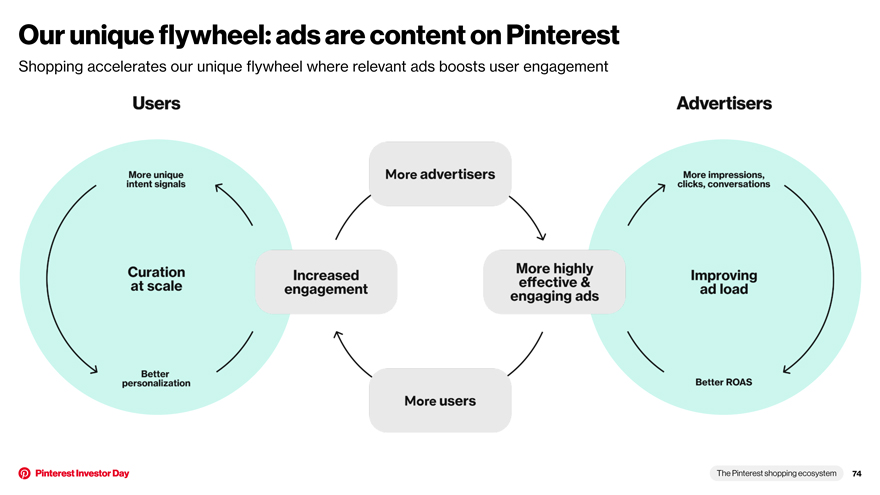
Our unique flywheel: ads are content on Pinterest Shopping accelerates our unique flywheel where relevant ads boosts user engagement The Pinterest shopping ecosystem 74
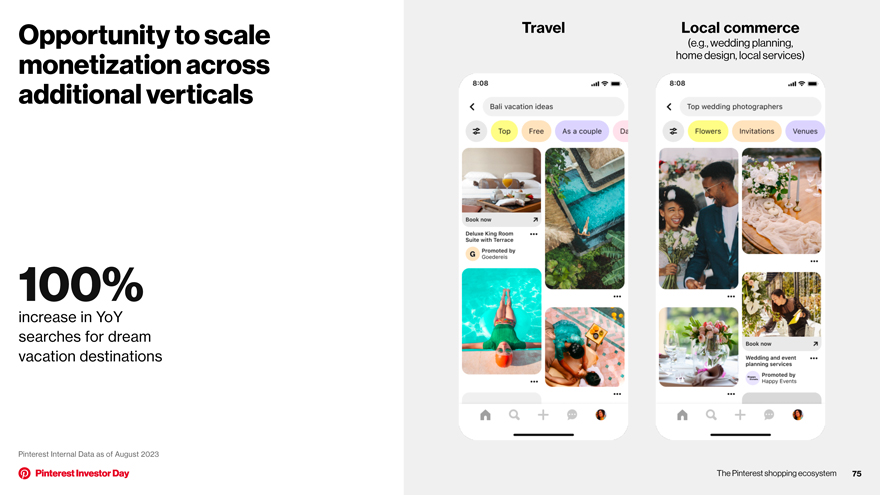
Opportunity to scale Travel Local commerce (e.g., wedding planning, monetization across home design, local services) additional verticals 100% increase in YoY searches for dream vacation destinations Pinterest Internal Data as of August 2023 The Pinterest shopping ecosystem 75
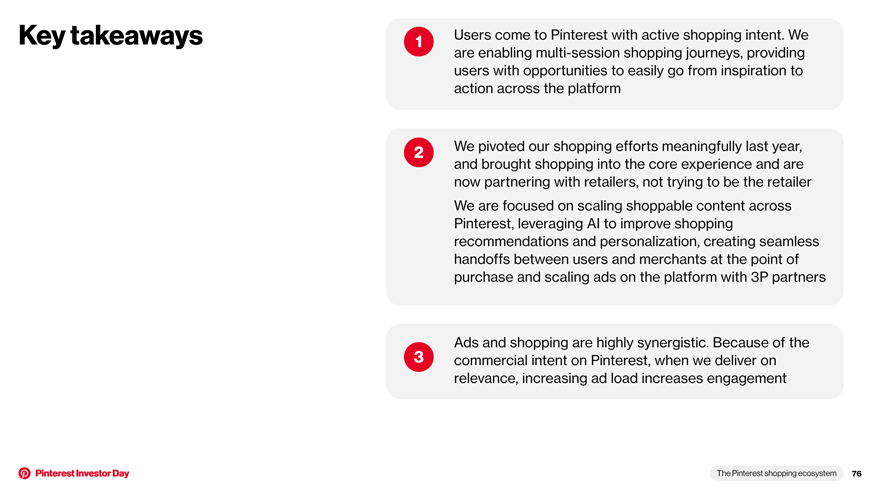
Key takeaways 1 Users come to Pinterest with active shopping intent. We are enabling multi-session shopping journeys, providing users with opportunities to easily go from inspiration to action across the platform 2 We pivoted our shopping efforts meaningfully last year, and brought shopping into the core experience and are now partnering with retailers, not trying to be the retailer We are focused on scaling shoppable content across Pinterest, leveraging AI to improve shopping recommendations and personalization, creating seamless handoffs between users and merchants at the point of purchase and scaling ads on the platform with 3P partners Ads and shopping are highly synergistic. Because of the 3 commercial intent on Pinterest, when we deliver on relevance, increasing ad load increases engagement The Pinterest shopping ecosystem 76
Our advertisers and ads product innovation
Agenda 1 Growth and increasing diversity of our advertiser base 2 The differentiated value we offer to advertisers 3 Key innovations that are driving our growth 4 Go forward advertiser solution priorities Our advertisers and ads product innovation 78
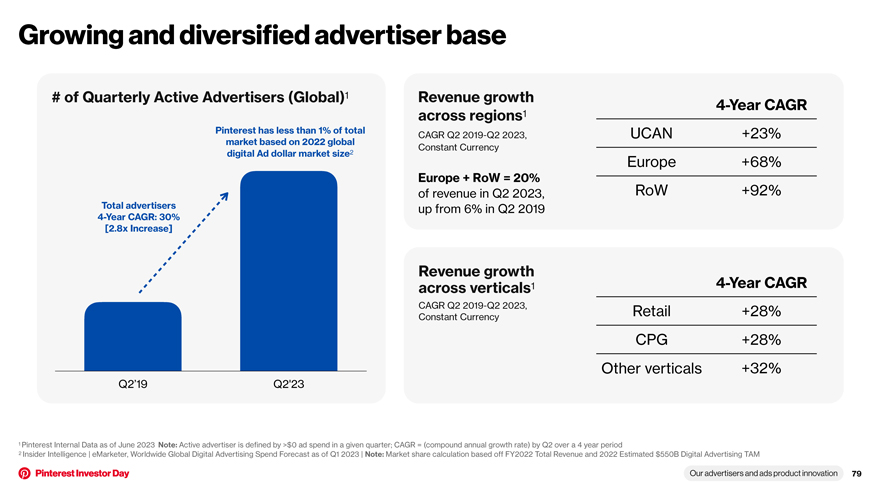
Growing and diversified advertiser base # of Quarterly Active Advertisers (Global)1 Revenue growth 4-Year CAGR across regions1 Pinterest has less than 1% of total CAGR Q2 2019-Q2 2023, UCAN +23% market based on 2022 global Constant Currency digital Ad dollar market size2 Europe +68% Europe + RoW = 20% of revenue in Q2 2023, RoW +92% Total advertisers up from 6% in Q2 2019 4-Year CAGR: 30% [2.8x Increase] Revenue growth across verticals1 4-Year CAGR CAGR Q2 2019-Q2 2023, Retail +28% Constant Currency CPG +28% Other verticals +32% Q2’19 Q2’23 1 Pinterest Internal Data as of June 2023 Note: Active advertiser is defined by >$0 ad spend in a given quarter; CAGR = (compound annual growth rate) by Q2 over a 4 year period 2 Insider Intelligence | eMarketer, Worldwide Global Digital Advertising Spend Forecast as of Q1 2023 | Note: Market share calculation based off FY2022 Total Revenue and 2022 Estimated $550B Digital Advertising TAM Our advertisers and ads product innovation 79
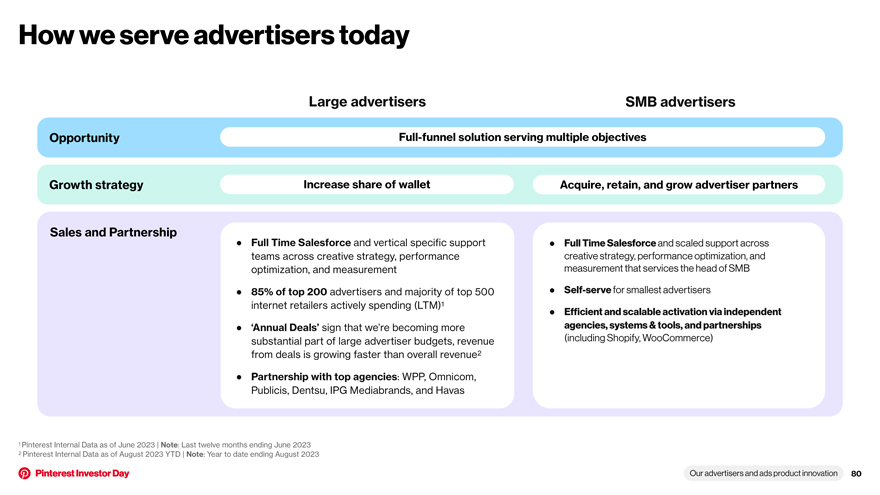
How we serve advertisers today Large advertisers SMB advertisers Opportunity Full-funnel solution serving multiple objectives Growth strategy Increase share of wallet Acquire, retain, and grow advertiser partners Sales and Partnership • Full Time Salesforce and vertical specific support • Full Time Salesforce and scaled support across teams across creative strategy, performance creative strategy, performance optimization, and optimization, and measurement measurement that services the head of SMB • 85% of top 200 advertisers and majority of top 500 • Self-serve for smallest advertisers internet retailers actively spending (LTM)1 • Efficient and scalable activation via independent • ‘Annual Deals’ sign that we’re becoming more agencies, systems & tools, and partnerships substantial part of large advertiser budgets, revenue (including Shopify, WooCommerce) from deals is growing faster than overall revenue2 • Partnership with top agencies: WPP, Omnicom, Publicis, Dentsu, IPG Mediabrands, and Havas 1 Pinterest Internal Data as of June 2023 | Note: Last twelve months ending June 2023 2 Pinterest Internal Data as of August 2023 YTD | Note: Year to date ending August 2023 Our advertisers and ads product innovation 80
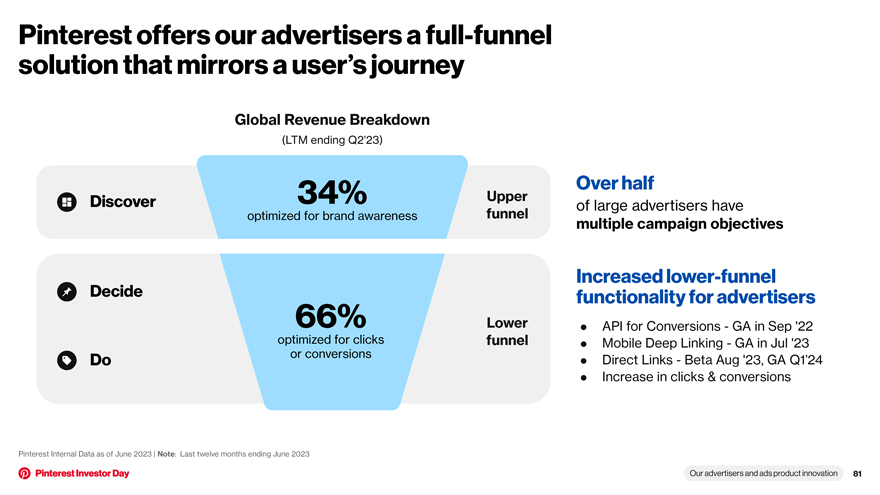
Pinterest offers our advertisers a full-funnel solution that mirrors a user’s journey Global Revenue Breakdown (LTM ending Q2’23) Over half Discover 34% Upper of large advertisers have optimized for brand awareness funnel multiple campaign objectives Increased lower-funnel Decide functionality for advertisers 66% Lower • API for Conversions—GA in Sep ‘22 optimized for clicks funnel • Mobile Deep Linking—GA in Jul ‘23 or conversions Direct Links—Beta Aug ‘23, GA Q1’24 Do • • Increase in clicks & conversions Pinterest Internal Data as of June 2023 | Note: Last twelve months ending June 2023 Our advertisers and ads product innovation 81
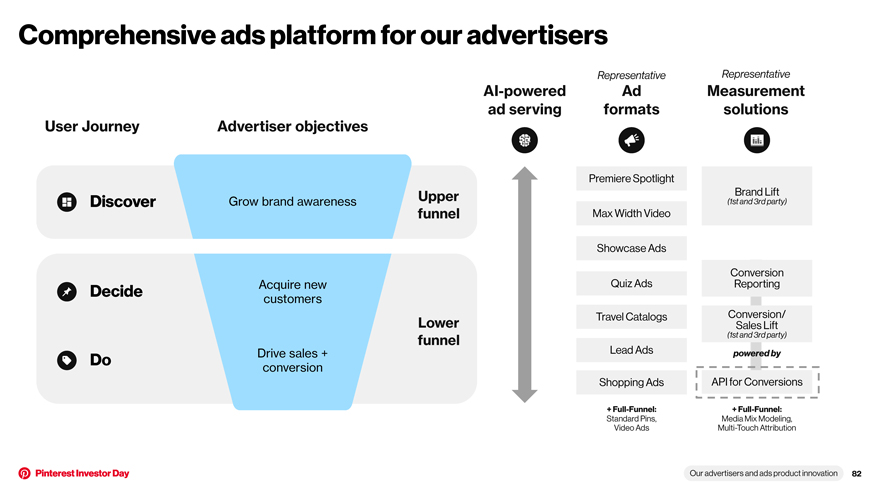
Comprehensive ads platform for our advertisers Representative Representative AI-powered Ad Measurement ad serving formats solutions User Journey Advertiser objectives Premiere Spotlight Upper Brand Lift Discover Grow brand awareness (1st and 3rd party) funnel Max Width Video Showcase Ads Conversion Decide Acquire new Quiz Ads Reporting customers Travel Catalogs Conversion/ Lower Sales Lift funnel (1st and 3rd party) Drive sales + Lead Ads powered by Do conversion Shopping Ads API for Conversions + Full-Funnel: + Full-Funnel: Standard Pins, Media Mix Modeling, Video Ads Multi-Touch Attribution Our advertisers and ads product innovation 82
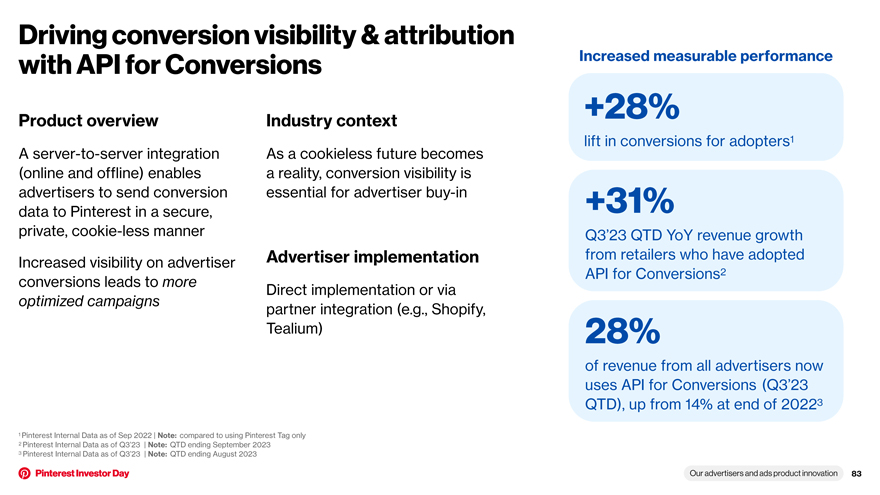
Driving conversion visibility & attribution with API for Conversions Increased measurable performance Product overview Industry context +28% lift in conversions for adopters1 A server-to-server integration As a cookieless future becomes (online and offline) enables a reality, conversion visibility is advertisers to send conversion essential for advertiser buy-in +31% data to Pinterest in a secure, private, cookie-less manner Q3’23 QTD YoY revenue growth Advertiser implementation from retailers who have adopted Increased visibility on advertiser API for Conversions2 conversions leads to more Direct implementation or via optimized campaigns partner integration (e.g., Shopify, Tealium) 28% of revenue from all advertisers now uses API for Conversions (Q3’23 QTD), up from 14% at end of 20223 1 Pinterest Internal Data as of Sep 2022 | Note: compared to using Pinterest Tag only 2 Pinterest Internal Data as of Q3’23 | Note: QTD ending September 2023 3 Pinterest Internal Data as of Q3’23 | Note: QTD ending August 2023 Our advertisers and ads product innovation 83
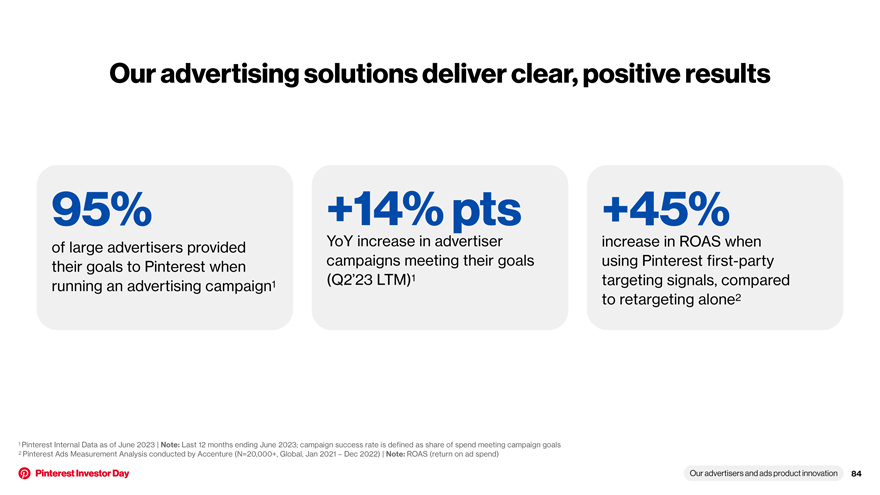
Our advertising solutions deliver clear, positive results 95% +14% pts +45% of large advertisers provided YoY increase in advertiser increase in ROAS when their goals to Pinterest when campaigns meeting their goals using Pinterest first-party (Q2’23 LTM)1 targeting signals, compared running an advertising campaign1 to retargeting alone2 1 Pinterest Internal Data as of June 2023 | Note: Last 12 months ending June 2023; campaign success rate is defined as share of spend meeting campaign goals 2 Pinterest Ads Measurement Analysis conducted by Accenture (N=20,000+, Global, Jan 2021 – Dec 2022) | Note: ROAS (return on ad spend) Our advertisers and ads product innovation 84
Key innovations that have driven growth
Ads product focus areas AI powered Ad formats Expanded Ease of use and Creative solutions across full measurement automation tools funnel solutions Our advertisers and ads product innovation 86
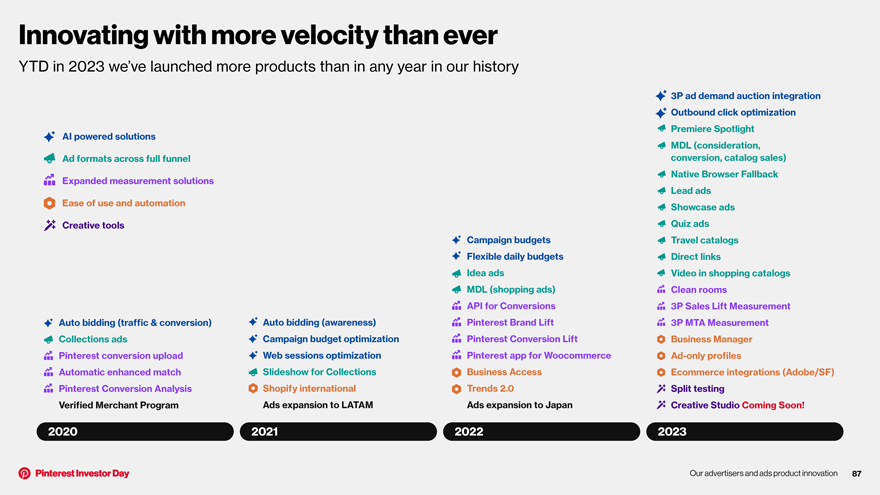
Innovating with more velocity than ever YTD in 2023 we’ve launched more products than in any year in our history 3P ad demand auction integration Outbound click optimization Premiere Spotlight AI powered solutions MDL (consideration, Ad formats across full funnel conversion, catalog sales) Native Browser Fallback Expanded measurement solutions Lead ads Ease of use and automation Showcase ads Creative tools Quiz ads Campaign budgets Travel catalogs Flexible daily budgets Direct links Idea ads Video in shopping catalogs MDL (shopping ads) Clean rooms API for Conversions 3P Sales Lift Measurement Auto bidding (traffic & conversion) Auto bidding (awareness) Pinterest Brand Lift 3P MTA Measurement Collections ads Campaign budget optimization Pinterest Conversion Lift Business Manager Pinterest conversion upload Web sessions optimization Pinterest app for Woocommerce Ad-only profiles Automatic enhanced match Slideshow for Collections Business Access Ecommerce integrations (Adobe/SF) Pinterest Conversion Analysis Shopify international Trends 2.0 Split testing Verified Merchant Program Ads expansion to LATAM Ads expansion to Japan Creative Studio Coming Soon! 2020 2021 2022 2023 Our advertisers and ads product innovation 87
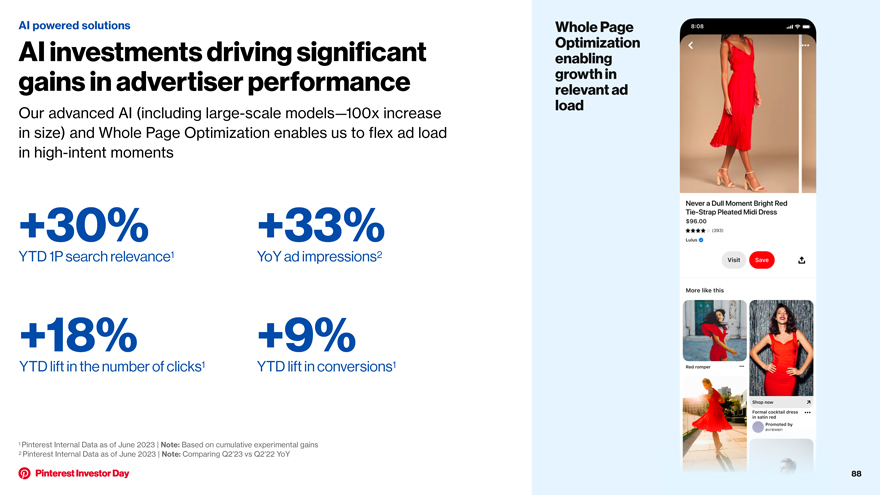
AI powered solutions Whole Page AI investments driving significant Optimization enabling gains in advertiser performance growth in relevant ad load Our advanced AI (including large-scale models—100x increase in size) and Whole Page Optimization enables us to flex ad load in high-intent moments +30% +33% YTD 1P search relevance1 YoY ad impressions2 +18% +9% YTD lift in the number of clicks1 YTD lift in conversions1 1 Pinterest Internal Data as of June 2023 | Note: Based on cumulative experimental gains 2 Pinterest Internal Data as of June 2023 | Note: Comparing Q2’23 vs Q2’22 YoY 88
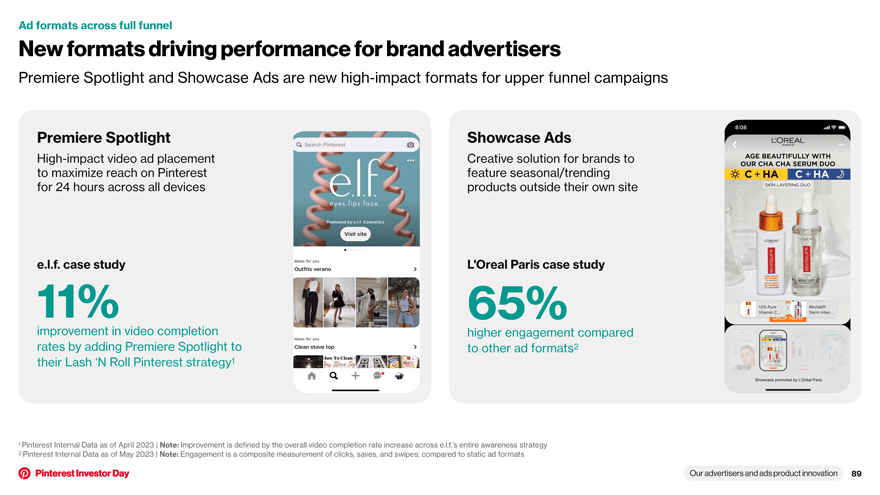
Ad formats across full funnel New formats driving performance for brand advertisers Premiere Spotlight and Showcase Ads are new high-impact formats for upper funnel campaigns Premiere Spotlight Showcase Ads High-impact video ad placement Creative solution for brands to to maximize reach on Pinterest feature seasonal/trending for 24 hours across all devices products outside their own site e.l.f. case study L’Oreal Paris case study 11% 65% improvement in video completion higher engagement compared rates by adding Premiere Spotlight to to other ad formats2 their Lash ‘N Roll Pinterest strategy1 1 Pinterest Internal Data as of April 2023 | Note: Improvement is defined by the overall video completion rate increase across e.l.f.’s entire awareness strategy 2 Pinterest Internal Data as of May 2023 | Note: Engagement is a composite measurement of clicks, saves, and swipes; compared to static ad formats Our advertisers and ads product innovation 89
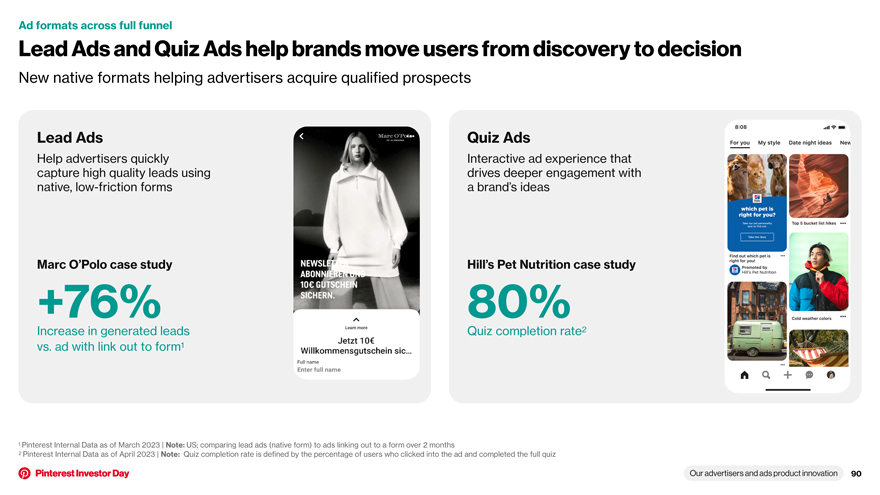
Ad formats across full funnel Lead Ads and Quiz Ads help brands move users from discovery to decision New native formats helping advertisers acquire qualified prospects Lead Ads Quiz Ads Help advertisers quickly Interactive ad experience that capture high quality leads using drives deeper engagement with native, low-friction forms a brand’s ideas Marc O’Polo case study Hill’s Pet Nutrition case study +76% 80% Increase in generated leads Quiz completion rate2 vs. ad with link out to form1 1 Pinterest Internal Data as of March 2023 | Note: US; comparing lead ads (native form) to ads linking out to a form over 2 months 2 Pinterest Internal Data as of April 2023 | Note: Quiz completion rate is defined by the percentage of users who clicked into the ad and completed the full quiz Our advertisers and ads product innovation 90
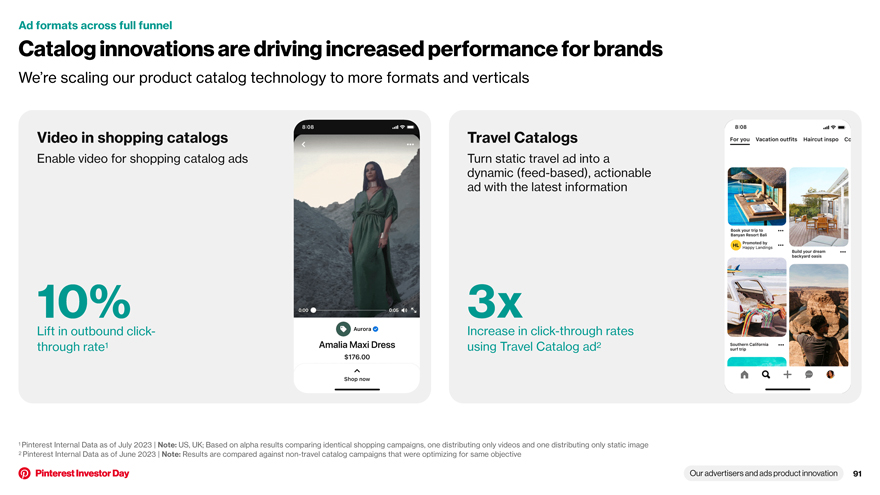
Ad formats across full funnel Catalog innovations are driving increased performance for brands We’re scaling our product catalog technology to more formats and verticals Video in shopping catalogs Travel Catalogs Enable video for shopping catalog ads Turn static travel ad into a dynamic (feed-based), actionable ad with the latest information 10% 3x Lift in outbound click- Increase in click-through rates through rate1 using Travel Catalog ad2 1 Pinterest Internal Data as of July 2023 | Note: US, UK; Based on alpha results comparing identical shopping campaigns, one distributing only videos and one distributing only static image 2 Pinterest Internal Data as of June 2023 | Note: Results are compared against non-travel catalog campaigns that were optimizing for same objective Our advertisers and ads product innovation 91
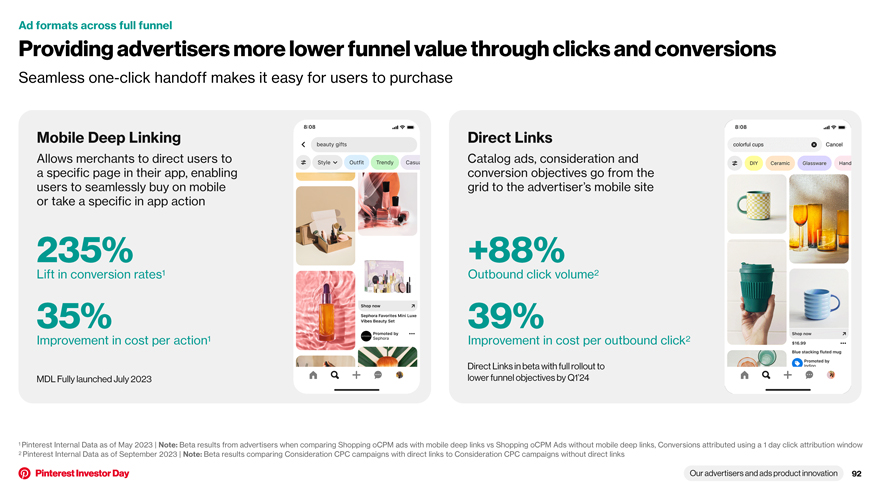
Ad formats across full funnel Providing advertisers more lower funnel value through clicks and conversions Seamless one-click handoff makes it easy for users to purchase Mobile Deep Linking Direct Links Allows merchants to direct users to Catalog ads, consideration and a specific page in their app, enabling conversion objectives go from the users to seamlessly buy on mobile grid to the advertiser’s mobile site or take a specific in app action 235% +88% Lift in conversion rates1 Outbound click volume2 35% 39% Improvement in cost per action1 Improvement in cost per outbound click2 Direct Links in beta with full rollout to MDL Fully launched July 2023 lower funnel objectives by Q1’24 1 Pinterest Internal Data as of May 2023 | Note: Beta results from advertisers when comparing Shopping oCPM ads with mobile deep links vs Shopping oCPM Ads without mobile deep links, Conversions attributed using a 1 day click attribution window 2 Pinterest Internal Data as of September 2023 | Note: Beta results comparing Consideration CPC campaigns with direct links to Consideration CPC campaigns without direct links Our advertisers and ads product innovation 92
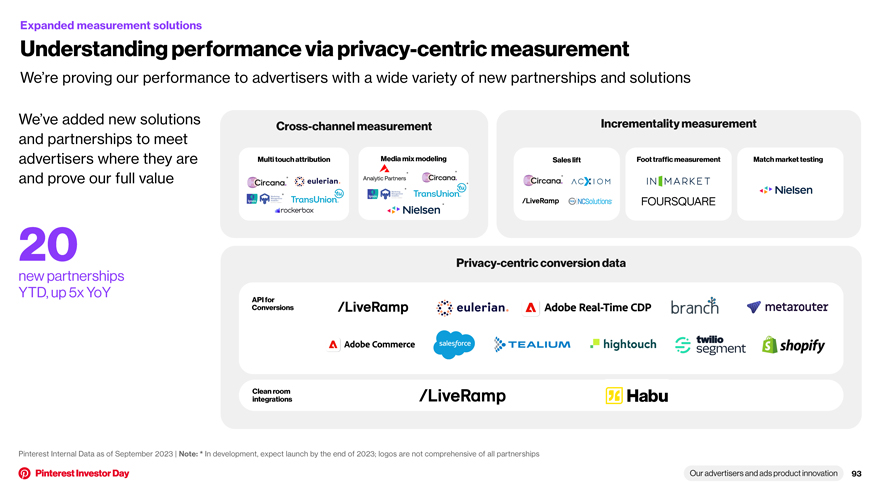
Expanded measurement solutions Understanding performance via privacy-centric measurement We’re proving our performance to advertisers with a wide variety of new partnerships and solutions We’ve added new solutions Incrementality measurement Cross-channel measurement and partnerships to meet advertisers where they are Multi touch attribution Media mix modeling Sales lift Foot traffic measurement Match market testing * * * and prove our full value * * * * * 20 Privacy-centric conversion data new partnerships YTD, up 5x YoY API for Conversions Clean room integrations Pinterest Internal Data as of September 2023 | Note: * In development, expect launch by the end of 2023; logos are not comprehensive of all partnerships Our advertisers and ads product innovation 93
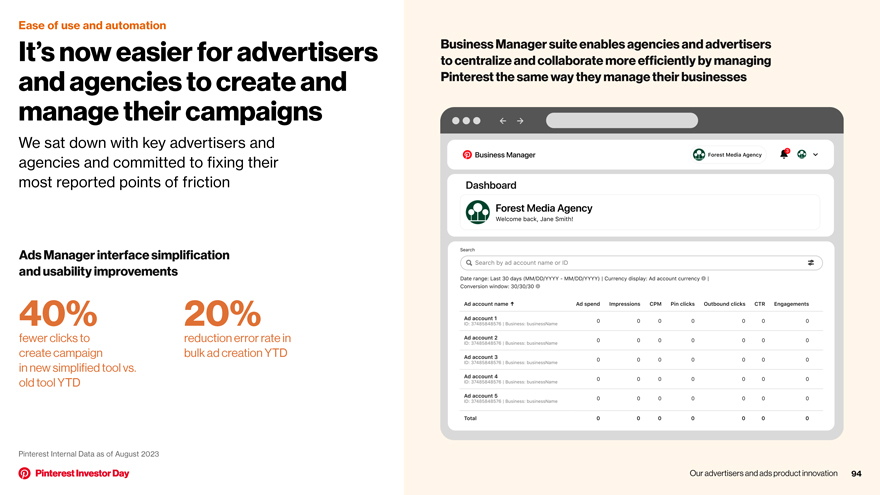
Ease of use and automation It’s now easier for advertisers Business Manager suite enables agencies and advertisers to centralize and collaborate more efficiently by managing and agencies to create and Pinterest the same way they manage their businesses manage their campaigns We sat down with key advertisers and agencies and committed to fixing their most reported points of friction Ads Manager interface simplification and usability improvements 40% 20% fewer clicks to reduction error rate in create campaign bulk ad creation YTD in new simplified tool vs. old tool YTD Pinterest Internal Data as of August 2023 Our advertisers and ads product innovation 94
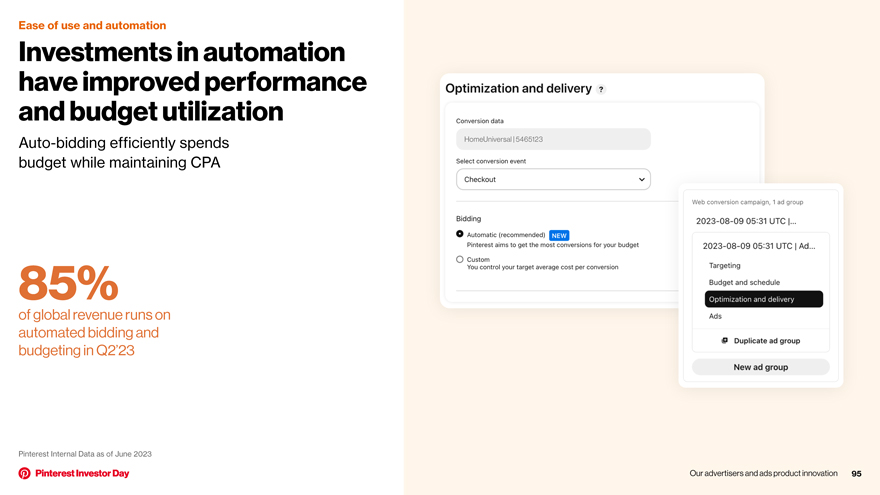
Ease of use and automation Investments in automation have improved performance and budget utilization Auto-bidding efficiently spends HomeUniversal | 5465123 budget while maintaining CPA 85% of global revenue runs on automated bidding and budgeting in Q2’23 Pinterest Internal Data as of June 2023 Our advertisers and ads product innovation 95
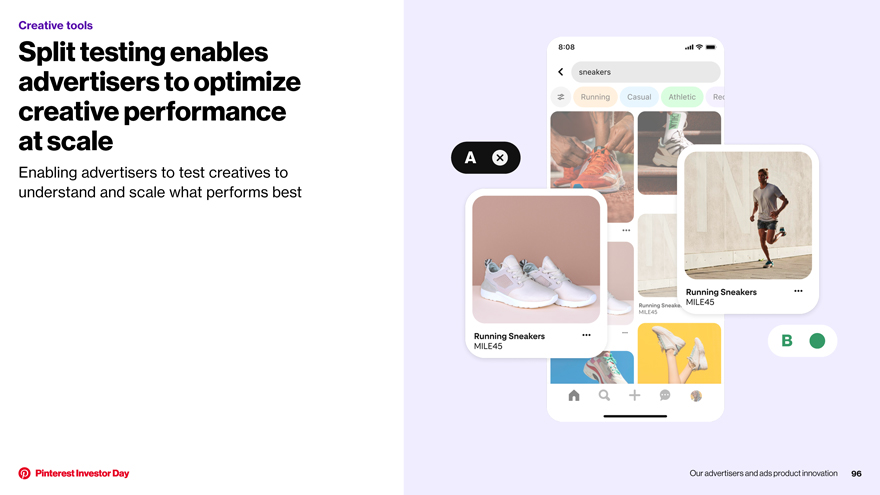
Creative tools Split testing enables advertisers to optimize creative performance at scale Enabling advertisers to test creatives to A understand and scale what performs best B Our advertisers and ads product innovation 96
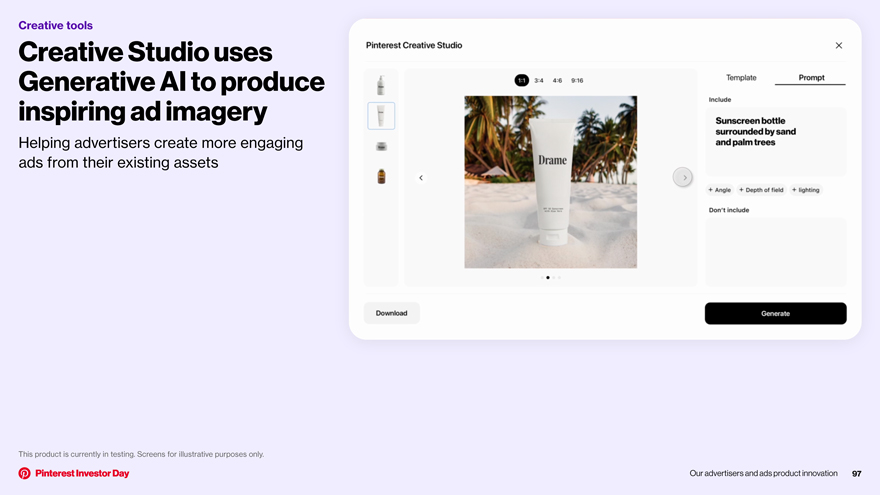
Creative tools Creative Studio uses Generative AI to produce inspiring ad imagery Helping advertisers create more engaging ads from their existing assets This product is currently in testing. Screens for illustrative purposes only. Our advertisers and ads product innovation 97
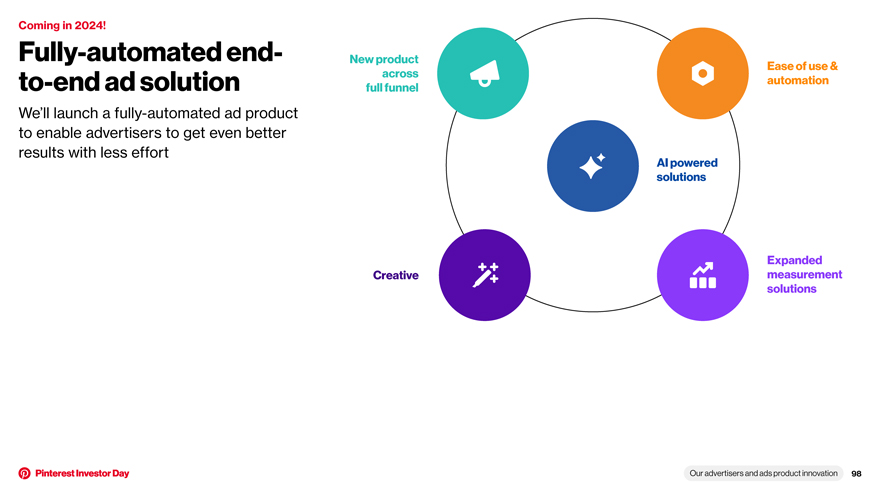
Coming in 2024! Fully-automated end- New product Ease of use & across to-end ad solution automation full funnel We’ll launch a fully-automated ad product to enable advertisers to get even better results with less effort AI powered solutions Expanded Creative measurement solutions Our advertisers and ads product innovation 98
Go-forward advertiser priorities
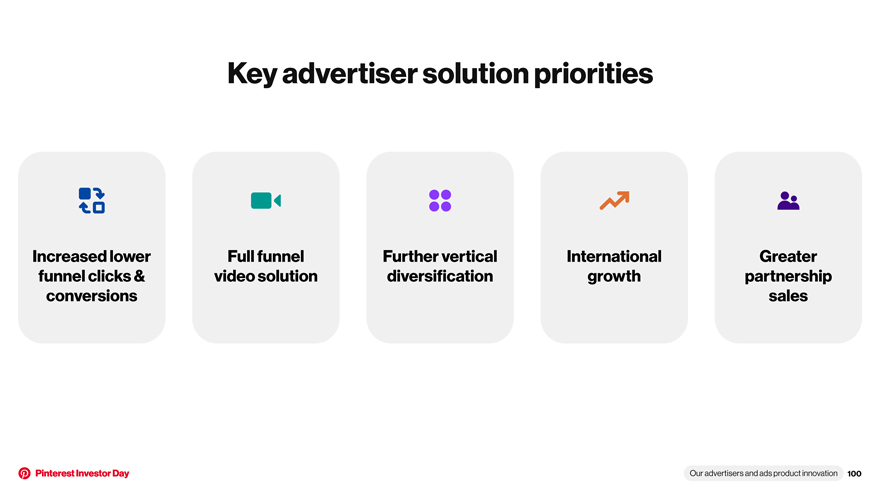
Key advertiser solution priorities Increased lower Full funnel Further vertical International Greater funnel clicks & video solution diversification growth partnership conversions sales Our advertisers and ads product innovation 100
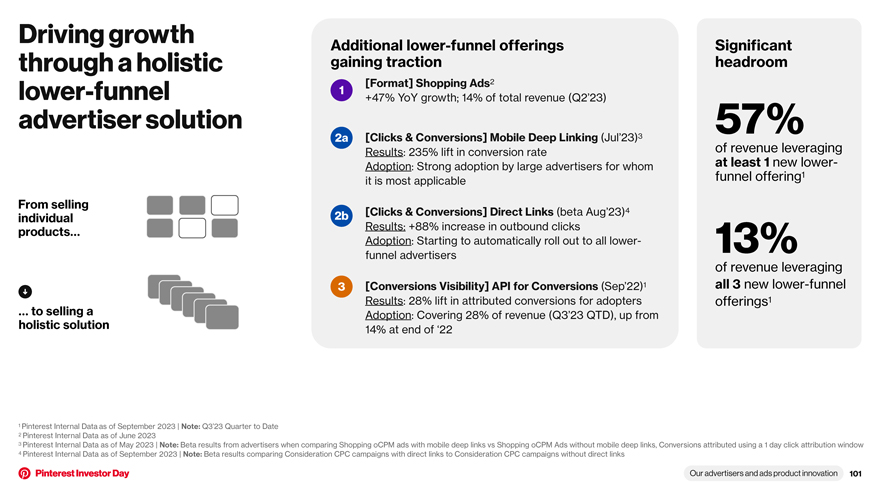
Driving growth Additional lower-funnel offerings Significant through a holistic gaining traction headroom [Format] Shopping Ads2 lower-funnel 1 +47% YoY growth; 14% of total revenue (Q2’23) advertiser solution 57% 2a [Clicks & Conversions] Mobile Deep Linking (Jul’23)3 Results: 235% lift in conversion rate of revenue leveraging Adoption: Strong adoption by large advertisers for whom at least 1 new lower- funnel offering1 it is most applicable From selling 2b [Clicks & Conversions] Direct Links (beta Aug’23)4 individual products… Results: +88% increase in outbound clicks Adoption: Starting to automatically roll out to all lower- 13% funnel advertisers of revenue leveraging 3 [Conversions Visibility] API for Conversions (Sep’22)1 all 3 new lower-funnel Results: 28% lift in attributed conversions for adopters offerings1 … to selling a Adoption: Covering 28% of revenue (Q3’23 QTD), up from holistic solution 14% at end of ‘22 1 Pinterest Internal Data as of September 2023 | Note: Q3’23 Quarter to Date 2 Pinterest Internal Data as of June 2023 3 Pinterest Internal Data as of May 2023 | Note: Beta results from advertisers when comparing Shopping oCPM ads with mobile deep links vs Shopping oCPM Ads without mobile deep links, Conversions attributed using a 1 day click attribution window 4 Pinterest Internal Data as of September 2023 | Note: Beta results comparing Consideration CPC campaigns with direct links to Consideration CPC campaigns without direct links Our advertisers and ads product innovation 101
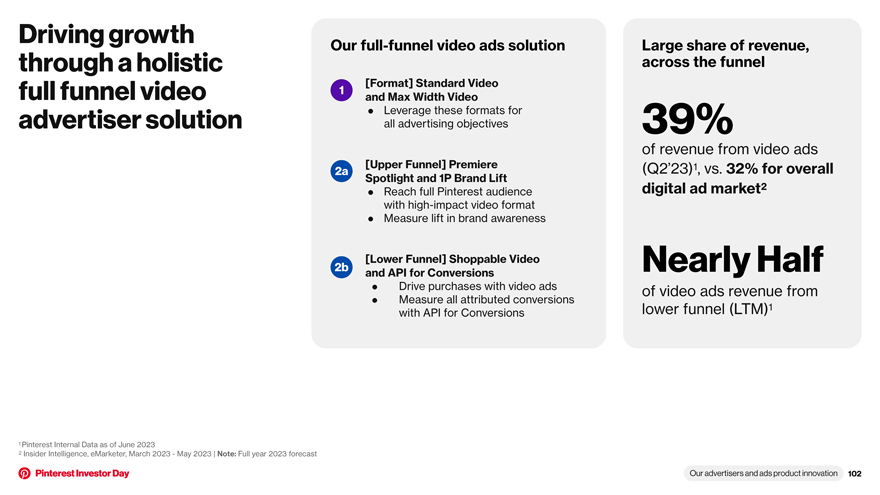
Driving growth Our full-funnel video ads solution Large share of revenue, through a holistic across the funnel [Format] Standard Video full funnel video 1 and Max Width Video • Leverage these formats for advertiser solution all advertising objectives 39% of revenue from video ads [Upper Funnel] Premiere (Q2’23)1, vs. 32% for overall 2a Spotlight and 1P Brand Lift Reach full Pinterest audience digital ad market2 • with high-impact video format • Measure lift in brand awareness [Lower Funnel] Shoppable Video 2b and API for Conversions Nearly Half • Drive purchases with video ads of video ads revenue from • Measure all attributed conversions lower funnel (LTM)1 with API for Conversions 1 Pinterest Internal Data as of June 2023 2 Insider Intelligence, eMarketer, March 2023—May 2023 | Note: Full year 2023 forecast Our advertisers and ads product innovation 102
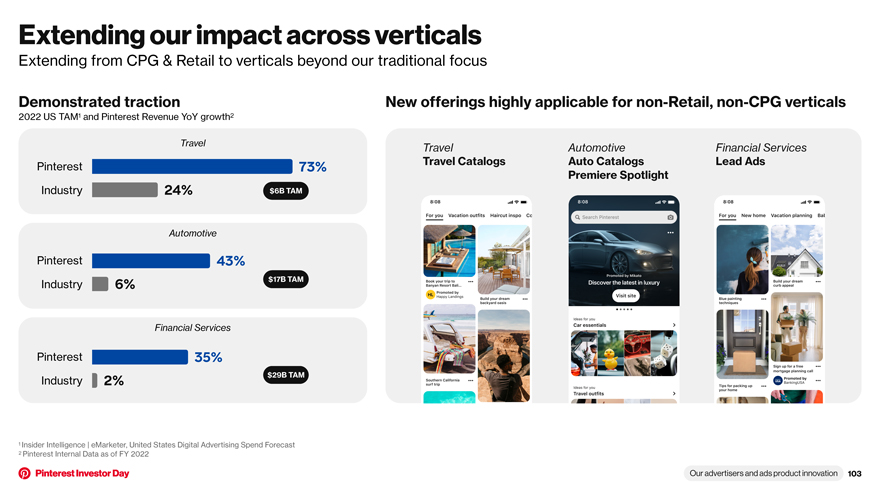
Extending our impact across verticals Extending from CPG & Retail to verticals beyond our traditional focus Demonstrated traction New offerings highly applicable for non-Retail, non-CPG verticals 2022 US TAM1 and Pinterest Revenue YoY growth2 Travel Travel Automotive Financial Services Pinterest 73% Travel Catalogs Auto Catalogs Lead Ads Premiere Spotlight Industry 24% $6B TAM Automotive Pinterest 43% Industry 6% $17B TAM Financial Services Pinterest 35% Industry 2% $29B TAM 1 Insider Intelligence | eMarketer, United States Digital Advertising Spend Forecast 2 Pinterest Internal Data as of FY 2022 Our advertisers and ads product innovation 103
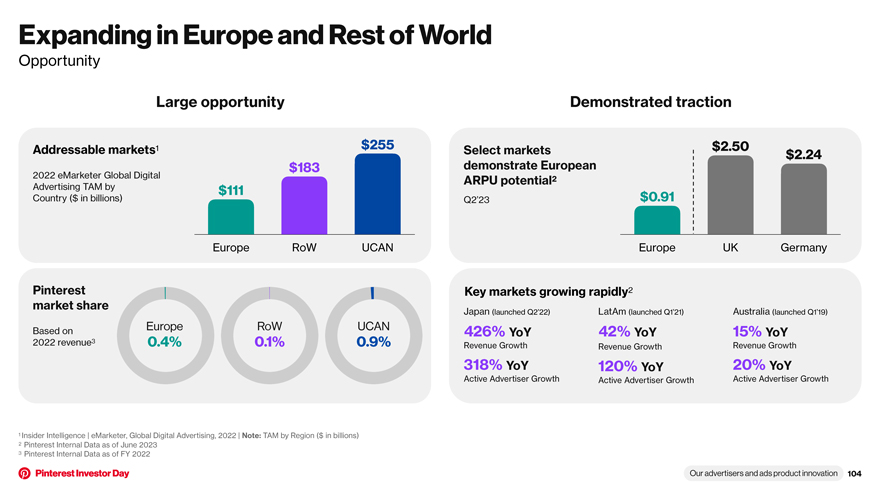
Expanding in Europe and Rest of World Opportunity Large opportunity Demonstrated traction Addressable markets1 $255 Select markets $2.50 $2.24 2022 eMarketer Global Digital $183 demonstrate European ARPU potential2 Advertising TAM by $111 Country ($ in billions) Q2’23 $0.91 Europe RoW UCAN Europe UK Germany Pinterest Key markets growing rapidly2 market share Japan (launched Q2’22) LatAm (launched Q1’21) Australia (launched Q1’19) Based on Europe RoW UCAN 426% YoY 42% YoY 15% YoY 2022 revenue3 0.4% 0.1% 0.9% Revenue Growth Revenue Growth Revenue Growth 318% YoY 120% YoY 20% YoY Active Advertiser Growth Active Advertiser Growth Active Advertiser Growth 1 Insider Intelligence | eMarketer, Global Digital Advertising, 2022 | Note: TAM by Region ($ in billions) 2 Pinterest Internal Data as of June 2023 3 Pinterest Internal Data as of FY 2022 Our advertisers and ads product innovation 104
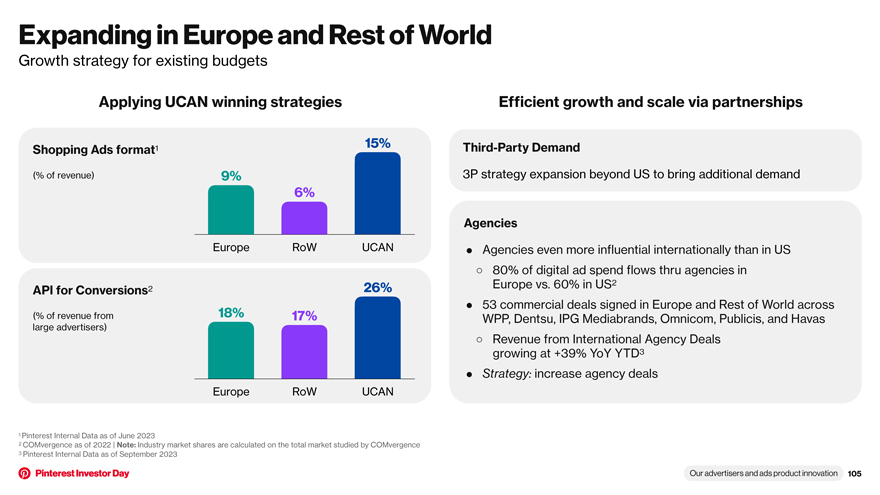
Expanding in Europe and Rest of World Growth strategy for existing budgets Applying UCAN winning strategies Efficient growth and scale via partnerships 1 15% Third-Party Demand Shopping Ads format (% of revenue) 9% 3P strategy expansion beyond US to bring additional demand 6% Agencies Europe RoW UCAN • Agencies even more influential internationally than in US â—‹ 80% of digital ad spend flows thru agencies in Europe vs. 60% in US2 API for Conversions2 26% • 53 commercial deals signed in Europe and Rest of World across (% of revenue from 18% 17% WPP, Dentsu, IPG Mediabrands, Omnicom, Publicis, and Havas large advertisers) â—‹ Revenue from International Agency Deals growing at +39% YoY YTD3 • Strategy: increase agency deals Europe RoW UCAN 1 Pinterest Internal Data as of June 2023 2 COMvergence as of 2022 | Note: Industry market shares are calculated on the total market studied by COMvergence 3 Pinterest Internal Data as of September 2023 Our advertisers and ads product innovation 105
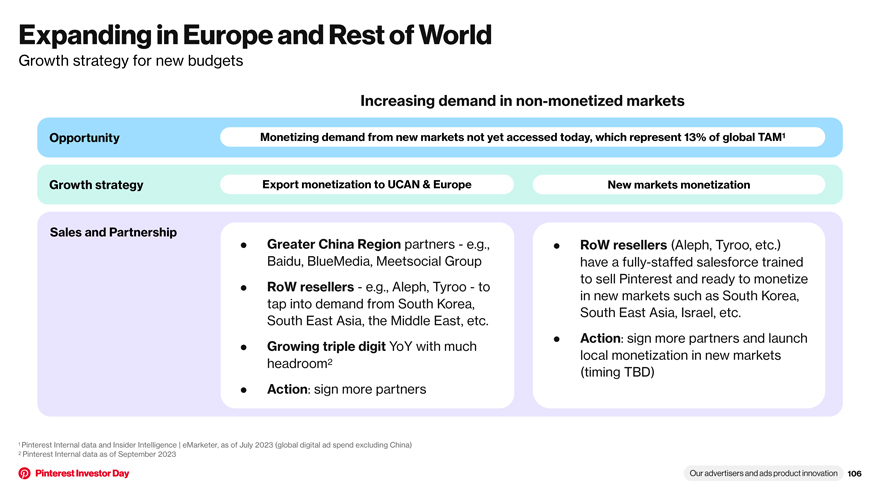
Expanding in Europe and Rest of World Growth strategy for new budgets Increasing demand in non-monetized markets Opportunity Monetizing demand from new markets not yet accessed today, which represent 13% of global TAM1 Growth strategy Export monetization to UCAN & Europe New markets monetization Sales and Partnership • Greater China Region partners—e.g., • RoW resellers (Aleph, Tyroo, etc.) Baidu, BlueMedia, Meetsocial Group have a fully-staffed salesforce trained to sell Pinterest and ready to monetize • RoW resellers—e.g., Aleph, Tyroo—to in new markets such as South Korea, tap into demand from South Korea, South East Asia, Israel, etc. South East Asia, the Middle East, etc. • Action: sign more partners and launch • Growing triple digit YoY with much local monetization in new markets headroom2 (timing TBD) • Action: sign more partners 1 Pinterest Internal data and Insider Intelligence | eMarketer, as of July 2023 (global digital ad spend excluding China) 2 Pinterest Internal data as of September 2023 Our advertisers and ads product innovation 106
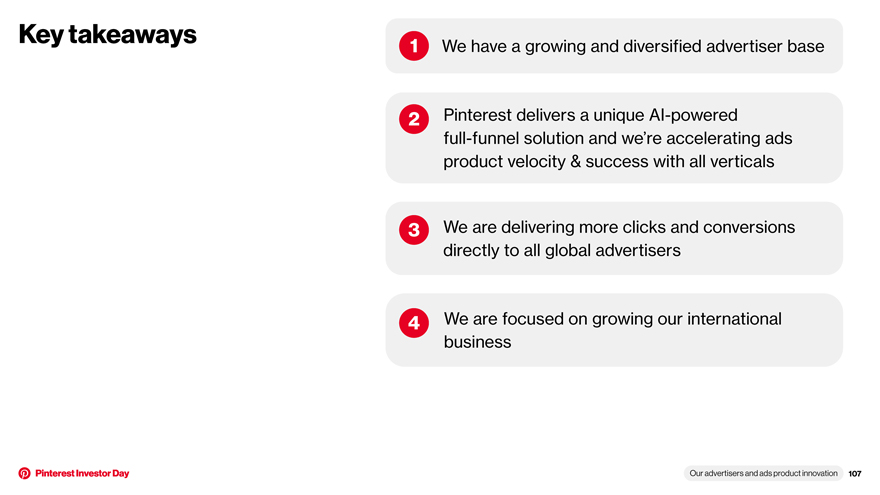
Key takeaways 1 We have a growing and diversified advertiser base 2 Pinterest delivers a unique AI-powered full-funnel solution and we’re accelerating ads product velocity & success with all verticals 3 We are delivering more clicks and conversions directly to all global advertisers 4 We are focused on growing our international business Our advertisers and ads product innovation 107
Chief Marketing Officer perspectives
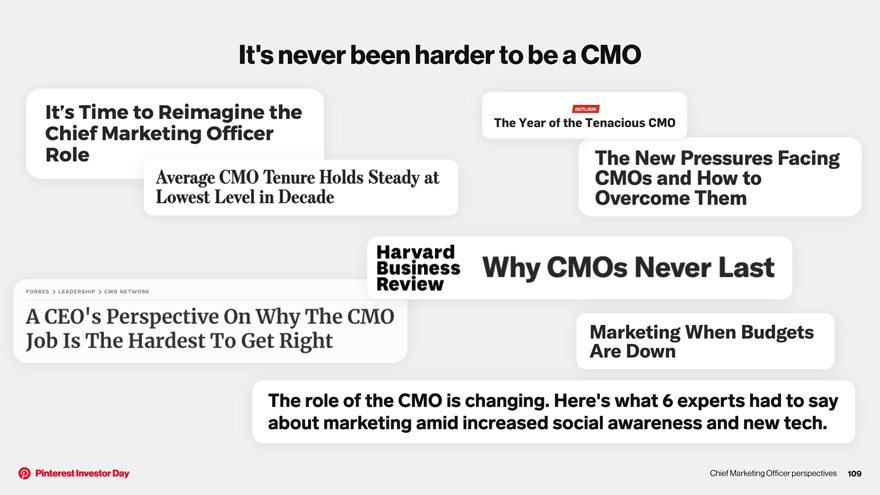
It’s never been harder to be a CMO Chief Marketing Officer perspectives 109
The Pinterest difference Only true Predictive insights A uniquely full funnel into tastes, interests, positive online solution and intent environment Chief Marketing Officer perspectives 110

Meet our panel William White Tracy-Ann Lim Morgan Brown Shenan Reed Chief Marketing Officer Chief Media Officer Head of Performance Marketing SVP, Head of Media Chief Marketing Officer perspectives 111

AI and Pinterest
Agenda 1 Industry leading AI team 2 AI at Pinterest leverages unique signals 3 World-class AI platform 4 Delivering for users, advertisers and Pinterest 5 The next chapter: Generative AI and Pinterest 113
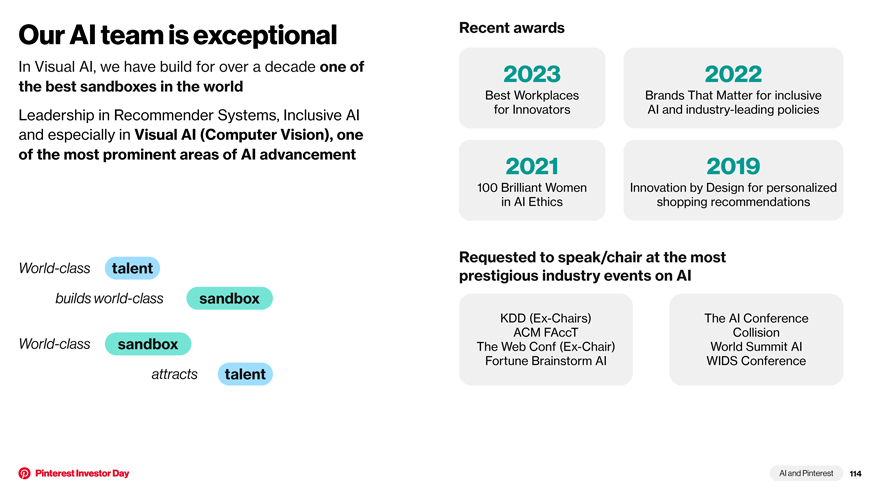
Our AI team is exceptional Recent awards In Visual AI, we have build for over a decade one of 2023 2022 the best sandboxes in the world Best Workplaces Brands That Matter for inclusive Leadership in Recommender Systems, Inclusive AI for Innovators AI and industry-leading policies and especially in Visual AI (Computer Vision), one of the most prominent areas of AI advancement 2021 2019 100 Brilliant Women Innovation by Design for personalized in AI Ethics shopping recommendations Requested to speak/chair at the most World-class talent prestigious industry events on AI builds world-class sandbox KDD (Ex-Chairs) The AI Conference ACM FAccT Collision World-class sandbox The Web Conf (Ex-Chair) World Summit AI Fortune Brainstorm AI WIDS Conference attracts talent AI and Pinterest 114
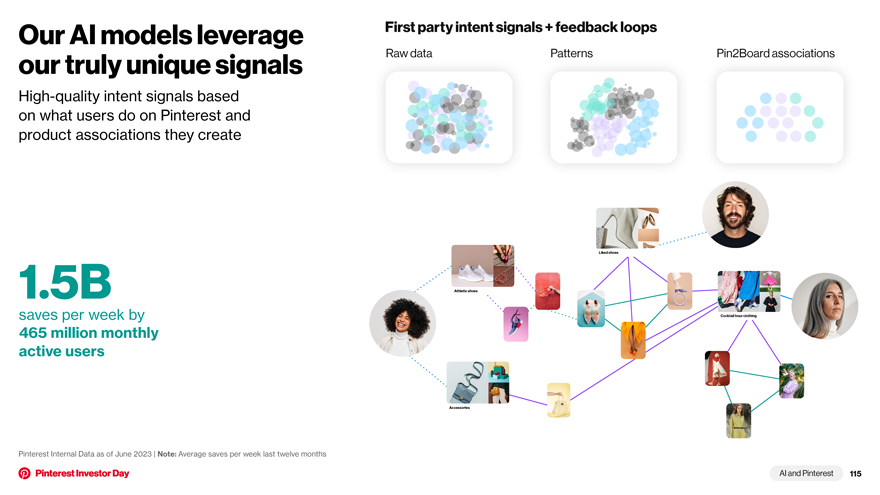
Our AI models leverage First party intent signals + feedback loops our truly unique signals Raw data Patterns Pin2Board associations High-quality intent signals based on what users do on Pinterest and product associations they create Liked shoes 1.5B Athletic shoes saves per week by Cocktail hour clothing 465 million monthly active users Accessories Pinterest Internal Data as of June 2023 | Note: Average saves per week last twelve months AI and Pinterest 115
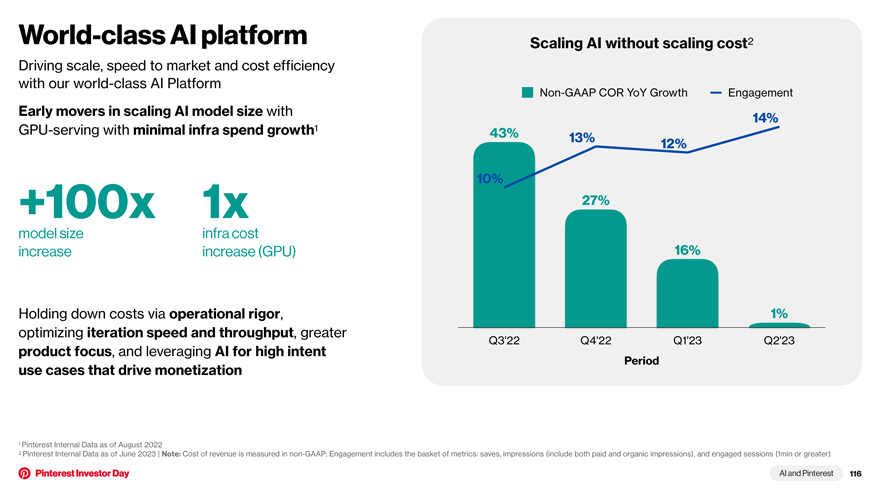
World-class AI platform Scaling AI without scaling cost2 Driving scale, speed to market and cost efficiency with our world-class AI Platform Non-GAAP COR YoY Growth Engagement Early movers in scaling AI model size with 1 14% GPU-serving with minimal infra spend growth 43% 13% 12% 10% +100x 1x 27% model size infra cost increase increase (GPU) 16% Holding down costs via operational rigor, 1% optimizing iteration speed and throughput, greater Q3’22 Q4’22 Q1’23 Q2’23 product focus, and leveraging AI for high intent Period use cases that drive monetization 1 Pinterest Internal Data as of August 2022 2 Pinterest Internal Data as of June 2023 | Note: Cost of revenue is measured in non-GAAP; Engagement includes the basket of metrics: saves, impressions (include both paid and organic impressions), and engaged sessions (1min or greater) AI and Pinterest 116
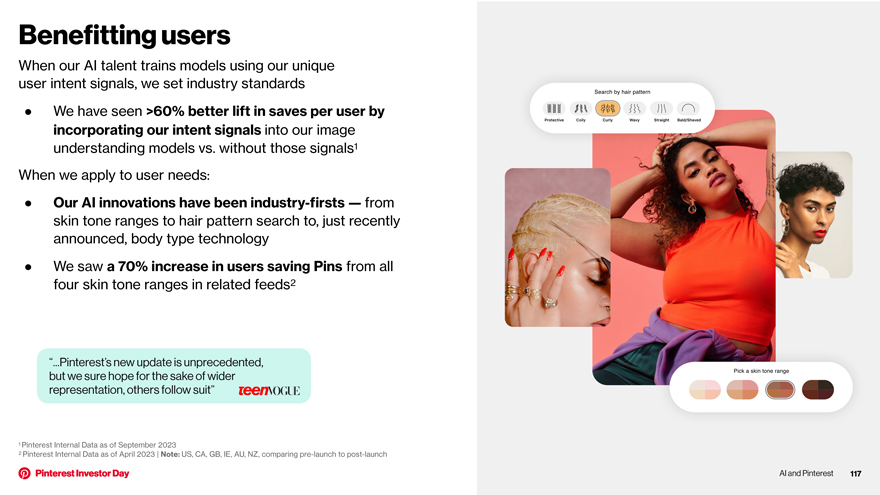
Benefitting users When our AI talent trains models using our unique user intent signals, we set industry standards • We have seen >60% better lift in saves per user by incorporating our intent signals into our image understanding models vs. without those signals1 When we apply to user needs: • Our AI innovations have been industry-firsts — from skin tone ranges to hair pattern search to, just recently announced, body type technology • We saw a 70% increase in users saving Pins from all four skin tone ranges in related feeds2 “...Pinterest’s new update is unprecedented, but we sure hope for the sake of wider representation, others follow suit” 1 Pinterest Internal Data as of September 2023 2 Pinterest Internal Data as of April 2023 | Note: US, CA, GB, IE, AU, NZ, comparing pre-launch to post-launch AI and and Pinterest Pinterest 117
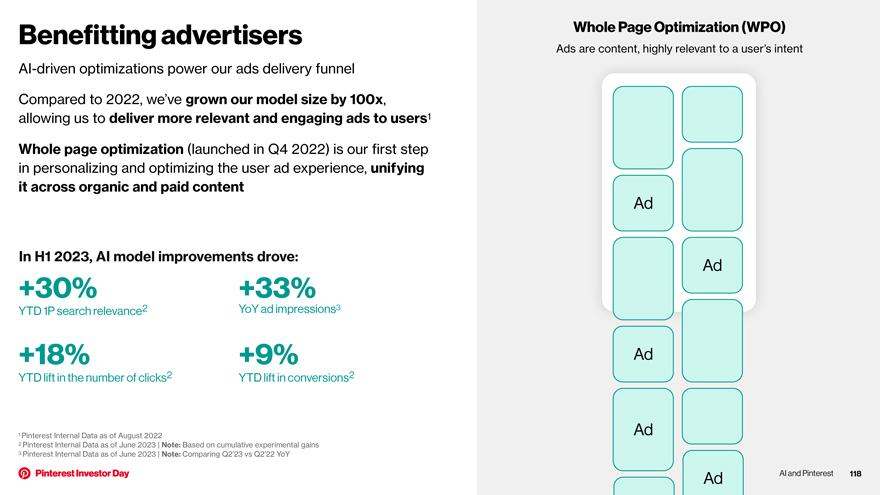
Benefitting advertisers AI-driven optimizations power our ads delivery funnel Compared to 2022, we’ve grown our model size by 100x, allowing us to deliver more relevant and engaging ads to users1 Whole page optimization (launched in Q4 2022) is our first step in personalizing and optimizing the user ad experience, unifying it across organic and paid content In H1 2023, AI model improvements drove: +30% +33% YTD 1P search relevance2 YoY ad impressions3 +18% +9% YTD lift in the number of clicks2 YTD lift in conversions2 1 Pinterest Internal Data as of August 2022 2 Pinterest Internal Data as of June 2023 | Note: Based on cumulative experimental gains 3 Pinterest Internal Data as of June 2023 | Note: Comparing Q2’23 vs Q2’22 YoY Whole Page Optimization (WPO) Ads are content, highly relevant to a user’s intent Ad Ad Ad Ad Ad AI and Pinterest 118
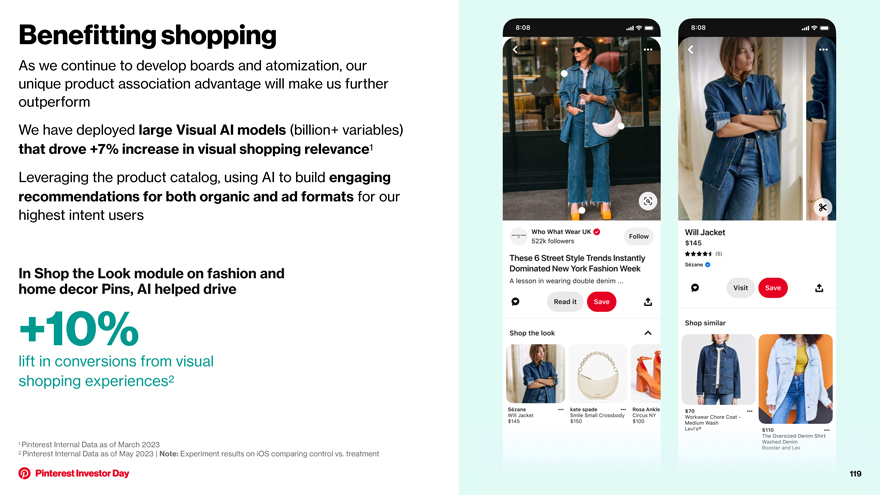
Benefitting shopping As we continue to develop boards and atomization, our unique product association advantage will make us further outperform We have deployed large Visual AI models (billion+ variables) that drove +7% increase in visual shopping relevance1 Leveraging the product catalog, using AI to build engaging recommendations for both organic and ad formats for our highest intent users In Shop the Look module on fashion and home decor Pins, AI helped drive +10% lift in conversions from visual shopping experiences2 1 Pinterest Internal Data as of March 2023 2 Pinterest Internal Data as of May 2023 | Note: Experiment results on iOS comparing control vs. treatment 119
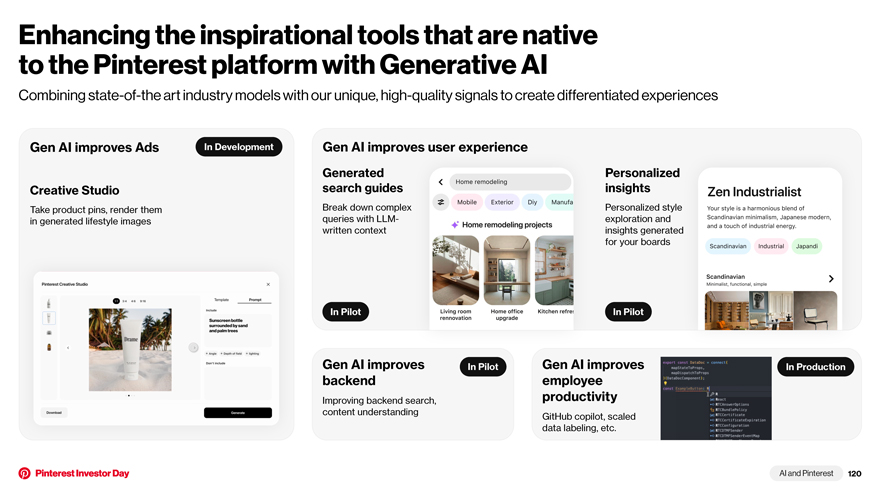
Enhancing the inspirational tools that are native to the Pinterest platform with Generative AI Combining state-of-the art industry models with our unique, high-quality signals to create differentiated experiences Gen AI improves Ads In Development Gen AI improves user experience Generated Personalized Creative Studio search guides insights Take product pins, render them Break down complex Personalized style in generated lifestyle images queries with LLM- exploration and written context insights generated for your boards In Pilot In Pilot Gen AI improves In Pilot Gen AI improves In Production backend employee Improving backend search, productivity content understanding GitHub copilot, scaled data labeling, etc. AI and Pinterest 120
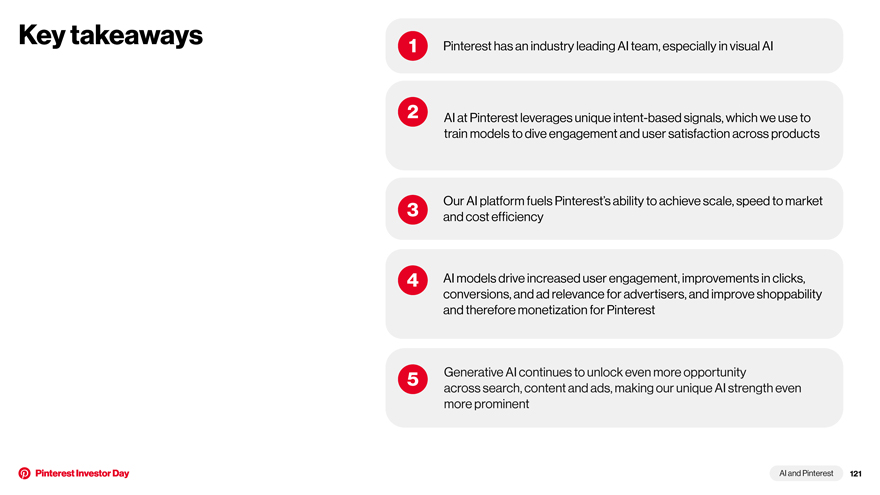
Key takeaways 1 Pinterest has an industry leading AI team, especially in visual AI 2 AI at Pinterest leverages unique intent-based signals, which we use to train models to dive engagement and user satisfaction across products 3 Our AI platform fuels Pinterest’s ability to achieve scale, speed to market and cost efficiency 4 AI models drive increased user engagement, improvements in clicks, conversions, and ad relevance for advertisers, and improve shoppability and therefore monetization for Pinterest 5 Generative AI continues to unlock even more opportunity across search, content and ads, making our unique AI strength even more prominent AI and Pinterest 121

Financial overview
Our business priorities … Growing users Improving Driving profitable and deepening monetization per growth engagement user (ARPU) Financial overview 123
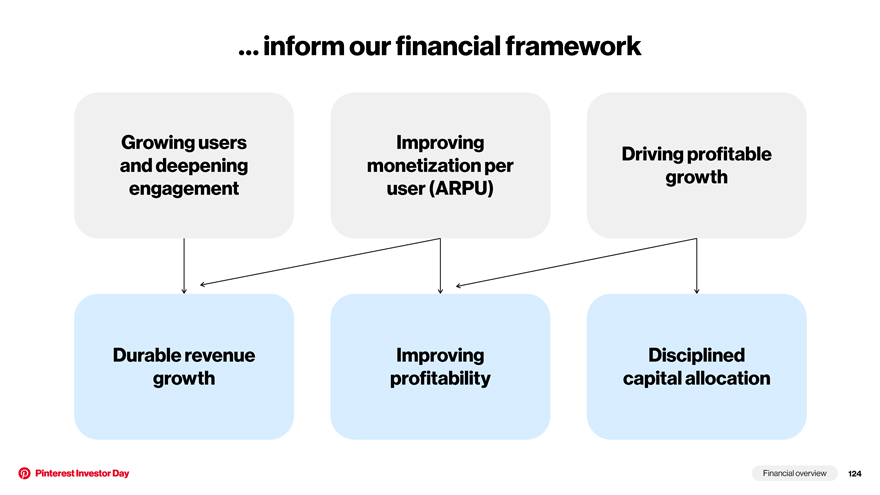
… inform our financial framework Growing users Improving Driving profitable and deepening monetization per growth engagement user (ARPU) Durable revenue Improving Disciplined growth profitability capital allocation Financial overview 124
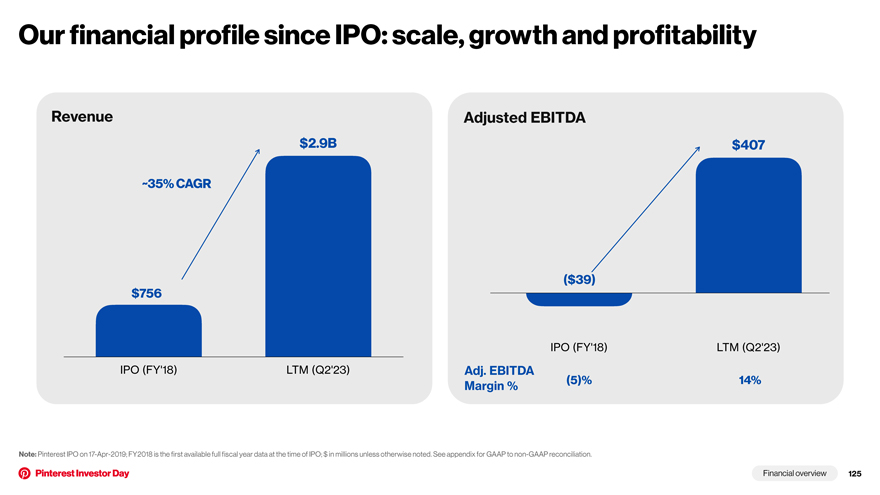
Our financial profile since IPO: scale, growth and profitability Revenue Adjusted EBITDA $2.9B $407 ~35% CAGR ( $ $—39) $0 $. 7 756B 56 IPO (FY’18) LTM (Q2’23) IPO (FY’18) LTM (Q2’23) Adj. EBITDA Margin % (5)% 14% Note: Pinterest IPO on 17-Apr-2019; FY2018 is the first available full fiscal year data at the time of IPO; $ in millions unless otherwise noted. See appendix for GAAP to non-GAAP reconciliation. Financial overview 125

The next 3–5 years: accelerating growth + profitability August ‘23 Earnings Call Our 3-5 Year Targets High single Mid-to-High Revenue digit range Expected to grow faster Growth teens CAGR than market growth (guidance for Q3 ‘23) ~400bps of YoY Committed to healthy Adjusted EBITDA Margin Low 30’s % profitability expansion EBITDA expansion while opportunistically Margin achieved in 3-5 years reinvesting into longer- (expected for full year 2023) term growth Financial overview 126
Durable revenue growth
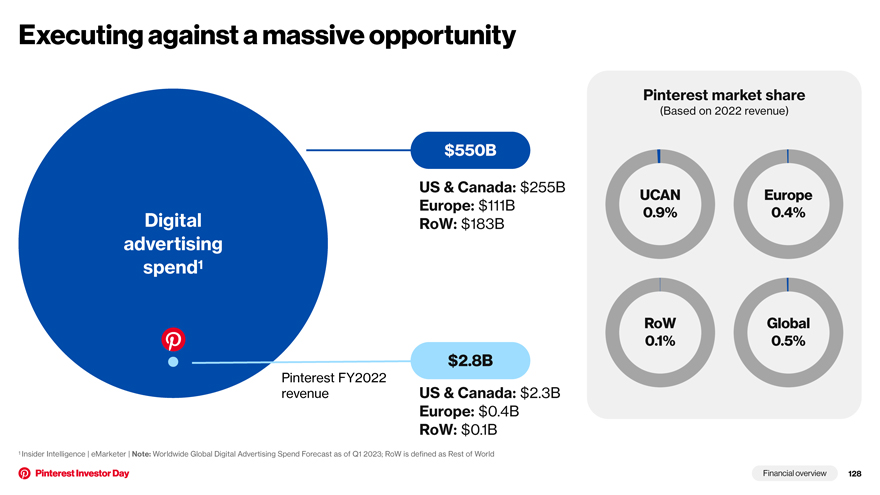
Executing against a massive opportunity $550B US & Canada: $255B Europe: $111B Digital RoW: $183B advertising spend1 $2.8B Pinterest FY2022 revenue US & Canada: $2.3B Europe: $0.4B RoW: $0.1B 1 Insider Intelligence | eMarketer | Note: Worldwide Global Digital Advertising Spend Forecast as of Q1 2023; RoW is defined as Rest of World Pinterest market share (Based on 2022 revenue) UCAN Europe 0.9% 0.4% RoW Global 0.1% 0.5% Financial overview 128
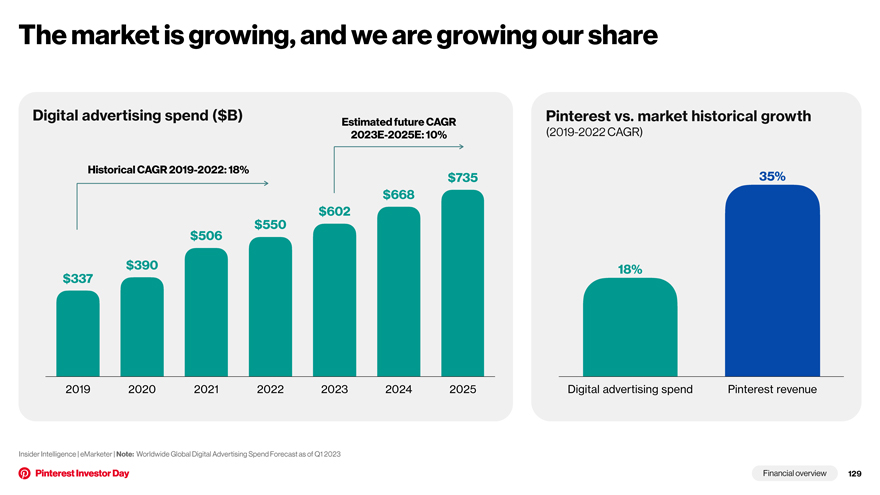
The market is growing, and we are growing our share Digital advertising spend ($B) Estimated future CAGR Pinterest vs. market historical growth 2023E-2025E: 10% (2019-2022 CAGR) Historical CAGR 2019-2022: 18% $735 35% $668 $602 $550 $506 $390 18% $337 2019 2020 2021 2022 2023 2024 2025 Digital advertising spend Pinterest revenue Insider Intelligence | eMarketer | Note: Worldwide Global Digital Advertising Spend Forecast as of Q1 2023 Financial overview 129
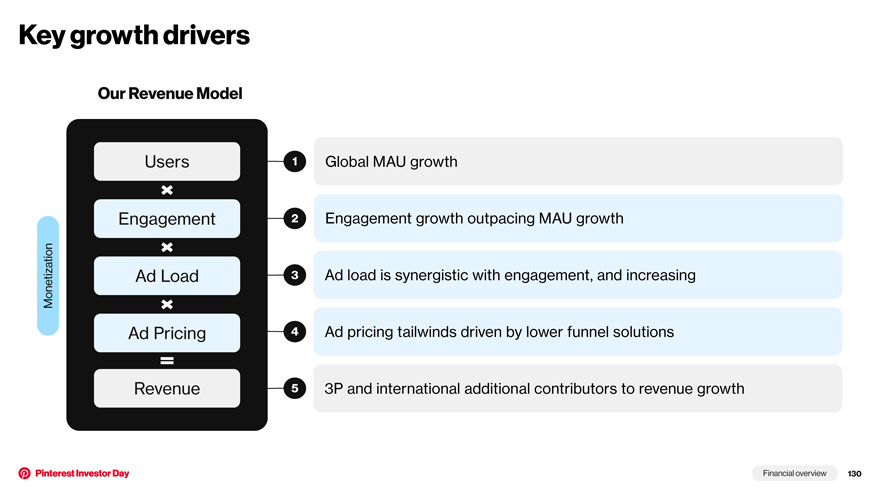
Key growth drivers Our Revenue Model Users 1 Global MAU growth Engagement 2 Engagement growth outpacing MAU growth Monetization Ad Load 3 Ad load is synergistic with engagement, and increasing Ad Pricing 4 Ad pricing tailwinds driven by lower funnel solutions Revenue 5 3P and international additional contributors to revenue growth Financial overview 130
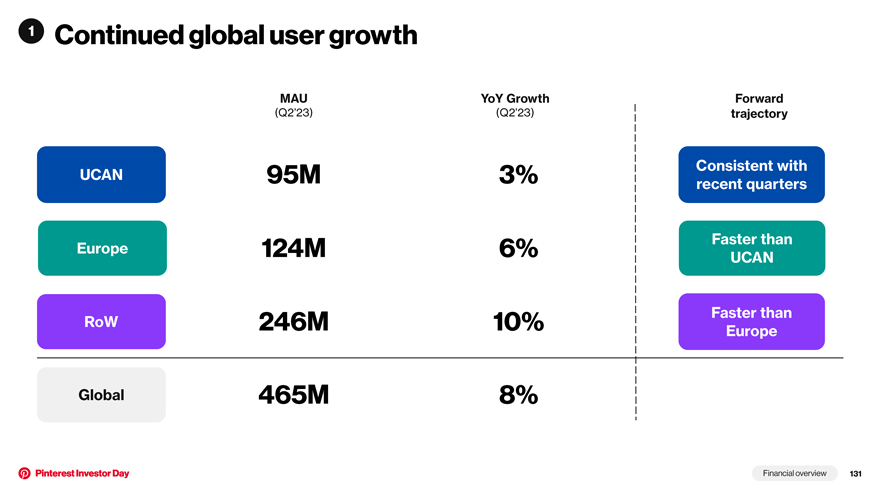
1 Continued global user growth MAU YoY Growth Forward (Q2’23) (Q2’23) trajectory Consistent with UCAN 95M 3% recent quarters Faster than Europe 124M 6% UCAN Faster than RoW 246M 10% Europe Global 465M 8% Financial overview 131
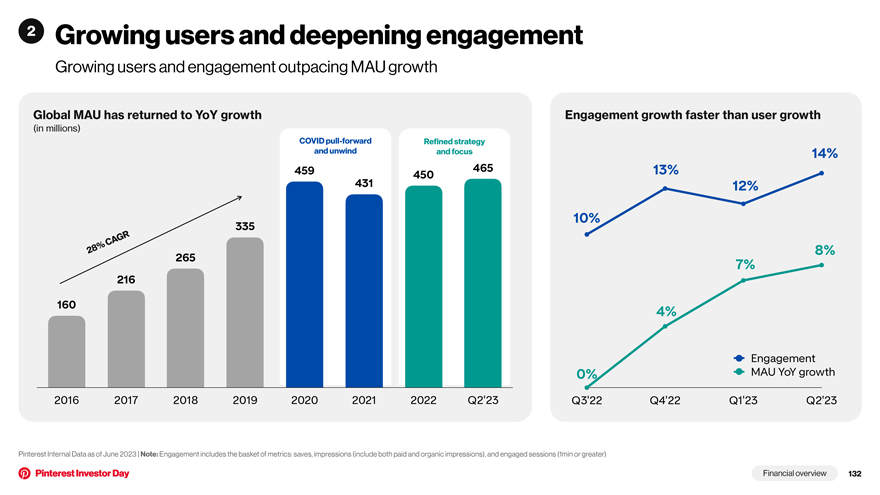
2 Growing users and deepening engagement Growing users and engagement outpacing MAU growth Global MAU has returned to YoY growth Engagement growth faster than user growth (in millions) COVID pull-forward Refined strategy and unwind and focus 14% 459 465 13% 450 431 12% 10% 335 A GR 28% C 8% 265 7% 216 160 4% Engagement 0% MAU YoY growth 2016 2017 2018 2019 2020 2021 2022 Q2’23 Q3’22 Q4’22 Q1’23 Q2’23 Pinterest Internal Data as of June 2023 | Note: Engagement includes the basket of metrics: saves, impressions (include both paid and organic impressions), and engaged sessions (1min or greater) Financial overview 132
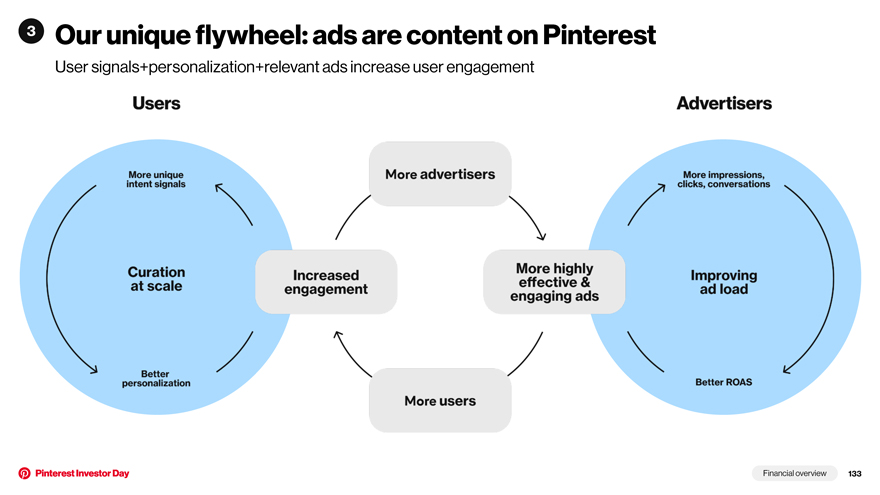
3 Our unique flywheel: ads are content on Pinterest User signals+personalization+relevant ads increase user engagement Financial overview 133
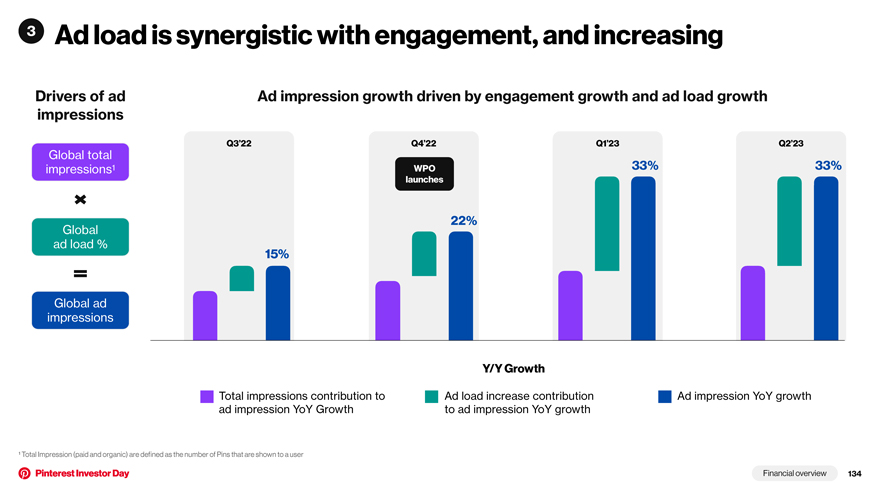
3 Ad load is synergistic with engagement, and increasing Drivers of ad Ad impression growth driven by engagement growth and ad load growth impressions Q3’22 Q4’22 Q1’23 Q2’23 Global total impressions1 WPO 33% 33% launches 22% Global ad load % 15% Global ad impressions Y/Y Growth Total impressions contribution to Ad load increase contribution Ad impression YoY growth ad impression YoY Growth to ad impression YoY growth ¹ Total Impression (paid and organic) are defined as the number of Pins that are shown to a user Financial overview 134
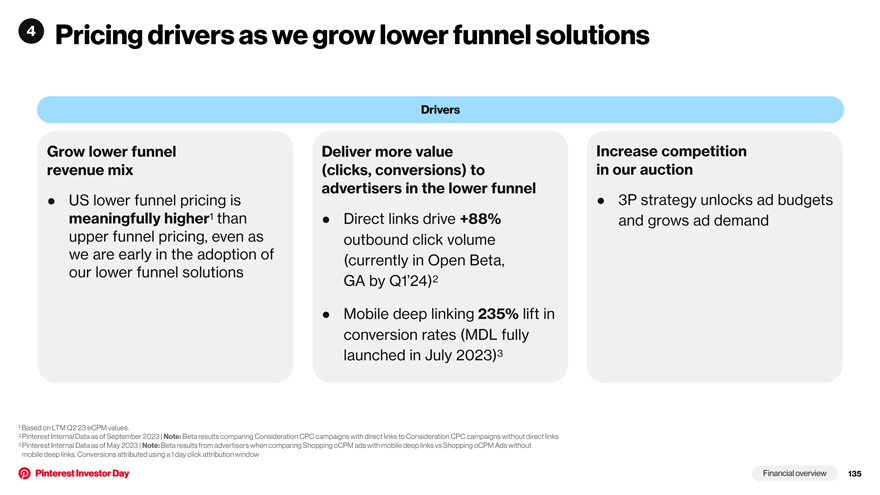
4 Pricing drivers as we grow lower funnel solutions Drivers Grow lower funnel revenue mix • US lower funnel pricing is meaningfully higher1 than upper funnel pricing, even as we are early in the adoption of our lower funnel solutions Deliver more value (clicks, conversions) to advertisers in the lower funnel • Direct links drive +88% outbound click volume (currently in Open Beta, GA by Q1’24)2 • Mobile deep linking 235% lift in conversion rates (MDL fully launched in July 2023)3 Increase competition in our auction • 3P strategy unlocks ad budgets and grows ad demand ¹ Based on LTM Q2’23 eCPM values. 2 Pinterest Internal Data as of September 2023 | Note: Beta results comparing Consideration CPC campaigns with direct links to Consideration CPC campaigns without direct links 3 Pinterest Internal Data as of May 2023 | Note: Beta results from advertisers when comparing Shopping oCPM ads with mobile deep links vs Shopping oCPM Ads without mobile deep links, Conversions attributed using a 1 day click attribution window
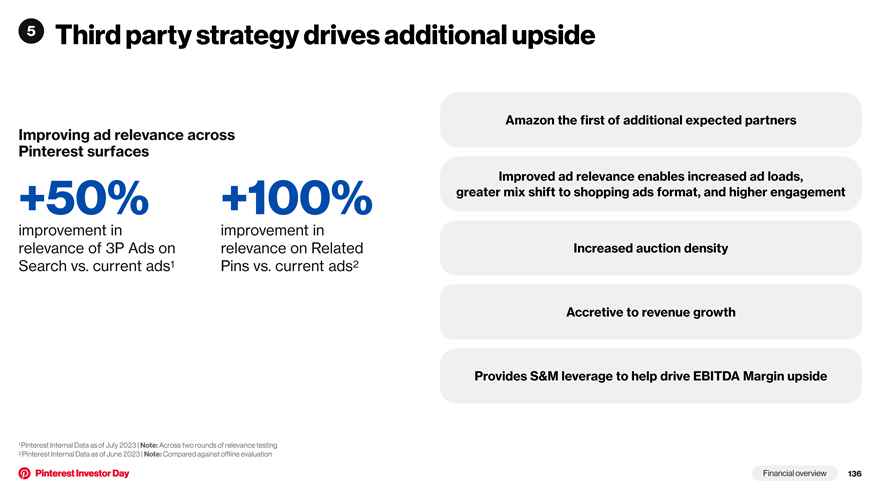
5 Third party strategy drives additional upside Improving ad relevance across Pinterest surfaces +50% +100% improvement in improvement in relevance of 3P Ads on relevance on Related Search vs. current ads1 Pins vs. current ads2 Amazon the first of additional expected partners Improved ad relevance enables increased ad loads, greater mix shift to shopping ads format, and higher engagement Increased auction density Accretive to revenue growth Provides S&M leverage to help drive EBITDA Margin upside 1 Pinterest Internal Data as of July 2023 | Note: Across two rounds of relevance testing 2 Pinterest Internal Data as of June 2023 | Note: Compared against offline evaluation
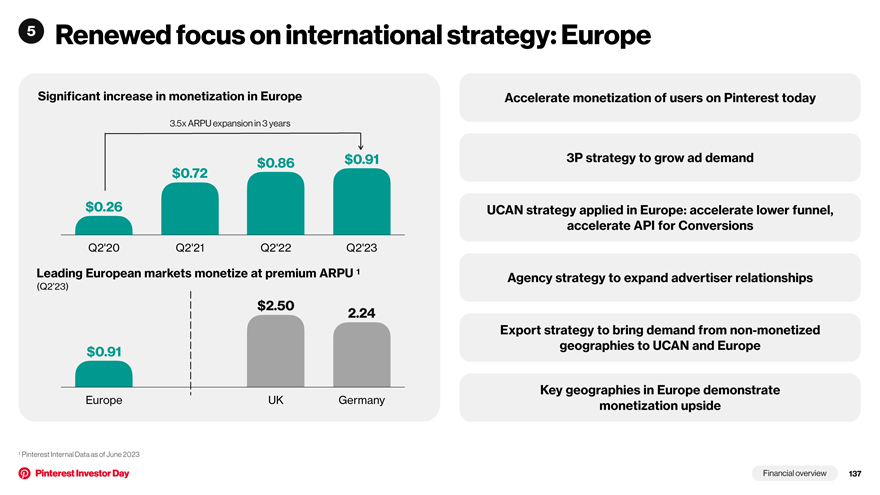
5 Renewed focus on international strategy: Europe Significant increase in monetization in Europe 3.5x ARPU expansion in 3 years $0.86 $0.91 $0.72 $0.26 Q2’20 Q2’21 Q2’22 Q2’23 Leading European markets monetize at premium ARPU 1 (Q2’23) $2.50 2.24 $0.91 Europe UK Germany Accelerate monetization of users on Pinterest today 3P strategy to grow ad demand UCAN strategy applied in Europe: accelerate lower funnel, accelerate API for Conversions Agency strategy to expand advertiser relationships Export strategy to bring demand from non-monetized geographies to UCAN and Europe Key geographies in Europe demonstrate monetization upside 1 Pinterest Internal Data as of June 2023
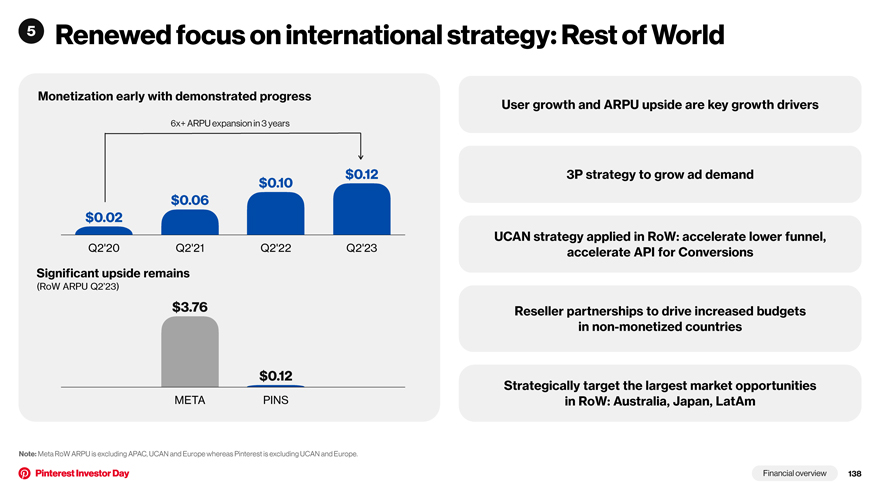
5 Renewed focus on international strategy: Rest of World Monetization early with demonstrated progress 6x+ ARPU expansion in 3 years $0.12 $0.10 $0.06 $0.02 Q2’20 Q2’21 Q2’22 Q2’23 Significant upside remains (RoW ARPU Q2’23) $3.76 $0.12 META PINS User growth and ARPU upside are key growth drivers 3P strategy to grow ad demand UCAN strategy applied in RoW: accelerate lower funnel, accelerate API for Conversions Reseller partnerships to drive increased budgets in non-monetized countries Strategically target the largest market opportunities in RoW: Australia, Japan, LatAm Note: Meta RoW ARPU is excluding APAC, UCAN and Europe whereas Pinterest is excluding UCAN and Europe.
Improving profitability
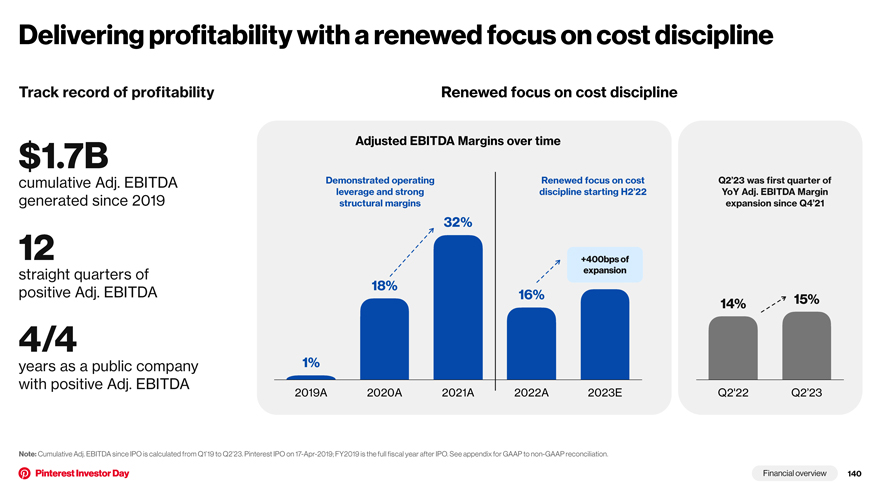
Delivering profitability with a renewed focus on cost discipline Track record of profitability $1.7B cumulative Adj. EBITDA generated since 2019 12 straight quarters of positive Adj. EBITDA 4/4 years as a public company with positive Adj. EBITDA Renewed focus on cost discipline Adjusted EBITDA Margins over time Demonstrated operating Renewed focus on cost Q2’23 was first quarter of leverage and strong discipline starting H2’22 YoY Adj. EBITDA Margin structural margins expansion since Q4’21 32% +400bps of expansion 20% 18% 16% 15% 14% 1% 2019A 2020A 2021A 2022A 2023E Q2’22 Q2’23 Note: Cumulative Adj. EBITDA since IPO is calculated from Q1’19 to Q2’23. Pinterest IPO on 17-Apr-2019; FY2019 is the full fiscal year after IPO. See appendix for GAAP to non-GAAP reconciliation.
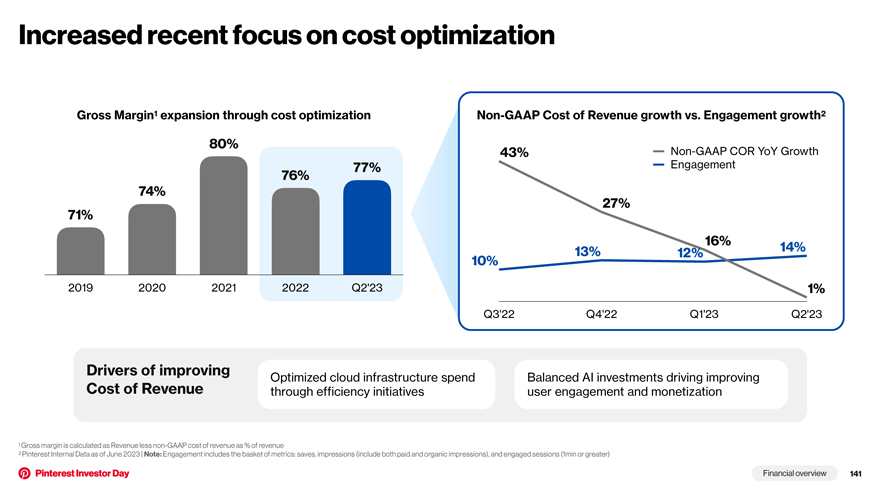
1 Gross margin is calculated as Revenue less non-GAAP cost of revenue as % of revenue 2 Pinterest Internal Data as of June 2023 | Note: Engagement includes the basket of metrics: saves, impressions (include both paid and organic impressions), and engaged sessions (1min or greater) Increased recent focus on cost optimization Gross Margin1 expansion through cost optimization 80% 77% 76% 74% 71% 2019 2020 2021 2022 Q2’23 Non-GAAP Cost of Revenue growth vs. Engagement growth2 43% Non-GAAP COR YoY Growth Engagement 27% 16% 14% 13% 12% 10% 1% Q3’22 Q4’22 Q1’23 Q2’23 Drivers of improving Optimized cloud infrastructure spend Balanced AI investments driving improving Cost of Revenue through efficiency initiatives user engagement and monetization
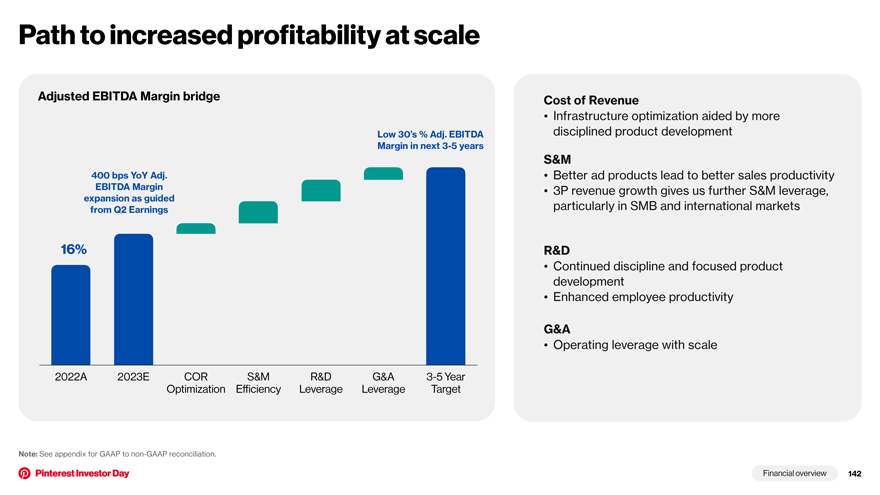
Path to increased profitability at scale Adjusted EBITDA Margin bridge Low 30’s % Adj. EBITDA Margin in next 3-5 years 400 bps YoY Adj. EBITDA Margin expansion as guided from Q2 Earnings 16% 2022A 2023E COR S&M R&D G&A 3-5 Year Optimization Efficiency Leverage Leverage Target Cost of Revenue • Infrastructure optimization aided by more disciplined product development S&M • Better ad products lead to better sales productivity • 3P revenue growth gives us further S&M leverage, particularly in SMB and international markets R&D • Continued discipline and focused product development • Enhanced employee productivity G&A • Operating leverage with scale Note: See appendix for GAAP to non-GAAP reconciliation.
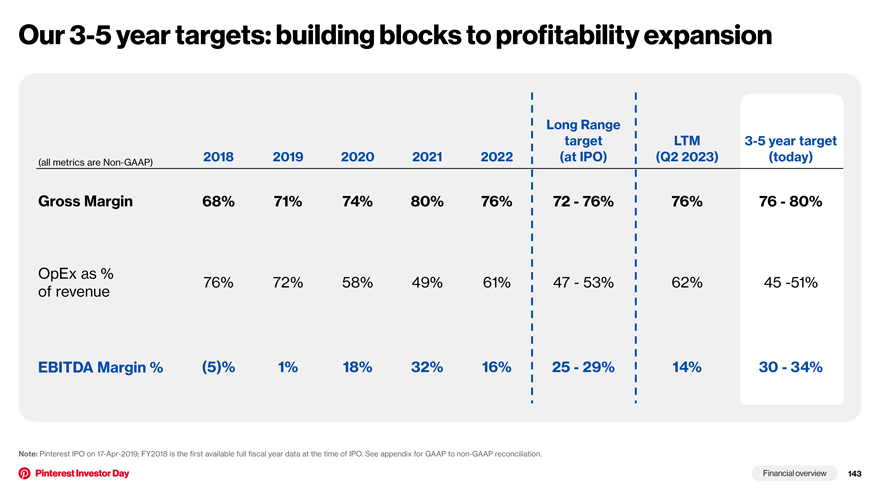
Our 3-5 year targets: building blocks to profitability expansion Long Range target LTM 3-5 year target (all metrics are Non-GAAP) 2018 2019 2020 2021 2022 (at IPO) (Q2 2023) (today) Gross Margin 68% 71% 74% 80% 76% 72—76% 76% 76—80% OpEx as % 76% 72% 58% 49% 61% 47—53% 62% 45 -51% of revenue EBITDA Margin % (5)% 1% 18% 32% 16% 25—29% 14% 30—34% Note: Pinterest IPO on 17-Apr-2019; FY2018 is the first available full fiscal year data at the time of IPO. See appendix for GAAP to non-GAAP reconciliation.
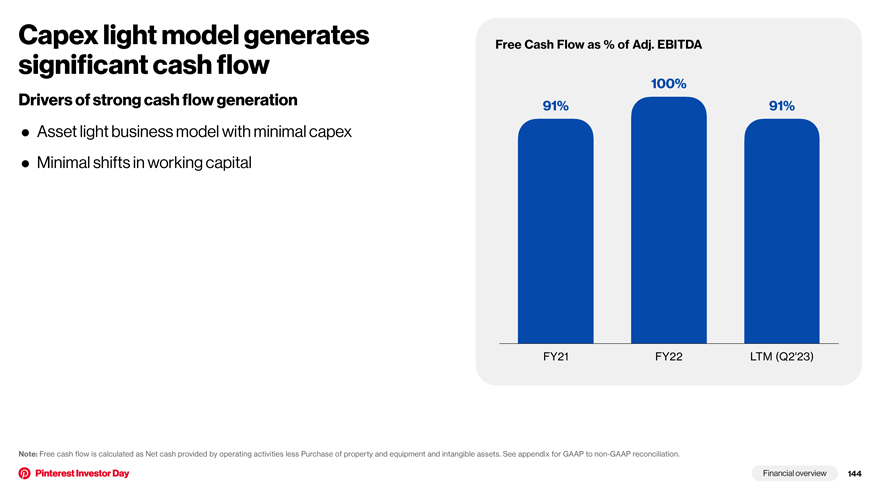
Capex light model generates significant cash flow Drivers of strong cash flow generation • Asset light business model with minimal capex • Minimal shifts in working capital Free Cash Flow as % of Adj. EBITDA 100% 91% 91% FY21 FY22 LTM (Q2’23) Note: Free cash flow is calculated as Net cash provided by operating activities less Purchase of property and equipment and intangible assets. See appendix for GAAP to non-GAAP reconciliation.

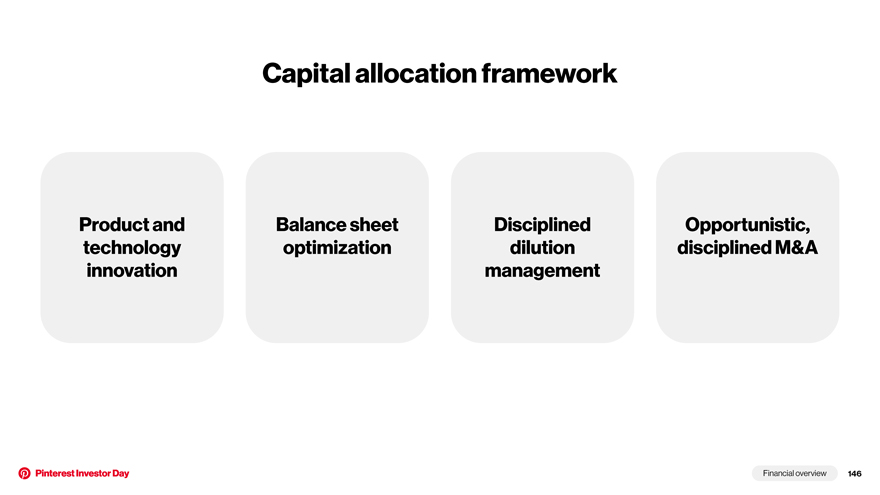
Capital allocation framework Product and Balance sheet Disciplined Opportunistic, technology optimization dilution disciplined M&A innovation management
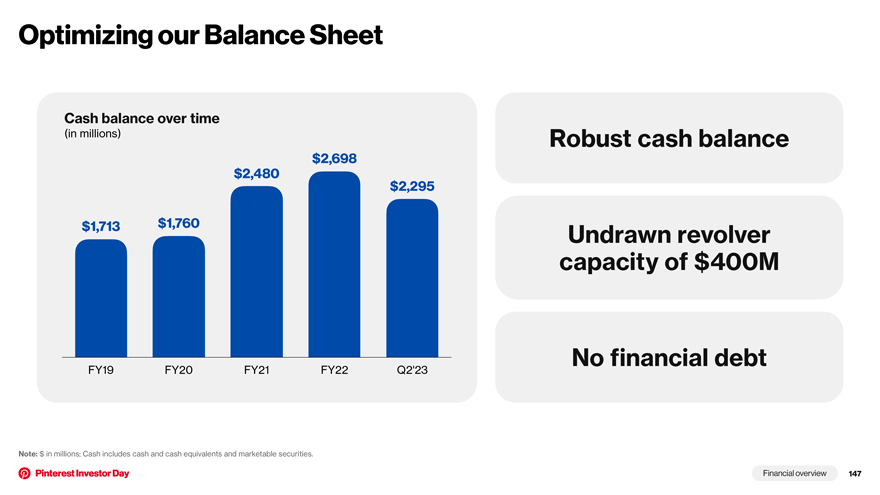
Optimizing our Balance Sheet Cash balance over time (in millions) $2,698 $2,480 $2,295 $1,713 $1,760 FY19 FY20 FY21 FY22 Q2’23 Robust cash balance Undrawn revolver capacity of $400M No financial debt Note: $ in millions; Cash includes cash and cash equivalents and marketable securities.
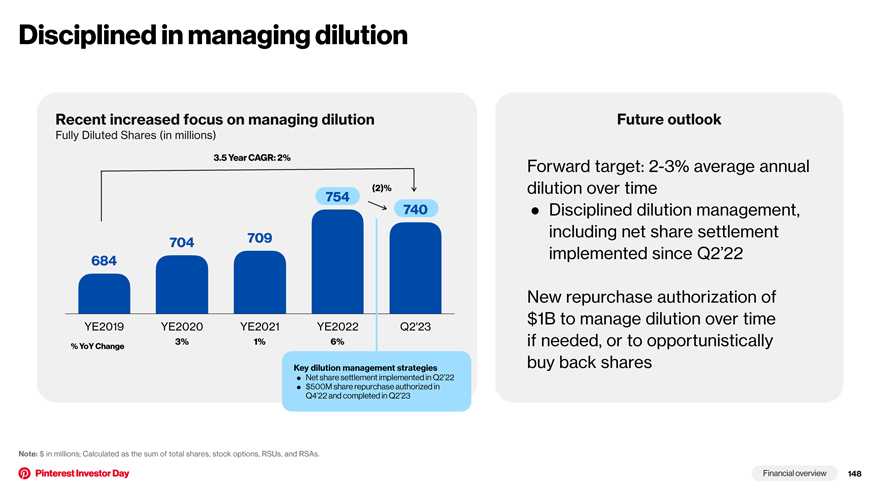
Disciplined in managing dilution Recent increased focus on managing dilution Fully Diluted Shares (in millions) 3.5 Year CAGR: 2% (2)% 754 740 704 709 684 YE2019 YE2020 YE2021 YE2022 Q2’23 3% 1% 6% % YoY Change Key dilution management strategies • Net share settlement implemented in Q2’22 • $500M share repurchase authorized in Q4’22 and completed in Q2’23 Future outlook Forward target: 2-3% average annual dilution over time • Disciplined dilution management, including net share settlement implemented since Q2’22 New repurchase authorization of $1B to manage dilution over time if needed, or to opportunistically buy back shares Note: $ in millions; Calculated as the sum of total shares, stock options, RSUs, and RSAs.
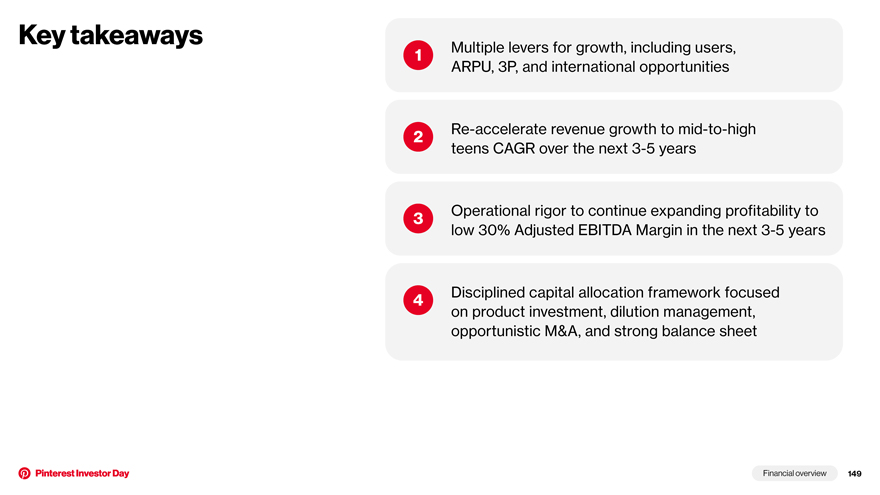
Key takeaways 1 Multiple levers for growth, including users, ARPU, 3P, and international opportunities 2 Re-accelerate revenue growth to mid-to-high teens CAGR over the next 3-5 years 3 Operational rigor to continue expanding profitability to low 30% Adjusted EBITDA Margin in the next 3-5 years 4 Disciplined capital allocation framework focused on product investment, dilution management, opportunistic M&A, and strong balance sheet Financial overview 149

Closing remarks
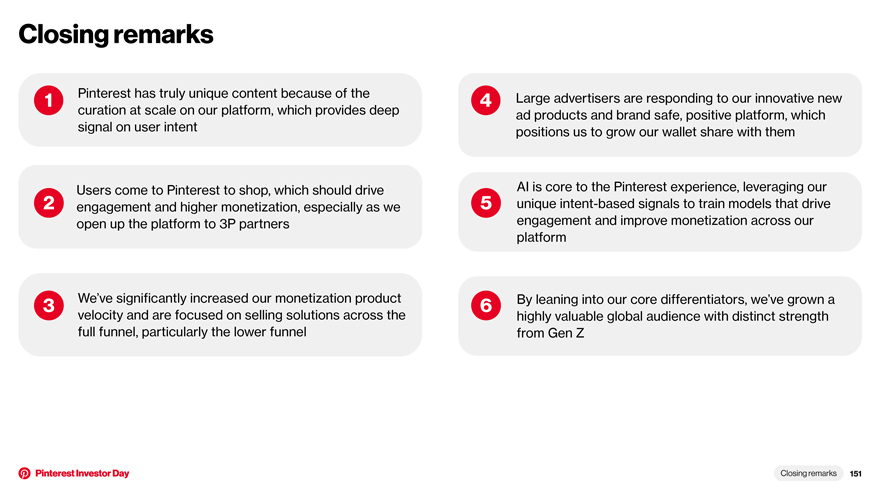
Closing remarks 1 Pinterest has truly unique content because of the curation at scale on our platform, which provides deep signal on user intent Users come to Pinterest to shop, which should drive 2 engagement and higher monetization, especially as we open up the platform to 3P partners 3 We’ve significantly increased our monetization product velocity and are focused on selling solutions across the full funnel, particularly the lower funnel 4 Large advertisers are responding to our innovative new ad products and brand safe, positive platform, which positions us to grow our wallet share with them AI is core to the Pinterest experience, leveraging our 5 unique intent-based signals to train models that drive engagement and improve monetization across our platform 6 By leaning into our core differentiators, we’ve grown a highly valuable global audience with distinct strength from Gen Z
Appendix
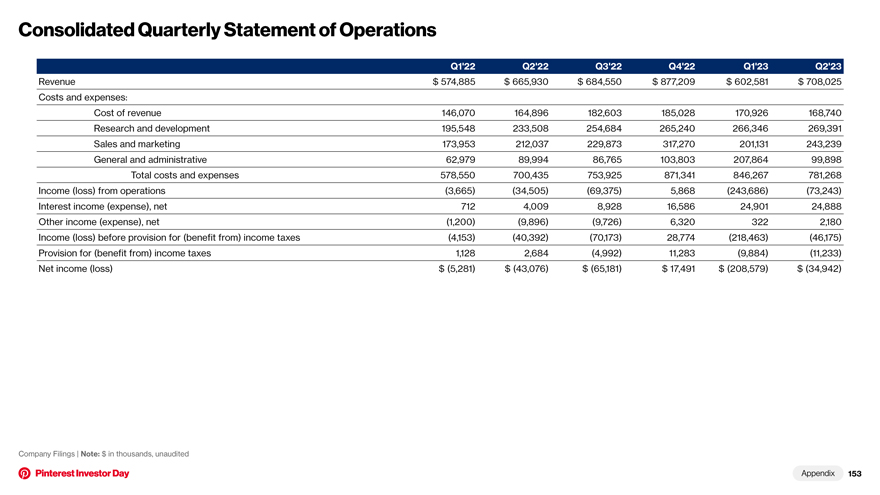
Consolidated Quarterly Statement of Operations Q1’22 Q2’22 Q3’22 Q4’22 Q1’23 Q2’23 Revenue $ 574,885 $ 665,930 $ 684,550 $ 877,209 $ 602,581 $ 708,025 Costs and expenses: Cost of revenue 146,070 164,896 182,603 185,028 170,926 168,740 Research and development 195,548 233,508 254,684 265,240 266,346 269,391 Sales and marketing 173,953 212,037 229,873 317,270 201,131 243,239 General and administrative 62,979 89,994 86,765 103,803 207,864 99,898 Total costs and expenses 578,550 700,435 753,925 871,341 846,267 781,268 Income (loss) from operations (3,665) (34,505) (69,375) 5,868 (243,686) (73,243) Interest income (expense), net 712 4,009 8,928 16,586 24,901 24,888 Other income (expense), net (1,200) (9,896) (9,726) 6,320 322 2,180 Income (loss) before provision for (benefit from) income taxes (4,153) (40,392) (70,173) 28,774 (218,463) (46,175) Provision for (benefit from) income taxes 1,128 2,684 (4,992) 11,283 (9,884) (11,233) Net income (loss) $ (5,281) $ (43,076) $ (65,181) $ 17,491 $ (208,579) $ (34,942) Company Filings | Note: $ in thousands, unaudited
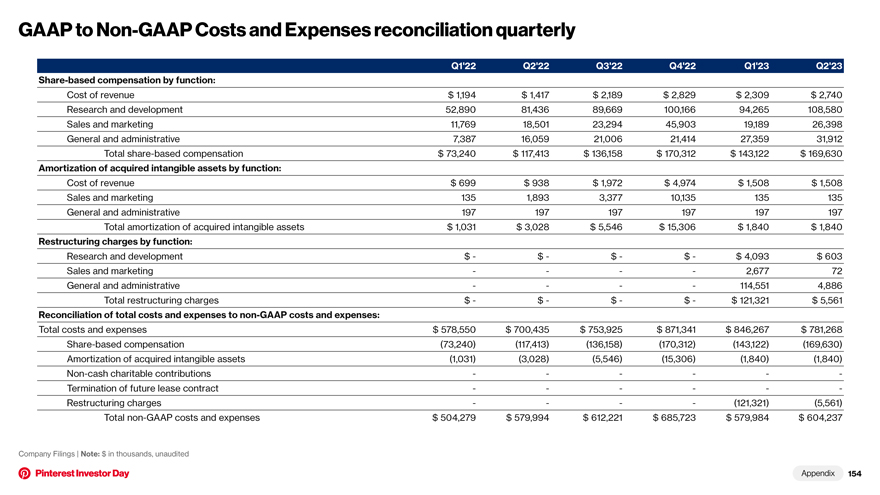
GAAP to Non-GAAP Costs and Expenses reconciliation quarterly Q1’22 Q2’22 Q3’22 Q4’22 Q1’23 Q2’23 Share-based compensation by function: Cost of revenue $ 1,194 $ 1,417 $ 2,189 $ 2,829 $ 2,309 $ 2,740 Research and development 52,890 81,436 89,669 100,166 94,265 108,580 Sales and marketing 11,769 18,501 23,294 45,903 19,189 26,398 General and administrative 7,387 16,059 21,006 21,414 27,359 31,912 Total share-based compensation $ 73,240 $ 117,413 $ 136,158 $ 170,312 $ 143,122 $ 169,630 Amortization of acquired intangible assets by function: Cost of revenue $ 699 $ 938 $ 1,972 $ 4,974 $ 1,508 $ 1,508 Sales and marketing 135 1,893 3,377 10,135 135 135 General and administrative 197 197 197 197 197 197 Total amortization of acquired intangible assets $ 1,031 $ 3,028 $ 5,546 $ 15,306 $ 1,840 $ 1,840 Restructuring charges by function: Research and development $—$—$—$—$ 4,093 $ 603 Sales and marketing — — 2,677 72 General and administrative — — 114,551 4,886 Total restructuring charges $—$—$—$—$ 121,321 $ 5,561 Reconciliation of total costs and expenses to non-GAAP costs and expenses: Total costs and expenses $ 578,550 $ 700,435 $ 753,925 $ 871,341 $ 846,267 $ 781,268 Share-based compensation (73,240) (117,413) (136,158) (170,312) (143,122) (169,630) Amortization of acquired intangible assets (1,031) (3,028) (5,546) (15,306) (1,840) (1,840) Non-cash charitable contributions — — —Termination of future lease contract — — —Restructuring charges — — (121,321) (5,561) Total non-GAAP costs and expenses $ 504,279 $ 579,994 $ 612,221 $ 685,723 $ 579,984 $ 604,237 Company Filings | Note: $ in thousands, unaudited Appendix
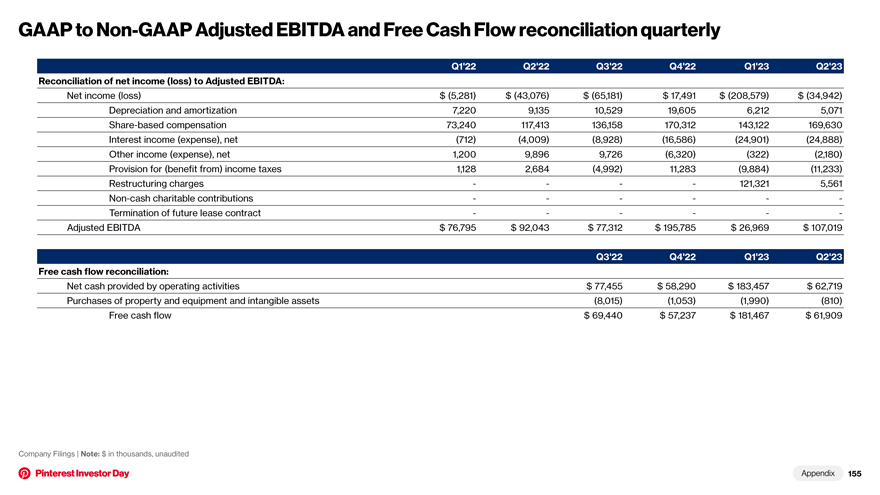
GAAP to Non-GAAP Adjusted EBITDA and Free Cash Flow reconciliation quarterly Q1’22 Q2’22 Q3’22 Q4’22 Q1’23 Q2’23 Reconciliation of net income (loss) to Adjusted EBITDA: Net income (loss) $ (5,281) $ (43,076) $ (65,181) $ 17,491 $ (208,579) $ (34,942) Depreciation and amortization 7,220 9,135 10,529 19,605 6,212 5,071 Share-based compensation 73,240 117,413 136,158 170,312 143,122 169,630 Interest income (expense), net (712) (4,009) (8,928) (16,586) (24,901) (24,888) Other income (expense), net 1,200 9,896 9,726 (6,320) (322) (2,180) Provision for (benefit from) income taxes 1,128 2,684 (4,992) 11,283 (9,884) (11,233) Restructuring charges — — 121,321 5,561 Non-cash charitable contributions — — —Termination of future lease contract — — —Adjusted EBITDA $ 76,795 $ 92,043 $ 77,312 $ 195,785 $ 26,969 $ 107,019 Q3’22 Q4’22 Q1’23 Q2’23 Free cash flow reconciliation: Net cash provided by operating activities $ 77,455 $ 58,290 $ 183,457 $ 62,719 Purchases of property and equipment and intangible assets (8,015) (1,053) (1,990) (810) Free cash flow $ 69,440 $ 57,237 $ 181,467 $ 61,909 Company Filings | Note: $ in thousands, unaudited Appendix
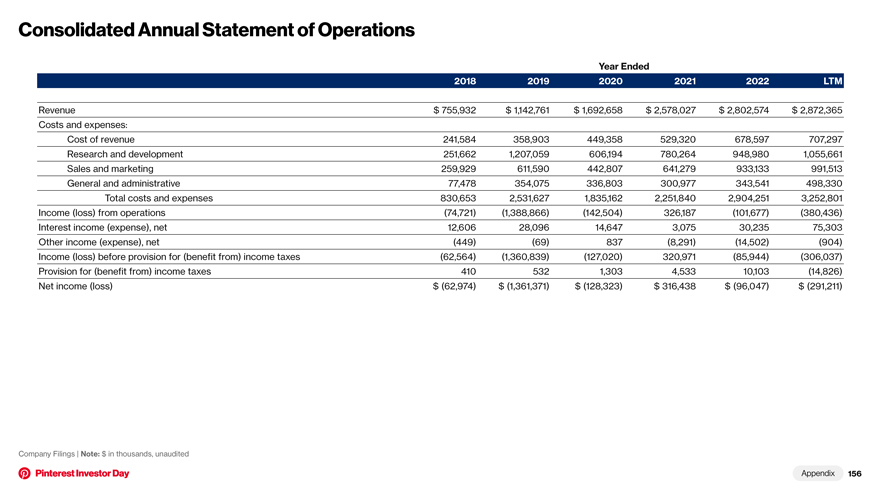
Consolidated Annual Statement of Operations Year Ended 2018 2019 2020 2021 2022 LTM Revenue $ 755,932 $ 1,142,761 $ 1,692,658 $ 2,578,027 $ 2,802,574 $ 2,872,365 Costs and expenses: Cost of revenue 241,584 358,903 449,358 529,320 678,597 707,297 Research and development 251,662 1,207,059 606,194 780,264 948,980 1,055,661 Sales and marketing 259,929 611,590 442,807 641,279 933,133 991,513 General and administrative 77,478 354,075 336,803 300,977 343,541 498,330 Total costs and expenses 830,653 2,531,627 1,835,162 2,251,840 2,904,251 3,252,801 Income (loss) from operations (74,721) (1,388,866) (142,504) 326,187 (101,677) (380,436) Interest income (expense), net 12,606 28,096 14,647 3,075 30,235 75,303 Other income (expense), net (449) (69) 837 (8,291) (14,502) (904) Income (loss) before provision for (benefit from) income taxes (62,564) (1,360,839) (127,020) 320,971 (85,944) (306,037) Provision for (benefit from) income taxes 410 532 1,303 4,533 10,103 (14,826) Net income (loss) $ (62,974) $ (1,361,371) $ (128,323) $ 316,438 $ (96,047) $ (291,211) Company Filings | Note: $ in thousands, unaudited
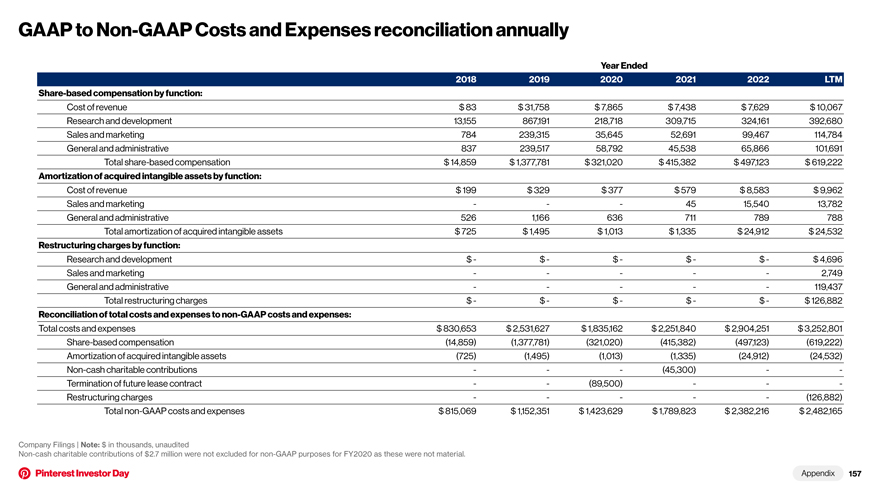
GAAP to Non-GAAP Costs and Expenses reconciliation annually Year Ended 2018 2019 2020 2021 2022 LTM Share-based compensation by function: Cost of revenue $ 83 $ 31,758 $ 7,865 $ 7,438 $ 7,629 $ 10,067 Research and development 13,155 867,191 218,718 309,715 324,161 392,680 Sales and marketing 784 239,315 35,645 52,691 99,467 114,784 General and administrative 837 239,517 58,792 45,538 65,866 101,691 Total share-based compensation $ 14,859 $ 1,377,781 $ 321,020 $ 415,382 $ 497,123 $ 619,222 Amortization of acquired intangible assets by function: Cost of revenue $ 199 $ 329 $ 377 $ 579 $ 8,583 $ 9,962 Sales and marketing ——45 15,540 13,782 General and administrative 526 1,166 636 711 789 788 Total amortization of acquired intangible assets $ 725 $ 1,495 $ 1,013 $ 1,335 $ 24,912 $ 24,532 Restructuring charges by function: Research and development $—$—$—$—$—$ 4,696 Sales and marketing — ——2,749 General and administrative — ——119,437 Total restructuring charges $—$—$—$—$—$ 126,882 Reconciliation of total costs and expenses to non-GAAP costs and expenses: Total costs and expenses $ 830,653 $ 2,531,627 $ 1,835,162 $ 2,251,840 $ 2,904,251 $ 3,252,801 Share-based compensation (14,859) (1,377,781) (321,020) (415,382) (497,123) (619,222) Amortization of acquired intangible assets (725) (1,495) (1,013) (1,335) (24,912) (24,532) Non-cash charitable contributions ——(45,300) —Termination of future lease contract — (89,500) — -Restructuring charges — ——(126,882) Total non-GAAP costs and expenses $ 815,069 $ 1,152,351 $ 1,423,629 $ 1,789,823 $ 2,382,216 $ 2,482,165 Company Filings | Note: $ in thousands, unaudited Non-cash charitable contributions of $2.7 million were not excluded for non-GAAP purposes for FY2020 as these were not material. Appendix
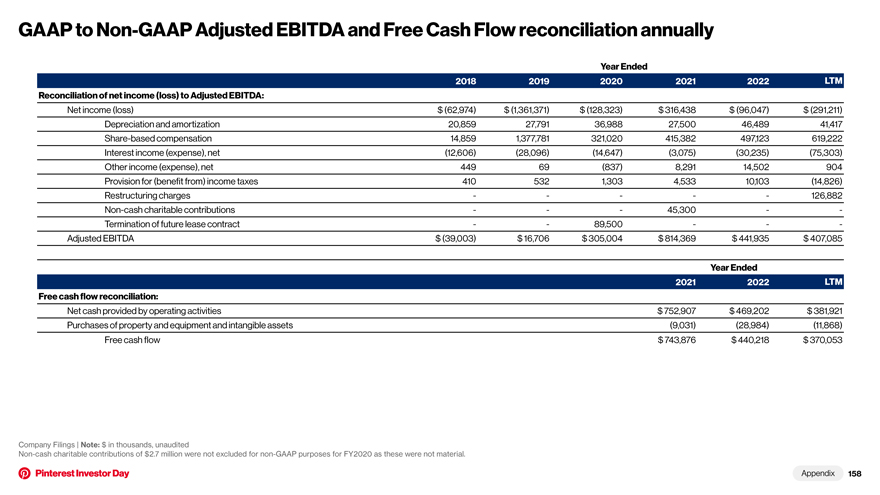
GAAP to Non-GAAP Adjusted EBITDA and Free Cash Flow reconciliation annually Year Ended 2018 2019 2020 2021 2022 LTM Reconciliation of net income (loss) to Adjusted EBITDA: Net income (loss) $ (62,974) $ (1,361,371) $ (128,323) $ 316,438 $ (96,047) $ (291,211) Depreciation and amortization 20,859 27,791 36,988 27,500 46,489 41,417 Share-based compensation 14,859 1,377,781 321,020 415,382 497,123 619,222 Interest income (expense), net (12,606) (28,096) (14,647) (3,075) (30,235) (75,303) Other income (expense), net 449 69 (837) 8,291 14,502 904 Provision for (benefit from) income taxes 410 532 1,303 4,533 10,103 (14,826) Restructuring charges — ——126,882 Non-cash charitable contributions ——45,300 —Termination of future lease contract — 89,500 — -Adjusted EBITDA $ (39,003) $ 16,706 $ 305,004 $ 814,369 $ 441,935 $ 407,085 Year Ended 2021 2022 LTM Free cash flow reconciliation: Net cash provided by operating activities $ 752,907 $ 469,202 $ 381,921 Purchases of property and equipment and intangible assets (9,031) (28,984) (11,868) Free cash flow $ 743,876 $ 440,218 $ 370,053 Company Filings | Note: $ in thousands, unaudited Non-cash charitable contributions of $2.7 million were not excluded for non-GAAP purposes for FY2020 as these were not material.