UNITED STATES
SECURITIES AND EXCHANGE COMMISSION
Washington, D.C. 20549
Form 6-K
REPORT OF FOREIGN PRIVATE ISSUER
PURSUANT TO RULE 13a-16 OR 15d-16
UNDER THE SECURITIES EXCHANGE ACT OF 1934
August 22, 2023
BHP GROUP LIMITED
(ABN 49 004 028 077)
(Exact name of Registrant as specified in its charter)
VICTORIA, AUSTRALIA
(Jurisdiction of incorporation or organisation)
171 COLLINS STREET, MELBOURNE, VICTORIA 3000 AUSTRALIA
(Address of principal executive offices)
Indicate by check mark whether the registrant files or will file annual reports under cover of Form 20-F or Form 40-F: ☒ Form 20-F ☐ Form 40-F
Indicate by check mark if the registrant is submitting the Form 6-K in paper as permitted by Regulation S-T Rule 101(b)(1): ☐
Indicate by check mark if the registrant is submitting the Form 6-K in paper as permitted by Regulation S-T Rule 101(b)(7): ☐
Indicate by check mark whether the registrant by furnishing the information contained in this Form is also thereby furnishing the information to the Commission pursuant to Rule 12g3-2(b) under the Securities Exchange Act of 1934: ☐ Yes ☒ No
If “Yes” is marked, indicate below the file number assigned to the registrant in connection with Rule 12g3-2(b): n/a
BHP BHP Group Limited ABN 49 004 028 077 Exchange release 22 August 2023 BHP FY2023 Results Presentation Attached are the presentation slides for BHP’s FY2023 Results Presentation by the Chief Executive Officer and Chief Financial Officer. The presentation slides and a video of this presentation are available at: https://www.bhp.com/financial-results Authorised for release by Stefanie Wilkinson, Group Company Secretary.
BHP Group Limited ABN 49 004 028 077 Contacts Media media.relations@bhp.com Investor Relations investor.relations@bhp.com Australia and Asia Gabrielle Notley +61 411 071 715 Australia and Asia John-Paul Santamaria +61 499 006 018 Europe, Middle East and Africa Neil Burrows +44 7786 661 683 Europe, Middle East and Africa James Bell +44 7961 636 432 Americas Renata Fernandaz +56 9 8229 5357 Americas Monica Nettleton +1 (416) 518-6293 BHP Group Limited ABN 49 004 028 077 LEI WZE1WSENV6JSZFK0JC28 Registered in Australia Level 18, 171 Collins Street, Melbourne, Victoria 3000 Australia Tel: +61 1300 55 4757 Fax: +61 3 9609 3015 BHP Group is headquartered in Australia bhp.com

Disciplined execution of our strategy Full year ended 30 June 2023 Western Australia Iron Ore

Disclaimer The information in this presentation is current as at 22 August 2023. It is in summary form and is not necessarily complete. It should be read together with the BHP Results for the full year ended 30 June 2023. Forward-looking statements This presentation contains forward-looking statements, which involve risks and uncertainties. Forward-looking statements include all statements other than statements of historical or present facts, including: statements regarding: trends in commodity prices and currency exchange rates; demand for commodities; global market conditions; guidance; reserves and resources and production forecasts; expectations, plans, strategies and objectives of management; our expectations, commitments, targets, goals and objectives with respect to social value or sustainability; climate scenarios; approval of certain projects and consummation of certain transactions; closure, divestment, acquisition or integration of certain assets, operations or facilities (including associated costs or benefits); anticipated production or construction commencement dates; capital expenditure or costs and scheduling; operating costs, and supply of materials and skilled employees; anticipated productive lives of projects, mines and facilities; the availability, implementation and adoption of new technologies; provisions and contingent liabilities; and tax, legal and other regulatory developments. Forward-looking statements may be identified by the use of terminology, including, but not limited to, ‘intend’, ‘aim’, ‘ambition’, ‘aspiration’, ‘goal’, ‘target’, ‘prospect’, ‘project’, ‘see’, ‘anticipate’, ‘estimate’, ‘plan’, ‘objective’, ‘believe’, ‘expect’, ‘commit’, ‘may’, ‘should’, ‘need’, ‘must’, ‘will’, ‘would’, ‘continue’, ‘forecast’, ‘guidance’, ‘outlook’, ‘trend’ or similar words. These statements discuss future expectations or performance, or provide other forward-looking information. The forward-looking statements are based on management’s expectations and reflect judgements, assumptions, estimates and other information available as at the date made. BHP cautions against reliance on any forward-looking statements or guidance. Additionally, forward-looking statements in this presentation do not represent guarantees or predictions of future financial or operational performance, and involve known and unknown risks, uncertainties and other factors, many of which are beyond our control, and which may cause actual results to differ materially from those expressed in the statements contained in this presentation. For example, our future revenues from our assets, projects or mines described in this presentation will be based, in part, upon the market price of the commodities produced, which may vary significantly from current levels. These variations, if materially adverse, may affect the timing or the feasibility of the development of a particular project, the expansion of certain facilities or mines, or the continuation of existing assets. In addition, there are limitations with scenario analysis and it is difficult to predict which, if any, of the scenarios might eventuate. Scenario analysis is not an indication of probable outcomes and relies on assumptions that may or may not prove to be correct or eventuate. Other factors that may affect the actual construction or production commencement dates, revenues, costs or production output and anticipated lives of assets, mines or facilities include our ability to profitably produce and deliver the products extracted to applicable markets; the impact of economic and geopolitical factors, including foreign currency exchange rates on the market prices of the commodities we produce and competition in the markets in which we operate; activities of government authorities in the countries where we sell our products and in the countries where we are exploring or developing projects, facilities or mines, including increases in taxes and royalties or implementation of trade or export restrictions; changes in environmental and other regulations; political or geopolitical uncertainty; labour unrest; and other factors identified in the risk factors discussed in section 8.1 of the Operating and Financial Review (OFR) in the BHP Annual Report 2023 and BHP’s filings with the U.S. Securities and Exchange Commission (the ‘SEC’) (including in Annual Reports on Form 20-F) which are available on the SEC’s website at www.sec.gov. Except as required by applicable regulations or by law, BHP does not undertake to publicly update or review any forward-looking statements, whether as a result of new information or future events. Past performance cannot be relied on as a guide to future performance. Presentation of data Unless specified otherwise: variance analysis relates to the relative performance of BHP and/or its operations during the full year ended 30 June 2023 compared with the full year ended 30 June 2022; operations includes operated assets and non-operated assets; total operations refers to the combination of continuing and discontinued operations; continuing operations refers to data presented excluding the impacts of Onshore US from the 2017 financial year onwards and excluding Petroleum from the 2021 financial year onwards; copper equivalent production based on 2023 financial year average realised prices; references to Underlying EBITDA margin exclude third party trading activities; data from subsidiaries are shown on a 100% basis and data from equity accounted investments and other operations is presented, with the exception of net operating assets, reflecting BHP’s share; medium term refers to a five-year horizon, unless otherwise noted. Throughout this presentation, production volumes and financials for the operations from BHP's acquisition of OZ Minerals Limited (OZL) are for the period of 1 May to 30 June 2023, whilst the acquisition completion date was 2 May 2023. Unless expressly stated, information and data in this presentation related to BHP's social value or sustainability position or performance does not reflect BHP's acquisition of OZL. Due to the inherent uncertainty and limitations in measuring greenhouse gas (GHG) emissions under the calculation methodologies used in the preparation of such data, all GHG emissions data or references to GHG emissions (including ratios or percentages) in this presentation are estimates. Emissions calculation and reporting methodologies may change or be progressively refined over time resulting in the need to restate previously reported data. Numbers presented may not add up precisely to the totals provided due to rounding. All footnote content (except in the Annexures) is contained on slide 21. Non-IFRS information We use various Non-IFRS information to reflect our underlying performance. For further information, the reconciliation of non-IFRS financial information to our statutory measures, reasons for usefulness and calculation methodology, please refer to section 10 ‘Non-IFRS financial information’ in the BHP Annual Report 2023. No offer of securities Nothing in this presentation should be construed as either an offer or a solicitation of an offer to buy or sell any securities, or a solicitation of any vote or approval, in any jurisdiction, or be treated or relied upon as a recommendation or advice by BHP. No offer of securities shall be made in the United States absent registration under the U.S. Securities Act of 1933, as amended, or pursuant to an exemption from, or in a transaction not subject to, such registration requirements. Reliance on third party information The views expressed in this presentation contain information that has been derived from publicly available sources that have not been independently verified. No representation or warranty is made as to the accuracy, completeness or reliability of the information. This presentation should not be relied upon as a recommendation or forecast by BHP. BHP and its subsidiaries In this presentation, the terms ‘BHP’, the ‘Company, the ‘Group’, ‘BHP Group’, ‘our business’, ‘organisation’, ‘we’, ‘us’, ‘our’ and ourselves’ refer to BHP Group Limited and, except where the context otherwise requires, our subsidiaries. Refer to note 30 ‘Subsidiaries’ of the Financial Statements in the BHP Annual Report 2023 for a list of our significant subsidiaries. Those terms do not include non-operated assets. This presentation covers BHP’s functions and assets (including those under exploration, projects in development or execution phases, sites and closed operations) that have been wholly owned 1 and/or operated by BHP or that have been owned as a joint venture operated by BHP (referred to in this presentation as ‘operated assets’ or ‘operations’) during the period from 1 July 2022 to 30 June 2023. BHP also holds interests in assets that are owned as a joint venture but not operated by BHP (referred to in this presentation as ‘non-operated joint ventures’ or ‘non-operated assets’). Notwithstanding that this presentation may include production, financial and other information from non-operated assets, non-operated assets are not included in the BHP Group and, as a result, statements regarding our operations, assets and values apply only to our operated assets unless stated otherwise. 1. References in this presentation to a ‘joint venture’ are used for convenience to collectively describe assets that are not wholly owned by BHP. Such references are not intended to characterise the legal relationship between the owners of the asset. Financial results 22 August 2023 2

Performance summary Full year ended 30 June 2023 Mike Henry Chief Executive Officer Olympic Dam

Disciplined execution of our strategy creates value Delivered robust results in the 2023 financial year Tragically, two fatalities in H2 Solid operating performance, with records at WAIO, Olympic Dam and Spence Strong financial results and returns OZ Minerals acquisition completed, integration underway Growth options in execution and further being generated Note: WAIO – Western Australia Iron Ore. Financial results 22 August 2023 4

FY23 social value highlights Delivering on our framework with tangible results Our social value framework Decarbonisation Healthy Indigenous Safe, inclusive Thriving, Responsible environment partnerships and future ready empowered supply chains workforce communities Operational GHG Natural Capital Indigenous Female Total economic Standards & 3 emissions Accounting (NCA) procurement representation contribution certifications BHP Responsible Pilot case ” 11% ~US$333 m > 35% US$54 bn Minerals Program study a fit for purpose due from FY22,“ 122% YoY female representation with ~US$14 bn a mining industry first diligence program for our on track to meet our across the Group paid to governments on NCA at our Beenup 1 2 supply chain aligned with FY30 target“ 2.9 % points YoY in the year 4 closed site OECD Guidance Note: Excludes OZ Minerals operations and functions. Financial results 22 August 2023 5

Financial results Full year ended 30 June 2023 David Lamont Chief Financial Officer Escondida

Financial performance Reliable operating performance delivers strong results Summary financials Income statement (US$ bn, Underlying) • Underlying attributable profit of US$13.4 bn at 28.8% ROCE 60 53.8 • Underlying EBITDA of US$28.0 bn Taxes and royalties: – Underlying EBITDA margin of 54% 50 US$10.6 bn 5 • Adjusted effective tax rate of 30.9% 40 5 – Adjusted effective tax rate including royalties of 41.3% 6 • Full year dividends of 170 US cents per share, a 64% payout ratio 28.0 30 – Final dividend of 80 US cents per share (25.8) 22.8 (5.1) • Net operating cash flow of US$18.7 bn 20 (1.1) 13.4 • US$13.1 bn of investments in the period: (6.8) (1.5) 8.6 10 – US$7.1 bn of capital and exploration expenditure – US$5.9 bn acquisition of OZ Minerals in May 2023 0 • Free cash flow of US$5.6 bn vs. dividends declared of US$8.6 bn • Net debt of US$11.2 bn (FY22: US$0.3 bn), includes US$7.0 bn 7 relating to the acquisition of OZ Minerals – Expected to stay at upper end of US$5 -15 bn target range in the near term Financial results 22 August 2023 7 Revenue 8 Operating costs EBITDA 9 D&A EBIT Net finance costs 10 Taxation Non-controlling interests Attributable profit Dividends declared
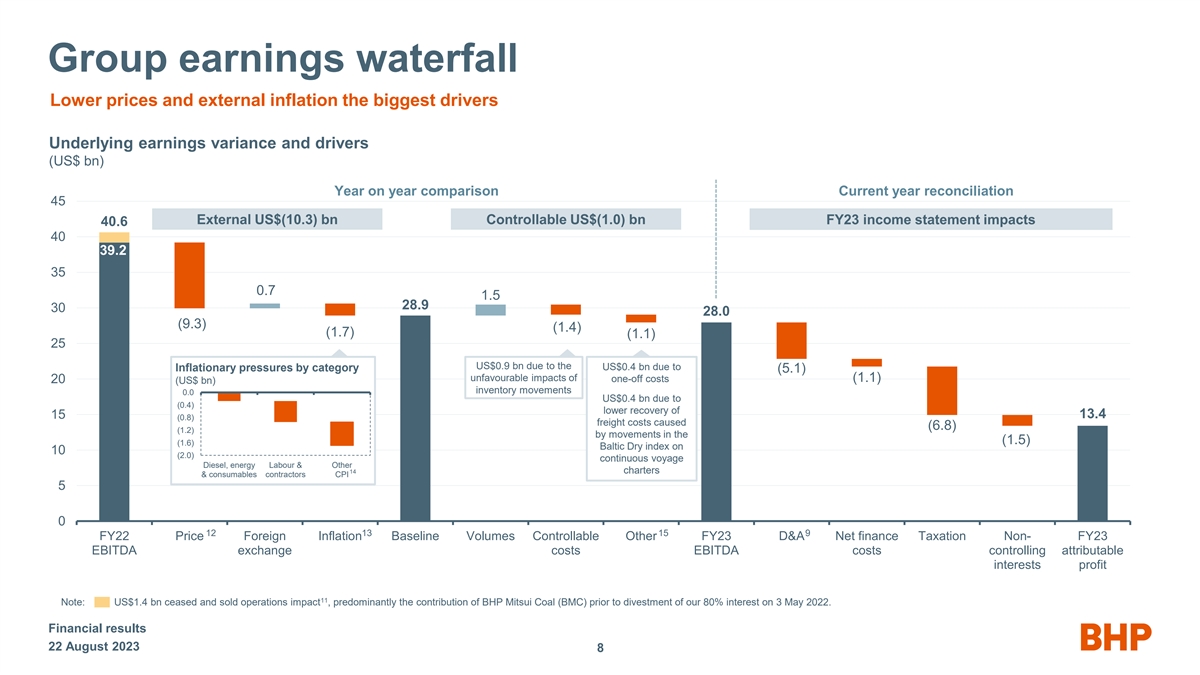
Group earnings waterfall Lower prices and external inflation the biggest drivers Underlying earnings variance and drivers (US$ bn) Year on year comparison Current year reconciliation 45 External US$(10.3) bn Controllable US$(1.0) bn FY23 income statement impacts 40.6 40 39.2 35 0.7 1.5 28.9 30 28.0 (9.3) (1.4) (1.7) (1.1) 25 US$0.9 bn due to the US$0.4 bn due to Inflationary pressures by category (5.1) unfavourable impacts of one-off costs (1.1) 20 (US$ bn) inventory movements 0.0 US$0.4 bn due to (0.4) lower recovery of 15 13.4 (0.8) freight costs caused (6.8) (1.2) by movements in the (1.5) (1.6) Baltic Dry index on 10 (2.0) continuous voyage Diesel, energy Labour & Other 14 charters & consumables contractors CPI 5 0 12 13 15 9 FY22 Price Foreign Inflation Baseline Volumes Controllable Other FY23 D&A Net finance Taxation Non- FY23 EBITDA exchange costs EBITDA costs controlling attributable interests profit 11 Note: US$1.4 bn ceased and sold operations impact , predominantly the contribution of BHP Mitsui Coal (BMC) prior to divestment of our 80% interest on 3 May 2022. Financial results 22 August 2023 8

Consistent performance Continue to deliver strong margins and a consistently high baseline of cash flow 16,17 17(i) Margins ahead of peers through commodity cycles Consistently delivered >US$15 bn in net operating cash flow (Underlying EBITDA margin, %) (Bloomberg commodity index, rebased) (US$ bn) 75 75 37.5 60 60 30.0 45 45 22.5 30 30 15.0 7.5 15 15 0.0 0 0 BHP Bloomberg commodity index (quarterly) Operating cash flow (H1) Operating cash flow (H2) Competitors range (i) Presented on a total operations basis. Financial results 22 August 2023 9 FY10 1… 1… 1… 1… 1… 1… FY11 1… 1… 1… 1… 1… 1… FY12 1… 1… 1… 1… 1… 1… FY13 1… 1… 1… 1… 1… 1… FY14 1… 1… 1… 1… 1… 1… FY15 1… 1… 1… 1… 1… 1… FY16 1… 1… 1… 1… 1… 1… FY17 1… 1… 1… 1… 1… 1… FY18 1… 1… 1… 1… 1… 1… FY19 1… 1… 1… 1… 1… 1… FY20 1… 1… 1… 1… 1… 1… FY21 1… 1… 1… 1… 1… 1… FY22 1… 1… 1… 1… 1… 1… FY23 1… FY10 FY11 FY12 FY13 FY14 FY15 FY16 FY17 FY18 FY19 FY20 FY21 FY22 FY23

Segment performance Iron ore Nickel Production: Production: 80 kt Ç 257 MtÇ Average realised price: Average realised price: US$92.54/wmtÈ US$24,021/tÇ EBITDA margin: 8% EBITDA margin: 67% 18 WAIO unit cost : US$17.79/t • Impacted by inventory draw downs, cost inflation and lower realised 19 prices for intermediate products in sales mix WAIO C1 unit cost : US$15.86/t Copper Potash • Jansen Stage 1 continues to be on time and on budget Production: 1,717 ktÇ • Stage 1: 26% complete Average realised price: US$3.65/lbÈ • US$3.1 bn in contracts awarded to date EBITDA margin: 47% 18 Escondida unit cost : US$1.40/lb 20 Metallurgical coal Energy coal BMA production: 29 Mt – NSWEC production: 14.2 Mt Ç Average realised price: US$271.05/tÈ Average realised price - export: US$236.51/t Ç BMA EBITDA margin: 42% NSWEC EBITDA margin: 56% 18 BMA unit cost : US$96.46/t 18 NSWEC unit cost : US$82.37/t Note: WAIO – Western Australia Iron Ore; BMA – BHP Mitsubishi Alliance; NSWEC – New South Wales Energy Coal. Arrow indicates movement relative to FY22. Financial results 22 August 2023 10

Capital spend increasing to deliver growth Medium term capital ~US$11 bn on average with flexibility to adjust spend for value 21 Increasing spend on future-facing commodities to ~70% (US$ bn, nominal) (capital in future-facing commodities, %) Major capital in future-facing commodities includes: 12.5 80 • In execution: Jansen Stage 1 and West Musgrave 70 10.0 • Projects under study: Jansen Stage 2, options at 60 Copper South Australia and in Chilean copper 50 7.5 Steelmaking materials major capital includes WAIO growth 40 to >305 Mtpa, and in medium term initial spend on 330 Mtpa 5.0 30 Exploration capital focused on copper and nickel 20 2.5 10 Improvement capital includes projects that enable improved productivity, quality, facilities and organisational culture 0.0 0 FY20 FY21 FY22 FY23 FY24e FY25e Medium term Maintenance and decarbonisation capital includes Maintenance and decarbonisation capital Organic development decarbonisation spend of ~US$4 bn through to FY30 Improvement capital Steelmaking materials major capital FFC major capital Exploration Petroleum % FFC Note: Medium term refers to FY26 – FY28 average. FFC – future-facing commodities. Major capital represents projects >US$250 m. Financial results 22 August 2023 11

Business update Full year ended 30 June 2023 Mike Henry Chief Executive Officer Jansen

Portfolio positively leveraged to megatrends Built to compete in a complex but opportunity-rich environment Copper Nickel Iron Ore Metallurgical Coal Potash Portfolio Largest mineral Second largest Lowest cost iron ore Leading met coal Large-scale resource supports 22 23 24 25 resources sulphide resources producer supplier up to 100 years of operation TRADITIONAL COST SUPPLY DECARBONISATION DEMAND COMPETITIVENESS HEADWINDS Demand amplification, Steeper cost curves, margin Tighter balances, Attractive fundamentals rising material intensity expansion for best operators durable inducement pricing Population growth Climate-positive land use End-to-end logistics Lack of new discoveries Urbanisation Decarbonising power Economies of scale Changing societal expectations Industrialisation Electrifying transport Operational decarbonisation Geological inflation Living standards Electrifying buildings Operational productivity Regulatory uncertainty Capital stock turnover Decarbonising industry Managing labour challenges Geopolitical risk Financial results 22 August 2023 13

Growing value over multiple time horizons A growing production base with multiple studies underway providing significant longer term optionality A strong pipeline of growth under study and in execution … … with additional opportunities … 26 Illustrative timeline FY24 FY25 FY26 FY27 FY28 FY29 FY30+ Jansen Stages 3 & 4 Antamina life extension Productivity initiatives Resolution Major projects – medium term Nickel West expansion Jansen Stage 1 Early-stage entry investments 27 West Musgrave WAIO growth to >305 Mtpa … and creation of more longer term options Delivery of studies – longer term Jansen Stage 2 Metals Exploration WAIO growth to 330 Mtpa Chilean copper brownfield options 28 Copper South Australia growth options Ventures Studies Potential FID Execution Targeted first production Note: FID - Final investment decision. Financial results 22 August 2023 14

Opportunities from the OZ Minerals acquisition Developing a new copper province with significant synergy potential Copper province in South Australia • Exposure to future-facing commodities in well-understood jurisdictions OZ Minerals • Near term synergies delivered, additional opportunities in the short and acquisition medium term • Integrating ‘best of both’ culture, including project development agility • Proximity of assets creates synergy potential: – Olympic Dam: Record copper, gold and silver production in FY23 – Prominent Hill: 13 year mine life with life extension options Copper – Carrapateena: Growth potential from FY29 via block cave expansion Nickel in Western Australia province • Exploration at Oak Dam and Olympic Dam to test extent of mineralisation • Assessing potential pathway to >500 ktpa, including through expansion with a 29 two-stage smelter • Growing nickel sulphide resource base Adding nickel • West Musgrave project progressing including optimal integration into Nickel West options • Aim to support increase in equity feed at the Nickel West smelter Financial results 22 August 2023 15

Near term opportunities to deliver value Early integration and productivity opportunities: >US$20 m per annum synergies already achieved Synergies of >US$50 m per annum from the OZ Minerals acquisition expected to be delivered by the end of FY24 Operations • Optimisation of mine plans and growth projects • Benefits from integrated development plans • Portion of Prominent Hill concentrate treated at Olympic Dam from Q1 FY24: capture value from processing • Integrated South Australian supply chain Procurement • Reduction in working capital from shared inventory • Procurement cost savings from BHP network, shared transport and logistics Corporate • Removal of duplicate corporate activities (e.g. ASX listing / compliance) • Streamlining of back-office functions • Rationalisation of physical property and insurance premiums Financial results 22 August 2023 16

Unlocking value from developing a new copper province Regional processing model expected to provide scale and growth; assessing potential pathway to >500 ktpa 29 Assessing potential pathway to >500 ktpa … … to release significant value (Copper South Australia production, ktpa) • Ramp up of Carrapateena Block Cave 1 expansion from FY28 plus Prominent Hill 600 Wira Shaft productivity improvements from FY26 • Further growth potential from exploration at Oak Dam and extensions at depth at Olympic Dam • Enables a larger expansion with a two-stage smelter to de-constrain province 450 FY24 production • Assessing potential for 0.8 Mt to 1.7 Mt smelting capacity range (from 0.5 Mt today) guidance range: – Regional optionality and concentrate feed source blending to optimise value chain 310 – 340 kt – Matches the smelter technology to the core mineralogy in the province 300 – Economies of scale from larger capacity FY24 FY25 FY26 FY27 FY28+ Illustrative timeline Delivery of near term synergies 150 Oak Dam exploration / decline 30 Carrapateena Block Cave 1 Two-stage smelter 0 FY23 FY24e ~FY30 Future Oak Dam potential development Actual Guidance Aspiration Studies Potential FID Execution Targeted first production Financial results 22 August 2023 17

Defining the path for growth in the Americas Studies progressing on options to grow potash volumes and offset longer term grade decline in copper Jansen Stage 2 could double potash volumes Unlocking resource and latent capacity in Chilean copper • Stage 2 on accelerated timeline to maximise optionality on potential sanction • Studies across Escondida, Spence and Cerro Colorado – Feasibility study expected to be completed in FY24 – Potential for new concentrator to replace Los Colorados at Escondida – Project would add ~4 Mtpa of production to the ~4.35 Mtpa of Stage 1 – Assessing sulphide leaching for application across all Chilean assets – Earliest potential FID date in FY24 and potential for first production in – Five leaching technologies under study or execution, trials aiming to FY29 if sanctioned unlock both resource and latent capacity 31 – Expected lower capital intensity ~US$1,000-1,200/t vs. Stage 1 – BHP designed leaching technology Full SaL deployed at Spence, on track to be implemented at Escondida 26 FY24 FY25 FY26 FY27 FY28 FY29 FY30+ Illustrative timeline Potential Escondida new concentrator Full SaL leaching at Escondida Potential leaching options Potential restart, Cerro Colorado Studies Potential FID Execution Targeted first production Financial results 22 August 2023 18

Investment proposition Attractive returns underpinned by operational excellence, capital allocation discipline and social value commitment Operational Disciplined Value and returns excellence capital allocation World class Differentiated Agile decision Strong Capital A framework Commitment to Increasing Resilience assets culture and making and balance Allocation for growth Social Value exposure to through the capability strategic sheet Framework with an active and future-facing cycle flexibility pursuit of sustainability commodities opportunities Financial results 22 August 2023 19


Footnotes 1. Slide 5: For our baseline year of FY20, our operational GHG emissions were 14.5 Mt CO2-e, adjusted for discontinued operations (Onshore US assets and Petroleum) and the divestment of BMC, and for methodological changes (use of Intergovernmental Panel on Climate Change Assessment Report 5 AR5 Global Warming Potentials and move to facility-specific emissions calculation methodology for fugitives at Caval Ridge). These adjustments have also been applied to the GHG emissions figures for subsequent years to aid comparability. The use of carbon credits will be governed by BHP’s approach to carbon offsetting described at bhp.com/climate. 2. Slide 5: Female employee representation as at 30 June 2023. 3. Slide 5: Total economic contribution includes contribution to suppliers, wages and benefits for employees, dividends, taxes, royalties and voluntary social investment. For more information refer to the BHP Economic Contribution Report 2023. 4. Slide 5: For further information refer to BHP Responsible Minerals Program. 5. Slide 7: Adjusted effective tax rate and Adjusted effective tax rate including royalties: excludes the influence of exchange rate movements and exceptional items. 6. Slide 7: Dividend per share refers to cash dividends. Payout ratio on underlying attributable profit. 7. Slide 7: US$7.0 bn net debt impact from OZ Minerals purchase includes US$5.9 bn acquisition cost and US$1.1 bn assumption of OZ Minerals interest bearing liabilities. 8. Slide 7: Operating costs net of other income. 9. Slide 7 and 8: D&A represents depreciation and amortisation expense and net impairments. 10. Slide 7: Taxation: includes foreign exchange movements in tax expense. 11. Slide 8: Total FY22 underlying EBITDA (on a continuing operations basis) of US$40.6 bn adjusted for US$1.4 bn ceased and sold operations impact. This is predominantly the contribution from BMC prior to divestment of our 80% interest in BMC to Stanmore SMC Holdings Pty Ltd, a wholly owned entity of Stanmore Resources Limited, on 3 May 2022. 12. Slide 8: Price: net of price-linked costs. 13. Slide 8: Inflation: includes CPI increases across the cost base, and price increases for consumable costs including diesel and explosives. 14. Slide 8: CPI is exclusive of any CPI relating to diesel, explosives and other consumable materials. 15. Slide 8: Other includes US$411 m of one-off items, including OZ Minerals transactions costs (US$131 m) and adjustment for employee allowances and entitlements in FY23 (US$280 m). Other also includes US$414 m impact of lower recovery of freight costs caused by movements in the Baltic Dry index on continuous voyage charters. 16. Slide 9: Bloomberg commodity index (Source: Bloomberg, BCOM Index) as at the end of each quarter, rebased to BHP FY10 EBITDA margin. BHP FY23 underlying EBITDA margin (excluding third party products). Peer data compiled from publicly available information (e.g. company reports). Peers include: Anglo American, Glencore (exc. Marketing), Rio Tinto, Vale. 17. Slide 9: BHP information related to periods prior to FY20 are as reported and have not been restated for IFRS5 Non-current Assets Held for Sale and Discontinued Operations. FY11 and FY10 have also not been restated for other accounting standard changes. 18. Slide 10: Average realised exchange rates for FY23 of AUD/USD 0.67 (FY23 guidance rate AUD/USD 0.72) and USD/CLP 864 (FY23 guidance rate USD/CLP 830). 19. Slide 10: WAIO C1 cost: excludes royalties (government and third party royalties), net inventory movements, depletion of production stripping, exploration expenses, marketing purchases, demurrage, exchange rate gains/losses, and other income. There may be differences in the manner that third parties calculate or report unit costs data compared to BHP, which means third party data may not be comparable with our data. 20. Slide 10: Total revenue from thermal coal sales, including BMA and NSWEC, was US$3,528 m (FY22: US$3,559 m). 21. Slide 11: Medium term capital and exploration expenditure refers to FY26 – FY28 average. Major capital represents projects >US$250 m. 22. Slide 13: Largest copper mineral resources on a contained metal basis, equity share. Peers include: Anglo American, Antofagasta, Codelco, First Quantum Minerals, Freeport, Glencore, Rio Tinto, Southern Copper and Teck. Source peers: Wood Mackenzie Ltd, Q2 2023. Source BHP data: BHP Annual Report 2023. 23. Slide 13: Second largest nickel sulphide resources on a contained metal basis, equity share. Source peers: MinEx Consulting Global Ni Database, July 2022. Source BHP data: BHP Annual Report 2023. 24. Slide 13: Based on published unit costs by major iron ore producers, as reported at 30 June 2023. There may be differences in the manner that third parties calculate or report unit costs data compared to BHP, which means third party data may not be comparable with our data. 25. Slide 13: Based on a Reserve life of 94 years as reported in BHP’s 17 August 2021 news release, available to view on www.bhp.com. 26. Slide 14 and 18: Represents FY30 and the proceeding decade. 27. Slide 14: The West Musgrave project is currently under review with the start of the targeted first production range based on the range previously disclosed by OZ Minerals (H2 CY25). 28. Slide 14: Timing of Copper South Australia growth options are aligned and subject to approval of the introduction of two-stage smelting at Olympic Dam. 29. Slide 15 and 17: Represents our current aspiration for Copper South Australia, and not intended to be a projection, forecast or production target. Includes potential increases in production rates, as well as potential impacts from our exploration program and the recent OZ Minerals acquisition including Ore Reserves and Mineral Resources (refer to slide 30 “Competent Person Statement – Copper Mineral Resources”). 30. Slide 17: Carrapateena Block Cave production representative of Mine Ore tonnes ramp-up. 31. Slide 18: Expected capital intensity Jansen Stage 2, US$/product tonne, Real 1 July 2023. Appendix Slide 24: Future GHG emissions estimates are based on latest annual business plans. Excludes acquired OZ Minerals assets and plans. FY20 to FY22 GHG emissions data has been adjusted for methodology changes and divestments; for more information refer to Metrics, targets and goals, in the Annual Report OFR 6.12. ‘Decarbonisation pathway’ represents planned decarbonisation activities to reach BHP’s operational GHG emissions target and goal. ‘Uncertainty range’ refers to higher-risk options currently identified that may enable faster or more substantive decarbonisation, but which currently have a relatively low Technology Readiness Level, higher operational integration risk and/or are not yet commercially available and includes project that may require changes to recognition of carbon sequestration such as mineral carbonation. ‘BHP’s net zero trajectory’ refers to a hypothetical straight line between our FY20 baseline and FY30 medium term target, and another hypothetical straight line between our FY30 medium term target and CY50 long term goal. ‘Negative GHG emissions solutions’ include carbon credits (avoidance, reductions or removals) or other technologies that result in emission reductions. This shows the requirement in order to reach net zero if decarbonisation at the lower line of the ‘Uncertainty range’ were achieved (but does not reflect probability). ‘Fugitive methane and other sources’ includes (as part of ‘other sources’) other feedstocks and heat sources, such as coal, coke, fuel oil and LPG, and use of self-generated carbon credits. GHG emissions calculation methodology changes may affect the information presented in these charts. ‘Fugitive methane and other sources’ is estimated in accordance with the Australian National Greenhouse and Energy Reporting measurement methodology and does not reflect the tendency for methane density to increase as coal mines deepen, due to current uncertainty with respect to future opportunities to manage methane at our BMA mines. Forecast information is subject to change due to technical, operational, or commercial risks that may impact future outcomes. Financial results 22 August 2023 21

Appendix
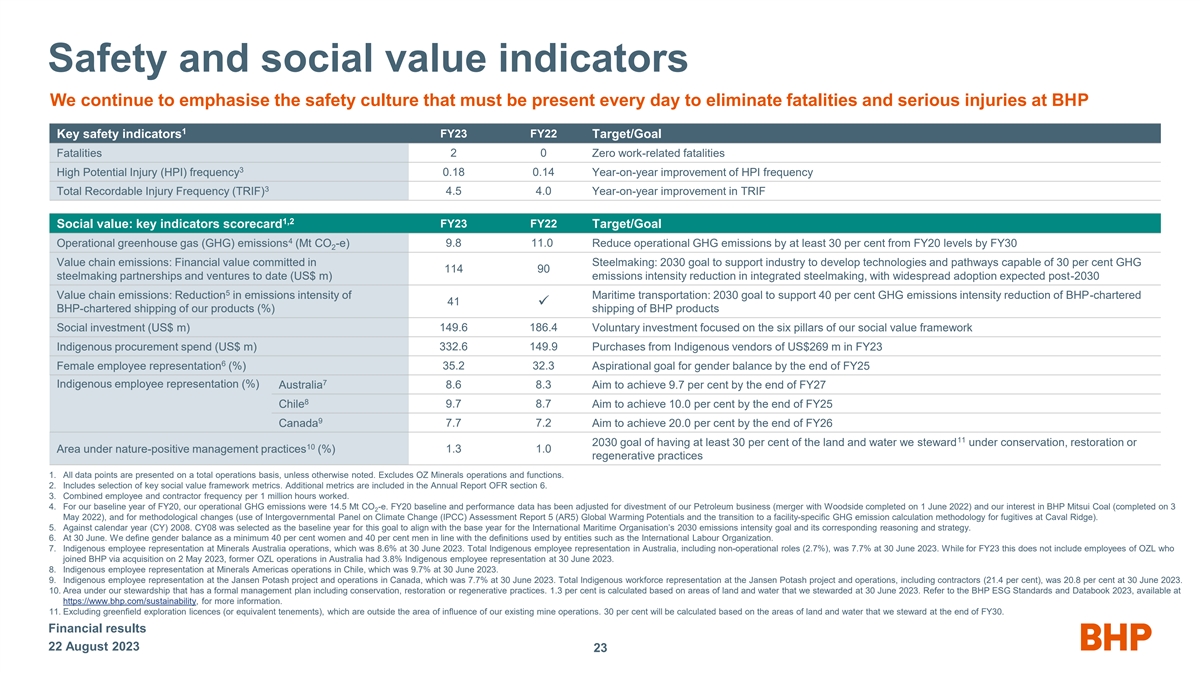
Safety and social value indicators We continue to emphasise the safety culture that must be present every day to eliminate fatalities and serious injuries at BHP 1 FY23 FY22 Key safety indicators Target/Goal Fatalities 2 0 Zero work-related fatalities 3 High Potential Injury (HPI) frequency 0.18 0.14 Year-on-year improvement of HPI frequency 3 Total Recordable Injury Frequency (TRIF) 4.5 4.0 Year-on-year improvement in TRIF 1,2 FY23 FY22 Social value: key indicators scorecard Target/Goal 4 Operational greenhouse gas (GHG) emissions (Mt CO -e) 9.8 11.0 Reduce operational GHG emissions by at least 30 per cent from FY20 levels by FY30 2 Value chain emissions: Financial value committed in Steelmaking: 2030 goal to support industry to develop technologies and pathways capable of 30 per cent GHG 114 90 steelmaking partnerships and ventures to date (US$ m) emissions intensity reduction in integrated steelmaking, with widespread adoption expected post-2030 5 Value chain emissions: Reduction in emissions intensity of Maritime transportation: 2030 goal to support 40 per cent GHG emissions intensity reduction of BHP-chartered 41 ü BHP-chartered shipping of our products (%) shipping of BHP products Social investment (US$ m) 149.6 186.4 Voluntary investment focused on the six pillars of our social value framework 332.6 149.9 Indigenous procurement spend (US$ m) Purchases from Indigenous vendors of US$269 m in FY23 6 Female employee representation (%) 35.2 32.3 Aspirational goal for gender balance by the end of FY25 7 Indigenous employee representation (%) Australia 8.6 8.3 Aim to achieve 9.7 per cent by the end of FY27 8 Chile 9.7 8.7 Aim to achieve 10.0 per cent by the end of FY25 9 7.7 7.2 Canada Aim to achieve 20.0 per cent by the end of FY26 11 2030 goal of having at least 30 per cent of the land and water we steward under conservation, restoration or 10 Area under nature-positive management practices (%) 1.3 1.0 regenerative practices 1. All data points are presented on a total operations basis, unless otherwise noted. Excludes OZ Minerals operations and functions. 2. Includes selection of key social value framework metrics. Additional metrics are included in the Annual Report OFR section 6. 3. Combined employee and contractor frequency per 1 million hours worked. 4. For our baseline year of FY20, our operational GHG emissions were 14.5 Mt CO -e. FY20 baseline and performance data has been adjusted for divestment of our Petroleum business (merger with Woodside completed on 1 June 2022) and our interest in BHP Mitsui Coal (completed on 3 2 May 2022), and for methodological changes (use of Intergovernmental Panel on Climate Change (IPCC) Assessment Report 5 (AR5) Global Warming Potentials and the transition to a facility-specific GHG emission calculation methodology for fugitives at Caval Ridge). 5. Against calendar year (CY) 2008. CY08 was selected as the baseline year for this goal to align with the base year for the International Maritime Organisation’s 2030 emissions intensity goal and its corresponding reasoning and strategy. 6. At 30 June. We define gender balance as a minimum 40 per cent women and 40 per cent men in line with the definitions used by entities such as the International Labour Organization. 7. Indigenous employee representation at Minerals Australia operations, which was 8.6% at 30 June 2023. Total Indigenous employee representation in Australia, including non-operational roles (2.7%), was 7.7% at 30 June 2023. While for FY23 this does not include employees of OZL who joined BHP via acquisition on 2 May 2023, former OZL operations in Australia had 3.8% Indigenous employee representation at 30 June 2023. 8. Indigenous employee representation at Minerals Americas operations in Chile, which was 9.7% at 30 June 2023. 9. Indigenous employee representation at the Jansen Potash project and operations in Canada, which was 7.7% at 30 June 2023. Total Indigenous workforce representation at the Jansen Potash project and operations, including contractors (21.4 per cent), was 20.8 per cent at 30 June 2023. 10. Area under our stewardship that has a formal management plan including conservation, restoration or regenerative practices. 1.3 per cent is calculated based on areas of land and water that we stewarded at 30 June 2023. Refer to the BHP ESG Standards and Databook 2023, available at https://www.bhp.com/sustainability, for more information. 11. Excluding greenfield exploration licences (or equivalent tenements), which are outside the area of influence of our existing mine operations. 30 per cent will be calculated based on the areas of land and water that we steward at the end of FY30. Financial results 22 August 2023 23

A proactive approach to decarbonisation Integrating decarbonisation into our operational and capital plans, and collaborating to achieve our climate targets and goals Projected and potential operational GHG emissions abatement A partnership approach to Scope 3 1 pathway to CY50 Steelmaking Shipping (Operational GHG emissions, MtCO -e) 2 14.5 Mt CO -e Decarbonisation pathway 2 Uncertainty range Electricity Collaborative partnerships with Five operationalised dual fuelled steelmakers representing 19 per cent of LNG vessels: 1 global reported steel production Capable of up to 30 per cent 2 GHG emissions reduction per journey Diesel Blast Furnace & Biofuels introduced into fuel mix: Basic Oxygen Potential Pathway: Expect up to 19 per cent GHG emissions China Baowu and Monash University 3 reduction per voyage leg ‘Low Carbon Knowledge Centre’ Natural gas Fugitive methane Direct Reduced Iron & and other sources Electric Smelting Potential Pathway: Hatch design study for pilot Negative GHG emission solutions ESF plant Electrolysis Pathway: FY20 FY25 FY30 FY35 FY40 FY45 F CY Y50 50 Boston Metals, Electra Photo: BHP, China Baowu and Monash University ‘Low Carbon Knowledge Centre’ 1. See Footnote on slide 21. 1. World Steel in Figures 2023, World Steel Association. 2. When run on LNG compared to conventional fuel and taking into account efficiency of the vessel design. Financial results 3. Compared to conventional fuel. The biofuels used are certified under the International Sustainability and Carbon Certification systems. 22 August 2023 24

Samarco and Renova Foundation Samarco plans restart of second concentrator by CY25. R$30.7 bn spent on reparation and compensation programs Renova Resettlement Samarco 1 3 • Claims processed for ~80% of people on Renova’s • ~75% of resettlement cases completed across the • Approved restart of the second concentrator to register and in its indemnification programs. Of those, region, with a further ~10% in progress, the majority of increase operating capacity to 60% in CY25 ~75% were eligible for and have received payment which are expected to be completed by end CY23 • Reached agreement with a group of financial creditors 2 • Candonga Hydro Power Plant is operating and • >40 families have moved into their new homes to restructure its financial debt connected to National Electricity System including in the communities of Bento Rodrigues and • Germano pit dam decommissioning complete. Main Paracatu • 42 programs to restore the environment and dam decommissioning on track for FY29 re-establish affected communities • First local businesses are open in Bento Rodrigues • ~11,600 direct and indirect jobs created by Samarco, and Paracatu, and the school in Bento Rodrigues has 4 • ~1.5 million pieces of data generated annually along and ~R$2.8 bn in taxes since restart commenced classes the river confirm the water quality in the Doce River has returned to historic levels 1. Based on current known number of claimants in Renova database. 2. Candonga is the Risoleta Neves Hydro Power Plant impacted by the dam failure. 3. Resettlement cases completed includes completed construction (families either moved in or handover to families in progress) or cash payment solution. 4. ~R$2.8 bn in taxes contributed until June 2023 includes taxes generated from Samarco’s value chain activities. Financial results 22 August 2023 25

1 Oak Dam exploration project update 2 We have commenced the next phase of drilling as we work towards defining a first Mineral Resource 3 Oak Dam Exploration Target FY23 Oak Dam project schematic cross section (Oak Dam cross section showing the target is open at depth, south and west of the Hardy Hill fault) Low High Mt 500 1,700 Cu% 0.8 1.1 The potential quantity and grade ranges of an Exploration Target are conceptual in nature and as such has insufficient exploration to estimate a Mineral Resource, and it is uncertain if further exploration or analysis will result in the estimation of a Mineral Resource. Oak Dam strategy update • Entered next phase of drilling campaign following environmental approvals in March 2023, progressing towards a first Mineral Resource • Currently running nine drill rigs, with eleven rigs expected by November 2023 • 150 rooms accommodation camp and supporting facilities planned in 2023 to advance additional information 1. Refer to “BHP Operational Review for the year ended 30 June 2023, Appendix 1 – Oak Dam Exploration Target”. 2. The potential quantity and grade of an Exploration Target is conceptual in nature and as such there has been insufficient exploration to estimate a Mineral Resource, and it is uncertain if further exploration or analysis will result in the estimation of a Mineral Resource. 3. The exploration target using the BHP range analysis process based on drilling provided in “BHP Results for the half year ended 31 December 2022, Appendix 1 – Explanatory Notes and JORC table 1“. Financial results 22 August 2023 26

Competent Person Statement – Oak Dam Competent Persons Statement The information in this presentation that relates to Exploration Targets is based on information compiled by Dr. Kathy Ehrig, a Competent Person who is a Fellow of The Australasian Institute of Mining and Metallurgy and a Fellow of the Australian Institute of Geoscientists. Dr. Kathy Ehrig has sufficient experience that is relevant to the style of mineralisation and type of deposit under consideration and to the activity being undertaken to qualify as a Competent Person as defined in the 2012 Edition of the ‘Australasian Code for Reporting of Exploration Results. Dr. Kathy Ehrig consents to the inclusion in the presentation of the matters based on her information in the form and context in which it appears. Financial results 22 August 2023 27

Chilean copper leaching overview Studies progressing on options to partially offset longer term grade decline in copper Potential Significant resource potential production Cycle Capital BHP Leaching technologies time Cost impact • Escondida ~26 Bt at 0.52% grade • Spence ~2.5 Bt at 0.43% grade BioLeach Existing Existing • Cerro Colorado ~2.3 Bt at 0.40% grade Existing methodology in operation, uses process process Long acid and bacterial leaching Success with BHP designed leaching technology Full SaL Full SaL 2 • Full SaL, a BHP designed leaching technology, has been successfully deployed at Leaching of crushed material with high Medium Spence and is on track to be implemented at Escondida chloride concentrations • Escondida expects first production in FY25 producing ~410 kt in copper cathodes over a 10-year period through improved recoveries and shorter leach cycle times for BHP Leach secondary sulphide ores Leaching with alternative reagents and • Capital expenditure is expected to be approximately US$300 m (100 per cent basis) Short increased process temperatures with first production during FY25 Other technologies Studies actively progressing on ores from across our Chilean assets • Five leaching technologies under study or execution with active trials and pilots aiming to unlock both resource and latent capacity • BioLeach already in operation at Escondida Jetti Nuton • Assessing both BHP developed technology and partnering with external parties to Addition of catalyst to current bioleach Rio Tinto Technology that uses catalyst process and temperature to processes primary maximise optionality hypogene ore among others Financial results 22 August 2023 28
Competent Person Statement – Copper Mineral Resources Copper Mineral Resources Competent Persons Statement The information in next slide relates to Copper Mineral Resources as at 30 June 2023. Mineral Resources are inclusive of Ore Reserves and is based on information compiled by Marcelo Cortes as Competent Person (compiler) for all declared Mineral Resources. The information in this presentation that relates to the FY2023 Mineral Resources reported by BHP in accordance with the ‘Australasian Code for Reporting of Exploration Results, Mineral Resources and Ore Reserves, 2012’ (‘The JORC Code 2012 Edition’) in the 2023 BHP Annual Report, available to view on www.bhp.com. M. Cortes is a current Member of the Australasian Institute of Mining and Metallurgy (MAusIMM) and he is a full-time employee of BHP. M. Cortes has sufficient experience that is relevant to the style of mineralisation and type of deposits under consideration and to the activity which he is undertaking to qualify as Competent Person as defined in the JORC Code 2012 Edition. M. Cortes owns shares in BHP and is entitled to participate in employee share holding plans. M. Cortes consents to the inclusion in the presentation of the matters based on his information in the form and context in which it appears. Mineral Resources as presented are reported in 100 per cent terms. Dry tonnages are reported and all tonnage and quality information has been rounded, hence small differences may be present in the totals. Total contained copper metal is presented in the table below as kilo tonnes (kt). Total contained Cu Metal presented is at equity basis. No metallurgical recovery has been applied to the calculation of contained copper metal. Mineral Resources classification is applied based on mineralisation type, geological understanding and an assessment of reasonable prospects for eventual economic extraction. Financial results 22 August 2023 29

Competent Person Statement – Copper Mineral Resources Compiled Copper Mineral Resources as at 30 June 2023 Measured Resources Indicated Resources Inferred Resources Total Resources Deposit Ore type Contained metal BHP interest (%) Tonnes (Mt) % Cu Tonnes (Mt) % Cu Tonnes (Mt) % Cu Tonnes (Mt) % Cu (Cu kt) Chile copper operations and projects Oxide 84 0.57 22 0.58 5.0 0.65 111 0.58 644 Escondida 58 0.47 45 0.47 22 0.47 125 0.47 588 57.5 Mixed Sulphide 5,120 0.59 3,660 0.51 9,980 0.53 18,800 0.54 101,520 Pampa Escondida 294 0.53 1,150 0.55 5,420 0.44 6,860 0.46 31,556 57.5 Sulphide Oxide 109 0.60 64 0.53 15 0.54 188 0.57 1,072 Pinta Verde 57.5 Sulphide − − 23 0.50 37 0.45 60 0.47 282 − − 137 0.50 81 0.60 218 0.53 1,155 57.5 Chimborazo Sulphide Escondida Total 5,665 0.59 5,101 0.52 15,560 0.50 26,362 0.52 136,816 68 0.61 113 0.62 5.7 0.58 187 0.62 1,159 Oxide Supergene Sulphide 48 0.58 97 0.58 22 0.64 167 0.59 985 100 Cerro Colorado 72 0.45 104 0.41 29 0.42 205 0.43 882 Transitional Sulphide – – – – 1,700 0.36 1,700 0.36 6,120 Hypogene Sulphide Cerro Colorado Total 188 0.54 314 0.54 1,757 0.37 2,259 0.40 9,146 19 0.61 1.6 0.58 – – 21 0.61 128 Oxide 90 0.54 29 0.31 0.3 0.42 119 0.48 571 Supergene Sulphide Spence 100 Transitional Sulphide 12 0.58 0.4 0.44 – – 12 0.58 70 748 0.47 716 0.43 831 0.39 2,300 0.43 9,890 Hypogene Sulphide Spence Total 869 0.48 747 0.43 831 0.39 2,452 0.43 10,659 Copper projects Pantera − − 13 1.28 7.1 1.09 20 1.21 242 100 OC Sulphide Succoth OC Sulphide − − 61 0.57 57 0.52 120 0.54 648 100 Copper gold operations Pedra Branca UG Sulphide 1.5 1.55 8.3 1.68 7.3 1.38 17 1.54 262 100 Carrapateena 130 1.01 470 0.62 300 0.26 900 0.56 5,040 100 UG Sulphide 45 1.17 51 0.86 66 0.85 162 0.94 1,523 UG Sulphide Prominent Hill 0.4 1.16 4.0 0.11 - - 4.4 0.19 8 100 SP Sulphide - - 2.2 0.16 - - 2.2 0.16 4 SP Low-grade Copper gold project - - - - 100 0.51 100 0.51 510 100 Fremantle Doctor UG Sulphide Copper uranium gold operations 3,410 0.59 3,330 0.56 2,900 0.58 9,640 0.58 55,912 Olympic Dam OC Sulphide 100 810 1.55 720 1.45 210 1.40 1,740 1.49 25,926 UG Sulphide Copper zinc operations Antamina 190 0.81 392 0.83 603 0.85 1,190 0.84 9,996 Sulphide Cu only 71 0.82 207 1.00 224 1.08 502 1.01 5,070 Sulphide Cu-Zn 33.75 – – – – 251 1.28 251 1.28 3,213 UG Sulphide Cu only UG Sulphide Cu-Zn – – – – 166 1.14 166 1.14 1,892 Financial results 22 August 2023 30

Competent Person Statement – Nickel Mineral Resources Nickel West Mineral Resources Competent Person Statement The information in this slide relates to Nickel West Mineral Resources as at 30 June 2023. Mineral Resources are inclusive of Ore Reserves and is based on information compiled by Richard Finch as Competent Person (compiler) for all declared Mineral Resources. The information in this presentation that relates to the FY2023 Mineral Resources reported by BHP in accordance with the ‘Australasian Code for Reporting of Exploration Results, Mineral Resources and Ore Reserves, 2012’ (‘The JORC Code 2012 Edition’) in the 2023 BHP Annual Report, available to view on www.bhp.com. R. Finch is a current Member of the Australasian Institute of Mining and Metallurgy (MAusIMM) and he is a full-time employee of BHP. R. Finch has sufficient experience that is relevant to the style of mineralisation and type of deposits under consideration and to the activity which he is undertaking to qualify as Competent Person as defined in the defined in the JORC Code 2012 Edition. R. Finch owns shares in BHP and is entitled to participate in employee share holding plans. R. Finch consents to the inclusion in the presentation of the matters based on his information in the form and context in which it appears. Mineral Resources as presented are reported in 100 per cent terms. Dry tonnages are reported and all tonnage and quality information has been rounded, hence small differences may be present in the totals. Total contained nickel metal is presented in the table below as kilo tonnes (kt). No metallurgical recovery has been applied to the calculation of contained nickel metal. Mineral Resources classification is applied based on mineralisation type, geological understanding and an assessment of reasonable prospects for eventual economic extraction. Table below only includes Nickel Sulphide resources. Compiled Nickel West Sulphide Mineral Resources as at 30 June 2023 Measured Resources Indicated Resources Inferred Resources Total Resources Deposit Ore type BHP interest (%) Contained metal Tonnes (Mt) % Ni Tonnes (Mt) % Ni Tonnes (Mt) % Ni Tonnes (Mt) % Ni (Ni kt) Nickel West operations OC Disseminated Sulphide 4.1 0.72 77 0.58 52 0.64 133 0.60 798 OC Massive Sulphide 0.25 4.4 1.0 4.9 0.37 4.7 1.6 4.8 77 100 Leinster UG Disseminated Sulphide 16 1.8 16 1.4 4.3 1.2 36 1.5 540 UG Massive Sulphide 0.74 5.4 2.3 5.6 1.2 4.4 4.2 5.2 218 Mt Keith OC Disseminated Sulphide 100 133 0.54 67 0.52 24 0.52 224 0.53 1,187 UG Disseminated Sulphide - - 6.4 0.89 1.6 1.0 8.0 0.92 74 100 Cliffs UG Massive Sulphide 0.64 3.7 1.0 3.8 0.35 3.5 2.0 3.7 74 Yakabindie OC Disseminated Sulphide 100 151 0.61 89 0.61 148 0.61 388 0.61 2,367 Nickel West projects OC Disseminated Sulphide - - 138 0.62 6.5 0.66 144 0.62 893 Honeymoon Well 100 UG Disseminated Sulphide 9.1 0.72 18 0.75 3.8 0.74 31 0.74 229 UG Massive Sulphide 0.35 6.0 0.92 6.4 0.17 6.6 1.4 6.3 88 Jericho OC Disseminated Sulphide 100 - - 9.1 0.59 77 0.55 86 0.55 473 Nickel West copper projects Nebo OC Sulphide – – 49 0.34 1.1 0.35 50 0.34 170 100 Babel OC Sulphide 91 0.31 190 0.28 58 0.32 340 0.30 1,020 Financial results 22 August 2023 31
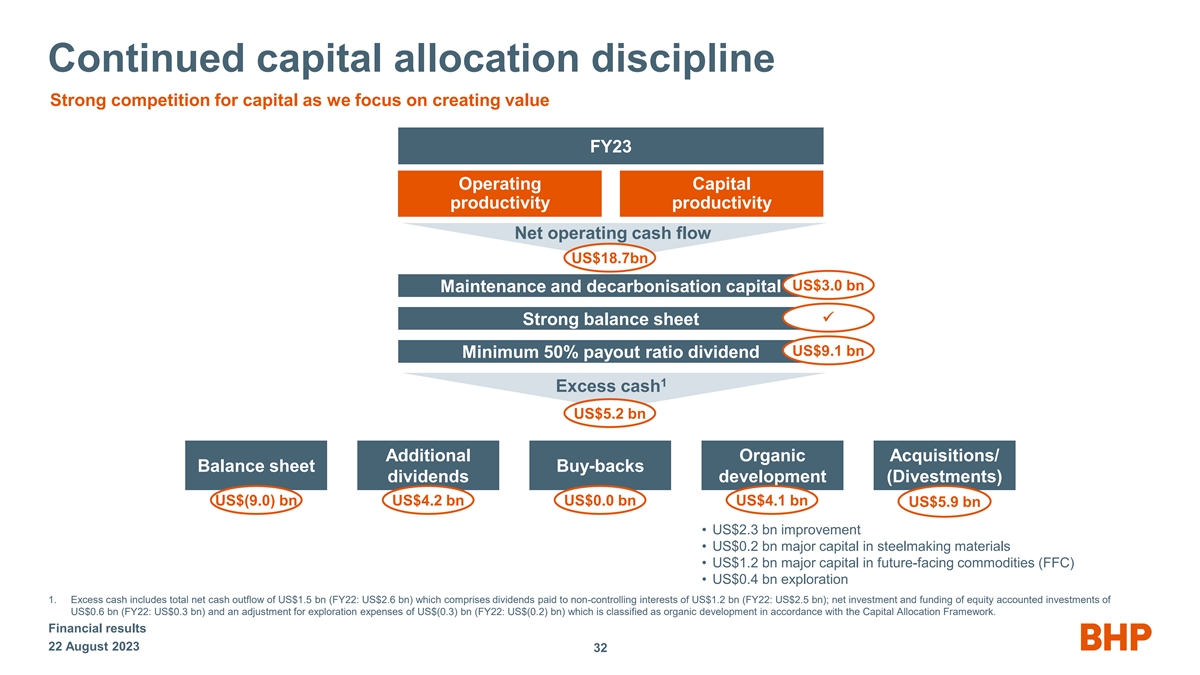
Continued capital allocation discipline Strong competition for capital as we focus on creating value FY23 Operating Capital productivity productivity Net operating cash flow US$18.7bn US$3.0 bn Maintenance and decarbonisation capital ü Strong balance sheet US$9.1 bn Minimum 50% payout ratio dividend 1 Excess cash US$5.2 bn Additional Organic Acquisitions/ Balance sheet Buy-backs dividends development (Divestments) US$(9.0) bn US$4.2 bn US$0.0 bn US$4.1 bn US$5.9 bn • US$2.3 bn improvement • US$0.2 bn major capital in steelmaking materials • US$1.2 bn major capital in future-facing commodities (FFC) • US$0.4 bn exploration 1. Excess cash includes total net cash outflow of US$1.5 bn (FY22: US$2.6 bn) which comprises dividends paid to non-controlling interests of US$1.2 bn (FY22: US$2.5 bn); net investment and funding of equity accounted investments of US$0.6 bn (FY22: US$0.3 bn) and an adjustment for exploration expenses of US$(0.3) bn (FY22: US$(0.2) bn) which is classified as organic development in accordance with the Capital Allocation Framework. Financial results 22 August 2023 32

Return on Capital Employed ROCE of 28.8% for FY23 ROCE ROCE by asset (%) (%) 55 60 50 50 45 40 40 1 35 Antamina 30 BMA Escondida 30 WAIO 25 20 20 10 15 Pampa Copper Norte South Australia 10 0 5 Nickel West (10) 0 0 10 20 30 40 50 FY18 FY19 FY20 FY21 FY22 FY23 Average capital employed Half year results (total) Full year results (total) (US$ bn) Note: ROCE represents profit after tax excluding exceptional items and net finance costs (after tax), which are 1. Antamina: average capital employed represents BHP’s equity interest. annualised for half year results, divided by average capital employed. Average capital employed is net assets less net Note: NSWEC has not been shown as ROCE is distorted by negative capital employed due to the debt for the last two reporting periods. rehabilitation provision being the primary balance remaining on Balance Sheet following previous impairments. Jansen and West Musgrave have not been shown as they are under development. Financial results 22 August 2023 33

Balance sheet Net debt of US$11.2 bn and gearing of 18.7% 2 Movements in net debt Debt maturity profile (US$ bn) (US$ bn) 8 12 0.5 11.2 1.1 0.5 1.2 13.3 8 6 4 4 (5.6) 0.3 0 2 (4) 0 FY24 FY25 FY26 FY27 FY28 FY29 FY30 FY31 - Post FY40 FY41 US$ Euro Sterling Bank 3 3 3 Bonds Bonds Bonds Debt Subsidiaries (8) FY22 Free cash Dividends Dividends Lease OZL interest Other FY23 35% 18% 11% 24% 12% 1 flow paid paid to NCI additions bearing movements % of portfolio Capital markets 64% Acquisition Asset financing 12% liabilities facility 24% 1. NCIs: dividends paid to non-controlling interests of US$1.2 bn predominantly relate to Escondida. 2. Debt maturity profile: all debt balances are represented in notional USD inception values and based on financial years; as at 30 June 2023; subsidiary debt is presented in accordance with IFRS 10 and IFRS 11. 3. Debt maturity profile: includes hybrid bonds (1.4% of portfolio, in Euro) with maturity shown at first call date. Financial results 22 August 2023 34

BHP guidance Group FY24e Capital and exploration expenditure (US$ bn) ~10.0 Cash basis. Split by category: Maintenance and decarbonisation capital 3.1 Includes non-discretionary spend for deferred development and production stripping; risk reduction, compliance and asset integrity; and decarbonisation. Improvement capital 3.3 Includes projects that enable improved productivity, quality, facilities and organisational culture. Major capital in steelmaking materials 0.5 Major capital in future-facing commodities 2.7 Includes Jansen, Full SaL (Escondida) and West Musgrave. Exploration 0.4 Split by segment: Copper 4.2 Includes ~US$0.9 bn for growth and exploration. Iron ore 2.0 Coal 0.7 Potash 1.2 Includes ~US$1.0 bn for Jansen Stage 1, and ~US$125 m of pre-commitment spend for Jansen Stage 2. Nickel 0.8 Other 1.1 Includes West Musgrave. Financial results 22 August 2023 35

BHP guidance (continued) Copper FY24e Medium term Copper production (kt) 1,720 – 1,910 Escondida: 1,080 – 1,180 kt; Spence: 210 – 250 kt ; Copper South Australia: 310 – 340 kt; Antamina: 120 – 140 kt (zinc 85 – 105 kt). Escondida Copper production (kt, 100% basis) 1,080 – 1,180 1,200 – 1,300 Medium term refers to FY25 and FY26. Unit cash costs (US$/lb) 1.40 – 1.70 1.30 – 1.60 Medium term refers to FY25 and FY26. Excludes freight and government royalties; net of by-product credits; based on an exchange rate of USD/CLP 810. Spence Copper production (kt) 210 – 250 ~250 Unit cash costs (US$/lb) 2.00 – 2.30 Excludes freight; net of by-product credits; based on an exchange rate of USD/CLP 810. Iron Ore FY24e Medium term Iron ore production (Mt) 254 – 264.5 Western Australia Iron Ore: 250 – 260 Mt; Samarco 4 – 4.5 Mt. Western Australia Iron Ore Iron ore production (Mt, 100% basis) 282 – 294 >305 Unit cash costs (US$/t) 17.40 – 18.90 <17 Excludes freight and government royalties; based on an exchange rate of AUD/USD 0.67. Sustaining capital expenditure (US$/t) – ~5.5 Medium term average; +/- 50% in any given year. Excludes costs associated with carbon abatement and automation programs. Coal FY24e BMA Production (Mt, 100% basis) 56 – 62 Unit cash costs (US$/t) 95 – 105 Excludes freight and royalties; based on an exchange rate of AUD/USD 0.67. NSWEC Production (Mt) 13 – 15 Nickel FY24e Production (kt) 77 – 87 Note: Medium term refers to a five-year horizon, unless otherwise noted. Financial results 22 August 2023 36

Key Underlying EBITDA sensitivities 1 Approximate impact on FY23 Underlying EBITDA of changes of: US$ m 2 US$1/t on iron ore price 227 US$1/t on metallurgical coal price 17 2 US¢1/lb on copper price 34 2 US$1/t on energy coal price 13 US¢1/lb on nickel price 1 3 AUD (US¢1/A$) operations 147 3 CLP (US¢0.10/CLP) operations 28 1. EBITDA sensitivities: assumes total volume exposed to price; determined on the basis of BHP’s existing portfolio. Does not include impact of OZ Minerals which was acquired on 2 May 2023. 2. EBITDA sensitivities: excludes impact of equity accounted investments. 3. EBITDA sensitivities: based on average exchange rate for the period. Financial results 22 August 2023 37

SIGNATURES
Pursuant to the requirements of the Securities Exchange Act of 1934, the registrant has duly caused this report to be signed on its behalf by the undersigned, thereunto duly authorized.
| BHP Group Limited | ||||||
| Date: August 22, 2023 | By: | /s/ Stefanie Wilkinson |
||||
| Name: | Stefanie Wilkinson | |||||
| Title: | Group Company Secretary | |||||