| Exhibits | Description | ||||
| 99.1 | 2023 Q2 Report Press Release dated August 8, 2023 | ||||
| 99.2 | Barrick Gold Corporation’s Comparative Unaudited Financial Statements prepared in accordance with International Financial Reporting Standards and the notes thereto for the three and six months ended June 30, 2023 and Management’s Discussion and Analysis for the same periods | ||||
| 101.INS | Inline XBRL Instance Document - the instance document does not appear in the Interactive Data File because its XBRL tags are embedded within the Inline XBRL document | ||||
| 101.SCH | Inline XBRL Taxonomy Extension Schema Document | ||||
| 101.CAL | Inline XBRL Taxonomy Extension Calculation Linkbase Document | ||||
| 101.DEF | Inline XBRL Taxonomy Extension Definition Linkbase Document | ||||
| 101.LAB | Inline XBRL Taxonomy Extension Labels Linkbase Document | ||||
| 101.PRE | Inline XBRL Taxonomy Extension Presentation Linkbase
Document |
||||
Exhibit 99.1
BARRICK PROGRESSES EXTENSION OF
LONG-TERM VALUE DELIVERY RUNWAY
| ALL AMOUNTS EXPRESSED IN U.S. DOLLARS
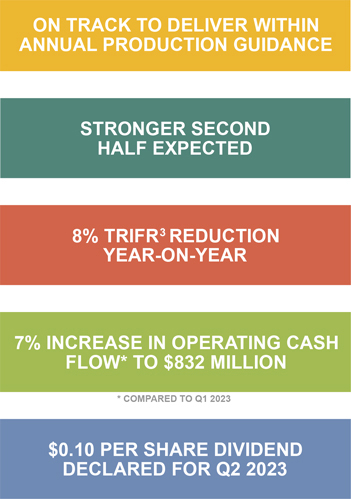
Toronto, August 8, 2023 — Barrick Gold Corporation (NYSE:GOLD)(TSX:ABX) is on target to meet its gold and copper production guidance for 2023 and continues to advance major projects which will drive value delivery in the long term through organic growth, president and chief executive Mark Bristow said today.
Commenting on the company’s Q2 results, Bristow said improved performances from the Carlin complex in Nevada, the Kibali gold mine in the Democratic Republic of Congo and the Lumwana copper mine in Zambia have laid a sound foundation for production in the second half of the year which, as guided, is expected to surpass the first. Key drivers of higher anticipated the H2 results are the Q2 completion of major maintenance projects at Nevada Gold Mines (“NGM”) and the commissioning of the plant expansion at the Pueblo Viejo gold mine in the Dominican Republic.
Compared to Q1, gold production in Q2 was up 6% at just over 1 million ounces1 while copper production increased by 22% to 107 million pounds.1 Operating cash flow rose by 7% to $832 million, net earnings increased by 143% to 17 cents per share, and adjusted net earnings2 increased by 36% to 19 cents per share. The quarterly dividend was maintained at 10 cents. Year-on-year, the total recordable injury frequency rate (“TRIFR”) was reduced by 8% and greenhouse gas emissions were reduced by 12%.3
CONTINUED ON PAGE 3 |
|

Key Performance Indicators
Financial and Operating Highlights
|
Financial Results
|
Q2 2023
|
Q1 2023
|
Q2 2022
|
|||||||||
| Realized gold price1,4 ($ per ounce) |
1,972 | 1,902 | 1,861 | |||||||||
| Net earnings ($ millions) |
305 | 120 | 488 | |||||||||
| Adjusted net earnings2 ($ millions) |
336 | 247 | 419 | |||||||||
| Net cash provided by operating activities ($ millions) |
832 | 776 | 924 | |||||||||
| Free cash flow5 ($ millions) |
63 | 88 | 169 | |||||||||
| Net earnings per share ($) |
0.17 | 0.07 | 0.27 | |||||||||
| Adjusted net earnings per share2 ($) |
0.19 | 0.14 | 0.24 | |||||||||
| Attributable capital expenditures6,7 ($ millions) |
588 | 526 | 587 | |||||||||
|
Operating Results
|
Q2 2023
|
Q1 2023
|
Q2 2022
|
|||||||||
| Gold |
||||||||||||
| Production1 (000s of ounces) |
1,009 | 952 | 1,043 | |||||||||
| Cost of sales1,8 ($ per ounce) |
1,323 | 1,378 | 1,216 | |||||||||
| Total cash costs1,9 ($ per ounce) |
963 | 986 | 855 | |||||||||
| All-in sustaining costs1,9 ($ per ounce) |
1,355 | 1,370 | 1,212 | |||||||||
| Copper |
||||||||||||
| Production1 (millions of pounds) |
107 | 88 | 120 | |||||||||
| Cost of sales1,8 ($ per pound) |
2.84 | 3.22 | 2.11 | |||||||||
| C1 cash costs1,10 ($ per pound) |
2.28 | 2.71 | 1.70 | |||||||||
| All-in sustaining costs1,10 ($ per pound) |
3.13 | 3.40 | 2.87 | |||||||||
Q2 2023 Results Presentation
Webinar and Conference Call
Mark Bristow will host a live presentation of the results today at 11:00 AM ET, with an interactive webinar linked to a conference call. Participants will be able to ask questions.
Go to the webinar
US and Canada (toll-free), 1 800 319 4610
UK (toll-free), 0808 101 2791
International (toll), +1 416 915 3239
The Q2 2023 presentation materials will be available on Barrick’s website at www.barrick.com and the webinar will remain on the website for later viewing.
Best Assets
| ∎ | Strong performances at Carlin, Kibali and Lumwana keep Barrick on track to deliver gold and copper production within annual guidance |
| ∎ | Stronger second half expected with completion of major shutdowns at NGM and Pueblo Viejo ramp-up in Q3 |
| ∎ | New equipment at Lumwana delivers 40% increase in copper production, 21% decrease in cost of sales and 26% decrease in C1 cash costs10 over Q1; more expected in H2 as we mine higher grade benches |
| ∎ | Solid Q2 production at Veladero places it firmly on track to deliver on full-year guidance |
| ∎ | Porgera continues to advance to restart, aided by settlement of legacy tax dispute and submission of new Special Mining Lease application |
| ∎ | Exploration progresses significant brownfields opportunities at Carlin, Cortez, Turquoise Ridge, Veladero, Loulo, Kibali and Lumwana while consolidating new prospective ground positions in USA, Canada, Dominican Republic, Peru, Chile, Tanzania and Côte d’Ivoire |
Leader in Sustainability
| ∎ | Pueblo Viejo receives environmental license for new tailings storage facility |
| ∎ | 8% reduction in TRIFR3 year-on-year |
| ∎ | 12% decrease in greenhouse gas emissions versus H1 2022 |
| ∎ | Successful reintroduction of 16 white rhinos into the Garamba National Park in DRC |
Delivering Value
| ∎ | 7% increase in operating cash flow over Q1 to $832 million |
| ∎ | 143% increase in net earnings per share over Q1 to $0.17 and 36% increase in adjusted net earnings per share2 to $0.19 for Q2 |
| ∎ | $0.10 per share dividend declared |
| BARRICK SECOND QUARTER 2023 | 2 | PRESS RELEASE |
CONTINUED FROM PAGE 1
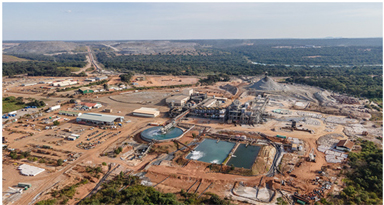
The massive Pueblo Viejo expansion project is making significant progress with the process plant currently ramping up to full capacity. The plant expansion and associated new tailings storage facility will extend the Tier One11 mine’s life to beyond 2040 and is designed to sustain gold production above 800,000 ounces pear year (100% basis) going forward.12 In Papua New Guinea, the resolution of the tax dispute has allowed us to work toward the re-opening of the Porgera gold mine by the end of the year13, with a potential Tier One production profile, while the prefeasibility study on a Super Pit at Lumwana is driving its transformation into another Tier One asset, capable of producing into the 2060s.
In Pakistan, Barrick continues to make solid progress on the Reko Diq project. Reko Diq is targeting first production in 2028, at the same time that the Lumwana expansion is expected to be completed. Together, these projects will elevate Barrick into the premier league of copper producers, in line with its strategy of significantly expanding its copper portfolio.
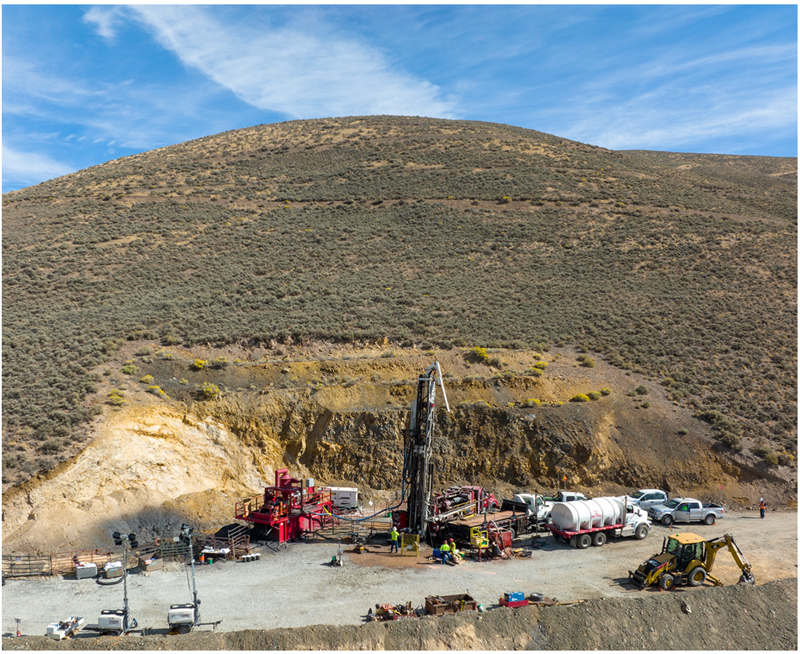
Exploration, traditionally Barrick’s key growth driver, is advancing significant resource and reserve growth opportunities at Carlin, Cortez and Turquoise Ridge in Nevada, Veladero in Argentina and Loulo, Kibali and Lumwana in Africa. Barrick is also continuing to expand its global exploration footprint and has consolidated new prospective ground holdings in the USA, Canada, the Dominican Republic, Peru, Chile, Tanzania and Côte d’Ivoire.
“Our asset base is the best in the business and it gives us a platform from which we can clearly see and plan for the future, managing the challenges and maximizing the opportunities. At the halfway mark of this year, we’ve again advanced significantly towards our goal of building the world’s most valued gold and copper mining company, and we have the strategy, the means and the motivation to achieve that,” Bristow said.
BARRICK DECLARES Q2 DIVIDEND
Barrick today announced the declaration of a dividend of $0.10 per share for the second quarter of 2023.
The dividend is consistent with the company’s Performance Dividend Policy announced at the start of 2022.
The Q2 2023 dividend will be paid on September 15, 2023 to shareholders of record at the close of business on August 31, 2023.
“As a result of the continuing overall strength of our business and balance sheet, we have maintained the distribution of a robust base dividend to our shareholders, while our Performance Dividend Policy provides the potential for additional upside going forward,” said senior executive vice-president and chief financial officer Graham Shuttleworth.
THE POSITIVE IMPACT OF RESPONSIBLE MINING
Effective and equitable socio-economic development worldwide would not be possible without the transformative contribution of responsible mining, Mark Bristow said at the group’s third annual Sustainability Update on July 25.
Bristow said Barrick’s sustainability strategy was geared to the United Nations’ Sustainable Development Goals (SDGs), and in line with its commitment to transparency, its recently published Sustainability Report for 2022 showed how its operations contributed to or impacted on specific SDGs.
“We believe mining is the flywheel of development and therefore the entire industry is essential to the achievement of the SDGs,” he said.
Barrick’s Sustainability Executive, Grant Beringer, said the group was also making progress towards complete conformance with the latest best practices, including the International Council on Mining and Metals’ Performance Expectations, the World Gold Council’s Responsible Gold Mining Principles and the Global Industry Standard on Tailings Management. Barrick continues to meet or exceed its environmental targets, including recycling and reusing water — up to 83% from 80% in 2021 — and reducing greenhouse gas emissions by 12% year-on-year and 6% for 2022.
“We believe the mining industry is a catalyst for socioeconomic development through the infrastructure we build, the jobs we create, the businesses we support through our supply chains and the investments we make in local communities,” Beringer said.
The group’s current key focus areas are: using its purchasing power to drive down Scope 3 emissions from suppliers; developing a tool to measure its contribution to the conservation and regeneration of biodiversity; continuing to provide ESG raters with the latest sustainability-related information; and progressing the environmental and social studies at the giant Reko Diq project in Balochistan, Pakistan, where it is already delivering on its community development commitments, far ahead of the targeted first production in 2028.
“Done right, the mining industry is a powerful force for good in the global drive for social and economic development,” Bristow said.
| BARRICK SECOND QUARTER 2023 | 3 | PRESS RELEASE |
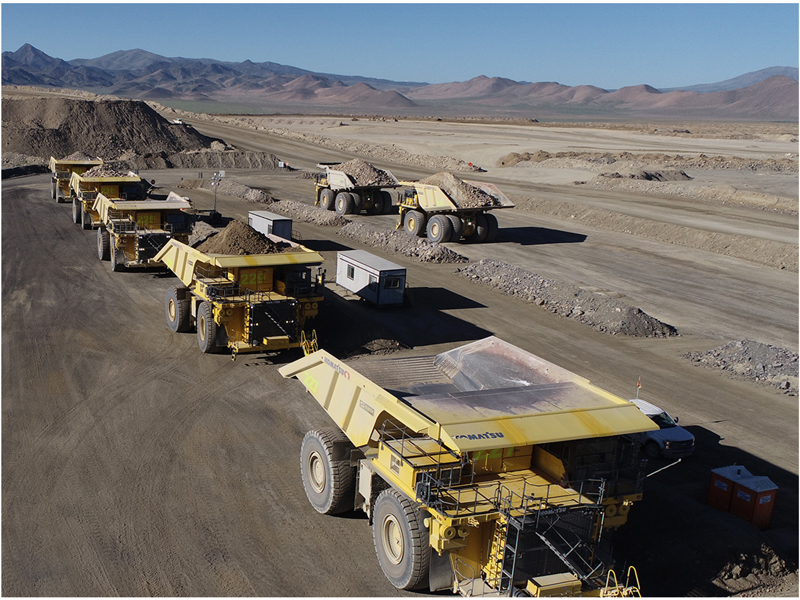
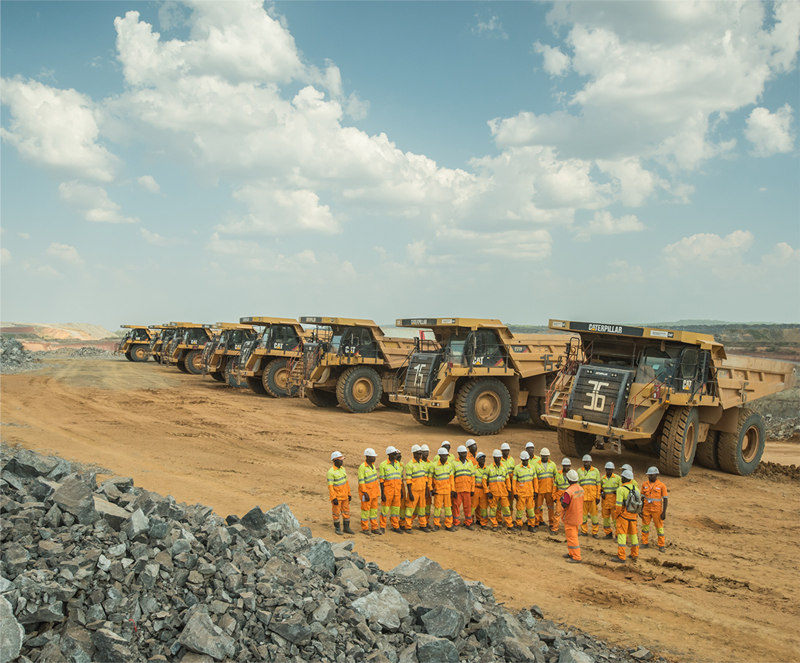
NGM’s operating muscle has been beefed up with the ahead-of-schedule commissioning of the first seven of a new 22-unit Komatsu 930 fleet due this year.
FOCUS ON FLEXIBILITY AT NEVADA
With the completion of major maintenance shutdowns at NGM, and a significantly improved performance from Carlin, the focus on driving flexibility and reducing production risk has intensified.
NGM chairman Mark Bristow says while the superb quality of the complex’s assets and its enormous untapped potential make Nevada the value foundation on which operator and majority shareholder Barrick is growing its business, it has processing constraints which need to be overcome by boosting operational flexibility.
“We see at each of the three Tier One assets (Carlin, Cortez and Turquoise Ridge) multiple opportunities to strengthen the life of mine with near-mine growth using the current infrastructure in the midterm (Leeville, Ren), new projects that can extend the use of the processing facilities (Robertson), and a long-term portfolio targeting significant brownfields and greenfields (Fourmile, Turquoise Ridge Underground) to sustain current production past the 15-year window.”
“We’re planning to achieve this by increasing processing and mining run times, stepping up development at all the underground mines, improving and standardizing
maintenance management, identifying and implementing efficiency initiatives, and tightening control of compliance with mine plans,” he says.
“Barrick’s mantra is that the best assets need to be managed by the best people so there’s been an equally strong focus on building a management team and a workforce with the skills and orientation required to make the most of the world’s largest gold mining complex. In this regard, it’s worth noting that the training center we established at NGM has already produced more than 170 frontline and support staff graduates.”
During the past quarter, NGM’s operating muscle was beefed up with the ahead-of-schedule commissioning of the first seven of a new 22-unit Komatsu 930 fleet due this year. The rest of a total of 62 are due to be commissioned over the next three years.
| BARRICK SECOND QUARTER 2023 | 4 | PRESS RELEASE |
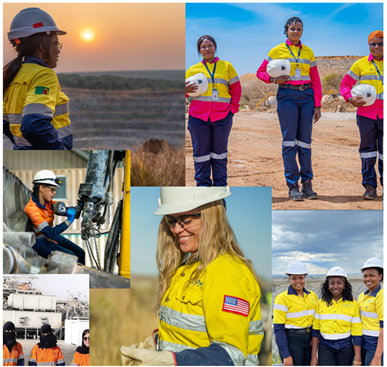
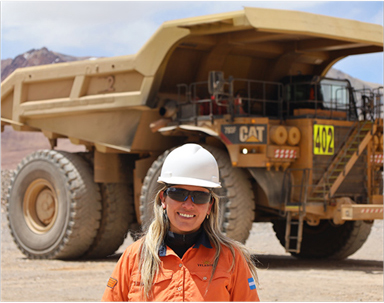
WHERE WOMEN SHINE
On June 15, Barrick joined the rest of the industry in celebrating the International Day of Women in Mining. As Mark Bristow notes, however, acknowledging and encouraging the important role women should be playing in this traditionally male-dominated business is an everyday strategic priority for Barrick.
“People are the ultimate resource, and we invest the same amount of attention into finding and developing them as we do in exploring for mineral resources,” Bristow says. “There’s a strong commercial as well as a moral motivation to make gender diversity part of this strategy. The communities in which we operate include large numbers of capable and committed women who just need an opportunity to show what they can contribute.
“That’s why we have recruitment drives and training programs specifically targeted at women as well as initiatives to raise awareness of the value of female economic empowerment in their communities.
“At our Pueblo Viejo mine in the Dominican Republic, for example, women represented 51% of new hires and 35% of internal promotions last year, and 23% of its workforce is now female. Across the group we had almost 3,000 female employees, representing 12% of our global workforce at the end of 2022, with 18% of management positions and 16% of senior management positions being held by women. We’re working hard to make that proportion larger.”
LUMWANA’S BURIED TREASURE
HOW BARRICK CREATES VALUE BY UNCOVERING POTENTIAL
Barrick’s post-merger focus on developing a clear understanding of the geological structures underlying its assets has unlocked enormous potential across the group, most recently at the 100% owned Lumwana copper mine in Zambia.
The transformation of this mine into a potential Tier One operation with a significant free cash flow and a life expectancy into the 2060s is well under way, with the accelerated pre-feasibility study scheduled for completion towards the end of next year. Pre-construction will start in 2025 with 2028 targeted for first production. Concurrent with the expansion, the existing process plant will be upgraded to support the new mine life.
“Resource conversion of the Chimiwungo Super Pit extension has started and the results to date have confirmed the deposit’s potential to provide the foundation for the Lumwana expansion project. Meanwhile resource definition drilling at the near-surface, low-strip Kamisengo deposit has shown that it can support the process plant feed during the stripping phase of the super pit,” says Sebastiaan Bock, chief operating officer of Barrick’s Africa & Middle East region.
Mark Bristow says when the new Lumwana and Reko Diq both come on stream, which is currently expected in 2028,
they will promote Barrick to the premier league of copper producers alongside its peerless gold portfolio.
“Both these projects demonstrate Barrick’s unique ability to extract every ounce or pound of value from assets already in its portfolio,” he says.
| BARRICK SECOND QUARTER 2023 | 5 | PRESS RELEASE |
ORGANIC GROWTH IN MINERAL RESERVES SUPPORTS
BARRICK’S 10-YEAR PRODUCTION PROFILE
Exploration continues to be the driving force that sets Barrick apart from its peers by delivering significant and sustained growth in attributable, proven and probable reserves.
“Since the 2019 merger with Randgold, we’ve replaced 125% of the gold depleted by mining (exclusive of divestments and acquisitions on a gold equivalent basis)14 by unlocking the full value of Barrick’s assets and successfully expanding the asset base through brownfields exploration,” says Simon Bottoms, mineral resource management and evaluation executive.
“One of the big advantages of having high-quality assets in the world’s most prospective regions is that we have a long replacement planning runway. A key group deliverable is the organic replacement of depletion on a rolling three-year basis. Our focus for the rest of this year is on building the mineral resources that will serve as the foundation for future conversion into reserves.”
In Nevada, Barrick continues to work on multiple Tier One targets that are expected to materially grow the resource and reserve potential of one of the world’s most endowed mining complexes. In the Africa & Middle East region, resource conversion drilling at Kibali, Yalea at Loulo-Gounkoto and Bulyanhulu is expected to again replace depletion this year.
“Looking ahead to 2024, the completion of the prefeasibility study on the Lumwana Super Pit expansion project and the updated feasibility study on the Reko Diq project in Pakistan is expected to deliver organic growth over and above annual depletion in the group’s mineral reserves. Next year’s reserve growth is also expected to be supported by the completion of conversion drilling in the greater Leeville complex and elsewhere at NGM,” says Bottoms.
| BARRICK SECOND QUARTER 2023 | 6 | PRESS RELEASE |
A PROUD HISTORY, A BRIGHT FUTURE
Barrick marked its 40th birthday this year, celebrating its growth from the modest, small-scale operation started by Canadian mining pioneer Peter Munk in the early 1980s.
When Barrick listed on the Toronto Stock Exchange on May 2, 1983, it had a market capitalization of C$100 million and produced 30,000 ounces of gold in its first full year of production. Since its merger with Randgold in 2019, the company aspires to be the world’s most valued gold and copper business with the best assets managed by the best people and delivering the best returns and benefits for all its stakeholders.
Barrick today has a multi billion dollar market capitalization and produced 4.1 million ounces of gold and 440 million pounds of copper in 20221 from a mine and project portfolio spanning 19 countries.

Ringing the closing bell of the Toronto Stock Exchange to commemorate Barrick’s 40th anniversary.
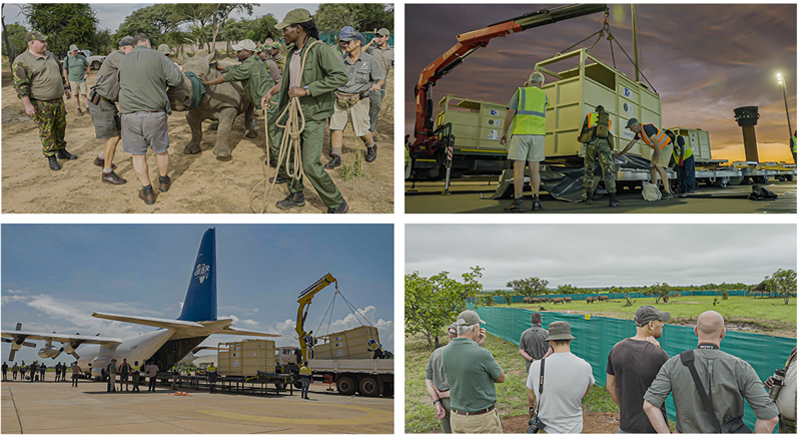
BRINGING BACK WHITE RHINOS TO THE DRC
Barrick was the sole donor in the recent translocation of 16 southern white rhinos to the Democratic Republic of the Congo’s Garamba National Park, near our Kibali Gold Mine, in collaboration with the Institut Congolais pour la Conservation de la Nature (ICCN), African Parks and &Beyond Phinda Private Game Reserve in Kwazulu-Natal, South Africa, from where the rhinos were sourced. Northern white rhinos were last seen in the park in 2006 and are now considered extinct.
This latest sustainability initiative forms part of Barrick’s longstanding partnership with African Parks and Garamba, which has seen the company provide more than $2.5 million for tracking collars, fuel for observation planes, rescue and rehabilitation programs as well as improvements to critical infrastructure such as roads and bridges.
Additionally, Barrick will fund the translocation of a further 60 white rhinos from South Africa to Garamba over the next three years. The project is aligned with Barrick’s biodiversity strategy which places importance on restoring and conserving areas with high conservation value and the species within those habitats.
| BARRICK SECOND QUARTER 2023 | 7 | PRESS RELEASE |
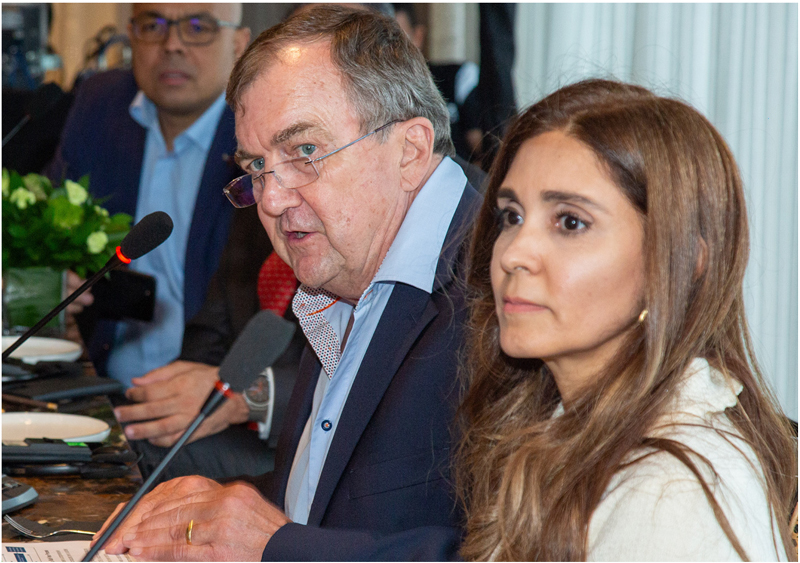
Barrick president and chief executive Mark Bristow and Pueblo Viejo president Juana Barceló speak to local media during a briefing on July 27.
A COMPREHENSIVE MULTI-YEAR PROCESS EXTENDS
THE LIFE OF PUEBLO VIEJO TO BEYOND 2040
The Barrick-operated Pueblo Viejo mine continues to advance the engineering design for the El Naranjo tailings storage facility (TSF) project which will extend its life to 2040 and beyond.12 The plant expansion and associated new TSF is designed to sustain gold production above 800,000 ounces per year (100% basis) going forward.12
Speaking at a local media briefing on July 27, Mark Bristow said that the comprehensive engineering, environmental and community process, conducted over several years, would enable Pueblo Viejo to double the enormous contribution it had already made to the Dominican Republic’s economy.
In line with its commitment to transparency, Bristow detailed the process leading up to the issuance of the environmental licence recently received for the new TSF. This started with a comprehensive site selection in line with the Global Industry Standard on Tailings Management (GISTM) and in consultation with the Government and communities.
Following the site selection process, an Environmental and Social Impact Assessment (ESIA) was completed which considered potential impacts associated with the preferred and alternative sites. This involved the completion of numerous specialist studies undertaken by independent in-
country and international experts, including an independent peer review.
The company consulted with interested and affected parties over the course of four years, including more than 3,000 community engagements and two open public participation meetings. In line with the company’s commitment to transparency and best practice, open public meetings were advertised in local and national media and allowed sufficient opportunity for all parties to raise concerns, questions and comments throughout the process.
“Mining is the driver for global development and to date, Pueblo Viejo has paid a total of $3.2 billion in direct and indirect taxes since commencing commercial production in 2013. The extension of the mine’s life will allow Pueblo Viejo to continue being a major creator of value for the Dominican Republic and its people far into the future,” Bristow said.
| BARRICK SECOND QUARTER 2023 | 8 | PRESS RELEASE |
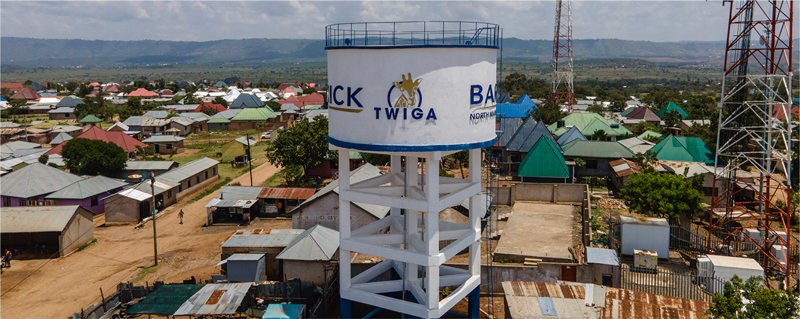
TWIGA TRANSFORMS TANZANIAN MINING,
SETS STANDARD FOR INDUSTRY
Twiga Minerals, the joint venture between the Tanzanian government and Barrick, has revitalized the country’s gold mining industry through a partnership that should serve as a model for similar operations, particularly in developing regions, says Mark Bristow.
Briefing media at a visit to the North Mara mine in July, Bristow said, in 2019, when Barrick took control over North Mara and Bulyanhulu — the mines that now form the Twiga complex – both were rundown and at a virtual standstill due to a deadlocked dispute between the government and the previous operators.
“We settled the dispute and established Twiga as a 50:50 economic benefits sharing partnership, which also vested a 16% shareholding in each mine with the government. We reinvented the mines which now, as a combined complex, produce gold at a Tier One level. So successful are these operations that, since Barrick’s buyout of the minority shareholders, they have contributed more than $2.8 billion to the Tanzanian economy in the form of taxes, levies, dividends, salaries and payments to local suppliers,” Bristow said.
“Equally important, we have fixed the environmental, land claims and human rights issues that destroyed these mines’ reputations and have restored their social licence to operate as an integral member of their communities. Since its establishment, Twiga has invested more than $12.5 million in landmark projects — identified in collaboration with the community development committees we established at the mines — to provide access to quality healthcare, educational facilities, potable water and alternative sources of income. Among these is an irrigation system which is expected to substantially improve production for more than 2,350 farmers, as well as a potable water tower that provides water to nearly 35,000 residents.”
Twiga has also committed $30 million to a Future Forward School Program. In partnership with the government, it will build 1,090 classrooms and other facilities across 161 schools nationwide, to accommodate some 49,000 students who started their A-levels in July this year. In addition, it has pledged $40 million to construct a 73 kilometre road from Kahama to Kakola.
Operationally, Bristow said the Twiga complex was continuing its strong production performance and was well on track to achieve its guidance for the year. Both mines are maintaining a strong focus on the health and safety of their workers, and in April Bulyanhulu won the Overall Tanzanian OSHA1 Compliance Award for 2023 in the Mining Sector Category and North Mara was second runner-up.
Globally, Barrick has a policy of prioritizing local employment and at Twiga this has delivered a workforce which is 96% Tanzanian, with almost half drawn from the communities around the mines.
Bristow said conversion drilling at North Mara was successfully replacing the reserves depleted by mining and first ore was mined at the mine’s new Gena pit last quarter. Additional opportunities for resource conversion have been identified at both mines.
“Barrick is committed to expanding its presence in Tanzania from our base here. We are currently consolidating key prospecting licences in the country with a view to expanding our existing reserves and resources as well as to discovering new world-class gold deposits,” he said.
| BARRICK SECOND QUARTER 2023 | 9 | PRESS RELEASE |
KIBALI SET TO ROLL OUT NEW 10-YEAR PLAN
ON BACK OF PRODUCTION RAMP-UP
AND RESERVE REPLACEMENT
Africa’s biggest gold mine, Kibali, stepped up production significantly in the past quarter as part of its planned ramp-up and is well on track to achieve its annual guidance. At the same time, successful exploration is expected to more than replace reserves depleted by mining again this year.
Briefing media in Kinshasa, Mark Bristow said the 10-year-old mine was now rolling out its business plan for the next decade, securing its status as one of the company’s elite portfolio of Tier One mines — those capable of producing 500,000 ounces or more of gold for at least 10 years at a cost below the industry average.
The mine draws most of its power from its three hydropower stations on the Kibali river. A planned 16MW solar farm, designed to back up the hydropower during the Democratic Republic of Congo’s (DRC’s) dry season, is expected to increase the renewable power contribution to the mine’s energy grid from 79% to 88%, with Kibali running entirely on renewables during the wet season.
Bristow said the creation of a world-class mine and a thriving local economy in one of the DRC’s remotest and least developed regions represented a triumph for the successful partnership between Barrick, the country’s government and its host communities.
“Our stakeholders in the DRC have benefited enormously from Kibali, which over the past 10 years has contributed
$4.6 billion to the country in the form of dividends, royalties and taxes. In line with our local procurement policy, Kibali gives preference to Congolese suppliers and contractors, who to date have received $2.5 billion from the mine,” Bristow said.
“Barrick’s commitment to the DRC is also evident from the extensive support we have given the Garamba National Park, contributing to the conservation of high value biodiversity. Most recently we led the drive to reintroduce white rhinos to the park, where they were last seen 17 years ago. Last month 16 of these rhinos were successfully introduced to Garamba with a further 60 scheduled for delivery over the next three years.”
Kibali’s Cahier des Charges program launched eleven projects in 2023 with seven of these scheduled for completion this July. The mine is investing $8.9 million in this program over five years. The community development fund is also implementing a number of new projects.
| BARRICK SECOND QUARTER 2023 | 10 | PRESS RELEASE |
SUCCESSFUL EXPLORATION CONTINUES
TO EXTEND TONGON’S LIFE OF MINE
Originally scheduled for closure in 2020, the life of Barrick’s Tongon gold mine continues to be extended through successful exploration campaigns.
Tongon general manager Hilaire Diarra says that since Tongon poured its first gold in 2010, the mine has contributed $2.2 billion to the Ivorian economy in the form of taxes, infrastructure development, salaries and payments to local suppliers.
“Extending its life will help ensure that Tongon is still able to share the value it creates with all its Ivorian stakeholders continuing its investment in community infrastructure development and income-generating projects. Exploration has further delivered the Seydou North, Tongon West and Djinni satellite targets adding to the life of mine. Barrick has
now also been awarded a new exploration permit for Boundiali and drilling is ongoing at the Fonondara conversion project,” he said.
“In spite of the fact that throughout its life Tongon has had to contend with serious operational issues, as well as a challenging socio-political environment, since pouring first gold it has never had an unprofitable quarter, which is a tribute to the dedication of the mine’s successive management teams. At the halfway mark of this year, it is on track to once again achieve its annual production guidance.”
| BARRICK SECOND QUARTER 2023 | 11 | PRESS RELEASE |
SUCCESSFUL PARTNERSHIP WILL
KEEP GOLD SHINING FOR MALI
The 26-year-long partnership between Barrick (previously Randgold) and the state of Mali has built the country’s gold mining industry into a world leader and positioned it strongly for further growth, says Mark Bristow.
Speaking at a media briefing at the Loulo-Gounkoto complex, Bristow said the complex was one of the world’s top 10 gold producers and the biggest business in terms of enterprise value in the whole of West Africa. Together with the Morila mine, the complex has contributed $9.3 billion to the Malian economy and accounted for between 5% and 10% of the country’s GDP over the past 10 years. Loulo-Gounkoto is one of Mali’s largest taxpayers and employers, with a workforce of some 7,000, 97% of whom are Malian nationals. Over the life of the complex the state has received more than 70% of the economic benefits it created.
“We are continuing to invest in the future of Loulo-Gounkoto. Successful exploration is more than replacing the ounces we mine as well as identifying new growth opportunities with the potential to deliver the next generation of major discoveries in the Loulo region. The new underground mine at Gounkoto – the complex’s third – has developed its first production stopes and the Yalea South cutback is ahead of plan,” Bristow said.
“We foresee that the complex will be a major contributor to the Malian economy for years to come. The achievement of that vision will require the continued commitment to the mutually rewarding partnership which has brought us this far
and delivered sustainable benefits to all stakeholders, including the country’s citizens.”
In line with Barrick’s global policy of local procurement, Malian suppliers accounted for 74% of the complex’s purchases, amounting to $298 million, during the first half of this year.
Turning to Loulo-Gounkoto’s operations, Bristow said the complex was continuing to perform strongly and was on track to achieve its production guidance for this year. It remains tightly focused on the safety of its workers and there were no lost-time injuries again during the past quarter.
As part of Barrick’s transition to renewable energy, the complex is extending its solar power installation by 48MW and battery storage system by 38MVA. The project is already feeding 10MW into the mines micro-grid and it is expected that its second phase will be commissioned well ahead of the current end-2024 completion date.
| BARRICK SECOND QUARTER 2023 | 12 | PRESS RELEASE |
HERITAGE FUND WILDLIFE ENDOWMENT SUPPORTS
HABITAT ENHANCEMENT AND RESTORATION PROJECTS
NGM has established a new Wildlife Endowment, created as an extension of the company’s non-profit employee giving program, the Heritage Fund.
The Wildlife Endowment was established in partnership with the Nevada Department of Wildlife (NDOW) as a sustainable environmental fund dedicated to wildlife habitat enhancement and restoration projects supporting wildland fire prevention, restoration, and riparian and stream health initiatives across Nevada.
The Heritage Fund recently approved $5 million of the $20 million commitment by NGM to be earmarked for Wildlife Endowment funding. Once fully funded in mid-2025, any environmental entity able to leverage qualified State or Federal matching grants whose efforts fit within fire prevention, restoration, and riparian and stream health categories will have the opportunity to request funding. One of the many benefits of the Wildlife Endowment is its accessibility to NGM employees, who will have the opportunity to easily donate to the fund and receive an additional 120% NGM match.
“We are very proud of this new environmental endowment, as it aligns with the Heritage Fund’s mission of supporting the sustainability of community programs and initiatives. It is a clear demonstration of our commitment to environmental stewardship alongside NDOW and other environmental agencies who are already doing great work in our communities and across the state,” says NGM executive managing director Peter Richardson.
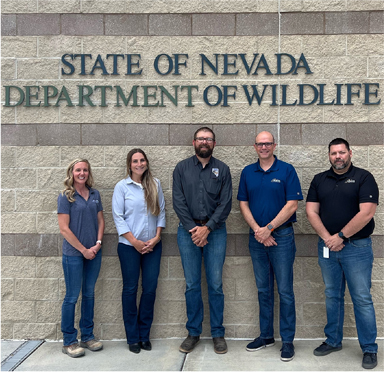
Pictured left to right: Mikayla Morfin, NGM Heritage Fund Board Vice President; Alissa Wood, Barrick North America Head of Corporate Social Responsibility; Caleb McAdoo, NDOW Regional Supervisor; Peter Richardson, NGM Executive Managing Director; and Chris McAnany, NGM Manager of Corporate Social Responsibility.
VELADERO RECOGNIZED AS FIRST ARGENTINE MINE
TO IMPLEMENT TSM STANDARD
Veladero has become the first mine in Argentina to achieve compliance with the Towards Sustainable Mining (TSM) Standard, earning a special distinction from the Argentine Chamber of Mining (CAEM) during the Arminera 2023 summit, the industry’s flagship event in the country.
“Attaining TSM verification for Veladero is a testament to our commitment to society, especially our employees, neighbouring communities, and future generations, in developing sustainable mining practices. The transformation effort at Veladero spanned four years of intense work across all departments in the company. Veladero has confirmed its status as an open and transparent partner, fully accountable to society,” said Marcelo Álvarez, executive director of government relations for Barrick South America, upon receiving the special mention.
Towards Sustainable Mining is a standard developed by the Mining Association of Canada (MAC) that sets quality and control standards to ensure responsible and transparent mining operations. The system consists of protocols with ratings that cover the most relevant environmental and social aspects, including biodiversity conservation, community engagement, human rights, and mine closure, among others.
| BARRICK SECOND QUARTER 2023 | 13 | PRESS RELEASE |
BARRICK TARGETS 2028
FOR FIRST PRODUCTION FROM REKO DIQ
Mark Bristow says with the updated feasibility study on the giant Reko Diq copper-gold project making rapid progress, the company is aiming to start production in 2028.
Speaking at the inaugural session of Pakistan’s first Minerals Summit on August 1, Bristow said the signing of the New Reko Diq agreement last year was a landmark event in the development of a mining industry in Pakistan, a process which will be accelerated by the Minerals Summit.
“I hope the momentum created by this event will be sustained by successive efforts to unlock this sector’s full potential and build its capacity by attracting other foreign investors to follow Barrick, to the lasting benefit of Pakistan and its people,” he said.
“There is a growing demand for metals and minerals, especially copper, and the challenge for mining companies
and their host governments is to ensure that these resources are extracted in a responsible and equitable manner. Barrick believes in the principle of mutual advantage and shares the value its operations create with all stakeholders, including its host countries and communities.”
Bristow noted that Reko Diq was the latest manifestation of Barrick’s partnership model, already successfully applied elsewhere in its global portfolio. Barrick owns 50% of Reko Diq and is developing and will operate the mine. The Balochistan province, which hosts the deposit, has a 25% share and the federal government holds the other 25% through state-owned entities.15

Reko Diq Mining Company constitutes a 25-member Community Development Committee at Nokkundi in the Chagai district of Balochistan in May 2023.

Barrick continues its social investment program around the Reko Diq project area with the inauguration of a primary school at the Mashki Chah village.
REKO DIQ CONSTITUTES COMMUNITY DEVELOPMENT
COMMITTEE FOR LOCALLY DRIVEN DEVELOPMENT
The Reko Diq Mining Company has constituted a 25-member Community Development Committee (CDC) at Nokkundi, the nearest town to Reko Diq, in the Chagai district of Balochistan. The CDC comprises local stakeholders and community leaders who will guide the company’s social investment plan in the area.
Reko Diq country manager Ali Ehsan Rind said: “In all its operations worldwide, Barrick strives to be a good corporate citizen and a genuine partner of the host communities in locally led development. With the formation of this CDC, representing all the key local stakeholders, I am confident that our work will become a catalyst for the social development of the local communities.”
The Nokkundi CDC, formed after an extensive consultation process, has the responsibility to identify social investment initiatives to be undertaken by the company. It is a concrete step to ensuring that Reko Diq delivers social investment projects of significant and lasting benefit to the local communities among whom it will operate.
Reko Diq will be a multi-generational mine with a life of at least 40 years. During peak construction the project is expected to employ 7,500 people and once in production it will create some 4,000 long-term jobs. Barrick’s policy of prioritizing local employment and suppliers will have a positive impact on the local economy.
The company plans to complete the Reko Diq feasibility study update by the end of 2024, with 2028 targeted for first production from the giant copper-gold mine in the country’s Balochistan province. The new Reko Diq agreement ensures that benefits from the project start accruing to the people of Balochistan well before the mine goes into production through advancing royalties and social development investments.
| BARRICK SECOND QUARTER 2023 | 14 | PRESS RELEASE |
APPENDIX
2023 Operating and Capital Expenditure Guidance
GOLD PRODUCTION AND COSTS
| 2023 forecast attributable production (000s oz) |
2023 forecast cost of sales8 ($/oz)
|
2023 forecast total
|
2023 forecast all-in
|
|||||||
| Carlin (61.5%) |
910 - 1,000 | 1,030 - 1,110 | 820 - 880 | 1,250 - 1,330 | ||||||
| Cortez (61.5%)16 |
580 - 650 | 1,080 - 1,160 | 680 - 740 | 930 - 1,010 | ||||||
| Turquoise Ridge (61.5%) |
300 - 340 | 1,290 - 1,370 | 900 - 960 | 1,170 - 1,250 | ||||||
| Phoenix (61.5%) |
100 - 120 | 1,860 - 1,940 | 880 - 940 | 1,110 - 1,190 | ||||||
| Long Canyon (61.5%) |
0 - 10 | 2,120 - 2,200 | 730 - 790 | 1,080 - 1,160 | ||||||
| Nevada Gold Mines (61.5%) |
1,900 - 2,100 | 1,140 - 1,220 | 790 - 850 | 1,140 - 1,220 | ||||||
| Hemlo |
150 - 170 | 1,400 - 1,480 | 1,210 - 1,270 | 1,590 - 1,670 | ||||||
| North America |
2,100 - 2,300 | 1,160 - 1,240 | 820 - 880 | 1,170 - 1,250 | ||||||
| Pueblo Viejo (60%) |
470 - 520 | 1,130 - 1,210 | 710 - 770 | 960 - 1,040 | ||||||
| Veladero (50%) |
160 - 180 | 1,630 - 1,710 | 1,060 - 1,120 | 1,550 - 1,630 | ||||||
| Porgera (47.5%)13 |
— | — | — | — | ||||||
| Latin America & Asia Pacific |
630 - 700 | 1,260 - 1,340 | 800 - 860 | 1,110 - 1,190 | ||||||
| Loulo-Gounkoto (80%) |
510 - 560 | 1,100 - 1,180 | 750 - 810 | 1,070 - 1,150 | ||||||
| Kibali (45%) |
320 - 360 | 1,080 - 1,160 | 710 - 770 | 880 - 960 | ||||||
| North Mara (84%) |
230 - 260 | 1,120 - 1,200 | 900 - 960 | 1,240 - 1,320 | ||||||
| Bulyanhulu (84%) |
160 - 190 | 1,230 - 1,310 | 880 - 940 | 1,160 - 1,240 | ||||||
| Tongon (89.7%) |
180 - 210 | 1,260 - 1,340 | 1,070 - 1,130 | 1,240 - 1,320 | ||||||
| Africa & Middle East |
1,450 - 1,600 | 1,130 - 1,210 | 820 - 880 | 1,080 - 1,160 | ||||||
| Total Attributable to Barrick17,18,19 |
4,200 - 4,600 | 1,170 - 1,250 | 820 - 880 | 1,170 - 1,250 | ||||||
|
COPPER PRODUCTION AND COSTS |
||||||||||
| 2023 forecast attributable production (Mlbs) |
2023 forecast cost of sales8 ($/lb) |
2023 forecast C1 cash costs9 ($/lb) |
2023 forecast
all-in sustaining costs9 ($/lb) |
|||||||
| Lumwana |
260 - 290 | 2.45 - 2.75 | 2.00 - 2.20 | 3.20 - 3.50 | ||||||
| Zaldívar (50%) |
100 - 110 | 3.40 - 3.70 | 2.60 - 2.80 | 2.90 - 3.20 | ||||||
| Jabal Sayid (50%) |
65 - 75 | 1.80 - 2.10 | 1.50 - 1.70 | 1.60 - 1.90 | ||||||
| Total Attributable to Barrick19 |
420 - 470 | 2.60 - 2.90 | 2.05 - 2.25 | 2.95 - 3.25 | ||||||
ATTRIBUTABLE CAPITAL EXPENDITURES
| ($ millions) | ||||
| Attributable minesite sustaining6 |
1,450 - 1,700 | |||
| Attributable project6 |
750 - 900 | |||
| Total attributable capital expenditures6 |
2,200 - 2,600 | |||
2023 OUTLOOK ASSUMPTIONS AND ECONOMIC SENSITIVITY ANALYSIS
| 2023 Guidance Assumption |
Hypothetical Change | Impact on EBITDA20 (millions) |
Impact on TCC and AISC9,10 |
|||||||
| Gold price sensitivity | $1,650/oz | +/- $100/oz | +/-$590 | +/-$5/oz | ||||||
| Copper price sensitivity | $3.50/lb | +/- $0.25/lb | +/- $110 | +/-$0.01/lb | ||||||
| BARRICK SECOND QUARTER 2023 | 15 | PRESS RELEASE |
Production and Cost Summary - Gold
| For the three months ended | ||||||||||||||||||||
| 6/30/23 | 3/31/23 | % Change | 6/30/22 | % Change | ||||||||||||||||
| Nevada Gold Mines LLC (61.5%)a |
||||||||||||||||||||
| Gold produced (000s oz attributable basis) |
458 | 416 | 10 % | 462 | (1)% | |||||||||||||||
| Gold produced (000s oz 100% basis) |
744 | 676 | 10 % | 751 | (1)% | |||||||||||||||
| Cost of sales ($/oz) |
1,357 | 1,461 | (7)% | 1,171 | 16 % | |||||||||||||||
| Total cash costs ($/oz)b |
1,009 | 1,074 | (6)% | 856 | 18 % | |||||||||||||||
| All-in sustaining costs ($/oz)b |
1,388 | 1,436 | (3)% | 1,238 | 12 % | |||||||||||||||
| Carlin (61.5%)c |
||||||||||||||||||||
| Gold produced (000s oz attributable basis) |
248 | 166 | 49 % | 243 | 2 % | |||||||||||||||
| Gold produced (000s oz 100% basis) |
403 | 270 | 49 % | 394 | 2 % | |||||||||||||||
| Cost of sales ($/oz) |
1,240 | 1,449 | (14)% | 1,042 | 19 % | |||||||||||||||
| Total cash costs ($/oz)b |
1,013 | 1,215 | (17)% | 862 | 18 % | |||||||||||||||
| All-in sustaining costs ($/oz)b |
1,407 | 1,689 | (17)% | 1,192 | 18 % | |||||||||||||||
| Cortez (61.5%)c |
||||||||||||||||||||
| Gold produced (000s oz attributable basis) |
110 | 140 | (21)% | 97 | 13 % | |||||||||||||||
| Gold produced (000s oz 100% basis) |
178 | 226 | (21)% | 158 | 13 % | |||||||||||||||
| Cost of sales ($/oz) |
1,346 | 1,324 | 2 % | 1,168 | 15 % | |||||||||||||||
| Total cash costs ($/oz)b |
972 | 913 | 6 % | 850 | 14 % | |||||||||||||||
| All-in sustaining costs ($/oz)b |
1,453 | 1,233 | 18 % | 1,538 | (6)% | |||||||||||||||
| Turquoise Ridge (61.5%) |
||||||||||||||||||||
| Gold produced (000s oz attributable basis) |
68 | 81 | (16)% | 75 | (9)% | |||||||||||||||
| Gold produced (000s oz 100% basis) |
112 | 131 | (16)% | 122 | (9)% | |||||||||||||||
| Cost of sales ($/oz) |
1,466 | 1,412 | 4 % | 1,289 | 14 % | |||||||||||||||
| Total cash costs ($/oz)b |
1,088 | 1,034 | 5 % | 928 | 17 % | |||||||||||||||
| All-in sustaining costs ($/oz)b |
1,302 | 1,271 | 2 % | 1,195 | 9 % | |||||||||||||||
| Phoenix (61.5%) |
||||||||||||||||||||
| Gold produced (000s oz attributable basis) |
29 | 27 | 7 % | 26 | 12 % | |||||||||||||||
| Gold produced (000s oz 100% basis) |
46 | 45 | 7 % | 43 | 12 % | |||||||||||||||
| Cost of sales ($/oz) |
2,075 | 2,380 | (13)% | 2,114 | (2)% | |||||||||||||||
| Total cash costs ($/oz)b |
948 | 1,198 | (21)% | 895 | 6 % | |||||||||||||||
| All-in sustaining costs ($/oz)b |
1,132 | 1,365 | (17)% | 1,152 | (2)% | |||||||||||||||
| Long Canyon (61.5%) |
||||||||||||||||||||
| Gold produced (000s oz attributable basis) |
3 | 2 | 50 % | 21 | (86)% | |||||||||||||||
| Gold produced (000s oz 100% basis) |
5 | 4 | 50 % | 34 | (86)% | |||||||||||||||
| Cost of sales ($/oz) |
1,640 | 1,621 | 1 % | 1,280 | 28 % | |||||||||||||||
| Total cash costs ($/oz)b |
637 | 579 | 10 % | 450 | 42 % | |||||||||||||||
| All-in sustaining costs ($/oz)b |
677 | 629 | 8 % | 459 | 47 % | |||||||||||||||
| Pueblo Viejo (60%) |
||||||||||||||||||||
| Gold produced (000s oz attributable basis) |
77 | 89 | (13)% | 105 | (27)% | |||||||||||||||
| Gold produced (000s oz 100% basis) |
128 | 149 | (13)% | 175 | (27)% | |||||||||||||||
| Cost of sales ($/oz) |
1,344 | 1,241 | 8 % | 1,154 | 16 % | |||||||||||||||
| Total cash costs ($/oz)b |
840 | 714 | 18 % | 724 | 16 % | |||||||||||||||
| All-in sustaining costs ($/oz)b |
1,219 | 1,073 | 14 % | 1,024 | 19 % | |||||||||||||||
| BARRICK SECOND QUARTER 2023 | 16 | PRESS RELEASE |
Production and Cost Summary - Gold (continued)
| For the three months ended | ||||||||||||||||||||
| 6/30/23 | 3/31/23 | % Change | 6/30/22 | % Change | ||||||||||||||||
| Loulo-Gounkoto (80%) |
||||||||||||||||||||
| Gold produced (000s oz attributable basis) |
141 | 137 | 3 % | 140 | 1 % | |||||||||||||||
| Gold produced (000s oz 100% basis) |
176 | 172 | 3 % | 175 | 1 % | |||||||||||||||
| Cost of sales ($/oz) |
1,150 | 1,275 | (10)% | 1,093 | 5 % | |||||||||||||||
| Total cash costs ($/oz)b |
801 | 855 | (6)% | 730 | 10 % | |||||||||||||||
| All-in sustaining costs ($/oz)b |
1,245 | 1,190 | 5 % | 1,013 | 23 % | |||||||||||||||
| Kibali (45%) |
||||||||||||||||||||
| Gold produced (000s oz attributable basis) |
87 | 64 | 36 % | 81 | 7 % | |||||||||||||||
| Gold produced (000s oz 100% basis) |
195 | 141 | 36 % | 180 | 7 % | |||||||||||||||
| Cost of sales ($/oz) |
1,269 | 1,367 | (7)% | 1,164 | 9 % | |||||||||||||||
| Total cash costs ($/oz)b |
797 | 987 | (19)% | 738 | 8 % | |||||||||||||||
| All-in sustaining costs ($/oz)b |
955 | 1,177 | (19)% | 946 | 1 % | |||||||||||||||
| Veladero (50%) |
||||||||||||||||||||
| Gold produced (000s oz attributable basis) |
54 | 43 | 26 % | 58 | (7)% | |||||||||||||||
| Gold produced (000s oz 100% basis) |
108 | 86 | 26 % | 116 | (7)% | |||||||||||||||
| Cost of sales ($/oz) |
1,424 | 1,587 | (10)% | 1,369 | 4 % | |||||||||||||||
| Total cash costs ($/oz)b |
999 | 1,035 | (3)% | 861 | 16 % | |||||||||||||||
| All-in sustaining costs ($/oz)b |
1,599 | 1,761 | (9)% | 1,461 | 9 % | |||||||||||||||
| Porgera (47.5%)d |
||||||||||||||||||||
| Gold produced (000s oz attributable basis) |
— | — | — % | — | — % | |||||||||||||||
| Gold produced (000s oz 100% basis) |
— | — | — % | — | — % | |||||||||||||||
| Cost of sales ($/oz) |
— | — | — % | — | — % | |||||||||||||||
| Total cash costs ($/oz)b |
— | — | — % | — | — % | |||||||||||||||
| All-in sustaining costs ($/oz)b |
— | — | — % | — | — % | |||||||||||||||
| Tongon (89.7%) |
||||||||||||||||||||
| Gold produced (000s oz attributable basis) |
44 | 50 | (12)% | 41 | 7 % | |||||||||||||||
| Gold produced (000s oz 100% basis) |
49 | 55 | (12)% | 46 | 7 % | |||||||||||||||
| Cost of sales ($/oz) |
1,514 | 1,453 | 4 % | 2,025 | (25)% | |||||||||||||||
| Total cash costs ($/oz)b |
1,380 | 1,182 | 17 % | 1,558 | (11)% | |||||||||||||||
| All-in sustaining costs ($/oz)b |
1,465 | 1,284 | 14 % | 1,655 | (11)% | |||||||||||||||
| Hemlo |
||||||||||||||||||||
| Gold produced (000s oz) |
35 | 41 | (15)% | 36 | (3)% | |||||||||||||||
| Cost of sales ($/oz) |
1,562 | 1,486 | 5 % | 1,698 | (8)% | |||||||||||||||
| Total cash costs ($/oz)b |
1,356 | 1,291 | 5 % | 1,489 | (9)% | |||||||||||||||
| All-in sustaining costs ($/oz)b |
1,634 | 1,609 | 2 % | 1,804 | (9)% | |||||||||||||||
| North Mara (84%) |
||||||||||||||||||||
| Gold produced (000s oz attributable basis) |
64 | 68 | (6)% | 66 | (3)% | |||||||||||||||
| Gold produced (000s oz 100% basis) |
77 | 81 | (6)% | 79 | (3)% | |||||||||||||||
| Cost of sales ($/oz) |
1,208 | 987 | 22 % | 1,060 | 14 % | |||||||||||||||
| Total cash costs ($/oz)b |
942 | 759 | 24 % | 756 | 25 % | |||||||||||||||
| All-in sustaining costs ($/oz)b |
1,355 | 1,137 | 19 % | 957 | 42 % | |||||||||||||||
| BARRICK SECOND QUARTER 2023 | 17 | PRESS RELEASE |
Production and Cost Summary - Gold (continued)
| For the three months ended | ||||||||||||||||||||
| 6/30/23 | 3/31/23 | % Change | 6/30/22 | % Change | ||||||||||||||||
| Bulyanhulu (84%) |
||||||||||||||||||||
| Gold produced (000s oz attributable basis) |
49 | 44 | 11 % | 54 | (9)% | |||||||||||||||
| Gold produced (000s oz 100% basis) |
58 | 53 | 11 % | 65 | (9)% | |||||||||||||||
| Cost of sales ($/oz) |
1,231 | 1,358 | (9)% | 1,163 | 6 % | |||||||||||||||
| Total cash costs ($/oz)b |
850 | 982 | (13)% | 836 | 2 % | |||||||||||||||
| All-in sustaining costs ($/oz)b |
1,105 | 1,332 | (17)% | 1,094 | 1 % | |||||||||||||||
| Total Attributable to Barricke |
||||||||||||||||||||
| Gold produced (000s oz) |
1,009 | 952 | 6 % | 1,043 | (3)% | |||||||||||||||
| Cost of sales ($/oz)f |
1,323 | 1,378 | (4)% | 1,216 | 9 % | |||||||||||||||
| Total cash costs ($/oz)b |
963 | 986 | (2)% | 855 | 13 % | |||||||||||||||
| All-in sustaining costs ($/oz)b |
1,355 | 1,370 | (1)% | 1,212 | 12 % | |||||||||||||||
| a. | These results represent our 61.5% interest in Carlin, Cortez, Turquoise Ridge, Phoenix and Long Canyon. |
| b. | Further information on these non-GAAP financial performance measures, including detailed reconciliations, is included in the endnotes to this press release. |
| c. | Includes Goldrush. |
| d. | As Porgera was placed on care and maintenance on April 25, 2020, no operating data or per ounce data is provided. |
| e. | Excludes Pierina, which is producing incidental ounces while in closure. |
| f. | Gold cost of sales per ounce is calculated as cost of sales across our gold operations (excluding sites in closure or care and maintenance) divided by ounces sold (both on an attributable basis using Barrick’s ownership share). |
| BARRICK SECOND QUARTER 2023 | 18 | PRESS RELEASE |
Production and Cost Summary - Copper
| For the three months ended | ||||||||||||||||||||
| 6/30/23 | 3/31/23 | % Change | 6/30/22 | % Change | ||||||||||||||||
| Lumwana |
||||||||||||||||||||
| Copper production (Mlbs) |
67 | 48 | 40 % | 75 | (11)% | |||||||||||||||
| Cost of sales ($/lb) |
2.80 | 3.56 | (21)% | 2.01 | 39 % | |||||||||||||||
| C1 cash costs ($/lb)a |
2.30 | 3.09 | (26)% | 1.68 | 37 % | |||||||||||||||
| All-in sustaining costs ($/lb)a |
3.29 | 3.98 | (17)% | 3.28 | — % | |||||||||||||||
| Zaldívar (50%) |
||||||||||||||||||||
| Copper production (Mlbs attributable basis) |
22 | 22 | 0 % | 25 | (12)% | |||||||||||||||
| Copper production (Mlbs 100% basis) |
43 | 44 | 0 % | 50 | (12)% | |||||||||||||||
| Cost of sales ($/lb) |
3.89 | 3.73 | 4 % | 2.88 | 35 % | |||||||||||||||
| C1 cash costs ($/lb)a |
3.02 | 2.86 | 6 % | 2.17 | 39 % | |||||||||||||||
| All-in sustaining costs ($/lb)a |
3.73 | 3.22 | 16 % | 2.65 | 41 % | |||||||||||||||
| Jabal Sayid (50%) |
||||||||||||||||||||
| Copper production (Mlbs attributable basis) |
18 | 18 | 0 % | 20 | (10)% | |||||||||||||||
| Copper production (Mlbs 100% basis) |
35 | 37 | 0 % | 40 | (10)% | |||||||||||||||
| Cost of sales ($/lb) |
1.61 | 1.53 | 5 % | 1.45 | 11 % | |||||||||||||||
| C1 cash costs ($/lb)a |
1.26 | 1.39 | (9)% | 1.09 | 16 % | |||||||||||||||
| All-in sustaining costs ($/lb)a |
1.42 | 1.61 | (12)% | 1.19 | 19 % | |||||||||||||||
| Total Attributable to Barrick |
||||||||||||||||||||
| Copper production (Mlbs) |
107 | 88 | 22 % | 120 | (11)% | |||||||||||||||
| Cost of sales ($/lb)b |
2.84 | 3.22 | (12)% | 2.11 | 35 % | |||||||||||||||
| C1 cash costs ($/lb)a |
2.28 | 2.71 | (16)% | 1.70 | 34 % | |||||||||||||||
| All-in sustaining costs ($/lb)a |
3.13 | 3.40 | (8)% | 2.87 | 9 % | |||||||||||||||
| a. | Further information on these non-GAAP financial performance measures, including detailed reconciliations, is included in the endnotes to this press release. |
| b. | Copper cost of sales per pound is calculated as cost of sales across our copper operations divided by pounds sold (both on an attributable basis using Barrick’s ownership share). |
| BARRICK SECOND QUARTER 2023 | 19 | PRESS RELEASE |
Financial and Operating Highlights
| For the three months ended | For the six months ended | |||||||||||||||||||||||||||||||
| 6/30/23 | 3/31/23 | % Change | 6/30/22 | % Change | 6/30/23 | 6/30/22 | % Change | |||||||||||||||||||||||||
| Financial Results ($ millions) |
||||||||||||||||||||||||||||||||
| Revenues |
2,833 | 2,643 | 7 % | 2,859 | (1)% | 5,476 | 5,712 | (4)% | ||||||||||||||||||||||||
| Cost of sales |
1,937 | 1,941 | 0 % | 1,850 | 5 % | 3,878 | 3,589 | 8 % | ||||||||||||||||||||||||
| Net earningsa |
305 | 120 | 154 % | 488 | (38)% | 425 | 926 | (54)% | ||||||||||||||||||||||||
| Adjusted net earningsb |
336 | 247 | 36 % | 419 | (20)% | 583 | 882 | (34)% | ||||||||||||||||||||||||
| Adjusted EBITDAb |
1,368 | 1,183 | 16 % | 1,527 | (10)% | 2,551 | 3,172 | (20)% | ||||||||||||||||||||||||
| Adjusted EBITDA marginc |
48 % | 45 % | 7 % | 53 % | (9)% | 47 % | 56 % | (16)% | ||||||||||||||||||||||||
| Minesite sustaining capital expendituresb,d |
524 | 454 | 15 % | 523 | 0 % | 978 | 943 | 4 % | ||||||||||||||||||||||||
| Project capital expendituresb,d |
238 | 226 | 5 % | 226 | 5 % | 464 | 412 | 13 % | ||||||||||||||||||||||||
| Total consolidated capital expendituresd,e |
769 | 688 | 12 % | 755 | 2 % | 1,457 | 1,366 | 7 % | ||||||||||||||||||||||||
| Net cash provided by operating activities |
832 | 776 | 7 % | 924 | (10)% | 1,608 | 1,928 | (17)% | ||||||||||||||||||||||||
| Net cash provided by operating activities marginf |
29 % | 29 % | 0 % | 32 % | (9)% | 29 % | 34 % | (15)% | ||||||||||||||||||||||||
| Free cash flowb |
63 | 88 | (28)% | 169 | (63)% | 151 | 562 | (73)% | ||||||||||||||||||||||||
| Net earnings per share (basic and diluted) |
0.17 | 0.07 | 143 % | 0.27 | (37)% | 0.24 | 0.52 | (54)% | ||||||||||||||||||||||||
| Adjusted net earnings (basic)b per share |
0.19 | 0.14 | 36 % | 0.24 | (21)% | 0.33 | 0.50 | (34)% | ||||||||||||||||||||||||
| Weighted average diluted common shares (millions of shares) |
1,755 | 1,755 | 0 % | 1,777 | (1)% | 1,755 | 1,778 | (1)% | ||||||||||||||||||||||||
| Operating Results |
||||||||||||||||||||||||||||||||
| Gold production (thousands of ounces)g |
1,009 | 952 | 6 % | 1,043 | (3)% | 1,961 | 2,033 | (4)% | ||||||||||||||||||||||||
| Gold sold (thousands of ounces)g |
1,001 | 954 | 5 % | 1,040 | (4)% | 1,955 | 2,033 | (4)% | ||||||||||||||||||||||||
| Market gold price ($/oz) |
1,976 | 1,890 | 5 % | 1,871 | 6 % | 1,932 | 1,874 | 3 % | ||||||||||||||||||||||||
| Realized gold priceb,g ($/oz) |
1,972 | 1,902 | 4 % | 1,861 | 6 % | 1,938 | 1,868 | 4 % | ||||||||||||||||||||||||
| Gold cost of sales (Barrick’s share)g,h ($/oz) |
1,323 | 1,378 | (4)% | 1,216 | 9 % | 1,350 | 1,203 | 12 % | ||||||||||||||||||||||||
| Gold total cash costsb,g ($/oz) |
963 | 986 | (2)% | 855 | 13 % | 974 | 844 | 15 % | ||||||||||||||||||||||||
| Gold all-in sustaining costsb,g ($/oz) |
1,355 | 1,370 | (1)% | 1,212 | 12 % | 1,362 | 1,188 | 15 % | ||||||||||||||||||||||||
| Copper production (millions of pounds)g |
107 | 88 | 22 % | 120 | (11)% | 195 | 221 | (12)% | ||||||||||||||||||||||||
| Copper sold (millions of pounds)g |
101 | 89 | 13 % | 113 | (11)% | 190 | 226 | (16)% | ||||||||||||||||||||||||
| Market copper price ($/lb) |
3.84 | 4.05 | (5)% | 4.32 | (11)% | 3.95 | 4.43 | (11)% | ||||||||||||||||||||||||
| Realized copper priceb,g ($/lb) |
3.70 | 4.20 | (12)% | 3.72 | (1)% | 3.93 | 4.20 | (6)% | ||||||||||||||||||||||||
| Copper cost of sales (Barrick’s share)g,i ($/lb) |
2.84 | 3.22 | (12)% | 2.11 | 35 % | 3.02 | 2.16 | 40 % | ||||||||||||||||||||||||
| Copper C1 cash costsb,g ($/lb) |
2.28 | 2.71 | (16)% | 1.70 | 34 % | 2.48 | 1.75 | 42 % | ||||||||||||||||||||||||
| Copper all-in sustaining costsb,g ($/lb) |
3.13 | 3.40 | (8)% | 2.87 | 9 % | 3.26 | 2.86 | 14 % | ||||||||||||||||||||||||
| As at 6/30/23 |
As at 3/31/23 |
% Change | As at 6/30/22 |
% Change | ||||||||||||||||||||||||||||
| Financial Position ($ millions) |
||||||||||||||||||||||||||||||||
| Debt (current and long-term) |
4,774 | 4,777 | 0 % | 5,144 | (7)% | |||||||||||||||||||||||||||
| Cash and equivalents |
4,157 | 4,377 | (5)% | 5,780 | (28)% | |||||||||||||||||||||||||||
| Debt, net of cash |
617 | 400 | 54 % | (636) | 197 % | |||||||||||||||||||||||||||
| a. | Net earnings represents net earnings attributable to the equity holders of the Company. |
| b. | Further information on these non-GAAP financial performance measures, including detailed reconciliations, is included in the endnotes to this press release. |
| c. | Represents adjusted EBITDA divided by revenue. |
| d. | Amounts presented on a consolidated cash basis. Project capital expenditures are included in our calculation of all-in costs, but not included in our calculation of all-in sustaining costs. |
| e. | Total consolidated capital expenditures also includes capitalized interest of $7 million and $15 million, respectively, for the three and six month periods ended June 30, 2023 (March 31, 2023: $8 million and June 30, 2022: $6 million and $11 million, respectively). |
| f. | Represents net cash provided by operating activities divided by revenue. |
| g. | On an attributable basis. |
| h. | Gold cost of sales per ounce is calculated as cost of sales across our gold operations (excluding sites in closure or care and maintenance) divided by ounces sold (both on an attributable basis using Barrick’s ownership share). |
| i. | Copper cost of sales per pound is calculated as cost of sales across our copper operations divided by pounds sold (both on an attributable basis using Barrick’s ownership share). |
| BARRICK SECOND QUARTER 2023 | 20 | PRESS RELEASE |
Consolidated Statements of Income
| Barrick Gold Corporation (in millions of United States dollars, except per share data) (Unaudited) |
Three months ended June 30, |
Six months ended June 30, |
||||||||||||||
| 2023 | 2022 | 2023 | 2022 | |||||||||||||
| Revenue (notes 4 and 5) |
$2,833 | $2,859 | $5,476 | $5,712 | ||||||||||||
| Costs and expenses (income) |
||||||||||||||||
| Cost of sales (notes 4 and 6) |
1,937 | 1,850 | 3,878 | 3,589 | ||||||||||||
| General and administrative expenses |
28 | 30 | 67 | 84 | ||||||||||||
| Exploration, evaluation and project expenses |
101 | 100 | 172 | 167 | ||||||||||||
| Impairment charges (notes 8b and 12) |
22 | 3 | 23 | 5 | ||||||||||||
| (Gain) loss on currency translation |
(12 | ) | 6 | 26 | 9 | |||||||||||
| Closed mine rehabilitation |
(13 | ) | (128 | ) | 9 | (125 | ) | |||||||||
| Income from equity investees (note 11) |
(58 | ) | (89 | ) | (111 | ) | (188 | ) | ||||||||
| Other expense (income) (note 8a) |
18 | 2 | 70 | (9 | ) | |||||||||||
| Income before finance costs and income taxes |
$810 | $1,085 | $1,342 | $2,180 | ||||||||||||
| Finance costs, net |
(44 | ) | (89 | ) | (102 | ) | (177 | ) | ||||||||
| Income before income taxes |
$766 | $996 | $1,240 | $2,003 | ||||||||||||
| Income tax expense (note 9) |
(264 | ) | (279 | ) | (469 | ) | (580 | ) | ||||||||
| Net income |
$502 | $717 | $771 | $1,423 | ||||||||||||
| Attributable to: |
||||||||||||||||
| Equity holders of Barrick Gold Corporation |
$305 | $488 | $425 | $926 | ||||||||||||
| Non-controlling interests (note 15) |
$197 | $229 | $346 | $497 | ||||||||||||
| Earnings per share data attributable to the equity holders of Barrick Gold Corporation (note 7) |
||||||||||||||||
| Net income |
||||||||||||||||
| Basic |
$0.17 | $0.27 | $0.24 | $0.52 | ||||||||||||
| Diluted |
$0.17 | $0.27 | $0.24 | $0.52 | ||||||||||||
The notes to these unaudited condensed interim financial statements, which are contained in the Second Quarter Report 2023 available on our website, are an integral part of these consolidated financial statements.
| BARRICK SECOND QUARTER 2023 | 21 | PRESS RELEASE |
Consolidated Statements of Comprehensive Income
| Barrick Gold Corporation (in millions of United States dollars) (Unaudited) |
Three months ended June 30, |
Six months ended June 30, |
||||||||||||||
| 2023 | 2022 | 2023 | 2022 | |||||||||||||
| Net income |
$502 | $717 | $771 | $1,423 | ||||||||||||
| Other comprehensive income (loss), net of taxes |
||||||||||||||||
| Items that may be reclassified subsequently to profit or loss: |
||||||||||||||||
| Currency translation adjustments, net of tax $nil, $nil, $nil and $nil |
— | 1 | (3 | ) | 1 | |||||||||||
| Items that will not be reclassified to profit or loss: |
||||||||||||||||
| Actuarial loss on post employment benefit obligations, net of tax $nil, $nil, $nil and $nil |
— | (1 | ) | — | (1 | ) | ||||||||||
| Net change on equity investments, net of tax $(1), $2, $(1) and $(6) |
(5 | ) | (26 | ) | (5 | ) | 32 | |||||||||
| Total other comprehensive (loss) income |
(5 | ) | (26 | ) | (8 | ) | 32 | |||||||||
| Total comprehensive income |
$497 | $691 | $763 | $1,455 | ||||||||||||
| Attributable to: |
||||||||||||||||
| Equity holders of Barrick Gold Corporation |
$300 | $462 | $417 | $958 | ||||||||||||
| Non-controlling interests |
$197 | $229 | $346 | $497 | ||||||||||||
The notes to these unaudited condensed interim financial statements, which are contained in the Second Quarter Report 2023 available on our website, are an integral part of these consolidated financial statements.
| BARRICK SECOND QUARTER 2023 | 22 | PRESS RELEASE |
Consolidated Statements of Cash Flow
| Barrick Gold Corporation (in millions of United States dollars) (Unaudited) |
Three months ended June 30, |
Six months ended June 30, |
||||||||||||||
| 2023 | 2022 | 2023 | 2022 | |||||||||||||
| OPERATING ACTIVITIES |
||||||||||||||||
| Net income |
$502 | $717 | $771 | $1,423 | ||||||||||||
| Adjustments for the following items: |
||||||||||||||||
| Depreciation |
480 | 476 | 975 | 936 | ||||||||||||
| Finance costs, net1 |
44 | 89 | 102 | 177 | ||||||||||||
| Impairment charges (notes 8b and 12) |
22 | 3 | 23 | 5 | ||||||||||||
| Income tax expense (note 9) |
264 | 279 | 469 | 580 | ||||||||||||
| Income from equity investees (note 11) |
(58 | ) | (89 | ) | (111 | ) | (188 | ) | ||||||||
| Gain on sale of non-current assets |
(3 | ) | (20 | ) | (6 | ) | (22 | ) | ||||||||
| (Gain) loss on currency translation |
(12 | ) | 6 | 26 | 9 | |||||||||||
| Change in working capital (note 10) |
(45 | ) | (34 | ) | (251 | ) | (165 | ) | ||||||||
| Other operating activities (note 10) |
(51 | ) | (126 | ) | 1 | (203 | ) | |||||||||
| Operating cash flows before interest and income taxes |
1,143 | 1,301 | 1,999 | 2,552 | ||||||||||||
| Interest paid |
(130 | ) | (129 | ) | (153 | ) | (152 | ) | ||||||||
| Interest received1 |
51 | 12 | 100 | 22 | ||||||||||||
| Income taxes paid2 |
(232 | ) | (260 | ) | (338 | ) | (494 | ) | ||||||||
| Net cash provided by operating activities |
832 | 924 | 1,608 | 1,928 | ||||||||||||
| INVESTING ACTIVITIES |
||||||||||||||||
| Property, plant and equipment |
||||||||||||||||
| Capital expenditures (note 4) |
(769 | ) | (755 | ) | (1,457 | ) | (1,366 | ) | ||||||||
| Sales proceeds |
3 | 22 | 6 | 23 | ||||||||||||
| Investment sales |
— | 122 | — | 382 | ||||||||||||
| Dividends received from equity method investments (note 11) |
18 | 310 | 85 | 669 | ||||||||||||
| Shareholder loan repayments from equity method investments (note 11) |
5 | — | 5 | — | ||||||||||||
| Net cash used in investing activities |
(743 | ) | (301 | ) | (1,361 | ) | (292 | ) | ||||||||
| FINANCING ACTIVITIES |
||||||||||||||||
| Lease repayments |
(4 | ) | (4 | ) | (8 | ) | (10 | ) | ||||||||
| Dividends |
(174 | ) | (353 | ) | (349 | ) | (531 | ) | ||||||||
| Share buyback program |
— | (173 | ) | — | (173 | ) | ||||||||||
| Funding from non-controlling interests (note 15) |
10 | — | 10 | — | ||||||||||||
| Disbursements to non-controlling interests (note 15) |
(162 | ) | (232 | ) | (224 | ) | (499 | ) | ||||||||
| Pueblo Viejo JV partner shareholder loan |
21 | 35 | 41 | 80 | ||||||||||||
| Net cash used in financing activities |
(309 | ) | (727 | ) | (530 | ) | (1,133 | ) | ||||||||
| Effect of exchange rate changes on cash and equivalents |
— | (3 | ) | — | (3 | ) | ||||||||||
| Net increase (decrease) in cash and equivalents |
(220 | ) | (107 | ) | (283 | ) | 500 | |||||||||
| Cash and equivalents at the beginning of period |
4,377 | 5,887 | 4,440 | 5,280 | ||||||||||||
| Cash and equivalents at the end of period |
$4,157 | $5,780 | $4,157 | $5,780 | ||||||||||||
| 1 | 2022 figures have been restated to reflect the change in presentation to present interest received ($12 million for the three months ended and $22 million for the six months ended June 30, 2022) separately from finance costs. |
| 2 | Income taxes paid excludes $28 million (2022: $10 million) for the three months ended June 30, 2023 and $56 million (2022: $36 million) for the six months ended June 30, 2023 of income taxes payable that were settled against offsetting value added tax (“VAT”) receivables. |
The notes to these unaudited condensed interim financial statements, which are contained in the Second Quarter Report 2023 available on our website, are an integral part of these consolidated financial statements.
| BARRICK SECOND QUARTER 2023 | 23 | PRESS RELEASE |
Consolidated Balance Sheets
| Barrick Gold Corporation (in millions of United States dollars) (Unaudited) |
As at June 30, 2023 |
As at December 31, 2022 |
||||||
| ASSETS |
||||||||
| Current assets |
||||||||
| Cash and equivalents |
$4,157 | $4,440 | ||||||
| Accounts receivable |
603 | 554 | ||||||
| Inventories |
1,868 | 1,781 | ||||||
| Other current assets (note 13b) |
742 | 1,690 | ||||||
| Total current assets |
$7,370 | $8,465 | ||||||
| Non-current assets |
||||||||
| Equity in investees (note 11) |
4,004 | 3,983 | ||||||
| Property, plant and equipment |
26,311 | 25,821 | ||||||
| Goodwill |
3,581 | 3,581 | ||||||
| Intangible assets |
149 | 149 | ||||||
| Deferred income tax assets |
19 | 19 | ||||||
| Non-current portion of inventory |
2,765 | 2,819 | ||||||
| Other assets |
1,087 | 1,128 | ||||||
| Total assets |
$45,286 | $45,965 | ||||||
| LIABILITIES AND EQUITY |
||||||||
| Current liabilities |
||||||||
| Accounts payable |
$1,525 | $1,556 | ||||||
| Debt |
13 | 13 | ||||||
| Current income tax liabilities |
320 | 163 | ||||||
| Other current liabilities (note 13b) |
412 | 1,388 | ||||||
| Total current liabilities |
$2,270 | $3,120 | ||||||
| Non-current liabilities |
||||||||
| Debt |
4,761 | 4,769 | ||||||
| Provisions |
2,181 | 2,211 | ||||||
| Deferred income tax liabilities |
3,286 | 3,247 | ||||||
| Other liabilities |
1,303 | 1,329 | ||||||
| Total liabilities |
$13,801 | $14,676 | ||||||
| Equity |
||||||||
| Capital stock (note 14) |
$28,116 | $28,114 | ||||||
| Deficit |
(7,208 | ) | (7,282 | ) | ||||
| Accumulated other comprehensive income (loss) |
18 | 26 | ||||||
| Other |
1,913 | 1,913 | ||||||
| Total equity attributable to Barrick Gold Corporation shareholders |
$22,839 | $22,771 | ||||||
|
Non-controlling interests (note 15) |
8,646 | 8,518 | ||||||
| Total equity |
$31,485 | $31,289 | ||||||
| Contingencies and commitments (notes 4 and 16) |
||||||||
| Total liabilities and equity |
$45,286 | $45,965 | ||||||
The notes to these unaudited condensed interim financial statements, which are contained in the Second Quarter Report 2023 available on our website, are an integral part of these consolidated financial statements.
| BARRICK SECOND QUARTER 2023 | 24 | PRESS RELEASE |
Consolidated Statements of Changes in Equity
| Barrick Gold Corporation | Attributable to equity holders of the company | |||||||||||||||||||||||||||||||
| (in millions of United States dollars) (Unaudited) |
Common Shares (in thousands) |
Capital stock |
Retained earnings (deficit) |
Accumulated other comprehensive income (loss)1 |
Other2 | Total equity attributable to shareholders |
Non- controlling interests |
Total equity |
||||||||||||||||||||||||
| At January 1, 2023 |
1,755,350 | $28,114 | ($7,282 | ) | $26 | $1,913 | $22,771 | $8,518 | $31,289 | |||||||||||||||||||||||
| Net income |
— | — | 425 | — | — | 425 | 346 | 771 | ||||||||||||||||||||||||
| Total other comprehensive loss |
— | — | — | (8 | ) | — | (8 | ) | — | (8 | ) | |||||||||||||||||||||
| Total comprehensive income (loss) |
— | — | 425 | (8 | ) | — | 417 | 346 | 763 | |||||||||||||||||||||||
| Transactions with owners |
||||||||||||||||||||||||||||||||
| Dividends |
— | — | (349 | ) | — | — | (349 | ) | — | (349 | ) | |||||||||||||||||||||
| Funding from non-controlling interests (note 15) |
— | — | — | — | — | — | 10 | 10 | ||||||||||||||||||||||||
| Disbursements to non-controlling interests (note 15) |
— | — | — | — | — | — | (228 | ) | (228 | ) | ||||||||||||||||||||||
| Dividend reinvestment plan (note 14) |
118 | 2 | (2 | ) | — | — | — | — | — | |||||||||||||||||||||||
| Total transactions with owners |
118 | 2 | (351 | ) | — | — | (349 | ) | (218 | ) | (567 | ) | ||||||||||||||||||||
| At June 30, 2023 |
1,755,468 | $28,116 | ($7,208 | ) | $18 | $1,913 | $22,839 | $8,646 | $31,485 | |||||||||||||||||||||||
| At January 1, 2022 |
1,779,331 | $28,497 | ($6,566 | ) | ($23 | ) | $1,949 | $23,857 | $8,450 | $32,307 | ||||||||||||||||||||||
| Net income |
— | — | 926 | — | — | 926 | 497 | 1,423 | ||||||||||||||||||||||||
| Total other comprehensive income |
— | — | — | 32 | — | 32 | — | 32 | ||||||||||||||||||||||||
| Total comprehensive income |
— | — | 926 | 32 | — | 958 | 497 | 1,455 | ||||||||||||||||||||||||
| Transactions with owners |
||||||||||||||||||||||||||||||||
| Dividends |
— | — | (531 | ) | — | — | (531 | ) | — | (531 | ) | |||||||||||||||||||||
| Disbursements to non-controlling interests |
— | — | — | — | — | — | (524 | ) | (524 | ) | ||||||||||||||||||||||
| Dividend reinvestment plan |
105 | 2 | (2 | ) | — | — | — | — | — | |||||||||||||||||||||||
| Share buyback program |
(8,500 | ) | (136 | ) | — | — | (37 | ) | (173 | ) | — | (173 | ) | |||||||||||||||||||
| Total transactions with owners |
(8,395 | ) | (134 | ) | (533 | ) | — | (37 | ) | (704 | ) | (524 | ) | (1,228 | ) | |||||||||||||||||
| At June 30, 2022 |
1,770,936 | $28,363 | ($6,173 | ) | $9 | $1,912 | $24,111 | $8,423 | $32,534 | |||||||||||||||||||||||
| 1 | Includes cumulative translation losses at June 30, 2023: $95 million (December 31, 2022: $93 million; June 30, 2022: $93 million). |
| 2 | Includes additional paid-in capital as at June 30, 2023: $1,875 million (December 31, 2022: $1,875 million; June 30, 2022: $1,874 million). |
The notes to these unaudited condensed interim financial statements, which are contained in the Second Quarter Report 2023 available on our website, are an integral part of these consolidated financial statements.
| BARRICK SECOND QUARTER 2023 | 25 | PRESS RELEASE |
Technical Information
The scientific and technical information contained in this press release has been reviewed and approved by Craig Fiddes, SME-RM, Lead, Resource Modeling, Nevada Gold Mines; Chad Yuhasz, P.Geo, Mineral Resource Manager, Latin America & Asia Pacific; Richard Peattie, MPhil, FAusIMM, Mineral Resources Manager: Africa and Middle East; Simon Bottoms, CGeol, MGeol, FGS, FAusIMM, Mineral Resource Management and Evaluation Executive; John Steele, CIM, Metallurgy, Engineering and Capital Projects Executive; and Joel Holliday, FAusIMM, Executive Vice-President, Exploration — each a “Qualified Person” as defined in National Instrument 43-101 – Standards of Disclosure for Mineral Projects.
All mineral reserve and mineral resource estimates are estimated in accordance with National Instrument 43-101 - Standards of Disclosure for Mineral Projects. Unless otherwise noted, such mineral reserve and mineral resource estimates are as of December 31, 2022.
Endnotes
Endnote 1
On an attributable basis.
Endnote 2
“Adjusted net earnings” and “adjusted net earnings per share” are non-GAAP financial performance measures. Adjusted net earnings excludes the following from net earnings: impairment charges (reversals) related to intangibles, goodwill, property, plant and equipment, and investments; acquisition/disposition gains/losses; foreign currency translation gains/losses; significant tax adjustments; other items that are not indicative of the underlying operating performance of our core mining business; and tax effect and non-controlling interest of the above items. Management uses this measure internally to evaluate our underlying operating performance for the reporting periods presented and to assist with the planning and forecasting of future operating results. Management believes that adjusted net earnings is a useful measure of our performance because impairment charges, acquisition/disposition gains/losses and significant tax adjustments do not reflect the underlying operating performance of our core mining business and are not necessarily indicative of future operating results. Adjusted net earnings and adjusted net earnings per share are intended to provide additional information only and does not have any standardized definition under IFRS and should not be considered in isolation or as a substitute for measures of performance prepared in accordance with IFRS. The measures are not necessarily indicative of operating profit or cash flow from operations as determined under IFRS. Other companies may calculate these measures differently. The following table reconciles these non-GAAP financial measures to the most directly comparable IFRS measure. Further details on these non-GAAP financial performance measures are provided in the MD&A accompanying Barrick’s financial statements filed from time to time on SEDAR at www.sedar.com and on EDGAR at www.sec.gov.
Reconciliation of Net Earnings to Net Earnings per Share, Adjusted Net Earnings and Adjusted Net Earnings per Share
| ($ millions, except per share amounts in dollars) |
For the three months ended | For the six months ended | ||||||||||||||||||
| 6/30/23 | 3/31/23 | 6/30/22 | 6/30/23 | 6/30/22 | ||||||||||||||||
| Net earnings attributable to equity holders of the Company |
305 | 120 | 488 | 425 | 926 | |||||||||||||||
| Impairment charges (reversals) related to intangibles, goodwill, property, plant and equipment, and investmentsa |
22 | 1 | 3 | 23 | 5 | |||||||||||||||
| Acquisition/disposition gainsb |
(3 | ) | (3 | ) | (20 | ) | (6 | ) | (22 | ) | ||||||||||
| (Gain) loss on currency translation |
(12 | ) | 38 | 6 | 26 | 9 | ||||||||||||||
| Significant tax adjustmentsc |
33 | 48 | 38 | 81 | 55 | |||||||||||||||
| Other (income) expense adjustmentsd |
(3 | ) | 63 | (95 | ) | 60 | (82 | ) | ||||||||||||
| Non-controlling intereste |
(7 | ) | (6 | ) | (7 | ) | (13 | ) | (7 | ) | ||||||||||
| Tax effecte |
1 | (14 | ) | 6 | (13 | ) | (2 | ) | ||||||||||||
| Adjusted net earnings |
336 | 247 | 419 | 583 | 882 | |||||||||||||||
| Net earnings per sharef |
0.17 | 0.07 | 0.27 | 0.24 | 0.52 | |||||||||||||||
| Adjusted net earnings per sharef |
0.19 | 0.14 | 0.24 | 0.33 | 0.50 | |||||||||||||||
| a. | For the three and six month periods ended June 30, 2023, net impairment charges were mainly related to miscellaneous assets. |
| b. | For the three and six month periods ended June 30, 2022, acquisition/disposition gains were primarily related to miscellaneous permit and land assets. |
| c. | For the three and six month periods ended June 30, 2023, significant tax adjustments were mainly related to the settlement agreement to resolve the tax dispute at Porgera, adjustments in respect of prior years and the re-measurement of deferred tax balances. |
| d. | For the three month period ended March 31, 2023 and the six month period ended June 30, 2023, other (income) expense adjustments mainly relate to the $30 million commitment we made towards the expansion of education infrastructure in Tanzania, per our community investment obligations under the Twiga partnership. Other (income) expense adjustments for all periods were also impacted by changes in the discount rate assumptions on our closed mine rehabilitation provision and care and maintenance expenses at Porgera. |
| e. | Non-controlling interest and tax effect for the three and six month periods ended June 30, 2023 primarily relates to loss on currency translation. |
| f. | Calculated using weighted average number of shares outstanding under the basic method of earnings per share. |
| BARRICK SECOND QUARTER 2023 | 26 | PRESS RELEASE |
Endnote 3
Total reportable incident frequency rate (“TRIFR”) is a ratio calculated as follows: number of reportable injuries x 1,000,000 hours divided by the total number of hours worked. Reportable injuries include fatalities, lost time injuries, restricted duty injuries, and medically treated injuries.
Endnote 4
“Realized price” is a non-GAAP financial performance measure which excludes from sales: treatment and refining charges; and cumulative catch-up adjustment to revenue relating to our streaming arrangements. We believe this provides investors and analysts with a more accurate measure with which to compare to market gold prices and to assess our gold sales performance. For those reasons, management believes that this measure provides a more accurate reflection of our company’s past performance and is a better indicator of its expected performance in future periods. The realized price measure is intended to provide additional information, and does not have any standardized definition under IFRS and should not be considered in isolation or as a substitute for measures of performance prepared in accordance with IFRS. The measure is not necessarily indicative of sales as determined under IFRS. Other companies may calculate this measure differently. The following table reconciles realized prices to the most directly comparable IFRS measure. Further details on these non-GAAP financial performance measures are provided in the MD&A accompanying Barrick’s financial statements filed from time to time on SEDAR at www.sedar.com and on EDGAR at www.sec.gov.
Reconciliation of Sales to Realized Price per ounce/pound
| ($ millions, except per ounce/pound information in dollars) |
Gold | Copper | Gold | Copper | ||||||||||||||||||||||||||||||||||||
| For the three months ended | For the six months ended | |||||||||||||||||||||||||||||||||||||||
| 6/30/23 | 3/31/23 | 6/30/22 | 6/30/23 | 3/31/23 | 6/30/22 | 6/30/23 | 6/30/22 | 6/30/23 | 6/30/22 | |||||||||||||||||||||||||||||||
| Sales |
2,584 | 2,411 | 2,597 | 189 | 171 | 211 | 4,995 | 5,108 | 360 | 498 | ||||||||||||||||||||||||||||||
| Sales applicable to non-controlling interests |
(787 | ) | (723 | ) | (779 | ) | 0 | 0 | 0 | (1,510 | ) | (1,566 | ) | 0 | 0 | |||||||||||||||||||||||||
| Sales applicable to equity method investmentsa,b |
171 | 126 | 145 | 133 | 160 | 164 | 297 | 281 | 293 | 352 | ||||||||||||||||||||||||||||||
| Sales applicable to sites in closure or care and maintenancec |
(2 | ) | (7 | ) | (30 | ) | 0 | 0 | 0 | (9 | ) | (30 | ) | 0 | 0 | |||||||||||||||||||||||||
| Treatment and refinement charges |
8 | 7 | 2 | 50 | 43 | 47 | 15 | 5 | 93 | 98 | ||||||||||||||||||||||||||||||
| Revenues – as adjusted |
1,974 | 1,814 | 1,935 | 372 | 374 | 422 | 3,788 | 3,798 | 746 | 948 | ||||||||||||||||||||||||||||||
| Ounces/pounds sold (000s ounces/millions pounds)c |
1,001 | 954 | 1,040 | 101 | 89 | 113 | 1,955 | 2,033 | 190 | 226 | ||||||||||||||||||||||||||||||
| Realized gold/copper price per ounce/poundd |
1,972 | 1,902 | 1,861 | 3.70 | 4.20 | 3.72 | 1,938 | 1,868 | 3.93 | 4.20 | ||||||||||||||||||||||||||||||
| a. | Represents sales of $171 million and $297 million, respectively, for the three and six month periods ended June 30, 2023 (March 31, 2023: $126 million and June 30, 2022: $145 million and $282 million, respectively) applicable to our 45% equity method investment in Kibali for gold. Represents sales of $81 million and $179 million, respectively, for the three and six month periods ended June 30, 2023 (March 31, 2023: $98 million and June 30, 2022: $99 million and $217 million, respectively) applicable to our 50% equity method investment in Zaldívar and $58 million and $127 million, respectively (March 31, 2023: $69 million and June 30, 2022: $69 million and $144 million, respectively), applicable to our 50% equity method investment in Jabal Sayid for copper. |
| b. | Sales applicable to equity method investments are net of treatment and refinement charges. |
| c. | Excludes Pierina, which is producing incidental ounces while in closure. |
| d. | Realized price per ounce/pound may not calculate based on amounts presented in this table due to rounding. |
Endnote 5
“Free cash flow” is a non-GAAP financial measure that deducts capital expenditures from net cash provided by operating activities. Management believes this to be a useful indicator of our ability to operate without reliance on additional borrowing or usage of existing cash. Free cash flow is intended to provide additional information only and does not have any standardized definition under IFRS, and should not be considered in isolation or as a substitute for measures of performance prepared in accordance with IFRS. The measure is not necessarily indicative of operating profit or cash flow from operations as determined under IFRS. Other companies may calculate this measure differently. Further details on this non-GAAP financial performance measure are provided in the MD&A accompanying Barrick’s financial statements filed from time to time on SEDAR at www.sedar.com and on EDGAR at www.sec.gov. The following table reconciles this non-GAAP financial measure to the most directly comparable IFRS measure.
Reconciliation of Net Cash Provided by Operating Activities to Free Cash Flow
| ($ millions) |
For the three months ended | For the six months ended | ||||||||||||||||||
| 6/30/23 | 3/31/23 | 6/30/22 | 6/30/23 | 6/30/22 | ||||||||||||||||
| Net cash provided by operating activities |
832 | 776 | 924 | 1,608 | 1,928 | |||||||||||||||
| Capital expenditures |
(769 | ) | (688 | ) | (755 | ) | (1,457 | ) | (1,366 | ) | ||||||||||
| Free cash flow |
63 | 88 | 169 | 151 | 562 | |||||||||||||||
Endnote 6
Capital expenditures are classified into minesite sustaining capital expenditures or project capital expenditures depending on the nature of the expenditure. Minesite sustaining capital expenditures is the capital spending required to support current production
| BARRICK SECOND QUARTER 2023 | 27 | PRESS RELEASE |
levels. Project capital expenditures represent the capital spending at new projects and major, discrete projects at existing operations intended to increase net present value through higher production or longer mine life. Management believes this to be a useful indicator of the purpose of capital expenditures and this distinction is an input into the calculation of all-in sustaining costs per ounce and all-in costs per ounce. Classifying capital expenditures is intended to provide additional information only and does not have any standardized definition under IFRS, and should not be considered in isolation or as a substitute for measures of performance prepared in accordance with IFRS. Other companies may calculate these measures differently. The following table reconciles these non-GAAP financial performance measures to the most directly comparable IFRS measure.
Reconciliation of the Classification of Capital Expenditures
| ($ millions) |
For the three months ended | For the six months ended | ||||||||||||||||||
| 6/30/23 | 3/31/23 | 6/30/22 | 6/30/23 | 6/30/22 | ||||||||||||||||
| Minesite sustaining capital expenditures |
524 | 454 | 523 | 978 | 943 | |||||||||||||||
| Project capital expenditures |
238 | 226 | 226 | 464 | 412 | |||||||||||||||
| Capitalized interest |
7 | 8 | 6 | 15 | 11 | |||||||||||||||
| Total consolidated capital expenditures |
769 | 688 | 755 | 1,457 | 1,366 | |||||||||||||||
Endnote 7
These amounts are presented on the same basis as our guidance.
Endnote 8
Gold cost of sales per ounce is calculated as cost of sales across our gold operations (excluding sites in closure or care and maintenance) divided by ounces sold (both on an attributable basis using Barrick’s ownership share). Copper cost of sales per pound is calculated as cost of sales across our copper operations divided by pounds sold (both on an attributable basis using Barrick’s ownership share). References to attributable basis means our 100% share of Hemlo and Lumwana, our 61.5% share of NGM, our 60% share of Pueblo Viejo, our 80% share of Loulo-Gounkoto, our 89.7% share of Tongon, our 84% share of North Mara, and Bulyanhulu, our 50% share of Veladero, Zaldívar and Jabal Sayid, our 47.5% share of Porgera and our 45% share of Kibali.
Endnote 9
“Total cash costs” per ounce, “All-in sustaining costs” per ounce and “All-in costs” per ounce are non-GAAP financial performance measures which are calculated based on the definition published by the World Gold Council (a market development organization for the gold industry comprised of and funded by gold mining companies from around the world, including Barrick, the “WGC”). The WGC is not a regulatory organization. Management uses these measures to monitor the performance of our gold mining operations and its ability to generate positive cash flow, both on an individual site basis and an overall company basis. “Total cash costs” per ounce start with our cost of sales related to gold production and removes depreciation, the noncontrolling interest of cost of sales and includes by-product credits. “All-in sustaining costs” per ounce start with “Total cash costs” per ounce and includes sustaining capital expenditures, sustaining leases, general and administrative costs, minesite exploration and evaluation costs and reclamation cost accretion and amortization. These additional costs reflect the expenditures made to maintain current production levels. “All-in costs” per ounce start with “All-in sustaining costs” and adds additional costs that reflect the varying costs of producing gold over the life-cycle of a mine, including: project capital expenditures (capital spending at new projects and major, discrete projects at existing operations intended to increase net present value through higher production or longer mine life) and other non-sustaining costs (primarily non-sustaining leases, exploration and evaluation costs, community relations costs and general and administrative costs that are not associated with current operations). These definitions recognize that there are different costs associated with the life-cycle of a mine, and that it is therefore appropriate to distinguish between sustaining and non-sustaining costs. Barrick believes that the use of “Total cash costs” per ounce, “All-in sustaining costs” per ounce and “All-in costs” per ounce will assist analysts, investors and other stakeholders of Barrick in understanding the costs associated with producing gold, understanding the economics of gold mining, assessing our operating performance and also our ability to generate free cash flow from current operations and to generate free cash flow on an overall company basis. “Total cash costs” per ounce, “All-in sustaining costs” per ounce and “All-in costs” per ounce are intended to provide additional information only and do not have standardized definitions under IFRS and should not be considered in isolation or as a substitute for measures of performance prepared in accordance with IFRS. These measures are not equivalent to net income or cash flow from operations as determined under IFRS. Although the WGC has published a standardized definition, other companies may calculate these measures differently. Further details on these non-GAAP financial performance measures are provided in the MD&A accompanying Barrick’s financial statements filed from time to time on SEDAR at www.sedar.com and on EDGAR at www.sec.gov.
| BARRICK SECOND QUARTER 2023 | 28 | PRESS RELEASE |
Reconciliation of Gold Cost of Sales to Total cash costs, All-in sustaining costs and All-in costs, including on a per ounce basis
| ($ millions, except per ounce information in dollars) |
For the three months ended | For the six months ended | ||||||||||||||||||||||
| Footnote | 6/30/23 | 3/31/23 | 6/30/22 | 6/30/23 | 6/30/22 | |||||||||||||||||||
| Cost of sales applicable to gold production |
1,753 | 1,761 | 1,703 | 3,514 | 3,285 | |||||||||||||||||||
| Depreciation |
(413 | ) | (445 | ) | (438 | ) | (858 | ) | (857 | ) | ||||||||||||||
| Cash cost of sales applicable to equity method investments |
67 | 63 | 54 | 130 | 105 | |||||||||||||||||||
| By-product credits |
(60 | ) | (61 | ) | (51 | ) | (121 | ) | (106 | ) | ||||||||||||||
| Non-recurring items |
a | 0 | 0 | 0 | 0 | 0 | ||||||||||||||||||
| Other |
b | 5 | 0 | (22 | ) | 5 | (23 | ) | ||||||||||||||||
|
Non-controlling interests |
c | (388 | ) | (378 | ) | (358 | ) | (766 | ) | (689 | ) | |||||||||||||
| Total cash costs |
964 | 940 | 888 | 1,904 | 1,715 | |||||||||||||||||||
| General & administrative costs |
28 | 39 | 30 | 67 | 84 | |||||||||||||||||||
| Minesite exploration and evaluation costs |
d | 14 | 11 | 20 | 25 | 30 | ||||||||||||||||||
| Minesite sustaining capital expenditures |
e | 524 | 454 | 523 | 978 | 943 | ||||||||||||||||||
| Sustaining leases |
9 | 7 | 6 | 16 | 15 | |||||||||||||||||||
| Rehabilitation - accretion and amortization (operating sites) |
f | 15 | 14 | 13 | 29 | 24 | ||||||||||||||||||
|
Non-controlling interest, copper operations and other |
g | (197 | ) | (159 | ) | (221 | ) | (356 | ) | (397 | ) | |||||||||||||
|
All-in sustaining costs |
1,357 | 1,306 | 1,259 | 2,663 | 2,414 | |||||||||||||||||||
| Global exploration and evaluation and project expense |
d | 87 | 60 | 80 | 147 | 137 | ||||||||||||||||||
| Community relations costs not related to current operations |
1 | 0 | 0 | 1 | 0 | |||||||||||||||||||
| Project capital expenditures |
e | 238 | 226 | 226 | 464 | 412 | ||||||||||||||||||
| Non-sustaining leases |
0 | 0 | 0 | 0 | 0 | |||||||||||||||||||
| Rehabilitation - accretion and amortization (non-operating sites) |
f | 6 | 6 | 5 | 12 | 8 | ||||||||||||||||||
|
Non-controlling interest and copper operations and other |
g | (122 | ) | (88 | ) | (68 | ) | (210 | ) | (126 | ) | |||||||||||||
|
All-in costs |
1,567 | 1,510 | 1,502 | 3,077 | 2,845 | |||||||||||||||||||
| Ounces sold - equity basis (000s ounces) |
h | 1,001 | 954 | 1,040 | 1,955 | 2,033 | ||||||||||||||||||
| Cost of sales per ounce |
i,j | 1,323 | 1,378 | 1,216 | 1,350 | 1,203 | ||||||||||||||||||
| Total cash costs per ounce |
j | 963 | 986 | 855 | 974 | 844 | ||||||||||||||||||
| Total cash costs per ounce (on a co-product basis) |
j,k | 1,003 | 1,030 | 887 | 1,016 | 878 | ||||||||||||||||||
| All-in sustaining costs per ounce |
j | 1,355 | 1,370 | 1,212 | 1,362 | 1,188 | ||||||||||||||||||
|
All-in sustaining costs per ounce (on a co-product basis) |
j,k | 1,395 | 1,414 | 1,244 | 1,404 | 1,222 | ||||||||||||||||||
| All-in costs per ounce |
j | 1,566 | 1,583 | 1,444 | 1,574 | 1,399 | ||||||||||||||||||
|
All-in costs per ounce (on a co-product basis) |
j,k | 1,606 | 1,627 | 1,476 | 1,616 | 1,433 | ||||||||||||||||||
| a. | Non-recurring items |
These costs are not indicative of our cost of production and have been excluded from the calculation of total cash costs.
| b. | Other |
Other adjustments for the three and six month periods ended June 30, 2023 include the removal of total cash costs and by-product credits associated with Pierina, Golden Sunlight, and Buzwagi, which all are producing incidental ounces, of $nil and $3 million, respectively (March 31, 2023: $3 million; June 30, 2022: $7 million and $10 million, respectively).
| c. | Non-controlling interests |
Non-controlling interests include non-controlling interests related to gold production of $533 million and $1,062 million, respectively, for the three and six month periods ended June 30, 2023 (March 31, 2023: $529 million and June 30, 2022: $505 million and $981 million, respectively). Non-controlling interests include NGM, Pueblo Viejo, Loulo-Gounkoto, Tongon, North Mara and Bulyanhulu. Refer to Note 5 to the Financial Statements for further information.
| d. | Exploration and evaluation costs |
Exploration, evaluation and project expenses are presented as minesite sustaining if it supports current mine operations and project if it relates to future projects. Refer to page 50 of Barrick’s Q2 2023 MD&A.
| e. | Capital expenditures |
Capital expenditures are related to our gold sites only and are split between minesite sustaining and project capital expenditures. Project capital expenditures are capital spending at new projects and major, discrete projects at existing operations intended to increase net present value through higher production or longer mine life. Significant projects in the current year are the plant expansion project at Pueblo Viejo and the solar projects at NGM and Loulo-Gounkoto. Refer to page 49 of Barrick’s Q2 2023 MD&A.
| f. | Rehabilitation—accretion and amortization |
Includes depreciation on the assets related to rehabilitation provisions of our gold operations and accretion on the rehabilitation provision of our gold operations, split between operating and non-operating sites.
| g. | Non-controlling interest and copper operations |
Removes general & administrative costs related to non-controlling interests and copper based on a percentage allocation of revenue. Also removes exploration, evaluation and project expenses, rehabilitation costs and capital expenditures incurred by our copper sites and the non-controlling interest of NGM, Pueblo Viejo, Loulo-Gounkoto, Tongon, North Mara and Bulyanhulu operating segments. It also includes capital expenditures applicable to our equity method investment in Kibali. Figures remove the impact of Pierina, Golden Sunlight, and Buzwagi. The impact is summarized as the following:
| BARRICK SECOND QUARTER 2023 | 29 | PRESS RELEASE |
| ($ millions) |
For the three months ended | For the six months ended | ||||||||||||||||||
| Non-controlling interest, copper operations and other | 6/30/23 | 3/31/23 | 6/30/22 | 6/30/23 | 6/30/22 | |||||||||||||||
| General & administrative costs |
(5 | ) | (6 | ) | (5 | ) | (11 | ) | (18 | ) | ||||||||||
| Minesite exploration and evaluation expenses |
(4 | ) | (4 | ) | (7 | ) | (8 | ) | (10 | ) | ||||||||||
| Rehabilitation - accretion and amortization (operating sites) |
(5 | ) | (5 | ) | (4 | ) | (10 | ) | (7 | ) | ||||||||||
| Minesite sustaining capital expenditures |
(183 | ) | (144 | ) | (205 | ) | (327 | ) | (362 | ) | ||||||||||
| All-in sustaining costs total |
(197 | ) | (159 | ) | (221 | ) | (356 | ) | (397 | ) | ||||||||||
| Global exploration and evaluation and project expense |
(37 | ) | (12 | ) | (11 | ) | (49 | ) | (15 | ) | ||||||||||
| Project capital expenditures |
(85 | ) | (76 | ) | (57 | ) | (161 | ) | (111 | ) | ||||||||||
|
All-in costs total |
(122 | ) | (88 | ) | (68 | ) | (210 | ) | (126 | ) | ||||||||||
| h. | Ounces sold - equity basis |
Figures remove the impact of: Pierina and Buzwagi. Some of these assets are producing incidental ounces while in closure or care and maintenance.
| i. | Cost of sales per ounce |
Figures remove the cost of sales impact of: Pierina of $nil and $3 million, respectively, for the three and six month periods ended June 30, 2023 (March 31, 2023: $3 million and June 30, 2022: $8 million and $11 million, respectively); Golden Sunlight of $nil and $nil, respectively, for the three and six month periods ended June 30, 2023 (March 31, 2023: $nil and June 30, 2022: $nil and $nil respectively); Buzwagi of $nil and $nil, respectively, for the three and six month periods ended June 30, 2023 (March 31, 2023: $nil and June 30, 2022: $nil and $nil, respectively), which are producing incidental ounces. Gold cost of sales per ounce is calculated as cost of sales across our gold operations (excluding sites in closure or care and maintenance) divided by ounces sold (both on an attributable basis using Barrick’s ownership share).
| j. | Per ounce figures |
Cost of sales per ounce, total cash costs per ounce, all-in sustaining costs per ounce and all-in costs per ounce may not calculate based on amounts presented in this table due to rounding.
| k. | Co-product costs per ounce |
Total cash costs per ounce, all-in sustaining costs per ounce and all-in costs per ounce presented on a co-product basis removes the impact of by-product credits of our gold production (net of non-controlling interest) calculated as:
| ($ millions) |
For the three months ended | For the six months ended | ||||||||||||||||||
| 6/30/23 | 3/31/23 | 6/30/22 | 6/30/23 | 6/30/22 | ||||||||||||||||
| By-product credits |
60 | 61 | 51 | 121 | 106 | |||||||||||||||
| Non-controlling interest |
(20 | ) | (19 | ) | (18 | ) | (39 | ) | (37 | ) | ||||||||||
| By-product credits (net of non-controlling interest) |
40 | 42 | 33 | 82 | 69 | |||||||||||||||
Endnote 10
“C1 cash costs” per pound and “All-in sustaining costs” per pound are non-GAAP financial performance measures related to our copper mine operations. We believe that “C1 cash costs” per pound enables investors to better understand the performance of our copper operations in comparison to other copper producers who present results on a similar basis. “C1 cash costs” per pound excludes royalties and production taxes and non-routine charges as they are not direct production costs. “All-in sustaining costs” per pound is similar to the gold all-in sustaining costs metric and management uses this to better evaluate the costs of copper production. We believe this measure enables investors to better understand the operating performance of our copper mines as this measure reflects all of the sustaining expenditures incurred in order to produce copper. “All-in sustaining costs” per pound includes C1 cash costs, sustaining capital expenditures, sustaining leases, general and administrative costs, minesite exploration and evaluation costs, royalties and production taxes, reclamation cost accretion and amortization and writedowns taken on inventory to net realizable value. Further details on these non-GAAP financial performance measures are provided in the MD&A accompanying Barrick’s financial statements filed from time to time on SEDAR at www.sedar.com and on EDGAR at www.sec.gov.
| BARRICK SECOND QUARTER 2023 | 30 | PRESS RELEASE |
Reconciliation of Copper Cost of Sales to C1 cash costs and All-in sustaining costs, including on a per pound basis
| ($ millions, except per pound information in dollars) |
For the three months ended | For the six months ended | ||||||||||||||||||
| 6/30/23 | 3/31/23 | 6/30/22 | 6/30/23 | 6/30/22 | ||||||||||||||||
| Cost of sales |
176 | 174 | 143 | 350 | 297 | |||||||||||||||
| Depreciation/amortization |
(59 | ) | (44 | ) | (34 | ) | (103 | ) | (72 | ) | ||||||||||
| Treatment and refinement charges |
50 | 43 | 47 | 93 | 98 | |||||||||||||||
| Cash cost of sales applicable to equity method investments |
84 | 87 | 74 | 171 | 146 | |||||||||||||||
| Less: royalties |
(16 | ) | (15 | ) | (32 | ) | (31 | ) | (64 | ) | ||||||||||
| By-product credits |
(6 | ) | (4 | ) | (6 | ) | (10 | ) | (9 | ) | ||||||||||
| Other |
0 | 0 | 0 | 0 | 0 | |||||||||||||||
| C1 cash costs |
229 | 241 | 192 | 470 | 396 | |||||||||||||||
| General & administrative costs |
4 | 6 | 6 | 10 | 18 | |||||||||||||||
| Rehabilitation - accretion and amortization |
2 | 2 | 1 | 4 | 2 | |||||||||||||||
| Royalties |
16 | 15 | 32 | 31 | 64 | |||||||||||||||
| Minesite exploration and evaluation costs |
2 | 2 | 5 | 4 | 8 | |||||||||||||||
| Minesite sustaining capital expenditures |
58 | 33 | 89 | 91 | 156 | |||||||||||||||
| Sustaining leases |
4 | 3 | 2 | 7 | 3 | |||||||||||||||
|
All-in sustaining costs |
315 | 302 | 327 | 617 | 647 | |||||||||||||||
| Pounds sold - consolidated basis (millions pounds) |
101 | 89 | 113 | 190 | 226 | |||||||||||||||
| Cost of sales per pounda,b |
2.84 | 3.22 | 2.11 | 3.02 | 2.16 | |||||||||||||||
| C1 cash costs per pounda |
2.28 | 2.71 | 1.70 | 2.48 | 1.75 | |||||||||||||||
|
All-in sustaining costs per pounda |
3.13 | 3.40 | 2.87 | 3.26 | 2.86 | |||||||||||||||
| a. | Cost of sales per pound, C1 cash costs per pound and all-in sustaining costs per pound may not calculate based on amounts presented in this table due to rounding. |
| b. | Copper cost of sales per pound is calculated as cost of sales across our copper operations divided by pounds sold (both on an attributable basis using Barrick’s ownership share). |
Endnote 11
A Tier One Gold Asset is an asset with a reserve potential to deliver a minimum 10-year life, annual production of at least 500,000 ounces of gold and total cash costs per ounce over the mine life that are in the lower half of the industry cost curve. A Tier One Copper Asset is an asset with a reserve potential of greater than five million tonnes of contained copper and C1 cash costs per pound over the mine life that are in the lower half of the industry cost curve.
Endnote 12
Refer to the Technical Report on the Pueblo Viejo Mine, Dominican Republic, dated March 17, 2023 and filed on SEDAR at www.sedar.com and EDGAR at www.sec.gov on March 17, 2023.
Endnote 13
Porgera was placed on temporary care and maintenance on April 25, 2020 and remains excluded from our 2023 guidance. We expect to update our guidance to include Porgera following both the execution of definitive agreements to implement the Commencement Agreement and the finalization of a timeline for the resumption of full mine operations.
Endnote 14
Gold Equivalent Ounces from copper assets are calculated using a gold price of $1,300/oz; and copper price of $3.00/lb.
Estimated in accordance with National Instrument 43-101 - Standards of Disclosure for Mineral Projects as required by Canadian securities regulatory authorities:
Estimates as of December 31, 2022: Proven mineral reserves of 260 million tonnes grading 2.26g/t, representing 19 million ounces of gold, and 390 million tonnes grading 0.40%, representing 3,500 million pounds of copper. Probable reserves of 1,200 million tonnes grading 1.53g/t, representing 57 million ounces of gold, and 1,100 million tonnes grading 0.37%, representing 8,800 million pounds of copper.
Estimates as of December 31, 2021: Proven mineral reserves of 240 million tonnes grading 2.20 g/t, representing 17 million ounces of gold, and 380 million tonnes grading 0.41%, representing 3,400 million pounds of copper. Probable reserves of 1,000 million tonnes grading 1.60 g/t, representing 53 million ounces of gold, and 1,100 million tonnes grading 0.37%, representing 8,800 million pounds of copper.
Estimates as of December 31, 2020: Proven reserves of 280 million tonnes grading 2.37 g/t, representing 21 million ounces of gold, and 350 million tonnes grading 0.39%, representing 3,000 million pounds of copper. Probable reserves of 990 million tonnes grading 1.46 g/t, representing 47 million ounces of gold, and 1,100 million tonnes grading 0.39%, representing 9,700 million pounds of copper.
Estimates as of December 31, 2019: Proven reserves of 280 million tonnes grading 2.42 g/t, representing 22 million ounces of gold, and 420 million tonnes grading 0.4%, representing 3,700 million pounds of copper. Probable reserves of 1,000 million tonnes grading 1.48 g/t, representing 49 million ounces of gold, and 1,200 million tonnes grading 0.38%, representing 9,800 million pounds of copper. Estimates as of December 31, 2019 reflect Barrick’s acquisition of all of the shares of Acacia Mining plc that it did not already own as of September 17, 2019.
Acquisitions and divestments includes the following: a decrease of 2.2 Moz in proven and probable gold reserves from December 31, 2019 to December 31, 2020, as a result of the divestiture of Barrick’s Massawa gold project effective March 4, 2020; and a decrease of 0.90 Moz in proven and probable gold reserves from December 31, 2020 to December 31, 2021, as a result of the change in Barrick’s equity interest in Porgera from 47.5% to 24.5% and the net impact of the asset exchange of Lone Tree to i-80 Gold for the remaining 50% of South Arturo that Nevada Gold Mines did not already own.
Endnote 15
Reko Diq is a world class copper-gold mine in the making located in Chagai district of Balochistan province, in Pakistan. One of the largest undeveloped copper-gold projects in the world, Reko Diq is owned 50% by Barrick, 25% by three federal state-owned enterprises, 15% by the Province of Balochistan on a fully funded basis and 10% by the Province of Balochistan on a free carried basis. Barrick is now updating the project’s 2010 feasibility and 2011 feasibility expansion studies. This should be completed by 2024, with 2028 targeted for first production.
Reko Diq is expected to have a life of at least 40 years as a truck-and-shovel open pit operation with processing facilities producing a high-quality copper-gold concentrate. Construction is expected in two phases with a combined process capacity of 80 million tonnes per annum.
Reko Diq will be a major contributor to Pakistan’s economy which is expected to have a transformative impact on the Balochistan province where, in addition to the economic benefits it will generate, the mine will also create jobs, promote the growth of a regional economy and invest in development programs.
Endnote 16
Includes Goldrush.
| BARRICK SECOND QUARTER 2023 | 31 | PRESS RELEASE |
Endnote 17
Total cash costs and all-in sustaining costs per ounce include costs allocated to non-operating sites.
Endnote 18
Operating division guidance ranges reflect expectations at each individual operating division and may not add up to the company-wide guidance range total. Guidance ranges exclude Pierina which is producing incidental ounces while in closure.
Endnote 19
Includes corporate administration costs.
Endnote 20
EBITDA is a non-GAAP financial performance measure, which excludes the following from net earnings: income tax expense; finance costs; finance income; and depreciation. Management believes that EBITDA is a valuable indicator of our ability to generate liquidity by producing operating cash flow to fund working capital needs, service debt obligations, and fund capital expenditures. Management uses EBITDA for this purpose. Adjusted EBITDA removes the effect of impairment charges; acquisition/disposition gains/losses; foreign currency translation gains/losses; and other expense adjustments. We also remove the impact of the income tax expense, finance costs, finance income and depreciation incurred in our equity method accounted investments. We believe these items provide a greater level of consistency with the adjusting items included in our adjusted net earnings reconciliation, with the exception that these amounts are adjusted to remove any impact on finance costs/income, income tax expense and/or depreciation as they do not affect EBITDA. We believe this additional information will assist analysts, investors and other stakeholders of Barrick in better understanding our ability to generate liquidity from our full business, including equity method investments, by excluding these amounts from the calculation as they are not indicative of the performance of our core mining business and not necessarily reflective of the underlying operating results for the periods presented. EBITDA and adjusted EBITDA are intended to provide additional information only and do not have any standardized definition under IFRS and should not be considered in isolation or as a substitute for measures of performance prepared in accordance with IFRS. Other companies may calculate EBITDA and adjusted EBITDA differently. Further details on these non-GAAP financial performance measures are provided in the MD&A accompanying Barrick’s financial statements filed from time to time on SEDAR at www.sedar.com and on EDGAR at www.sec.gov.
Reconciliation of Net Earnings to EBITDA and Adjusted EBITDA
| ($ millions) |
For the three months ended | For the six months ended | ||||||||||||||||||
| 6/30/23 | 3/31/23 | 6/30/22 | 6/30/23 | 6/30/22 | ||||||||||||||||
| Net earnings |
502 | 269 | 717 | 771 | 1,423 | |||||||||||||||
| Income tax expense |
264 | 205 | 279 | 469 | 580 | |||||||||||||||
| Finance costs, neta |
23 | 37 | 73 | 60 | 149 | |||||||||||||||
| Depreciation |
480 | 495 | 476 | 975 | 936 | |||||||||||||||
| EBITDA |
1,269 | 1,006 | 1,545 | 2,275 | 3,088 | |||||||||||||||
| Impairment charges (reversals) of non-current assetsb |
22 | 1 | 3 | 23 | 5 | |||||||||||||||
| Acquisition/disposition gainsc |
(3 | ) | (3 | ) | (20 | ) | (6 | ) | (22 | ) | ||||||||||
| (Gain) loss on currency translation |
(12 | ) | 38 | 6 | 26 | 9 | ||||||||||||||
| Other (income) expense adjustmentsd |
(3 | ) | 63 | (95 | ) | 60 | (82 | ) | ||||||||||||
| Income tax expense, net finance costsa, and depreciation from equity investees |
95 | 78 | 88 | 173 | 174 | |||||||||||||||
| Adjusted EBITDA |
1,368 | 1,183 | 1,527 | 2,551 | 3,172 | |||||||||||||||
| a. | Finance costs exclude accretion. |
| b. | For the three and six month periods ended June 30, 2023, net impairment charges were mainly related to miscellaneous assets. |
| c. | For the three and six month periods ended June 30, 2022, acquisition/disposition gains were primarily related to miscellaneous permit and land assets. |
| d. | For the three month period ended March 31, 2023 and the six month period ended June 30, 2023, other (income) expense adjustments mainly relate to the $30 million commitment we made towards the expansion of education infrastructure in Tanzania, per our community investment obligations under the Twiga partnership. Other (income) expense adjustments for all periods were also impacted by changes in the discount rate assumptions on our closed mine rehabilitation provision and care and maintenance expenses at Porgera. |
| BARRICK SECOND QUARTER 2023 | 32 | PRESS RELEASE |
Corporate Office
Barrick Gold Corporation
161 Bay Street, Suite 3700
Toronto, Ontario M5J 2S1
Canada
Telephone: +1 416 861-9911
Email: investor@barrick.com
Website: www.barrick.com
Shares Listed
| GOLD | The New York Stock Exchange |
| ABX | The Toronto Stock Exchange |
Transfer Agents and Registrars
TSX Trust Company
301 – 100 Adelaide Street West
Toronto, Ontario M5H 4H1
or
Equiniti Trust Company, LLC
6201 – 15 Avenue
Brooklyn, New York 11219
Telephone: 1-800-387-0825
Fax: 1-888-249-6189
Email: shareholderinquiries@tmx.com
Website: www.tsxtrust.com
Enquiries
President and Chief Executive Officer
Mark Bristow
+1 647 205 7694
+44 788 071 1386
Senior Executive Vice-President and
Chief Financial Officer
Graham Shuttleworth
+1 647 262 2095
+44 779 771 1338
Investor and Media Relations
Kathy du Plessis
+44 20 7557 7738
Email: barrick@dpapr.com
Cautionary Statement on Forward-Looking Information
Certain information contained or incorporated by reference in this press release, including any information as to our strategy, projects, plans or future financial or operating performance, constitutes “forward-looking statements”. All statements, other than statements of historical fact, are forward-looking statements. The words “believe”, “expect”, “strategy”, “target”, “plan”, “focus”, “scheduled”, “commitment” “opportunities”, “guidance”, “project”, “expand”, “continue”, “progress”, “runway”, “on track”, “estimate”, “growth”, “potential”, “future”, “extend”, “will”, “could”, “would”, “should”, “may” and similar expressions identify forward-looking statements. In particular, this press release contains forward-looking statements including, without limitation, with respect to: Barrick’s forward-looking production guidance, including our ten-year production profile for gold and copper; projected capital, operating and exploration expenditures; our ability to convert resources into reserves and replace reserves net of depletion from production; mine life and production rates, including expected mineral reserve replacement in 2023 and 2024; Barrick’s global exploration strategy and planned exploration activities, including the expected benefits of conversion drilling at the greater Leeville complex; our ability to identify new Tier One assets and the potential for existing assets to attain Tier One status, including Porgera and Lumwana; Barrick’s copper strategy; our plans and expected completion and benefits of our growth projects, including the Pueblo Viejo plant expansion and mine life extension project, solar and battery storage system
expansion project at Loulo-Gounkoto and maintenance and processing initiatives at Nevada Gold Mines; potential mineralization and metal or mineral recoveries; expected timing for the feasibility study and targeted first production for the Reko Diq project; the duration of the temporary suspension of operations at Porgera, the conditions for the reopening of the mine and the timeline to recommence operations; our pipeline of high confidence projects at or near existing operations; Barrick’s global exploration strategy and planned exploration activities; Barrick’s partnership with the Government of Tanzania under the framework agreement; Lumwana’s ability to further extend the life of mine through the development of a Super Pit and targeted pre-construction and first production; Barrick’s strategy, plans, targets and goals in respect of environmental and social governance issues, including local community relations, economic contributions and education, infrastructure and procurement initiatives, climate change and biodiversity initiatives; Barrick’s talent management strategy; and expectations regarding future price assumptions, financial performance and other outlook or guidance.
Forward-looking statements are necessarily based upon a number of estimates and assumptions including material estimates and assumptions related to the factors set forth below that, while considered reasonable by the Company as at the date of this press release in light of management’s experience and
| BARRICK SECOND QUARTER 2023 | 33 | PRESS RELEASE |
perception of current conditions and expected developments, are inherently subject to significant business, economic and competitive uncertainties and contingencies. Known and unknown factors could cause actual results to differ materially from those projected in the forward-looking statements and undue reliance should not be placed on such statements and information. Such factors include, but are not limited to: fluctuations in the spot and forward price of gold, copper or certain other commodities (such as silver, diesel fuel, natural gas and electricity); risks associated with projects in the early stages of evaluation and for which additional engineering and other analysis is required; risks related to the possibility that future exploration results will not be consistent with the Company’s expectations, that quantities or grades of reserves will be diminished, and that resources may not be converted to reserves; risks associated with the fact that certain of the initiatives described in this press release are still in the early stages and may not materialize; changes in mineral production performance, exploitation and exploration successes; risks that exploration data may be incomplete and considerable additional work may be required to complete further evaluation, including but not limited to drilling, engineering and socioeconomic studies and investment; the speculative nature of mineral exploration and development; lack of certainty with respect to foreign legal systems, corruption and other factors that are inconsistent with the rule of law; changes in national and local government legislation, taxation, controls or regulations and/or changes in the administration of laws, policies and practices; the potential impact of proposed changes to Chilean law on the status of value added tax refunds received in Chile in connection with the development of the Pascua-Lama project; expropriation or nationalization of property and political or economic developments in Canada, the United States or other countries in which Barrick does or may carry on business in the future; risks relating to political instability in certain of the jurisdictions in which Barrick operates; timing of receipt of, or failure to comply with, necessary permits and approvals, including the issuance of a Record of Decision for the Goldrush Project and/or whether the Goldrush Project will be permitted to advance as currently designed under its Feasibility Study, the environmental license for the construction and operation of the El Naranjo tailings storage facility for Pueblo Viejo, and permitting activities required to optimize Long Canyon’s life of mine; non-renewal of key licenses by governmental authorities, including the new Special Mining Lease for Porgera; failure to comply with environmental and health and safety laws and regulations; increased costs and physical and transition risks related to climate change, including extreme weather events, resource shortages, emerging policies and increased regulations relating to greenhouse gas emission levels, energy efficiency and reporting of risks; contests over title to properties, particularly title to undeveloped properties, or over access to water, power and other required infrastructure; the liability associated with risks and hazards in the mining industry, and the ability to maintain insurance to cover such losses; damage to the Company’s reputation due to the actual or perceived occurrence of any number of events, including negative publicity with respect to the Company’s handling of environmental matters or dealings with community groups, whether true or not; risks related to operations near communities that may regard Barrick’s operations as being detrimental to them; litigation and legal and administrative proceedings; operating or technical difficulties in connection with mining or development activities, including geotechnical challenges, tailings dam and storage facilities failures, and disruptions in the maintenance or provision of required infrastructure and information technology systems; increased costs, delays, suspensions and technical challenges associated with the construction of capital projects; risks associated with working with partners in jointly controlled assets; risks related to
disruption of supply routes which may cause delays in construction and mining activities, including disruptions in the supply of key mining inputs due to the invasion of Ukraine by Russia; risk of loss due to acts of war, terrorism, sabotage and civil disturbances; risks associated with artisanal and illegal mining; risks associated with Barrick’s infrastructure, information technology systems and the implementation of Barrick’s technological initiatives, including risks related to cyber-attacks, cybersecurity breaches, or similar network or system disruptions; the impact of global liquidity and credit availability on the timing of cash flows and the values of assets and liabilities based on projected future cash flows; the impact of inflation, including global inflationary pressures driven by supply chain disruptions caused by the ongoing Covid-19 pandemic, global energy cost increases following the invasion of Ukraine by Russia and country-specific political and economic factors in Argentina; adverse changes in our credit ratings; fluctuations in the currency markets; changes in U.S. dollar interest rates; risks arising from holding derivative instruments (such as credit risk, market liquidity risk and mark-to-market risk); risks related to the demands placed on the Company’s management, the ability of management to implement its business strategy and enhanced political risk in certain jurisdictions; uncertainty whether some or all of Barrick’s targeted investments and projects will meet the Company’s capital allocation objectives and internal hurdle rate; whether benefits expected from recent transactions are realized; business opportunities that may be presented to, or pursued by, the Company; our ability to successfully integrate acquisitions or complete divestitures; risks related to competition in the mining industry; employee relations including loss of key employees; availability and increased costs associated with mining inputs and labor; risks associated with diseases, epidemics and pandemics, including the effects and potential effects of the global Covid-19 pandemic; risks related to the failure of internal controls; and risks related to the impairment of the Company’s goodwill and assets. Barrick also cautions that its 2023 guidance, as well as its ten-year production profile for gold and copper, may be impacted by the ongoing business and social disruption caused by the spread of Covid-19.
In addition, there are risks and hazards associated with the business of mineral exploration, development and mining, including environmental hazards, industrial accidents, unusual or unexpected formations, pressures, cave-ins, flooding and gold bullion, copper cathode or gold or copper concentrate losses (and the risk of inadequate insurance, or inability to obtain insurance, to cover these risks).
Many of these uncertainties and contingencies can affect our actual results and could cause actual results to differ materially from those expressed or implied in any forward-looking statements made by, or on behalf of, us. Readers are cautioned that forward-looking statements are not guarantees of future performance. All of the forward-looking statements made in this press release are qualified by these cautionary statements. Specific reference is made to the most recent Form 40-F/Annual Information Form on file with the SEC and Canadian provincial securities regulatory authorities for a more detailed discussion of some of the factors underlying forward-looking statements and the risks that may affect Barrick’s ability to achieve the expectations set forth in the forward-looking statements contained in this press release. We disclaim any intention or obligation to update or revise any forward-looking statements whether as a result of new information, future events or otherwise, except as required by applicable law.
| BARRICK SECOND QUARTER 2023 | 34 | PRESS RELEASE |
| BAP | Biodiversity Action Plans | ||||
| BLM | Bureau of Land Management | ||||
| BMSZ | Bambadji Main Shear Zone |
||||
| BNL | Barrick Niugini Limited | ||||
| CDCs | Community Development Committees | ||||
| CHUG | Cortez Hills Underground | ||||
| CIL | Carbon-in-leach | ||||
| Commencement Agreement | Detailed Porgera Project Commencement Agreement between PNG and BNL | ||||
| DRC | Democratic Republic of Congo | ||||
| DOI | Department of the Interior | ||||
| E&S Committee | Environmental and Social Oversight Committee | ||||
| ESG | Environmental, Social and Governance | ||||
| ESG & Nominating Committee | Environmental, Social, Governance & Nominating Committee | ||||
| ESIA | Environmental and Social Impact Assessment | ||||
| FEIS | Final Environmental Impact Statement | ||||
| GHG | Greenhouse Gas | ||||
| GISTM | Global Industry Standard for Tailings Management | ||||
| GoT | Government of Tanzania | ||||
| IASB | International Accounting Standards Board | ||||
| ICMM | International Council on Mining and Metals | ||||
| IFRS | International Financial Reporting Standards | ||||
| IRC | Internal Revenue Commission | ||||
| ISSB | International Sustainability Standards Board | ||||
| KCD | Karagba, Chauffeur and Durba | ||||
| Kumul Minerals | Kumul Minerals Holdings Limited | ||||
| LTI | Lost Time Injury | ||||
| LTIFR | Lost Time Injury Frequency Rate | ||||
| MRE | Mineral Resources Enga Limited | ||||
| MVA | Megavolt-amperes | ||||
| MW | Megawatt | ||||
| NOA | Notice of Availability | ||||
| NGM | Nevada Gold Mines | ||||
| NSR | Net Smelter Return | ||||
| OECD | Organisation for Economic Co-operation and Development | ||||
| PFS | Prefeasibility Study | ||||
| PNG | Papua New Guinea | ||||
| Randgold | Randgold Resources Limited | ||||
| RC | Reverse Circulation | ||||
| RIL | Resin-in-leach | ||||
| ROD | Record of Decision | ||||
| Roundtable | Environmental, Social and Governance Raters Roundtable | ||||
| SDG | Sustainable Development Goals |
||||
| SML | Special Mining Lease | ||||
| TCFD | Task Force for Climate-related Financial Disclosures | ||||
| TRIFR | Total Recordable Injury Frequency Rate | ||||
| TSF | Tailings Storage Facilities | ||||
| TW | True Width | ||||
| WGC | World Gold Council | ||||
| WTI | West Texas Intermediate | ||||
BARRICK SECOND QUARTER 2023 |
1 |
MANAGEMENT'S DISCUSSION AND ANALYSIS | ||||||
BARRICK SECOND QUARTER 2023 |
2 |
MANAGEMENT'S DISCUSSION AND ANALYSIS | ||||||
BARRICK SECOND QUARTER 2023 |
3 |
MANAGEMENT'S DISCUSSION AND ANALYSIS | ||||||
| Overview | ||||||||
| Financial and Operating Highlights | ||||||||
| Key Business Developments | ||||||||
| Environmental, Social and Governance | ||||||||
| Outlook | ||||||||
| Production and Cost Summary | ||||||||
| Operating Performance | ||||||||
| Nevada Gold Mines | ||||||||
| Carlin | ||||||||
| Cortez | ||||||||
| Turquoise Ridge | ||||||||
| Other Mines - Nevada Gold Mines | ||||||||
| Pueblo Viejo | ||||||||
| Loulo-Gounkoto | ||||||||
| Kibali | ||||||||
| North Mara | ||||||||
| Bulyanhulu | ||||||||
| Other Mines - Gold | ||||||||
| Lumwana | ||||||||
| Other Mines - Copper | ||||||||
| Growth Projects | ||||||||
| Exploration and Mineral Resource Management | ||||||||
| Review of Financial Results | ||||||||
| Revenue | ||||||||
| Production Costs | ||||||||
| Capital Expenditures | ||||||||
| General and Administrative Expenses | ||||||||
| Exploration, Evaluation and Project Expenses | ||||||||
| Finance Costs, Net | ||||||||
| Additional Significant Statement of Income Items | ||||||||
| Income Tax Expense | ||||||||
| Financial Condition Review | ||||||||
| Balance Sheet Review | ||||||||
| Shareholders’ Equity | ||||||||
| Financial Position and Liquidity | ||||||||
| Summary of Cash Inflow (Outflow) | ||||||||
| Commitments and Contingencies | ||||||||
| Review of Quarterly Results | ||||||||
| Internal Control over Financial Reporting and Disclosure Controls and Procedures |
||||||||
| IFRS Critical Accounting Policies and Accounting Estimates | ||||||||
| Non-GAAP Financial Measures | ||||||||
| Technical Information | ||||||||
| Endnotes | ||||||||
| Financial Statements | ||||||||
| Notes to Consolidated Financial Statements | ||||||||
BARRICK SECOND QUARTER 2023 |
4 |
MANAGEMENT'S DISCUSSION AND ANALYSIS | ||||||
| For the three months ended | For the six months ended | |||||||||||||||||||||||||||||||
| 6/30/23 | 3/31/23 | % Change | 6/30/22 | % Change | 6/30/23 | 6/30/22 | % Change | |||||||||||||||||||||||||
Financial Results ($ millions) |
||||||||||||||||||||||||||||||||
| Revenues | 2,833 | 2,643 | 7 | % | 2,859 | (1) | % | 5,476 | 5,712 | (4) | % | |||||||||||||||||||||
| Cost of sales | 1,937 | 1,941 | 0 | % | 1,850 | 5 | % | 3,878 | 3,589 | 8 | % | |||||||||||||||||||||
Net earningsa |
305 | 120 | 154 | % | 488 | (38) | % | 425 | 926 | (54) | % | |||||||||||||||||||||
Adjusted net earningsb |
336 | 247 | 36 | % | 419 | (20) | % | 583 | 882 | (34) | % | |||||||||||||||||||||
Adjusted EBITDAb |
1,368 | 1,183 | 16 | % | 1,527 | (10) | % | 2,551 | 3,172 | (20) | % | |||||||||||||||||||||
Adjusted EBITDA marginc |
48 | % | 45 | % | 7 | % | 53 | % | (9) | % | 47 | % | 56 | % | (16) | % | ||||||||||||||||
Minesite sustaining capital expendituresb,d |
524 | 454 | 15 | % | 523 | 0 | % | 978 | 943 | 4 | % | |||||||||||||||||||||
Project capital expendituresb,d |
238 | 226 | 5 | % | 226 | 5 | % | 464 | 412 | 13 | % | |||||||||||||||||||||
Total consolidated capital expendituresd,e |
769 | 688 | 12 | % | 755 | 2 | % | 1,457 | 1,366 | 7 | % | |||||||||||||||||||||
| Net cash provided by operating activities | 832 | 776 | 7 | % | 924 | (10) | % | 1,608 | 1,928 | (17) | % | |||||||||||||||||||||
Net cash provided by operating activities marginf |
29 | % | 29 | % | 0 | % | 32 | % | (9) | % | 29 | % | 34 | % | (15) | % | ||||||||||||||||
Free cash flowb |
63 | 88 | (28) | % | 169 | (63) | % | 151 | 562 | (73) | % | |||||||||||||||||||||
| Net earnings per share (basic and diluted) | 0.17 | 0.07 | 143 | % | 0.27 | (37) | % | 0.24 | 0.52 | (54) | % | |||||||||||||||||||||
Adjusted net earnings (basic)b per share |
0.19 | 0.14 | 36 | % | 0.24 | (21) | % | 0.33 | 0.50 | (34) | % | |||||||||||||||||||||
| Weighted average diluted common shares (millions of shares) | 1,755 | 1,755 | 0 | % | 1,777 | (1) | % | 1,755 | 1,778 | (1) | % | |||||||||||||||||||||
| Operating Results | ||||||||||||||||||||||||||||||||
Gold production (thousands of ounces)g |
1,009 | 952 | 6 | % | 1,043 | (3) | % | 1,961 | 2,033 | (4) | % | |||||||||||||||||||||
Gold sold (thousands of ounces)g |
1,001 | 954 | 5 | % | 1,040 | (4) | % | 1,955 | 2,033 | (4) | % | |||||||||||||||||||||
| Market gold price ($/oz) | 1,976 | 1,890 | 5 | % | 1,871 | 6 | % | 1,932 | 1,874 | 3 | % | |||||||||||||||||||||
Realized gold priceb,g ($/oz) |
1,972 | 1,902 | 4 | % | 1,861 | 6 | % | 1,938 | 1,868 | 4 | % | |||||||||||||||||||||
Gold cost of sales (Barrick’s share)g,h ($/oz) |
1,323 | 1,378 | (4) | % | 1,216 | 9 | % | 1,350 | 1,203 | 12 | % | |||||||||||||||||||||
Gold total cash costsb,g ($/oz) |
963 | 986 | (2) | % | 855 | 13 | % | 974 | 844 | 15 | % | |||||||||||||||||||||
Gold all-in sustaining costsb,g ($/oz) |
1,355 | 1,370 | (1) | % | 1,212 | 12 | % | 1,362 | 1,188 | 15 | % | |||||||||||||||||||||
Copper production (millions of pounds)g |
107 | 88 | 22 | % | 120 | (11) | % | 195 | 221 | (12) | % | |||||||||||||||||||||
Copper sold (millions of pounds)g |
101 | 89 | 13 | % | 113 | (11) | % | 190 | 226 | (16) | % | |||||||||||||||||||||
| Market copper price ($/lb) | 3.84 | 4.05 | (5) | % | 4.32 | (11) | % | 3.95 | 4.43 | (11) | % | |||||||||||||||||||||
Realized copper priceb,g ($/lb) |
3.70 | 4.20 | (12) | % | 3.72 | (1) | % | 3.93 | 4.20 | (6) | % | |||||||||||||||||||||
Copper cost of sales (Barrick’s share)g,i ($/lb) |
2.84 | 3.22 | (12) | % | 2.11 | 35 | % | 3.02 | 2.16 | 40 | % | |||||||||||||||||||||
Copper C1 cash costsb,g ($/lb) |
2.28 | 2.71 | (16) | % | 1.70 | 34 | % | 2.48 | 1.75 | 42 | % | |||||||||||||||||||||
Copper all-in sustaining costsb,g ($/lb) |
3.13 | 3.40 | (8) | % | 2.87 | 9 | % | 3.26 | 2.86 | 14 | % | |||||||||||||||||||||
| As at 6/30/23 | As at 3/31/23 | % Change | As at 6/30/22 | % Change | ||||||||||||||||||||||||||||
Financial Position ($ millions) |
||||||||||||||||||||||||||||||||
| Debt (current and long-term) | 4,774 | 4,777 | 0 | % | 5,144 | (7) | % | |||||||||||||||||||||||||
| Cash and equivalents | 4,157 | 4,377 | (5) | % | 5,780 | (28) | % | |||||||||||||||||||||||||
| Debt, net of cash | 617 | 400 | 54 | % | (636) | 197 | % | |||||||||||||||||||||||||
BARRICK SECOND QUARTER 2023 |
5 |
MANAGEMENT'S DISCUSSION AND ANALYSIS | ||||||
GOLD PRODUCTIONa (thousands of ounces) |
COPPER PRODUCTIONa (millions of pounds) |
||||
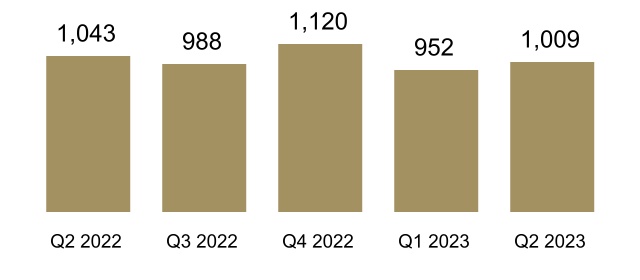
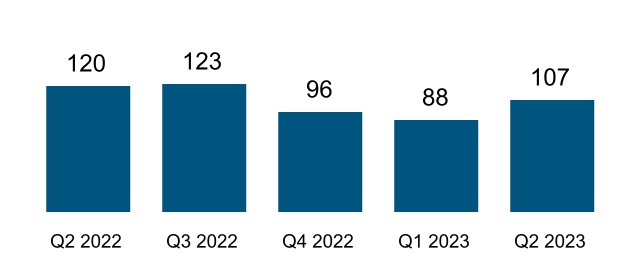
GOLD COST OF SALESb, TOTAL CASH COSTSc, |
COPPER COST OF SALESb, C1 CASH COSTSc, |
||||
AND ALL-IN SUSTAINING COSTSc ($ per ounce) |
AND ALL-IN SUSTAINING COSTSc ($ per pound) |
||||
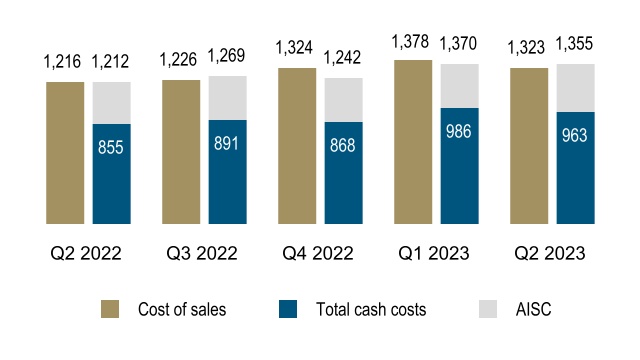
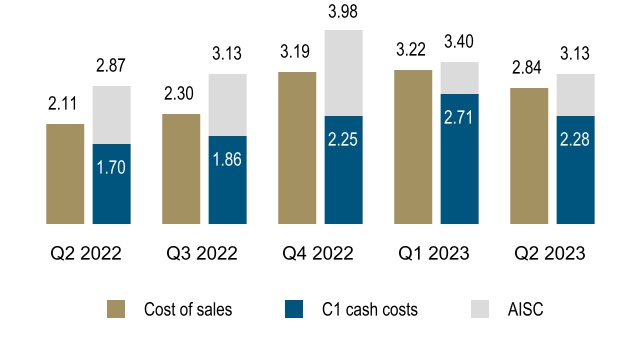
NET EARNINGS, ADJUSTED EBITDAc AND |
ATTRIBUTABLE CAPITAL EXPENDITURESe
|
||||
ADJUSTED EBITDA MARGINd |
($ millions) | ||||
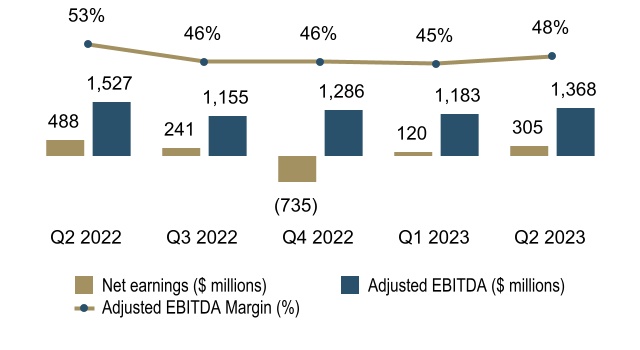
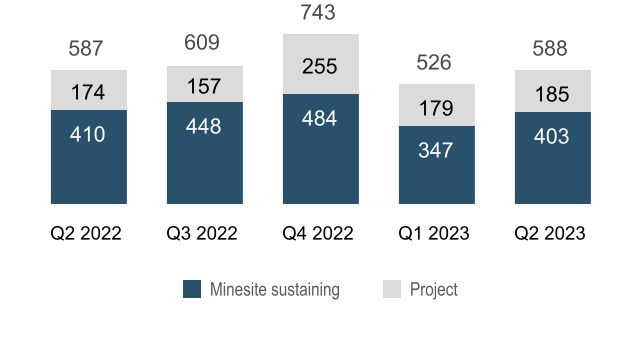
OPERATING CASH FLOW AND FREE CASH FLOWc |
DIVIDENDSf (cents per share) |
||||
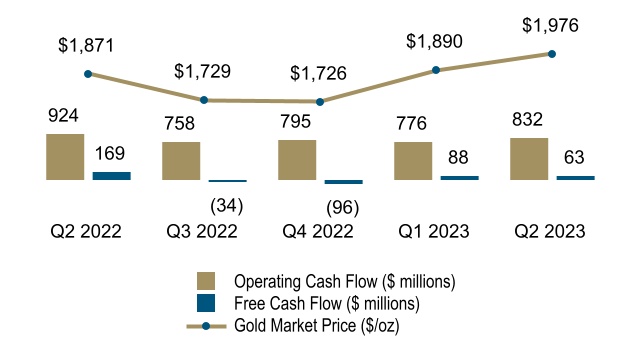
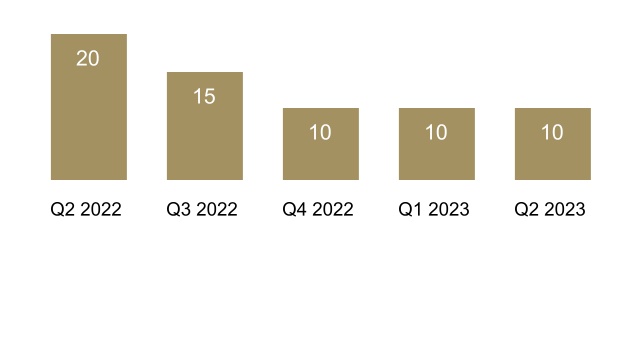
BARRICK SECOND QUARTER 2023 |
6 |
MANAGEMENT'S DISCUSSION AND ANALYSIS | ||||||
BARRICK SECOND QUARTER 2023 |
7 |
MANAGEMENT'S DISCUSSION AND ANALYSIS | ||||||
BARRICK SECOND QUARTER 2023 |
8 |
MANAGEMENT'S DISCUSSION AND ANALYSIS | ||||||
BARRICK SECOND QUARTER 2023 |
9 |
MANAGEMENT'S DISCUSSION AND ANALYSIS | ||||||
BARRICK SECOND QUARTER 2023 |
10 |
MANAGEMENT'S DISCUSSION AND ANALYSIS | ||||||
BARRICK SECOND QUARTER 2023 |
11 |
MANAGEMENT'S DISCUSSION AND ANALYSIS | ||||||
BARRICK SECOND QUARTER 2023 |
12 |
MANAGEMENT'S DISCUSSION AND ANALYSIS | ||||||
|
Company Guidance
($ millions, except per ounce/pound data)
|
2023 Estimate |
||||
| Gold production (millions of ounces) | 4.20 - 4.60 | ||||
| Gold cost metrics | |||||
| Cost of sales - gold ($/oz) | 1,170 - 1,250 | ||||
Total cash costs ($/oz)a |
820 - 880 | ||||
| Depreciation ($/oz) | 320 - 350 | ||||
All-in sustaining costs ($/oz)a |
1,170 - 1,250 | ||||
| Copper production (millions of pounds) | 420 - 470 | ||||
| Copper cost metrics | |||||
| Cost of sales - copper ($/lb) | 2.60 - 2.90 | ||||
C1 cash costs ($/lb)a |
2.05 - 2.25 | ||||
| Depreciation ($/lb) | 0.80 - 0.90 | ||||
All-in sustaining costs ($/lb)a |
2.95 - 3.25 | ||||
| Exploration and project expenses | 400 - 440 | ||||
| Exploration and evaluation | 180 - 200 | ||||
| Project expenses | 220 - 240 | ||||
| General and administrative expenses | ~180 | ||||
| Corporate administration | ~130 | ||||
Share-based compensationb |
~50 | ||||
| Other expense | 70 - 90 | ||||
| Finance costs, net | 280 - 320 | ||||
| Attributable capital expenditures: | |||||
Attributable minesite sustaininga |
1,450 - 1,700 | ||||
Attributable projecta |
750 - 900 | ||||
| Total attributable capital expenditures | 2,200 - 2,600 | ||||
Effective income tax ratec |
27% - 32% | ||||
| Key assumptions (used for guidance) | |||||
| Gold Price ($/oz) | 1,650 | ||||
| Copper Price ($/lb) | 3.50 | ||||
| Oil Price (WTI) ($/barrel) | 90 | ||||
| AUD Exchange Rate (AUD:USD) | 0.75 | ||||
| ARS Exchange Rate (USD:ARS) | 170 | ||||
| CAD Exchange Rate (USD:CAD) | 1.30 | ||||
| CLP Exchange Rate (USD:CLP) | 900 | ||||
| EUR Exchange Rate (EUR:USD) | 1.20 | ||||
BARRICK SECOND QUARTER 2023 |
13 |
MANAGEMENT'S DISCUSSION AND ANALYSIS | ||||||
| Operating Division | 2023 forecast attributable production (000s ozs) | 2023 forecast cost of salesa ($/oz) |
2023 forecast total cash costsb ($/oz) |
2023 forecast all-in sustaining costsb ($/oz) |
||||||||||
| Gold | ||||||||||||||
| Carlin (61.5%) | 910 - 1,000 | 1,030 - 1,110 | 820 - 880 | 1,250 - 1,330 | ||||||||||
Cortez (61.5%)c |
580 - 650 | 1,080 - 1,160 | 680 - 740 | 930 - 1,010 | ||||||||||
Turquoise Ridge (61.5%) |
300 - 340 | 1,290 - 1,370 | 900 - 960 | 1,170 - 1,250 | ||||||||||
| Phoenix (61.5%) | 100 - 120 | 1,860 - 1,940 | 880 - 940 | 1,110 - 1,190 | ||||||||||
Long Canyon (61.5%) |
0 - 10 | 2,120 - 2,200 | 730 - 790 | 1,080 - 1,160 | ||||||||||
Nevada Gold Mines (61.5%) |
1,900 - 2,100 | 1,140 - 1,220 | 790 - 850 | 1,140 - 1,220 | ||||||||||
Hemlo |
150 - 170 | 1,400 - 1,480 | 1,210 - 1,270 | 1,590 - 1,670 | ||||||||||
| North America | 2,100 - 2,300 | 1,160 - 1,240 | 820 - 880 | 1,170 - 1,250 | ||||||||||
Pueblo Viejo (60%) |
470 - 520 | 1,130 - 1,210 | 710 - 770 | 960 - 1,040 | ||||||||||
Veladero (50%) |
160 - 180 | 1,630 - 1,710 | 1,060 - 1,120 | 1,550 - 1,630 | ||||||||||
Porgera (47.5%)d |
— | — | — | — | ||||||||||
| Latin America & Asia Pacific | 630 - 700 | 1,260 - 1,340 | 800 - 860 | 1,110 - 1,190 | ||||||||||
Loulo-Gounkoto (80%) |
510 - 560 | 1,100 - 1,180 | 750 - 810 | 1,070 - 1,150 | ||||||||||
Kibali (45%) |
320 - 360 | 1,080 - 1,160 | 710 - 770 | 880 - 960 | ||||||||||
| North Mara (84%) | 230 - 260 | 1,120 - 1,200 | 900 - 960 | 1,240 - 1,320 | ||||||||||
| Bulyanhulu (84%) | 160 - 190 | 1,230 - 1,310 | 880 - 940 | 1,160 - 1,240 | ||||||||||
| Tongon (89.7%) | 180 - 210 | 1,260 - 1,340 | 1,070 - 1,130 | 1,240 - 1,320 | ||||||||||
| Africa & Middle East | 1,450 - 1,600 | 1,130 - 1,210 | 820 - 880 | 1,080 - 1,160 | ||||||||||
Total Attributable to Barricke,f,g |
4,200 - 4,600 | 1,170 - 1,250 | 820 - 880 | 1,170 - 1,250 | ||||||||||
2023 forecast attributable production (M lbs) |
2023 forecast cost of salesa ($/lb) |
2023 forecast C1 cash costsb ($/lb) |
2023 forecast all-in sustaining costsb ($/lb) |
|||||||||||
| Copper | ||||||||||||||
| Lumwana | 260 - 290 | 2.45 - 2.75 | 2.00 - 2.20 | 3.20 - 3.50 | ||||||||||
| Zaldívar (50%) | 100 - 110 | 3.40 - 3.70 | 2.60 - 2.80 | 2.90 - 3.20 | ||||||||||
| Jabal Sayid (50%) | 65 - 75 | 1.80 - 2.10 | 1.50 - 1.70 | 1.60 - 1.90 | ||||||||||
Total Copperg |
420 - 470 | 2.60 - 2.90 | 2.05 - 2.25 | 2.95 - 3.25 | ||||||||||
BARRICK SECOND QUARTER 2023 |
14 |
MANAGEMENT'S DISCUSSION AND ANALYSIS | ||||||
| For the three months ended | ||||||||||||||||||||
| 6/30/23 | 3/31/23 | % Change | 6/30/22 | % Change | ||||||||||||||||
Nevada Gold Mines LLC (61.5%)a |
||||||||||||||||||||
| Gold produced (000s oz) | 458 | 416 | 10 | % | 462 | (1) | % | |||||||||||||
| Cost of sales ($/oz) | 1,357 | 1,461 | (7) | % | 1,171 | 16 | % | |||||||||||||
Total cash costs ($/oz)b |
1,009 | 1,074 | (6) | % | 856 | 18 | % | |||||||||||||
All-in sustaining costs ($/oz)b |
1,388 | 1,436 | (3) | % | 1,238 | 12 | % | |||||||||||||
| Carlin (61.5%) | ||||||||||||||||||||
| Gold produced (000s oz) | 248 | 166 | 49 | % | 243 | 2 | % | |||||||||||||
| Cost of sales ($/oz) | 1,240 | 1,449 | (14) | % | 1,042 | 19 | % | |||||||||||||
Total cash costs ($/oz)b |
1,013 | 1,215 | (17) | % | 862 | 18 | % | |||||||||||||
All-in sustaining costs ($/oz)b |
1,407 | 1,689 | (17) | % | 1,192 | 18 | % | |||||||||||||
Cortez (61.5%)c |
||||||||||||||||||||
| Gold produced (000s oz) | 110 | 140 | (21) | % | 97 | 13 | % | |||||||||||||
| Cost of sales ($/oz) | 1,346 | 1,324 | 2 | % | 1,168 | 15 | % | |||||||||||||
Total cash costs ($/oz)b |
972 | 913 | 6 | % | 850 | 14 | % | |||||||||||||
All-in sustaining costs ($/oz)b |
1,453 | 1,233 | 18 | % | 1,538 | (6) | % | |||||||||||||
| Turquoise Ridge (61.5%) | ||||||||||||||||||||
| Gold produced (000s oz) | 68 | 81 | (16) | % | 75 | (9) | % | |||||||||||||
| Cost of sales ($/oz) | 1,466 | 1,412 | 4 | % | 1,289 | 14 | % | |||||||||||||
Total cash costs ($/oz)b |
1,088 | 1,034 | 5 | % | 928 | 17 | % | |||||||||||||
All-in sustaining costs ($/oz)b |
1,302 | 1,271 | 2 | % | 1,195 | 9 | % | |||||||||||||
| Phoenix (61.5%) | ||||||||||||||||||||
| Gold produced (000s oz) | 29 | 27 | 7 | % | 26 | 12 | % | |||||||||||||
| Cost of sales ($/oz) | 2,075 | 2,380 | (13) | % | 2,114 | (2) | % | |||||||||||||
Total cash costs ($/oz)b |
948 | 1,198 | (21) | % | 895 | 6 | % | |||||||||||||
All-in sustaining costs ($/oz)b |
1,132 | 1,365 | (17) | % | 1,152 | (2) | % | |||||||||||||
| Long Canyon (61.5%) | ||||||||||||||||||||
| Gold produced (000s oz) | 3 | 2 | 50 | % | 21 | (86) | % | |||||||||||||
| Cost of sales ($/oz) | 1,640 | 1,621 | 1 | % | 1,280 | 28 | % | |||||||||||||
Total cash costs ($/oz)b |
637 | 579 | 10 | % | 450 | 42 | % | |||||||||||||
All-in sustaining costs ($/oz)b |
677 | 629 | 8 | % | 459 | 47 | % | |||||||||||||
| Pueblo Viejo (60%) | ||||||||||||||||||||
| Gold produced (000s oz) | 77 | 89 | (13) | % | 105 | (27) | % | |||||||||||||
| Cost of sales ($/oz) | 1,344 | 1,241 | 8 | % | 1,154 | 16 | % | |||||||||||||
Total cash costs ($/oz)b |
840 | 714 | 18 | % | 724 | 16 | % | |||||||||||||
All-in sustaining costs ($/oz)b |
1,219 | 1,073 | 14 | % | 1,024 | 19 | % | |||||||||||||
| Loulo-Gounkoto (80%) | ||||||||||||||||||||
| Gold produced (000s oz) | 141 | 137 | 3 | % | 140 | 1 | % | |||||||||||||
| Cost of sales ($/oz) | 1,150 | 1,275 | (10) | % | 1,093 | 5 | % | |||||||||||||
Total cash costs ($/oz)b |
801 | 855 | (6) | % | 730 | 10 | % | |||||||||||||
All-in sustaining costs ($/oz)b |
1,245 | 1,190 | 5 | % | 1,013 | 23 | % | |||||||||||||
| Kibali (45%) | ||||||||||||||||||||
| Gold produced (000s oz) | 87 | 64 | 36 | % | 81 | 7 | % | |||||||||||||
| Cost of sales ($/oz) | 1,269 | 1,367 | (7) | % | 1,164 | 9 | % | |||||||||||||
Total cash costs ($/oz)b |
797 | 987 | (19) | % | 738 | 8 | % | |||||||||||||
All-in sustaining costs ($/oz)b |
955 | 1,177 | (19) | % | 946 | 1 | % | |||||||||||||
| Veladero (50%) | ||||||||||||||||||||
| Gold produced (000s oz) | 54 | 43 | 26 | % | 58 | (7) | % | |||||||||||||
| Cost of sales ($/oz) | 1,424 | 1,587 | (10) | % | 1,369 | 4 | % | |||||||||||||
Total cash costs ($/oz)b |
999 | 1,035 | (3) | % | 861 | 16 | % | |||||||||||||
All-in sustaining costs ($/oz)b |
1,599 | 1,761 | (9) | % | 1,461 | 9 | % | |||||||||||||
Porgera (47.5%)d |
||||||||||||||||||||
| Gold produced (000s oz) | — | — | — | % | — | — | % | |||||||||||||
| Cost of sales ($/oz) | — | — | — | % | — | — | % | |||||||||||||
Total cash costs ($/oz)b |
— | — | — | % | — | — | % | |||||||||||||
All-in sustaining costs ($/oz)b |
— | — | — | % | — | — | % | |||||||||||||
BARRICK SECOND QUARTER 2023 |
15 |
MANAGEMENT'S DISCUSSION AND ANALYSIS | ||||||
| For the three months ended | ||||||||||||||||||||
| 6/30/23 | 3/31/23 | % Change | 6/30/22 | % Change | ||||||||||||||||
| Tongon (89.7%) | ||||||||||||||||||||
| Gold produced (000s oz) | 44 | 50 | (12) | % | 41 | 7 | % | |||||||||||||
| Cost of sales ($/oz) | 1,514 | 1,453 | 4 | % | 2,025 | (25) | % | |||||||||||||
Total cash costs ($/oz)b |
1,380 | 1,182 | 17 | % | 1,558 | (11) | % | |||||||||||||
All-in sustaining costs ($/oz)b |
1,465 | 1,284 | 14 | % | 1,655 | (11) | % | |||||||||||||
| Hemlo | ||||||||||||||||||||
| Gold produced (000s oz) | 35 | 41 | (15) | % | 36 | (3) | % | |||||||||||||
| Cost of sales ($/oz) | 1,562 | 1,486 | 5 | % | 1,698 | (8) | % | |||||||||||||
Total cash costs ($/oz)b |
1,356 | 1,291 | 5 | % | 1,489 | (9) | % | |||||||||||||
All-in sustaining costs ($/oz)b |
1,634 | 1,609 | 2 | % | 1,804 | (9) | % | |||||||||||||
| North Mara (84%) | ||||||||||||||||||||
| Gold produced (000s oz) | 64 | 68 | (6) | % | 66 | (3) | % | |||||||||||||
| Cost of sales ($/oz) | 1,208 | 987 | 22 | % | 1,060 | 14 | % | |||||||||||||
Total cash costs ($/oz)b |
942 | 759 | 24 | % | 756 | 25 | % | |||||||||||||
All-in sustaining costs ($/oz)b |
1,355 | 1,137 | 19 | % | 957 | 42 | % | |||||||||||||
| Bulyanhulu (84%) | ||||||||||||||||||||
| Gold produced (000s oz) | 49 | 44 | 11 | % | 54 | (9) | % | |||||||||||||
| Cost of sales ($/oz) | 1,231 | 1,358 | (9) | % | 1,163 | 6 | % | |||||||||||||
Total cash costs ($/oz)b |
850 | 982 | (13) | % | 836 | 2 | % | |||||||||||||
All-in sustaining costs ($/oz)b |
1,105 | 1,332 | (17) | % | 1,094 | 1 | % | |||||||||||||
Total Attributable to Barricke |
||||||||||||||||||||
| Gold produced (000s oz) | 1,009 | 952 | 6 | % | 1,043 | (3) | % | |||||||||||||
Cost of sales ($/oz)f |
1,323 | 1,378 | (4) | % | 1,216 | 9 | % | |||||||||||||
Total cash costs ($/oz)b |
963 | 986 | (2) | % | 855 | 13 | % | |||||||||||||
All-in sustaining costs ($/oz)b |
1,355 | 1,370 | (1) | % | 1,212 | 12 | % | |||||||||||||
BARRICK SECOND QUARTER 2023 |
16 |
MANAGEMENT'S DISCUSSION AND ANALYSIS | ||||||
| For the three months ended | ||||||||||||||||||||
| 6/30/23 | 3/31/23 | % Change | 6/30/22 | % Change | ||||||||||||||||
| Lumwana | ||||||||||||||||||||
| Copper production (millions lbs) | 67 | 48 | 40 | % | 75 | (11) | % | |||||||||||||
| Cost of sales ($/lb) | 2.80 | 3.56 | (21) | % | 2.01 | 39 | % | |||||||||||||
C1 cash costs ($/lb)a |
2.30 | 3.09 | (26) | % | 1.68 | 37 | % | |||||||||||||
All-in sustaining costs ($/lb)a |
3.29 | 3.98 | (17) | % | 3.28 | 0 | % | |||||||||||||
Zaldívar (50%) |
||||||||||||||||||||
| Copper production (millions lbs) | 22 | 22 | 0 | % | 25 | (12) | % | |||||||||||||
| Cost of sales ($/lb) | 3.89 | 3.73 | 4 | % | 2.88 | 35 | % | |||||||||||||
C1 cash costs ($/lb)a |
3.02 | 2.86 | 6 | % | 2.17 | 39 | % | |||||||||||||
All-in sustaining costs ($/lb)a |
3.73 | 3.22 | 16 | % | 2.65 | 41 | % | |||||||||||||
| Jabal Sayid (50%) | ||||||||||||||||||||
| Copper production (millions lbs) | 18 | 18 | 0 | % | 20 | (10) | % | |||||||||||||
| Cost of sales ($/lb) | 1.61 | 1.53 | 5 | % | 1.45 | 11 | % | |||||||||||||
C1 cash costs ($/lb)a |
1.26 | 1.39 | (9) | % | 1.09 | 16 | % | |||||||||||||
All-in sustaining costs ($/lb)a |
1.42 | 1.61 | (12) | % | 1.19 | 19 | % | |||||||||||||
| Total Copper | ||||||||||||||||||||
| Copper production (millions lbs) | 107 | 88 | 22 | % | 120 | (11) | % | |||||||||||||
Cost of sales ($/lb)b |
2.84 | 3.22 | (12) | % | 2.11 | 35 | % | |||||||||||||
C1 cash costs ($/lb)a |
2.28 | 2.71 | (16) | % | 1.70 | 34 | % | |||||||||||||
All-in sustaining costs ($/lb)a |
3.13 | 3.40 | (8) | % | 2.87 | 9 | % | |||||||||||||
BARRICK SECOND QUARTER 2023 |
17 |
MANAGEMENT'S DISCUSSION AND ANALYSIS | ||||||
| For the three months ended | For the six months ended | |||||||||||||||||||||||||||||||
| 6/30/23 | 3/31/23 | % Change | 6/30/22 | % Change | 6/30/23 | 6/30/22 | % Change | |||||||||||||||||||||||||
| Total tonnes mined (000s) | 45,386 | 36,501 | 24 | % | 45,274 | 0 | % | 81,887 | 90,705 | (10) | % | |||||||||||||||||||||
| Open pit ore | 8,311 | 5,682 | 46 | % | 4,877 | 70 | % | 13,993 | 10,983 | 27 | % | |||||||||||||||||||||
| Open pit waste | 35,741 | 29,572 | 21 | % | 38,972 | (8) | % | 65,313 | 76,972 | (15) | % | |||||||||||||||||||||
| Underground | 1,334 | 1,247 | 7 | % | 1,425 | (6) | % | 2,581 | 2,750 | (6) | % | |||||||||||||||||||||
| Average grade (grams/tonne) | ||||||||||||||||||||||||||||||||
| Open pit mined | 1.20 | 1.16 | 3 | % | 0.93 | 29 | % | 1.19 | 0.83 | 43 | % | |||||||||||||||||||||
| Underground mined | 8.75 | 8.57 | 2 | % | 9.17 | (5) | % | 8.67 | 8.99 | (4) | % | |||||||||||||||||||||
| Processed | 2.17 | 2.37 | (8) | % | 2.23 | (3) | % | 2.24 | 2.10 | 7 | % | |||||||||||||||||||||
| Ore tonnes processed (000s) | 9,054 | 7,367 | 23 | % | 8,152 | 11 | % | 16,421 | 17,227 | (5) | % | |||||||||||||||||||||
| Oxide mill | 2,385 | 2,725 | (12) | % | 3,027 | (21) | % | 5,110 | 5,981 | (15) | % | |||||||||||||||||||||
| Roaster | 1,199 | 1,005 | 19 | % | 1,339 | (10) | % | 2,204 | 2,733 | (19) | % | |||||||||||||||||||||
| Autoclave | 808 | 716 | 13 | % | 1,188 | (32) | % | 1,524 | 2,174 | (30) | % | |||||||||||||||||||||
| Heap leach | 4,662 | 2,921 | 60 | % | 2,598 | 79 | % | 7,583 | 6,339 | 20 | % | |||||||||||||||||||||
Recovery rateb |
83 | % | 82 | % | 1 | % | 77 | % | 8 | % | 83 | % | 77 | % | 8 | % | ||||||||||||||||
Oxide Millb |
77 | % | 76 | % | 1 | % | 69 | % | 12 | % | 77 | % | 70 | % | 10 | % | ||||||||||||||||
| Roaster | 86 | % | 85 | % | 1 | % | 85 | % | 1 | % | 86 | % | 85 | % | 1 | % | ||||||||||||||||
| Autoclave | 81 | % | 81 | % | 0 | % | 64 | % | 27 | % | 81 | % | 65 | % | 25 | % | ||||||||||||||||
| Gold produced (000s oz) | 458 | 416 | 10 | % | 462 | (1) | % | 874 | 921 | (5) | % | |||||||||||||||||||||
| Oxide mill | 86 | 103 | (17) | % | 74 | 16 | % | 189 | 144 | 31 | % | |||||||||||||||||||||
| Roaster | 247 | 182 | 36 | % | 239 | 3 | % | 429 | 471 | (9) | % | |||||||||||||||||||||
| Autoclave | 90 | 82 | 10 | % | 93 | (3) | % | 172 | 180 | (4) | % | |||||||||||||||||||||
| Heap leach | 35 | 49 | (29) | % | 56 | (38) | % | 84 | 126 | (33) | % | |||||||||||||||||||||
| Gold sold (000s oz) | 458 | 411 | 11 | % | 463 | (1) | % | 869 | 921 | (6) | % | |||||||||||||||||||||
| Revenue ($ millions) | 922 | 807 | 14 | % | 878 | 5 | % | 1,729 | 1,766 | (2) | % | |||||||||||||||||||||
| Cost of sales ($ millions) | 624 | 606 | 3 | % | 564 | 11 | % | 1,230 | 1,099 | 12 | % | |||||||||||||||||||||
| Income ($ millions) | 287 | 189 | 52 | % | 302 | (5) | % | 476 | 665 | (28) | % | |||||||||||||||||||||
EBITDA ($ millions)c |
425 | 329 | 29 | % | 435 | (2) | % | 754 | 937 | (20) | % | |||||||||||||||||||||
EBITDA margind |
46 | % | 41 | % | 12 | % | 50 | % | (8) | % | 44 | % | 53 | % | (17) | % | ||||||||||||||||
| Capital expenditures ($ millions) | 208 | 169 | 23 | % | 187 | 11 | % | 377 | 347 | 9 | % | |||||||||||||||||||||
Minesite sustainingc |
162 | 137 | 18 | % | 163 | (1) | % | 299 | 293 | 2 | % | |||||||||||||||||||||
Projectc |
46 | 32 | 44 | % | 24 | 92 | % | 78 | 54 | 44 | % | |||||||||||||||||||||
| Cost of sales ($/oz) | 1,357 | 1,461 | (7) | % | 1,171 | 16 | % | 1,406 | 1,170 | 20 | % | |||||||||||||||||||||
Total cash costs ($/oz)c |
1,009 | 1,074 | (6) | % | 856 | 18 | % | 1,040 | 838 | 24 | % | |||||||||||||||||||||
All-in sustaining costs ($/oz)c |
1,388 | 1,436 | (3) | % | 1,238 | 12 | % | 1,411 | 1,178 | 20 | % | |||||||||||||||||||||
All-in costs ($/oz)c |
1,489 | 1,514 | (2 | %) | 1,288 | 16 | % | 1,501 | 1,237 | 21 | % | |||||||||||||||||||||
BARRICK SECOND QUARTER 2023 |
18 |
MANAGEMENT'S DISCUSSION AND ANALYSIS | ||||||
| For the three months ended | For the six months ended | |||||||||||||||||||||||||||||||
| 6/30/23 | 3/31/23 | % Change | 6/30/22 | % Change | 6/30/23 | 6/30/22 | % Change | |||||||||||||||||||||||||
| Total tonnes mined (000s) | 18,690 | 14,357 | 30 | % | 19,917 | (6) | % | 33,047 | 38,551 | (14) | % | |||||||||||||||||||||
| Open pit ore | 1,641 | 1,087 | 51 | % | 1,507 | 9 | % | 2,728 | 2,464 | 11 | % | |||||||||||||||||||||
| Open pit waste | 16,290 | 12,554 | 30 | % | 17,535 | (7) | % | 28,844 | 34,376 | (16) | % | |||||||||||||||||||||
| Underground | 759 | 716 | 6 | % | 875 | (13) | % | 1,475 | 1,711 | (14) | % | |||||||||||||||||||||
| Average grade (grams/tonne) | ||||||||||||||||||||||||||||||||
| Open pit mined | 2.80 | 2.47 | 13 | % | 1.43 | 96 | % | 2.67 | 1.25 | 114 | % | |||||||||||||||||||||
| Underground mined | 7.76 | 7.73 | 0 | % | 8.35 | (7) | % | 7.74 | 8.11 | (5) | % | |||||||||||||||||||||
| Processed | 4.55 | 4.12 | 10 | % | 3.41 | 33 | % | 4.36 | 3.40 | 28 | % | |||||||||||||||||||||
| Ore tonnes processed (000s) | 2,072 | 1,637 | 27 | % | 3,113 | (33) | % | 3,709 | 6,086 | (39) | % | |||||||||||||||||||||
| Oxide mill | 0 | 377 | (100) | % | 620 | (100) | % | 377 | 1,213 | (69) | % | |||||||||||||||||||||
| Roasters | 1,047 | 852 | 23 | % | 1,119 | (6) | % | 1,899 | 2,241 | (15) | % | |||||||||||||||||||||
| Autoclave | 384 | 88 | 336 | % | 577 | (33) | % | 472 | 1,117 | (58) | % | |||||||||||||||||||||
| Heap leach | 641 | 320 | 100 | % | 797 | (20) | % | 961 | 1,515 | (37) | % | |||||||||||||||||||||
Recovery ratea |
84 | % | 84 | % | 0 | % | 75 | % | 12 | % | 84 | % | 76 | % | 11 | % | ||||||||||||||||
| Roasters | 86 | % | 85 | % | 1 | % | 85 | % | 1 | % | 85 | % | 85 | % | 0 | % | ||||||||||||||||
| Autoclave | 69 | % | 72 | % | (4) | % | 39 | % | 77 | % | 70 | % | 42 | % | 67 | % | ||||||||||||||||
| Gold produced (000s oz) | 248 | 166 | 49 | % | 243 | 2 | % | 414 | 472 | (12) | % | |||||||||||||||||||||
| Oxide mill | 0 | 4 | (100) | % | 13 | (100) | % | 4 | 22 | (82) | % | |||||||||||||||||||||
| Roasters | 213 | 151 | 41 | % | 192 | 11 | % | 364 | 375 | (3) | % | |||||||||||||||||||||
| Autoclave | 26 | 5 | 420 | % | 23 | 13 | % | 31 | 48 | (35) | % | |||||||||||||||||||||
| Heap leach | 9 | 6 | 50 | % | 15 | (40) | % | 15 | 27 | (44) | % | |||||||||||||||||||||
| Gold sold (000s oz) | 243 | 164 | 48 | % | 246 | (1) | % | 407 | 476 | (14) | % | |||||||||||||||||||||
| Revenue ($ millions) | 479 | 314 | 53 | % | 460 | 4 | % | 793 | 895 | (11) | % | |||||||||||||||||||||
| Cost of sales ($ millions) | 304 | 242 | 26 | % | 279 | 9 | % | 546 | 511 | 7 | % | |||||||||||||||||||||
| Income ($ millions) | 169 | 66 | 156 | % | 176 | (4) | % | 235 | 391 | (40) | % | |||||||||||||||||||||
EBITDA ($ millions)b |
225 | 105 | 114 | % | 226 | 0 | % | 330 | 483 | (32) | % | |||||||||||||||||||||
EBITDA marginc |
47 | % | 33 | % | 42 | % | 49 | % | (4) | % | 42 | % | 54 | % | (22) | % | ||||||||||||||||
| Capital expenditures ($ millions) | 90 | 72 | 25 | % | 76 | 18 | % | 162 | 145 | 12 | % | |||||||||||||||||||||
Minesite sustainingb |
90 | 72 | 25 | % | 76 | 18 | % | 162 | 145 | 12 | % | |||||||||||||||||||||
Projectb |
0 | 0 | 0 | % | 0 | 0 | % | 0 | 0 | 0 | % | |||||||||||||||||||||
| Cost of sales ($/oz) | 1,240 | 1,449 | (14) | % | 1,042 | 19 | % | 1,325 | 1,029 | 29 | % | |||||||||||||||||||||
Total cash costs ($/oz)b |
1,013 | 1,215 | (17) | % | 862 | 18 | % | 1,094 | 846 | 29 | % | |||||||||||||||||||||
All-in sustaining costs ($/oz)b |
1,407 | 1,689 | (17) | % | 1,192 | 18 | % | 1,521 | 1,166 | 30 | % | |||||||||||||||||||||
All-in costs ($/oz)b |
1,407 | 1,689 | (17) | % | 1,192 | 18 | % | 1,521 | 1,166 | 30 | % | |||||||||||||||||||||
| For the three months ended | ||||||||
| 6/30/23 | 3/31/23 | |||||||
| LTI | 1 | 4 | ||||||
LTIFR3 |
1.07 | 1.75 | ||||||
TRIFR3 |
1.93 | 3.07 | ||||||
Class 14 environmental incidents |
0 | 0 | ||||||
BARRICK SECOND QUARTER 2023 |
19 |
MANAGEMENT'S DISCUSSION AND ANALYSIS | ||||||
BARRICK SECOND QUARTER 2023 |
20 |
MANAGEMENT'S DISCUSSION AND ANALYSIS | ||||||
| For the three months ended | For the six months ended | |||||||||||||||||||||||||||||||
| 6/30/23 | 3/31/23 | % Change | 6/30/22 | % Change | 6/30/23 | 6/30/22 | % Change | |||||||||||||||||||||||||
| Total tonnes mined (000s) | 20,143 | 15,326 | 31 | % | 18,333 | 10 | % | 35,469 | 36,228 | (2) | % | |||||||||||||||||||||
| Open pit ore | 4,104 | 2,172 | 89 | % | 1,084 | 279 | % | 6,276 | 2,707 | 132 | % | |||||||||||||||||||||
| Open pit waste | 15,682 | 12,856 | 22 | % | 16,911 | (7) | % | 28,538 | 32,905 | (13) | % | |||||||||||||||||||||
| Underground | 357 | 298 | 20 | % | 338 | 6 | % | 655 | 616 | 6 | % | |||||||||||||||||||||
| Average grade (grams/tonne) | ||||||||||||||||||||||||||||||||
| Open pit mined | 0.79 | 0.82 | (4) | % | 0.81 | (2) | % | 0.80 | 0.93 | (14) | % | |||||||||||||||||||||
| Underground mined | 9.21 | 9.34 | (1) | % | 10.04 | (8) | % | 9.27 | 9.68 | (4) | % | |||||||||||||||||||||
| Processed | 1.21 | 1.77 | (32) | % | 2.34 | (48) | % | 1.43 | 2.00 | (29) | % | |||||||||||||||||||||
| Ore tonnes processed (000s) | 3,973 | 2,537 | 57 | % | 1,430 | 178 | % | 6,510 | 3,444 | 89 | % | |||||||||||||||||||||
| Oxide mill | 630 | 564 | 12 | % | 618 | 2 | % | 1,194 | 1,282 | (7) | % | |||||||||||||||||||||
| Roasters | 152 | 153 | (1) | % | 220 | (31) | % | 305 | 492 | (38) | % | |||||||||||||||||||||
| Heap leach | 3,191 | 1,820 | 75 | % | 592 | 439 | % | 5,011 | 1,670 | 200 | % | |||||||||||||||||||||
| Recovery rate | 82 | % | 83 | % | (1) | % | 78 | % | 5 | % | 83 | % | 79 | % | 5 | % | ||||||||||||||||
| Oxide Mill | 80 | % | 82 | % | (2) | % | 68 | % | 18 | % | 81 | % | 70 | % | 16 | % | ||||||||||||||||
| Roasters | 87 | % | 87 | % | 0 | % | 88 | % | (1) | % | 87 | % | 87 | % | 0 | % | ||||||||||||||||
| Gold produced (000s oz) | 110 | 140 | (21) | % | 97 | 13 | % | 250 | 212 | 18 | % | |||||||||||||||||||||
| Oxide Mill | 55 | 69 | (20) | % | 32 | 72 | % | 124 | 67 | 85 | % | |||||||||||||||||||||
| Roasters | 33 | 31 | 6 | % | 47 | (30) | % | 64 | 96 | (33) | % | |||||||||||||||||||||
| Heap leach | 22 | 40 | (45) | % | 18 | 22 | % | 62 | 49 | 27 | % | |||||||||||||||||||||
| Gold sold (000s oz) | 112 | 137 | (18) | % | 95 | 18 | % | 249 | 213 | 17 | % | |||||||||||||||||||||
| Revenue ($ millions) | 220 | 262 | (16) | % | 175 | 26 | % | 482 | 399 | 21 | % | |||||||||||||||||||||
| Cost of sales ($ millions) | 150 | 182 | (18) | % | 111 | 35 | % | 332 | 242 | 37 | % | |||||||||||||||||||||
| Income ($ millions) | 66 | 78 | (15) | % | 60 | 10 | % | 144 | 152 | (5) | % | |||||||||||||||||||||
EBITDA ($ millions)b |
107 | 134 | (20) | % | 90 | 19 | % | 241 | 220 | 10 | % | |||||||||||||||||||||
EBITDA marginc |
49 | % | 51 | % | (4) | % | 51 | % | (4) | % | 50 | % | 55 | % | (9) | % | ||||||||||||||||
| Capital expenditures ($ millions) | 68 | 56 | 21 | % | 76 | (11) | % | 124 | 129 | (4) | % | |||||||||||||||||||||
Minesite sustainingb |
50 | 41 | 22 | % | 61 | (18) | % | 91 | 102 | (11) | % | |||||||||||||||||||||
Projectb |
18 | 15 | 20 | % | 15 | 20 | % | 33 | 27 | 22 | % | |||||||||||||||||||||
| Cost of sales ($/oz) | 1,346 | 1,324 | 2 | % | 1,168 | 15 | % | 1,334 | 1,138 | 17 | % | |||||||||||||||||||||
Total cash costs ($/oz)b |
972 | 913 | 6 | % | 850 | 14 | % | 940 | 814 | 15 | % | |||||||||||||||||||||
All-in sustaining costs ($/oz)b |
1,453 | 1,233 | 18 | % | 1,538 | (6) | % | 1,332 | 1,323 | 1 | % | |||||||||||||||||||||
All-in costs ($/oz)b |
1,618 | 1,340 | 21 | % | 1,692 | (4) | % | 1,465 | 1,450 | 1 | % | |||||||||||||||||||||
| For the three months ended | ||||||||
| 6/30/23 | 3/31/23 | |||||||
| LTI | 1 | 1 | ||||||
LTIFR3 |
0.94 | 0.95 | ||||||
TRIFR3 |
1.88 | 1.89 | ||||||
Class 14 environmental incidents |
0 | 0 | ||||||
BARRICK SECOND QUARTER 2023 |
21 |
MANAGEMENT'S DISCUSSION AND ANALYSIS | ||||||
BARRICK SECOND QUARTER 2023 |
22 |
MANAGEMENT'S DISCUSSION AND ANALYSIS | ||||||
| For the three months ended | For the six months ended | |||||||||||||||||||||||||||||||
| 6/30/23 | 3/31/23 | % Change | 6/30/22 | % Change | 6/30/23 | 6/30/22 | % Change | |||||||||||||||||||||||||
| Total tonnes mined (000s) | 218 | 233 | (6) | % | 235 | (7) | % | 451 | 446 | 1 | % | |||||||||||||||||||||
| Open pit ore | 0 | 0 | 0 | % | 24 | (100) | % | 0 | 24 | (100) | % | |||||||||||||||||||||
| Open pit waste | 0 | 0 | 0 | % | 0 | 0 | % | 0 | 0 | 0 | % | |||||||||||||||||||||
| Underground | 218 | 233 | (6) | % | 211 | 3 | % | 451 | 422 | 7 | % | |||||||||||||||||||||
| Average grade (grams/tonne) | ||||||||||||||||||||||||||||||||
| Open pit mined | n/a | n/a | n/a | 1.52 | n/a | n/a | 1.52 | n/a | ||||||||||||||||||||||||
| Underground mined | 11.22 | 10.08 | 11 | % | 11.05 | 2 | % | 10.64 | 11.46 | (7) | % | |||||||||||||||||||||
| Processed | 4.85 | 3.84 | 26 | % | 4.06 | 19 | % | 4.25 | 4.32 | (2) | % | |||||||||||||||||||||
| Ore tonnes processed (000s) | 504 | 729 | (31) | % | 701 | (28) | % | 1,233 | 1,240 | (1) | % | |||||||||||||||||||||
| Oxide Mill | 80 | 101 | (21) | % | 90 | (11) | % | 181 | 183 | (1) | % | |||||||||||||||||||||
| Autoclave | 424 | 628 | (32) | % | 611 | (31) | % | 1,052 | 1,057 | 0 | % | |||||||||||||||||||||
| Recovery rate | 87 | % | 83 | % | 5 | % | 81 | % | 7 | % | 85 | % | 80 | % | 6 | % | ||||||||||||||||
| Oxide Mill | 85 | % | 87 | % | (2) | % | 82 | % | 4 | % | 86 | % | 80 | % | 7 | % | ||||||||||||||||
| Autoclave | 87 | % | 82 | % | 6 | % | 81 | % | 7 | % | 85 | % | 80 | % | 6 | % | ||||||||||||||||
| Gold produced (000s oz) | 68 | 81 | (16) | % | 75 | (9) | % | 149 | 142 | 5 | % | |||||||||||||||||||||
| Oxide Mill | 3 | 3 | 0 | % | 3 | 0 | % | 6 | 6 | 0 | % | |||||||||||||||||||||
| Autoclave | 64 | 77 | (17) | % | 70 | (9) | % | 141 | 132 | 7 | % | |||||||||||||||||||||
| Heap leach | 1 | 1 | 0 | % | 2 | (50) | % | 2 | 4 | (50) | % | |||||||||||||||||||||
| Gold sold (000s oz) | 72 | 82 | (12) | % | 76 | (5) | % | 154 | 140 | 10 | % | |||||||||||||||||||||
| Revenue ($ millions) | 143 | 156 | (8) | % | 143 | 0 | % | 299 | 263 | 14 | % | |||||||||||||||||||||
| Cost of sales ($ millions) | 106 | 116 | (9) | % | 99 | 7 | % | 222 | 191 | 16 | % | |||||||||||||||||||||
| Income ($ millions) | 35 | 40 | (13) | % | 42 | (17) | % | 75 | 70 | 7 | % | |||||||||||||||||||||
EBITDA ($ millions)a |
61 | 71 | (14) | % | 69 | (12) | % | 132 | 123 | 7 | % | |||||||||||||||||||||
EBITDA marginb |
43 | % | 46 | % | (7) | % | 48 | % | (10) | % | 44 | % | 47 | % | (6) | % | ||||||||||||||||
| Capital expenditures ($ millions) | 15 | 21 | (29) | % | 24 | (38) | % | 36 | 46 | (22) | % | |||||||||||||||||||||
Minesite sustaininga |
14 | 18 | (22) | % | 17 | (18) | % | 32 | 33 | (3) | % | |||||||||||||||||||||
Projecta |
1 | 3 | (67) | % | 7 | (86) | % | 4 | 13 | (69) | % | |||||||||||||||||||||
| Cost of sales ($/oz) | 1,466 | 1,412 | 4 | % | 1,289 | 14 | % | 1,438 | 1,356 | 6 | % | |||||||||||||||||||||
Total cash costs ($/oz)a |
1,088 | 1,034 | 5 | % | 928 | 17 | % | 1,059 | 974 | 9 | % | |||||||||||||||||||||
All-in sustaining costs ($/oz)a |
1,302 | 1,271 | 2 | % | 1,195 | 9 | % | 1,286 | 1234 | 4 | % | |||||||||||||||||||||
All-in costs ($/oz)a |
1,310 | 1,306 | 0 | % | 1,284 | 2 | % | 1,308 | 1326 | (1) | % | |||||||||||||||||||||
| For the three months ended | ||||||||
| 6/30/23 | 3/31/23 | |||||||
| LTI | 1 | 1 | ||||||
LTIFR3 |
1.59 | 1.62 | ||||||
TRIFR3 |
1.59 | 4.87 | ||||||
Class 14 environmental incidents |
0 | 0 | ||||||
BARRICK SECOND QUARTER 2023 |
23 |
MANAGEMENT'S DISCUSSION AND ANALYSIS | ||||||
BARRICK SECOND QUARTER 2023 |
24 |
MANAGEMENT'S DISCUSSION AND ANALYSIS | ||||||
| For the three months ended | ||||||||||||||||||||||||||||||||
| 6/30/23 | 3/31/23 | |||||||||||||||||||||||||||||||
| Gold produced (000s oz) | Cost of sales ($/oz) |
Total cash costs ($/oz)a |
All-in sustaining costs ($/oz)a |
Capital Expend-ituresb |
Gold produced (000s oz) | Cost of sales ($/oz) |
Total cash costs
($/oz)a
|
All-in sustaining costs
($/oz)a
|
Capital Expend-ituresb |
|||||||||||||||||||||||
| Phoenix (61.5%) | 29 | 2,075 | 948 | 1,132 | 5 | 27 | 2,380 | 1,198 | 1,365 | 3 | ||||||||||||||||||||||
| Long Canyon (61.5%) | 3 | 1,640 | 637 | 677 | 0 | 2 | 1,621 | 579 | 629 | 0 | ||||||||||||||||||||||
BARRICK SECOND QUARTER 2023 |
25 |
MANAGEMENT'S DISCUSSION AND ANALYSIS | ||||||
| For the three months ended | For the six months ended | |||||||||||||||||||||||||||||||
| 6/30/23 | 3/31/23 | % Change | 6/30/22 | % Change | 6/30/23 | 6/30/22 | % Change | |||||||||||||||||||||||||
| Open pit tonnes mined (000s) | 5,115 | 5,651 | (9) | % | 4,821 | 6 | % | 10,766 | 9,139 | 18 | % | |||||||||||||||||||||
| Open pit ore | 1,513 | 2,342 | (35) | % | 1,341 | 13 | % | 3,855 | 2,540 | 52 | % | |||||||||||||||||||||
| Open pit waste | 3,602 | 3,309 | 9 | % | 3,480 | 4 | % | 6,911 | 6,599 | 5 | % | |||||||||||||||||||||
| Average grade (grams/tonne) | ||||||||||||||||||||||||||||||||
| Open pit mined | 1.89 | 1.85 | 2 | % | 2.69 | (30) | % | 1.87 | 2.58 | (28) | % | |||||||||||||||||||||
| Processed | 2.31 | 2.22 | 4 | % | 2.95 | (22) | % | 2.26 | 2.69 | (16) | % | |||||||||||||||||||||
| Autoclave ore tonnes processed (000s) | 1,206 | 1,377 | (12) | % | 1,304 | (8) | % | 2,583 | 2,815 | (8) | % | |||||||||||||||||||||
| Recovery rate | 89 | % | 89 | % | 0 | % | 84 | % | 6 | % | 89 | % | 86 | % | 3 | % | ||||||||||||||||
| Gold produced (000s oz) | 77 | 89 | (13) | % | 105 | (27) | % | 166 | 209 | (21) | % | |||||||||||||||||||||
| Gold sold (000s oz) | 79 | 90 | (12) | % | 102 | (23) | % | 169 | 206 | (18) | % | |||||||||||||||||||||
| Revenue ($ millions) | 153 | 175 | (13) | % | 188 | (19) | % | 328 | 391 | (16) | % | |||||||||||||||||||||
| Cost of sales ($ millions) | 105 | 112 | (6) | % | 118 | (11) | % | 217 | 230 | (6) | % | |||||||||||||||||||||
| Income ($ millions) | 46 | 61 | (25) | % | 59 | (22) | % | 107 | 148 | (28) | % | |||||||||||||||||||||
EBITDA ($ millions)b |
82 | 100 | (18) | % | 95 | (14) | % | 182 | 219 | (17) | % | |||||||||||||||||||||
EBITDA marginc |
54 | % | 57 | % | (5) | % | 51 | % | 6 | % | 55 | % | 56 | % | (2) | % | ||||||||||||||||
| Capital expenditures ($ millions) | 74 | 68 | 9 | % | 82 | (10) | % | 142 | 155 | (8) | % | |||||||||||||||||||||
Minesite sustainingb |
29 | 31 | (6) | % | 30 | (3) | % | 60 | 56 | 7 | % | |||||||||||||||||||||
Projectb |
45 | 37 | 22 | % | 52 | (13) | % | 82 | 99 | (17) | % | |||||||||||||||||||||
| Cost of sales ($/oz) | 1,344 | 1,241 | 8 | % | 1,154 | 16 | % | 1,289 | 1,115 | 16 | % | |||||||||||||||||||||
Total cash costs ($/oz)b |
840 | 714 | 18 | % | 724 | 16 | % | 772 | 703 | 10 | % | |||||||||||||||||||||
All-in sustaining costs ($/oz)b |
1,219 | 1,073 | 14 | % | 1,024 | 19 | % | 1,141 | 985 | 16 | % | |||||||||||||||||||||
All-in costs ($/oz)b |
1,788 | 1,481 | 21 | % | 1,536 | 16 | % | 1,625 | 1,468 | 11 | % | |||||||||||||||||||||
| For the three months ended | ||||||||
| 6/30/23 | 3/31/23 | |||||||
| LTI | 0 | 0 | ||||||
LTIFR3 |
0.00 | 0.00 | ||||||
TRIFR3 |
1.03 | 0.96 | ||||||
Class 14 environmental incidents |
0 | 0 | ||||||
BARRICK SECOND QUARTER 2023 |
26 |
MANAGEMENT'S DISCUSSION AND ANALYSIS | ||||||
BARRICK SECOND QUARTER 2023 |
27 |
MANAGEMENT'S DISCUSSION AND ANALYSIS | ||||||
| For the three months ended | For the six months ended | |||||||||||||||||||||||||||||||
| 6/30/23 | 3/31/23 | % Change | 6/30/22 | % Change | 6/30/23 | 6/30/22 | % Change | |||||||||||||||||||||||||
| Total tonnes mined (000s) | 7,614 | 8,370 | (9) | % | 7,832 | (3) | % | 15,984 | 17,157 | (7) | % | |||||||||||||||||||||
| Open pit ore | 512 | 125 | 310 | % | 684 | (25) | % | 637 | 1,419 | (55) | % | |||||||||||||||||||||
| Open pit waste | 6,189 | 7,399 | (16) | % | 6,310 | (2) | % | 13,588 | 14,107 | (4) | % | |||||||||||||||||||||
| Underground | 913 | 846 | 8 | % | 838 | 9 | % | 1,759 | 1,631 | 8 | % | |||||||||||||||||||||
| Average grade (grams/tonne) | ||||||||||||||||||||||||||||||||
| Open pit mined | 2.72 | 2.22 | 23 | % | 2.09 | 30 | % | 2.62 | 1.91 | 37 | % | |||||||||||||||||||||
| Underground mined | 5.05 | 5.62 | (10) | % | 4.33 | 17 | % | 5.33 | 4.61 | 16 | % | |||||||||||||||||||||
| Processed | 4.67 | 4.69 | 0 | % | 4.72 | (1) | % | 4.68 | 4.73 | (1) | % | |||||||||||||||||||||
| Ore tonnes processed (000s) | 1,018 | 1,006 | 1 | % | 1,018 | 0 | % | 2,024 | 2,013 | 1 | % | |||||||||||||||||||||
| Recovery rate | 92 | % | 91 | % | 1 | % | 91 | % | 1 | % | 91 | % | 91 | % | 0 | % | ||||||||||||||||
| Gold produced (000s oz) | 141 | 137 | 3 | % | 140 | 1 | % | 278 | 278 | 0 | % | |||||||||||||||||||||
| Gold sold (000s oz) | 140 | 134 | 4 | % | 141 | (1) | % | 274 | 278 | (1) | % | |||||||||||||||||||||
| Revenue ($ millions) | 275 | 257 | 7 | % | 265 | 4 | % | 532 | 523 | 2 | % | |||||||||||||||||||||
| Cost of sales ($ millions) | 160 | 171 | (6) | % | 155 | 3 | % | 331 | 304 | 9 | % | |||||||||||||||||||||
| Income ($ millions) | 110 | 85 | 29 | % | 106 | 4 | % | 195 | 212 | (8) | % | |||||||||||||||||||||
EBITDA ($ millions)b |
159 | 141 | 13 | % | 158 | 1 | % | 300 | 314 | (4) | % | |||||||||||||||||||||
EBITDA marginc |
58 | % | 55 | % | 5 | % | 60 | % | (3) | % | 56 | % | 60 | % | (7) | % | ||||||||||||||||
| Capital expenditures ($ millions) | 73 | 83 | (12) | % | 66 | 11 | % | 156 | 117 | 33 | % | |||||||||||||||||||||
Minesite sustainingb |
61 | 43 | 42 | % | 39 | 56 | % | 104 | 72 | 44 | % | |||||||||||||||||||||
Projectb |
12 | 40 | (70) | % | 27 | (56) | % | 52 | 45 | 16 | % | |||||||||||||||||||||
| Cost of sales ($/oz) | 1,150 | 1,275 | (10) | % | 1,093 | 5 | % | 1,211 | 1,091 | 11 | % | |||||||||||||||||||||
Total cash costs ($/oz)b |
801 | 855 | (6) | % | 730 | 10 | % | 827 | 725 | 14 | % | |||||||||||||||||||||
All-in sustaining costs ($/oz)b |
1,245 | 1,190 | 5 | % | 1,013 | 23 | % | 1,218 | 997 | 22 | % | |||||||||||||||||||||
All-in costs ($/oz)b |
1,335 | 1,485 | (10) | % | 1,205 | 11 | % | 1,409 | 1,158 | 22 | % | |||||||||||||||||||||
| For the three months ended | ||||||||
| 6/30/23 | 3/31/23 | |||||||
| LTI | 0 | 0 | ||||||
LTIFR3 |
0.00 | 0.00 | ||||||
TRIFR3 |
0.53 | 0.52 | ||||||
Class 14 environmental incidents |
0 | 0 | ||||||
BARRICK SECOND QUARTER 2023 |
28 |
MANAGEMENT'S DISCUSSION AND ANALYSIS | ||||||
BARRICK SECOND QUARTER 2023 |
29 |
MANAGEMENT'S DISCUSSION AND ANALYSIS | ||||||
| For the three months ended | For the six months ended | |||||||||||||||||||||||||||||||
| 6/30/23 | 3/31/23 | % Change | 6/30/22 | % Change | 6/30/23 | 6/30/22 | % Change | |||||||||||||||||||||||||
| Total tonnes mined (000s) | 4,475 | 4,902 | (9) | % | 3,884 | 15 | % | 9,377 | 7,690 | 22 | % | |||||||||||||||||||||
| Open pit ore | 698 | 640 | 9 | % | 586 | 19 | % | 1,338 | 962 | 39 | % | |||||||||||||||||||||
| Open pit waste | 3,317 | 3,882 | (15) | % | 2,855 | 16 | % | 7,199 | 5,934 | 21 | % | |||||||||||||||||||||
| Underground | 460 | 380 | 21 | % | 443 | 4 | % | 840 | 794 | 6 | % | |||||||||||||||||||||
| Average grade (grams/tonne) | ||||||||||||||||||||||||||||||||
| Open pit mined | 1.38 | 1.42 | (3) | % | 1.81 | (24) | % | 1.40 | 1.66 | (16) | % | |||||||||||||||||||||
| Underground mined | 5.37 | 4.35 | 23 | % | 5.38 | 0 | % | 4.92 | 5.60 | (12) | % | |||||||||||||||||||||
| Processed | 3.18 | 2.55 | 25 | % | 3.37 | (6) | % | 2.88 | 3.37 | (15) | % | |||||||||||||||||||||
| Ore tonnes processed (000s) | 949 | 880 | 8 | % | 862 | 10 | % | 1,829 | 1,643 | 11 | % | |||||||||||||||||||||
| Recovery rate | 90 | % | 88 | % | 2 | % | 87 | % | 3 | % | 89 | % | 88 | % | 1 | % | ||||||||||||||||
| Gold produced (000s oz) | 87 | 64 | 36 | % | 81 | 7 | % | 151 | 157 | (4) | % | |||||||||||||||||||||
| Gold sold (000s oz) | 87 | 67 | 30 | % | 77 | 13 | % | 154 | 150 | 3 | % | |||||||||||||||||||||
| Revenue ($ millions) | 172 | 127 | 35 | % | 145 | 19 | % | 299 | 282 | 6 | % | |||||||||||||||||||||
| Cost of sales ($ millions) | 111 | 91 | 22 | % | 90 | 23 | % | 202 | 173 | 17 | % | |||||||||||||||||||||
| Income ($ millions) | 60 | 33 | 82 | % | 49 | 22 | % | 93 | 90 | 3 | % | |||||||||||||||||||||
EBITDA ($ millions)b |
101 | 58 | 74 | % | 82 | 23 | % | 159 | 151 | 5 | % | |||||||||||||||||||||
EBITDA marginc |
59 | % | 46 | % | 28 | % | 57 | % | 4 | % | 53 | % | 54 | % | (2) | % | ||||||||||||||||
| Capital expenditures ($ millions) | 18 | 19 | (5) | % | 20 | (10) | % | 37 | 39 | (5) | % | |||||||||||||||||||||
Minesite sustainingb |
10 | 12 | (17) | % | 14 | (29) | % | 22 | 29 | (24) | % | |||||||||||||||||||||
Projectb |
8 | 7 | 14 | % | 6 | 33 | % | 15 | 10 | 50 | % | |||||||||||||||||||||
| Cost of sales ($/oz) | 1,269 | 1,367 | (7) | % | 1,164 | 9 | % | 1,311 | 1,151 | 14 | % | |||||||||||||||||||||
Total cash costs ($/oz)b |
797 | 987 | (19) | % | 738 | 8 | % | 879 | 741 | 19 | % | |||||||||||||||||||||
All-in sustaining costs ($/oz)b |
955 | 1,177 | (19) | % | 946 | 1 | % | 1,052 | 970 | 8 | % | |||||||||||||||||||||
All-in costs ($/oz)b |
1,043 | 1,289 | (19) | % | 1,027 | 2 | % | 1,150 | 1,036 | 11 | % | |||||||||||||||||||||
| For the three months ended | ||||||||
| 6/30/23 | 3/31/23 | |||||||
| LTI | 1 | 0 | ||||||
LTIFR3 |
0.23 | 0 | ||||||
TRIFR3 |
0.92 | 2.10 | ||||||
Class 14 environmental incidents |
0 | 0 | ||||||
BARRICK SECOND QUARTER 2023 |
30 |
MANAGEMENT'S DISCUSSION AND ANALYSIS | ||||||
BARRICK SECOND QUARTER 2023 |
31 |
MANAGEMENT'S DISCUSSION AND ANALYSIS | ||||||
| For the three months ended | For the six months ended | |||||||||||||||||||||||||||||||
| 6/30/23 | 3/31/23 | % Change | 6/30/22 | % Change | 6/30/23 | 6/30/22 | % Change | |||||||||||||||||||||||||
| Total tonnes mined (000s) | 4,252 | 3,525 | 21 | % | 1,789 | 138 | % | 7,777 | 3,201 | 143 | % | |||||||||||||||||||||
| Open pit ore | 86 | 469 | (82) | % | 1,108 | (92) | % | 555 | 1,817 | (69) | % | |||||||||||||||||||||
| Open pit waste | 3,826 | 2,691 | 42 | % | 345 | 1,009 | % | 6,517 | 724 | 800 | % | |||||||||||||||||||||
| Underground | 340 | 365 | (7) | % | 336 | 1 | % | 705 | 660 | 7 | % | |||||||||||||||||||||
| Average grade (grams/tonne) | ||||||||||||||||||||||||||||||||
| Open pit mined | 1.51 | 2.07 | (27) | % | 1.94 | (22) | % | 1.98 | 2.02 | (2) | % | |||||||||||||||||||||
| Underground mined | 2.96 | 3.40 | (13) | % | 3.97 | (25) | % | 3.19 | 4.88 | (35) | % | |||||||||||||||||||||
| Processed | 3.08 | 3.25 | (5) | % | 3.35 | (8) | % | 3.17 | 3.33 | (5) | % | |||||||||||||||||||||
| Ore tonnes processed (000s) | 698 | 716 | (3) | % | 676 | 3 | % | 1,414 | 1,274 | 11 | % | |||||||||||||||||||||
| Recovery rate | 92 | % | 92 | % | 0 | % | 92 | % | 0 | % | 92 | % | 90 | % | 2 | % | ||||||||||||||||
| Gold produced (000s oz) | 64 | 68 | (6) | % | 66 | (3) | % | 132 | 122 | 8 | % | |||||||||||||||||||||
| Gold sold (000s oz) | 64 | 70 | (9) | % | 67 | (4) | % | 134 | 125 | 7 | % | |||||||||||||||||||||
| Revenue ($ millions) | 125 | 133 | (6) | % | 125 | 0 | % | 258 | 235 | 10 | % | |||||||||||||||||||||
| Cost of sales ($ millions) | 76 | 70 | 9 | % | 70 | 9 | % | 146 | 120 | 22 | % | |||||||||||||||||||||
| Income ($ millions) | 43 | 47 | (9) | % | 55 | (22) | % | 90 | 113 | (20) | % | |||||||||||||||||||||
EBITDA ($ millions)b |
59 | 63 | (6) | % | 75 | (21) | % | 122 | 141 | (13) | % | |||||||||||||||||||||
EBITDA marginc |
47 | % | 47 | % | 0 | % | 60 | % | (22) | % | 47 | % | 60 | % | (22) | % | ||||||||||||||||
| Capital expenditures ($ millions) | 41 | 35 | 17 | % | 34 | 21 | % | 76 | 52 | 46 | % | |||||||||||||||||||||
Minesite sustainingb |
25 | 25 | 0 | % | 11 | 127 | % | 50 | 18 | 178 | % | |||||||||||||||||||||
Projectb |
16 | 10 | 60 | % | 23 | (30) | % | 26 | 34 | (24) | % | |||||||||||||||||||||
| Cost of sales ($/oz) | 1,208 | 987 | 22 | % | 1,060 | 14 | % | 1,092 | 963 | 13 | % | |||||||||||||||||||||
Total cash costs ($/oz)b |
942 | 759 | 24 | % | 756 | 25 | % | 846 | 734 | 15 | % | |||||||||||||||||||||
All-in sustaining costs ($/oz)b |
1,355 | 1,137 | 19 | % | 957 | 42 | % | 1,240 | 918 | 35 | % | |||||||||||||||||||||
All-in costs ($/oz)b |
1,606 | 1,278 | 26 | % | 1,301 | 23 | % | 1,434 | 1,187 | 21 | % | |||||||||||||||||||||
| For the three months ended | ||||||||
| 6/30/23 | 3/31/23 | |||||||
| LTI | 0 | 1 | ||||||
LTIFR3 |
0.40 | 0.42 | ||||||
TRIFR3 |
0.81 | 0.83 | ||||||
Class 14 environmental incidents |
0 | 0 | ||||||
BARRICK SECOND QUARTER 2023 |
32 |
MANAGEMENT'S DISCUSSION AND ANALYSIS | ||||||
BARRICK SECOND QUARTER 2023 |
33 |
MANAGEMENT'S DISCUSSION AND ANALYSIS | ||||||
| For the three months ended | For the six months ended | |||||||||||||||||||||||||||||||
| 6/30/23 | 3/31/23 | % Change | 6/30/22 | % Change | 6/30/23 | 6/30/22 | % Change | |||||||||||||||||||||||||
| Underground tonnes mined (000s) | 314 | 285 | 10 | % | 246 | 28 | % | 599 | 477 | 26 | % | |||||||||||||||||||||
| Average grade (grams/tonne) | ||||||||||||||||||||||||||||||||
| Underground mined | 7.21 | 6.97 | 3 | % | 8.44 | (15) | % | 7.10 | 8.35 | (15) | % | |||||||||||||||||||||
| Processed | 7.07 | 7.39 | (4) | % | 8.58 | (18) | % | 7.22 | 8.19 | (12) | % | |||||||||||||||||||||
| Ore tonnes processed (000s) | 222 | 195 | 14 | % | 210 | 6 | % | 417 | 403 | 3 | % | |||||||||||||||||||||
| Recovery rate | 96 | % | 95 | % | 1 | % | 94 | % | 2 | % | 96 | % | 93 | % | 3 | % | ||||||||||||||||
| Gold produced (000s oz) | 49 | 44 | 11 | % | 54 | (9) | % | 93 | 99 | (6) | % | |||||||||||||||||||||
| Gold sold (000s oz) | 48 | 46 | 4 | % | 51 | (6) | % | 94 | 106 | (11) | % | |||||||||||||||||||||
| Revenue ($ millions) | 100 | 93 | 8 | % | 99 | 1 | % | 193 | 209 | (8) | % | |||||||||||||||||||||
| Cost of sales ($ millions) | 59 | 62 | (5) | % | 60 | (2) | % | 121 | 126 | (4) | % | |||||||||||||||||||||
| Income ($ millions) | 41 | 17 | 141 | % | 35 | 17 | % | 58 | 78 | (26) | % | |||||||||||||||||||||
EBITDA ($ millions)b |
54 | 30 | 80 | % | 47 | 15 | % | 84 | 104 | (19) | % | |||||||||||||||||||||
EBITDA marginc |
54 | % | 32 | % | 69 | % | 47 | % | 15 | % | 44 | % | 50 | % | (12) | % | ||||||||||||||||
| Capital expenditures ($ millions) | 20 | 20 | 0 | % | 23 | (13) | % | 40 | 34 | 18 | % | |||||||||||||||||||||
Minesite sustainingb |
12 | 16 | (25) | % | 13 | (8) | % | 28 | 20 | 40 | % | |||||||||||||||||||||
Projectb |
8 | 4 | 100 | % | 10 | (20) | % | 12 | 14 | (14) | % | |||||||||||||||||||||
| Cost of sales ($/oz) | 1,231 | 1,358 | (9) | % | 1,163 | 6 | % | 1,293 | 1,190 | 9 | % | |||||||||||||||||||||
Total cash costs ($/oz)b |
850 | 982 | (13) | % | 836 | 2 | % | 914 | 842 | 9 | % | |||||||||||||||||||||
All-in sustaining costs ($/oz)b |
1,105 | 1,332 | (17) | % | 1,094 | 1 | % | 1,215 | 1,037 | 17 | % | |||||||||||||||||||||
All-in costs ($/oz)b |
1,273 | 1,423 | (11) | % | 1,292 | (1) | % | 1,346 | 1,168 | 15 | % | |||||||||||||||||||||
| For the three months ended | ||||||||
| 6/30/23 | 3/31/23 | |||||||
| LTI | 2 | 0 | ||||||
LTIFR3 |
1.20 | 0.00 | ||||||
TRIFR3 |
3.60 | 3.77 | ||||||
Class 14 environmental incidents |
0 | 0 | ||||||
BARRICK SECOND QUARTER 2023 |
34 |
MANAGEMENT'S DISCUSSION AND ANALYSIS | ||||||
BARRICK SECOND QUARTER 2023 |
35 |
MANAGEMENT'S DISCUSSION AND ANALYSIS | ||||||
| For the three months ended | ||||||||||||||||||||||||||||||||
| 6/30/23 | 3/31/23 | |||||||||||||||||||||||||||||||
| Gold produced (000s oz) | Cost of sales ($/oz) |
Total cash costs ($/oz)a |
All-in sustaining costs ($/oz)a |
Capital Expend-ituresb |
Gold produced (000s oz) | Cost of sales ($/oz) |
Total cash costs
($/oz)a
|
All-in sustaining costs ($/oz)a |
Capital Expend-ituresb |
|||||||||||||||||||||||
| Veladero (50%) | 54 | 1,424 | 999 | 1,599 | 26 | 43 | 1,587 | 1,035 | 1,761 | 36 | ||||||||||||||||||||||
| Tongon (89.7%) | 44 | 1,514 | 1,380 | 1,465 | 4 | 50 | 1,453 | 1,182 | 1,284 | 4 | ||||||||||||||||||||||
| Hemlo | 35 | 1,562 | 1,356 | 1,634 | 9 | 41 | 1,486 | 1,291 | 1,609 | 12 | ||||||||||||||||||||||
Porgerac (47.5%) |
— | — | — | — | — | — | — | — | — | — | ||||||||||||||||||||||
BARRICK SECOND QUARTER 2023 |
36 |
MANAGEMENT'S DISCUSSION AND ANALYSIS | ||||||
| For the three months ended | For the six months ended | |||||||||||||||||||||||||||||||
| 6/30/23 | 3/31/23 | % Change | 6/30/22 | % Change | 6/30/23 | 6/30/22 | % Change | |||||||||||||||||||||||||
| Open pit tonnes mined (000s) | 26,919 | 17,178 | 57 | % | 26,205 | 3 | % | 44,097 | 44,850 | (2) | % | |||||||||||||||||||||
| Open pit ore | 7,834 | 4,568 | 71 | % | 5,830 | 34 | % | 12,402 | 10,396 | 19 | % | |||||||||||||||||||||
| Open pit waste | 19,085 | 12,610 | 51 | % | 20,375 | (6) | % | 31,695 | 34,454 | (8) | % | |||||||||||||||||||||
| Average grade | ||||||||||||||||||||||||||||||||
| Open pit mined | 0.46 | % | 0.38 | % | 21 | % | 0.64 | % | (28) | % | 0.43 | % | 0.60 | % | (28) | % | ||||||||||||||||
| Processed | 0.50 | % | 0.38 | % | 32 | % | 0.59 | % | (15) | % | 0.44 | % | 0.53 | % | (17) | % | ||||||||||||||||
| Tonnes processed (000s) | 6,578 | 6,523 | 1 | % | 6,171 | 7 | % | 13,101 | 11,956 | 10 | % | |||||||||||||||||||||
| Recovery rate | 93 | % | 87 | % | 7 | % | 94 | % | (1) | % | 90 | % | 94 | % | (4) | % | ||||||||||||||||
| Copper produced (millions of pounds) | 67 | 48 | 40 | % | 75 | (11) | % | 115 | 132 | (13) | % | |||||||||||||||||||||
| Copper sold (millions of pounds) | 63 | 49 | 29 | % | 71 | (11) | % | 112 | 141 | (21) | % | |||||||||||||||||||||
| Revenue ($ millions) | 189 | 171 | 11 | % | 211 | (10) | % | 360 | 498 | (28) | % | |||||||||||||||||||||
| Cost of sales ($ millions) | 176 | 174 | 1 | % | 142 | 24 | % | 350 | 296 | 18 | % | |||||||||||||||||||||
| Income (loss) ($ millions) | 0 | (12) | 100 | % | 62 | (100) | % | (12) | 195 | (106) | % | |||||||||||||||||||||
EBITDA ($ millions)a |
59 | 32 | 84 | % | 95 | (38) | % | 91 | 266 | (66) | % | |||||||||||||||||||||
EBITDA marginb |
31 | % | 19 | % | 63 | % | 45 | % | (31) | % | 25 | % | 53 | % | (53) | % | ||||||||||||||||
| Capital expenditures ($ millions) | 71 | 52 | 37 | % | 79 | (10) | % | 123 | 136 | (10) | % | |||||||||||||||||||||
Minesite sustaininga |
44 | 26 | 69 | % | 79 | (44) | % | 70 | 136 | (49) | % | |||||||||||||||||||||
Projecta |
27 | 26 | 4 | % | 0 | 100 | % | 53 | 0 | 100 | % | |||||||||||||||||||||
| Cost of sales ($/lb) | 2.80 | 3.56 | (21) | % | 2.01 | 39 | % | 3.13 | 2.10 | 49 | % | |||||||||||||||||||||
C1 cash costs ($/lb)a |
2.30 | 3.09 | (26) | % | 1.68 | 37 | % | 2.64 | 1.77 | 49 | % | |||||||||||||||||||||
All-in sustaining costs ($/lb)a |
3.29 | 3.98 | (17) | % | 3.28 | 0 | % | 3.59 | 3.22 | 11 | % | |||||||||||||||||||||
All-in costs ($/lb)a |
3.71 | 4.51 | (18) | % | 3.29 | 13 | % | 4.06 | 3.22 | 26 | % | |||||||||||||||||||||
| For the three months ended | ||||||||
| 6/30/23 | 3/31/23 | |||||||
| LTI | 0 | 0 | ||||||
LTIFR3 |
0.00 | 0.00 | ||||||
TRIFR3 |
0.33 | 0.00 | ||||||
Class 14 environmental incidents |
0 | 0 | ||||||
BARRICK SECOND QUARTER 2023 |
37 |
MANAGEMENT'S DISCUSSION AND ANALYSIS | ||||||
BARRICK SECOND QUARTER 2023 |
38 |
MANAGEMENT'S DISCUSSION AND ANALYSIS | ||||||
| For the three months ended | ||||||||||||||||||||||||||||||||
| 6/30/23 | 3/31/23 | |||||||||||||||||||||||||||||||
| Copper production (millions of pounds) | Cost of sales ($/lb) |
C1 cash costs ($/lb)a |
All-in sustaining costs ($/lb)a |
Capital Expend-ituresb |
Copper production (millions of pounds) | Cost of sales ($/lb) |
C1 cash costs ($/lb)a |
All-in sustaining costs ($/lb)a |
Capital Expend-ituresb |
|||||||||||||||||||||||
Zaldívar (50%) |
22 | 3.89 | 3.02 | 3.73 | 15 | 22 | 3.73 | 2.86 | 3.22 | 5 | ||||||||||||||||||||||
| Jabal Sayid (50%) | 18 | 1.61 | 1.26 | 1.42 | 5 | 18 | 1.53 | 1.39 | 1.61 | 4 | ||||||||||||||||||||||
BARRICK SECOND QUARTER 2023 |
39 |
MANAGEMENT'S DISCUSSION AND ANALYSIS | ||||||
BARRICK SECOND QUARTER 2023 |
40 |
MANAGEMENT'S DISCUSSION AND ANALYSIS | ||||||
BARRICK SECOND QUARTER 2023 |
41 |
MANAGEMENT'S DISCUSSION AND ANALYSIS | ||||||
BARRICK SECOND QUARTER 2023 |
42 |
MANAGEMENT'S DISCUSSION AND ANALYSIS | ||||||
BARRICK SECOND QUARTER 2023 |
43 |
MANAGEMENT'S DISCUSSION AND ANALYSIS | ||||||
BARRICK SECOND QUARTER 2023 |
44 |
MANAGEMENT'S DISCUSSION AND ANALYSIS | ||||||
BARRICK SECOND QUARTER 2023 |
45 |
MANAGEMENT'S DISCUSSION AND ANALYSIS | ||||||
| ($ millions, except per ounce/pound data in dollars) | For the three months ended | For the six months ended | |||||||||||||||
| 6/30/23 | 3/31/23 | 6/30/22 | 6/30/23 | 6/30/22 | |||||||||||||
| Gold | |||||||||||||||||
000s oz solda |
1,001 | 954 | 1,040 | 1,955 | 2,033 | ||||||||||||
000s oz produceda |
1,009 | 952 | 1,043 | 1,961 | 2,033 | ||||||||||||
| Market price ($/oz)
|
1,976 | 1,890 | 1,871 | 1,932 | 1,874 | ||||||||||||
|
Realized price
($/oz)b
|
1,972 | 1,902 | 1,861 | 1,938 | 1,868 | ||||||||||||
| Revenue | 2,584 | 2,411 | 2,597 | 4,995 | 5,108 | ||||||||||||
| Copper | |||||||||||||||||
millions lbs solda |
101 | 89 | 113 | 190 | 226 | ||||||||||||
millions lbs produceda |
107 | 88 | 120 | 195 | 221 | ||||||||||||
| Market price ($/lb)
|
3.84 | 4.05 | 4.32 | 3.95 | 4.43 | ||||||||||||
|
Realized price
($/lb)b
|
3.70 | 4.20 | 3.72 | 3.93 | 4.20 | ||||||||||||
| Revenue | 189 | 171 | 211 | 360 | 498 | ||||||||||||
| Other sales | 60 | 61 | 51 | 121 | 106 | ||||||||||||
| Total revenue | 2,833 | 2,643 | 2,859 | 5,476 | 5,712 | ||||||||||||
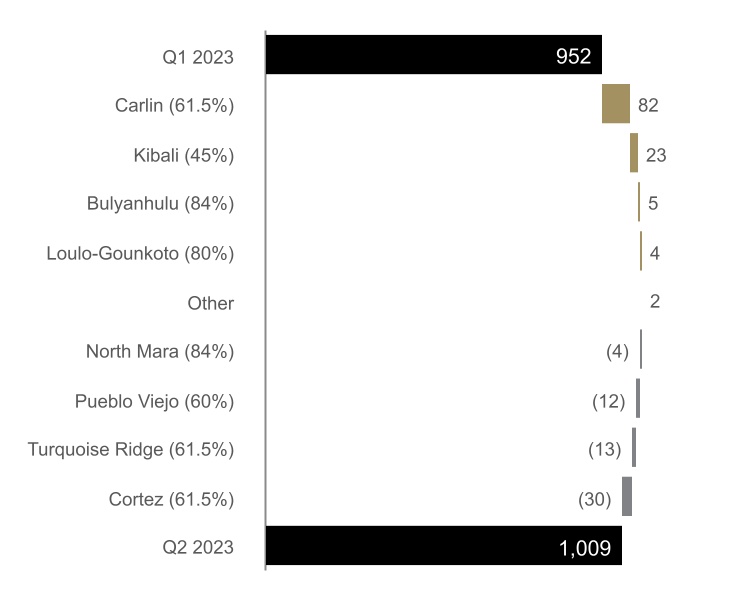
BARRICK SECOND QUARTER 2023 |
46 |
MANAGEMENT'S DISCUSSION AND ANALYSIS | ||||||
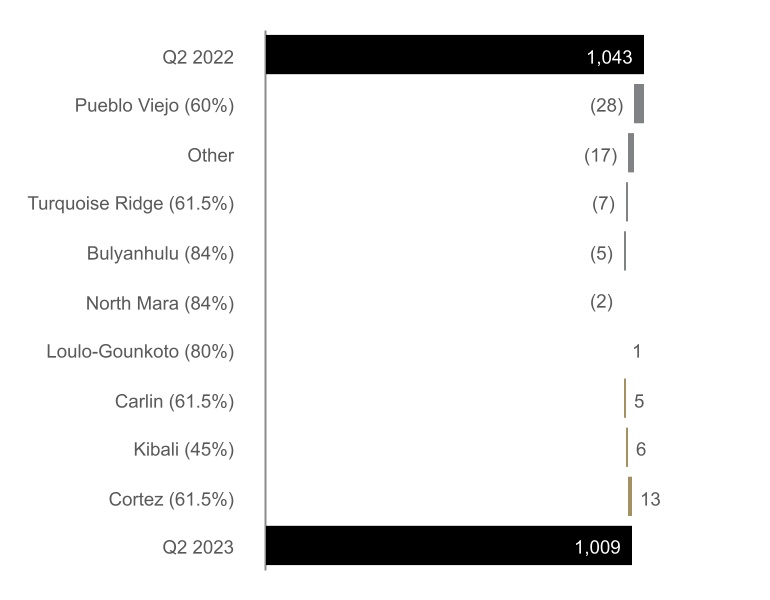
| ($ millions, except per ounce/pound data in dollars) | For the three months ended | For the six months ended | |||||||||||||||
| 6/30/23 | 3/31/23 | 6/30/22 | 6/30/23 | 6/30/22 | |||||||||||||
| Gold | |||||||||||||||||
| Site operating costs | 1,244 | 1,208 | 1,163 | 2,452 | 2,231 | ||||||||||||
| Depreciation | 413 | 445 | 438 | 858 | 857 | ||||||||||||
| Royalty expense | 88 | 101 | 95 | 189 | 183 | ||||||||||||
| Community relations | 8 | 7 | 7 | 15 | 14 | ||||||||||||
| Cost of sales | 1,753 | 1,761 | 1,703 | 3,514 | 3,285 | ||||||||||||
|
Cost of sales
($/oz)a
|
1,323 | 1,378 | 1,216 | 1,350 | 1,203 | ||||||||||||
Total cash costs ($/oz)b |
963 | 986 | 855 | 974 | 844 | ||||||||||||
All-in sustaining costs ($/oz)b |
1,355 | 1,370 | 1,212 | 1,362 | 1,188 | ||||||||||||
| Copper | |||||||||||||||||
| Site operating costs | 100 | 115 | 76 | 215 | 159 | ||||||||||||
| Depreciation | 59 | 44 | 34 | 103 | 72 | ||||||||||||
| Royalty expense | 16 | 15 | 32 | 31 | 64 | ||||||||||||
| Community relations | 1 | 0 | 1 | 1 | 2 | ||||||||||||
| Cost of sales | 176 | 174 | 143 | 350 | 297 | ||||||||||||
|
Cost of sales
($/lb)a
|
2.84 | 3.22 | 2.11 | 3.02 | 2.16 | ||||||||||||
|
C1 cash costs
($/lb)b
|
2.28 | 2.71 | 1.70 | 2.48 | 1.75 | ||||||||||||
All-in sustaining costs ($/lb)b |
3.13 | 3.40 | 2.87 | 3.26 | 2.86 | ||||||||||||
BARRICK SECOND QUARTER 2023 |
47 |
MANAGEMENT'S DISCUSSION AND ANALYSIS | ||||||
BARRICK SECOND QUARTER 2023 |
48 |
MANAGEMENT'S DISCUSSION AND ANALYSIS | ||||||
| ($ millions) | For the three months ended | For the six months ended | |||||||||||||||
| 6/30/23 | 3/31/23 | 6/30/22 | 6/30/23 | 6/30/22 | |||||||||||||
Minesite sustainingb |
524 | 454 | 523 | 978 | 943 | ||||||||||||
Project capital expendituresb,c |
238 | 226 | 226 | 464 | 412 | ||||||||||||
| Capitalized interest | 7 | 8 | 6 | 15 | 11 | ||||||||||||
| Total consolidated capital expenditures | 769 | 688 | 755 | 1,457 | 1,366 | ||||||||||||
Attributable capital expendituresd |
588 | 526 | 587 | 1,114 | 1,065 | ||||||||||||
| ($ millions) | For the three months ended | For the six months ended | |||||||||||||||
| 6/30/23 | 3/31/23 | 6/30/22 | 6/30/23 | 6/30/22 | |||||||||||||
| Corporate administration | 23 | 28 | 25 | 51 | 55 | ||||||||||||
Share-based compensationa |
5 | 11 | 5 | 16 | 29 | ||||||||||||
| General & administrative expenses | 28 | 39 | 30 | 67 | 84 | ||||||||||||
BARRICK SECOND QUARTER 2023 |
49 |
MANAGEMENT'S DISCUSSION AND ANALYSIS | ||||||
| ($ millions) | For the three months ended | For the six months ended | |||||||||||||||
| 6/30/23 | 3/31/23 | 6/30/22 | 6/30/23 | 6/30/22 | |||||||||||||
| Global exploration and evaluation | 37 | 27 | 33 | 64 | 60 | ||||||||||||
| Project costs: | |||||||||||||||||
| Reko Diq | 14 | 5 | 2 | 19 | 2 | ||||||||||||
| Lumwana | 10 | 7 | 0 | 17 | 0 | ||||||||||||
| Pascua-Lama | 7 | 8 | 15 | 15 | 29 | ||||||||||||
| Pueblo Viejo | 1 | 1 | 11 | 2 | 13 | ||||||||||||
| Other | 14 | 11 | 17 | 25 | 28 | ||||||||||||
| Corporate development | 4 | 1 | 2 | 5 | 5 | ||||||||||||
| Global exploration and evaluation and project expense | 87 | 60 | 80 | 147 | 137 | ||||||||||||
| Minesite exploration and evaluation | 14 | 11 | 20 | 25 | 30 | ||||||||||||
| Total exploration, evaluation and project expenses | 101 | 71 | 100 | 172 | 167 | ||||||||||||
| ($ millions) | For the three months ended | For the six months ended | |||||||||||||||
| 6/30/23 | 3/31/23 | 6/30/22 | 6/30/23 | 6/30/22 | |||||||||||||
Interest expensea |
94 | 105 | 91 | 199 | 182 | ||||||||||||
| Accretion | 21 | 21 | 16 | 42 | 28 | ||||||||||||
| Interest capitalized | (8) | (7) | (6) | (15) | (11) | ||||||||||||
| Other finance costs | 1 | 1 | 2 | 2 | 3 | ||||||||||||
| Finance income | (64) | (62) | (14) | (126) | (25) | ||||||||||||
| Finance costs, net | 44 | 58 | 89 | 102 | 177 | ||||||||||||
BARRICK SECOND QUARTER 2023 |
50 |
MANAGEMENT'S DISCUSSION AND ANALYSIS | ||||||
| ($ millions) | For the three months ended | For the six months ended | |||||||||||||||
| 6/30/23 | 3/31/23 | 6/30/22 | 6/30/23 | 6/30/22 | |||||||||||||
| Impairment charges | 22 | 1 | 3 | 23 | 5 | ||||||||||||
| (Gain) loss on currency translation | (12) | 38 | 6 | 26 | 9 | ||||||||||||
| Closed mine rehabilitation | (13) | 22 | (128) | 9 | (125) | ||||||||||||
| Other expense (income) | 18 | 52 | 2 | 70 | (9) | ||||||||||||
BARRICK SECOND QUARTER 2023 |
51 |
MANAGEMENT'S DISCUSSION AND ANALYSIS | ||||||
BARRICK SECOND QUARTER 2023 |
52 |
MANAGEMENT'S DISCUSSION AND ANALYSIS | ||||||
| ($ millions, except ratios and share amounts) | As at 6/30/23 | As at 12/31/22 | ||||||
| Total cash and equivalents | 4,157 | 4,440 | ||||||
| Current assets | 3,213 | 4,025 | ||||||
| Non-current assets | 37,916 | 37,500 | ||||||
| Total Assets | 45,286 | 45,965 | ||||||
| Current liabilities excluding short-term debt | 2,257 | 3,107 | ||||||
Non-current liabilities excluding long-term debta |
6,770 | 6,787 | ||||||
| Debt (current and long-term) | 4,774 | 4,782 | ||||||
| Total Liabilities | 13,801 | 14,676 | ||||||
| Total shareholders’ equity | 22,839 | 22,771 | ||||||
| Non-controlling interests | 8,646 | 8,518 | ||||||
| Total Equity | 31,485 | 31,289 | ||||||
| Total common shares outstanding (millions of shares) | 1,755 | 1,755 | ||||||
| Debt, net of cash | 617 | 342 | ||||||
| Key Financial Ratios: | ||||||||
Current ratiob |
3.25:1 | 2.71:1 | ||||||
Debt-to-equityc |
0.15:1 | 0.15:1 | ||||||
| 7/25/2023 | Number of shares | ||||
| Common shares | 1,755,467,937 | ||||
| Stock options | — | ||||
BARRICK SECOND QUARTER 2023 |
53 |
MANAGEMENT'S DISCUSSION AND ANALYSIS | ||||||
| Performance Dividend Level | Threshold Level | Quarterly Base Dividend | Quarterly Performance Dividend | Quarterly Total Dividend | ||||||||||
| Level I | Net cash <$0 | $0.10 per share |
$0.00 per share |
$0.10 per share |
||||||||||
| Level II | Net cash >$0 and <$0.5B |
$0.10 per share |
$0.05 per share |
$0.15 per share |
||||||||||
| Level III | Net cash >$0.5B and <$1B |
$0.10 per share |
$0.10 per share |
$0.20 per share |
||||||||||
| Level IV | Net cash >$1B | $0.10 per share |
$0.15 per share |
$0.25 per share |
||||||||||
| ($ millions) | For the three months ended |
For the six months ended | |||||||||||||||
| 6/30/23 | 3/31/23 | 6/30/22 | 6/30/23 | 6/30/22 | |||||||||||||
| Net cash provided by operating activities | 832 | 776 | 924 | 1,608 | 1,928 | ||||||||||||
| Investing activities | |||||||||||||||||
| Capital expenditures | (769) | (688) | (755) | (1,457) | (1,366) | ||||||||||||
| Investment sales | 0 | 0 | 122 | 0 | 382 | ||||||||||||
| Dividends received from equity method investments | 18 | 67 | 310 | 85 | 669 | ||||||||||||
| Other | 8 | 3 | 22 | 11 | 23 | ||||||||||||
| Total investing outflows | (743) | (618) | (301) | (1,361) | (292) | ||||||||||||
Net change in debta |
(4) | (4) | (4) | (8) | (10) | ||||||||||||
Dividendsb |
(174) | (175) | (353) | (349) | (531) | ||||||||||||
| Net disbursements to non-controlling interests | (152) | (62) | (232) | (214) | (499) | ||||||||||||
| Share buyback program | 0 | 0 | (173) | 0 | (173) | ||||||||||||
| Other | 21 | 20 | 35 | 41 | 80 | ||||||||||||
| Total financing outflows | (309) | (221) | (727) | (530) | (1,133) | ||||||||||||
| Effect of exchange rate | 0 | 0 | (3) | 0 | (3) | ||||||||||||
| Decrease in cash and equivalents | (220) | (63) | (107) | (283) | 500 | ||||||||||||
BARRICK SECOND QUARTER 2023 |
54 |
MANAGEMENT'S DISCUSSION AND ANALYSIS | ||||||
BARRICK SECOND QUARTER 2023 |
55 |
MANAGEMENT'S DISCUSSION AND ANALYSIS | ||||||
| ($ millions) | Payments due as at 6/30/23 | ||||||||||||||||||||||
| 2023 | 2024 | 2025 | 2026 | 2027 | 2028 and thereafter | Total | |||||||||||||||||
Debta |
|||||||||||||||||||||||
| Repayment of principal | 0 | 0 | 12 | 47 | 0 | 4,675 | 4,734 | ||||||||||||||||
| Capital leases | 7 | 9 | 8 | 8 | 7 | 22 | 61 | ||||||||||||||||
| Interest | 145 | 290 | 289 | 286 | 282 | 3,250 | 4,542 | ||||||||||||||||
Provisions for environmental rehabilitationb |
189 | 128 | 104 | 98 | 77 | 2,002 | 2,598 | ||||||||||||||||
| Restricted share units | 6 | 14 | 3 | 0 | 0 | 0 | 23 | ||||||||||||||||
| Pension benefits and other post-retirement benefits | 2 | 5 | 5 | 5 | 5 | 40 | 62 | ||||||||||||||||
Purchase obligations for supplies and consumablesc |
513 | 290 | 189 | 159 | 155 | 338 | 1,644 | ||||||||||||||||
Capital commitmentsd |
456 | 14 | 2 | 0 | 0 | 0 | 472 | ||||||||||||||||
Social development costse |
14 | 24 | 10 | 8 | 4 | 46 | 106 | ||||||||||||||||
Other obligationsf |
23 | 39 | 45 | 67 | 52 | 523 | 749 | ||||||||||||||||
| Total | 1,355 | 813 | 667 | 678 | 582 | 10,896 | 14,991 | ||||||||||||||||
BARRICK SECOND QUARTER 2023 |
56 |
MANAGEMENT'S DISCUSSION AND ANALYSIS | ||||||
| ($ millions, except where indicated) | 2023 | 2023 | 2022 | 2022 | 2022 | 2022 | 2021 | 2021 | ||||||||||||||||||
| Q2 | Q1 | Q4 | Q3 | Q2 | Q1 | Q4 | Q3 | |||||||||||||||||||
| Revenues | 2,833 | 2,643 | 2,774 | 2,527 | 2,859 | 2,853 | 3,310 | 2,826 | ||||||||||||||||||
Realized price per ounce – goldb |
1,972 | 1,902 | 1,728 | 1,722 | 1,861 | 1,876 | 1,793 | 1,771 | ||||||||||||||||||
Realized price per pound – copperb |
3.70 | 4.20 | 3.81 | 3.24 | 3.72 | 4.68 | 4.63 | 3.98 | ||||||||||||||||||
| Cost of sales | 1,937 | 1,941 | 2,093 | 1,815 | 1,850 | 1,739 | 1,905 | 1,768 | ||||||||||||||||||
| Net earnings | 305 | 120 | (735) | 241 | 488 | 438 | 726 | 347 | ||||||||||||||||||
Per share (dollars)c |
0.17 | 0.07 | (0.42) | 0.14 | 0.27 | 0.25 | 0.41 | 0.20 | ||||||||||||||||||
Adjusted net earningsb |
336 | 247 | 220 | 224 | 419 | 463 | 626 | 419 | ||||||||||||||||||
Per share (dollars)b,c |
0.19 | 0.14 | 0.13 | 0.13 | 0.24 | 0.26 | 0.35 | 0.24 | ||||||||||||||||||
| Operating cash flow | 832 | 776 | 795 | 758 | 924 | 1,004 | 1,387 | 1,050 | ||||||||||||||||||
Consolidated capital expendituresd |
769 | 688 | 891 | 792 | 755 | 611 | 669 | 569 | ||||||||||||||||||
Free cash flowb |
63 | 88 | (96) | (34) | 169 | 393 | 718 | 481 | ||||||||||||||||||
BARRICK SECOND QUARTER 2023 |
57 |
MANAGEMENT'S DISCUSSION AND ANALYSIS | ||||||
BARRICK SECOND QUARTER 2023 |
58 |
MANAGEMENT'S DISCUSSION AND ANALYSIS | ||||||
| ($ millions, except per share amounts in dollars) | For the three months ended | For the six months ended | |||||||||||||||
| 6/30/23 | 3/31/23 | 6/30/22 | 6/30/23 | 6/30/22 | |||||||||||||
| Net earnings attributable to equity holders of the Company | 305 | 120 | 488 | 425 | 926 | ||||||||||||
Impairment charges (reversals) related to intangibles, goodwill, property, plant and equipment, and investmentsa |
22 | 1 | 3 | 23 | 5 | ||||||||||||
Acquisition/disposition gainsb |
(3) | (3) | (20) | (6) | (22) | ||||||||||||
| (Gain) loss on currency translation | (12) | 38 | 6 | 26 | 9 | ||||||||||||
Significant tax adjustmentsc |
33 | 48 | 38 | 81 | 55 | ||||||||||||
Other (income) expense adjustmentsd |
(3) | 63 | (95) | 60 | (82) | ||||||||||||
Non-controlling intereste |
(7) | (6) | (7) | (13) | (7) | ||||||||||||
Tax effecte |
1 | (14) | 6 | (13) | (2) | ||||||||||||
| Adjusted net earnings | 336 | 247 | 419 | 583 | 882 | ||||||||||||
Net earnings per sharef |
0.17 | 0.07 | 0.27 | 0.24 | 0.52 | ||||||||||||
Adjusted net earnings per sharef |
0.19 | 0.14 | 0.24 | 0.33 | 0.50 | ||||||||||||
| ($ millions) | For the three months ended | For the six months ended | |||||||||||||||
| 6/30/23 | 3/31/23 | 6/30/22 | 6/30/23 | 6/30/22 | |||||||||||||
| Net cash provided by operating activities | 832 | 776 | 924 | 1,608 | 1,928 | ||||||||||||
| Capital expenditures | (769) | (688) | (755) | (1,457) | (1,366) | ||||||||||||
| Free cash flow | 63 | 88 | 169 | 151 | 562 | ||||||||||||
| ($ millions) | For the three months ended | For the six months ended | |||||||||||||||
| 6/30/23 | 3/31/23 | 6/30/22 | 6/30/23 | 6/30/22 | |||||||||||||
| Minesite sustaining capital expenditures | 524 | 454 | 523 | 978 | 943 | ||||||||||||
| Project capital expenditures | 238 | 226 | 226 | 464 | 412 | ||||||||||||
| Capitalized interest | 7 | 8 | 6 | 15 | 11 | ||||||||||||
| Total consolidated capital expenditures | 769 | 688 | 755 | 1,457 | 1,366 | ||||||||||||
BARRICK SECOND QUARTER 2023 |
59 |
MANAGEMENT'S DISCUSSION AND ANALYSIS | ||||||
BARRICK SECOND QUARTER 2023 |
60 |
MANAGEMENT'S DISCUSSION AND ANALYSIS | ||||||
| ($ millions, except per ounce information in dollars) | For the three months ended | For the six months ended | ||||||||||||||||||
| Footnote | 6/30/23 | 3/31/23 | 6/30/22 | 6/30/23 | 6/30/22 | |||||||||||||||
| Cost of sales applicable to gold production | 1,753 | 1,761 | 1,703 | 3,514 | 3,285 | |||||||||||||||
| Depreciation | (413) | (445) | (438) | (858) | (857) | |||||||||||||||
| Cash cost of sales applicable to equity method investments | 67 | 63 | 54 | 130 | 105 | |||||||||||||||
| By-product credits | (60) | (61) | (51) | (121) | (106) | |||||||||||||||
| Non-recurring items | a | 0 | 0 | 0 | 0 | 0 | ||||||||||||||
| Other | b | 5 | 0 | (22) | 5 | (23) | ||||||||||||||
| Non-controlling interests | c | (388) | (378) | (358) | (766) | (689) | ||||||||||||||
| Total cash costs | 964 | 940 | 888 | 1,904 | 1,715 | |||||||||||||||
| General & administrative costs | 28 | 39 | 30 | 67 | 84 | |||||||||||||||
| Minesite exploration and evaluation costs | d | 14 | 11 | 20 | 25 | 30 | ||||||||||||||
| Minesite sustaining capital expenditures | e | 524 | 454 | 523 | 978 | 943 | ||||||||||||||
| Sustaining leases | 9 | 7 | 6 | 16 | 15 | |||||||||||||||
| Rehabilitation - accretion and amortization (operating sites) | f | 15 | 14 | 13 | 29 | 24 | ||||||||||||||
| Non-controlling interest, copper operations and other | g | (197) | (159) | (221) | (356) | (397) | ||||||||||||||
| All-in sustaining costs | 1,357 | 1,306 | 1,259 | 2,663 | 2,414 | |||||||||||||||
| Global exploration and evaluation and project expense | d | 87 | 60 | 80 | 147 | 137 | ||||||||||||||
| Community relations costs not related to current operations | 1 | 0 | 0 | 1 | 0 | |||||||||||||||
| Project capital expenditures | e | 238 | 226 | 226 | 464 | 412 | ||||||||||||||
| Non-sustaining leases | 0 | 0 | 0 | 0 | 0 | |||||||||||||||
| Rehabilitation - accretion and amortization (non-operating sites) | f | 6 | 6 | 5 | 12 | 8 | ||||||||||||||
| Non-controlling interest and copper operations and other | g | (122) | (88) | (68) | (210) | (126) | ||||||||||||||
| All-in costs | 1,567 | 1,510 | 1,502 | 3,077 | 2,845 | |||||||||||||||
| Ounces sold - equity basis (000s ounces) | h | 1,001 | 954 | 1,040 | 1,955 | 2,033 | ||||||||||||||
| Cost of sales per ounce | i,j | 1,323 | 1,378 | 1,216 | 1,350 | 1,203 | ||||||||||||||
| Total cash costs per ounce | j | 963 | 986 | 855 | 974 | 844 | ||||||||||||||
| Total cash costs per ounce (on a co-product basis) | j,k | 1,003 | 1,030 | 887 | 1,016 | 878 | ||||||||||||||
| All-in sustaining costs per ounce | j | 1,355 | 1,370 | 1,212 | 1,362 | 1,188 | ||||||||||||||
| All-in sustaining costs per ounce (on a co-product basis) | j,k | 1,395 | 1,414 | 1,244 | 1,404 | 1,222 | ||||||||||||||
| All-in costs per ounce | j | 1,566 | 1,583 | 1,444 | 1,574 | 1,399 | ||||||||||||||
| All-in costs per ounce (on a co-product basis) | j,k | 1,606 | 1,627 | 1,476 | 1,616 | 1,433 | ||||||||||||||
BARRICK SECOND QUARTER 2023 |
61 |
MANAGEMENT'S DISCUSSION AND ANALYSIS | ||||||
| ($ millions) | For the three months ended | For the six months ended | |||||||||||||||
| Non-controlling interest, copper operations and other | 6/30/23 | 3/31/23 | 6/30/22 | 6/30/23 | 6/30/22 | ||||||||||||
| General & administrative costs | (5) | (6) | (5) | (11) | (18) | ||||||||||||
| Minesite exploration and evaluation expenses | (4) | (4) | (7) | (8) | (10) | ||||||||||||
| Rehabilitation - accretion and amortization (operating sites) | (5) | (5) | (4) | (10) | (7) | ||||||||||||
| Minesite sustaining capital expenditures | (183) | (144) | (205) | (327) | (362) | ||||||||||||
| All-in sustaining costs total | (197) | (159) | (221) | (356) | (397) | ||||||||||||
| Global exploration and evaluation and project expense | (37) | (12) | (11) | (49) | (15) | ||||||||||||
| Project capital expenditures | (85) | (76) | (57) | (161) | (111) | ||||||||||||
| All-in costs total | (122) | (88) | (68) | (210) | (126) | ||||||||||||
| ($ millions) | For the three months ended | For the six months ended | |||||||||||||||
| 6/30/23 | 3/31/23 | 6/30/22 | 6/30/23 | 6/30/22 | |||||||||||||
| By-product credits | 60 | 61 | 51 | 121 | 106 | ||||||||||||
| Non-controlling interest | (20) | (19) | (18) | (39) | (37) | ||||||||||||
| By-product credits (net of non-controlling interest) | 40 | 42 | 33 | 82 | 69 | ||||||||||||
BARRICK SECOND QUARTER 2023 |
62 |
MANAGEMENT'S DISCUSSION AND ANALYSIS | ||||||
| ($ millions, except per ounce information in dollars) | For the three months ended 6/30/23 | ||||||||||||||||||||||||||||
| Footnote | Carlin | Corteza |
Turquoise Ridge | Long Canyon | Phoenix | Nevada Gold Minesb |
Hemlo | North America | |||||||||||||||||||||
| Cost of sales applicable to gold production | 495 | 245 | 172 | 8 | 96 | 1,016 | 56 | 1,072 | |||||||||||||||||||||
| Depreciation | (91) | (67) | (43) | (5) | (18) | (224) | (7) | (231) | |||||||||||||||||||||
| By-product credits | 0 | (1) | (1) | 0 | (40) | (42) | 0 | (42) | |||||||||||||||||||||
| Non-recurring items | c | 0 | 0 | 0 | 0 | 0 | 0 | 0 | 0 | ||||||||||||||||||||
| Other | d | (3) | 0 | 0 | 0 | 7 | 4 | 0 | 4 | ||||||||||||||||||||
| Non-controlling interests | (155) | (68) | (50) | (1) | (18) | (292) | 0 | (292) | |||||||||||||||||||||
| Total cash costs | 246 | 109 | 78 | 2 | 27 | 462 | 49 | 511 | |||||||||||||||||||||
| General & administrative costs | 0 | 0 | 0 | 0 | 0 | 0 | 0 | 0 | |||||||||||||||||||||
| Minesite exploration and evaluation costs | e | 7 | 2 | 2 | 0 | 0 | 11 | 0 | 11 | ||||||||||||||||||||
| Minesite sustaining capital expenditures | f | 146 | 81 | 23 | 0 | 6 | 261 | 8 | 269 | ||||||||||||||||||||
| Sustaining capital leases | 0 | 0 | 0 | 0 | 1 | 1 | 0 | 1 | |||||||||||||||||||||
| Rehabilitation - accretion and amortization (operating sites) | g | 3 | 5 | 0 | 0 | 1 | 9 | 1 | 10 | ||||||||||||||||||||
| Non-controlling interests | (60) | (34) | (9) | 0 | (3) | (108) | 0 | (108) | |||||||||||||||||||||
| All-in sustaining costs | 342 | 163 | 94 | 2 | 32 | 636 | 58 | 694 | |||||||||||||||||||||
| Global exploration and evaluation and project expense | e | 0 | 0 | 0 | 0 | 0 | 0 | 0 | 0 | ||||||||||||||||||||
| Project capital expenditures | f | 0 | 30 | 1 | 0 | 0 | 74 | 1 | 75 | ||||||||||||||||||||
| Non-controlling interests | 0 | (12) | 0 | 0 | 0 | (29) | 0 | (29) | |||||||||||||||||||||
| All-in costs | 342 | 181 | 95 | 2 | 32 | 681 | 59 | 740 | |||||||||||||||||||||
| Ounces sold - equity basis (000s ounces) | 243 | 112 | 72 | 3 | 28 | 458 | 35 | 493 | |||||||||||||||||||||
| Cost of sales per ounce | h,i | 1,240 | 1,346 | 1,466 | 1,640 | 2,075 | 1,357 | 1,562 | 1,371 | ||||||||||||||||||||
| Total cash costs per ounce | i | 1,013 | 972 | 1,088 | 637 | 948 | 1,009 | 1,356 | 1,034 | ||||||||||||||||||||
| Total cash costs per ounce (on a co-product basis) | i,j | 1,014 | 976 | 1,098 | 640 | 1,676 | 1,057 | 1,361 | 1,079 | ||||||||||||||||||||
| All-in sustaining costs per ounce | i | 1,407 | 1,453 | 1,302 | 677 | 1,132 | 1,388 | 1,634 | 1,406 | ||||||||||||||||||||
| All-in sustaining costs per ounce (on a co-product basis) | i,j | 1,408 | 1,457 | 1,312 | 680 | 1,860 | 1,436 | 1,639 | 1,451 | ||||||||||||||||||||
| All-in costs per ounce | i | 1,407 | 1,618 | 1,310 | 677 | 1,132 | 1,489 | 1,666 | 1,502 | ||||||||||||||||||||
| All-in costs per ounce (on a co-product basis) | i,j | 1,408 | 1,622 | 1,320 | 680 | 1,860 | 1,537 | 1,671 | 1,547 | ||||||||||||||||||||
| ($ millions, except per ounce information in dollars) | For the three months ended 6/30/23 | |||||||||||||
| Footnote | Pueblo Viejo | Veladero | Latin America & Asia Pacific | |||||||||||
| Cost of sales applicable to gold production | 177 | 65 | 242 | |||||||||||
| Depreciation | (60) | (18) | (78) | |||||||||||
| By-product credits | (6) | (2) | (8) | |||||||||||
| Non-recurring items | c | 0 | 0 | 0 | ||||||||||
| Other | d | 0 | 0 | 0 | ||||||||||
| Non-controlling interests | (45) | 0 | (45) | |||||||||||
| Total cash costs | 66 | 45 | 111 | |||||||||||
| General & administrative costs | 0 | 0 | 0 | |||||||||||
| Minesite exploration and evaluation costs | e | 0 | 2 | 2 | ||||||||||
| Minesite sustaining capital expenditures | f | 48 | 25 | 73 | ||||||||||
| Sustaining capital leases | 0 | 0 | 0 | |||||||||||
| Rehabilitation - accretion and amortization (operating sites) | g | 2 | 1 | 3 | ||||||||||
| Non-controlling interests | (19) | 0 | (19) | |||||||||||
| All-in sustaining costs | 97 | 73 | 170 | |||||||||||
| Global exploration and evaluation and project expense | e | 0 | 0 | 0 | ||||||||||
| Project capital expenditures | f | 75 | 1 | 76 | ||||||||||
| Non-controlling interests | (30) | 0 | (30) | |||||||||||
| All-in costs | 142 | 74 | 216 | |||||||||||
| Ounces sold - equity basis (000s ounces) | 79 | 45 | 124 | |||||||||||
| Cost of sales per ounce | h,i | 1,344 | 1,424 | 1,390 | ||||||||||
| Total cash costs per ounce | i | 840 | 999 | 896 | ||||||||||
| Total cash costs per ounce (on a co-product basis) | i,j | 886 | 1,048 | 943 | ||||||||||
| All-in sustaining costs per ounce | i | 1,219 | 1,599 | 1,392 | ||||||||||
| All-in sustaining costs per ounce (on a co-product basis) | i,j | 1,265 | 1,648 | 1,439 | ||||||||||
| All-in costs per ounce | i | 1,788 | 1,614 | 1,818 | ||||||||||
| All-in costs per ounce (on a co-product basis) | i,j | 1,834 | 1,663 | 1,865 | ||||||||||
BARRICK SECOND QUARTER 2023 |
63 |
MANAGEMENT'S DISCUSSION AND ANALYSIS | ||||||
| ($ millions, except per ounce information in dollars) | For the three months ended 6/30/23 | ||||||||||||||||||||||
| Footnote | Loulo-Gounkoto | Kibali | North Mara | Tongon | Bulyanhulu | Africa & Middle East | |||||||||||||||||
| Cost of sales applicable to gold production | 199 | 111 | 91 | 76 | 71 | 548 | |||||||||||||||||
| Depreciation | (60) | (41) | (19) | (7) | (15) | (142) | |||||||||||||||||
| By-product credits | 0 | (1) | 0 | 0 | (6) | (7) | |||||||||||||||||
| Non-recurring items | c | 0 | 0 | 0 | 0 | 0 | 0 | ||||||||||||||||
| Other | d | 0 | 0 | 0 | 0 | 0 | 0 | ||||||||||||||||
| Non-controlling interests | (28) | 0 | (12) | (7) | (9) | (56) | |||||||||||||||||
| Total cash costs | 111 | 69 | 60 | 62 | 41 | 343 | |||||||||||||||||
| General & administrative costs | 0 | 0 | 0 | 0 | 0 | 0 | |||||||||||||||||
| Minesite exploration and evaluation costs | e | 0 | 0 | 0 | 0 | 0 | 0 | ||||||||||||||||
| Minesite sustaining capital expenditures | f | 76 | 10 | 30 | 5 | 14 | 135 | ||||||||||||||||
| Sustaining capital leases | 1 | 3 | 0 | 1 | 0 | 5 | |||||||||||||||||
| Rehabilitation - accretion and amortization (operating sites) | g | 1 | 0 | 2 | 0 | 1 | 4 | ||||||||||||||||
| Non-controlling interests | (16) | 0 | (5) | (1) | (3) | (25) | |||||||||||||||||
| All-in sustaining costs | 173 | 82 | 87 | 67 | 53 | 462 | |||||||||||||||||
| Global exploration and evaluation and project expense | e | 0 | 0 | 0 | 0 | 0 | 0 | ||||||||||||||||
| Project capital expenditures | f | 16 | 8 | 19 | 0 | 9 | 52 | ||||||||||||||||
| Non-controlling interests | (3) | 0 | (3) | 0 | (1) | (7) | |||||||||||||||||
| All-in costs | 186 | 90 | 103 | 67 | 61 | 507 | |||||||||||||||||
| Ounces sold - equity basis (000s ounces) | 140 | 87 | 64 | 45 | 48 | 384 | |||||||||||||||||
| Cost of sales per ounce | h,i | 1,150 | 1,269 | 1,208 | 1,514 | 1,231 | 1,239 | ||||||||||||||||
| Total cash costs per ounce | i | 801 | 797 | 942 | 1,380 | 850 | 898 | ||||||||||||||||
| Total cash costs per ounce (on a co-product basis) | i,j | 801 | 801 | 949 | 1,384 | 960 | 915 | ||||||||||||||||
| All-in sustaining costs per ounce | i | 1,245 | 955 | 1,355 | 1,465 | 1,105 | 1,206 | ||||||||||||||||
| All-in sustaining costs per ounce (on a co-product basis) | i,j | 1,245 | 959 | 1,362 | 1,469 | 1,215 | 1,223 | ||||||||||||||||
| All-in costs per ounce | i | 1,335 | 1,043 | 1,606 | 1,465 | 1,273 | 1,321 | ||||||||||||||||
| All-in costs per ounce (on a co-product basis) | i,j | 1,335 | 1,047 | 1,613 | 1,469 | 1,383 | 1,338 | ||||||||||||||||
| ($ millions, except per ounce information in dollars) | For the three months ended 3/31/23 | ||||||||||||||||||||||||||||
| Footnote | Carlin | Corteza |
Turquoise Ridge | Long Canyon | Phoenix | Nevada Gold Minesb |
Hemlo | North America | |||||||||||||||||||||
| Cost of sales applicable to gold production | 393 | 295 | 189 | 6 | 99 | 982 | 59 | 1,041 | |||||||||||||||||||||
| Depreciation | (63) | (91) | (50) | (4) | (19) | (227) | (8) | (235) | |||||||||||||||||||||
| By-product credits | (1) | (1) | (1) | 0 | (38) | (41) | 0 | (41) | |||||||||||||||||||||
| Non-recurring items | c | 0 | 0 | 0 | 0 | 0 | 0 | 0 | 0 | ||||||||||||||||||||
| Other | d | (5) | 0 | 0 | 0 | 7 | 2 | 0 | 2 | ||||||||||||||||||||
| Non-controlling interests | (125) | (78) | (53) | (1) | (18) | (275) | 0 | (275) | |||||||||||||||||||||
| Total cash costs | 199 | 125 | 85 | 1 | 31 | 441 | 51 | 492 | |||||||||||||||||||||
| General & administrative costs | 0 | 0 | 0 | 0 | 0 | 0 | 0 | 0 | |||||||||||||||||||||
| Minesite exploration and evaluation costs | e | 8 | 0 | 1 | 0 | 0 | 10 | 0 | 10 | ||||||||||||||||||||
| Minesite sustaining capital expenditures | f | 116 | 67 | 30 | 0 | 6 | 224 | 12 | 236 | ||||||||||||||||||||
| Sustaining capital leases | 0 | 0 | 0 | 0 | 0 | 0 | 1 | 1 | |||||||||||||||||||||
| Rehabilitation - accretion and amortization (operating sites) | g | 3 | 4 | 1 | 0 | 1 | 9 | 0 | 9 | ||||||||||||||||||||
| Non-controlling interests | (49) | (27) | (13) | 0 | (3) | (94) | 0 | (94) | |||||||||||||||||||||
| All-in sustaining costs | 277 | 169 | 104 | 1 | 35 | 590 | 64 | 654 | |||||||||||||||||||||
| Global exploration and evaluation and project expense | e | 0 | 0 | 0 | 0 | 0 | 0 | 0 | 0 | ||||||||||||||||||||
| Project capital expenditures | f | 0 | 24 | 5 | 0 | 0 | 53 | 0 | 53 | ||||||||||||||||||||
| Non-controlling interests | 0 | (9) | (2) | 0 | 0 | (20) | 0 | (20) | |||||||||||||||||||||
| All-in costs | 277 | 184 | 107 | 1 | 35 | 623 | 64 | 687 | |||||||||||||||||||||
| Ounces sold - equity basis (000s ounces) | 164 | 137 | 82 | 2 | 26 | 411 | 40 | 451 | |||||||||||||||||||||
| Cost of sales per ounce | h,i | 1,449 | 1,324 | 1,412 | 1,621 | 2,380 | 1,461 | 1,486 | 1,463 | ||||||||||||||||||||
| Total cash costs per ounce | i | 1,215 | 913 | 1,034 | 579 | 1,198 | 1,074 | 1,291 | 1,093 | ||||||||||||||||||||
| Total cash costs per ounce (on a co-product basis) | i,j | 1,218 | 916 | 1,041 | 579 | 1,930 | 1,124 | 1,296 | 1,139 | ||||||||||||||||||||
| All-in sustaining costs per ounce | i | 1,689 | 1,233 | 1,271 | 629 | 1,365 | 1,436 | 1,609 | 1,451 | ||||||||||||||||||||
| All-in sustaining costs per ounce (on a co-product basis) | i,j | 1,692 | 1,236 | 1,278 | 629 | 2,097 | 1,486 | 1,614 | 1,497 | ||||||||||||||||||||
| All-in costs per ounce | i | 1,689 | 1,340 | 1,306 | 629 | 1,365 | 1,514 | 1,610 | 1,522 | ||||||||||||||||||||
| All-in costs per ounce (on a co-product basis) | i,j | 1,692 | 1,343 | 1,313 | 629 | 2,097 | 1,564 | 1,615 | 1,568 | ||||||||||||||||||||
BARRICK SECOND QUARTER 2023 |
64 |
MANAGEMENT'S DISCUSSION AND ANALYSIS | ||||||
| ($ millions, except per ounce information in dollars) | For the three months ended 3/31/23 | |||||||||||||
| Footnote | Pueblo Viejo | Veladero | Latin America & Asia Pacific | |||||||||||
| Cost of sales applicable to gold production | 184 | 70 | 254 | |||||||||||
| Depreciation | (64) | (22) | (86) | |||||||||||
| By-product credits | (12) | (2) | (14) | |||||||||||
| Non-recurring items | c | 0 | 0 | 0 | ||||||||||
| Other | d | 0 | 0 | 0 | ||||||||||
| Non-controlling interests | (44) | 0 | (44) | |||||||||||
| Total cash costs | 64 | 46 | 110 | |||||||||||
| General & administrative costs | 0 | 0 | 0 | |||||||||||
| Minesite exploration and evaluation costs | e | 0 | 1 | 1 | ||||||||||
| Minesite sustaining capital expenditures | f | 52 | 30 | 82 | ||||||||||
| Sustaining capital leases | 0 | 1 | 1 | |||||||||||
| Rehabilitation - accretion and amortization (operating sites) | g | 1 | 0 | 1 | ||||||||||
| Non-controlling interests | (21) | 0 | (21) | |||||||||||
| All-in sustaining costs | 96 | 78 | 174 | |||||||||||
| Global exploration and evaluation and project expense | e | 0 | 0 | 0 | ||||||||||
| Project capital expenditures | f | 61 | 6 | 67 | ||||||||||
| Non-controlling interests | (24) | 0 | (24) | |||||||||||
| All-in costs | 133 | 84 | 217 | |||||||||||
| Ounces sold - equity basis (000s ounces) | 90 | 44 | 134 | |||||||||||
| Cost of sales per ounce | h,i | 1,241 | 1,587 | 1,377 | ||||||||||
| Total cash costs per ounce | i | 714 | 1,035 | 819 | ||||||||||
| Total cash costs per ounce (on a co-product basis) | i,j | 808 | 1,074 | 895 | ||||||||||
| All-in sustaining costs per ounce | i | 1,073 | 1,761 | 1,304 | ||||||||||
| All-in sustaining costs per ounce (on a co-product basis) | i,j | 1,167 | 1,800 | 1,380 | ||||||||||
| All-in costs per ounce | i | 1,481 | 1,910 | 1,661 | ||||||||||
| All-in costs per ounce (on a co-product basis) | i,j | 1,575 | 1,949 | 1,737 | ||||||||||
| ($ millions, except per ounce information in dollars) | For the three months ended 3/31/23 | ||||||||||||||||||||||
| Footnote | Loulo-Gounkoto | Kibali | North Mara | Tongon | Bulyanhulu | Africa & Middle East | |||||||||||||||||
| Cost of sales applicable to gold production | 215 | 91 | 83 | 83 | 74 | 546 | |||||||||||||||||
| Depreciation | (71) | (25) | (19) | (15) | (16) | (146) | |||||||||||||||||
| By-product credits | 0 | 0 | (1) | 0 | (5) | (6) | |||||||||||||||||
| Non-recurring items | c | 0 | 0 | 0 | 0 | 0 | 0 | ||||||||||||||||
| Other | d | 0 | 0 | 0 | 0 | 0 | 0 | ||||||||||||||||
| Non-controlling interests | (29) | 0 | (10) | (7) | (8) | (54) | |||||||||||||||||
| Total cash costs | 115 | 66 | 53 | 61 | 45 | 340 | |||||||||||||||||
| General & administrative costs | 0 | 0 | 0 | 0 | 0 | 0 | |||||||||||||||||
| Minesite exploration and evaluation costs | e | 0 | 0 | 0 | 0 | 0 | 0 | ||||||||||||||||
| Minesite sustaining capital expenditures | f | 55 | 12 | 30 | 4 | 19 | 120 | ||||||||||||||||
| Sustaining capital leases | 1 | 0 | 0 | 0 | 0 | 1 | |||||||||||||||||
| Rehabilitation - accretion and amortization (operating sites) | g | 0 | 0 | 1 | 1 | 0 | 2 | ||||||||||||||||
| Non-controlling interests | (11) | 0 | (5) | 0 | (3) | (19) | |||||||||||||||||
| All-in sustaining costs | 160 | 78 | 79 | 66 | 61 | 444 | |||||||||||||||||
| Global exploration and evaluation and project expense | e | 0 | 0 | 0 | 0 | 0 | 0 | ||||||||||||||||
| Project capital expenditures | f | 49 | 7 | 12 | 0 | 5 | 73 | ||||||||||||||||
| Non-controlling interests | (10) | 0 | (2) | 0 | (1) | (13) | |||||||||||||||||
| All-in costs | 199 | 85 | 89 | 66 | 65 | 504 | |||||||||||||||||
| Ounces sold - equity basis (000s ounces) | 134 | 67 | 70 | 52 | 46 | 369 | |||||||||||||||||
| Cost of sales per ounce | h,i | 1,275 | 1,367 | 987 | 1,453 | 1,358 | 1,272 | ||||||||||||||||
| Total cash costs per ounce | i | 855 | 987 | 759 | 1,182 | 982 | 922 | ||||||||||||||||
| Total cash costs per ounce (on a co-product basis) | i,j | 855 | 993 | 765 | 1,185 | 1,070 | 936 | ||||||||||||||||
| All-in sustaining costs per ounce | i | 1,190 | 1,177 | 1,137 | 1,284 | 1,332 | 1,208 | ||||||||||||||||
| All-in sustaining costs per ounce (on a co-product basis) | i,j | 1,190 | 1,183 | 1,143 | 1,287 | 1,420 | 1,222 | ||||||||||||||||
| All-in costs per ounce | i | 1,485 | 1,289 | 1,278 | 1,284 | 1,423 | 1,374 | ||||||||||||||||
| All-in costs per ounce (on a co-product basis) | i,j | 1,485 | 1,295 | 1,284 | 1,287 | 1,511 | 1,388 | ||||||||||||||||
BARRICK SECOND QUARTER 2023 |
65 |
MANAGEMENT'S DISCUSSION AND ANALYSIS | ||||||
| ($ millions, except per ounce information in dollars) | For the three months ended 6/30/22 | ||||||||||||||||||||||||||||
| Footnote | Carlin | Corteza |
Turquoise Ridge | Long Canyon | Phoenix | Nevada Gold Minesb |
Hemlo | North America | |||||||||||||||||||||
| Cost of sales applicable to gold production | 451 | 179 | 161 | 42 | 84 | 917 | 60 | 977 | |||||||||||||||||||||
| Depreciation | (80) | (48) | (44) | (27) | (19) | (218) | (7) | (225) | |||||||||||||||||||||
| By-product credits | 0 | (1) | (1) | 0 | (30) | (32) | 0 | (32) | |||||||||||||||||||||
| Non-recurring items | c | 0 | 0 | 0 | 0 | 0 | 0 | 0 | 0 | ||||||||||||||||||||
| Other | d | (24) | 0 | 0 | 0 | 1 | (23) | 0 | (23) | ||||||||||||||||||||
| Non-controlling interests | (134) | (50) | (45) | (6) | (14) | (249) | 0 | (249) | |||||||||||||||||||||
| Total cash costs | 213 | 80 | 71 | 9 | 22 | 395 | 53 | 448 | |||||||||||||||||||||
| General & administrative costs | 0 | 0 | 0 | 0 | 0 | 0 | 0 | 0 | |||||||||||||||||||||
| Minesite exploration and evaluation costs | e | 5 | 3 | 4 | 0 | 0 | 13 | 1 | 14 | ||||||||||||||||||||
| Minesite sustaining capital expenditures | f | 124 | 100 | 29 | 0 | 8 | 266 | 9 | 275 | ||||||||||||||||||||
| Sustaining capital leases | 1 | 0 | 0 | 0 | 0 | 1 | 0 | 1 | |||||||||||||||||||||
| Rehabilitation - accretion and amortization (operating sites) | g | 3 | 2 | 1 | 1 | 1 | 8 | 1 | 9 | ||||||||||||||||||||
| Non-controlling interests | (51) | (40) | (13) | 0 | (3) | (108) | 0 | (108) | |||||||||||||||||||||
| All-in sustaining costs | 295 | 145 | 92 | 10 | 28 | 575 | 64 | 639 | |||||||||||||||||||||
| Global exploration and evaluation and project expense | e | 0 | 0 | 0 | 0 | 0 | 0 | 0 | 0 | ||||||||||||||||||||
| Project capital expenditures | f | 0 | 24 | 11 | 0 | 0 | 39 | 0 | 39 | ||||||||||||||||||||
| Non-controlling interests | 0 | (9) | (4) | 0 | 0 | (15) | 0 | (15) | |||||||||||||||||||||
| All-in costs | 295 | 160 | 99 | 10 | 28 | 599 | 64 | 663 | |||||||||||||||||||||
| Ounces sold - equity basis (000s ounces) | 246 | 95 | 76 | 21 | 25 | 463 | 36 | 499 | |||||||||||||||||||||
| Cost of sales per ounce | h,i | 1,042 | 1,168 | 1,289 | 1,280 | 2,114 | 1,171 | 1,698 | 1,208 | ||||||||||||||||||||
| Total cash costs per ounce | i | 862 | 850 | 928 | 450 | 895 | 856 | 1,489 | 901 | ||||||||||||||||||||
| Total cash costs per ounce (on a co-product basis) | i,j | 863 | 853 | 932 | 451 | 1,644 | 897 | 1,494 | 940 | ||||||||||||||||||||
| All-in sustaining costs per ounce | i | 1,192 | 1,538 | 1,195 | 459 | 1,152 | 1,238 | 1,804 | 1,278 | ||||||||||||||||||||
| All-in sustaining costs per ounce (on a co-product basis) | i,j | 1,193 | 1,541 | 1,199 | 460 | 1,901 | 1,279 | 1,809 | 1,317 | ||||||||||||||||||||
| All-in costs per ounce | i | 1,192 | 1,692 | 1,284 | 459 | 1,152 | 1,288 | 1,805 | 1,325 | ||||||||||||||||||||
| All-in costs per ounce (on a co-product basis) | i,j | 1,193 | 1,695 | 1,288 | 460 | 1,901 | 1,329 | 1,810 | 1,364 | ||||||||||||||||||||
| ($ millions, except per ounce information in dollars) | For the three months ended 6/30/22 | |||||||||||||
| Footnote | Pueblo Viejo | Veladero | Latin America & Asia Pacific | |||||||||||
| Cost of sales applicable to gold production | 196 | 86 | 282 | |||||||||||
| Depreciation | (60) | (31) | (91) | |||||||||||
| By-product credits | (12) | (1) | (13) | |||||||||||
| Non-recurring items | c | 0 | 0 | 0 | ||||||||||
| Other | d | 0 | 0 | 0 | ||||||||||
| Non-controlling interests | (50) | 0 | (50) | |||||||||||
| Total cash costs | 74 | 54 | 128 | |||||||||||
| General & administrative costs | 0 | 0 | 0 | |||||||||||
| Minesite exploration and evaluation costs | e | 0 | 1 | 1 | ||||||||||
| Minesite sustaining capital expenditures | f | 49 | 36 | 85 | ||||||||||
| Sustaining capital leases | 0 | 1 | 1 | |||||||||||
| Rehabilitation - accretion and amortization (operating sites) | g | 2 | 0 | 2 | ||||||||||
| Non-controlling interests | (21) | 0 | (21) | |||||||||||
| All-in sustaining costs | 104 | 92 | 196 | |||||||||||
| Global exploration and evaluation and project expense | e | 1 | 0 | 1 | ||||||||||
| Project capital expenditures | f | 87 | 10 | 97 | ||||||||||
| Non-controlling interests | (35) | 0 | (35) | |||||||||||
| All-in costs | 157 | 102 | 259 | |||||||||||
| Ounces sold - equity basis (000s ounces) | 102 | 63 | 165 | |||||||||||
| Cost of sales per ounce | h,i | 1,154 | 1,369 | 1,250 | ||||||||||
| Total cash costs per ounce | i | 724 | 861 | 775 | ||||||||||
| Total cash costs per ounce (on a co-product basis) | i,j | 796 | 879 | 826 | ||||||||||
| All-in sustaining costs per ounce | i | 1,024 | 1,461 | 1,192 | ||||||||||
| All-in sustaining costs per ounce (on a co-product basis) | i,j | 1,096 | 1,479 | 1,243 | ||||||||||
| All-in costs per ounce | i | 1,536 | 1,627 | 1,579 | ||||||||||
| All-in costs per ounce (on a co-product basis) | i,j | 1,608 | 1,645 | 1,630 | ||||||||||
BARRICK SECOND QUARTER 2023 |
66 |
MANAGEMENT'S DISCUSSION AND ANALYSIS | ||||||
| ($ millions, except per ounce information in dollars) | For the three months ended 6/30/22 | ||||||||||||||||||||||
| Footnote | Loulo-Gounkoto | Kibali | North Mara | Tongon | Bulyanhulu | Africa & Middle East | |||||||||||||||||
| Cost of sales applicable to gold production | 193 | 90 | 83 | 91 | 71 | 528 | |||||||||||||||||
| Depreciation | (64) | (33) | (23) | (21) | (14) | (155) | |||||||||||||||||
| By-product credits | 0 | (1) | (1) | 0 | (6) | (8) | |||||||||||||||||
| Non-recurring items | c | 0 | 0 | 0 | 0 | 0 | 0 | ||||||||||||||||
| Other | d | 0 | 0 | 0 | 0 | 0 | 0 | ||||||||||||||||
| Non-controlling interests | (25) | 0 | (10) | (7) | (8) | (50) | |||||||||||||||||
| Total cash costs | 104 | 56 | 49 | 63 | 43 | 315 | |||||||||||||||||
| General & administrative costs | 0 | 0 | 0 | 0 | 0 | 0 | |||||||||||||||||
| Minesite exploration and evaluation costs | e | 1 | 3 | 1 | 1 | 0 | 6 | ||||||||||||||||
| Minesite sustaining capital expenditures | f | 48 | 14 | 13 | 2 | 15 | 92 | ||||||||||||||||
| Sustaining capital leases | 0 | 0 | 0 | 1 | 0 | 1 | |||||||||||||||||
| Rehabilitation - accretion and amortization (operating sites) | g | 1 | 0 | 2 | 1 | 1 | 5 | ||||||||||||||||
| Non-controlling interests | (10) | 0 | (2) | (1) | (2) | (15) | |||||||||||||||||
| All-in sustaining costs | 144 | 73 | 63 | 67 | 57 | 404 | |||||||||||||||||
| Global exploration and evaluation and project expense | e | 0 | 0 | 0 | 0 | 0 | 0 | ||||||||||||||||
| Project capital expenditures | f | 34 | 6 | 27 | 1 | 12 | 80 | ||||||||||||||||
| Non-controlling interests | (7) | 0 | (4) | 0 | (2) | (13) | |||||||||||||||||
| All-in costs | 171 | 79 | 86 | 68 | 67 | 471 | |||||||||||||||||
| Ounces sold - equity basis (000s ounces) | 141 | 77 | 67 | 40 | 51 | 376 | |||||||||||||||||
| Cost of sales per ounce | h,i | 1,093 | 1,164 | 1,060 | 2,025 | 1,163 | 1,211 | ||||||||||||||||
| Total cash costs per ounce | i | 730 | 738 | 756 | 1,558 | 836 | 839 | ||||||||||||||||
| Total cash costs per ounce (on a co-product basis) | i,j | 730 | 742 | 762 | 1,561 | 930 | 854 | ||||||||||||||||
| All-in sustaining costs per ounce | i | 1,013 | 946 | 957 | 1,655 | 1,094 | 1,069 | ||||||||||||||||
| All-in sustaining costs per ounce (on a co-product basis) | i,j | 1,013 | 950 | 963 | 1,658 | 1,188 | 1,084 | ||||||||||||||||
| All-in costs per ounce | i | 1,205 | 1,027 | 1,301 | 1,673 | 1,292 | 1,247 | ||||||||||||||||
| All-in costs per ounce (on a co-product basis) | i,j | 1,205 | 1,031 | 1,307 | 1,676 | 1,386 | 1,262 | ||||||||||||||||
| ($ millions, except per ounce information in dollars) | For the six months ended 6/30/23 | ||||||||||||||||||||||||||||
| Footnote | Carlin | Corteza |
Turquoise Ridge | Long Canyon | Phoenix | Nevada Gold Minesb |
Hemlo | North America | |||||||||||||||||||||
| Cost of sales applicable to gold production | 888 | 540 | 361 | 14 | 195 | 1,998 | 115 | 2,113 | |||||||||||||||||||||
| Depreciation | (154) | (158) | (93) | (9) | (37) | (451) | (15) | (466) | |||||||||||||||||||||
| By-product credits | (1) | (2) | (2) | 0 | (78) | (83) | 0 | (83) | |||||||||||||||||||||
| Non-recurring items | c | 0 | 0 | 0 | 0 | 0 | 0 | 0 | 0 | ||||||||||||||||||||
| Other | d | (8) | 0 | 0 | 0 | 14 | 6 | 0 | 6 | ||||||||||||||||||||
| Non-controlling interests | (280) | (146) | (103) | (2) | (36) | (567) | 0 | (567) | |||||||||||||||||||||
| Total cash costs | 445 | 234 | 163 | 3 | 58 | 903 | 100 | 1,003 | |||||||||||||||||||||
| General & administrative costs | 0 | 0 | 0 | 0 | 0 | 0 | 0 | 0 | |||||||||||||||||||||
| Minesite exploration and evaluation costs | e | 15 | 2 | 3 | 0 | 0 | 21 | 0 | 21 | ||||||||||||||||||||
| Minesite sustaining capital expenditures | f | 262 | 148 | 53 | 0 | 12 | 485 | 20 | 505 | ||||||||||||||||||||
| Sustaining capital leases | 0 | 0 | 0 | 0 | 1 | 1 | 1 | 2 | |||||||||||||||||||||
| Rehabilitation - accretion and amortization (operating sites) | g | 6 | 9 | 1 | 0 | 2 | 18 | 1 | 19 | ||||||||||||||||||||
| Non-controlling interests | (109) | (61) | (22) | 0 | (6) | (202) | 0 | (202) | |||||||||||||||||||||
| All-in sustaining costs | 619 | 332 | 198 | 3 | 67 | 1,226 | 122 | 1,348 | |||||||||||||||||||||
| Global exploration and evaluation and project expense | e | 0 | 0 | 0 | 0 | 0 | 0 | 0 | 0 | ||||||||||||||||||||
| Project capital expenditures | f | 0 | 54 | 6 | 0 | 0 | 127 | 1 | 128 | ||||||||||||||||||||
| Non-controlling interests | 0 | (21) | (2) | 0 | 0 | (49) | 0 | (49) | |||||||||||||||||||||
| All-in costs | 619 | 365 | 202 | 3 | 67 | 1,304 | 123 | 1,427 | |||||||||||||||||||||
| Ounces sold - equity basis (000s ounces) | 407 | 249 | 154 | 5 | 54 | 869 | 75 | 944 | |||||||||||||||||||||
| Cost of sales per ounce | h,i | 1,325 | 1,334 | 1,438 | 1,632 | 2,221 | 1,406 | 1,521 | 1,415 | ||||||||||||||||||||
| Total cash costs per ounce | i | 1,094 | 940 | 1,059 | 611 | 1,068 | 1,040 | 1,322 | 1,062 | ||||||||||||||||||||
| Total cash costs per ounce (on a co-product basis) | i,j | 1,096 | 944 | 1,068 | 613 | 1,798 | 1,089 | 1,327 | 1,107 | ||||||||||||||||||||
| All-in sustaining costs per ounce | i | 1,521 | 1,332 | 1,286 | 656 | 1,244 | 1,411 | 1,621 | 1,427 | ||||||||||||||||||||
| All-in sustaining costs per ounce (on a co-product basis) | i,j | 1,523 | 1,336 | 1,295 | 658 | 1,974 | 1,460 | 1,626 | 1,472 | ||||||||||||||||||||
| All-in costs per ounce | i | 1,521 | 1,465 | 1,308 | 656 | 1,244 | 1,501 | 1,637 | 1,512 | ||||||||||||||||||||
| All-in costs per ounce (on a co-product basis) | i,j | 1,523 | 1,469 | 1,317 | 658 | 1,974 | 1,550 | 1,642 | 1,557 | ||||||||||||||||||||
BARRICK SECOND QUARTER 2023 |
67 |
MANAGEMENT'S DISCUSSION AND ANALYSIS | ||||||
| ($ millions, except per ounce information in dollars) | For the six months ended 6/30/23 | |||||||||||||
| Footnote | Pueblo Viejo | Veladero | Latin America & Asia Pacific | |||||||||||
| Cost of sales applicable to gold production | 361 | 135 | 496 | |||||||||||
| Depreciation | (124) | (40) | (164) | |||||||||||
| By-product credits | (18) | (4) | (22) | |||||||||||
| Non-recurring items | c | 0 | 0 | 0 | ||||||||||
| Other | d | 0 | 0 | 0 | ||||||||||
| Non-controlling interests | (89) | 0 | (89) | |||||||||||
| Total cash costs | 130 | 91 | 221 | |||||||||||
| General & administrative costs | 0 | 0 | 0 | |||||||||||
| Minesite exploration and evaluation costs | e | 0 | 3 | 3 | ||||||||||
| Minesite sustaining capital expenditures | f | 100 | 55 | 155 | ||||||||||
| Sustaining capital leases | 0 | 1 | 1 | |||||||||||
| Rehabilitation - accretion and amortization (operating sites) | g | 3 | 1 | 4 | ||||||||||
| Non-controlling interests | (40) | 0 | (40) | |||||||||||
| All-in sustaining costs | 193 | 151 | 344 | |||||||||||
| Global exploration and evaluation and project expense | e | 0 | 0 | 0 | ||||||||||
| Project capital expenditures | f | 136 | 7 | 143 | ||||||||||
| Non-controlling interests | (54) | 0 | (54) | |||||||||||
| All-in costs | 275 | 158 | 433 | |||||||||||
| Ounces sold - equity basis (000s ounces) | 169 | 89 | 258 | |||||||||||
| Cost of sales per ounce | h,i | 1,289 | 1,504 | 1,383 | ||||||||||
| Total cash costs per ounce | i | 772 | 1,017 | 856 | ||||||||||
| Total cash costs per ounce (on a co-product basis) | i,j | 844 | 1,061 | 918 | ||||||||||
| All-in sustaining costs per ounce | i | 1,141 | 1,678 | 1,346 | ||||||||||
| All-in sustaining costs per ounce (on a co-product basis) | i,j | 1,213 | 1,722 | 1,408 | ||||||||||
| All-in costs per ounce | i | 1,625 | 1,760 | 1,736 | ||||||||||
| All-in costs per ounce (on a co-product basis) | i,j | 1,697 | 1,804 | 1,798 | ||||||||||
| ($ millions, except per ounce information in dollars) | For the six months ended 6/30/23 | ||||||||||||||||||||||
| Footnote | Loulo-Gounkoto | Kibali | North Mara | Tongon | Bulyanhulu | Africa & Middle East | |||||||||||||||||
| Cost of sales applicable to gold production | 414 | 202 | 174 | 159 | 145 | 1,094 | |||||||||||||||||
| Depreciation | (131) | (66) | (38) | (22) | (31) | (288) | |||||||||||||||||
| By-product credits | 0 | (1) | (1) | 0 | (11) | (13) | |||||||||||||||||
| Non-recurring items | c | 0 | 0 | 0 | 0 | 0 | 0 | ||||||||||||||||
| Other | d | 0 | 0 | 0 | 0 | 0 | 0 | ||||||||||||||||
| Non-controlling interests | (57) | 0 | (22) | (14) | (17) | (110) | |||||||||||||||||
| Total cash costs | 226 | 135 | 113 | 123 | 86 | 683 | |||||||||||||||||
| General & administrative costs | 0 | 0 | 0 | 0 | 0 | 0 | |||||||||||||||||
| Minesite exploration and evaluation costs | e | 0 | 0 | 0 | 0 | 0 | 0 | ||||||||||||||||
| Minesite sustaining capital expenditures | f | 131 | 22 | 60 | 9 | 33 | 255 | ||||||||||||||||
| Sustaining capital leases | 2 | 3 | 0 | 1 | 0 | 6 | |||||||||||||||||
| Rehabilitation - accretion and amortization (operating sites) | g | 1 | 0 | 3 | 1 | 1 | 6 | ||||||||||||||||
| Non-controlling interests | (27) | 0 | (10) | (1) | (6) | (44) | |||||||||||||||||
| All-in sustaining costs | 333 | 160 | 166 | 133 | 114 | 906 | |||||||||||||||||
| Global exploration and evaluation and project expense | e | 0 | 0 | 0 | 0 | 0 | 0 | ||||||||||||||||
| Project capital expenditures | f | 65 | 15 | 31 | 0 | 14 | 125 | ||||||||||||||||
| Non-controlling interests | (13) | 0 | (5) | 0 | (2) | (20) | |||||||||||||||||
| All-in costs | 385 | 175 | 192 | 133 | 126 | 1,011 | |||||||||||||||||
| Ounces sold - equity basis (000s ounces) | 274 | 154 | 134 | 97 | 94 | 753 | |||||||||||||||||
| Cost of sales per ounce | h,i | 1,211 | 1,311 | 1,092 | 1,481 | 1,293 | 1,255 | ||||||||||||||||
| Total cash costs per ounce | i | 827 | 879 | 846 | 1,275 | 914 | 910 | ||||||||||||||||
| Total cash costs per ounce (on a co-product basis) | i,j | 827 | 884 | 853 | 1,278 | 1,014 | 925 | ||||||||||||||||
| All-in sustaining costs per ounce | i | 1,218 | 1,052 | 1,240 | 1,369 | 1,215 | 1,207 | ||||||||||||||||
| All-in sustaining costs per ounce (on a co-product basis) | i,j | 1,218 | 1,057 | 1,247 | 1,372 | 1,315 | 1,222 | ||||||||||||||||
| All-in costs per ounce | i | 1,409 | 1,150 | 1,434 | 1,369 | 1,346 | 1,347 | ||||||||||||||||
| All-in costs per ounce (on a co-product basis) | i,j | 1,409 | 1,155 | 1,441 | 1,372 | 1,446 | 1,362 | ||||||||||||||||
BARRICK SECOND QUARTER 2023 |
68 |
MANAGEMENT'S DISCUSSION AND ANALYSIS | ||||||
| ($ millions, except per ounce information in dollars) | For the six months ended 6/30/22 | ||||||||||||||||||||||||||||
| Footnote | Carlin | Corteza |
Turquoise Ridge | Long Canyon | Phoenix | Nevada Gold Minesb |
Hemlo | North America | |||||||||||||||||||||
| Cost of sales applicable to gold production | 830 | 393 | 310 | 87 | 163 | 1,783 | 114 | 1,897 | |||||||||||||||||||||
| Depreciation | (149) | (110) | (86) | (58) | (37) | (440) | (14) | (454) | |||||||||||||||||||||
| By-product credits | 0 | (2) | (1) | 0 | (64) | (67) | 0 | (67) | |||||||||||||||||||||
| Non-recurring items | c | 0 | 0 | 0 | 0 | 0 | 0 | 0 | 0 | ||||||||||||||||||||
| Other | d | (24) | 0 | 0 | 0 | 3 | (21) | 0 | (21) | ||||||||||||||||||||
| Non-controlling interests | (253) | (108) | (86) | (11) | (25) | (483) | 0 | (483) | |||||||||||||||||||||
| Total cash costs | 404 | 173 | 137 | 18 | 40 | 772 | 100 | 872 | |||||||||||||||||||||
| General & administrative costs | 0 | 0 | 0 | 0 | 0 | 0 | 0 | 0 | |||||||||||||||||||||
| Minesite exploration and evaluation costs | e | 7 | 6 | 4 | 0 | 0 | 18 | 2 | 20 | ||||||||||||||||||||
| Minesite sustaining capital expenditures | f | 235 | 166 | 55 | 0 | 13 | 475 | 22 | 497 | ||||||||||||||||||||
| Sustaining capital leases | 1 | 0 | 0 | 0 | 1 | 3 | 1 | 4 | |||||||||||||||||||||
| Rehabilitation - accretion and amortization (operating sites) | g | 5 | 4 | 1 | 1 | 2 | 13 | 1 | 14 | ||||||||||||||||||||
| Non-controlling interests | (96) | (68) | (23) | 0 | (6) | (195) | 0 | (195) | |||||||||||||||||||||
| All-in sustaining costs | 556 | 281 | 174 | 19 | 50 | 1,086 | 126 | 1,212 | |||||||||||||||||||||
| Global exploration and evaluation and project expense | e | 0 | 0 | 0 | 0 | 0 | 0 | 0 | 0 | ||||||||||||||||||||
| Project capital expenditures | f | 0 | 44 | 21 | 0 | 0 | 88 | 0 | 88 | ||||||||||||||||||||
| Non-controlling interests | 0 | (17) | (8) | 0 | 0 | (34) | 0 | (34) | |||||||||||||||||||||
| All-in costs | 556 | 308 | 187 | 19 | 50 | 1,140 | 126 | 1,266 | |||||||||||||||||||||
| Ounces sold - equity basis (000s ounces) | 476 | 213 | 140 | 46 | 46 | 921 | 67 | 988 | |||||||||||||||||||||
| Cost of sales per ounce | h,i | 1,029 | 1,138 | 1,356 | 1,176 | 2,179 | 1,170 | 1,712 | 1,206 | ||||||||||||||||||||
| Total cash costs per ounce | i | 846 | 814 | 974 | 390 | 867 | 838 | 1,496 | 882 | ||||||||||||||||||||
| Total cash costs per ounce (on a co-product basis) | i,j | 847 | 819 | 978 | 391 | 1,684 | 881 | 1,503 | 923 | ||||||||||||||||||||
| All-in sustaining costs per ounce | i | 1,166 | 1,323 | 1,234 | 407 | 1,093 | 1,178 | 1,888 | 1,226 | ||||||||||||||||||||
| All-in sustaining costs per ounce (on a co-product basis) | i,j | 1,167 | 1,328 | 1,238 | 408 | 1,910 | 1,221 | 1,895 | 1,267 | ||||||||||||||||||||
| All-in costs per ounce | i | 1,166 | 1,450 | 1,326 | 407 | 1,093 | 1,237 | 1,889 | 1,281 | ||||||||||||||||||||
| All-in costs per ounce (on a co-product basis) | i,j | 1,167 | 1,455 | 1,330 | 408 | 1,910 | 1,280 | 1,896 | 1,322 | ||||||||||||||||||||
| ($ millions, except per ounce information in dollars) | For the six months ended 6/30/22 | |||||||||||||
| Footnote | Pueblo Viejo | Veladero | Latin America & Asia Pacific | |||||||||||
| Cost of sales applicable to gold production | 383 | 140 | 523 | |||||||||||
| Depreciation | (118) | (50) | (168) | |||||||||||
| By-product credits | (23) | (2) | (25) | |||||||||||
| Non-recurring items | c | 0 | 0 | 0 | ||||||||||
| Other | d | 0 | 0 | 0 | ||||||||||
| Non-controlling interests | (97) | 0 | (97) | |||||||||||
| Total cash costs | 145 | 88 | 233 | |||||||||||
| General & administrative costs | 0 | 0 | 0 | |||||||||||
| Minesite exploration and evaluation costs | e | 0 | 1 | 1 | ||||||||||
| Minesite sustaining capital expenditures | f | 93 | 64 | 157 | ||||||||||
| Sustaining capital leases | 0 | 2 | 2 | |||||||||||
| Rehabilitation - accretion and amortization (operating sites) | g | 4 | 1 | 5 | ||||||||||
| Non-controlling interests | (39) | 0 | (39) | |||||||||||
| All-in sustaining costs | 203 | 156 | 359 | |||||||||||
| Global exploration and evaluation and project expense | e | 1 | 0 | 1 | ||||||||||
| Project capital expenditures | f | 166 | 18 | 184 | ||||||||||
| Non-controlling interests | (67) | 0 | (67) | |||||||||||
| All-in costs | 303 | 174 | 477 | |||||||||||
| Ounces sold - equity basis (000s ounces) | 206 | 102 | 308 | |||||||||||
| Cost of sales per ounce | h,i | 1,115 | 1,361 | 1,216 | ||||||||||
| Total cash costs per ounce | i | 703 | 856 | 753 | ||||||||||
| Total cash costs per ounce (on a co-product basis) | i,j | 770 | 875 | 804 | ||||||||||
| All-in sustaining costs per ounce | i | 985 | 1,511 | 1,164 | ||||||||||
| All-in sustaining costs per ounce (on a co-product basis) | i,j | 1,052 | 1,530 | 1,215 | ||||||||||
| All-in costs per ounce | i | 1,468 | 1,692 | 1,552 | ||||||||||
| All-in costs per ounce (on a co-product basis) | i,j | 1,535 | 1,711 | 1,603 | ||||||||||
BARRICK SECOND QUARTER 2023 |
69 |
MANAGEMENT'S DISCUSSION AND ANALYSIS | ||||||
| ($ millions, except per ounce information in dollars) | For the six months ended 6/30/22 | ||||||||||||||||||||||
| Footnote | Loulo-Gounkoto | Kibali | North Mara | Tongon | Bulyanhulu | Africa & Middle East | |||||||||||||||||
| Cost of sales applicable to gold production | 379 | 173 | 143 | 176 | 150 | 1,021 | |||||||||||||||||
| Depreciation | (127) | (61) | (33) | (36) | (31) | (288) | |||||||||||||||||
| By-product credits | 0 | (1) | (1) | 0 | (13) | (15) | |||||||||||||||||
| Non-recurring items | c | 0 | 0 | 0 | 0 | 0 | 0 | ||||||||||||||||
| Other | d | 0 | 0 | 0 | 0 | 0 | 0 | ||||||||||||||||
| Non-controlling interests | (50) | 0 | (18) | (14) | (17) | (99) | |||||||||||||||||
| Total cash costs | 202 | 111 | 91 | 126 | 89 | 619 | |||||||||||||||||
| General & administrative costs | 0 | 0 | 0 | 0 | 0 | 0 | |||||||||||||||||
| Minesite exploration and evaluation costs | e | 3 | 6 | 2 | 2 | 0 | 13 | ||||||||||||||||
| Minesite sustaining capital expenditures | f | 90 | 29 | 22 | 6 | 24 | 171 | ||||||||||||||||
| Sustaining capital leases | 0 | 0 | 0 | 1 | 0 | 1 | |||||||||||||||||
| Rehabilitation - accretion and amortization (operating sites) | g | 2 | 0 | 3 | 1 | 1 | 7 | ||||||||||||||||
| Non-controlling interests | (19) | 0 | (4) | (2) | (4) | (29) | |||||||||||||||||
| All-in sustaining costs | 278 | 146 | 114 | 134 | 110 | 782 | |||||||||||||||||
| Global exploration and evaluation and project expense | e | 0 | 0 | 0 | 0 | 0 | 0 | ||||||||||||||||
| Project capital expenditures | f | 56 | 10 | 40 | 1 | 16 | 123 | ||||||||||||||||
| Non-controlling interests | (11) | 0 | (6) | 0 | (2) | (19) | |||||||||||||||||
| All-in costs | 323 | 156 | 148 | 135 | 124 | 886 | |||||||||||||||||
| Ounces sold - equity basis (000s ounces) | 278 | 150 | 125 | 78 | 106 | 737 | |||||||||||||||||
| Cost of sales per ounce | h,i | 1,091 | 1,151 | 963 | 2,030 | 1,190 | 1,195 | ||||||||||||||||
| Total cash costs per ounce | i | 725 | 741 | 734 | 1,611 | 842 | 840 | ||||||||||||||||
| Total cash costs per ounce (on a co-product basis) | i,j | 725 | 746 | 740 | 1,614 | 944 | 857 | ||||||||||||||||
| All-in sustaining costs per ounce | i | 997 | 970 | 918 | 1,727 | 1,037 | 1,061 | ||||||||||||||||
| All-in sustaining costs per ounce (on a co-product basis) | i,j | 997 | 975 | 924 | 1,730 | 1,139 | 1,078 | ||||||||||||||||
| All-in costs per ounce | i | 1,158 | 1,036 | 1,187 | 1,735 | 1,168 | 1,201 | ||||||||||||||||
| All-in costs per ounce (on a co-product basis) | i,j | 1,158 | 1,041 | 1,193 | 1,738 | 1,270 | 1,218 | ||||||||||||||||
BARRICK SECOND QUARTER 2023 |
70 |
MANAGEMENT'S DISCUSSION AND ANALYSIS | ||||||
| ($ millions) | For the three months ended 6/30/23 | ||||||||||||||||||||||
| Carlin | Corteza |
Turquoise Ridge | Long Canyon | Phoenix | Nevada Gold Minesb |
Hemlo | |||||||||||||||||
| By-product credits | 0 | 1 | 1 | 0 | 40 | 42 | 0 | ||||||||||||||||
| Non-controlling interest | 0 | (1) | (1) | 0 | (16) | (18) | 0 | ||||||||||||||||
| By-product credits (net of non-controlling interest) | 0 | 0 | 0 | 0 | 24 | 24 | 0 | ||||||||||||||||
| ($ millions) | For the three months ended 6/30/23 | ||||||||||||||||||||||
| Pueblo Viejo | Veladero | Loulo-Gounkoto | Kibali | North Mara | Tongon | Bulyanhulu | |||||||||||||||||
| By-product credits | 6 | 2 | 0 | 1 | 0 | 0 | 6 | ||||||||||||||||
| Non-controlling interest | (2) | 0 | 0 | 0 | 0 | 0 | (1) | ||||||||||||||||
| By-product credits (net of non-controlling interest) | 4 | 2 | 0 | 1 | 0 | 0 | 5 | ||||||||||||||||
| ($ millions) | For the three months ended 3/31/23 | ||||||||||||||||||||||
| Carlin | Corteza |
Turquoise Ridge | Long Canyon | Phoenix | Nevada Gold Minesb |
Hemlo | |||||||||||||||||
| By-product credits | 1 | 1 | 1 | 0 | 38 | 41 | 0 | ||||||||||||||||
| Non-controlling interest | 0 | 0 | 0 | 0 | (14) | (14) | 0 | ||||||||||||||||
| By-product credits (net of non-controlling interest) | 1 | 1 | 1 | 0 | 24 | 27 | 0 | ||||||||||||||||
| ($ millions) | For the three months ended 3/31/23 | ||||||||||||||||||||||
| Pueblo Viejo | Veladero | Loulo-Gounkoto | Kibali | North Mara | Tongon | Bulyanhulu | |||||||||||||||||
| By-product credits | 12 | 2 | 0 | 0 | 1 | 0 | 5 | ||||||||||||||||
| Non-controlling interest | (4) | 0 | 0 | 0 | 0 | 0 | (1) | ||||||||||||||||
| By-product credits (net of non-controlling interest) | 8 | 2 | 0 | 0 | 1 | 0 | 4 | ||||||||||||||||
| ($ millions) | For the three months ended 6/30/22 | ||||||||||||||||||||||
| Carlin | Corteza |
Turquoise Ridge | Long Canyon | Phoenix | Nevada Gold Minesb |
Hemlo | |||||||||||||||||
| By-product credits | 0 | 1 | 1 | 0 | 30 | 32 | 0 | ||||||||||||||||
| Non-controlling interest | 0 | (1) | 0 | 0 | (12) | (13) | 0 | ||||||||||||||||
| By-product credits (net of non-controlling interest) | 0 | 0 | 1 | 0 | 18 | 19 | 0 | ||||||||||||||||
| ($ millions) | For the three months ended 6/30/22 | ||||||||||||||||||||||
| Pueblo Viejo | Veladero | Loulo-Gounkoto | Kibali | North Mara | Tongon | Bulyanhulu | |||||||||||||||||
| By-product credits | 12 | 1 | 0 | 1 | 1 | 0 | 6 | ||||||||||||||||
| Non-controlling interest | (5) | 0 | 0 | 0 | 0 | 0 | (1) | ||||||||||||||||
| By-product credits (net of non-controlling interest) | 7 | 1 | 0 | 1 | 1 | 0 | 5 | ||||||||||||||||
| ($ millions) | For the six months ended 6/30/23 | ||||||||||||||||||||||
| Carlin | Corteza |
Turquoise Ridge | Long Canyon | Phoenix | Nevada Gold Minesb |
Hemlo | |||||||||||||||||
| By-product credits | 1 | 2 | 2 | 0 | 78 | 83 | 0 | ||||||||||||||||
| Non-controlling interest | 0 | (1) | (1) | 0 | (30) | (32) | 0 | ||||||||||||||||
| By-product credits (net of non-controlling interest) | 1 | 1 | 1 | 0 | 48 | 51 | 0 | ||||||||||||||||
| ($ millions) | For the six months ended 6/30/23 | ||||||||||||||||||||||
| Pueblo Viejo | Veladero | Loulo-Gounkoto | Kibali | North Mara | Tongon | Bulyanhulu | |||||||||||||||||
| By-product credits | 18 | 4 | 0 | 1 | 1 | 0 | 11 | ||||||||||||||||
| Non-controlling interest | (6) | 0 | 0 | 0 | 0 | 0 | (2) | ||||||||||||||||
| By-product credits (net of non-controlling interest) | 12 | 4 | 0 | 1 | 1 | 0 | 9 | ||||||||||||||||
| ($ millions) | For the six months ended 6/30/22 | ||||||||||||||||||||||
| Carlin | Corteza |
Turquoise Ridge | Long Canyon | Phoenix | Nevada Gold Minesb |
Hemlo | |||||||||||||||||
| By-product credits | 0 | 2 | 1 | 0 | 64 | 67 | 0 | ||||||||||||||||
| Non-controlling interest | 0 | (1) | 0 | 0 | (25) | (26) | 0 | ||||||||||||||||
| By-product credits (net of non-controlling interest) | 0 | 1 | 1 | 0 | 39 | 41 | 0 | ||||||||||||||||
BARRICK SECOND QUARTER 2023 |
71 |
MANAGEMENT'S DISCUSSION AND ANALYSIS | ||||||
| ($ millions) | For the six months ended 6/30/22 | ||||||||||||||||||||||
| Pueblo Viejo | Veladero | Loulo-Gounkoto | Kibali | North Mara | Tongon | Bulyanhulu | |||||||||||||||||
| By-product credits | 23 | 2 | 0 | 1 | 1 | 0 | 13 | ||||||||||||||||
| Non-controlling interest | (9) | 0 | 0 | 0 | 0 | 0 | (2) | ||||||||||||||||
| By-product credits (net of non-controlling interest) | 14 | 2 | 0 | 1 | 1 | 0 | 11 | ||||||||||||||||
| ($ millions, except per pound information in dollars) | For the three months ended | For the six months ended | |||||||||||||||
| 6/30/23 | 3/31/23 | 6/30/22 | 6/30/23 | 6/30/22 | |||||||||||||
| Cost of sales | 176 | 174 | 143 | 350 | 297 | ||||||||||||
| Depreciation/amortization | (59) | (44) | (34) | (103) | (72) | ||||||||||||
| Treatment and refinement charges | 50 | 43 | 47 | 93 | 98 | ||||||||||||
| Cash cost of sales applicable to equity method investments | 84 | 87 | 74 | 171 | 146 | ||||||||||||
| Less: royalties | (16) | (15) | (32) | (31) | (64) | ||||||||||||
| By-product credits | (6) | (4) | (6) | (10) | (9) | ||||||||||||
| Other | 0 | 0 | 0 | 0 | 0 | ||||||||||||
| C1 cash costs | 229 | 241 | 192 | 470 | 396 | ||||||||||||
| General & administrative costs | 4 | 6 | 6 | 10 | 18 | ||||||||||||
| Rehabilitation - accretion and amortization | 2 | 2 | 1 | 4 | 2 | ||||||||||||
| Royalties | 16 | 15 | 32 | 31 | 64 | ||||||||||||
| Minesite exploration and evaluation costs | 2 | 2 | 5 | 4 | 8 | ||||||||||||
| Minesite sustaining capital expenditures | 58 | 33 | 89 | 91 | 156 | ||||||||||||
| Sustaining leases | 4 | 3 | 2 | 7 | 3 | ||||||||||||
| All-in sustaining costs | 315 | 302 | 327 | 617 | 647 | ||||||||||||
| Pounds sold - consolidated basis (millions pounds) | 101 | 89 | 113 | 190 | 226 | ||||||||||||
Cost of sales per pounda,b |
2.84 | 3.22 | 2.11 | 3.02 | 2.16 | ||||||||||||
C1 cash costs per pounda |
2.28 | 2.71 | 1.70 | 2.48 | 1.75 | ||||||||||||
All-in sustaining costs per pounda |
3.13 | 3.40 | 2.87 | 3.26 | 2.86 | ||||||||||||
| ($ millions, except per pound information in dollars) | For the three months ended | ||||||||||||||||||||||||||||
| 6/30/23 | 3/31/23 | 6/30/22 | |||||||||||||||||||||||||||
| Zaldívar | Lumwana | Jabal Sayid | Zaldívar | Lumwana | Jabal Sayid | Zaldívar | Lumwana | Jabal Sayid | |||||||||||||||||||||
| Cost of sales | 83 | 176 | 25 | 87 | 174 | 26 | 70 | 143 | 26 | ||||||||||||||||||||
| Depreciation/amortization | (19) | (59) | (5) | (20) | (44) | (6) | (17) | (34) | (5) | ||||||||||||||||||||
| Treatment and refinement charges | 0 | 44 | 6 | 0 | 36 | 7 | 0 | 43 | 4 | ||||||||||||||||||||
| Less: royalties | 0 | (16) | 0 | 0 | (15) | 0 | 0 | (32) | 0 | ||||||||||||||||||||
| By-product credits | 0 | 0 | (6) | 0 | 0 | (4) | 0 | 0 | (6) | ||||||||||||||||||||
| Other | 0 | 0 | 0 | 0 | 0 | 0 | 0 | 0 | 0 | ||||||||||||||||||||
| C1 cash costs | 64 | 145 | 20 | 67 | 151 | 23 | 53 | 120 | 19 | ||||||||||||||||||||
| Rehabilitation - accretion and amortization | 0 | 2 | 0 | 0 | 2 | 0 | 0 | 1 | 0 | ||||||||||||||||||||
| Royalties | 0 | 16 | 0 | 0 | 15 | 0 | 0 | 32 | 0 | ||||||||||||||||||||
| Minesite exploration and evaluation costs | 2 | 0 | 0 | 2 | 0 | 0 | 3 | 2 | 0 | ||||||||||||||||||||
| Minesite sustaining capital expenditures | 12 | 44 | 2 | 5 | 26 | 2 | 8 | 79 | 2 | ||||||||||||||||||||
| Sustaining leases | 3 | 0 | 1 | 0 | 1 | 2 | 1 | 1 | 0 | ||||||||||||||||||||
| All-in sustaining costs | 81 | 207 | 23 | 74 | 195 | 27 | 65 | 235 | 21 | ||||||||||||||||||||
| Pounds sold - consolidated basis (millions pounds) | 22 | 63 | 16 | 23 | 49 | 17 | 24 | 71 | 18 | ||||||||||||||||||||
Cost of sales per pounda,b |
3.89 | 2.80 | 1.61 | 3.73 | 3.56 | 1.53 | 2.88 | 2.01 | 1.45 | ||||||||||||||||||||
C1 cash costs per pounda |
3.02 | 2.30 | 1.26 | 2.86 | 3.09 | 1.39 | 2.17 | 1.68 | 1.09 | ||||||||||||||||||||
All-in sustaining costs per pounda |
3.73 | 3.29 | 1.42 | 3.22 | 3.98 | 1.61 | 2.65 | 3.28 | 1.19 | ||||||||||||||||||||
BARRICK SECOND QUARTER 2023 |
72 |
MANAGEMENT'S DISCUSSION AND ANALYSIS | ||||||
| ($ millions, except per pound information in dollars) | For the six months ended | |||||||||||||||||||
| 6/30/23 | 6/30/22 | |||||||||||||||||||
| Zaldívar | Lumwana | Jabal Sayid | Zaldívar | Lumwana | Jabal Sayid | |||||||||||||||
| Cost of sales | 170 | 350 | 51 | 143 | 297 | 48 | ||||||||||||||
| Depreciation/amortization | (39) | (103) | (11) | (35) | (72) | (10) | ||||||||||||||
| Treatment and refinement charges | 0 | 80 | 13 | 0 | 89 | 9 | ||||||||||||||
| Less: royalties | 0 | (31) | 0 | 0 | (64) | 0 | ||||||||||||||
| By-product credits | 0 | 0 | (10) | 0 | 0 | (9) | ||||||||||||||
| Other | 0 | 0 | 0 | 0 | 0 | 0 | ||||||||||||||
| C1 cash costs | 131 | 296 | 43 | 108 | 250 | 38 | ||||||||||||||
| Rehabilitation - accretion and amortization | 0 | 4 | 0 | 0 | 2 | 0 | ||||||||||||||
| Royalties | 0 | 31 | 0 | 0 | 64 | 0 | ||||||||||||||
| Minesite exploration and evaluation costs | 4 | 0 | 0 | 6 | 2 | 0 | ||||||||||||||
| Minesite sustaining capital expenditures | 17 | 70 | 4 | 17 | 136 | 3 | ||||||||||||||
| Sustaining leases | 3 | 1 | 3 | 1 | 2 | 0 | ||||||||||||||
| All-in sustaining costs | 155 | 402 | 50 | 132 | 456 | 41 | ||||||||||||||
| Pounds sold - consolidated basis (millions pounds) | 45 | 112 | 33 | 50 | 141 | 35 | ||||||||||||||
Cost of sales per pounda,b |
3.81 | 3.13 | 1.57 | 2.87 | 2.10 | 1.38 | ||||||||||||||
C1 cash cost per pounda |
2.93 | 2.64 | 1.32 | 2.16 | 1.77 | 1.10 | ||||||||||||||
All-in sustaining costs per pounda |
3.46 | 3.59 | 1.51 | 2.65 | 3.22 | 1.18 | ||||||||||||||
BARRICK SECOND QUARTER 2023 |
73 |
MANAGEMENT'S DISCUSSION AND ANALYSIS | ||||||
| ($ millions) | For the three months ended | For the six months ended | |||||||||||||||
| 6/30/23 | 3/31/23 | 6/30/22 | 6/30/23 | 6/30/22 | |||||||||||||
| Net earnings | 502 | 269 | 717 | 771 | 1,423 | ||||||||||||
| Income tax expense | 264 | 205 | 279 | 469 | 580 | ||||||||||||
Finance costs, neta |
23 | 37 | 73 | 60 | 149 | ||||||||||||
| Depreciation | 480 | 495 | 476 | 975 | 936 | ||||||||||||
| EBITDA | 1,269 | 1,006 | 1,545 | 2,275 | 3,088 | ||||||||||||
Impairment charges (reversals) of non-current assetsb |
22 | 1 | 3 | 23 | 5 | ||||||||||||
Acquisition/disposition gainsc |
(3) | (3) | (20) | (6) | (22) | ||||||||||||
| (Gain) loss on currency translation | (12) | 38 | 6 | 26 | 9 | ||||||||||||
Other (income) expense adjustmentsd |
(3) | 63 | (95) | 60 | (82) | ||||||||||||
Income tax expense, net finance costsa, and depreciation from equity investees |
95 | 78 | 88 | 173 | 174 | ||||||||||||
| Adjusted EBITDA | 1,368 | 1,183 | 1,527 | 2,551 | 3,172 | ||||||||||||
| ($ millions) | For the three months ended 6/30/23 | |||||||||||||||||||||||||||||||
Carlin (61.5%) |
Corteza (61.5%) |
Turquoise Ridge (61.5%) |
Nevada Gold Minesb (61.5%) |
Pueblo Viejo (60%) |
Loulo-Gounkoto (80%) | Kibali (45%) |
North Mara
(84%)
|
Bulyanhulu (84%) |
Lumwana (100%) | |||||||||||||||||||||||
| Income | 169 | 66 | 35 | 287 | 46 | 110 | 60 | 43 | 41 | 0 | ||||||||||||||||||||||
| Depreciation | 56 | 41 | 26 | 138 | 36 | 49 | 41 | 16 | 13 | 59 | ||||||||||||||||||||||
| EBITDA | 225 | 107 | 61 | 425 | 82 | 159 | 101 | 59 | 54 | 59 | ||||||||||||||||||||||
| For the three months ended 3/31/23 | ||||||||||||||||||||||||||||||||
Carlin (61.5%) |
Corteza (61.5%) |
Turquoise Ridge (61.5%) |
Nevada Gold Minesb (61.5%) |
Pueblo Viejo (60%) |
Loulo-Gounkoto (80%) | Kibali (45%) | North Mara (84%) |
Bulyanhulu (84%) |
Lumwana (100%) | |||||||||||||||||||||||
| Income (loss) | 66 | 78 | 40 | 189 | 61 | 85 | 33 | 47 | 17 | (12) | ||||||||||||||||||||||
| Depreciation | 39 | 56 | 31 | 140 | 39 | 56 | 25 | 16 | 13 | 44 | ||||||||||||||||||||||
| EBITDA | 105 | 134 | 71 | 329 | 100 | 141 | 58 | 63 | 30 | 32 | ||||||||||||||||||||||
| For the three months ended 6/30/22 | ||||||||||||||||||||||||||||||||
Carlin (61.5%) |
Corteza (61.5%) |
Turquoise Ridge (61.5%) |
Nevada Gold Minesb (61.5%) |
Pueblo Viejo (60%) |
Loulo-Gounkoto (80%) | Kibali (45%) | North Mara (84%) |
Bulyanhulu (84%) |
Lumwana (100%) | |||||||||||||||||||||||
| Income | 176 | 60 | 42 | 302 | 59 | 106 | 49 | 55 | 35 | 62 | ||||||||||||||||||||||
| Depreciation | 50 | 30 | 27 | 133 | 36 | 52 | 33 | 20 | 12 | 33 | ||||||||||||||||||||||
| EBITDA | 226 | 90 | 69 | 435 | 95 | 158 | 82 | 75 | 47 | 95 | ||||||||||||||||||||||
| ($ millions) | For the six months ended 6/30/2023 | |||||||||||||||||||||||||||||||
Carlin (61.5%) |
Corteza (61.5%) |
Turquoise Ridge (61.5%) |
Nevada Gold Minesb (61.5%) |
Pueblo Viejo (60%) |
Loulo-Gounkoto (80%) | Kibali (45%) |
North Mara
(84%)
|
Bulyanhulu (84%) |
Lumwana (100%) | |||||||||||||||||||||||
| Income | 235 | 144 | 75 | 476 | 107 | 195 | 93 | 90 | 58 | (12) | ||||||||||||||||||||||
| Depreciation | 95 | 97 | 57 | 278 | 75 | 105 | 66 | 32 | 26 | 103 | ||||||||||||||||||||||
| EBITDA | 330 | 241 | 132 | 754 | 182 | 300 | 159 | 122 | 84 | 91 | ||||||||||||||||||||||
| ($ millions) | For the six months ended 6/30/2022 | |||||||||||||||||||||||||||||||
Carlin (61.5%) |
Corteza (61.5%) |
Turquoise Ridge (61.5%) |
Nevada Gold Minesb (61.5%) |
Pueblo Viejo (60%) |
Loulo-Gounkoto (80%) | Kibali (45%) | North Mara (84%) |
Bulyanhulu (84%) |
Lumwana (100%) | |||||||||||||||||||||||
| Income | 391 | 152 | 70 | 665 | 148 | 212 | 90 | 113 | 78 | 195 | ||||||||||||||||||||||
| Depreciation | 92 | 68 | 53 | 272 | 71 | 102 | 61 | 28 | 26 | 71 | ||||||||||||||||||||||
| EBITDA | 483 | 220 | 123 | 937 | 219 | 314 | 151 | 141 | 104 | 266 | ||||||||||||||||||||||
BARRICK SECOND QUARTER 2023 |
74 |
MANAGEMENT'S DISCUSSION AND ANALYSIS | ||||||
| ($ millions, except per ounce/pound information in dollars) | Gold | Copper | Gold | Copper | ||||||||||||||||||||||||||||
| For the three months ended | For the six months ended | |||||||||||||||||||||||||||||||
| 6/30/23 | 3/31/23 | 6/30/22 | 6/30/23 | 3/31/23 | 6/30/22 | 6/30/23 | 6/30/22 | 6/30/23 | 6/30/22 | |||||||||||||||||||||||
| Sales | 2,584 | 2,411 | 2,597 | 189 | 171 | 211 | 4,995 | 5,108 | 360 | 498 | ||||||||||||||||||||||
| Sales applicable to non-controlling interests | (787) | (723) | (779) | 0 | 0 | 0 | (1,510) | (1,566) | 0 | 0 | ||||||||||||||||||||||
Sales applicable to equity method investmentsa,b |
171 | 126 | 145 | 133 | 160 | 164 | 297 | 281 | 293 | 352 | ||||||||||||||||||||||
Sales applicable to sites in closure or care and maintenancec |
(2) | (7) | (30) | 0 | 0 | 0 | (9) | (30) | 0 | 0 | ||||||||||||||||||||||
| Treatment and refinement charges | 8 | 7 | 2 | 50 | 43 | 47 | 15 | 5 | 93 | 98 | ||||||||||||||||||||||
| Revenues – as adjusted | 1,974 | 1,814 | 1,935 | 372 | 374 | 422 | 3,788 | 3,798 | 746 | 948 | ||||||||||||||||||||||
Ounces/pounds sold (000s ounces/millions pounds)c |
1,001 | 954 | 1,040 | 101 | 89 | 113 | 1,955 | 2,033 | 190 | 226 | ||||||||||||||||||||||
Realized gold/copper price per ounce/poundd |
1,972 | 1,902 | 1,861 | 3.70 | 4.20 | 3.72 | 1,938 | 1,868 | 3.93 | 4.20 | ||||||||||||||||||||||
BARRICK SECOND QUARTER 2023 |
75 |
MANAGEMENT'S DISCUSSION AND ANALYSIS | ||||||
| Drill Results from Q2 2023 | ||||||||||||||||||||
Drill Holeb |
Azimuth | Dip | Interval (m) | Width (m)c |
True Width (m)c |
Ag (g/t) | ||||||||||||||
| HSC-23001 | 129 | (26) | 250.5-283.2 | 32.6 | 32.88 | |||||||||||||||
| HSC-23002 | 112 | (28) | 263.0-270.6 | 7.6 | 28.49 | |||||||||||||||
| 359.1-366.7 | 7.6 | 7.10 | ||||||||||||||||||
| HSC-23003 | 101 | (27) | 317.9-329.5 | 11.6 | 13.20 | |||||||||||||||
| 350.8-354.2 | 3.4 | 5.42 | ||||||||||||||||||
| 363-381.3 | 18.3 | 6.07 | ||||||||||||||||||
| NLX-23017 | 290 | (79) | 798.7-803.3 | 4.6 | 4.0 | 24.28 | ||||||||||||||
| 866.9-881.0 | 14.2 | 12.3 | 8.67 | |||||||||||||||||
| NLX-22015 | 115 | (79) | 787.0-806.8 | 19.8 | 19.7 | 15.59 | ||||||||||||||
| NLX-22016 | 255 | (80) | 793.4-801.6 | 8.2 | 7.8 | 24.89 | ||||||||||||||
| NLX-22018 | 250 | (74) | 834.2-842.0 | 7.8 | 6.1 | 10.85 | ||||||||||||||
| NLX-22023 | 265 | (74) | 807.7-817.0 | 9.8 | 4.25 | |||||||||||||||
| 842.8-849.5 | 6.7 | 3.87 | ||||||||||||||||||
| 925.4-932.1 | 6.7 | 8.16 | ||||||||||||||||||
| RKX-00027 | 068 | (82) | 570.1-573.3 | 3.2 | 6.01 | |||||||||||||||
| 635.8-640.1 | 4.3 | 11.88 | ||||||||||||||||||
BARRICK SECOND QUARTER 2023 |
76 |
MANAGEMENT'S DISCUSSION AND ANALYSIS | ||||||
| NTC-22025 | 265 | (42) | 74.4-81.7 | 7.3 | 4.9 | 14.17 | ||||||||||||||
| 96.6-178.0 | 81.4 | 54.5 | 13.20 | |||||||||||||||||
| NTC-22044 | 265 | (42) | 96.0-101.2 | 5.2 | 5.2 | 7.68 | ||||||||||||||
| 107.6-144.5 | 36.9 | 36.9 | 12.37 | |||||||||||||||||
| 168.2-172.1 | 3.9 | 4.0 | 24.27 | |||||||||||||||||
| NTC-22015 | 85 | (28) | 142.6-176.2 | 33.5 | 32.4 | 9.22 | ||||||||||||||
| 198.1-204.2 | 6.1 | 5.9 | 7.82 | |||||||||||||||||
| 214.0-217.3 | 3.4 | 3.2 | 5.58 | |||||||||||||||||
| 259.1-267.9 | 8.8 | 8.3 | 8.36 | |||||||||||||||||
| NTC-22052 | 190 | (85) | 16.2-21.6 | 5.5 | 4.2 | 9.09 | ||||||||||||||
| 132.6-142.3 | 9.8 | 5.6 | 4.35 | |||||||||||||||||
| 155.3-177.7 | 22.4 | 22.1 | 20.07 | |||||||||||||||||
| 183.8-201.2 | 17.4 | 16.3 | 13.99 | |||||||||||||||||
| NTC-23001 | 300 | (42) | 98.7-110.3 | 11.6 | 11.5 | 8.53 | ||||||||||||||
| 113.1-121.3 | 8.2 | 8.2 | 44.53 | |||||||||||||||||
| NTC-23008 | 94 | (22) | 15.2-22.6 | 5.0 | 4.6 | 12.10 | ||||||||||||||
| 168.2-188.9 | 20.7 | 13.3 | 5.07 | |||||||||||||||||
| 192.1-200.9 | 8.8 | 5.7 | 4.80 | |||||||||||||||||
| 213.1-296.6 | 83.5 | 53.7 | 19.07 | |||||||||||||||||
| NTC-23012 | 230 | (53) | 52.7-87.5 | 4.6 | 4.3 | 6.01 | ||||||||||||||
| 87.5-98.6 | 11.1 | 10.5 | 13.66 | |||||||||||||||||
| 172.5-180.7 | 8.2 | 7.7 | 8.18 | |||||||||||||||||
| NTC-23022 | 275 | (60) | 34.4-37.8 | 3.4 | 3.3 | 4.08 | ||||||||||||||
| 44.5-56.7 | 12.2 | 12.1 | 8.36 | |||||||||||||||||
| 78.8-98.3 | 19.5 | 19.4 | 12.39 | |||||||||||||||||
| 255.4-258.5 | 3.1 | 3.0 | 11.42 | |||||||||||||||||
| 269.1-272.8 | 3.7 | 3.6 | 5.06 | |||||||||||||||||
| RKU-23001 | 230 | 8 | 2.4-8.5 | 6.1 | 5.40 | |||||||||||||||
| 234.1-238.7 | 4.6 | 3.58 | ||||||||||||||||||
| 277.5-283.8 | 6.2 | 5.38 | ||||||||||||||||||
| 309.4-318.5 | 9.1 | 24.77 | ||||||||||||||||||
| RKU-23003 | 315 | 22 | 149.0-156.7 | 7.6 | 4.04 | |||||||||||||||
| 179.8-187.5 | 7.6 | 5.47 | ||||||||||||||||||
| RKU-23013 | 245 | 6 | NSI | |||||||||||||||||
| RKU-23004 | 0 | (35) | 1.5-29.6 | 28.0 | 14.2 | 9.33 | ||||||||||||||
| RKU-23005 | 209 | (55) | 0-21.0 | 21.0 | 9.4 | 8.01 | ||||||||||||||
| RKU-23006 | 228 | (28) | 0-24.1 | 24.1 | 15.5 | 6.40 | ||||||||||||||
| 34.1-38.7 | 4.4 | 1.7 | 4.95 | |||||||||||||||||
| 54.3-57.3 | 3.0 | 1.3 | 4.14 | |||||||||||||||||
| RKU-23008 | 315 | (30) | 0-20.4 | 20.4 | 16.4 | 5.36 | ||||||||||||||
| 37.2-43.3 | 6.1 | 3.6 | 6.00 | |||||||||||||||||
| 55.5-66.4 | 11.0 | 3 | 7.89 | |||||||||||||||||
| Drill Results from Q2 2023 | |||||||||||||||||
Drill Holeb |
Azimuth | Dip | Interval (m) | Width (m)c |
Au (g/t) | ||||||||||||
| LBB-23008 | 200 | (80) | 650.6-654.4 | 3.8 | 6.70 | ||||||||||||
| 662.3-663.5 | 1.2 | 3.46 | |||||||||||||||
| LBB-23009 | 200 | (80) | 896.6-898.3 | 1.7 | 4.98 | ||||||||||||
BARRICK SECOND QUARTER 2023 |
77 |
MANAGEMENT'S DISCUSSION AND ANALYSIS | ||||||
| Drill Results from Q2 2023 | |||||||||||||||||
Drill Holeb |
Azimuth | Dip | Interval (m) | Width (m)c |
Au (g/t) | ||||||||||||
| CMX-22016 | 216 | (42) | 479.4-480.6 | 2.0 | 11.78 | ||||||||||||
| 519-521.9 | 2.9 | 5.13 | |||||||||||||||
| 568.4-593.1 | 24.7 | 6.67 | |||||||||||||||
| 596.8-599.5 | 2.7 | 5.75 | |||||||||||||||
| 601-602.4 | 1.4 | 3.55 | |||||||||||||||
| CMX-22026 | 191 | (65) | 437.2-443.8 | 6.6 | 12.71 | ||||||||||||
| 478.5-481.5 | 3 | 7.64 | |||||||||||||||
| 502.3-521.9 | 19.6 | 11.67 | |||||||||||||||
| CMX-23001 | 267 | (71) | 476.5-478 | 1.5 | 5.3 | ||||||||||||
| CMX-23002 | 182 | (78) | 479.4-486.7 | 7.3 | 15.33 | ||||||||||||
| 611-614 | 3 | 6.59 | |||||||||||||||
| 615.5-617 | 1.5 | 5.69 | |||||||||||||||
| CMX-23003 | 195 | (61) | 506-507.5 | 1.5 | 4.11 | ||||||||||||
| 595-605 | 9.5 | 5.91 | |||||||||||||||
| CMX-23005 | 245 | (67) | 505-509.6 | 4.6 | 6.17 | ||||||||||||
| 534.6-539.1 | 4.6 | 7.31 | |||||||||||||||
| 609.7-612.9 | 3.2 | 11.35 | |||||||||||||||
| CMX-23006A | 238 | (73) | 435.5-438.1 | 2.6 | 6.33 | ||||||||||||
| 498.9-511.5 | 12.6 | 13.71 | |||||||||||||||
| 516.3-519.7 | 3.4 | 4.18 | |||||||||||||||
| 608.7-618.5 | 9.8 | 7.59 | |||||||||||||||
| CMX-23008 | 190 | (74) | 446.2-461.9 | 15.7 | 10.39 | ||||||||||||
| 472.9-483 | 10.1 | 9.54 | |||||||||||||||
| 487.1-488.9 | 1.8 | 8.97 | |||||||||||||||
| Drill Results from Q2 2023 | ||||||||||||||||||||
Drill Holeb |
Azimuth | Dip | Interval (m) | Width (m)c |
True Width (m)d |
Ag (g/t) | ||||||||||||||
| AHC-23006 | 10 | (68) | 0.91-91.9 | 91.0 | 67.0 | 0.62 | ||||||||||||||
| 102.4-106.1 | 3.7 | 2.8 | 0.26 | |||||||||||||||||
| 109.1-112.2 | 3.0 | 2.2 | 0.73 | |||||||||||||||||
| AHC-23009 | 340 | (65) | 25.9-39.5 | 13.6 | 9.6 | 0.51 | ||||||||||||||
| 46.9-91.1 | 44.2 | 31.3 | 0.74 | |||||||||||||||||
| 108.2-128 | 19.8 | 14.0 | 1.57 | |||||||||||||||||
| AHW-23001 | 185 | (74) | 17.4-22.7 | 5.3 | 0.24 | |||||||||||||||
| 103.6-132.7 | 30.0 | 0.39 | ||||||||||||||||||
| DTL-23003 | 237 | (72) | 85.9-94.2 | 8.2 | 8.1 | 0.66 | ||||||||||||||
| 96.9-102.7 | 5.8 | 5.7 | 1.64 | |||||||||||||||||
| 106.5-126.2 | 19.7 | 19.4 | 0.42 | |||||||||||||||||
| 140.7-146.9 | 6.2 | 6.1 | 4.05 | |||||||||||||||||
BARRICK SECOND QUARTER 2023 |
78 |
MANAGEMENT'S DISCUSSION AND ANALYSIS | ||||||
| 157.6-188.7 | 31.1 | 30.6 | 1.64 | |||||||||||||||||
| 193.2-197.1 | 3.8 | 3.7 | 1.97 | |||||||||||||||||
| DTL-23009 | 240 | (70) | 125.9-128.9 | 3.0 | 3.0 | 0.35 | ||||||||||||||
| 136.9-139.9 | 3.0 | 3.0 | 0.64 | |||||||||||||||||
| 144.5-177.7 | 33.2 | 32.7 | 4.54 | |||||||||||||||||
| DTL-23016 | 234 | (64) | 13.1-16.8 | 3.7 | 3.7 | 0.39 | ||||||||||||||
| 91.7-110.3 | 18.6 | 18.6 | 1.32 | |||||||||||||||||
| 120.4-126.5 | 6.1 | 6.1 | 15.90 | |||||||||||||||||
| DTL-22008 | 280 | (70) | 208.3-214.1 | 5.8 | 1.16 | |||||||||||||||
| 222.5-230.6 | 8.1 | 0.24 | ||||||||||||||||||
| WPC-22006 | 84 | (90) | 58.8-62.9 | 4.1 | 0.64 | |||||||||||||||
| 144.2-151.8 | 7.6 | 3.29 | ||||||||||||||||||
| PYC-22002 | 260 | (60) | 7.9-45.3 | 37.3 | 28.6 | 0.35 | ||||||||||||||
| 48.8-53.6 | 4.9 | 3.8 | 0.32 | |||||||||||||||||
| 89.1-95.1 | 5.9 | 4.5 | 0.3 | |||||||||||||||||
| 100.7-104.7 | 4.0 | 3.1 | 0.21 | |||||||||||||||||
| 120.7-123.7 | 3.0 | 2.3 | 0.21 | |||||||||||||||||
| Drill Results from Q2 2023 | ||||||||||||||||||||
Drill Holeb |
Azimuth | Dip | Interval (m) | Width (m)c |
True Width (m)c |
Au (g/t) | ||||||||||||||
| TUM-23203 | 81 | (31) | 227.7 -232.3 | 4.6 | 3.0 | 6.04 | ||||||||||||||
| 236.4 -262.5 | 26.1 | 18.5 | 30.16 | |||||||||||||||||
| 315.7 -317.4 | 1.7 | 0.4 | 28.54 | |||||||||||||||||
| TUM-23204 | 85 | (28) | 232.8 -259.1 | 26.3 | 17.0 | 19.56 | ||||||||||||||
| 264.5 -266.8 | 2.3 | 1.5 | 27.81 | |||||||||||||||||
| 314.0 -319.5 | 5.5 | 3.5 | 9.39 | |||||||||||||||||
| TUM-23207 | 95 | (45) | 56.8 -64.9 | 8.2 | 7.1 | 8.46 | ||||||||||||||
| 75.6 -81.7 | 6.1 | 5.3 | 7.93 | |||||||||||||||||
| 129.0 -133.5 | 4.6 | 4.0 | 13.59 | |||||||||||||||||
| 153.2 -157.9 | 4.8 | 4.2 | 61.01 | |||||||||||||||||
| TUM-23102 | 180 | (62) | 107.6 –111.9 | 4.3 | 3.7 | 9.34 | ||||||||||||||
| 186.3 –191.2 | 4.9 | 4.2 | 4.68 | |||||||||||||||||
| 200.6 –202.1 | 1.5 | 1.3 | 4.42 | |||||||||||||||||
| 208.2 –218.9 | 10.7 | 9.2 | 8.33 | |||||||||||||||||
| 251.5 –257.0 | 5.5 | 4.8 | 6.74 | |||||||||||||||||
| 269.2 -282.9 | 13.7 | 11.9 | 9.73 | |||||||||||||||||
| 290.5 -296.6 | 6.1 | 5.3 | 10.47 | |||||||||||||||||
BARRICK SECOND QUARTER 2023 |
79 |
MANAGEMENT'S DISCUSSION AND ANALYSIS | ||||||
| Drill Results from Q2 2023 | |||||||||||||||||
Drill Holeb |
Azimuth | Dip | Interval (m) | Width (m)c |
Au (g/t) | ||||||||||||
| MFC-23001 | 130 | (55) | 66.1-68.4 | 2.3 | 2.66 | ||||||||||||
| 95.4-96.3 | 0.9 | 4.56 | |||||||||||||||
| 573.8-574.9 | 1.1 | 2.37 | |||||||||||||||
| 694.8-697.1 | 2.3 | 3.62 | |||||||||||||||
| 698.6-700.1 | 1.5 | 5.37 | |||||||||||||||
| MFC-23002 | 180 | (55) | 234.9-261.3 | 26.5 | 6.17 | ||||||||||||
| 313.1-314.6 | 1.5 | 2.35 | |||||||||||||||
| 478.9-480.0 | 1.2 | 7.03 | |||||||||||||||
| 519.6-521.1 | 1.5 | 3.55 | |||||||||||||||
| 526.9-528.9 | 2.0 | 4.30 | |||||||||||||||
| 563.5-582.0 | 18.5 | 3.18 | |||||||||||||||
| Drill Results from Q2 2023 | ||||||||||||||||||||
Drill Holeb |
Azimuth | Dip | Interval (m) | Width (m)c |
True Width (m)c |
Au (g/t) | ||||||||||||||
| 90352306 | 118 | (47) | 344.3 – 349.9 | 5.6 | 4.6 | 4.15 | ||||||||||||||
| 90352308 | 130 | (30) | 220 – 225 | 5 | 3.8 | 6.28 | ||||||||||||||
| 90352312 | 143 | (44) | 212 – 215.5 | 3.5 | 3.1 | 9.67 | ||||||||||||||
| 90352315 | 210 | (72) | 329 – 334.9 | 5.9 | 3.4 | 9.54 | ||||||||||||||
| 90352318 | 132 | (39) | 239.1 – 245.5 | 6.4 | 6.0 | 6.30 | ||||||||||||||
| 90352319 | 172 | (71) | 209.8 – 213.6 | 3.8 | 3.5 | 8.18 | ||||||||||||||
| 228.0 – 236.0 | 8.0 | 7.5 | 10.11 | |||||||||||||||||
| 1152312 | 147 | (56) | 207 – 211 | 4.0 | 2.8 | 10.47 | ||||||||||||||
| 1152319 | 172 | (71) | 245.2 – 249 | 3.8 | 2.7 | 7.00 | ||||||||||||||
| 252 – 256.8 | 4.8 | 3.4 | 7.15 | |||||||||||||||||
| 1152322 | 182 | (48) | 155.1 – 161.4 | 6.3 | 5.2 | 3.31 | ||||||||||||||
BARRICK SECOND QUARTER 2023 |
80 |
MANAGEMENT'S DISCUSSION AND ANALYSIS | ||||||
| Drill Results from Q2 2023 | ||||||||||||||||||||||||||
| Including | ||||||||||||||||||||||||||
Drill Holeb,d |
Azimuth | Dip | Interval (m) | Width (m)c |
Au (g/t) | Interval (m) | Width (m)c |
Au (g/t) | ||||||||||||||||||
| DDH-MES-13 | 285 | (65) | 2.0 - 205.0 | 203.0 | 0.63 | 2.0 - 61.0 | 59.0 | 1.19 | ||||||||||||||||||
| DDH-MES-16 | 310 | (65) | 129.0 - 147.7 | 18.7 | 0.35 | |||||||||||||||||||||
| DDH-MES-19 | 050 | (60) | 3.0 - 94.5 | 91.5 | 0.40 | |||||||||||||||||||||
| DDH-MES-22 | 270 | (60) | 0.0 - 98.0 | 98.0 | 0.40 | |||||||||||||||||||||
| DDH-MES-25 | 306 | (60) | 0.0 - 79.0 | 79.0 | 0.91 | 0 - 16.0 | 16.0 | 1.61 | ||||||||||||||||||
| 22.15 - 25.5 | 3.35 | 1.09 | ||||||||||||||||||||||||
| 47.4 - 49.85 | 2.45 | 1.49 | ||||||||||||||||||||||||
| DDH-MES-27 | 040 | (60) | 15.5 - 36.0 | 20.5 | 1.28 | |||||||||||||||||||||
| DDH-MES-28 | 235 | (60) | 37.0 - 64.0 | 27.0 | 0.51 | |||||||||||||||||||||
| 83.0 - 115.0 | 32.0 | 0.48 | ||||||||||||||||||||||||
| DDH-MES-33 | 280 | (65) | 0.0 - 150.0 | 150.0 | 0.73 | 0.0 - 73.0 | 73.0 | 1.09 | ||||||||||||||||||
| 103.4 - 104.5 | 1.10 | 2.48 | ||||||||||||||||||||||||
| 135.15 - 139.0 | 3.85 | 1.11 | ||||||||||||||||||||||||
| DDH-MES-34 | 270 | (60) | 29.0 - 80.0 | 51.0 | 2.94 | 33.0 - 53.0 | 20.0 | 4.69 | ||||||||||||||||||
| Drill Results from Q2 2023 | ||||||||||||||||||||
Drill Holea |
Azimuth | Dip | Interval (m) | Width (m)b |
Au (g/t) | True Widthc |
||||||||||||||
DDH-SNC-006d |
55 | (60) | 161-180 | 19 | 2.72 | 9.5 | ||||||||||||||
DDH-SNC-006e |
55 | (60) | 201-236 | 35 | 11.06 | 17.5 | ||||||||||||||
BARRICK SECOND QUARTER 2023 |
81 |
MANAGEMENT'S DISCUSSION AND ANALYSIS | ||||||
| Drill Results from Q2 2023 | ||||||||||||||||||||||||||
| Including | ||||||||||||||||||||||||||
Drill Holea |
Azimuth | Dip | Interval (m) | Width (m)b |
Au (g/t) | Interval (m) | Width (m)b |
Au (g/t) | ||||||||||||||||||
| MZDD23-001 | 138 | 60 | 345-347 | 2 | 0.9 | |||||||||||||||||||||
| MZDD23-002 | 318 | 50 | 126.7-132.8 | 6.1 | 1.4 | |||||||||||||||||||||
| MZDD23-003 | 138 | 50 | 58-76.75 | 18.75 | 0.6 | 61-64 | 3 | 1 | ||||||||||||||||||
| 81.75-94.75 | 13 | 0.7 | 81.75-86.75 | 5 | 1 | |||||||||||||||||||||
| 122.75-138.75 | 16.0 | 2.77 | 122.75-132.75 | 10.0 | 4.27 | |||||||||||||||||||||
| 176.95-191 | 14.05 | 1 | ||||||||||||||||||||||||
| Drill Results from Q2 2023 | ||||||||||||||||||||||||||
| Including | ||||||||||||||||||||||||||
Drill Holeb |
Azimuth | Dip | Interval (m) | Width (m)c |
Au (g/t) | Interval (m) | Width (m)c |
Au (g/t) | ||||||||||||||||||
| SFNRC001 | 135 | (50) | 23-32 | 9.00 | 0.83 | |||||||||||||||||||||
| SFNRC002 | 135 | (50) | 0-10 | 10.0 | 2.51 | 6-8 | 2.00 | 10.13 | ||||||||||||||||||
| SFRC002 | 135 | (50) | 11-15 | 4.0 | 2.00 | |||||||||||||||||||||
| SFRC003 | 135 | (50) | 36-52 | 16.0 | 1.35 | 47-51 | 4.0 | 3.02 | ||||||||||||||||||
| SFRC004 | 135 | (50) | 23-44 | 21.0 | 1.94 | 37-44 | 7.0 | 4.10 | ||||||||||||||||||
| SFDH001 | 135 | (50) | 108-116 | 8.0 | 4.63 | |||||||||||||||||||||
| SFDH001 | 135 | (50) | 124-127 | 3.0 | 1.00 | |||||||||||||||||||||
| Drill Results from Q2 2023 | ||||||||||||||||||||||||||
Includingd |
||||||||||||||||||||||||||
Drill Holeb |
Azimuth | Dip | Interval (m) | Width (m)c |
Au (g/t) | Interval (m) | Width (m)c |
Au (g/t) | ||||||||||||||||||
| GWTRC005 | 110 | (55) | 7 - 24 | 17 | 2.34 | 13 - 16 | 3 | 5.52 | ||||||||||||||||||
| GWTRC005 | 110 | (55) | 26 - 36 | 10 | 1.28 | |||||||||||||||||||||
| GWTRC005 | 110 | (55) | 161 - 163 | 2 | 0.68 | |||||||||||||||||||||
| GWTRC007 | 110 | (55) | 45 - 47 | 2 | 3.24 | |||||||||||||||||||||
| PQ10RC116 | 110.43 | (54.34) | 201 - 203 | 2 | 1.1 | |||||||||||||||||||||
| PQ10RC118 | 114.98 | (57.52) | 2 - 5 | 3 | 0.8 | |||||||||||||||||||||
| PQ10RC118 | 114.98 | (57.52) | 278 - 280 | 2 | 0.99 | |||||||||||||||||||||
| WRC005 | 270 | (50) | 13 - 15 | 2 | 0.95 | |||||||||||||||||||||
| WRC005 | 270 | (50) | 29 - 32 | 3 | 1.09 | |||||||||||||||||||||
| WRC006 | 270 | (50) | 106 - 110 | 4 | 0.77 | |||||||||||||||||||||
| WRC007 | 270 | (50) | 118 - 120 | 2 | 0.58 | |||||||||||||||||||||
BARRICK SECOND QUARTER 2023 |
82 |
MANAGEMENT'S DISCUSSION AND ANALYSIS | ||||||
| YADH234 | 238.24 | (65.79) | 1324.55 - 1327.7 | 3.15 | 1.32 | |||||||||||||||||||||
| YADH234 | 238.24 | (65.79) | 1337.9 - 1349.15 | 11.25 | 22.3 | 1342.95 - 1347.85 | 4.9 | 48.91 | ||||||||||||||||||
| Drill Results from Q2 2023 | ||||||||||||||||||||||||||
Includingd |
||||||||||||||||||||||||||
Drill Holeb |
Azimuth | Dip | Interval (m) | Width (m)c |
Au (g/t) | Interval (m) | Width (m)c |
Au (g/t) | ||||||||||||||||||
| ADD026 | 140 | (78) | 208.50 - 212.35 | 3.85 | 3.21 | |||||||||||||||||||||
| ADD027 | 140 | (85) | 3.00 - 8.00 | 5 | 1.33 | |||||||||||||||||||||
| 133.00 - 140.00 | 7 | 0.52 | ||||||||||||||||||||||||
| 150.00 - 152.00 | 2 | 1.11 | ||||||||||||||||||||||||
| 217.00 - 220.00 | 3 | 0.86 | ||||||||||||||||||||||||
| ADD028 | 135 | (75) | 110.35 - 117.00 | 6.65 | 2.53 | 110.35 - 113.17 | 2.82 | 4.83 | ||||||||||||||||||
| 198.00 - 201.00 | 3 | 0.95 | ||||||||||||||||||||||||
| 231.9 - 237.00 | 5.1 | 0.86 | ||||||||||||||||||||||||
| 240.00 - 246.00 | 6 | 1.30 | ||||||||||||||||||||||||
| 309.7 - 312.00 | 2.3 | 1.10 | ||||||||||||||||||||||||
| DDD606 | 200 | (70) | 299.40 - 312.20 | 12.8 | 1.41 | |||||||||||||||||||||
| 317.40 - 330.80 | 13.4 | 3.30 | 324.50 - 325.70 | 1.2 | 5.13 | |||||||||||||||||||||
| 327.9 - 329.00 | 1.1 | 19.07 | ||||||||||||||||||||||||
| 575.35 - 586.6 | 11.25 | 3.12 | ||||||||||||||||||||||||
| DDD607 | 200 | (70) | 582.90 - 590.90 | 8 | 1.07 | |||||||||||||||||||||
| 597.60 - 603.00 | 5.4 | 7.17 | ||||||||||||||||||||||||
| MDD122 | 309 | (67) | 546.50 - 556.05 | 9.55 | 0.59 | |||||||||||||||||||||
| 558.45 - 560.45 | 2 | 0.56 | ||||||||||||||||||||||||
| 567.45 - 569.82 | 2.37 | 0.67 | ||||||||||||||||||||||||
| 576.84 - 582.10 | 5.26 | 0.89 | ||||||||||||||||||||||||
| 588.50 - 592.21 | 3.71 | 1.36 | ||||||||||||||||||||||||
| MDD122W1 | 309 | (67) | 616.83 - 621.35 | 4.52 | 2.52 | 620.65 - 621.35 | 0.7 | 9.93 | ||||||||||||||||||
| ZBDD0003 | 260 | (50) | 234.00 - 239.00 | 5 | 0.63 | |||||||||||||||||||||
| 280.88 - 285.00 | 4.12 | 0.89 | ||||||||||||||||||||||||
| ZBDD0004 | 260 | (50) | 293.00 - 295.00 | 2 | 0.88 | |||||||||||||||||||||
BARRICK SECOND QUARTER 2023 |
83 |
MANAGEMENT'S DISCUSSION AND ANALYSIS | ||||||
| Drill Results from Q2 2023 | ||||||||||||||||||||||||||
Includingd |
||||||||||||||||||||||||||
Drill Holeb |
Azimuth | Dip | Interval (m) | Width (m)c |
Au (g/t) | Interval (m) | Width (m)c |
Au (g/t) | ||||||||||||||||||
| SBKDD002 | 221 | (60) | 180 - 181 | 1 | 1.51 | |||||||||||||||||||||
| 221 | (60) | 287 - 288 | 1 | 4.08 | ||||||||||||||||||||||
| 221 | (60) | 435.2 - 436.6 | 1.4 | 15.25 | ||||||||||||||||||||||
| SBKRC003 | 221 | (50) | 119 - 123 | 4 | 0.71 | |||||||||||||||||||||
| SBKRC004 | 221 | (50) | 66 - 67 | 1 | 5.51 | |||||||||||||||||||||
| SBKRC005 | 221 | (50) | 11 - 13 | 2 | 0.80 | |||||||||||||||||||||
| 221 | (50) | 55 - 56 | 1 | 0.84 | ||||||||||||||||||||||
| 221 | (50) | 87 - 89 | 2 | 4.63 | ||||||||||||||||||||||
| 221 | (50) | 104 - 105 | 1 | 2.48 | ||||||||||||||||||||||
| SBKRC006 | 221 | (50) | 147 - 151 | 4 | 6.95 | 147-148 | 1 | 26.6 | ||||||||||||||||||
| 221 | (50) | 157 - 158 | 1 | 2.68 | ||||||||||||||||||||||
| 221 | (50) | 164 - 165 | 1 | 0.98 | ||||||||||||||||||||||
| 221 | (50) | 175 - 176 | 1 | 0.95 | ||||||||||||||||||||||
| SBKRC007 | 221 | (50) | 157 - 164 | 7 | 3.56 | 160-161 | 1 | 16.29 | ||||||||||||||||||
| SBKRC007 | 221 | (50) | 167 - 168 | 1 | 0.99 | |||||||||||||||||||||
| 221 | (50) | 171 - 172 | 1 | 5.50 | ||||||||||||||||||||||
| SBKRC014 | 45 | (55) | 12 - 13 | 1 | 0.55 | |||||||||||||||||||||
| 45 | (55) | 20 - 21 | 1 | 1.07 | ||||||||||||||||||||||
| 45 | (55) | 49 - 50 | 1 | 2.19 | ||||||||||||||||||||||
| 45 | (55) | 76 - 77 | 1 | 0.52 | ||||||||||||||||||||||
| 45 | (55) | 88 - 90 | 2 | 1.92 | ||||||||||||||||||||||
| 45 | (55) | 93 - 94 | 1 | 4.58 | ||||||||||||||||||||||
| 45 | (55) | 152 - 155 | 3 | 2.75 | ||||||||||||||||||||||
| 45 | (55) | 161 - 164 | 3 | 1.23 | ||||||||||||||||||||||
| 45 | (55) | 176 - 177 | 1 | 0.77 | ||||||||||||||||||||||
| 45 | (55) | 179 - 180 | 1 | 2.14 | ||||||||||||||||||||||
| 45 | (55) | 193 - 194 | 1 | 0.52 | ||||||||||||||||||||||
| 45 | (55) | 196 - 198 | 1 | 2.33 | ||||||||||||||||||||||
| SBKRC018 | 221 | (50) | 93 - 95 | 2 | 1.11 | |||||||||||||||||||||
| SBKRC013 | 221 | (55) | 64 - 66 | 2 | 0.88 | |||||||||||||||||||||
| 221 | (55) | 77 - 80 | 3 | 4.28 | 79-80 | 1 | 12.02 | |||||||||||||||||||
| 221 | (55) | 93 - 95 | 2 | 1.69 | ||||||||||||||||||||||
| SBKRC010 | 221 | (55) | 13 - 14 | 1 | 1.46 | |||||||||||||||||||||
| 221 | (55) | 109 - 110 | 1 | 0.58 | ||||||||||||||||||||||
| 221 | (55) | 111 - 112 | 1 | 0.52 | ||||||||||||||||||||||
| 221 | (55) | 140 - 141 | 1 | 3.94 | ||||||||||||||||||||||
| 221 | (55) | 239 - 240 | 1 | 0.53 | ||||||||||||||||||||||
| SBKRC011 | 221 | (55) | 112 - 115 | 3 | 1.35 | |||||||||||||||||||||
| SBKRC015 | 221 | (55) | 187 - 190 | 3 | 0.55 | |||||||||||||||||||||
BARRICK SECOND QUARTER 2023 |
84 |
MANAGEMENT'S DISCUSSION AND ANALYSIS | ||||||
| Barrick Gold Corporation (in millions of United States dollars, except per share data) (Unaudited) |
Three months ended June 30, | Six months ended June 30, | ||||||||||||
| 2023 | 2022 | 2023 | 2022 | |||||||||||
| Revenue (notes 4 and 5) | $2,833 | $2,859 | $5,476 | $5,712 | ||||||||||
| Costs and expenses (income) | ||||||||||||||
| Cost of sales (notes 4 and 6) | 1,937 | 1,850 | 3,878 | 3,589 | ||||||||||
| General and administrative expenses | 28 | 30 | 67 | 84 | ||||||||||
| Exploration, evaluation and project expenses | 101 | 100 | 172 | 167 | ||||||||||
| Impairment charges (notes 8b and 12) | 22 | 3 | 23 | 5 | ||||||||||
| (Gain) loss on currency translation | (12) | 6 | 26 | 9 | ||||||||||
| Closed mine rehabilitation | (13) | (128) | 9 | (125) | ||||||||||
| Income from equity investees (note 11) | (58) | (89) | (111) | (188) | ||||||||||
| Other expense (income) (note 8a) | 18 | 2 | 70 | (9) | ||||||||||
| Income before finance costs and income taxes | $810 | $1,085 | $1,342 | $2,180 | ||||||||||
| Finance costs, net | (44) | (89) | (102) | (177) | ||||||||||
| Income before income taxes | $766 | $996 | $1,240 | $2,003 | ||||||||||
| Income tax expense (note 9) | (264) | (279) | (469) | (580) | ||||||||||
| Net income | $502 | $717 | $771 | $1,423 | ||||||||||
| Attributable to: | ||||||||||||||
| Equity holders of Barrick Gold Corporation | $305 | $488 | $425 | $926 | ||||||||||
| Non-controlling interests (note 15) | $197 | $229 | $346 | $497 | ||||||||||
| Earnings per share data attributable to the equity holders of Barrick Gold Corporation (note 7) | ||||||||||||||
| Net income | ||||||||||||||
| Basic | $0.17 | $0.27 | $0.24 | $0.52 | ||||||||||
| Diluted | $0.17 | $0.27 | $0.24 | $0.52 | ||||||||||
BARRICK SECOND QUARTER 2023 |
85 |
FINANCIAL STATEMENTS (UNAUDITED) | ||||||
|
Barrick Gold Corporation
(in millions of United States dollars) (Unaudited)
|
Three months ended June 30, | Six months ended June 30, | ||||||||||||
| 2023 | 2022 | 2023 | 2022 | |||||||||||
| Net income | $502 | $717 | $771 | $1,423 | ||||||||||
| Other comprehensive income (loss), net of taxes | ||||||||||||||
| Items that may be reclassified subsequently to profit or loss: | ||||||||||||||
Currency translation adjustments, net of tax $nil, $nil, $nil and $nil |
— | 1 | (3) | 1 | ||||||||||
| Items that will not be reclassified to profit or loss: | ||||||||||||||
Actuarial loss on post employment benefit obligations, net of tax $nil, $nil, $nil and $nil |
— | (1) | — | (1) | ||||||||||
Net change on equity investments, net of tax $(1), $2 , $(1) and $(6) |
(5) | (26) | (5) | 32 | ||||||||||
| Total other comprehensive (loss) income | (5) | (26) | (8) | 32 | ||||||||||
| Total comprehensive income | $497 | $691 | $763 | $1,455 | ||||||||||
| Attributable to: | ||||||||||||||
| Equity holders of Barrick Gold Corporation | $300 | $462 | $417 | $958 | ||||||||||
| Non-controlling interests | $197 | $229 | $346 | $497 | ||||||||||
BARRICK SECOND QUARTER 2023 |
86 |
FINANCIAL STATEMENTS (UNAUDITED) | ||||||
| Barrick Gold Corporation (in millions of United States dollars) (Unaudited) |
Three months ended June 30, | Six months ended June 30, | ||||||||||||
| 2023 | 2022 | 2023 | 2022 | |||||||||||
| OPERATING ACTIVITIES | ||||||||||||||
| Net income | $502 | $717 | $771 | $1,423 | ||||||||||
| Adjustments for the following items: | ||||||||||||||
| Depreciation | 480 | 476 | 975 | 936 | ||||||||||
Finance costs, net1 |
44 | 89 | 102 | 177 | ||||||||||
| Impairment charges (notes 8b and 12) | 22 | 3 | 23 | 5 | ||||||||||
| Income tax expense (note 9) | 264 | 279 | 469 | 580 | ||||||||||
| Income from equity investees (note 11) | (58) | (89) | (111) | (188) | ||||||||||
| Gain on sale of non-current assets | (3) | (20) | (6) | (22) | ||||||||||
| (Gain) loss on currency translation | (12) | 6 | 26 | 9 | ||||||||||
| Change in working capital (note 10) | (45) | (34) | (251) | (165) | ||||||||||
| Other operating activities (note 10) | (51) | (126) | 1 | (203) | ||||||||||
| Operating cash flows before interest and income taxes | 1,143 | 1,301 | 1,999 | 2,552 | ||||||||||
| Interest paid | (130) | (129) | (153) | (152) | ||||||||||
Interest received1 |
51 | 12 | 100 | 22 | ||||||||||
Income taxes paid2 |
(232) | (260) | (338) | (494) | ||||||||||
| Net cash provided by operating activities | 832 | 924 | 1,608 | 1,928 | ||||||||||
| INVESTING ACTIVITIES | ||||||||||||||
| Property, plant and equipment | ||||||||||||||
| Capital expenditures (note 4) | (769) | (755) | (1,457) | (1,366) | ||||||||||
| Sales proceeds | 3 | 22 | 6 | 23 | ||||||||||
| Investment sales | — | 122 | — | 382 | ||||||||||
| Dividends received from equity method investments (note 11) | 18 | 310 | 85 | 669 | ||||||||||
| Shareholder loan repayments from equity method investments (note 11) | 5 | — | 5 | — | ||||||||||
| Net cash used in investing activities | (743) | (301) | (1,361) | (292) | ||||||||||
| FINANCING ACTIVITIES | ||||||||||||||
| Lease repayments | (4) | (4) | (8) | (10) | ||||||||||
| Dividends | (174) | (353) | (349) | (531) | ||||||||||
| Share buyback program | — | (173) | — | (173) | ||||||||||
| Funding from non-controlling interests (note 15) | 10 | — | 10 | — | ||||||||||
| Disbursements to non-controlling interests (note 15) | (162) | (232) | (224) | (499) | ||||||||||
| Pueblo Viejo JV partner shareholder loan | 21 | 35 | 41 | 80 | ||||||||||
| Net cash used in financing activities | (309) | (727) | (530) | (1,133) | ||||||||||
| Effect of exchange rate changes on cash and equivalents | — | (3) | — | (3) | ||||||||||
| Net increase (decrease) in cash and equivalents | (220) | (107) | (283) | 500 | ||||||||||
| Cash and equivalents at the beginning of period | 4,377 | 5,887 | 4,440 | 5,280 | ||||||||||
| Cash and equivalents at the end of period | $4,157 | $5,780 | $4,157 | $5,780 | ||||||||||
BARRICK SECOND QUARTER 2023 |
87 |
FINANCIAL STATEMENTS (UNAUDITED) | ||||||
| Barrick Gold Corporation | As at June 30, | As at December 31, | ||||||
| (in millions of United States dollars) (Unaudited) | 2023 | 2022 | ||||||
| ASSETS | ||||||||
| Current assets | ||||||||
| Cash and equivalents | $4,157 | $4,440 | ||||||
| Accounts receivable | 603 | 554 | ||||||
| Inventories | 1,868 | 1,781 | ||||||
| Other current assets (note 13b) | 742 | 1,690 | ||||||
| Total current assets | $7,370 | $8,465 | ||||||
| Non-current assets | ||||||||
| Equity in investees (note 11) | 4,004 | 3,983 | ||||||
| Property, plant and equipment | 26,311 | 25,821 | ||||||
| Goodwill | 3,581 | 3,581 | ||||||
| Intangible assets | 149 | 149 | ||||||
| Deferred income tax assets | 19 | 19 | ||||||
| Non-current portion of inventory | 2,765 | 2,819 | ||||||
| Other assets | 1,087 | 1,128 | ||||||
| Total assets | $45,286 | $45,965 | ||||||
| LIABILITIES AND EQUITY | ||||||||
| Current liabilities | ||||||||
| Accounts payable | $1,525 | $1,556 | ||||||
| Debt | 13 | 13 | ||||||
| Current income tax liabilities | 320 | 163 | ||||||
| Other current liabilities (note 13b) | 412 | 1,388 | ||||||
| Total current liabilities | $2,270 | $3,120 | ||||||
| Non-current liabilities | ||||||||
| Debt | 4,761 | 4,769 | ||||||
| Provisions | 2,181 | 2,211 | ||||||
| Deferred income tax liabilities | 3,286 | 3,247 | ||||||
| Other liabilities | 1,303 | 1,329 | ||||||
| Total liabilities | $13,801 | $14,676 | ||||||
| Equity | ||||||||
| Capital stock (note 14) | $28,116 | $28,114 | ||||||
| Deficit | (7,208) | (7,282) | ||||||
| Accumulated other comprehensive income (loss) | 18 | 26 | ||||||
| Other | 1,913 | 1,913 | ||||||
| Total equity attributable to Barrick Gold Corporation shareholders | $22,839 | $22,771 | ||||||
| Non-controlling interests (note 15) | 8,646 | 8,518 | ||||||
| Total equity | $31,485 | $31,289 | ||||||
| Contingencies and commitments (notes 4 and 16) | ||||||||
| Total liabilities and equity | $45,286 | $45,965 | ||||||
BARRICK SECOND QUARTER 2023 |
88 |
FINANCIAL STATEMENTS (UNAUDITED) | ||||||
| Barrick Gold Corporation | Attributable to equity holders of the company | |||||||||||||||||||||||||
| (in millions of United States dollars) (Unaudited) | Common Shares (in thousands) | Capital stock | Retained earnings (deficit) | Accumulated other comprehensive income (loss)1 |
Other2 |
Total equity attributable to shareholders | Non-controlling interests | Total equity | ||||||||||||||||||
| At January 1, 2023 | 1,755,350 | $28,114 | ($7,282) | $26 | $1,913 | $22,771 | $8,518 | $31,289 | ||||||||||||||||||
| Net income | — | — | 425 | — | — | 425 | 346 | 771 | ||||||||||||||||||
| Total other comprehensive loss | — | — | — | (8) | — | (8) | — | (8) | ||||||||||||||||||
| Total comprehensive income (loss) | — | — | 425 | (8) | — | 417 | 346 | 763 | ||||||||||||||||||
| Transactions with owners | ||||||||||||||||||||||||||
| Dividends | — | — | (349) | — | — | (349) | — | (349) | ||||||||||||||||||
| Funding from non-controlling interests (note 15) | — | — | — | — | — | — | 10 | 10 | ||||||||||||||||||
| Disbursements to non-controlling interests (note 15) | — | — | — | — | — | — | (228) | (228) | ||||||||||||||||||
| Dividend reinvestment plan (note 14) | 118 | 2 | (2) | — | — | — | — | — | ||||||||||||||||||
| Total transactions with owners | 118 | 2 | (351) | — | — | (349) | (218) | (567) | ||||||||||||||||||
| At June 30, 2023 | 1,755,468 | $28,116 | ($7,208) | $18 | $1,913 | $22,839 | $8,646 | $31,485 | ||||||||||||||||||
| At January 1, 2022 | 1,779,331 | $28,497 | ($6,566) | ($23) | $1,949 | $23,857 | $8,450 | $32,307 | ||||||||||||||||||
| Net income | — | — | 926 | — | — | 926 | 497 | 1,423 | ||||||||||||||||||
| Total other comprehensive income | — | — | — | 32 | — | 32 | — | 32 | ||||||||||||||||||
| Total comprehensive income | — | — | 926 | 32 | — | 958 | 497 | 1,455 | ||||||||||||||||||
| Transactions with owners | ||||||||||||||||||||||||||
| Dividends | — | — | (531) | — | — | (531) | — | (531) | ||||||||||||||||||
| Disbursements to non-controlling interests | — | — | — | — | — | — | (524) | (524) | ||||||||||||||||||
| Dividend reinvestment plan | 105 | 2 | (2) | — | — | — | — | — | ||||||||||||||||||
| Share buyback program | (8,500) | (136) | — | — | (37) | (173) | — | (173) | ||||||||||||||||||
| Total transactions with owners | (8,395) | (134) | (533) | — | (37) | (704) | (524) | (1,228) | ||||||||||||||||||
| At June 30, 2022 | 1,770,936 | $28,363 | ($6,173) | $9 | $1,912 | $24,111 | $8,423 | $32,534 | ||||||||||||||||||
BARRICK SECOND QUARTER 2023 |
89 |
FINANCIAL STATEMENTS (UNAUDITED) | ||||||
BARRICK SECOND QUARTER 2023 |
90 |
NOTES TO FINANCIAL STATEMENTS (UNAUDITED) | ||||||
| Cost of Sales | ||||||||||||||||||||
| For the three months ended June 30, 2023 | Revenue | Site operating costs, royalties and community relations | Depreciation | Exploration, evaluation and project expenses | Other expenses (income)1 |
Segment income (loss) | ||||||||||||||
Carlin2 |
$779 | $404 | $91 | $7 | $2 | $275 | ||||||||||||||
Cortez2 |
359 | 178 | 67 | 5 | 1 | 108 | ||||||||||||||
Turquoise Ridge2 |
232 | 129 | 43 | 2 | — | 58 | ||||||||||||||
Pueblo Viejo2 |
258 | 117 | 60 | 1 | 3 | 77 | ||||||||||||||
Loulo-Gounkoto2 |
344 | 139 | 60 | 2 | 4 | 139 | ||||||||||||||
| Kibali | 172 | 70 | 41 | — | 1 | 60 | ||||||||||||||
| Lumwana | 189 | 117 | 59 | 10 | 3 | — | ||||||||||||||
North Mara2 |
149 | 72 | 19 | — | 7 | 51 | ||||||||||||||
Bulyanhulu2 |
119 | 56 | 15 | — | 1 | 47 | ||||||||||||||
Other Mines2 |
392 | 245 | 56 | 2 | 16 | 73 | ||||||||||||||
| Reportable segment total | $2,993 | $1,527 | $511 | $29 | $38 | $888 | ||||||||||||||
| Share of equity investees | (172) | (70) | (41) | — | (1) | (60) | ||||||||||||||
| Segment total | $2,821 | $1,457 | $470 | $29 | $37 | $828 | ||||||||||||||
| Cost of Sales | ||||||||||||||||||||
| For the three months ended June 30, 2022 | Revenue | Site operating costs, royalties and community relations | Depreciation | Exploration, evaluation and project expenses | Other expenses (income)1 |
Segment income (loss) | ||||||||||||||
Carlin2 |
$748 | $371 | $80 | $5 | $3 | $289 | ||||||||||||||
Cortez2 |
284 | 131 | 48 | 4 | 1 | 100 | ||||||||||||||
Turquoise Ridge2 |
232 | 117 | 44 | 4 | — | 67 | ||||||||||||||
Pueblo Viejo2 |
318 | 136 | 60 | 12 | 4 | 106 | ||||||||||||||
Loulo-Gounkoto2 |
331 | 129 | 64 | 1 | 5 | 132 | ||||||||||||||
| Kibali | 145 | 57 | 33 | 1 | 5 | 49 | ||||||||||||||
| Lumwana | 211 | 109 | 33 | 2 | 5 | 62 | ||||||||||||||
North Mara2 |
149 | 60 | 23 | 1 | (1) | 66 | ||||||||||||||
Bulyanhulu2 |
118 | 57 | 14 | — | 5 | 42 | ||||||||||||||
Other Mines2 |
429 | 258 | 108 | 3 | 12 | 48 | ||||||||||||||
| Reportable segment total | $2,965 | $1,425 | $507 | $33 | $39 | $961 | ||||||||||||||
| Share of equity investees | (145) | (57) | (33) | (1) | (5) | (49) | ||||||||||||||
| Segment total | $2,820 | $1,368 | $474 | $32 | $34 | $912 | ||||||||||||||
BARRICK SECOND QUARTER 2023 |
91 |
NOTES TO FINANCIAL STATEMENTS (UNAUDITED) | ||||||
| Cost of Sales | ||||||||||||||||||||
| For the six months ended June 30, 2023 | Revenue | Site operating costs, royalties and community relations | Depreciation | Exploration, evaluation and project expenses | Other expenses (income)1 |
Segment income (loss) | ||||||||||||||
Carlin2 |
$1,290 | $734 | $154 | $15 | $4 | $383 | ||||||||||||||
Cortez2 |
784 | 382 | 158 | 7 | 3 | 234 | ||||||||||||||
Turquoise Ridge2 |
486 | 268 | 93 | 3 | — | 122 | ||||||||||||||
Pueblo Viejo2 |
549 | 237 | 124 | 2 | 4 | 182 | ||||||||||||||
Loulo-Gounkoto2 |
665 | 283 | 131 | 2 | 5 | 244 | ||||||||||||||
| Kibali | 299 | 136 | 66 | — | 4 | 93 | ||||||||||||||
| Lumwana | 360 | 247 | 103 | 17 | 5 | (12) | ||||||||||||||
North Mara2 |
307 | 136 | 38 | — | 26 | 107 | ||||||||||||||
Bulyanhulu2 |
230 | 114 | 31 | — | 17 | 68 | ||||||||||||||
Other Mines2 |
786 | 496 | 127 | 4 | 36 | 123 | ||||||||||||||
| Reportable segment total | $5,756 | $3,033 | $1,025 | $50 | $104 | $1,544 | ||||||||||||||
| Share of equity investees | (299) | (136) | (66) | — | (4) | (93) | ||||||||||||||
| Segment total | $5,457 | $2,897 | $959 | $50 | $100 | $1,451 | ||||||||||||||
| Cost of Sales | ||||||||||||||||||||
| For the six months ended June 30, 2022 | Revenue | Site operating costs, royalties and community relations | Depreciation | Exploration, evaluation and project expenses | Other expenses (income)1 |
Segment income (loss) | ||||||||||||||
Carlin2 |
$1,455 | $681 | $149 | $7 | ($18) | $636 | ||||||||||||||
Cortez2 |
648 | 283 | 110 | 6 | 1 | 248 | ||||||||||||||
Turquoise Ridge2 |
427 | 224 | 86 | 4 | 1 | 112 | ||||||||||||||
Pueblo Viejo2 |
656 | 265 | 118 | 14 | 5 | 254 | ||||||||||||||
Loulo-Gounkoto2 |
653 | 252 | 127 | 3 | 7 | 264 | ||||||||||||||
| Kibali | 282 | 112 | 61 | 4 | 15 | 90 | ||||||||||||||
| Lumwana | 498 | 225 | 71 | 2 | 5 | 195 | ||||||||||||||
North Mara2 |
280 | 110 | 33 | 2 | — | 135 | ||||||||||||||
Bulyanhulu2 |
249 | 119 | 31 | — | 6 | 93 | ||||||||||||||
Other Mines2 |
822 | 485 | 202 | 6 | 30 | 99 | ||||||||||||||
| Reportable segment total | $5,970 | $2,756 | $988 | $48 | $52 | $2,126 | ||||||||||||||
| Share of equity investees | (282) | (112) | (61) | (4) | (15) | (90) | ||||||||||||||
| Segment total | $5,688 | $2,644 | $927 | $44 | $37 | $2,036 | ||||||||||||||
BARRICK SECOND QUARTER 2023 |
92 |
NOTES TO FINANCIAL STATEMENTS (UNAUDITED) | ||||||
| For the three months ended June 30 | For the six months ended June 30 | |||||||||||||
| 2023 | 2022 | 2023 | 2022 | |||||||||||
| Segment income | $828 | $912 | $1,451 | $2,036 | ||||||||||
| Other revenue | 12 | 39 | 19 | 24 | ||||||||||
| Other cost of sales/amortization | (10) | (8) | (22) | (18) | ||||||||||
| Exploration, evaluation and project expenses not attributable to segments | (72) | (68) | (122) | (123) | ||||||||||
| General and administrative expenses | (28) | (30) | (67) | (84) | ||||||||||
| Other income not attributable to segments | 6 | 23 | 4 | 23 | ||||||||||
| Impairment charges | (22) | (3) | (23) | (5) | ||||||||||
| Gain (loss) on currency translation | 12 | (6) | (26) | (9) | ||||||||||
| Closed mine rehabilitation | 13 | 128 | (9) | 125 | ||||||||||
| Income from equity investees | 58 | 89 | 111 | 188 | ||||||||||
| Finance costs, net (includes non-segment accretion) | (32) | (80) | (78) | (161) | ||||||||||
| Gain on non-hedge derivatives | 1 | — | 2 | 7 | ||||||||||
| Income before income taxes | $766 | $996 | $1,240 | $2,003 | ||||||||||
Capital Expenditures Information |
Segment capital expenditures1 |
|||||||||||||
| For the three months ended June 30 | For the six months ended June 30 | |||||||||||||
| 2023 | 2022 | 2023 | 2022 | |||||||||||
| Carlin | $143 | $130 | $263 | $247 | ||||||||||
| Cortez | 115 | 126 | 201 | 219 | ||||||||||
| Turquoise Ridge | 23 | 44 | 50 | 86 | ||||||||||
| Pueblo Viejo | 119 | 150 | 246 | 294 | ||||||||||
| Loulo-Gounkoto | 91 | 82 | 195 | 144 | ||||||||||
| Kibali | 25 | 21 | 44 | 38 | ||||||||||
| Lumwana | 72 | 78 | 124 | 135 | ||||||||||
| North Mara | 45 | 35 | 85 | 57 | ||||||||||
| Bulyanhulu | 23 | 23 | 43 | 35 | ||||||||||
| Other Mines | 54 | 67 | 115 | 125 | ||||||||||
| Reportable segment total | $710 | $756 | $1,366 | $1,380 | ||||||||||
| Other items not allocated to segments | 92 | 29 | 133 | 63 | ||||||||||
| Total | $802 | $785 | $1,499 | $1,443 | ||||||||||
| Share of equity investees | (25) | (21) | (44) | (38) | ||||||||||
| Total | $777 | $764 | $1,455 | $1,405 | ||||||||||
| Lumwana | Cost of Sales | ||||||||||||||||||||||
| For the year ended | Revenue | Site operating costs, royalties and community relations | Depreciation | Exploration, evaluation and project expenses | Other expenses (income)1 |
Segment income (loss) | Capital Expenditures | ||||||||||||||||
| December 31, 2022 | $868 | $443 | $223 | $11 | $11 | $180 | $380 | ||||||||||||||||
| December 31, 2021 | $962 | $373 | $197 | $— | $1 | $391 | $222 | ||||||||||||||||
BARRICK SECOND QUARTER 2023 |
93 |
NOTES TO FINANCIAL STATEMENTS (UNAUDITED) | ||||||
| For the three months ended June 30 | For the six months ended June 30 | |||||||||||||
| 2023 | 2022 | 2023 | 2022 | |||||||||||
| Gold sales | ||||||||||||||
| Spot market sales | $2,490 | $2,524 | $4,816 | $4,950 | ||||||||||
| Concentrate sales | 97 | 77 | 174 | 158 | ||||||||||
| Provisional pricing adjustments | (3) | (4) | 5 | — | ||||||||||
| $2,584 | $2,597 | $4,995 | $5,108 | |||||||||||
| Copper sales | ||||||||||||||
| Concentrate sales | $200 | $263 | $359 | $534 | ||||||||||
| Provisional pricing adjustments | (11) | (52) | 1 | (36) | ||||||||||
| $189 | $211 | $360 | $498 | |||||||||||
Other sales1 |
60 | 51 | 121 | 106 | ||||||||||
| Total | $2,833 | $2,859 | $5,476 | $5,712 | ||||||||||
| Gold | Copper | Other3 |
Total | |||||||||||||||||||||||
| For the three months ended June 30 | 2023 | 2022 | 2023 | 2022 | 2023 | 2022 | 2023 | 2022 | ||||||||||||||||||
Site operating costs1,2 |
$1,244 | $1,163 | $100 | $76 | $— | $— | $1,344 | $1,239 | ||||||||||||||||||
Depreciation1 |
413 | 438 | 59 | 34 | 8 | 4 | 480 | 476 | ||||||||||||||||||
| Royalty expense | 88 | 95 | 16 | 32 | — | — | 104 | 127 | ||||||||||||||||||
| Community relations | 8 | 7 | 1 | 1 | — | — | 9 | 8 | ||||||||||||||||||
| $1,753 | $1,703 | $176 | $143 | $8 | $4 | $1,937 | $1,850 | |||||||||||||||||||
| Gold | Copper | Other3 |
Total | |||||||||||||||||||||||
| For the six months ended June 30 | 2023 | 2022 | 2023 | 2022 | 2023 | 2022 | 2023 | 2022 | ||||||||||||||||||
Site operating costs1,2 |
$2,452 | $2,231 | $215 | $159 | $— | $— | $2,667 | $2,390 | ||||||||||||||||||
Depreciation1 |
858 | 857 | 103 | 72 | 14 | 7 | 975 | 936 | ||||||||||||||||||
| Royalty expense | 189 | 183 | 31 | 64 | — | — | 220 | 247 | ||||||||||||||||||
| Community relations | 15 | 14 | 1 | 2 | — | — | 16 | 16 | ||||||||||||||||||
| $3,514 | $3,285 | $350 | $297 | $14 | $7 | $3,878 | $3,589 | |||||||||||||||||||
| For the three months ended June 30 | For the six months ended June 30 | |||||||||||||||||||||||||
| 2023 | 2022 | 2023 | 2022 | |||||||||||||||||||||||
| Basic | Diluted | Basic | Diluted | Basic | Diluted | Basic | Diluted | |||||||||||||||||||
| Net income | $502 | $502 | $717 | $717 | $771 | $771 | $1,423 | $1,423 | ||||||||||||||||||
| Net income attributable to non-controlling interests | (197) | (197) | (229) | (229) | (346) | (346) | (497) | (497) | ||||||||||||||||||
| Net income attributable to equity holders of Barrick Gold Corporation | $305 | $305 | $488 | $488 | $425 | $425 | $926 | $926 | ||||||||||||||||||
| Weighted average shares outstanding | 1,755 | 1,755 | 1,777 | 1,777 | 1,755 | 1,755 | 1,778 | 1,778 | ||||||||||||||||||
| Basic and diluted earnings per share data attributable to the equity holders of Barrick Gold Corporation | $0.17 | $0.17 | $0.27 | $0.27 | $0.24 | $0.24 | $0.52 | $0.52 | ||||||||||||||||||
BARRICK SECOND QUARTER 2023 |
94 |
NOTES TO FINANCIAL STATEMENTS (UNAUDITED) | ||||||
| For the three months ended June 30 | For the six months ended June 30 | |||||||||||||
| 2023 | 2022 | 2023 | 2022 | |||||||||||
| Other expense: | ||||||||||||||
| Bank charges | $— | $— | $1 | $2 | ||||||||||
| Litigation | 4 | 3 | 9 | 7 | ||||||||||
| Loss (gain) on warrant investments at fair value through profit or loss ("FVPL") | 3 | (2) | 5 | (4) | ||||||||||
| Porgera care and maintenance costs | 13 | 14 | 30 | 27 | ||||||||||
| Buzwagi supplies obsolescence | — | — | — | 2 | ||||||||||
| Tanzania education program | — | — | 30 | — | ||||||||||
| Other | 8 | 10 | 14 | 18 | ||||||||||
| Total other expense | $28 | $25 | $89 | $52 | ||||||||||
| Other income: | ||||||||||||||
| Gain on sale of non-current assets | ($3) | ($20) | ($6) | ($22) | ||||||||||
| Gain on non-hedge derivatives | (1) | — | (2) | (7) | ||||||||||
| Insurance proceeds related to NGM | — | — | — | (22) | ||||||||||
| Interest income on other assets | (6) | (3) | (11) | (7) | ||||||||||
| Other | — | — | — | (3) | ||||||||||
| Total other income | ($10) | ($23) | ($19) | ($61) | ||||||||||
| Total | $18 | $2 | $70 | ($9) | ||||||||||
| For the three months ended June 30 | For the six months ended June 30 | |||||||||||||
| 2023 | 2022 | 2023 | 2022 | |||||||||||
Impairment charges of non-current assets1 |
$22 | $3 | $23 | $5 | ||||||||||
| Total | $22 | $3 | $23 | $5 | ||||||||||
| For the three months ended June 30 | For the six months ended June 30 | |||||||||||||
| 2023 | 2022 | 2023 | 2022 | |||||||||||
| Current | $246 | $206 | $428 | $483 | ||||||||||
| Deferred | 18 | 73 | 41 | 97 | ||||||||||
| Total | $264 | $279 | $469 | $580 | ||||||||||
BARRICK SECOND QUARTER 2023 |
95 |
NOTES TO FINANCIAL STATEMENTS (UNAUDITED) | ||||||
| Operating Cash Flows – Other Items | For the three months ended June 30 | For the six months ended June 30 | ||||||||||||
| 2023 | 2022 | 2023 | 2022 | |||||||||||
| Adjustments for non-cash income statement items: | ||||||||||||||
| Gain on non-hedge derivatives | ($1) | $— | ($2) | ($7) | ||||||||||
| Loss (gain) on warrant investments at FVPL | 3 | (2) | 5 | (4) | ||||||||||
| Tanzania education program | — | — | 30 | — | ||||||||||
| Share-based compensation expense (recovery) | 6 | (6) | 25 | 29 | ||||||||||
| Change in estimate of rehabilitation costs at closed mines | (13) | (128) | 9 | (125) | ||||||||||
| Insurance proceeds related to NGM | — | 22 | — | — | ||||||||||
| Inventory impairment charges | 1 | 24 | 10 | 24 | ||||||||||
| Change in other assets and liabilities | (8) | (3) | 30 | (18) | ||||||||||
| Settlement of share-based compensation | — | (1) | (29) | (46) | ||||||||||
| Settlement of rehabilitation obligations | (39) | (32) | (77) | (56) | ||||||||||
| Other operating activities | ($51) | ($126) | $1 | ($203) | ||||||||||
| Cash flow arising from changes in: | ||||||||||||||
| Accounts receivable | ($31) | $41 | ($25) | $68 | ||||||||||
| Inventory | (3) | (40) | (75) | (80) | ||||||||||
| Other current assets | (61) | (68) | (65) | (172) | ||||||||||
| Accounts payable | 71 | 42 | (48) | 17 | ||||||||||
| Other current liabilities | (21) | (9) | (38) | 2 | ||||||||||
| Change in working capital | ($45) | ($34) | ($251) | ($165) | ||||||||||
| Kibali | Jabal Sayid | Zaldívar | Other | Total | |||||||||||||
| At January 1, 2022 | $3,267 | $382 | $893 | $52 | $4,594 | ||||||||||||
| Equity pick-up from equity investees | 86 | 124 | 47 | 1 | 258 | ||||||||||||
| Dividends received from equity investees | (694) | (124) | (50) | (1) | (869) | ||||||||||||
| At December 31, 2022 | $2,659 | $382 | $890 | $52 | $3,983 | ||||||||||||
| Equity pick-up from equity investees | 61 | 51 | (2) | 1 | 111 | ||||||||||||
| Dividends received from equity investees | (37) | (48) | — | — | (85) | ||||||||||||
| Shareholder loan repayment | — | — | — | (5) | (5) | ||||||||||||
| At June 30, 2023 | $2,683 | $385 | $888 | $48 | $4,004 | ||||||||||||
BARRICK SECOND QUARTER 2023 |
96 |
NOTES TO FINANCIAL STATEMENTS (UNAUDITED) | ||||||
| As at June 30, 2023 | Quoted prices in active markets for identical assets | Significant other observable inputs | Significant unobservable inputs | Aggregate fair value | ||||||||||
| (Level 1) | (Level 2) | (Level 3) | ||||||||||||
Other investments1 |
$102 | $— | $— | $102 | ||||||||||
| Receivables from provisional copper and gold sales | — | 216 | — | 216 | ||||||||||
| $102 | $216 | $— | $318 | |||||||||||
| As at June 30, 2023 | As at December 31, 2022 | |||||||||||||
| Carrying amount | Estimated fair value | Carrying amount | Estimated fair value | |||||||||||
| Financial assets | ||||||||||||||
Other assets1, 5 |
$417 | $417 | $1,358 | $1,358 | ||||||||||
Other investments2 |
102 | 102 | 112 | 112 | ||||||||||
Derivative assets3 |
— | — | 59 | 59 | ||||||||||
| $519 | $519 | $1,529 | $1,529 | |||||||||||
| Financial liabilities | ||||||||||||||
Debt4 |
$4,774 | $4,940 | $4,782 | $4,922 | ||||||||||
Other liabilities5 |
632 | 632 | 1,562 | 1,562 | ||||||||||
| $5,406 | $5,572 | $6,344 | $6,484 | |||||||||||
BARRICK SECOND QUARTER 2023 |
97 |
NOTES TO FINANCIAL STATEMENTS (UNAUDITED) | ||||||
| Nevada Gold Mines | Pueblo Viejo | Tanzania Mines1 |
Loulo-Gounkoto | Tongon | Reko Diq | Other | Total | |||||||||||||||||||
| NCI in subsidiary at June 30, 2023 | 38.5 | % | 40 | % | 16 | % | 20 | % | 10.3 | % | 50 | % | Various | |||||||||||||
| At January 1, 2022 | $6,061 | $1,189 | $298 | $953 | $29 | $— | ($80) | $8,450 | ||||||||||||||||||
| Acquisitions | — | — | — | — | — | 329 | — | 329 | ||||||||||||||||||
| Share of income (loss) | 633 | 96 | 35 | (179) | — | — | — | 585 | ||||||||||||||||||
| Disbursements | (626) | (157) | (12) | (35) | (16) | — | — | (846) | ||||||||||||||||||
| At December 31, 2022 | $6,068 | $1,128 | $321 | $739 | $13 | $329 | ($80) | $8,518 | ||||||||||||||||||
| Share of income (loss) | 262 | 40 | 15 | 35 | 4 | (10) | — | 346 | ||||||||||||||||||
| Cash contributed | — | — | — | — | — | 10 | — | 10 | ||||||||||||||||||
| Disbursements | (156) | (40) | — | (28) | (4) | — | — | (228) | ||||||||||||||||||
| At June 30, 2023 | $6,174 | $1,128 | $336 | $746 | $13 | $329 | ($80) | $8,646 | ||||||||||||||||||
BARRICK SECOND QUARTER 2023 |
98 |
NOTES TO FINANCIAL STATEMENTS (UNAUDITED) | ||||||
BARRICK SECOND QUARTER 2023 |
99 |
NOTES TO FINANCIAL STATEMENTS (UNAUDITED) | ||||||