UNITED STATES
SECURITIES AND EXCHANGE COMMISSION
Washington, D.C. 20549
FORM 8-K
CURRENT REPORT
Pursuant to Section 13 or 15(d)
of The Securities Exchange Act of 1934
Date of Report (Date of earliest event reported): August 3, 2023
Block, Inc.
(Exact name of registrant as specified in its charter)
| Delaware | 001-37622 | 80-0429876 | ||
| (State or other jurisdiction of incorporation) |
(Commission File Number) |
(IRS Employer Identification No.) |
| 1955 Broadway, Suite 600 |
| Oakland, CA 946121 |
| (Address of principal executive offices, including zip code) |
(415) 375-3176
(Registrant’s telephone number, including area code)
Not Applicable
(Former name or former address, if changed since last report)
Check the appropriate box below if the Form 8-K filing is intended to simultaneously satisfy the filing obligation of the registrant under any of the following provisions (see General Instruction A.2. below):
| ☐ | Written communications pursuant to Rule 425 under the Securities Act (17 CFR 230.425) |
| ☐ | Soliciting material pursuant to Rule 14a-12 under the Exchange Act (17 CFR 240.14a-12) |
| ☐ | Pre-commencement communications pursuant to Rule 14d-2(b) under the Exchange Act (17 CFR 240.14d-2(b)) |
| ☐ | Pre-commencement communications pursuant to Rule 13e-4(c) under the Exchange Act (17 CFR 240.13e-4(c)) |
Securities registered pursuant to Section 12(b) of the Act:
| Title of each class |
Trading |
Name of each exchange |
||
| Class A Common Stock, $0.0000001 par value per share | SQ | New York Stock Exchange |
Indicate by check mark whether the registrant is an emerging growth company as defined in Rule 405 of the Securities Act of 1933 (§230.405 of this chapter) or Rule 12b-2 of the Securities Exchange Act of 1934 (§240.12b-2 of this chapter).
Emerging growth company ☐
If an emerging growth company, indicate by check mark if the registrant has elected not to use the extended transition period for complying with any new or revised financial accounting standards provided pursuant to Section 13(a) of the Exchange Act. ☐
| 1 | We have adopted a distributed work model and, therefore, have no formal headquarters. This address represents our “principal executive office,” which we are required to identify under Securities and Exchange Commission rules. |
| Item 2.02 | Results of Operations and Financial Condition. |
On August 3, 2023, Block, Inc. (the “Company”) issued a Shareholder Letter (the “Letter”) announcing its financial results for the second quarter ended June 30, 2023. In the Letter, the Company also announced that it would be holding a conference call and earnings webcast on August 3, 2023 at 2:00 p.m. Pacific Time to discuss its financial results for the second quarter ended June 30, 2023. The Letter is furnished as Exhibit 99.1 to this Current Report on Form 8-K (this “Report”).
The Company is making reference to non-GAAP financial information in both the Letter and the conference call. A reconciliation of these non-GAAP financial measures to their nearest GAAP equivalents is provided in the Letter.
The information furnished pursuant to Item 2.02 on this Report, including Exhibit 99.1 attached hereto, shall not be deemed “filed” for purposes of Section 18 of the Securities Exchange Act of 1934, as amended (the “Exchange Act”), or otherwise subject to the liabilities of that section, nor shall it be deemed incorporated by reference into any other filing under the Securities Act of 1933, as amended, or the Exchange Act, except as expressly set forth by specific reference in such a filing.
| Item 9.01 | Financial Statements and Exhibits. |
(d) Exhibits
| Exhibit No. |
Description |
|
| 99.1 | Shareholder Letter, dated August 3, 2023. | |
| 104 | Cover Page Interactive Data File, formatted in inline XBRL. | |
SIGNATURES
Pursuant to the requirements of the Securities Exchange Act of 1934, the registrant has duly caused this report to be signed on its behalf by the undersigned hereunto duly authorized.
| BLOCK, INC. | ||||||
| Date: August 3, 2023 | By: | /s/ Chrysty Esperanza |
||||
| Chrysty Esperanza Chief Legal Officer and Corporate Secretary |
||||||
Exhibit 99.1

BLOCK Q2 2023 Shareholder Letter investors. block.xyz
Q2’23 Highlights
|
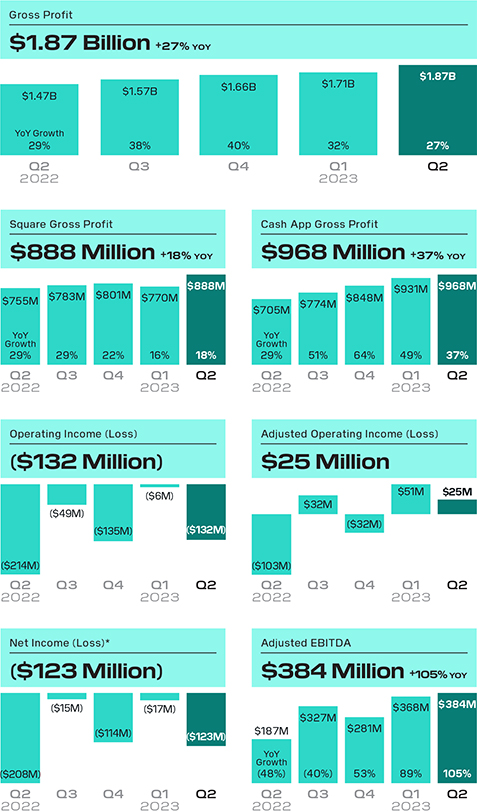
In the second quarter of 2023, we generated gross profit of $1.87 billion, up 27% year over year. Square generated gross profit of $888 million, up 18% year over year, and Cash App generated gross profit of $968 million, up 37% year over year.
Square had strong momentum with its banking products, which generated $167 million in gross profit, up 24% year over year, driven primarily by Square Loans, Instant Transfer, and Square Debit Card.
More than half of Cash App’s actives in the second quarter had a network of four or more accounts, which significantly enhanced retention and increased spend over time: Peer-to-peer transactions per active reached an all-time quarterly high in the second quarter, while peer-to-peer volume was $53 billion, up 18% year over year. |
fu Gross Profit $1.87 Billion +27% yoy $1.87B $1.66B $1.71B $1.47B $1.57B YoY Growth 29% 38% 40% 32% 27% Q2 Q3 Q4 Q1 Q2 2022 2023 Square Gross Profit Cash App Gross Profit $888 Million +18% yoy $968 Million +37% yoy $888M $931M $968M $783M $801M $770M $848M $755M $774M $705M YoY YoY Growth 29% 29% 22% 16% 18% Growth 29% 51% 64% 49% 37% Q2 Q3 Q4 Q1 Q2 Q2 Q3 Q4 Q1 Q2 2022 2023 2022 2023 Operating Income (Loss) Adjusted Operating Income (Loss) ($132 Million) $25 Million ($6M) $51M $25M $32M ($49M) ($132M) ($32M) ($135M) ($214M) ($103M) Q2 Q3 Q4 Q1 Q2 Q2 Q3 Q4 Q1 Q2 2022 2023 2022 2023 Net Income (Loss)* Adjusted EBITDA ($123 Million) $384 Million +105% yoy ($15M) ($17M) $368M $384M $327M $187M $281M ($114M) ($123M) YoY ($208M) Growth (48%) (40%) 53% 89% 105% Q2 Q3 Q4 Q1 Q2 Q2 Q3 Q4 Q1 Q2 2022 2023 2022 2023 |
|
|
In the second quarter of 2023, total net revenue was $5.53 billion, up 26% year over year, and, excluding bitcoin revenue, revenue was $3.14 billion, up 20% year over year.
Reconciliations of non-GAAP financial measures used in this letter to their nearest GAAP equivalents are provided at the end of this letter. Please see these reconciliations for a description of certain items that affected operating income (loss) and net income (loss) in the second quarter of 2023. |
||
|
|
BLOCK Q2 2023 2 |
| ON THE COVER Photodom is a vintage camera store located in Brooklyn, New York. They use ten products across Square’s ecosystem, including Square for Retail, Square Appointments, Square Loyalty, Square Gift Cards, Square Payroll, Team Management, Square Bill Pay, Square Savings, Afterpay, and multiple Square hardware devices.
CASH APP HIGHLIGHT The Mood Card is a heat-reactive Cash App Card that launched alongside a Cash by Cash App apparel line. |
$reesehills |
|
| To Our Shareholders |
||
| August 3, 2023 | We delivered strong growth and profitability at scale during the second quarter of 2023. Gross profit grew 27% year over year to $1.87 billion. Our Square ecosystem delivered gross profit of $888 million, an increase of 18% year over year. Our Cash App ecosystem delivered gross profit of $968 million, an increase of 37% year over year. Operating loss was $132 million and Adjusted Operating Income was $25 million, for Adjusted Operating Income margin of 1%. Net loss attributable to common stockholders was $123 million and Adjusted EBITDA was $384 million. In the second quarter of 2023, the sum of our combined year-over-year gross profit growth and Adjusted Operating Income margin totaled 28%. |
|
|
|
BLOCK Q2 2023 3 |
Square Ecosystem
We’re focused on four strategic priorities to drive Square’s business: enabling omnichannel, growing upmarket, expanding globally, and integrating generative artificial intelligence.
Enhancing Our Ecosystem of Products
Square Banking features accessible financial services that connect directly with sellers’ payments, helping them unlock instant access to their sales, automate their savings, and receive personalized financing offerings. During the second quarter, we continued to see strong momentum in our Square Banking products, which generated $167 million in gross profit, up 24% year over year, driven primarily by Square Loans, Instant Transfer, and Square Debit Card.
We are focused on further expanding our banking offerings to help sellers manage their cash flow. Our Square Credit Card, currently in beta, provides sellers with a rewards program to reinvest in their business and allows for flexibility without any late or annual fees. By using transaction-level data, we can proactively offer this credit option to select sellers based on their business performance and processing history. We also recently expanded Square Loans by offering a fixed monthly payment schedule option to serve larger sellers who wanted more visibility into managing their cash flow. While early, both Square Credit Card and our new loan options have seen strong usage, particularly among larger sellers who value the flexibility and ability to reinvest into their business: Since these products entered beta, mid-market sellers have accounted for 25% of Credit Card spend and approximately 25% of originations from loans with fixed monthly payments.

With no late fees or annual fees, Square Credit Card provides sellers with more spending flexibility when they need it and a rewards program that helps them reinvest in their business.
|
|
BLOCK Q2 2023 4 |
Growing Upmarket
Growing upmarket continues to be a strategic priority for the Square business as mid-market sellers adopt more of our ecosystem, which has led to stronger retention over time. In the second quarter, gross profit from mid-market sellers was up 20% year over year, outpacing total Square gross profit.
Over the past several years, our product suite for Square has significantly expanded from primarily payments products to a robust set of more than 30 software and financial services offerings, attracting sellers of all sizes. The growth of our business has led us to evolve our go-to-market efforts, specifically our sales and marketing teams. We recently verticalized our inbound U.S. sales team to focus on the verticals where Square sees the strongest growth potential — restaurants, finished goods retailers, and service providers. Since we have verticalized our inbound sales team, we have seen an increase in gross profit contribution per account executive. In July, we finalized the verticalization of our outbound U.S. sales team, which we believe will further improve our efforts in growing upmarket and complement our robust product offerings.
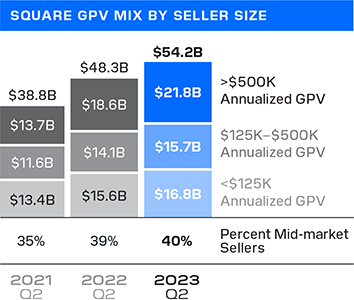
square gpv mix by seller size $48.3B $54.2B >$500K $38.8B $21.8B Annualized GPV $18.6B $13.7B $125K–$500K $14.1B $15.7B Annualized GPV $11.6B <$125K $13.4B $15.6B $16.8B Annualized GPV 35% 39% 40% Percent Mid-market Sellers 2021 2022 2023 Q2 Q2 Q2
We determine seller size based on annualized GPV during the applicable quarter. A mid-market seller generates more than $500,000 in annualized GPV. GPV does not include transactions from our BNPL platform because GPV is related only to transaction-based revenue and not to subscription and services-based revenue. Gross profit from mid-market sellers does not include gross profit contributions from our BNPL platform.
|
|
BLOCK Q2 2023 5 |
Expanding Globally
We remain focused on expanding our international presence by improving product parity and introducing new ways for sellers to take full advantage of the breadth of our ecosystem: In the second quarter, gross profit in markets outside the U.S. grew 23% year over year and represented 16% of Square gross profit. Driving product adoption has also been a focus in our international markets. In Australia, in the twelve months ended in June, nearly half of Square’s gross profit came from sellers that used four or more monetized products, up from approximately 20% compared to the same period two years ago due in part to our advancement in product parity.
Integrating Generative Artificial Intelligence (AI)
In early 2023 we incorporated generative AI as a strategic priority because we believe the technology can create new features and efficiencies for our customers. In July, we launched the Square Team Communication product to allow sellers and team members to easily message each other, send important updates, and share knowledge with their entire team. The product also includes Announcements AI, which enables a seller to quickly input key points and options for length and tone, reducing the amount of time it takes to craft a well-written announcement.
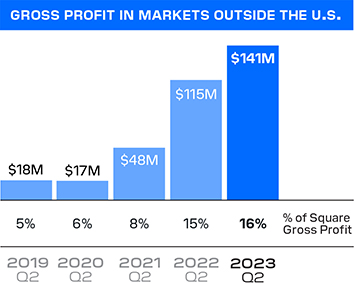
gross profit in markets outside the u.s. $141M $115M $48M $18M $17M 5% 6% 8% 15% 16% % of Square Gross Profit 2019 2020 2021 2022 2023 Q2 Q2 Q2 Q2 Q2
Square gross profit in markets outside the U.S. includes contributions from our BNPL platform beginning in the second quarter of 2022. Excluding our BNPL platform, Square gross profit in markets outside the U.S. was $90 million in the second quarter of 2023, representing 11% of Square gross profit.

|
Square Team Communication lets sellers and team members send important updates, share knowledge with the entire team, and stay connected. |
|
|
BLOCK Q2 2023 6 |
A transacting active is a Cash App account that has at least one financial transaction using any product or service within Cash App during a specified period. A transacting active for a specific Cash App product has at least one financial transaction using that product during the specified period and is referred to as an active. Certain of these accounts may share an alias identifier with one or more other transacting active accounts. This could represent, among other things, one customer with multiple accounts or multiple customers sharing one alias identifier (for example, families).
Inflows per transacting active refers to total inflows in the quarter divided by monthly actives for the last month of the quarter. Inflows refers to funds entering the Cash App ecosystem. Inflows does not include the movement of funds when funds remain in the Cash App ecosystem or when funds leave the Cash App ecosystem, or inflows related to the Afterpay or Verse apps. Inflows from Verse actives are not material to overall inflows.
Cash App Ecosystem
We use our inflows framework to assess the performance of Cash App’s gross profit as a result of three primary variables: (1) Actives, (2) Inflows per Active, and (3) Monetization Rate on Inflows. We are investing in the following development pillars: Trust, Financial Services, Community, Commerce, Global, Bitcoin, and Operating System.
Community
Peer to peer is an essential part of how Cash App continues to grow and retain its network. When customers use peer-to-peer payments, they invite their friends, family, and coworkers to download Cash App so they can send each other money — Cash App becomes more useful for our customers as the community scales.
We continue to see significantly enhanced retention for actives with a larger network size, and, in the second quarter, more than half of our actives had a network of four or more accounts. A large and engaged network has led to our actives transacting more through Cash App over time: In the second quarter, peer-to-peer transactions per active increased on a year-over-year basis and reached an all-time quarterly high, while peer-to-peer volume was $53 billion, up 18% year over year. Continued momentum in peer-to-peer volumes has helped drive growth in our active base: In June, Cash App had 54 million monthly transacting actives, up 15% year over year.
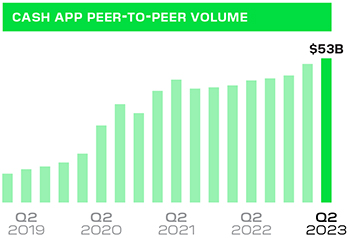
cash app peer-to-peer volume $53B Q2 Q2 Q2 Q2 Q2 2019 2020 2021 2022 2023
Peer-to-peer transactions per active reached an all-time quarterly high in the second quarter, with peer-to-peer volumes up 18% year over year to $53 billion. Cash App peer-to-peer volume is defined as all volume from peer-to-peer payments on the platform in the specified time period and does not include Cash App Card volume or Cash App Business GPV.
|
|
BLOCK Q2 2023 7 |
1. “How a ‘Youth Boom’ Could Shake Up Spending Trends, Morgan Stanley Research, August 16, 2019
Financial Services
As part of our financial services offerings, Cash App Taxes provides a way for customers to file their taxes digitally, easily, and for free. This has resonated with our customer base — in 2023, there were 1.3 million Cash App Taxes actives, the majority of which were existing Cash App customers, showing the ability to cross-sell our products. We see Cash App Taxes as an ecosystem product and a way to promote direct deposit adoption over time, which is important given our direct deposit actives bring in greater inflows and transact more frequently than other customers: More than one-third of Cash App Taxes actives chose to receive their refund directly into Cash App during this tax season, a meaningful increase year over year.
Our ability to encourage customer adoption of financial services continues to be a key driver of inflows per active: In the second quarter, inflows per transacting active were $1,134, up 8% year over year and relatively stable on a quarter-over-quarter basis despite a greater impact from tax refunds in the first quarter of 2023.
Commerce
We are continuing to prioritize commerce across Cash App and Square. We initially launched Cash App Pay with Square sellers as a new way to conduct commerce, offering a fast and simple payment solution for both sellers and consumers. In the second quarter, we launched Cash App Pay with several marquee Afterpay merchants such as Steve Madden and Fenty Beauty, and, recently, we expanded to payment providers such as Stripe, Adyen, and PayNearMe, an important step in broadening our distribution and reaching a much wider range of merchants.
We believe Cash App Pay is highly differentiated as merchants can access a unique customer base with Cash App: More than two-thirds of Cash App’s monthly transacting actives were Millennial or Gen-Z customers as of the second quarter. According to a research article by Morgan Stanley, the outsized population sizes of Millennials and Gen Z could lead to more spending in the U.S. in the coming years, showcasing the large spend opportunity for merchants to access.¹ During the second quarter, nearly $500 million in volume was processed through Cash App Pay on an annualized basis, and there were nearly 1 million Cash App Pay monthly actives as of June.
Cash App Taxes provides a way for customers to file their taxes digitally, easily, and for free. During this tax season, one-third of Cash App Taxes actives chose to receive their refund into Cash App.

We launched Cash App Pay with several marquee Afterpay merchants such as Fenty Beauty and Steve Madden in the second quarter, as well as payment providers such as Stripe, Adyen and PayNearMe.
|
|
BLOCK Q2 2023 8 |
Reconciliations of non-GAAP metrics used in this letter to their nearest GAAP equivalents are provided at the end of this letter.
GPV includes Square GPV and Cash App Business GPV. Square GPV is defined as the total dollar amount of all card payments processed by sellers using Square, net of refunds, and ACH transfers. Cash App Business GPV comprises Cash App activity related to peer-to-peer transactions received by business accounts and peer-to-peer payments sent from a credit card. GPV does not include transactions from our BNPL platform because GPV is related only to transaction-based revenue and not to subscription and services-based revenue.
We acquired our BNPL platform through the acquisition of Afterpay. We recognize revenue from our BNPL platform as subscription and services-based revenue, and have allocated 50% of revenue and gross profit from our BNPL platform to each of Square and Cash App. Revenue from our BNPL platform includes fees generated from consumer receivables, late fees, and certain affiliate and advertising fees from the platform.
Financial Discussion
REVENUE AND GROSS PROFIT
Total net revenue was $5.53 billion in the second quarter of 2023, up 26% year over year. Excluding bitcoin revenue, revenue in the second quarter was $3.14 billion, up 20% year over year. Gross profit was $1.87 billion, up 27% year over year.
Transaction-based revenue was $1.64 billion in the second quarter of 2023, up 11% year over year, and transaction-based gross profit was $687 million, up 15% year over year. We processed $59.01 billion in GPV in the second quarter of 2023, up 12% year over year. Transaction-based gross profit as a percentage of GPV was 1.16% in the second quarter, up 2 basis points year over year and down 1 basis point quarter over quarter.
Subscription and services-based revenue was $1.46 billion in the second quarter of 2023, up 33% year over year, and subscription and services-based gross profit was $1.18 billion, up 34% year over year.
In the second quarter of 2023, gross profit included $18 million of amortization of acquired technology assets, the majority of which was from the acquisition of our BNPL platform.
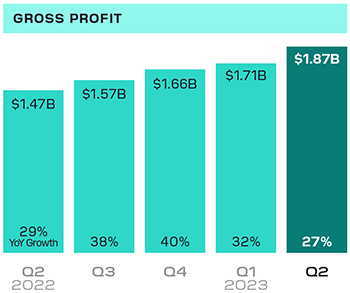
gross profit $1.87B $1.71B $1.66B $1.57B $1.47B 29% YoY Growth 38% 40% 32% 27% Q2 Q3 Q4 Q1 Q2 2022 2023
Bitcoin gross profit was $44 million in the second quarter of 2023. The total sale amount of bitcoin sold to customers, which we recognize as bitcoin revenue, was $2.39 billion. Bitcoin gross profit was 2% of bitcoin revenue.
|
|
BLOCK Q2 2023 9 |
Software and integrated payments gross profit excludes contributions from our BNPL platform.
SQUARE ECOSYSTEM REVENUE
AND GROSS PROFIT
In the second quarter of 2023, Square generated $1.93 billion of revenue and $888 million of gross profit, up 12% and 18% year over year, respectively. Our BNPL platform contributed $118 million of revenue and $84 million of gross profit to Square in the second quarter of 2023.
We continued to drive growth in software and integrated payments, with gross profit from these products up 18% year over year. Gross profit from sidecar payments, or transactions where sellers enter an amount on the keypad and hit charge, grew 5% year over year. Gross profit from our banking products, which primarily include Square Loans, Instant Transfer, and Square Debit Card, was up 24% year over year and 33% year over year excluding gross profit attributable to Paycheck Protection Program (PPP) loan forgiveness.
Square generated $1.50 billion of transaction-based revenue in the second quarter of 2023, up 11% year over year. During the quarter, Square saw more favorable interchange economics, which offset a higher percentage of card-present and credit card transactions on a year-over-year basis, which are less favorable to our economics on a per transaction basis.
In the second quarter of 2023, Square GPV was $54.15 billion, up 12% year over year and 13% year over year on a constant currency basis. We observed the following trends in Square GPV during the second quarter of 2023:
| • | Products: Card-present GPV was up 16% year over year and card-not-present GPV was up 5% year over year, driven by growth in online channels. |
| • | Geographies: Square GPV in our U.S. market grew 10% year over year, and growth in our international markets was 26% year over year. On a constant currency basis, Square GPV in our international markets was up 32% year over year. |
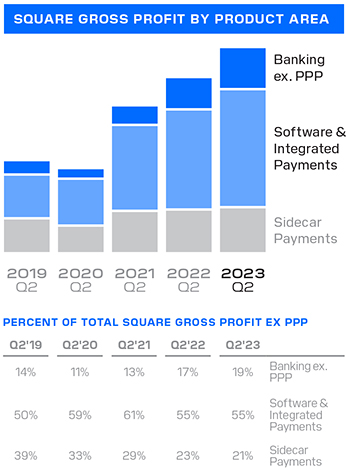
square gross profit by product area Banking ex. PPP Software & Integrated Payments Sidecar Payments 2019 2020 2021 2022 2023 Q2 Q2 Q2 Q2 Q2 percent of total square gross profit ex ppp Q2’19 Q2’20 Q2’21 Q2’22 Q2’23 14% 11% 13% 17% 19% Banking ex. PPP Software & 50% 59% 61% 55% 55% Integrated Payments 39% 33% 29% 23% 21% Sidecar Payments
Hardware gross profit losses and gross profit contributions from our BNPL platform are not presented for any period. Percentages are of Square gross profit excluding contributions from PPP loan forgiveness for each period.
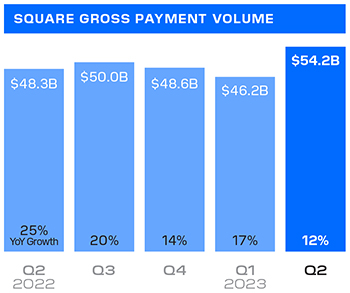
square gross payment volume $54.2B $48.3B $50.0B $48.6B $46.2B 25% YoY Growth 20% 14% 17% 12% Q2 Q3 Q4 Q1 Q2 2022 2023
Square GPV is defined as the total dollar amount of all card payments processed by sellers using Square, net of refunds, and ACH transfers. Square GPV does not include transactions from our BNPL platform because GPV is related only to transaction-based revenue and not to subscription and services-based revenue.
|
|
BLOCK Q2 2023 10 |
| • | Verticals: Food and drink and retail, our two largest verticals on a GPV basis, were the greatest drivers of GPV growth year over year. Food and drink GPV was up 17% year over year and retail GPV was up 9% year over year. Gross profit from our vertical point-of-sale solutions, including Square Appointments, Square for Restaurants, and Square for Retail, was up 37% year over year. |
| • | Acquisition and Retention: We achieved positive growth in acquisition of new sellers and saw relative stability in churn of existing sellers compared to historical levels. Growth in GPV per seller continued to be affected by consumer demand as year-over-year growth in spend per card and in the number of unique cards decelerated in the second quarter of 2023 compared to the second quarter of 2022. |
Square generated $381 million of subscription and services-based revenue during the second quarter of 2023, up 20% year over year. Square Loans facilitated approximately 119,000 loans totaling $1.10 billion in originations, up 9% year over year.
Hardware revenue in the second quarter of 2023 was $45 million, down 7% year over year, and gross loss was $29 million as we use hardware as an acquisition tool.
|
|
BLOCK Q2 2023 11 |
We calculate monetization rate by dividing Cash App gross profit, excluding contributions from our BNPL platform, by Cash App inflows.
Bitcoin revenue is the total sale amount of bitcoin sold to customers. Bitcoin costs are the total amount we pay to purchase bitcoin in order to facilitate customers’ access to bitcoin. In future quarters, bitcoin revenue and gross profit may fluctuate as a result of changes in customer demand or the market price of bitcoin. In the third quarter of 2022, we reclassified revenue related to bitcoin withdrawals from “Bitcoin revenue” to “Subscription and services-based revenue.” In the second quarter of 2022, bitcoin withdrawals revenue was $10 million and bitcoin withdrawals gross profit was $10 million.
CASH APP ECOSYSTEM REVENUE
AND GROSS PROFIT
In the second quarter of 2023, Cash App generated $3.56 billion of revenue and $968 million of gross profit, up 36% and 37% year over year, respectively. Excluding bitcoin revenue, Cash App revenue was $1.16 billion, up 39% year over year. Our BNPL platform contributed $118 million of revenue and $84 million of gross profit to Cash App in the second quarter of 2023.
We drove growth in net new transacting actives and strong engagement across products in our Cash App ecosystem. Inflows per transacting active were $1,134, up 8% year over year and relatively stable quarter over quarter, despite a greater impact from tax refunds in the first quarter of 2023. Overall inflows were $62 billion, up 25% year over year. Monetization rate was 1.44%, up 16 basis points year over year and 3 basis points quarter over quarter.
In the second quarter of 2023, Cash App Business GPV was $4.86 billion, up 15% year over year. Cash App Business GPV comprises Cash App activity related to peer-to-peer transactions received by business accounts and peer-to-peer payments sent from a credit card. Cash App generated $134 million of transaction-based revenue during the second quarter of 2023, up 15% year over year. Growth was driven by an increase in the number of transactions and in the number of business accounts.
Cash App generated $1.03 billion of subscription and services-based revenue during the second quarter of 2023, up 43% year over year. Growth was driven by transaction fees from both Cash App Card and Instant Deposit, as well as interest earned on customer funds and revenue from other financial services products.
Cash App generated $44 million of bitcoin gross profit in the second quarter of 2023, up 7% year over year. The total sale amount of bitcoin sold to customers, which we recognize as bitcoin revenue, was $2.39 billion, up 34% year over year. The year-over-year increase in bitcoin revenue and gross profit was driven by an increase in the quantity of bitcoin sold to customers, partially offset by a decrease in the average market price of bitcoin compared to the prior-year period.
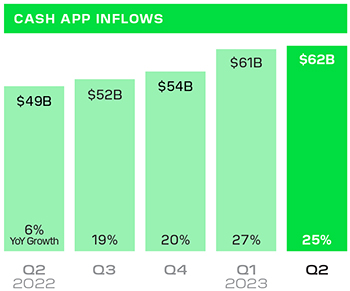
cash app inflows $61B $62B $54B $49B $52B 6% YoY Growth 19% 20% 27% 25% Q2 Q3 Q4 Q1 Q2 2022 2023
|
|
BLOCK Q2 2023 12 |
We discuss Cash App marketing expenses because a large portion is generated by our peer-to-peer service, which we offer free to our Cash App customers, and we consider it to be a marketing tool to encourage the use of Cash App. In the third quarter of 2022, we reclassified marketing expenses related to our BNPL platform from “Cash App marketing” expenses to “other sales and marketing” expenses. In the second quarter of 2022, this amount was $38 million. Accordingly, year over year “Cash App marketing” and “other sales and marketing” expense growth rates provided in this letter are calculated assuming this reclassification took place in the second quarter of 2022.
CORPORATE AND OTHER REVENUE
AND GROSS PROFIT
Corporate and Other generated $50 million in revenue and $10 million in gross profit in the second quarter of 2023. Corporate and Other comprised areas outside Square and Cash App, which were primarily TIDAL and intersegment eliminations between Cash App and Square in the second quarter of 2023.
OPERATING EXPENSES
Operating expenses were $2.00 billion on a GAAP basis and $1.50 billion on a non-GAAP basis in the second quarter of 2023, up 19% and 15% year over year, respectively.
Product development expenses were $695 million on a GAAP basis and $429 million on a non-GAAP basis in the second quarter of 2023, up 32% and 38% year over year, respectively. The increase was driven primarily by headcount and personnel costs related to our engineering team.
Sales and marketing expenses were $538 million on a GAAP basis and $503 million on a non-GAAP basis in the second quarter of 2023, up 1% and relatively flat year over year, respectively.
| • | Cash App marketing expenses were up 10% year over year, driven by an increase in peer-to-peer processing costs, related peer-to-peer transaction losses, and card issuance costs. |
| • | Other sales and marketing expenses were down 6% year over year. Other sales and marketing expenses primarily include expenses related to Square, our BNPL platform, and TIDAL. |
General and administrative expenses were $549 million on a GAAP basis and $377 million on a non-GAAP basis in the second quarter of 2023, up 39% and 21% year over year, respectively. The increase was driven primarily by headcount and personnel costs related to our customer support and compliance teams.
|
|
BLOCK Q2 2023 13 |
The accounting rules for bitcoin currently require us to recognize any decreases in market price below carrying value as an impairment charge, with no upward revisions recognized when the market price increases until the sale of that bitcoin. Bitcoin impairment loss is a GAAP expense. Non-GAAP operating expenses exclude bitcoin impairment losses. To determine the impairment charge, Block revalues its bitcoin holdings using the lowest price in the period.
Transaction, loan, and consumer receivables losses were $180 million in the second quarter of 2023, up 15% year over year. The increase was driven primarily from growth in Square Loans volumes and Cash App Card transactions. In the second quarter, loss rates for Square GPV, Square Loans, and BNPL consumer receivables remained consistent with historical ranges, and we will continue to monitor trends closely given the dynamic macro environment.
In the second quarter of 2023, operating expenses included $37 million of amortization of customer and other acquired intangible assets, the majority of which was from the acquisition of our BNPL platform.
In the fourth quarter of 2020 and first quarter of 2021, we invested $50 million and $170 million, respectively, in bitcoin. As an indefinite-lived intangible asset, bitcoin is subject to impairment losses if the fair value of bitcoin decreases below the carrying value during the assessed period. In the second quarter of 2023, we did not recognize a bitcoin impairment loss. As of June 30, 2023, the fair value of our investment in bitcoin was $245 million based on observable market prices, which was $142 million greater than the carrying value of the investment after cumulative impairment charges.
|
|
BLOCK Q2 2023 14 |
EARNINGS
In the second quarter of 2023, operating loss was $132 million and Adjusted Operating Income was $25 million. Adjusted Operating Income (Loss) is a non-GAAP financial measure that excludes certain expenses that we believe are not reflective of our core operating performance, including amortization of intangible assets, bitcoin impairment losses, acquisition-related accelerated share-based compensation expenses, and acquisition-related, integration, and other costs. We present Adjusted Operating Income (Loss) because we use it to evaluate our operating performance, generate future operating plans, and make strategic decisions.
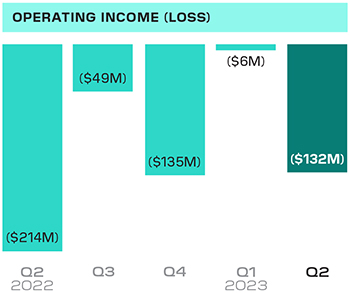
operating income (loss) ($6M) ($49M) ($135M) ($132M) ($214M) Q2 Q3 Q4 Q1 Q2 2022 2023
Please see the reconciliations at the end of this letter for a description of certain items that affected operating income (loss) in the second quarter of 2023.
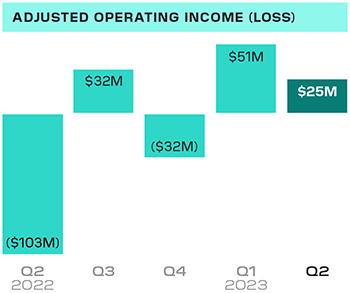
adjusted operating income (loss) $51M $32M $25M ($32M) ($103M) Q2 Q3 Q4 Q1 Q2 2022 2023
|
|
BLOCK Q2 2023 15 |
EARNINGS
Net loss attributable to common stockholders was $123 million in the second quarter of 2023. Net loss per share attributable to common stockholders was $0.20 on a basic and diluted basis in the second quarter of 2023, based on 607 million weighted-average basic and diluted shares outstanding during the second quarter of 2023.
Adjusted EBITDA was $384 million in the second quarter of 2023, compared to $187 million in the second quarter of 2022. The increase in Adjusted EBITDA compared to the prior-year period was driven by gross profit growth across our Cash App and Square ecosystems.
In the second quarter of 2023, Adjusted Net Income Per Share (Adjusted EPS) was $0.39 on a diluted basis based on 627 million weighted-average diluted shares, representing a $0.21 increase year over year.
BALANCE SHEET/CASH FLOW
We ended the second quarter of 2023 with $7.5 billion in available liquidity, with $6.8 billion in cash, cash equivalents, restricted cash, and investments in marketable debt securities, as well as $775 million available to be withdrawn from our revolving credit facility. During the quarter, liquidity was affected by a $462 million cash payment for the settlement of the outstanding 2023 Convertible Notes that matured in May 2023. Additionally, we had $0.9 billion available to be withdrawn under our warehouse funding facilities, to support funding of growth in our consumer receivables related to our BNPL platform.
In the second quarter of 2023, Adjusted EBITDA contributed positively to our overall liquidity.
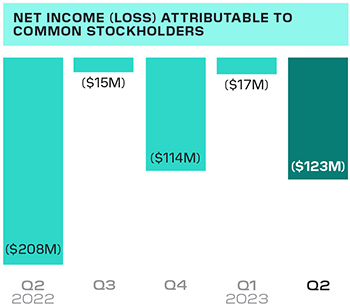
net income (loss) attributable to common stockholders ($15M) ($17M) ($114M) ($123M) ($208M) Q2 Q3 Q4 Q1 Q2 2022 2023
Please see the reconciliations at the end of this letter for a description of certain items that affected net income (loss) in the second quarter of 2023.
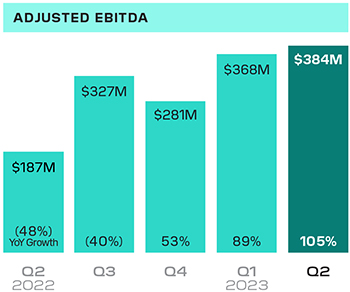
adjusted ebitda $384M $368M $327M $281M $187M (48%) YoY Growth (40%) 53% 89% 105% Q2 Q3 Q4 Q1 Q2 2022 2023
|
|
BLOCK Q2 2023 16 |
Trends and Forward-
Looking Commentary
| Q2 2023 YoY growth % |
July 2023 YoY growth % |
|||
| BUSINESS TRENDS
|
||||
| Gross Profit | 27% | 21% | ||
|
|
|
|
||
Note: The table above presents preliminary gross profit growth estimates for the month of July 2023. These represent our current estimates as we have not yet finalized our financial statements for the month of July, and our monthly results are not subject to interim review by our auditors. As a result, actual July results may differ from these preliminary estimates.
| OPERATING EXPENSES
|
Q3 2023
|
|
| Block Non-GAAP Operating Expenses1 |
$1,550M | |
|
|
|
|
On a GAAP basis, we currently expect to recognize approximately $55 million in quarterly expenses related to amortization of intangible assets over the next few years, based on the intangible assets as of June 30, 2023. This quarterly expense includes approximately $18 million recognized in cost of sales and approximately $37 million in operating expenses. These amounts may be affected by fluctuations in foreign exchange rates in future periods.
In the third quarter of 2023, we expect our share-based compensation expense to increase quarter over quarter on a dollar basis. These share-based compensation expenses are not included in the aforementioned non-GAAP operating expenses.
| 2023 OUTLOOK
|
Current 2023 |
Previous 2023 |
||
| Adjusted EBITDA1 |
$1,500M | $1,360M | ||
| Adjusted Operating Income (Loss)1 |
$25M | ($115M) | ||
|
|
|
|
||
1. We have not provided the forward-looking GAAP equivalents for certain forward-looking non-GAAP metrics, including Block Non-GAAP Operating Expenses, Adjusted EBITDA, and Adjusted Operating Income (Loss), or GAAP reconciliations of any of the aforementioned, as a result of the uncertainty regarding, and the potential variability of, reconciling items such as share-based compensation expense. Accordingly, reconciliations of these non-GAAP guidance metrics to their corresponding GAAP equivalents are not available without unreasonable effort. However, it is important to note that material changes to reconciling items could have a significant effect on future GAAP results. We have provided reconciliations of other historical GAAP to non-GAAP metrics in tables at the end of this letter.
Adjusted Operating Income margin is defined by dividing Adjusted Operating Income over a given period by gross profit over the same period.
|
|
BLOCK Q2 2023 17 |
MEDIA CONTACT
press@block.xyz
INVESTOR RELATIONS CONTACT
ir@block.xyz
Earnings
Webcast
Block (NYSE:SQ) will host a conference call and earnings webcast at 2:00 p.m. Pacific time/5:00 p.m. Eastern time, August 3, to discuss these financial results. To register to participate in the conference call, or to listen to the live audio webcast, please visit the Events & Presentations section of Block’s Investor Relations website at investors.block.xyz. A replay will be available on the same website following the call.
We will release financial results for the third quarter of 2023 on November 2, 2023, after the market closes, and will also host a conference call and earnings webcast at 2:00 p.m. Pacific time/5:00 p.m. Eastern time on the same day to discuss those financial results.
|
|
|
|
| Jack Dorsey | Amrita Ahuja |
|
|
BLOCK Q2 2023 18 |
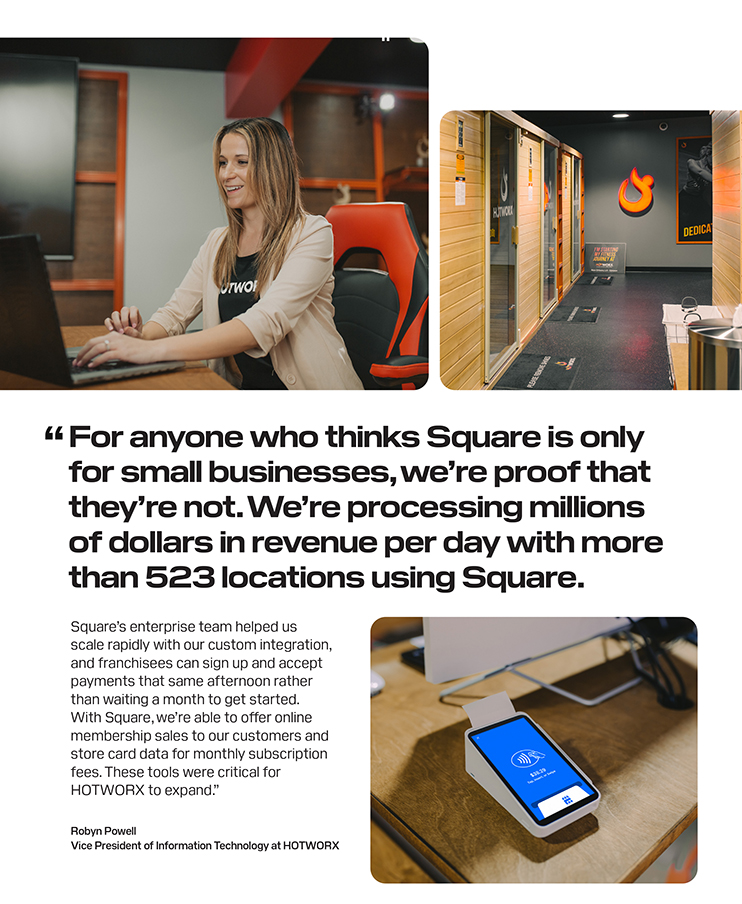
“For anyone who thinks Square is only for small businesses, we’re proof that they’re not. We’re processing millions of dollars in revenue per day with more than 523 locations using Square.“ Square’s enterprise team helped us scale rapidly with our custom integration, and franchisees can sign up and accept payments that same afternoon rather than waiting a month to get started. With Square, we’re able to offer online membership sales to our customers and store card data for monthly subscription fees. These tools were critical for HOTWORX to expand.” Robyn Powell Vice President of Information Technology at HOTWORX
|
|
BLOCK Q2 2023 19 |

Pay day + cash app transfer + tax return = happiness The new cash @Ryanstateofmind app mood card is Via Twitter lowkey fire @RaavenWith2As Via Twitter Cash App pay is @LadiesLoveLauny Via Twitter Love using my boosts with bitcoin earnings! #paidinbitcoin @annylorena_ Via Instagram W cashapp they respond pretty fast and directly answer questions @ mickeyreviews Via TikTok block q2 2023 20
|
|
BLOCK Q2 2023 20 |
SAFE HARBOR STATEMENT
This letter contains “forward-looking statements” within the meaning of the Safe Harbor provisions of the U.S. Private Securities Litigation Reform Act of 1995. All statements other than statements of historical fact could be deemed forward-looking, including, but not limited to, statements regarding the future performance of Block, Inc. and its consolidated subsidiaries (the Company); the Company’s strategies, including expected impact of such strategies on our customers, actives, and sellers as well as our business and financial performance, expected financial results, guidance, and general business outlook for current and future periods; the Company’s integration of Afterpay into its Square and Cash App businesses, and its impacts on the Company’s business and financial results; future profitability and growth in the Company’s businesses and products and the Company’s ability to drive such profitability and growth; the Company’s expectations regarding scale, economics, and the demand for or benefits from its products, product features, and services; the Company’s product development plans; the ability of the Company’s products to attract and retain customers, particularly in new or different markets or demographics; trends in the Company’s markets and the continuation of such trends; the Company’s expectations and intentions regarding future expenses, including future transaction and loan losses and the Company’s estimated reserves for such losses; the Company’s bitcoin investments and strategy as well as the potential financial impact and volatility; and management’s statements related to business strategy, plans, investments, opportunities, and objectives for future operations. In some cases, forward-looking statements can be identified by terms such as “may,” “will,” “appears,” “should,” “expects,” “plans,” “anticipates,” “could,” “intends,” “target,” “projects,” “contemplates,” “believes,” “estimates,” “predicts,” “potential,” or “continue,” or the negative of these words or other similar terms or expressions that concern our expectations, strategy, plans, or intentions.
Such statements are subject to a number of known and unknown risks, uncertainties, assumptions, and other factors that may cause the Company’s actual results, performance, or achievements to differ materially from results expressed or implied in this letter. Investors are cautioned not to place undue reliance on these statements, and reported results should not be considered as an indication of future performance.
Risks that contribute to the uncertain nature of the forward-looking statements include, among others, a continued or prolonged economic downturn in the United States and in other countries around the world; the Company’s investments in its business and ability to maintain profitability; the Company’s efforts to expand its product portfolio and market reach; the Company’s ability to develop products and services to address the rapidly evolving market for payments and financial services; the Company’s ability to deal with the substantial and increasingly intense competition in its industry; acquisitions, strategic investments, entries into new businesses, joint ventures, divestitures, and other transactions that the Company may undertake; the integration of Afterpay; the Company’s ability to ensure the integration of its services with a variety of operating systems and the interoperability of its technology with that of third parties; the Company’s ability to retain existing customers, attract new customers, and increase sales to all customers; the Company’s dependence on payment card networks and acquiring processors; our participation in government relief programs set up in response to the COVID-19 pandemic; the effect of extensive regulation and oversight related to the Company’s business in a variety of areas; risks related to the banking ecosystem, including through our bank partnerships, and FDIC and other regulatory obligations; the effect of management changes and business initiatives; the liabilities and loss potential associated with new products, product features, and services; litigation, including intellectual property claims, government investigations or inquiries, and regulatory matters or disputes; adoption of the Company’s products and services in international markets; changes in political, business, and economic conditions; as well as other risks listed or described from time to time in the Company’s filings with the Securities and Exchange Commission (the SEC), including the Company’s Annual Report on Form 10-K for the fiscal year ended December 31, 2022, and Quarterly Report on Form 10-Q for the quarter ended March 31, 2023, which are on file with the SEC and available on the Investor Relations page of the Company’s website. Additional information will also be set forth in the Company’s Quarterly Report on Form 10-Q for the quarter ended June 30, 2023. All forward-looking statements represent management’s current expectations and predictions regarding trends affecting the Company’s business and industry and are based on information and estimates available to the Company at the time of this letter and are not guarantees of future performance. Except as required by law, the Company assumes no obligation to update any of the statements in this letter.
|
|
BLOCK Q2 2023 21 |
KEY OPERATING METRICS AND
NON-GAAP FINANCIAL MEASURES
To supplement our financial information presented in accordance with generally accepted accounting principles in the United States (GAAP), from period to period, we consider and present certain operating and financial measures that we consider key metrics or are not prepared in accordance with GAAP, including Gross Payment Volume (GPV), Adjusted EBITDA, Adjusted Net Income (Loss), Diluted Adjusted Net Income (Loss) Per Share (Adjusted EPS), Adjusted Operating Income (Loss), Adjusted Operating Income (Loss) margin, constant currency, and non-GAAP operating expenses as well as other measures defined in this letter such as measures excluding bitcoin revenue, measures excluding gross profit contributions from our BNPL platform, and measures excluding PPP loan forgiveness gross profit. We believe these metrics and measures are useful to facilitate period-to-period comparisons of our business and to facilitate comparisons of our performance to that of other payments solution providers.
We define GPV as the total dollar amount of all card payments processed by sellers using Square, net of refunds, and ACH transfers. Additionally, GPV includes Cash App Business GPV, which comprises Cash App activity related to peer-to-peer transactions received by business accounts, and peer-to-peer payments sent from a credit card. GPV does not include transactions from our BNPL platform.
Adjusted EBITDA, Adjusted Net Income (Loss), and Diluted Adjusted Net Income (Loss) Per Share (Adjusted EPS) are non-GAAP financial measures that represent our net income (loss) and net income (loss) per share, adjusted to eliminate the effect of share-based compensation expenses; amortization of intangible assets; gain or loss on revaluation of equity investments; bitcoin impairment losses; amortization of debt discount and issuance costs; and the gain or loss on the disposal of property and equipment, as applicable. Adjusted Operating Income (Loss) is a non-GAAP financial measure that represents our operating income (loss), adjusted to eliminate the effect of amortization of acquired technology assets; acquisition-related, integration, and other costs; bitcoin impairment losses; amortization of customer and other acquired intangible assets; and acquisition-related share-based acceleration costs. We also exclude from these measures certain acquisition-related and integration costs associated with business combinations, and various other costs that are not reflective of our core operating performance. We exclude amortization of intangible assets arising from business combinations because the amount of such expenses in any specific period may not directly correlate to the underlying performance of our ongoing business operations. Acquisition-related costs include amounts paid to redeem acquirees’ unvested stock-based compensation awards, and legal, accounting, and due diligence costs. Integration costs include advisory and other professional services or consulting fees necessary to integrate acquired businesses. Other costs that are not reflective of our core business operating expenses may include contingent losses, impairment charges, and certain litigation and regulatory charges. We also add back the impact of the acquired deferred revenue and deferred cost adjustment, which was written down to fair value in purchase accounting. Additionally, for purposes of calculating diluted Adjusted EPS, we add back cash interest expense on convertible senior notes, as if converted at the beginning of the period, if the impact is dilutive. In addition to the items above, Adjusted EBITDA is a non-GAAP financial measure that also excludes depreciation and amortization, interest income and expense, other income and expense, and provision or benefit from income taxes, as applicable. Adjusted Operating Income (Loss) margin is calculated as Adjusted Operating Income (Loss) divided by gross profit. To calculate the diluted Adjusted EPS, we adjust the weighted-average number of shares of common stock outstanding for the dilutive effect of all potential shares of common stock. In periods when we recorded an Adjusted Net Loss, the diluted Adjusted EPS is the same as basic Adjusted EPS because the effects of potentially dilutive items were anti-dilutive given the Adjusted Net Loss position.
|
|
BLOCK Q2 2023 22 |
KEY OPERATING METRICS AND
NON-GAAP FINANCIAL MEASURES
Constant currency growth is calculated by assuming international results in a given period and the comparative prior period are translated from local currencies to the U.S. dollar at rates consistent with the monthly average rates in the comparative prior period. We discuss growth on a constant currency basis because a portion of our business operates in markets outside the U.S. and is subject to changes in foreign exchange rates.
Non-GAAP operating expenses is a non-GAAP financial measure that represents operating expenses adjusted to remove the impact of share-based compensation, depreciation and amortization, bitcoin impairment losses, loss on disposal of property and equipment, and acquisition-related integration and other costs.
We have included Adjusted EBITDA, Adjusted Operating Income (Loss), Adjusted Operating Income (Loss) margin, Adjusted Net Income, Adjusted EPS, and non-GAAP operating expenses because they are key measures used by our management to evaluate our operating performance, generate future operating plans, and make strategic decisions, including those relating to operating expenses and the allocation of internal resources. Accordingly, we believe that Adjusted EBITDA, Adjusted Operating Income (Loss), Adjusted Operating Income (Loss) margin, Adjusted Net Income, Adjusted EPS, and non-GAAP operating expenses provide useful information to investors and others in understanding and evaluating our operating results in the same manner as our management and board of directors. In addition, they provide useful measures for period-to-period comparisons of our business, as they remove the effect of certain non-cash items and certain variable charges that do not vary with our operations. We have included measures excluding our BNPL platform because we believe these measures are useful in understanding the ongoing results of our operations. We have included measures excluding bitcoin revenue because our role is to facilitate customers’ access to bitcoin. When customers buy bitcoin through Cash App, we only apply a small margin to the market cost of bitcoin, which tends to be volatile and outside our control. Therefore, we believe deducting bitcoin revenue or gross profit better reflects the economic benefits as well as our performance from these transactions. We have included measures excluding PPP loan forgiveness gross profit because we believe these measures are useful in order to facilitate comparisons of our business without PPP loan forgiveness.
Adjusted EBITDA, Adjusted Net Income, Adjusted Operating Income (Loss), Adjusted Operating Income (Loss) margin, Adjusted EPS, and non-GAAP operating expenses, as well as other measures defined in the shareholder letter, such as measures excluding our BNPL platform, bitcoin revenue and PPP loan forgiveness gross profit, have limitations as financial measures, should be considered as supplemental in nature, and are not meant as substitutes for the related financial information prepared in accordance with GAAP.
We believe that the aforementioned metrics and measures provide useful information about our operating results, enhance the overall understanding of our past performance and future prospects, and provide useful measures for period-to-period comparisons of our business, as they remove the effect of certain variable amounts, or they remove amounts that were not repeated across periods and therefore make comparisons more difficult. Our management uses these measures to evaluate our operating performance, generate future operating plans, and make strategic decisions, including those relating to operating expenses and the allocation of internal resources.
These non-GAAP financial measures should not be considered in isolation from, or as a substitute for, financial information prepared in accordance with GAAP. These non-GAAP financial measures are not based on any standardized methodology prescribed by GAAP. Other companies, including companies in our industry, may calculate the non-GAAP financial measures differently or not at all, which reduces their usefulness as comparative measures.
|
|
BLOCK Q2 2023 23 |
Condensed Consolidated
Statements of Operations
UNAUDITED
In thousands, except per share data
| THREE MONTHS ENDED | SIX MONTHS ENDED | |||||||||||||||
| June 30, 2023 | June 30, 2022 | June 30, 2023 | June 30, 2022 | |||||||||||||
| Revenue: |
||||||||||||||||
| Transaction-based revenue |
$ | 1,637,654 | $ | 1,475,707 | $ | 3,060,359 | $ | 2,708,676 | ||||||||
| Subscription and services-based revenue |
1,461,497 | 1,094,856 | 2,827,721 | 2,054,413 | ||||||||||||
| Hardware revenue |
44,922 | 48,051 | 82,373 | 85,377 | ||||||||||||
| Bitcoin revenue |
2,390,884 | 1,785,885 | 4,554,635 | 3,516,678 | ||||||||||||
|
|
|
|
|
|
|
|
||||||||||
| Total net revenue |
5,534,957 | 4,404,499 | 10,525,088 | 8,365,144 | ||||||||||||
|
|
|
|
|
|
|
|
||||||||||
| Cost of revenue: |
||||||||||||||||
| Transaction-based costs |
950,523 | 875,762 | 1,771,310 | 1,591,998 | ||||||||||||
| Subscription and services-based costs |
279,223 | 213,271 | 543,315 | 396,128 | ||||||||||||
| Hardware costs |
74,085 | 83,494 | 132,870 | 147,158 | ||||||||||||
| Bitcoin costs |
2,346,633 | 1,744,425 | 4,460,008 | 3,431,884 | ||||||||||||
| Amortization of acquired technology assets |
18,392 | 17,899 | 36,900 | 33,368 | ||||||||||||
|
|
|
|
|
|
|
|
||||||||||
| Total cost of revenue |
3,668,856 | 2,934,851 | 6,944,403 | 5,600,536 | ||||||||||||
|
|
|
|
|
|
|
|
||||||||||
| Gross profit |
1,866,101 | 1,469,648 | 3,580,685 | 2,764,608 | ||||||||||||
|
|
|
|
|
|
|
|
||||||||||
| Operating expenses: |
||||||||||||||||
| Product development |
694,672 | 524,827 | 1,321,609 | 983,051 | ||||||||||||
| Sales and marketing |
537,607 | 530,827 | 1,033,618 | 1,032,389 | ||||||||||||
| General and administrative |
549,293 | 395,720 | 982,118 | 839,869 | ||||||||||||
| Transaction, loan, and consumer receivable losses |
179,771 | 156,697 | 307,667 | 247,847 | ||||||||||||
| Bitcoin impairment losses |
— | 35,961 | — | 35,961 | ||||||||||||
| Amortization of customer and other acquired intangible assets |
36,865 | 39,389 | 73,952 | 66,053 | ||||||||||||
|
|
|
|
|
|
|
|
||||||||||
| Total operating expenses |
1,998,208 | 1,683,421 | 3,718,964 | 3,205,170 | ||||||||||||
|
|
|
|
|
|
|
|
||||||||||
| Operating loss |
(132,107) | (213,773) | (138,279) | (440,562) | ||||||||||||
|
|
|
|
|
|
|
|
||||||||||
| Interest expense (income), net |
(3,944) | 12,966 | (7,105) | 28,714 | ||||||||||||
| Other expense (income), net |
1,379 | (18,766) | 19,750 | (52,238) | ||||||||||||
|
|
|
|
|
|
|
|
||||||||||
| Loss before income tax |
(129,542) | (207,973) | (150,924) | (417,038) | ||||||||||||
|
|
|
|
|
|
|
|
||||||||||
| Provision (benefit) for income taxes |
(3,700) | 1,304 | (5,756) | (398) | ||||||||||||
|
|
|
|
|
|
|
|
||||||||||
| Net loss |
(125,842) | (209,277) | (145,168) | (416,640) | ||||||||||||
| Less: Net loss attributable to noncontrolling interests |
(3,336) | (1,263) | (5,824) | (4,427) | ||||||||||||
|
|
|
|
|
|
|
|
||||||||||
| Net loss attributable to common stockholders |
$ | (122,506) | $ | (208,014) | $ | (139,344) | $ | (412,213) | ||||||||
|
|
|
|
|
|
|
|
||||||||||
| Net loss per share attributable to common stockholders: |
||||||||||||||||
| Basic |
$ | (0.20) | $ | (0.36) | $ | (0.23) | $ | (0.73) | ||||||||
|
|
|
|
|
|
|
|
||||||||||
| Diluted |
$ | (0.20) | $ | (0.36) | $ | (0.23) | $ | (0.73) | ||||||||
|
|
|
|
|
|
|
|
||||||||||
| Weighted-average shares used to compute net loss per share attributable to common stockholders: |
||||||||||||||||
| Basic |
606,692 | 581,350 | 604,476 | 561,501 | ||||||||||||
|
|
|
|
|
|
|
|
||||||||||
| Diluted |
606,692 | 581,350 | 604,476 | 561,501 | ||||||||||||
|
|
|
|
|
|
|
|
||||||||||
|
|
BLOCK Q2 2023 24 |
Condensed Consolidated
Balance Sheets
In thousands, except per share data
| June 30, 2023 | Dec 31, 2022 | |||||||
| Assets | UNAUDITED | |||||||
| Current assets: |
||||||||
| Cash and cash equivalents |
$ | 4,745,884 | $ | 4,544,202 | ||||
| Investments in short-term debt securities |
1,121,830 | 1,081,851 | ||||||
| Settlements receivable |
2,055,298 | 2,416,324 | ||||||
| Customer funds |
3,352,656 | 3,180,324 | ||||||
| Consumer receivables, net |
1,627,580 | 1,871,160 | ||||||
| Loans held for sale |
499,250 | 474,036 | ||||||
| Safeguarding asset related to bitcoin held for other parties |
763,516 | 428,243 | ||||||
| Other current assets |
1,675,082 | 1,627,265 | ||||||
|
|
|
|
||||||
| Total current assets |
15,841,096 | 15,623,405 | ||||||
|
|
|
|
||||||
| Goodwill |
11,944,085 | 11,966,761 | ||||||
| Acquired intangible assets, net |
1,878,238 | 2,014,034 | ||||||
| Investments in long-term debt securities |
297,230 | 573,429 | ||||||
| Operating lease right-of-use assets |
282,808 | 373,172 | ||||||
| Other non-current assets |
832,467 | 813,539 | ||||||
|
|
|
|
||||||
| Total assets |
$ | 31,075,924 | $ | 31,364,340 | ||||
|
|
|
|
||||||
| Liabilities and Stockholders’ Equity |
||||||||
| Current liabilities: |
||||||||
| Customers payable |
$ | 5,536,418 | $ | 5,548,656 | ||||
| Settlements payable |
323,197 | 462,505 | ||||||
| Accrued expenses and other current liabilities |
1,085,584 | 1,073,516 | ||||||
| Current portion of long-term debt (Note 13) |
— | 460,356 | ||||||
| Warehouse funding facilities, current |
530,321 | 461,240 | ||||||
| Safeguarding obligation liability related to bitcoin held for other parties |
763,516 | 428,243 | ||||||
|
|
|
|
||||||
| Total current liabilities |
8,239,036 | 8,434,516 | ||||||
|
|
|
|
||||||
| Warehouse funding facilities, non-current |
289,849 | 877,066 | ||||||
| Long-term debt (Note 13) |
4,114,916 | 4,109,829 | ||||||
| Operating lease liabilities, non-current |
315,130 | 357,419 | ||||||
| Other non-current liabilities |
347,185 | 334,155 | ||||||
|
|
|
|
||||||
| Total liabilities |
13,306,116 | 14,112,985 | ||||||
|
|
|
|
||||||
| Commitments and contingencies (Note 18) |
||||||||
| Stockholders’ equity: |
||||||||
| Preferred stock, $0.0000001 par value: 100,000 shares authorized at June 30, 2023 and December 31, 2022. None issued and outstanding at June 30, 2023 and December 31, 2022. |
— | — | ||||||
| Class A common stock, $0.0000001 par value: 1,000,000 shares authorized at June 30, 2023 and December 31, 2022; 548,237 and 539,408 issued and outstanding at June 30, 2023 and December 31, 2022, respectively. |
— | — | ||||||
| Class B common stock, $0.0000001 par value: 500,000 shares authorized at June 30, 2023 and December 31, 2022; 60,636 and 60,652 issued and outstanding at June 30, 2023 and December 31, 2022, respectively. |
— | — | ||||||
| Additional paid-in capital |
18,992,590 | 18,314,681 | ||||||
| Accumulated other comprehensive loss |
(537,378) | (523,090) | ||||||
| Accumulated deficit |
(708,056) | (568,712) | ||||||
|
|
|
|
||||||
| Total stockholders’ equity attributable to common stockholders |
17,747,156 | 17,222,879 | ||||||
| Noncontrolling interests |
22,652 | 28,476 | ||||||
|
|
|
|
||||||
| Total stockholders’ equity |
17,769,808 | 17,251,355 | ||||||
| Total liabilities and stockholders’ equity |
$ | 31,075,924 | $ | 31,364,340 | ||||
|
|
|
|
||||||
|
|
BLOCK Q2 2023 25 |
Condensed Consolidated
Statements of Cash Flows
UNAUDITED
In thousands
| SIX MONTHS ENDED | ||||||||
| June 30, 2023 | June 30, 2022 | |||||||
| Cash flows from operating activities: |
||||||||
| Net loss |
$ | (145,168) | $ | (416,640) | ||||
| Adjustments to reconcile net loss to net cash provided by operating activities: |
||||||||
| Depreciation and amortization |
187,718 | 160,895 | ||||||
| Amortization of discounts and premiums and other non-cash adjustments |
(221,679) | (218,185) | ||||||
| Non-cash lease expense |
94,416 | 47,871 | ||||||
| Share-based compensation |
598,845 | 532,061 | ||||||
| Loss (gain) on revaluation of equity investments |
16,255 | (44,626) | ||||||
| Transaction, loan, and consumer receivable losses |
307,667 | 247,847 | ||||||
| Bitcoin impairment losses |
— | 35,961 | ||||||
| Change in deferred income taxes |
39,919 | (21,374) | ||||||
| Changes in operating assets and liabilities: |
||||||||
| Settlements receivable |
203,697 | (428,991) | ||||||
| Purchases and originations of loans |
(3,770,864) | (2,382,295) | ||||||
| Proceeds from payments and forgiveness of loans |
3,590,923 | 2,411,683 | ||||||
| Customers payable |
(184,570) | 332,827 | ||||||
| Settlements payable |
(139,308) | 10,325 | ||||||
| Other assets and liabilities |
(170,132) | (152,562) | ||||||
|
|
|
|
||||||
| Net cash provided by operating activities |
407,719 | 114,797 | ||||||
|
|
|
|
||||||
| Cash flows from investing activities: |
||||||||
| Purchases of marketable debt securities |
(423,751) | (383,372) | ||||||
| Proceeds from maturities of marketable debt securities |
656,502 | 540,914 | ||||||
| Proceeds from sale of marketable debt securities |
24,874 | 234,142 | ||||||
| Proceeds from maturities of marketable debt securities from customer funds |
— | 73,000 | ||||||
| Proceeds from sale of marketable debt securities from customer funds |
— | 316,576 | ||||||
| Payments from originations of consumer receivables |
(10,546,501) | (7,543,996) | ||||||
| Proceeds from principal repayments and sales of consumer receivables |
10,933,947 | 7,688,413 | ||||||
| Purchases of property and equipment |
(61,775) | (85,420) | ||||||
| Purchases of other investments |
(4,397) | (39,448) | ||||||
| Business combinations, net of cash acquired |
— | 539,474 | ||||||
|
|
|
|
||||||
| Net cash provided by investing activities |
578,899 | 1,340,283 | ||||||
|
|
|
|
||||||
| Cash flows from financing activities: |
||||||||
| Repayments of Paycheck Protection Program Liquidity Facility advances |
(16,840) | (429,117) | ||||||
| Payments to redeem convertible notes |
(461,761) | (1,071,788) | ||||||
| Proceeds from warehouse facilities borrowings |
289,418 | 376,219 | ||||||
| Repayments of warehouse facilities borrowings |
(794,384) | (282,550) | ||||||
| Proceeds from the exercise of stock options and purchases under the employee stock purchase plan |
65,962 | 43,117 | ||||||
| Payments for tax withholding related to vesting of restricted stock units |
— | (4,253) | ||||||
| Other financing activities |
(4,320) | — | ||||||
| Net increase in interest-bearing deposits |
28,583 | 53,791 | ||||||
| Change in customer funds, restricted from use in the Company’s operations |
172,332 | 74,382 | ||||||
|
|
|
|
||||||
| Net cash used in financing activities |
(721,010) | (1,240,199) | ||||||
|
|
|
|
||||||
| Effect of foreign exchange rate on cash and cash equivalents |
6,955 | (35,442) | ||||||
|
|
|
|
||||||
| Net increase in cash, cash equivalents, restricted cash, and customer funds |
272,563 | 179,439 | ||||||
| Cash, cash equivalents, restricted cash, and customer funds, beginning of the period |
8,435,906 | 6,975,090 | ||||||
|
|
|
|
||||||
| Cash, cash equivalents, restricted cash, and customer funds, end of the period |
$ | 8,708,469 | $ | 7,154,529 | ||||
|
|
|
|
||||||
|
|
BLOCK Q2 2023 26 |
Reportable Segment Disclosures
UNAUDITED
Information on the reportable segments revenue and segment operating profit are as
follows (in thousands):
| THREE MONTHS ENDED | SIX MONTHS ENDED | |||||||||||||||||||||||||||||||
| June 30, 2023 | June 30, 2023 | |||||||||||||||||||||||||||||||
| Cash App | Square | Corporate and Other (i) |
Total | Cash App | Square | Corporate and Other (i) |
Total | |||||||||||||||||||||||||
| Revenue: |
||||||||||||||||||||||||||||||||
| Transaction-based revenue |
$ | 133,741 | $ | 1,503,913 | $ | — | $ | 1,637,654 | $ | 268,404 | $ | 2,791,955 | $ | — | $3,060,359 | |||||||||||||||||
| Subscription and services-based revenue |
1,030,822 | 380,596 | 50,079 | 1,461,497 | 2,004,713 | 722,337 | 100,671 | 2,827,721 | ||||||||||||||||||||||||
| Hardware revenue |
— | 44,922 | — | 44,922 | — | 82,373 | — | 82,373 | ||||||||||||||||||||||||
| Bitcoin revenue |
2,390,884 | — | — | 2,390,884 | 4,554,635 | — | — | 4,554,635 | ||||||||||||||||||||||||
|
|
|
|
|
|
|
|
|
|
|
|
|
|
|
|
|
|
|
|
|
|
|
|
|
|
||||||||
| Segment revenue |
3,555,447 | 1,929,431 | 50,079 | 5,534,957 | 6,827,752 | 3,596,665 | 100,671 | 10,525,088 | ||||||||||||||||||||||||
|
|
|
|
|
|
|
|
|
|
|
|
|
|
|
|
|
|
|
|
|
|
|
|
|
|
||||||||
| Segment gross profit (ii) | $ | 968,045 | $ | 888,273 | $ | 9,783 | $ | 1,866,101 | $ | 1,899,285 | $ | 1,658,554 | $ | 22,846 | $3,580,685 | |||||||||||||||||
|
|
|
|
|
|
|
|
|
|
|
|
|
|
|
|
|
|
|
|
|
|
|
|
|
|
||||||||
| THREE MONTHS ENDED | SIX MONTHS ENDED | |||||||||||||||||||||||||||||||
| June 30, 2022 | June 30, 2022 | |||||||||||||||||||||||||||||||
| Cash App | Square | Corporate and Other (i) |
Total | Cash App | Square | Corporate and Other (i) |
Total | |||||||||||||||||||||||||
| Revenue: |
||||||||||||||||||||||||||||||||
| Transaction-based revenue |
$ | 116,068 | $ | 1,359,639 | $ | — | $ | 1,475,707 | $ | 225,309 | $ | 2,483,367 | $ | — | $2,708,676 | |||||||||||||||||
| Subscription and services-based revenue |
720,180 | 317,835 | 56,841 | 1,094,856 | 1,342,489 | 600,485 | 111,439 | 2,054,413 | ||||||||||||||||||||||||
| Hardware revenue |
— | 48,051 | — | 48,051 | — | 85,377 | — | 85,377 | ||||||||||||||||||||||||
| Bitcoin revenue |
1,785,885 | — | — | 1,785,885 | 3,516,678 | — | — | 3,516,678 | ||||||||||||||||||||||||
|
|
|
|
|
|
|
|
|
|
|
|
|
|
|
|
|
|
|
|
|
|
|
|
|
|
||||||||
| Segment revenue |
2,622,133 | 1,725,525 | 56,841 | 4,404,499 | 5,084,476 | 3,169,229 | 111,439 | 8,365,144 | ||||||||||||||||||||||||
|
|
|
|
|
|
|
|
|
|
|
|
|
|
|
|
|
|
|
|
|
|
|
|
|
|
||||||||
| Segment gross profit (ii) | $ | 704,893 | $ | 755,439 | $ | 9,316 | $ | 1,469,648 | $ | 1,328,552 | $ | 1,416,660 | $ | 19,396 | $2,764,608 | |||||||||||||||||
|
|
|
|
|
|
|
|
|
|
|
|
|
|
|
|
|
|
|
|
|
|
|
|
|
|
||||||||
Operating Segment Disclosures
UNAUDITED
A reconciliation of total segment gross profit to the Company’s income (loss) before
applicable income taxes is as follows (in thousands):
| THREE MONTHS ENDED | SIX MONTHS ENDED | |||||||||||||||
| June 30, 2023 | June 30, 2022 | June 30, 2023 | June 30, 2022 | |||||||||||||
| Total segment gross profit |
$ | 1,866,101 | $ | 1,469,648 | $ | 3,580,685 | $ | 2,764,608 | ||||||||
| Less: Product development |
694,672 | 524,827 | 1,321,609 | 983,051 | ||||||||||||
| Less: Sales and marketing |
537,607 | 530,827 | 1,033,618 | 1,032,389 | ||||||||||||
| Less: General and administrative |
549,293 | 395,720 | 982,118 | 839,869 | ||||||||||||
| Less: Transaction, loan, and consumer receivable losses |
179,771 | 156,697 | 307,667 | 247,847 | ||||||||||||
| Less: Bitcoin impairment losses |
— | 35,961 | — | 35,961 | ||||||||||||
| Less: Amortization of customer and other intangible assets |
36,865 | 39,389 | 73,952 | 66,053 | ||||||||||||
| Less: Interest expense (income), net |
(3,944) | 12,966 | (7,105 | ) | 28,714 | |||||||||||
| Less: Other expense (income), net |
1,379 | (18,766 | ) | 19,750 | (52,238 | ) | ||||||||||
|
|
|
|
|
|
|
|
|
|
|
|||||||
| Loss before applicable income taxes |
$ | (129,542) | $ | (207,973 | ) | $ | (150,924 | ) | $ | (417,038 | ) | |||||
|
|
|
|
|
|
|
|
|
|
|
|||||||
(i) Corporate and other represents results related to products and services that are not assigned to a specific reportable segment, and intersegment eliminations between Cash App and Square.
(ii) Segment gross profit for Cash App for the three and six months ended June 30, 2023 included $8.4 million and $16.9 million of amortization of acquired technology assets expense, respectively. Segment gross profit for Cash App for the three and six months ended June 30, 2022 included $8.2 million and $15.3 million of amortization of acquired technology assets expense, respectively. Segment gross profit for Square for the three and six months ended June 30, 2023 included $8.5 million and $17.1 million of amortization of acquired technology assets expense, respectively. Segment gross profit for Square for the three and six months ended June 30, 2022 included $8.2 million and $15.2 million of amortization of acquired technology assets expense, respectively. Amortization of acquired technology assets expense included in Corporate and Other was immaterial for the three and six months ended June 30, 2023 and June 30, 2022.
|
|
BLOCK Q2 2023 27 |
Key Operating Metrics and
Non-GAAP Financial Measures
UNAUDITED
| THREE MONTHS ENDED
|
SIX MONTHS ENDED
|
|||||||||||||||||||
| June 30, 2023 | June 30, 2022 | June 30, 2023 | June 30, 2022 | |||||||||||||||||
| Gross Payment Volume (“GPV”) (in millions) |
$ | 59,012 | $ | 52,499 | $ | 110,129 | $ | 96,003 | ||||||||||||
| Adjusted EBITDA (in thousands) |
$ | 384,402 | $ | 187,342 | $ | 752,769 | $ | 382,703 | ||||||||||||
| Adjusted Operating Income (Loss) (in thousands) |
$ | 25,499 | $ | (103,457) | $ | 76,473 | $ | (145,711) | ||||||||||||
| Adjusted Net Income Per Share: |
||||||||||||||||||||
| Basic |
$ | 0.41 | $ | 0.19 | $ | 0.82 | $ | 0.38 | ||||||||||||
| Diluted |
$ | 0.39 | $ | 0.18 | $ | 0.80 | $ | 0.36 | ||||||||||||
| THREE MONTHS ENDED
|
SIX MONTHS ENDED
|
|||||||||||||||||||
| June 30, 2023 | June 30, 2022 | June 30, 2023 | June 30, 2022 | |||||||||||||||||
| GPV Square |
$ | 54,152 | $ | 48,275 | $ | 100,372 | $ | 87,818 | ||||||||||||
| GPV Cash App |
$ | 4,860 | $ | 4,224 | $ | 9,757 | $ | 8,185 | ||||||||||||
|
|
|
|
|
|
|
|
||||||||||||||
| Total GPV |
$ | 59,012 | $ | 52,499 | $ | 110,129 | $ | 96,003 | ||||||||||||
|
|
|
|
|
|
|
|
||||||||||||||
| Adjusted EBITDA UNAUDITED In thousands |
|
|||||||||||||||||||
| THREE MONTHS ENDED
|
||||||||||||||||||||
| June 30, 2023 | June 30, 2022 | Sept 30, 2022 | Dec 31, 2022 | Mar 31, 2023 | ||||||||||||||||
| Net loss attributable to common stockholders |
$ | (122,506) | $ | (208,014) | $ | (14,711) | $ | (113,823) | $ | (16,838) | ||||||||||
| Net loss attributable to noncontrolling interests |
(3,336) | (1,263) | (4,033) | (3,798) | (2,488) | |||||||||||||||
|
|
|
|
|
|
|
|
|
|
||||||||||||
| Net loss |
(125,842) | (209,277) | (18,744) | (117,621) | (19,326) | |||||||||||||||
| Share-based compensation expense |
319,248 | 256,638 | 262,733 | 274,495 | 279,591 | |||||||||||||||
| Depreciation and amortization |
94,545 | 90,839 | 88,721 | 90,907 | 93,173 | |||||||||||||||
| Acquisition-related, integration and other costs |
102,349 | 17,067 | 23,470 | 40,662 | 1,551 | |||||||||||||||
| Interest expense (income), net |
(3,944) | 12,966 | 6,042 | 1,472 | (3,161) | |||||||||||||||
| Other expense (income), net |
1,379 | (18,766) | (18,798) | (24,407) | 18,371 | |||||||||||||||
| Bitcoin impairment losses |
— | 35,961 | 1,619 | 8,991 | — | |||||||||||||||
| Provision (benefit) for income taxes |
(3,700) | 1,304 | (17,289) | 5,375 | (2,056) | |||||||||||||||
| Loss on disposal of property and equipment |
343 | 548 | (447) | 984 | 191 | |||||||||||||||
| Acquired deferred revenue and cost adjustment |
24 | 62 | 53 | 43 | 33 | |||||||||||||||
|
|
|
|
|
|
|
|
|
|
||||||||||||
| Adjusted EBITDA |
$ | 384,402 | $ | 187,342 | $ | 327,360 | $ | 280,901 | $ | 368,367 | ||||||||||
|
|
|
|
|
|
|
|
|
|
||||||||||||
| Adjusted Operating Income (Loss) UNAUDITED In thousands |
|
|||||||||||||||||||
| THREE MONTHS ENDED
|
||||||||||||||||||||
| June 30, 2023 | June 30, 2022 | Sept 30, 2022 | Dec 31, 2022 | Mar 31, 2023 | ||||||||||||||||
| Operating loss |
$ | (132,107) | $ | (213,773) | $ | (48,789) | $ | (135,181) | $ | (6,172) | ||||||||||
| Amortization of acquired technology assets |
18,392 | 17,899 | 18,506 | 18,320 | 18,508 | |||||||||||||||
| Acquisition-related, integration and other costs |
102,349 | 17,067 | 23,470 | 40,662 | 1,551 | |||||||||||||||
| Bitcoin impairment losses |
— | 35,961 | 1,619 | 8,991 | — | |||||||||||||||
| Amortization of customer and other acquired intangible |
$ | 36,865 | $ | 39,389 | $ | 37,361 | $ | 35,344 | $ | 37,087 | ||||||||||
|
|
|
|
|
|
|
|
|
|
||||||||||||
| Adjusted Operating Income (Loss) |
$ | 25,499 | $ | (103,457) | $ | 32,167 | $ | (31,864) | $ | 50,974 | ||||||||||
|
|
|
|
|
|
|
|
|
|
||||||||||||
|
|
BLOCK Q2 2023 28 |
Select Financial Results Excluding
Bitcoin, BNPL and PPP
UNAUDITED
In thousands
| THREE MONTHS ENDED | SIX MONTHS ENDED | |||||||||||||||||||
| June 30, 2023 | June 30, 2022 | June 30, 2023 | June 30, 2022 | |||||||||||||||||
| Bitcoin revenue |
$ | 2,390,884 | $ | 1,785,885 | $ | 4,554,635 | $ | 3,516,678 | ||||||||||||
| Bitcoin costs |
2,346,633 | 1,744,425 | 4,460,008 | 3,431,884 | ||||||||||||||||
|
|
|
|
|
|
|
|
||||||||||||||
| Bitcoin gross profit |
$ | 44,251 | $ | 41,460 | $ | 94,627 | $ | 84,794 | ||||||||||||
|
|
|
|
|
|
|
|
||||||||||||||
| THREE MONTHS ENDED | SIX MONTHS ENDED | |||||||||||||||||||
| June 30, 2023 | June 30, 2022 | June 30, 2023 | June 30, 2022 | |||||||||||||||||
| Revenue (GAAP) |
$ | 5,534,957 | $ | 4,404,499 | $ | 10,525,088 | $ | 8,365,144 | ||||||||||||
| Less: Bitcoin revenue |
2,390,884 | 1,785,885 | 4,554,635 | 3,516,678 | ||||||||||||||||
|
|
|
|
|
|
|
|
||||||||||||||
| Total revenue less excluding Bitcoin |
$ | 3,144,073 | $ | 2,618,614 | $ | 5,970,453 | $ | 4,848,466 | ||||||||||||
|
|
|
|
|
|
|
|
||||||||||||||
| THREE MONTHS ENDED | SIX MONTHS ENDED | |||||||||||||||||||
| June 30, 2023 | June 30, 2022 | June 30, 2023 | June 30, 2022 | |||||||||||||||||
| Cash App revenue (GAAP) |
$ | 3,555,447 | $ | 2,622,133 | $ | 6,827,752 | $ | 5,084,476 | ||||||||||||
| Less: Bitcoin contribution to Cash App revenue | $ | 2,390,884 | $ | 1,785,885 | $ | 4,554,635 | $ | 3,516,678 | ||||||||||||
|
|
|
|
|
|
|
|
||||||||||||||
| Total Cash App revenue, excluding Bitcoin |
$ | 1,164,563 | $ | 836,248 | $ | 2,273,117 | $ | 1,567,798 | ||||||||||||
|
|
|
|
|
|
|
|
||||||||||||||
| THREE MONTHS ENDED | SIX MONTHS ENDED | |||||||||||||||||||
| June 30, 2023 | June 30, 2022 | June 30, 2023 | June 30, 2022 | |||||||||||||||||
| Square gross profit (GAAP) |
$ | 888,273 | $ | 755,439 | $ | 1,658,554 | $ | 1,416,660 | ||||||||||||
| Less: Square gross profit - U.S. |
747,075 | 640,841 | 1,395,005 | 1,216,307 | ||||||||||||||||
|
|
|
|
|
|
|
|
||||||||||||||
| Total Square gross profit - International |
141,198 | 114,598 | 263,549 | 200,353 | ||||||||||||||||
| Less: BNPL Platform contribution to Square gross profit - International |
|
51,261 | 47,822 | 98,889 | 75,410 | |||||||||||||||
|
|
|
|
|
|
|
|
||||||||||||||
| Total Square gross profit - International, excluding BNPL Platform |
|
89,937 | 66,776 | 164,660 | 124,943 | |||||||||||||||
|
|
|
|
|
|
|
|
||||||||||||||
| THREE MONTHS ENDED | SIX MONTHS ENDED | |||||||||||||||||||
| June 30, 2023 | June 30, 2022 | June 30, 2023 | June 30, 2022 | |||||||||||||||||
| Square gross profit (GAAP) |
$ | 888,273 | $ | 755,439 | $ | 1,658,554 | $ | 1,416,660 | ||||||||||||
| Less: gross profit from Paycheck Protection Program (PPP) loan forgiveness |
|
388 | 9,146 | 1,081 | 60,600 | |||||||||||||||
|
|
|
|
|
|
|
|
||||||||||||||
| Square gross profit excluding loan forgiveness from Paycheck Protection Program (PPP) |
|
887,885 | 746,293 | 1,657,473 | 1,356,060 | |||||||||||||||
|
|
|
|
|
|
|
|
||||||||||||||
| THREE MONTHS ENDED | ||||||||||||||||||||
| June 30, 2023 | June 30, 2022 | June 30, 2021 | June 30, 2020 | June 30, 2019 | ||||||||||||||||
| Square gross profit (GAAP) |
$ | 888,273 | $ | 755,439 | $ | 585,137 | $ | 315,700 | $ | 347,208 | ||||||||||
| Less: gross profit from Paycheck Protection Program (PPP) loan forgiveness |
388 | 9,146 | 14,880 | — | — | |||||||||||||||
|
|
|
|
|
|
|
|
|
|
||||||||||||
| Square gross profit excluding PPP |
887,885 | 746,293 | 570,257 | 315,700 | 347,208 | |||||||||||||||
|
|
|
|
|
|
|
|
|
|
||||||||||||
| THREE MONTHS ENDED | ||||||||||||||||||||
| June 30, 2023 | June 30, 2022 | June 30, 2021 | June 30, 2020 | June 30, 2019 | ||||||||||||||||
| Square gross profit from Banking |
$ | 166,526 | $ | 134,255 | $ | 86,617 | $ | 33,817 | $ | 49,983 | ||||||||||
| Less: gross profit from Paycheck Protection Program (PPP) loan forgiveness |
388 | 9,146 | 14,880 | — | — | |||||||||||||||
|
|
|
|
|
|
|
|
|
|
||||||||||||
| Square banking gross profit excluding PPP |
166,138 | 125,109 | 71,737 | 33,817 | 49,983 | |||||||||||||||
|
|
|
|
|
|
|
|
|
|
||||||||||||
|
|
BLOCK Q2 2023 29 |
Adjusted Net Income and
Adjusted EPS
UNAUDITED
In thousands, except per share data
| THREE MONTHS ENDED | SIX MONTHS ENDED | |||||||||||||||
| June 30, 2023 | June 30, 2022 | June 30, 2023 | June 30, 2022 | |||||||||||||
| Net loss attributable to common stockholders |
$ | (122,506) | $ | (208,014) | $ | (139,344) | $ | (412,213) | ||||||||
| Net loss attributable to noncontrolling interests |
(3,336) | (1,263) | (5,824) | (4,427) | ||||||||||||
|
|
|
|
|
|
|
|
||||||||||
| Net loss |
(125,842) | (209,277) | (145,168) | (416,640) | ||||||||||||
| Share-based compensation expense |
319,248 | 256,638 | 598,839 | 532,061 | ||||||||||||
| Acquisition-related, integration and other costs |
102,349 | 17,067 | 103,900 | 93,132 | ||||||||||||
| Amortization of intangible assets |
55,257 | 57,288 | 110,852 | 99,421 | ||||||||||||
| Amortization of debt discount and issuance costs |
2,885 | 3,826 | 5,834 | 7,456 | ||||||||||||
| Loss (gain) on revaluation of equity investments |
1,370 | 5,115 | 16,255 | (44,626) | ||||||||||||
| Bitcoin impairment losses |
— | 35,961 | — | 35,961 | ||||||||||||
| Loss on disposal of property and equipment |
343 | 548 | 534 | 1,082 | ||||||||||||
| Acquired deferred revenue and cost adjustment |
24 | 62 | 57 | 134 | ||||||||||||
| Tax effect of non-GAAP net income adjustments |
(109,647) | (57,734) | (194,254) | (96,060) | ||||||||||||
|
|
|
|
|
|
|
|
||||||||||
| Adjusted Net Income (Loss) - basic |
$ | 245,987 | $ | 109,494 | $ | 496,849 | $ | 211,921 | ||||||||
|
|
|
|
|
|
|
|
||||||||||
| Cash interest expense on convertible notes |
$ | 958 | $ | 1,247 | $ | 2,194 | $ | 2,488 | ||||||||
| Adjusted Net Income - diluted |
$ | 246,945 | $ | 110,741 | $ | 499,043 | $ | 214,409 | ||||||||
|
|
|
|
|
|
|
|
||||||||||
| Weighted-average shares used to compute net income per share attributable to common stockholders: |
||||||||||||||||
| Basic |
606,692 | 581,350 | 604,476 | 561,501 | ||||||||||||
|
|
|
|
|
|
|
|
||||||||||
| Diluted |
606,692 | 581,350 | 604,476 | 561,501 | ||||||||||||
|
|
|
|
|
|
|
|
||||||||||
| Net loss per share attributable to common stockholders: |
||||||||||||||||
| Basic |
$ | (0.20) | $ | (0.36) | $ | (0.23) | $ | (0.73) | ||||||||
|
|
|
|
|
|
|
|
||||||||||
| Diluted |
$ | (0.20) | $ | (0.36) | $ | (0.23) | $ | (0.73) | ||||||||
|
|
|
|
|
|
|
|
||||||||||
| Weighted-average shares used to compute Adjusted Net Income Per Share: |
||||||||||||||||
| Basic |
606,692 | 581,350 | 604,476 | 561,501 | ||||||||||||
|
|
|
|
|
|
|
|
||||||||||
| Diluted |
626,669 | 619,272 | 627,153 | 602,002 | ||||||||||||
|
|
|
|
|
|
|
|
||||||||||
| Adjusted Net Income Per Share: |
||||||||||||||||
| Basic |
$ | 0.41 | $ | 0.19 | $ | 0.82 | $ | 0.38 | ||||||||
|
|
|
|
|
|
|
|
||||||||||
| Diluted |
$ | 0.39 | $ | 0.18 | $ | 0.80 | $ | 0.36 | ||||||||
|
|
|
|
|
|
|
|
||||||||||
|
|
BLOCK Q2 2023 30 |
Non-GAAP Operating Expenses
UNAUDITED
In thousands
| THREE MONTHS ENDED | SIX MONTHS ENDED | |||||||||||||||
| June 30, 2023 | June 30, 2022 | June 30, 2023 | June 30, 2022 | |||||||||||||
| Operating expenses |
$ | (1,998,208) | $ | (1,683,421) | $ | (3,718,964) | $ | (3,205,170) | ||||||||
| Share-based compensation |
319,106 | 256,499 | 598,555 | 531,813 | ||||||||||||
| Depreciation and amortization |
74,961 | 72,715 | 148,912 | 127,302 | ||||||||||||
| Bitcoin impairment losses |
— | 35,961 | — | 35,961 | ||||||||||||
| Loss on disposal of property and equipment |
343 | 548 | 534 | 1,082 | ||||||||||||
| Acquisition related, integration and other costs |
102,349 | 17,067 | 103,900 | 93,132 | ||||||||||||
|
|
|
|
|
|
|
|
||||||||||
| Non-GAAP operating expenses |
$ | (1,501,449) | $ | (1,300,631) | $ | (2,867,063) | $ | (2,415,880) | ||||||||
|
|
|
|
|
|
|
|
||||||||||
| THREE MONTHS ENDED | SIX MONTHS ENDED | |||||||||||||||
| June 30, 2023 | June 30, 2022 | June 30, 2023 | June 30, 2022 | |||||||||||||
| Product development |
$ | (694,672) | $ | (524,827) | $ | (1,321,609) | $ | (983,051) | ||||||||
| Share-based compensation |
223,411 | 179,137 | 421,268 | 324,212 | ||||||||||||
| Depreciation and amortization |
41,829 | 33,705 | 72,366 | 60,556 | ||||||||||||
| Loss on disposal of property and equipment |
(12) | 29 | 312 | 10 | ||||||||||||
|
|
|
|
|
|
|
|
||||||||||
| Non-GAAP product development |
$ | (429,444) | $ | (311,956) | $ | (827,663) | $ | (598,273) | ||||||||
|
|
|
|
|
|
|
|
||||||||||
| THREE MONTHS ENDED | SIX MONTHS ENDED | |||||||||||||||
| June 30, 2023 | June 30, 2022 | June 30, 2023 | June 30, 2022 | |||||||||||||
| Sales and marketing |
$ | (537,607) | $ | (530,827) | $ | (1,033,618) | $ | (1,032,389) | ||||||||
| Share-based compensation |
32,790 | 25,133 | 62,155 | 46,389 | ||||||||||||
| Depreciation and amortization |
1,970 | 1,438 | 3,428 | 2,929 | ||||||||||||
| Loss on disposal of property and equipment |
— | 80 | — | 500 | ||||||||||||
|
|
|
|
|
|
|
|
||||||||||
| Non-GAAP sales and marketing |
$ | (502,847) | $ | (504,176) | $ | (968,035) | $ | (982,571) | ||||||||
|
|
|
|
|
|
|
|
||||||||||
| THREE MONTHS ENDED | SIX MONTHS ENDED | |||||||||||||||
| June 30, 2023 | June 30, 2022 | June 30, 2023 | June 30, 2022 | |||||||||||||
| General and administrative |
$ | (549,293) | $ | (395,720) | $ | (982,118) | $ | (839,869) | ||||||||
| Share-based compensation |
62,905 | 52,229 | 115,132 | 161,212 | ||||||||||||
| Depreciation and amortization |
6,228 | 13,036 | 23,107 | 20,388 | ||||||||||||
| Loss on disposal of property and equipment |
355 | 439 | 222 | 572 | ||||||||||||
| Acquisition related, integration and other costs |
102,349 | 17,067 | 103,900 | 93,132 | ||||||||||||
|
|
|
|
|
|
|
|
||||||||||
| Non-GAAP general and administrative |
$ | (377,456) | $ | (312,949) | $ | (739,757) | $ | (564,565) | ||||||||
|
|
|
|
|
|
|
|
||||||||||
| Depreciation and Amortization by Function UNAUDITED In thousands |
|
|||||||||||||||
| THREE MONTHS ENDED | SIX MONTHS ENDED | |||||||||||||||
| June 30, 2023 | June 30, 2022 | June 30, 2023 | June 30, 2022 | |||||||||||||
| Cost of revenue |
$ | 19,584 | $ | 18,124 | $ | 38,806 | $ | 33,593 | ||||||||
| Product development |
41,829 | 33,705 | 72,366 | 60,556 | ||||||||||||
| Sales and marketing |
1,970 | 1,438 | 3,428 | 2,929 | ||||||||||||
| General and administrative |
6,228 | 13,036 | 23,107 | 20,388 | ||||||||||||
| Amortization of acquired customer assets |
24,934 | 24,536 | 50,011 | 43,429 | ||||||||||||
|
|
|
|
|
|
|
|
||||||||||
| Total depreciation and amortization |
$ | 94,545 | $ | 90,839 | $ | 187,718 | $ | 160,895 | ||||||||
|
|
|
|
|
|
|
|
||||||||||
|
|
BLOCK Q2 2023 31 |